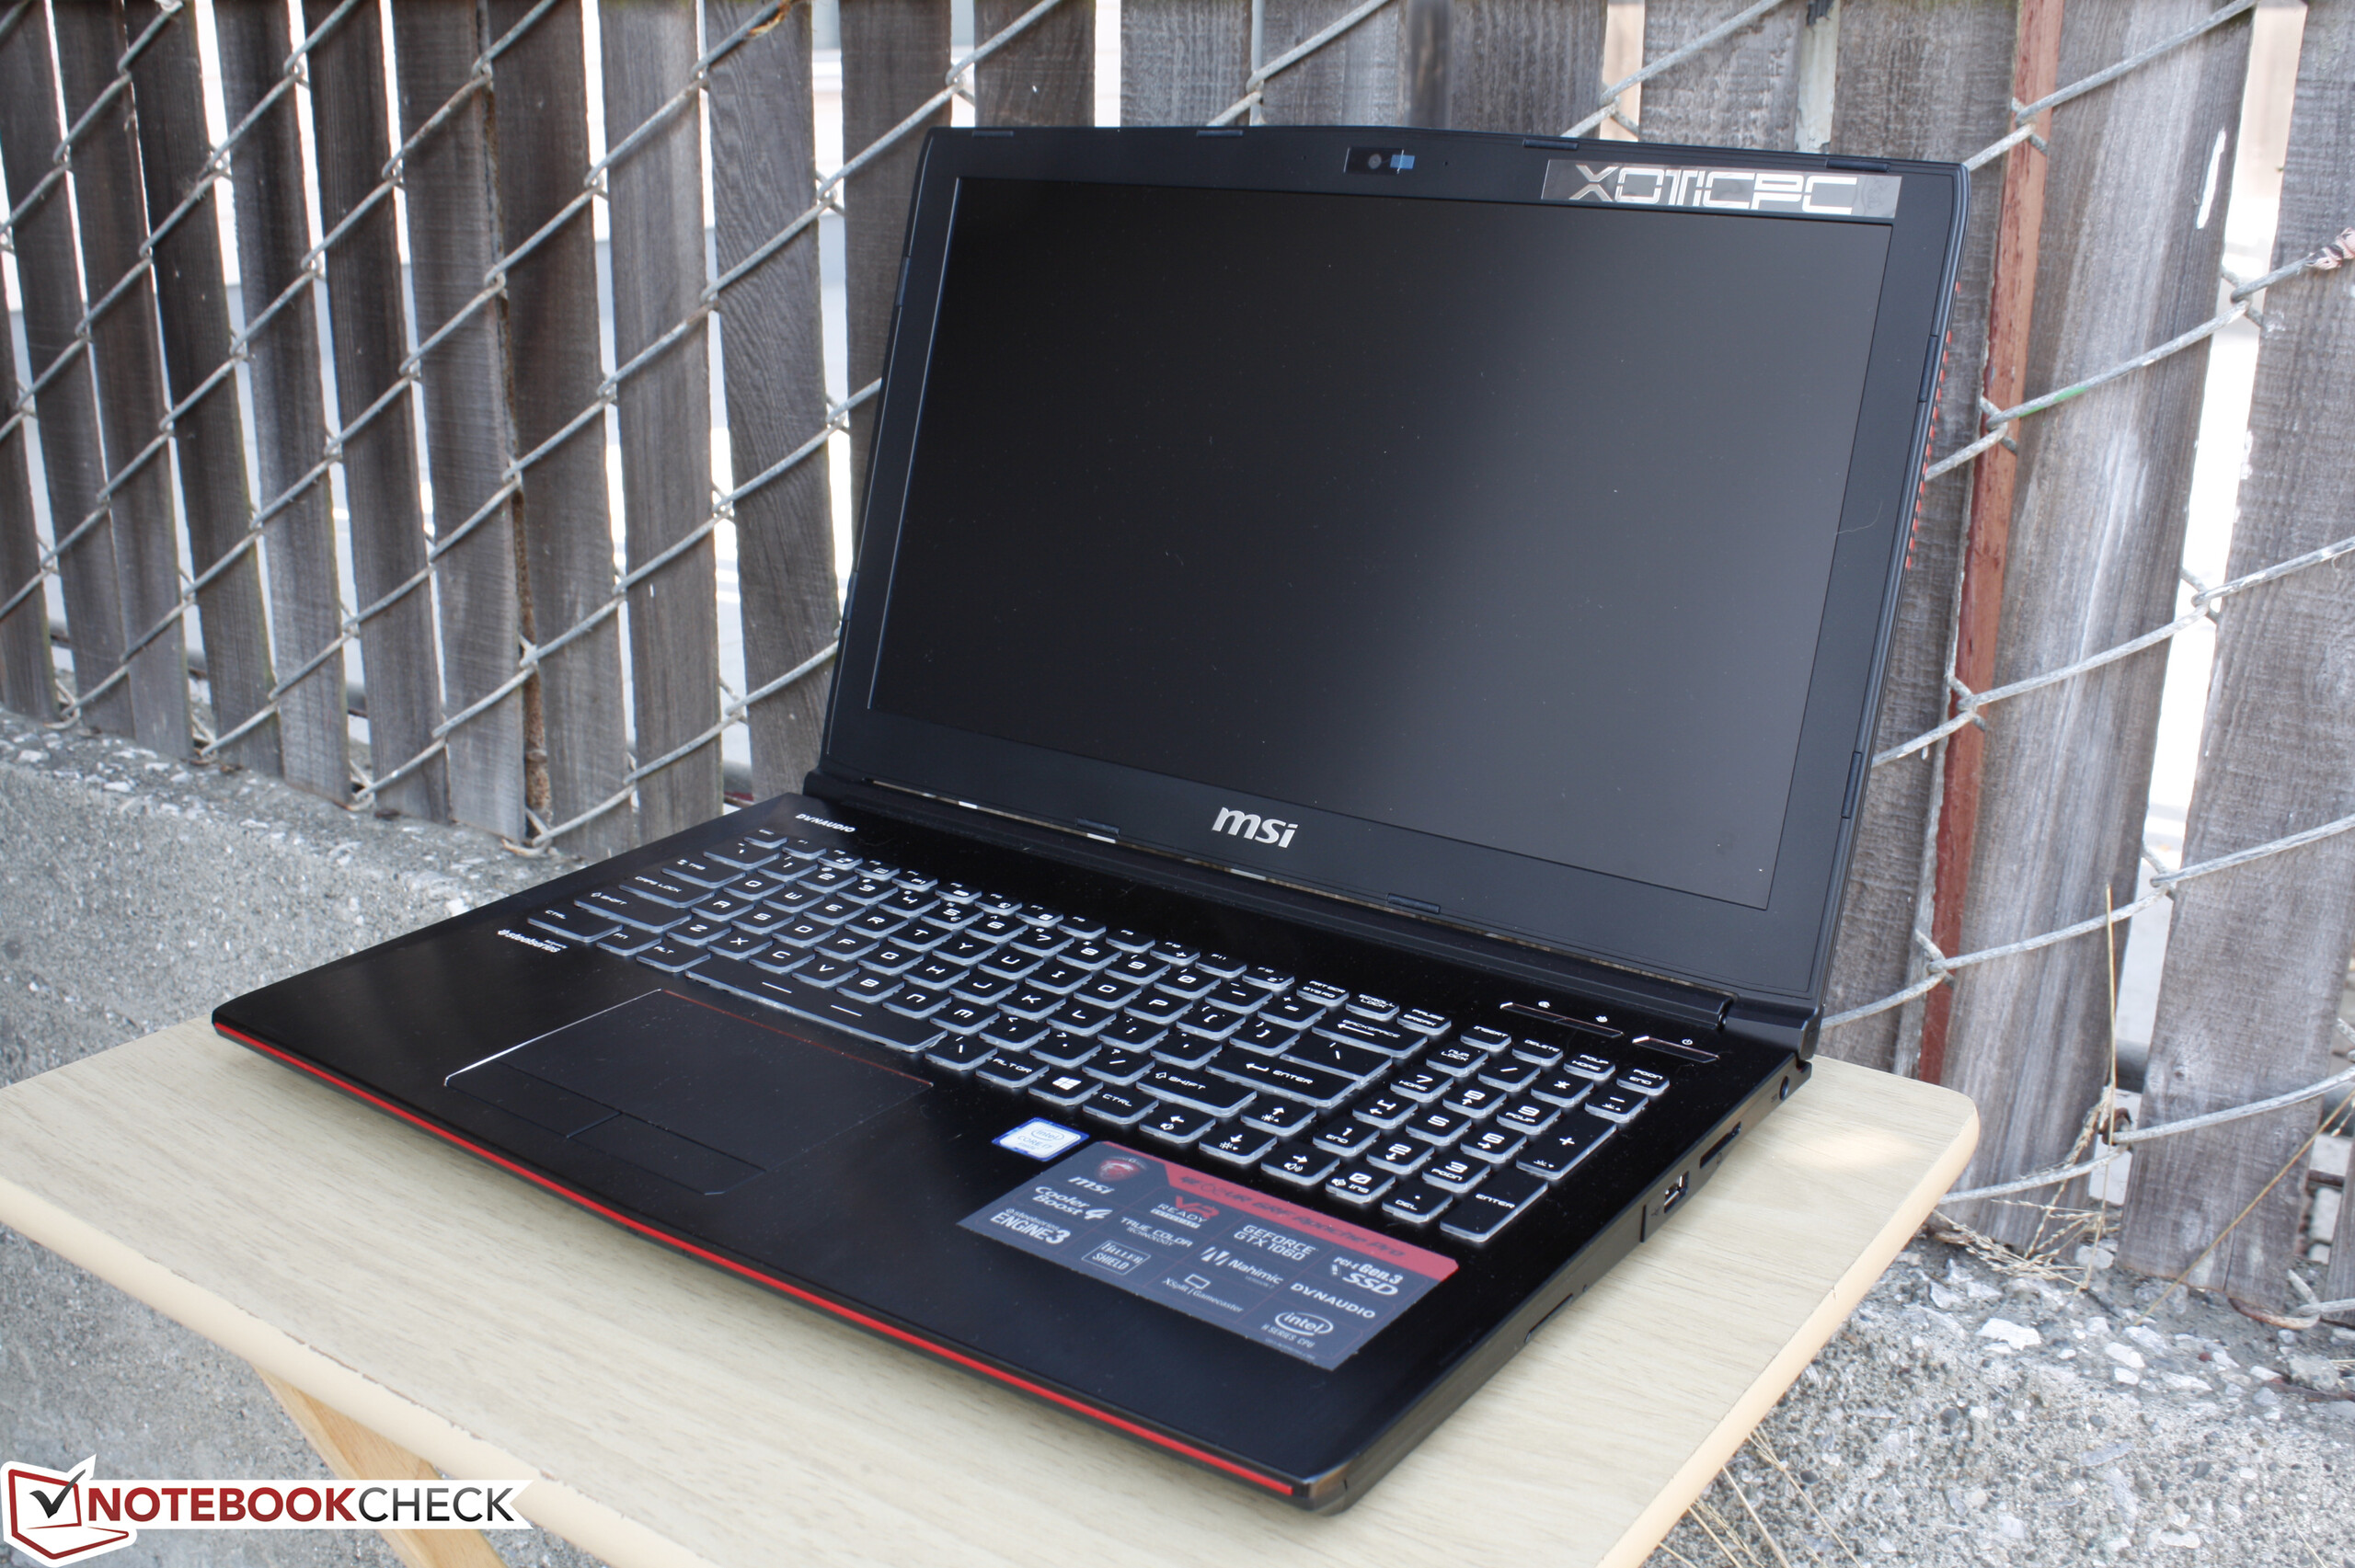
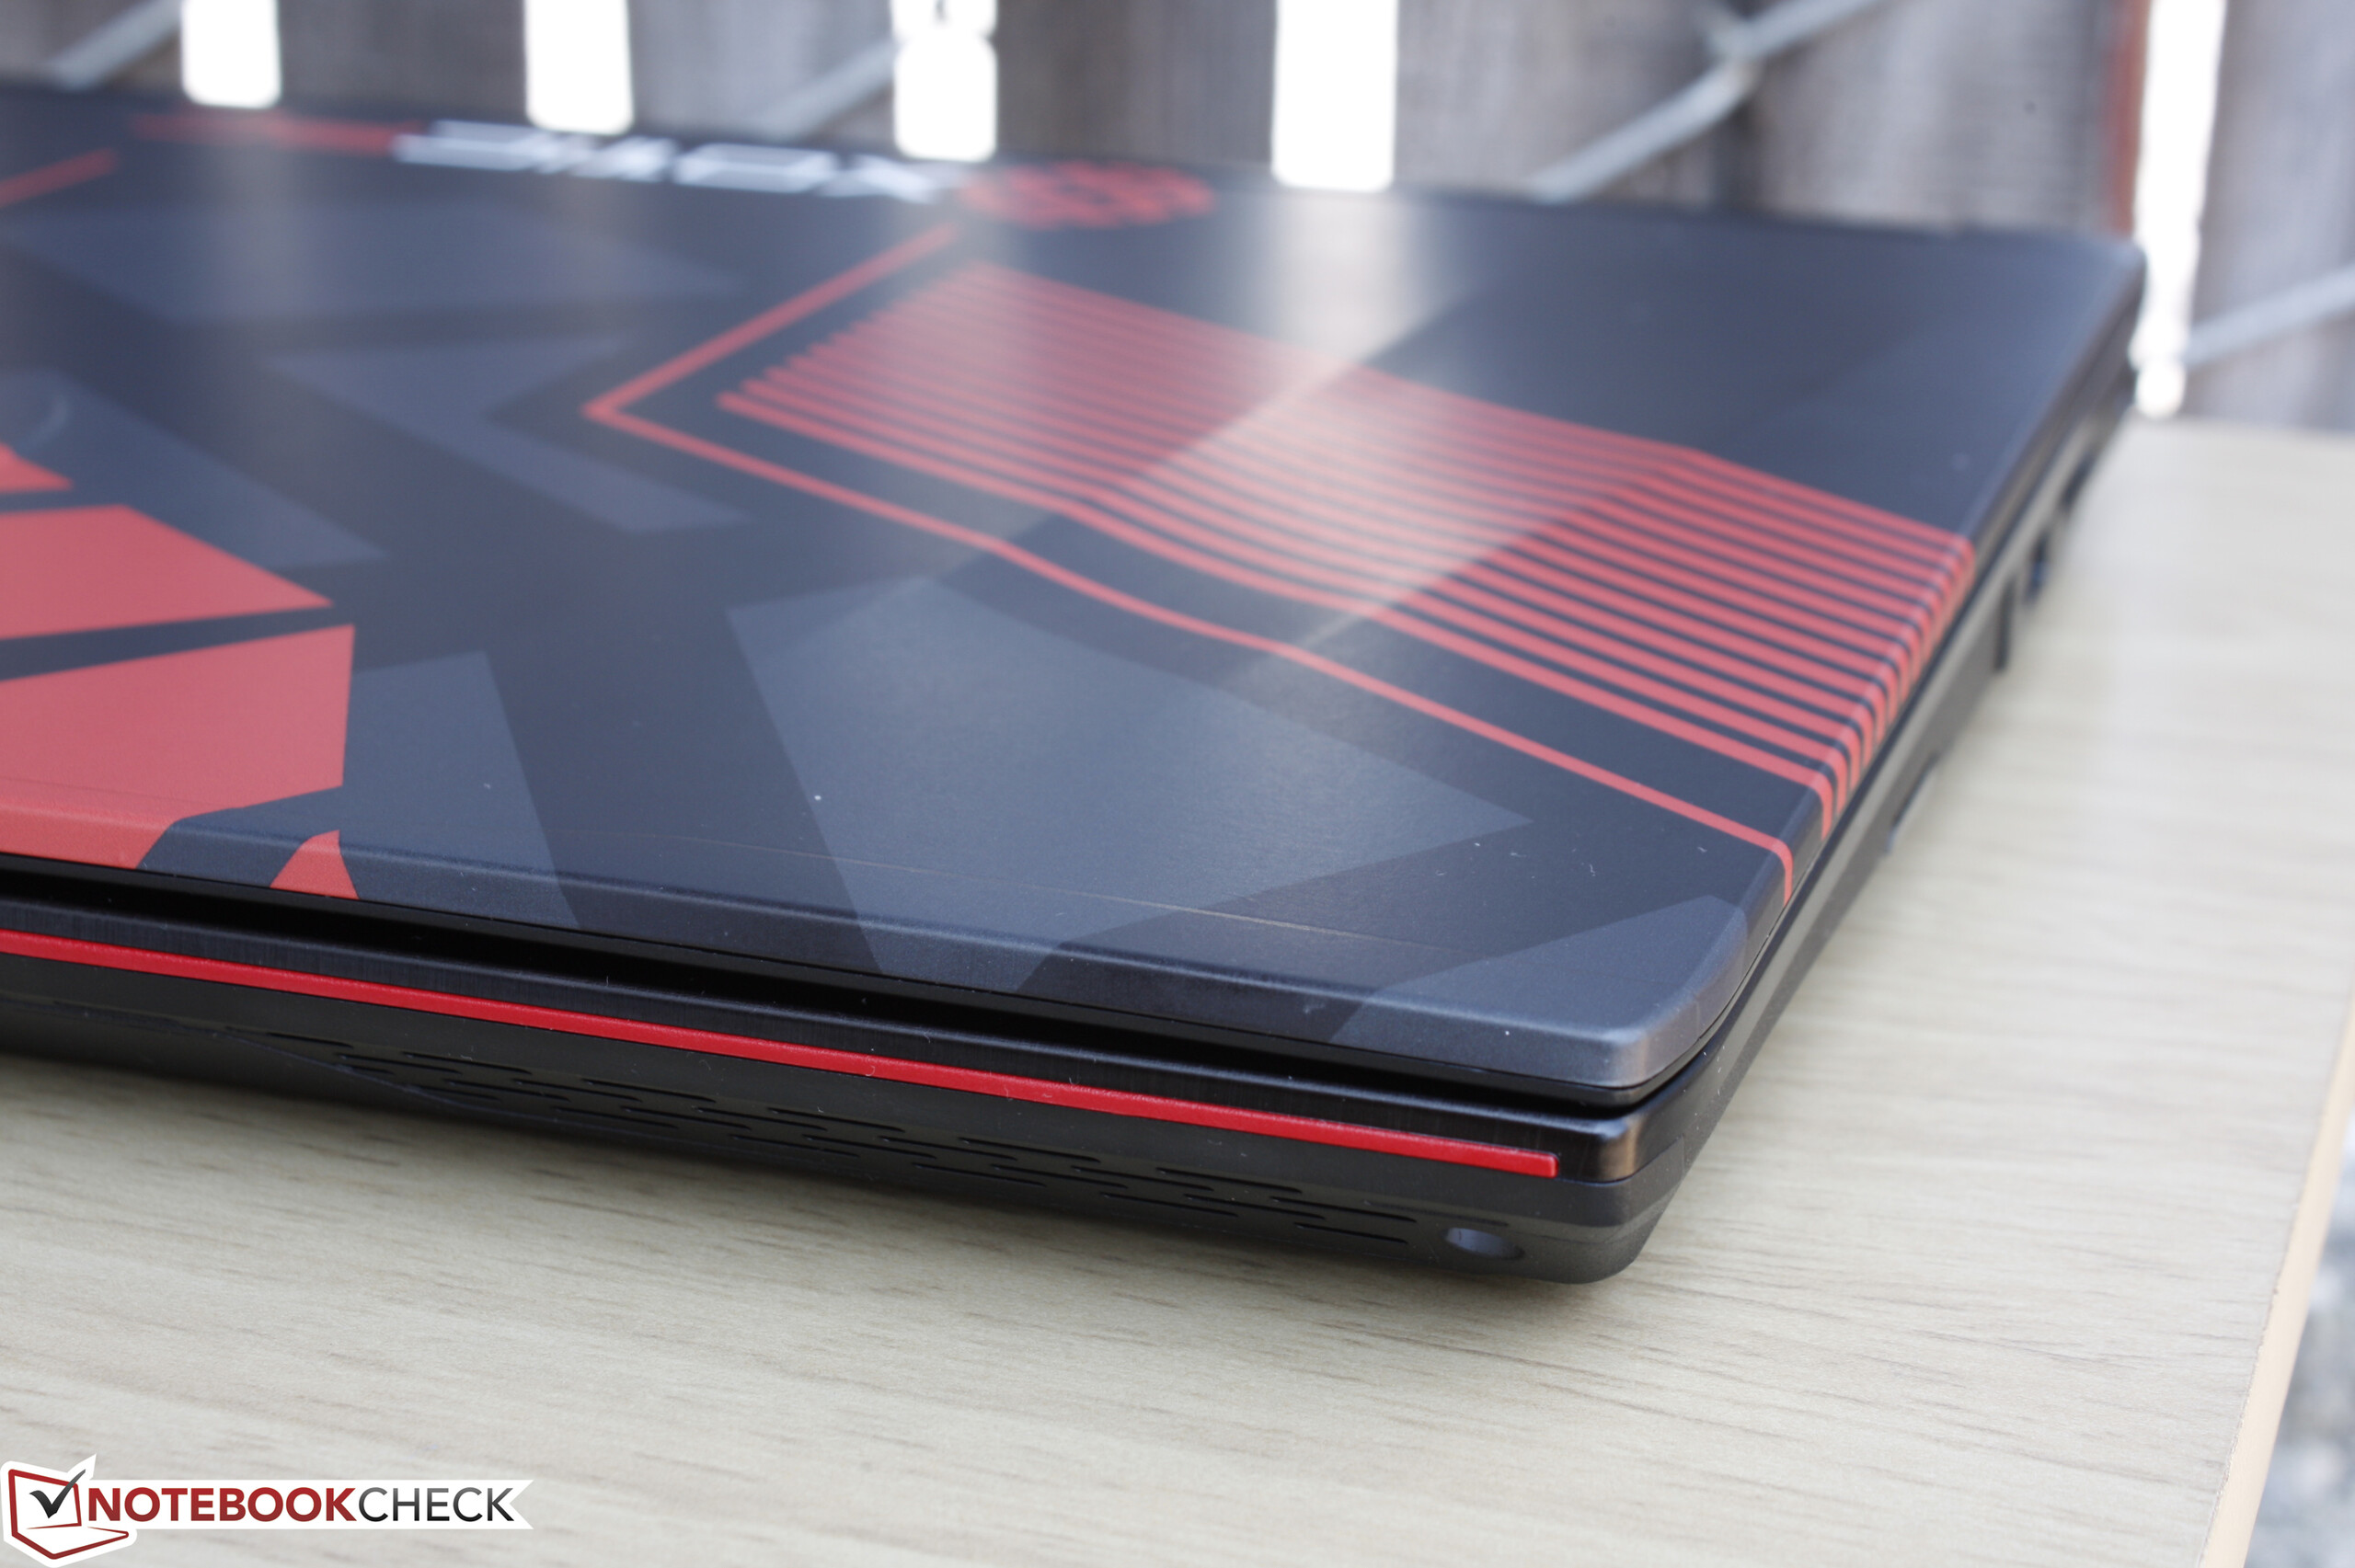
Breve análisis del MSI GE62VR 6RF Apache Xotic PC Edition
| SD Card Reader | |
| average JPG Copy Test (av. of 3 runs) | |
| MSI GT72VR 6RE-015US | |
| MSI GE62VR 6RF-001US | |
| MSI GS43VR 6RE-006US | |
| maximum AS SSD Seq Read Test (1GB) | |
| MSI GT72VR 6RE-015US | |
| MSI GS43VR 6RE-006US | |
| MSI GE62VR 6RF-001US | |
| Networking | |
| iperf Server (receive) TCP 1 m 512KB | |
| MSI GE62VR 6RF-001US | |
| iperf Client (transmit) TCP 1 m 512KB | |
| MSI GE62VR 6RF-001US | |
| |||||||||||||||||||||||||
iluminación: 87 %
Brillo con batería: 302 cd/m²
Contraste: 1787:1 (Negro: 0.169 cd/m²)
ΔE ColorChecker Calman: 4.61 | ∀{0.5-29.43 Ø4.71}
ΔE Greyscale Calman: 3.32 | ∀{0.09-98 Ø4.96}
84.4% sRGB (Argyll 1.6.3 3D)
55.4% AdobeRGB 1998 (Argyll 1.6.3 3D)
61.7% AdobeRGB 1998 (Argyll 3D)
84.3% sRGB (Argyll 3D)
65.6% Display P3 (Argyll 3D)
Gamma: 2.24
CCT: 6358 K
| MSI GE62VR 6RF-001US IPS, 15.6", 1920x1080 | MSI GT62VR-6RE16H21 LG Philips LP156WF6 (LGD046F), IPS, 15.6", 1920x1080 | Asus Strix GL502VS-FY032T LG Philips LP156WF6-SPB6 (LGD046F), IPS, 15.6", 1920x1080 | Dell XPS 15 9550 i7 FHD IPS, 15.6", 1920x1080 | Asus ZenBook Pro UX501VW-DS71T IPS, 15.6", 3840x2160 | |
|---|---|---|---|---|---|
| Display | -1% | -1% | 11% | 4% | |
| Display P3 Coverage (%) | 65.6 | 64.6 -2% | 64.5 -2% | 68.5 4% | 64.3 -2% |
| sRGB Coverage (%) | 84.3 | 84.6 0% | 83.1 -1% | 97.2 15% | 89.9 7% |
| AdobeRGB 1998 Coverage (%) | 61.7 | 61.8 0% | 60.8 -1% | 70.4 14% | 65.4 6% |
| Response Times | 13% | 5% | -82% | -10% | |
| Response Time Grey 50% / Grey 80% * (ms) | 36.8 ? | 34 ? 8% | 38 ? -3% | 64 ? -74% | 43.2 ? -17% |
| Response Time Black / White * (ms) | 26.4 ? | 22 ? 17% | 23 ? 13% | 50 ? -89% | 27.2 ? -3% |
| PWM Frequency (Hz) | |||||
| Screen | -7% | -16% | -14% | -39% | |
| Brightness middle (cd/m²) | 302 | 273 -10% | 315 4% | 371.5 23% | 252.9 -16% |
| Brightness (cd/m²) | 303 | 278 -8% | 290 -4% | 356 17% | 250 -17% |
| Brightness Distribution (%) | 87 | 88 1% | 85 -2% | 92 6% | 89 2% |
| Black Level * (cd/m²) | 0.169 | 0.27 -60% | 0.32 -89% | 0.252 -49% | 0.5 -196% |
| Contrast (:1) | 1787 | 1011 -43% | 984 -45% | 1474 -18% | 506 -72% |
| Colorchecker dE 2000 * | 4.61 | 3.67 20% | 4.88 -6% | 5.55 -20% | 5.22 -13% |
| Colorchecker dE 2000 max. * | 9.98 | 8.33 17% | 8.88 11% | 10.95 -10% | 8.33 17% |
| Greyscale dE 2000 * | 3.32 | 2.73 18% | 4.17 -26% | 7.1 -114% | 6.74 -103% |
| Gamma | 2.24 98% | 2.49 88% | 2.53 87% | 2.1 105% | 2.45 90% |
| CCT | 6358 102% | 7029 92% | 6683 97% | 6026 108% | |
| Color Space (Percent of AdobeRGB 1998) (%) | 55.4 | 55 -1% | 55 -1% | 63.4 14% | 58.4 5% |
| Color Space (Percent of sRGB) (%) | 84.4 | 84 0% | 83 -2% | 97.9 16% | 89.7 6% |
| Media total (Programa/Opciones) | 2% /
-3% | -4% /
-10% | -28% /
-18% | -15% /
-26% |
* ... más pequeño es mejor
Tiempos de respuesta del display
| ↔ Tiempo de respuesta de Negro a Blanco | ||
|---|---|---|
| 26.4 ms ... subida ↗ y bajada ↘ combinada | ↗ 5.2 ms subida | 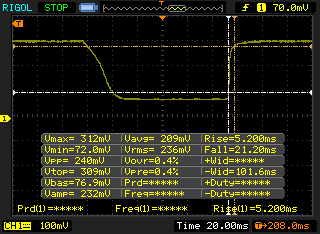 |
| ↘ 21.2 ms bajada | ||
| La pantalla mostró tiempos de respuesta relativamente lentos en nuestros tests pero podría ser demasiado lenta para los jugones. En comparación, todos los dispositivos de prueba van de ##min### (mínimo) a 240 (máximo) ms. » 66 % de todos los dispositivos son mejores. Eso quiere decir que el tiempo de respuesta es peor que la media (19.8 ms) de todos los dispositivos testados. | ||
| ↔ Tiempo de respuesta 50% Gris a 80% Gris | ||
| 36.8 ms ... subida ↗ y bajada ↘ combinada | ↗ 16.4 ms subida | 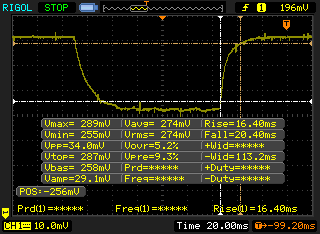 |
| ↘ 20.4 ms bajada | ||
| La pantalla mostró tiempos de respuesta lentos en nuestros tests y podría ser demasiado lenta para los jugones. En comparación, todos los dispositivos de prueba van de ##min### (mínimo) a 636 (máximo) ms. » 53 % de todos los dispositivos son mejores. Eso quiere decir que el tiempo de respuesta es peor que la media (30.9 ms) de todos los dispositivos testados. | ||
Parpadeo de Pantalla / PWM (Pulse-Width Modulation)
| Parpadeo de Pantalla / PWM no detectado | 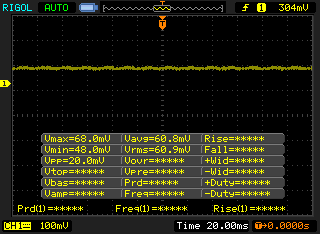 | ||
Comparación: 52 % de todos los dispositivos testados no usaron PWM para atenuar el display. Si se usó, medimos una media de 7748 (mínimo: 5 - máxmo: 343500) Hz. | |||
| Cinebench R15 | |
| CPU Single 64Bit | |
| DogHouse Systems Mobius SS | |
| MSI GT73VR-6RE16SR451 | |
| MSI GE62 2QC-468XPL | |
| Toshiba Tecra Z40-C-11F | |
| MSI GE62VR 6RF-001US | |
| Lenovo IdeaPad Y50 | |
| CPU Multi 64Bit | |
| DogHouse Systems Mobius SS | |
| MSI GT73VR-6RE16SR451 | |
| MSI GE62 2QC-468XPL | |
| MSI GE62VR 6RF-001US | |
| Lenovo IdeaPad Y50 | |
| Toshiba Tecra Z40-C-11F | |
| Cinebench R11.5 | |
| CPU Single 64Bit | |
| DogHouse Systems Mobius SS | |
| MSI GT73VR-6RE16SR451 | |
| MSI GE62 2QC-468XPL | |
| MSI GE62VR 6RF-001US | |
| Lenovo IdeaPad Y50 | |
| CPU Multi 64Bit | |
| DogHouse Systems Mobius SS | |
| MSI GT73VR-6RE16SR451 | |
| MSI GE62 2QC-468XPL | |
| MSI GE62VR 6RF-001US | |
| Lenovo IdeaPad Y50 | |
| Cinebench R10 | |
| Rendering Multiple CPUs 32Bit | |
| DogHouse Systems Mobius SS | |
| MSI GE62 2QC-468XPL | |
| MSI GE62VR 6RF-001US | |
| Lenovo IdeaPad Y50 | |
| Rendering Single 32Bit | |
| DogHouse Systems Mobius SS | |
| MSI GE62 2QC-468XPL | |
| MSI GE62VR 6RF-001US | |
| Lenovo IdeaPad Y50 | |
| wPrime 2.10 - 1024m | |
| Toshiba Tecra Z40-C-11F | |
| Lenovo IdeaPad Y50 | |
| MSI GE62VR 6RF-001US | |
| MSI GE62 2QC-468XPL | |
| DogHouse Systems Mobius SS | |
| Super Pi Mod 1.5 XS 32M - 32M | |
| MSI GE62VR 6RF-001US | |
| MSI GE62 2QC-468XPL | |
| Toshiba Tecra Z40-C-11F | |
| Lenovo IdeaPad Y50 | |
| DogHouse Systems Mobius SS | |
* ... más pequeño es mejor
| PCMark 8 | |
| Home Score Accelerated v2 | |
| Asus Strix GL502VS-FY032T | |
| MSI GE62VR 6RF-001US | |
| HP Omen 15-ax007ng | |
| Dell XPS 15 9550 i7 FHD | |
| Work Score Accelerated v2 | |
| MSI GE62VR 6RF-001US | |
| Asus Strix GL502VS-FY032T | |
| HP Omen 15-ax007ng | |
| Dell XPS 15 9550 i7 FHD | |
| Creative Score Accelerated v2 | |
| MSI GE62VR 6RF-001US | |
| HP Omen 15-ax007ng | |
| Dell XPS 15 9550 i7 FHD | |
| PCMark 8 Home Score Accelerated v2 | 4059 puntos | |
| PCMark 8 Creative Score Accelerated v2 | 5136 puntos | |
| PCMark 8 Work Score Accelerated v2 | 5046 puntos | |
ayuda | ||
| MSI GE62VR 6RF-001US Samsung SM951 MZVPV512HDGL m.2 PCI-e | Asus Strix GL502VS-FY032T SanDisk SD8SNAT256G1002 | MSI GT62VR-6RE16H21 Toshiba HG6 THNSNJ256G8NY | Dell XPS 15 9550 i7 FHD Samsung PM951 NVMe 512 GB | Asus ZenBook Pro UX501VW-DS71T Samsung SM951 MZVPV512HDGL m.2 PCI-e | |
|---|---|---|---|---|---|
| CrystalDiskMark 3.0 | -65% | -57% | -30% | -5% | |
| Read Seq (MB/s) | 1696 | 485.4 -71% | 523 -69% | 1291 -24% | 1633 -4% |
| Write Seq (MB/s) | 1584 | 312.4 -80% | 485.5 -69% | 590 -63% | 1579 0% |
| Read 512 (MB/s) | 1044 | 294.8 -72% | 444.7 -57% | 632 -39% | 1068 2% |
| Write 512 (MB/s) | 1562 | 287.8 -82% | 471.2 -70% | 588 -62% | 1570 1% |
| Read 4k (MB/s) | 50.8 | 21.44 -58% | 21.86 -57% | 41.4 -19% | 50.4 -1% |
| Write 4k (MB/s) | 139.2 | 75.7 -46% | 98.8 -29% | 132.4 -5% | 128.6 -8% |
| Read 4k QD32 (MB/s) | 591 | 149.4 -75% | 350.3 -41% | 542 -8% | 534 -10% |
| Write 4k QD32 (MB/s) | 422.8 | 256.3 -39% | 162.2 -62% | 343.8 -19% | 344 -19% |

| 3DMark 11 Performance | 12762 puntos | |
| 3DMark Ice Storm Standard Score | 84062 puntos | |
| 3DMark Cloud Gate Standard Score | 21817 puntos | |
| 3DMark Fire Strike Score | 9873 puntos | |
| 3DMark Fire Strike Extreme Score | 5261 puntos | |
ayuda | ||
| Fallout 4 - 1920x1080 Ultra Preset AA:T AF:16x | |
| MSI GT62VR-6RE16H21 | |
| Zotac ZBOX Magnus EN980-U | |
| MSI GE62VR 6RF-001US | |
| Asus Strix GL502VY-DS71 | |
| MSI GS73VR 6RF | |
| Asus Strix GL502VT-DS74 | |
| BioShock Infinite - 1920x1080 Ultra Preset, DX11 (DDOF) | |
| MSI GT62VR-6RE16H21 | |
| Zotac ZBOX Magnus EN980-U | |
| MSI GS73VR 6RF | |
| MSI GE62VR 6RF-001US | |
| Asus Strix GL502VY-DS71 | |
| Asus Strix GL502VT-DS74 | |
| Guild Wars 2 - 1920x1080 All Maximum / On AA:FX | |
| Zotac ZBOX Magnus EN980-U | |
| MSI GE62VR 6RF-001US | |
| MSI GS73VR 6RF | |
| Metro: Last Light - 1920x1080 Very High (DX11) AF:16x | |
| MSI GT62VR-6RE16H21 | |
| Zotac ZBOX Magnus EN980-U | |
| MSI GS73VR 6RF | |
| MSI GE62VR 6RF-001US | |
| Asus Strix GL502VT-DS74 | |
| Thief - 1920x1080 Very High Preset AA:FXAA & High SS AF:8x | |
| Zotac ZBOX Magnus EN980-U | |
| MSI GT62VR-6RE16H21 | |
| MSI GE62VR 6RF-001US | |
| MSI GS73VR 6RF | |
| Asus Strix GL502VY-DS71 | |
| Asus Strix GL502VT-DS74 | |
| Batman: Arkham Knight - 1920x1080 High / On AA:SM AF:16x | |
| MSI GT62VR-6RE16H21 | |
| Zotac ZBOX Magnus EN980-U | |
| MSI GS73VR 6RF | |
| MSI GE62VR 6RF-001US | |
| Asus Strix GL502VT-DS74 | |
| Metal Gear Solid V - 1920x1080 Extra High / On | |
| Asus Strix GL502VT-DS74 | |
| Asus Strix GL502VY-DS71 | |
| Zotac ZBOX Magnus EN980-U | |
| MSI GS73VR 6RF | |
| MSI GE62VR 6RF-001US | |
| Rise of the Tomb Raider - 1920x1080 Very High Preset AA:FX AF:16x | |
| MSI GT62VR-6RE16H21 | |
| Zotac ZBOX Magnus EN980-U | |
| MSI GS73VR 6RF | |
| Asus Strix GL502VY-DS71 | |
| MSI GE62VR 6RF-001US | |
| Asus Strix GL502VT-DS74 | |
| Doom - 1920x1080 Ultra Preset AA:SM | |
| MSI GT62VR-6RE16H21 | |
| MSI GE62VR 6RF-001US | |
| MSI GS73VR 6RF | |
| Asus Strix GL502VY-DS71 | |
| Overwatch - 1920x1080 Epic (Render Scale 100 %) AA:SM AF:16x | |
| MSI GT62VR-6RE16H21 | |
| Zotac ZBOX Magnus EN980-U | |
| MSI GE62VR 6RF-001US | |
| MSI GS73VR 6RF | |
| Asus Strix GL502VY-DS71 | |
| bajo | medio | alto | ultra | |
|---|---|---|---|---|
| Guild Wars 2 (2012) | 57.4 | |||
| BioShock Infinite (2013) | 97.7 | |||
| Metro: Last Light (2013) | 68.3 | |||
| Thief (2014) | 67.9 | |||
| Batman: Arkham Knight (2015) | 83 | 45 | ||
| Metal Gear Solid V (2015) | 60 | |||
| Fallout 4 (2015) | 63.9 | |||
| Rise of the Tomb Raider (2016) | 52 | |||
| Doom (2016) | 82.1 | |||
| Overwatch (2016) | 108.5 |
Ruido
| Ocioso |
| 32.8 / 32.9 / 32.9 dB(A) |
| Carga |
| 41.6 / 55 dB(A) |
 | ||
30 dB silencioso 40 dB(A) audible 50 dB(A) ruidosamente alto |
||
min: | ||
| MSI GE62VR 6RF-001US GeForce GTX 1060 Mobile, 6700HQ, Samsung SM951 MZVPV512HDGL m.2 PCI-e | MSI GT62VR-6RE16H21 GeForce GTX 1070 Mobile, 6700HQ, Toshiba HG6 THNSNJ256G8NY | Asus Strix GL502VS-FY032T GeForce GTX 1070 Mobile, 6700HQ, SanDisk SD8SNAT256G1002 | MSI GE62-6QD16H11 GeForce GTX 960M, 6700HQ, Samsung SSD 850 EVO M.2 250 GB | Asus ZenBook Pro UX501VW-DS71T GeForce GTX 960M, 6700HQ, Samsung SM951 MZVPV512HDGL m.2 PCI-e | |
|---|---|---|---|---|---|
| Noise | 2% | 1% | -1% | 10% | |
| apagado / medio ambiente * (dB) | 28.2 | 30 -6% | 30 -6% | ||
| Idle Minimum * (dB) | 32.8 | 32 2% | 32 2% | 33 -1% | 28.9 12% |
| Idle Average * (dB) | 32.9 | 33 -0% | 33 -0% | 34 -3% | 28.9 12% |
| Idle Maximum * (dB) | 32.9 | 34 -3% | 34 -3% | 38 -16% | 30.2 8% |
| Load Average * (dB) | 41.6 | 40 4% | 39 6% | 42 -1% | 41.8 -0% |
| Load Maximum * (dB) | 55 | 46 16% | 51 7% | 46 16% | 43.9 20% |
* ... más pequeño es mejor
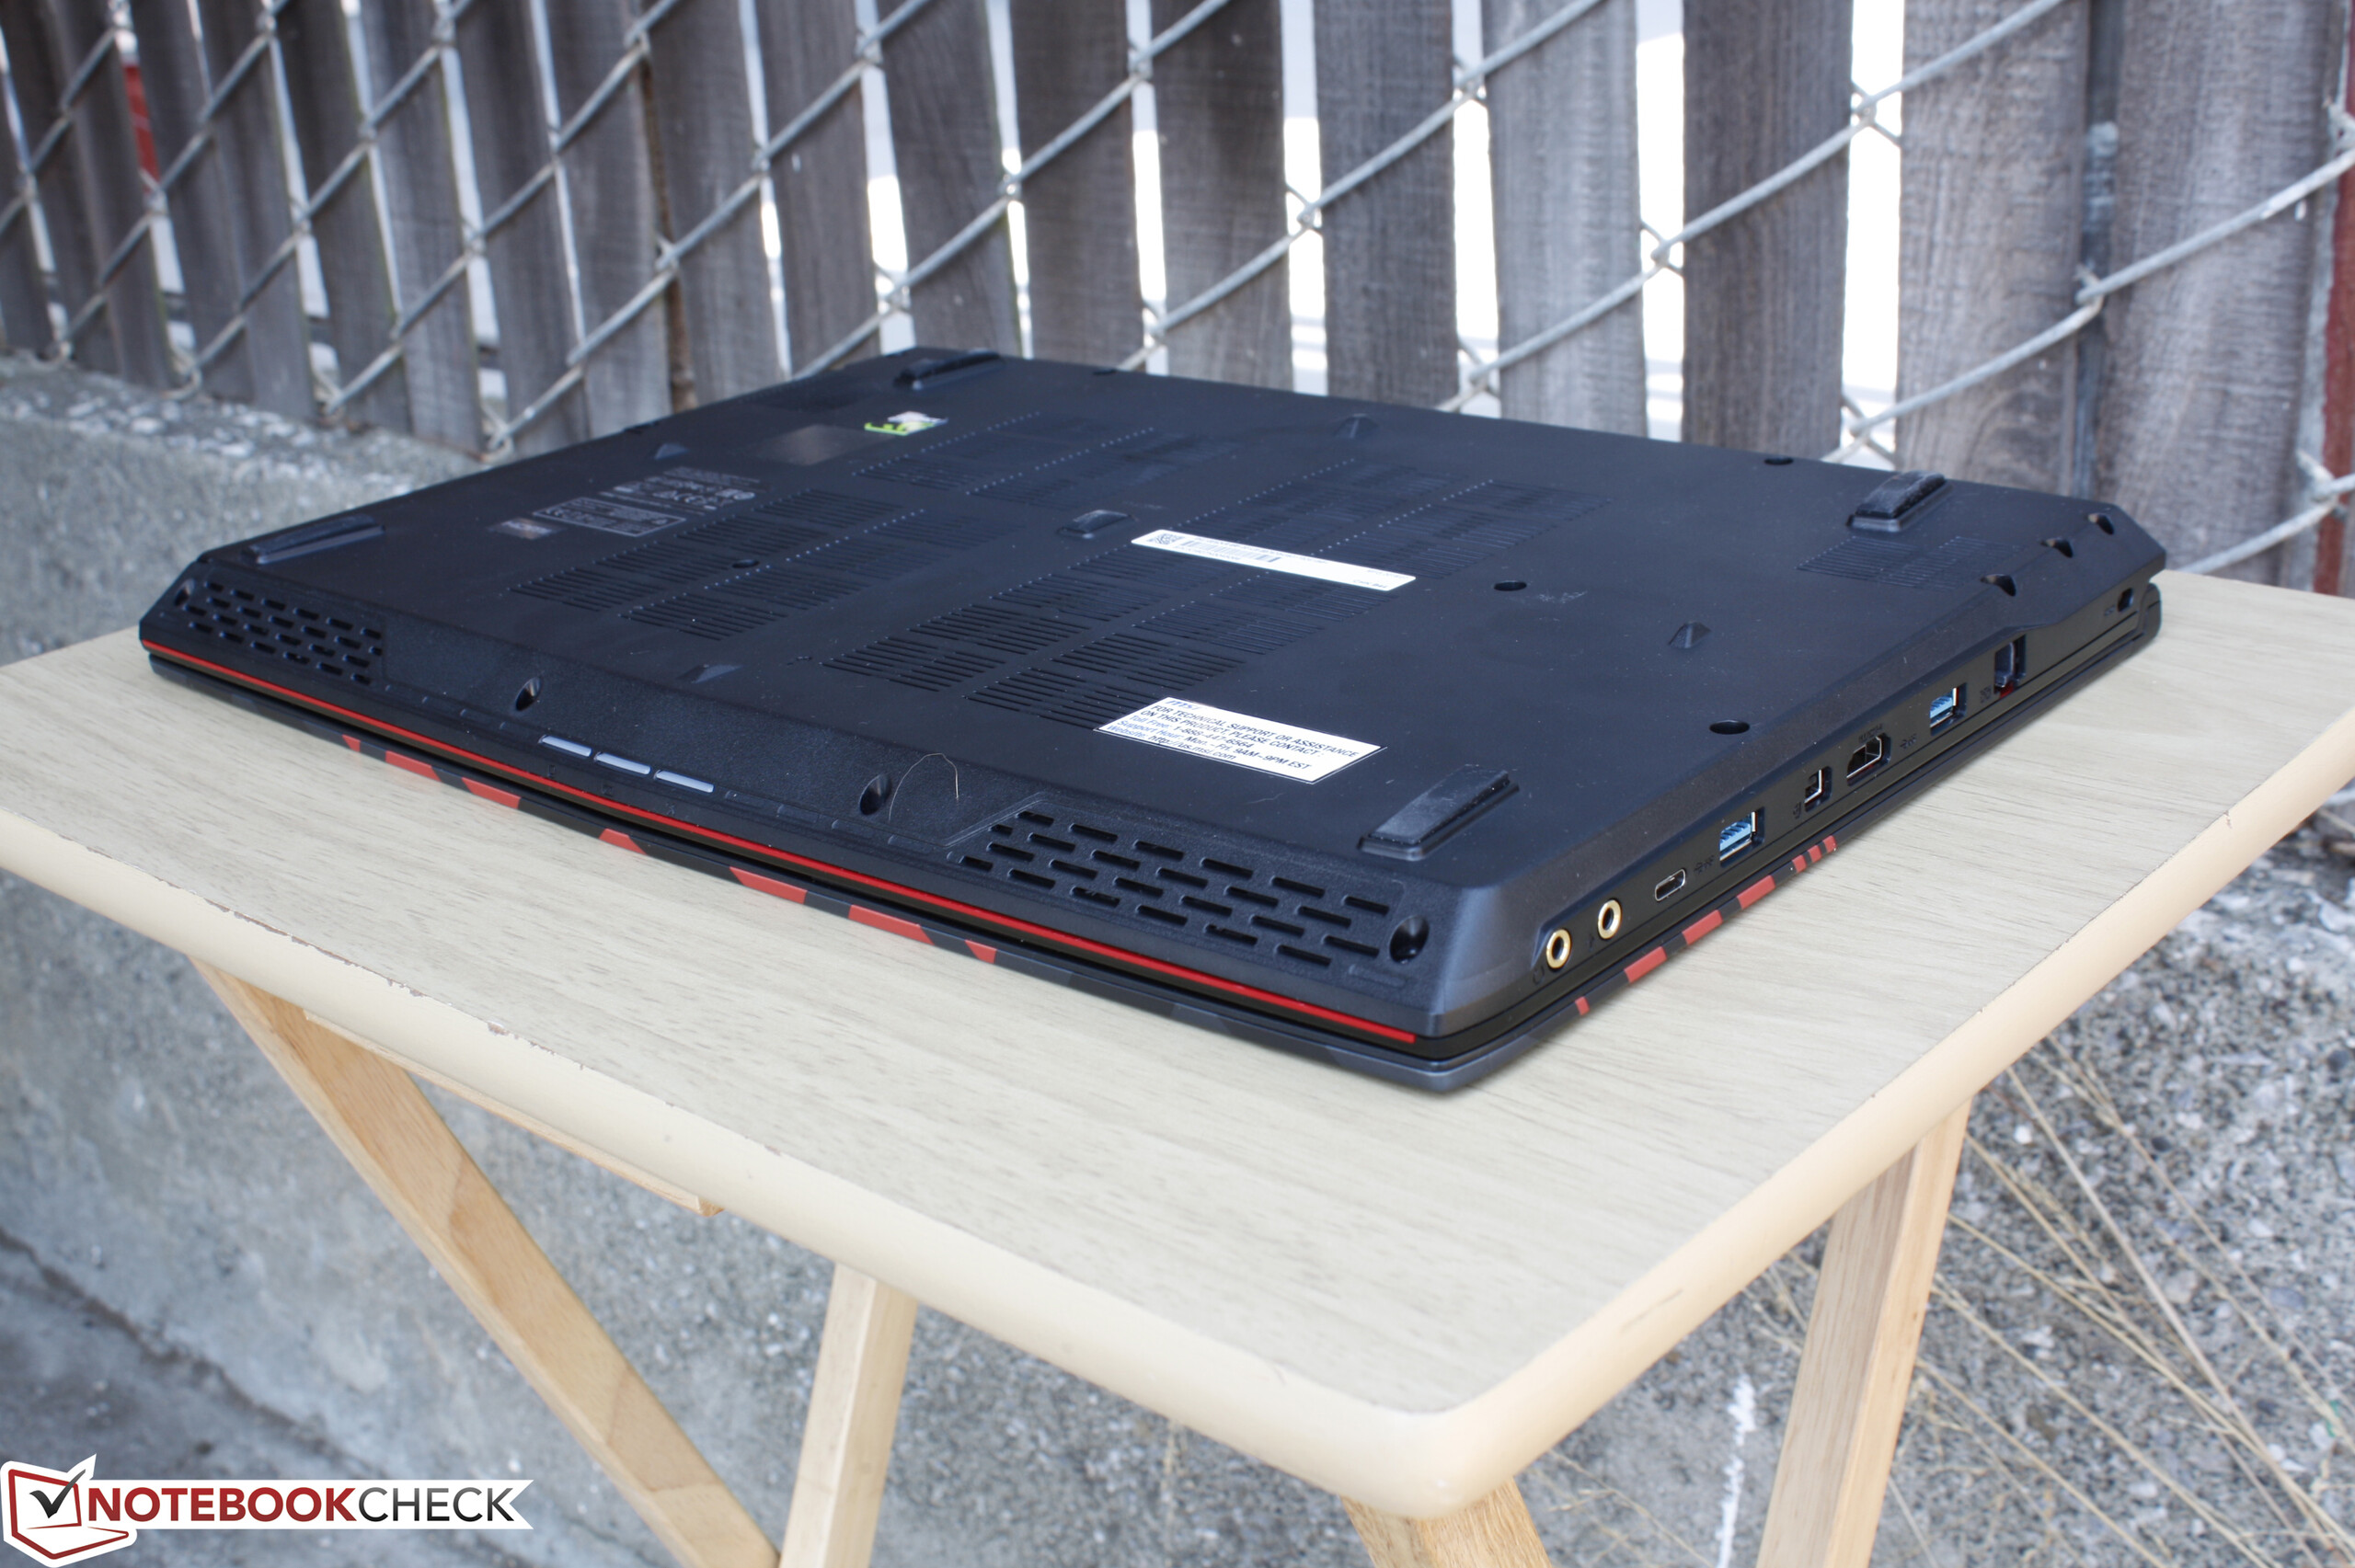
(-) La temperatura máxima en la parte superior es de 53.2 °C / 128 F, frente a la media de 40.4 °C / 105 F, que oscila entre 21.2 y 68.8 °C para la clase Gaming.
(-) El fondo se calienta hasta un máximo de 59.4 °C / 139 F, frente a la media de 43.2 °C / 110 F
(+) En reposo, la temperatura media de la parte superior es de 29.4 °C / 85# F, frente a la media del dispositivo de 33.9 °C / 93 F.
(-) El reposamanos y el touchpad pueden calentarse mucho al tacto con un máximo de 47.8 °C / 118 F.
(-) La temperatura media de la zona del reposamanos de dispositivos similares fue de 28.8 °C / 83.8 F (-19 °C / -34.2 F).
MSI GE62VR 6RF-001US análisis de audio
(±) | la sonoridad del altavoz es media pero buena (76.9 dB)
Graves 100 - 315 Hz
(±) | lubina reducida - en promedio 13.1% inferior a la mediana
(±) | la linealidad de los graves es media (12% delta a frecuencia anterior)
Medios 400 - 2000 Hz
(+) | medios equilibrados - a sólo 3% de la mediana
(±) | la linealidad de los medios es media (12% delta respecto a la frecuencia anterior)
Altos 2 - 16 kHz
(+) | máximos equilibrados - a sólo 4.4% de la mediana
(±) | la linealidad de los máximos es media (10.1% delta a frecuencia anterior)
Total 100 - 16.000 Hz
(±) | la linealidad del sonido global es media (18.6% de diferencia con la mediana)
En comparación con la misma clase
» 61% de todos los dispositivos probados de esta clase eran mejores, 9% similares, 31% peores
» El mejor tuvo un delta de 6%, la media fue 18%, el peor fue ###max##%
En comparación con todos los dispositivos probados
» 42% de todos los dispositivos probados eran mejores, 8% similares, 50% peores
» El mejor tuvo un delta de 4%, la media fue 23%, el peor fue ###max##%
Apple MacBook 12 (Early 2016) 1.1 GHz análisis de audio
(+) | los altavoces pueden reproducir a un volumen relativamente alto (#83.6 dB)
Graves 100 - 315 Hz
(±) | lubina reducida - en promedio 11.3% inferior a la mediana
(±) | la linealidad de los graves es media (14.2% delta a frecuencia anterior)
Medios 400 - 2000 Hz
(+) | medios equilibrados - a sólo 2.4% de la mediana
(+) | los medios son lineales (5.5% delta a la frecuencia anterior)
Altos 2 - 16 kHz
(+) | máximos equilibrados - a sólo 2% de la mediana
(+) | los máximos son lineales (4.5% delta a la frecuencia anterior)
Total 100 - 16.000 Hz
(+) | el sonido global es lineal (10.2% de diferencia con la mediana)
En comparación con la misma clase
» 7% de todos los dispositivos probados de esta clase eran mejores, 2% similares, 90% peores
» El mejor tuvo un delta de 5%, la media fue 18%, el peor fue ###max##%
En comparación con todos los dispositivos probados
» 5% de todos los dispositivos probados eran mejores, 1% similares, 94% peores
» El mejor tuvo un delta de 4%, la media fue 23%, el peor fue ###max##%
| Off / Standby | |
| Ocioso | |
| Carga |
|
Clave:
min: | |
| MSI GE62VR 6RF-001US 6700HQ, GeForce GTX 1060 Mobile, Samsung SM951 MZVPV512HDGL m.2 PCI-e, IPS, 1920x1080, 15.6" | MSI GT62VR-6RE16H21 6700HQ, GeForce GTX 1070 Mobile, Toshiba HG6 THNSNJ256G8NY, IPS, 1920x1080, 15.6" | Asus Strix GL502VS-FY032T 6700HQ, GeForce GTX 1070 Mobile, SanDisk SD8SNAT256G1002, IPS, 1920x1080, 15.6" | MSI GE62-6QD16H11 6700HQ, GeForce GTX 960M, Samsung SSD 850 EVO M.2 250 GB, IPS, 1920x1080, 15.6" | Asus Zenbook Pro UX501JW-FI218H 4720HQ, GeForce GTX 960M, SanDisk SD7SN3Q128G1002, IPS, 3840x2160, 15.6" | |
|---|---|---|---|---|---|
| Power Consumption | 4% | 12% | 13% | 38% | |
| Idle Minimum * (Watt) | 25.4 | 20 21% | 20 21% | 20 21% | 15.6 39% |
| Idle Average * (Watt) | 30.3 | 26 14% | 24 21% | 24 21% | 20.5 32% |
| Idle Maximum * (Watt) | 31.5 | 32 -2% | 29 8% | 30 5% | 21.2 33% |
| Load Average * (Watt) | 111.8 | 100 11% | 86 23% | 97 13% | 75.8 32% |
| Load Maximum * (Watt) | 163.2 | 202 -24% | 183 -12% | 155 5% | 72.9 55% |
* ... más pequeño es mejor
| MSI GE62VR 6RF-001US 6700HQ, GeForce GTX 1060 Mobile, 51 Wh | MSI GT62VR-6RE16H21 6700HQ, GeForce GTX 1070 Mobile, 75.24 Wh | Asus Strix GL502VS-FY032T 6700HQ, GeForce GTX 1070 Mobile, 62 Wh | MSI GE62-6QD16H11 6700HQ, GeForce GTX 960M, 53 Wh | Asus ZenBook Pro UX501VW-DS71T 6700HQ, GeForce GTX 960M, 96 Wh | |
|---|---|---|---|---|---|
| Duración de Batería | 142% | 80% | 50% | 301% | |
| Reader / Idle (h) | 2.3 | 5 117% | 4.1 78% | 3.1 35% | 11.5 400% |
| WiFi v1.3 (h) | 1.7 | 4.1 141% | 3.3 94% | 2.5 47% | 6.3 271% |
| Load (h) | 0.6 | 1.6 167% | 1 67% | 1 67% | 2 233% |
Pro
Contra

El GE62 salió a principios del pasado año rondando los $1700 USD con la gráfica GTX 965M/970M y una CPU Haswell. Adelantamos 18 meses y el GE62VR ahora ofrece gráficos del nivel GTX 980M y una CPU Skylake más eficiente por casi el mismo precio. A diferencia del salto del GT72 al GT72VR, el GE62VR no elimina ninguna característica importante de su predecesor GE62 para hacerlo una compra más atractiva especialmente considerando que hay sistemas más rápidos con la GTX 1070 que se venden a $2000 USD o más.
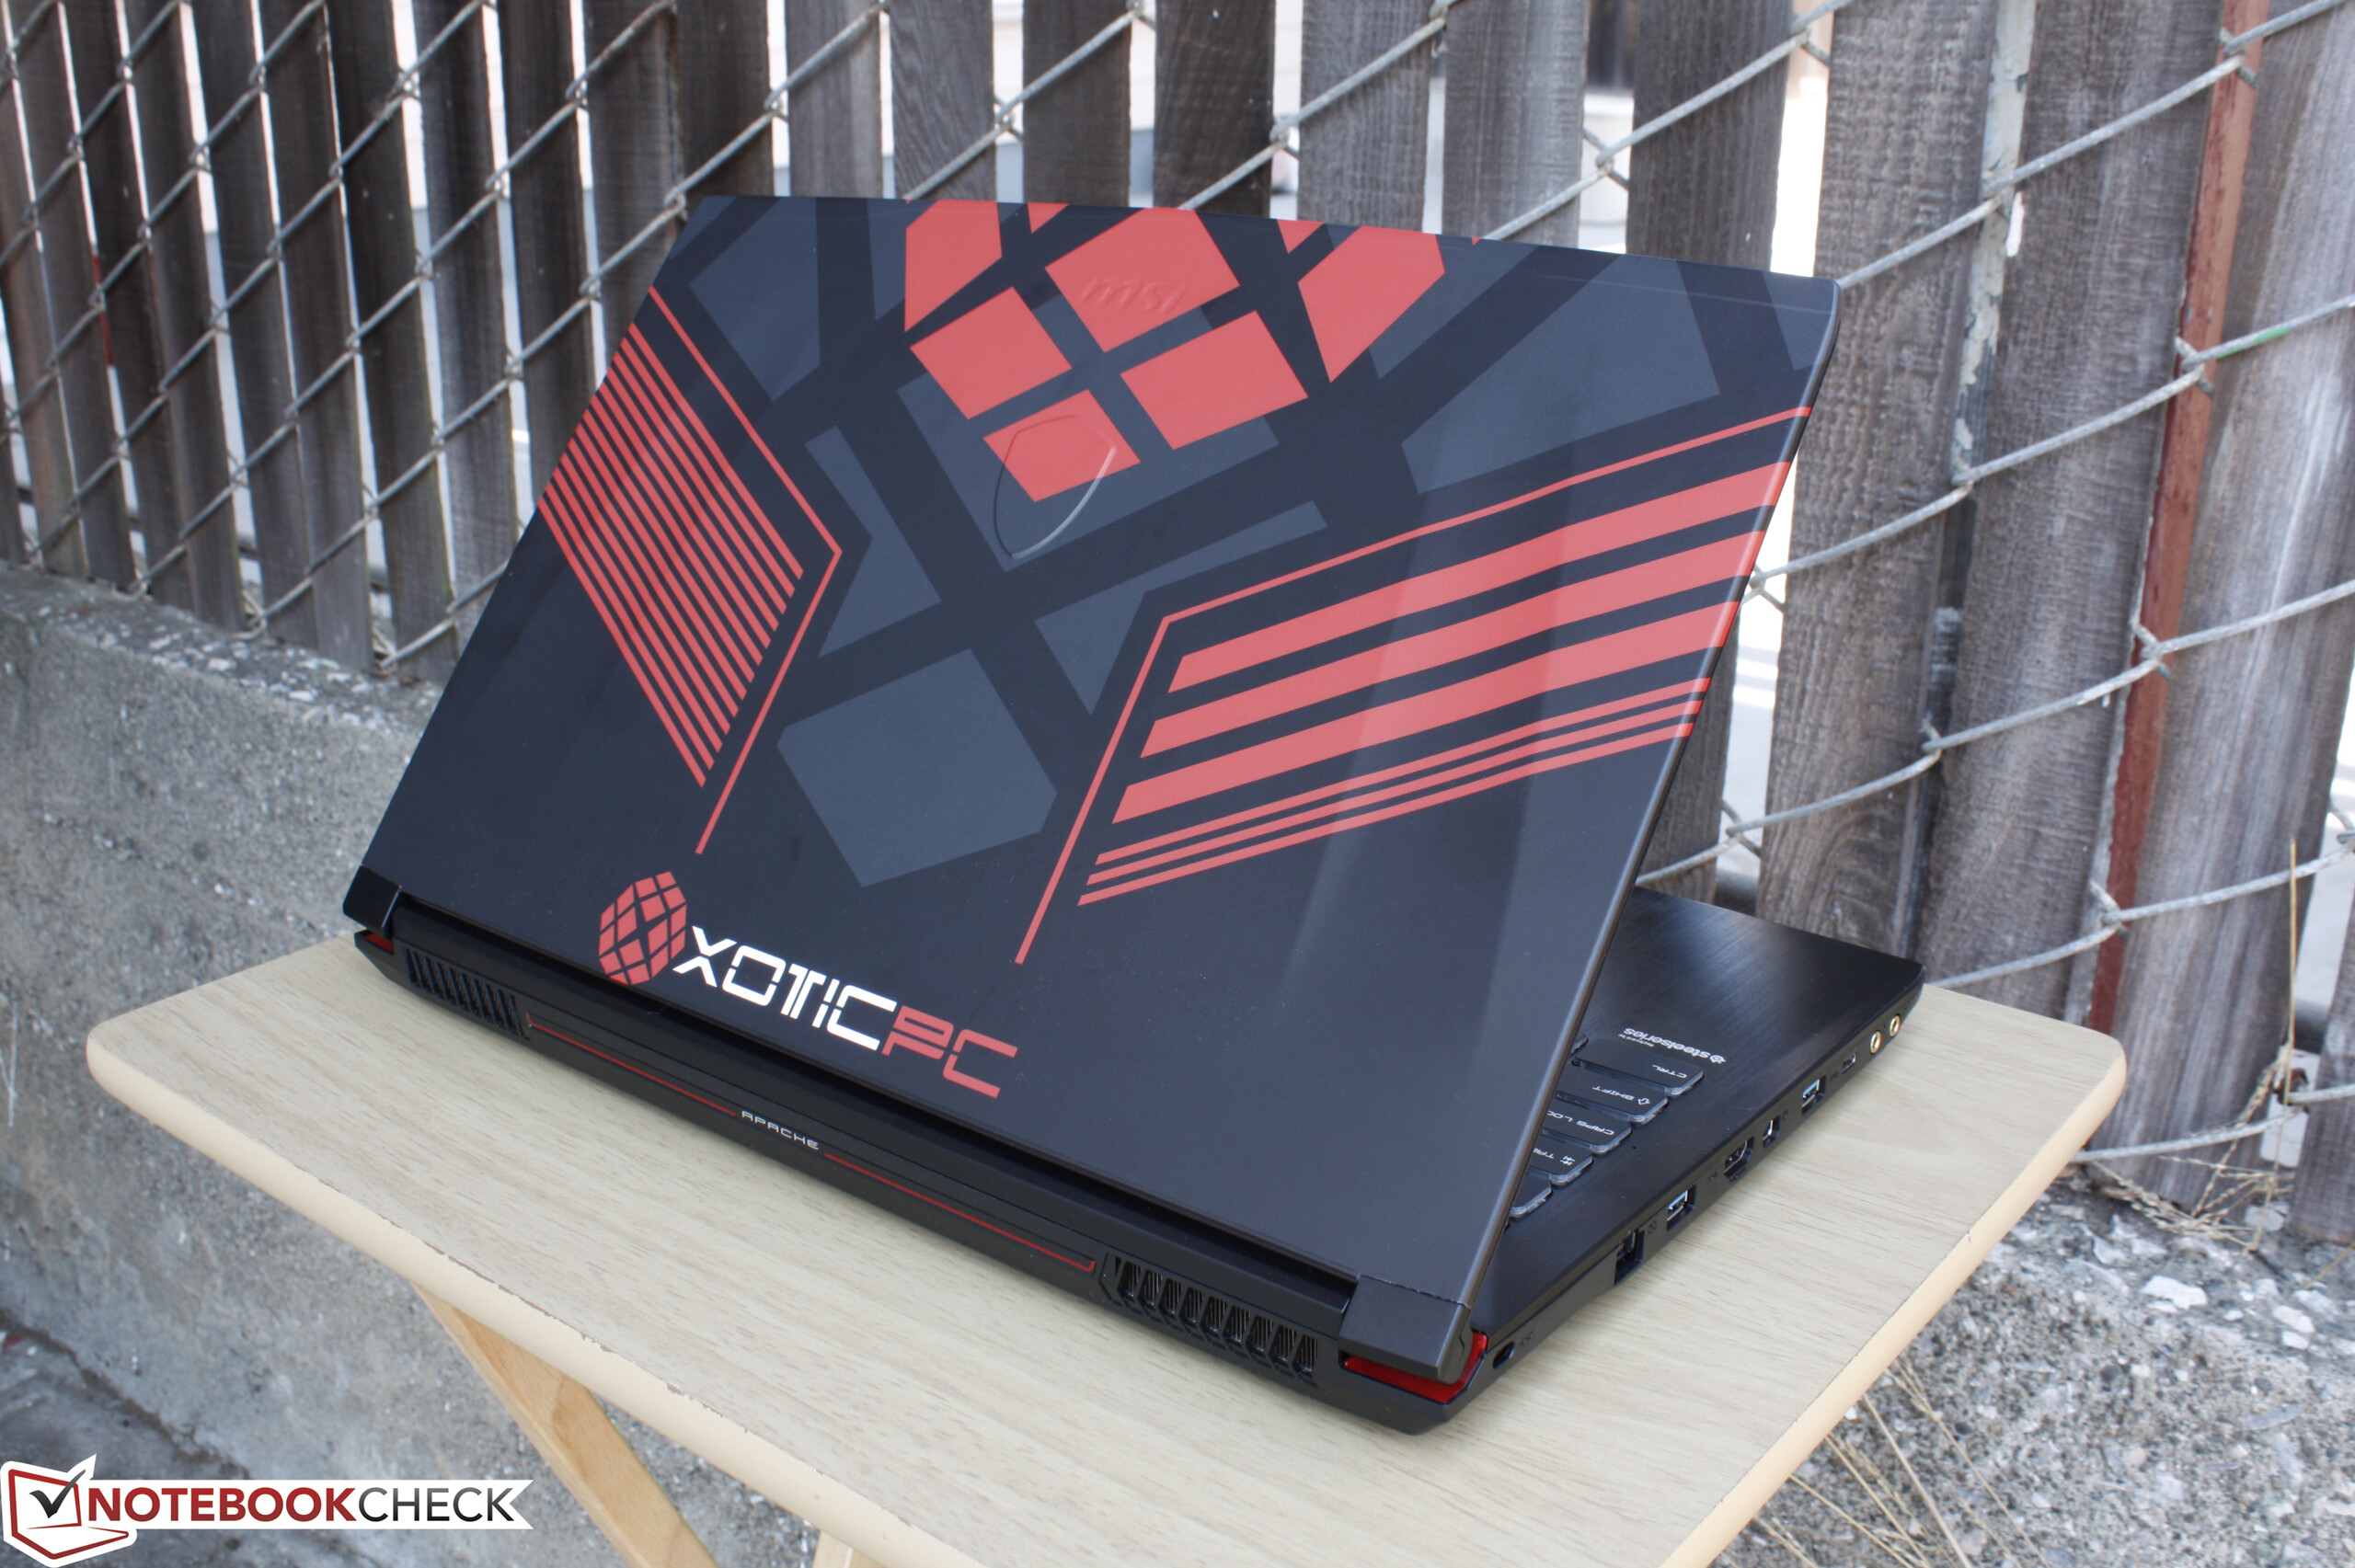
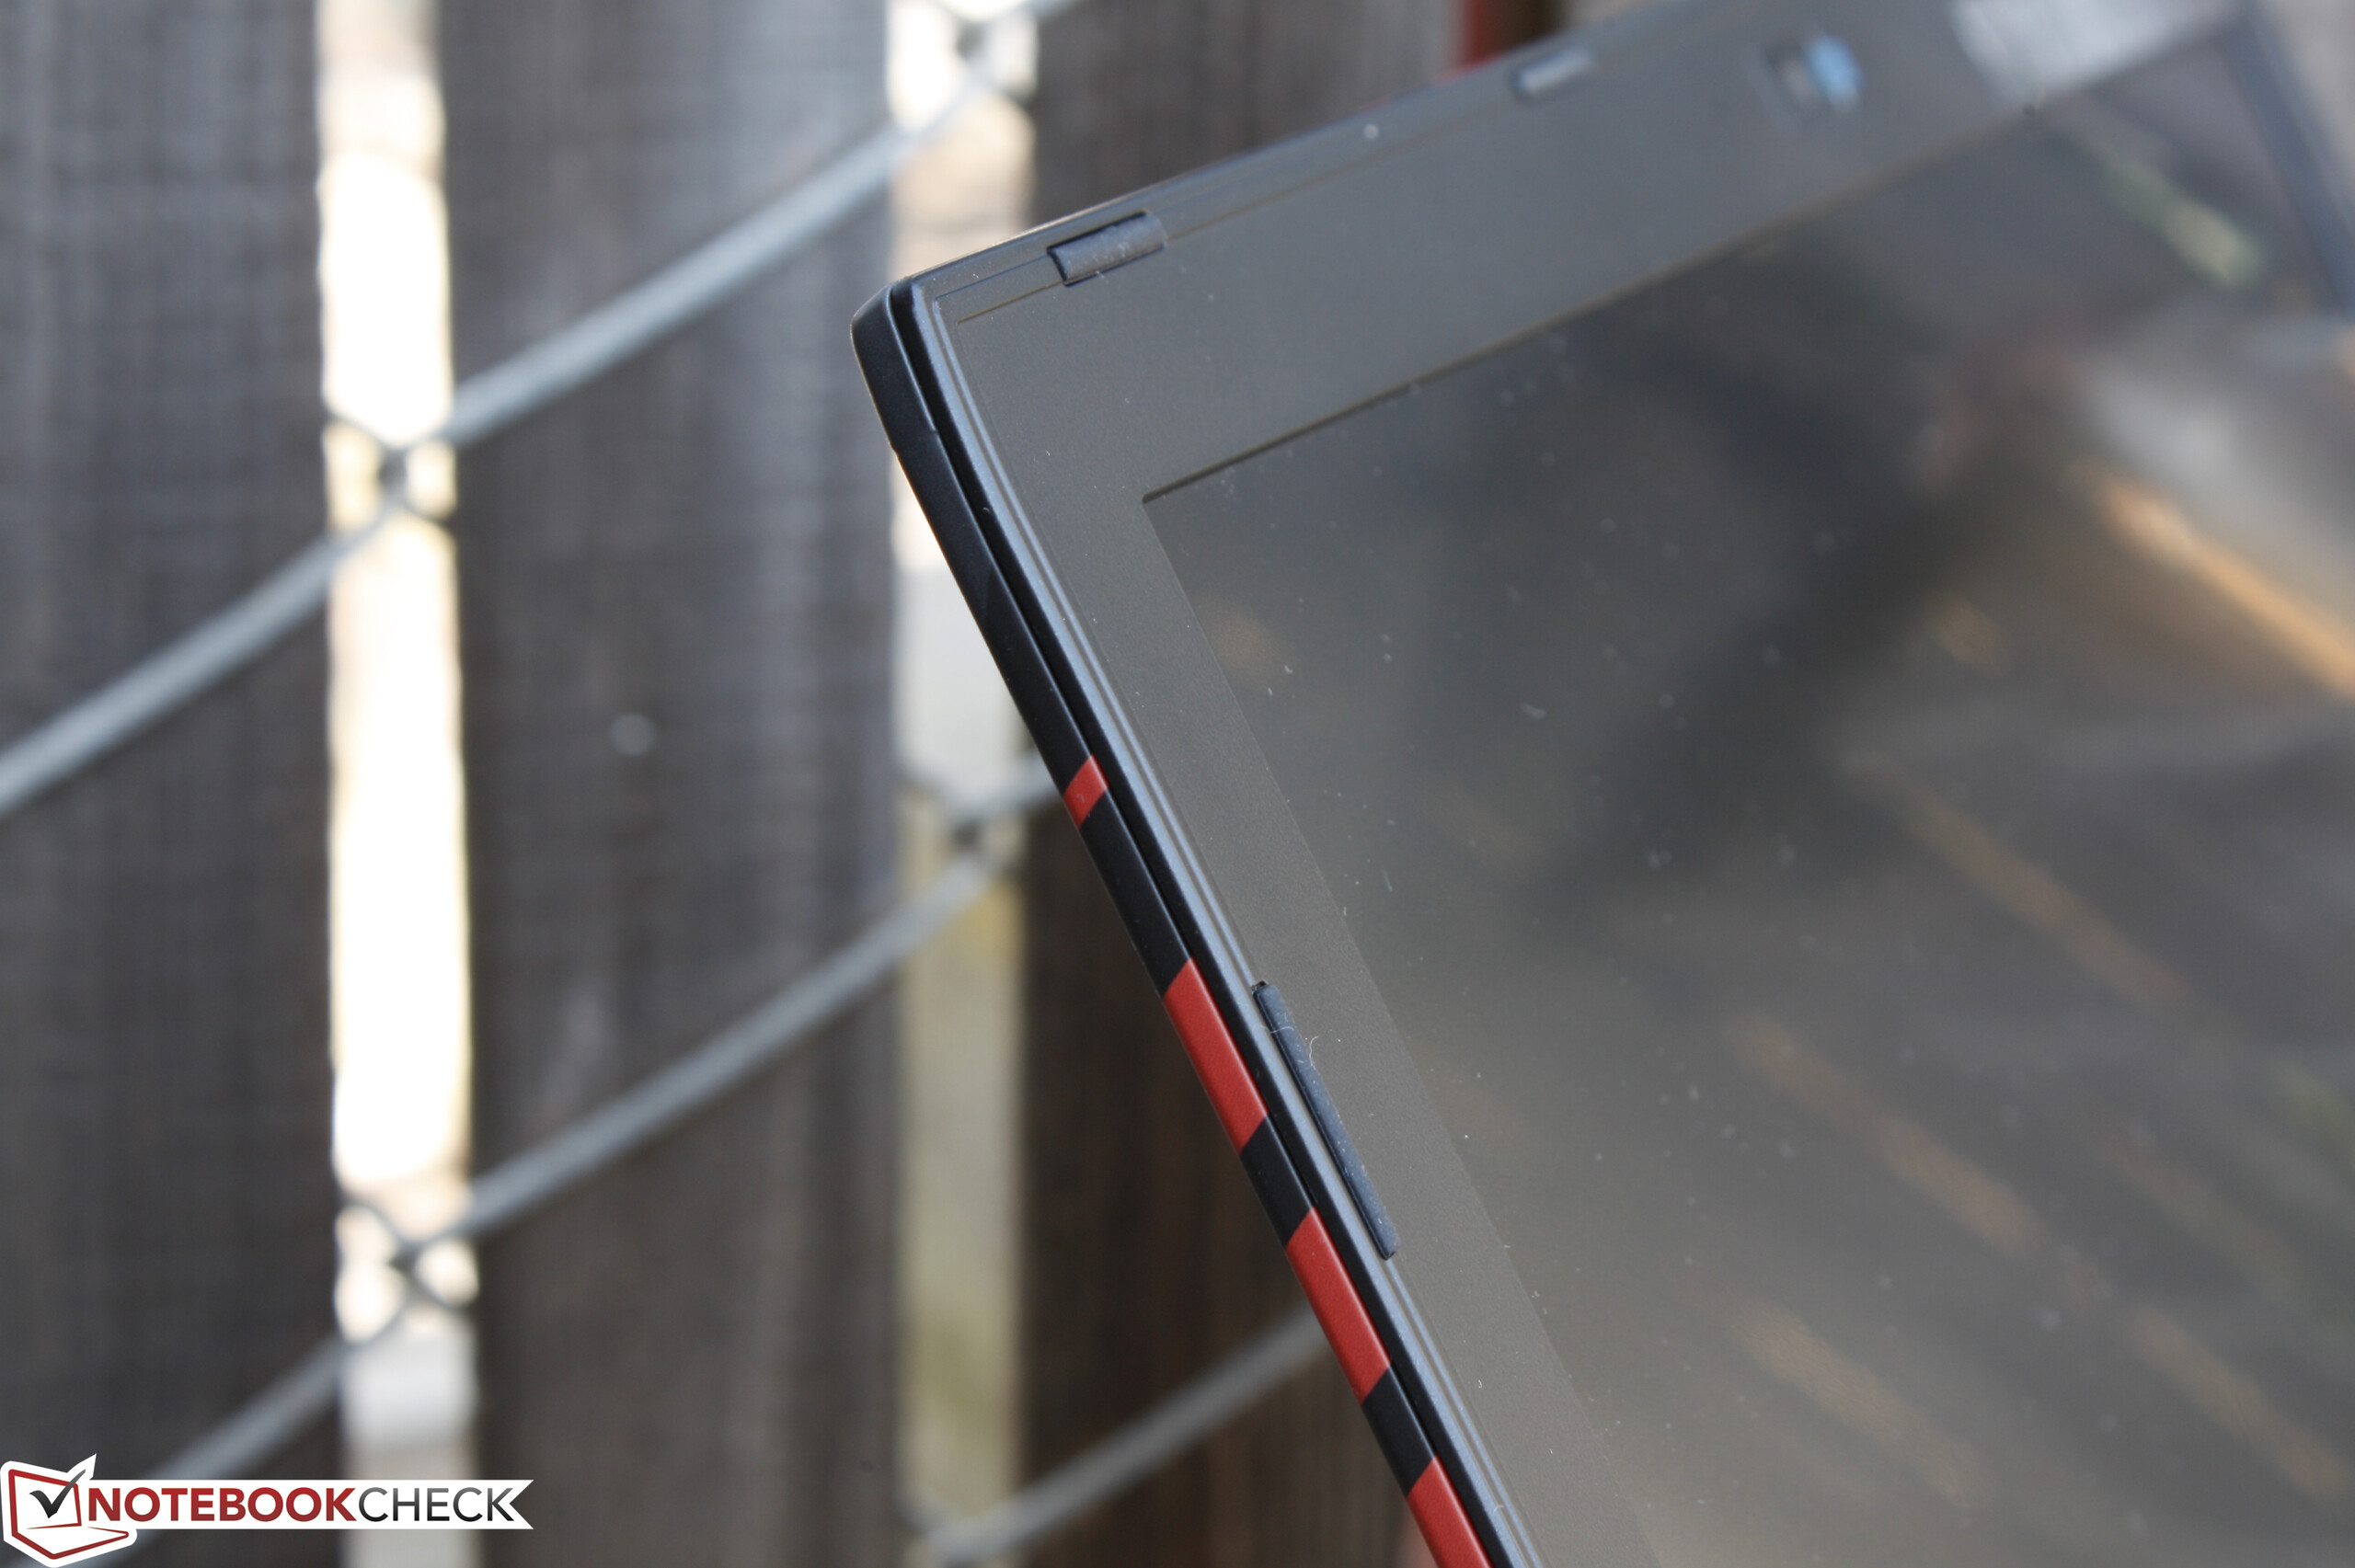
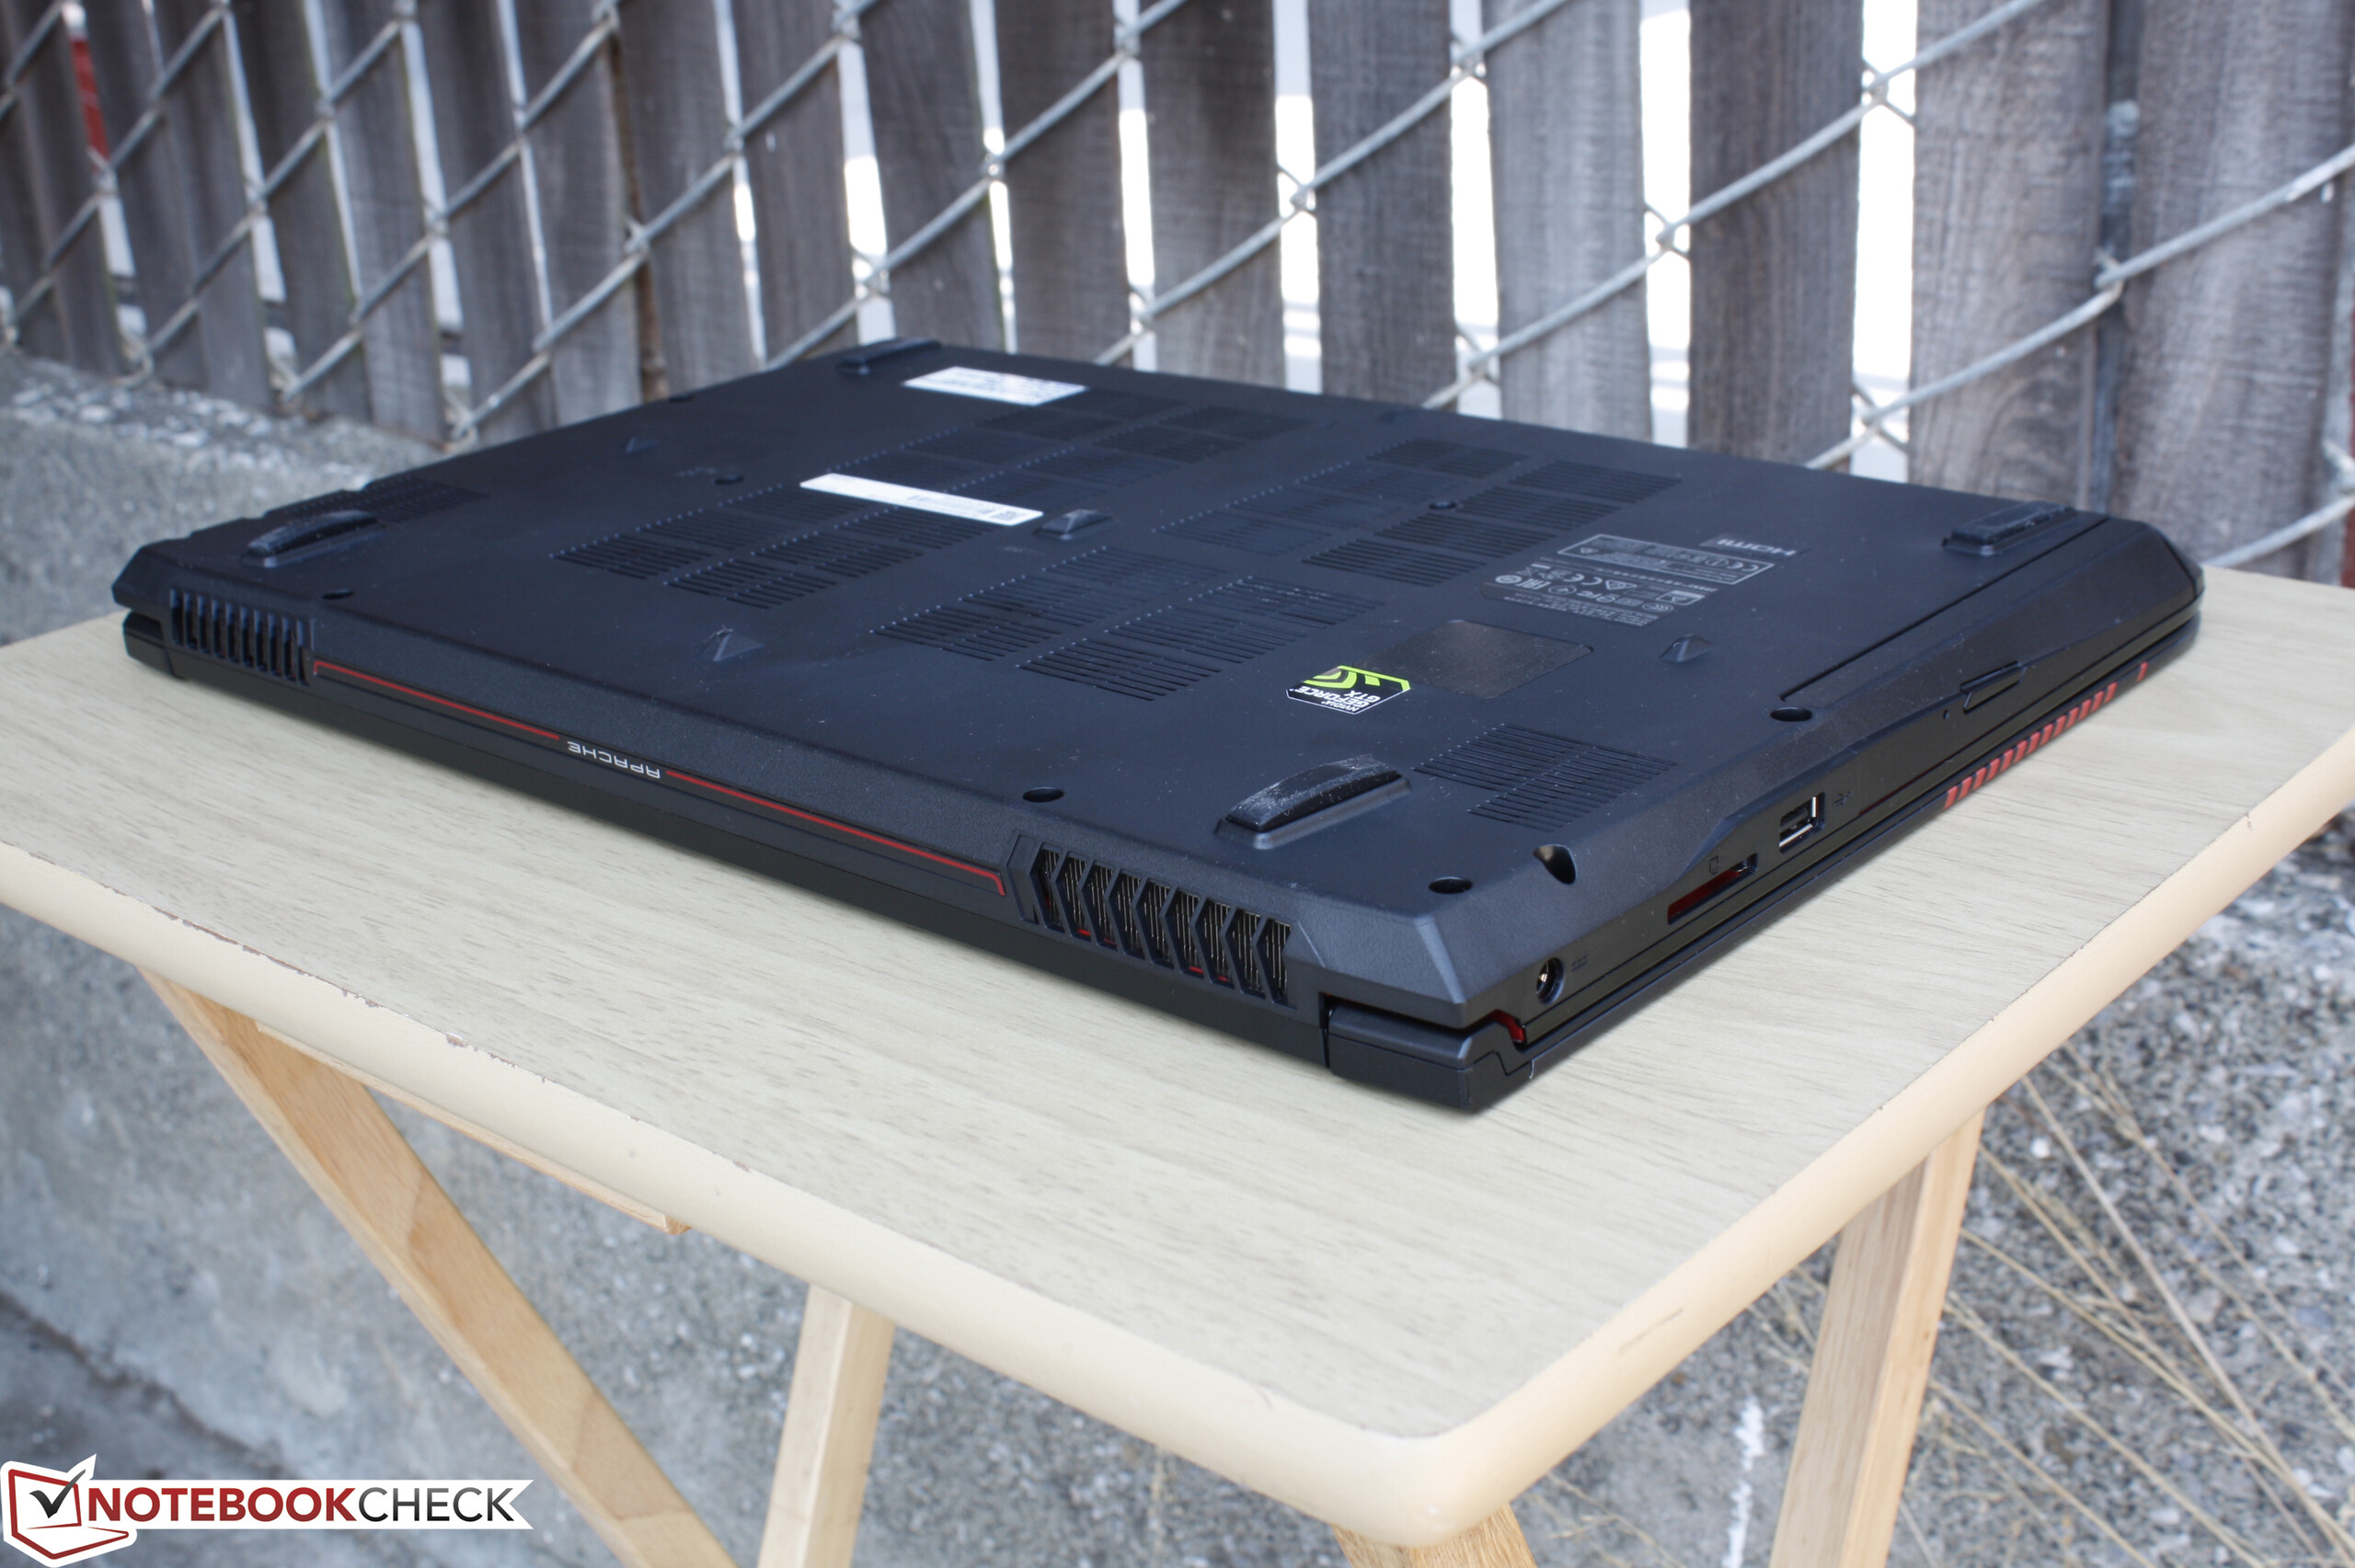
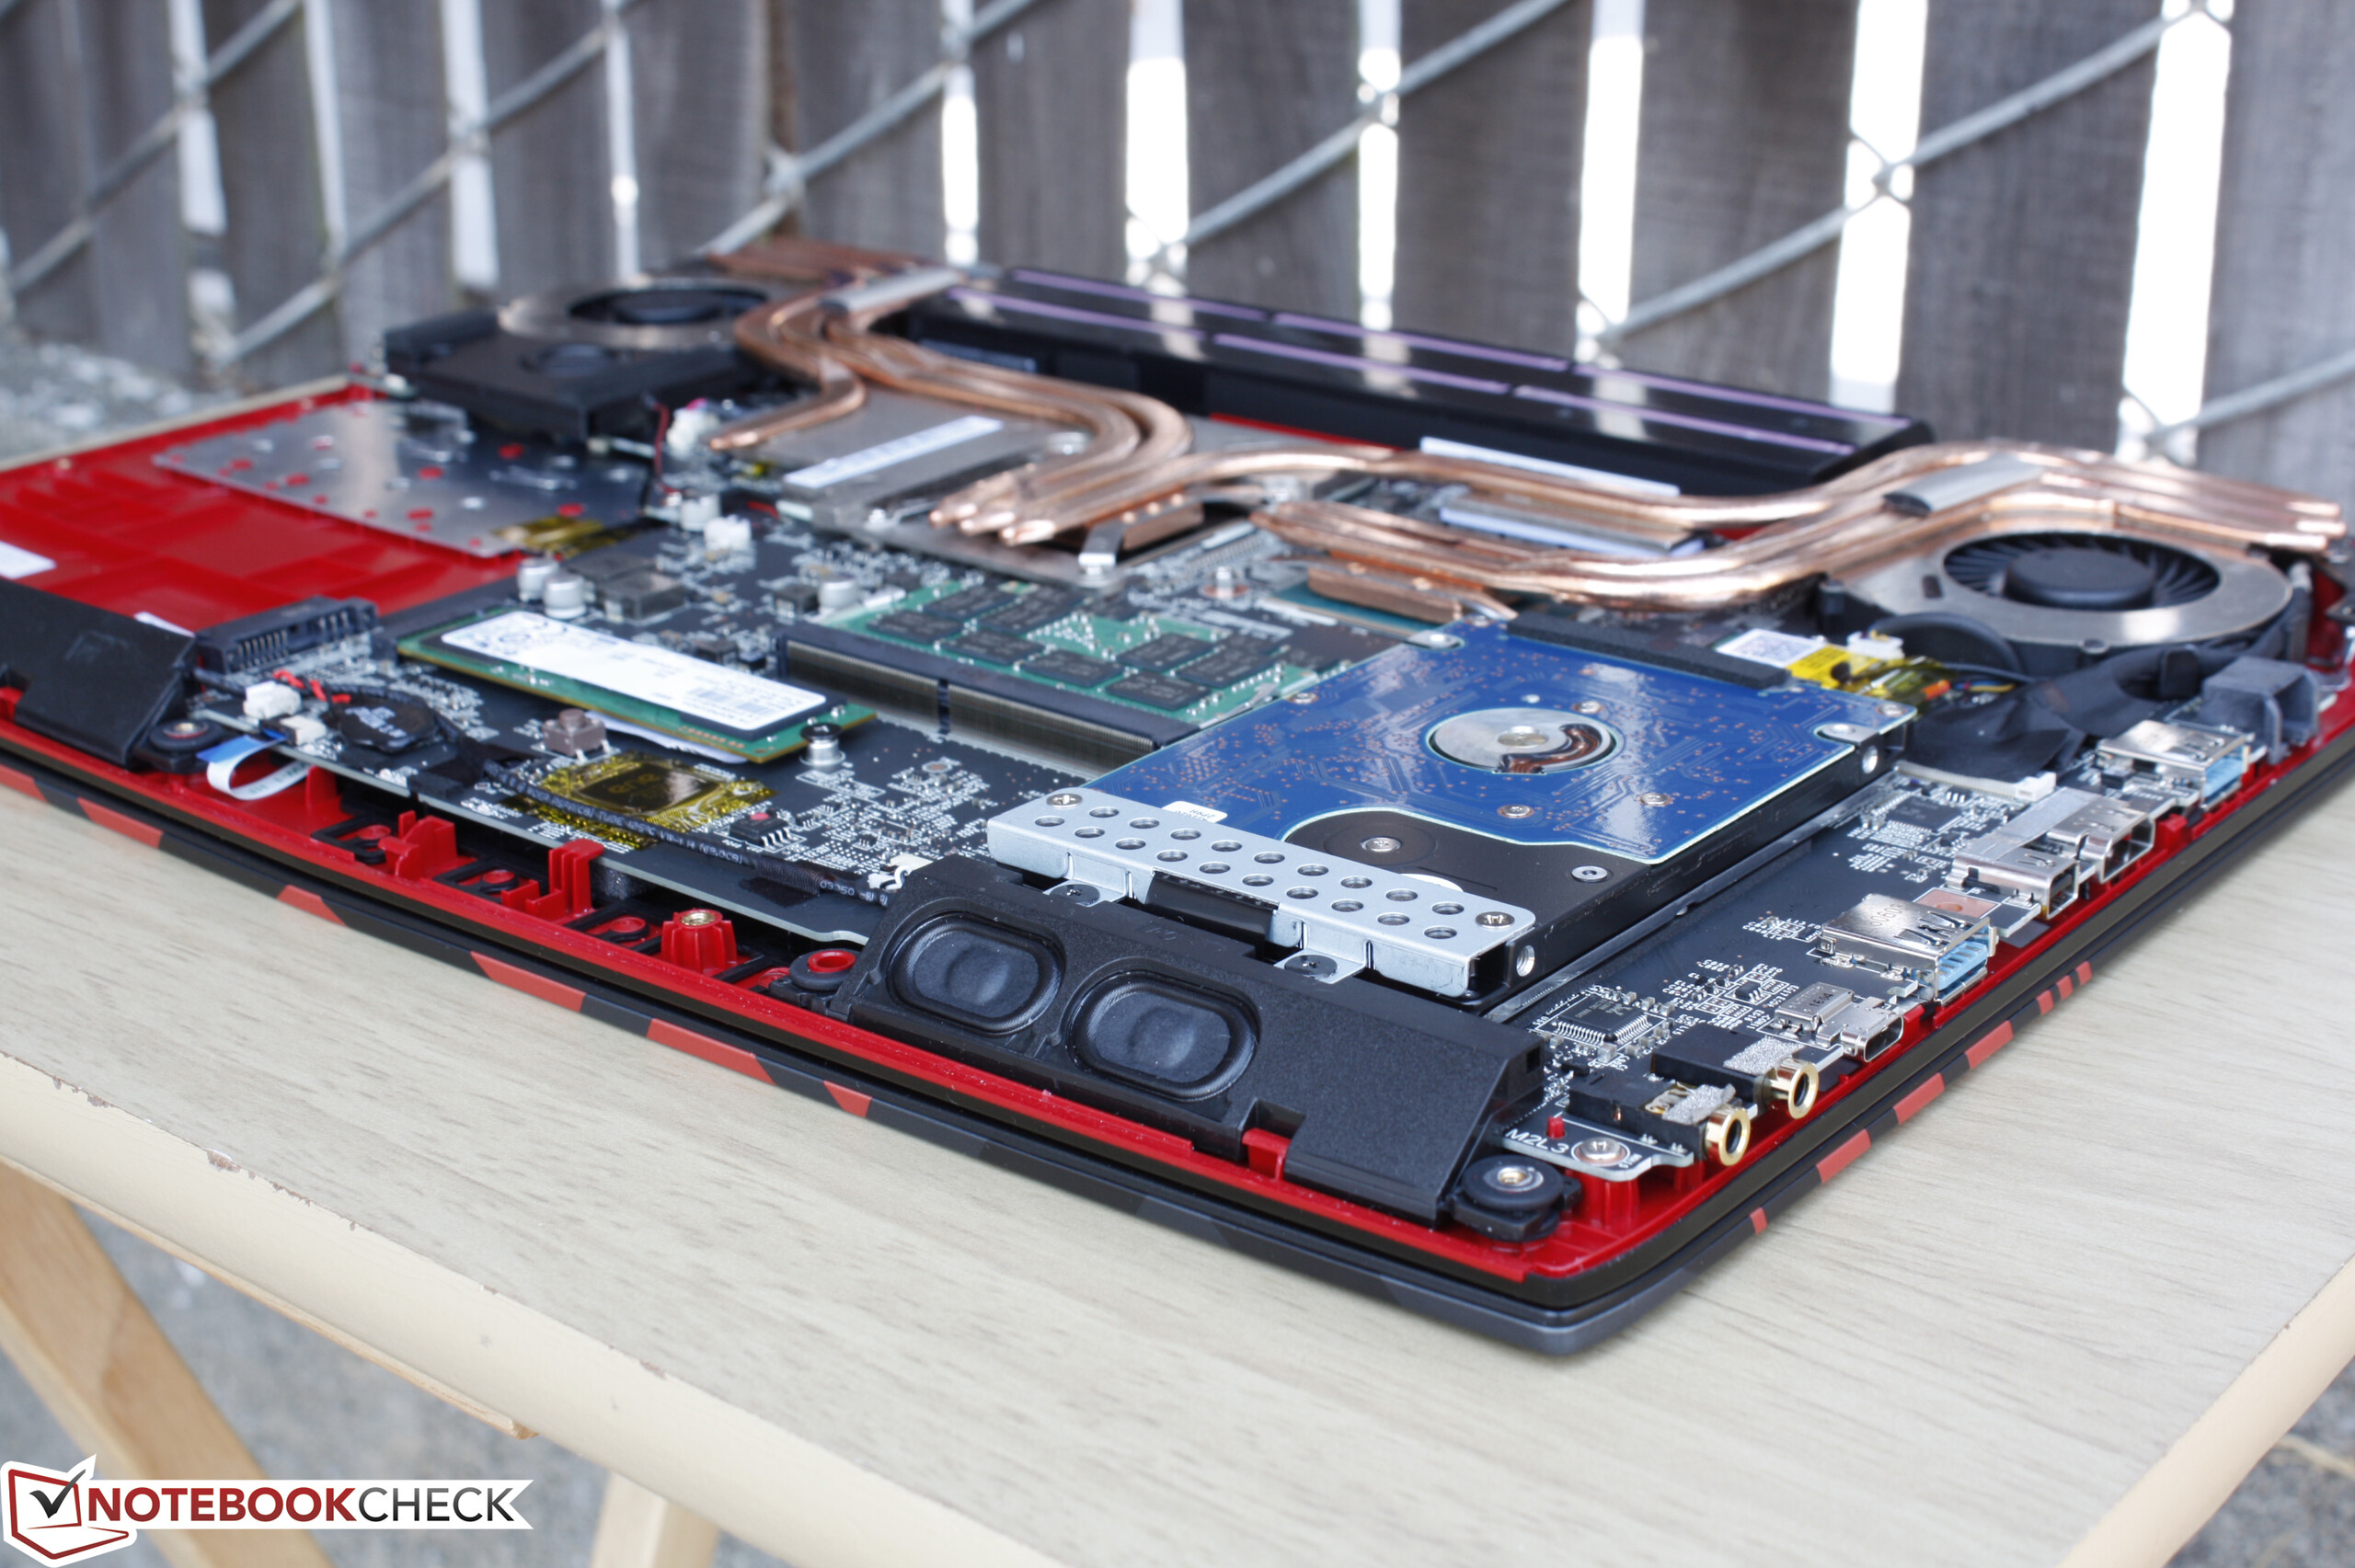
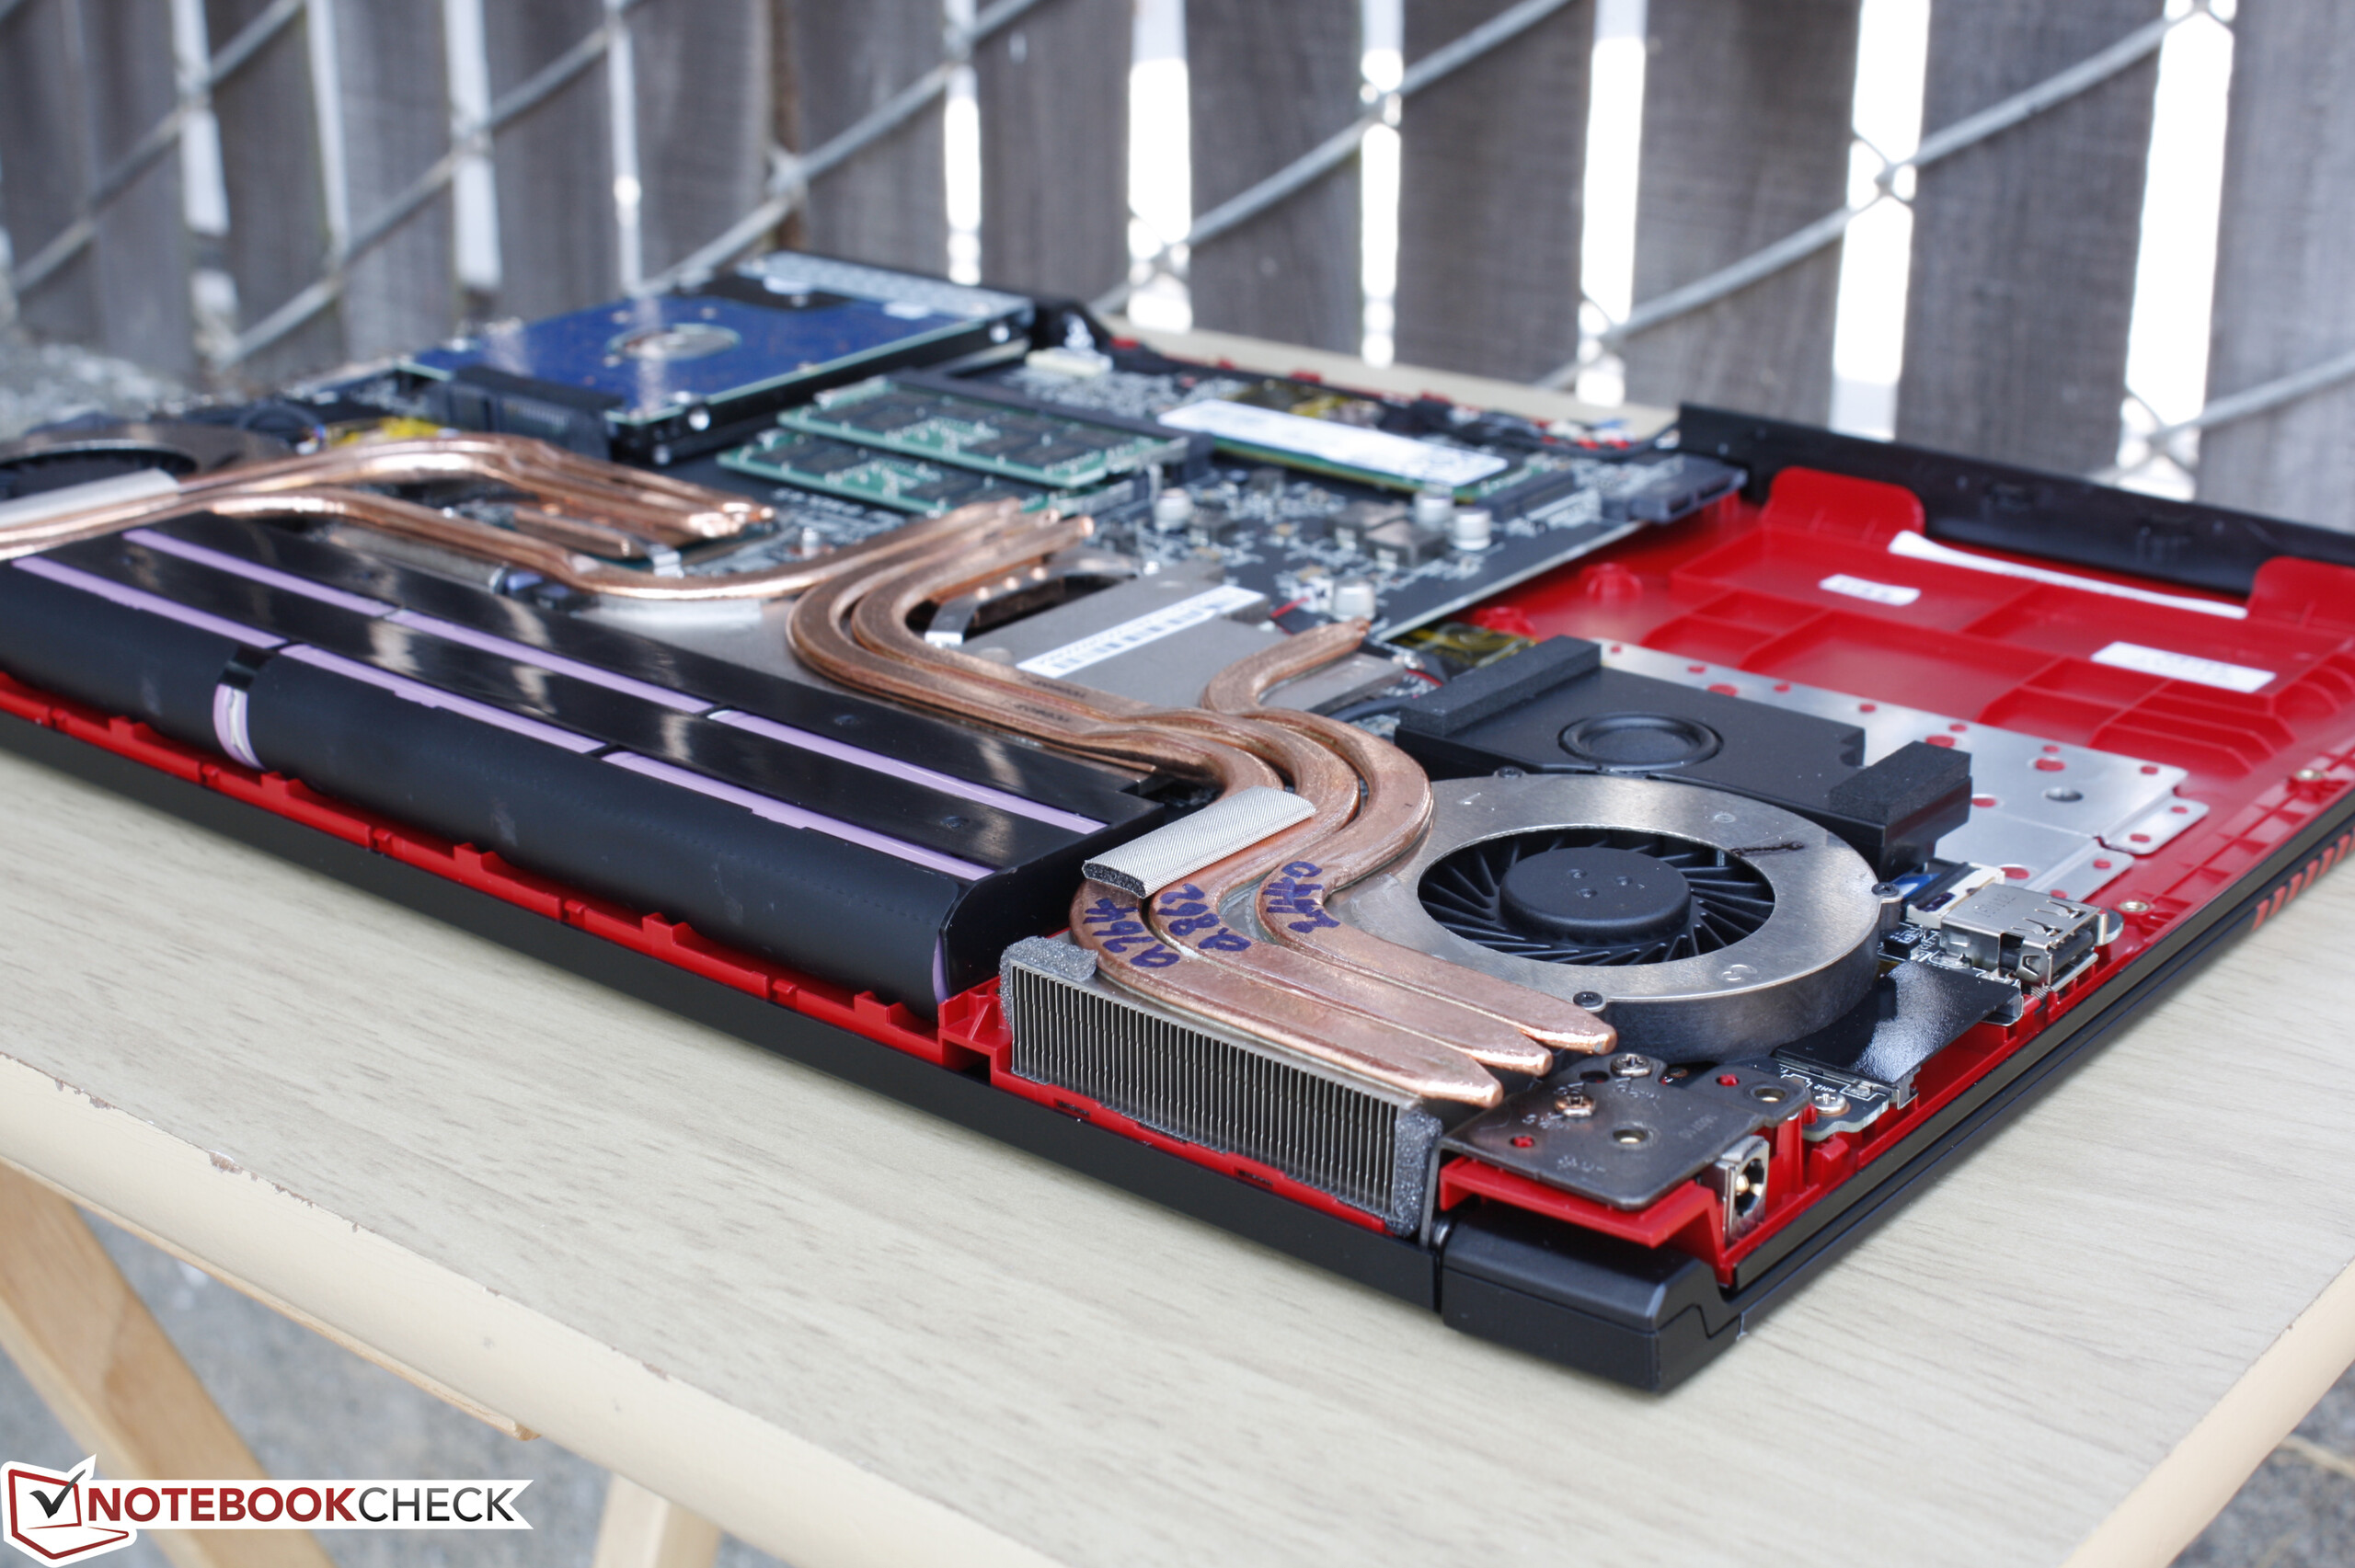
Las mismas ventajas y defectos del GE62 siguen siendo válidas ya que sólo es una mejora de hardware menor. El aguante de batería sigue siendo inferior a la media, la tapa se hunde algo fácilm ente, y el ruido de ventilador es audible sin importar la carga de trabajo incluso después de que se añadieran dos tubos de calor más. El sangrado de pantalla desigual y los huecos entre el bisel y los bordes de la pantalla de nuestro modelo de pruebas nos preocupó un poco respecto al control de calidad de algunas de las unidades MSI más recientes. Las características ausentes como Thunderbolt 3, Sabre Audio DAC, y paneles 120 Hz se siguen reservando para los modelos de la serie de gama alta MSI G.
La serie GE va de rendimiento y el E62VR cumple muy bien en este aspecto. No hay ralentización y las temperaturas de núcleo se mantienen más bajas de lo que anticipamos. Sigue siendo la misma experiencia barebones - mucho más fresco y rápido que antes.
Ésta es una versión acortada del análisis original. Puedes leer el análisis completo en inglés aquí.
MSI GE62VR 6RF-001US
- 09/08/2016 v5.1 (old)
Allen Ngo
Price comparison
