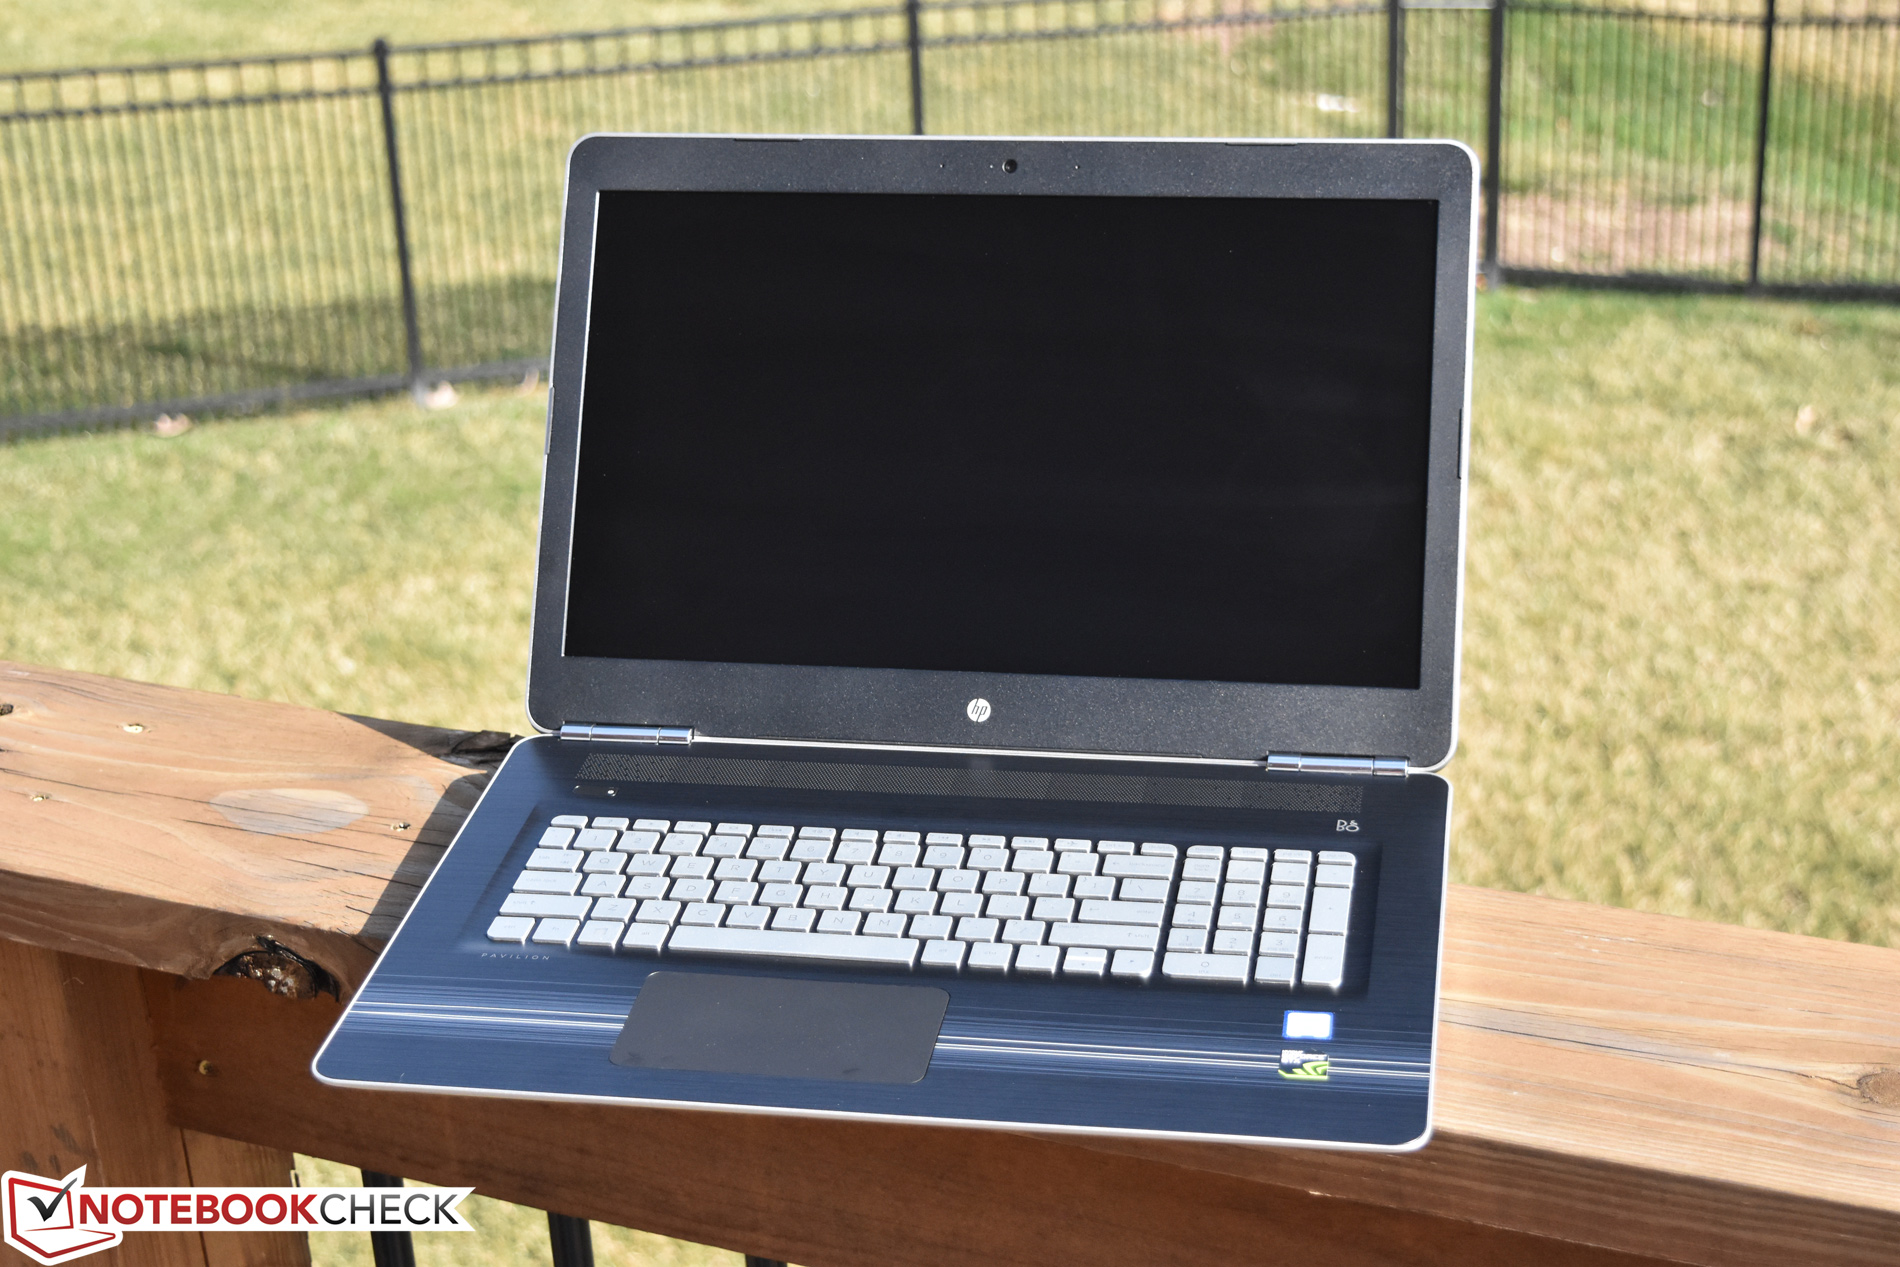
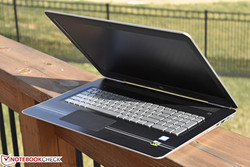
Breve análisis del portátil HP Pavilion 17t (7700HQ, UHD, GTX 1050)
| |||||||||||||||||||||||||
iluminación: 90 %
Brillo con batería: 325.7 cd/m²
Contraste: 880:1 (Negro: 0.37 cd/m²)
ΔE ColorChecker Calman: 6.5 | ∀{0.5-29.43 Ø4.72}
ΔE Greyscale Calman: 5.6 | ∀{0.09-98 Ø4.97}
100% sRGB (Argyll 1.6.3 3D)
87% AdobeRGB 1998 (Argyll 1.6.3 3D)
99.4% AdobeRGB 1998 (Argyll 3D)
99.9% sRGB (Argyll 3D)
87.1% Display P3 (Argyll 3D)
Gamma: 2.59
CCT: 5860 K
| HP Pavilion 17t-ab200 UHD AUO119B, IPS, 17.3", 3840x2160 | HP Pavilion 17t-ab200 AUO109D, IPS, 17.3", 1920x1080 | Gigabyte P57X v7 SHP145E, IPS, 17.3", 3840x2160 | MSI GT73VR 6RF IPS, 17.3", 3840x2160 | |
|---|---|---|---|---|
| Display | -24% | 0% | -22% | |
| Display P3 Coverage (%) | 87.1 | 65.2 -25% | 87.8 1% | 63.6 -27% |
| sRGB Coverage (%) | 99.9 | 87.6 -12% | 100 0% | 95.8 -4% |
| AdobeRGB 1998 Coverage (%) | 99.4 | 64.1 -36% | 98.9 -1% | 65.7 -34% |
| Response Times | 22% | -25% | 22% | |
| Response Time Grey 50% / Grey 80% * (ms) | 50.8 | 36.8 28% | 55.6 ? -9% | 33.6 ? 34% |
| Response Time Black / White * (ms) | 33.2 | 28 16% | 46.8 ? -41% | 30 ? 10% |
| PWM Frequency (Hz) | 1000 ? | |||
| Screen | -8% | 10% | -0% | |
| Brightness middle (cd/m²) | 325.7 | 278.8 -14% | 441.3 35% | 334.8 3% |
| Brightness (cd/m²) | 309 | 265 -14% | 408 32% | 316 2% |
| Brightness Distribution (%) | 90 | 91 1% | 86 -4% | 87 -3% |
| Black Level * (cd/m²) | 0.37 | 0.28 24% | 0.44 -19% | 0.422 -14% |
| Contrast (:1) | 880 | 996 13% | 1003 14% | 793 -10% |
| Colorchecker dE 2000 * | 6.5 | 5.8 11% | 5.1 22% | 4.11 37% |
| Colorchecker dE 2000 max. * | 9.6 | 10.6 -10% | 9.8 -2% | 7.8 19% |
| Greyscale dE 2000 * | 5.6 | 8.3 -48% | 4.3 23% | 5.74 -3% |
| Gamma | 2.59 85% | 2.1 105% | 2.08 106% | 2.3 96% |
| CCT | 5860 111% | 5723 114% | 7345 88% | 5987 109% |
| Color Space (Percent of AdobeRGB 1998) (%) | 87 | 57 -34% | 87 0% | 60.5 -30% |
| Color Space (Percent of sRGB) (%) | 100 | 87 -13% | 100 0% | 96 -4% |
| Media total (Programa/Opciones) | -3% /
-8% | -5% /
3% | 0% /
-2% |
* ... más pequeño es mejor
Tiempos de respuesta del display
| ↔ Tiempo de respuesta de Negro a Blanco | ||
|---|---|---|
| 33.2 ms ... subida ↗ y bajada ↘ combinada | ↗ ms subida | 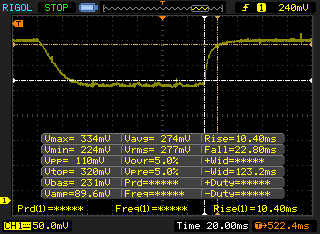 |
| ↘ ms bajada | ||
| La pantalla mostró tiempos de respuesta lentos en nuestros tests y podría ser demasiado lenta para los jugones. En comparación, todos los dispositivos de prueba van de ##min### (mínimo) a 240 (máximo) ms. » 90 % de todos los dispositivos son mejores. Eso quiere decir que el tiempo de respuesta es peor que la media (19.8 ms) de todos los dispositivos testados. | ||
| ↔ Tiempo de respuesta 50% Gris a 80% Gris | ||
| 50.8 ms ... subida ↗ y bajada ↘ combinada | ↗ ms subida | 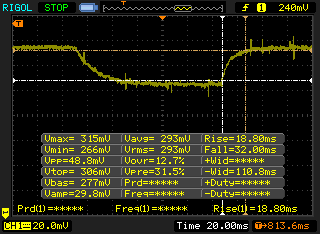 |
| ↘ ms bajada | ||
| La pantalla mostró tiempos de respuesta lentos en nuestros tests y podría ser demasiado lenta para los jugones. En comparación, todos los dispositivos de prueba van de ##min### (mínimo) a 636 (máximo) ms. » 87 % de todos los dispositivos son mejores. Eso quiere decir que el tiempo de respuesta es peor que la media (31 ms) de todos los dispositivos testados. | ||
Parpadeo de Pantalla / PWM (Pulse-Width Modulation)
| Parpadeo de Pantalla / PWM no detectado |  | ||
Comparación: 52 % de todos los dispositivos testados no usaron PWM para atenuar el display. Si se usó, medimos una media de 7763 (mínimo: 5 - máxmo: 343500) Hz. | |||
| Cinebench R11.5 | |
| CPU Single 64Bit | |
| MSI GT73VR 6RF | |
| HP Pavilion 17t-ab200 UHD | |
| Gigabyte P57X v7 | |
| HP Pavilion 17t-ab200 | |
| CPU Multi 64Bit | |
| MSI GT73VR 6RF | |
| HP Pavilion 17t-ab200 | |
| Gigabyte P57X v7 | |
| HP Pavilion 17t-ab200 UHD | |
| wPrime 2.10 - 1024m | |
| Gigabyte P57X v7 | |
| HP Pavilion 17t-ab200 UHD | |
| HP Pavilion 17t-ab200 | |
* ... más pequeño es mejor
| PCMark 8 | |
| Home Score Accelerated v2 | |
| MSI GT73VR 6RF | |
| HP Pavilion 17t-ab200 | |
| Gigabyte P57X v7 | |
| HP Pavilion 17t-ab200 UHD | |
| Acer Aspire V17 Nitro BE VN7-793G-706L | |
| Work Score Accelerated v2 | |
| HP Pavilion 17t-ab200 | |
| MSI GT73VR 6RF | |
| Gigabyte P57X v7 | |
| HP Pavilion 17t-ab200 UHD | |
| Creative Score Accelerated v2 | |
| MSI GT73VR 6RF | |
| HP Pavilion 17t-ab200 | |
| Gigabyte P57X v7 | |
| HP Pavilion 17t-ab200 UHD | |
| PCMark 8 Home Score Accelerated v2 | 3056 puntos | |
| PCMark 8 Creative Score Accelerated v2 | 4516 puntos | |
| PCMark 8 Work Score Accelerated v2 | 2213 puntos | |
ayuda | ||
| HP Pavilion 17t-ab200 UHD Intel SSD 600p SSDPEKKW256G7 | HP Pavilion 17t-ab200 Samsung CM871a MZNTY128HDHP | Gigabyte P57X v7 Transcend MTS800 256GB M.2 (TS256GMTS800) | Acer Aspire V17 Nitro BE VN7-793G-706L Toshiba NVMe THNSN5512GPU7 | MSI GT73VR 6RF 2x SanDisk X400 1TB M.2 SD8SN8U1T001122 (RAID 0) | |
|---|---|---|---|---|---|
| CrystalDiskMark 3.0 | -16% | -19% | 59% | 50% | |
| Read Seq (MB/s) | 1076 | 520 -52% | 517 -52% | 1172 9% | 914 -15% |
| Write Seq (MB/s) | 263.2 | 353.6 34% | 305.7 16% | 1073 308% | 916 248% |
| Read 512 (MB/s) | 695 | 376.2 -46% | 315 -55% | 760 9% | 698 0% |
| Write 512 (MB/s) | 472.3 | 118.5 -75% | 306.1 -35% | 878 86% | 916 94% |
| Read 4k (MB/s) | 20.09 | 32.7 63% | 26.04 30% | 21.04 5% | 31.37 56% |
| Write 4k (MB/s) | 116.2 | 85.3 -27% | 82.3 -29% | 59.8 -49% | 65.7 -43% |
| Read 4k QD32 (MB/s) | 282.7 | 399 41% | 281.3 0% | 573 103% | 425 50% |
| Write 4k QD32 (MB/s) | 405.2 | 132.5 -67% | 296 -27% | 419.8 4% | 441.8 9% |

| 3DMark 11 | |
| 1280x720 Performance GPU | |
| MSI GT73VR 6RF | |
| Gigabyte P57X v7 | |
| Acer Aspire V17 Nitro BE VN7-793G-706L | |
| HP Pavilion 17t-ab200 UHD | |
| HP Pavilion 17t-ab200 | |
| 1280x720 Performance Combined | |
| Gigabyte P57X v7 | |
| MSI GT73VR 6RF | |
| HP Pavilion 17t-ab200 | |
| HP Pavilion 17t-ab200 UHD | |
| Acer Aspire V17 Nitro BE VN7-793G-706L | |
| 3DMark | |
| 1280x720 Cloud Gate Standard Graphics | |
| MSI GT73VR 6RF | |
| Gigabyte P57X v7 | |
| HP Pavilion 17t-ab200 | |
| Acer Aspire V17 Nitro BE VN7-793G-706L | |
| HP Pavilion 17t-ab200 UHD | |
| 1920x1080 Fire Strike Graphics | |
| MSI GT73VR 6RF | |
| Gigabyte P57X v7 | |
| Acer Aspire V17 Nitro BE VN7-793G-706L | |
| HP Pavilion 17t-ab200 UHD | |
| HP Pavilion 17t-ab200 | |
| 3DMark 06 Standard Score | 25817 puntos | |
| 3DMark 11 Performance | 7554 puntos | |
| 3DMark Ice Storm Standard Score | 11692 puntos | |
| 3DMark Cloud Gate Standard Score | 11173 puntos | |
| 3DMark Fire Strike Score | 5383 puntos | |
ayuda | ||
| Rise of the Tomb Raider - 3840x2160 High Preset AA:FX AF:4x (ordenar por valor) | |
| HP Pavilion 17t-ab200 UHD | |
| Gigabyte P57X v7 | |
| Acer Aspire V17 Nitro BE VN7-793G-706L | |
| MSI GT73VR 6RF | |
| Doom - 3840x2160 High Preset AA:FX (ordenar por valor) | |
| HP Pavilion 17t-ab200 UHD | |
| MSI GT73VR 6RF | |
| Batman: Arkham Knight - 3840x2160 High / On (Interactive Smoke & Paper Debris Off) AA:SM AF:8x (ordenar por valor) | |
| HP Pavilion 17t-ab200 UHD | |
| Gigabyte P57X v7 | |
| MSI GT73VR 6RF | |
| bajo | medio | alto | ultra | 4K | |
|---|---|---|---|---|---|
| Batman: Arkham Knight (2015) | 13 | ||||
| Rise of the Tomb Raider (2016) | 12 | ||||
| Doom (2016) | 15 |
Ruido
| Ocioso |
| 34.5 / 34.5 / 36.6 dB(A) |
| DVD |
| 36.6 / dB(A) |
| Carga |
| 46.6 / 52.3 dB(A) |
 | ||
30 dB silencioso 40 dB(A) audible 50 dB(A) ruidosamente alto |
||
min: | ||
| HP Pavilion 17t-ab200 UHD GeForce GTX 1050 Mobile, i7-7700HQ, Intel SSD 600p SSDPEKKW256G7 | HP Pavilion 17t-ab200 GeForce GTX 1050 Mobile, i7-7700HQ, Samsung CM871a MZNTY128HDHP | Gigabyte P57X v7 GeForce GTX 1070 Mobile, i7-7700HQ, Transcend MTS800 256GB M.2 (TS256GMTS800) | MSI GT73VR 6RF GeForce GTX 1080 Mobile, 6820HK, 2x SanDisk X400 1TB M.2 SD8SN8U1T001122 (RAID 0) | |
|---|---|---|---|---|
| Noise | -1% | 6% | -2% | |
| apagado / medio ambiente * (dB) | 29.6 | 30.8 -4% | 29 2% | 29.2 1% |
| Idle Minimum * (dB) | 34.5 | 35.3 -2% | 30.4 12% | 32 7% |
| Idle Average * (dB) | 34.5 | 35.4 -3% | 32.1 7% | 32 7% |
| Idle Maximum * (dB) | 36.6 | 35.4 3% | 32.1 12% | 35 4% |
| Load Average * (dB) | 46.6 | 48.6 -4% | 45.6 2% | 50 -7% |
| Load Maximum * (dB) | 52.3 | 49.8 5% | 51.5 2% | 64 -22% |
* ... más pequeño es mejor
(-) La temperatura máxima en la parte superior es de 48.8 °C / 120 F, frente a la media de 36.8 °C / 98 F, que oscila entre 21 y 71 °C para la clase Multimedia.
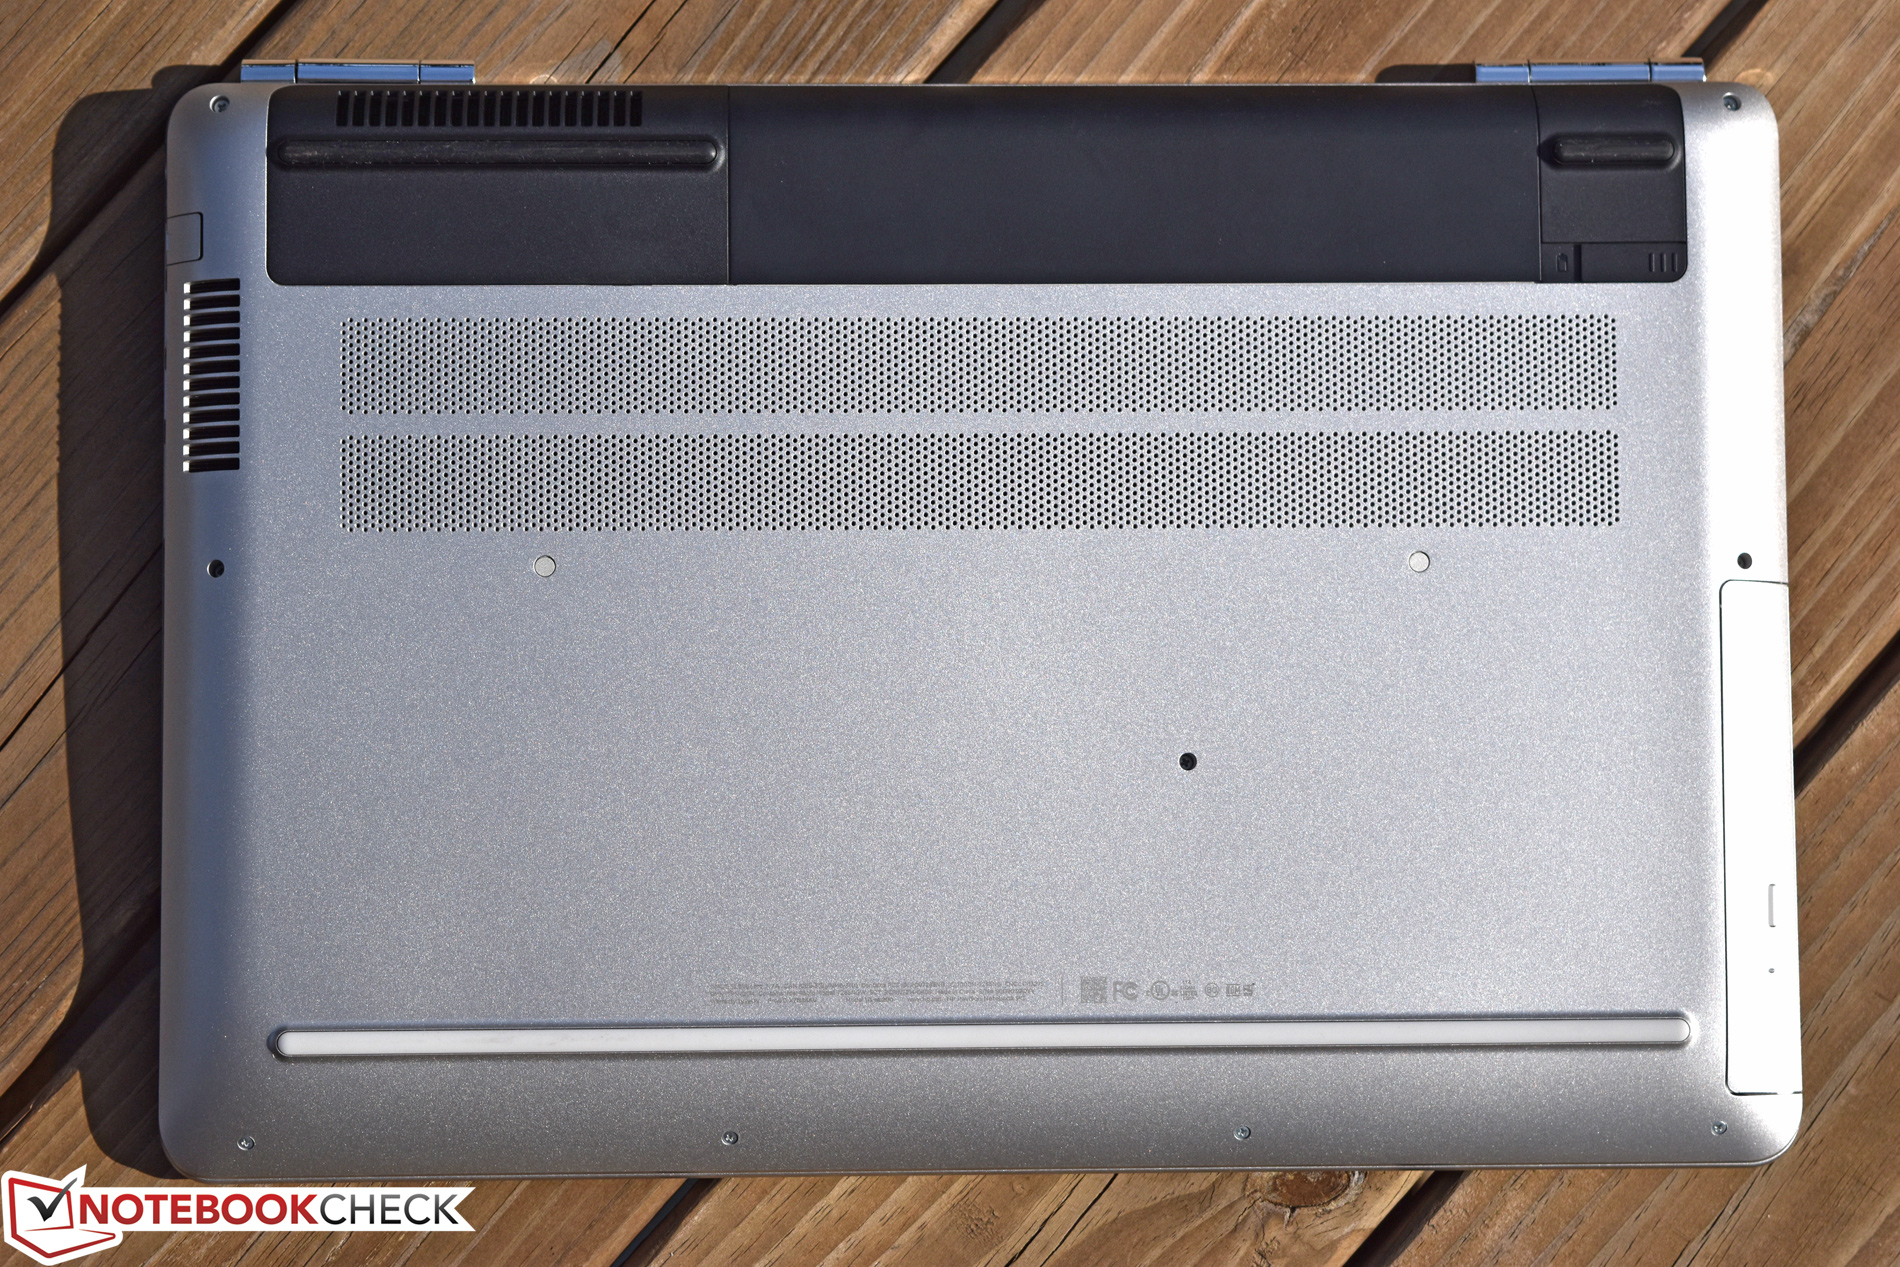
(+) El fondo se calienta hasta un máximo de 38.4 °C / 101 F, frente a la media de 39.1 °C / 102 F
(+) En reposo, la temperatura media de la parte superior es de 22.2 °C / 72# F, frente a la media del dispositivo de 31.3 °C / 88 F.
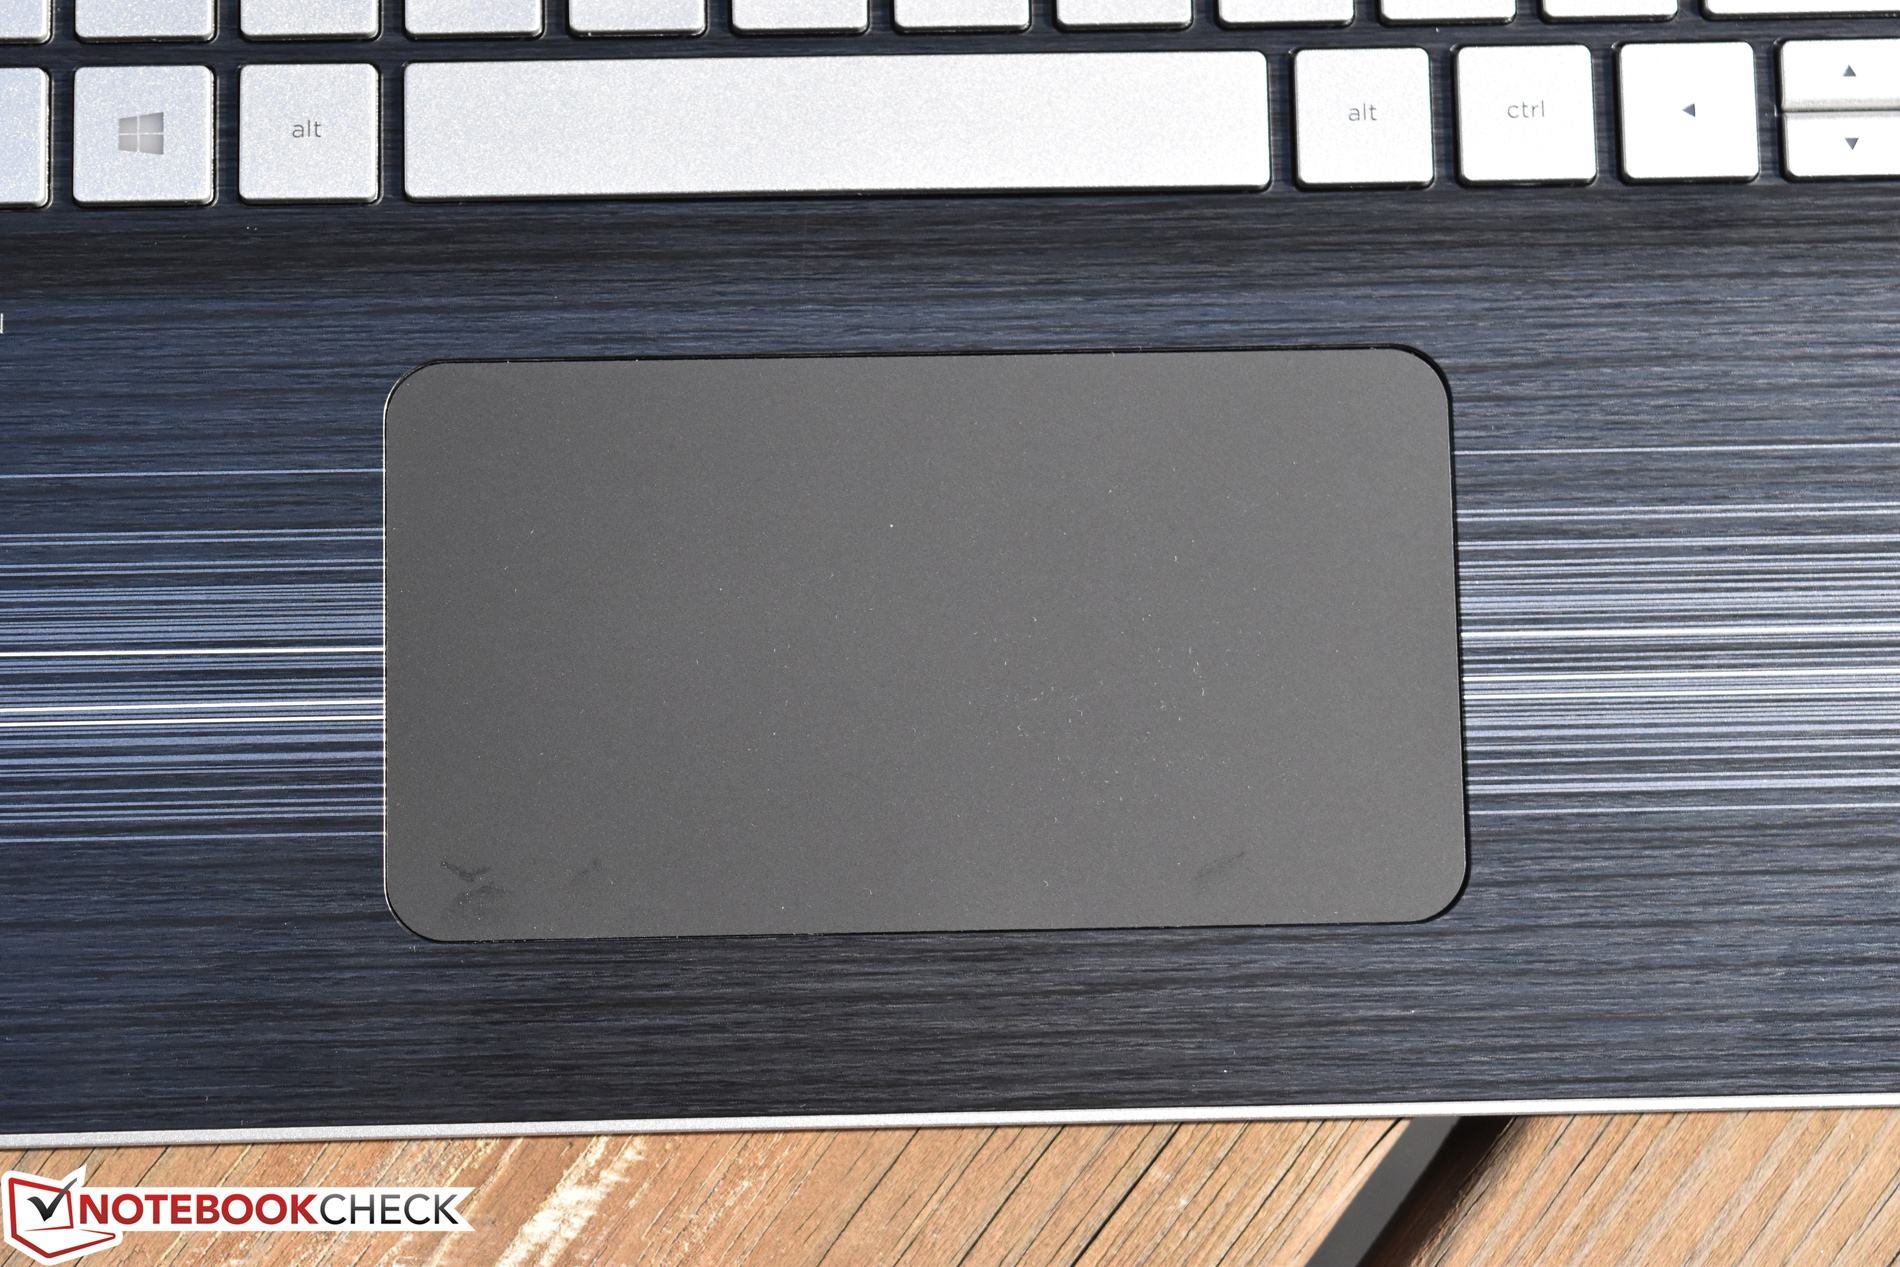
(+) El reposamanos y el panel táctil están a una temperatura inferior a la de la piel, con un máximo de 31 °C / 87.8 F y, por tanto, son fríos al tacto.
(-) La temperatura media de la zona del reposamanos de dispositivos similares fue de 28.7 °C / 83.7 F (-2.3 °C / -4.1 F).
HP Pavilion 17t-ab200 UHD análisis de audio
(±) | la sonoridad del altavoz es media pero buena (73.9 dB)
Graves 100 - 315 Hz
(±) | lubina reducida - en promedio 13.3% inferior a la mediana
(±) | la linealidad de los graves es media (10.8% delta a frecuencia anterior)
Medios 400 - 2000 Hz
(+) | medios equilibrados - a sólo 3.1% de la mediana
(+) | los medios son lineales (5.4% delta a la frecuencia anterior)
Altos 2 - 16 kHz
(+) | máximos equilibrados - a sólo 3.5% de la mediana
(±) | la linealidad de los máximos es media (7.8% delta a frecuencia anterior)
Total 100 - 16.000 Hz
(±) | la linealidad del sonido global es media (23.7% de diferencia con la mediana)
En comparación con la misma clase
» 83% de todos los dispositivos probados de esta clase eran mejores, 6% similares, 10% peores
» El mejor tuvo un delta de 5%, la media fue 17%, el peor fue ###max##%
En comparación con todos los dispositivos probados
» 71% de todos los dispositivos probados eran mejores, 6% similares, 23% peores
» El mejor tuvo un delta de 4%, la media fue 24%, el peor fue ###max##%
MSI GT73VR 6RF análisis de audio
(±) | la sonoridad del altavoz es media pero buena (79.1 dB)
Graves 100 - 315 Hz
(±) | lubina reducida - en promedio 8.2% inferior a la mediana
(±) | la linealidad de los graves es media (8% delta a frecuencia anterior)
Medios 400 - 2000 Hz
(+) | medios equilibrados - a sólo 3.3% de la mediana
(+) | los medios son lineales (6.4% delta a la frecuencia anterior)
Altos 2 - 16 kHz
(+) | máximos equilibrados - a sólo 4.6% de la mediana
(±) | la linealidad de los máximos es media (9.9% delta a frecuencia anterior)
Total 100 - 16.000 Hz
(±) | la linealidad del sonido global es media (19.9% de diferencia con la mediana)
En comparación con la misma clase
» 70% de todos los dispositivos probados de esta clase eran mejores, 6% similares, 24% peores
» El mejor tuvo un delta de 6%, la media fue 18%, el peor fue ###max##%
En comparación con todos los dispositivos probados
» 51% de todos los dispositivos probados eran mejores, 7% similares, 42% peores
» El mejor tuvo un delta de 4%, la media fue 24%, el peor fue ###max##%
| Off / Standby | |
| Ocioso | |
| Carga |
|
Clave:
min: | |
| HP Pavilion 17t-ab200 UHD i7-7700HQ, GeForce GTX 1050 Mobile, Intel SSD 600p SSDPEKKW256G7, IPS, 3840x2160, 17.3" | HP Pavilion 17t-ab200 i7-7700HQ, GeForce GTX 1050 Mobile, Samsung CM871a MZNTY128HDHP, IPS, 1920x1080, 17.3" | Gigabyte P57X v7 i7-7700HQ, GeForce GTX 1070 Mobile, Transcend MTS800 256GB M.2 (TS256GMTS800), IPS, 3840x2160, 17.3" | MSI GT73VR 6RF 6820HK, GeForce GTX 1080 Mobile, 2x SanDisk X400 1TB M.2 SD8SN8U1T001122 (RAID 0), IPS, 3840x2160, 17.3" | |
|---|---|---|---|---|
| Power Consumption | 24% | -62% | -122% | |
| Idle Minimum * (Watt) | 13.3 | 8.2 38% | 15.7 -18% | 28.9 -117% |
| Idle Average * (Watt) | 18.5 | 11 41% | 23.4 -26% | 30.6 -65% |
| Idle Maximum * (Watt) | 19 | 11.1 42% | 23.5 -24% | 33.1 -74% |
| Load Average * (Watt) | 78 | 77 1% | 184.6 -137% | 224.4 -188% |
| Load Maximum * (Watt) | 113.4 | 116.9 -3% | 233.1 -106% | 302.6 -167% |
* ... más pequeño es mejor
| HP Pavilion 17t-ab200 UHD i7-7700HQ, GeForce GTX 1050 Mobile, 63 Wh | HP Pavilion 17t-ab200 i7-7700HQ, GeForce GTX 1050 Mobile, 62 Wh | Gigabyte P57X v7 i7-7700HQ, GeForce GTX 1070 Mobile, 75.81 Wh | Acer Aspire V17 Nitro BE VN7-793G-706L i7-7700HQ, GeForce GTX 1060 Mobile, 69 Wh | MSI GT73VR 6RF 6820HK, GeForce GTX 1080 Mobile, 75.2 Wh | |
|---|---|---|---|---|---|
| Duración de Batería | 31% | -28% | -21% | -32% | |
| Reader / Idle (h) | 8.9 | 11.5 29% | 4.3 -52% | 5.1 -43% | |
| WiFi v1.3 (h) | 4.8 | 6.8 42% | 2.6 -46% | 3.8 -21% | 3.3 -31% |
| Load (h) | 1.4 | 1.7 21% | 1.6 14% | 1.1 -21% |
Pro
Contra

Mientras que el Pavilio 17t que analizamos el mes pasado, con todos sus problemas, parecía un buen candidato como máquina para entusiastas de los juegos con poco poder adquisitivo, esta configuración esta menos equilibrada con respecto a sus puntos fuertes y débiles. A pesar de que la GPU y otros componentes se mantienen con respecto a la configuración anterior, algunas limitaciones de potencia relacionadas con el firmware resultan en un rendimiento peor que el obtenido con el modelo 1080p, y la mayor resolución de pantalla -a pesar de ser indiscutiblemente más atractiva- significa que la jugar a resolución nativa con ajustes decentes y buenas tasas de refresco es una misión casi imposible para la GTX 1050. Este caso es un gran ejemplo de una situación donde más es menos -además teniendo en cuenta el nicho de mercado al que se orienta el Pavilion 17p parece que no tiene sentido pagar más por un panel al que no se puede sacar partido mientras se juega.
También entran en juego los entusiastas de la edición de fotografía y video, ya que el panel UHD proporciona una buena cobertura de la gama de colores y un brillo y resolución mucho mejores que el panel 1080p. Sin embargo, existen máquinas mejores para estos propósitos y, considerando los problemas de solidez en el rendimiento que hemos encontrado con el 17t en nuestro periodo de prueba (incluyendo algunas pausas en el funcionamiento que no se solucionaron tras actualizar el firmware), si vas a realizar una inversión en tu afición a editar fotos y videos, mejor no malgastar el dinero en una maquina que va a dar problemas por mucho ahorro que suponga.
Si, incluso tras todos estos problemas, sigues considerando la idea de hacerte con un Pavilion 17t, es obligado aplicar el firmware BIOS F.35 REV A con el fin de solucionar o atenuar algunos de los problemas más evidentes.
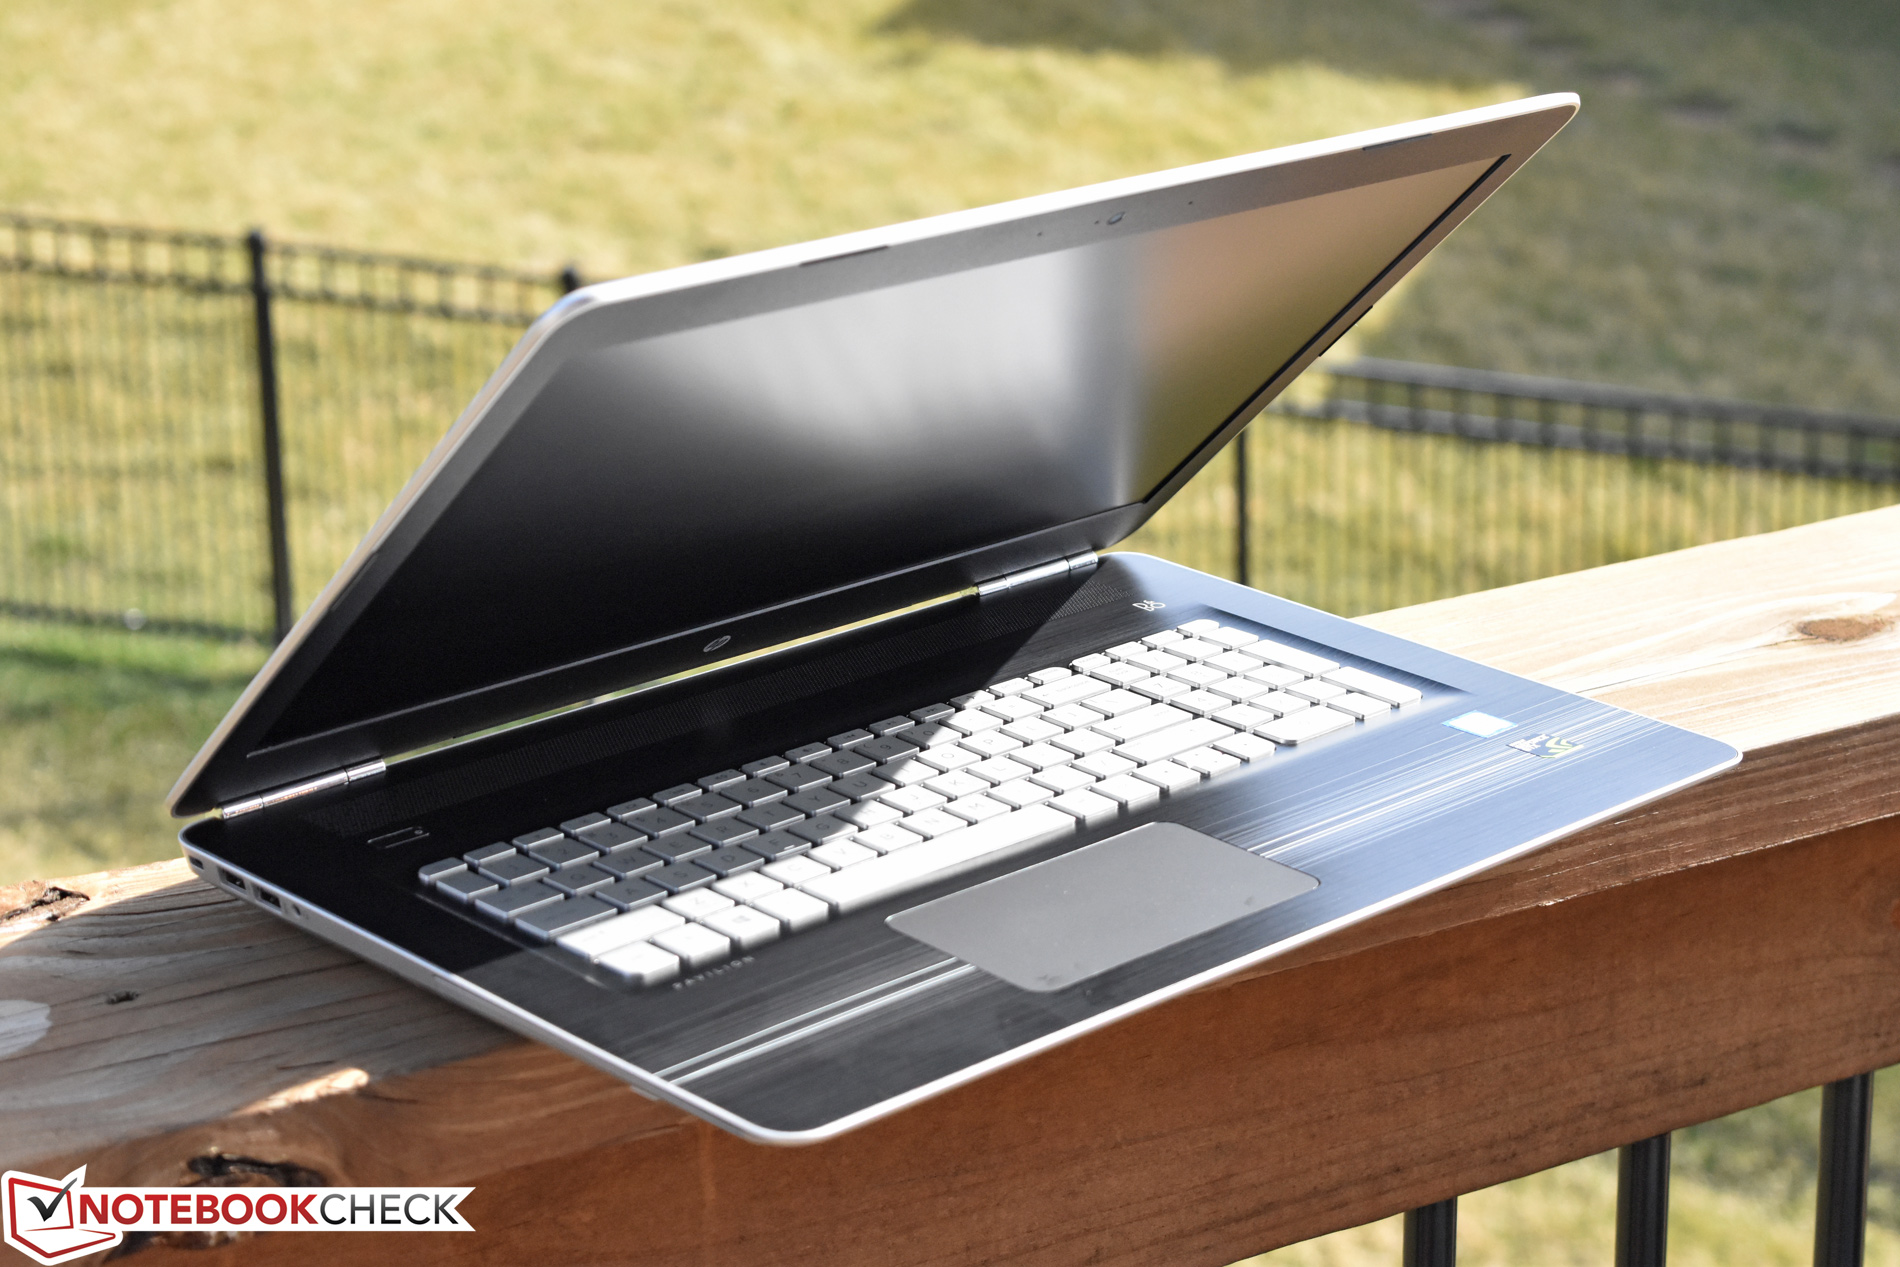
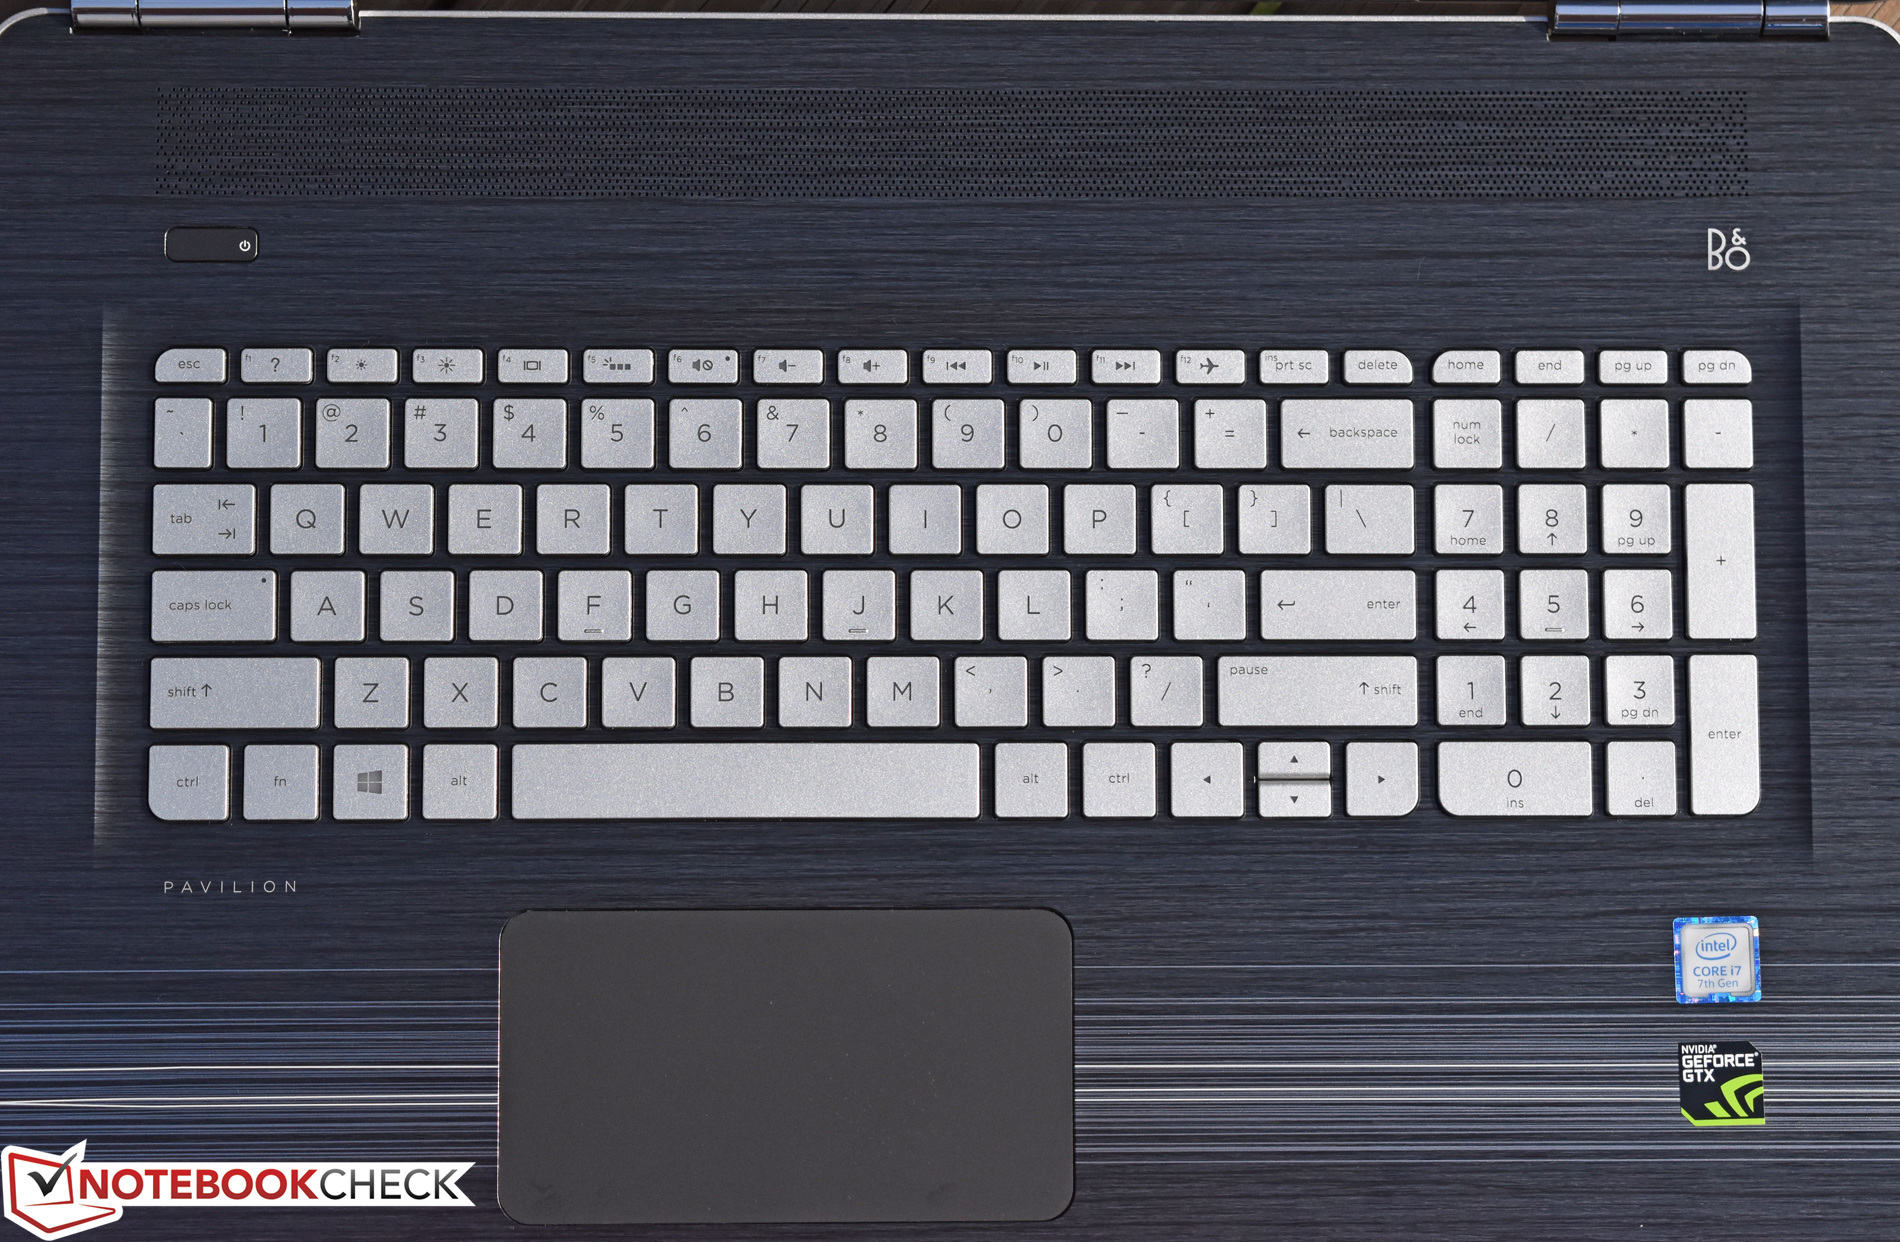
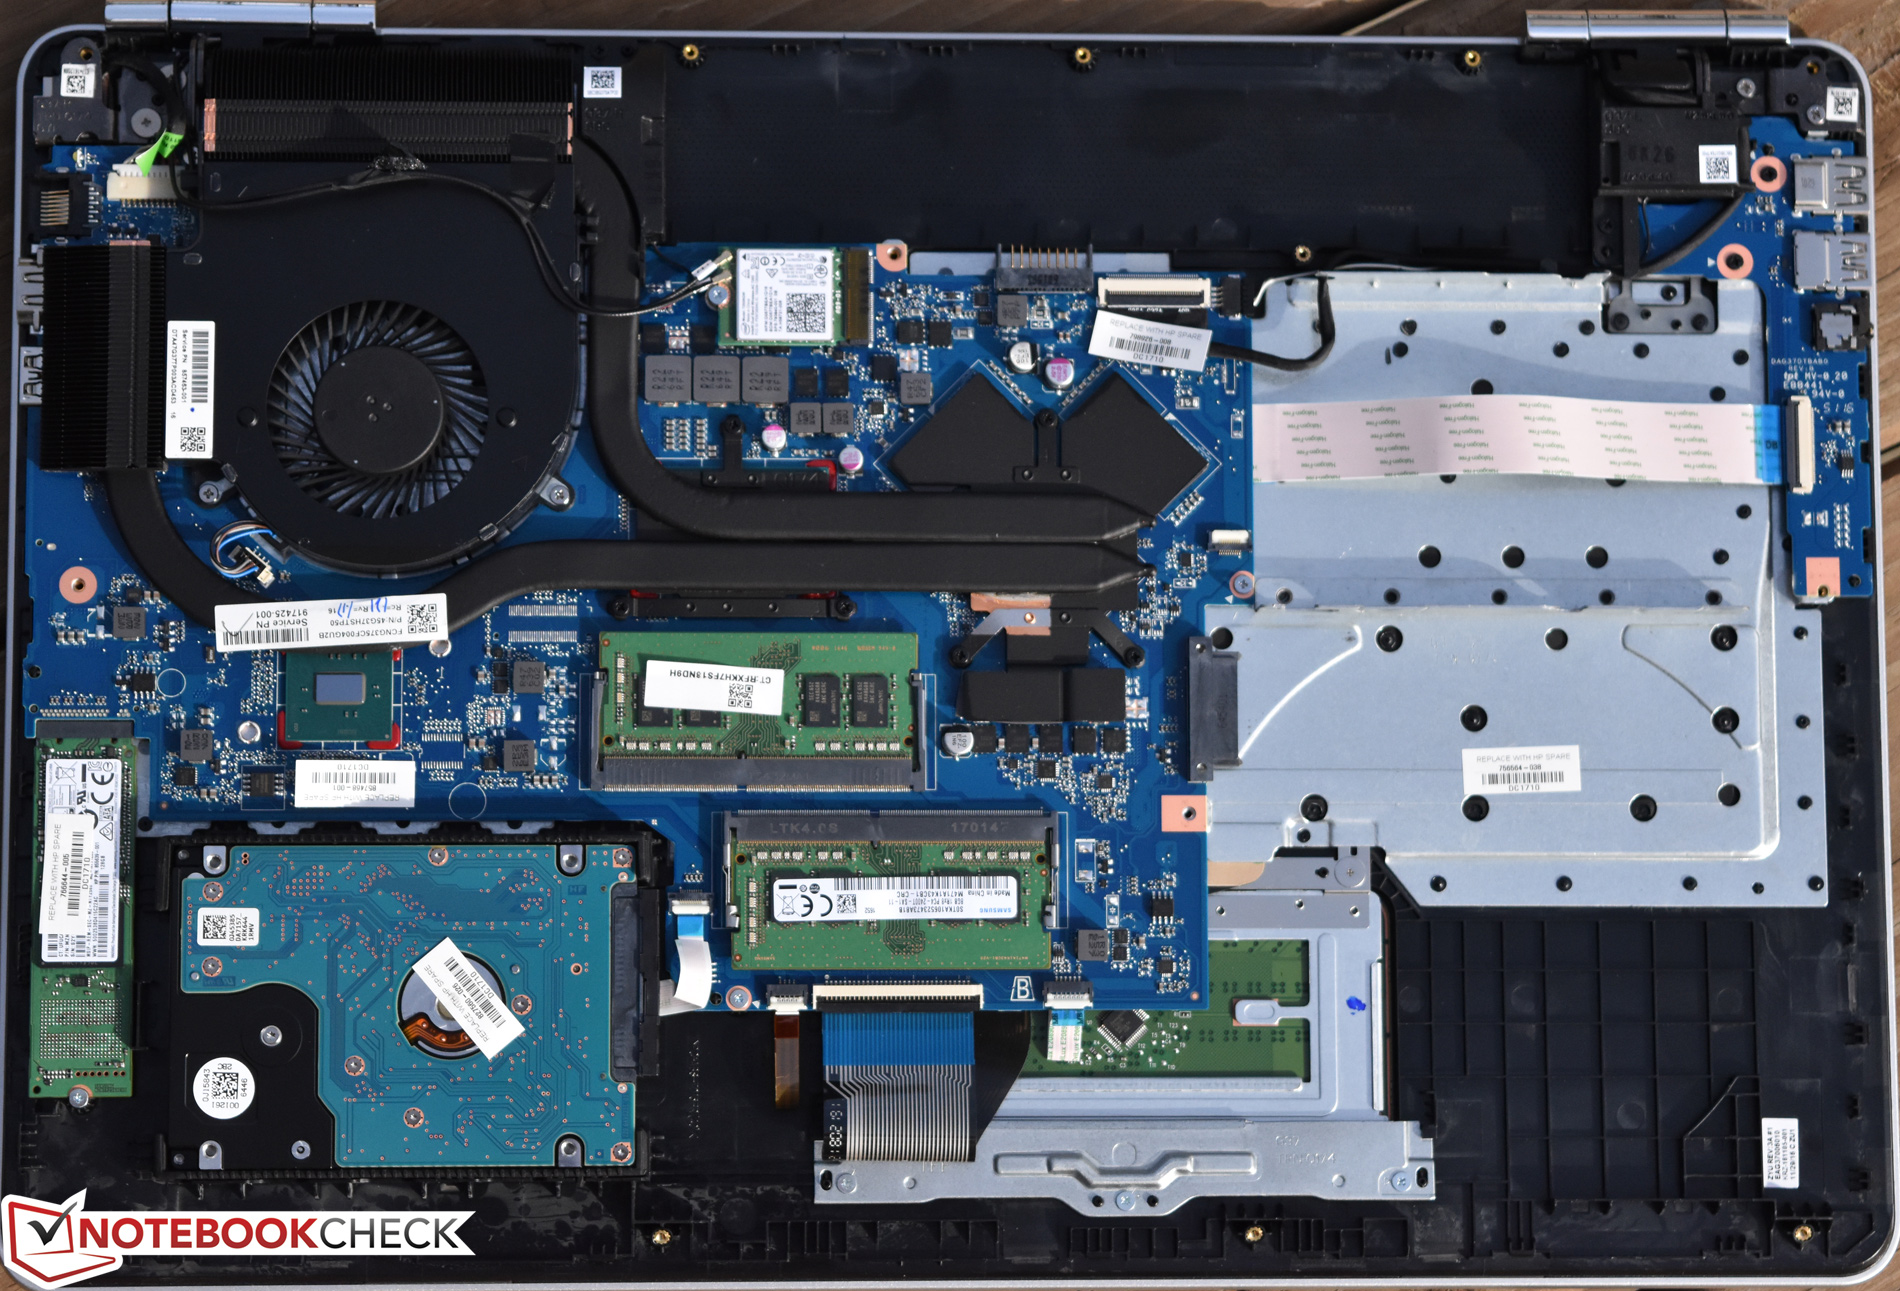
Y no podemos olvidarnos de otra serie de problemas que sufre este modelo en particular, incluyendo la fina carcasa de plástico, el complicado mantenimiento, el mediocre touchpad, la mala selección de puertos y el ruidoso funcionamiento. El resumen final es que no tienes que mirar en otras marcas para encontrar opciones mejores, cualquier máquina desde un HP Spectre a un Dell XPS 15 o un Lenovo Yoga 720, aunque resulten más caras, suponen una mejor inversión. El Pavilion 17t es un portátil que podemos animarte a obviar si estás pensando en comprar un portátil.
Ésta es una versión acortada del análisis original. Puedes leer el análisis completo en inglés aquí.
HP Pavilion 17t-ab200 UHD
- 03/27/2017 v6 (old)
Steve Schardein
Price comparison
