Breve análisis del Dell XPS 15 9560 (i7-7700HQ, UHD)

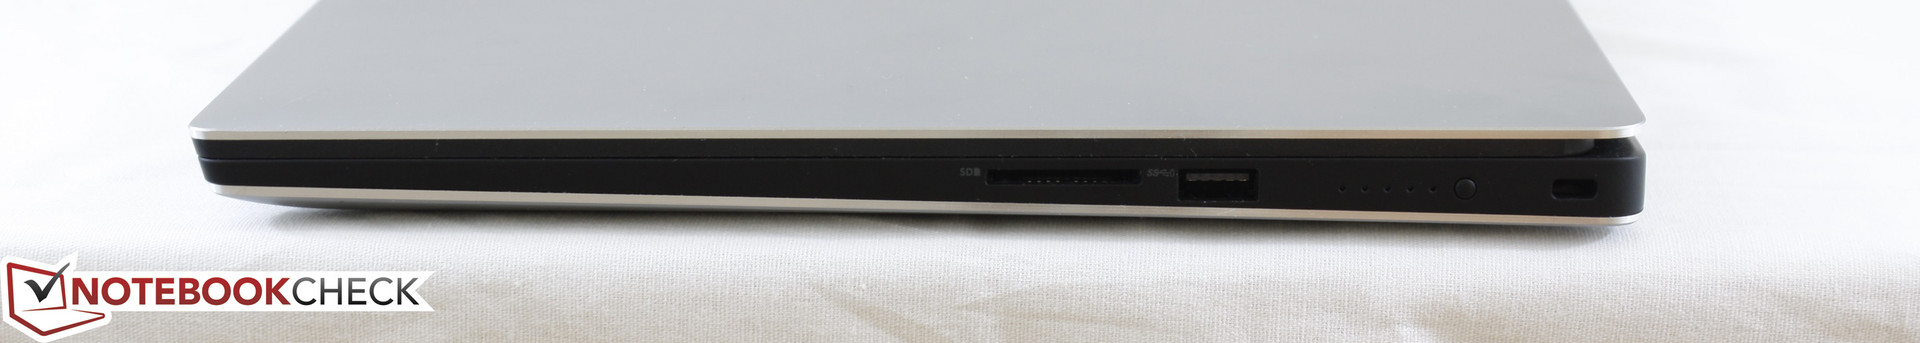
| SD Card Reader | |
| average JPG Copy Test (av. of 3 runs) | |
| HP Spectre x360 15-bl002xx | |
| Dell XPS 15 9560 (i7-7700HQ, UHD) | |
| Asus FX502VM-AS73 | |
| maximum AS SSD Seq Read Test (1GB) | |
| Dell XPS 15 9560 (i7-7700HQ, UHD) | |
| HP Spectre x360 15-bl002xx | |
| Asus FX502VM-AS73 | |
| Networking | |
| iperf3 transmit AX12 | |
| Dell XPS 15 9560 (i7-7700HQ, UHD) | |
| Asus FX502VM-AS73 | |
| HP Spectre x360 15-bl002xx | |
| iperf3 receive AX12 | |
| Dell XPS 15 9560 (i7-7700HQ, UHD) | |
| HP Spectre x360 15-bl002xx | |
| Asus FX502VM-AS73 | |
| |||||||||||||||||||||||||
iluminación: 87 %
Brillo con batería: 370.1 cd/m²
Contraste: 1000:1 (Negro: 0.37 cd/m²)
ΔE ColorChecker Calman: 5.3 | ∀{0.5-29.43 Ø4.71}
ΔE Greyscale Calman: 4.6 | ∀{0.09-98 Ø4.96}
100% sRGB (Argyll 1.6.3 3D)
88.3% AdobeRGB 1998 (Argyll 1.6.3 3D)
100% AdobeRGB 1998 (Argyll 3D)
100% sRGB (Argyll 3D)
89.7% Display P3 (Argyll 3D)
Gamma: 2.31
CCT: 6284 K
| Dell XPS 15 9560 (i7-7700HQ, UHD) IGZO IPS, 15.6", 3840x2160 | Asus FX502VM-AS73 TN LED, 15.6", 1920x1080 | Apple MacBook Pro 15 2016 (2.9 GHz, 460) Apple APPA030, IPS, 15.4", 2880x1800 | HP Spectre x360 15-bl002xx UHD UWVA eDP BrightView WLED-backlit , IPS, 15.6", 3840x2160 | Dell XPS 15 2017 9560 (7300HQ, Full-HD) Sharp SHP1453 LQ156M1, LED IGZO IPS InfinityEdge, 15.6", 1920x1080 | |
|---|---|---|---|---|---|
| Display | -54% | -1% | -24% | -18% | |
| Display P3 Coverage (%) | 89.7 | 38.28 -57% | 99 10% | 67.9 -24% | 68.9 -23% |
| sRGB Coverage (%) | 100 | 56.9 -43% | 100 0% | 88.2 -12% | 98.9 -1% |
| AdobeRGB 1998 Coverage (%) | 100 | 39.47 -61% | 87.3 -13% | 64.4 -36% | 70.9 -29% |
| Response Times | 47% | -12% | 12% | -14% | |
| Response Time Grey 50% / Grey 80% * (ms) | 57.2 ? | 28.4 ? 50% | 46 ? 20% | 44 ? 23% | 54 ? 6% |
| Response Time Black / White * (ms) | 39.2 ? | 22.4 ? 43% | 56 ? -43% | 38.8 ? 1% | 52.4 ? -34% |
| PWM Frequency (Hz) | 962 | 119000 ? | 1000 ? | ||
| Screen | -36% | 20% | 15% | 2% | |
| Brightness middle (cd/m²) | 370.1 | 209.5 -43% | 420 13% | 351.5 -5% | 400 8% |
| Brightness (cd/m²) | 356 | 205 -42% | 401 13% | 336 -6% | 392 10% |
| Brightness Distribution (%) | 87 | 92 6% | 90 3% | 83 -5% | 89 2% |
| Black Level * (cd/m²) | 0.37 | 0.69 -86% | 0.3 19% | 0.24 35% | 0.26 30% |
| Contrast (:1) | 1000 | 304 -70% | 1400 40% | 1465 47% | 1538 54% |
| Colorchecker dE 2000 * | 5.3 | 4.7 11% | 3.33 37% | 3.3 38% | 4.9 8% |
| Colorchecker dE 2000 max. * | 9.9 | 19.7 -99% | 5.11 48% | 7.3 26% | 11 -11% |
| Greyscale dE 2000 * | 4.6 | 1.8 61% | 2.73 41% | 1.9 59% | 7.2 -57% |
| Gamma | 2.31 95% | 2.23 99% | 2.48 89% | 2.09 105% | 2.11 104% |
| CCT | 6284 103% | 6975 93% | 6457 101% | 6784 96% | 6911 94% |
| Color Space (Percent of AdobeRGB 1998) (%) | 88.3 | 36.2 -59% | 78.09 -12% | 64.4 -27% | 64.2 -27% |
| Color Space (Percent of sRGB) (%) | 100 | 56.6 -43% | 99.97 0% | 88.2 -12% | 98.9 -1% |
| Media total (Programa/Opciones) | -14% /
-29% | 2% /
12% | 1% /
7% | -10% /
-4% |
* ... más pequeño es mejor
Tiempos de respuesta del display
| ↔ Tiempo de respuesta de Negro a Blanco | ||
|---|---|---|
| 39.2 ms ... subida ↗ y bajada ↘ combinada | ↗ 23.6 ms subida | 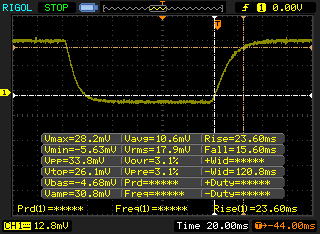 |
| ↘ 15.6 ms bajada | ||
| La pantalla mostró tiempos de respuesta lentos en nuestros tests y podría ser demasiado lenta para los jugones. En comparación, todos los dispositivos de prueba van de ##min### (mínimo) a 240 (máximo) ms. » 97 % de todos los dispositivos son mejores. Eso quiere decir que el tiempo de respuesta es peor que la media (19.8 ms) de todos los dispositivos testados. | ||
| ↔ Tiempo de respuesta 50% Gris a 80% Gris | ||
| 57.2 ms ... subida ↗ y bajada ↘ combinada | ↗ 27.2 ms subida | 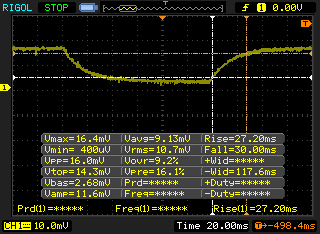 |
| ↘ 30 ms bajada | ||
| La pantalla mostró tiempos de respuesta lentos en nuestros tests y podría ser demasiado lenta para los jugones. En comparación, todos los dispositivos de prueba van de ##min### (mínimo) a 636 (máximo) ms. » 94 % de todos los dispositivos son mejores. Eso quiere decir que el tiempo de respuesta es peor que la media (30.9 ms) de todos los dispositivos testados. | ||
Parpadeo de Pantalla / PWM (Pulse-Width Modulation)
| Parpadeo de Pantalla / PWM detectado | 962 Hz | 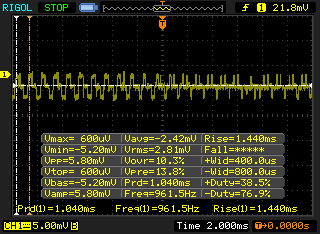 | |
La retroiluminación del display parpadea a 962 Hz (seguramente usa PWM - Pulse-Width Modulation) . La frecuencia de 962 Hz es bastante alta, por lo que la mayoría de gente sensible al parpadeo no debería ver parpadeo o tener fatiga visual. Comparación: 52 % de todos los dispositivos testados no usaron PWM para atenuar el display. Si se usó, medimos una media de 7748 (mínimo: 5 - máxmo: 343500) Hz. | |||
| Cinebench R11.5 | |
| CPU Single 64Bit | |
| Apple MacBook Pro 15 2016 (2.9 GHz, 460) | |
| MSI GT62VR 7RE-223 | |
| Dell XPS 15 9560 (i7-7700HQ, UHD) | |
| Eurocom Sky X7E2 | |
| MSI GE62 2QC-468XPL | |
| Asus GL702VM-GC102D | |
| Toshiba Satellite S70-B-106 | |
| CPU Multi 64Bit | |
| Eurocom Sky X7E2 | |
| MSI GT62VR 7RE-223 | |
| Dell XPS 15 9560 (i7-7700HQ, UHD) | |
| MSI GE62 2QC-468XPL | |
| Apple MacBook Pro 15 2016 (2.9 GHz, 460) | |
| Asus GL702VM-GC102D | |
| Toshiba Satellite S70-B-106 | |
| Cinebench R10 | |
| Rendering Multiple CPUs 32Bit | |
| Eurocom Sky X7E2 | |
| Apple MacBook Pro 15 2016 (2.9 GHz, 460) | |
| MSI GT62VR 7RE-223 | |
| MSI GE62 2QC-468XPL | |
| Dell XPS 15 9560 (i7-7700HQ, UHD) | |
| Asus GL702VM-GC102D | |
| Rendering Single 32Bit | |
| Eurocom Sky X7E2 | |
| Apple MacBook Pro 15 2016 (2.9 GHz, 460) | |
| MSI GT62VR 7RE-223 | |
| Dell XPS 15 9560 (i7-7700HQ, UHD) | |
| MSI GE62 2QC-468XPL | |
| Asus GL702VM-GC102D | |
| wPrime 2.10 - 1024m | |
| Apple MacBook Pro 15 2016 (2.9 GHz, 460) | |
| Dell XPS 15 9560 (i7-7700HQ, UHD) | |
| MSI GE62 2QC-468XPL | |
| Eurocom Sky X7E2 | |
* ... más pequeño es mejor
| PCMark 8 Home Score Accelerated v2 | 3588 puntos | |
| PCMark 8 Creative Score Accelerated v2 | 5114 puntos | |
| PCMark 8 Work Score Accelerated v2 | 4422 puntos | |
ayuda | ||
| Dell XPS 15 9560 (i7-7700HQ, UHD) Lite-On CX2-8B512-Q11 | Asus FX502VM-AS73 SK Hynix HFS256G39TND-N210A | Apple MacBook Pro 15 2016 (2.9 GHz, 460) Apple SSD SM1024L | HP Spectre x360 15-bl002xx Toshiba XG4 NVMe (THNSN5512GPUK) | Dell Latitude 15 E5570 Samsung SSD PM871 MZ7LN128HCHP | |
|---|---|---|---|---|---|
| CrystalDiskMark 3.0 | -62% | -11% | -11% | -58% | |
| Read Seq (MB/s) | 1684 | 503 -70% | 1458 -13% | 1266 -25% | 474.7 -72% |
| Write Seq (MB/s) | 1106 | 138.2 -88% | 1440 30% | 982 -11% | 155 -86% |
| Read 512 (MB/s) | 977 | 343.5 -65% | 914 -6% | 834 -15% | 393.6 -60% |
| Write 512 (MB/s) | 1119 | 137.8 -88% | 1058 -5% | 714 -36% | 119.7 -89% |
| Read 4k (MB/s) | 45.14 | 29.36 -35% | 9.786 -78% | 40.72 -10% | 34 -25% |
| Write 4k (MB/s) | 134.1 | 70.9 -47% | 10.9 -92% | 139.4 4% | 96.6 -28% |
| Read 4k QD32 (MB/s) | 509 | 369.9 -27% | 679 33% | 527 4% | 383.3 -25% |
| Write 4k QD32 (MB/s) | 398.1 | 99.7 -75% | 562 41% | 395.2 -1% | 100.2 -75% |

| 3DMark Ice Storm Standard Score | 31054 puntos | |
| 3DMark Cloud Gate Standard Score | 18212 puntos | |
| 3DMark Fire Strike Score | 5524 puntos | |
| 3DMark Fire Strike Extreme Score | 2686 puntos | |
ayuda | ||
| Rise of the Tomb Raider - 1920x1080 Very High Preset AA:FX AF:16x | |
| Asus FX502VM-AS73 | |
| MSI GE72 7RE-046 | |
| Zotac GeForce GTX 1050 2GB | |
| Dell XPS 15 9560 (i7-7700HQ, UHD) | |
| Dell XPS 15 9550 i7 FHD | |
| Metro: Last Light - 1920x1080 Very High (DX11) AF:16x | |
| Asus FX502VM-AS73 | |
| Aorus X3 Plus v5 | |
| Zotac GeForce GTX 1050 2GB | |
| Dell XPS 15 9560 (i7-7700HQ, UHD) | |
| Dell XPS 15 9550 i7 FHD | |
| BioShock Infinite - 1920x1080 Ultra Preset, DX11 (DDOF) | |
| Asus FX502VM-AS73 | |
| Aorus X3 Plus v5 | |
| Zotac GeForce GTX 1050 2GB | |
| Dell XPS 15 9560 (i7-7700HQ, UHD) | |
| Dell XPS 15 9550 i7 FHD | |
| Thief - 1920x1080 Very High Preset AA:FXAA & High SS AF:8x | |
| Asus FX502VM-AS73 | |
| Aorus X3 Plus v5 | |
| Dell XPS 15 9560 (i7-7700HQ, UHD) | |
| Dell XPS 15 9550 i7 FHD | |
| Batman: Arkham Knight - 1920x1080 High / On AA:SM AF:16x | |
| MSI GE72 7RE-046 | |
| Dell XPS 15 9560 (i7-7700HQ, UHD) | |
| Dell XPS 15 9550 i7 FHD | |
| Fallout 4 - 1920x1080 Ultra Preset AA:T AF:16x | |
| Asus FX502VM-AS73 | |
| MSI GE72 7RE-046 | |
| Aorus X3 Plus v5 | |
| Zotac GeForce GTX 1050 2GB | |
| Dell XPS 15 9560 (i7-7700HQ, UHD) | |
| Dell XPS 15 9550 i7 FHD | |
| Doom - 1920x1080 Ultra Preset AA:SM | |
| Asus FX502VM-AS73 | |
| MSI GE72 7RE-046 | |
| Dell XPS 15 9560 (i7-7700HQ, UHD) | |
| Zotac GeForce GTX 1050 2GB | |
| Overwatch - 1920x1080 Epic (Render Scale 100 %) AA:SM AF:16x | |
| Asus FX502VM-AS73 | |
| MSI GE72 7RE-046 | |
| Zotac GeForce GTX 1050 2GB | |
| Dell XPS 15 9560 (i7-7700HQ, UHD) | |
| Mafia 3 - 1920x1080 High Preset | |
| Asus FX502VM-AS73 | |
| MSI GE72 7RE-046 | |
| Zotac GeForce GTX 1050 2GB | |
| Dell XPS 15 9560 (i7-7700HQ, UHD) | |
| bajo | medio | alto | ultra | 4K | |
|---|---|---|---|---|---|
| StarCraft II: Heart of the Swarm (2013) | 71 | ||||
| BioShock Infinite (2013) | 152.5 | 66 | |||
| Metro: Last Light (2013) | 83.9 | 45.1 | |||
| Thief (2014) | 76 | 41.9 | |||
| The Witcher 3 (2015) | 64.9 | 38.2 | 19.8 | ||
| Batman: Arkham Knight (2015) | 83 | 48 | 33 | 15 | |
| Metal Gear Solid V (2015) | 60 | 53.4 | 24.8 | ||
| Dota 2 Reborn (2015) | 34 | ||||
| Fallout 4 (2015) | 41.7 | 34.6 | 14 | ||
| Rise of the Tomb Raider (2016) | 71.9 | 39.8 | 32.9 | 13.1 | |
| Ashes of the Singularity (2016) | 34.9 | 29.8 | |||
| Doom (2016) | 57 | 53.8 | 17.5 | ||
| Overwatch (2016) | 90.7 | 54.5 | 30.2 | ||
| Mafia 3 (2016) | 21 |
Ruido
| Ocioso |
| 29 / 29 / 32.2 dB(A) |
| Carga |
| 47.1 / 47.1 dB(A) |
 | ||
30 dB silencioso 40 dB(A) audible 50 dB(A) ruidosamente alto |
||
min: | ||
| Dell XPS 15 9560 (i7-7700HQ, UHD) | Asus FX502VM-AS73 | Apple MacBook Pro 15 2016 (2.9 GHz, 460) | Dell XPS 15 2017 9560 (7300HQ, Full-HD) | Dell XPS 15 9550 i7 FHD | |
|---|---|---|---|---|---|
| Noise | -3% | 4% | -5% | 6% | |
| apagado / medio ambiente * (dB) | 28.4 | 28.7 -1% | 29 -2% | 30.3 -7% | |
| Idle Minimum * (dB) | 29 | 30.6 -6% | 30.3 -4% | 31.6 -9% | 29.2 -1% |
| Idle Average * (dB) | 29 | 30.6 -6% | 30.3 -4% | 31.6 -9% | 29.3 -1% |
| Idle Maximum * (dB) | 32.2 | 31 4% | 30.3 6% | 33.4 -4% | 29.5 8% |
| Load Average * (dB) | 47.1 | 46.2 2% | 35.1 25% | 47.8 -1% | 36.5 23% |
| Witcher 3 ultra * (dB) | 52 | ||||
| Load Maximum * (dB) | 47.1 | 52.3 -11% | 46 2% | 47.8 -1% | 47.7 -1% |
* ... más pequeño es mejor
(-) La temperatura máxima en la parte superior es de 48.8 °C / 120 F, frente a la media de 36.8 °C / 98 F, que oscila entre 21 y 71 °C para la clase Multimedia.
(±) El fondo se calienta hasta un máximo de 42.6 °C / 109 F, frente a la media de 39.1 °C / 102 F
(+) En reposo, la temperatura media de la parte superior es de 24.6 °C / 76# F, frente a la media del dispositivo de 31.3 °C / 88 F.
(±) Jugando a The Witcher 3, la temperatura media de la parte superior es de 36.8 °C / 98 F, frente a la media del dispositivo de 31.3 °C / 88 F.
(+) El reposamanos y el panel táctil están a una temperatura inferior a la de la piel, con un máximo de 30.2 °C / 86.4 F y, por tanto, son fríos al tacto.
(±) La temperatura media de la zona del reposamanos de dispositivos similares fue de 28.7 °C / 83.7 F (-1.5 °C / -2.7 F).
Dell XPS 15 9560 (i7-7700HQ, UHD) análisis de audio
(-) | altavoces no muy altos (#70.9 dB)
Graves 100 - 315 Hz
(±) | lubina reducida - en promedio 12.9% inferior a la mediana
(±) | la linealidad de los graves es media (14.3% delta a frecuencia anterior)
Medios 400 - 2000 Hz
(+) | medios equilibrados - a sólo 3.5% de la mediana
(±) | la linealidad de los medios es media (8.9% delta respecto a la frecuencia anterior)
Altos 2 - 16 kHz
(+) | máximos equilibrados - a sólo 2.3% de la mediana
(±) | la linealidad de los máximos es media (7.3% delta a frecuencia anterior)
Total 100 - 16.000 Hz
(±) | la linealidad del sonido global es media (16.2% de diferencia con la mediana)
En comparación con la misma clase
» 41% de todos los dispositivos probados de esta clase eran mejores, 7% similares, 51% peores
» El mejor tuvo un delta de 5%, la media fue 17%, el peor fue ###max##%
En comparación con todos los dispositivos probados
» 26% de todos los dispositivos probados eran mejores, 6% similares, 68% peores
» El mejor tuvo un delta de 4%, la media fue 23%, el peor fue ###max##%
Apple MacBook 12 (Early 2016) 1.1 GHz análisis de audio
(+) | los altavoces pueden reproducir a un volumen relativamente alto (#83.6 dB)
Graves 100 - 315 Hz
(±) | lubina reducida - en promedio 11.3% inferior a la mediana
(±) | la linealidad de los graves es media (14.2% delta a frecuencia anterior)
Medios 400 - 2000 Hz
(+) | medios equilibrados - a sólo 2.4% de la mediana
(+) | los medios son lineales (5.5% delta a la frecuencia anterior)
Altos 2 - 16 kHz
(+) | máximos equilibrados - a sólo 2% de la mediana
(+) | los máximos son lineales (4.5% delta a la frecuencia anterior)
Total 100 - 16.000 Hz
(+) | el sonido global es lineal (10.2% de diferencia con la mediana)
En comparación con la misma clase
» 7% de todos los dispositivos probados de esta clase eran mejores, 2% similares, 90% peores
» El mejor tuvo un delta de 5%, la media fue 18%, el peor fue ###max##%
En comparación con todos los dispositivos probados
» 5% de todos los dispositivos probados eran mejores, 1% similares, 94% peores
» El mejor tuvo un delta de 4%, la media fue 23%, el peor fue ###max##%
| Off / Standby | |
| Ocioso | |
| Carga |
|
Clave:
min: | |
| Dell XPS 15 9560 (i7-7700HQ, UHD) i7-7700HQ, GeForce GTX 1050 Mobile, Lite-On CX2-8B512-Q11, IGZO IPS, 3840x2160, 15.6" | Asus FX502VM-AS73 i7-7700HQ, GeForce GTX 1060 Mobile, SK Hynix HFS256G39TND-N210A, TN LED, 1920x1080, 15.6" | Apple MacBook Pro 15 2016 (2.9 GHz, 460) 6920HQ, Radeon Pro 460, Apple SSD SM1024L, IPS, 2880x1800, 15.4" | HP Spectre x360 15-bl002xx i7-7500U, GeForce 940MX, Toshiba XG4 NVMe (THNSN5512GPUK), IPS, 3840x2160, 15.6" | Dell XPS 15 2017 9560 (7300HQ, Full-HD) i5-7300HQ, GeForce GTX 1050 Mobile, WDC WD10SPCX-75KHST0 + SanDisk Z400s M.2 2242 32 GB Cache, LED IGZO IPS InfinityEdge, 1920x1080, 15.6" | |
|---|---|---|---|---|---|
| Power Consumption | -7% | 39% | 38% | 28% | |
| Idle Minimum * (Watt) | 11.9 | 14.9 -25% | 3 75% | 8.14 32% | 6.6 45% |
| Idle Average * (Watt) | 17.1 | 15.1 12% | 9.9 42% | 10.91 36% | 9 47% |
| Idle Maximum * (Watt) | 17.3 | 15.2 12% | 12.5 28% | 12.26 29% | 10.7 38% |
| Load Average * (Watt) | 94.7 | 105.8 -12% | 70.6 25% | 45.67 52% | 77.5 18% |
| Witcher 3 ultra * (Watt) | 104.8 | ||||
| Load Maximum * (Watt) | 122 | 148.8 -22% | 90.8 26% | 74.94 39% | 130 -7% |
* ... más pequeño es mejor
| Dell XPS 15 9560 (i7-7700HQ, UHD) i7-7700HQ, GeForce GTX 1050 Mobile, 97 Wh | Asus FX502VM-AS73 i7-7700HQ, GeForce GTX 1060 Mobile, 64 Wh | Apple MacBook Pro 15 2016 (2.9 GHz, 460) 6920HQ, Radeon Pro 460, 76 Wh | HP Spectre x360 15-bl002xx i7-7500U, GeForce 940MX, 79.2 Wh | Dell XPS 15 2017 9560 (7300HQ, Full-HD) i5-7300HQ, GeForce GTX 1050 Mobile, 56 Wh | |
|---|---|---|---|---|---|
| Duración de Batería | -42% | -2% | 25% | -24% | |
| Reader / Idle (h) | 13.9 | 6.1 -56% | 14.4 4% | 9.4 -32% | |
| WiFi v1.3 (h) | 7.2 | 4.6 -36% | 10.3 43% | 8.9 24% | 5.6 -22% |
| Load (h) | 1.7 | 1.1 -35% | 0.9 -47% | 2.5 47% | 1.4 -18% |
Pro
Contra
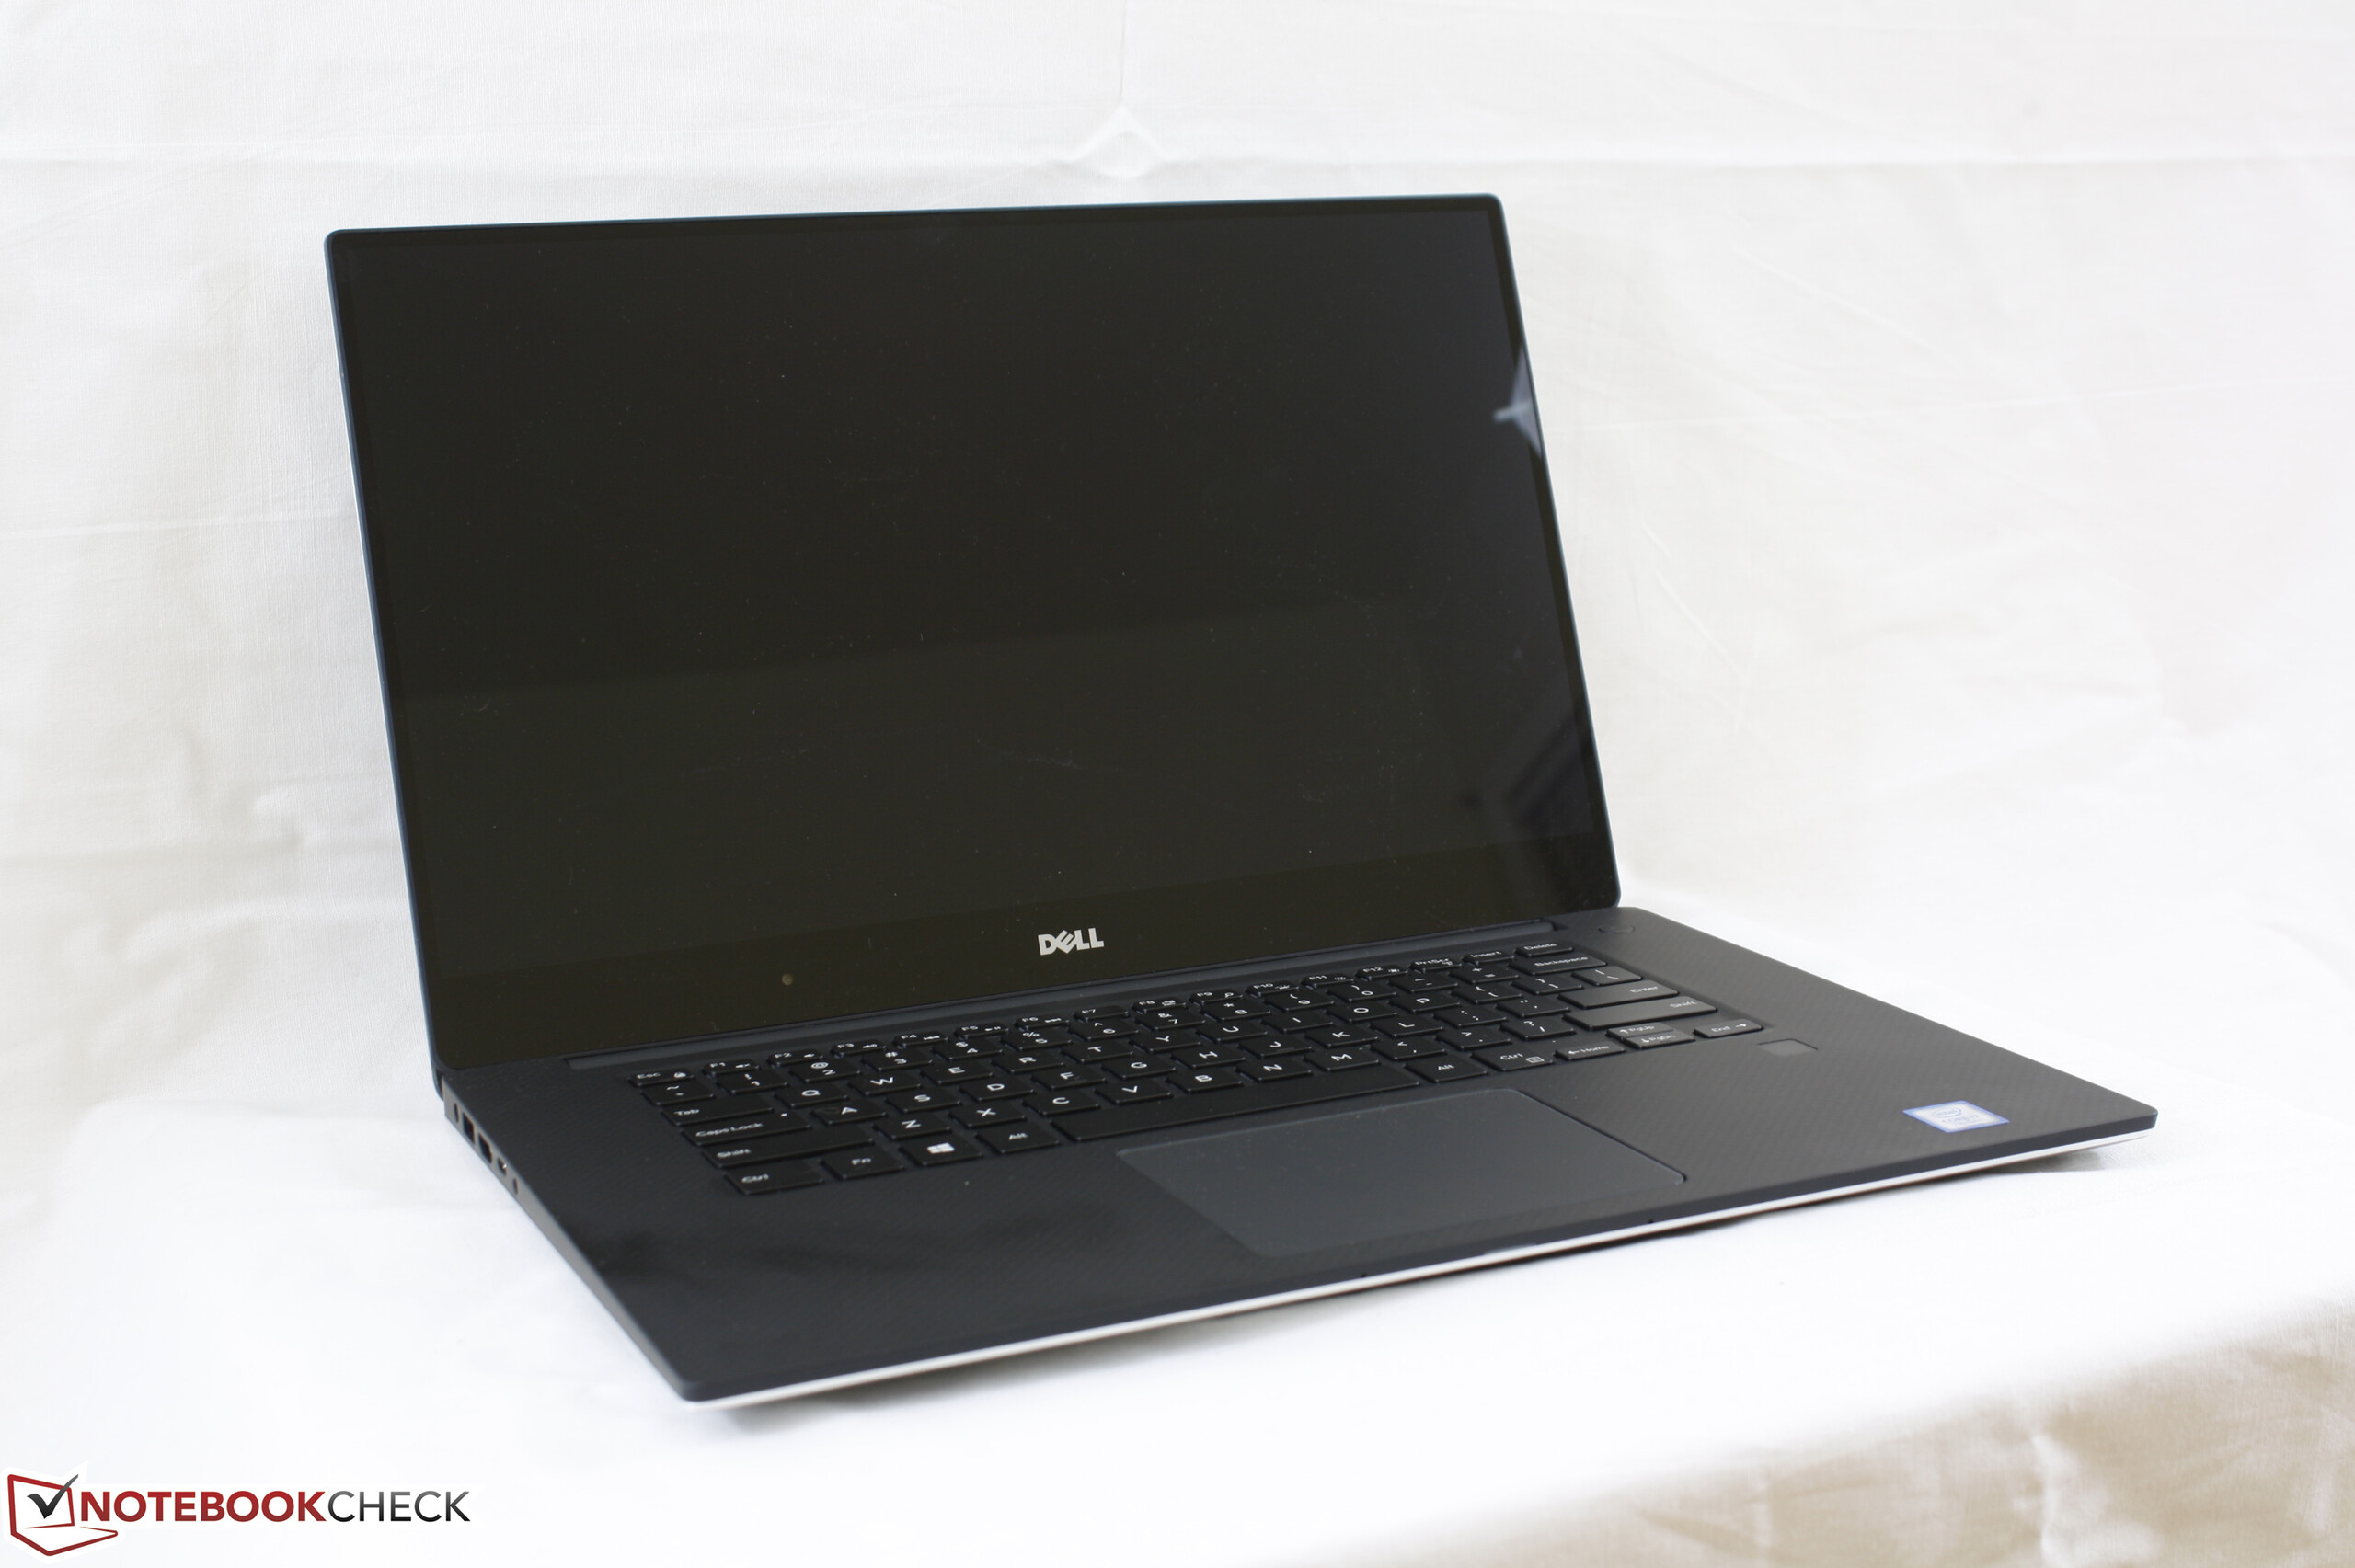
En nuestro análisis del Kaby Lake XPS 9360, mencionamos que las ventajas de rendimiento y aguante de batería respecto al XPS 9350 Skylake son tan minúsculas que los usuarios podrían querer plantearse ahorrarse unos cientos al comprar el modelo anterior. Lo mismo se puede decir del XPS 9560 ya que la i7-7700HQ ofrece muy pocos beneficios tangibles respecto a la i7-6700HQ del XPS 9550 cuando se comparan las diferencias de precio entre ambos.
Una consideración más complicada es la GPU GTX 1050 de esta última iteración del XPS 15. El rendimiento gráfico aumenta mucho respecto al de la GTX 960M del XPS 15 9550 e incluso se podría pensar que es demasiado para usuarios que sencillamente quieren el portátil para procesar textos y hacer streaming. Para esos usuarios a los que les atrae más la calidad y el diseño del portátil que su rendimiento, la configuración básica de $999 sin dGPU resulta muy atractiva. Los jugones casuales que busquen una máquina Windows versátil para la oficina y el juego encontrarán que el XPS 9560 es mucho más potente que el que tienen que ofrecer XPS 15 9550, Radeon MacBook Pro 15, y otros competidores en esta categoría particular en este momento. Hay alternativas más baratas tales como el Pavilion 15 UHD con opciones GTX 1050, pero la calidad de construcción está en otro mundo.
La característica definitoria del XPS 15 9560 respecto al XPS 15 9550 es el enorme salto en potencia GPU. Si el rendimiento gráfico extra no es necesario, la configuración básica del 9560 o incluso un modelo anterior 9550 serían más suaves con la cartera.
Ésta es una versión acortada del análisis original. Puedes leer el análisis completo en inglés aquí.
Dell XPS 15 9560 (i7-7700HQ, UHD)
- 03/15/2017 v6 (old)
Allen Ngo
Price comparison
