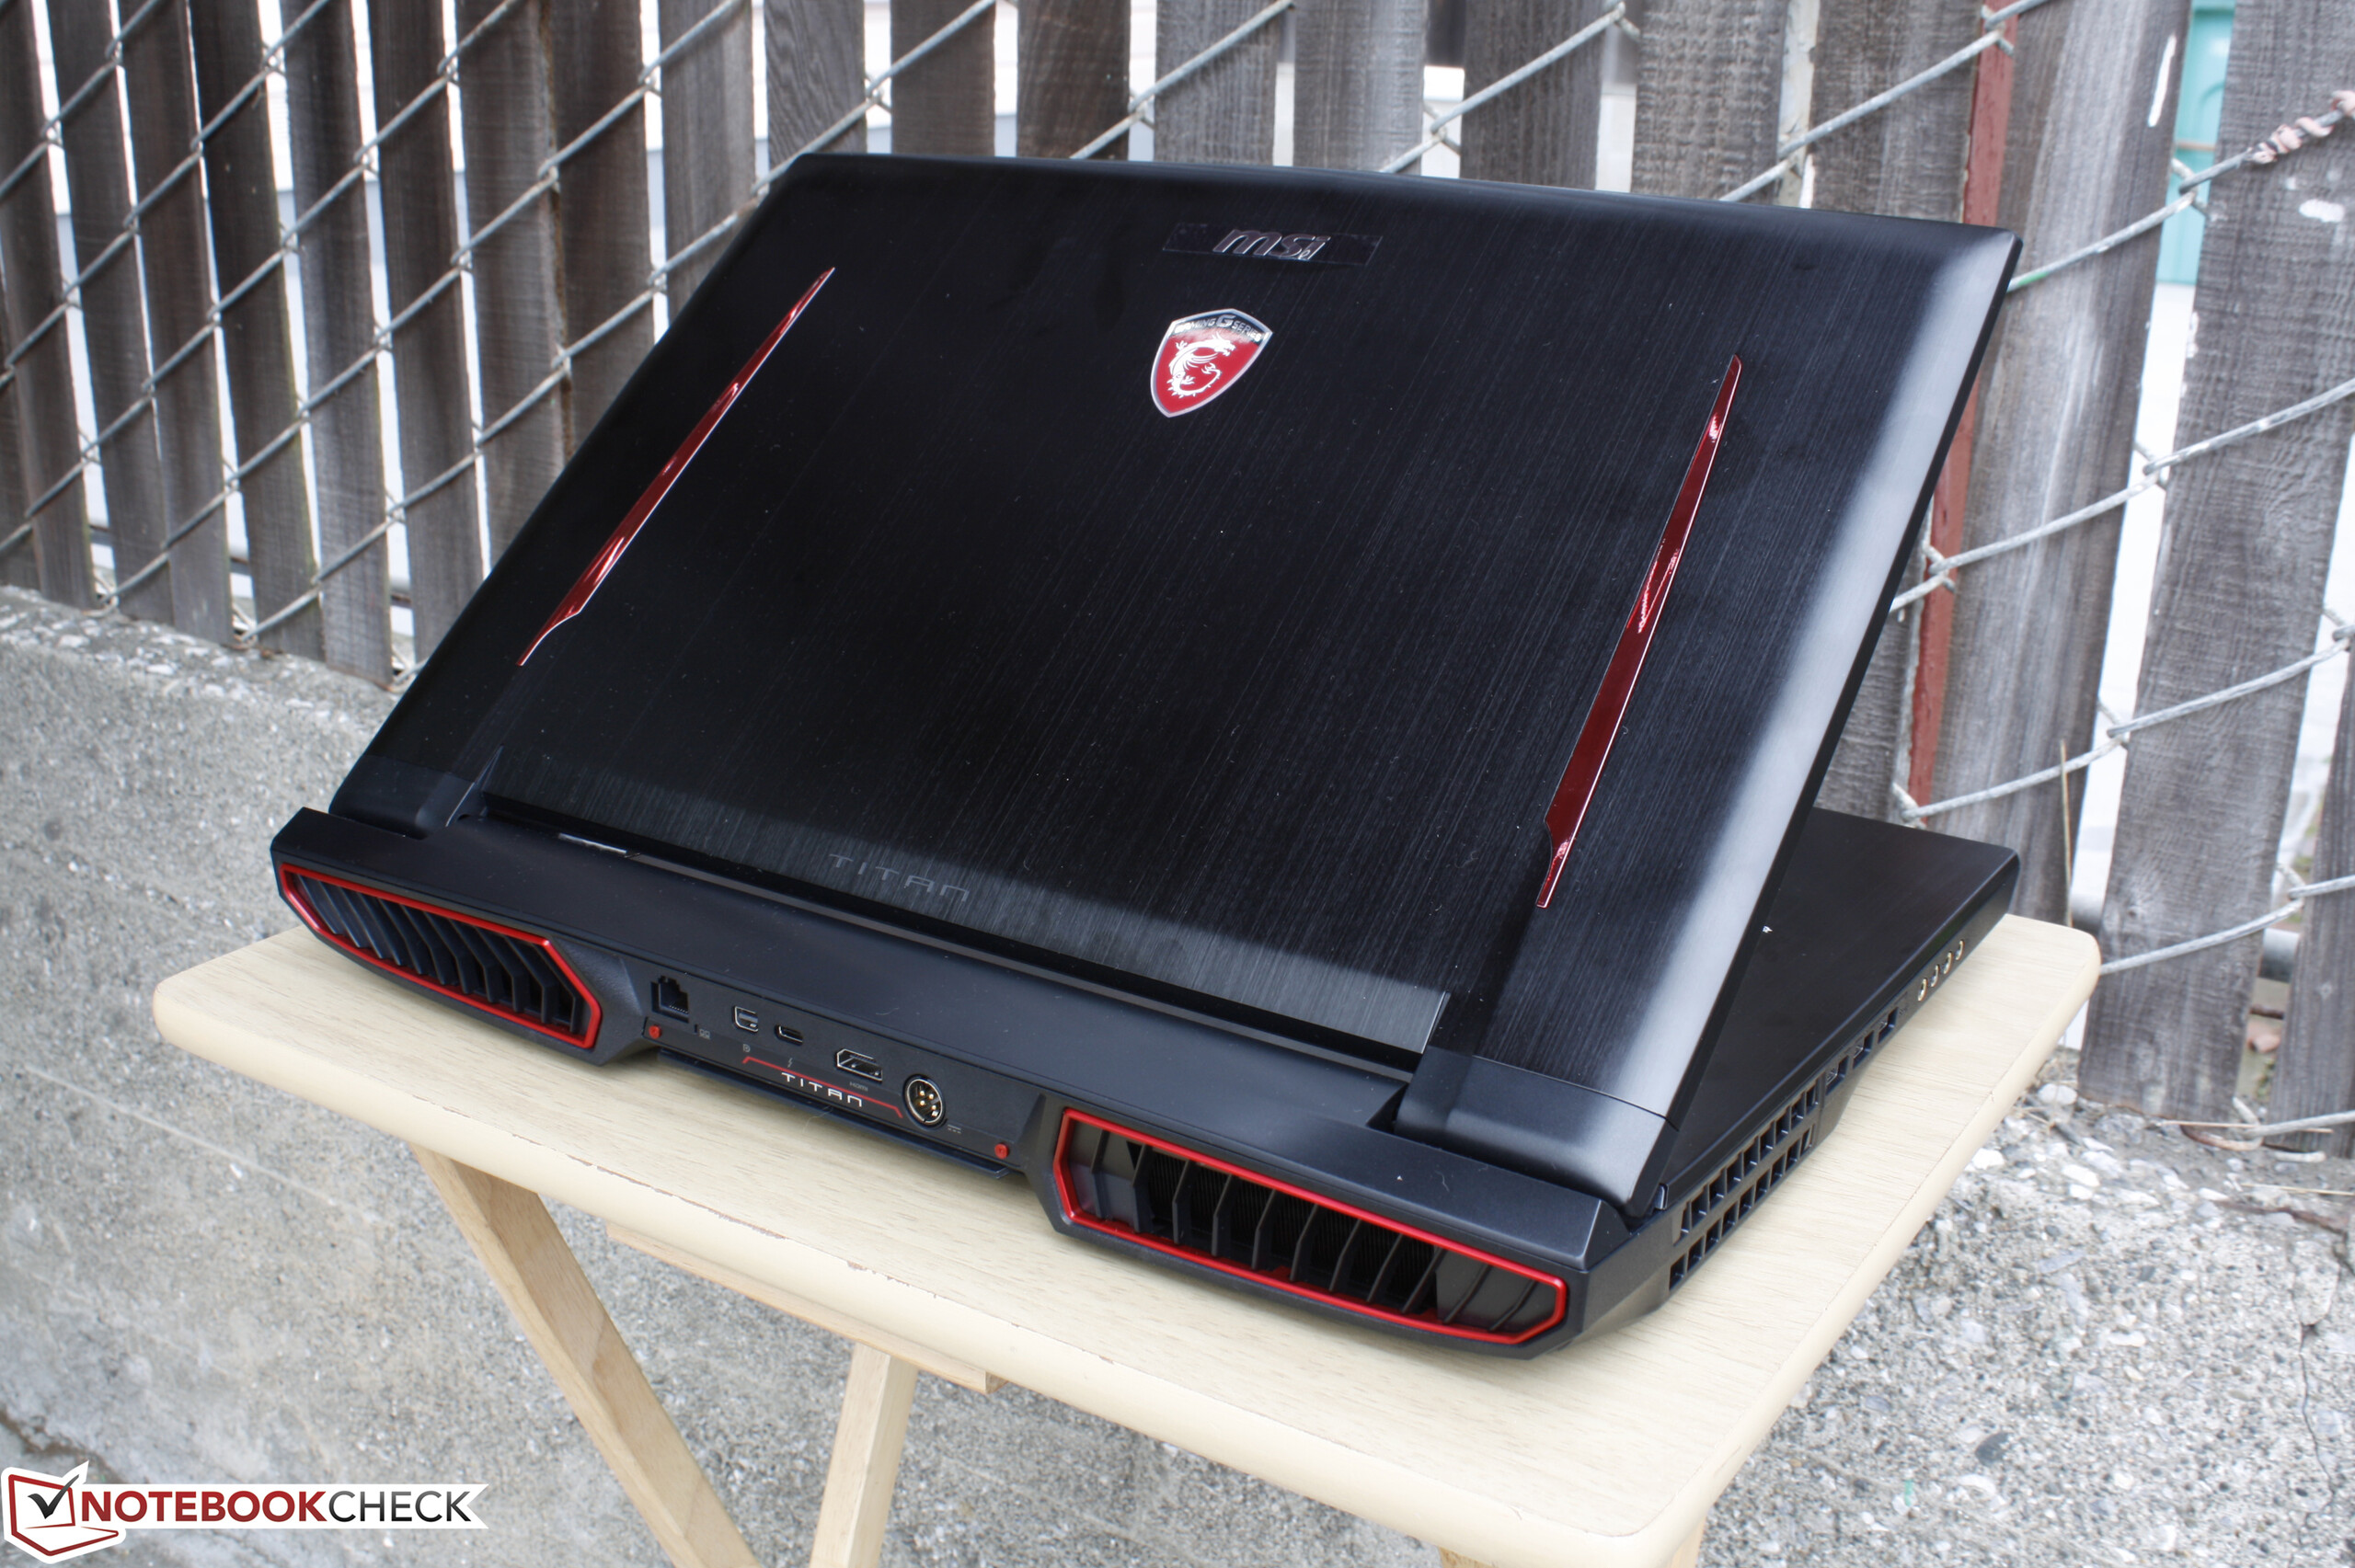
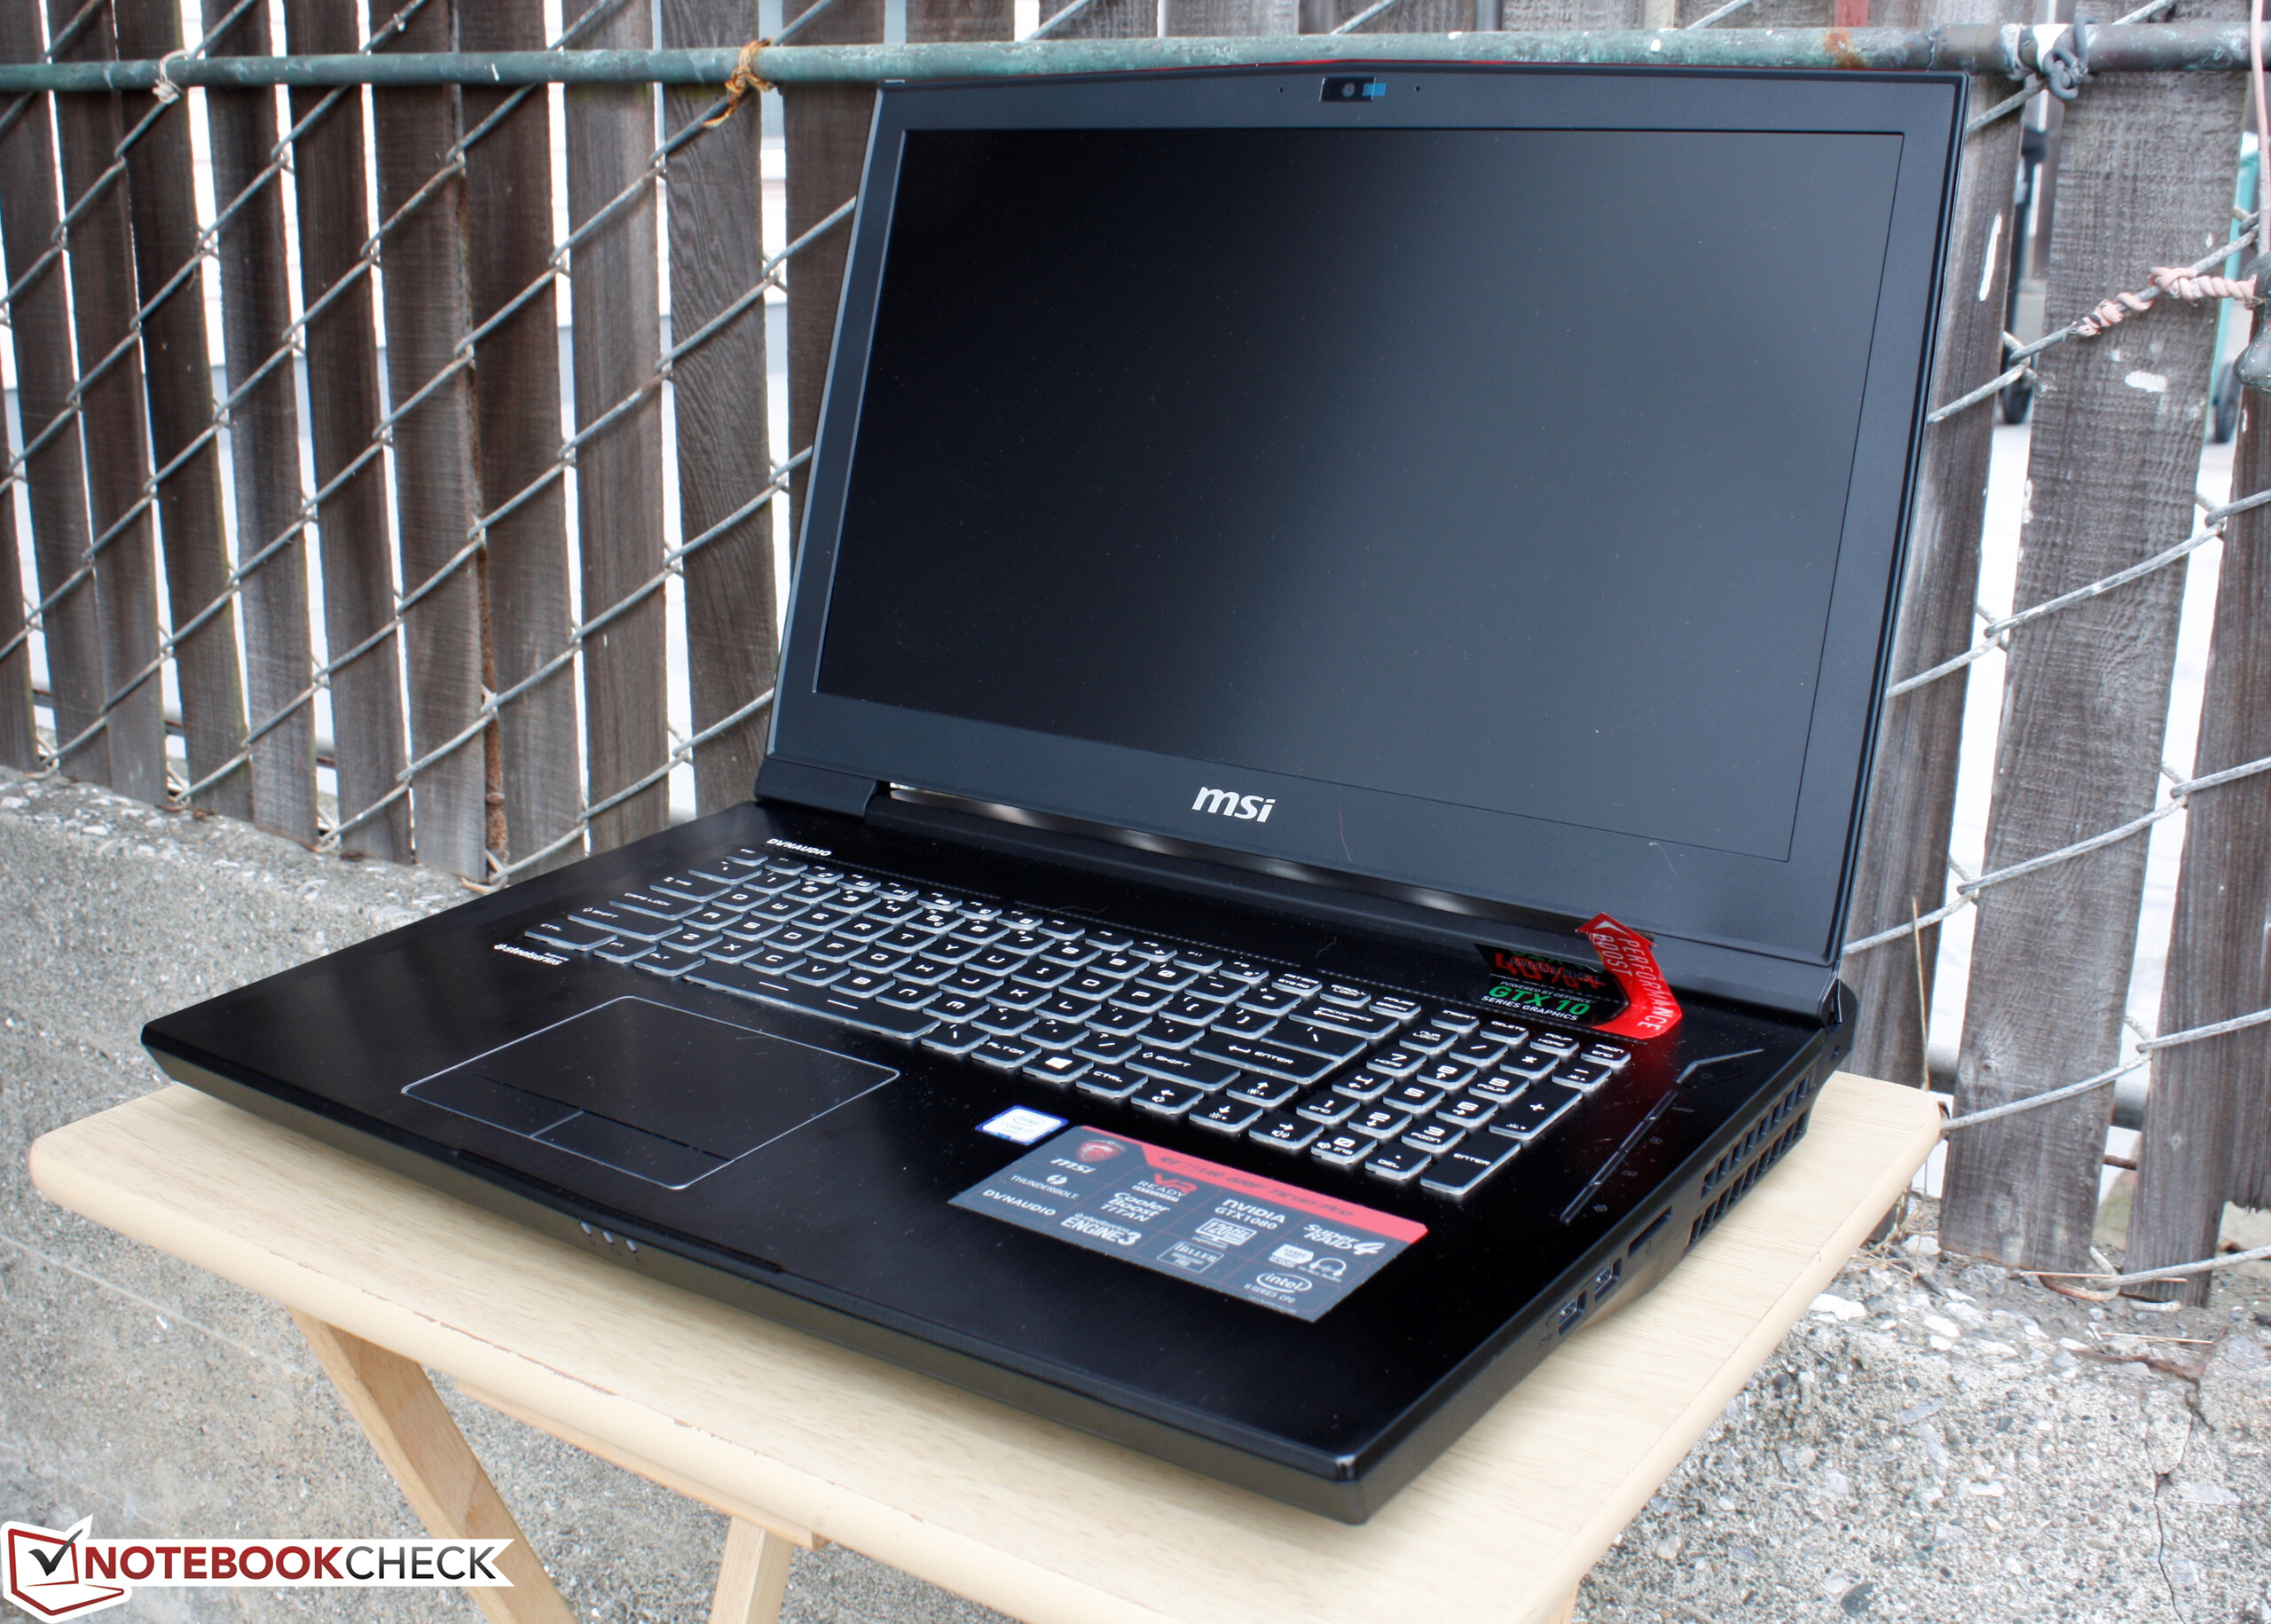
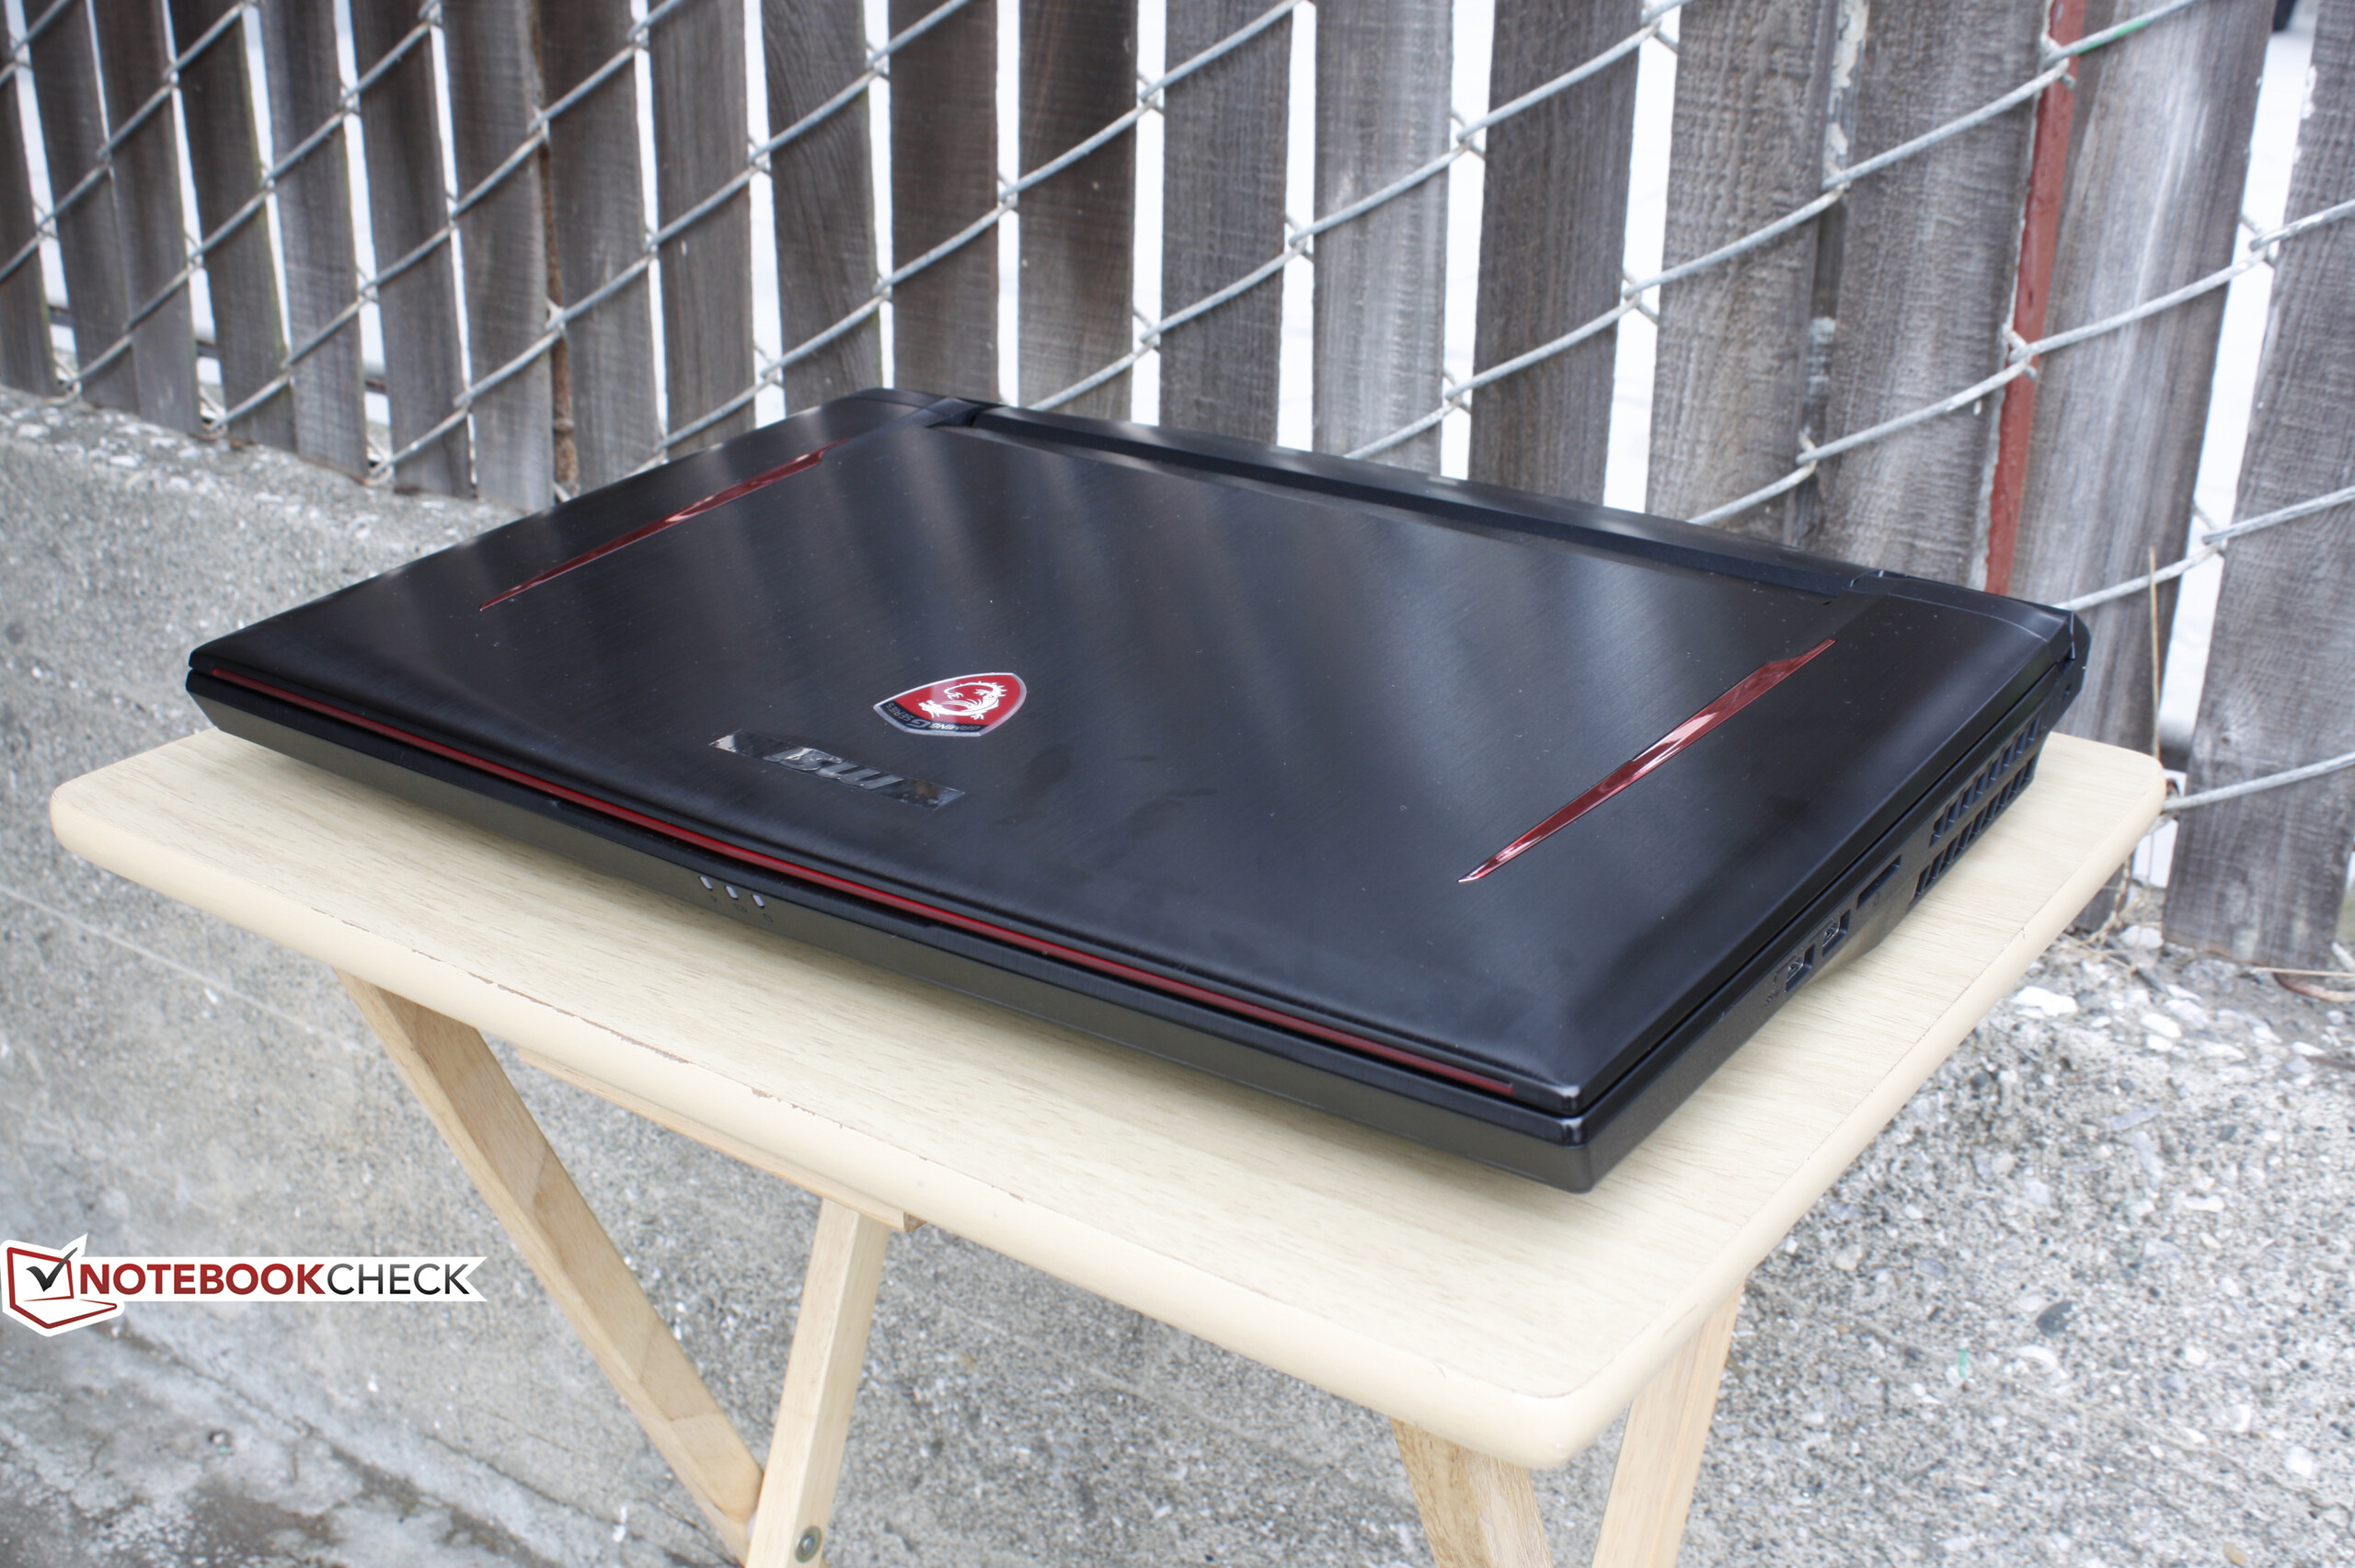
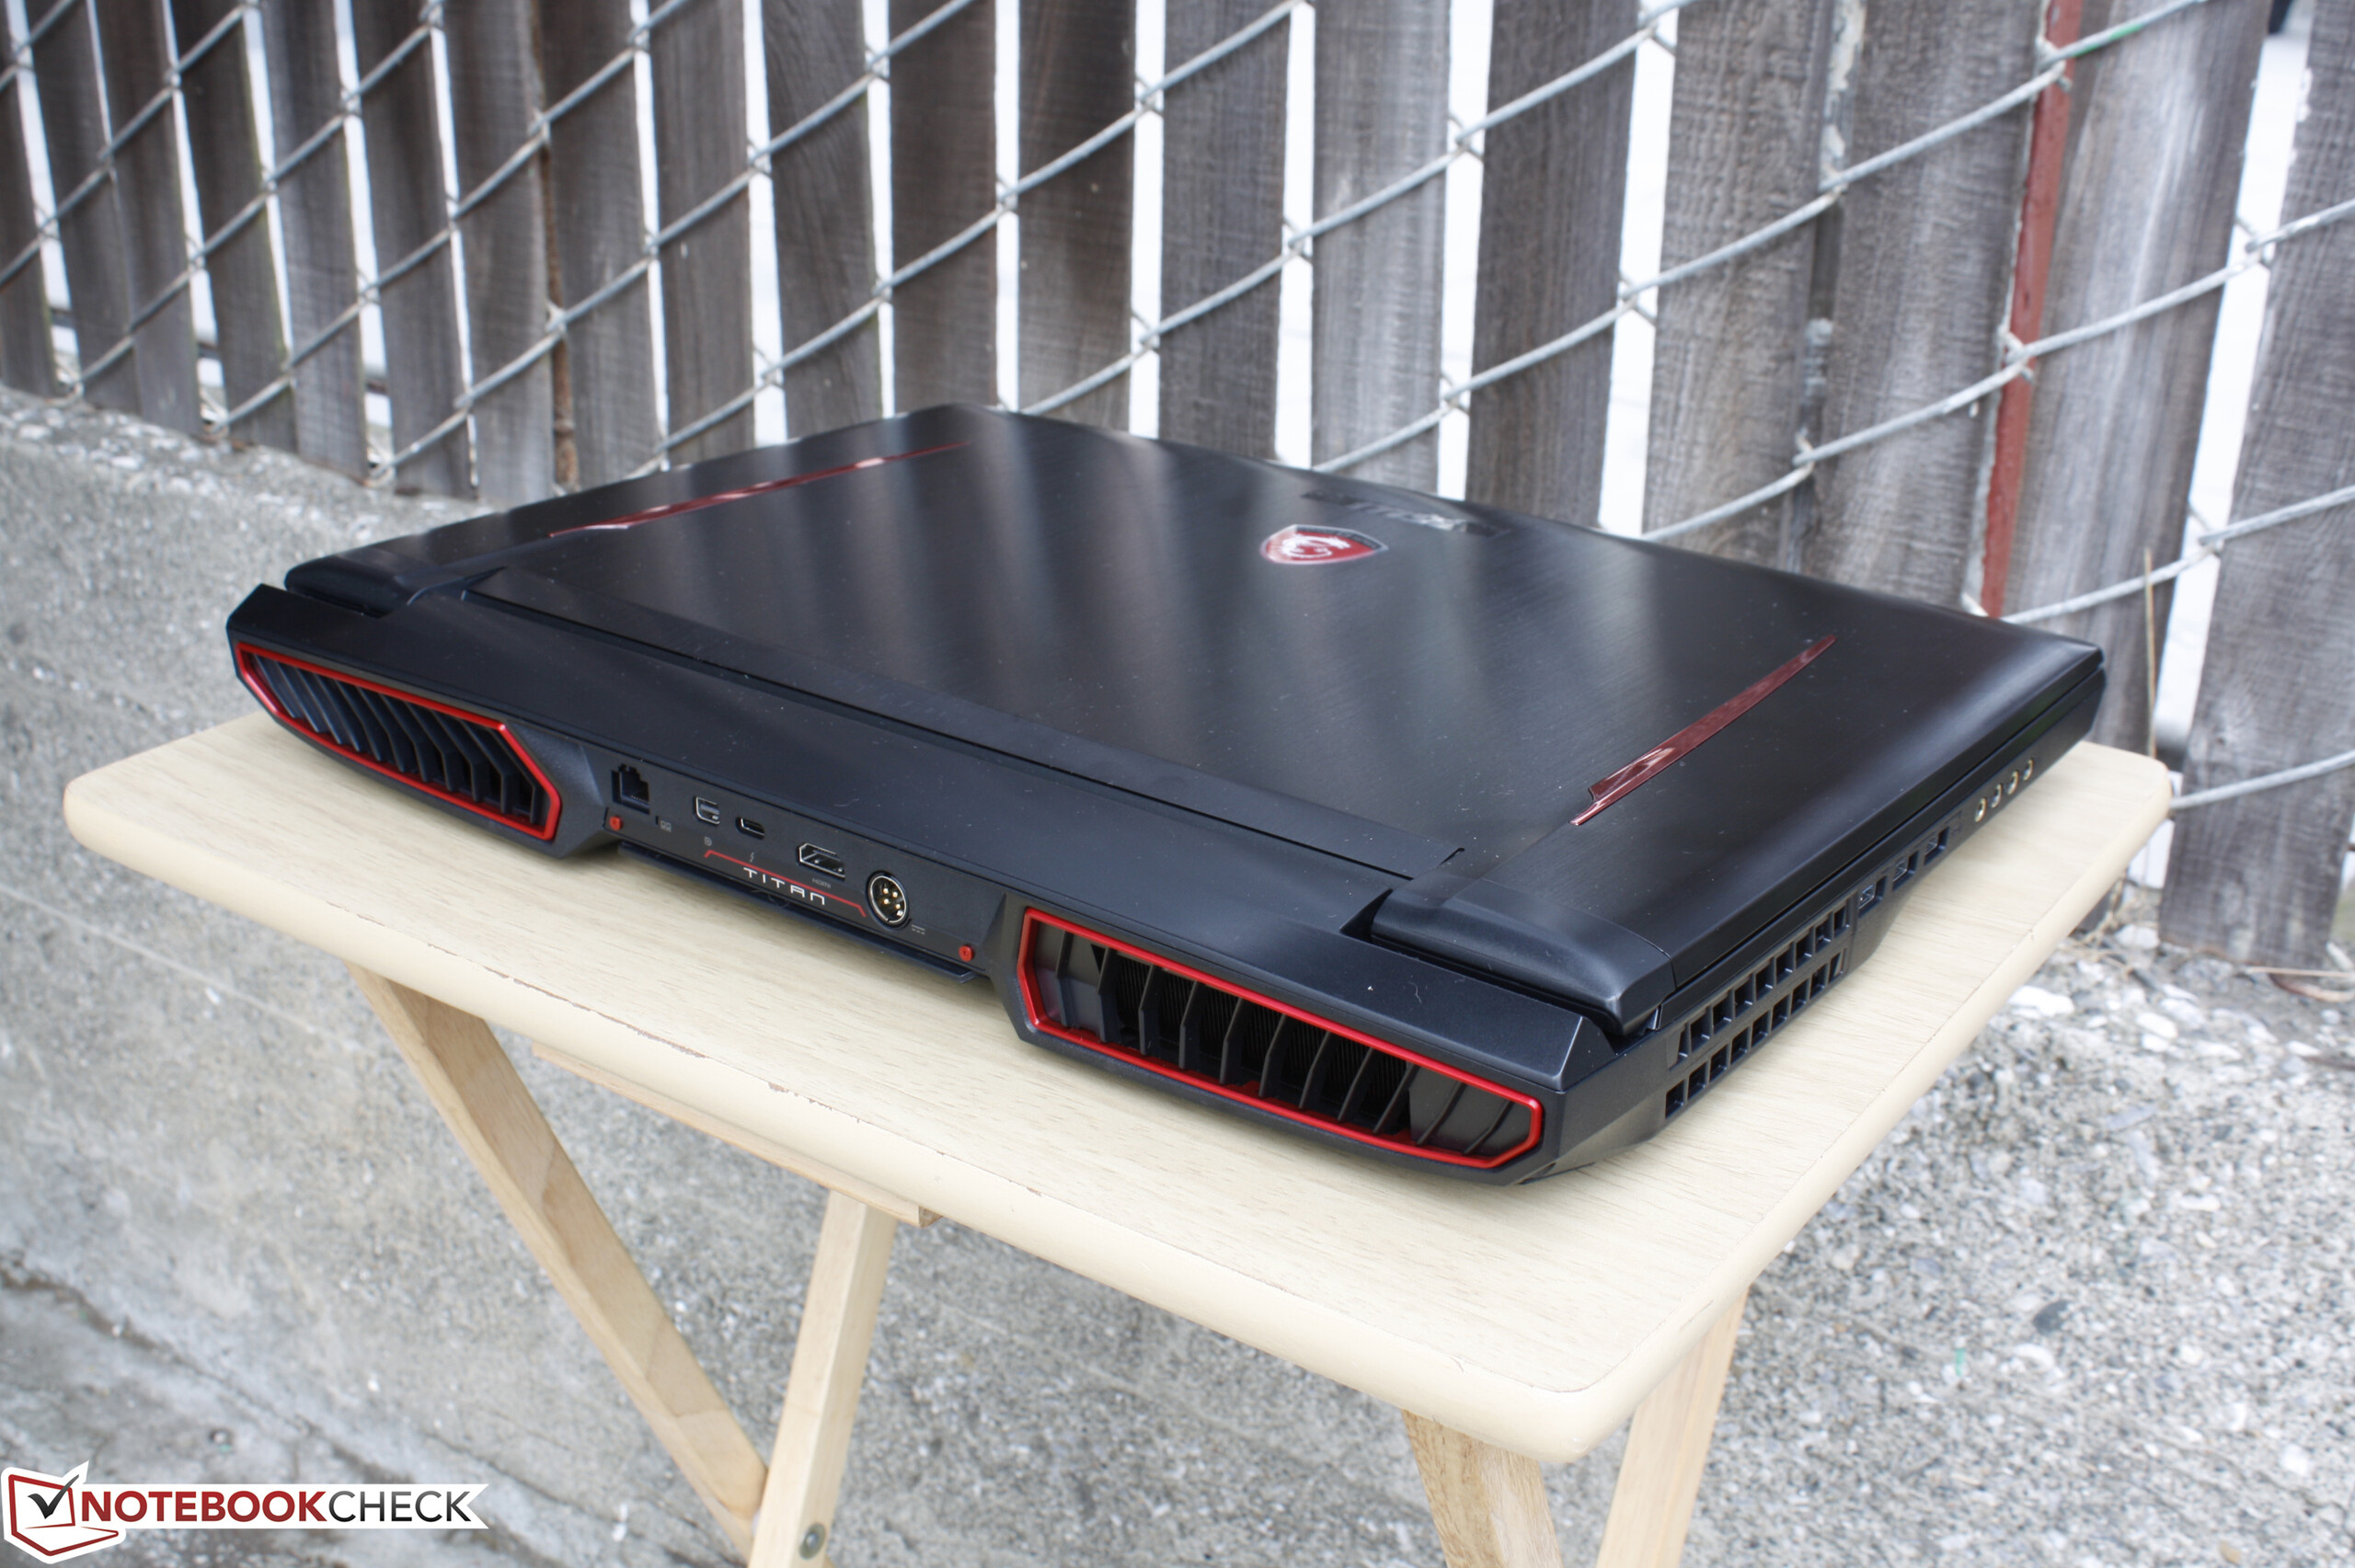
Breve análisis del MSI GT73VR 6RF Titan


| SD Card Reader | |
| average JPG Copy Test (av. of 3 runs) | |
| Asus G701VO-CS74K | |
| MSI GT73VR 6RF | |
| MSI GS73VR 6RF | |
| maximum AS SSD Seq Read Test (1GB) | |
| Asus G701VO-CS74K | |
| MSI GT73VR 6RF | |
| MSI GS73VR 6RF | |
| Networking | |
| Wi-Fi Client 1m 512KB | |
| Wi-Fi Server 1m 512KB |
| |||||||||||||||||||||||||
iluminación: 87 %
Brillo con batería: 334.8 cd/m²
Contraste: 793:1 (Negro: 0.422 cd/m²)
ΔE ColorChecker Calman: 4.11 | ∀{0.5-29.43 Ø4.72}
ΔE Greyscale Calman: 5.74 | ∀{0.09-98 Ø4.97}
96% sRGB (Argyll 1.6.3 3D)
60.5% AdobeRGB 1998 (Argyll 1.6.3 3D)
65.7% AdobeRGB 1998 (Argyll 3D)
95.8% sRGB (Argyll 3D)
63.6% Display P3 (Argyll 3D)
Gamma: 2.3
CCT: 5987 K
| MSI GT73VR 6RF IPS, 17.3", 3840x2160 | MSI GT73VR-6RE16SR451 N173HHE-G32 (CMN1747), TN, 17.3", 1920x1080 | Acer Predator 17 G9-793-77LG AU Optronics B173ZAN01.0 (AUO109B), IPS, 17.3", 3840x2160 | Asus G701VO-CS74K IPS, 17.3", 1920x1080 | MSI GS73VR 6RF TN LED, 17.3", 1920x1080 | |
|---|---|---|---|---|---|
| Display | 25% | 31% | -1% | 24% | |
| Display P3 Coverage (%) | 63.6 | 91.2 43% | 86.9 37% | 68.8 8% | 90 42% |
| sRGB Coverage (%) | 95.8 | 100 4% | 100 4% | 87.7 -8% | 99.9 4% |
| AdobeRGB 1998 Coverage (%) | 65.7 | 84.9 29% | 99.4 51% | 64.1 -2% | 83.6 27% |
| Response Times | 50% | 5% | 13% | 43% | |
| Response Time Grey 50% / Grey 80% * (ms) | 33.6 ? | 26 ? 23% | 37 ? -10% | 29.2 ? 13% | 28 ? 17% |
| Response Time Black / White * (ms) | 30 ? | 6.8 ? 77% | 24 ? 20% | 26.4 ? 12% | 9.6 ? 68% |
| PWM Frequency (Hz) | |||||
| Screen | -17% | 21% | 7% | 21% | |
| Brightness middle (cd/m²) | 334.8 | 314 -6% | 336 0% | 368.1 10% | 337.2 1% |
| Brightness (cd/m²) | 316 | 294 -7% | 320 1% | 349 10% | 315 0% |
| Brightness Distribution (%) | 87 | 89 2% | 88 1% | 86 -1% | 86 -1% |
| Black Level * (cd/m²) | 0.422 | 0.23 45% | 0.25 41% | 0.365 14% | 0.308 27% |
| Contrast (:1) | 793 | 1365 72% | 1344 69% | 1008 27% | 1095 38% |
| Colorchecker dE 2000 * | 4.11 | 9.74 -137% | 3.61 12% | 4.16 -1% | 2.96 28% |
| Colorchecker dE 2000 max. * | 7.8 | 15.71 -101% | 6.02 23% | 8.7 -12% | 5.45 30% |
| Greyscale dE 2000 * | 5.74 | 9.58 -67% | 4.78 17% | 3.86 33% | 2.57 55% |
| Gamma | 2.3 96% | 2.5 88% | 2.32 95% | 2.19 100% | 2.25 98% |
| CCT | 5987 109% | 11854 55% | 6185 105% | 6892 94% | 7114 91% |
| Color Space (Percent of AdobeRGB 1998) (%) | 60.5 | 76 26% | 88 45% | 57.6 -5% | 74.3 23% |
| Color Space (Percent of sRGB) (%) | 96 | 100 4% | 100 4% | 87.6 -9% | 100 4% |
| Media total (Programa/Opciones) | 19% /
0% | 19% /
21% | 6% /
6% | 29% /
24% |
* ... más pequeño es mejor
Tiempos de respuesta del display
| ↔ Tiempo de respuesta de Negro a Blanco | ||
|---|---|---|
| 30 ms ... subida ↗ y bajada ↘ combinada | ↗ 5.2 ms subida | 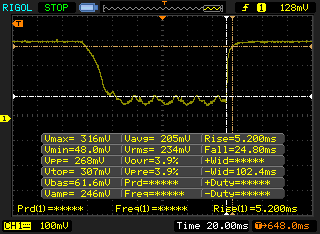 |
| ↘ 24.8 ms bajada | ||
| La pantalla mostró tiempos de respuesta lentos en nuestros tests y podría ser demasiado lenta para los jugones. En comparación, todos los dispositivos de prueba van de ##min### (mínimo) a 240 (máximo) ms. » 80 % de todos los dispositivos son mejores. Eso quiere decir que el tiempo de respuesta es peor que la media (19.9 ms) de todos los dispositivos testados. | ||
| ↔ Tiempo de respuesta 50% Gris a 80% Gris | ||
| 33.6 ms ... subida ↗ y bajada ↘ combinada | ↗ 13.2 ms subida | 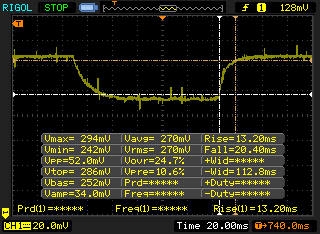 |
| ↘ 20.4 ms bajada | ||
| La pantalla mostró tiempos de respuesta lentos en nuestros tests y podría ser demasiado lenta para los jugones. En comparación, todos los dispositivos de prueba van de ##min### (mínimo) a 636 (máximo) ms. » 46 % de todos los dispositivos son mejores. Eso quiere decir que el tiempo de respuesta es similar al dispositivo testado medio (31.1 ms). | ||
Parpadeo de Pantalla / PWM (Pulse-Width Modulation)
| Parpadeo de Pantalla / PWM no detectado | 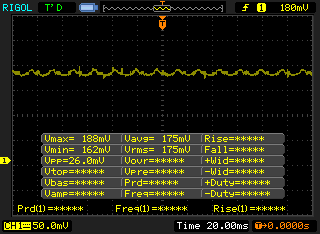 | ||
Comparación: 52 % de todos los dispositivos testados no usaron PWM para atenuar el display. Si se usó, medimos una media de 7784 (mínimo: 5 - máxmo: 343500) Hz. | |||
| Cinebench R11.5 | |
| CPU Single 64Bit | |
| MSI GT73VR 6RF | |
| Eurocom Sky X7E2 | |
| MSI GP62-2QEi781FD | |
| MSI GT72VR 6RD-063US | |
| Toshiba Satellite S70-B-106 | |
| CPU Multi 64Bit | |
| MSI GT73VR 6RF | |
| Eurocom Sky X7E2 | |
| MSI GP62-2QEi781FD | |
| MSI GT72VR 6RD-063US | |
| Toshiba Satellite S70-B-106 | |
| Cinebench R10 | |
| Rendering Multiple CPUs 32Bit | |
| MSI GT73VR 6RF | |
| Eurocom Sky X7E2 | |
| MSI GT72VR 6RD-063US | |
| MSI GP62-2QEi781FD | |
| Rendering Single 32Bit | |
| Eurocom Sky X7E2 | |
| MSI GT73VR 6RF | |
| MSI GP62-2QEi781FD | |
| MSI GT72VR 6RD-063US | |
| PCMark 8 | |
| Home Score Accelerated v2 | |
| Asus G752VS-XB78K | |
| Asus G701VO-CS74K | |
| MSI GT73VR 6RF | |
| MSI GS73VR 6RF | |
| EVGA SC17 | |
| Work Score Accelerated v2 | |
| Asus G752VS-XB78K | |
| Asus G701VO-CS74K | |
| MSI GS73VR 6RF | |
| MSI GT73VR 6RF | |
| EVGA SC17 | |
| Creative Score Accelerated v2 | |
| Asus G752VS-XB78K | |
| MSI GT73VR 6RF | |
| Asus G701VO-CS74K | |
| MSI GS73VR 6RF | |
| EVGA SC17 | |
| PCMark 8 Home Score Accelerated v2 | 4252 puntos | |
| PCMark 8 Creative Score Accelerated v2 | 8227 puntos | |
| PCMark 8 Work Score Accelerated v2 | 4378 puntos | |
ayuda | ||
| MSI GT73VR 6RF 2x SanDisk X400 1TB M.2 SD8SN8U1T001122 (RAID 0) | MSI GT73VR-6RE16SR451 2x Samsung SM951 MZVPV256HDGL (RAID 0) | Asus G701VO-CS74K 2x Samsung SM951 MZVPV512HDGL (RAID 0) | Eurocom Sky X7E2 Samsung SM951 MZVPV512HDGL m.2 PCI-e | MSI GS73VR 6RF SanDisk SD8SN8U1T001122 | |
|---|---|---|---|---|---|
| CrystalDiskMark 3.0 | 127% | 105% | 67% | -55% | |
| Read Seq (MB/s) | 914 | 3285 259% | 3067 236% | 1673 83% | 334.3 -63% |
| Write Seq (MB/s) | 916 | 2560 179% | 2434 166% | 1576 72% | 319 -65% |
| Read 512 (MB/s) | 698 | 1775 154% | 1582 127% | 1180 69% | 242.3 -65% |
| Write 512 (MB/s) | 916 | 2327 154% | 2255 146% | 1561 70% | 254.4 -72% |
| Read 4k (MB/s) | 31.37 | 52.2 66% | 47.25 51% | 51.5 64% | 20.3 -35% |
| Write 4k (MB/s) | 65.7 | 153.1 133% | 110.7 68% | 144 119% | 42.51 -35% |
| Read 4k QD32 (MB/s) | 425 | 627 48% | 584 37% | 694 63% | 251.6 -41% |
| Write 4k QD32 (MB/s) | 441.8 | 527 19% | 463.3 5% | 422.1 -4% | 167.1 -62% |

| 3DMark | |
| 1920x1080 Fire Strike Graphics | |
| MSI GT73VR 6RF | |
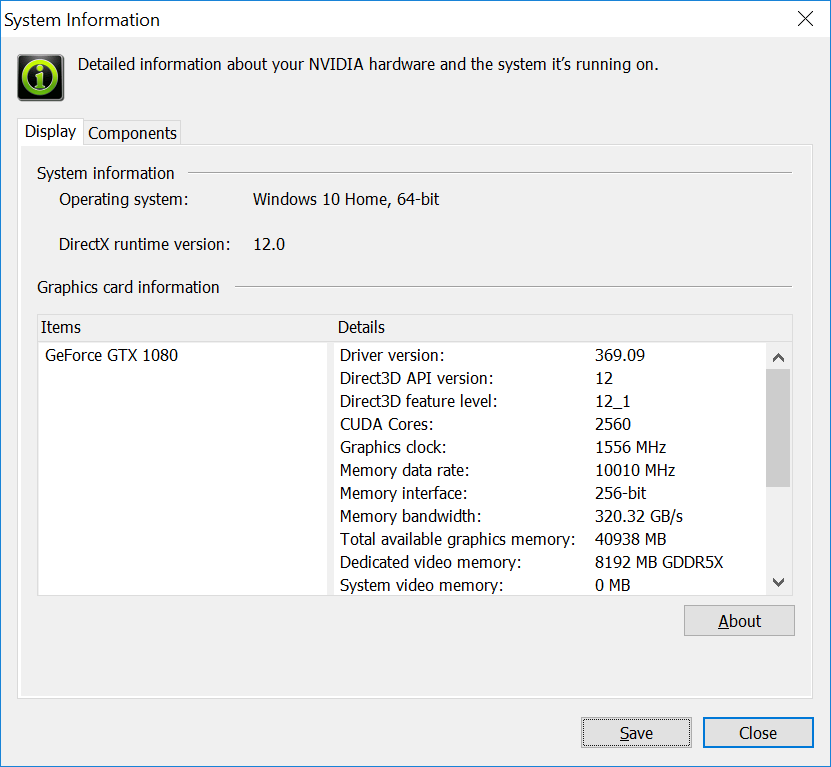
| Nvidia GeForce GTX 1080 Founders Edition | |
| Eurocom X8 | |
| MSI GT73VR-6RE16SR451 | |
| Asus G701VO-CS74K | |
| MSI GT72VR 6RD-063US | |
| Asus Strix GL502VY-DS71 | |
| 3840x2160 Fire Strike Ultra Graphics | |
| MSI GT73VR 6RF | |
| Nvidia GeForce GTX 1080 Founders Edition | |
| MSI GT73VR-6RE16SR451 | |
| Asus G701VO-CS74K | |
| MSI GT72VR 6RD-063US | |
| Asus Strix GL502VY-DS71 | |
| Fire Strike Extreme Graphics | |
| MSI GT73VR 6RF | |
| Nvidia GeForce GTX 1080 Founders Edition | |
| Eurocom X8 | |
| Asus G701VO-CS74K | |
| MSI GT72VR 6RD-063US | |
| Asus Strix GL502VY-DS71 | |
| 3DMark 11 | |
| 1280x720 Performance GPU | |
| Nvidia GeForce GTX 1080 Founders Edition | |
| MSI GT73VR 6RF | |
| MSI GT73VR-6RE16SR451 | |
| Eurocom X8 | |
| Asus G701VO-CS74K | |
| MSI GT72VR 6RD-063US | |
| Asus Strix GL502VY-DS71 | |
| 1280x720 Performance Combined | |
| Nvidia GeForce GTX 1080 Founders Edition | |
| MSI GT73VR-6RE16SR451 | |
| Asus G701VO-CS74K | |
| MSI GT73VR 6RF | |
| Eurocom X8 | |
| Asus Strix GL502VY-DS71 | |
| MSI GT72VR 6RD-063US | |
| 3DMark 11 Performance | 18087 puntos | |
| 3DMark Ice Storm Standard Score | 124187 puntos | |
| 3DMark Cloud Gate Standard Score | 24487 puntos | |
| 3DMark Fire Strike Score | 14820 puntos | |
| 3DMark Fire Strike Extreme Score | 9042 puntos | |
ayuda | ||
| Fallout 4 - 3840x2160 High Preset AA:T AF:16x | |
| Nvidia GeForce GTX 1080 Founders Edition | |
| MSI GT73VR 6RF | |
| Nvidia GeForce GTX 1070 Founders Edition | |
| Nvidia GeForce GTX 1060 Founders Edition 6 GB | |
| Batman: Arkham Knight - 3840x2160 High / On (Interactive Smoke & Paper Debris Off) AA:SM AF:8x | |
| MSI GT73VR 6RF | |
| Nvidia GeForce GTX 1060 Founders Edition 6 GB | |
| Rise of the Tomb Raider - 3840x2160 High Preset AA:FX AF:4x | |
| Nvidia GeForce GTX 1080 Founders Edition | |
| Nvidia GeForce GTX 1080 Founders Edition | |
| MSI GT73VR 6RF | |
| Nvidia GeForce GTX 1070 Founders Edition | |
| Nvidia GeForce GTX 1060 Founders Edition 6 GB | |
| Nvidia GeForce GTX 1060 Founders Edition 6 GB | |
| Doom - 3840x2160 High Preset AA:FX | |
| MSI GT73VR 6RF | |
| Nvidia GeForce GTX 1080 Founders Edition | |
| Nvidia GeForce GTX 1070 Founders Edition | |
| Nvidia GeForce GTX 1060 Founders Edition 6 GB | |
| Overwatch - 3840x2160 High (Render Scale 100 %) AA:SM AF:4x | |
| Nvidia GeForce GTX 1080 Founders Edition | |
| MSI GT73VR 6RF | |
| Nvidia GeForce GTX 1070 Founders Edition | |
| Nvidia GeForce GTX 1060 Founders Edition 6 GB | |
| Mafia 3 - 3840x2160 High Preset | |
| Nvidia GeForce GTX 1080 Founders Edition | |
| bajo | medio | alto | ultra | 4K | |
|---|---|---|---|---|---|
| Batman: Arkham Knight (2015) | 52 | ||||
| Metal Gear Solid V (2015) | 60 | ||||
| Fallout 4 (2015) | 51.7 | ||||
| Rise of the Tomb Raider (2016) | 49.8 | ||||
| Doom (2016) | 64.1 | ||||
| Overwatch (2016) | 103.1 | ||||
| Mafia 3 (2016) | 73.6 |
Ruido
| Ocioso |
| 32 / 32 / 35 dB(A) |
| Carga |
| 50 / 64 dB(A) |
 | ||
30 dB silencioso 40 dB(A) audible 50 dB(A) ruidosamente alto |
||
min: | ||
| MSI GT73VR 6RF GeForce GTX 1080 Mobile, 6820HK, 2x SanDisk X400 1TB M.2 SD8SN8U1T001122 (RAID 0) | MSI GT73VR-6RE16SR451 GeForce GTX 1070 Mobile, 6820HK, 2x Samsung SM951 MZVPV256HDGL (RAID 0) | Acer Predator 17 G9-793-77LG GeForce GTX 1070 Mobile, 6700HQ, Toshiba NVMe THNSN5256GPU7 | Asus G701VO-CS74K GeForce GTX 980 (Laptop), 6820HK, 2x Samsung SM951 MZVPV512HDGL (RAID 0) | MSI GS73VR 6RF GeForce GTX 1060 Mobile, 6700HQ, SanDisk SD8SN8U1T001122 | |
|---|---|---|---|---|---|
| Noise | 8% | 1% | 9% | 6% | |
| apagado / medio ambiente * (dB) | 29.2 | 30 -3% | 31 -6% | 29.1 -0% | 28.4 3% |
| Idle Minimum * (dB) | 32 | 32 -0% | 33 -3% | 29.1 9% | 31.9 -0% |
| Idle Average * (dB) | 32 | 33 -3% | 34 -6% | 31.9 -0% | 32 -0% |
| Idle Maximum * (dB) | 35 | 35 -0% | 40 -14% | 31.9 9% | 34 3% |
| Load Average * (dB) | 50 | 35 30% | 44 12% | 46 8% | 47 6% |
| Load Maximum * (dB) | 64 | 49 23% | 50 22% | 47.5 26% | 49.4 23% |
* ... más pequeño es mejor
(±) La temperatura máxima en la parte superior es de 41.4 °C / 107 F, frente a la media de 40.4 °C / 105 F, que oscila entre 21.2 y 68.8 °C para la clase Gaming.
(-) El fondo se calienta hasta un máximo de 59 °C / 138 F, frente a la media de 43.2 °C / 110 F
(+) En reposo, la temperatura media de la parte superior es de 26.8 °C / 80# F, frente a la media del dispositivo de 33.9 °C / 93 F.
(+) El reposamanos y el panel táctil están a una temperatura inferior a la de la piel, con un máximo de 30.4 °C / 86.7 F y, por tanto, son fríos al tacto.
(±) La temperatura media de la zona del reposamanos de dispositivos similares fue de 28.8 °C / 83.8 F (-1.6 °C / -2.9 F).
MSI GT73VR 6RF análisis de audio
(±) | la sonoridad del altavoz es media pero buena (79.1 dB)
Graves 100 - 315 Hz
(±) | lubina reducida - en promedio 8.2% inferior a la mediana
(±) | la linealidad de los graves es media (8% delta a frecuencia anterior)
Medios 400 - 2000 Hz
(+) | medios equilibrados - a sólo 3.3% de la mediana
(+) | los medios son lineales (6.4% delta a la frecuencia anterior)
Altos 2 - 16 kHz
(+) | máximos equilibrados - a sólo 4.6% de la mediana
(±) | la linealidad de los máximos es media (9.9% delta a frecuencia anterior)
Total 100 - 16.000 Hz
(±) | la linealidad del sonido global es media (19.9% de diferencia con la mediana)
En comparación con la misma clase
» 70% de todos los dispositivos probados de esta clase eran mejores, 6% similares, 24% peores
» El mejor tuvo un delta de 6%, la media fue 18%, el peor fue ###max##%
En comparación con todos los dispositivos probados
» 51% de todos los dispositivos probados eran mejores, 7% similares, 42% peores
» El mejor tuvo un delta de 4%, la media fue 24%, el peor fue ###max##%
Apple MacBook 12 (Early 2016) 1.1 GHz análisis de audio
(+) | los altavoces pueden reproducir a un volumen relativamente alto (#83.6 dB)
Graves 100 - 315 Hz
(±) | lubina reducida - en promedio 11.3% inferior a la mediana
(±) | la linealidad de los graves es media (14.2% delta a frecuencia anterior)
Medios 400 - 2000 Hz
(+) | medios equilibrados - a sólo 2.4% de la mediana
(+) | los medios son lineales (5.5% delta a la frecuencia anterior)
Altos 2 - 16 kHz
(+) | máximos equilibrados - a sólo 2% de la mediana
(+) | los máximos son lineales (4.5% delta a la frecuencia anterior)
Total 100 - 16.000 Hz
(+) | el sonido global es lineal (10.2% de diferencia con la mediana)
En comparación con la misma clase
» 7% de todos los dispositivos probados de esta clase eran mejores, 2% similares, 91% peores
» El mejor tuvo un delta de 5%, la media fue 18%, el peor fue ###max##%
En comparación con todos los dispositivos probados
» 5% de todos los dispositivos probados eran mejores, 1% similares, 94% peores
» El mejor tuvo un delta de 4%, la media fue 24%, el peor fue ###max##%
| Off / Standby | |
| Ocioso | |
| Carga |
|
Clave:
min: | |
| MSI GT73VR 6RF 6820HK, GeForce GTX 1080 Mobile, 2x SanDisk X400 1TB M.2 SD8SN8U1T001122 (RAID 0), IPS, 3840x2160, 17.3" | MSI GT73VR-6RE16SR451 6820HK, GeForce GTX 1070 Mobile, 2x Samsung SM951 MZVPV256HDGL (RAID 0), TN, 1920x1080, 17.3" | Acer Predator 17 G9-793-77LG 6700HQ, GeForce GTX 1070 Mobile, Toshiba NVMe THNSN5256GPU7, IPS, 3840x2160, 17.3" | Asus G701VO-CS74K 6820HK, GeForce GTX 980 (Laptop), 2x Samsung SM951 MZVPV512HDGL (RAID 0), IPS, 1920x1080, 17.3" | MSI GS73VR 6RF 6700HQ, GeForce GTX 1060 Mobile, SanDisk SD8SN8U1T001122, TN LED, 1920x1080, 17.3" | |
|---|---|---|---|---|---|
| Power Consumption | 8% | 8% | 14% | 22% | |
| Idle Minimum * (Watt) | 28.9 | 31 -7% | 25 13% | 28.2 2% | 22.6 22% |
| Idle Average * (Watt) | 30.6 | 35 -14% | 35 -14% | 32 -5% | 32.7 -7% |
| Idle Maximum * (Watt) | 33.1 | 40 -21% | 46 -39% | 32.6 2% | 32.8 1% |
| Load Average * (Watt) | 224.4 | 106 53% | 103 54% | 162.2 28% | 114.7 49% |
| Load Maximum * (Watt) | 302.6 | 218 28% | 223 26% | 173.5 43% | 167.9 45% |
* ... más pequeño es mejor
| MSI GT73VR 6RF 6820HK, GeForce GTX 1080 Mobile, 75.2 Wh | MSI GT73VR-6RE16SR451 6820HK, GeForce GTX 1070 Mobile, 75.2 Wh | Acer Predator 17 G9-793-77LG 6700HQ, GeForce GTX 1070 Mobile, 88 Wh | Asus G701VO-CS74K 6820HK, GeForce GTX 980 (Laptop), 93 Wh | MSI GS73VR 6RF 6700HQ, GeForce GTX 1060 Mobile, 65 Wh | |
|---|---|---|---|---|---|
| Duración de Batería | 2% | 9% | 6% | 8% | |
| Reader / Idle (h) | 5.1 | 4.8 -6% | 4.6 -10% | 4 -22% | 5.9 16% |
| WiFi v1.3 (h) | 3.3 | 3.4 3% | 3.3 0% | 3.4 3% | 3.6 9% |
| Load (h) | 1.1 | 1.2 9% | 1.5 36% | 1.5 36% | 1.1 0% |
Pro
Contra

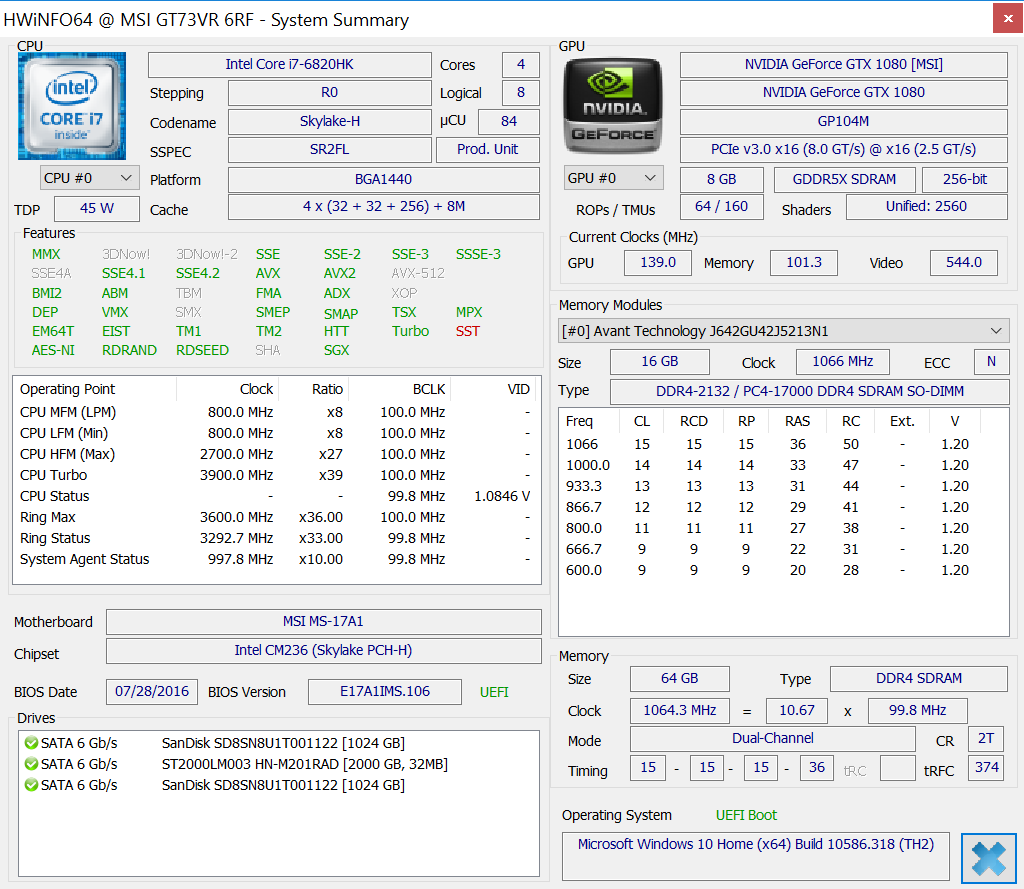
La combinación de pantalla 4K UHD y GPU GTX 1080 es la configuración "definitiva" a GPU sencilla para el actual GT73VR. El rendimiento es ridículo y sus características sun múltiples, aunque los defectos comparados con el modelo FHD y GTX 1070 más barato cuestan ignorar para los entusiastas.
Primero, la pantalla 4K UHD está limitada a 60 Hz y tiene más ghosting quie la opción FHD 120 Hz/5 ms. Su contraste y cobertura de color también son inferiores a los del panel FHD. En segundo lugar, la GPU GTX 1080 se calienta y hace más ruido que la GTX 1070, por lo que el aumento de la potencia gráfica tiene otro coste además de la diferencia de precios.
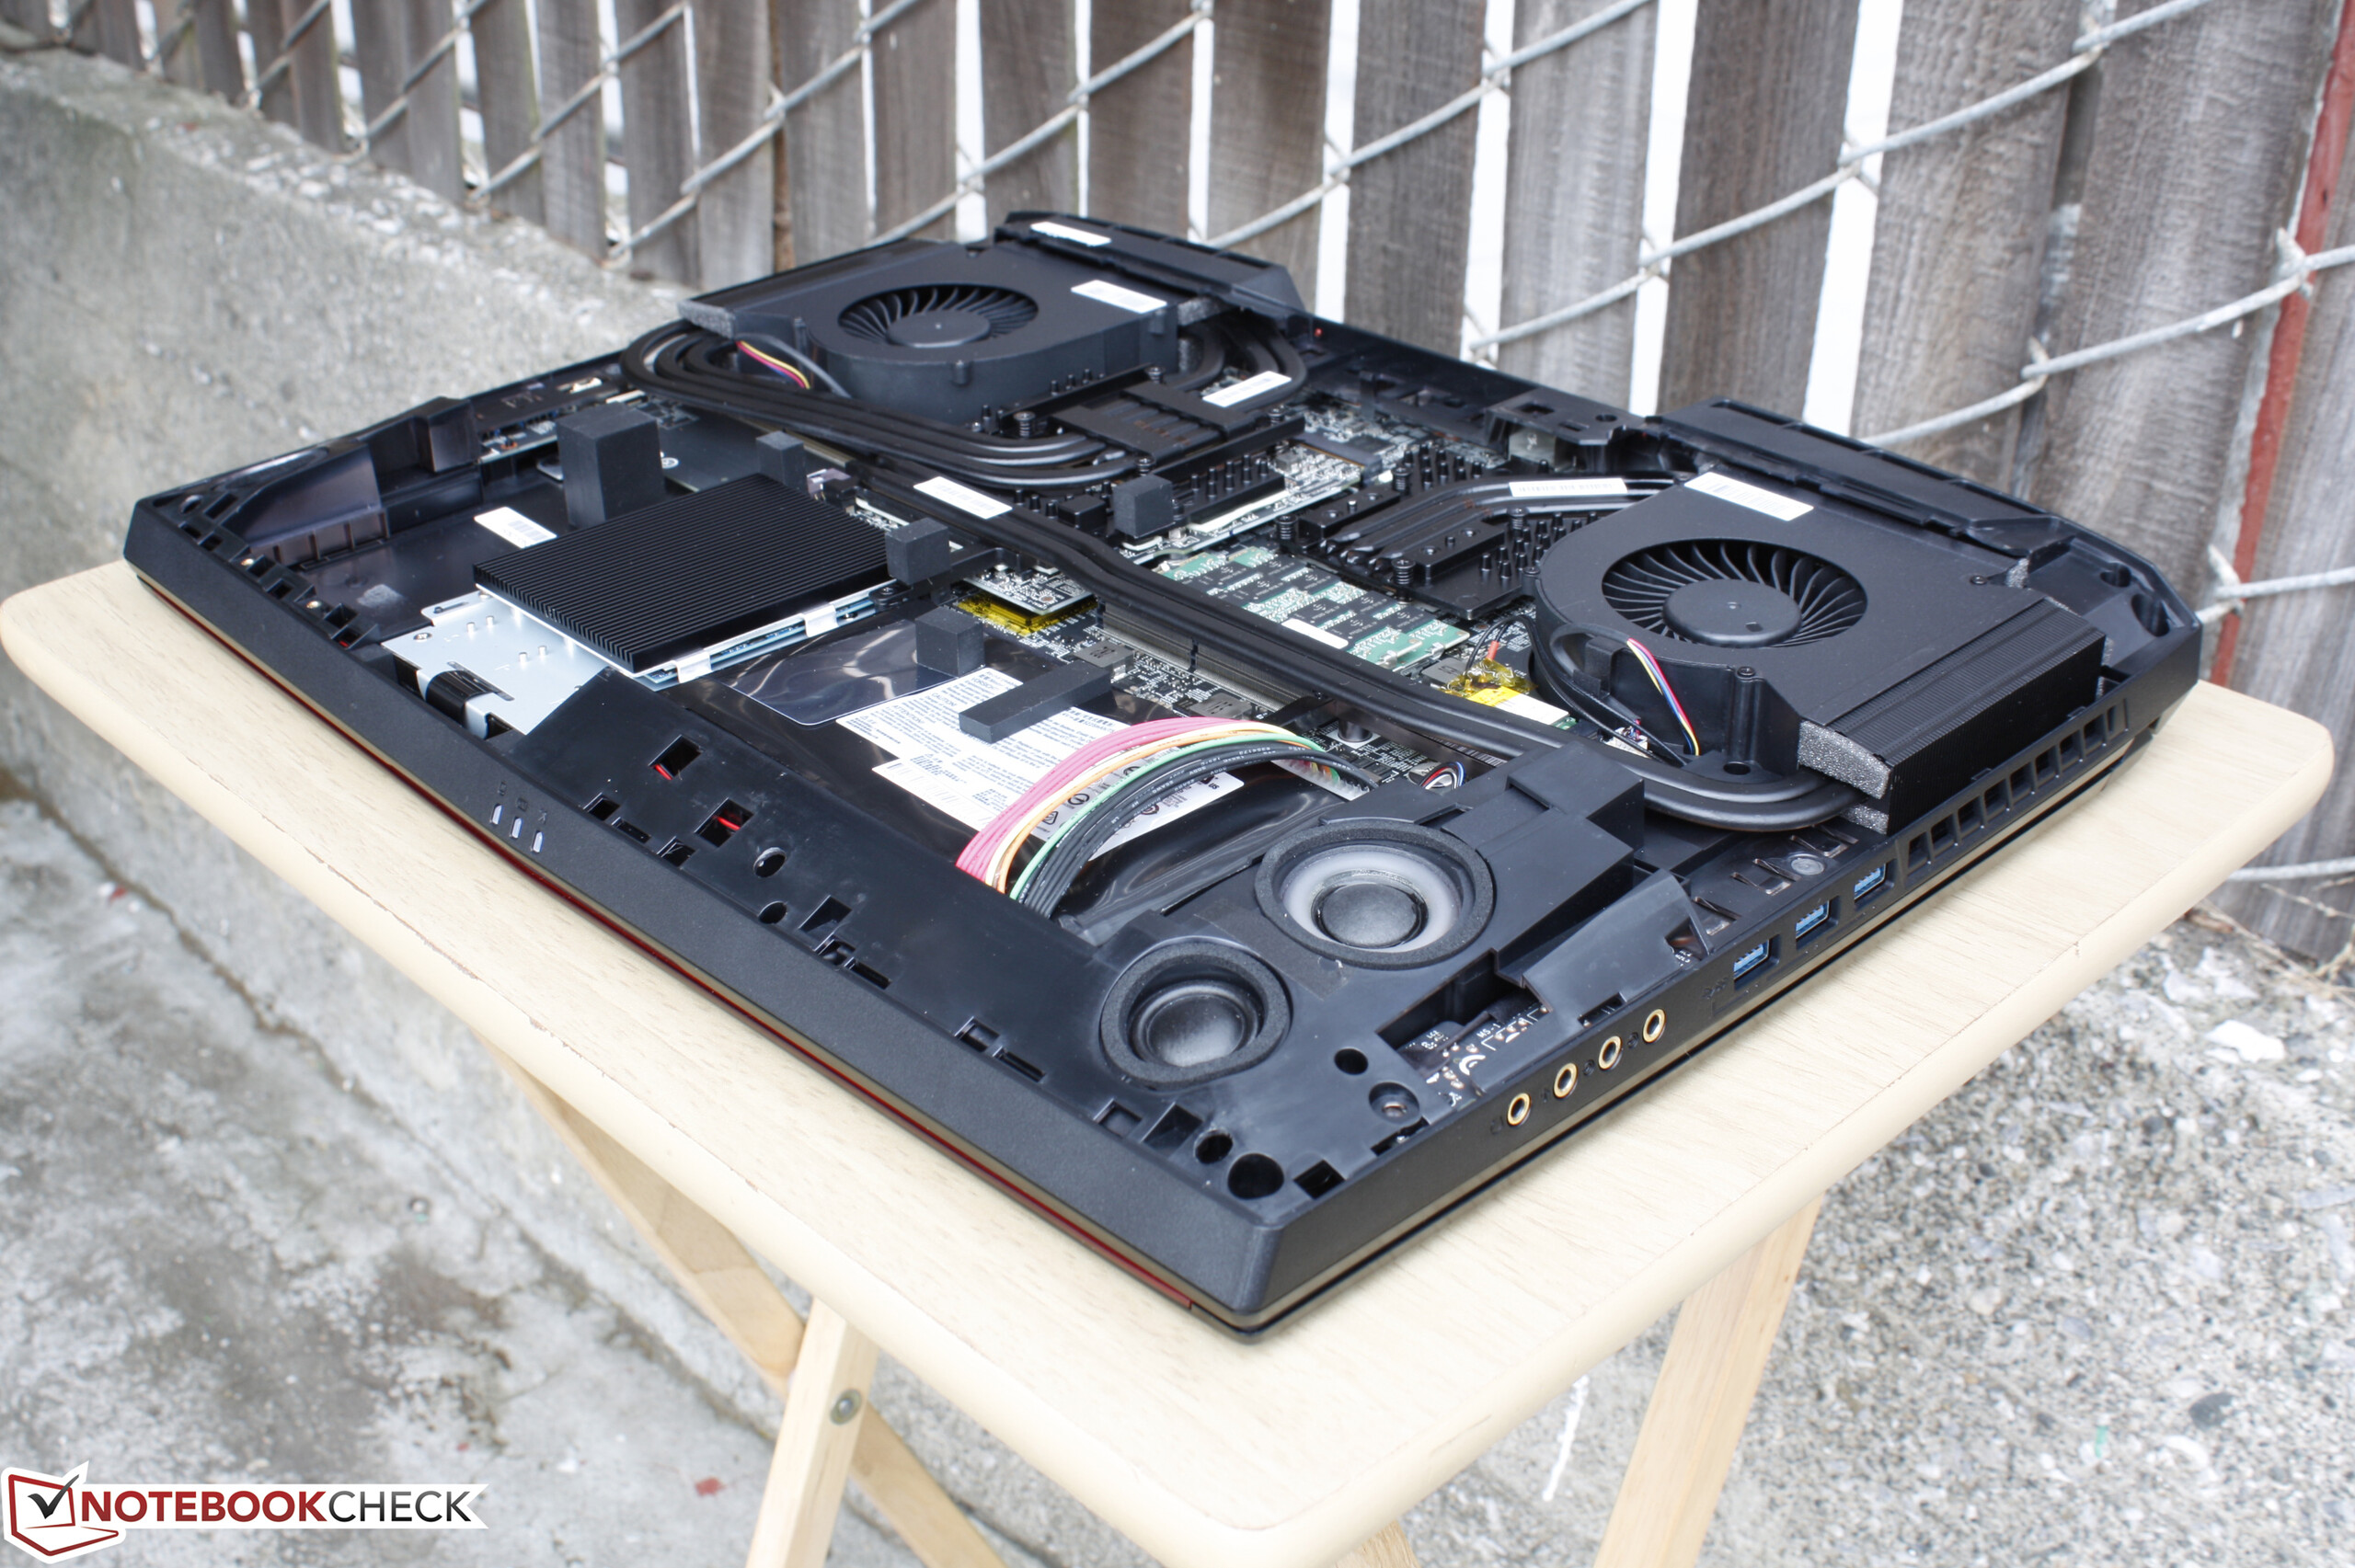
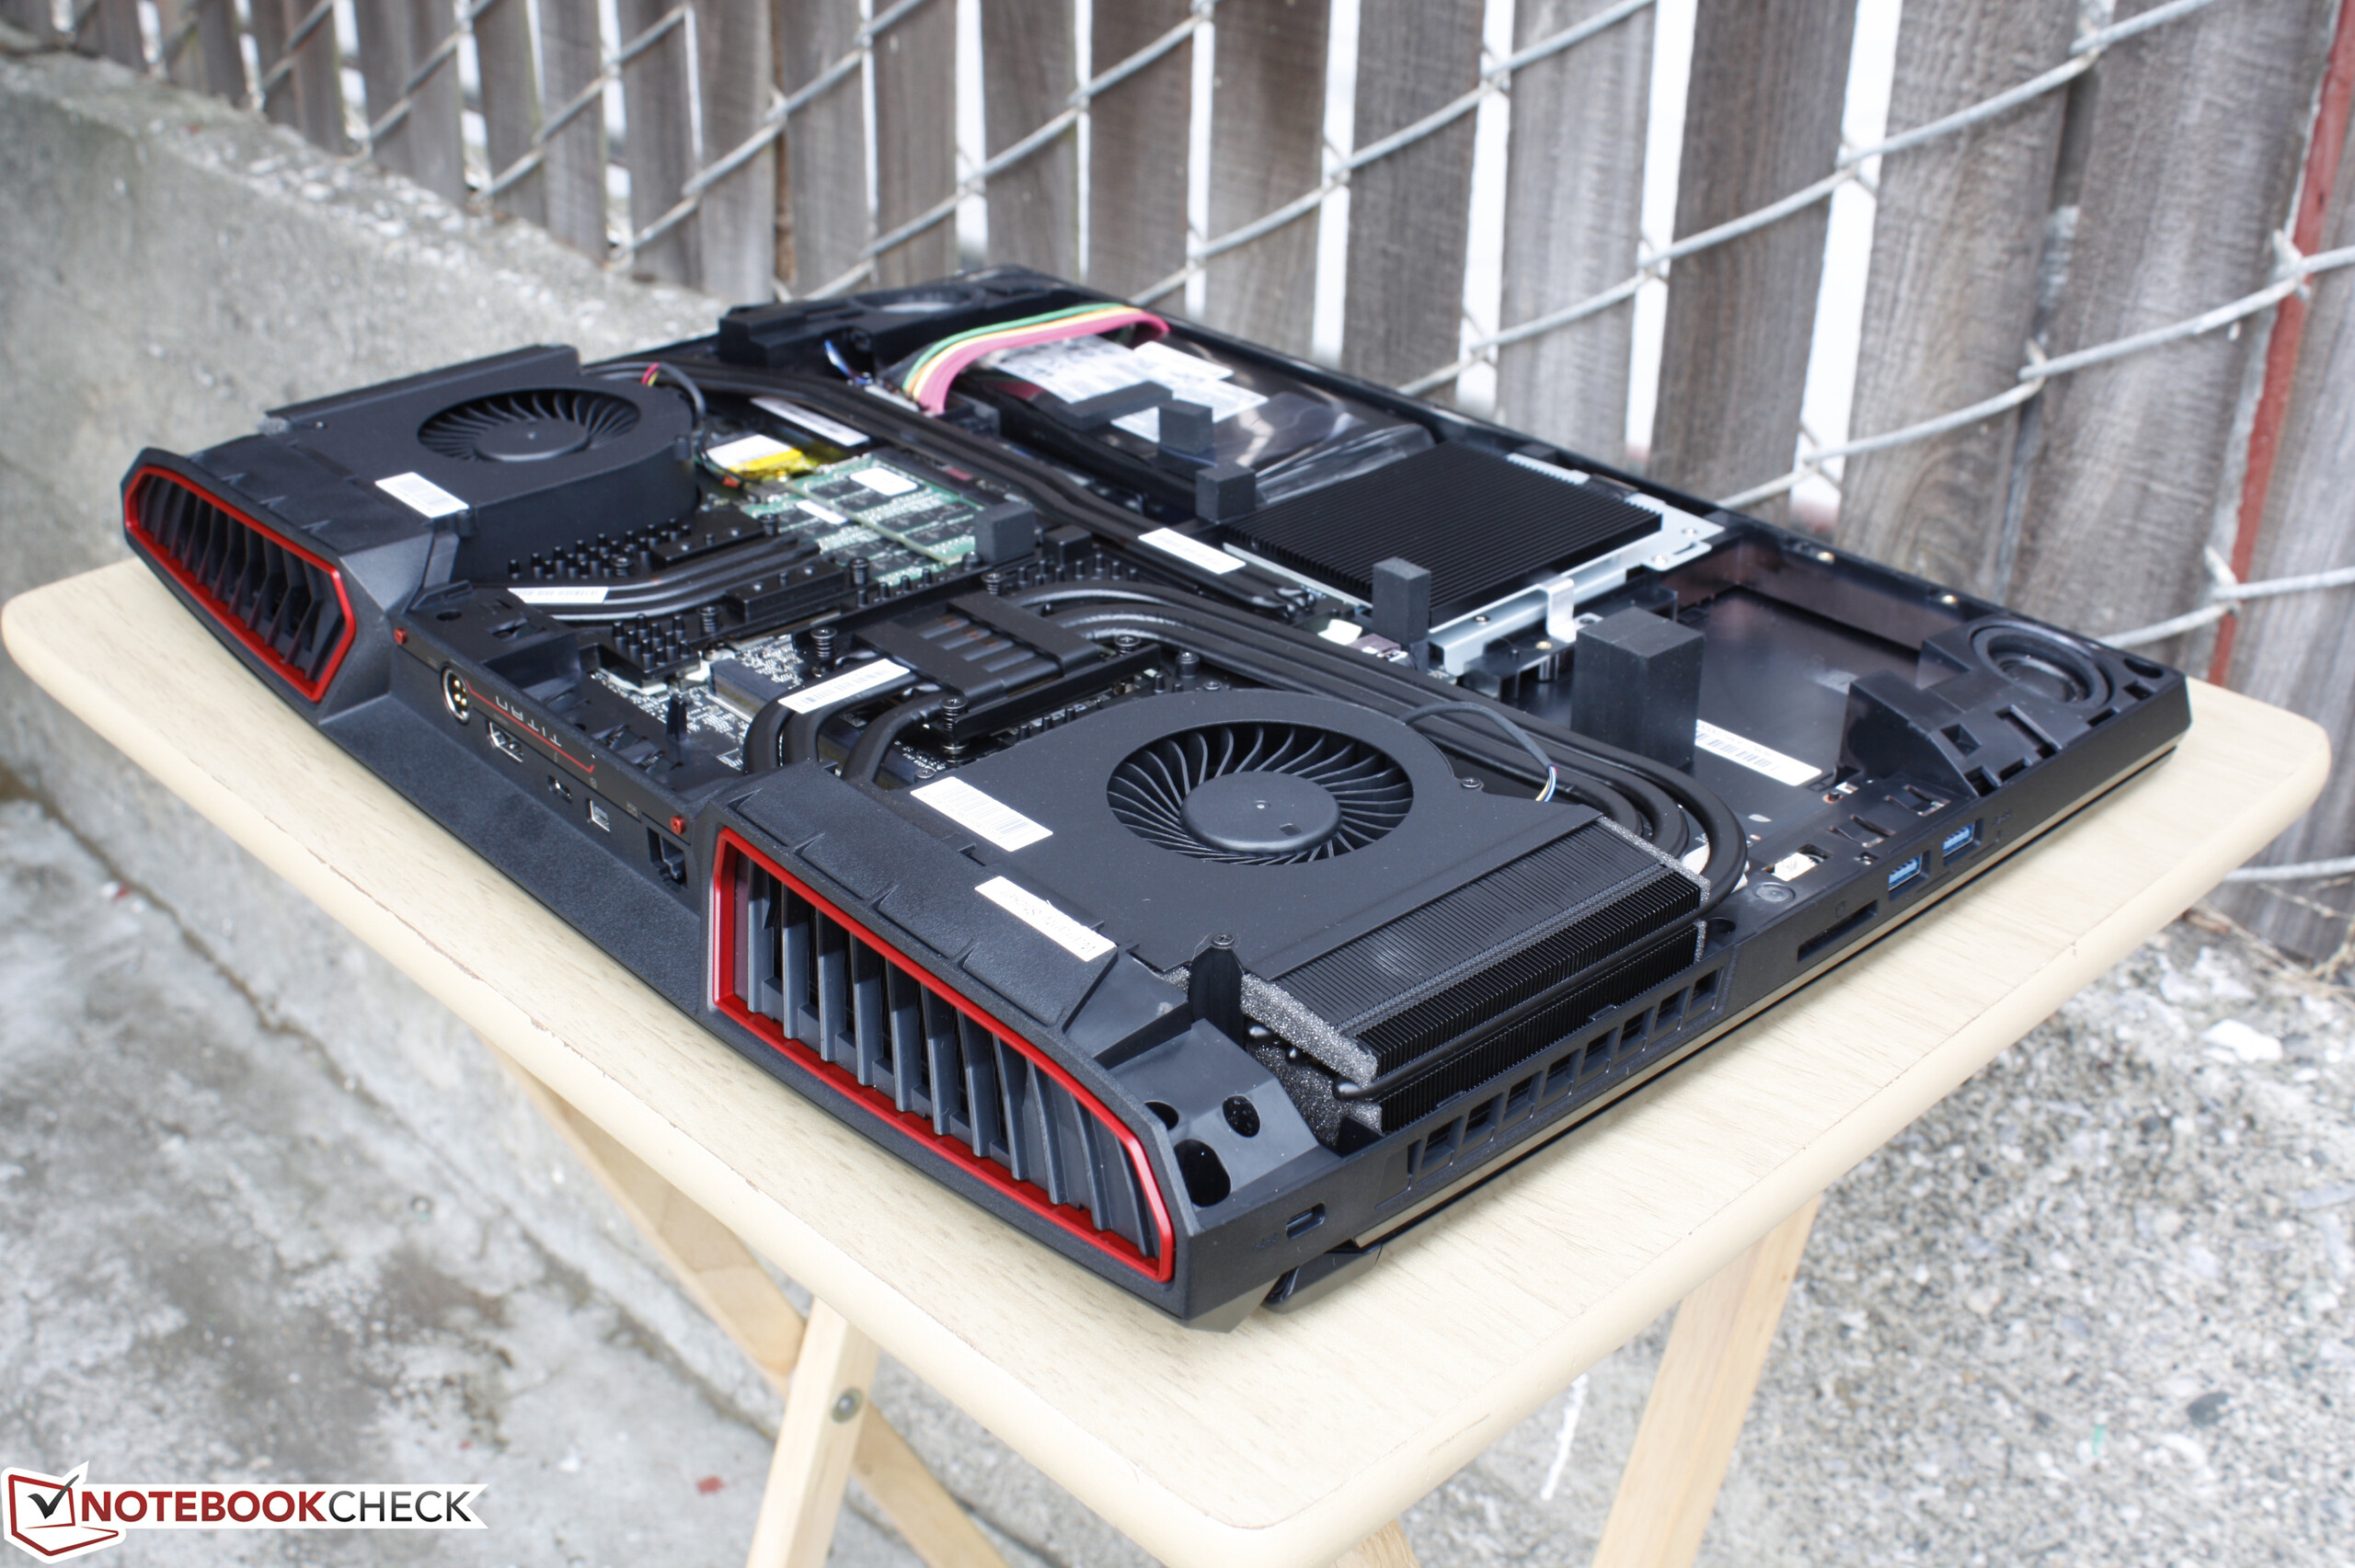
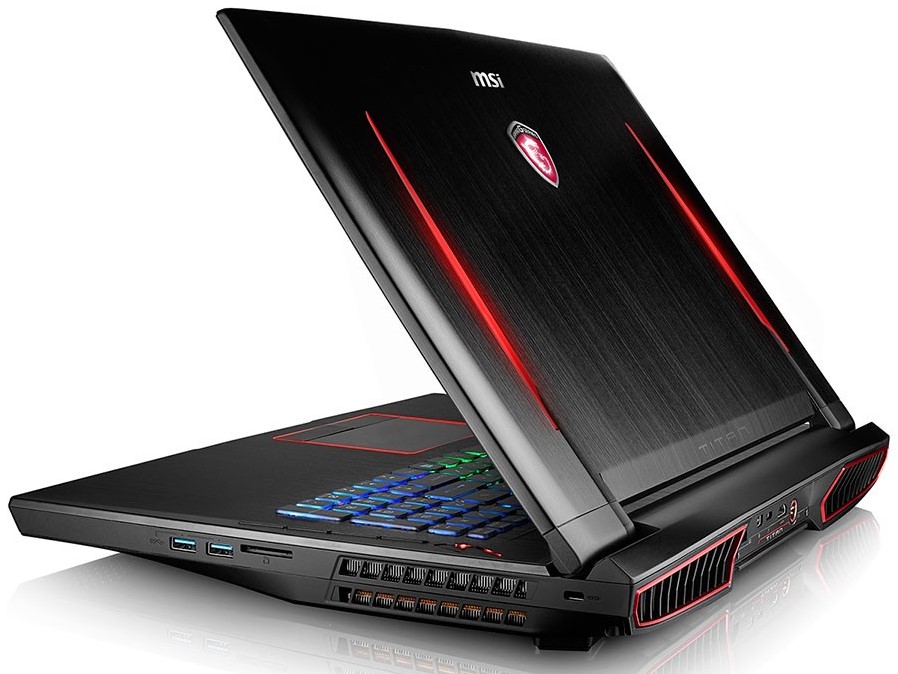
El chasis del GT73VR sigue siendo uno de los mejores portátiles para la GTX 1080 dadas sus versátiles características y su muy capaz solución de ventilación. Portátiles delgadísimos de 17" con la misma GPU saldrán a finales de año incluyendo el Aorus X7 v6 y el Razer Blade Pro, pero difícilmente esas alternativas más portables irán más frescas y silenciosas que el MSI.
El GT73VR es un paso en la dirección adecuada para la serie GT y es superior al GT72 en casi cualquier otro modo. Es más grueso y pesado, pero el peso y grosor extra se usan bien para una experiencia gaming muy mejorada.
Ésta es una versión acortada del análisis original. Puedes leer el análisis completo en inglés aquí.
MSI GT73VR 6RF
- 11/04/2016 v5.1 (old)
Allen Ngo
Price comparison
