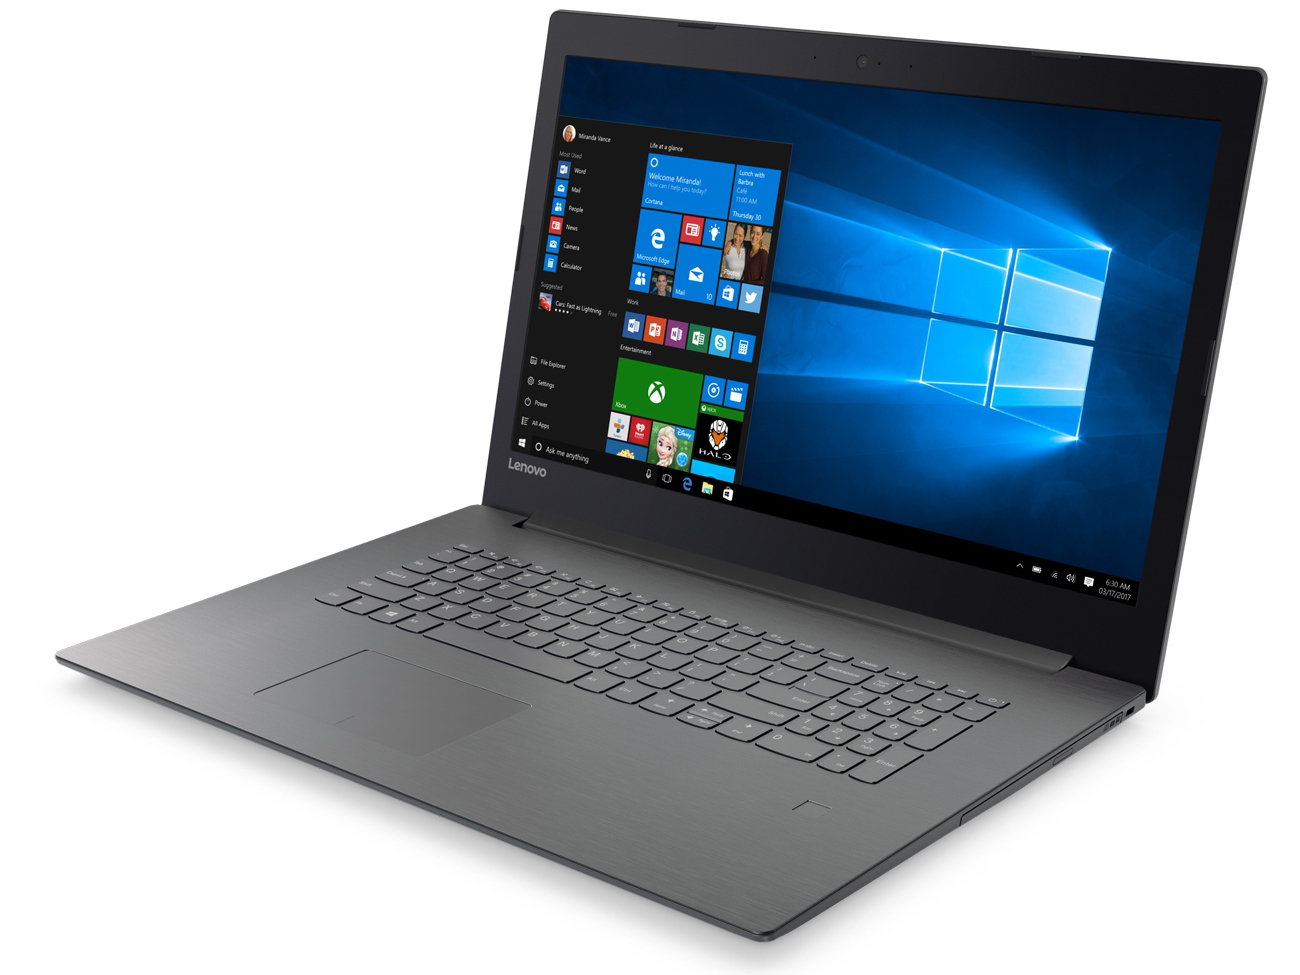
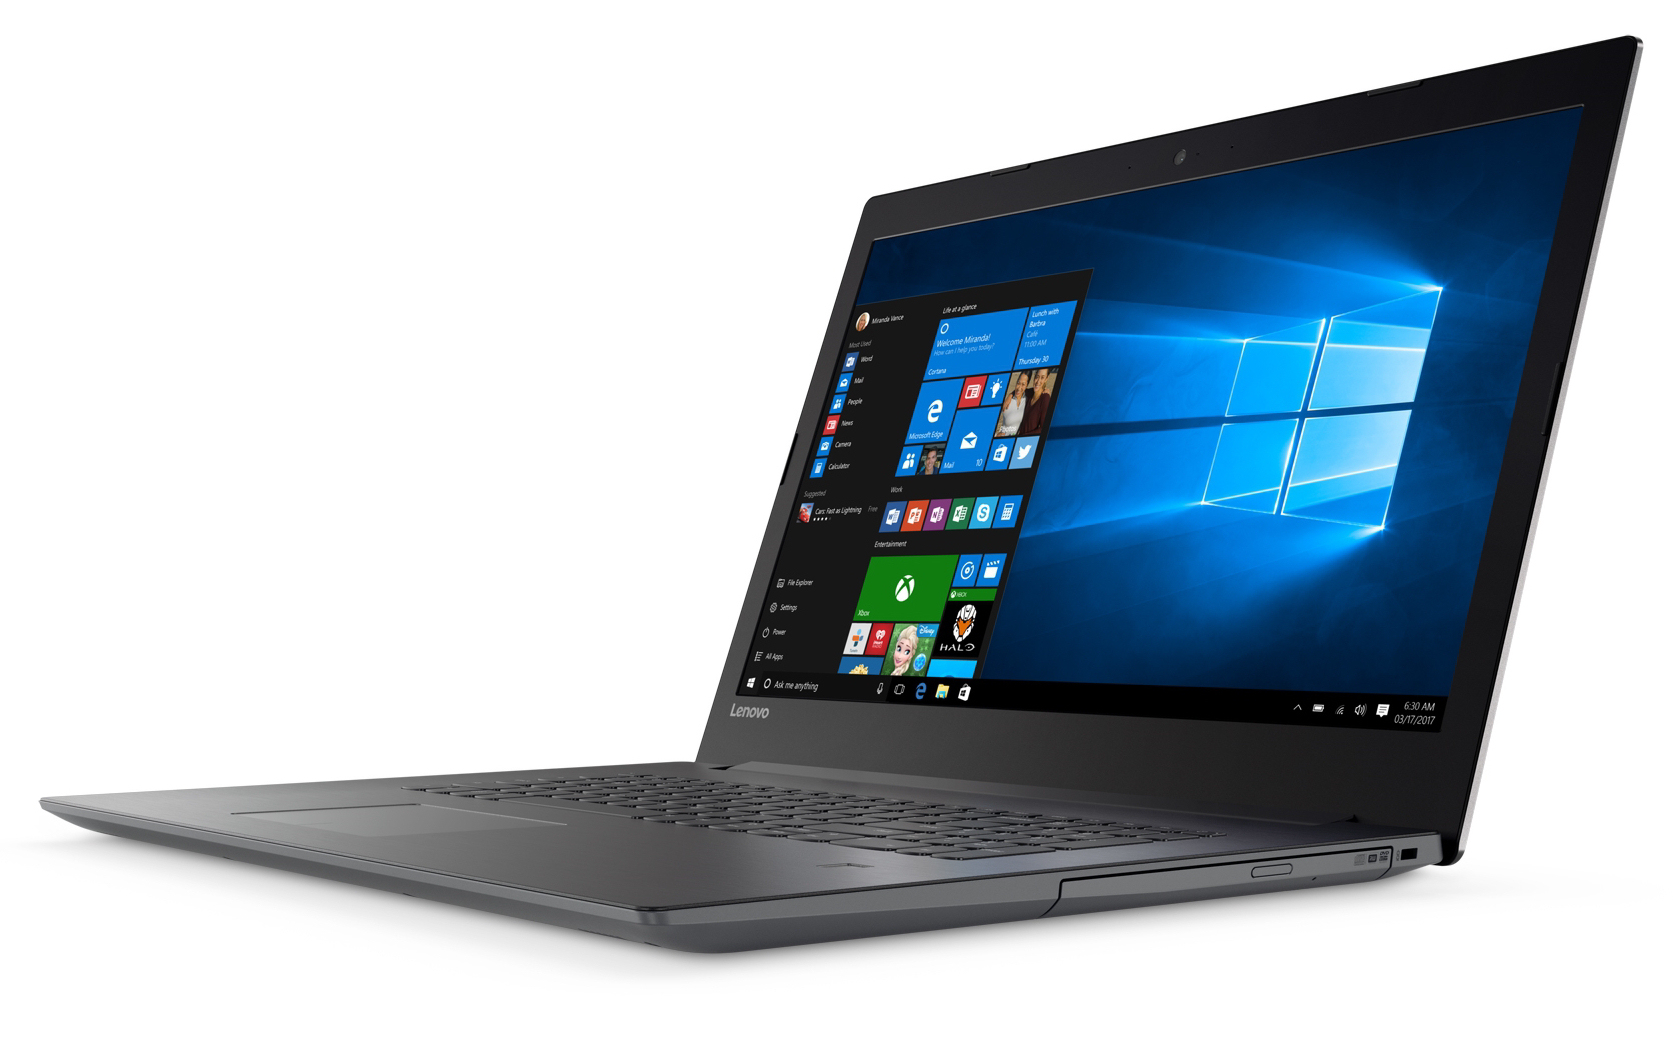
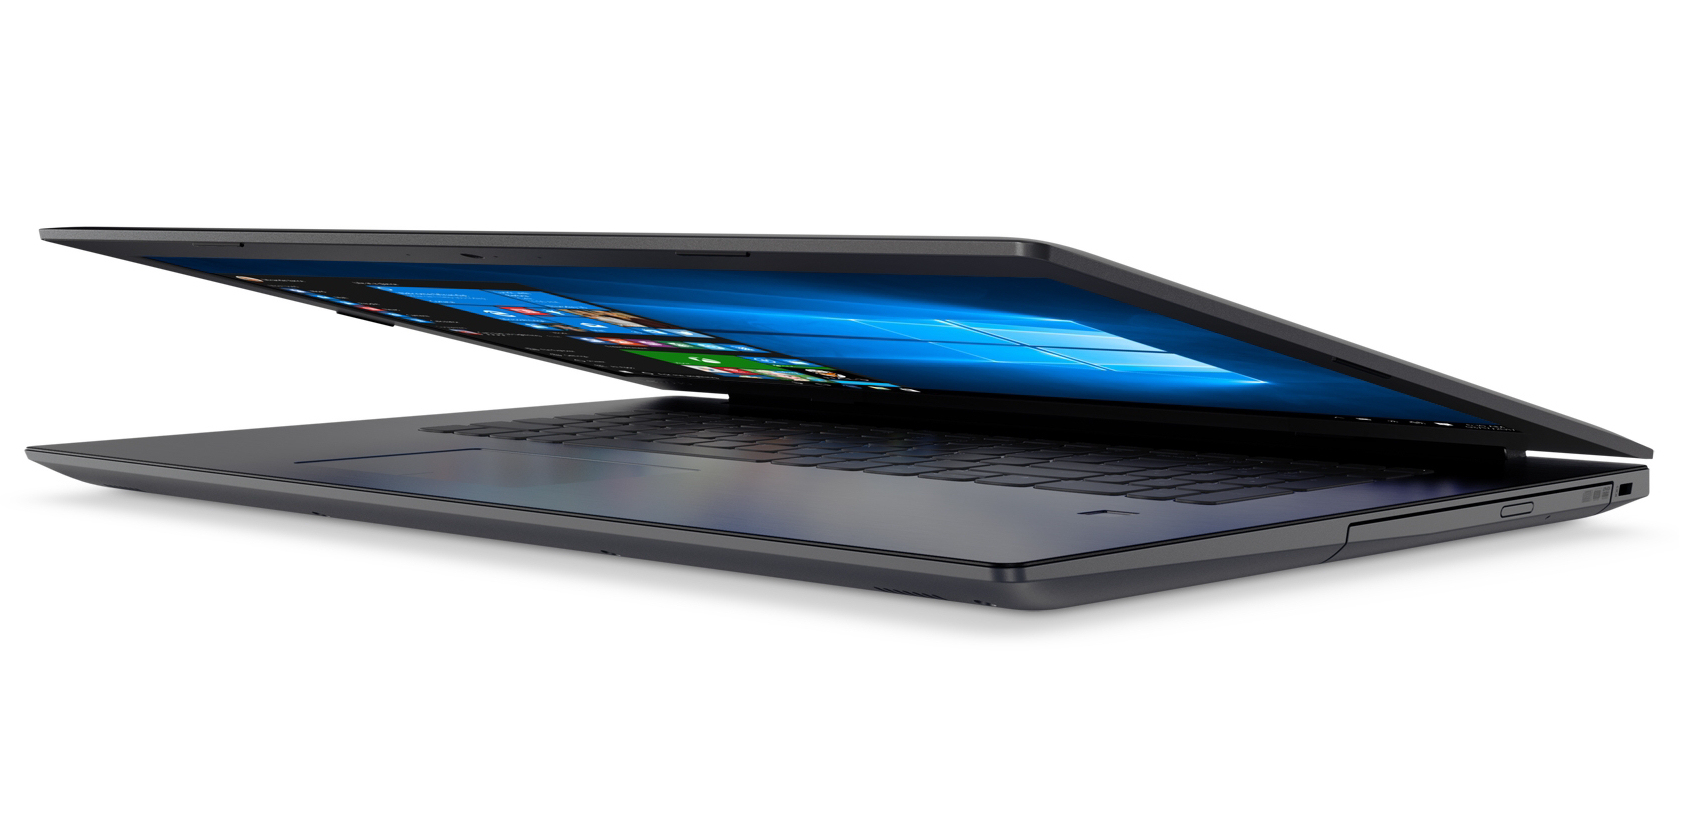
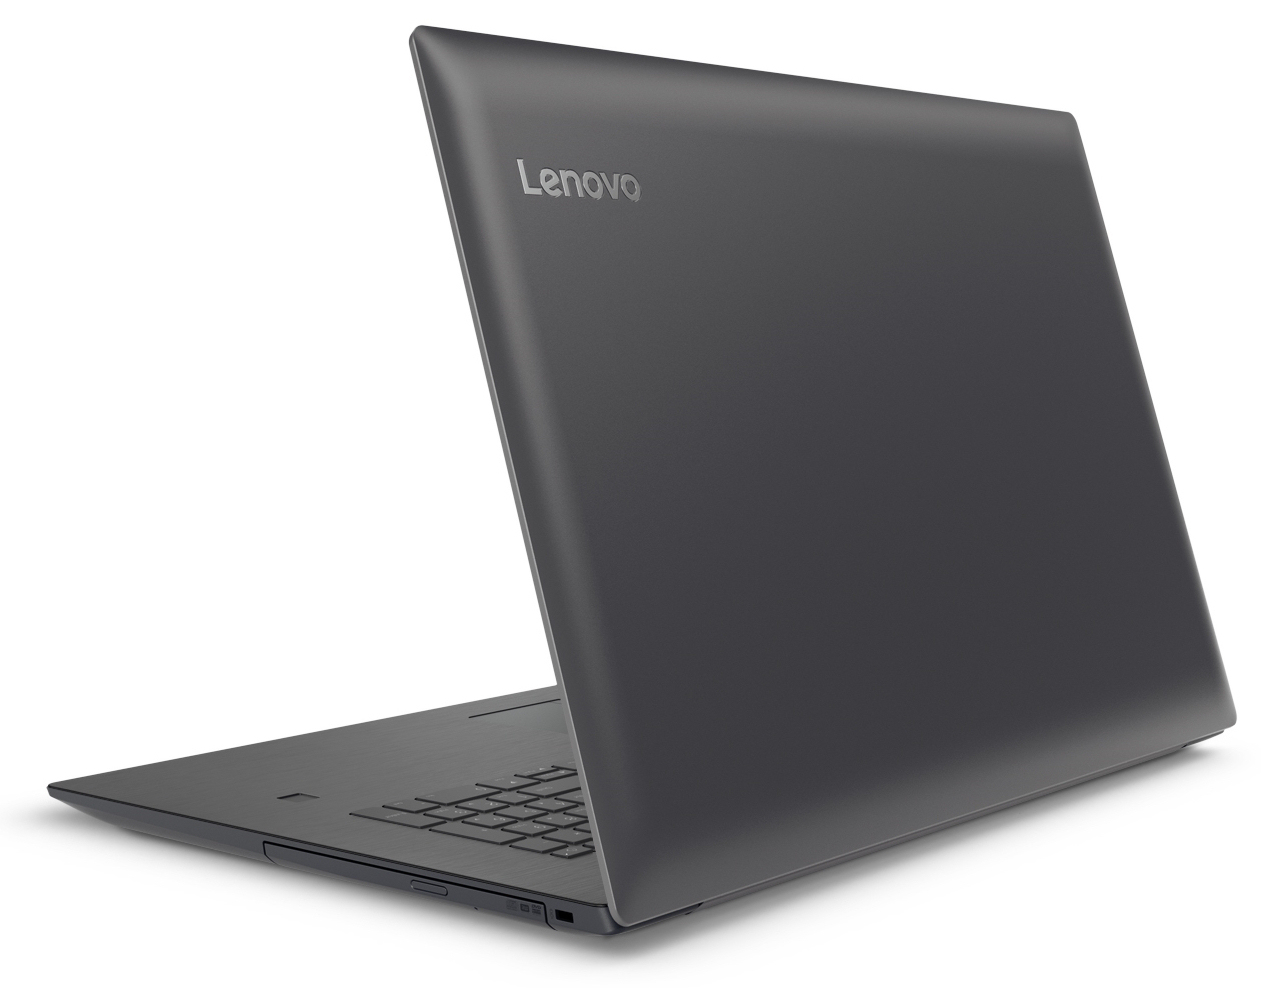
Breve análisis del portátil Lenovo V320-17IKB (7200U, FHD)
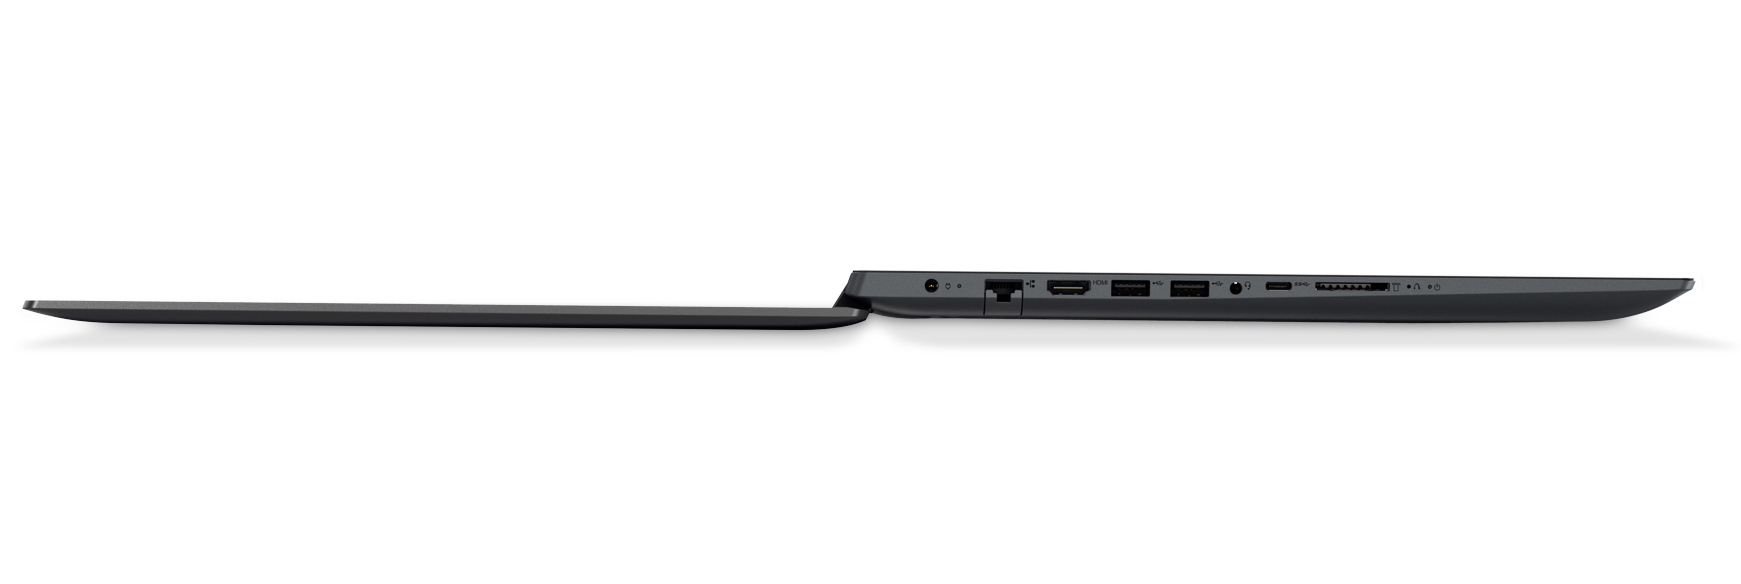


| SD Card Reader | |
| average JPG Copy Test (av. of 3 runs) | |
| Acer Aspire E5-774-54HJ (Toshiba Exceria Pro SDXC 64 GB UHS-II) | |
| Lenovo V320-17IKB 81AH0002GE (Toshiba Exceria Pro SDXC 64 GB UHS-II) | |
| HP 17-x066ng (Toshiba Exceria Pro SDXC 64 GB UHS-II) | |
| HP Pavilion 17-x110ng (Toshiba Exceria Pro SDXC 64 GB UHS-II) | |
| maximum AS SSD Seq Read Test (1GB) | |
| Acer Aspire E5-774-54HJ (Toshiba Exceria Pro SDXC 64 GB UHS-II) | |
| Lenovo V320-17IKB 81AH0002GE (Toshiba Exceria Pro SDXC 64 GB UHS-II) | |
| HP 17-x066ng (Toshiba Exceria Pro SDXC 64 GB UHS-II) | |
| HP Pavilion 17-x110ng (Toshiba Exceria Pro SDXC 64 GB UHS-II) | |
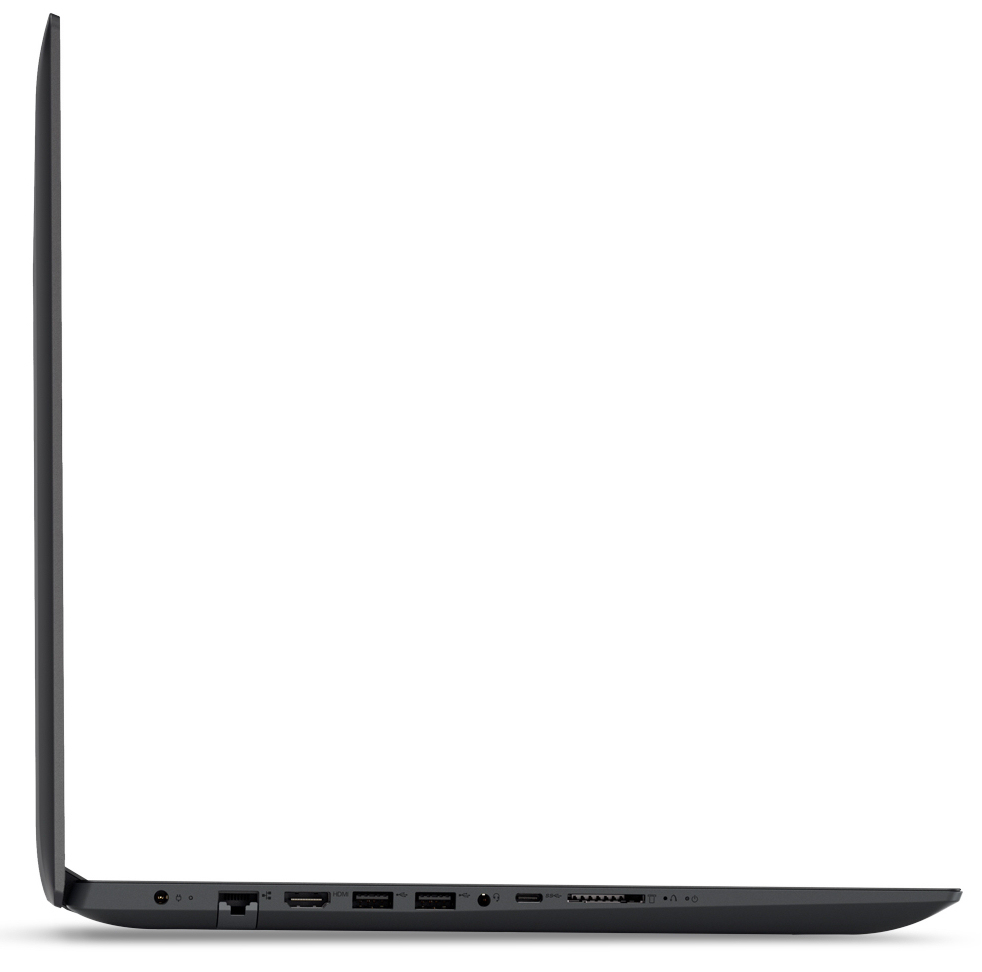
| Networking | |
| iperf3 transmit AX12 | |
| Lenovo V320-17IKB 81AH0002GE | |
| HP 17-x066ng | |
| HP Pavilion 17-x110ng | |
| iperf3 receive AX12 | |
| Lenovo V320-17IKB 81AH0002GE | |
| HP 17-x066ng | |
| HP Pavilion 17-x110ng | |
| |||||||||||||||||||||||||
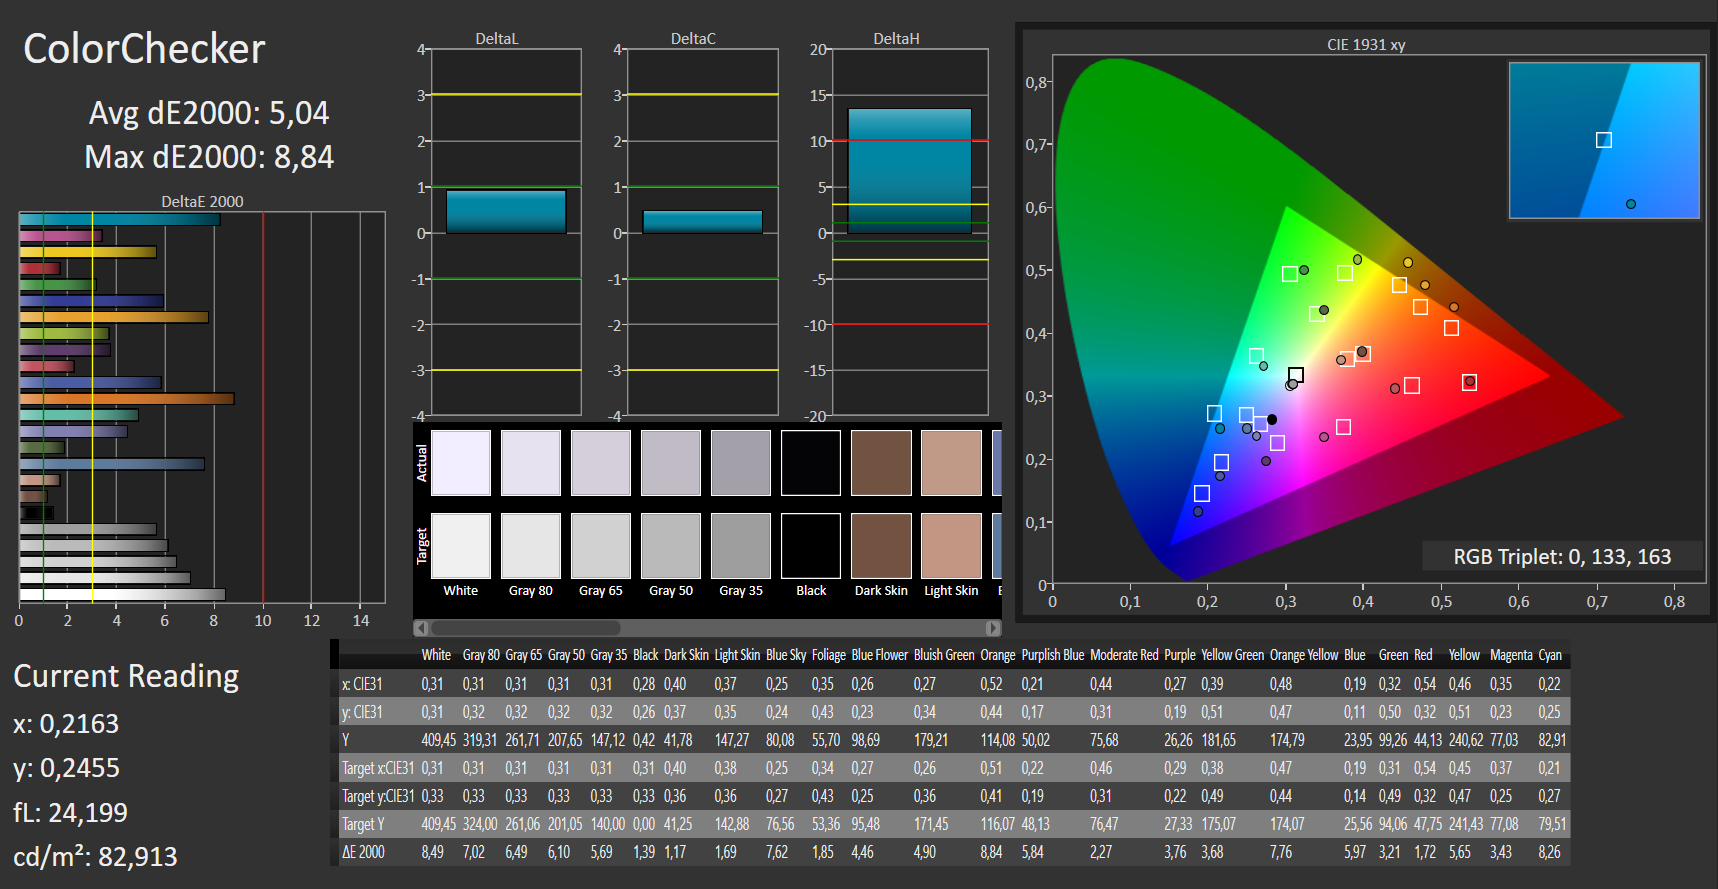
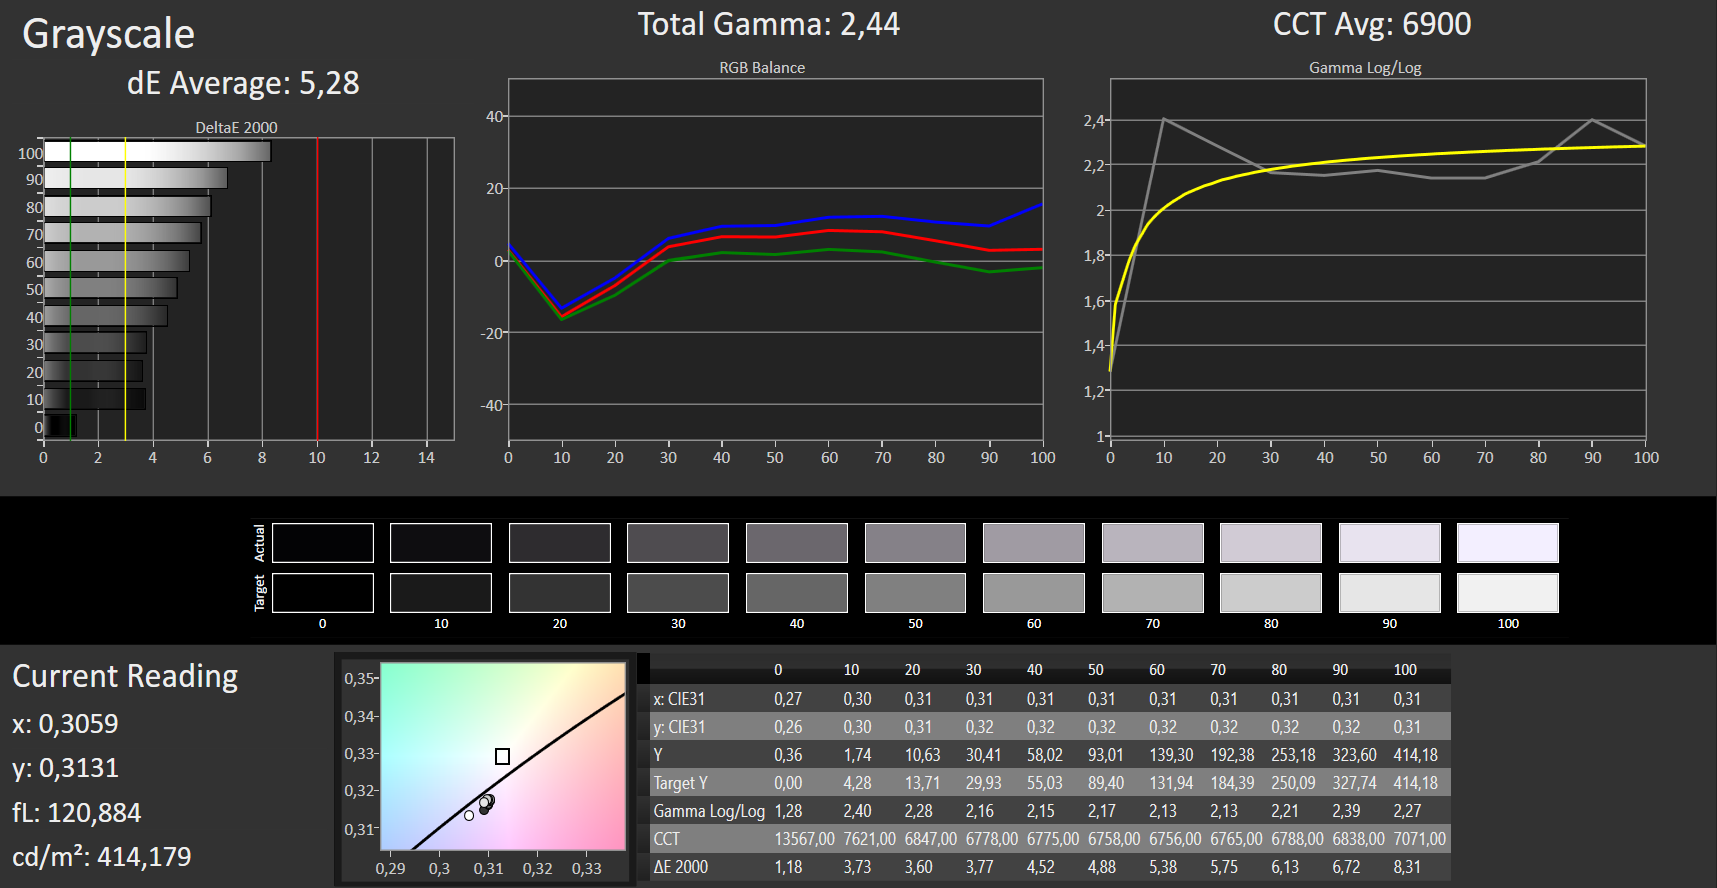
iluminación: 83 %
Brillo con batería: 412 cd/m²
Contraste: 1056:1 (Negro: 0.39 cd/m²)
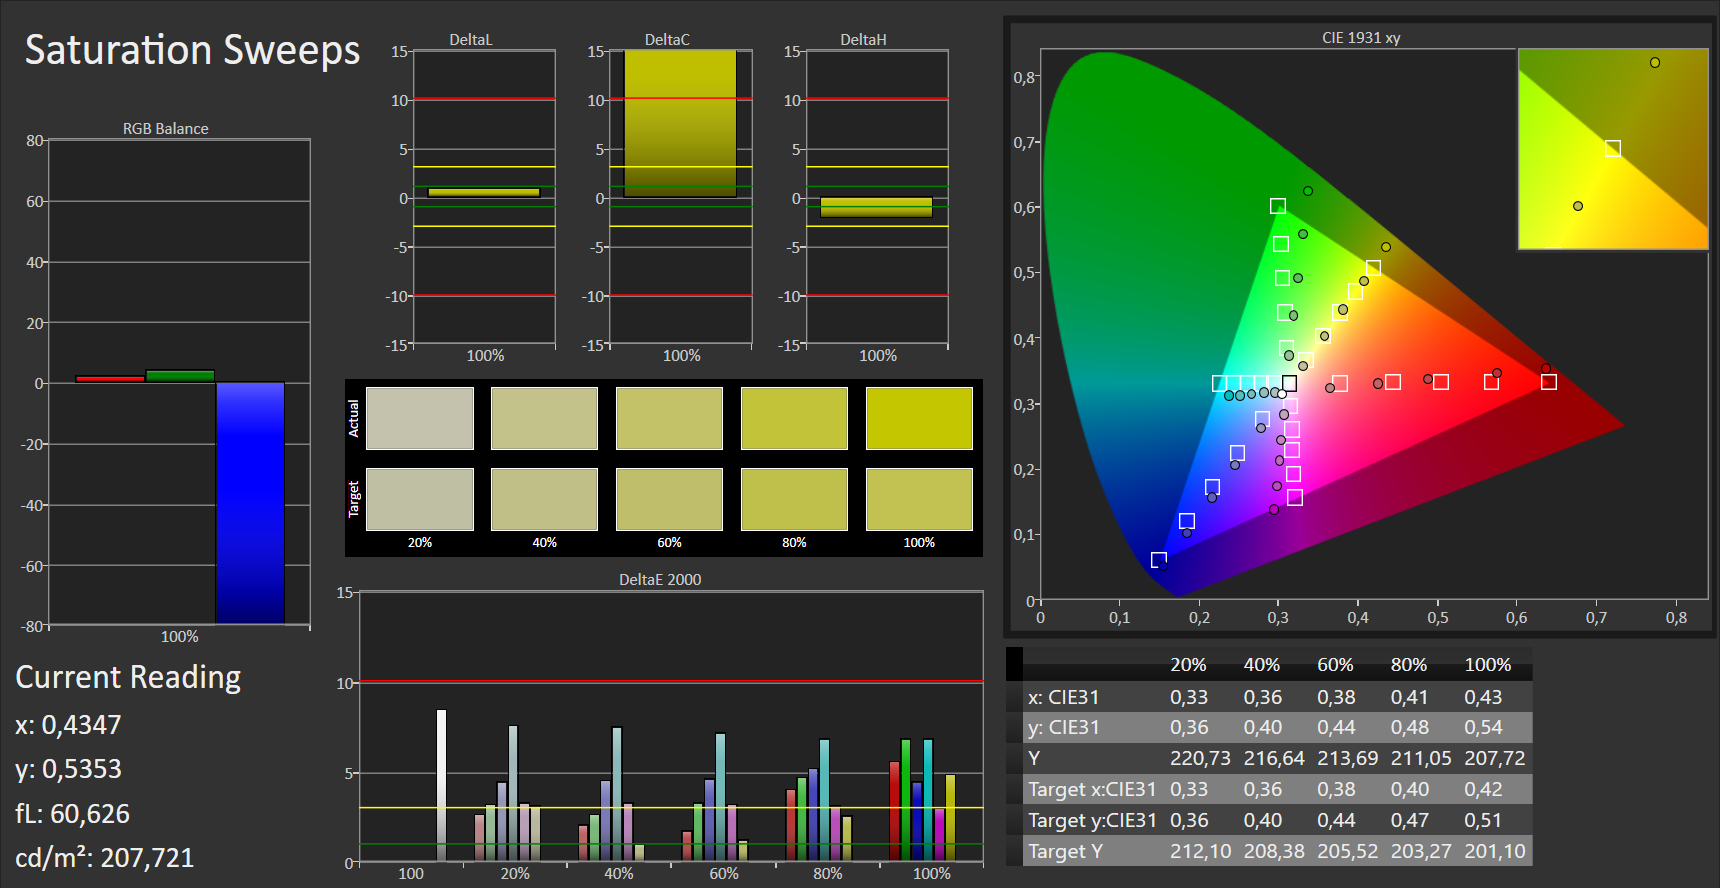
ΔE ColorChecker Calman: 5.04 | ∀{0.5-29.43 Ø4.73}
ΔE Greyscale Calman: 5.28 | ∀{0.09-98 Ø4.97}
84% sRGB (Argyll 1.6.3 3D)
55% AdobeRGB 1998 (Argyll 1.6.3 3D)
61.8% AdobeRGB 1998 (Argyll 3D)
84.5% sRGB (Argyll 3D)
66.5% Display P3 (Argyll 3D)
Gamma: 2.44
CCT: 6900 K
| Lenovo V320-17IKB 81AH0002GE IPS, 1920x1080, 17.3" | Acer Aspire E5-774-54HJ TN LED, 1920x1080, 17.3" | HP 17-x066ng IPS, 1920x1080, 17.3" | HP Pavilion 17-x110ng IPS, WLED, 1920x1080, 17.3" | |
|---|---|---|---|---|
| Display | 8% | 0% | 0% | |
| Display P3 Coverage (%) | 66.5 | 71.3 7% | 63.6 -4% | 63.6 -4% |
| sRGB Coverage (%) | 84.5 | 91.7 9% | 86.5 2% | 86.5 2% |
| AdobeRGB 1998 Coverage (%) | 61.8 | 67.1 9% | 63.3 2% | 63.3 2% |
| Response Times | -8% | -9% | -21% | |
| Response Time Grey 50% / Grey 80% * (ms) | 35 ? | 42 ? -20% | 38 ? -9% | 41 ? -17% |
| Response Time Black / White * (ms) | 24 ? | 23 ? 4% | 26 ? -8% | 30 ? -25% |
| PWM Frequency (Hz) | 119000 ? | 1000 ? | 200 ? | |
| Screen | -19% | -2% | -13% | |
| Brightness middle (cd/m²) | 412 | 353 -14% | 331 -20% | 288 -30% |
| Brightness (cd/m²) | 377 | 320 -15% | 310 -18% | 285 -24% |
| Brightness Distribution (%) | 83 | 82 -1% | 87 5% | 88 6% |
| Black Level * (cd/m²) | 0.39 | 0.38 3% | 0.33 15% | 0.61 -56% |
| Contrast (:1) | 1056 | 929 -12% | 1003 -5% | 472 -55% |
| Colorchecker dE 2000 * | 5.04 | 5.07 -1% | 4.58 9% | 4.56 10% |
| Colorchecker dE 2000 max. * | 8.84 | 10.12 -14% | 7.83 11% | 7.76 12% |
| Greyscale dE 2000 * | 5.28 | 13.38 -153% | 6.18 -17% | 4.95 6% |
| Gamma | 2.44 90% | 2.69 82% | 2.34 94% | 2.48 89% |
| CCT | 6900 94% | 15991 41% | 6076 107% | 7669 85% |
| Color Space (Percent of AdobeRGB 1998) (%) | 55 | 60.1 9% | 56 2% | |
| Color Space (Percent of sRGB) (%) | 84 | 91.6 9% | 86 2% | 93 11% |
| Media total (Programa/Opciones) | -6% /
-12% | -4% /
-2% | -11% /
-12% |
* ... más pequeño es mejor
Parpadeo de Pantalla / PWM (Pulse-Width Modulation)
| Parpadeo de Pantalla / PWM detectado | 119000 Hz | ≤ 80 % de brillo | 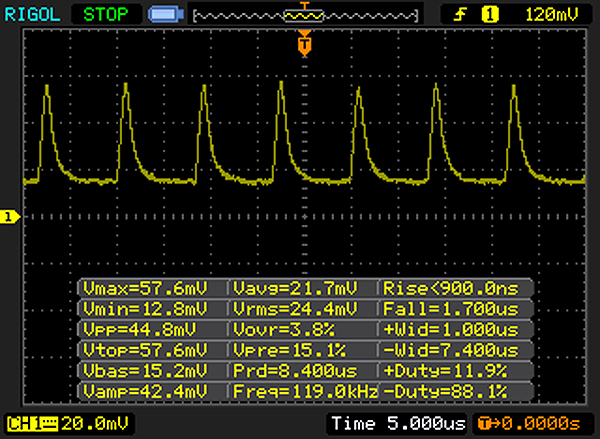 |
La retroiluminación del display parpadea a 119000 Hz (seguramente usa PWM - Pulse-Width Modulation) a un brillo del 80 % e inferior. Sobre este nivel de brillo no debería darse parpadeo / PWM. La frecuencia de 119000 Hz es bastante alta, por lo que la mayoría de gente sensible al parpadeo no debería ver parpadeo o tener fatiga visual. Comparación: 52 % de todos los dispositivos testados no usaron PWM para atenuar el display. Si se usó, medimos una media de 7794 (mínimo: 5 - máxmo: 343500) Hz. | |||
Tiempos de respuesta del display
| ↔ Tiempo de respuesta de Negro a Blanco | ||
|---|---|---|
| 24 ms ... subida ↗ y bajada ↘ combinada | ↗ 14 ms subida | 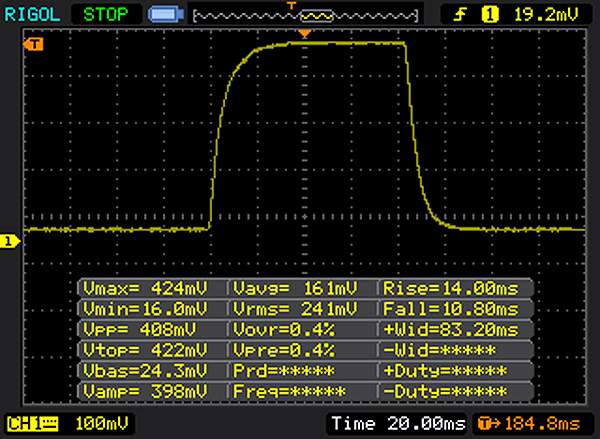 |
| ↘ 10 ms bajada | ||
| La pantalla mostró buenos tiempos de respuesta en nuestros tests pero podría ser demasiado lenta para los jugones competitivos. En comparación, todos los dispositivos de prueba van de ##min### (mínimo) a 240 (máximo) ms. » 54 % de todos los dispositivos son mejores. Eso quiere decir que el tiempo de respuesta es peor que la media (19.9 ms) de todos los dispositivos testados. | ||
| ↔ Tiempo de respuesta 50% Gris a 80% Gris | ||
| 35 ms ... subida ↗ y bajada ↘ combinada | ↗ 18 ms subida | 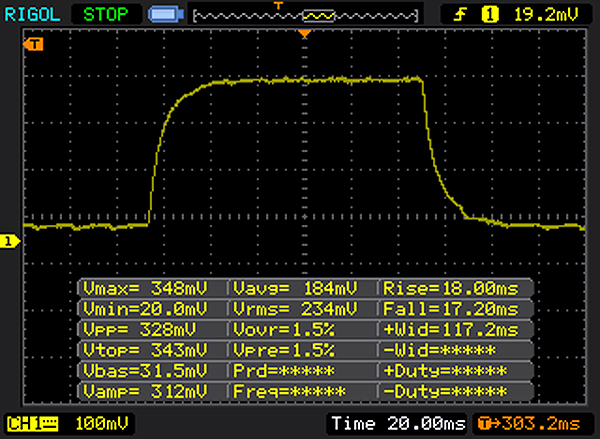 |
| ↘ 17 ms bajada | ||
| La pantalla mostró tiempos de respuesta lentos en nuestros tests y podría ser demasiado lenta para los jugones. En comparación, todos los dispositivos de prueba van de ##min### (mínimo) a 636 (máximo) ms. » 49 % de todos los dispositivos son mejores. Eso quiere decir que el tiempo de respuesta es peor que la media (31.1 ms) de todos los dispositivos testados. | ||
| Cinebench R15 | |
| CPU Single 64Bit | |
| HP Pavilion 17-x110ng | |
| Acer Aspire E5-774-54HJ | |
| Lenovo V320-17IKB 81AH0002GE | |
| HP 17-x066ng | |
| CPU Multi 64Bit | |
| HP Pavilion 17-x110ng | |
| Lenovo V320-17IKB 81AH0002GE | |
| Acer Aspire E5-774-54HJ | |
| HP 17-x066ng | |
| Cinebench R11.5 | |
| CPU Multi 64Bit | |
| HP Pavilion 17-x110ng | |
| Lenovo V320-17IKB 81AH0002GE | |
| CPU Single 64Bit | |
| HP Pavilion 17-x110ng | |
| Lenovo V320-17IKB 81AH0002GE | |
| Cinebench R10 | |
| Rendering Multiple CPUs 32Bit | |
| Acer Aspire E5-774-54HJ | |
| HP Pavilion 17-x110ng | |
| Lenovo V320-17IKB 81AH0002GE | |
| Rendering Single 32Bit | |
| HP Pavilion 17-x110ng | |
| Acer Aspire E5-774-54HJ | |
| Lenovo V320-17IKB 81AH0002GE | |
| Geekbench 3 | |
| 32 Bit Multi-Core Score | |
| Lenovo V320-17IKB 81AH0002GE | |
| Acer Aspire E5-774-54HJ | |
| 32 Bit Single-Core Score | |
| Lenovo V320-17IKB 81AH0002GE | |
| Acer Aspire E5-774-54HJ | |
| Geekbench 4.0 | |
| 64 Bit Multi-Core Score | |
| Lenovo V320-17IKB 81AH0002GE | |
| Acer Aspire E5-774-54HJ | |
| 64 Bit Single-Core Score | |
| Lenovo V320-17IKB 81AH0002GE | |
| Acer Aspire E5-774-54HJ | |
| Geekbench 4.4 | |
| 64 Bit Multi-Core Score | |
| Lenovo V320-17IKB 81AH0002GE | |
| 64 Bit Single-Core Score | |
| Lenovo V320-17IKB 81AH0002GE | |
| JetStream 1.1 - 1.1 Total | |
| Lenovo V320-17IKB 81AH0002GE | |
| HP Pavilion 17-x110ng | |
| Acer Aspire E5-774-54HJ | |
| Mozilla Kraken 1.1 - Total | |
| Lenovo V320-17IKB 81AH0002GE | |
| HP Pavilion 17-x110ng | |
| Octane V2 - Total Score | |
| HP Pavilion 17-x110ng | |
| Lenovo V320-17IKB 81AH0002GE | |
* ... más pequeño es mejor
| PCMark 7 Score | 5479 puntos | |
| PCMark 8 Home Score Accelerated v2 | 3820 puntos | |
| PCMark 8 Creative Score Accelerated v2 | 4587 puntos | |
| PCMark 8 Work Score Accelerated v2 | 4706 puntos | |
| PCMark 10 Score | 3285 puntos | |
ayuda | ||
| PCMark 8 - Home Score Accelerated v2 | |
| Lenovo V320-17IKB 81AH0002GE | |
| HP Pavilion 17-x110ng | |
| Acer Aspire E5-774-54HJ | |
| HP 17-x066ng | |

| Lenovo V320-17IKB 81AH0002GE SK Hynix HFS256G3BTND | Acer Aspire E5-774-54HJ Western Digital Scorpio Blue WD5000LPCX-24C6HT0 | HP 17-x066ng WDC WD10JPVX-08JC3T5 | HP Pavilion 17-x110ng SanDisk Z400s SD8SNAT-256G | |
|---|---|---|---|---|
| CrystalDiskMark 3.0 | -90% | -89% | -7% | |
| Read Seq (MB/s) | 473.7 | 88.9 -81% | 98.6 -79% | 500 6% |
| Write Seq (MB/s) | 260.8 | 70.9 -73% | 98.2 -62% | 325.1 25% |
| Read 512 (MB/s) | 337 | 33.01 -90% | 33.8 -90% | 290.2 -14% |
| Write 512 (MB/s) | 263.3 | 51.6 -80% | 45.98 -83% | 300.3 14% |
| Read 4k (MB/s) | 29.41 | 0.381 -99% | 0.395 -99% | 11.24 -62% |
| Write 4k (MB/s) | 73.3 | 1.117 -98% | 0.96 -99% | 86 17% |
| Read 4k QD32 (MB/s) | 298.3 | 0.891 -100% | 1.039 -100% | 145.4 -51% |
| Write 4k QD32 (MB/s) | 242.5 | 1.13 -100% | 0.959 -100% | 272.7 12% |
| 3DMark 06 Standard Score | 10189 puntos | |
| 3DMark 11 Performance | 1703 puntos | |
| 3DMark Ice Storm Standard Score | 65525 puntos | |
| 3DMark Cloud Gate Standard Score | 6489 puntos | |
| 3DMark Fire Strike Score | 935 puntos | |
| 3DMark Time Spy Score | 378 puntos | |
ayuda | ||
| 3DMark 11 - 1280x720 Performance GPU | |
| Acer Aspire E5-774G-78NA | |
| HP Pavilion 17-x110ng | |
| Lenovo Ideapad 110-17IKB 80VK0001GE | |
| Lenovo V320-17IKB 81AH0002GE | |
| HP 17-y044ng | |
| Acer Aspire E5-774-54HJ | |
| HP 17-x066ng | |
| 3DMark | |
| 1280x720 Cloud Gate Standard Graphics | |
| Acer Aspire E5-774G-78NA | |
| Lenovo V320-17IKB 81AH0002GE | |
| HP Pavilion 17-x110ng | |
| 1920x1080 Fire Strike Graphics | |
| Acer Aspire E5-774G-78NA | |
| HP Pavilion 17-x110ng | |
| Lenovo V320-17IKB 81AH0002GE | |
| bajo | medio | alto | ultra | |
|---|---|---|---|---|
| Tomb Raider (2013) | 87.3 | 44 | 26.9 | 12.5 |
| BioShock Infinite (2013) | 56.5 | 32.5 | 26.5 | 9 |
| Rise of the Tomb Raider (2016) | 19 | 11.8 | 6.4 | 4.3 |
| Mass Effect Andromeda (2017) | 15.6 | 6.4 | ||
| Prey (2017) | 27.8 | 11.6 | 9.2 | |
| Dirt 4 (2017) | 44.8 | 12.4 | 9.9 | |
| Team Fortress 2 (2017) | 76.7 | 71 | 40 | 18 |
| F1 2017 (2017) | 31 | 13 | 13 |
Ruido
| Ocioso |
| 30.5 / 30.5 / 30.5 dB(A) |
| Carga |
| 35 / 35.8 dB(A) |
 | ||
30 dB silencioso 40 dB(A) audible 50 dB(A) ruidosamente alto |
||
min: | ||
| Lenovo V320-17IKB 81AH0002GE i5-7200U, HD Graphics 620 | Acer Aspire E5-774-54HJ i5-7200U, HD Graphics 620 | HP 17-x066ng 6006U, HD Graphics 520 | HP Pavilion 17-x110ng i5-7200U, Radeon R7 M440 | |
|---|---|---|---|---|
| Noise | 2% | -1% | -4% | |
| apagado / medio ambiente * (dB) | 30 | 30.5 -2% | 30.6 -2% | 29 3% |
| Idle Minimum * (dB) | 30.5 | 30.8 -1% | 32.7 -7% | 31 -2% |
| Idle Average * (dB) | 30.5 | 30.8 -1% | 32.7 -7% | 31 -2% |
| Idle Maximum * (dB) | 30.5 | 30.8 -1% | 32.7 -7% | 31 -2% |
| Load Average * (dB) | 35 | 32.1 8% | 33 6% | 33.8 3% |
| Load Maximum * (dB) | 35.8 | 33.8 6% | 32.7 9% | 44.8 -25% |
* ... más pequeño es mejor
(+) La temperatura máxima en la parte superior es de 37.3 °C / 99 F, frente a la media de 34.3 °C / 94 F, que oscila entre 21.2 y 62.5 °C para la clase Office.
(+) El fondo se calienta hasta un máximo de 37 °C / 99 F, frente a la media de 36.8 °C / 98 F
(+) En reposo, la temperatura media de la parte superior es de 27.2 °C / 81# F, frente a la media del dispositivo de 29.5 °C / 85 F.
(+) El reposamanos y el panel táctil están a una temperatura inferior a la de la piel, con un máximo de 31.6 °C / 88.9 F y, por tanto, son fríos al tacto.
(-) La temperatura media de la zona del reposamanos de dispositivos similares fue de 27.5 °C / 81.5 F (-4.1 °C / -7.4 F).
| Lenovo V320-17IKB 81AH0002GE i5-7200U, HD Graphics 620 | Acer Aspire E5-774-54HJ i5-7200U, HD Graphics 620 | HP 17-x066ng 6006U, HD Graphics 520 | HP Pavilion 17-x110ng i5-7200U, Radeon R7 M440 | |
|---|---|---|---|---|
| Heat | 14% | 5% | 2% | |
| Maximum Upper Side * (°C) | 37.3 | 30.4 18% | 36.5 2% | 40.3 -8% |
| Maximum Bottom * (°C) | 37 | 30.6 17% | 37.2 -1% | 46.1 -25% |
| Idle Upper Side * (°C) | 28.7 | 26.7 7% | 26 9% | 23.8 17% |
| Idle Bottom * (°C) | 30.1 | 26 14% | 27.1 10% | 23.4 22% |
* ... más pequeño es mejor
Lenovo V320-17IKB 81AH0002GE análisis de audio
(-) | altavoces no muy altos (#65 dB)
Graves 100 - 315 Hz
(±) | lubina reducida - en promedio 8.4% inferior a la mediana
(±) | la linealidad de los graves es media (13.3% delta a frecuencia anterior)
Medios 400 - 2000 Hz
(+) | medios equilibrados - a sólo 1.9% de la mediana
(+) | los medios son lineales (6.3% delta a la frecuencia anterior)
Altos 2 - 16 kHz
(+) | máximos equilibrados - a sólo 3.5% de la mediana
(+) | los máximos son lineales (5.8% delta a la frecuencia anterior)
Total 100 - 16.000 Hz
(+) | el sonido global es lineal (13.7% de diferencia con la mediana)
En comparación con la misma clase
» 8% de todos los dispositivos probados de esta clase eran mejores, 4% similares, 88% peores
» El mejor tuvo un delta de 7%, la media fue 21%, el peor fue ###max##%
En comparación con todos los dispositivos probados
» 15% de todos los dispositivos probados eran mejores, 4% similares, 81% peores
» El mejor tuvo un delta de 4%, la media fue 24%, el peor fue ###max##%
Apple MacBook 12 (Early 2016) 1.1 GHz análisis de audio
(+) | los altavoces pueden reproducir a un volumen relativamente alto (#83.6 dB)
Graves 100 - 315 Hz
(±) | lubina reducida - en promedio 11.3% inferior a la mediana
(±) | la linealidad de los graves es media (14.2% delta a frecuencia anterior)
Medios 400 - 2000 Hz
(+) | medios equilibrados - a sólo 2.4% de la mediana
(+) | los medios son lineales (5.5% delta a la frecuencia anterior)
Altos 2 - 16 kHz
(+) | máximos equilibrados - a sólo 2% de la mediana
(+) | los máximos son lineales (4.5% delta a la frecuencia anterior)
Total 100 - 16.000 Hz
(+) | el sonido global es lineal (10.2% de diferencia con la mediana)
En comparación con la misma clase
» 7% de todos los dispositivos probados de esta clase eran mejores, 2% similares, 91% peores
» El mejor tuvo un delta de 5%, la media fue 18%, el peor fue ###max##%
En comparación con todos los dispositivos probados
» 5% de todos los dispositivos probados eran mejores, 1% similares, 94% peores
» El mejor tuvo un delta de 4%, la media fue 24%, el peor fue ###max##%
| Off / Standby | |
| Ocioso | |
| Carga |
|
Clave:
min: | |
| Lenovo V320-17IKB 81AH0002GE i5-7200U, HD Graphics 620 | Acer Aspire E5-774-54HJ i5-7200U, HD Graphics 620 | HP 17-x066ng 6006U, HD Graphics 520 | HP Pavilion 17-x110ng i5-7200U, Radeon R7 M440 | |
|---|---|---|---|---|
| Power Consumption | -10% | -8% | -50% | |
| Idle Minimum * (Watt) | 3.8 | 5.3 -39% | 5.5 -45% | 7.7 -103% |
| Idle Average * (Watt) | 9.6 | 10.1 -5% | 9.9 -3% | 14 -46% |
| Idle Maximum * (Watt) | 10.4 | 10.5 -1% | 14.6 -40% | 15.1 -45% |
| Load Average * (Watt) | 35.4 | 34.3 3% | 28 21% | 33 7% |
| Load Maximum * (Watt) | 34 | 37 -9% | 24.6 28% | 54.6 -61% |
* ... más pequeño es mejor
| Lenovo V320-17IKB 81AH0002GE i5-7200U, HD Graphics 620, 35 Wh | Acer Aspire E5-774-54HJ i5-7200U, HD Graphics 620, 41 Wh | HP 17-x066ng 6006U, HD Graphics 520, 41.5 Wh | HP Pavilion 17-x110ng i5-7200U, Radeon R7 M440, 41 Wh | |
|---|---|---|---|---|
| Duración de Batería | 6% | 26% | 0% | |
| Reader / Idle (h) | 12.7 | 8.8 -31% | ||
| H.264 (h) | 4.8 | 4.8 0% | ||
| WiFi v1.3 (h) | 5 | 5.3 6% | 6.3 26% | 5.8 16% |
| Load (h) | 1.3 | 1.5 15% |
Pro
Contra
Lenovo ha creado un portátil de oficina de 17,3" que está dirigido principalmente a freelancers y pequeñas empresas. Pero también podría atraer a usuarios privados con su procesador Kaby Lake, que ofrece suficiente potencia de procesamiento para todas las áreas de aplicación. El dispositivo apenas se calienta y normalmente funciona en silencio.
El Lenovo V320-17IKB es un portátil de oficina bien hecho de 17,3", adecuado para trabajar en casa.
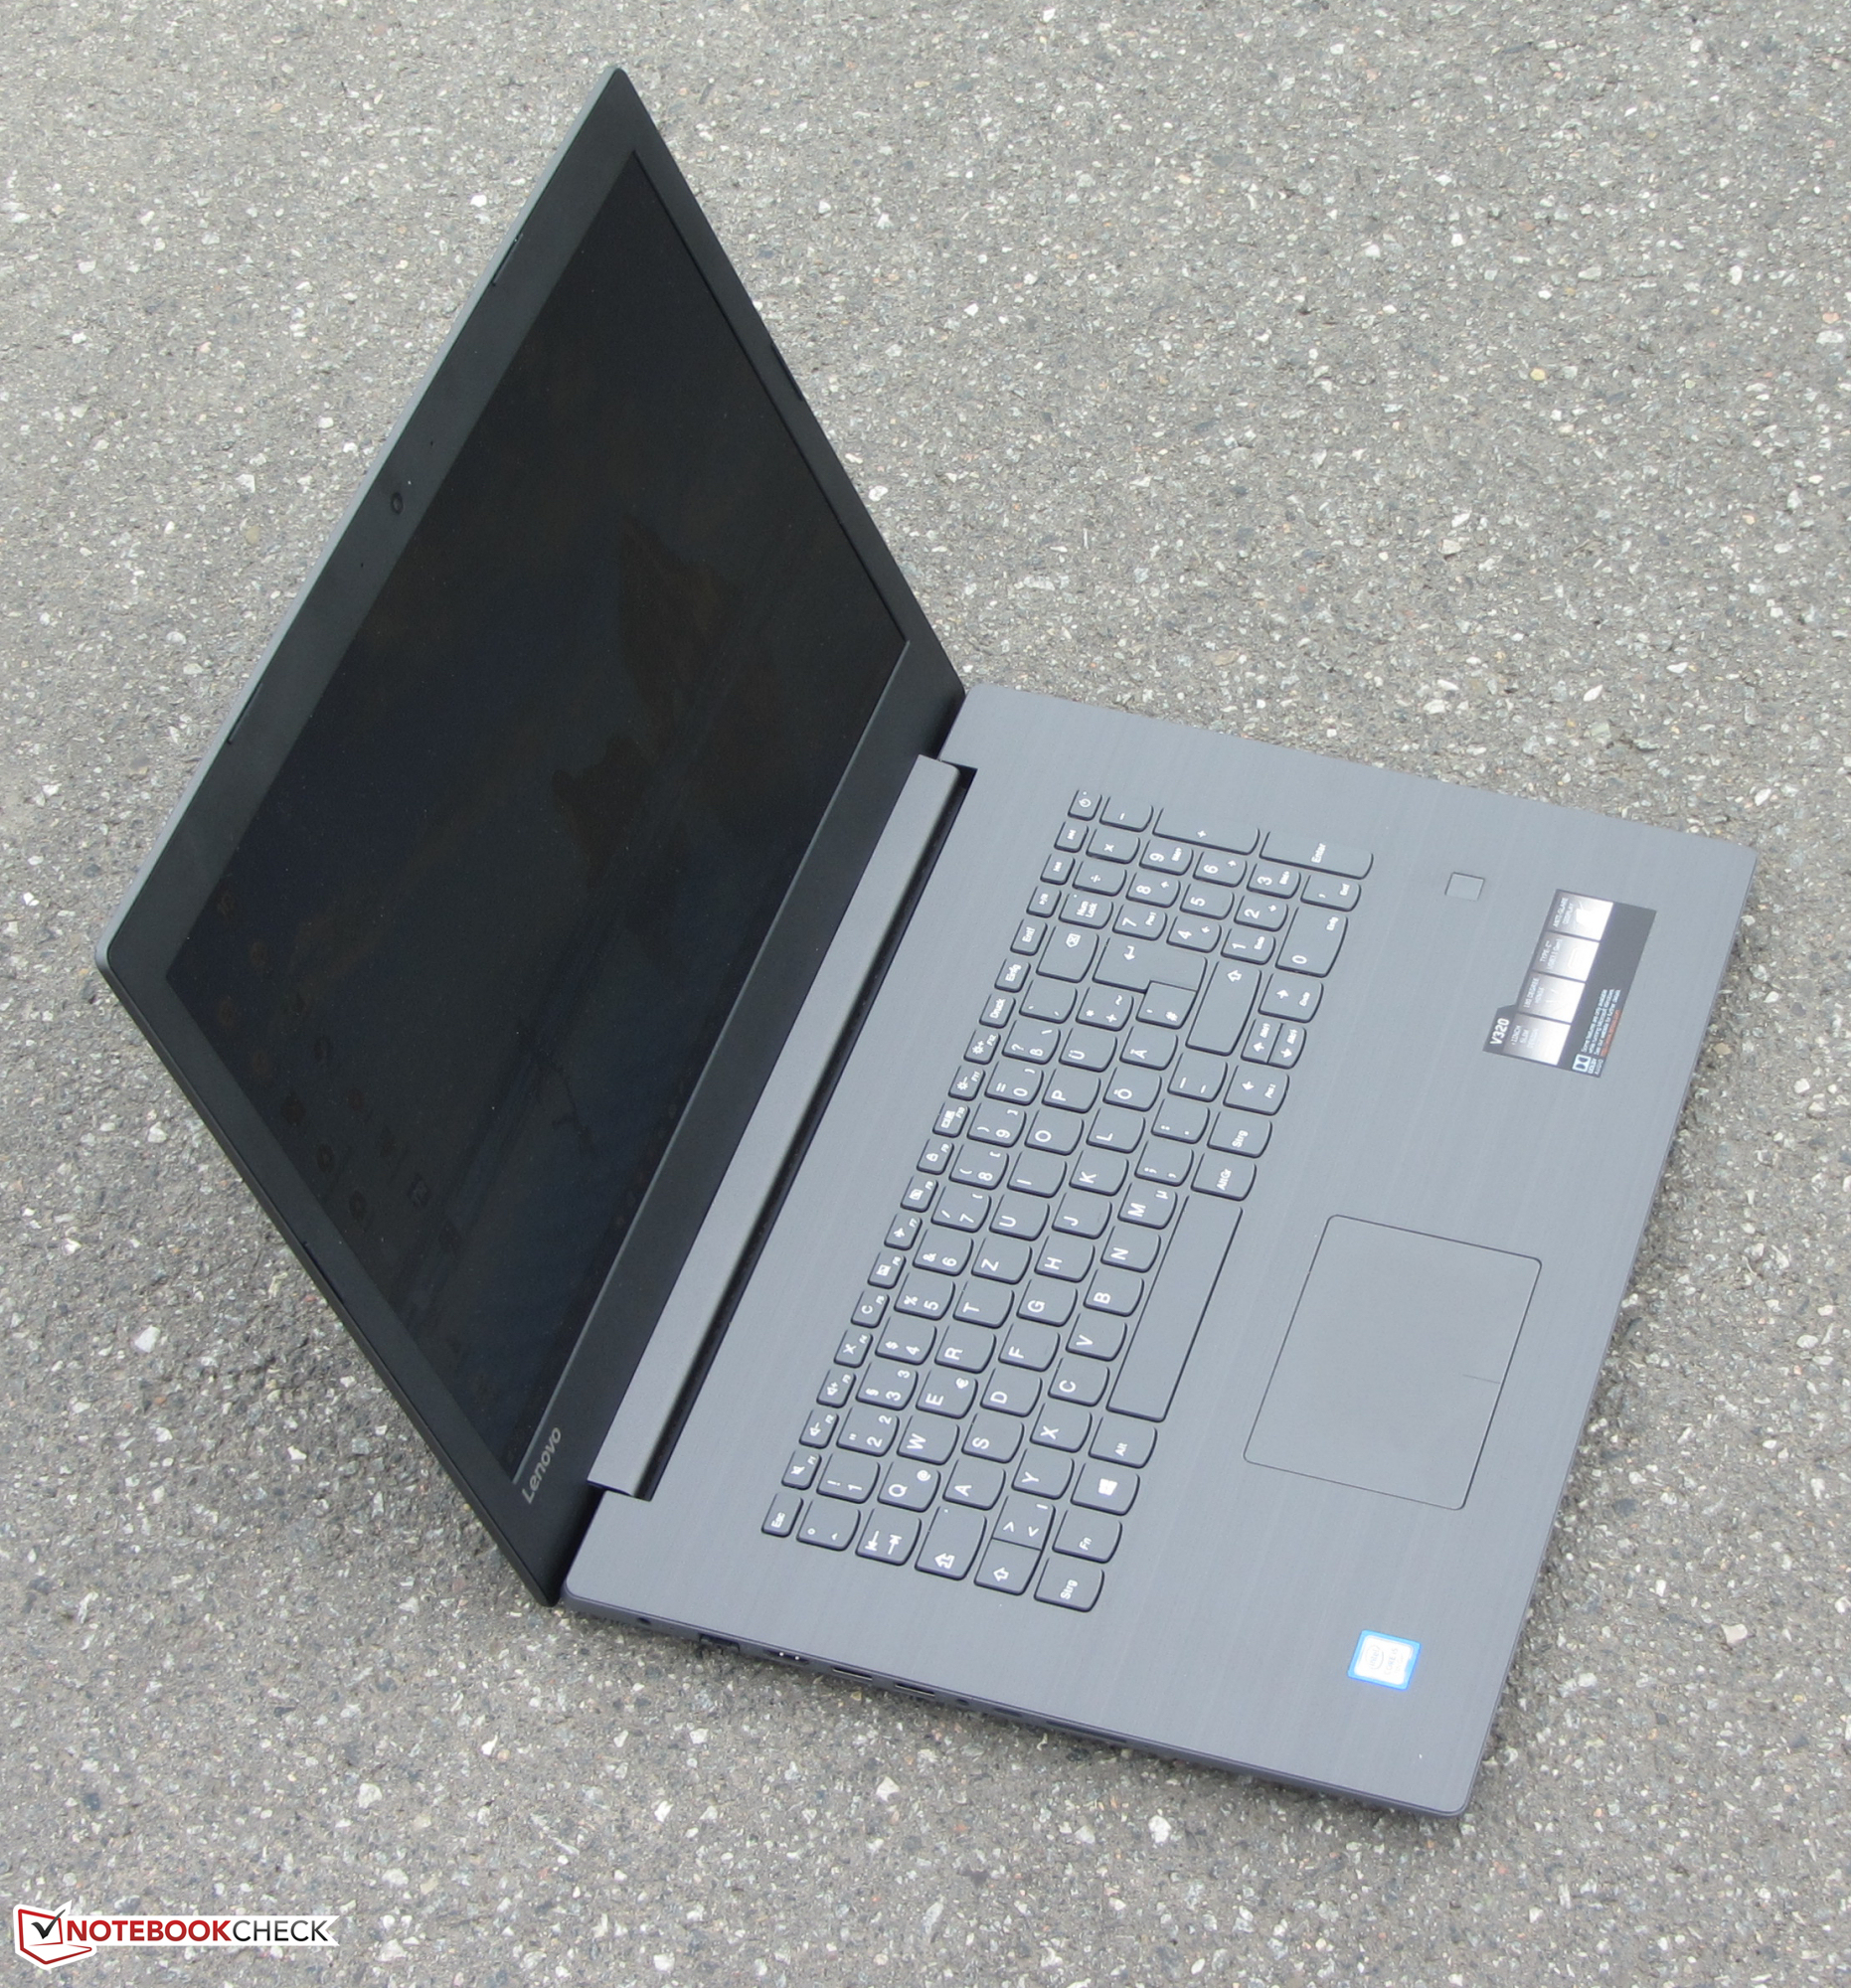
El dispositivo está equipado con un disco de estado sólido rápido, que permite un rendimiento rápido del sistema. Es posible cambiar el SSD, aunque se tendría que abrir la carcasa, ya que el dispositivo no dispone de una escotilla de mantenimiento.
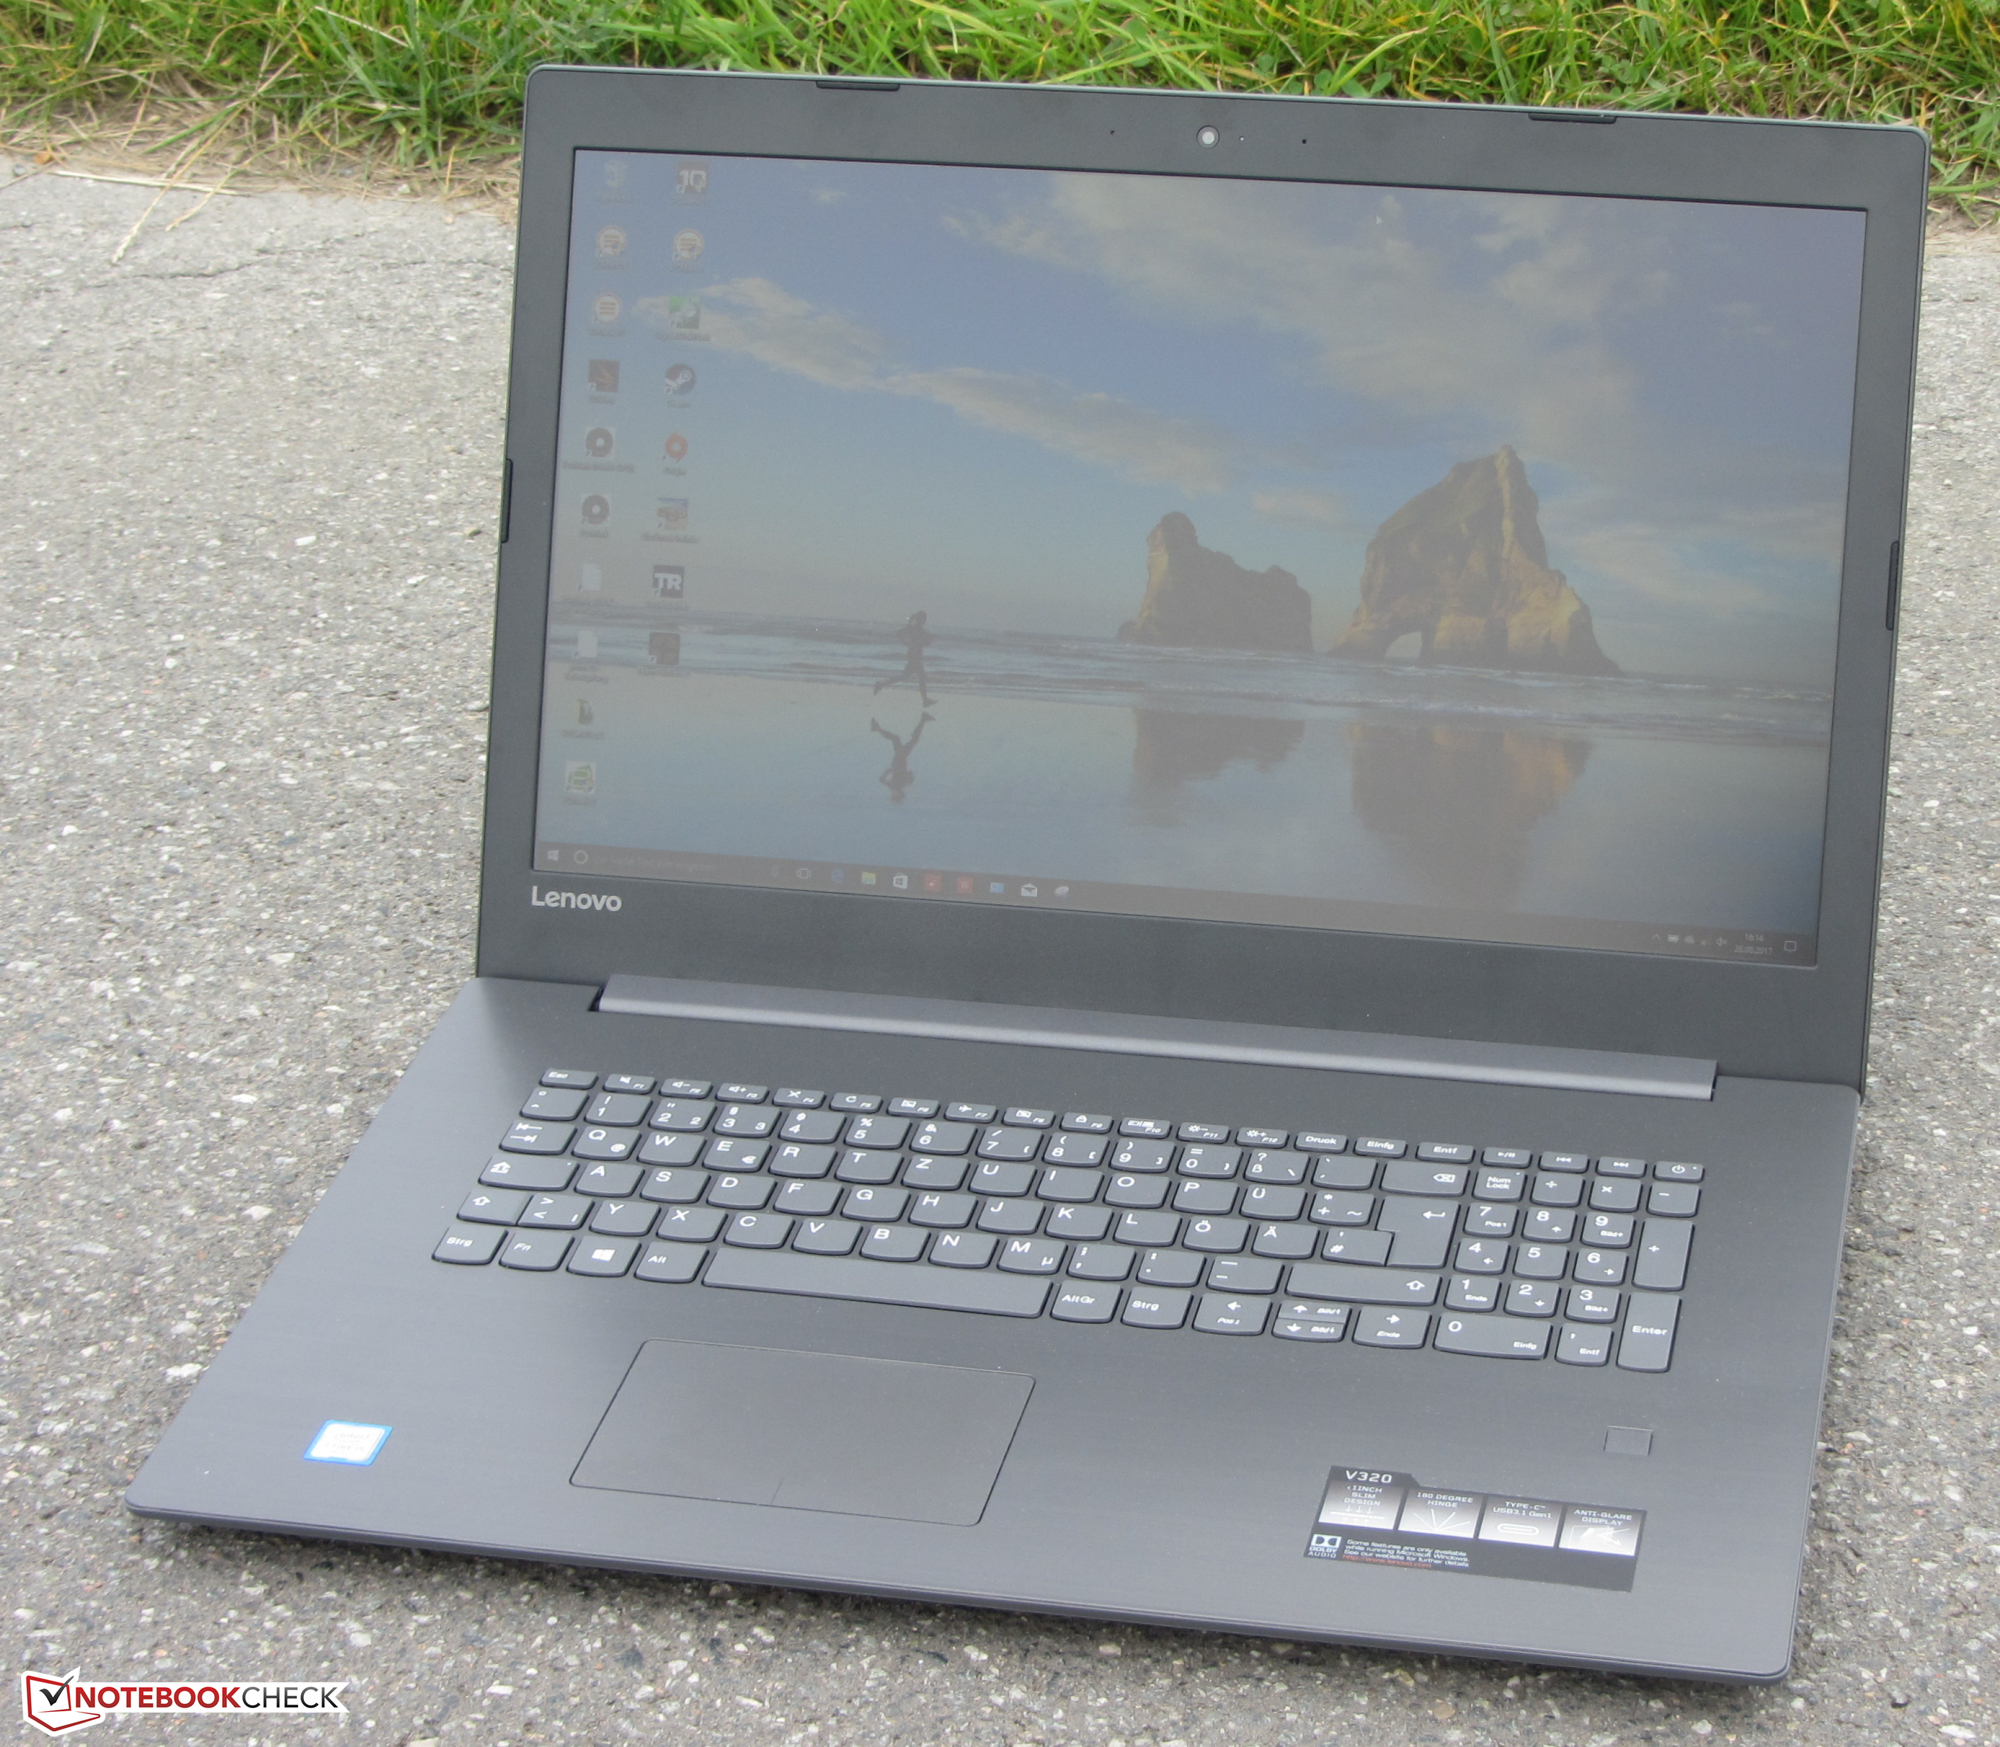
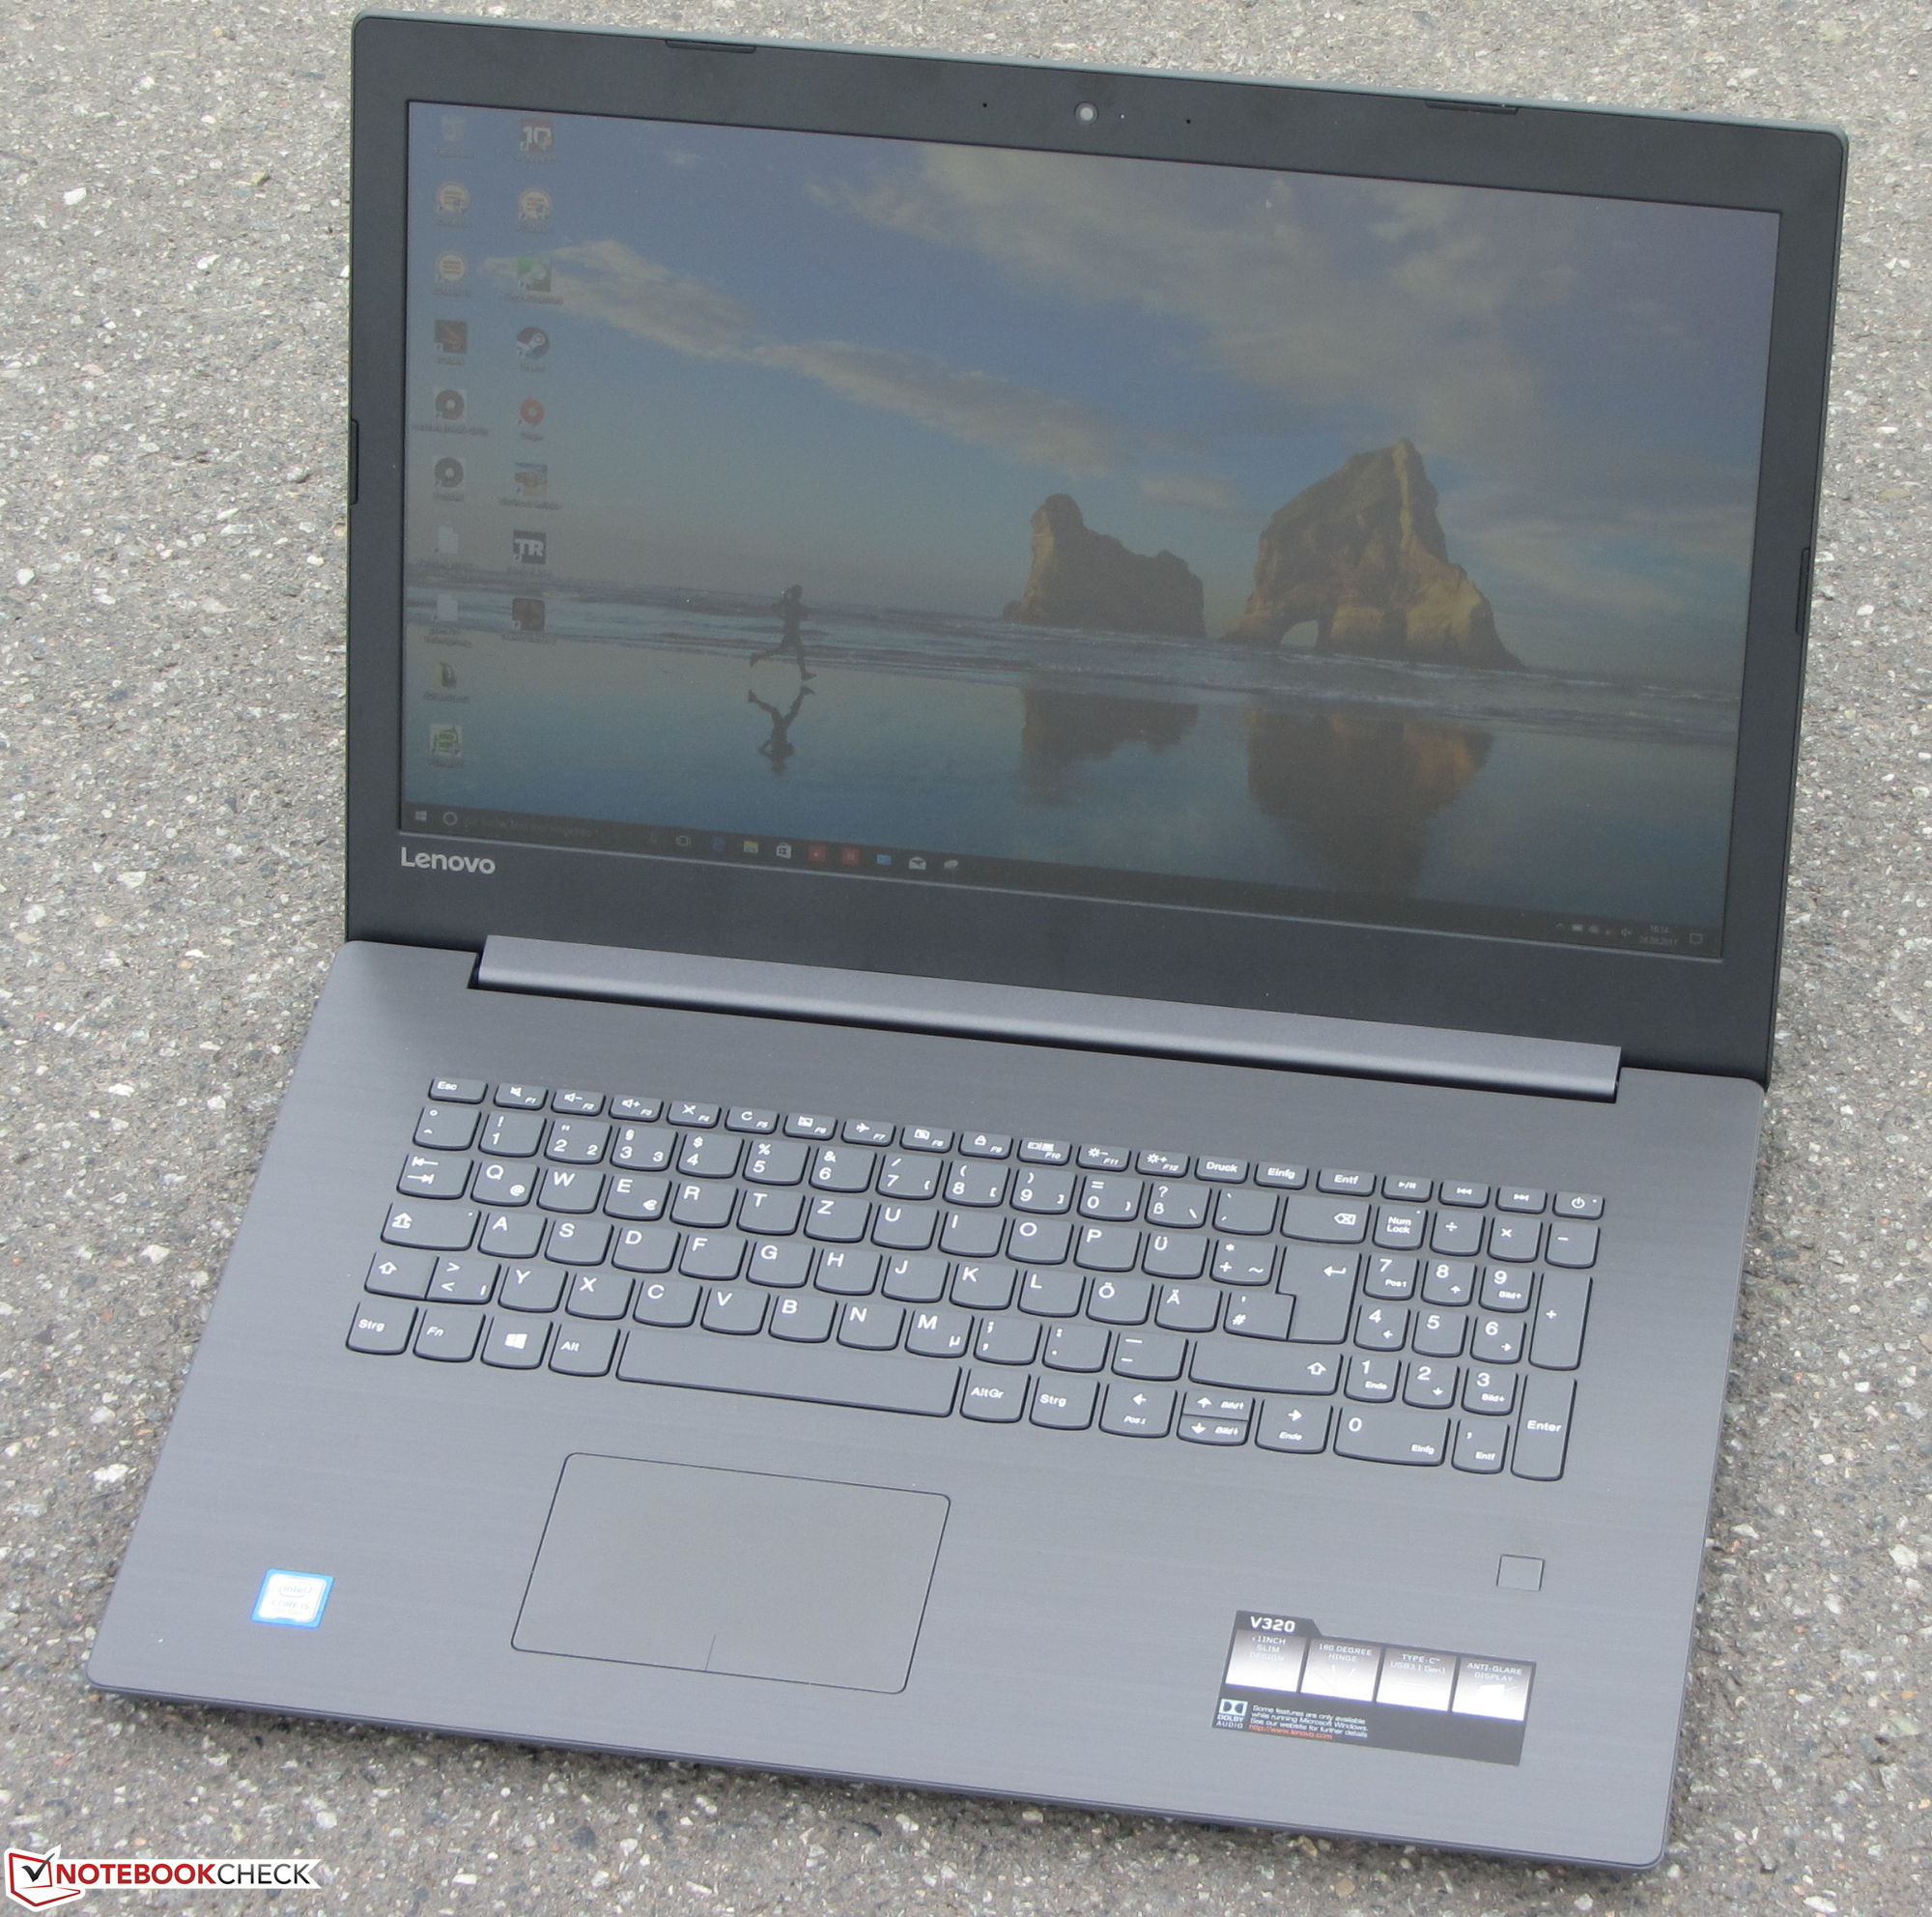
La pantalla es sorprendentemente buena: el modelo IPS mate ofrece un alto brillo, un buen ratio de contraste y ángulos de visión estables. Hemos visto peores pantallas en dispositivos comparables.
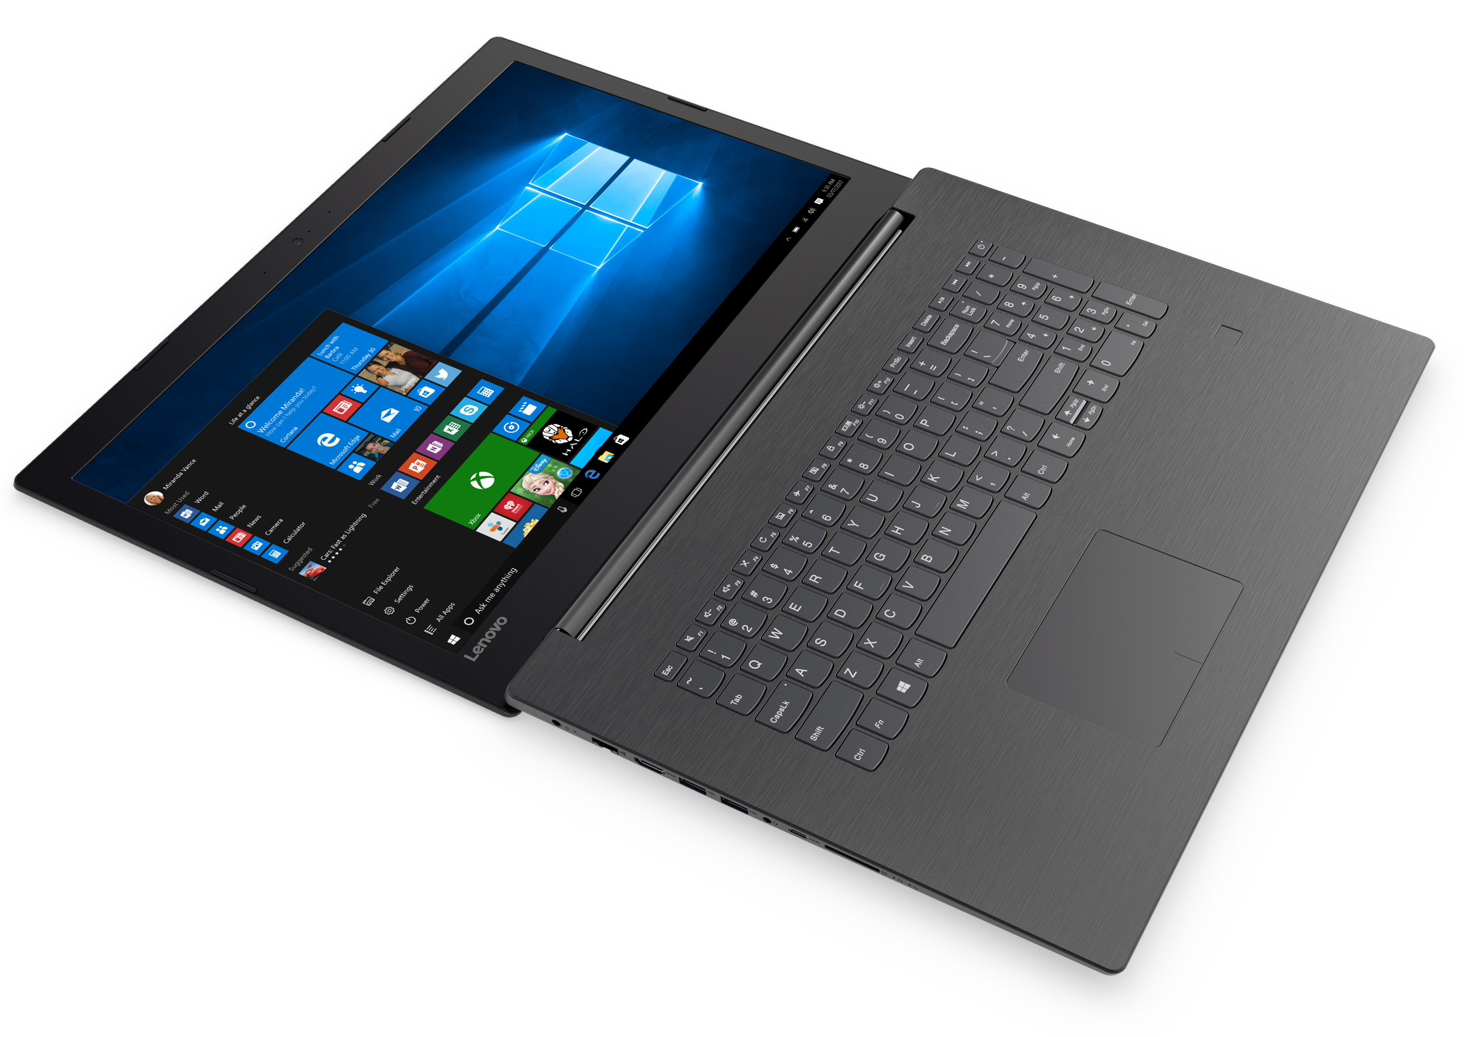
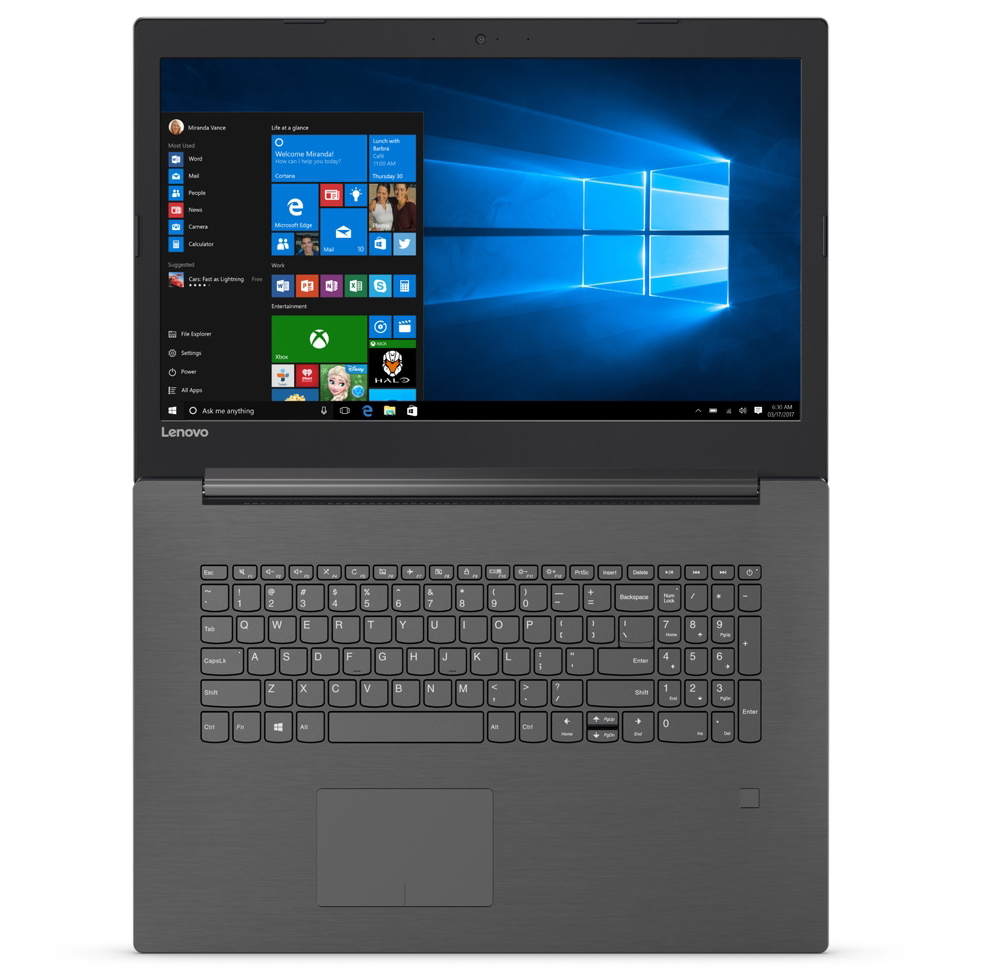
El teclado nos dio una impresión muy buena y es adecuado para mecanografiar. Sin embargo, nos perdimos la retroiluminación del teclado. Esto debe ser obligatorio para un portátil de oficina de este rango de precios. El precio comparativamente alto de alrededor de 720 € se debe al sistema operativo Windows 10 Pro con el que viene. Los usuarios que podrían prescindir de la versión Pro podrían encontrar una opción más barata entre la serie Ideabad V320 17IKB con la misma versión.
Sólo había una cosa que criticar: la garantía de un año. La norma hoy en día sería de dos años, pero afortunadamente no es demasiado caro ampliar la garantía de este dispositivo Lenovo.
Ésta es una versión acortada del análisis original. Puedes leer el análisis completo en inglés aquí.
Lenovo V320-17IKB 81AH0002GE
- 09/04/2017 v6 (old)
Sascha Mölck