Breve análisis del portátil HP 17-y044ng
| SD Card Reader | |
| average JPG Copy Test (av. of 3 runs) | |
| Acer Aspire E5-774-54HJ | |
| HP 17-y044ng | |
| Lenovo Ideapad 110-17IKB 80VK0001GE | |
| HP Pavilion 17-x110ng | |
| Dell Inspiron 17 5759-5118 | |
| maximum AS SSD Seq Read Test (1GB) | |
| Acer Aspire E5-774-54HJ | |
| HP 17-y044ng | |
| Lenovo Ideapad 110-17IKB 80VK0001GE | |
| Dell Inspiron 17 5759-5118 | |
| HP Pavilion 17-x110ng | |
| Networking | |
| iperf3 transmit AX12 | |
| Lenovo Ideapad 110-17IKB 80VK0001GE | |
| HP Pavilion 17-x110ng | |
| HP 17-y044ng (jseb) | |
| iperf3 receive AX12 | |
| Lenovo Ideapad 110-17IKB 80VK0001GE | |
| HP 17-y044ng (jseb) | |
| HP Pavilion 17-x110ng | |
| |||||||||||||||||||||||||
iluminación: 80 %
Brillo con batería: 263 cd/m²
Contraste: 447:1 (Negro: 0.59 cd/m²)
ΔE ColorChecker Calman: 10.58 | ∀{0.5-29.43 Ø4.71}
ΔE Greyscale Calman: 13.13 | ∀{0.09-98 Ø4.96}
74% sRGB (Argyll 1.6.3 3D)
48% AdobeRGB 1998 (Argyll 1.6.3 3D)
52.6% AdobeRGB 1998 (Argyll 3D)
73.8% sRGB (Argyll 3D)
50.9% Display P3 (Argyll 3D)
Gamma: 2.49
CCT: 14044 K
| HP 17-y044ng TN LED, 1600x900, 17.3" | HP Pavilion 17-x110ng IPS, WLED, 1920x1080, 17.3" | Lenovo Ideapad 110-17IKB 80VK0001GE TN LED, 1600x900, 17.3" | Acer Aspire E5-774-54HJ TN LED, 1920x1080, 17.3" | Dell Inspiron 17 5759-5118 TN LED, 1920x1080, 17.3" | |
|---|---|---|---|---|---|
| Display | 21% | -0% | 31% | 28% | |
| Display P3 Coverage (%) | 50.9 | 63.6 25% | 51.1 0% | 71.3 40% | 69.3 36% |
| sRGB Coverage (%) | 73.8 | 86.5 17% | 73.4 -1% | 91.7 24% | 90.6 23% |
| AdobeRGB 1998 Coverage (%) | 52.6 | 63.3 20% | 52.6 0% | 67.1 28% | 66.3 26% |
| Response Times | -13% | -6% | 1% | -52% | |
| Response Time Grey 50% / Grey 80% * (ms) | 43 ? | 41 ? 5% | 50 ? -16% | 42 ? 2% | 86 ? -100% |
| Response Time Black / White * (ms) | 23 ? | 30 ? -30% | 22 ? 4% | 23 ? -0% | 24 ? -4% |
| PWM Frequency (Hz) | 200 ? | 50 ? | 1000 ? | 200 ? | |
| Screen | 28% | 7% | 36% | 25% | |
| Brightness middle (cd/m²) | 264 | 288 9% | 231 -12% | 353 34% | 304 15% |
| Brightness (cd/m²) | 232 | 285 23% | 210 -9% | 320 38% | 292 26% |
| Brightness Distribution (%) | 80 | 88 10% | 83 4% | 82 2% | 84 5% |
| Black Level * (cd/m²) | 0.59 | 0.61 -3% | 0.37 37% | 0.38 36% | 0.37 37% |
| Contrast (:1) | 447 | 472 6% | 624 40% | 929 108% | 822 84% |
| Colorchecker dE 2000 * | 10.58 | 4.56 57% | 9.83 7% | 5.07 52% | 10.62 -0% |
| Colorchecker dE 2000 max. * | 18.96 | 7.76 59% | 18.35 3% | 10.12 47% | |
| Greyscale dE 2000 * | 13.13 | 4.95 62% | 12.46 5% | 13.38 -2% | 11.78 10% |
| Gamma | 2.49 88% | 2.48 89% | 2.43 91% | 2.69 82% | 2.39 92% |
| CCT | 14044 46% | 7669 85% | 13115 50% | 15991 41% | 12997 50% |
| Color Space (Percent of AdobeRGB 1998) (%) | 48 | 48 0% | 60.1 25% | 59 23% | |
| Color Space (Percent of sRGB) (%) | 74 | 93 26% | 73 -1% | 91.6 24% | 90 22% |
| Media total (Programa/Opciones) | 12% /
20% | 0% /
4% | 23% /
31% | 0% /
15% |
* ... más pequeño es mejor
Parpadeo de Pantalla / PWM (Pulse-Width Modulation)
| Parpadeo de Pantalla / PWM no detectado | ||
Comparación: 52 % de todos los dispositivos testados no usaron PWM para atenuar el display. Si se usó, medimos una media de 7757 (mínimo: 5 - máxmo: 343500) Hz. | ||
Tiempos de respuesta del display
| ↔ Tiempo de respuesta de Negro a Blanco | ||
|---|---|---|
| 23 ms ... subida ↗ y bajada ↘ combinada | ↗ 7 ms subida | 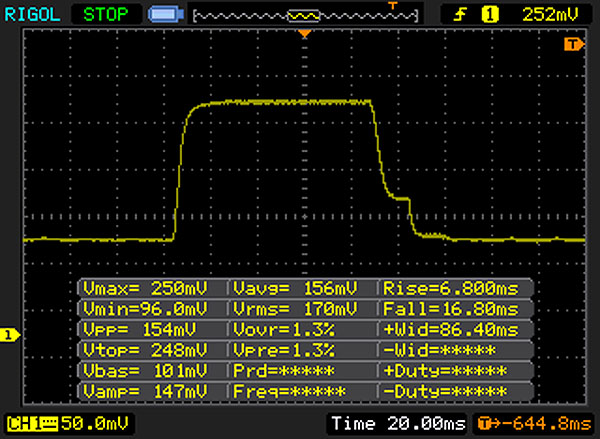 |
| ↘ 16 ms bajada | ||
| La pantalla mostró buenos tiempos de respuesta en nuestros tests pero podría ser demasiado lenta para los jugones competitivos. En comparación, todos los dispositivos de prueba van de ##min### (mínimo) a 240 (máximo) ms. » 52 % de todos los dispositivos son mejores. Eso quiere decir que el tiempo de respuesta es peor que la media (19.8 ms) de todos los dispositivos testados. | ||
| ↔ Tiempo de respuesta 50% Gris a 80% Gris | ||
| 43 ms ... subida ↗ y bajada ↘ combinada | ↗ 21 ms subida | 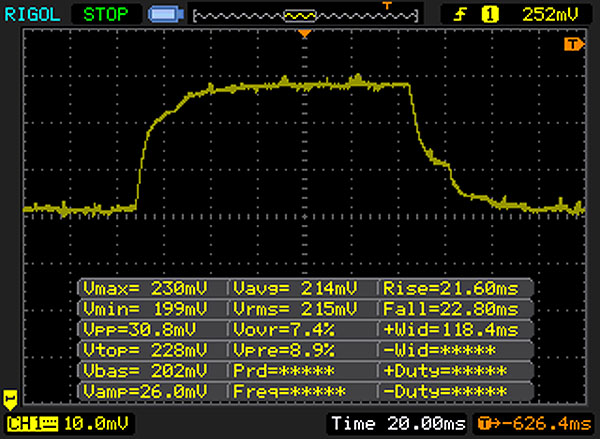 |
| ↘ 22 ms bajada | ||
| La pantalla mostró tiempos de respuesta lentos en nuestros tests y podría ser demasiado lenta para los jugones. En comparación, todos los dispositivos de prueba van de ##min### (mínimo) a 636 (máximo) ms. » 71 % de todos los dispositivos son mejores. Eso quiere decir que el tiempo de respuesta es peor que la media (31 ms) de todos los dispositivos testados. | ||
| Geekbench 3 | |
| 32 Bit Single-Core Score | |
| Lenovo Ideapad 110-17IKB 80VK0001GE | |
| Acer Aspire E5-774-54HJ | |
| Dell Inspiron 17 5759-5118 | |
| HP 17-y044ng | |
| 32 Bit Multi-Core Score | |
| Lenovo Ideapad 110-17IKB 80VK0001GE | |
| Acer Aspire E5-774-54HJ | |
| Dell Inspiron 17 5759-5118 | |
| HP 17-y044ng | |
| Geekbench 4.0 | |
| 64 Bit Single-Core Score | |
| Lenovo Ideapad 110-17IKB 80VK0001GE | |
| Acer Aspire E5-774-54HJ | |
| HP 17-y044ng | |
| 64 Bit Multi-Core Score | |
| Lenovo Ideapad 110-17IKB 80VK0001GE | |
| Acer Aspire E5-774-54HJ | |
| HP 17-y044ng | |
| JetStream 1.1 - 1.1 Total | |
| Lenovo Ideapad 110-17IKB 80VK0001GE | |
| HP Pavilion 17-x110ng | |
| Acer Aspire E5-774-54HJ | |
| Dell Inspiron 17 5759-5118 | |
| HP 17-y044ng | |
| PCMark 8 Home Score Accelerated v2 | 2754 puntos | |
ayuda | ||
| PCMark 8 - Home Score Accelerated v2 | |
| Lenovo Ideapad 110-17IKB 80VK0001GE | |
| Dell Inspiron 17 5759-5118 | |
| HP Pavilion 17-x110ng | |
| Acer Aspire E5-774-54HJ | |
| HP 17-y044ng | |
| Acer Aspire ES1-731G-P5UR | |

| HP 17-y044ng WDC Scorpio Blue WD10JPVX-75JC3T0 | HP Pavilion 17-x110ng SanDisk Z400s SD8SNAT-256G | Lenovo Ideapad 110-17IKB 80VK0001GE WDC Scorpio Blue WD10JPCX-24UE4T0 | Acer Aspire E5-774-54HJ Western Digital Scorpio Blue WD5000LPCX-24C6HT0 | Acer Aspire ES1-731G-P5UR Toshiba MQ01ABD100 | Dell Inspiron 17 5759-5118 Seagate Momentus SpinPoint M8 ST1000LM024 HN-M101MBB | |
|---|---|---|---|---|---|---|
| CrystalDiskMark 3.0 | 7160% | 38% | 18% | 4% | -12% | |
| Read Seq (MB/s) | 105.5 | 500 374% | 110.3 5% | 88.9 -16% | 105 0% | 91.8 -13% |
| Write Seq (MB/s) | 102 | 325.1 219% | 109 7% | 70.9 -30% | 96 -6% | 84.7 -17% |
| Read 512 (MB/s) | 19.17 | 290.2 1414% | 39.19 104% | 33.01 72% | 32.89 72% | 26.59 39% |
| Write 512 (MB/s) | 28.27 | 300.3 962% | 52.9 87% | 51.6 83% | 25.77 -9% | 32.7 16% |
| Read 4k (MB/s) | 0.328 | 11.24 3327% | 0.45 37% | 0.381 16% | 0.324 -1% | 0.288 -12% |
| Write 4k (MB/s) | 1.013 | 86 8390% | 1.201 19% | 1.117 10% | 0.755 -25% | 0.638 -37% |
| Read 4k QD32 (MB/s) | 0.891 | 145.4 16219% | 1.079 21% | 0.891 0% | 0.892 0% | 0.59 -34% |
| Write 4k QD32 (MB/s) | 1.03 | 272.7 26376% | 1.234 20% | 1.13 10% | 1 -3% | 0.642 -38% |
| 3DMark 11 Performance | 1913 puntos | |
ayuda | ||
| bajo | medio | alto | ultra | |
|---|---|---|---|---|
| The Elder Scrolls V: Skyrim (2011) | 36.2 | 25.9 | 18.8 | |
| BioShock Infinite (2013) | 63.9 | 32.7 | 25.5 | |
| Middle-earth: Shadow of Mordor (2014) | 34.6 | 18.3 | ||
| F1 2014 (2014) | 54 | 34 | ||
| Dragon Age: Inquisition (2014) | 25.7 | 18.2 | ||
| Battlefield Hardline (2015) | 22.8 | 12.8 | ||
| GTA V (2015) | 38 | 35.2 | ||
| Metal Gear Solid V (2015) | 46.1 | 30 | ||
| Anno 2205 (2015) | 17.4 | 11 | ||
| Rainbow Six Siege (2015) | 36.3 | 24.3 | ||
| XCOM 2 (2016) | 15.9 | 6.1 | ||
| Far Cry Primal (2016) | 13 | 8 | ||
| The Division (2016) | 19.6 | 11.5 | ||
| Need for Speed 2016 (2016) | 18.6 | 15 | ||
| Mirror's Edge Catalyst (2016) | 21.1 | 13.6 | ||
| Deus Ex Mankind Divided (2016) | 13.9 | 10.1 | ||
| Battlefield 1 (2016) | 16.5 | 12.1 | ||
| Civilization 6 (2016) | 30.5 | 13.9 | ||
| Farming Simulator 17 (2016) | 60.3 | 38.4 | ||
| Titanfall 2 (2016) | 27.9 | 23.4 | ||
| Resident Evil 7 (2017) | 38.8 | 29.1 |
Ruido
| Ocioso |
| 32 / 32 / 32 dB(A) |
| HDD |
| 33.4 dB(A) |
| DVD |
| 36.3 / dB(A) |
| Carga |
| 35.6 / 34.8 dB(A) |
 | ||
30 dB silencioso 40 dB(A) audible 50 dB(A) ruidosamente alto |
||
min: | ||
(+) La temperatura máxima en la parte superior es de 33.9 °C / 93 F, frente a la media de 34.3 °C / 94 F, que oscila entre 21.2 y 62.5 °C para la clase Office.
(±) El fondo se calienta hasta un máximo de 40.1 °C / 104 F, frente a la media de 36.8 °C / 98 F
(+) En reposo, la temperatura media de la parte superior es de 26 °C / 79# F, frente a la media del dispositivo de 29.5 °C / 85 F.
(+) Los reposamanos y el panel táctil alcanzan como máximo la temperatura de la piel (33.9 °C / 93 F) y, por tanto, no están calientes.
(-) La temperatura media de la zona del reposamanos de dispositivos similares fue de 27.5 °C / 81.5 F (-6.4 °C / -11.5 F).
HP 17-y044ng análisis de audio
(-) | altavoces no muy altos (#69 dB)
Graves 100 - 315 Hz
(±) | lubina reducida - en promedio 13.6% inferior a la mediana
(+) | el bajo es lineal (6.4% delta a la frecuencia anterior)
Medios 400 - 2000 Hz
(+) | medios equilibrados - a sólo 2.7% de la mediana
(+) | los medios son lineales (6.1% delta a la frecuencia anterior)
Altos 2 - 16 kHz
(+) | máximos equilibrados - a sólo 4.8% de la mediana
(+) | los máximos son lineales (6.8% delta a la frecuencia anterior)
Total 100 - 16.000 Hz
(±) | la linealidad del sonido global es media (16.4% de diferencia con la mediana)
En comparación con la misma clase
» 20% de todos los dispositivos probados de esta clase eran mejores, 6% similares, 73% peores
» El mejor tuvo un delta de 7%, la media fue 21%, el peor fue ###max##%
En comparación con todos los dispositivos probados
» 27% de todos los dispositivos probados eran mejores, 6% similares, 67% peores
» El mejor tuvo un delta de 4%, la media fue 23%, el peor fue ###max##%
Apple MacBook 12 (Early 2016) 1.1 GHz análisis de audio
(+) | los altavoces pueden reproducir a un volumen relativamente alto (#83.6 dB)
Graves 100 - 315 Hz
(±) | lubina reducida - en promedio 11.3% inferior a la mediana
(±) | la linealidad de los graves es media (14.2% delta a frecuencia anterior)
Medios 400 - 2000 Hz
(+) | medios equilibrados - a sólo 2.4% de la mediana
(+) | los medios son lineales (5.5% delta a la frecuencia anterior)
Altos 2 - 16 kHz
(+) | máximos equilibrados - a sólo 2% de la mediana
(+) | los máximos son lineales (4.5% delta a la frecuencia anterior)
Total 100 - 16.000 Hz
(+) | el sonido global es lineal (10.2% de diferencia con la mediana)
En comparación con la misma clase
» 7% de todos los dispositivos probados de esta clase eran mejores, 2% similares, 90% peores
» El mejor tuvo un delta de 5%, la media fue 18%, el peor fue ###max##%
En comparación con todos los dispositivos probados
» 5% de todos los dispositivos probados eran mejores, 1% similares, 94% peores
» El mejor tuvo un delta de 4%, la media fue 23%, el peor fue ###max##%
| Off / Standby | |
| Ocioso | |
| Carga |
|
Clave:
min: | |
Pro
Contra
La potencia de proceso de la APU AMD es más que suficiente para aplicaciones web y de oficina. El portátil apenas se calienta y puede, al menos en reposo, funcionar en silencio. No te quedarás sin espacio de almacenamiento gracias a la unidad de disco de 1 TB. Reemplazar el HDD con un SSD es posible, pero esto requiere abrir la carcasa porque el portátil no tiene ranura de mantenimiento. El teclado incluido es más que adecuado para uso doméstico. La duración de batería no es destacable, pero es correcta para un dispositivo de 17.3 pulgadas. La pantalla mate ofrece poco brillo, bajo contraste y malos ángulos de visualización.
Con el 17-y044ng, HP ofrece un decente portátil de 17.3 pulgadas para uso doméstico. Sin embargo, tiene una gran cantidad de aspectos mejorables.
Además de los inconvenientes más obvios, hay otros que no se aprecian a primera vista: por ejemplo, HP ofrece solo un año de garantía; muchos modelos rivales vienen con dos años de garantía. Además, el chip WLAN integrado no soporta el estandar AC. HP también a ahorrado en la conectividad Ethernet: solo se ofrece Fast Ethernet. Además no tiene USB Type-C.
El HP 17 cuesta 500 euros. Por este precio tendrá difícil encontrar compradores, ya que la competencía ofrece más por el mismo precio. El Acer Aspire E5-774 es un ejemplo. El modelo que probamos ofrecía un procesador más potente (Core i5-7200U) un panel Full HD más brillante, USB Type-C, Ethernet Gigabit, una cubierta de mantenimiento y una ranura M.2. Todo por 550 euros que es solo ligeramente más caro que el HP 17.
Ésta es una versión acortada del análisis original. Puedes leer el análisis completo en inglés aquí.
HP 17-y044ng
- 02/01/2017 v6 (old)
Sascha Mölck