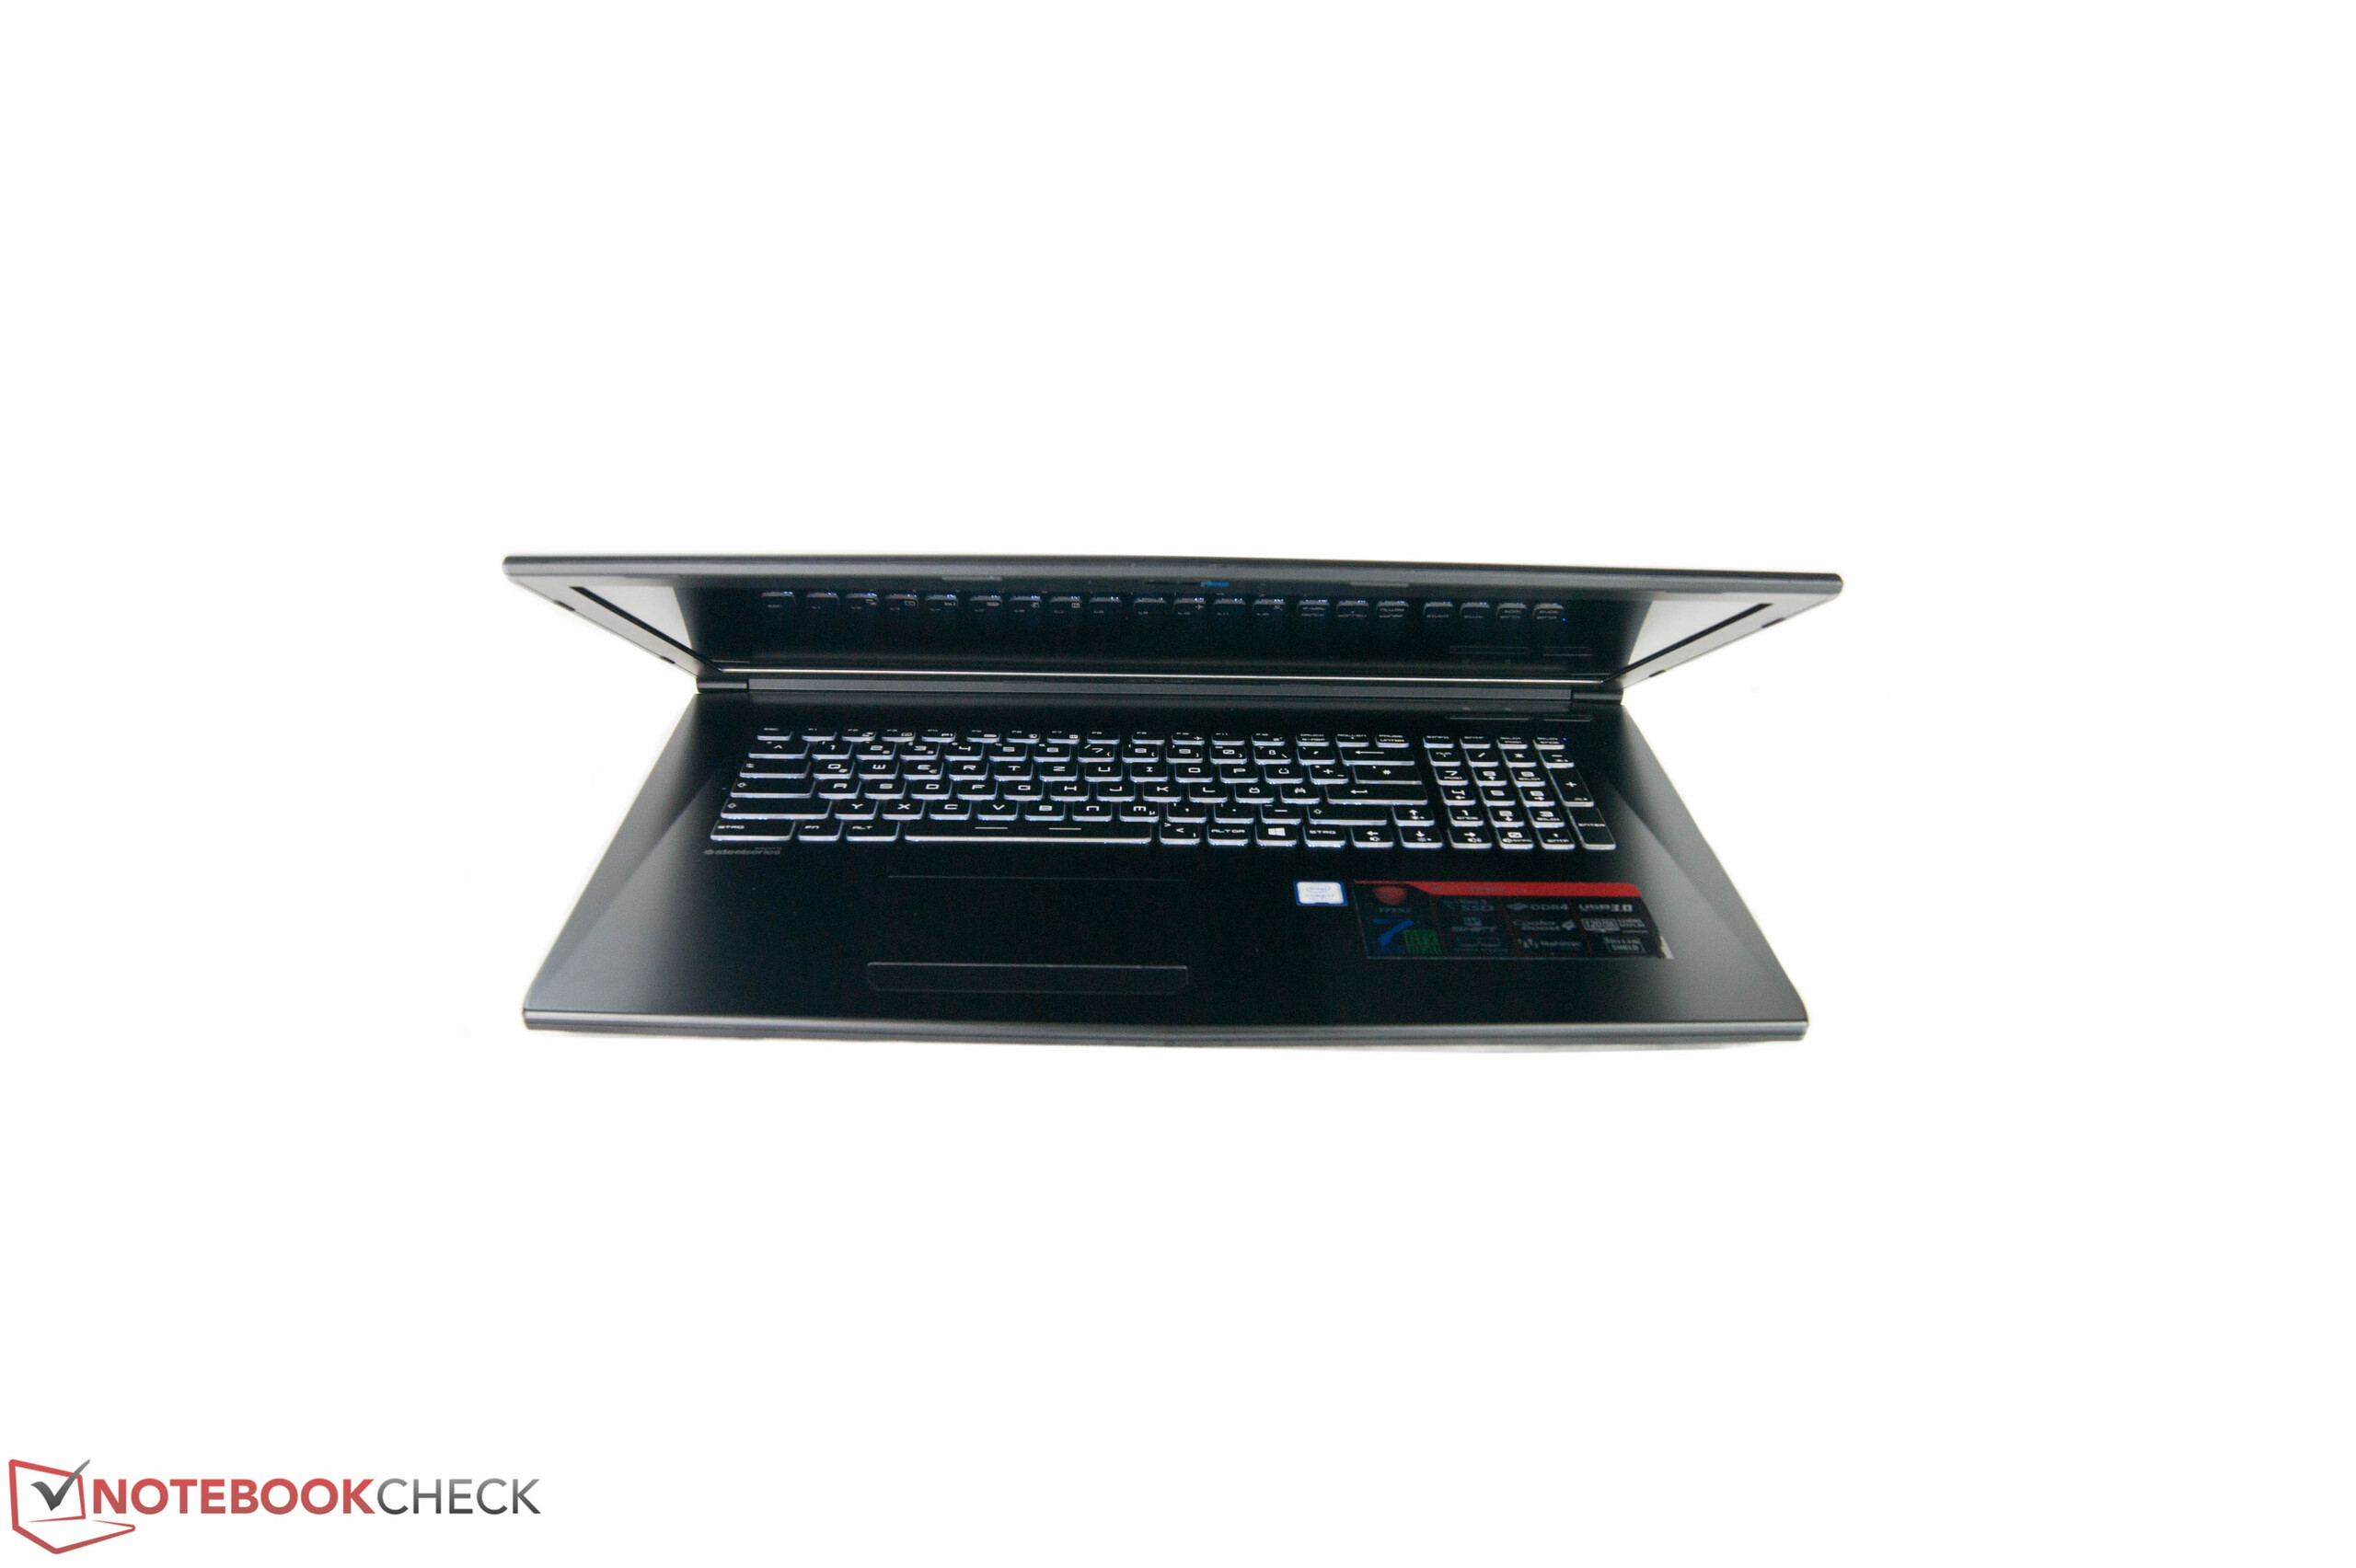
Breve análisis del portátil MSI GL72 7RD-028 (Core i7, Full HD)

| SD Card Reader | |
| average JPG Copy Test (av. of 3 runs) | |
| Nexoc G739 | |
| Asus GL753VE-DS74 | |
| MSI GE72 7RE-046 | |
| Acer Aspire Nitro BE VN7-793G-5811 | |
| MSI GL72 7RDX-602 | |
| maximum AS SSD Seq Read Test (1GB) | |
| Asus GL753VE-DS74 | |
| Nexoc G739 | |
| MSI GE72 7RE-046 | |
| Acer Aspire Nitro BE VN7-793G-5811 | |
| MSI GL72 7RDX-602 | |
| Networking | |
| iperf3 transmit AX12 | |
| Acer Aspire Nitro BE VN7-793G-5811 | |
| Asus GL753VE-DS74 | |
| Nexoc G739 | |
| MSI GL72 7RDX-602 | |
| MSI GE72 7RE-046 | |
| iperf3 receive AX12 | |
| Asus GL753VE-DS74 | |
| Acer Aspire Nitro BE VN7-793G-5811 | |
| Nexoc G739 | |
| MSI GE72 7RE-046 | |
| MSI GL72 7RDX-602 | |
| |||||||||||||||||||||||||
iluminación: 80 %
Brillo con batería: 300 cd/m²
Contraste: 1196:1 (Negro: 0.25 cd/m²)
ΔE ColorChecker Calman: 12.92 | ∀{0.5-29.43 Ø4.72}
ΔE Greyscale Calman: 13.16 | ∀{0.09-98 Ø4.97}
94% sRGB (Argyll 1.6.3 3D)
60% AdobeRGB 1998 (Argyll 1.6.3 3D)
65.6% AdobeRGB 1998 (Argyll 3D)
94.3% sRGB (Argyll 3D)
65.2% Display P3 (Argyll 3D)
Gamma: 2.36
CCT: 15046 K
| MSI GL72 7RDX-602 Chi Mei CMN1735 N173HGE-E11, , 1920x1080, 17.3" | Acer Aspire Nitro BE VN7-793G-5811 AU Optronics, , 1920x1080, 17.3" | Nexoc G739 CMN1738, , 1920x1080, 17.3" | Asus GL753VE-DS74 LG Philips LP173WF4-SPF3, , 1920x1080, 17.3" | MSI GE72 7RE-046 N173HHE-G32 (CMN1747), , 1920x1080, 17.3" | MSI GL72 6QF 1920x1080, 17.3" | |
|---|---|---|---|---|---|---|
| Display | -5% | 0% | 25% | 1% | ||
| Display P3 Coverage (%) | 65.2 | 63.1 -3% | 66.7 2% | 90.7 39% | 65.9 1% | |
| sRGB Coverage (%) | 94.3 | 86.5 -8% | 91 -3% | 99.9 6% | 95.6 1% | |
| AdobeRGB 1998 Coverage (%) | 65.6 | 63.3 -4% | 66.4 1% | 85.2 30% | 66.7 2% | |
| Response Times | -18% | -32% | -5% | 36% | -28% | |
| Response Time Grey 50% / Grey 80% * (ms) | 29 ? | 38 ? -31% | 45 ? -55% | 36 ? -24% | 27 ? 7% | 45.6 ? -57% |
| Response Time Black / White * (ms) | 26 ? | 27 ? -4% | 28 ? -8% | 22 ? 15% | 9 ? 65% | 25.6 ? 2% |
| PWM Frequency (Hz) | 961 | 450 ? | 980 ? | |||
| Screen | 12% | 23% | 19% | 16% | -7% | |
| Brightness middle (cd/m²) | 299 | 301 1% | 312 4% | 366 22% | 253 -15% | 194.7 -35% |
| Brightness (cd/m²) | 274 | 270 -1% | 304 11% | 348 27% | 230 -16% | 183 -33% |
| Brightness Distribution (%) | 80 | 79 -1% | 85 6% | 90 13% | 86 8% | 79 -1% |
| Black Level * (cd/m²) | 0.25 | 0.38 -52% | 0.23 8% | 0.35 -40% | 0.24 4% | 0.247 1% |
| Contrast (:1) | 1196 | 792 -34% | 1357 13% | 1046 -13% | 1054 -12% | 788 -34% |
| Colorchecker dE 2000 * | 12.92 | 3.49 73% | 4.19 68% | 4.4 66% | 5.01 61% | 11.44 11% |
| Colorchecker dE 2000 max. * | 19.91 | 7.49 62% | 8.7 56% | 9.7 51% | 10.4 48% | 18.78 6% |
| Greyscale dE 2000 * | 13.16 | 1.88 86% | 3.72 72% | 3 77% | 7.26 45% | 11.36 14% |
| Gamma | 2.36 93% | 2.35 94% | 2.29 96% | 2.1 105% | 2.09 105% | 2.12 104% |
| CCT | 15046 43% | 6587 99% | 7104 91% | 6362 102% | 6329 103% | 12948 50% |
| Color Space (Percent of AdobeRGB 1998) (%) | 60 | 56 -7% | 59 -2% | 56 -7% | 76 27% | 60.8 1% |
| Color Space (Percent of sRGB) (%) | 94 | 86 -9% | 91 -3% | 86 -9% | 100 6% | 95.3 1% |
| Media total (Programa/Opciones) | -4% /
5% | -3% /
11% | 7% /
15% | 26% /
20% | -11% /
-8% |
* ... más pequeño es mejor
Tiempos de respuesta del display
| ↔ Tiempo de respuesta de Negro a Blanco | ||
|---|---|---|
| 26 ms ... subida ↗ y bajada ↘ combinada | ↗ 21 ms subida | 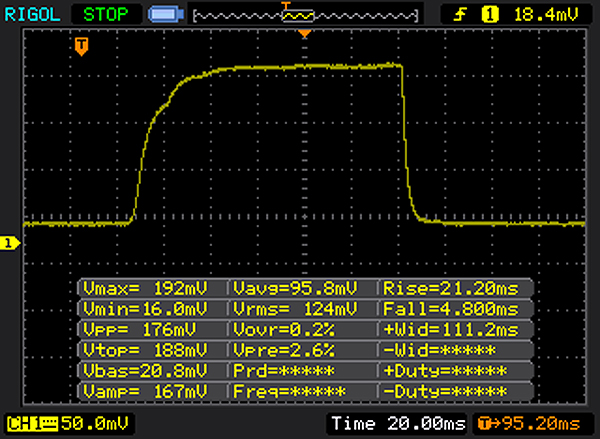 |
| ↘ 5 ms bajada | ||
| La pantalla mostró tiempos de respuesta relativamente lentos en nuestros tests pero podría ser demasiado lenta para los jugones. En comparación, todos los dispositivos de prueba van de ##min### (mínimo) a 240 (máximo) ms. » 63 % de todos los dispositivos son mejores. Eso quiere decir que el tiempo de respuesta es peor que la media (19.8 ms) de todos los dispositivos testados. | ||
| ↔ Tiempo de respuesta 50% Gris a 80% Gris | ||
| 29 ms ... subida ↗ y bajada ↘ combinada | ↗ 14 ms subida | 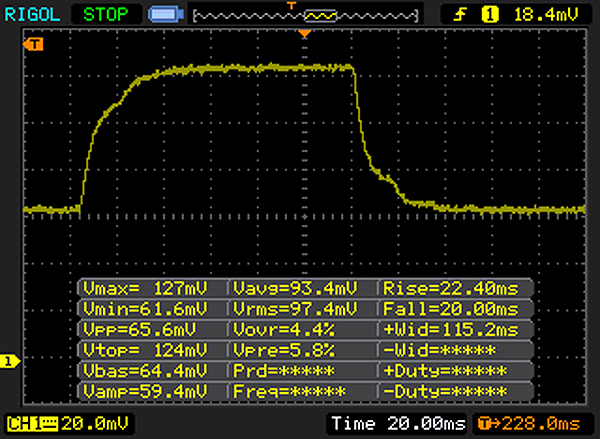 |
| ↘ 15 ms bajada | ||
| La pantalla mostró tiempos de respuesta relativamente lentos en nuestros tests pero podría ser demasiado lenta para los jugones. En comparación, todos los dispositivos de prueba van de ##min### (mínimo) a 636 (máximo) ms. » 39 % de todos los dispositivos son mejores. Eso quiere decir que el tiempo de respuesta es similar al dispositivo testado medio (31 ms). | ||
Parpadeo de Pantalla / PWM (Pulse-Width Modulation)
| Parpadeo de Pantalla / PWM detectado | 961 Hz | 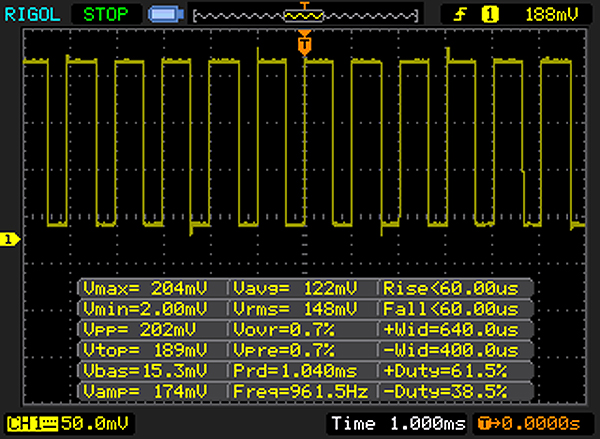 | |
La retroiluminación del display parpadea a 961 Hz (seguramente usa PWM - Pulse-Width Modulation) . La frecuencia de 961 Hz es bastante alta, por lo que la mayoría de gente sensible al parpadeo no debería ver parpadeo o tener fatiga visual. Comparación: 52 % de todos los dispositivos testados no usaron PWM para atenuar el display. Si se usó, medimos una media de 7750 (mínimo: 5 - máxmo: 343500) Hz. | |||
| PCMark 8 | |
| Home Score Accelerated v2 | |
| Nexoc G739 | |
| MSI GL72 6QF | |
| Acer Aspire Nitro BE VN7-793G-5811 | |
| Asus GL753VE-DS74 | |
| MSI GL72 7RDX-602 | |
| Work Score Accelerated v2 | |
| Nexoc G739 | |
| Asus GL753VE-DS74 | |
| MSI GL72 6QF | |
| MSI GL72 7RDX-602 | |
| Acer Aspire Nitro BE VN7-793G-5811 | |
| PCMark 8 Home Score Accelerated v2 | 3220 puntos | |
| PCMark 8 Creative Score Accelerated v2 | 3553 puntos | |
| PCMark 8 Work Score Accelerated v2 | 4735 puntos | |
ayuda | ||
| MSI GL72 7RDX-602 HGST Travelstar 7K1000 HTS721010A9E630 | Acer Aspire Nitro BE VN7-793G-5811 Seagate Mobile HDD 1TB ST1000LM035 | Nexoc G739 Samsung PM961 MZVLW256HEHP | Asus GL753VE-DS74 Intel SSD 600p SSDPEKKW512G7 | MSI GL72 6QF Samsung SSD 950 Pro 256GB m.2 NVMe | |
|---|---|---|---|---|---|
| CrystalDiskMark 3.0 | 67% | 17392% | 5607% | 14630% | |
| Read Seq (MB/s) | 135.3 | 117.6 -13% | 1666 1131% | 1049 675% | 2217 1539% |
| Write Seq (MB/s) | 127 | 109.1 -14% | 1192 839% | 584 360% | 950 648% |
| Read 512 (MB/s) | 45.57 | 39.93 -12% | 857 1781% | 583 1179% | 938 1958% |
| Write 512 (MB/s) | 58.3 | 98.6 69% | 827 1319% | 458 686% | 719 1133% |
| Read 4k (MB/s) | 0.582 | 0.435 -25% | 60.7 10330% | 14.1 2323% | 51.9 8818% |
| Write 4k (MB/s) | 1.022 | 3.152 208% | 154.5 15017% | 108 10468% | 149.7 14548% |
| Read 4k QD32 (MB/s) | 1.068 | 1.008 -6% | 636 59451% | 57.8 5312% | 634 59263% |
| Write 4k QD32 (MB/s) | 1.102 | 4.705 327% | 544 49265% | 264 23856% | 322.1 29129% |

| 3DMark 11 - 1280x720 Performance GPU | |
| Acer Aspire Nitro BE VN7-793G-5811 | |
| MSI GE72 7RE-046 | |
| Nexoc G739 | |
| MSI GL72 7RDX-602 | |
| MSI GL72 6QF | |
| 3DMark | |
| 1280x720 Cloud Gate Standard Graphics | |
| Nexoc G739 | |
| Acer Aspire Nitro BE VN7-793G-5811 | |
| MSI GE72 7RE-046 | |
| Asus GL753VE-DS74 | |
| MSI GL72 7RDX-602 | |
| MSI GL72 6QF | |
| 1920x1080 Fire Strike Graphics | |
| MSI GE72 7RE-046 | |
| Nexoc G739 | |
| Acer Aspire Nitro BE VN7-793G-5811 | |
| Asus GL753VE-DS74 | |
| MSI GL72 7RDX-602 | |
| MSI GL72 6QF | |
| 3DMark 11 Performance | 7594 puntos | |
| 3DMark Ice Storm Standard Score | 63241 puntos | |
| 3DMark Cloud Gate Standard Score | 19306 puntos | |
| 3DMark Fire Strike Score | 5622 puntos | |
ayuda | ||
| BioShock Infinite | |
| 1366x768 High Preset | |
| Acer Aspire Nitro BE VN7-793G-5811 | |
| MSI GL72 7RDX-602 | |
| MSI GL72 6QF | |
| 1920x1080 Ultra Preset, DX11 (DDOF) | |
| Asus GL753VE-DS74 | |
| Nexoc G739 | |
| Acer Aspire Nitro BE VN7-793G-5811 | |
| MSI GL72 7RDX-602 | |
| MSI GL72 6QF | |
| The Witcher 3 | |
| 1920x1080 High Graphics & Postprocessing (Nvidia HairWorks Off) | |
| Nexoc G739 | |
| MSI GE72 7RE-046 | |
| Acer Aspire Nitro BE VN7-793G-5811 | |
| MSI GL72 7RDX-602 | |
| 1920x1080 Ultra Graphics & Postprocessing (HBAO+) | |
| Asus GL753VE-DS74 | |
| Nexoc G739 | |
| MSI GE72 7RE-046 | |
| Acer Aspire Nitro BE VN7-793G-5811 | |
| MSI GL72 7RDX-602 | |
| Rise of the Tomb Raider | |
| 1366x768 Medium Preset AF:2x | |
| Nexoc G739 | |
| MSI GL72 6QF | |
| MSI GL72 7RDX-602 | |
| 1920x1080 High Preset AA:FX AF:4x | |
| Nexoc G739 | |
| MSI GE72 7RE-046 | |
| MSI GL72 7RDX-602 | |
| MSI GL72 6QF | |
| 1920x1080 Very High Preset AA:FX AF:16x | |
| Nexoc G739 | |
| MSI GE72 7RE-046 | |
| Asus GL753VE-DS74 | |
| MSI GL72 7RDX-602 | |
| MSI GL72 6QF | |
| bajo | medio | alto | ultra | |
|---|---|---|---|---|
| BioShock Infinite (2013) | 178.2 | 146.7 | 140 | 65.2 |
| The Witcher 3 (2015) | 94.1 | 64 | 36.3 | 23.8 |
| Rise of the Tomb Raider (2016) | 110.4 | 63.3 | 38.4 | 32.2 |
Ruido
| Ocioso |
| 32.4 / 32.4 / 32.8 dB(A) |
| HDD |
| 32.8 dB(A) |
| DVD |
| 47 / dB(A) |
| Carga |
| 40.9 / 43.6 dB(A) |
 | ||
30 dB silencioso 40 dB(A) audible 50 dB(A) ruidosamente alto |
||
min: | ||
(±) La temperatura máxima en la parte superior es de 45 °C / 113 F, frente a la media de 40.4 °C / 105 F, que oscila entre 21.2 y 68.8 °C para la clase Gaming.
(±) El fondo se calienta hasta un máximo de 44 °C / 111 F, frente a la media de 43.2 °C / 110 F
(+) En reposo, la temperatura media de la parte superior es de 26.4 °C / 80# F, frente a la media del dispositivo de 33.9 °C / 93 F.
(+) Los reposamanos y el panel táctil alcanzan como máximo la temperatura de la piel (34 °C / 93.2 F) y, por tanto, no están calientes.
(-) La temperatura media de la zona del reposamanos de dispositivos similares fue de 28.8 °C / 83.8 F (-5.2 °C / -9.4 F).
MSI GL72 7RDX-602 análisis de audio
(±) | la sonoridad del altavoz es media pero buena (78 dB)
Graves 100 - 315 Hz
(-) | casi sin bajos - de media 21.1% inferior a la mediana
(±) | la linealidad de los graves es media (10.7% delta a frecuencia anterior)
Medios 400 - 2000 Hz
(±) | medias más altas - de media 8% más altas que la mediana
(±) | la linealidad de los medios es media (7.3% delta respecto a la frecuencia anterior)
Altos 2 - 16 kHz
(±) | máximos más altos - de media 5.1% más altos que la mediana
(+) | los máximos son lineales (4.4% delta a la frecuencia anterior)
Total 100 - 16.000 Hz
(±) | la linealidad del sonido global es media (22.4% de diferencia con la mediana)
En comparación con la misma clase
» 80% de todos los dispositivos probados de esta clase eran mejores, 6% similares, 14% peores
» El mejor tuvo un delta de 6%, la media fue 18%, el peor fue ###max##%
En comparación con todos los dispositivos probados
» 66% de todos los dispositivos probados eran mejores, 6% similares, 29% peores
» El mejor tuvo un delta de 4%, la media fue 23%, el peor fue ###max##%
Apple MacBook 12 (Early 2016) 1.1 GHz análisis de audio
(+) | los altavoces pueden reproducir a un volumen relativamente alto (#83.6 dB)
Graves 100 - 315 Hz
(±) | lubina reducida - en promedio 11.3% inferior a la mediana
(±) | la linealidad de los graves es media (14.2% delta a frecuencia anterior)
Medios 400 - 2000 Hz
(+) | medios equilibrados - a sólo 2.4% de la mediana
(+) | los medios son lineales (5.5% delta a la frecuencia anterior)
Altos 2 - 16 kHz
(+) | máximos equilibrados - a sólo 2% de la mediana
(+) | los máximos son lineales (4.5% delta a la frecuencia anterior)
Total 100 - 16.000 Hz
(+) | el sonido global es lineal (10.2% de diferencia con la mediana)
En comparación con la misma clase
» 7% de todos los dispositivos probados de esta clase eran mejores, 2% similares, 91% peores
» El mejor tuvo un delta de 5%, la media fue 18%, el peor fue ###max##%
En comparación con todos los dispositivos probados
» 5% de todos los dispositivos probados eran mejores, 1% similares, 94% peores
» El mejor tuvo un delta de 4%, la media fue 23%, el peor fue ###max##%
Nexoc G739 análisis de audio
(±) | la sonoridad del altavoz es media pero buena (76 dB)
Graves 100 - 315 Hz
(-) | casi sin bajos - de media 23.2% inferior a la mediana
(±) | la linealidad de los graves es media (13.3% delta a frecuencia anterior)
Medios 400 - 2000 Hz
(±) | medias más altas - de media 7.8% más altas que la mediana
(±) | la linealidad de los medios es media (8% delta respecto a la frecuencia anterior)
Altos 2 - 16 kHz
(±) | máximos más altos - de media 6.4% más altos que la mediana
(±) | la linealidad de los máximos es media (12.4% delta a frecuencia anterior)
Total 100 - 16.000 Hz
(-) | el sonido global no es lineal (31.5% de diferencia con la mediana)
En comparación con la misma clase
» 97% de todos los dispositivos probados de esta clase eran mejores, 1% similares, 2% peores
» El mejor tuvo un delta de 6%, la media fue 18%, el peor fue ###max##%
En comparación con todos los dispositivos probados
» 90% de todos los dispositivos probados eran mejores, 2% similares, 8% peores
» El mejor tuvo un delta de 4%, la media fue 23%, el peor fue ###max##%
| Off / Standby | |
| Ocioso | |
| Carga |
|
Clave:
min: | |
| MSI GL72 7RDX-602 i7-7700HQ, GeForce GTX 1050 Mobile, HGST Travelstar 7K1000 HTS721010A9E630, TN LED, 1920x1080, 17.3" | Nexoc G739 i7-7700HQ, GeForce GTX 1050 Ti Mobile, Samsung PM961 MZVLW256HEHP, IPS, 1920x1080, 17.3" | Asus GL753VE-DS74 i7-7700HQ, GeForce GTX 1050 Ti Mobile, Intel SSD 600p SSDPEKKW512G7, IPS, 1920x1080, 17.3" | MSI GE72 7RE-046 i7-7700HQ, GeForce GTX 1050 Ti Mobile, Toshiba HG6 THNSNJ256G8NY, TN LED, 1920x1080, 17.3" | MSI GL72 6QF 6700HQ, GeForce GTX 960M, Samsung SSD 950 Pro 256GB m.2 NVMe, TN, 1920x1080, 17.3" | |
|---|---|---|---|---|---|
| Power Consumption | -2% | 21% | -23% | -58% | |
| Idle Minimum * (Watt) | 9.6 | 7 27% | 7.5 22% | 14 -46% | 22.1 -130% |
| Idle Average * (Watt) | 15 | 14 7% | 11.3 25% | 20 -33% | 28.3 -89% |
| Idle Maximum * (Watt) | 16.5 | 23 -39% | 11.8 28% | 25 -52% | 29.8 -81% |
| Load Average * (Watt) | 104 | 82 21% | 82.1 21% | 82 21% | 87 16% |
| Load Maximum * (Watt) | 129 | 163 -26% | 116.6 10% | 135 -5% | 134.1 -4% |
| Witcher 3 ultra * (Watt) | 96.3 |
* ... más pequeño es mejor
| MSI GL72 7RDX-602 i7-7700HQ, GeForce GTX 1050 Mobile, 43.2 Wh | Acer Aspire Nitro BE VN7-793G-5811 i5-7300HQ, GeForce GTX 1050 Ti Mobile, 52.5 Wh | Nexoc G739 i7-7700HQ, GeForce GTX 1050 Ti Mobile, 62 Wh | Asus GL753VE-DS74 i7-7700HQ, GeForce GTX 1050 Ti Mobile, 48 Wh | MSI GE72 7RE-046 i7-7700HQ, GeForce GTX 1050 Ti Mobile, 51.4 Wh | MSI GL72 6QF 6700HQ, GeForce GTX 960M, 43 Wh | |
|---|---|---|---|---|---|---|
| Duración de Batería | 35% | 105% | 29% | 5% | -10% | |
| Reader / Idle (h) | 5.5 | 10.2 85% | 8.7 58% | 4 -27% | ||
| H.264 (h) | 2.8 | 5.4 93% | 3.3 18% | |||
| WiFi v1.3 (h) | 3.4 | 4.6 35% | 4.8 41% | 3.9 15% | 3.1 -9% | 1.8 -47% |
| Load (h) | 0.7 | 2.1 200% | 0.8 14% | 1 43% |
Pro
Contra
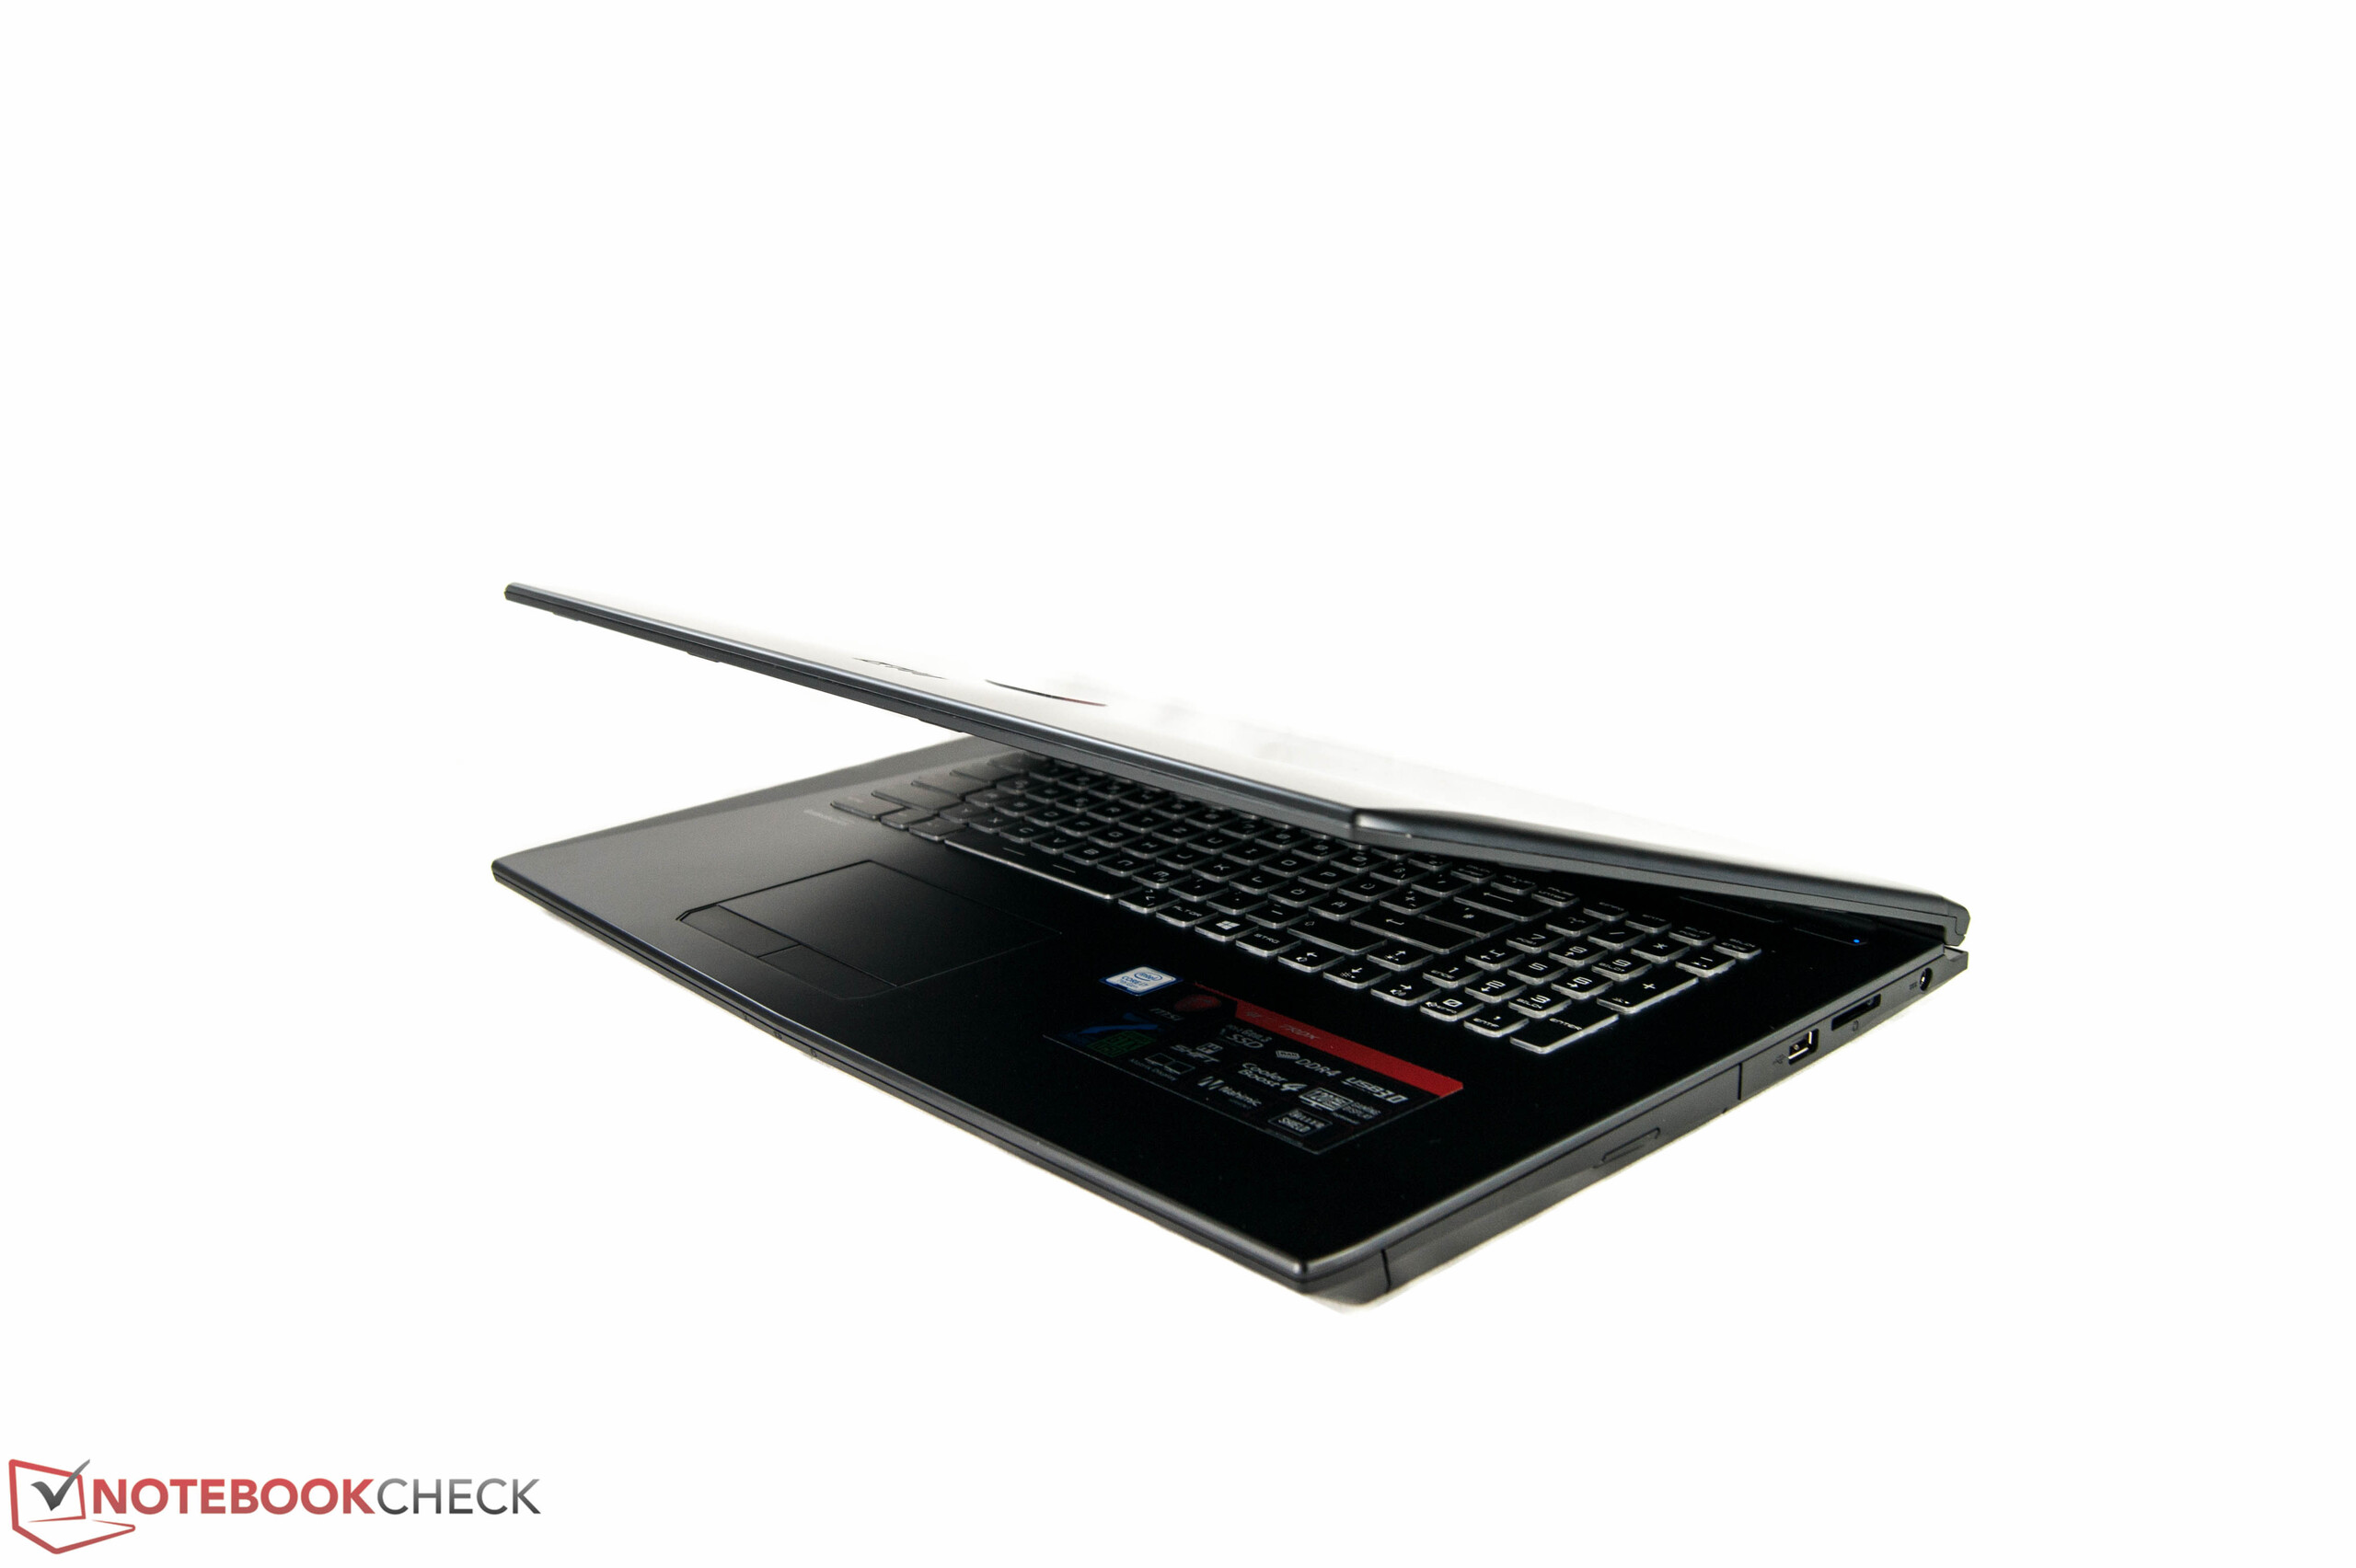
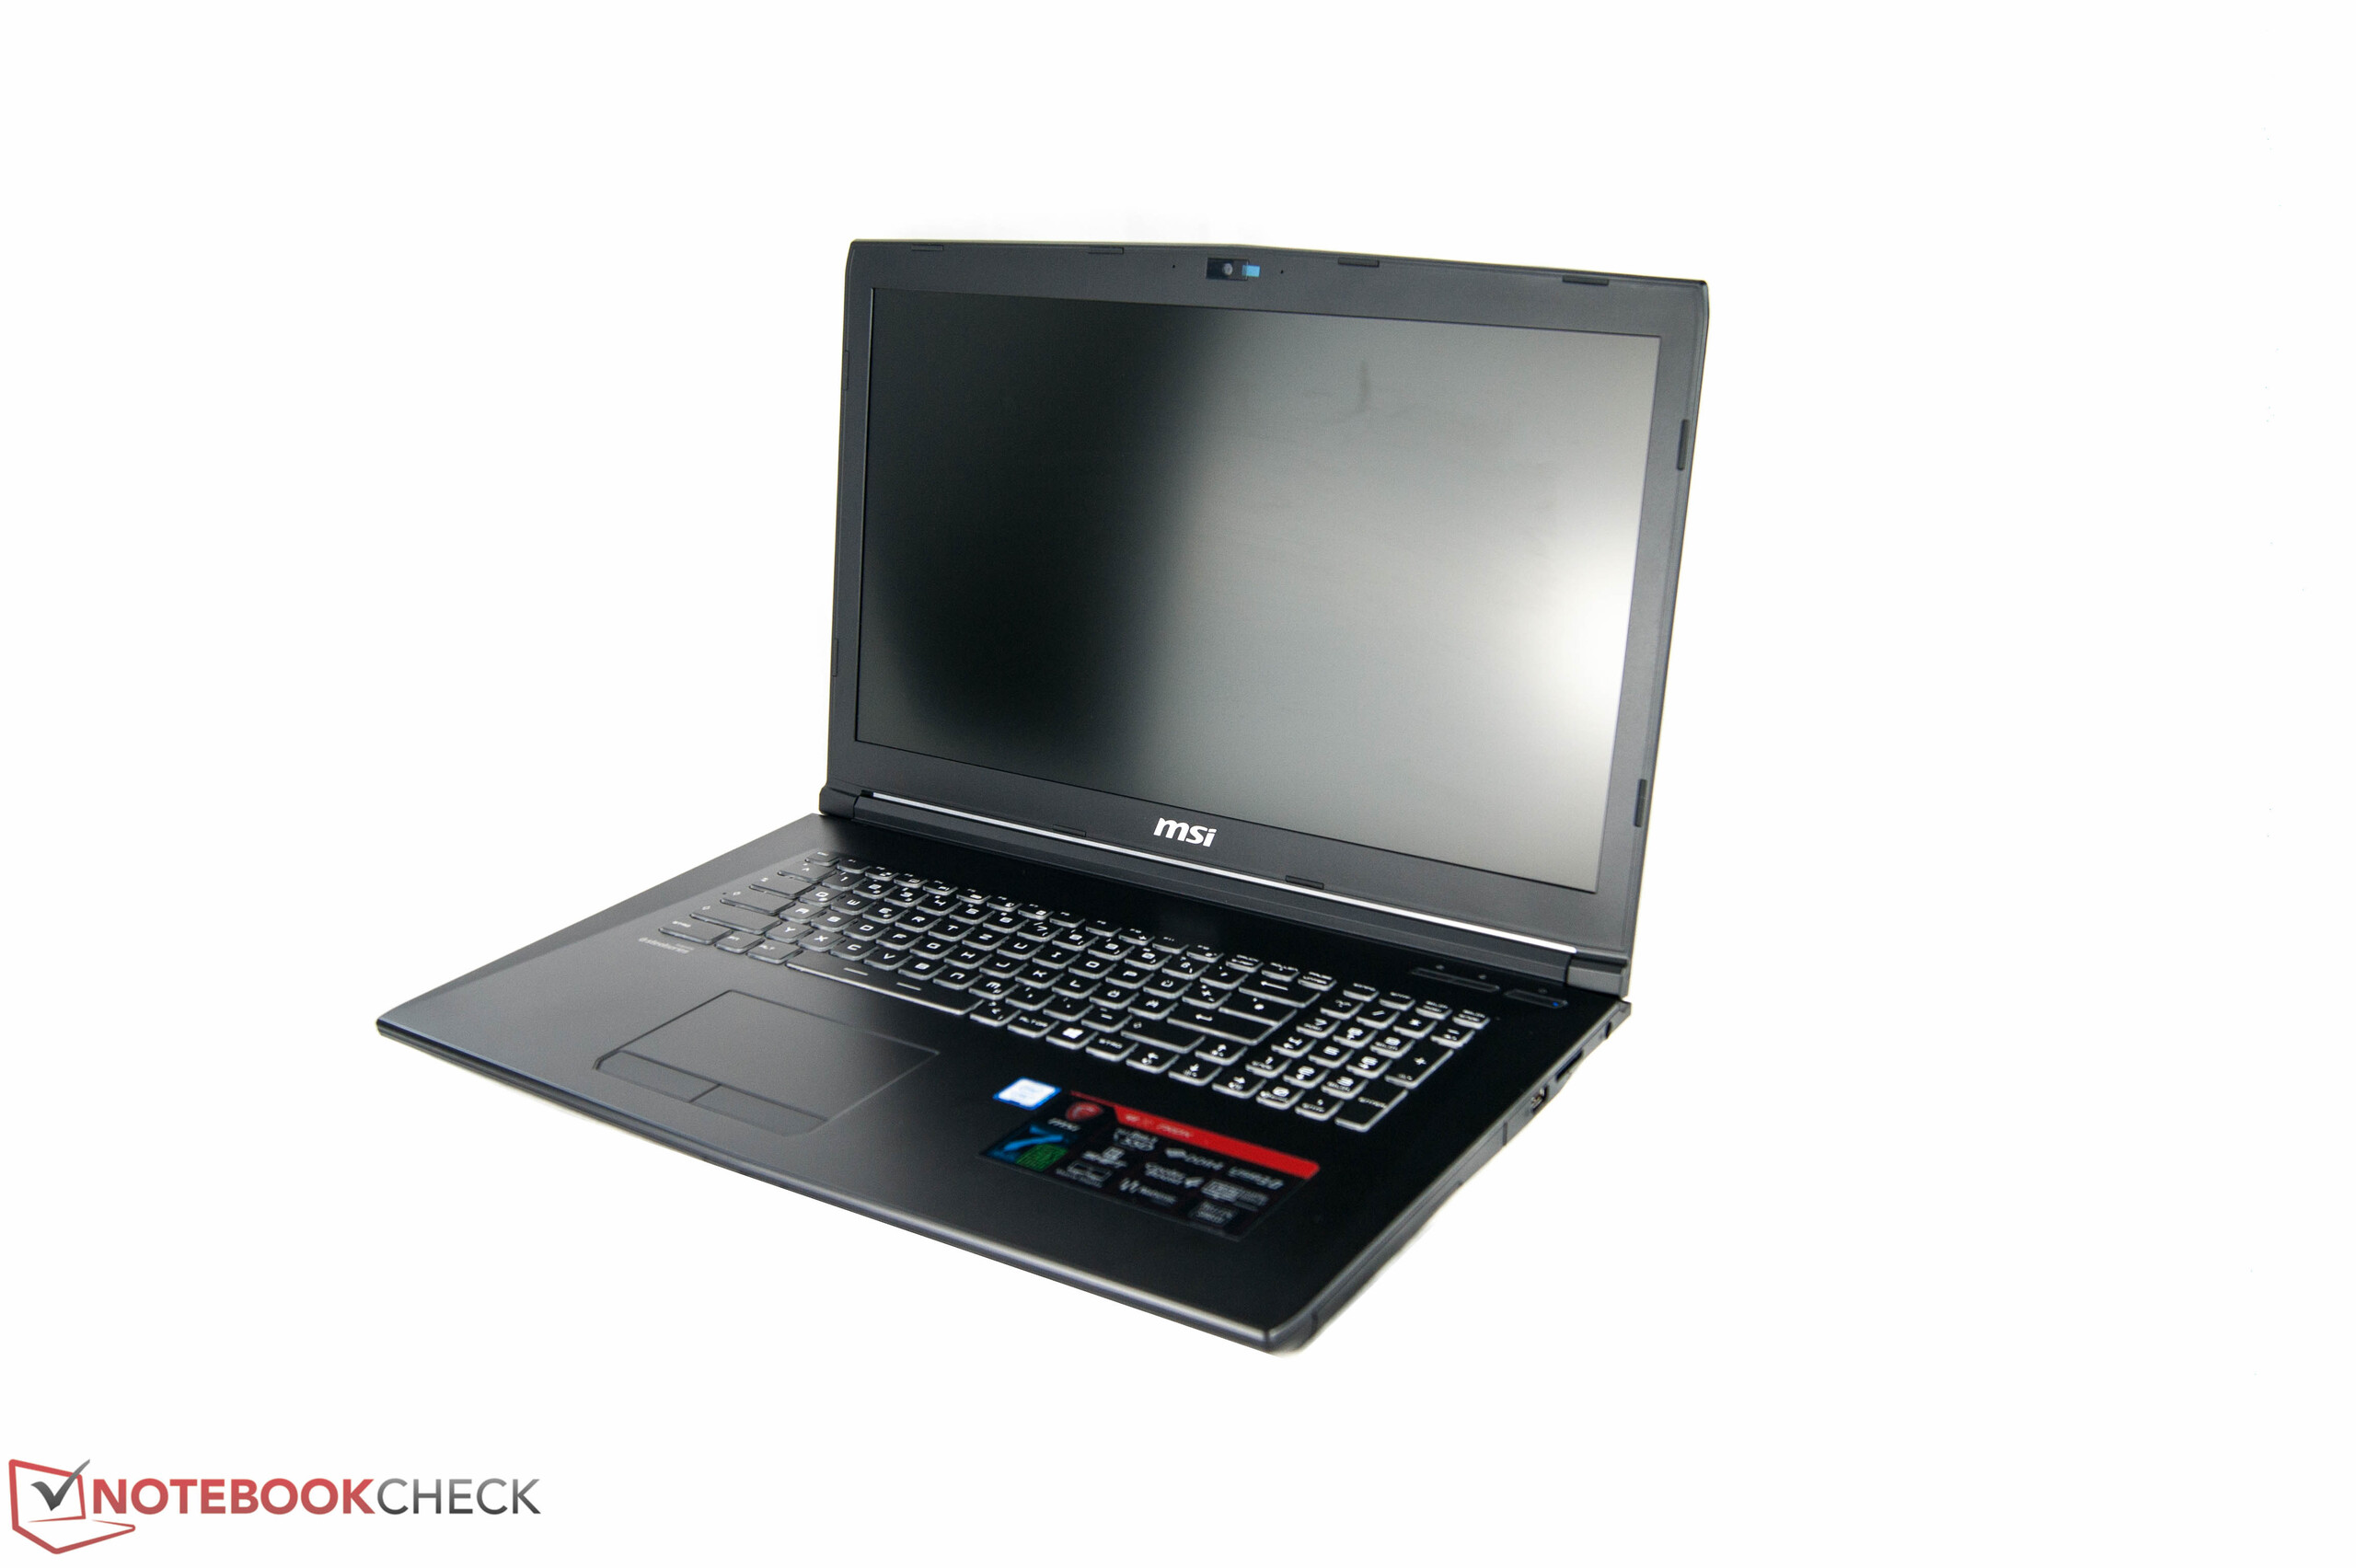
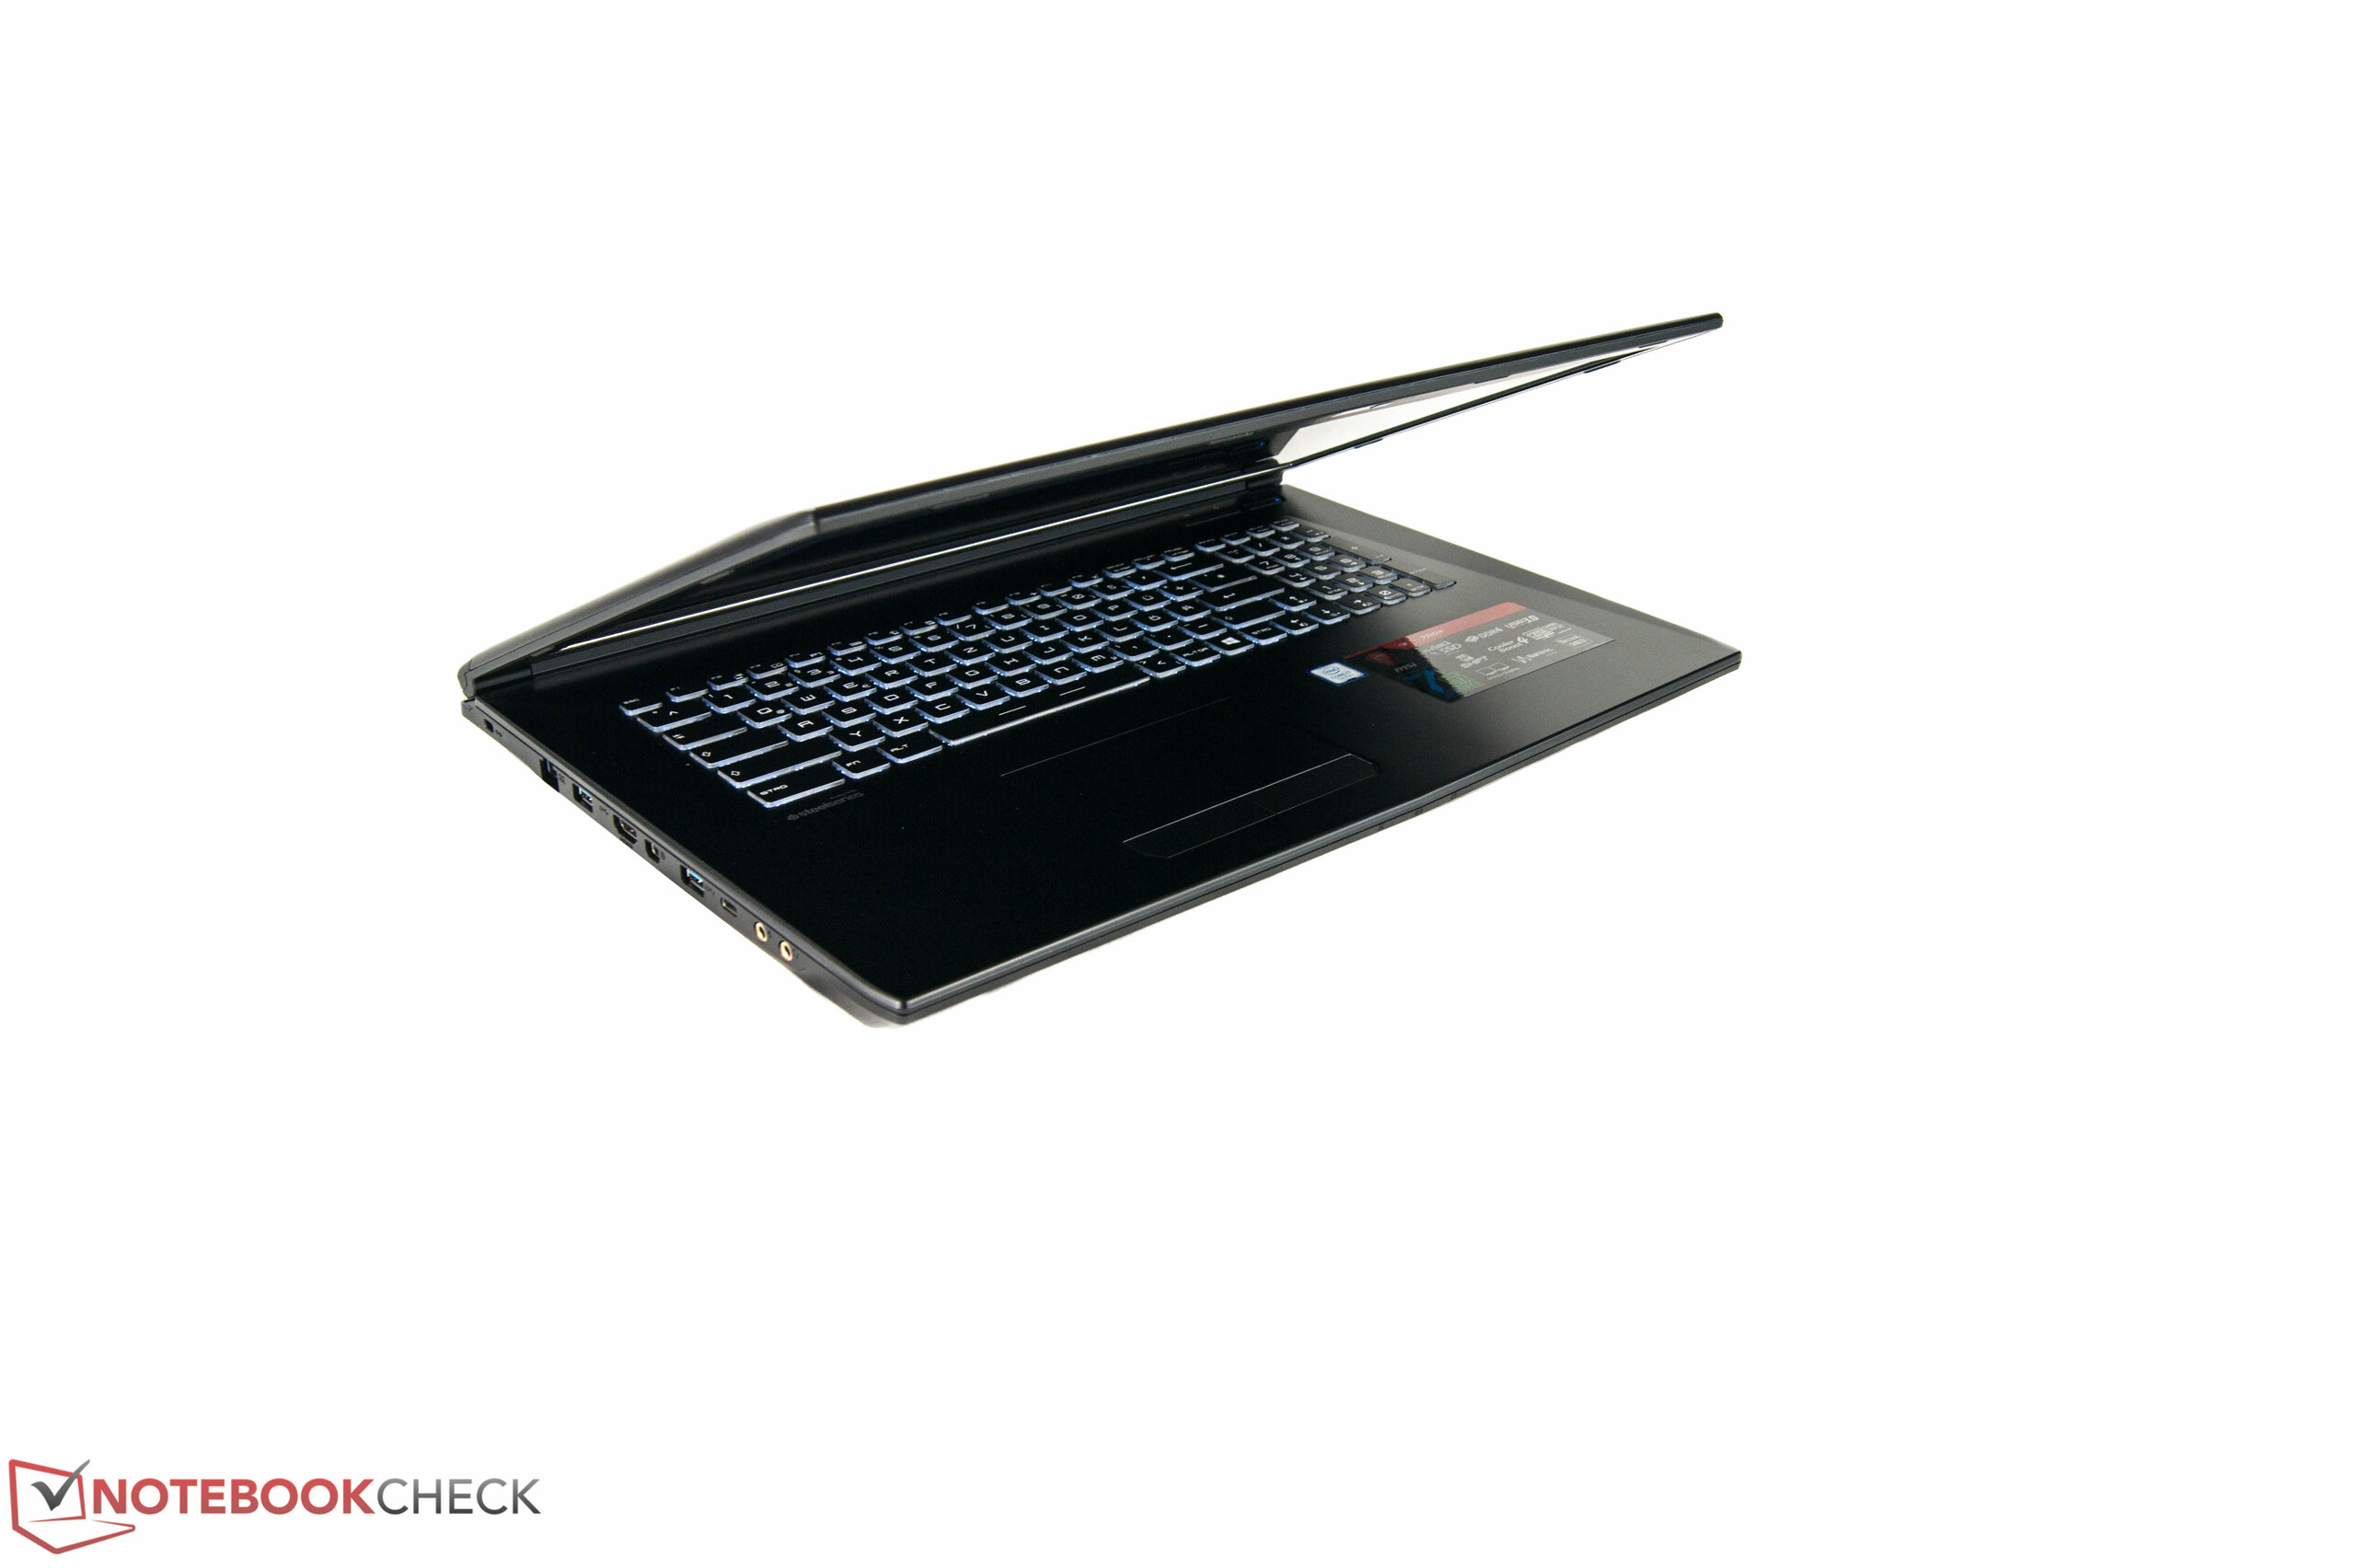
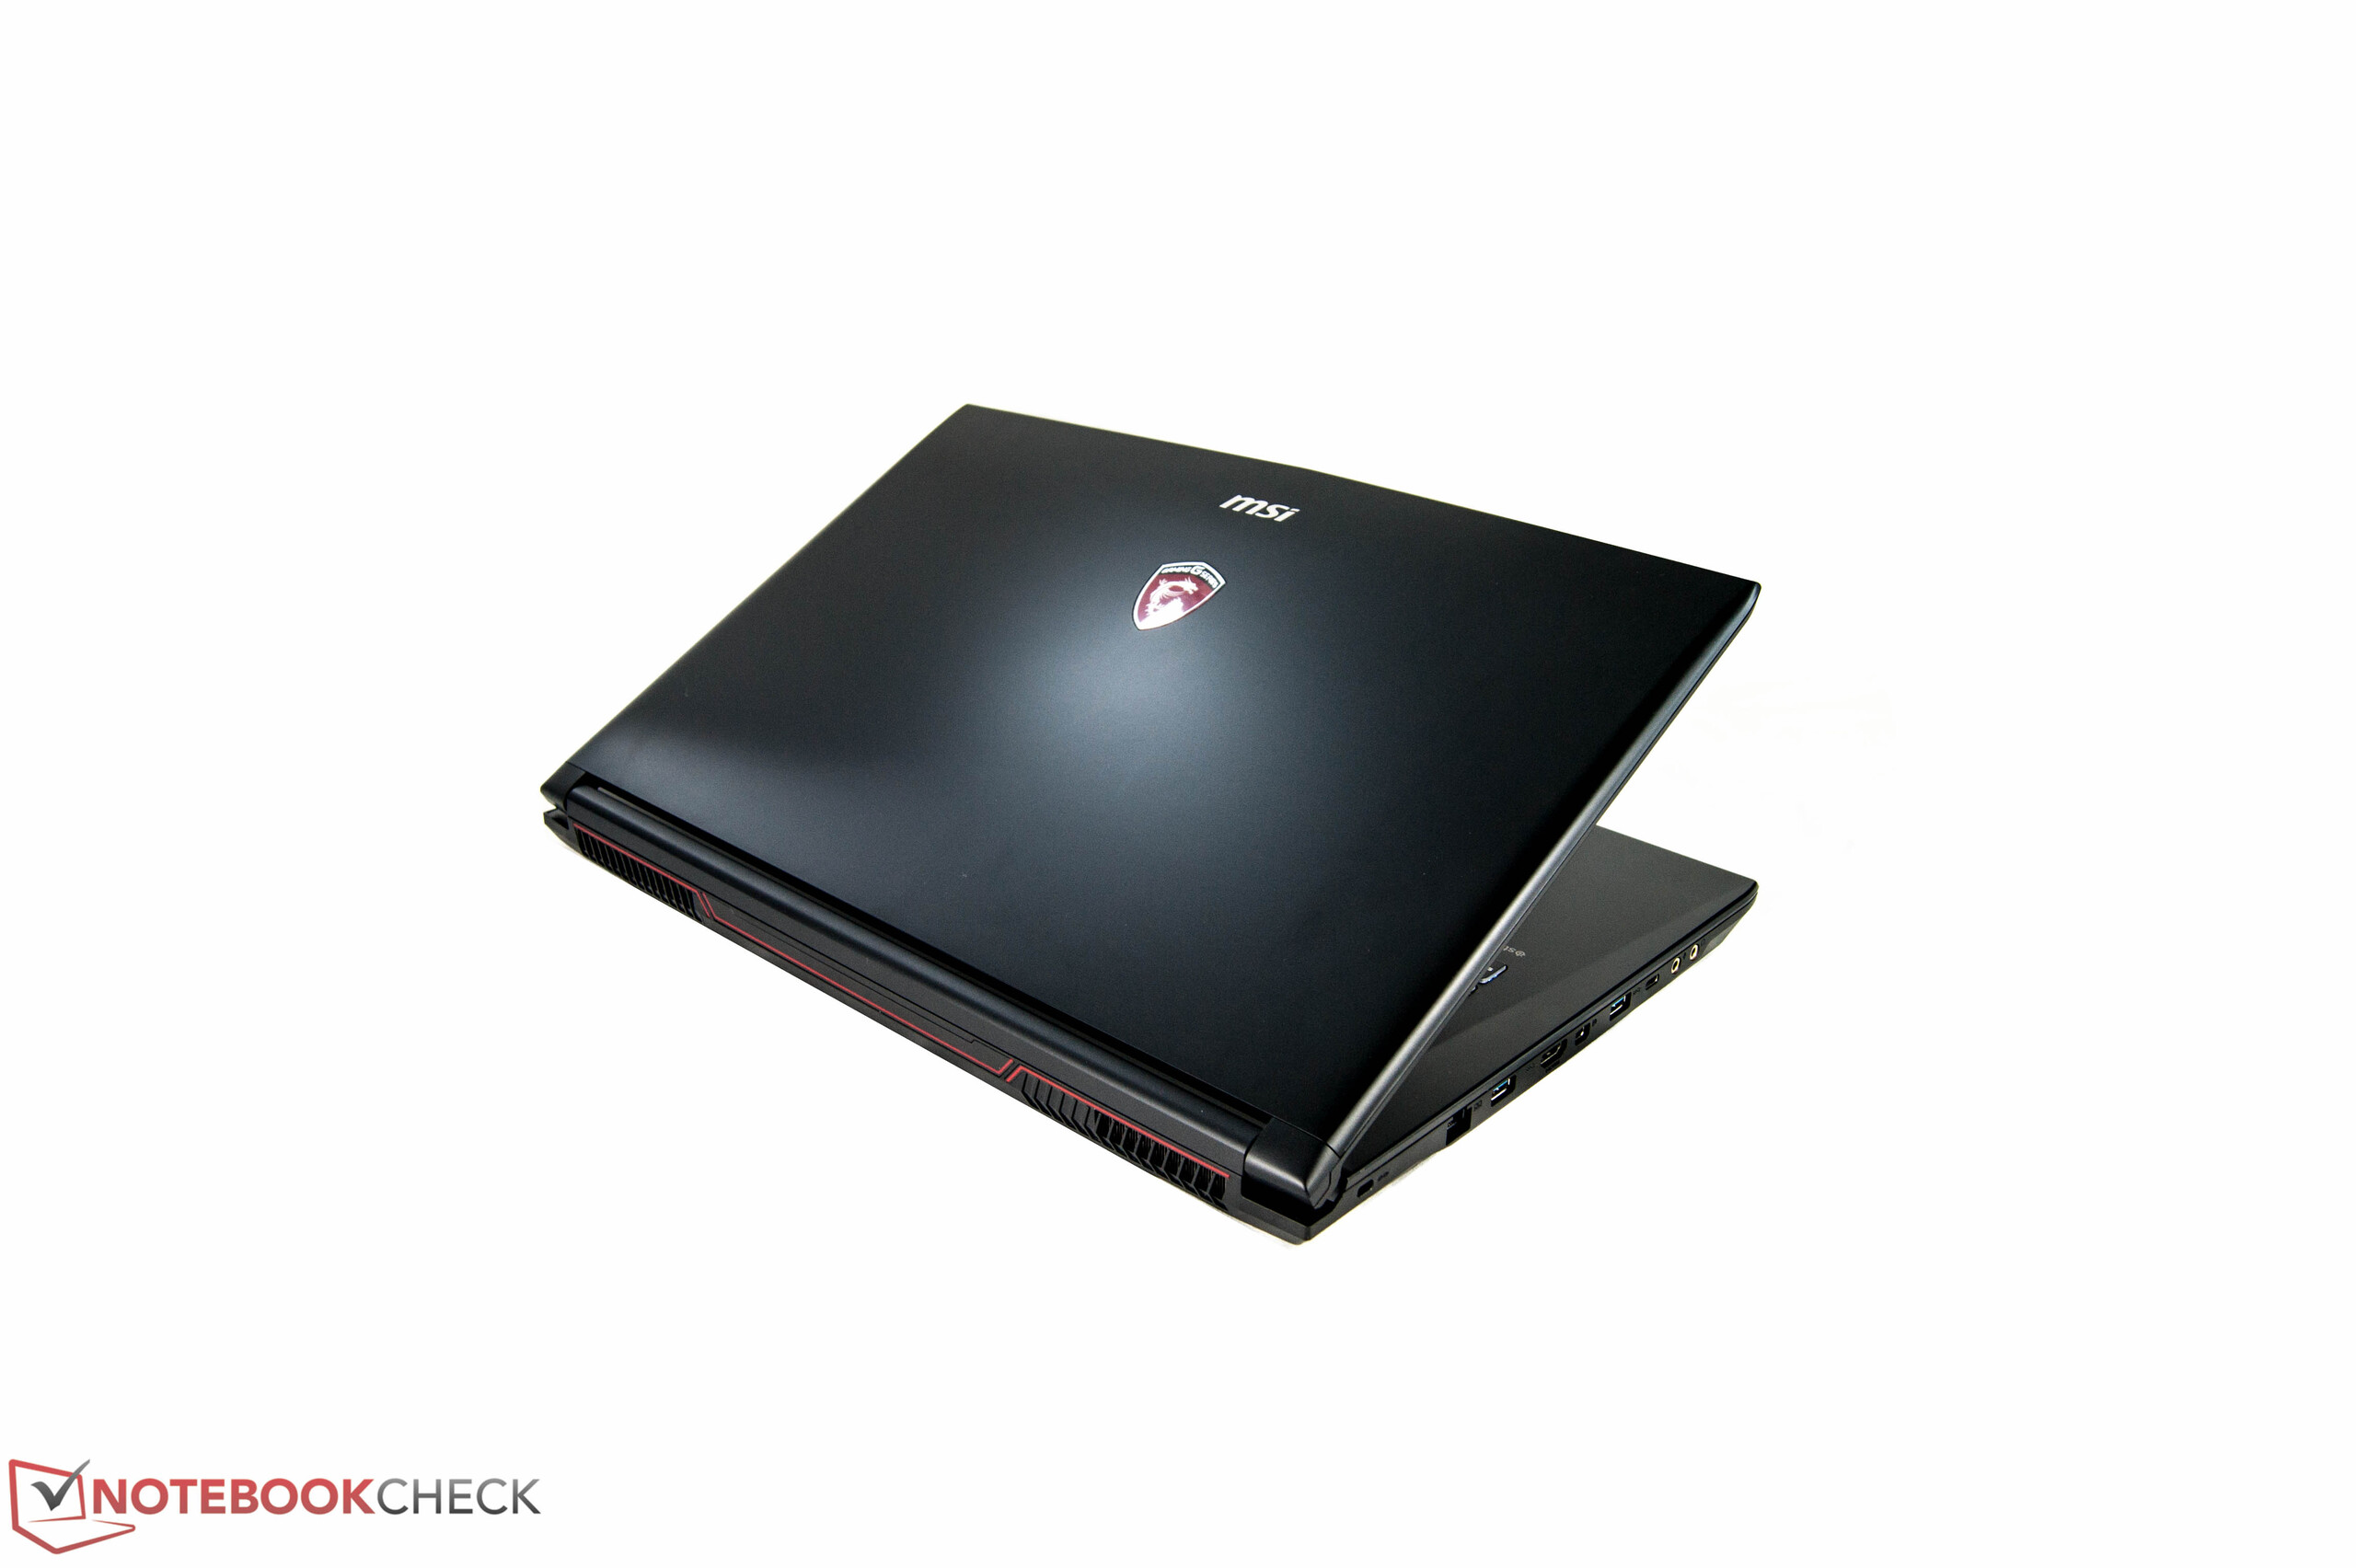
Un portátil gaming rápido y grande por un precio asequible. Esto es lo que el MSI GL72 quiere ser. Para poder ofrecer un portatil gaming por $1100 hay que hacer algunos sacrificios. Empieza con una carcasa mate y elegante. Desafortunadamente está hecha de plástico por completo. La manufactura y la calidad llegan a las expectativas básicas, pero podría ser mejor. Particularmente molesto: La carcasa se llena de huellas muy rápido. La pantalla ha mejorado y es mas brillante que la de su predecesor, aunque esta mejora es limitada - nuestros dispositivos comparación han tenido mejores pantallas que ofrecer.Usar un panel TN es no estar al día. Todos los dispositivos de comparación tenían pantallas IPS. Aparte de esta desventaja, el nuevo MSI GL72 tiene una ventaja: siempre está listo para rendir. El portátil de 17" demuestra perfectamente como los portátiles gaming deben hacer uso de sus componentes
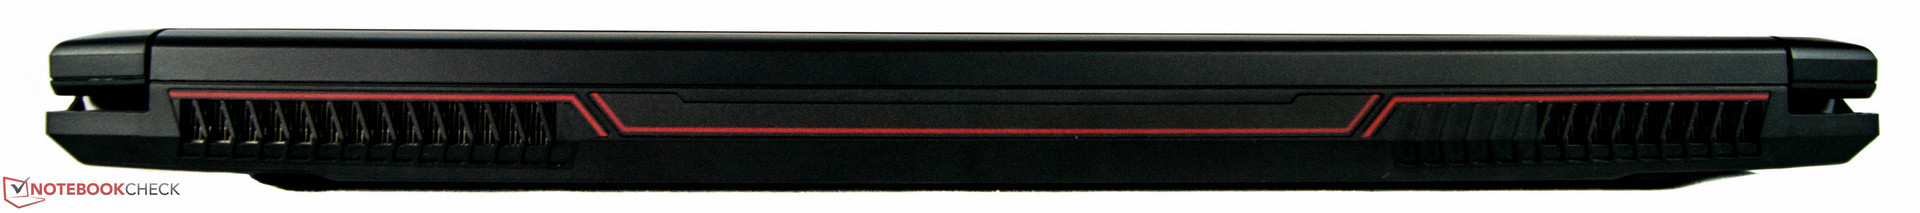
Los niveles de ruido y la temperatura permanecen a un nivel aceptable. Los jugadores casuales que estén buscando un portátil grande y que tengan una idea clara del precio que quieren pagar estarán bastante felices con el MSI GL72.
Por un poco más de dinero puedes conseguir tambien un panel IPS más brillante, SSD PCIe y un aumento en los gráficos con el Asus GL753VE o el Nexoc G739.
Ésta es una versión acortada del análisis original. Puedes leer el análisis completo en inglés aquí.
MSI GL72 7RDX-602
- 06/21/2017 v6 (old)
Nino Ricchizzi