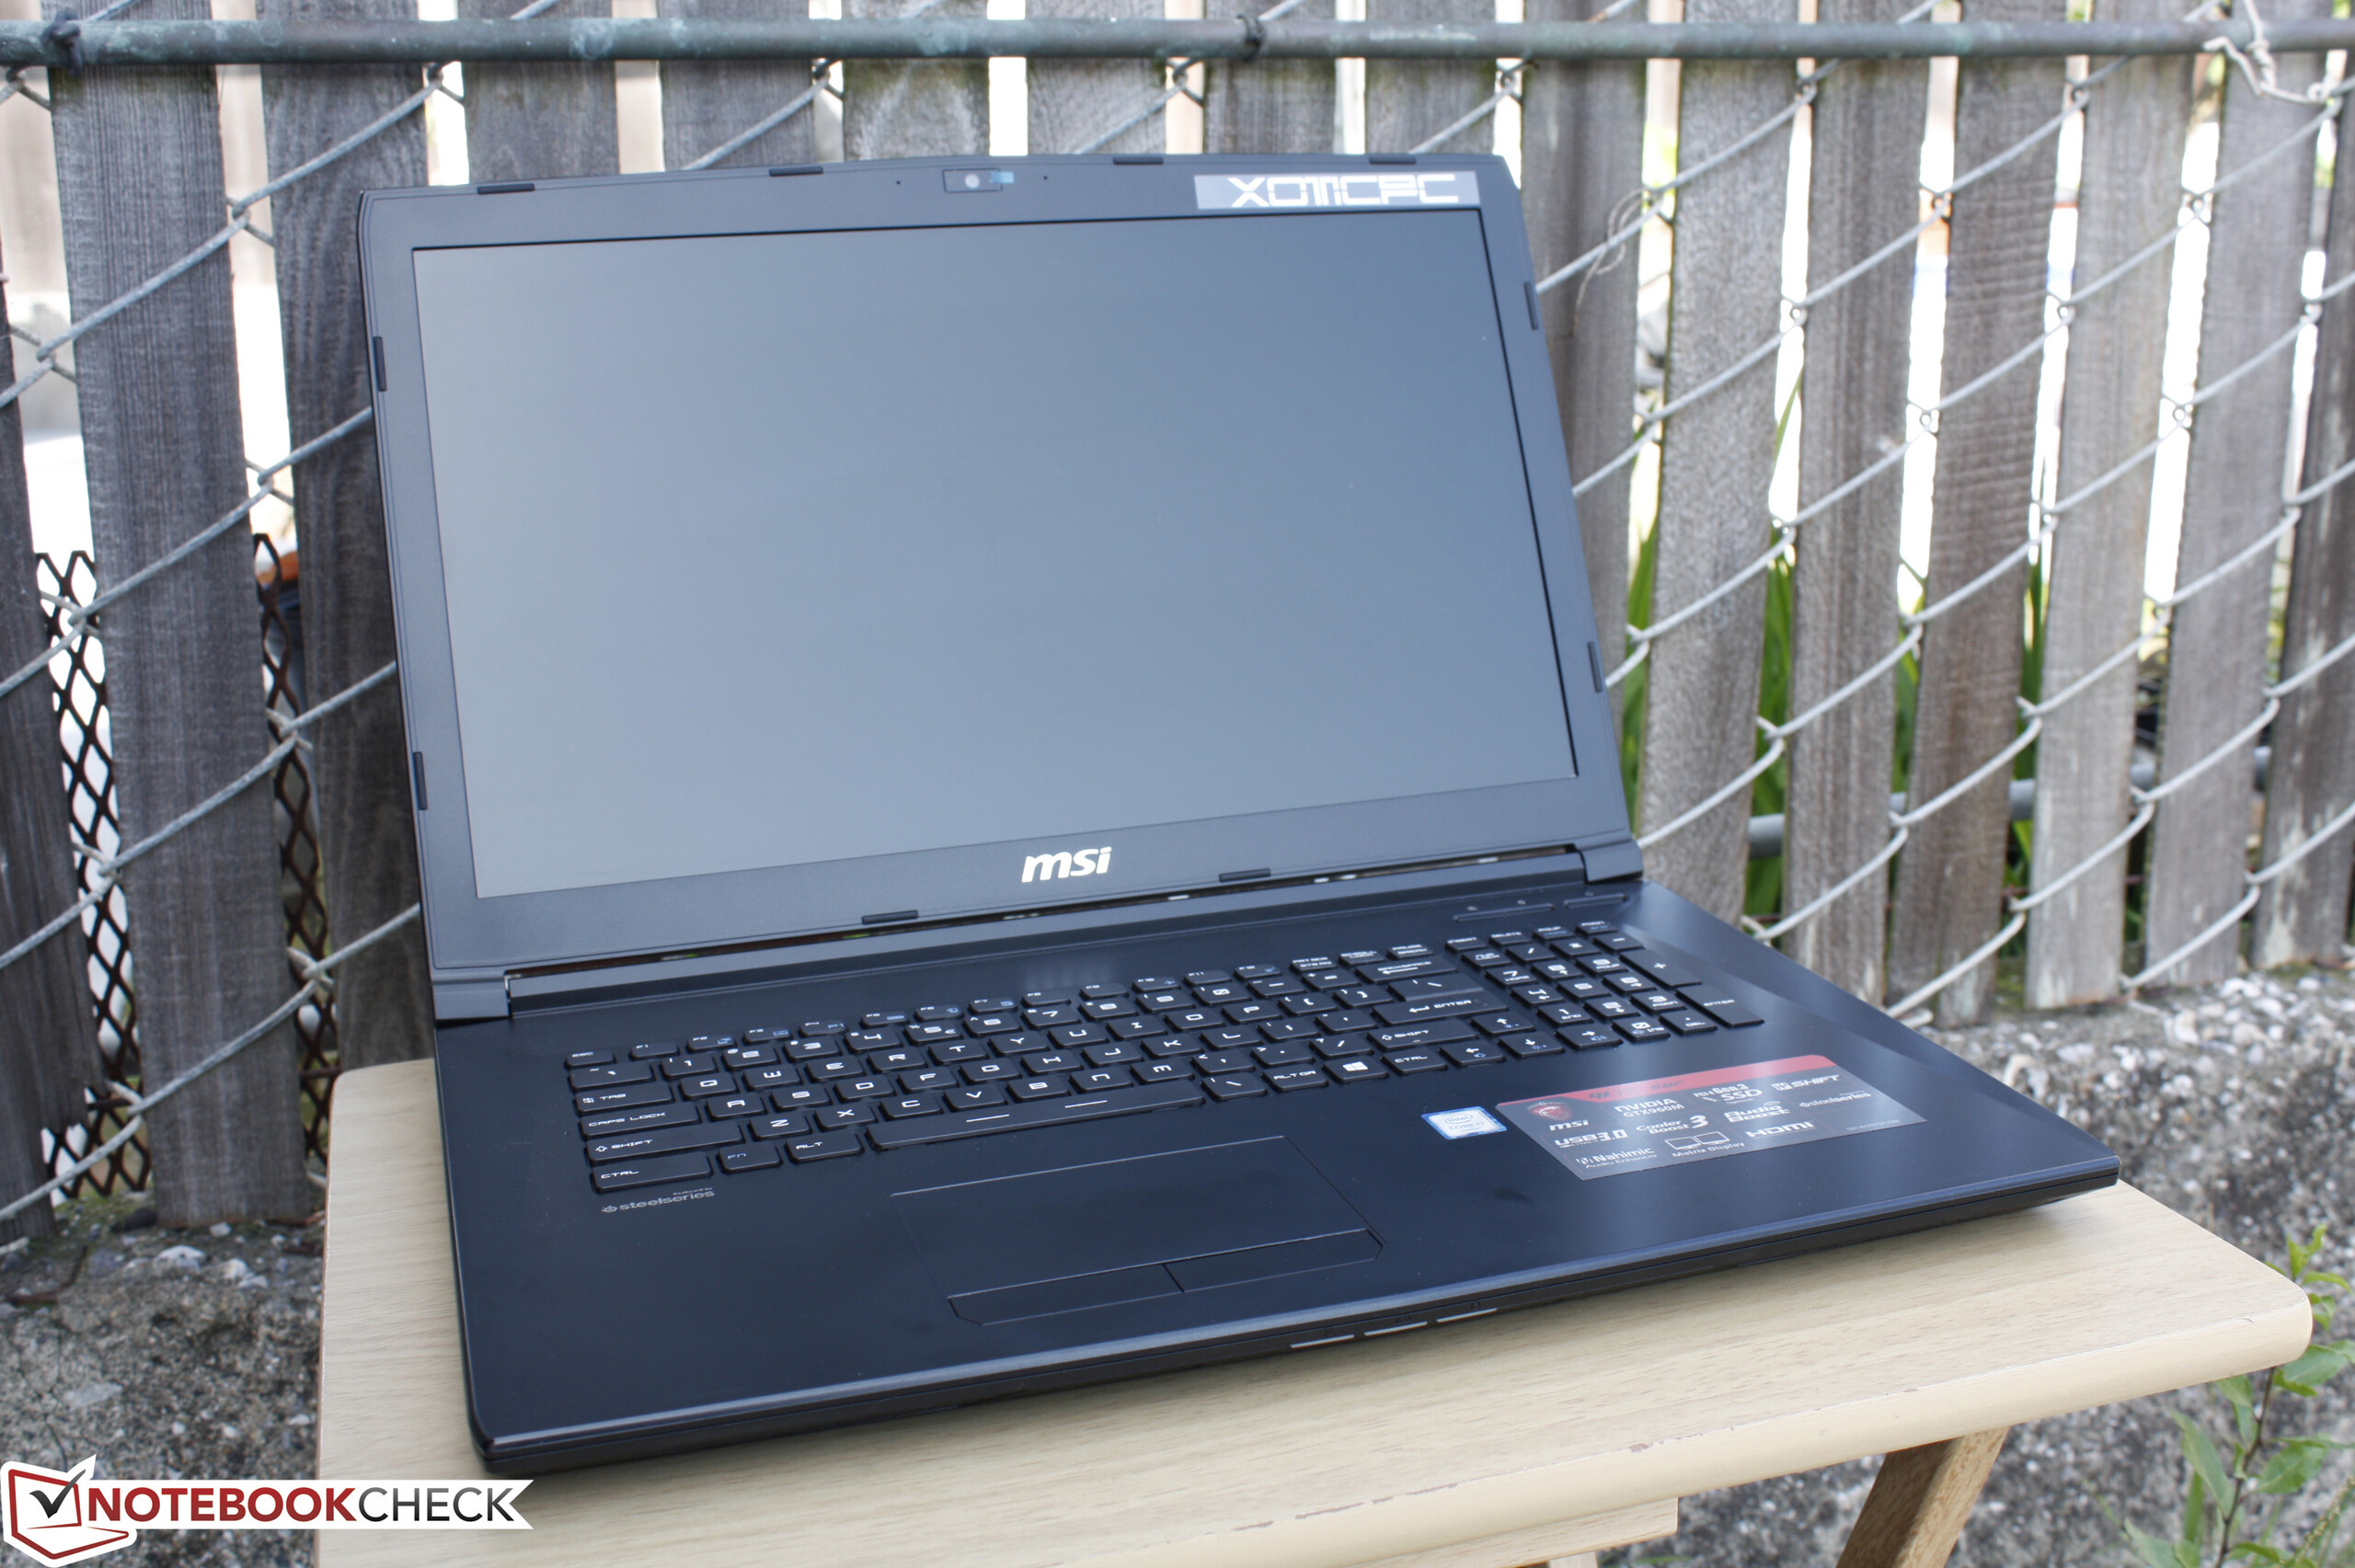
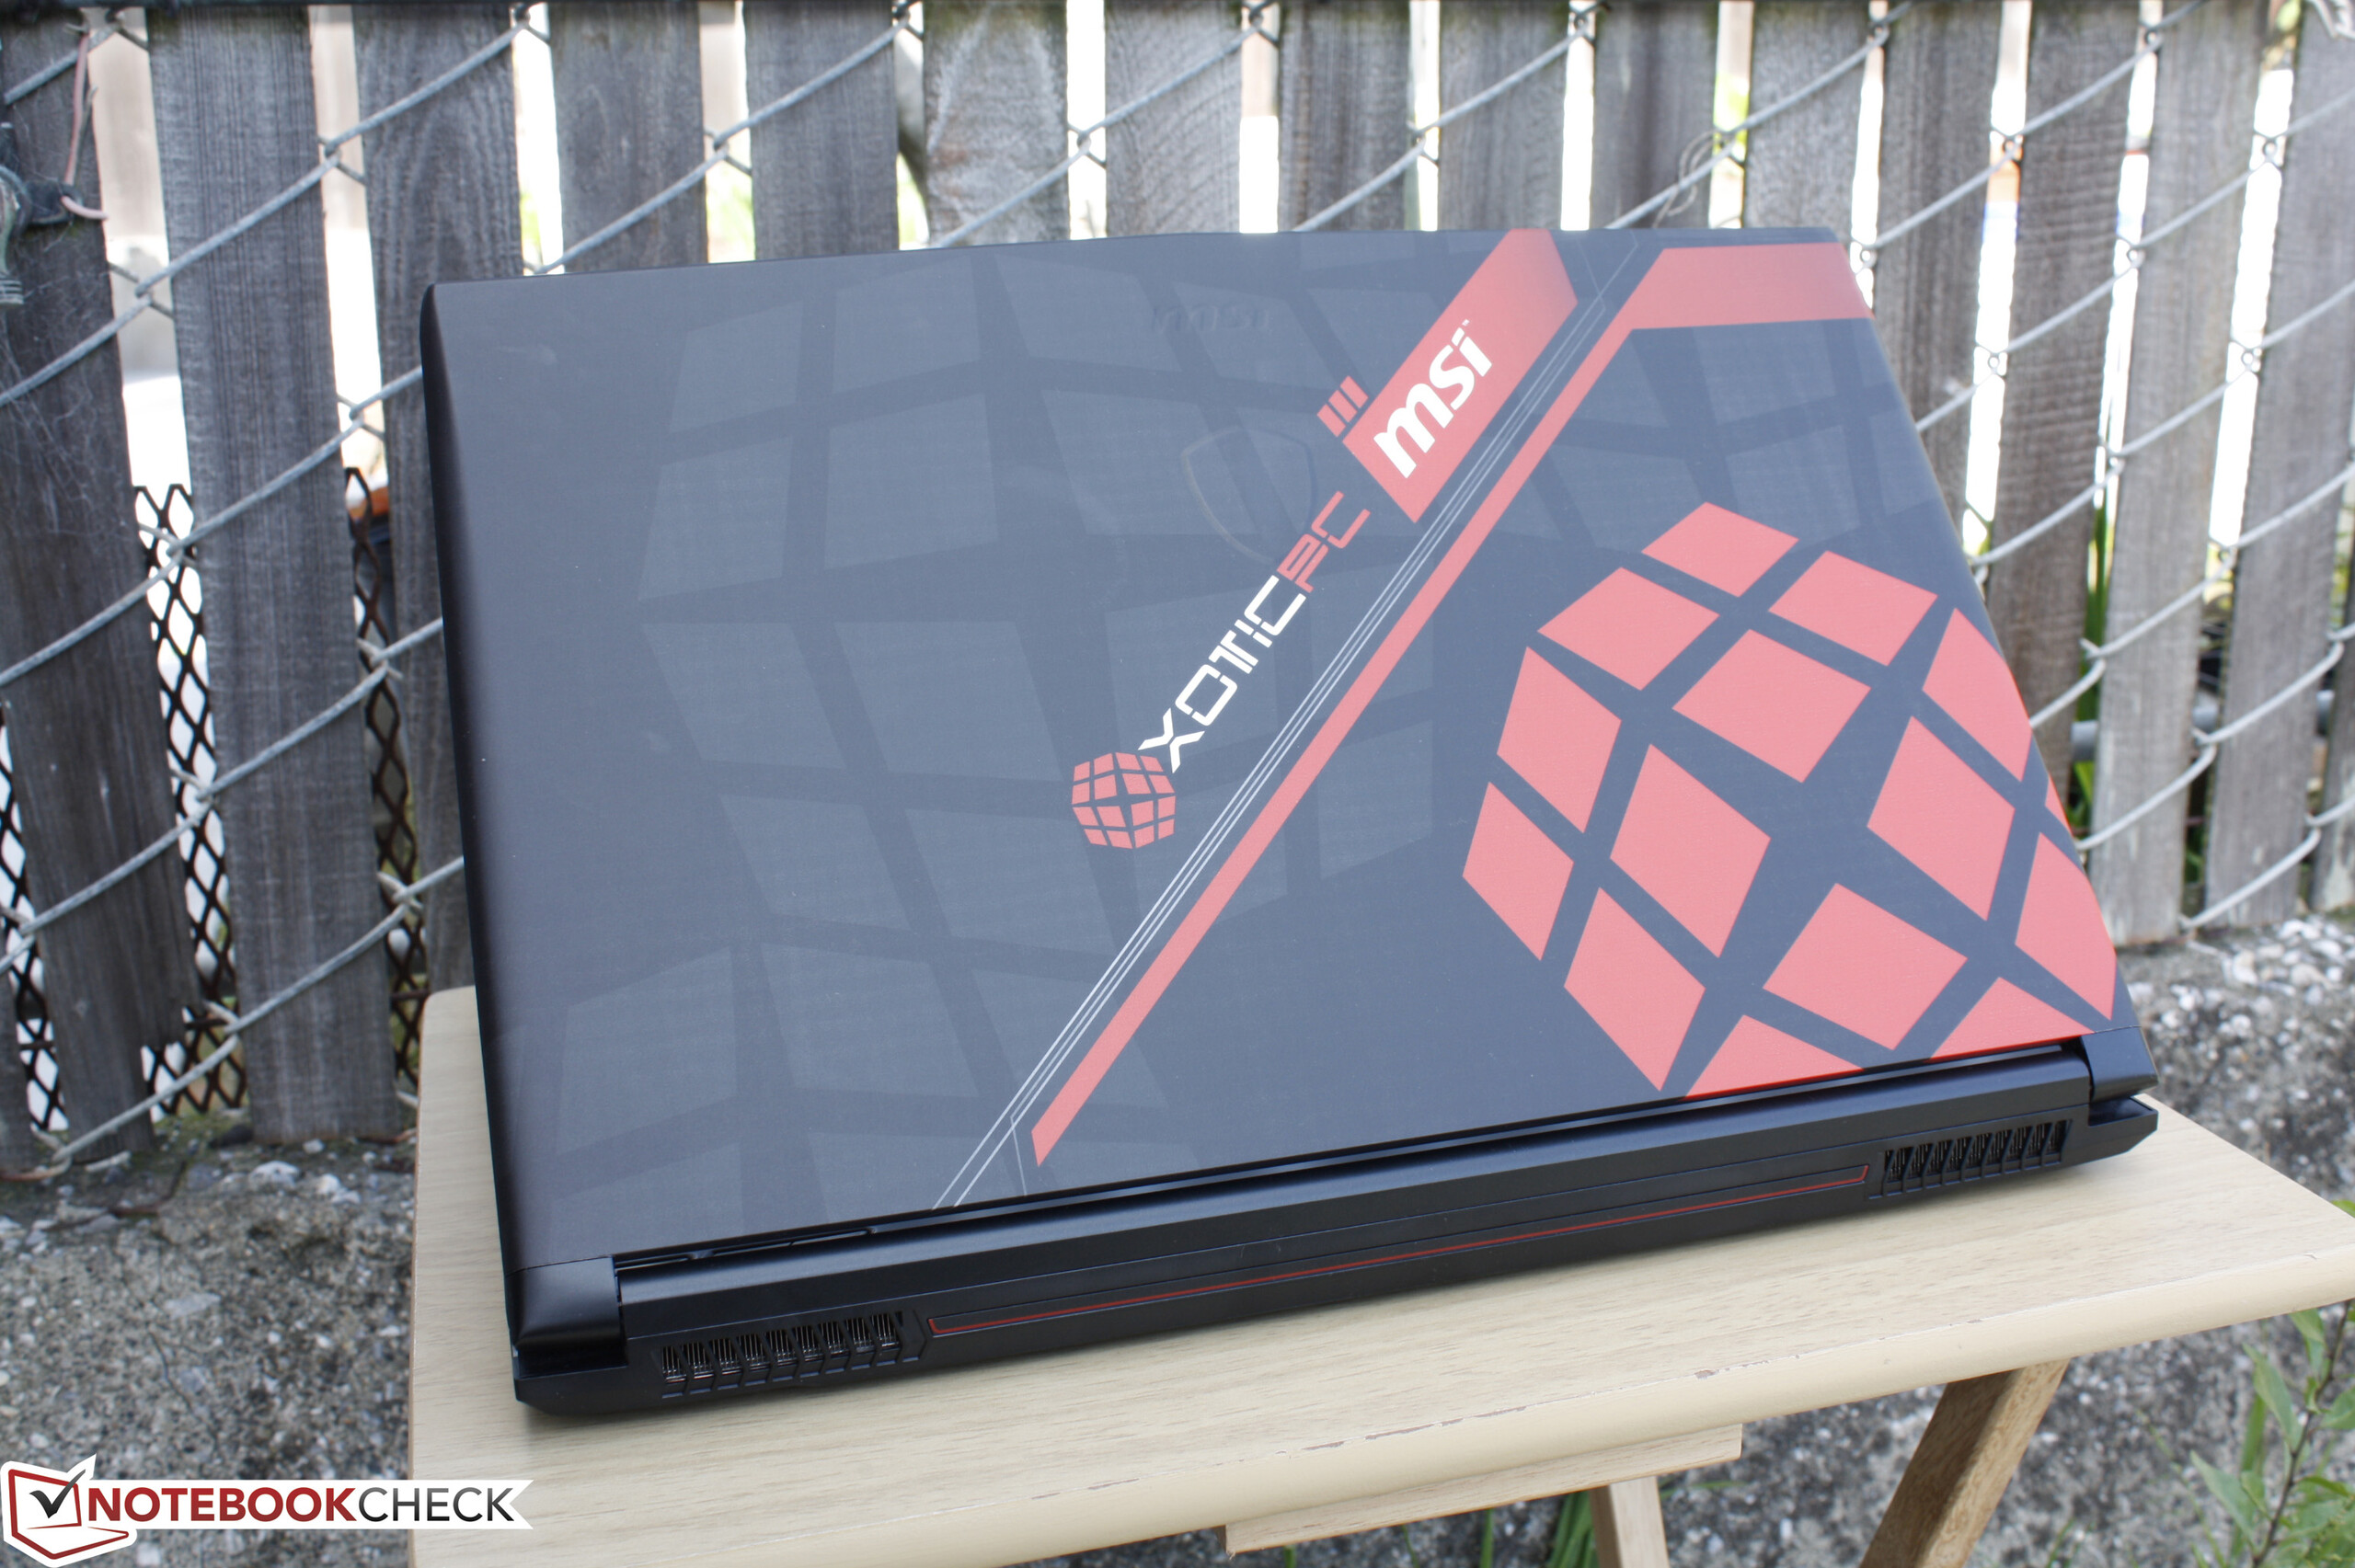
MSI GL72 6QF Xotic PC Edition


| |||||||||||||||||||||||||
iluminación: 79 %
Brillo con batería: 194.7 cd/m²
Contraste: 788:1 (Negro: 0.247 cd/m²)
ΔE ColorChecker Calman: 11.44 | ∀{0.5-29.43 Ø4.73}
ΔE Greyscale Calman: 11.36 | ∀{0.09-98 Ø4.97}
95.3% sRGB (Argyll 1.6.3 3D)
60.8% AdobeRGB 1998 (Argyll 1.6.3 3D)
66.7% AdobeRGB 1998 (Argyll 3D)
95.6% sRGB (Argyll 3D)
65.9% Display P3 (Argyll 3D)
Gamma: 2.12
CCT: 12948 K
| MSI GL72 6QF 17.3", 1920x1080 | Asus GL771JW-T7082H 17.3", 1920x1080 | MSI GE72-2QDi716H11 17.3", 1920x1080 | Acer Predator 17 G9-791-75PV 17.3", 1920x1080 | Acer Aspire V Nitro Black Edition VN7-792G-74Q4 17.3", 1920x1080 | |
|---|---|---|---|---|---|
| Display | 1% | -0% | -6% | -1% | |
| Display P3 Coverage (%) | 65.9 | 73.4 11% | 65.1 -1% | 66.7 1% | 67 2% |
| sRGB Coverage (%) | 95.6 | 90 -6% | 94.2 -1% | 84.7 -11% | 91.3 -4% |
| AdobeRGB 1998 Coverage (%) | 66.7 | 65.7 -1% | 67.1 1% | 62 -7% | 66.7 0% |
| Response Times | 21% | -18% | |||
| Response Time Grey 50% / Grey 80% * (ms) | 45.6 ? | 37 ? 19% | 58 ? -27% | ||
| Response Time Black / White * (ms) | 25.6 ? | 20 ? 22% | 28 ? -9% | ||
| PWM Frequency (Hz) | 980 ? | ||||
| Screen | 29% | 19% | 30% | 44% | |
| Brightness middle (cd/m²) | 194.7 | 343 76% | 255 31% | 337 73% | 346 78% |
| Brightness (cd/m²) | 183 | 333 82% | 246 34% | 303 66% | 326 78% |
| Brightness Distribution (%) | 79 | 92 16% | 80 1% | 85 8% | 88 11% |
| Black Level * (cd/m²) | 0.247 | 0.38 -54% | 0.2 19% | 0.26 -5% | 0.32 -30% |
| Contrast (:1) | 788 | 903 15% | 1275 62% | 1296 64% | 1081 37% |
| Colorchecker dE 2000 * | 11.44 | 7 39% | 10.01 12% | 5.92 48% | 4.01 65% |
| Colorchecker dE 2000 max. * | 18.78 | ||||
| Greyscale dE 2000 * | 11.36 | 4.33 62% | 10.5 8% | 7.55 34% | 3.58 68% |
| Gamma | 2.12 104% | 2.12 104% | 2.25 98% | 2.42 91% | 2.23 99% |
| CCT | 12948 50% | 6111 106% | 12631 51% | 7270 89% | 6426 101% |
| Color Space (Percent of AdobeRGB 1998) (%) | 60.8 | 59 -3% | 62 2% | 56 -8% | |
| Color Space (Percent of sRGB) (%) | 95.3 | 94 -1% | 85 -11% | ||
| Media total (Programa/Opciones) | 15% /
22% | 10% /
14% | 15% /
21% | 8% /
22% |
* ... más pequeño es mejor
Tiempos de respuesta del display
| ↔ Tiempo de respuesta de Negro a Blanco | ||
|---|---|---|
| 25.6 ms ... subida ↗ y bajada ↘ combinada | ↗ 8.4 ms subida | 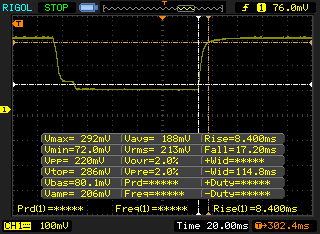 |
| ↘ 17.2 ms bajada | ||
| La pantalla mostró tiempos de respuesta relativamente lentos en nuestros tests pero podría ser demasiado lenta para los jugones. En comparación, todos los dispositivos de prueba van de ##min### (mínimo) a 240 (máximo) ms. » 61 % de todos los dispositivos son mejores. Eso quiere decir que el tiempo de respuesta es peor que la media (19.9 ms) de todos los dispositivos testados. | ||
| ↔ Tiempo de respuesta 50% Gris a 80% Gris | ||
| 45.6 ms ... subida ↗ y bajada ↘ combinada | ↗ 23.6 ms subida | 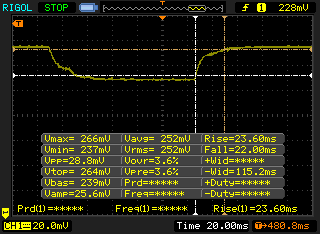 |
| ↘ 22 ms bajada | ||
| La pantalla mostró tiempos de respuesta lentos en nuestros tests y podría ser demasiado lenta para los jugones. En comparación, todos los dispositivos de prueba van de ##min### (mínimo) a 636 (máximo) ms. » 78 % de todos los dispositivos son mejores. Eso quiere decir que el tiempo de respuesta es peor que la media (31.1 ms) de todos los dispositivos testados. | ||
Parpadeo de Pantalla / PWM (Pulse-Width Modulation)
| Parpadeo de Pantalla / PWM detectado | 980 Hz | ≤ 99 % de brillo | 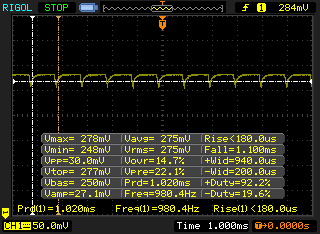 |
La retroiluminación del display parpadea a 980 Hz (seguramente usa PWM - Pulse-Width Modulation) a un brillo del 99 % e inferior. Sobre este nivel de brillo no debería darse parpadeo / PWM. La frecuencia de 980 Hz es bastante alta, por lo que la mayoría de gente sensible al parpadeo no debería ver parpadeo o tener fatiga visual. Comparación: 52 % de todos los dispositivos testados no usaron PWM para atenuar el display. Si se usó, medimos una media de 7798 (mínimo: 5 - máxmo: 343500) Hz. | |||
| Cinebench R15 | |
| CPU Single 64Bit (ordenar por valor) | |
| MSI GL72 6QF | |
| DogHouse Systems Mobius SS | |
| MSI GE62 2QC-468XPL | |
| Eurocom Shark 4 | |
| Lenovo IdeaPad Y50 | |
| CPU Multi 64Bit (ordenar por valor) | |
| MSI GL72 6QF | |
| DogHouse Systems Mobius SS | |
| MSI GE62 2QC-468XPL | |
| Eurocom Shark 4 | |
| Lenovo IdeaPad Y50 | |
| Cinebench R11.5 | |
| CPU Single 64Bit (ordenar por valor) | |
| MSI GL72 6QF | |
| DogHouse Systems Mobius SS | |
| MSI GE62 2QC-468XPL | |
| Eurocom Shark 4 | |
| Lenovo IdeaPad Y50 | |
| CPU Multi 64Bit (ordenar por valor) | |
| MSI GL72 6QF | |
| DogHouse Systems Mobius SS | |
| MSI GE62 2QC-468XPL | |
| Eurocom Shark 4 | |
| Lenovo IdeaPad Y50 | |
| wPrime 2.10 - 1024m (ordenar por valor) | |
| MSI GL72 6QF | |
| DogHouse Systems Mobius SS | |
| MSI GE62 2QC-468XPL | |
| Eurocom Shark 4 | |
| Lenovo IdeaPad Y50 | |
| Super Pi Mod 1.5 XS 32M - 32M (ordenar por valor) | |
| MSI GL72 6QF | |
| DogHouse Systems Mobius SS | |
| MSI GE62 2QC-468XPL | |
| Eurocom Shark 4 | |
| Lenovo IdeaPad Y50 | |
* ... más pequeño es mejor
| PCMark 8 Home Score Accelerated v2 | 3903 puntos | |
| PCMark 8 Creative Score Accelerated v2 | 4734 puntos | |
| PCMark 8 Work Score Accelerated v2 | 5090 puntos | |
ayuda | ||
| MSI GL72 6QF GeForce GTX 960M, 6700HQ, Samsung SSD 950 Pro 256GB m.2 NVMe | Asus GL771JW-T7082H GeForce GTX 960M, 4720HQ, Samsung SSD XP941 MZHPU256HCGL | MSI GE72-6QF8H11 GeForce GTX 970M, 6700HQ, Toshiba HG6 THNSNJ128G8NU | Acer Predator 17 G9-791-75PV GeForce GTX 970M, 6700HQ, Lite-On CV1-8B256 | MSI GT72S 6QF GeForce GTX 980 (Laptop), 6820HK, 2x Micron M600 MTFDDAV128MBF NVMe (RAID 0) | |
|---|---|---|---|---|---|
| AS SSD | -49% | -82% | -103% | 11% | |
| Copy Game MB/s (MB/s) | 1140 | 750 -34% | 267.3 -77% | 265.4 -77% | 1209 6% |
| Copy Program MB/s (MB/s) | 491.1 | 372.7 -24% | 163.4 -67% | 170.1 -65% | 543 11% |
| Copy ISO MB/s (MB/s) | 1520 | 749 -51% | 315.3 -79% | 339.2 -78% | 1944 28% |
| Score Total (Points) | 2340 | 1177 -50% | 892 -62% | 769 -67% | 2568 10% |
| Score Write (Points) | 501 | 354 -29% | 262 -48% | 285 -43% | 688 37% |
| Score Read (Points) | 1248 | 553 -56% | 424 -66% | 322 -74% | 1281 3% |
| Access Time Write * (ms) | 0.032 | 0.06 -88% | 0.06 -88% | 0.188 -488% | 0.039 -22% |
| Access Time Read * (ms) | 0.04 | 0.085 -113% | 0.17 -325% | 0.111 -178% | 0.051 -27% |
| 4K-64 Write (MB/s) | 296.4 | 216.2 -27% | 161 -46% | 218.5 -26% | 462.6 56% |
| 4K-64 Read (MB/s) | 998 | 419 -58% | 352 -65% | 259 -74% | 984 -1% |
| 4K Write (MB/s) | 115.2 | 65.1 -43% | 70.8 -39% | 33.45 -71% | 97.8 -15% |
| 4K Read (MB/s) | 46.38 | 23.79 -49% | 21 -55% | 15.09 -67% | 42.98 -7% |
| Seq Write (MB/s) | 897 | 728 -19% | 458.1 -49% | 332.9 -63% | 1279 43% |
| Seq Read (MB/s) | 2039 | 1107 -46% | 509 -75% | 483.6 -76% | 2544 25% |
* ... más pequeño es mejor

| 3DMark 11 Performance | 6161 puntos | |
| 3DMark Ice Storm Standard Score | 94088 puntos | |
| 3DMark Cloud Gate Standard Score | 17891 puntos | |
| 3DMark Fire Strike Score | 4340 puntos | |
| 3DMark Fire Strike Extreme Score | 2169 puntos | |
ayuda | ||
| Rise of the Tomb Raider | |
| 1920x1080 High Preset AA:FX AF:4x | |
| DogHouse Systems Mobius SS | |
| Gigabyte P55W v5 | |
| MSI GL72 6QF | |
| Dell XPS 15 9550 i7 FHD | |
| Asus N552VX-FY103T | |
| 1920x1080 Very High Preset AA:FX AF:16x | |
| DogHouse Systems Mobius SS | |
| Gigabyte P55W v5 | |
| MSI GL72 6QF | |
| Dell XPS 15 9550 i7 FHD | |
| BioShock Infinite | |
| 1366x768 High Preset | |
| DogHouse Systems Mobius SS | |
| Gigabyte P55W v5 | |
| MSI GL72 6QF | |
| Dell XPS 15 9550 i7 FHD | |
| Asus N552VX-FY103T | |
| 1920x1080 Ultra Preset, DX11 (DDOF) | |
| DogHouse Systems Mobius SS | |
| Gigabyte P55W v5 | |
| MSI GL72 6QF | |
| Dell XPS 15 9550 i7 FHD | |
| Asus N552VX-FY103T | |
| Metro: Last Light | |
| 1366x768 High (DX11) AF:16x | |
| DogHouse Systems Mobius SS | |
| MSI GL72 6QF | |
| Dell XPS 15 9550 i7 FHD | |
| 1920x1080 Very High (DX11) AF:16x | |
| DogHouse Systems Mobius SS | |
| MSI GL72 6QF | |
| Dell XPS 15 9550 i7 FHD | |
| Fallout 4 | |
| 1920x1080 High Preset AA:T AF:16x | |
| DogHouse Systems Mobius SS | |
| MSI GL72 6QF | |
| Dell XPS 15 9550 i7 FHD | |
| 1920x1080 Ultra Preset AA:T AF:16x | |
| DogHouse Systems Mobius SS | |
| MSI GL72 6QF | |
| Dell XPS 15 9550 i7 FHD | |
| bajo | medio | alto | ultra | |
|---|---|---|---|---|
| BioShock Infinite (2013) | 133.5 | 120.2 | 49.9 | |
| Metro: Last Light (2013) | 109.4 | 79 | 34.3 | |
| Thief (2014) | 69.3 | 58.8 | 29.7 | |
| Batman: Arkham Knight (2015) | 65 | 33 | ||
| Fallout 4 (2015) | 59.2 | 33.6 | 26.4 | |
| Rise of the Tomb Raider (2016) | 64.8 | 34.6 | 25.6 |
| MSI GL72 6QF GeForce GTX 960M, 6700HQ, Samsung SSD 950 Pro 256GB m.2 NVMe | Asus G771JM-T7025H GeForce GTX 860M, 4710HQ, HGST Travelstar 7K1000 HTS721075A9E630 | MSI GE72-6QF8H11 GeForce GTX 970M, 6700HQ, Toshiba HG6 THNSNJ128G8NU | Acer Predator 17 G9-791-75PV GeForce GTX 970M, 6700HQ, Lite-On CV1-8B256 | Acer Aspire V Nitro Black Edition VN7-792G-74Q4 GeForce GTX 960M, 6700HQ, Toshiba MQ02ABD100H | Lenovo Ideapad Y700-17 80QK7709PB GeForce GTX 960M, 6700HQ, Samsung SSD 850 EVO 500GB | |
|---|---|---|---|---|---|---|
| Noise | 11% | 7% | -1% | 5% | 5% | |
| apagado / medio ambiente * (dB) | 29.3 | |||||
| Idle Minimum * (dB) | 35.3 | 30.9 12% | 30 15% | 32 9% | 32.6 8% | 31.4 11% |
| Idle Average * (dB) | 35.4 | 31.3 12% | 30.2 15% | 33 7% | 32.6 8% | 31.4 11% |
| Idle Maximum * (dB) | 35.4 | 32.3 9% | 33 7% | 37 -5% | 33.4 6% | 34.3 3% |
| Load Average * (dB) | 40.9 | 37.3 9% | 40.4 1% | 44 -8% | 36.5 11% | 41.3 -1% |
| Load Maximum * (dB) | 45 | 39.5 12% | 46.2 -3% | 49 -9% | 48 -7% | 44 2% |
* ... más pequeño es mejor
Ruido
| Ocioso |
| 35.3 / 35.4 / 35.4 dB(A) |
| DVD |
| 39.9 / dB(A) |
| Carga |
| 40.9 / 45 dB(A) |
 | ||
30 dB silencioso 40 dB(A) audible 50 dB(A) ruidosamente alto |
||
min: | ||
(-) La temperatura máxima en la parte superior es de 47.2 °C / 117 F, frente a la media de 40.4 °C / 105 F, que oscila entre 21.2 y 68.8 °C para la clase Gaming.
(-) El fondo se calienta hasta un máximo de 49 °C / 120 F, frente a la media de 43.2 °C / 110 F
(+) En reposo, la temperatura media de la parte superior es de 24.4 °C / 76# F, frente a la media del dispositivo de 33.9 °C / 93 F.
(±) El reposamanos y el touchpad pueden calentarse mucho al tacto con un máximo de 38.6 °C / 101.5 F.
(-) La temperatura media de la zona del reposamanos de dispositivos similares fue de 28.8 °C / 83.8 F (-9.8 °C / -17.7 F).
| MSI GL72 6QF GeForce GTX 960M, 6700HQ, Samsung SSD 950 Pro 256GB m.2 NVMe | Asus GL771JW-T7082H GeForce GTX 960M, 4720HQ, Samsung SSD XP941 MZHPU256HCGL | MSI GE72-6QF8H11 GeForce GTX 970M, 6700HQ, Toshiba HG6 THNSNJ128G8NU | Acer Predator 17 G9-791-75PV GeForce GTX 970M, 6700HQ, Lite-On CV1-8B256 | Acer Aspire V Nitro Black Edition VN7-792G-74Q4 GeForce GTX 960M, 6700HQ, Toshiba MQ02ABD100H | Lenovo Ideapad Y700-17 80QK7709PB GeForce GTX 960M, 6700HQ, Samsung SSD 850 EVO 500GB | |
|---|---|---|---|---|---|---|
| Power Consumption | 28% | 4% | 17% | 41% | 28% | |
| Idle Minimum * (Watt) | 22.1 | 8.8 60% | 16.7 24% | 11 50% | 5.8 74% | 4.3 81% |
| Idle Average * (Watt) | 28.3 | 14.8 48% | 23 19% | 17 40% | 9 68% | 13.8 51% |
| Idle Maximum * (Watt) | 29.8 | 24.3 18% | 31.7 -6% | 22 26% | 14.7 51% | 19.8 34% |
| Load Average * (Watt) | 87 | 88.8 -2% | 97.4 -12% | 96 -10% | 85 2% | 115.9 -33% |
| Load Maximum * (Watt) | 134.1 | 111.2 17% | 141.4 -5% | 164 -22% | 121.5 9% | 123.5 8% |
* ... más pequeño es mejor
| Off / Standby | |
| Ocioso | |
| Carga |
|
Clave:
min: | |
| MSI GL72 6QF 43 Wh | Asus GL771JW-T7082H 56 Wh | MSI GE72-6QF8H11 51 Wh | Acer Predator 17 G9-791-75PV 88 Wh | Acer Aspire V Nitro Black Edition VN7-792G-74Q4 53 Wh | Lenovo Ideapad Y700 17ISK 80Q0 60 Wh | |
|---|---|---|---|---|---|---|
| Duración de Batería | 110% | 31% | 169% | 88% | 150% | |
| Reader / Idle (h) | 4 | 10 150% | 6.7 68% | 11.7 193% | 6.8 70% | 11.5 188% |
| WiFi v1.3 (h) | 1.8 | 4.5 150% | 2.6 44% | 6 233% | 4.2 133% | 5.6 211% |
| Load (h) | 1 | 1.3 30% | 0.8 -20% | 1.8 80% | 1.6 60% | 1.5 50% |
Pro
Contra

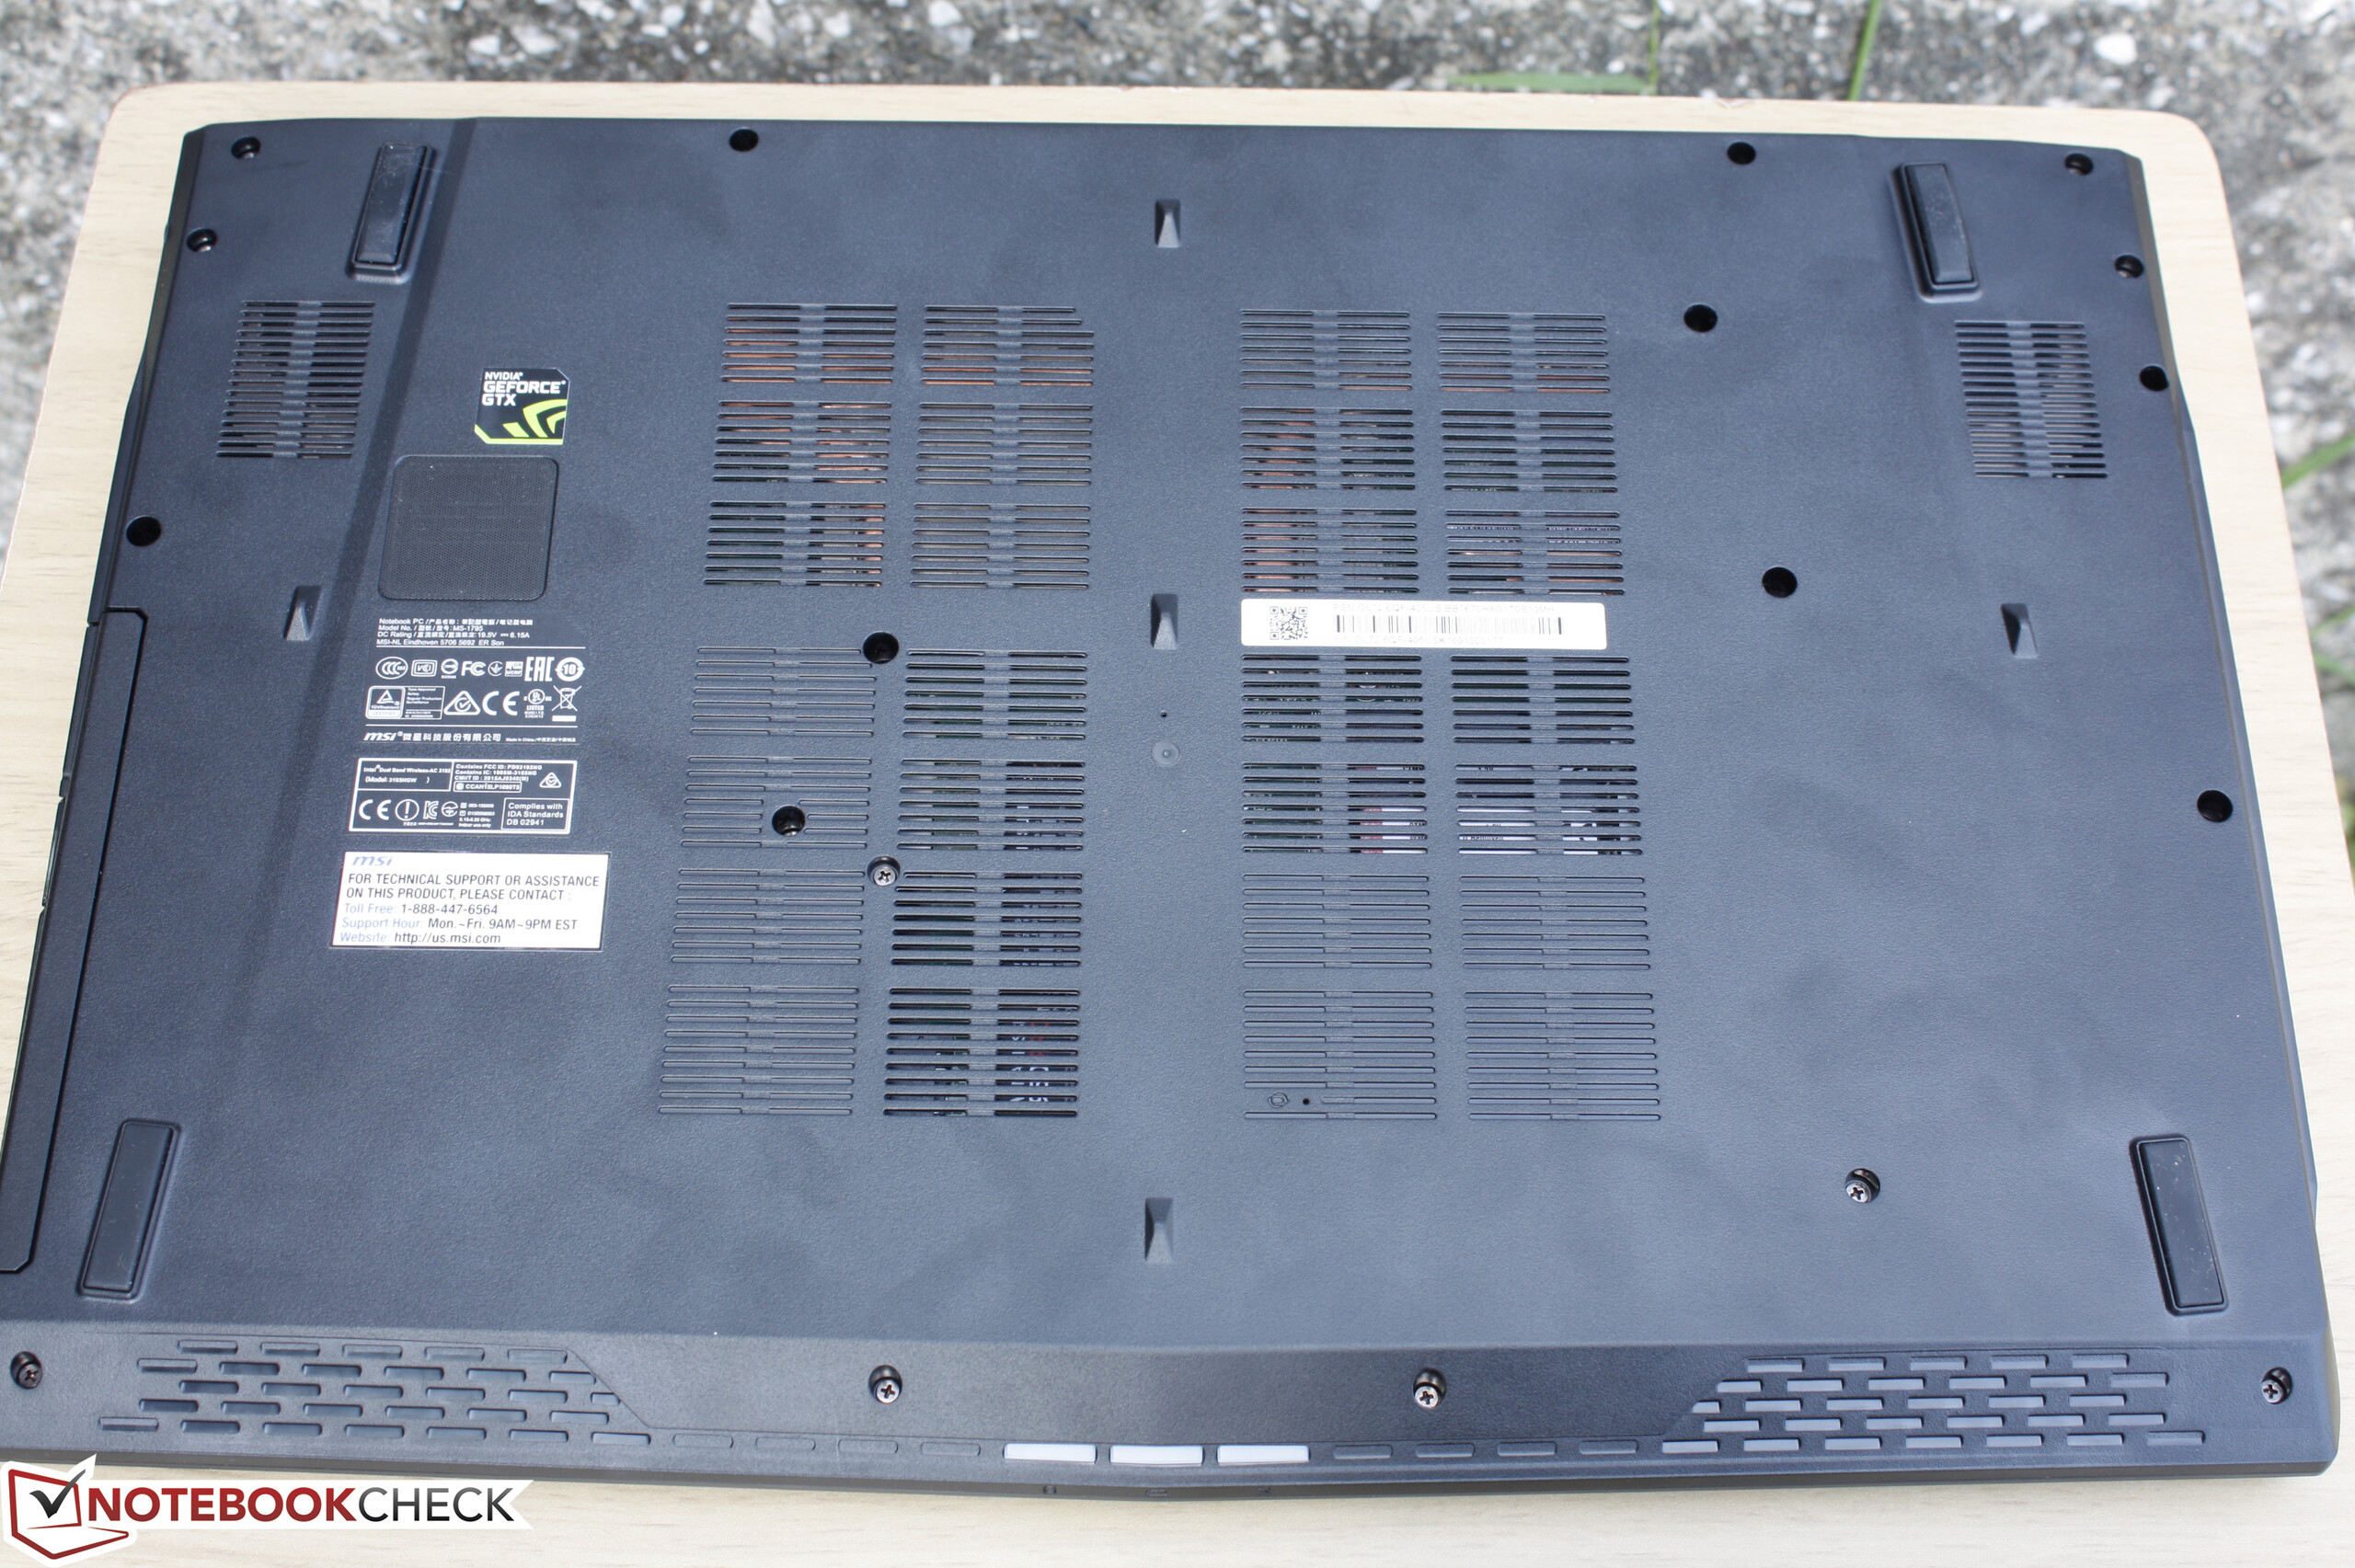
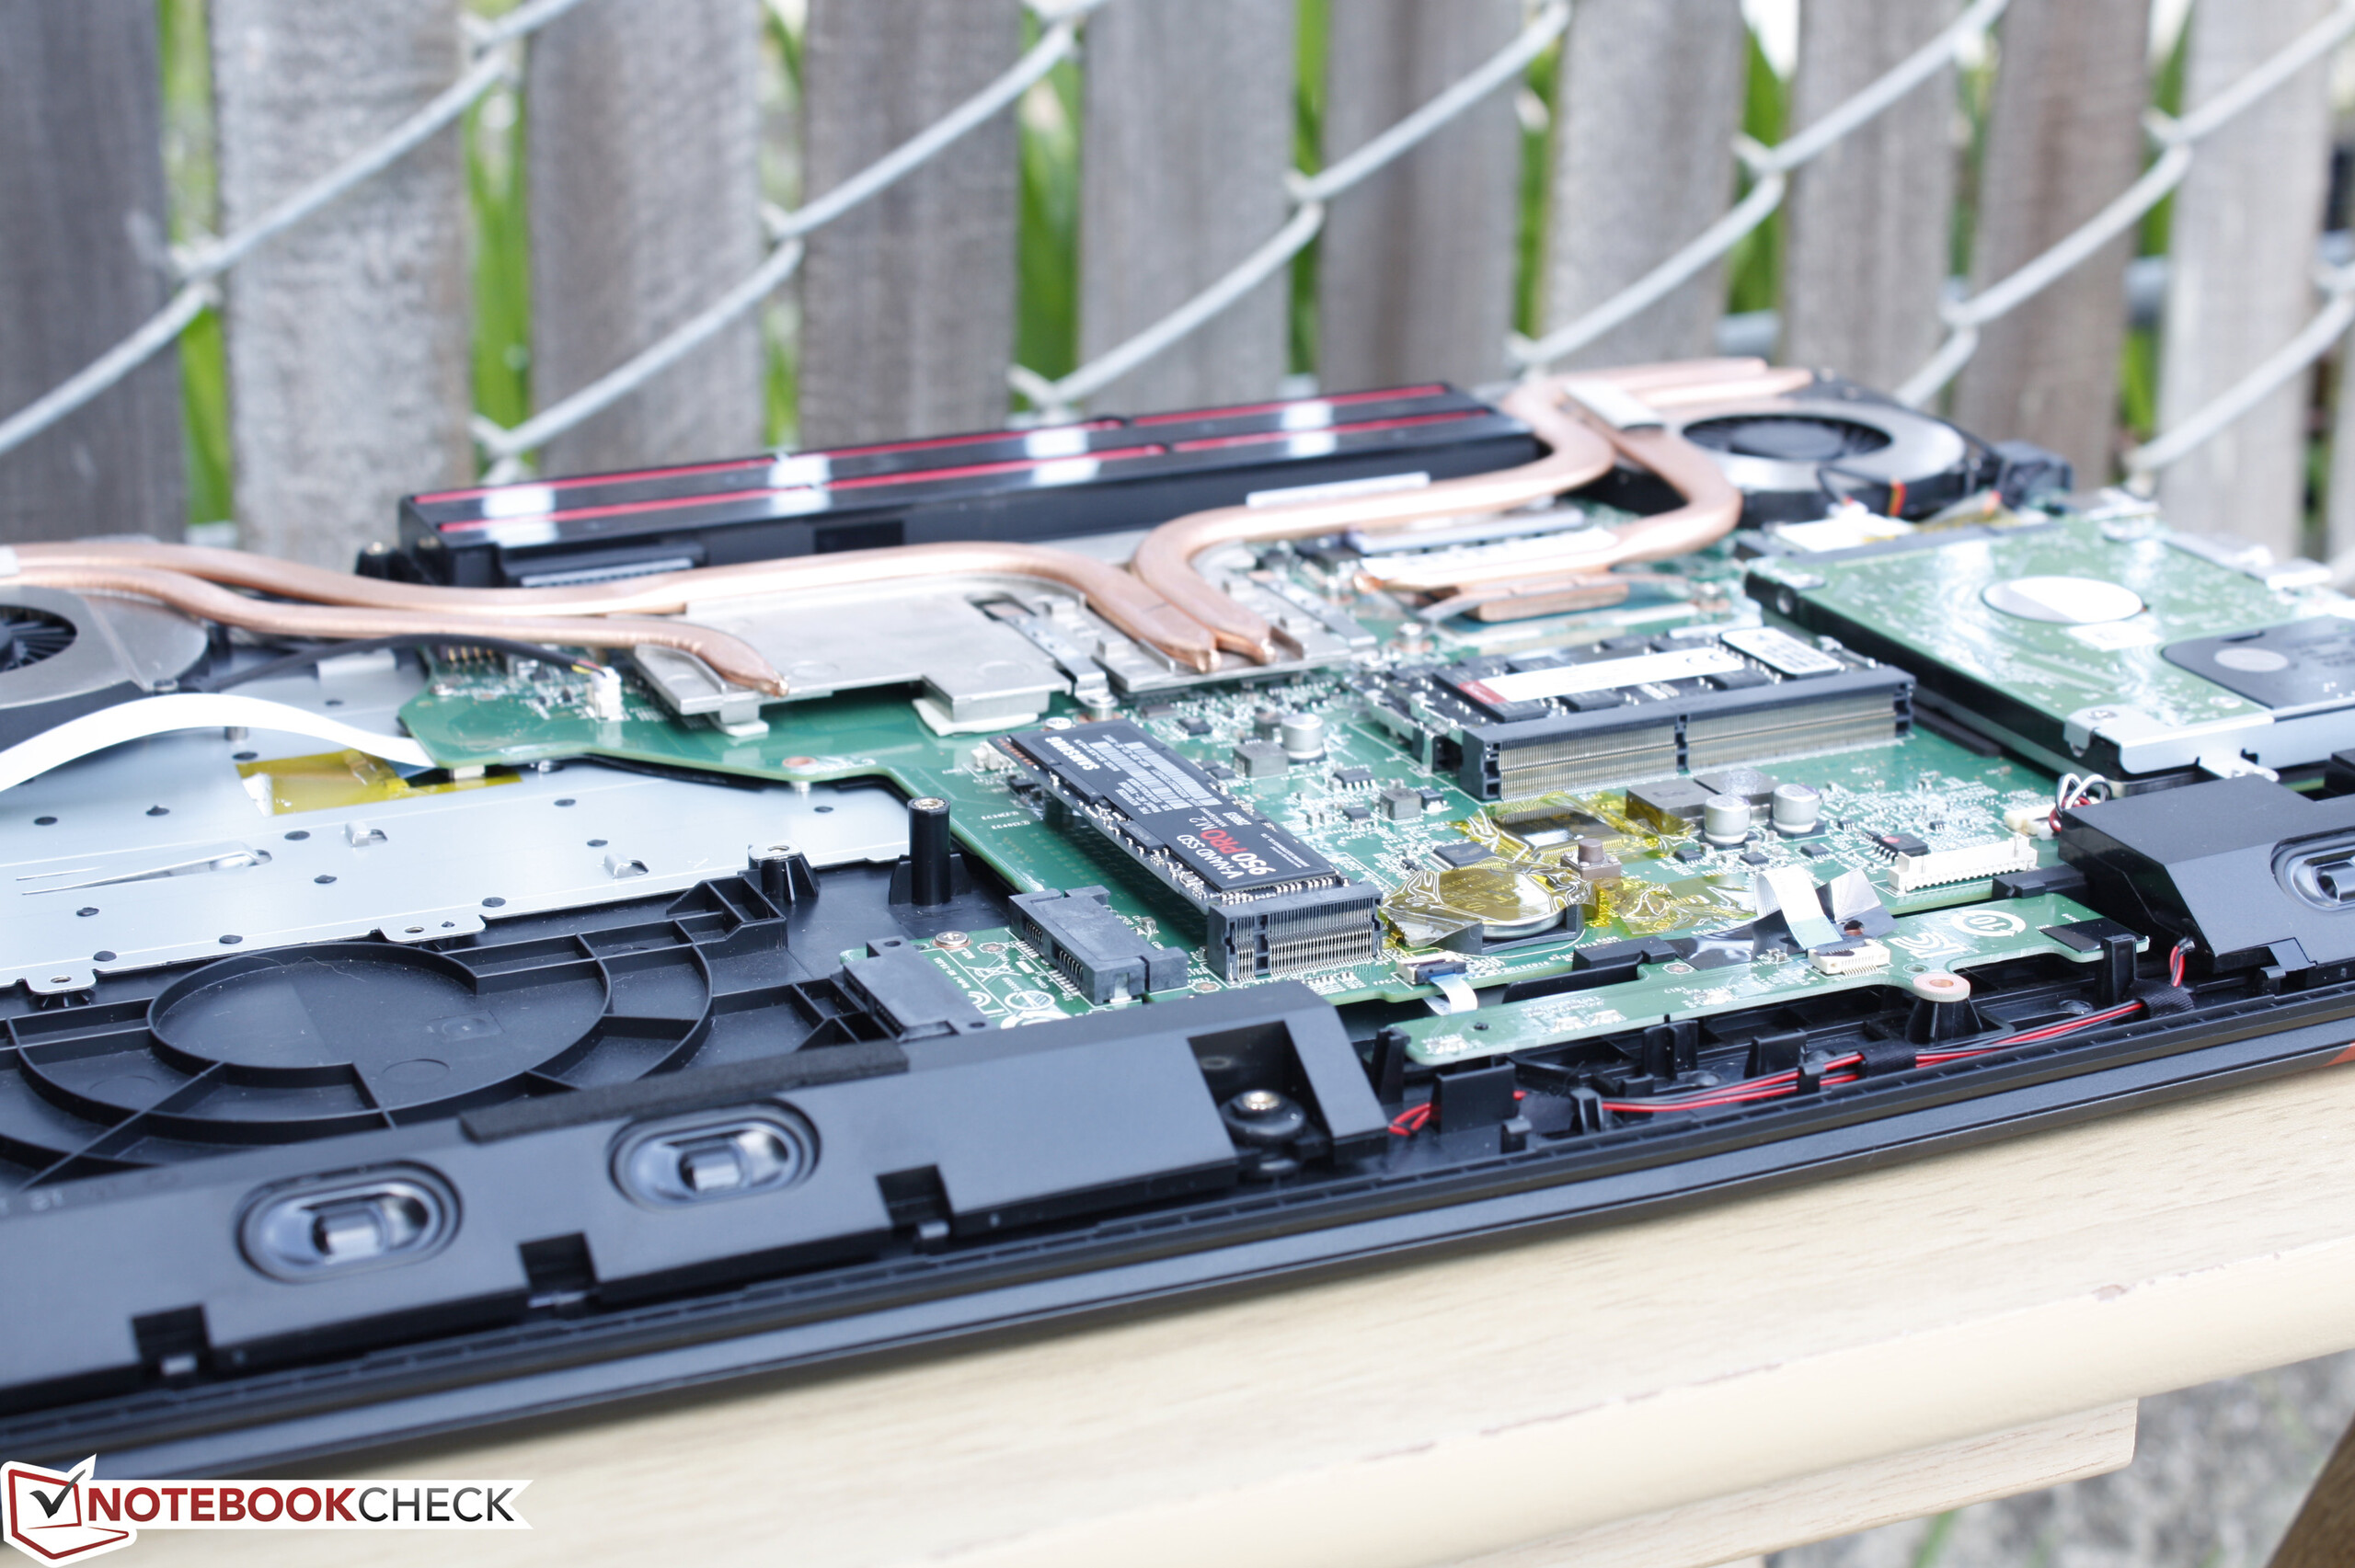
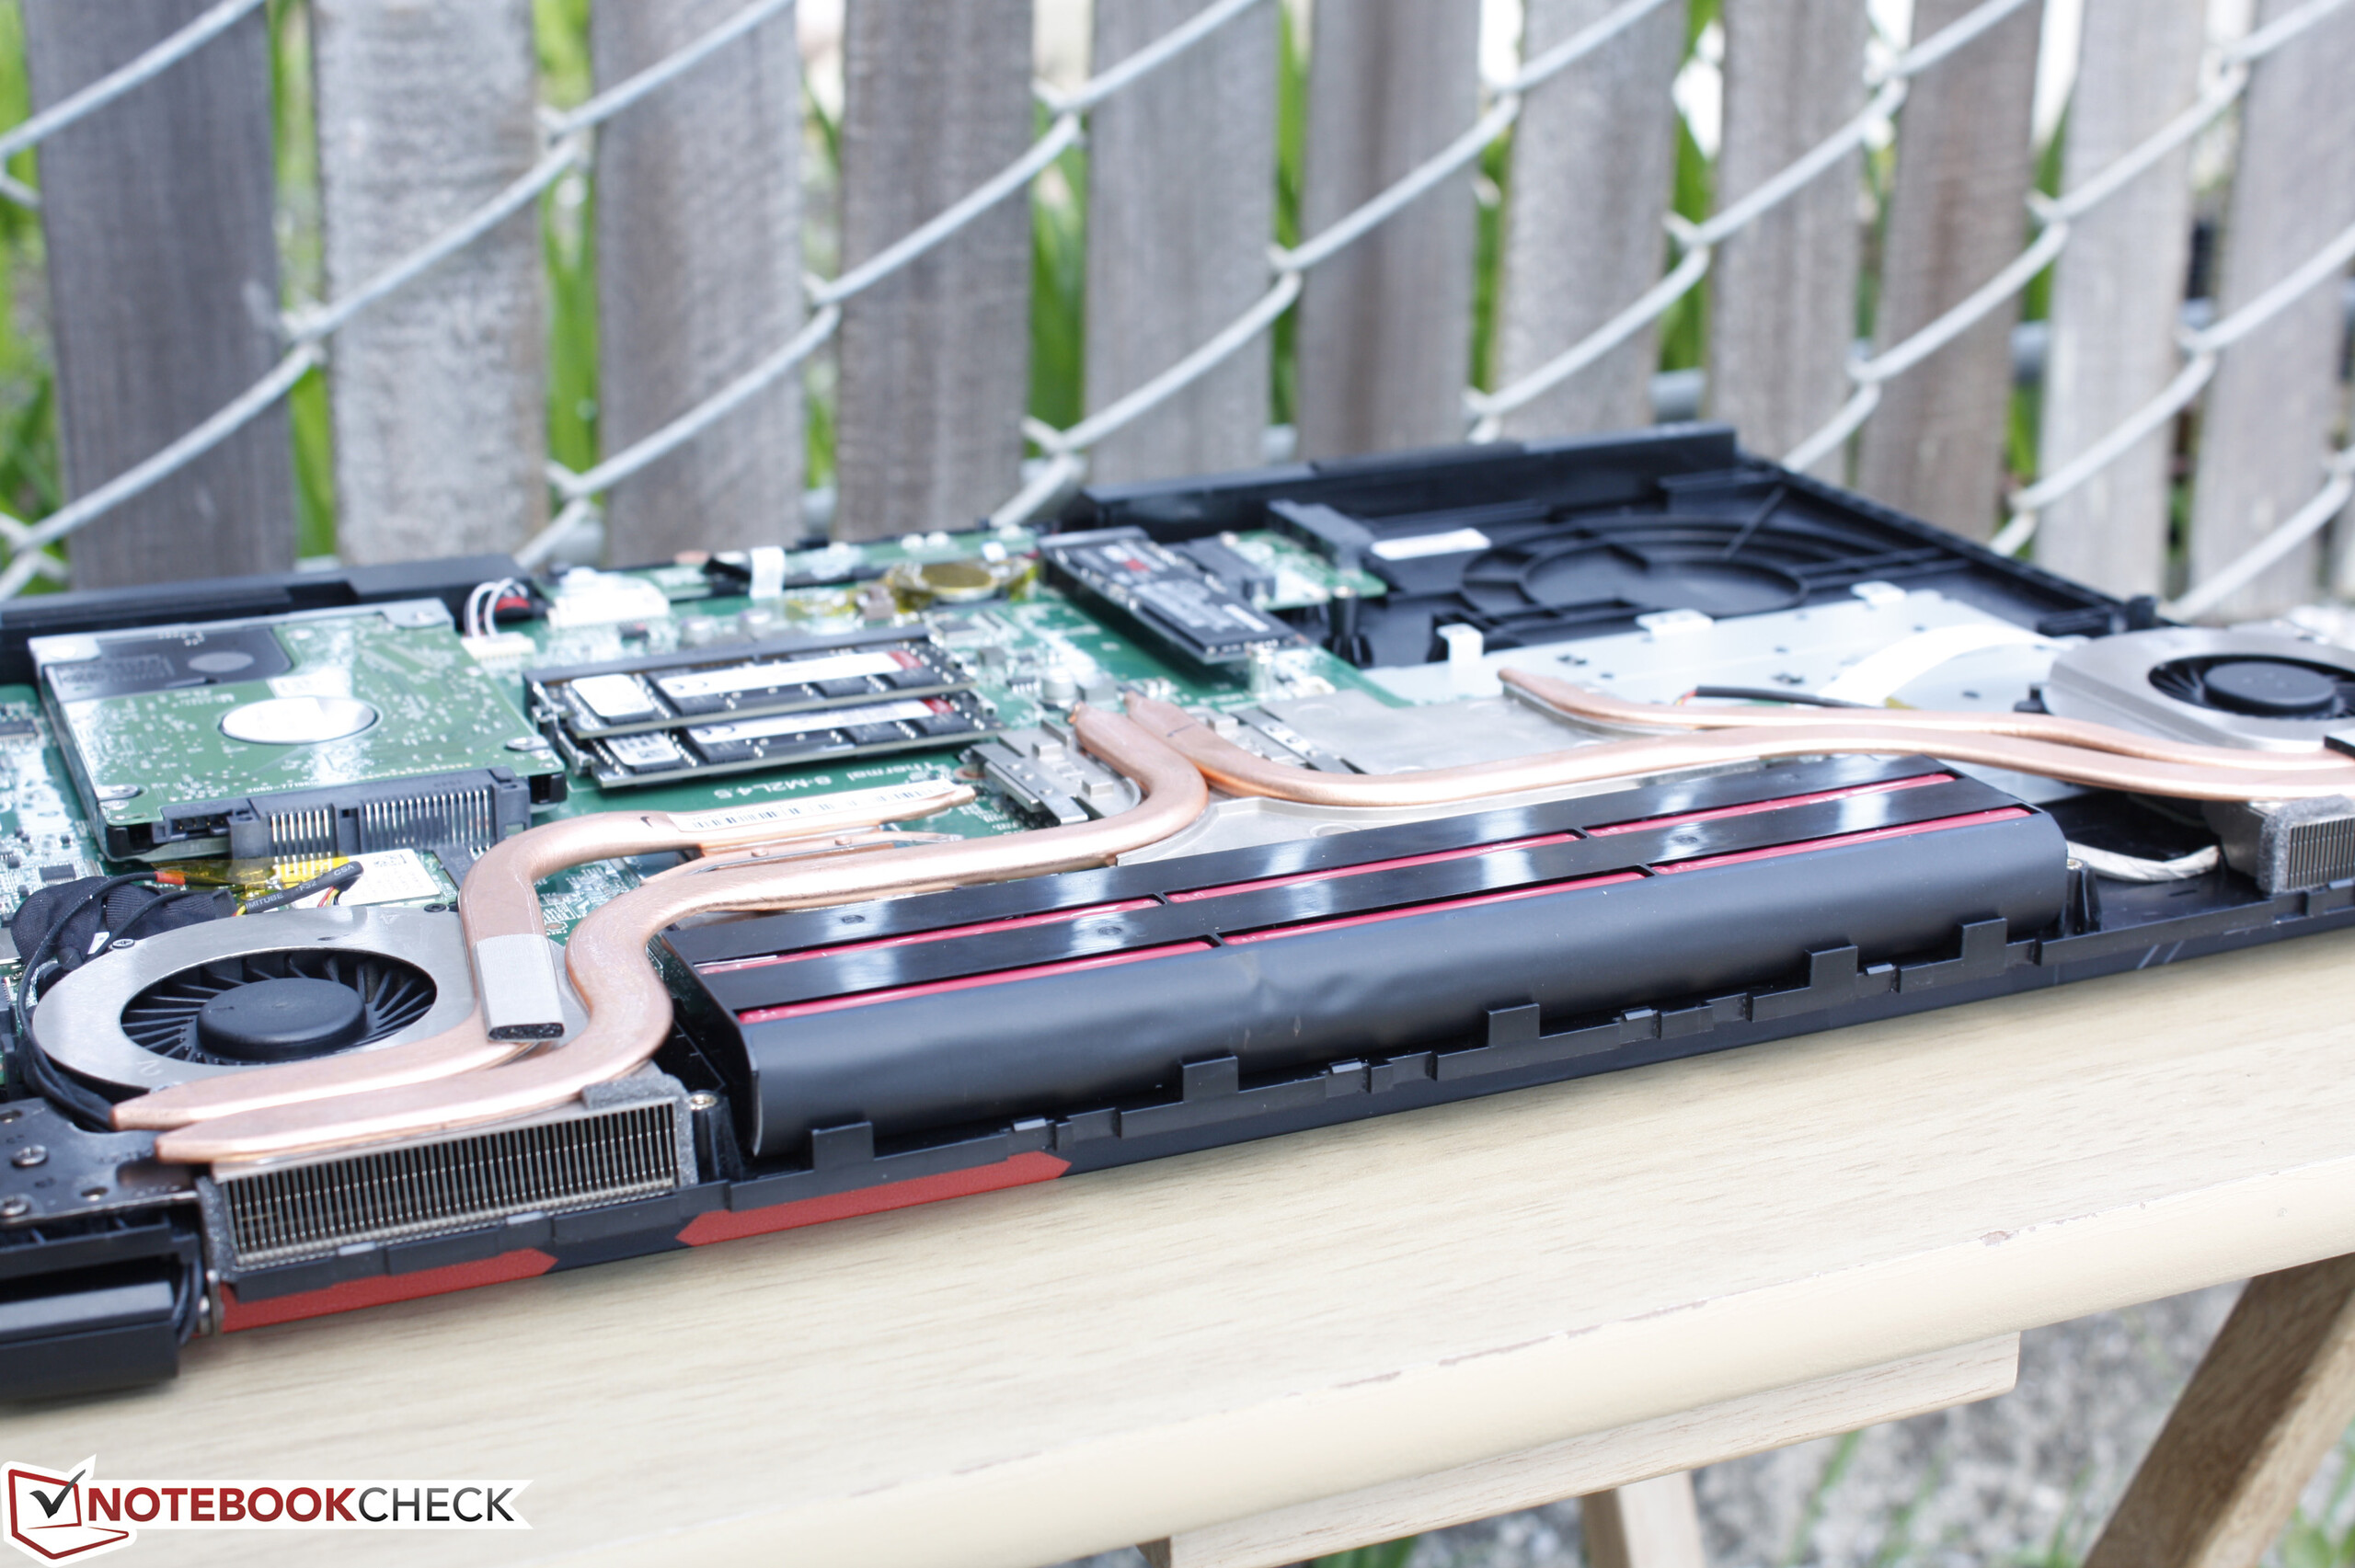
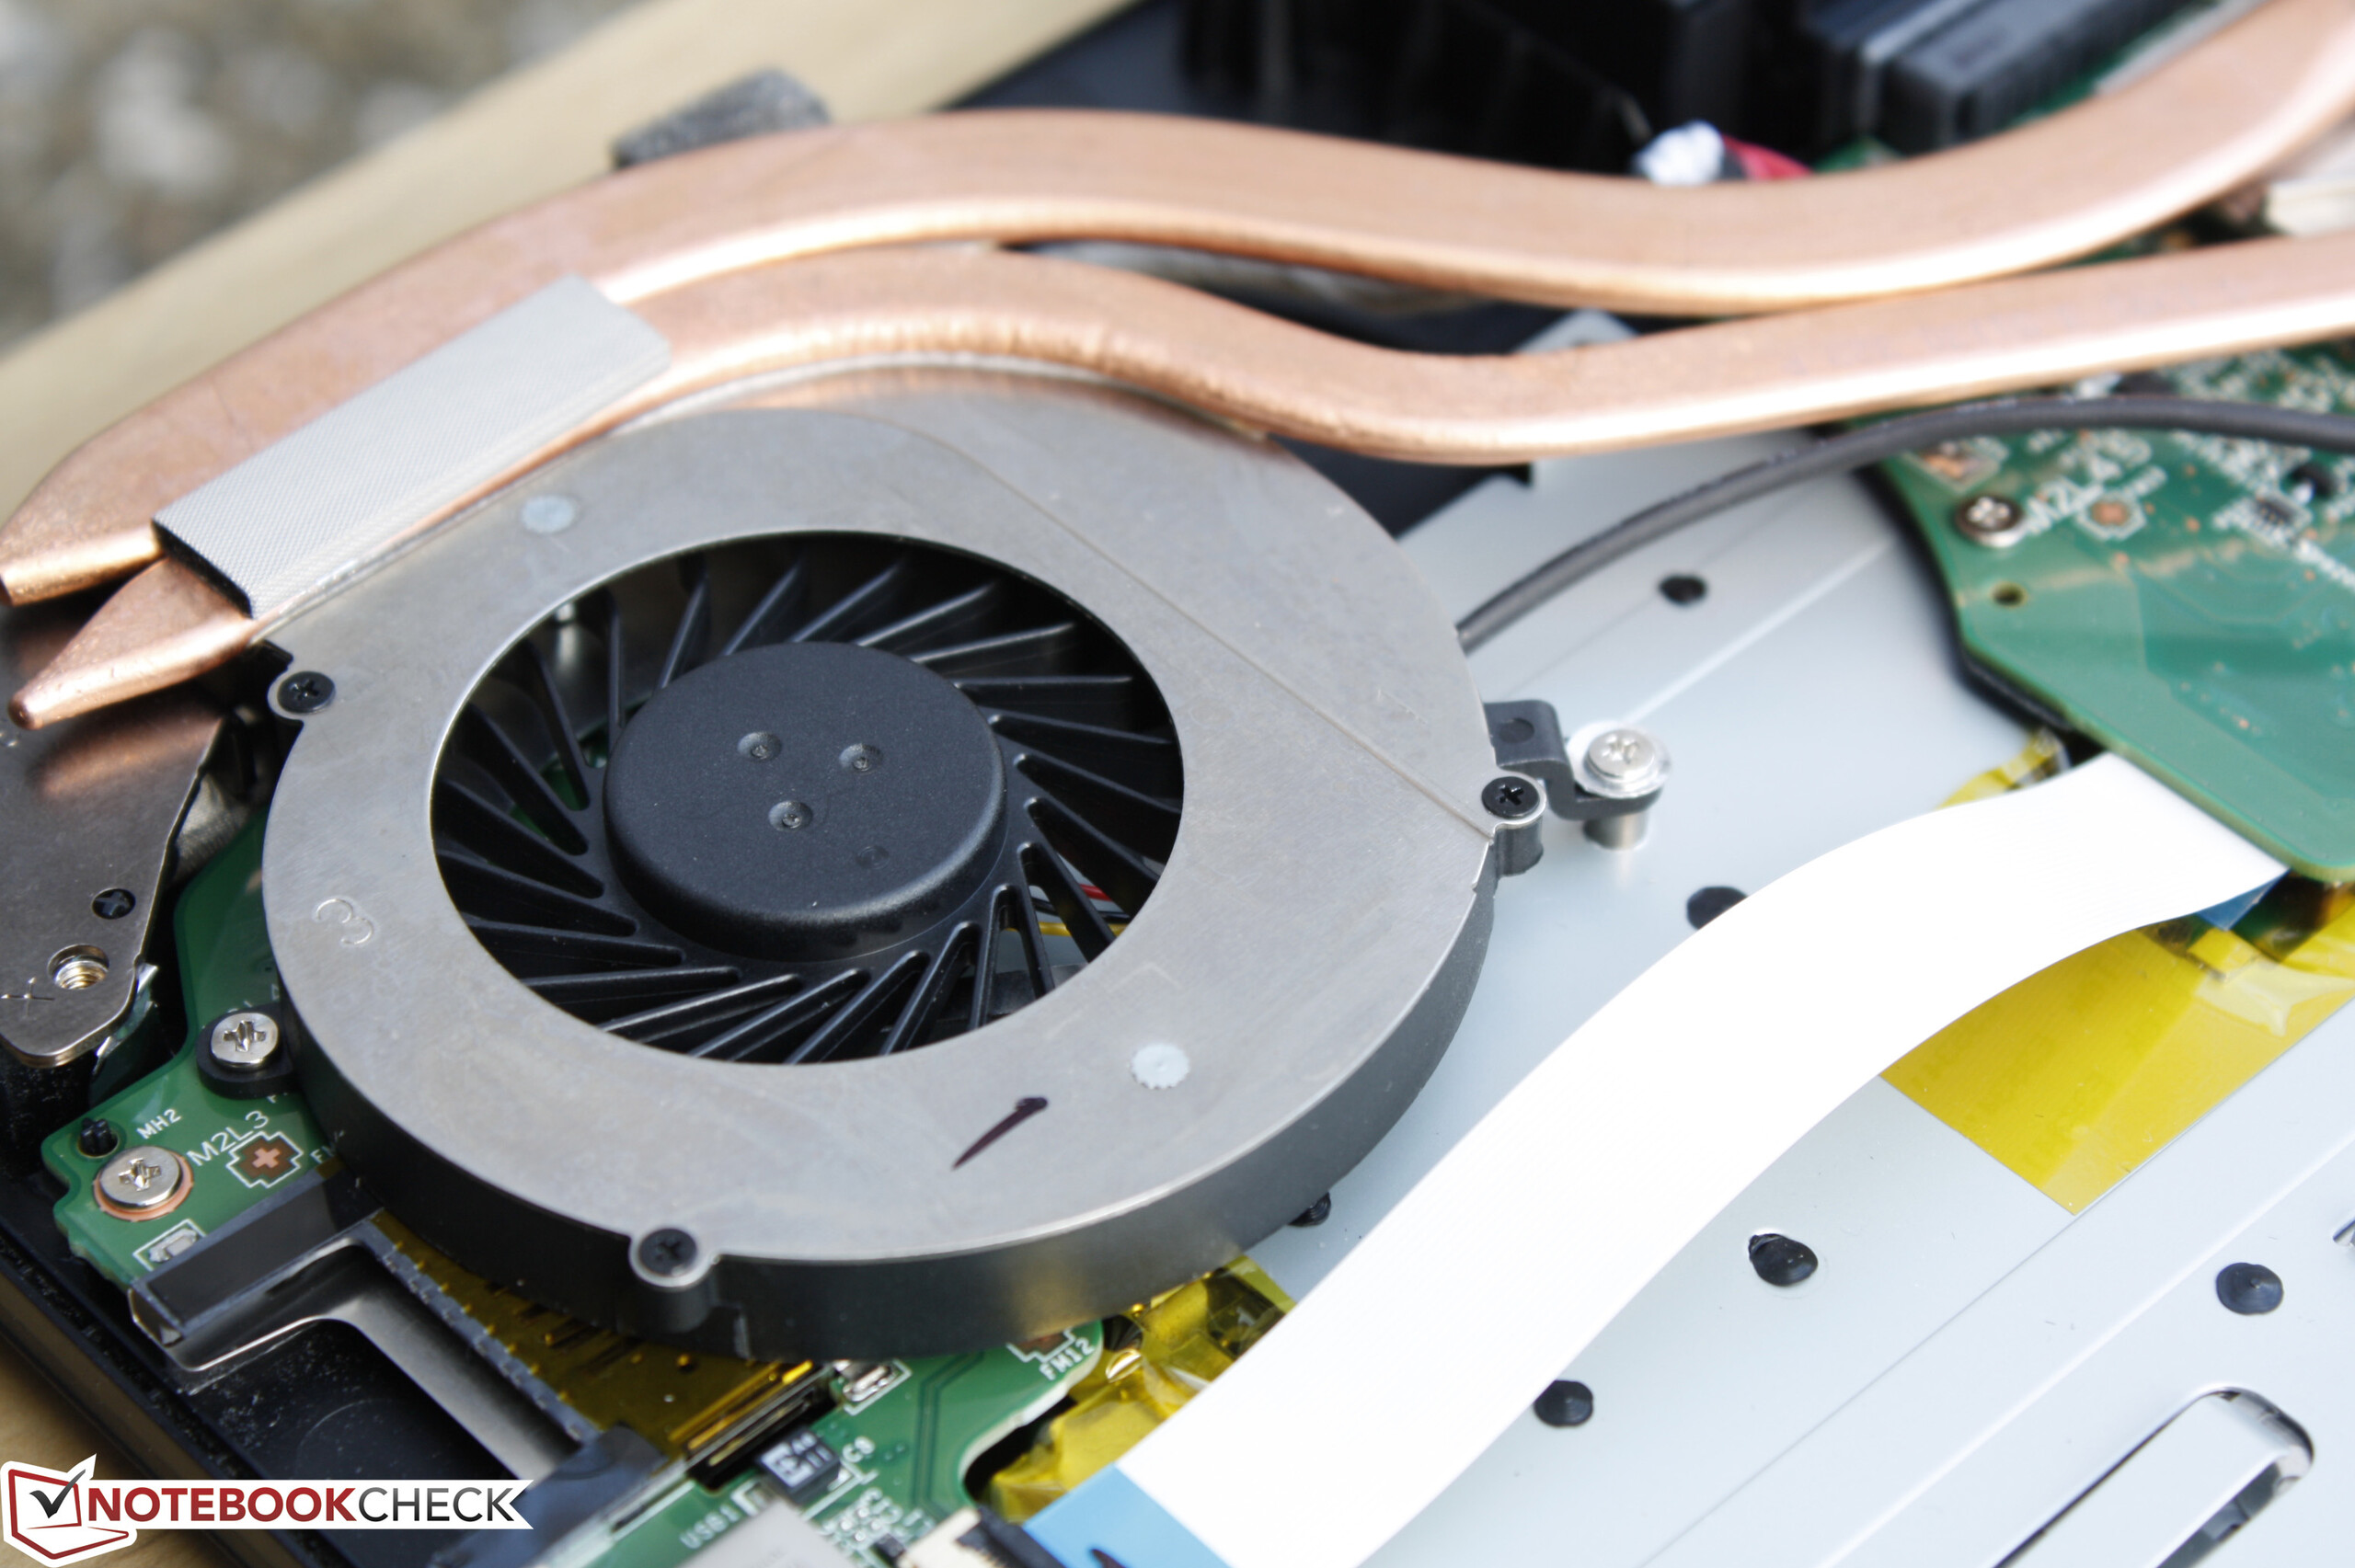
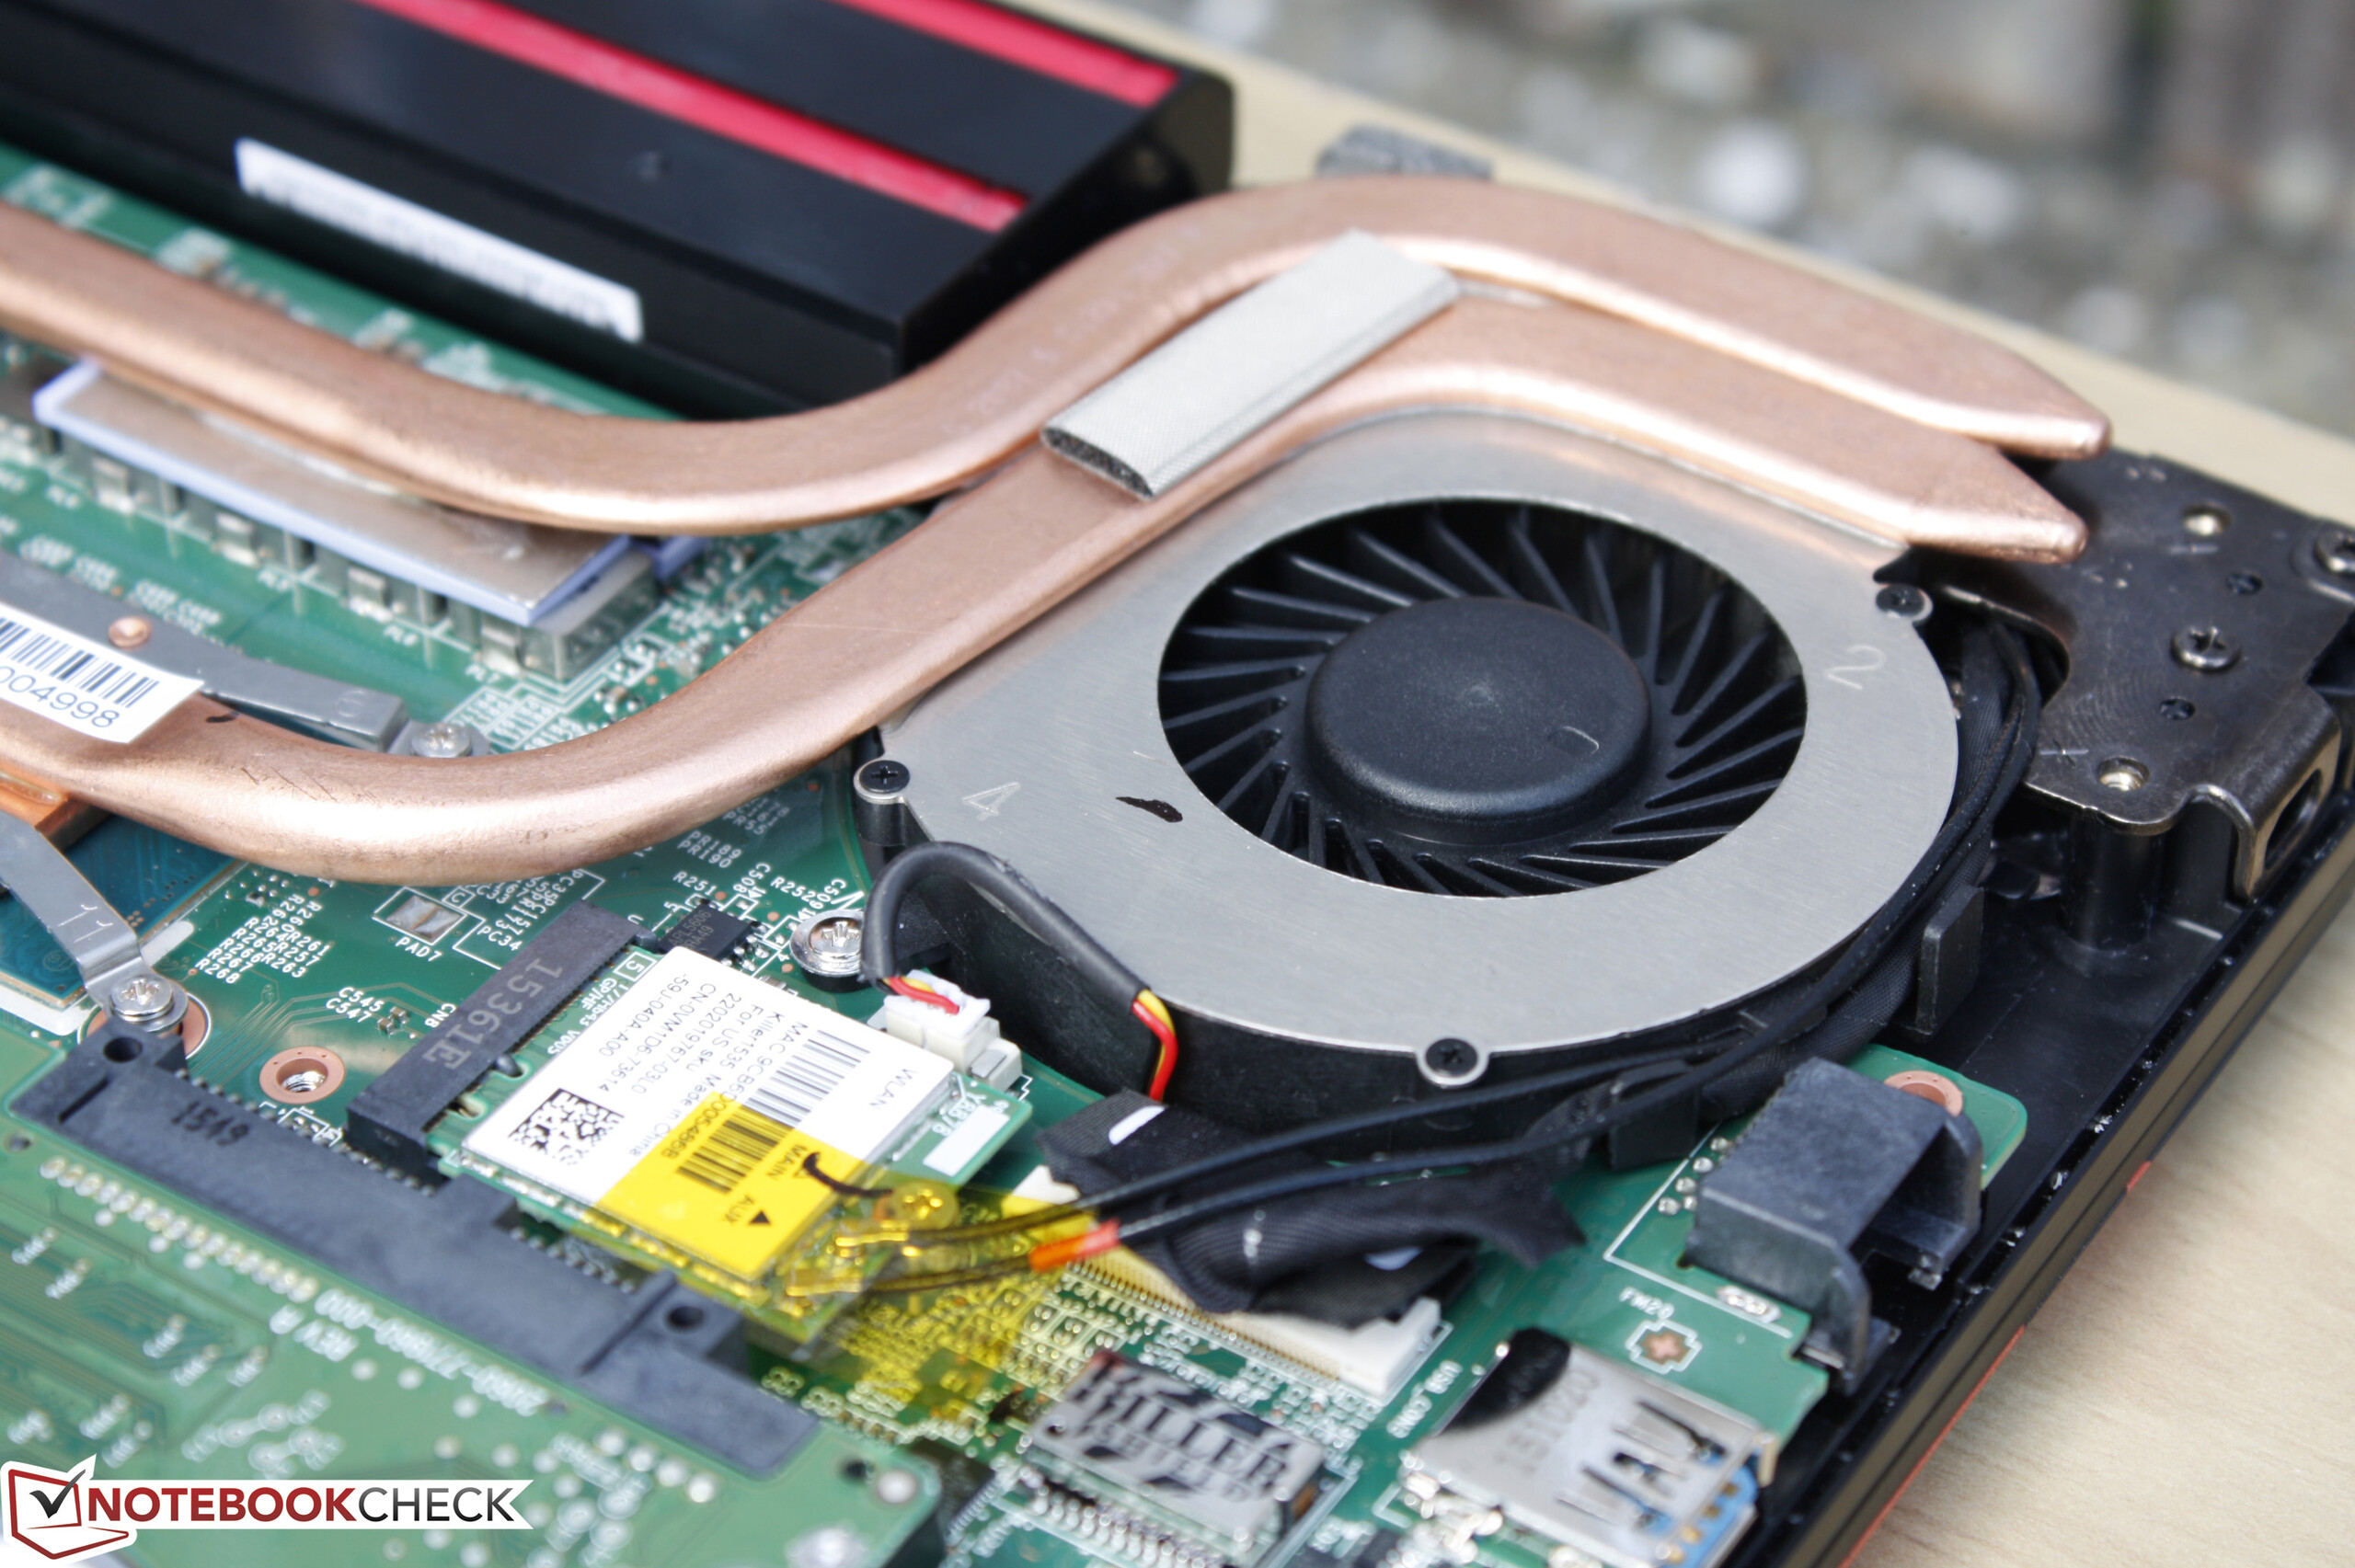
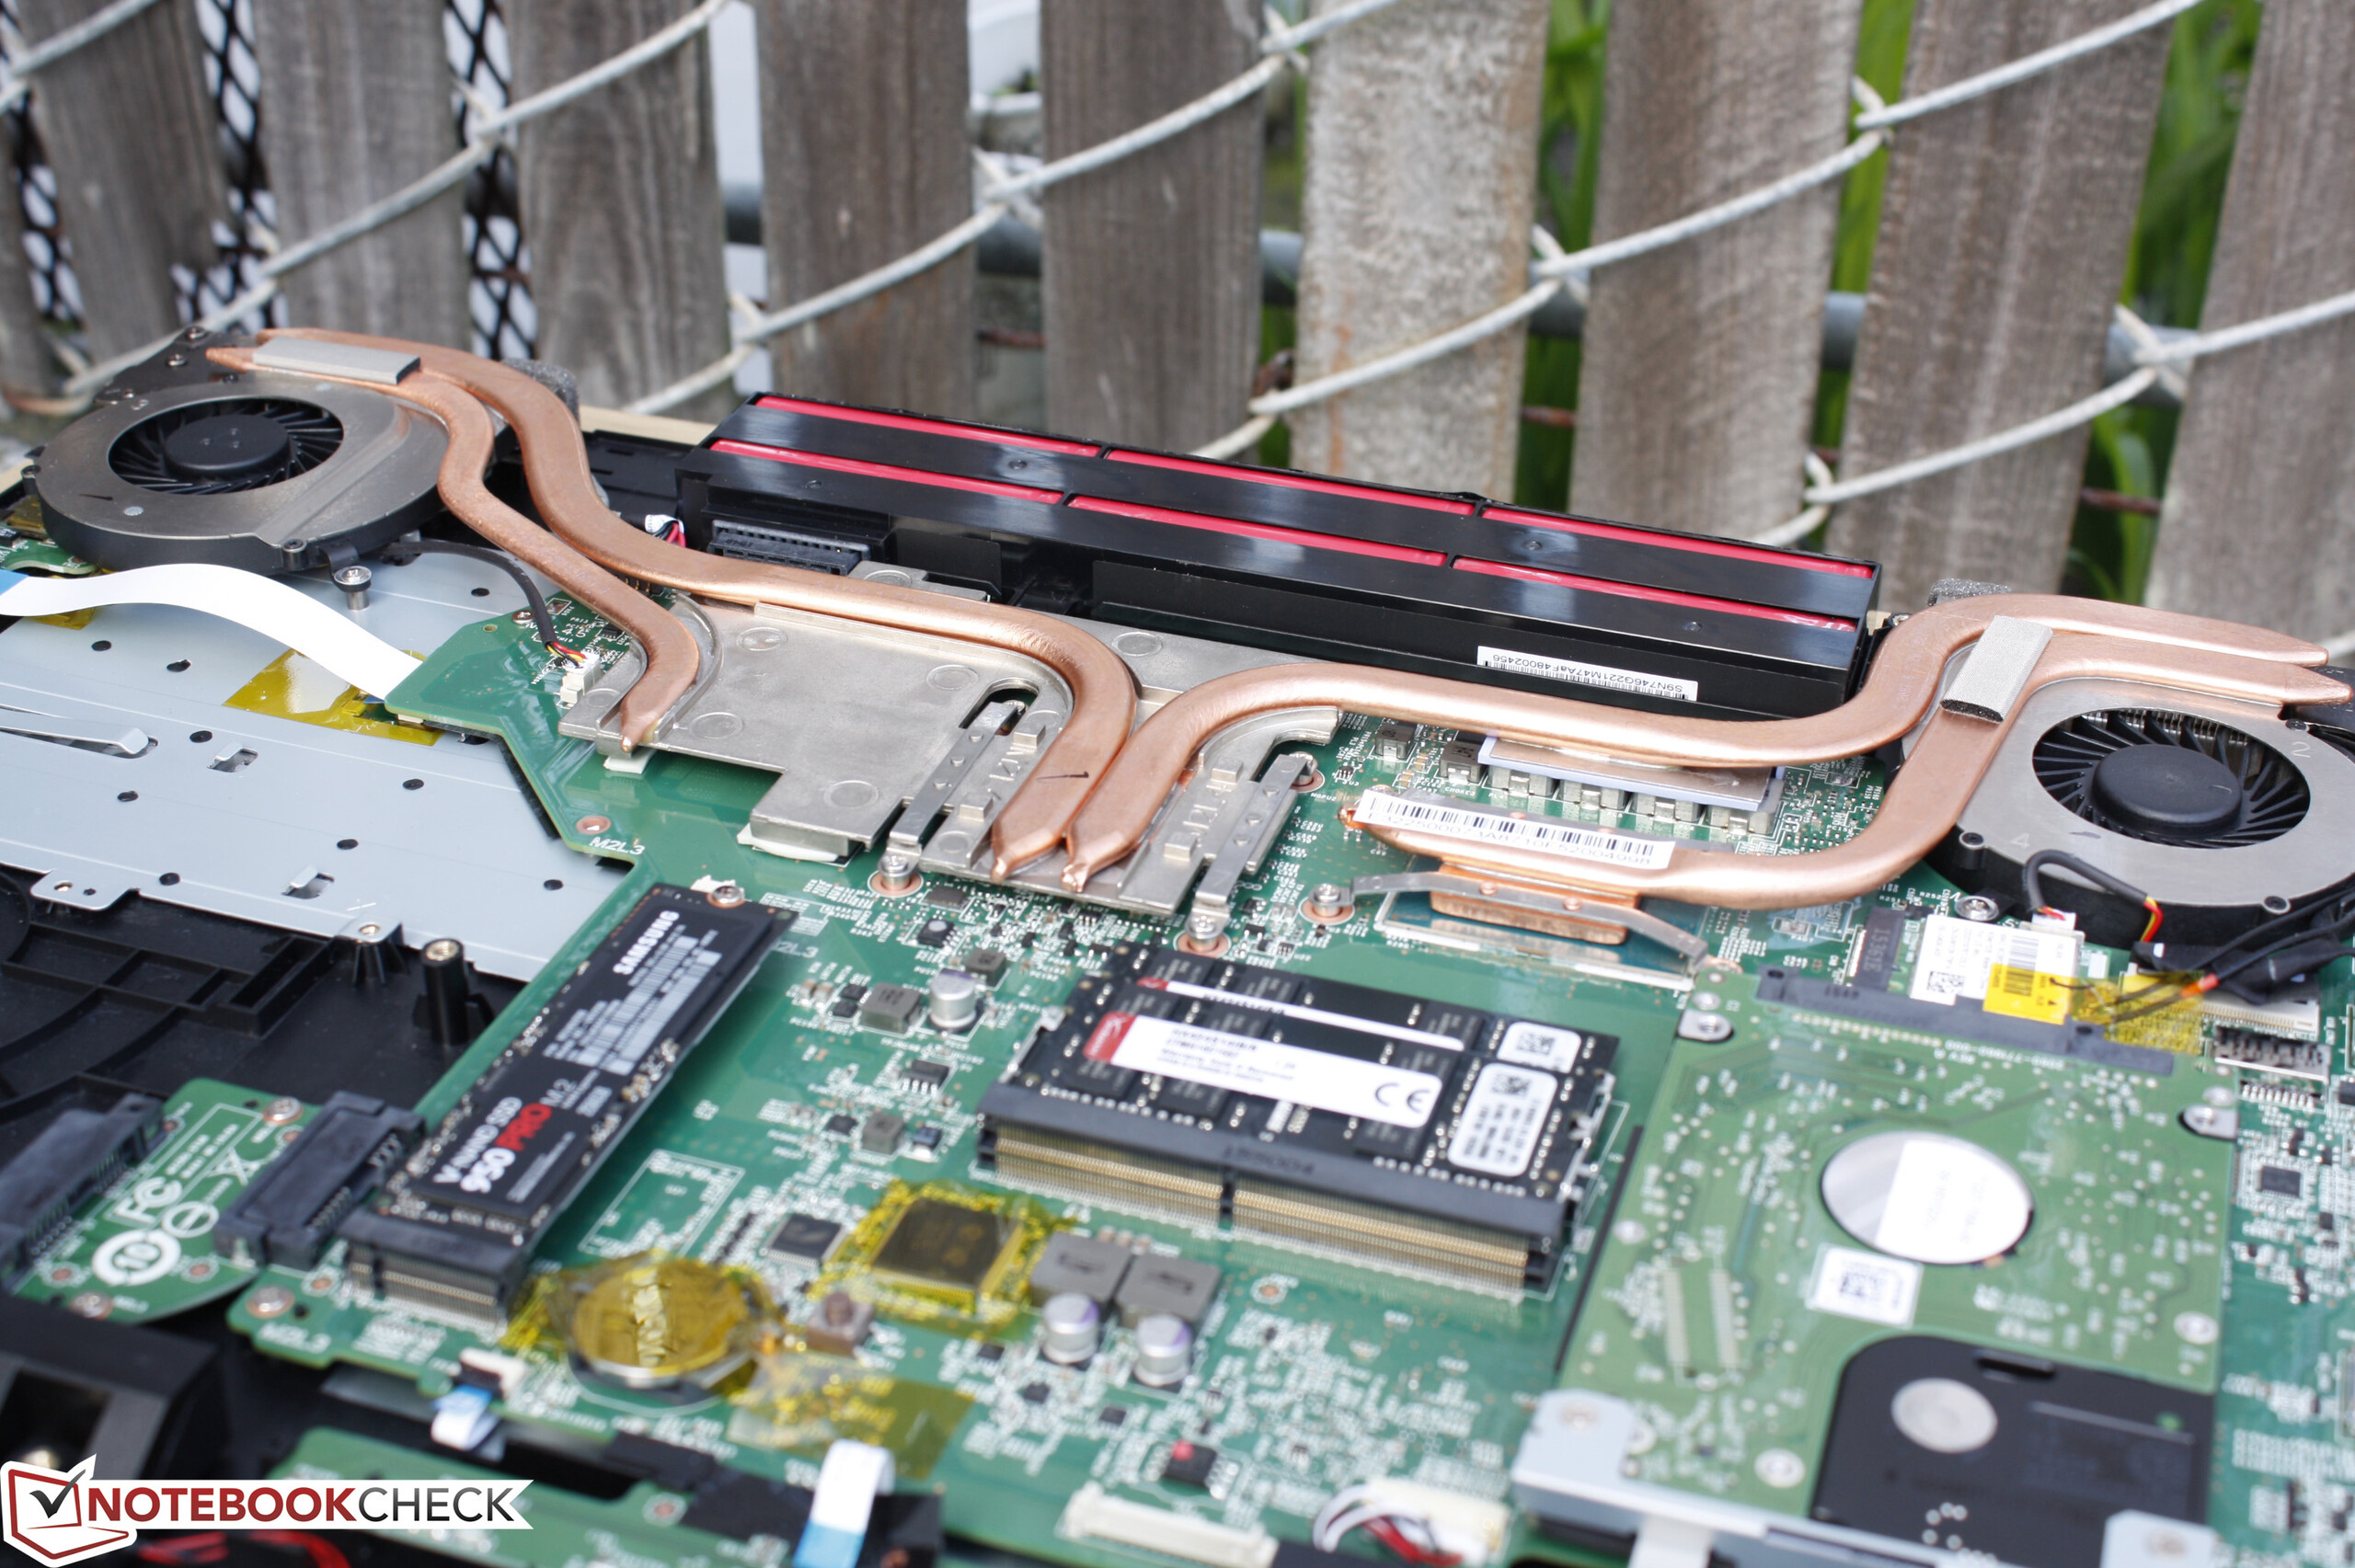
La ventaja clave del MSI GL72 yace en su precio inicial de casi $1000. Dado este precio, los usuarios se llevan una potente CPU Core i7-6700HQ, GPU GTX 960M, SSD NVMe, unidad óptica modular y entrañas accesibles en general para reparaciones o mejora básica del almacenamiento o la RAM. Las temperaturas internas y el rendimiento son excelentes para los títulos actuales a 1080p y una holgura razonable de aceleración GPU gracias a MSI Afterburner.
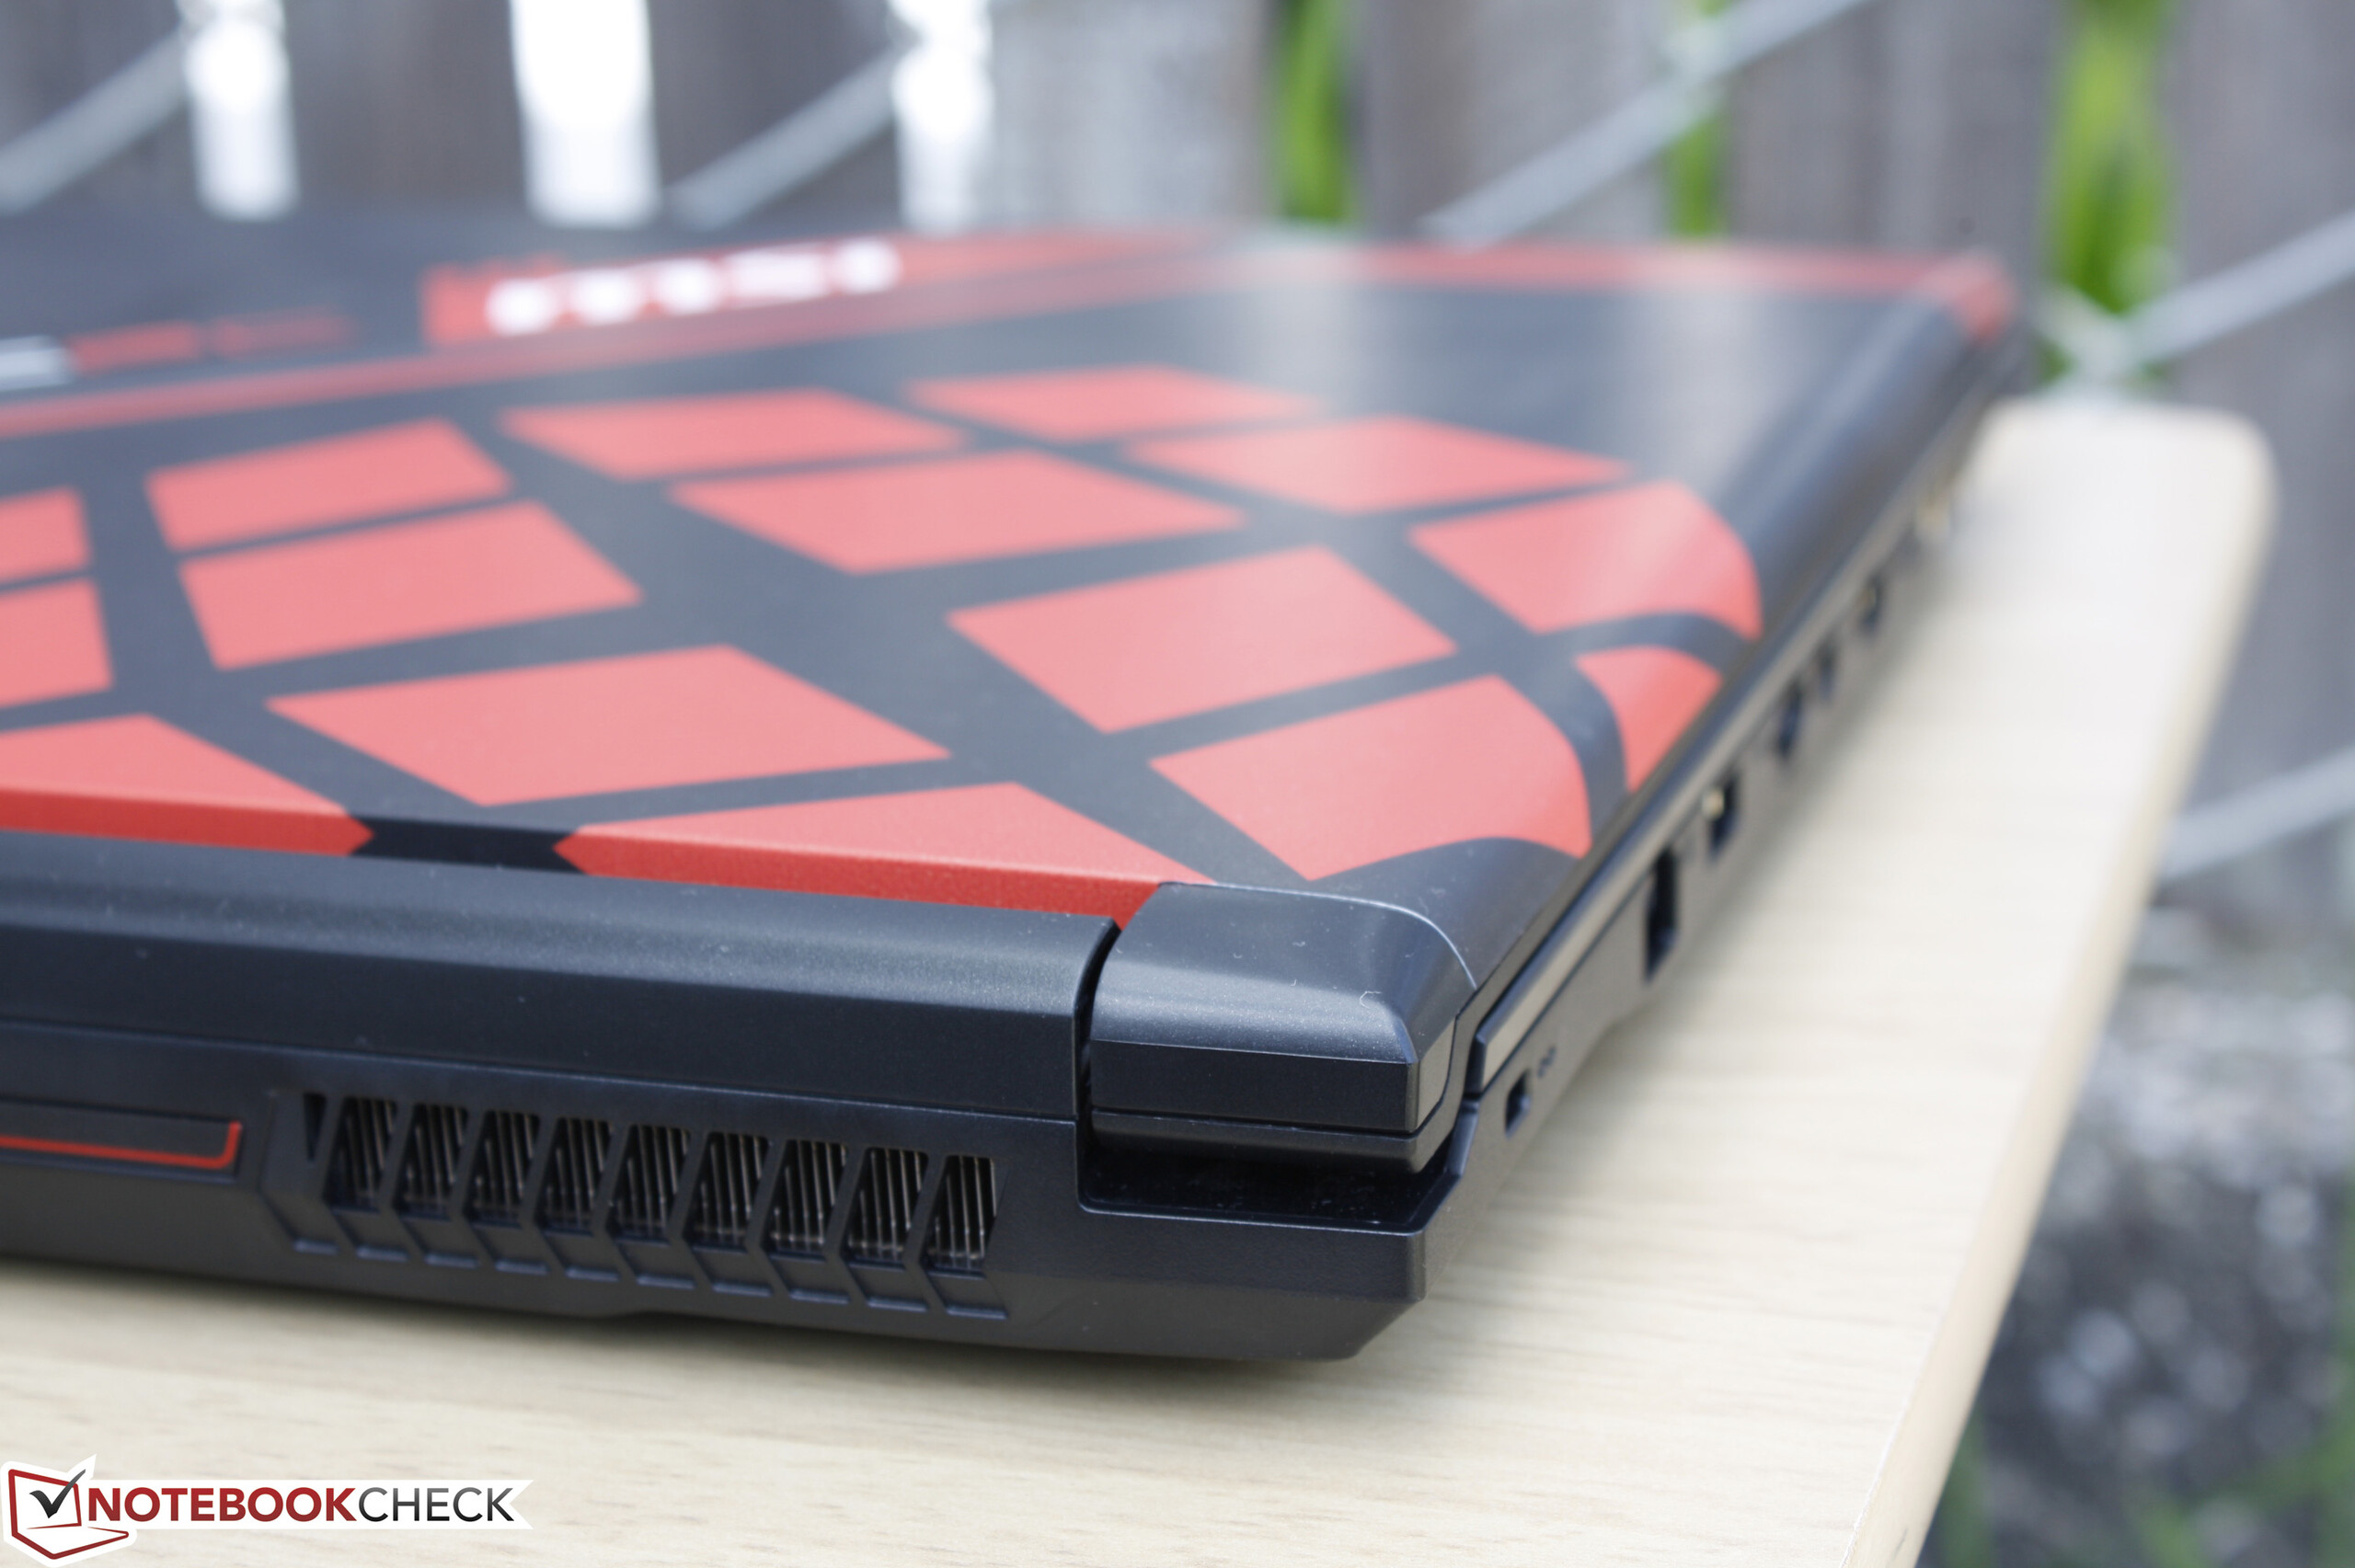
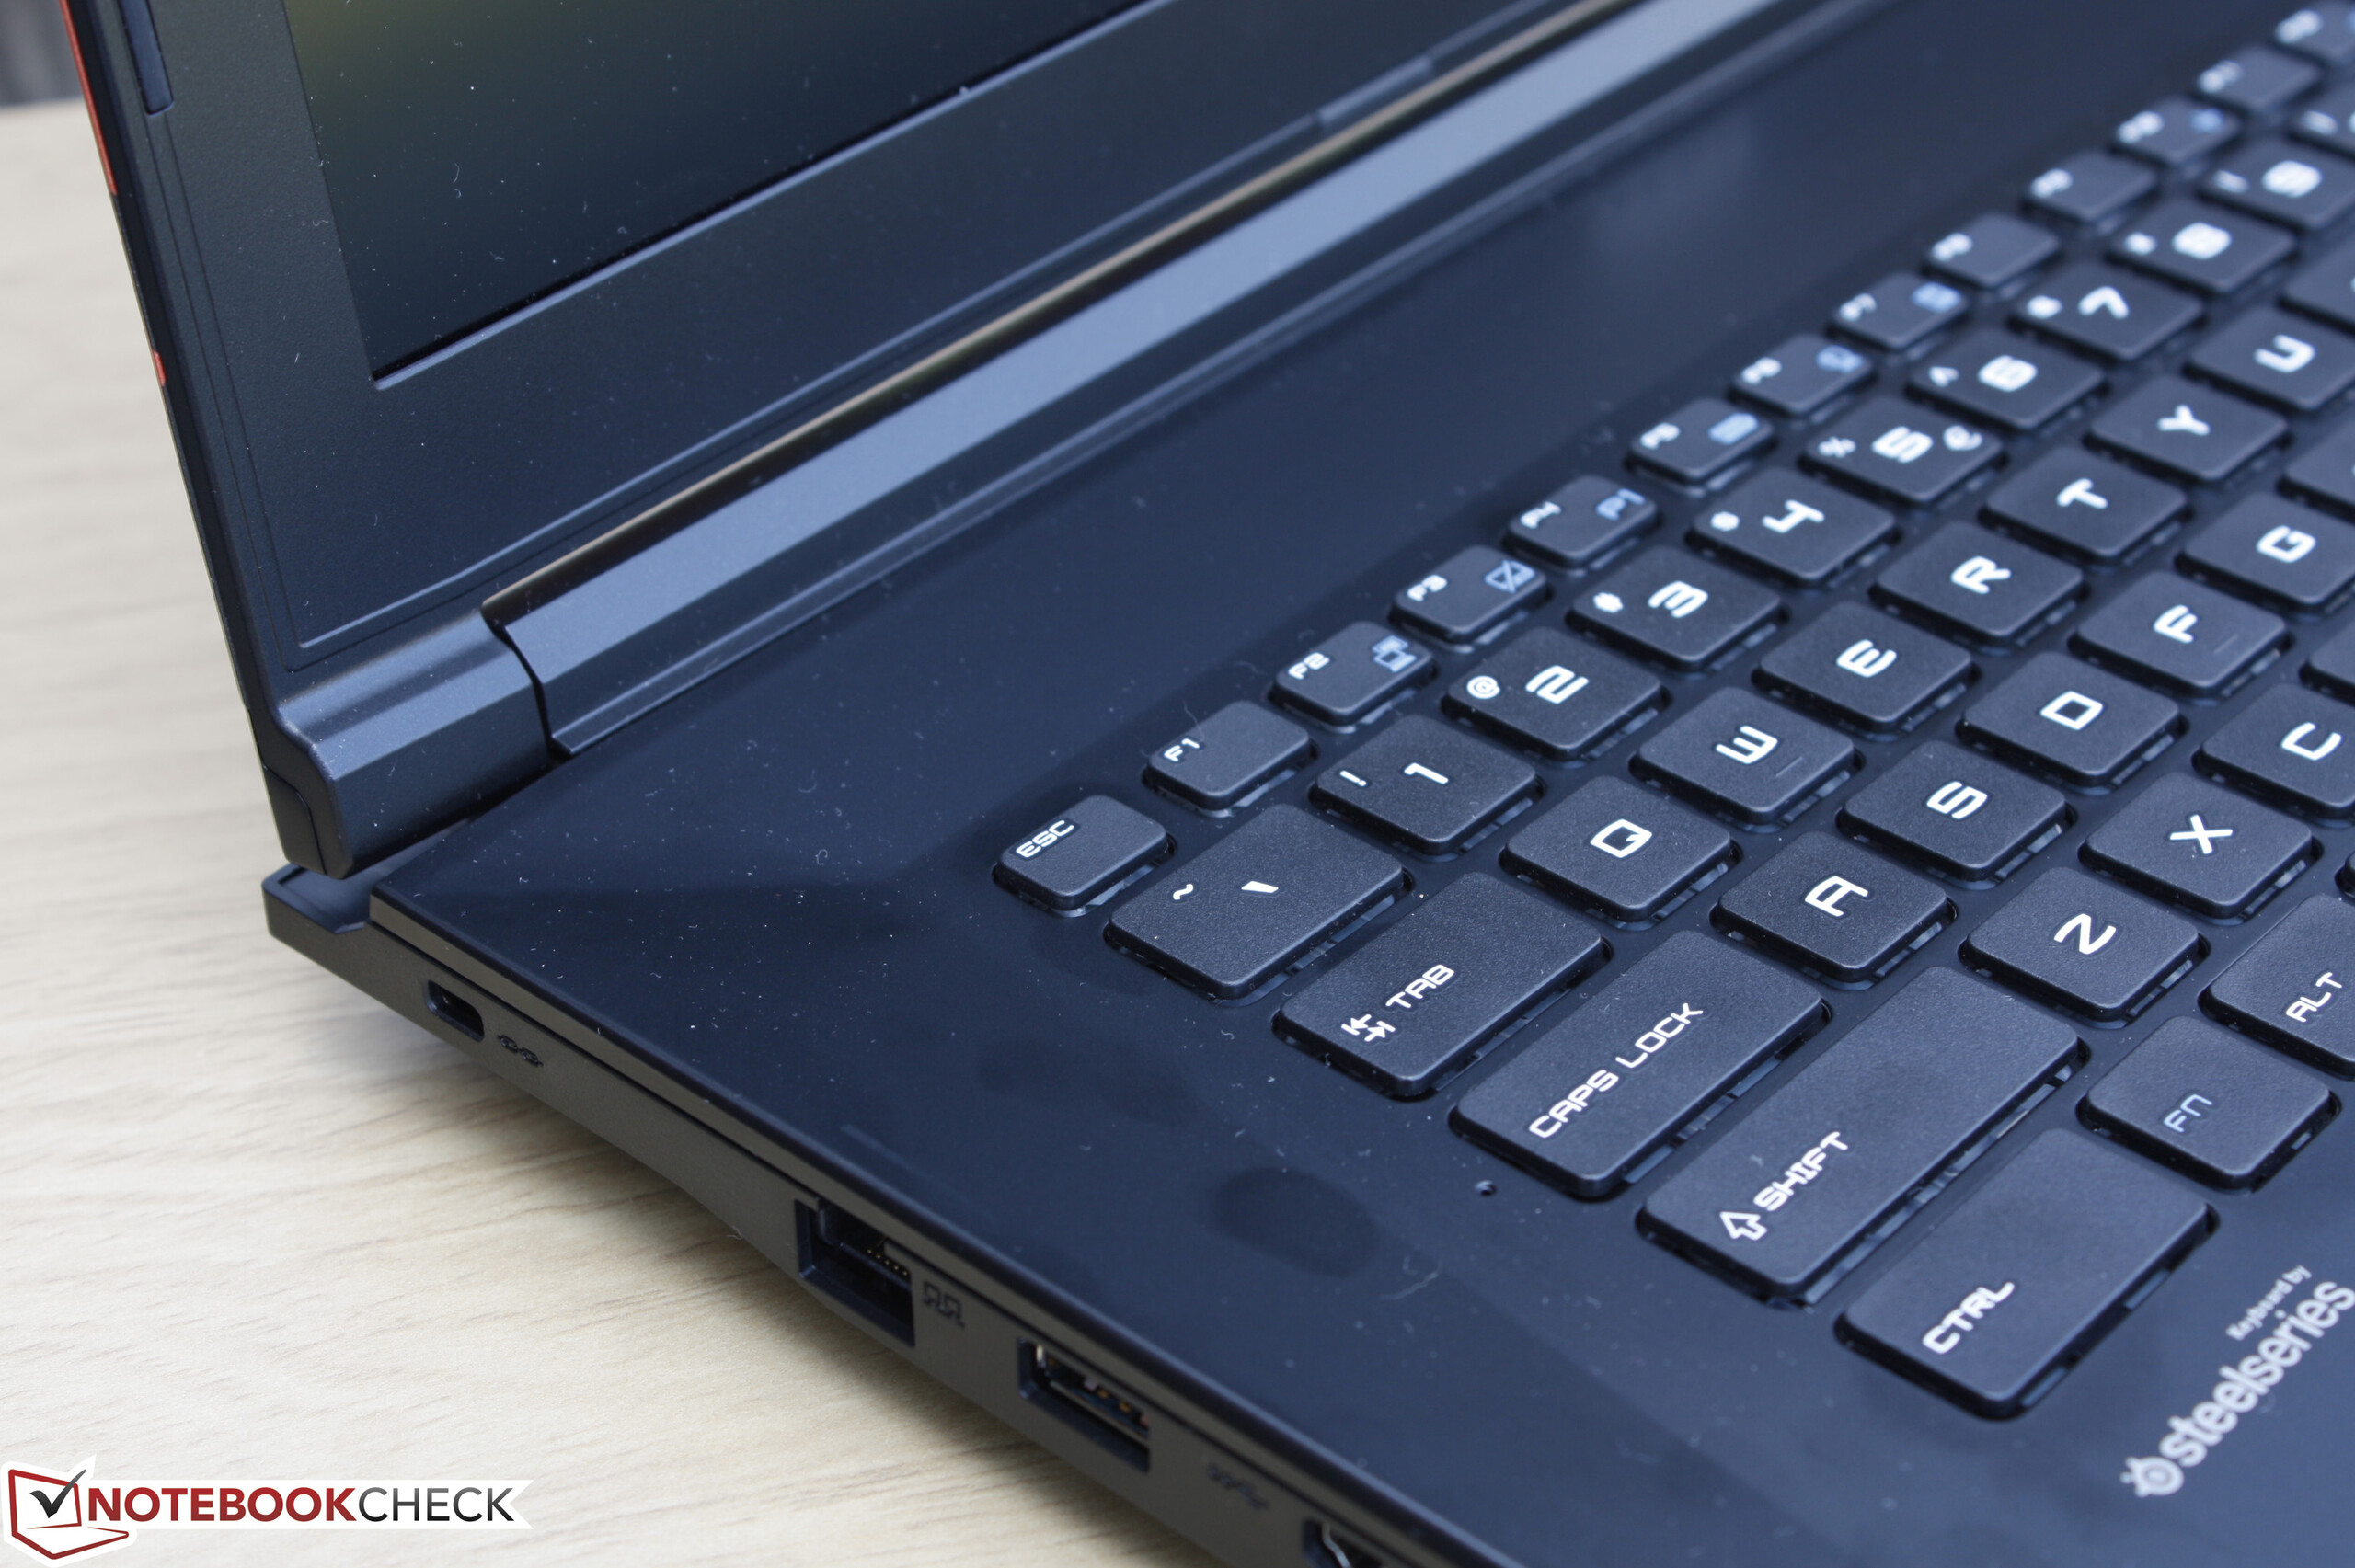
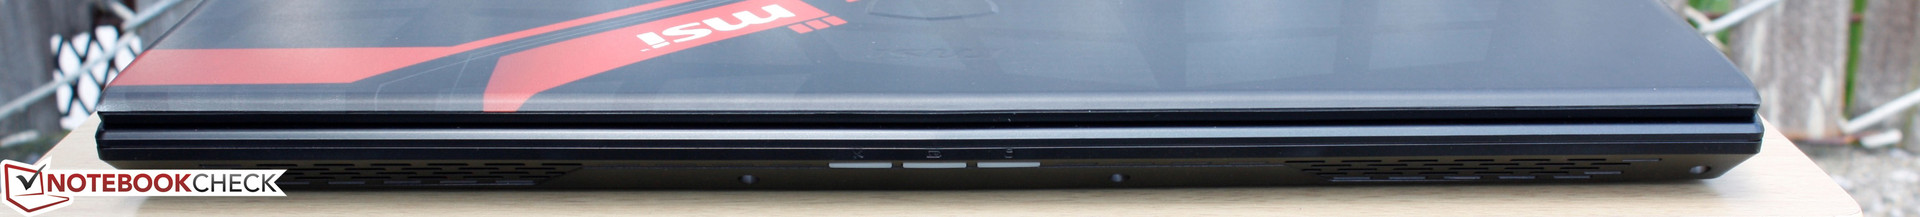
Muchos de los recortes son desafortunadamente obvios. Además de no tener teclas retroiluminadas, la retroiluminación del display es inferior a la media y su panel TN pide un calibrado a gritos. Los altavoces carecen severamente de graves y el aguante de la batería es bajísimo incluso para un portátil de juego. El ruido de ventilador es alto y siempre se oye aún con las cargas de sistemas más ligeras y las opciones de mejora avanzada son imposibles dado que GPU y CPU van integradas. El chasis es más bien grueso y carente de diseño.
Si el bolsillo va justo, los usuarios pueden tener en cuenta el GL72 por su sólido rendimiento de juego. Por lo demás, el sistema es moderadamente ruidoso y está muy limitado en términos de duración de batería y usabilidad en exteriores.
Ésta es una versión acortada del análisis original. Puedes leer el análisis completo en inglés aquí.
MSI GL72 6QF
- 03/16/2016 v5 (old)
Allen Ngo
Price comparison
