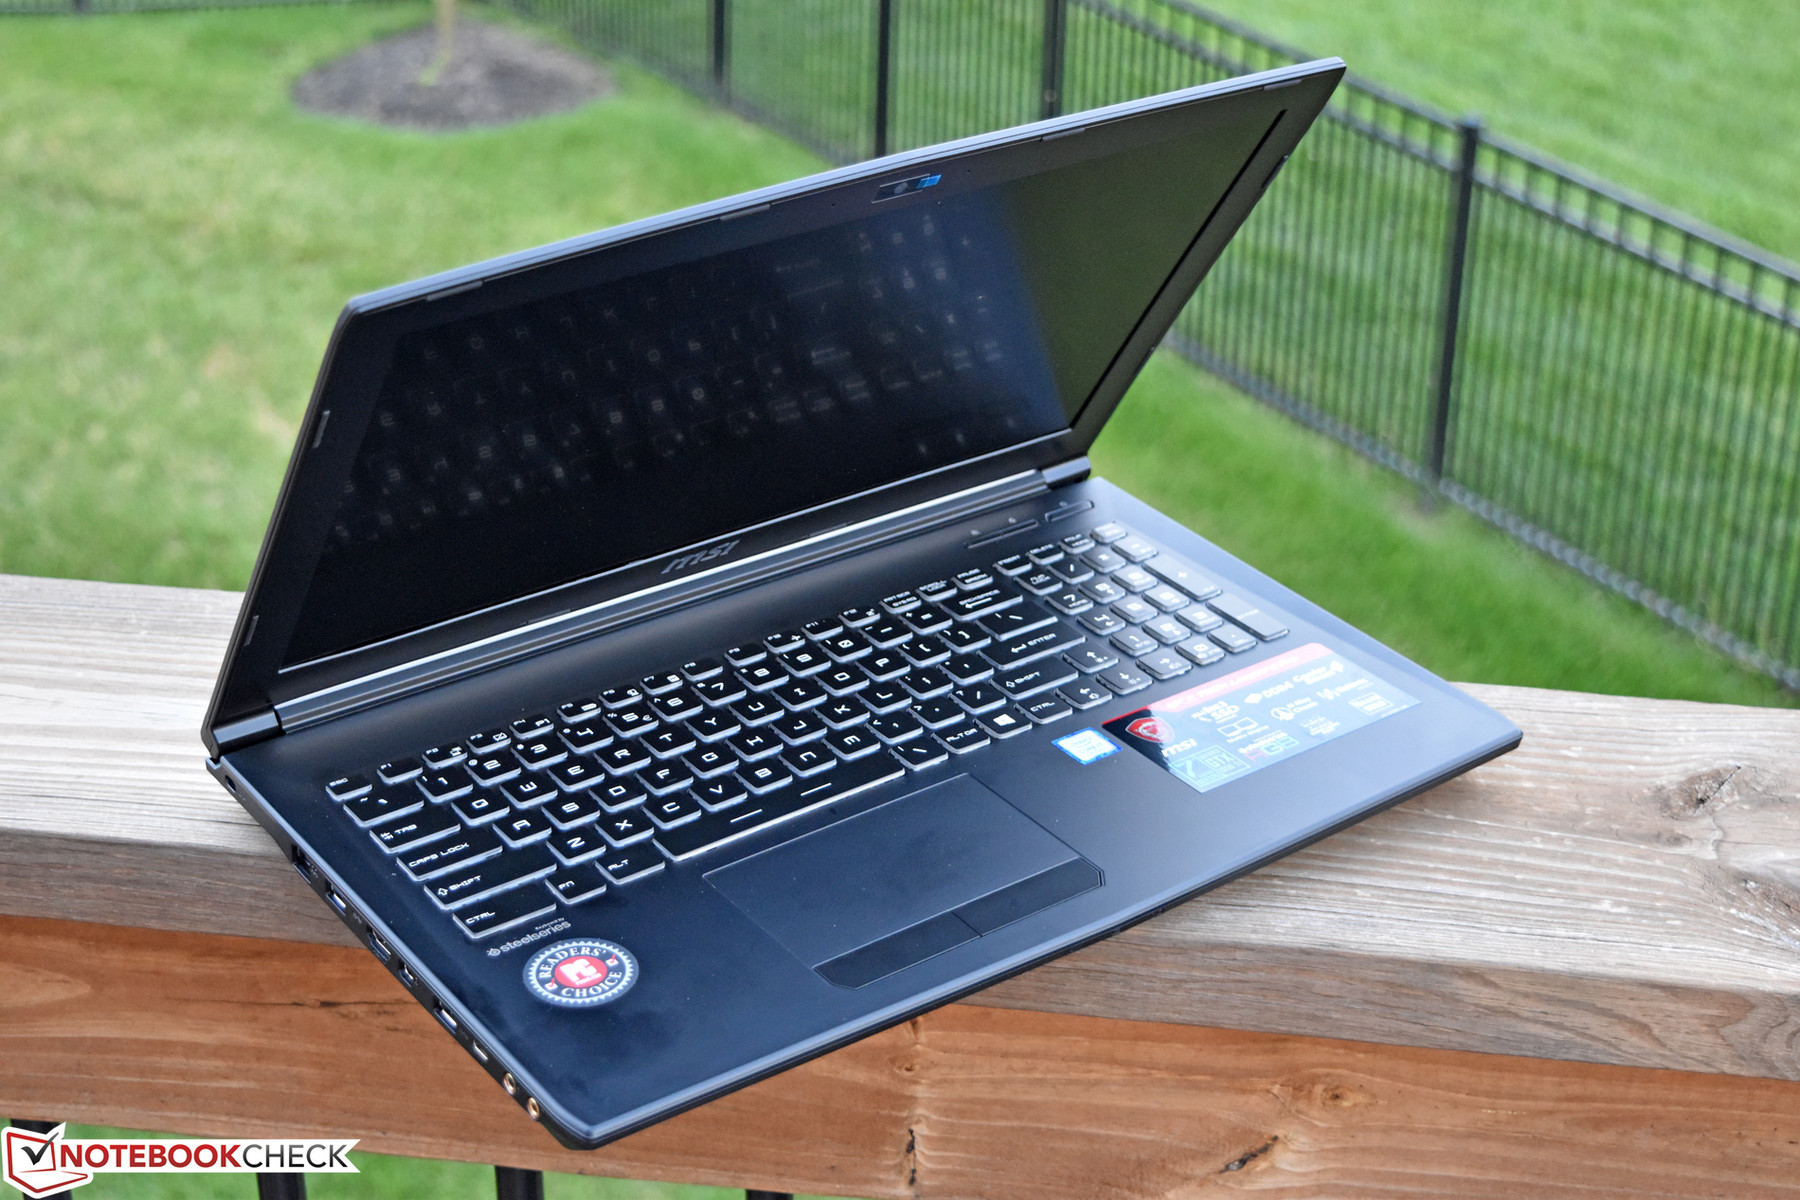
Breve análisis del portátil MSI GP62 7REX (i7-7700HQ, GTX 1050 Ti) Xotic PC


| SD Card Reader | |
| average JPG Copy Test (av. of 3 runs) | |
| Lenovo Legion Y520-15IKBN-80WK001KUS | |
| Asus GL753VE-DS74 | |
| MSI GL72 7RDX-602 | |
| Acer Aspire V17 Nitro BE VN7-793-738J | |
| MSI GP62 7REX-1045US | |
| maximum AS SSD Seq Read Test (1GB) | |
| Asus GL753VE-DS74 | |
| Lenovo Legion Y520-15IKBN-80WK001KUS | |
| Acer Aspire V17 Nitro BE VN7-793-738J | |
| MSI GL72 7RDX-602 | |
| MSI GP62 7REX-1045US | |
| |||||||||||||||||||||||||
iluminación: 87 %
Brillo con batería: 265.7 cd/m²
Contraste: 422:1 (Negro: 0.63 cd/m²)
ΔE ColorChecker Calman: 9.6 | ∀{0.5-29.43 Ø4.72}
ΔE Greyscale Calman: 12.7 | ∀{0.09-98 Ø4.97}
100% sRGB (Argyll 1.6.3 3D)
76% AdobeRGB 1998 (Argyll 1.6.3 3D)
84.2% AdobeRGB 1998 (Argyll 3D)
100% sRGB (Argyll 3D)
85.8% Display P3 (Argyll 3D)
Gamma: 2.01
CCT: 13654 K
| MSI GP62 7REX-1045US CMN N156HGE-EAL, TN LED, 15.6", 1920x1080 | Asus GL753VE-DS74 LG Philips LP173WF4-SPF3, IPS, 17.3", 1920x1080 | Lenovo Legion Y520-15IKBN-80WK001KUS LP156WF6-SPK3, IPS, 15.6", 1920x1080 | EVGA SC15 ID: AUO42ED, Name: AU Optronics B156HAN04.2, , 15.6", 1920x1080 | MSI GL72 7RDX-602 Chi Mei CMN1735 N173HGE-E11, TN LED, 17.3", 1920x1080 | Acer Aspire V17 Nitro BE VN7-793-738J AU Optronics B173ZAN01.0, IPS, 17.3", 3840x2160 | |
|---|---|---|---|---|---|---|
| Display | -20% | -17% | 5% | |||
| Display P3 Coverage (%) | 85.8 | 62.3 -27% | 65.2 -24% | 85.4 0% | ||
| sRGB Coverage (%) | 100 | 89.6 -10% | 94.3 -6% | 100 0% | ||
| AdobeRGB 1998 Coverage (%) | 84.2 | 63.6 -24% | 65.6 -22% | 97.8 16% | ||
| Response Times | 5% | -55% | -20% | 8% | 6% | |
| Response Time Grey 50% / Grey 80% * (ms) | 34.4 ? | 36 ? -5% | 58.8 ? -71% | 41.6 ? -21% | 29 ? 16% | 29 ? 16% |
| Response Time Black / White * (ms) | 26 ? | 22 ? 15% | 36 ? -38% | 30.8 ? -18% | 26 ? -0% | 27 ? -4% |
| PWM Frequency (Hz) | 200 ? | 21550 ? | 961 | |||
| Screen | 41% | 5% | 35% | 19% | 49% | |
| Brightness middle (cd/m²) | 265.7 | 366 38% | 239 -10% | 281.5 6% | 299 13% | 380 43% |
| Brightness (cd/m²) | 243 | 348 43% | 244 0% | 253 4% | 274 13% | 336 38% |
| Brightness Distribution (%) | 87 | 90 3% | 88 1% | 73 -16% | 80 -8% | 81 -7% |
| Black Level * (cd/m²) | 0.63 | 0.35 44% | 0.35 44% | 0.27 57% | 0.25 60% | 0.32 49% |
| Contrast (:1) | 422 | 1046 148% | 683 62% | 1043 147% | 1196 183% | 1188 182% |
| Colorchecker dE 2000 * | 9.6 | 4.4 54% | 7.3 24% | 3.9 59% | 12.92 -35% | 5.32 45% |
| Colorchecker dE 2000 max. * | 18.5 | 9.7 48% | 24.7 -34% | 7.1 62% | 19.91 -8% | 7.63 59% |
| Greyscale dE 2000 * | 12.7 | 3 76% | 4.9 61% | 3.8 70% | 13.16 -4% | 4.9 61% |
| Gamma | 2.01 109% | 2.1 105% | 2.19 100% | 2.27 97% | 2.36 93% | 2.61 84% |
| CCT | 13654 48% | 6362 102% | 7332 89% | 7322 89% | 15046 43% | 6558 99% |
| Color Space (Percent of AdobeRGB 1998) (%) | 76 | 56 -26% | 35 -54% | 57.8 -24% | 60 -21% | 87.2 15% |
| Color Space (Percent of sRGB) (%) | 100 | 86 -14% | 55 -45% | 89.3 -11% | 94 -6% | 100 0% |
| Media total (Programa/Opciones) | 23% /
35% | -25% /
-5% | -2% /
17% | 3% /
10% | 20% /
34% |
* ... más pequeño es mejor
Tiempos de respuesta del display
| ↔ Tiempo de respuesta de Negro a Blanco | ||
|---|---|---|
| 26 ms ... subida ↗ y bajada ↘ combinada | ↗ 20 ms subida | 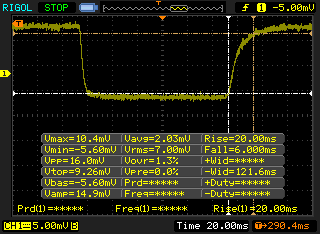 |
| ↘ 6 ms bajada | ||
| La pantalla mostró tiempos de respuesta relativamente lentos en nuestros tests pero podría ser demasiado lenta para los jugones. En comparación, todos los dispositivos de prueba van de ##min### (mínimo) a 240 (máximo) ms. » 63 % de todos los dispositivos son mejores. Eso quiere decir que el tiempo de respuesta es peor que la media (19.8 ms) de todos los dispositivos testados. | ||
| ↔ Tiempo de respuesta 50% Gris a 80% Gris | ||
| 34.4 ms ... subida ↗ y bajada ↘ combinada | ↗ 22.4 ms subida | 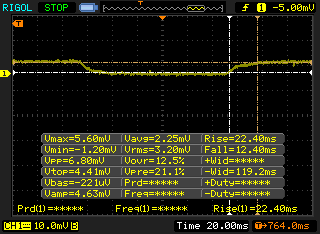 |
| ↘ 12.4 ms bajada | ||
| La pantalla mostró tiempos de respuesta lentos en nuestros tests y podría ser demasiado lenta para los jugones. En comparación, todos los dispositivos de prueba van de ##min### (mínimo) a 636 (máximo) ms. » 48 % de todos los dispositivos son mejores. Eso quiere decir que el tiempo de respuesta es peor que la media (31 ms) de todos los dispositivos testados. | ||
Parpadeo de Pantalla / PWM (Pulse-Width Modulation)
| Parpadeo de Pantalla / PWM detectado | 200 Hz | ≤ 99 % de brillo | 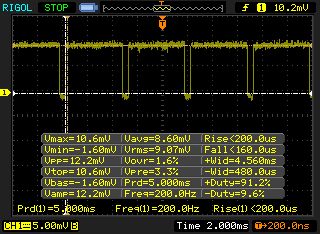 |
La retroiluminación del display parpadea a 200 Hz (seguramente usa PWM - Pulse-Width Modulation) a un brillo del 99 % e inferior. Sobre este nivel de brillo no debería darse parpadeo / PWM. La frecuencia de 200 Hz es relativamente baja, por lo que la gente sensible debería ver parpadeos y padecer fatiga visual por la pantalla (usado al brillo indicado a continuación). Comparación: 52 % de todos los dispositivos testados no usaron PWM para atenuar el display. Si se usó, medimos una media de 7747 (mínimo: 5 - máxmo: 343500) Hz. | |||
| Cinebench R11.5 | |
| CPU Single 64Bit | |
| EVGA SC15 | |
| Lenovo Legion Y520-15IKBN-80WK001KUS | |
| MSI GP62 7REX-1045US | |
| Asus GL753VE-DS74 | |
| CPU Multi 64Bit | |
| EVGA SC15 | |
| Asus GL753VE-DS74 | |
| MSI GP62 7REX-1045US | |
| Lenovo Legion Y520-15IKBN-80WK001KUS | |
| wPrime 2.10 - 1024m | |
| MSI GP62 7REX-1045US | |
| Asus GL753VE-DS74 | |
| EVGA SC15 | |
* ... más pequeño es mejor
| PCMark 8 | |
| Home Score Accelerated v2 | |
| EVGA SC15 | |
| MSI GP62 7REX-1045US | |
| Asus GL753VE-DS74 | |
| Acer Aspire V17 Nitro BE VN7-793-738J | |
| MSI GL72 7RDX-602 | |
| Work Score Accelerated v2 | |
| EVGA SC15 | |
| Asus GL753VE-DS74 | |
| MSI GP62 7REX-1045US | |
| MSI GL72 7RDX-602 | |
| Acer Aspire V17 Nitro BE VN7-793-738J | |
| Creative Score Accelerated v2 | |
| EVGA SC15 | |
| MSI GP62 7REX-1045US | |
| Acer Aspire V17 Nitro BE VN7-793-738J | |
| Asus GL753VE-DS74 | |
| MSI GL72 7RDX-602 | |
| PCMark 8 Home Score Accelerated v2 | 3928 puntos | |
| PCMark 8 Creative Score Accelerated v2 | 5054 puntos | |
| PCMark 8 Work Score Accelerated v2 | 5130 puntos | |
| PCMark 10 Score | 4568 puntos | |
ayuda | ||
| MSI GP62 7REX-1045US Toshiba NVMe THNSN5128GP | Asus GL753VE-DS74 Intel SSD 600p SSDPEKKW512G7 | Lenovo Legion Y520-15IKBN-80WK001KUS Samsung PM961 MZVLW256HEHP | EVGA SC15 Toshiba NVMe THNSN5256GPU7 | Acer Aspire V17 Nitro BE VN7-793-738J Intel SSD 600p SSDPEKKW512G7 | |
|---|---|---|---|---|---|
| AS SSD | -10% | 48% | 31% | -6% | |
| Score Total (Points) | 1829 | 1566 -14% | 2617 43% | 2474 35% | 1678 -8% |
| Score Write (Points) | 600 | 575 -4% | 807 35% | 896 49% | 677 13% |
| Score Read (Points) | 849 | 681 -20% | 1232 45% | 1081 27% | 692 -18% |
| 4K-64 Write (MB/s) | 428.2 | 399.3 -7% | 529 24% | 706 65% | 516 21% |
| 4K-64 Read (MB/s) | 628 | 498.6 -21% | 919 46% | 822 31% | 503 -20% |
| 4K Write (MB/s) | 112 | 119.7 7% | 139.4 24% | 95.5 -15% | 104.8 -6% |
| 4K Read (MB/s) | 35.84 | 32.5 -9% | 48.57 36% | 39.13 9% | 29.75 -17% |
| Seq Write (MB/s) | 601 | 558 -7% | 1392 132% | 943 57% | 566 -6% |
| Seq Read (MB/s) | 1848 | 1500 -19% | 2649 43% | 2203 19% | 1590 -14% |

| 3DMark 11 | |
| 1280x720 Performance GPU | |
| EVGA SC15 | |
| Acer Aspire V17 Nitro BE VN7-793-738J | |
| MSI GP62 7REX-1045US | |
| MSI GL72 7RDX-602 | |
| 1280x720 Performance Combined | |
| EVGA SC15 | |
| Acer Aspire V17 Nitro BE VN7-793-738J | |
| MSI GP62 7REX-1045US | |
| MSI GL72 7RDX-602 | |
| 3DMark | |
| 1280x720 Cloud Gate Standard Graphics | |
| EVGA SC15 | |
| MSI GP62 7REX-1045US | |
| Lenovo Legion Y520-15IKBN-80WK001KUS | |
| Asus GL753VE-DS74 | |
| MSI GL72 7RDX-602 | |
| 1920x1080 Fire Strike Graphics | |
| Acer Aspire V17 Nitro BE VN7-793-738J | |
| EVGA SC15 | |
| MSI GP62 7REX-1045US | |
| Lenovo Legion Y520-15IKBN-80WK001KUS | |
| Asus GL753VE-DS74 | |
| MSI GL72 7RDX-602 | |
| 1920x1080 Ice Storm Extreme Graphics | |
| EVGA SC15 | |
| Lenovo Legion Y520-15IKBN-80WK001KUS | |
| MSI GP62 7REX-1045US | |
| Asus GL753VE-DS74 | |
| 3DMark 06 Standard Score | 27557 puntos | |
| 3DMark 11 Performance | 8766 puntos | |
| 3DMark Ice Storm Standard Score | 66682 puntos | |
| 3DMark Cloud Gate Standard Score | 21898 puntos | |
| 3DMark Fire Strike Score | 6834 puntos | |
| 3DMark Fire Strike Extreme Score | 3590 puntos | |
| 3DMark Time Spy Score | 2474 puntos | |
ayuda | ||
| Rise of the Tomb Raider | |
| 1920x1080 Very High Preset AA:FX AF:16x (ordenar por valor) | |
| MSI GP62 7REX-1045US | |
| Asus GL753VE-DS74 | |
| Lenovo Legion Y520-15IKBN-80WK001KUS | |
| EVGA SC15 | |
| MSI GL72 7RDX-602 | |
| 1920x1080 High Preset AA:FX AF:4x (ordenar por valor) | |
| MSI GP62 7REX-1045US | |
| Lenovo Legion Y520-15IKBN-80WK001KUS | |
| MSI GL72 7RDX-602 | |
| 1366x768 Medium Preset AF:2x (ordenar por valor) | |
| MSI GP62 7REX-1045US | |
| Lenovo Legion Y520-15IKBN-80WK001KUS | |
| MSI GL72 7RDX-602 | |
| 1024x768 Lowest Preset (ordenar por valor) | |
| Lenovo Legion Y520-15IKBN-80WK001KUS | |
| MSI GL72 7RDX-602 | |
| Tomb Raider | |
| 1920x1080 Ultra Preset AA:FX AF:16x (ordenar por valor) | |
| MSI GP62 7REX-1045US | |
| 1366x768 High Preset AA:FX AF:8x (ordenar por valor) | |
| MSI GP62 7REX-1045US | |
| 1366x768 Normal Preset AA:FX AF:4x (ordenar por valor) | |
| MSI GP62 7REX-1045US | |
| Metro: Last Light | |
| 1920x1080 Very High (DX11) AF:16x (ordenar por valor) | |
| MSI GP62 7REX-1045US | |
| Asus GL753VE-DS74 | |
| EVGA SC15 | |
| 1366x768 High (DX11) AF:16x (ordenar por valor) | |
| MSI GP62 7REX-1045US | |
| 1366x768 Medium (DX10) AF:4x (ordenar por valor) | |
| MSI GP62 7REX-1045US | |
| 1024x768 Low (DX10) AF:4x (ordenar por valor) | |
| MSI GP62 7REX-1045US | |
| Thief | |
| 1920x1080 Very High Preset AA:FXAA & High SS AF:8x (ordenar por valor) | |
| MSI GP62 7REX-1045US | |
| Asus GL753VE-DS74 | |
| EVGA SC15 | |
| 1366x768 High Preset AA:FXAA & Low SS AF:4x (ordenar por valor) | |
| MSI GP62 7REX-1045US | |
| 1366x768 Normal Preset AA:FX (ordenar por valor) | |
| MSI GP62 7REX-1045US | |
| 1024x768 Very Low Preset (ordenar por valor) | |
| MSI GP62 7REX-1045US | |
| The Witcher 3 | |
| 1920x1080 Ultra Graphics & Postprocessing (HBAO+) (ordenar por valor) | |
| Asus GL753VE-DS74 | |
| Lenovo Legion Y520-15IKBN-80WK001KUS | |
| EVGA SC15 | |
| MSI GL72 7RDX-602 | |
| 1920x1080 High Graphics & Postprocessing (Nvidia HairWorks Off) (ordenar por valor) | |
| EVGA SC15 | |
| MSI GL72 7RDX-602 | |
| 1366x768 Medium Graphics & Postprocessing (ordenar por valor) | |
| MSI GL72 7RDX-602 | |
| 1024x768 Low Graphics & Postprocessing (ordenar por valor) | |
| MSI GL72 7RDX-602 | |
| Batman: Arkham Knight | |
| 1920x1080 High / On AA:SM AF:16x (ordenar por valor) | |
| MSI GP62 7REX-1045US | |
| Lenovo Legion Y520-15IKBN-80WK001KUS | |
| EVGA SC15 | |
| 1920x1080 High / On (Interactive Smoke & Paper Debris Off) AA:SM AF:8x (ordenar por valor) | |
| MSI GP62 7REX-1045US | |
| Lenovo Legion Y520-15IKBN-80WK001KUS | |
| EVGA SC15 | |
| 1366x768 Normal / Off AF:4x (ordenar por valor) | |
| MSI GP62 7REX-1045US | |
| Lenovo Legion Y520-15IKBN-80WK001KUS | |
| 1280x720 Low / Off AF:Trilinear (ordenar por valor) | |
| MSI GP62 7REX-1045US | |
| Lenovo Legion Y520-15IKBN-80WK001KUS | |
| Ashes of the Singularity | |
| 1280x768 low (ordenar por valor) | |
| MSI GP62 7REX-1045US | |
| 1920x1080 Standard (ordenar por valor) | |
| MSI GP62 7REX-1045US | |
| EVGA SC15 | |
| 1920x1080 high (ordenar por valor) | |
| MSI GP62 7REX-1045US | |
| Asus GL753VE-DS74 | |
| EVGA SC15 | |
| bajo | medio | alto | ultra | |
|---|---|---|---|---|
| Tomb Raider (2013) | 231.2 | 191.1 | 91.2 | |
| BioShock Infinite (2013) | 190 | 164 | 155 | 71 |
| Metro: Last Light (2013) | 113 | 106 | 87 | 49 |
| Thief (2014) | 77.5 | 69.4 | 68.9 | 49.8 |
| Batman: Arkham Knight (2015) | 96 | 87 | 58 | 36 |
| Rise of the Tomb Raider (2016) | 71 | 44 | 36 | |
| Ashes of the Singularity (2016) | 52.3 | 41.5 | 37.9 |
Ruido
| Ocioso |
| 32.2 / 32.2 / 32.2 dB(A) |
| Carga |
| 40.9 / 48.6 dB(A) |
 | ||
30 dB silencioso 40 dB(A) audible 50 dB(A) ruidosamente alto |
||
min: | ||
| MSI GP62 7REX-1045US GeForce GTX 1050 Ti Mobile, i7-7700HQ, Toshiba NVMe THNSN5128GP | Asus GL753VE-DS74 GeForce GTX 1050 Ti Mobile, i7-7700HQ, Intel SSD 600p SSDPEKKW512G7 | Lenovo Legion Y520-15IKBN-80WK001KUS GeForce GTX 1050 Ti Mobile, i7-7700HQ, Samsung PM961 MZVLW256HEHP | EVGA SC15 GeForce GTX 1060 Mobile, i7-7700HQ, Toshiba NVMe THNSN5256GPU7 | Acer Aspire V17 Nitro BE VN7-793-738J GeForce GTX 1060 Mobile, i7-7700HQ, Intel SSD 600p SSDPEKKW512G7 | |
|---|---|---|---|---|---|
| Noise | -2% | 6% | 2% | 2% | |
| apagado / medio ambiente * (dB) | 28 | 29.1 -4% | 27.7 1% | 28 -0% | 30.8 -10% |
| Idle Minimum * (dB) | 32.2 | 33.3 -3% | 30.5 5% | 31.9 1% | 31.4 2% |
| Idle Average * (dB) | 32.2 | 33.3 -3% | 30.5 5% | 32 1% | 31.4 2% |
| Idle Maximum * (dB) | 32.2 | 33.4 -4% | 30.6 5% | 32 1% | 31.4 2% |
| Load Average * (dB) | 40.9 | 42.6 -4% | 40 2% | 36.5 11% | 38.6 6% |
| Witcher 3 ultra * (dB) | 45.4 | 46.8 -3% | 40 12% | 40.3 11% | |
| Load Maximum * (dB) | 48.6 | 46.8 4% | 42.6 12% | 53.4 -10% | 44.3 9% |
* ... más pequeño es mejor
(±) La temperatura máxima en la parte superior es de 45 °C / 113 F, frente a la media de 40.4 °C / 105 F, que oscila entre 21.2 y 68.8 °C para la clase Gaming.
(-) El fondo se calienta hasta un máximo de 48.6 °C / 119 F, frente a la media de 43.2 °C / 110 F
(+) En reposo, la temperatura media de la parte superior es de 26 °C / 79# F, frente a la media del dispositivo de 33.9 °C / 93 F.
(±) Jugando a The Witcher 3, la temperatura media de la parte superior es de 35.6 °C / 96 F, frente a la media del dispositivo de 33.9 °C / 93 F.
(-) El reposamanos y el touchpad pueden calentarse mucho al tacto con un máximo de 40 °C / 104 F.
(-) La temperatura media de la zona del reposamanos de dispositivos similares fue de 28.8 °C / 83.8 F (-11.2 °C / -20.2 F).
MSI GP62 7REX-1045US análisis de audio
(+) | los altavoces pueden reproducir a un volumen relativamente alto (#87.3 dB)
Graves 100 - 315 Hz
(-) | casi sin bajos - de media 23.4% inferior a la mediana
(±) | la linealidad de los graves es media (9.9% delta a frecuencia anterior)
Medios 400 - 2000 Hz
(±) | medios reducidos - de media 7.1% inferior a la mediana
(±) | la linealidad de los medios es media (10.4% delta respecto a la frecuencia anterior)
Altos 2 - 16 kHz
(±) | máximos más altos - de media 7.6% más altos que la mediana
(±) | la linealidad de los máximos es media (9.3% delta a frecuencia anterior)
Total 100 - 16.000 Hz
(±) | la linealidad del sonido global es media (26.4% de diferencia con la mediana)
En comparación con la misma clase
» 93% de todos los dispositivos probados de esta clase eran mejores, 1% similares, 6% peores
» El mejor tuvo un delta de 6%, la media fue 18%, el peor fue ###max##%
En comparación con todos los dispositivos probados
» 81% de todos los dispositivos probados eran mejores, 4% similares, 15% peores
» El mejor tuvo un delta de 4%, la media fue 23%, el peor fue ###max##%
Apple MacBook 12 (Early 2016) 1.1 GHz análisis de audio
(+) | los altavoces pueden reproducir a un volumen relativamente alto (#83.6 dB)
Graves 100 - 315 Hz
(±) | lubina reducida - en promedio 11.3% inferior a la mediana
(±) | la linealidad de los graves es media (14.2% delta a frecuencia anterior)
Medios 400 - 2000 Hz
(+) | medios equilibrados - a sólo 2.4% de la mediana
(+) | los medios son lineales (5.5% delta a la frecuencia anterior)
Altos 2 - 16 kHz
(+) | máximos equilibrados - a sólo 2% de la mediana
(+) | los máximos son lineales (4.5% delta a la frecuencia anterior)
Total 100 - 16.000 Hz
(+) | el sonido global es lineal (10.2% de diferencia con la mediana)
En comparación con la misma clase
» 7% de todos los dispositivos probados de esta clase eran mejores, 2% similares, 90% peores
» El mejor tuvo un delta de 5%, la media fue 18%, el peor fue ###max##%
En comparación con todos los dispositivos probados
» 5% de todos los dispositivos probados eran mejores, 1% similares, 94% peores
» El mejor tuvo un delta de 4%, la media fue 23%, el peor fue ###max##%
| Off / Standby | |
| Ocioso | |
| Carga |
|
Clave:
min: | |
| MSI GP62 7REX-1045US i7-7700HQ, GeForce GTX 1050 Ti Mobile, Toshiba NVMe THNSN5128GP, TN LED, 1920x1080, 15.6" | Asus GL753VE-DS74 i7-7700HQ, GeForce GTX 1050 Ti Mobile, Intel SSD 600p SSDPEKKW512G7, IPS, 1920x1080, 17.3" | Lenovo Legion Y520-15IKBN-80WK001KUS i7-7700HQ, GeForce GTX 1050 Ti Mobile, Samsung PM961 MZVLW256HEHP, IPS, 1920x1080, 15.6" | EVGA SC15 i7-7700HQ, GeForce GTX 1060 Mobile, Toshiba NVMe THNSN5256GPU7, , 1920x1080, 15.6" | MSI GL72 7RDX-602 i7-7700HQ, GeForce GTX 1050 Mobile, HGST Travelstar 7K1000 HTS721010A9E630, TN LED, 1920x1080, 17.3" | |
|---|---|---|---|---|---|
| Power Consumption | 24% | 26% | -36% | 6% | |
| Idle Minimum * (Watt) | 14.6 | 7.5 49% | 8.5 42% | 25.8 -77% | 9.6 34% |
| Idle Average * (Watt) | 17.2 | 11.3 34% | 9.1 47% | 26.6 -55% | 15 13% |
| Idle Maximum * (Watt) | 17.3 | 11.8 32% | 9.7 44% | 26.7 -54% | 16.5 5% |
| Load Average * (Watt) | 82.7 | 82.1 1% | 79.9 3% | 80.3 3% | 104 -26% |
| Witcher 3 ultra * (Watt) | 107 | 96.3 10% | 97.7 9% | 121.2 -13% | |
| Load Maximum * (Watt) | 136.7 | 116.6 15% | 121.5 11% | 159.3 -17% | 129 6% |
* ... más pequeño es mejor
| MSI GP62 7REX-1045US i7-7700HQ, GeForce GTX 1050 Ti Mobile, 41 Wh | Asus GL753VE-DS74 i7-7700HQ, GeForce GTX 1050 Ti Mobile, 48 Wh | Lenovo Legion Y520-15IKBN-80WK001KUS i7-7700HQ, GeForce GTX 1050 Ti Mobile, 45 Wh | EVGA SC15 i7-7700HQ, GeForce GTX 1060 Mobile, 62 Wh | MSI GL72 7RDX-602 i7-7700HQ, GeForce GTX 1050 Mobile, 43.2 Wh | Acer Aspire V17 Nitro BE VN7-793-738J i7-7700HQ, GeForce GTX 1060 Mobile, 69 Wh | |
|---|---|---|---|---|---|---|
| Duración de Batería | 50% | 50% | 28% | 15% | 59% | |
| Reader / Idle (h) | 4.3 | 8.7 102% | 8.5 98% | 3.7 -14% | 5.5 28% | |
| WiFi v1.3 (h) | 2.9 | 3.9 34% | 4 38% | 2.8 -3% | 3.4 17% | 4.6 59% |
| Load (h) | 0.7 | 0.8 14% | 0.8 14% | 1.4 100% | 0.7 0% |
Pro
Contra

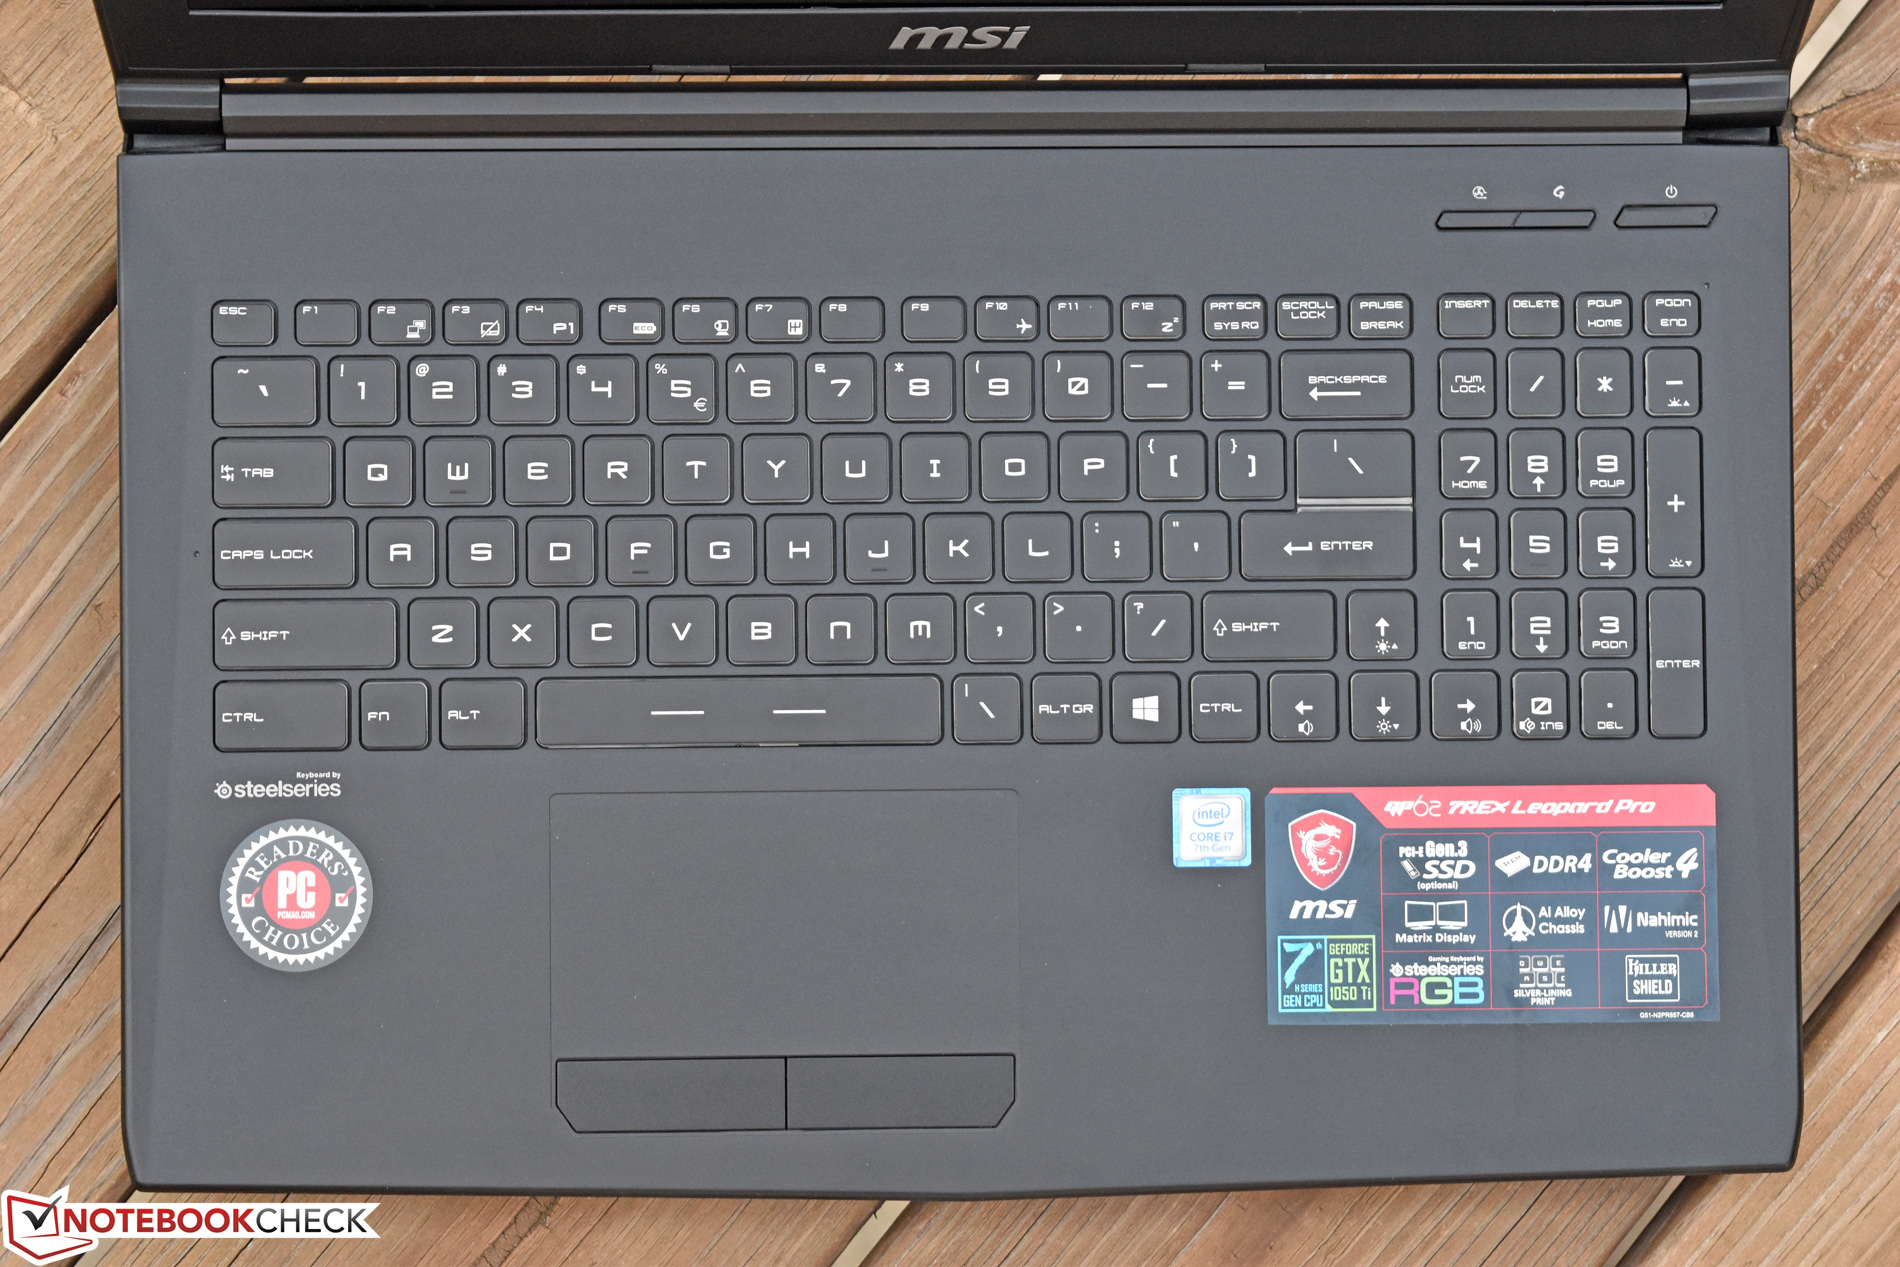
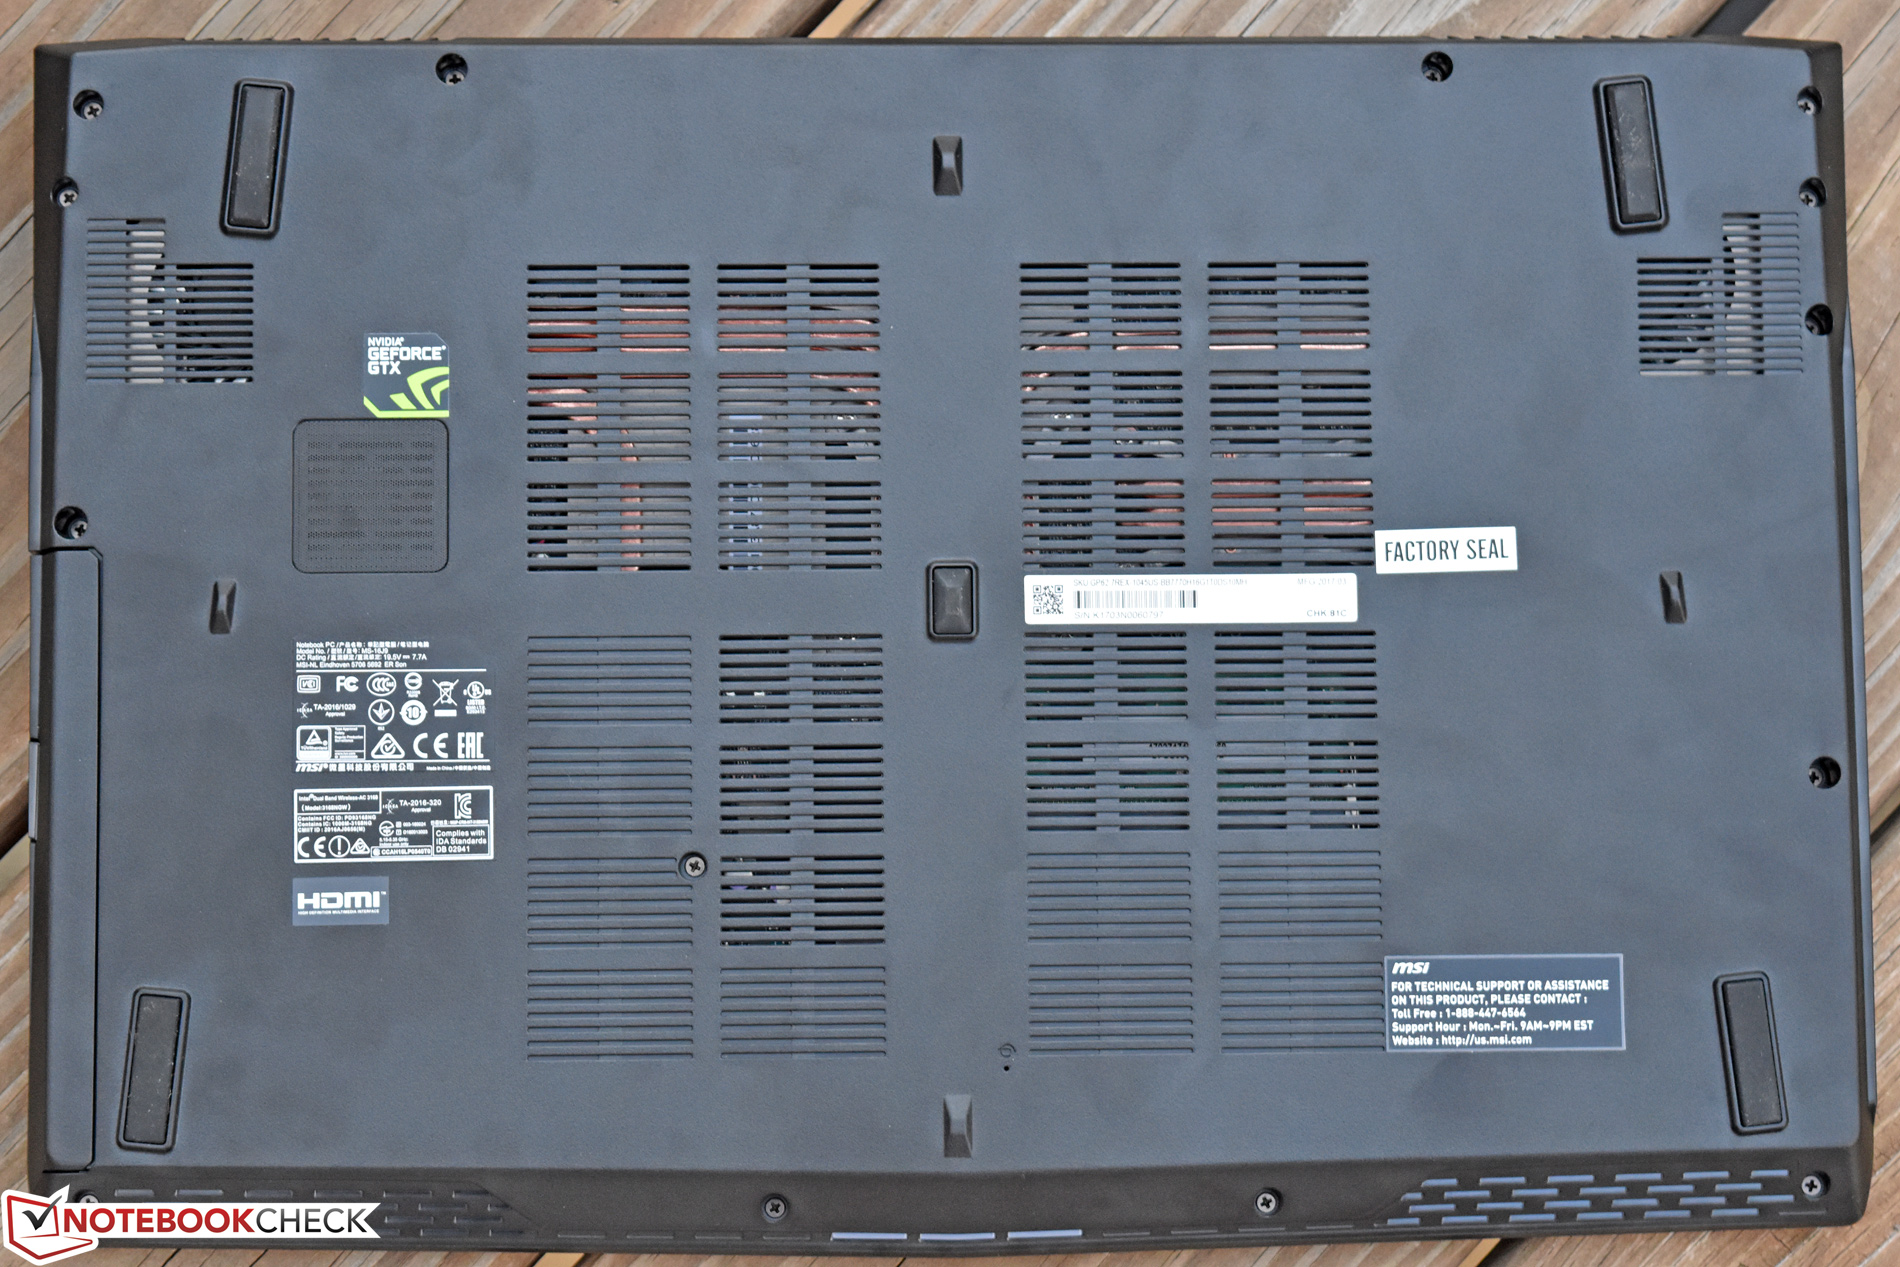
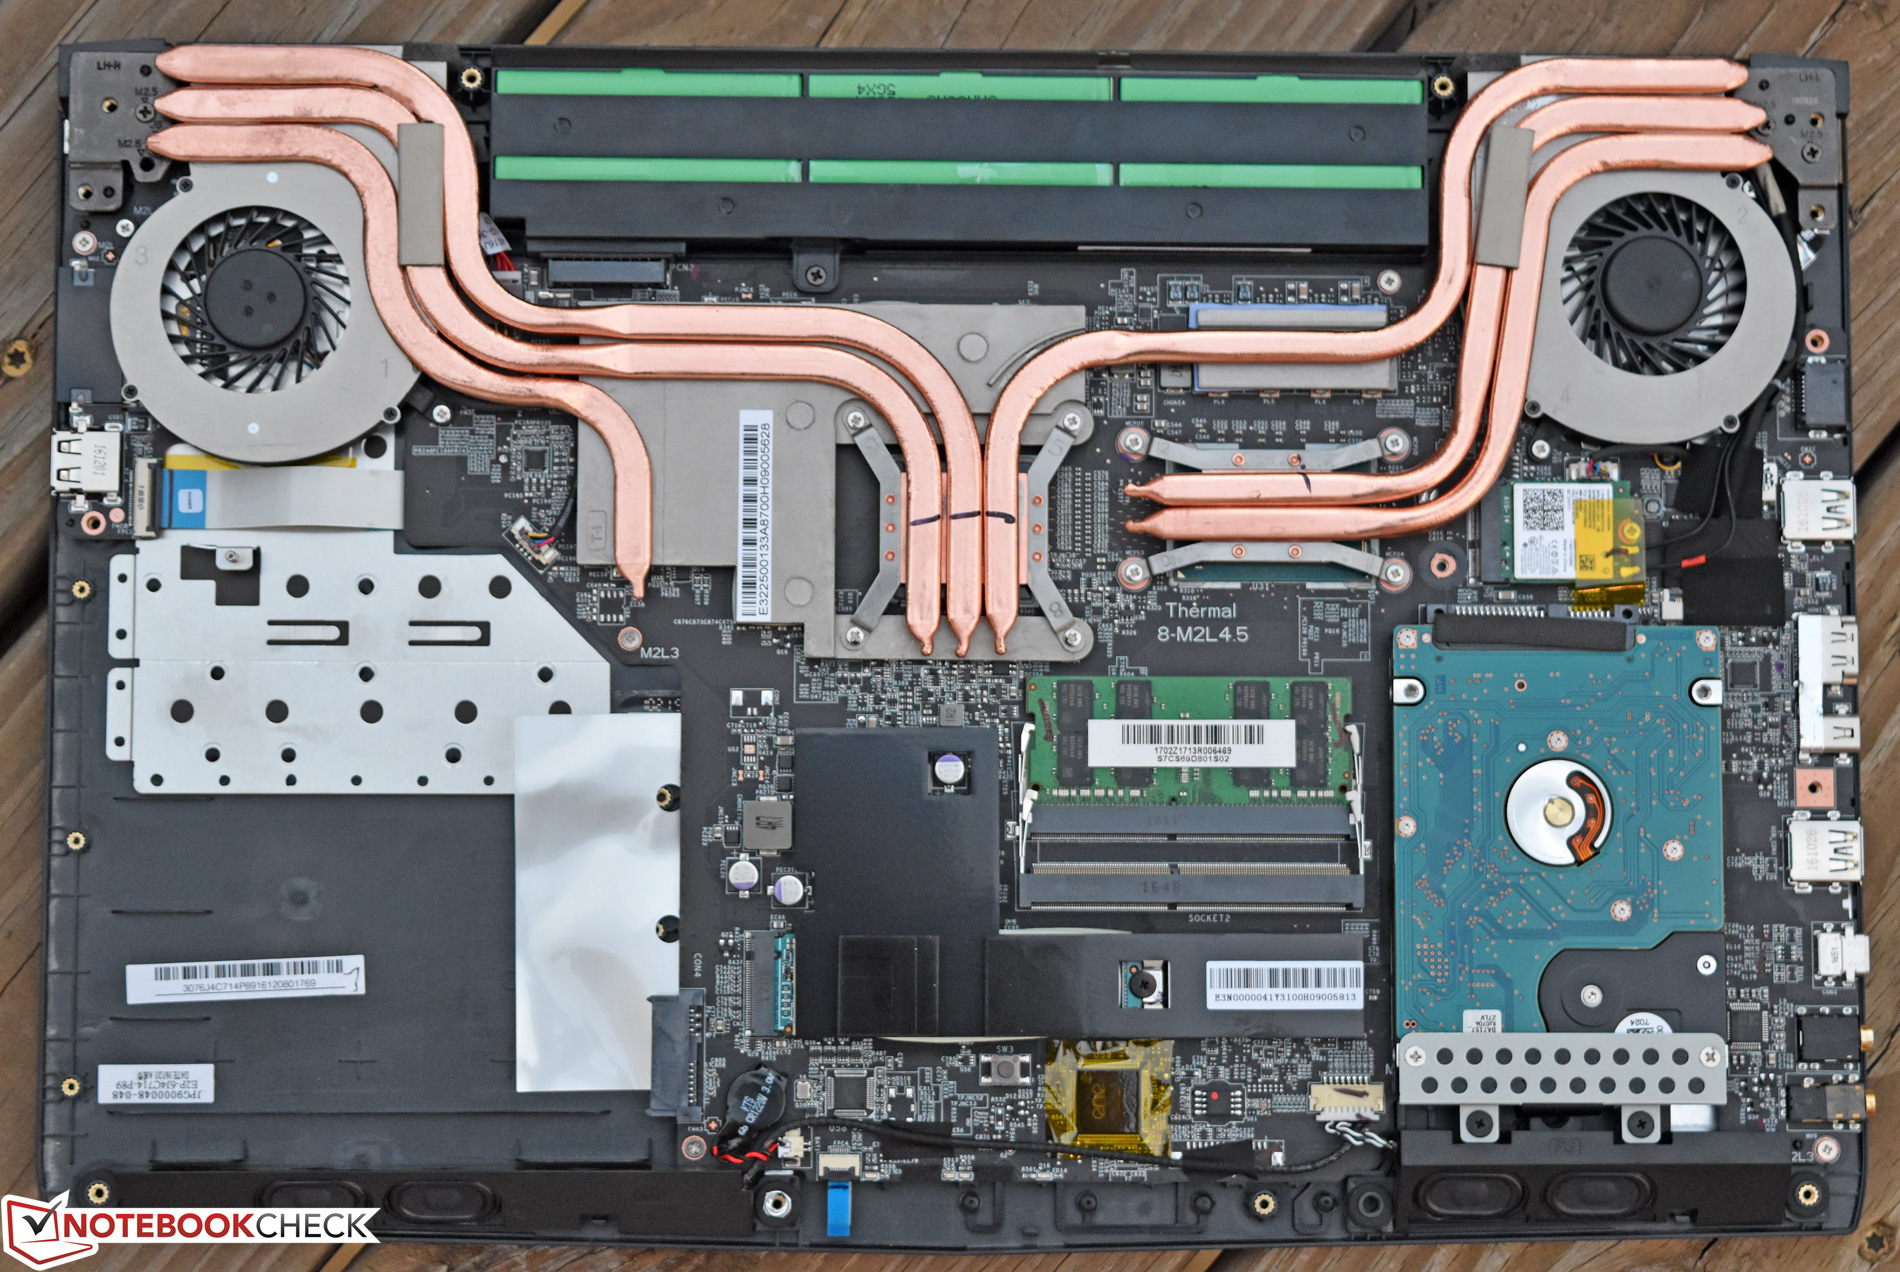
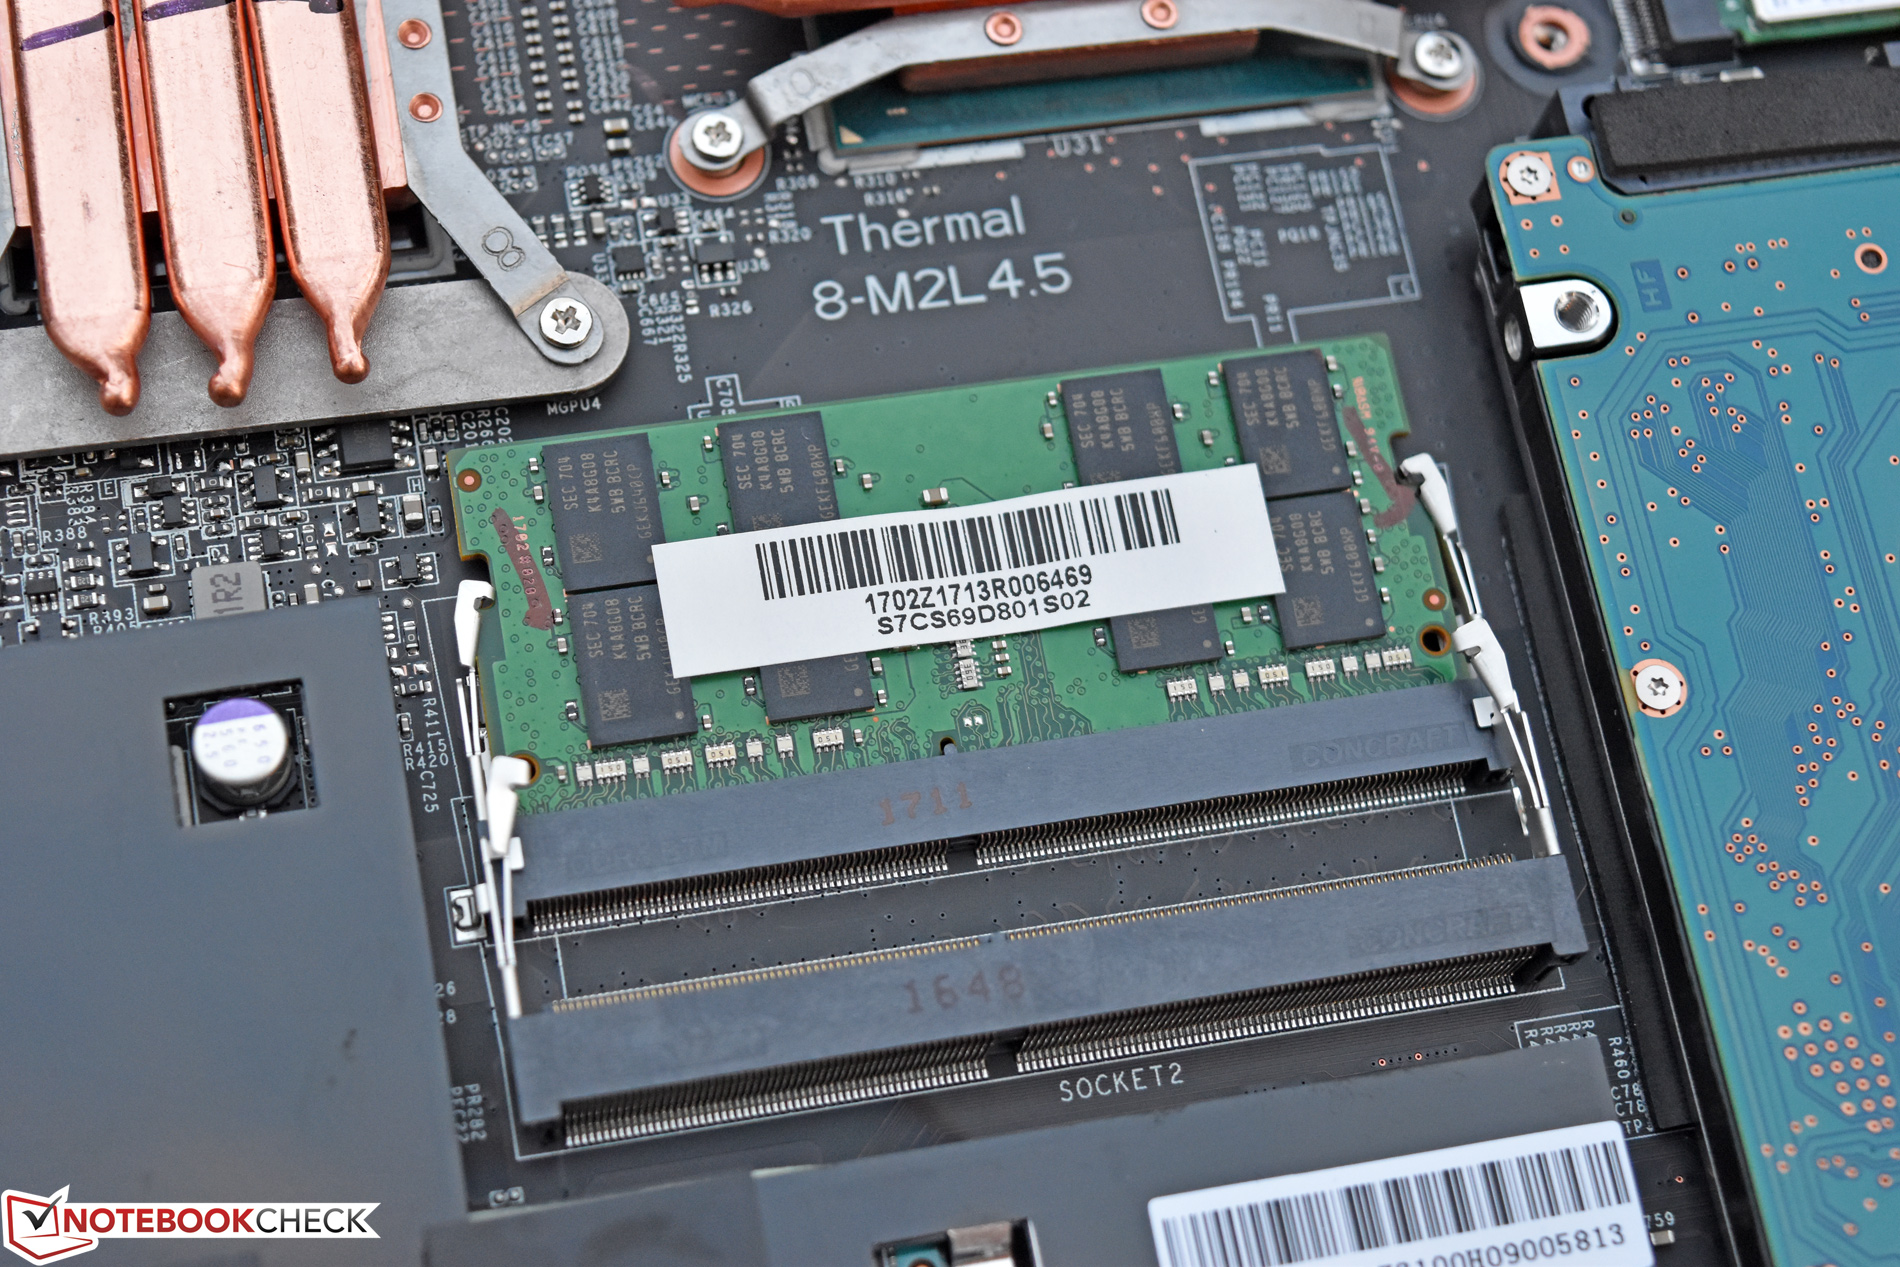
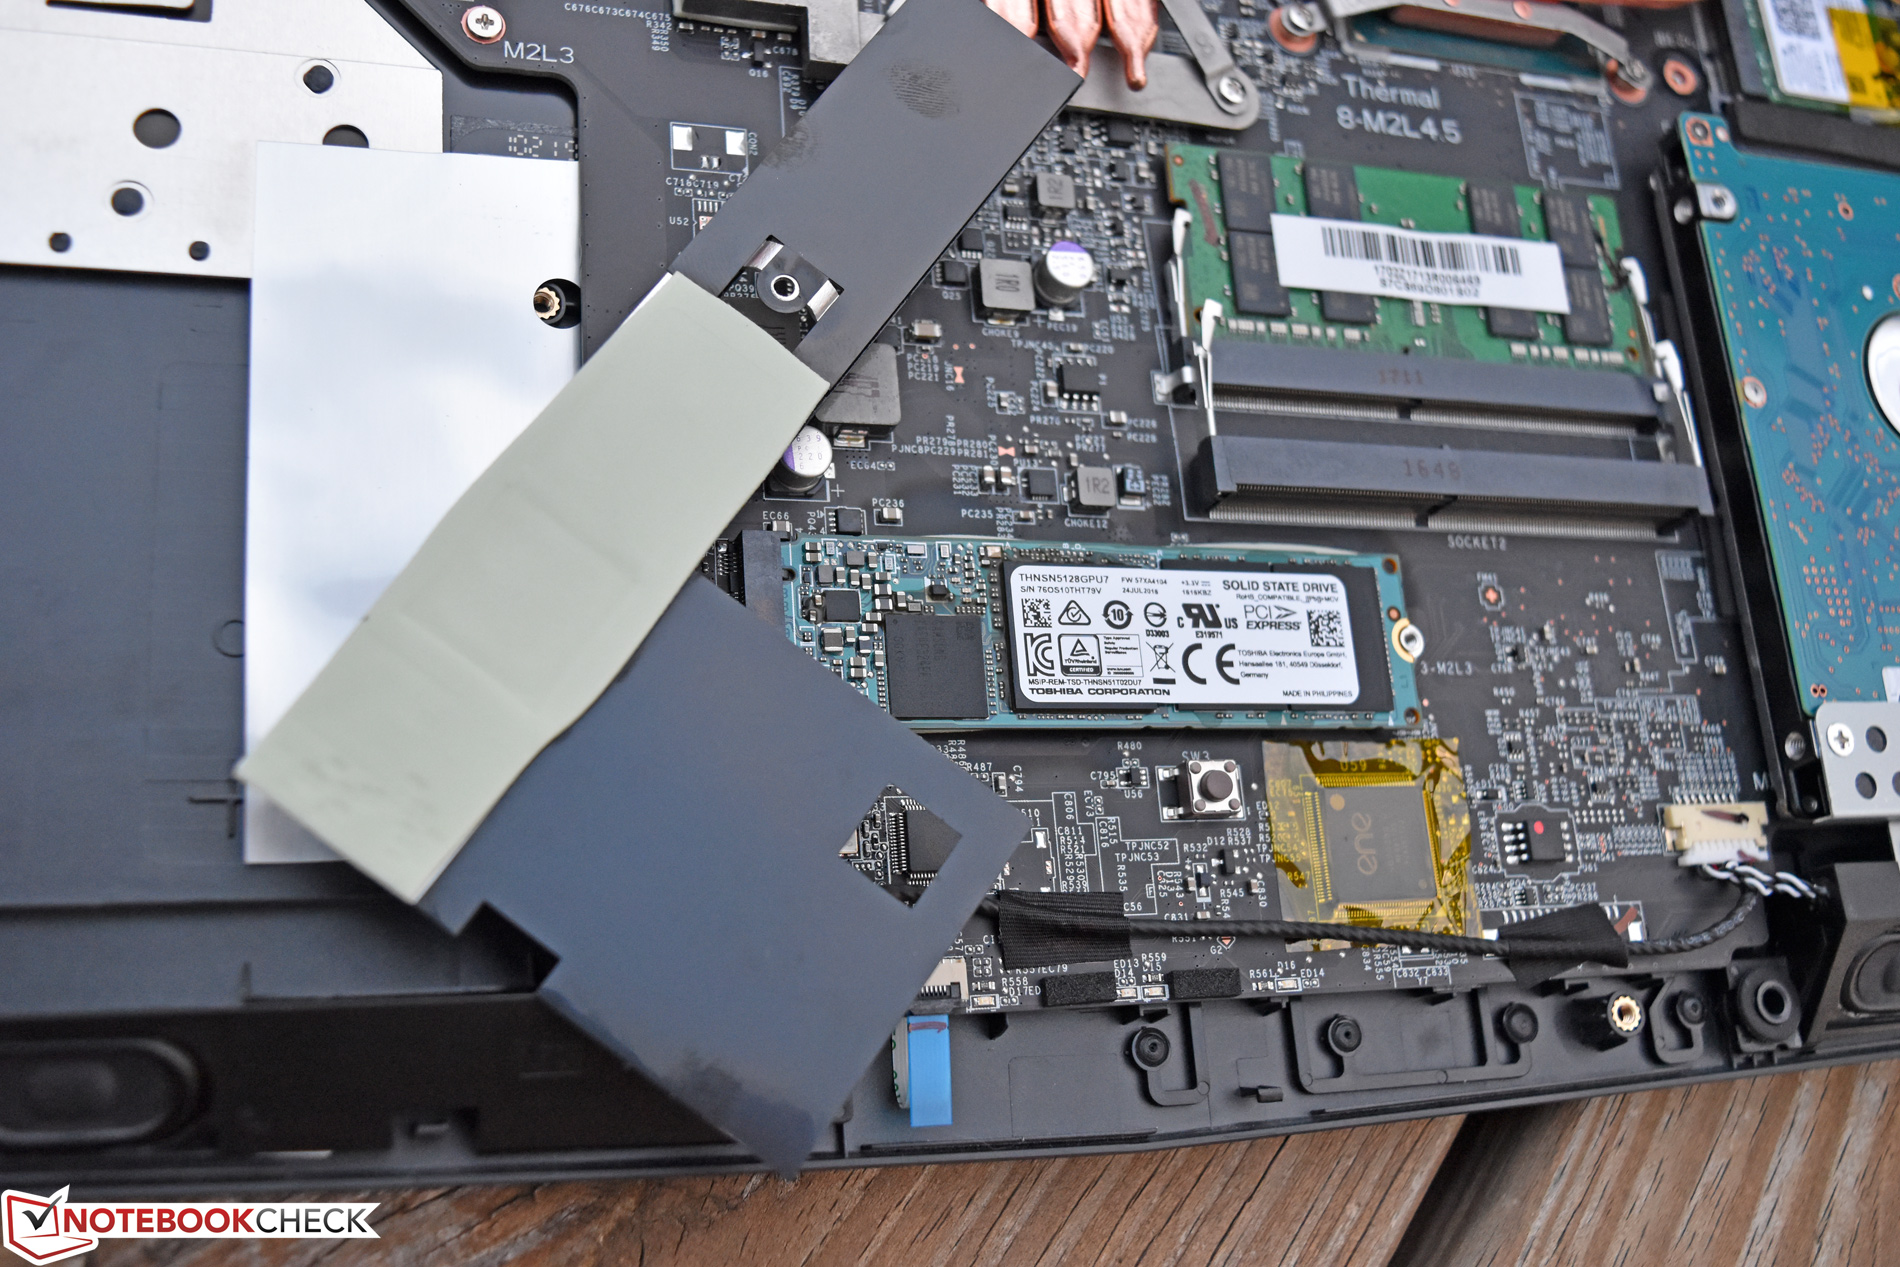
El MSI GP62 no es ni glamuroso ni pionero. Es un portátil gaming MSI clásico y del montón (aparte de las marcas Xotic PC y el atractivo teclado retroiluminado RGB) con un enfoque primario en el rendimiento bruto, y de manera equivalente, de bajo costo. Por $ 1,299, es difícil discutir con el rendimiento de la GPU de todos modos, incluso si algunos competidores (como la Lenovo Legion Y520) pueden manejar puntuaciones similares por un par de cientos de dólares menos. Además de eso, los dispositivos de entrada son muy buenos, la pantalla es decente (aparte de los ángulos de visión, PWM, y un ratio de contraste relativamente bajo), y la máquina no es demasiado difícil de actualizar y mantener - Quitando la enerable pegatina de garantía que cubre uno de los tornillos.
Sin embargo, el rendimiento de la CPU es insuficiente debido a las limitaciones térmicas, las temperaturas son a veces molestas, los altavoces son débiles y el consumo de energía es sorprendentemente alto (y, en consecuencia, la duración de la batería es corta). No hay nada particularmente ofensivo sobre la máquina, pero nada es realmente impresionante, tampoco. Es una máquina gaming asequible lo mires por donde lo mires.
El MSI GP62 7REX es una máquina gaming asequible lo mires por donde lo mires.
Dentro de este rango de precios, existen opciones claramente mejores, como el Asus ROG GL753VE, que tiene un precio idéntico y ofrece un mejor rendimiento en general, así como temperaturas mucho más razonables, un mejor display y tiempos de funcionamiento más largos de la batería. Por un poco más de dinero, otros portátiles de MSI como el GS73VR 6RF STEALTH PRO representan un mejor valor (especialmente cuando están equipados con un panel FHD en lugar del UHD en nuestra unidad de análisis). Con un descuento más pronunciado, el GP62 podría ser más fácil de aceptar. Tal y como está, los usuarios pueden primero echar un vistazo a otras opciones.
Ésta es una versión acortada del análisis original. Puedes leer el análisis completo en inglés aquí.
MSI GP62 7REX-1045US
- 07/22/2017 v6 (old)
Steve Schardein
Price comparison
