Breve análisis del portátil convertible Lenovo IdeaPad Miix 720 (7500U, QHD)
| Networking | |
| iperf3 transmit AX12 | |
| Asus Transformer 3 Pro T303UA-GN050T | |
| Lenovo Ideapad Miix 720-12IKB | |
| Lenovo Miix 510 Pro 80U10006GE (jseb) | |
| iperf3 receive AX12 | |
| Lenovo Miix 510 Pro 80U10006GE (jseb) | |
| Asus Transformer 3 Pro T303UA-GN050T | |
| Lenovo Ideapad Miix 720-12IKB | |
| |||||||||||||||||||||||||
iluminación: 88 %
Brillo con batería: 414 cd/m²
Contraste: 1353:1 (Negro: 0.3 cd/m²)
ΔE ColorChecker Calman: 5.28 | ∀{0.5-29.43 Ø4.72}
ΔE Greyscale Calman: 6.71 | ∀{0.09-98 Ø4.97}
91% sRGB (Argyll 1.6.3 3D)
59% AdobeRGB 1998 (Argyll 1.6.3 3D)
66.1% AdobeRGB 1998 (Argyll 3D)
91% sRGB (Argyll 3D)
65.2% Display P3 (Argyll 3D)
Gamma: 2.29
CCT: 6532 K
| Lenovo Ideapad Miix 720-12IKB AUO B120YAN01 / AUO106F, , 2880x1920, 12" | Microsoft Surface Pro 4 Core i7 Samsung 123YL01-001 ID: SDC3853, , 2736x1824, 12.3" | Asus Transformer 3 Pro T303UA-GN050T BOE BOE06AC (NV126A1M-N51), , 2880x1920, 12.6" | Lenovo Miix 510 Pro 80U10006GE Unknown, , 1920x1200, 12.2" | Acer Aspire Switch Alpha 12 SA5-271-56HM Panasonic VVX12T041N00, , 2160x1440, 12" | HP Elite x2 1012 G1 LG Philips, , 1920x1280, 12.1" | Dell XPS 12 9250 4K Sharp SHP143D, , 3840x2160, 12.5" | |
|---|---|---|---|---|---|---|---|
| Display | 5% | 19% | -0% | 2% | -18% | 29% | |
| Display P3 Coverage (%) | 65.2 | 66.9 3% | 81.8 25% | 64.5 -1% | 65.5 0% | 53.8 -17% | 83.9 29% |
| sRGB Coverage (%) | 91 | 97.5 7% | 98.3 8% | 92 1% | 96.1 6% | 73.7 -19% | 99.8 10% |
| AdobeRGB 1998 Coverage (%) | 66.1 | 68.6 4% | 82.2 24% | 65.5 -1% | 66.9 1% | 53.8 -19% | 98.1 48% |
| Response Times | -28% | 6% | 16% | 7% | 16% | -13% | |
| Response Time Grey 50% / Grey 80% * (ms) | 45 ? | 48.4 ? -8% | 30 ? 33% | 33 ? 27% | 20 ? 56% | 33.2 ? 26% | 36 ? 20% |
| Response Time Black / White * (ms) | 24 ? | 35.6 ? -48% | 29 ? -21% | 23 ? 4% | 34 ? -42% | 22.8 ? 5% | 35 ? -46% |
| PWM Frequency (Hz) | 10420 | 200 ? | 125 ? | 1000 ? | 1000 ? | ||
| Screen | 18% | 4% | -21% | -14% | -16% | 13% | |
| Brightness middle (cd/m²) | 406 | 436.7 8% | 316 -22% | 327 -19% | 345 -15% | 322 -21% | 437 8% |
| Brightness (cd/m²) | 396 | 433 9% | 307 -22% | 324 -18% | 328 -17% | 319 -19% | 399 1% |
| Brightness Distribution (%) | 88 | 87 -1% | 91 3% | 88 0% | 91 3% | 97 10% | 81 -8% |
| Black Level * (cd/m²) | 0.3 | 0.326 -9% | 0.29 3% | 0.35 -17% | 0.38 -27% | 0.42 -40% | 0.35 -17% |
| Contrast (:1) | 1353 | 1340 -1% | 1090 -19% | 934 -31% | 908 -33% | 767 -43% | 1249 -8% |
| Colorchecker dE 2000 * | 5.28 | 1.82 66% | 3.91 26% | 6.54 -24% | 8.4 -59% | 6.02 -14% | 3.56 33% |
| Colorchecker dE 2000 max. * | 9.83 | 7.9 20% | 15.59 -59% | 11.9 -21% | 10.06 -2% | 9.3 5% | |
| Greyscale dE 2000 * | 6.71 | 1.44 79% | 5.37 20% | 9.52 -42% | 4.3 36% | 6.29 6% | 2.67 60% |
| Gamma | 2.29 96% | 2.1 105% | 2.36 93% | 2.35 94% | 2.63 84% | 2.4 92% | 2.17 101% |
| CCT | 6532 100% | 6560 99% | 7812 83% | 8802 74% | 7368 88% | 7712 84% | 6681 97% |
| Color Space (Percent of AdobeRGB 1998) (%) | 59 | 62.3 6% | 72 22% | 59 0% | 62 5% | 47.8 -19% | 86 46% |
| Color Space (Percent of sRGB) (%) | 91 | 97.5 7% | 98 8% | 92 1% | 73.2 -20% | 100 10% | |
| Media total (Programa/Opciones) | -2% /
9% | 10% /
7% | -2% /
-12% | -2% /
-8% | -6% /
-12% | 10% /
13% |
* ... más pequeño es mejor
Tiempos de respuesta del display
| ↔ Tiempo de respuesta de Negro a Blanco | ||
|---|---|---|
| 24 ms ... subida ↗ y bajada ↘ combinada | ↗ 14 ms subida | 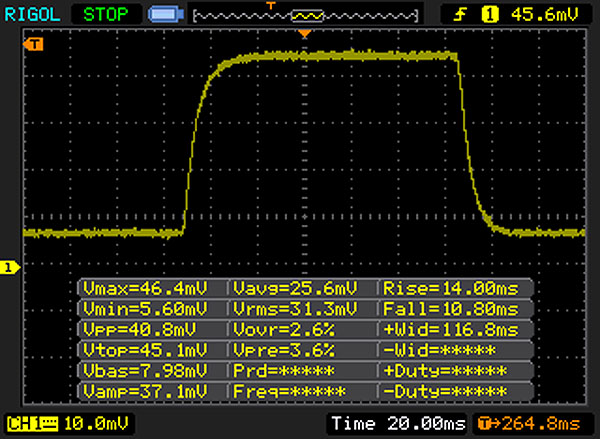 |
| ↘ 10 ms bajada | ||
| La pantalla mostró buenos tiempos de respuesta en nuestros tests pero podría ser demasiado lenta para los jugones competitivos. En comparación, todos los dispositivos de prueba van de ##min### (mínimo) a 240 (máximo) ms. » 54 % de todos los dispositivos son mejores. Eso quiere decir que el tiempo de respuesta es peor que la media (19.8 ms) de todos los dispositivos testados. | ||
| ↔ Tiempo de respuesta 50% Gris a 80% Gris | ||
| 45 ms ... subida ↗ y bajada ↘ combinada | ↗ 22 ms subida | 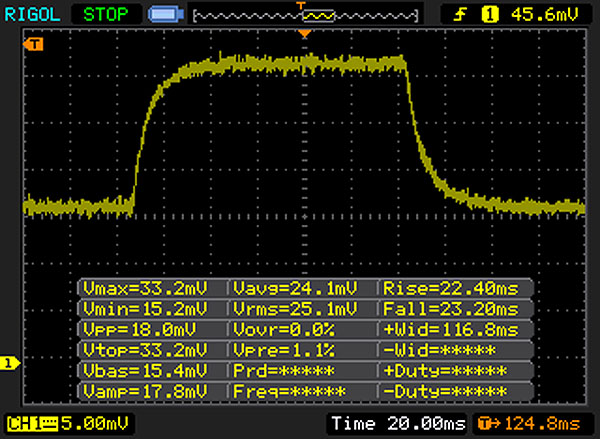 |
| ↘ 23 ms bajada | ||
| La pantalla mostró tiempos de respuesta lentos en nuestros tests y podría ser demasiado lenta para los jugones. En comparación, todos los dispositivos de prueba van de ##min### (mínimo) a 636 (máximo) ms. » 77 % de todos los dispositivos son mejores. Eso quiere decir que el tiempo de respuesta es peor que la media (31 ms) de todos los dispositivos testados. | ||
Parpadeo de Pantalla / PWM (Pulse-Width Modulation)
| Parpadeo de Pantalla / PWM no detectado | ||
Comparación: 52 % de todos los dispositivos testados no usaron PWM para atenuar el display. Si se usó, medimos una media de 7769 (mínimo: 5 - máxmo: 343500) Hz. | ||
| PCMark 8 Home Score Accelerated v2 | 3186 puntos | |
| PCMark 8 Work Score Accelerated v2 | 4216 puntos | |
ayuda | ||
| Lenovo Ideapad Miix 720-12IKB Samsung SSD PM961 1TB M.2 PCIe 3.0 x4 NVMe (MZVLW1T0) | Microsoft Surface Pro 4 Core i7 Samsung MZFLV256 NVMe | Asus Transformer 3 Pro T303UA-GN050T SK Hynix Canvas SC300 512GB M.2 (HFS512G39MND) | Lenovo Miix 510 Pro 80U10006GE Samsung PM951 NVMe MZVLV256 | Acer Aspire Switch Alpha 12 SA5-271-56HM Kingston RBU-SNS8152S3256GG2 | HP Elite x2 1012 G1 Liteon L8H-256V2G | Dell XPS 12 9250 4K Samsung PM951 NVMe 512 GB | |
|---|---|---|---|---|---|---|---|
| CrystalDiskMark 3.0 | -51% | -65% | -43% | -65% | -60% | -55% | |
| Read Seq (MB/s) | 2408 | 834 -65% | 398.9 -83% | 1271 -47% | 518 -78% | 501 -79% | 984 -59% |
| Write Seq (MB/s) | 1702 | 304 -82% | 402 -76% | 305.4 -82% | 199.9 -88% | 297.2 -83% | 525 -69% |
| Read 512 (MB/s) | 1301 | 396.7 -70% | 303.1 -77% | 651 -50% | 374.9 -71% | 351.7 -73% | 428.7 -67% |
| Write 512 (MB/s) | 1288 | 304.3 -76% | 320.3 -75% | 305.2 -76% | 201 -84% | 295.7 -77% | 176.6 -86% |
| Read 4k (MB/s) | 53.6 | 40.75 -24% | 26.11 -51% | 41.07 -23% | 29.3 -45% | 28.31 -47% | 37.31 -30% |
| Write 4k (MB/s) | 162.2 | 106.3 -34% | 57.7 -64% | 122.7 -24% | 76.8 -53% | 90.3 -44% | 104 -36% |
| Read 4k QD32 (MB/s) | 504 | 393.1 -22% | 245.8 -51% | 411.2 -18% | 272 -46% | 285 -43% | 254.4 -50% |
| Write 4k QD32 (MB/s) | 420.8 | 292.3 -31% | 253.8 -40% | 305.1 -27% | 197.1 -53% | 268.4 -36% | 234.1 -44% |

| 3DMark 11 Performance | 1558 puntos | |
| 3DMark Cloud Gate Standard Score | 5620 puntos | |
ayuda | ||
| Thief - 1024x768 Very Low Preset | |
| Lenovo Ideapad Miix 720-12IKB | |
| Lenovo Miix 510 Pro 80U10006GE | |
| Rise of the Tomb Raider - 1024x768 Lowest Preset | |
| Asus Transformer 3 Pro T303UA-GN050T | |
| Lenovo Miix 510 Pro 80U10006GE | |
| Acer Aspire Switch Alpha 12 SA5-271-56HM | |
| Lenovo Ideapad Miix 720-12IKB | |
| Dell XPS 12 9250 4K | |
| bajo | medio | alto | ultra | |
|---|---|---|---|---|
| BioShock Infinite (2013) | 48 | 29 | 24.7 | 7.4 |
| Thief (2014) | 21.7 | 14.1 | 11.7 | 5.7 |
| Rise of the Tomb Raider (2016) | 16.7 | 10.2 | 5.5 |
Ruido
| Ocioso |
| 30.4 / 32.4 / 32.4 dB(A) |
| Carga |
| 36 / 36.3 dB(A) |
 | ||
30 dB silencioso 40 dB(A) audible 50 dB(A) ruidosamente alto |
||
min: | ||
(±) La temperatura máxima en la parte superior es de 42 °C / 108 F, frente a la media de 35.4 °C / 96 F, que oscila entre 19.6 y 60 °C para la clase Convertible.
(±) El fondo se calienta hasta un máximo de 43.6 °C / 110 F, frente a la media de 36.9 °C / 98 F
(+) En reposo, la temperatura media de la parte superior es de 30.2 °C / 86# F, frente a la media del dispositivo de 30.3 °C / 87 F.
(±) El reposamanos y el touchpad pueden calentarse mucho al tacto con un máximo de 37.5 °C / 99.5 F.
(-) La temperatura media de la zona del reposamanos de dispositivos similares fue de 28 °C / 82.4 F (-9.5 °C / -17.1 F).
Lenovo Ideapad Miix 720-12IKB análisis de audio
(-) | altavoces no muy altos (#64 dB)
Graves 100 - 315 Hz
(±) | lubina reducida - en promedio 9.9% inferior a la mediana
(-) | los graves no son lineales (16.2% delta a la frecuencia anterior)
Medios 400 - 2000 Hz
(±) | medias más altas - de media 7.3% más altas que la mediana
(±) | la linealidad de los medios es media (13.3% delta respecto a la frecuencia anterior)
Altos 2 - 16 kHz
(+) | máximos equilibrados - a sólo 3.3% de la mediana
(±) | la linealidad de los máximos es media (12.2% delta a frecuencia anterior)
Total 100 - 16.000 Hz
(±) | la linealidad del sonido global es media (25.1% de diferencia con la mediana)
En comparación con la misma clase
» 76% de todos los dispositivos probados de esta clase eran mejores, 7% similares, 17% peores
» El mejor tuvo un delta de 6%, la media fue 20%, el peor fue ###max##%
En comparación con todos los dispositivos probados
» 77% de todos los dispositivos probados eran mejores, 5% similares, 18% peores
» El mejor tuvo un delta de 4%, la media fue 24%, el peor fue ###max##%
Asus Transformer 3 Pro T303UA-GN050T análisis de audio
(±) | la sonoridad del altavoz es media pero buena (73 dB)
Graves 100 - 315 Hz
(±) | lubina reducida - en promedio 11.2% inferior a la mediana
(±) | la linealidad de los graves es media (8.2% delta a frecuencia anterior)
Medios 400 - 2000 Hz
(+) | medios equilibrados - a sólo 1.8% de la mediana
(+) | los medios son lineales (6.7% delta a la frecuencia anterior)
Altos 2 - 16 kHz
(±) | máximos más altos - de media 9% más altos que la mediana
(+) | los máximos son lineales (5.7% delta a la frecuencia anterior)
Total 100 - 16.000 Hz
(±) | la linealidad del sonido global es media (19% de diferencia con la mediana)
En comparación con la misma clase
» 45% de todos los dispositivos probados de esta clase eran mejores, 7% similares, 48% peores
» El mejor tuvo un delta de 6%, la media fue 20%, el peor fue ###max##%
En comparación con todos los dispositivos probados
» 45% de todos los dispositivos probados eran mejores, 7% similares, 48% peores
» El mejor tuvo un delta de 4%, la media fue 24%, el peor fue ###max##%
| Off / Standby | |
| Ocioso | |
| Carga |
|
Clave:
min: | |
| Lenovo Ideapad Miix 720-12IKB i7-7500U, HD Graphics 620, Samsung SSD PM961 1TB M.2 PCIe 3.0 x4 NVMe (MZVLW1T0), IPS, 2880x1920, 12" | Microsoft Surface Pro 4, Core i5, 128GB 6300U, HD Graphics 520, Samsung MZFLV128 NVMe, IPS, 2736x1824, 12.3" | Asus Transformer 3 Pro T303UA-GN050T 6500U, HD Graphics 520, SK Hynix Canvas SC300 512GB M.2 (HFS512G39MND), IPS, 2880x1920, 12.6" | Lenovo Miix 510 Pro 80U10006GE 6200U, HD Graphics 520, Samsung PM951 NVMe MZVLV256, IPS, 1920x1200, 12.2" | Acer Aspire Switch Alpha 12 SA5-271-56HM 6200U, HD Graphics 520, Kingston RBU-SNS8152S3256GG2, IPS, 2160x1440, 12" | HP Elite x2 1012 G1 6Y54, HD Graphics 515, Liteon L8H-256V2G, IPS, 1920x1280, 12.1" | Dell XPS 12 9250 4K 6Y75, HD Graphics 515, Samsung PM951 NVMe 512 GB, IPS, 3840x2160, 12.5" | |
|---|---|---|---|---|---|---|---|
| Power Consumption | -3% | -37% | -24% | -31% | 3% | -21% | |
| Idle Minimum * (Watt) | 3.5 | 4.4 -26% | 6.7 -91% | 4.2 -20% | 7.3 -109% | 3.7 -6% | 5.4 -54% |
| Idle Average * (Watt) | 7.2 | 9 -25% | 10.3 -43% | 11.5 -60% | 10 -39% | 6.8 6% | 10.2 -42% |
| Idle Maximum * (Watt) | 7.9 | 10.7 -35% | 13.5 -71% | 11.7 -48% | 10.15 -28% | 7.6 4% | 12.5 -58% |
| Load Average * (Watt) | 29.6 | 19.6 34% | 26 12% | 31 -5% | 25.2 15% | 22.5 24% | 21.4 28% |
| Load Maximum * (Watt) | 30.8 | 19.9 35% | 28.8 6% | 27.4 11% | 29.3 5% | 34.5 -12% | 24.4 21% |
* ... más pequeño es mejor
| Lenovo Ideapad Miix 720-12IKB i7-7500U, HD Graphics 620, 41 Wh | Microsoft Surface Pro 4 Core i7 6650U, Iris Graphics 540, 38 Wh | Asus Transformer 3 Pro T303UA-GN050T 6500U, HD Graphics 520, 39 Wh | Lenovo Miix 510 Pro 80U10006GE 6200U, HD Graphics 520, 50 Wh | Acer Aspire Switch Alpha 12 SA5-271-56HM 6200U, HD Graphics 520, 37 Wh | HP Elite x2 1012 G1 6Y54, HD Graphics 515, 37 Wh | Dell XPS 12 9250 4K 6Y75, HD Graphics 515, 28 Wh | |
|---|---|---|---|---|---|---|---|
| Duración de Batería | -19% | -29% | -3% | -6% | 16% | -31% | |
| Reader / Idle (h) | 11.9 | 10.9 -8% | 7.1 -40% | 11.6 -3% | 10.7 -10% | 12.2 3% | 6.2 -48% |
| WiFi v1.3 (h) | 5.8 | 4.9 -16% | 3.7 -36% | 5.4 -7% | 5.4 -7% | 7.4 28% | 4.1 -29% |
| Load (h) | 1.9 | 1.3 -32% | 1.7 -11% | 1.9 0% | 1.9 0% | 2.2 16% | 1.6 -16% |
| H.264 (h) | 3.4 | 7.8 | 7.2 |
Pro
Contra

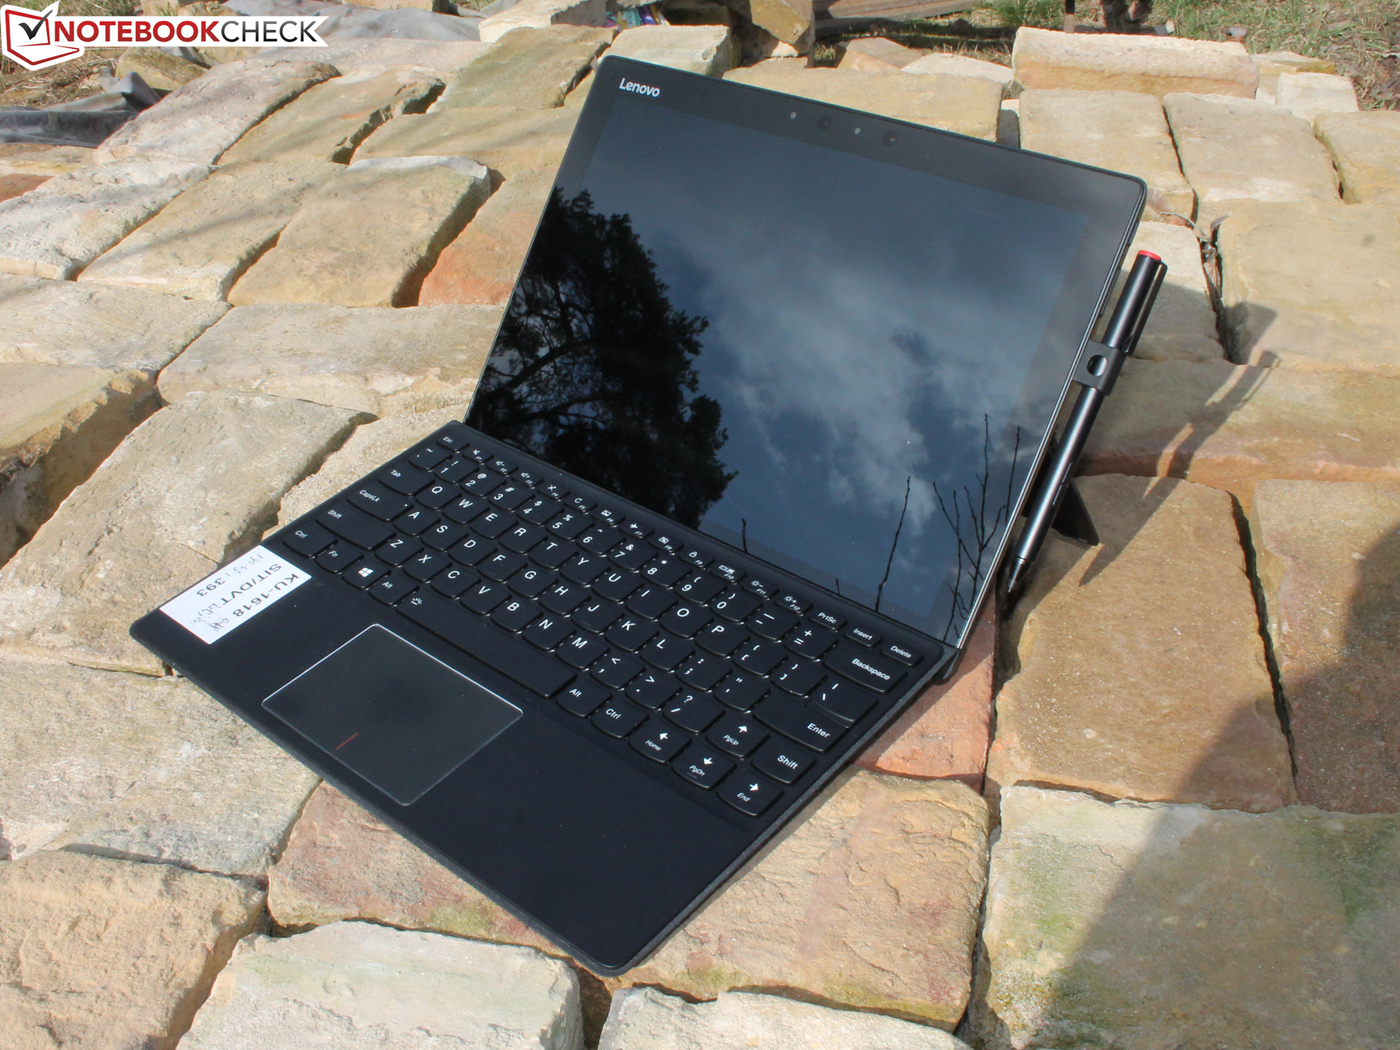
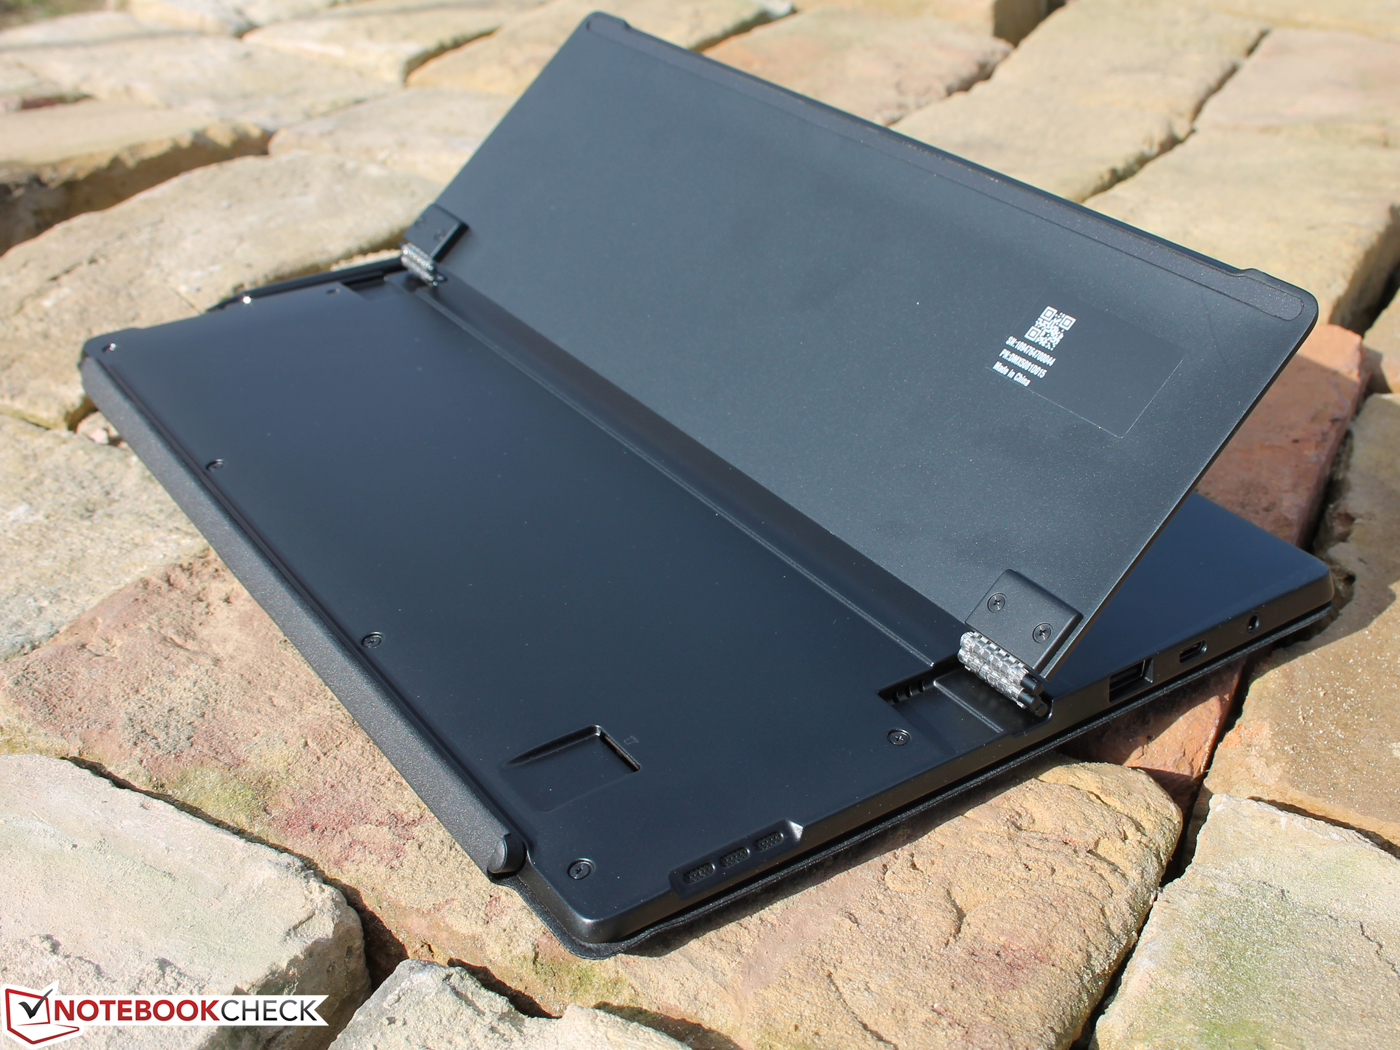
Con el IdeaPad Miix 720 Lenovo lanza una respuesta al Surface Pro 4, la similitud de las pantallas con el mismo ratio 3:2 y la alta resolución (2736x1.824 en el surface, 2880x1920 en el Miix 720) hace que sean casi intercambiables. Respecto a la pantalla no hay nada que criticar excepto, quizás, que la cobertura del espacio de color es mejorable.
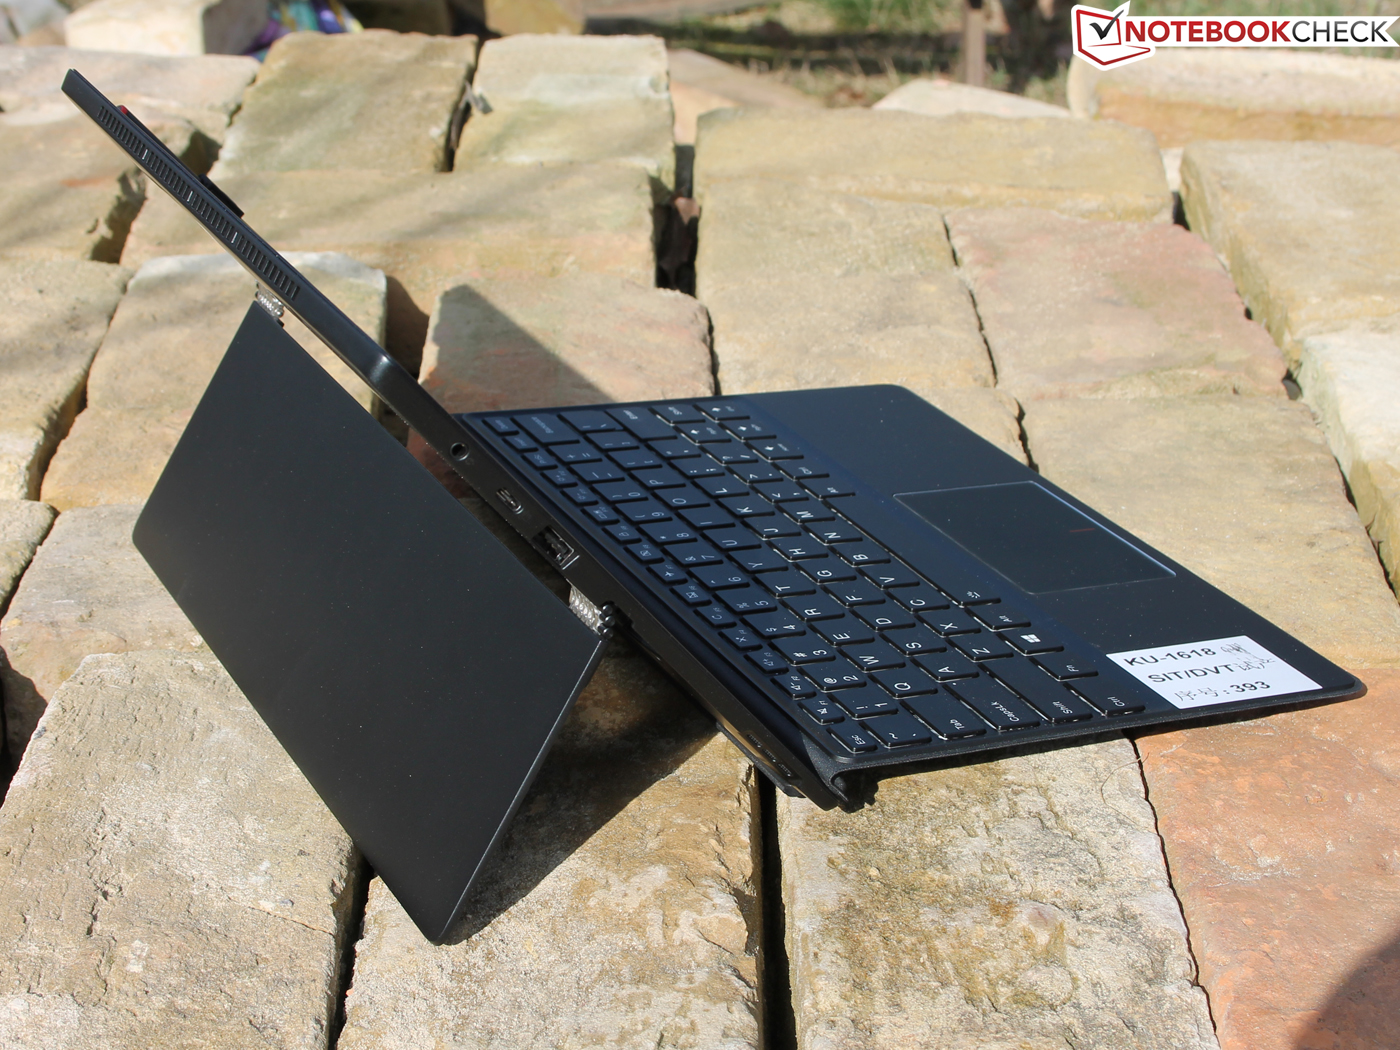
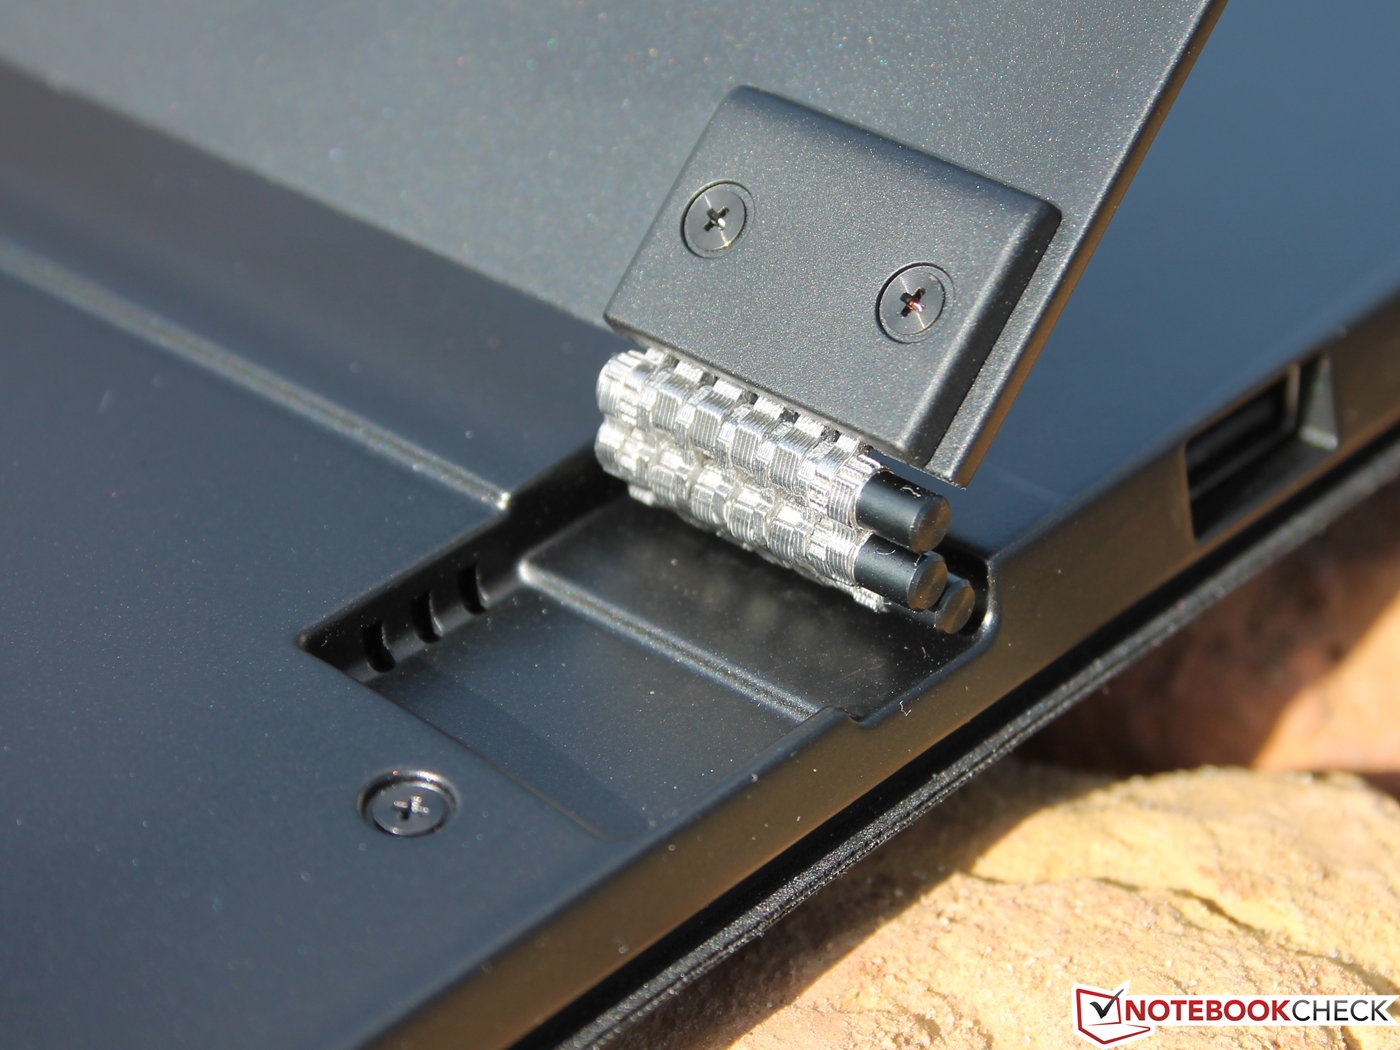
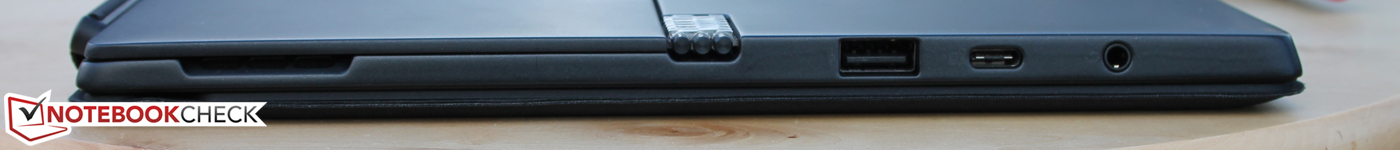
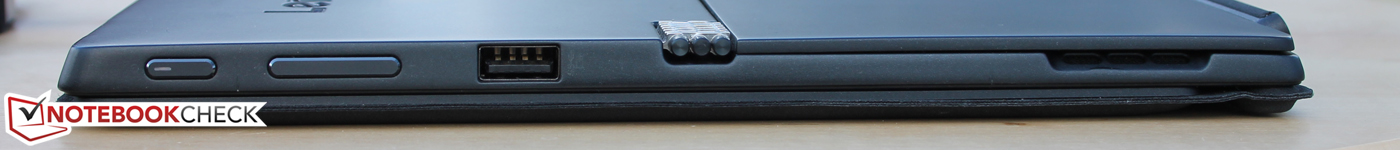
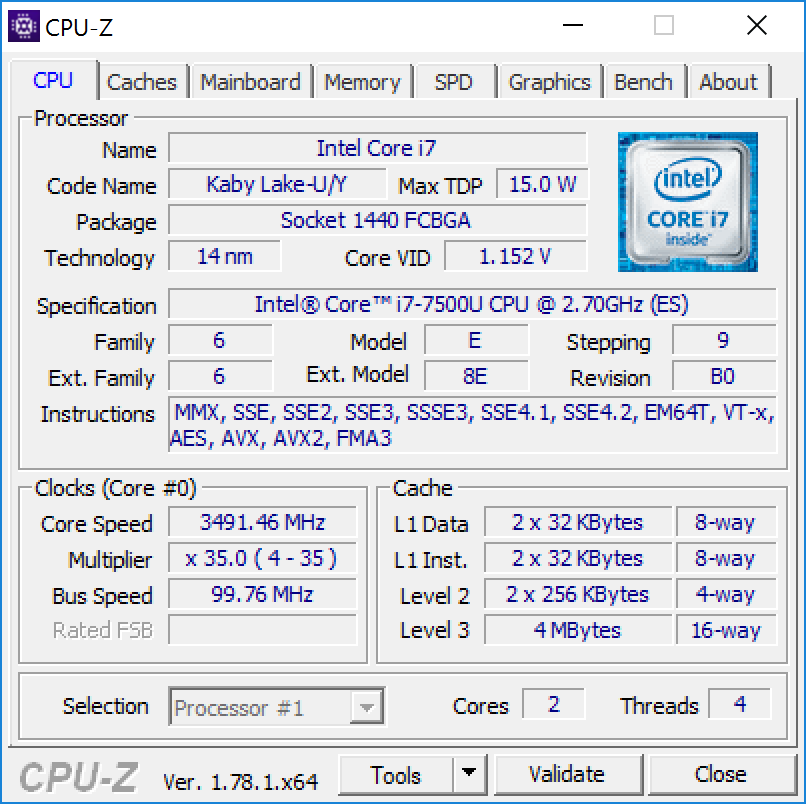
La ventaja del Miix es que está equipado con más puertos: 2x USB 3.0 Type-A, USB Type-C Gen2 con Thunderbolt 3 y una cámara IR para usar Windows Hello. En el aspecto técnico, se incluye un procesador Kaby Lake además de un RAID-SSD muy rápido.
Desafortunadamente, el mix 720 no puede utilizar toda la potencia del SoC, se pierde un 10% de rendimiento durante el funcionamiento continuo de aplicaciones cotidianas. Esto lo pone al mismo nivel que el el Surface Pro 4 i7. Incluso modelos más asequibles como el Aspire Switch Alpha 12 (i5) llevan su SoC Skylake SoCs a rendimientos iguales o superiores.
El Switch Alpha 12 con i5 está disponible desde 750 Euros, el Microsoft Surface Pro 4 + Type Cover (i5-6300U) por 1200 Euros. La pregunta entonces es: ¿Por que comprar el Miix 720 cuando el rendimiento del procesador está por debajo de lo deseado?
El Miix 720 no resulta barato: La versión con 7500U, 16 GB SSD de 1 TB cuesta 1700 Euros. Para la mayor parte de los usuarios, sin embargo, la versión con 256 o 128 GB y Core i3 o i5 7200U debería ser suficiente. Están disponibles por 1070 Euros.
La variante más pequeña es suficiente para disfrutar de las ventajas del Thunderbolt 3 al funcionar conectado a la base, la duración de batería, la gran pantalla, la cámara IR compatible con Windows Hello y el versátil teclado retroiluminado. En algún momento el precio bajará, un precio de unos 900 euros por la versión i3 sería un precio competitivo.
Ésta es una versión acortada del análisis original. Puedes leer el análisis completo en inglés aquí.
Lenovo Ideapad Miix 720-12IKB
- 03/21/2017 v6 (old)
Sebastian Jentsch