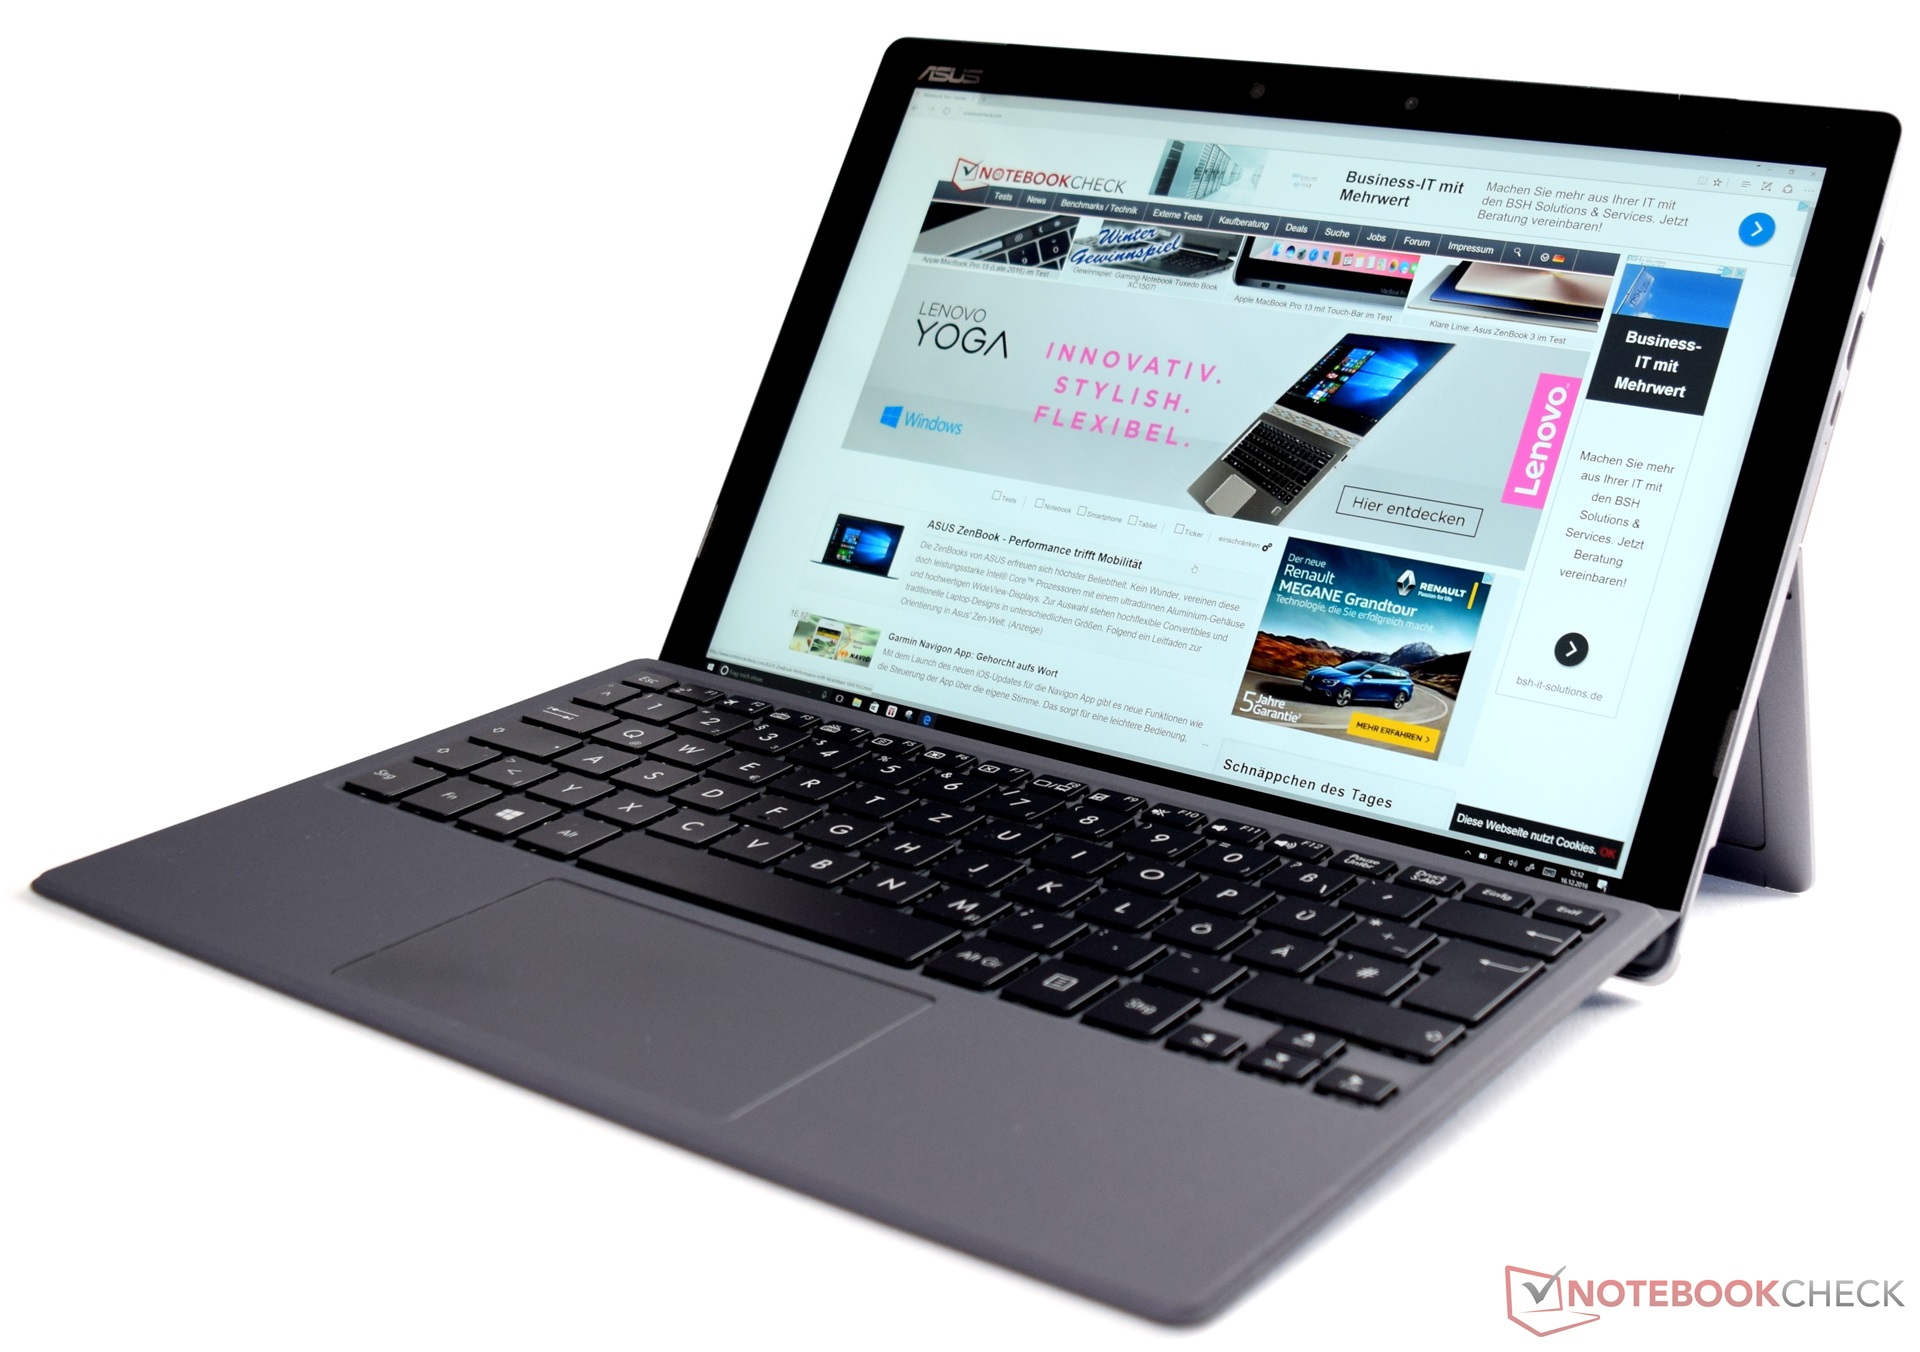
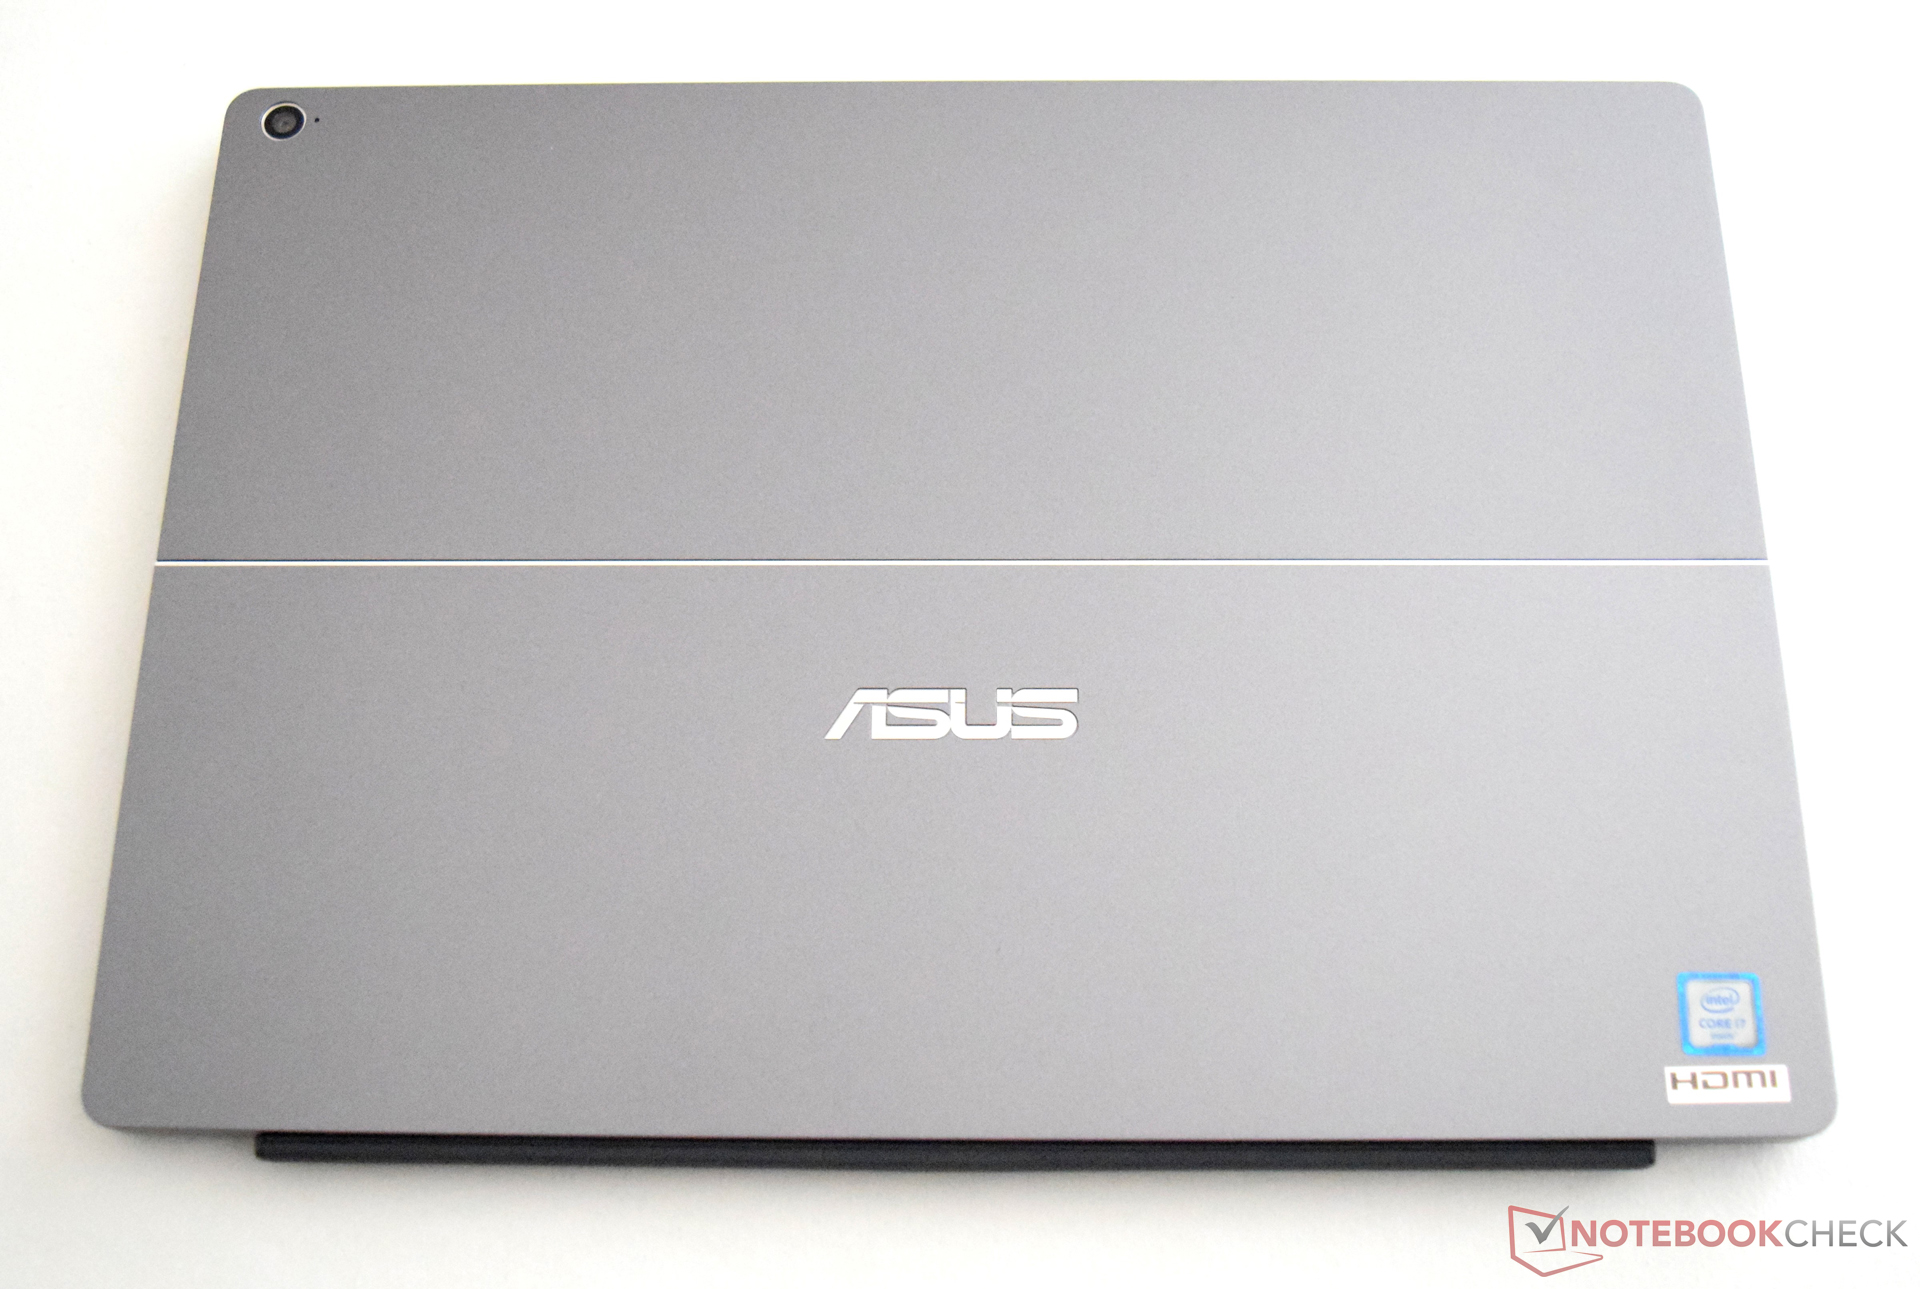
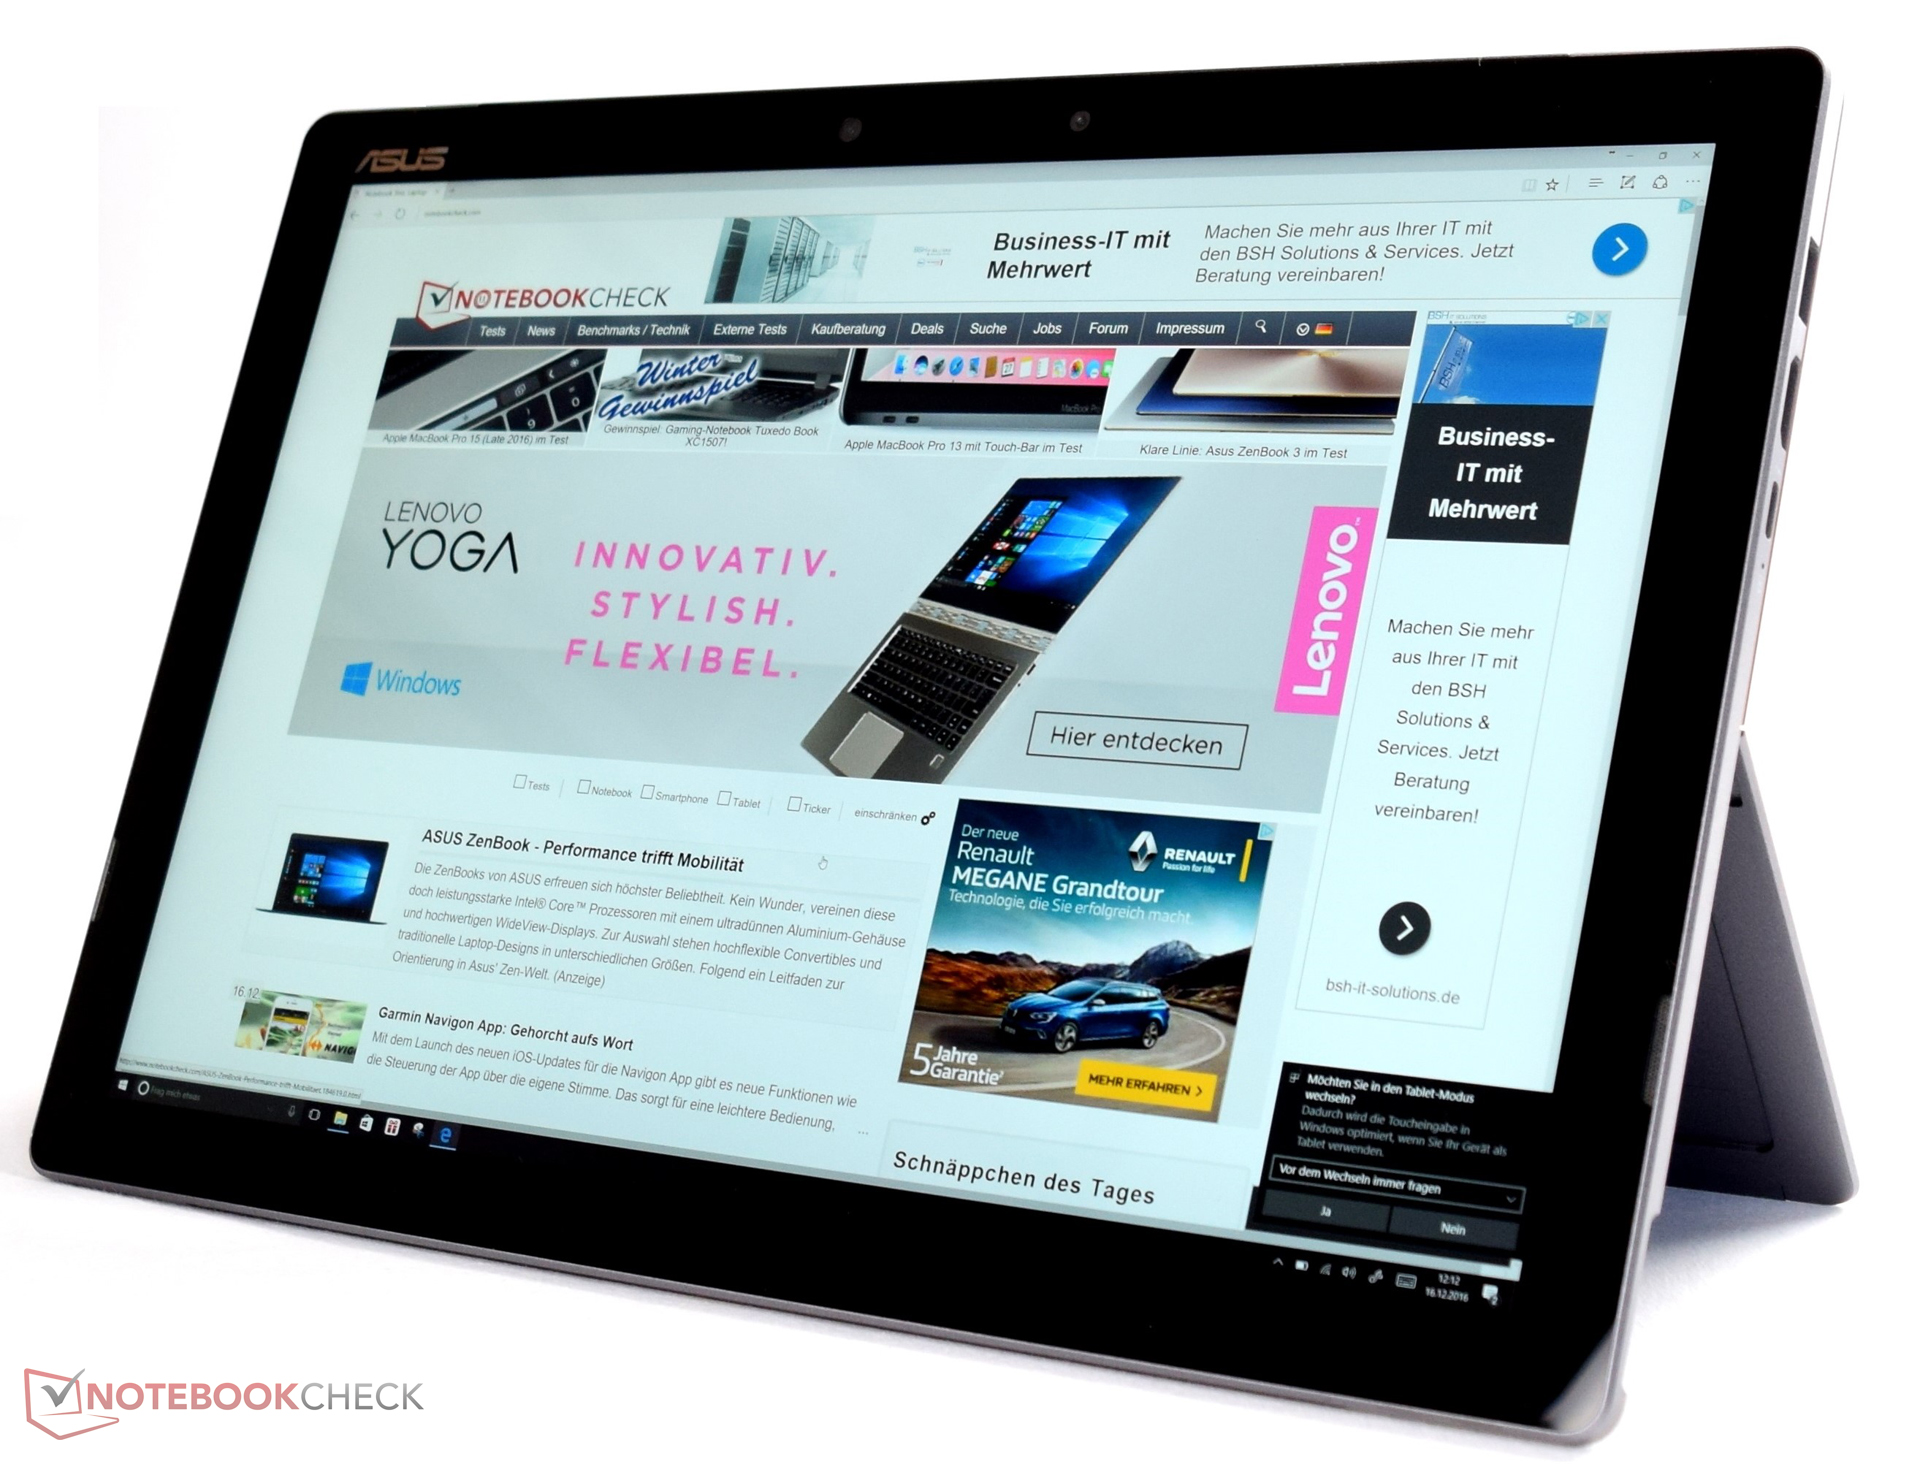
Breve análisis del convertible Asus Transformer 3 Pro T303UA-GN050T

| |||||||||||||||||||||||||
iluminación: 91 %
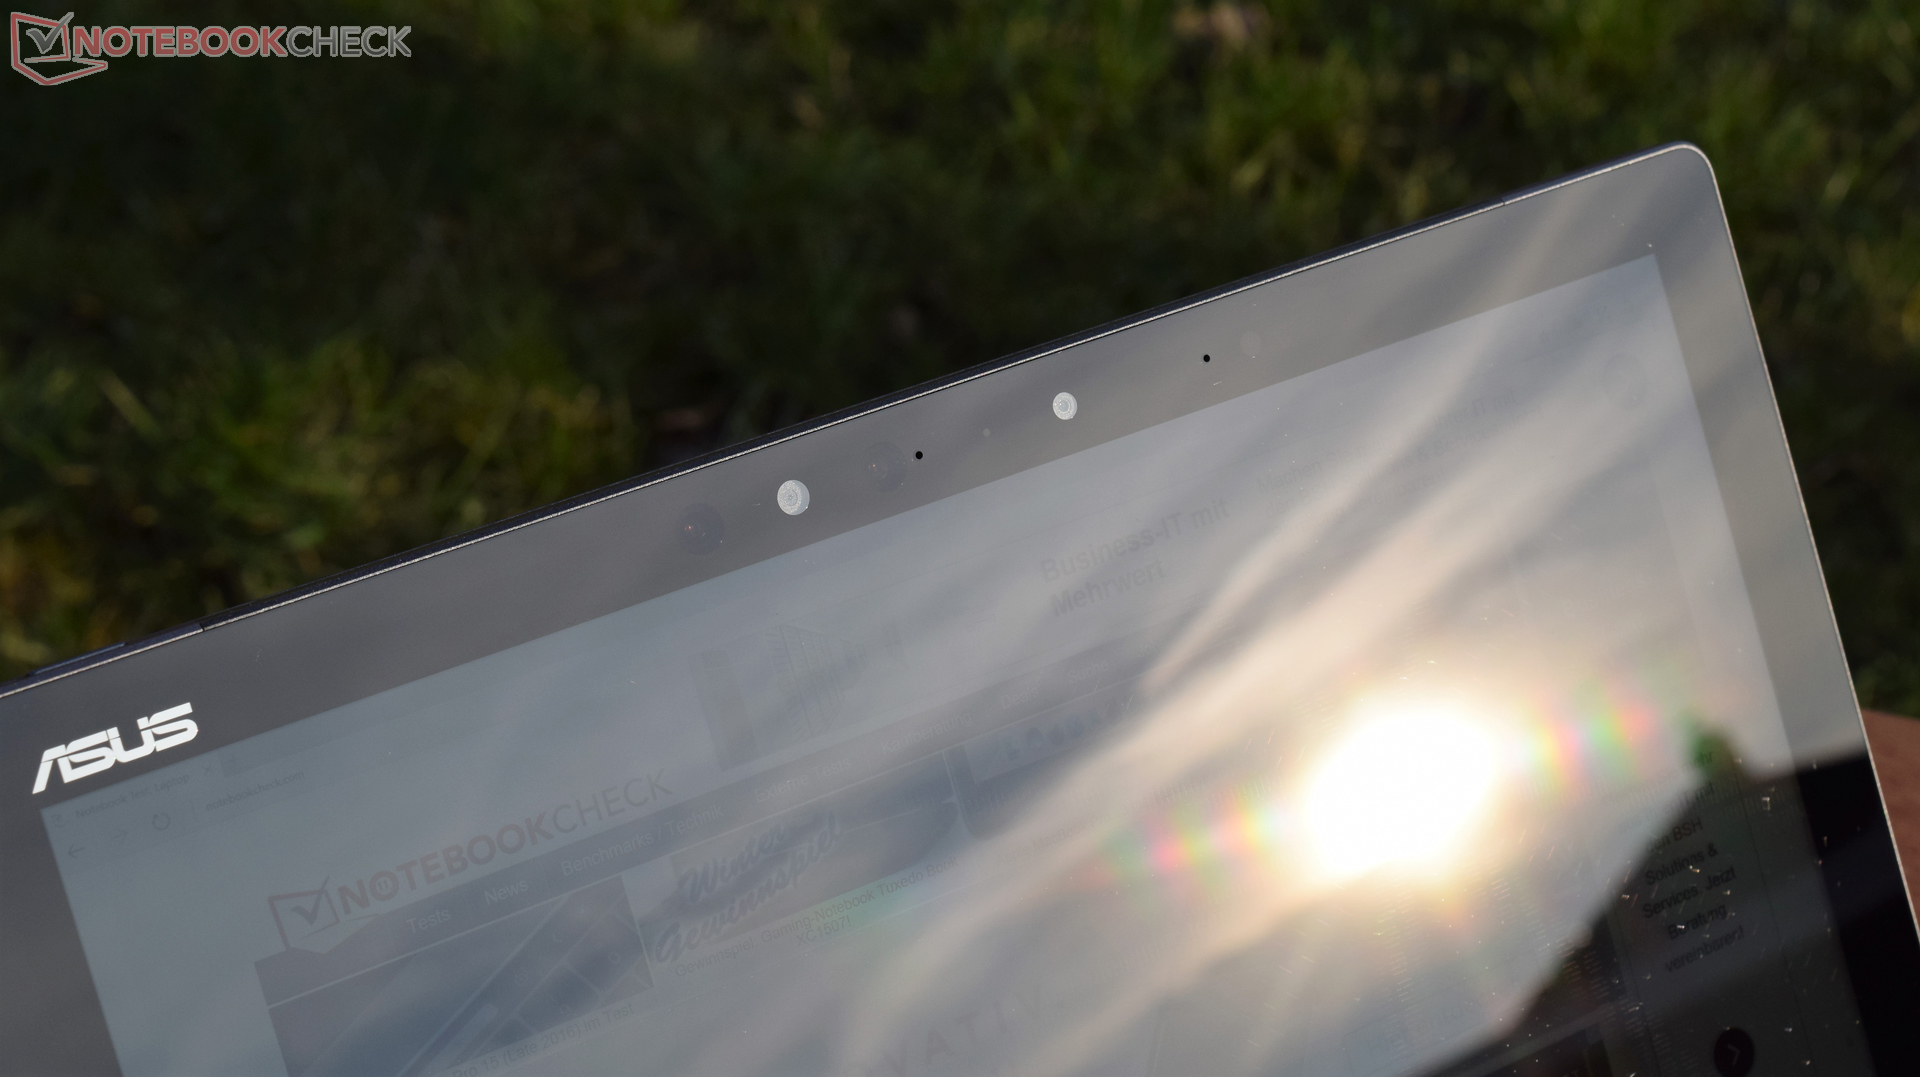
Brillo con batería: 316 cd/m²
Contraste: 1090:1 (Negro: 0.29 cd/m²)
ΔE ColorChecker Calman: 3.91 | ∀{0.5-29.43 Ø4.72}
ΔE Greyscale Calman: 5.37 | ∀{0.09-98 Ø4.97}
98% sRGB (Argyll 1.6.3 3D)
72% AdobeRGB 1998 (Argyll 1.6.3 3D)
82.2% AdobeRGB 1998 (Argyll 3D)
98.3% sRGB (Argyll 3D)
81.8% Display P3 (Argyll 3D)
Gamma: 2.36
CCT: 7812 K
| Asus Transformer 3 Pro T303UA-GN050T BOE BOE06AC (NV126A1M-N51), , 2880x1920, 12.6" | Microsoft Surface Pro 4, Core m3 Samsung SDC3853, , 2736x1824, 12.3" | Lenovo ThinkPad X1 Yoga-20FRS1VS00 Samsung ATNA40JU01-0, , 2560x1440, 14" | HP Elite x2 1012 G1 LG Philips, , 1920x1280, 12.1" | Acer Aspire Switch Alpha 12 SA5-271-56HM Panasonic VVX12T041N00, , 2160x1440, 12" | |
|---|---|---|---|---|---|
| Display | -12% | -31% | -14% | ||
| Display P3 Coverage (%) | 81.8 | 67.5 -17% | 53.8 -34% | 65.5 -20% | |
| sRGB Coverage (%) | 98.3 | 96.6 -2% | 73.7 -25% | 96.1 -2% | |
| AdobeRGB 1998 Coverage (%) | 82.2 | 69 -16% | 53.8 -35% | 66.9 -19% | |
| Response Times | -30% | 97% | 5% | 8% | |
| Response Time Grey 50% / Grey 80% * (ms) | 30 ? | 46 ? -53% | 1 ? 97% | 33.2 ? -11% | 20 ? 33% |
| Response Time Black / White * (ms) | 29 ? | 31 ? -7% | 1 ? 97% | 22.8 ? 21% | 34 ? -17% |
| PWM Frequency (Hz) | 200 ? | 50 ? | 240 ? | 1000 ? | |
| Screen | 13% | -3% | -22% | -21% | |
| Brightness middle (cd/m²) | 316 | 389.2 23% | 279 -12% | 322 2% | 345 9% |
| Brightness (cd/m²) | 307 | 392 28% | 277 -10% | 319 4% | 328 7% |
| Brightness Distribution (%) | 91 | 92 1% | 91 0% | 97 7% | 91 0% |
| Black Level * (cd/m²) | 0.29 | 0.27 7% | 0.42 -45% | 0.38 -31% | |
| Contrast (:1) | 1090 | 1441 32% | 767 -30% | 908 -17% | |
| Colorchecker dE 2000 * | 3.91 | 3.61 8% | 5.15 -32% | 6.02 -54% | 8.4 -115% |
| Colorchecker dE 2000 max. * | 7.9 | 8.28 -5% | 10.06 -27% | 11.9 -51% | |
| Greyscale dE 2000 * | 5.37 | 3.8 29% | 5.44 -1% | 6.29 -17% | 4.3 20% |
| Gamma | 2.36 93% | 2.16 102% | 2.28 96% | 2.4 92% | 2.63 84% |
| CCT | 7812 83% | 5969 109% | 5686 114% | 7712 84% | 7368 88% |
| Color Space (Percent of AdobeRGB 1998) (%) | 72 | 63 -12% | 98 36% | 47.8 -34% | 62 -14% |
| Color Space (Percent of sRGB) (%) | 98 | 97 -1% | 100 2% | 73.2 -25% | |
| Media total (Programa/Opciones) | -10% /
1% | 47% /
17% | -16% /
-20% | -9% /
-16% |
* ... más pequeño es mejor
Tiempos de respuesta del display
| ↔ Tiempo de respuesta de Negro a Blanco | ||
|---|---|---|
| 29 ms ... subida ↗ y bajada ↘ combinada | ↗ 8 ms subida | 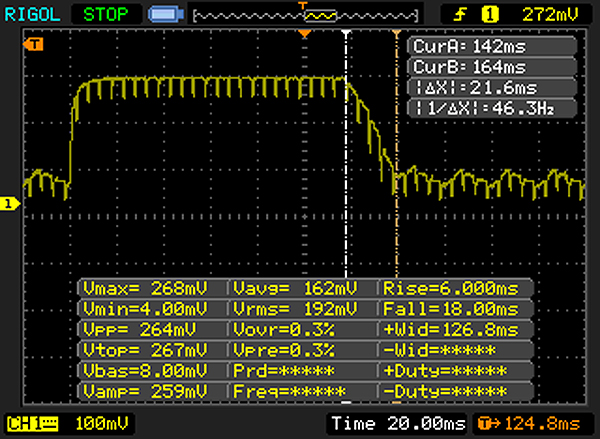 |
| ↘ 21 ms bajada | ||
| La pantalla mostró tiempos de respuesta relativamente lentos en nuestros tests pero podría ser demasiado lenta para los jugones. En comparación, todos los dispositivos de prueba van de ##min### (mínimo) a 240 (máximo) ms. » 77 % de todos los dispositivos son mejores. Eso quiere decir que el tiempo de respuesta es peor que la media (19.8 ms) de todos los dispositivos testados. | ||
| ↔ Tiempo de respuesta 50% Gris a 80% Gris | ||
| 30 ms ... subida ↗ y bajada ↘ combinada | ↗ 14 ms subida | 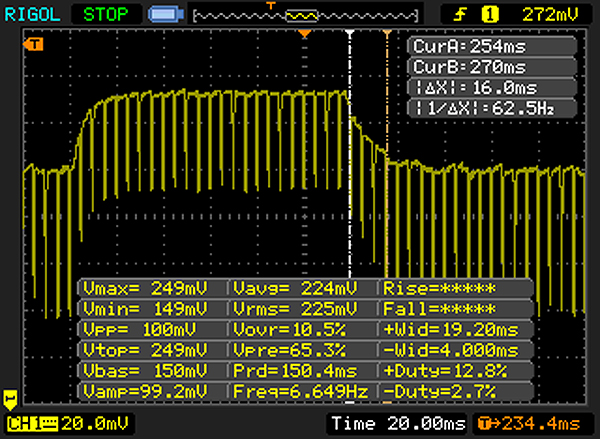 |
| ↘ 16 ms bajada | ||
| La pantalla mostró tiempos de respuesta lentos en nuestros tests y podría ser demasiado lenta para los jugones. En comparación, todos los dispositivos de prueba van de ##min### (mínimo) a 636 (máximo) ms. » 40 % de todos los dispositivos son mejores. Eso quiere decir que el tiempo de respuesta es similar al dispositivo testado medio (31 ms). | ||
Parpadeo de Pantalla / PWM (Pulse-Width Modulation)
| Parpadeo de Pantalla / PWM detectado | 200 Hz | ≤ 90 % de brillo | 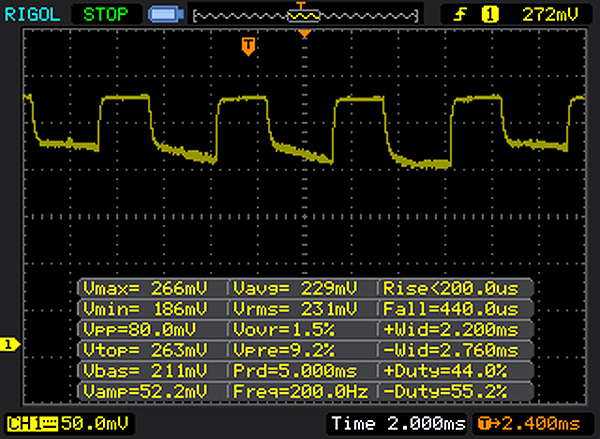 |
La retroiluminación del display parpadea a 200 Hz (seguramente usa PWM - Pulse-Width Modulation) a un brillo del 90 % e inferior. Sobre este nivel de brillo no debería darse parpadeo / PWM. La frecuencia de 200 Hz es relativamente baja, por lo que la gente sensible debería ver parpadeos y padecer fatiga visual por la pantalla (usado al brillo indicado a continuación). Comparación: 52 % de todos los dispositivos testados no usaron PWM para atenuar el display. Si se usó, medimos una media de 7763 (mínimo: 5 - máxmo: 343500) Hz. | |||
| Cinebench R10 | |
| Rendering Single CPUs 64Bit | |
| Asus Transformer 3 Pro T303UA-GN050T | |
| Microsoft Surface Pro 4, Core m3 | |
| Rendering Multiple CPUs 64Bit | |
| Asus Transformer 3 Pro T303UA-GN050T | |
| Microsoft Surface Pro 4, Core m3 | |
| JetStream 1.1 - 1.1 Total | |
| Asus Transformer 3 Pro T303UA-GN050T | |
| Lenovo ThinkPad X1 Yoga-20FRS1VS00 | |
| HP Elite x2 1012 G1 | |
| Acer Aspire Switch Alpha 12 SA5-271-56HM | |
| Octane V2 - Total Score | |
| Lenovo ThinkPad X1 Yoga-20FRS1VS00 | |
| Asus Transformer 3 Pro T303UA-GN050T | |
| HP Elite x2 1012 G1 | |
| Acer Aspire Switch Alpha 12 SA5-271-56HM | |
| Mozilla Kraken 1.1 - Total | |
| Microsoft Surface Pro 4, Core m3 | |
| Acer Aspire Switch Alpha 12 SA5-271-56HM | |
| HP Elite x2 1012 G1 | |
| Asus Transformer 3 Pro T303UA-GN050T | |
| Lenovo ThinkPad X1 Yoga-20FRS1VS00 | |
* ... más pequeño es mejor
| PCMark 7 | |
| Score | |
| Asus Transformer 3 Pro T303UA-GN050T | |
| HP Elite x2 1012 G1 | |
| Microsoft Surface Pro 4, Core m3 | |
| Productivity | |
| HP Elite x2 1012 G1 | |
| Asus Transformer 3 Pro T303UA-GN050T | |
| PCMark Vantage Result | 13886 puntos | |
| PCMark 7 Score | 5152 puntos | |
| PCMark 8 Home Score Accelerated v2 | 2985 puntos | |
| PCMark 8 Creative Score Accelerated v2 | 4043 puntos | |
| PCMark 8 Work Score Accelerated v2 | 3830 puntos | |
ayuda | ||
| Asus Transformer 3 Pro T303UA-GN050T SK Hynix Canvas SC300 512GB M.2 (HFS512G39MND) | Microsoft Surface Pro 4, Core m3 Samsung MZFLV128 NVMe | Lenovo ThinkPad X1 Yoga-20FRS1VS00 Samsung SSD PM961 1TB M.2 PCIe 3.0 x4 NVMe (MZSLW1T0) | HP Elite x2 1012 G1 Liteon L8H-256V2G | Acer Aspire Switch Alpha 12 SA5-271-56HM Kingston RBU-SNS8152S3256GG2 | |
|---|---|---|---|---|---|
| CrystalDiskMark 3.0 | -7% | 121% | 12% | 0% | |
| Read Seq (MB/s) | 398.9 | 663 66% | 1510 279% | 501 26% | 518 30% |
| Write Seq (MB/s) | 402 | 158.2 -61% | 1193 197% | 297.2 -26% | 199.9 -50% |
| Read 512 (MB/s) | 303.1 | 313.1 3% | 351.7 16% | 374.9 24% | |
| Write 512 (MB/s) | 320.3 | 158.2 -51% | 295.7 -8% | 201 -37% | |
| Read 4k (MB/s) | 26.11 | 30.14 15% | 37 42% | 28.31 8% | 29.3 12% |
| Write 4k (MB/s) | 57.7 | 68 18% | 126 118% | 90.3 56% | 76.8 33% |
| Read 4k QD32 (MB/s) | 245.8 | 243.7 -1% | 404 64% | 285 16% | 272 11% |
| Write 4k QD32 (MB/s) | 253.8 | 149.2 -41% | 319 26% | 268.4 6% | 197.1 -22% |

| 3DMark | |
| 1280x720 Cloud Gate Standard Graphics | |
| Lenovo ThinkPad X1 Yoga-20FRS1VS00 | |
| Acer Aspire Switch Alpha 12 SA5-271-56HM | |
| Microsoft Surface Pro 4, Core m3 | |
| HP Elite x2 1012 G1 | |
| Asus Transformer 3 Pro T303UA-GN050T | |
| 1920x1080 Fire Strike Graphics | |
| Lenovo ThinkPad X1 Yoga-20FRS1VS00 | |
| Microsoft Surface Pro 4, Core m3 | |
| HP Elite x2 1012 G1 | |
| Asus Transformer 3 Pro T303UA-GN050T | |
| 1280x720 Ice Storm Standard Score | |
| HP Elite x2 1012 G1 | |
| Microsoft Surface Pro 4, Core m3 | |
| Asus Transformer 3 Pro T303UA-GN050T | |
| 3DMark 06 - 1280x1024 Standard Score AA:0x AF:0x | |
| HP Elite x2 1012 G1 | |
| Microsoft Surface Pro 4, Core m3 | |
| Asus Transformer 3 Pro T303UA-GN050T | |
| 3DMark 03 Standard | 20325 puntos | |
| 3DMark 05 Standard | 9082 puntos | |
| 3DMark 06 Standard Score | 7464 puntos | |
| 3DMark Vantage P Result | 4650 puntos | |
| 3DMark 11 Performance | 1381 puntos | |
| 3DMark Ice Storm Standard Score | 35293 puntos | |
| 3DMark Cloud Gate Standard Score | 4401 puntos | |
| 3DMark Fire Strike Score | 676 puntos | |
| 3DMark Fire Strike Extreme Score | 309 puntos | |
| 3DMark Time Spy Score | 297 puntos | |
ayuda | ||
| bajo | medio | alto | ultra | |
|---|---|---|---|---|
| BioShock Infinite (2013) | 45.2 | 26.9 | 22.5 | 6.6 |
| Battlefield 4 (2013) | 31.3 | 23.2 | 15.9 | |
| Rise of the Tomb Raider (2016) | 20 | 11 | 9 |
| Asus Transformer 3 Pro T303UA-GN050T HD Graphics 520, 6500U, SK Hynix Canvas SC300 512GB M.2 (HFS512G39MND) | Microsoft Surface Pro 4 Core i7 Iris Graphics 540, 6650U, Samsung MZFLV256 NVMe | Lenovo ThinkPad X1 Yoga-20FRS1VS00 HD Graphics 520, 6600U, Samsung SSD PM961 1TB M.2 PCIe 3.0 x4 NVMe (MZSLW1T0) | Apple MacBook Pro 13 2016 (2.9 GHz) Iris Graphics 550, 6267U, Apple SSD AP0256 | Dell XPS 13 9360 QHD+ i5 HD Graphics 620, i5-7200U, Toshiba NVMe THNSN5256GPUK | |
|---|---|---|---|---|---|
| Noise | -0% | 4% | 4% | 1% | |
| apagado / medio ambiente * (dB) | 30.7 | 28.9 6% | 30.2 2% | 30.3 1% | |
| Idle Minimum * (dB) | 30.7 | 28.4 7% | 28.9 6% | 30.2 2% | 30.6 -0% |
| Idle Average * (dB) | 30.7 | 28.6 7% | 28.9 6% | 30.2 2% | 30.6 -0% |
| Idle Maximum * (dB) | 30.7 | 28.7 7% | 28.9 6% | 30.2 2% | 32.2 -5% |
| Load Average * (dB) | 37 | 40.8 -10% | 35.3 5% | 33 11% | 32.2 13% |
| Load Maximum * (dB) | 37.1 | 41.4 -12% | 38.9 -5% | 36.2 2% | 38.5 -4% |
* ... más pequeño es mejor
Ruido
| Ocioso |
| 30.7 / 30.7 / 30.7 dB(A) |
| Carga |
| 37 / 37.1 dB(A) |
 | ||
30 dB silencioso 40 dB(A) audible 50 dB(A) ruidosamente alto |
||
min: | ||
| Asus Transformer 3 Pro T303UA-GN050T HD Graphics 520, 6500U, SK Hynix Canvas SC300 512GB M.2 (HFS512G39MND) | Microsoft Surface Pro 4, Core m3 HD Graphics 515, 6Y30, Samsung MZFLV128 NVMe | Lenovo ThinkPad X1 Yoga-20FRS1VS00 HD Graphics 520, 6600U, Samsung SSD PM961 1TB M.2 PCIe 3.0 x4 NVMe (MZSLW1T0) | HP Elite x2 1012 G1 HD Graphics 515, 6Y54, Liteon L8H-256V2G | Acer Aspire Switch Alpha 12 SA5-271-56HM HD Graphics 520, 6200U, Kingston RBU-SNS8152S3256GG2 | |
|---|---|---|---|---|---|
| Heat | -8% | -12% | 1% | -11% | |
| Maximum Upper Side * (°C) | 34.9 | 43.6 -25% | 45.5 -30% | 39 -12% | 46.7 -34% |
| Maximum Bottom * (°C) | 36.7 | 45.2 -23% | 47.1 -28% | 41.2 -12% | 51 -39% |
| Idle Upper Side * (°C) | 35.8 | 32.4 9% | 31.1 13% | 29.5 18% | 29.5 18% |
| Idle Bottom * (°C) | 32.4 | 29.6 9% | 33.1 -2% | 29.8 8% | 28.6 12% |
* ... más pequeño es mejor
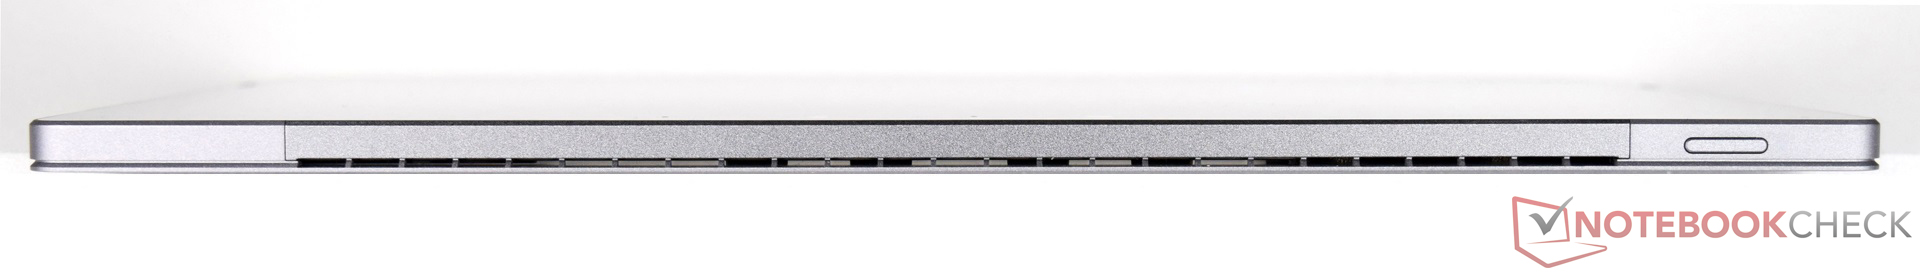
(+) La temperatura máxima en la parte superior es de 34.9 °C / 95 F, frente a la media de 35.4 °C / 96 F, que oscila entre 19.6 y 60 °C para la clase Convertible.
(+) El fondo se calienta hasta un máximo de 36.7 °C / 98 F, frente a la media de 36.9 °C / 98 F
(±) En reposo, la temperatura media de la parte superior es de 32 °C / 90# F, frente a la media del dispositivo de 30.3 °C / 87 F.
(+) Los reposamanos y el panel táctil alcanzan como máximo la temperatura de la piel (35.8 °C / 96.4 F) y, por tanto, no están calientes.
(-) La temperatura media de la zona del reposamanos de dispositivos similares fue de 28 °C / 82.4 F (-7.8 °C / -14 F).
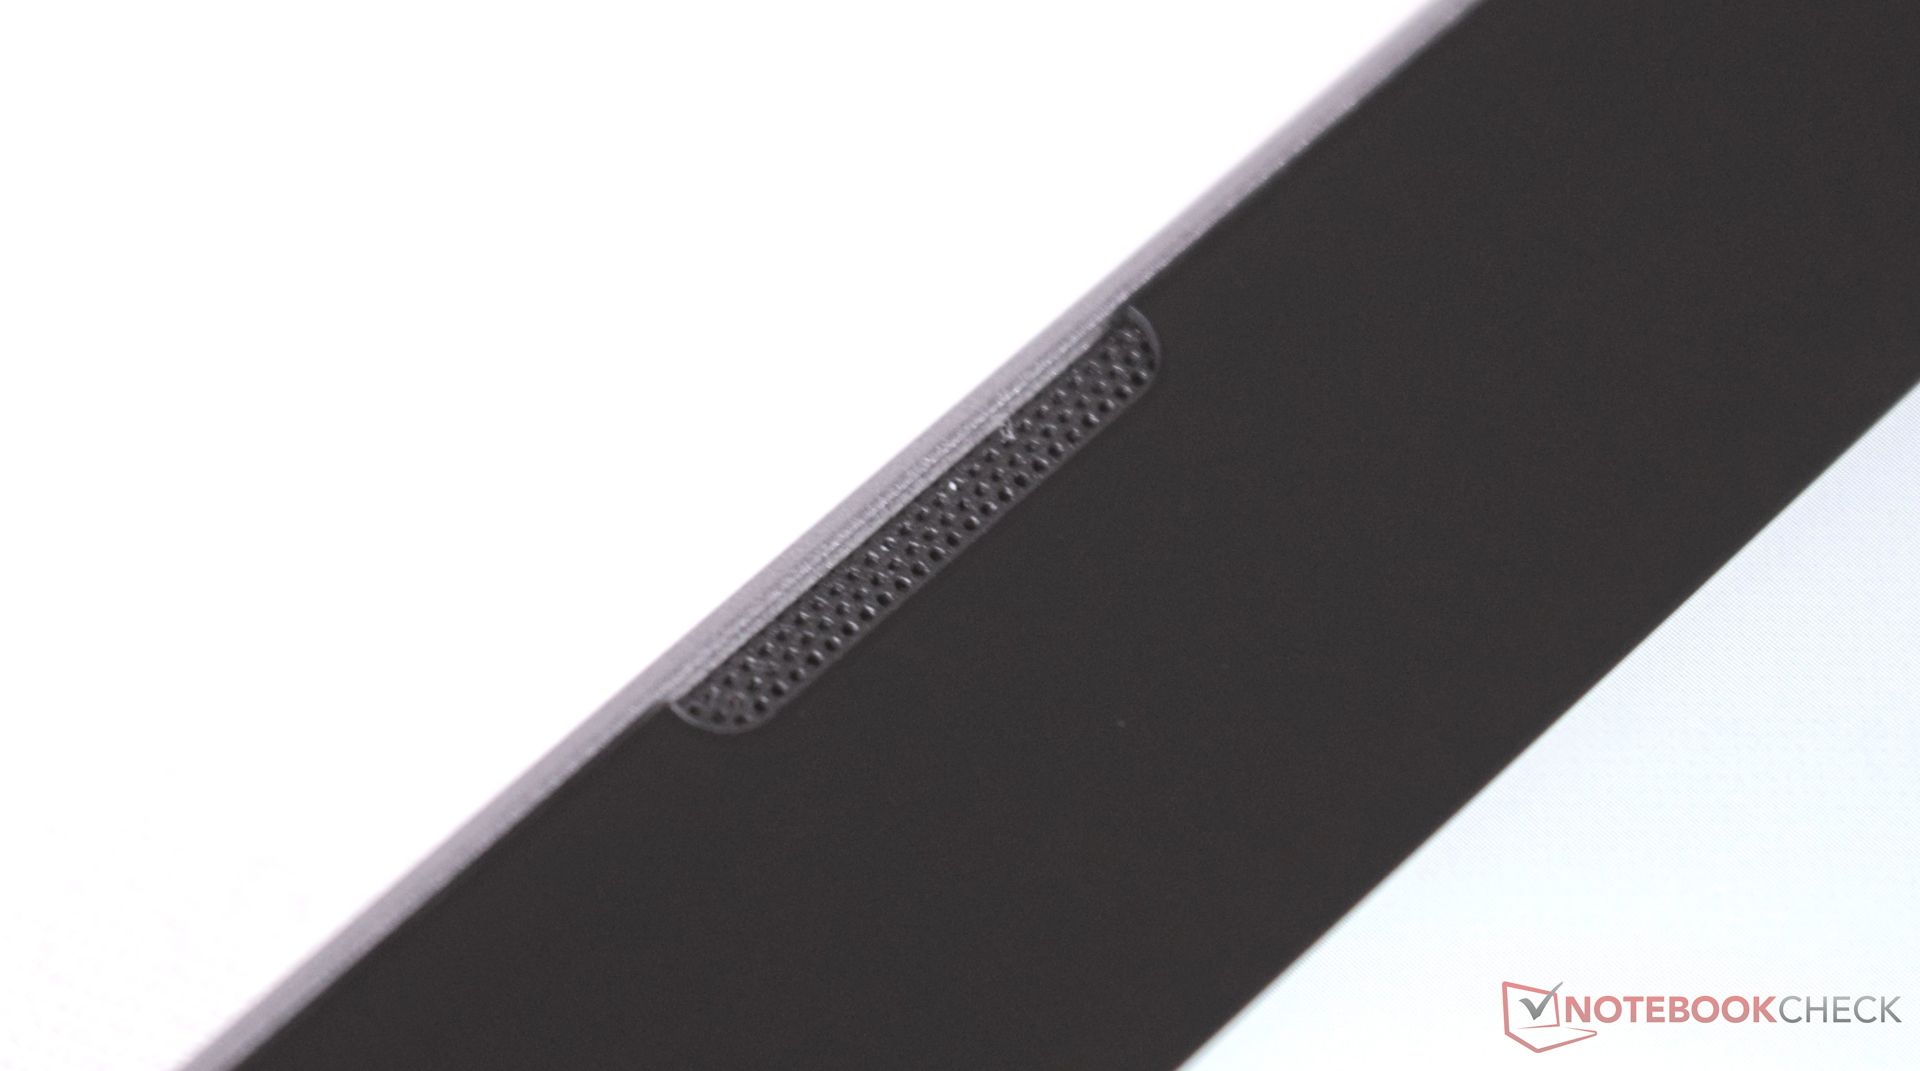
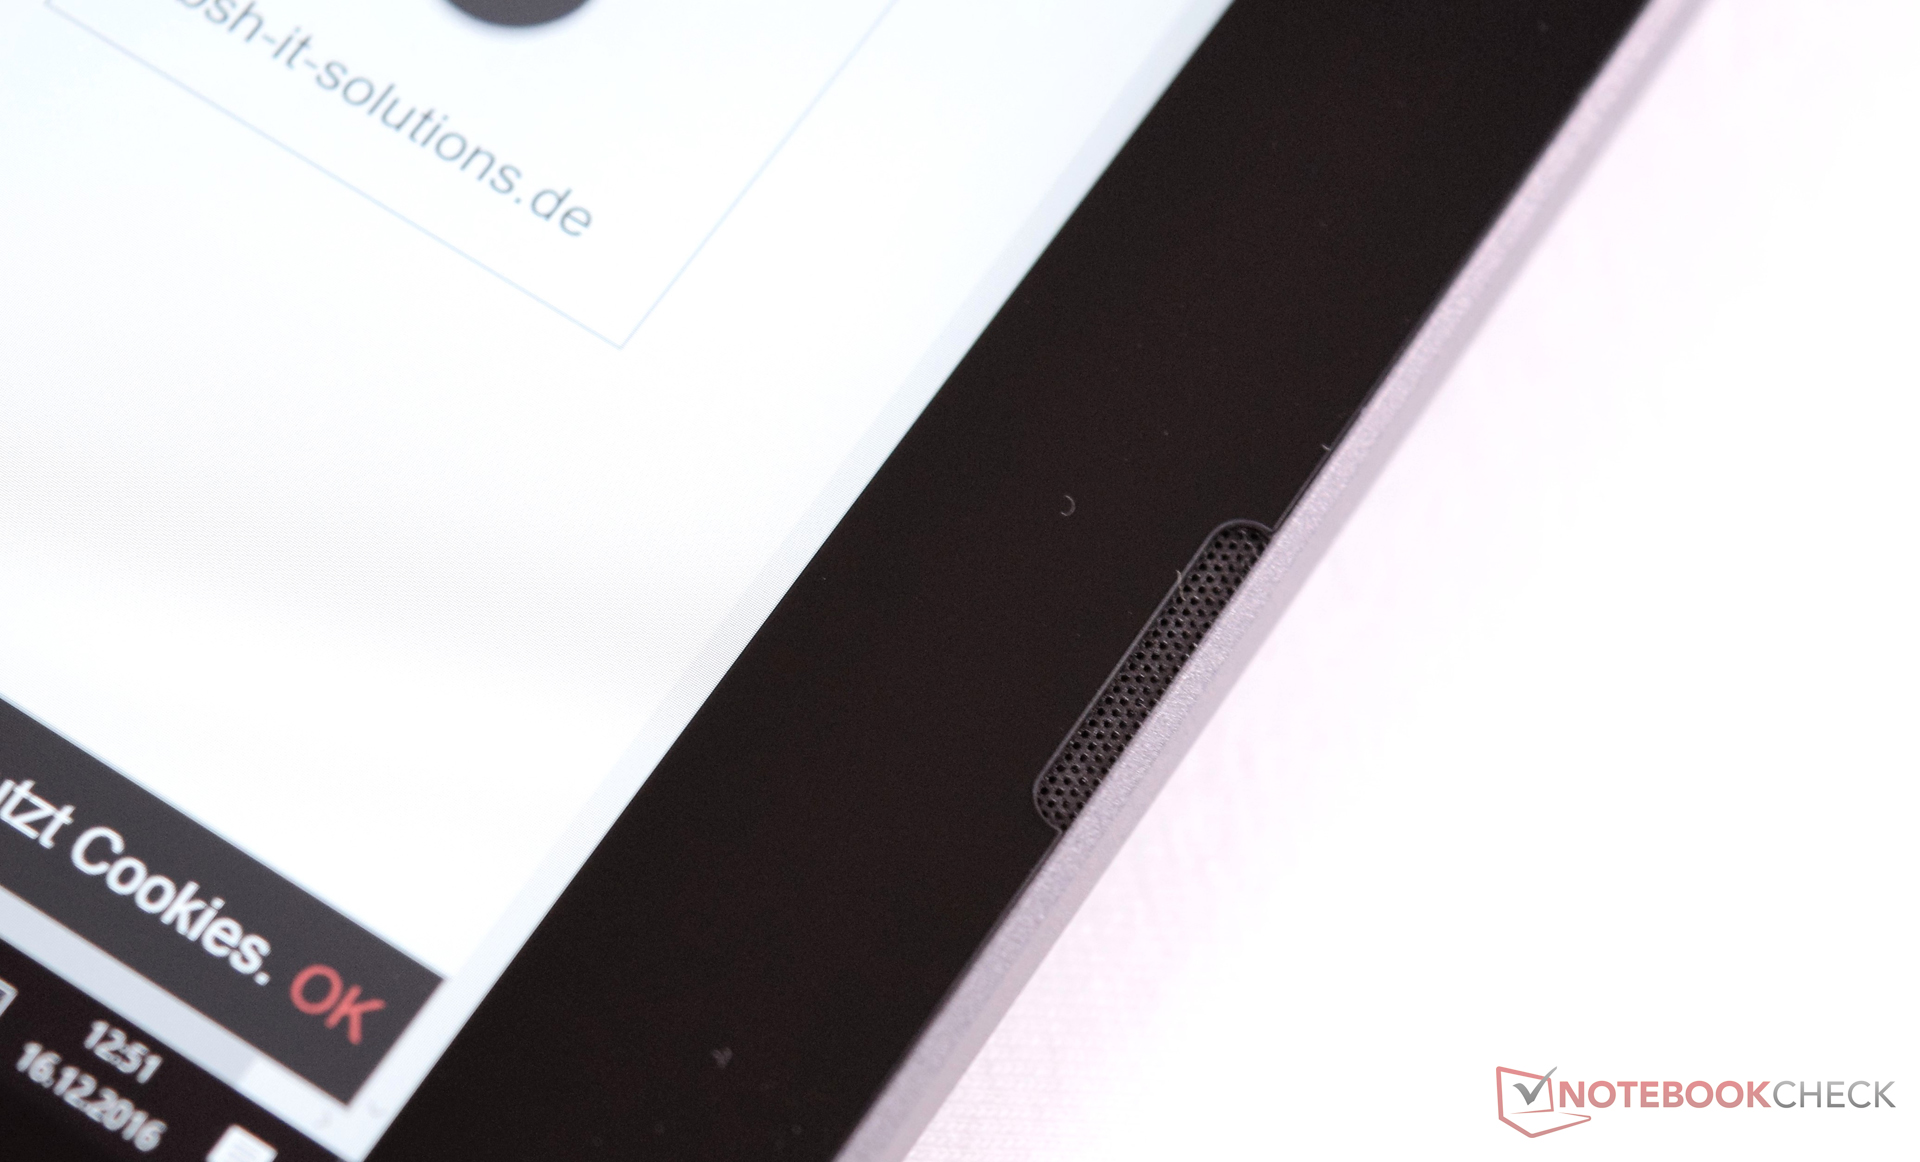
Asus Transformer 3 Pro T303UA-GN050T análisis de audio
(±) | la sonoridad del altavoz es media pero buena (73 dB)
Graves 100 - 315 Hz
(±) | lubina reducida - en promedio 11.2% inferior a la mediana
(±) | la linealidad de los graves es media (8.2% delta a frecuencia anterior)
Medios 400 - 2000 Hz
(+) | medios equilibrados - a sólo 1.8% de la mediana
(+) | los medios son lineales (6.7% delta a la frecuencia anterior)
Altos 2 - 16 kHz
(±) | máximos más altos - de media 9% más altos que la mediana
(+) | los máximos son lineales (5.7% delta a la frecuencia anterior)
Total 100 - 16.000 Hz
(±) | la linealidad del sonido global es media (19% de diferencia con la mediana)
En comparación con la misma clase
» 45% de todos los dispositivos probados de esta clase eran mejores, 7% similares, 48% peores
» El mejor tuvo un delta de 6%, la media fue 20%, el peor fue ###max##%
En comparación con todos los dispositivos probados
» 45% de todos los dispositivos probados eran mejores, 7% similares, 48% peores
» El mejor tuvo un delta de 4%, la media fue 24%, el peor fue ###max##%
Apple MacBook 12 (Early 2016) 1.1 GHz análisis de audio
(+) | los altavoces pueden reproducir a un volumen relativamente alto (#83.6 dB)
Graves 100 - 315 Hz
(±) | lubina reducida - en promedio 11.3% inferior a la mediana
(±) | la linealidad de los graves es media (14.2% delta a frecuencia anterior)
Medios 400 - 2000 Hz
(+) | medios equilibrados - a sólo 2.4% de la mediana
(+) | los medios son lineales (5.5% delta a la frecuencia anterior)
Altos 2 - 16 kHz
(+) | máximos equilibrados - a sólo 2% de la mediana
(+) | los máximos son lineales (4.5% delta a la frecuencia anterior)
Total 100 - 16.000 Hz
(+) | el sonido global es lineal (10.2% de diferencia con la mediana)
En comparación con la misma clase
» 7% de todos los dispositivos probados de esta clase eran mejores, 2% similares, 91% peores
» El mejor tuvo un delta de 5%, la media fue 18%, el peor fue ###max##%
En comparación con todos los dispositivos probados
» 5% de todos los dispositivos probados eran mejores, 1% similares, 94% peores
» El mejor tuvo un delta de 4%, la media fue 24%, el peor fue ###max##%
| Off / Standby | |
| Ocioso | |
| Carga |
|
Clave:
min: | |
| Asus Transformer 3 Pro T303UA-GN050T 6500U, HD Graphics 520, SK Hynix Canvas SC300 512GB M.2 (HFS512G39MND), IPS, 2880x1920, 12.6" | Lenovo ThinkPad X1 Yoga-20FRS1VS00 6600U, HD Graphics 520, Samsung SSD PM961 1TB M.2 PCIe 3.0 x4 NVMe (MZSLW1T0), OLED, 2560x1440, 14" | HP Elite x2 1012 G1 6Y54, HD Graphics 515, Liteon L8H-256V2G, IPS, 1920x1280, 12.1" | Acer Aspire Switch Alpha 12 SA5-271-56HM 6200U, HD Graphics 520, Kingston RBU-SNS8152S3256GG2, IPS, 2160x1440, 12" | Apple MacBook Pro 13 2016 (2.9 GHz) 6267U, Iris Graphics 550, Apple SSD AP0256, , 2560x1600, 13.3" | Dell XPS 13 9360 QHD+ i5 i5-7200U, HD Graphics 620, Toshiba NVMe THNSN5256GPUK, , 3200x1800, 13.3" | |
|---|---|---|---|---|---|---|
| Power Consumption | -6% | 23% | 4% | -18% | 22% | |
| Idle Minimum * (Watt) | 6.7 | 4.7 30% | 3.7 45% | 7.3 -9% | 2.1 69% | 3.7 45% |
| Idle Average * (Watt) | 10.3 | 8.6 17% | 6.8 34% | 10 3% | 7.6 26% | 6.1 41% |
| Idle Maximum * (Watt) | 13.5 | 12.2 10% | 7.6 44% | 10.15 25% | 8.2 39% | 6.5 52% |
| Load Average * (Watt) | 26 | 29.7 -14% | 22.5 13% | 25.2 3% | 56.4 -117% | 29.5 -13% |
| Load Maximum * (Watt) | 28.8 | 50.5 -75% | 34.5 -20% | 29.3 -2% | 59.8 -108% | 33 -15% |
* ... más pequeño es mejor
| Asus Transformer 3 Pro T303UA-GN050T 6500U, HD Graphics 520, 39 Wh | Microsoft Surface Pro 4, Core m3 6Y30, HD Graphics 515, 38 Wh | Lenovo ThinkPad X1 Yoga-20FRS1VS00 6600U, HD Graphics 520, 56 Wh | HP Elite x2 1012 G1 6Y54, HD Graphics 515, 37 Wh | Acer Aspire Switch Alpha 12 SA5-271-56HM 6200U, HD Graphics 520, 37 Wh | |
|---|---|---|---|---|---|
| Duración de Batería | 80% | 80% | 78% | 60% | |
| Reader / Idle (h) | 7.1 | 13.2 86% | 13.7 93% | 12.2 72% | 10.7 51% |
| H.264 (h) | 3.4 | 8.7 156% | 7.2 112% | 7.8 129% | |
| WiFi v1.3 (h) | 3.7 | 8.1 119% | 5.3 43% | 7.4 100% | 5.4 46% |
| Load (h) | 1.7 | 2.3 35% | 2.2 29% | 2.2 29% | 1.9 12% |
Pro
Contra
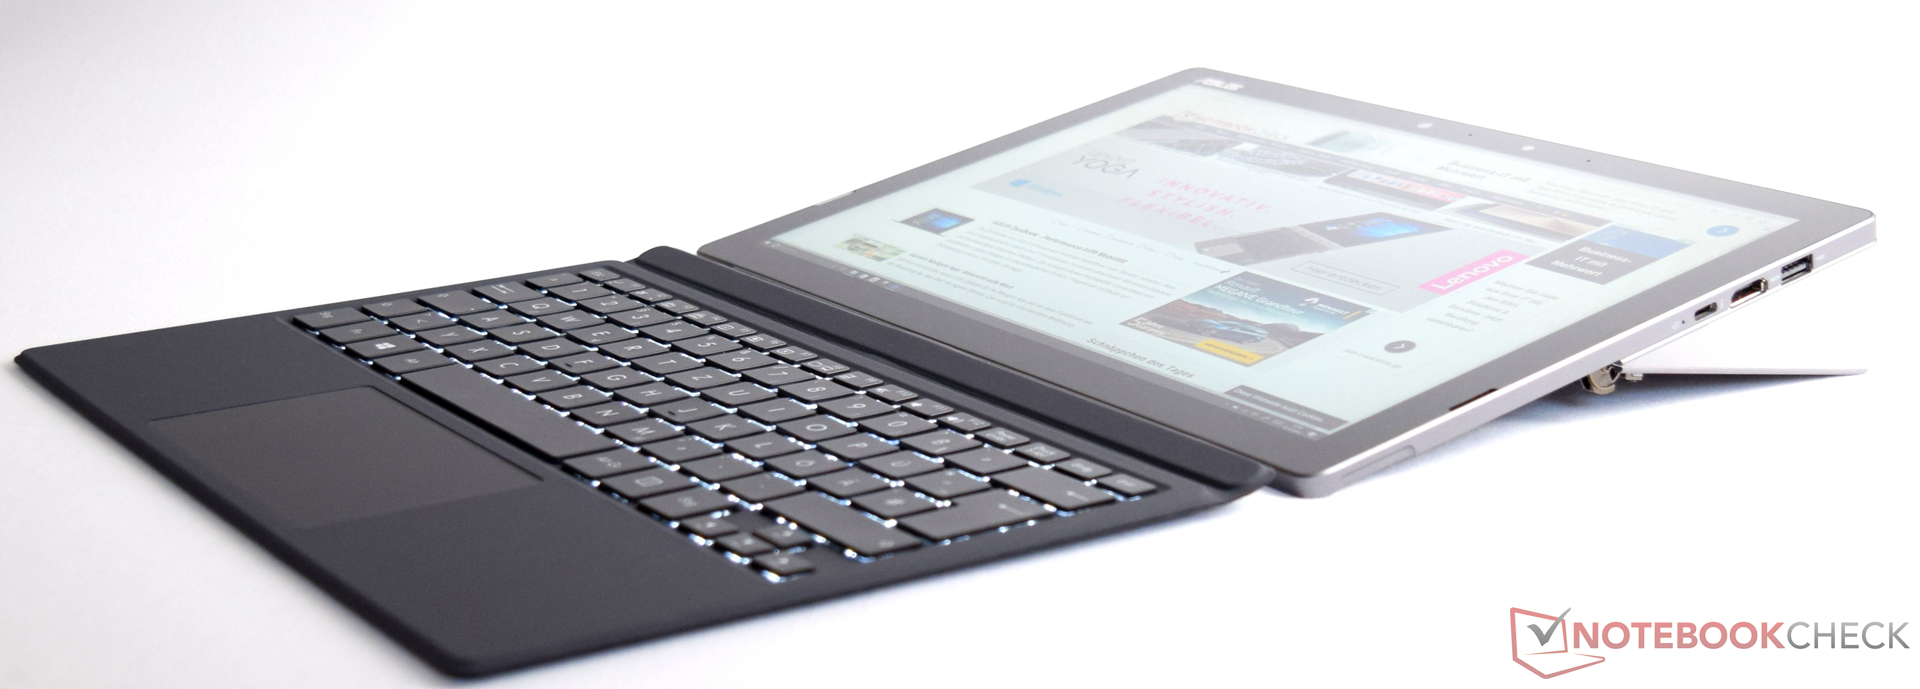
Asus ha decidido competir cara a cara con el Microsoft Surface. El Asus Transformer 3 Pro es un paso adelante: un procesador más rápido, mucha memoria RAM y un amplio SSD. El teclado transforma la tablet e un portátil. En el momento de hacer la prueba, el precio del convertible era de 1599 Euros. El comprador recibe a cambio un dispositivo fiable con rendimiento suficiente para las tareas cotidianas. Desafortunadamente el modelo de prueba nunca pudo mostrar todo su rendimiento. Ésta es la razón por la que no podemos considerarlo un competidor real del Microsoft Surface Pro 4.
La diferencia entre el rendimiento potencial y el real puede asustar a muchos compradores. Sin embargo, el Asus Transformer 3 Pro es un convertible bonito con muy buena fabricación. La buena pantalla ofrece una estupenda reproducción de color y es adecuada para su uso profesional.
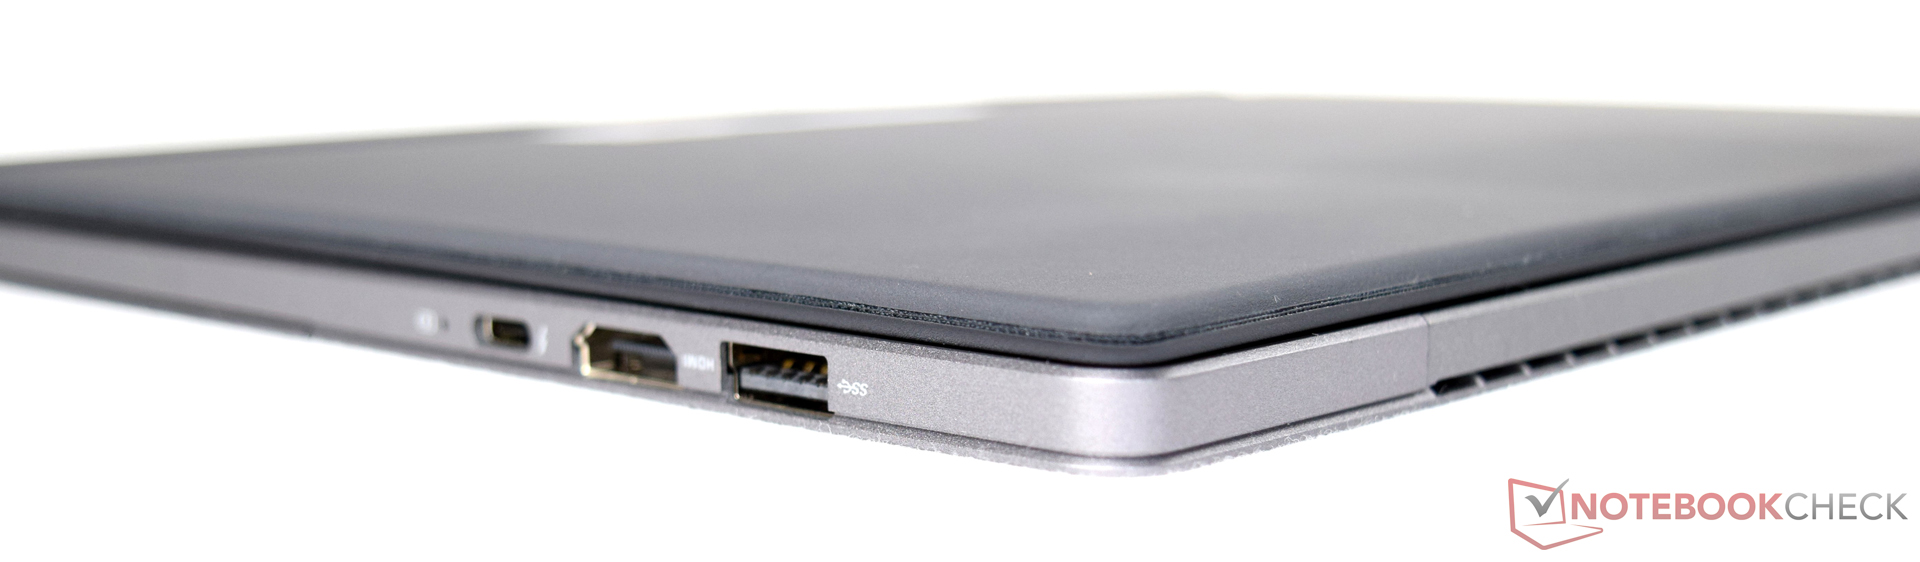
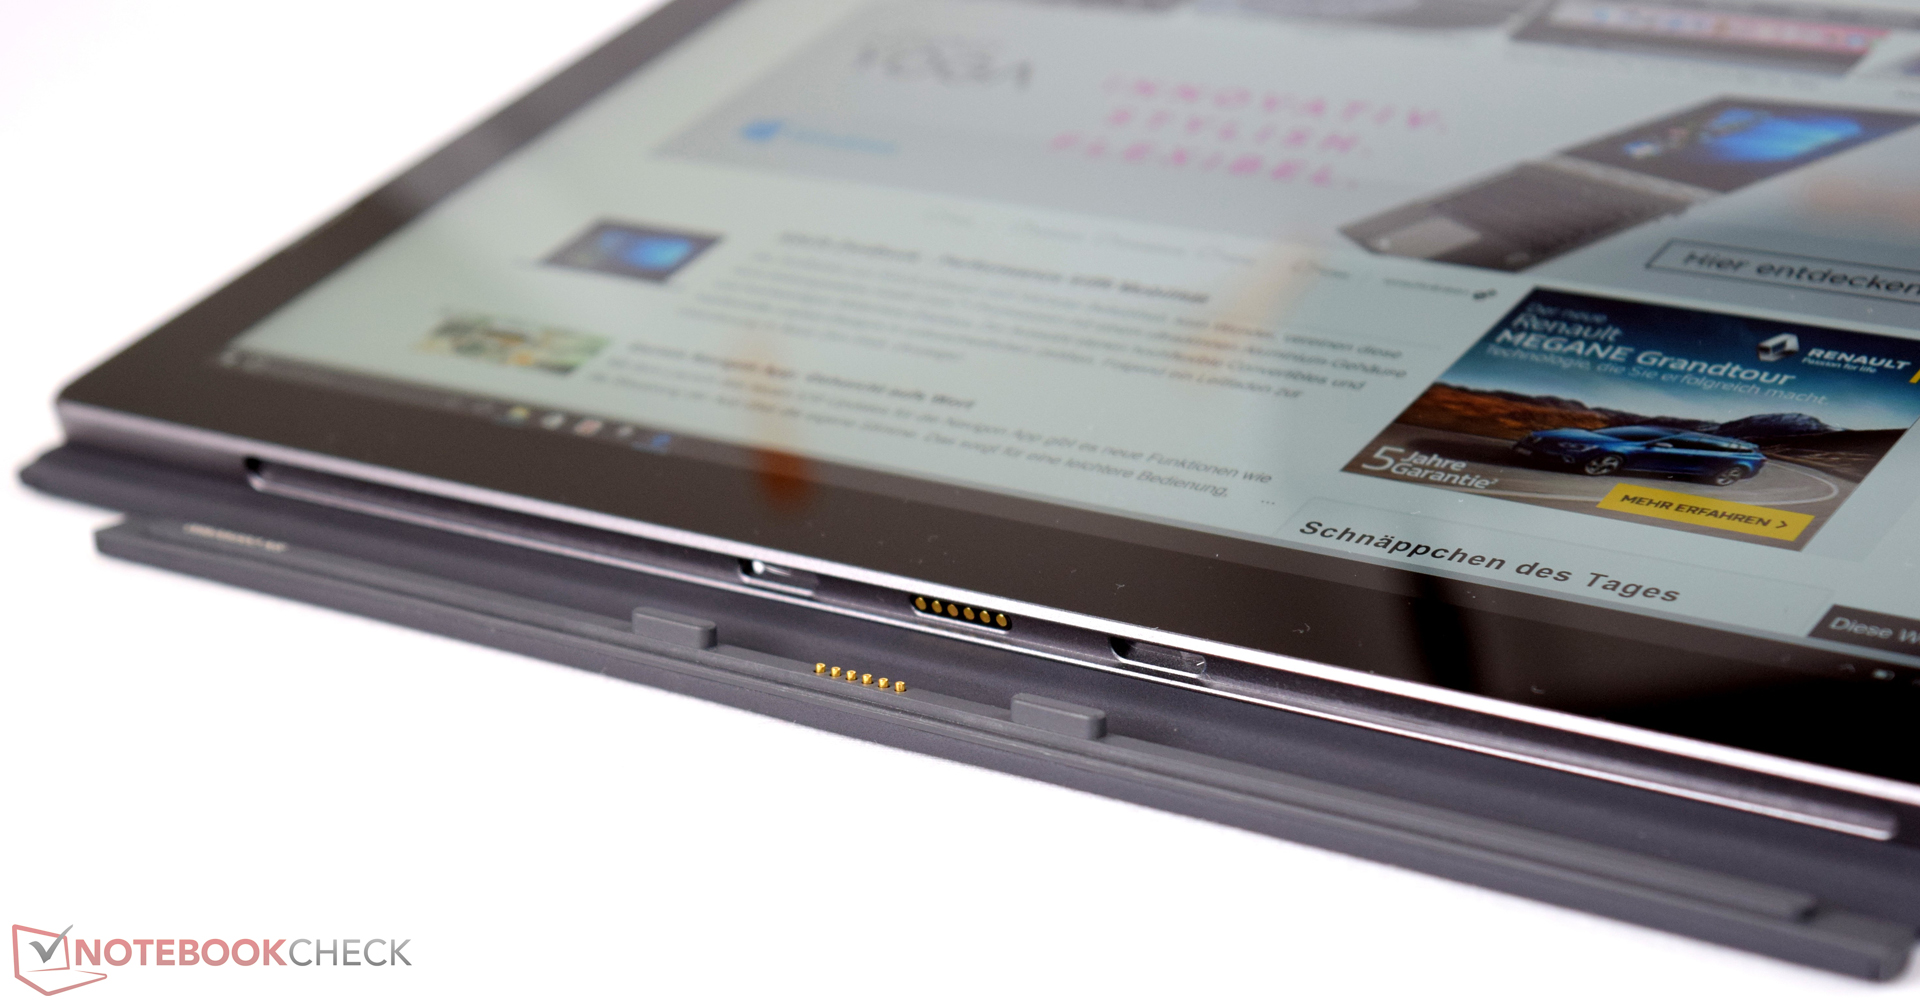
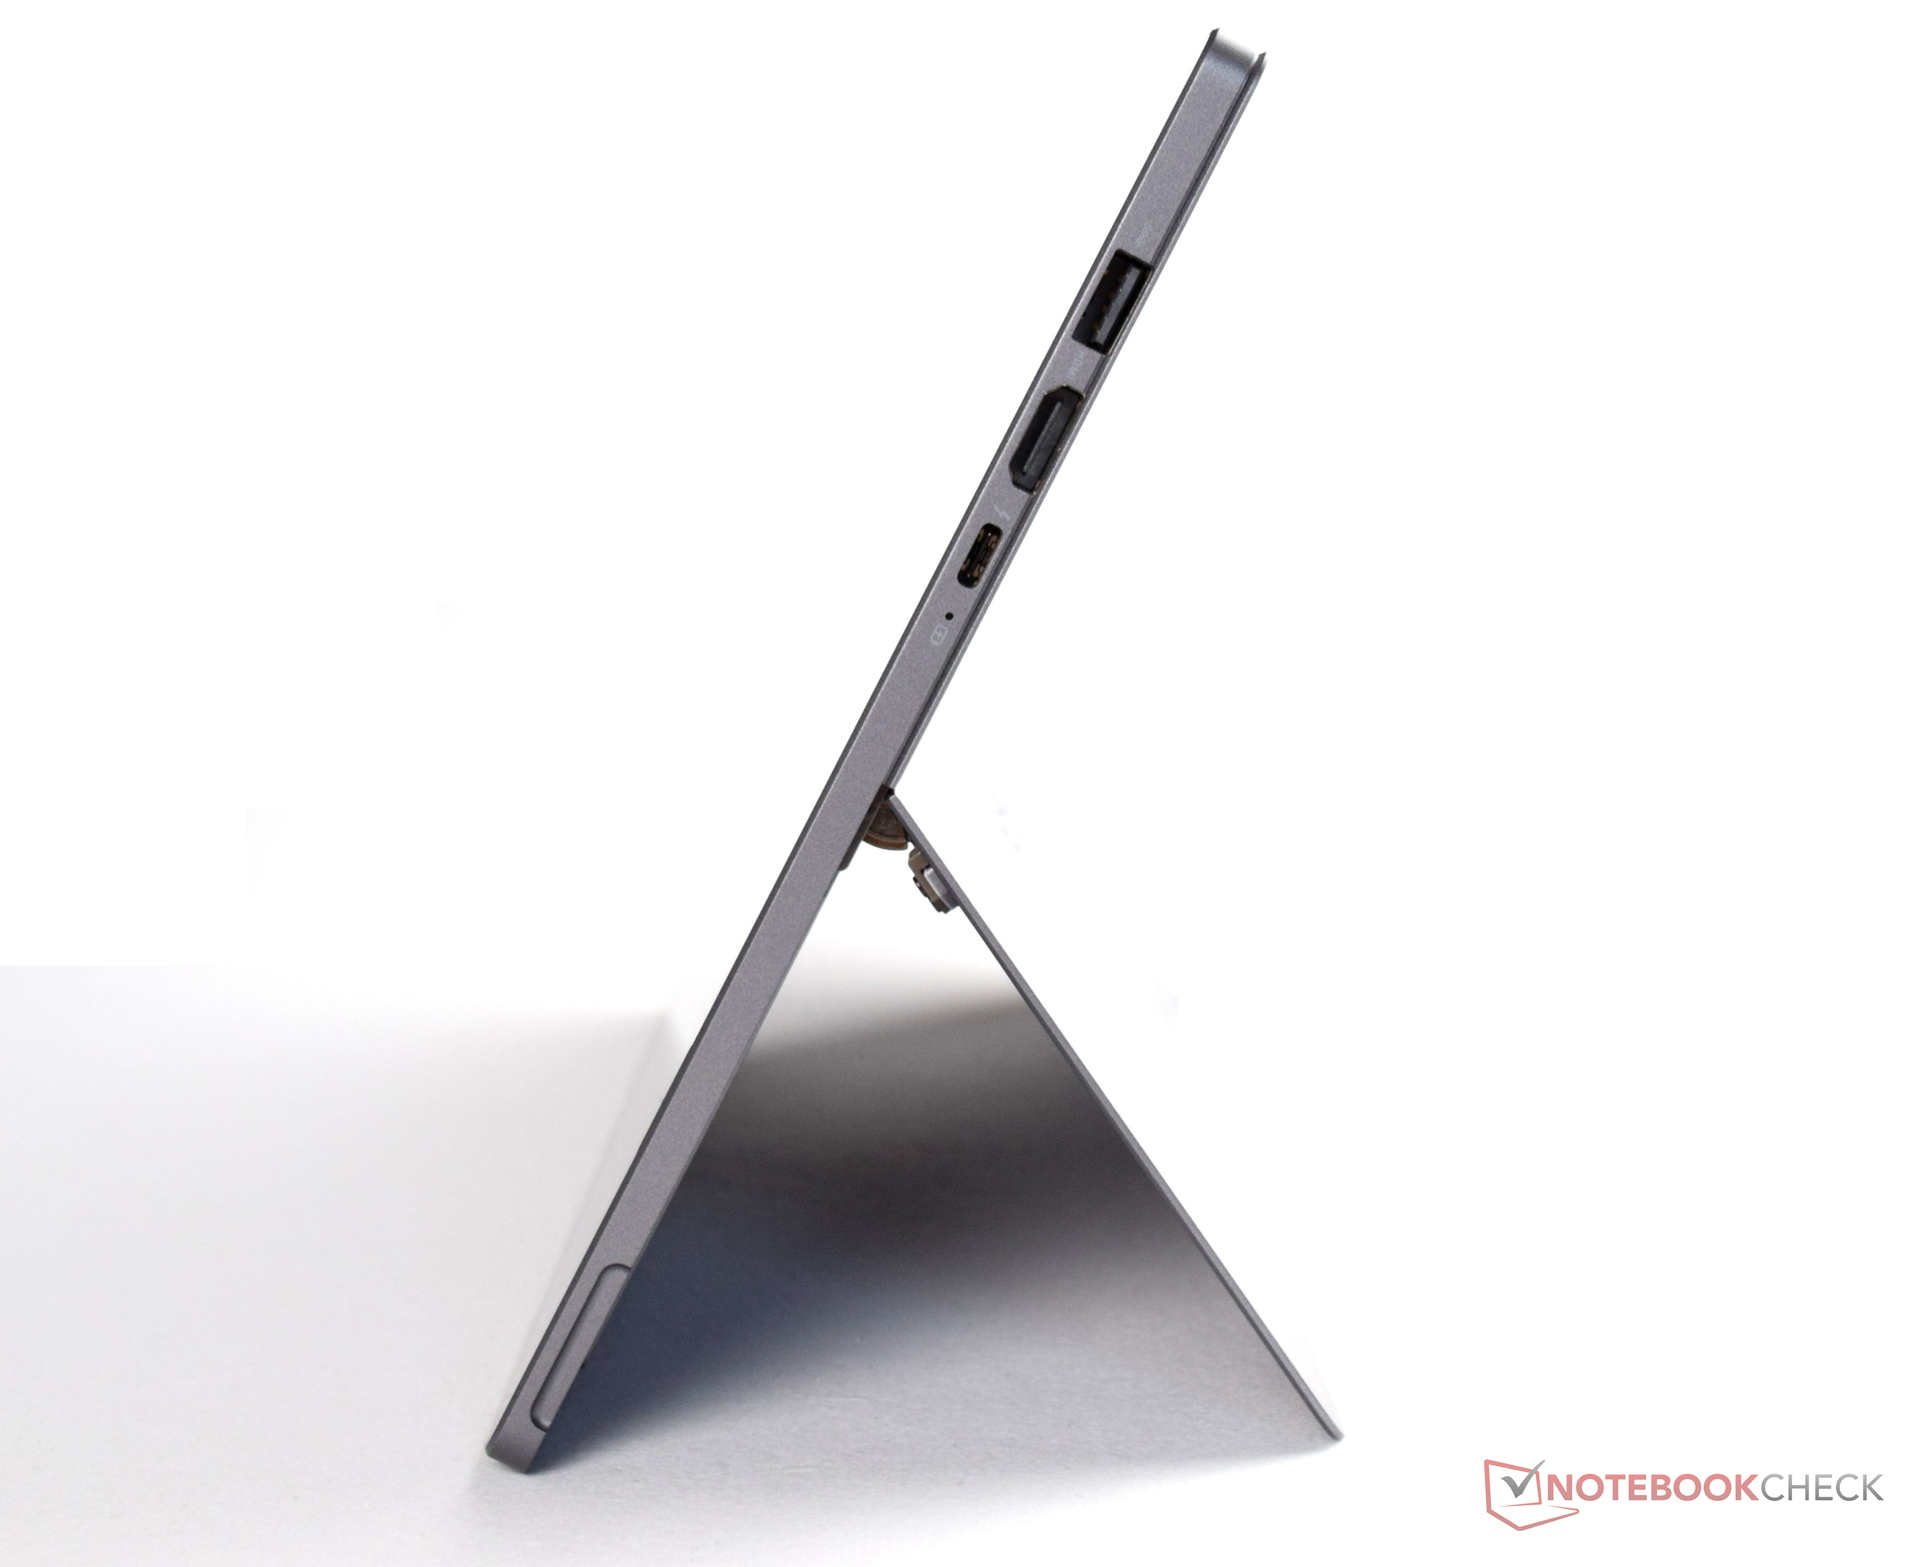
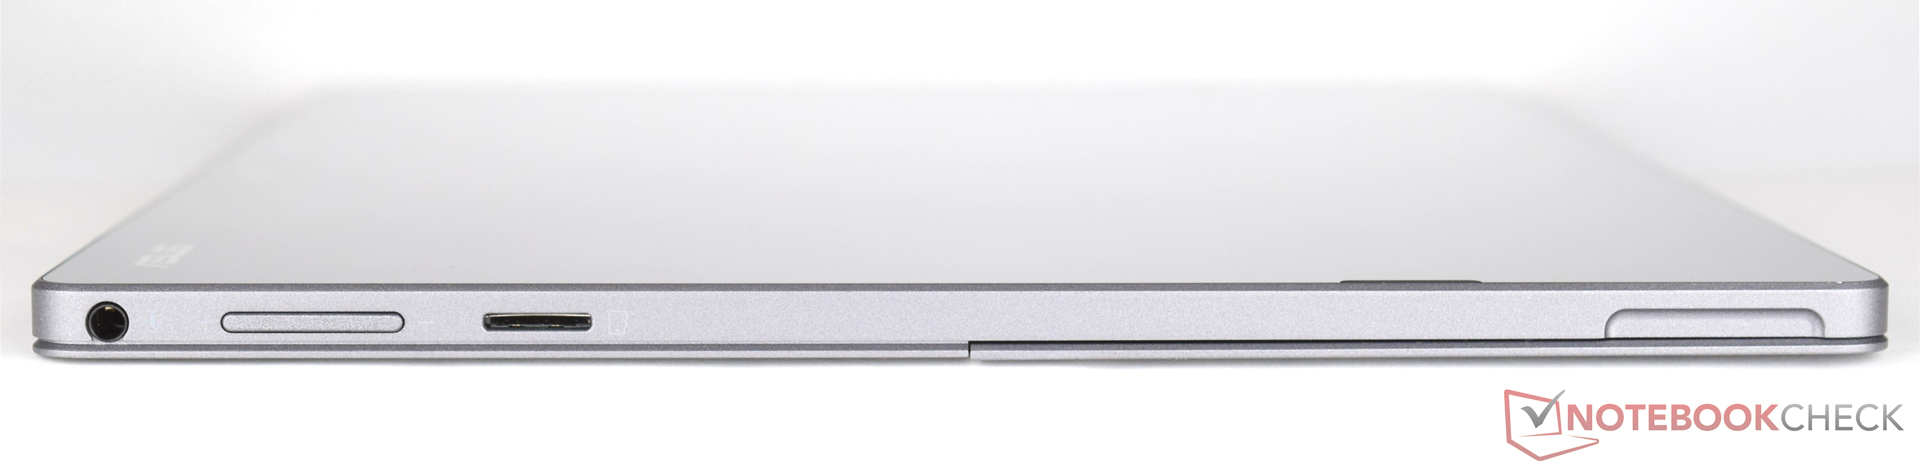
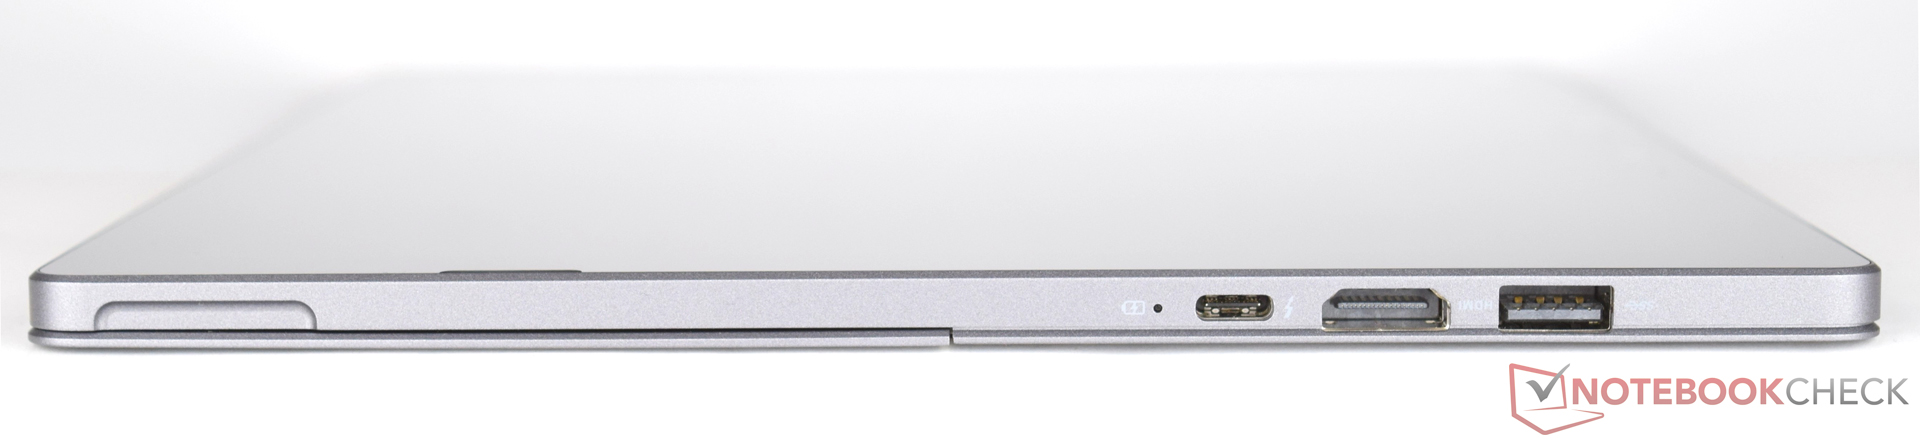
Un procesador más rápido siempre se agradece. Pero ¿es realmente necesario si el fabricante reduce su rendimiento? Un Intel Core i5-7Y54 puede funcionar con refrigeración pasiva y conseguir el mismo rendimiento que el Intel Core i7-6500U de nuestro modelo de prueba. La conectividad del Asus es típica, pero nos habría gustado que se incluyera un puerto USB 3.1 adicional (y que ambos soportaran Thunderbolt 3) en el futuro para que el usuario pudiera usar uno para cargar y el otro para ampliar la conectividad.
Ésta es una versión acortada del análisis original. Puedes leer el análisis completo en inglés aquí.
Asus Transformer 3 Pro T303UA-GN050T
- 12/21/2016 v6 (old)
Sebastian Bade