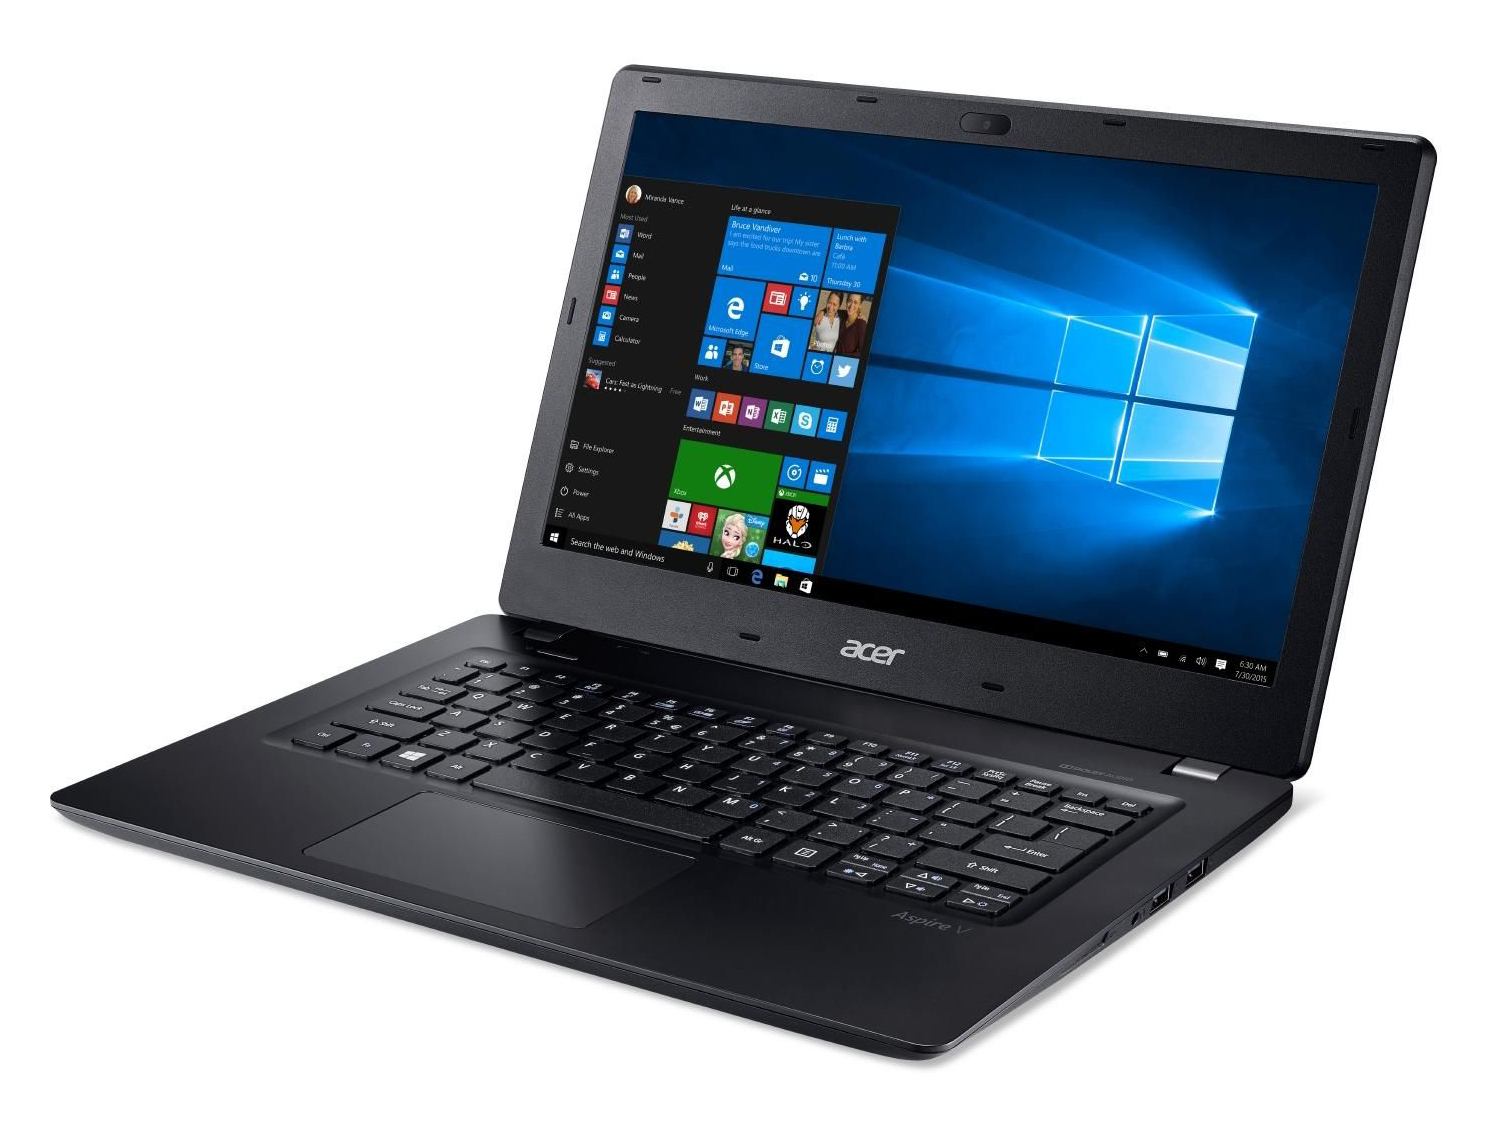
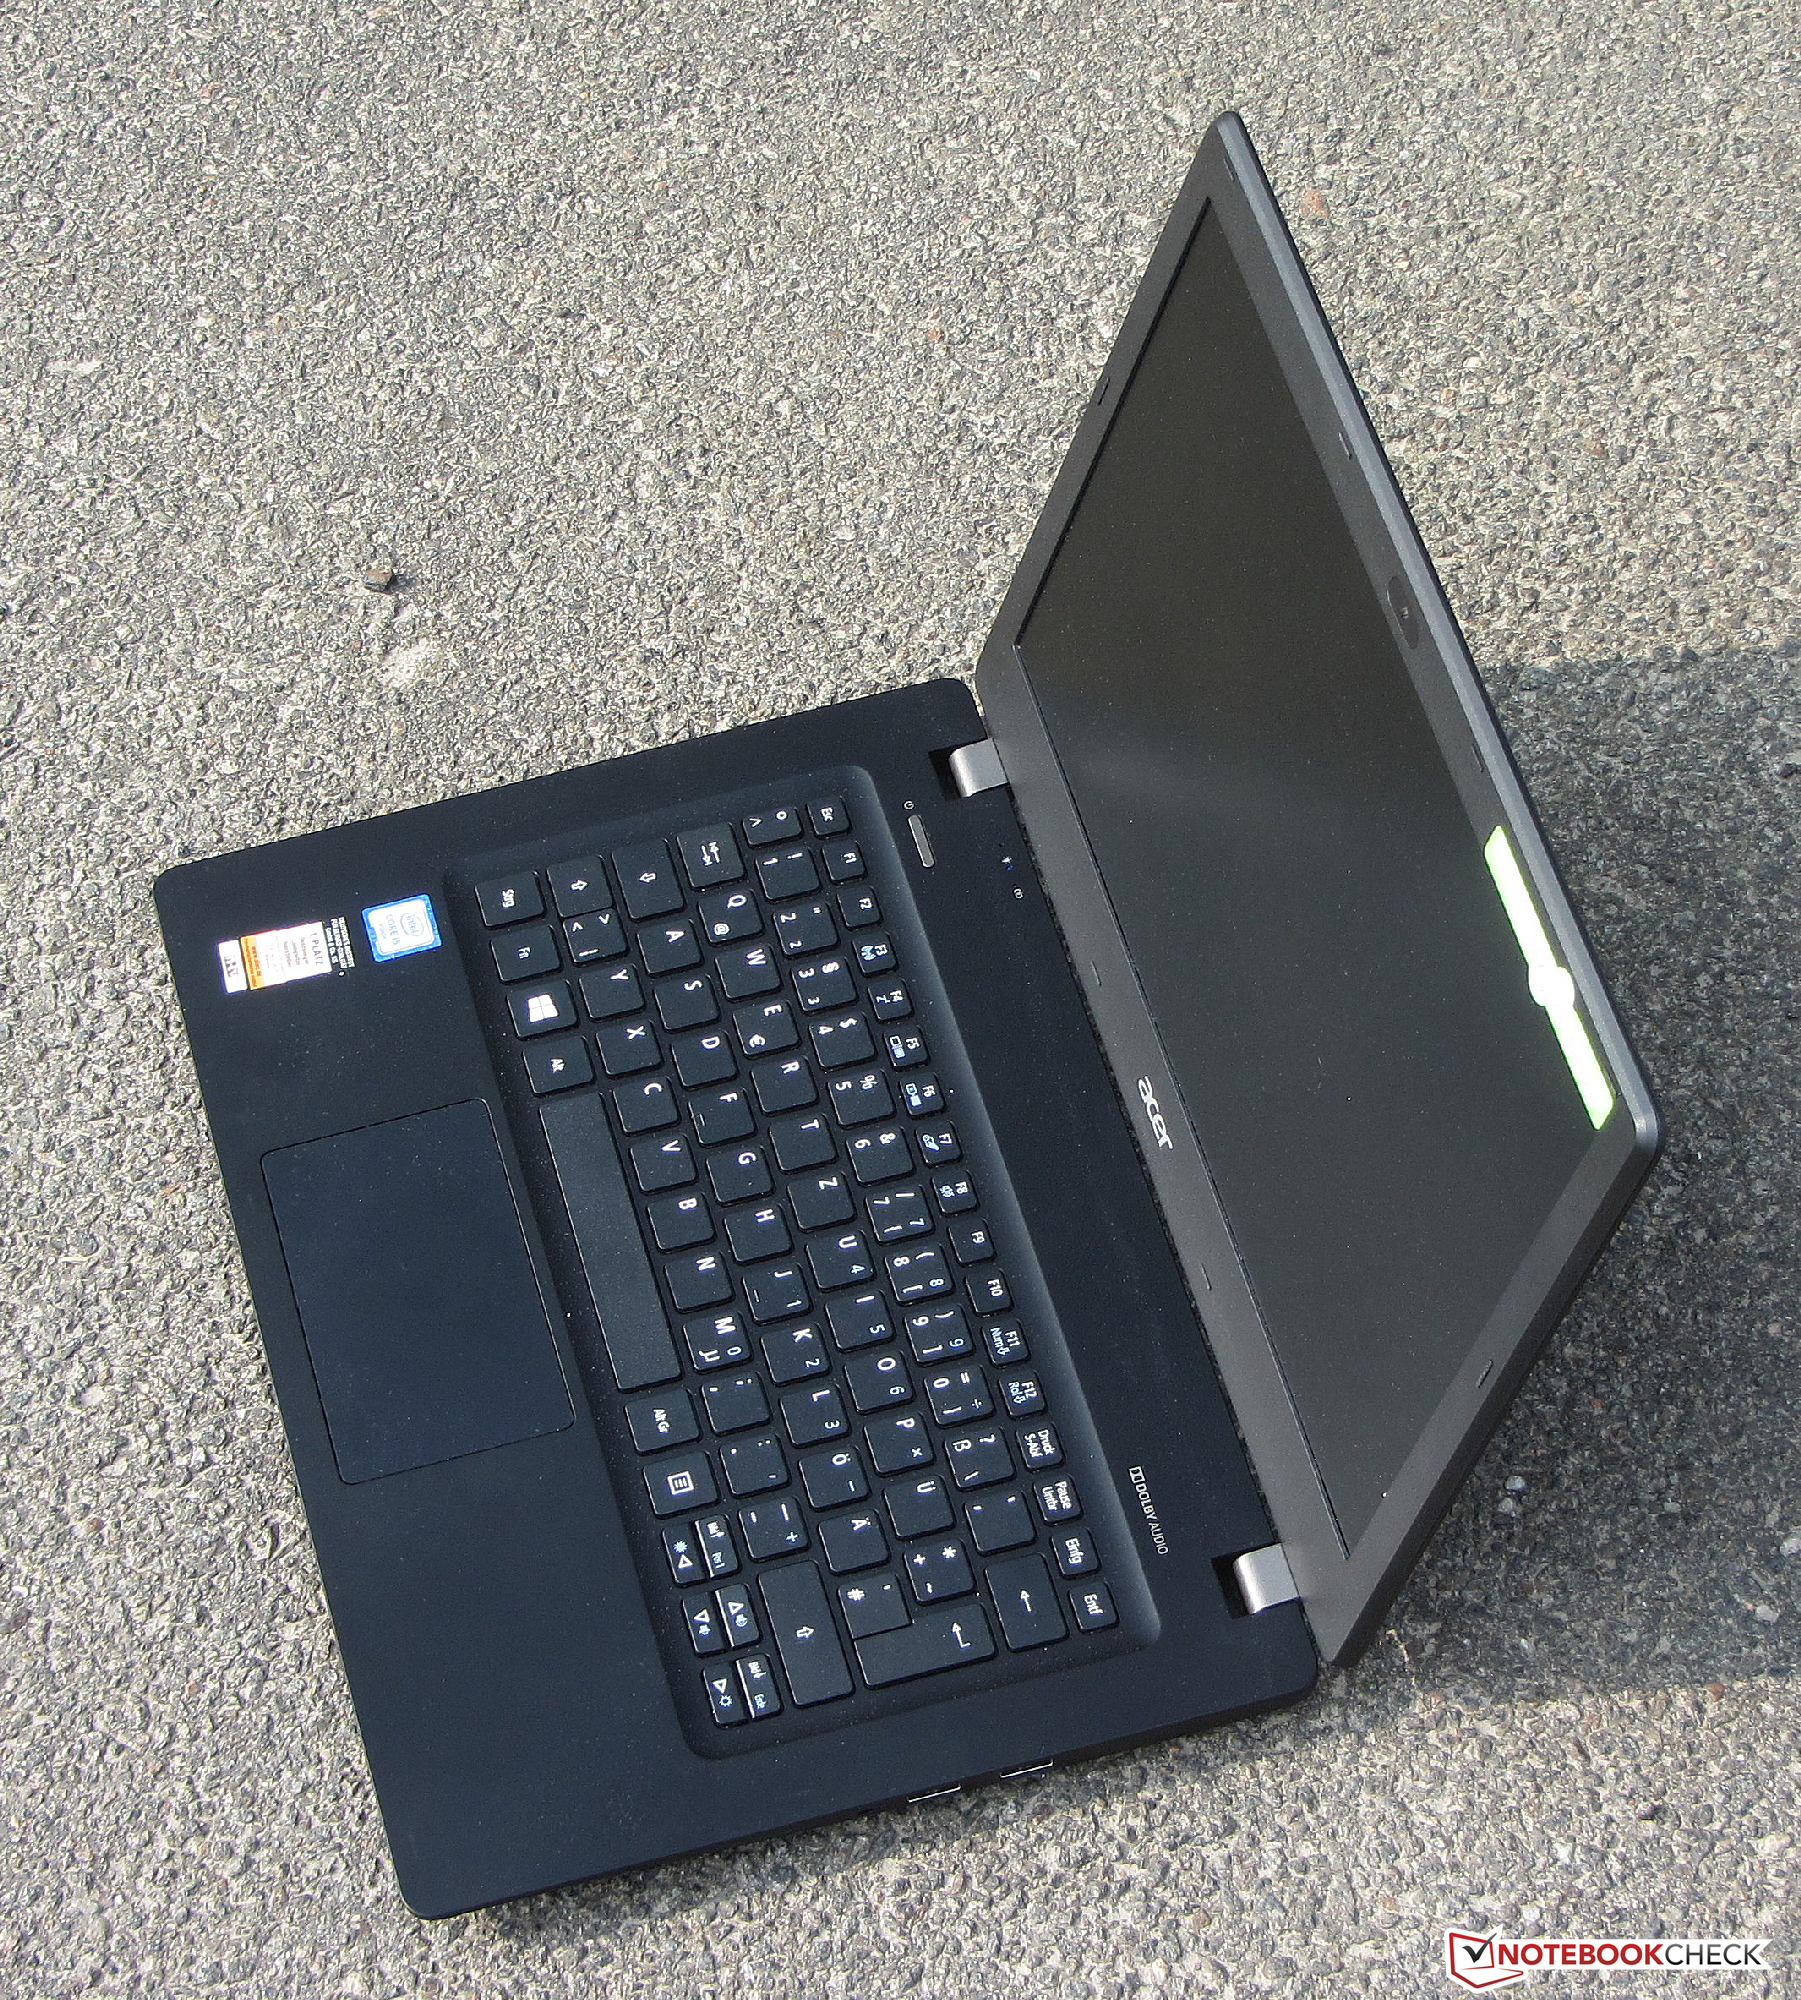
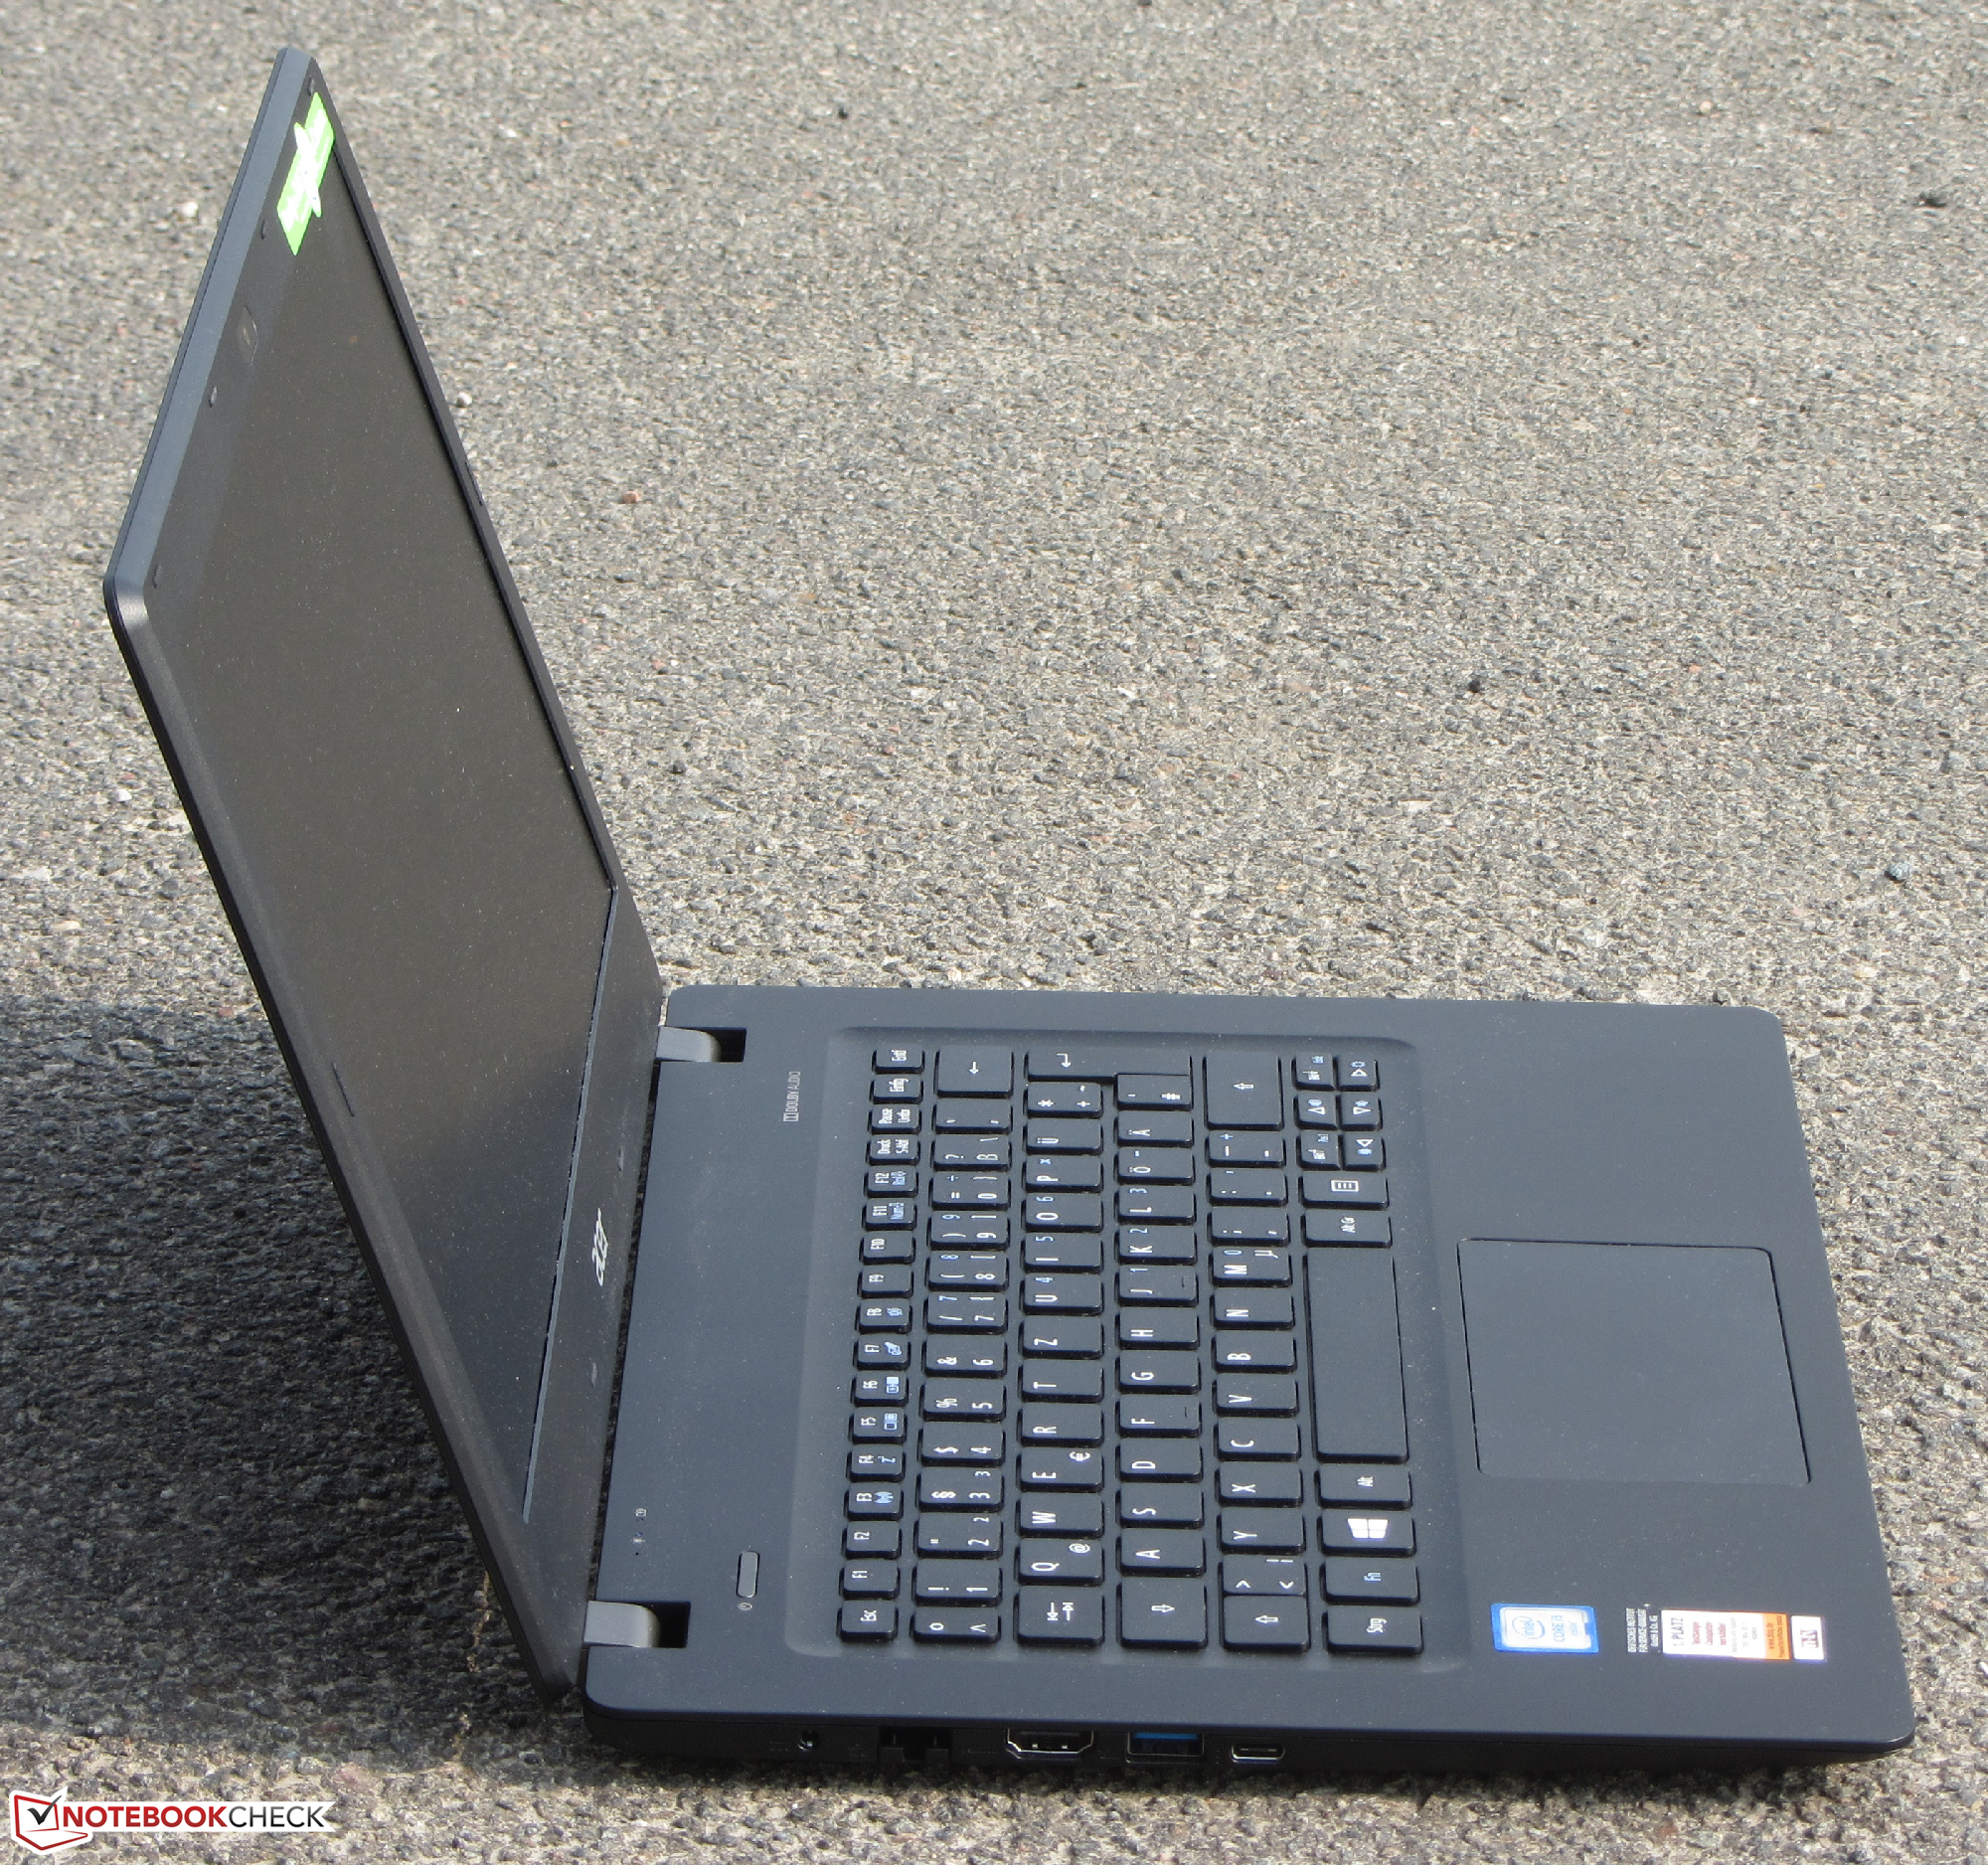
Breve análisis del subportátil Acer TravelMate P238-M-5575
| |||||||||||||||||||||||||
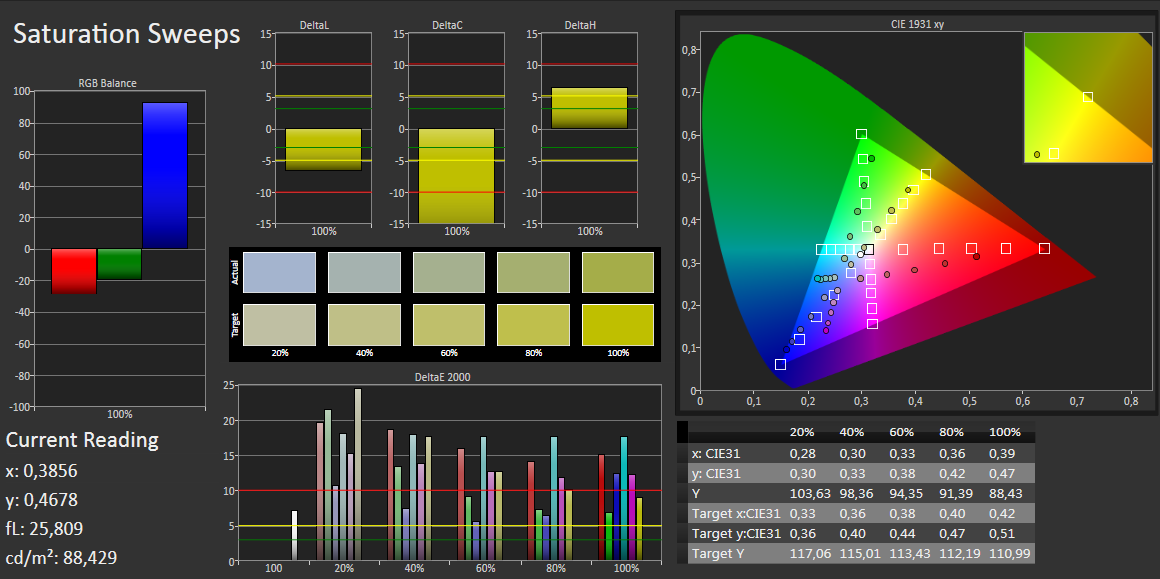
iluminación: 91 %
Brillo con batería: 223 cd/m²
Contraste: 461:1 (Negro: 0.49 cd/m²)
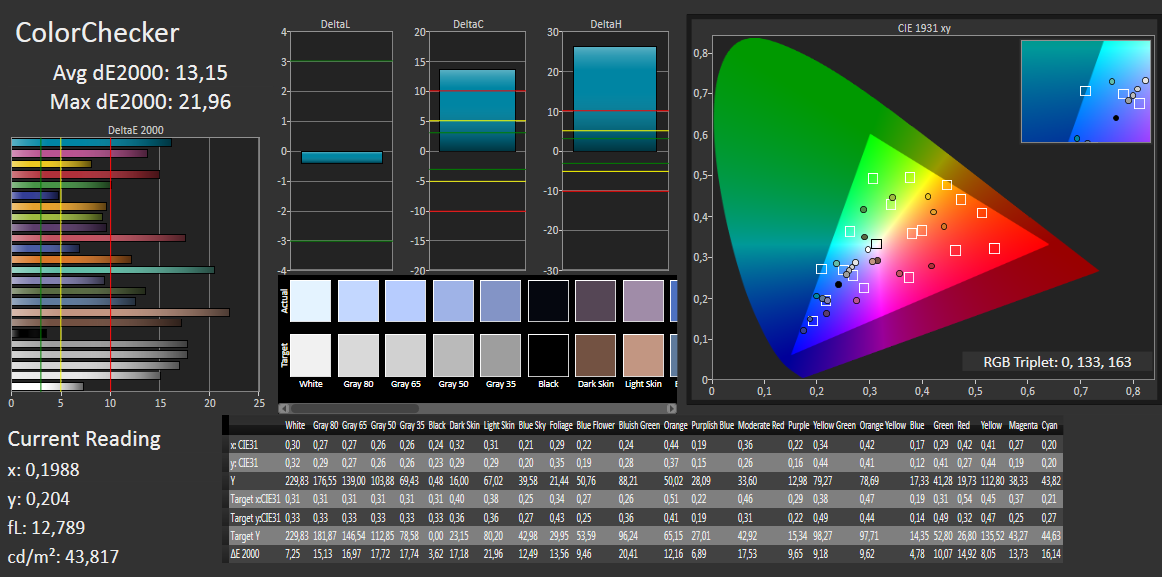
ΔE ColorChecker Calman: 13.15 | ∀{0.5-29.43 Ø4.73}
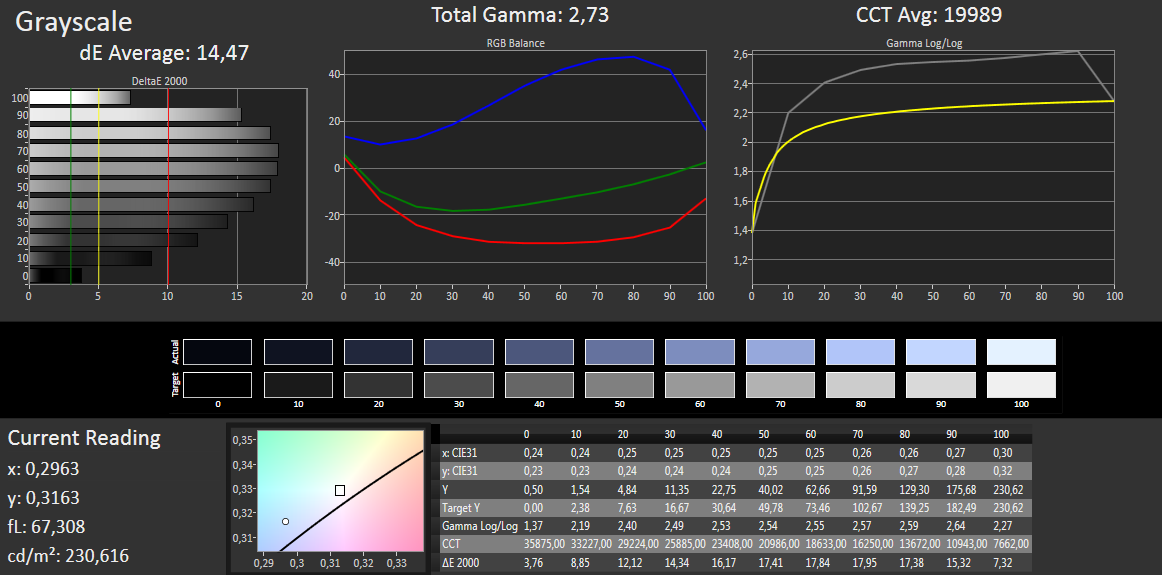
ΔE Greyscale Calman: 14.47 | ∀{0.09-98 Ø4.97}
56% sRGB (Argyll 1.6.3 3D)
36% AdobeRGB 1998 (Argyll 1.6.3 3D)
38.49% AdobeRGB 1998 (Argyll 3D)
56.1% sRGB (Argyll 3D)
37.25% Display P3 (Argyll 3D)
Gamma: 2.73
CCT: 19989 K
Parpadeo de Pantalla / PWM (Pulse-Width Modulation)
| Parpadeo de Pantalla / PWM no detectado | ||
Comparación: 52 % de todos los dispositivos testados no usaron PWM para atenuar el display. Si se usó, medimos una media de 7798 (mínimo: 5 - máxmo: 343500) Hz. | ||
Tiempos de respuesta del display
| ↔ Tiempo de respuesta de Negro a Blanco | ||
|---|---|---|
| 28 ms ... subida ↗ y bajada ↘ combinada | ↗ 10 ms subida | 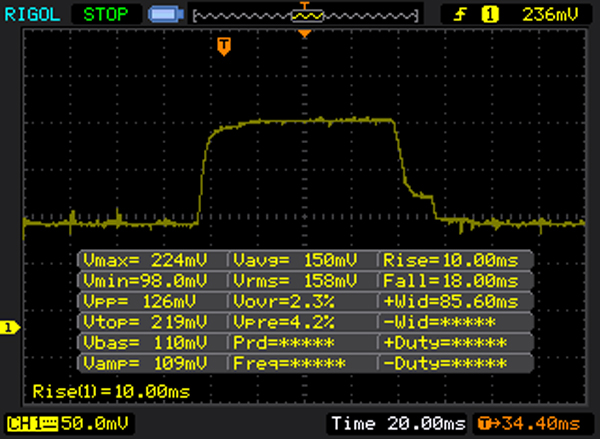 |
| ↘ 18 ms bajada | ||
| La pantalla mostró tiempos de respuesta relativamente lentos en nuestros tests pero podría ser demasiado lenta para los jugones. En comparación, todos los dispositivos de prueba van de ##min### (mínimo) a 240 (máximo) ms. » 71 % de todos los dispositivos son mejores. Eso quiere decir que el tiempo de respuesta es peor que la media (19.9 ms) de todos los dispositivos testados. | ||
| ↔ Tiempo de respuesta 50% Gris a 80% Gris | ||
| 42 ms ... subida ↗ y bajada ↘ combinada | ↗ 22 ms subida | 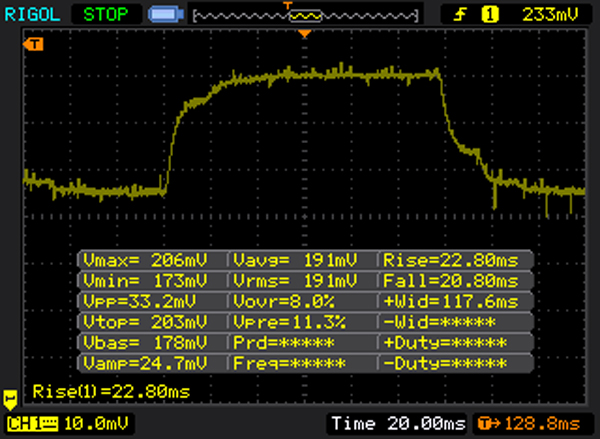 |
| ↘ 20 ms bajada | ||
| La pantalla mostró tiempos de respuesta lentos en nuestros tests y podría ser demasiado lenta para los jugones. En comparación, todos los dispositivos de prueba van de ##min### (mínimo) a 636 (máximo) ms. » 67 % de todos los dispositivos son mejores. Eso quiere decir que el tiempo de respuesta es peor que la media (31.1 ms) de todos los dispositivos testados. | ||
| Acer TravelMate P238-M-5575 TN LED, 1366x768 | Acer Aspire V3-372-50LK IPS, 1920x1080 | HP ProBook 430 G3 P5T00ES TN LED, 1366x768 | Apple MacBook Air 13 inch 2015-03 TN LED, 1440x900 | Lenovo IdeaPad 500S-13ISK IPS, 1920x1080 | Acer TravelMate P236-M-57R4 TN, 1366x768 | HP Envy 13-d020ng IPS, 1920x1080 | Schenker S306 IPS, 1920x1080 | Asus Zenbook UX303UA-FN121T TN LED, 1366x768 | |
|---|---|---|---|---|---|---|---|---|---|
| Display | 5% | -4% | 8% | 7% | 11% | 69% | 76% | 16% | |
| Display P3 Coverage (%) | 37.25 | 39.05 5% | 35.87 -4% | 40.1 8% | 40.74 9% 38.91 4% | 41.26 11% | 63.7 71% | 68.1 83% | 43.08 16% |
| sRGB Coverage (%) | 56.1 | 58.7 5% | 54 -4% | 59.8 7% | 60.6 8% 58.5 4% | 62.1 11% | 93 66% | 93.4 66% | 64.8 16% |
| AdobeRGB 1998 Coverage (%) | 38.49 | 40.35 5% | 37.06 -4% | 41.51 8% | 42.15 10% 40.21 4% | 42.64 11% | 65.1 69% | 68.4 78% | 44.52 16% |
| Response Times | 2% | -24% | 6% | 17% | -2% | 46% | |||
| Response Time Grey 50% / Grey 80% * (ms) | 42 ? | 46 ? -10% | 54.4 ? -30% | 46 ? -10% | 34 ? 19% | 46 ? -10% | 23 ? 45% | ||
| Response Time Black / White * (ms) | 28 ? | 24 ? 14% | 32.8 ? -17% | 22 ? 21% | 24 ? 14% | 26 ? 7% | 15 ? 46% | ||
| PWM Frequency (Hz) | 192 ? | 208 ? | 1020 ? | 192 ? | |||||
| Screen | 23% | -9% | 40% | 24% | -16% | 68% | 56% | 23% | |
| Brightness middle (cd/m²) | 226 | 250 11% | 212 -6% | 329 46% | 219 -3% | 188 -17% | 345 53% | 347 54% | 203 -10% |
| Brightness (cd/m²) | 216 | 247 14% | 205 -5% | 310 44% | 212 -2% | 187 -13% | 335 55% | 333 54% | 193 -11% |
| Brightness Distribution (%) | 91 | 87 -4% | 90 -1% | 82 -10% | 82 -10% | 78 -14% | 95 4% | 80 -12% | 84 -8% |
| Black Level * (cd/m²) | 0.49 | 0.43 12% | 0.71 -45% | 0.405 17% | 0.35 29% | 0.777 -59% | 0.25 49% | 0.39 20% | 0.49 -0% |
| Contrast (:1) | 461 | 581 26% | 299 -35% | 812 76% | 626 36% | 242 -48% | 1380 199% | 890 93% | 414 -10% |
| Colorchecker dE 2000 * | 13.15 | 4.51 66% | 12.06 8% | 3.96 70% | 4.95 62% | 12.21 7% | 4.94 62% | 3.66 72% | 3.2 76% |
| Colorchecker dE 2000 max. * | 21.96 | 7.51 66% | 11.17 49% | 8.85 60% | 6.48 70% | 4.13 81% | |||
| Greyscale dE 2000 * | 14.47 | 3.18 78% | 13.41 7% | 3.51 76% | 3.45 76% | 13.1 9% | 5.85 60% | 4.18 71% | 2.77 81% |
| Gamma | 2.73 81% | 2.43 91% | 2.41 91% | 3.83 57% | 2.34 94% | 2.66 83% | 2.25 98% | 2.79 79% | 2.46 89% |
| CCT | 19989 33% | 6743 96% | 15382 42% | 6711 97% | 6815 95% | 17666 37% | 7105 91% | 6670 97% | 7176 91% |
| Color Space (Percent of AdobeRGB 1998) (%) | 36 | 37 3% | 34.3 -5% | 38.4 7% | 37 3% | 39.4 9% | 60 67% | 61 69% | 41 14% |
| Color Space (Percent of sRGB) (%) | 56 | 58 4% | 54.2 -3% | 59.8 7% | 58 4% | 93 66% | 93 66% | 65 16% | |
| Media total (Programa/Opciones) | 10% /
16% | -12% /
-10% | 24% /
32% | 12% /
16% | -3% /
-8% | 51% /
61% | 43% /
52% | 28% /
25% |
* ... más pequeño es mejor
| JetStream 1.1 - 1.1 Total | |
| HP Envy 13-d020ng | |
| Schenker S306 | |
| Asus Zenbook UX303UA-FN121T | |
| Lenovo U31-70 80M5003EGE | |
| Acer TravelMate P238-M-5575 | |
| HP ProBook 430 G3 P5T00ES | |
| Peacekeeper - --- | |
| Lenovo U31-70 80M5003EGE | |
| HP Envy 13-d020ng | |
| Schenker S306 | |
| Acer TravelMate P238-M-5575 | |
| Asus Zenbook UX303UA-FN121T | |
| HP ProBook 430 G3 P5T00ES | |
* ... más pequeño es mejor
| PCMark 7 Score | 4629 puntos | |
| PCMark 8 Home Score Accelerated v2 | 3589 puntos | |
| PCMark 8 Creative Score Accelerated v2 | 3705 puntos | |
| PCMark 8 Work Score Accelerated v2 | 4748 puntos | |
ayuda | ||

| 3DMark 06 Standard Score | 8980 puntos | |
| 3DMark 11 Performance | 1461 puntos | |
| 3DMark Ice Storm Standard Score | 53522 puntos | |
| 3DMark Cloud Gate Standard Score | 5882 puntos | |
| 3DMark Fire Strike Score | 773 puntos | |
ayuda | ||
| bajo | medio | alto | ultra | |
|---|---|---|---|---|
| Tomb Raider (2013) | 74.9 | 38.1 | 23.8 | |
| BioShock Infinite (2013) | 51.8 | 27.7 | 22.9 | |
| Battlefield 4 (2013) | 31.3 | 24.3 | 16.9 | |
| World of Warships (2015) | 80 | 45.3 | ||
| FIFA 16 (2015) | 62.5 | 39.4 | ||
| Need for Speed 2016 (2016) | 15.2 | 13.5 |
Ruido
| Ocioso |
| 31.2 / 31.2 / 31.2 dB(A) |
| Carga |
| 35.71 / 38.1 dB(A) |
 | ||
30 dB silencioso 40 dB(A) audible 50 dB(A) ruidosamente alto |
||
min: | ||
| Acer TravelMate P238-M-5575 6200U, HD Graphics 520 | Acer Aspire V3-372-50LK 6200U, HD Graphics 520 | HP ProBook 430 G3 P5T00ES 6200U, HD Graphics 520 | Apple MacBook Air 13 inch 2015-03 5650U, HD Graphics 6000 | Lenovo IdeaPad 500S-13ISK 6200U, HD Graphics 520 | Acer TravelMate P236-M-57R4 5200U, HD Graphics 5500 | HP Envy 13-d020ng 6200U, HD Graphics 520 | Schenker S306 6200U, HD Graphics 520 | Asus Zenbook UX303UA-FN121T 6200U, HD Graphics 520 | |
|---|---|---|---|---|---|---|---|---|---|
| Noise | 4% | 4% | -3% | -2% | 1% | -2% | -6% | 1% | |
| apagado / medio ambiente * (dB) | 31.2 | 31.3 -0% | 31.3 -0% | ||||||
| Idle Minimum * (dB) | 31.2 | 31.5 -1% | 29.8 4% | 29.2 6% | 31.3 -0% | 29.1 7% | 32.5 -4% | 31.3 -0% | 32.6 -4% |
| Idle Average * (dB) | 31.2 | 31.5 -1% | 29.8 4% | 29.2 6% | 31.7 -2% | 29.1 7% | 32.5 -4% | 31.3 -0% | 32.7 -5% |
| Idle Maximum * (dB) | 31.2 | 31.5 -1% | 30.9 1% | 29.2 6% | 31.8 -2% | 29.1 7% | 32.4 -4% | 31.4 -1% | 32.7 -5% |
| Load Average * (dB) | 35.71 | 32.4 9% | 33.3 7% | 40.2 -13% | 36.7 -3% | 38.7 -8% | 36 -1% | 38.6 -8% | 33.4 6% |
| Load Maximum * (dB) | 38.1 | 32.3 15% | 37.4 2% | 46.3 -22% | 39.4 -3% | 40.8 -7% | 36.5 4% | 48.5 -27% | 33.4 12% |
* ... más pequeño es mejor
(+) La temperatura máxima en la parte superior es de 34.2 °C / 94 F, frente a la media de 35.9 °C / 97 F, que oscila entre 21.4 y 59 °C para la clase Subnotebook.
(+) El fondo se calienta hasta un máximo de 31 °C / 88 F, frente a la media de 39.2 °C / 103 F
(+) En reposo, la temperatura media de la parte superior es de 25.4 °C / 78# F, frente a la media del dispositivo de 30.8 °C / 87 F.
(+) El reposamanos y el panel táctil están a una temperatura inferior a la de la piel, con un máximo de 24.6 °C / 76.3 F y, por tanto, son fríos al tacto.
(+) La temperatura media de la zona del reposamanos de dispositivos similares fue de 28.2 °C / 82.8 F (+3.6 °C / 6.5 F).
| Acer TravelMate P238-M-5575 6200U, HD Graphics 520 | Acer Aspire V3-372-50LK 6200U, HD Graphics 520 | HP ProBook 430 G3 P5T00ES 6200U, HD Graphics 520 | Apple MacBook Air 13 inch 2015-03 5650U, HD Graphics 6000 | Lenovo IdeaPad 500S-13ISK 6200U, HD Graphics 520 | Acer TravelMate P236-M-57R4 5200U, HD Graphics 5500 | HP Envy 13-d020ng 6200U, HD Graphics 520 | Schenker S306 6200U, HD Graphics 520 | Asus Zenbook UX303UA-FN121T 6200U, HD Graphics 520 | |
|---|---|---|---|---|---|---|---|---|---|
| Heat | -35% | -25% | -18% | -10% | -18% | -20% | -20% | -7% | |
| Maximum Upper Side * (°C) | 34.2 | 49.3 -44% | 42.1 -23% | 43.8 -28% | 35.9 -5% | 33.5 2% | 51 -49% | 44.2 -29% | 39.7 -16% |
| Maximum Bottom * (°C) | 31 | 53.3 -72% | 44.1 -42% | 42.1 -36% | 39.1 -26% | 44.8 -45% | 46 -48% | 42.3 -36% | 34.8 -12% |
| Idle Upper Side * (°C) | 27.1 | 28.2 -4% | 31.1 -15% | 28.5 -5% | 27.8 -3% | 29.5 -9% | 25.5 6% | 29.6 -9% | 27.4 -1% |
| Idle Bottom * (°C) | 27.7 | 32.6 -18% | 32.9 -19% | 28.9 -4% | 29.1 -5% | 33 -19% | 24.4 12% | 29.2 -5% | 27.7 -0% |
* ... más pequeño es mejor
| Off / Standby | |
| Ocioso | |
| Carga |
|
Clave:
min: | |
| Acer TravelMate P238-M-5575 6200U, HD Graphics 520 | Acer Aspire V3-372-50LK 6200U, HD Graphics 520 | HP ProBook 430 G3 P5T00ES 6200U, HD Graphics 520 | Apple MacBook Air 13 inch 2015-03 5650U, HD Graphics 6000 | Lenovo IdeaPad 500S-13ISK 6200U, HD Graphics 520 | Acer TravelMate P236-M-57R4 5200U, HD Graphics 5500 | HP Envy 13-d020ng 6200U, HD Graphics 520 | Schenker S306 6200U, HD Graphics 520 | Asus Zenbook UX303UA-FN121T 6200U, HD Graphics 520 | |
|---|---|---|---|---|---|---|---|---|---|
| Power Consumption | -13% | -22% | -3% | -18% | -6% | -32% | -67% | -10% | |
| Idle Minimum * (Watt) | 3.2 | 3.8 -19% | 4.7 -47% | 2.7 16% | 5.2 -63% | 3 6% | 4.2 -31% | 6.3 -97% | 4.2 -31% |
| Idle Average * (Watt) | 5.5 | 5.8 -5% | 7.2 -31% | 5.7 -4% | 6.9 -25% | 5.7 -4% | 7.4 -35% | 10.1 -84% | 6.2 -13% |
| Idle Maximum * (Watt) | 6 | 8.1 -35% | 8.3 -38% | 6 -0% | 7.2 -20% | 6.3 -5% | 10.1 -68% | 12.6 -110% | 6.4 -7% |
| Load Average * (Watt) | 29.5 | 30.2 -2% | 26.4 11% | 32.1 -9% | 26.7 9% | 30.2 -2% | 33.4 -13% | 34.6 -17% | 29 2% |
| Load Maximum * (Watt) | 30.9 | 32.4 -5% | 32 -4% | 36.2 -17% | 28.2 9% | 39.1 -27% | 34.7 -12% | 38.7 -25% | 31 -0% |
* ... más pequeño es mejor
| Acer TravelMate P238-M-5575 49.7 Wh | Acer Aspire V3-372-50LK 51 Wh | HP ProBook 430 G3 P5T00ES 44 Wh | Apple MacBook Air 13 inch 2015-03 54 Wh | Lenovo IdeaPad 500S-13ISK 35 Wh | Acer TravelMate P236-M-57R4 49 Wh | HP Envy 13-d020ng 45 Wh | Schenker S306 45 Wh | Asus Zenbook UX303UA-FN121T 50 Wh | |
|---|---|---|---|---|---|---|---|---|---|
| Duración de Batería | -27% | -41% | -4% | -48% | -37% | -46% | -28% | ||
| Reader / Idle (h) | 21.5 | 15.1 -30% | 7.5 -65% | 26.2 22% | 10.3 -52% | ||||
| H.264 (h) | 9.3 | 5.6 -40% | 5.2 -44% | ||||||
| WiFi v1.3 (h) | 10.1 | 5.8 -43% | 6.3 -38% | 10.3 2% | 5 -50% | 6.4 -37% | 5.5 -46% | 7.3 -28% | |
| Load (h) | 2.5 | 2.3 -8% | 2 -20% | 1.6 -36% | 1.4 -44% | ||||
| WiFi (h) | 6 |
Pro
Contra
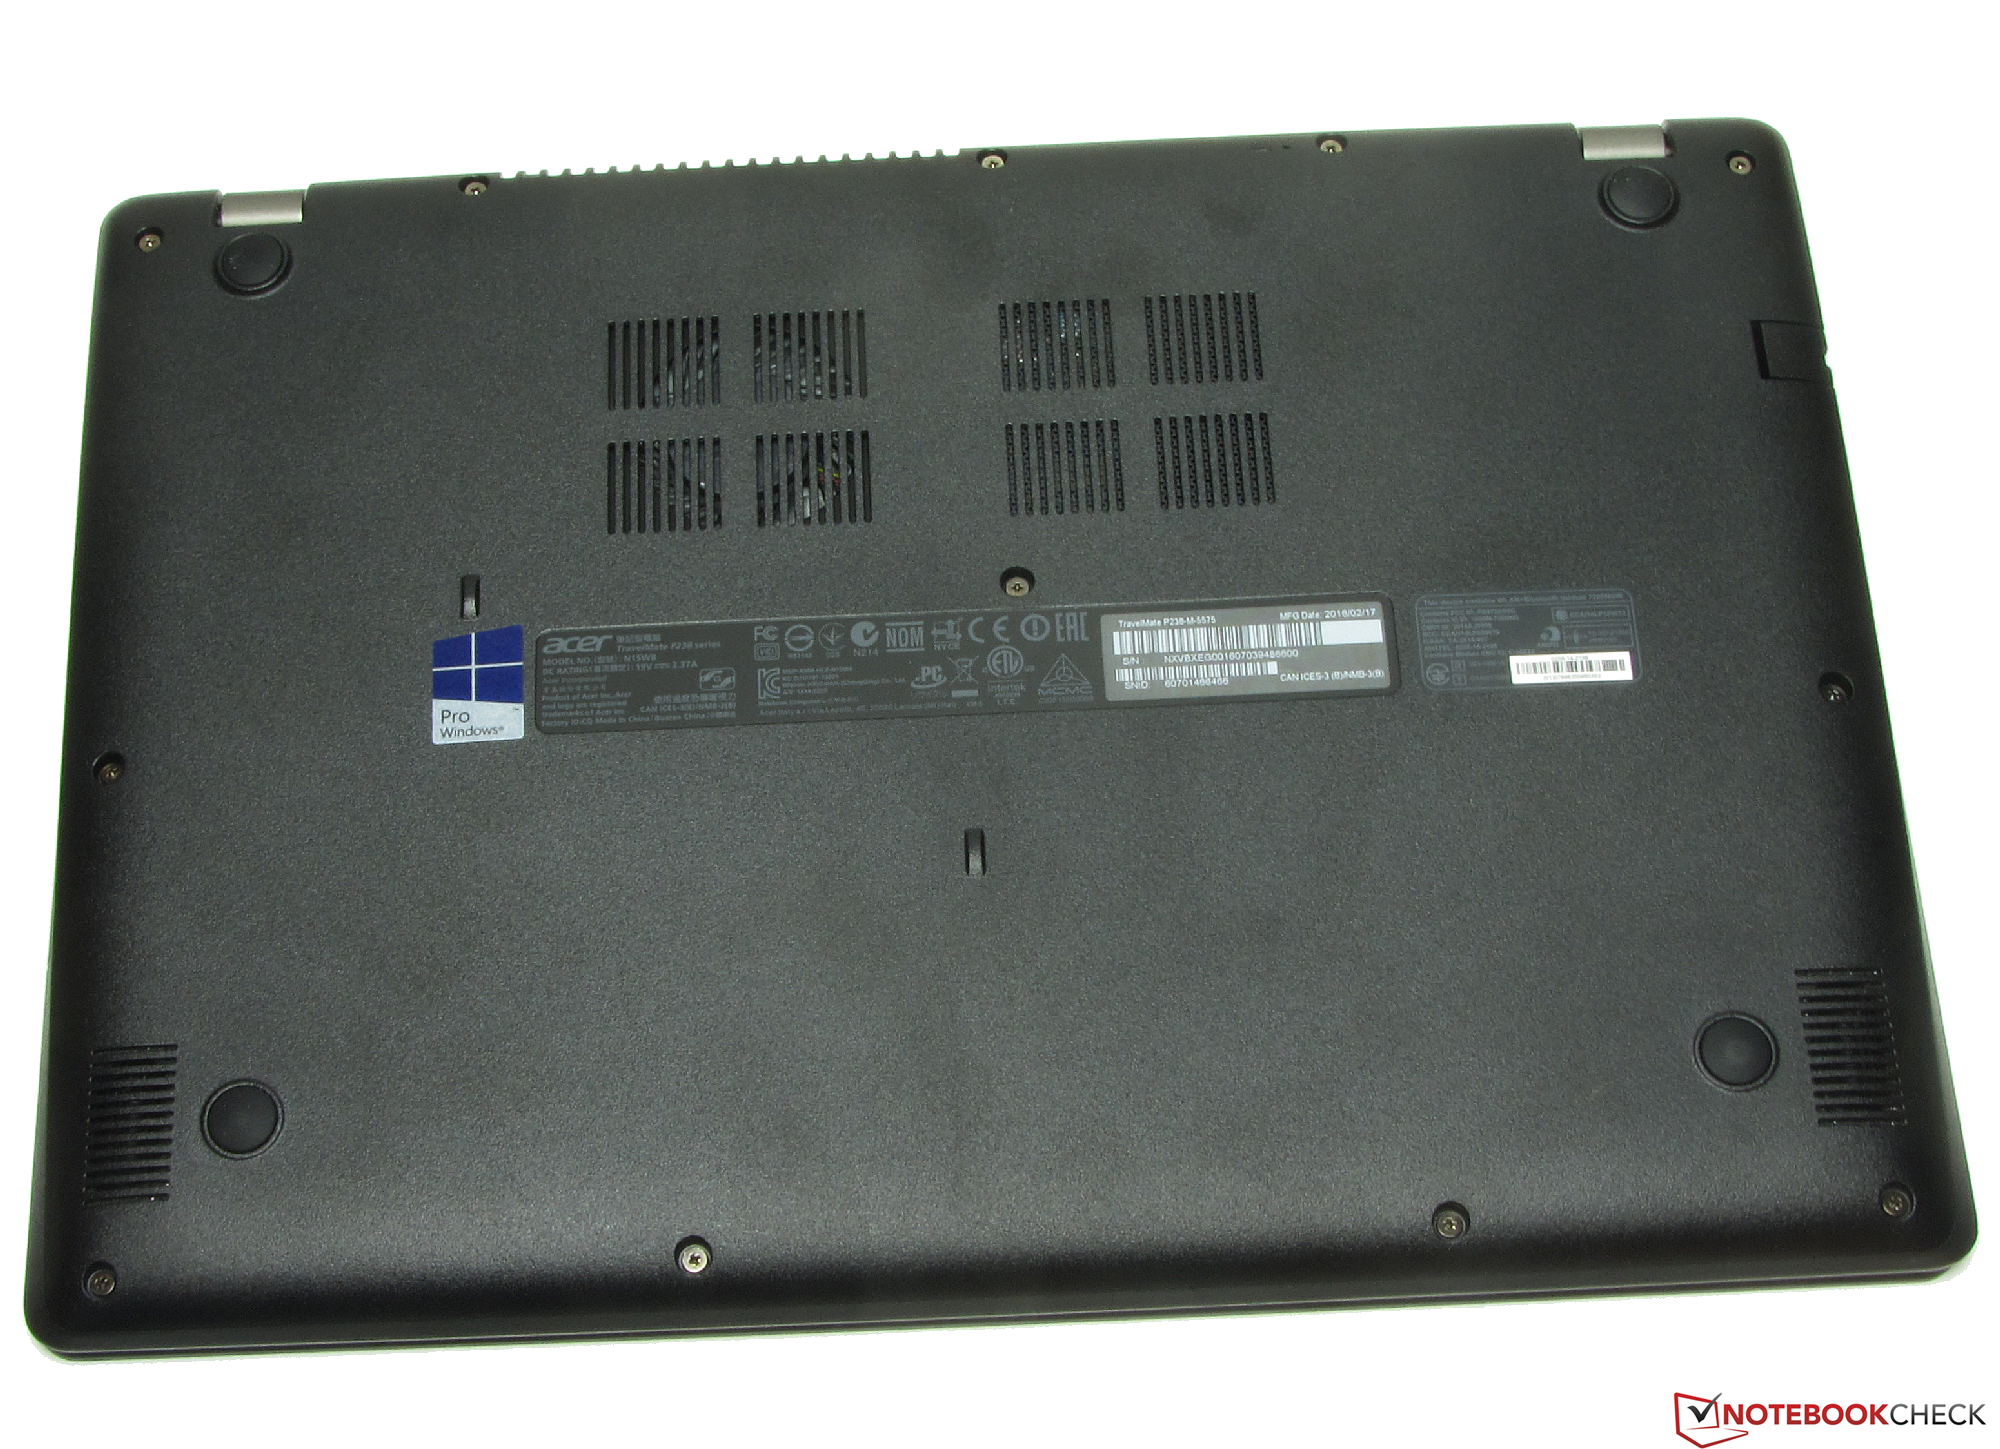
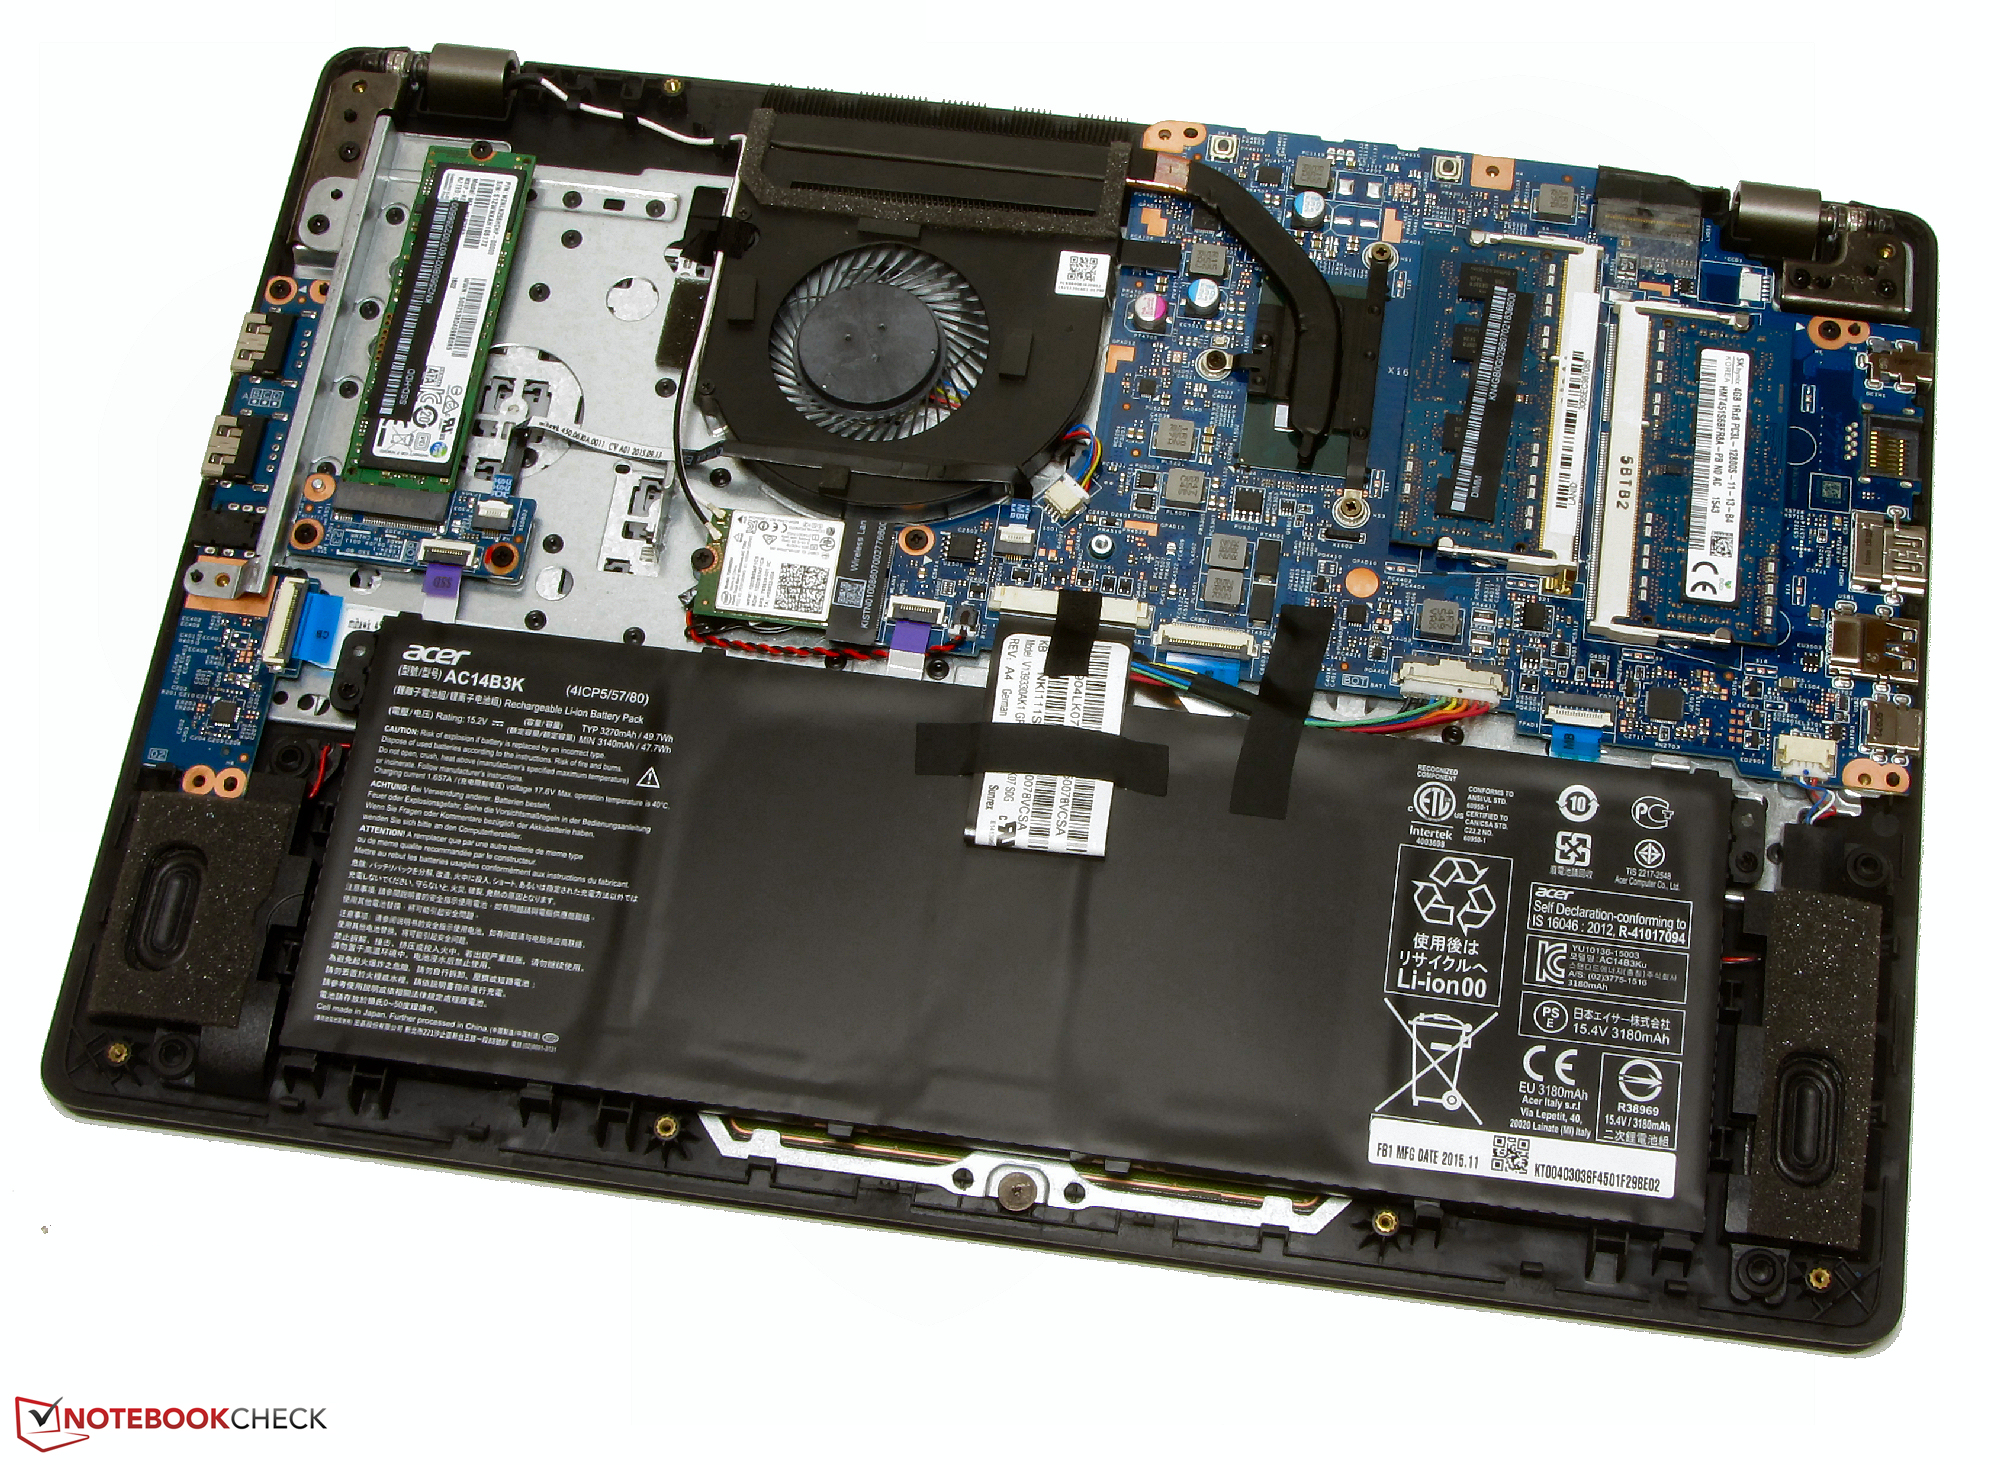
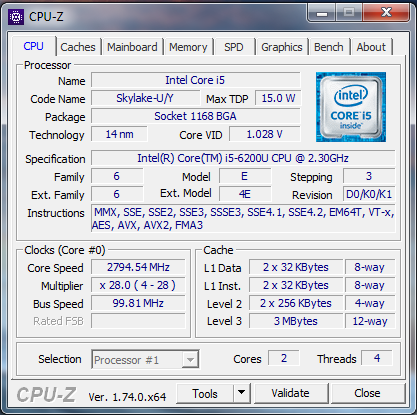
El subportátil Acer trae un potente procesador Core i5 que queda bien en todos los escenarios de uso. El portátil apenas se calienta y va en silencio durante el uso rutinario a pesar de la potente CPU. Un veloz SSD asegura un sistema rápido. Se podría cambiar el SSD, pero habría que desmantelar la bandeja base del portátil ya que no hay escotilla de mantenimiento.
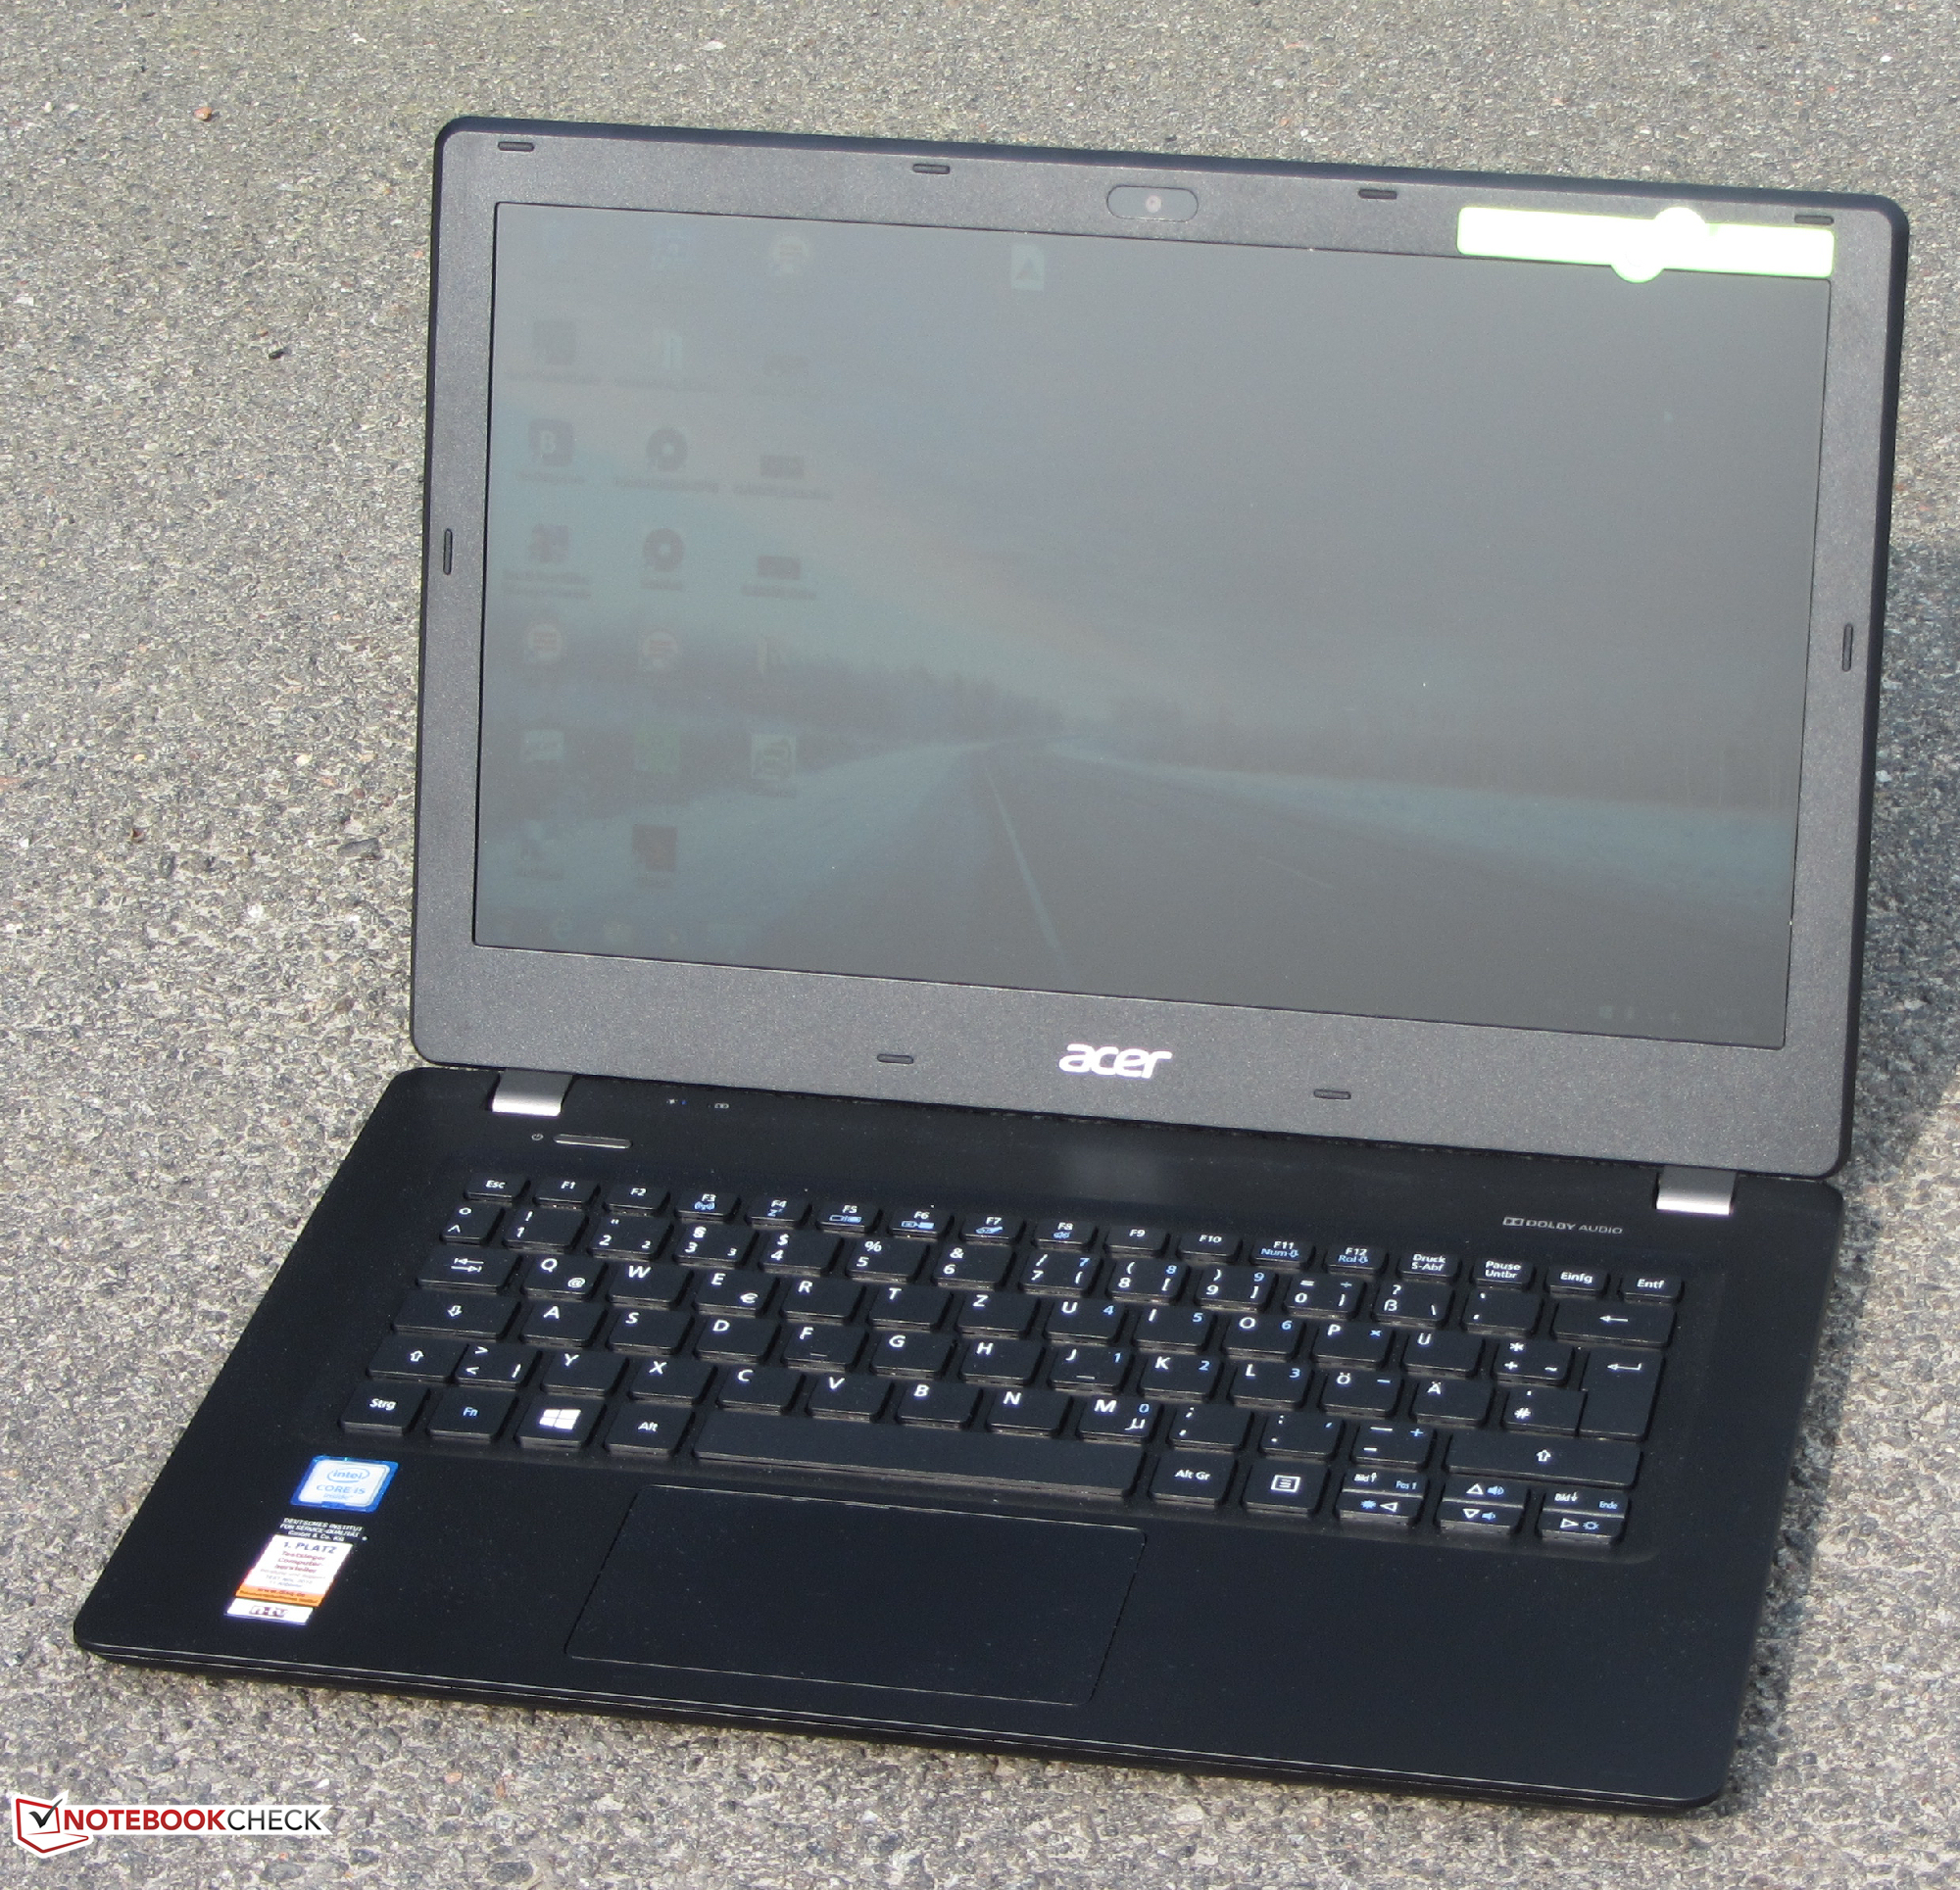
Con el TravelMate P238-M, Acer podría haber tenido un subportátil buenísimo en su línea si no hubiera hecho tantos recortes en el teclado y el display. Los compradores que puedan aceptar esto encontrarán un compañero con aguante para la escuela, los estudios y el trabajo.
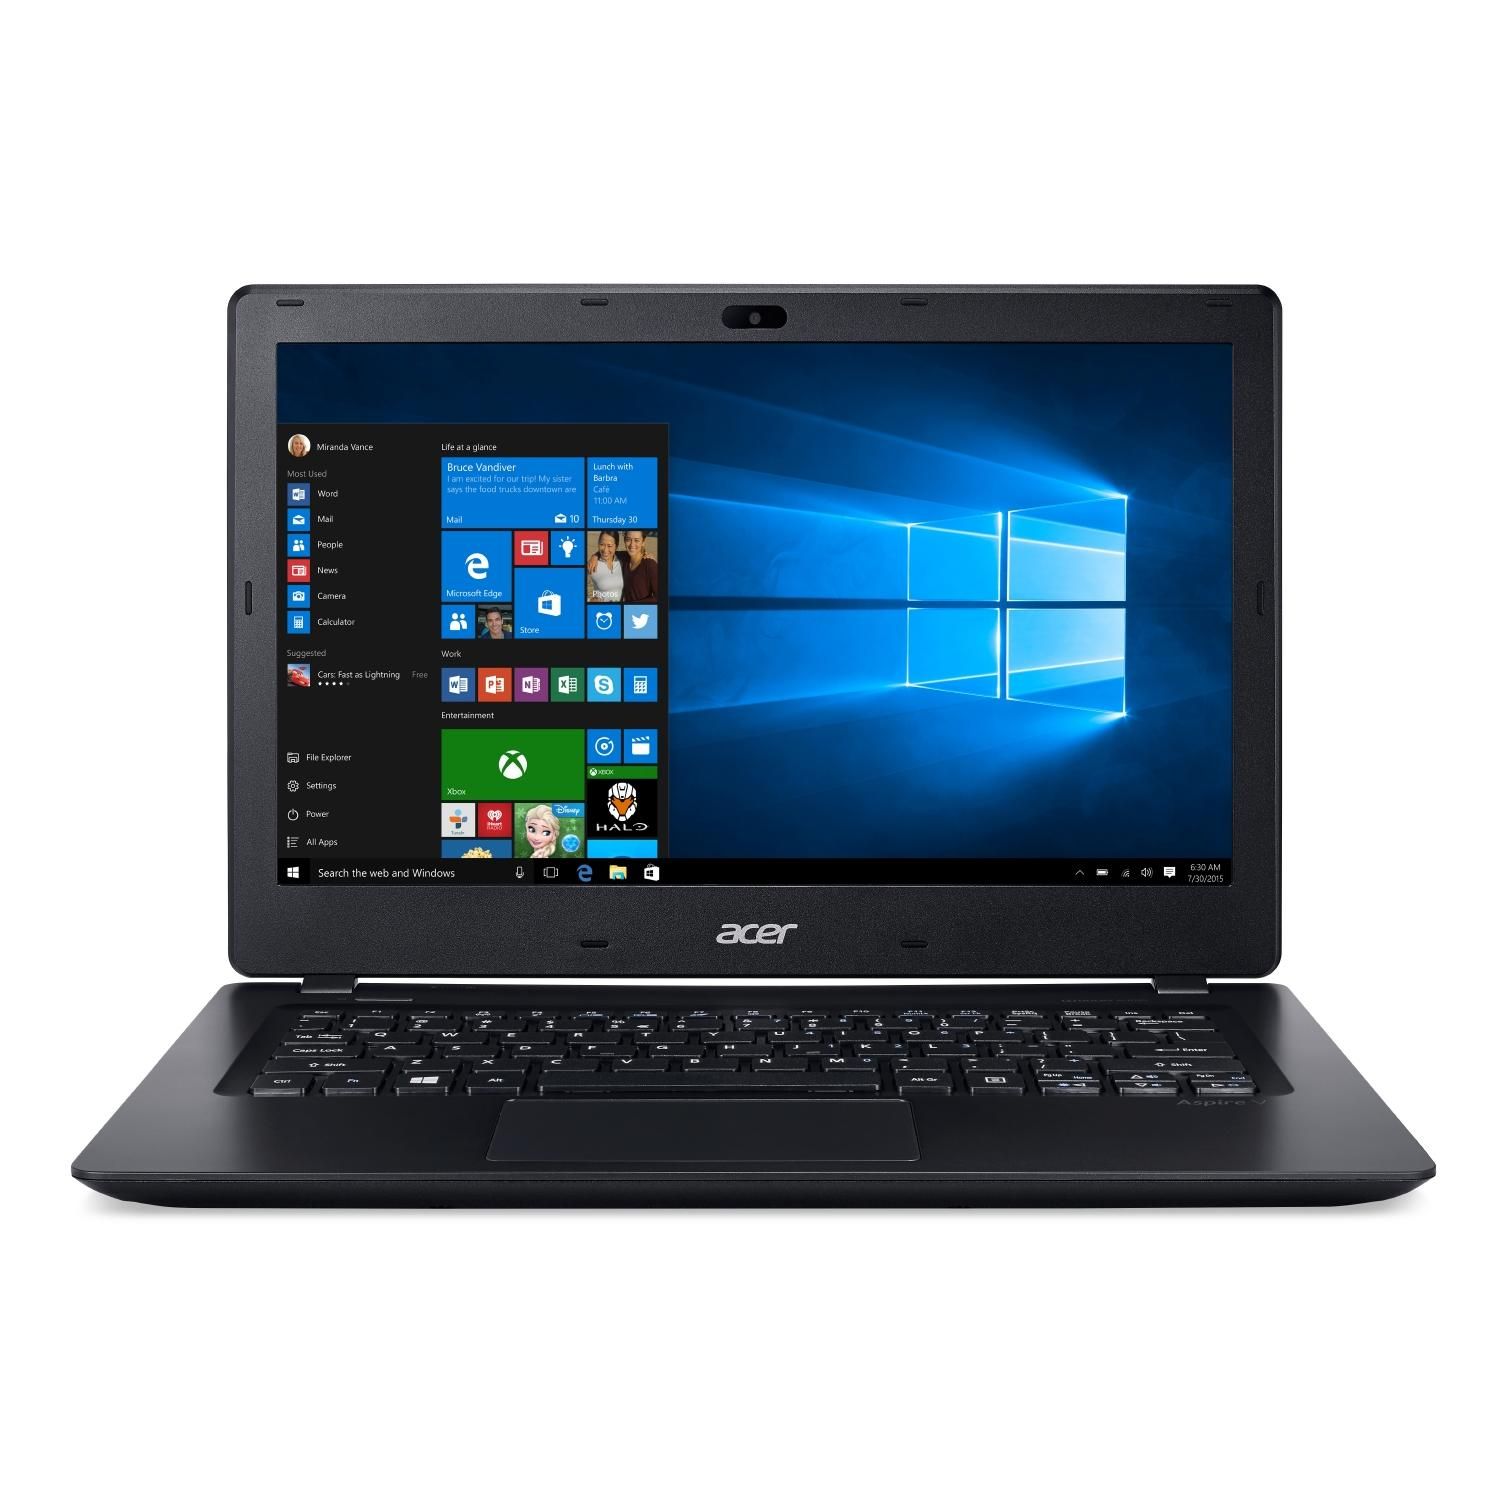
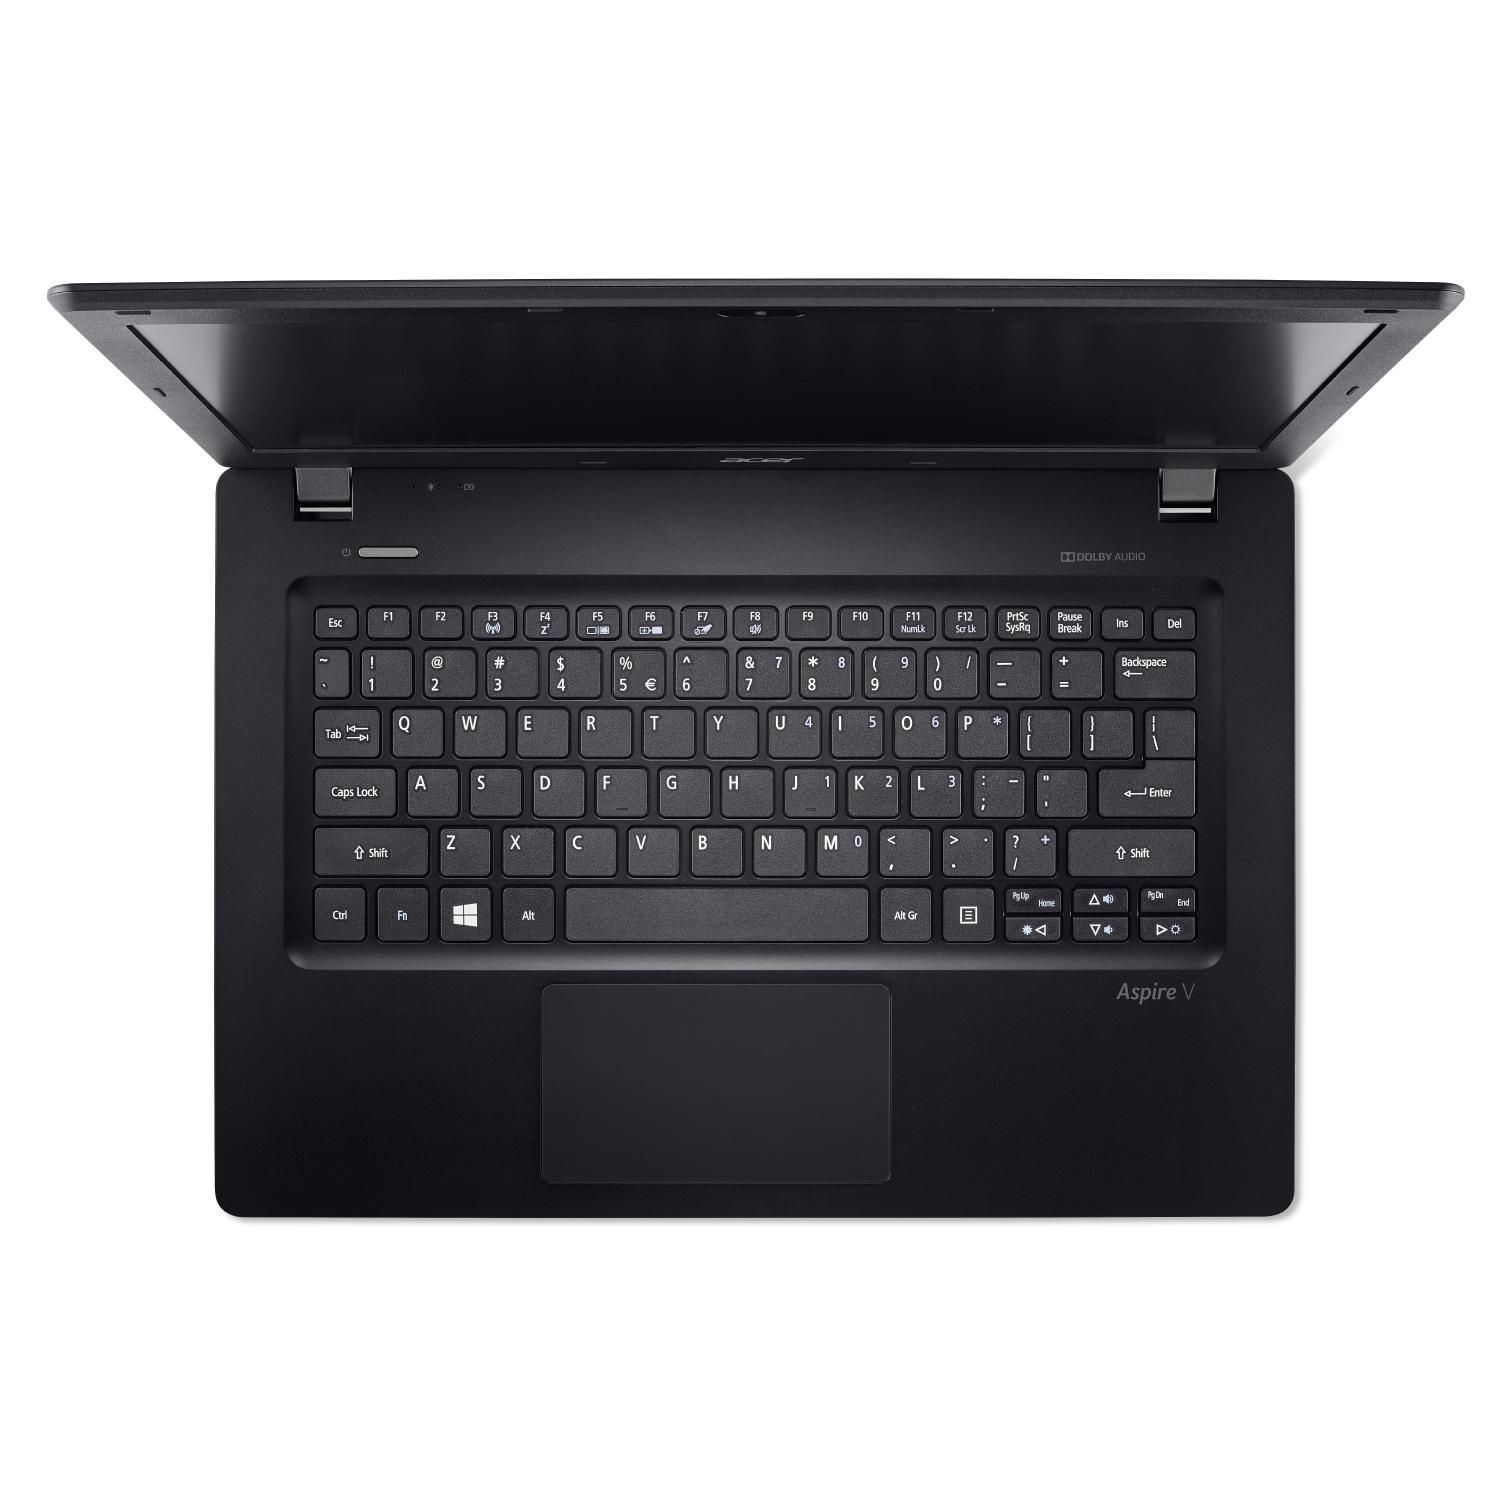
Acer ha equipado al TravelMate con un teclado decente que, empero, no es uno de los top models. Esperamos más por un precio de unos 750 Euros. Después de todo, el TravelMate es una máquina de escribir y navegar móvil. La pantalla tampoco se va a llevar un premio. Es oscura, su contraste es bajo y depende del ángulo de visión. Un portátil de 750 Euros tiene que ofrecer más en este aspecto.
Ésta es una versión acortada del análisis original. Puedes leer el análisis completo en inglés aquí.
Acer TravelMate P238-M-5575
- 04/21/2016 v5.1 (old)
Sascha Mölck