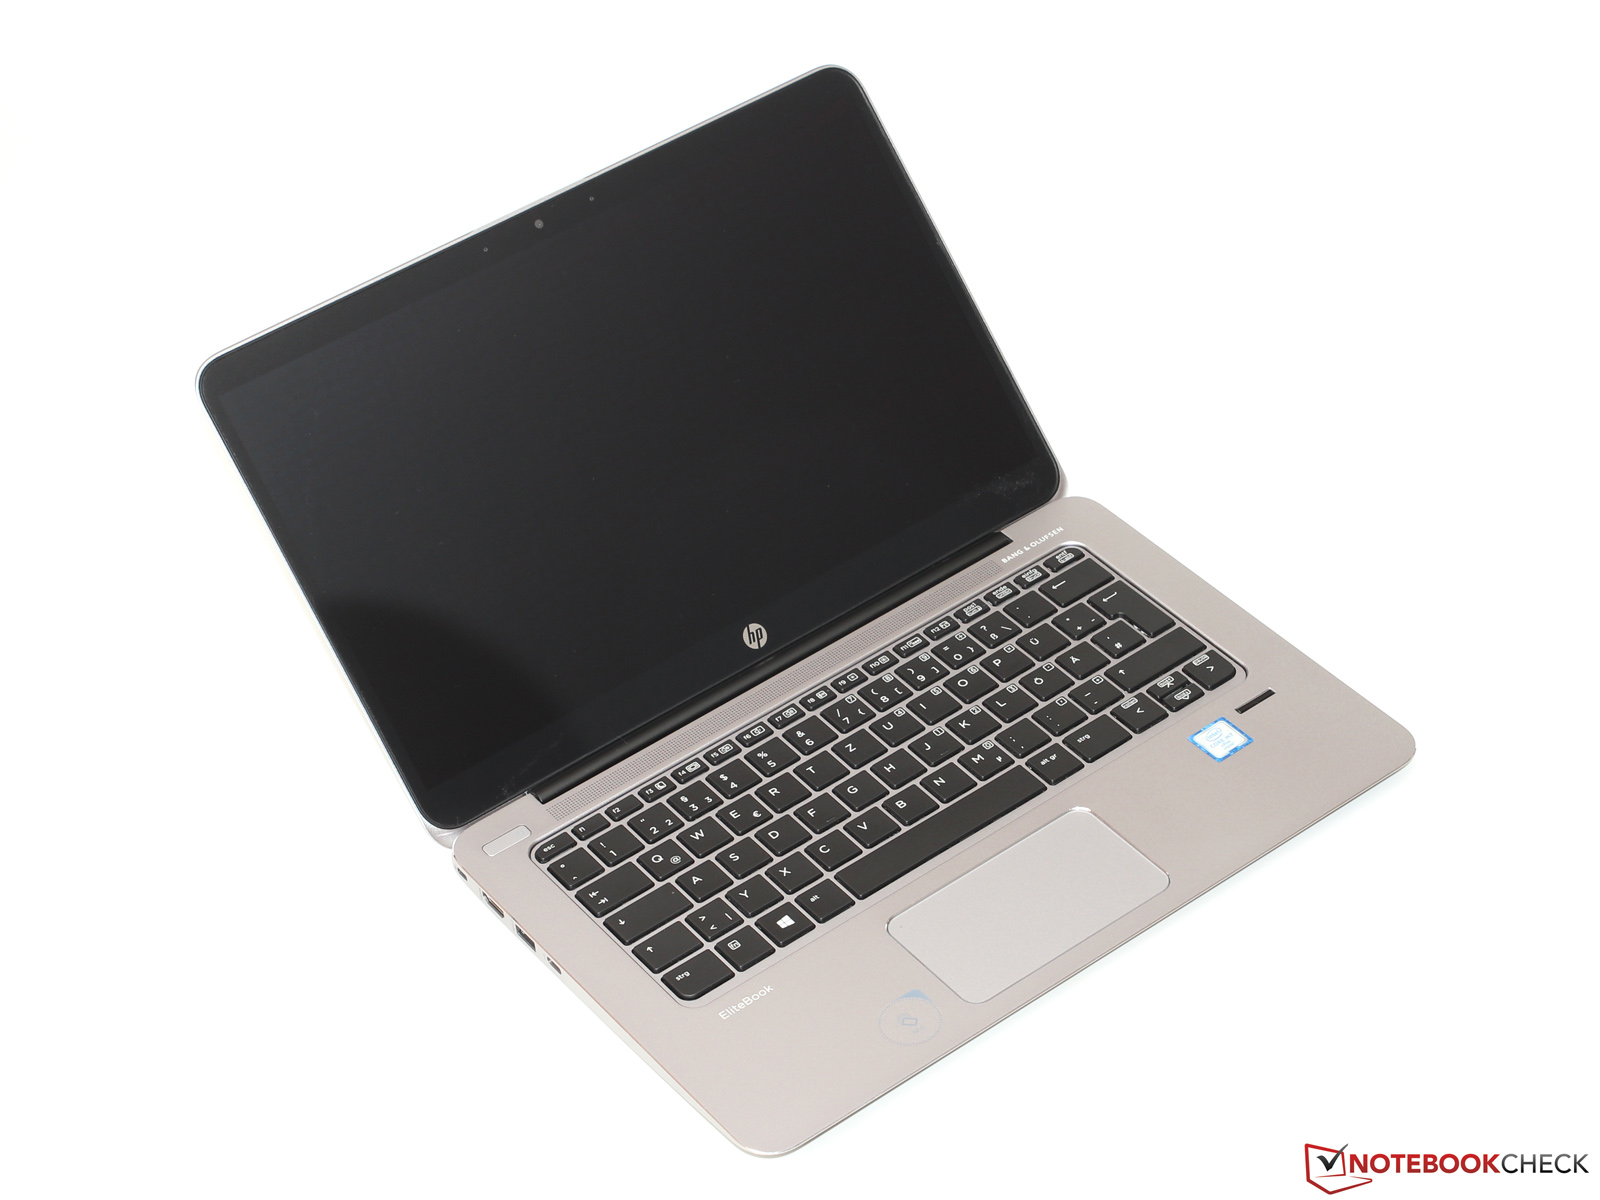
Breve análisis del subportátil HP EliteBook 1030 G1

| Networking | |
| iperf Server (receive) TCP 1 m | |
| Apple MacBook 12 (Early 2016) 1.1 GHz | |
| iperf Client (transmit) TCP 1 m | |
| Apple MacBook 12 (Early 2016) 1.1 GHz | |
| |||||||||||||||||||||||||
iluminación: 85 %
Brillo con batería: 399 cd/m²
Contraste: 1146:1 (Negro: 0.35 cd/m²)
ΔE ColorChecker Calman: 3.5 | ∀{0.5-29.43 Ø4.72}
ΔE Greyscale Calman: 4.13 | ∀{0.09-98 Ø4.97}
94.64% sRGB (Argyll 1.6.3 3D)
61.56% AdobeRGB 1998 (Argyll 1.6.3 3D)
69% AdobeRGB 1998 (Argyll 3D)
94.7% sRGB (Argyll 3D)
67.6% Display P3 (Argyll 3D)
Gamma: 2.28
CCT: 6508 K
Parpadeo de Pantalla / PWM (Pulse-Width Modulation)
| Parpadeo de Pantalla / PWM no detectado | ||
Comparación: 52 % de todos los dispositivos testados no usaron PWM para atenuar el display. Si se usó, medimos una media de 7750 (mínimo: 5 - máxmo: 343500) Hz. | ||
| HP EliteBook 1030 G1-X2F03EA Sharp SHP1465, IPS, 3200x1800, 13.3" | Dell Latitude 13 7370 Sharp LQ133M1, IPS, 1920x1080, 13.3" | HP EliteBook Folio G1 V1C37EA AUO226D, IPS, 1920x1080, 12.5" | Toshiba Portege Z30-C-138 TOS508F, IPS, 1920x1080, 13.3" | Lenovo ThinkPad X1 Carbon 20FB003RGE VVX14T058J00, IPS, 2560x1440, 14" | |
|---|---|---|---|---|---|
| Display | -21% | -33% | 1% | -1% | |
| Display P3 Coverage (%) | 67.6 | 52.2 -23% | 44.45 -34% | 67.9 0% | 66.7 -1% |
| sRGB Coverage (%) | 94.7 | 78.3 -17% | 65.2 -31% | 98 3% | 94.7 0% |
| AdobeRGB 1998 Coverage (%) | 69 | 53.9 -22% | 45.96 -33% | 69.8 1% | 68.4 -1% |
| Response Times | -25% | 16% | -4% | 1% | |
| Response Time Grey 50% / Grey 80% * (ms) | 42.4 ? | 50.4 ? -19% | 32 ? 25% | 42 ? 1% | 44 ? -4% |
| Response Time Black / White * (ms) | 25.6 ? | 33.6 ? -31% | 24 ? 6% | 28 ? -9% | 24 ? 6% |
| PWM Frequency (Hz) | 217 ? | 220 ? | |||
| Screen | -20% | -19% | -19% | -2% | |
| Brightness middle (cd/m²) | 401 | 261 -35% | 289 -28% | 300 -25% | 272 -32% |
| Brightness (cd/m²) | 369 | 241 -35% | 298 -19% | 280 -24% | 268 -27% |
| Brightness Distribution (%) | 85 | 85 0% | 87 2% | 87 2% | 95 12% |
| Black Level * (cd/m²) | 0.35 | 0.26 26% | 0.27 23% | 0.31 11% | 0.32 9% |
| Contrast (:1) | 1146 | 1004 -12% | 1070 -7% | 968 -16% | 850 -26% |
| Colorchecker dE 2000 * | 3.5 | 4.3 -23% | 4.82 -38% | 4.9 -40% | 2.61 25% |
| Colorchecker dE 2000 max. * | 6.33 | 8.66 -37% | 10.73 -70% | 8.91 -41% | 6.43 -2% |
| Greyscale dE 2000 * | 4.13 | 5.82 -41% | 3.84 7% | 6.69 -62% | 3.31 20% |
| Gamma | 2.28 96% | 2.44 90% | 2.41 91% | 2.33 94% | 2.35 94% |
| CCT | 6508 100% | 6771 96% | 6492 100% | 6487 100% | 6360 102% |
| Color Space (Percent of AdobeRGB 1998) (%) | 61.56 | 49.18 -20% | 42.03 -32% | 63 2% | 63 2% |
| Color Space (Percent of sRGB) (%) | 94.64 | 77.84 -18% | 64.8 -32% | 98 4% | 95 0% |
| Media total (Programa/Opciones) | -22% /
-20% | -12% /
-17% | -7% /
-13% | -1% /
-1% |
* ... más pequeño es mejor
Tiempos de respuesta del display
| ↔ Tiempo de respuesta de Negro a Blanco | ||
|---|---|---|
| 25.6 ms ... subida ↗ y bajada ↘ combinada | ↗ 11.6 ms subida | 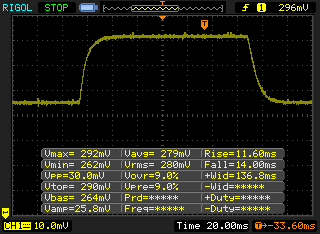 |
| ↘ 14 ms bajada | ||
| La pantalla mostró tiempos de respuesta relativamente lentos en nuestros tests pero podría ser demasiado lenta para los jugones. En comparación, todos los dispositivos de prueba van de ##min### (mínimo) a 240 (máximo) ms. » 61 % de todos los dispositivos son mejores. Eso quiere decir que el tiempo de respuesta es peor que la media (19.8 ms) de todos los dispositivos testados. | ||
| ↔ Tiempo de respuesta 50% Gris a 80% Gris | ||
| 42.4 ms ... subida ↗ y bajada ↘ combinada | ↗ 17.2 ms subida | 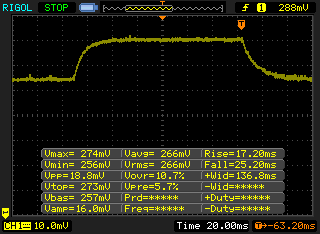 |
| ↘ 25.2 ms bajada | ||
| La pantalla mostró tiempos de respuesta lentos en nuestros tests y podría ser demasiado lenta para los jugones. En comparación, todos los dispositivos de prueba van de ##min### (mínimo) a 636 (máximo) ms. » 70 % de todos los dispositivos son mejores. Eso quiere decir que el tiempo de respuesta es peor que la media (31 ms) de todos los dispositivos testados. | ||
| Cinebench R15 | |
| CPU Single 64Bit | |
| Toshiba Portege Z30-C-125 | |
| HP EliteBook 820 G3 T8X20EA | |
| HP EliteBook 1030 G1-X2F03EA | |
| HP EliteBook Folio G1 V1C37EA | |
| Dell Latitude 13 7370 | |
| Apple MacBook 12 (Early 2016) 1.1 GHz | |
| Apple MacBook 12 (Early 2016) 1.1 GHz | |
| Microsoft Surface Pro 4, Core m3 | |
| CPU Multi 64Bit | |
| Toshiba Portege Z30-C-125 | |
| HP EliteBook 820 G3 T8X20EA | |
| HP EliteBook 1030 G1-X2F03EA | |
| HP EliteBook Folio G1 V1C37EA | |
| Apple MacBook 12 (Early 2016) 1.1 GHz | |
| Microsoft Surface Pro 4, Core m3 | |
| Dell Latitude 13 7370 | |
| Cinebench R11.5 | |
| CPU Single 64Bit | |
| HP EliteBook 1030 G1-X2F03EA | |
| HP EliteBook 820 G3 T8X20EA | |
| Dell Latitude 13 7370 | |
| Apple MacBook 12 (Early 2016) 1.1 GHz | |
| Apple MacBook 12 (Early 2016) 1.1 GHz | |
| Microsoft Surface Pro 4, Core m3 | |
| CPU Multi 64Bit | |
| HP EliteBook 1030 G1-X2F03EA | |
| HP EliteBook 820 G3 T8X20EA | |
| Apple MacBook 12 (Early 2016) 1.1 GHz | |
| Apple MacBook 12 (Early 2016) 1.1 GHz | |
| Microsoft Surface Pro 4, Core m3 | |
| Dell Latitude 13 7370 | |
| X264 HD Benchmark 4.0 | |
| Pass 1 | |
| HP EliteBook 1030 G1-X2F03EA | |
| Toshiba Portege Z30-C-125 | |
| HP EliteBook 820 G3 T8X20EA | |
| Dell Latitude 13 7370 | |
| Microsoft Surface Pro 4, Core m3 | |
| Apple MacBook 12 (Early 2016) 1.1 GHz | |
| Pass 2 | |
| Toshiba Portege Z30-C-125 | |
| HP EliteBook 1030 G1-X2F03EA | |
| HP EliteBook 820 G3 T8X20EA | |
| Microsoft Surface Pro 4, Core m3 | |
| Apple MacBook 12 (Early 2016) 1.1 GHz | |
| Dell Latitude 13 7370 | |
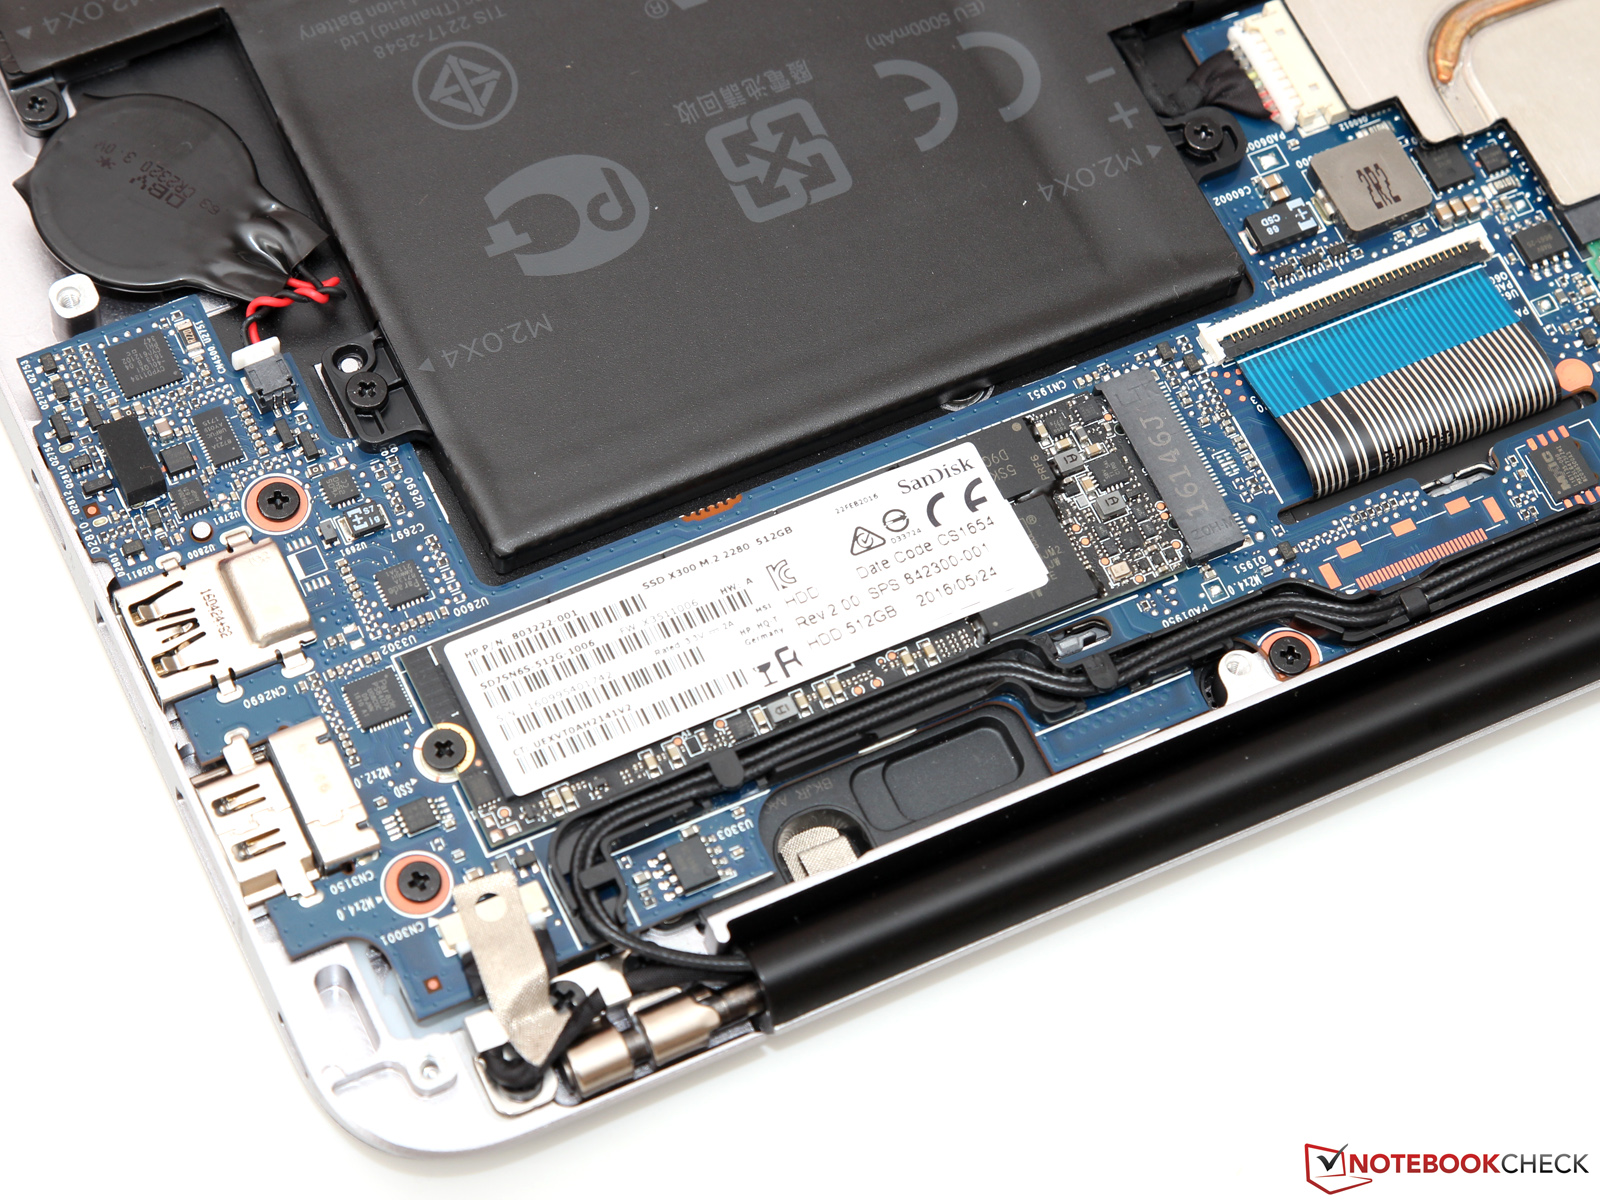
| HP EliteBook 1030 G1-X2F03EA Sandisk X300 SD7SN6S-512G-1006 | Dell Latitude 13 7370 Toshiba NVMe THNSN5256GPU7 | HP EliteBook Folio G1 V1C37EA Samsung SM951 MZVPV256 m.2 | Apple MacBook 12 (Early 2016) 1.1 GHz Apple SSD AP0256 | Toshiba Portege Z30-C-138 Toshiba HG6 THNSNJ512G8NY | |
|---|---|---|---|---|---|
| CrystalDiskMark 3.0 | 154% | 173% | 53% | 11% | |
| Read Seq (MB/s) | 387.5 | 1354 249% | 1482 282% | 754 95% | 518 34% |
| Write Seq (MB/s) | 348.7 | 1132 225% | 1232 253% | 638 83% | 423.3 21% |
| Read 512 (MB/s) | 239.9 | 1140 375% | 1191 396% | 616 157% | 414.8 73% |
| Write 512 (MB/s) | 335.3 | 1020 204% | 1220 264% | 678 102% | 379.9 13% |
| Read 4k (MB/s) | 30.34 | 42.13 39% | 46.96 55% | 14.6 -52% | 21.17 -30% |
| Write 4k (MB/s) | 75.9 | 105.8 39% | 100.7 33% | 20.5 -73% | 86.3 14% |
| Read 4k QD32 (MB/s) | 311.3 | 400.5 29% | 464 49% | 464 49% | 227.3 -27% |
| Write 4k QD32 (MB/s) | 192.8 | 328.4 70% | 292.1 52% | 315 63% | 174.7 -9% |
| PCMark 7 - Score | |
| Lenovo ThinkPad X1 Carbon 20FB003RGE | |
| HP EliteBook 1030 G1-X2F03EA | |
| Microsoft Surface Pro 4, Core m3 | |
| Dell Latitude 13 7370 | |
| PCMark 7 Score | 4917 puntos | |
| PCMark 8 Home Score Accelerated v2 | 2838 puntos | |
| PCMark 8 Creative Score Accelerated v2 | 3555 puntos | |
| PCMark 8 Work Score Accelerated v2 | 3784 puntos | |
ayuda | ||

| 3DMark 06 Standard Score | 7197 puntos | |
| 3DMark 11 Performance | 1219 puntos | |
| 3DMark Ice Storm Standard Score | 43571 puntos | |
| 3DMark Cloud Gate Standard Score | 5242 puntos | |
| 3DMark Fire Strike Score | 774 puntos | |
ayuda | ||
| bajo | medio | alto | ultra | |
|---|---|---|---|---|
| BioShock Infinite (2013) | 44.6 | 19.5 | 16.7 | 5.1 |
| Metro: Last Light (2013) | 21.5 | 18 | 12.5 | |
| Dirt Rally (2015) | 67.2 | 15.8 | 12.5 |
(±) La temperatura máxima en la parte superior es de 43.4 °C / 110 F, frente a la media de 35.9 °C / 97 F, que oscila entre 21.4 y 59 °C para la clase Subnotebook.
(±) El fondo se calienta hasta un máximo de 44.5 °C / 112 F, frente a la media de 39.2 °C / 103 F
(+) En reposo, la temperatura media de la parte superior es de 30.6 °C / 87# F, frente a la media del dispositivo de 30.8 °C / 87 F.
(±) El reposamanos y el touchpad pueden calentarse mucho al tacto con un máximo de 38.7 °C / 101.7 F.
(-) La temperatura media de la zona del reposamanos de dispositivos similares fue de 28.2 °C / 82.8 F (-10.5 °C / -18.9 F).
| Off / Standby | |
| Ocioso | |
| Carga |
|
Clave:
min: | |
| HP EliteBook 1030 G1-X2F03EA 6Y75, HD Graphics 515, Sandisk X300 SD7SN6S-512G-1006, IPS, 3200x1800, 13.3" | Dell Latitude 13 7370 6Y57, HD Graphics 515, Toshiba NVMe THNSN5256GPU7, IPS, 1920x1080, 13.3" | HP EliteBook Folio G1 V1C37EA 6Y54, HD Graphics 515, Samsung SM951 MZVPV256 m.2, IPS, 1920x1080, 12.5" | Toshiba Portege Z30-C-138 6500U, HD Graphics 520, Toshiba HG6 THNSNJ512G8NY, IPS, 1920x1080, 13.3" | Lenovo ThinkPad X1 Carbon 20FB003RGE 6500U, HD Graphics 520, Samsung SSD PM871 MZNLN256HCHP, IPS, 2560x1440, 14" | |
|---|---|---|---|---|---|
| Power Consumption | 11% | 13% | -8% | -3% | |
| Idle Minimum * (Watt) | 4 | 5 -25% | 4.3 -8% | 3.2 20% | 3.8 5% |
| Idle Average * (Watt) | 8 | 7.5 6% | 6 25% | 7.8 2% | 7.1 11% |
| Idle Maximum * (Watt) | 8.6 | 8 7% | 6.4 26% | 8.7 -1% | 7.7 10% |
| Load Average * (Watt) | 26.5 | 15.3 42% | 22.7 14% | 42.2 -59% | 30.2 -14% |
| Load Maximum * (Watt) | 34.8 | 26.8 23% | 31.2 10% | 35.7 -3% | 44.7 -28% |
* ... más pequeño es mejor
| HP EliteBook 1030 G1-X2F03EA 6Y75, HD Graphics 515, 40 Wh | Dell Latitude 13 7370 6Y57, HD Graphics 515, 34 Wh | HP EliteBook Folio G1 V1C37EA 6Y54, HD Graphics 515, 38 Wh | Toshiba Portege Z30-C-138 6500U, HD Graphics 520, 52 Wh | Lenovo ThinkPad X1 Carbon 20FB003RGE 6500U, HD Graphics 520, 52 Wh | Apple MacBook 12 (Early 2016) 1.1 GHz 6Y30, HD Graphics 515, 41.4 Wh | |
|---|---|---|---|---|---|---|
| Duración de Batería | 10% | 4% | 14% | 27% | 54% | |
| Reader / Idle (h) | 10.3 | 9.8 -5% | 8.8 -15% | 15.7 52% | ||
| H.264 (h) | 6.3 | 6.5 3% | 6.9 10% | 8.5 35% | 8.5 35% | |
| WiFi v1.3 (h) | 5.1 | 6.1 20% | 5.9 16% | 5.8 14% | 7.2 41% | 8.4 65% |
| Load (h) | 2.4 | 2.9 21% | 2.5 4% | 1.9 -21% | 3.9 63% |
Pro
Contra
Puede haber diferentes opiniones sobre el concepto básico de un portátil business ventilado pasivamente: Si tiene que ejecutar cálculos exigentes en temperaturas veraniegas y necesita todo el rendimiento posible, estarás mejor con un procesador clásico Core i. Para aplicaciones ofimáticas sencillas, navegar o videoconferencias, empero, normalmente no necesitas tanto – otros aspectos como los dispositivos de entrada, peso y desarrollo de ruido son más importantes.
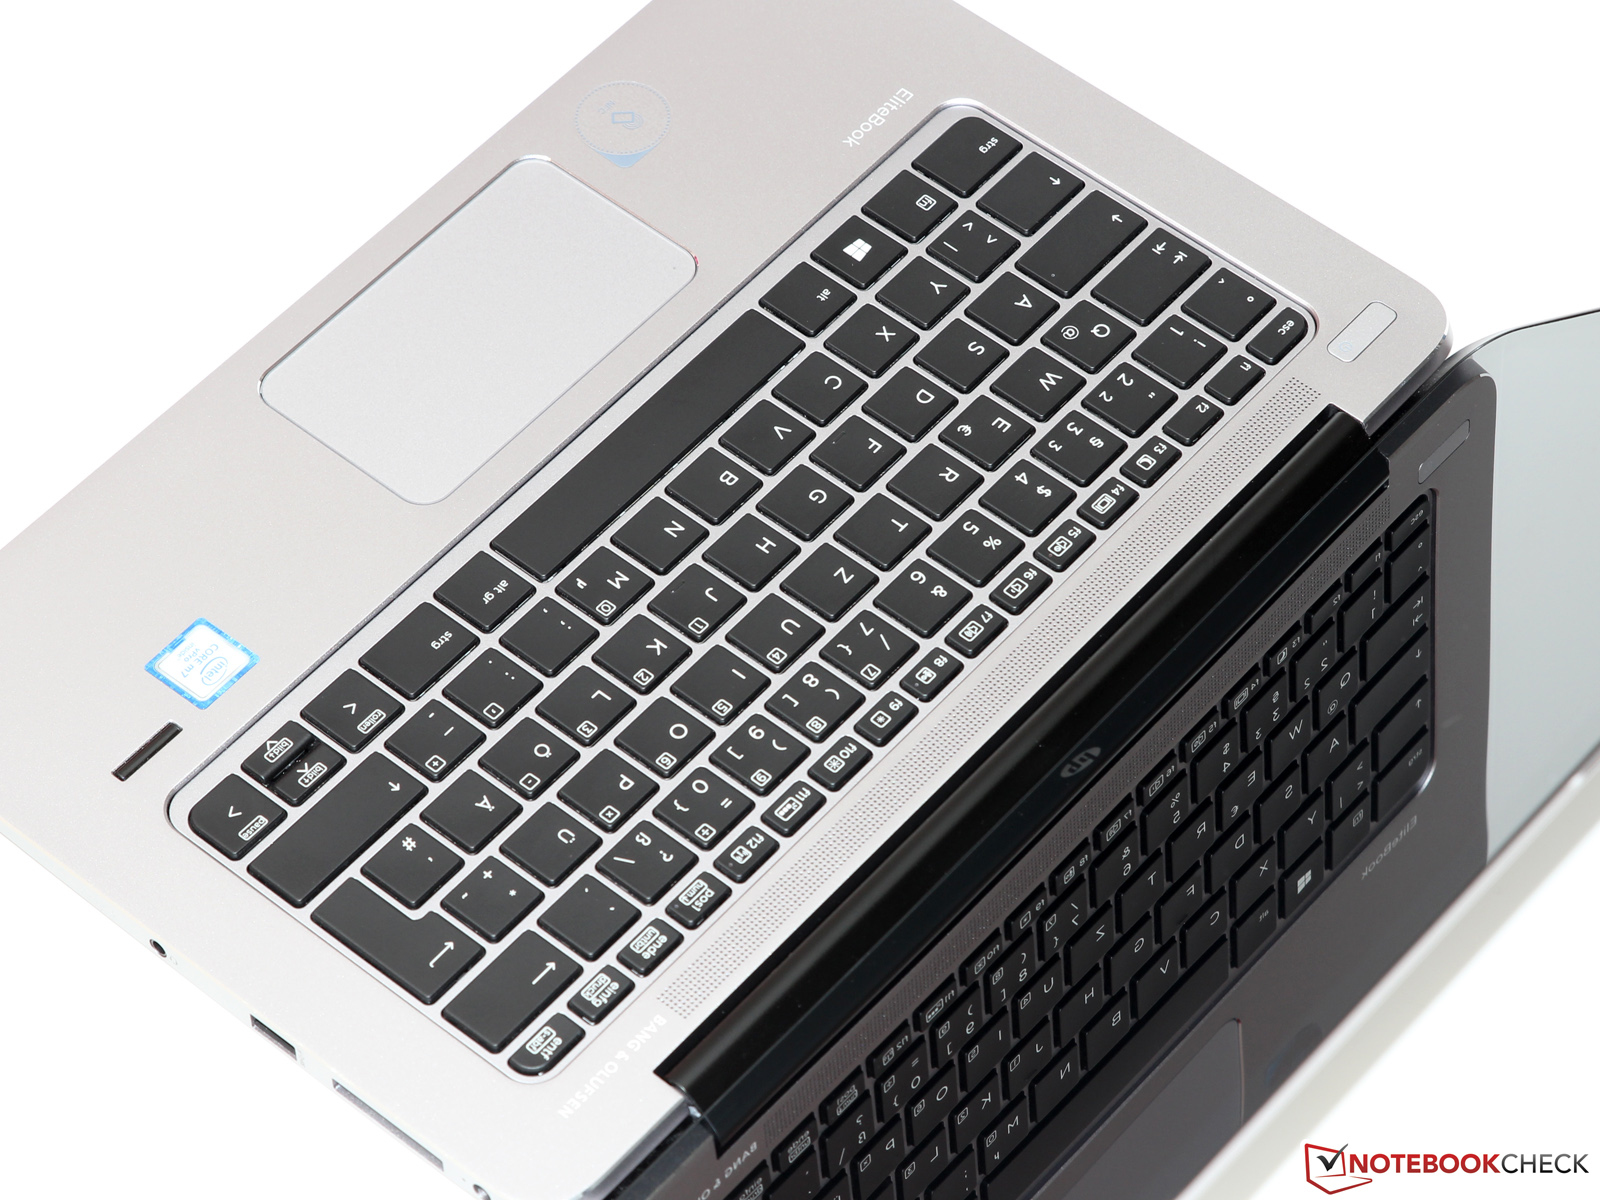
HP tomó este enfoque y creó un dispositivo casi perfecto con el EliteBook 1030 G1. El portátil está entre los mejores dispositivos en términos de calidad y puede convencer particularmente con su calidad de construcción, el teclado, y el display. El rendimiento de aplicación también es bastante bueno, a pesar de las limitaciones mencionadas. Dado que HP ha logrado un buen compromiso entre rendimiento y desarrollo de calor gracias a un ingenioso TDP y límites de temperatura. Sólo el aguante de batería relativamente corto no termina de cuadrar en nuestra idea del perfecto Ultrabook – el modelo Full HD probablemente tendrá más aguante si puedes pasar sin el panel QHD+.
Con todo, el 1030 G1 realmente merece una recomendación, aunque los elevados precios de entre 1,500 y 2,000 Euros pueden asustar a algunos clientes potenciales al principio. Los competidores similares, empero, no son más baratos.
Ésta es una versión acortada del análisis original. Puedes leer el análisis completo en inglés aquí.
HP EliteBook 1030 G1-X2F03EA
- 07/11/2016 v5.1 (old)
Till Schönborn
Price comparison
