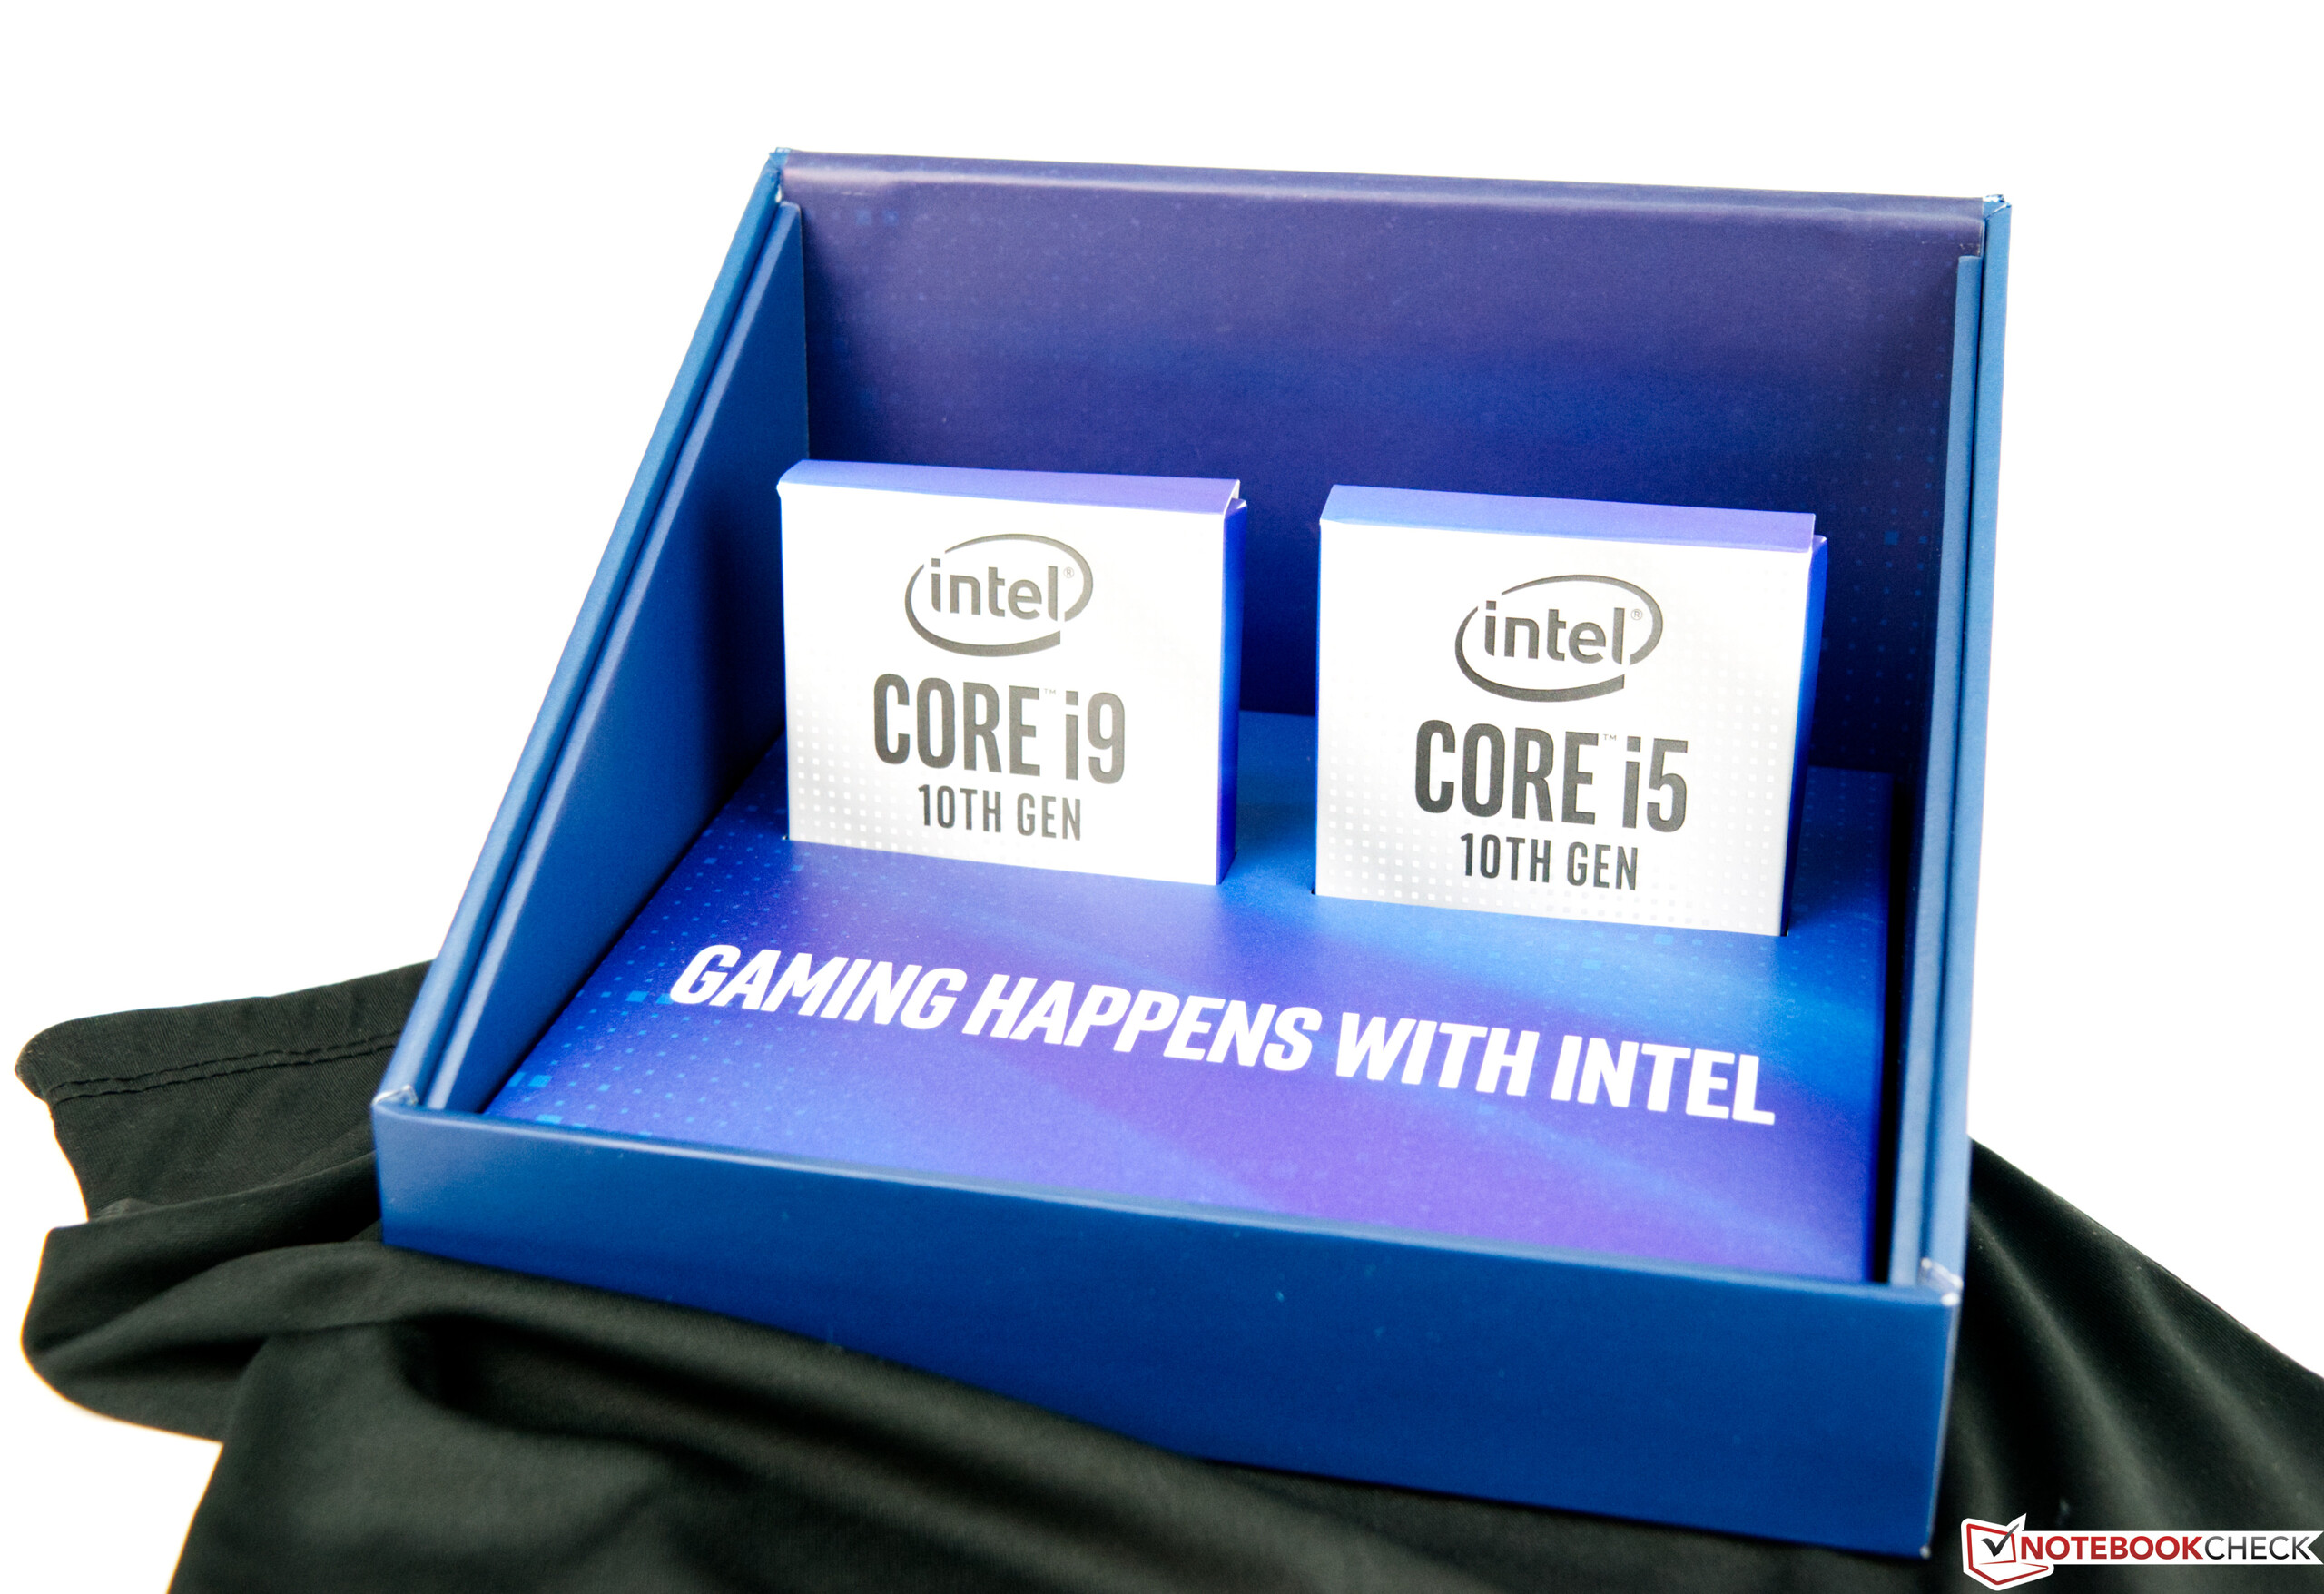
Comparación de las CPUs Intel Comet Lake-S con hasta 10 núcleos
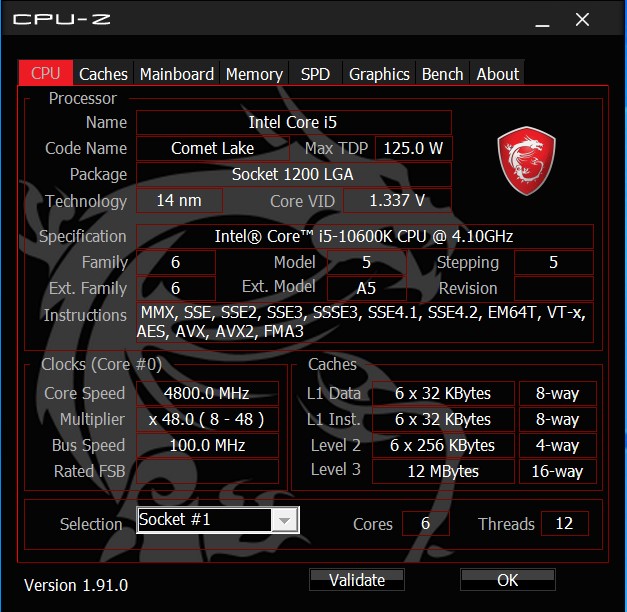
Comet Lake-S es el nombre de la última generación de procesadores de Intel, que fue revelado por primera vez el 30 de abril de 2020. Se basa en el proceso de fabricación de 14 nm, que ha existido durante años. Aquí, AMD está muy por delante. Produce chips Ryzen 3000 usando el nodo de 7-nm.
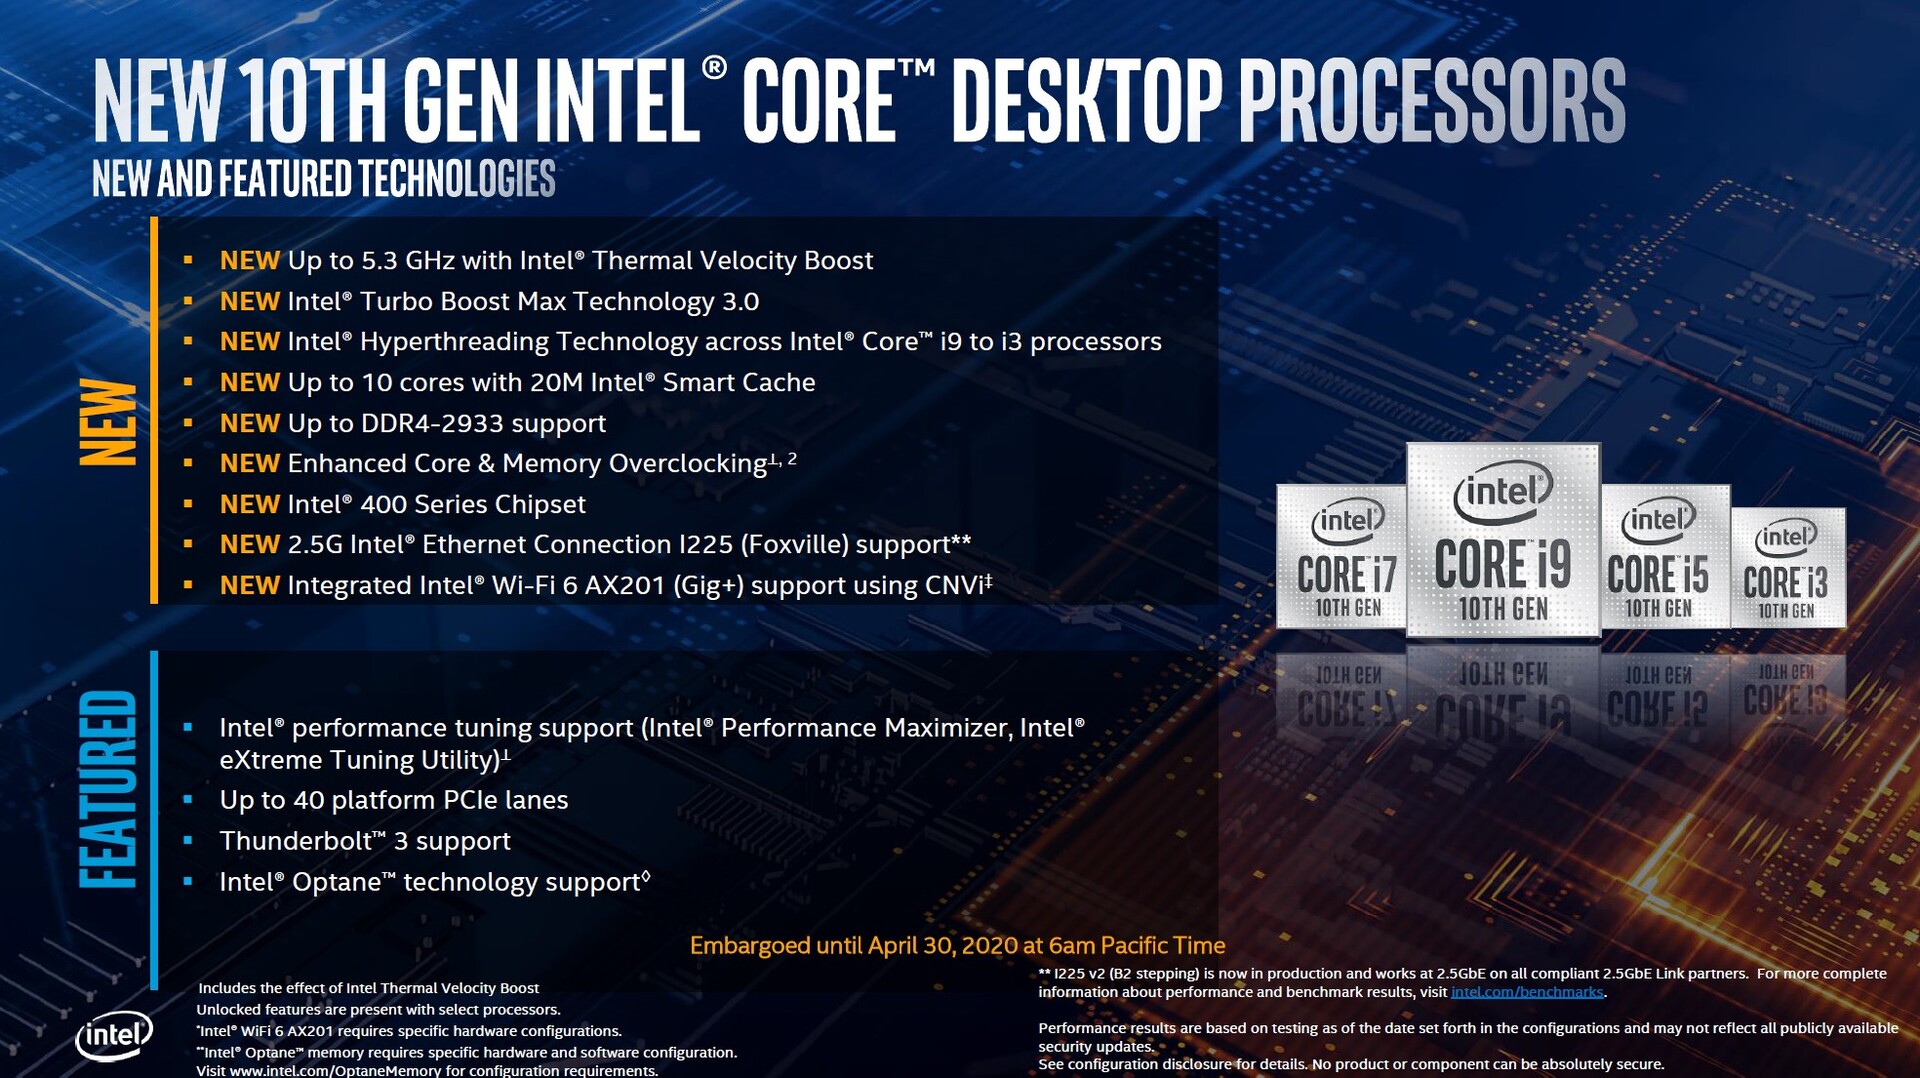
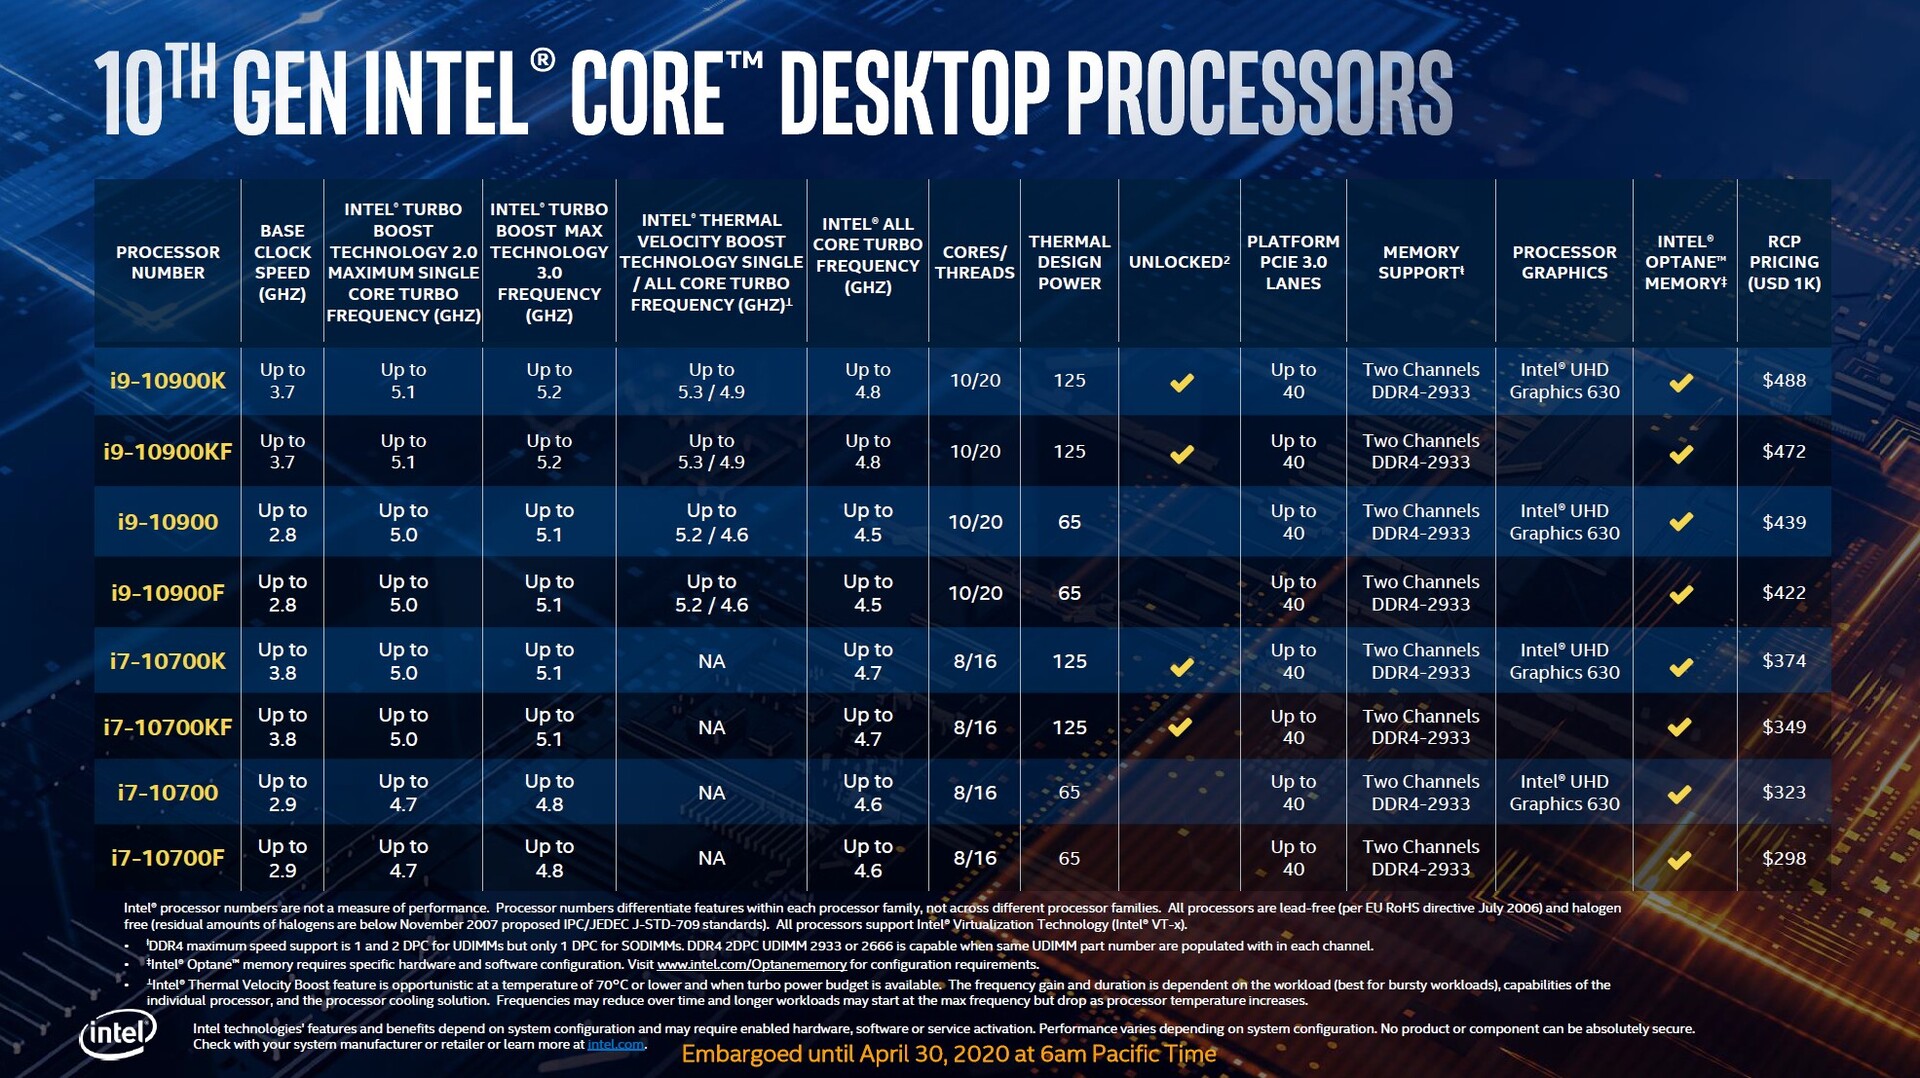
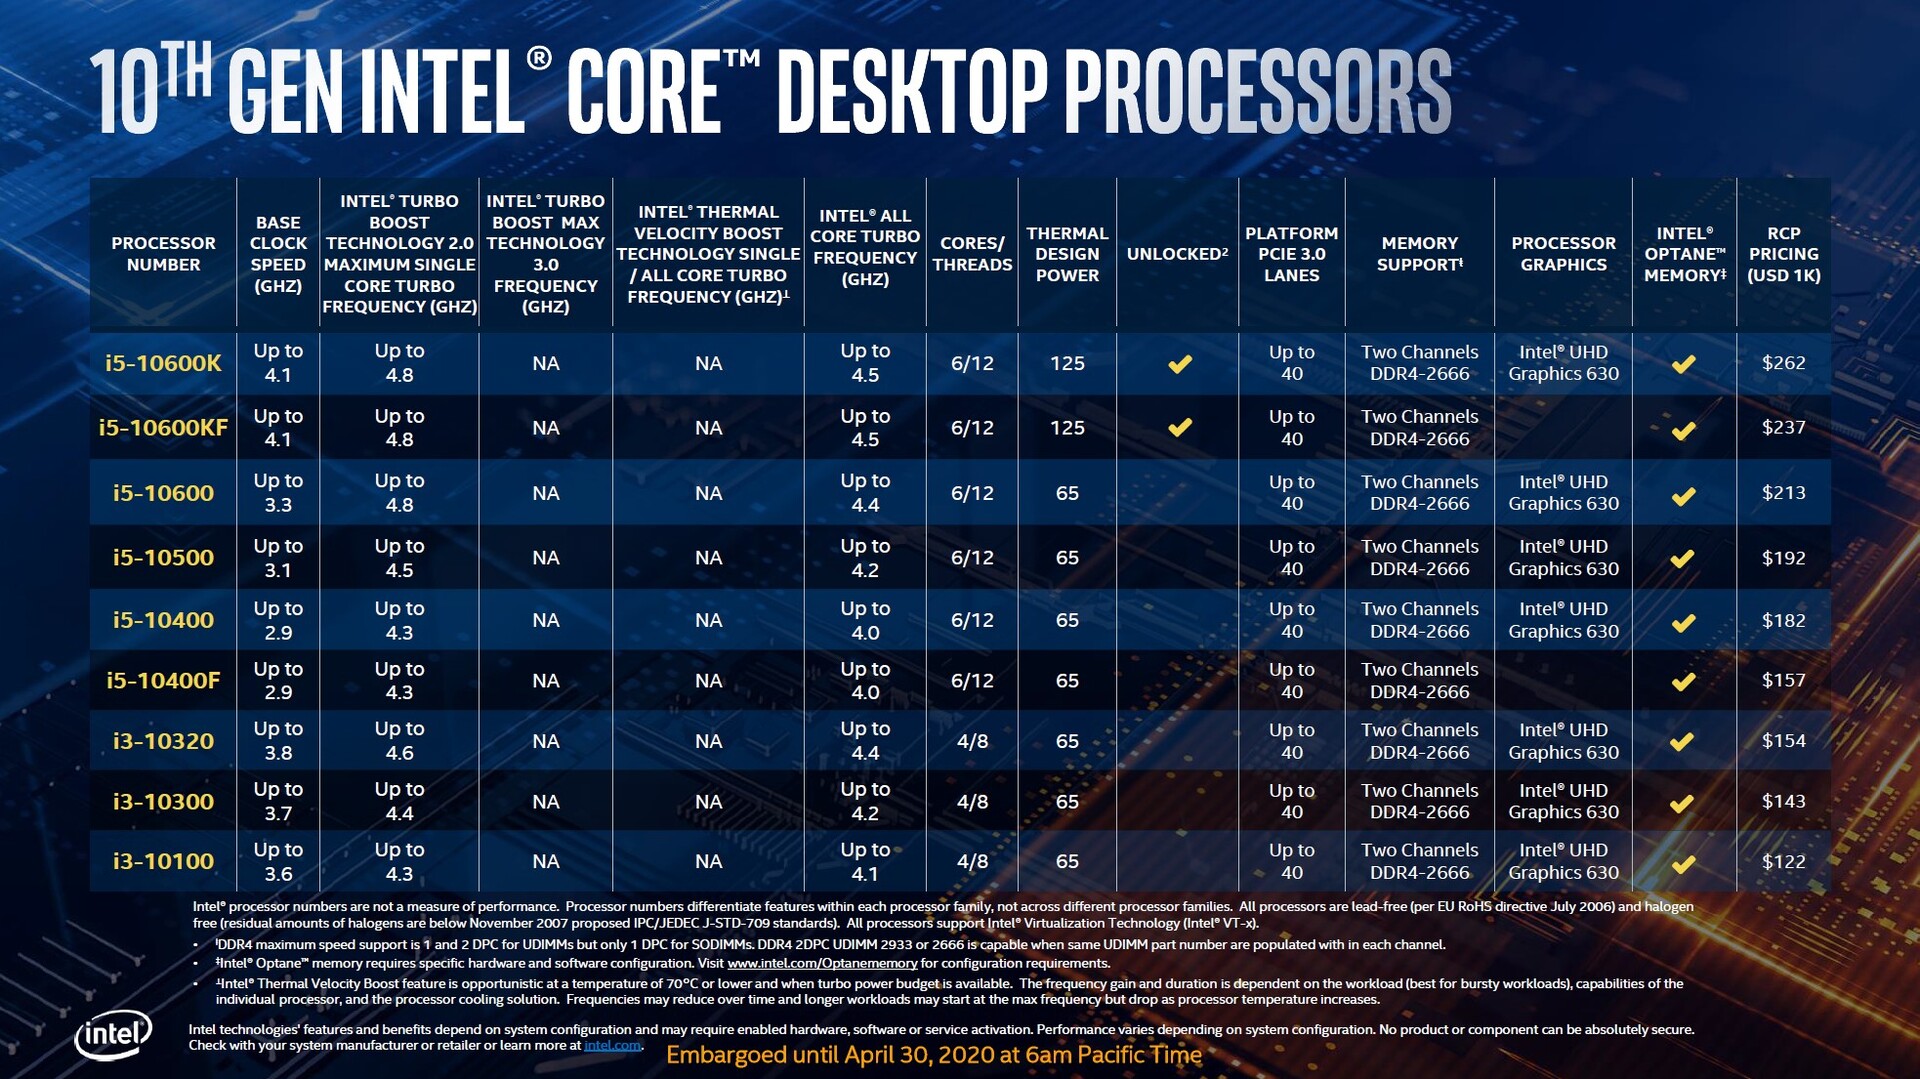
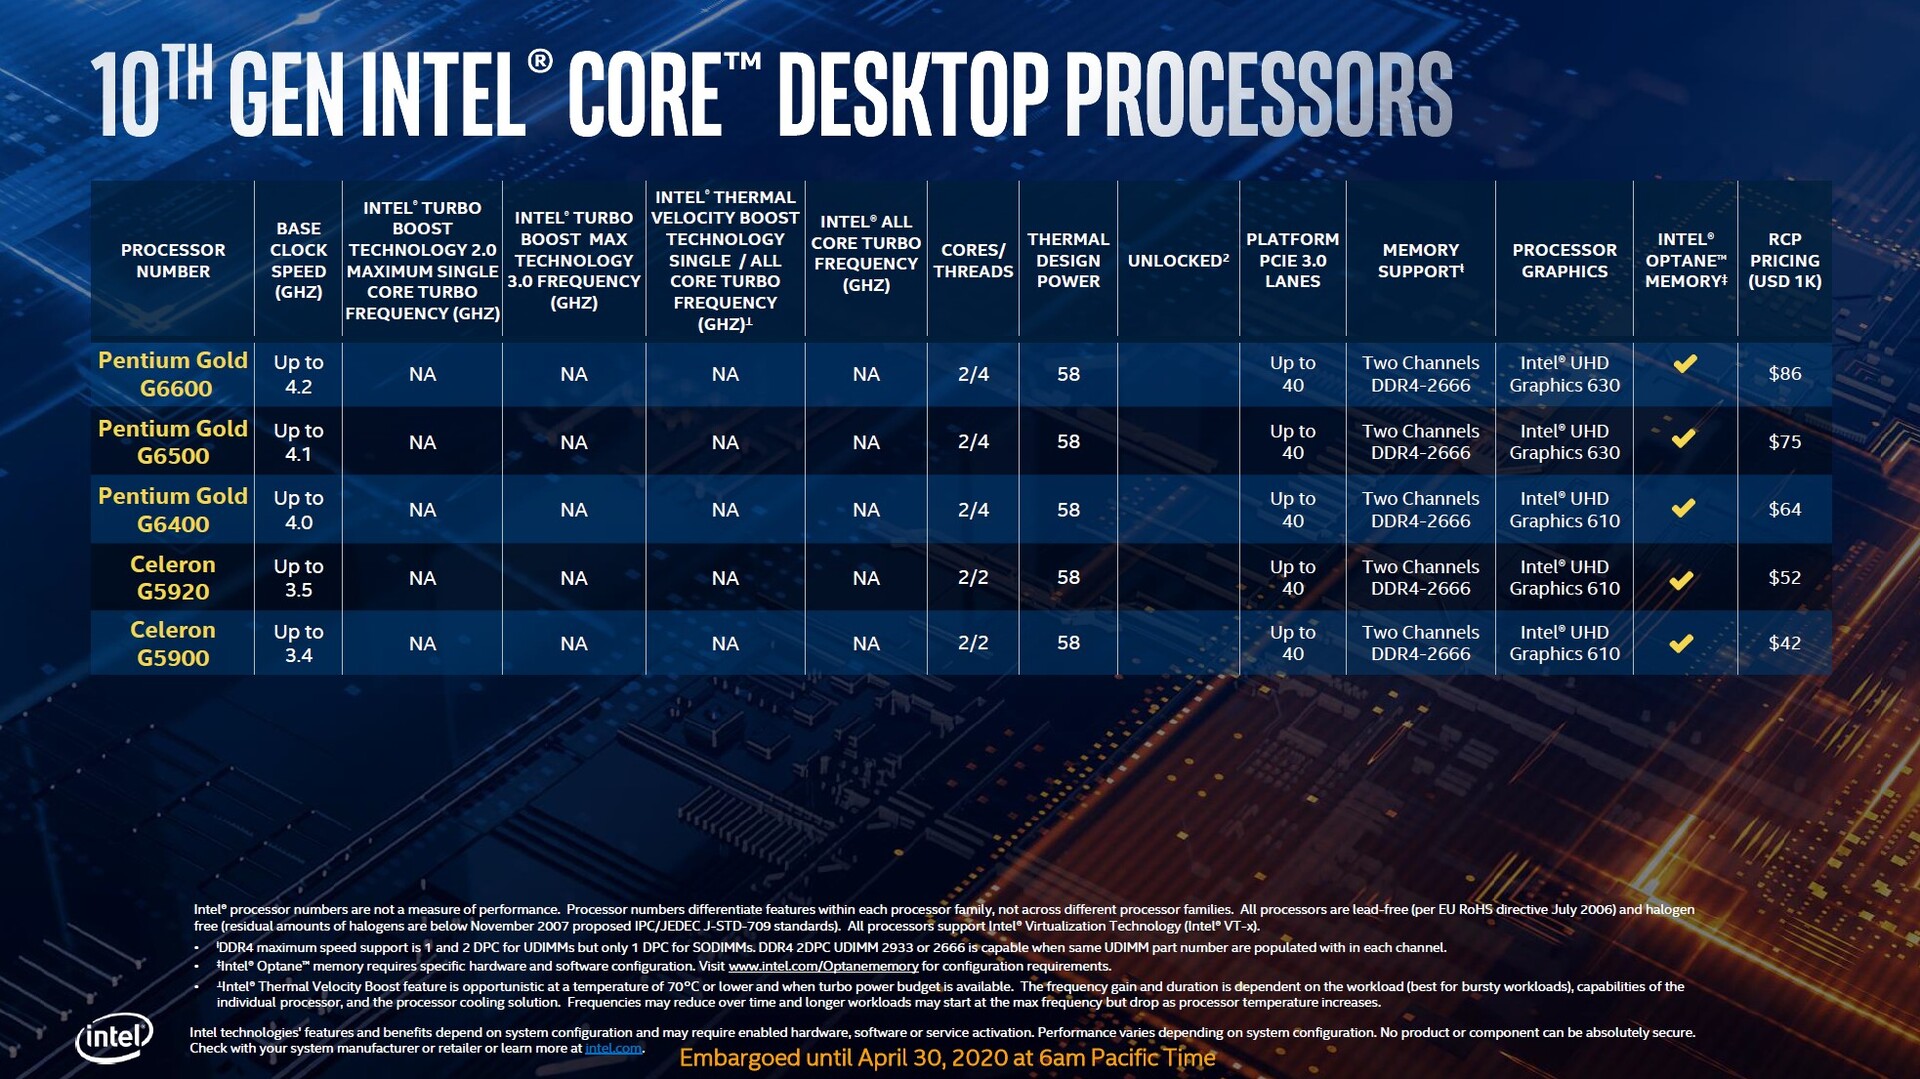
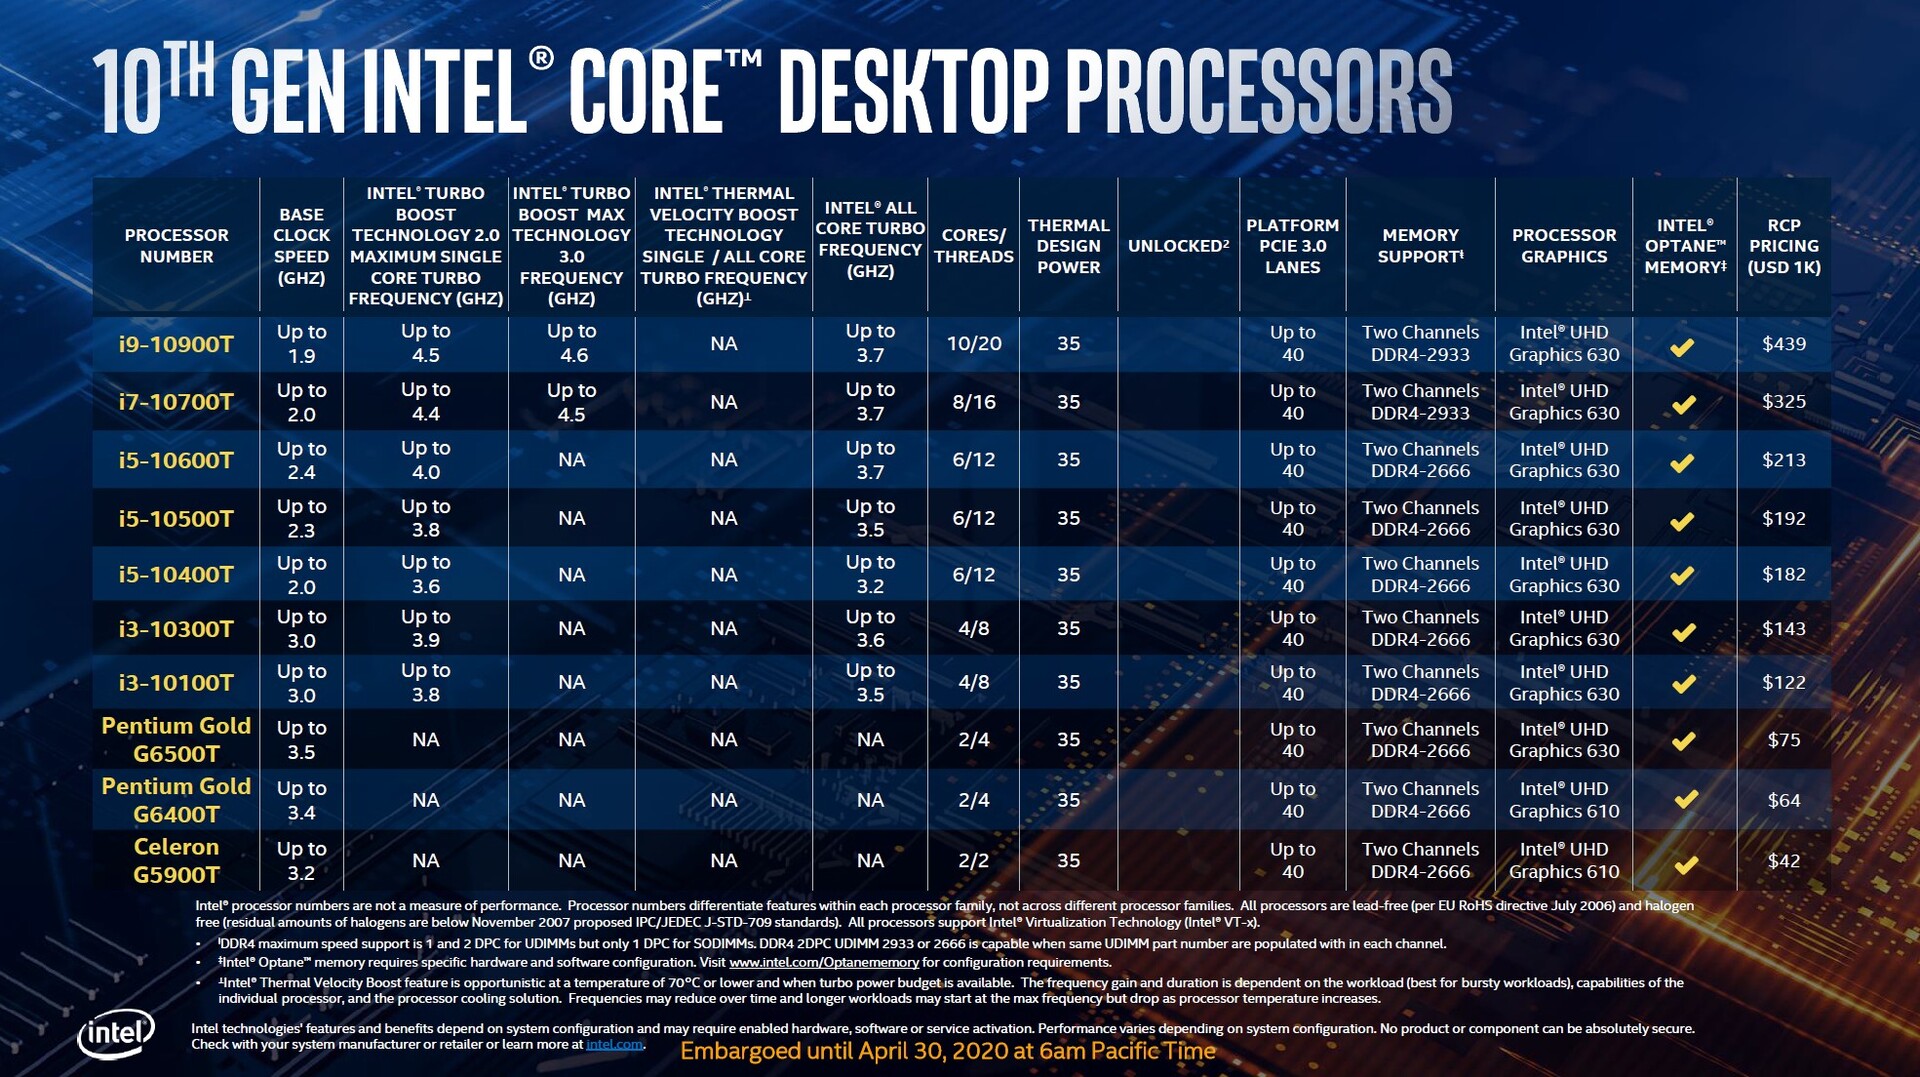
Cuando se compara con la novena generación, el modelo de más alta gama ofrece dos núcleos más. Este es el primer chip de consumo de 10 núcleos. Sin embargo, Intel ha estado vendiendo chips de 10 núcleos para su plataforma HEDT durante años. En la tabla de abajo, puedes ver todos los nuevos procesadores de la serie principal de Intel. Intel ha mantenido las letras al final de los nombres de los procesadores para ayudar a distinguir los diferentes modelos. Por ejemplo, la letra T al final del nombre de la CPU significa que la pieza tiene un TDP de 35 vatios, y los nombres de todas las CPUs con overclocking terminan con la letra K.
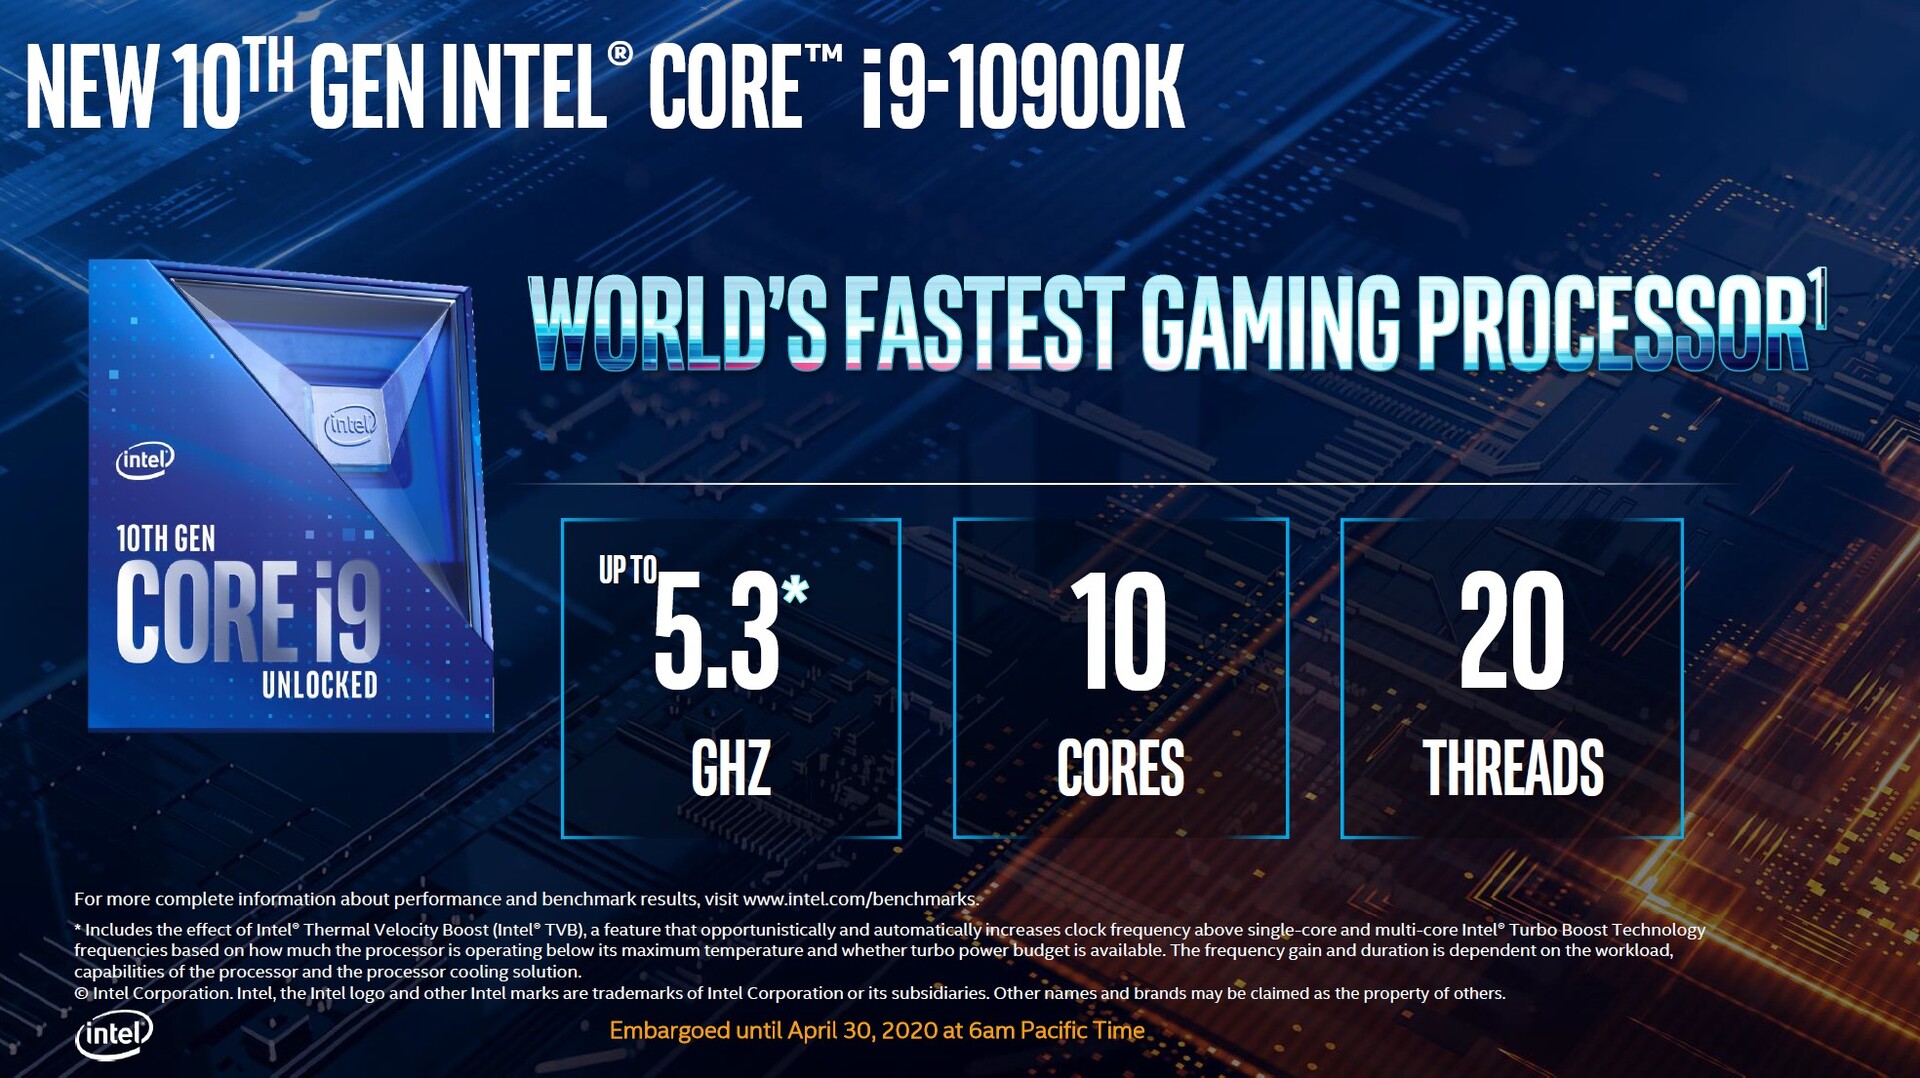
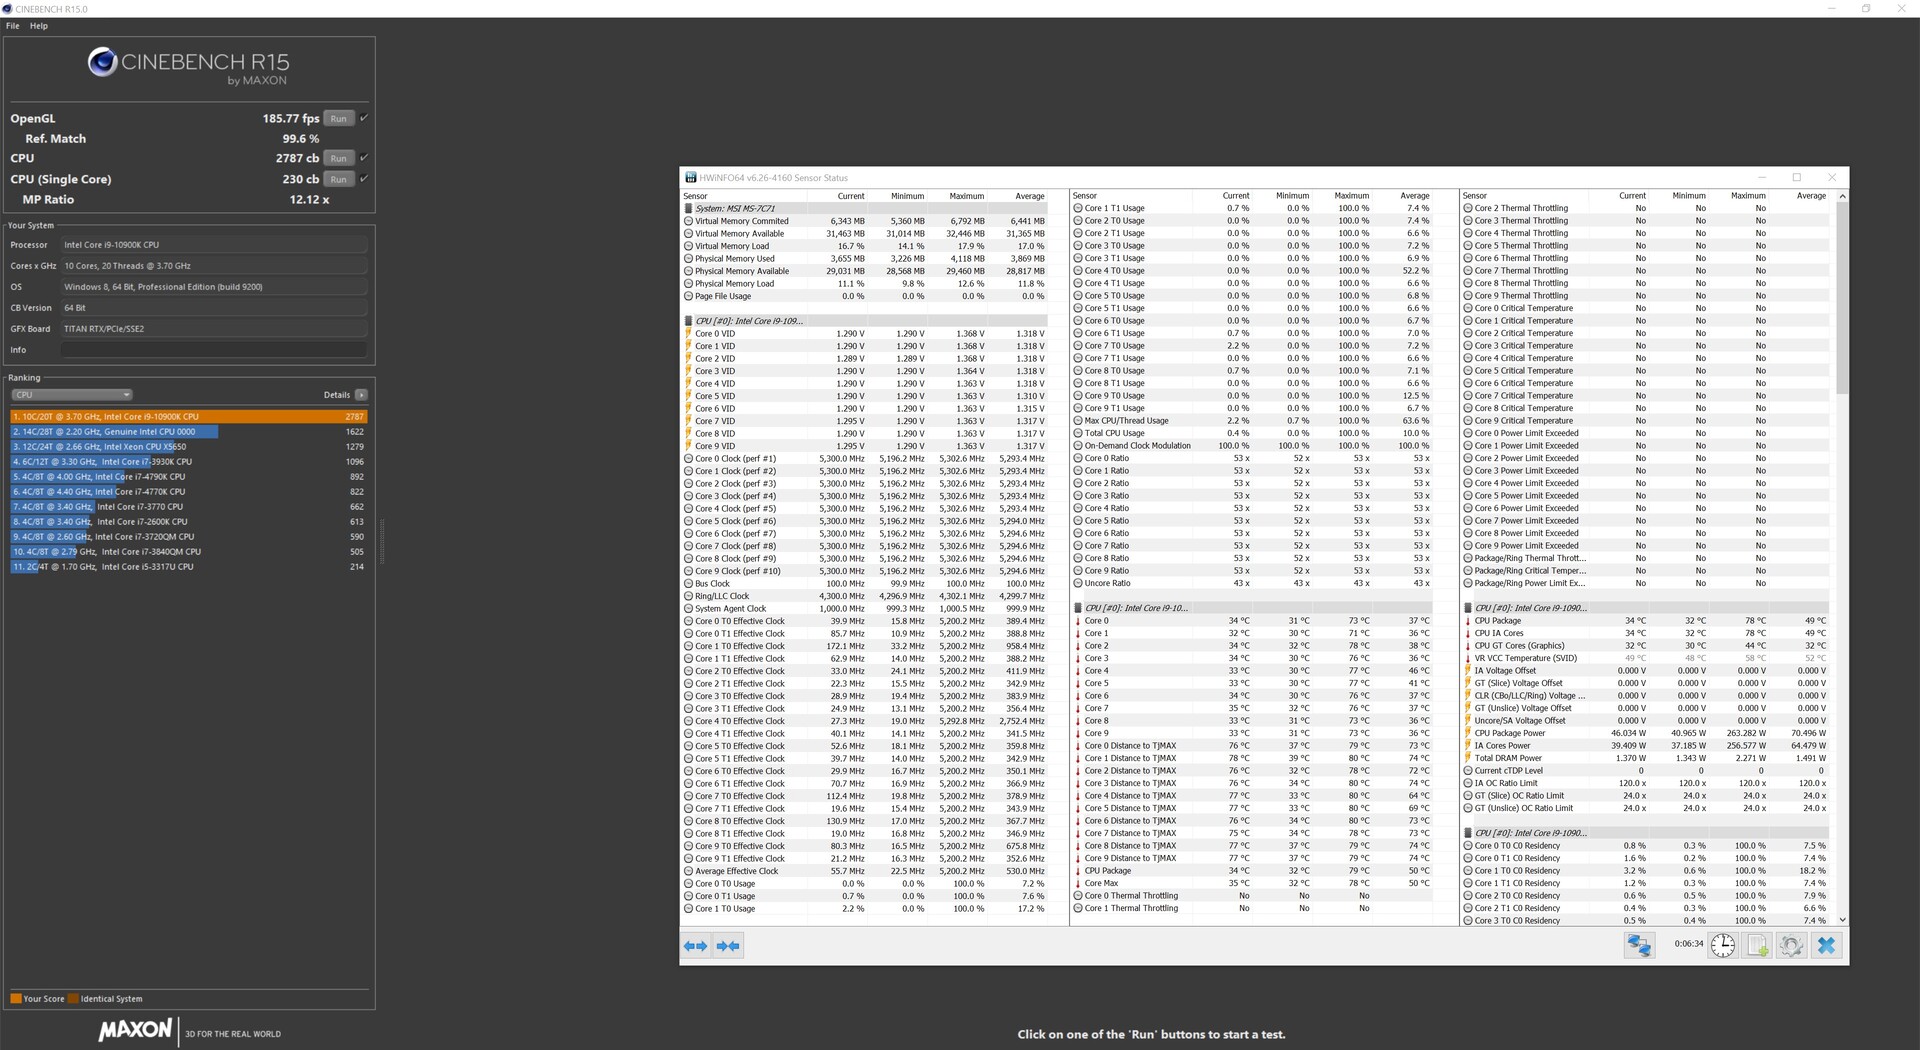
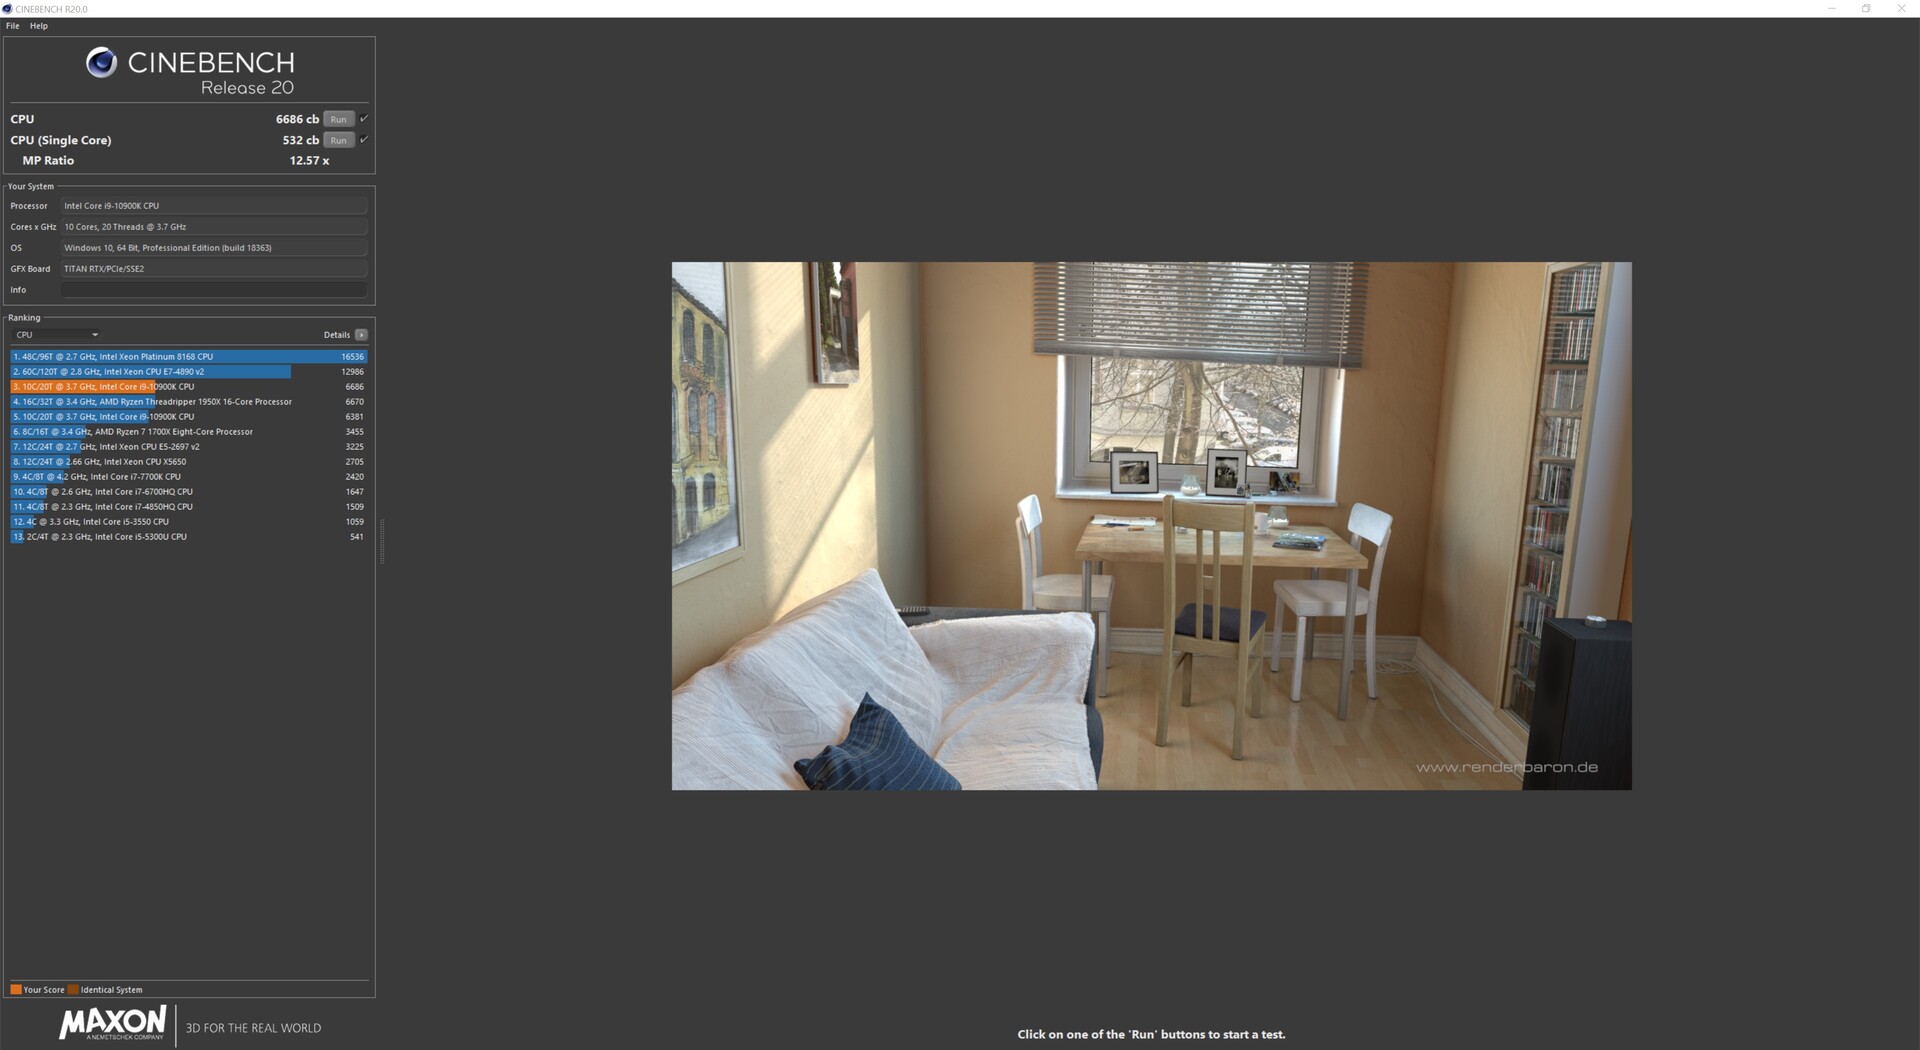
En cuanto a las velocidades, Intel ha hecho algunos cambios en comparación con la generación anterior. Las últimas piezas tienen la tecnología Turbo Boost Max 3.0. Permite a la CPU alcanzar velocidades de reloj más altas en ciertas circunstancias. Lo mismo puede decirse de la tecnología Thermal Velocity Boost de Intel, que permite al Core i9-10900K alcanzar hasta 5,3 GHz. Sin embargo, los compradores deben tener cuidado porque todas las especificaciones de Boost son frecuencias máximas teóricas, que dependen de toda una serie de factores como el tipo de carga de trabajo, el número de núcleos utilizados, el consumo de energía calculado y la temperatura de la CPU. En nuestra revisión, pudimos observar el Core i9-10900K golpeando 5,3 GHz en el Cinebench R15. Sin embargo, la CPU no fue capaz de mantener una tasa de reloj tan alta durante un período prolongado. Por lo tanto, sería poco realista asumir que la CPU sería capaz de mantener un reloj de impulso de 5,3 GHz durante un período prolongado sin ningún tipo de overclocking.
Cuando se compara con la novena generación de CPUs, el TDP ha aumentado significativamente. La duración del Turbo Boost también se ha incrementado, por lo que los nuevos chips funcionan significativamente mejor en muchos puntos de referencia. En total, hay dos estados de poder: PL1 (Nivel de potencia 1) y PL2 (Nivel de potencia 2).
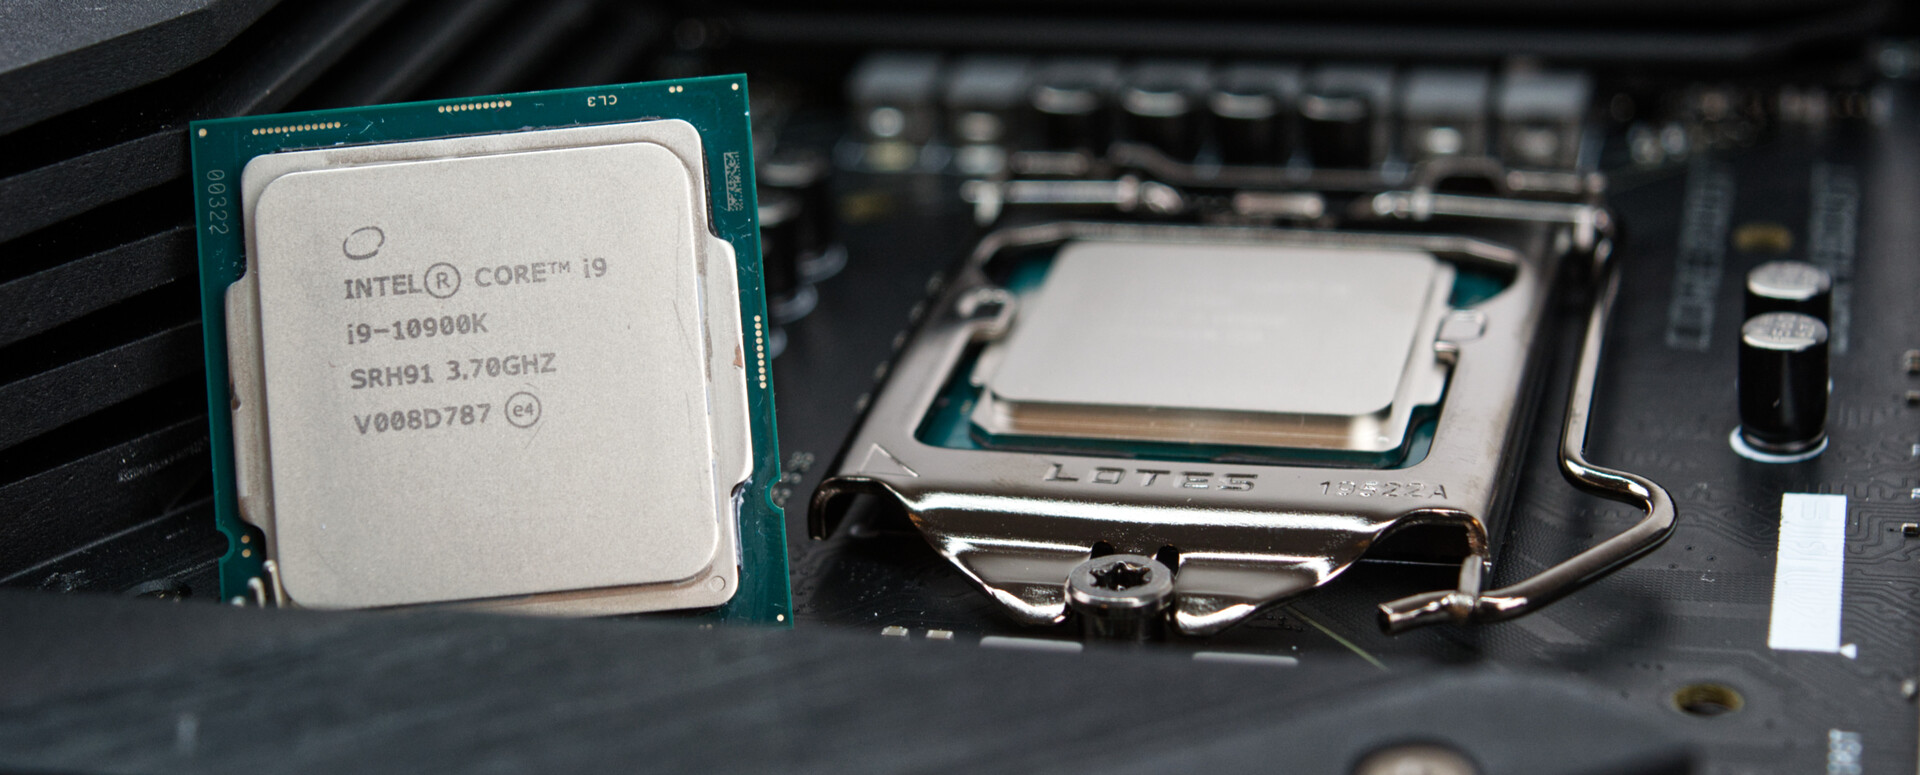
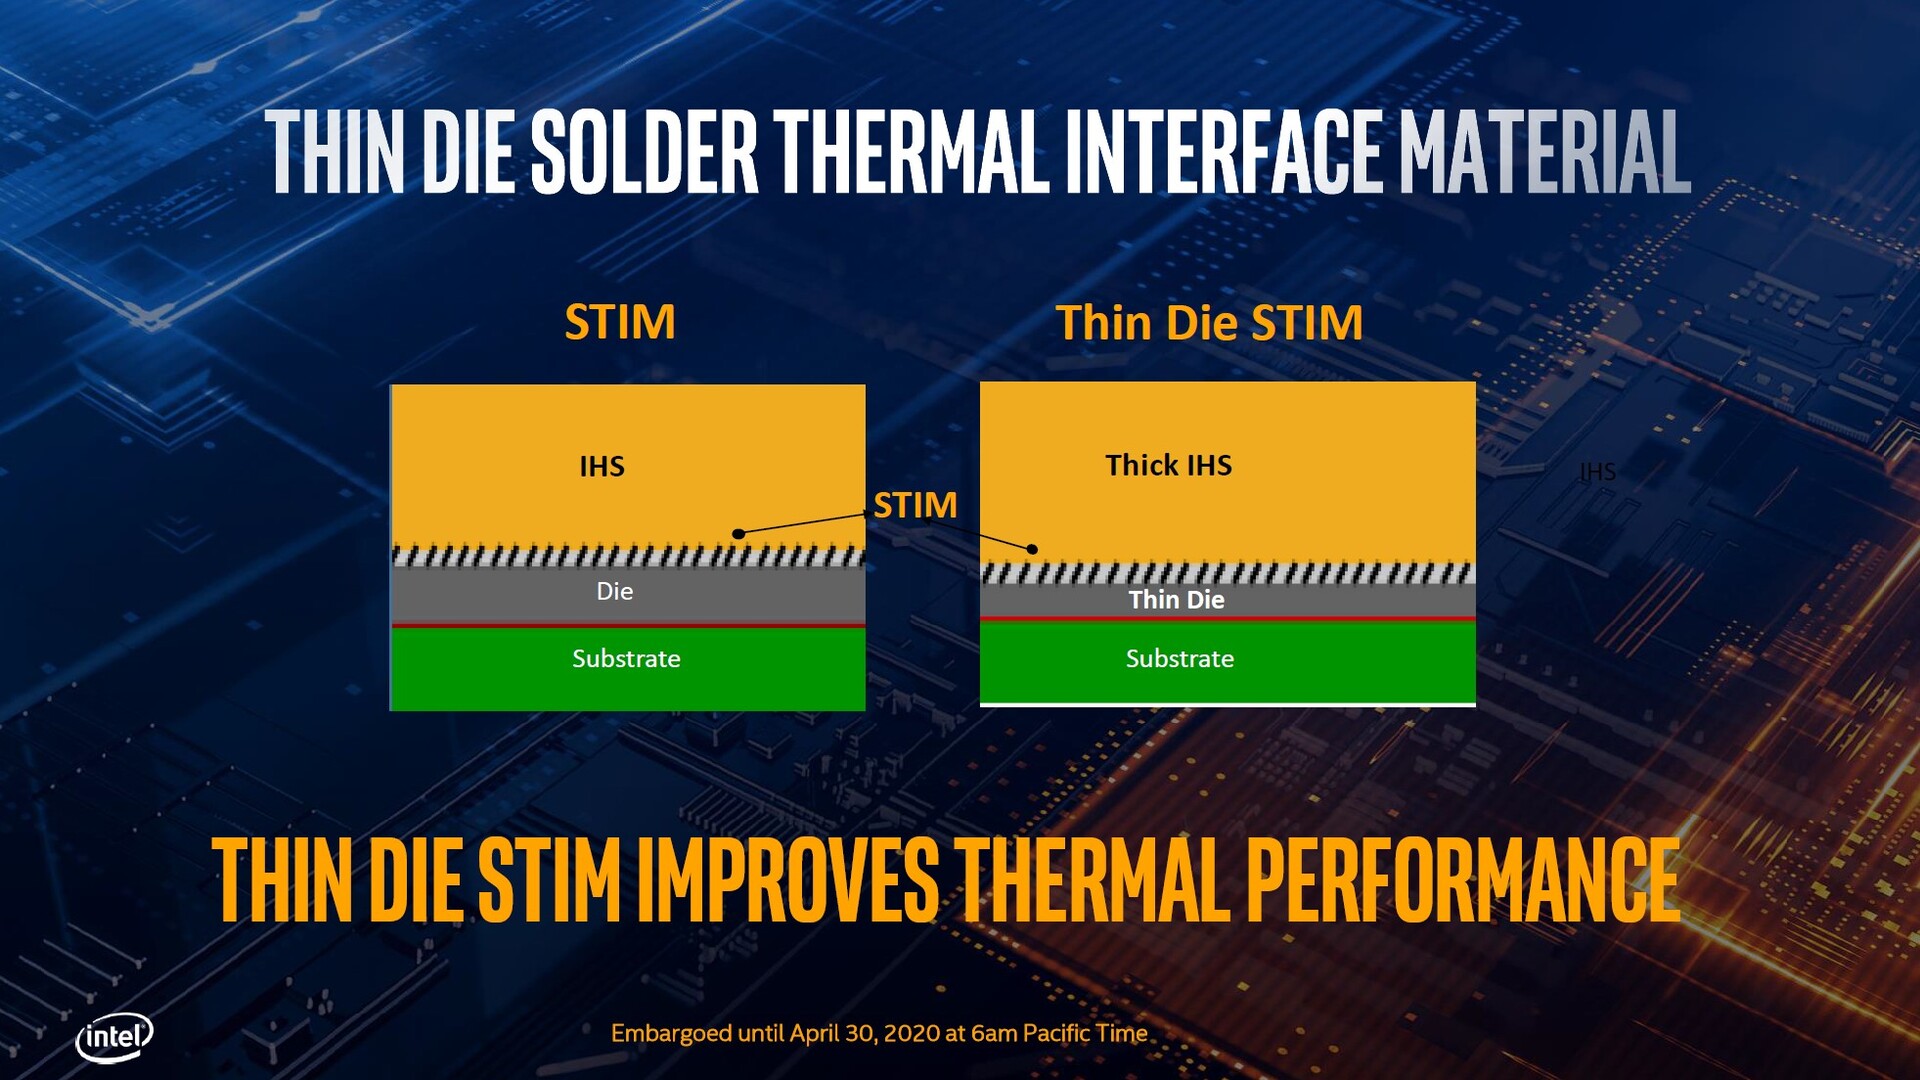
Intel ha lijado el dado para lograr un mejor rendimiento térmico. Esto también significa que el esparcidor de calor integrado es ahora un poco más grueso porque el procesador sigue teniendo las mismas dimensiones. Por eso todos los refrigeradores que son compatibles con el zócalo LGA 1151 también son compatibles con el nuevo zócalo. Intel dijo que se necesitaba un nuevo zócalo debido a los mayores requerimientos de energía. Dicho esto, los nuevos chipsets (Z490, H470, B460, H410) no son compatibles con PCI Express 4.0 cuando se utilizan con los nuevos procesadores.
The overview of the mainstream Comet Lake-S parts
| Modelo | Núcleos / Hilos |
Velocidad base | Turbo 2.0 | Turbo 3.0 | TVB 1C/xC | Reloj de impulso de todos los núcleos | Memoria | Gráficos | TDP | Precio de lanzamiento |
|---|---|---|---|---|---|---|---|---|---|---|
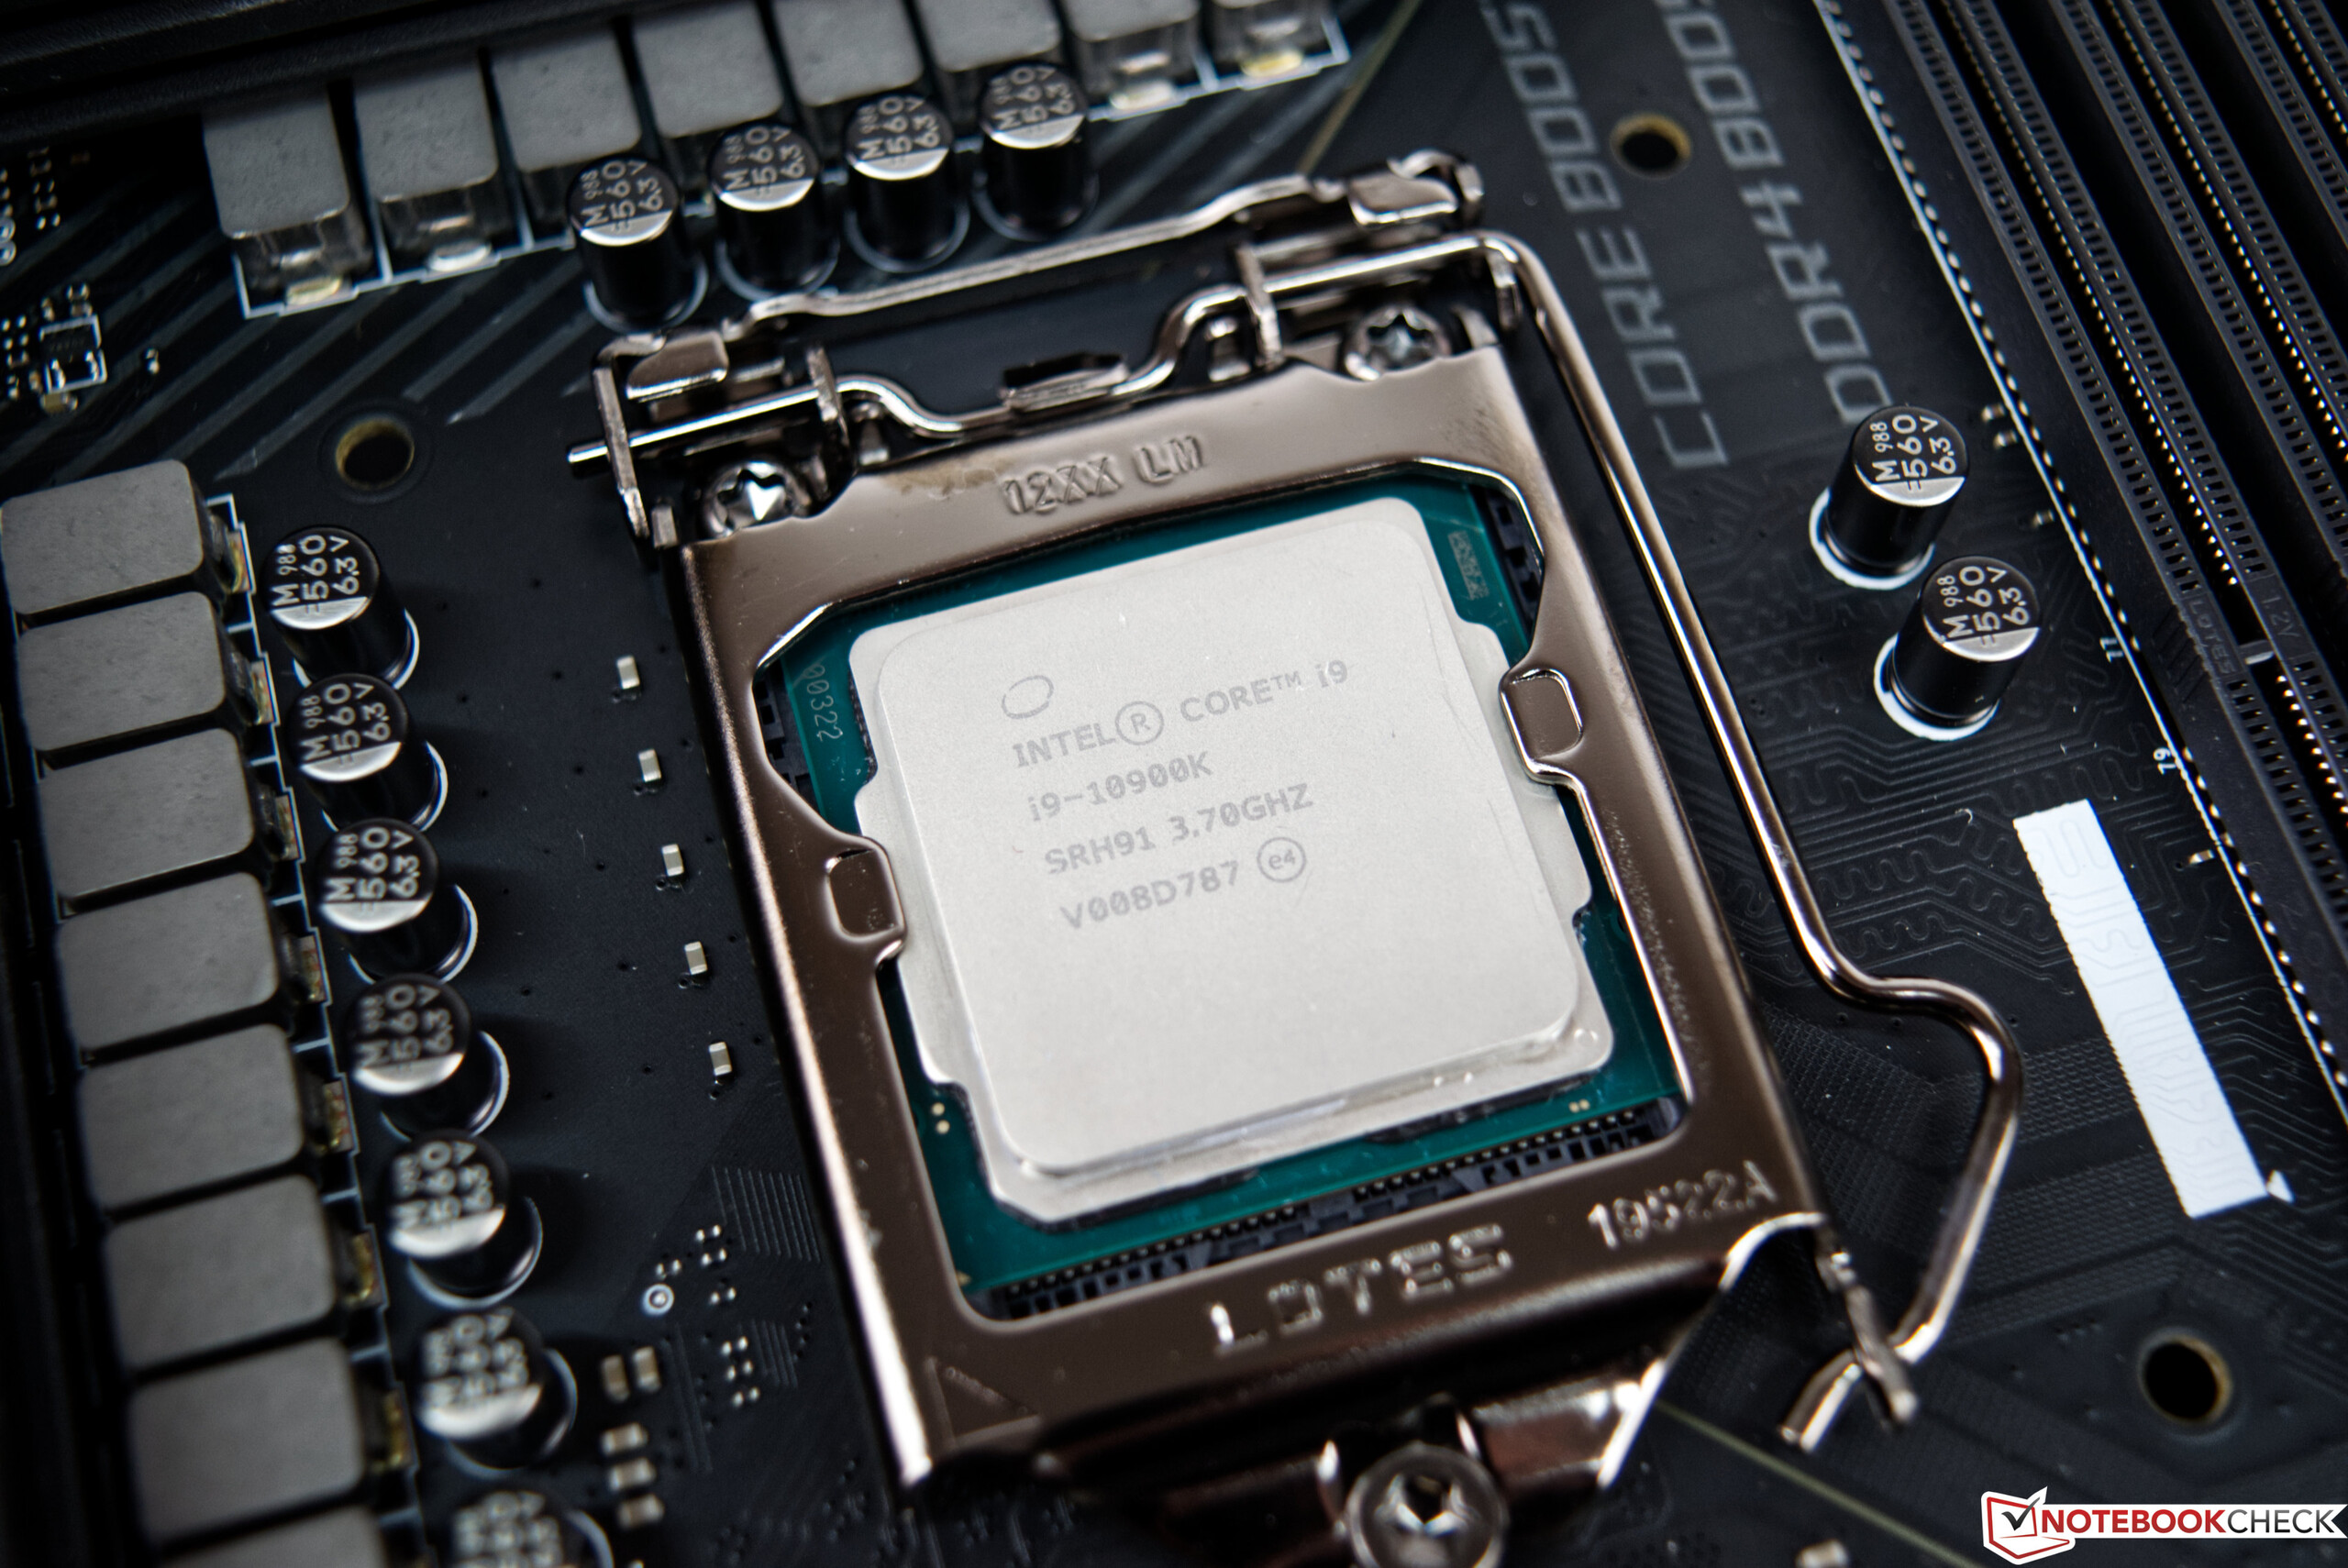
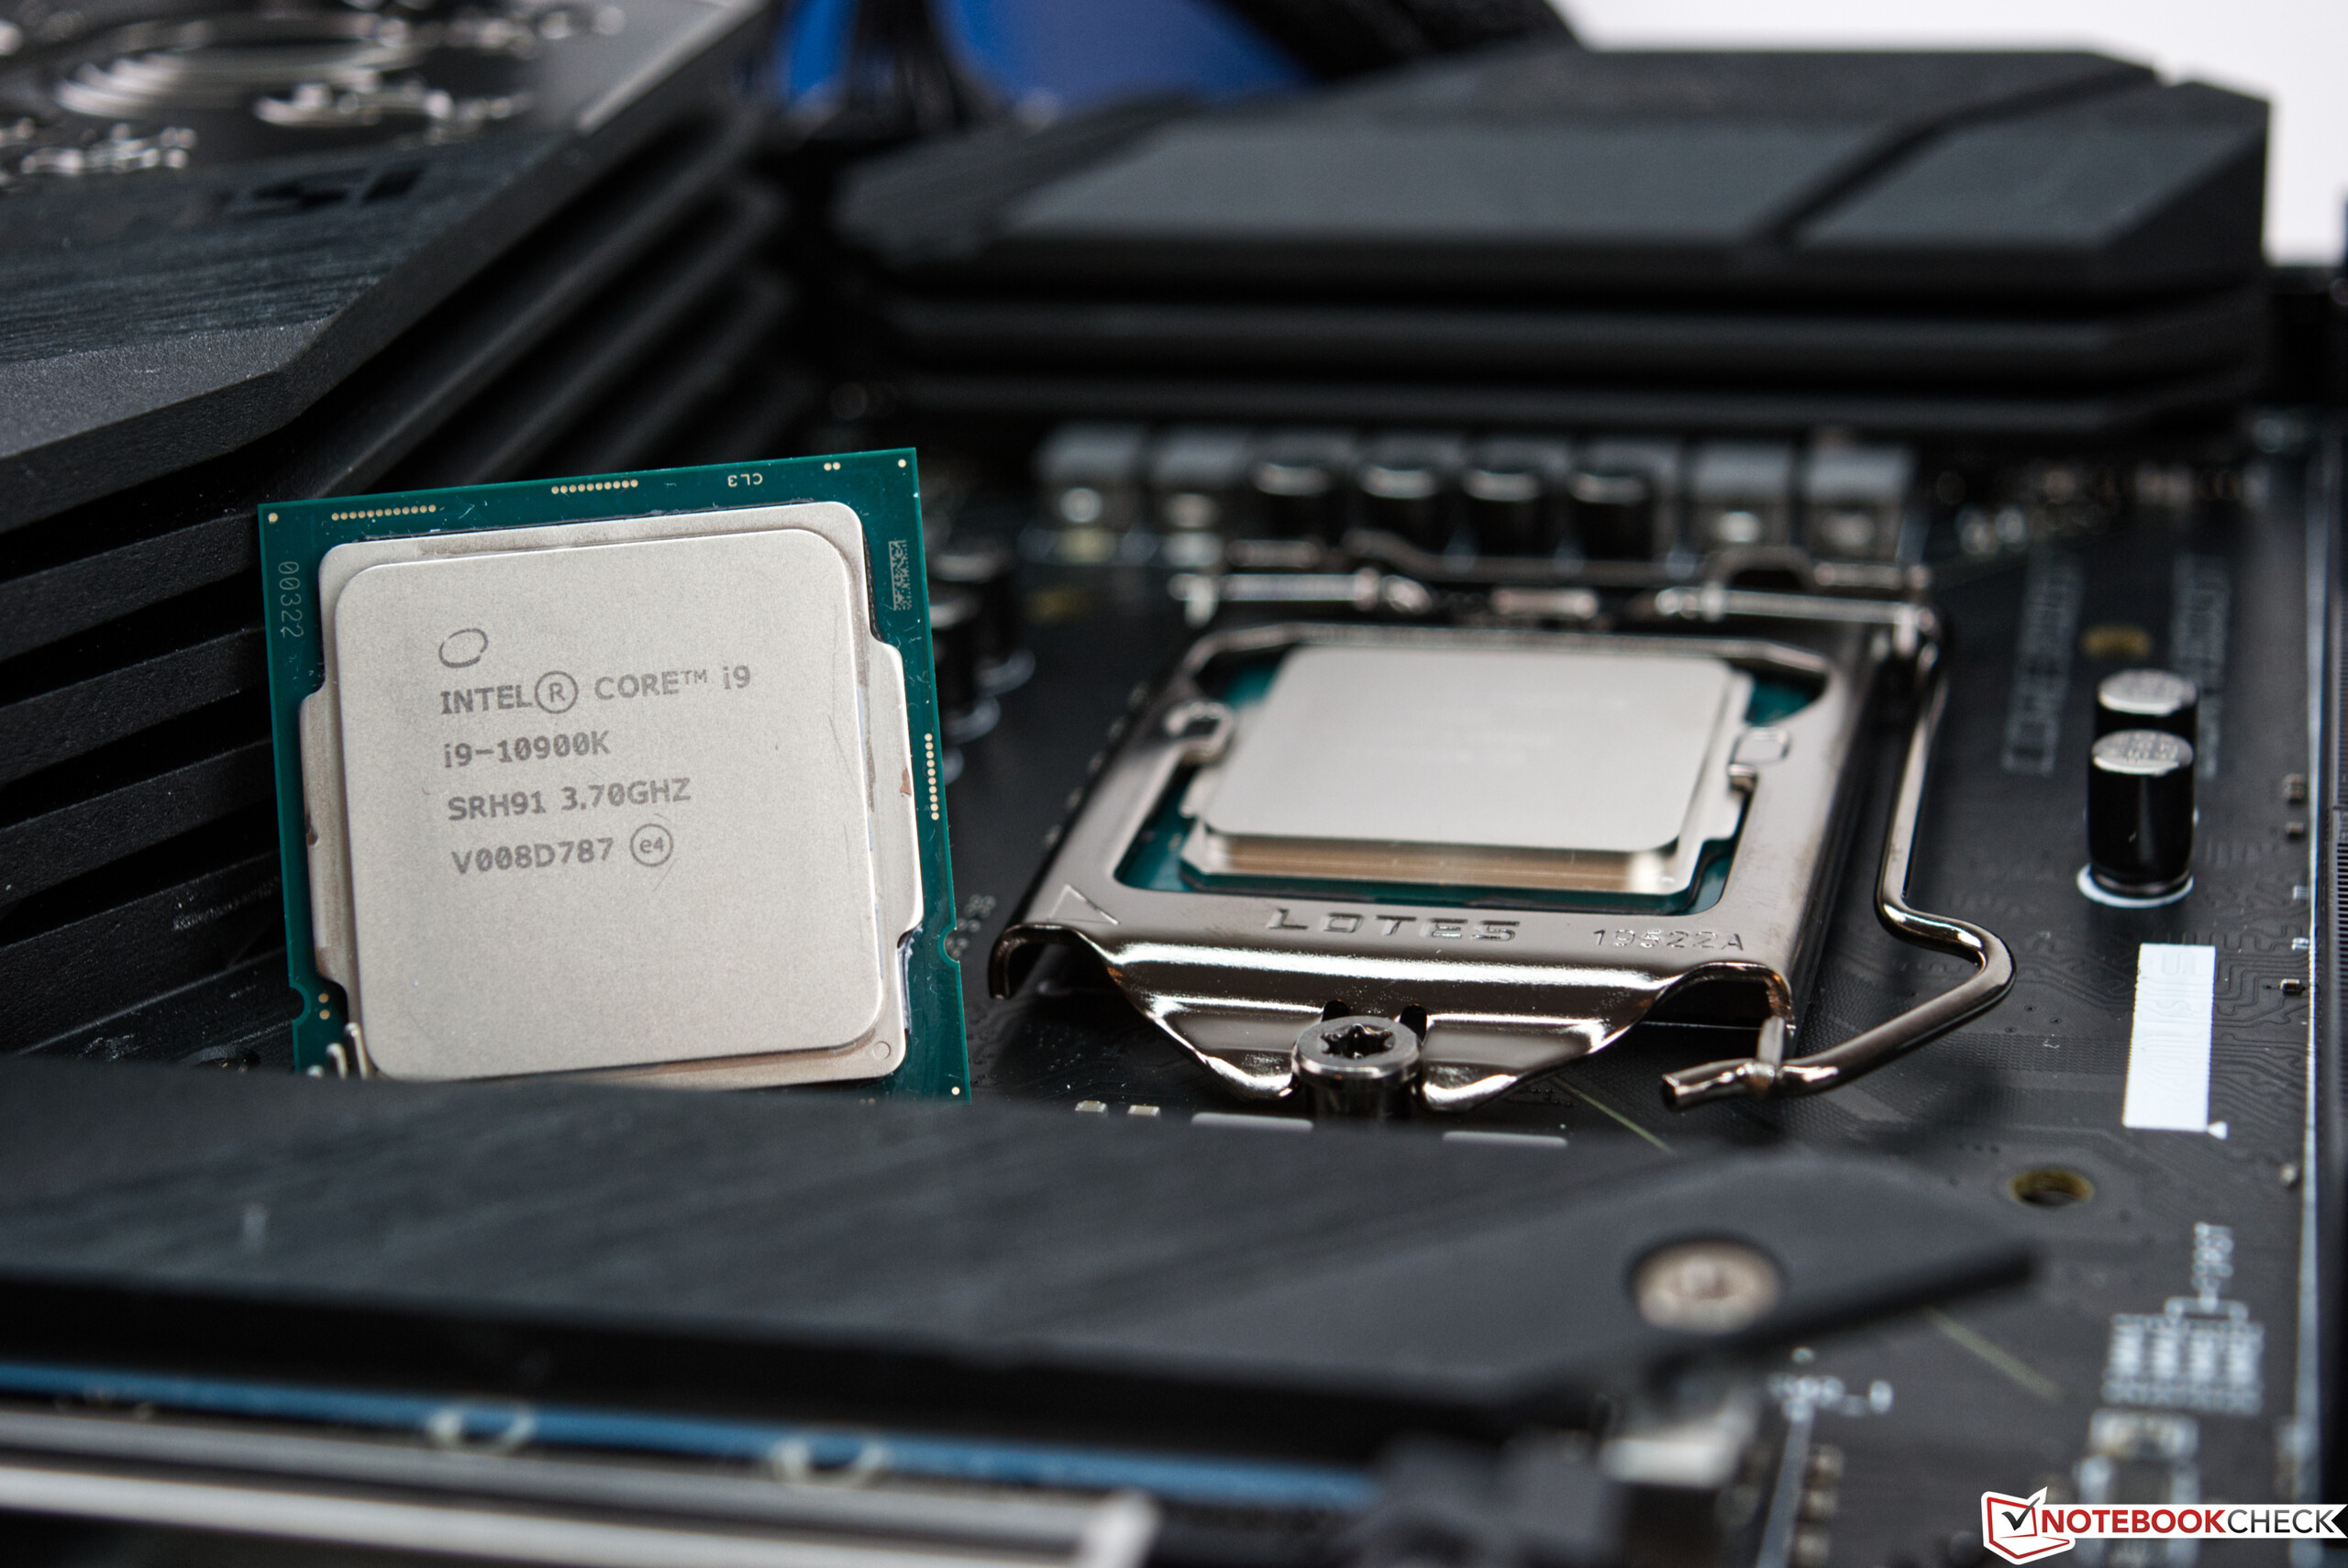
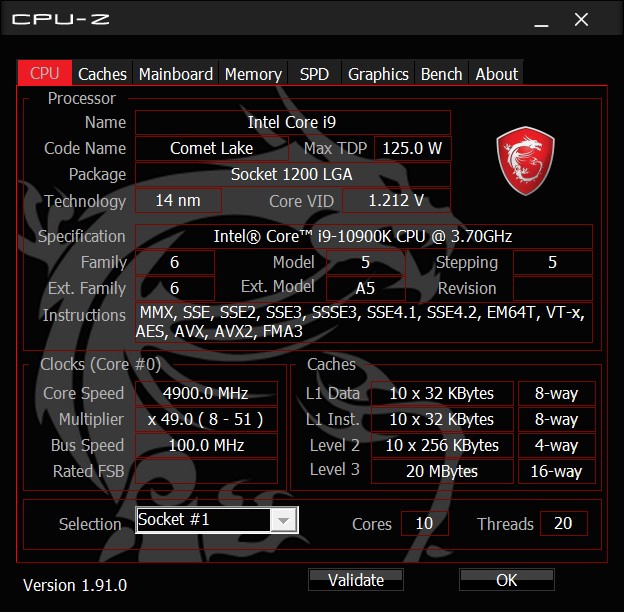
| Core i9-10900K | 10/20 | 3.7 GHz | 5.1 GHz | 5.2 GHz | 5.3 / 4.9 GHz | 4.8 GHz | DDR4-2933 | UHD 630 | 125 vatios | 488 $ |
| Core i9-10900KF | 10/20 | 3.7 GHz | 5.1 GHz | 5.2 GHz | 5.3 / 4.9 GHz | 4.8 GHz | DDR4-2933 | - | 125 vatios | 472 $ |
| Core i9-10900 | 10/20 | 2.8 GHz | 5.0 GHz | 5.1 GHz | 5.2 / 4.6 GHz | 4.5 GHz | DDR4-2933 | UHD 630 | 65 vatios | 439 $ |
| Core i9-10900F | 10/20 | 2.8 GHz | 5.0 GHz | 5.1 GHz | 5.2 / 4.6 GHz | 4.5 GHz | DDR4-2933 | - | 65 vatios | 422 $ |
| Core i9-10900T | 10/20 | 1.9 GHz | 4.5 GHz | 4.6 GHz | - | 3.7 GHz | DDR4-2933 | UHD 630 | 35 vatios | 439 $ |
| Core i7-10700K | 8/16 | 3.8 GHz | 5.0 GHz | 5.1 GHz | - | 4.7 GHz | DDR4-2933 | UHD 630 | 125 vatios | 374 $ |
| Core i7-10700KF | 8/16 | 3.8 GHz | 5.0 GHz | 5.1 GHz | - | 4.7 GHz | DDR4-2933 | - | 125 vatios | 349 $ |
| Core i7-10700 | 8/16 | 2.9 GHz | 4.7 GHz | 4.8 GHz | - | 4.6 GHz | DDR4-2933 | UHD 630 | 65 vatios | 323 $ |
| Core i7-10700F | 8/16 | 2.9 GHz | 4.7 GHz | 4.8 GHz | - | 4.6 GHz | DDR4-2933 | - | 65 vatios | 298 $ |
| Core i7-10700T | 8/16 | 2.0 GHz | 4.4 GHz | 4.5 GHz | - | 3.7 GHz | DDR4-2933 | UHD 630 | 35 vatios | 325 $ |
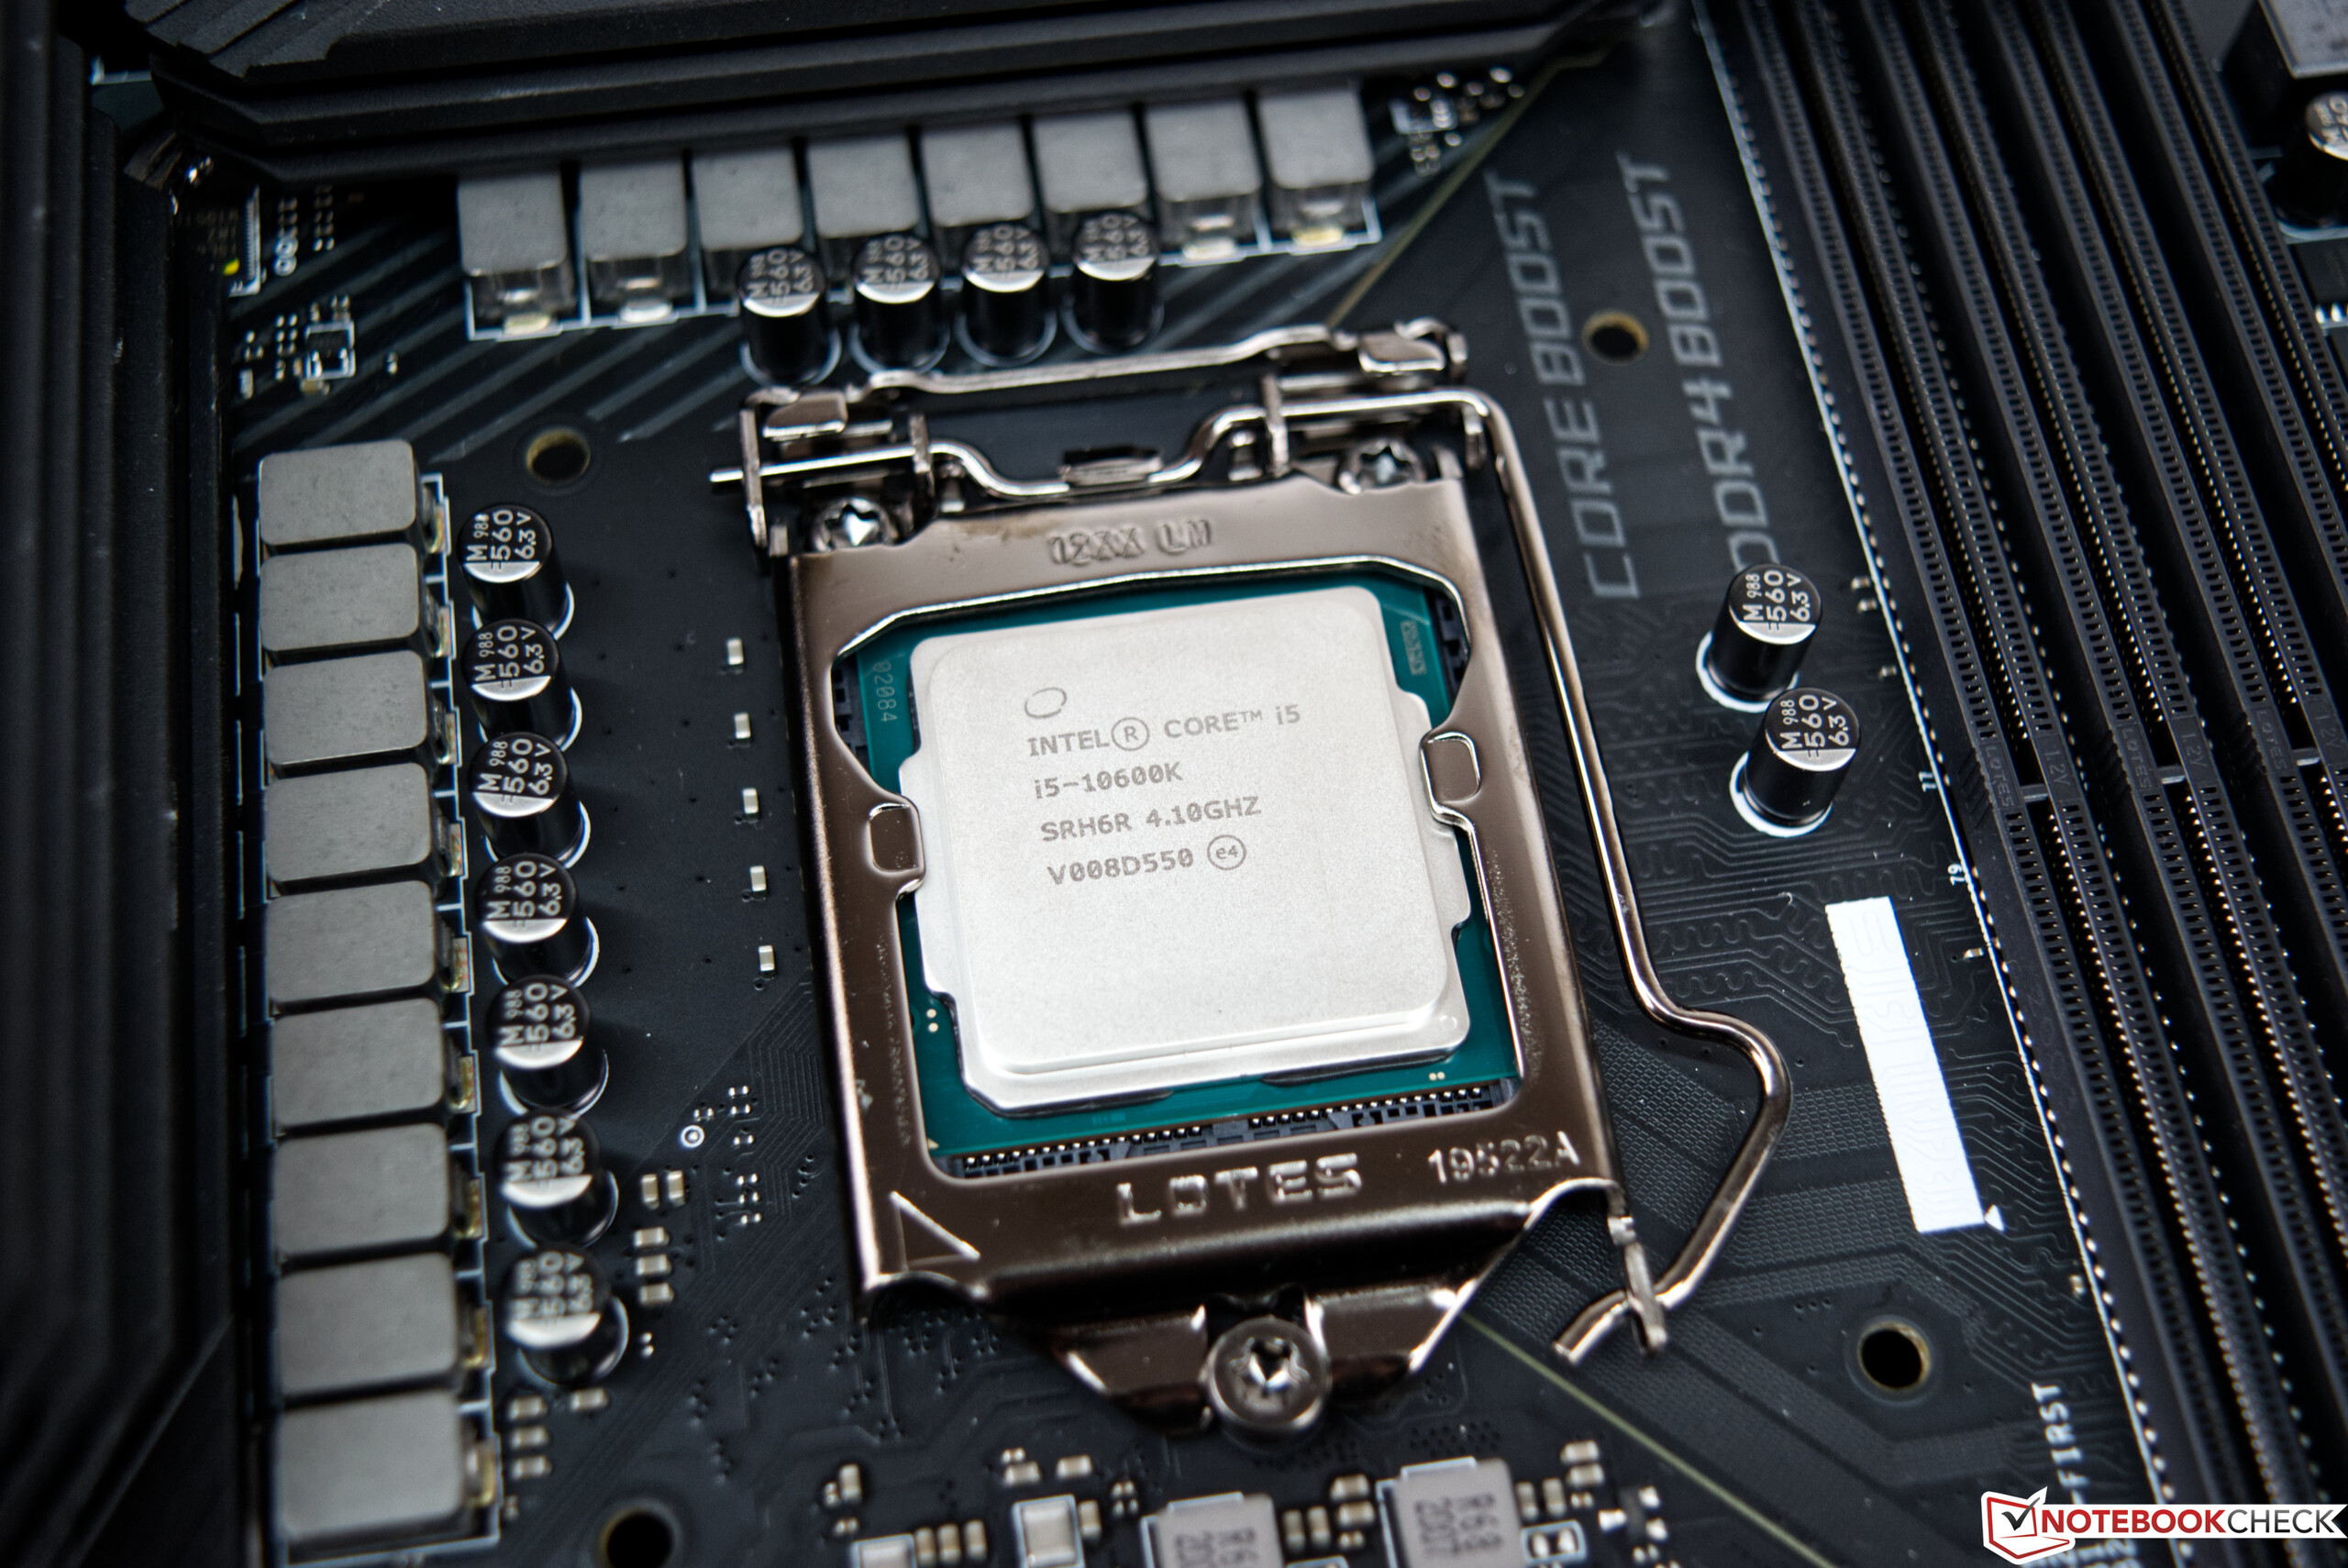
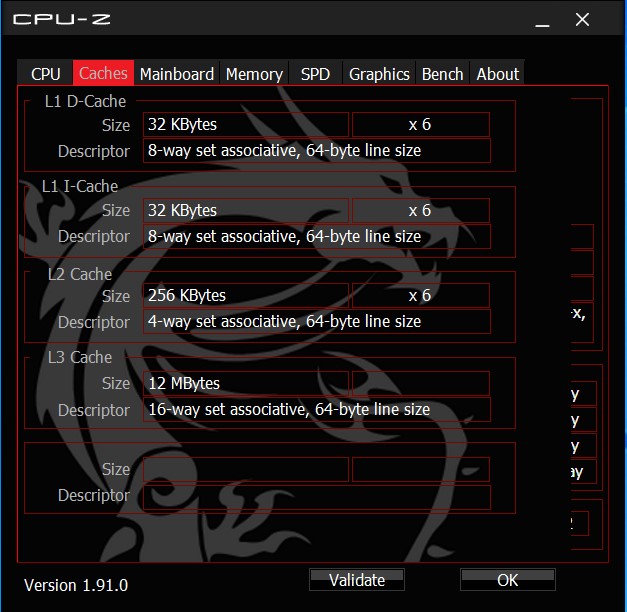
| Core i5-10600K | 6/12 | 4.1 GHz | 4.8 GHz | - | - | 4.5 GHz | DDR4-2666 | UHD 630 | 125 vatios | 262 $ |
| Core i5-10600KF | 6/12 | 4.1 GHz | 4.8 GHz | - | - | 4.5 GHz | DDR4-2666 | - | 125 vatios | 237 $ |
| Core i5-10600 | 6/12 | 3.3 GHz | 4.8 GHz | - | - | 4.4 GHz | DDR4-2666 | UHD 630 | 65 vatios | 213 $ |
| Core i5-10600T | 6/12 | 2.4 GHz | 4.0 GHz | - | - | 3.7 GHz | DDR4-2666 | UHD 630 | 35 vatios | 213 $ |
| Core i5-10500 | 6/12 | 3.1 GHz | 4.5 GHz | - | - | 4.2 GHz | DDR4-2666 | UHD 630 | 65 vatios | 192 $ |
| Core i5-10500T | 6/12 | 2.3 GHz | 3.8 GHz | - | - | 3.5 GHz | DDR4-2666 | UHD 630 | 35 vatios | 192 $ |
| Core i5-10400 | 6/12 | 2.9 GHz | 4.3 GHz | - | - | 4.0 GHz | DDR4-2666 | UHD 630 | 65 vatios | 182 $ |
| Core i5-10400F | 6/12 | 2.9 GHz | 4.3 GHz | - | - | 4.0 GHz | DDR4-2666 | - | 65 vatios | 157 $ |
| Core i5-10400T | 6/12 | 2.0 GHz | 3.6 GHz | - | - | 3.2 GHz | DDR4-2666 | UHD 630 | 35 vatios | 182 $ |
| Core i3-10320 | 4/8 | 3.8 GHz | 4.4 GHz | - | - | 4.4 GHz | DDR4-2666 | UHD 630 | 65 vatios | 154 $ |
| Core i3-10300 | 4/8 | 3.7 GHz | 4.4 GHz | - | - | 4.2 GHz | DDR4-2666 | UHD 630 | 65 vatios | 143 $ |
| Core i3-10300T | 4/8 | 3.0 GHz | 3.9 GHz | - | - | 3.6 GHz | DDR4-2666 | UHD 630 | 35 vatios | 143 $ |
| Core i3-10100 | 4/8 | 3.6 GHz | 4.3 GHz | - | - | 4.1 GHz | DDR4-2666 | UHD 630 | 65 vatios | 122 $ |
| Core i3-10100T | 4/8 | 3.0 GHz | 3.8 GHz | - | - | 3.5 GHz | DDR4-2666 | UHD 630 | 35 vatios | 122 $ |
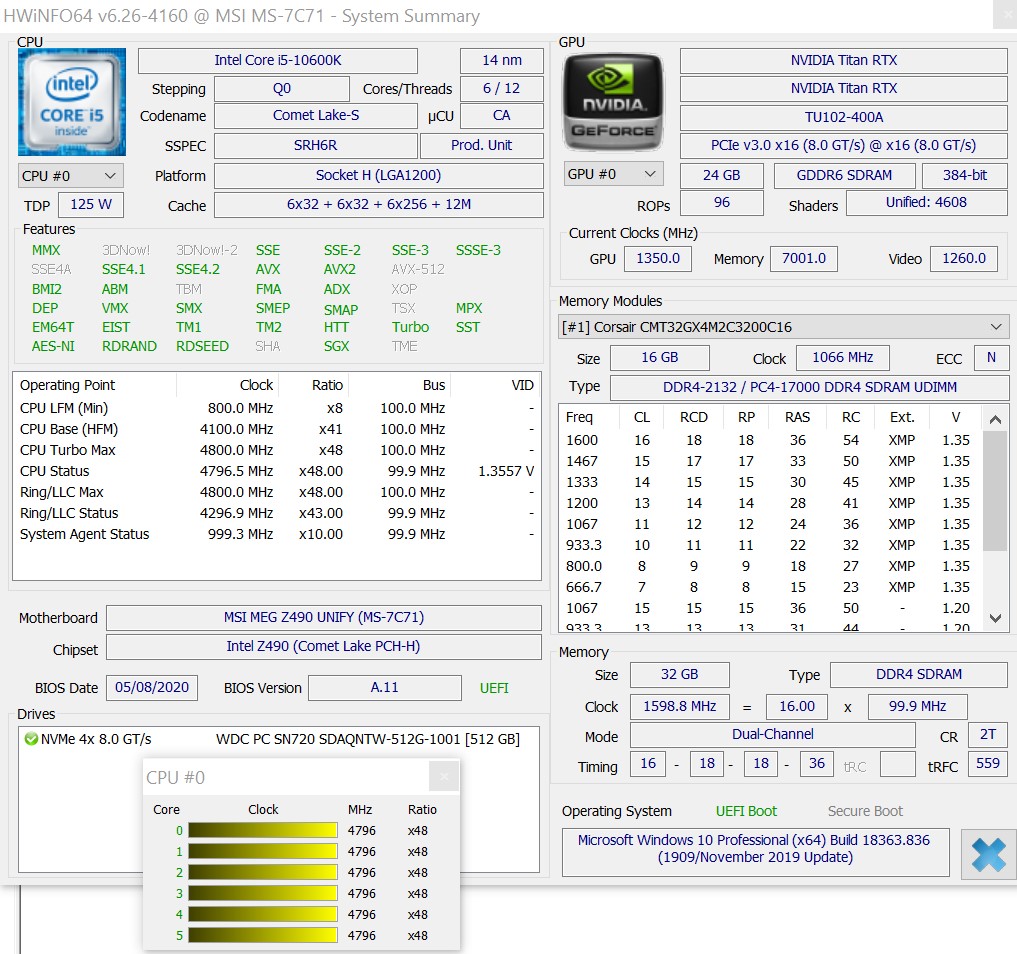
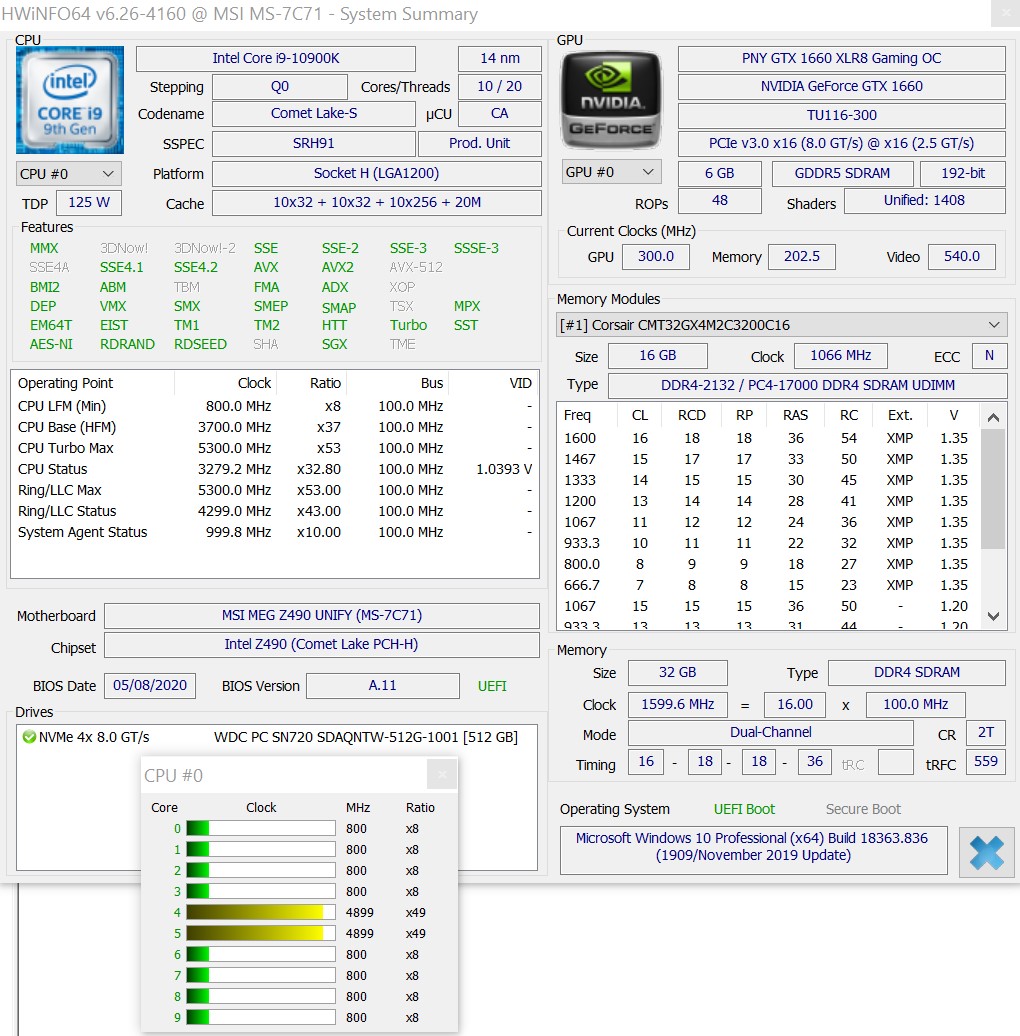
Banco de pruebas
Utilizamos el siguiente sistema para nuestros puntos de referencia:
- Raijintek Paean Benchtable
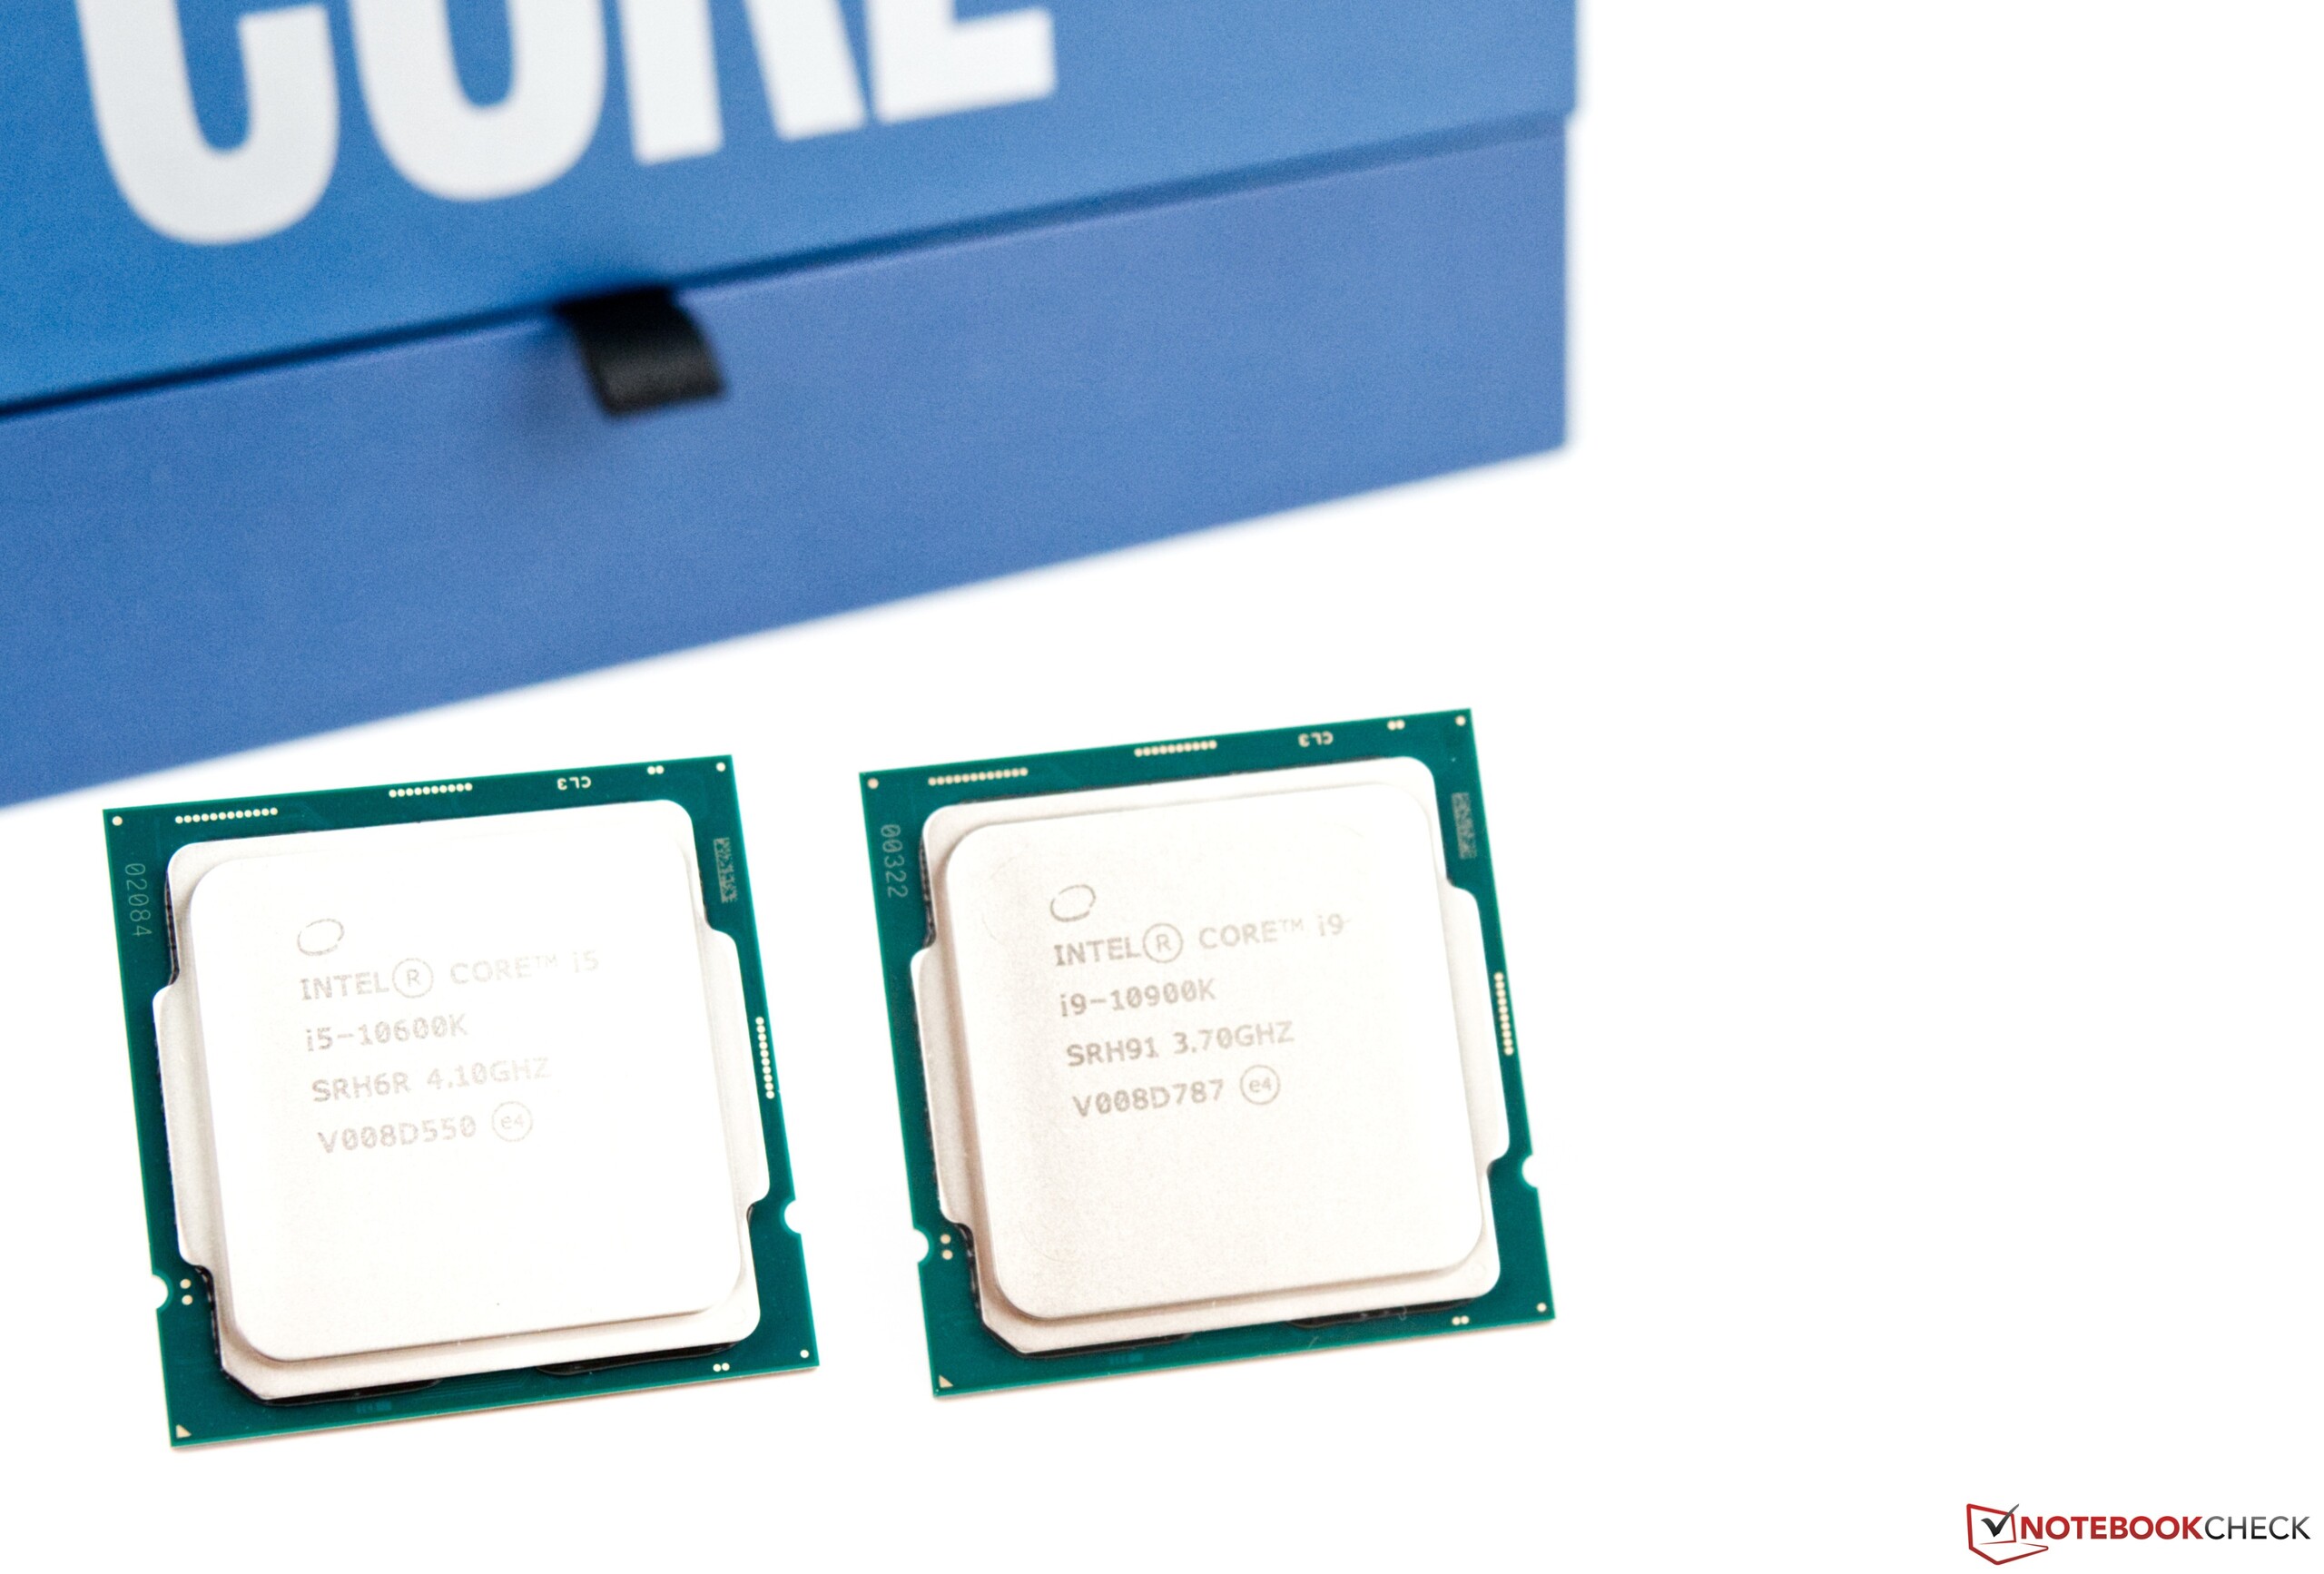
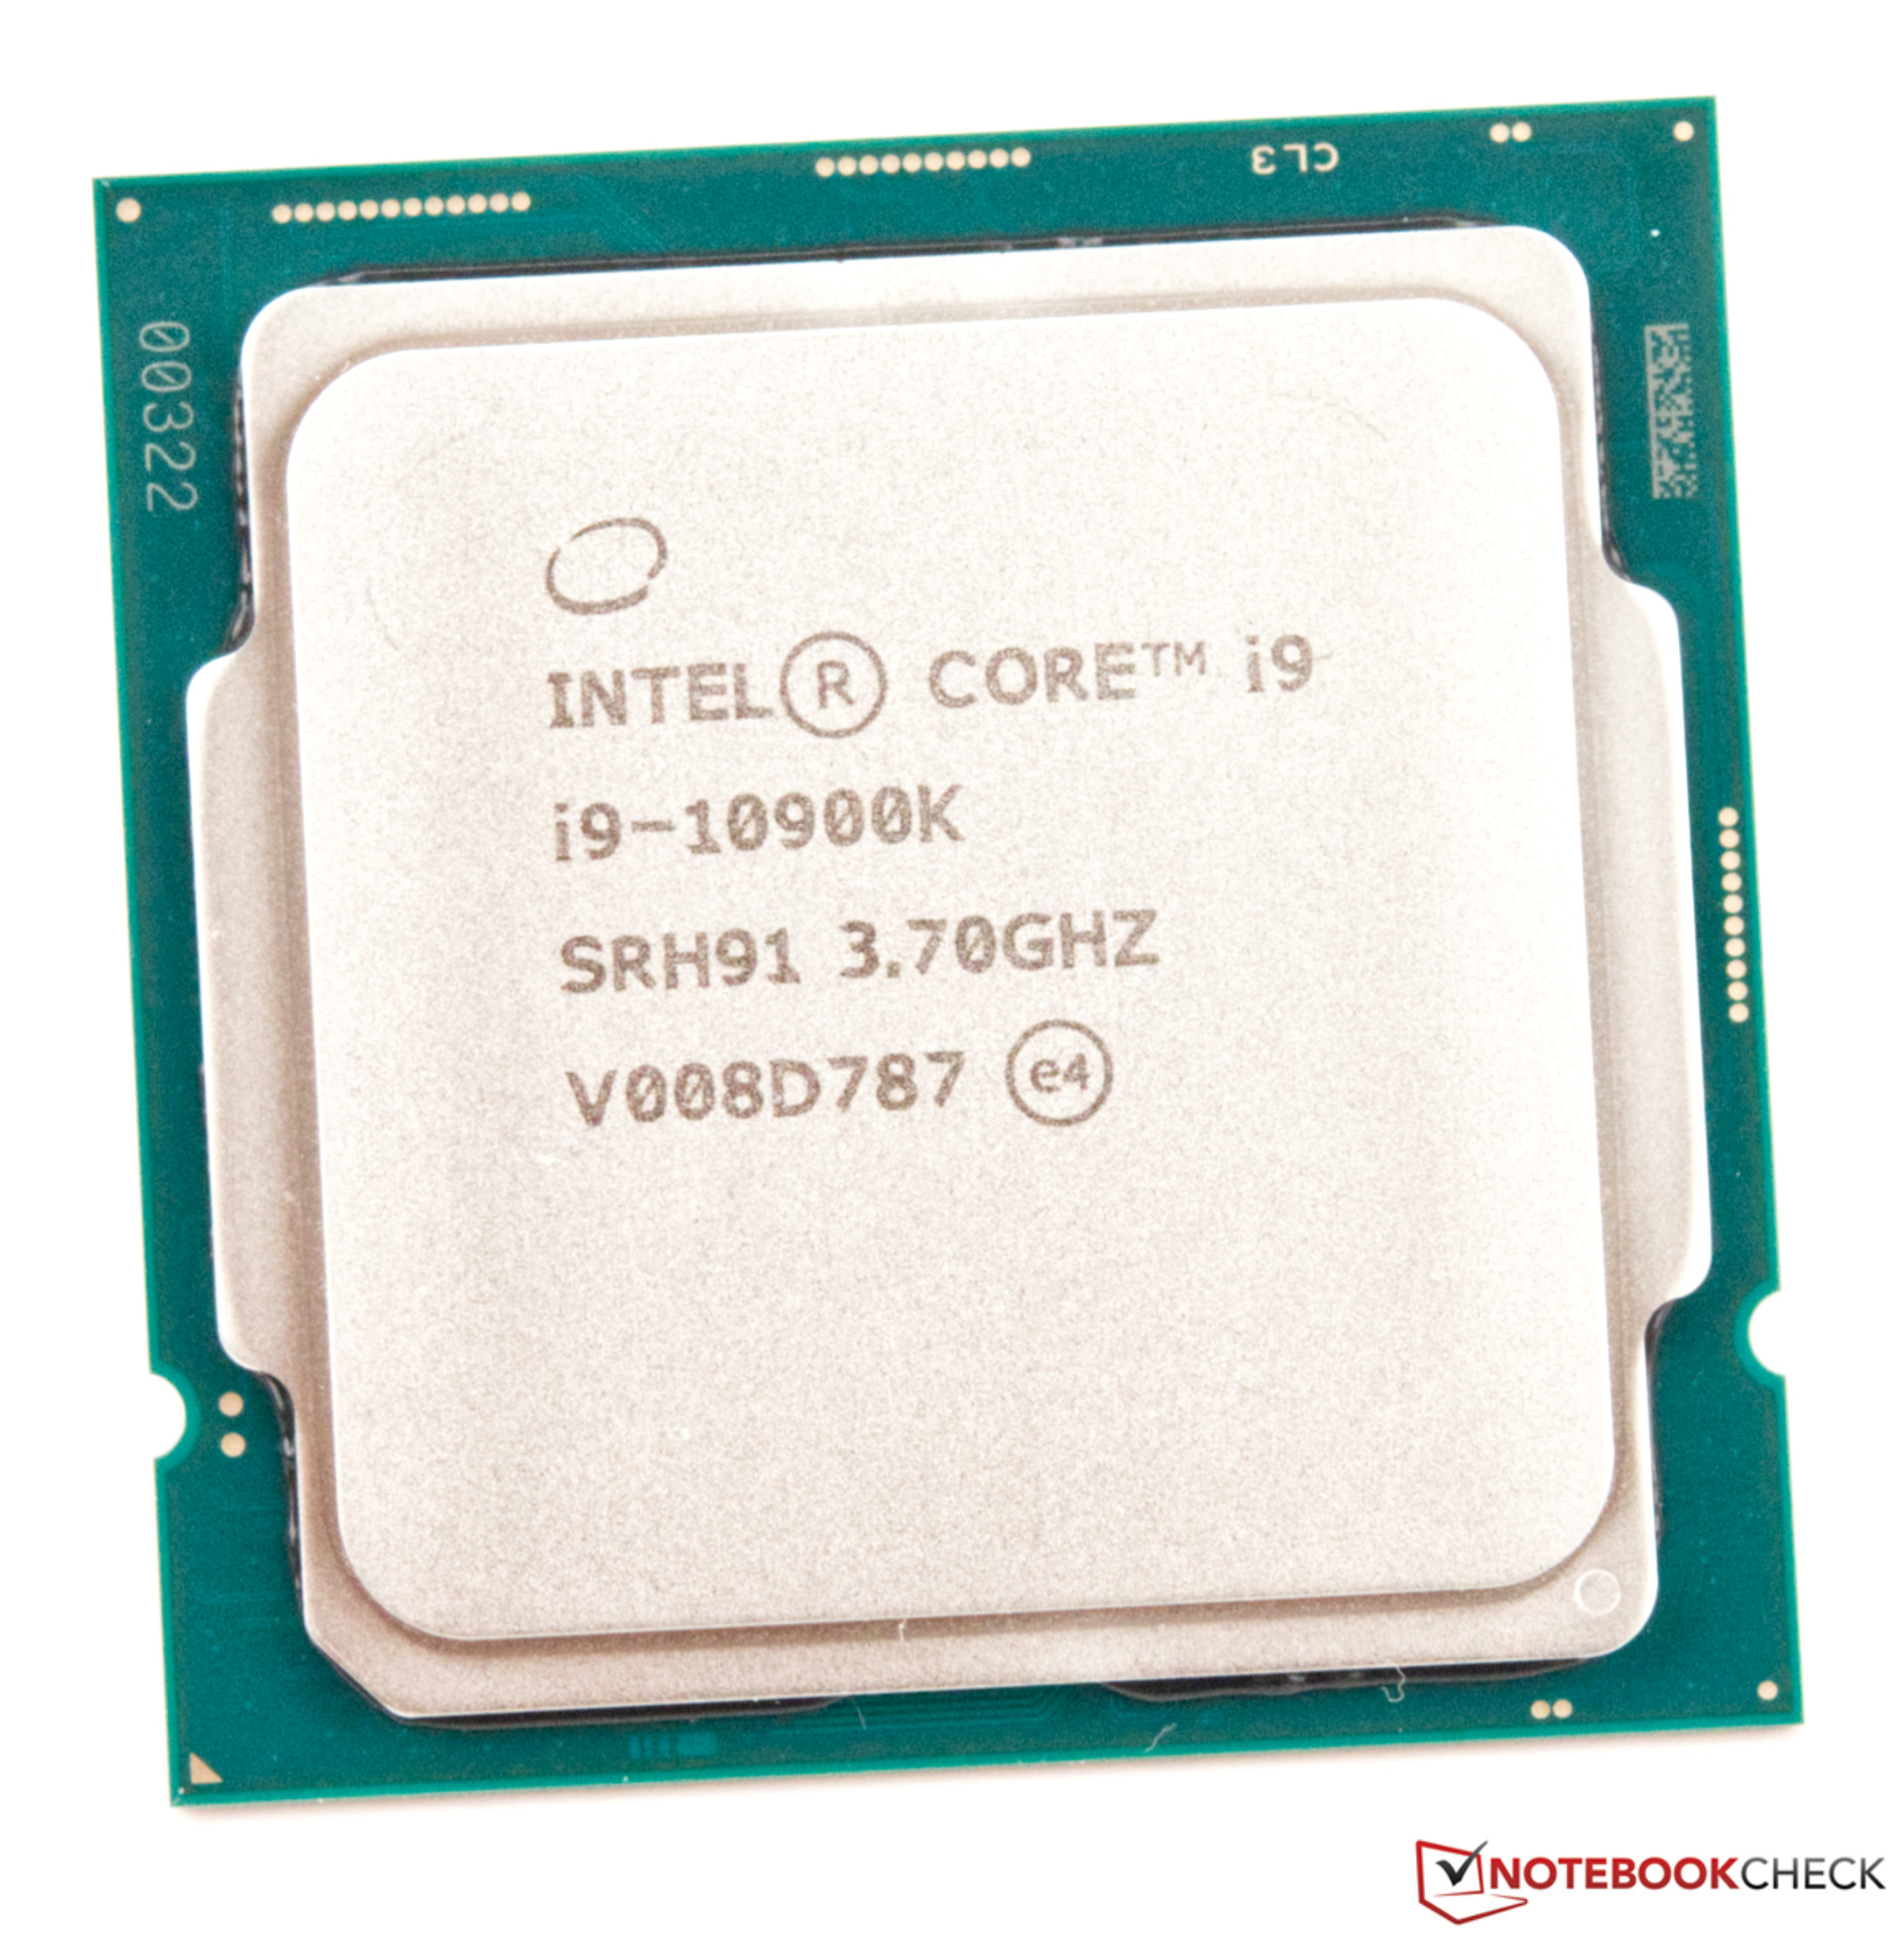
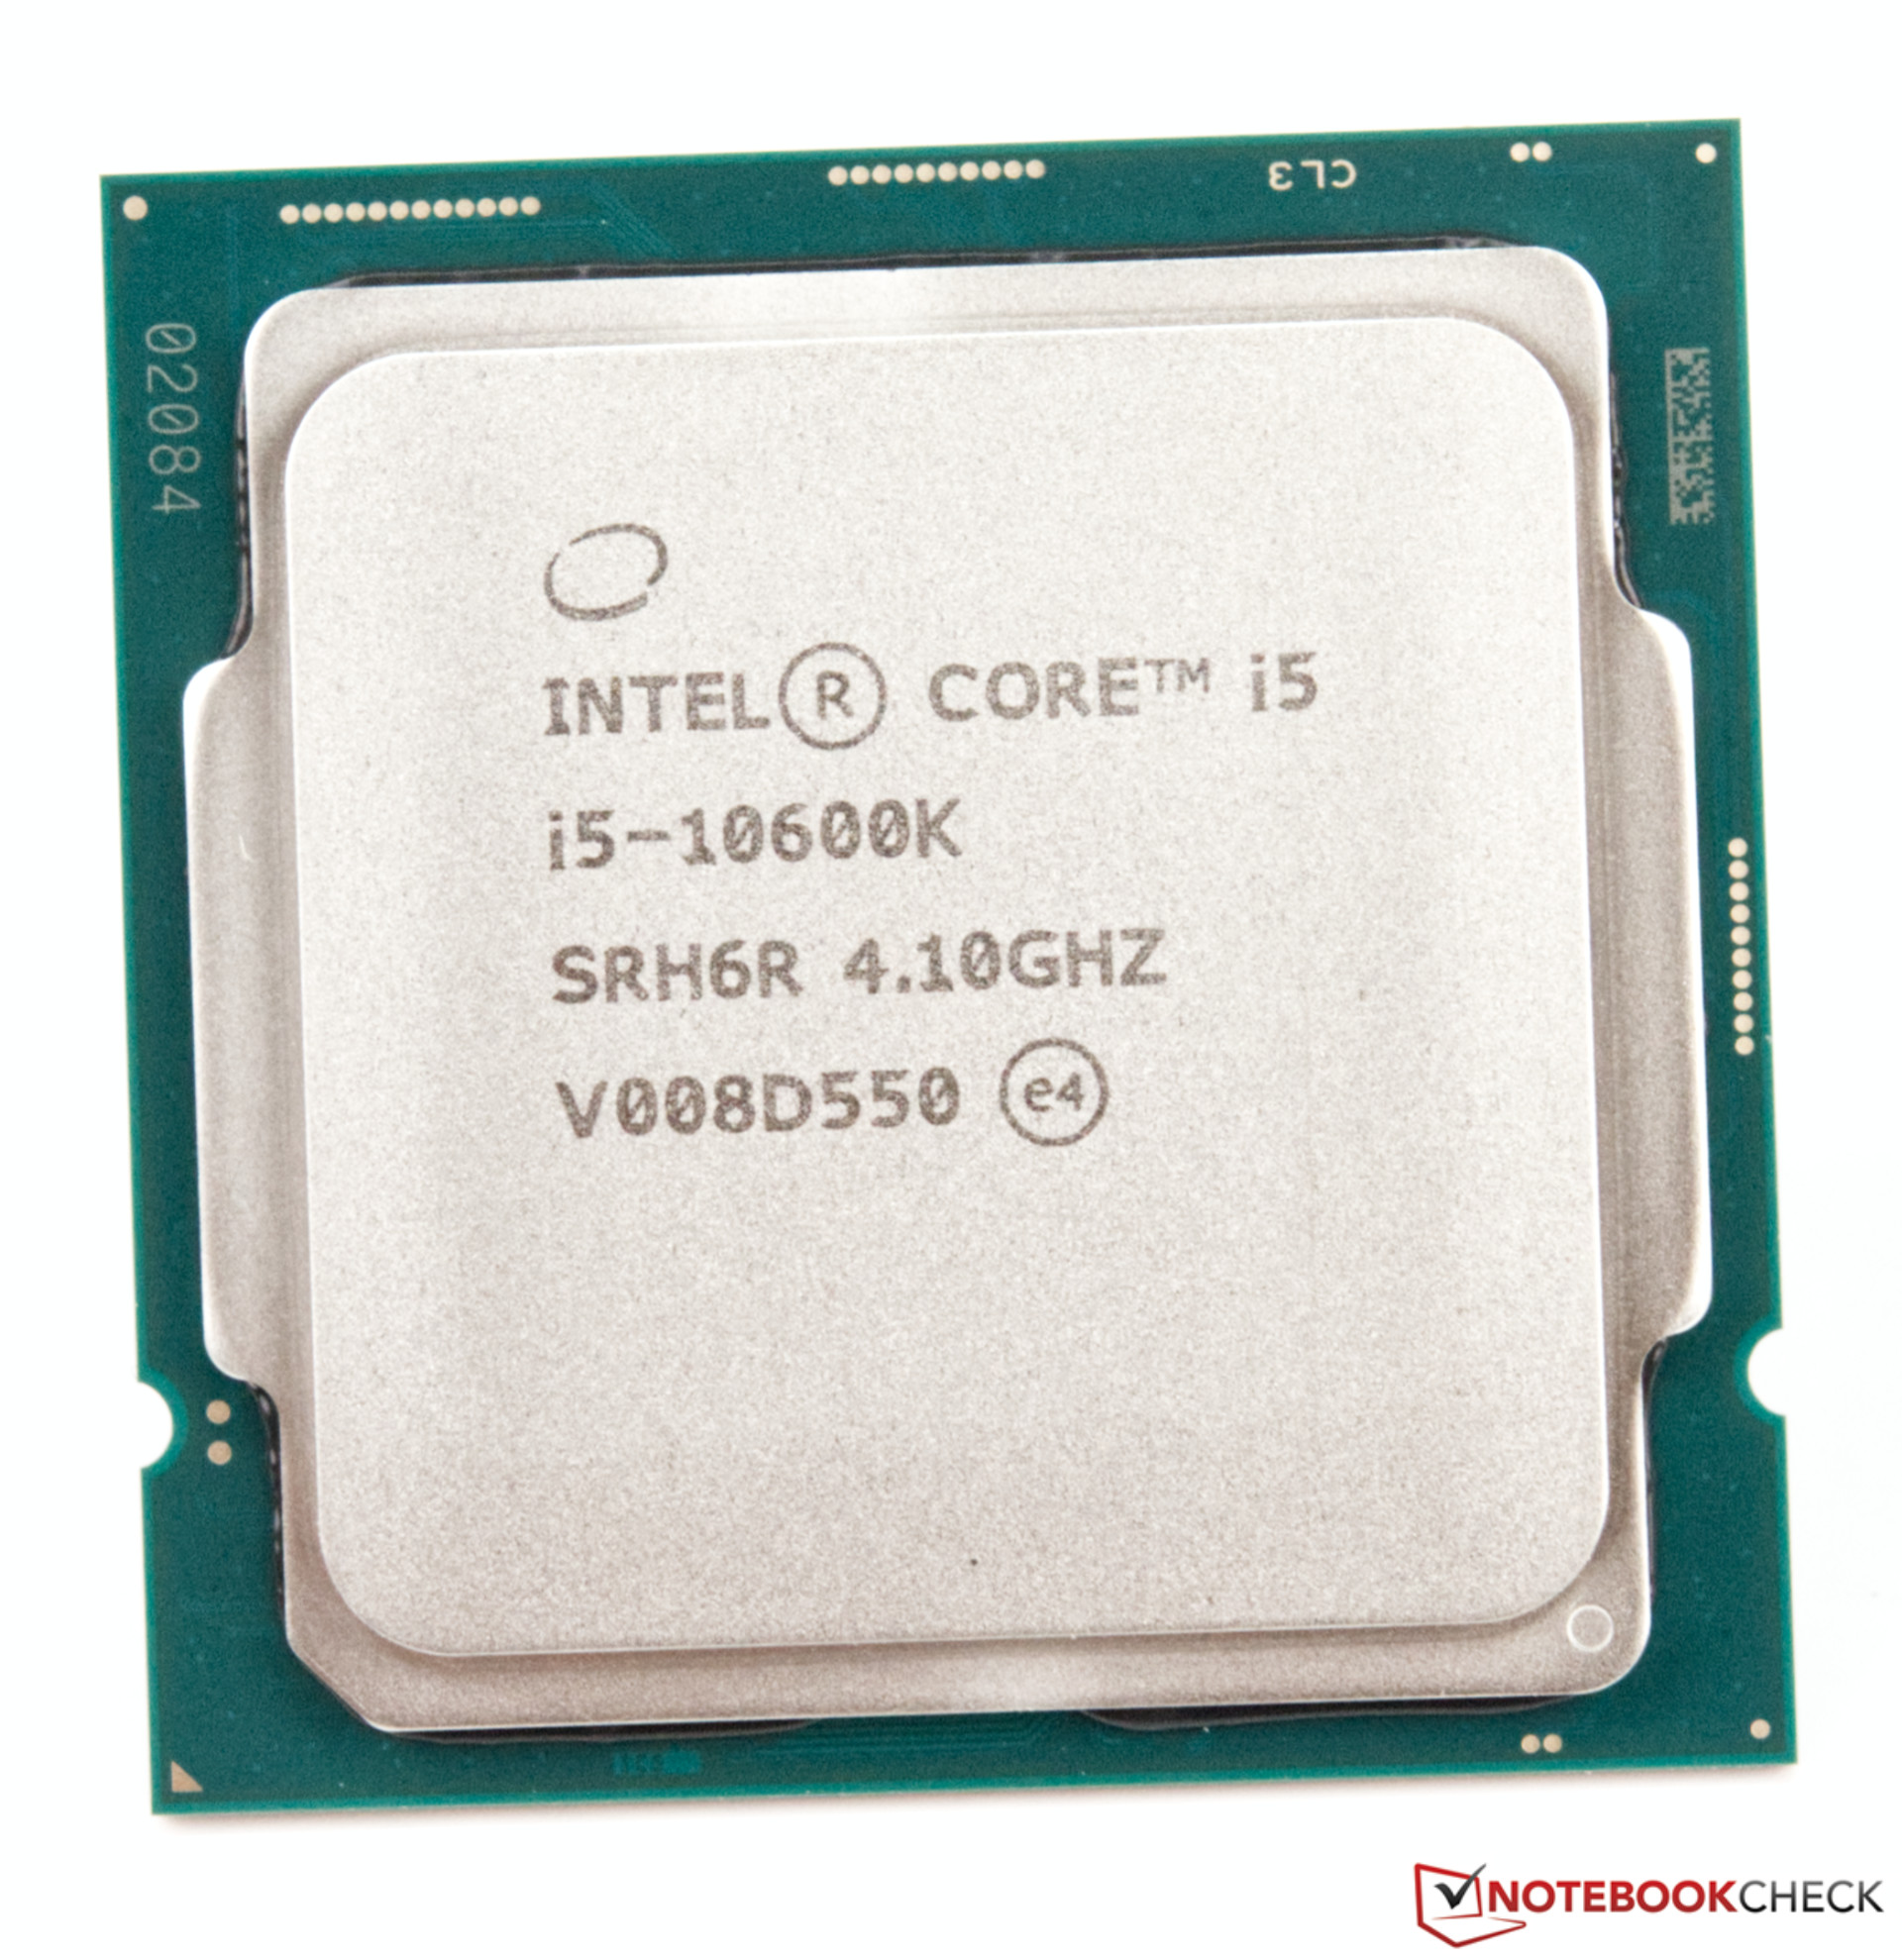
- Intel Core i9-10900K, Intel Core i5-10600K
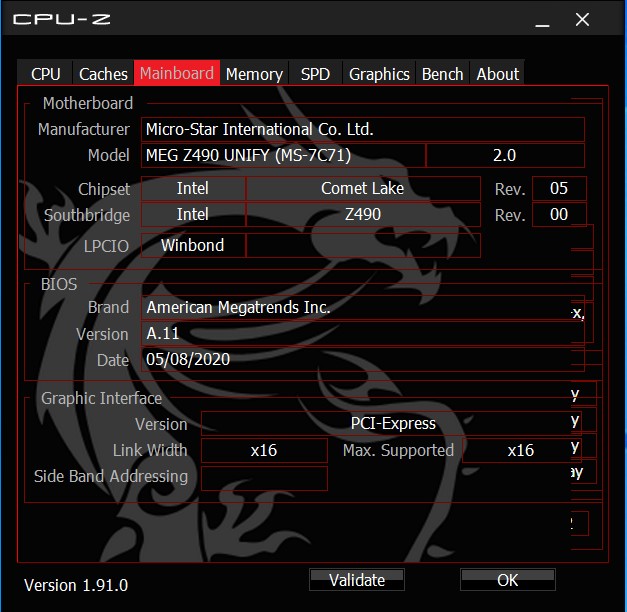
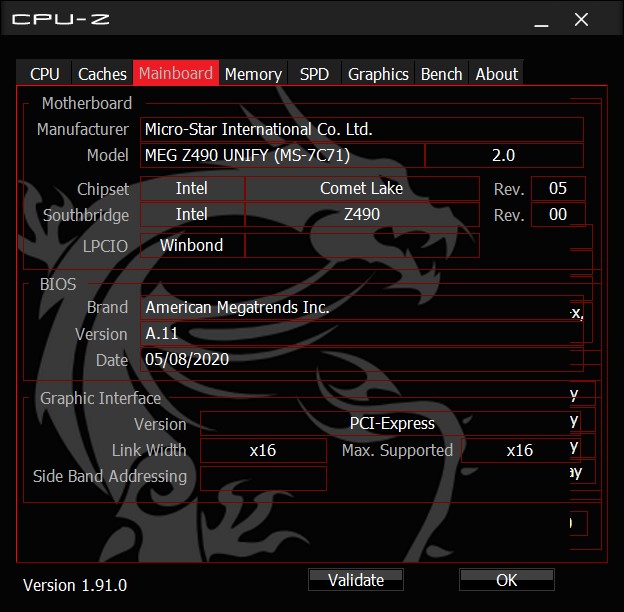
- MSI Z490 Unify
- Alphacool Eisbaer 280 AiO
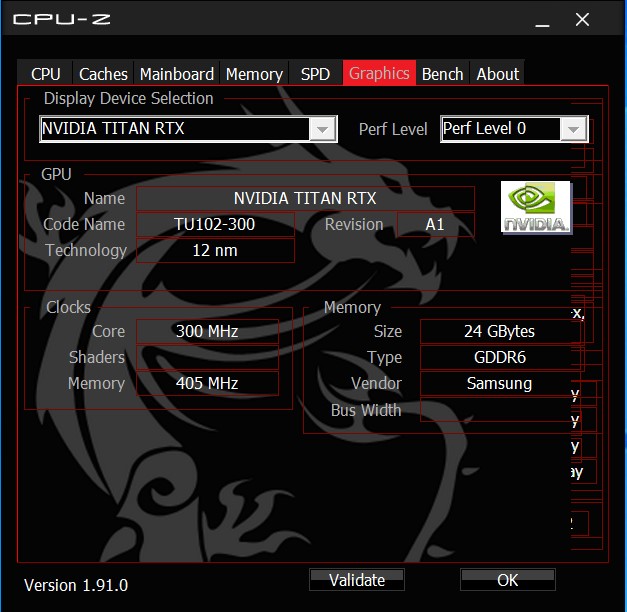
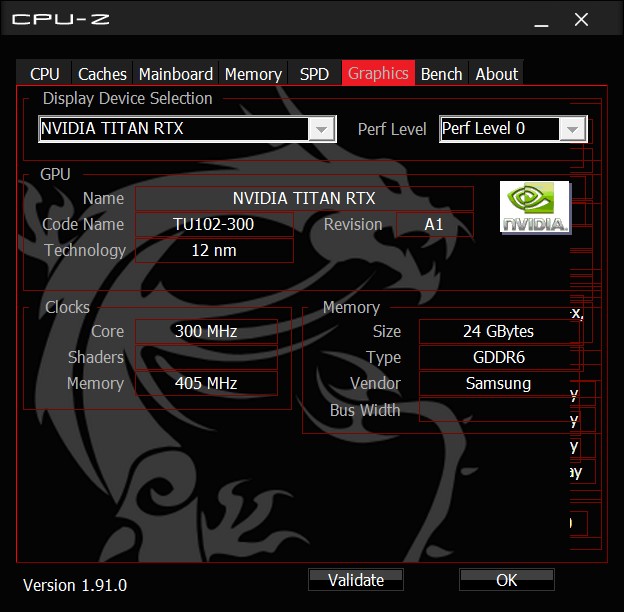
- Nvidia Titan RTX
- Corsair RM 1000X Netzteil
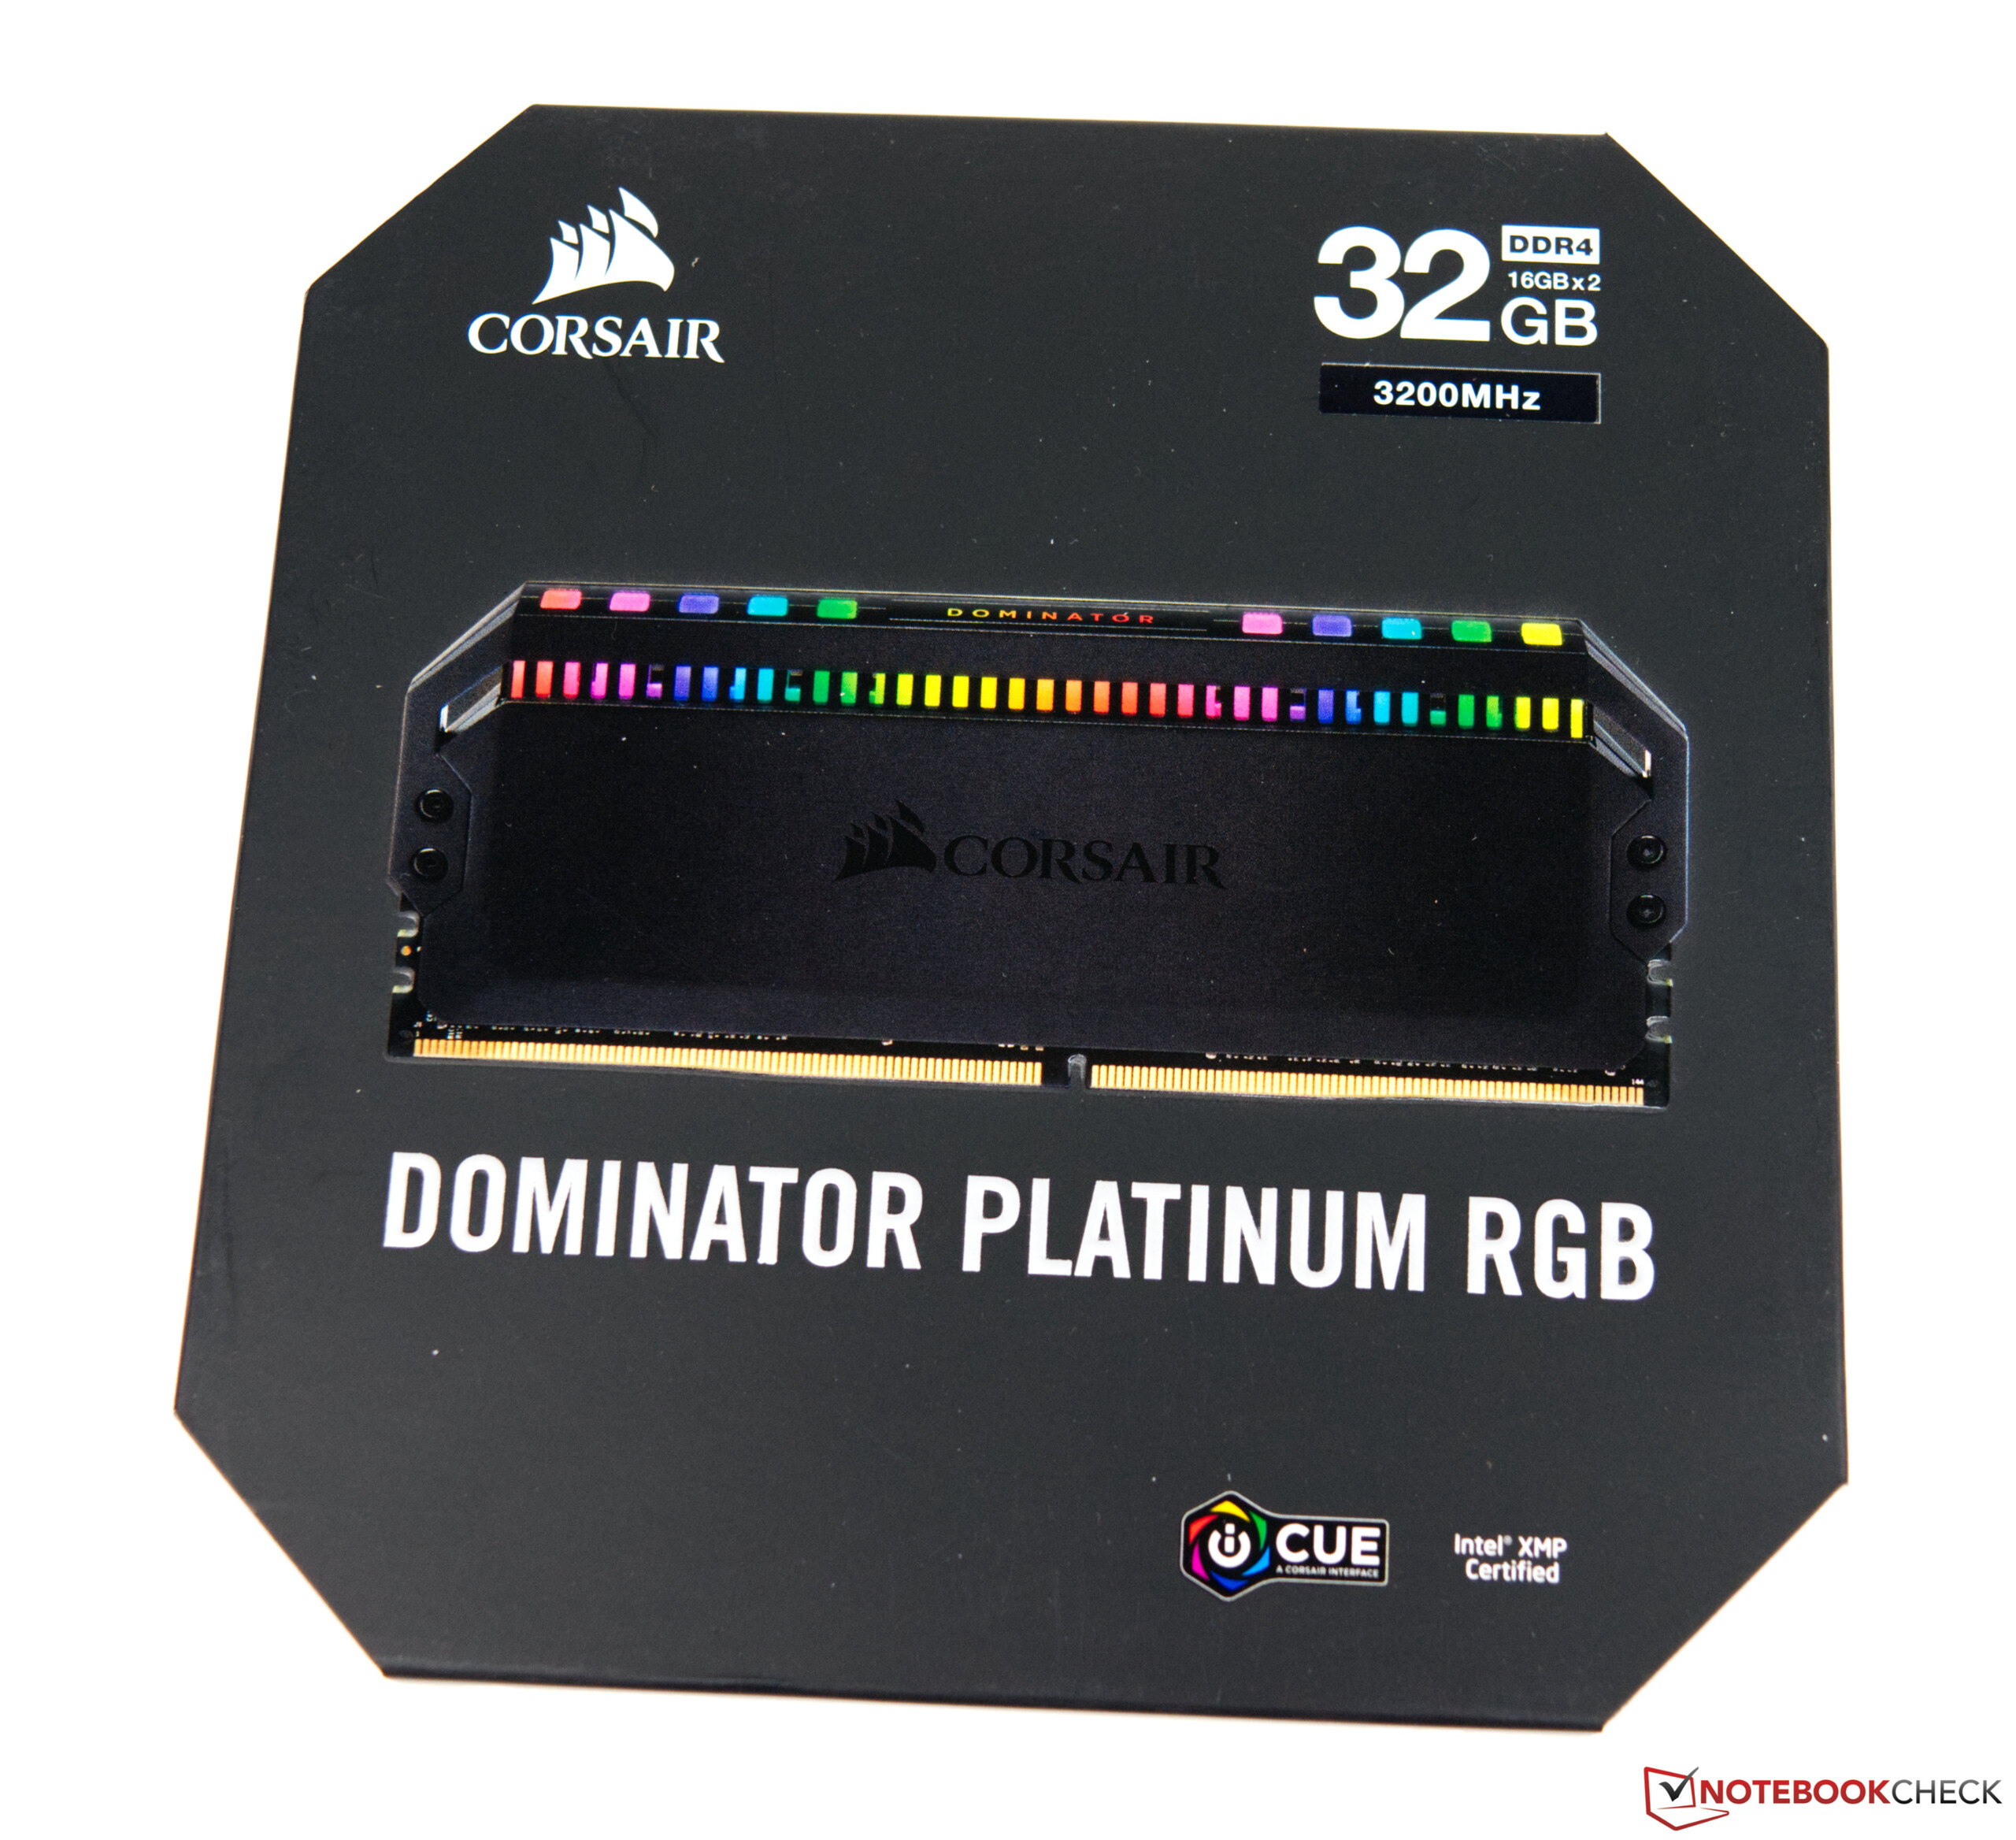
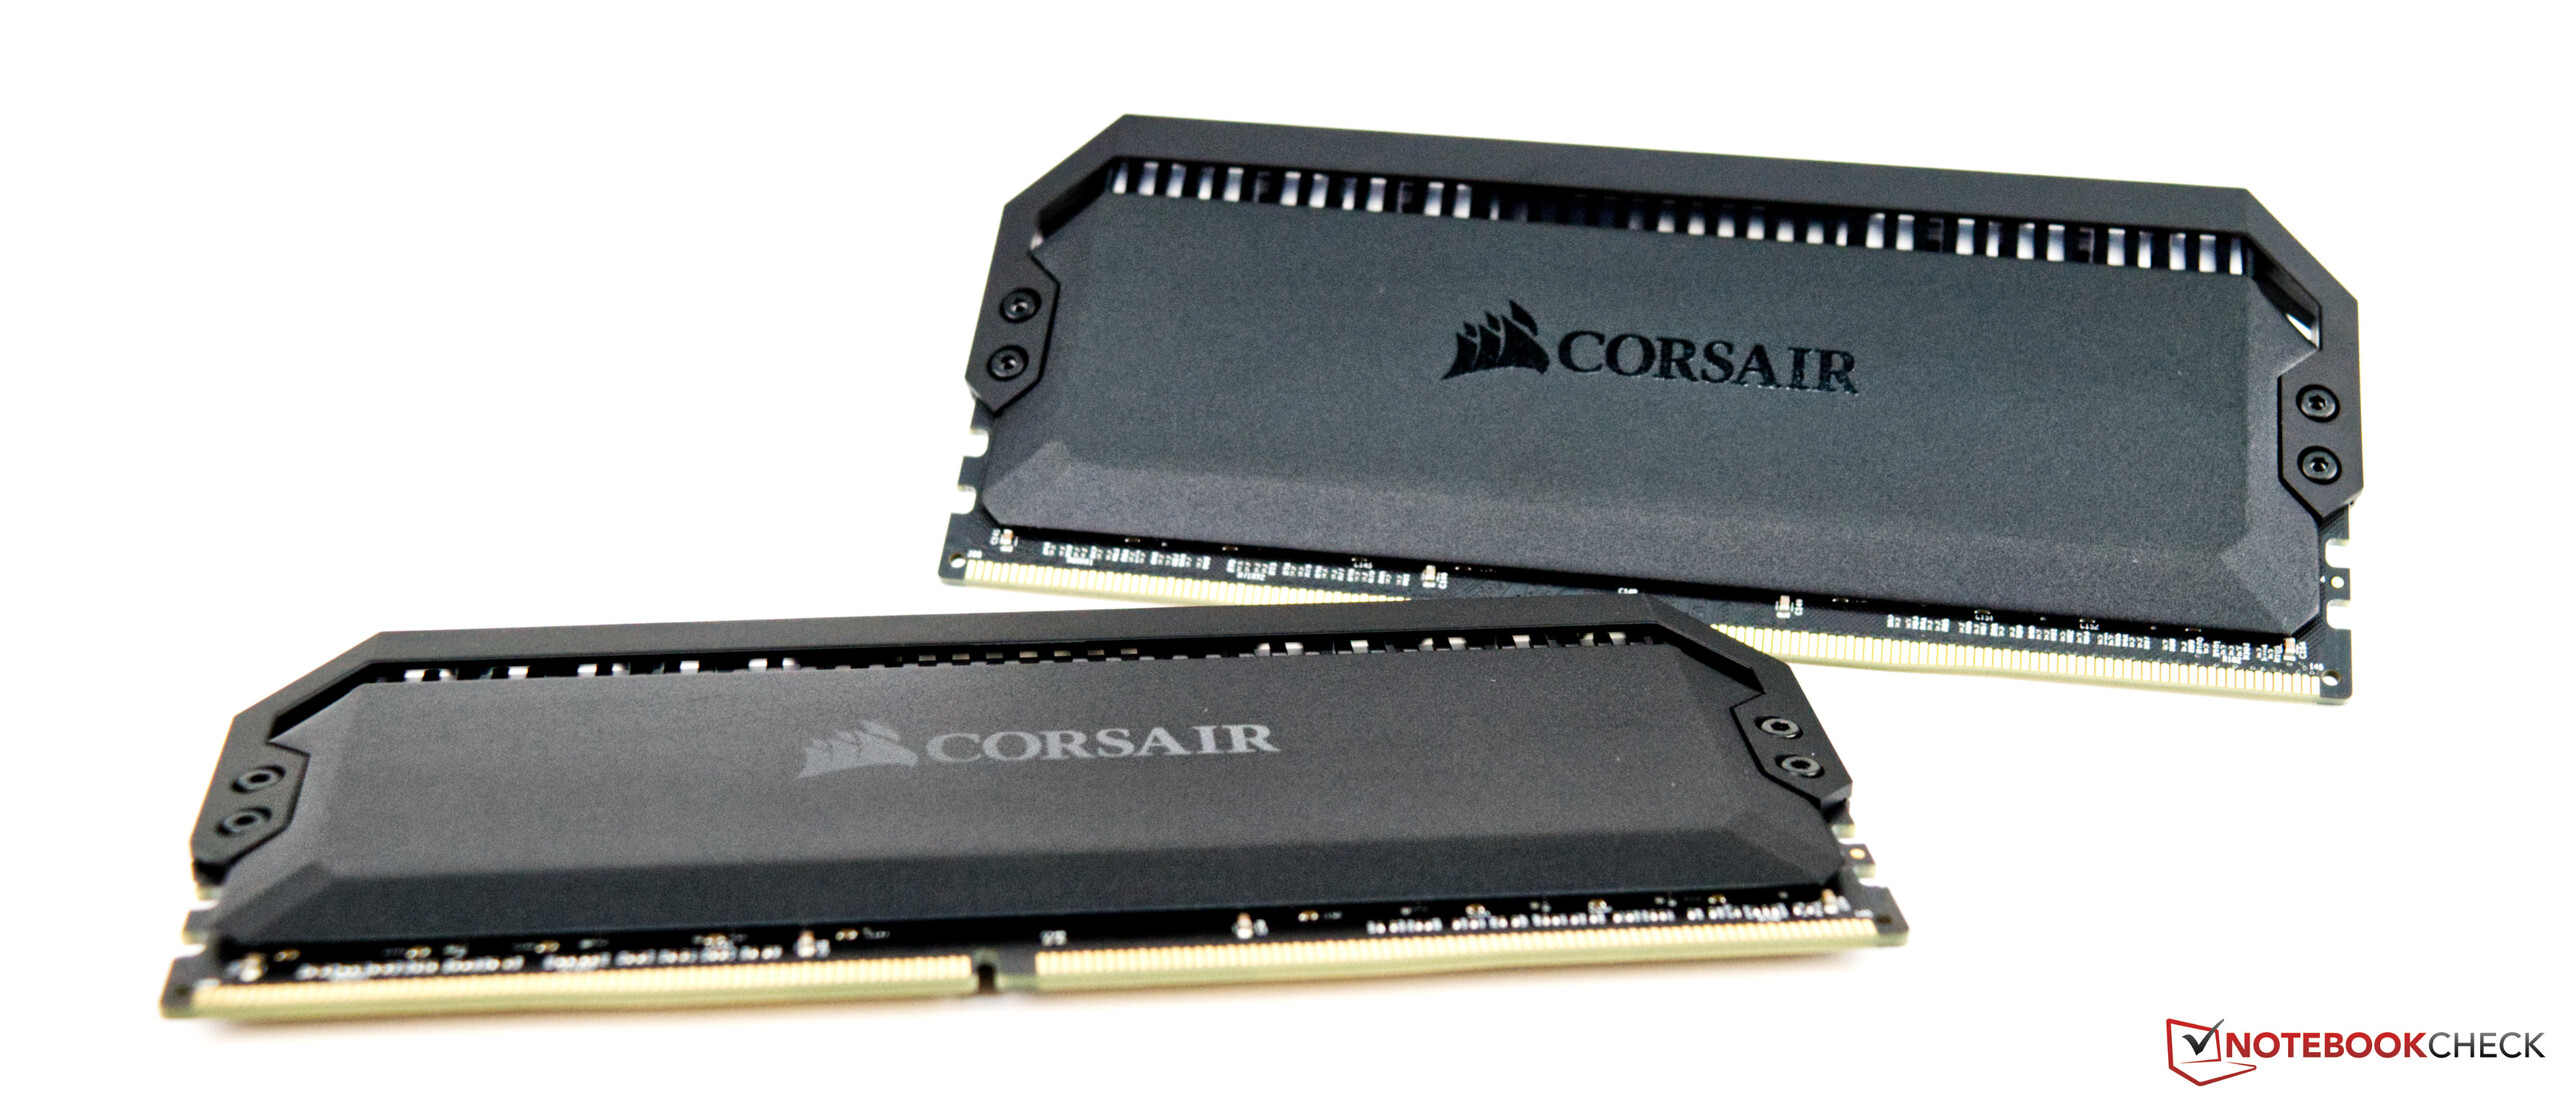
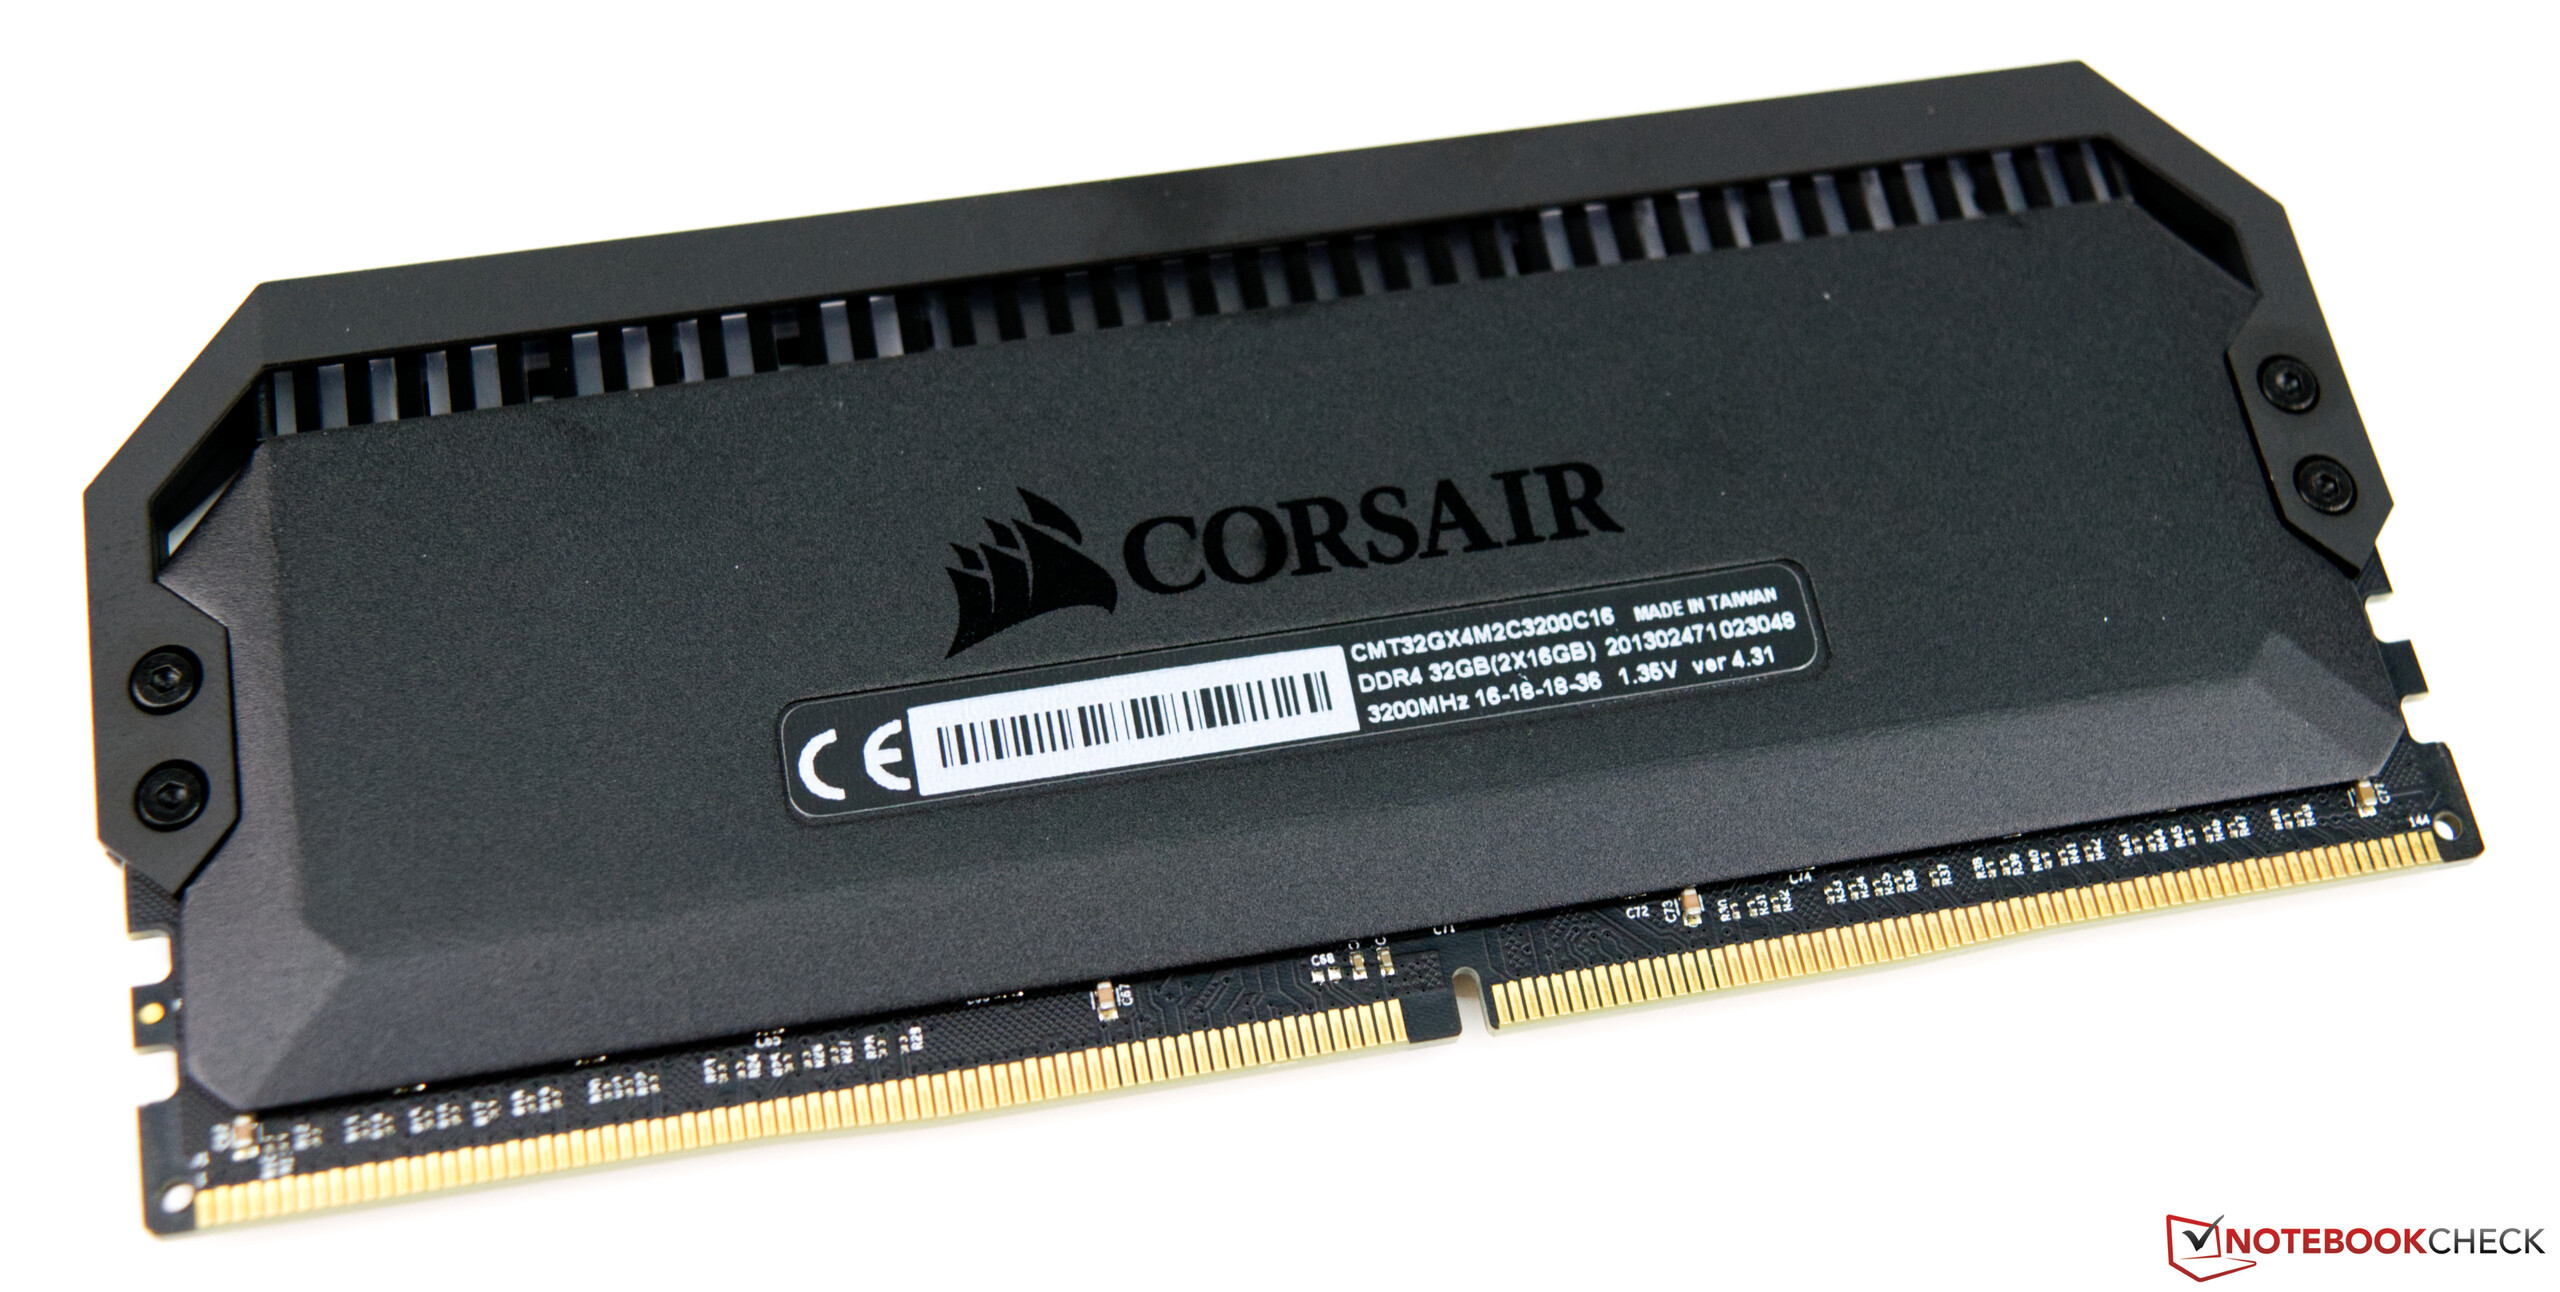
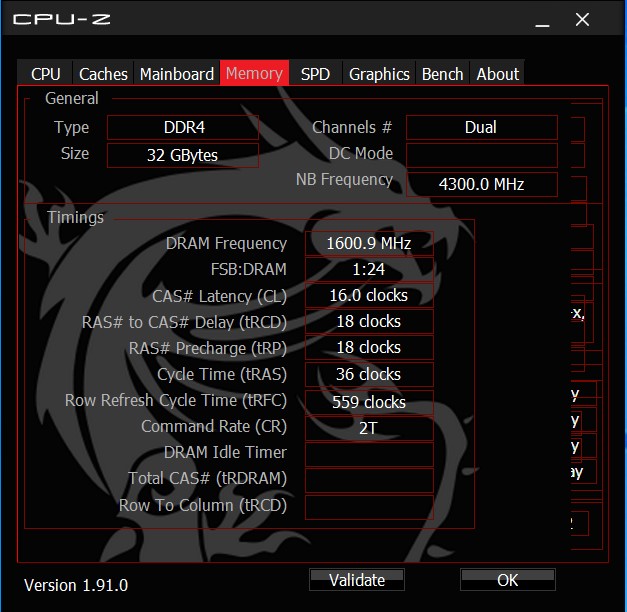
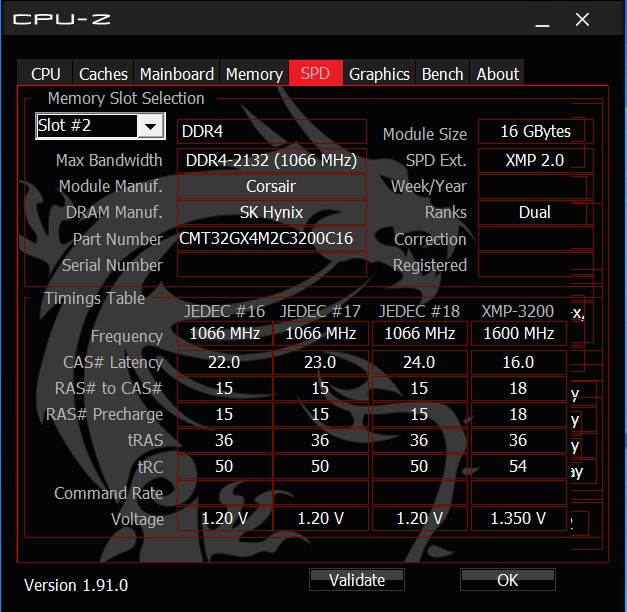
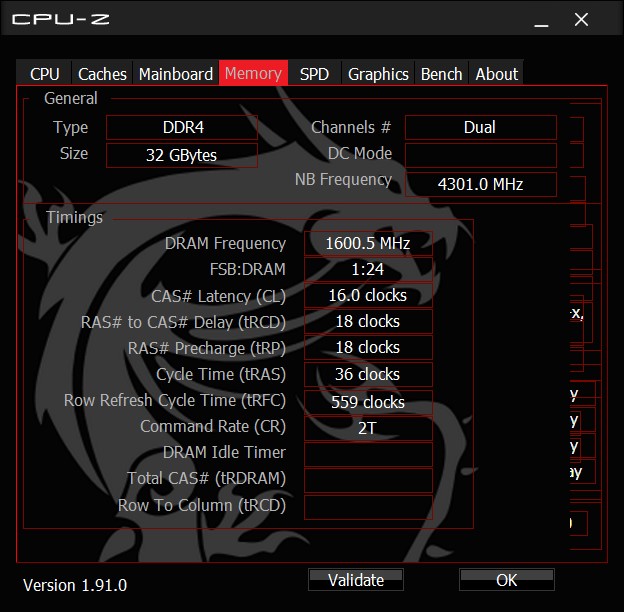
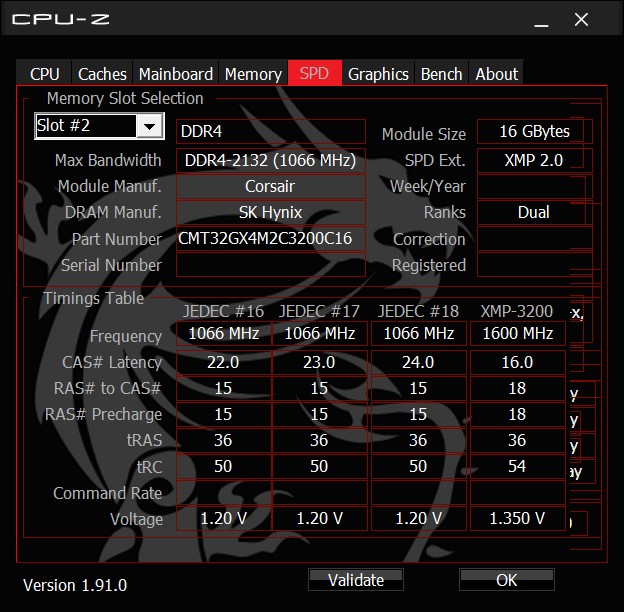
- Corsair Dominator Platinum RGB (2x 16GB - DDR4-3200)
- Western Digital PC SN720 NVMe SSD 512GB
- Microsoft Windows 10 Professional 64-Bit (Version 1909)
Intel nos suministró tanto las CPU como la RAM. MSI nos proporcionó la placa madre y nuestro caso viene de Raijintek Paean. Para nuestra solución de refrigeración, usamos el Alphacool Eisbaer 280 AiO.
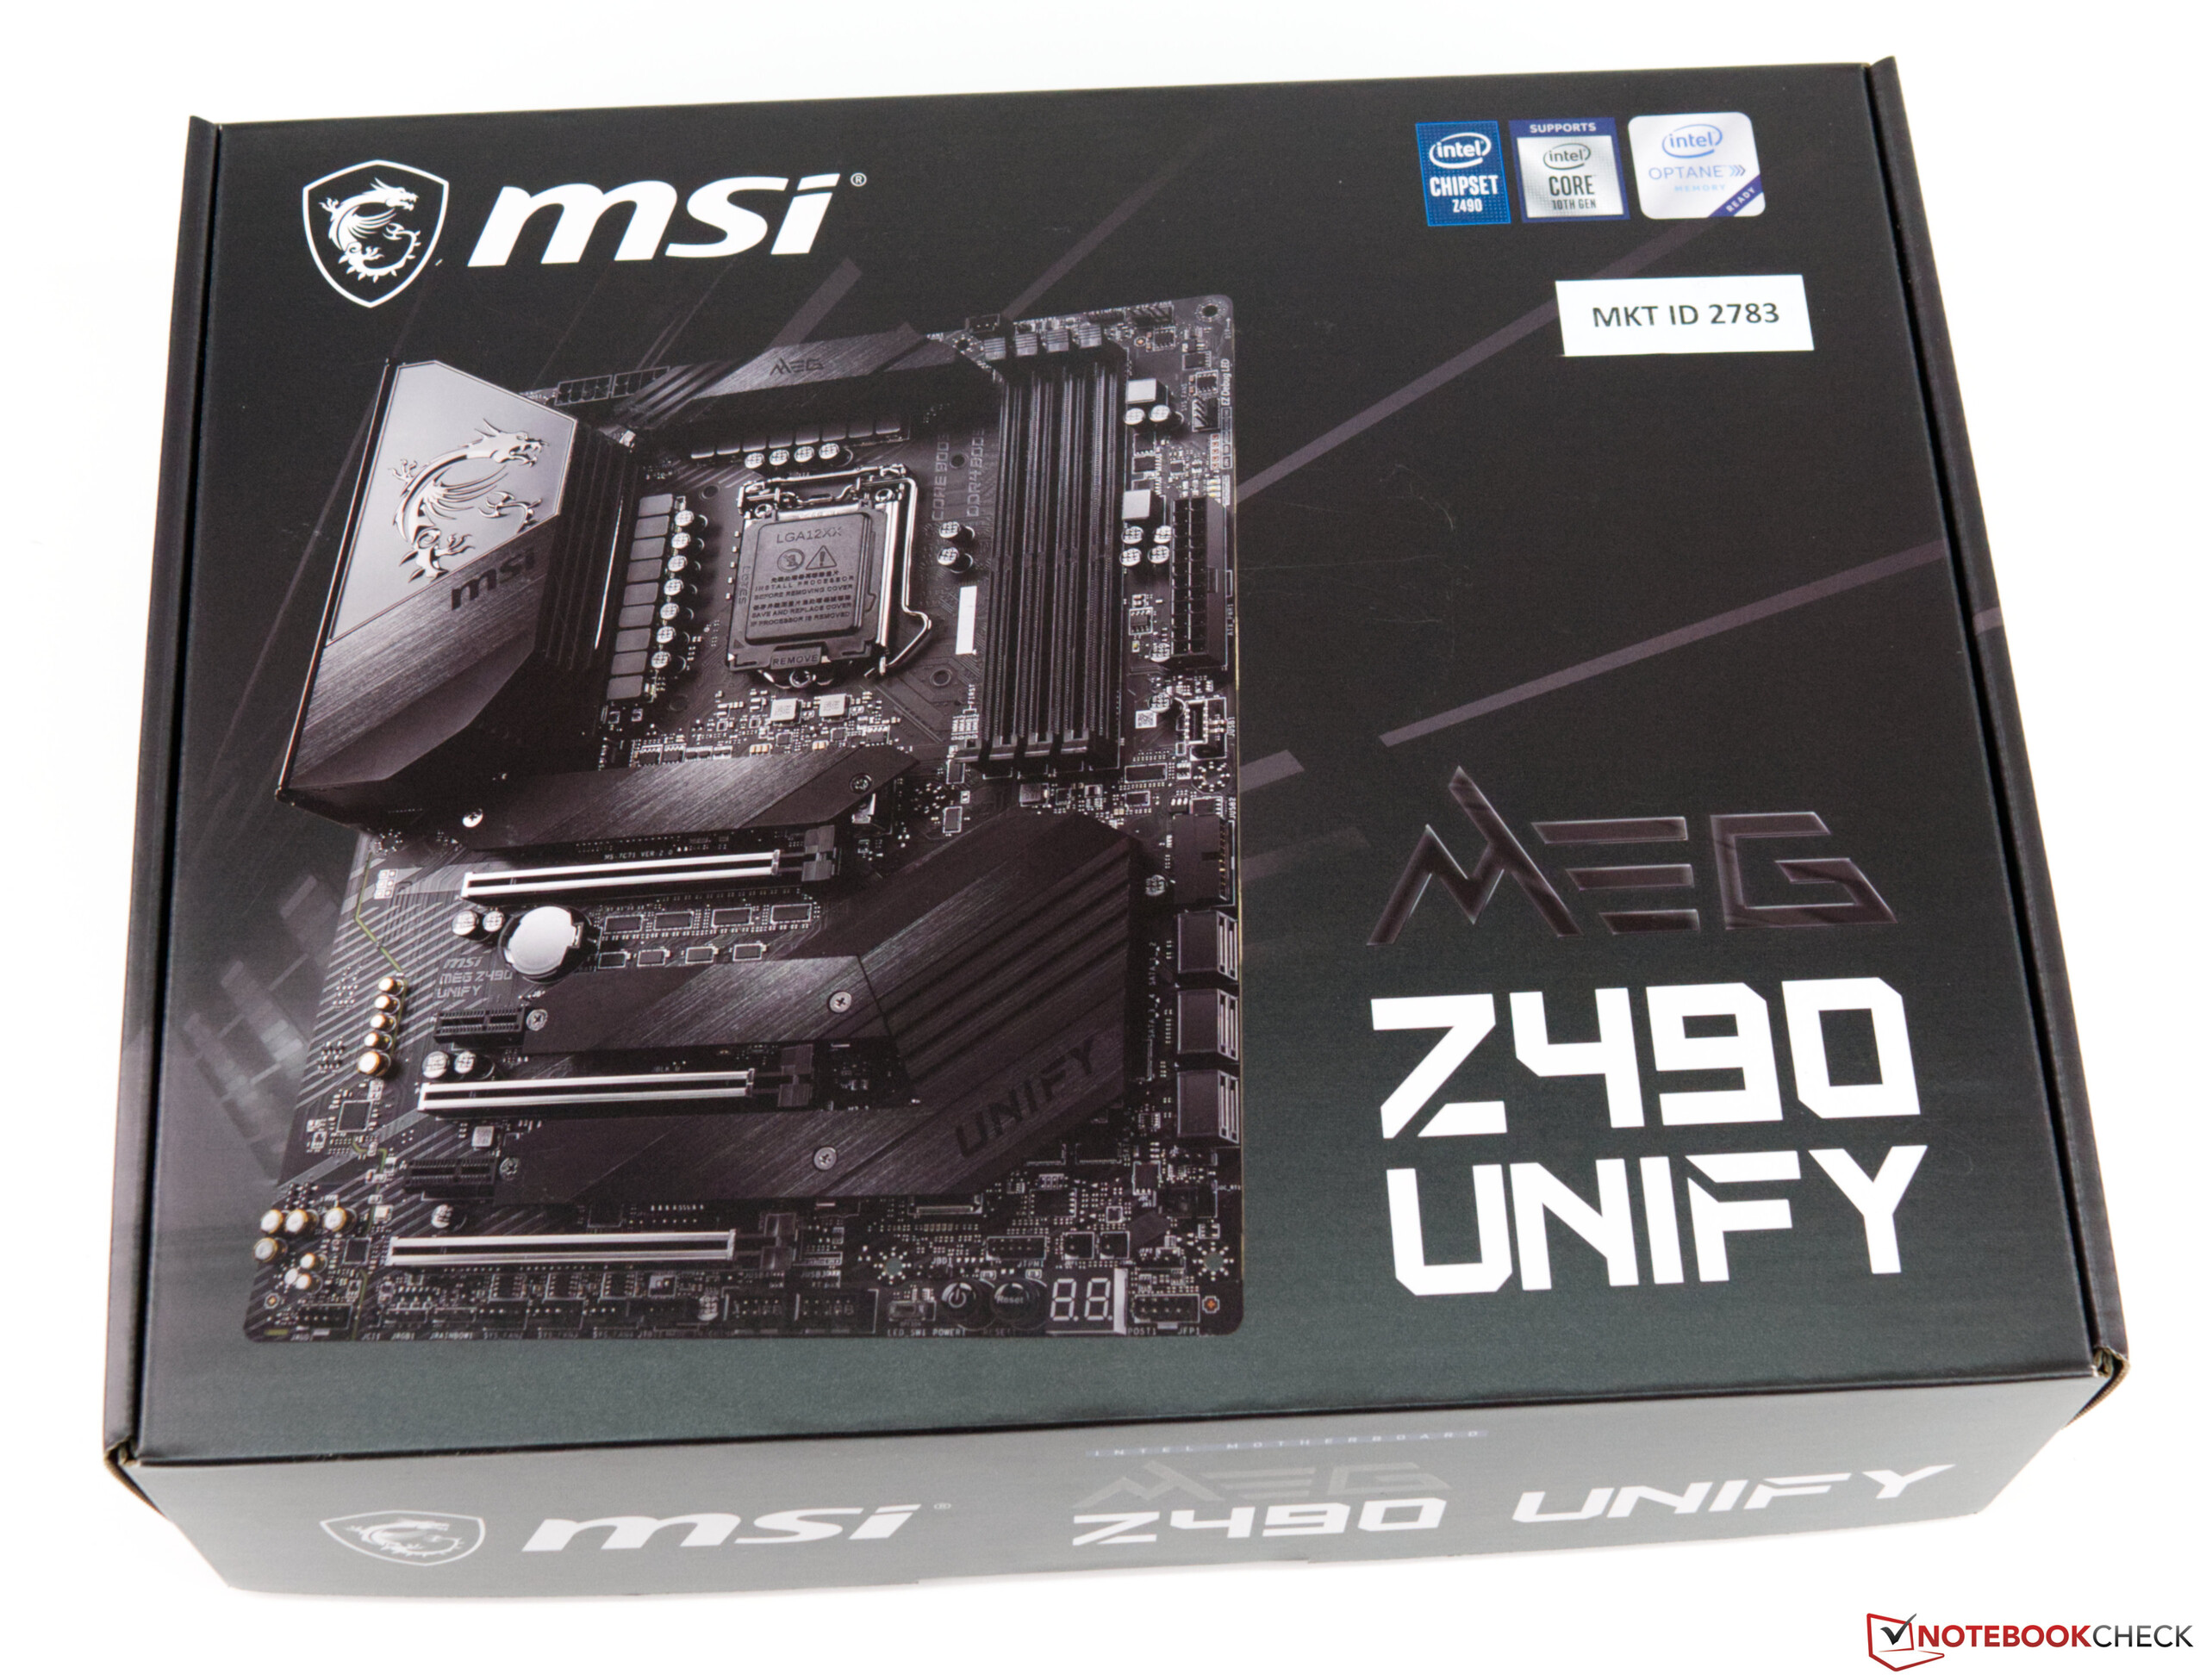
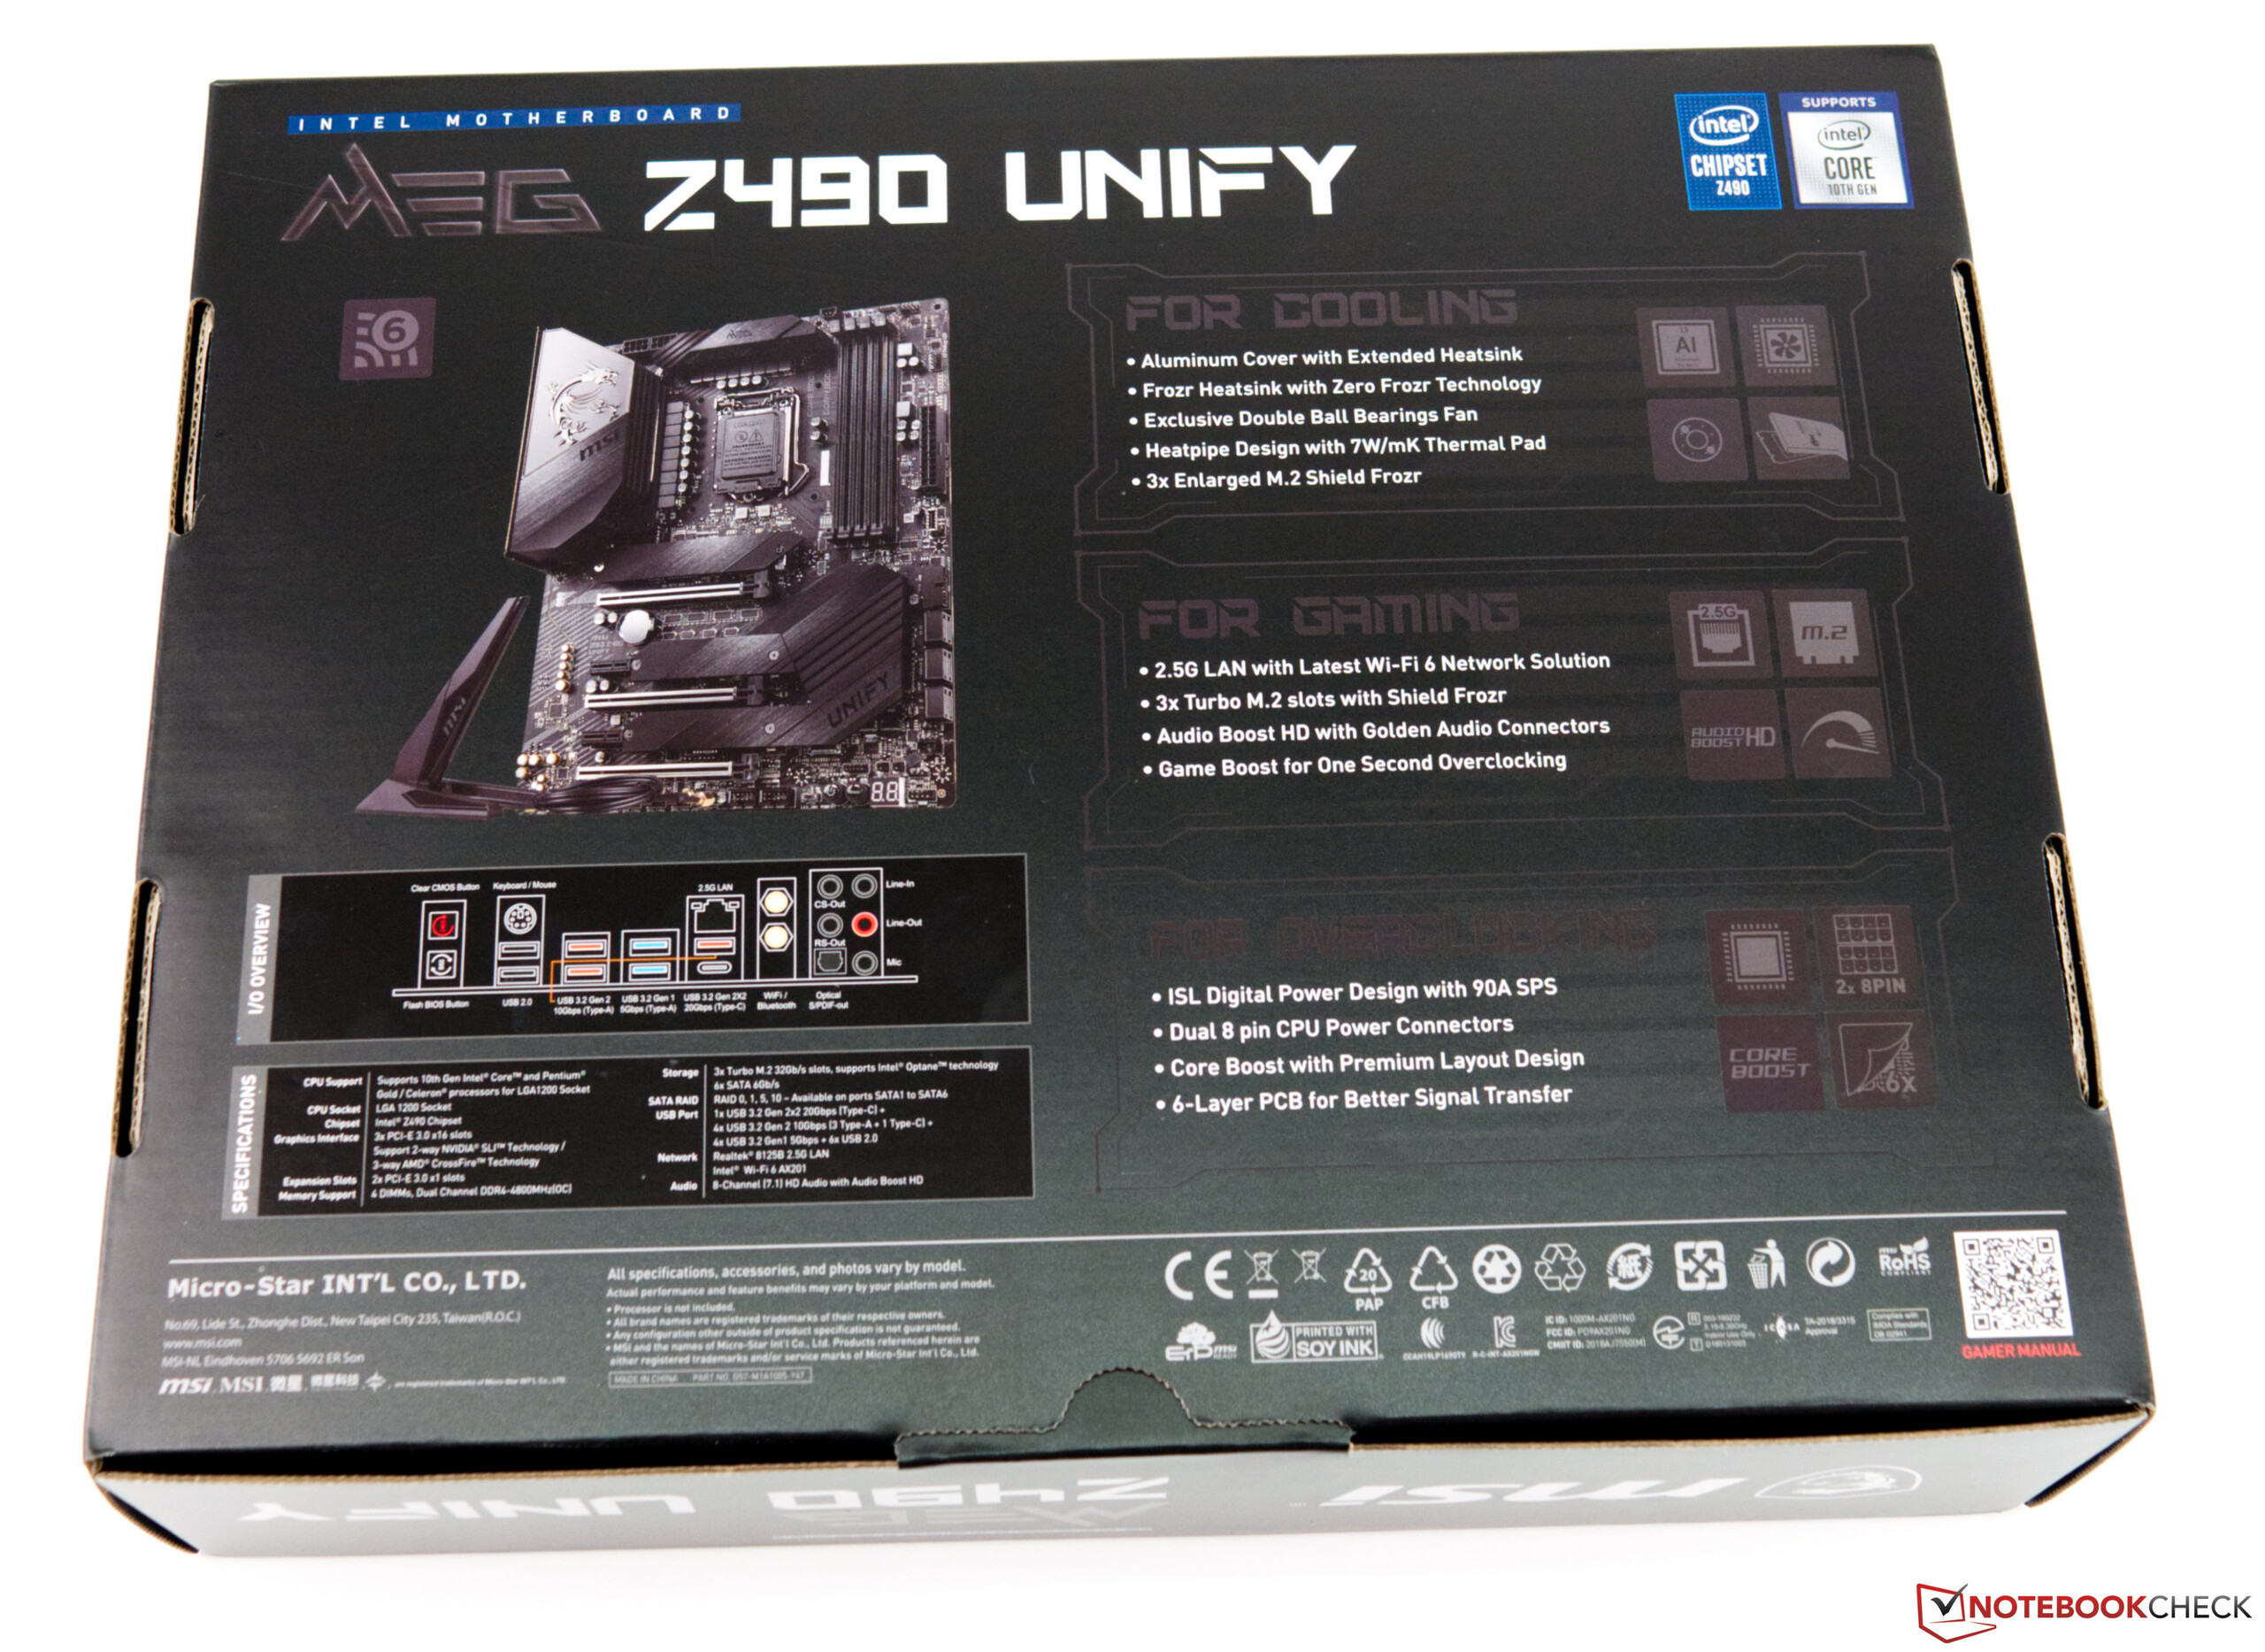
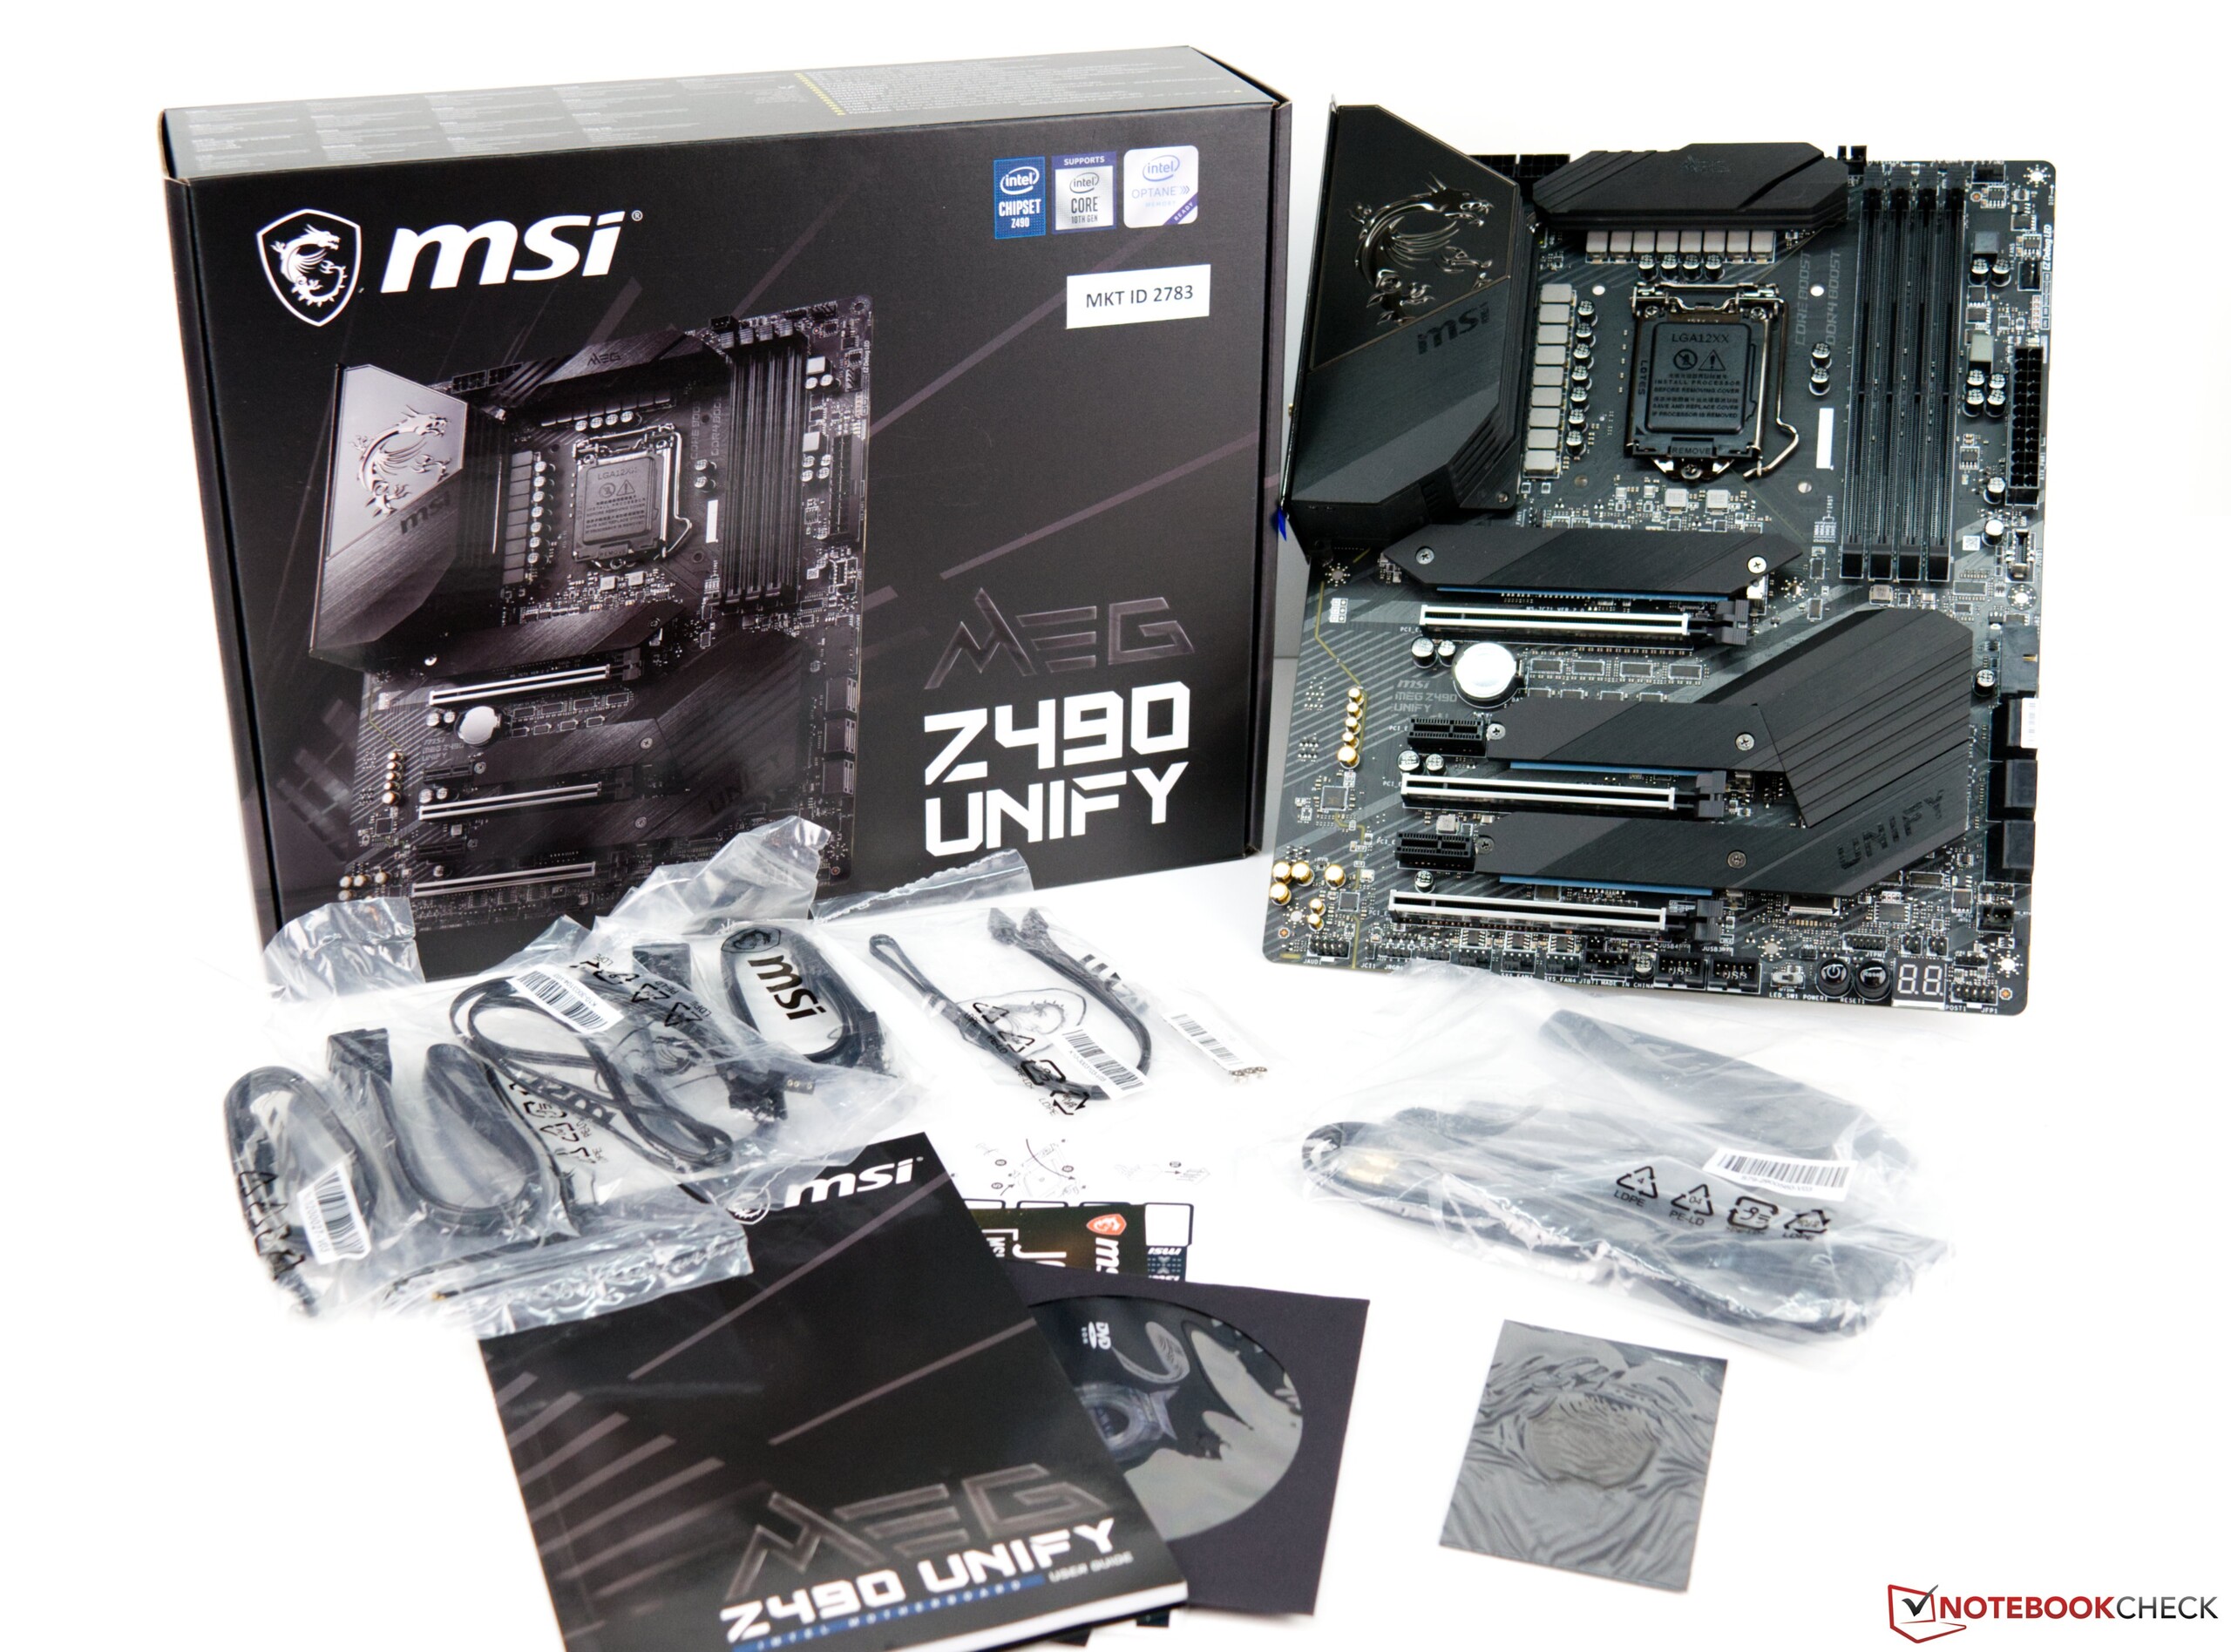
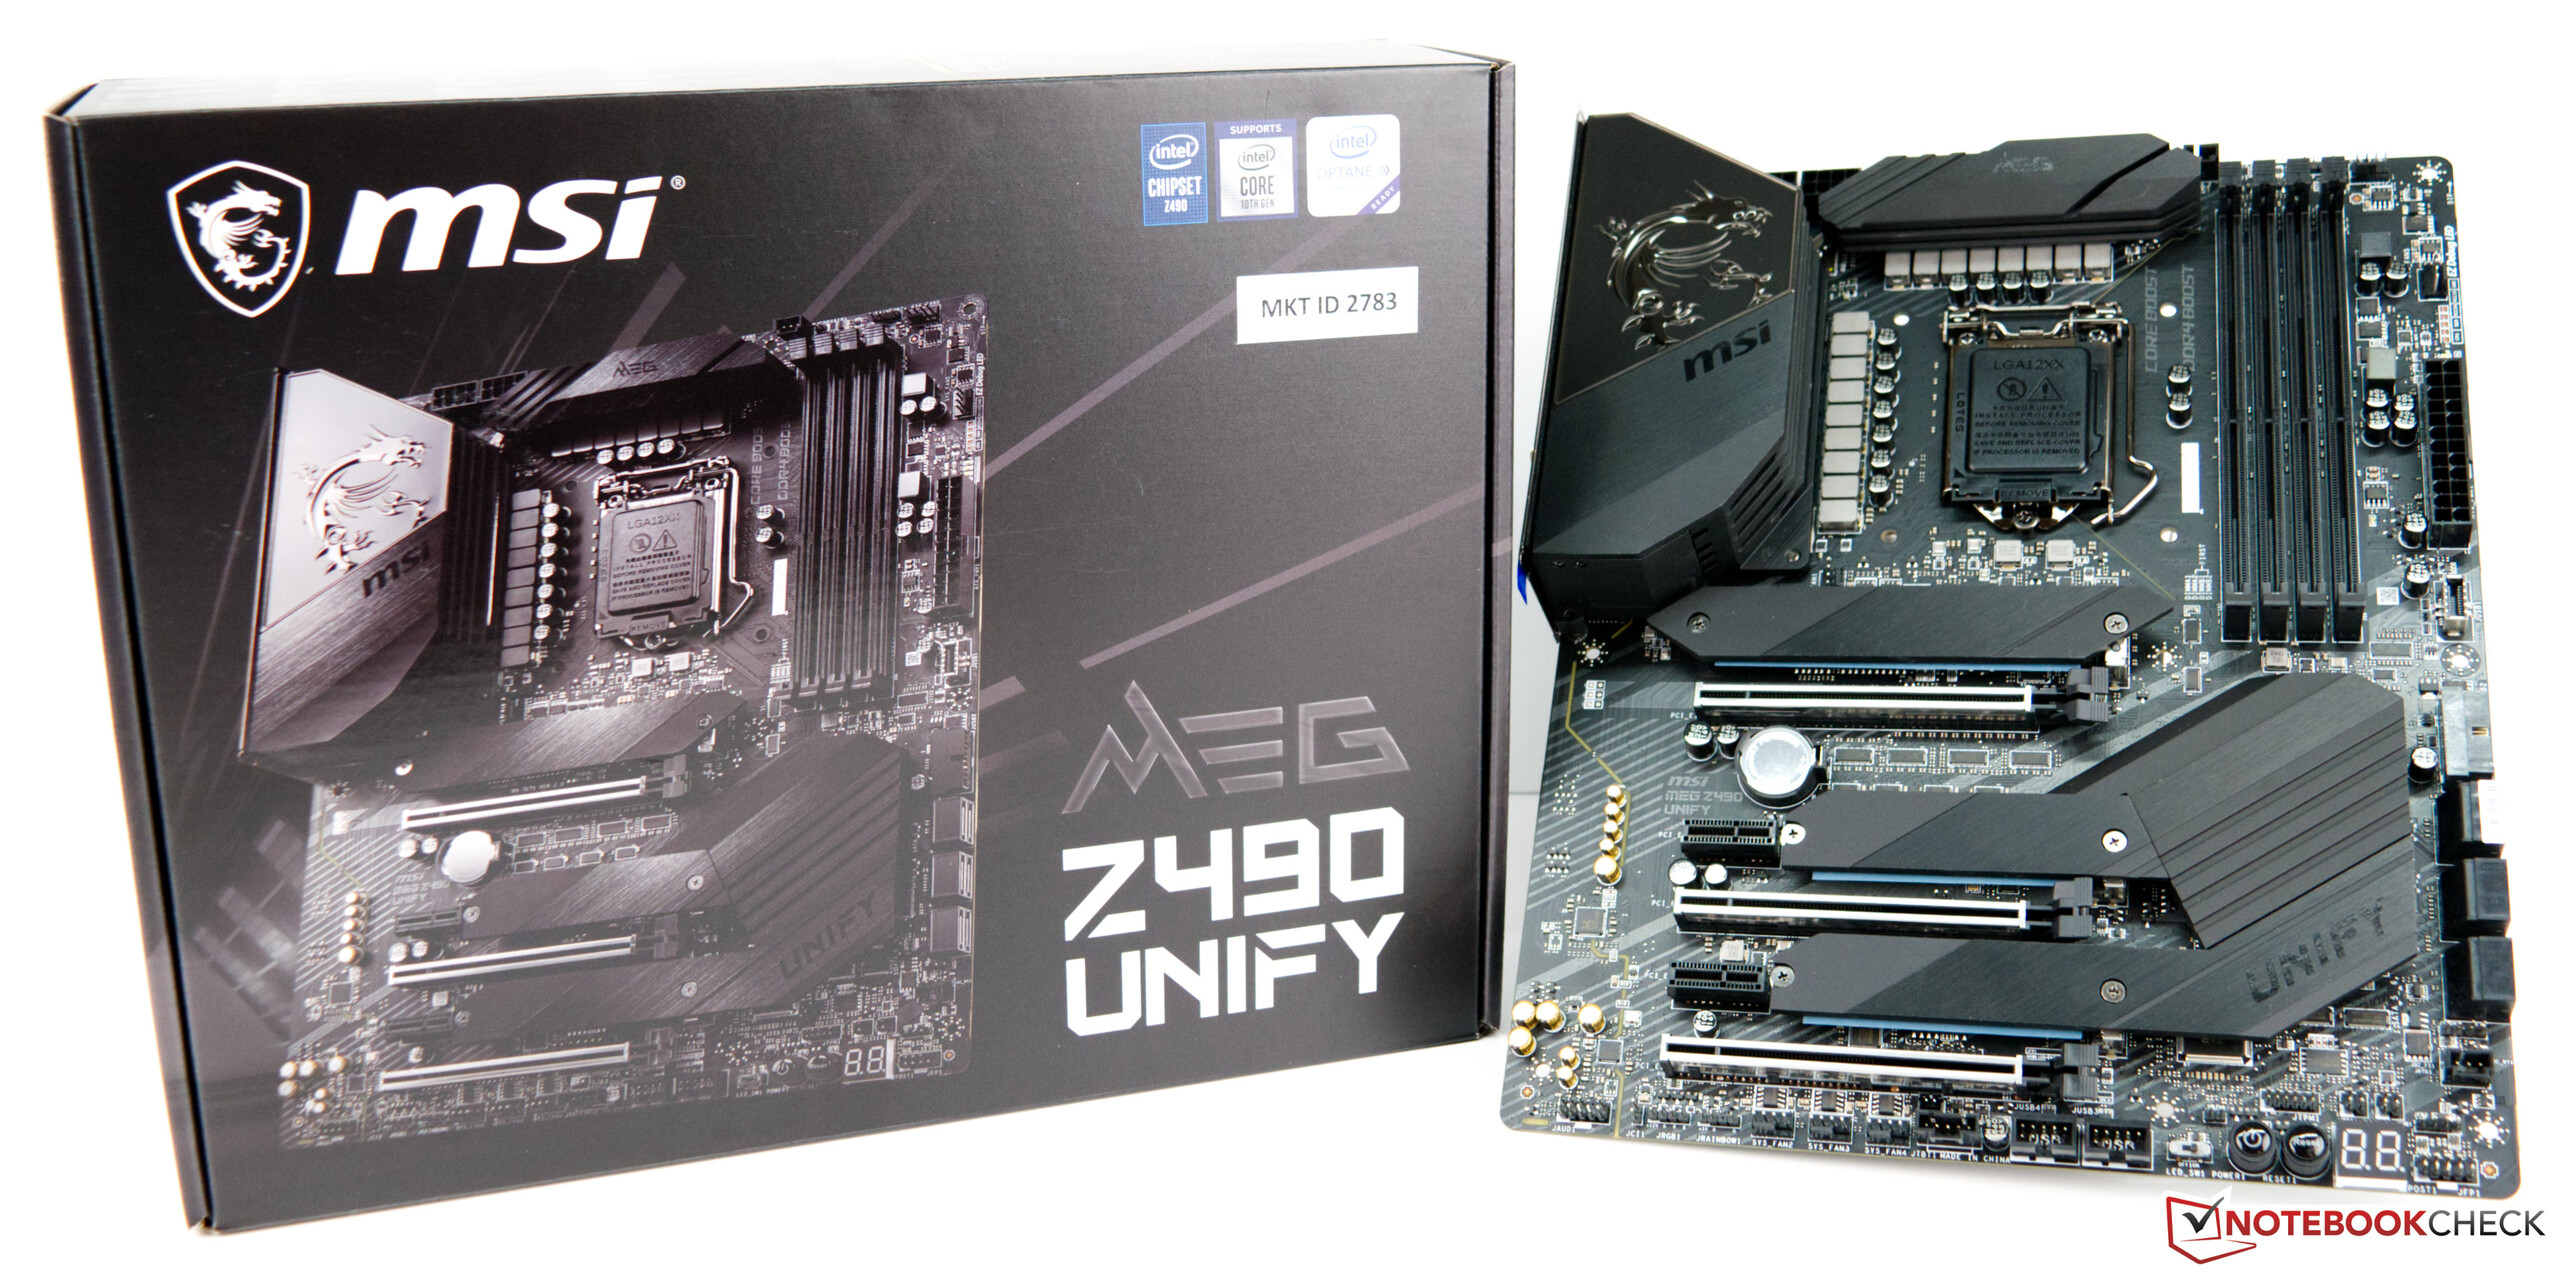
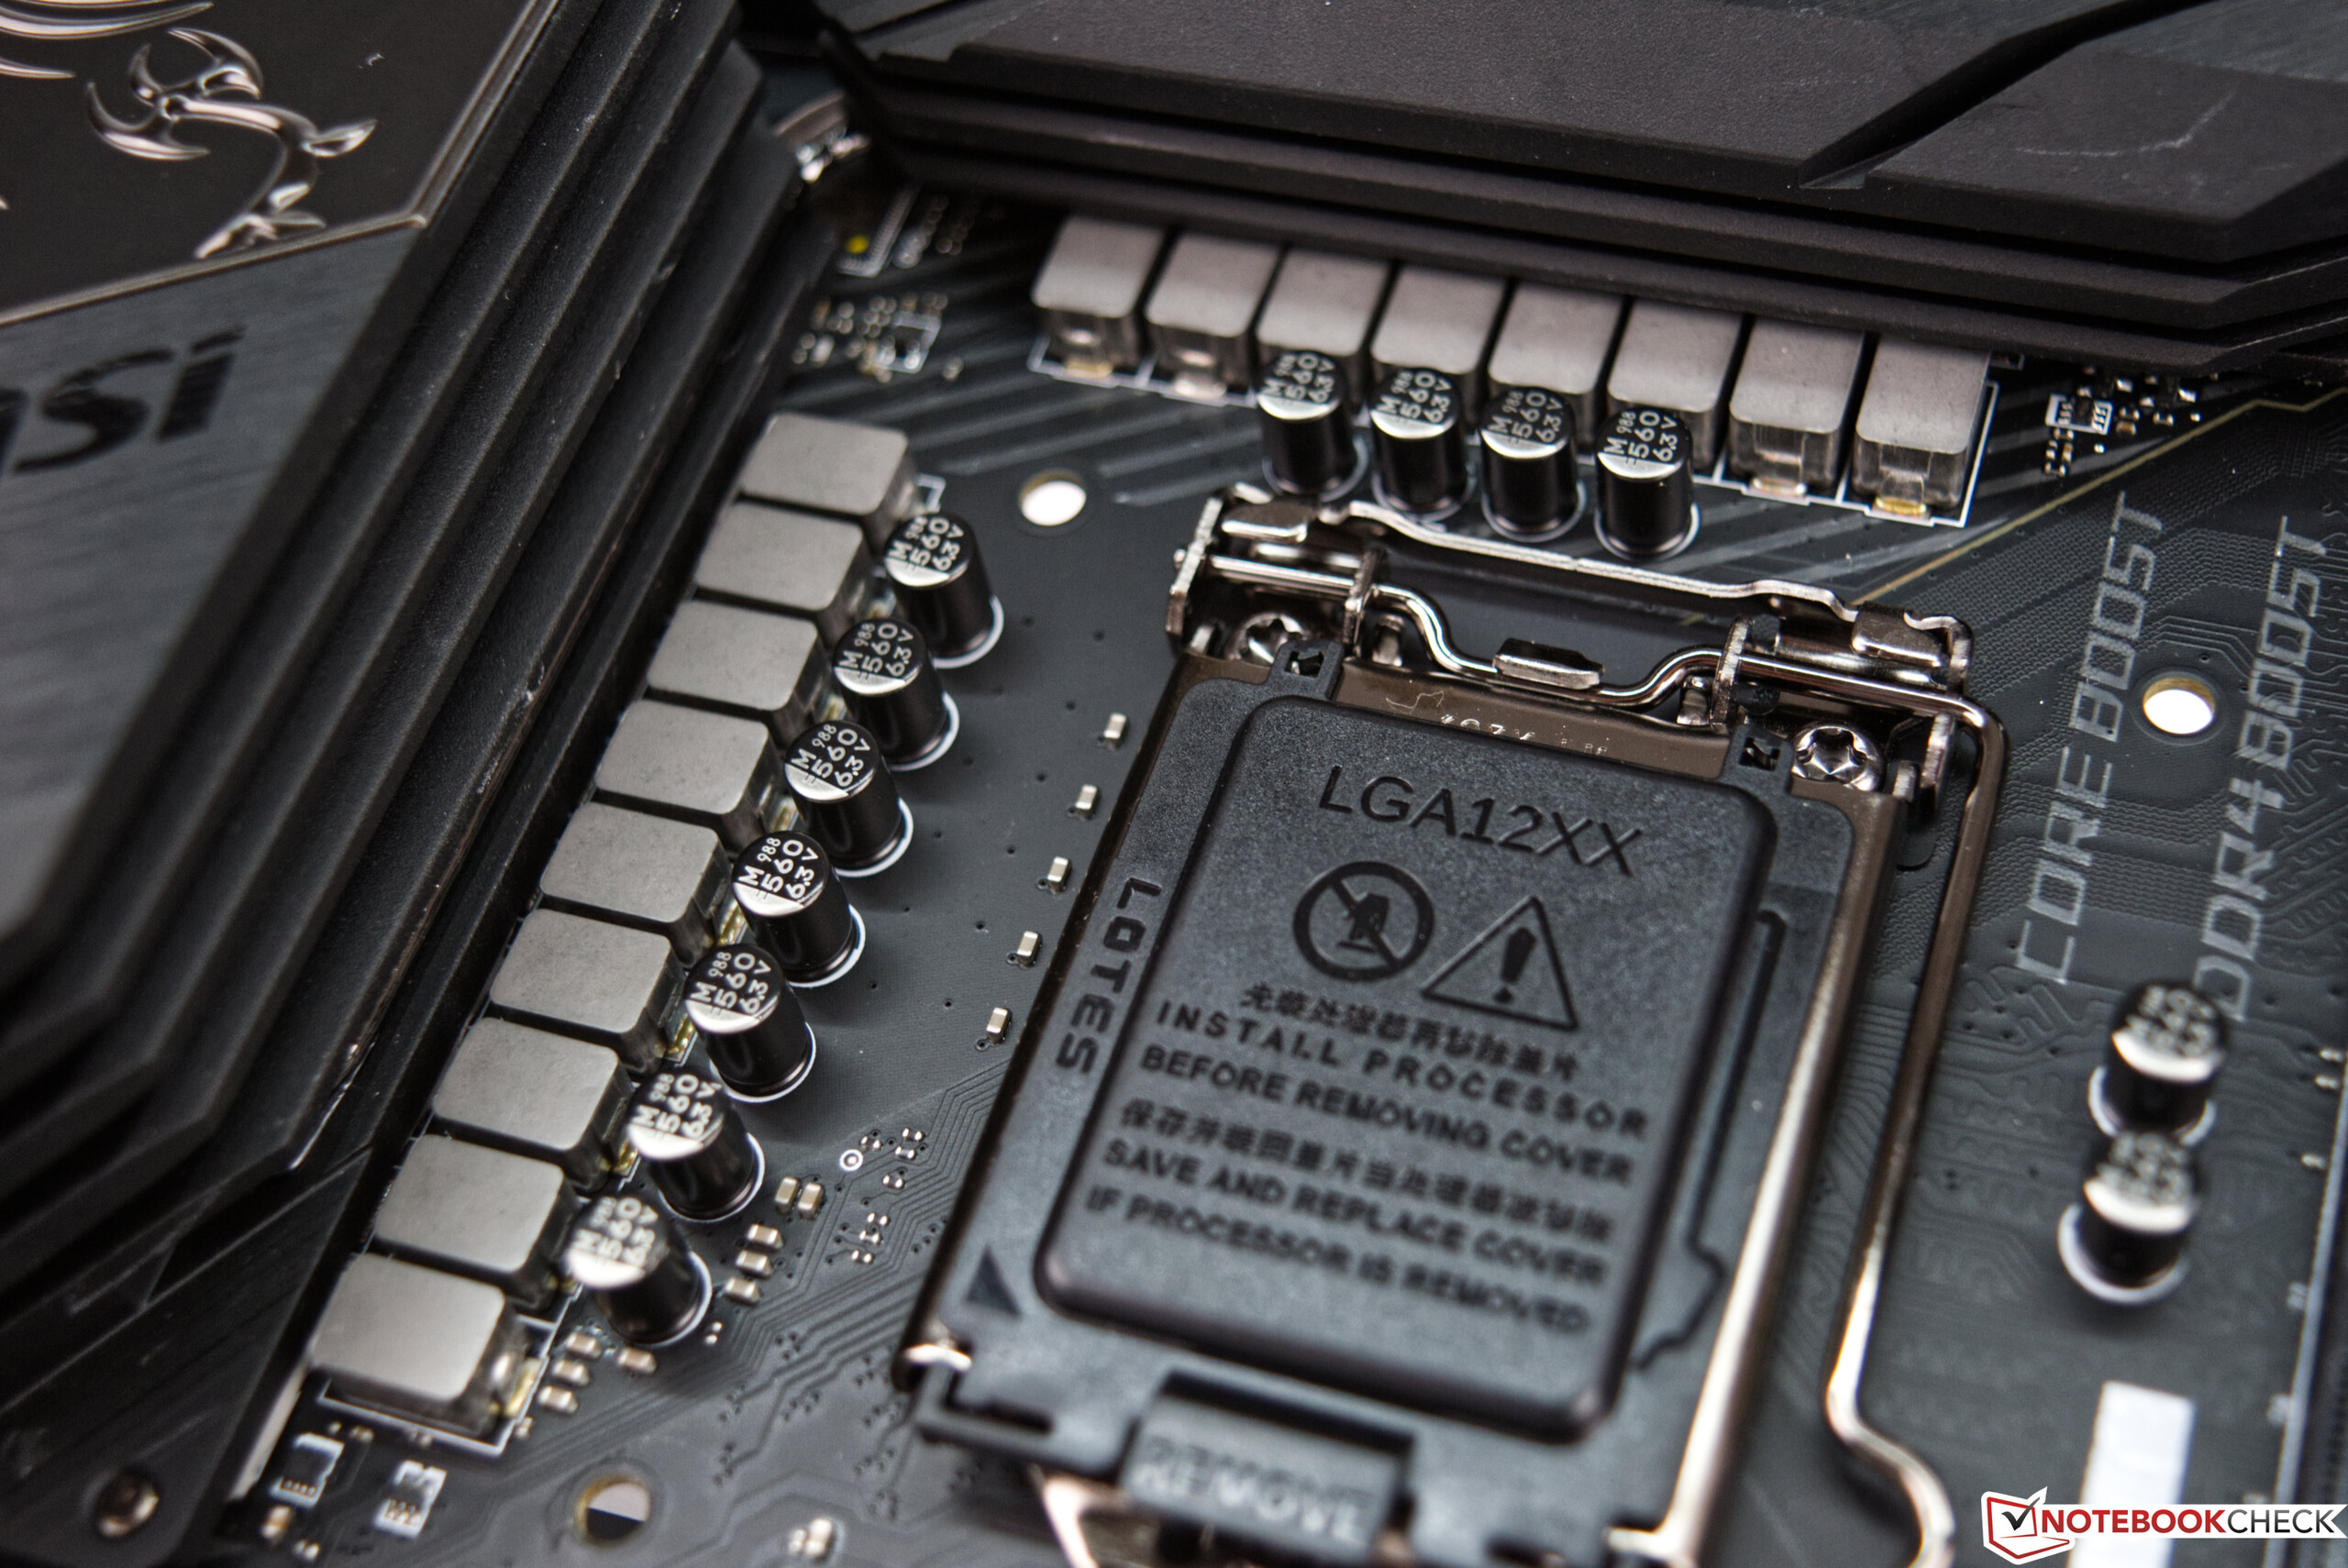
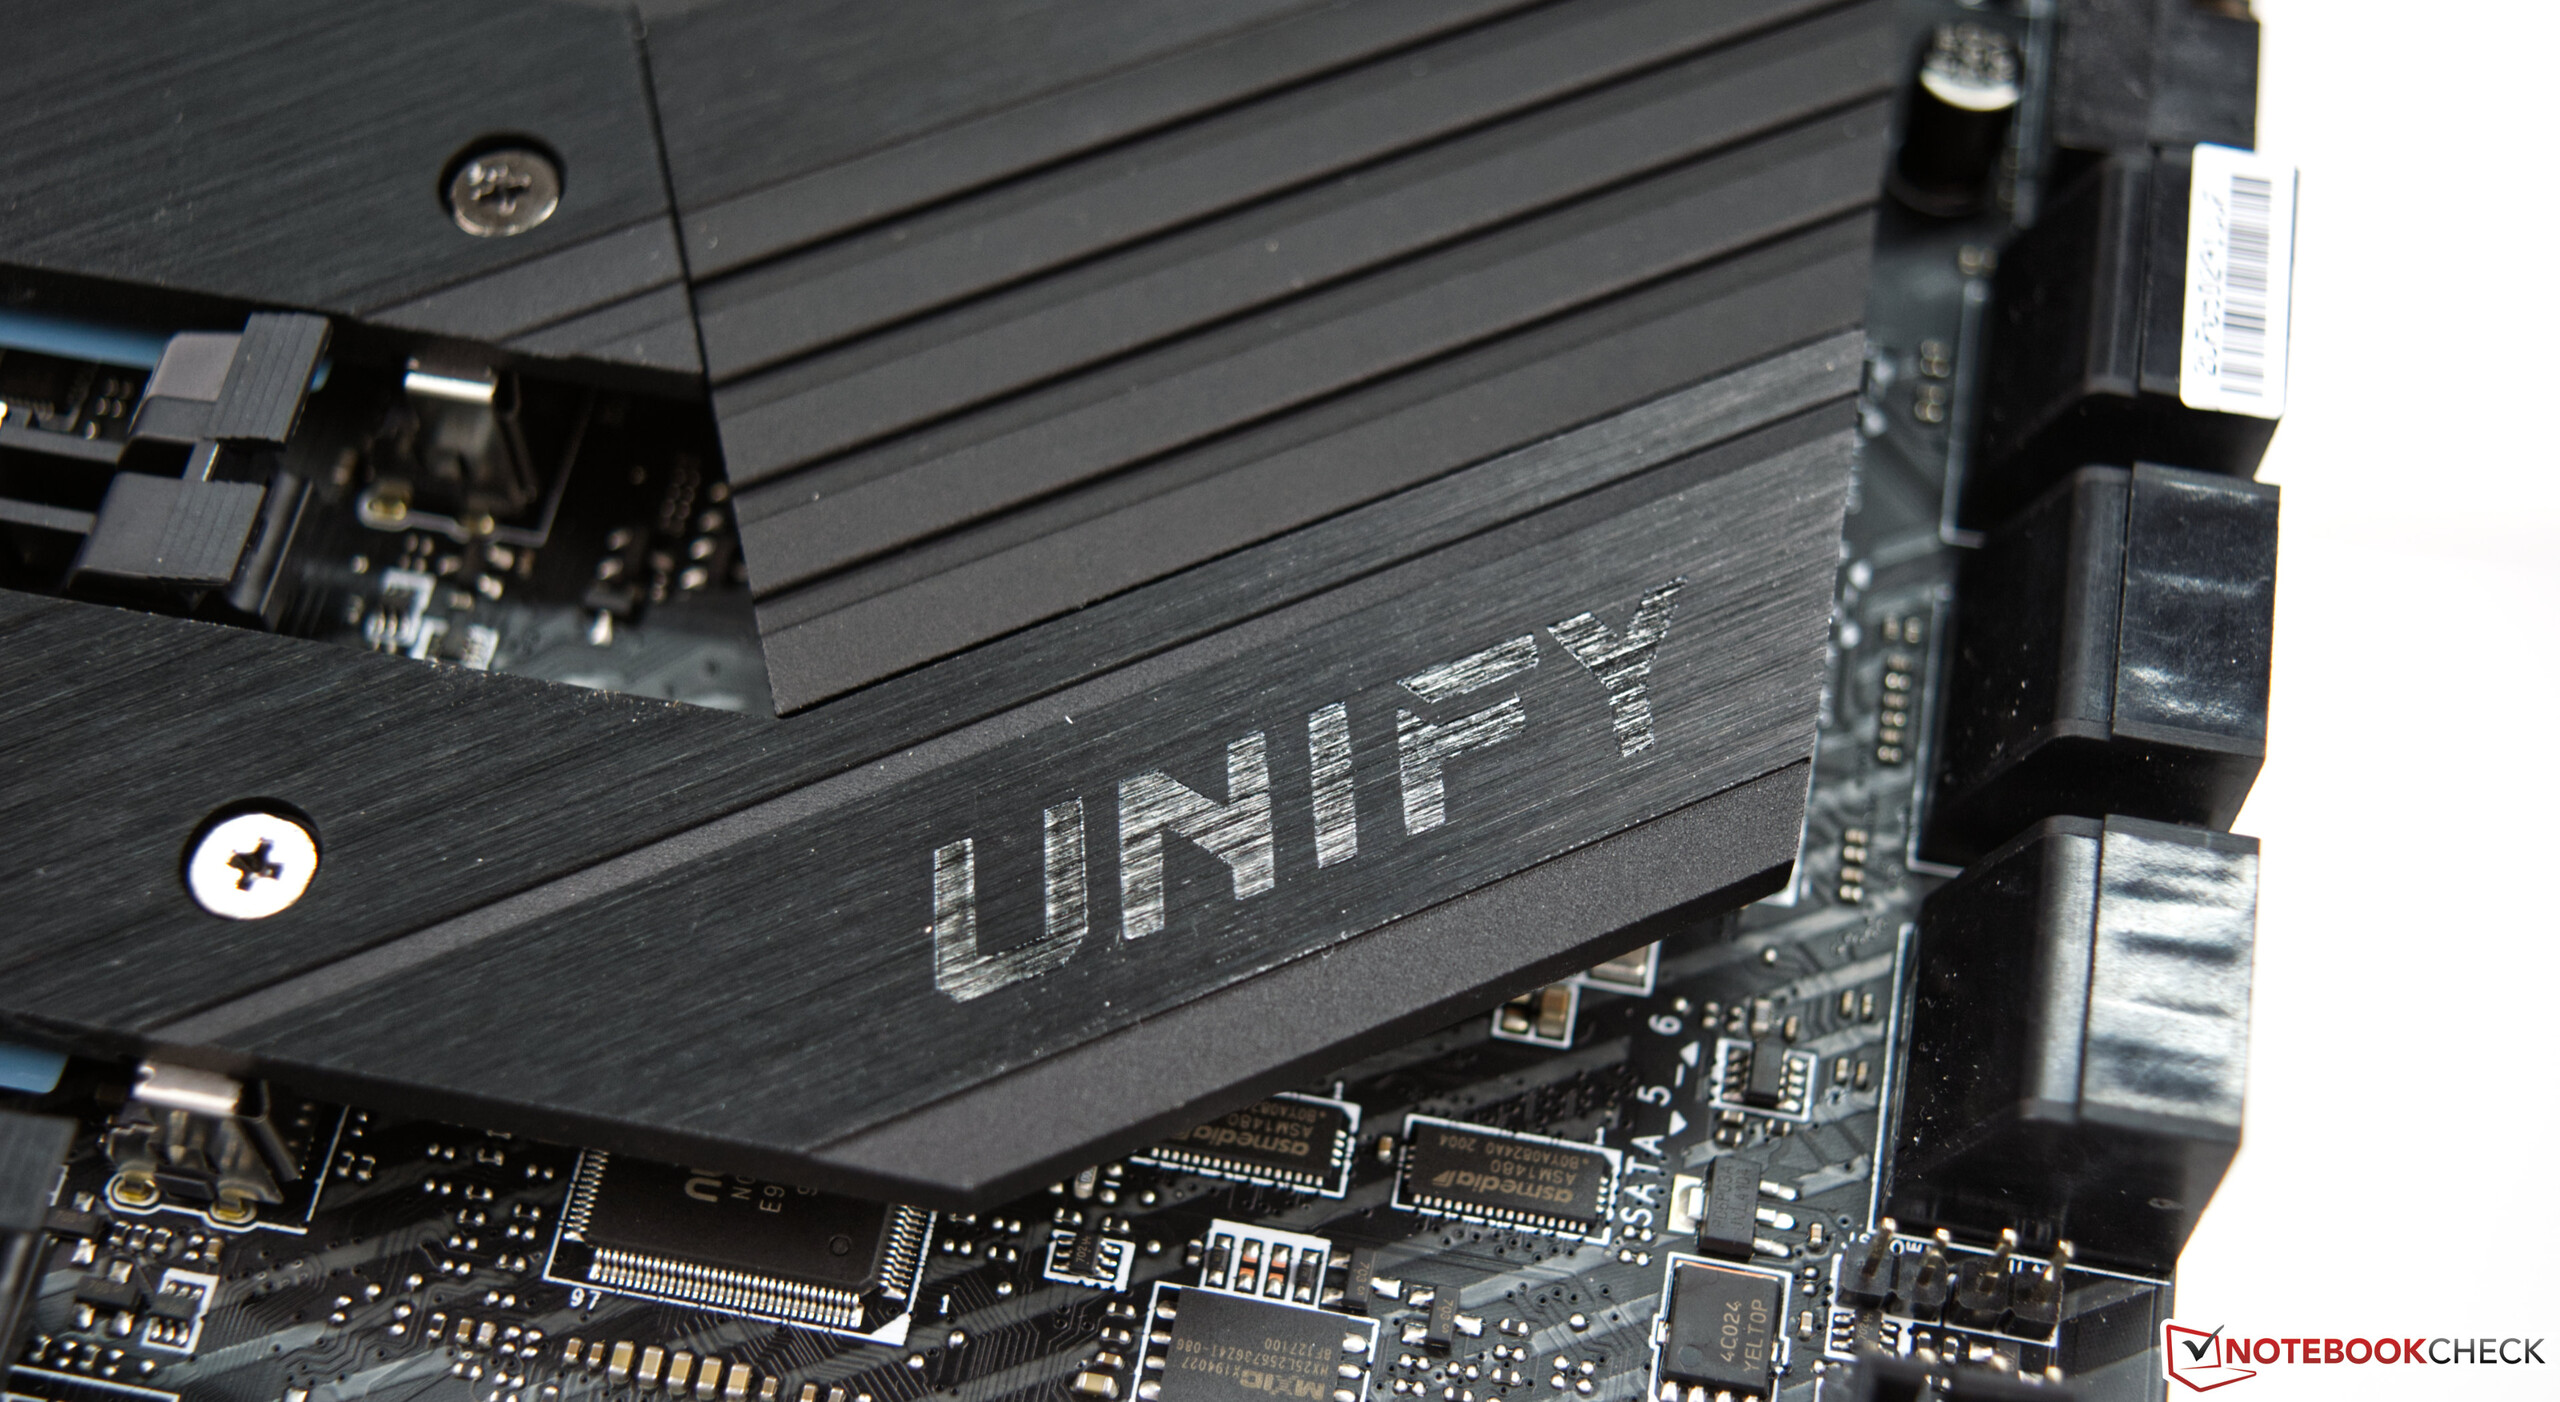
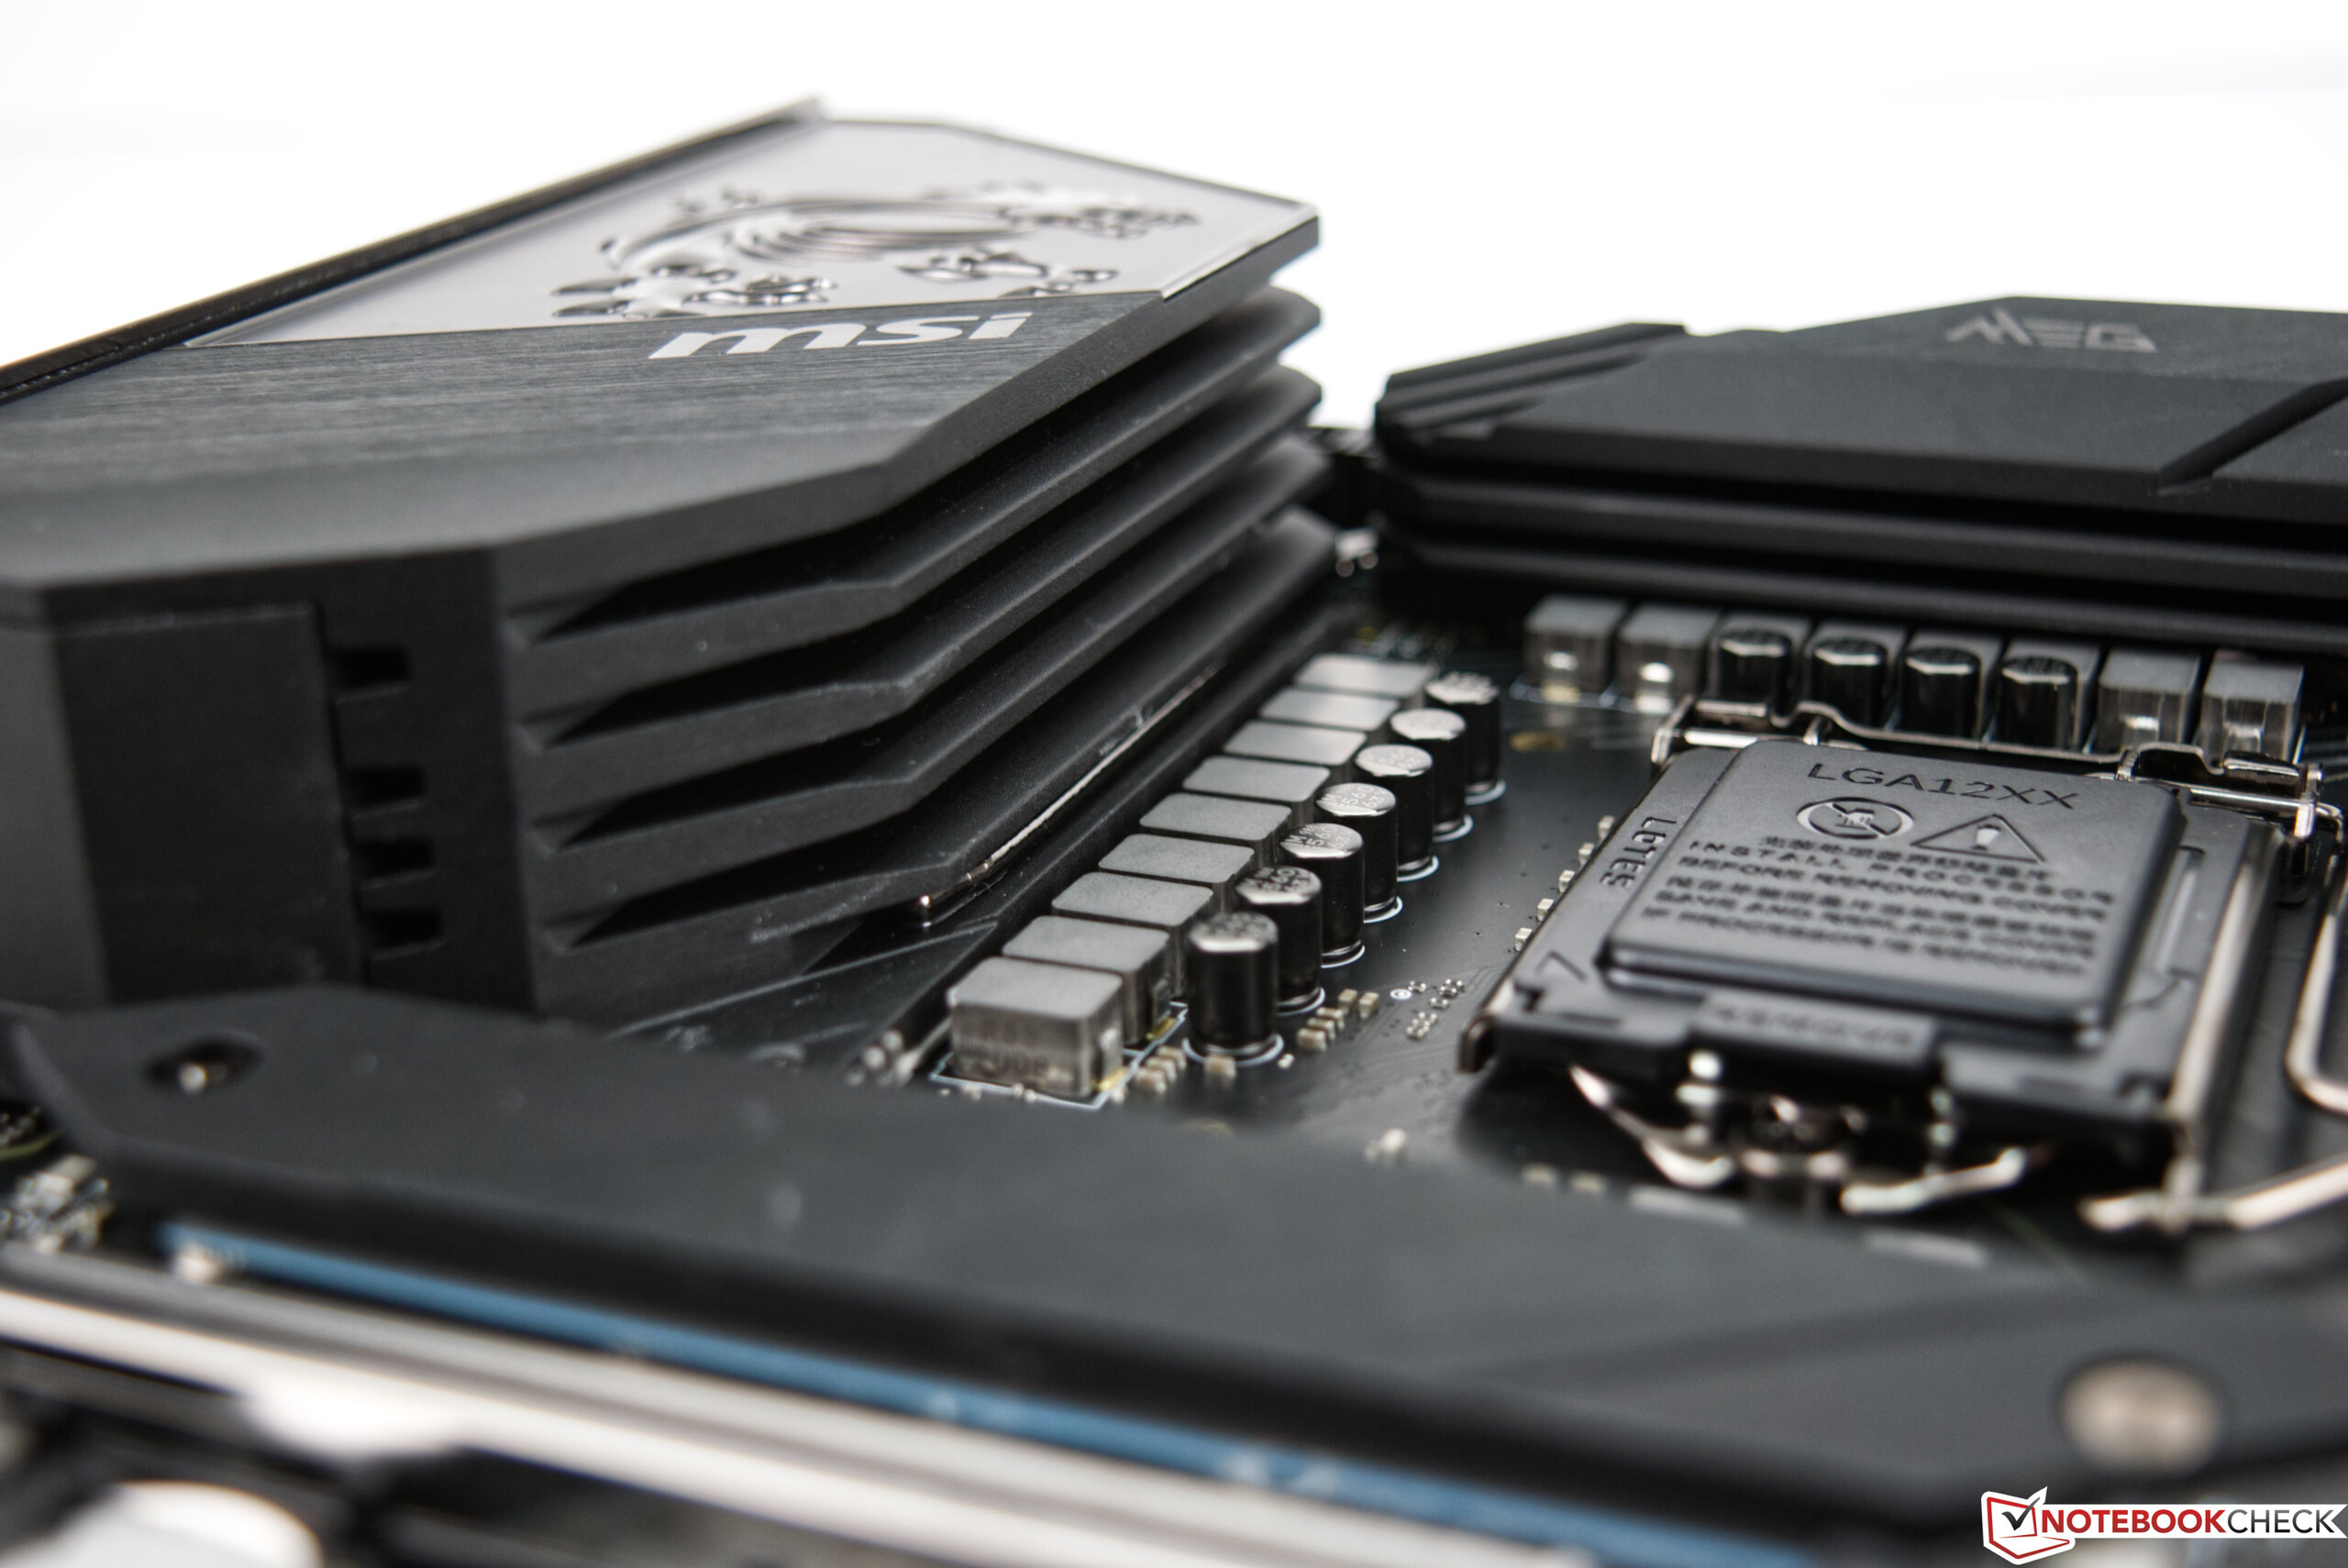
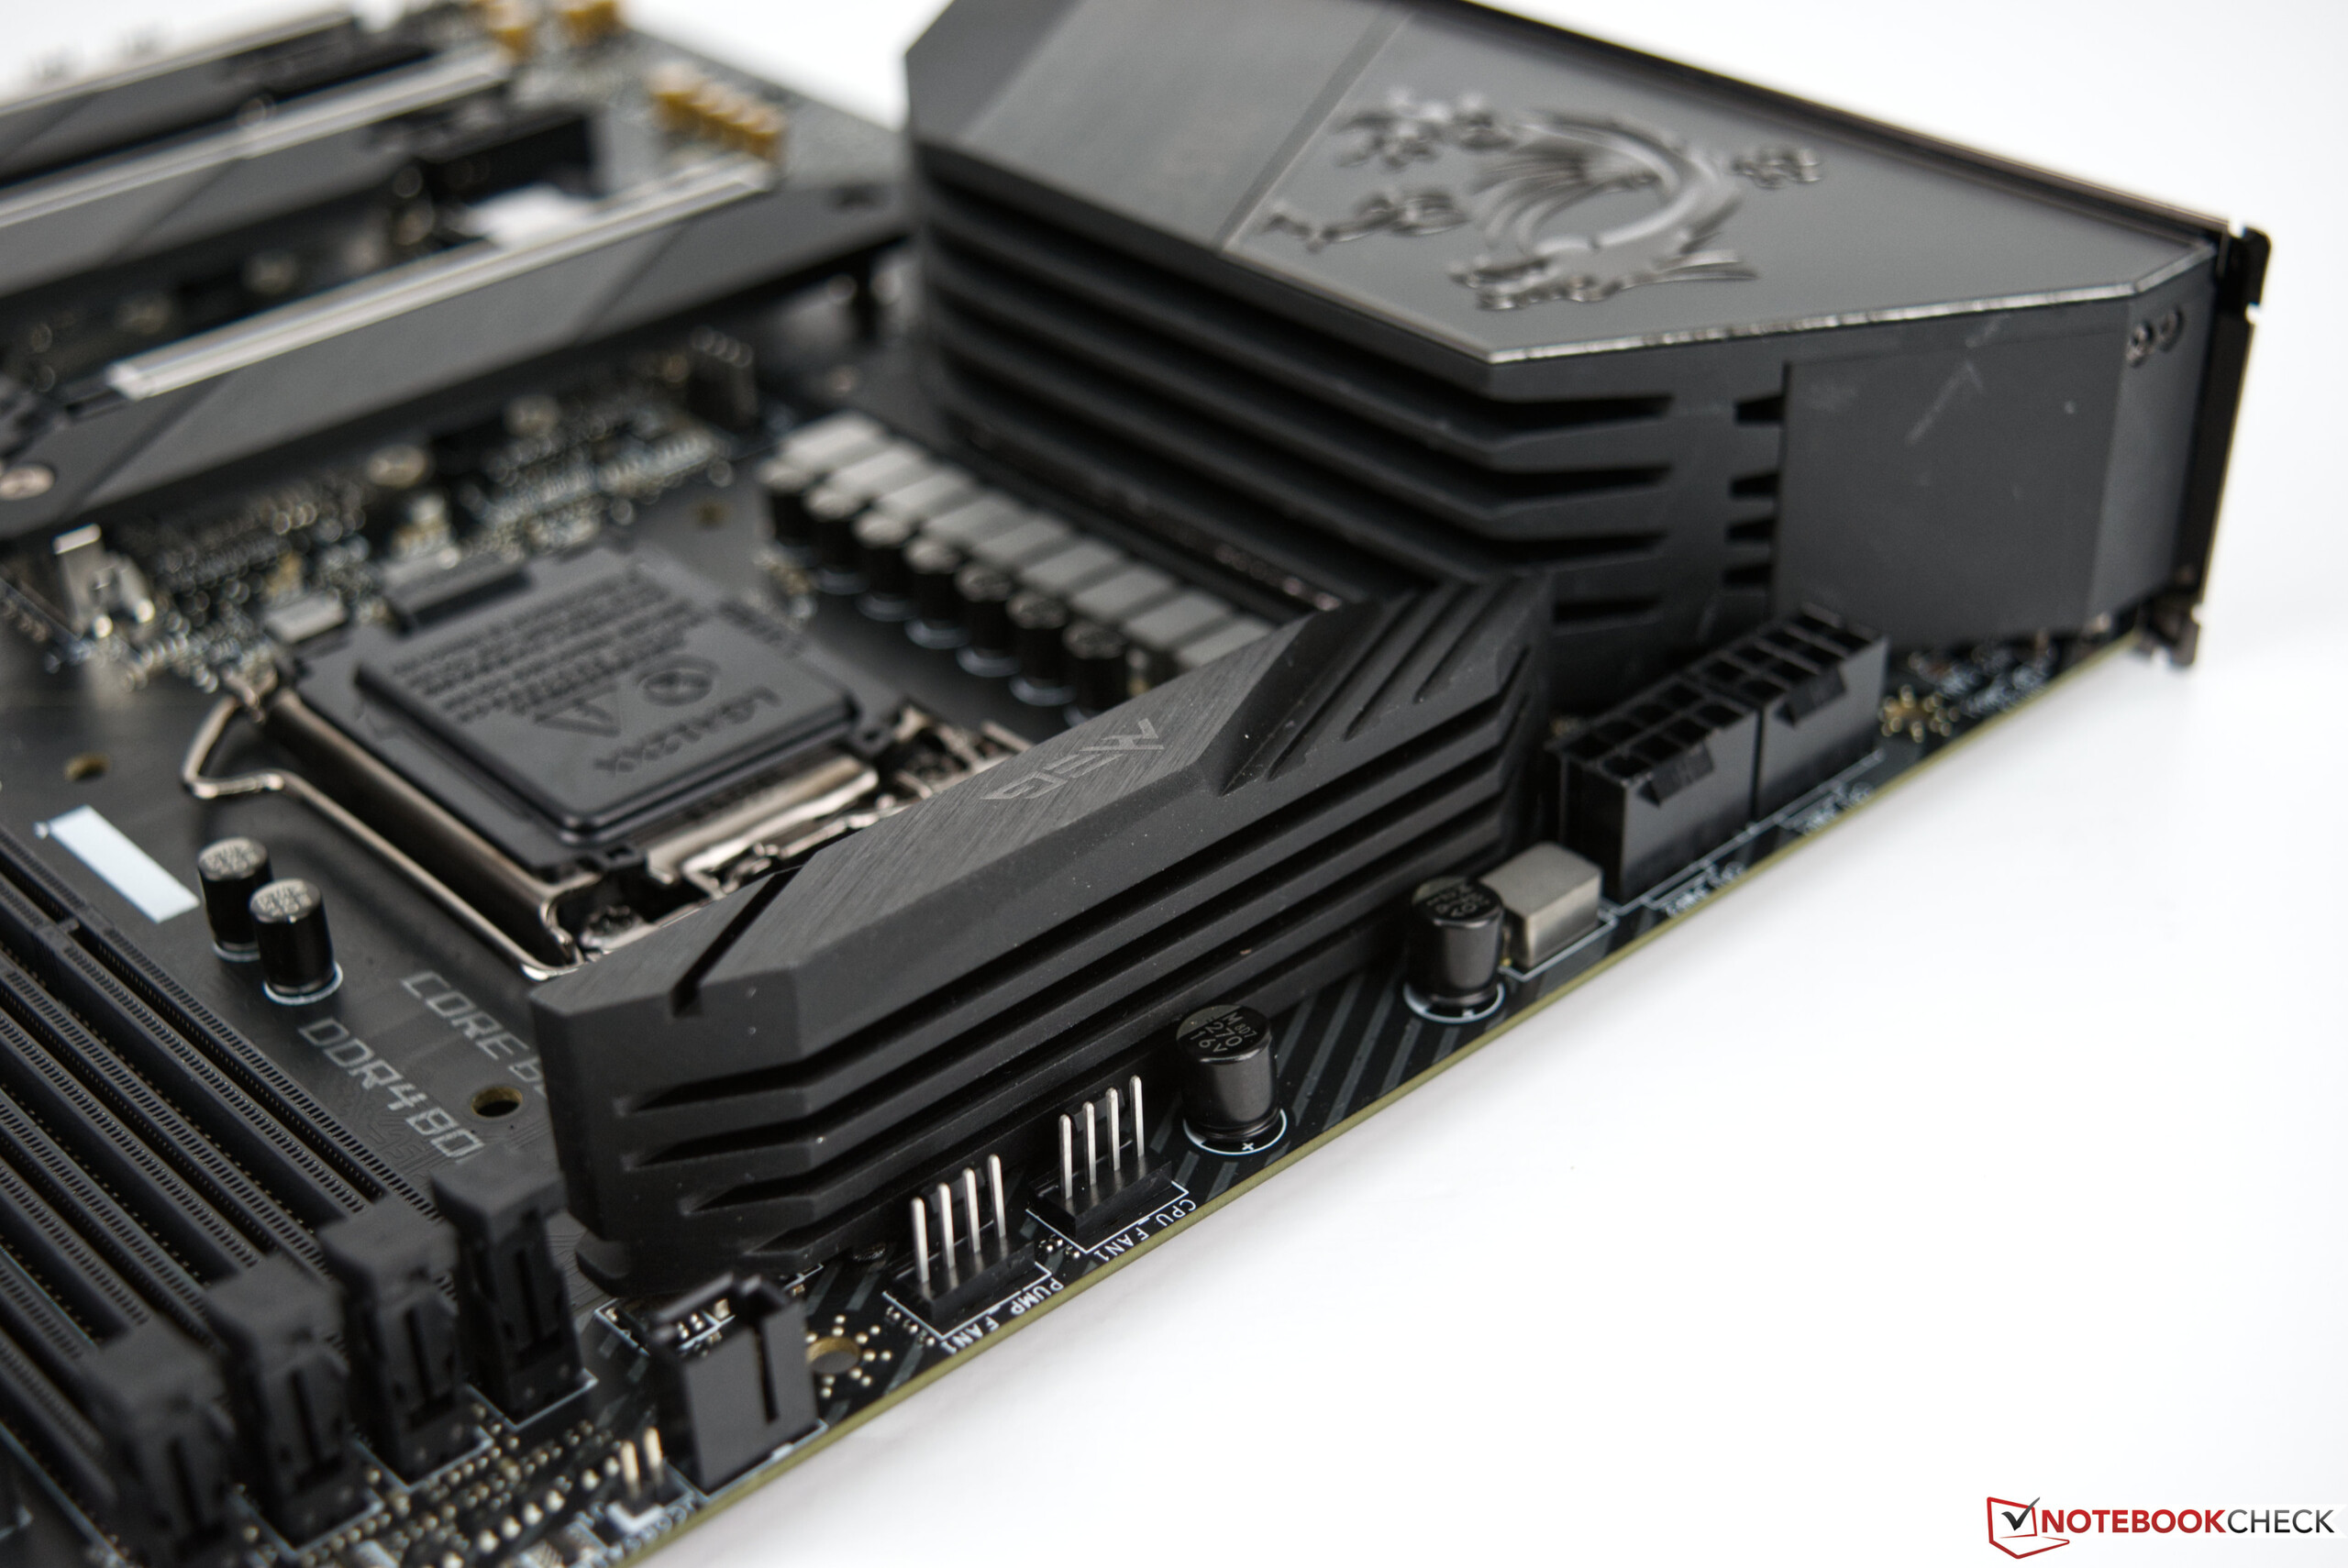
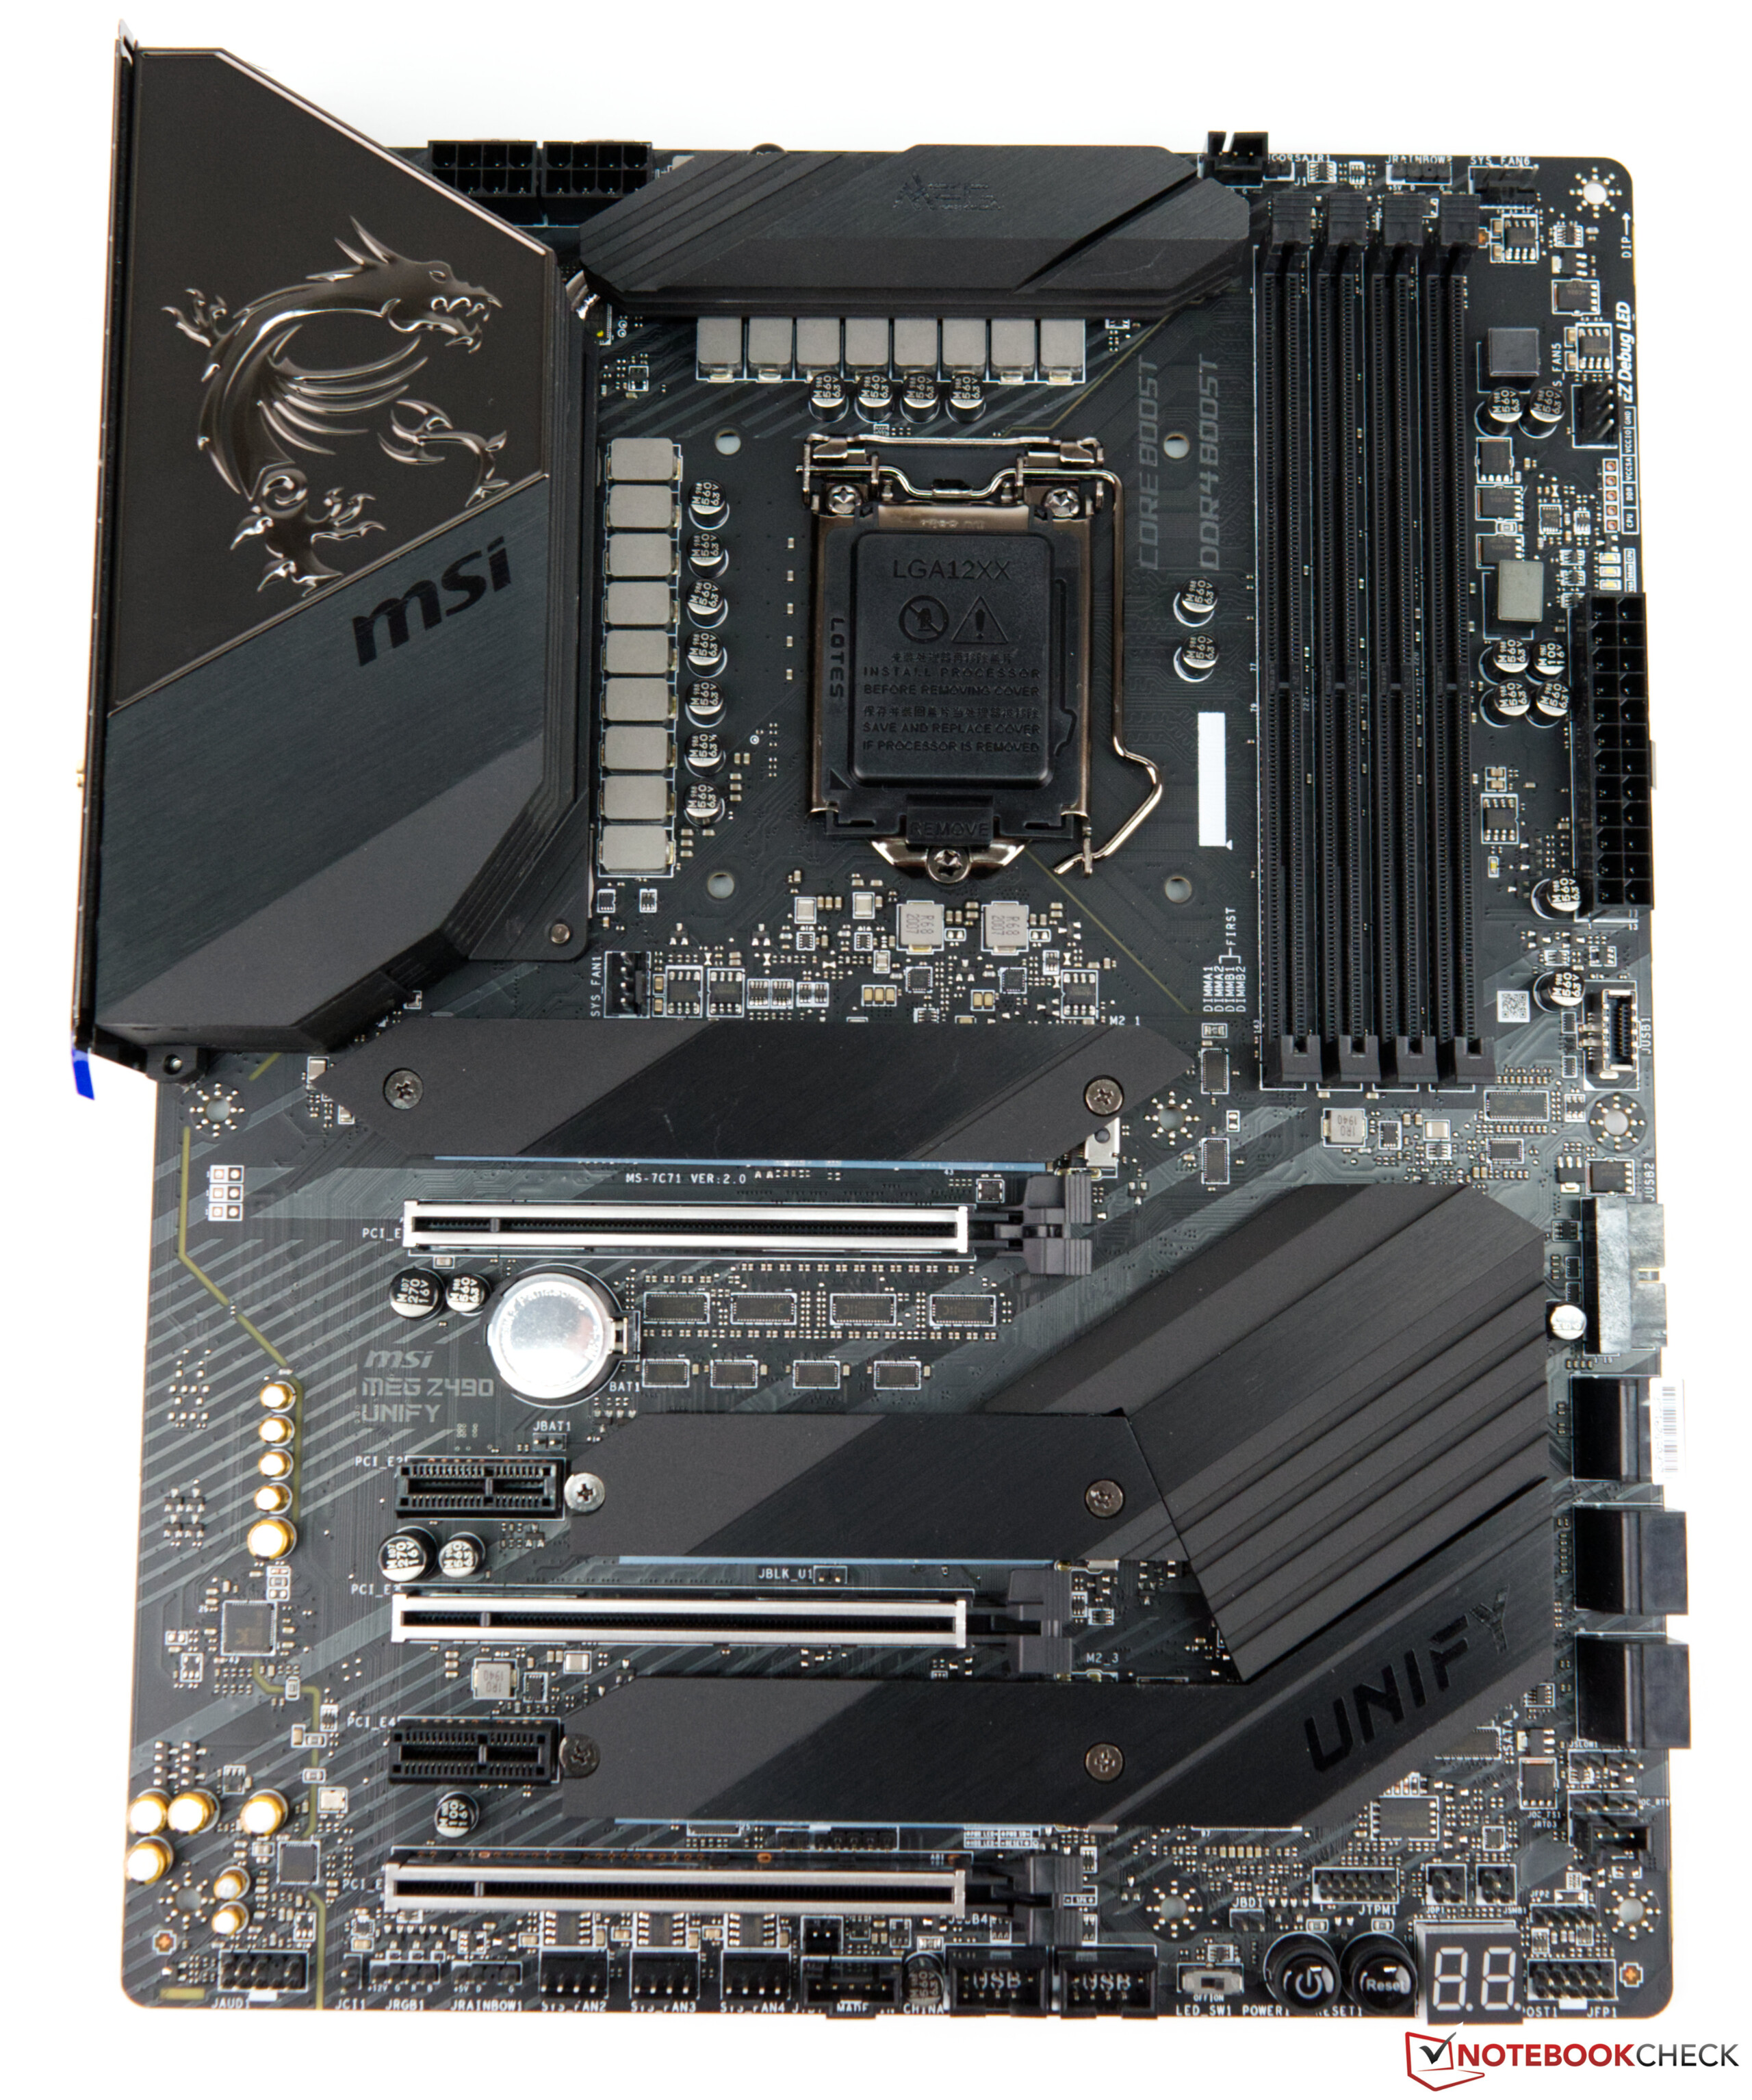
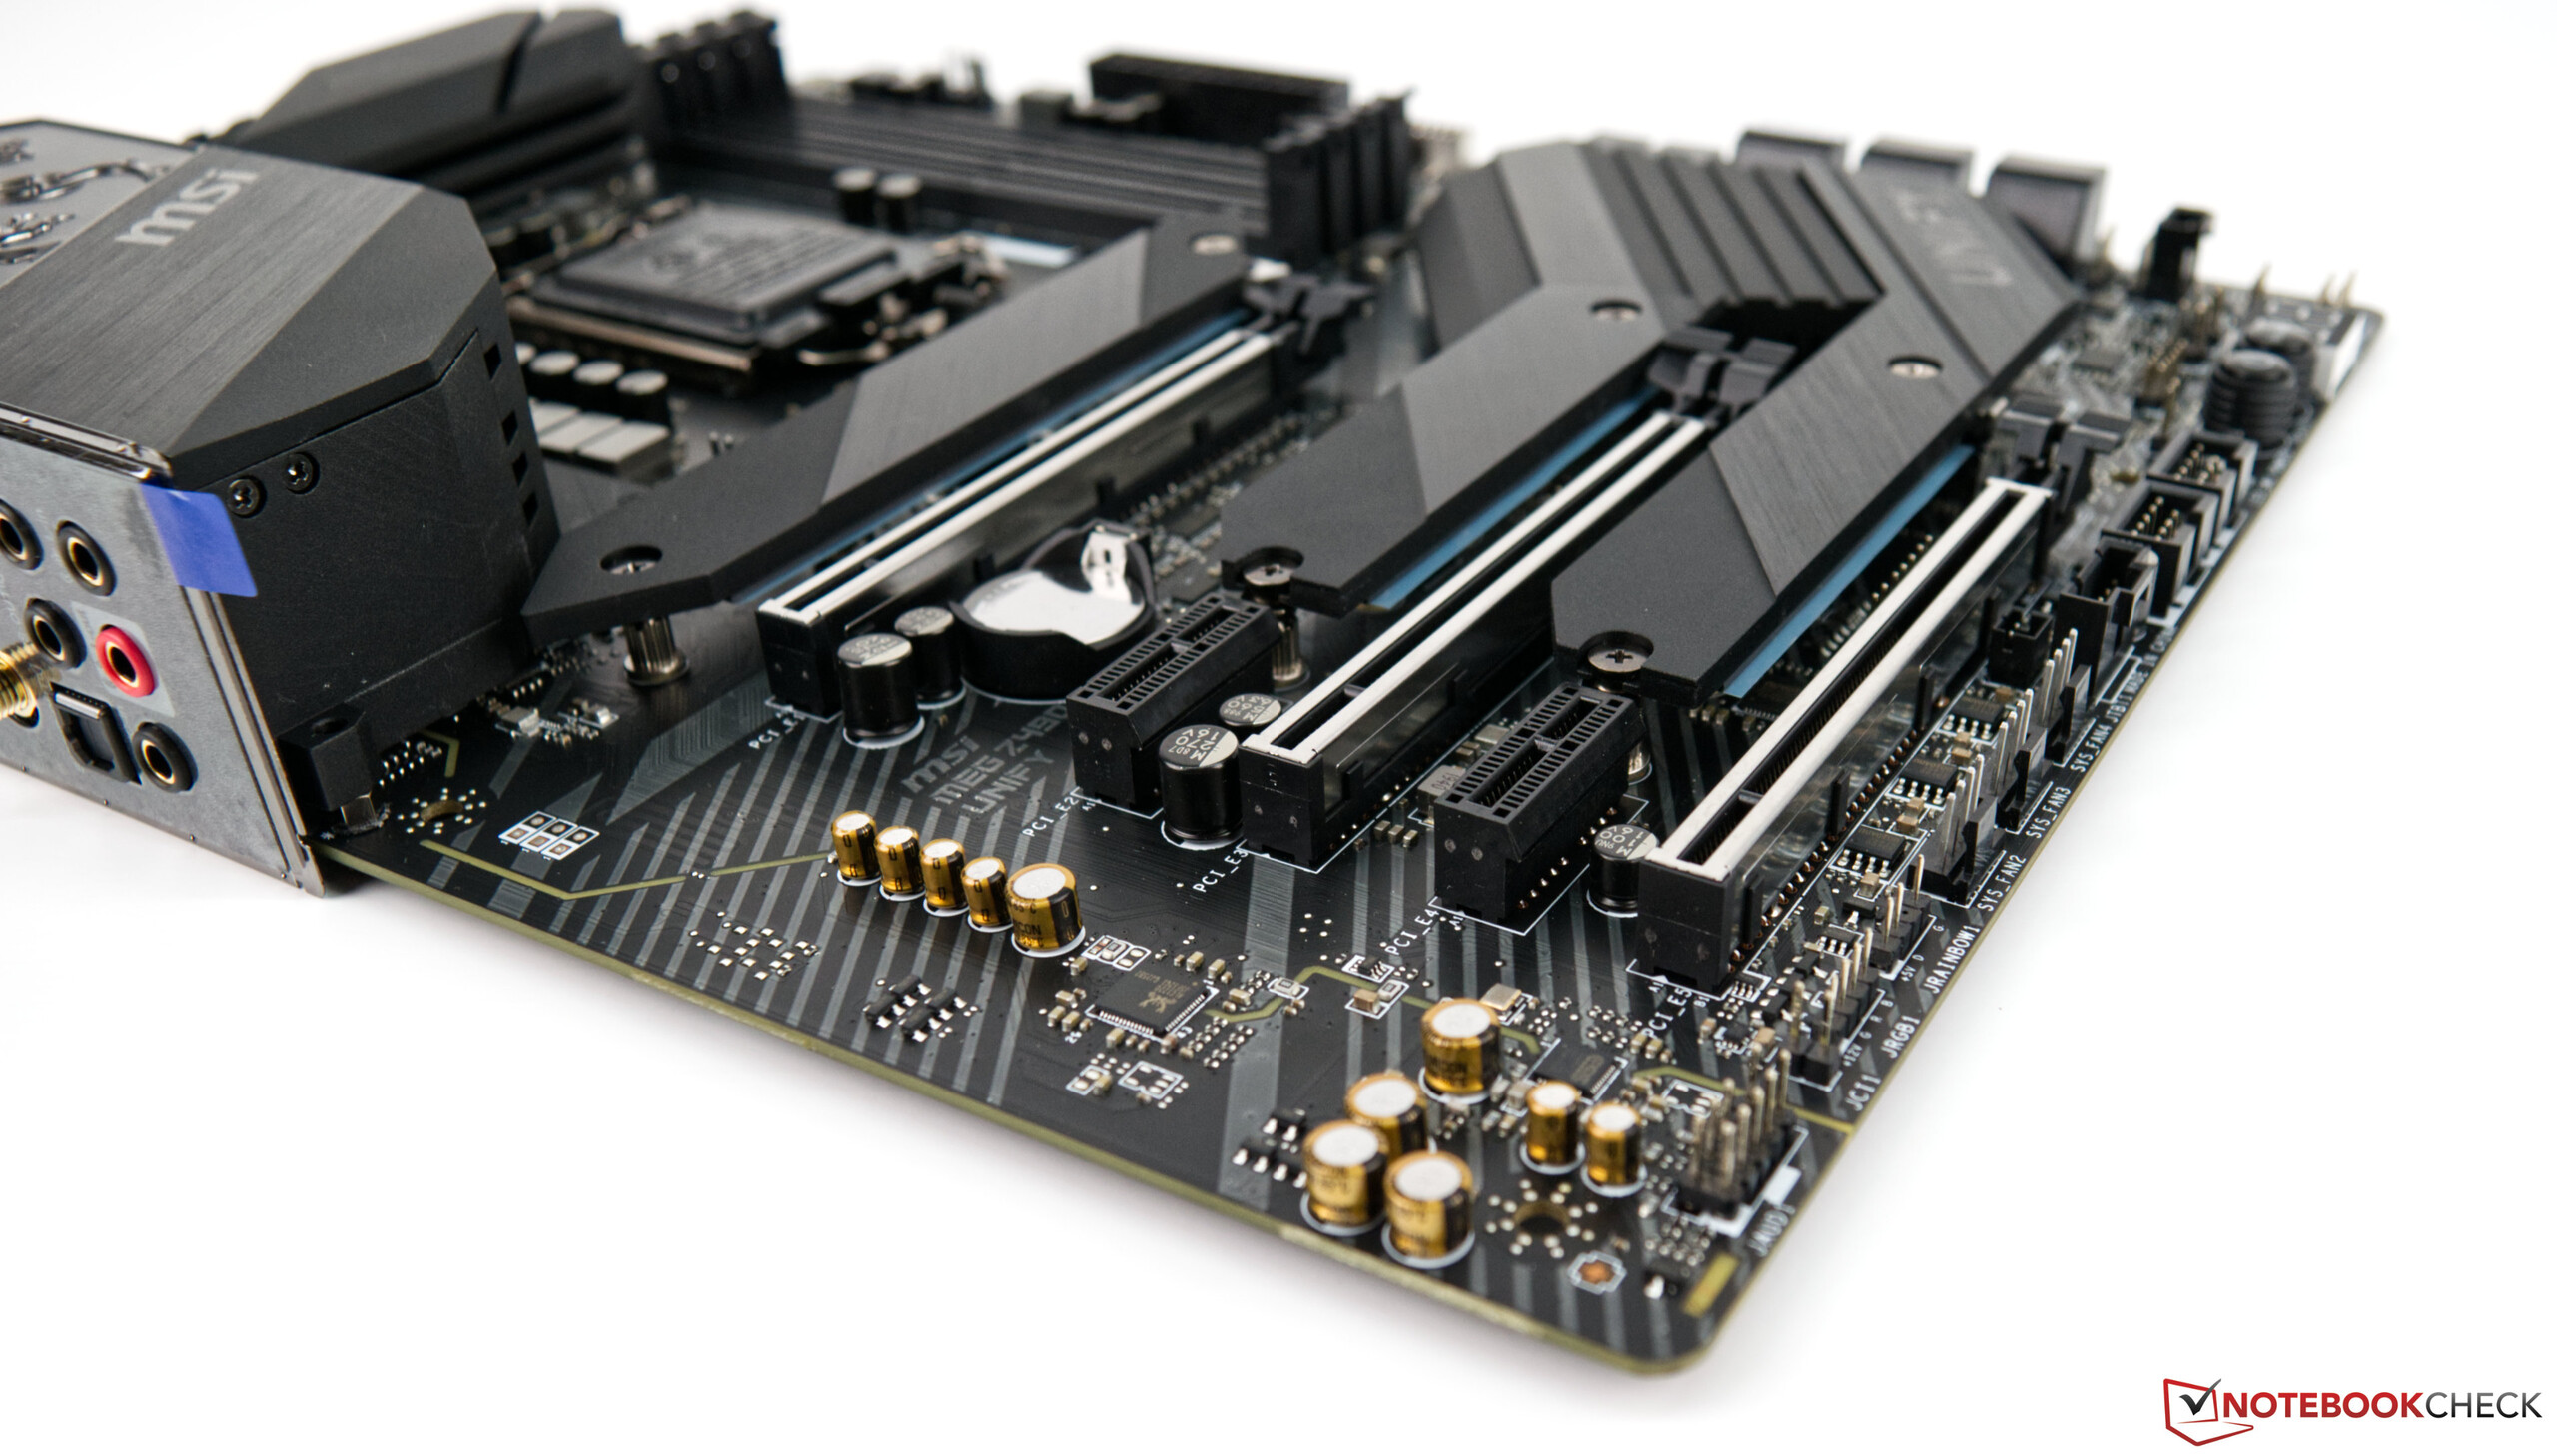
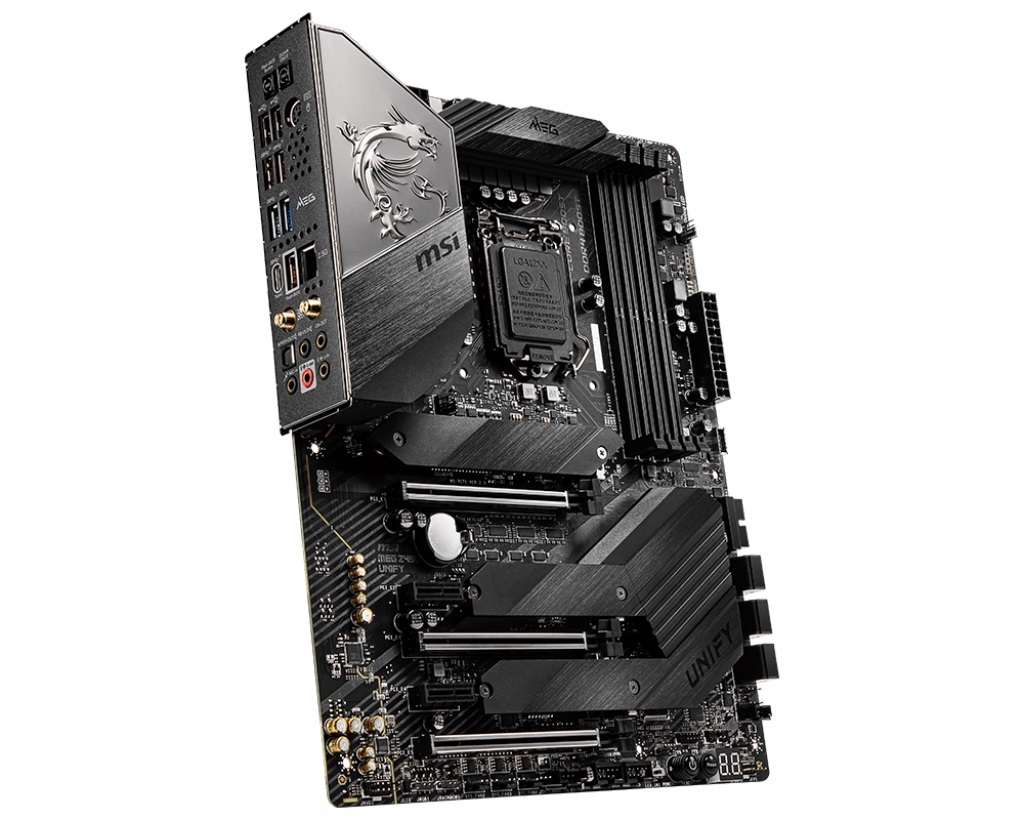
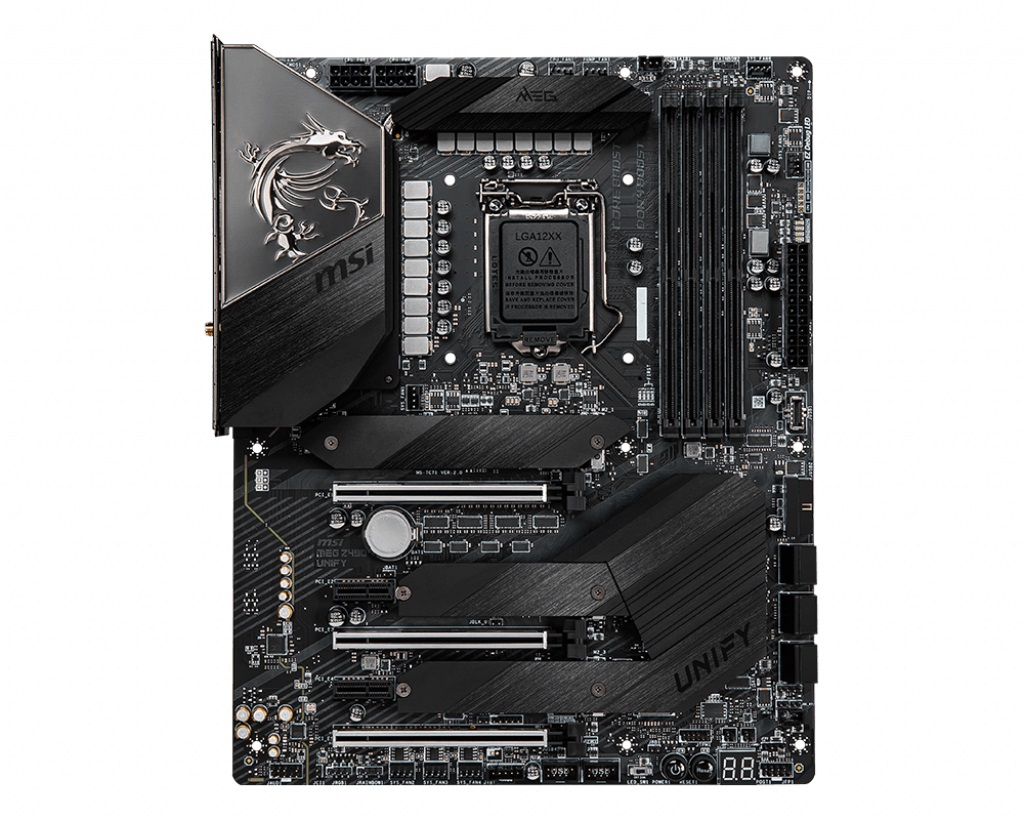
Visión general del MSI Z490 Unify
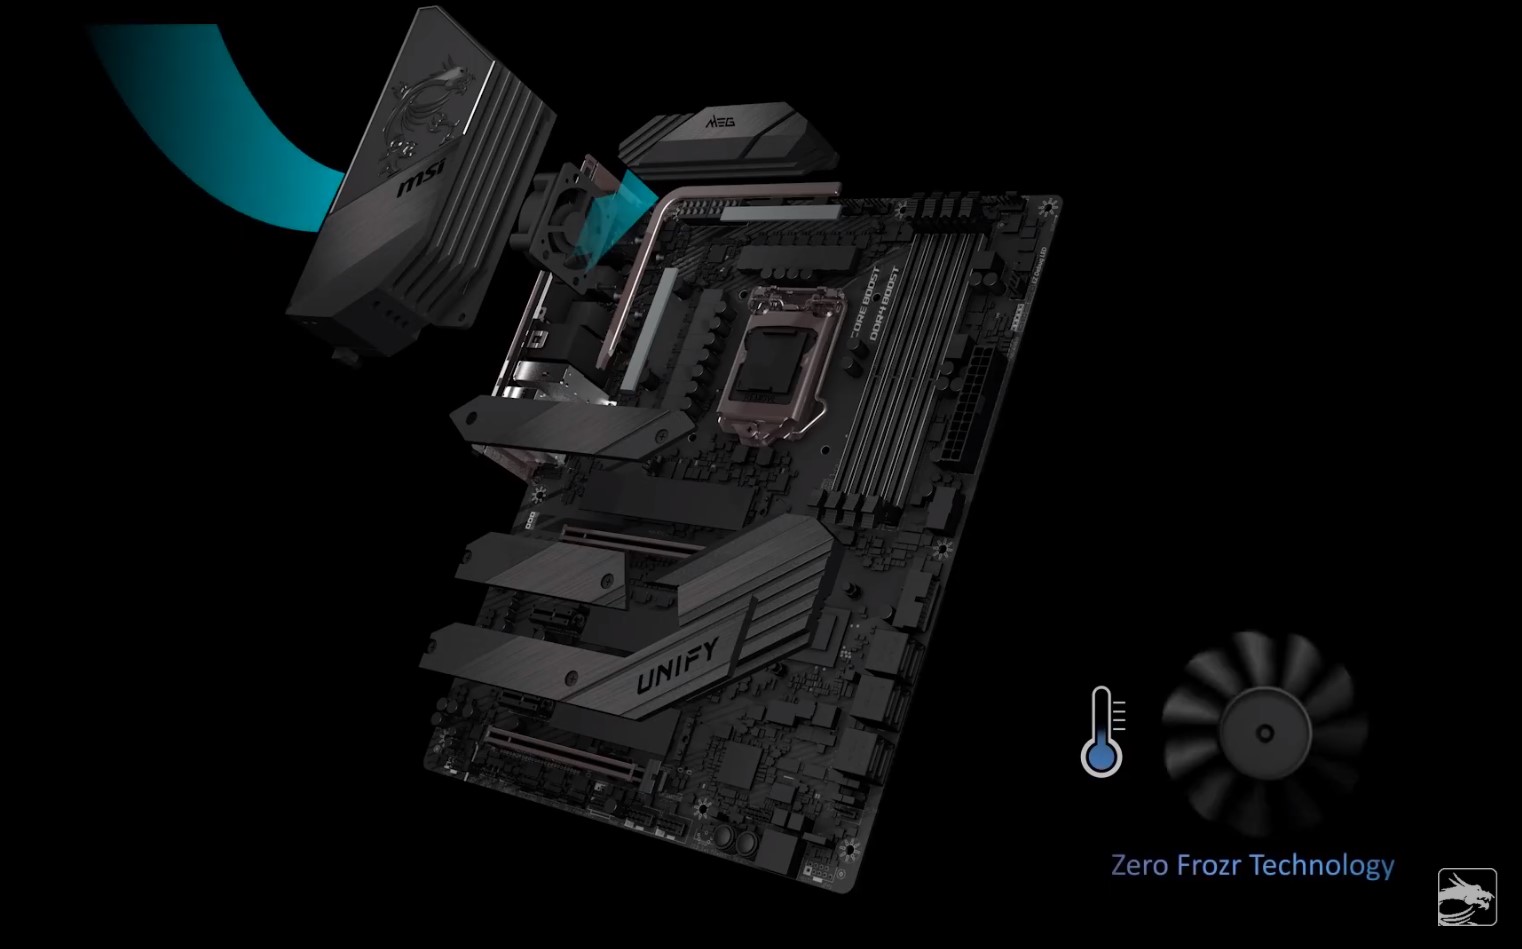
Recibimos la placa madre Z490 Unify de nuestro socio MSI justo a tiempo para revisar los nuevos procesadores del Comet Lake-S. Estamos muy agradecidos de que MSI nos haya prestado esta placa madre. La placa madre impresiona por su simplicidad y renuncia completamente a la iluminación RGB, que es algo que bastantes usuarios pueden apreciar. La caja contiene la placa madre, un par de cables, antenas Wi-Fi, una guía de inicio rápido y un DVD con los drivers. La placa base ATX tiene tres ranuras para unidades de estado sólido M.2 y tres ranuras PCI Express 3.0 x16. Según MSI, las dos ranuras superiores soportan PCI Express 4.0, pero no sabremos con certeza si esto es así hasta que salgan las CPU Rocket Lake-S. Los chips del Comet Lake-S todavía no soportan PCIe 4.0. Las cuatro ranuras de RAM soportan módulos DDR4 a una frecuencia de hasta 4800 MHz. Además, los usuarios también pueden conectar hasta seis unidades SATA adicionales a la placa madre.
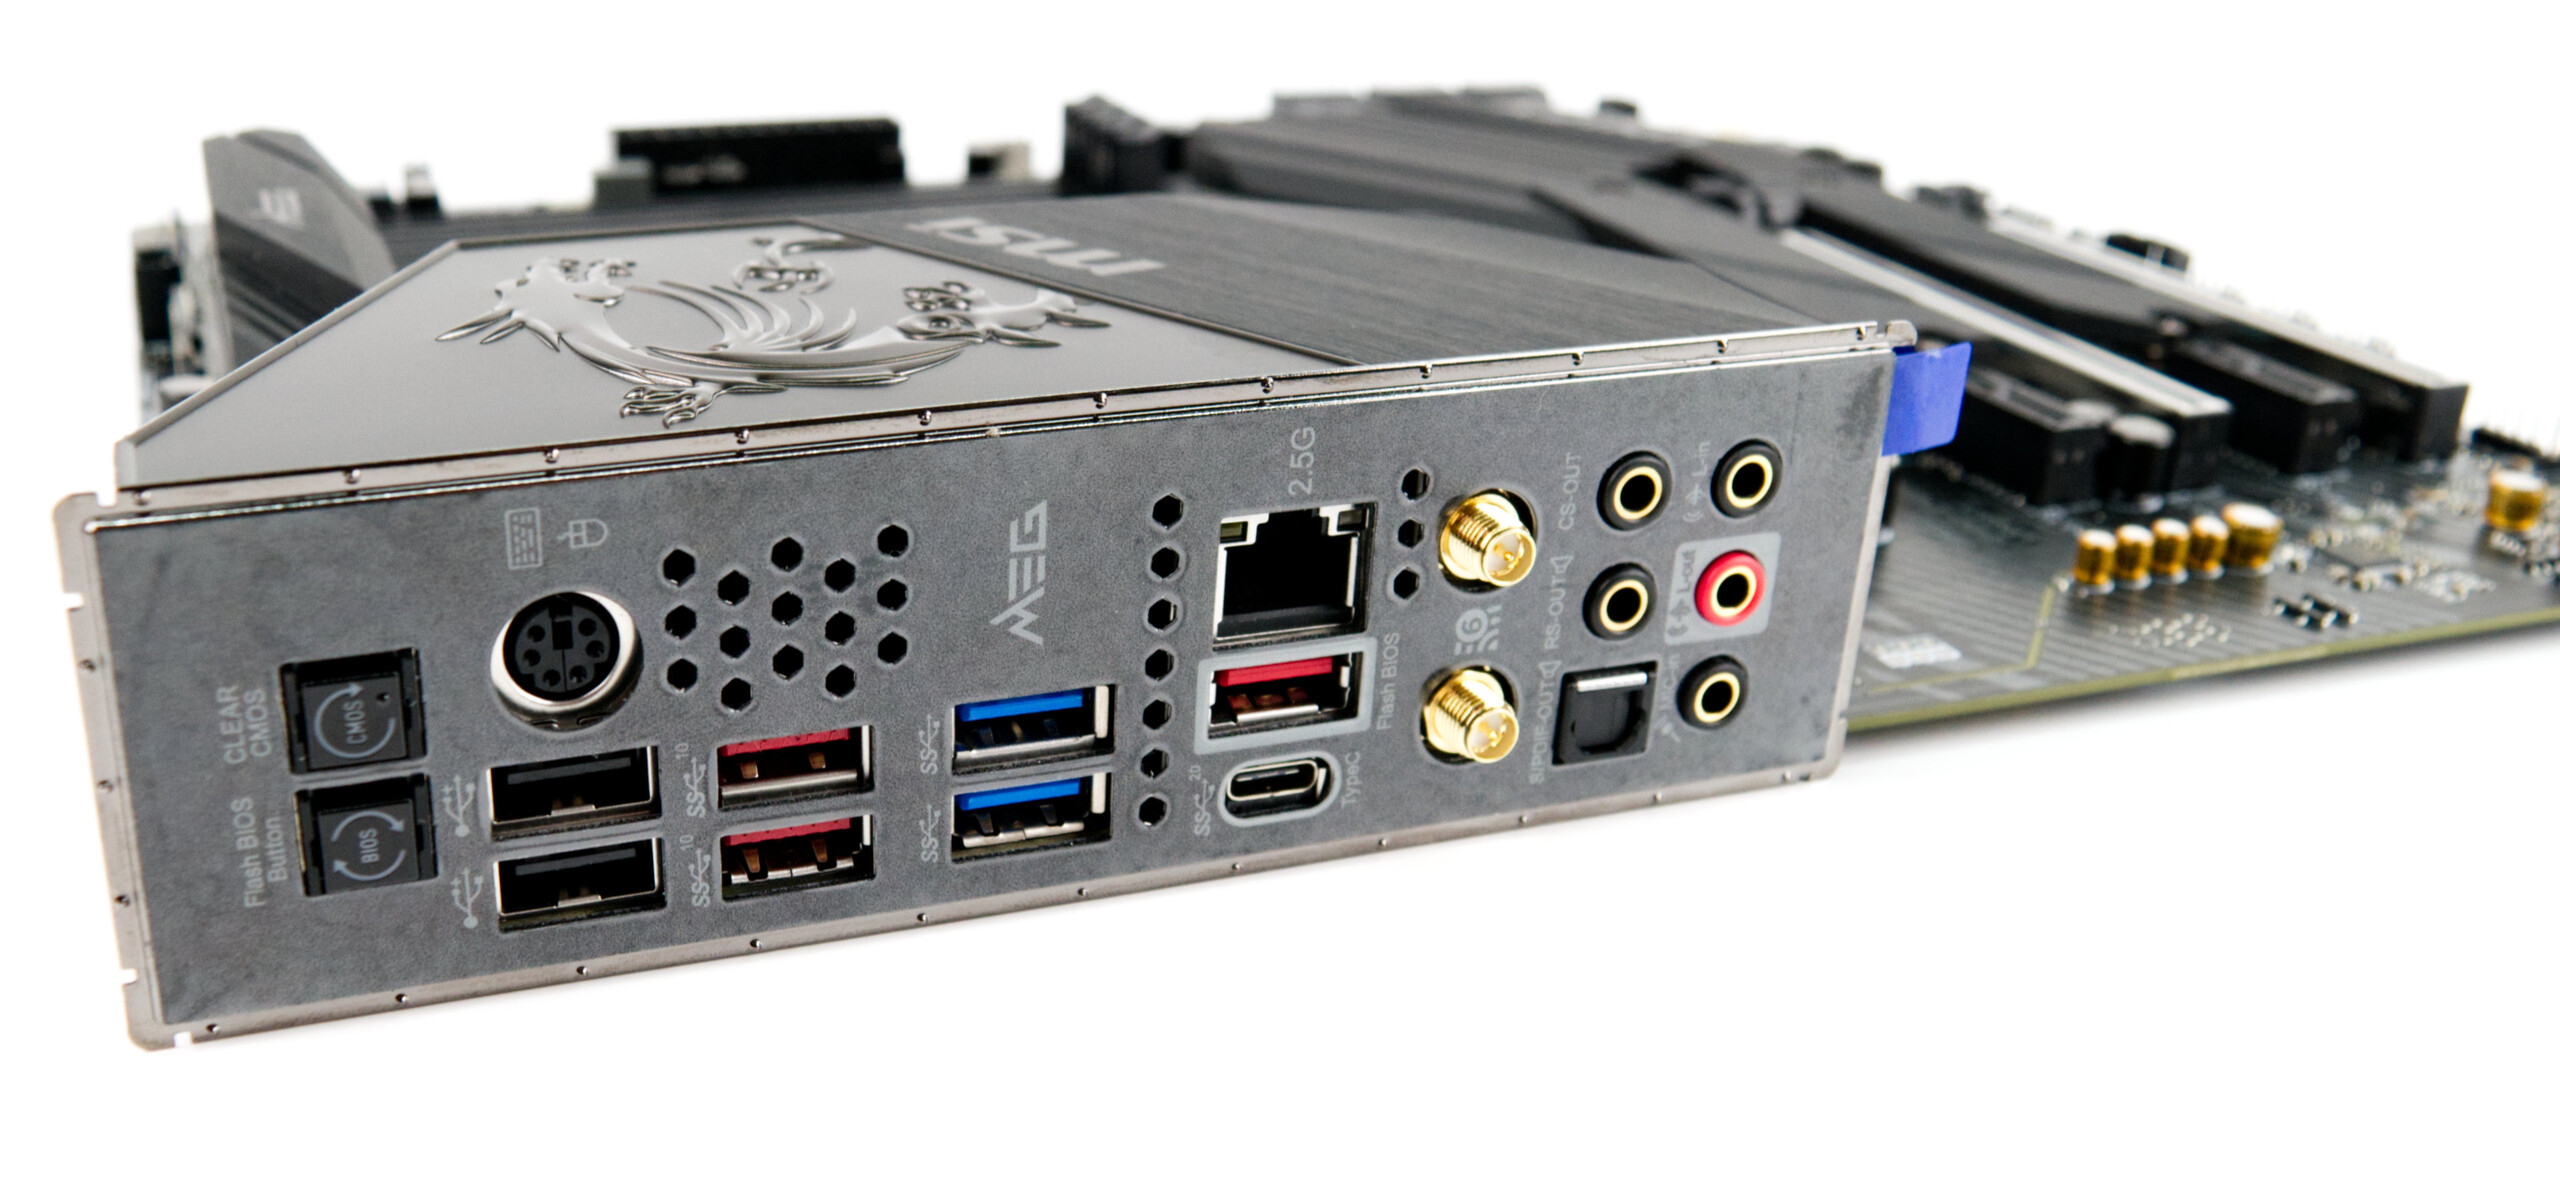
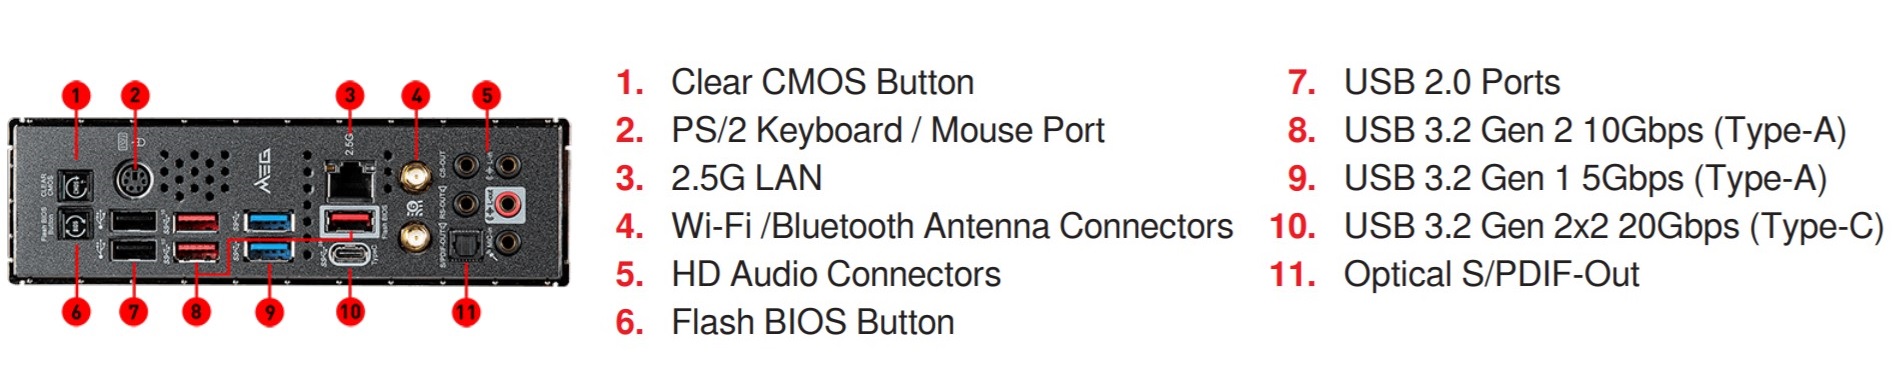
Hay 8 puertos USB en total, uno de los cuales funciona en realidad a velocidades USB 3.2 Gen 2x2 (20 GBit/s). Los overclockers extremos estarán muy contentos de ver un puerto PS2 en la placa madre. Los usuarios pueden transferir datos a través del puerto Ethernet a 2,5 GBit/s. Cuando se trata de redes inalámbricas, el Z490 Unify está muy preparado para el futuro, porque soporta Wi-Fi 6.
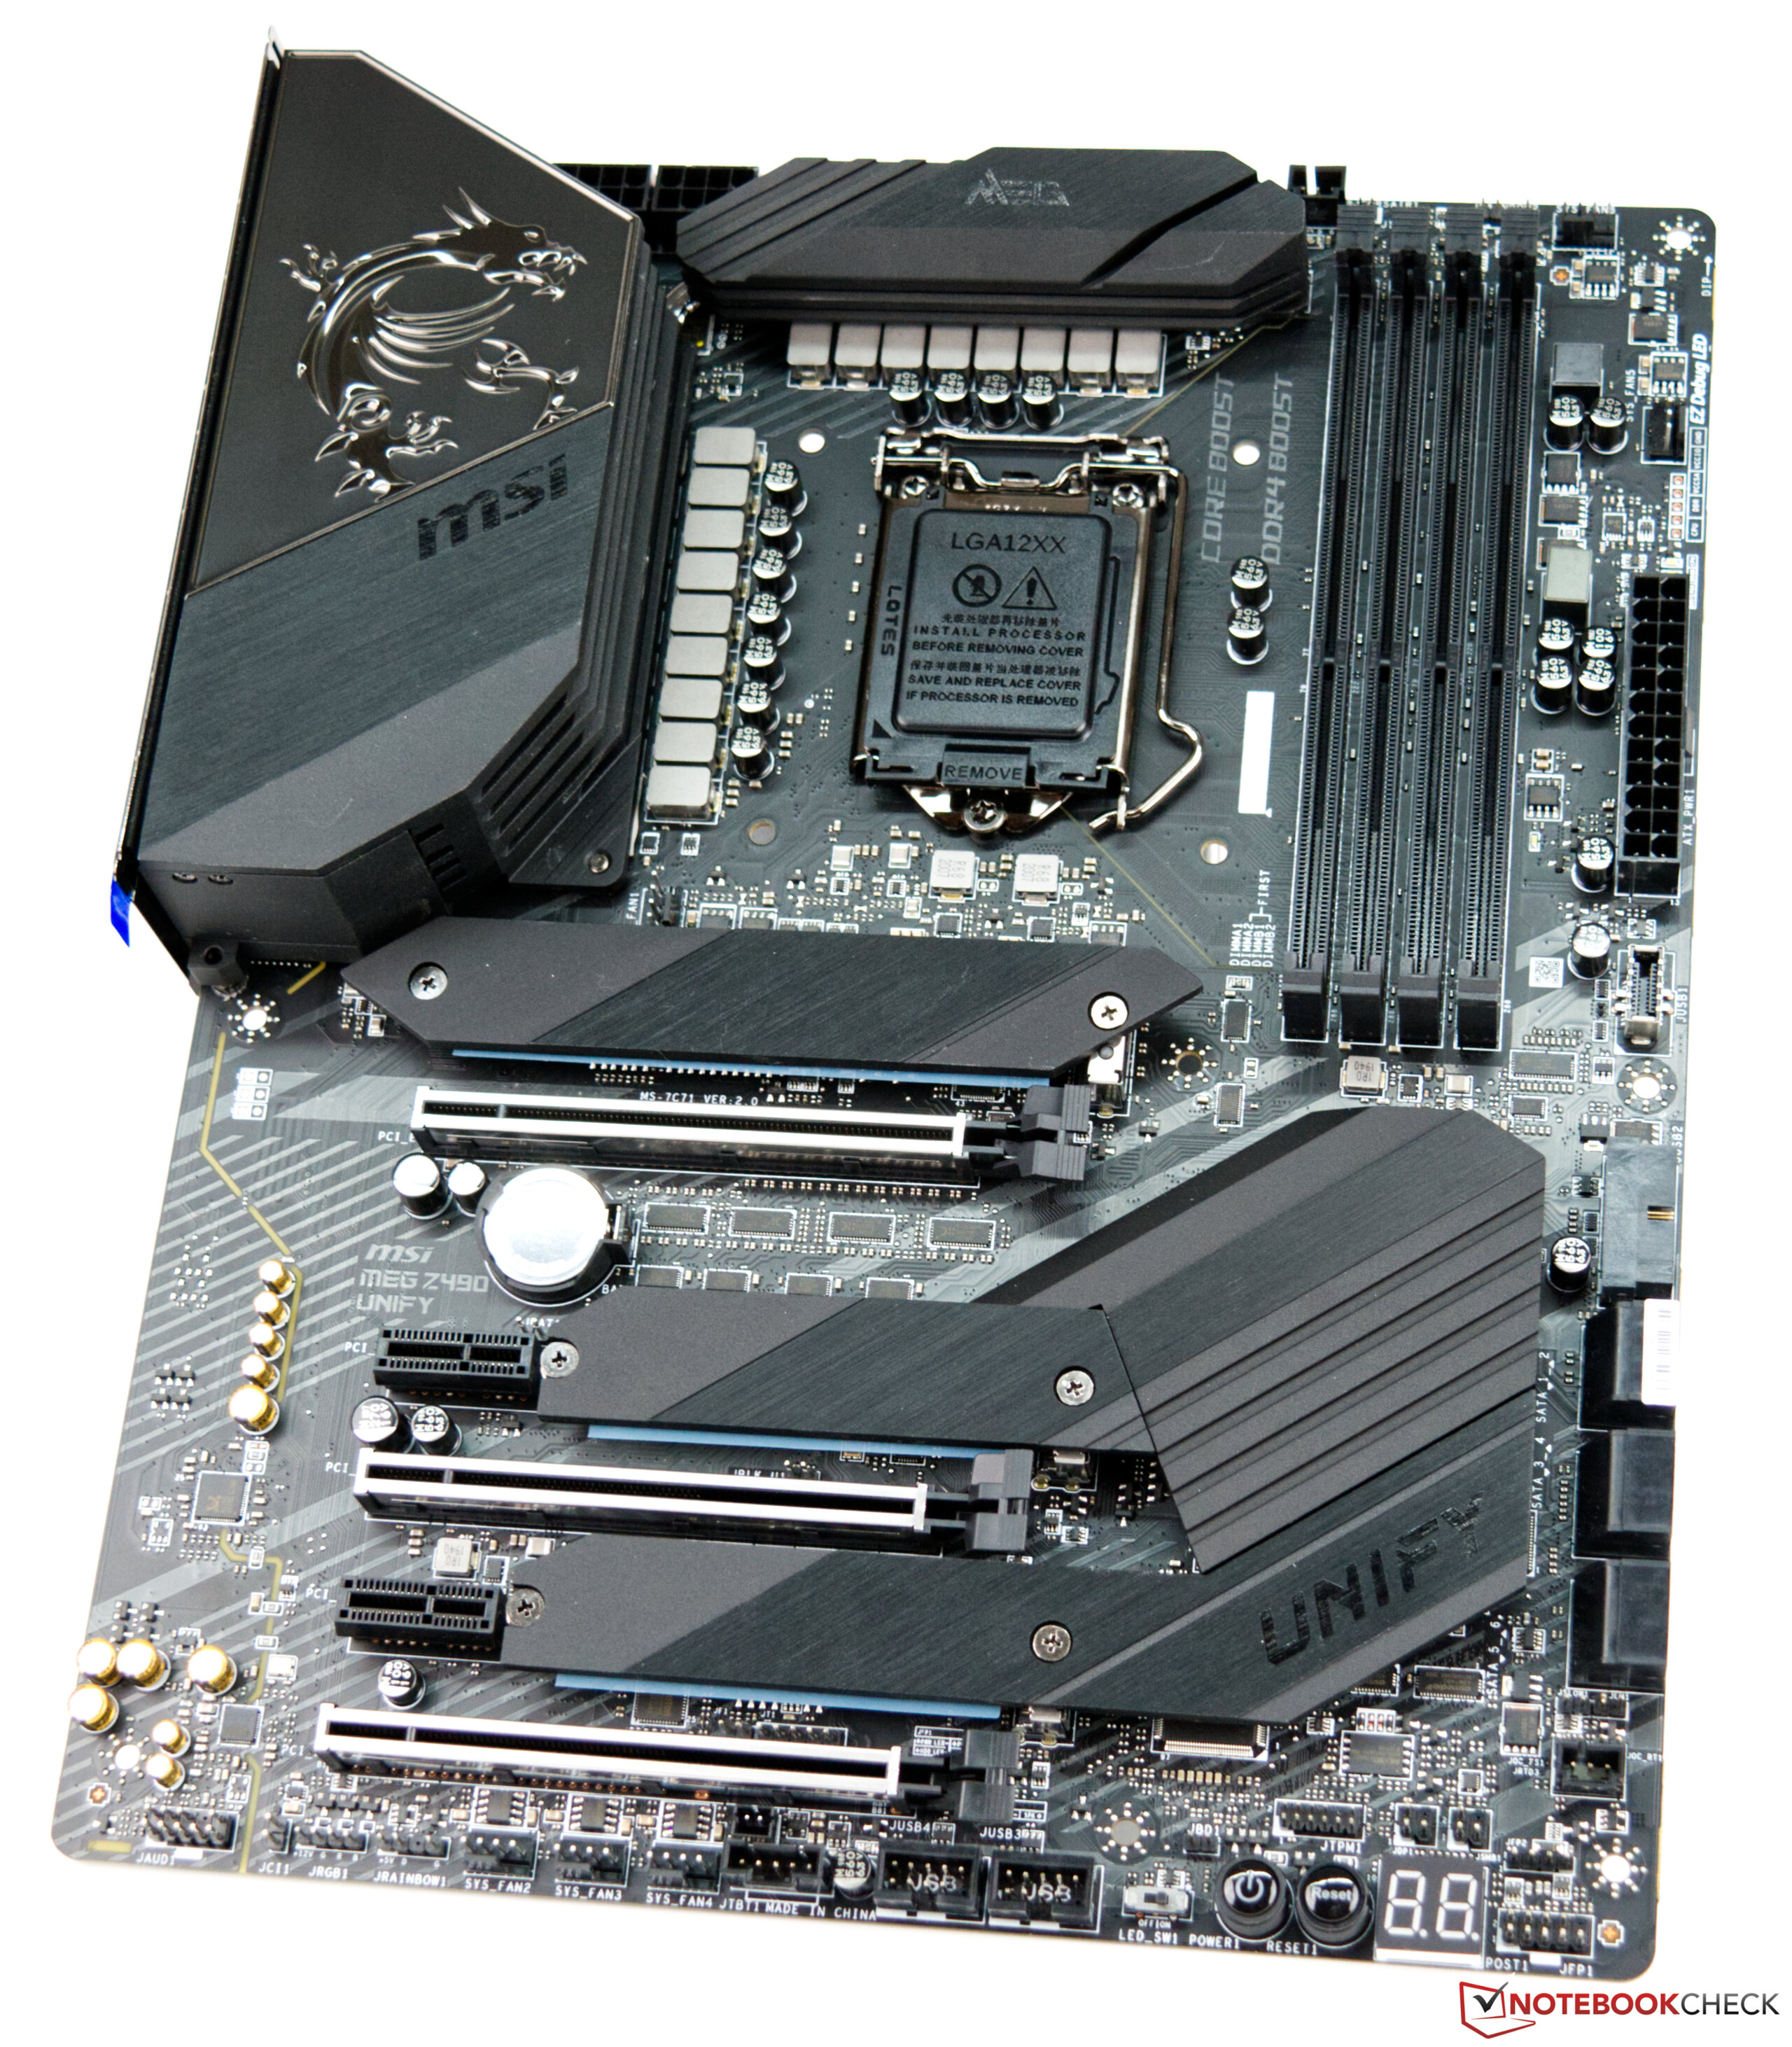
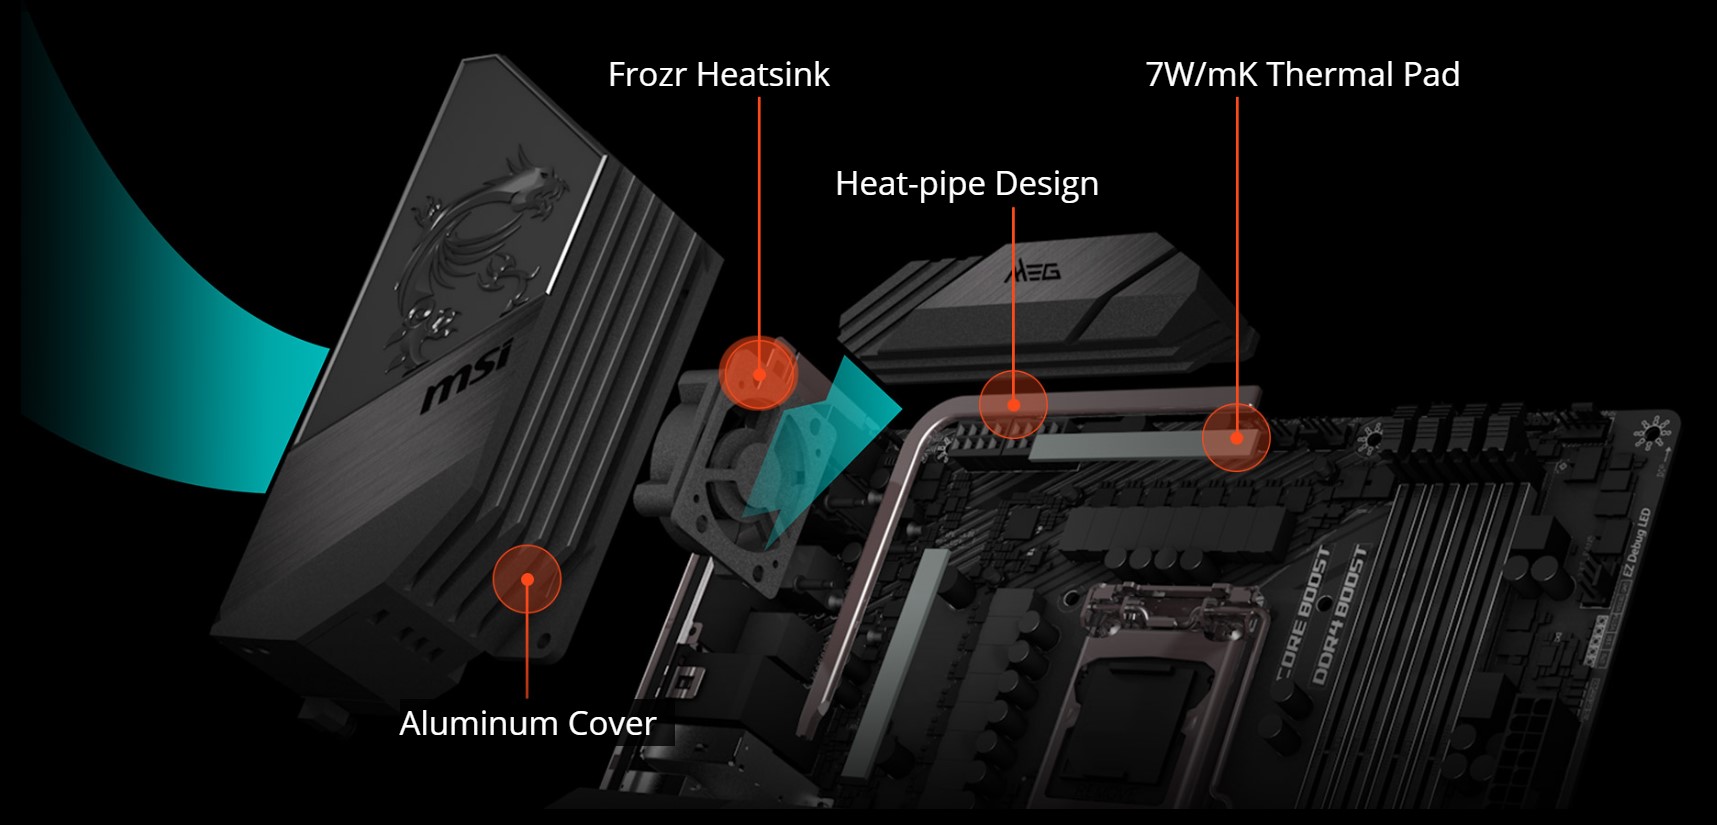
La placa madre cuenta con un sistema de suministro de energía de 16+1 fases y dos conectores de energía de 8 pines. Un disipador de calor masivo con un tubo de calor está conectado a los módulos reguladores de voltaje, que son responsables de mantener un suministro constante de energía. Además, hay un pequeño ventilador detrás del escudo de E/S, que está destinado a enfriar los VRMs. Es básicamente inaudible durante el funcionamiento. Los ventiladores del chipset X570 son significativamente más ruidosos.
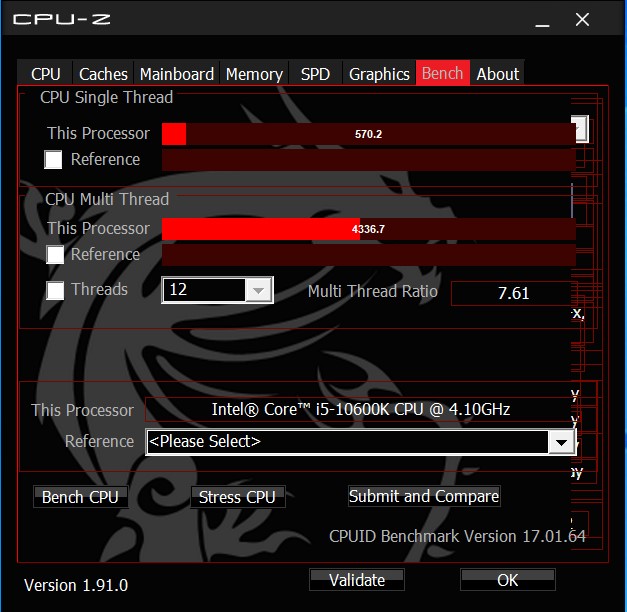
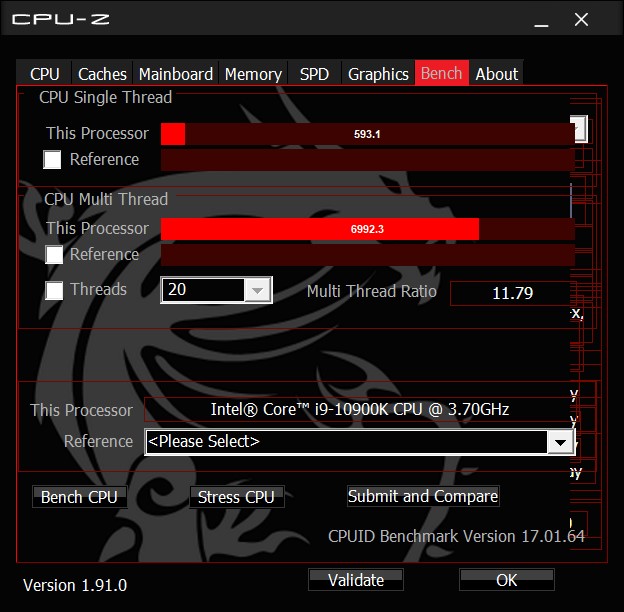
Puntos de referencia de la CPU
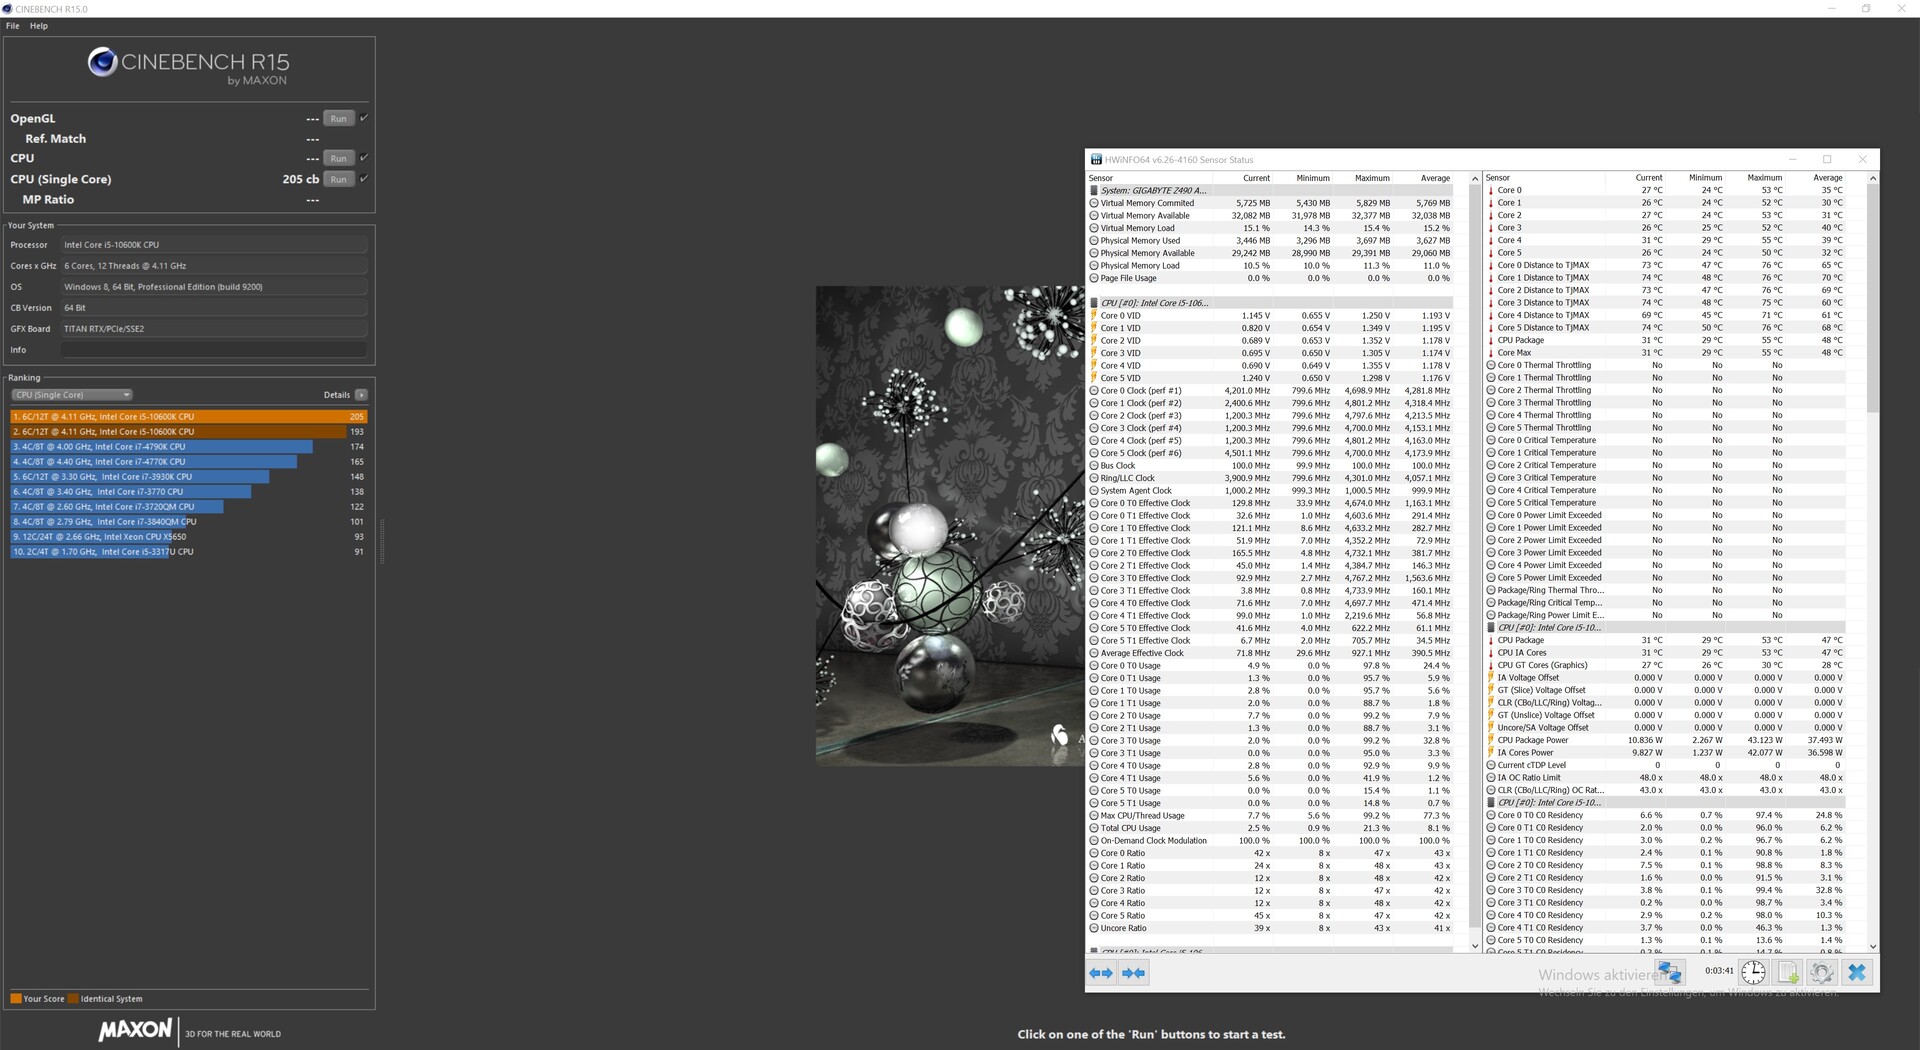
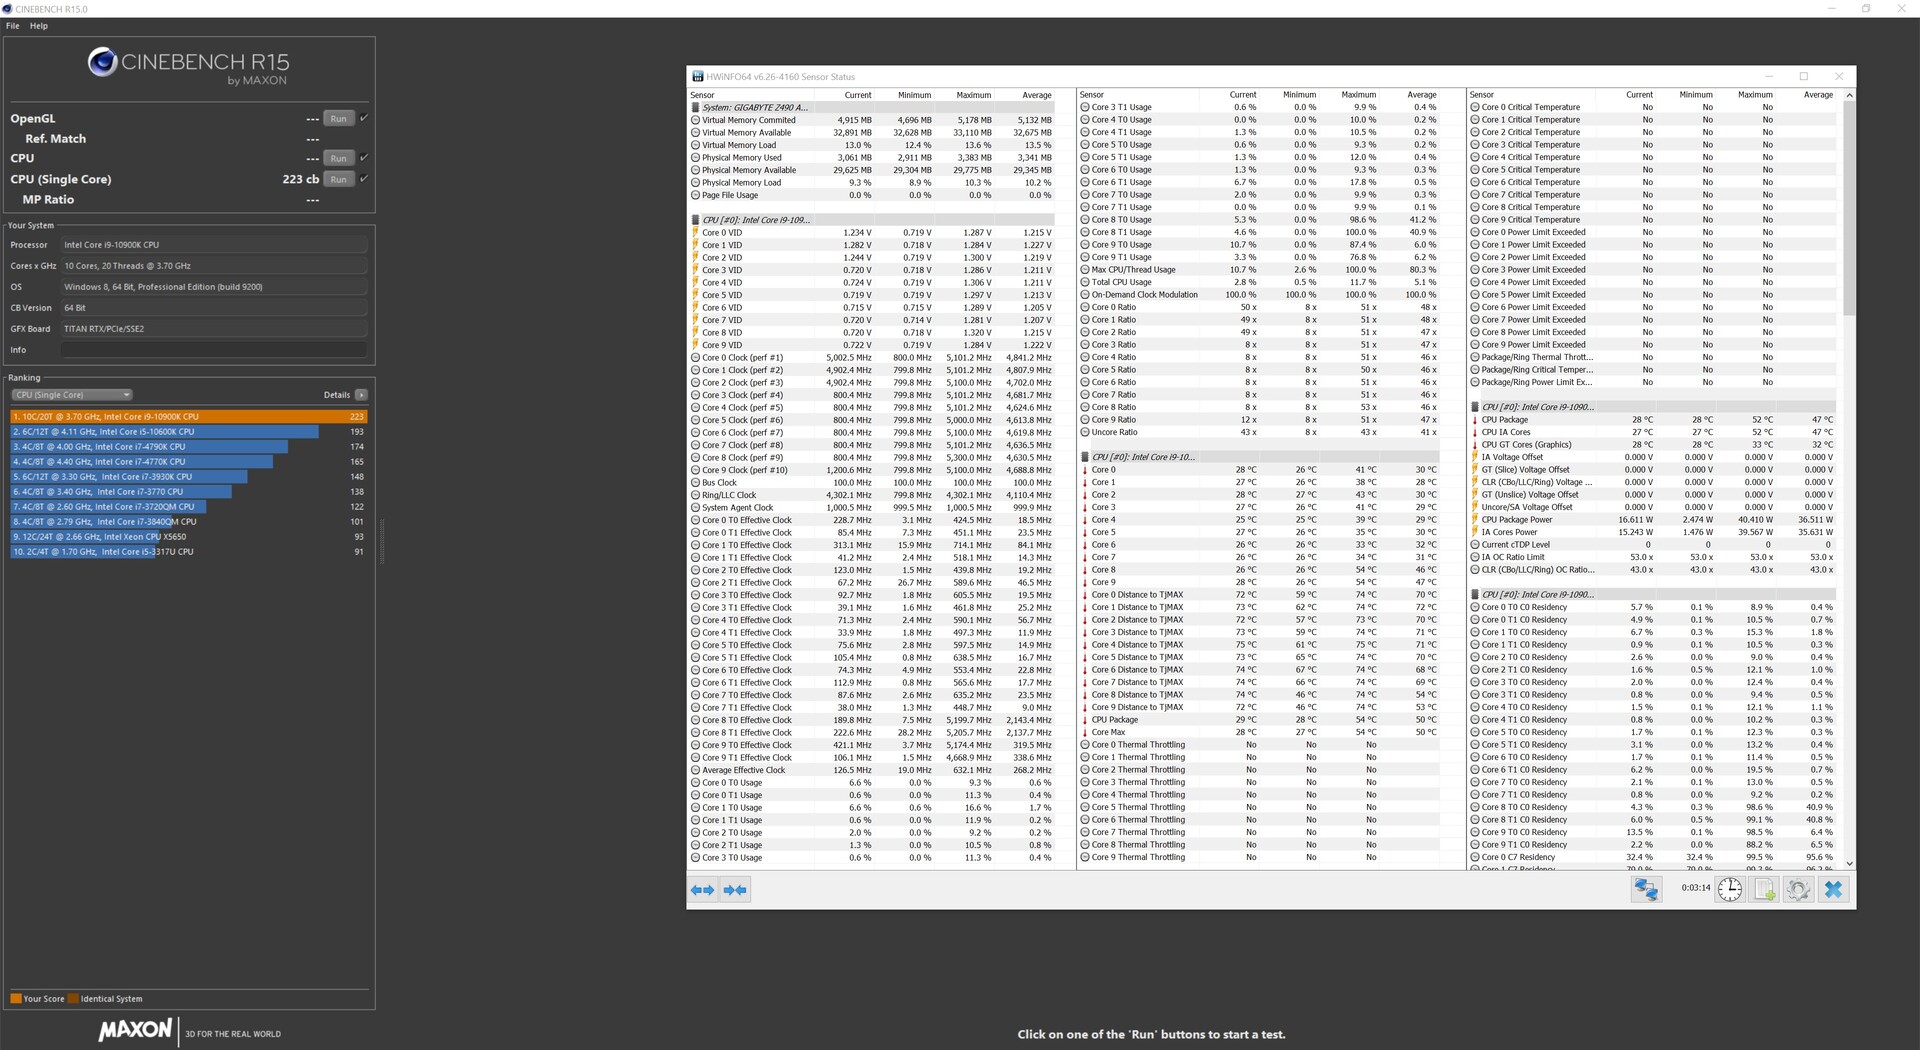
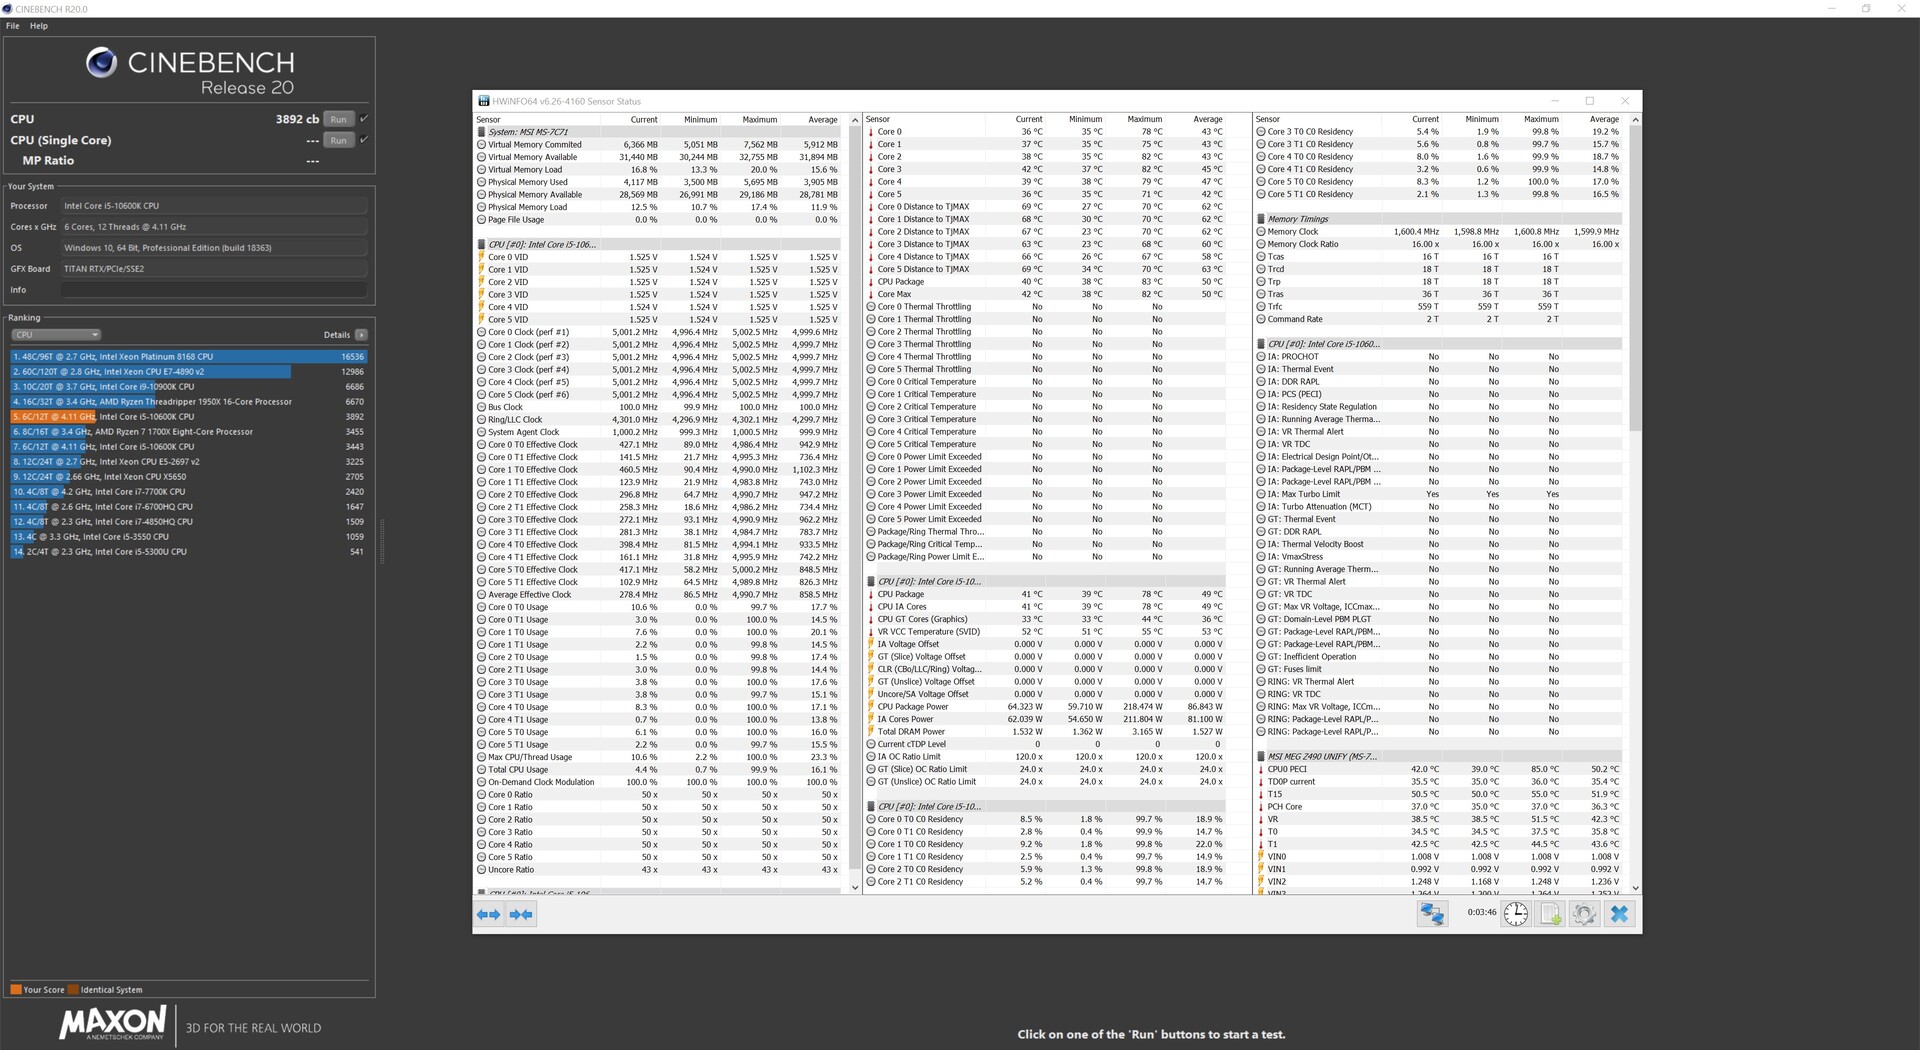
La velocidad base más baja del Intel Core i9-10900K, cuando se compara con el Intel Core i9-9900KS, está compensado por su velocidad Boost más alta. En nuestros benchmarks de un solo núcleo, la CPU de 10 núcleos ocupó el primer lugar, pero con un margen bastante estrecho. Aquí, el Intel Core i5-10600K de 6 núcleos está empatado con su predecesor directo.
La diferencia de rendimiento es mucho más fácil de ver en las aplicaciones multi-hilo. Aquí, el Intel Core i9-10900K se beneficia enormemente de dos núcleos adicionales. El Intel Core i5-10600K también es capaz de superar a su predecesor directo (Intel Core i5-9600K) en aplicaciones con muchos hilos. Aquí, el soporte de Hyper-threading hace una verdadera diferencia. Sin embargo, el Ryzen 9 3950X de 16 núcleos, el chip insignia de AMD, supera al Intel Core i9-10900K.
Intel Core i5-10600K
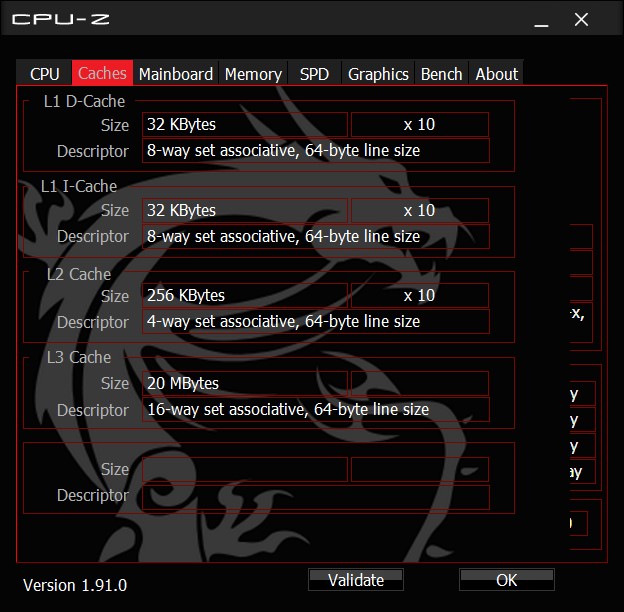
Intel Core i9-10900K
| Cinebench R15 | |
| CPU Single 64Bit | |
| Intel Core i9-10900K | |
| Intel Core i9-9900KS | |
| AMD Ryzen 9 3950X | |
| AMD Ryzen 9 3900X | |
| Intel Core i5-10600K | |
| Intel Core i5-9600K | |
| CPU Multi 64Bit | |
| AMD Ryzen 9 3950X | |
| AMD Ryzen 9 3900X | |
| Intel Core i9-10900K | |
| Intel Core i9-9900KS | |
| Intel Core i5-10600K | |
| Intel Core i5-9600K | |
| Cinebench R20 | |
| CPU (Single Core) | |
| Intel Core i9-10900K | |
| AMD Ryzen 9 3950X | |
| AMD Ryzen 9 3900X | |
| Intel Core i9-9900KS | |
| Intel Core i5-10600K | |
| CPU (Multi Core) | |
| AMD Ryzen 9 3950X | |
| AMD Ryzen 9 3900X | |
| Intel Core i9-10900K | |
| Intel Core i9-9900KS | |
| Intel Core i5-10600K | |
| Cinebench R11.5 | |
| CPU Single 64Bit | |
| Intel Core i9-10900K | |
| Intel Core i9-9900KS | |
| AMD Ryzen 9 3950X | |
| AMD Ryzen 9 3900X | |
| Intel Core i5-9600K | |
| Intel Core i5-10600K | |
| CPU Multi 64Bit | |
| AMD Ryzen 9 3950X | |
| AMD Ryzen 9 3900X | |
| Intel Core i9-10900K | |
| Intel Core i9-9900KS | |
| Intel Core i5-10600K | |
| Intel Core i5-9600K | |
| Cinebench R10 | |
| Rendering Single CPUs 64Bit | |
| Intel Core i9-9900KS | |
| Intel Core i9-10900K | |
| AMD Ryzen 9 3950X | |
| AMD Ryzen 9 3900X | |
| Intel Core i5-10600K | |
| Intel Core i5-9600K | |
| Rendering Multiple CPUs 64Bit | |
| AMD Ryzen 9 3950X | |
| Intel Core i9-10900K | |
| AMD Ryzen 9 3900X | |
| Intel Core i9-9900KS | |
| Intel Core i5-10600K | |
| Intel Core i5-9600K | |
| Blender - v2.79 BMW27 CPU | |
| Intel Core i5-9600K | |
| Intel Core i5-10600K | |
| Intel Core i9-9900KS | |
| Intel Core i9-10900K | |
| AMD Ryzen 9 3900X | |
| AMD Ryzen 9 3950X | |
| wPrime 2.10 | |
| 32m | |
| Intel Core i5-9600K | |
| Intel Core i5-10600K | |
| AMD Ryzen 9 3950X | |
| Intel Core i9-9900KS | |
| Intel Core i9-10900K | |
| AMD Ryzen 9 3900X | |
| 1024m | |
| Intel Core i5-9600K | |
| Intel Core i5-10600K | |
| Intel Core i9-9900KS | |
| AMD Ryzen 9 3900X | |
| Intel Core i9-10900K | |
| AMD Ryzen 9 3950X | |
| X264 HD Benchmark 4.0 | |
| Pass 1 | |
| Intel Core i9-10900K | |
| Intel Core i9-9900KS | |
| AMD Ryzen 9 3950X | |
| Intel Core i5-10600K | |
| Intel Core i5-9600K | |
| Pass 2 | |
| AMD Ryzen 9 3950X | |
| Intel Core i9-10900K | |
| Intel Core i9-9900KS | |
| Intel Core i5-10600K | |
| Intel Core i5-9600K | |
| WinRAR - Result | |
| Intel Core i9-10900K | |
| Intel Core i9-9900KS | |
| AMD Ryzen 9 3900X | |
| AMD Ryzen 9 3950X | |
| Intel Core i5-10600K | |
| Intel Core i5-9600K | |
| TrueCrypt | |
| AES Mean 100MB | |
| Intel Core i9-10900K | |
| Intel Core i9-9900KS | |
| AMD Ryzen 9 3950X | |
| AMD Ryzen 9 3900X | |
| Intel Core i5-10600K | |
| Intel Core i5-9600K | |
| Twofish Mean 100MB | |
| AMD Ryzen 9 3950X | |
| AMD Ryzen 9 3900X | |
| Intel Core i9-10900K | |
| Intel Core i9-9900KS | |
| Intel Core i5-10600K | |
| Intel Core i5-9600K | |
| Serpent Mean 100MB | |
| AMD Ryzen 9 3950X | |
| AMD Ryzen 9 3900X | |
| Intel Core i9-10900K | |
| Intel Core i9-9900KS | |
| Intel Core i5-10600K | |
| Intel Core i5-9600K | |
| Geekbench 5.5 | |
| Multi-Core | |
| AMD Ryzen 9 3950X | |
| Intel Core i9-10900K | |
| AMD Ryzen 9 3900X | |
| Intel Core i5-10600K | |
| Intel Core i5-9600K | |
| Single-Core | |
| Intel Core i9-10900K | |
| AMD Ryzen 9 3950X | |
| Intel Core i5-10600K | |
| AMD Ryzen 9 3900X | |
| Intel Core i5-9600K | |
| Geekbench 5.0 | |
| 5.0 Multi-Core | |
| AMD Ryzen 9 3950X | |
| Intel Core i9-10900K | |
| AMD Ryzen 9 3900X | |
| Intel Core i5-10600K | |
| 5.0 Single-Core | |
| Intel Core i9-10900K | |
| AMD Ryzen 9 3950X | |
| Intel Core i5-10600K | |
| AMD Ryzen 9 3900X | |
| Geekbench 4.4 | |
| 64 Bit Single-Core Score | |
| Intel Core i9-10900K | |
| Intel Core i9-9900KS | |
| Intel Core i5-9600K | |
| Intel Core i5-10600K | |
| AMD Ryzen 9 3950X | |
| AMD Ryzen 9 3900X | |
| 64 Bit Multi-Core Score | |
| AMD Ryzen 9 3950X | |
| Intel Core i9-10900K | |
| AMD Ryzen 9 3900X | |
| Intel Core i9-9900KS | |
| Intel Core i5-10600K | |
| Intel Core i5-9600K | |
| 3DMark 11 - 1280x720 Performance Physics | |
| Intel Core i9-10900K | |
| AMD Ryzen 9 3950X | |
| AMD Ryzen 9 3900X | |
| Intel Core i9-9900KS | |
| Intel Core i5-10600K | |
| Intel Core i5-9600K | |
| 7-Zip 18.03 | |
| 7z b 4 | |
| AMD Ryzen 9 3950X | |
| AMD Ryzen 9 3900X | |
| Intel Core i9-10900K | |
| Intel Core i9-9900KS | |
| Intel Core i5-10600K | |
| 7z b 4 -mmt1 | |
| Intel Core i9-10900K | |
| Intel Core i9-9900KS | |
| AMD Ryzen 9 3950X | |
| Intel Core i5-10600K | |
| AMD Ryzen 9 3900X | |
| HWBOT x265 Benchmark v2.2 - 4k Preset | |
| Intel Core i9-10900K | |
| Intel Core i9-9900KS | |
| AMD Ryzen 9 3950X | |
| Intel Core i5-10600K | |
| Intel Core i5-9600K | |
| R Benchmark 2.5 - Overall mean | |
| Intel Core i5-10600K | |
| AMD Ryzen 9 3900X | |
| Intel Core i9-10900K | |
| AMD Ryzen 9 3950X | |
| LibreOffice - 20 Documents To PDF | |
| Intel Core i9-10900K | |
| AMD Ryzen 9 3900X | |
| AMD Ryzen 9 3950X | |
| Intel Core i5-10600K | |
| WebXPRT 3 - Overall | |
| Intel Core i9-10900K | |
| AMD Ryzen 9 3950X | |
| Intel Core i5-10600K | |
| Mozilla Kraken 1.1 - Total | |
| Intel Core i5-10600K | |
| Intel Core i9-10900K | |
| AMD Ryzen 9 3950X | |
| 3DMark | |
| 3840x2160 Fire Strike Ultra Physics | |
| AMD Ryzen 9 3950X | |
| Intel Core i9-10900K | |
| AMD Ryzen 9 3900X | |
| Intel Core i9-9900KS | |
| Intel Core i5-10600K | |
| Intel Core i5-9600K | |
| 1920x1080 Fire Strike Physics | |
| AMD Ryzen 9 3950X | |
| Intel Core i9-10900K | |
| AMD Ryzen 9 3900X | |
| Intel Core i9-9900KS | |
| Intel Core i5-10600K | |
| Intel Core i5-9600K | |
| 2560x1440 Time Spy CPU | |
| Intel Core i9-10900K | |
| AMD Ryzen 9 3950X | |
| AMD Ryzen 9 3900X | |
| Intel Core i9-9900KS | |
| Intel Core i5-10600K | |
| Intel Core i5-9600K | |
* ... más pequeño es mejor
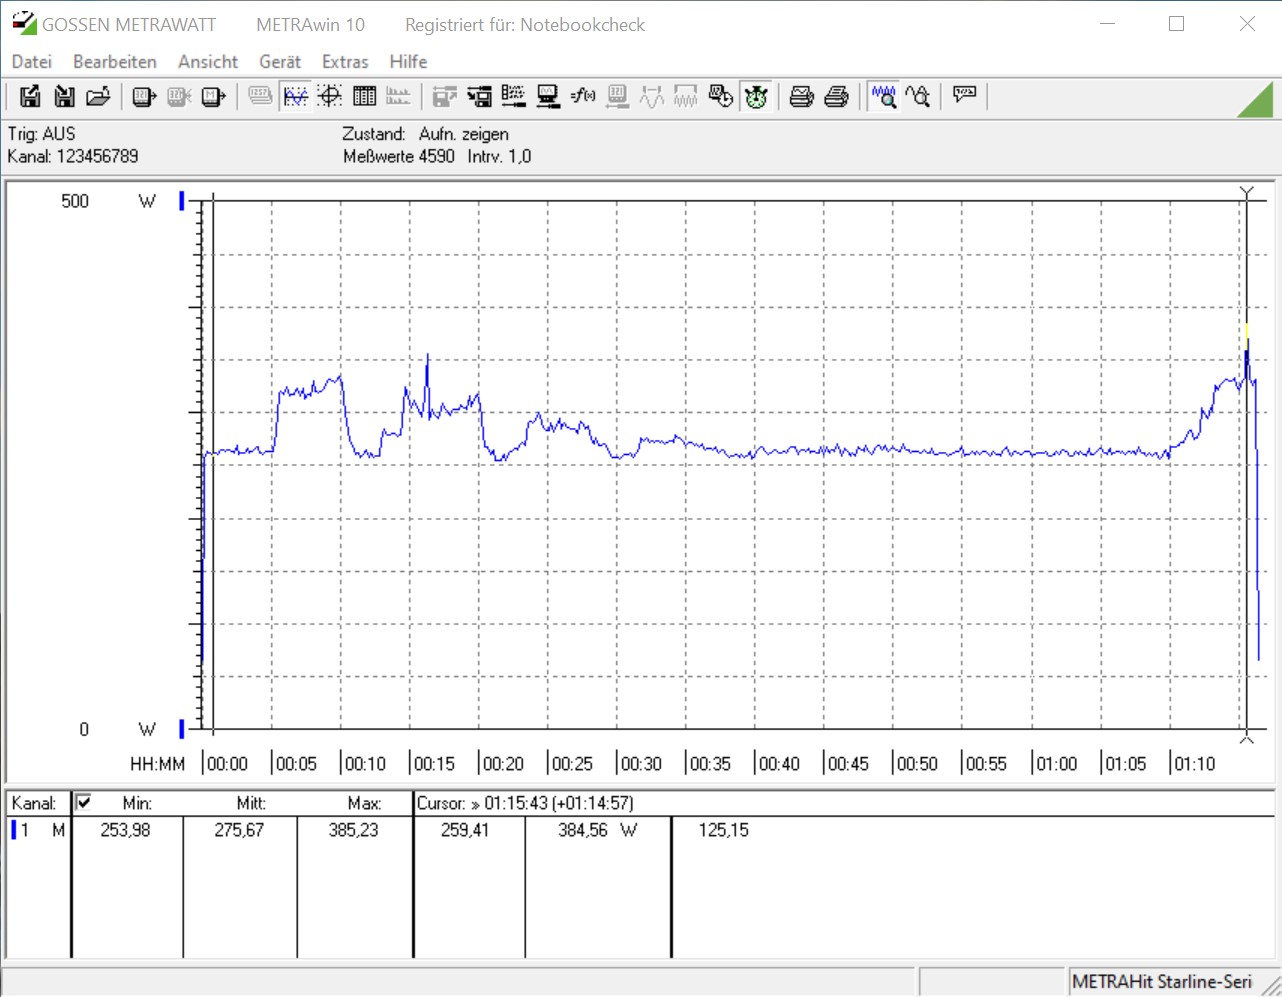
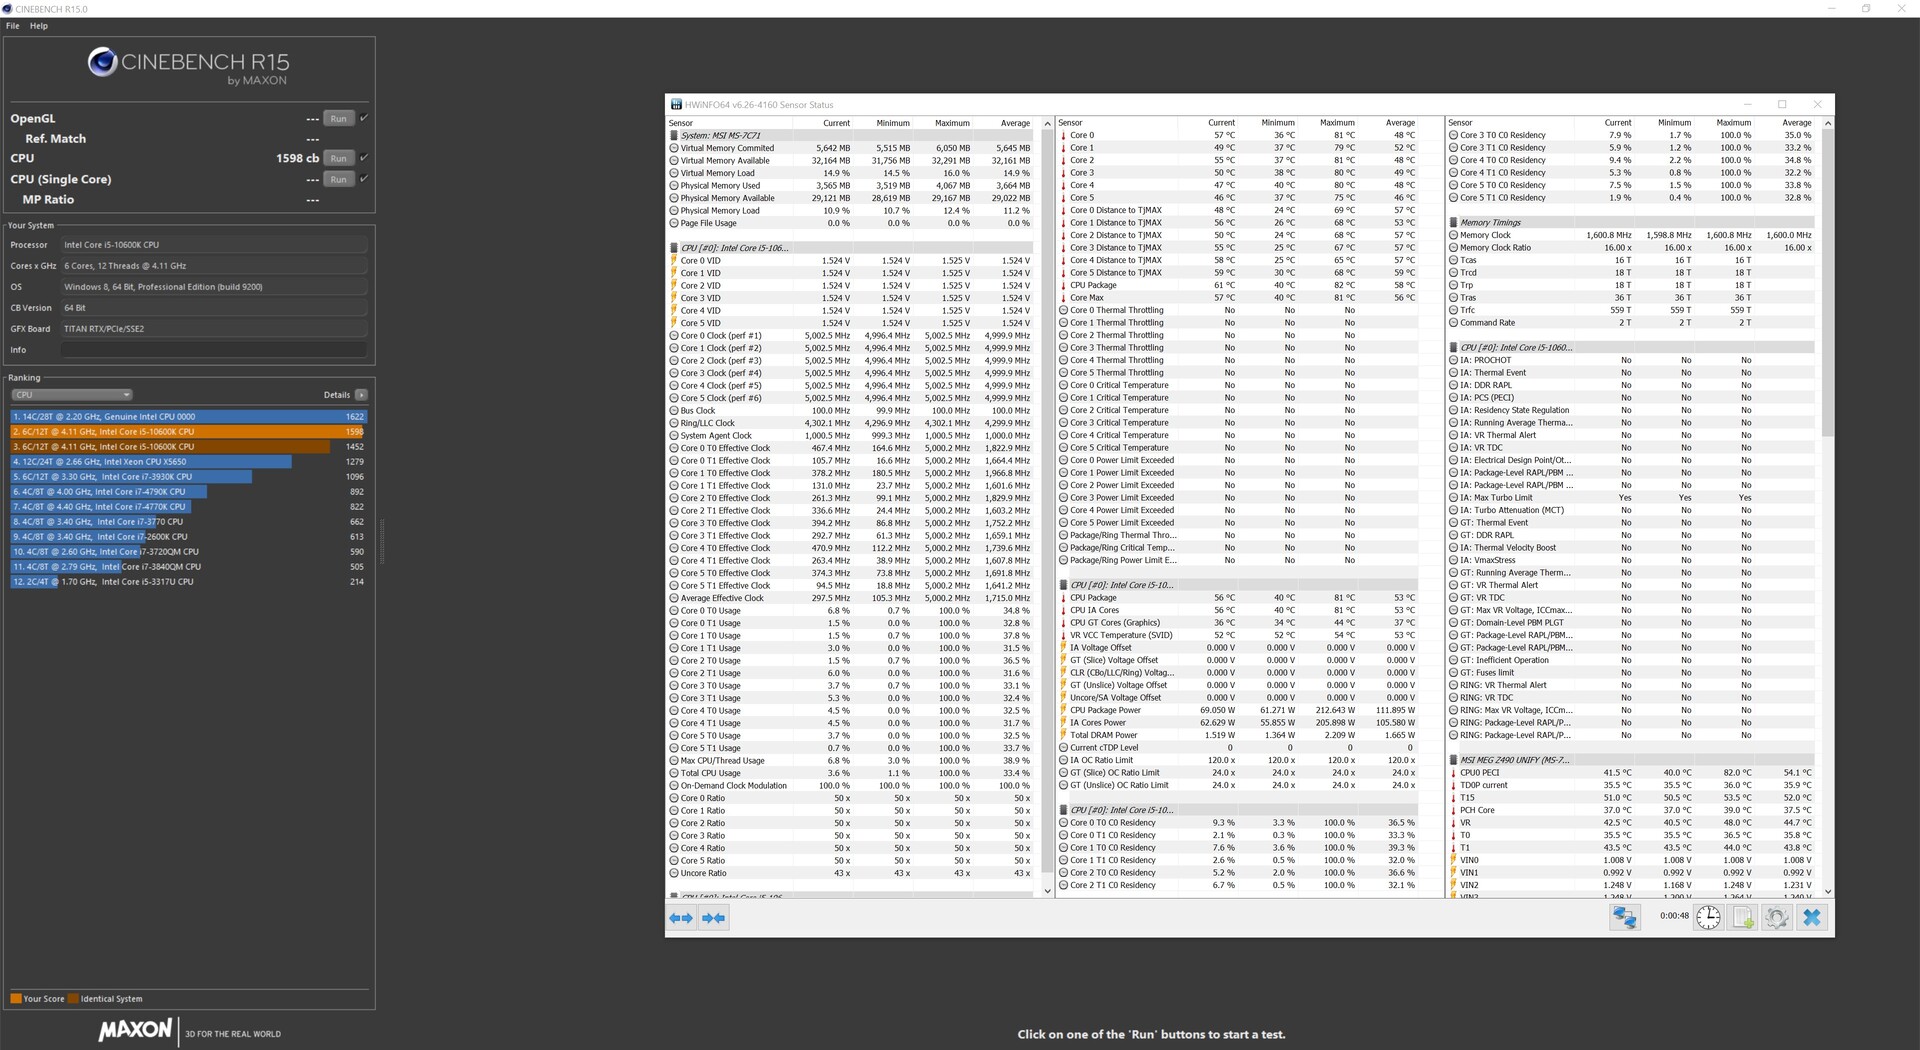
Comet Lake-S vs. Cinebench R15 Loop
Nuestra primera mirada a la estabilidad de las nuevas piezas de Intel viene de ejecutar la versión multi-core del Cinebench R15 en un bucle continuo. El enfriador líquido todo en uno de Alphacool no tiene problemas para mantener las CPU frías en nuestro banco de pruebas al aire libre. Los resultados del banco de pruebas son relativamente estables y no hay caídas en el rendimiento. Los resultados del Intel Core i5-10600K están un poco más juntos.
Puntos de referencia de la productividad
Aquí, ambos chips funcionan igual de bien. En el uso diario, no podrás saber si estás usando el Intel Core i5-10600K o el Intel Core i9-10900K. No hay claros ganadores o perdedores en los benchmarks sintéticos.
| PCMark 10 - Score | |
| Intel Core i9-9900KS | |
| AMD Ryzen 9 3950X | |
| Intel Core i9-10900K | |
| AMD Ryzen 9 3900X | |
| Intel Core i5-10600K | |
| Intel Core i5-9600K | |
| PCMark 8 | |
| Work Score Accelerated v2 | |
| AMD Ryzen 9 3950X | |
| Intel Core i9-9900KS | |
| AMD Ryzen 9 3900X | |
| Intel Core i5-10600K | |
| Intel Core i9-10900K | |
| Intel Core i5-9600K | |
| Creative Score Accelerated v2 | |
| Intel Core i9-9900KS | |
| AMD Ryzen 9 3950X | |
| AMD Ryzen 9 3900X | |
| Intel Core i5-10600K | |
| Intel Core i9-10900K | |
| Intel Core i5-9600K | |
| Home Score Accelerated v2 | |
| Intel Core i9-9900KS | |
| AMD Ryzen 9 3950X | |
| AMD Ryzen 9 3900X | |
| Intel Core i5-10600K | |
| Intel Core i9-10900K | |
| Intel Core i5-9600K | |
Sigue siendo la CPU de juego más rápida
Intel todavía ofrece la CPU de juegos más rápida del mundo. El Intel Core i9-10900K puede alcanzar velocidades de cuadro muy altas siempre que no esté ligado a la GPU. Sin embargo, una vez que se introduce un cuello de botella en la GPU al aumentar la resolución o los ajustes de los gráficos, la ventaja de rendimiento que tiene se evapora. No obstante, el Intel Core i9-10900K sigue siendo la CPU elegida por aquellos que necesitan o quieren las mayores velocidades de cuadro posibles. El Intel Core i5-10600K se queda un poco atrás del modelo de más alta gama, pero sigue siendo una CPU de juego excepcional. Ambos chips de Intel ofrecen un mejor rendimiento en los juegos con un Nvidia Titan RTX que las dos CPUs Ryzen 9 de AMD.
| Performance rating - Percent | |
| Intel Core i9-10900K | |
| Intel Core i9-9900KS, Nvidia Titan RTX | |
| Intel Core i5-10600K | |
| AMD Ryzen 9 3900X | |
| AMD Ryzen 9 3950X | |
| Borderlands 3 | |
| 1280x720 Very Low Overall Quality (DX11) | |
| Intel Core i9-10900K | |
| Intel Core i5-10600K | |
| Intel Core i9-9900KS, Nvidia Titan RTX | |
| AMD Ryzen 9 3900X | |
| AMD Ryzen 9 3950X | |
| 1920x1080 Badass Overall Quality (DX11) | |
| Intel Core i9-10900K | |
| Intel Core i5-10600K | |
| Intel Core i9-9900KS, Nvidia Titan RTX | |
| AMD Ryzen 9 3900X | |
| AMD Ryzen 9 3950X | |
| Metro Exodus | |
| 1280x720 Low Quality AF:4x | |
| Intel Core i9-10900K | |
| Intel Core i5-10600K | |
| Intel Core i9-9900KS, Nvidia Titan RTX | |
| AMD Ryzen 9 3900X | |
| AMD Ryzen 9 3950X | |
| 1920x1080 Ultra Quality AF:16x | |
| Intel Core i9-10900K | |
| Intel Core i5-10600K | |
| Intel Core i9-9900KS, Nvidia Titan RTX | |
| AMD Ryzen 9 3900X | |
| AMD Ryzen 9 3950X | |
| Far Cry New Dawn | |
| 1280x720 Low Preset | |
| Intel Core i9-10900K | |
| Intel Core i9-9900KS, Nvidia Titan RTX | |
| Intel Core i5-10600K | |
| AMD Ryzen 9 3900X | |
| AMD Ryzen 9 3950X | |
| 1920x1080 Ultra Preset | |
| Intel Core i9-9900KS, Nvidia Titan RTX | |
| Intel Core i5-10600K | |
| Intel Core i9-10900K | |
| AMD Ryzen 9 3950X | |
| AMD Ryzen 9 3900X | |
| Forza Horizon 4 | |
| 1280x720 Very Low Preset | |
| Intel Core i9-10900K | |
| Intel Core i9-9900KS, Nvidia Titan RTX | |
| Intel Core i5-10600K | |
| AMD Ryzen 9 3950X | |
| AMD Ryzen 9 3900X | |
| 1920x1080 Ultra Preset AA:2xMS | |
| Intel Core i9-10900K | |
| Intel Core i5-10600K | |
| Intel Core i9-9900KS, Nvidia Titan RTX | |
| AMD Ryzen 9 3950X | |
| AMD Ryzen 9 3900X | |
| Far Cry 5 | |
| 1280x720 Low Preset AA:T | |
| Intel Core i9-10900K | |
| Intel Core i9-9900KS, Nvidia Titan RTX | |
| Intel Core i5-10600K | |
| AMD Ryzen 9 3900X | |
| AMD Ryzen 9 3950X | |
| 1920x1080 Ultra Preset AA:T | |
| Intel Core i9-10900K | |
| Intel Core i9-9900KS, Nvidia Titan RTX | |
| Intel Core i5-10600K | |
| AMD Ryzen 9 3900X | |
| AMD Ryzen 9 3950X | |
| X-Plane 11.11 | |
| 1280x720 low (fps_test=1) | |
| Intel Core i9-10900K | |
| Intel Core i9-9900KS, Nvidia Titan RTX | |
| Intel Core i5-10600K | |
| AMD Ryzen 9 3900X | |
| AMD Ryzen 9 3950X | |
| 1920x1080 high (fps_test=3) | |
| Intel Core i9-9900KS, Nvidia Titan RTX | |
| Intel Core i9-10900K | |
| Intel Core i5-10600K | |
| AMD Ryzen 9 3900X | |
| AMD Ryzen 9 3950X | |
| Final Fantasy XV Benchmark | |
| 1280x720 Lite Quality | |
| Intel Core i9-10900K | |
| Intel Core i9-9900KS, Nvidia Titan RTX | |
| Intel Core i5-10600K | |
| AMD Ryzen 9 3950X | |
| AMD Ryzen 9 3900X | |
| 1920x1080 High Quality | |
| Intel Core i9-10900K | |
| Intel Core i5-10600K | |
| Intel Core i9-9900KS, Nvidia Titan RTX | |
| AMD Ryzen 9 3950X | |
| AMD Ryzen 9 3900X | |
| Dota 2 Reborn | |
| 1280x720 min (0/3) fastest | |
| Intel Core i9-10900K | |
| Intel Core i9-9900KS, Nvidia Titan RTX | |
| Intel Core i5-10600K | |
| AMD Ryzen 9 3900X | |
| AMD Ryzen 9 3950X | |
| 1920x1080 ultra (3/3) best looking | |
| Intel Core i9-10900K | |
| Intel Core i9-9900KS, Nvidia Titan RTX | |
| Intel Core i5-10600K | |
| AMD Ryzen 9 3900X | |
| AMD Ryzen 9 3950X | |
| The Witcher 3 | |
| 1024x768 Low Graphics & Postprocessing | |
| Intel Core i9-10900K | |
| Intel Core i9-9900KS, Nvidia Titan RTX | |
| Intel Core i5-10600K | |
| AMD Ryzen 9 3900X | |
| AMD Ryzen 9 3950X | |
| 1920x1080 Ultra Graphics & Postprocessing (HBAO+) | |
| Intel Core i5-10600K | |
| Intel Core i9-10900K | |
| AMD Ryzen 9 3900X | |
| Intel Core i9-9900KS, Nvidia Titan RTX | |
| AMD Ryzen 9 3950X | |
Intel Core i9-10900K + Nvidia Titan RTX
| bajo | medio | alto | ultra | QHD | 4K | |
|---|---|---|---|---|---|---|
| The Witcher 3 (2015) | 518 | 400 | 265 | 139 | 103 | |
| Dota 2 Reborn (2015) | 198.8 | 181 | 174.2 | 172.2 | 158.9 | |
| Final Fantasy XV Benchmark (2018) | 221 | 187 | 142 | 65.4 | ||
| X-Plane 11.11 (2018) | 149 | 130 | 106 | 91.9 | ||
| Far Cry 5 (2018) | 193 | 169 | 159 | 149 | 137 | 83 |
| Shadow of the Tomb Raider (2018) | 204 | 180 | 173 | 165 | 122 | 67 |
| Forza Horizon 4 (2018) | 246 | 218 | 216 | 193 | 164 | 117 |
| Far Cry New Dawn (2019) | 151 | 120 | 113 | 98 | 97 | 85 |
| Metro Exodus (2019) | 220 | 175 | 136 | 109 | 86.4 | 55.1 |
| Borderlands 3 (2019) | 191.1 | 166.7 | 139 | 117 | 85 | 46.5 |
Intel Core i5-10600K + Nvidia Titan RTX
| bajo | medio | alto | ultra | QHD | 4K | |
|---|---|---|---|---|---|---|
| The Witcher 3 (2015) | 413 | 371 | 258 | 140 | 101 | |
| Dota 2 Reborn (2015) | 171.6 | 160.6 | 155.2 | 148.1 | 146.1 | |
| Final Fantasy XV Benchmark (2018) | 201 | 176 | 140 | 64.5 | ||
| X-Plane 11.11 (2018) | 133 | 118 | 96.8 | 83.7 | ||
| Far Cry 5 (2018) | 157 | 139 | 132 | 126 | 121 | 81 |
| Shadow of the Tomb Raider (2018) | 178 | 161 | 156 | 149 | 122 | 66 |
| Forza Horizon 4 (2018) | 222 | 200 | 200 | 187 | 164 | 117 |
| Far Cry New Dawn (2019) | 147 | 125 | 120 | 109 | 113 | 83 |
| Metro Exodus (2019) | 210 | 164 | 135 | 109 | 86.3 | 53.9 |
| Borderlands 3 (2019) | 166 | 143 | 130 | 114 | 86 | 47.9 |
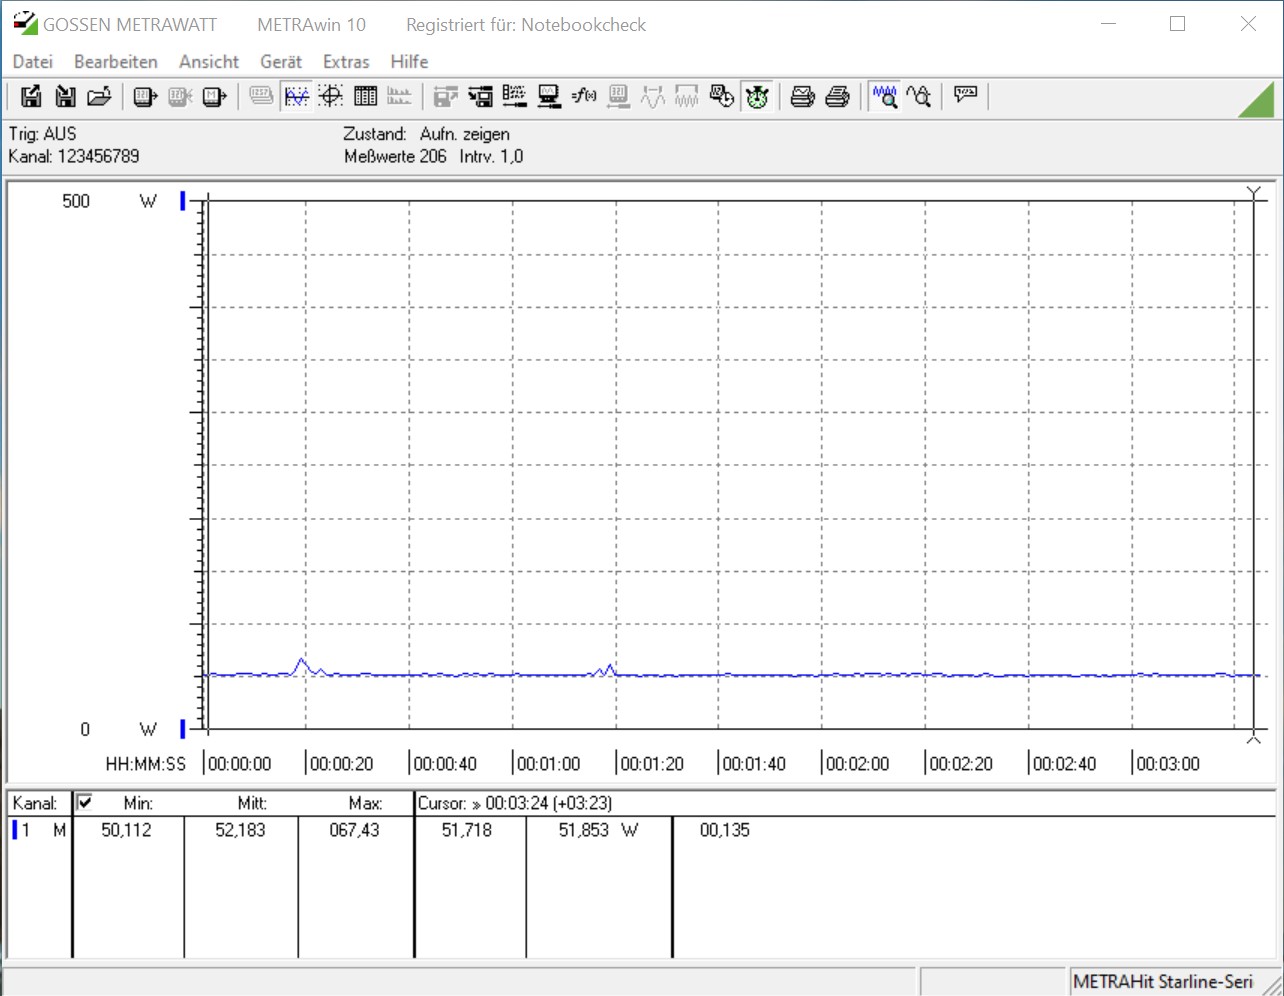
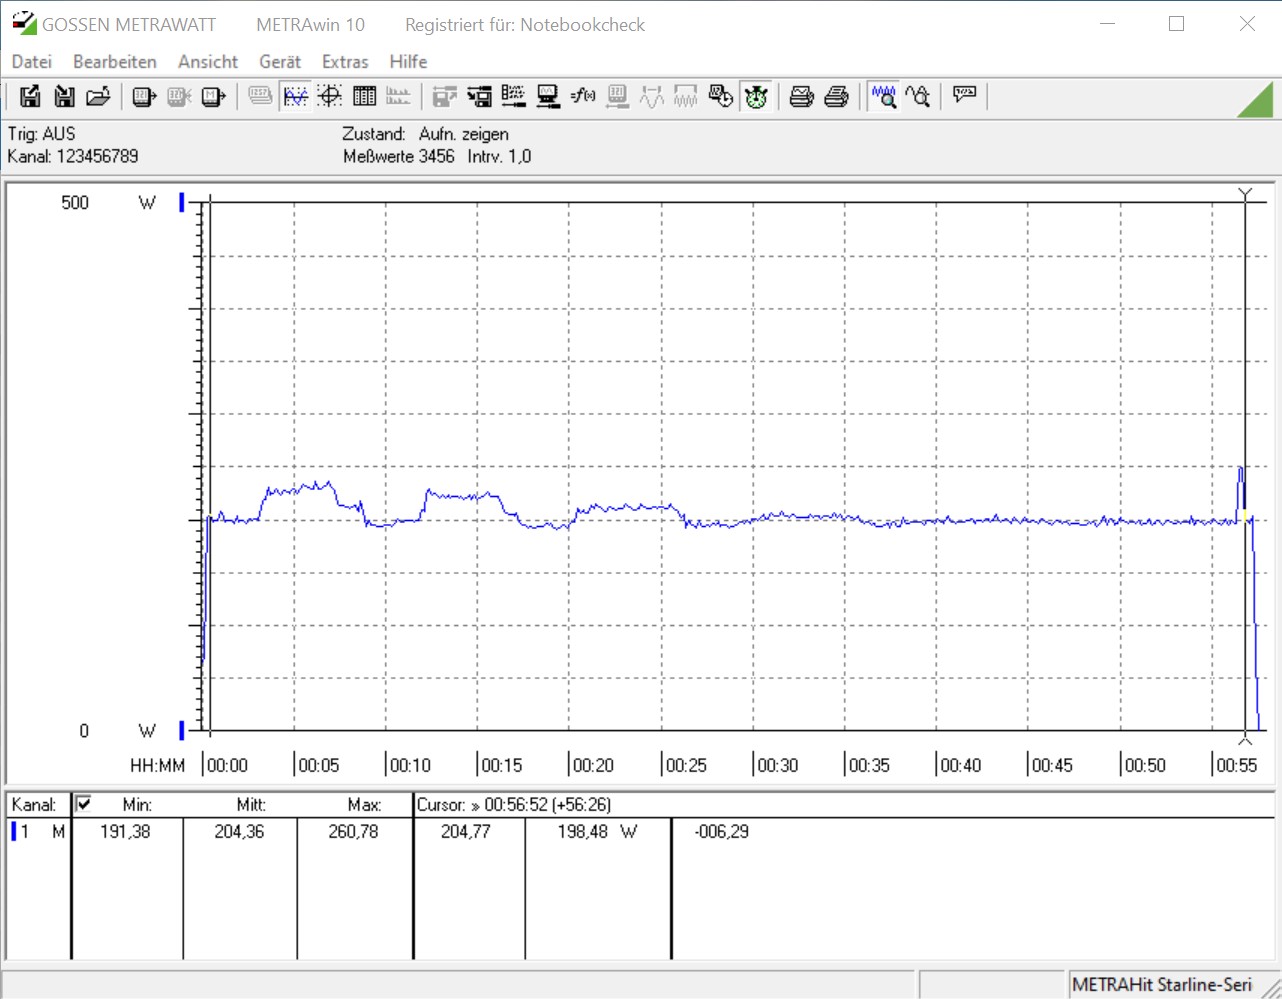
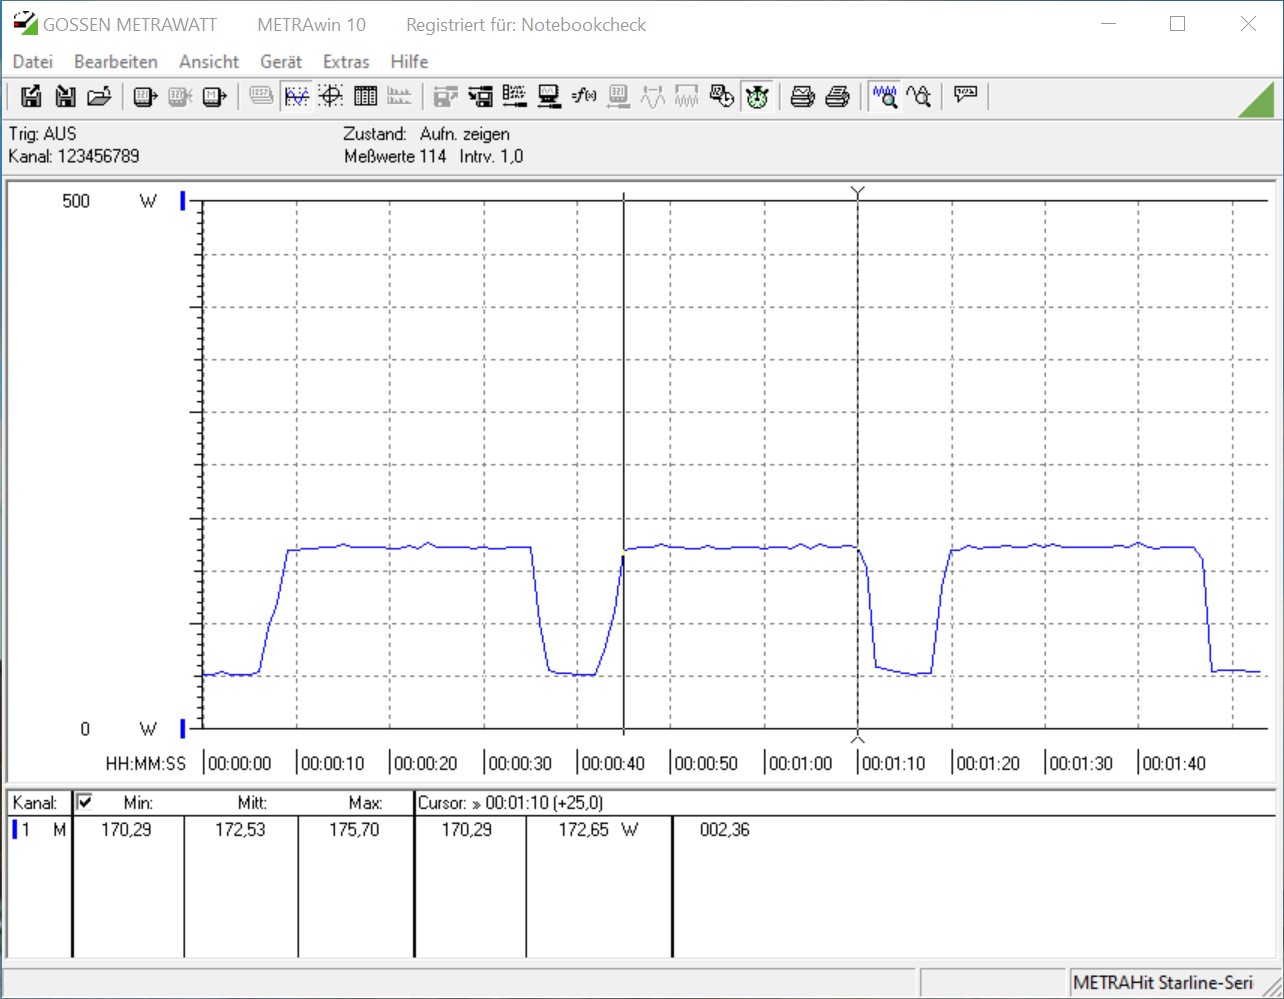
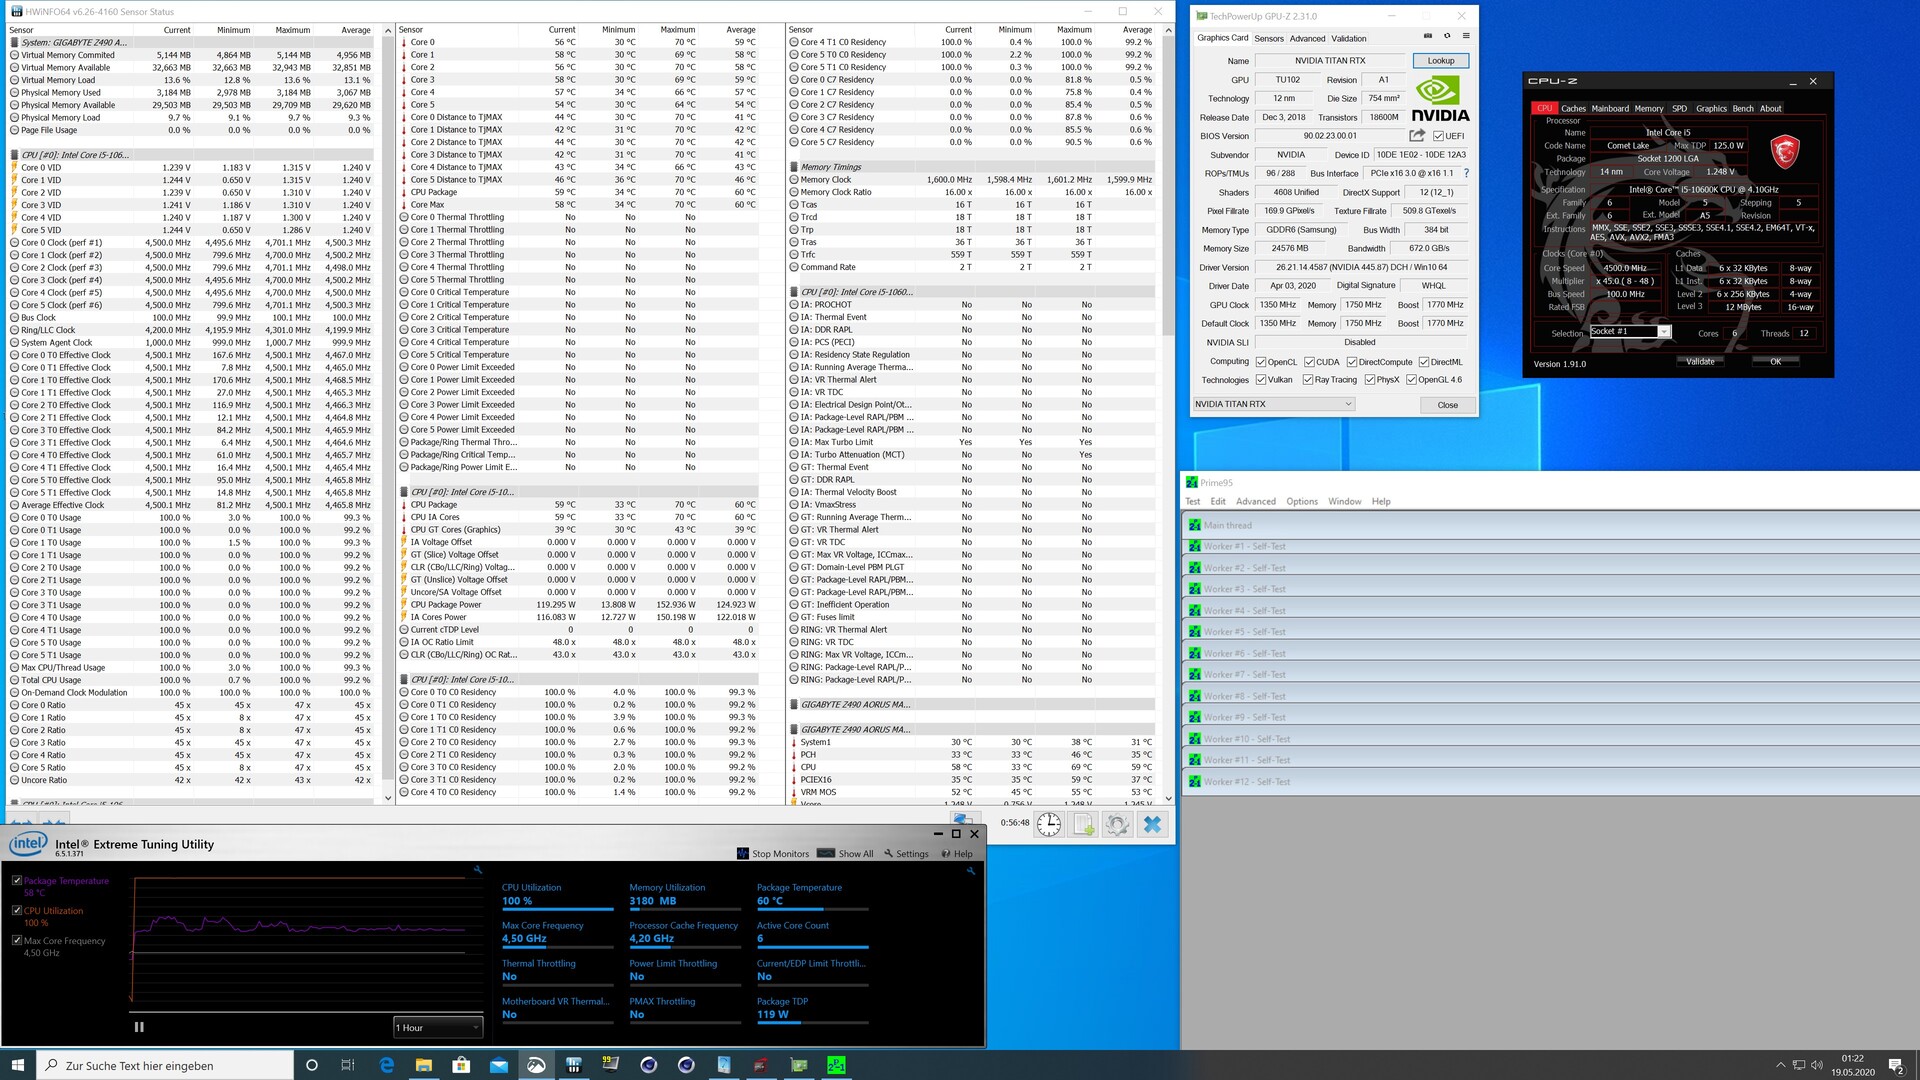
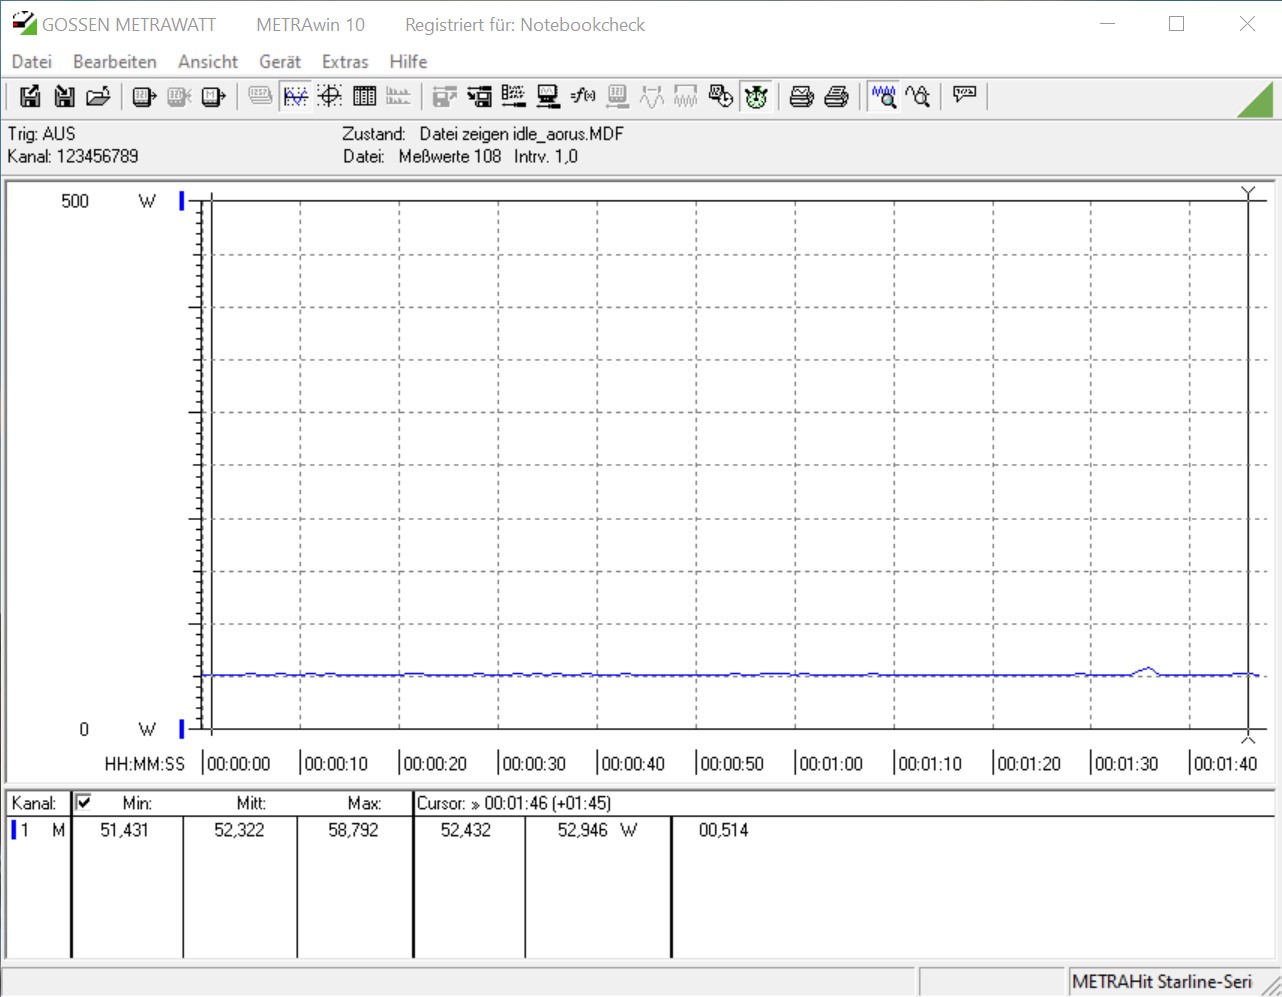
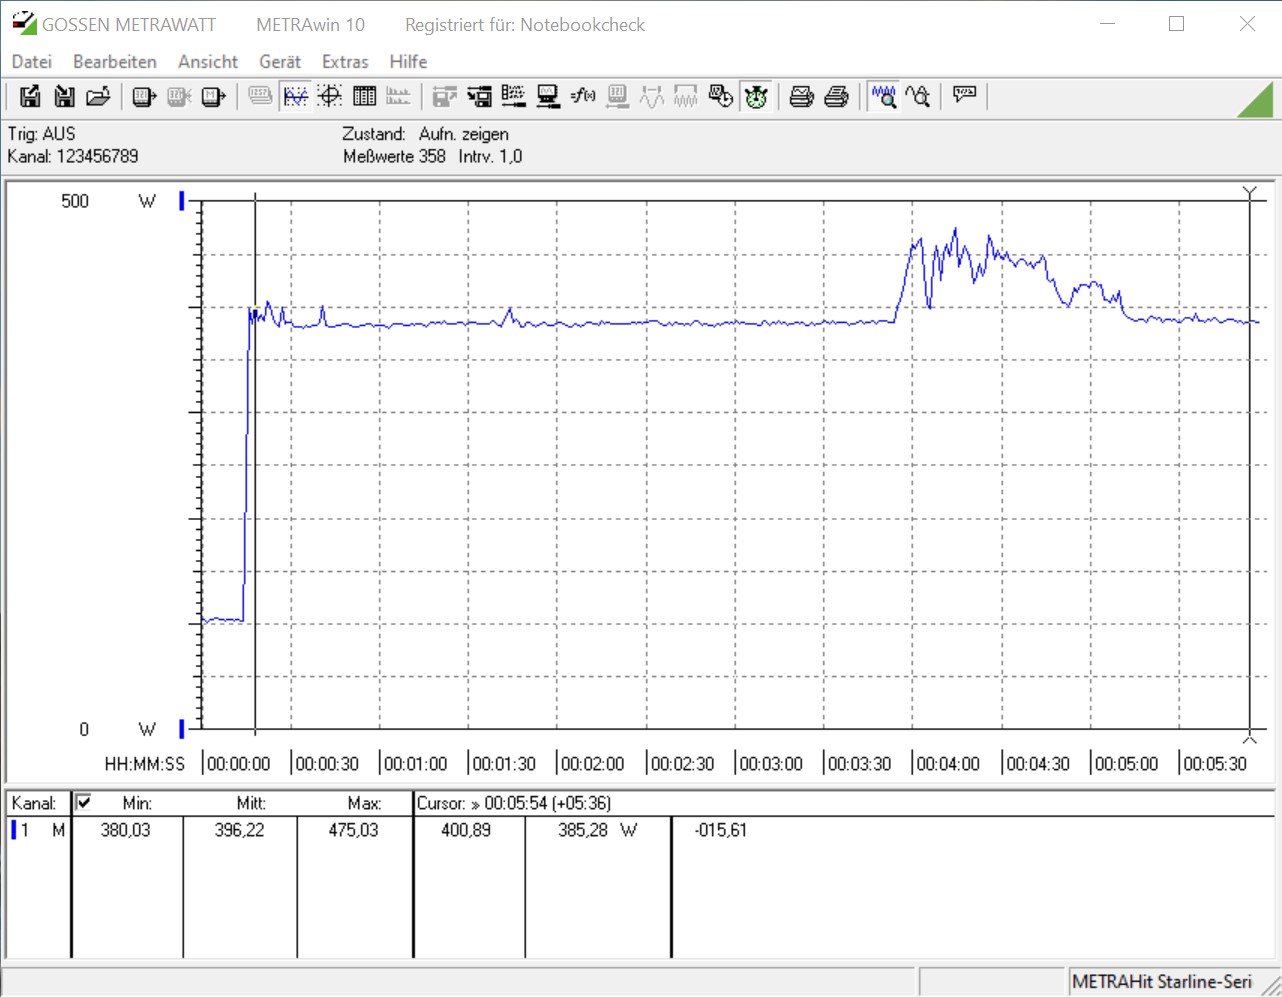
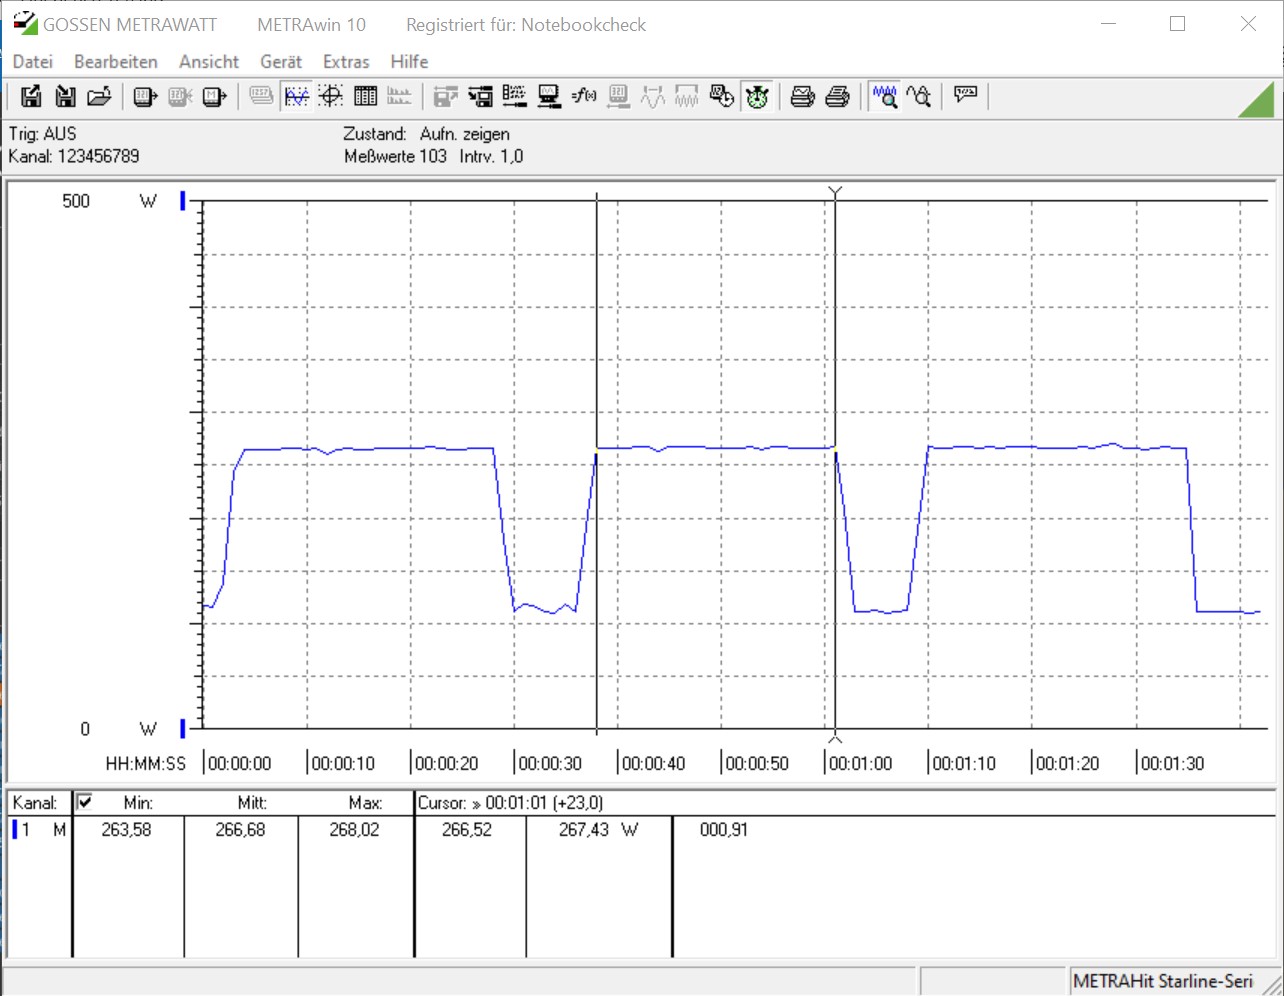
Consumo de energía - 10 núcleos se cobran su precio
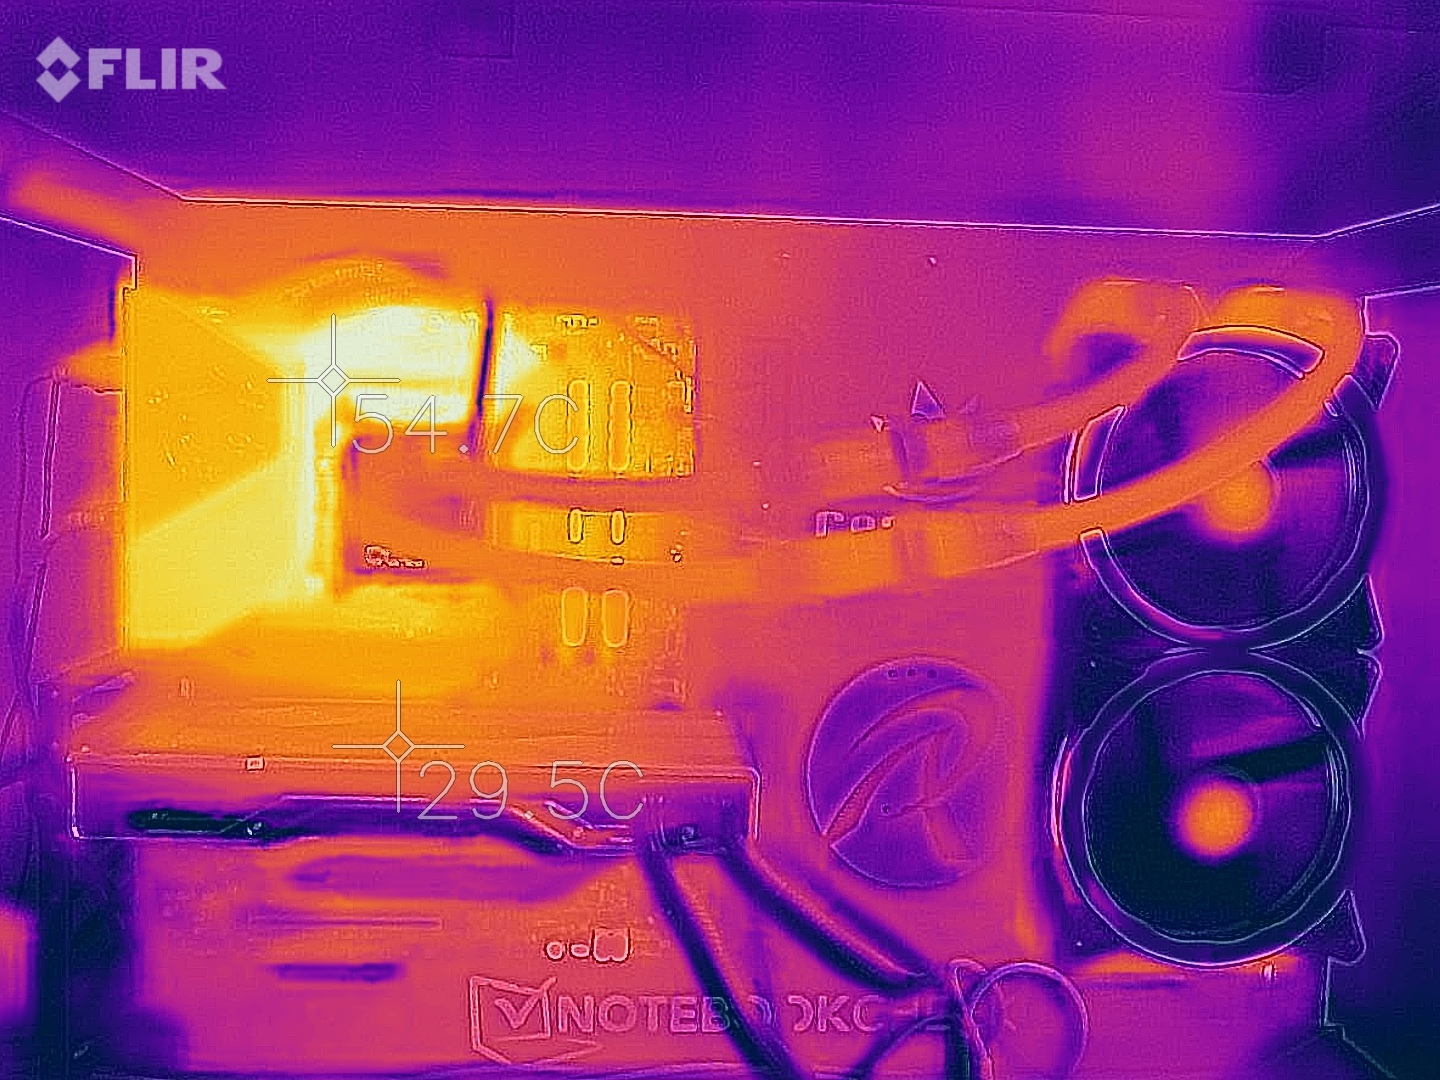
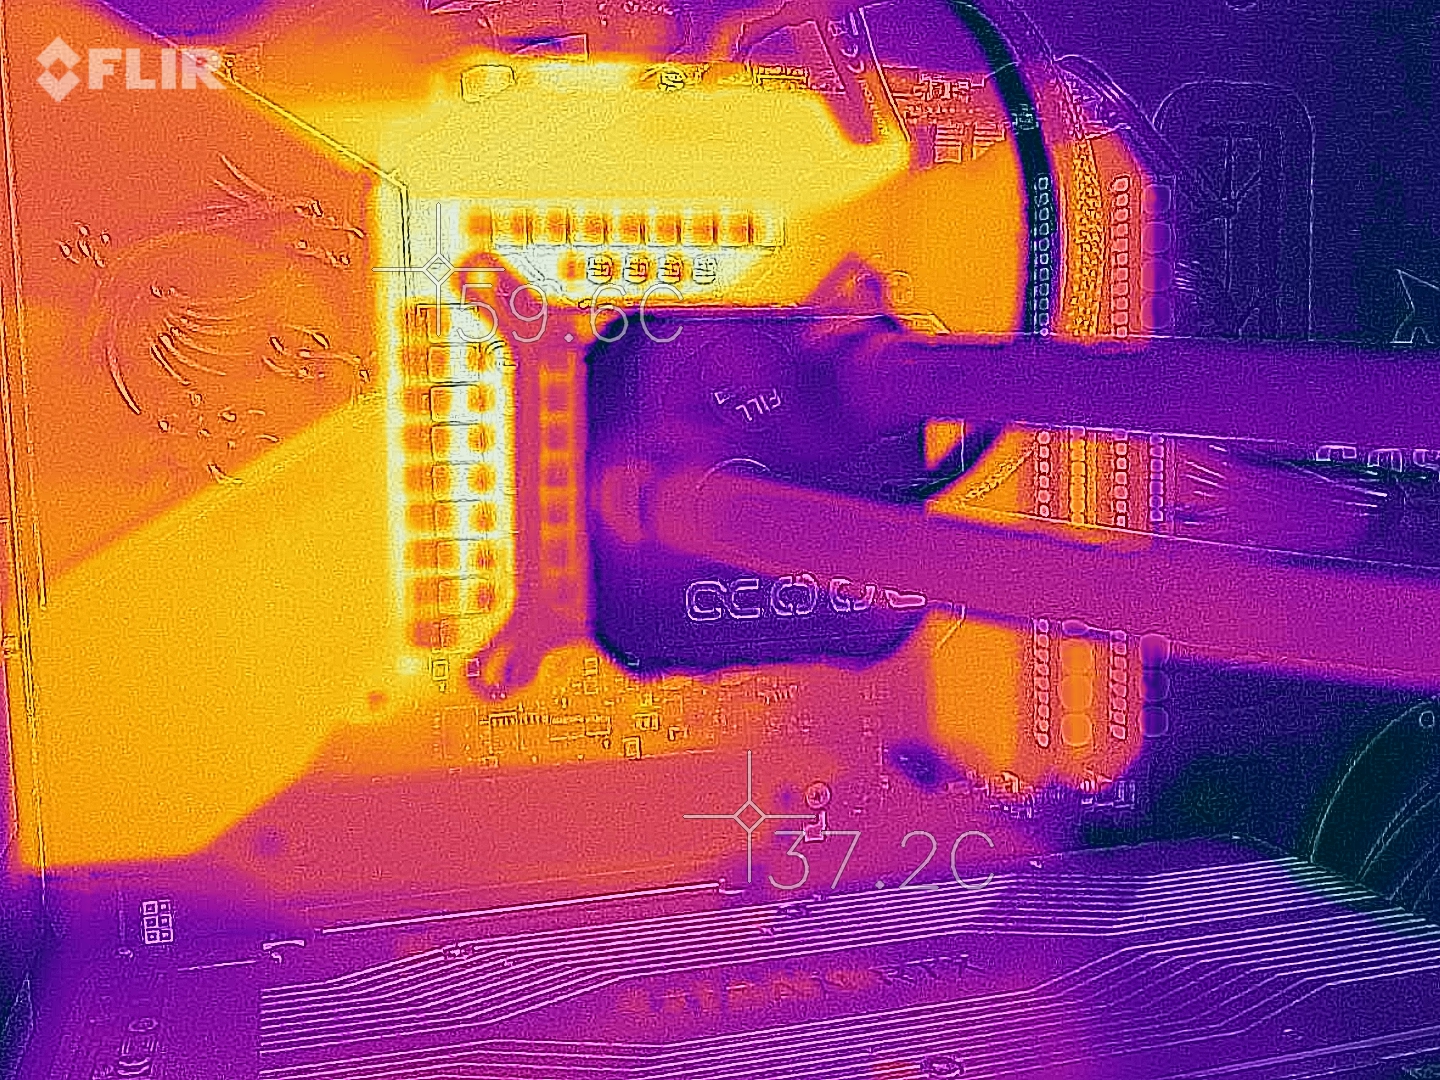
El consumo de energía es de lo que la mayoría de la gente habla cuando habla de los nuevos procesadores del Comet Lake-S. El Intel Core i9-10900K puede consumir hasta 250 vatios durante 56 segundos. El consumo de energía del Core i9-10900K en el bucle continuo del Cinebench R15 multi-núcleo es de aproximadamente 269 vatios. Este resultado significa que el chip de 10 núcleos de Intel consume más energía que el procesador de 16 núcleos de AMD en el mismo benchmark. Aquí, el consumo de energía del Core i5-10600K de gama media es mucho más bajo, y asciende a 173 vatios.
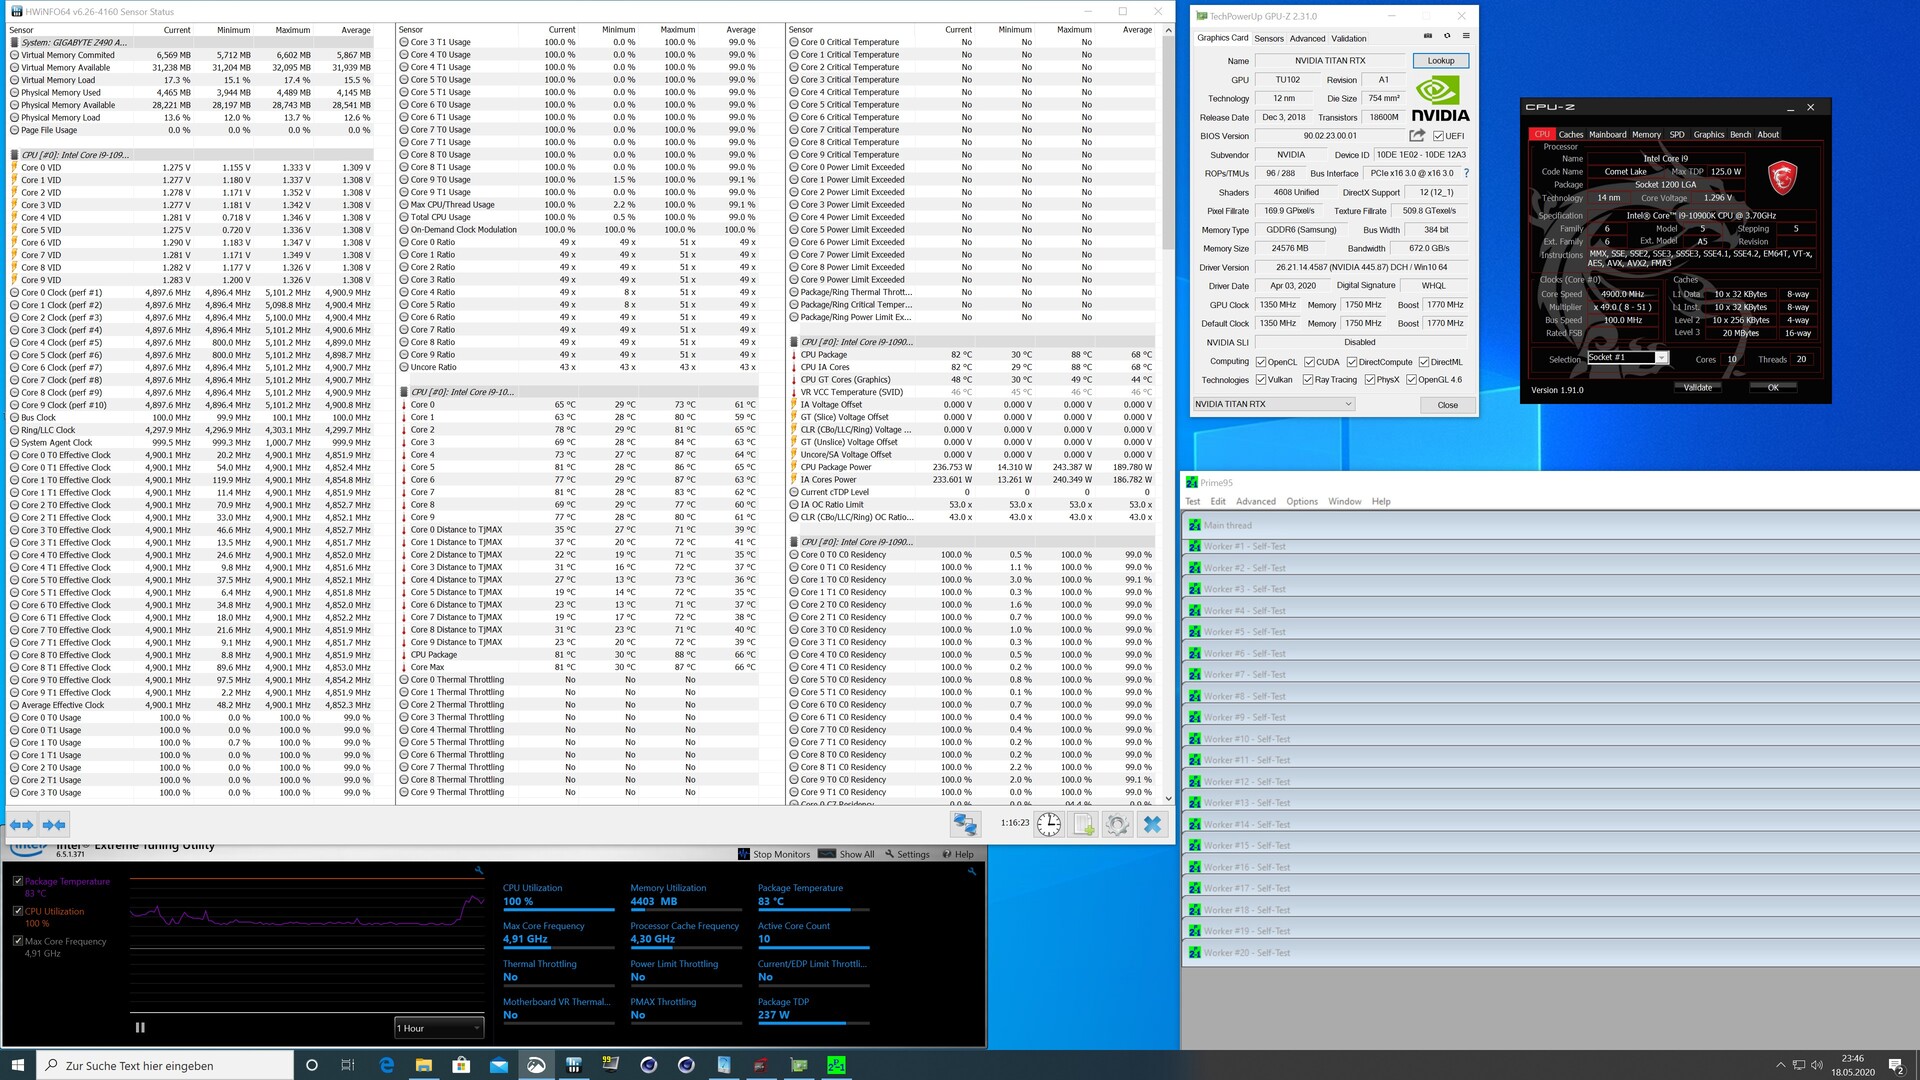
En la prueba de estrés del Prime95, el chip de 10 núcleos consumió 275 vatios y el de 6 núcleos 204 vatios. Aquí, Intel se superó a sí misma. El Core i9-10900K consume más energía que el Core i9-9900KS, pero esto no debería sorprender a nadie.
Bajo carga, incluso un refrigerador líquido todo en uno de Alphacool lucha por mantener el Core i9-10900K de Intel lo suficientemente frío. El chip de diez núcleos alcanzó los 88 °C en nuestra prueba de esfuerzo. El Core i5-10600K es más fácil de enfriar. Durante la prueba de estrés, sólo llegó a unos 70 °C.
Por favor, tenga en cuenta:
Debido a que el consumo de energía varió enormemente en el MSI Z490 Unify, utilizamos el Gigabyte Aorus Z490 Master para medir el consumo de energía.
| Power Consumption | |
| 1920x1080 The Witcher 3 ultra (external Monitor) | |
| AMD Ryzen 9 3950X (Idle: 95 W) | |
| AMD Ryzen 9 3900X (Idle: 87.4 W) | |
| Intel Core i9-10900K (Idle: 52.3 W) | |
| Intel Core i9-9900KS, Nvidia Titan RTX (Idle: 48.6 W) | |
| Intel Core i5-10600K (Idle: 52.2 W) | |
| Intel Core i5-9600K, AMD Radeon RX Vega 64 | |
| Prime95 V2810 Stress (external Monitor) | |
| Intel Core i9-10900K (Idle: 52.3 W) | |
| Intel Core i9-9900KS, Nvidia Titan RTX (Idle: 48.6 W) | |
| Intel Core i5-10600K (Idle: 52.2 W) | |
| AMD Ryzen 9 3950X (Idle: 95 W) | |
| AMD Ryzen 9 3900X (Idle: 87.4 W) | |
| Intel Core i5-9600K, AMD Radeon RX Vega 64 | |
| Cinebench R15 Multi (external Monitor) | |
| Intel Core i9-9900KS, Nvidia Titan RTX (Idle: 48.6 W) | |
| Intel Core i9-10900K (Idle: 52.3 W) | |
| AMD Ryzen 9 3950X (Idle: 95 W) | |
| AMD Ryzen 9 3900X (Idle: 87.4 W) | |
| Intel Core i5-10600K (Idle: 52.2 W) | |
| Intel Core i5-9600K, AMD Radeon RX Vega 64 | |
| Temperatures - CPU Temperature Prime95 | |
| Intel Core i9-10900K | |
| AMD Ryzen 9 3950X | |
| AMD Ryzen 9 3900X | |
| Intel Core i5-10600K | |
* ... más pequeño es mejor
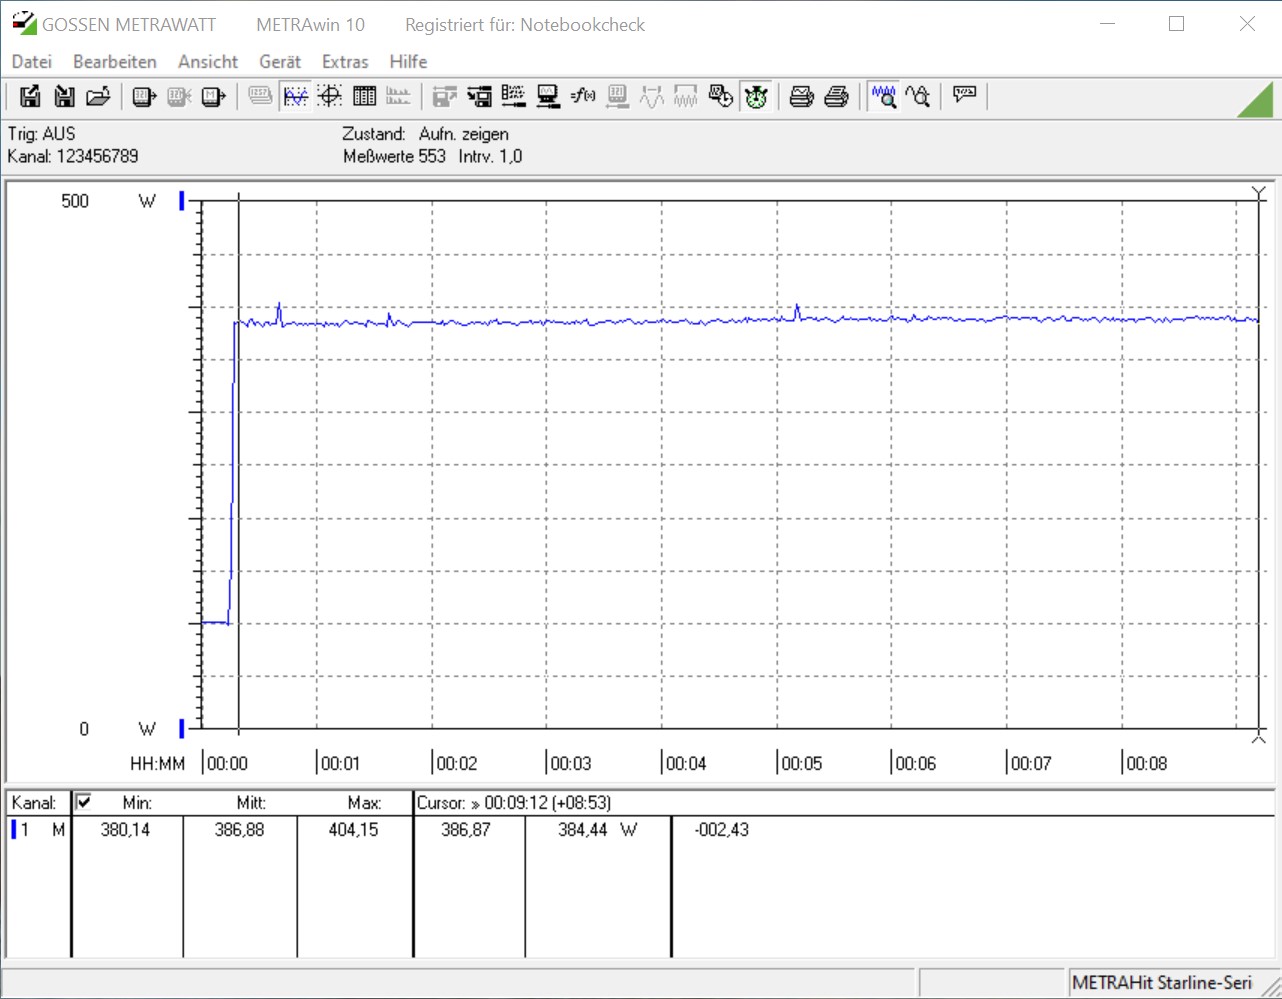
Overclocking - No se recomienda
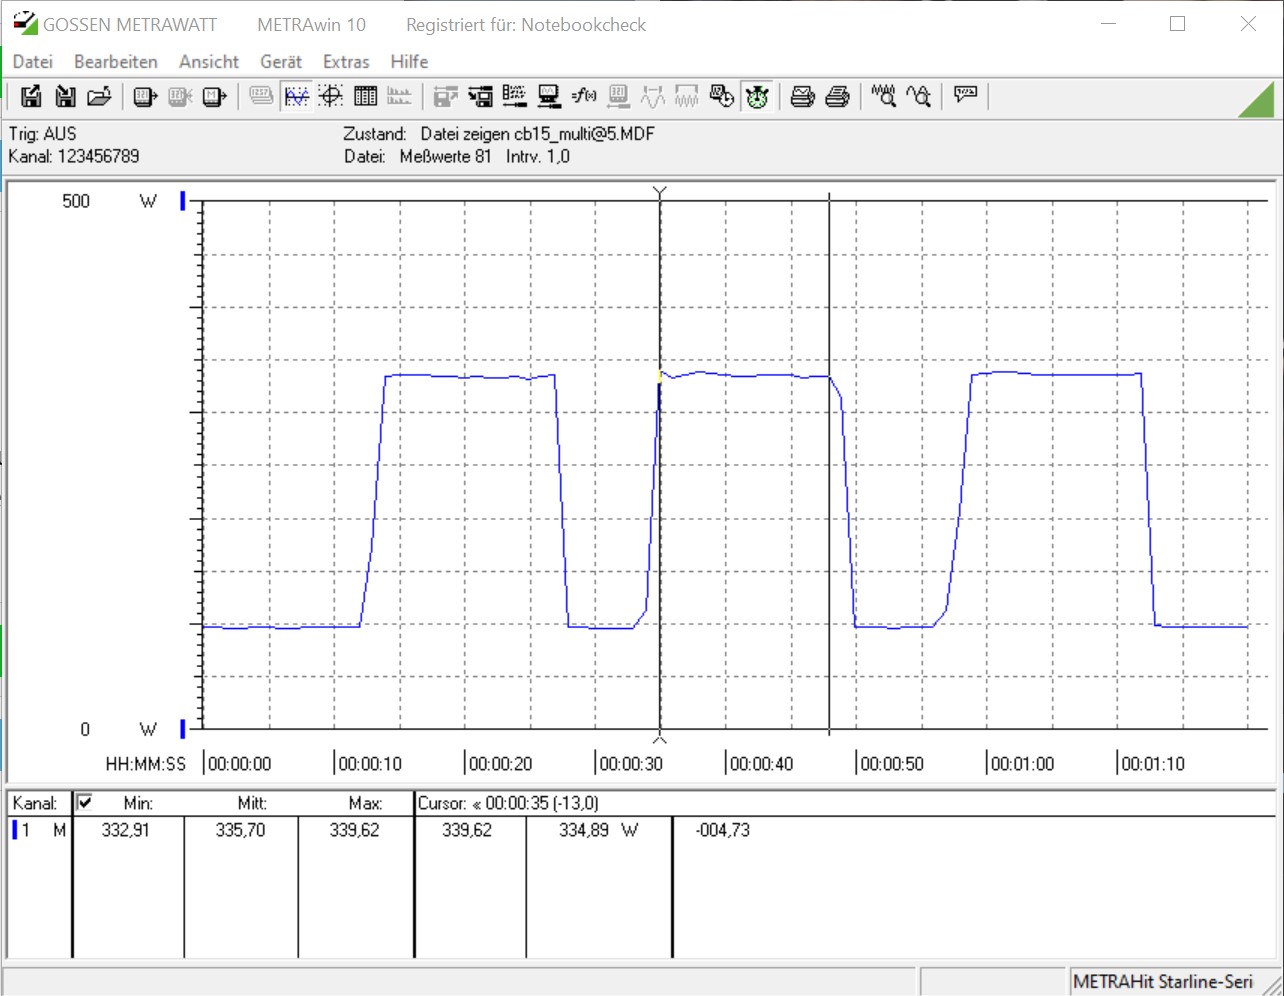
A pesar de que las CPU de Intel están construidas para un máximo rendimiento, hicimos algunos intentos de overclocking. Todos los chips "K" ofrecen un multiplicador desbloqueado, lo que simplifica enormemente el proceso de overclocking. En nuestro caso, pudimos lograr un overclocking estable de 5.3-GHz con el Intel Core i9-10900K. Sin embargo, con este overclock, nuestro sistema extrajo 336 vatios en el bucle multinúcleo Cinebench R15, que es 67 vatios más de lo que consumía la configuración de la reserva. Al hacer overclocking con el Intel Core i5-10600K vimos resultados muy similares. Aquí, pudimos lograr un overclock de 5.0-GHz para todos los núcleos, con el consumo de energía saltando de 173 watts a 266 watts en el bucle multi-núcleo Cinebench R15.
Intel Core i9-10900K
Pro
Contra
Intel Core i5-10600K
Pro
Contra
Veredicto - Todavía la CPU de juegos más rápida del mundo

Con las CPU Comet Lake-S, Intel lleva los chips de 10 núcleos a la corriente principal por primera vez. Sin embargo, aquellos que quieran actualizarse tendrán que conseguir una nueva placa base, porque el zócalo LGA 1151 ha sido reemplazado por el LGA 1200. Hay cuatro nuevos chipsets, siendo el Z490 el que más se ofrece.
Tanto el Intel Core i9-10900K como el Intel Core i5-10600K lo hicieron muy bien en nuestra revisión. El Core i9-10900K es el chip insignia de Intel en el nuevo zócalo. Ofrece un nivel muy alto de rendimiento en los videojuegos. Gracias a los 10 núcleos físicos, el procesador funciona muy bien en aplicaciones multi-hilo, lo que le da una ventaja sobre el Intel Core i9-9900KS. Sin embargo, el chip de Intel no supera a sus homólogos de AMD en muchas cargas de trabajo con muchos hilos.
El Intel Core i9-10900K es la CPU de juegos más rápida. Sin embargo, esta es una victoria pírrica para Intel, porque su CPU de 10 núcleos consume 250 vatios durante sus 56 segundos de Turbo Boost.
En total, Intel sacó al mercado 32 nuevos procesadores. También pudimos ver el Core i5-10600K, que es la oferta de gama media de Intel. Tiene 6 núcleos y soporta Hyper-threading, que antes estaba reservado sólo a los modelos de gama alta. Cuando se compara con el Core i5-9600K de Intel, el Core i5-10600K ofrece un mayor nivel de rendimiento. El chip Comet Lake-S de gama media también lo hizo muy bien en nuestros benchmarks de juegos.
Sin embargo, hay un gran inconveniente, que tiene que ver con el hecho de que las nuevas CPU consumen mucha energía. Además, Intel todavía utiliza el nodo de 14 nm para fabricar estos chips, lo que está empezando a mostrar su edad. Veremos si los chips Rocket Lake-S serán construidos usando el mismo proceso o no.