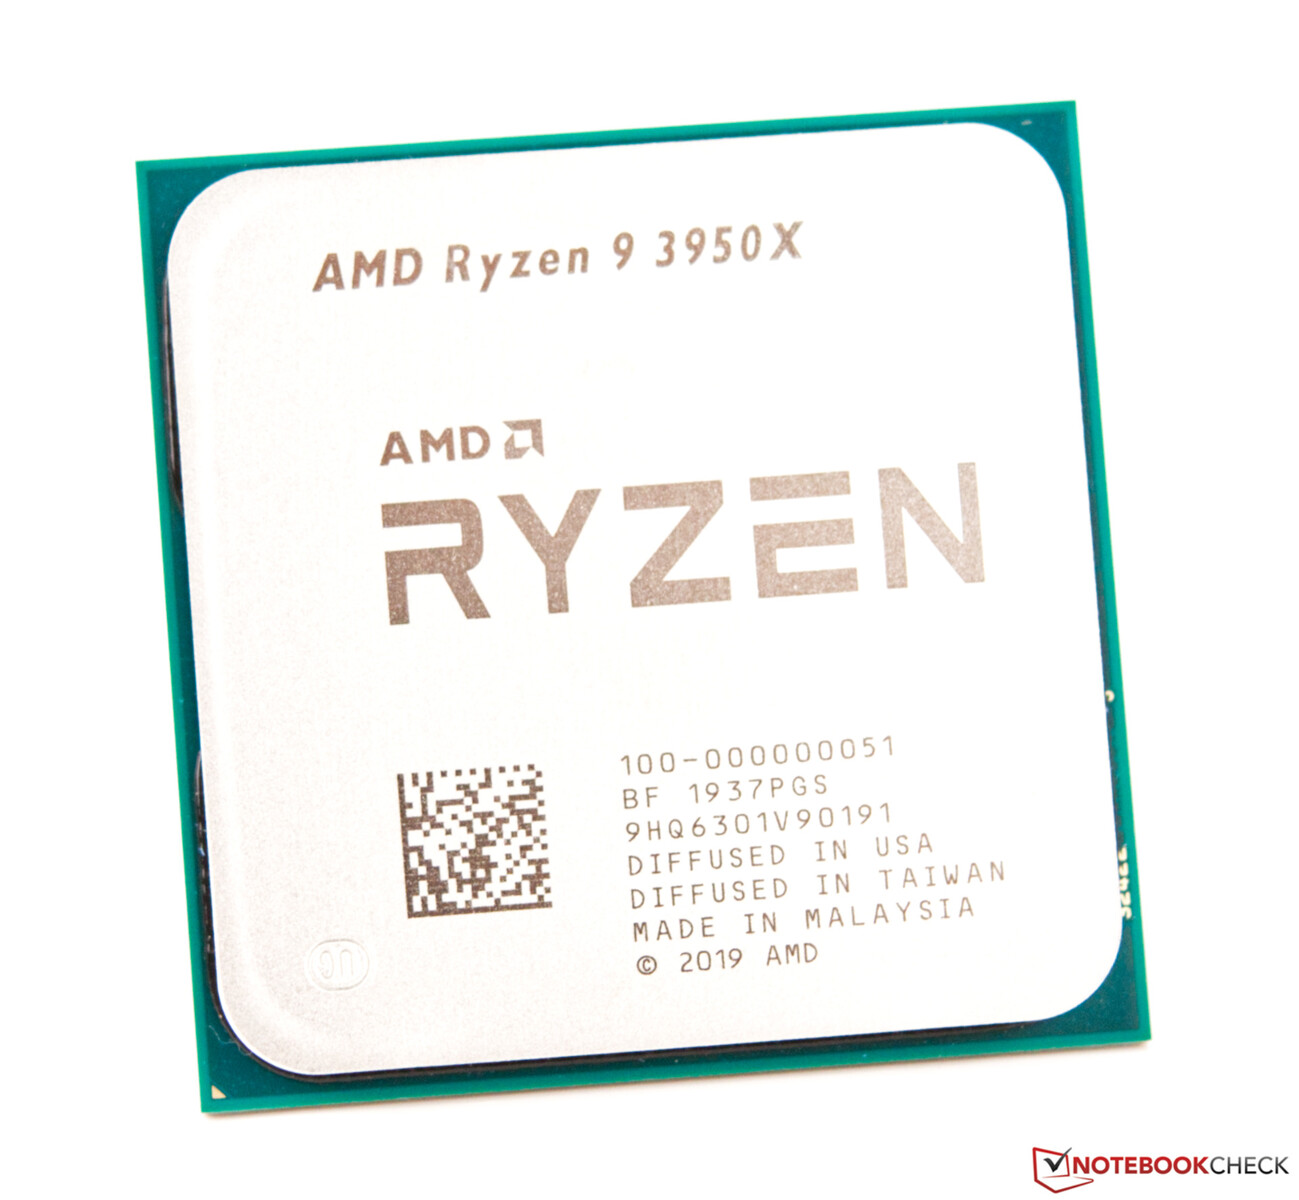
AMD Ryzen 9 3950X - Review del el buque insignia del zócalo AM4
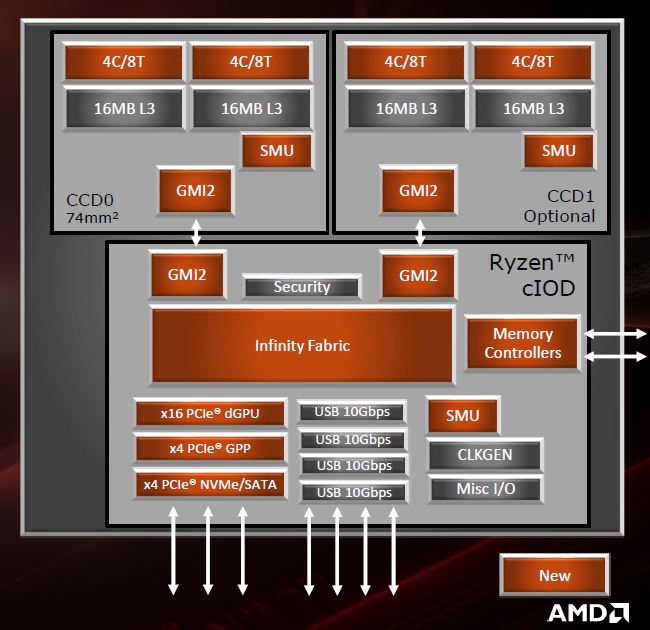
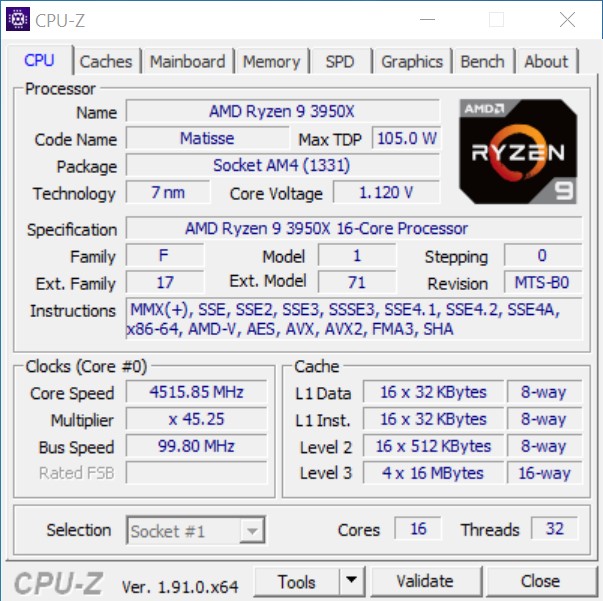
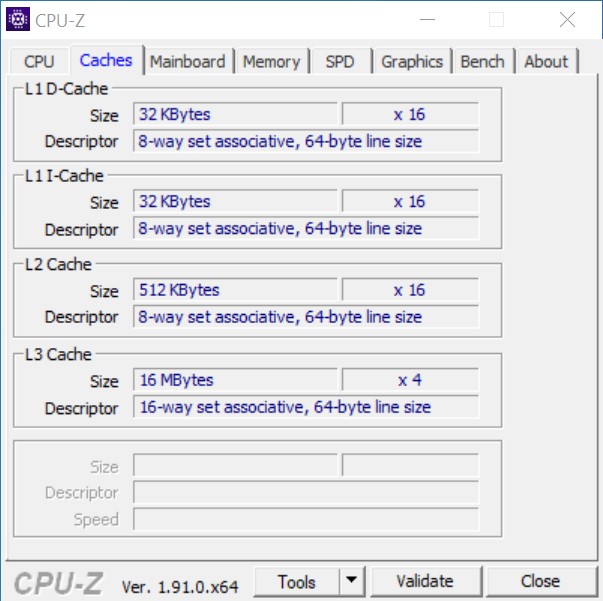
Ya hemos explicado lo que la nueva arquitectura Zen2 es capaz de hacer en varias revisiones. Con el AMD Ryzen 9 3950X, ahora nos centramos en el modelo superior de la plataforma AM4. El nuevo diseño del chip permite a AMD acomodar hasta 16 núcleos en un tablero. Dos clusters CCD están completamente equipados con dos módulos CCX cada uno, lo que significa que hay un total de 16 núcleos de computación activos. Gracias a SMT, el Ryzen 9 3900X puede manejar hasta 32 hilos en paralelo, lo que es especialmente beneficioso para aplicaciones multihilo. En comparación con el ligeramente más pequeño Ryzen 9 3900X, el procesador de 16 núcleos sólo tiene una velocidad de reloj base de 3,5 GHz en lugar de 3,9 GHz. Sin embargo, el 3950X potencia 100 MHz más con una velocidad de hasta 4,7 GHz, lo que es una pequeña ventaja para las aplicaciones de un solo hilo.
Con un TDP de 105 vatios, la configuración completa está al mismo nivel que el procesador de 12 núcleos. En la práctica, sin embargo, rápidamente se hace evidente que 105 vatios no es el final de la historia si se desactivan las restricciones de la UEFI.
En el lanzamiento al mercado en noviembre del año pasado, el precio fue de alrededor de 820 euros (~ 887 dólares). Desde entonces, ha bajado un poco, pero en el momento de realizar nuestra revisión, todavía hay que contar con el pago de 770 Euros (~ $833) por el modelo superior. Una subestructura decente en forma de placa madre con el chipset X570 debería estar disponible para poder usar las nuevas características como PCI Express 4.0.
The AMD Ryzen processors at a glance
| Modelo: Núcleos, hilos, velocidad del reloj base, velocidad del reloj turbo, caché L3, precio de lanzamiento. |
|---|
| Ryzen R9 3950X |
| Ryzen R9 3900X |
| Ryzen R7 3800X |
| Ryzen R7 3700X |
| Ryzen R5 3600X |
| Ryzen R5 3600 |
| Ryzen R3 3300X |
| Ryzen R3 3100 |
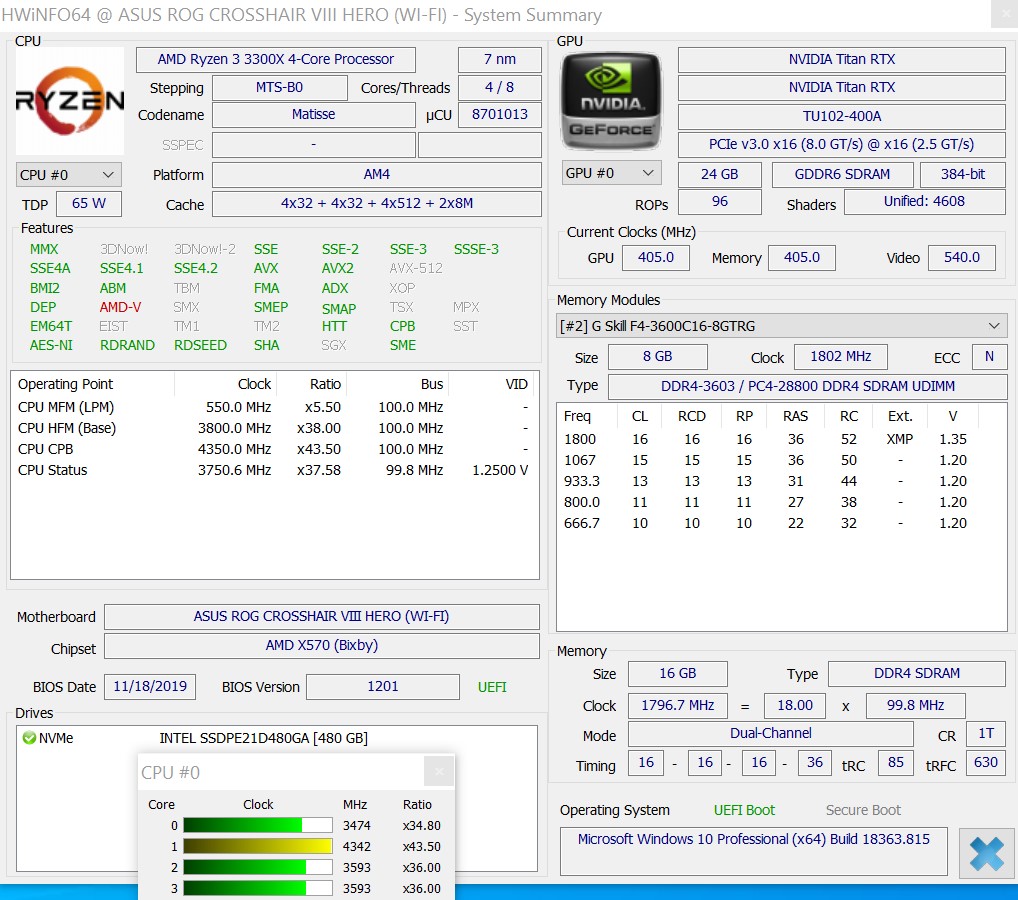
Detalles del sistema de pruebas - AMD vs. Intel
Utilizamos el siguiente sistema para los siguientes puntos de referencia y pruebas:
- Raijintek Pean Benchtable
- AMD Ryzen 9 3950X
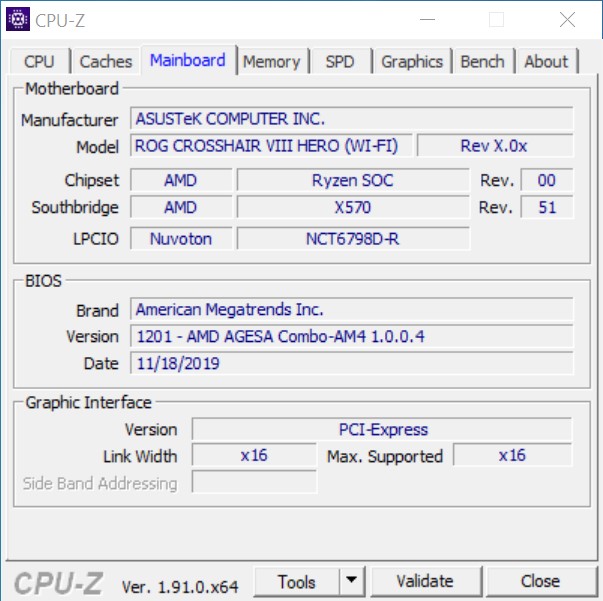
- Asus ROG Crosshair VIII Hero X570
- Alphacool Eisbaer 280 AiO
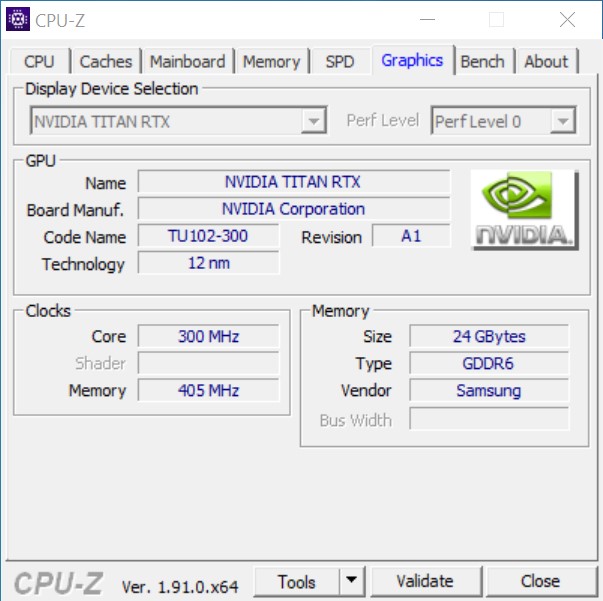
- Nvidia Titan RTX
- Fuente de alimentación Corsair RM 1000X
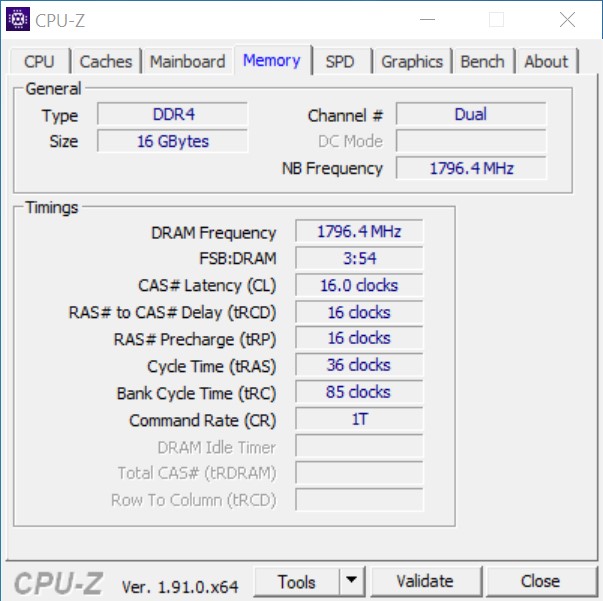
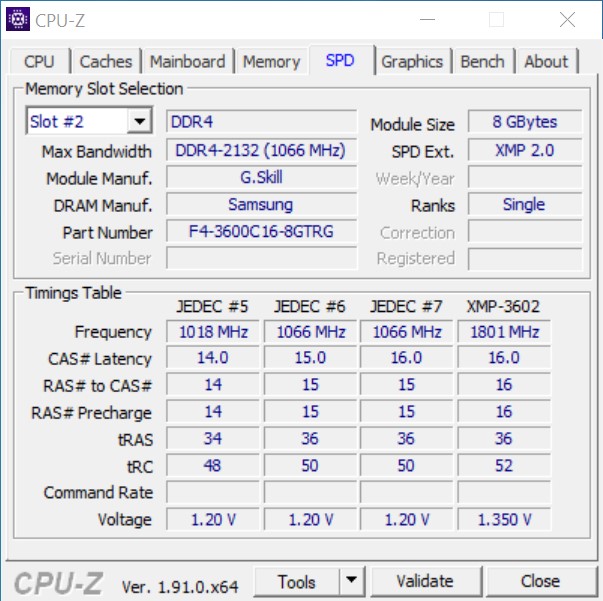
- Kit de memoria G.Skill Trident Z Royal gold DDR4-3600 (2 x 8 GB), ajustado a DDR4-3600 CL16-16-16-36
- Intel Optane 905P 480 GB PCIe SSD
- Microsoft Windows 10 Professional 64-bit (Version 1909)
Nos gustaría agradecer a Caseking en este momento por proporcionarnos el AMD Ryzen 9 3950X. El Raijintek Pean también es de Caseking y fue personalizado por grabado láser. La placa madre y la RAM vinieron directamente de AMD y se incluyeron en el kit de prensa para el lanzamiento del AMD Ryzen 9 3900X. Para el enfriamiento usamos el Alphacool Eisbaer 280, que nos proporcionó Alphacool.
Puntos de referencia del procesador
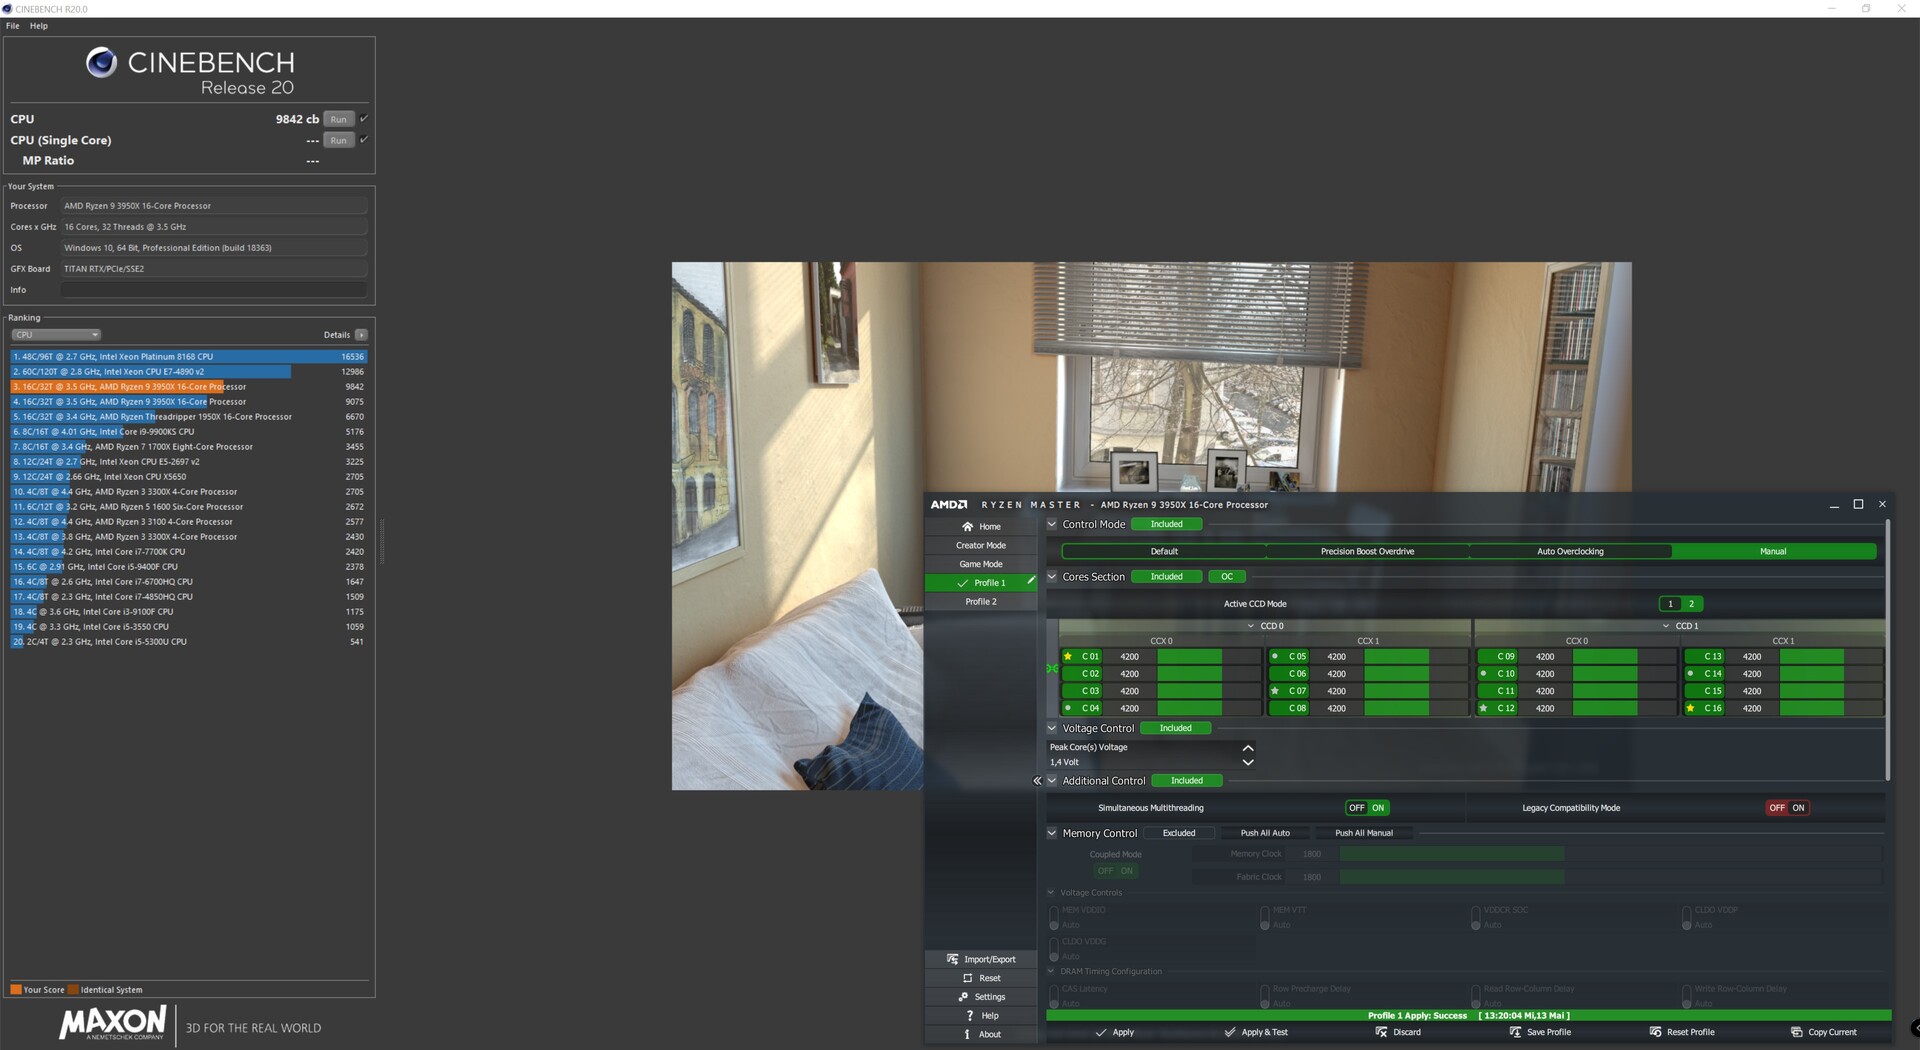
Si miramos más de cerca los puntos de referencia de la CPU pura, queda claro que el AMD Ryzen 9 3950X es una vez más significativamente más rápido que el AMD Ryzen 9 3900X. Esto se debe claramente a sus ocho hilos adicionales. Pero incluso en el rendimiento de un solo núcleo, nuestra muestra de prueba está un parpadeo por delante del procesador de 12 núcleos. Sin embargo, Intel lidera el popular benchmark Cinebench R15 con el Core i9-9900KS, seguido de cerca por el Core i9-9900K. AMD es claramente superior a Intel en aplicaciones multihilo debido al doble número de unidades de computación.
| Cinebench R20 | |
| CPU (Single Core) | |
| AMD Ryzen 9 3950X | |
| AMD Ryzen 9 3900X | |
| Intel Core i9-9900KS | |
| AMD Ryzen 7 3700X | |
| AMD Ryzen 3 3300X | |
| CPU (Multi Core) | |
| AMD Ryzen 9 3950X | |
| AMD Ryzen 9 3900X | |
| Intel Core i9-9900KS | |
| AMD Ryzen 7 3700X | |
| AMD Ryzen 3 3300X | |
| Cinebench R10 | |
| Rendering Single CPUs 64Bit | |
| Intel Core i9-9900KS | |
| AMD Ryzen 9 3950X | |
| AMD Ryzen 9 3900X | |
| Intel Core i9-9900K | |
| AMD Ryzen 3 3300X | |
| AMD Ryzen 7 3700X | |
| Rendering Multiple CPUs 64Bit | |
| AMD Ryzen 9 3950X | |
| AMD Ryzen 9 3900X | |
| Intel Core i9-9900KS | |
| AMD Ryzen 7 3700X | |
| Intel Core i9-9900K | |
| AMD Ryzen 3 3300X | |
| Blender - v2.79 BMW27 CPU | |
| AMD Ryzen 3 3300X | |
| Intel Core i9-9900K | |
| Intel Core i9-9900KS | |
| AMD Ryzen 7 3700X | |
| AMD Ryzen 9 3900X | |
| AMD Ryzen 9 3950X | |
| WinRAR - Result | |
| Intel Core i9-9900KS | |
| Intel Core i9-9900K | |
| AMD Ryzen 9 3900X | |
| AMD Ryzen 7 3700X | |
| AMD Ryzen 9 3950X | |
| AMD Ryzen 3 3300X | |
| Geekbench 5.5 | |
| Multi-Core | |
| AMD Ryzen 9 3950X | |
| AMD Ryzen 9 3900X | |
| AMD Ryzen 7 3700X | |
| AMD Ryzen 3 3300X | |
| Single-Core | |
| AMD Ryzen 9 3950X | |
| AMD Ryzen 7 3700X | |
| AMD Ryzen 3 3300X | |
| AMD Ryzen 9 3900X | |
| Geekbench 5.0 | |
| 5.0 Multi-Core | |
| AMD Ryzen 9 3950X | |
| AMD Ryzen 9 3900X | |
| AMD Ryzen 3 3300X | |
| 5.0 Single-Core | |
| AMD Ryzen 9 3950X | |
| AMD Ryzen 3 3300X | |
| AMD Ryzen 9 3900X | |
| Geekbench 4.4 | |
| 64 Bit Single-Core Score | |
| Intel Core i9-9900K | |
| Intel Core i9-9900KS | |
| AMD Ryzen 9 3900X | |
| AMD Ryzen 7 3700X | |
| AMD Ryzen 3 3300X | |
| AMD Ryzen 9 3950X | |
| 64 Bit Multi-Core Score | |
| AMD Ryzen 9 3950X | |
| AMD Ryzen 9 3900X | |
| Intel Core i9-9900KS | |
| AMD Ryzen 7 3700X | |
| Intel Core i9-9900K | |
| AMD Ryzen 3 3300X | |
| 3DMark 11 - 1280x720 Performance Physics | |
| AMD Ryzen 9 3950X | |
| Intel Core i9-9900KS | |
| AMD Ryzen 9 3900X | |
| AMD Ryzen 7 3700X | |
| AMD Ryzen 3 3300X | |
| HWBOT x265 Benchmark v2.2 - 4k Preset | |
| AMD Ryzen 9 3900X | |
| Intel Core i9-9900KS | |
| Intel Core i9-9900K | |
| AMD Ryzen 9 3950X | |
| AMD Ryzen 7 3700X | |
| AMD Ryzen 3 3300X | |
| R Benchmark 2.5 - Overall mean | |
| AMD Ryzen 9 3900X | |
| AMD Ryzen 3 3300X | |
| AMD Ryzen 9 3950X | |
| LibreOffice - 20 Documents To PDF | |
| AMD Ryzen 9 3900X | |
| AMD Ryzen 9 3950X | |
| AMD Ryzen 3 3300X | |
| WebXPRT 3 - Overall | |
| AMD Ryzen 9 3950X | |
| AMD Ryzen 3 3300X | |
| Mozilla Kraken 1.1 - Total | |
| AMD Ryzen 3 3300X | |
| AMD Ryzen 9 3950X | |
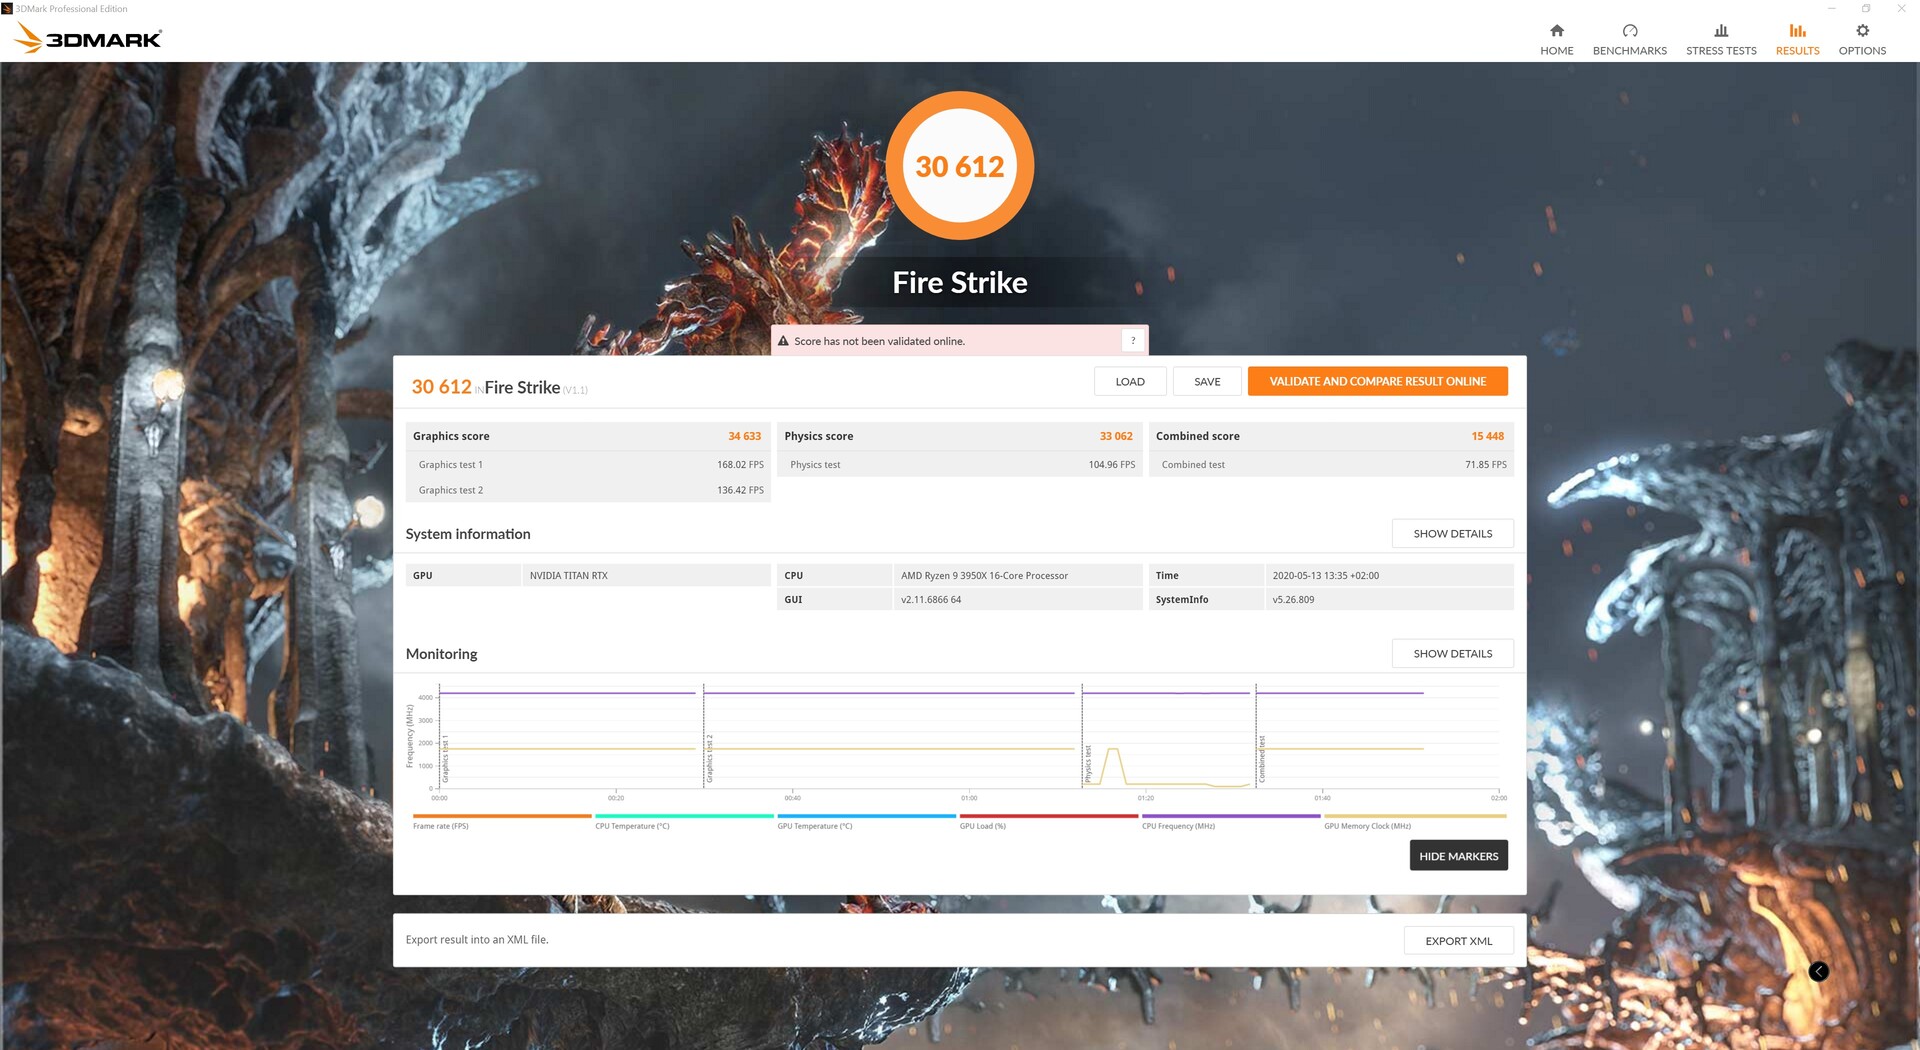
| 3DMark | |
| 3840x2160 Fire Strike Ultra Physics | |
| AMD Ryzen 9 3950X | |
| AMD Ryzen 9 3900X | |
| Intel Core i9-9900KS | |
| Intel Core i9-9900K | |
| AMD Ryzen 7 3700X | |
| AMD Ryzen 3 3300X | |
| 1920x1080 Fire Strike Physics | |
| AMD Ryzen 9 3950X | |
| AMD Ryzen 9 3900X | |
| Intel Core i9-9900KS | |
| Intel Core i9-9900K | |
| AMD Ryzen 7 3700X | |
| AMD Ryzen 3 3300X | |
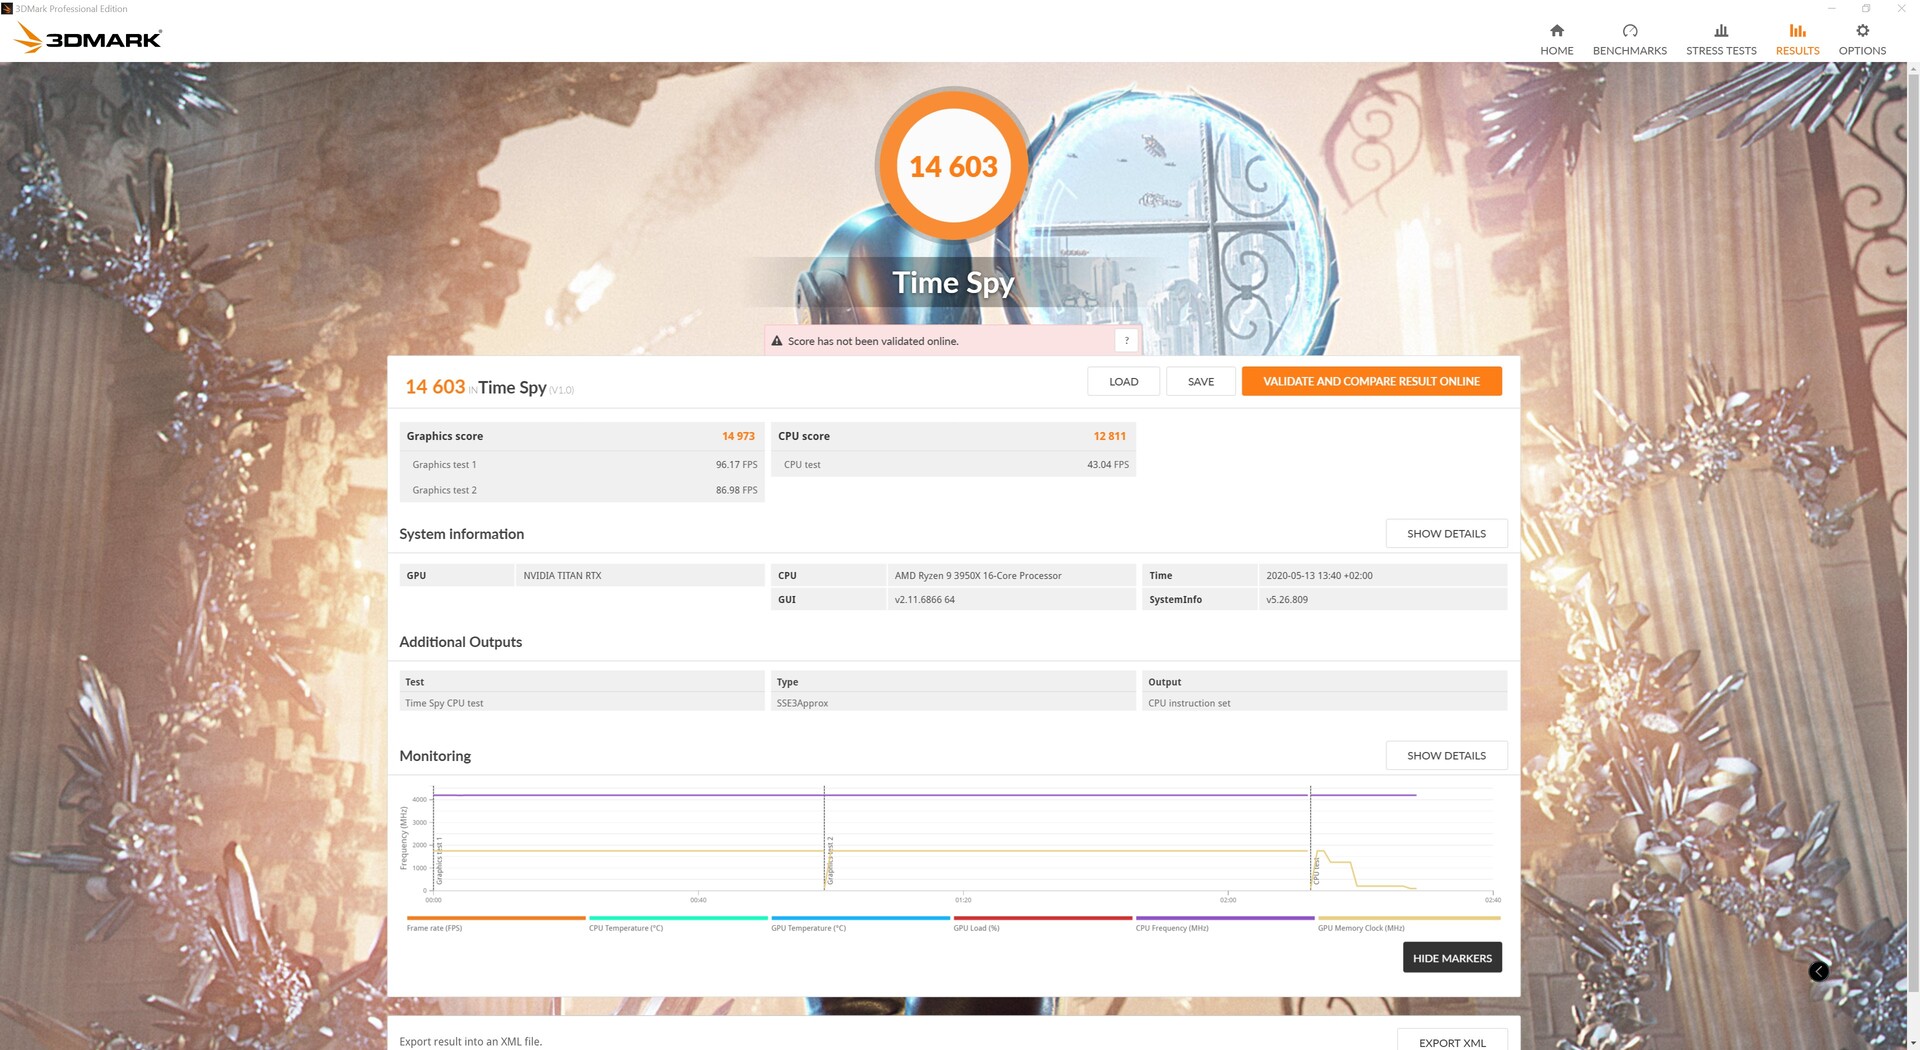
| 2560x1440 Time Spy CPU | |
| AMD Ryzen 9 3950X | |
| AMD Ryzen 9 3900X | |
| Intel Core i9-9900KS | |
| Intel Core i9-9900K | |
| AMD Ryzen 7 3700X | |
| AMD Ryzen 3 3300X | |
* ... más pequeño es mejor
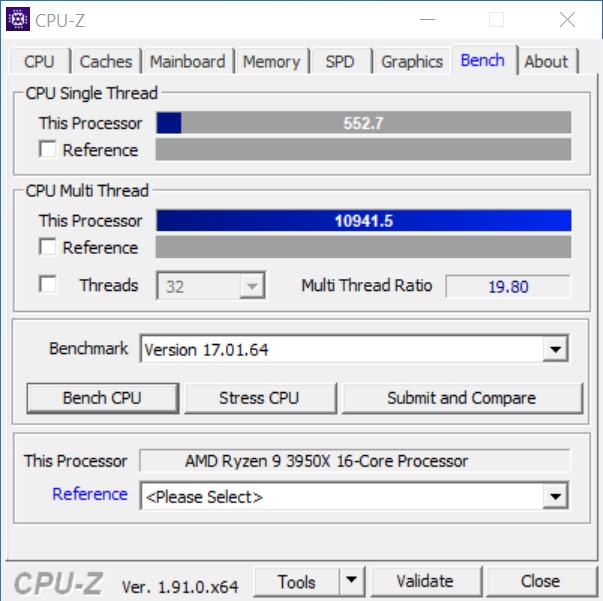
Con 16 núcleos en el multilazo Cinebench R15
Nuestra muestra de prueba no tiene dificultades en la primera prueba de carga extrema con el multilazo Cinebench R15. El AiO incorporado con el radiador de 280 milímetros no tiene problemas para enfriar el AMD Ryzen 9 3950X de forma fiable.
Rendimiento de la aplicación
Muchas aplicaciones no se benefician de esta cantidad de núcleos como se muestra en nuestra prueba. El AMD Ryzen 9 3950X está casi a la par con el Intel Core i9-9900KS. Lo mismo se aplica a los benchmarks 3D sintéticos. Estos tampoco se benefician de los núcleos adicionales del AMD Ryzen 9 3950X. Incluso el recientemente probado AMD Ryzen 3 3300X puede mantenerse muy bien con el buque insignia aquí.
| Performance rating - Percent | |
| Intel Core i9-9900KS | |
| AMD Ryzen 9 3950X | |
| AMD Ryzen 3 3300X | |
| PCMark 10 - Score | |
| Intel Core i9-9900KS | |
| AMD Ryzen 9 3950X | |
| AMD Ryzen 3 3300X | |
| PCMark 8 | |
| Work Score Accelerated v2 | |
| AMD Ryzen 9 3950X | |
| Intel Core i9-9900KS | |
| AMD Ryzen 3 3300X | |
| Creative Score Accelerated v2 | |
| Intel Core i9-9900KS | |
| AMD Ryzen 9 3950X | |
| AMD Ryzen 3 3300X | |
| Home Score Accelerated v2 | |
| Intel Core i9-9900KS | |
| AMD Ryzen 3 3300X | |
| AMD Ryzen 9 3950X | |
| 3DMark 11 | |
| 1280x720 Performance | |
| Intel Core i9-9900KS | |
| AMD Ryzen 9 3950X | |
| AMD Ryzen 3 3300X | |
| 1280x720 Performance GPU | |
| Intel Core i9-9900KS | |
| AMD Ryzen 3 3300X | |
| AMD Ryzen 9 3950X | |
| 3DMark | |
| 1920x1080 Fire Strike Score | |
| AMD Ryzen 9 3950X | |
| Intel Core i9-9900KS | |
| AMD Ryzen 3 3300X | |
| 1920x1080 Fire Strike Graphics | |
| Intel Core i9-9900KS | |
| AMD Ryzen 3 3300X | |
| AMD Ryzen 9 3950X | |
| 3840x2160 Fire Strike Ultra Score | |
| Intel Core i9-9900KS | |
| AMD Ryzen 9 3950X | |
| AMD Ryzen 3 3300X | |
| 3840x2160 Fire Strike Ultra Graphics | |
| AMD Ryzen 3 3300X | |
| Intel Core i9-9900KS | |
| AMD Ryzen 9 3950X | |
| 2560x1440 Time Spy Score | |
| Intel Core i9-9900KS | |
| AMD Ryzen 9 3950X | |
| AMD Ryzen 3 3300X | |
| 2560x1440 Time Spy Graphics | |
| AMD Ryzen 3 3300X | |
| Intel Core i9-9900KS | |
| AMD Ryzen 9 3950X | |
| SPECviewperf 12 | |
| 1900x1060 Solidworks (sw-03) | |
| AMD Ryzen 9 3950X | |
| AMD Ryzen 3 3300X | |
| Intel Core i9-9900KS | |
| 1900x1060 Siemens NX (snx-02) | |
| AMD Ryzen 9 3950X | |
| Intel Core i9-9900KS | |
| AMD Ryzen 3 3300X | |
| 1900x1060 Showcase (showcase-01) | |
| Intel Core i9-9900KS | |
| AMD Ryzen 3 3300X | |
| AMD Ryzen 9 3950X | |
| 1900x1060 Medical (medical-01) | |
| Intel Core i9-9900KS | |
| AMD Ryzen 9 3950X | |
| AMD Ryzen 3 3300X | |
| 1900x1060 Maya (maya-04) | |
| Intel Core i9-9900KS | |
| AMD Ryzen 9 3950X | |
| AMD Ryzen 3 3300X | |
| 1900x1060 Energy (energy-01) | |
| Intel Core i9-9900KS | |
| AMD Ryzen 9 3950X | |
| AMD Ryzen 3 3300X | |
| 1900x1060 Creo (creo-01) | |
| Intel Core i9-9900KS | |
| AMD Ryzen 9 3950X | |
| AMD Ryzen 3 3300X | |
| 1900x1060 Catia (catia-04) | |
| Intel Core i9-9900KS | |
| AMD Ryzen 9 3950X | |
| AMD Ryzen 3 3300X | |
| 1900x1060 3ds Max (3dsmax-05) | |
| Intel Core i9-9900KS | |
| AMD Ryzen 9 3950X | |
| AMD Ryzen 3 3300X | |
| SPECviewperf 13 | |
| Solidworks (sw-04) | |
| AMD Ryzen 9 3950X | |
| Intel Core i9-9900KS | |
| AMD Ryzen 3 3300X | |
| Siemens NX (snx-03) | |
| AMD Ryzen 9 3950X | |
| Intel Core i9-9900KS | |
| AMD Ryzen 3 3300X | |
| Showcase (showcase-02) | |
| Intel Core i9-9900KS | |
| AMD Ryzen 3 3300X | |
| AMD Ryzen 9 3950X | |
| Medical (medical-02) | |
| AMD Ryzen 9 3950X | |
| AMD Ryzen 3 3300X | |
| Intel Core i9-9900KS | |
| Maya (maya-05) | |
| Intel Core i9-9900KS | |
| AMD Ryzen 9 3950X | |
| AMD Ryzen 3 3300X | |
| Energy (energy-02) | |
| AMD Ryzen 3 3300X | |
| AMD Ryzen 9 3950X | |
| Intel Core i9-9900KS | |
| Creo (creo-02) | |
| AMD Ryzen 9 3950X | |
| Intel Core i9-9900KS | |
| AMD Ryzen 3 3300X | |
| Catia (catia-05) | |
| AMD Ryzen 9 3950X | |
| Intel Core i9-9900KS | |
| AMD Ryzen 3 3300X | |
| 3ds Max (3dsmax-06) | |
| Intel Core i9-9900KS | |
| AMD Ryzen 9 3950X | |
| AMD Ryzen 3 3300X | |
Consumo de energía - Eficiencia en la configuración de las existencias
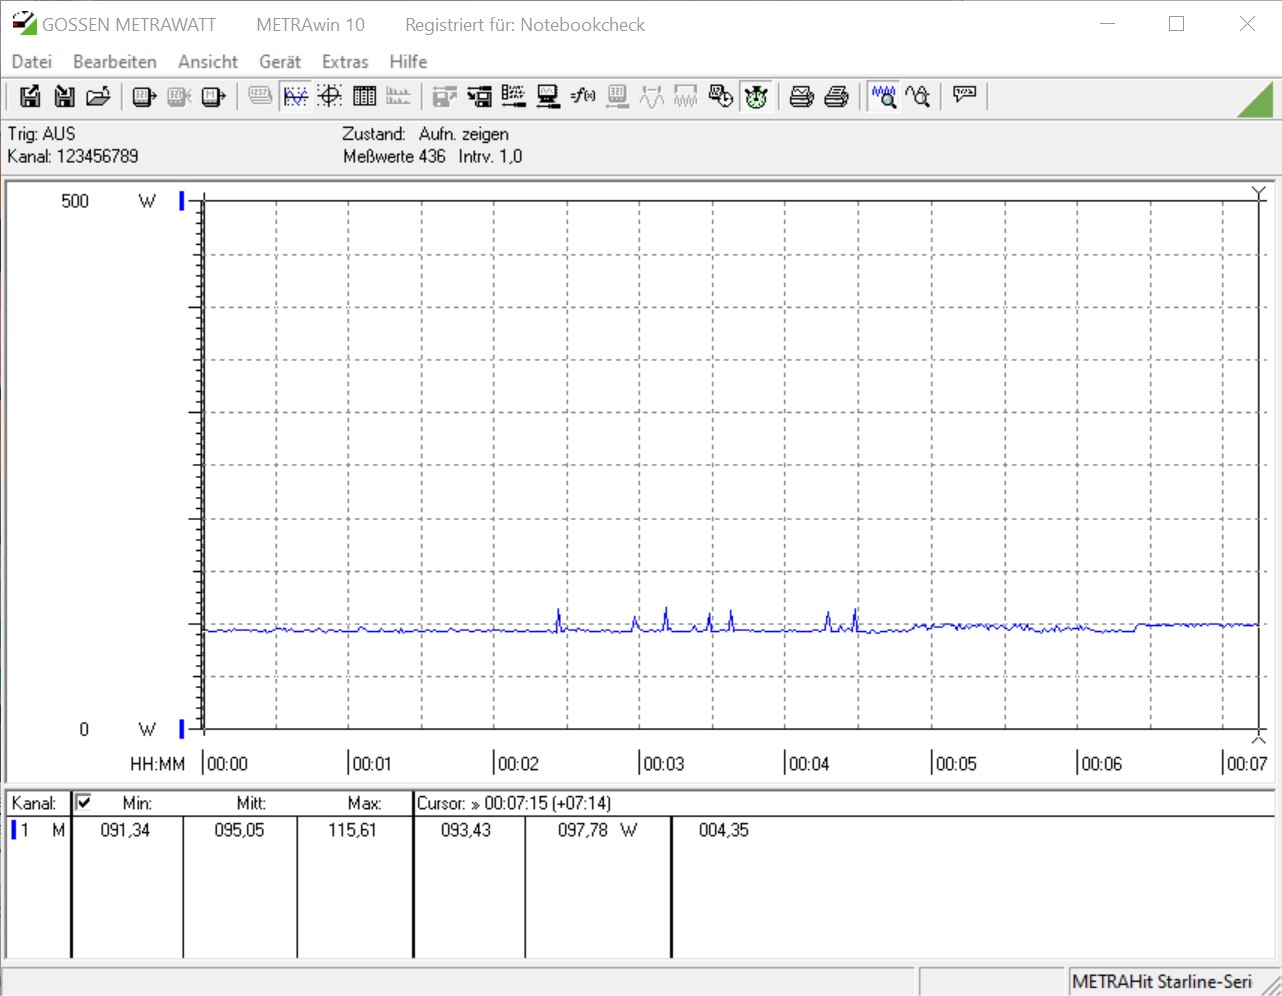
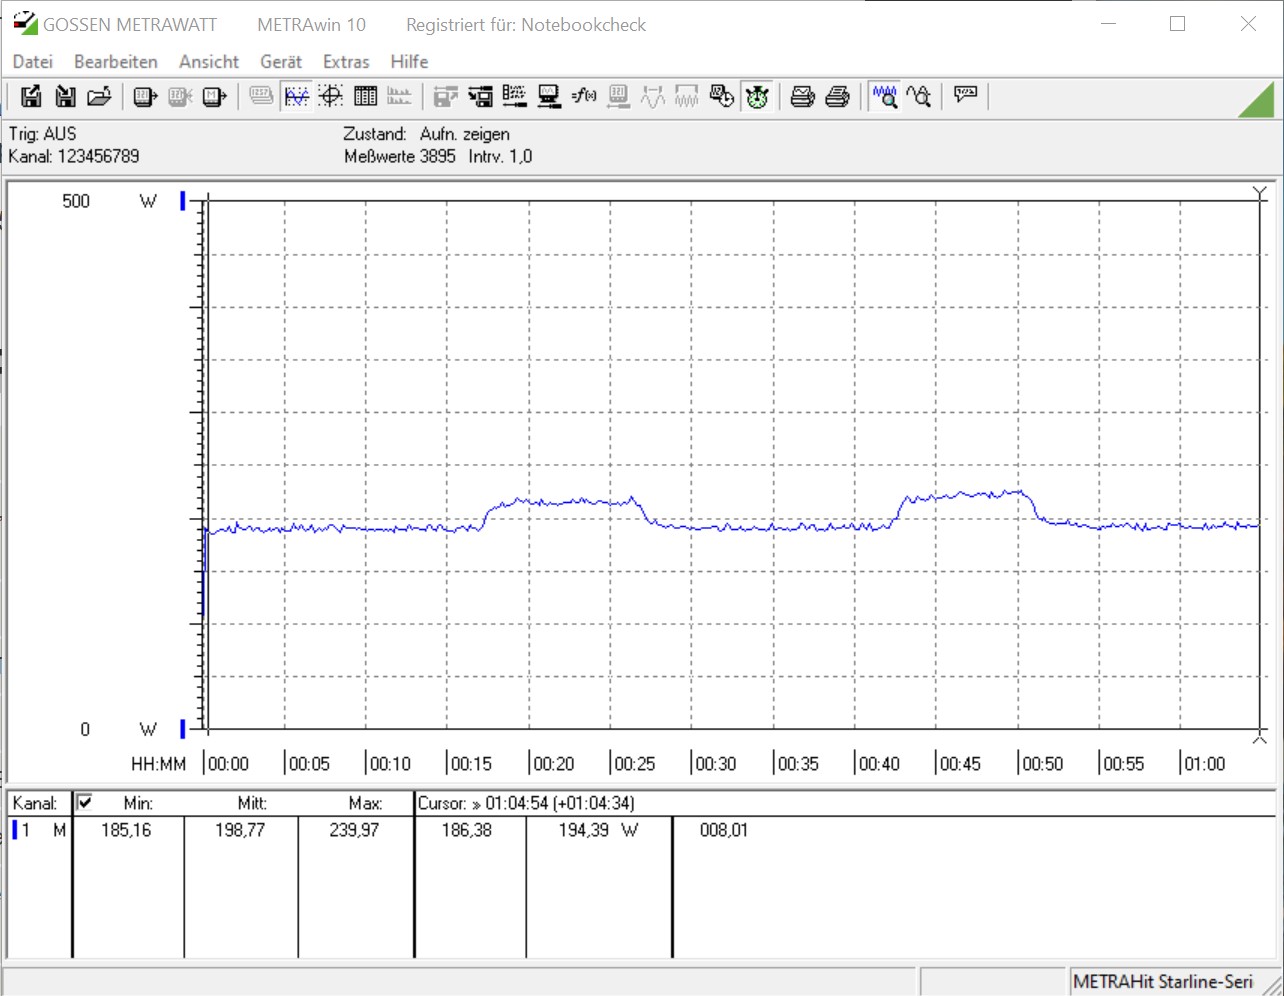
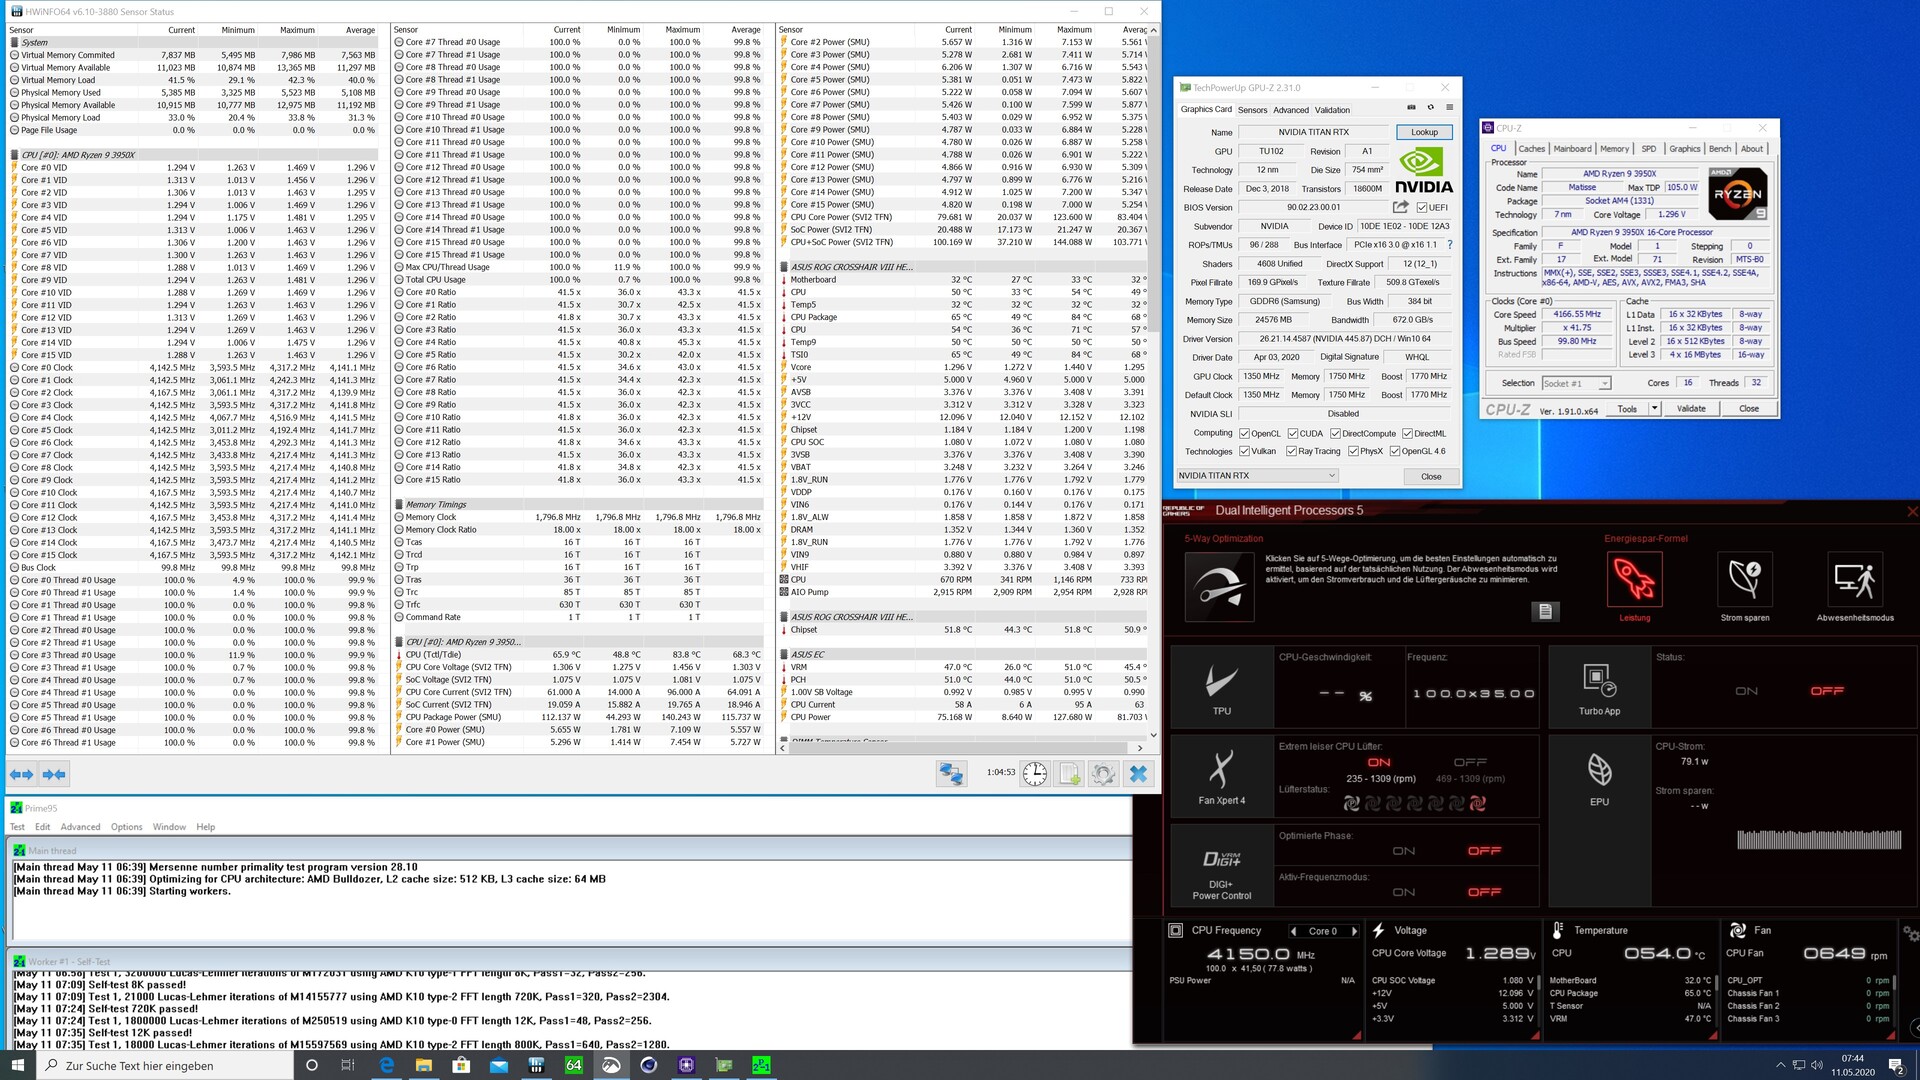
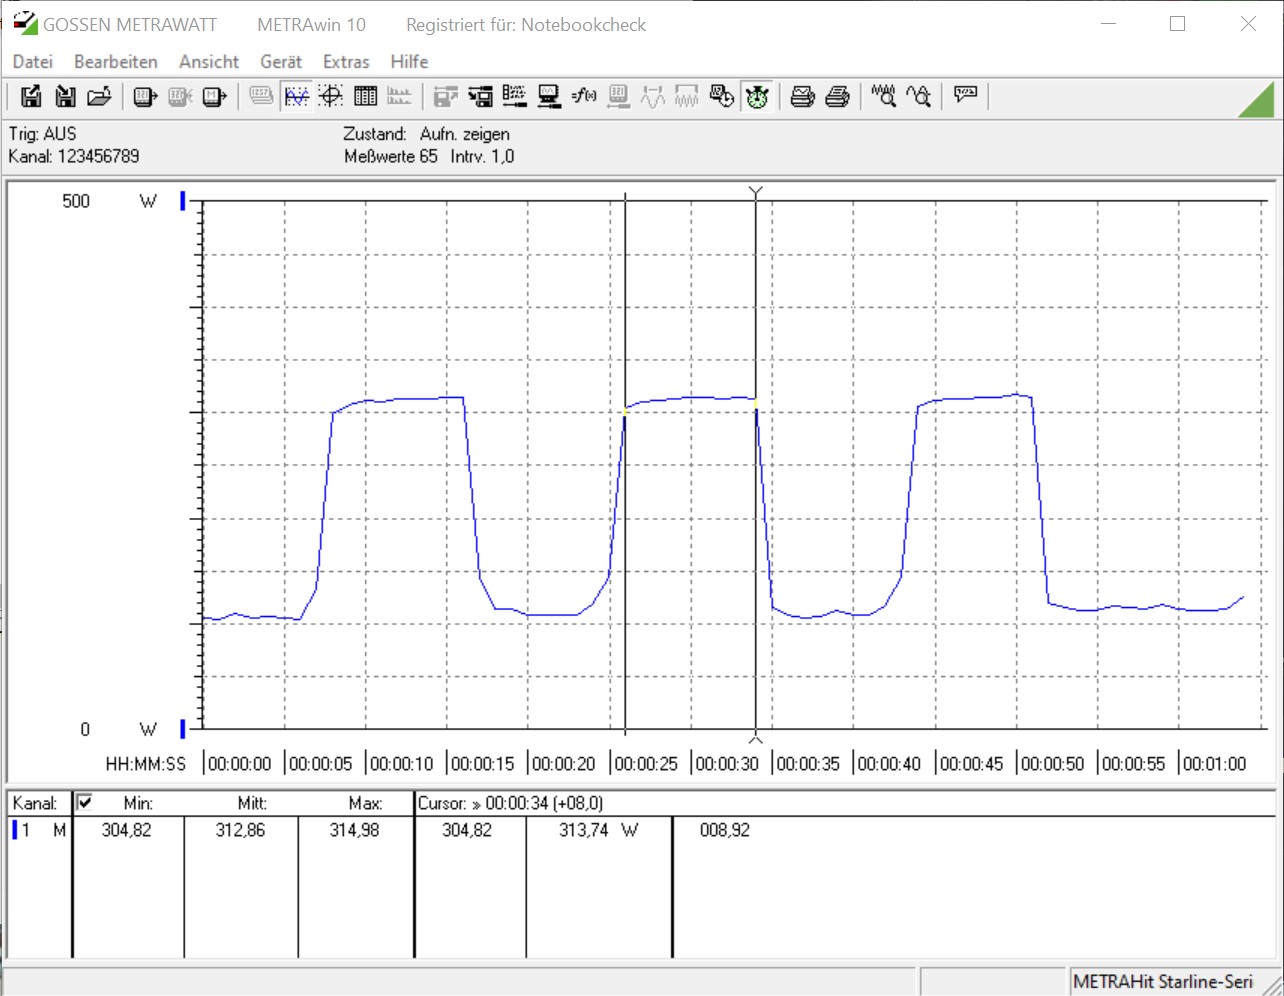
Que el AMD Ryzen 9 3950X no es un procesador eficiente en cuanto a la energía debería quedar claro rápidamente al mirar los datos técnicos. Sin embargo, AMD especifica un TDP de sólo 105 vatios para el procesador insignia al igual que con el Ryzen 9 3900X. Sin embargo, esto suele ser superado y en la prueba de esfuerzo, que realizamos con Prime95, la CPU por sí sola se permitió hasta 140 vatios. Esto está en línea con las especificaciones del fabricante para todo el paquete de la CPU. Para todo el sistema sin monitor, medimos un poco menos de 199 vatios en la prueba de esfuerzo, que es significativamente menor que con el Intel Core i9-9900KS (unos 260 vatios).
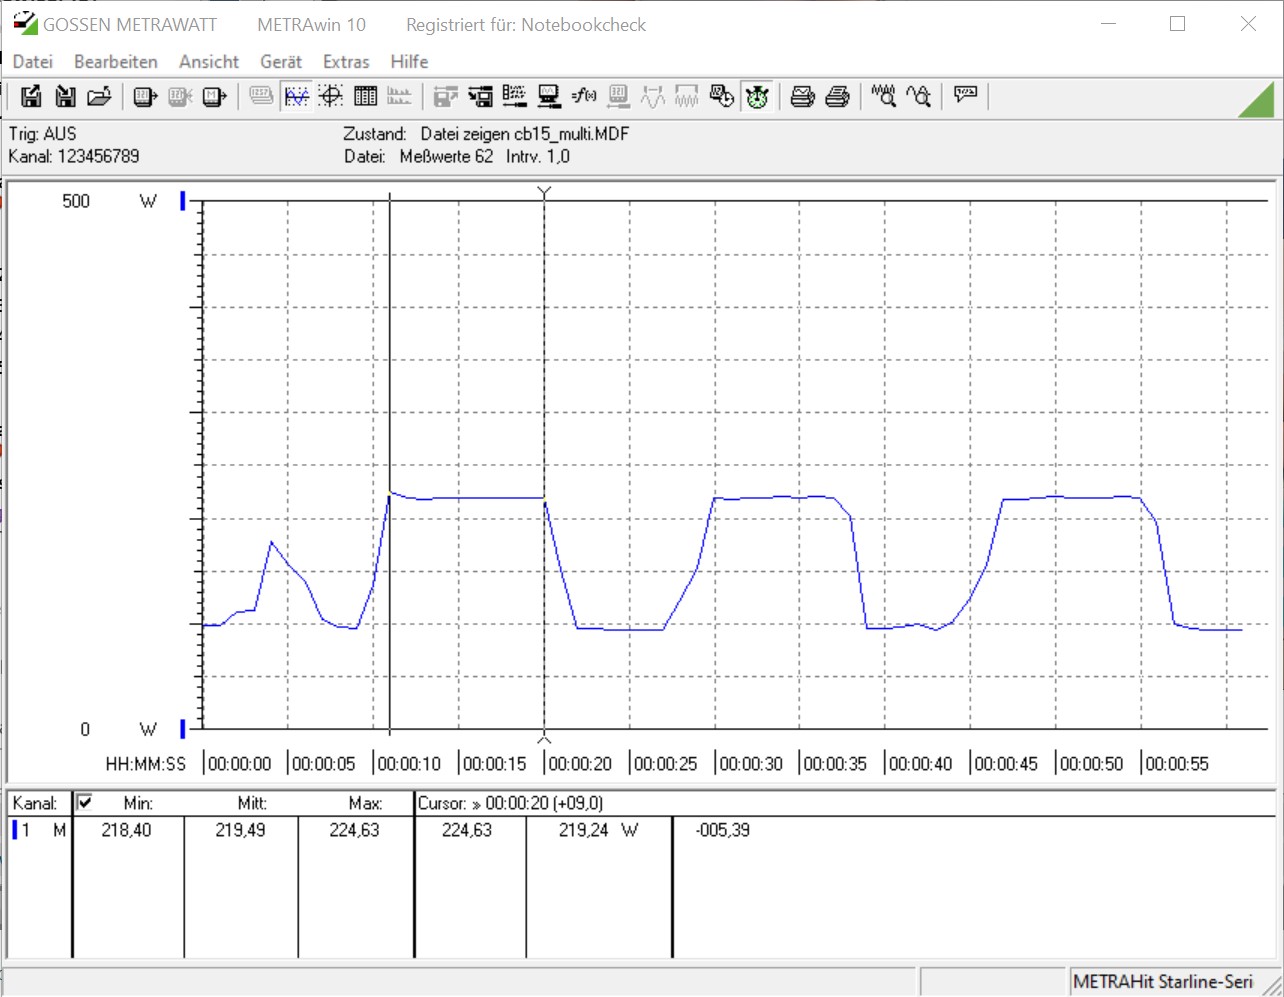
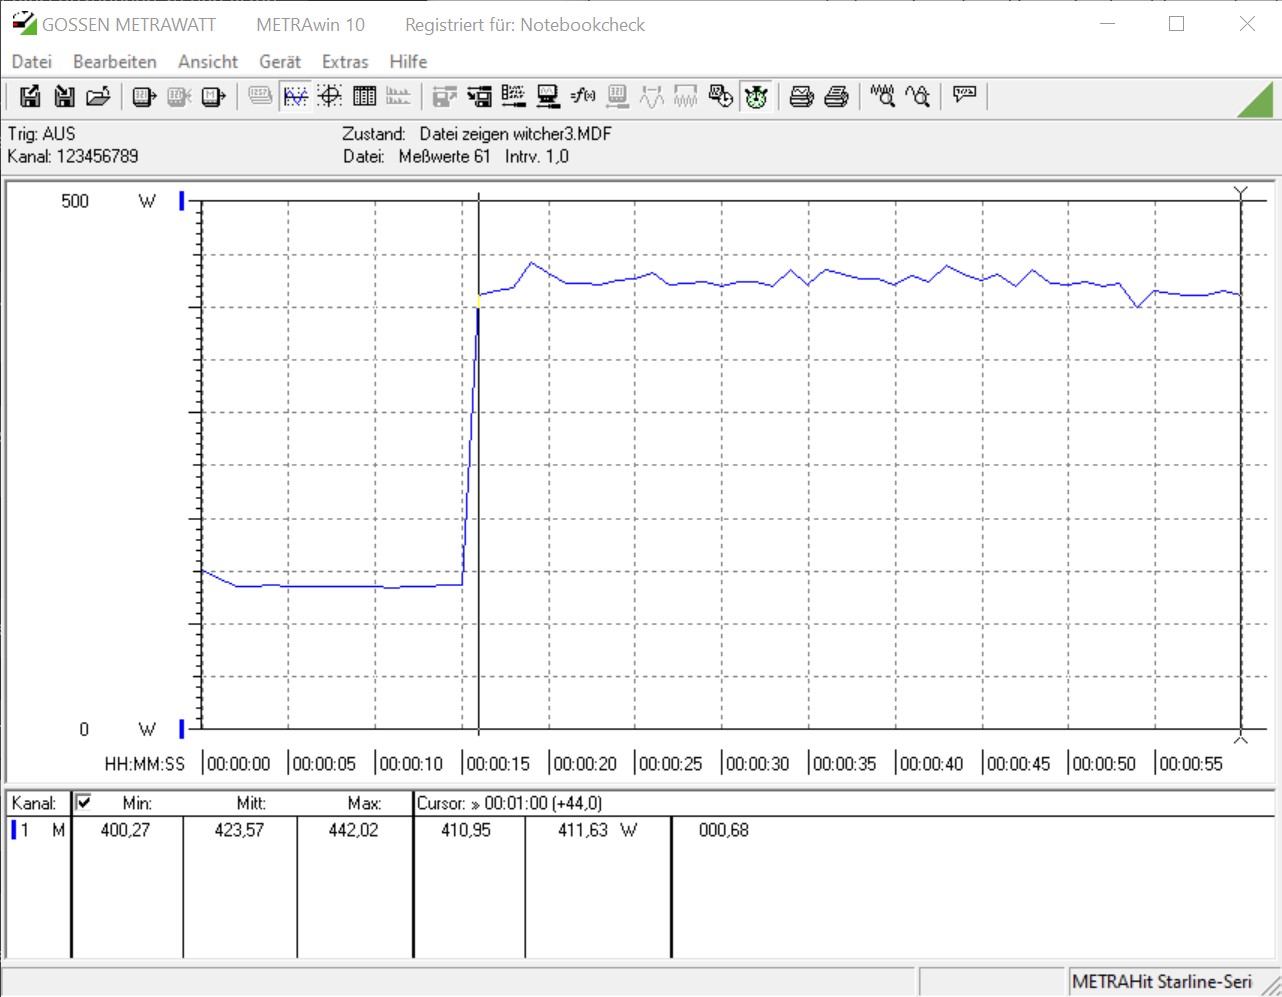
El sistema AMD también es un 35% más económico en la popular prueba Cinebench R15 Multi, aunque nuestro sistema de prueba AMD consume casi 50 vatios más de energía sin carga. Sin embargo, hemos visto esto más a menudo en otros modelos de la serie AMD Ryzen 3000. El fabricante necesita hacer mejoras en el futuro en este sentido para poder vencer a Intel. Sin embargo, nuestro sistema de prueba con el AMD Ryzen 9 3950X es el más hambriento de energía cuando se juega, y somete la fuente de alimentación a una tensión de casi 424 vatios. Las dos contrapartes de Intel son un poco más económicas aquí, aunque no por mucho.
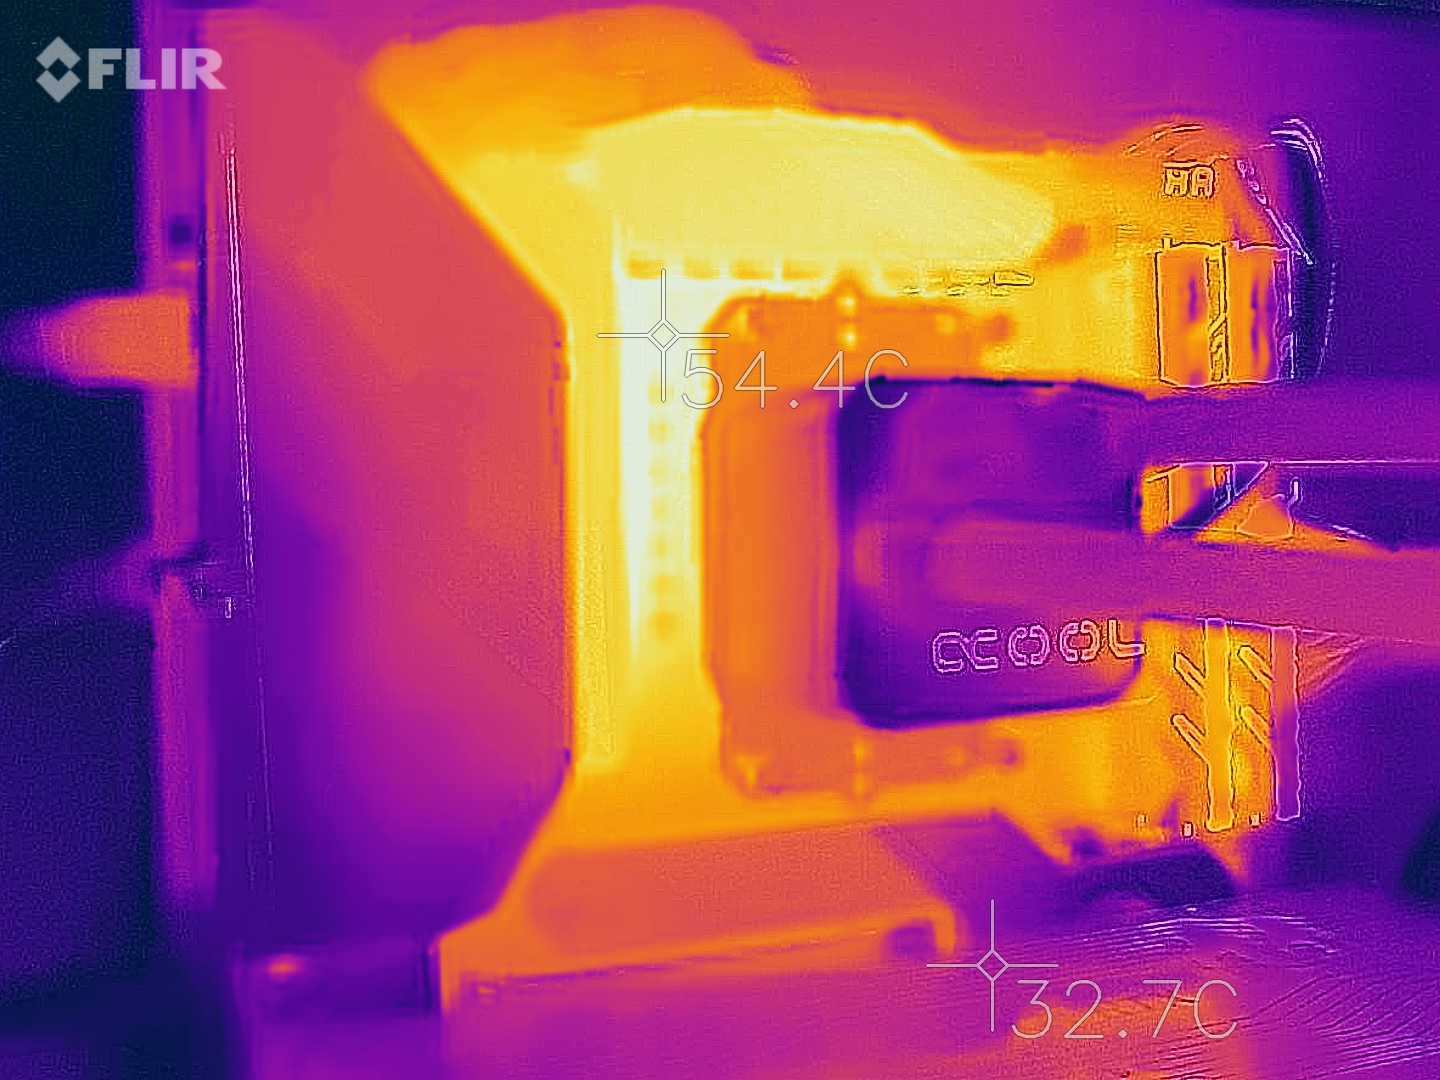
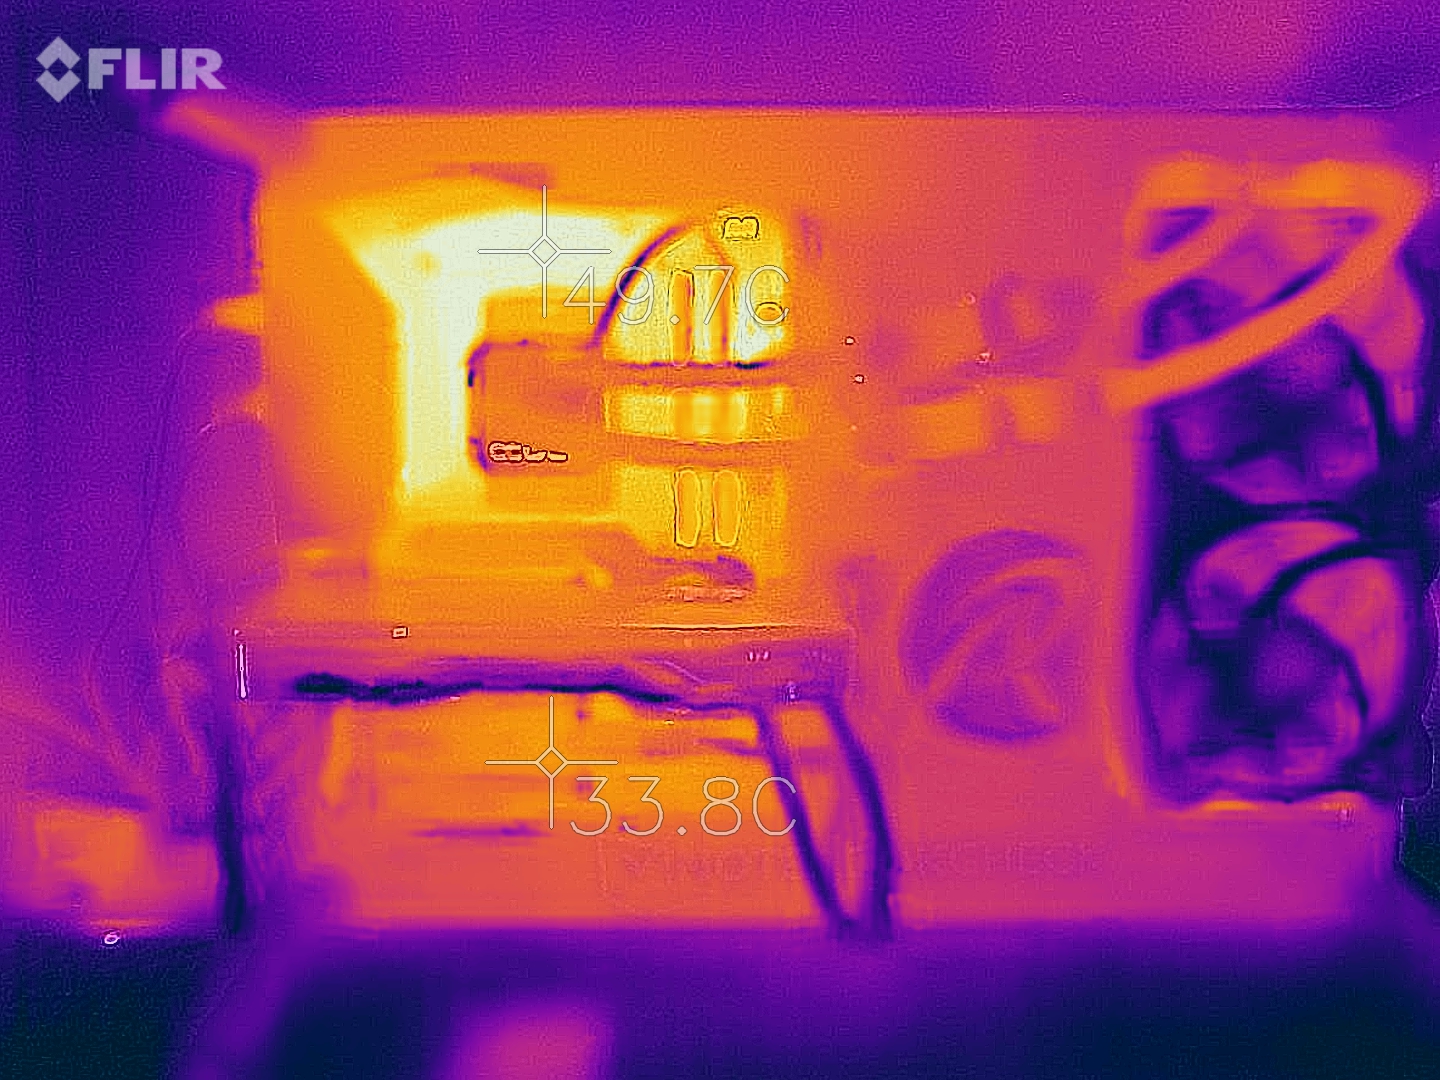
En términos de temperaturas bajo carga, definitivamente deberías usar un refrigerador potente. Ni siquiera el AiO que usamos puede evitar que el AMD Ryzen 9 3950X se caliente hasta 84 °C en nuestra instalación de prueba abierta. Pero este es sólo el valor máximo durante la prueba de esfuerzo. En promedio, la temperatura de la CPU se sentó a unos agradables 68 °C (~154 °F).
Nota: El consumo de energía determinado siempre se refiere sólo al sistema de prueba sin monitor.
* ... más pequeño es mejor
Overclocking - Destrucción de la eficiencia
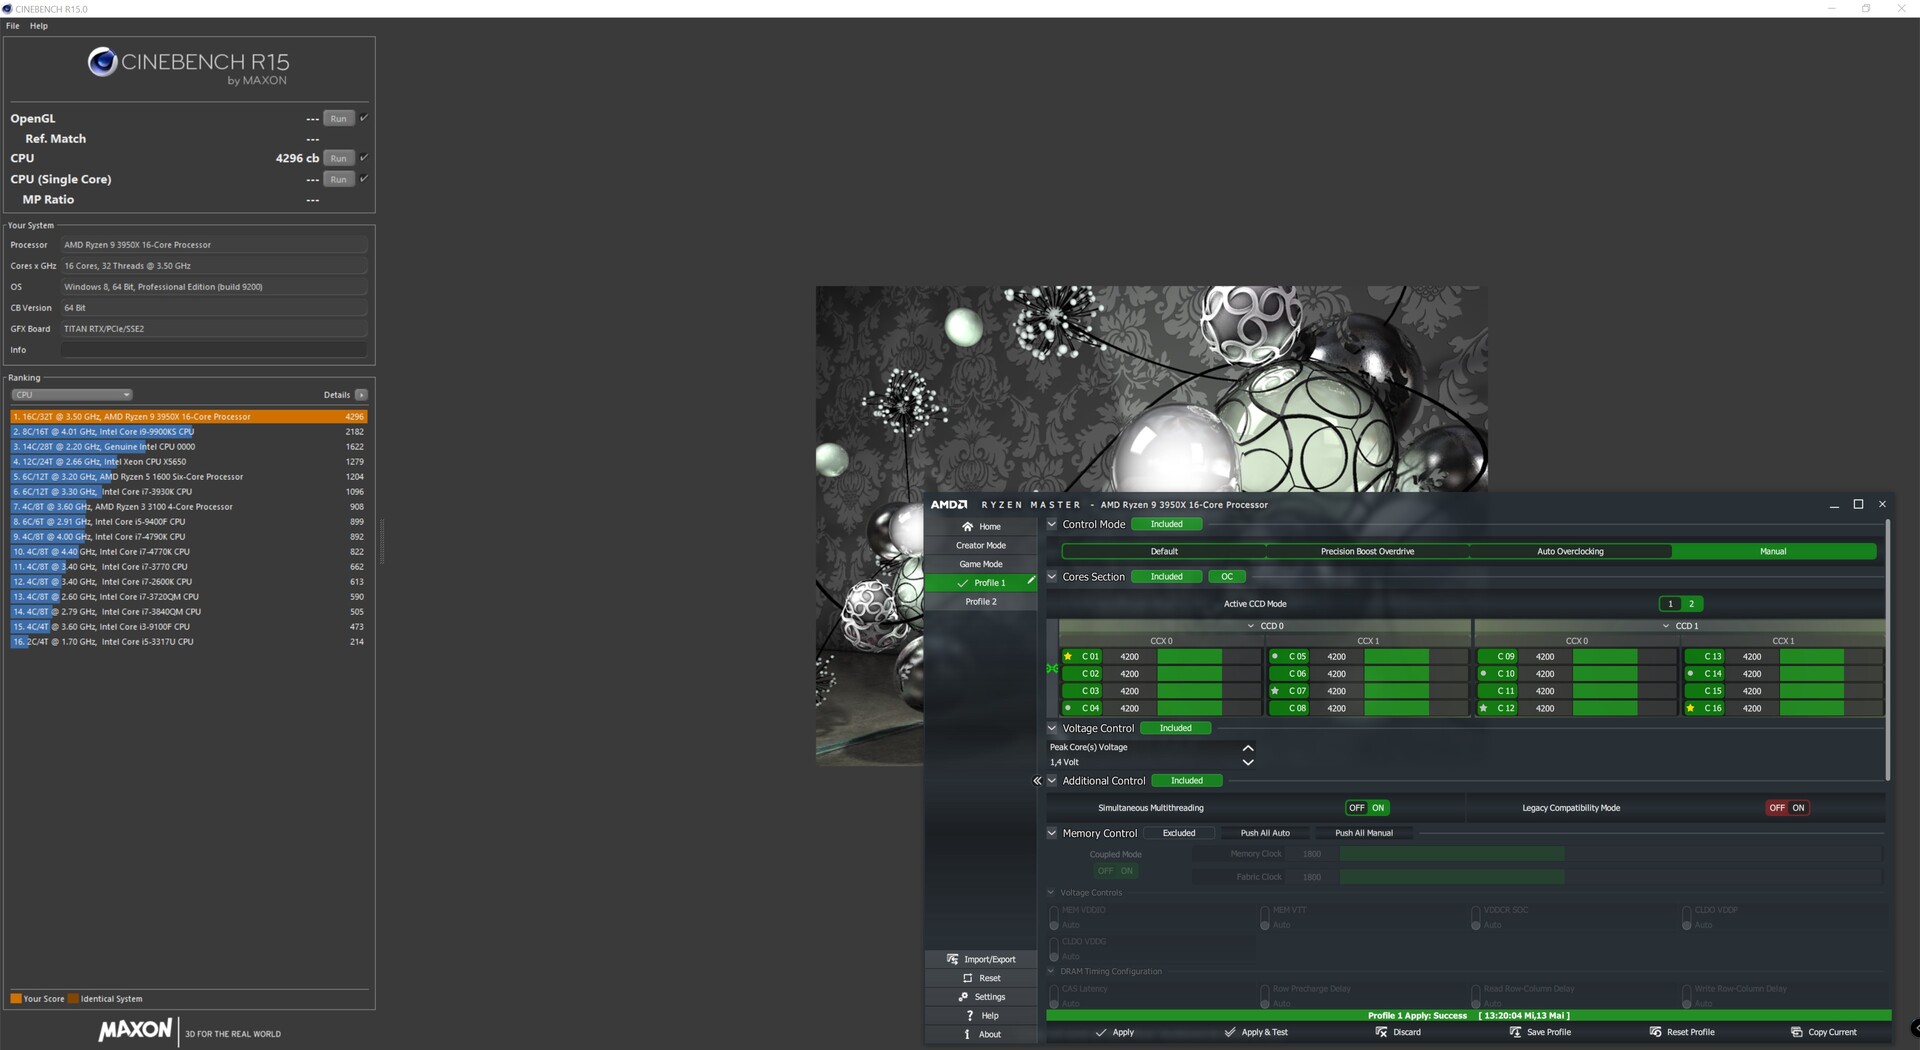
El AMD Ryzen 9 3950X también puede ser overclockeado con unos simples pasos. Lo hicimos con la herramienta Ryzen Master y pudimos lograr una operación estable a 4.2 GHz en los 16 núcleos. Como resultado, se obtiene entre un 5% y un 10% más de potencia, pero esto también hace que el consumo de energía aumente exponencialmente. En nuestro caso, esto significa un consumo de energía 100 vatios más alto en la prueba Cinebench R15 Multi.
Debido a que el PBO (Precision Boost Overdrive) está desactivado por el overclocking, el procesador ya no aumenta a 4,7 GHz, lo que se puede conseguir en los ajustes de stock cuando se carga un núcleo. Si aún así quieres hacer overclocking en tu AMD Ryzen 9 3950X, debes saber que esto anulará la garantía del procesador y que se necesita una solución de refrigeración muy potente. Desde el punto de vista del usuario, no tiene sentido hacer overclocking del ya muy rápido procesador.
Pro
Contra
Veredicto - 16 núcleos - Es mejor tener que necesitar

La familia de AMD Ryzen 3000 tiene una buena eficiencia energética cuando los procesadores funcionan dentro de sus especificaciones. Con el AMD Ryzen 9 3950X, AMD ha introducido un procesador de 16 núcleos para el popular zócalo AM4, que puede ser utilizado incluso en antiguas placas base X370. Los usuarios que decidan poner sobre la mesa poco menos de 770 euros (~$833) para el procesador serán recompensados con el mejor rendimiento. El AMD Ryzen 9 3950X marca puntos especialmente en aplicaciones multi-hilo, pero también domina muy bien los juegos, y la brecha con Intel puede ser cada vez más cerrada.
Intel sigue siendo la primera opción cuando se trata de puro rendimiento en los juegos. Pero en tiempos en los que cualquiera puede convertirse rápidamente en un creador de contenidos con Twitch y YouTube, el procesador AMD está una vez más un paso adelante ya que los juegos y el streaming en un PC se pueden hacer sin problemas gracias a los 16 núcleos y 32 hilos.
Aquellos que pueden llamar al AMD Ryzen 9 3950X su propio, pueden sentarse y relajarse mientras se saltan con confianza la próxima generación de CPU.
Lo mismo es posible con el AMD Ryzen 9 3900X con 12 núcleos y 24 hilos. Pero si quieres un poco de rendimiento extra, la única opción es el AMD Ryzen 9 3950X. Este último es un poco más rápido en las pruebas. Al final, los usuarios necesitan decidir por sí mismos lo que quieren hacer con su PC para tomar una decisión de compra. Con un AMD Ryzen 9 3950X en sus manos, podrán pasar bien los próximos años para luego poder dar un salto sensato al Zen4.
