Veredicto - Aspecto profesional para la oficina o el hogar
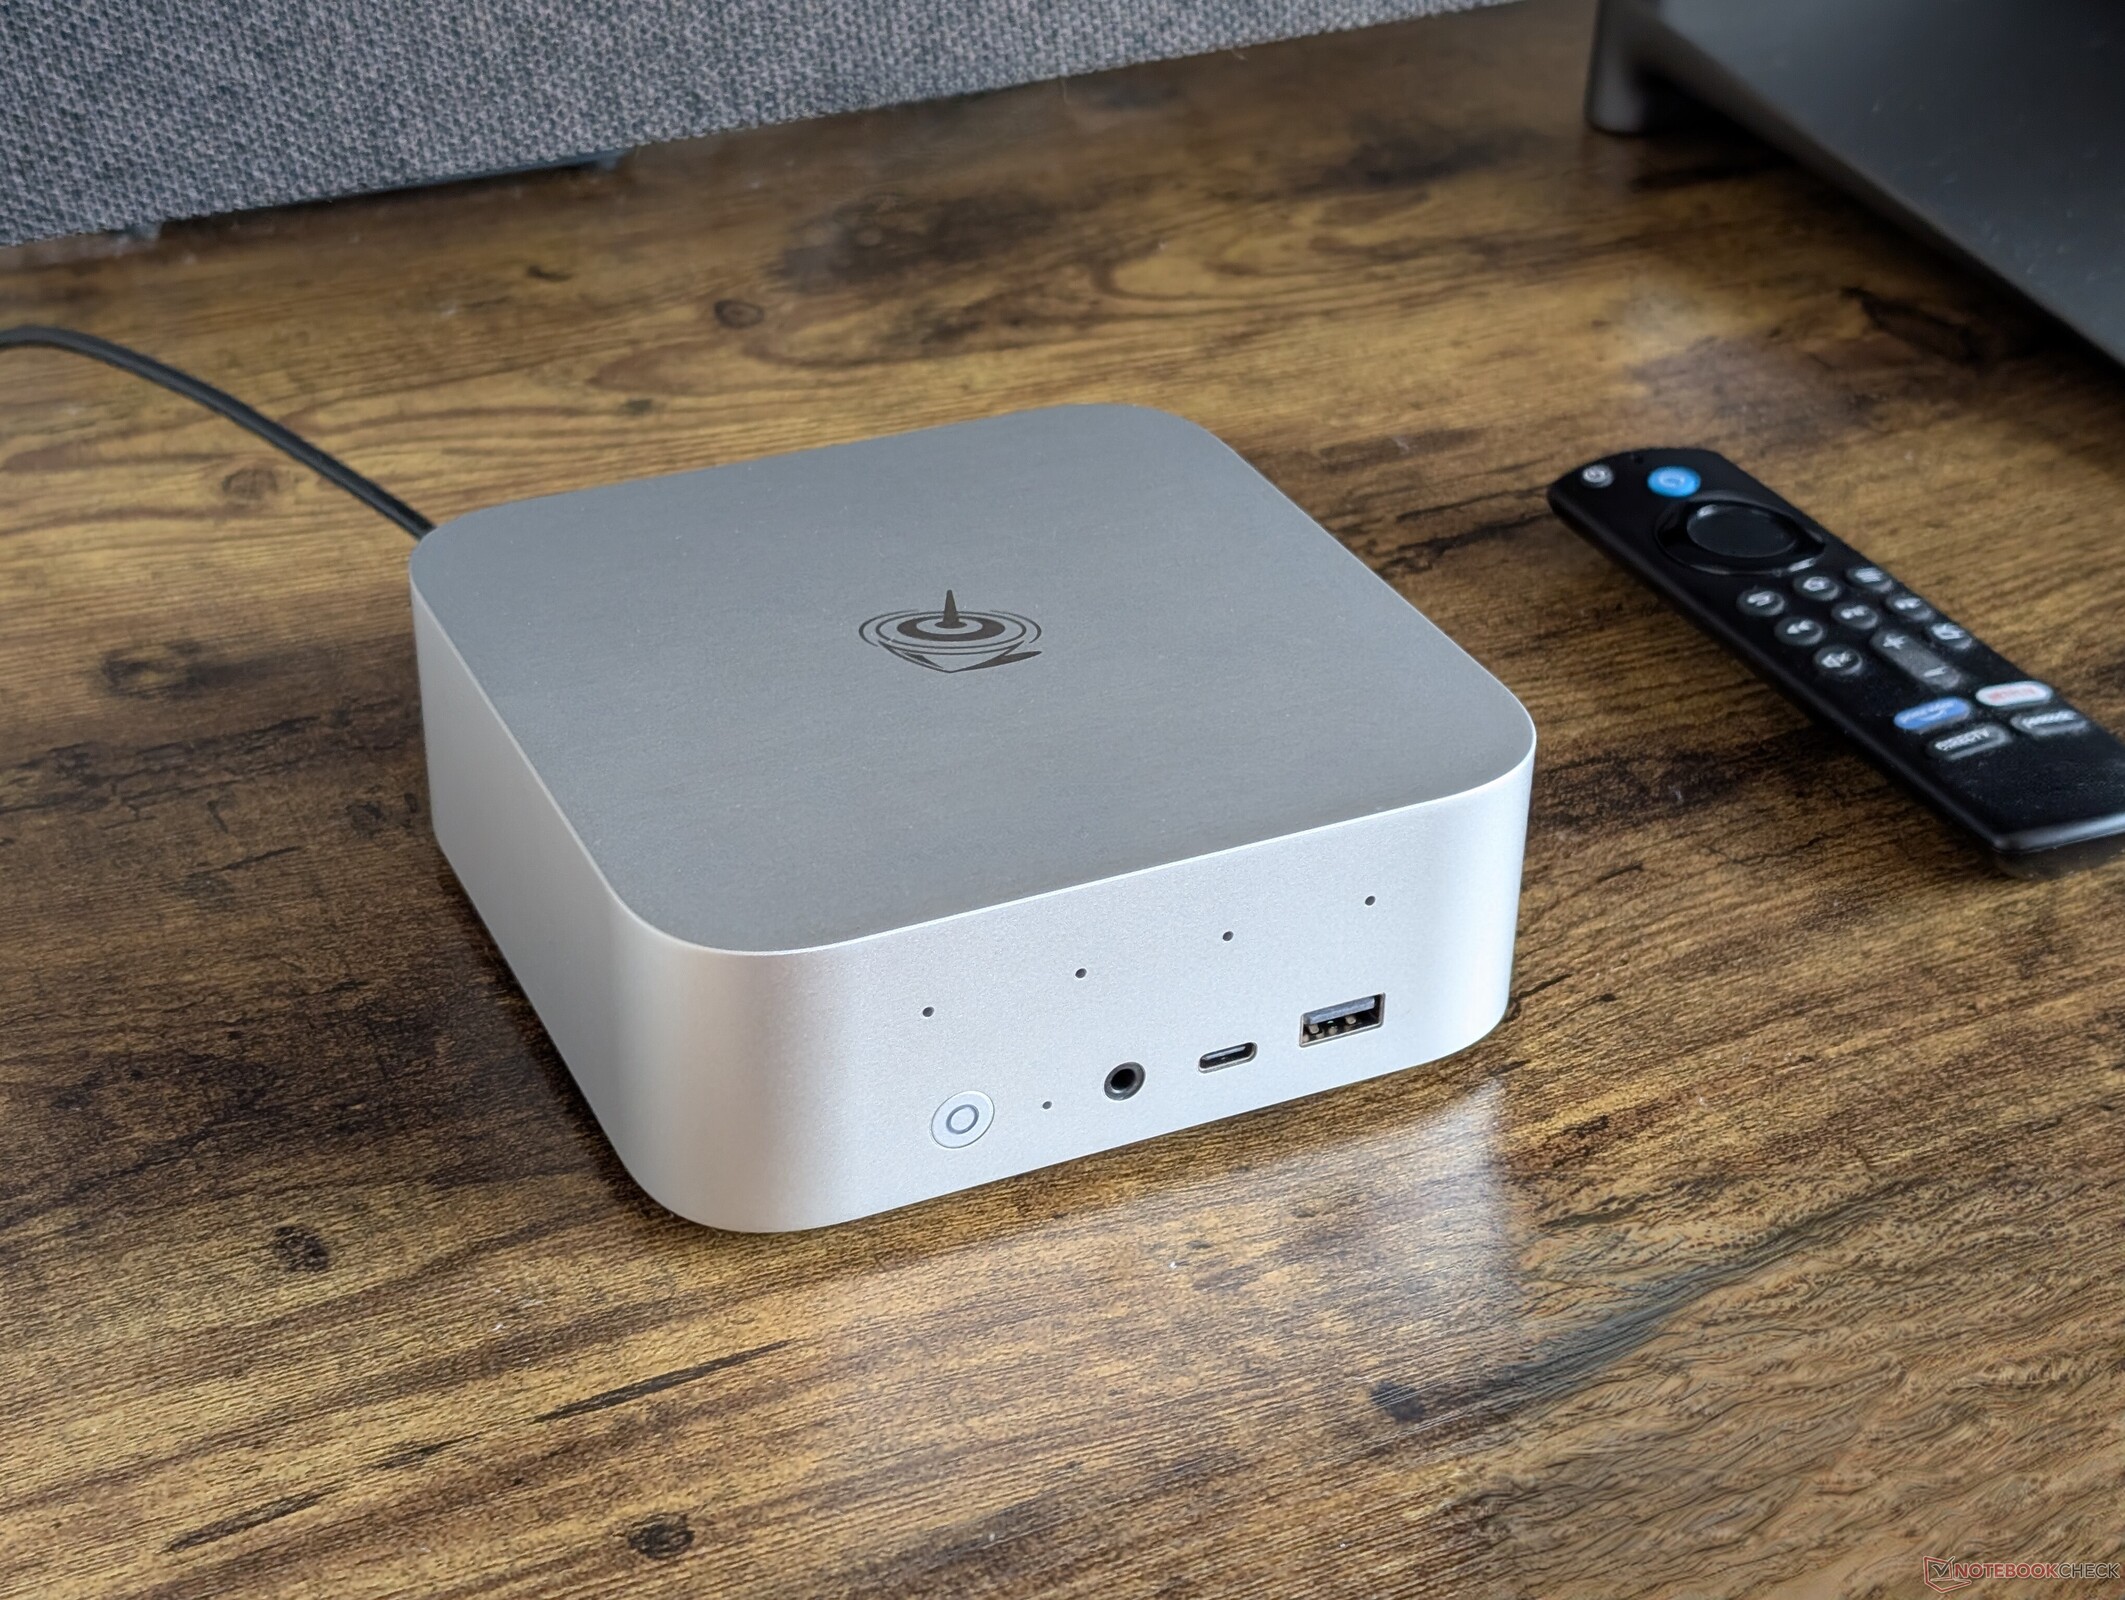
Uno de los aspectos más atractivos del Beelink SEi13 Pro es su diseño inspirado en Apple, ya que el sistema se integra mejor en entornos de oficina o domésticos que los antiguos diseños pesados de plástico del SER7 o SEi12 generación. La construcción y los materiales de mayor calidad no han conllevado un aumento significativo del precio, lo que significa que el SEi13 Pro sigue siendo relativamente asequible en el rango de 500 a 600 dólares.
El rendimiento de la CPU y los puertos también siguen siendo fuertes con el Core i9-13900HK y tres tipos de puertos de salida de vídeo que son más que suficientes para la mayoría de las configuraciones de oficina o multimedia. También apreciamos su silencio y sus dimensiones más compactas en comparación con el mayor y más caro GTi13 Ultra que viene con exactamente el mismo procesador Intel para casi el mismo nivel de rendimiento.
Mientras que la mayoría de los usuarios encontrarán que el SEi13 Pro es suficiente, los usuarios avanzados pueden quejarse de la falta de aceleración de IA de la CPU y del débil rendimiento gráfico en general, incluso para una GPU integrada. Los altavoces estéreo integrados, aunque buenos sobre el papel, no son lo suficientemente fuertes como para llenar salas de conferencias o salones. La ausencia de funciones como VESA, compatibilidad con Thunderbolt e incluso un lector de tarjetas SD puede limitar las opciones de conectividad y repercutir negativamente en la experiencia del usuario. La actualización al GTi13 Ultra resuelve algunos de estos problemas mientras que las alternativas de AMD como el SER8 pueden proporcionar más potencia gráfica por aproximadamente el mismo precio.
Pro
Contra
Precio y disponibilidad
Amazon ya está enviando el Beelink SEi13 Pro por 540 USD. Los usuarios también pueden comprar directamente al fabricante por el mismo precio.
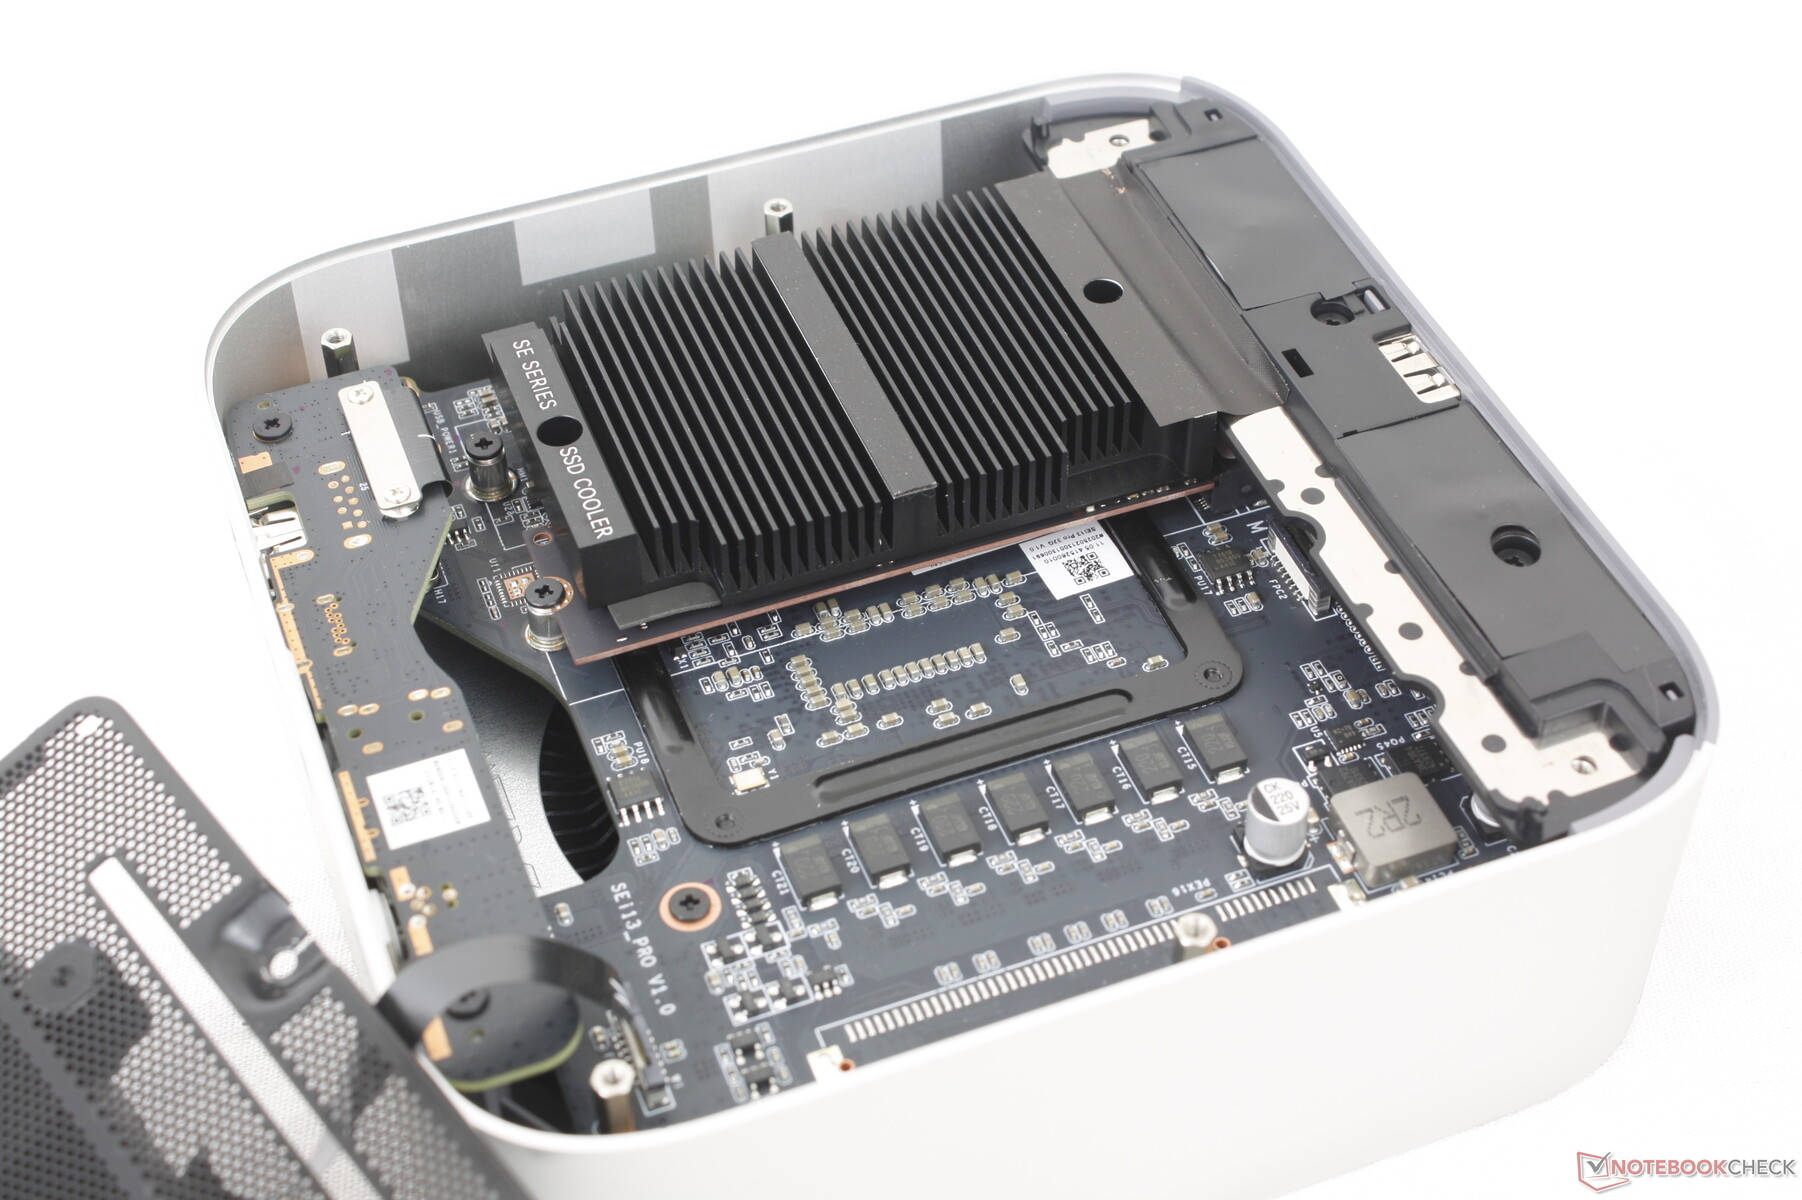
El SEi13 Pro es un mini PC multimedia inspirado en el Apple Mac Mini para el hogar o la oficina. Destaca por sus altavoces estéreo integrados y su refrigeración por cámara de vapor, poco comunes en otros mini PC del mismo rango de precios.
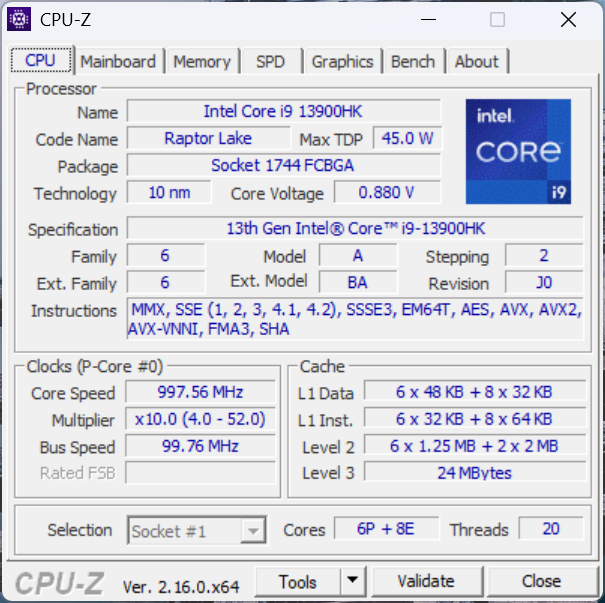
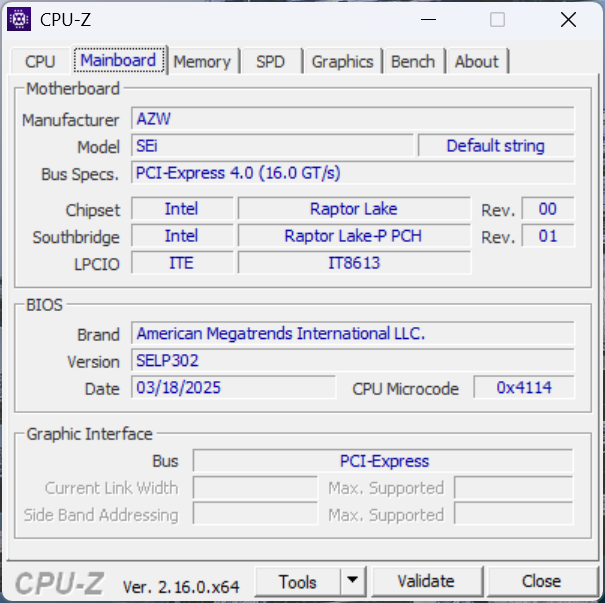
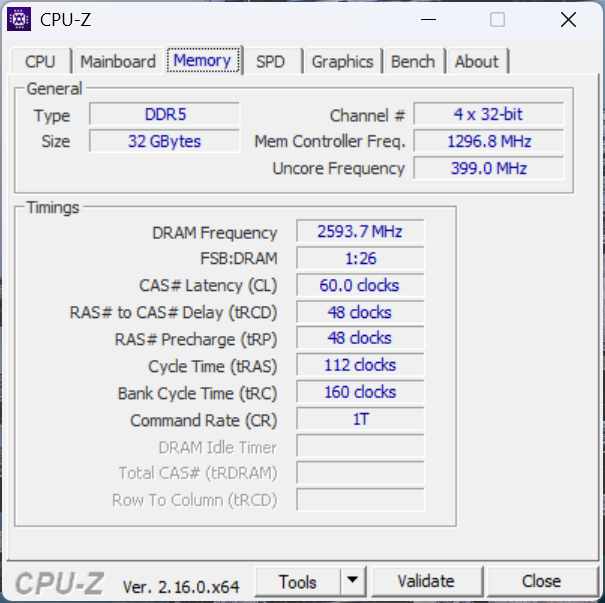
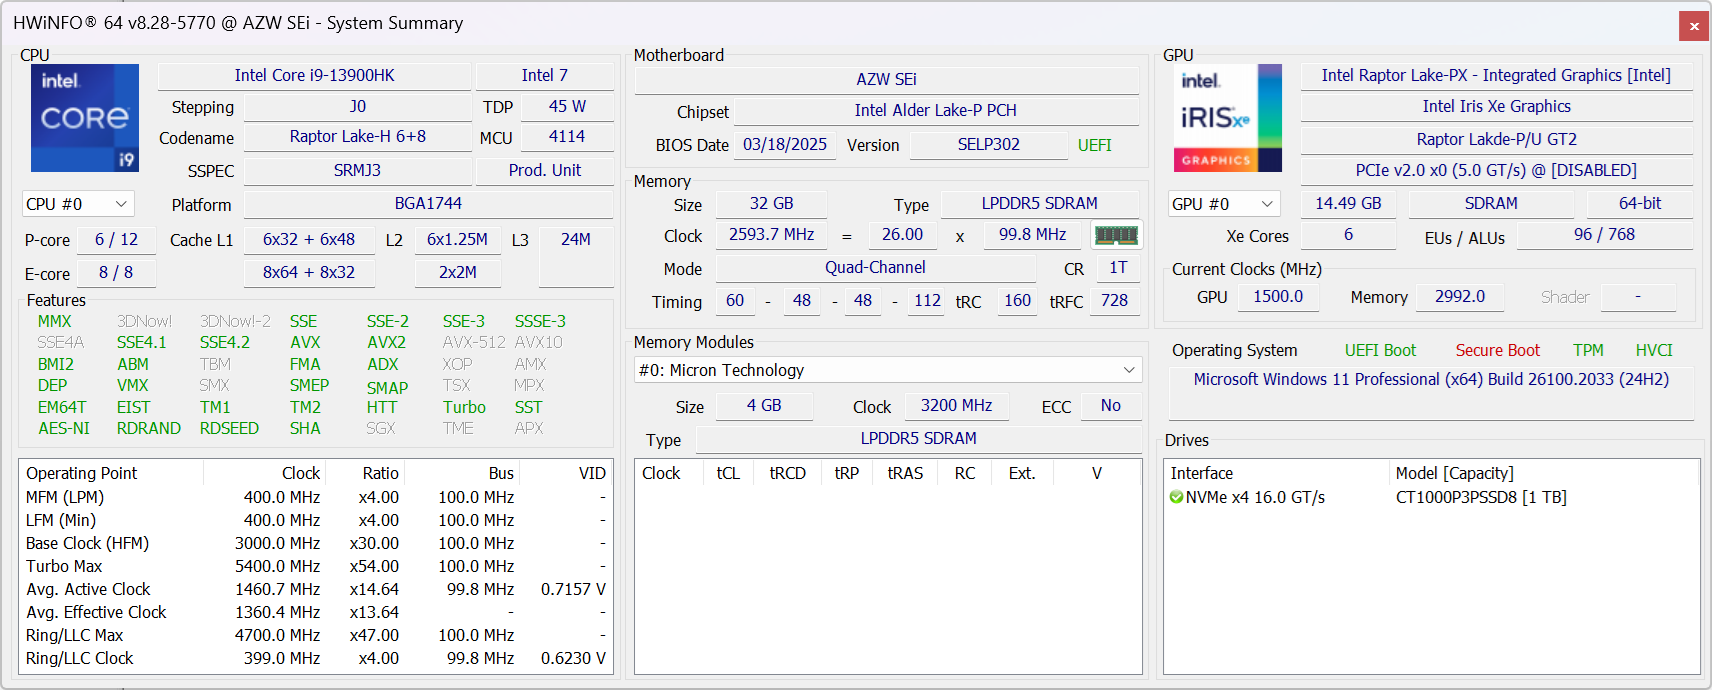
Nuestra unidad de prueba se entrega con la CPU Raptor Lake Core i9-13900HK, 32 GB de RAM y una unidad SSD de 1 TB por 540 dólares. Hay disponibles opciones de color gris y plata.
Más reseñas de Beelink:
Especificaciones
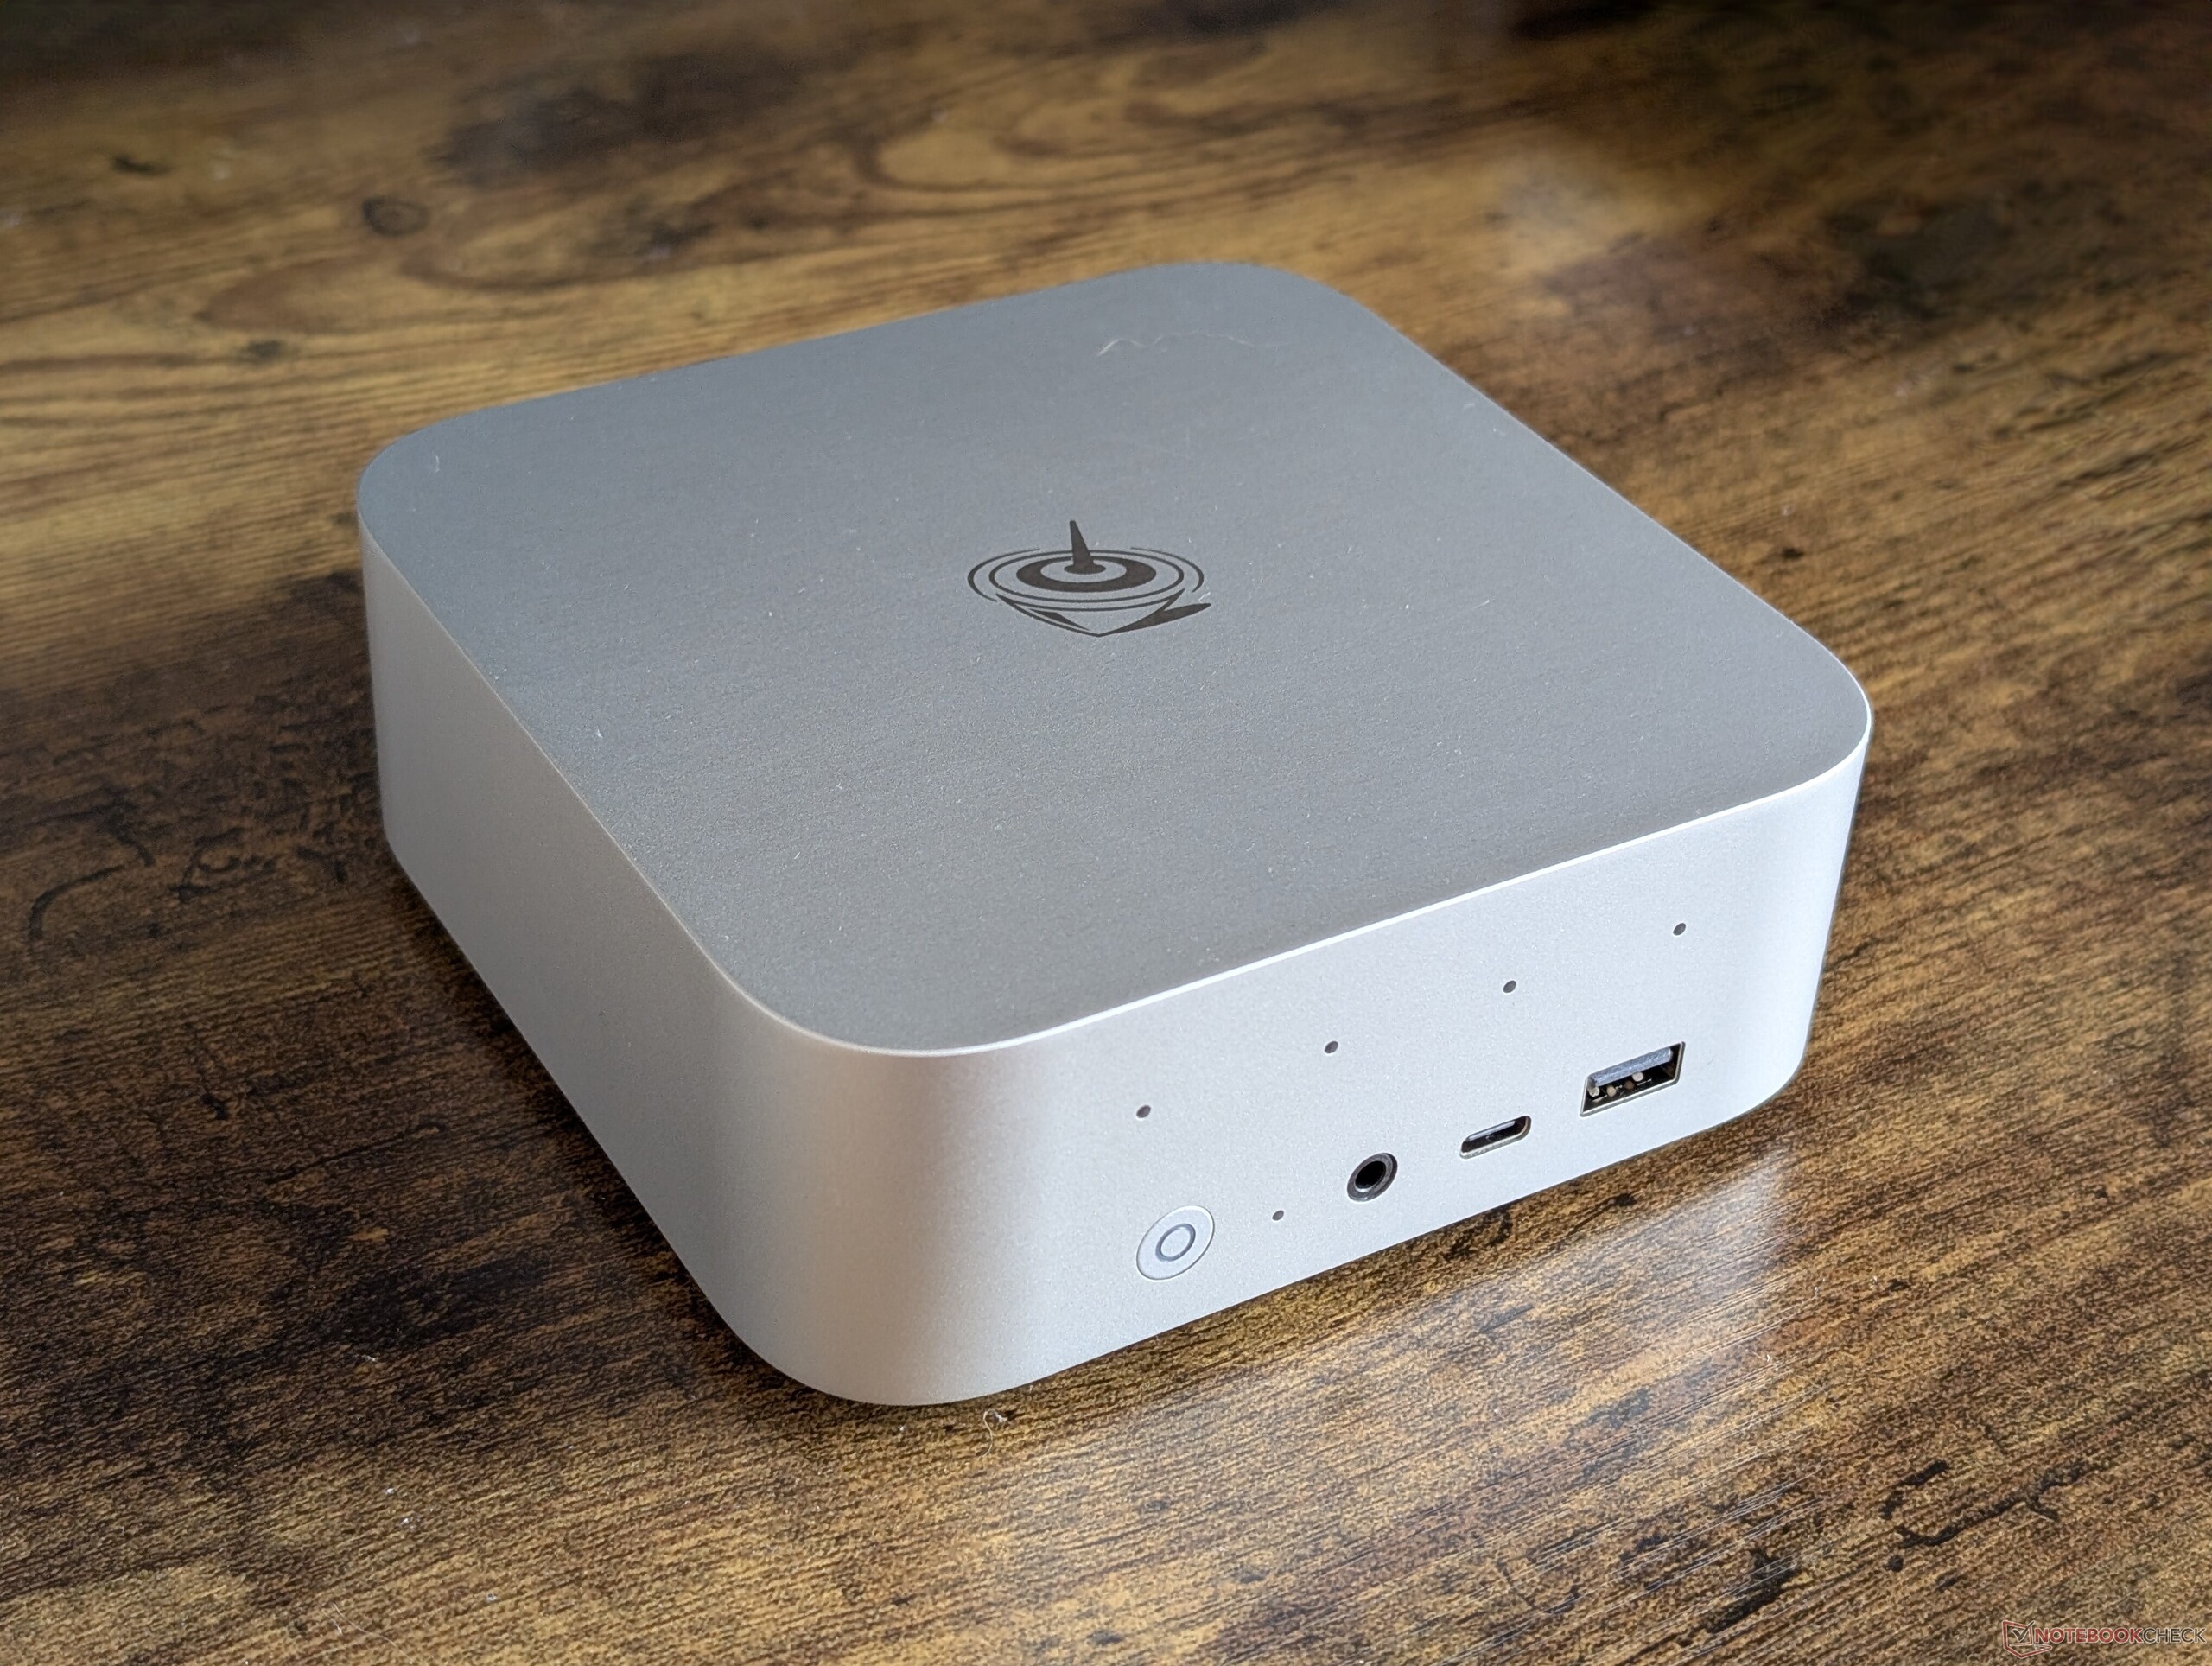
Caso
El SEi13 Pro es esencialmente una versión más pequeña y ligera del GTi13 Ultra. El material de la carcasa metálica sigue siendo el mismo para ofrecer impresiones similares a las del Mac Mini.
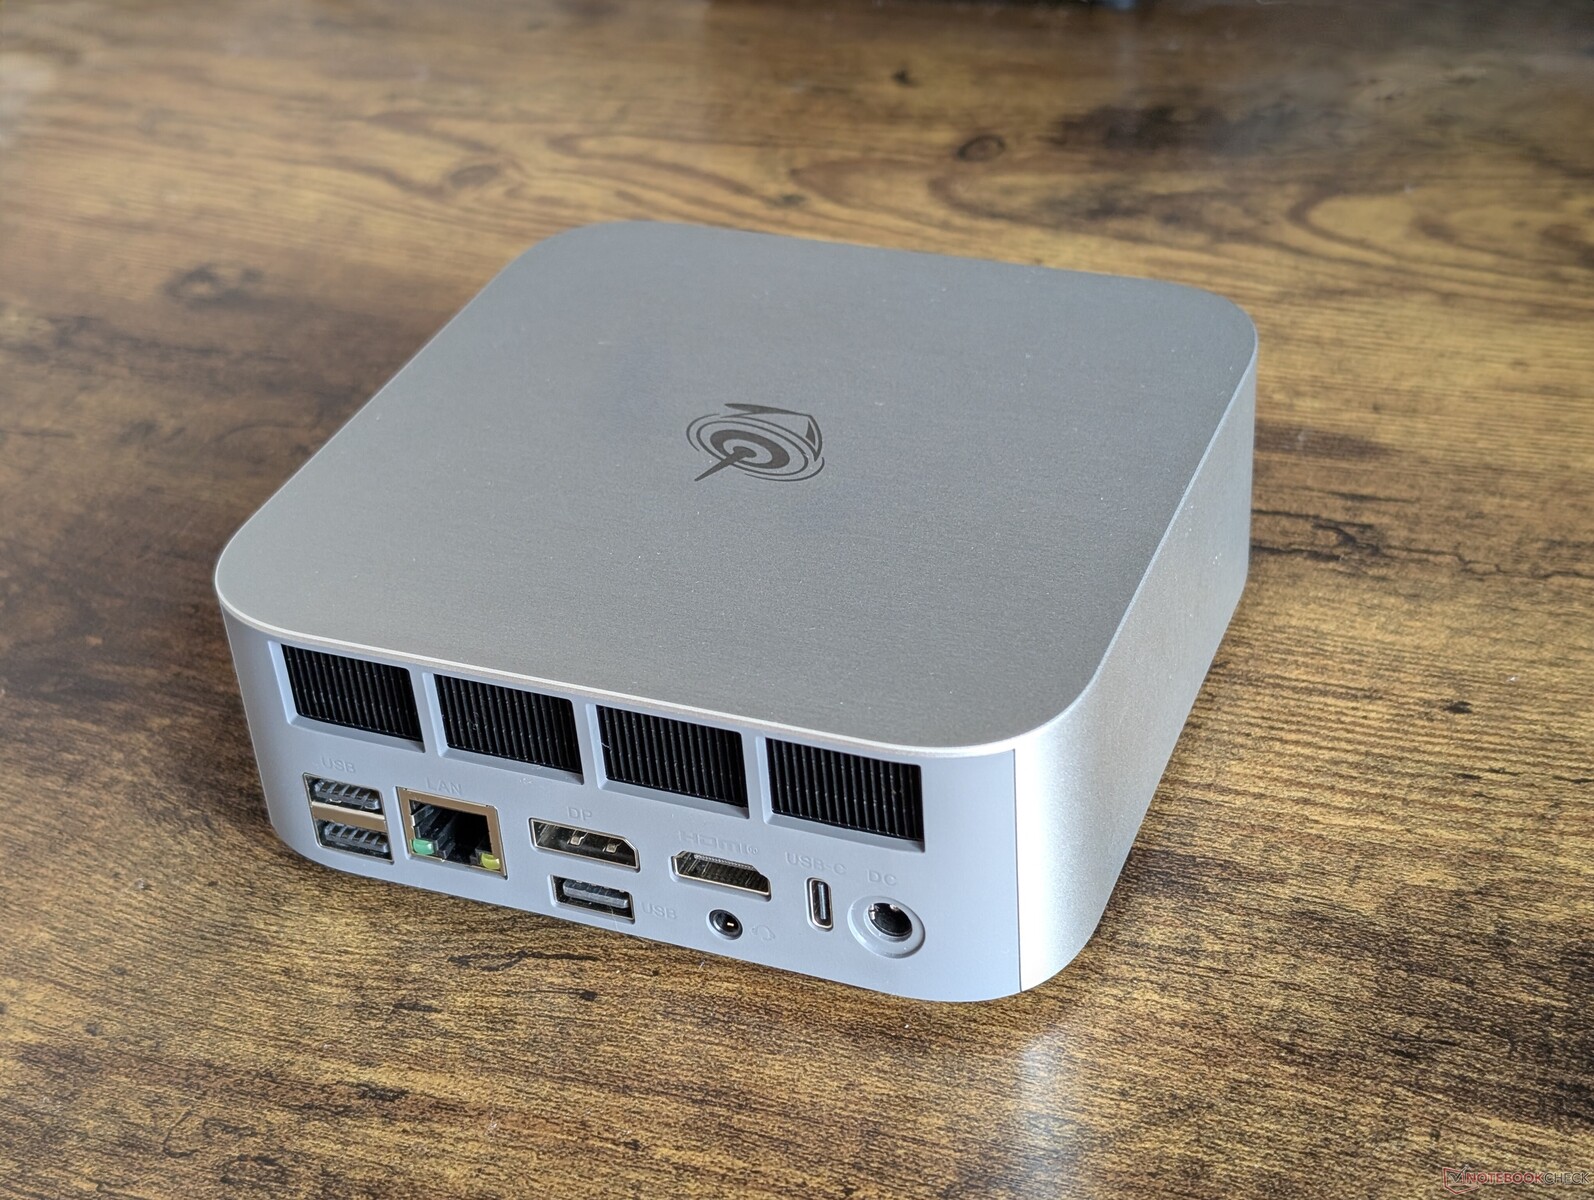
Conectividad
Puertos integrados casi todo lo que se encuentra en el SEi13 Ultra salvo el puerto diferente para el adaptador de CA y menos puertos USB-A y RJ-45 en la parte trasera. También se ha prescindido del lector de tarjetas SD.
Tenga en cuenta que el sistema se puede alimentar a través de adaptadores de CA USB-C genéricos si alguna vez pierde el adaptador de CA de barril de 100 W que se entrega con la unidad.
Comunicación
| Networking | |
| iperf3 transmit AXE11000 | |
| BOSGAME M4 Neo | |
| Beelink SEi12 Core i5-1235U | |
| HP Z2 Mini G1a | |
| Beelink GTI13 Ultra | |
| Beelink SEi13 Pro | |
| iperf3 receive AXE11000 | |
| BOSGAME M4 Neo | |
| Beelink SEi12 Core i5-1235U | |
| HP Z2 Mini G1a | |
| Beelink GTI13 Ultra | |
| Beelink SEi13 Pro | |
| iperf3 transmit AXE11000 6GHz | |
| HP Z2 Mini G1a | |
| BOSGAME M4 Neo | |
| iperf3 receive AXE11000 6GHz | |
| HP Z2 Mini G1a | |
| BOSGAME M4 Neo | |
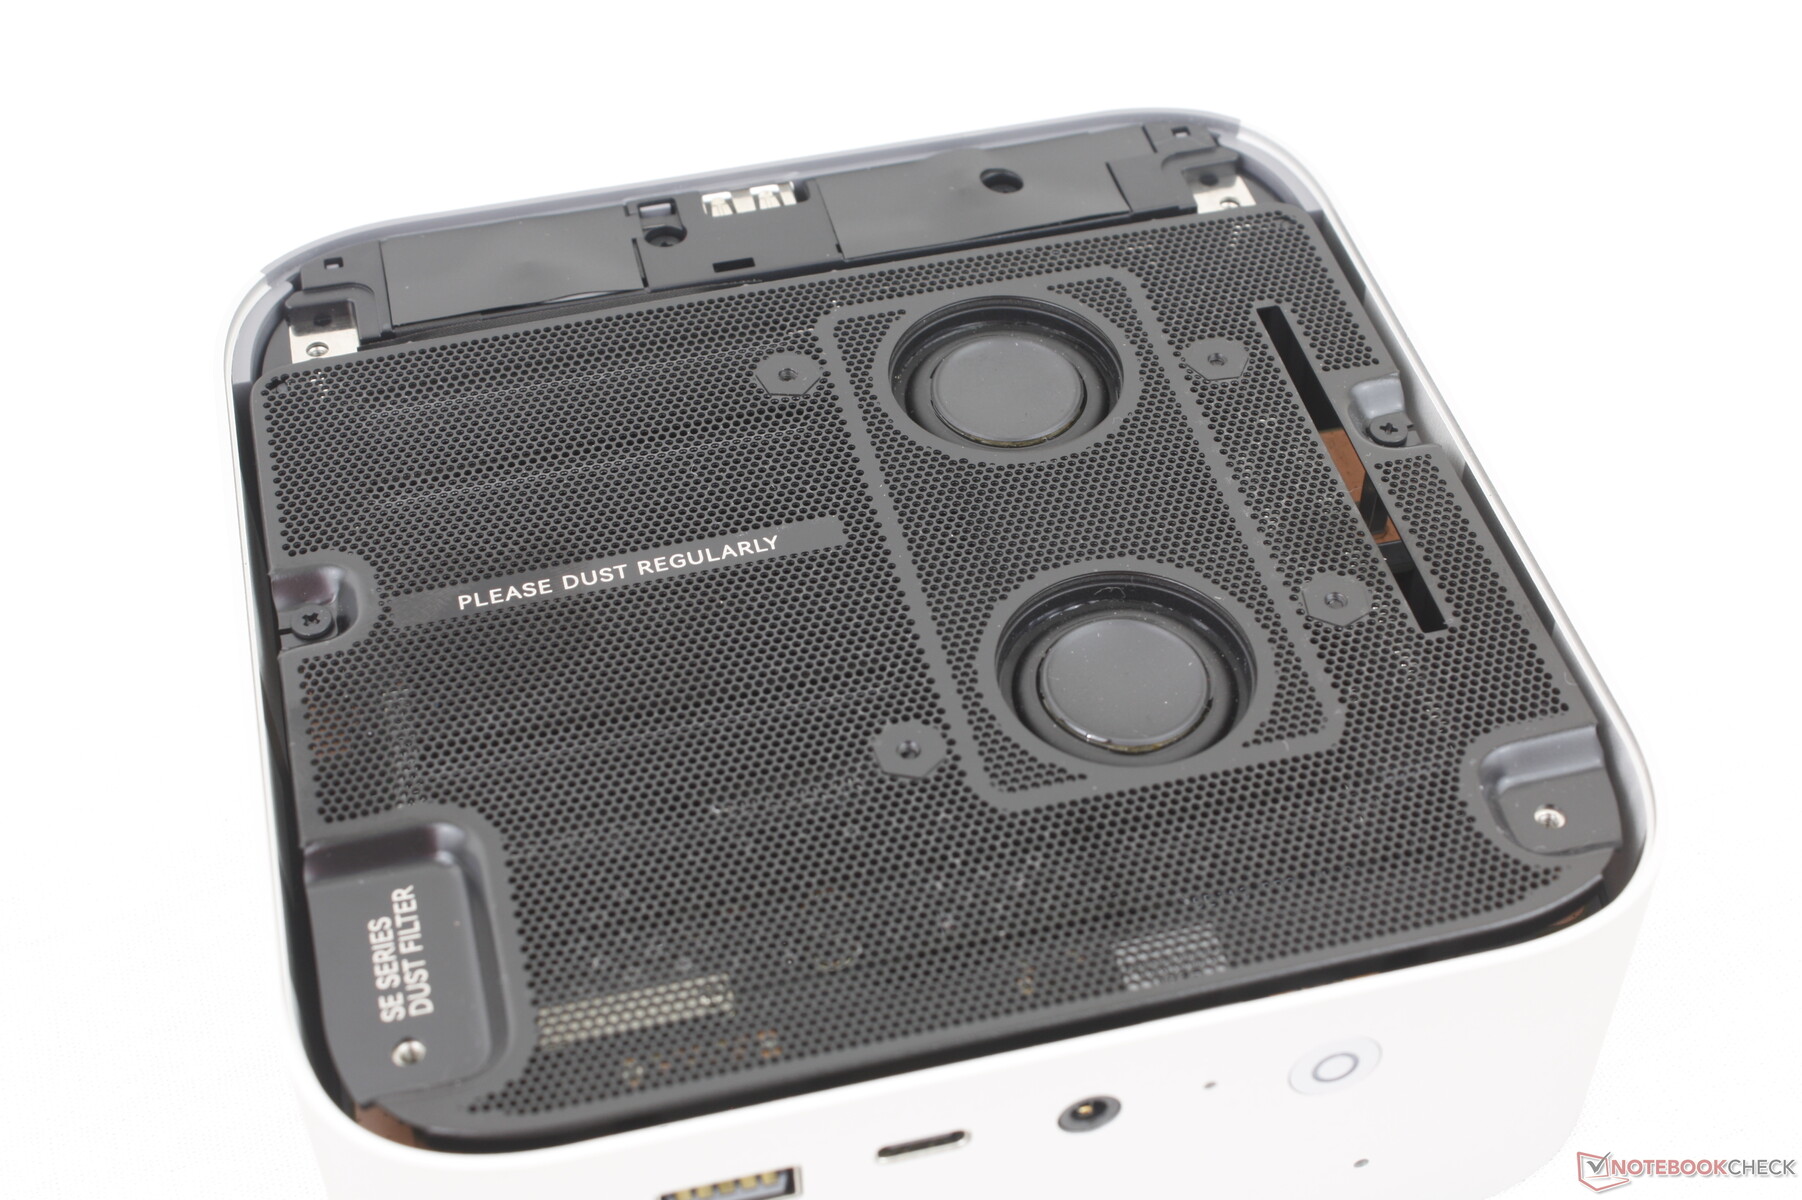
Mantenimiento
Las actualizaciones son más sencillas que en la GTi13 Ultra ya que el diseño de la SEi13 no tiene una fuente de alimentación integrada sobre la placa base. No obstante, las ampliaciones están limitadas a sólo dos SSD M.2 ya que la RAM está soldada, a diferencia de la mencionada GTi13 Ultra.
Sostenibilidad
El fabricante no menciona los materiales reciclados utilizados durante la fabricación. EL envase en sí es todo de cartón y papel con envoltorio de plástico.
Accesorios y garantía
La caja de venta incluye un cable HDMI y un adaptador de CA con manual. Se aplica la garantía limitada habitual del fabricante de un año si se adquiere en EE.UU.
Rendimiento
Condiciones de prueba
Pusimos Windows en modo Rendimiento antes de ejecutar las pruebas comparativas que se indican a continuación.
Procesador
Aunque sigue siendo bastante rápido para su precio, el Core i9-13900HK carece de una NPU integrada para la aceleración de IA.
Cinebench R15 Multi Loop
Cinebench R23: Multi Core | Single Core
Cinebench R20: CPU (Multi Core) | CPU (Single Core)
Cinebench R15: CPU Multi 64Bit | CPU Single 64Bit
Blender: v2.79 BMW27 CPU
7-Zip 18.03: 7z b 4 | 7z b 4 -mmt1
Geekbench 6.7: Multi-Core | Single-Core
Geekbench 5.5: Multi-Core | Single-Core
HWBOT x265 Benchmark v2.2: 4k Preset
LibreOffice : 20 Documents To PDF
R Benchmark 2.5: Overall mean
| CPU Performance rating | |
| Minisforum MS-A2 | |
| HP Z2 Mini G1a | |
| Acemagic F3A | |
| Geekom Mini IT15, Ultra 9 285H | |
| Khadas Mind 2s | |
| Beelink GTI13 Ultra | |
| BOSGAME M4 Neo | |
| Medio Intel Core i9-13900HK | |
| Geekom Mini IT13 | |
| Beelink SEi13 Pro | |
| Minix Elite EU512-AI -2! | |
| BMAX B9 Power | |
| Beelink SEi12 Core i5-1235U -2! | |
| NiPoGi AM06 Pro | |
| Cinebench R20 / CPU (Multi Core) | |
| HP Z2 Mini G1a | |
| Minisforum MS-A2 | |
| Acemagic F3A | |
| Geekom Mini IT15, Ultra 9 285H | |
| Khadas Mind 2s | |
| BOSGAME M4 Neo | |
| Beelink GTI13 Ultra | |
| Medio Intel Core i9-13900HK (4968 - 7542, n=4) | |
| Beelink SEi13 Pro | |
| Minix Elite EU512-AI | |
| BMAX B9 Power | |
| Geekom Mini IT13 | |
| Beelink SEi12 Core i5-1235U | |
| NiPoGi AM06 Pro | |
| Cinebench R20 / CPU (Single Core) | |
| Minisforum MS-A2 | |
| Geekom Mini IT15, Ultra 9 285H | |
| Khadas Mind 2s | |
| Acemagic F3A | |
| Beelink GTI13 Ultra | |
| HP Z2 Mini G1a | |
| Medio Intel Core i9-13900HK (549 - 798, n=4) | |
| BOSGAME M4 Neo | |
| Geekom Mini IT13 | |
| Minix Elite EU512-AI | |
| Beelink SEi12 Core i5-1235U | |
| Beelink SEi13 Pro | |
| BMAX B9 Power | |
| NiPoGi AM06 Pro | |
| Cinebench R15 / CPU Multi 64Bit | |
| HP Z2 Mini G1a | |
| Minisforum MS-A2 | |
| Acemagic F3A | |
| Geekom Mini IT15, Ultra 9 285H | |
| Khadas Mind 2s | |
| BOSGAME M4 Neo | |
| Medio Intel Core i9-13900HK (2004 - 2950, n=4) | |
| Beelink GTI13 Ultra | |
| Beelink SEi13 Pro | |
| BMAX B9 Power | |
| Minix Elite EU512-AI | |
| Geekom Mini IT13 | |
| Beelink SEi12 Core i5-1235U | |
| NiPoGi AM06 Pro | |
| Cinebench R15 / CPU Single 64Bit | |
| Minisforum MS-A2 | |
| Acemagic F3A | |
| Khadas Mind 2s | |
| Geekom Mini IT15, Ultra 9 285H | |
| HP Z2 Mini G1a | |
| Beelink GTI13 Ultra | |
| BOSGAME M4 Neo | |
| Medio Intel Core i9-13900HK (204 - 296, n=4) | |
| Geekom Mini IT13 | |
| Minix Elite EU512-AI | |
| Beelink SEi12 Core i5-1235U | |
| Beelink SEi13 Pro | |
| BMAX B9 Power | |
| NiPoGi AM06 Pro | |
| Geekbench 6.7 / Multi-Core | |
| Minisforum MS-A2 | |
| HP Z2 Mini G1a | |
| Geekom Mini IT15, Ultra 9 285H | |
| Khadas Mind 2s | |
| Beelink GTI13 Ultra | |
| BOSGAME M4 Neo | |
| Acemagic F3A | |
| Geekom Mini IT13 | |
| Medio Intel Core i9-13900HK (7103 - 13309, n=4) | |
| BMAX B9 Power | |
| Beelink SEi13 Pro | |
| NiPoGi AM06 Pro | |
| Geekbench 6.7 / Single-Core | |
| Minisforum MS-A2 | |
| Geekom Mini IT15, Ultra 9 285H | |
| Acemagic F3A | |
| Khadas Mind 2s | |
| HP Z2 Mini G1a | |
| Beelink GTI13 Ultra | |
| BOSGAME M4 Neo | |
| Geekom Mini IT13 | |
| Medio Intel Core i9-13900HK (1849 - 2883, n=4) | |
| Beelink SEi13 Pro | |
| BMAX B9 Power | |
| NiPoGi AM06 Pro | |
| HWBOT x265 Benchmark v2.2 / 4k Preset | |
| Minisforum MS-A2 | |
| HP Z2 Mini G1a | |
| Acemagic F3A | |
| Geekom Mini IT15, Ultra 9 285H | |
| BOSGAME M4 Neo | |
| Khadas Mind 2s | |
| Beelink GTI13 Ultra | |
| Medio Intel Core i9-13900HK (14.2 - 21.9, n=4) | |
| Beelink SEi13 Pro | |
| BMAX B9 Power | |
| Minix Elite EU512-AI | |
| Geekom Mini IT13 | |
| Beelink SEi12 Core i5-1235U | |
| NiPoGi AM06 Pro | |
| LibreOffice / 20 Documents To PDF | |
| NiPoGi AM06 Pro | |
| Minix Elite EU512-AI | |
| Acemagic F3A | |
| BMAX B9 Power | |
| HP Z2 Mini G1a | |
| Beelink SEi13 Pro | |
| Geekom Mini IT13 | |
| Beelink SEi12 Core i5-1235U | |
| BOSGAME M4 Neo | |
| Medio Intel Core i9-13900HK (37.3 - 56, n=4) | |
| Khadas Mind 2s | |
| Minisforum MS-A2 | |
| Geekom Mini IT15, Ultra 9 285H | |
| Beelink GTI13 Ultra | |
Cinebench R23: Multi Core | Single Core
Cinebench R20: CPU (Multi Core) | CPU (Single Core)
Cinebench R15: CPU Multi 64Bit | CPU Single 64Bit
Blender: v2.79 BMW27 CPU
7-Zip 18.03: 7z b 4 | 7z b 4 -mmt1
Geekbench 6.7: Multi-Core | Single-Core
Geekbench 5.5: Multi-Core | Single-Core
HWBOT x265 Benchmark v2.2: 4k Preset
LibreOffice : 20 Documents To PDF
R Benchmark 2.5: Overall mean
* ... más pequeño es mejor
AIDA64: FP32 Ray-Trace | FPU Julia | CPU SHA3 | CPU Queen | FPU SinJulia | FPU Mandel | CPU AES | CPU ZLib | FP64 Ray-Trace | CPU PhotoWorxx
| Performance rating | |
| HP Z2 Mini G1a | |
| BOSGAME M4 Neo | |
| Beelink GTI13 Ultra | |
| Medio Intel Core i9-13900HK | |
| BMAX B9 Power | |
| Beelink SEi13 Pro | |
| Beelink SEi12 Core i5-1235U | |
| AIDA64 / FP32 Ray-Trace | |
| HP Z2 Mini G1a | |
| BOSGAME M4 Neo | |
| Beelink SEi13 Pro | |
| Medio Intel Core i9-13900HK (12351 - 18326, n=4) | |
| Beelink GTI13 Ultra | |
| BMAX B9 Power | |
| Beelink SEi12 Core i5-1235U | |
| AIDA64 / FPU Julia | |
| HP Z2 Mini G1a | |
| BOSGAME M4 Neo | |
| Beelink GTI13 Ultra | |
| Medio Intel Core i9-13900HK (61409 - 92925, n=4) | |
| Beelink SEi13 Pro | |
| BMAX B9 Power | |
| Beelink SEi12 Core i5-1235U | |
| AIDA64 / CPU SHA3 | |
| HP Z2 Mini G1a | |
| BOSGAME M4 Neo | |
| Medio Intel Core i9-13900HK (2923 - 4190, n=4) | |
| Beelink GTI13 Ultra | |
| Beelink SEi13 Pro | |
| BMAX B9 Power | |
| Beelink SEi12 Core i5-1235U | |
| AIDA64 / CPU Queen | |
| HP Z2 Mini G1a | |
| BOSGAME M4 Neo | |
| Beelink GTI13 Ultra | |
| Medio Intel Core i9-13900HK (75615 - 118166, n=4) | |
| Beelink SEi13 Pro | |
| BMAX B9 Power | |
| Beelink SEi12 Core i5-1235U | |
| AIDA64 / FPU SinJulia | |
| HP Z2 Mini G1a | |
| BOSGAME M4 Neo | |
| Beelink GTI13 Ultra | |
| Medio Intel Core i9-13900HK (7427 - 11249, n=4) | |
| Beelink SEi13 Pro | |
| BMAX B9 Power | |
| Beelink SEi12 Core i5-1235U | |
| AIDA64 / FPU Mandel | |
| HP Z2 Mini G1a | |
| BOSGAME M4 Neo | |
| Beelink SEi13 Pro | |
| Beelink GTI13 Ultra | |
| Medio Intel Core i9-13900HK (30549 - 45616, n=4) | |
| BMAX B9 Power | |
| Beelink SEi12 Core i5-1235U | |
| AIDA64 / CPU AES | |
| HP Z2 Mini G1a | |
| BMAX B9 Power | |
| BOSGAME M4 Neo | |
| Medio Intel Core i9-13900HK (68508 - 100891, n=4) | |
| Beelink GTI13 Ultra | |
| Beelink SEi13 Pro | |
| Beelink SEi12 Core i5-1235U | |
| AIDA64 / CPU ZLib | |
| HP Z2 Mini G1a | |
| Beelink GTI13 Ultra | |
| Medio Intel Core i9-13900HK (797 - 1249, n=4) | |
| BOSGAME M4 Neo | |
| Beelink SEi13 Pro | |
| BMAX B9 Power | |
| Beelink SEi12 Core i5-1235U | |
| AIDA64 / FP64 Ray-Trace | |
| HP Z2 Mini G1a | |
| BOSGAME M4 Neo | |
| Medio Intel Core i9-13900HK (6839 - 10018, n=4) | |
| Beelink SEi13 Pro | |
| Beelink GTI13 Ultra | |
| BMAX B9 Power | |
| Beelink SEi12 Core i5-1235U | |
| AIDA64 / CPU PhotoWorxx | |
| HP Z2 Mini G1a | |
| Beelink GTI13 Ultra | |
| BOSGAME M4 Neo | |
| Medio Intel Core i9-13900HK (15421 - 49539, n=4) | |
| Beelink SEi12 Core i5-1235U | |
| BMAX B9 Power | |
| Beelink SEi13 Pro | |
Rendimiento del sistema
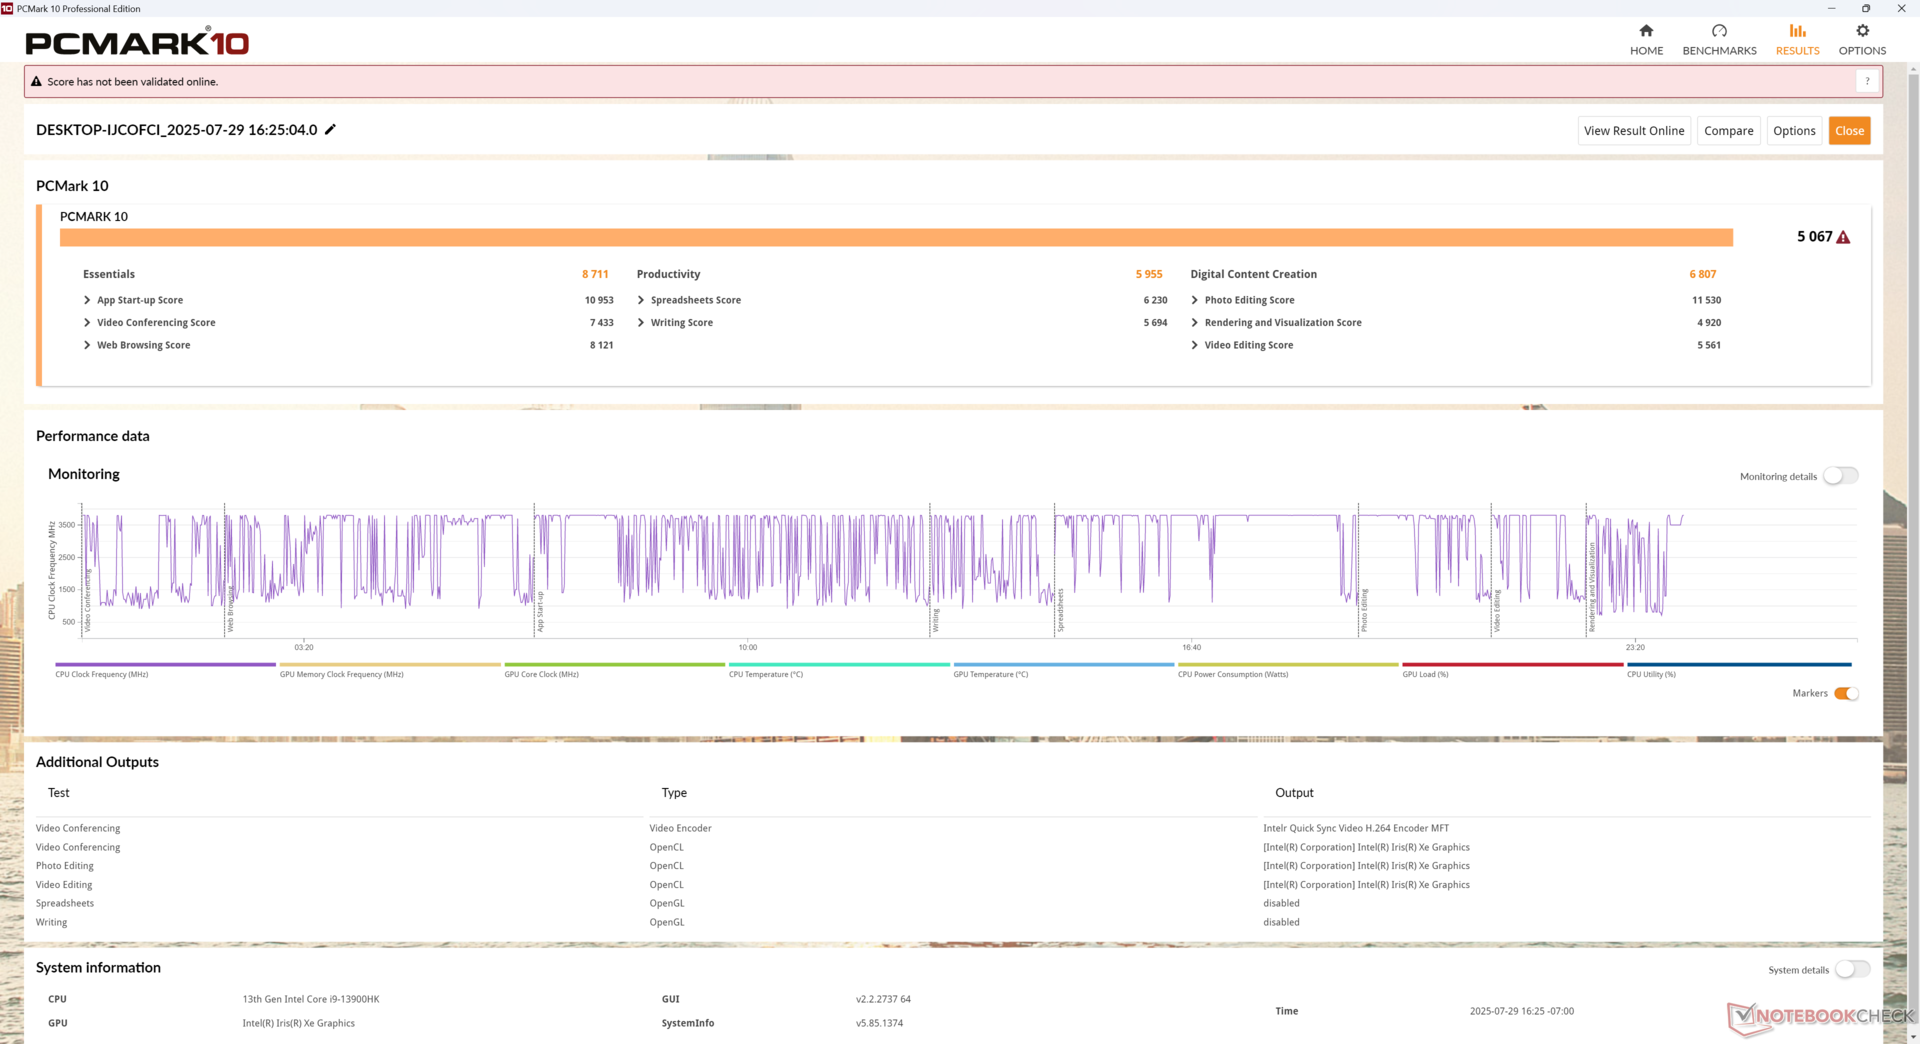
PCMark 10: Score | Essentials | Productivity | Digital Content Creation
CrossMark: Overall | Productivity | Creativity | Responsiveness
WebXPRT 3: Overall
WebXPRT 4: Overall
Mozilla Kraken 1.1: Total
| Performance rating | |
| HP Z2 Mini G1a | |
| Beelink GTI13 Ultra | |
| BOSGAME M4 Neo | |
| Beelink SEi12 Core i5-1235U | |
| Beelink SEi13 Pro -4! | |
| BMAX B9 Power -4! | |
| PCMark 10 / Score | |
| HP Z2 Mini G1a | |
| BOSGAME M4 Neo | |
| Beelink GTI13 Ultra | |
| Beelink SEi12 Core i5-1235U | |
| PCMark 10 / Essentials | |
| Beelink GTI13 Ultra | |
| Beelink SEi12 Core i5-1235U | |
| HP Z2 Mini G1a | |
| BOSGAME M4 Neo | |
| PCMark 10 / Productivity | |
| HP Z2 Mini G1a | |
| BOSGAME M4 Neo | |
| Beelink GTI13 Ultra | |
| Beelink SEi12 Core i5-1235U | |
| PCMark 10 / Digital Content Creation | |
| HP Z2 Mini G1a | |
| BOSGAME M4 Neo | |
| Beelink GTI13 Ultra | |
| Beelink SEi12 Core i5-1235U | |
| CrossMark / Overall | |
| Beelink GTI13 Ultra | |
| HP Z2 Mini G1a | |
| BOSGAME M4 Neo | |
| Beelink SEi12 Core i5-1235U | |
| Beelink SEi13 Pro | |
| BMAX B9 Power | |
| CrossMark / Productivity | |
| Beelink GTI13 Ultra | |
| BOSGAME M4 Neo | |
| Beelink SEi12 Core i5-1235U | |
| HP Z2 Mini G1a | |
| Beelink SEi13 Pro | |
| BMAX B9 Power | |
| CrossMark / Creativity | |
| HP Z2 Mini G1a | |
| Beelink GTI13 Ultra | |
| BOSGAME M4 Neo | |
| Beelink SEi12 Core i5-1235U | |
| BMAX B9 Power | |
| Beelink SEi13 Pro | |
| CrossMark / Responsiveness | |
| Beelink GTI13 Ultra | |
| Beelink SEi12 Core i5-1235U | |
| BOSGAME M4 Neo | |
| Beelink SEi13 Pro | |
| HP Z2 Mini G1a | |
| BMAX B9 Power | |
| WebXPRT 3 / Overall | |
| Beelink GTI13 Ultra | |
| HP Z2 Mini G1a | |
| BOSGAME M4 Neo | |
| Beelink SEi12 Core i5-1235U | |
| BMAX B9 Power | |
| Beelink SEi13 Pro | |
| WebXPRT 4 / Overall | |
| Beelink GTI13 Ultra | |
| HP Z2 Mini G1a | |
| BOSGAME M4 Neo | |
| Beelink SEi12 Core i5-1235U | |
| Beelink SEi13 Pro | |
| BMAX B9 Power | |
| Mozilla Kraken 1.1 / Total | |
| BMAX B9 Power | |
| Beelink SEi13 Pro | |
| Beelink SEi12 Core i5-1235U | |
| BOSGAME M4 Neo | |
| Beelink GTI13 Ultra | |
| HP Z2 Mini G1a | |
* ... más pequeño es mejor
» No benchmarks for this notebook found!
| AIDA64 / Memory Copy | |
| HP Z2 Mini G1a | |
| Beelink GTI13 Ultra | |
| BOSGAME M4 Neo | |
| Beelink SEi13 Pro | |
| Medio Intel Core i9-13900HK (45935 - 74460, n=4) | |
| Beelink SEi12 Core i5-1235U | |
| BMAX B9 Power | |
| AIDA64 / Memory Read | |
| HP Z2 Mini G1a | |
| Beelink GTI13 Ultra | |
| BOSGAME M4 Neo | |
| Medio Intel Core i9-13900HK (34298 - 74896, n=4) | |
| Beelink SEi12 Core i5-1235U | |
| BMAX B9 Power | |
| Beelink SEi13 Pro | |
| AIDA64 / Memory Write | |
| HP Z2 Mini G1a | |
| BOSGAME M4 Neo | |
| Beelink SEi13 Pro | |
| Beelink GTI13 Ultra | |
| Medio Intel Core i9-13900HK (47347 - 85917, n=4) | |
| Beelink SEi12 Core i5-1235U | |
| BMAX B9 Power | |
| AIDA64 / Memory Latency | |
| HP Z2 Mini G1a | |
| Beelink SEi13 Pro | |
| BMAX B9 Power | |
| Medio Intel Core i9-13900HK (83 - 115.3, n=4) | |
| Beelink SEi12 Core i5-1235U | |
| BOSGAME M4 Neo | |
| Beelink GTI13 Ultra | |
* ... más pequeño es mejor
Latencia del CPD
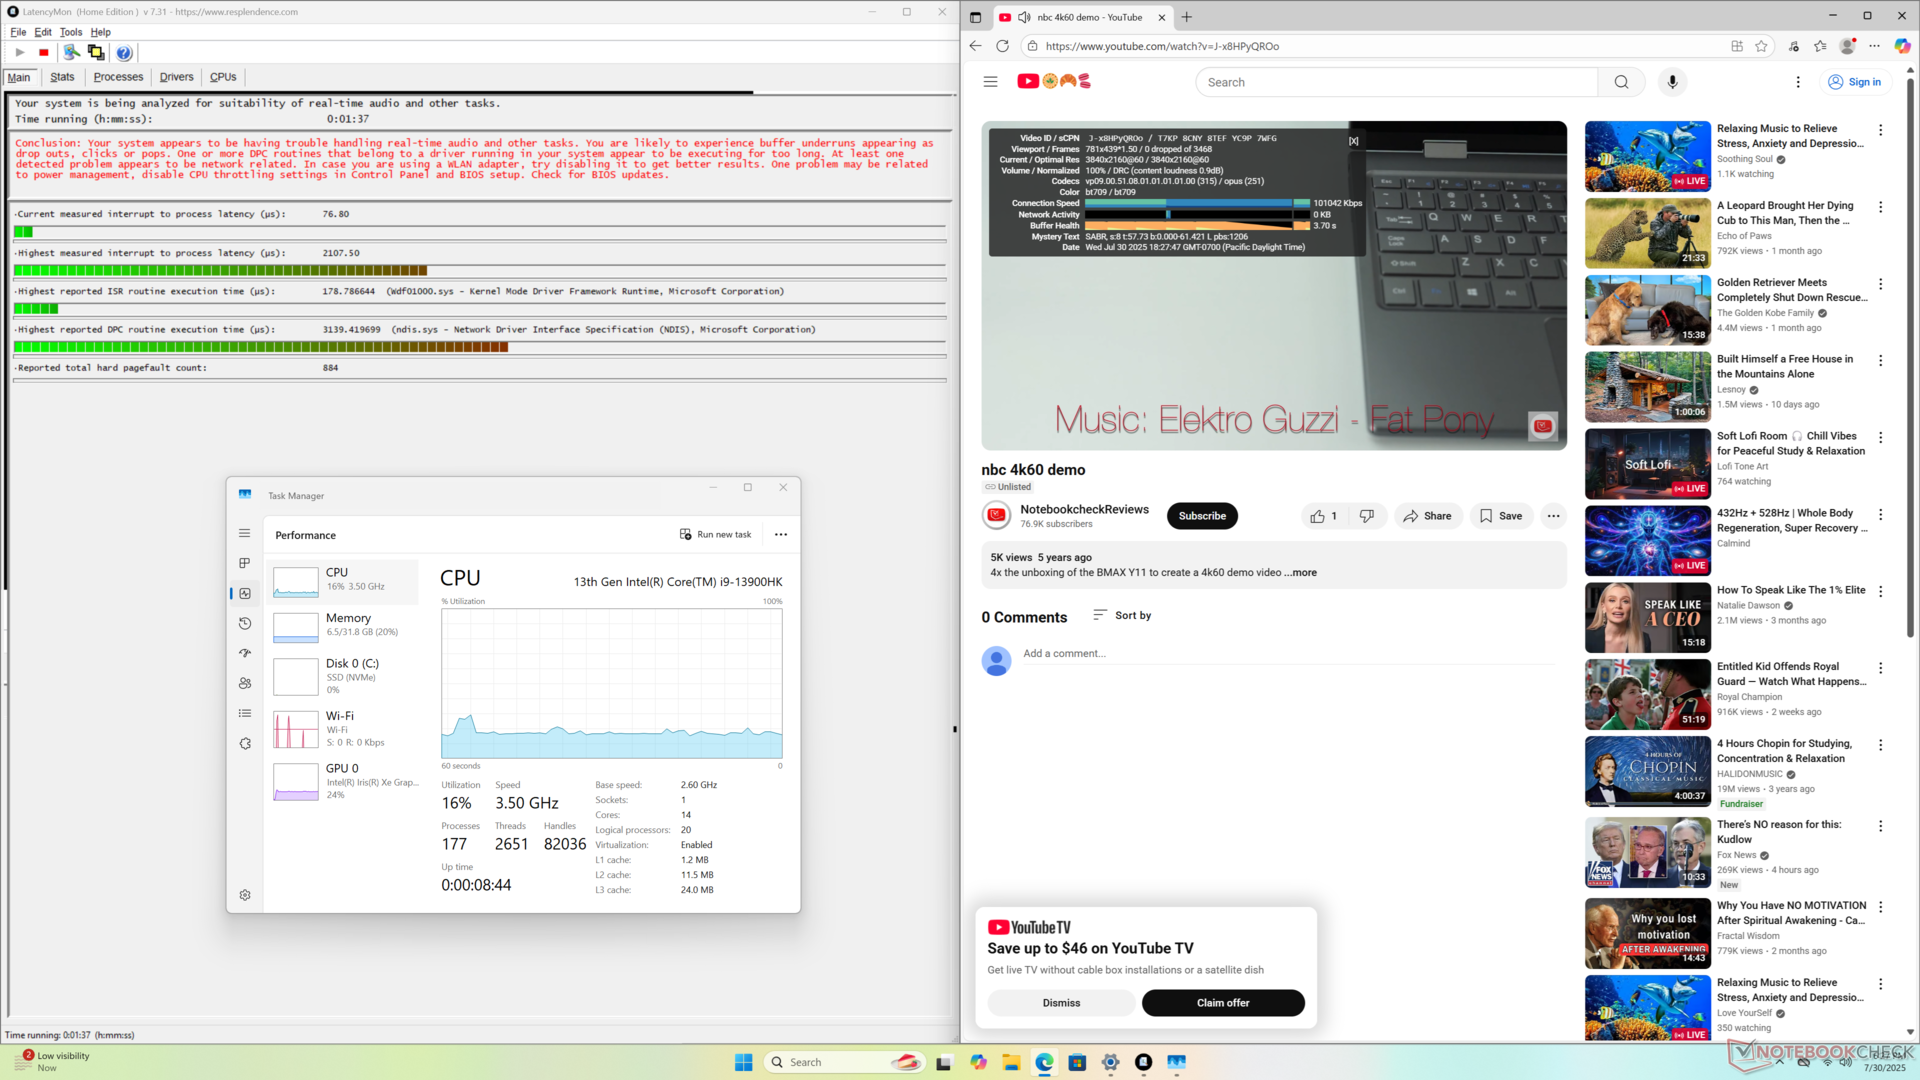
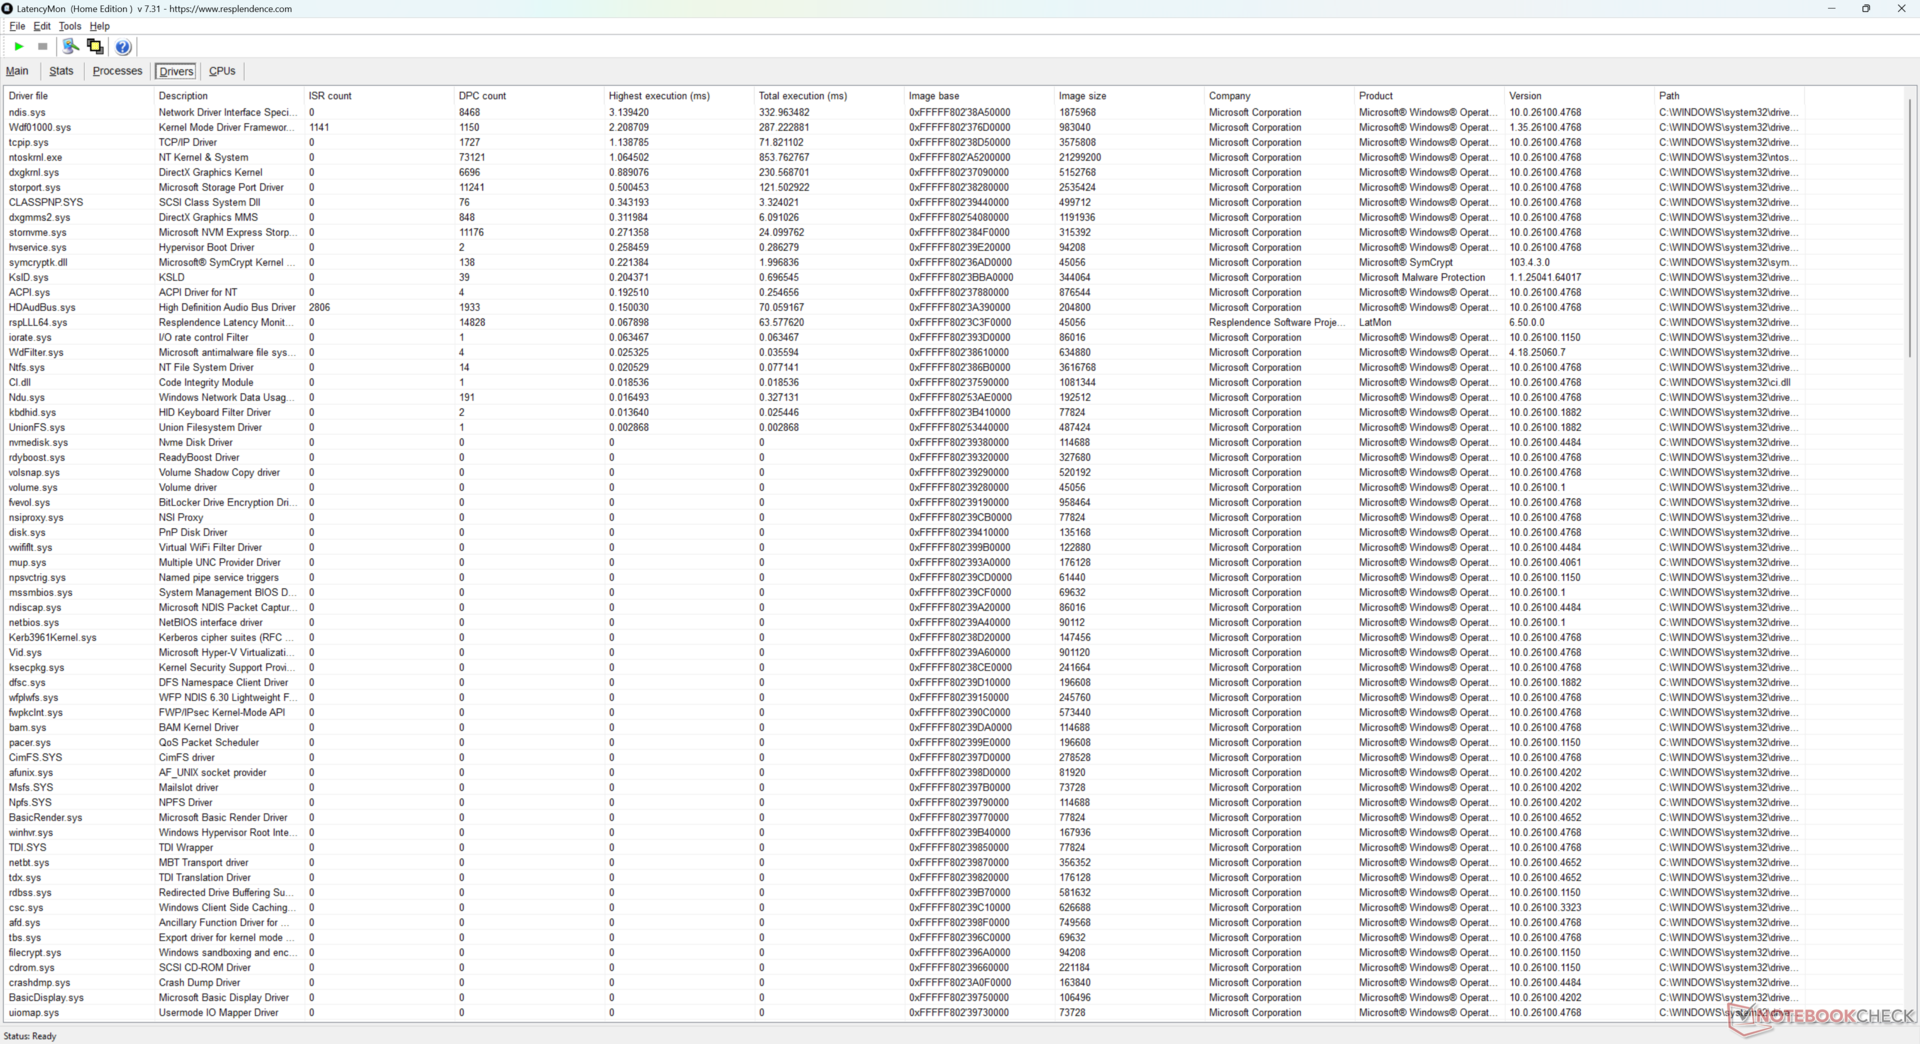
| DPC Latencies / LatencyMon - interrupt to process latency (max), Web, Youtube, Prime95 | |
| HP Z2 Mini G1a | |
| Beelink SEi13 Pro | |
| Beelink GTI13 Ultra | |
| Beelink SEi12 Core i5-1235U | |
| BOSGAME M4 Neo | |
* ... más pequeño es mejor
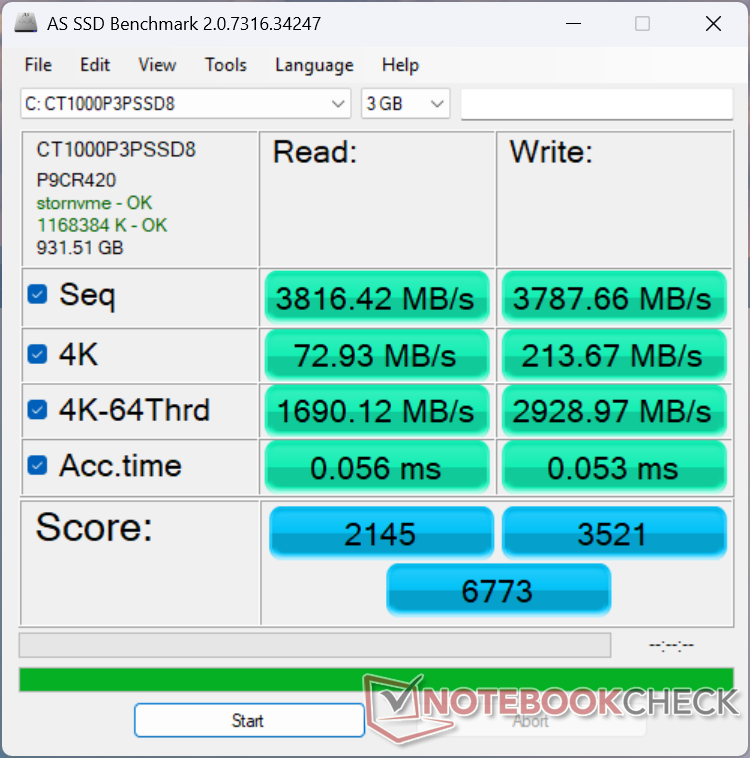
Dispositivos de almacenamiento
Se incluye un gran disipador de calor para refrigerar las dos ranuras SSD.
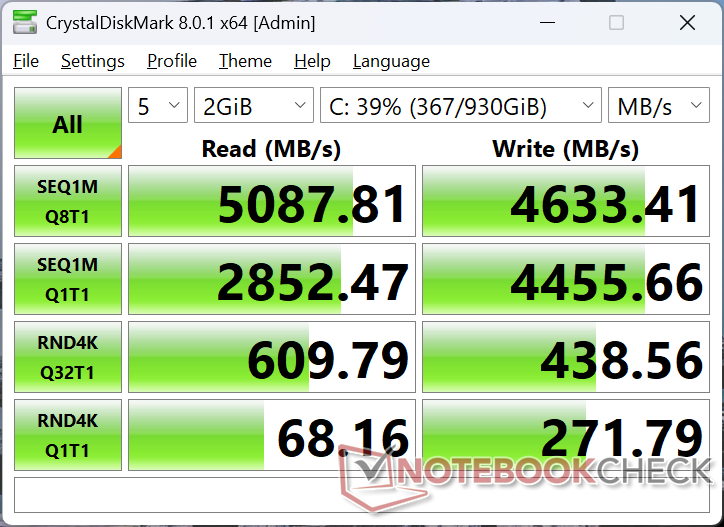

| Drive Performance rating - Percent | |
| Beelink GTI13 Ultra | |
| Beelink SEi13 Pro | |
| HP Z2 Mini G1a | |
| BOSGAME M4 Neo | |
| Beelink SEi12 Core i5-1235U | |
| BMAX B9 Power | |
* ... más pequeño es mejor
Disk Throttling: DiskSpd Read Loop, Queue Depth 8
Rendimiento de la GPU
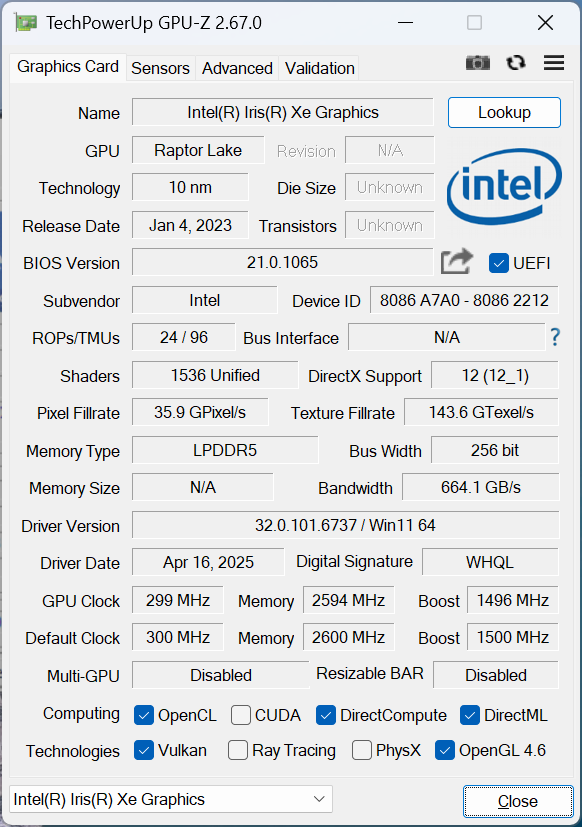
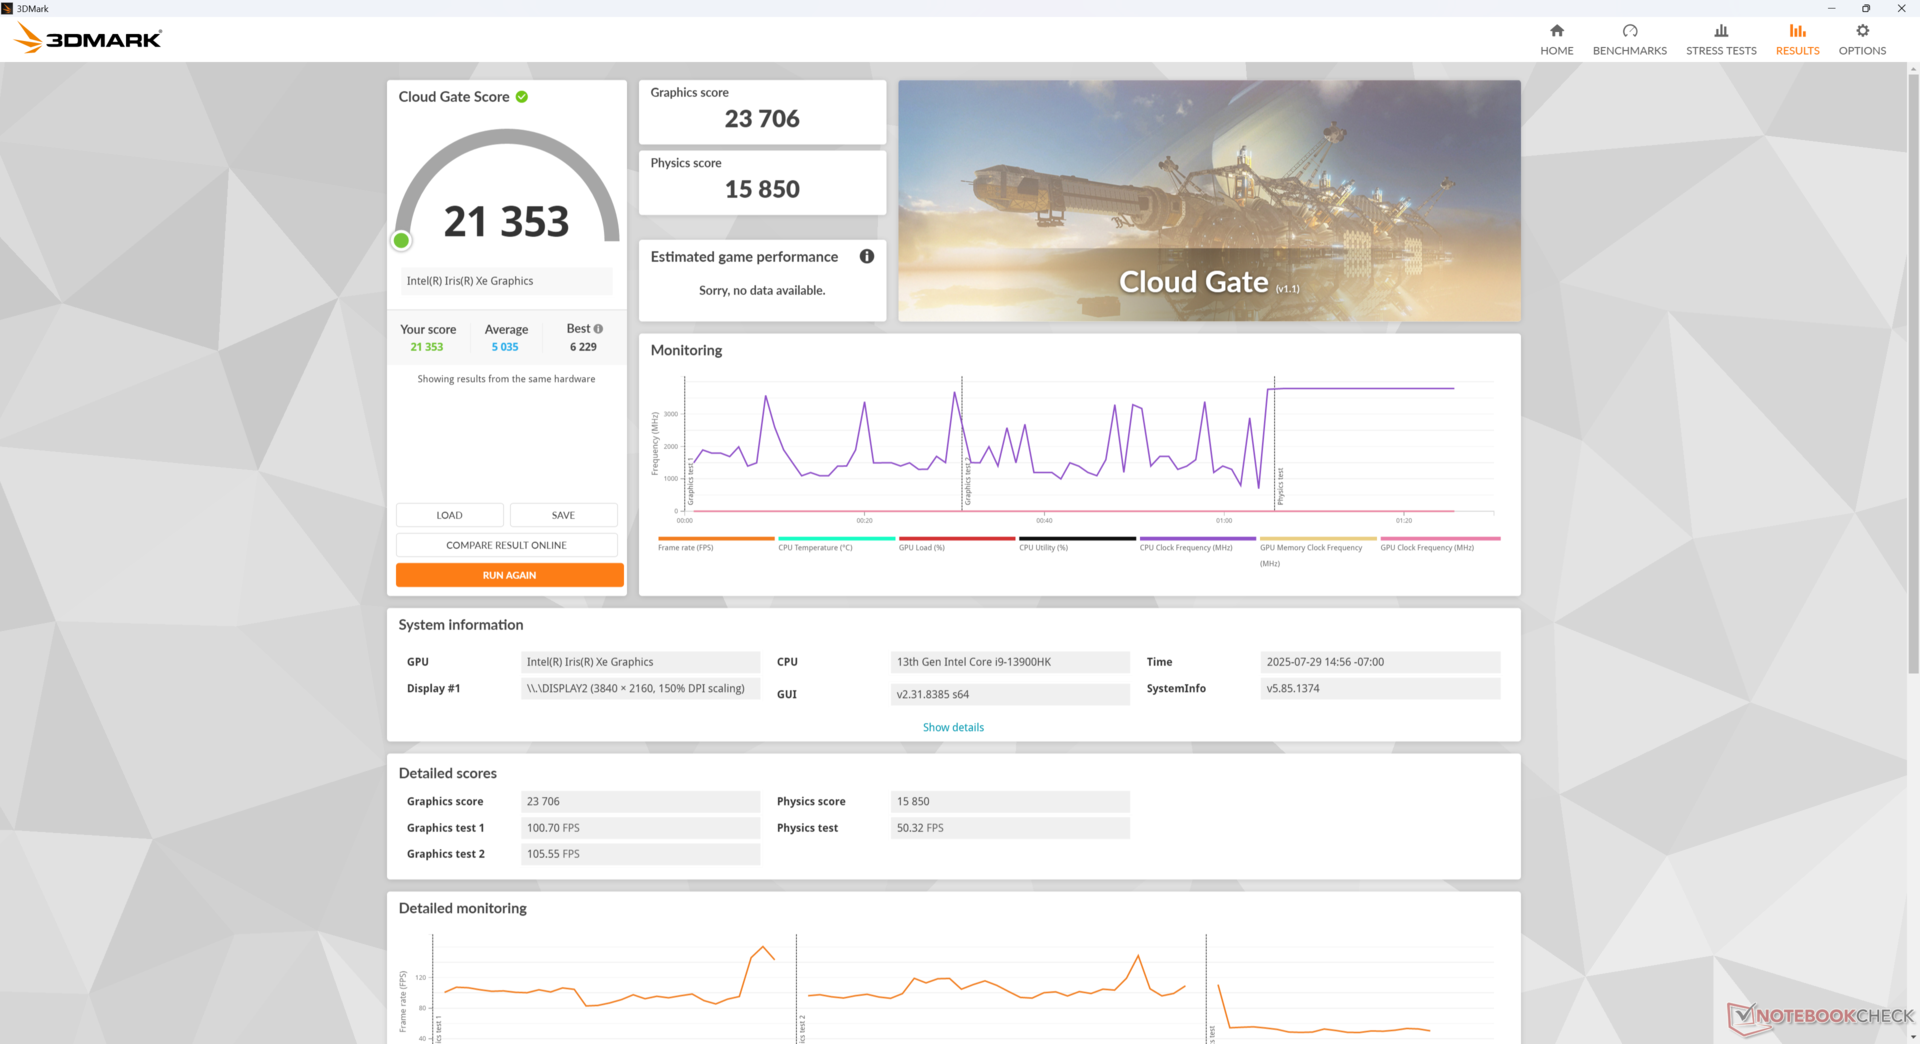
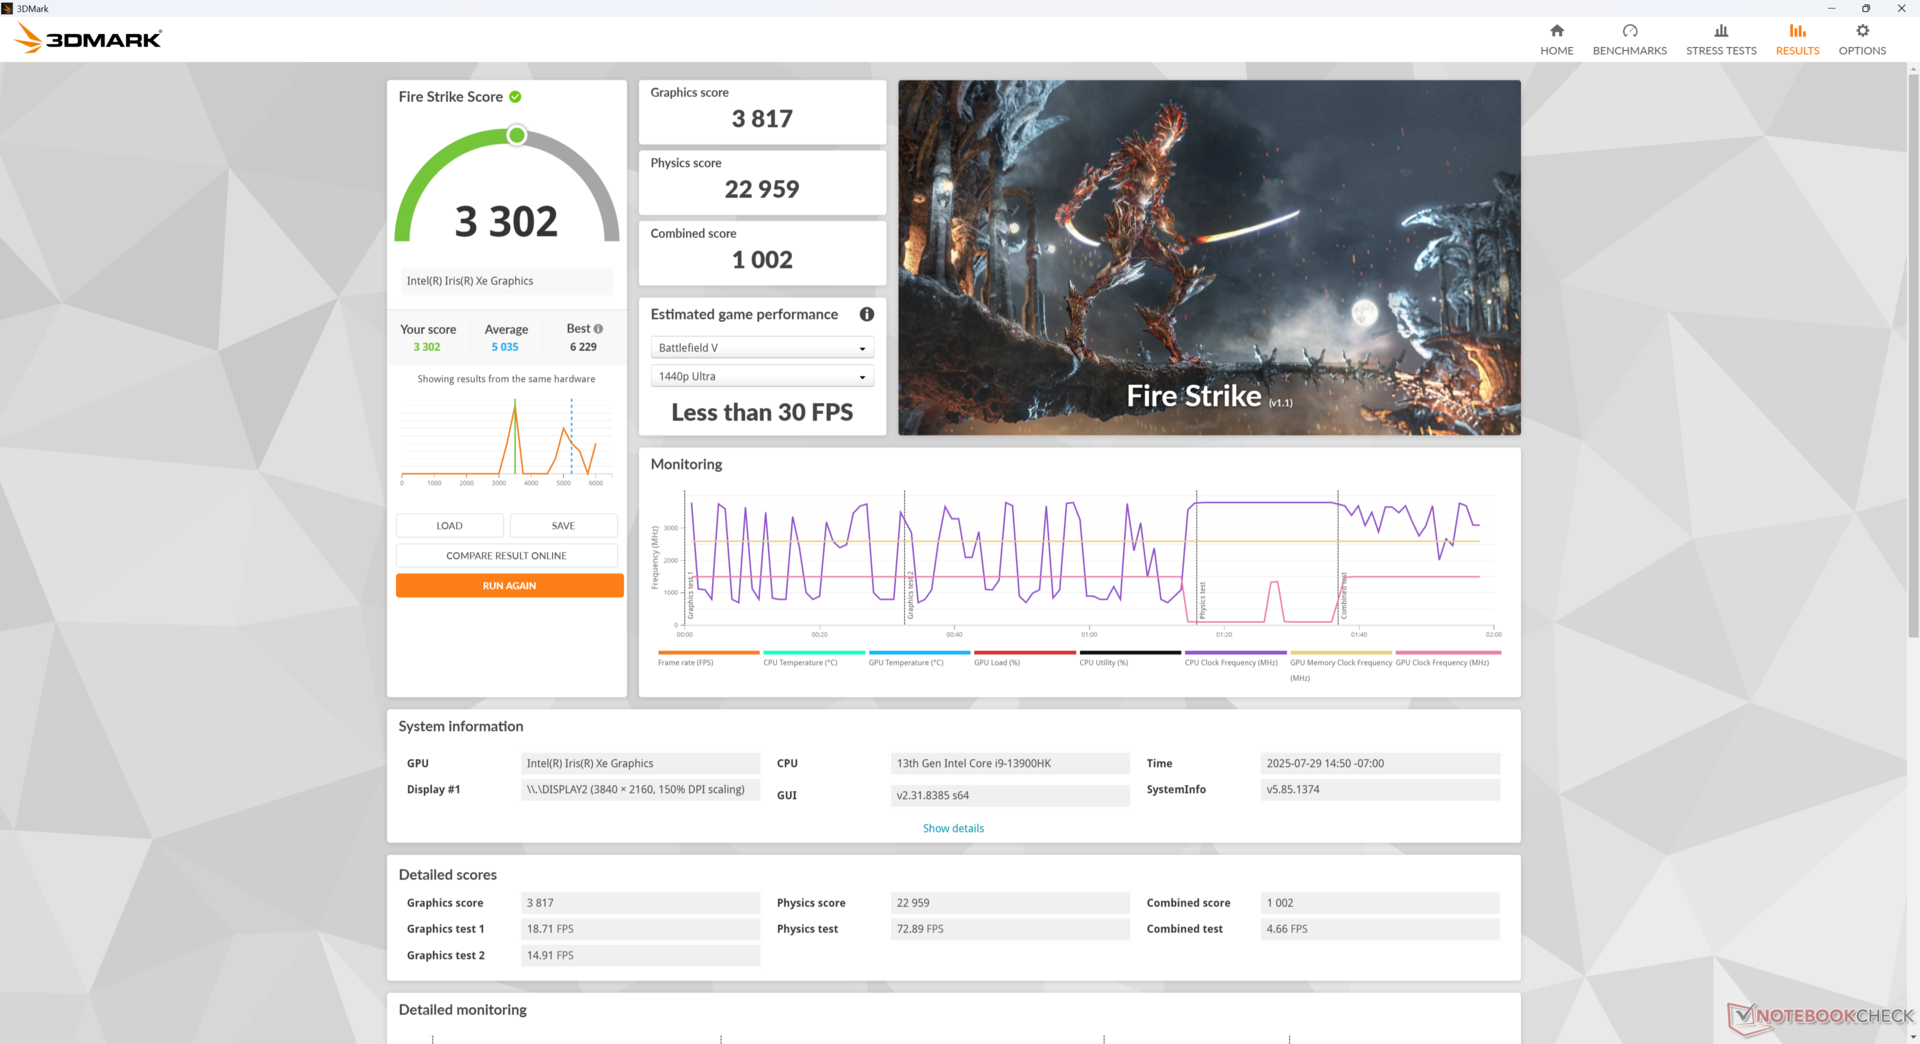
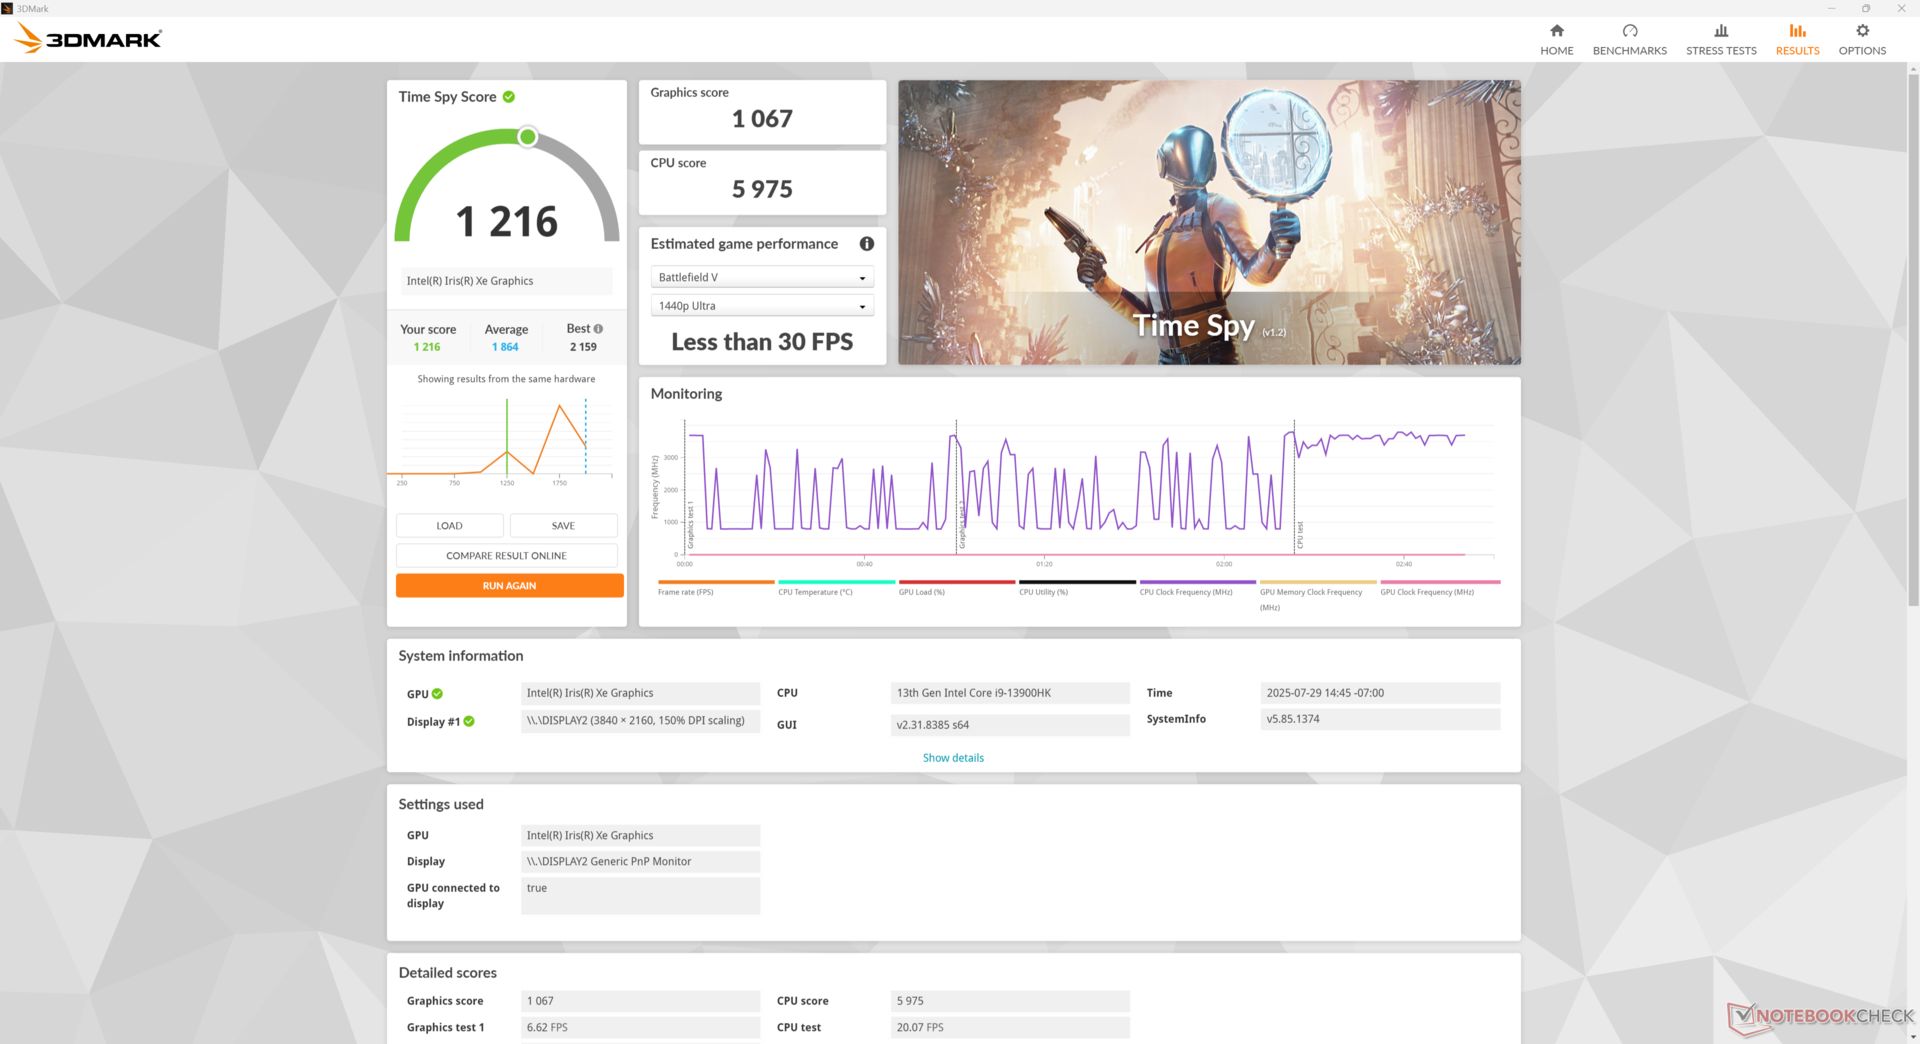
El Iris Xe Graphics G7 96 UEs se sitúa unas generaciones por detrás de la actual serie Arc para ser una de las GPU integradas más lentas disponibles. Aunque no es para juegos, sigue siendo lo suficientemente potente para fines de streaming 4K sin problemas.
Vale la pena mencionar que tanto X-Plane 11.11 como el benchmark Cyberpunk 2077 siempre se bloqueaban incluso después de múltiples reintentos y reinicios.
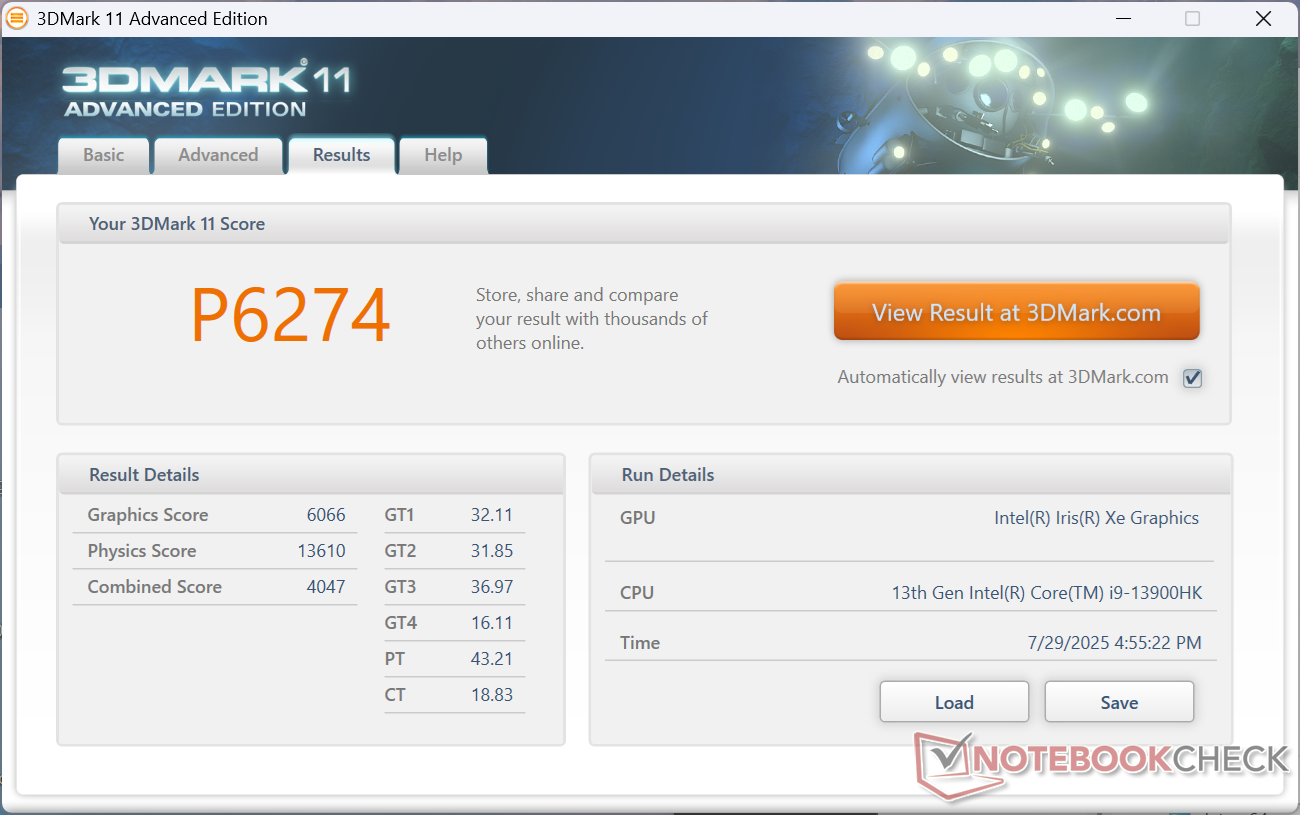
| 3DMark 11 Performance | 6274 puntos | |
| 3DMark Cloud Gate Standard Score | 21353 puntos | |
| 3DMark Fire Strike Score | 3302 puntos | |
| 3DMark Time Spy Score | 1216 puntos | |
ayuda | ||
* ... más pequeño es mejor
Cyberpunk 2077 ultra FPS Chart
| bajo | medio | alto | ultra | |
|---|---|---|---|---|
| GTA V (2015) | 67.2 | 56.2 | 11.7 | 4.79 |
| Dota 2 Reborn (2015) | 84.4 | 68 | 46.1 | 44 |
| Final Fantasy XV Benchmark (2018) | 30.2 | 14.9 | 10.7 | |
| Strange Brigade (2018) | 67 | 23.4 | 20.1 | 17 |
| Baldur's Gate 3 (2023) | 12.9 | 10.7 | 9.2 | 9.2 |
| Cyberpunk 2077 (2023) | ||||
| F1 24 (2024) | 25.7 | 23.8 | 18 | 14.8 |
Emisiones
Ruido del sistema
Los niveles de ruido del ventilador son ligeramente más altos que en la GTi13 Ultra, de mayor tamaño. Aun así, el techo es notablemente más bajo que en alternativas como el BOSGAME M4 Neo o el más antiguo y lento SEi12.
Ruido
| Ocioso |
| 28 / 28 / 28 dB(A) |
| Carga |
| 32.6 / 36.3 dB(A) |
 | ||
30 dB silencioso 40 dB(A) audible 50 dB(A) ruidosamente alto |
||
min: | ||
| Beelink SEi13 Pro Iris Xe G7 96EUs, i9-13900HK, Crucial P3 Plus CT1000P3PSSD8 | Beelink GTI13 Ultra Iris Xe G7 96EUs, i9-13900HK, Crucial P5 Plus 1TB CT1000P5PSSD8 | Beelink SEi12 Core i5-1235U Iris Xe G7 80EUs, i5-1235U, Kingston NV1 SNVS/500GCN | HP Z2 Mini G1a Radeon 8060S, Ryzen AI Max+ PRO 395, Samsung PM9A1 MZVL22T0HBLB | BOSGAME M4 Neo Radeon 780M, R7 7840HS, Kingston OM8PGP41024N-A0 | |
|---|---|---|---|---|---|
| Noise | 5% | -1% | -37% | -23% | |
| apagado / medio ambiente * (dB) | 23.1 | 23.4 -1% | 23.3 -1% | 24.9 -8% | 24.3 -5% |
| Idle Minimum * (dB) | 28 | 26.5 5% | 27.8 1% | 32.1 -15% | 37.6 -34% |
| Idle Average * (dB) | 28 | 26.7 5% | 27.8 1% | 32.4 -16% | 37.9 -35% |
| Idle Maximum * (dB) | 28 | 28.5 -2% | 27.8 1% | 32.6 -16% | 38 -36% |
| Load Average * (dB) | 32.6 | 30.6 6% | 32 2% | 41.1 -26% | 40.8 -25% |
| Cyberpunk 2077 ultra * (dB) | 34.3 | 32.5 5% | 67 -95% | 40.18 -17% | |
| Load Maximum * (dB) | 36.3 | 30.8 15% | 39.2 -8% | 67.3 -85% | 40.2 -11% |
| Witcher 3 ultra * (dB) | 34.1 | 70 |
* ... más pequeño es mejor
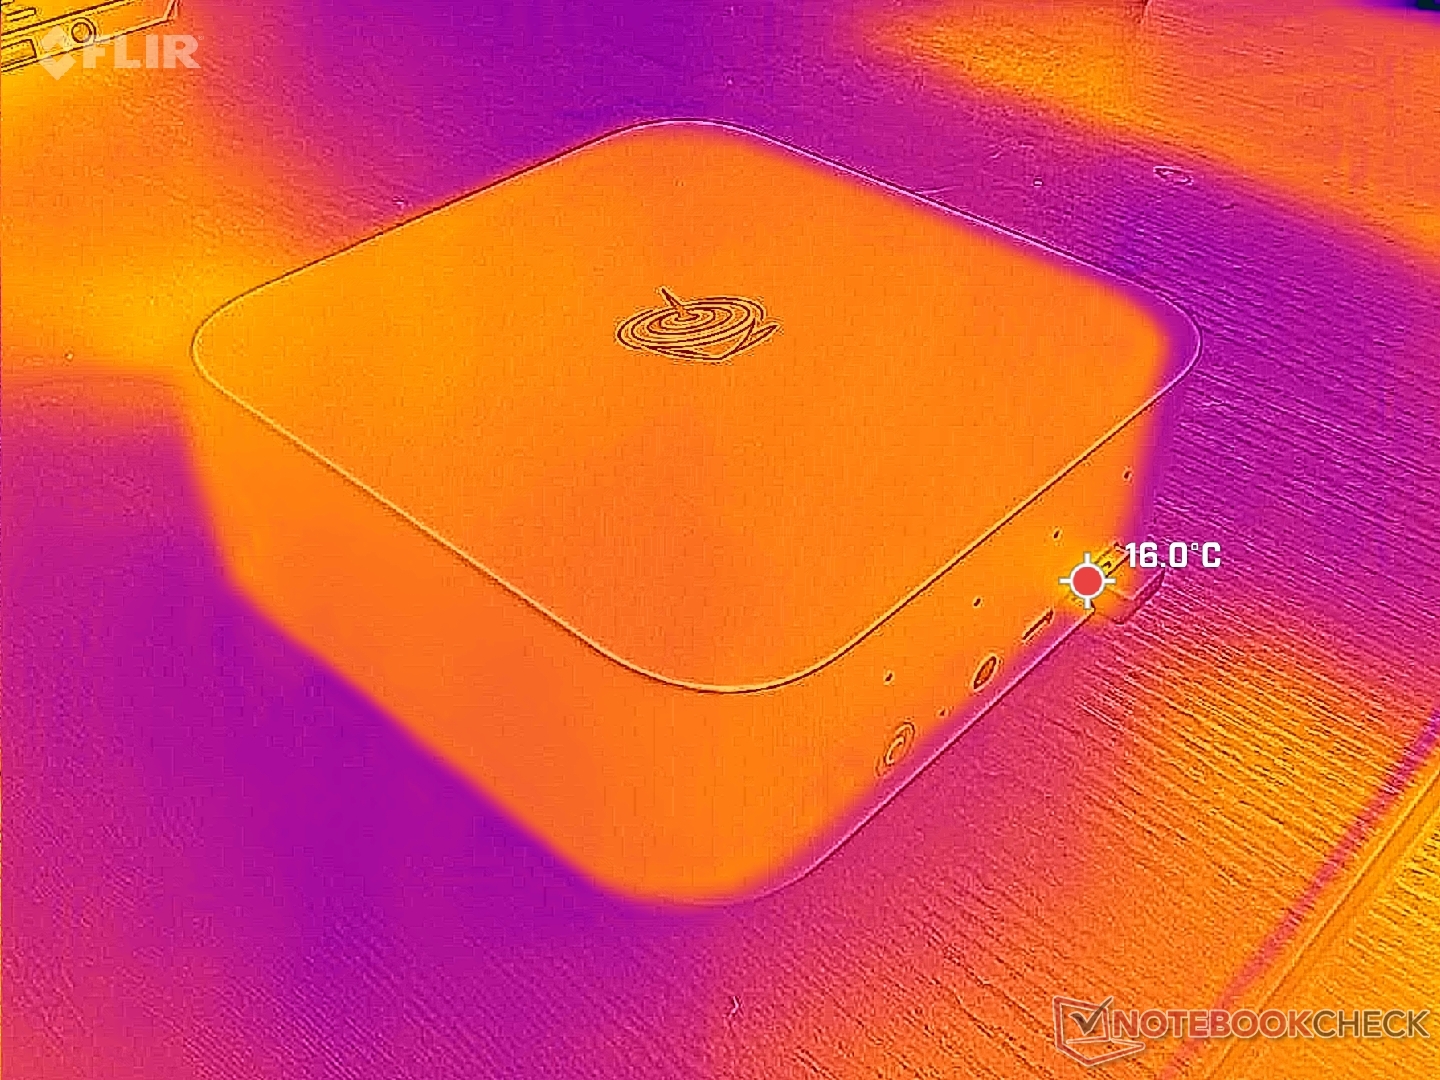
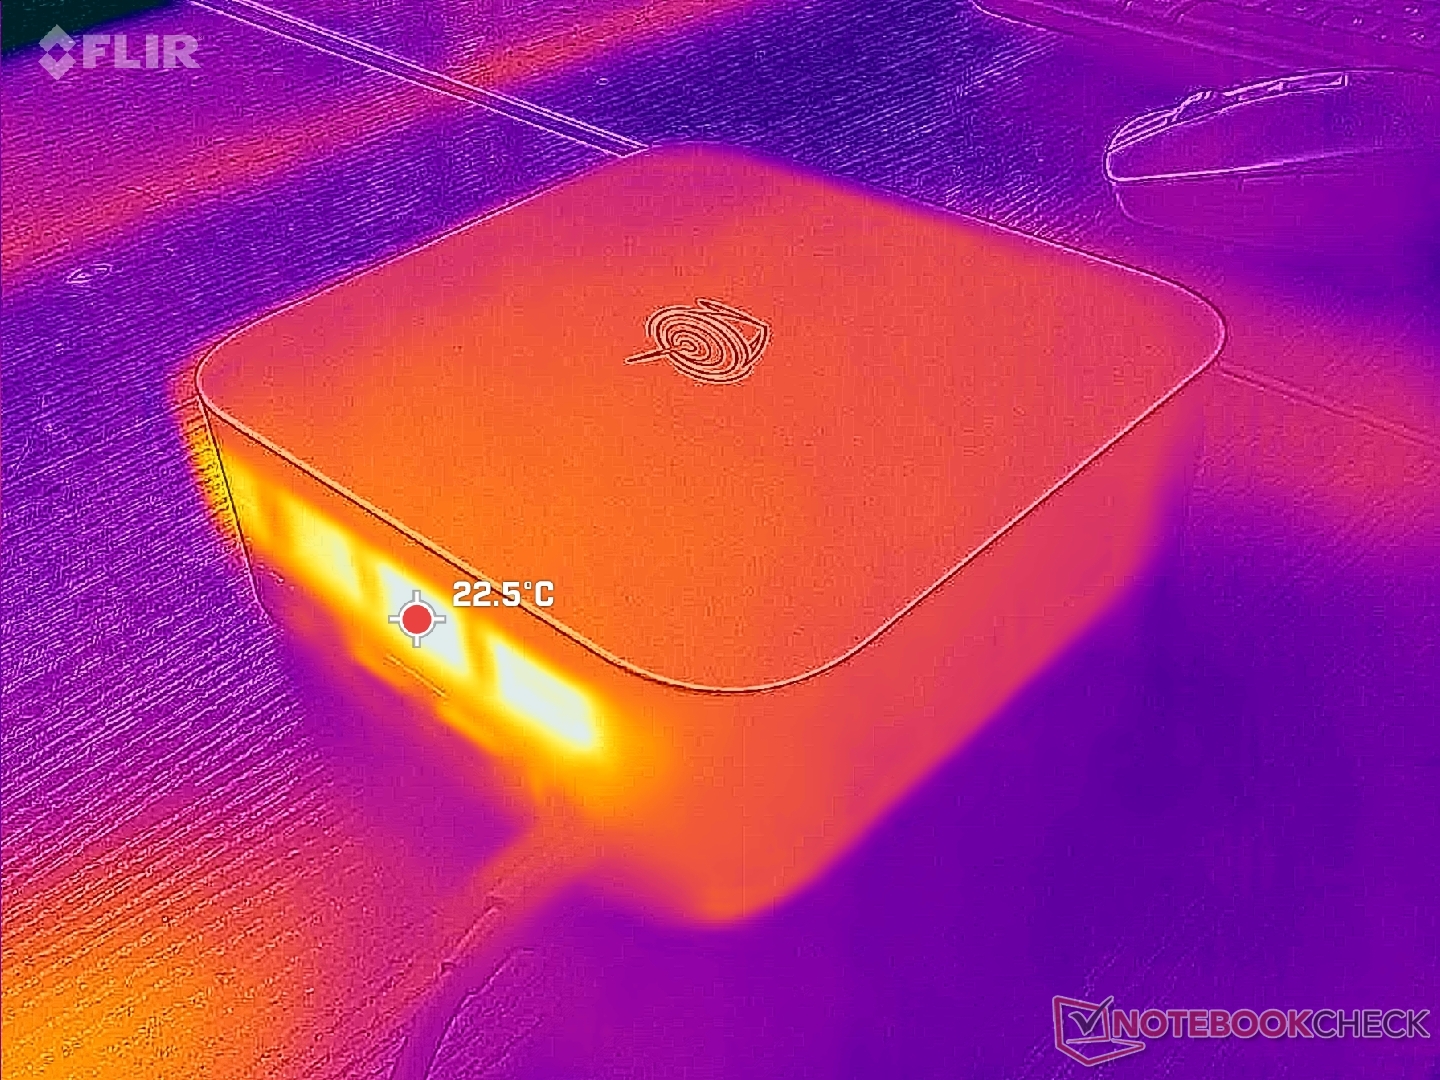
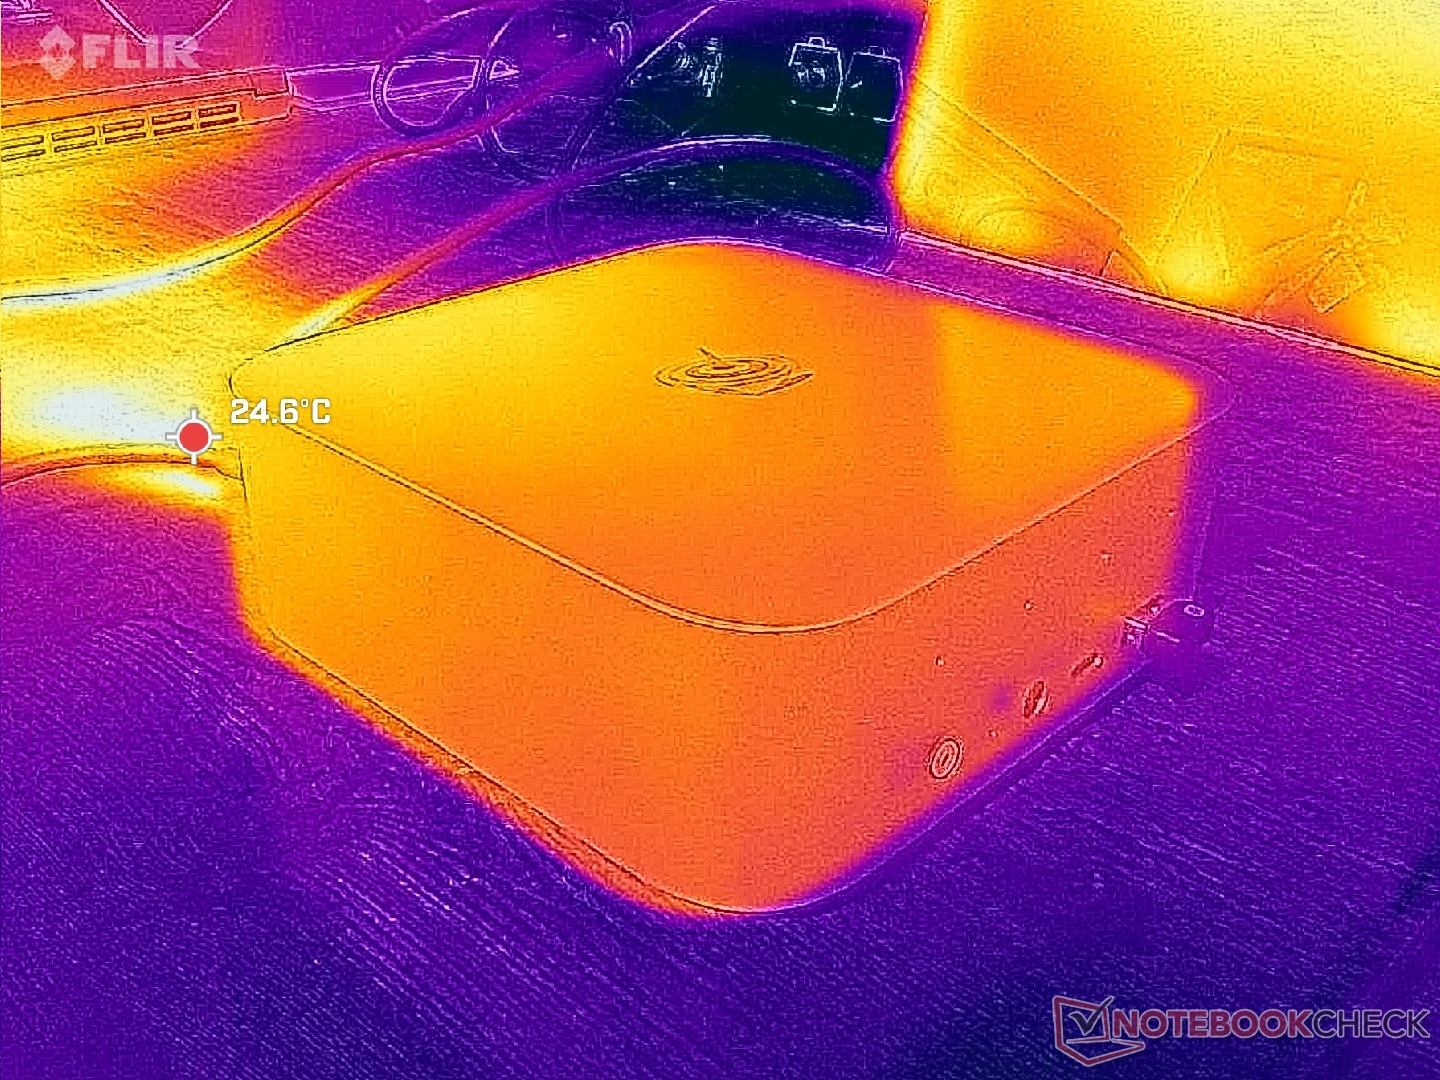
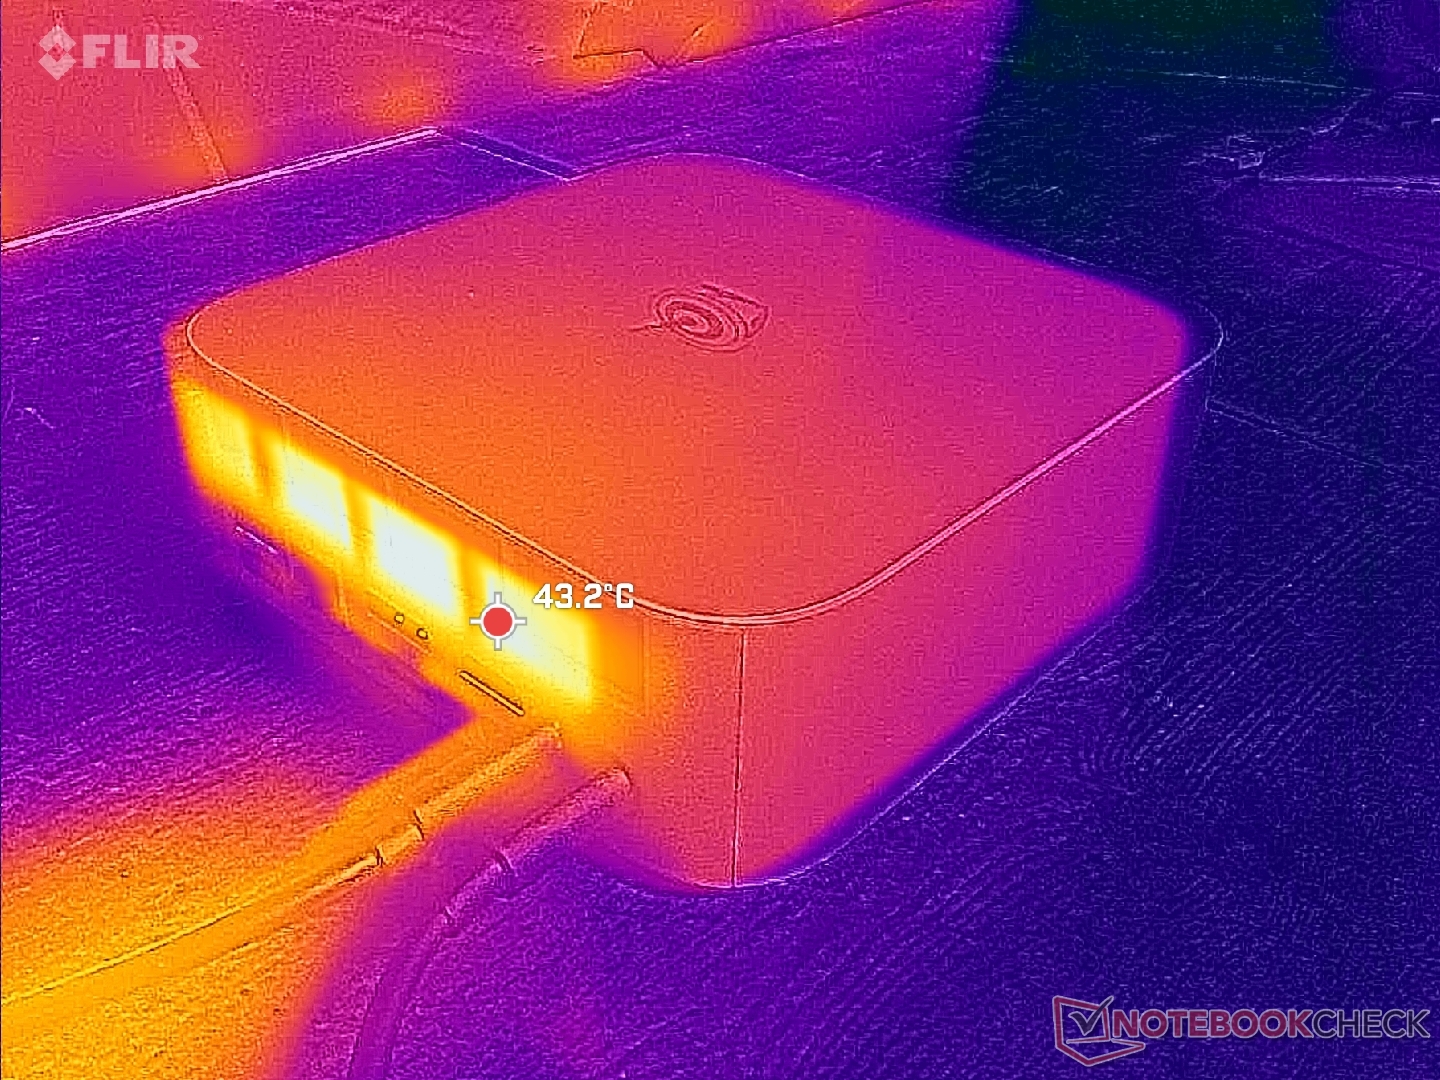
Temperatura
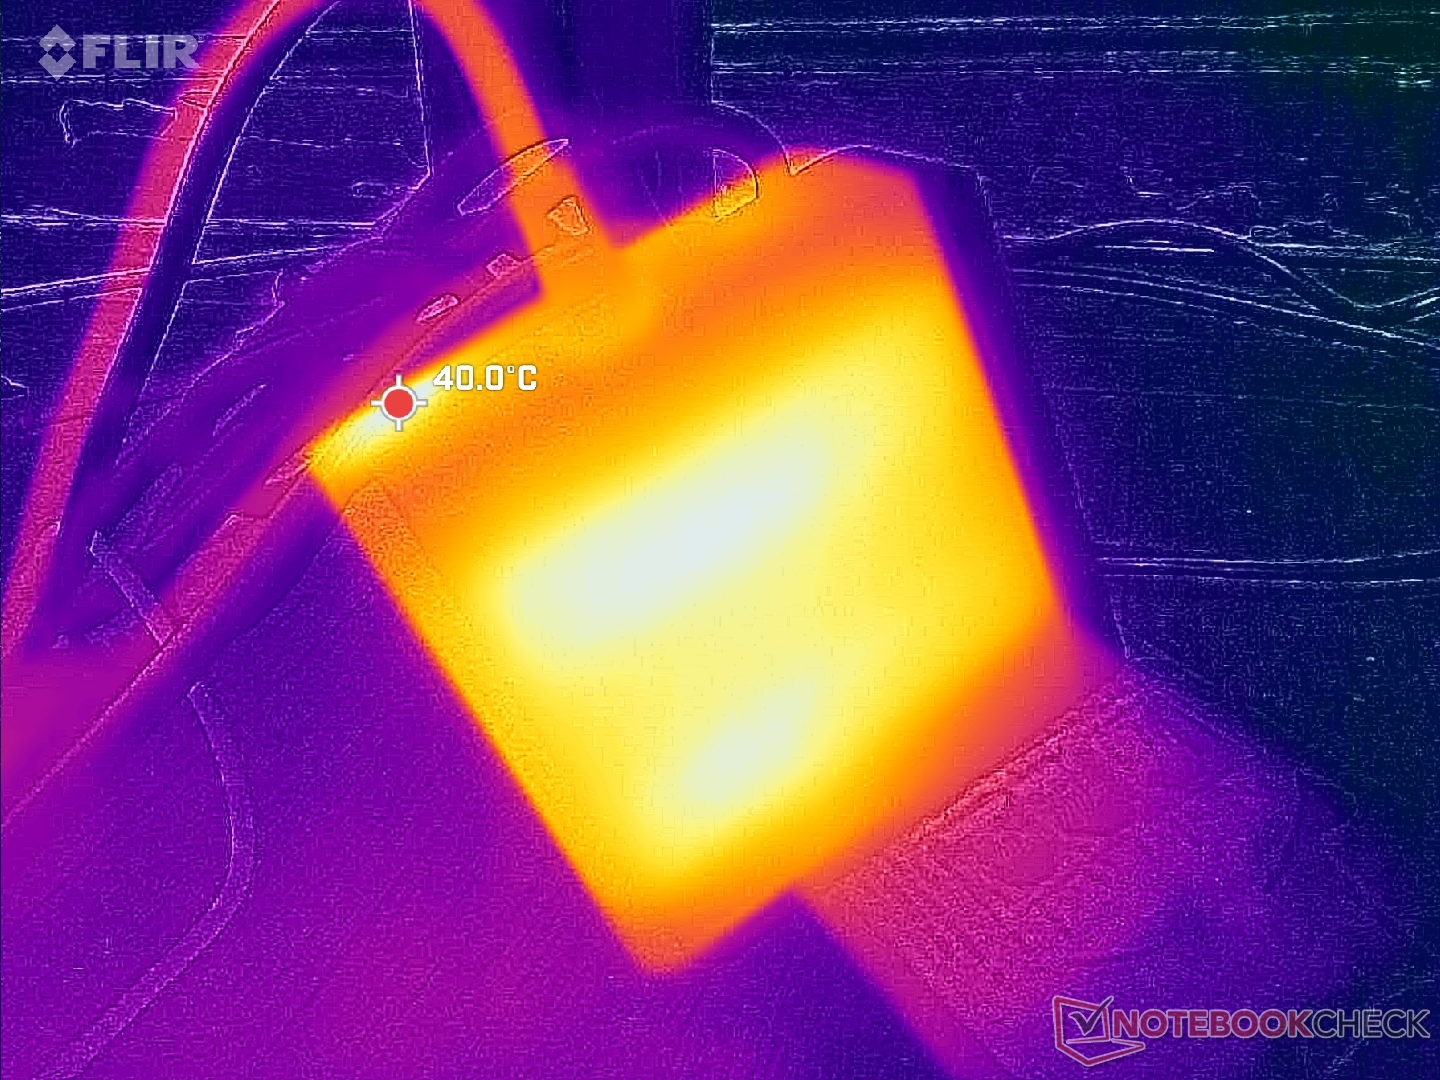
El calor residual se escapa por la parte trasera mientras que el aire fresco entra por la parte inferior. La superficie superior se calienta pero nunca de forma incómoda a pesar de que hay pocas rejillas de ventilación.
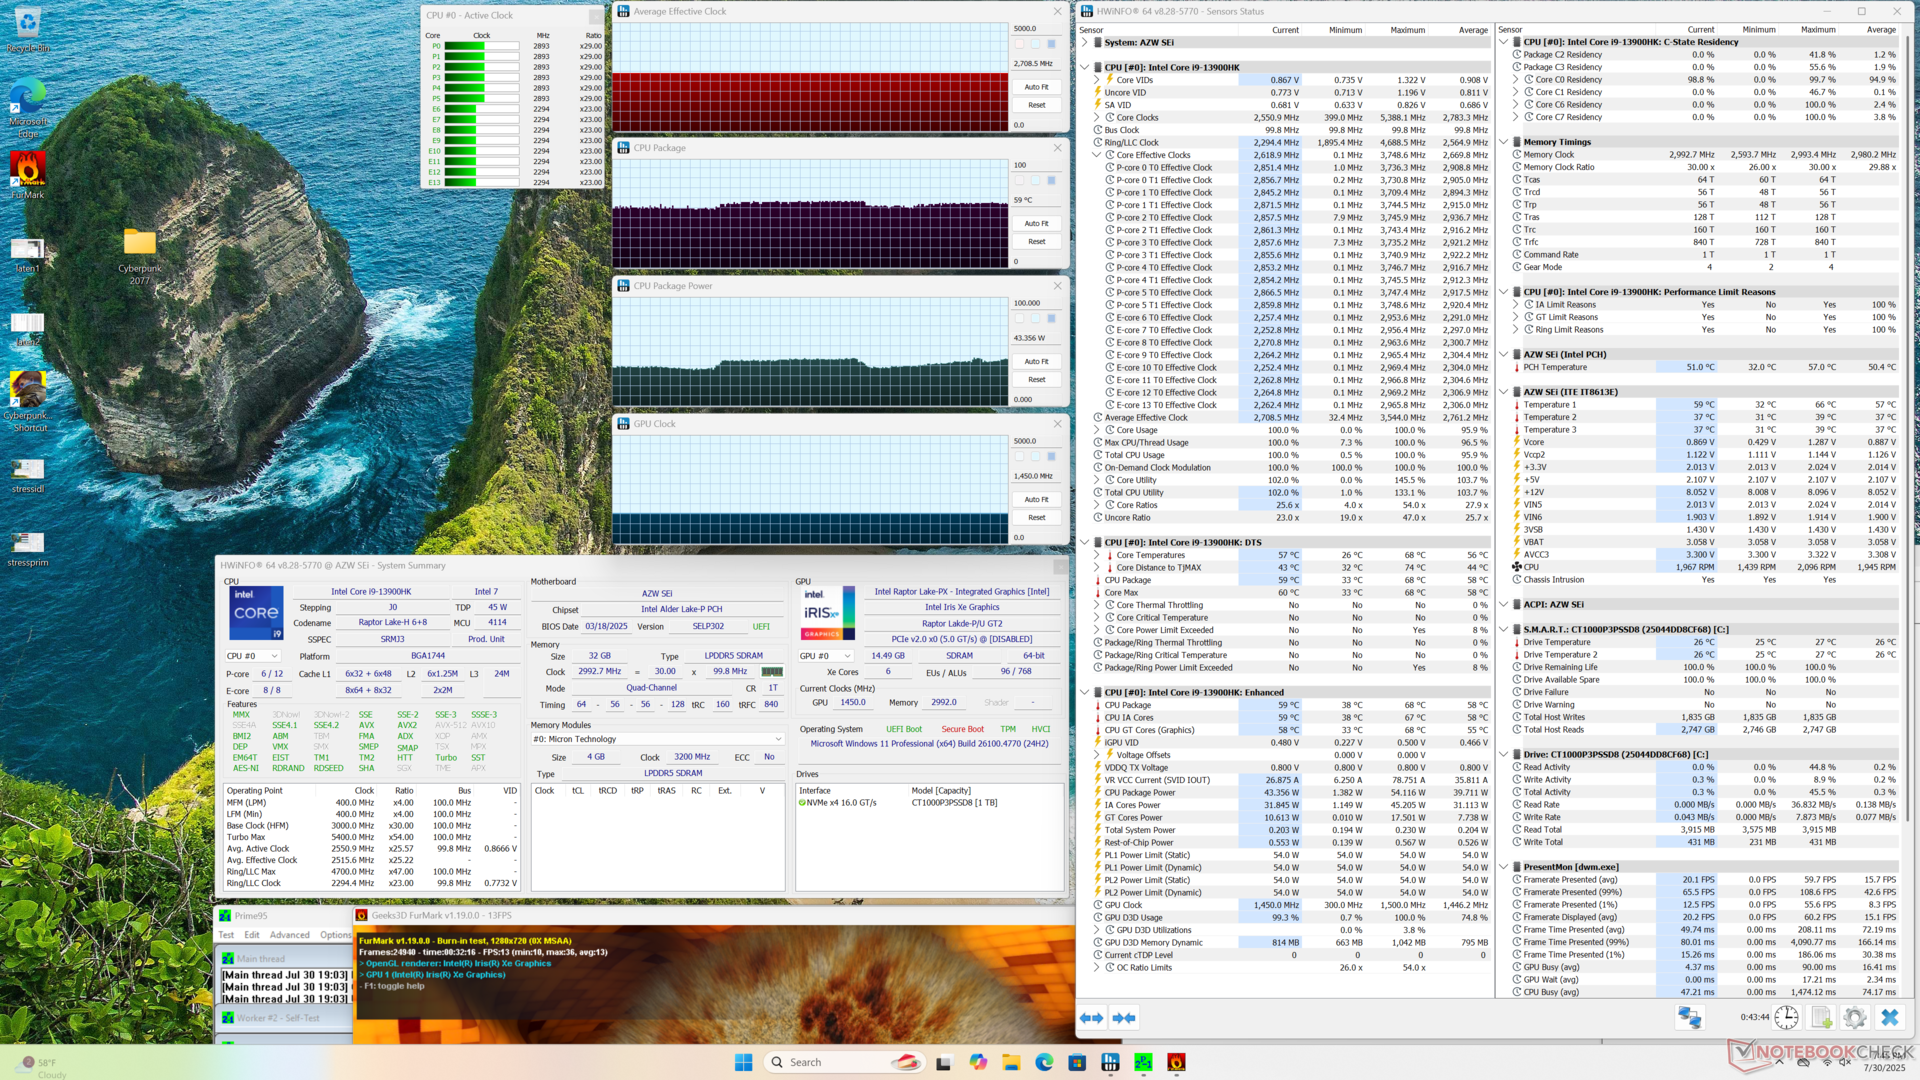
Prueba de estrés
La CPU se estabiliza en 3,5 GHz, 44 W y 60 C cuando se ejecuta el estrés Prime95, que en realidad es más frío que lo que observamos en la GTI13 Ultra por unos pocos grados.
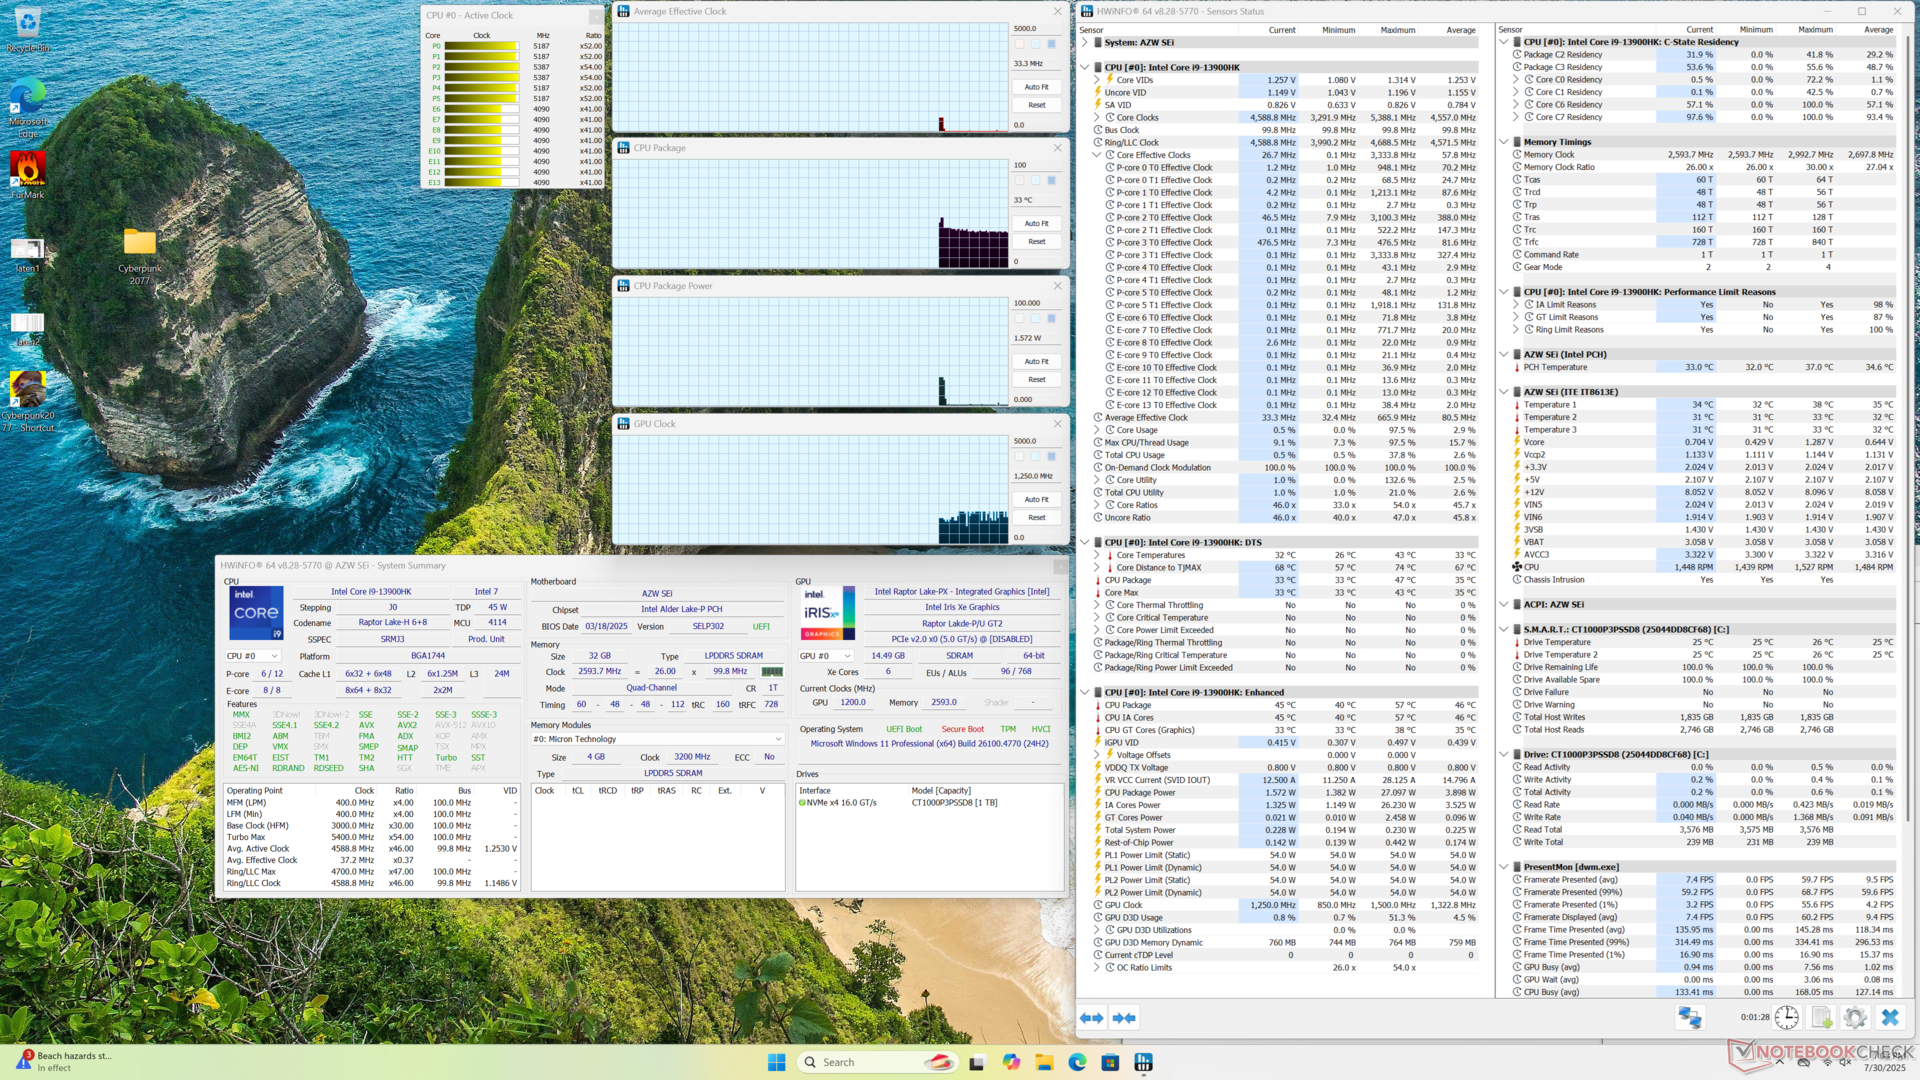
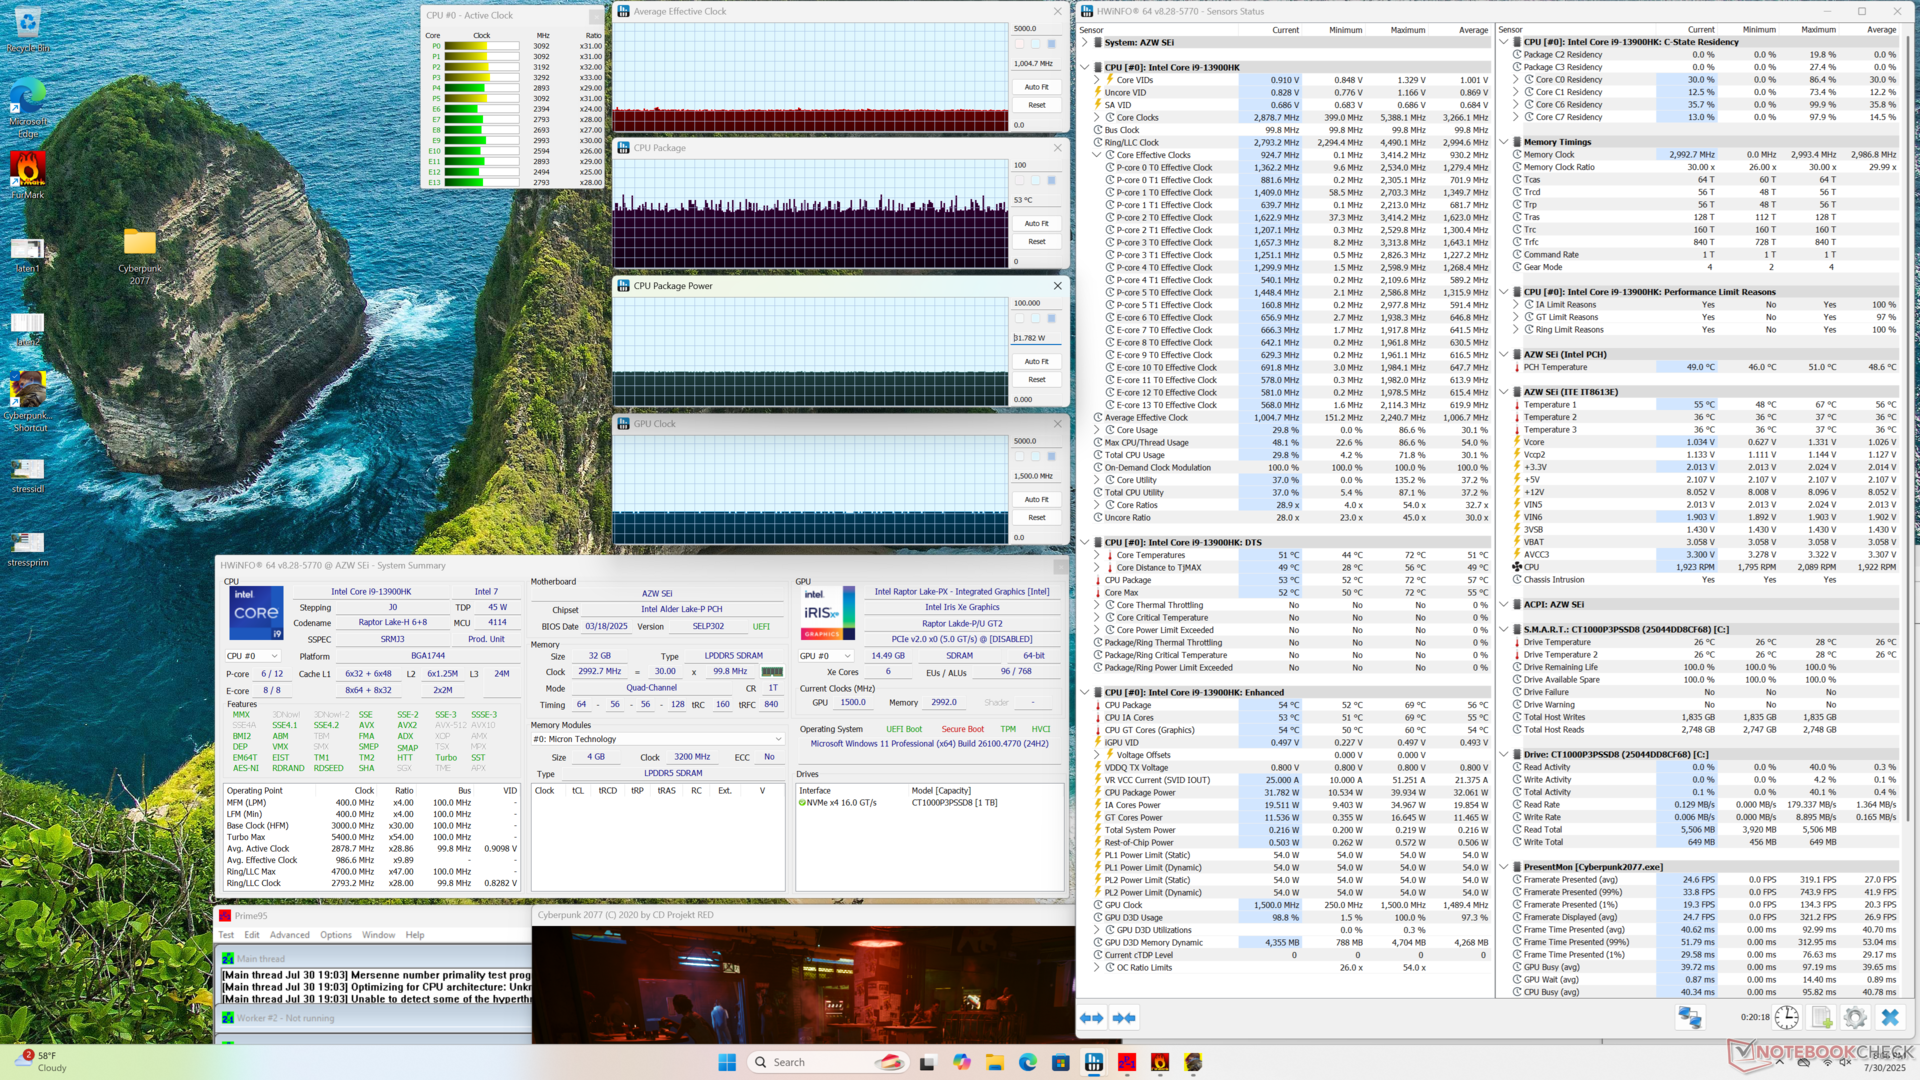

| Reloj medio de la CPU (GHz) | Reloj de la GPU (MHz) | Temperatura media de la CPU (°C) | |
| Sistema en reposo | -- | -- | 33 |
| Prime95 Estrés | 3,5 | -- | 60 |
| Prime95 + FurMark Stress | 2.7 | 1450 | 59 |
| Cyberpunk 2077 Estrés | 1.0 | 1500 | 53 |
Altavoces
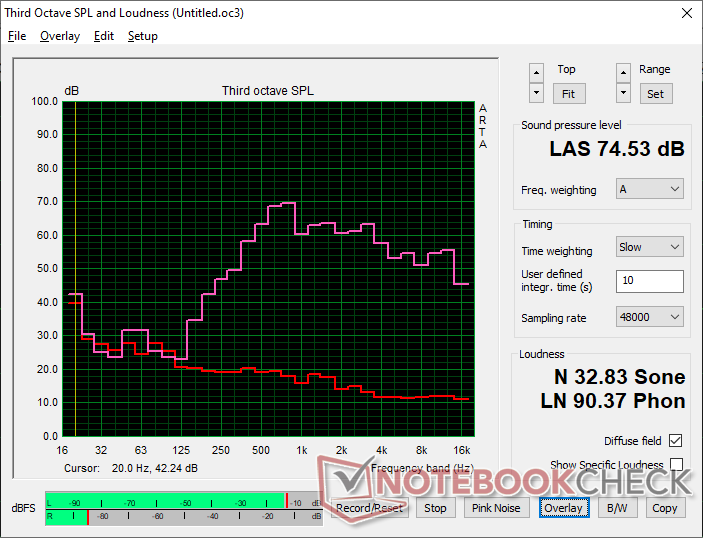
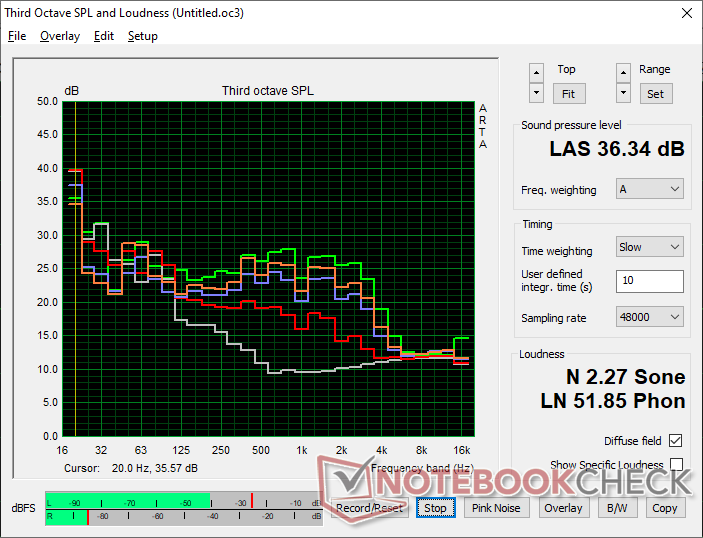
Beelink SEi13 Pro análisis de audio
(±) | la sonoridad del altavoz es media pero buena (74.5 dB)
Graves 100 - 315 Hz
(-) | casi sin bajos - de media 18.9% inferior a la mediana
(±) | la linealidad de los graves es media (12.7% delta a frecuencia anterior)
Medios 400 - 2000 Hz
(±) | medias más altas - de media 7.9% más altas que la mediana
(±) | la linealidad de los medios es media (11.9% delta respecto a la frecuencia anterior)
Altos 2 - 16 kHz
(+) | máximos equilibrados - a sólo 3.5% de la mediana
(±) | la linealidad de los máximos es media (8.1% delta a frecuencia anterior)
Total 100 - 16.000 Hz
(±) | la linealidad del sonido global es media (26.7% de diferencia con la mediana)
En comparación con la misma clase
» 71% de todos los dispositivos probados de esta clase eran mejores, 4% similares, 25% peores
» El mejor tuvo un delta de 13%, la media fue 24%, el peor fue ###max##%
En comparación con todos los dispositivos probados
» 82% de todos los dispositivos probados eran mejores, 4% similares, 14% peores
» El mejor tuvo un delta de 4%, la media fue 23%, el peor fue ###max##%
Apple MacBook Pro 16 2021 M1 Pro análisis de audio
(+) | los altavoces pueden reproducir a un volumen relativamente alto (#84.7 dB)
Graves 100 - 315 Hz
(+) | buen bajo - sólo 3.8% lejos de la mediana
(+) | el bajo es lineal (5.2% delta a la frecuencia anterior)
Medios 400 - 2000 Hz
(+) | medios equilibrados - a sólo 1.3% de la mediana
(+) | los medios son lineales (2.1% delta a la frecuencia anterior)
Altos 2 - 16 kHz
(+) | máximos equilibrados - a sólo 1.9% de la mediana
(+) | los máximos son lineales (2.7% delta a la frecuencia anterior)
Total 100 - 16.000 Hz
(+) | el sonido global es lineal (4.6% de diferencia con la mediana)
En comparación con la misma clase
» 0% de todos los dispositivos probados de esta clase eran mejores, 0% similares, 100% peores
» El mejor tuvo un delta de 5%, la media fue 17%, el peor fue ###max##%
En comparación con todos los dispositivos probados
» 0% de todos los dispositivos probados eran mejores, 0% similares, 100% peores
» El mejor tuvo un delta de 4%, la media fue 23%, el peor fue ###max##%
Gestión de la energía
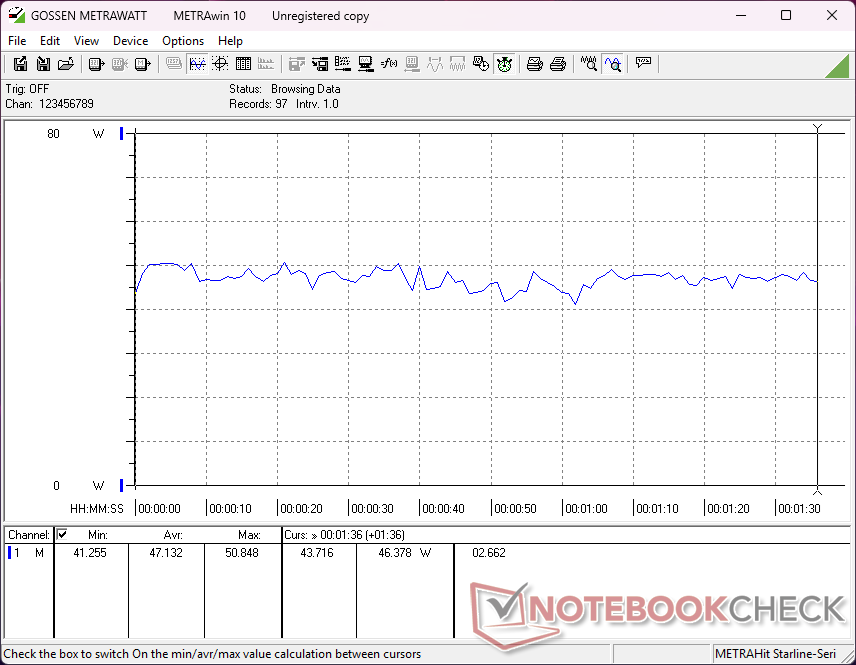
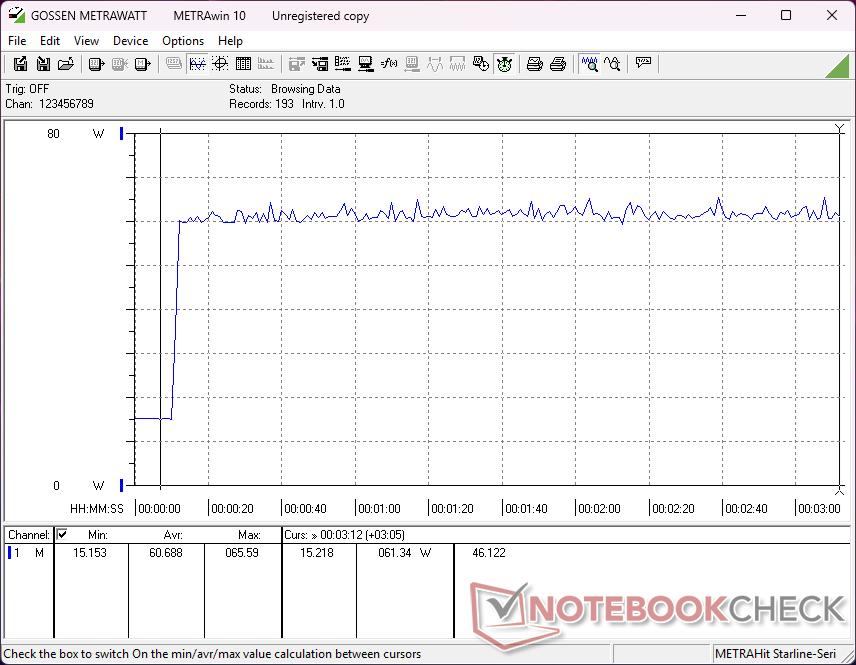
Consumo de energía
El sistema demanda menos energía que el GTi13 Ultra cuando está bajo carga, ya que la CPU alcanza un máximo de 44 W por defecto, frente a los 55 W de esta última. El consumo también es menor que en el BOSGAME M4pero este último ofrece un rendimiento gráfico más rápido para compensar.
| Off / Standby | |
| Ocioso | |
| Carga |
|
Clave:
min: | |
| Beelink SEi13 Pro i9-13900HK, Iris Xe G7 96EUs, Crucial P3 Plus CT1000P3PSSD8, , x, | Beelink GTI13 Ultra i9-13900HK, Iris Xe G7 96EUs, Crucial P5 Plus 1TB CT1000P5PSSD8, , x, | Beelink SEi12 Core i5-1235U i5-1235U, Iris Xe G7 80EUs, Kingston NV1 SNVS/500GCN, , x, | HP Z2 Mini G1a Ryzen AI Max+ PRO 395, Radeon 8060S, Samsung PM9A1 MZVL22T0HBLB, , x, | BOSGAME M4 Neo R7 7840HS, Radeon 780M, Kingston OM8PGP41024N-A0, , x, | |
|---|---|---|---|---|---|
| Power Consumption | -31% | -17% | -69% | 1% | |
| Idle Minimum * (Watt) | 14.5 | 15.7 -8% | 15.8 -9% | 7.1 51% | 7.6 48% |
| Idle Average * (Watt) | 14.9 | 16.5 -11% | 16.8 -13% | 9.5 36% | 9.1 39% |
| Idle Maximum * (Watt) | 15.8 | 16.5 -4% | 17 -8% | 13.8 13% | 11.1 30% |
| Load Average * (Watt) | 47.1 | 77.3 -64% | 54.4 -15% | 76.7 -63% | 67.2 -43% |
| Cyberpunk 2077 ultra external monitor * (Watt) | 53.4 | 91.9 -72% | 195.1 -265% | 81.3 -52% | |
| Load Maximum * (Watt) | 85.7 | 106 -24% | 119.1 -39% | 245.4 -186% | 98.4 -15% |
| Witcher 3 ultra * (Watt) | 50.7 |
* ... más pequeño es mejor
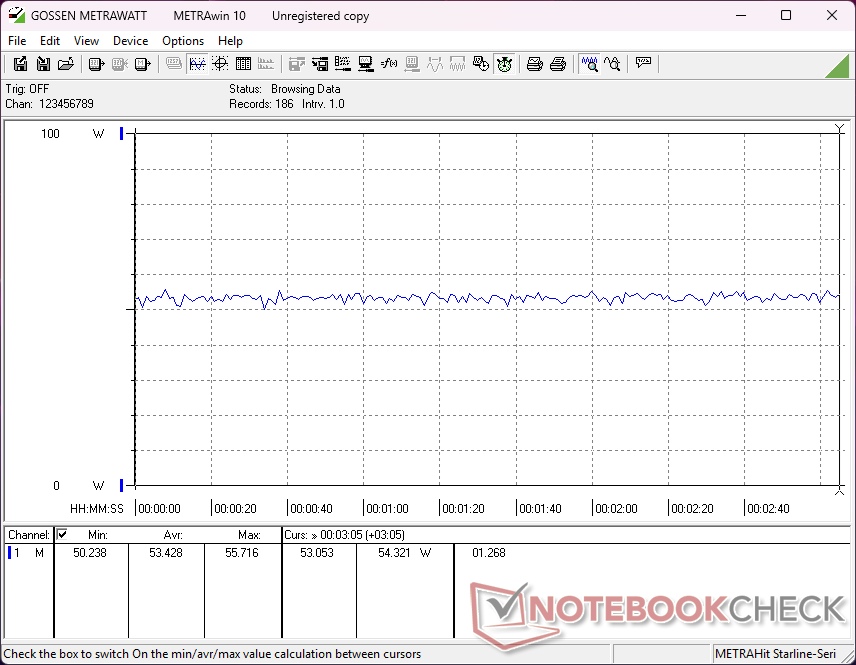
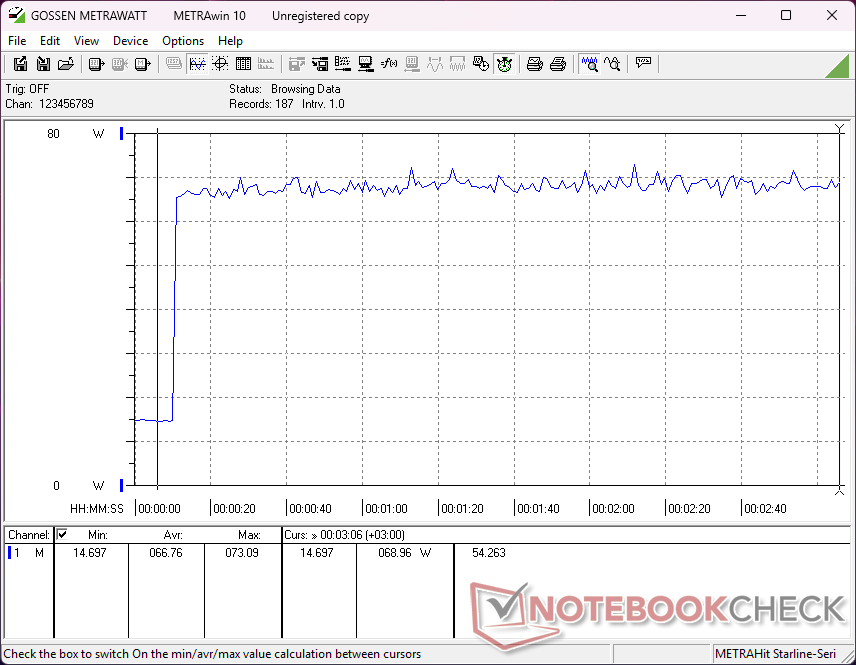
Power Consumption Cyberpunk / Stress Test
Power Consumption external Monitor
Valoración de Notebookcheck
Beelink SEi13 Pro
- 08/01/2025 v8
Allen Ngo
 Total Sustainability Score:
 Competidores potenciales en comparación
Transparencia
La selección de los dispositivos que se van a reseñar corre a cargo de nuestro equipo editorial. La muestra de prueba fue proporcionada al autor en calidad de préstamo por el fabricante o el minorista a los efectos de esta reseña. El prestamista no tuvo ninguna influencia en esta reseña, ni el fabricante recibió una copia de la misma antes de su publicación. No había ninguna obligación de publicar esta reseña. Como empresa de medios independiente, Notebookcheck no está sujeta a la autoridad de fabricantes, minoristas o editores.
Así es como prueba Notebookcheck
Cada año, Notebookcheck revisa de forma independiente cientos de portátiles y smartphones utilizando procedimientos estandarizados para asegurar que todos los resultados son comparables. Hemos desarrollado continuamente nuestros métodos de prueba durante unos 20 años y hemos establecido los estándares de la industria en el proceso. En nuestros laboratorios de pruebas, técnicos y editores experimentados utilizan equipos de medición de alta calidad. Estas pruebas implican un proceso de validación en varias fases. Nuestro complejo sistema de clasificación se basa en cientos de mediciones y puntos de referencia bien fundamentados, lo que mantiene la objetividad.
