Análisis del Beelink SEi8: Uncommon Core i3-8109U para un nuevo mini PC
Beelink se está convirtiendo en una importante alternativa a la serie NUC de Intel con su creciente gama de mini PC. El reciente SER4, por ejemplo, ha demostrado ser tan rápido como muchos modelos de Intel NUC con CPUs de la serie Core U de 11ª generación, a la vez que cuesta cientos de dólares menos
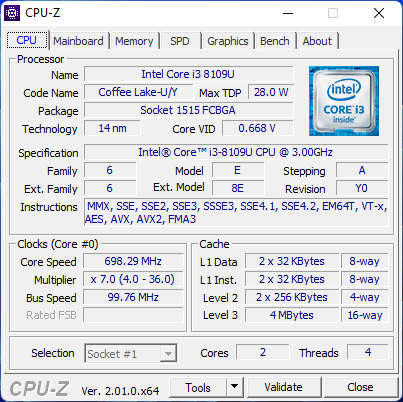
El SEi8 viene con un antiguo Core i3-8109U o Core i5-8259U de 8ª generación, mientras que el SEi10 del año pasado viene con opciones de Core de 10ª generación de la serie U. El Core i3 más antiguo hace que el modelo sea aún más asequible y una alternativa atractiva a los NUC de Intel con Core i3
Beelink está distribuyendo actualmente el SEi8 a partir de 320 dólares con 8 GB de RAM o 380 dólares con 16 GB de RAM. Si se configura con el Core i5-8279U, el precio aumenta hasta los 400 dólares
Más opiniones de Beelink:
Posibles contendientes en la comparación
Valoración | Fecha | Modelo | Peso | Altura | Tamaño | Resolución | Precio |
|---|---|---|---|---|---|---|---|
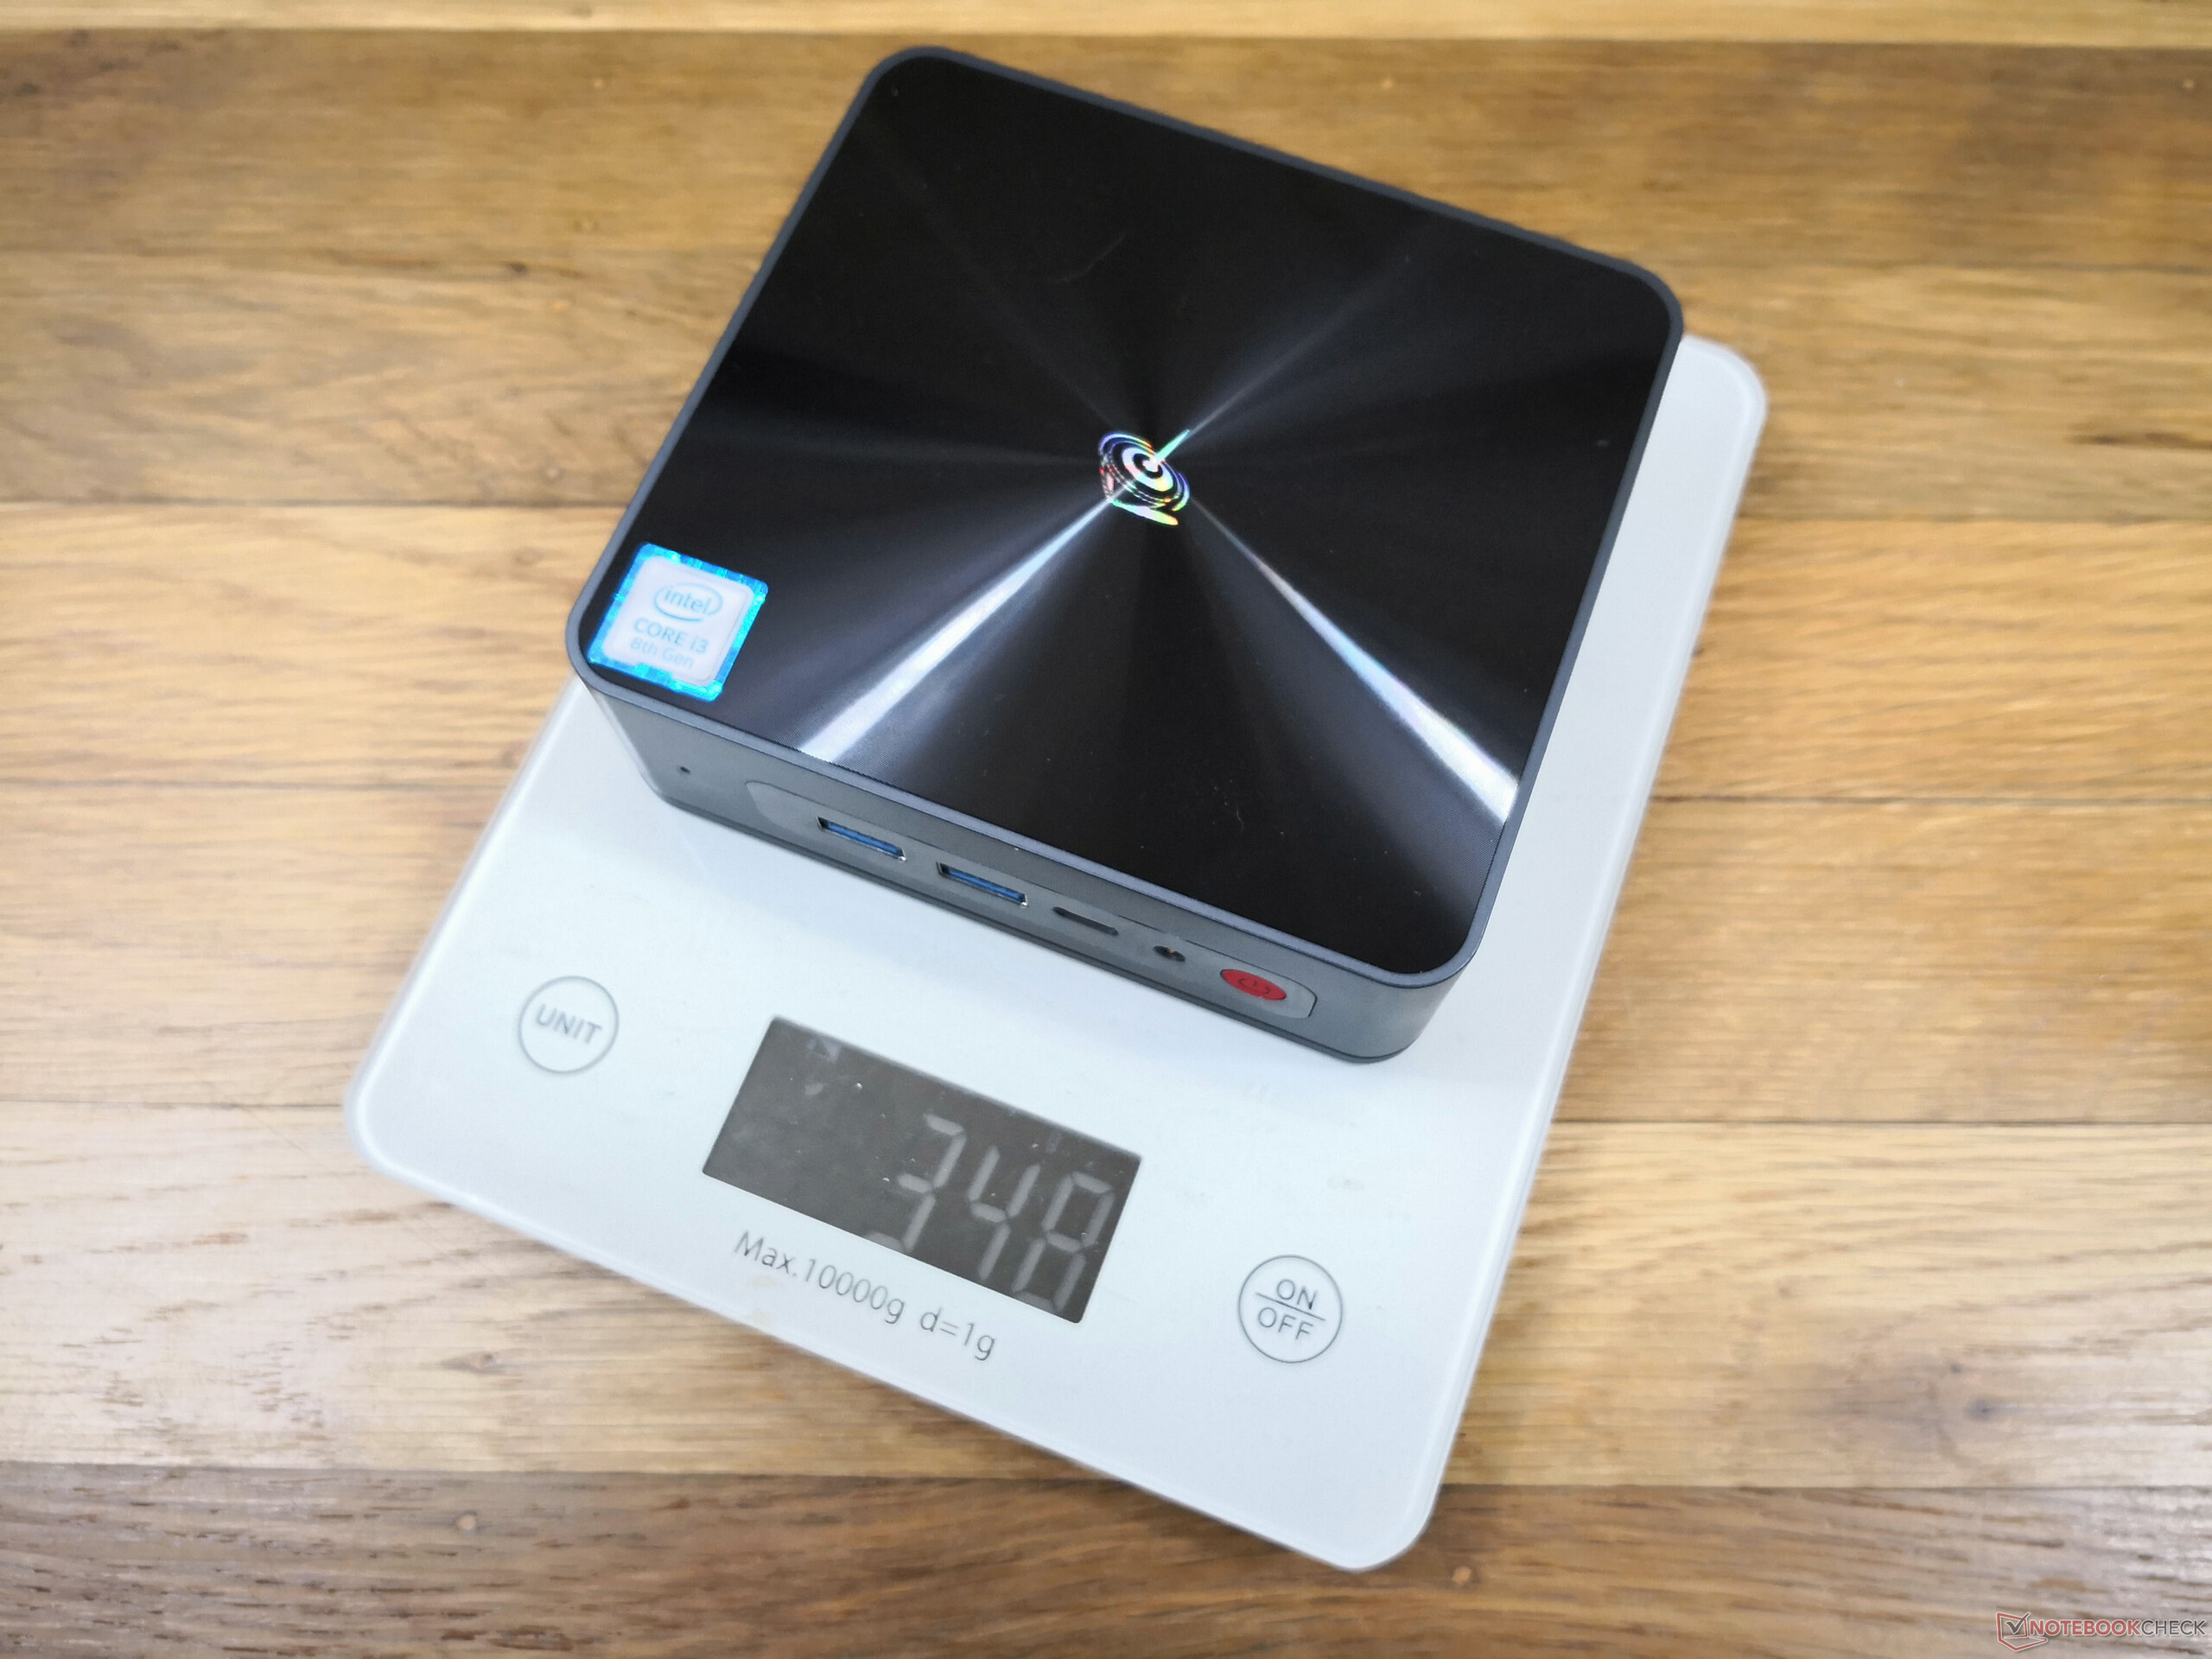
v (old) | 04/2022 | Beelink SEi8 i3-8109U, Iris Plus Graphics 655 | 346 g | 41 mm | x | ||
v (old) | Beelink SEi10 i3-1005G1, UHD Graphics G1 (Ice Lake 32 EU) | 350 g | 41 mm | x | |||
v (old) | 04/2022 | Beelink SER4 R7 4800U, Vega 8 | 494 g | 40 mm | x | ||
v (old) | 04/2021 | Intel NUC11TNKi5 i5-1135G7, Iris Xe G7 80EUs | 504 g | 37 mm | x | ||
v (old) | 11/2018 | Intel NUC8i7BE i7-8559U, Iris Plus Graphics 655 | 683 g | 51 mm | x | ||
v (old) | 03/2021 | GMK NucBox 2 i5-8259U, Iris Plus Graphics 655 | 430 g | 50 mm | x |
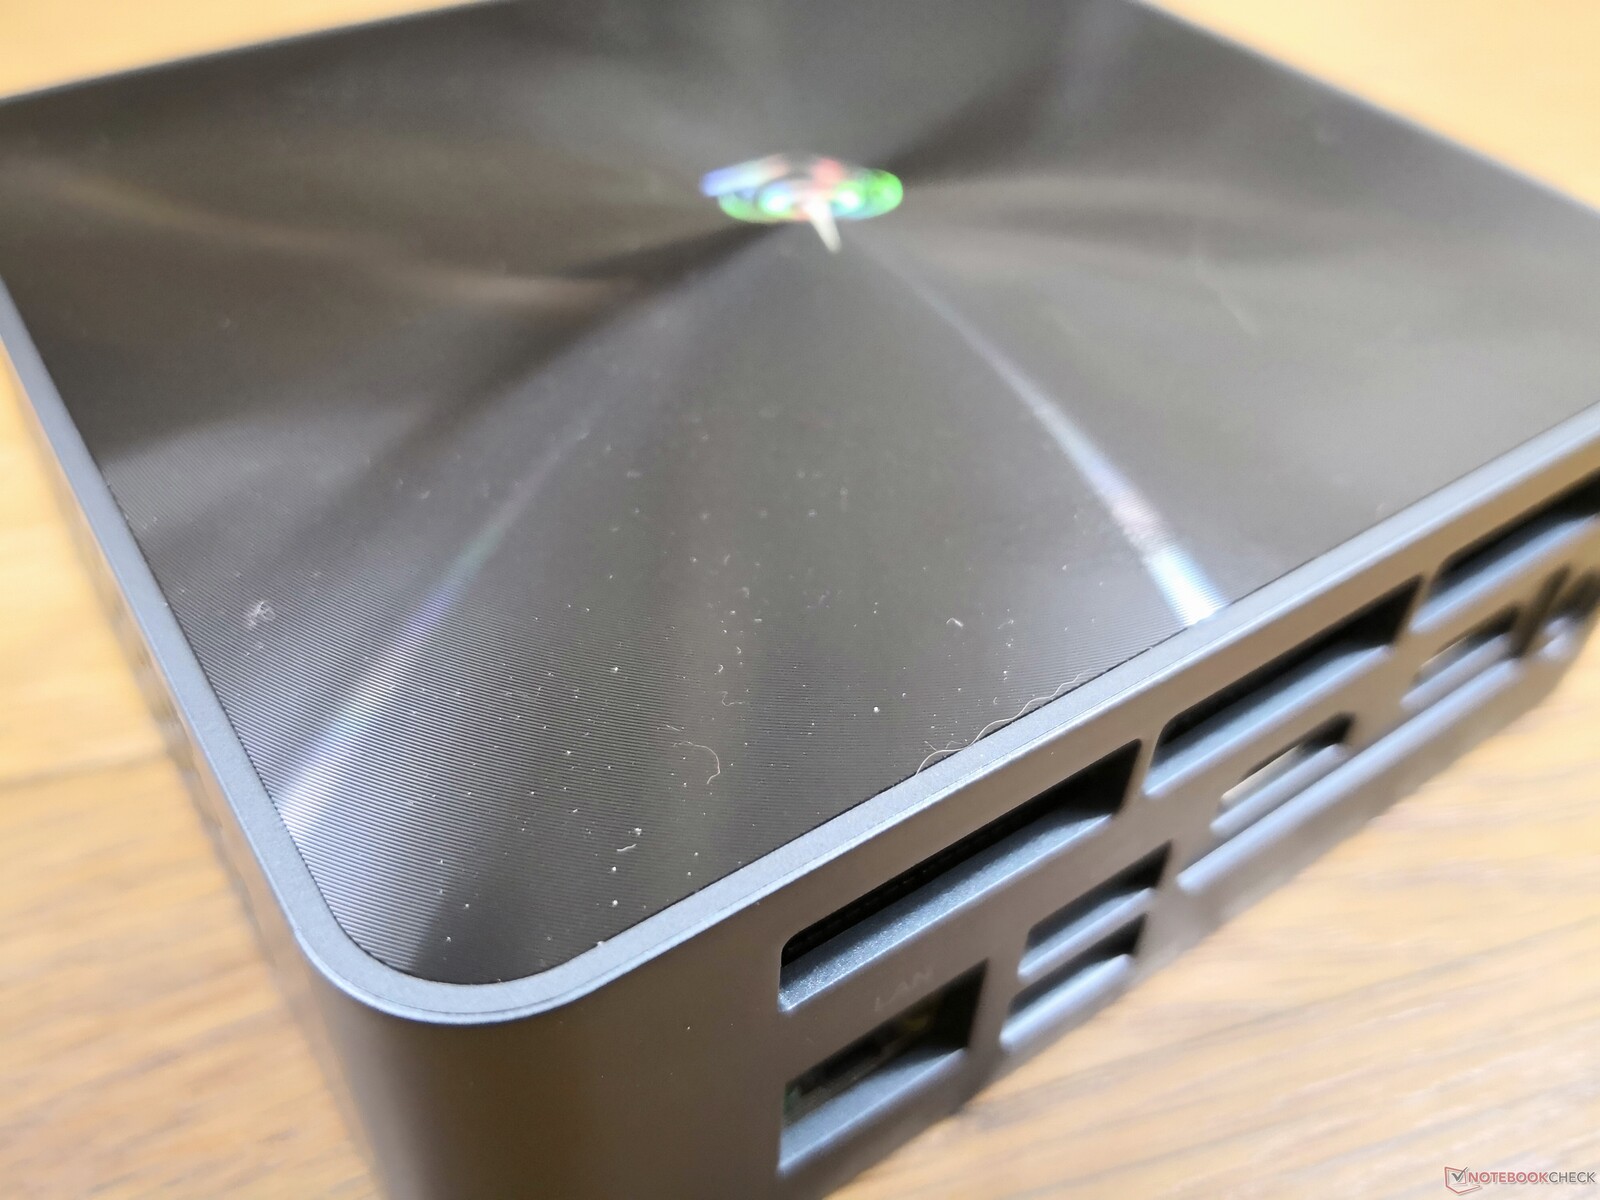
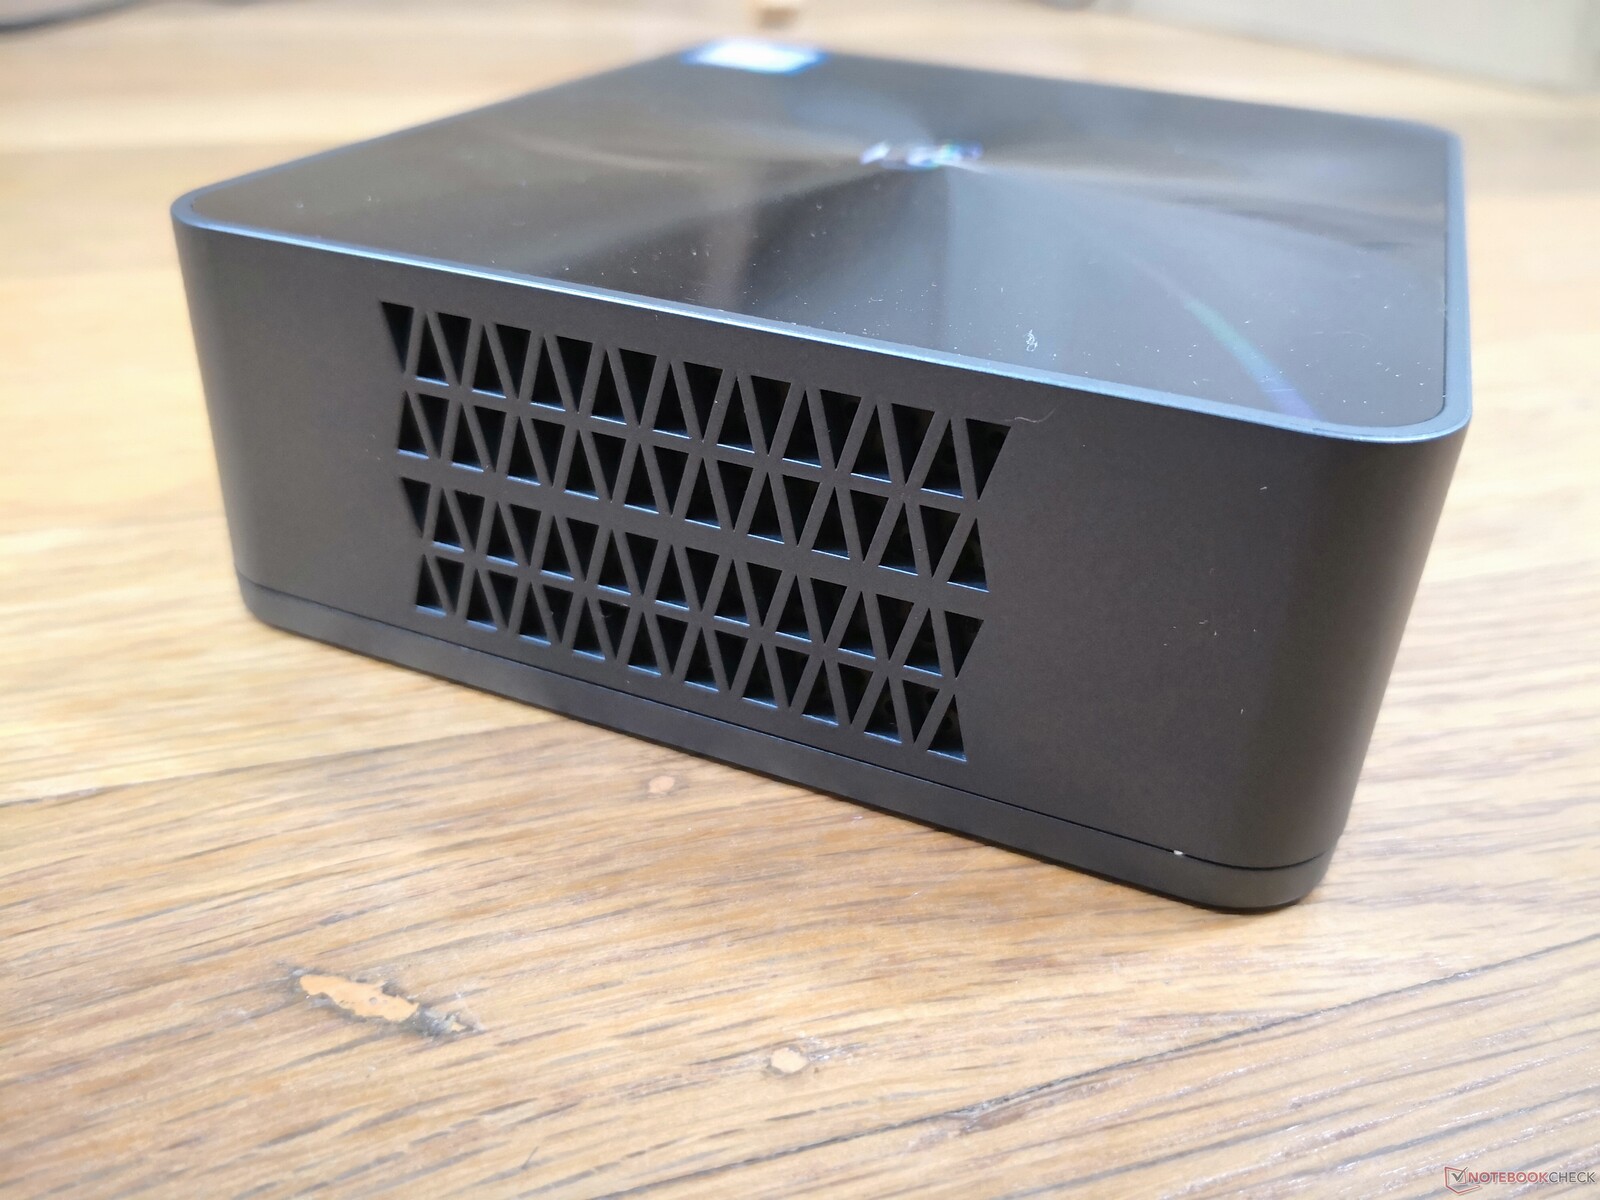
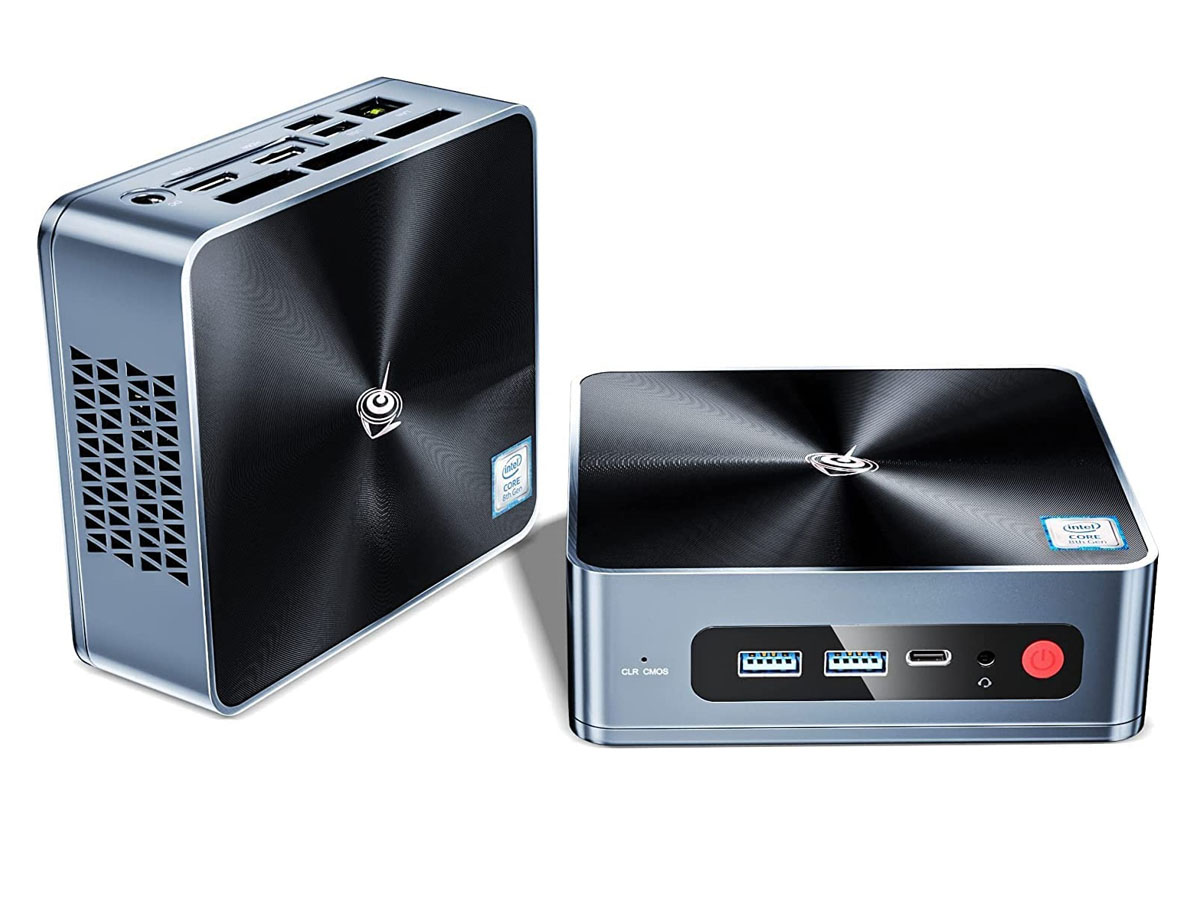
Caso
El chasis externo es idéntico al del SEi10. Su diseño destaca por ser casi del mismo tamaño que un NUC de Intel, pero pesa un 30% menos. El material del chasis, aunque sigue siendo rígido, no es tan grueso o resistente como el de una NUC.
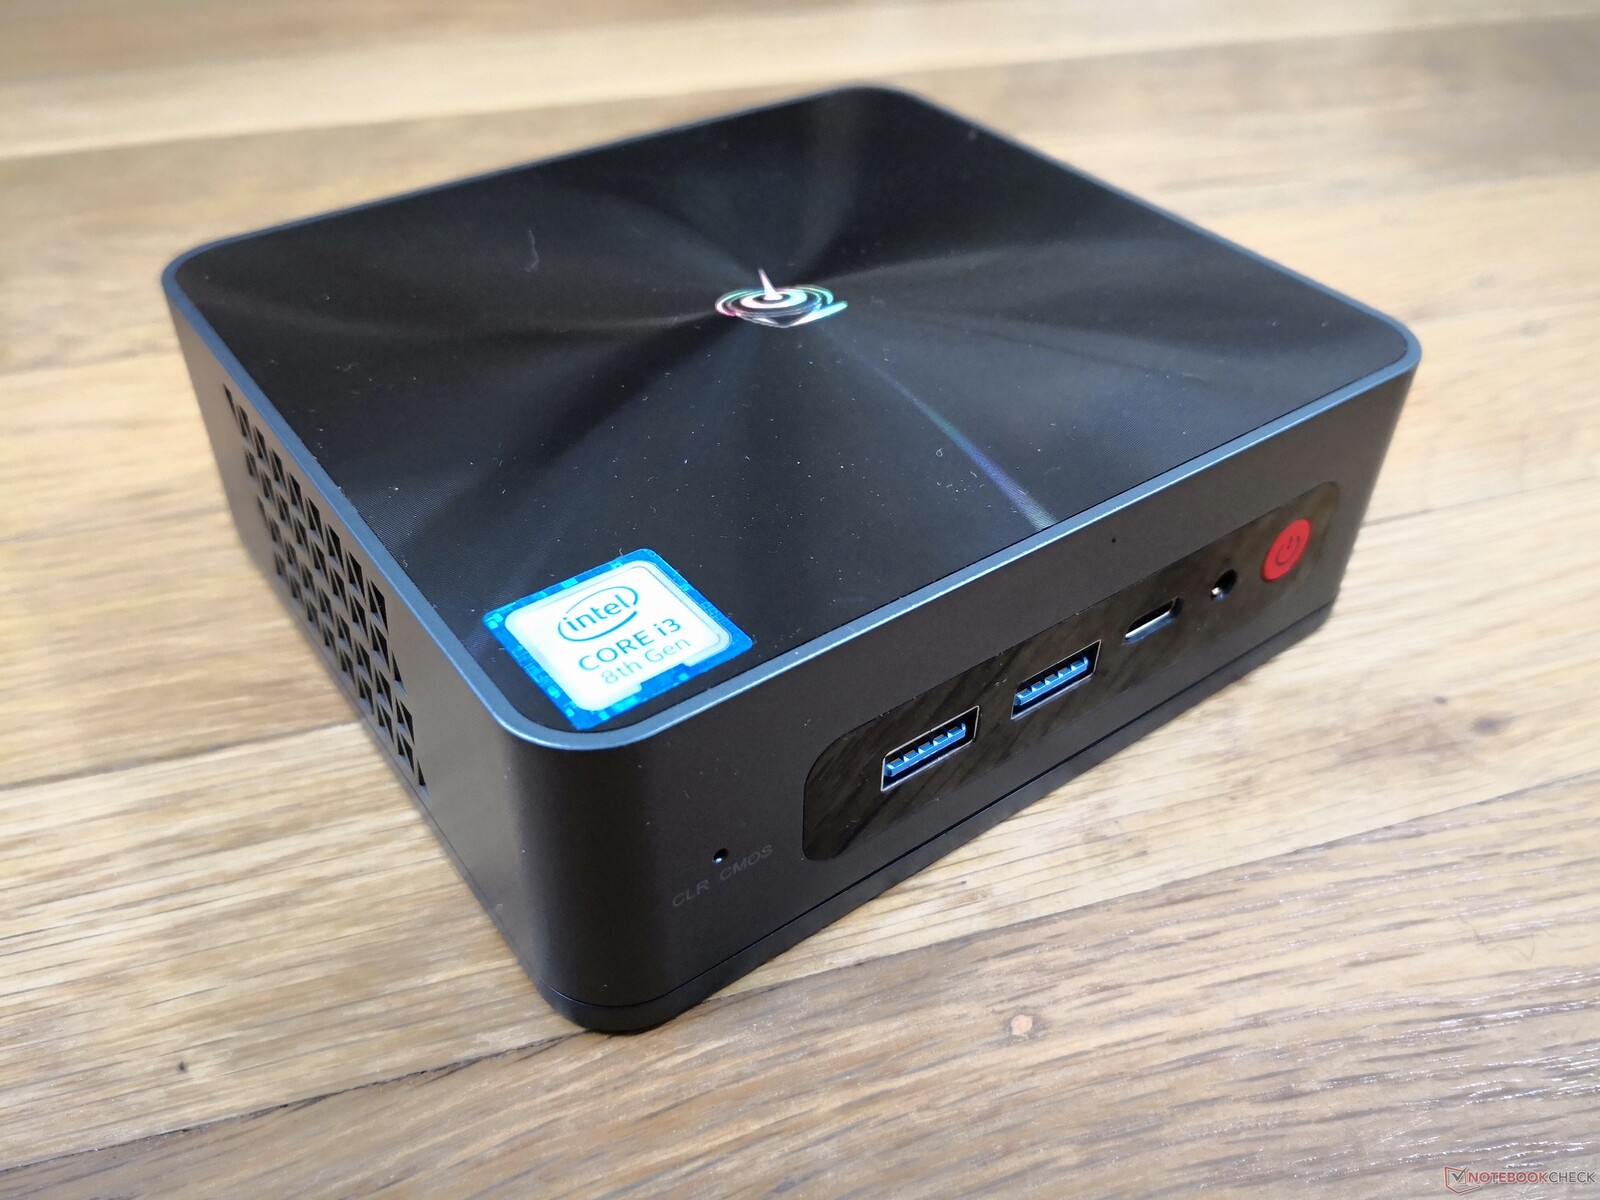
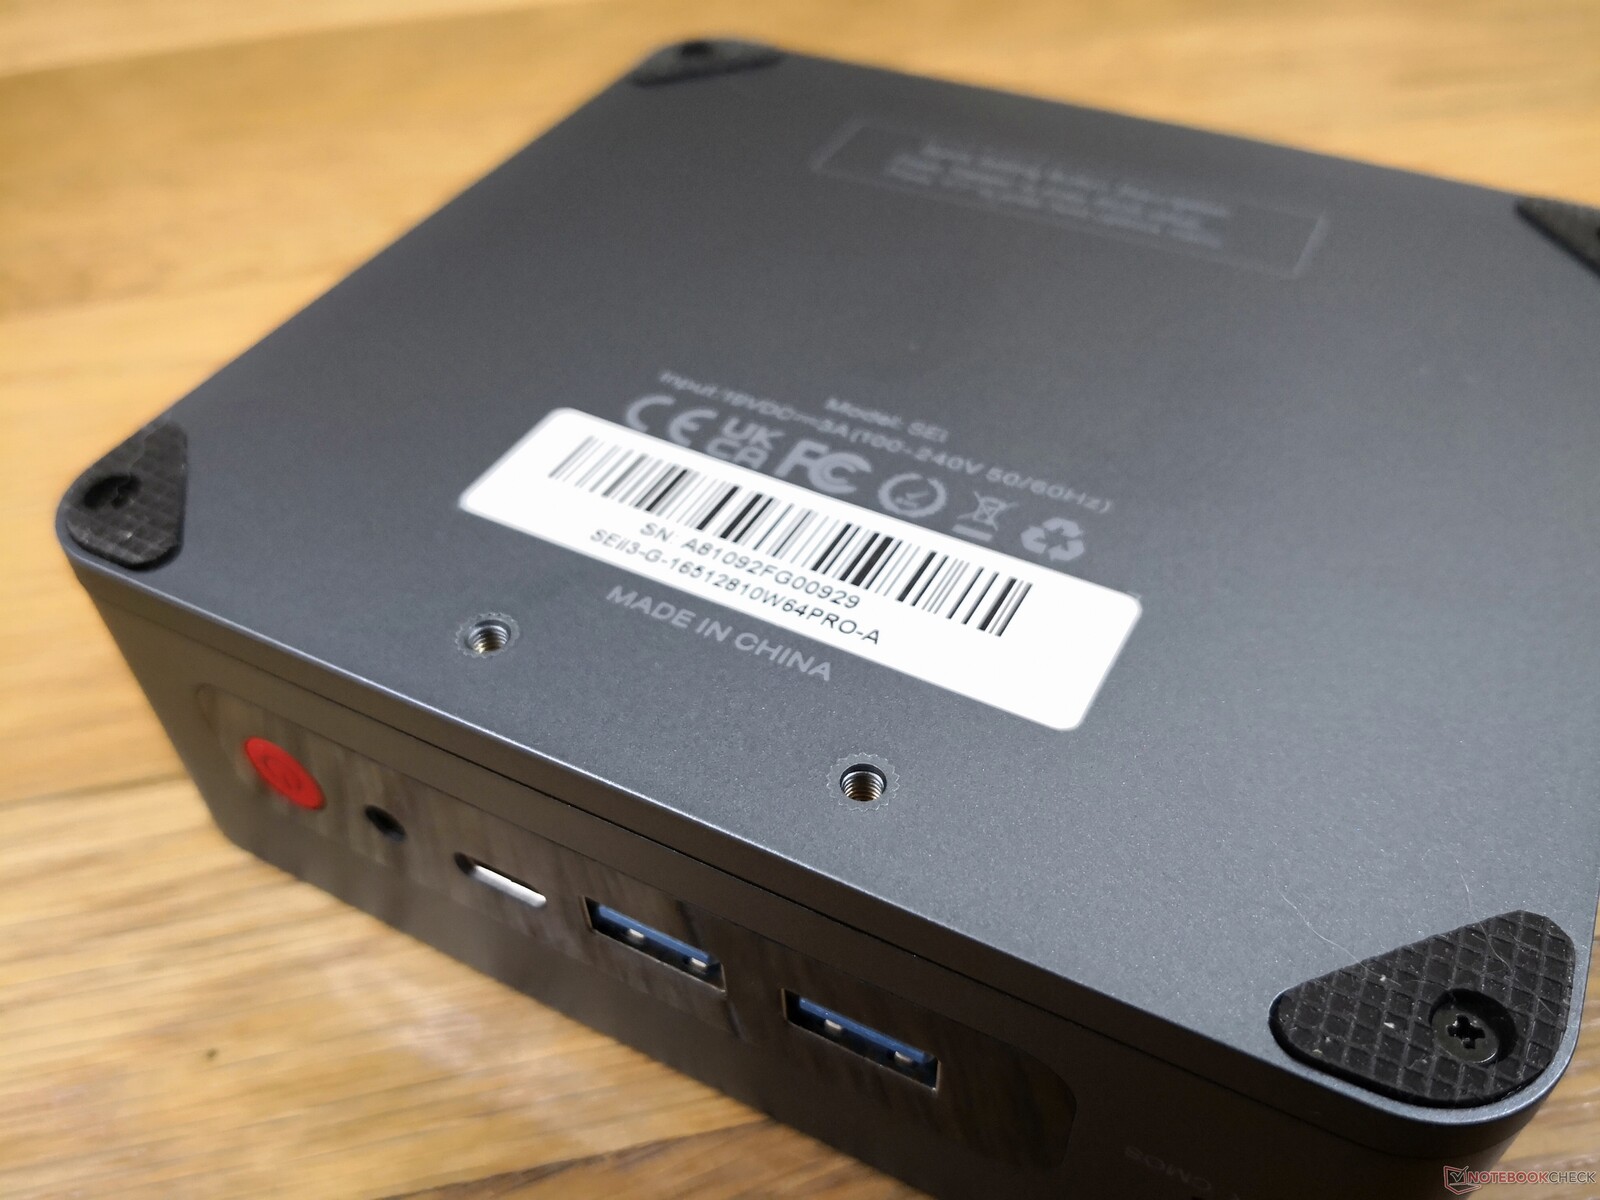
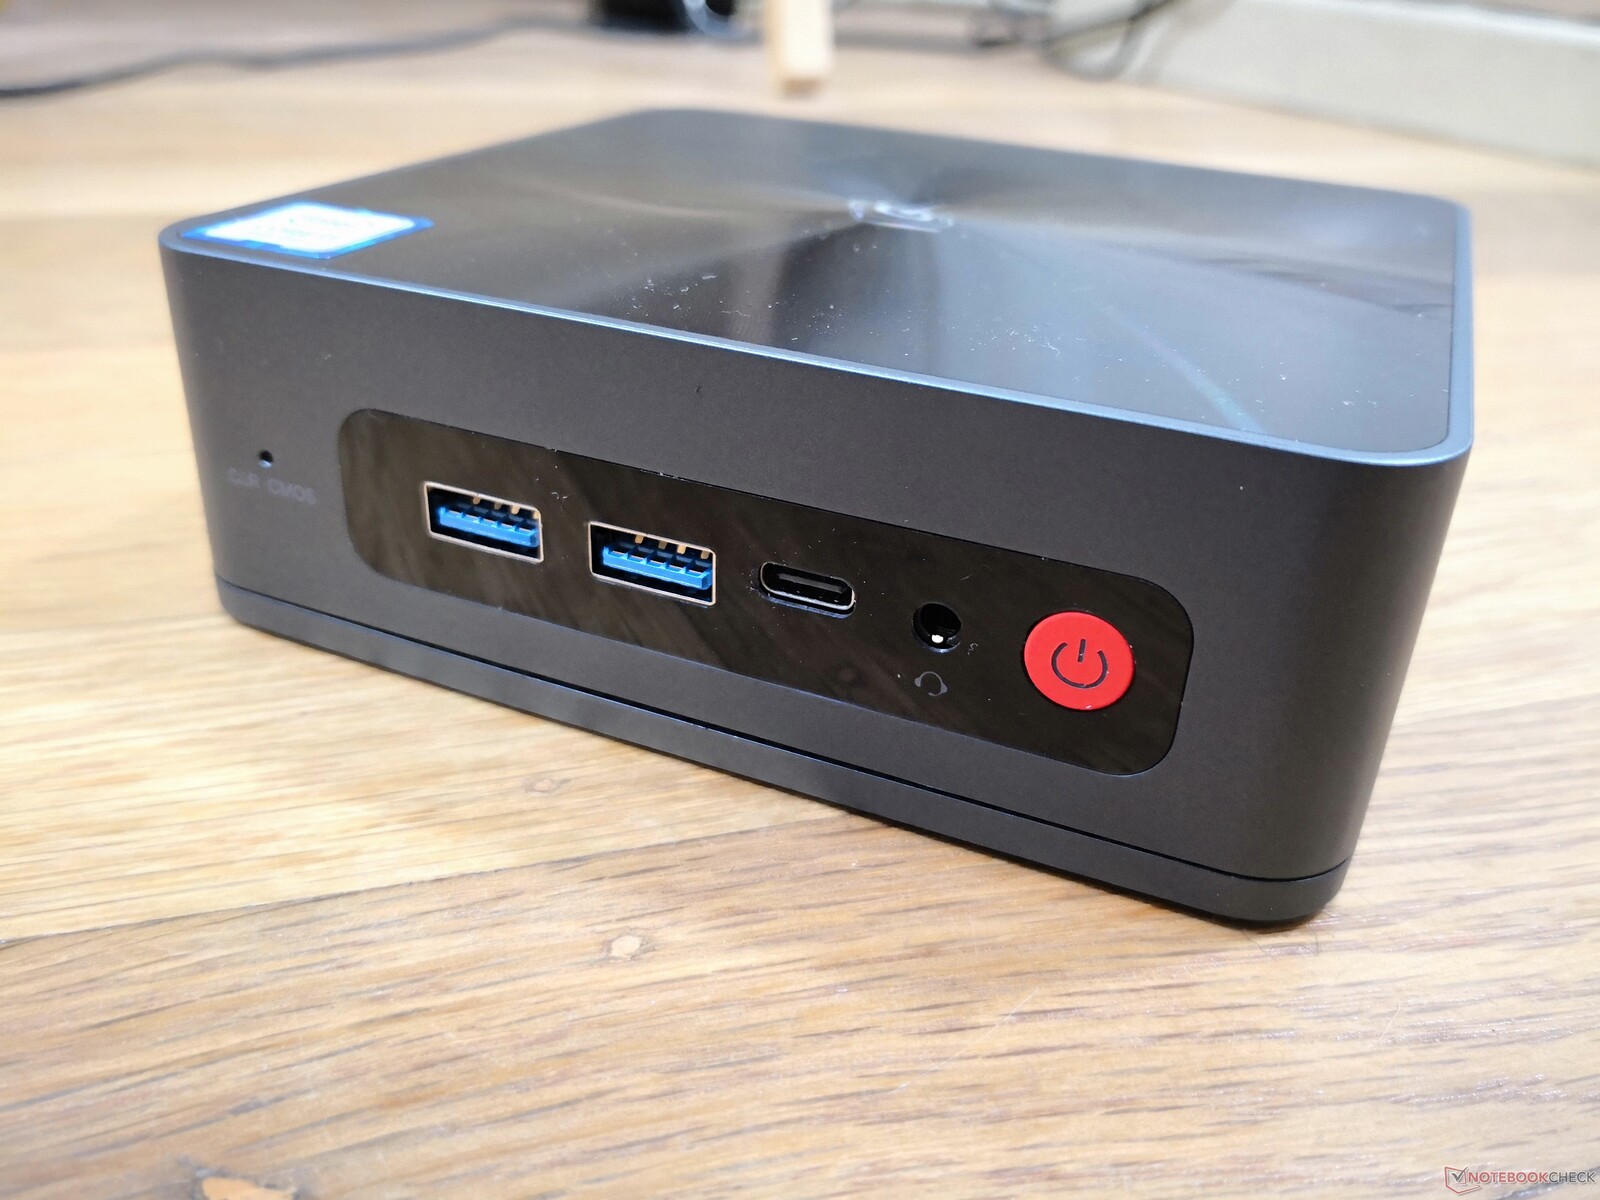
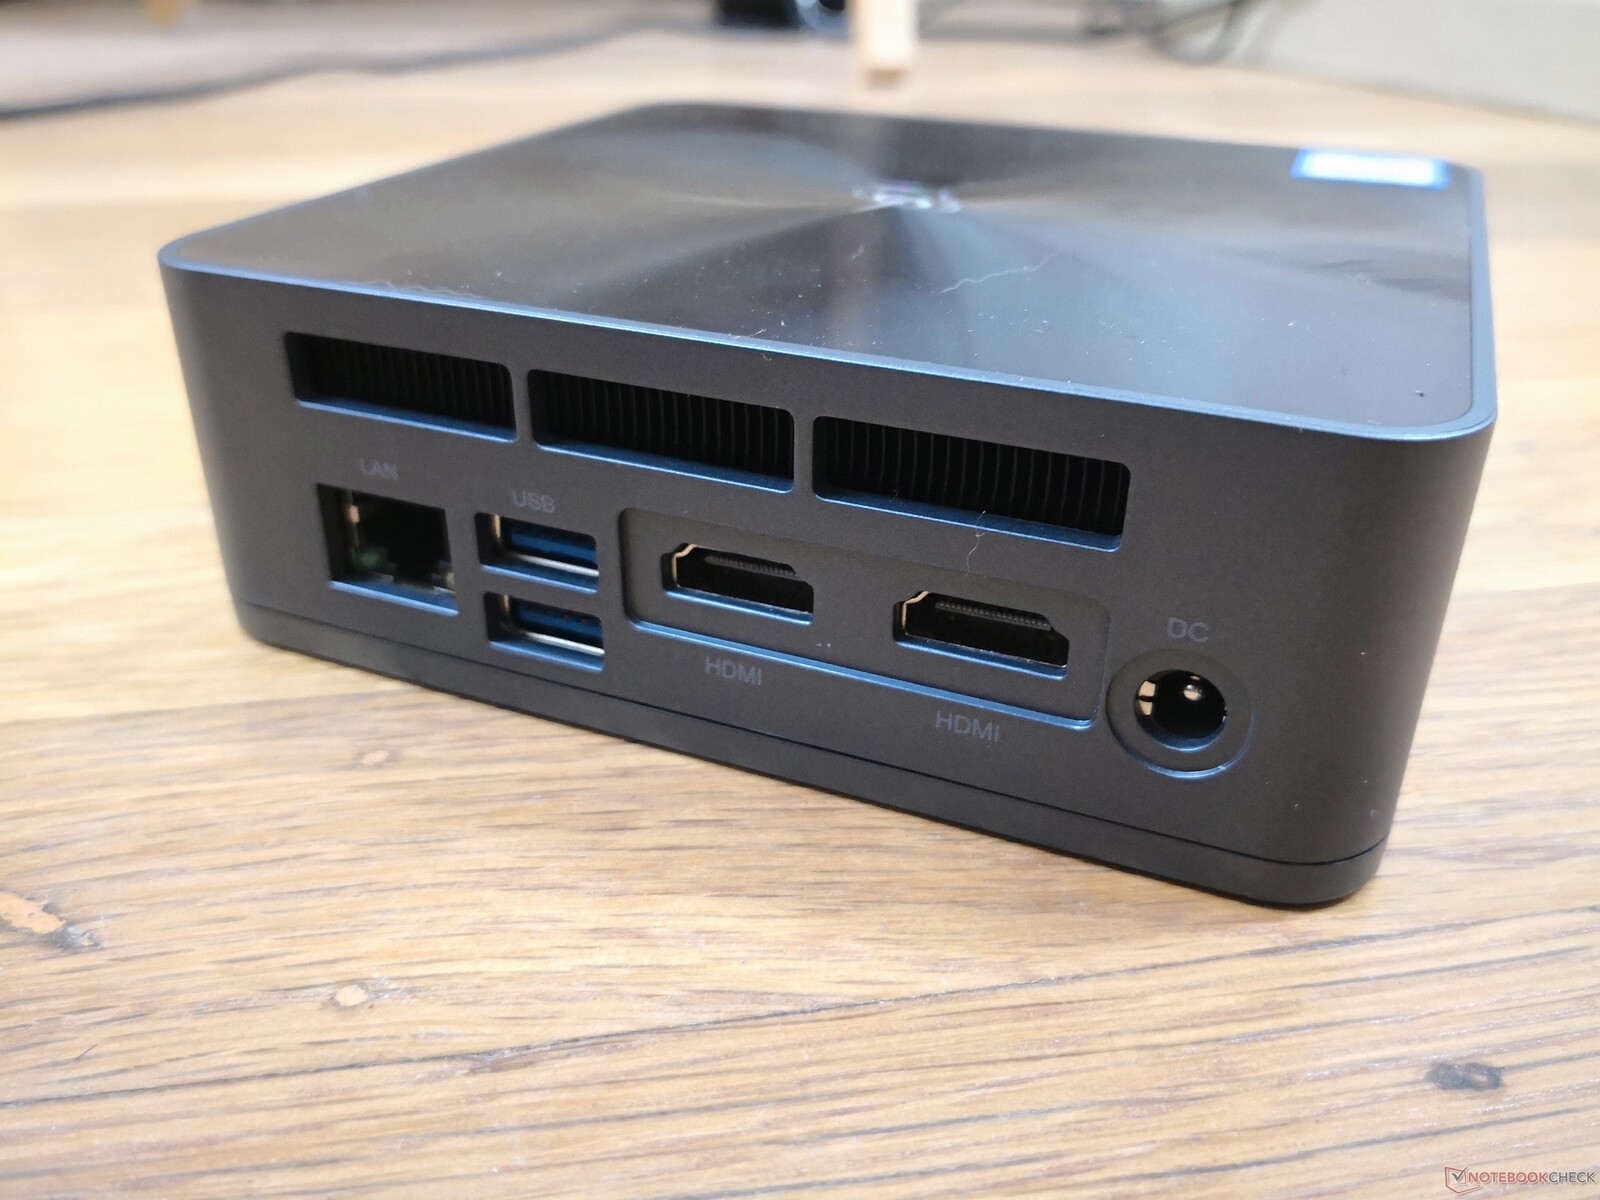
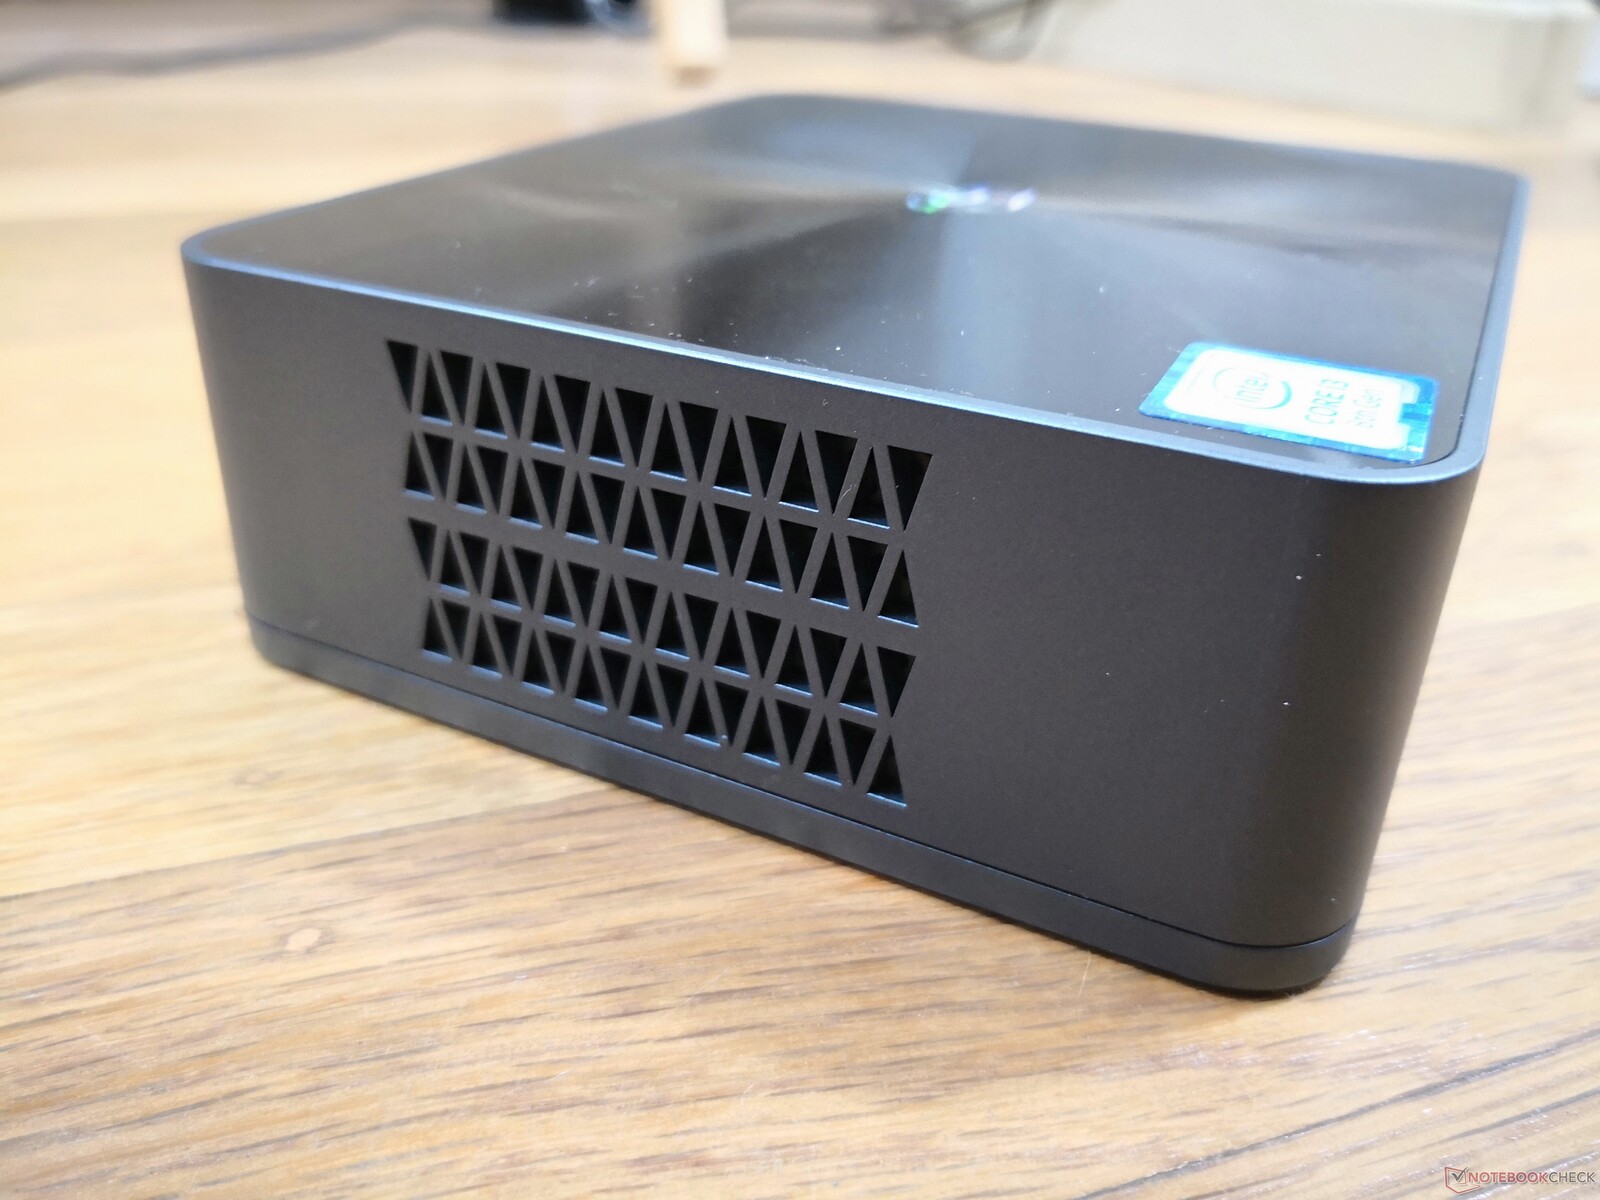
Conectividad
Las opciones de puerto son idénticas a las del SEi10, salvo que no se admite Thunderbolt y que ya no hay un lector de tarjetas SD integrado. Podemos confirmar que el puerto USB-C sigue siendo compatible con DisplayPort, pero no puede utilizarse para alimentar el mini PC, a diferencia del SER4.
Comunicación
Módulos de comunicación por cable e inalámbricos incorporados, comparación de los datos de las pruebas de red con los de la competencia, soluciones alternativas disponibles (5G/LTE)..., Irregularidades (recepción de radio)..
| Networking | |
| iperf3 transmit AX12 | |
| Intel NUC11TNKi5 | |
| Beelink SER4 | |
| Beelink SEi10 | |
| Intel NUC8i7BE | |
| GMK NucBox 2 | |
| Beelink SEi8 | |
| iperf3 receive AX12 | |
| Intel NUC11TNKi5 | |
| Beelink SEi10 | |
| Beelink SER4 | |
| GMK NucBox 2 | |
| Intel NUC8i7BE | |
| Beelink SEi8 | |
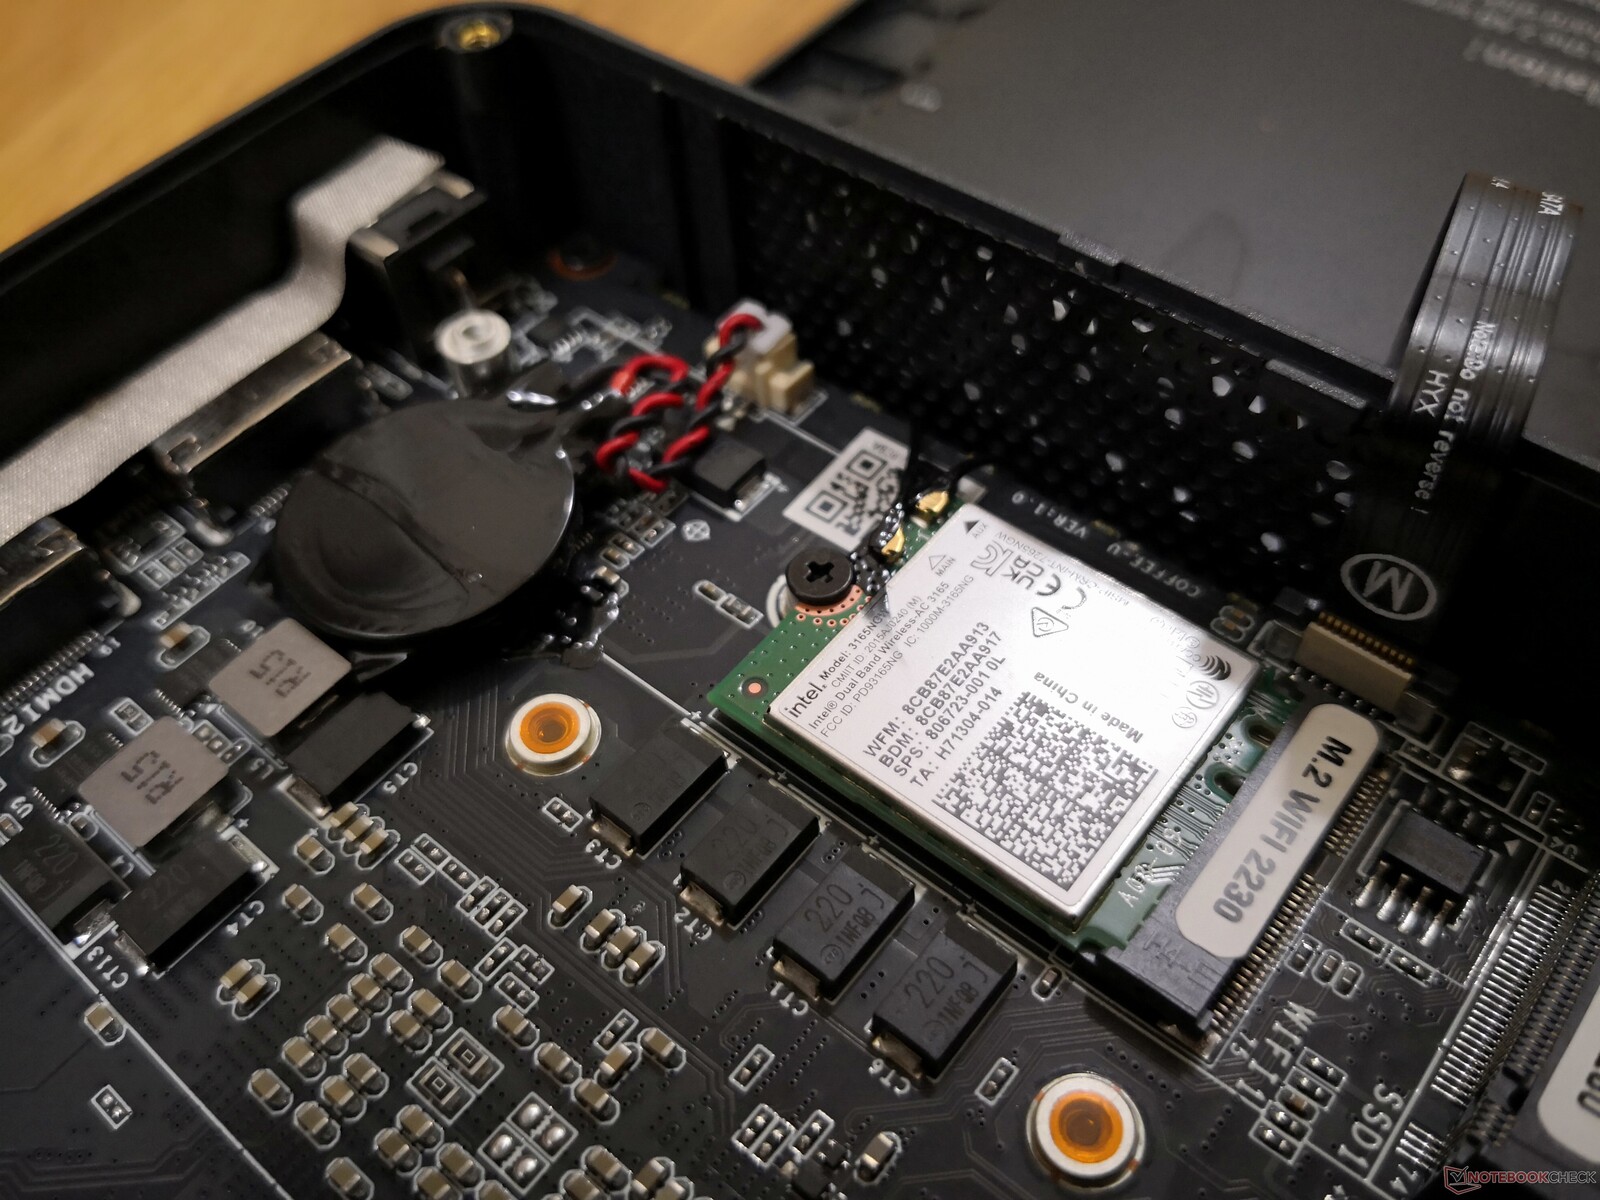
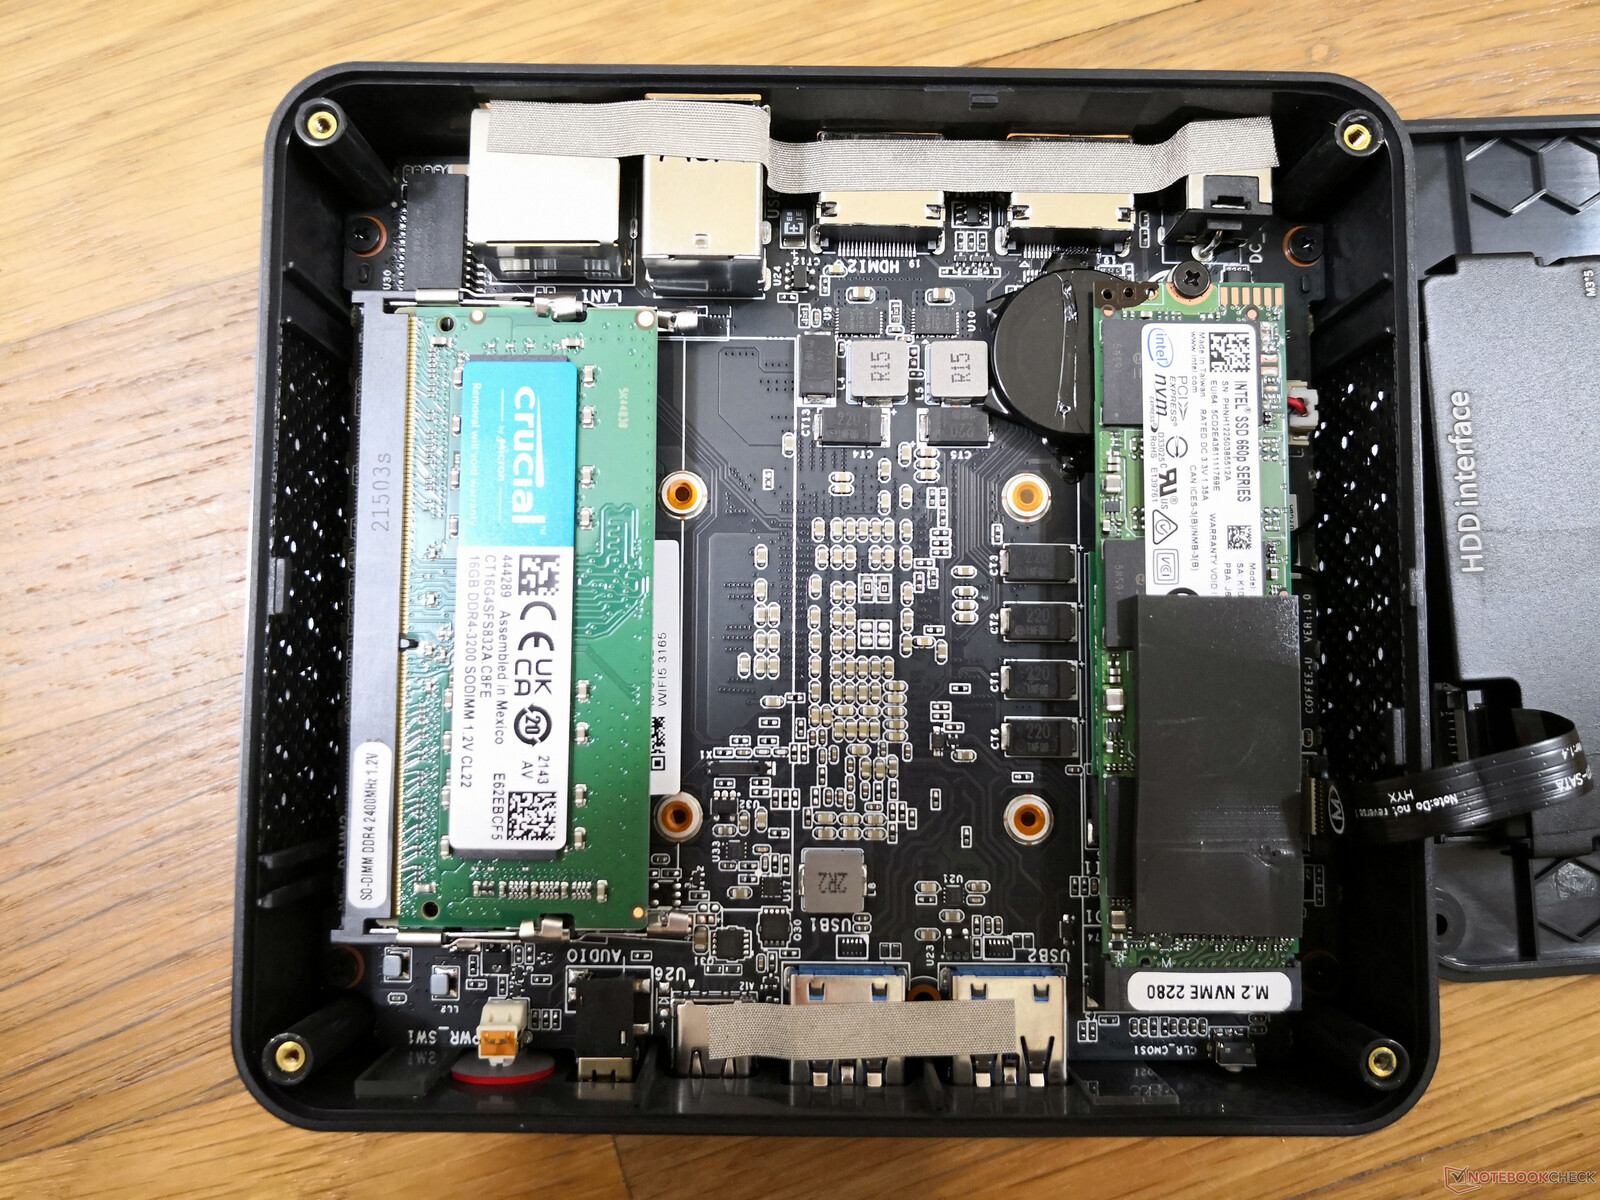
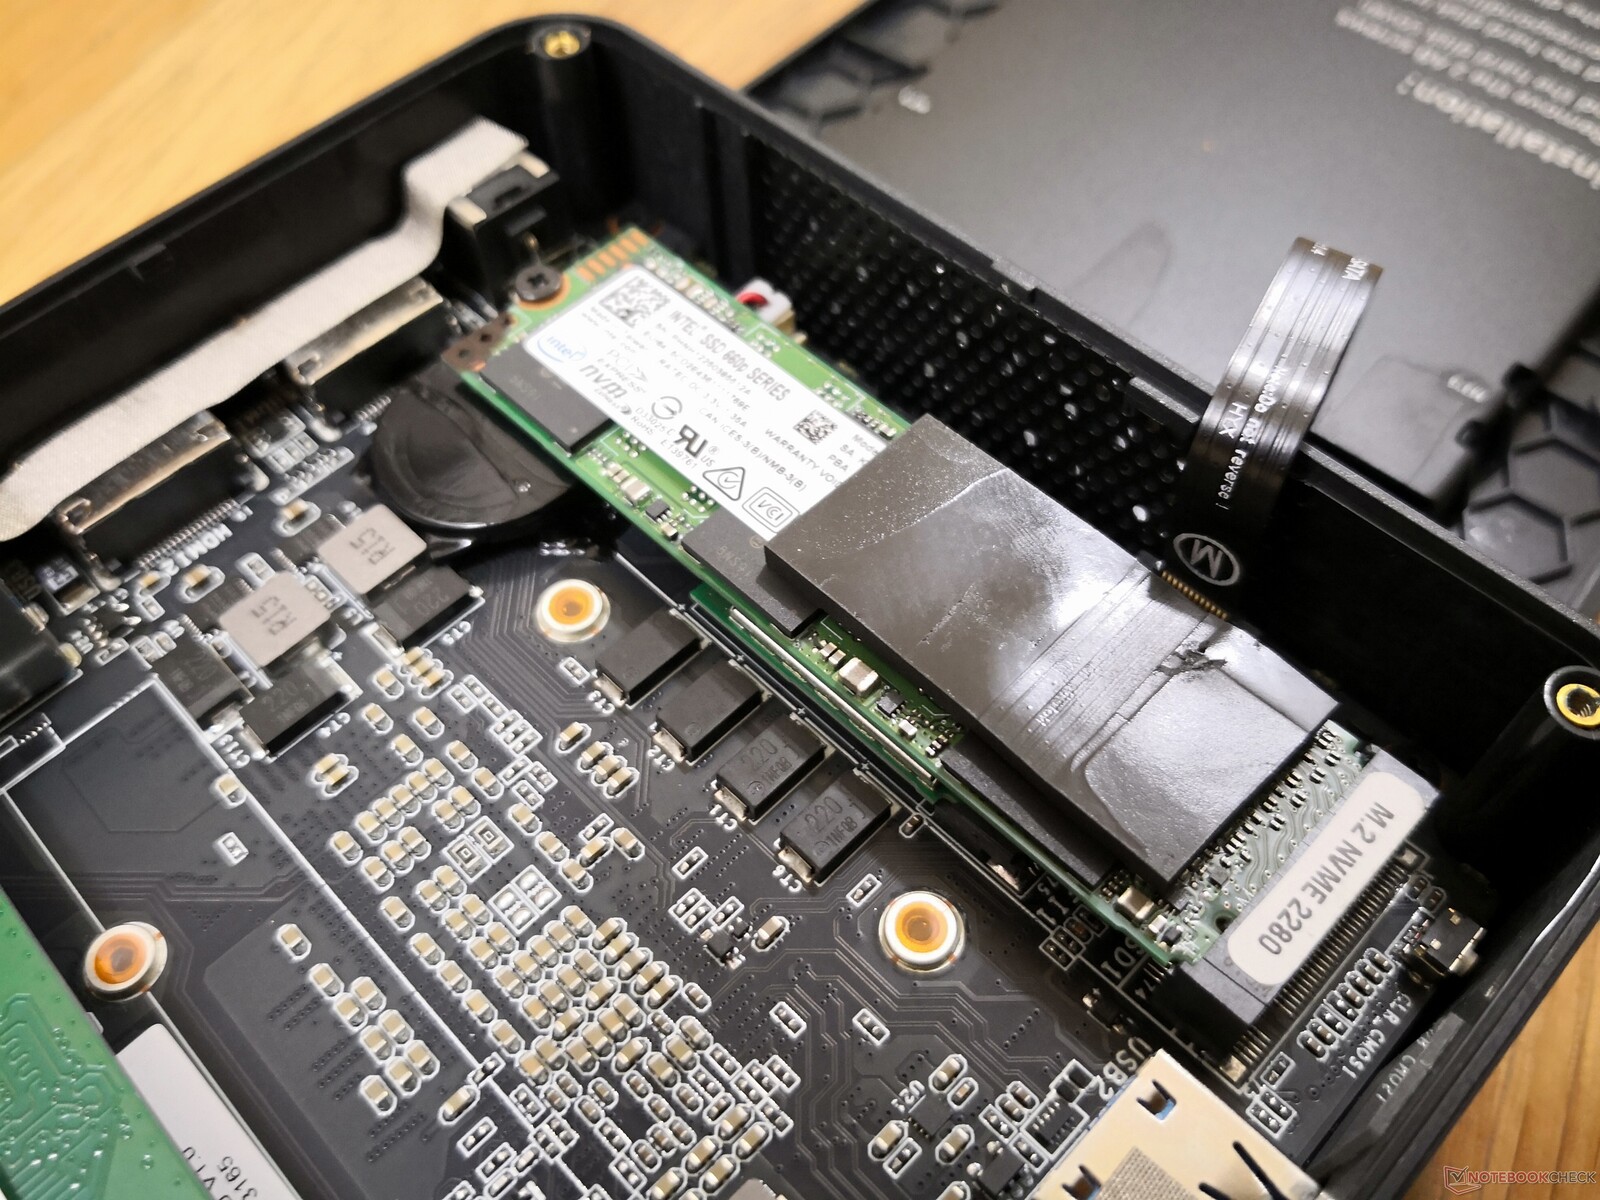
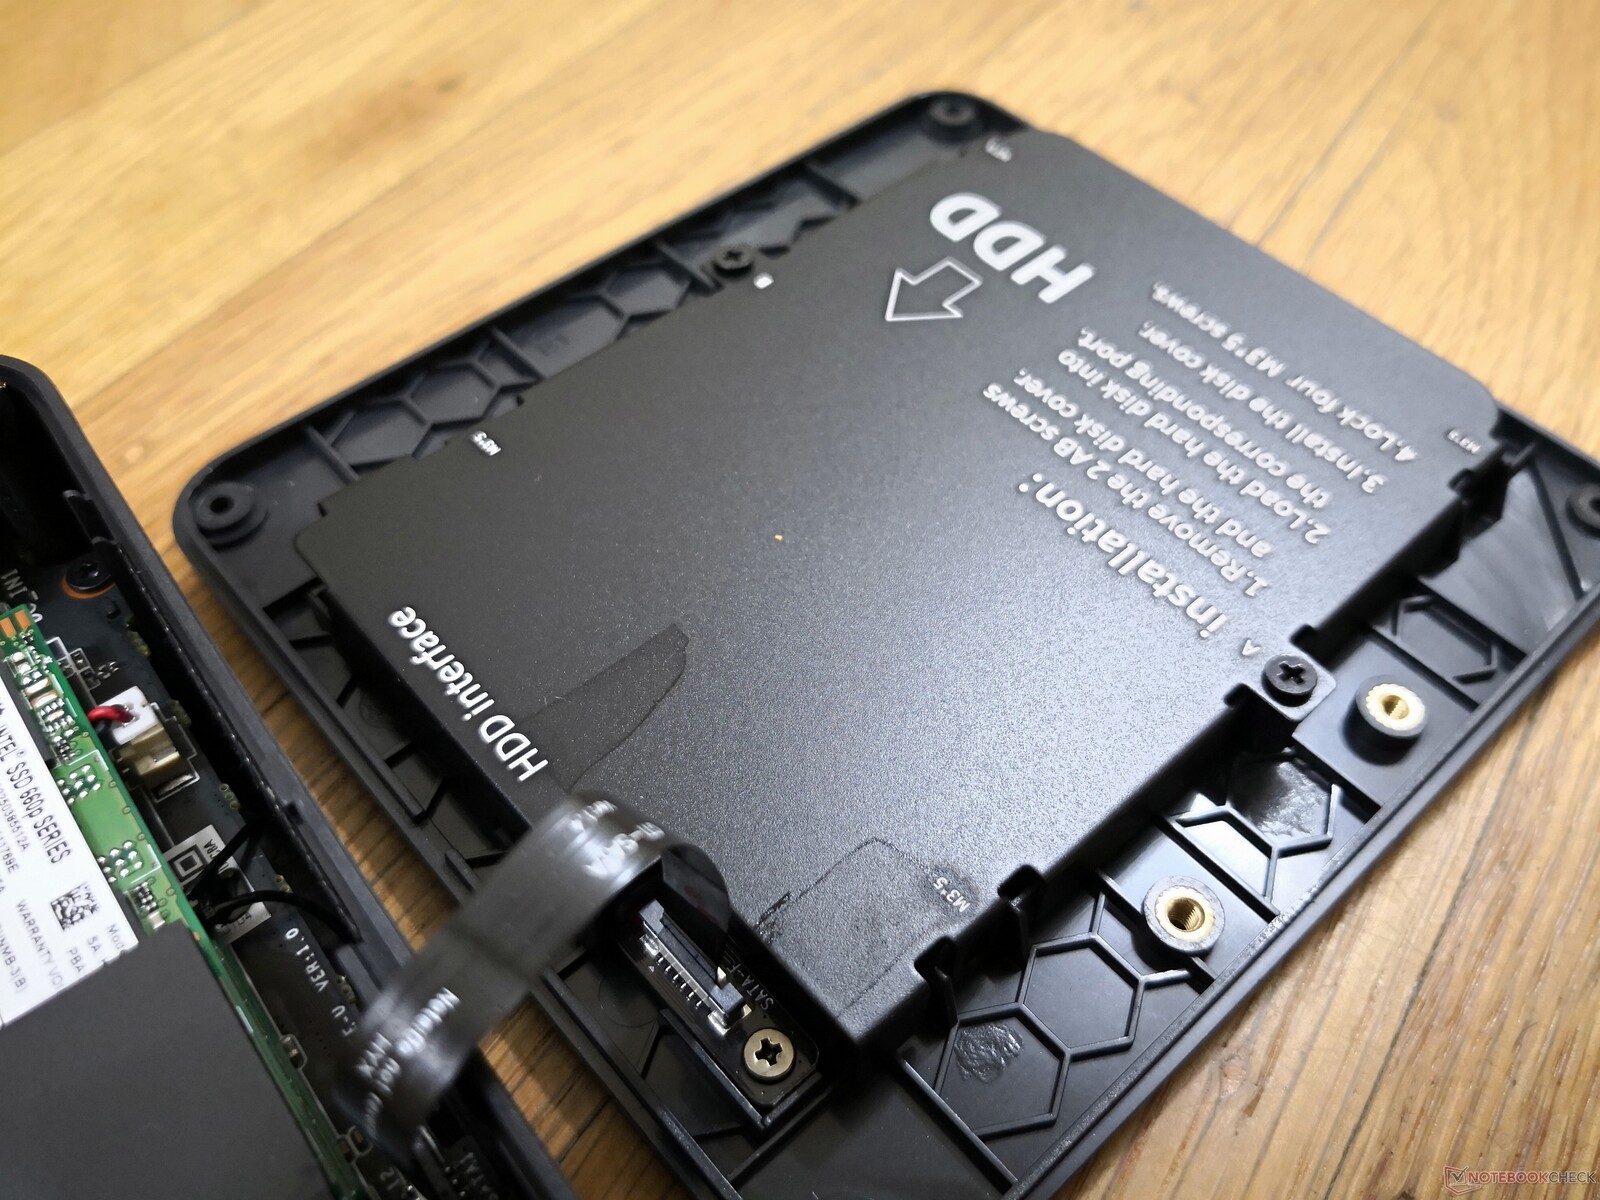
Mantenimiento
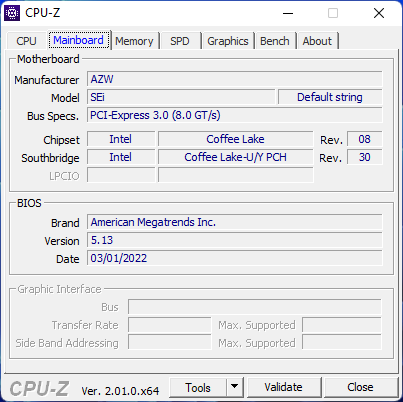
La placa base del SEi8 es ligeramente diferente a la del SEi10. La ranura M.2 SSD, por ejemplo, está ahora orientada en sentido contrario, mientras que la batería de la BIOS es ahora más fácilmente accesible.
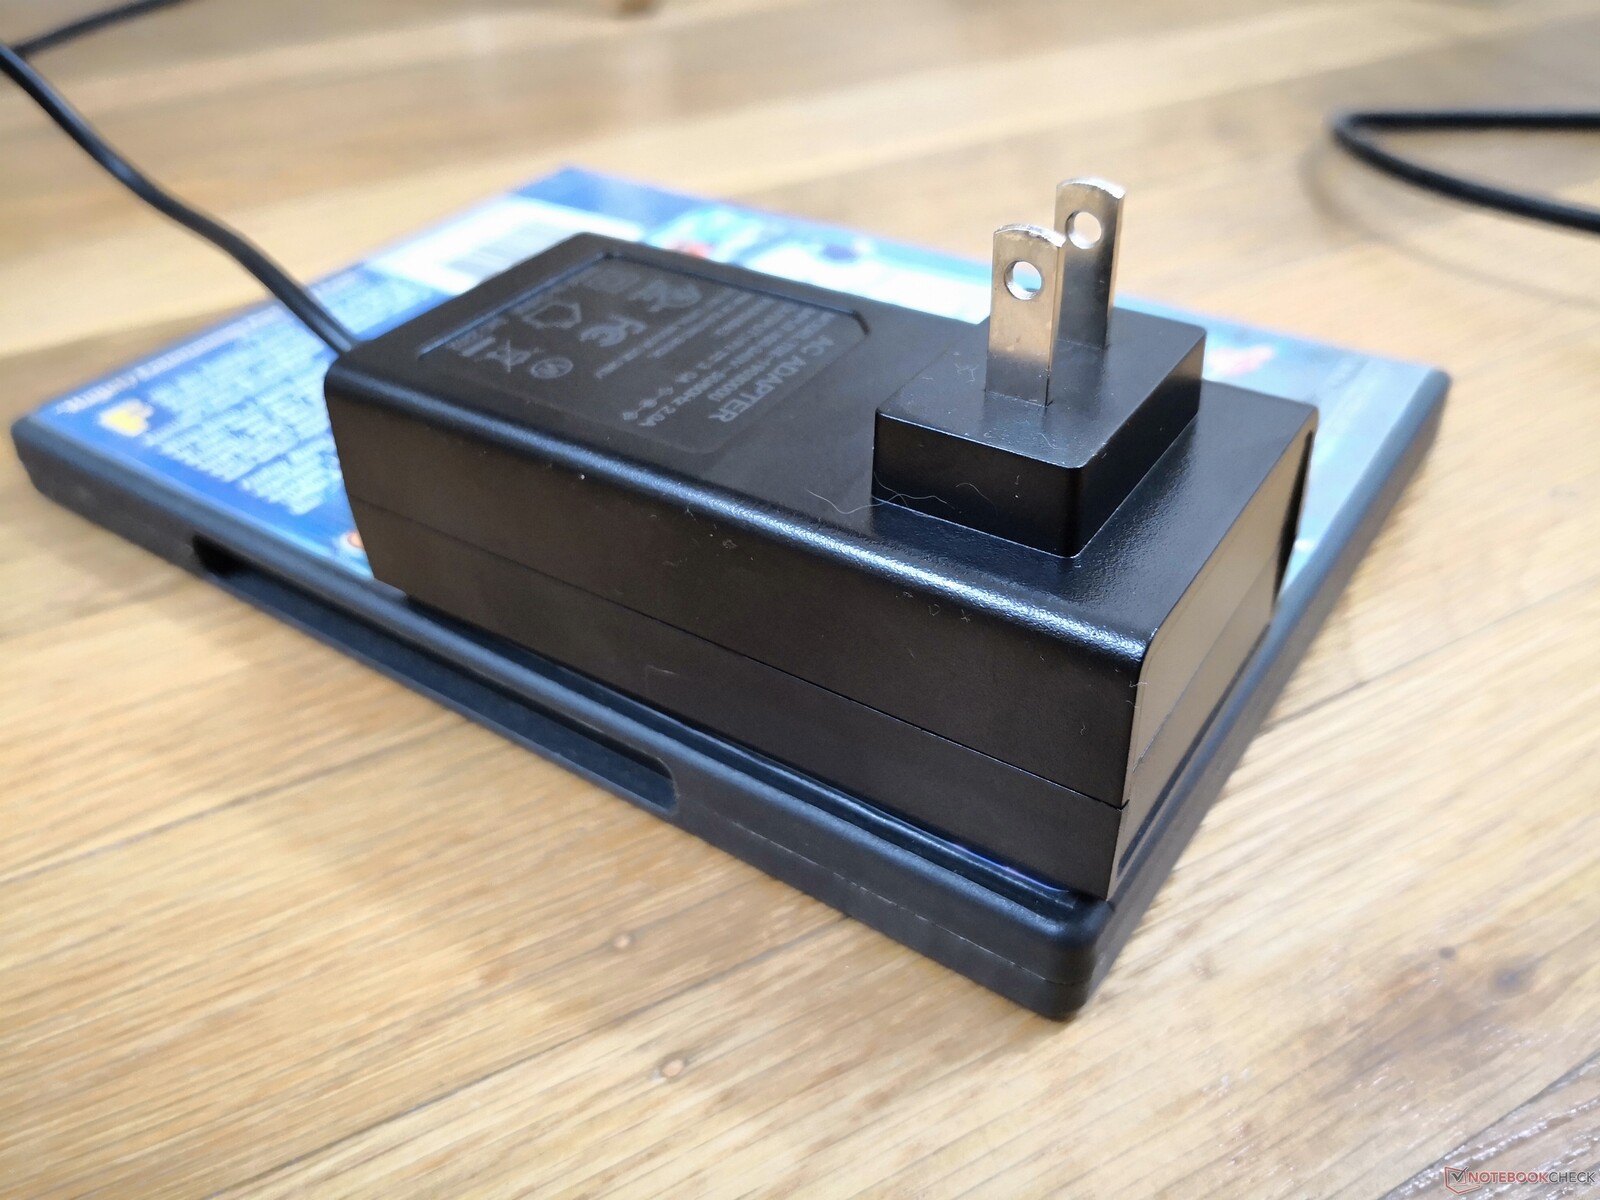
Accesorios y garantía
La caja de venta incluye tornillos adicionales, manual y un soporte VESA extraíble. Reclamar la garantía puede ser difícil ya que puede implicar el envío al extranjero. Sólo se ofrece una garantía básica de un año, a diferencia de los tres años de la mayoría de los NUC de Intel.
Rendimiento
Condiciones de la prueba
Nuestra unidad estaba configurada en el modo de rendimiento de Windows antes de ejecutar las pruebas de referencia que se indican a continuación.
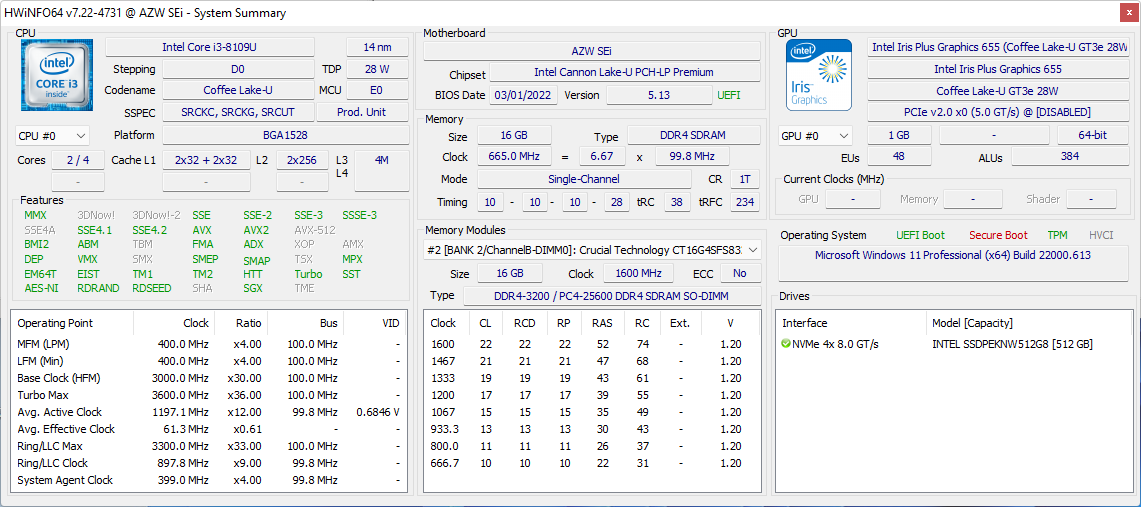
Procesador
El rendimiento bruto de la CPU se sitúa entre las series Celeron y Atom y la serie U de Core i5 de gama alta. Quizá lo más destacable es que es notablemente más rápido que el competidor Ryzen 3 3200U y los Core i3-10100Y de refrigeración pasiva Core i3-10100Y que se encuentran en el Microsoft Surface Go 3. El procesador de la Surface Go 3 fue muy criticado por su lentitud en comparación con la Surface Pro
Beelink ofrece el SEi8 con Core i5-8279U como actualización que proporcionaría un rendimiento de un solo hilo aproximadamente un 20% más rápido y más del doble de rendimiento multihilo que nuestro Core i3-8109U.
Cinebench R15 Multi Loop
Cinebench R23: Multi Core | Single Core
Cinebench R15: CPU Multi 64Bit | CPU Single 64Bit
Blender: v2.79 BMW27 CPU
7-Zip 18.03: 7z b 4 | 7z b 4 -mmt1
Geekbench 5.5: Multi-Core | Single-Core
HWBOT x265 Benchmark v2.2: 4k Preset
LibreOffice : 20 Documents To PDF
R Benchmark 2.5: Overall mean
| Cinebench R20 / CPU (Multi Core) | |
| Beelink SER4 | |
| Intel NUC11TNKi5 | |
| Apple MacBook Pro 13 2019 i5 4TB3 | |
| Intel NUC8i7BE | |
| Acer Swift 3 SF314-42-R27B | |
| GMK NucBox 2 | |
| Beelink SEi10 | |
| Beelink U59 | |
| Beelink SEi8 | |
| Medio Intel Core i3-8109U (n=1) | |
| Microsoft Surface Go 3 Core i3 | |
| HP 255 G7 159P1EA | |
| GMK NucBox 3 | |
| Chuwi LapBook Plus | |
| Teclast Tbook 16 Power | |
| Cinebench R20 / CPU (Single Core) | |
| Intel NUC11TNKi5 | |
| Beelink SER4 | |
| Intel NUC8i7BE | |
| Acer Swift 3 SF314-42-R27B | |
| Apple MacBook Pro 13 2019 i5 4TB3 | |
| Beelink SEi10 | |
| GMK NucBox 2 | |
| Beelink SEi8 | |
| Medio Intel Core i3-8109U (n=1) | |
| Microsoft Surface Go 3 Core i3 | |
| HP 255 G7 159P1EA | |
| Beelink U59 | |
| GMK NucBox 3 | |
| Chuwi LapBook Plus | |
| Teclast Tbook 16 Power | |
| Cinebench R23 / Multi Core | |
| Beelink SER4 | |
| Intel NUC11TNKi5 | |
| GMK NucBox 2 | |
| Beelink U59 | |
| Beelink SEi8 | |
| Medio Intel Core i3-8109U (n=1) | |
| HP 255 G7 159P1EA | |
| Microsoft Surface Go 3 Core i3 | |
| GMK NucBox 3 | |
| Teclast Tbook 16 Power | |
| Cinebench R23 / Single Core | |
| Intel NUC11TNKi5 | |
| Beelink SER4 | |
| GMK NucBox 2 | |
| Beelink SEi8 | |
| Medio Intel Core i3-8109U (n=1) | |
| Microsoft Surface Go 3 Core i3 | |
| HP 255 G7 159P1EA | |
| Beelink U59 | |
| GMK NucBox 3 | |
| Teclast Tbook 16 Power | |
| Cinebench R15 / CPU Multi 64Bit | |
| Beelink SER4 | |
| Intel NUC8i7BE | |
| Intel NUC11TNKi5 | |
| Apple MacBook Pro 13 2019 i5 4TB3 | |
| Apple MacBook Pro 13 2019 i5 4TB3 | |
| GMK NucBox 2 | |
| Acer Swift 3 SF314-42-R27B | |
| Beelink SEi10 | |
| Beelink U59 | |
| HP 255 G7 159P1EA | |
| Medio Intel Core i3-8109U (324 - 381, n=2) | |
| Beelink SEi8 | |
| Microsoft Surface Go 3 Core i3 | |
| GMK NucBox 3 | |
| Teclast Tbook 16 Power | |
| Chuwi LapBook Plus | |
| Cinebench R15 / CPU Single 64Bit | |
| Intel NUC11TNKi5 | |
| Intel NUC8i7BE | |
| Beelink SER4 | |
| Apple MacBook Pro 13 2019 i5 4TB3 | |
| Apple MacBook Pro 13 2019 i5 4TB3 | |
| Acer Swift 3 SF314-42-R27B | |
| Beelink SEi10 | |
| GMK NucBox 2 | |
| Medio Intel Core i3-8109U (124.3 - 153, n=2) | |
| HP 255 G7 159P1EA | |
| Beelink SEi8 | |
| Microsoft Surface Go 3 Core i3 | |
| Beelink U59 | |
| GMK NucBox 3 | |
| Chuwi LapBook Plus | |
| Teclast Tbook 16 Power | |
| Blender / v2.79 BMW27 CPU | |
| Teclast Tbook 16 Power | |
| Chuwi LapBook Plus | |
| GMK NucBox 3 | |
| Microsoft Surface Go 3 Core i3 | |
| Beelink U59 | |
| HP 255 G7 159P1EA | |
| Beelink SEi8 | |
| Medio Intel Core i3-8109U (n=1) | |
| Beelink SEi10 | |
| Acer Swift 3 SF314-42-R27B | |
| GMK NucBox 2 | |
| Intel NUC8i7BE | |
| Intel NUC8i7BE | |
| Apple MacBook Pro 13 2019 i5 4TB3 | |
| Intel NUC11TNKi5 | |
| Beelink SER4 | |
| 7-Zip 18.03 / 7z b 4 | |
| Beelink SER4 | |
| Intel NUC8i7BE | |
| Intel NUC8i7BE | |
| Intel NUC11TNKi5 | |
| Apple MacBook Pro 13 2019 i5 4TB3 | |
| GMK NucBox 2 | |
| Acer Swift 3 SF314-42-R27B | |
| Beelink U59 | |
| Beelink SEi10 | |
| Beelink SEi8 | |
| Medio Intel Core i3-8109U (n=1) | |
| HP 255 G7 159P1EA | |
| Microsoft Surface Go 3 Core i3 | |
| GMK NucBox 3 | |
| Chuwi LapBook Plus | |
| 7-Zip 18.03 / 7z b 4 -mmt1 | |
| Intel NUC8i7BE | |
| Intel NUC8i7BE | |
| Intel NUC11TNKi5 | |
| Beelink SER4 | |
| Apple MacBook Pro 13 2019 i5 4TB3 | |
| Beelink SEi10 | |
| Acer Swift 3 SF314-42-R27B | |
| GMK NucBox 2 | |
| Beelink SEi8 | |
| Medio Intel Core i3-8109U (n=1) | |
| Microsoft Surface Go 3 Core i3 | |
| HP 255 G7 159P1EA | |
| Beelink U59 | |
| GMK NucBox 3 | |
| Chuwi LapBook Plus | |
| Geekbench 5.5 / Multi-Core | |
| Beelink SER4 | |
| Intel NUC11TNKi5 | |
| Intel NUC8i7BE | |
| GMK NucBox 2 | |
| Acer Swift 3 SF314-42-R27B | |
| Beelink SEi10 | |
| Microsoft Surface Go 3 Core i3 | |
| Beelink SEi8 | |
| Medio Intel Core i3-8109U (n=1) | |
| HP 255 G7 159P1EA | |
| GMK NucBox 3 | |
| Teclast Tbook 16 Power | |
| Geekbench 5.5 / Single-Core | |
| Intel NUC11TNKi5 | |
| Beelink SER4 | |
| Beelink SEi10 | |
| Acer Swift 3 SF314-42-R27B | |
| Microsoft Surface Go 3 Core i3 | |
| GMK NucBox 2 | |
| Beelink SEi8 | |
| Medio Intel Core i3-8109U (n=1) | |
| HP 255 G7 159P1EA | |
| Intel NUC8i7BE | |
| GMK NucBox 3 | |
| Teclast Tbook 16 Power | |
| HWBOT x265 Benchmark v2.2 / 4k Preset | |
| Beelink SER4 | |
| Intel NUC11TNKi5 | |
| Apple MacBook Pro 13 2019 i5 4TB3 | |
| Intel NUC8i7BE | |
| Intel NUC8i7BE | |
| GMK NucBox 2 | |
| Acer Swift 3 SF314-42-R27B | |
| Beelink SEi10 | |
| Beelink SEi8 | |
| Medio Intel Core i3-8109U (n=1) | |
| Beelink U59 | |
| Microsoft Surface Go 3 Core i3 | |
| HP 255 G7 159P1EA | |
| GMK NucBox 3 | |
| Chuwi LapBook Plus | |
| Teclast Tbook 16 Power | |
| LibreOffice / 20 Documents To PDF | |
| Teclast Tbook 16 Power | |
| GMK NucBox 3 | |
| Microsoft Surface Go 3 Core i3 | |
| Beelink U59 | |
| HP 255 G7 159P1EA | |
| Beelink SEi8 | |
| Medio Intel Core i3-8109U (n=1) | |
| GMK NucBox 2 | |
| Beelink SER4 | |
| Acer Swift 3 SF314-42-R27B | |
| Beelink SEi10 | |
| Intel NUC11TNKi5 | |
| R Benchmark 2.5 / Overall mean | |
| Teclast Tbook 16 Power | |
| GMK NucBox 3 | |
| Beelink U59 | |
| Microsoft Surface Go 3 Core i3 | |
| Beelink SEi8 | |
| Medio Intel Core i3-8109U (n=1) | |
| HP 255 G7 159P1EA | |
| GMK NucBox 2 | |
| Beelink SEi10 | |
| Acer Swift 3 SF314-42-R27B | |
| Intel NUC8i7BE | |
| Intel NUC11TNKi5 | |
| Beelink SER4 | |
Cinebench R23: Multi Core | Single Core
Cinebench R15: CPU Multi 64Bit | CPU Single 64Bit
Blender: v2.79 BMW27 CPU
7-Zip 18.03: 7z b 4 | 7z b 4 -mmt1
Geekbench 5.5: Multi-Core | Single-Core
HWBOT x265 Benchmark v2.2: 4k Preset
LibreOffice : 20 Documents To PDF
R Benchmark 2.5: Overall mean
* ... más pequeño es mejor
AIDA64: FP32 Ray-Trace | FPU Julia | CPU SHA3 | CPU Queen | FPU SinJulia | FPU Mandel | CPU AES | CPU ZLib | FP64 Ray-Trace | CPU PhotoWorxx
| Performance rating | |
| Beelink SER4 | |
| Intel NUC11TNKi5 | |
| Intel NUC8i7BE -1! | |
| GMK NucBox 2 | |
| Beelink SEi8 | |
| AIDA64 / FP32 Ray-Trace | |
| Beelink SER4 | |
| Intel NUC11TNKi5 | |
| Intel NUC8i7BE | |
| GMK NucBox 2 | |
| Beelink SEi8 | |
| AIDA64 / FPU Julia | |
| Beelink SER4 | |
| Intel NUC11TNKi5 | |
| Intel NUC8i7BE | |
| GMK NucBox 2 | |
| Beelink SEi8 | |
| AIDA64 / CPU SHA3 | |
| Intel NUC11TNKi5 | |
| Beelink SER4 | |
| GMK NucBox 2 | |
| Beelink SEi8 | |
| AIDA64 / CPU Queen | |
| Beelink SER4 | |
| Intel NUC8i7BE | |
| Intel NUC11TNKi5 | |
| GMK NucBox 2 | |
| Beelink SEi8 | |
| AIDA64 / FPU SinJulia | |
| Beelink SER4 | |
| Intel NUC8i7BE | |
| Intel NUC11TNKi5 | |
| GMK NucBox 2 | |
| Beelink SEi8 | |
| AIDA64 / FPU Mandel | |
| Beelink SER4 | |
| Intel NUC11TNKi5 | |
| Intel NUC8i7BE | |
| GMK NucBox 2 | |
| Beelink SEi8 | |
| AIDA64 / CPU AES | |
| Intel NUC11TNKi5 | |
| Beelink SER4 | |
| Intel NUC8i7BE | |
| GMK NucBox 2 | |
| Beelink SEi8 | |
| AIDA64 / CPU ZLib | |
| Beelink SER4 | |
| Intel NUC11TNKi5 | |
| Intel NUC8i7BE | |
| GMK NucBox 2 | |
| Beelink SEi8 | |
| AIDA64 / FP64 Ray-Trace | |
| Beelink SER4 | |
| Intel NUC11TNKi5 | |
| Intel NUC8i7BE | |
| GMK NucBox 2 | |
| Beelink SEi8 | |
| AIDA64 / CPU PhotoWorxx | |
| Beelink SER4 | |
| Intel NUC8i7BE | |
| Intel NUC11TNKi5 | |
| Beelink SEi8 | |
| GMK NucBox 2 | |
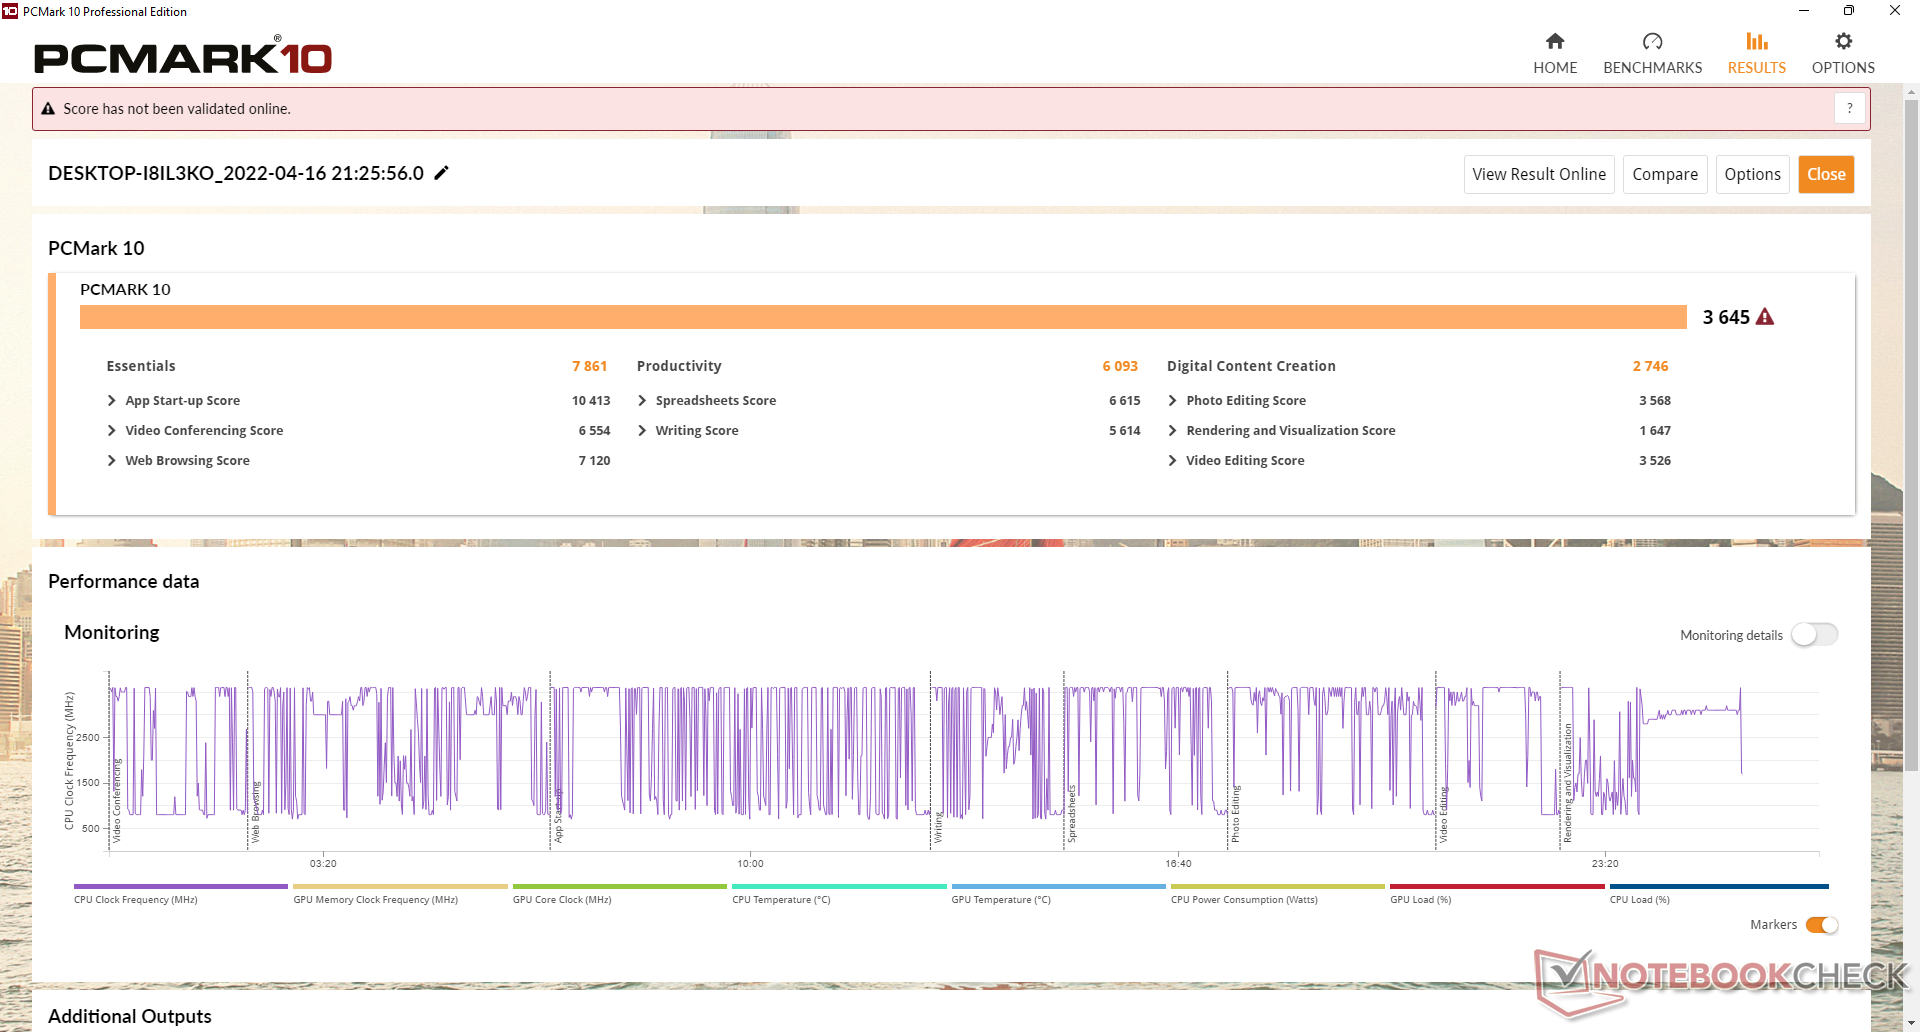
Rendimiento del sistema
Los resultados de PCMark son ligeramente superiores a los del SEi10, probablemente debido a la mayor velocidad de los gráficos Iris integrados de nuestro SEi8. No experimentamos ningún problema al ejecutar Windows 11 Pro en nuestra unidad de prueba, aparte de la ralentización ocasional al lanzar aplicaciones o durante la multitarea moderada.
| PCMark 10 / Score | |
| Beelink SER4 | |
| Intel NUC8i7BE | |
| Intel NUC11TNKi5 | |
| GMK NucBox 2 | |
| Beelink SEi8 | |
| Beelink SEi10 | |
| PCMark 10 / Essentials | |
| Beelink SER4 | |
| Intel NUC11TNKi5 | |
| Intel NUC8i7BE | |
| GMK NucBox 2 | |
| Beelink SEi8 | |
| Beelink SEi10 | |
| PCMark 10 / Productivity | |
| Beelink SER4 | |
| Intel NUC8i7BE | |
| GMK NucBox 2 | |
| Intel NUC11TNKi5 | |
| Beelink SEi8 | |
| Beelink SEi10 | |
| PCMark 10 / Digital Content Creation | |
| Beelink SER4 | |
| Intel NUC11TNKi5 | |
| Intel NUC8i7BE | |
| GMK NucBox 2 | |
| Beelink SEi8 | |
| Beelink SEi10 | |
| PCMark 10 Score | 3645 puntos | |
ayuda | ||
| AIDA64 / Memory Copy | |
| Intel NUC8i7BE | |
| GMK NucBox 2 | |
| Beelink SER4 | |
| Beelink SEi8 | |
| Intel NUC11TNKi5 | |
| AIDA64 / Memory Read | |
| Intel NUC8i7BE | |
| Beelink SER4 | |
| GMK NucBox 2 | |
| Beelink SEi8 | |
| Intel NUC11TNKi5 | |
| AIDA64 / Memory Write | |
| Intel NUC8i7BE | |
| GMK NucBox 2 | |
| Beelink SER4 | |
| Intel NUC11TNKi5 | |
| Beelink SEi8 | |
| AIDA64 / Memory Latency | |
| Beelink SER4 | |
| Intel NUC11TNKi5 | |
| Beelink SEi8 | |
| GMK NucBox 2 | |
| Intel NUC8i7BE | |
* ... más pequeño es mejor
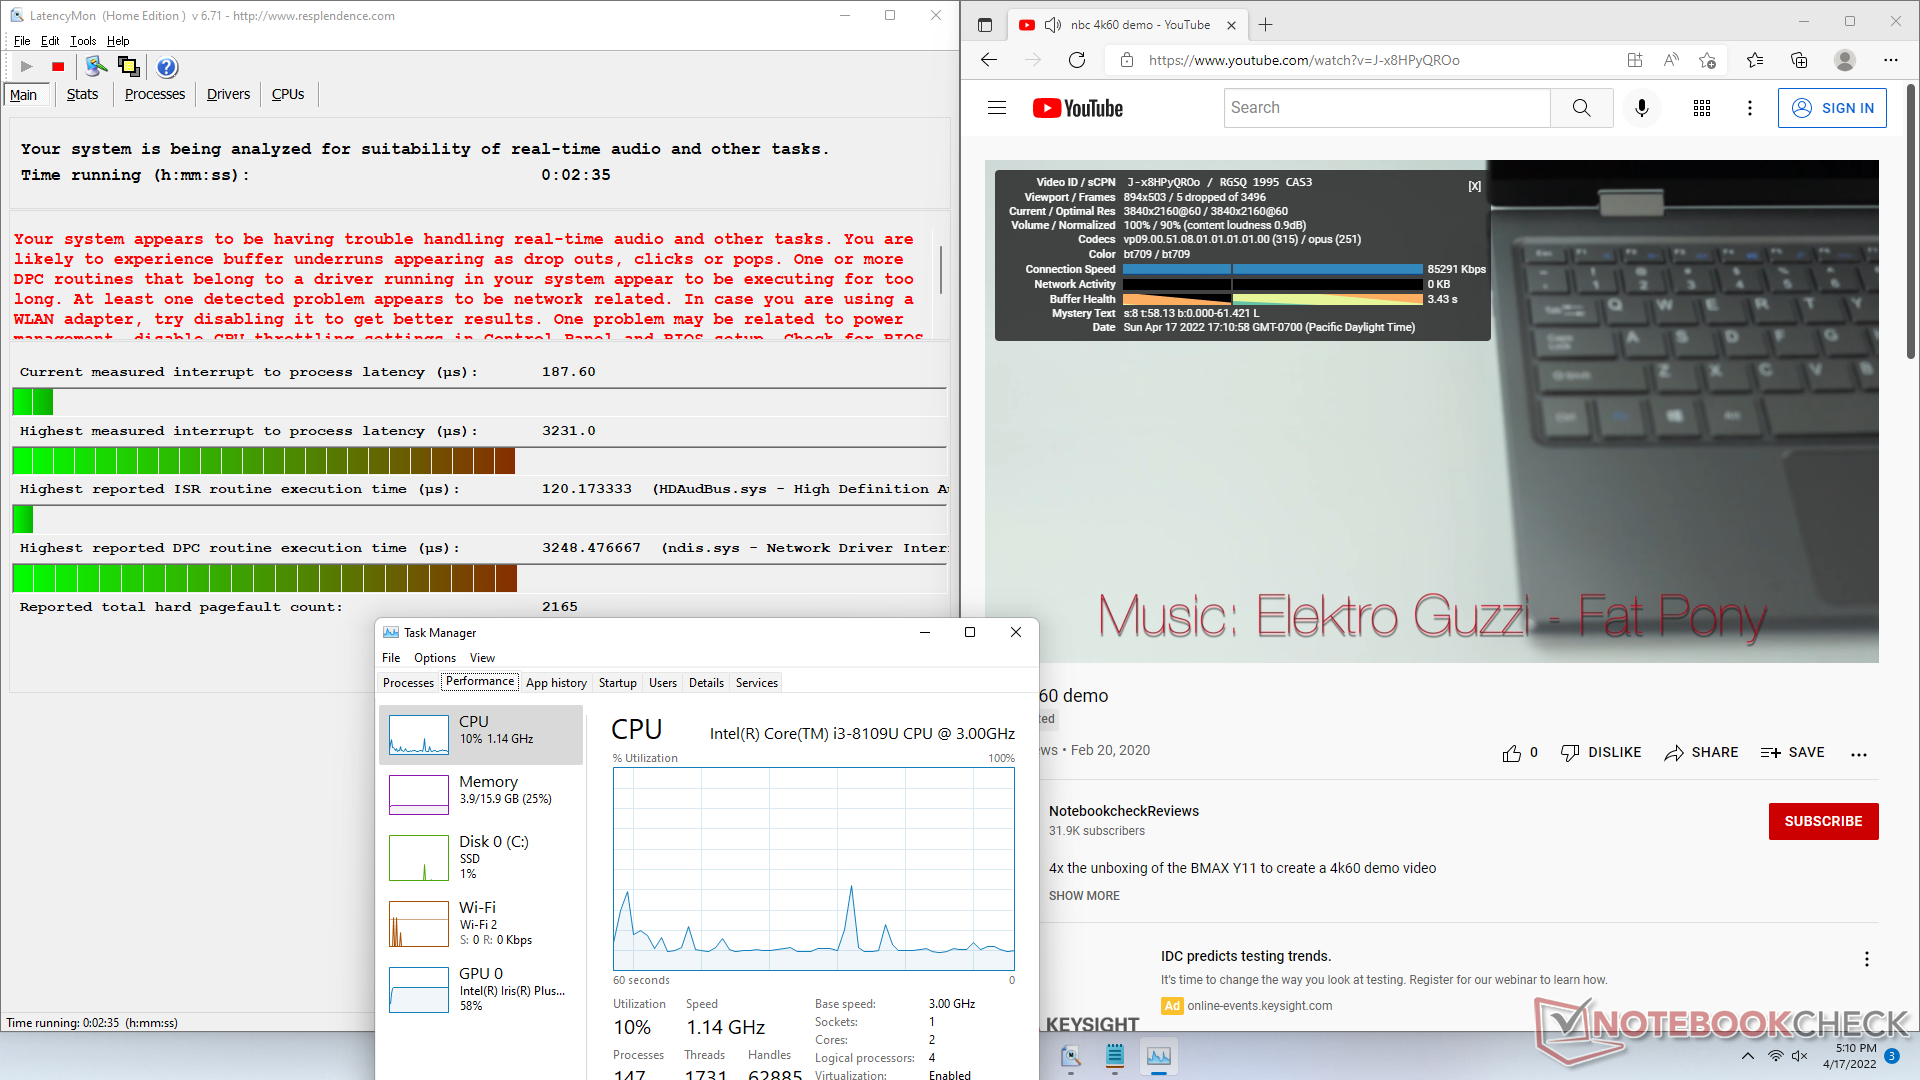
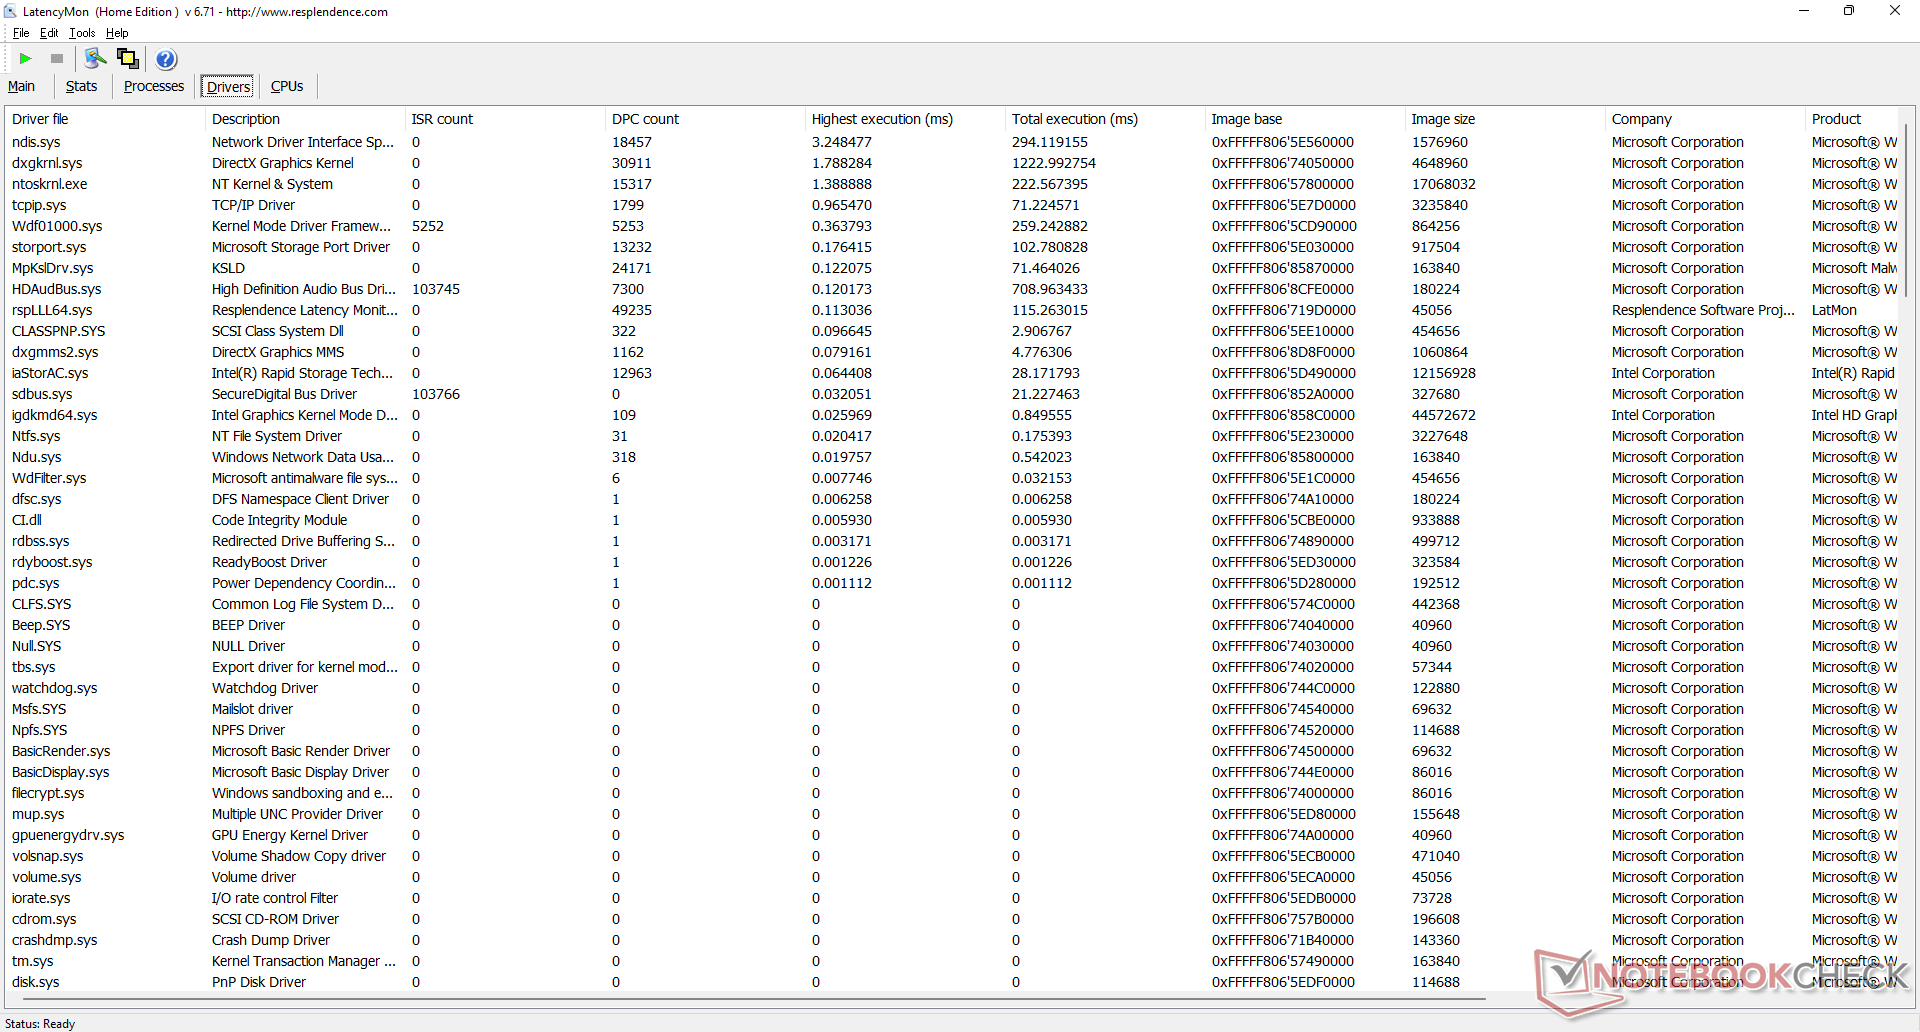
Latencia del CPD
LatencyMon revela problemas de CPD al abrir varias pestañas del navegador de nuestra página web. la reproducción de vídeo 4K es mayormente fluida, con sólo 5 fotogramas perdidos durante nuestra prueba de vídeo de un minuto de duración.
| DPC Latencies / LatencyMon - interrupt to process latency (max), Web, Youtube, Prime95 | |
| Beelink SEi8 | |
| Beelink SEi10 | |
| GMK NucBox 2 | |
| Intel NUC11TNKi5 | |
| Beelink SER4 | |
* ... más pequeño es mejor
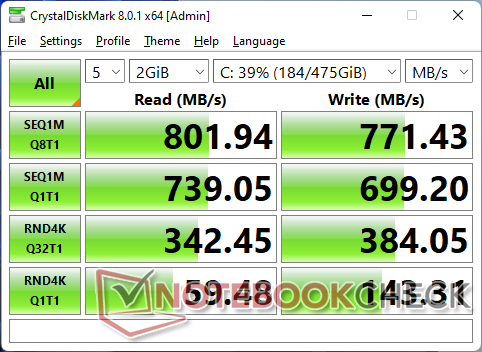
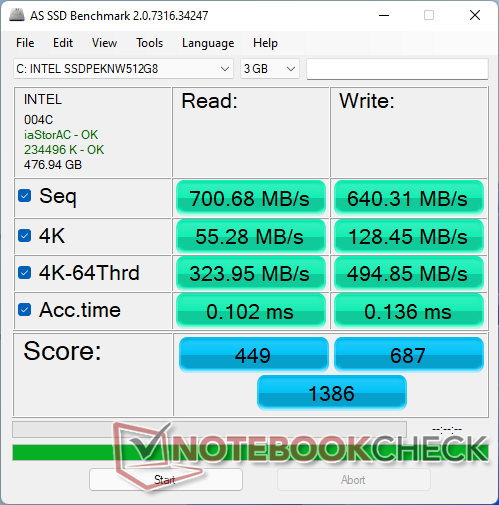
Dispositivos de almacenamiento
Nuestra unidad viene configurada con un económico SSD de 512 GB Intel 660p NVMe SSD. Aunque la unidad en sí es capaz de alcanzar velocidades de lectura y escritura secuenciales de hasta 1500 MB/s y 1000 MB/s, respectivamente, solo pudimos registrar máximos de 800 MB/s en nuestro SEi8.

| Drive Performance rating - Percent | |
| Beelink SER4 | |
| GMK NucBox 2 | |
| Beelink SEi8 | |
| Beelink SEi10 | |
| Intel NUC11TNKi5 | |
| DiskSpd | |
| seq read | |
| GMK NucBox 2 | |
| Beelink SER4 | |
| Beelink SEi10 | |
| Beelink SEi8 | |
| Intel NUC11TNKi5 | |
| seq write | |
| GMK NucBox 2 | |
| Beelink SER4 | |
| Beelink SEi10 | |
| Beelink SEi8 | |
| Intel NUC11TNKi5 | |
| seq q8 t1 read | |
| GMK NucBox 2 | |
| Beelink SEi10 | |
| Beelink SER4 | |
| Beelink SEi8 | |
| Intel NUC11TNKi5 | |
| seq q8 t1 write | |
| GMK NucBox 2 | |
| Beelink SER4 | |
| Beelink SEi10 | |
| Beelink SEi8 | |
| Intel NUC11TNKi5 | |
| 4k q1 t1 read | |
| Beelink SER4 | |
| Beelink SEi8 | |
| Beelink SEi10 | |
| GMK NucBox 2 | |
| Intel NUC11TNKi5 | |
| 4k q1 t1 write | |
| Beelink SER4 | |
| Beelink SEi10 | |
| GMK NucBox 2 | |
| Beelink SEi8 | |
| Intel NUC11TNKi5 | |
| 4k q32 t16 read | |
| Beelink SEi10 | |
| Beelink SEi8 | |
| Beelink SER4 | |
| GMK NucBox 2 | |
| Intel NUC11TNKi5 | |
| 4k q32 t16 write | |
| Beelink SER4 | |
| GMK NucBox 2 | |
| Beelink SEi8 | |
| Beelink SEi10 | |
| Intel NUC11TNKi5 | |
| AS SSD | |
| Score Total | |
| Beelink SER4 | |
| GMK NucBox 2 | |
| Beelink SEi8 | |
| Beelink SEi10 | |
| Intel NUC11TNKi5 | |
| Score Read | |
| GMK NucBox 2 | |
| Beelink SER4 | |
| Beelink SEi10 | |
| Beelink SEi8 | |
| Intel NUC11TNKi5 | |
| Score Write | |
| Beelink SER4 | |
| Beelink SEi8 | |
| GMK NucBox 2 | |
| Intel NUC11TNKi5 | |
| Beelink SEi10 | |
| Seq Read | |
| GMK NucBox 2 | |
| Beelink SER4 | |
| Beelink SEi10 | |
| Beelink SEi8 | |
| Intel NUC11TNKi5 | |
| Seq Write | |
| GMK NucBox 2 | |
| Beelink SER4 | |
| Beelink SEi8 | |
| Intel NUC11TNKi5 | |
| Beelink SEi10 | |
| 4K Read | |
| Beelink SER4 | |
| Beelink SEi8 | |
| GMK NucBox 2 | |
| Beelink SEi10 | |
| Intel NUC11TNKi5 | |
| 4K Write | |
| Beelink SER4 | |
| GMK NucBox 2 | |
| Beelink SEi8 | |
| Beelink SEi10 | |
| Intel NUC11TNKi5 | |
| 4K-64 Read | |
| GMK NucBox 2 | |
| Beelink SEi10 | |
| Beelink SEi8 | |
| Beelink SER4 | |
| Intel NUC11TNKi5 | |
| 4K-64 Write | |
| Beelink SER4 | |
| Beelink SEi8 | |
| GMK NucBox 2 | |
| Intel NUC11TNKi5 | |
| Beelink SEi10 | |
| Access Time Read | |
| Intel NUC11TNKi5 | |
| Beelink SEi8 | |
| Beelink SER4 | |
| Beelink SEi10 | |
| GMK NucBox 2 | |
| Access Time Write | |
| Beelink SEi10 | |
| GMK NucBox 2 | |
| Intel NUC11TNKi5 | |
| Beelink SER4 | |
| Beelink SEi8 | |
* ... más pequeño es mejor
Disk Throttling: DiskSpd Read Loop, Queue Depth 8
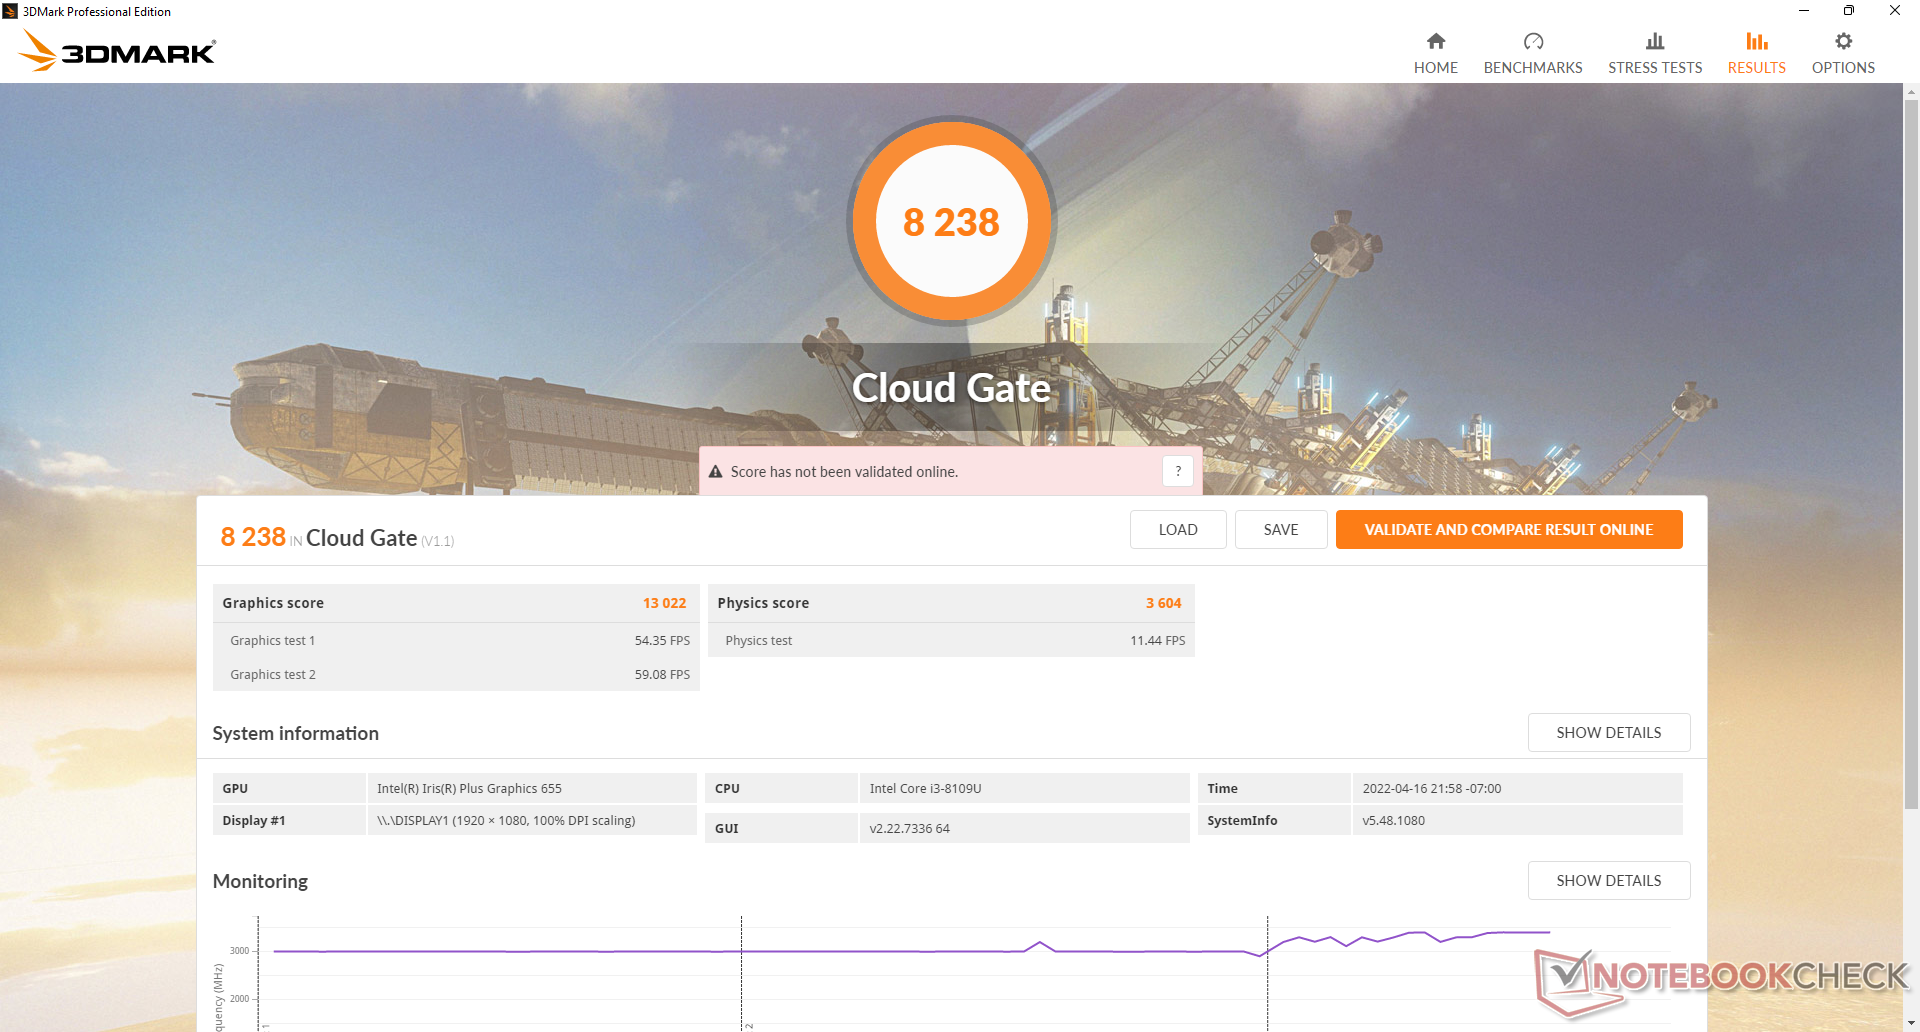
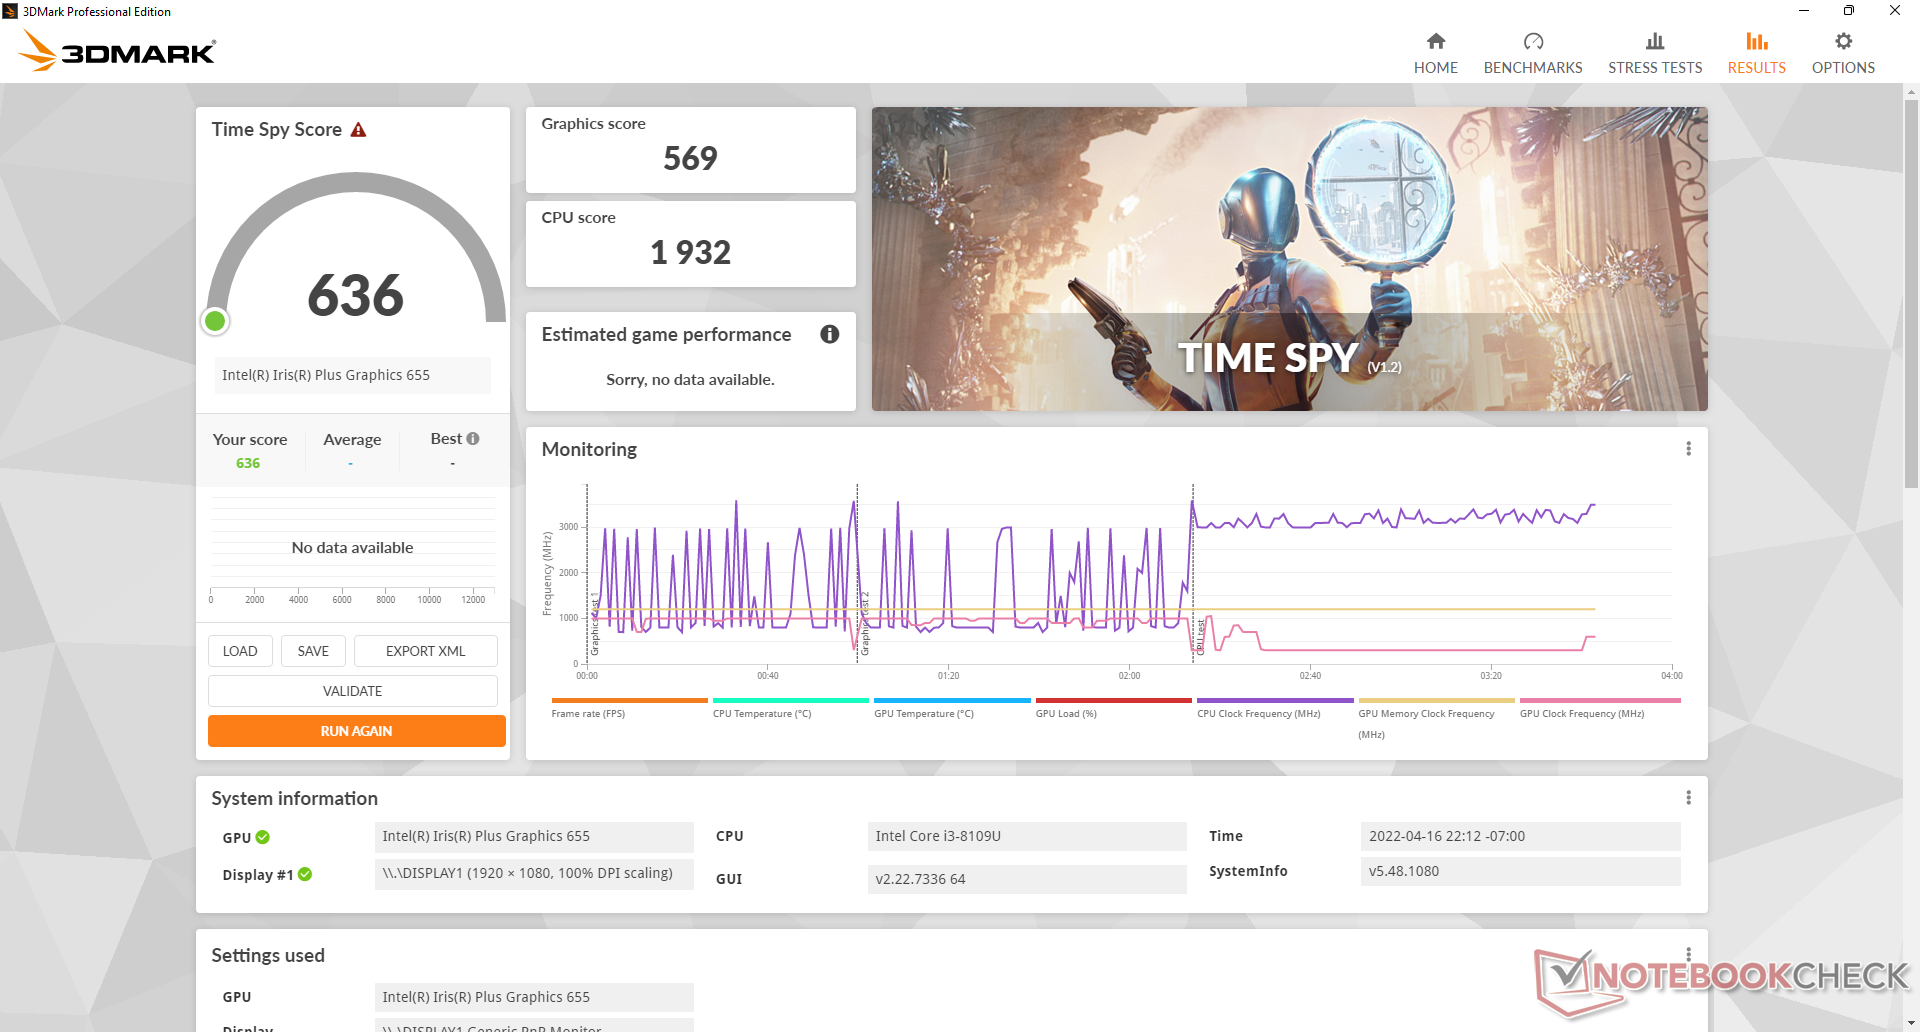
Rendimiento de la GPU
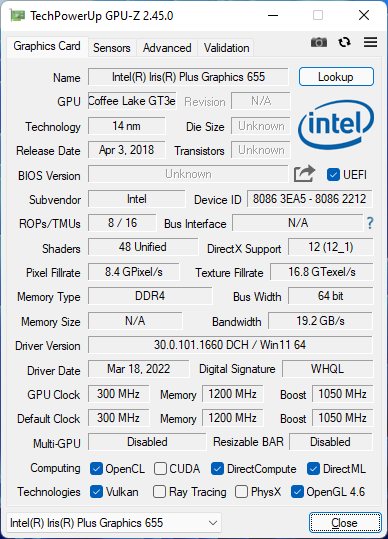
El rendimiento gráfico bruto del Iris Plus 655 es aproximadamente entre un 40 y un 50 por ciento más rápido que la media de los UHD Graphics 620 que se encuentra en muchos mini PCs con tecnología Intel anteriores a la 10ª generación Ice Lake. El aumento del rendimiento es respetable para tareas como el streaming y la reproducción de vídeo 4K, pero no es suficiente para los juegos Witcher 3por ejemplo, en nuestra unidad de prueba, el juego se iniciaba con problemas incluso después de actualizar todos los controladores de Windows y de los gráficos
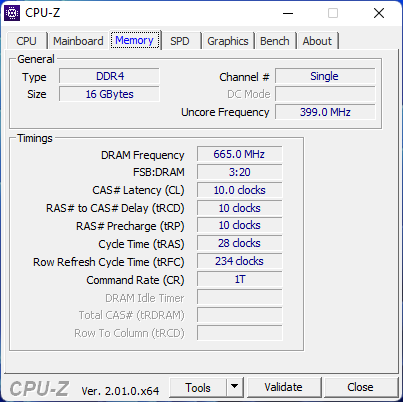
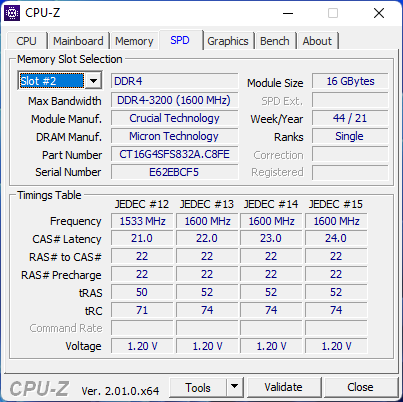
Dado que nuestra unidad de pruebas se suministró con una memoria de un solo canal, los resultados serán probablemente más rápidos que los que hemos registrado a continuación si se configura con una memoria de doble canal.
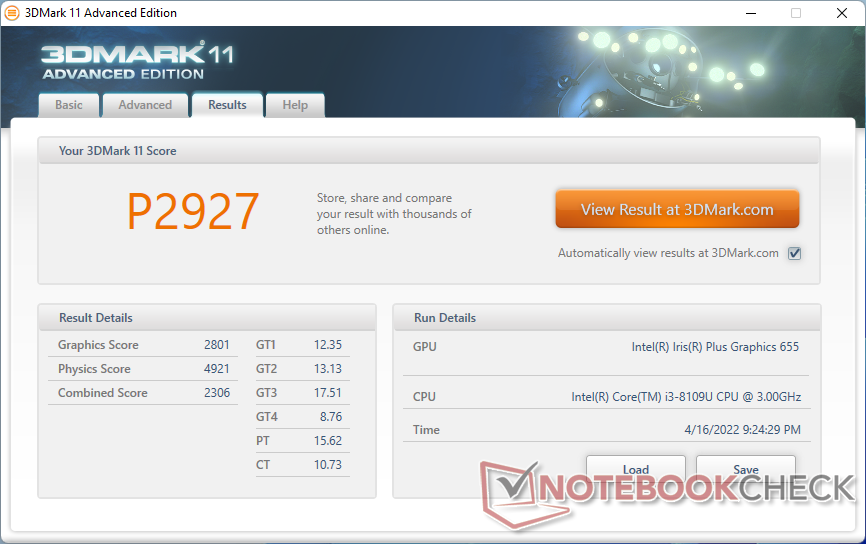
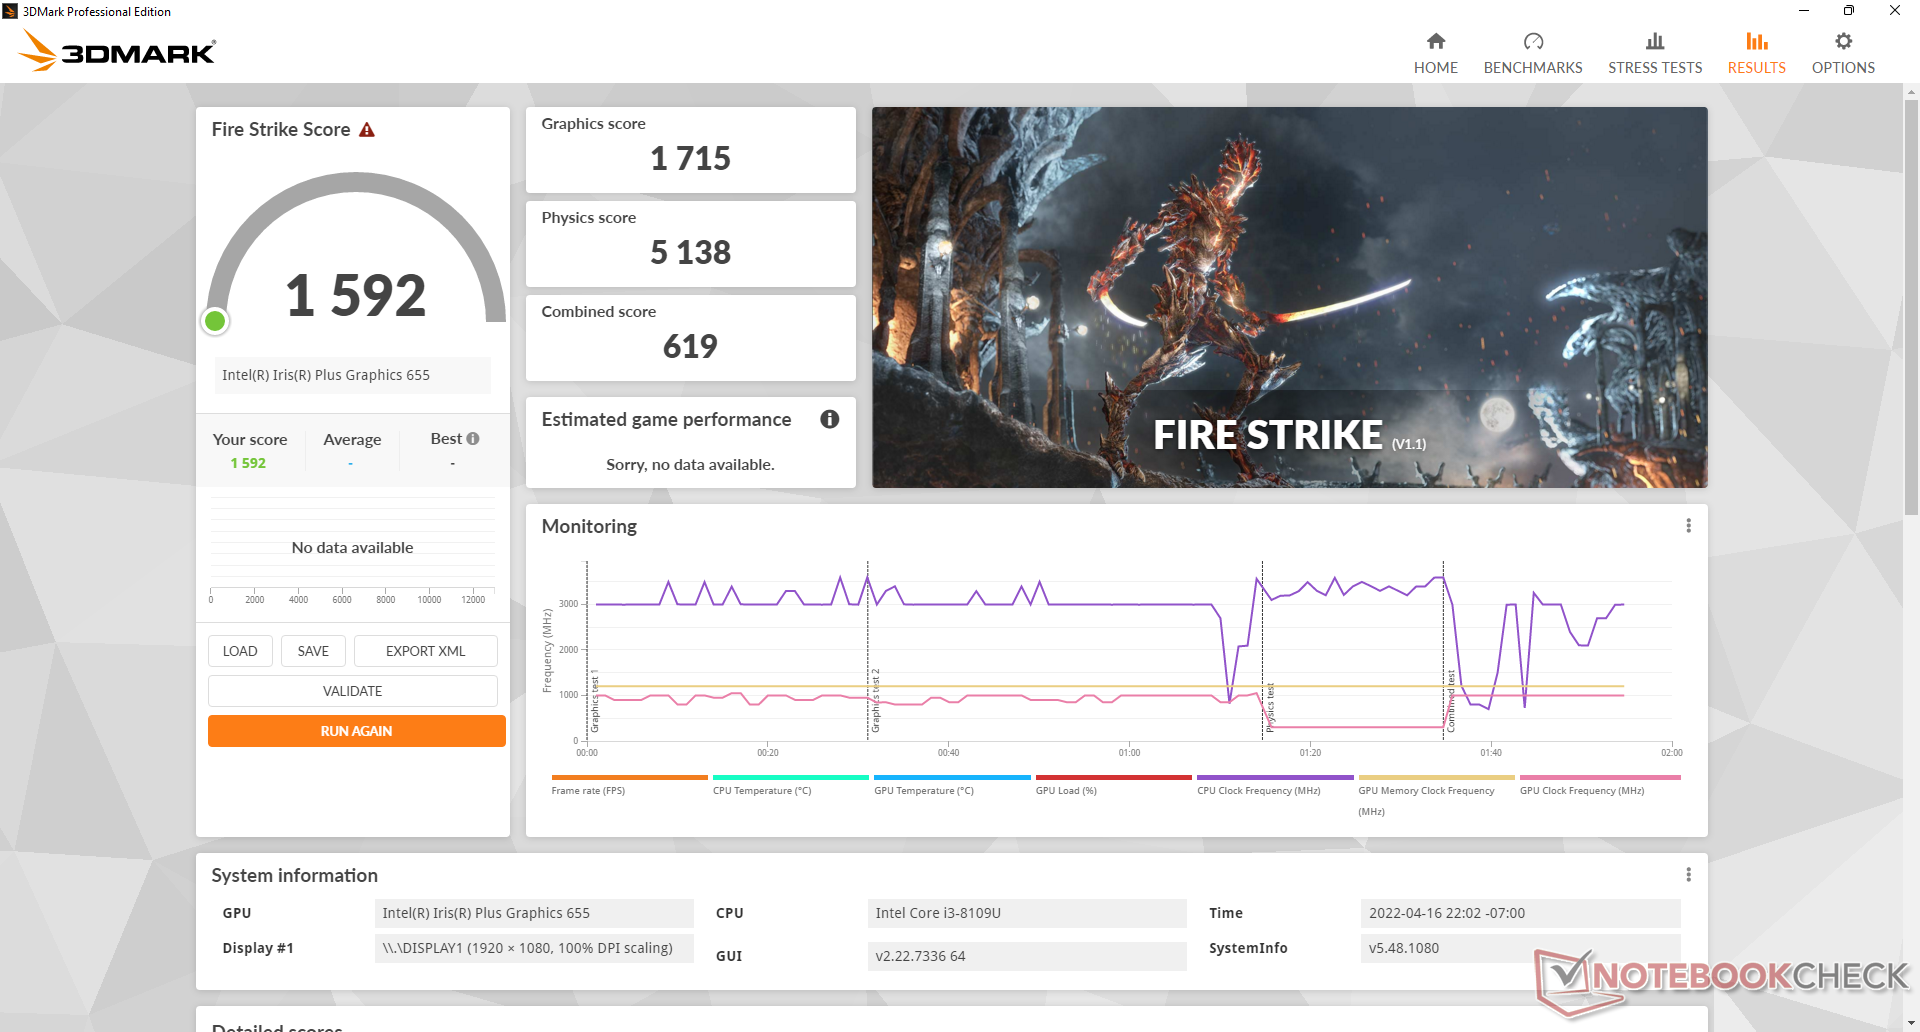
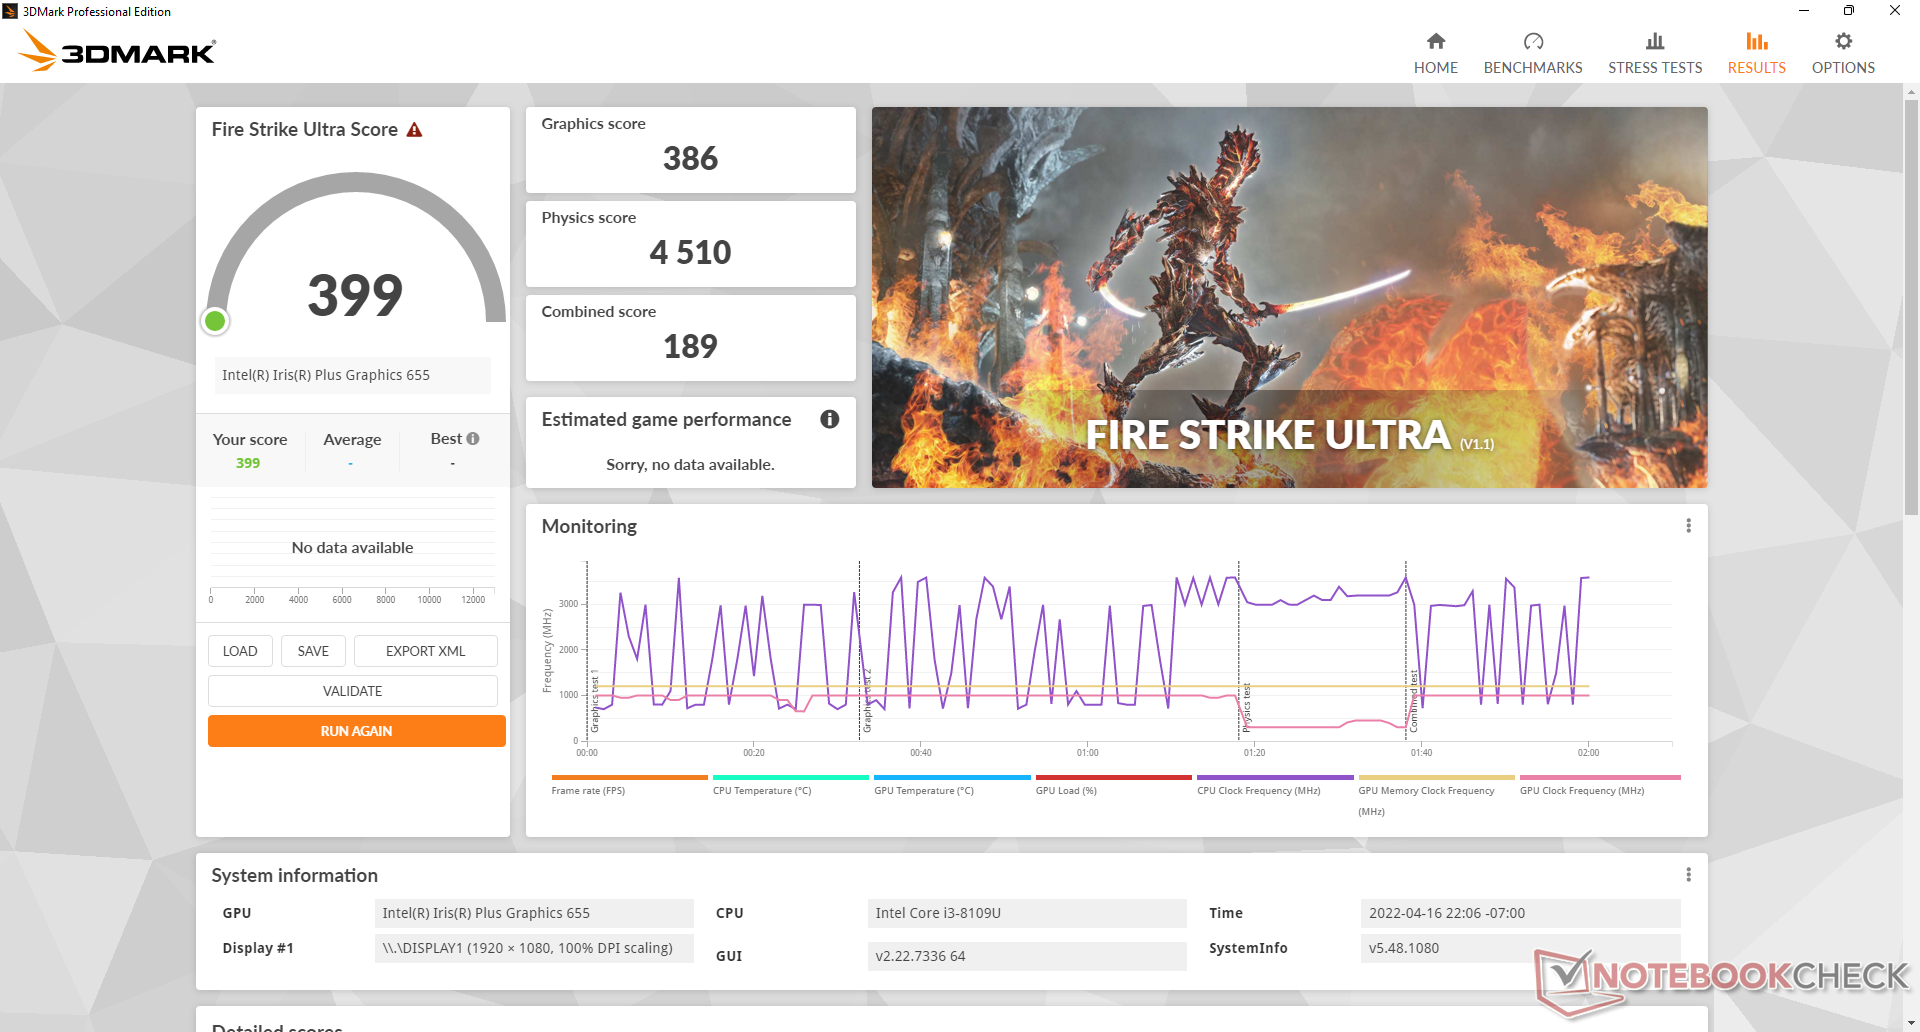
| 3DMark 11 Performance | 2927 puntos | |
| 3DMark Cloud Gate Standard Score | 8238 puntos | |
| 3DMark Fire Strike Score | 1592 puntos | |
| 3DMark Time Spy Score | 636 puntos | |
ayuda | ||
| Final Fantasy XV Benchmark | |
| 1280x720 Lite Quality | |
| Beelink SER4 | |
| Intel NUC11TNKi5 | |
| GMK NucBox 2 | |
| Intel NUC8i7BE | |
| Beelink SEi8 | |
| Medio Intel Iris Plus Graphics 655 (9.11 - 18.1, n=8) | |
| Beelink U59 | |
| GMK NucBox 3 | |
| 1920x1080 Standard Quality | |
| Beelink SER4 | |
| Intel NUC11TNKi5 | |
| GMK NucBox 2 | |
| Medio Intel Iris Plus Graphics 655 (7.88 - 9.73, n=4) | |
| Beelink SEi8 | |
| 1920x1080 High Quality | |
| Beelink SER4 | |
| Intel NUC11TNKi5 | |
| Beelink SEi8 | |
| GMK NucBox 2 | |
| Medio Intel Iris Plus Graphics 655 (5.25 - 6.55, n=4) | |
| bajo | medio | alto | ultra | |
|---|---|---|---|---|
| Dota 2 Reborn (2015) | 94.4 | 34.6 | 25.3 | 22.7 |
| Final Fantasy XV Benchmark (2018) | 16.6 | 8.8 | 6.08 | |
| X-Plane 11.11 (2018) | 22.4 | 15 | 12.3 |
Emisiones
Ruido del sistema
El ruido del ventilador es en gran medida binario, en el sentido de que las RPM tienden a fluctuar entre el mínimo y el máximo con muy pocos pasos intermedios. En otras palabras, espera que el ventilador pase de silencioso a ruidoso con bastante frecuencia al realizar varias tareas o lanzar aplicaciones. No es tan malo como en la serie Beelink GTi11 o SER4 más potente, pero los cambios de ruido del ventilador son, sin embargo, más notables y frecuentes en comparación con un NUC.
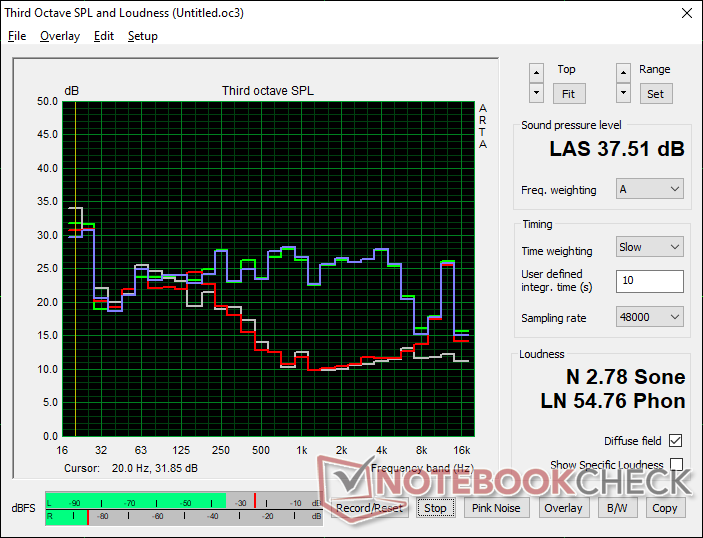
Ruido
| Ocioso |
| 26.5 / 26.5 / 31.1 dB(A) |
| Carga |
| 37.7 / 37.5 dB(A) |
 | ||
30 dB silencioso 40 dB(A) audible 50 dB(A) ruidosamente alto |
||
min: | ||
| Beelink SEi8 Iris Plus Graphics 655, i3-8109U, Intel SSD 660p SSDPEKNW512G8 | Beelink SEi10 UHD Graphics G1 (Ice Lake 32 EU), i3-1005G1, Silicon Motion AZW 256G M.2280 NVMe 4X 200725 D | Beelink SER4 Vega 8, R7 4800U, Intel SSD 660p SSDPEKNW512G8 | Intel NUC11TNKi5 Iris Xe G7 80EUs, i5-1135G7, Transcend M.2 SSD 430S TS512GMTS430S | Intel NUC8i7BE Iris Plus Graphics 655, i7-8559U | GMK NucBox 2 Iris Plus Graphics 655, i5-8259U, Netac S930E8/256GPN | |
|---|---|---|---|---|---|---|
| Noise | -17% | -11% | -18% | -9% | 5% | |
| apagado / medio ambiente * (dB) | 24.5 | 27.5 -12% | 23.4 4% | 24.8 -1% | 28.7 -17% | 25.6 -4% |
| Idle Minimum * (dB) | 26.5 | 30.9 -17% | 33.2 -25% | 35.6 -34% | 28.7 -8% | 25.7 3% |
| Idle Average * (dB) | 26.5 | 33.5 -26% | 33.2 -25% | 35.6 -34% | 29.3 -11% | 25.7 3% |
| Idle Maximum * (dB) | 31.1 | 33.5 -8% | 33.2 -7% | 35.6 -14% | 31.8 -2% | 25.7 17% |
| Load Average * (dB) | 37.7 | 38.5 -2% | 38.6 -2% | 36.2 4% | 39 -3% | 35.3 6% |
| Load Maximum * (dB) | 37.5 | 51.6 -38% | 40.8 -9% | 47.6 -27% | 41.4 -10% | 35.1 6% |
| Witcher 3 ultra * (dB) | 39.2 | 38 | 39 |
* ... más pequeño es mejor
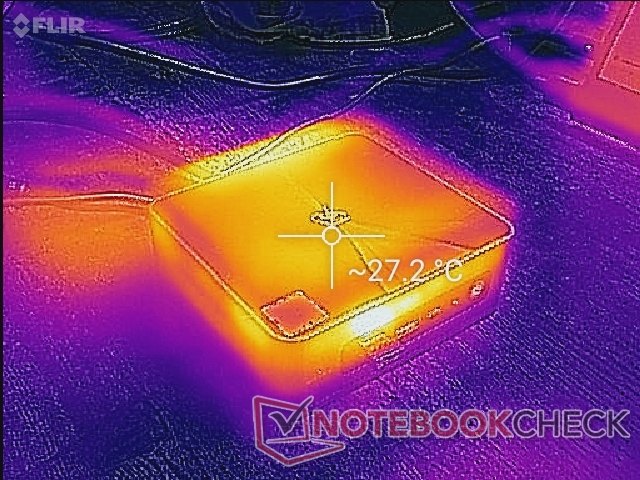
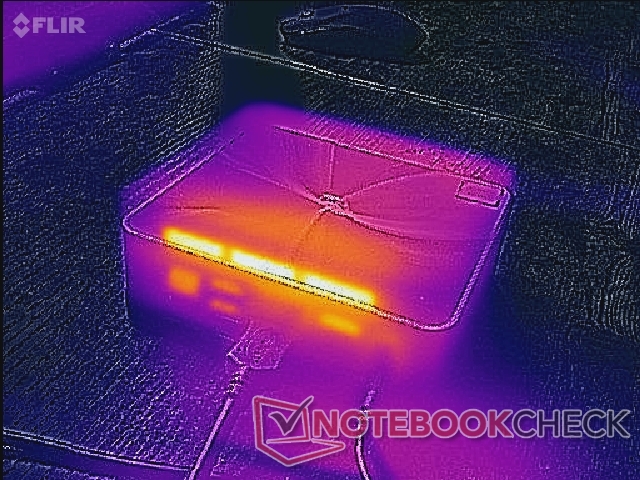
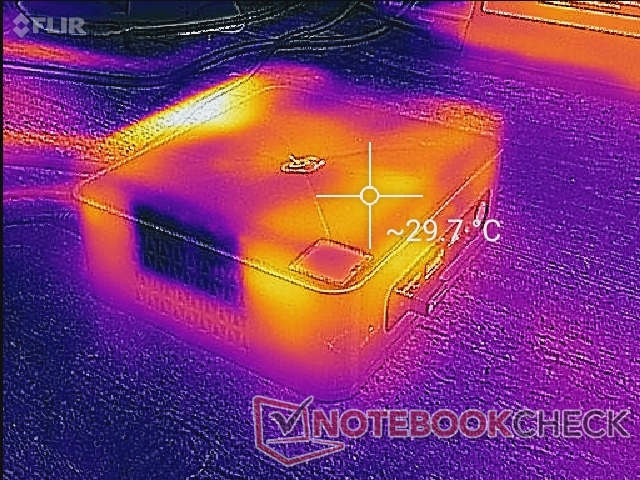
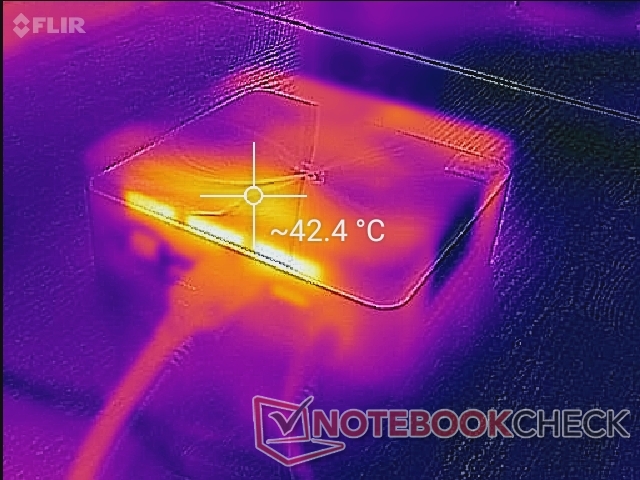
Temperatura
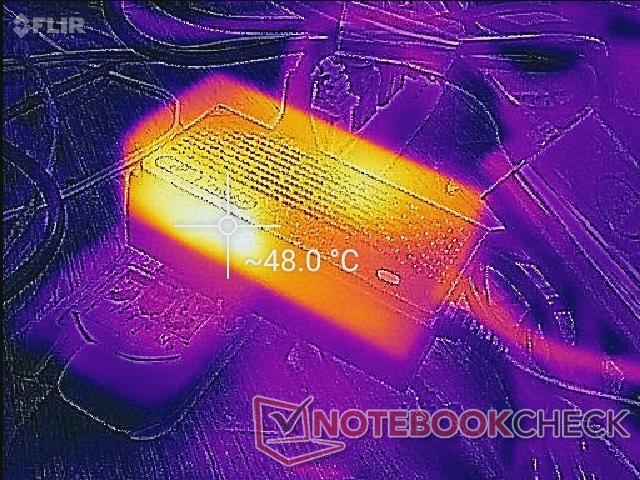
A diferencia del SER4, más potente, el SEi8 no tiene rejillas de ventilación en la superficie superior, por lo que los usuarios pueden colocar con seguridad papeles y otros objetos en la parte superior sin afectar a la refrigeración. Las rejillas de entrada de aire sólo se encuentran a lo largo de los dos lados del chasis. El punto caliente puede alcanzar más de 42 C en la parte superior más cercana a la parte trasera y junto a las rejillas de escape.
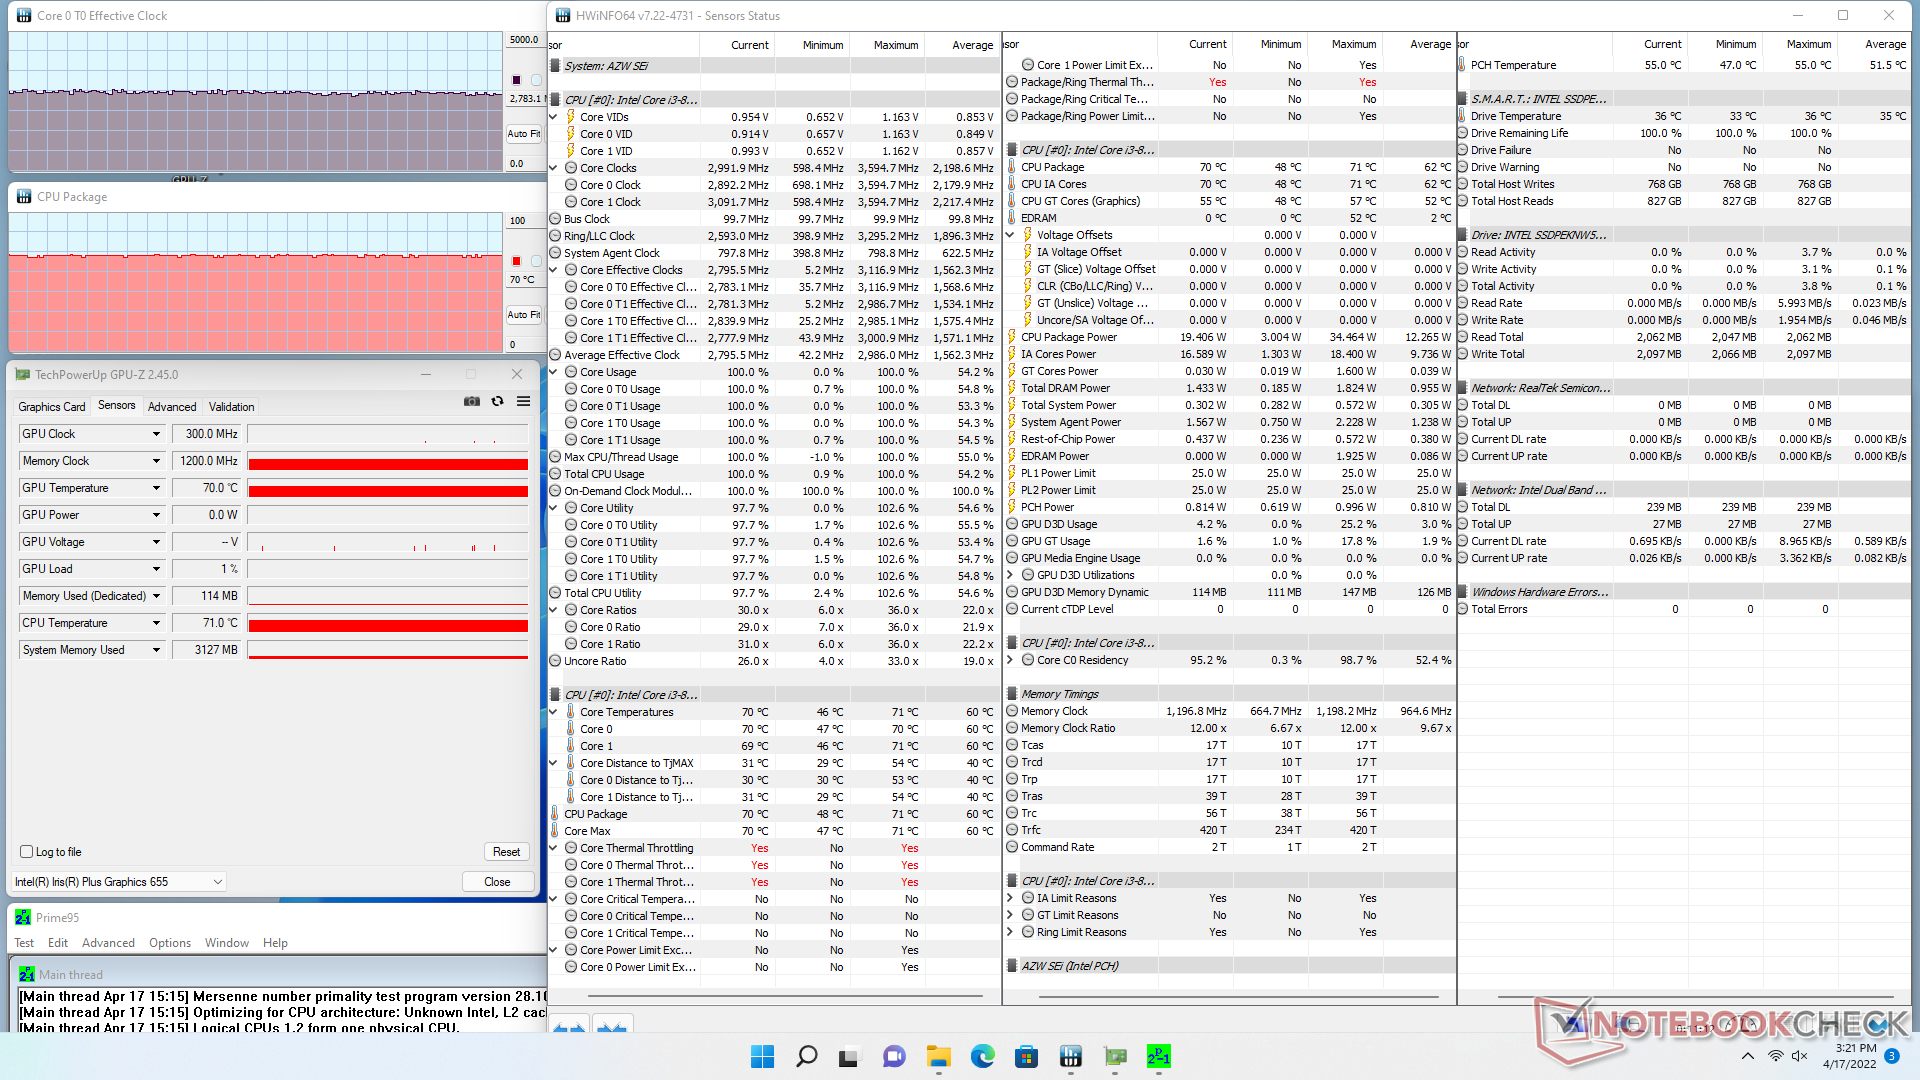
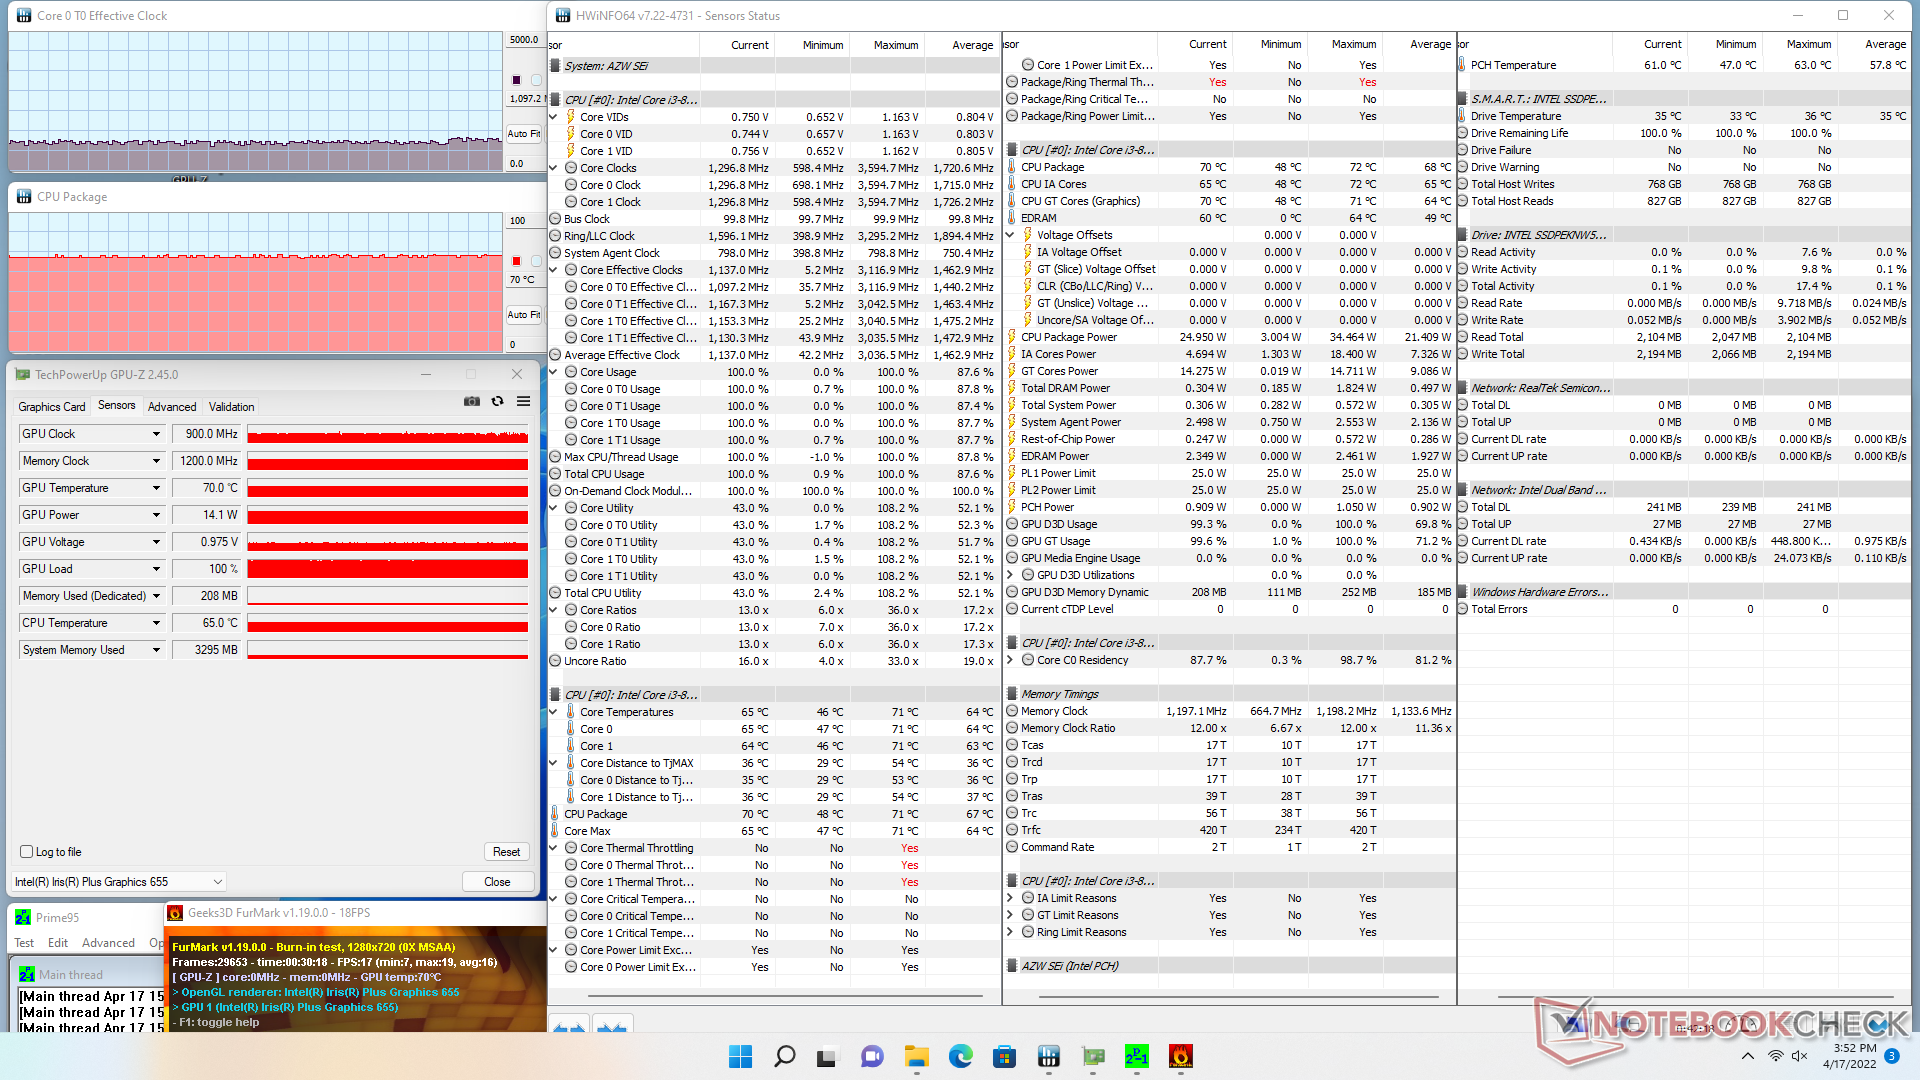
Prueba de esfuerzo
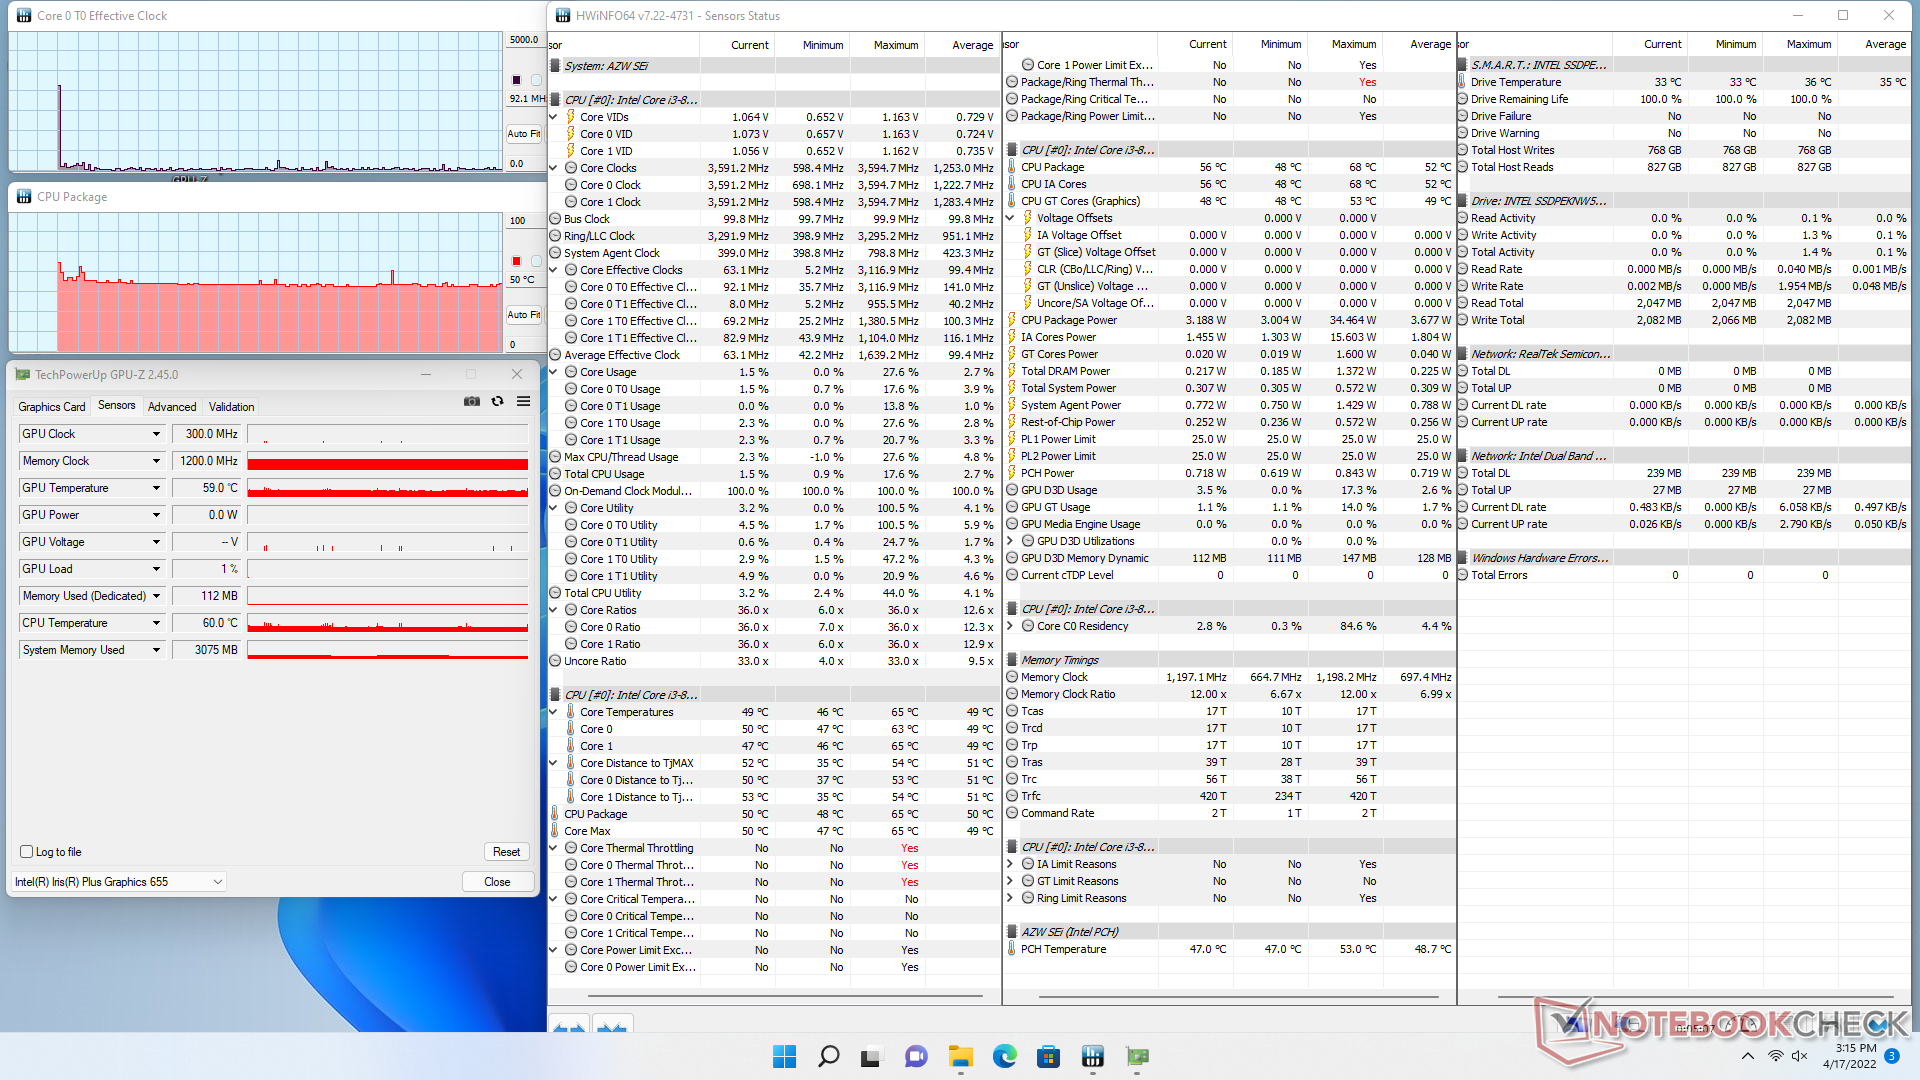
Cuando se ejecutaba Prime95, la CPU aumentaba a 2,9 GHz antes de estabilizarse en 2,8 GHz y 70 C. La potencia del paquete de la CPU también llegaba a 34,4 W durante el inicio de la prueba antes de caer y estabilizarse en 19,4 W. Al ejecutar esta misma prueba en el SEi10 con el nuevo Core i3-1005G1 se observan velocidades de reloj más altas y temperaturas del núcleo de 3,4 GHz y 90 C, respectivamente.
| Reloj dela CPU (GHz) | Reloj de la GPU (MHz) | Temperatura media de la CPU (°C) | |
| Sistema en reposo | -- | -- | 50 |
| Prime95Stress | 2.8 | -- | 70 |
| Prime95+ FurMarkStress | 1,1 | 900 | 70 |
Gestión de la energía
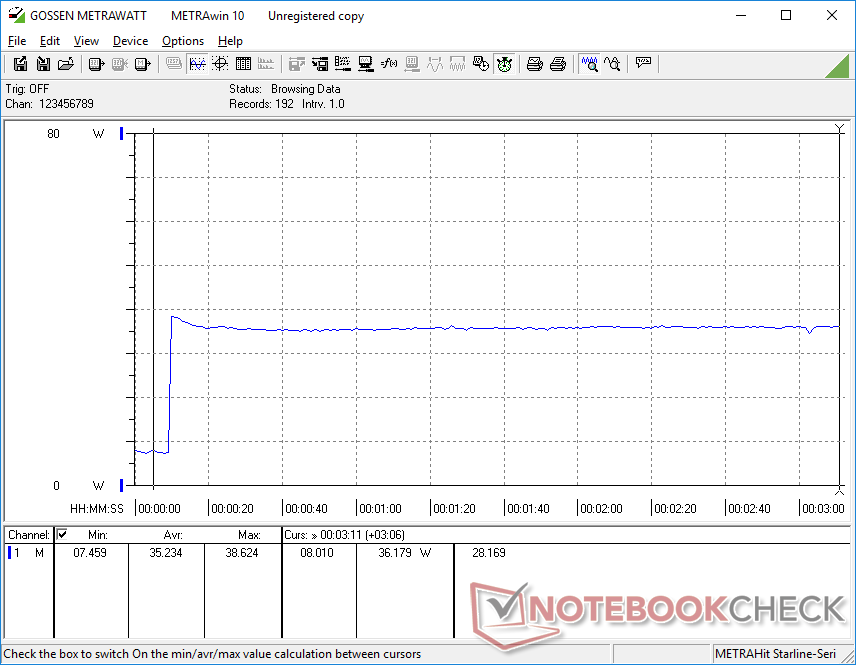
Consumo de energía
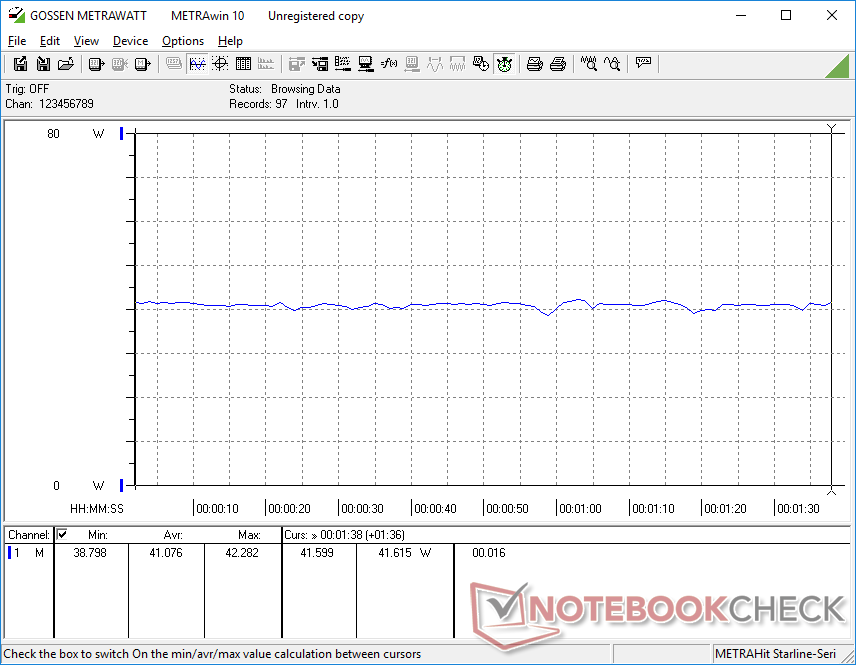
El SEi8 consume casi tanta energía como el NUC 11 con las nuevas CPUs de 11ª generación a pesar de las ventajas de rendimiento de la serie de CPUs de 11ª generación. Esto se debe a que la serie de 8ª generación está mucho menos optimizada, especialmente en términos de rendimiento gráfico integrado. Para un mayor rendimiento por vatio, los usuarios querrán considerar el SEi8 con la serie Core i5-8279U o SEi10 en su lugar.
El sistema consumirá algo más de 40 W cuando ejecute cargas exigentes.

| Off / Standby | |
| Ocioso | |
| Carga |
|
Clave:
min: | |
| Beelink SEi8 i3-8109U, Iris Plus Graphics 655, Intel SSD 660p SSDPEKNW512G8, , x, | Beelink SEi10 i3-1005G1, UHD Graphics G1 (Ice Lake 32 EU), Silicon Motion AZW 256G M.2280 NVMe 4X 200725 D, , x, | Beelink SER4 R7 4800U, Vega 8, Intel SSD 660p SSDPEKNW512G8, , x, | Intel NUC11TNKi5 i5-1135G7, Iris Xe G7 80EUs, Transcend M.2 SSD 430S TS512GMTS430S, , x, | Intel NUC8i7BE i7-8559U, Iris Plus Graphics 655, , , x, | GMK NucBox 2 i5-8259U, Iris Plus Graphics 655, Netac S930E8/256GPN, , x, | |
|---|---|---|---|---|---|---|
| Power Consumption | 16% | 32% | -47% | 4% | 3% | |
| Idle Minimum * (Watt) | 7.5 | 6.3 16% | 4.1 45% | 11.5 -53% | 2.7 64% | 6.1 19% |
| Idle Average * (Watt) | 7.6 | 6.6 13% | 4.1 46% | 12.4 -63% | 3.1 59% | 6.8 11% |
| Idle Maximum * (Watt) | 9.2 | 6.7 27% | 4.6 50% | 12.9 -40% | 6.3 32% | 7.3 21% |
| Load Average * (Watt) | 41.1 | 25.9 37% | 35.6 13% | 40.7 1% | 59.7 -45% | 46.3 -13% |
| Load Maximum * (Watt) | 41.4 | 46.7 -13% | 39.9 4% | 73.5 -78% | 78 -88% | 50.7 -22% |
| Witcher 3 ultra * (Watt) | 35.6 | 43.9 | 47.2 |
* ... más pequeño es mejor
Power Consumption Witcher 3 / Stresstest
Pro
Contra
Veredicto
Al igual que la mayoría de los otros mini PC de Beelink, el bajo precio del SEi8 es su mayor ventaja en comparación con la competencia. Un SEi8 completamente cargado con la CPU Core i3-3109U, 16 GB de RAM, Windows 11 Pro con licencia y 256 GB de SSD NVMe se vende por unos 380 dólares, mientras que un Intel NUC8I3BEK con exactamente el mismo procesador pero en una configuración barebones se puede encontrar en línea por 350 dólares.
Para ser un procesador de hace cuatro años, el Core i3-8109U es lo suficientemente rápido para las aplicaciones básicas de un HTPC, como la navegación, el streaming, la navegación por el sistema operativo y la multitarea ligera, sin las constantes ralentizaciones que suelen experimentar las soluciones más débiles basadas en Celeron o Atom. Si quieres que sea lo más barato posible y minimizar el impacto en la experiencia de la interfaz de usuario, el SEi8 Core i3 debería estar entre los primeros de la lista. Pasar al SEi8 Core i5 aumentará el rendimiento de forma significativa sin un aumento excesivo del precio para los usuarios que necesiten un procesador más rápido con más recorrido y más potencial multitarea.
Las desventajas notables del Intel NUC incluyen los materiales más delgados del chasis, el módulo WLAN más lento, la garantía más corta, el pulso más frecuente del ventilador, la ausencia de lector de tarjetas SD y las opciones más limitadas del BIOS. Afortunadamente, los recortes no son suficientes para romper el acuerdo para la configuración del HTPC de presupuesto objetivo.
Precio y disponibilidad
Beelink ya está enviando el SEi8 en múltiples configuraciones a partir de 319 dólares. Alternativamente, los usuarios pueden pedir en Amazon por 359 dólares.
Price comparison

