Análisis del mini PC Beelink SEi11: Más barato que un Intel NUC 11 pero igual de rápido

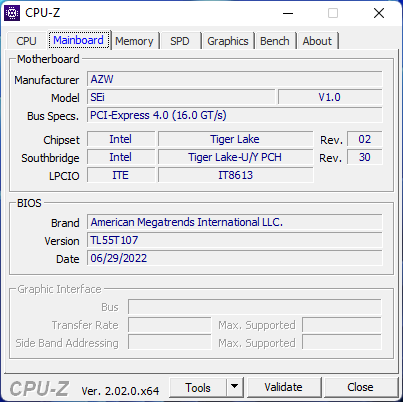
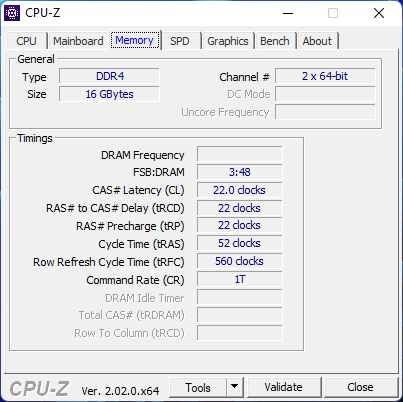
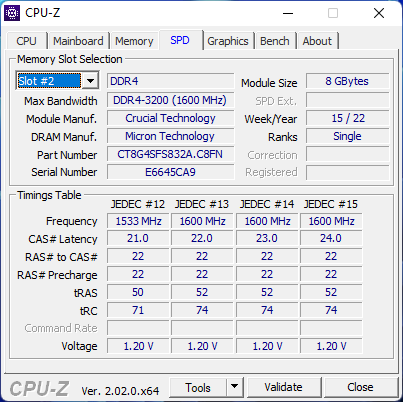
A diferencia del Beelink GTI 11, el SEi11 cuenta con una CPU de la serie Intel Core H en lugar de la serie Core U. Solo hay una configuración disponible por el momento con el Core i5-11320H de la 11ª generación Tiger Lake-H, 16 GB de RAM y 500 GB de SSD NVMe por aproximadamente 450 dólares
El SEi11 compite directamente con la serie NUC de Intel como el NUC11PAQ o NUC11TNK
Más opiniones de Beelink:
Posibles contendientes en la comparación
Valoración | Fecha | Modelo | Peso | Altura | Tamaño | Resolución | Precio |
|---|---|---|---|---|---|---|---|
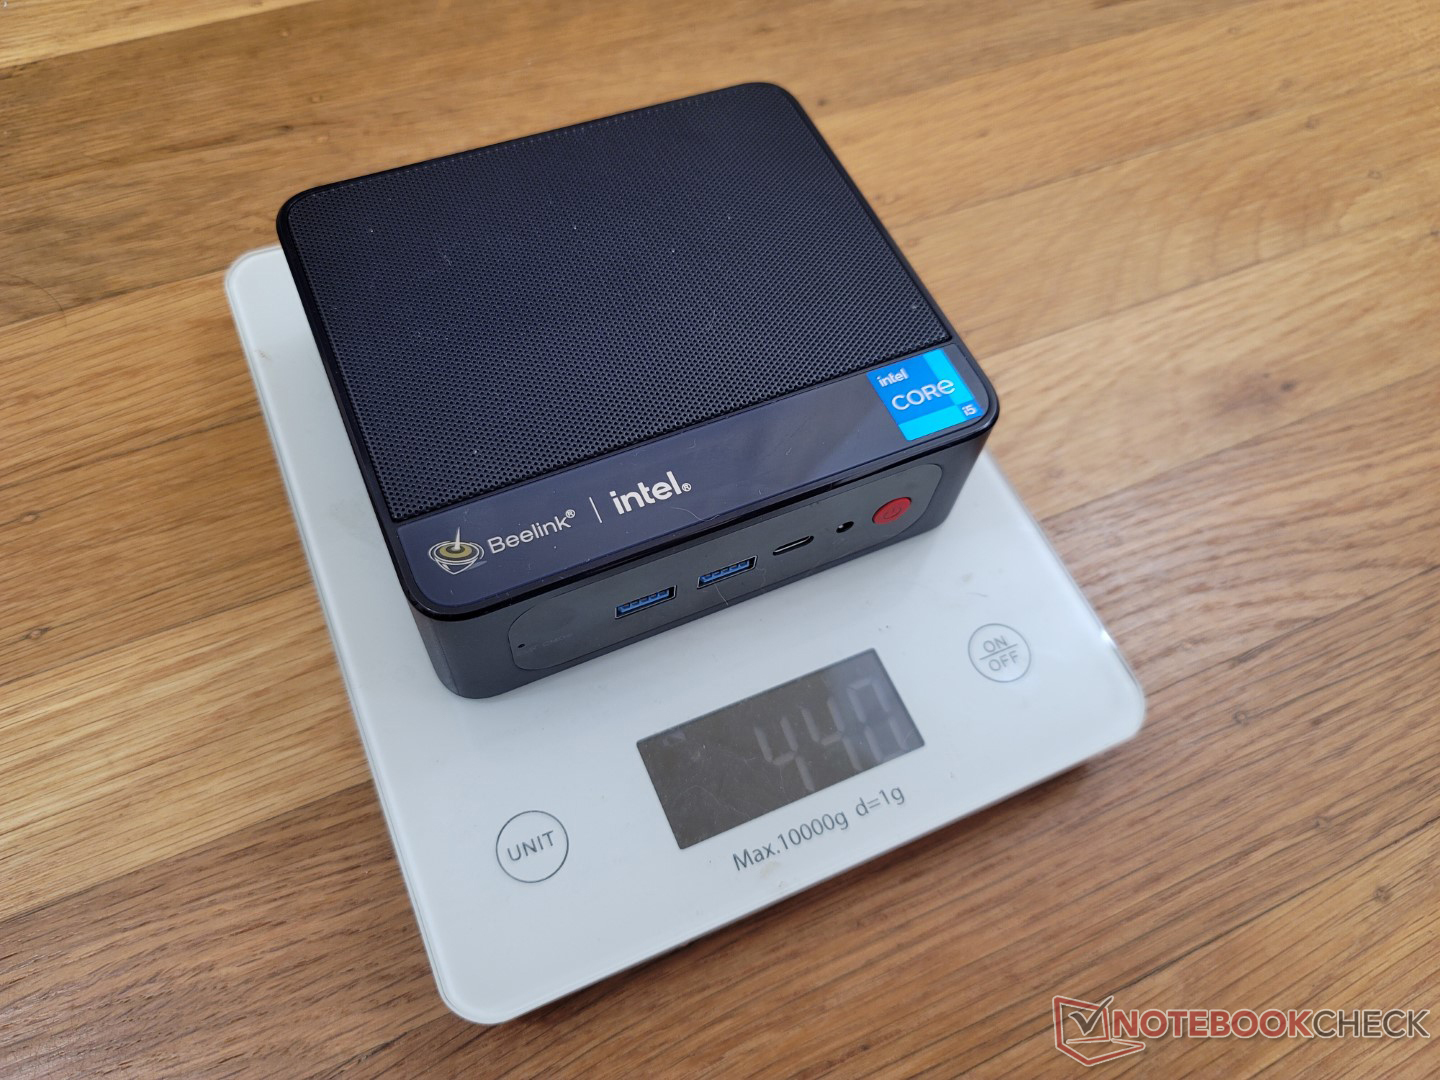
v (old) | 09/2022 | Beelink SEi11 Pro i5-11320H, Iris Xe G7 96EUs | 440 g | 40 mm | x | ||
v (old) | 01/2022 | Beelink GTR5 R9 5900HX, Vega 8 | 686 g | 39 mm | x | ||
v (old) | 12/2021 | Beelink GTI 11 i5-1135G7, Iris Xe G7 80EUs | 638 g | 39 mm | x | ||
v (old) | 04/2022 | Beelink SER4 R7 4800U, Vega 8 | 494 g | 40 mm | x | ||
v (old) | 04/2021 | Intel NUC11TNKi5 i5-1135G7, Iris Xe G7 80EUs | 504 g | 37 mm | x |
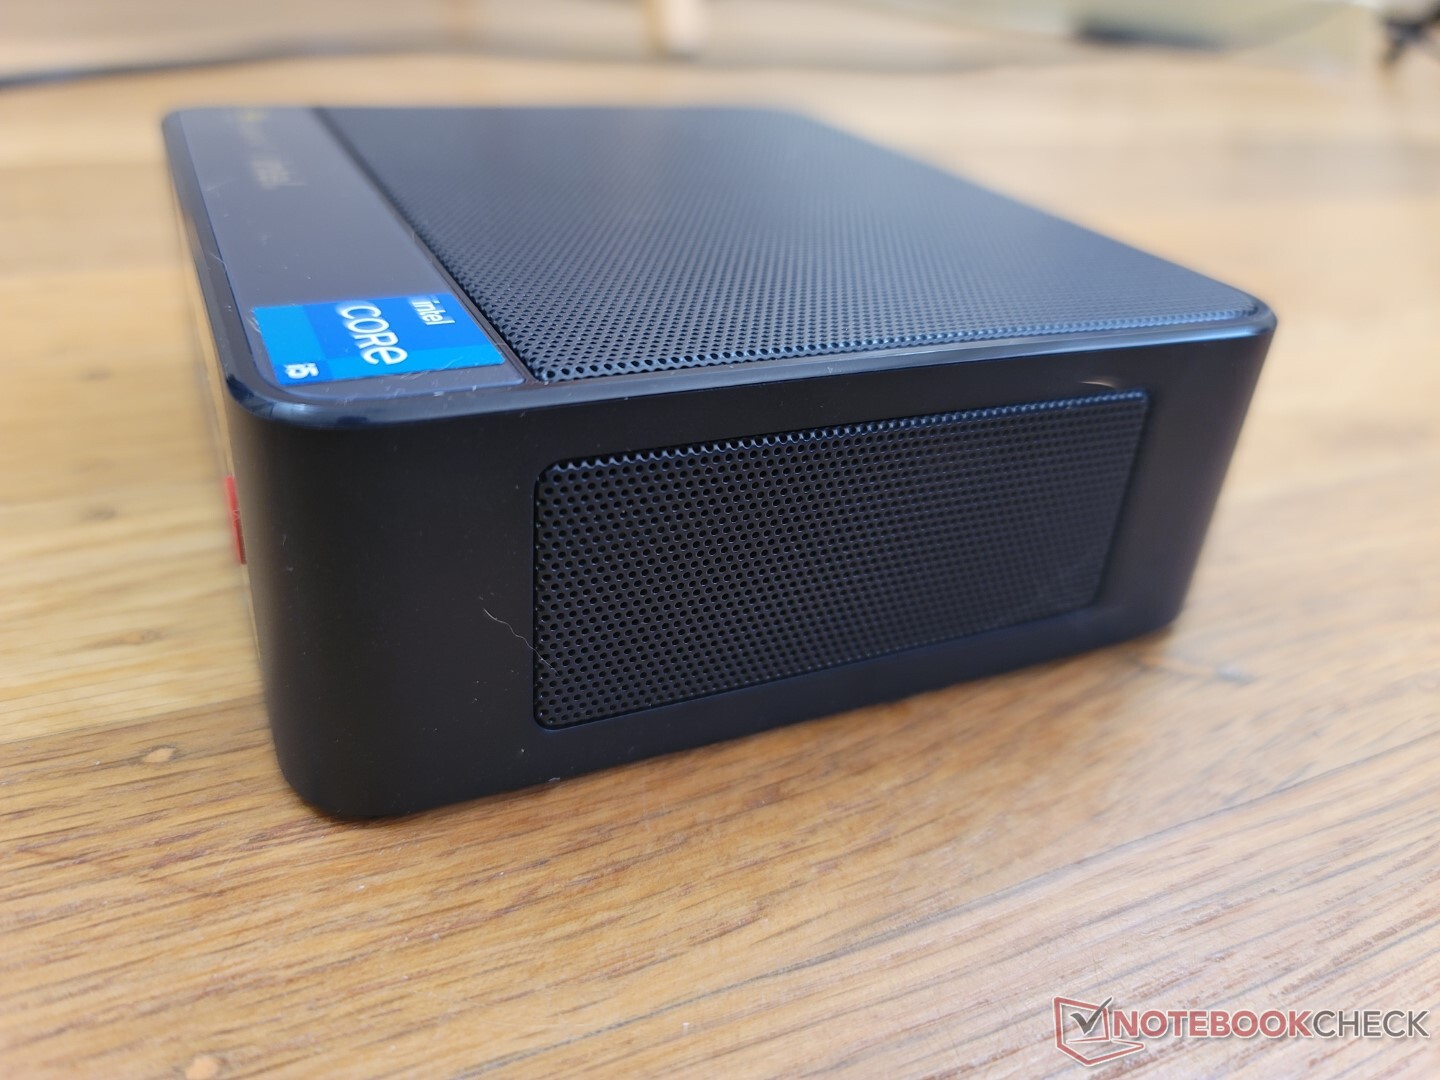
Caso
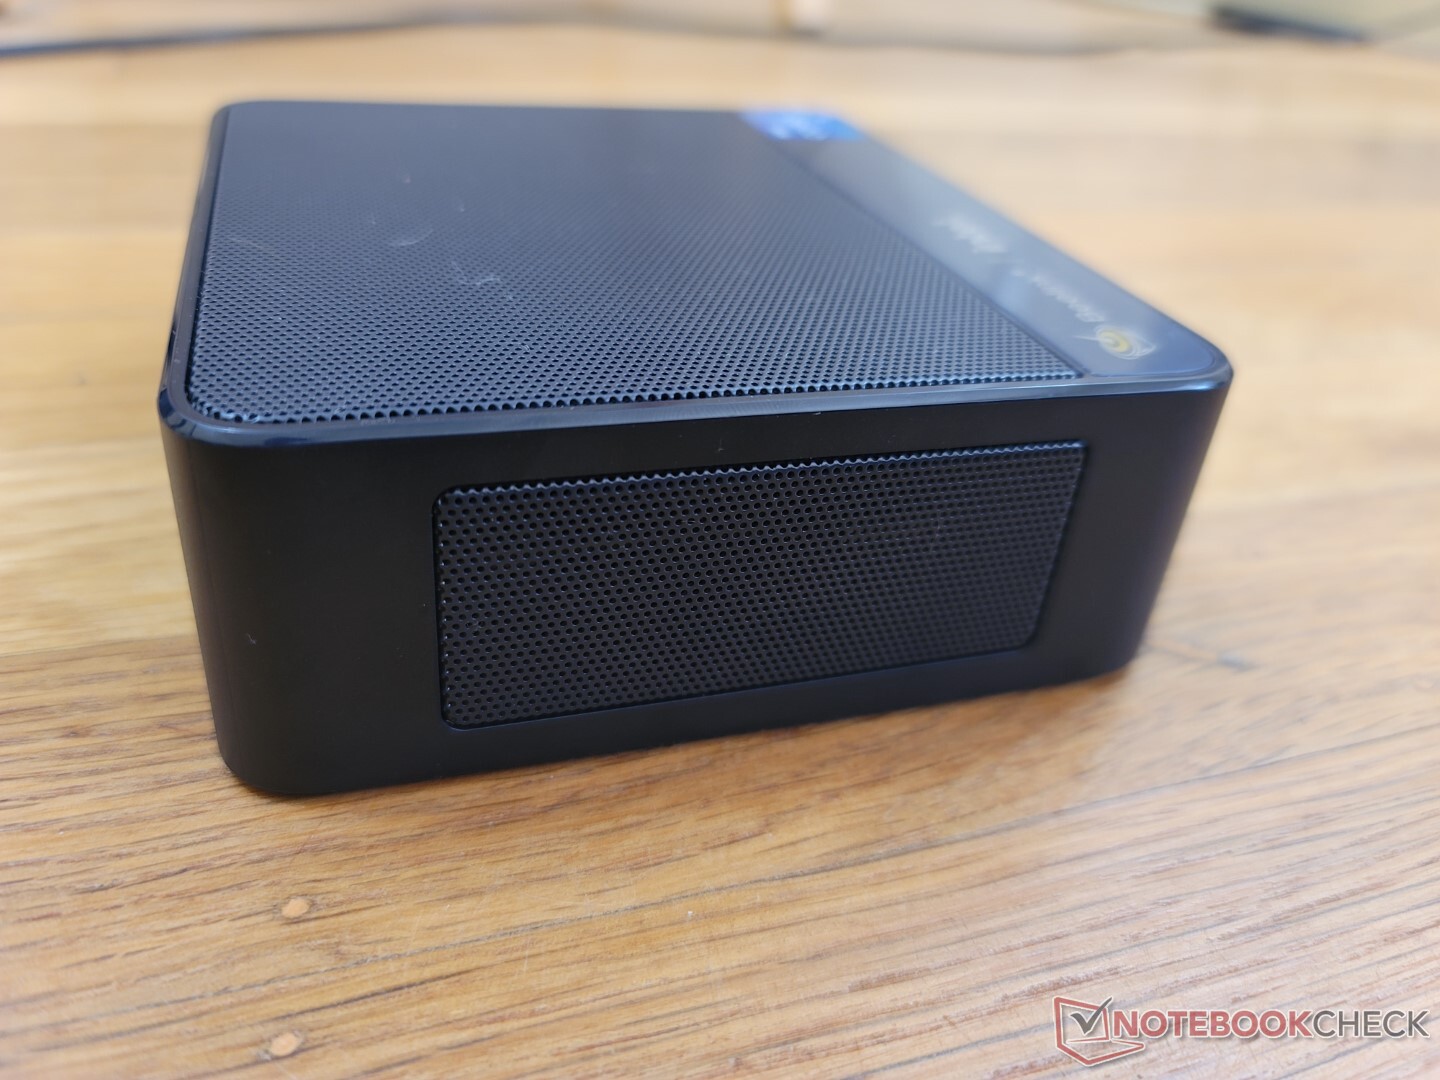
El chasis es esencialmente la versión de Intel del Beelink de AMD SER4. Las dimensiones y la construcción son casi idénticas, pero el SEi11 es aproximadamente 50 gramos más ligero, probablemente debido a algunos cambios internos menores. Visualmente, la unidad carece de la malla de color rojo en los lados y los bordes y esquinas cromados presentes en el SER4.
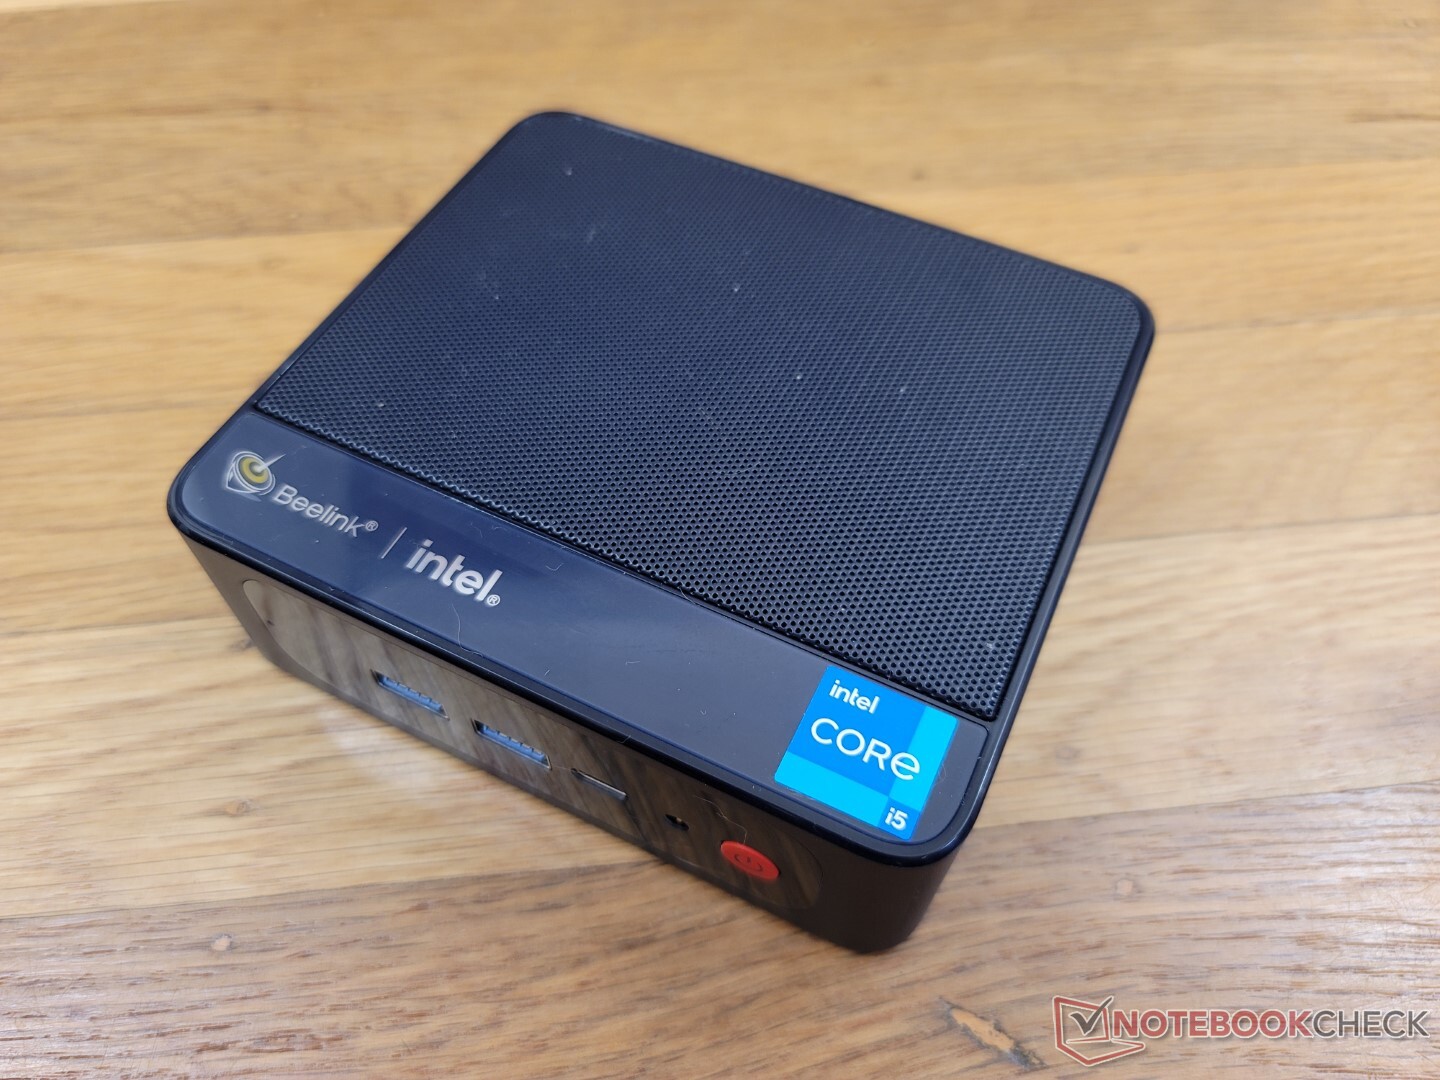
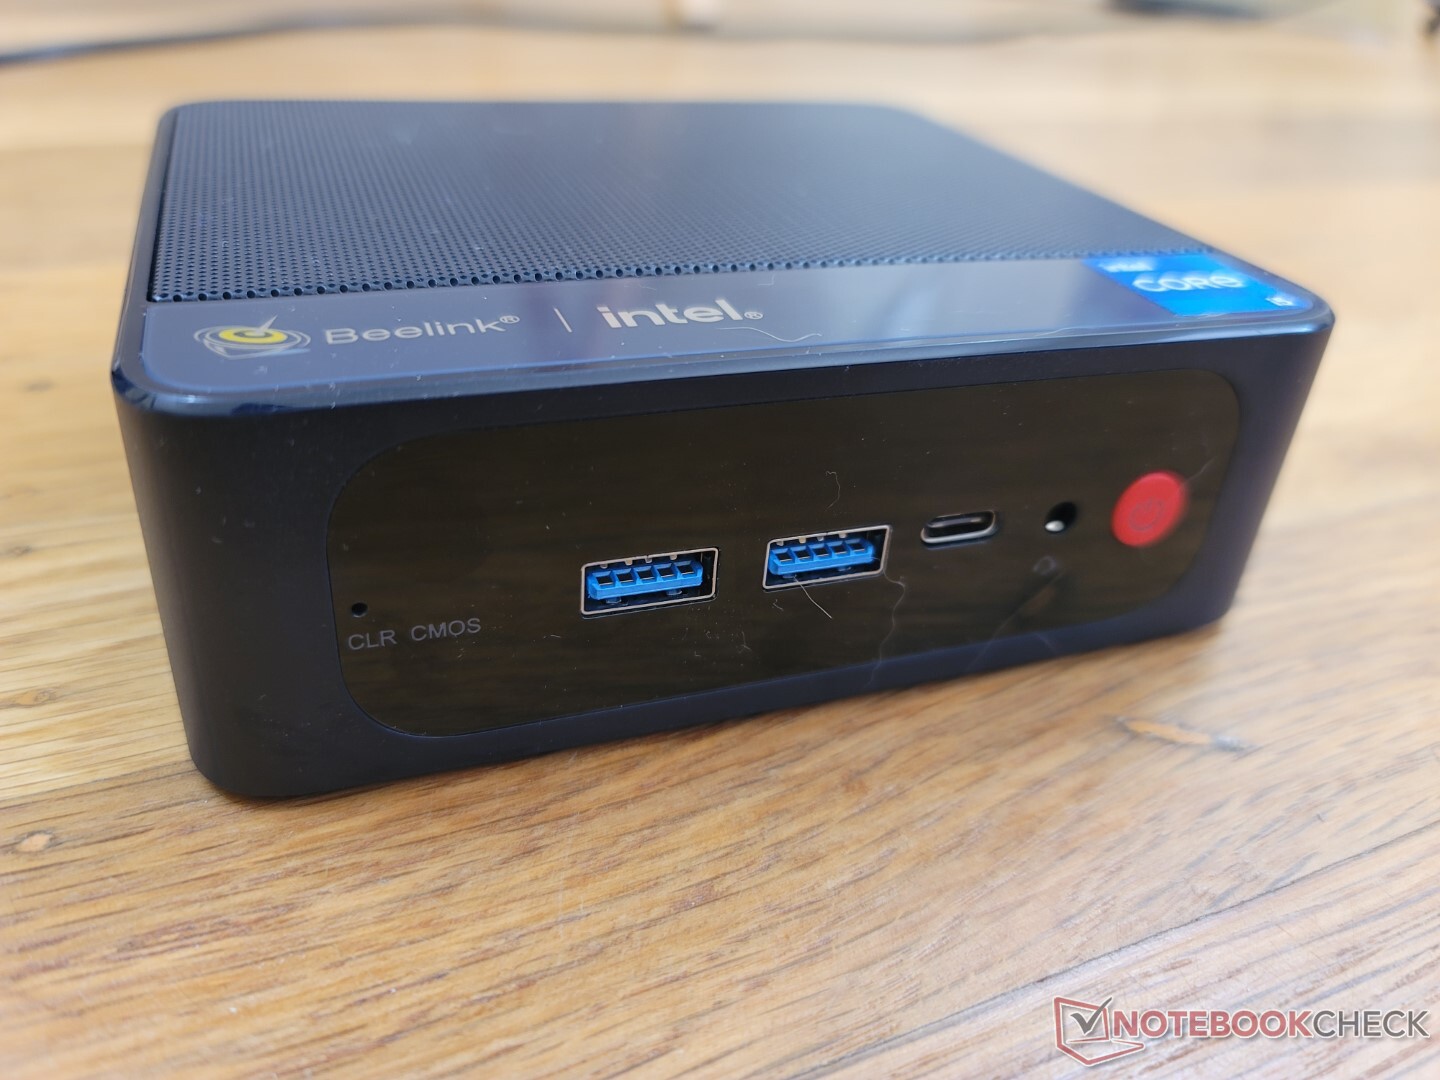
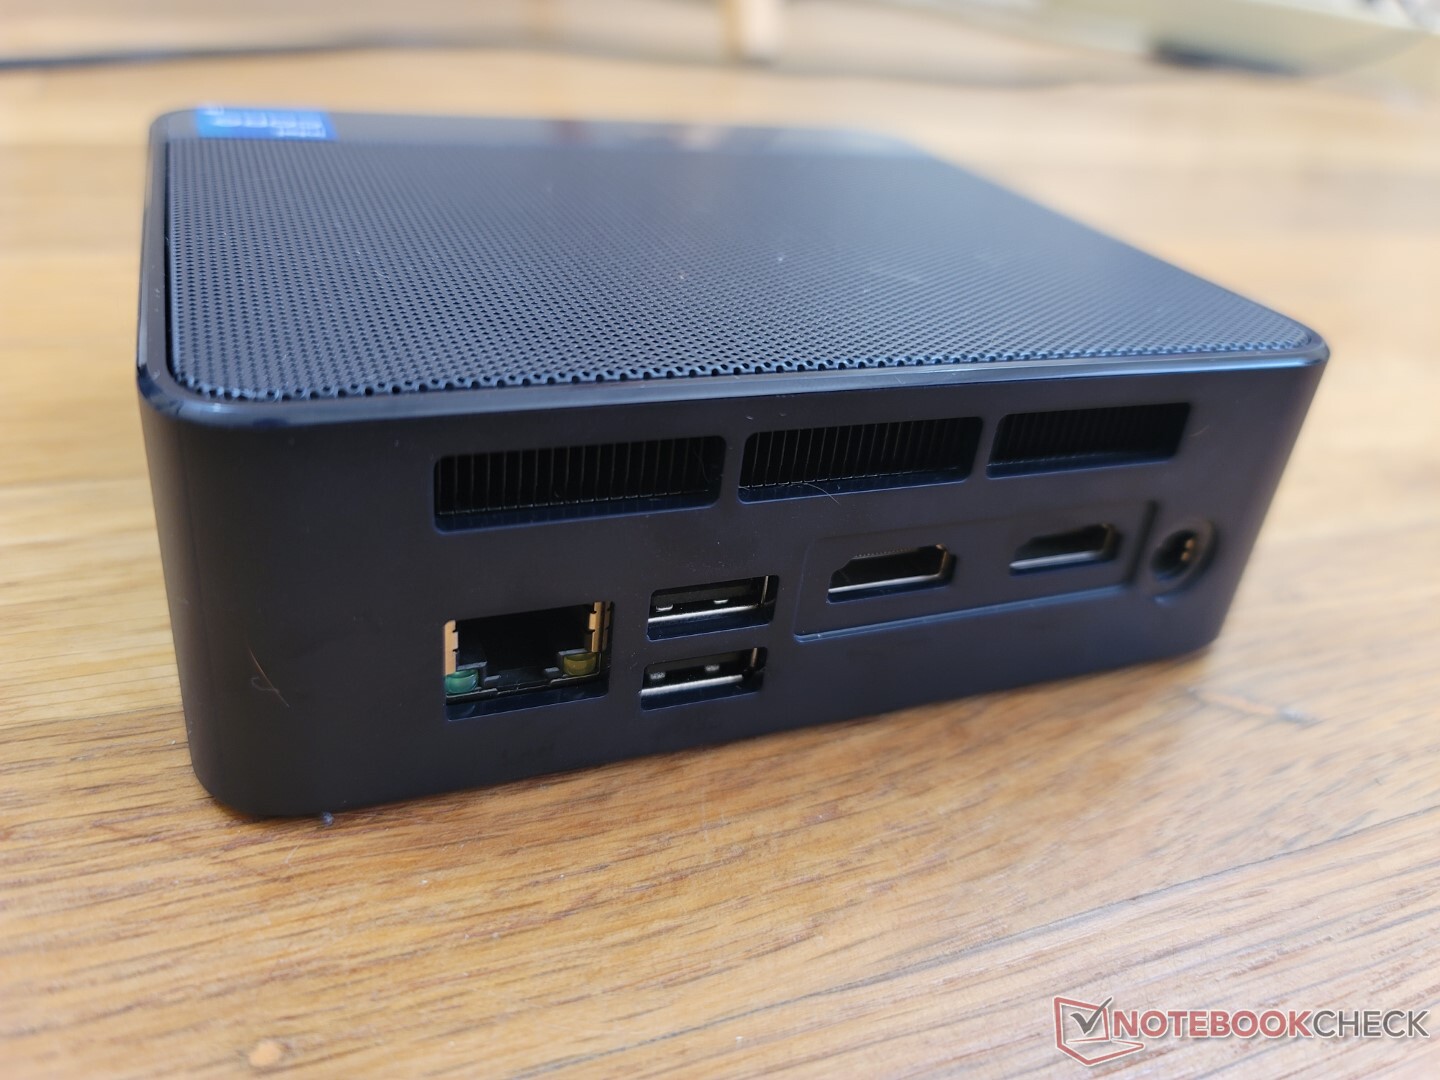
Conectividad
Las opciones de puerto y la posición son idénticas a las del SER4. Hay que tener en cuenta que el puerto USB-C no admite DisplayPort ni Power Delivery, por lo que sólo es útil para datos o carga de dispositivos externos. Intentamos conectar monitores externos USB-C y adaptadores de corriente USB-C, pero ninguno funcionó con el SEi11.
Comunicación
La unidad viene con el relativamente nuevo MediaTek RZ608 para la conectividad Wi-Fi 6E y Bluetooth 5.2. Por desgracia, el módulo no es tan fiable ni tan rápido como las soluciones Intel AX habituales. Cuando se acopla a nuestra red de 6 GHz, las tasas de transferencia alcanzan un máximo de ~750 Mbps en comparación con casi el doble de una Intel AX201 o AX210. Además, el sistema tendría problemas para detectar nuestra red de 6 GHz.
| Networking | |
| iperf3 transmit AX12 | |
| Intel NUC11TNKi5 | |
| Beelink GTI 11 | |
| Beelink SER4 | |
| Beelink GTR5 | |
| iperf3 receive AX12 | |
| Intel NUC11TNKi5 | |
| Beelink GTI 11 | |
| Beelink SER4 | |
| Beelink GTR5 | |
| iperf3 receive AXE11000 6GHz | |
| Beelink SEi11 Pro | |
| iperf3 transmit AXE11000 6GHz | |
| Beelink SEi11 Pro | |
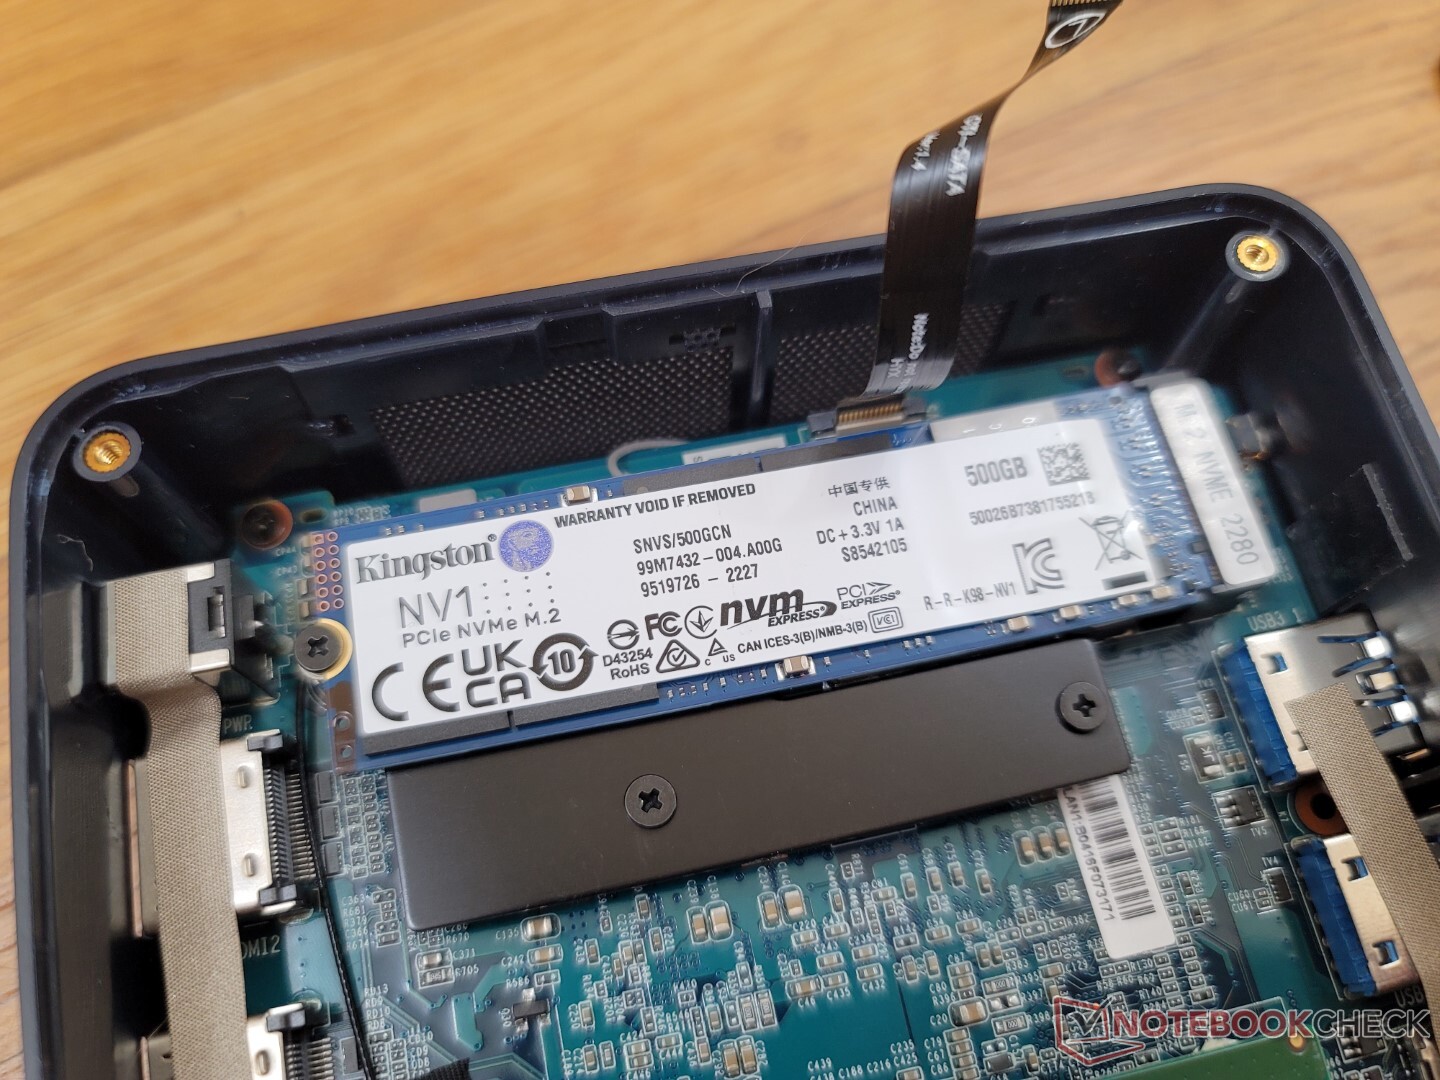
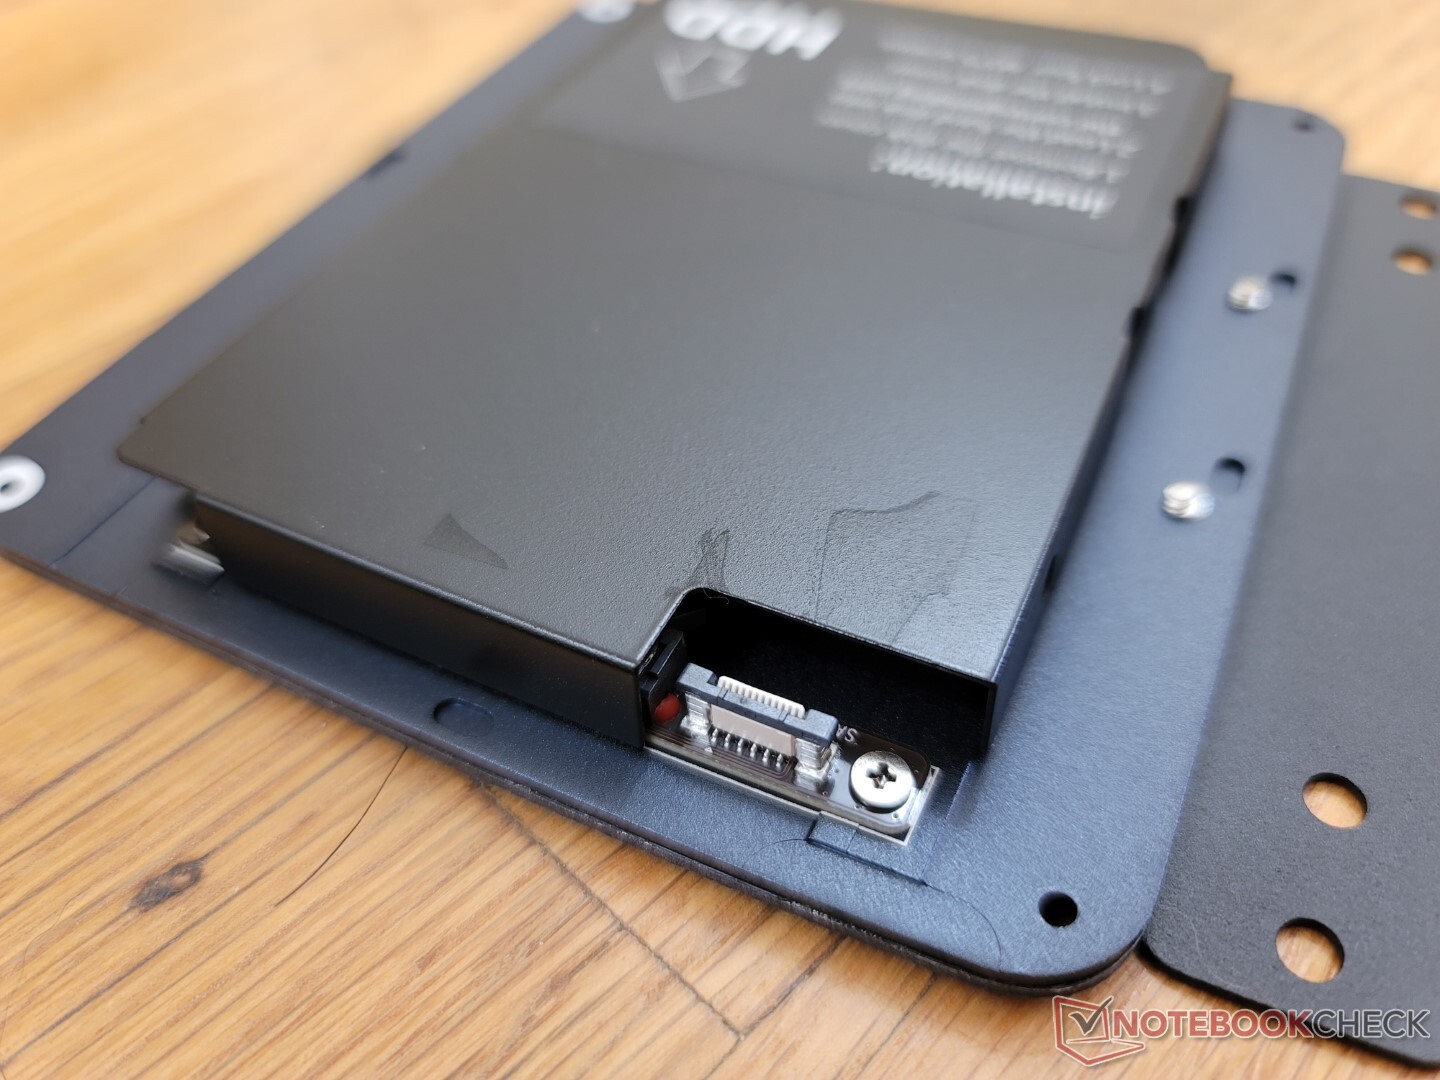
Mantenimiento
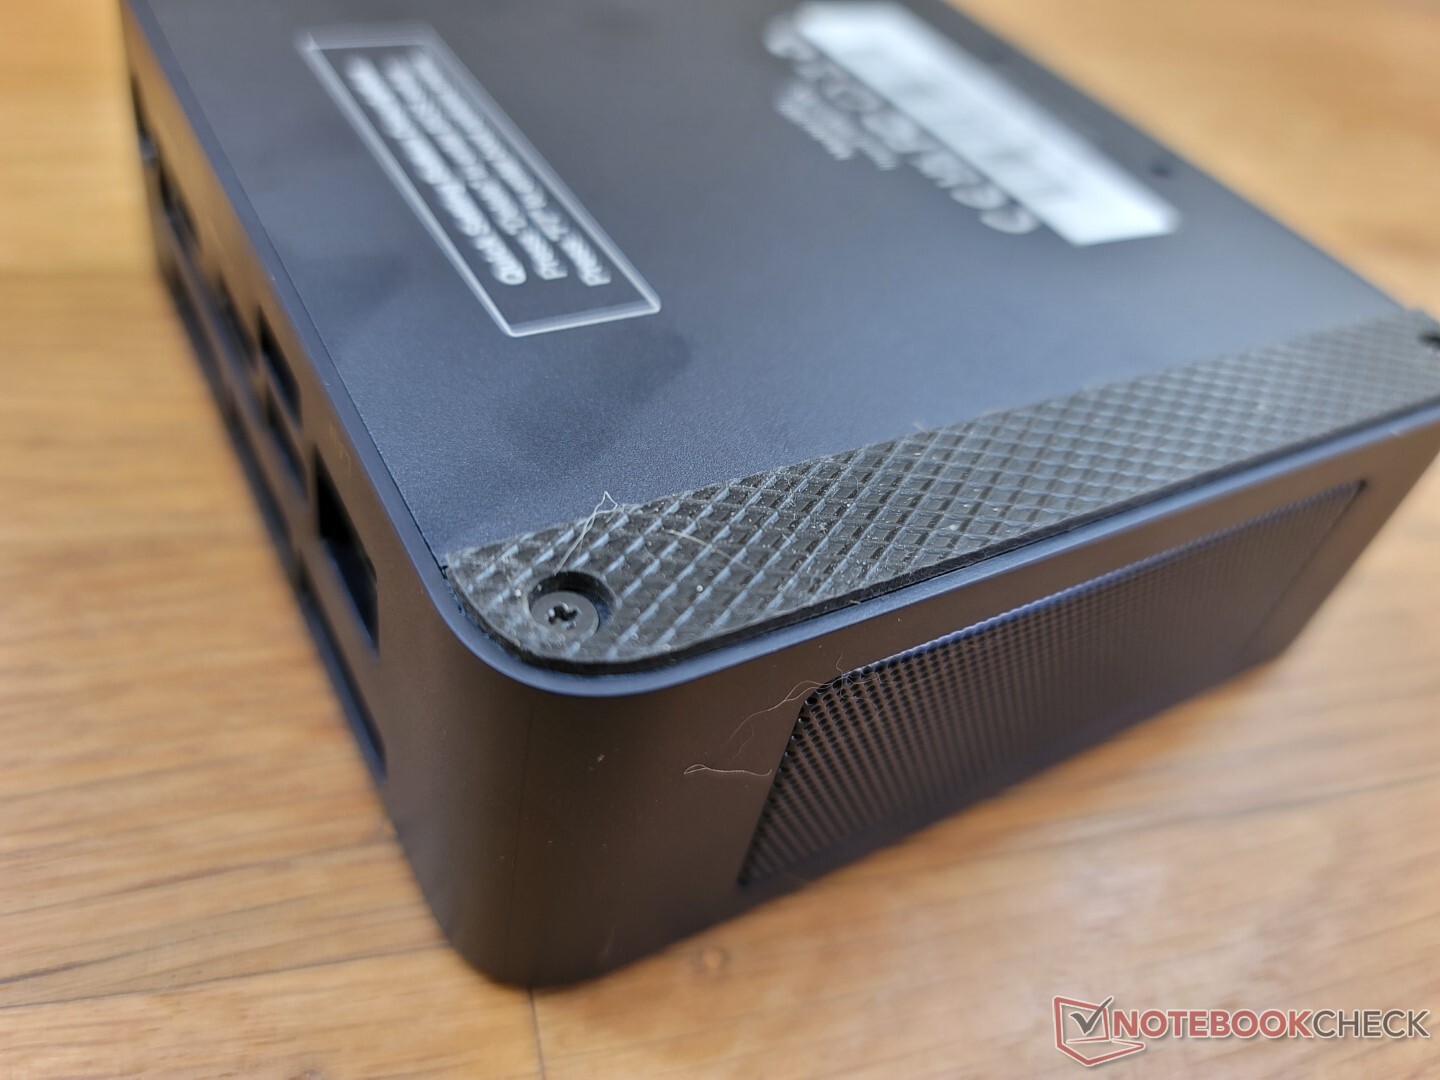
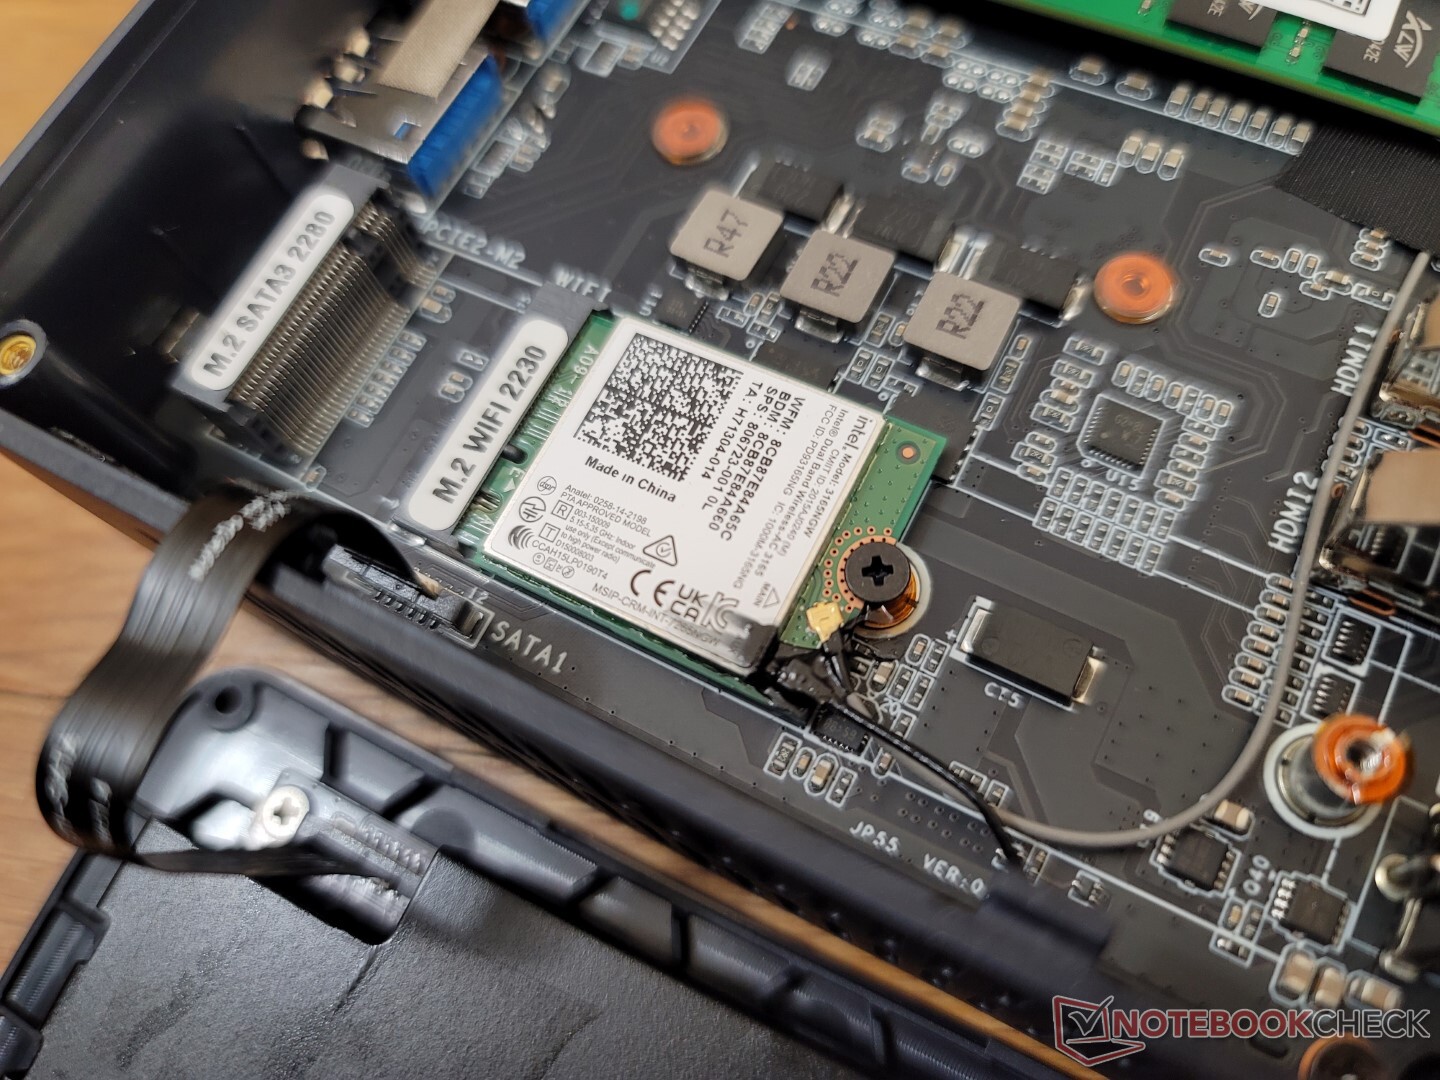
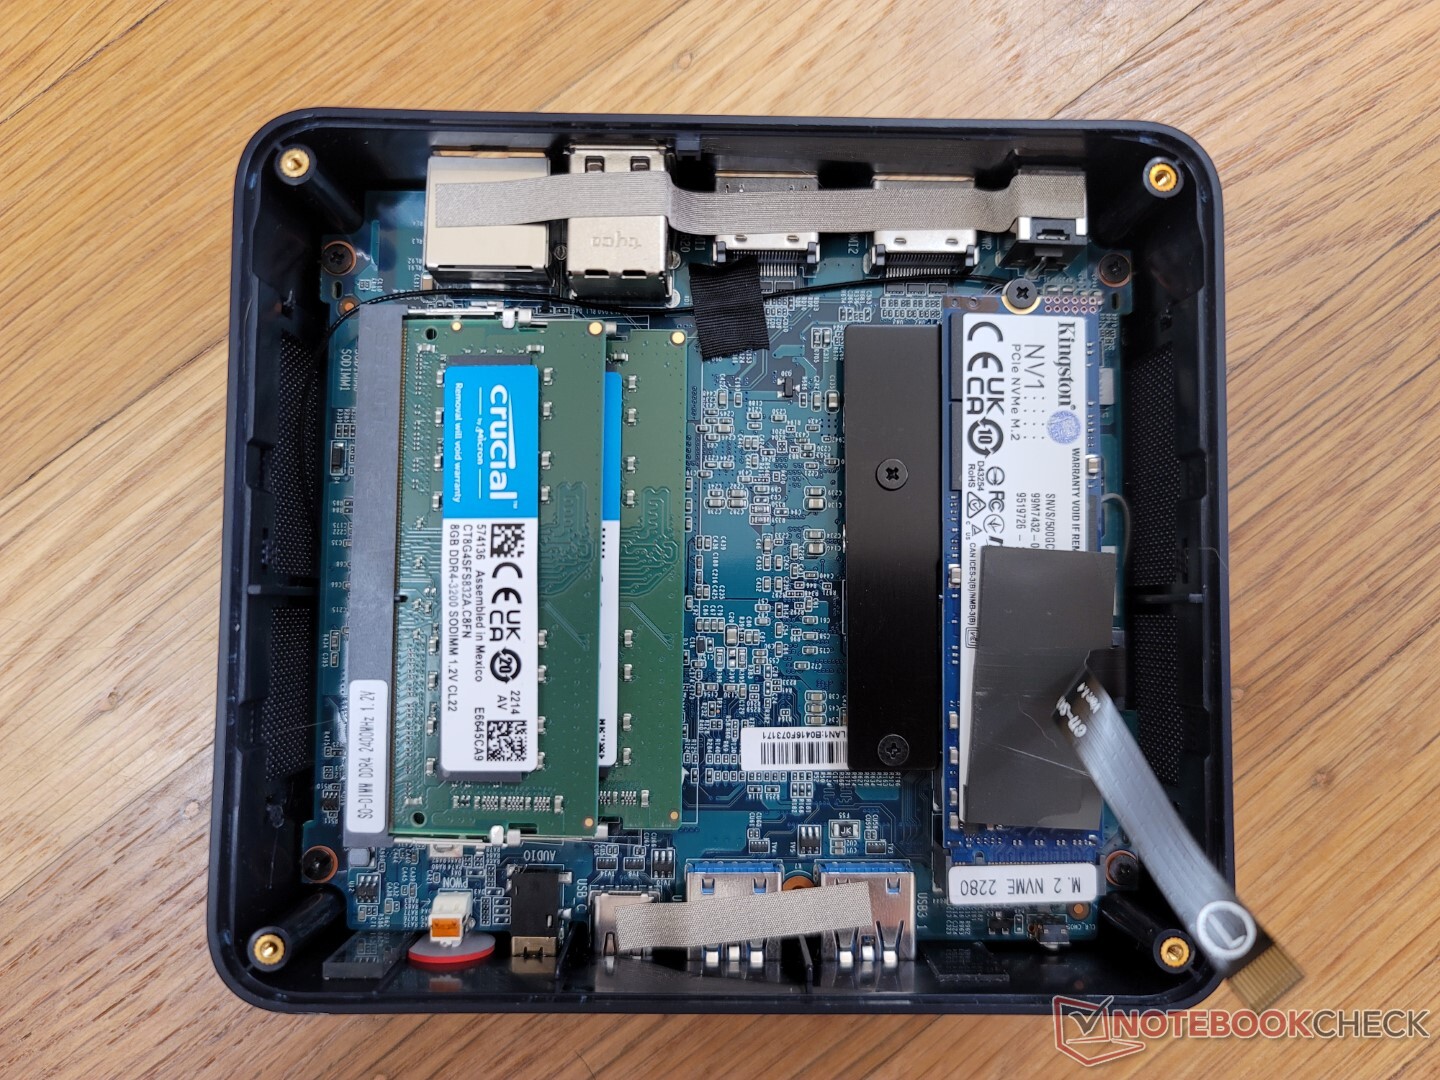
El panel inferior se fija con 4 tornillos Philips. Sin embargo, para quitarlo, recomendamos fijar el soporte de montaje VESA para que pueda usarse como asa para sacar la placa plana
Los usuarios tienen acceso directo a la ranura para SSD M.2 2280, a la bahía SATA III de 2,5 pulgadas, al módulo WLAN y a 2 ranuras SODIMM DDR4.
Accesorios y garantía
La caja incluye 2 cables HDMI, adaptador de CA, documentación, soporte de montaje VESA y tornillos adicionales. Si se adquiere en los Estados Unidos, se aplica una garantía limitada de un año. En comparación, los modelos NUC de Intel suelen venir con una garantía de tres años de serie.
Rendimiento
Condiciones de la prueba
Hemos puesto nuestra unidad en el modo de rendimiento a través de Windows antes de ejecutar cualquier punto de referencia a continuación. No hay ninguna aplicación preinstalada del tipo centro de control para ajustar el rendimiento del procesador.
Procesador
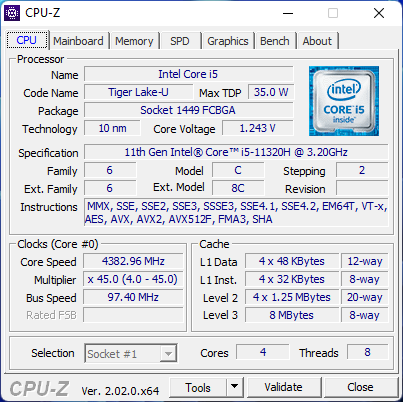
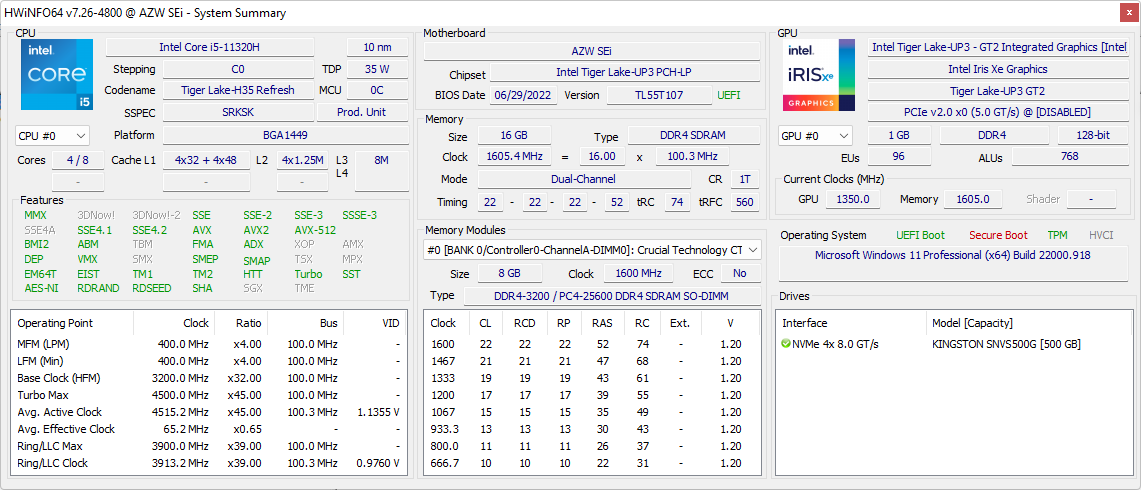
El Core i5-11320H es una CPU poco común, ya que la mayoría de los PCs con CPUs Tiger Lake-H suelen utilizar el Core i5-11300H en su lugar. El i5-11320H funciona esencialmente igual a todos los efectos. Tiene ligeras diferencias de velocidad de reloj sobre el papel que no tienen impacto en la mayoría de las aplicaciones según nuestras observaciones con el Beelink.
Cinebench R15 Multi Loop
Cinebench R23: Multi Core | Single Core
Cinebench R15: CPU Multi 64Bit | CPU Single 64Bit
Blender: v2.79 BMW27 CPU
7-Zip 18.03: 7z b 4 | 7z b 4 -mmt1
Geekbench 5.5: Multi-Core | Single-Core
HWBOT x265 Benchmark v2.2: 4k Preset
LibreOffice : 20 Documents To PDF
R Benchmark 2.5: Overall mean
* ... más pequeño es mejor
AIDA64: FP32 Ray-Trace | FPU Julia | CPU SHA3 | CPU Queen | FPU SinJulia | FPU Mandel | CPU AES | CPU ZLib | FP64 Ray-Trace | CPU PhotoWorxx
| Performance rating | |
| Beelink GTR5 | |
| Beelink SER4 | |
| Beelink GTI 11 | |
| Medio Intel Core i5-11320H | |
| Beelink SEi11 Pro | |
| Intel NUC11TNKi5 | |
| AIDA64 / FP32 Ray-Trace | |
| Beelink GTR5 | |
| Beelink SER4 | |
| Beelink GTI 11 | |
| Beelink SEi11 Pro | |
| Medio Intel Core i5-11320H (6369 - 7489, n=4) | |
| Intel NUC11TNKi5 | |
| AIDA64 / FPU Julia | |
| Beelink GTR5 | |
| Beelink SER4 | |
| Beelink GTI 11 | |
| Beelink SEi11 Pro | |
| Medio Intel Core i5-11320H (27391 - 31637, n=4) | |
| Intel NUC11TNKi5 | |
| AIDA64 / CPU SHA3 | |
| Beelink GTR5 | |
| Beelink GTI 11 | |
| Beelink SEi11 Pro | |
| Medio Intel Core i5-11320H (1847 - 2099, n=4) | |
| Intel NUC11TNKi5 | |
| Beelink SER4 | |
| AIDA64 / CPU Queen | |
| Beelink GTR5 | |
| Beelink SER4 | |
| Medio Intel Core i5-11320H (43565 - 52477, n=4) | |
| Beelink SEi11 Pro | |
| Beelink GTI 11 | |
| Intel NUC11TNKi5 | |
| AIDA64 / FPU SinJulia | |
| Beelink GTR5 | |
| Beelink SER4 | |
| Beelink SEi11 Pro | |
| Medio Intel Core i5-11320H (4381 - 5011, n=4) | |
| Intel NUC11TNKi5 | |
| Beelink GTI 11 | |
| AIDA64 / FPU Mandel | |
| Beelink GTR5 | |
| Beelink SER4 | |
| Beelink GTI 11 | |
| Beelink SEi11 Pro | |
| Medio Intel Core i5-11320H (16659 - 18770, n=4) | |
| Intel NUC11TNKi5 | |
| AIDA64 / CPU AES | |
| Beelink GTR5 | |
| Beelink SEi11 Pro | |
| Medio Intel Core i5-11320H (59851 - 76500, n=4) | |
| Beelink GTI 11 | |
| Intel NUC11TNKi5 | |
| Beelink SER4 | |
| AIDA64 / CPU ZLib | |
| Beelink GTR5 | |
| Beelink SER4 | |
| Intel NUC11TNKi5 | |
| Beelink GTI 11 | |
| Beelink SEi11 Pro | |
| Medio Intel Core i5-11320H (330 - 410, n=4) | |
| AIDA64 / FP64 Ray-Trace | |
| Beelink GTR5 | |
| Beelink SER4 | |
| Beelink GTI 11 | |
| Beelink SEi11 Pro | |
| Medio Intel Core i5-11320H (3536 - 4021, n=4) | |
| Intel NUC11TNKi5 | |
| AIDA64 / CPU PhotoWorxx | |
| Beelink GTI 11 | |
| Medio Intel Core i5-11320H (25964 - 36644, n=4) | |
| Beelink SEi11 Pro | |
| Beelink SER4 | |
| Beelink GTR5 | |
| Intel NUC11TNKi5 | |
Rendimiento del sistema
CrossMark: Overall | Productivity | Creativity | Responsiveness
| PCMark 10 / Score | |
| Beelink GTR5 | |
| Beelink SER4 | |
| Medio Intel Core i5-11320H, Intel Iris Xe Graphics G7 96EUs (5095 - 5302, n=3) | |
| Beelink SEi11 Pro | |
| Beelink GTI 11 | |
| Intel NUC11TNKi5 | |
| PCMark 10 / Essentials | |
| Beelink GTR5 | |
| Beelink SEi11 Pro | |
| Medio Intel Core i5-11320H, Intel Iris Xe Graphics G7 96EUs (9556 - 10558, n=3) | |
| Beelink GTI 11 | |
| Beelink SER4 | |
| Intel NUC11TNKi5 | |
| PCMark 10 / Productivity | |
| Beelink GTR5 | |
| Beelink SER4 | |
| Beelink SEi11 Pro | |
| Medio Intel Core i5-11320H, Intel Iris Xe Graphics G7 96EUs (6832 - 6963, n=3) | |
| Beelink GTI 11 | |
| Intel NUC11TNKi5 | |
| PCMark 10 / Digital Content Creation | |
| Beelink GTR5 | |
| Beelink SER4 | |
| Medio Intel Core i5-11320H, Intel Iris Xe Graphics G7 96EUs (5048 - 5615, n=3) | |
| Beelink GTI 11 | |
| Beelink SEi11 Pro | |
| Intel NUC11TNKi5 | |
| CrossMark / Overall | |
| Beelink GTR5 | |
| Beelink SEi11 Pro | |
| Medio Intel Core i5-11320H, Intel Iris Xe Graphics G7 96EUs (1300 - 1371, n=3) | |
| CrossMark / Productivity | |
| Beelink GTR5 | |
| Beelink SEi11 Pro | |
| Medio Intel Core i5-11320H, Intel Iris Xe Graphics G7 96EUs (1376 - 1456, n=3) | |
| CrossMark / Creativity | |
| Beelink GTR5 | |
| Beelink SEi11 Pro | |
| Medio Intel Core i5-11320H, Intel Iris Xe Graphics G7 96EUs (1241 - 1256, n=3) | |
| CrossMark / Responsiveness | |
| Medio Intel Core i5-11320H, Intel Iris Xe Graphics G7 96EUs (1260 - 1494, n=3) | |
| Beelink SEi11 Pro | |
| Beelink GTR5 | |
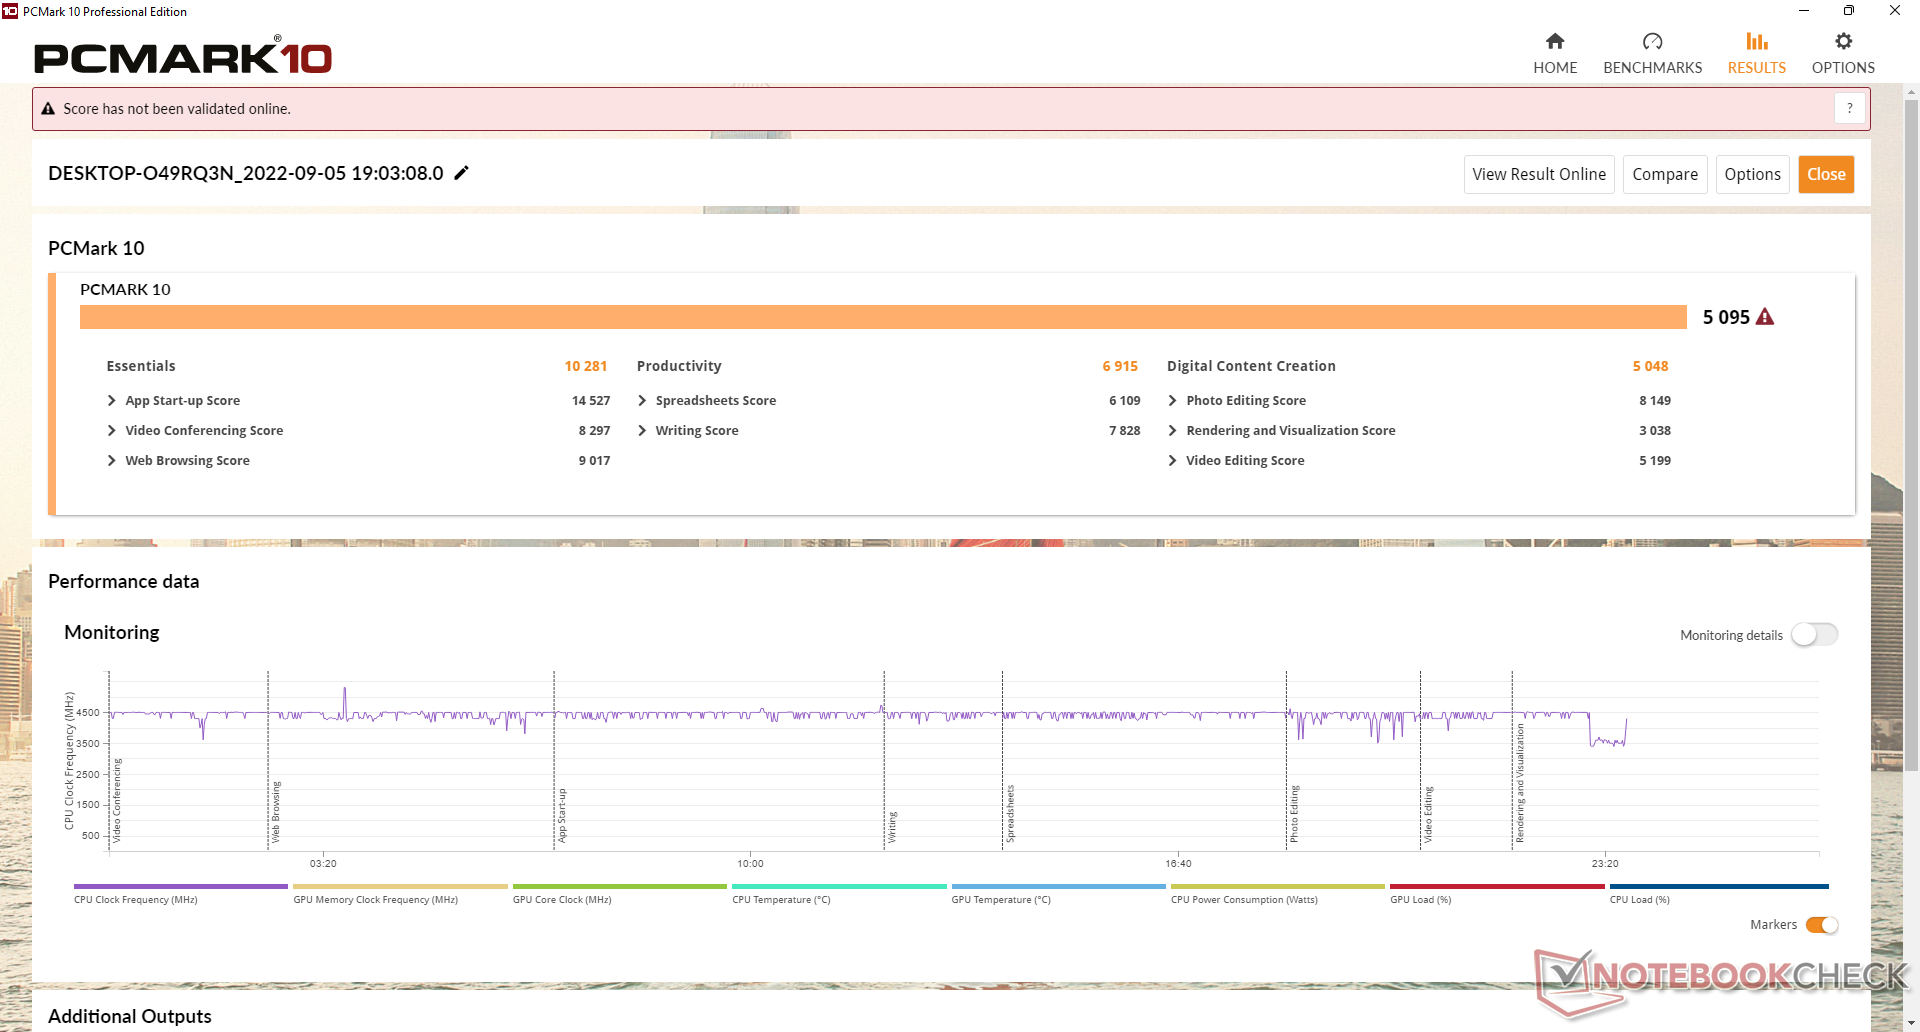
| PCMark 10 Score | 5095 puntos | |
ayuda | ||
| AIDA64 / Memory Copy | |
| Medio Intel Core i5-11320H (41106 - 55961, n=4) | |
| Beelink GTR5 | |
| Beelink SEi11 Pro | |
| Beelink GTI 11 | |
| Beelink SER4 | |
| Intel NUC11TNKi5 | |
| AIDA64 / Memory Read | |
| Medio Intel Core i5-11320H (46516 - 52799, n=4) | |
| Beelink GTR5 | |
| Beelink GTI 11 | |
| Beelink SEi11 Pro | |
| Beelink SER4 | |
| Intel NUC11TNKi5 | |
| AIDA64 / Memory Write | |
| Medio Intel Core i5-11320H (46760 - 63323, n=4) | |
| Beelink SEi11 Pro | |
| Beelink GTI 11 | |
| Beelink SER4 | |
| Beelink GTR5 | |
| Intel NUC11TNKi5 | |
| AIDA64 / Memory Latency | |
| Beelink SER4 | |
| Medio Intel Core i5-11320H (77.6 - 114.1, n=4) | |
| Intel NUC11TNKi5 | |
| Beelink SEi11 Pro | |
| Beelink GTR5 | |
| Beelink GTI 11 | |
* ... más pequeño es mejor
Latencia del CPD
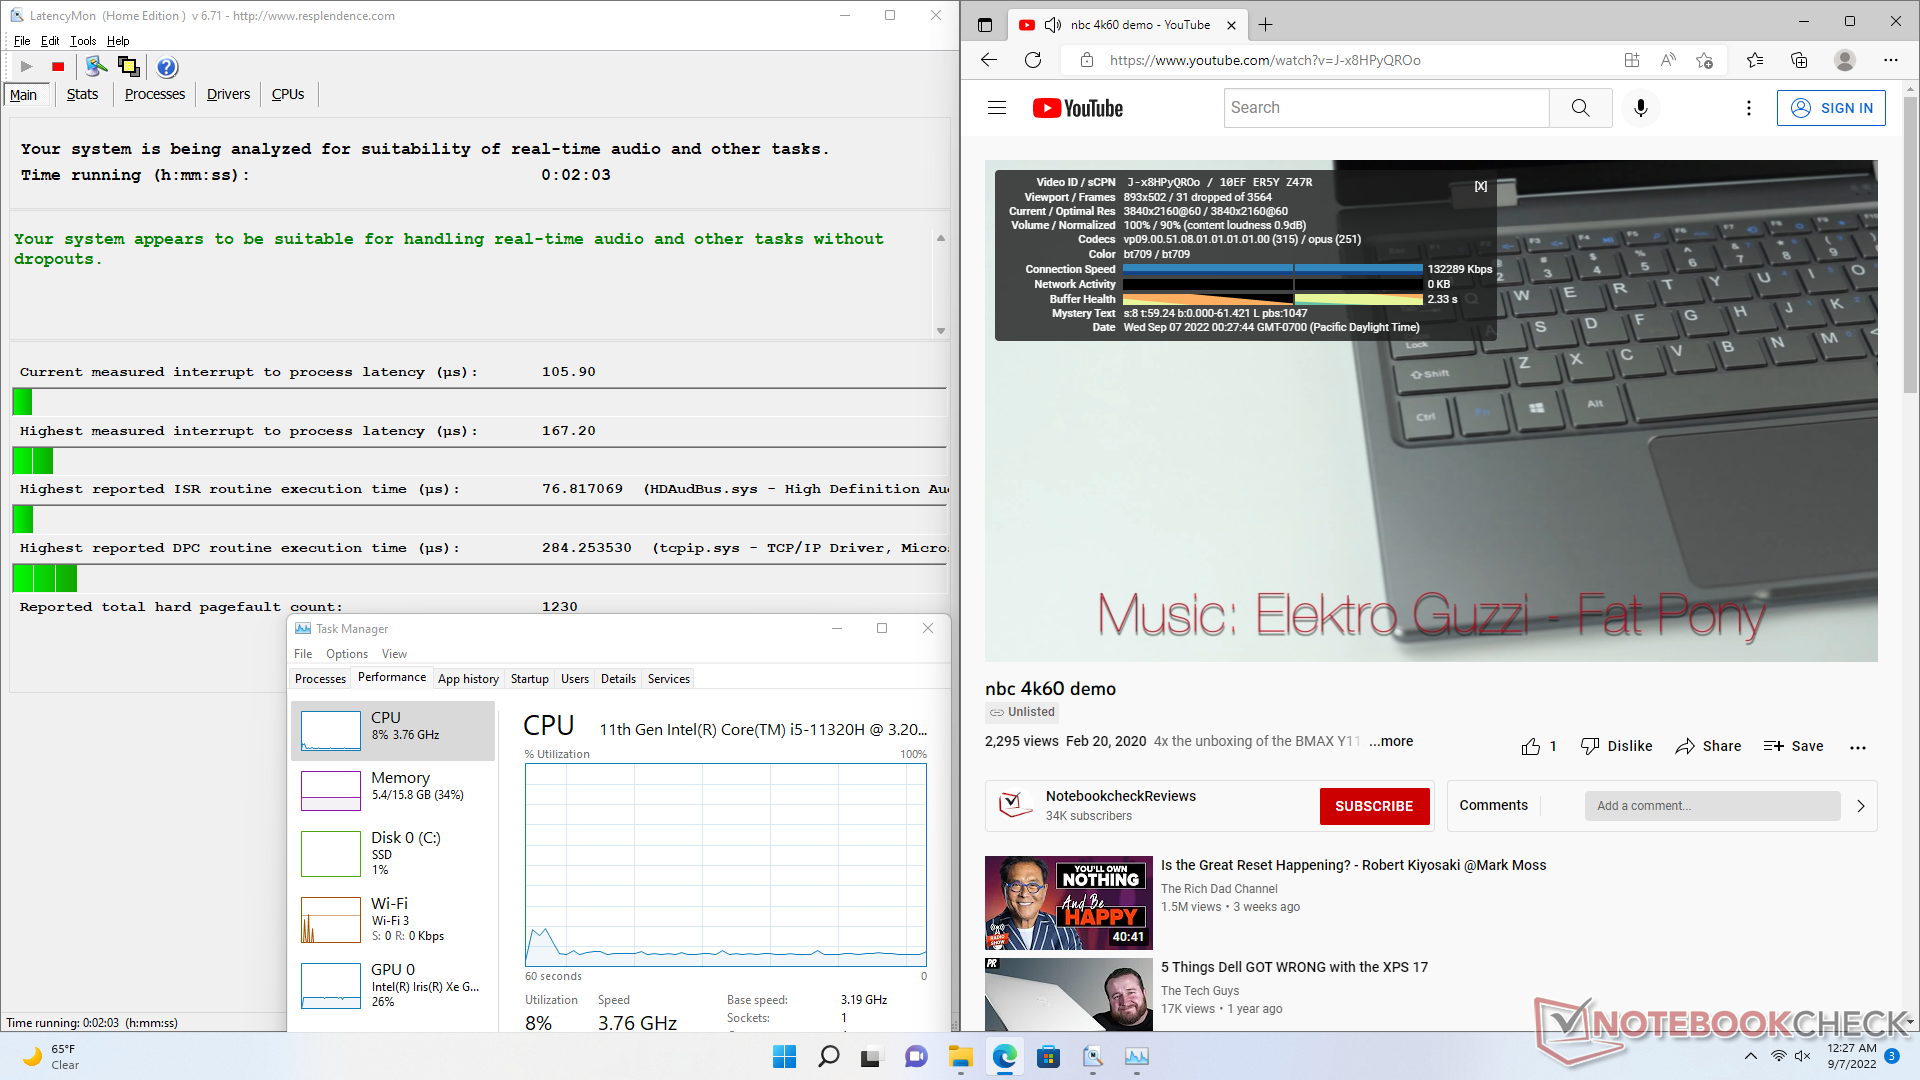
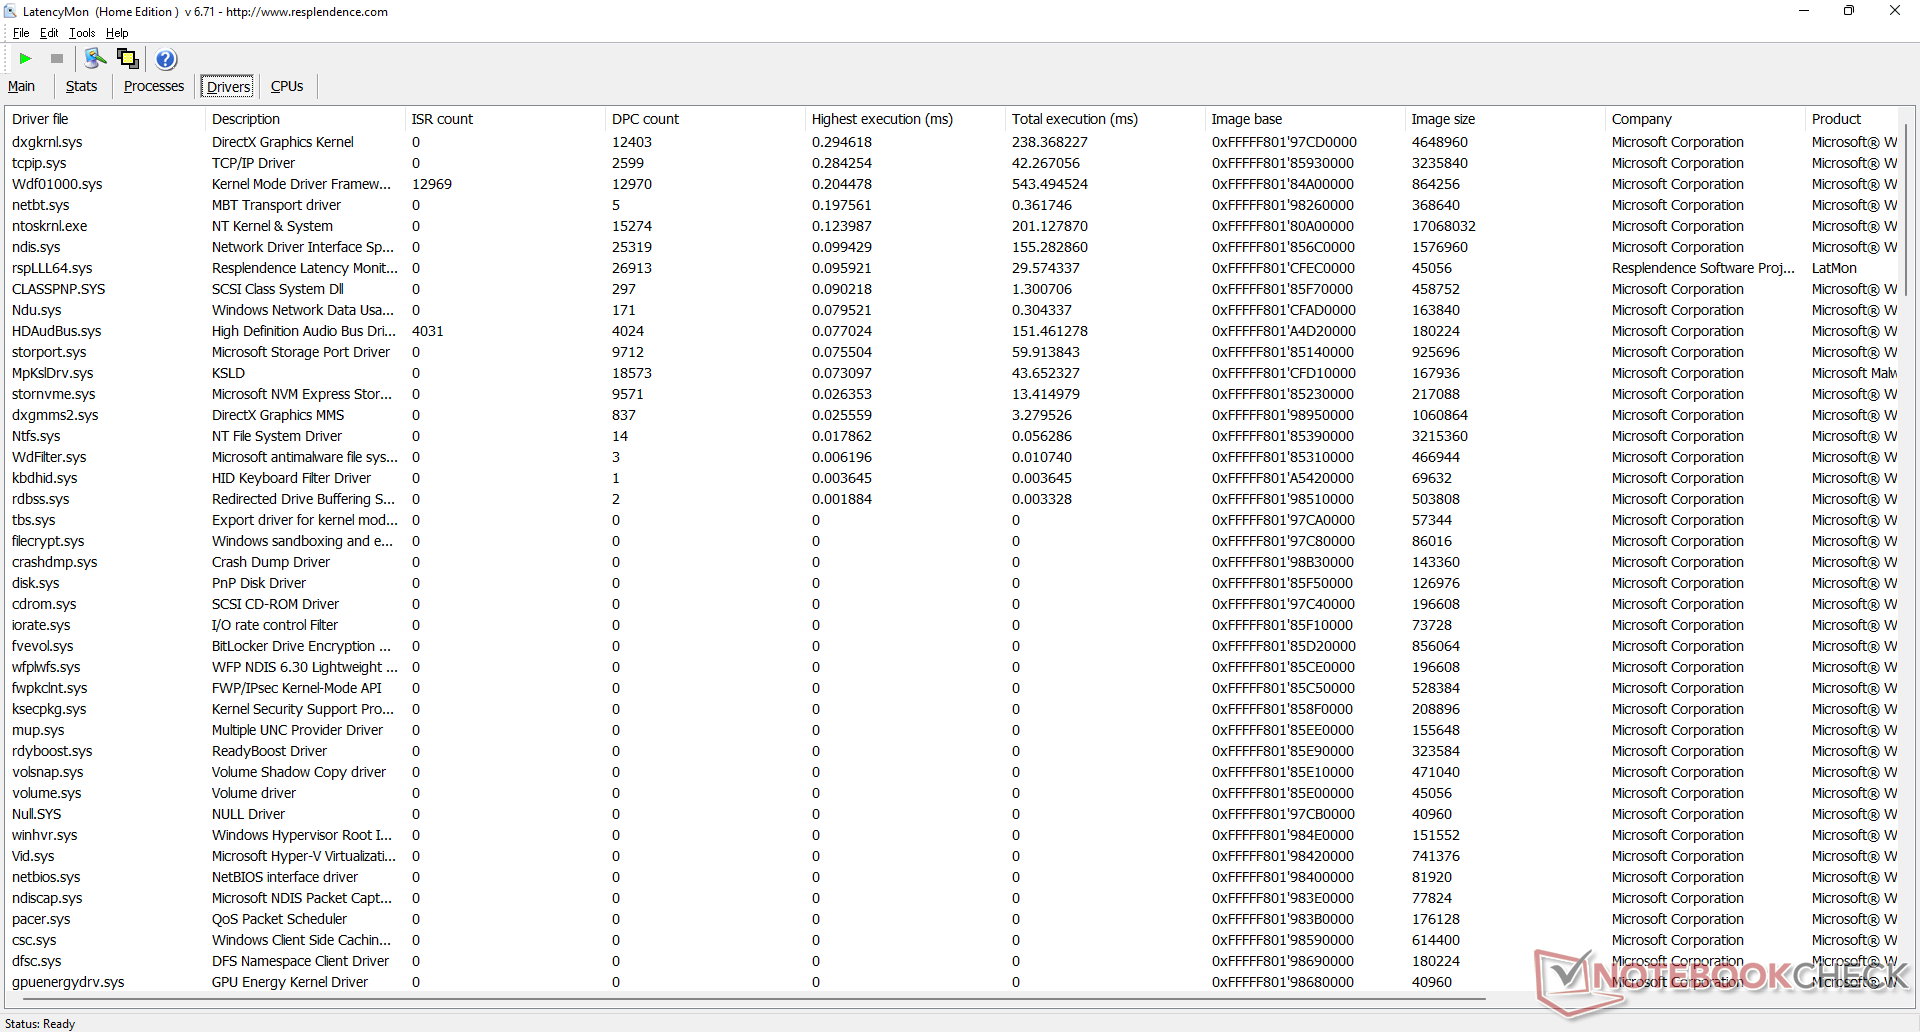
LatencyMon no muestra problemas de CPD al abrir varias pestañas del navegador en nuestra página de inicio o al ejecutar el estrés de Prime95. Por desgracia, la reproducción 4K a 60 FPS es imperfecta, con 31 fotogramas perdidos durante nuestra prueba de vídeo de un minuto de duración.
| DPC Latencies / LatencyMon - interrupt to process latency (max), Web, Youtube, Prime95 | |
| Intel NUC11TNKi5 | |
| Beelink SER4 | |
| Beelink GTI 11 | |
| Beelink SEi11 Pro | |
| Beelink GTR5 | |
* ... más pequeño es mejor
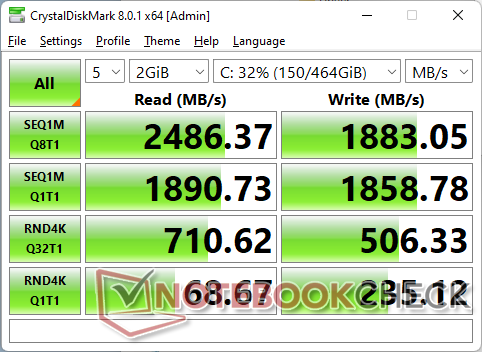
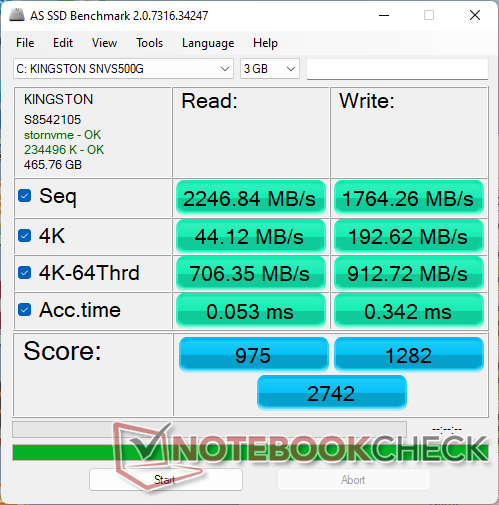
Dispositivos de almacenamiento
El SEi11 Pro se envía con el mismoKingston NV1 SBVS500GCN M.2 que se encuentra en el GTR5. Se trata de una unidad PCIe3 x4 de gama media con velocidades de lectura secuencial de alrededor de 2300 MB/s en comparación con los >3000 MB/s de una Samsung PM981a.

| Drive Performance rating - Percent | |
| Beelink GTI 11 | |
| Beelink GTR5 | |
| Beelink SEi11 Pro | |
| Beelink SER4 | |
| Intel NUC11TNKi5 | |
* ... más pequeño es mejor
Disk Throttling: DiskSpd Read Loop, Queue Depth 8
Rendimiento de la GPU
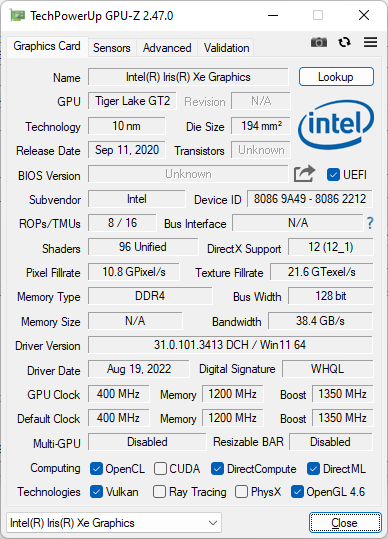
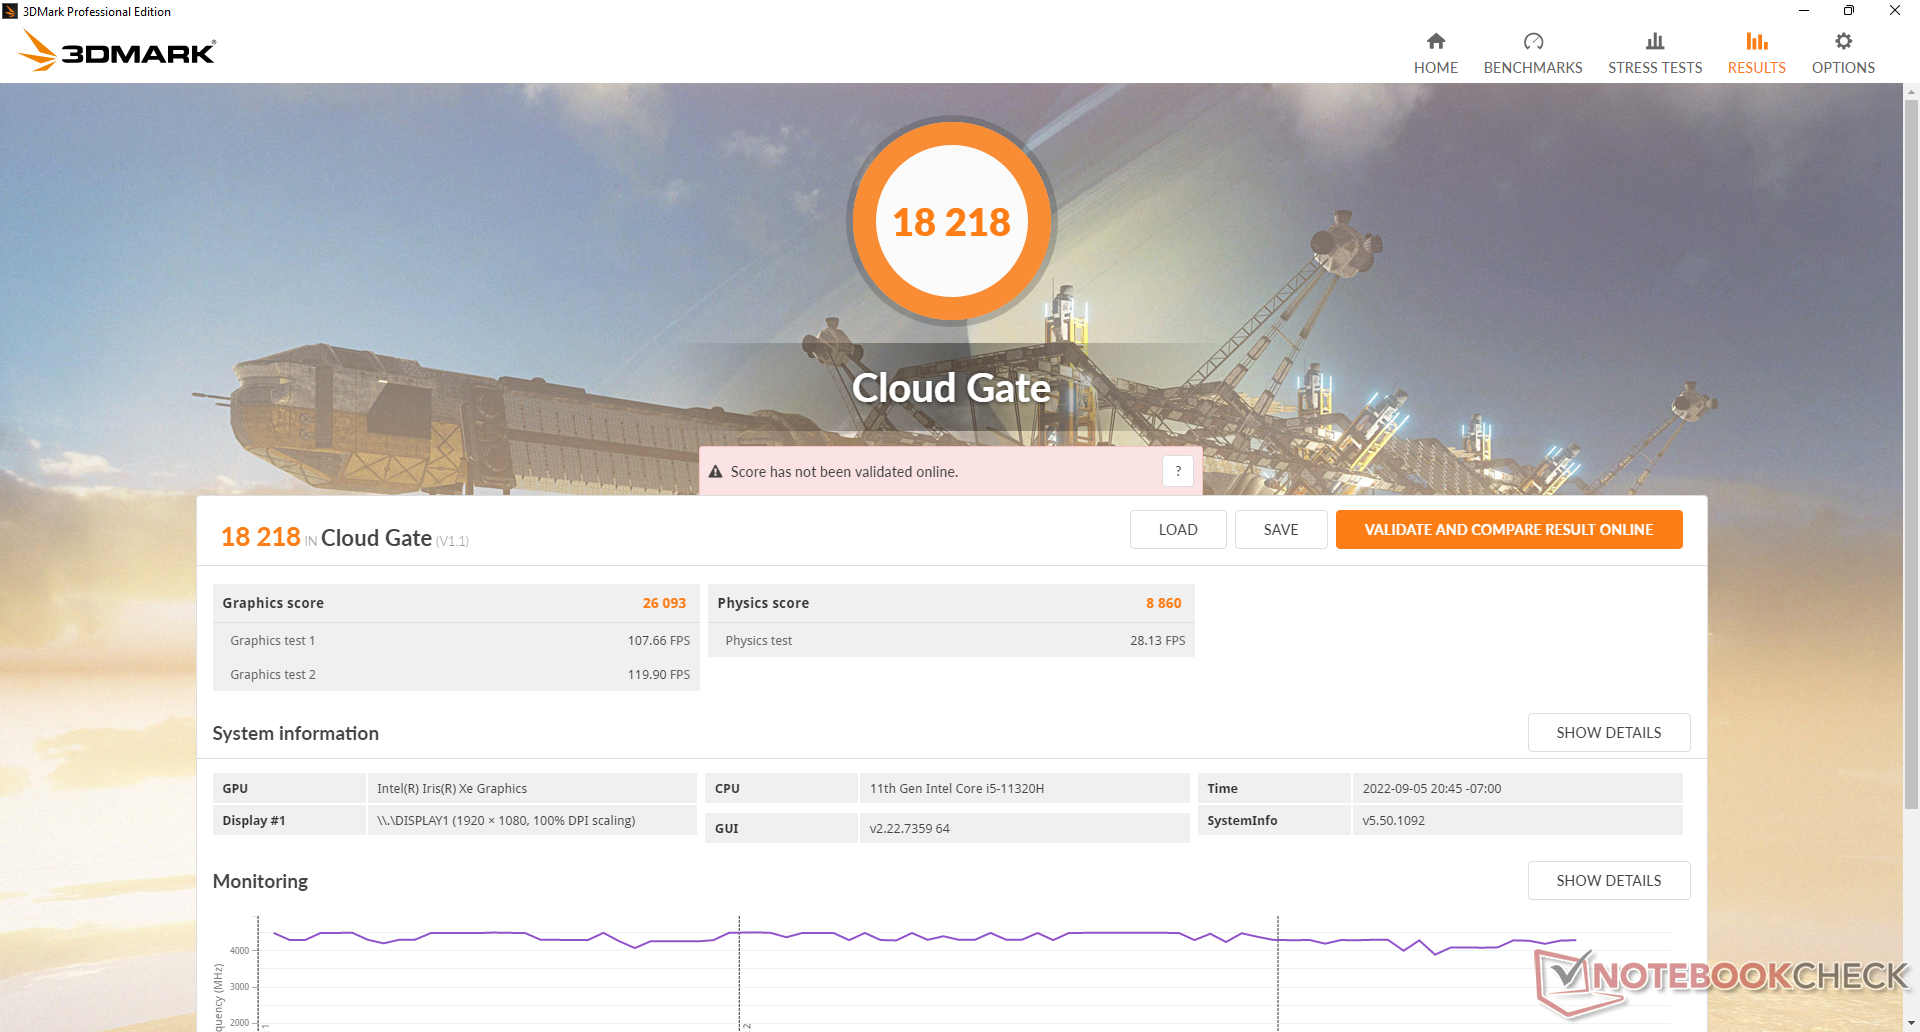
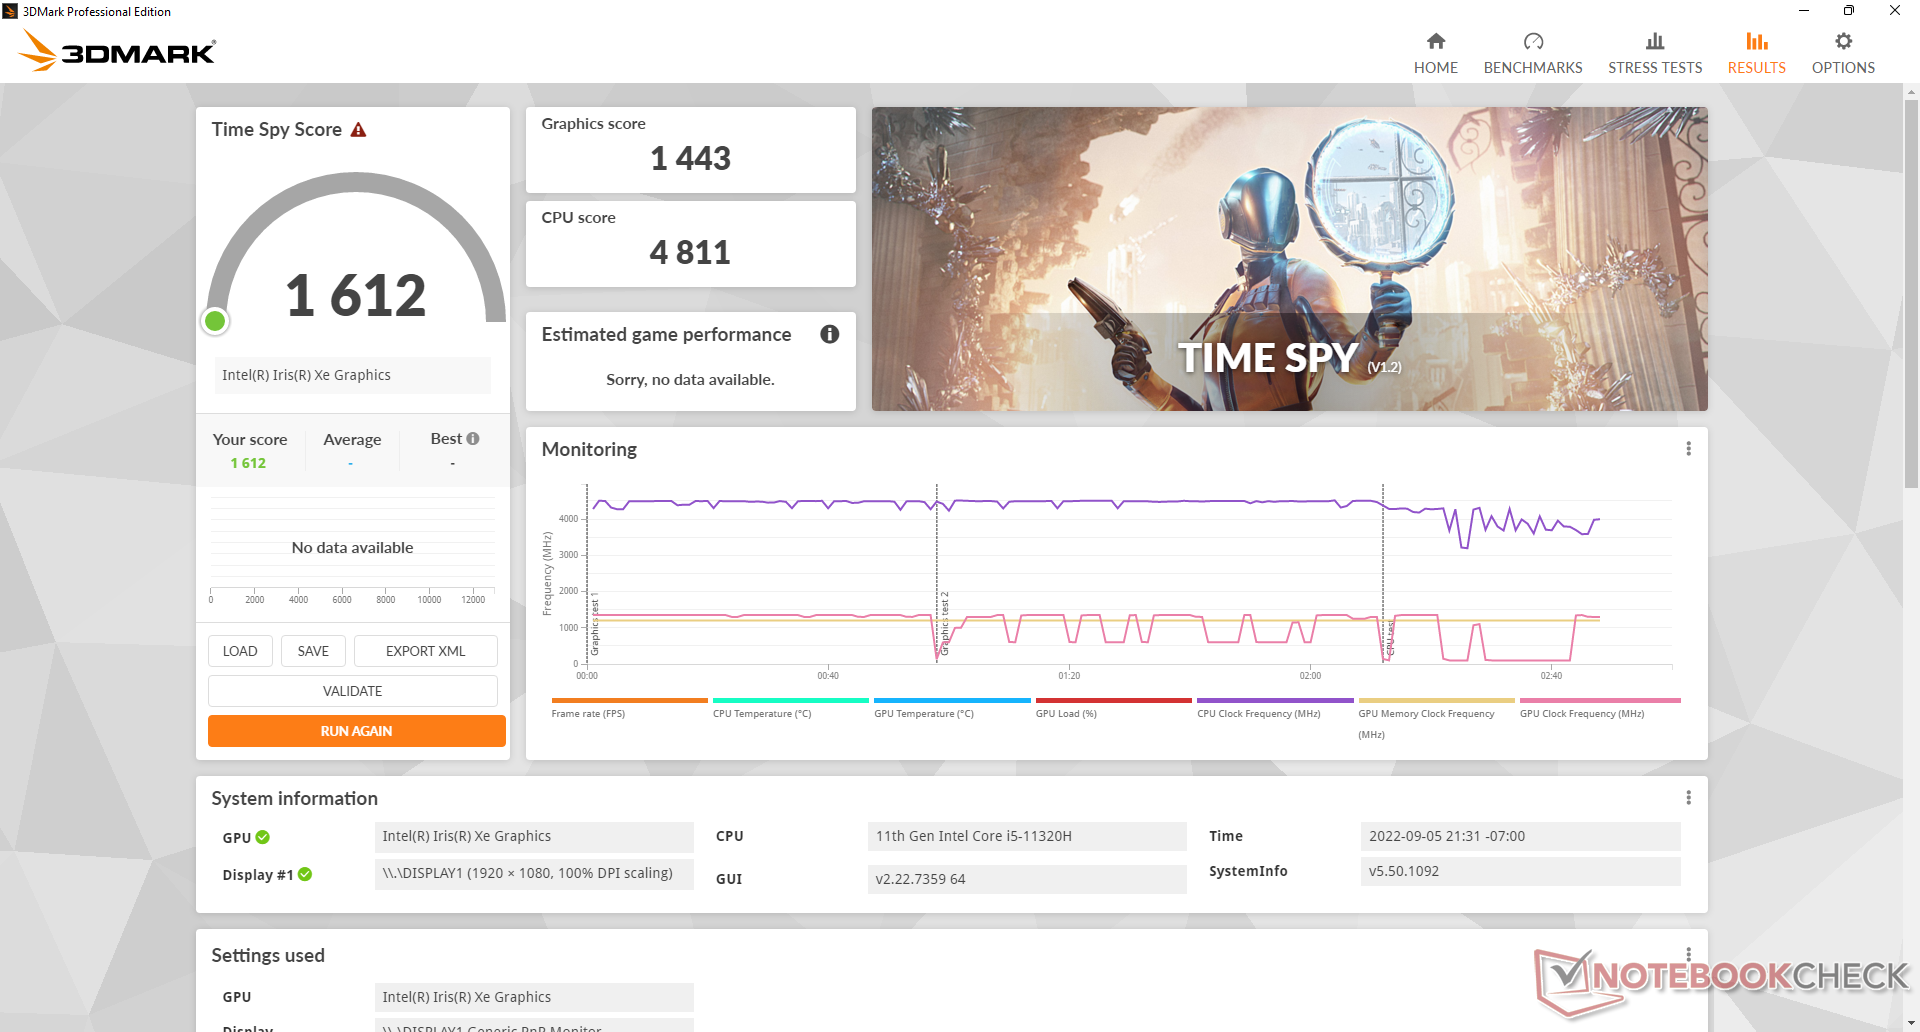
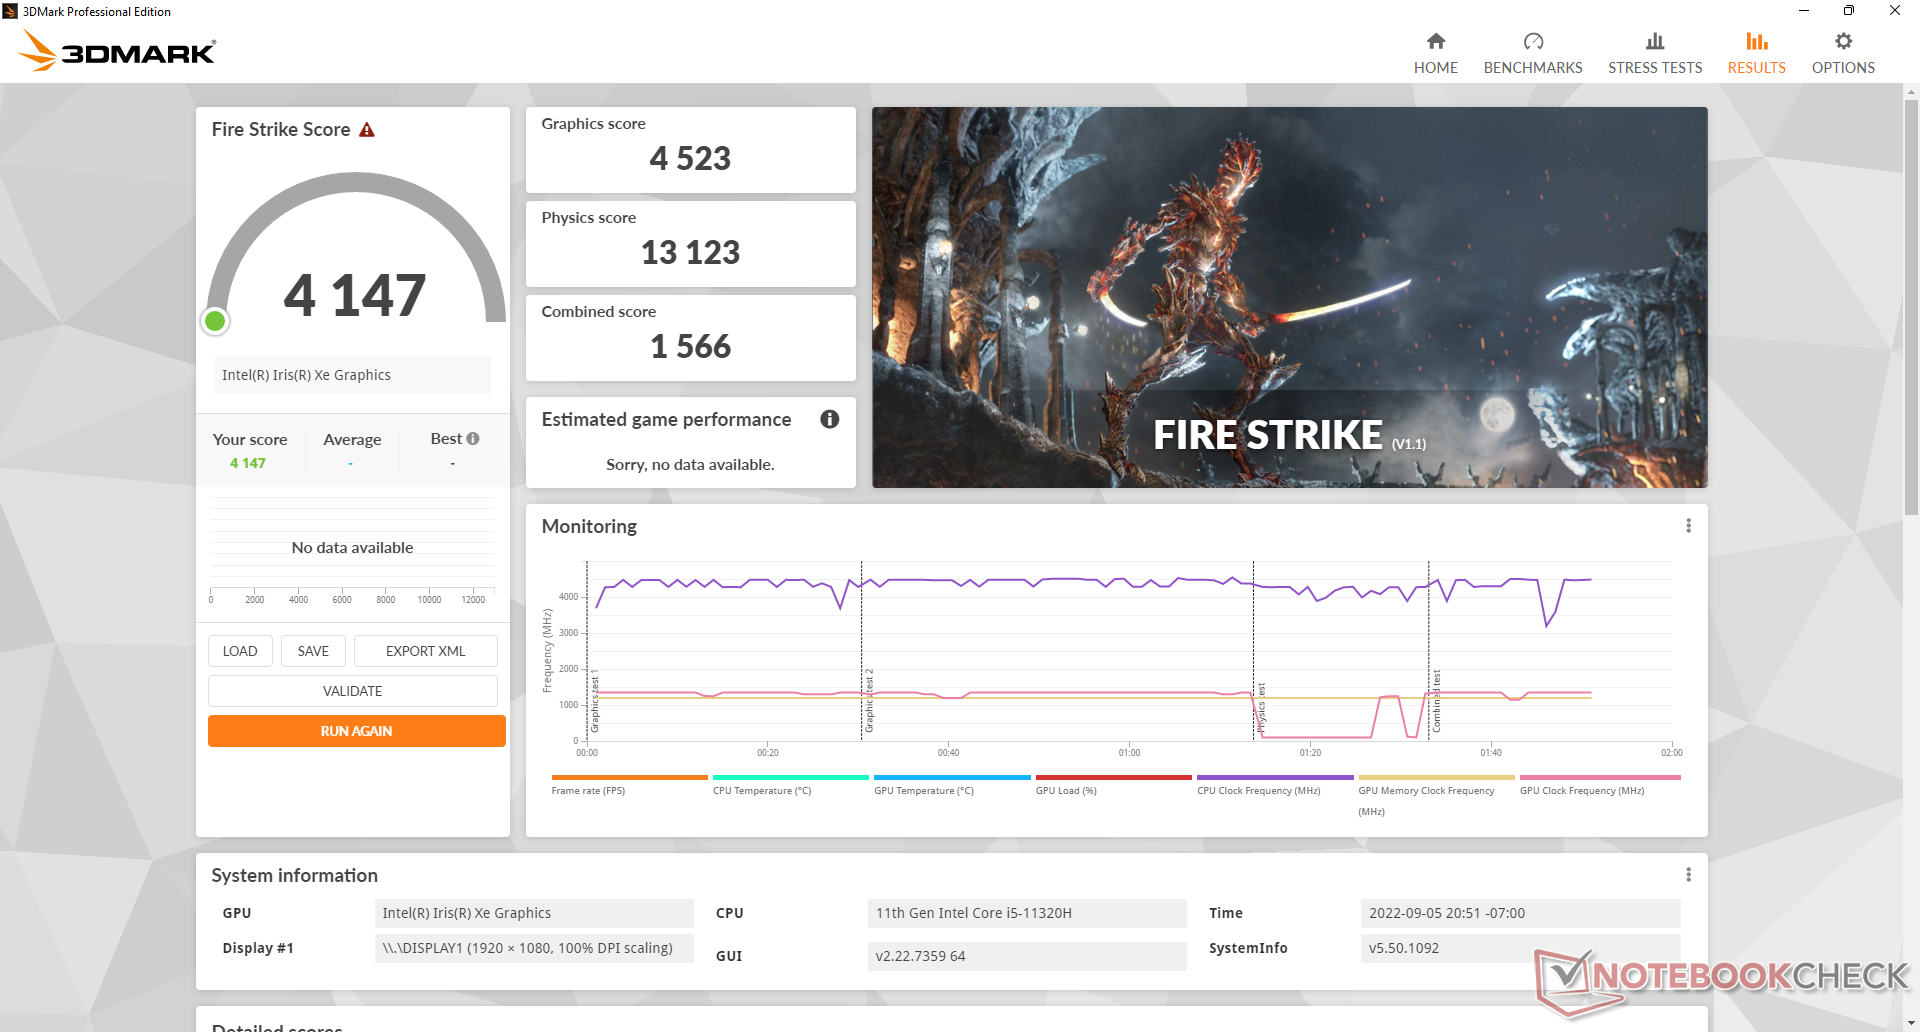
El rendimiento de los gráficos integrados está donde esperamos que esté en relación con otros PC con la misma Iris Xe 96 EUs GPU. Asegúrate de configurar el SEi11 con memoria RAM de doble canal o, de lo contrario, el rendimiento de los gráficos puede disminuir hasta un 30 o 40 por ciento.
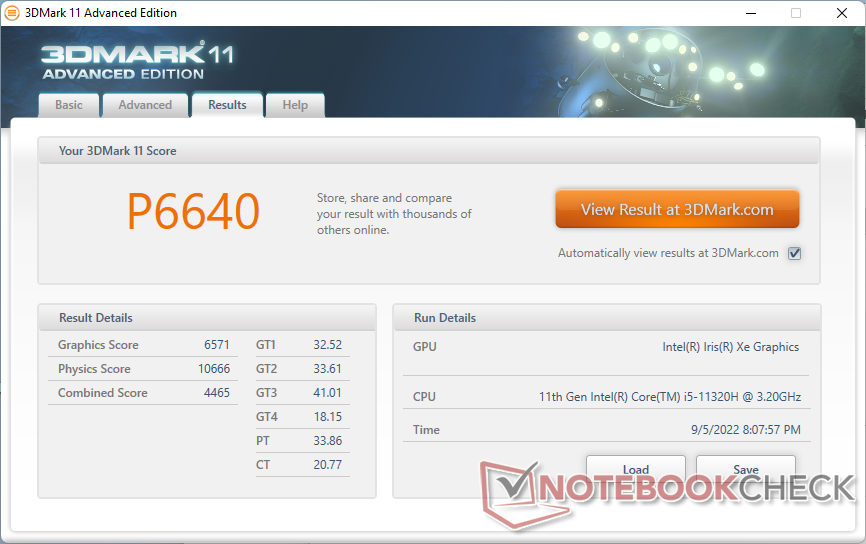
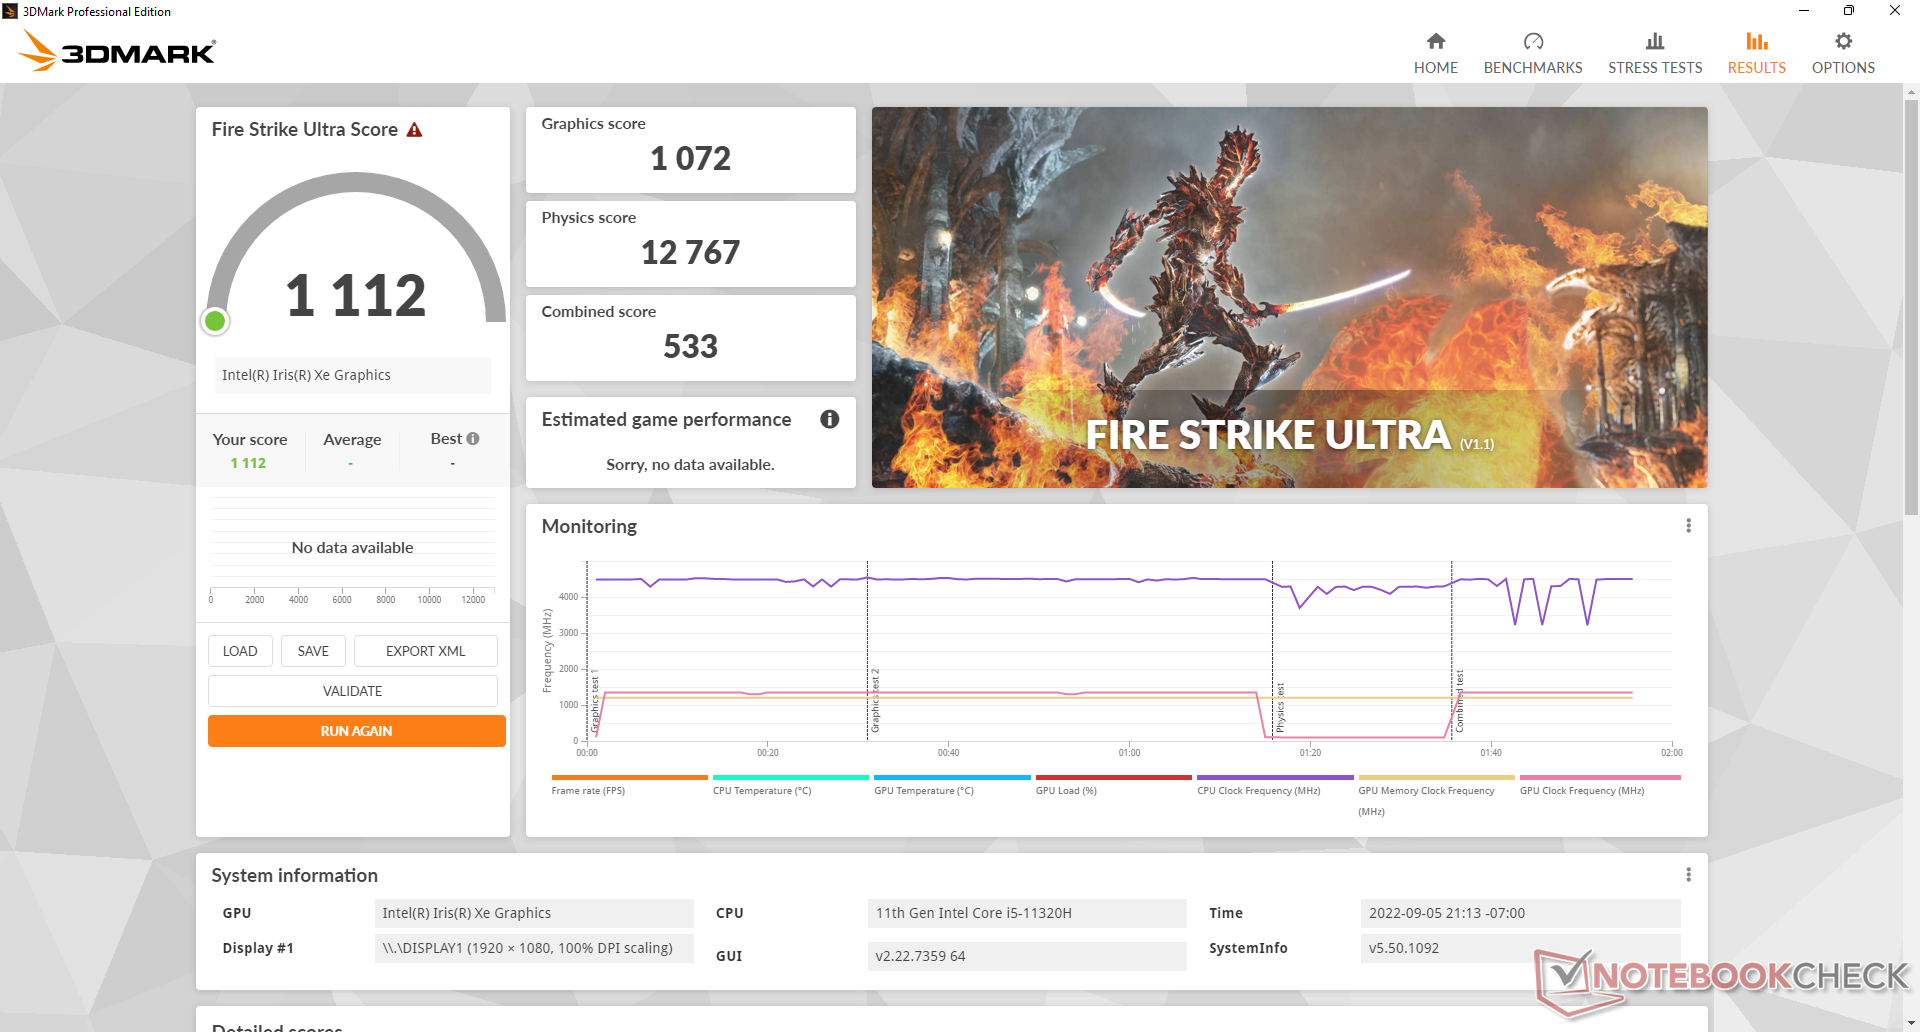
| 3DMark 11 Performance | 6640 puntos | |
| 3DMark Cloud Gate Standard Score | 18218 puntos | |
| 3DMark Fire Strike Score | 4147 puntos | |
| 3DMark Time Spy Score | 1612 puntos | |
ayuda | ||
| The Witcher 3 | |
| 1024x768 Low Graphics & Postprocessing | |
| Beelink SEi11 Pro | |
| Beelink GTR5 | |
| Medio Intel Iris Xe Graphics G7 96EUs (28.9 - 117.2, n=188) | |
| Beelink GTI 11 | |
| Beelink SER4 | |
| Intel NUC11TNKi5 | |
| 1366x768 Medium Graphics & Postprocessing | |
| Beelink GTR5 | |
| Beelink SEi11 Pro | |
| Medio Intel Iris Xe Graphics G7 96EUs (21.4 - 77.8, n=185) | |
| Beelink GTI 11 | |
| Beelink SER4 | |
| 1920x1080 High Graphics & Postprocessing (Nvidia HairWorks Off) | |
| Medio Intel Iris Xe Graphics G7 96EUs (10.6 - 45.9, n=191) | |
| Beelink SEi11 Pro | |
| Beelink GTR5 | |
| Beelink GTI 11 | |
| Beelink SER4 | |
| 1920x1080 Ultra Graphics & Postprocessing (HBAO+) | |
| Beelink GTR5 | |
| Beelink SER4 | |
| Medio Intel Iris Xe Graphics G7 96EUs (8.79 - 20.1, n=181) | |
| Beelink SEi11 Pro | |
| Beelink GTI 11 | |
| Cyberpunk 2077 1.6 | |
| 1920x1080 Low Preset | |
| Medio Intel Iris Xe Graphics G7 96EUs (13 - 25.9, n=42) | |
| Beelink SEi11 Pro | |
| 1920x1080 Medium Preset | |
| Medio Intel Iris Xe Graphics G7 96EUs (10.8 - 21.7, n=37) | |
| Beelink SEi11 Pro | |
| 1920x1080 High Preset | |
| Medio Intel Iris Xe Graphics G7 96EUs (9.8 - 16.9, n=34) | |
| Beelink SEi11 Pro | |
| 1920x1080 Ultra Preset | |
| Medio Intel Iris Xe Graphics G7 96EUs (7.4 - 16.8, n=32) | |
| Beelink SEi11 Pro | |
| GTA V | |
| 1024x768 Lowest Settings possible | |
| Beelink GTR5 | |
| Beelink SER4 | |
| Medio Intel Iris Xe Graphics G7 96EUs (52 - 166.4, n=168) | |
| Beelink GTI 11 | |
| Beelink SEi11 Pro | |
| 1920x1080 Lowest Settings possible | |
| Beelink GTR5 | |
| Medio Intel Iris Xe Graphics G7 96EUs (34.7 - 132.1, n=141) | |
| Beelink SER4 | |
| Beelink SEi11 Pro | |
| Beelink GTI 11 | |
| 1366x768 Normal/Off AF:4x | |
| Beelink GTR5 | |
| Beelink SER4 | |
| Medio Intel Iris Xe Graphics G7 96EUs (24.1 - 152.7, n=169) | |
| Beelink GTI 11 | |
| Beelink SEi11 Pro | |
| 1920x1080 Normal/Off AF:4x | |
| Beelink GTR5 | |
| Beelink SER4 | |
| Medio Intel Iris Xe Graphics G7 96EUs (20 - 119.3, n=142) | |
| Beelink SEi11 Pro | |
| Beelink GTI 11 | |
| 1920x1080 High/On (Advanced Graphics Off) AA:2xMSAA + FX AF:8x | |
| Beelink GTR5 | |
| Beelink SER4 | |
| Beelink SEi11 Pro | |
| Medio Intel Iris Xe Graphics G7 96EUs (9.39 - 51.6, n=162) | |
| Beelink GTI 11 | |
| 1920x1080 Highest AA:4xMSAA + FX AF:16x | |
| Beelink GTR5 | |
| Beelink SER4 | |
| Medio Intel Iris Xe Graphics G7 96EUs (4.13 - 22.9, n=156) | |
| Beelink GTI 11 | |
| Final Fantasy XV Benchmark | |
| 1280x720 Lite Quality | |
| Beelink GTR5 | |
| Medio Intel Iris Xe Graphics G7 96EUs (14.9 - 56.5, n=189) | |
| Beelink SEi11 Pro | |
| Beelink SER4 | |
| Beelink GTI 11 | |
| Intel NUC11TNKi5 | |
| 1920x1080 Standard Quality | |
| Beelink GTR5 | |
| Medio Intel Iris Xe Graphics G7 96EUs (10.5 - 31.2, n=185) | |
| Beelink SEi11 Pro | |
| Beelink SER4 | |
| Beelink GTI 11 | |
| Intel NUC11TNKi5 | |
| 1920x1080 High Quality | |
| Medio Intel Iris Xe Graphics G7 96EUs (8.15 - 27.8, n=178) | |
| Beelink GTR5 | |
| Beelink SEi11 Pro | |
| Beelink SER4 | |
| Beelink GTI 11 | |
| Intel NUC11TNKi5 | |
| X-Plane 11.11 | |
| 1280x720 low (fps_test=1) | |
| Beelink GTR5 | |
| Beelink SEi11 Pro | |
| Medio Intel Iris Xe Graphics G7 96EUs (13.4 - 88.4, n=213) | |
| Beelink SER4 | |
| Intel NUC11TNKi5 | |
| Beelink GTI 11 | |
| 1920x1080 med (fps_test=2) | |
| Beelink GTR5 | |
| Beelink SEi11 Pro | |
| Medio Intel Iris Xe Graphics G7 96EUs (11.6 - 69.5, n=214) | |
| Beelink SER4 | |
| Intel NUC11TNKi5 | |
| Beelink GTI 11 | |
| 1920x1080 high (fps_test=3) | |
| Beelink GTR5 | |
| Beelink SEi11 Pro | |
| Medio Intel Iris Xe Graphics G7 96EUs (11.1 - 59.8, n=213) | |
| Beelink SER4 | |
| Intel NUC11TNKi5 | |
| Beelink GTI 11 | |
| Strange Brigade | |
| 1280x720 lowest AF:1 | |
| Beelink GTR5 | |
| Medio Intel Iris Xe Graphics G7 96EUs (48.5 - 115.1, n=172) | |
| Beelink SER4 | |
| Beelink SEi11 Pro | |
| Beelink GTI 11 | |
| 1920x1080 medium AA:medium AF:4 | |
| Beelink GTR5 | |
| Medio Intel Iris Xe Graphics G7 96EUs (18.2 - 51.4, n=170) | |
| Beelink SEi11 Pro | |
| Beelink SER4 | |
| Beelink GTI 11 | |
| 1920x1080 high AA:high AF:8 | |
| Beelink GTR5 | |
| Medio Intel Iris Xe Graphics G7 96EUs (15.4 - 39.8, n=169) | |
| Beelink SER4 | |
| Beelink SEi11 Pro | |
| Beelink GTI 11 | |
| 1920x1080 ultra AA:ultra AF:16 | |
| Beelink GTR5 | |
| Beelink SER4 | |
| Medio Intel Iris Xe Graphics G7 96EUs (13.2 - 31.7, n=167) | |
| Beelink SEi11 Pro | |
| Beelink GTI 11 | |
Witcher 3 FPS Chart
| bajo | medio | alto | ultra | |
|---|---|---|---|---|
| GTA V (2015) | 94.2 | 77.6 | 23.2 | |
| The Witcher 3 (2015) | 89.7 | 53.7 | 27.8 | 13.8 |
| Dota 2 Reborn (2015) | 119.6 | 78.6 | 50.4 | 47.4 |
| Final Fantasy XV Benchmark (2018) | 38.6 | 20.3 | 14.9 | |
| X-Plane 11.11 (2018) | 58.2 | 41.2 | 37.3 | |
| Strange Brigade (2018) | 79.3 | 33.9 | 27.7 | 22.2 |
| Cyberpunk 2077 1.6 (2022) | 18.6 | 15.6 | 11.7 | 9.8 |
Emisiones
Ruido del sistema
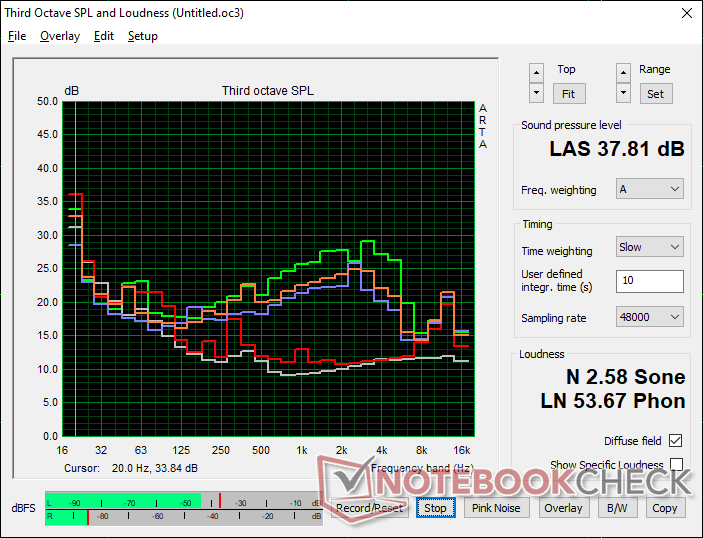
El ventilador de la unidad está siempre activo sin importar la carga o actividad en pantalla. Afortunadamente es relativamente silencioso, con sólo 24,7 dB(A) frente a un fondo de 22,8 dB(A), pero los usuarios que esperen un mini PC completamente silencioso no lo encontrarán aquí
El ruido general del ventilador sigue siendo más silencioso que en muchos otros mini PC cuando se ejecutan cargas más exigentes. Cuando se navega por la web o se hace streaming de vídeo, por ejemplo, el ruido del ventilador tiende a rondar entre los 25 y 28 dB(A) en comparación con los más de 30 dB(A) del GTR5 o el Intel NUC11. El ventilador alcanza un máximo de poco menos de 38 dB(A) cuando la CPU está al 100 por ciento de utilización durante periodos prolongados, lo que de nuevo es notablemente más silencioso que muchas alternativas.
Ruido
| Ocioso |
| 24.7 / 24.7 / 25.3 dB(A) |
| Carga |
| 33.2 / 37.8 dB(A) |
 | ||
30 dB silencioso 40 dB(A) audible 50 dB(A) ruidosamente alto |
||
min: | ||
| Beelink SEi11 Pro Iris Xe G7 96EUs, i5-11320H, Kingston NV1 SNVS/500GCN | Beelink GTR5 Vega 8, R9 5900HX, Kingston NV1 SNVS/500GCN | Beelink GTI 11 Iris Xe G7 80EUs, i5-1135G7, Kingston SA2000M8500G | Beelink SER4 Vega 8, R7 4800U, Intel SSD 660p SSDPEKNW512G8 | Intel NUC11TNKi5 Iris Xe G7 80EUs, i5-1135G7, Transcend M.2 SSD 430S TS512GMTS430S | |
|---|---|---|---|---|---|
| Noise | -26% | -31% | -20% | -26% | |
| apagado / medio ambiente * (dB) | 22.8 | 23.1 -1% | 25.7 -13% | 23.4 -3% | 24.8 -9% |
| Idle Minimum * (dB) | 24.7 | 34.2 -38% | 28.4 -15% | 33.2 -34% | 35.6 -44% |
| Idle Average * (dB) | 24.7 | 34.2 -38% | 32 -30% | 33.2 -34% | 35.6 -44% |
| Idle Maximum * (dB) | 25.3 | 34.2 -35% | 37.7 -49% | 33.2 -31% | 35.6 -41% |
| Load Average * (dB) | 33.2 | 44.6 -34% | 44.2 -33% | 38.6 -16% | 36.2 -9% |
| Witcher 3 ultra * (dB) | 34.5 | 41.4 -20% | 44.5 -29% | 39.2 -14% | 38 -10% |
| Load Maximum * (dB) | 37.8 | 45.1 -19% | 56 -48% | 40.8 -8% | 47.6 -26% |
* ... más pequeño es mejor
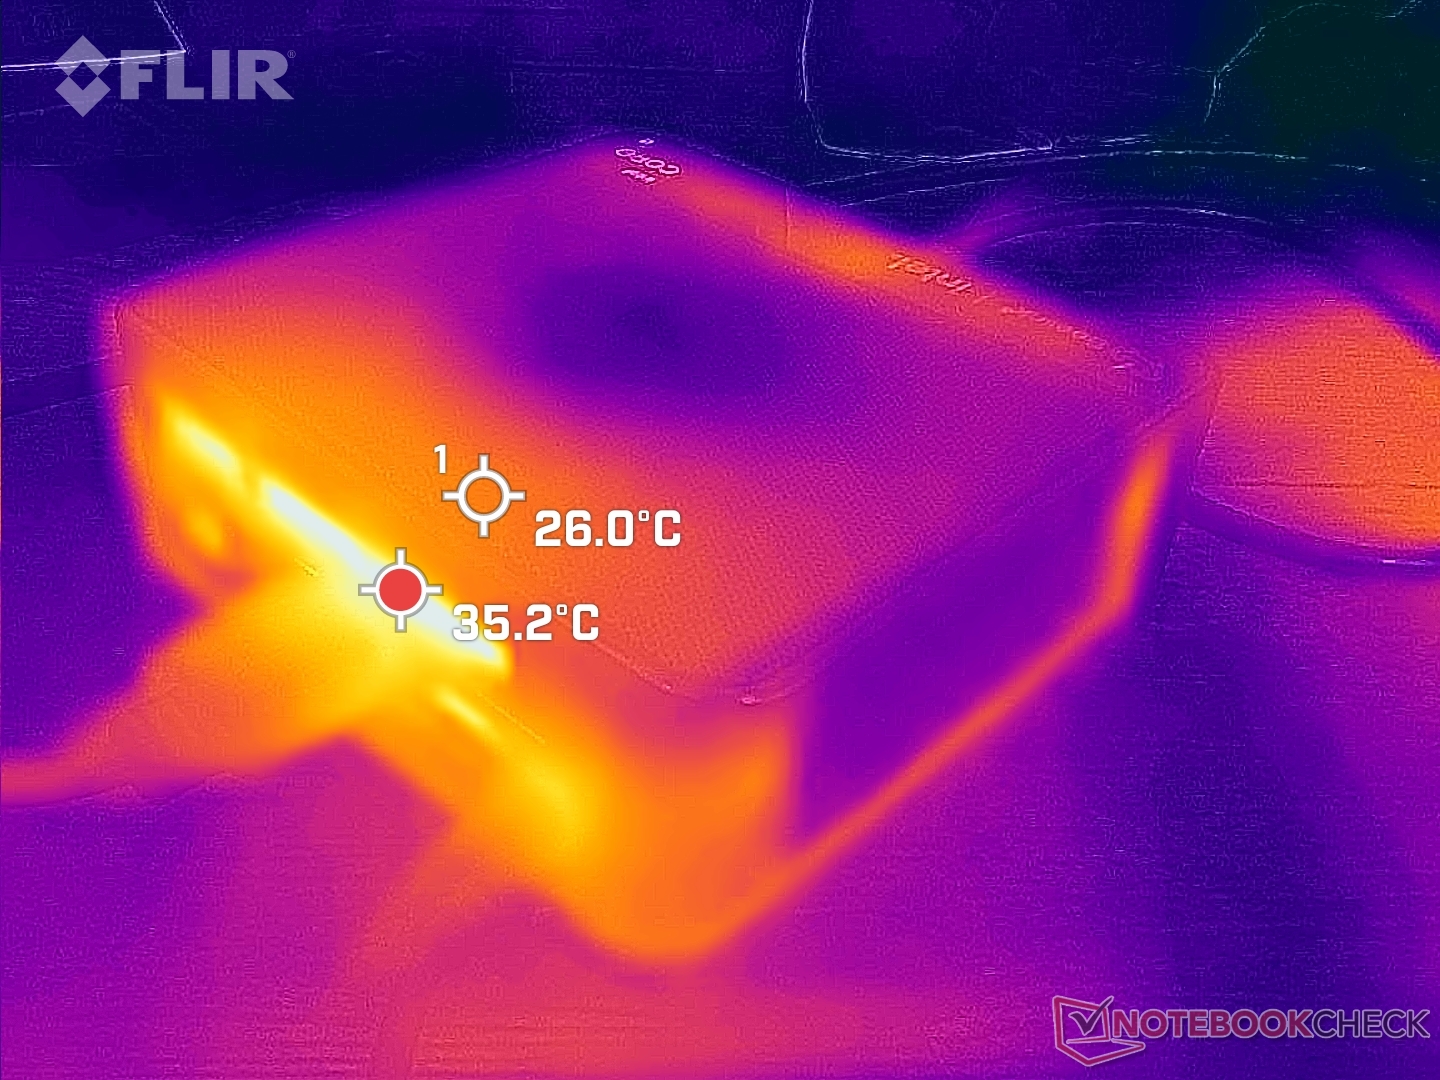
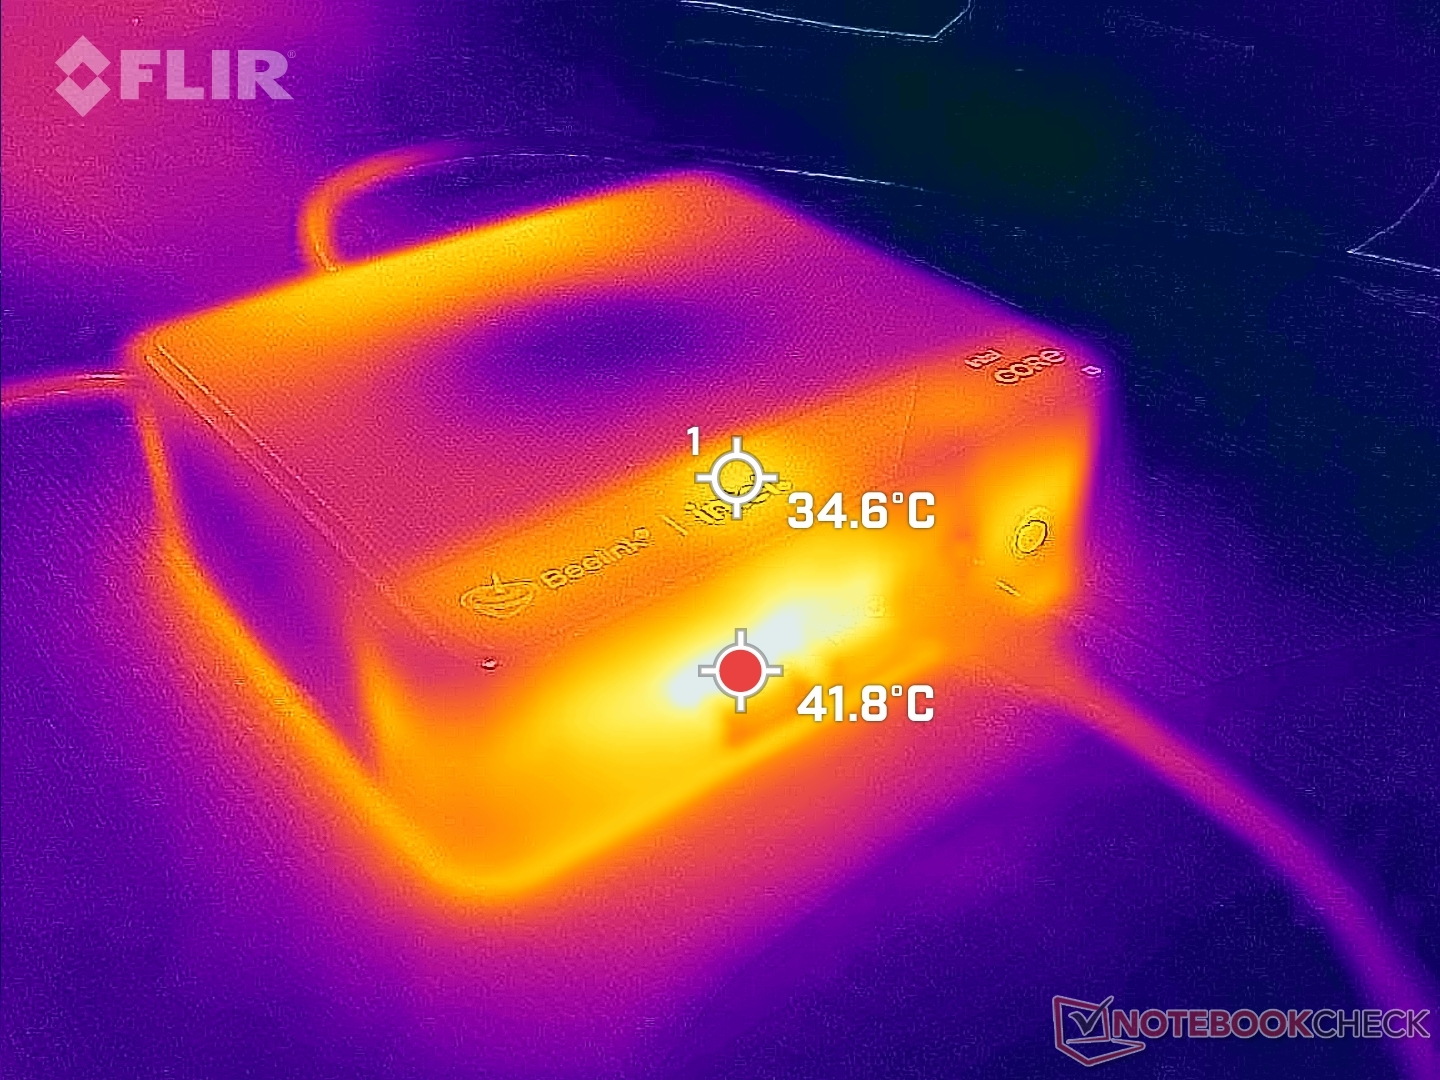
Temperatura
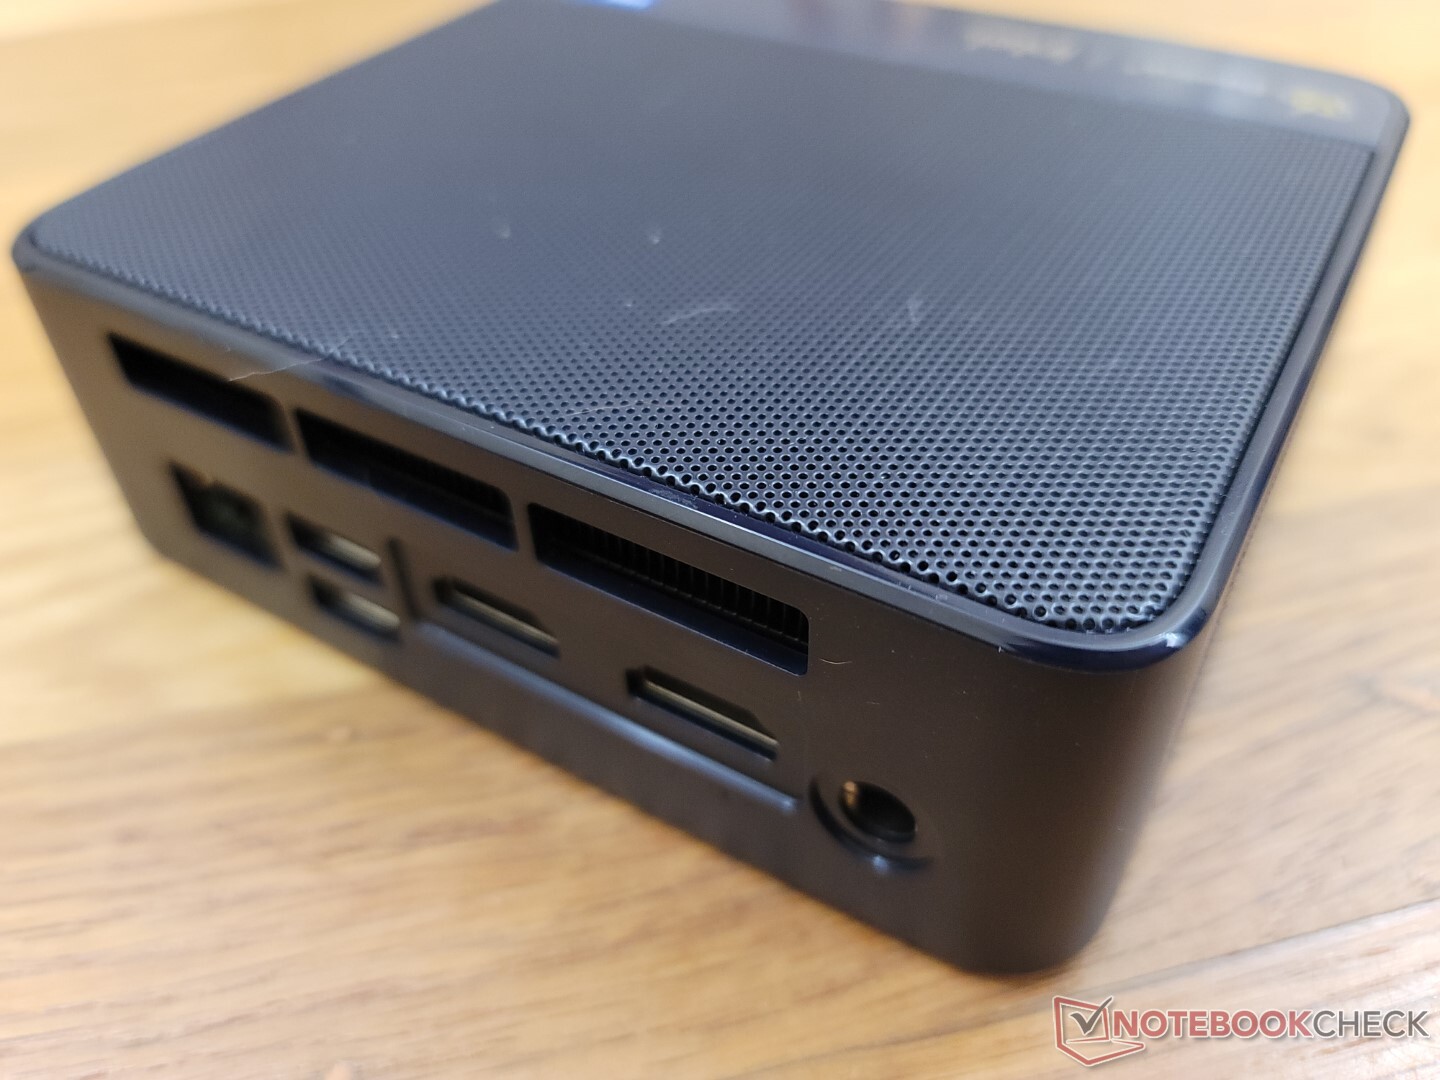
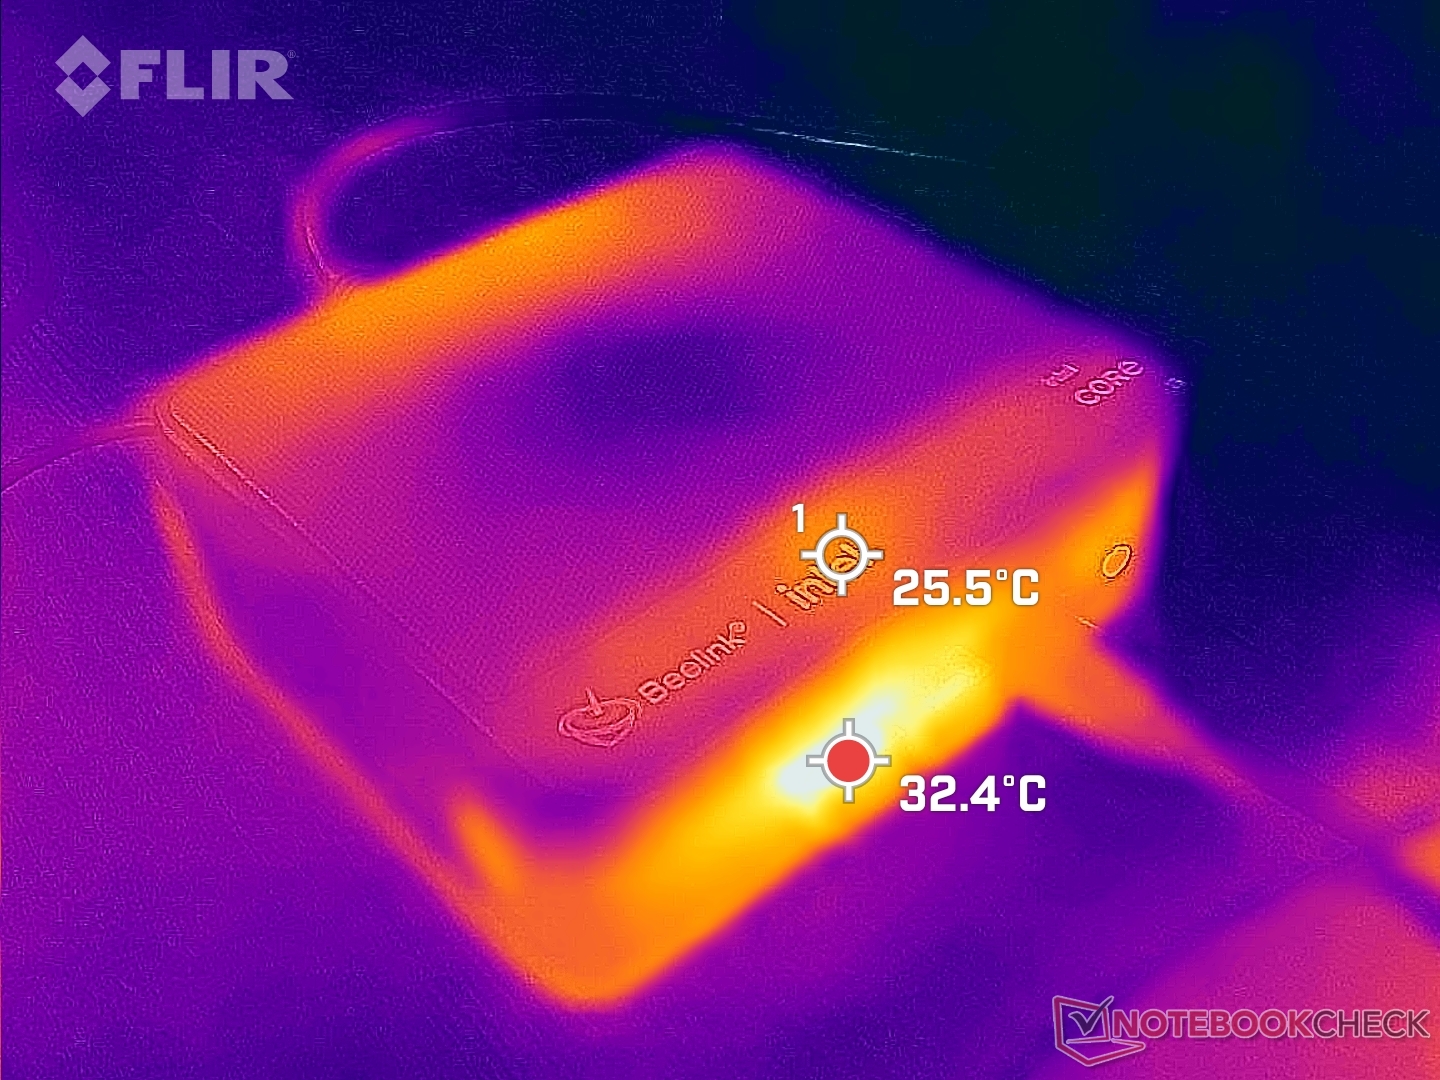
El aire frío es aspirado por la superficie superior de la unidad, mientras que el escape sale por la parte trasera, como muestran nuestros mapas de temperatura más abajo. Por lo tanto, no se deben colocar objetos como libros y papeles en la parte superior.
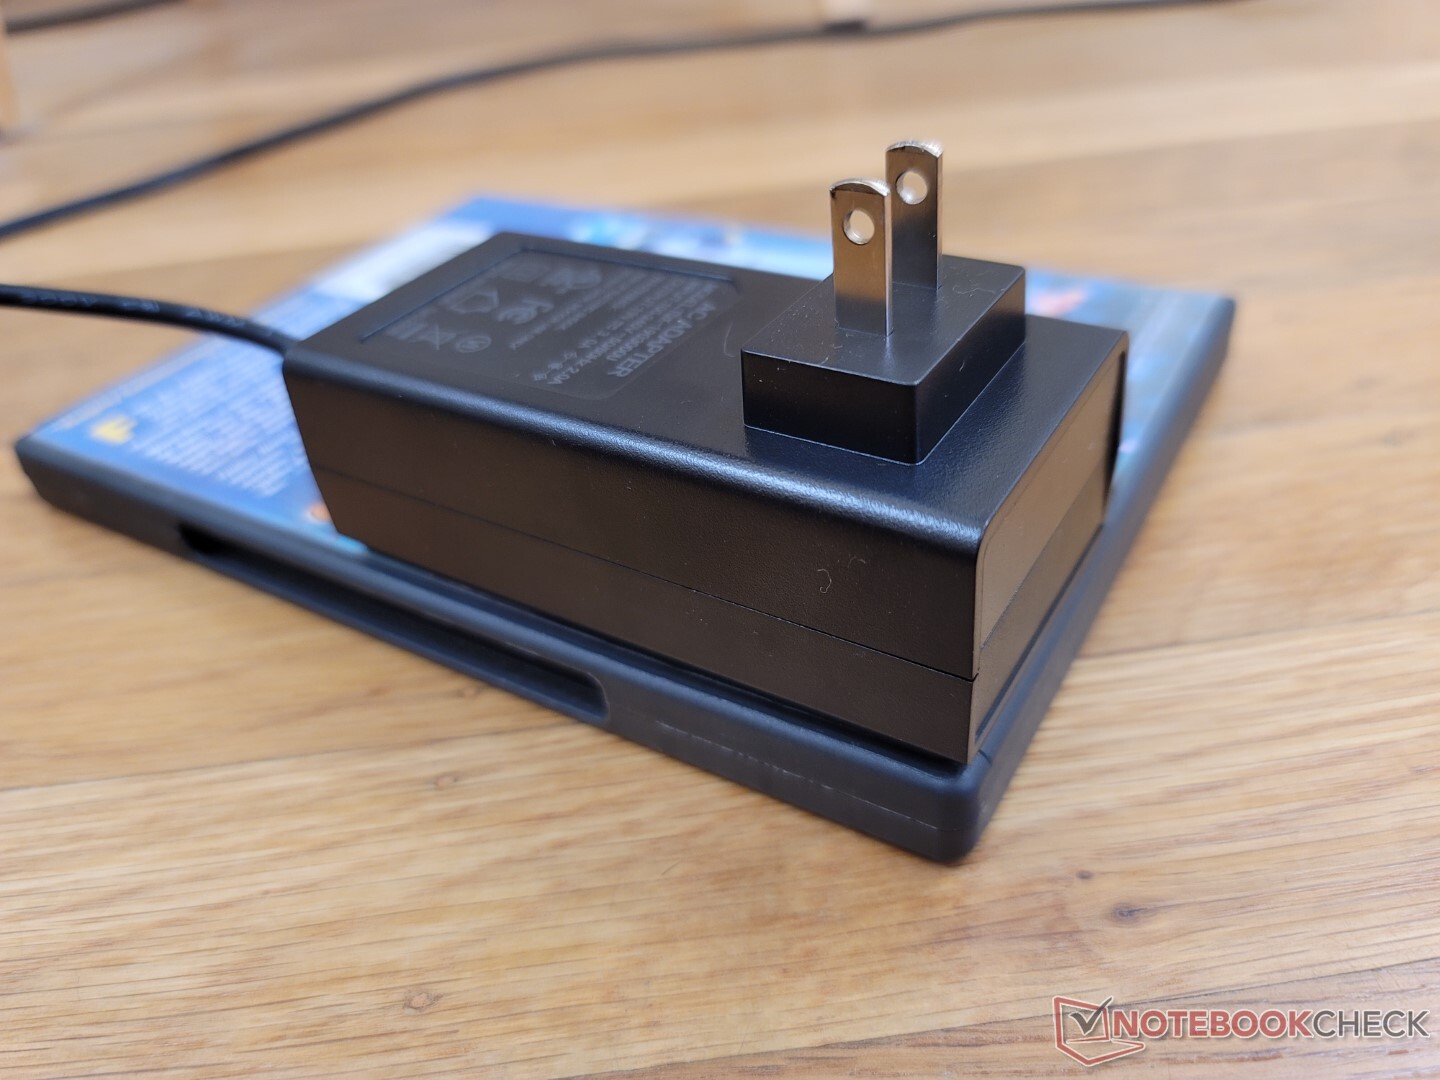
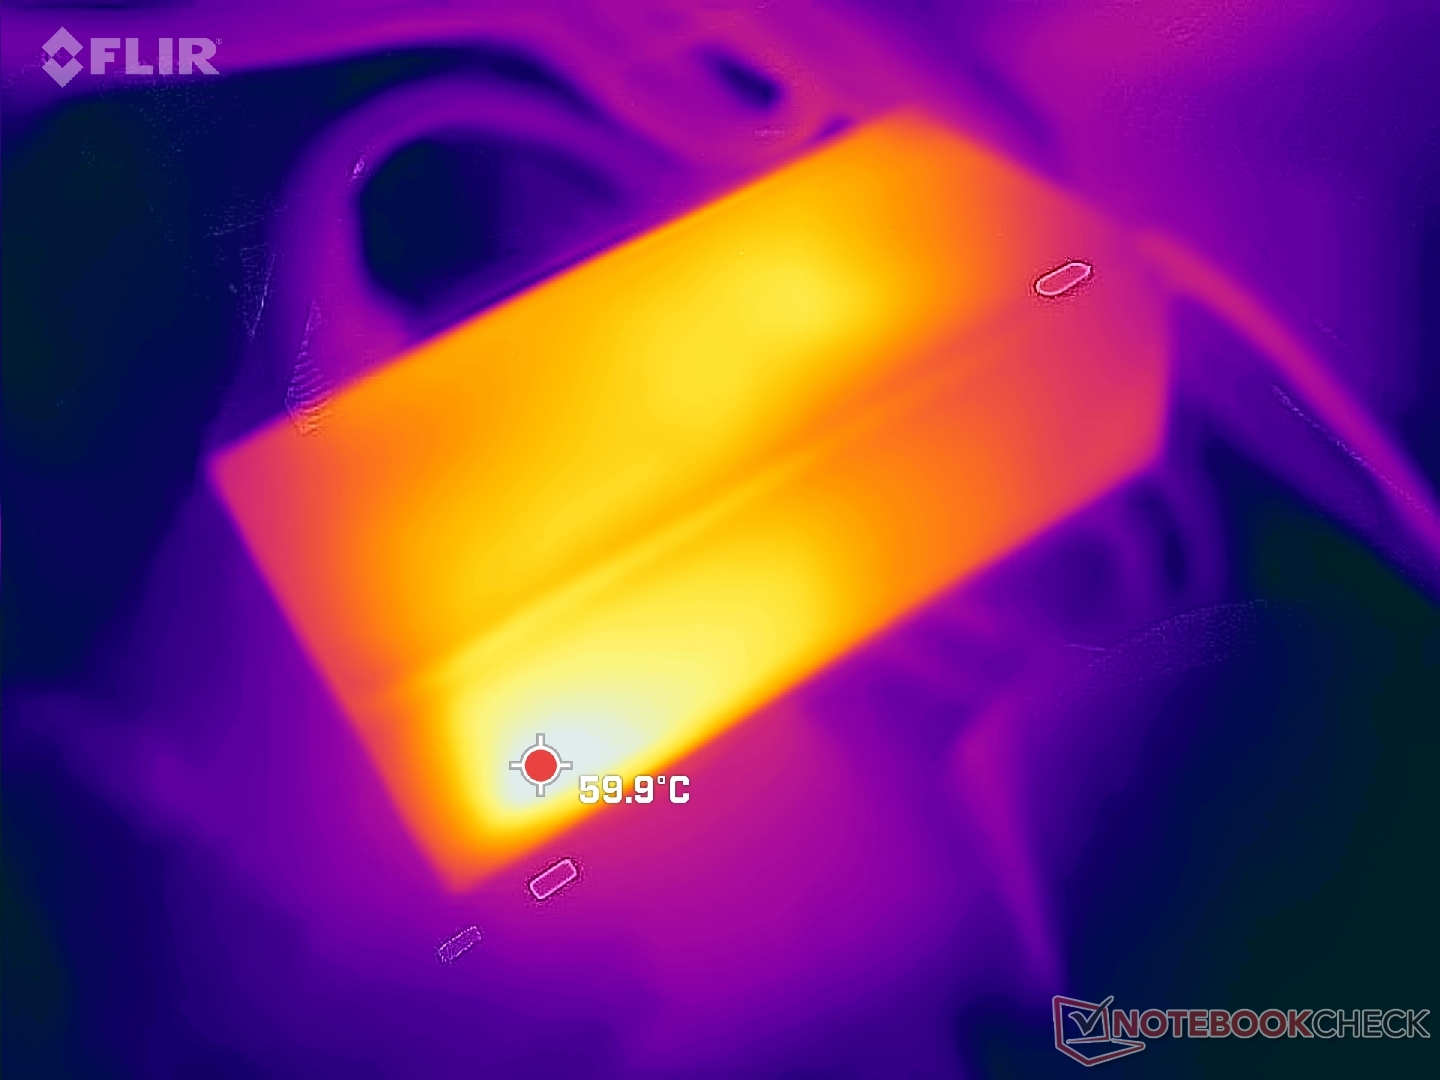
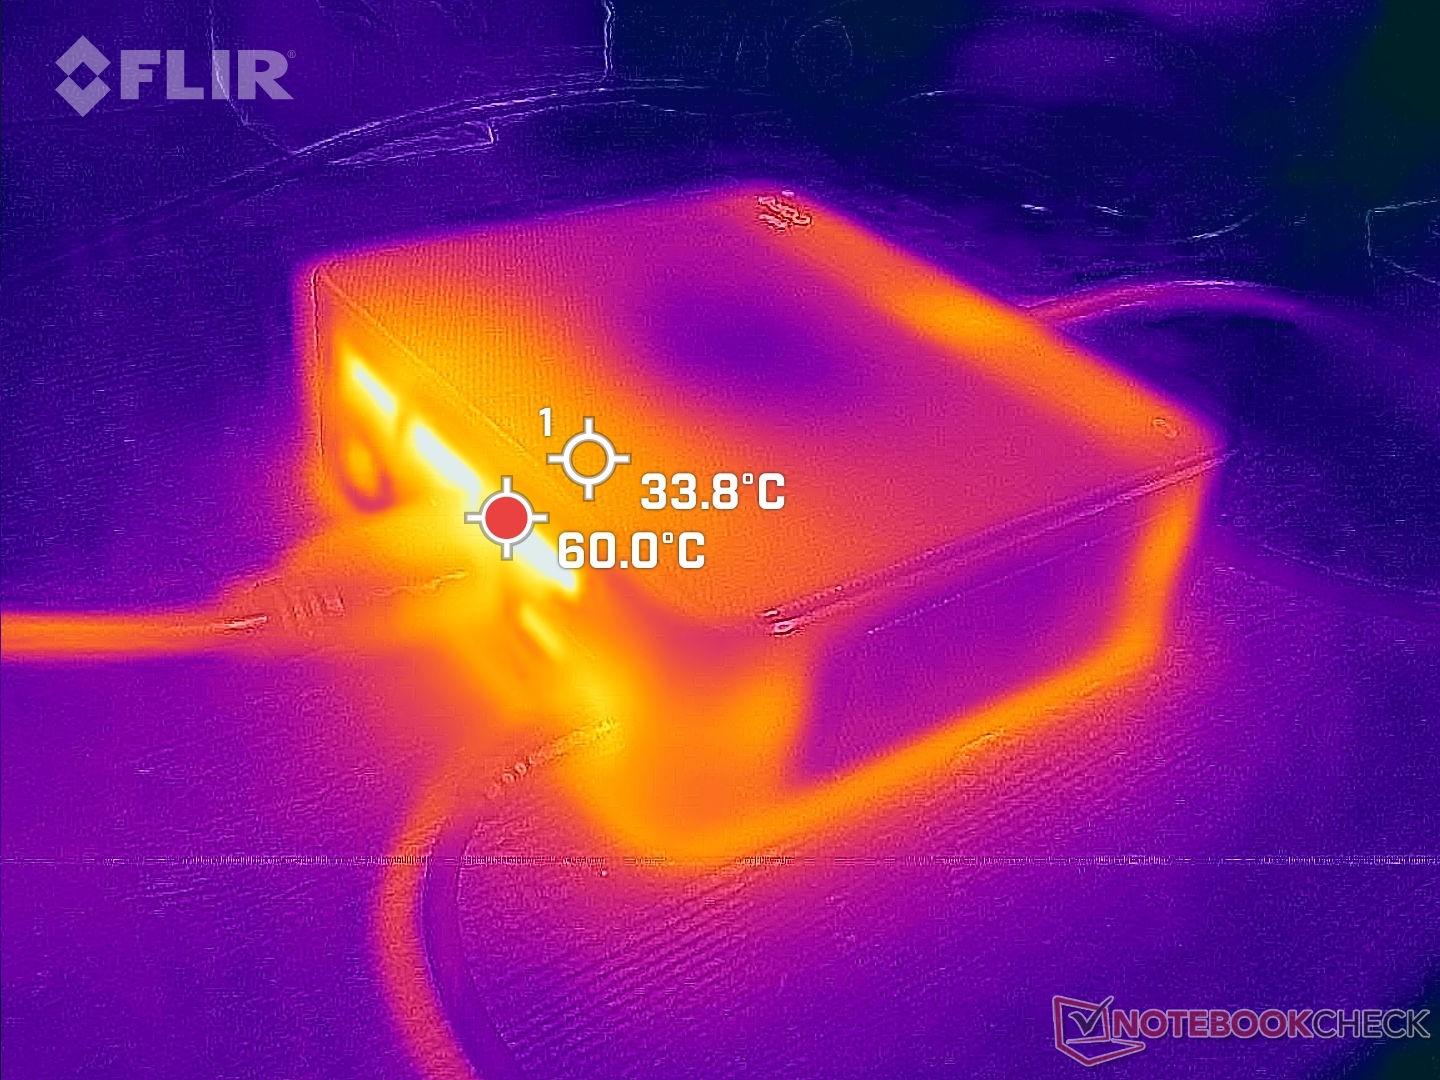
Tenga en cuenta que el adaptador de CA puede llegar a ser notablemente más caliente que la mayoría de los adaptadores de CA que se envían con los ordenadores portátiles.
Prueba de esfuerzo
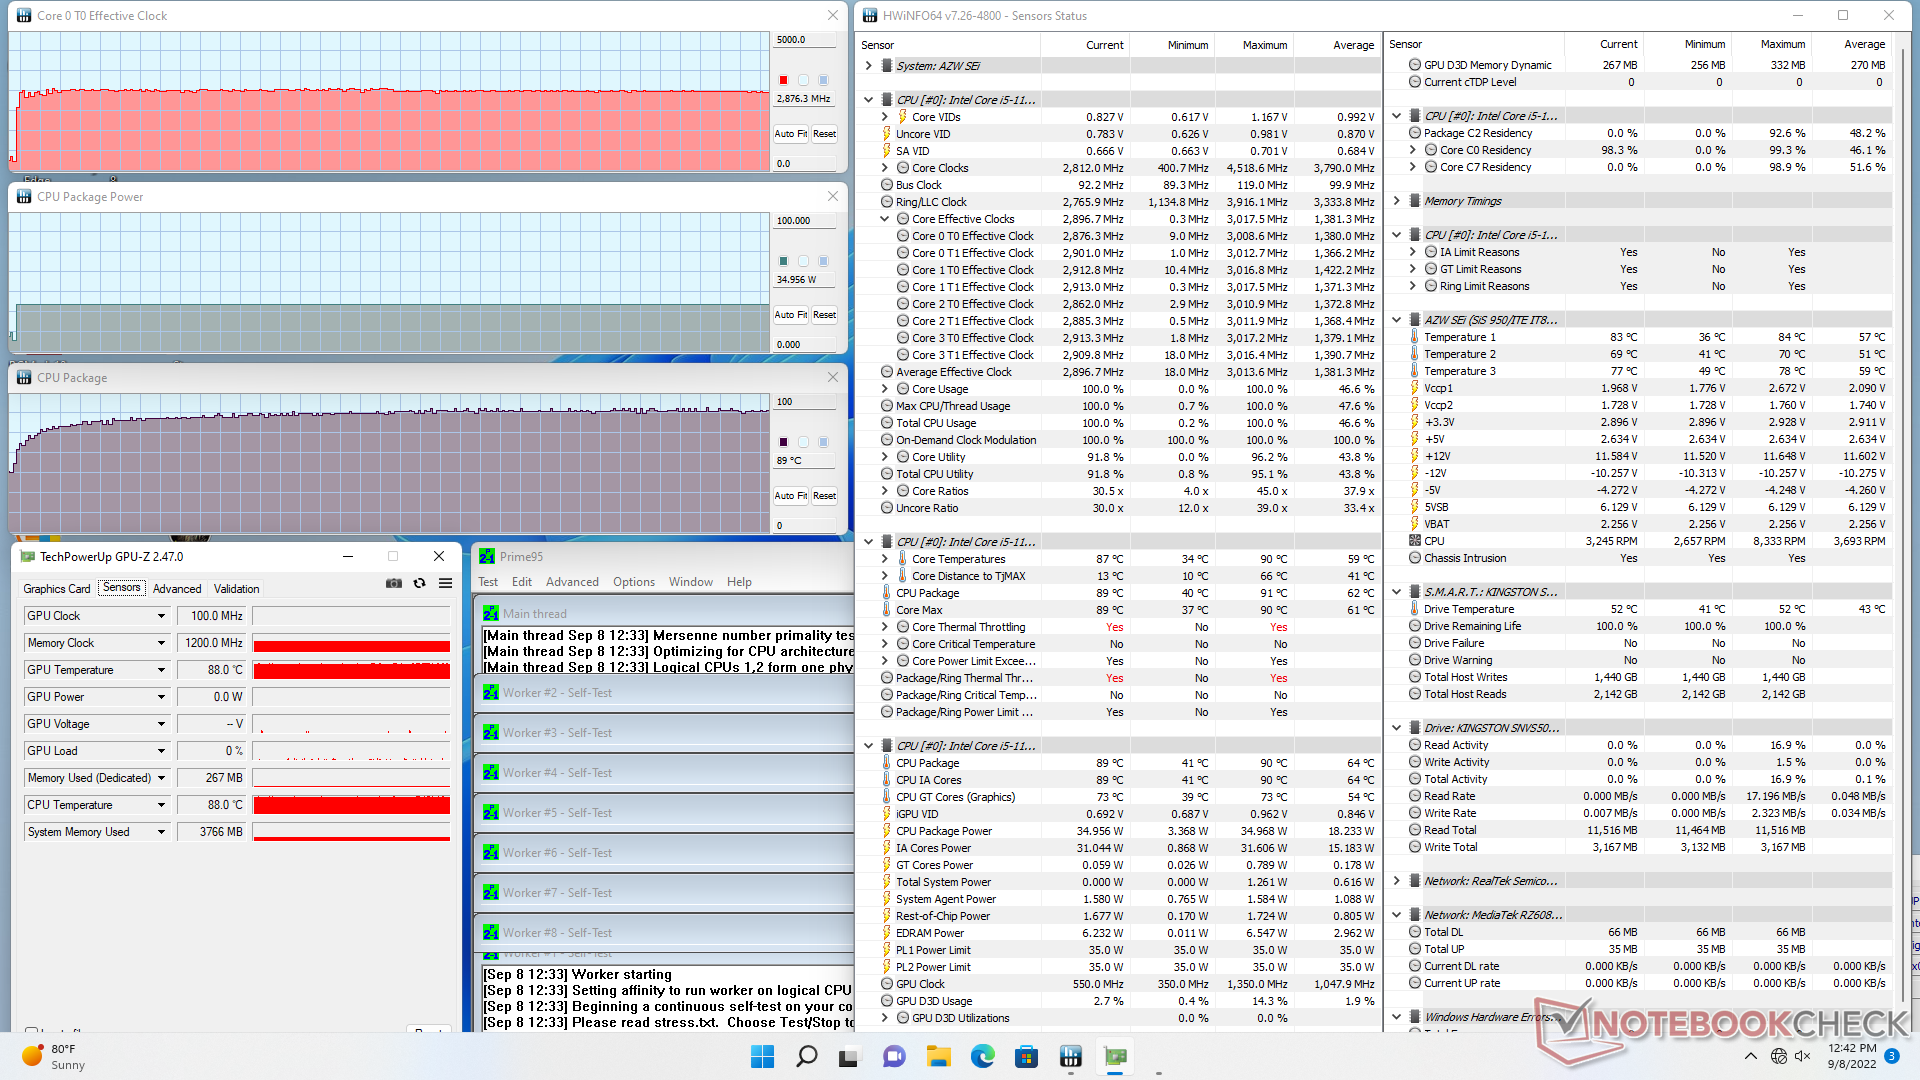
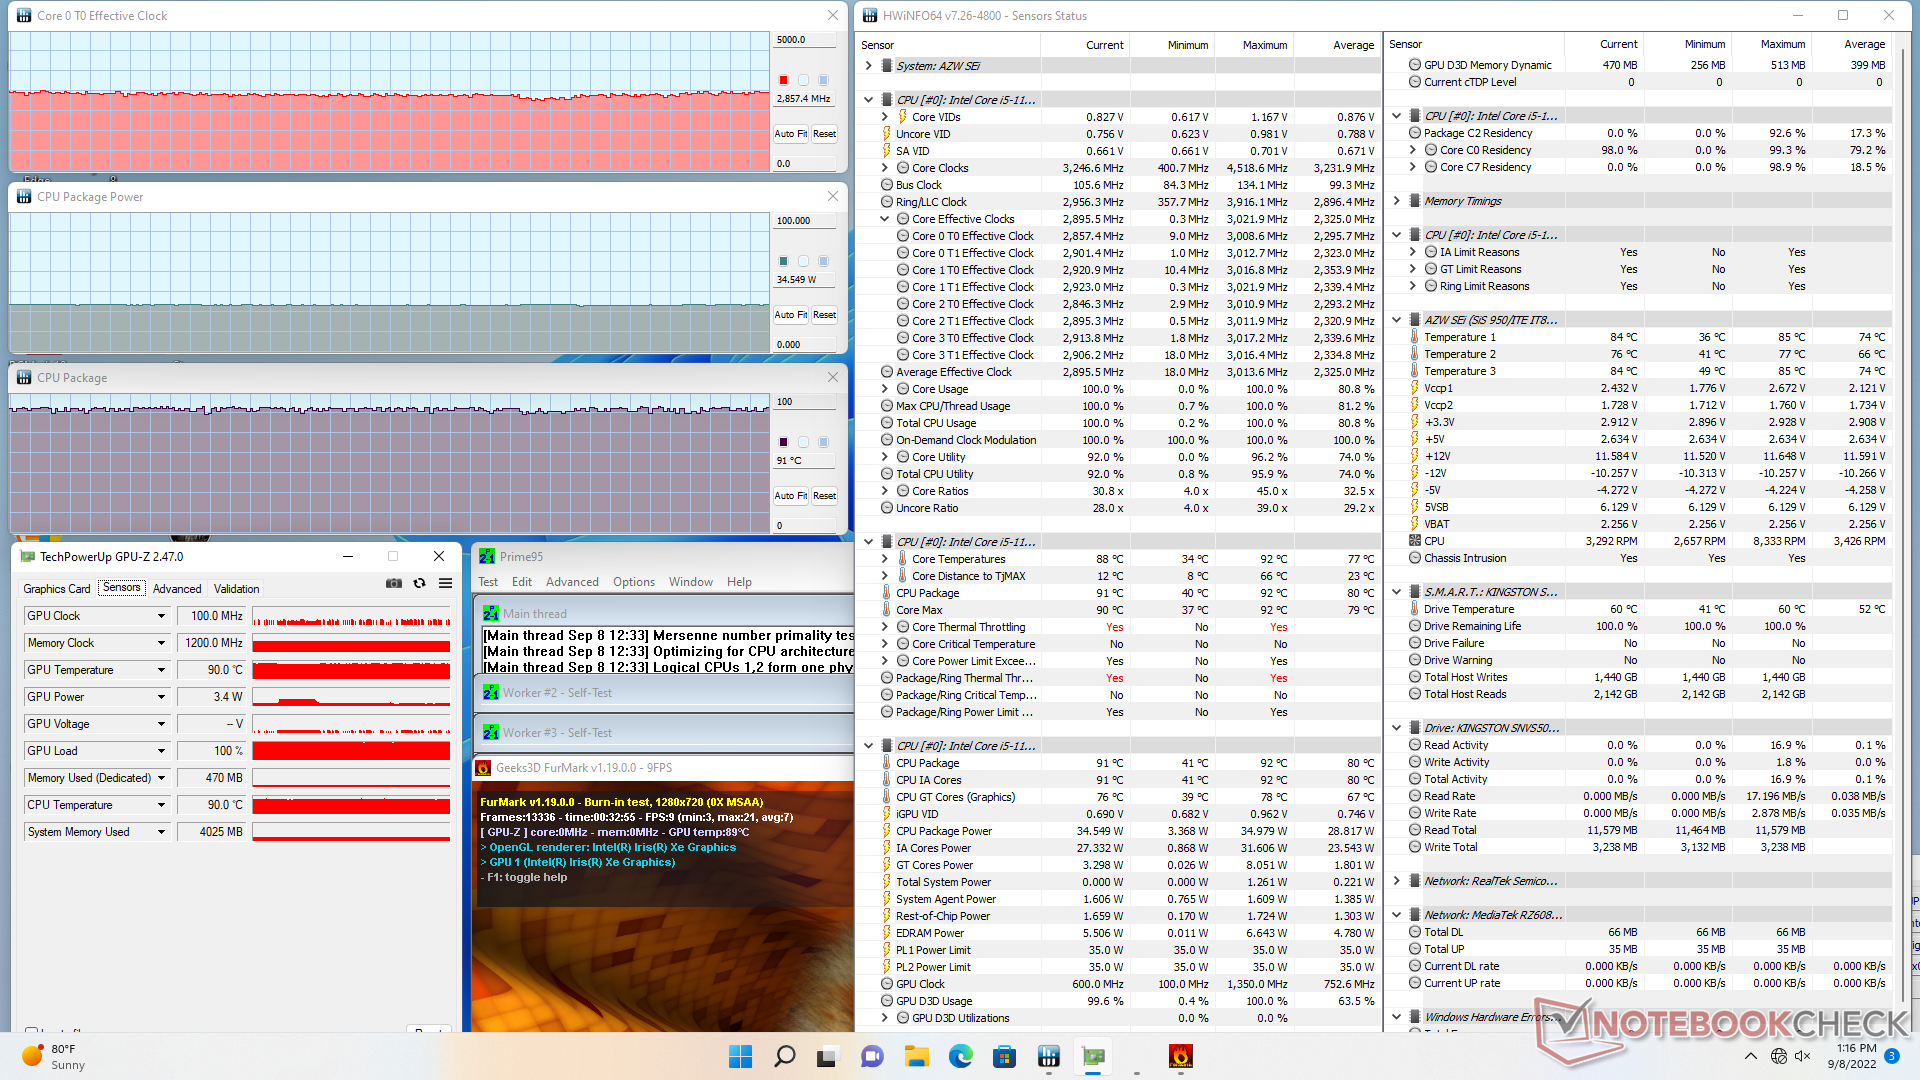
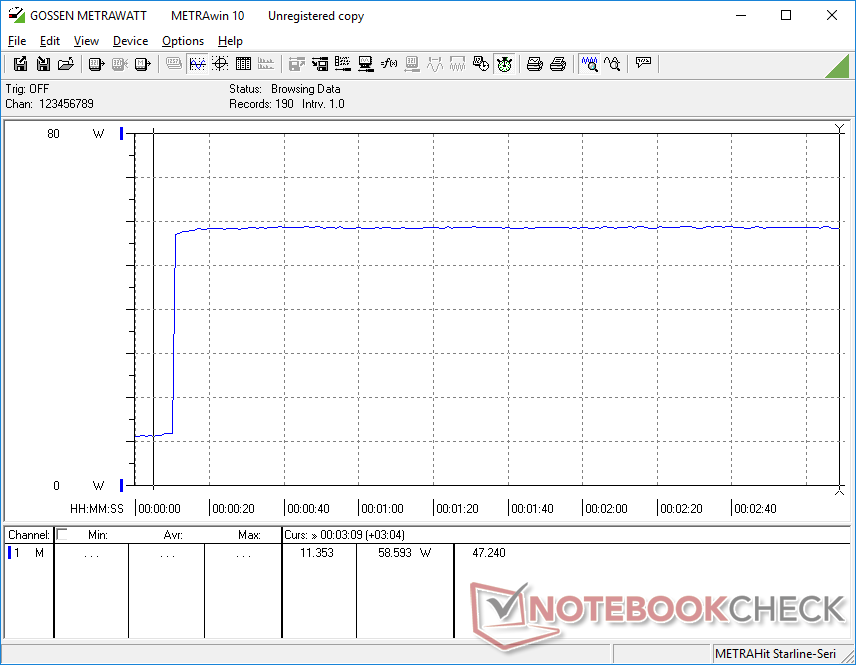
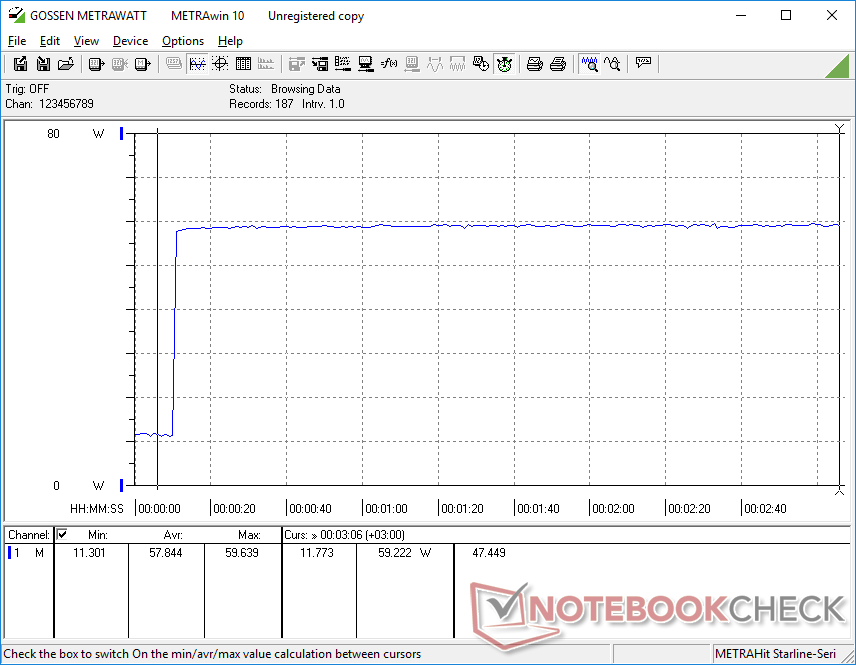
La velocidad de reloj y el consumo de energía de la placa se disparan a 2,9 GHz y 35 W, respectivamente, al iniciar el estrés de Prime95. El sistema es capaz de mantener estos valores indefinidamente, aunque con una temperatura del núcleo relativamente alta, de 90 C. 35 W es el rango superior de TDP para el Core i5-11320H, por lo que el SEi11 está utilizando el procesador cerca de su máximo potencial.
Las velocidades de reloj de la GPU y la temperatura en funcionamiento Witcher 3 son relativamente estables a 1350 MHz y 83 C, respectivamente. Al ejecutar esta misma prueba en el Intel NUC11 con el Core i5-1135G7 resultaría en una temperatura del núcleo mucho más fría de 58 C en comparación.
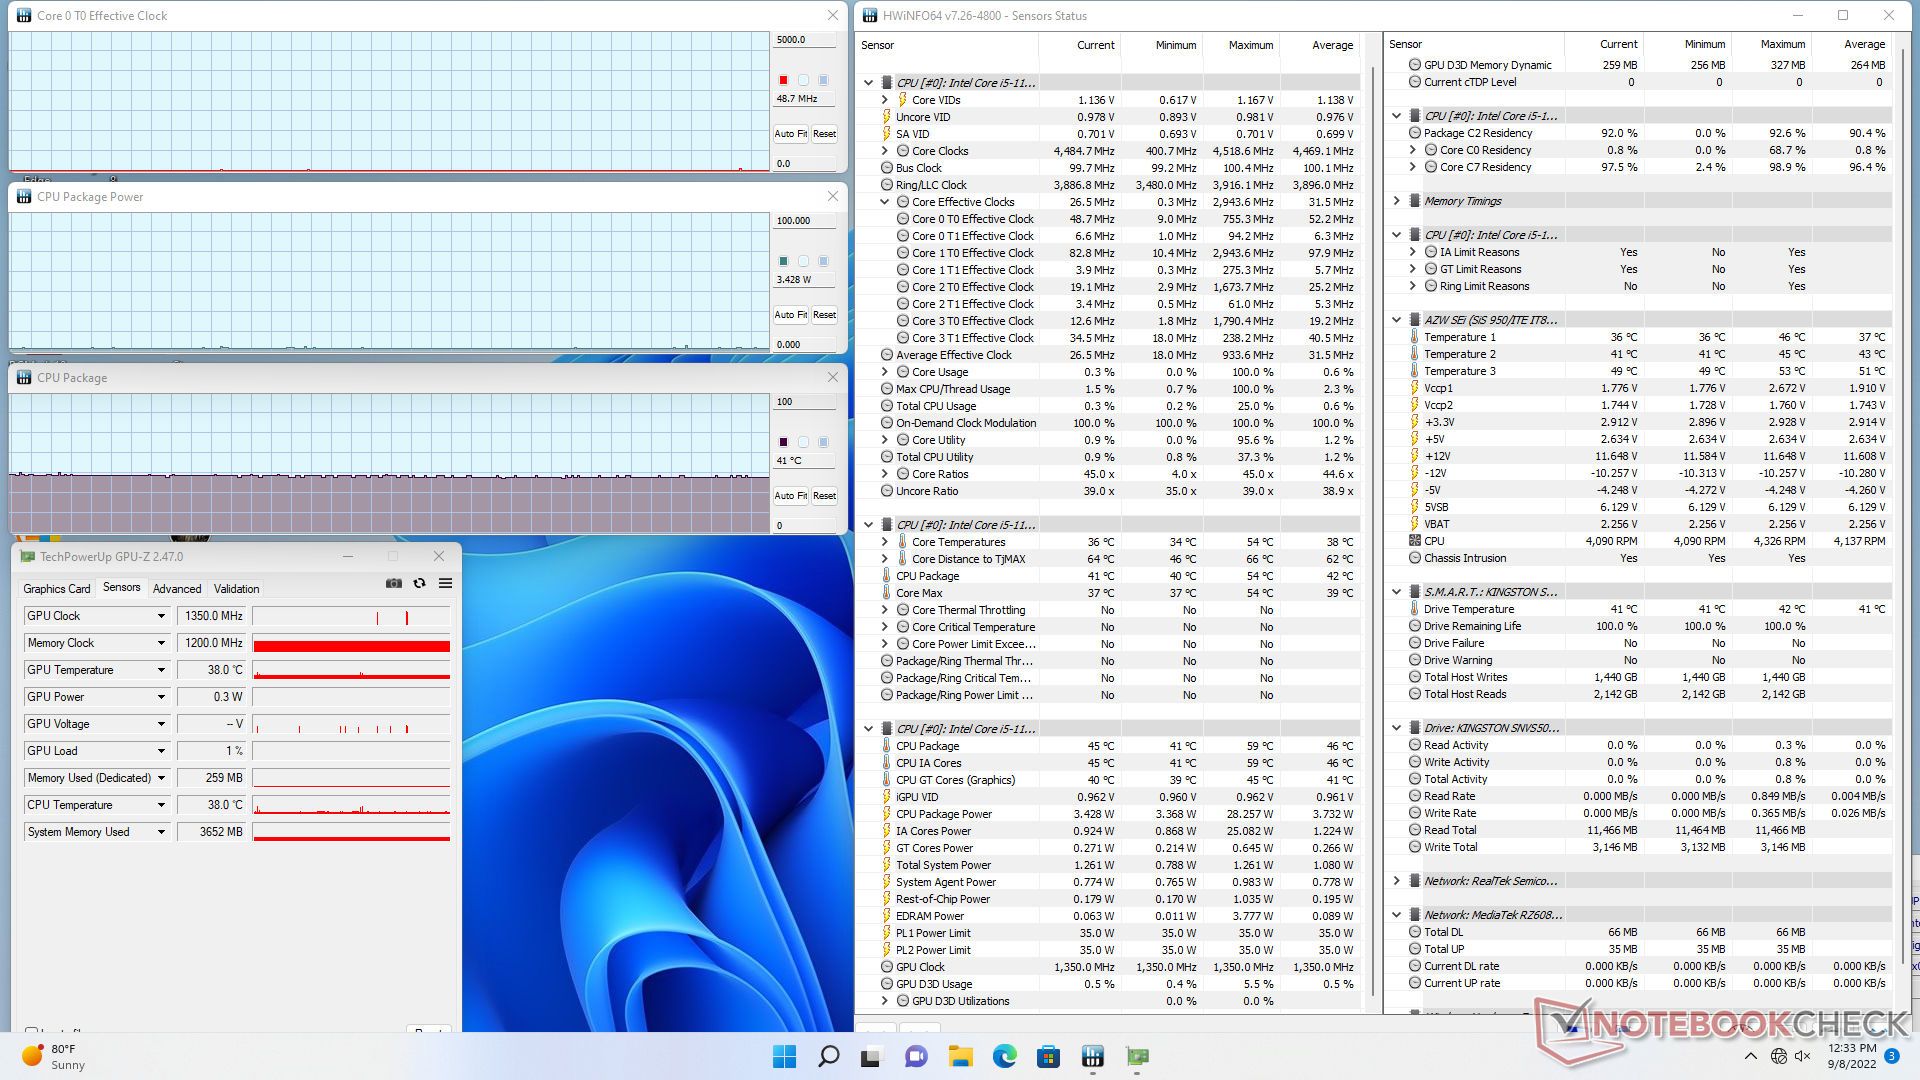
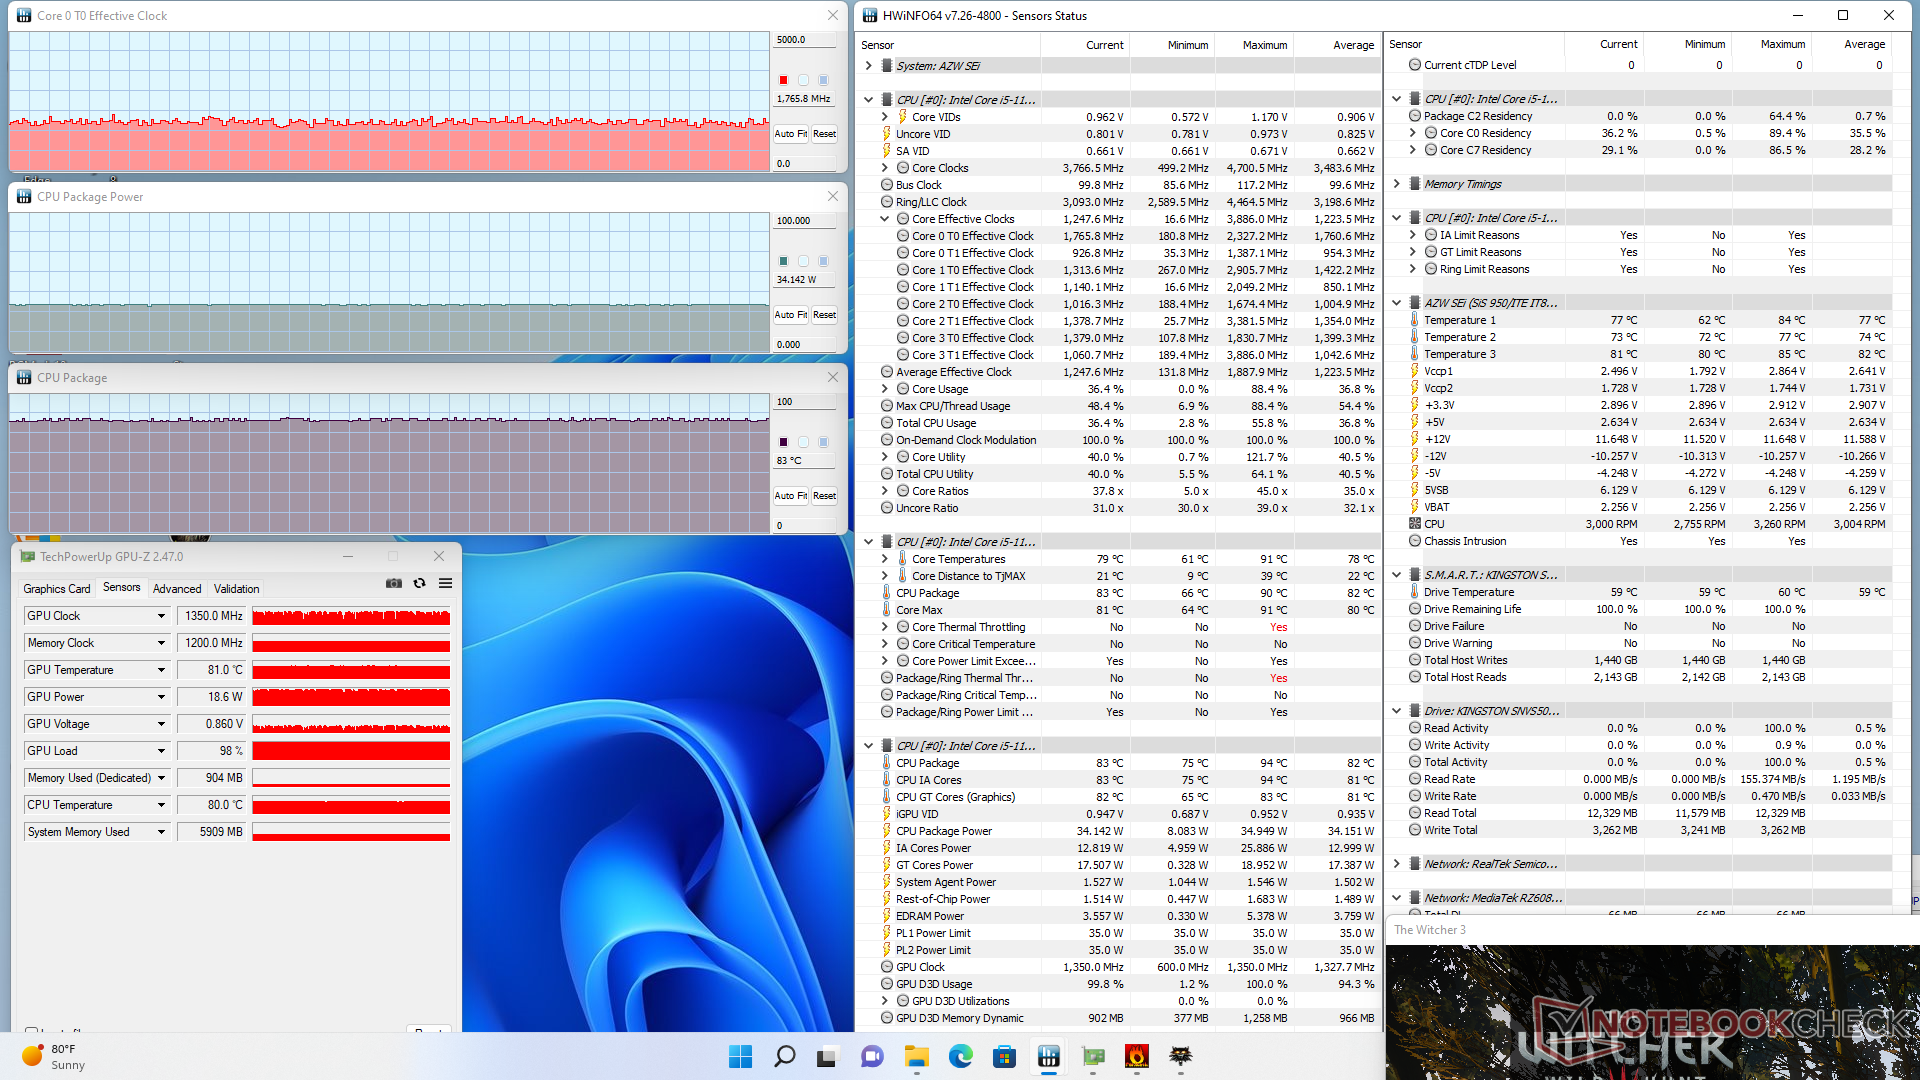
| Reloj dela CPU (GHz) | Reloj de la GPU (MHz) | Temperatura media de la CPU (°C) | |
| Sistema en reposo | -- | -- | 41 |
| Prime95 Stress | 2.9 | -- | 89 |
| Prime95+ FurMark Stress | ~2,9 | 600 | 91 |
| Witcher 3 Estrés | ~1,8 | 1350 | 83 |
Gestión de la energía
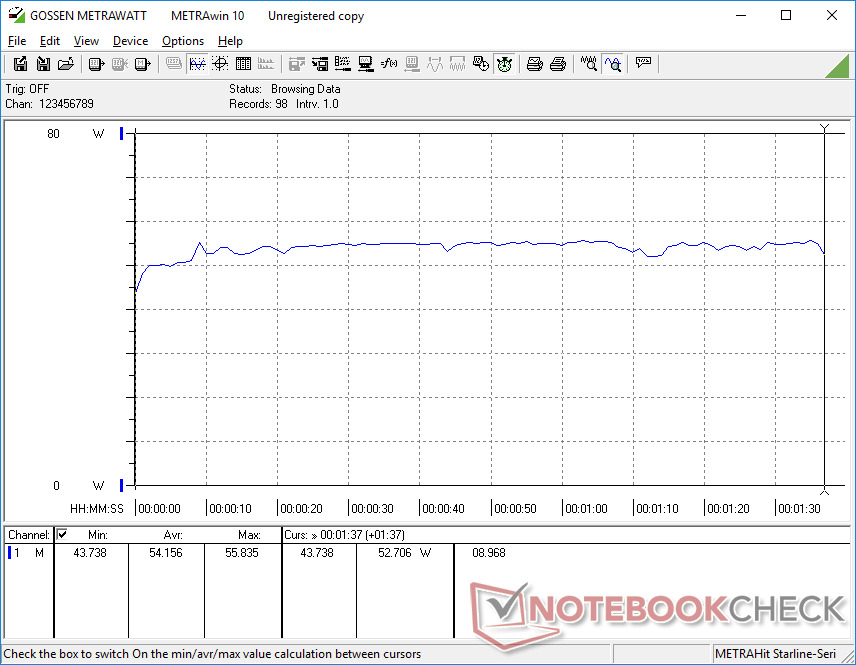
Consumo de energía
El sistema es más exigente que los mini PCs que funcionan con CPUs de la serie Core U de 11ª generación, como el GTI 11 o el Intel NUC11. Sin embargo, si valoras el rendimiento multihilo de la CPU en bruto, el SER4 puede ser la mejor opción, ya que ofrece un rendimiento multihilo más rápido y consume más de un 30% menos de energía que nuestro SEi11.
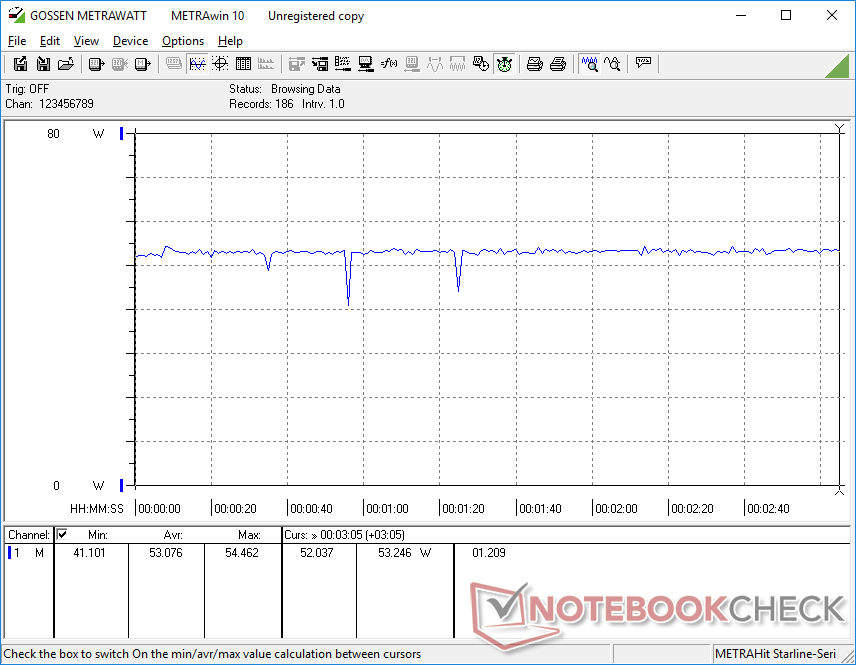
Hemos podido registrar un consumo máximo de 59 W con el adaptador de CA relativamente pequeño (~10 x 4,3 x 4,8 cm) de 57 W (19 V, 3 A) cuando se ejecuta Prime95.
| Off / Standby | |
| Ocioso | |
| Carga |
|
Clave:
min: | |
| Beelink SEi11 Pro i5-11320H, Iris Xe G7 96EUs, Kingston NV1 SNVS/500GCN, , x, | Beelink GTR5 R9 5900HX, Vega 8, Kingston NV1 SNVS/500GCN, , x, | Beelink GTI 11 i5-1135G7, Iris Xe G7 80EUs, Kingston SA2000M8500G, , x, | Beelink SER4 R7 4800U, Vega 8, Intel SSD 660p SSDPEKNW512G8, , x, | Intel NUC11TNKi5 i5-1135G7, Iris Xe G7 80EUs, Transcend M.2 SSD 430S TS512GMTS430S, , x, | |
|---|---|---|---|---|---|
| Power Consumption | -2% | -38% | 46% | -7% | |
| Idle Minimum * (Watt) | 9.8 | 6.2 37% | 15.2 -55% | 4.1 58% | 11.5 -17% |
| Idle Average * (Watt) | 10.3 | 8.9 14% | 16 -55% | 4.1 60% | 12.4 -20% |
| Idle Maximum * (Watt) | 10.5 | 9 14% | 16 -52% | 4.6 56% | 12.9 -23% |
| Load Average * (Watt) | 54.2 | 66.8 -23% | 48.6 10% | 35.6 34% | 40.7 25% |
| Witcher 3 ultra * (Watt) | 53.1 | 62.6 -18% | 53.8 -1% | 35.6 33% | 43.9 17% |
| Load Maximum * (Watt) | 59 | 81.6 -38% | 104.3 -77% | 39.9 32% | 73.5 -25% |
* ... más pequeño es mejor
Power Consumption Witcher 3 / Stresstest
Power Consumption external Monitor
Pro
Contra
Veredicto - HTPC Core i5 Sweet Spot
La cartera de mini PC de Beelink alberga un puñado de "asesinos de NUC de Intel" que pueden ofrecer la mayoría de las mismas características pero por cientos de dólares menos. El SEi11 es otra historia de éxito para la compañía debido en gran parte al Core i5-11320H que hemos demostrado que es comparable al Core i7-1165G7 que se encuentra en los modelos NUC que cuestan casi el doble de precio. En resumen, los usuarios no tendrán que conformarse con un rendimiento más lento de Core i3, Ryzen 3, Celeron o Atom sólo porque la alternativa NUC sea mucho más asequible. La accesible memoria RAM, la solución de almacenamiento dual y la amplia selección de puertos deberían satisfacer la mayoría de los propósitos de los HTPC o las configuraciones de pequeñas oficinas domésticas
El Beelink SEi11 tiene un rendimiento casi idéntico al de un Intel NUC11 con el Core i7-1165G7, pero su precio es significativamente inferior.
Hay que tener cuidado con algunos recortes. Thunderbolt y DisplayPort, en particular, no son compatibles, mientras que la WLAN es más débil de lo esperado. La garantía estándar también es más corta que la garantía de 36 meses de un NUC de Intel. El ruido de los ventiladores es, en general, más silencioso que el de la mayoría de los mini PC, aunque a costa de temperaturas más elevadas en el núcleo. Por lo demás, es lo más parecido a un NUC de Intel que se puede conseguir sin pagar los precios de los NUC.
Precio y disponibilidad
Amazon tiene el Beelink SEi11 en stock completo con Windows 11 Pro, 500 GB SSD y 16 GB de RAM por 479 dólares o 419 dólares después de aplicar el código de cupón en el momento de escribir este artículo. Alternativamente, los usuarios pueden comprar directamente del fabricante por 429 dólares.
Price comparison

