Análisis breve de la estación de trabajo Lenovo ThinkPad P51s (Core i7, 4K)
| SD Card Reader | |
| average JPG Copy Test (av. of 3 runs) | |
| Dell Precision 5520 UHD | |
| HP ZBook Studio G3 | |
| Lenovo ThinkPad P51s 20HB000SGE | |
| Lenovo ThinkPad T570-20HAS01E00 | |
| Lenovo ThinkPad P50s-20FKS00400 | |
| maximum AS SSD Seq Read Test (1GB) | |
| Dell Precision 5520 UHD | |
| HP ZBook Studio G3 | |
| Lenovo ThinkPad T570-20HAS01E00 | |
| Lenovo ThinkPad P50s-20FKS00400 | |
| Lenovo ThinkPad P51s 20HB000SGE | |
| Networking | |
| iperf3 transmit AX12 | |
| Lenovo ThinkPad P51s 20HB000SGE | |
| Dell Precision 5520 UHD | |
| Lenovo ThinkPad T570-20HAS01E00 | |
| iperf3 receive AX12 | |
| Lenovo ThinkPad P51s 20HB000SGE | |
| Lenovo ThinkPad T570-20HAS01E00 | |
| Dell Precision 5520 UHD | |
| |||||||||||||||||||||||||
iluminación: 85 %
Brillo con batería: 318 cd/m²
Contraste: 991:1 (Negro: 0.32 cd/m²)
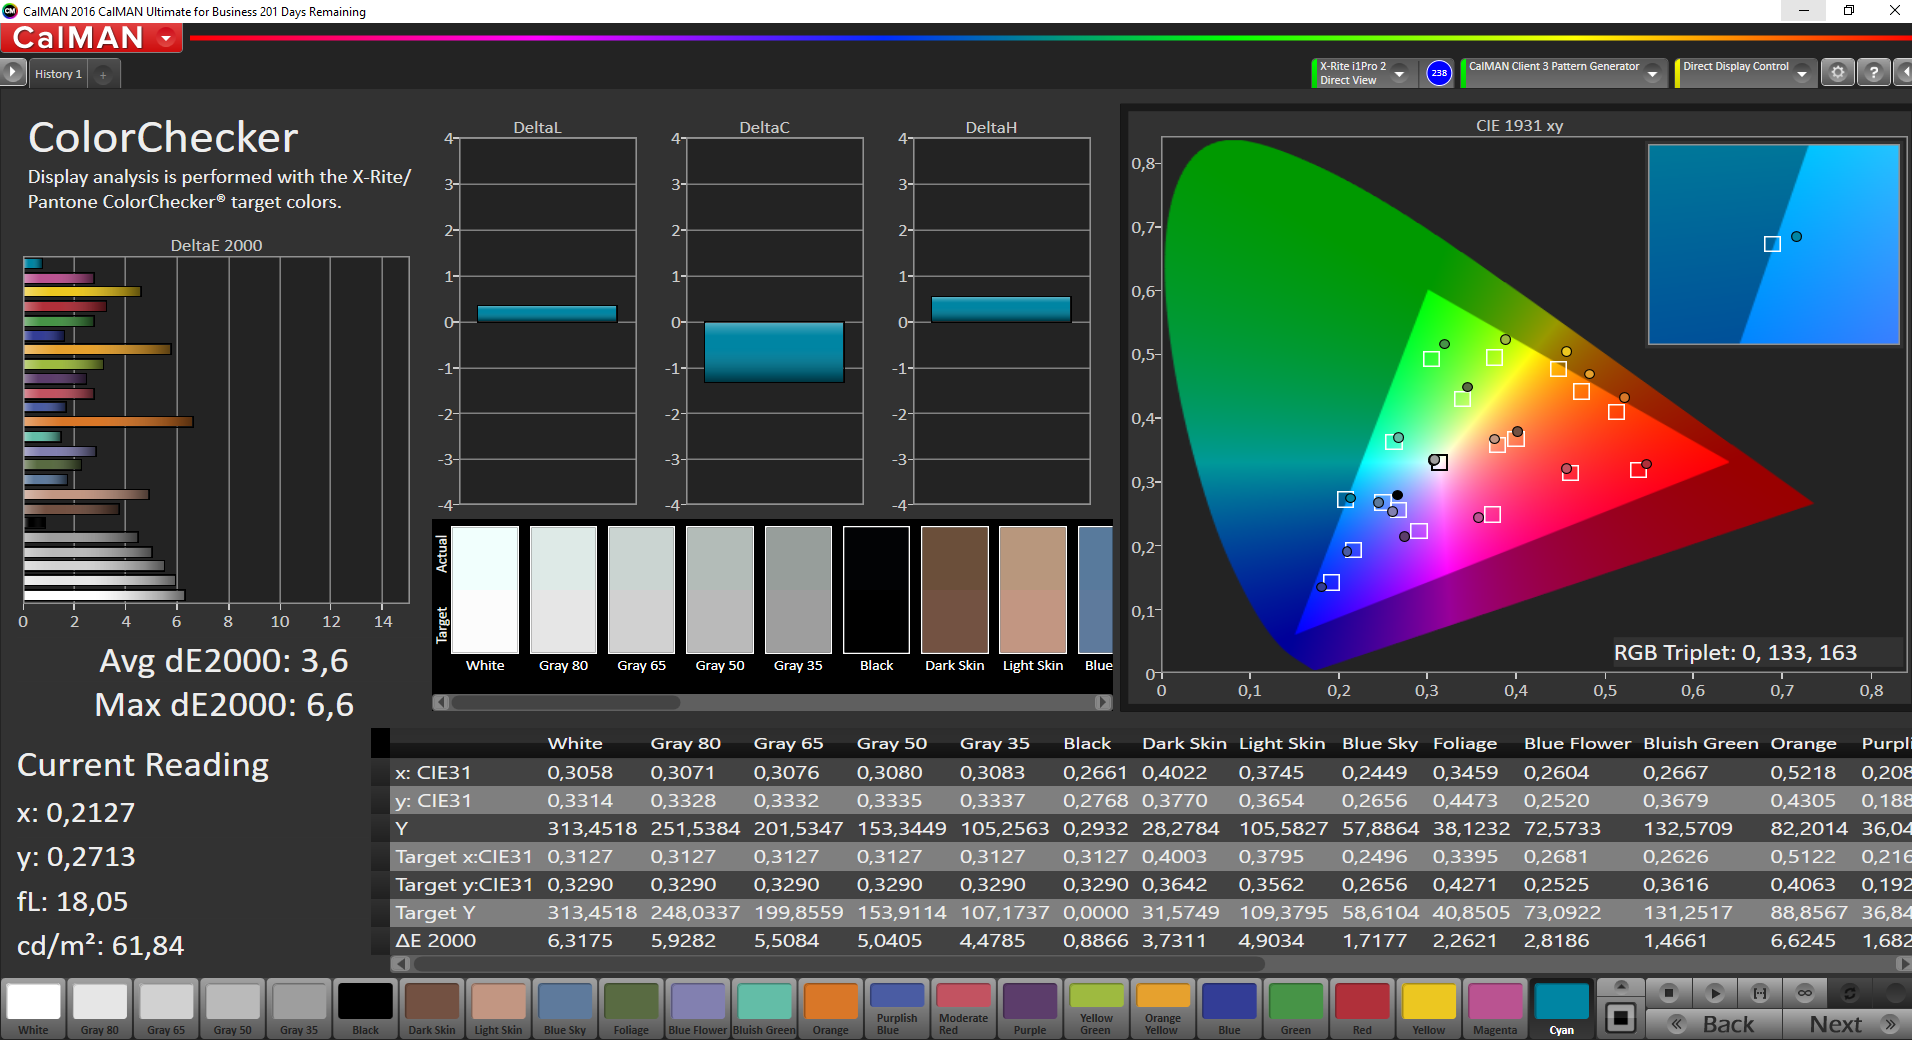
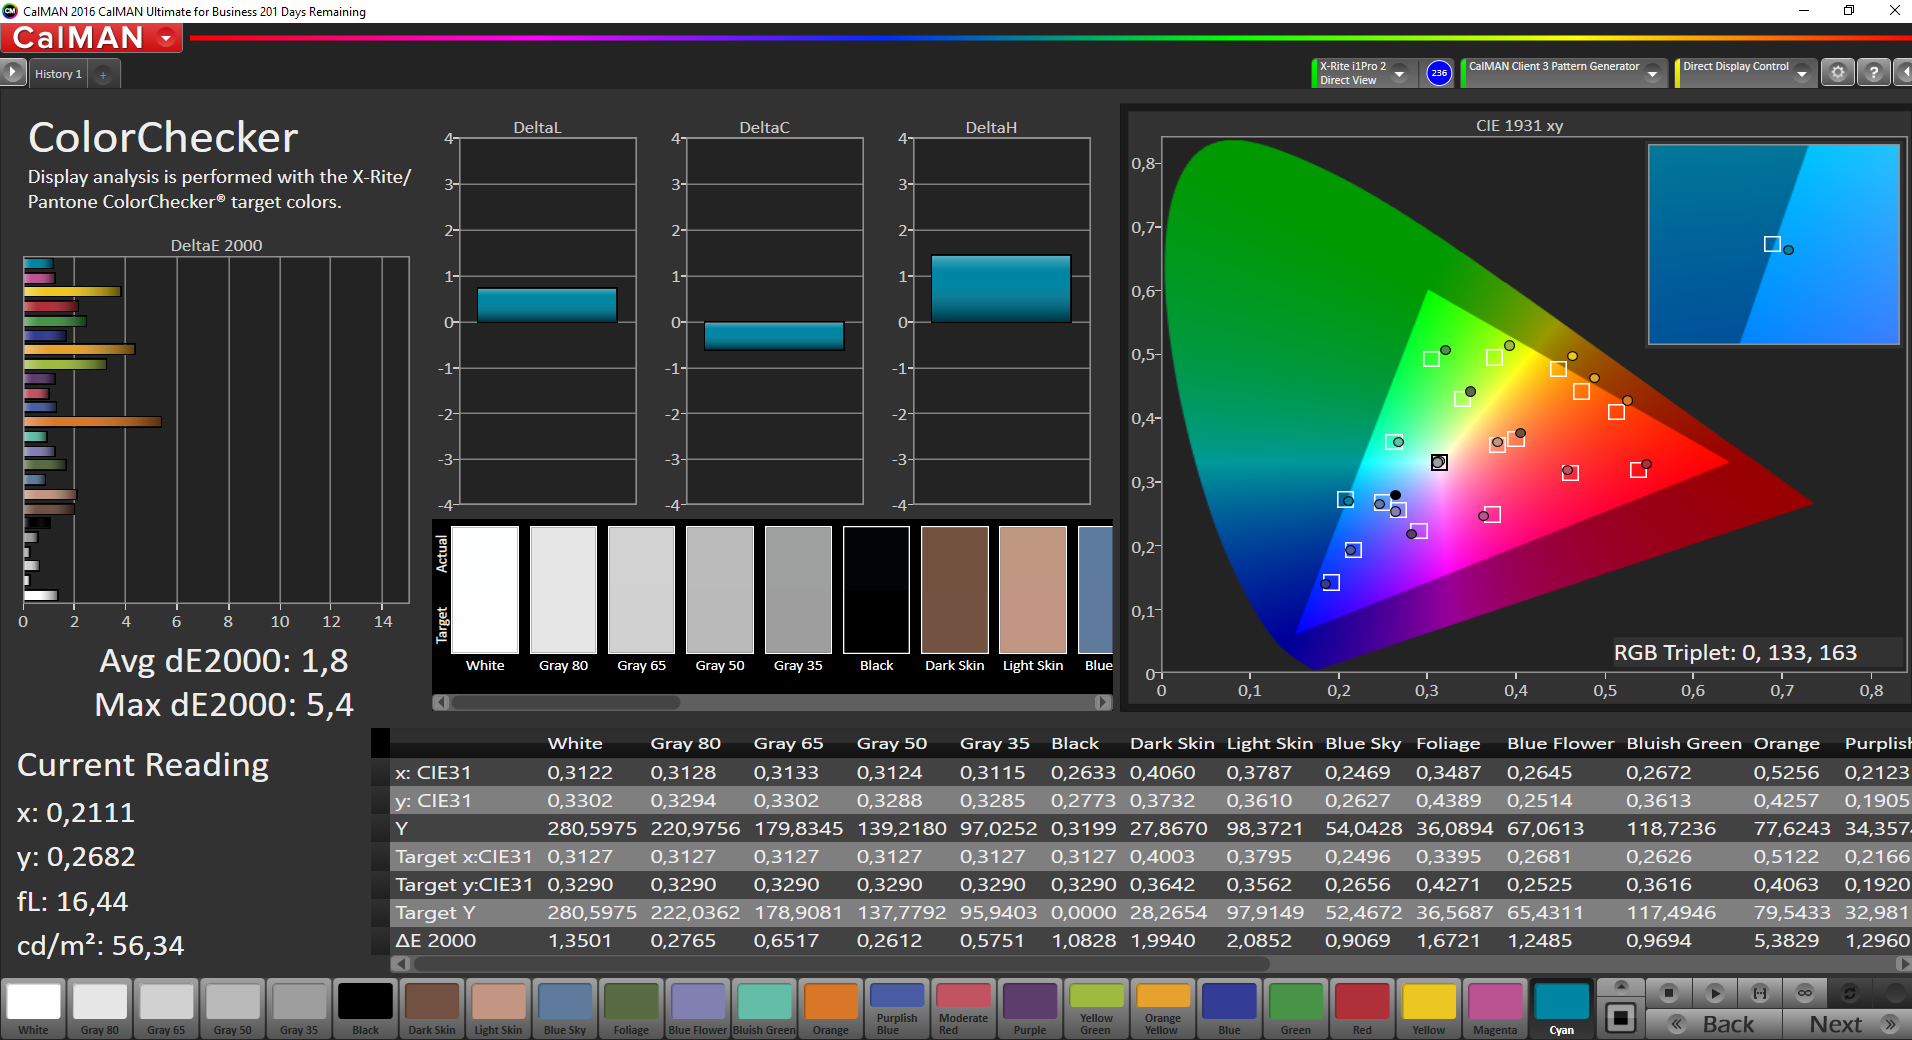
ΔE ColorChecker Calman: 3.6 | ∀{0.5-29.43 Ø4.72}
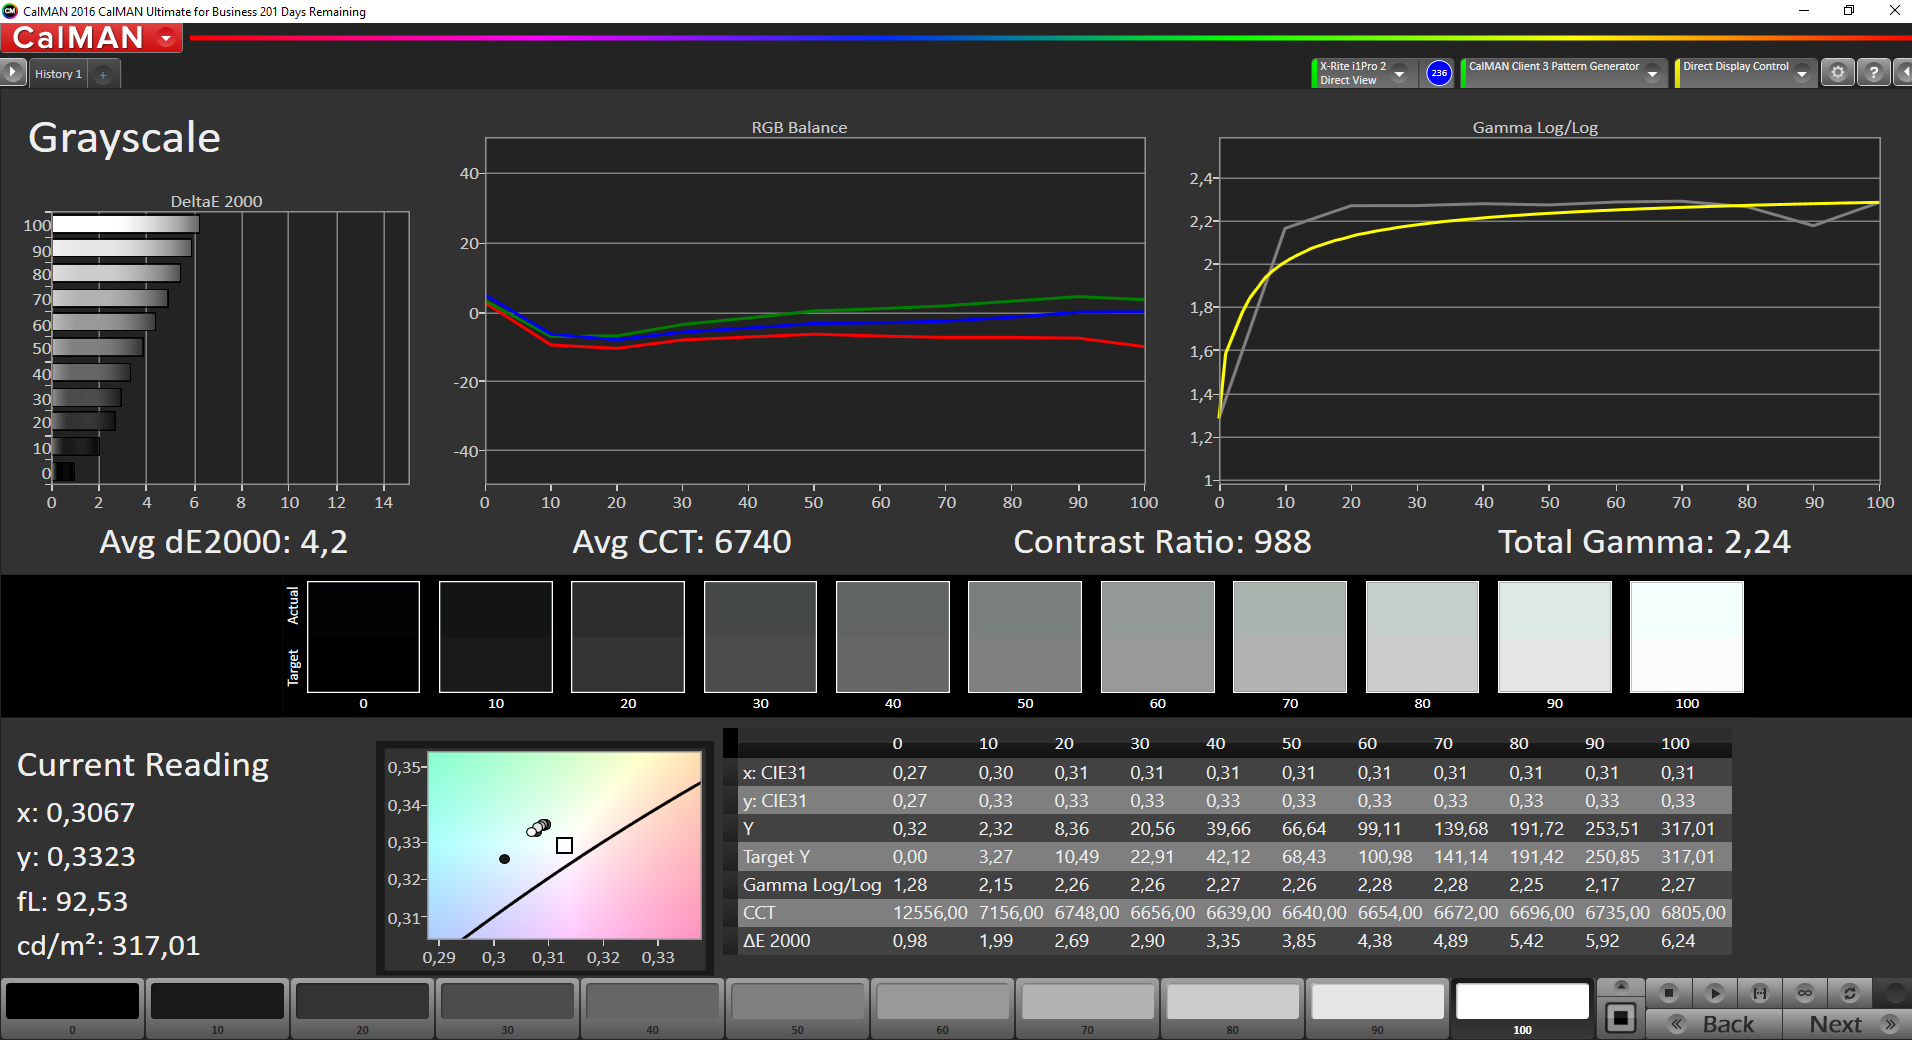
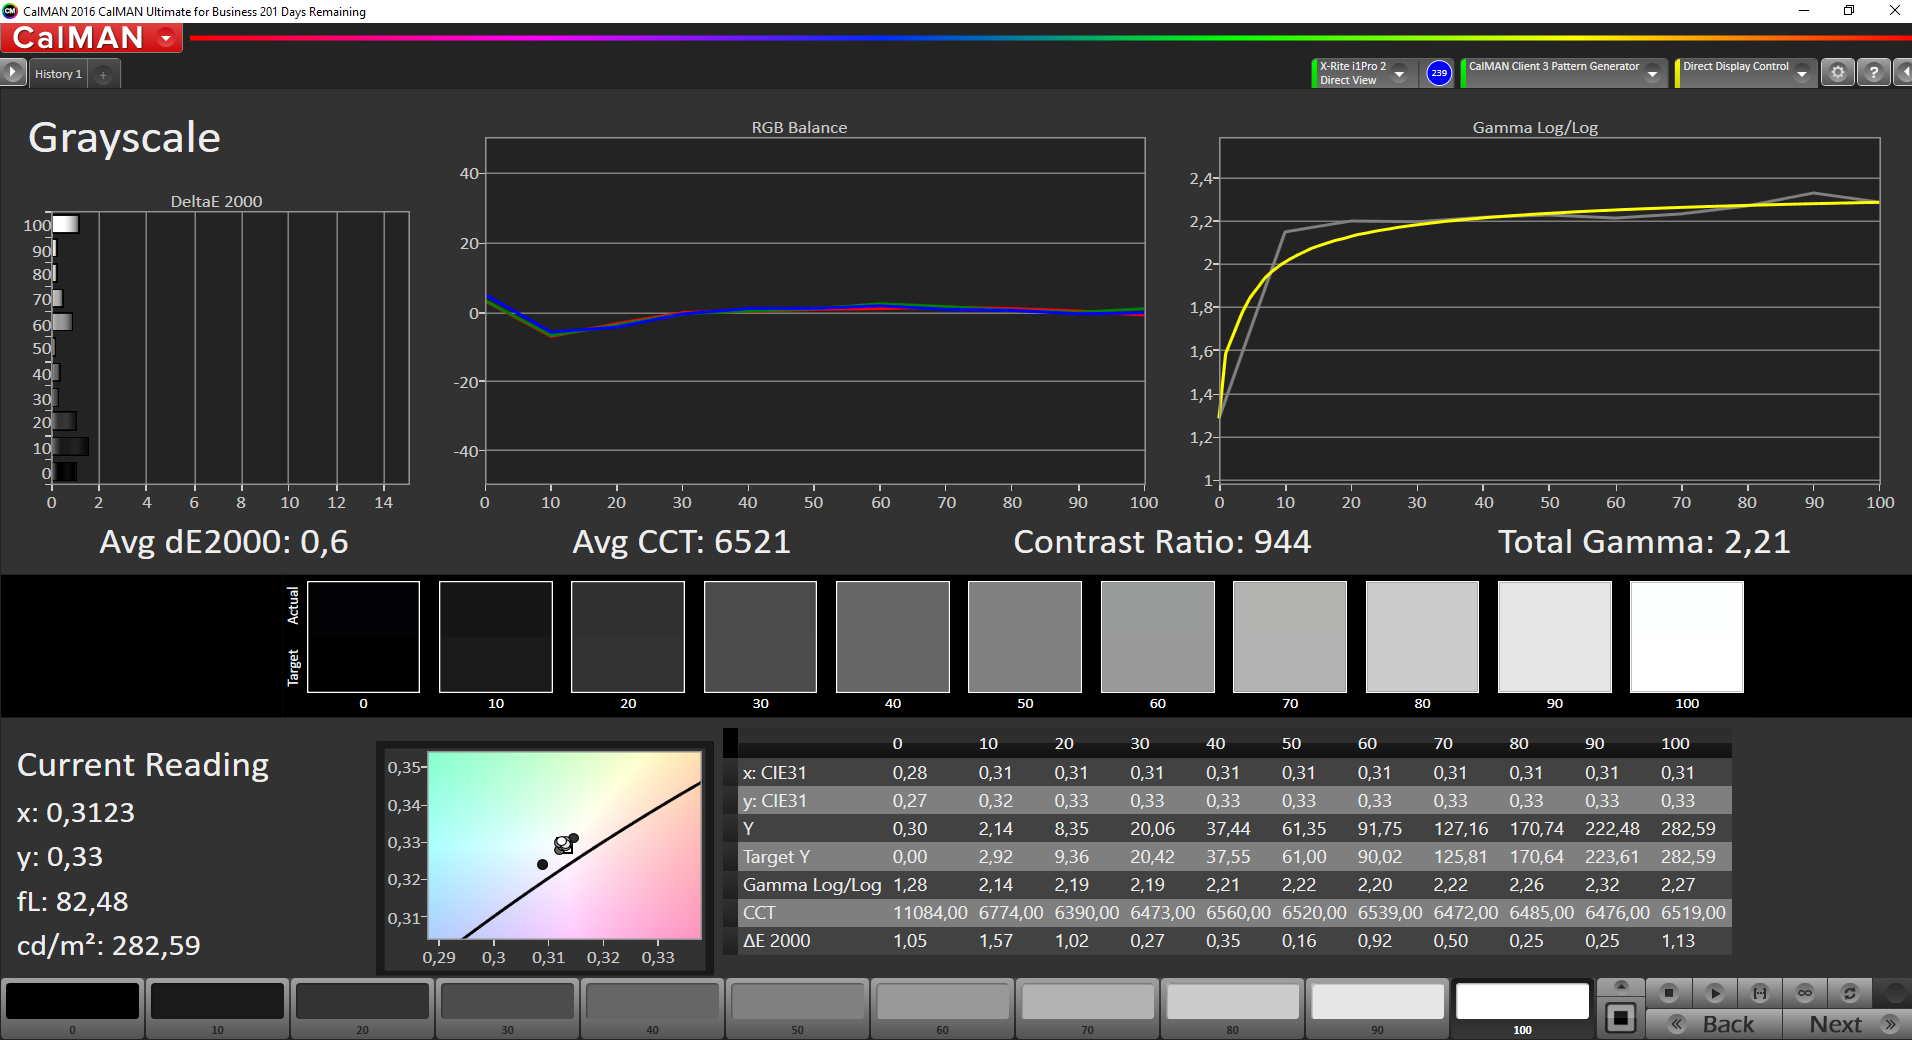
ΔE Greyscale Calman: 4.2 | ∀{0.09-98 Ø4.97}
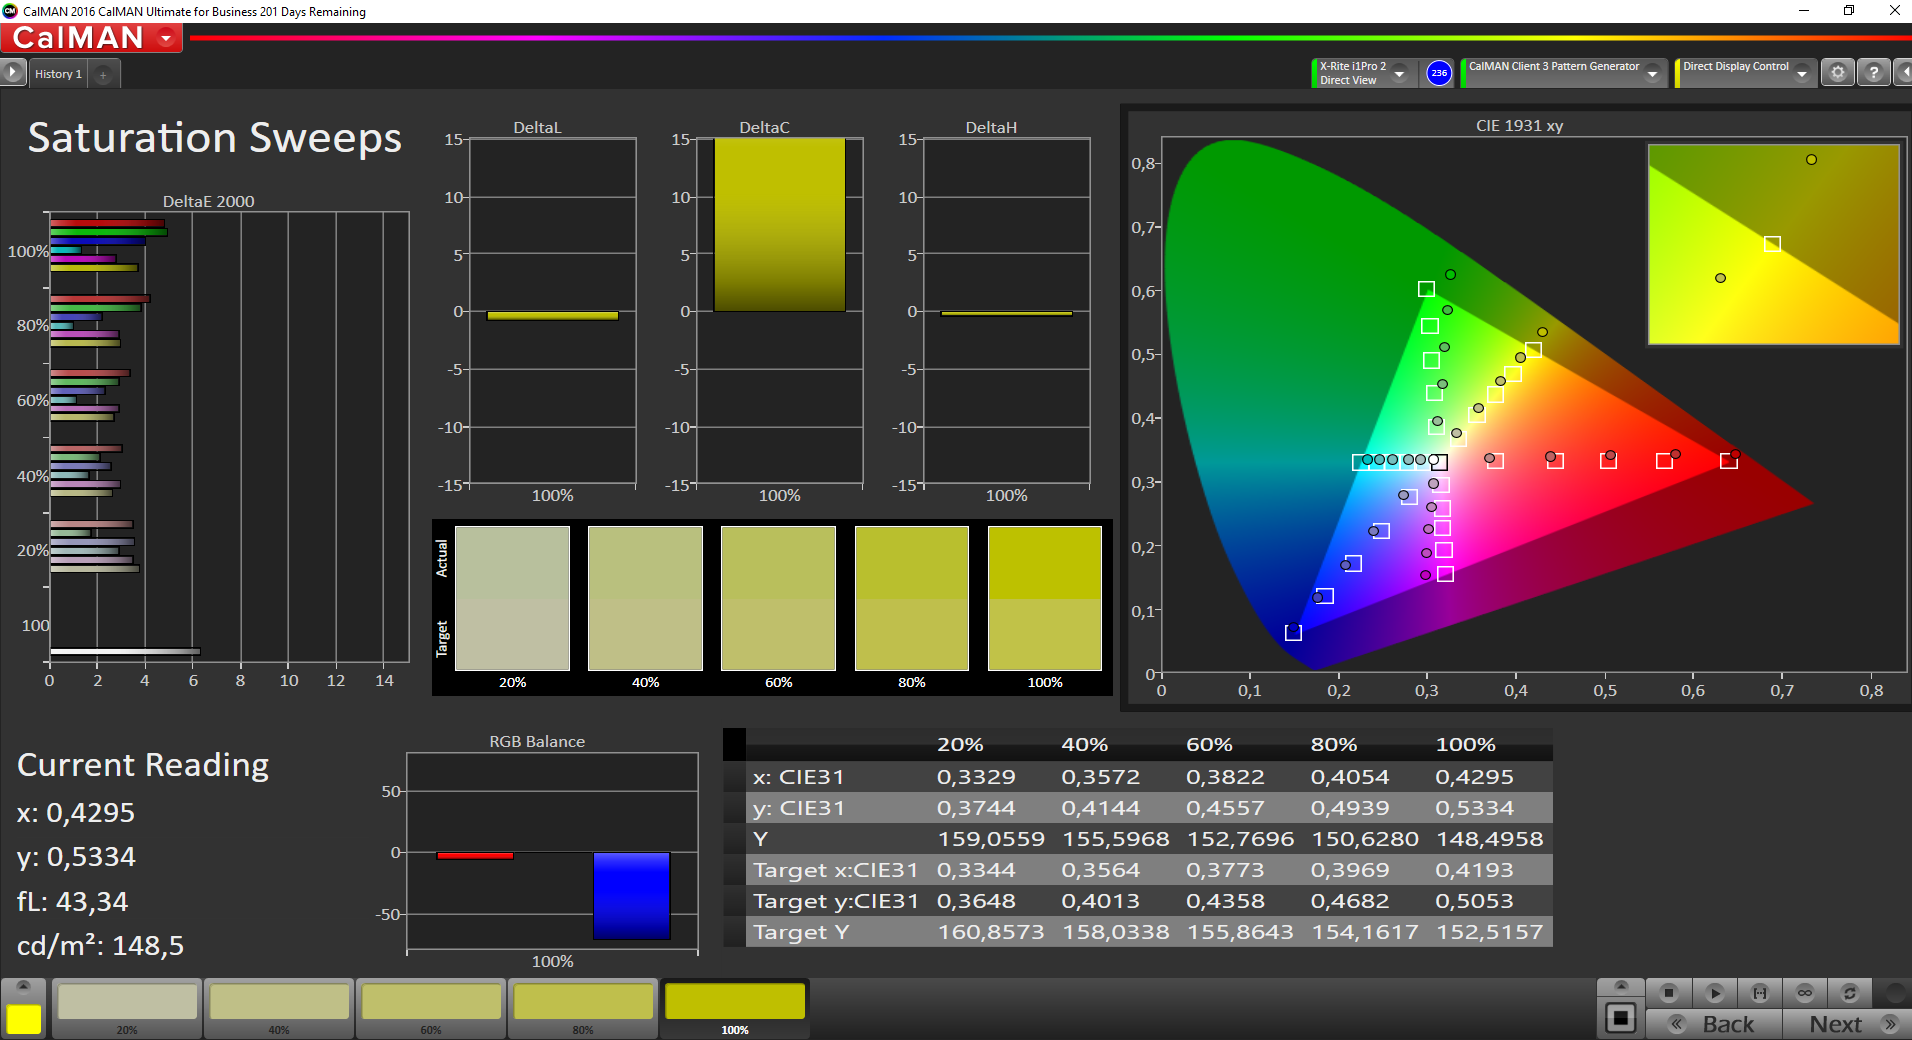
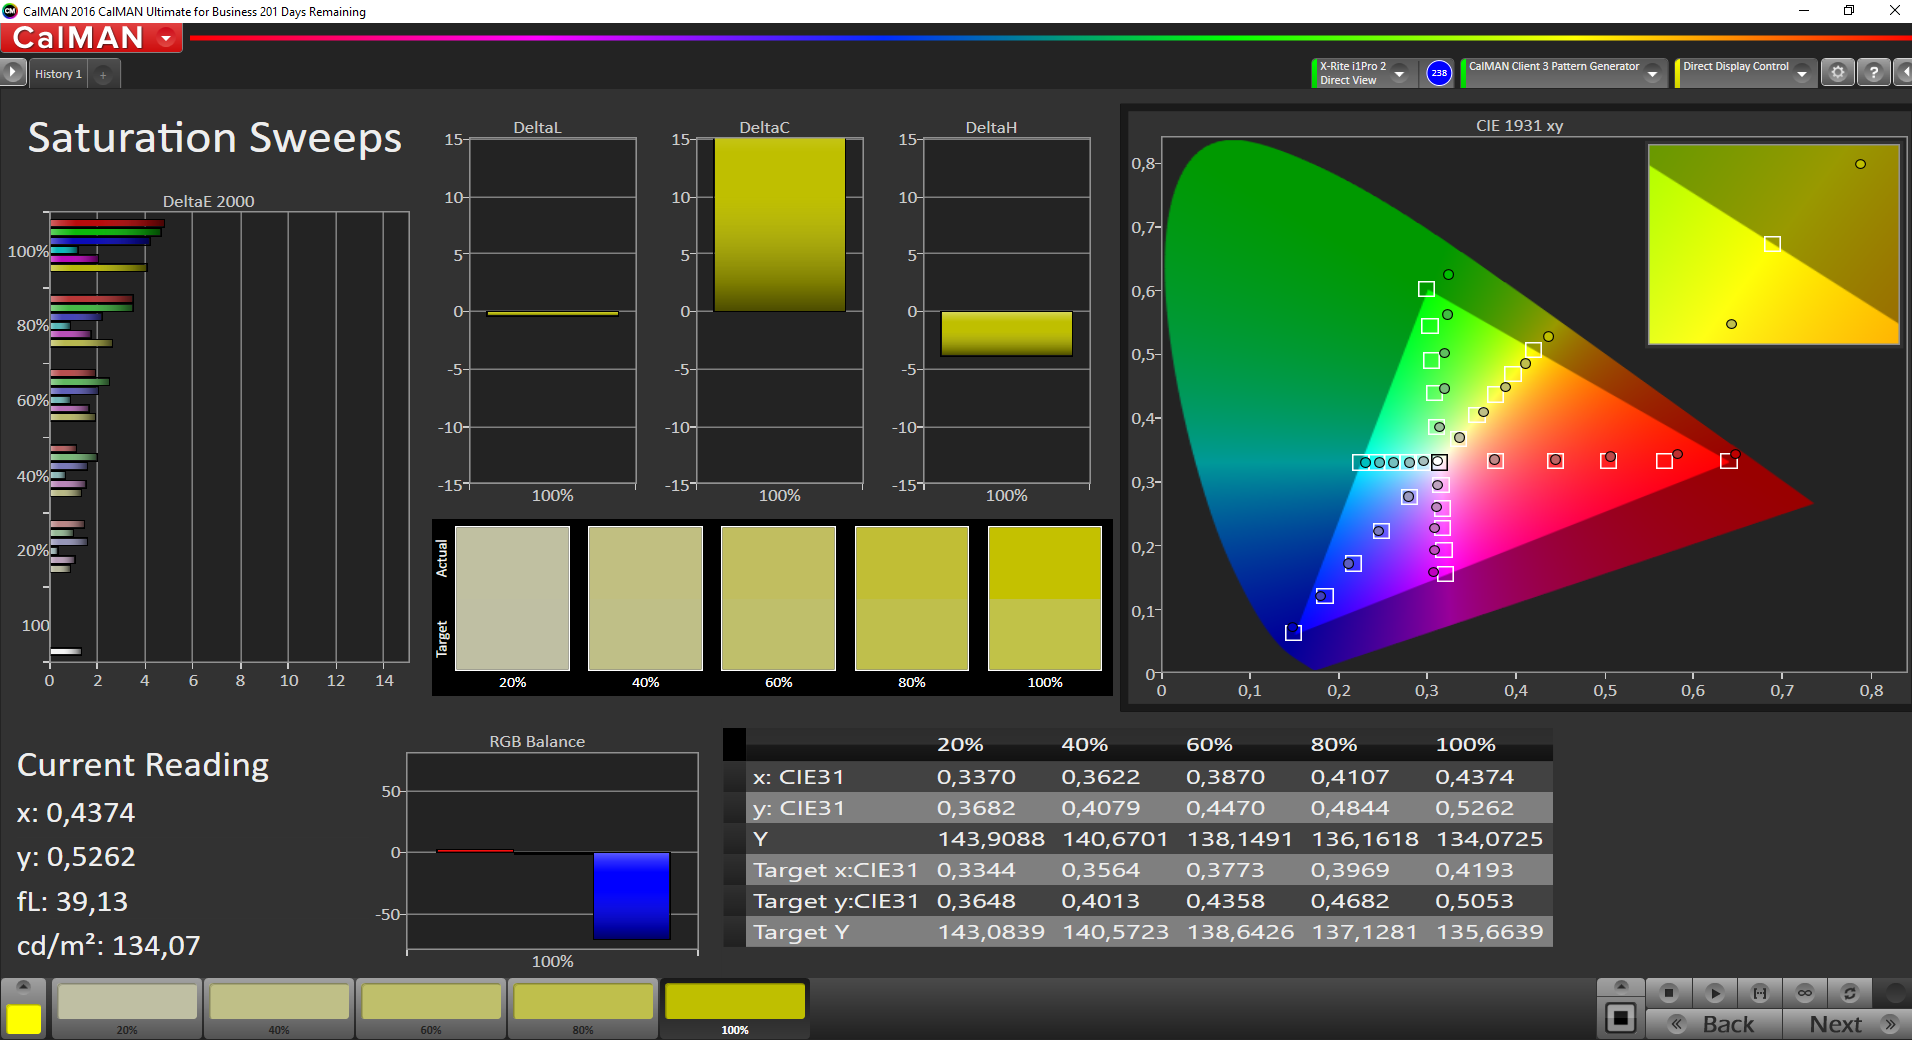
91.1% sRGB (Argyll 1.6.3 3D)
59.5% AdobeRGB 1998 (Argyll 1.6.3 3D)
66.8% AdobeRGB 1998 (Argyll 3D)
91.2% sRGB (Argyll 3D)
69.7% Display P3 (Argyll 3D)
Gamma: 2.24
CCT: 6740 K
| Lenovo ThinkPad P51s 20HB000SGE IPS, 3840x2160, 15.6", BOE NV156QUM-N44 | Lenovo ThinkPad P50s-20FKS00400 IPS, 2880x1620, 15.5", WX16T028J00, LEN40B5 | Lenovo ThinkPad T570-20HAS01E00 IPS, 3840x2160, 15.6", BOE NV156QUM-N44 | Dell Precision 5520 UHD IPS, 3840x2160, 15.6", SHP1476 | HP ZBook Studio G3 IPS, 3840x2160, 15.6", Sharp SPH1445 | |
|---|---|---|---|---|---|
| Display | -6% | 0% | 3% | 26% | |
| Display P3 Coverage (%) | 69.7 | 63.7 -9% | 70 0% | 67.4 -3% | 86 23% |
| sRGB Coverage (%) | 91.2 | 87.6 -4% | 91.1 0% | 98.5 8% | 98.9 8% |
| AdobeRGB 1998 Coverage (%) | 66.8 | 63.8 -4% | 66.7 0% | 68.9 3% | 98 47% |
| Response Times | -8% | 16% | -61% | -5% | |
| Response Time Grey 50% / Grey 80% * (ms) | 38.4 ? | 38 ? 1% | 41.6 ? -8% | 59.2 ? -54% | 44 ? -15% |
| Response Time Black / White * (ms) | 24.8 ? | 28.8 ? -16% | 15.2 ? 39% | 41.6 ? -68% | 23.2 ? 6% |
| PWM Frequency (Hz) | 980 ? | 219 ? | 926 ? | 200 ? | |
| Screen | -9% | -5% | 5% | -9% | |
| Brightness middle (cd/m²) | 317 | 319 1% | 339 7% | 372.4 17% | 310 -2% |
| Brightness (cd/m²) | 290 | 290 0% | 314 8% | 368 27% | 299 3% |
| Brightness Distribution (%) | 85 | 82 -4% | 89 5% | 90 6% | 86 1% |
| Black Level * (cd/m²) | 0.32 | 0.31 3% | 0.36 -13% | 0.48 -50% | 0.29 9% |
| Contrast (:1) | 991 | 1029 4% | 942 -5% | 776 -22% | 1069 8% |
| Colorchecker dE 2000 * | 3.6 | 4.8 -33% | 4.2 -17% | 2.6 28% | 5.9 -64% |
| Colorchecker dE 2000 max. * | 6.6 | 7.8 -18% | 7.8 -18% | 5.6 15% | 10.7 -62% |
| Greyscale dE 2000 * | 4.2 | 5.7 -36% | 5.1 -21% | 3.7 12% | 5.5 -31% |
| Gamma | 2.24 98% | 2.07 106% | 2.16 102% | 2.14 103% | 2.09 105% |
| CCT | 6740 96% | 6260 104% | 6569 99% | 7096 92% | 5980 109% |
| Color Space (Percent of AdobeRGB 1998) (%) | 59.5 | 56.9 -4% | 59.4 0% | 63 6% | 85 43% |
| Color Space (Percent of sRGB) (%) | 91.1 | 87.4 -4% | 91 0% | 99 9% | 99 9% |
| Media total (Programa/Opciones) | -8% /
-8% | 4% /
-2% | -18% /
-4% | 4% /
-1% |
* ... más pequeño es mejor
Parpadeo de Pantalla / PWM (Pulse-Width Modulation)
| Parpadeo de Pantalla / PWM detectado | 980 Hz | ≤ 90 % de brillo | 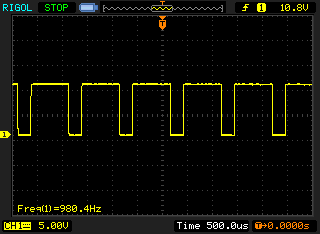 |
La retroiluminación del display parpadea a 980 Hz (seguramente usa PWM - Pulse-Width Modulation) a un brillo del 90 % e inferior. Sobre este nivel de brillo no debería darse parpadeo / PWM. La frecuencia de 980 Hz es bastante alta, por lo que la mayoría de gente sensible al parpadeo no debería ver parpadeo o tener fatiga visual. Comparación: 52 % de todos los dispositivos testados no usaron PWM para atenuar el display. Si se usó, medimos una media de 7747 (mínimo: 5 - máxmo: 343500) Hz. | |||
Tiempos de respuesta del display
| ↔ Tiempo de respuesta de Negro a Blanco | ||
|---|---|---|
| 24.8 ms ... subida ↗ y bajada ↘ combinada | ↗ 13.6 ms subida | 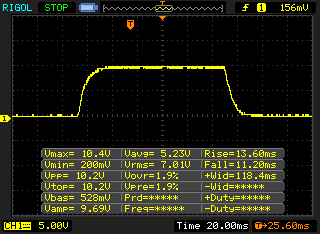 |
| ↘ 11.2 ms bajada | ||
| La pantalla mostró buenos tiempos de respuesta en nuestros tests pero podría ser demasiado lenta para los jugones competitivos. En comparación, todos los dispositivos de prueba van de ##min### (mínimo) a 240 (máximo) ms. » 58 % de todos los dispositivos son mejores. Eso quiere decir que el tiempo de respuesta es peor que la media (19.8 ms) de todos los dispositivos testados. | ||
| ↔ Tiempo de respuesta 50% Gris a 80% Gris | ||
| 38.4 ms ... subida ↗ y bajada ↘ combinada | ↗ 20.4 ms subida | 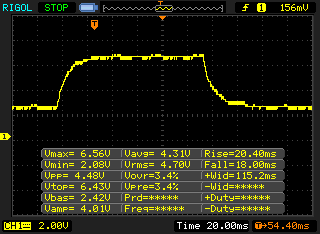 |
| ↘ 18 ms bajada | ||
| La pantalla mostró tiempos de respuesta lentos en nuestros tests y podría ser demasiado lenta para los jugones. En comparación, todos los dispositivos de prueba van de ##min### (mínimo) a 636 (máximo) ms. » 57 % de todos los dispositivos son mejores. Eso quiere decir que el tiempo de respuesta es peor que la media (31 ms) de todos los dispositivos testados. | ||
| Cinebench R10 | |
| Rendering Single 32Bit | |
| Lenovo ThinkPad P51 20HH0016GE | |
| Lenovo ThinkPad P51s 20HB000SGE | |
| HP ZBook Studio G3 | |
| Lenovo ThinkPad P50s-20FKS00400 | |
| Rendering Multiple CPUs 32Bit | |
| Lenovo ThinkPad P51 20HH0016GE | |
| HP ZBook Studio G3 | |
| Lenovo ThinkPad P51s 20HB000SGE | |
| Lenovo ThinkPad P50s-20FKS00400 | |
| Geekbench 3 | |
| 32 Bit Multi-Core Score | |
| Lenovo ThinkPad P51 20HH0016GE | |
| Lenovo ThinkPad P51s 20HB000SGE | |
| 32 Bit Single-Core Score | |
| Lenovo ThinkPad P51 20HH0016GE | |
| Lenovo ThinkPad P51s 20HB000SGE | |
| Geekbench 4.0 | |
| 64 Bit Multi-Core Score | |
| Lenovo ThinkPad P51s 20HB000SGE | |
| 64 Bit Single-Core Score | |
| Lenovo ThinkPad P51s 20HB000SGE | |
| Geekbench 4.4 | |
| 64 Bit Multi-Core Score | |
| Lenovo ThinkPad P51s 20HB000SGE | |
| 64 Bit Single-Core Score | |
| Lenovo ThinkPad P51s 20HB000SGE | |
| JetStream 1.1 - 1.1 Total | |
| Lenovo ThinkPad P51 20HH0016GE | |
| Dell Precision 5520 UHD | |
| Lenovo ThinkPad P51s 20HB000SGE | |
| PCMark 7 Score | 5568 puntos | |
| PCMark 8 Home Score Accelerated v2 | 3232 puntos | |
| PCMark 8 Creative Score Accelerated v2 | 4640 puntos | |
| PCMark 8 Work Score Accelerated v2 | 4193 puntos | |
ayuda | ||

| Lenovo ThinkPad P51s 20HB000SGE Samsung SSD PM961 1TB M.2 PCIe 3.0 x4 NVMe (MZVLW1T0) | Lenovo ThinkPad P50s-20FKS00400 Samsung PM871 MZYLN256HCHP | Dell Precision 5520 UHD Samsung SM961 MZVKW512HMJP m.2 PCI-e | HP ZBook Studio G3 Samsung SM951 MZVPV512HDGL m.2 PCI-e | Lenovo ThinkPad T570-20HAS01E00 Samsung PM961 NVMe MZVLW512HMJP | Lenovo ThinkPad P51 20HH0016GE Samsung PM961 NVMe MZVLW512HMJP | |
|---|---|---|---|---|---|---|
| CrystalDiskMark 3.0 | -54% | 20% | 29% | -4% | 20% | |
| Read Seq (MB/s) | 1189 | 475.5 -60% | 2253 89% | 1578 33% | 1210 2% | 1705 43% |
| Write Seq (MB/s) | 1138 | 304.7 -73% | 1662 46% | 1557 37% | 1134 0% | 1541 35% |
| Read 512 (MB/s) | 782 | 379.3 -51% | 459.1 -41% | 1234 58% | 789 1% | 1038 33% |
| Write 512 (MB/s) | 959 | 303.4 -68% | 1611 68% | 1391 45% | 903 -6% | 1157 21% |
| Read 4k (MB/s) | 54.8 | 34.31 -37% | 56.1 2% | 59.9 9% | 58.4 7% | 61.3 12% |
| Write 4k (MB/s) | 161.4 | 89.4 -45% | 169.4 5% | 225.6 40% | 144.1 -11% | 176 9% |
| Read 4k QD32 (MB/s) | 642 | 319.9 -50% | 633 -1% | 946 47% | 559 -13% | 664 3% |
| Write 4k QD32 (MB/s) | 549 | 279.4 -49% | 506 -8% | 359 -35% | 474.4 -14% | 560 2% |
| 3DMark 06 Standard Score | 17305 puntos | |
| 3DMark Vantage P Result | 11278 puntos | |
| 3DMark 11 Performance | 2884 puntos | |
| 3DMark Ice Storm Standard Score | 32374 puntos | |
| 3DMark Cloud Gate Standard Score | 8544 puntos | |
| 3DMark Fire Strike Score | 2139 puntos | |
| 3DMark Fire Strike Extreme Score | 1058 puntos | |
| 3DMark Time Spy Score | 684 puntos | |
ayuda | ||
| Geekbench 4.0 - Compute OpenCL Score | |
| Lenovo ThinkPad P51s 20HB000SGE | |
| Geekbench 4.4 - Compute OpenCL Score | |
| Lenovo ThinkPad P51s 20HB000SGE | |
| GFXBench (DX / GLBenchmark) 2.7 | |
| 1920x1080 T-Rex Offscreen | |
| Lenovo ThinkPad P51s 20HB000SGE | |
| Lenovo ThinkPad P50s-20FKS00400 | |
| T-Rex Onscreen | |
| Lenovo ThinkPad P51s 20HB000SGE | |
| Lenovo ThinkPad P50s-20FKS00400 | |
| GFXBench 3.0 | |
| 1920x1080 1080p Manhattan Offscreen | |
| Lenovo ThinkPad P51s 20HB000SGE | |
| Lenovo ThinkPad P50s-20FKS00400 | |
| on screen Manhattan Onscreen OGL | |
| Lenovo ThinkPad P50s-20FKS00400 | |
| Lenovo ThinkPad P51s 20HB000SGE | |
| GFXBench 3.1 | |
| 1920x1080 Manhattan ES 3.1 Offscreen | |
| Lenovo ThinkPad P51s 20HB000SGE | |
| Lenovo ThinkPad P50s-20FKS00400 | |
| on screen Manhattan ES 3.1 Onscreen | |
| Lenovo ThinkPad P50s-20FKS00400 | |
| Lenovo ThinkPad P51s 20HB000SGE | |
| GFXBench | |
| 1920x1080 Car Chase Offscreen | |
| Lenovo ThinkPad P51s 20HB000SGE | |
| Lenovo ThinkPad P50s-20FKS00400 | |
| on screen Car Chase Onscreen | |
| Lenovo ThinkPad P50s-20FKS00400 | |
| Lenovo ThinkPad P51s 20HB000SGE | |
| ComputeMark v2.1 - 1024x600 Normal, Score | |
| Lenovo ThinkPad P51s 20HB000SGE | |
| Lenovo ThinkPad P50s-20FKS00400 | |
| Dell Precision 5520 UHD | |
| Unigine Heaven 2.1 - 1280x1024 high, Tesselation (normal), DirectX11 AA:off AF:1x | |
| HP ZBook Studio G3 | |
| Lenovo ThinkPad P51s 20HB000SGE | |
| Lenovo ThinkPad P50s-20FKS00400 | |
| Unigine Heaven 3.0 | |
| 1920x1080 OpenGL, Normal Tessellation, High Shaders AA:Off AF:Off | |
| HP ZBook Studio G3 | |
| Lenovo ThinkPad P51s 20HB000SGE | |
| Lenovo ThinkPad P50s-20FKS00400 | |
| 1920x1080 DX 11, Normal Tessellation, High Shaders AA:Off AF:Off | |
| HP ZBook Studio G3 | |
| Lenovo ThinkPad P51s 20HB000SGE | |
| Lenovo ThinkPad P50s-20FKS00400 | |
| Unigine Heaven 4.0 | |
| Extreme Preset OpenGL | |
| Lenovo ThinkPad P51 20HH0016GE | |
| Lenovo ThinkPad P51s 20HB000SGE | |
| Extreme Preset DX11 | |
| Lenovo ThinkPad P51 20HH0016GE | |
| Lenovo ThinkPad P51s 20HB000SGE | |
| Unigine Valley 1.0 | |
| 1920x1080 Extreme HD DirectX AA:x8 | |
| Lenovo ThinkPad P51 20HH0016GE | |
| HP ZBook Studio G3 | |
| Lenovo ThinkPad P51s 20HB000SGE | |
| Lenovo ThinkPad P50s-20FKS00400 | |
| 1920x1080 Extreme HD Preset OpenGL AA:x8 | |
| Lenovo ThinkPad P51 20HH0016GE | |
| HP ZBook Studio G3 | |
| Lenovo ThinkPad P51s 20HB000SGE | |
| Lenovo ThinkPad P50s-20FKS00400 | |
| SiSoft Sandra 2016 | |
| GP Financial Analysis (FP High/Double Precision) | |
| Lenovo ThinkPad P51 20HH0016GE | |
| HP ZBook Studio G3 | |
| Lenovo ThinkPad P51s 20HB000SGE | |
| Lenovo ThinkPad P50s-20FKS00400 | |
| GP Cryptography (Higher Security AES256+SHA2-512) | |
| Lenovo ThinkPad P51 20HH0016GE | |
| HP ZBook Studio G3 | |
| Lenovo ThinkPad P50s-20FKS00400 | |
| Lenovo ThinkPad P51s 20HB000SGE | |
| Image Processing | |
| Lenovo ThinkPad P51 20HH0016GE | |
| HP ZBook Studio G3 | |
| Lenovo ThinkPad P51s 20HB000SGE | |
| Lenovo ThinkPad P50s-20FKS00400 | |
| bajo | medio | alto | ultra | 4K | |
|---|---|---|---|---|---|
| Tomb Raider (2013) | 188.1 | 97.9 | 59.5 | 28.8 | |
| BioShock Infinite (2013) | 138.2 | 76.9 | 64.1 | 24.2 | |
| Middle-earth: Shadow of Mordor (2014) | 54.6 | 32.9 | 22.8 | 16.2 | |
| Dragon Age: Inquisition (2014) | 68.2 | 51.7 | 18.3 | 12.2 | |
| Battlefield Hardline (2015) | 81.1 | 74.2 | 30.4 | 19.6 | |
| Dirt Rally (2015) | 145.6 | 75.1 | 40.5 | 18.7 | 14.7 |
| World of Warships (2015) | 135.6 | 108.1 | 54 | 36.7 | 11 |
| Anno 2205 (2015) | 60.1 | 36.2 | 17.7 | 7.4 | |
| Star Wars Battlefront (2015) | 78.2 | 48.9 | 22.3 | 19.1 | |
| Rainbow Six Siege (2015) | 94.5 | 60.1 | 31.8 | 22.8 | 8.1 |
| Rise of the Tomb Raider (2016) | 30 | 21.5 | 13.3 | 11.7 | |
| Far Cry Primal (2016) | 46 | 20 | 18 | 12 | |
| The Division (2016) | 52.2 | 31.8 | 14.8 | 11.2 | |
| Ashes of the Singularity (2016) | 23.6 | 14.3 | 12 | ||
| Deus Ex Mankind Divided (2016) | 27.2 | 21 | 11.6 | 5.3 | |
| Battlefield 1 (2016) | 56.4 | 43.9 | 33 | 28.2 | |
| Civilization 6 (2016) | 50.8 | 30.4 | 15.2 | 11.7 | |
| Farming Simulator 17 (2016) | 183.1 | 120.6 | 49.8 | 32.1 | 13.7 |
| Titanfall 2 (2016) | 72.2 | 52.5 | 21.3 | 17.3 | |
| Resident Evil 7 (2017) | 84 | 40 | 22.1 | 6.6 | |
| For Honor (2017) | 64.6 | 23 | 21.9 | 15.9 | |
| Ghost Recon Wildlands (2017) | 38.1 | 14.3 | 12 | 3.6 | |
| Prey (2017) | 85.4 | 32.8 | 26.7 | 22 |
| BioShock Infinite - 1366x768 High Preset | |
| Dell Precision 5520 UHD | |
| HP ZBook Studio G3 | |
| Lenovo ThinkPad T570-20HAS01E00 | |
| Lenovo ThinkPad P51s 20HB000SGE | |
| Lenovo ThinkPad P50s-20FKS00400 | |
Ruido
| Ocioso |
| 29.2 / 29.2 / 31.1 dB(A) |
| Carga |
| 36.7 / 39.4 dB(A) |
 | ||
30 dB silencioso 40 dB(A) audible 50 dB(A) ruidosamente alto |
||
min: | ||
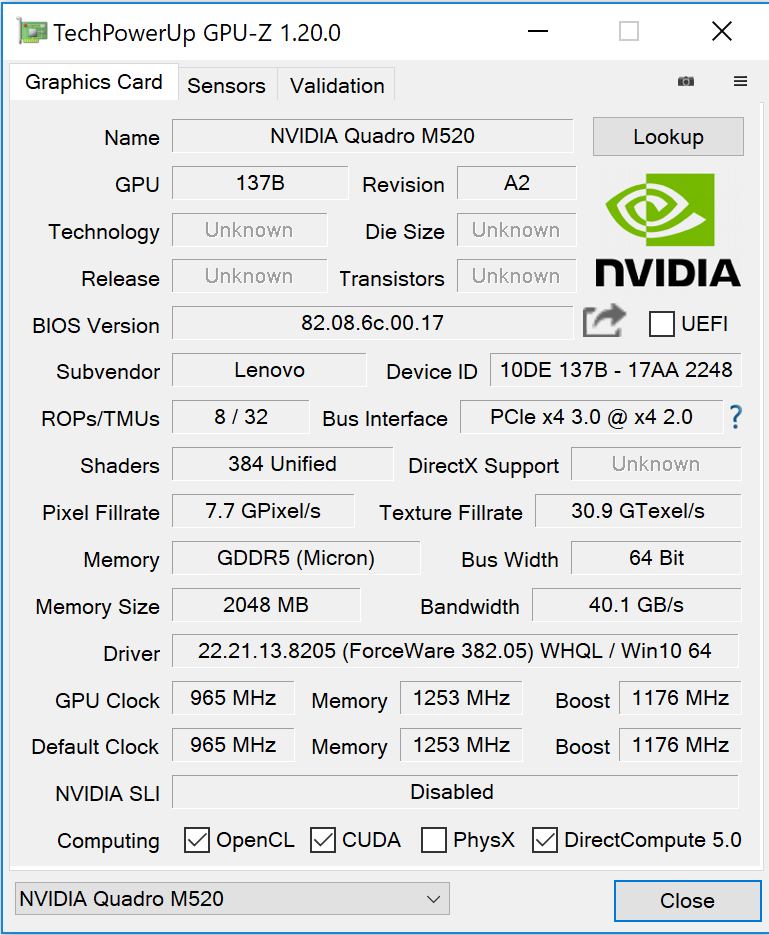
| Lenovo ThinkPad P51s 20HB000SGE i7-7600U, Quadro M520 | Lenovo ThinkPad P50s-20FKS00400 6500U, Quadro M500M | Dell Precision 5520 UHD E3-1505M v6, Quadro M1200 | HP ZBook Studio G3 6820HQ, Quadro M1000M | Lenovo ThinkPad T570-20HAS01E00 i7-7500U, GeForce 940MX | |
|---|---|---|---|---|---|
| Noise | 0% | -6% | -13% | -0% | |
| apagado / medio ambiente * (dB) | 29.2 | 28.7 2% | 30 -3% | 29.3 -0% | |
| Idle Minimum * (dB) | 29.2 | 30 -3% | 28.7 2% | 30 -3% | 29.3 -0% |
| Idle Average * (dB) | 29.2 | 30 -3% | 32.1 -10% | 30 -3% | 29.3 -0% |
| Idle Maximum * (dB) | 31.1 | 30 4% | 32.1 -3% | 30 4% | 31.1 -0% |
| Load Average * (dB) | 36.7 | 33.5 9% | 41.3 -13% | 51 -39% | 35.2 4% |
| Load Maximum * (dB) | 39.4 | 41.9 -6% | 45.5 -15% | 52.8 -34% | 41.3 -5% |
| Witcher 3 ultra * (dB) | 45.5 |
* ... más pequeño es mejor
(±) La temperatura máxima en la parte superior es de 43.6 °C / 110 F, frente a la media de 38.2 °C / 101 F, que oscila entre 22.2 y 69.8 °C para la clase Workstation.
(-) El fondo se calienta hasta un máximo de 60.8 °C / 141 F, frente a la media de 41.1 °C / 106 F
(+) En reposo, la temperatura media de la parte superior es de 26.5 °C / 80# F, frente a la media del dispositivo de 32 °C / 90 F.
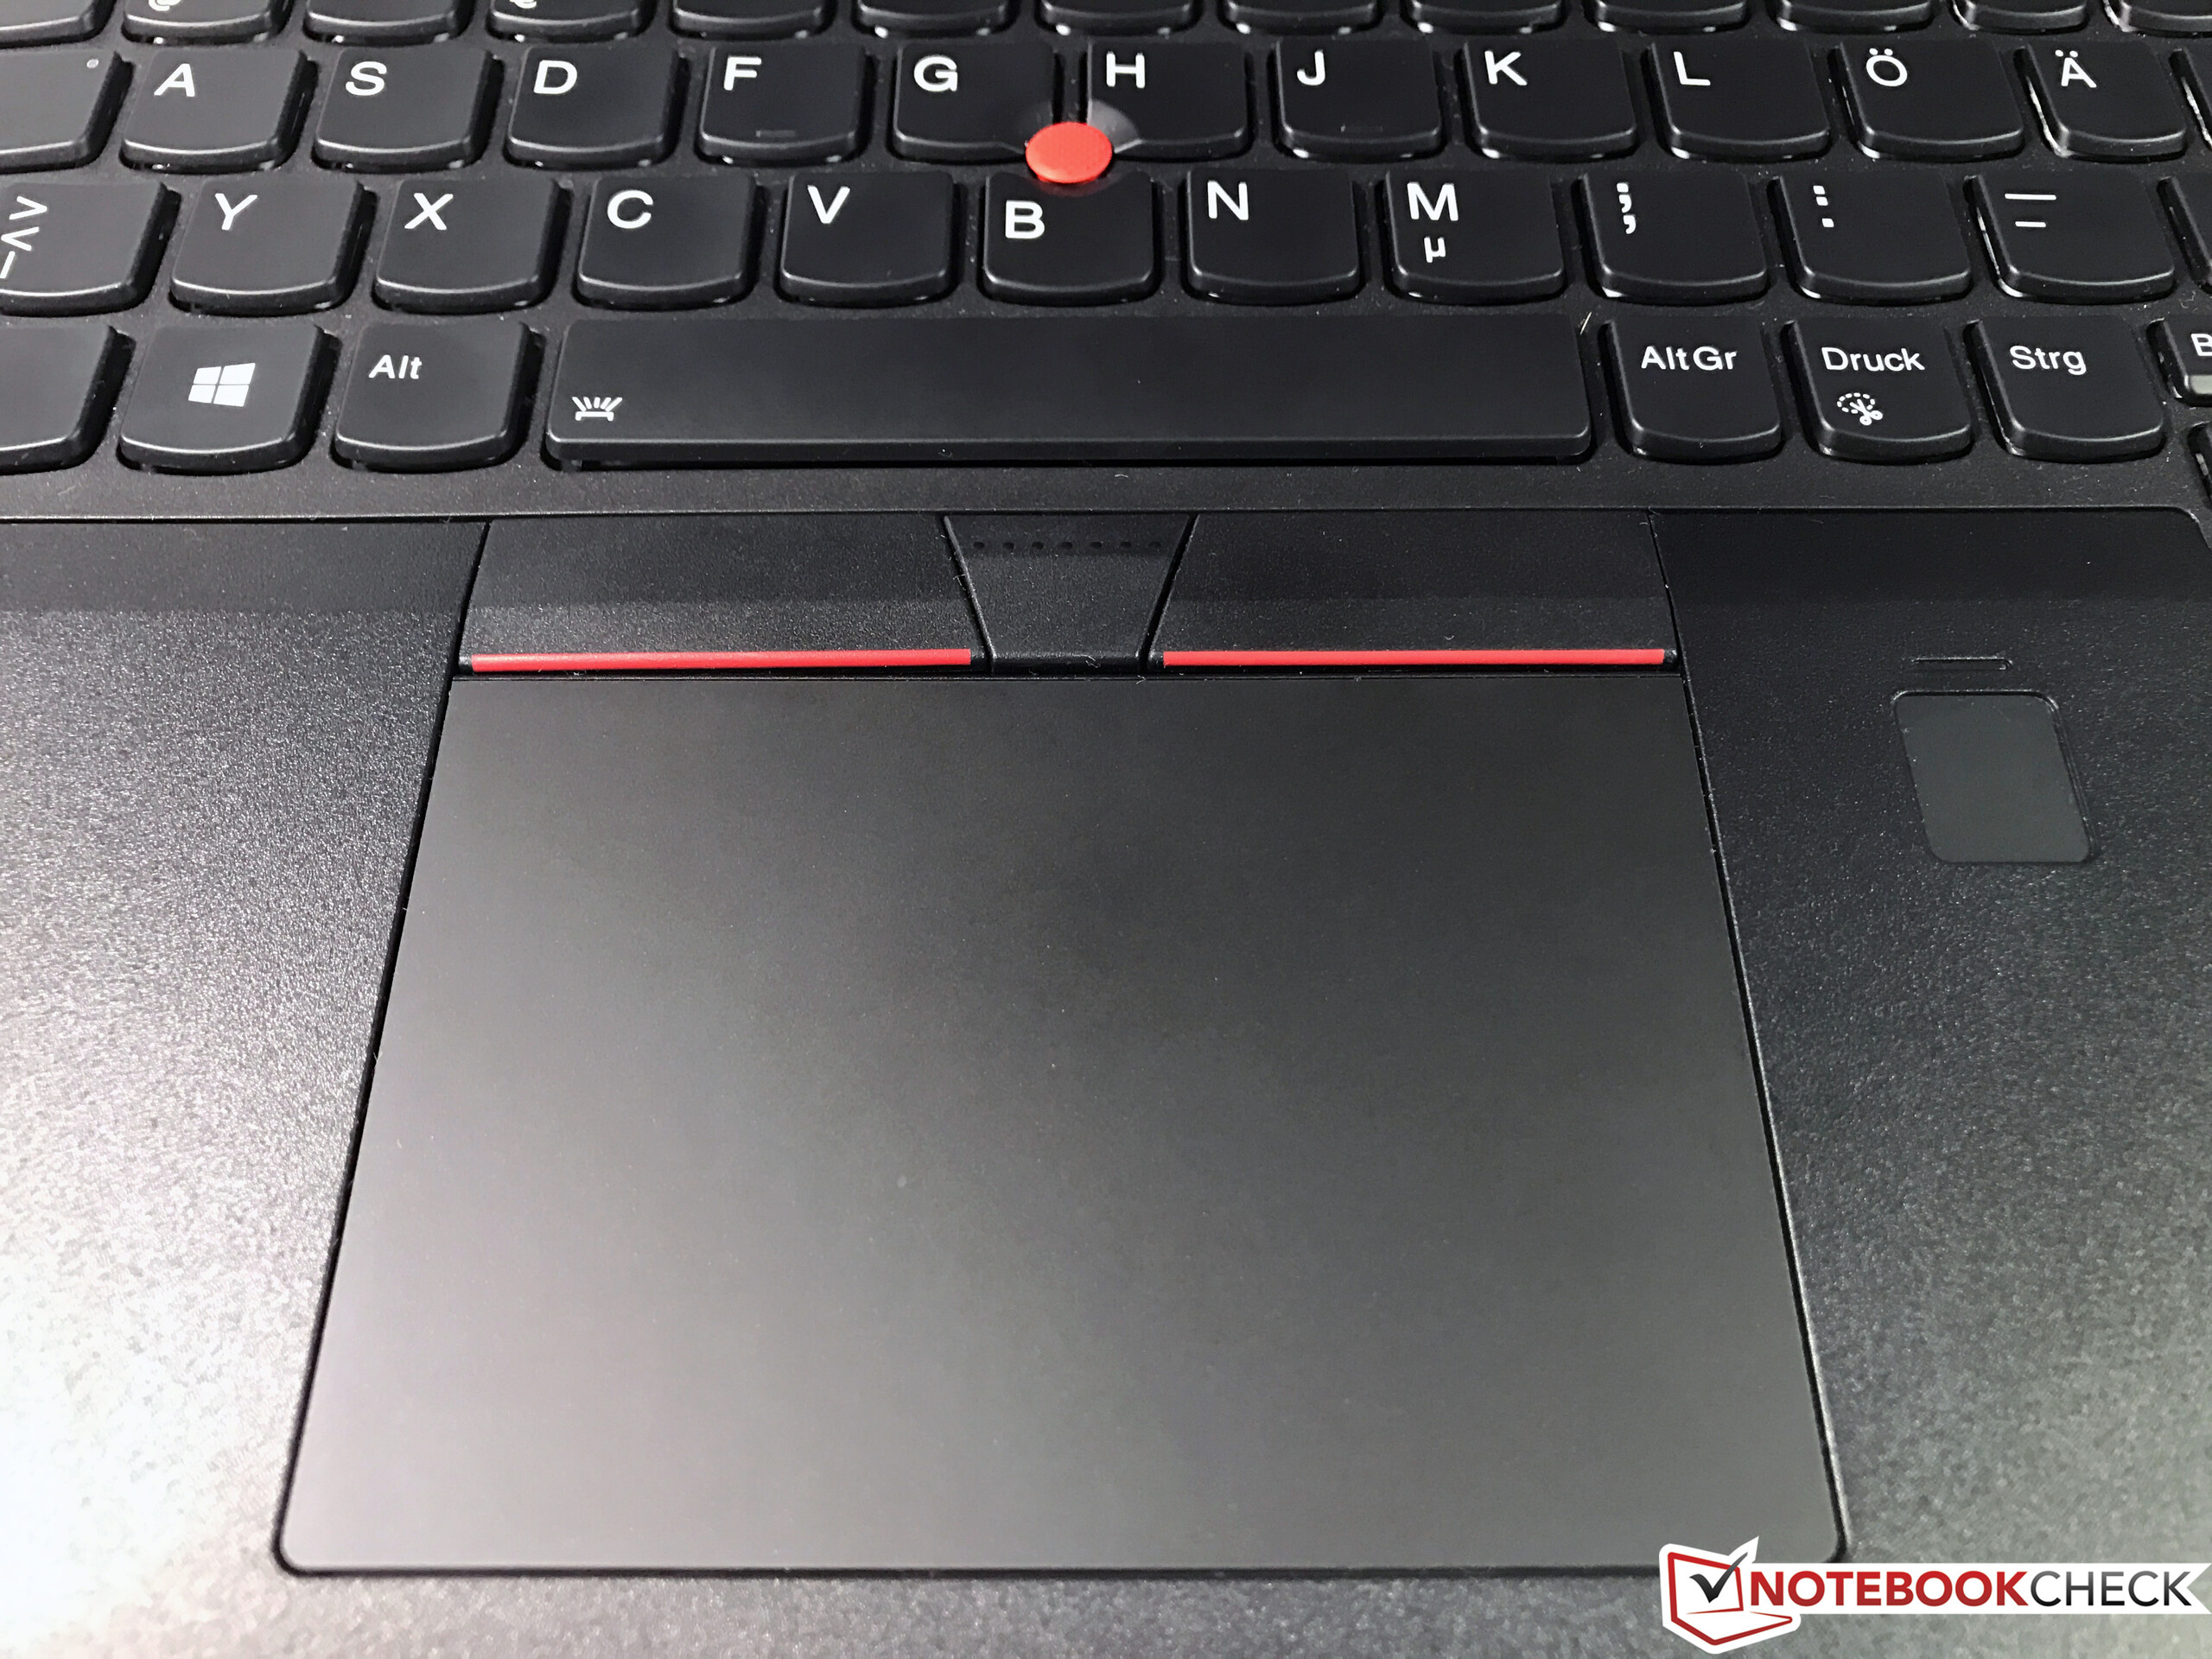
(±) El reposamanos y el touchpad pueden calentarse mucho al tacto con un máximo de 39 °C / 102.2 F.
(-) La temperatura media de la zona del reposamanos de dispositivos similares fue de 27.8 °C / 82 F (-11.2 °C / -20.2 F).
| Lenovo ThinkPad P51s 20HB000SGE i7-7600U, Quadro M520 | Lenovo ThinkPad P50s-20FKS00400 6500U, Quadro M500M | Dell Precision 5520 UHD E3-1505M v6, Quadro M1200 | HP ZBook Studio G3 6820HQ, Quadro M1000M | Lenovo ThinkPad T570-20HAS01E00 i7-7500U, GeForce 940MX | |
|---|---|---|---|---|---|
| Heat | 3% | 6% | -33% | 9% | |
| Maximum Upper Side * (°C) | 43.6 | 44.2 -1% | 51.6 -18% | 69.8 -60% | 43.1 1% |
| Maximum Bottom * (°C) | 60.8 | 57.8 5% | 43.6 28% | 77.3 -27% | 55.4 9% |
| Idle Upper Side * (°C) | 27.3 | 26.4 3% | 26.6 3% | 37.8 -38% | 24.3 11% |
| Idle Bottom * (°C) | 29 | 28.1 3% | 26.2 10% | 31.4 -8% | 25 14% |
* ... más pequeño es mejor
Lenovo ThinkPad P51s 20HB000SGE análisis de audio
(±) | la sonoridad del altavoz es media pero buena (75.2 dB)
Graves 100 - 315 Hz
(±) | lubina reducida - en promedio 10.7% inferior a la mediana
(±) | la linealidad de los graves es media (11% delta a frecuencia anterior)
Medios 400 - 2000 Hz
(+) | medios equilibrados - a sólo 3.9% de la mediana
(±) | la linealidad de los medios es media (10.5% delta respecto a la frecuencia anterior)
Altos 2 - 16 kHz
(+) | máximos equilibrados - a sólo 3.1% de la mediana
(±) | la linealidad de los máximos es media (7.1% delta a frecuencia anterior)
Total 100 - 16.000 Hz
(±) | la linealidad del sonido global es media (15.6% de diferencia con la mediana)
En comparación con la misma clase
» 35% de todos los dispositivos probados de esta clase eran mejores, 11% similares, 54% peores
» El mejor tuvo un delta de 7%, la media fue 17%, el peor fue ###max##%
En comparación con todos los dispositivos probados
» 23% de todos los dispositivos probados eran mejores, 5% similares, 72% peores
» El mejor tuvo un delta de 4%, la media fue 23%, el peor fue ###max##%
Dell Precision 5520 UHD análisis de audio
(±) | la sonoridad del altavoz es media pero buena (79.6 dB)
Graves 100 - 315 Hz
(±) | lubina reducida - en promedio 12.8% inferior a la mediana
(±) | la linealidad de los graves es media (14.2% delta a frecuencia anterior)
Medios 400 - 2000 Hz
(+) | medios equilibrados - a sólo 4% de la mediana
(±) | la linealidad de los medios es media (9.9% delta respecto a la frecuencia anterior)
Altos 2 - 16 kHz
(+) | máximos equilibrados - a sólo 3.3% de la mediana
(±) | la linealidad de los máximos es media (12% delta a frecuencia anterior)
Total 100 - 16.000 Hz
(±) | la linealidad del sonido global es media (16.7% de diferencia con la mediana)
En comparación con la misma clase
» 46% de todos los dispositivos probados de esta clase eran mejores, 9% similares, 45% peores
» El mejor tuvo un delta de 7%, la media fue 17%, el peor fue ###max##%
En comparación con todos los dispositivos probados
» 29% de todos los dispositivos probados eran mejores, 7% similares, 64% peores
» El mejor tuvo un delta de 4%, la media fue 23%, el peor fue ###max##%
| Off / Standby | |
| Ocioso | |
| Carga |
|
Clave:
min: | |
| Lenovo ThinkPad P51s 20HB000SGE i7-7600U, Quadro M520 | Lenovo ThinkPad P50s-20FKS00400 6500U, Quadro M500M | Dell Precision 5520 UHD E3-1505M v6, Quadro M1200 | HP ZBook Studio G3 6820HQ, Quadro M1000M | Lenovo ThinkPad T570-20HAS01E00 i7-7500U, GeForce 940MX | |
|---|---|---|---|---|---|
| Power Consumption | 22% | -44% | -42% | 10% | |
| Idle Minimum * (Watt) | 5.8 | 4.3 26% | 8.9 -53% | 8.7 -50% | 4.7 19% |
| Idle Average * (Watt) | 10.4 | 9.7 7% | 13.6 -31% | 14.2 -37% | 9.9 5% |
| Idle Maximum * (Watt) | 13.5 | 10.2 24% | 14.1 -4% | 14.4 -7% | 10.9 19% |
| Load Average * (Watt) | 62.4 | 45.7 27% | 100.3 -61% | 85.6 -37% | 56.1 10% |
| Load Maximum * (Watt) | 73.1 | 55.8 24% | 126.3 -73% | 129.7 -77% | 75 -3% |
| Witcher 3 ultra * (Watt) | 100.2 |
* ... más pequeño es mejor
| Lenovo ThinkPad P51s 20HB000SGE i7-7600U, Quadro M520, 104 Wh | Lenovo ThinkPad P50s-20FKS00400 6500U, Quadro M500M, 67 Wh | Dell Precision 5520 UHD E3-1505M v6, Quadro M1200, 97 Wh | HP ZBook Studio G3 6820HQ, Quadro M1000M, 64 Wh | Lenovo ThinkPad T570-20HAS01E00 i7-7500U, GeForce 940MX, 56 Wh | |
|---|---|---|---|---|---|
| Duración de Batería | -39% | -67% | -72% | -42% | |
| Reader / Idle (h) | 26.4 | 18.5 -30% | 12.1 -54% | 8.5 -68% | 13.3 -50% |
| H.264 (h) | 11.7 | 9 -23% | 3.8 -68% | 8.1 -31% | |
| WiFi v1.3 (h) | 11.9 | 6.8 -43% | 4.2 -65% | 3.5 -71% | 6.9 -42% |
| Load (h) | 5.4 | 2.2 -59% | 1 -81% | 1.1 -80% | 2.9 -46% |
Pro
Contra
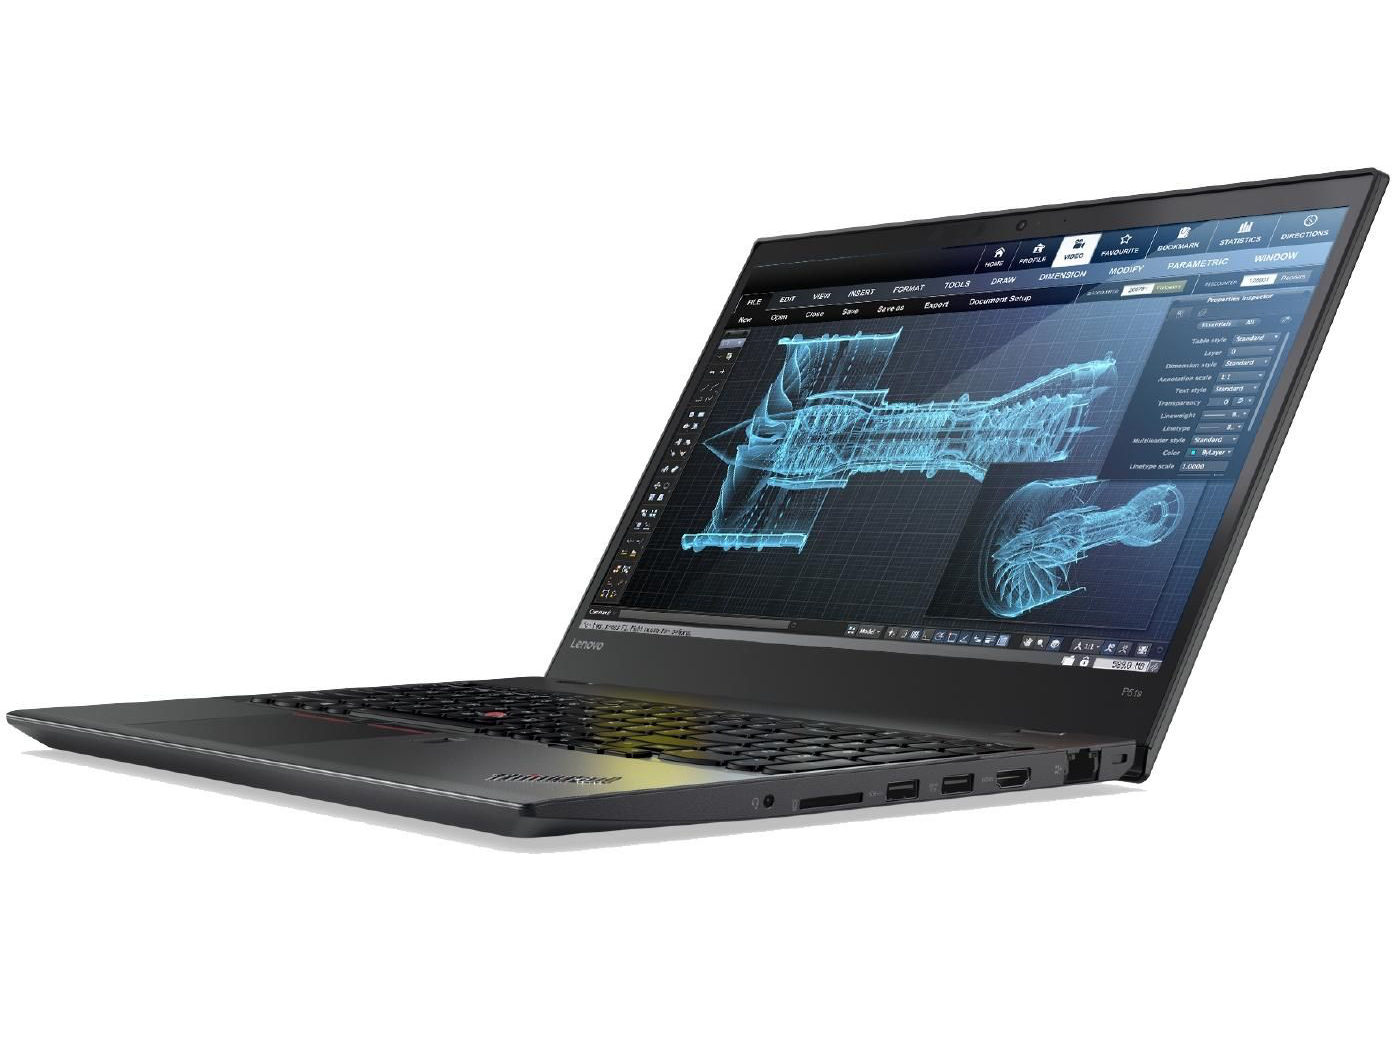
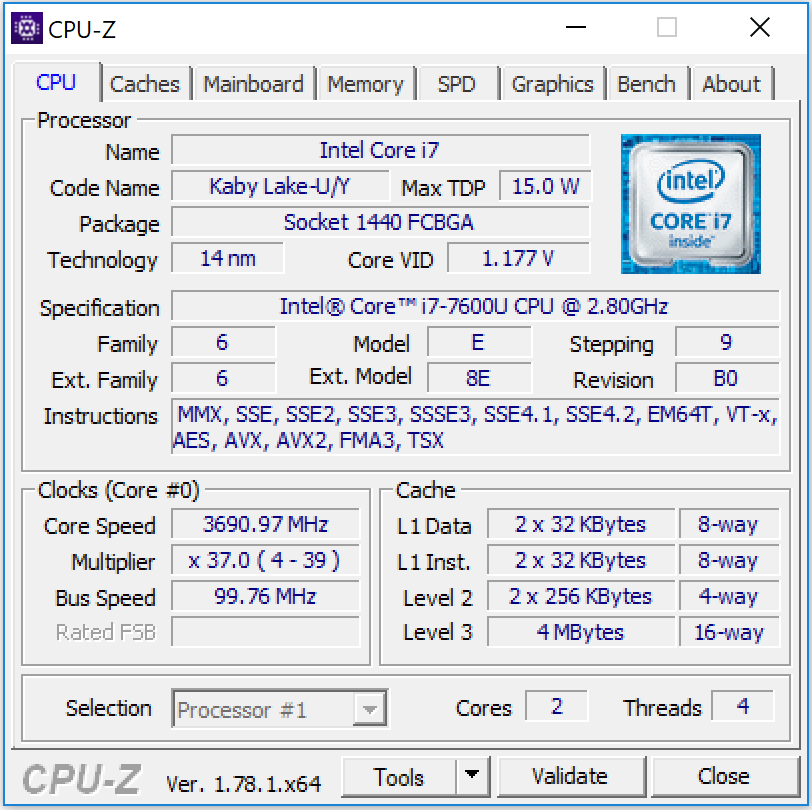
Lenovo aporta una estación de trabajo portátil de 15,6" con su ThinkPad P51s. Sin embargo, los compradores deben tener en cuenta que su rendimiento es limitado debido al procesador ULV. Una estación de trabajo con un procesador de 4 núcleos necesitaría uno de mayor rendimiento- por ejemplo el ThinkPad P51.
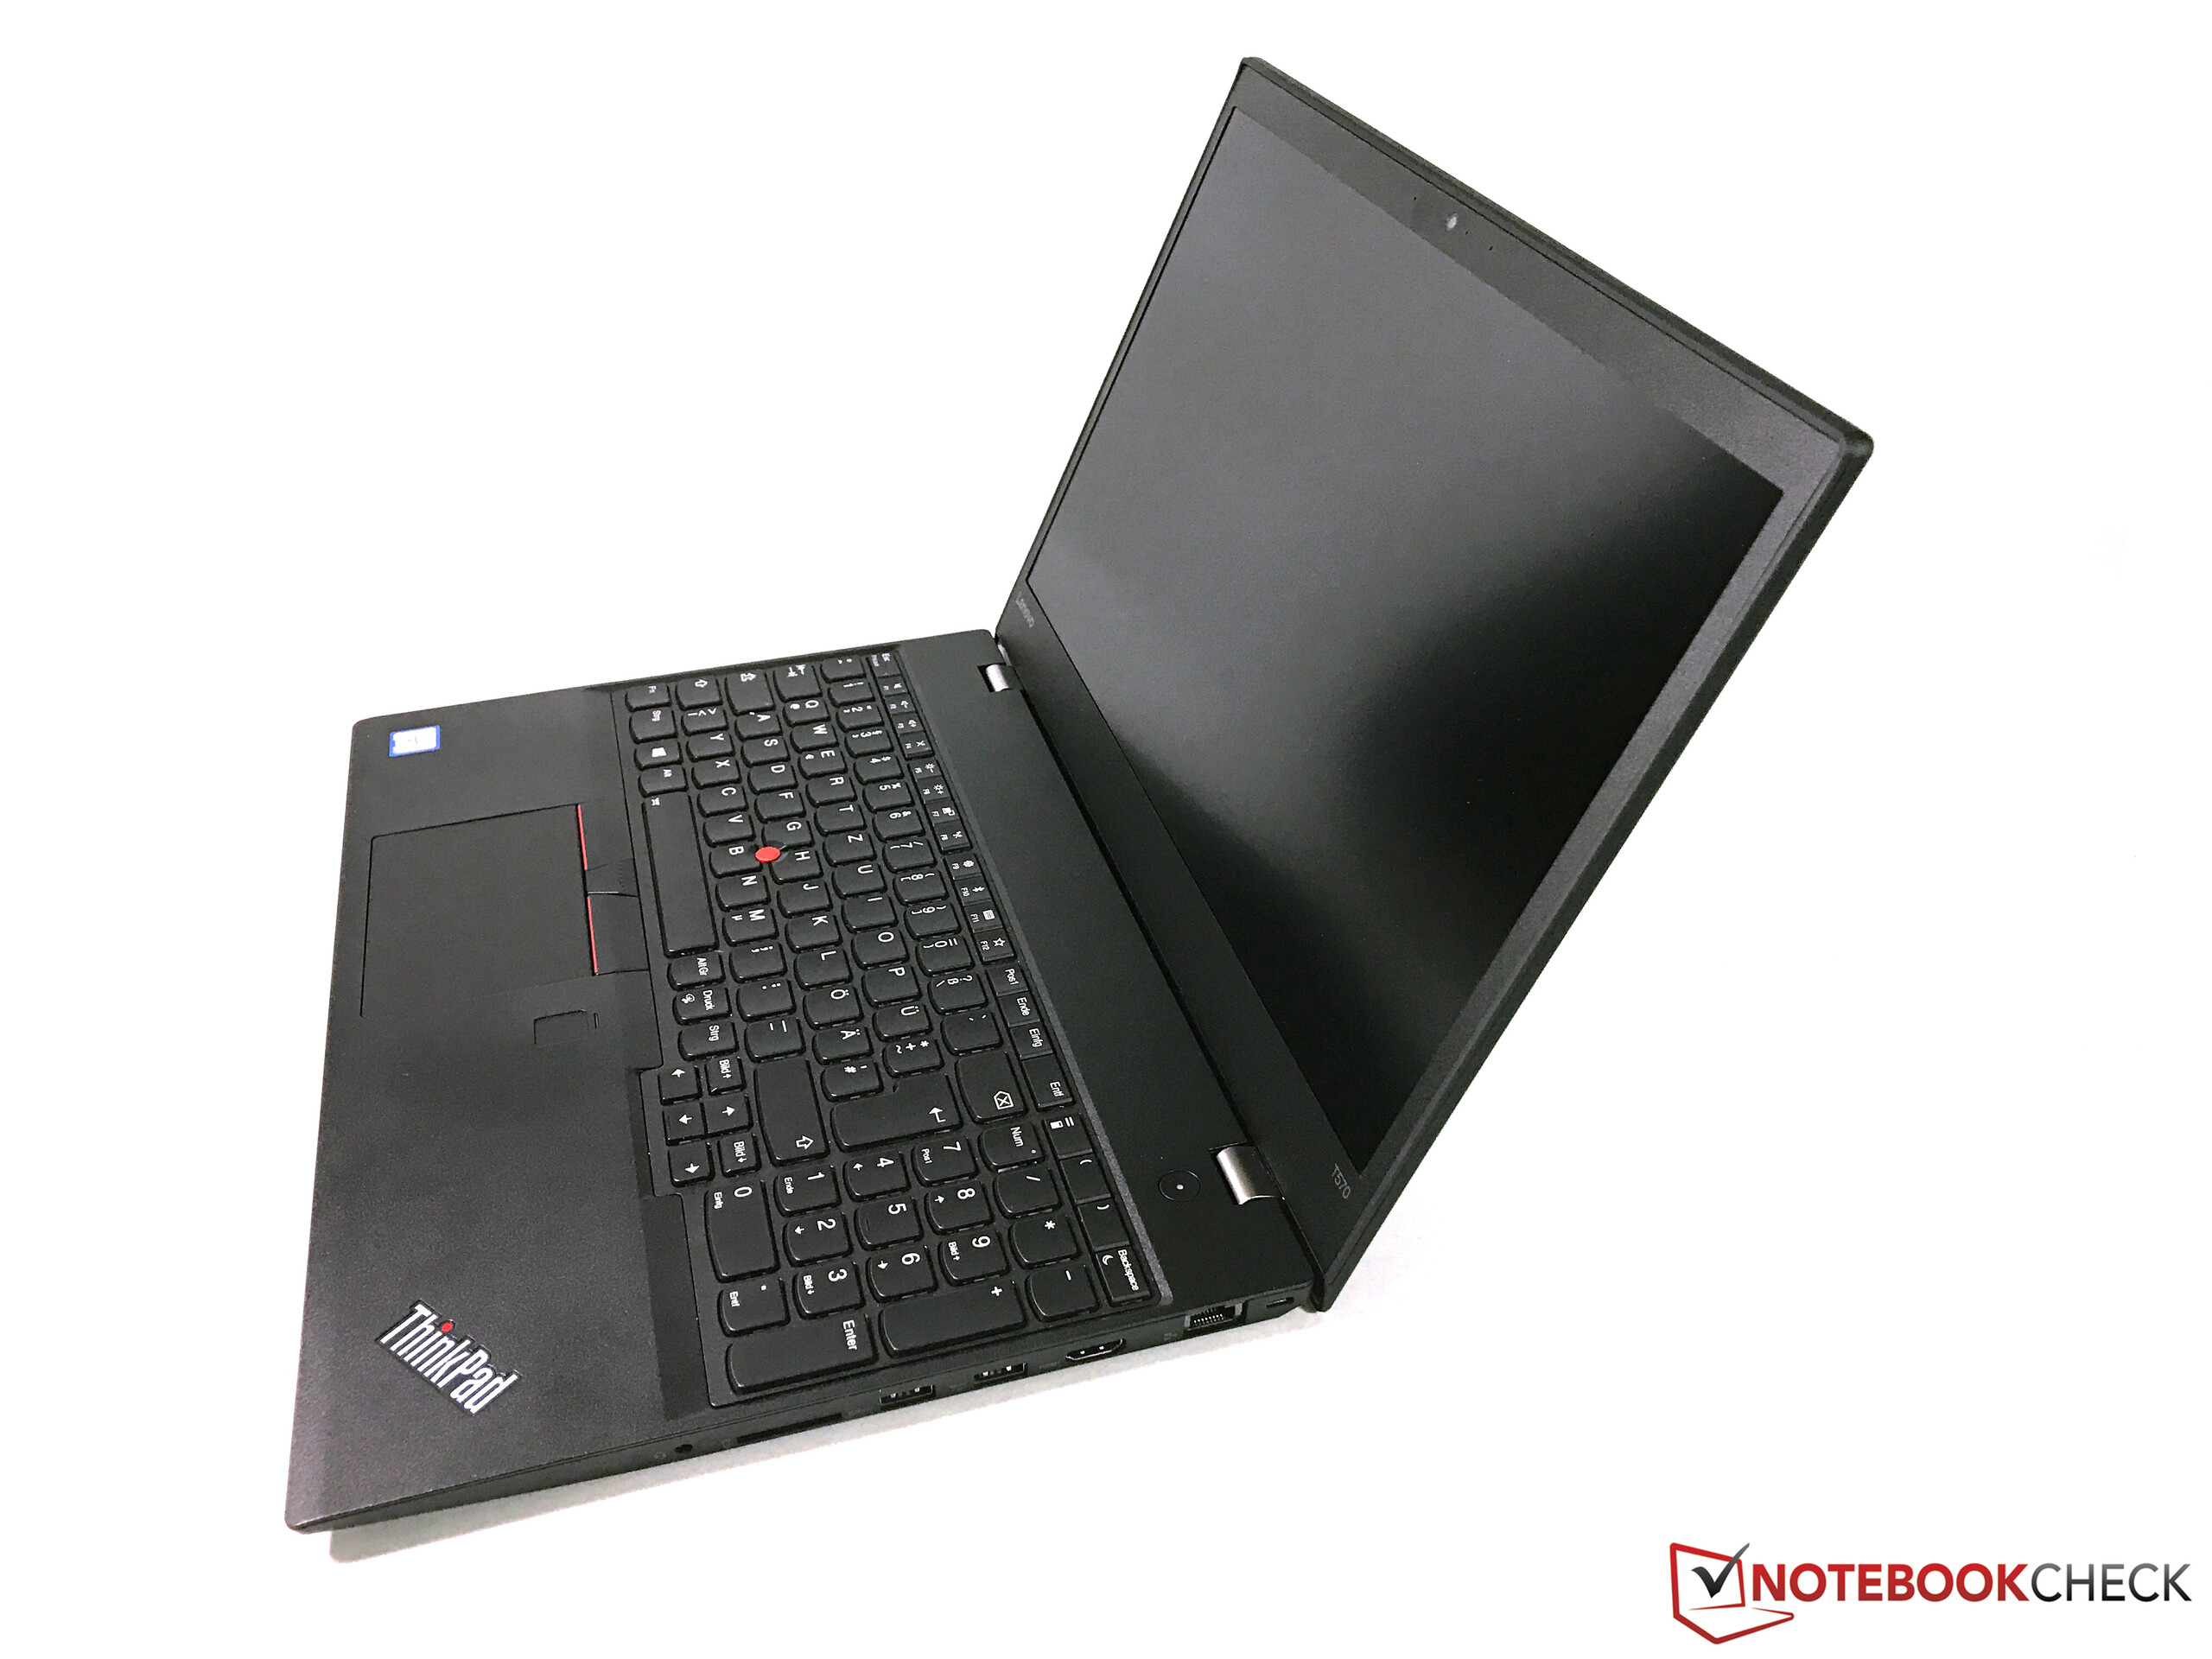
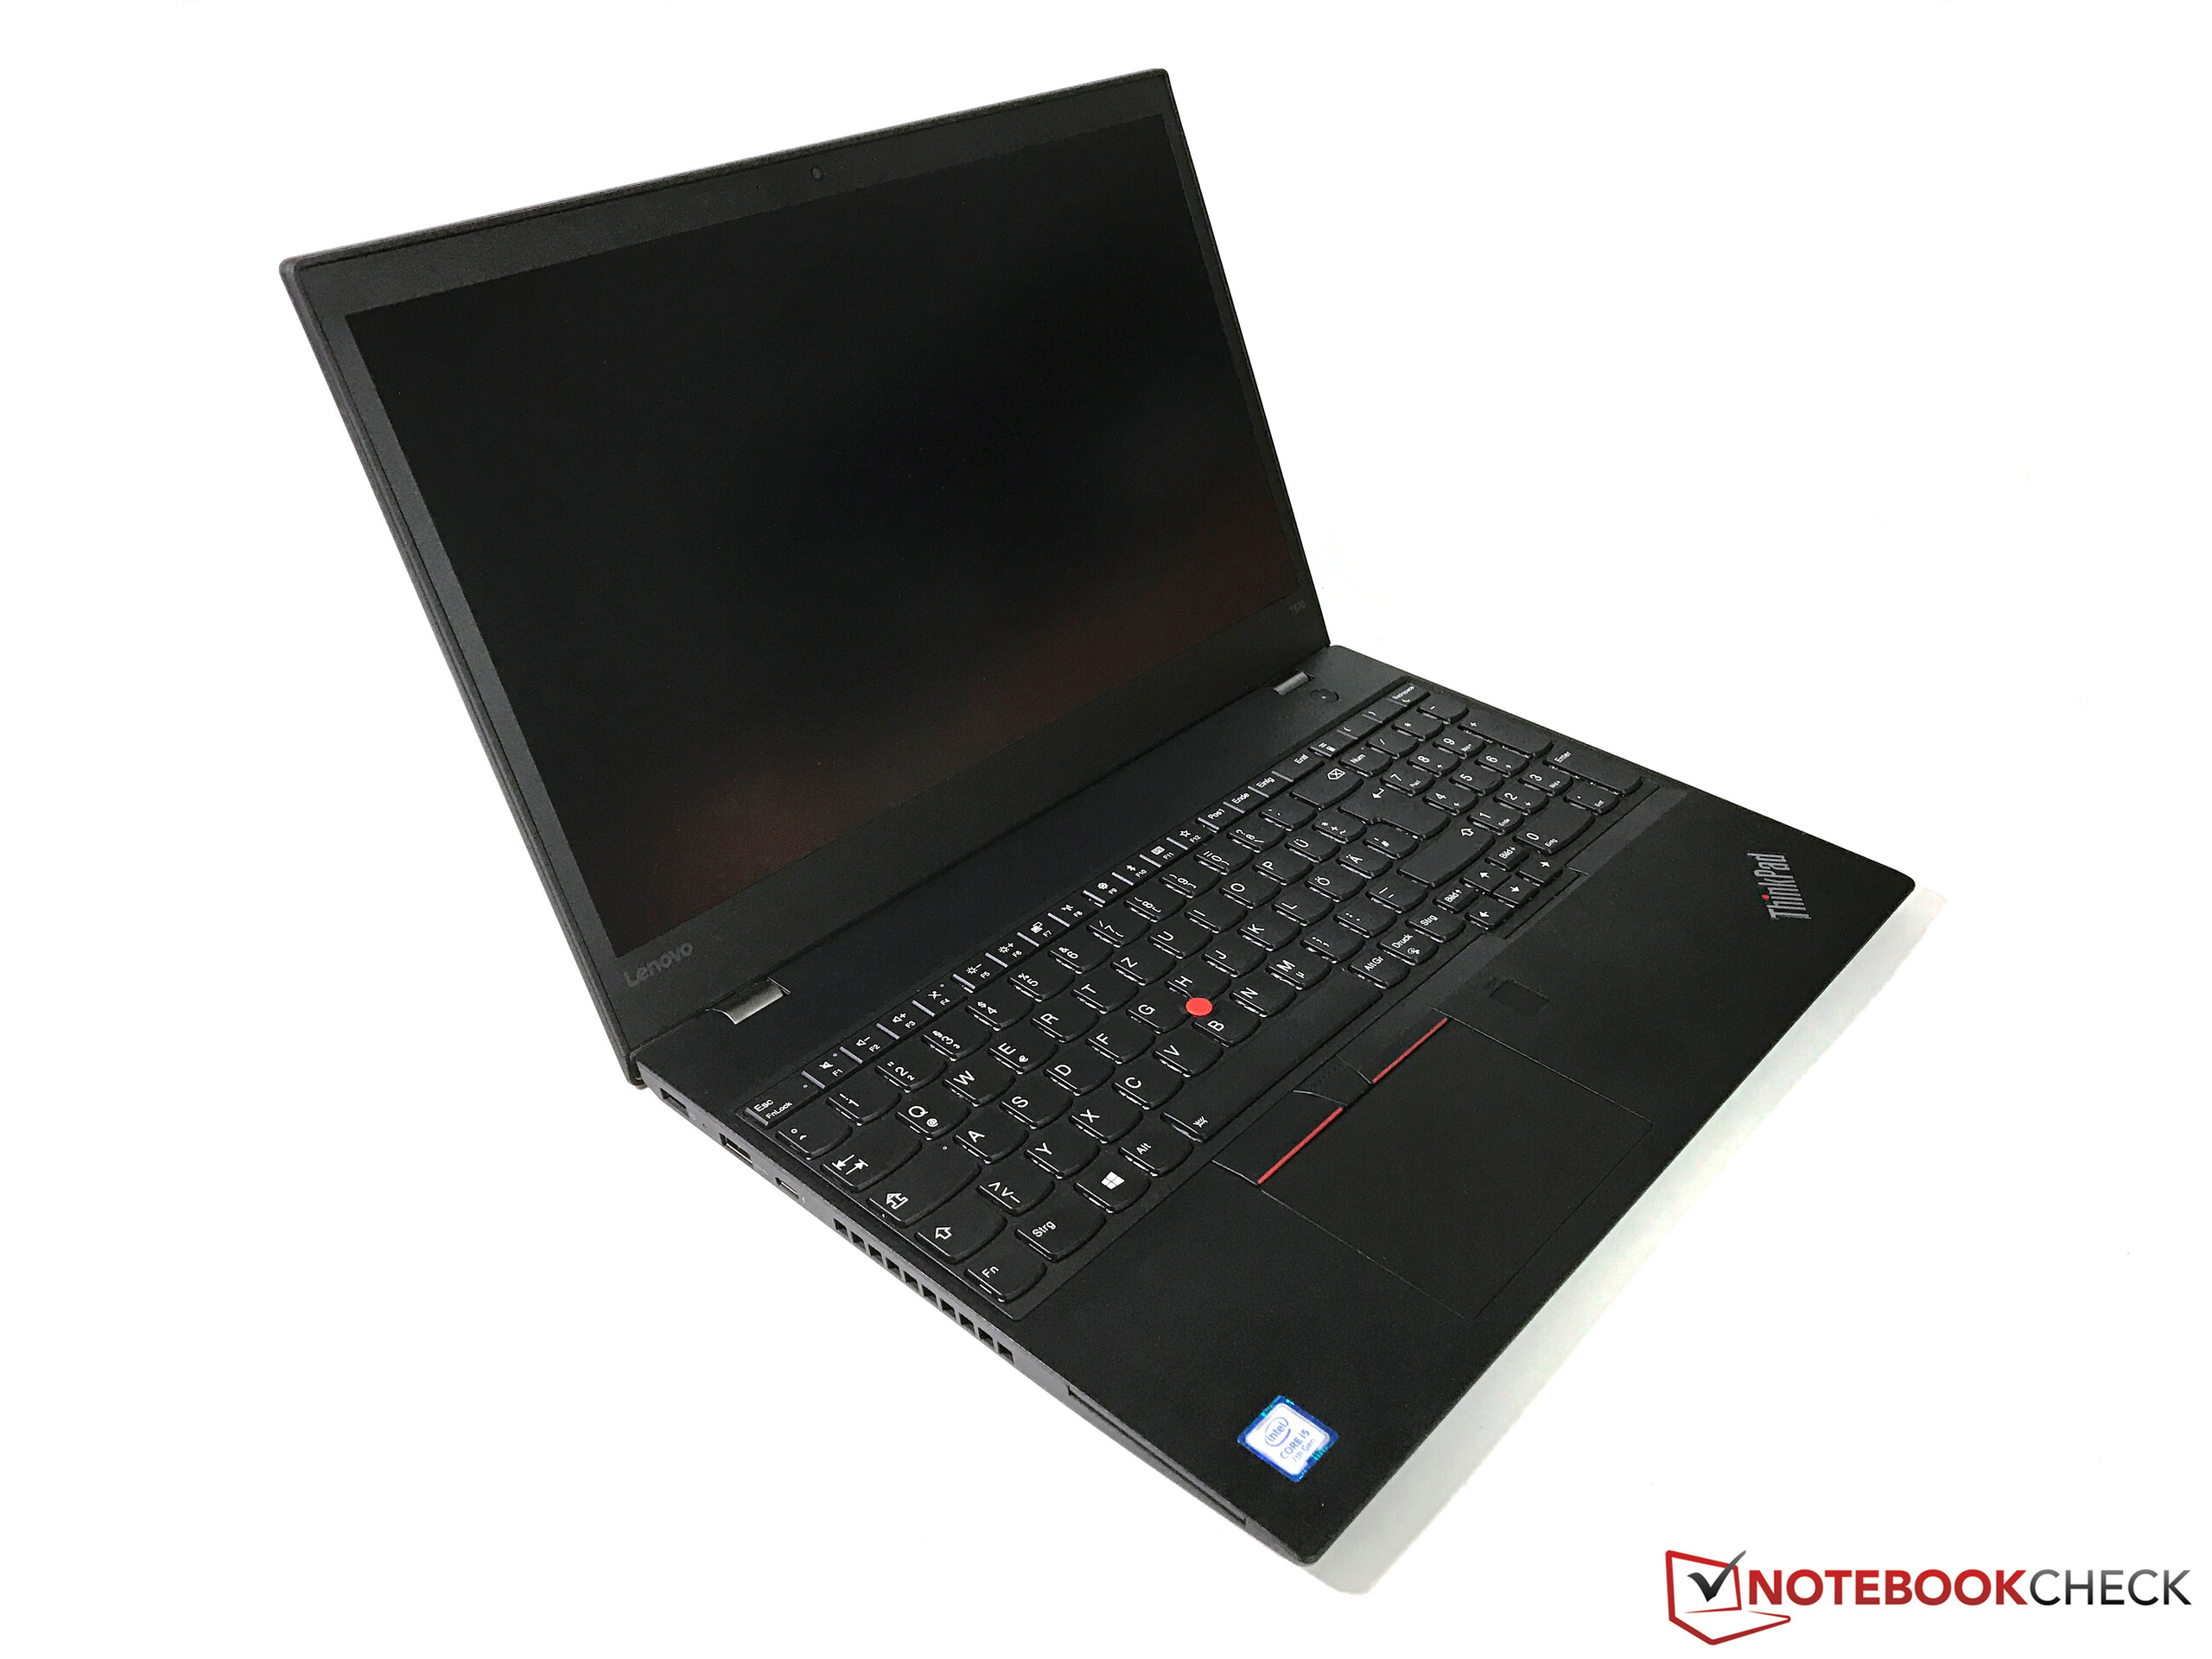
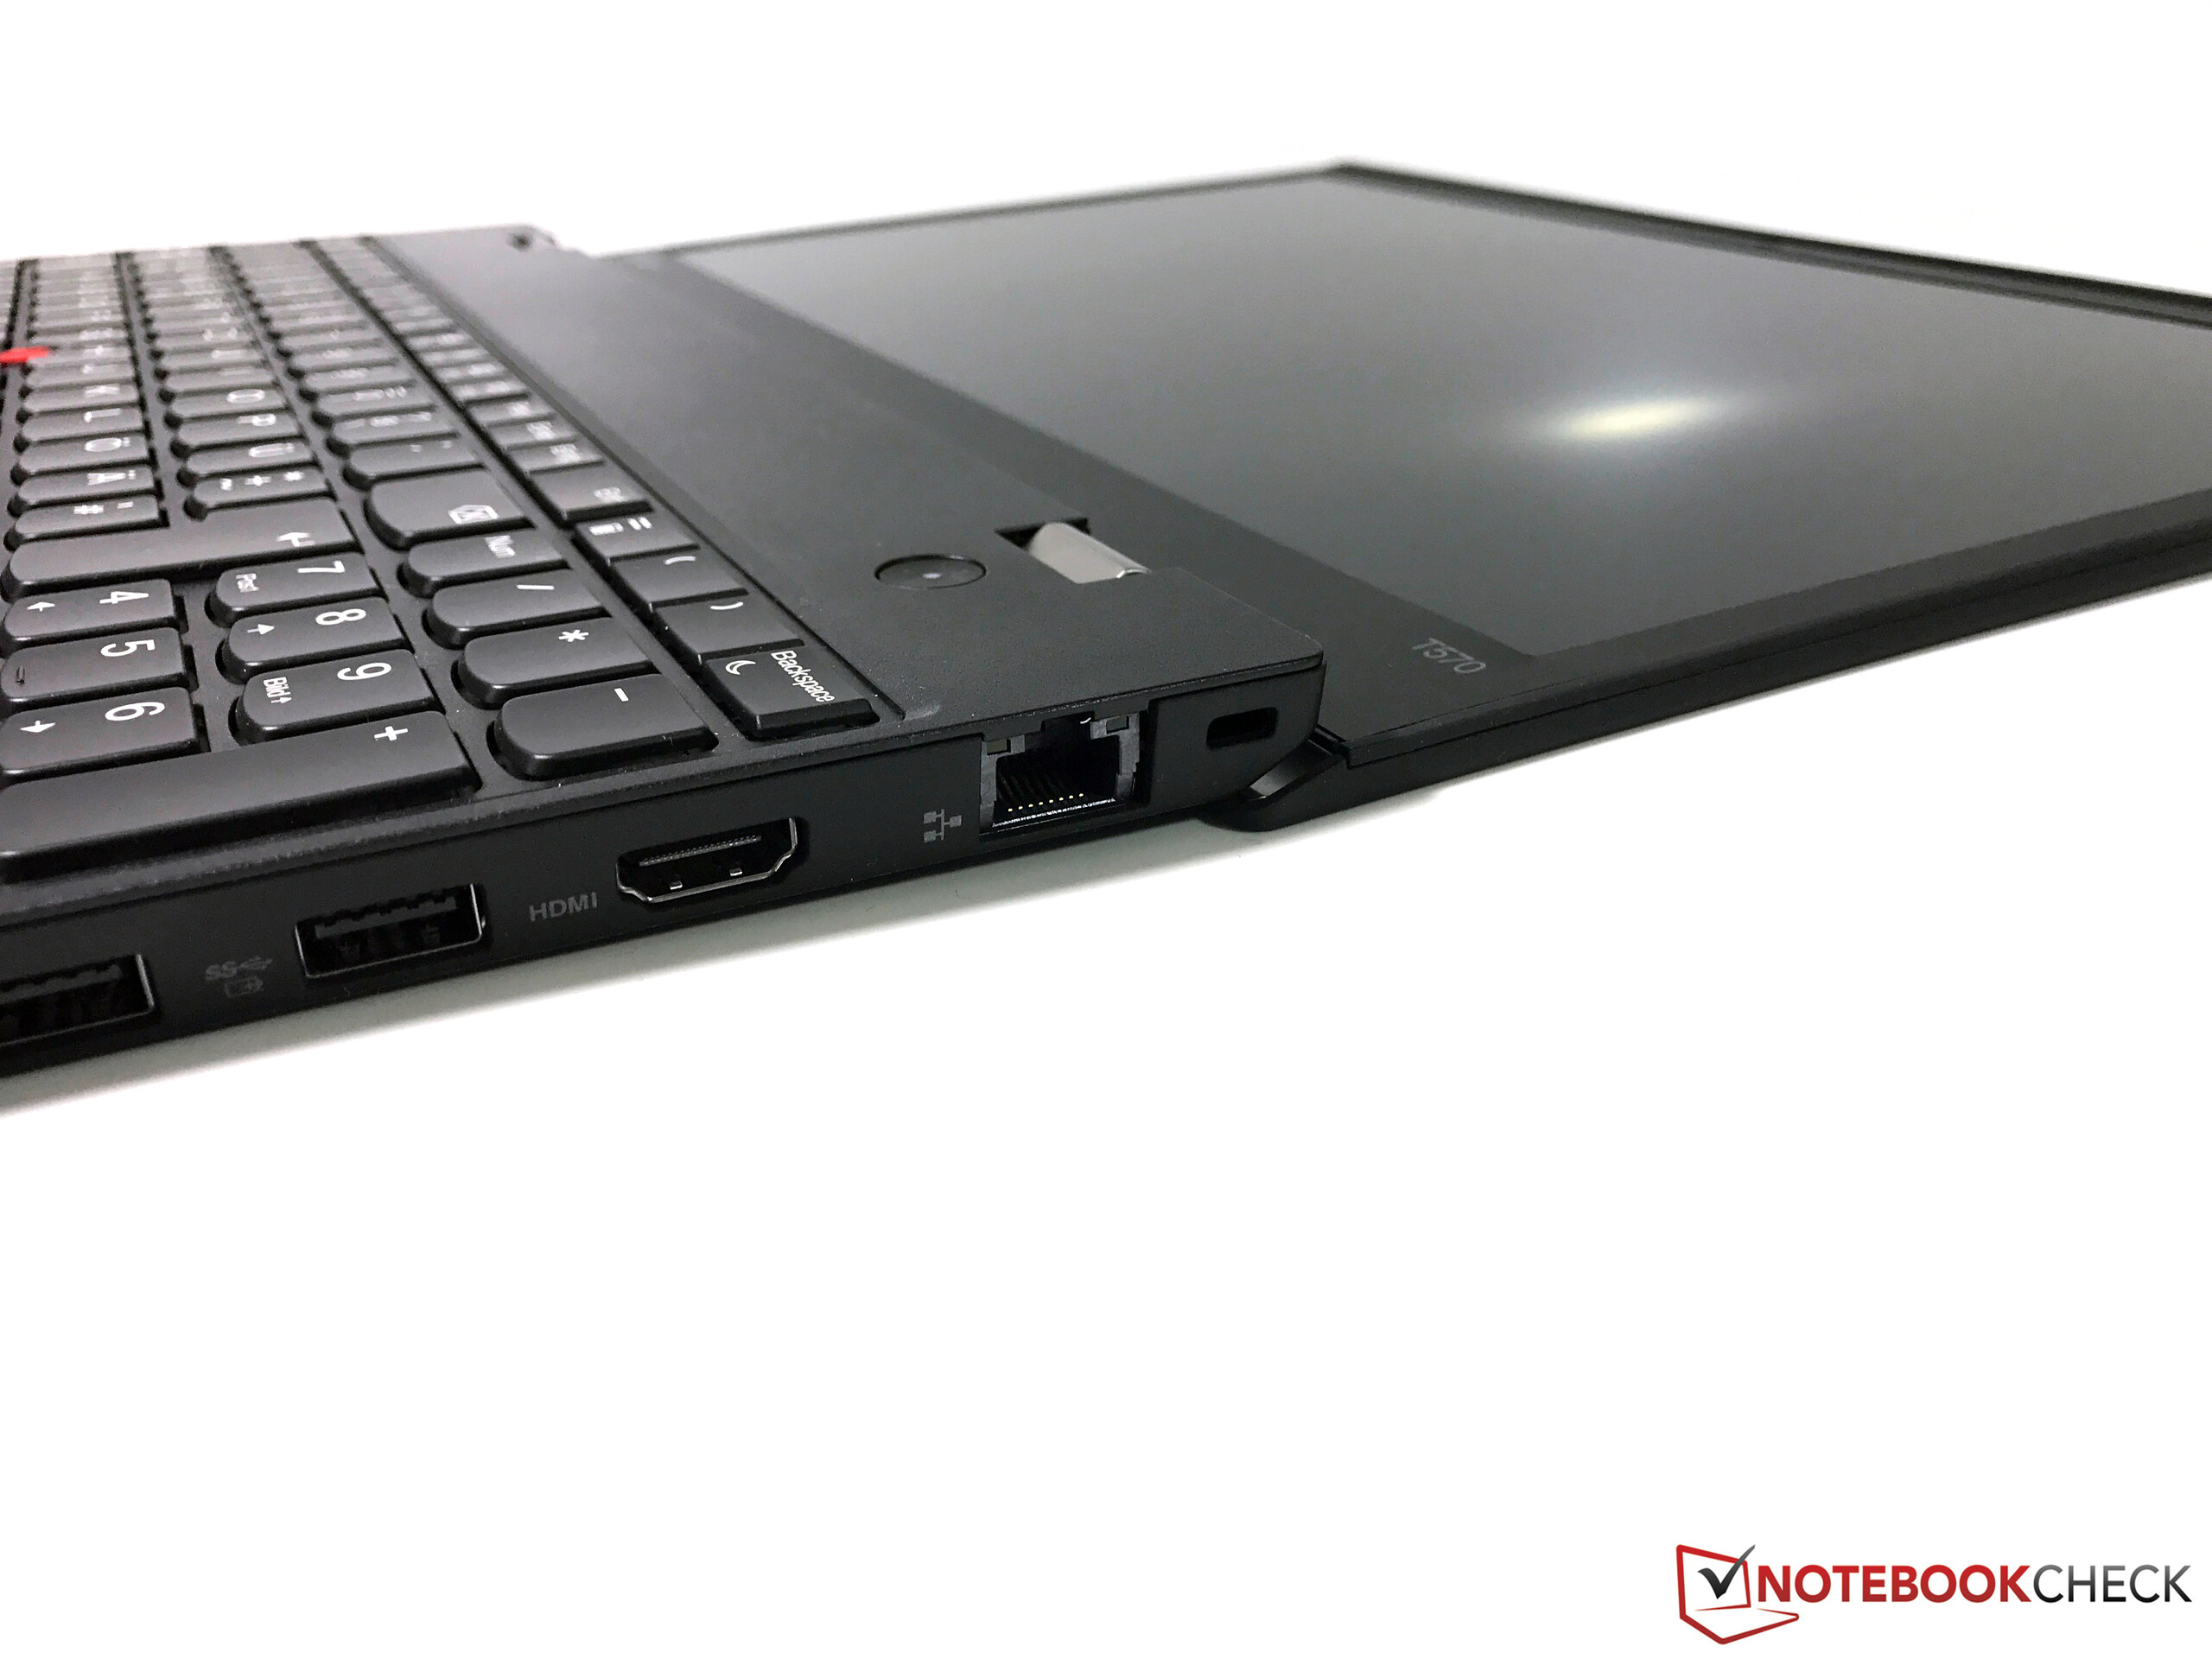
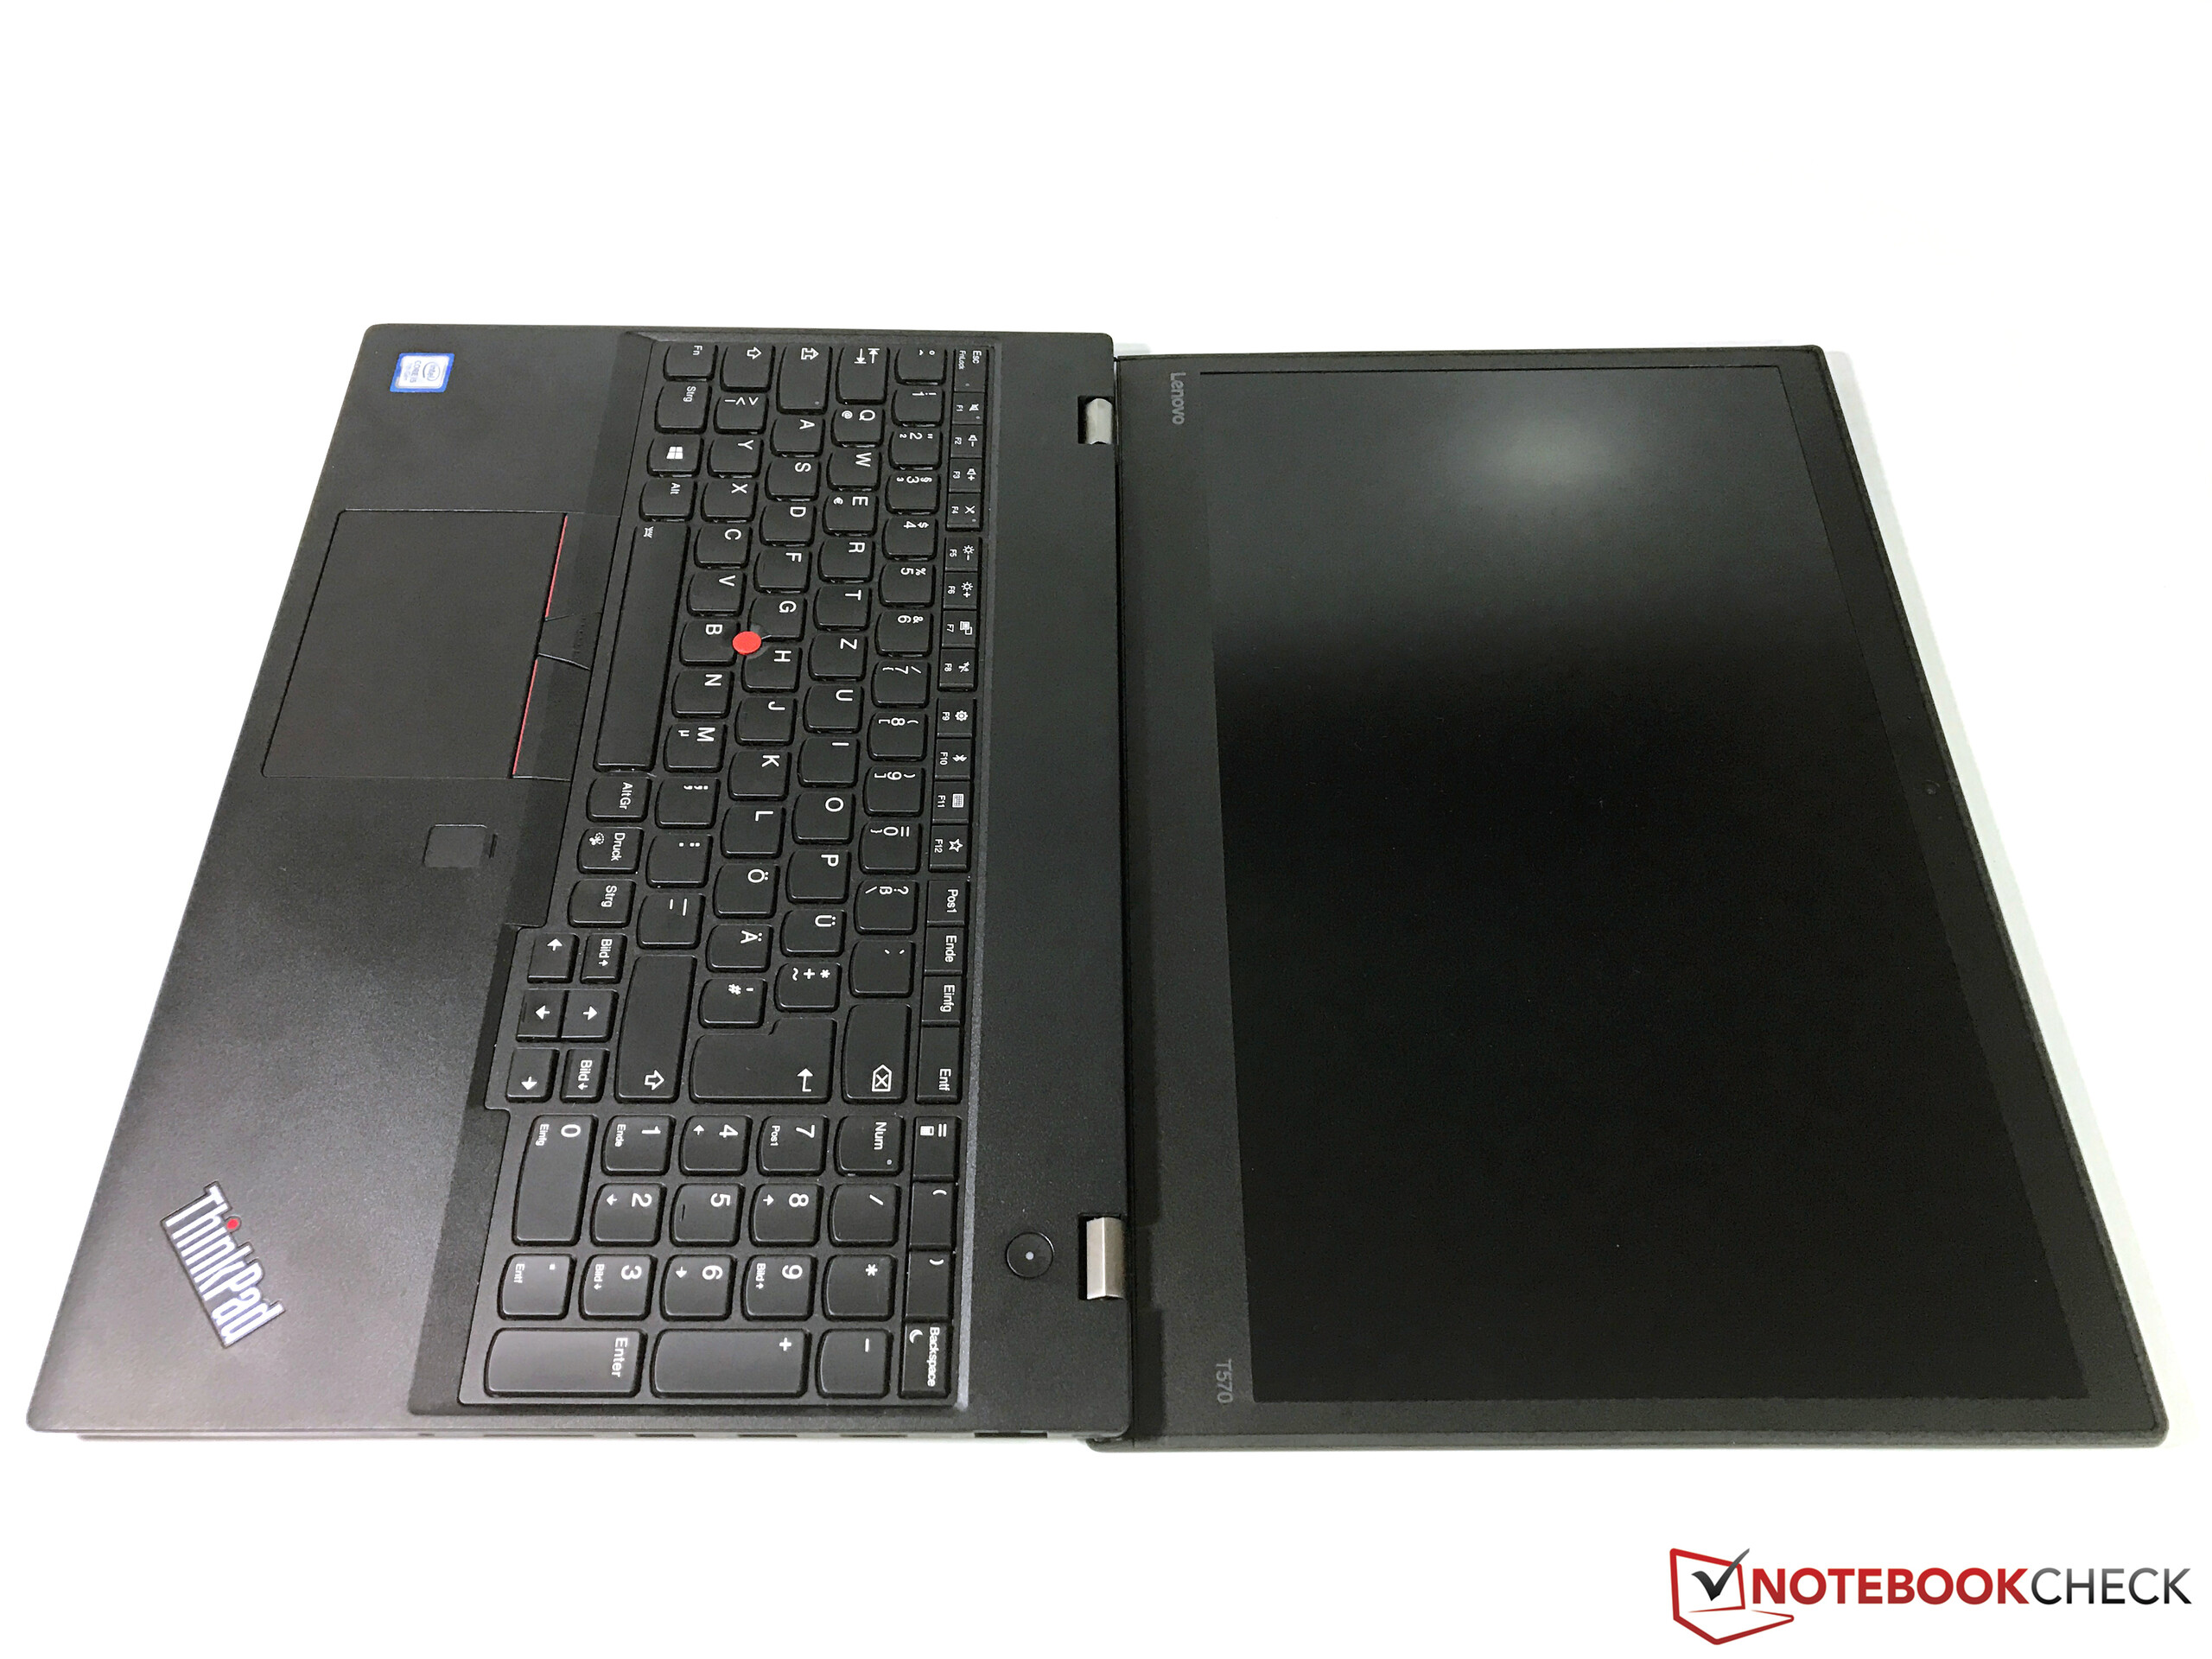
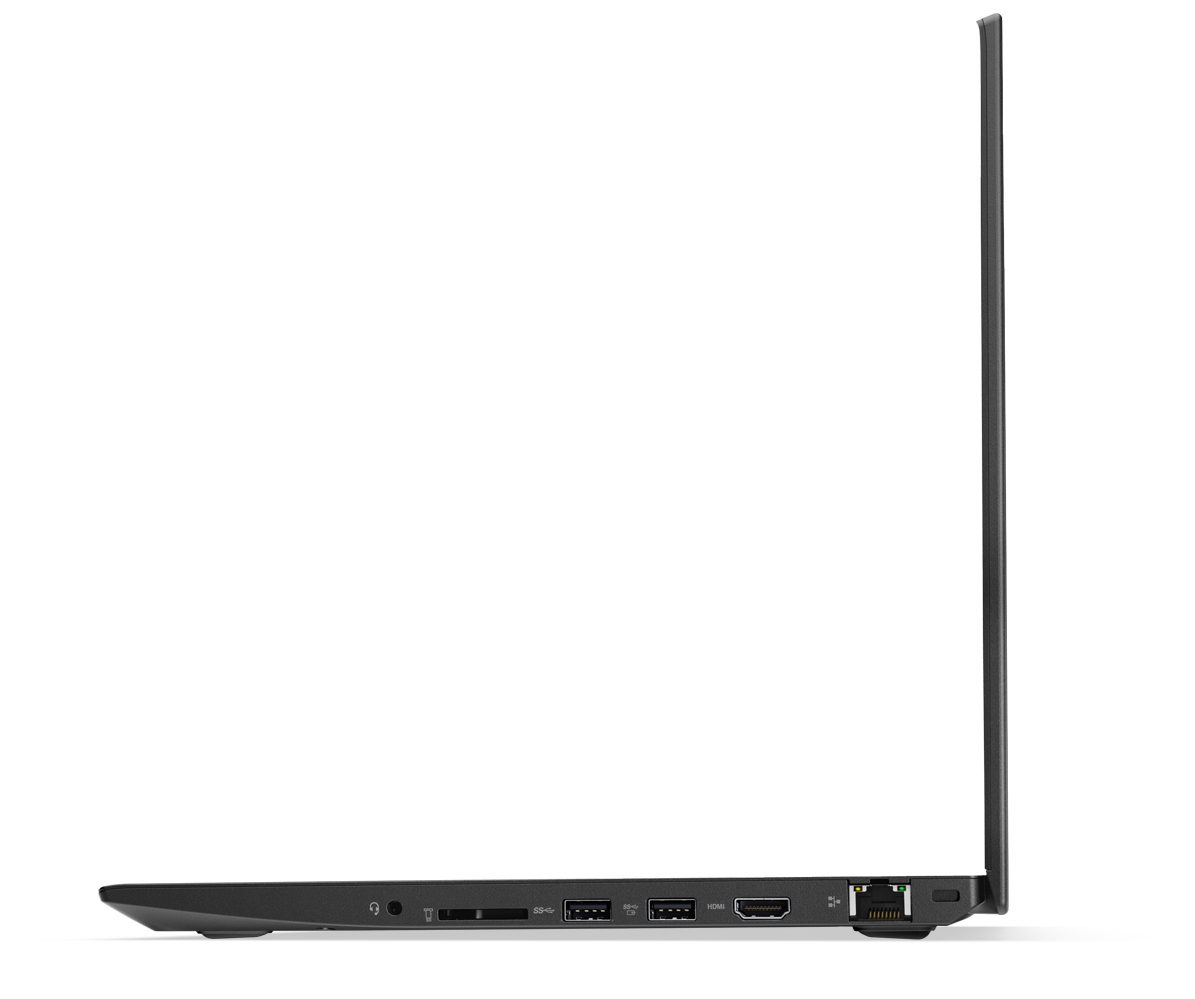
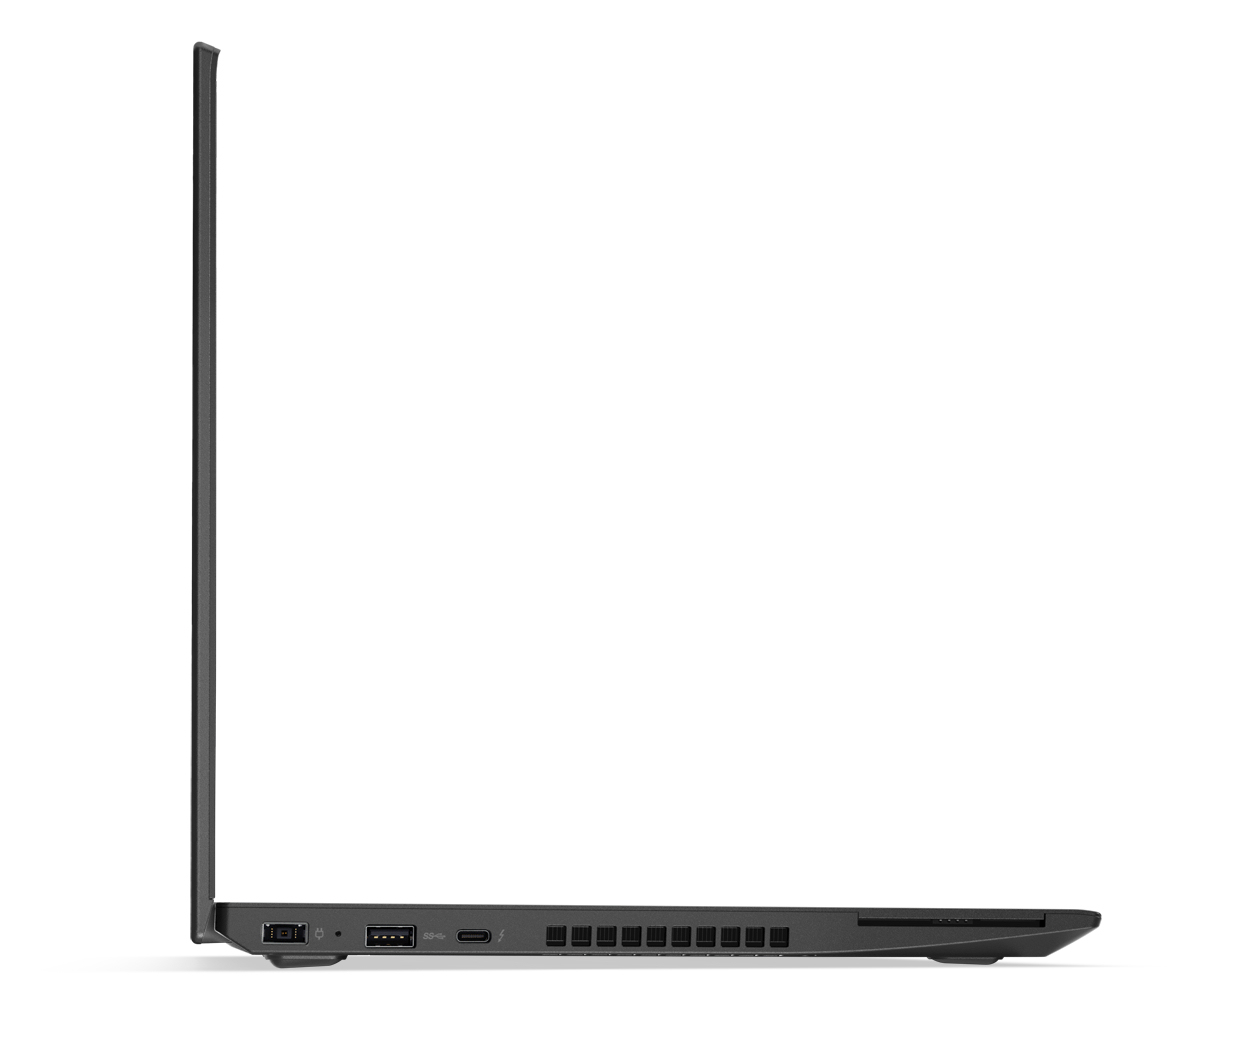
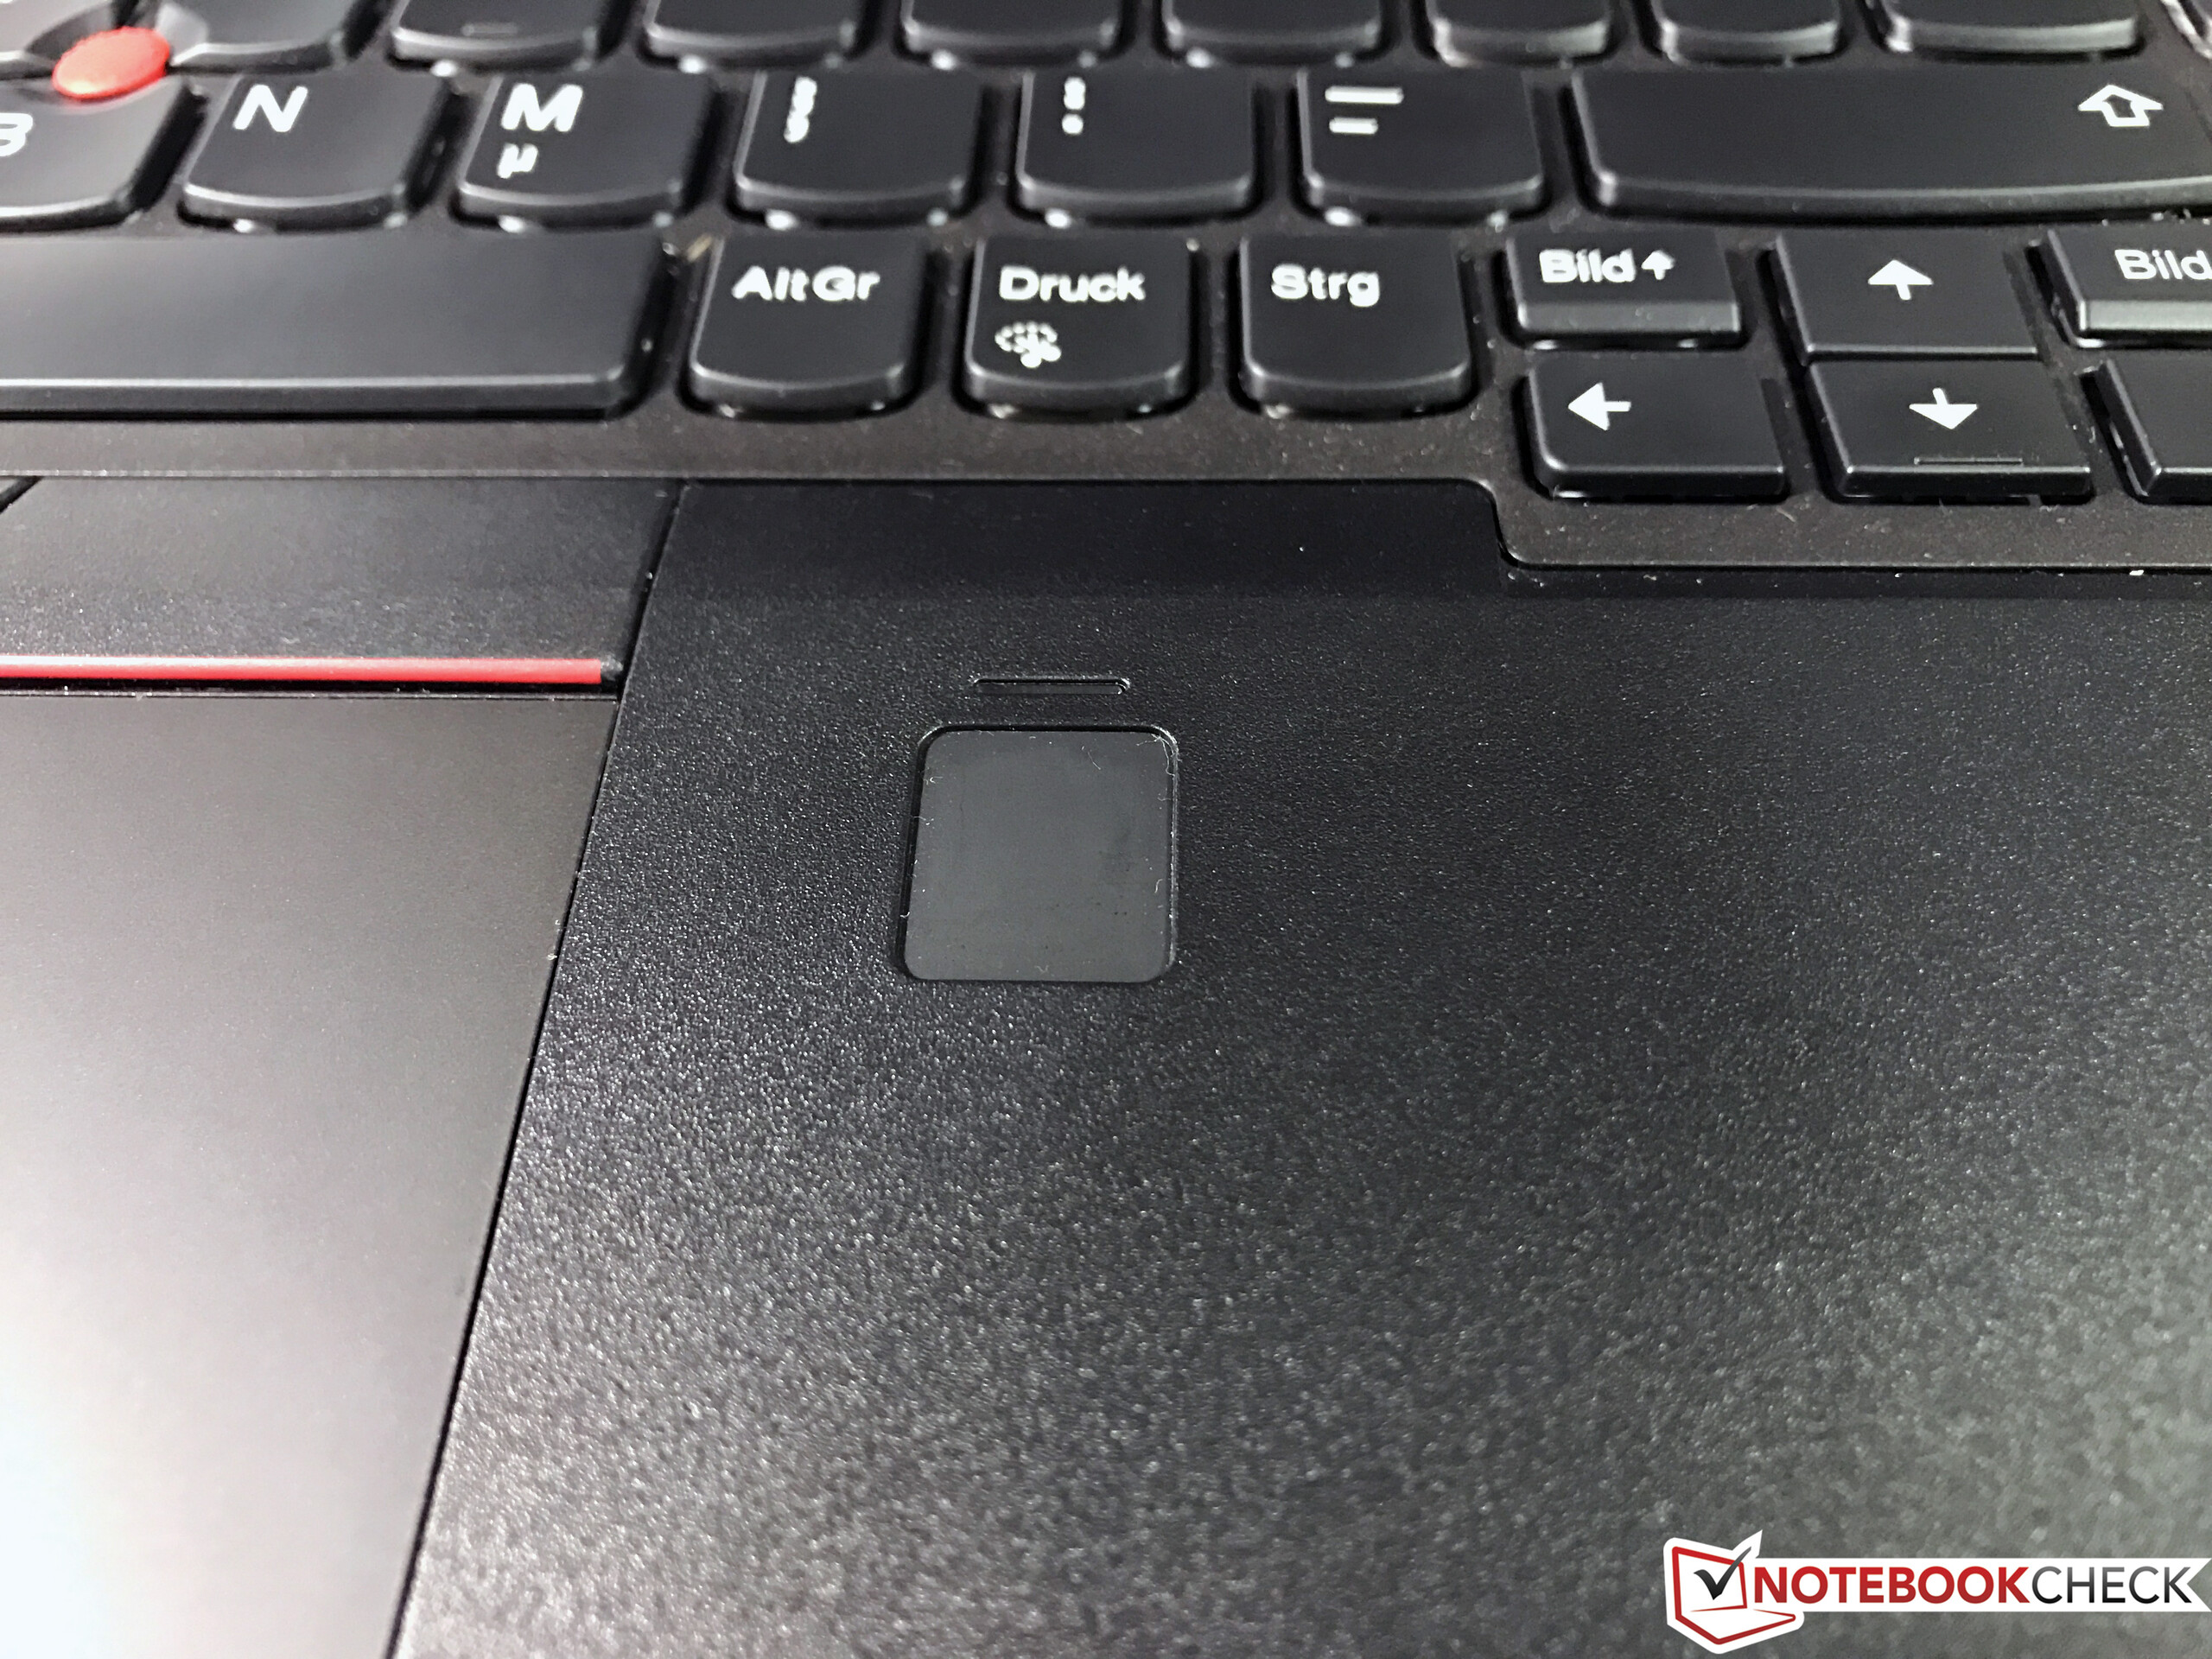
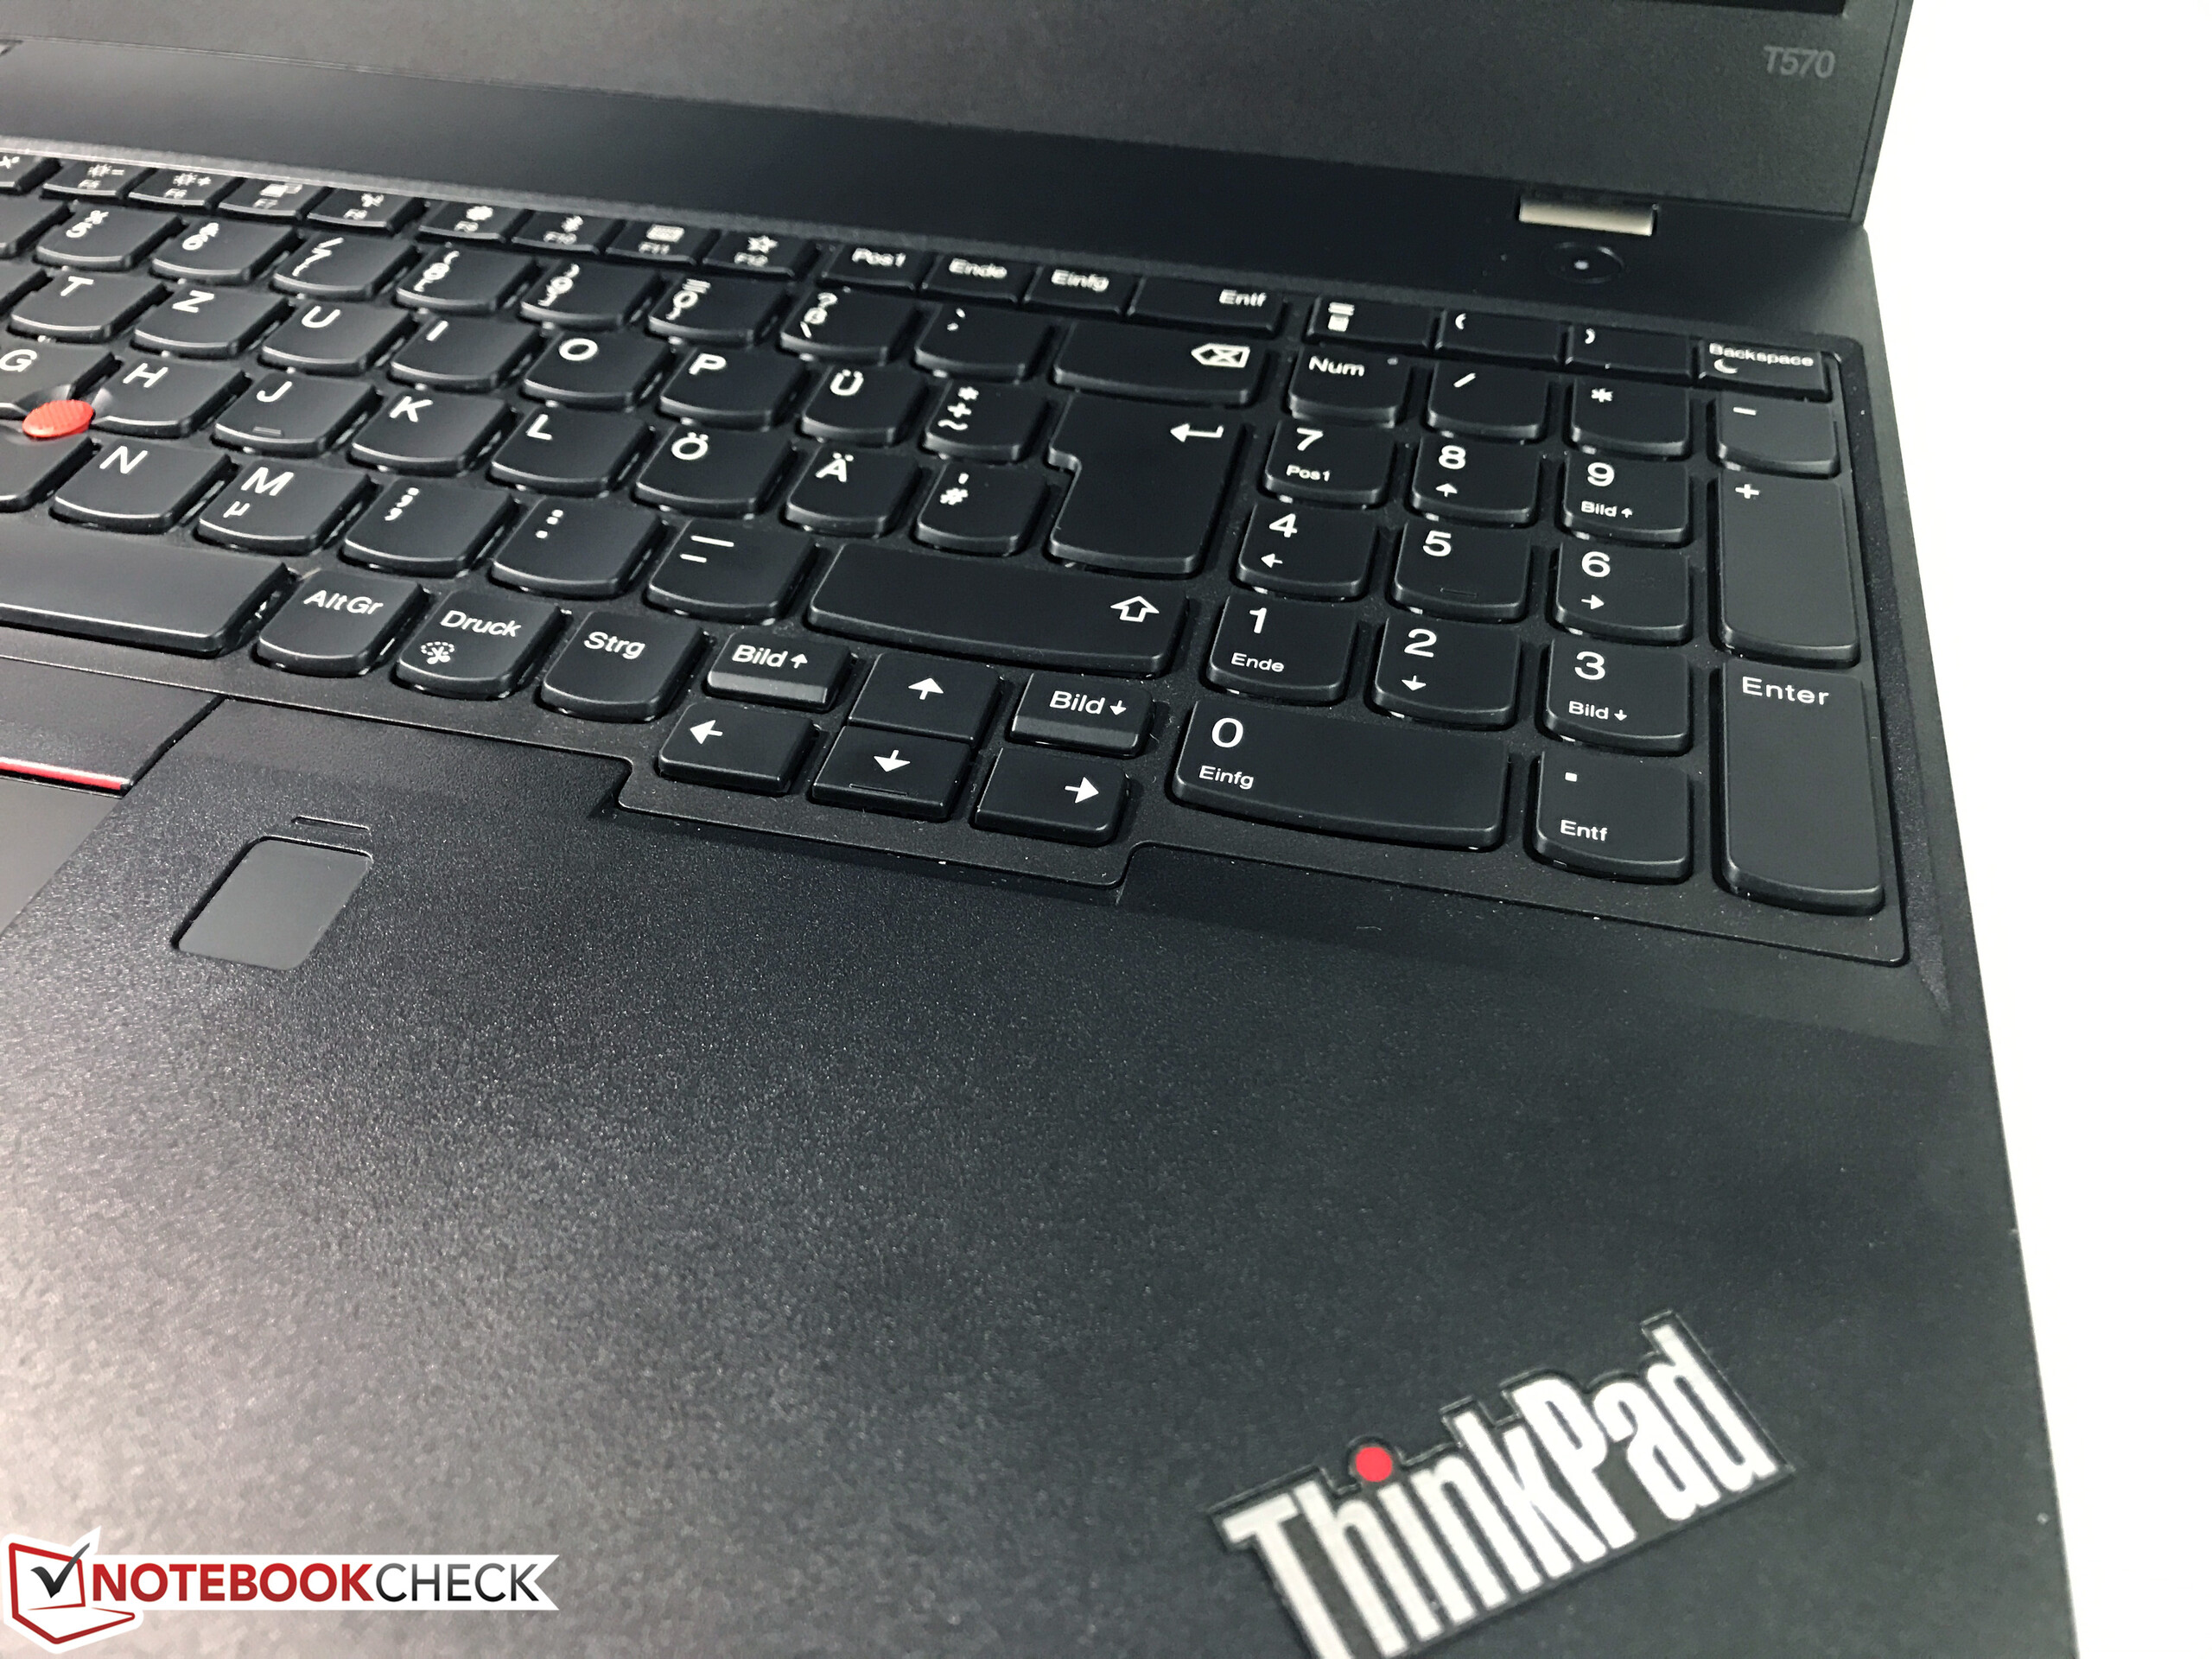
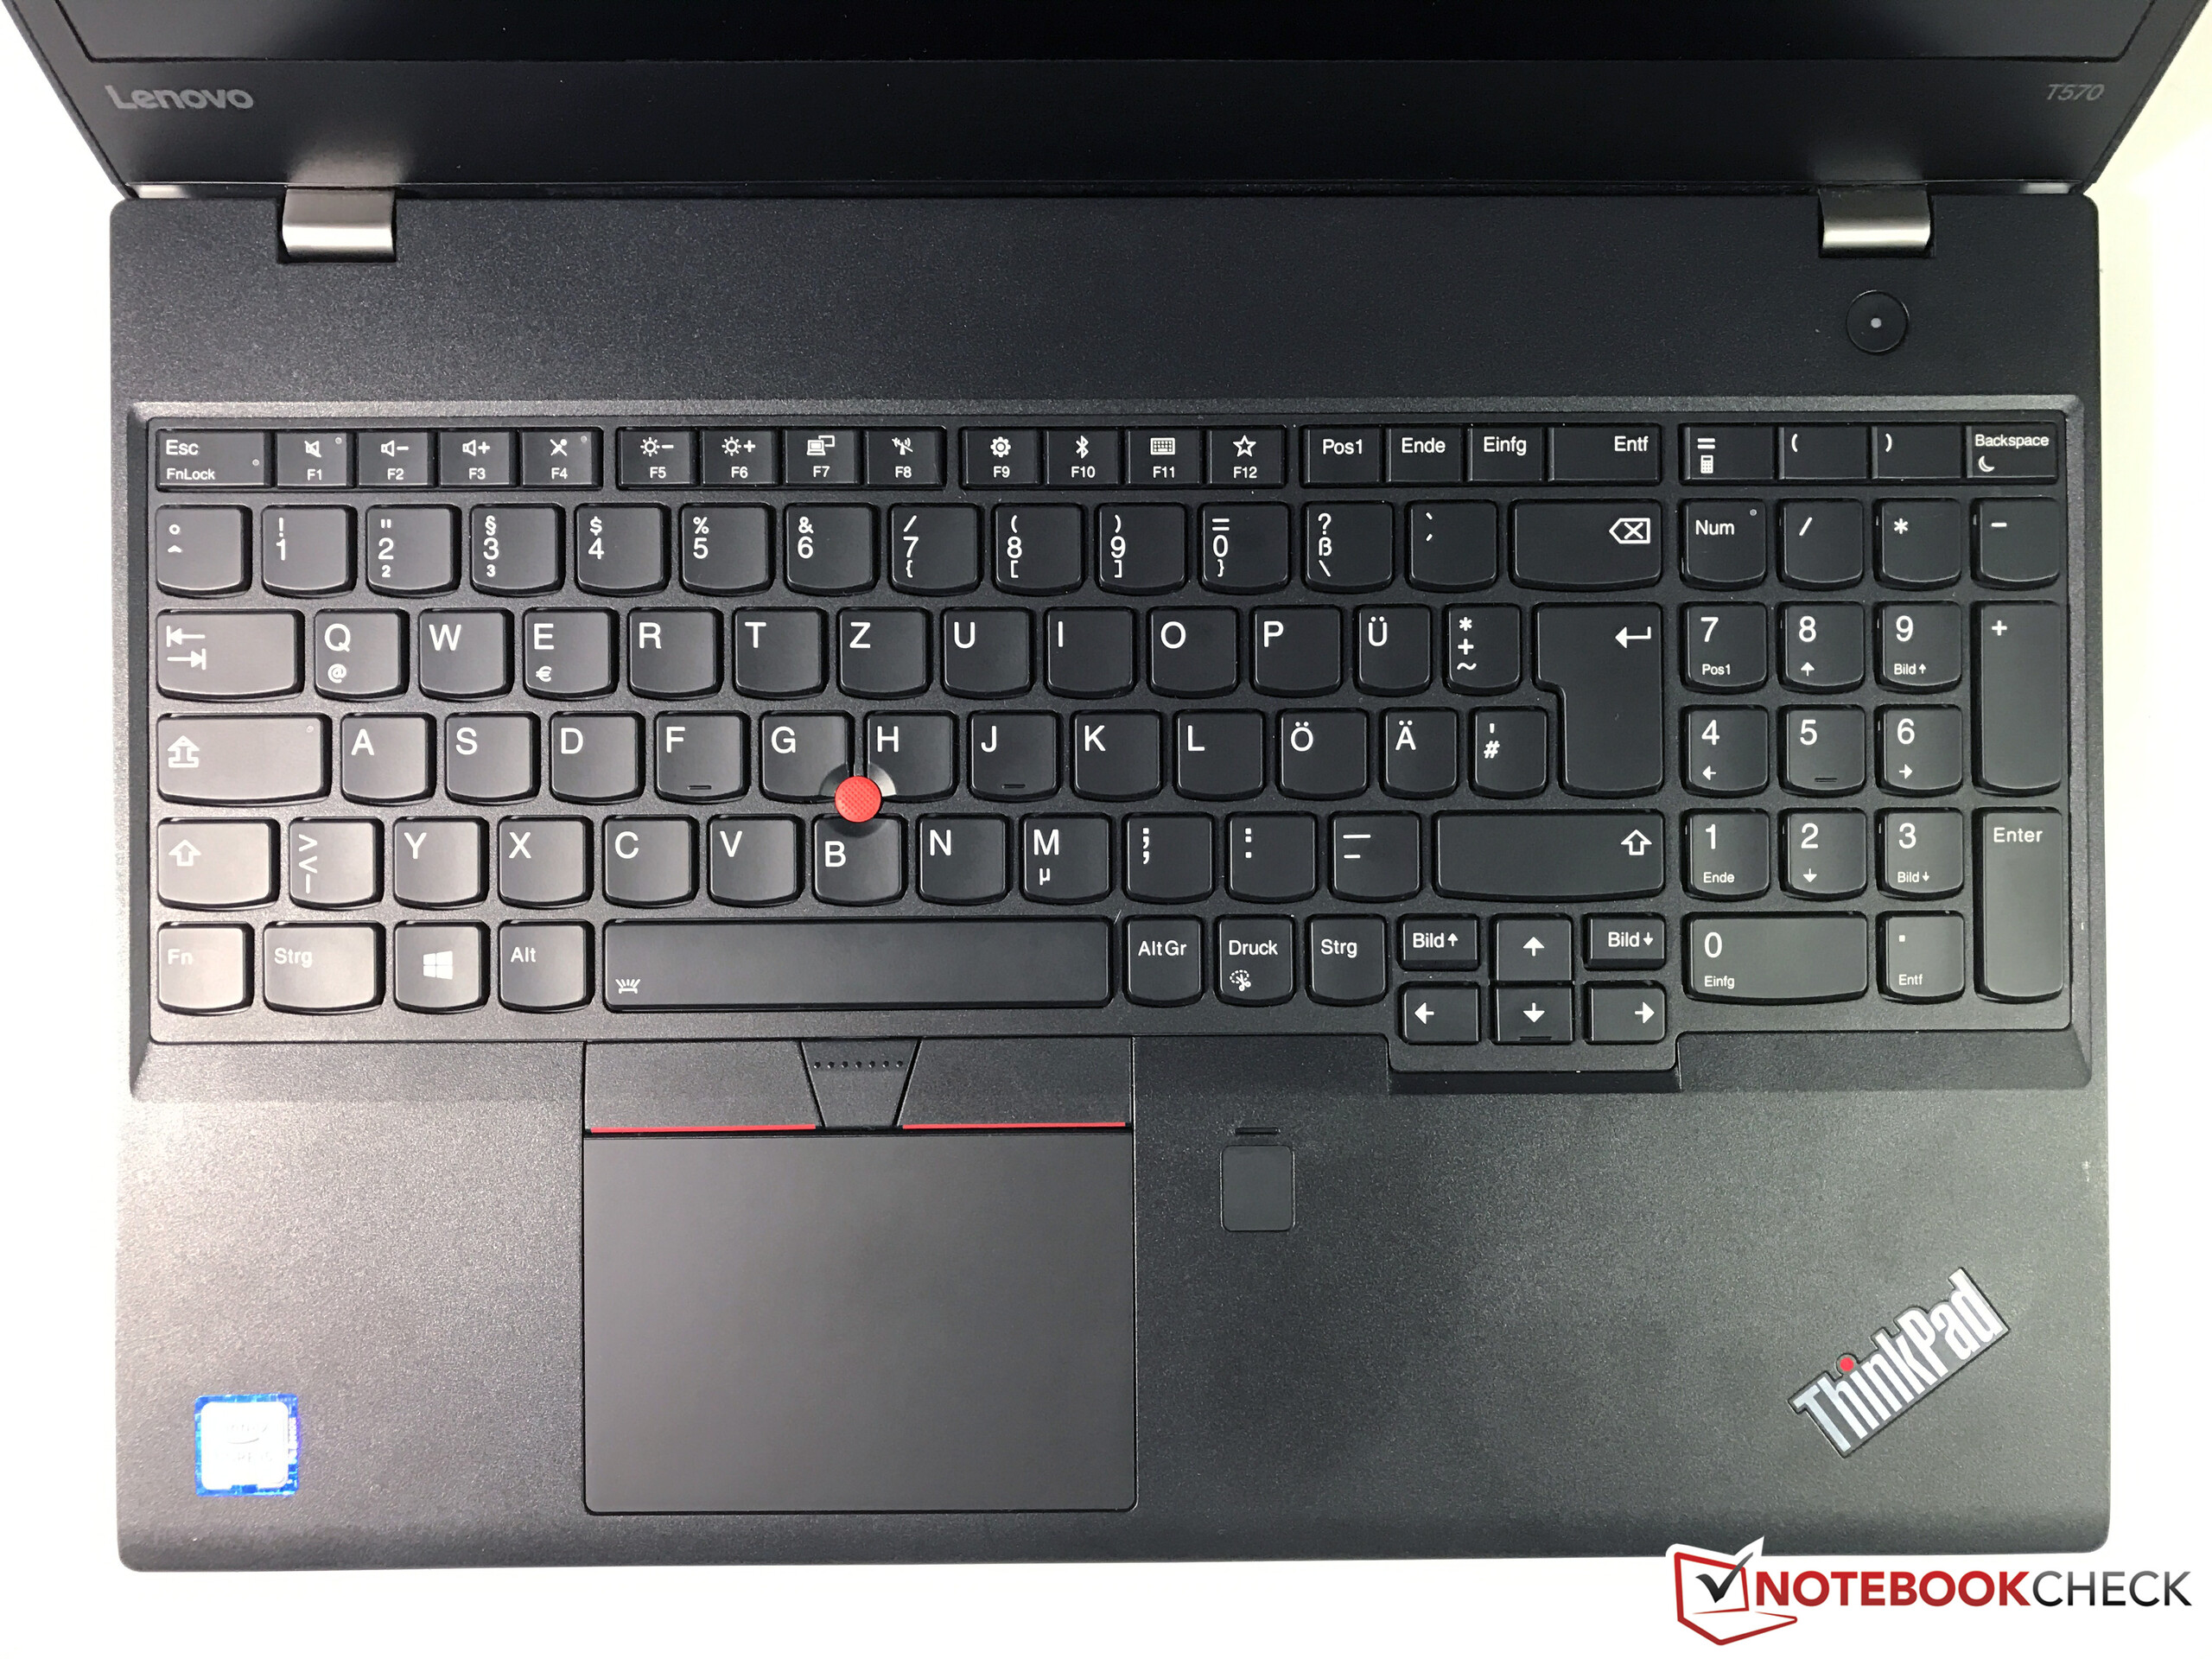
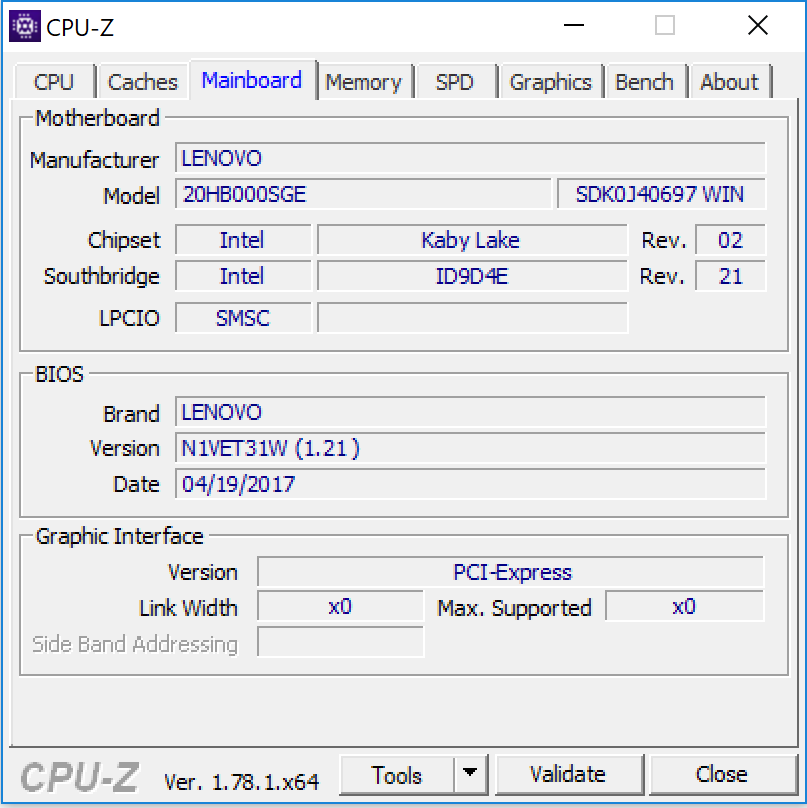
Es un hermano del ThinkPad T570 con idéntica construcción. Así, el P51s utiliza la misma carcasa sólida, los buenos dispositivos de entrada y la conectividad diversa del T750. La cámara infrarroja también está instalada.
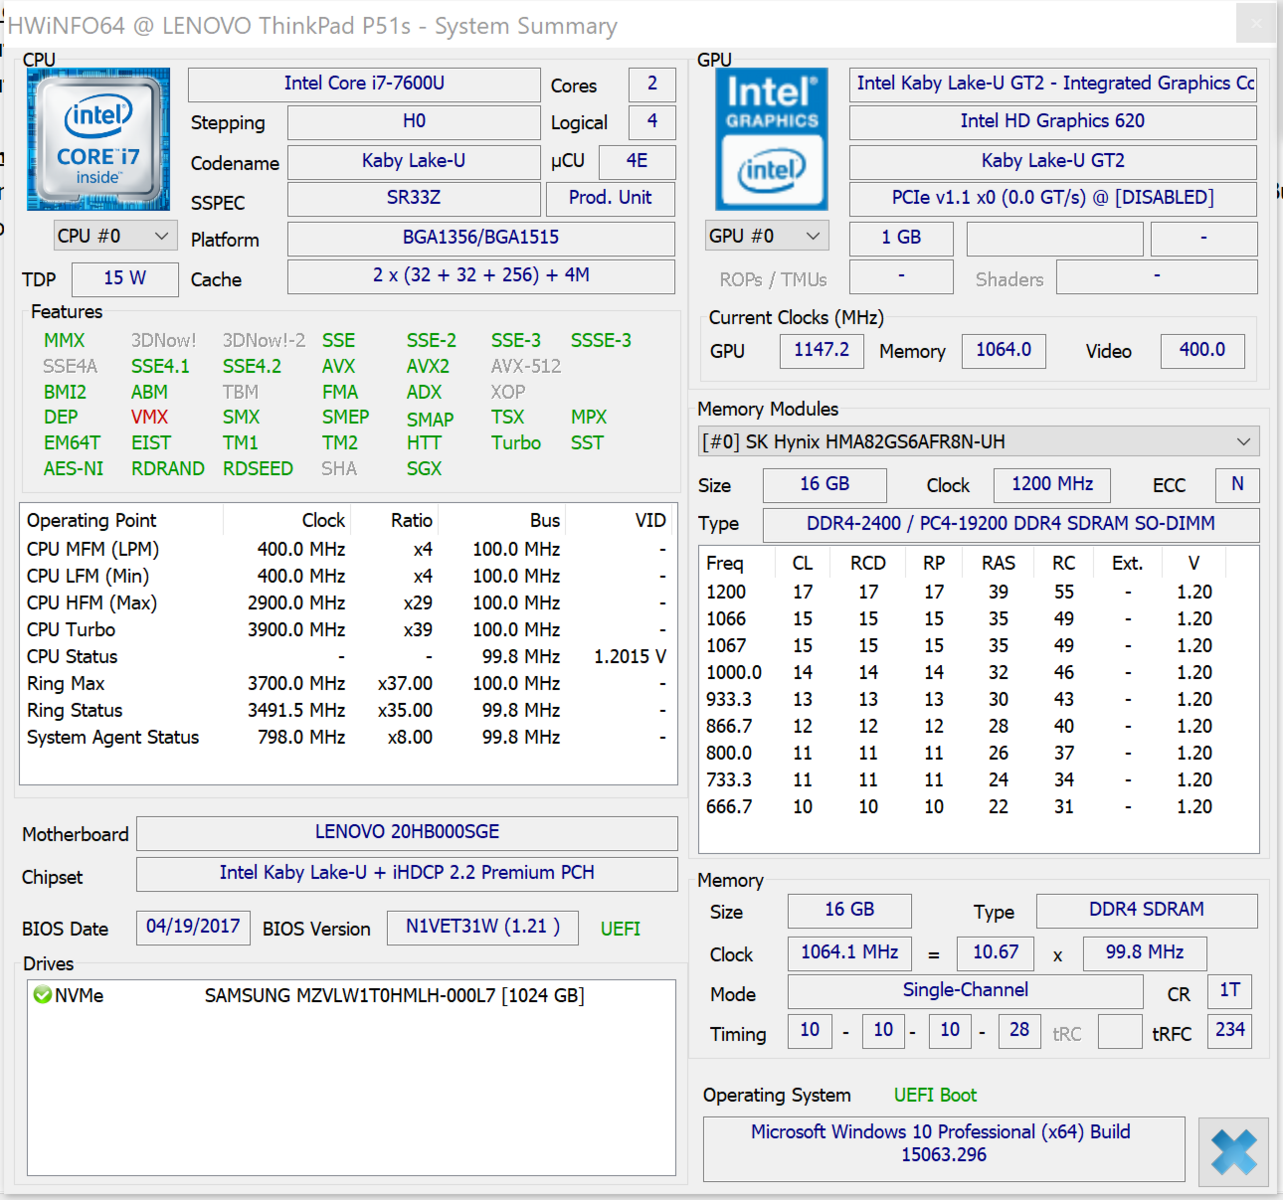
Desafortunadamente, el P51s también hereda los defectos del T570. Por ejemplo, la CPU sufre cuello de botella en modo batería. Medimos la frecuencia y va de entre aproximadamente 1,8 y 2,4GHz. Por este embotellamiento le restamos puntos. Además el portátil se calentaba demasiado en nuestras pruebas de estrés. Llegó a los 60,8ºC en un punto, demasiado alto para un portátil ULV. El ruido parece ser mejor, aquí, el ThinkPad está a un nivel normal.
El excelente aguante de la batería es una virtud del portátil.
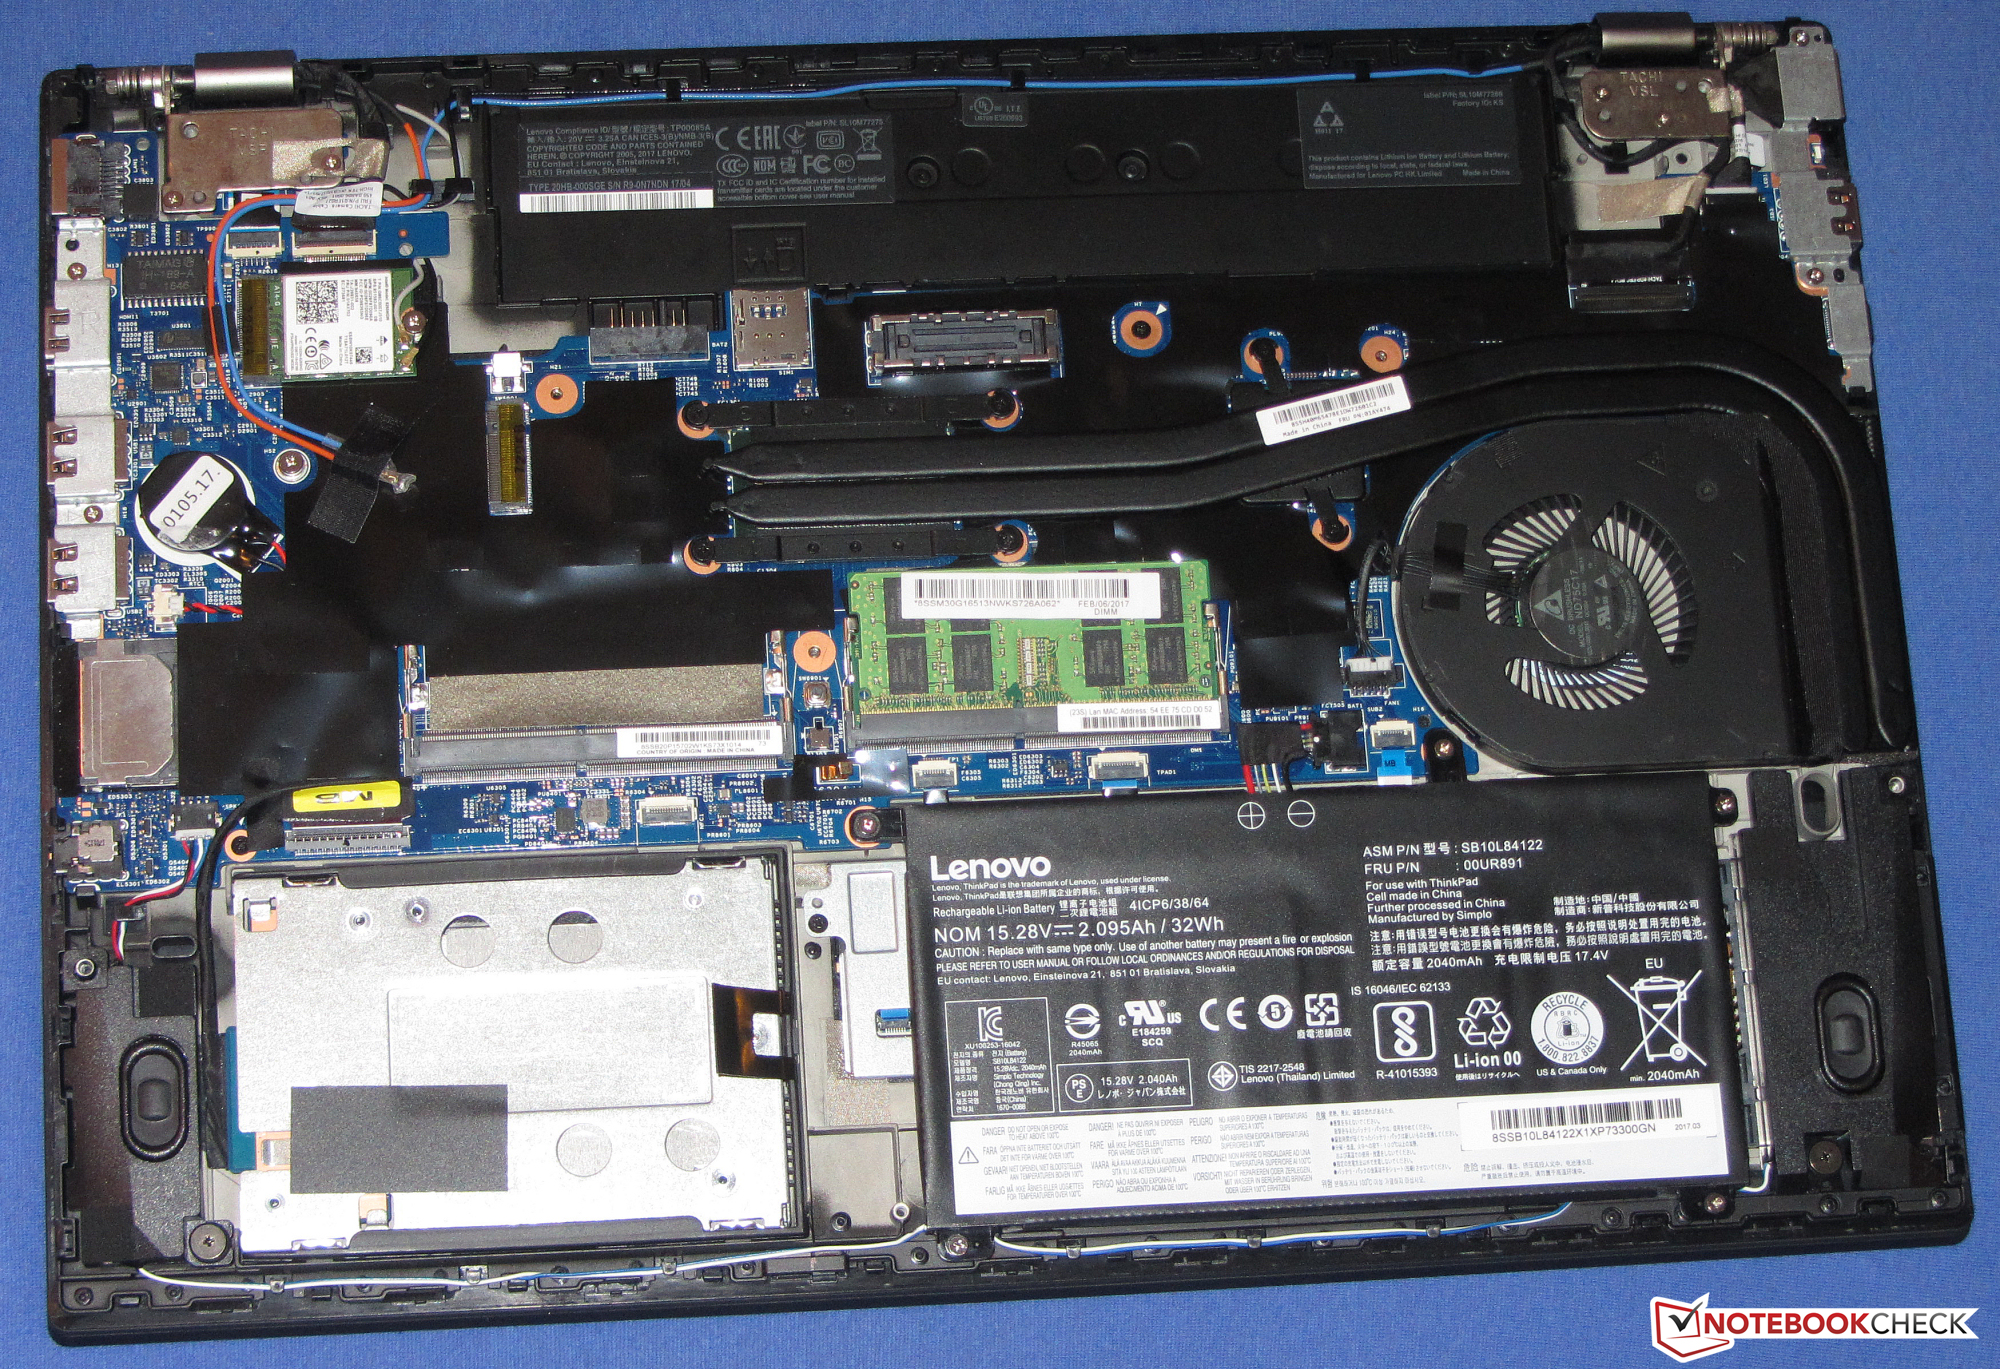
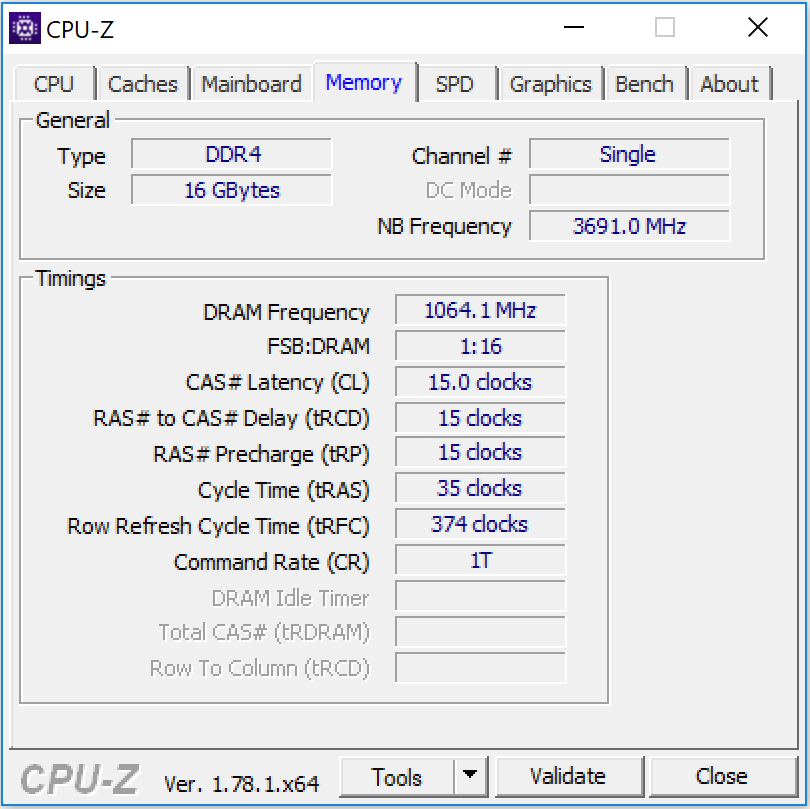
En resumen, el P51s tiene una capacidad de batería de 104Wh (internos: 32Wh, externos: 72 Wh). Es suficiente para mantener un portátil 4K funcionando por mucho tiempo. Un veolz SSD NVMe asegura un sistema rápido. El portátil puede traer un HDD de 2.5 pulgadas en lugar de un M.2 SSD NVMe . También se le podría instalar un módem LTE, nuestro modelo de análisis tenía una ranura vacía y las antenas correspondientes.
La pantalla 4K mate del P51s ya la conocíamos del Thinkpad T570. Ambos portátiles están equipados con el mismo panel. La pantalla IPS tiene ángulos de visión estable y buen contraste. El brillo es satisfactorio aunque podría ser mayor. Desafortunadamente, la pantalla muestra parpadeos PWM con el brillo al 90% o menos.
Ésta es una versión acortada del análisis original. Puedes leer el análisis completo en inglés aquí.
Lenovo ThinkPad P51s 20HB000SGE
- 06/03/2017 v6 (old)
Sascha Mölck