Análisis de Lenovo Legion C7 15IMH05: Un todoterreno para jugadores y creadores con tres años de garantía

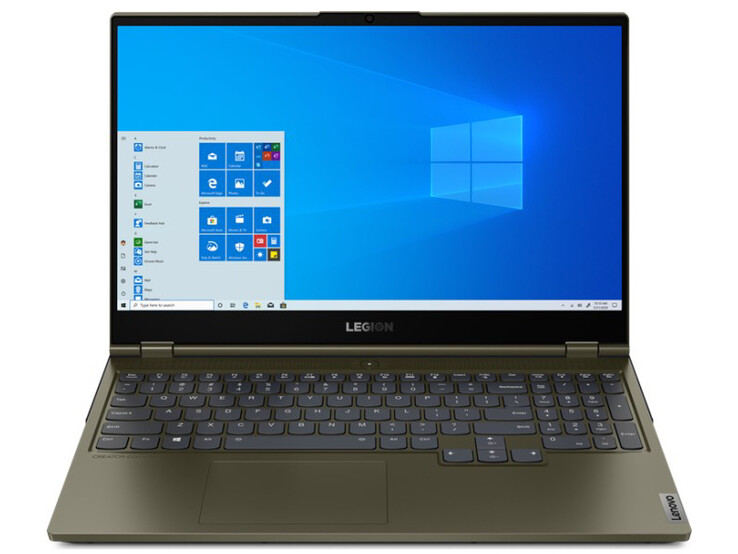
"Un dispositivo para el trabajo creativo". Así es como Lenovo describe el Legion C7 15IMH05 en su propio sitio web. Es una descripción acertada, porque el Legion C7 puede manejar juegos, edición de vídeo, edición de imágenes y streaming sin problemas.
El Legion C7 compite con el Alienware m15 R4y elAsus ROG Strix G15 G513QR y elSchenker XMG Pro 15. Los dispositivos de la competencia tienen un precio muy similar pero vienen con GPUs más nuevas y rápidas.
Likely Competitors
Valoración | Fecha | Modelo | Peso | Altura | Tamaño | Resolución | Precio |
|---|---|---|---|---|---|---|---|
| 85.5 % v7 (old) | 04/2021 | Lenovo Legion C7 15IMH05 82EH0030GE i7-10875H, GeForce RTX 2070 Max-Q | 2.3 kg | 19.9 mm | 15.60" | 1920x1080 | |
| 85.4 % v7 (old) | 04/2021 | Alienware m15 R4 i9-10980HK, GeForce RTX 3070 Laptop GPU | 2.3 kg | 20 mm | 15.60" | 1920x1080 | |
| 85 % v7 (old) | 02/2021 | Asus ROG Strix G15 G513QR R9 5900HX, GeForce RTX 3070 Laptop GPU | 2.3 kg | 27.2 mm | 15.60" | 1920x1080 | |
| 86 % v7 (old) | 03/2021 | Schenker XMG Pro 15 (Early 2021, RTX 3080) i7-10870H, GeForce RTX 3080 Laptop GPU | 2 kg | 19.8 mm | 15.60" | 1920x1080 |
Caja y conectividad - Legion C7 con puerto Thunderbolt 3
A diferencia del Legion 7, que contaba con salidas de ventilación retroiluminadas, el Legion C7 no cuenta con iluminación RGB. Sin embargo, el Legion C7 conserva la "Y" retroiluminada del logotipo de LEGION en la tapa de la pantalla. Tanto el Legion 7 como el Legion C7 comparten el mismo chasis de aluminio. Sin embargo, el C7 tiene un color diferente (Dark Moss). La batería no es reemplazable. Para acceder a los componentes internos, los usuarios tendrán que retirar la cubierta inferior.
El Lenovo Legion C7 viene con dos puertos USB 3.2 Gen 2 Tipo-A y un puerto USB 3.2 Gen 1 Tipo-A. También hay dos puertos USB-C (un puerto Thunderbolt 3 y un puerto USB 3.2 Gen 1). El puerto USB 3.2 Gen 1 Tipo-C puede usarse para cargar. También puede emitir una señal DisplayPort. Además, el portátil también cuenta con un puerto HDMI. En total, el Legion C7 ofrece dos salidas DP y una salida HDMI. No hay lector de tarjetas SD.
El módulo Wi-Fi es de Intel (Intel AX201). Además de los estándares Wi-Fi 802.11a, b, g, n y ac, también soporta el nuevo estándar AX. Las velocidades de transferencia de datos que hemos medido en condiciones óptimas (sin otros dispositivos con Wi-Fi cerca, una distancia corta entre el portátil y el PC servidor) están a muy buen nivel. El Legion C7 soporta Bluetooth 5.0
Top 10 Análisis
» Top 10 Portátiles Multimedia
» Top 10 Portátiles de Juego
» Top 10 Portátiles de Juego ligeros
» Top 10 Portátiles Asequibles de Oficina/Empresa
» Top 10 Portátiles de Juego Ligeros
» Top 10 Portátiles de Oficina/Empresa Premium
» Top 10 Estaciones de Trabajo
» Top 10 Subportátiles
» Top 10 Ultrabooks
» Top 10 Convertibles
» Top 10 Tablets
» Top 10 Tablets Windows
» Top 10 Tablets de menos de 250 Euros
» Top 10 Phablets (>5.5")
» Top 10 Smartphones
» Top 10 Smartphones (≤5")
» Top 10 Smartphones de menos de 300 Euros
» Top 10 Smartphones de menos de 120 Euros
» Top 10 Portátiles de menos de 1000 Euros
» Top 10 Portátiles de menos de 500 Euros
» Top 10 Portátiles de menos de 300 Euros
» Los Mejores Displays de Portátiles Analizados por Notebookcheck
Conectividad
Dispositivos de entrada: portátil Lenovo con teclado retroiluminado
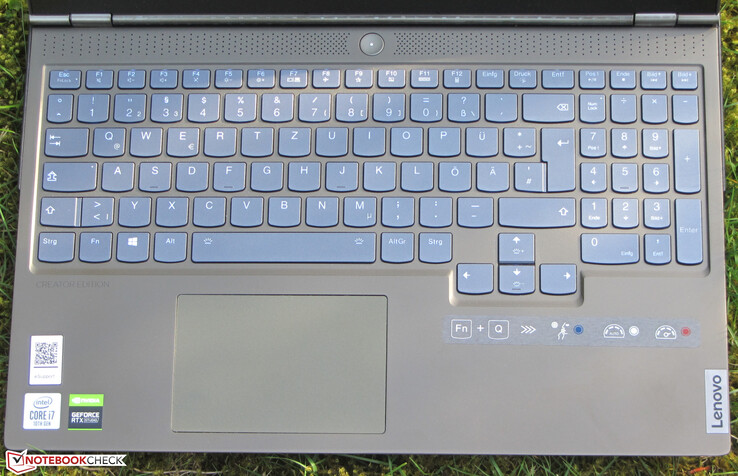
Las teclas lisas y planas tienen un recorrido corto y un punto de accionamiento claro. En nuestra opinión, las teclas son demasiado blandas. Al escribir, el teclado muestra algo de flexión, pero no resulta molesto. La retroiluminación ofrece tres niveles de brillo y se puede controlar con dos teclas de función. En general, Lenovo ofrece un teclado decente.
El Clickpad multitáctil ocupa un área de 10,5 x 7 cm. La superficie lisa del pad facilita el deslizamiento de los dedos. El pad tiene una distancia de desplazamiento corta y un punto de accionamiento claro. No tiene problemas para registrar las entradas, incluso en las esquinas.
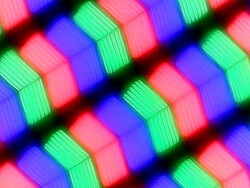
Pantalla - Legion C7 con un panel IPS
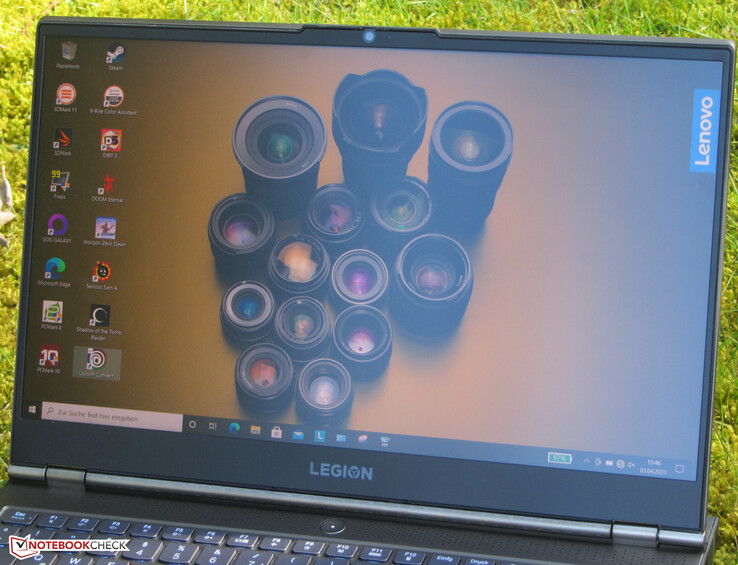
El panel 1080p del Legion C7 ofrece un buen ratio de contraste (1048:1) y un buen brillo (414,4 cd/m²). Con la energía de la batería, el brillo máximo cae ligeramente a 358 cd/m². El panel de 144 Hz ofrece tiempos de respuesta muy rápidos. Positivo: La pantalla no utiliza PWM para el control del brillo. La pantalla soporta Dolby Vision, una variante de HDR
| |||||||||||||||||||||||||
iluminación: 87 %
Brillo con batería: 358 cd/m²
Contraste: 1048:1 (Negro: 0.42 cd/m²)
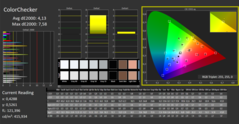
ΔE ColorChecker Calman: 6.32 | ∀{0.5-29.43 Ø4.76}
calibrated: 4.13
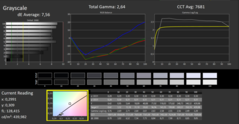
ΔE Greyscale Calman: 7.56 | ∀{0.09-98 Ø5}
100% sRGB (Argyll 1.6.3 3D)
88% AdobeRGB 1998 (Argyll 1.6.3 3D)
99.5% AdobeRGB 1998 (Argyll 3D)
99.8% sRGB (Argyll 3D)
91.9% Display P3 (Argyll 3D)
Gamma: 2.64
CCT: 7681 K
| Lenovo Legion C7 15IMH05 82EH0030GE BOW CQ NV156FHM-NY5, IPS, 1920x1080, 15.6" | Alienware m15 R4 LG Philips LGD066E, IPS, 1920x1080, 15.6" | Asus ROG Strix G15 G513QR LQ156M1JW25, IPS, 1920x1080, 15.6" | Schenker XMG Pro 15 (Early 2021, RTX 3080) AU Optronics AUO7A8C (B156HAN12.0), IPS, 1920x1080, 15.6" | Lenovo Legion 7 15IMH05-81YT001VGE AUO048E, IPS, 1920x1080, 15.6" | |
|---|---|---|---|---|---|
| Display | -18% | -21% | -18% | -17% | |
| Display P3 Coverage (%) | 91.9 | 69.4 -24% | 67.7 -26% | 69.2 -25% | 70.3 -24% |
| sRGB Coverage (%) | 99.8 | 99 -1% | 94.3 -6% | 99.7 0% | 99.4 0% |
| AdobeRGB 1998 Coverage (%) | 99.5 | 70.5 -29% | 68.2 -31% | 70.8 -29% | 71.3 -28% |
| Response Times | -93% | -83% | -80% | -62% | |
| Response Time Grey 50% / Grey 80% * (ms) | 14 ? | 7.4 ? 47% | 8.2 ? 41% | 3.6 ? 74% | 8 ? 43% |
| Response Time Black / White * (ms) | 3 ? | 10 ? -233% | 9.2 ? -207% | 10 ? -233% | 8 ? -167% |
| PWM Frequency (Hz) | |||||
| Screen | 22% | 14% | 26% | 32% | |
| Brightness middle (cd/m²) | 440 | 333 -24% | 308 -30% | 327 -26% | 470 7% |
| Brightness (cd/m²) | 414 | 303 -27% | 288 -30% | 335 -19% | 468 13% |
| Brightness Distribution (%) | 87 | 86 -1% | 86 -1% | 89 2% | 85 -2% |
| Black Level * (cd/m²) | 0.42 | 0.29 31% | 0.23 45% | 0.22 48% | 0.21 50% |
| Contrast (:1) | 1048 | 1148 10% | 1339 28% | 1486 42% | 2238 114% |
| Colorchecker dE 2000 * | 6.32 | 1.8 72% | 3.28 48% | 2.18 66% | 3.28 48% |
| Colorchecker dE 2000 max. * | 9.96 | 4.49 55% | 8.51 15% | 4.24 57% | 7.31 27% |
| Colorchecker dE 2000 calibrated * | 4.13 | 1.13 73% | 0.83 80% | 1 76% | 0.8 81% |
| Greyscale dE 2000 * | 7.56 | 1.9 75% | 5 34% | 2.6 66% | 4.49 41% |
| Gamma | 2.64 83% | 2.265 97% | 2.057 107% | 2.123 104% | 2.4 92% |
| CCT | 7681 85% | 6840 95% | 7393 88% | 6815 95% | 7438 87% |
| Color Space (Percent of AdobeRGB 1998) (%) | 88 | 71 -19% | 68 -23% | 71 -19% | 65 -26% |
| Color Space (Percent of sRGB) (%) | 100 | 93 -7% | 90 -10% | 93 -7% | 99 -1% |
| Media total (Programa/Opciones) | -30% /
-0% | -30% /
-5% | -24% /
5% | -16% /
11% |
* ... más pequeño es mejor
Tiempos de respuesta del display
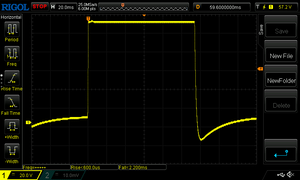
| ↔ Tiempo de respuesta de Negro a Blanco | ||
|---|---|---|
| 3 ms ... subida ↗ y bajada ↘ combinada | ↗ 1 ms subida | |
| ↘ 2 ms bajada | ||
| La pantalla mostró tiempos de respuesta muy rápidos en nuestros tests y debería ser adecuada para juegos frenéticos. En comparación, todos los dispositivos de prueba van de ##min### (mínimo) a 240 (máximo) ms. » 14 % de todos los dispositivos son mejores. Esto quiere decir que el tiempo de respuesta medido es mejor que la media (20.1 ms) de todos los dispositivos testados. | ||
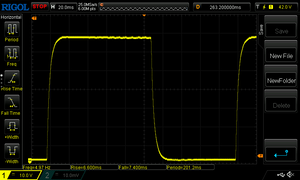
| ↔ Tiempo de respuesta 50% Gris a 80% Gris | ||
| 14 ms ... subida ↗ y bajada ↘ combinada | ↗ 7 ms subida | |
| ↘ 7 ms bajada | ||
| La pantalla mostró buenos tiempos de respuesta en nuestros tests pero podría ser demasiado lenta para los jugones competitivos. En comparación, todos los dispositivos de prueba van de ##min### (mínimo) a 636 (máximo) ms. » 27 % de todos los dispositivos son mejores. Esto quiere decir que el tiempo de respuesta medido es mejor que la media (31.4 ms) de todos los dispositivos testados. | ||
Parpadeo de Pantalla / PWM (Pulse-Width Modulation)
| Parpadeo de Pantalla / PWM no detectado | |||
Comparación: 53 % de todos los dispositivos testados no usaron PWM para atenuar el display. Si se usó, medimos una media de 8016 (mínimo: 5 - máxmo: 343500) Hz. | |||
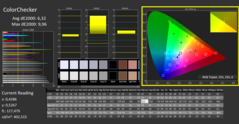
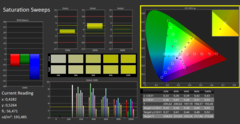
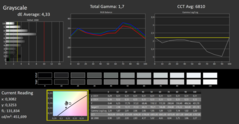
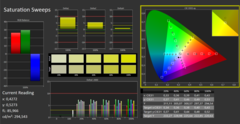
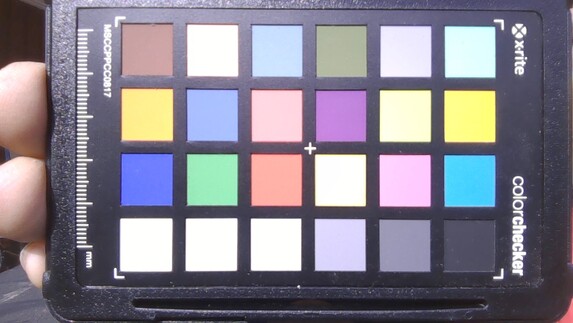
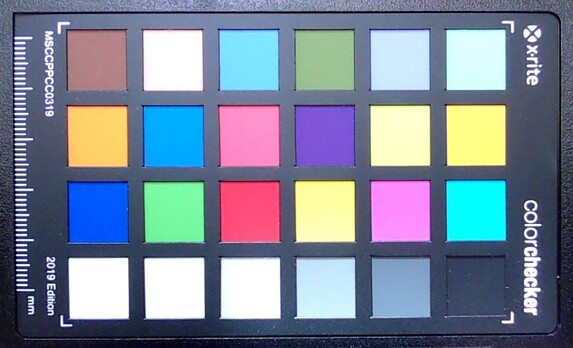
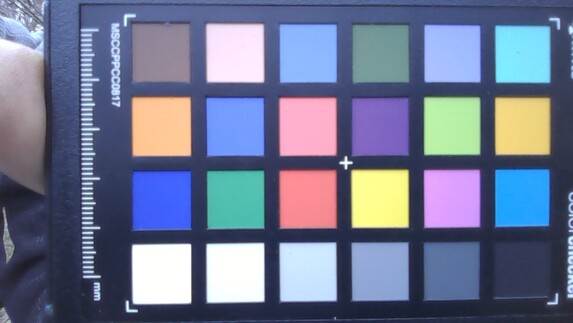
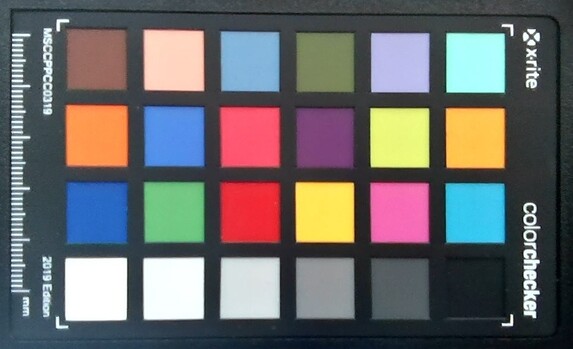
Nada más sacarlo de la caja, la reproducción del color no impresiona. Medimos un Delta E de 7, que está muy lejos del valor ideal de menos de 3. La pantalla no sufre de un tinte azulado. Mediante la calibración, la reproducción del color puede mejorarse ligeramente: El Delta E baja a 4,1 y el seguimiento de la escala de grises también mejora. El panel cubre el 100% del espacio de color sRGB y el 88% de AdobeRGB.
Rendimiento - Suficiente para los próximos años
El Lenovo Legion Creator 7 15IMH05 es un portátil para juegos de 15,6 pulgadas. El hecho de que nunca se vuelva demasiado ruidoso o demasiado caliente lo hace adecuado para otros escenarios de uso también
Revisar la configuración
El portátil ofrece tres modos de energía: "Auto", "Alto rendimiento" y "Silencio". Los usuarios pueden cambiar entre los modos de energía pulsando "Fn" + "Q". Utilizamos el modo "Auto" para nuestro análisis
Procesador
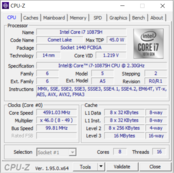
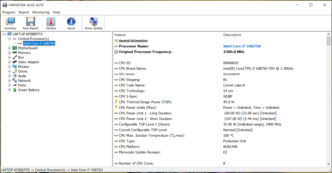
El Core i7-10875H es un procesador octa-core basado en Comet Lake con un reloj base de 2,3 GHz y un reloj boost para todos los núcleos de 4,3 GHz. Un solo núcleo puede acelerar hasta 5,1 GHz. Soporta Hyper-threading (dos hilos por núcleo).
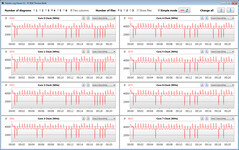
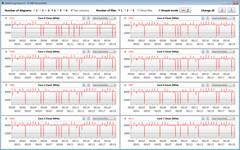
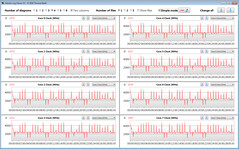
En la sección multinúcleo de Cinebench R15, la CPU funciona a 4,2 GHz cuando el portátil está enchufado y a entre 2,3 y 3,6 GHz cuando funciona con batería. En la parte de un solo núcleo de Cinebench R15, el procesador siempre funciona a 4,2 a 4,8 GHz
Comprobamos si la tecnología Turbo Boost puede usarse durante un periodo prolongado de tiempo ejecutando la sección multinúcleo del benchmark Cinebench R15 durante 30 minutos seguidos en un bucle continuo. Realizamos esta prueba con el portátil enchufado. El Turbo Boost se utiliza, pero no completamente. Sin embargo, en el modo "Alto Rendimiento", la CPU es capaz de mantener frecuencias más altas.
| Cinebench R15 | |
| CPU Single 64Bit | |
| Media de la clase Gaming (188.8 - 343, n=134, últimos 2 años) | |
| Asus ROG Strix G15 G513QR | |
| Lenovo Legion 7 15IMH05-81YT001VGE | |
| Lenovo Legion C7 15IMH05 82EH0030GE | |
| Medio Intel Core i7-10875H (190 - 220, n=37) | |
| Schenker XMG Pro 15 (Early 2021, RTX 3080) | |
| Alienware m15 R4 | |
| Lenovo Legion C7 15IMH05 82EH0030GE (Hoechstleistung) | |
| Lenovo Legion C7 15IMH05 82EH0030GE (Fluestermodus) | |
| CPU Multi 64Bit | |
| Media de la clase Gaming (1537 - 6271, n=135, últimos 2 años) | |
| Asus ROG Strix G15 G513QR | |
| Schenker XMG Pro 15 (Early 2021, RTX 3080) | |
| Lenovo Legion C7 15IMH05 82EH0030GE | |
| Lenovo Legion 7 15IMH05-81YT001VGE | |
| Lenovo Legion C7 15IMH05 82EH0030GE (Hoechstleistung) | |
| Alienware m15 R4 | |
| Medio Intel Core i7-10875H (1003 - 1833, n=38) | |
| Lenovo Legion C7 15IMH05 82EH0030GE (Fluestermodus) | |
| Blender - v2.79 BMW27 CPU | |
| Lenovo Legion C7 15IMH05 82EH0030GE (Fluestermodus) | |
| Medio Intel Core i7-10875H (259 - 535, n=30) | |
| Lenovo Legion C7 15IMH05 82EH0030GE | |
| Schenker XMG Pro 15 (Early 2021, RTX 3080) | |
| Lenovo Legion C7 15IMH05 82EH0030GE (Hoechstleistung) | |
| Alienware m15 R4 | |
| Lenovo Legion 7 15IMH05-81YT001VGE | |
| Asus ROG Strix G15 G513QR | |
| Media de la clase Gaming (80 - 517, n=132, últimos 2 años) | |
| 7-Zip 18.03 | |
| 7z b 4 -mmt1 | |
| Media de la clase Gaming (4199 - 7508, n=133, últimos 2 años) | |
| Asus ROG Strix G15 G513QR | |
| Lenovo Legion 7 15IMH05-81YT001VGE | |
| Alienware m15 R4 | |
| Lenovo Legion C7 15IMH05 82EH0030GE | |
| Medio Intel Core i7-10875H (5071 - 5780, n=31) | |
| Lenovo Legion C7 15IMH05 82EH0030GE (Hoechstleistung) | |
| Schenker XMG Pro 15 (Early 2021, RTX 3080) | |
| Lenovo Legion C7 15IMH05 82EH0030GE (Fluestermodus) | |
| 7z b 4 | |
| Media de la clase Gaming (23795 - 148086, n=133, últimos 2 años) | |
| Asus ROG Strix G15 G513QR | |
| Lenovo Legion C7 15IMH05 82EH0030GE (Hoechstleistung) | |
| Lenovo Legion 7 15IMH05-81YT001VGE | |
| Alienware m15 R4 | |
| Lenovo Legion C7 15IMH05 82EH0030GE | |
| Schenker XMG Pro 15 (Early 2021, RTX 3080) | |
| Medio Intel Core i7-10875H (29844 - 49562, n=31) | |
| Lenovo Legion C7 15IMH05 82EH0030GE (Fluestermodus) | |
| Cinebench R20 | |
| CPU (Single Core) | |
| Media de la clase Gaming (439 - 870, n=135, últimos 2 años) | |
| Asus ROG Strix G15 G513QR | |
| Lenovo Legion 7 15IMH05-81YT001VGE | |
| Lenovo Legion C7 15IMH05 82EH0030GE (Hoechstleistung) | |
| Medio Intel Core i7-10875H (430 - 524, n=32) | |
| Lenovo Legion C7 15IMH05 82EH0030GE | |
| Alienware m15 R4 | |
| Schenker XMG Pro 15 (Early 2021, RTX 3080) | |
| Lenovo Legion C7 15IMH05 82EH0030GE (Fluestermodus) | |
| CPU (Multi Core) | |
| Media de la clase Gaming (2179 - 16108, n=135, últimos 2 años) | |
| Asus ROG Strix G15 G513QR | |
| Lenovo Legion 7 15IMH05-81YT001VGE | |
| Alienware m15 R4 | |
| Lenovo Legion C7 15IMH05 82EH0030GE (Hoechstleistung) | |
| Medio Intel Core i7-10875H (1986 - 4176, n=32) | |
| Schenker XMG Pro 15 (Early 2021, RTX 3080) | |
| Lenovo Legion C7 15IMH05 82EH0030GE | |
| Lenovo Legion C7 15IMH05 82EH0030GE (Fluestermodus) | |
| Geekbench 5.5 | |
| Single-Core | |
| Media de la clase Gaming (986 - 2474, n=133, últimos 2 años) | |
| Asus ROG Strix G15 G513QR | |
| Lenovo Legion 7 15IMH05-81YT001VGE | |
| Alienware m15 R4 | |
| Lenovo Legion C7 15IMH05 82EH0030GE | |
| Lenovo Legion C7 15IMH05 82EH0030GE (Hoechstleistung) | |
| Medio Intel Core i7-10875H (1233 - 1371, n=29) | |
| Schenker XMG Pro 15 (Early 2021, RTX 3080) | |
| Lenovo Legion C7 15IMH05 82EH0030GE (Fluestermodus) | |
| Multi-Core | |
| Media de la clase Gaming (4557 - 27010, n=133, últimos 2 años) | |
| Lenovo Legion 7 15IMH05-81YT001VGE | |
| Lenovo Legion C7 15IMH05 82EH0030GE | |
| Lenovo Legion C7 15IMH05 82EH0030GE (Hoechstleistung) | |
| Alienware m15 R4 | |
| Schenker XMG Pro 15 (Early 2021, RTX 3080) | |
| Medio Intel Core i7-10875H (5715 - 8620, n=29) | |
| Asus ROG Strix G15 G513QR | |
| Lenovo Legion C7 15IMH05 82EH0030GE (Fluestermodus) | |
| HWBOT x265 Benchmark v2.2 - 4k Preset | |
| Media de la clase Gaming (7.7 - 44.3, n=133, últimos 2 años) | |
| Asus ROG Strix G15 G513QR | |
| Lenovo Legion 7 15IMH05-81YT001VGE | |
| Alienware m15 R4 | |
| Lenovo Legion C7 15IMH05 82EH0030GE (Hoechstleistung) | |
| Lenovo Legion C7 15IMH05 82EH0030GE | |
| Medio Intel Core i7-10875H (7.27 - 14.1, n=27) | |
| Schenker XMG Pro 15 (Early 2021, RTX 3080) | |
| Lenovo Legion C7 15IMH05 82EH0030GE (Fluestermodus) | |
| LibreOffice - 20 Documents To PDF | |
| Schenker XMG Pro 15 (Early 2021, RTX 3080) | |
| Lenovo Legion C7 15IMH05 82EH0030GE (Fluestermodus) | |
| Lenovo Legion C7 15IMH05 82EH0030GE | |
| Lenovo Legion 7 15IMH05-81YT001VGE | |
| Asus ROG Strix G15 G513QR | |
| Medio Intel Core i7-10875H (30.2 - 84.3, n=30) | |
| Alienware m15 R4 | |
| Media de la clase Gaming (19 - 88.8, n=133, últimos 2 años) | |
| Lenovo Legion C7 15IMH05 82EH0030GE (Hoechstleistung) | |
| R Benchmark 2.5 - Overall mean | |
| Lenovo Legion C7 15IMH05 82EH0030GE (Fluestermodus) | |
| Schenker XMG Pro 15 (Early 2021, RTX 3080) | |
| Medio Intel Core i7-10875H (0.546 - 0.662, n=29) | |
| Lenovo Legion C7 15IMH05 82EH0030GE | |
| Alienware m15 R4 | |
| Lenovo Legion C7 15IMH05 82EH0030GE (Hoechstleistung) | |
| Lenovo Legion 7 15IMH05-81YT001VGE | |
| Asus ROG Strix G15 G513QR | |
| Media de la clase Gaming (0.3439 - 0.759, n=134, últimos 2 años) | |
* ... más pequeño es mejor
Rendimiento del sistema
El sistema tiene una gran capacidad de respuesta. Nuestra configuración de hardware ofrece un rendimiento más que suficiente para todos los escenarios de uso: trabajo de oficina, navegación por Internet, juegos, edición de vídeo, edición de imágenes. Además, el portátil Lenovo lo hace muy bien en las pruebas PCMark.
| PCMark 8 Home Score Accelerated v2 | 4388 puntos | |
| PCMark 8 Creative Score Accelerated v2 | 6297 puntos | |
| PCMark 8 Work Score Accelerated v2 | 5551 puntos | |
| PCMark 10 Score | 6263 puntos | |
ayuda | ||
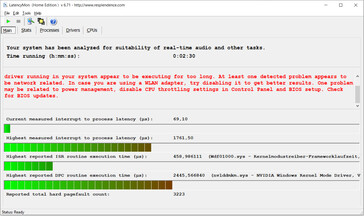
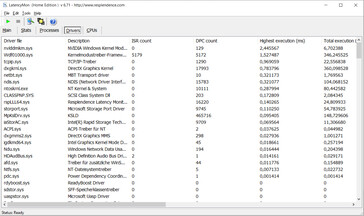
| DPC Latencies / LatencyMon - interrupt to process latency (max), Web, Youtube, Prime95 | |
| Alienware m15 R4 | |
| Lenovo Legion C7 15IMH05 82EH0030GE | |
| Lenovo Legion 7 15IMH05-81YT001VGE | |
| Schenker XMG Pro 15 (Early 2021, RTX 3080) | |
| Asus ROG Strix G15 G513QR | |
* ... más pequeño es mejor
Dispositivos de almacenamiento
| Lenovo Legion C7 15IMH05 82EH0030GE Samsung PM981a MZVLB1T0HBLR | Alienware m15 R4 Micron 2300 1TB MTFDHBA1T0TDV | Asus ROG Strix G15 G513QR SK Hynix HFM001TD3JX013N | Schenker XMG Pro 15 (Early 2021, RTX 3080) Samsung SSD 970 EVO Plus 1TB | Lenovo Legion 7 15IMH05-81YT001VGE 2x Samsung PM981a MZVLB1T0HBLR (RAID 0) | Medio Samsung PM981a MZVLB1T0HBLR | Media de la clase Gaming | |
|---|---|---|---|---|---|---|---|
| CrystalDiskMark 5.2 / 6 | 5% | 19% | 9% | 2% | 62% | ||
| Write 4K (MB/s) | 107.9 | 93.7 -13% | 160.9 49% | 110.4 2% | 139.7 ? 29% | 202 ? 87% | |
| Read 4K (MB/s) | 48.48 | 48.1 -1% | 54 11% | 55.1 14% | 49.9 ? 3% | 75.2 ? 55% | |
| Write Seq (MB/s) | 2910 | 2785 -4% | 2944 1% | 2036 ? -30% | 3717 ? 28% | ||
| Read Seq (MB/s) | 2015 | 2598 29% | 2781 38% | 2014 ? 0% | 3534 ? 75% | ||
| Write 4K Q32T1 (MB/s) | 413 | 481.9 17% | 495.2 20% | 466.6 13% | 461 ? 12% | 584 ? 41% | |
| Read 4K Q32T1 (MB/s) | 468.9 | 521 11% | 593 26% | 517 10% | 499 ? 6% | 700 ? 49% | |
| Write Seq Q32T1 (MB/s) | 3016 | 3362 11% | 3283 9% | 3424 14% | 2903 ? -4% | 5095 ? 69% | |
| Read Seq Q32T1 (MB/s) | 3533 | 3200 -9% | 3549 0% | 3519 0% | 3479 ? -2% | 6803 ? 93% | |
| Write 4K Q8T8 (MB/s) | 1496 | 1491 ? | 1285 ? | ||||
| Read 4K Q8T8 (MB/s) | 1597 | 1499 ? | 1651 ? | ||||
| AS SSD | -23% | 2% | 24% | 1% | 1% | 51% | |
| Seq Read (MB/s) | 2804 | 2658 -5% | 2881 3% | 2959 6% | 3088 10% | 2553 ? -9% | 5335 ? 90% |
| Seq Write (MB/s) | 2765 | 2769 0% | 1570 -43% | 2521 -9% | 2561 -7% | 2084 ? -25% | 3893 ? 41% |
| 4K Read (MB/s) | 44.96 | 46.07 2% | 52.4 17% | 50.9 13% | 43.01 -4% | 53.1 ? 18% | 69.4 ? 54% |
| 4K Write (MB/s) | 98.3 | 87.2 -11% | 124 26% | 141.1 44% | 102 4% | 131.2 ? 33% | 217 ? 121% |
| 4K-64 Read (MB/s) | 1503 | 1372 -9% | 1334 -11% | 2110 40% | 1549 3% | 1477 ? -2% | 1710 ? 14% |
| 4K-64 Write (MB/s) | 1845 | 1247 -32% | 2189 19% | 2329 26% | 1378 -25% | 1805 ? -2% | 2859 ? 55% |
| Access Time Read * (ms) | 0.058 | 0.052 10% | 0.055 5% | 0.034 41% | 0.051 12% | 0.04983 ? 14% | 0.06095 ? -5% |
| Access Time Write * (ms) | 0.038 | 0.098 -158% | 0.03 21% | 0.026 32% | 0.037 3% | 0.04222 ? -11% | 0.03679 ? 3% |
| Score Read (Points) | 1828 | 1684 -8% | 1675 -8% | 2457 34% | 1901 4% | 1786 ? -2% | 2312 ? 26% |
| Score Write (Points) | 2220 | 1611 -27% | 2470 11% | 2722 23% | 1737 -22% | 2144 ? -3% | 3464 ? 56% |
| Score Total (Points) | 4983 | 4166 -16% | 4943 -1% | 6412 29% | 4583 -8% | 4826 ? -3% | 6894 ? 38% |
| Copy ISO MB/s (MB/s) | 1904 | 1277 -33% | 2275 19% | 2684 41% | 2098 ? 10% | 3020 ? 59% | |
| Copy Program MB/s (MB/s) | 567 | 575 1% | 593 5% | 544 -4% | 500 ? -12% | 964 ? 70% | |
| Copy Game MB/s (MB/s) | 1112 | 1272 14% | 1408 27% | 1116 0% | 1132 ? 2% | 2067 ? 86% | |
| Media total (Programa/Opciones) | -9% /
-11% | 2% /
2% | 22% /
22% | 5% /
3% | 2% /
1% | 57% /
55% |
* ... más pequeño es mejor
Continuous read speed: DiskSpd Read Loop, Queue Depth 8
Tarjeta gráfica
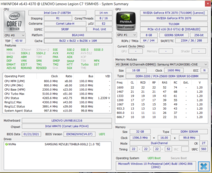
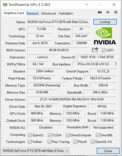
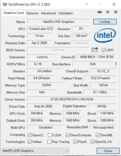
La GeForce RTX 2070 Max-Q es una GPU de juegos para portátiles ligeros y delgados. La GPU viene con 8 GB de memoria GDDR6 rápida. El UHD Graphics 630, que está integrado en el Core i7-10875H, está habilitado. La tecnología Optimus de Nvidia es compatible. La iGPU puede desactivarse en la configuración de la BIOS.
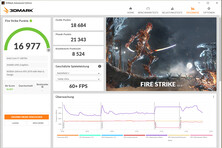
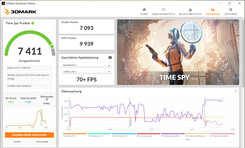
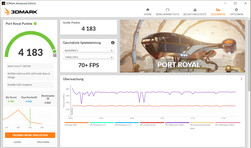
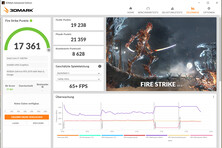
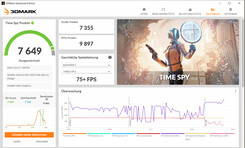
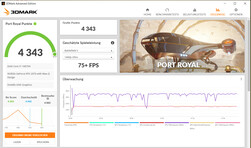
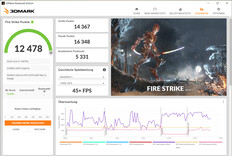
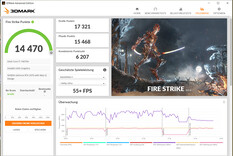
Los resultados de 3DMark están en un nivel normal para este tipo de GPU. En el modo "Alto Rendimiento", el TGP aumenta ligeramente (de 94 a 104 vatios en la prueba de estrés con The Witcher 3), lo que lleva a un aumento de la velocidad de fotogramas.
| 3DMark 11 Performance | 22214 puntos | |
| 3DMark Cloud Gate Standard Score | 45007 puntos | |
| 3DMark Fire Strike Score | 16977 puntos | |
| 3DMark Time Spy Score | 7411 puntos | |
ayuda | ||
| 3DMark 11 - 1280x720 Performance GPU | |
| Media de la clase Gaming (16033 - 80022, n=129, últimos 2 años) | |
| Alienware m15 R4 | |
| Schenker XMG Pro 15 (Early 2021, RTX 3080) | |
| Asus ROG Strix G15 G513QR | |
| Lenovo Legion 7 15IMH05-81YT001VGE | |
| Lenovo Legion C7 15IMH05 82EH0030GE (Hoechstleistung) | |
| Lenovo Legion C7 15IMH05 82EH0030GE | |
| Medio NVIDIA GeForce RTX 2070 Max-Q (14723 - 27694, n=31) | |
| 3DMark | |
| 1920x1080 Fire Strike Graphics | |
| Media de la clase Gaming (12242 - 62849, n=143, últimos 2 años) | |
| Alienware m15 R4 | |
| Schenker XMG Pro 15 (Early 2021, RTX 3080) | |
| Asus ROG Strix G15 G513QR | |
| Lenovo Legion 7 15IMH05-81YT001VGE | |
| Lenovo Legion C7 15IMH05 82EH0030GE (Hoechstleistung) | |
| Lenovo Legion C7 15IMH05 82EH0030GE | |
| Medio NVIDIA GeForce RTX 2070 Max-Q (11563 - 21191, n=31) | |
| 1280x720 Cloud Gate Standard Graphics | |
| Alienware m15 R4 | |
| Media de la clase Gaming (84648 - 223650, n=64, últimos 2 años) | |
| Schenker XMG Pro 15 (Early 2021, RTX 3080) | |
| Lenovo Legion C7 15IMH05 82EH0030GE | |
| Medio NVIDIA GeForce RTX 2070 Max-Q (39014 - 134255, n=28) | |
| Asus ROG Strix G15 G513QR | |
| 2560x1440 Time Spy Graphics | |
| Media de la clase Gaming (4310 - 25984, n=140, últimos 2 años) | |
| Alienware m15 R4 | |
| Asus ROG Strix G15 G513QR | |
| Schenker XMG Pro 15 (Early 2021, RTX 3080) | |
| Lenovo Legion 7 15IMH05-81YT001VGE | |
| Lenovo Legion C7 15IMH05 82EH0030GE (Hoechstleistung) | |
| Lenovo Legion C7 15IMH05 82EH0030GE | |
| Medio NVIDIA GeForce RTX 2070 Max-Q (5948 - 8065, n=28) | |
Rendimiento de los juegos
El portátil Lenovo puede ejecutar todos los juegos actuales sin problemas a 1080p en la configuración más alta. Para lograr velocidades de fotogramas jugables a resoluciones más altas (por ejemplo, cuando se juega con un monitor externo), la configuración de los gráficos tendrá que ser reducida en muchos casos. En el modo de energía "Alto Rendimiento", el rendimiento de los juegos mejora ligeramente.
| The Witcher 3 - 1920x1080 Ultra Graphics & Postprocessing (HBAO+) | |
| Media de la clase Gaming (80.2 - 240, n=35, últimos 2 años) | |
| Alienware m15 R4 | |
| Schenker XMG Pro 15 (Early 2021, RTX 3080) | |
| Asus ROG Strix G15 G513QR | |
| Lenovo Legion 7 15IMH05-81YT001VGE | |
| Lenovo Legion C7 15IMH05 82EH0030GE (Hoechstleistung) | |
| Lenovo Legion C7 15IMH05 82EH0030GE | |
| Medio NVIDIA GeForce RTX 2070 Max-Q (56 - 83.8, n=31) | |
| Dota 2 Reborn - 1920x1080 ultra (3/3) best looking | |
| Media de la clase Gaming (65.1 - 248, n=133, últimos 2 años) | |
| Alienware m15 R4 | |
| Lenovo Legion 7 15IMH05-81YT001VGE | |
| Lenovo Legion C7 15IMH05 82EH0030GE | |
| Lenovo Legion C7 15IMH05 82EH0030GE (Hoechstleistung) | |
| Medio NVIDIA GeForce RTX 2070 Max-Q (105.8 - 126, n=13) | |
| Schenker XMG Pro 15 (Early 2021, RTX 3080) | |
| Lenovo Legion C7 15IMH05 82EH0030GE (Fluestermodus) | |
| Asus ROG Strix G15 G513QR | |
| X-Plane 11.11 - 1920x1080 high (fps_test=3) | |
| Media de la clase Gaming (33.4 - 150.2, n=136, últimos 2 años) | |
| Alienware m15 R4 | |
| Lenovo Legion 7 15IMH05-81YT001VGE | |
| Lenovo Legion C7 15IMH05 82EH0030GE (Hoechstleistung) | |
| Lenovo Legion C7 15IMH05 82EH0030GE | |
| Schenker XMG Pro 15 (Early 2021, RTX 3080) | |
| Medio NVIDIA GeForce RTX 2070 Max-Q (61.6 - 85.3, n=11) | |
| Lenovo Legion C7 15IMH05 82EH0030GE (Fluestermodus) | |
| Asus ROG Strix G15 G513QR | |
| Far Cry 5 - 1920x1080 Ultra Preset AA:T | |
| Media de la clase Gaming (70 - 174, n=32, últimos 2 años) | |
| Lenovo Legion 7 15IMH05-81YT001VGE | |
| Alienware m15 R4 | |
| Lenovo Legion C7 15IMH05 82EH0030GE (Hoechstleistung) | |
| Lenovo Legion C7 15IMH05 82EH0030GE | |
| Asus ROG Strix G15 G513QR | |
| Medio NVIDIA GeForce RTX 2070 Max-Q (67 - 101, n=7) | |
| Shadow of the Tomb Raider - 1920x1080 Highest Preset AA:T | |
| Media de la clase Gaming (96 - 212, n=4, últimos 2 años) | |
| Lenovo Legion 7 15IMH05-81YT001VGE | |
| Schenker XMG Pro 15 (Early 2021, RTX 3080) | |
| Lenovo Legion C7 15IMH05 82EH0030GE | |
| Medio NVIDIA GeForce RTX 2070 Max-Q (57 - 89, n=12) | |
| Dirt 5 - 1920x1080 Ultra High Preset | |
| Lenovo Legion C7 15IMH05 82EH0030GE | |
| Medio NVIDIA GeForce RTX 2070 Max-Q (n=1) | |
| Hitman 3 - 1920x1080 Maximum Settings AF:16x | |
| Lenovo Legion C7 15IMH05 82EH0030GE | |
| Medio NVIDIA GeForce RTX 2070 Max-Q (n=1) | |
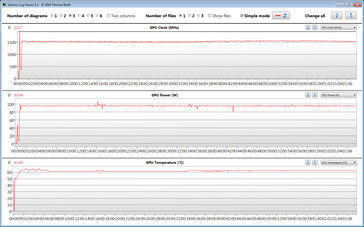
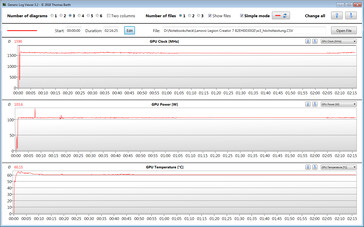
Utilizamos el videojuego conocido como "The Witcher 3" para comprobar si las velocidades de fotogramas se pueden mantener de forma constante durante un periodo de tiempo prolongado. Para ello, ejecutamos el juego en la configuración más alta a 1080p durante una hora. Durante toda la partida, el personaje controlado por el jugador se queda quieto. No hay caídas de la velocidad de fotogramas.
| bajo | medio | alto | ultra | |
|---|---|---|---|---|
| The Witcher 3 (2015) | 301 | 221 | 130 | 72.4 |
| Dota 2 Reborn (2015) | 155 | 139 | 131 | 125 |
| X-Plane 11.11 (2018) | 115 | 101 | 84.4 | |
| Far Cry 5 (2018) | 160 | 113 | 105 | 99 |
| Shadow of the Tomb Raider (2018) | 144 | 107 | 96 | 86 |
| Serious Sam 4 (2020) | 120 | 82.6 | 73.2 | 59.8 |
| Watch Dogs Legion (2020) | 123 | 88.2 | 77.5 | 51.5 |
| Dirt 5 (2020) | 168 | 92.1 | 75.5 | 56.6 |
| Assassin´s Creed Valhalla (2020) | 102 | 71 | 59 | 53 |
| Immortals Fenyx Rising (2020) | 124 | 84 | 76 | 70 |
| Cyberpunk 2077 1.0 (2020) | 115 | 65 | 54.9 | 47.1 |
| Hitman 3 (2021) | 192.7 | 117.2 | 104.5 | 95.5 |
Emissions & Energy - The Lenovo Laptop can be quiet
Ruido del sistema
En reposo y con poca carga, los ventiladores suelen quedarse quietos, lo que provoca un funcionamiento silencioso. Bajo carga alta, los ventiladores empiezan a girar muy rápido. Medimos un nivel máximo de presión sonora de 47,7 dB(A).
Recomendamos utilizar el modo de alimentación "silencioso" en el uso diario. En este modo, los ventiladores permanecen quietos incluso bajo alto nivel de ruido. Sin embargo, el portátil Lenovo sigue ofreciendo suficiente rendimiento para las aplicaciones ofimáticas y la navegación por internet.
Ruido
| Ocioso |
| 24.9 / 24.9 / 24.9 dB(A) |
| Carga |
| 34.6 / 47.7 dB(A) |
 | ||
30 dB silencioso 40 dB(A) audible 50 dB(A) ruidosamente alto |
||
min: | ||
Temperatura
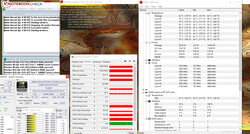
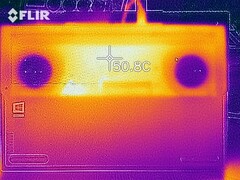
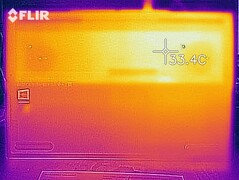
En nuestra prueba de estrés (Prime95 y FurMark ejecutados de forma continua durante al menos una hora), el procesador funcionó a 2,9 GHz cuando estaba enchufado y a entre 600 y 900 MHz cuando funcionaba con la batería, y el chip gráfico funcionó a entre 1300 y 1400 MHz cuando estaba enchufado y a entre 900 y 1100 MHz cuando funcionaba con la batería. La prueba de estrés es un caso extremo, que es muy poco probable que ocurra en la vida real. Lo utilizamos para probar la estabilidad del sistema bajo carga completa.
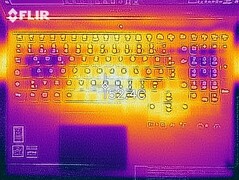
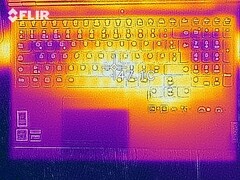
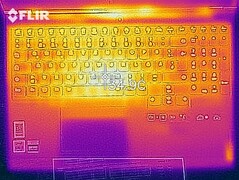
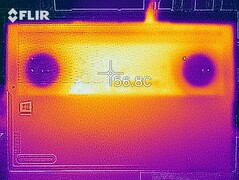
El portátil no se calienta mucho. Durante la prueba de estrés, se superó la marca de 40°C en tres puntos de medición. En la prueba de estrés para juegos, las temperaturas superficiales fueron menores. En el uso diario, las temperaturas son siempre más que aceptables.
(±) La temperatura máxima en la parte superior es de 41.4 °C / 107 F, frente a la media de 40.4 °C / 105 F, que oscila entre 21.2 y 68.8 °C para la clase Gaming.
(-) El fondo se calienta hasta un máximo de 45.1 °C / 113 F, frente a la media de 43.3 °C / 110 F
(+) En reposo, la temperatura media de la parte superior es de 25.4 °C / 78# F, frente a la media del dispositivo de 33.9 °C / 93 F.
(±) Jugando a The Witcher 3, la temperatura media de la parte superior es de 33.1 °C / 92 F, frente a la media del dispositivo de 33.9 °C / 93 F.
(+) El reposamanos y el panel táctil están a una temperatura inferior a la de la piel, con un máximo de 30.6 °C / 87.1 F y, por tanto, son fríos al tacto.
(±) La temperatura media de la zona del reposamanos de dispositivos similares fue de 28.8 °C / 83.8 F (-1.8 °C / -3.3 F).
Altavoces
Los altavoces estéreo tienen un sonido aceptable, pero producen muy pocos graves
Lenovo Legion C7 15IMH05 82EH0030GE análisis de audio
(±) | la sonoridad del altavoz es media pero buena (72 dB)
Graves 100 - 315 Hz
(-) | casi sin bajos - de media 20.7% inferior a la mediana
(±) | la linealidad de los graves es media (10.6% delta a frecuencia anterior)
Medios 400 - 2000 Hz
(+) | medios equilibrados - a sólo 3.7% de la mediana
(+) | los medios son lineales (5.9% delta a la frecuencia anterior)
Altos 2 - 16 kHz
(+) | máximos equilibrados - a sólo 2.6% de la mediana
(+) | los máximos son lineales (4.4% delta a la frecuencia anterior)
Total 100 - 16.000 Hz
(±) | la linealidad del sonido global es media (15.3% de diferencia con la mediana)
En comparación con la misma clase
» 33% de todos los dispositivos probados de esta clase eran mejores, 6% similares, 61% peores
» El mejor tuvo un delta de 6%, la media fue 18%, el peor fue ###max##%
En comparación con todos los dispositivos probados
» 22% de todos los dispositivos probados eran mejores, 4% similares, 74% peores
» El mejor tuvo un delta de 4%, la media fue 24%, el peor fue ###max##%
Consumo de energía
En reposo, medimos un consumo máximo de energía de 12,6 vatios. Durante la prueba de estrés, el consumo de energía alcanzó un máximo de 201 vatios. Durante los juegos, el consumo de energía fluctuó entre 140 vatios y 149 vatios, con una media de 144 vatios. La potencia nominal del adaptador de CA es de 230 vatios
| Off / Standby | |
| Ocioso | |
| Carga |
|
Clave:
min: | |
Duración de la batería
Nuestra prueba de Wi-Fi orientada a la práctica simula cargas que son consistentes con la navegación por la web. Aquí, el portátil Lenovo logra una duración de batería de 5h 51m. En nuestro test de vídeo, el Legion C7 duró 7h y 8m
| Lenovo Legion C7 15IMH05 82EH0030GE i7-10875H, GeForce RTX 2070 Max-Q, 80 Wh | Alienware m15 R4 i9-10980HK, GeForce RTX 3070 Laptop GPU, 86 Wh | Asus ROG Strix G15 G513QR R9 5900HX, GeForce RTX 3070 Laptop GPU, 90 Wh | Schenker XMG Pro 15 (Early 2021, RTX 3080) i7-10870H, GeForce RTX 3080 Laptop GPU, 73 Wh | Lenovo Legion 7 15IMH05-81YT001VGE i9-10980HK, GeForce RTX 2080 Super Max-Q, 80 Wh | Media de la clase Gaming | |
|---|---|---|---|---|---|---|
| Duración de Batería | -54% | 45% | -5% | -40% | 1% | |
| Reader / Idle (h) | 12.7 | 3.7 -71% | 8.4 -34% | 9.06 ? -29% | ||
| H.264 (h) | 7.1 | 13.5 90% | 5.5 -23% | 1.5 -79% | 7.93 ? 12% | |
| WiFi v1.3 (h) | 5.9 | 2.7 -54% | 7.4 25% | 7.2 22% | 3.4 -42% | 6.67 ? 13% |
| Load (h) | 1.4 | 0.9 -36% | 1.7 21% | 1.6 14% | 1.4 0% | 1.483 ? 6% |
Pro
Contra
Veredicto
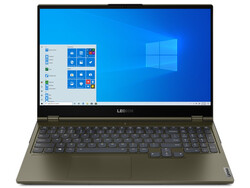
El Legion C7 hace lo que se supone que debe hacer: Puede ejecutar todos los juegos actuales a 1080p en la configuración más alta. El hecho de que nunca se vuelva demasiado ruidoso o demasiado caliente lo hace adecuado para otros escenarios de uso también.
El Lenovo Legion C7 15IMH05 es un portátil muy completo para jugadores y creadores de contenidos.
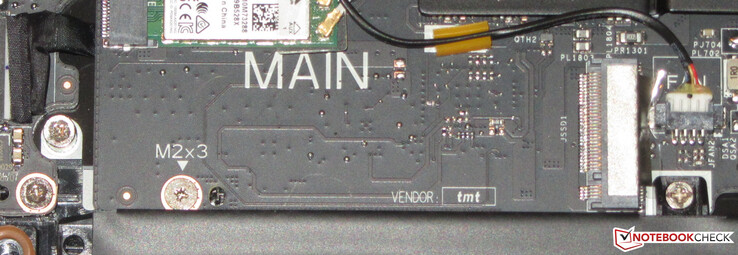
Gracias al Core i7-10875H, GeForce RTX 2070 Max-Q, 32 GB de RAM de doble canal (64 GB como máximo) y un SSD de 1 TB, el portátil Lenovo puede manejar todas las aplicaciones actuales. Si es necesario, los usuarios pueden poner un segundo SSD NVMe en el dispositivo. El puerto Thunderbolt 3 permite a los usuarios conectar GPUs externas al portátil
La duración de la batería para este tipo de dispositivo está a buen nivel. La pantalla Full HD de 144-Hz ofrece una superficie mate, buenos ángulos de visión y rápidos tiempos de respuesta. Además, soporta Dolby Vision (una variante de HDR) y cubre el 100% del espacio de color sRGB. Tanto el ratio de contraste como el brillo están a buen nivel. El teclado retroiluminado es decente. Además, Lenovo ofrece tres años de garantía para el C7
Precio y disponibilidad
Por desgracia, el Lenovo Legion C7 15IMH05 no está disponible actualmente en los Estados Unidos. En el Reino Unido, el modelo hermano Legion Creator 7i se vende por 1729,99 libras en el sitio web de Lenovo
Lenovo Legion C7 15IMH05 82EH0030GE
- 04/14/2021 v7 (old)
Sascha Mölck


