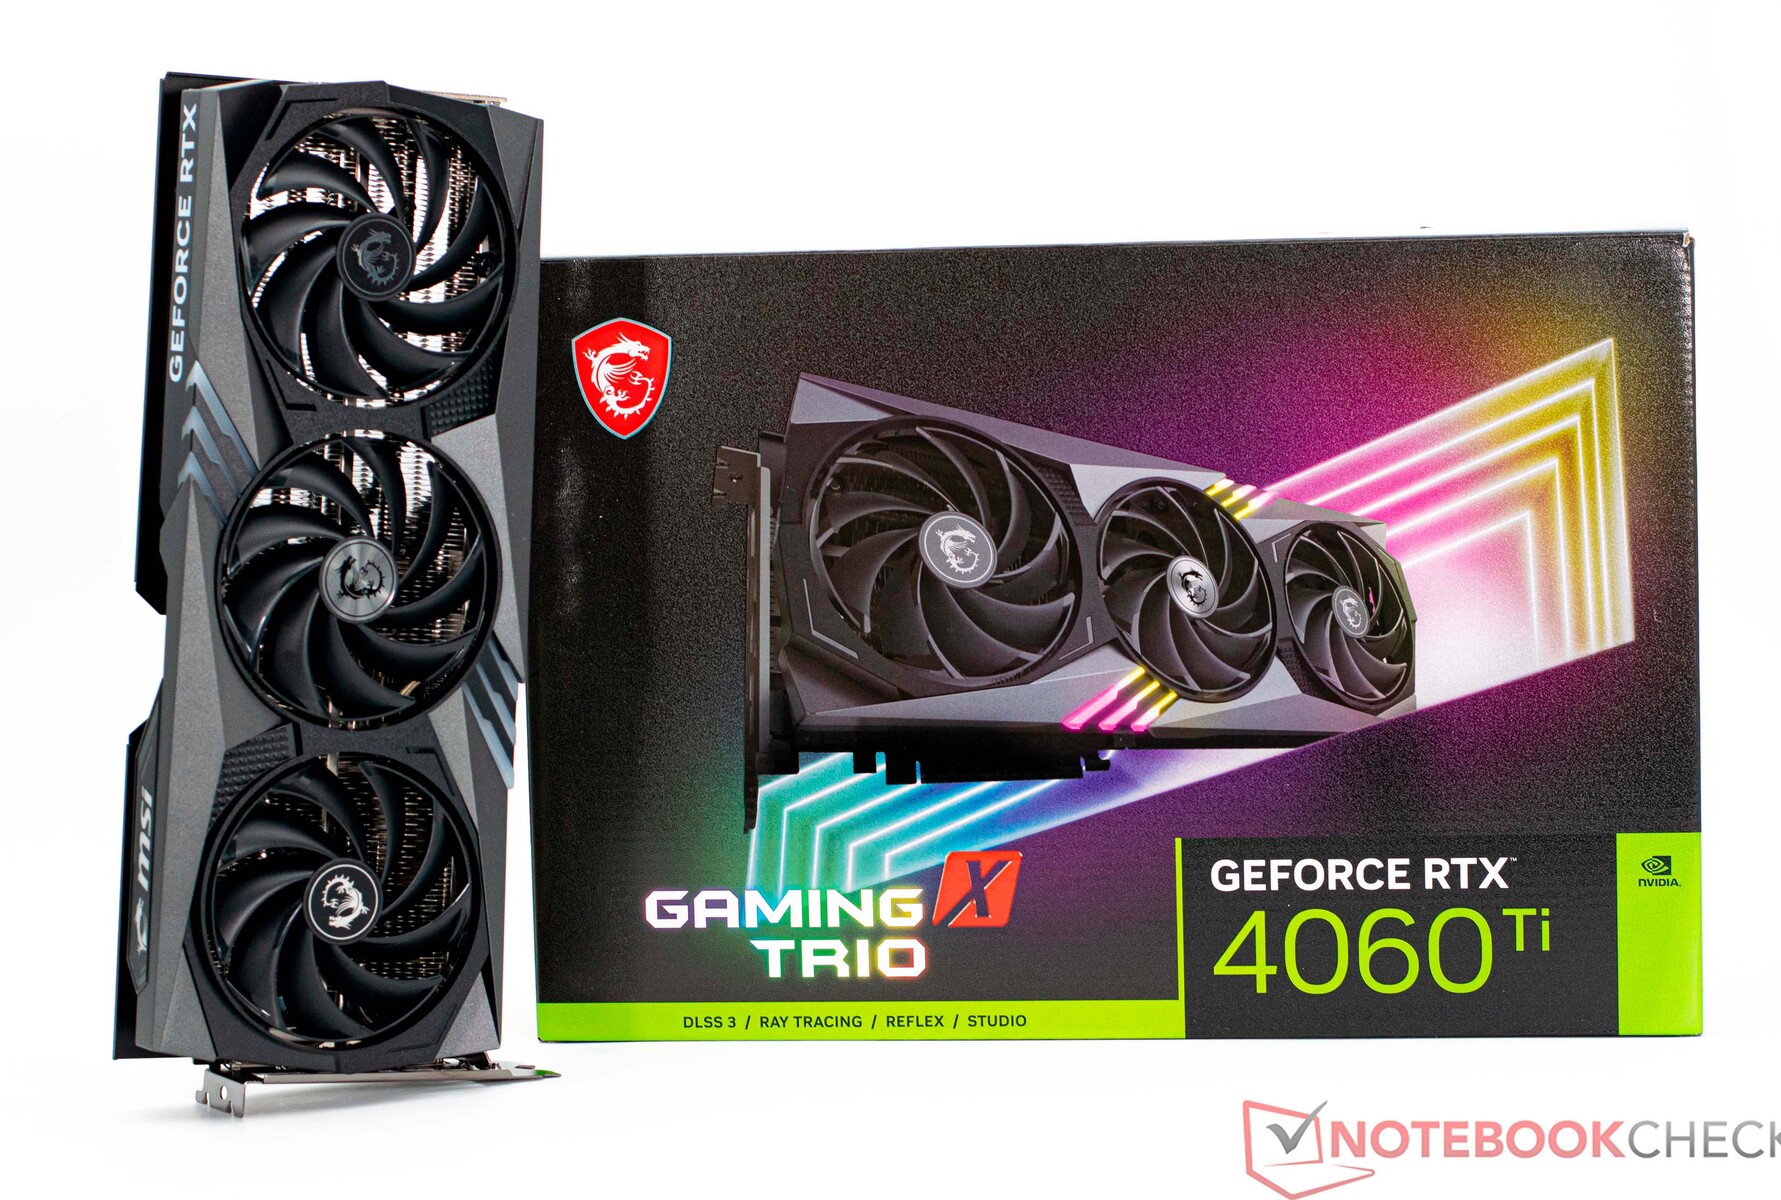
Análisis de la tarjeta gráfica de sobremesa MSI GeForce RTX 4060 Ti: La GPU de gama media más grande que una RTX 4090

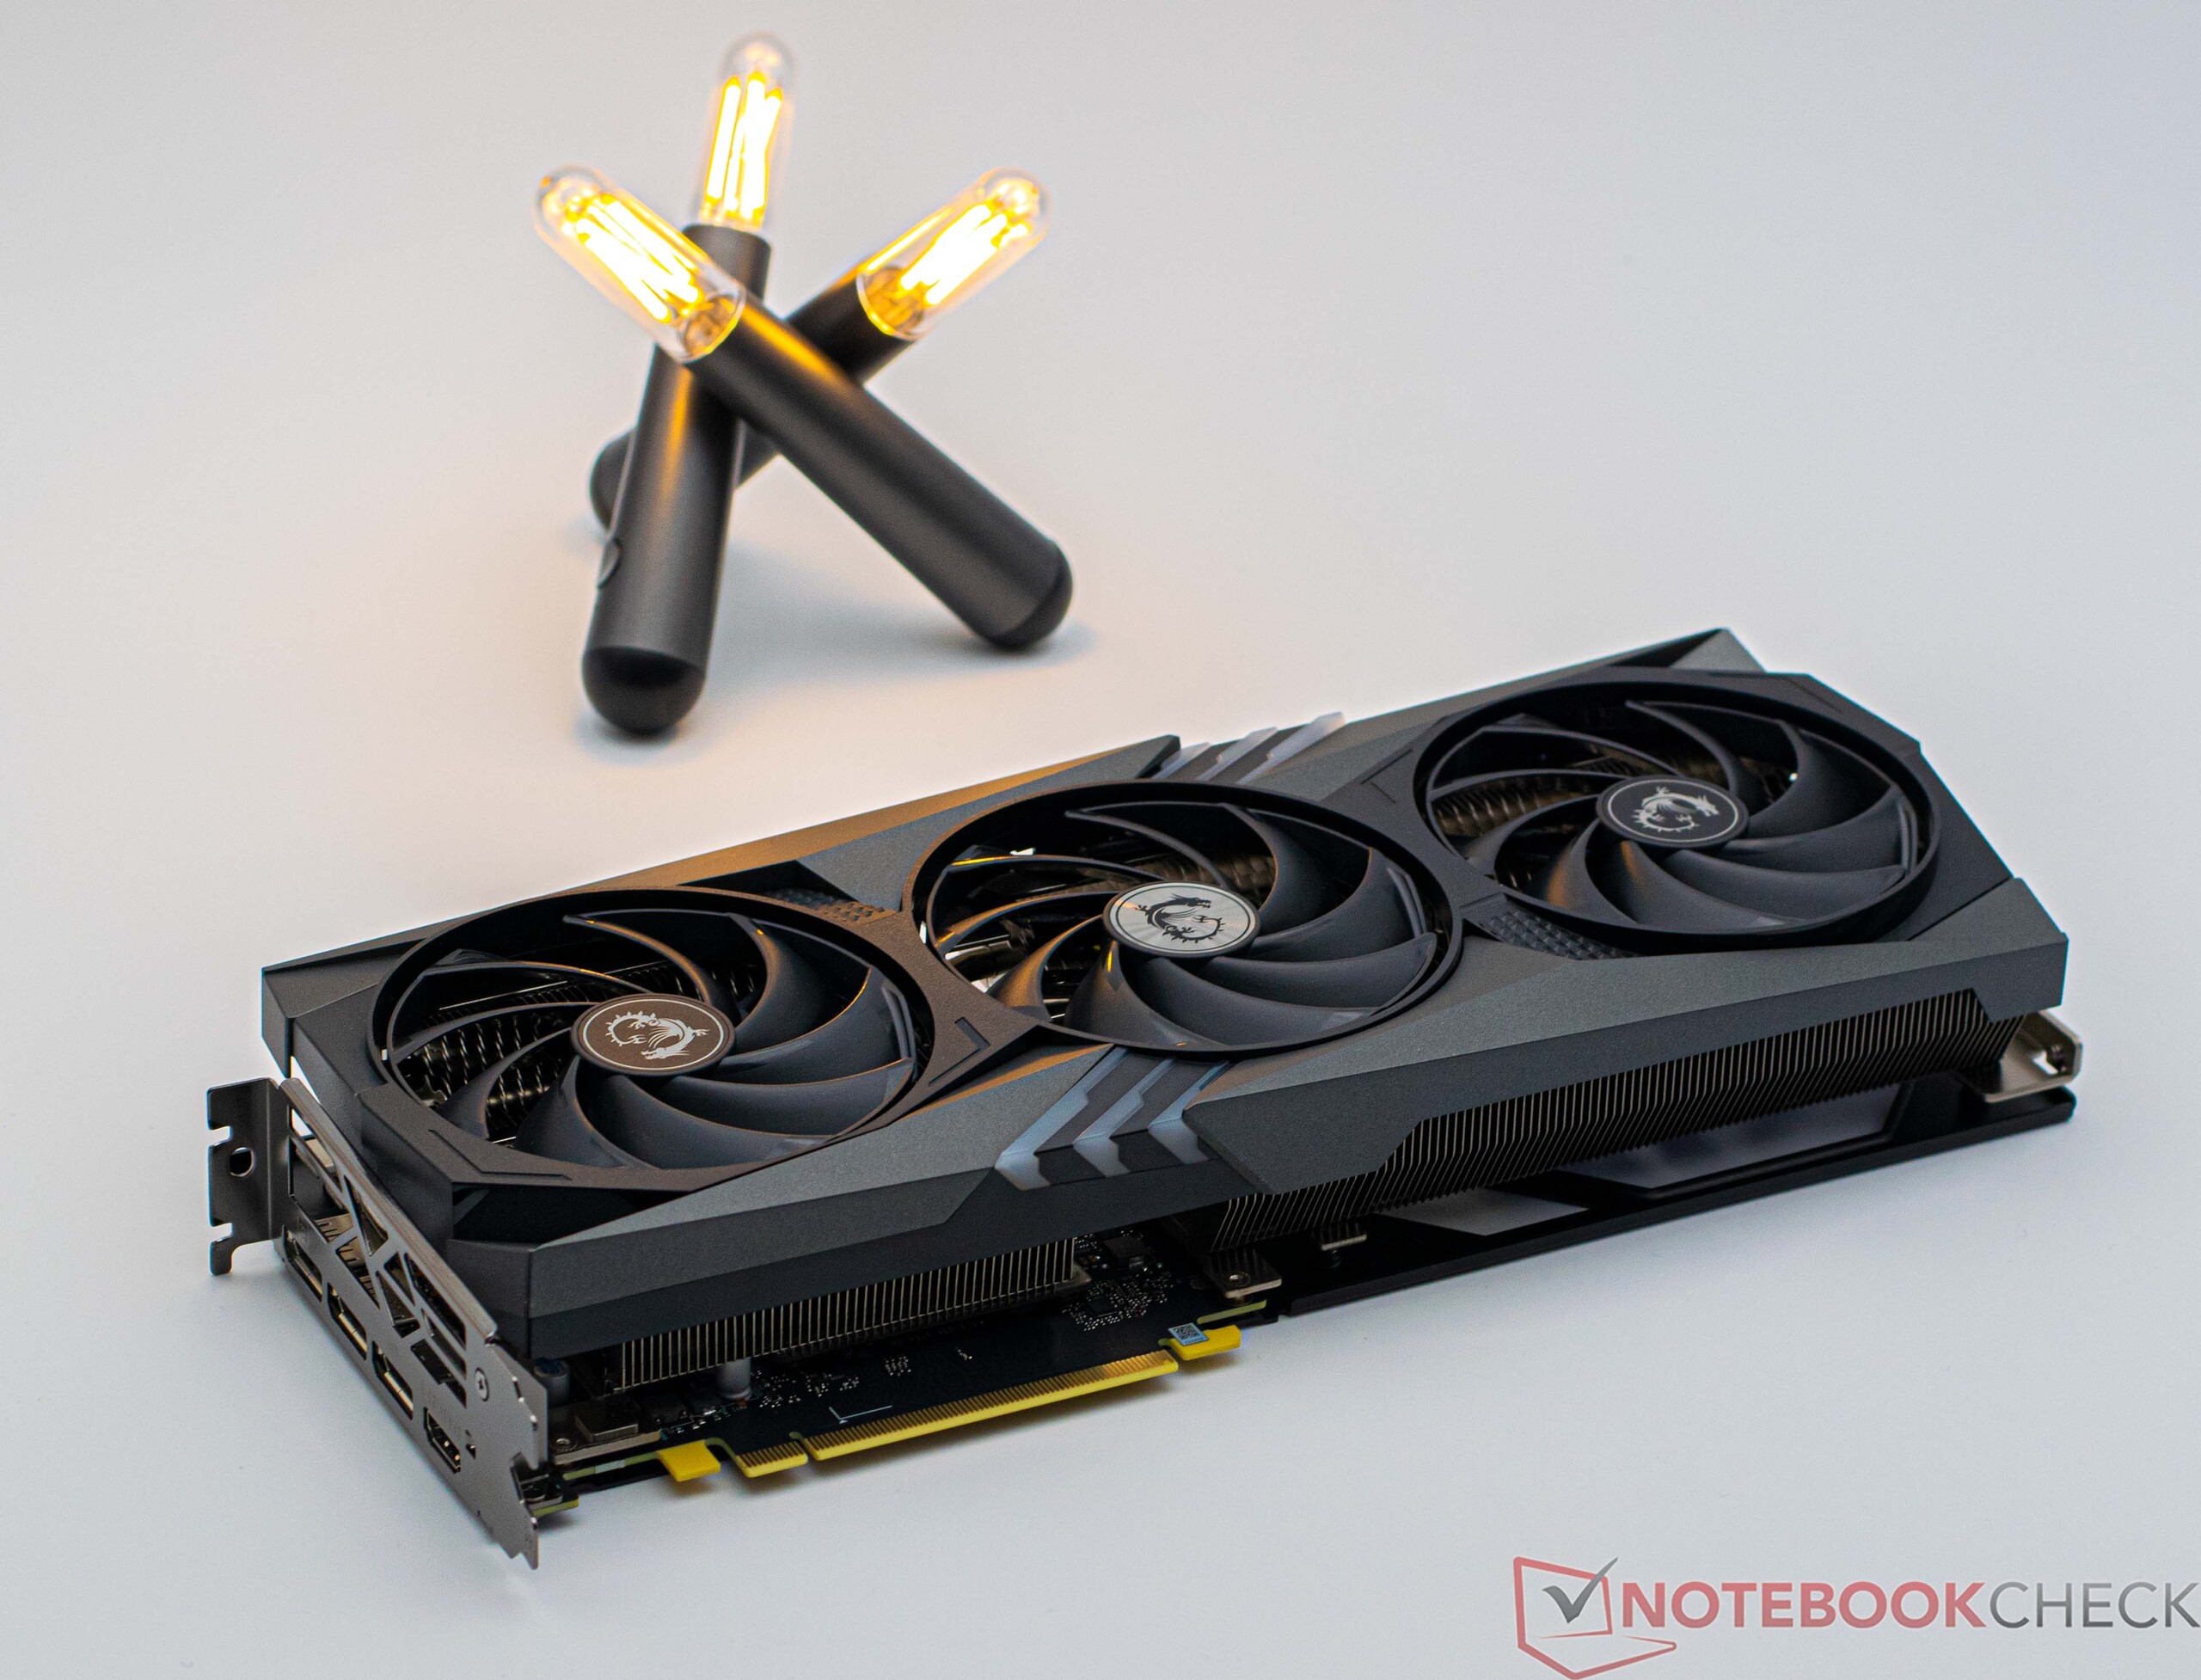
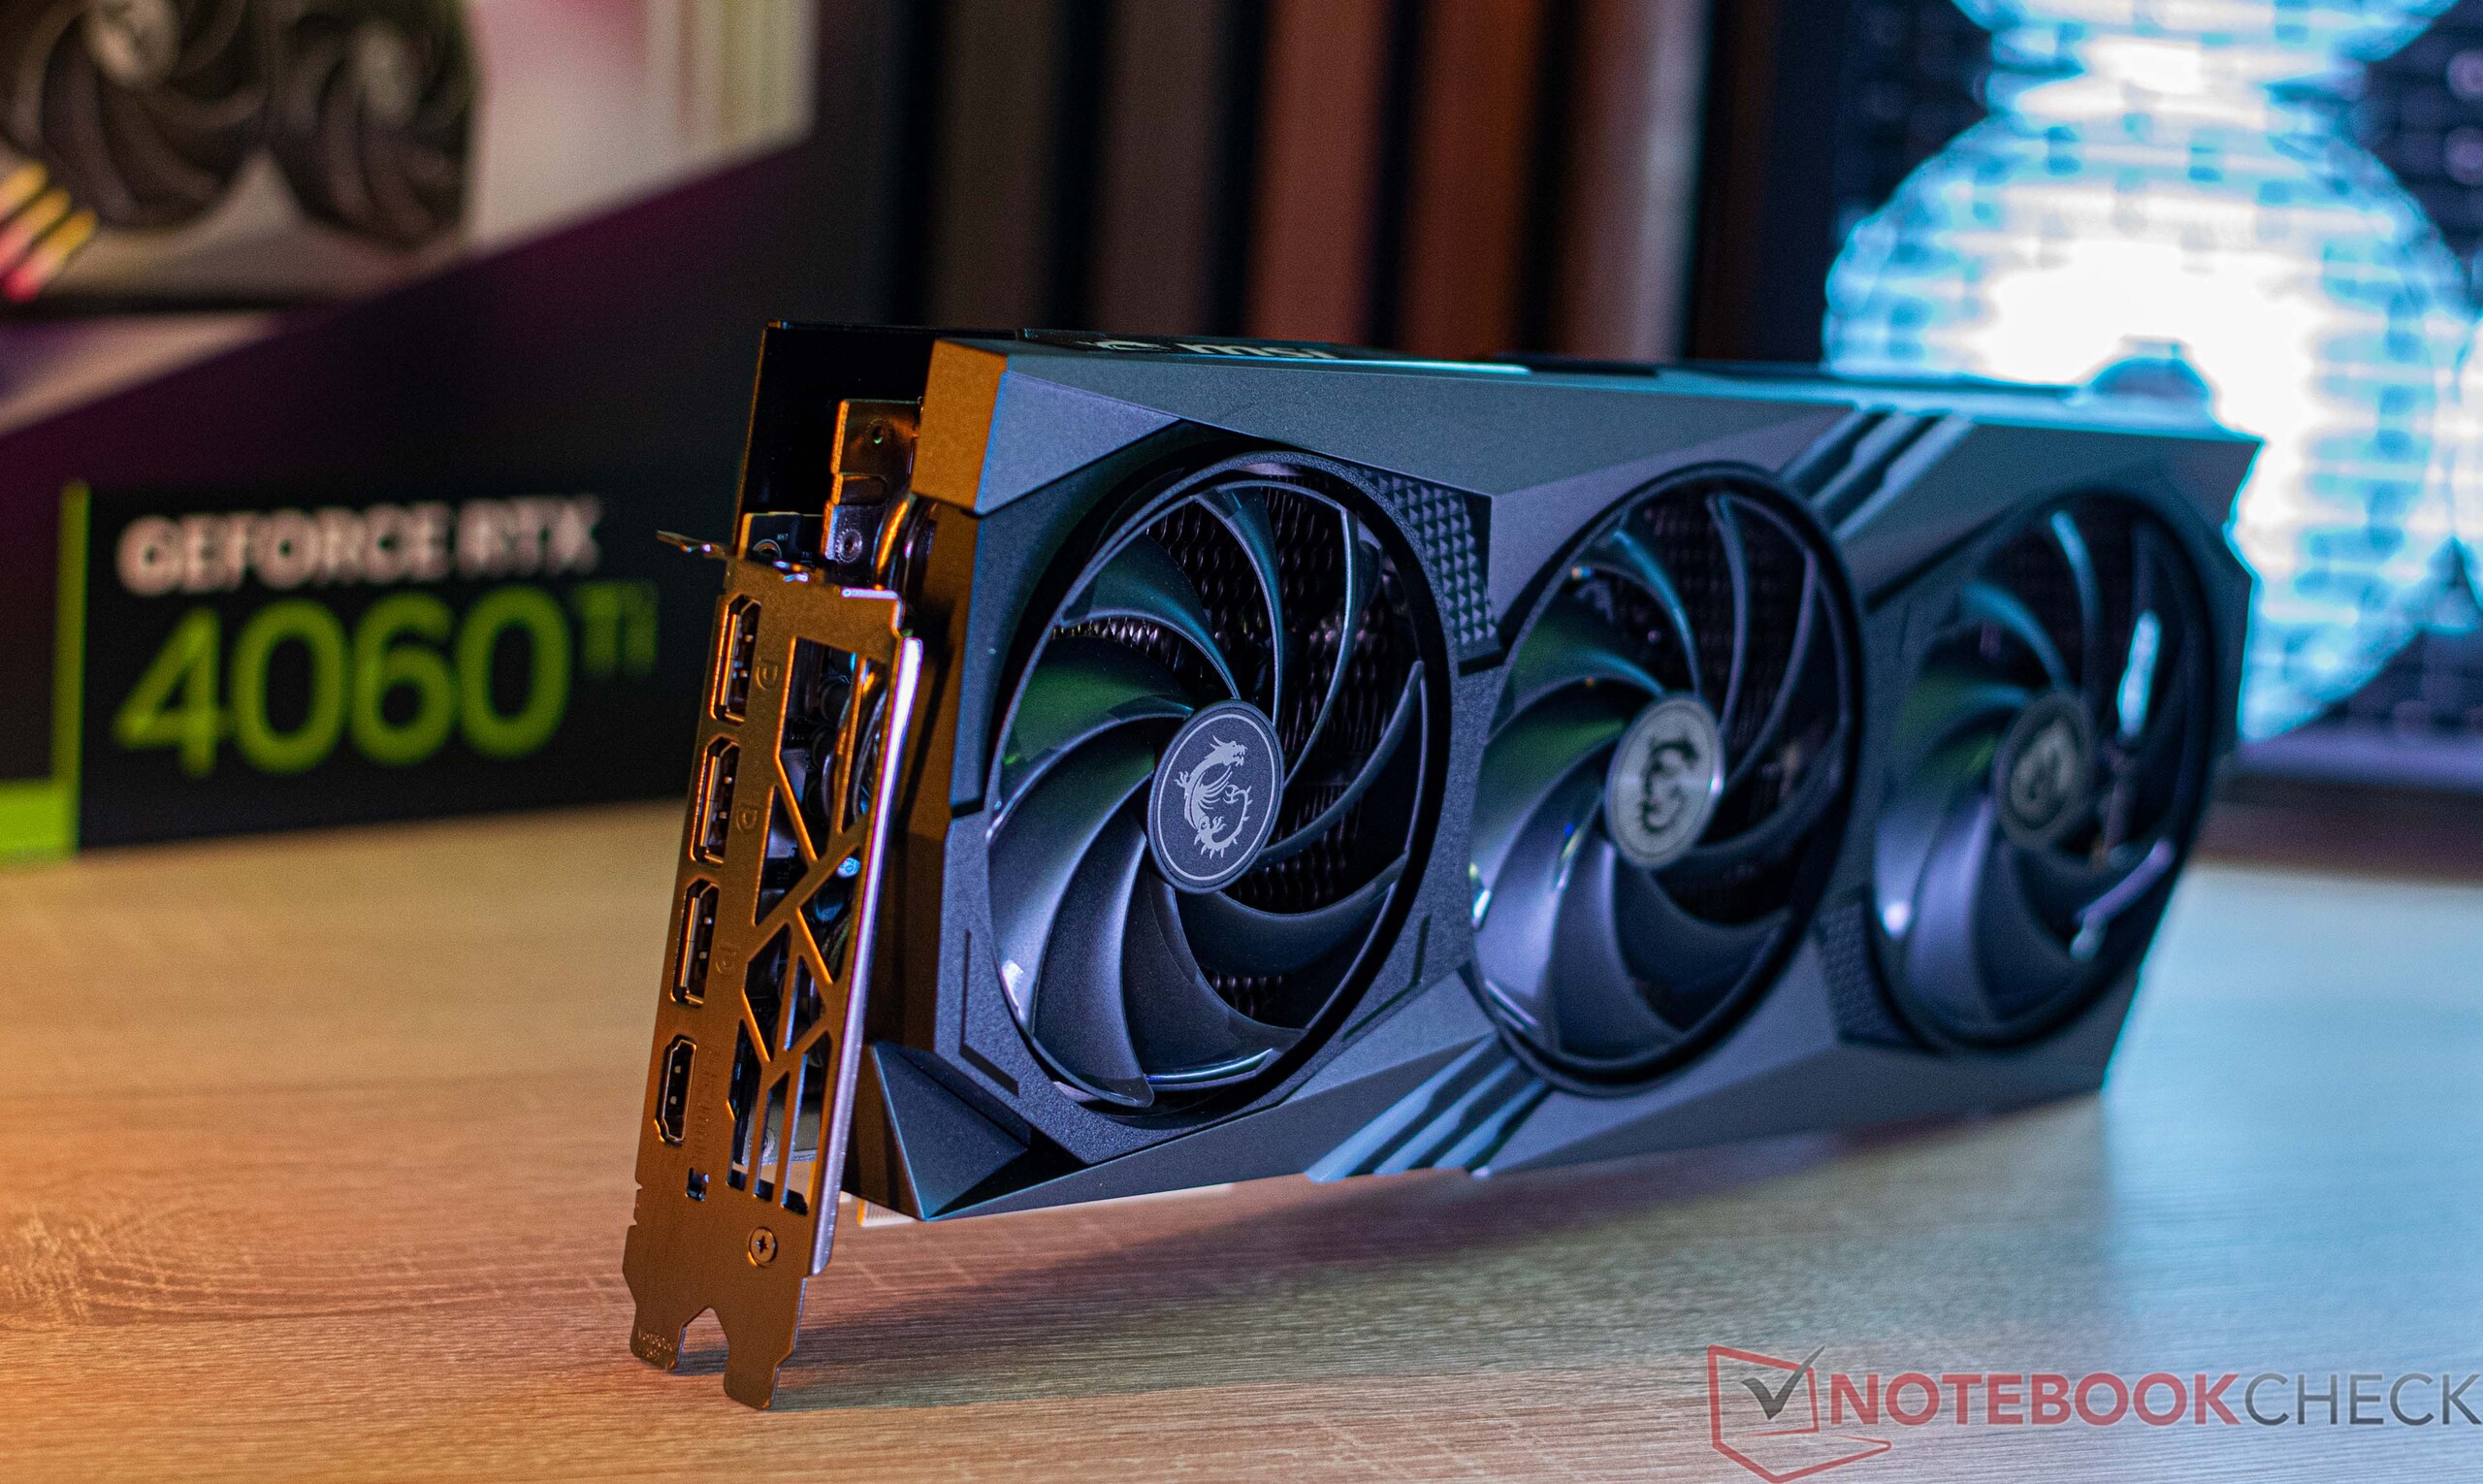
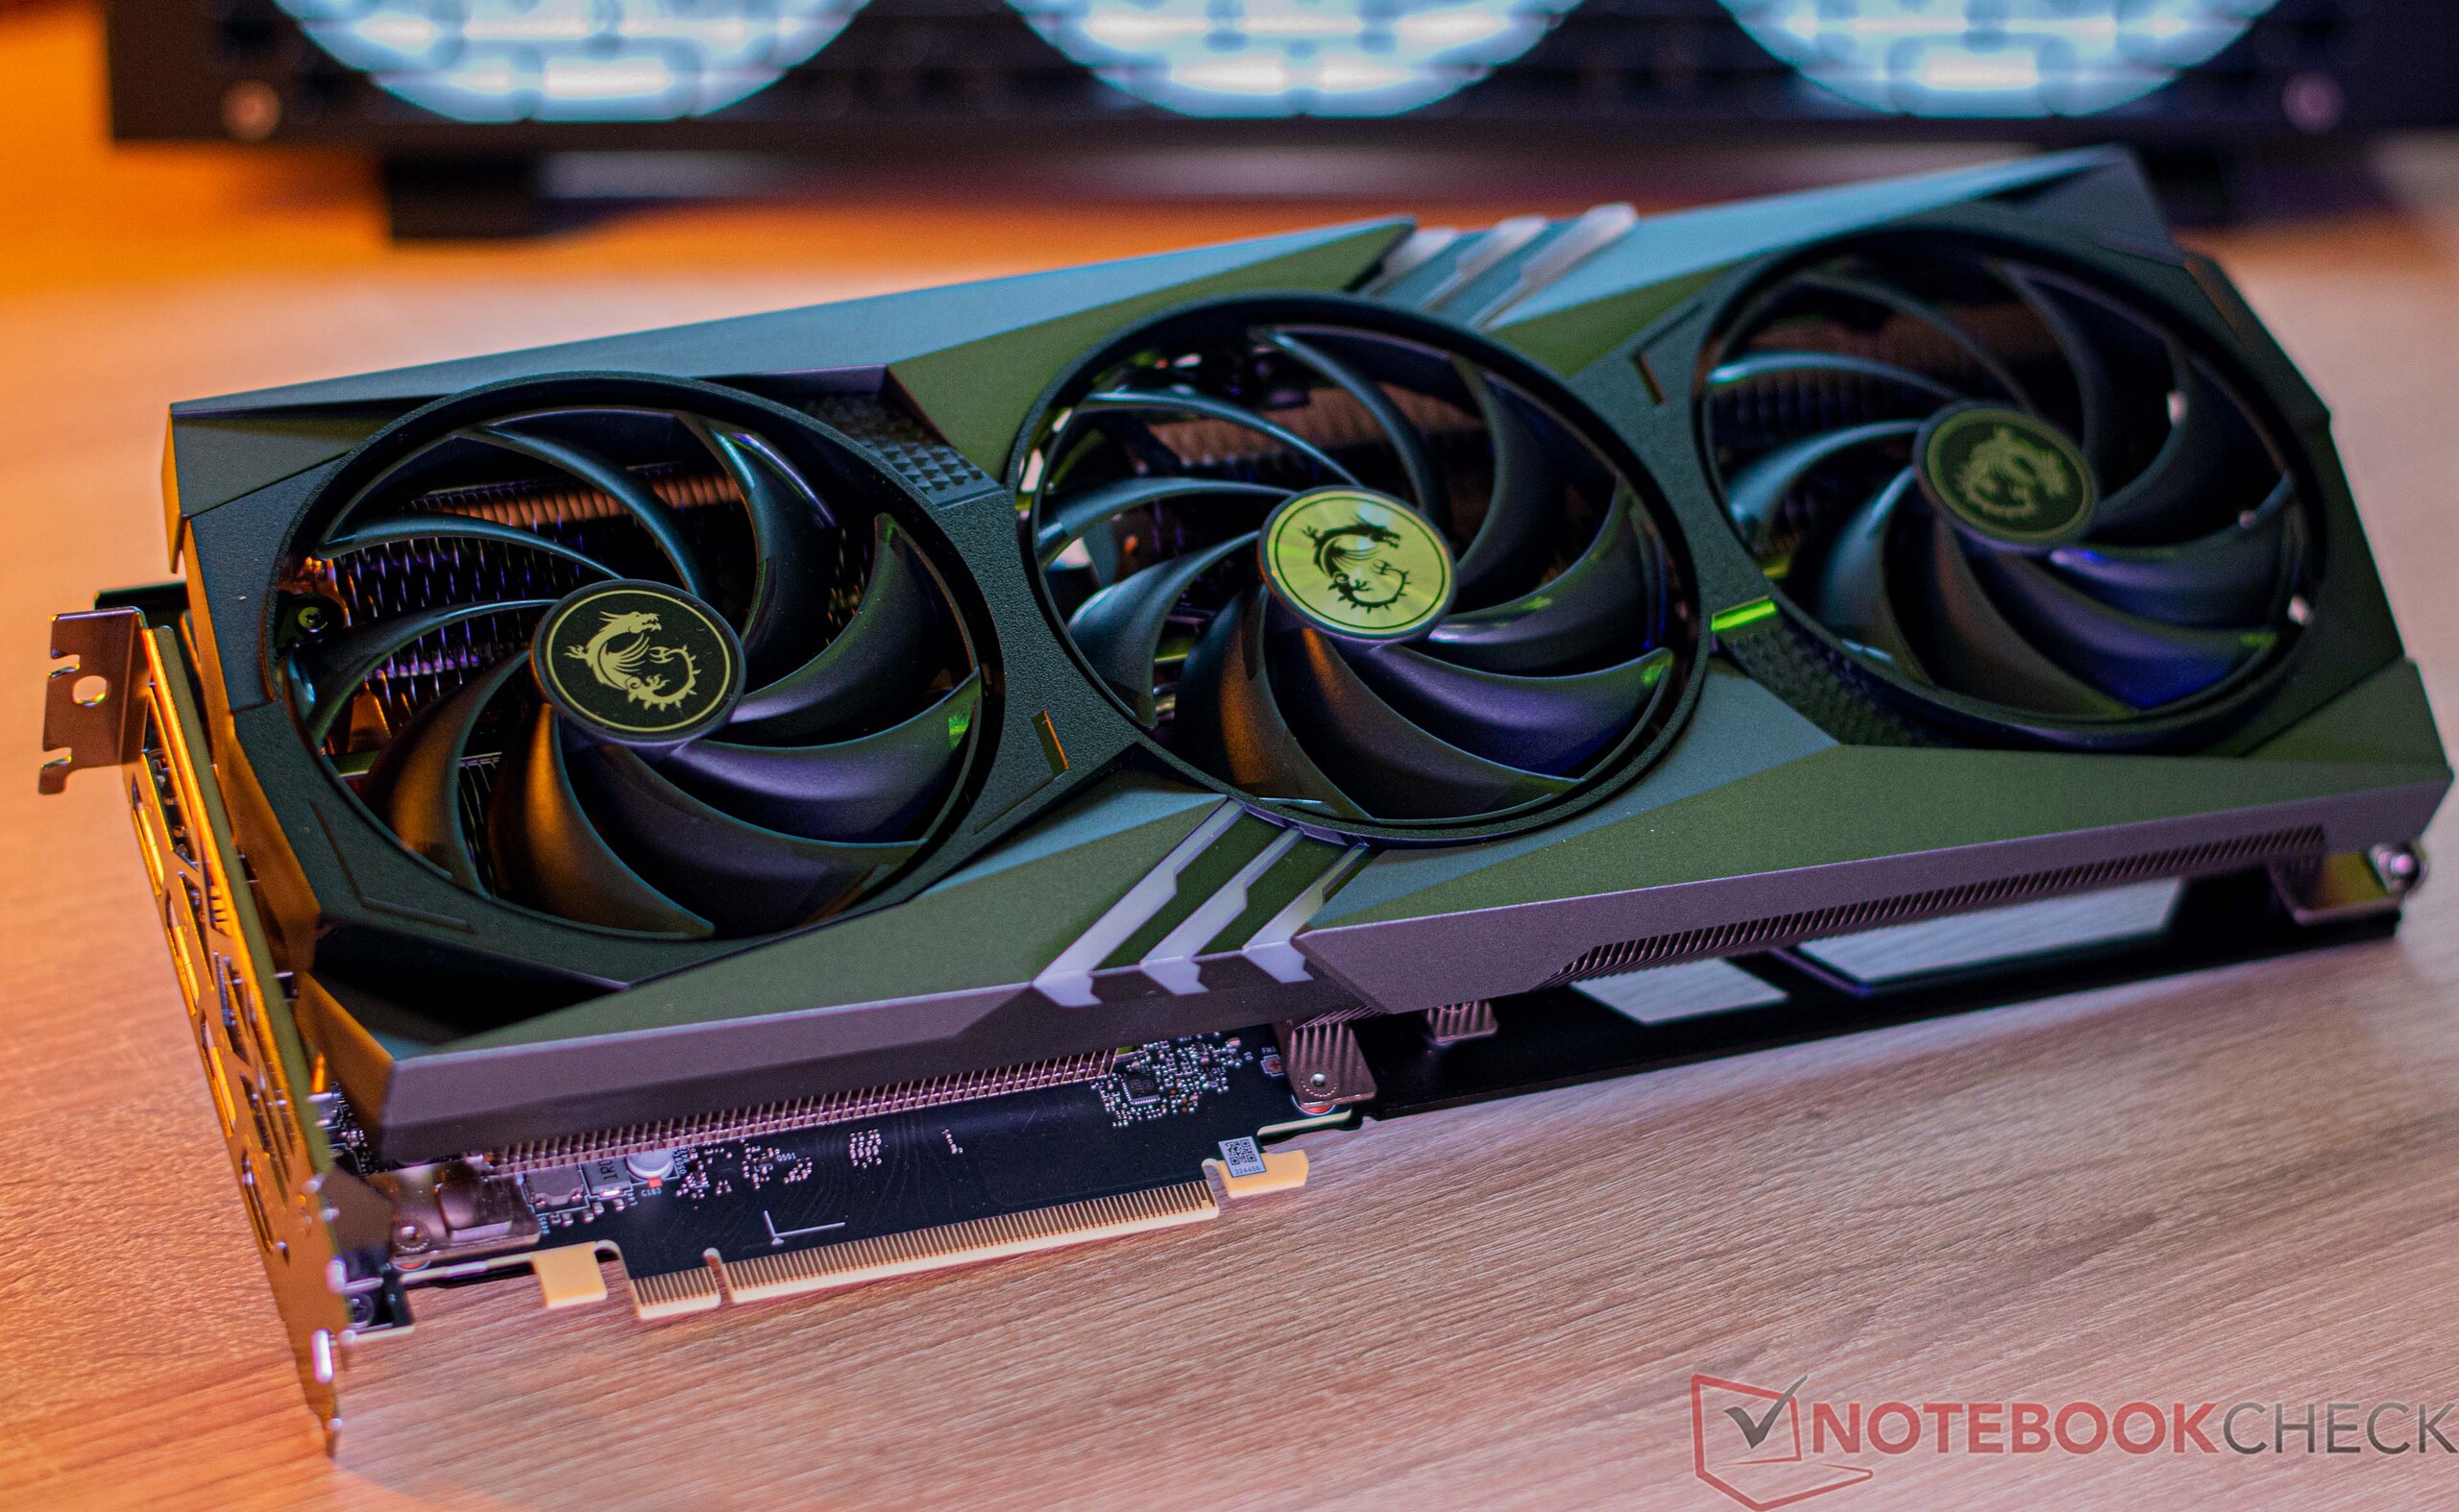
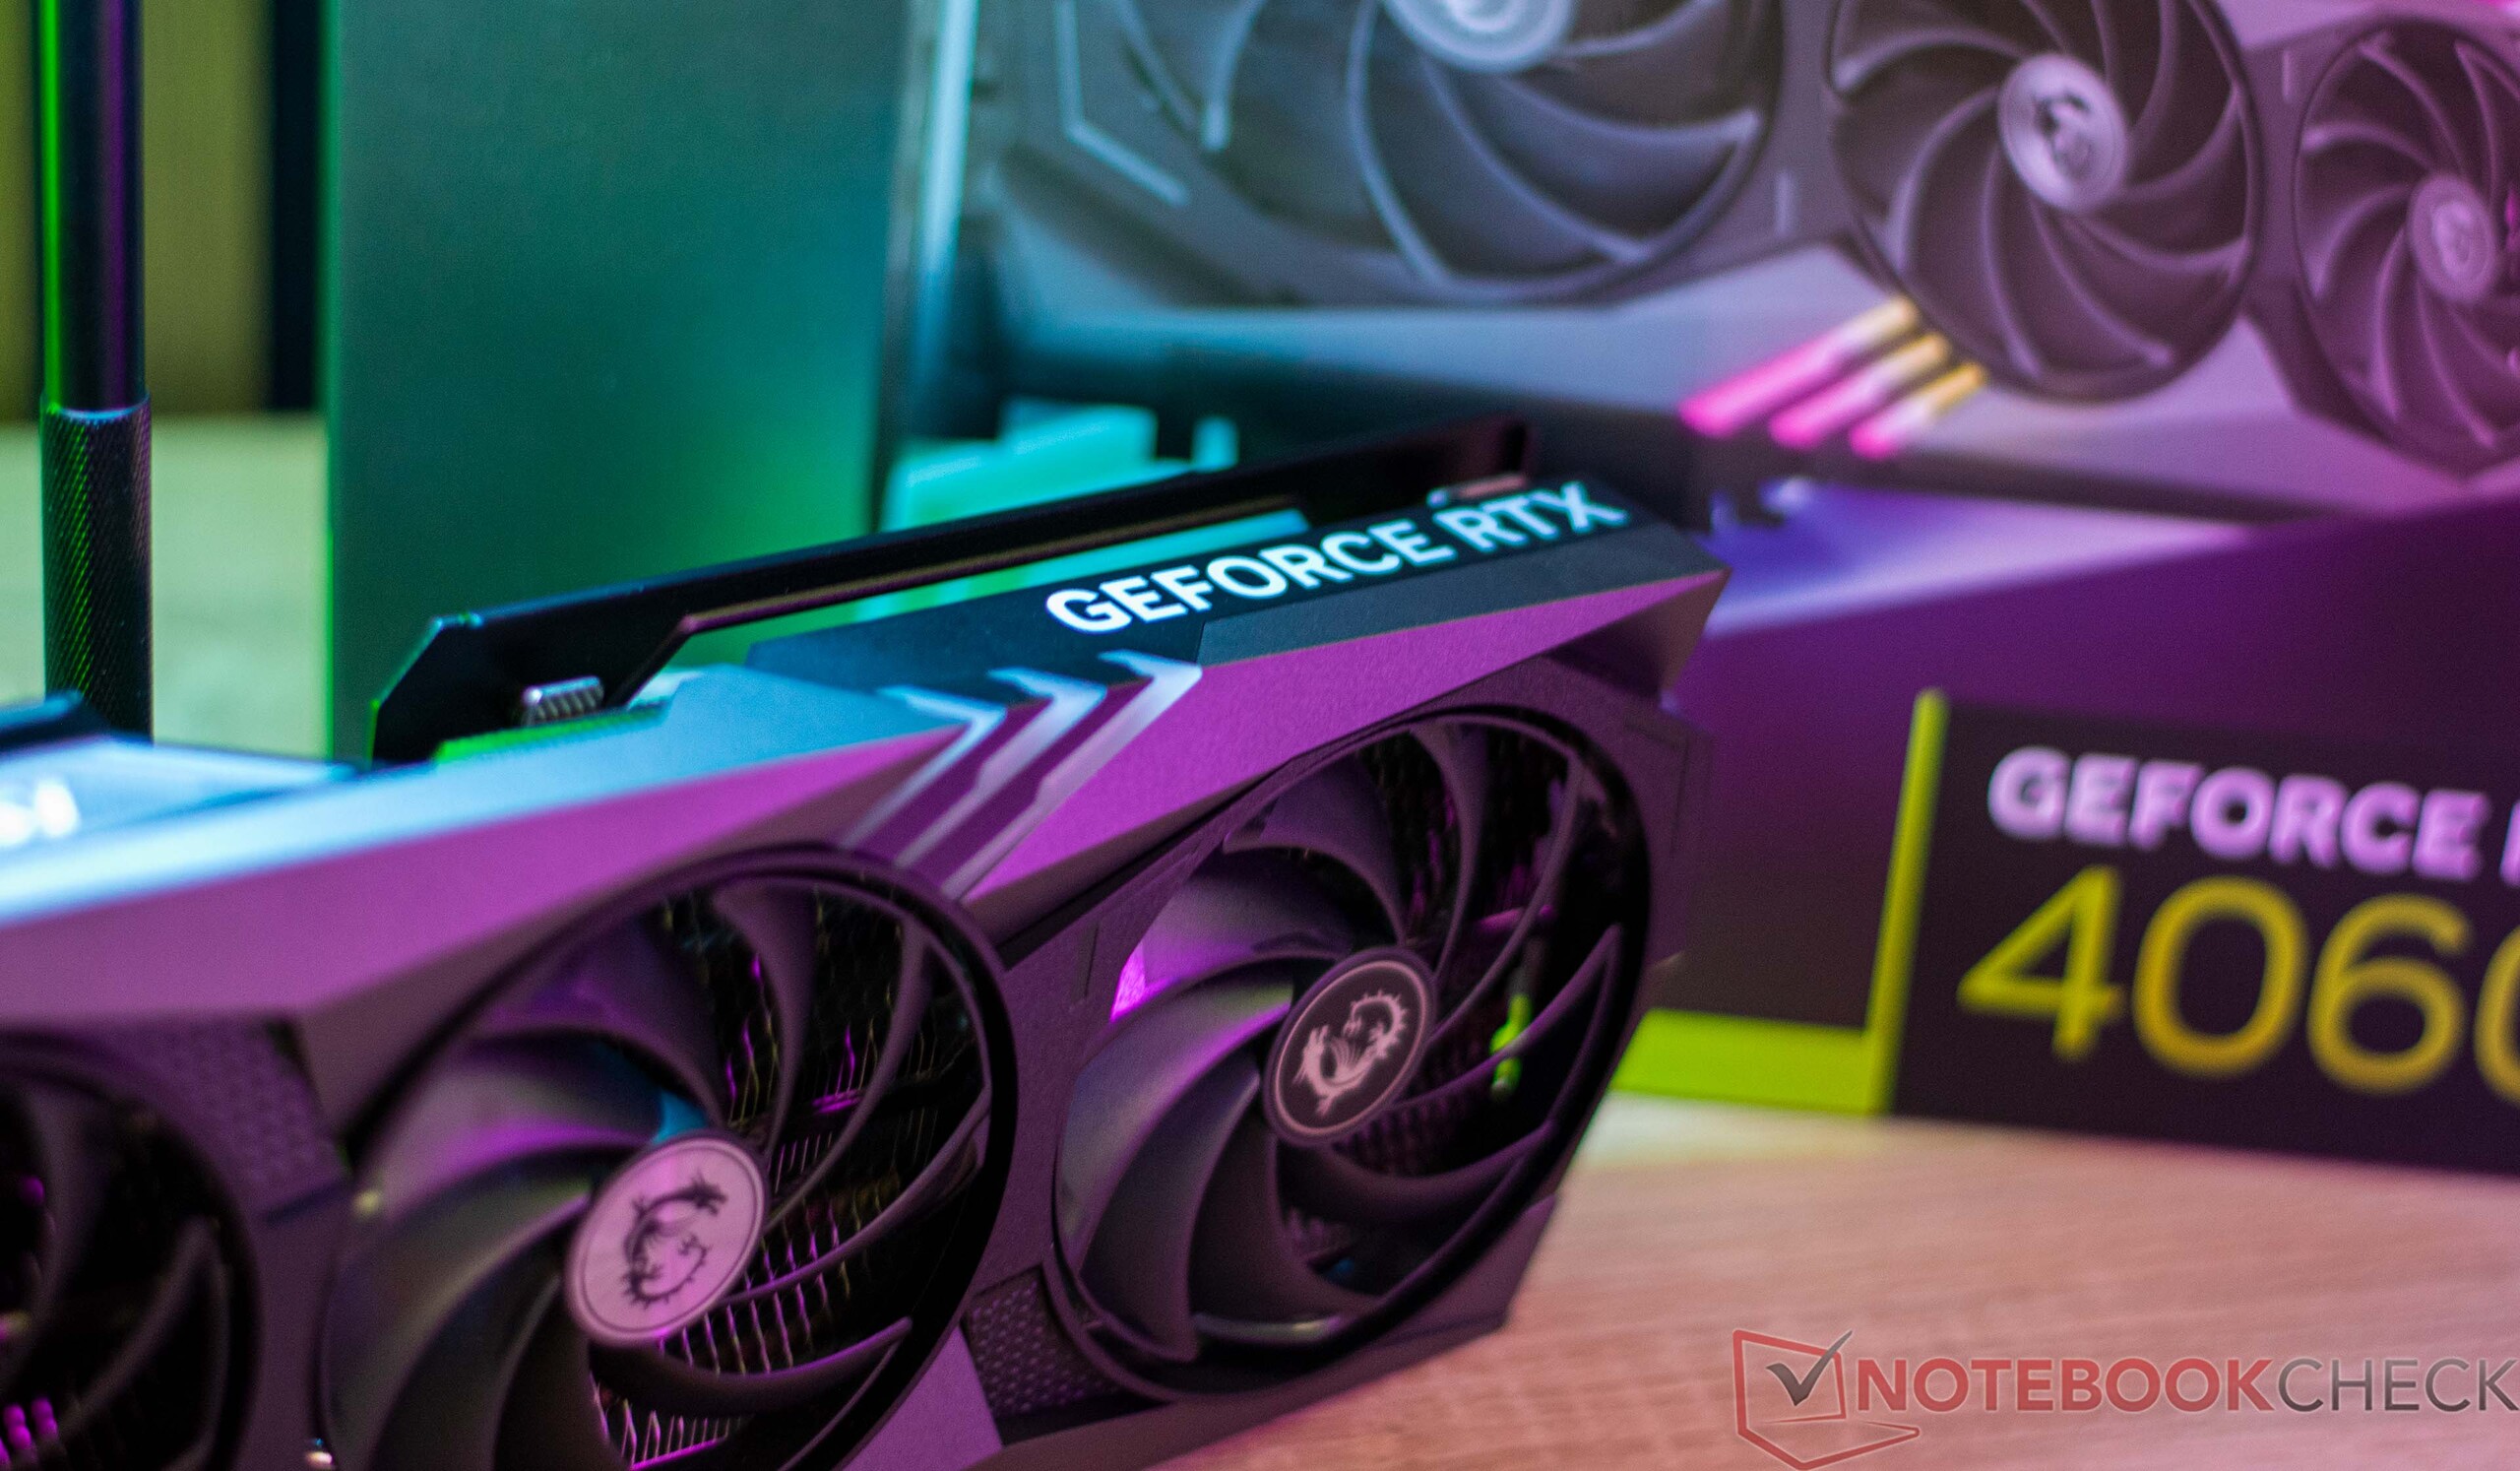
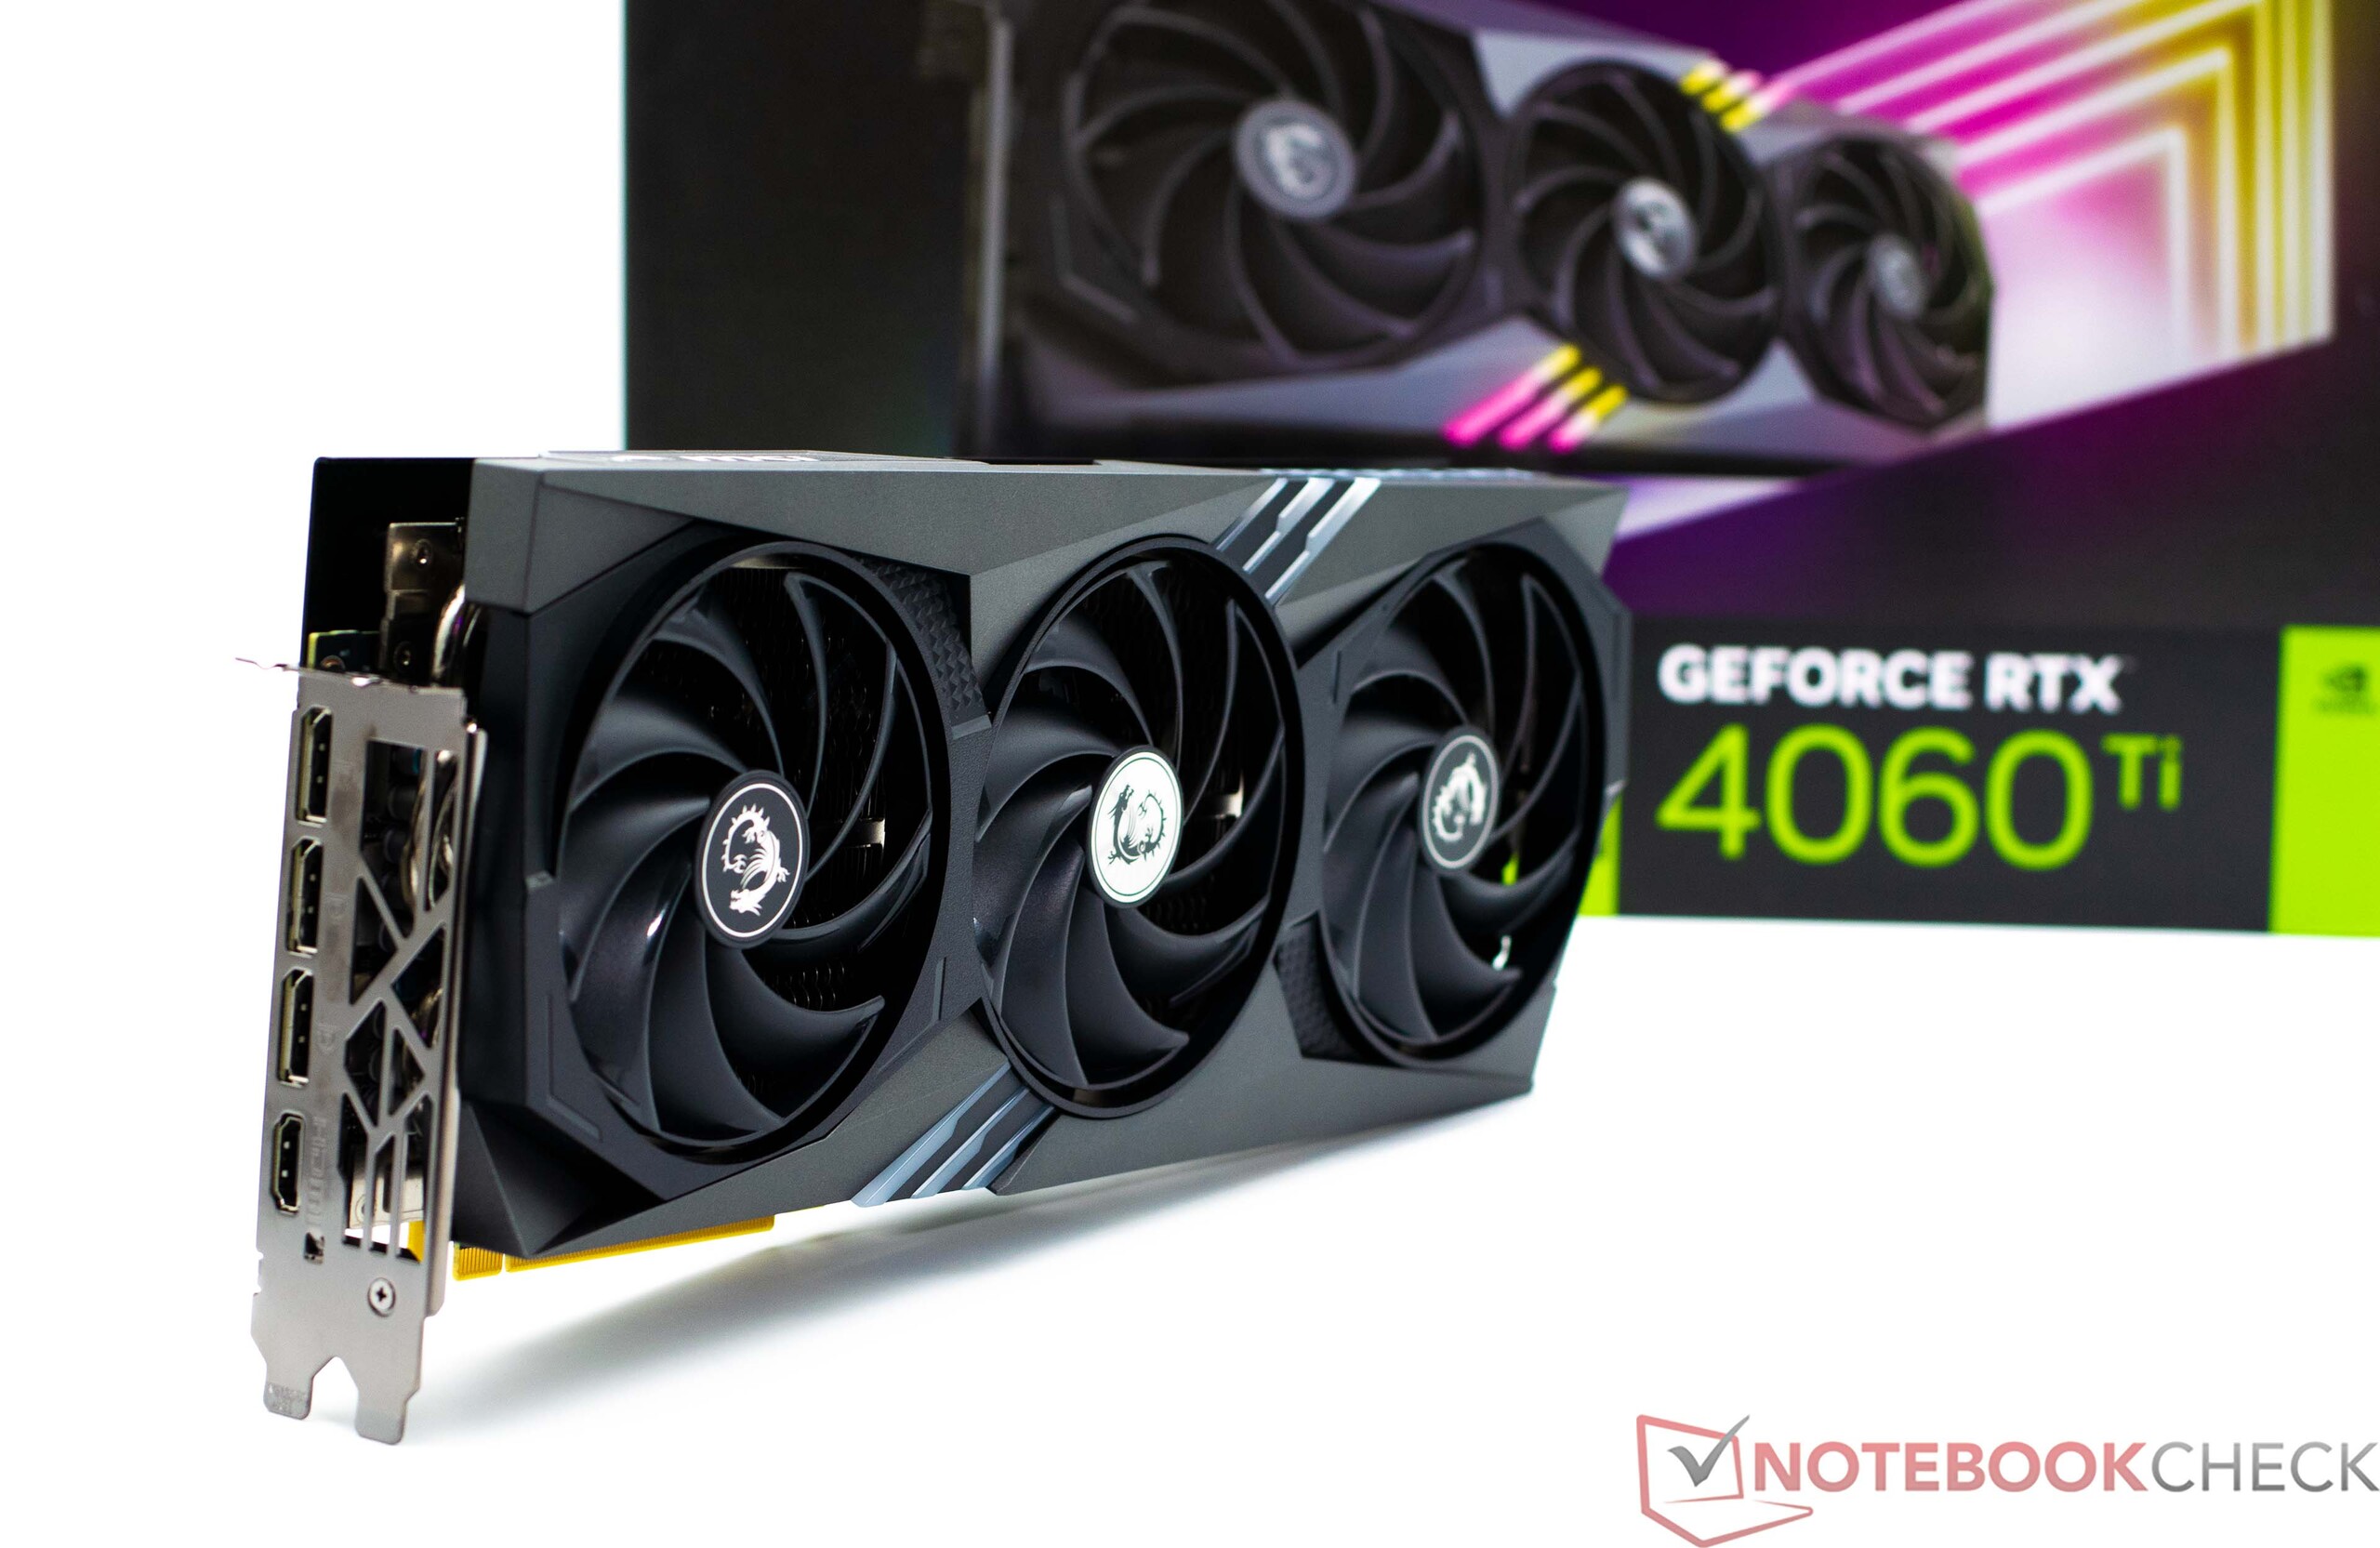
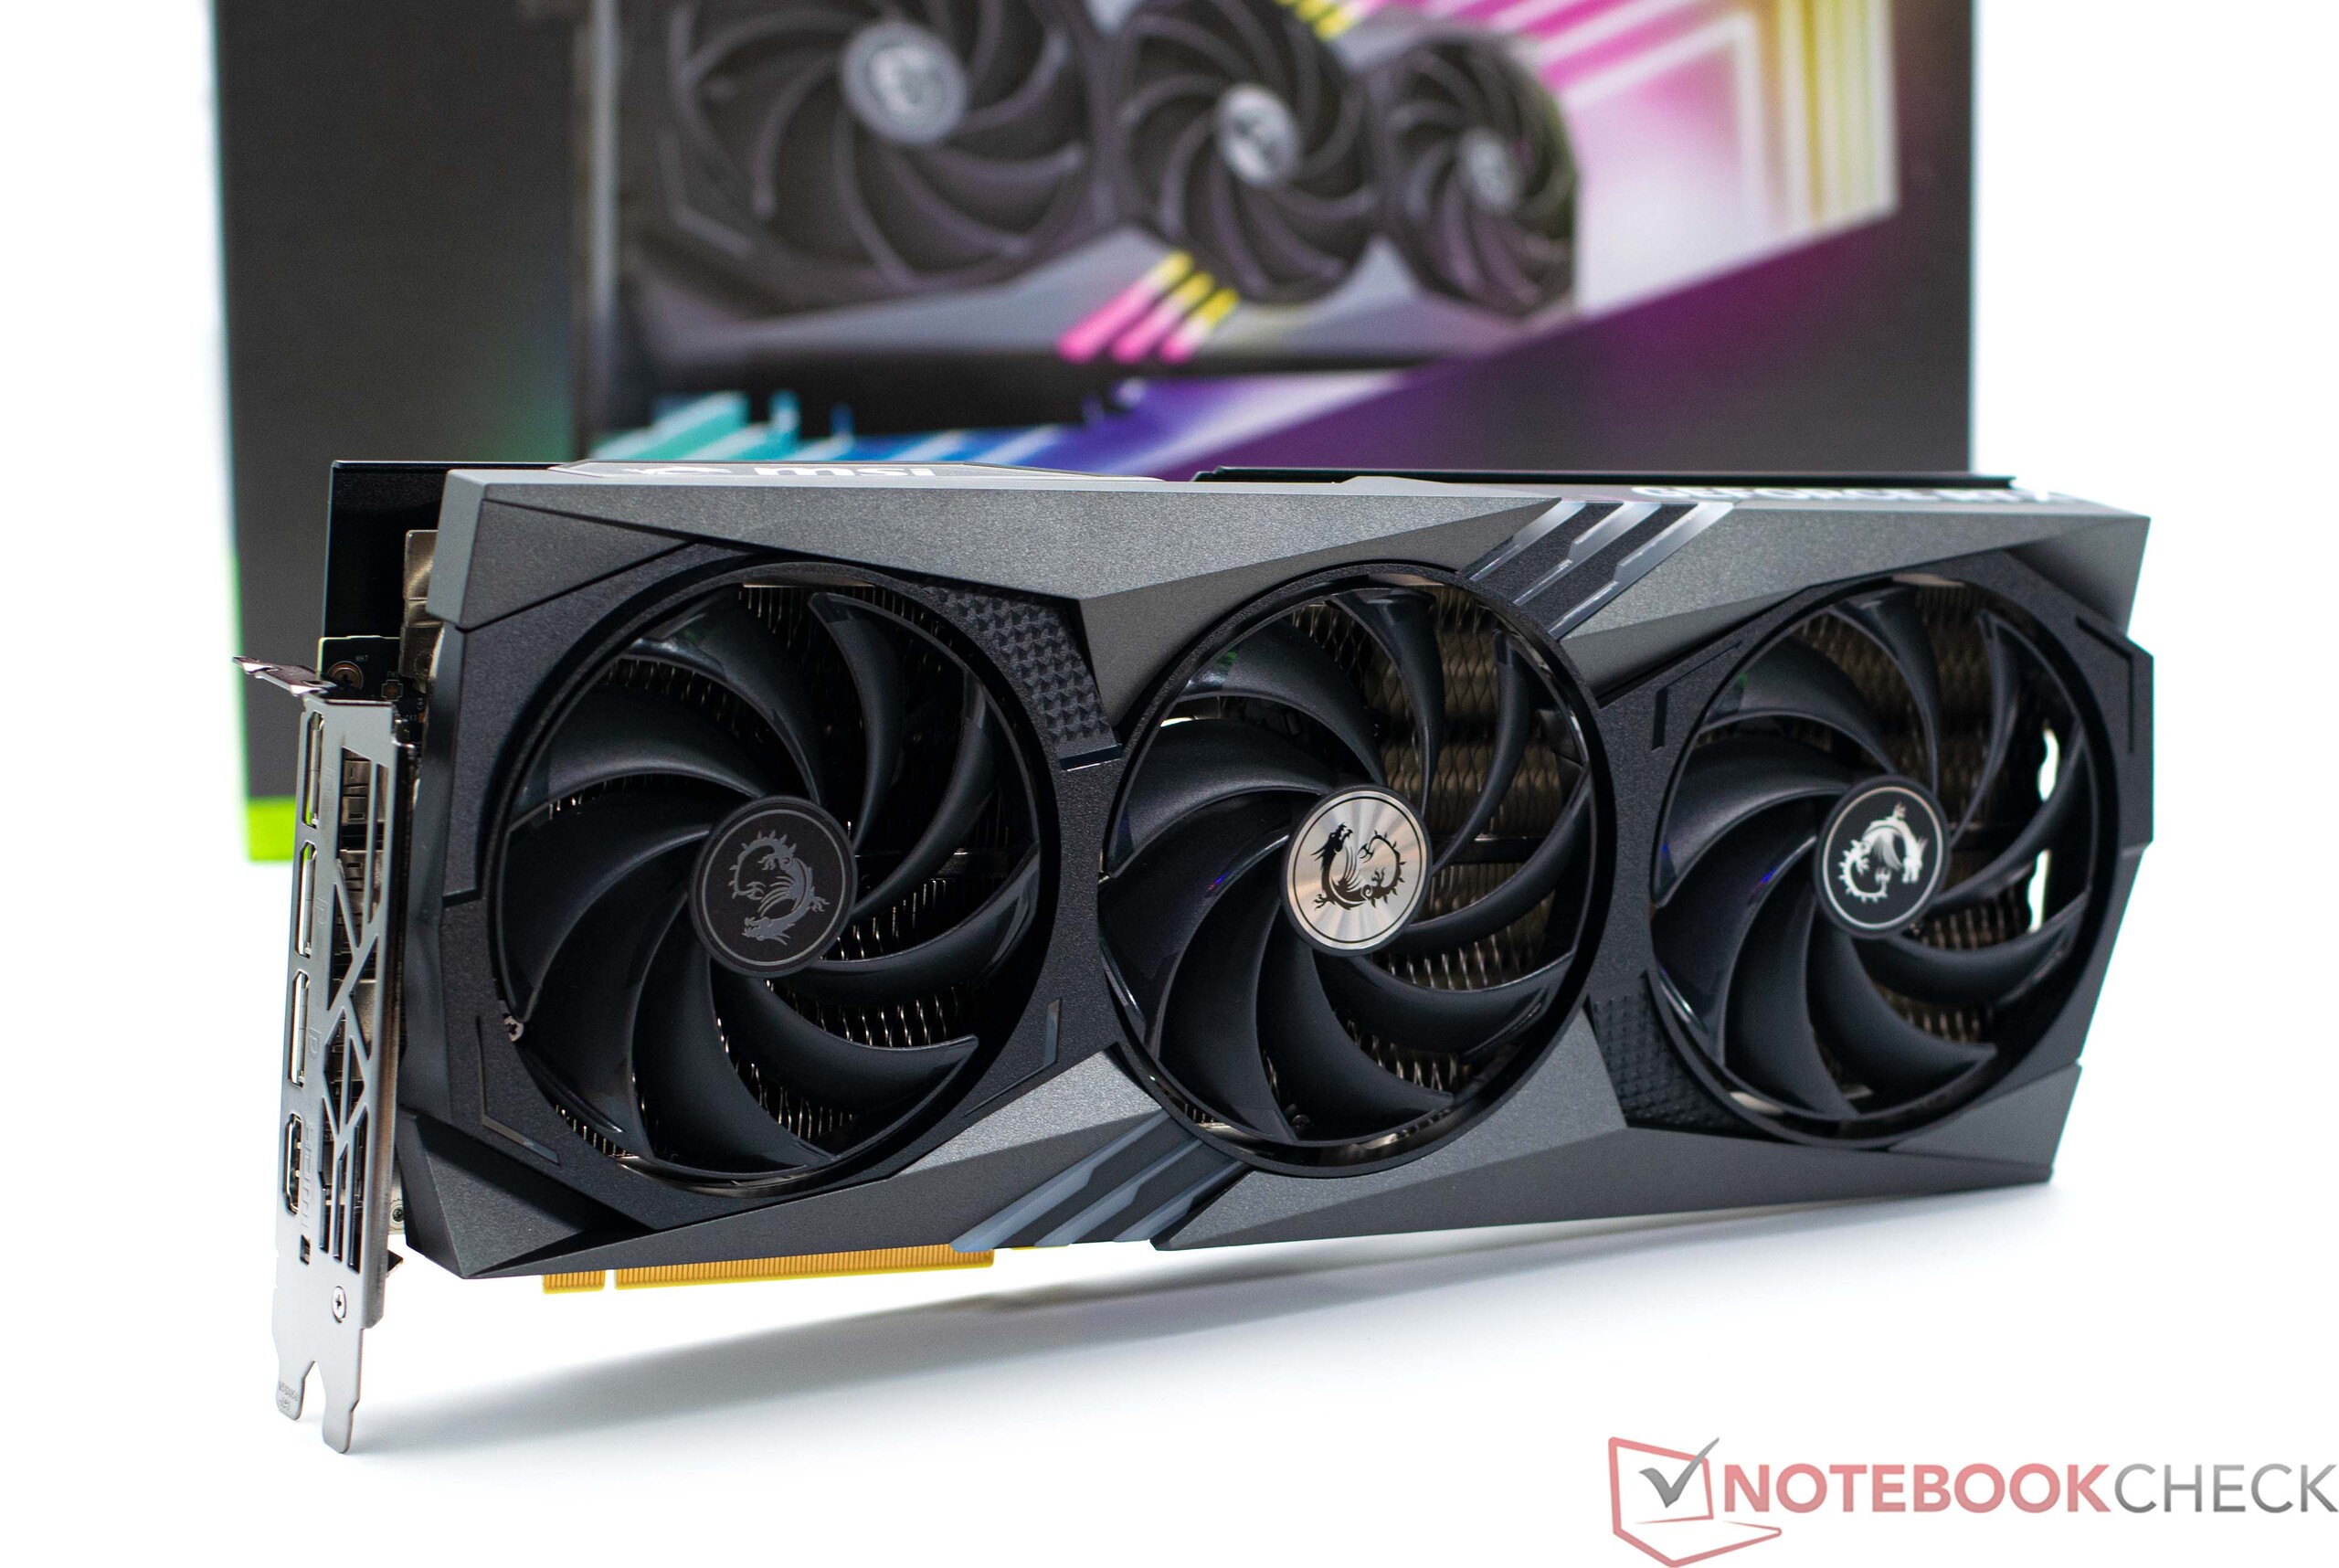
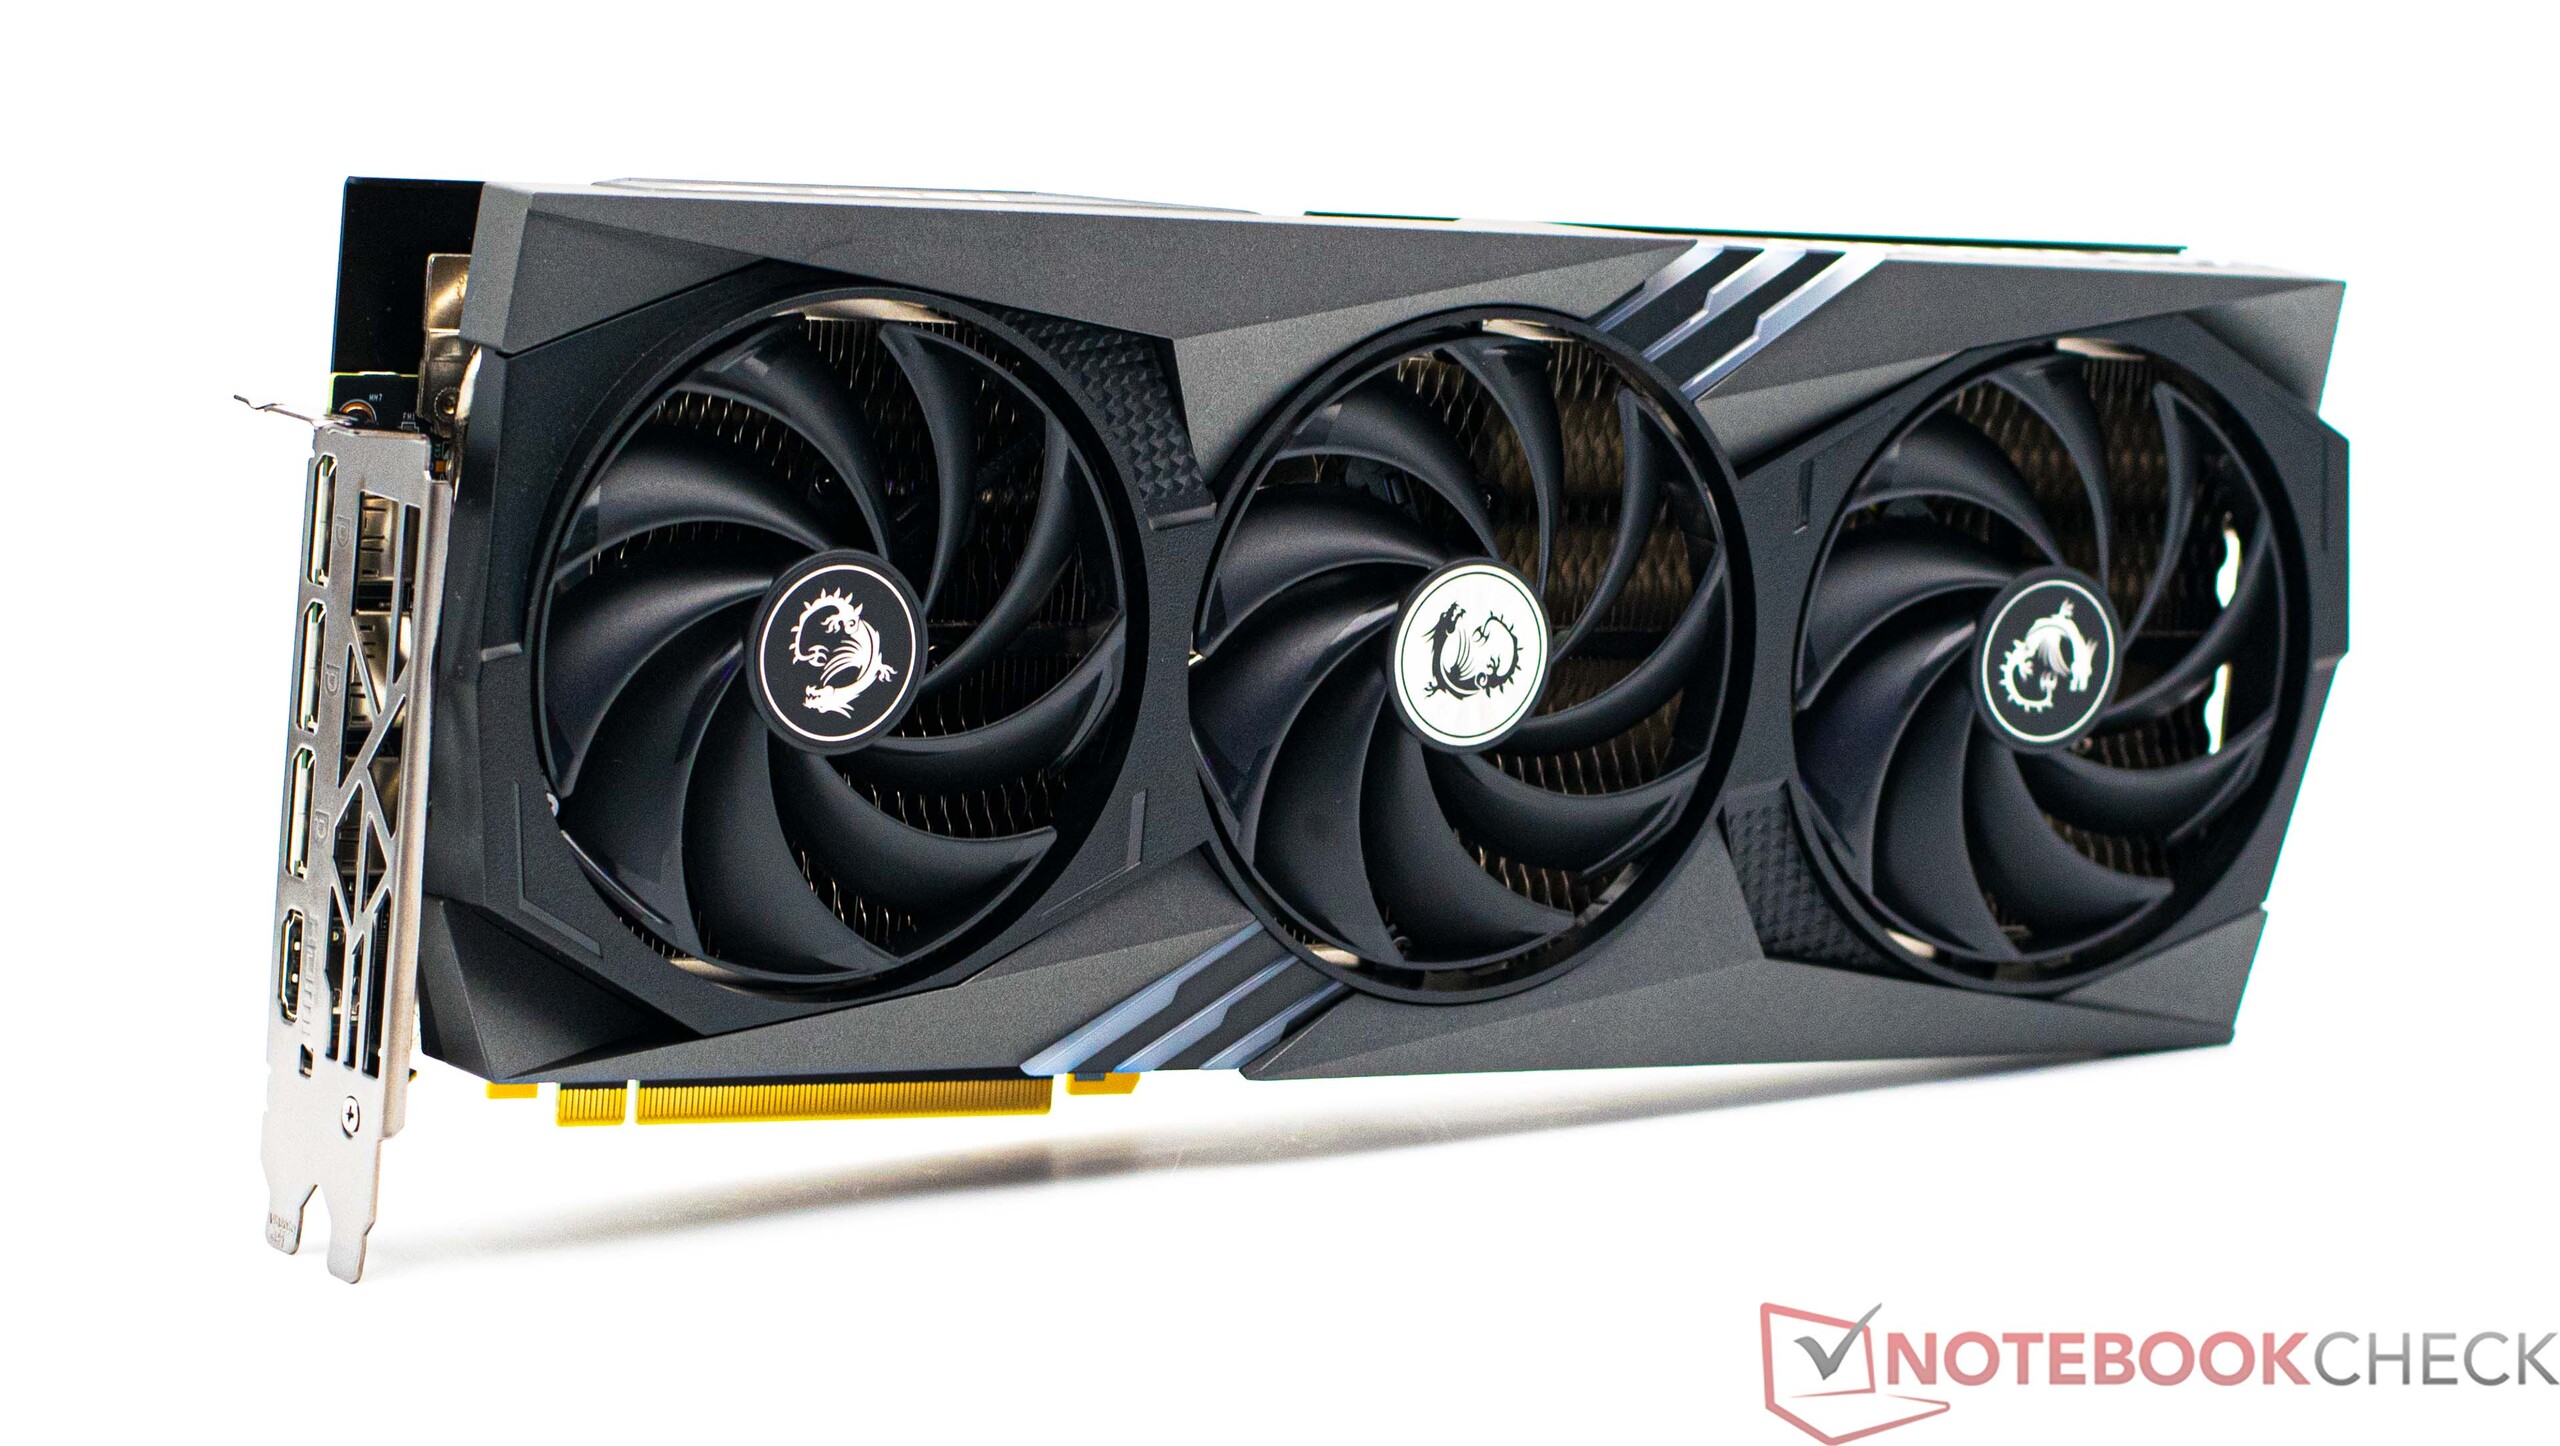
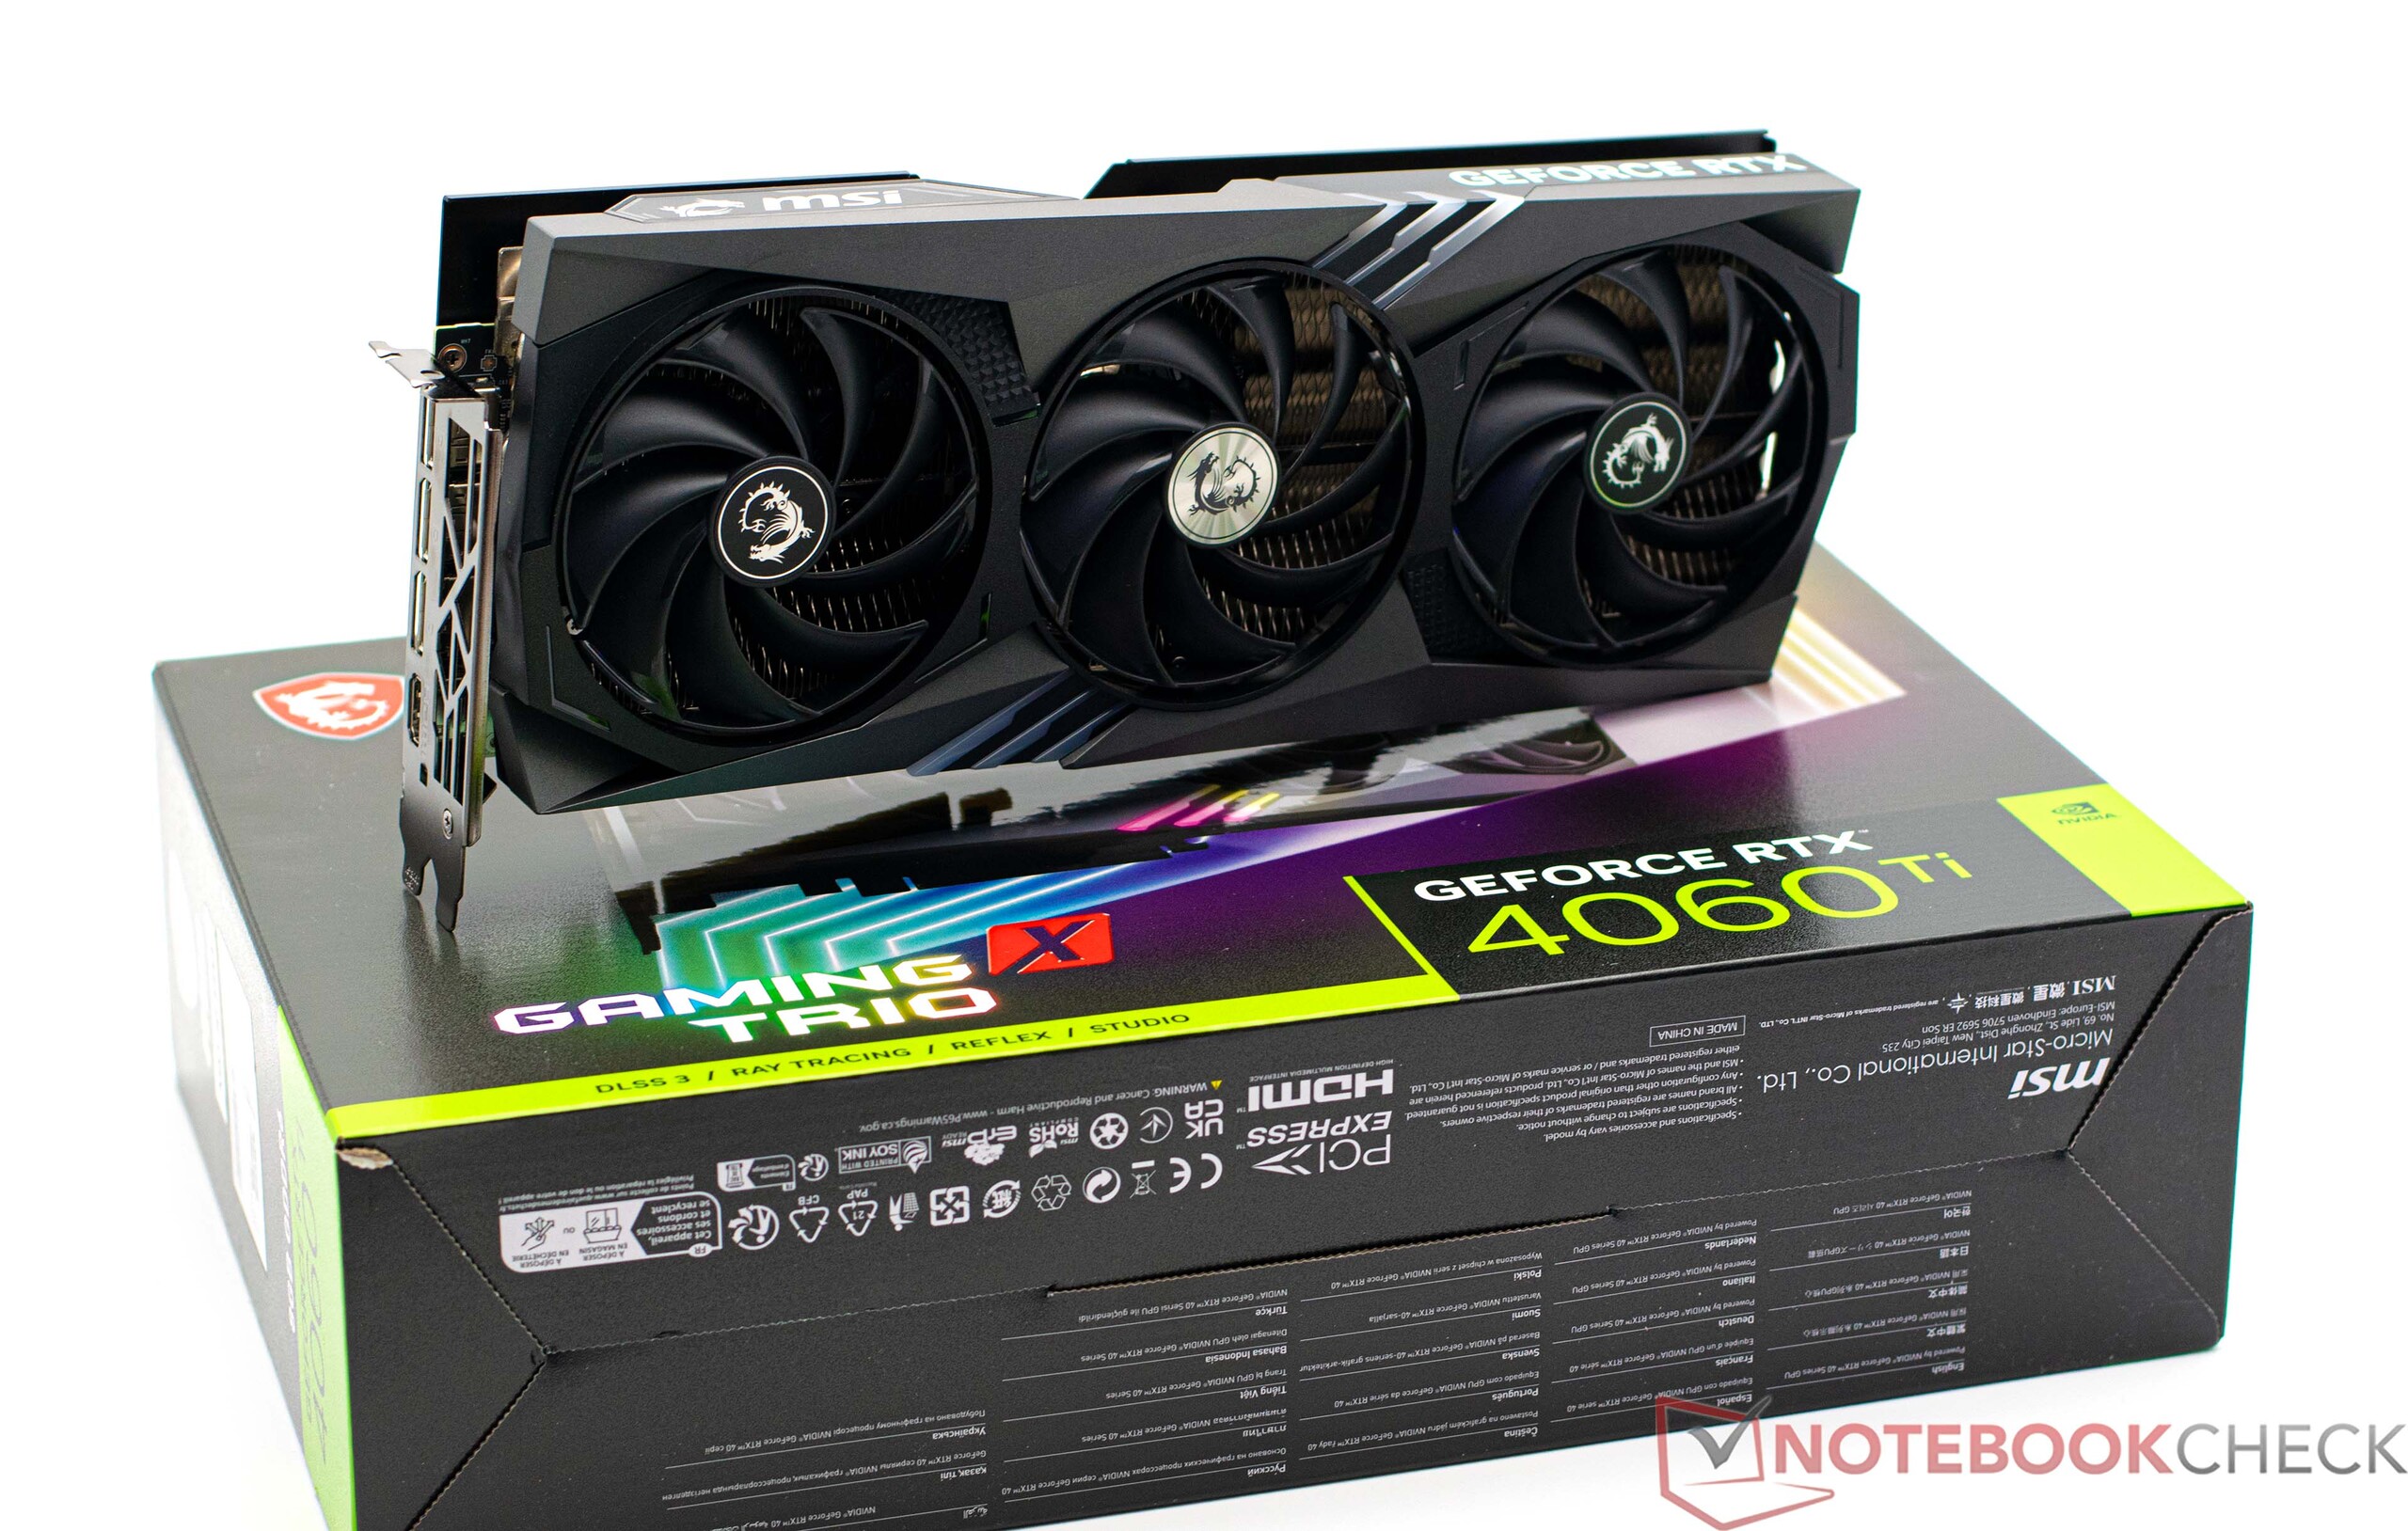
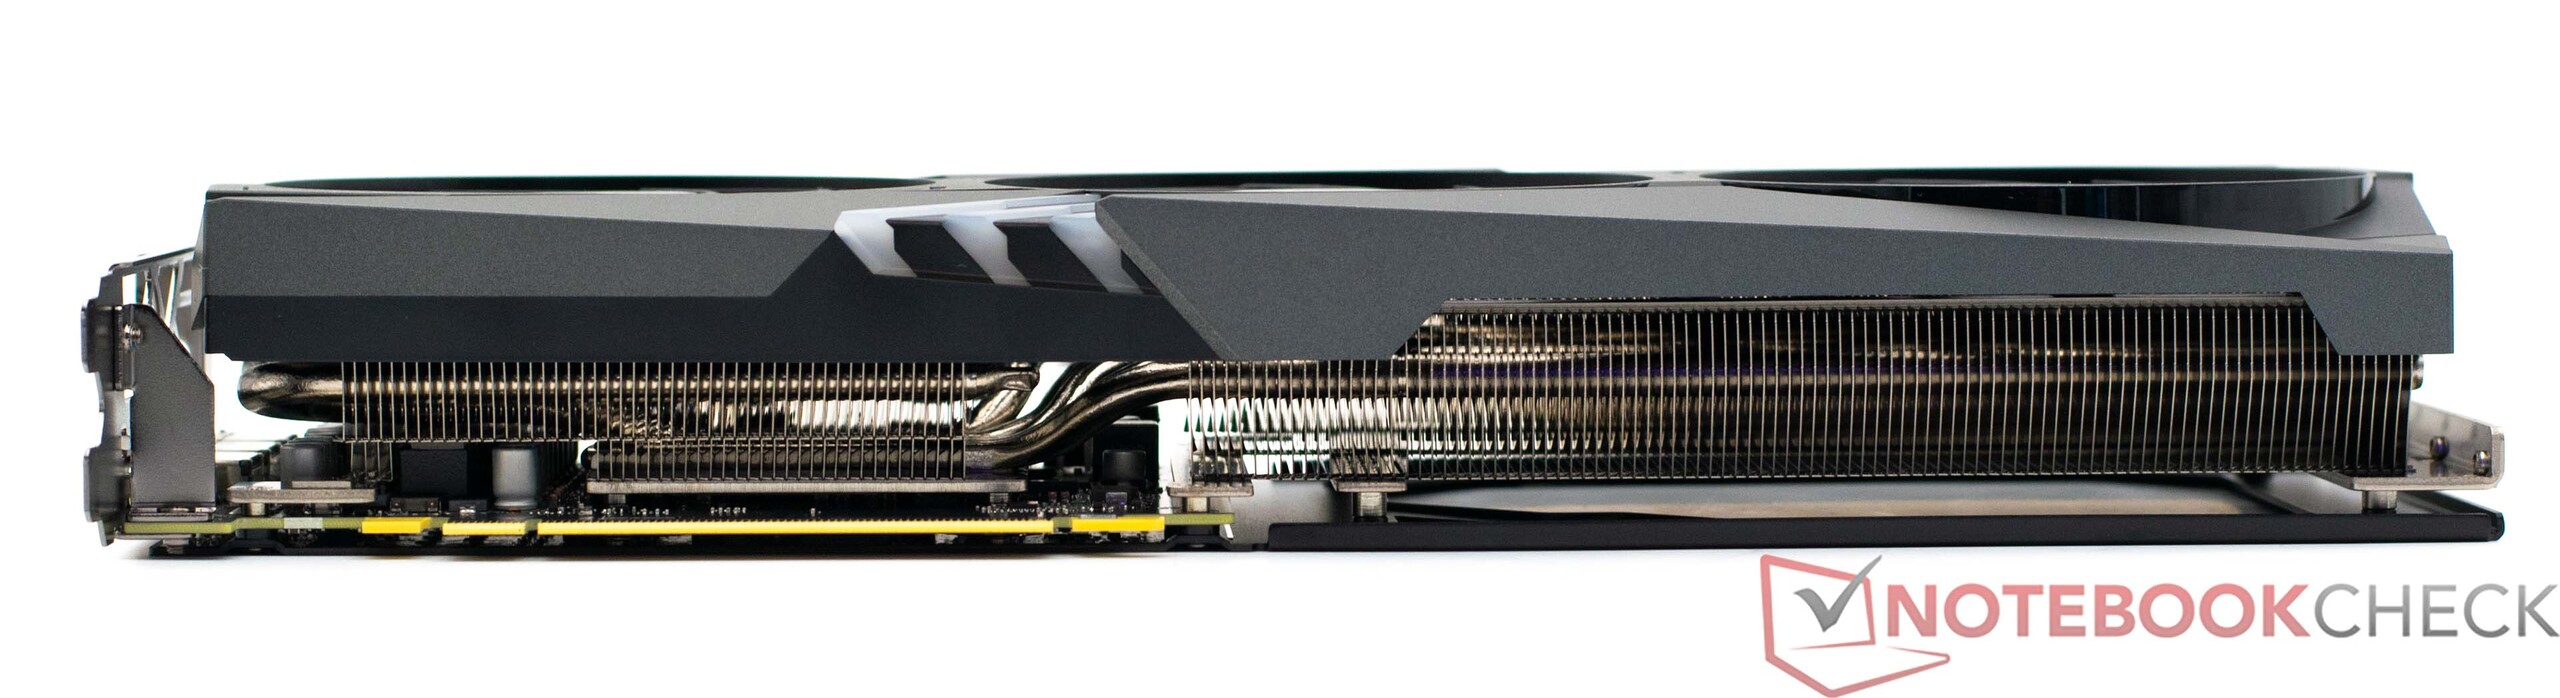
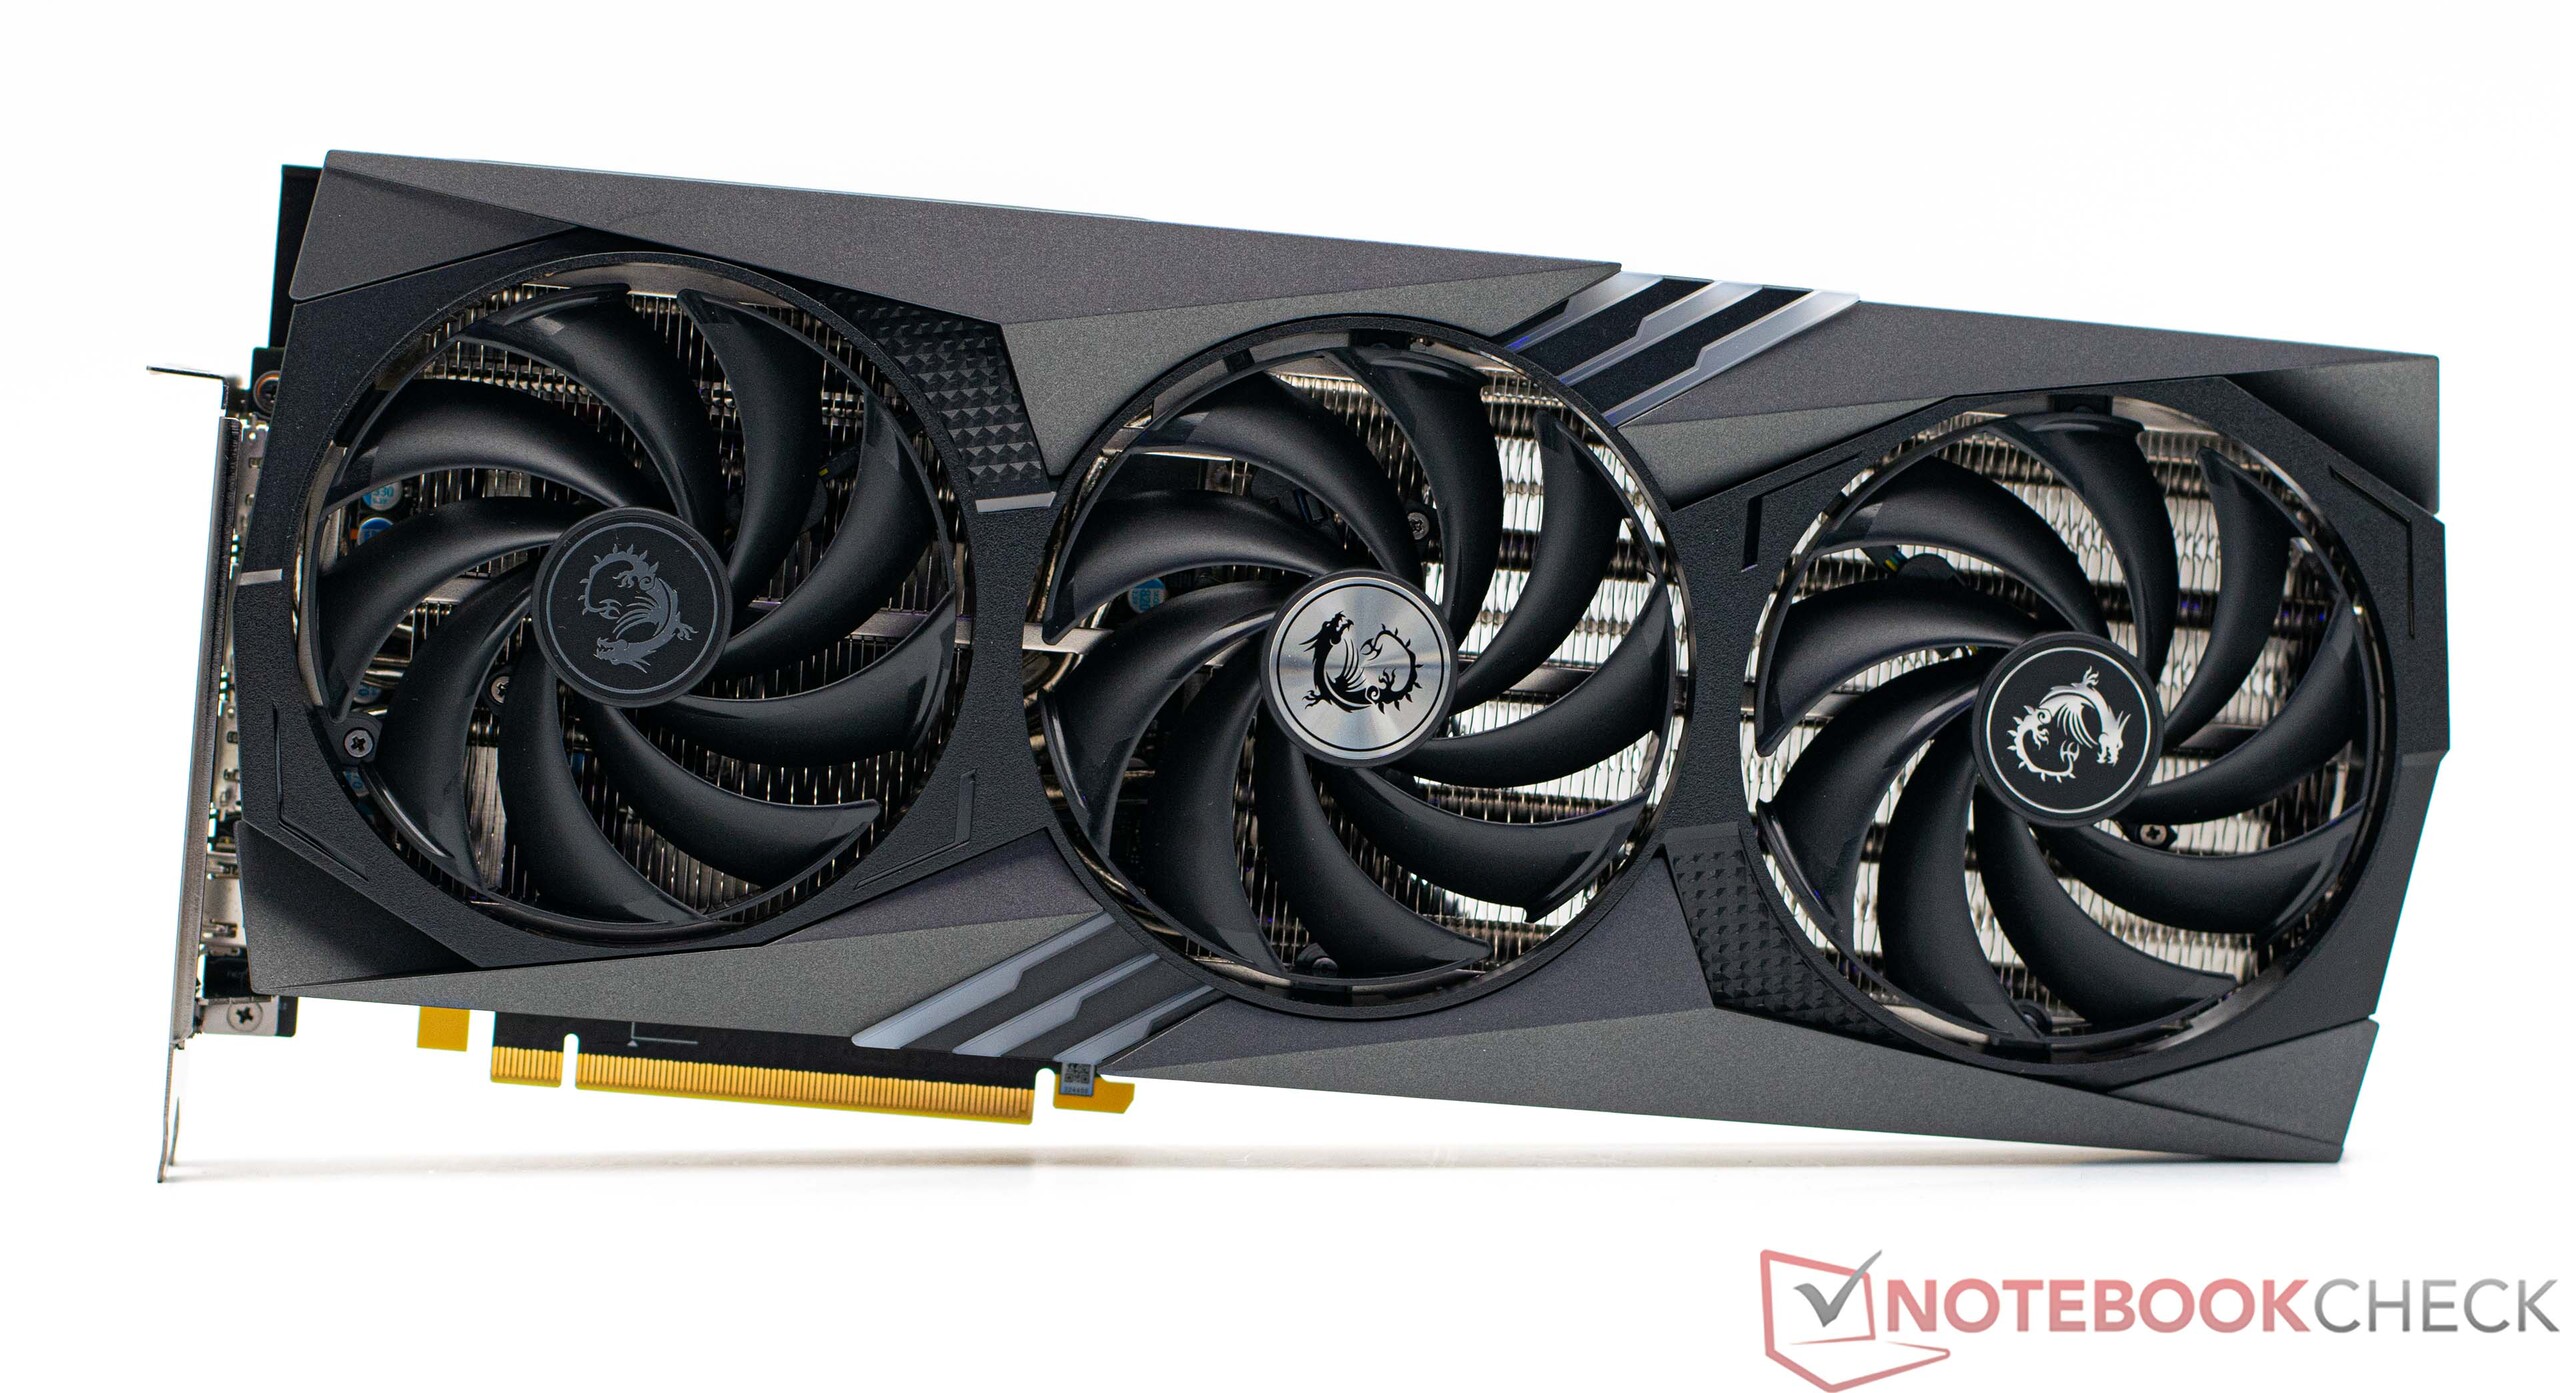
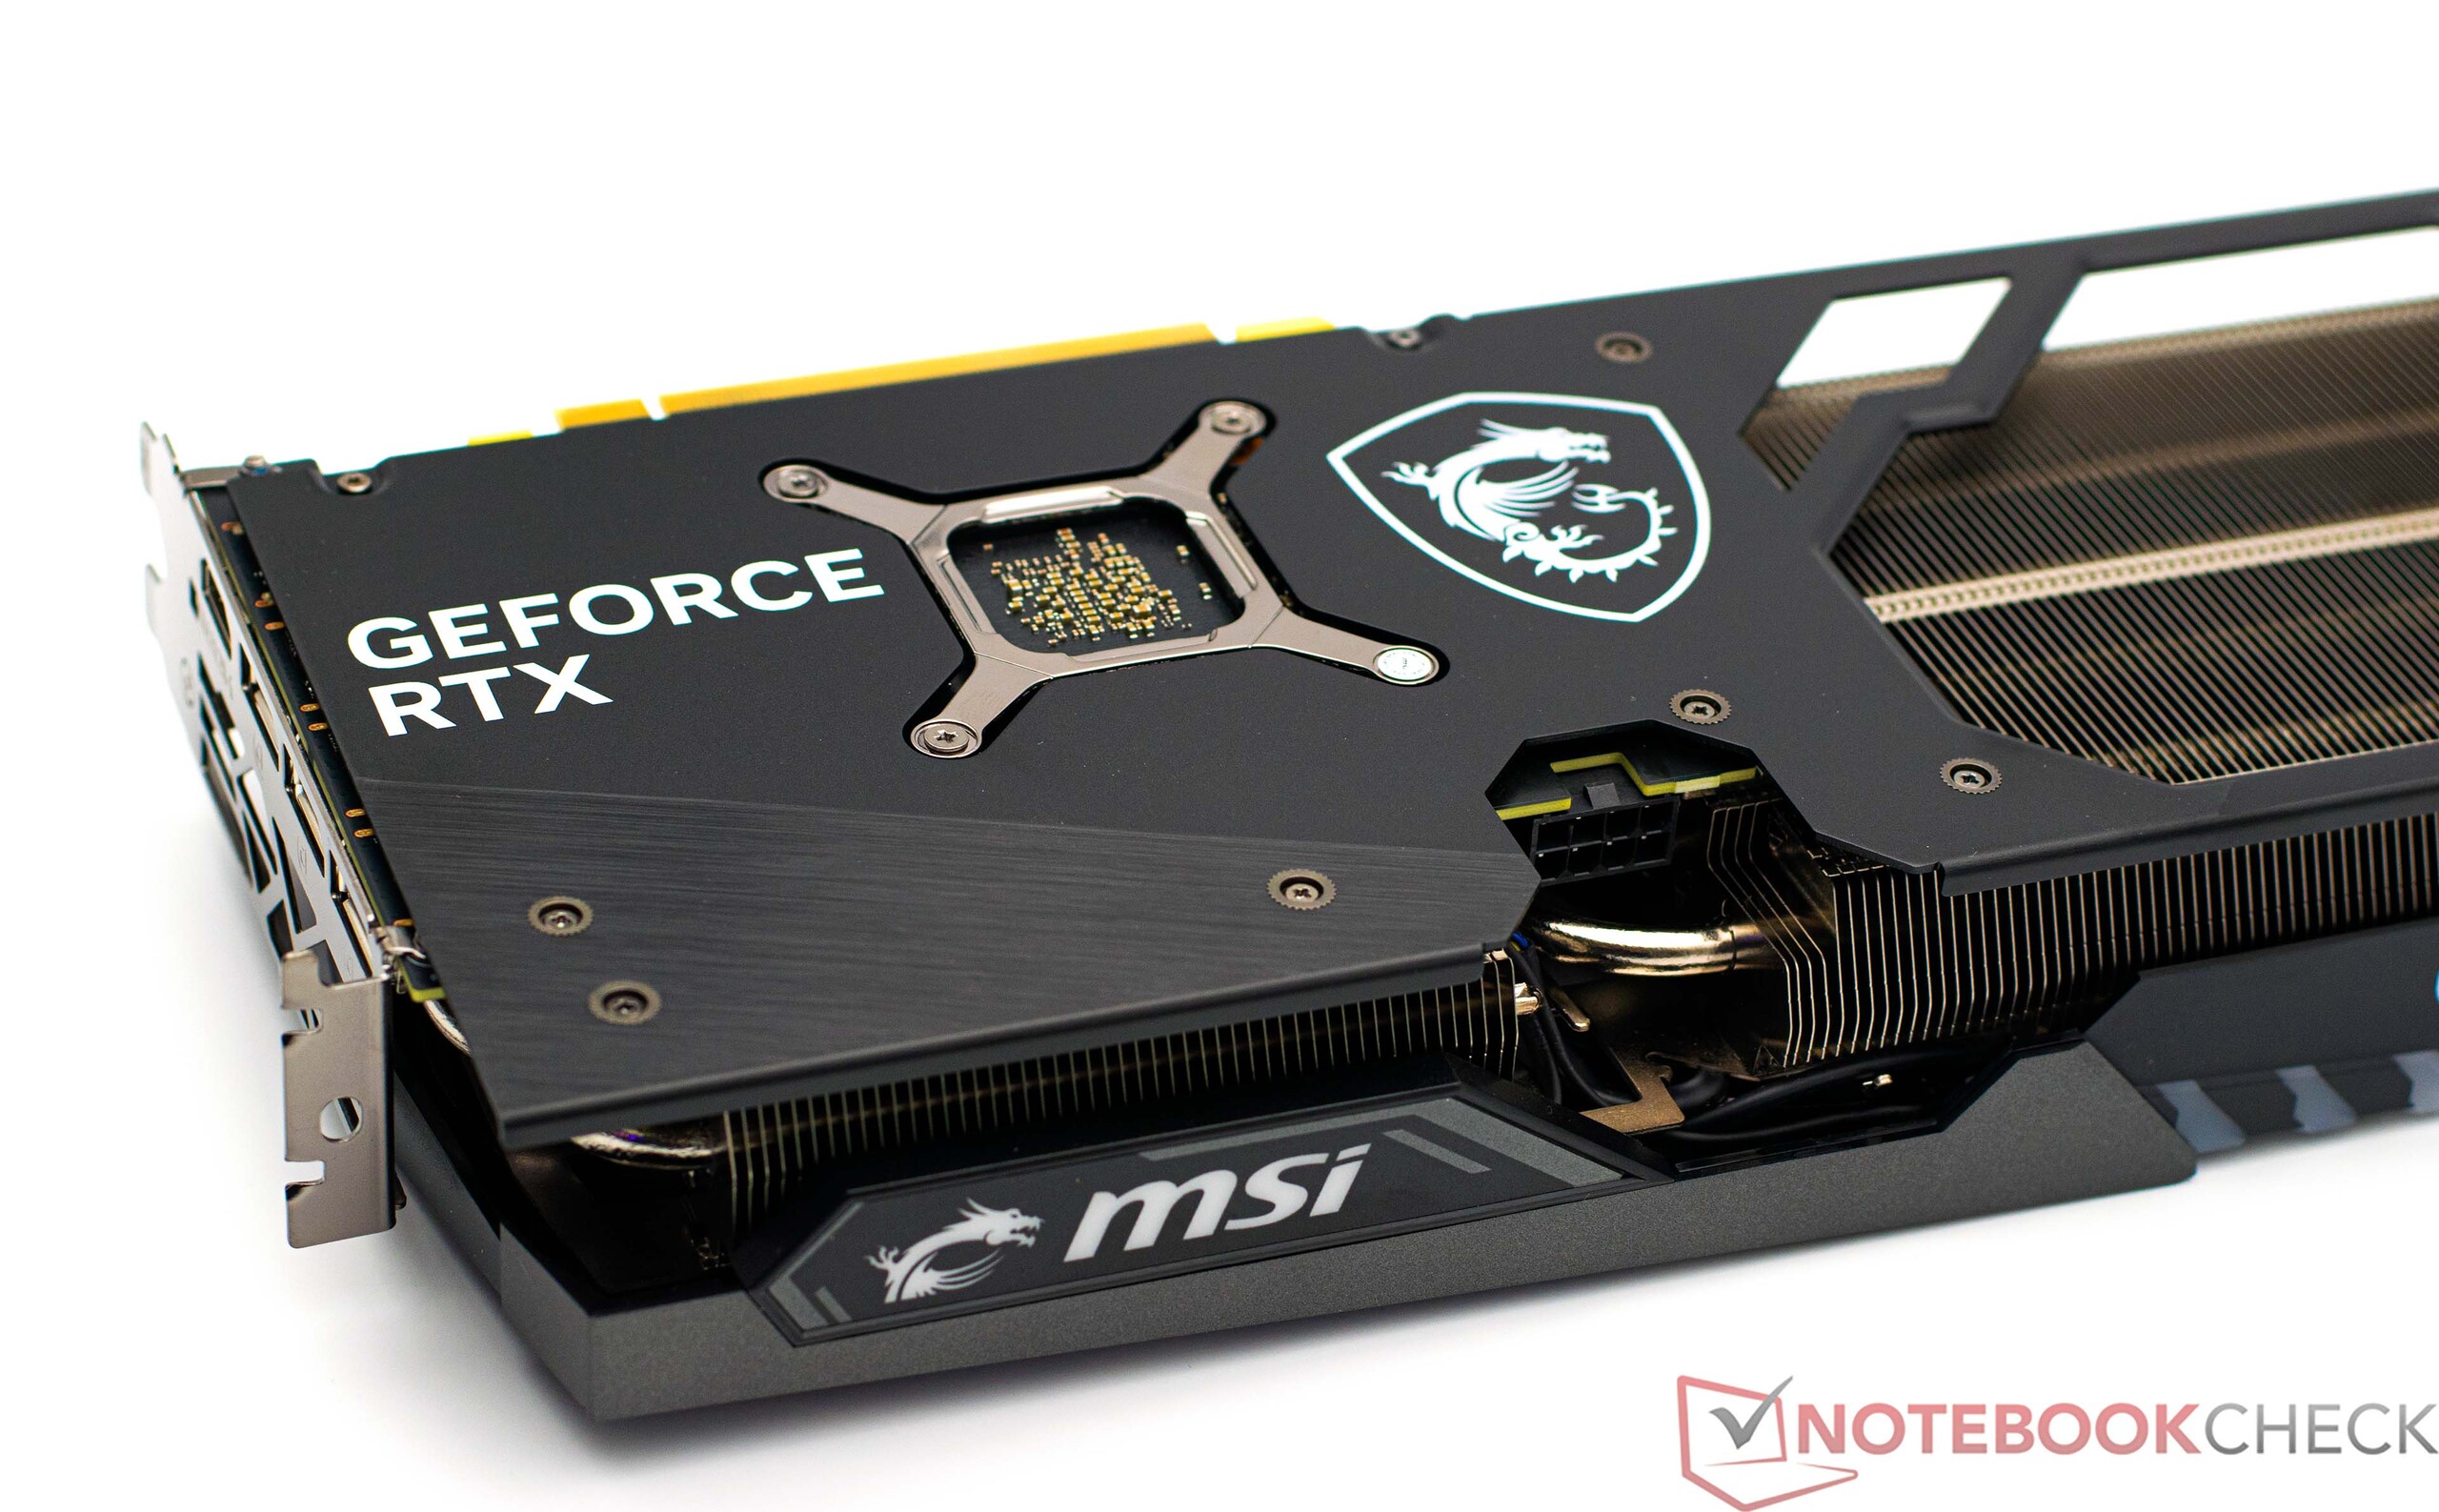
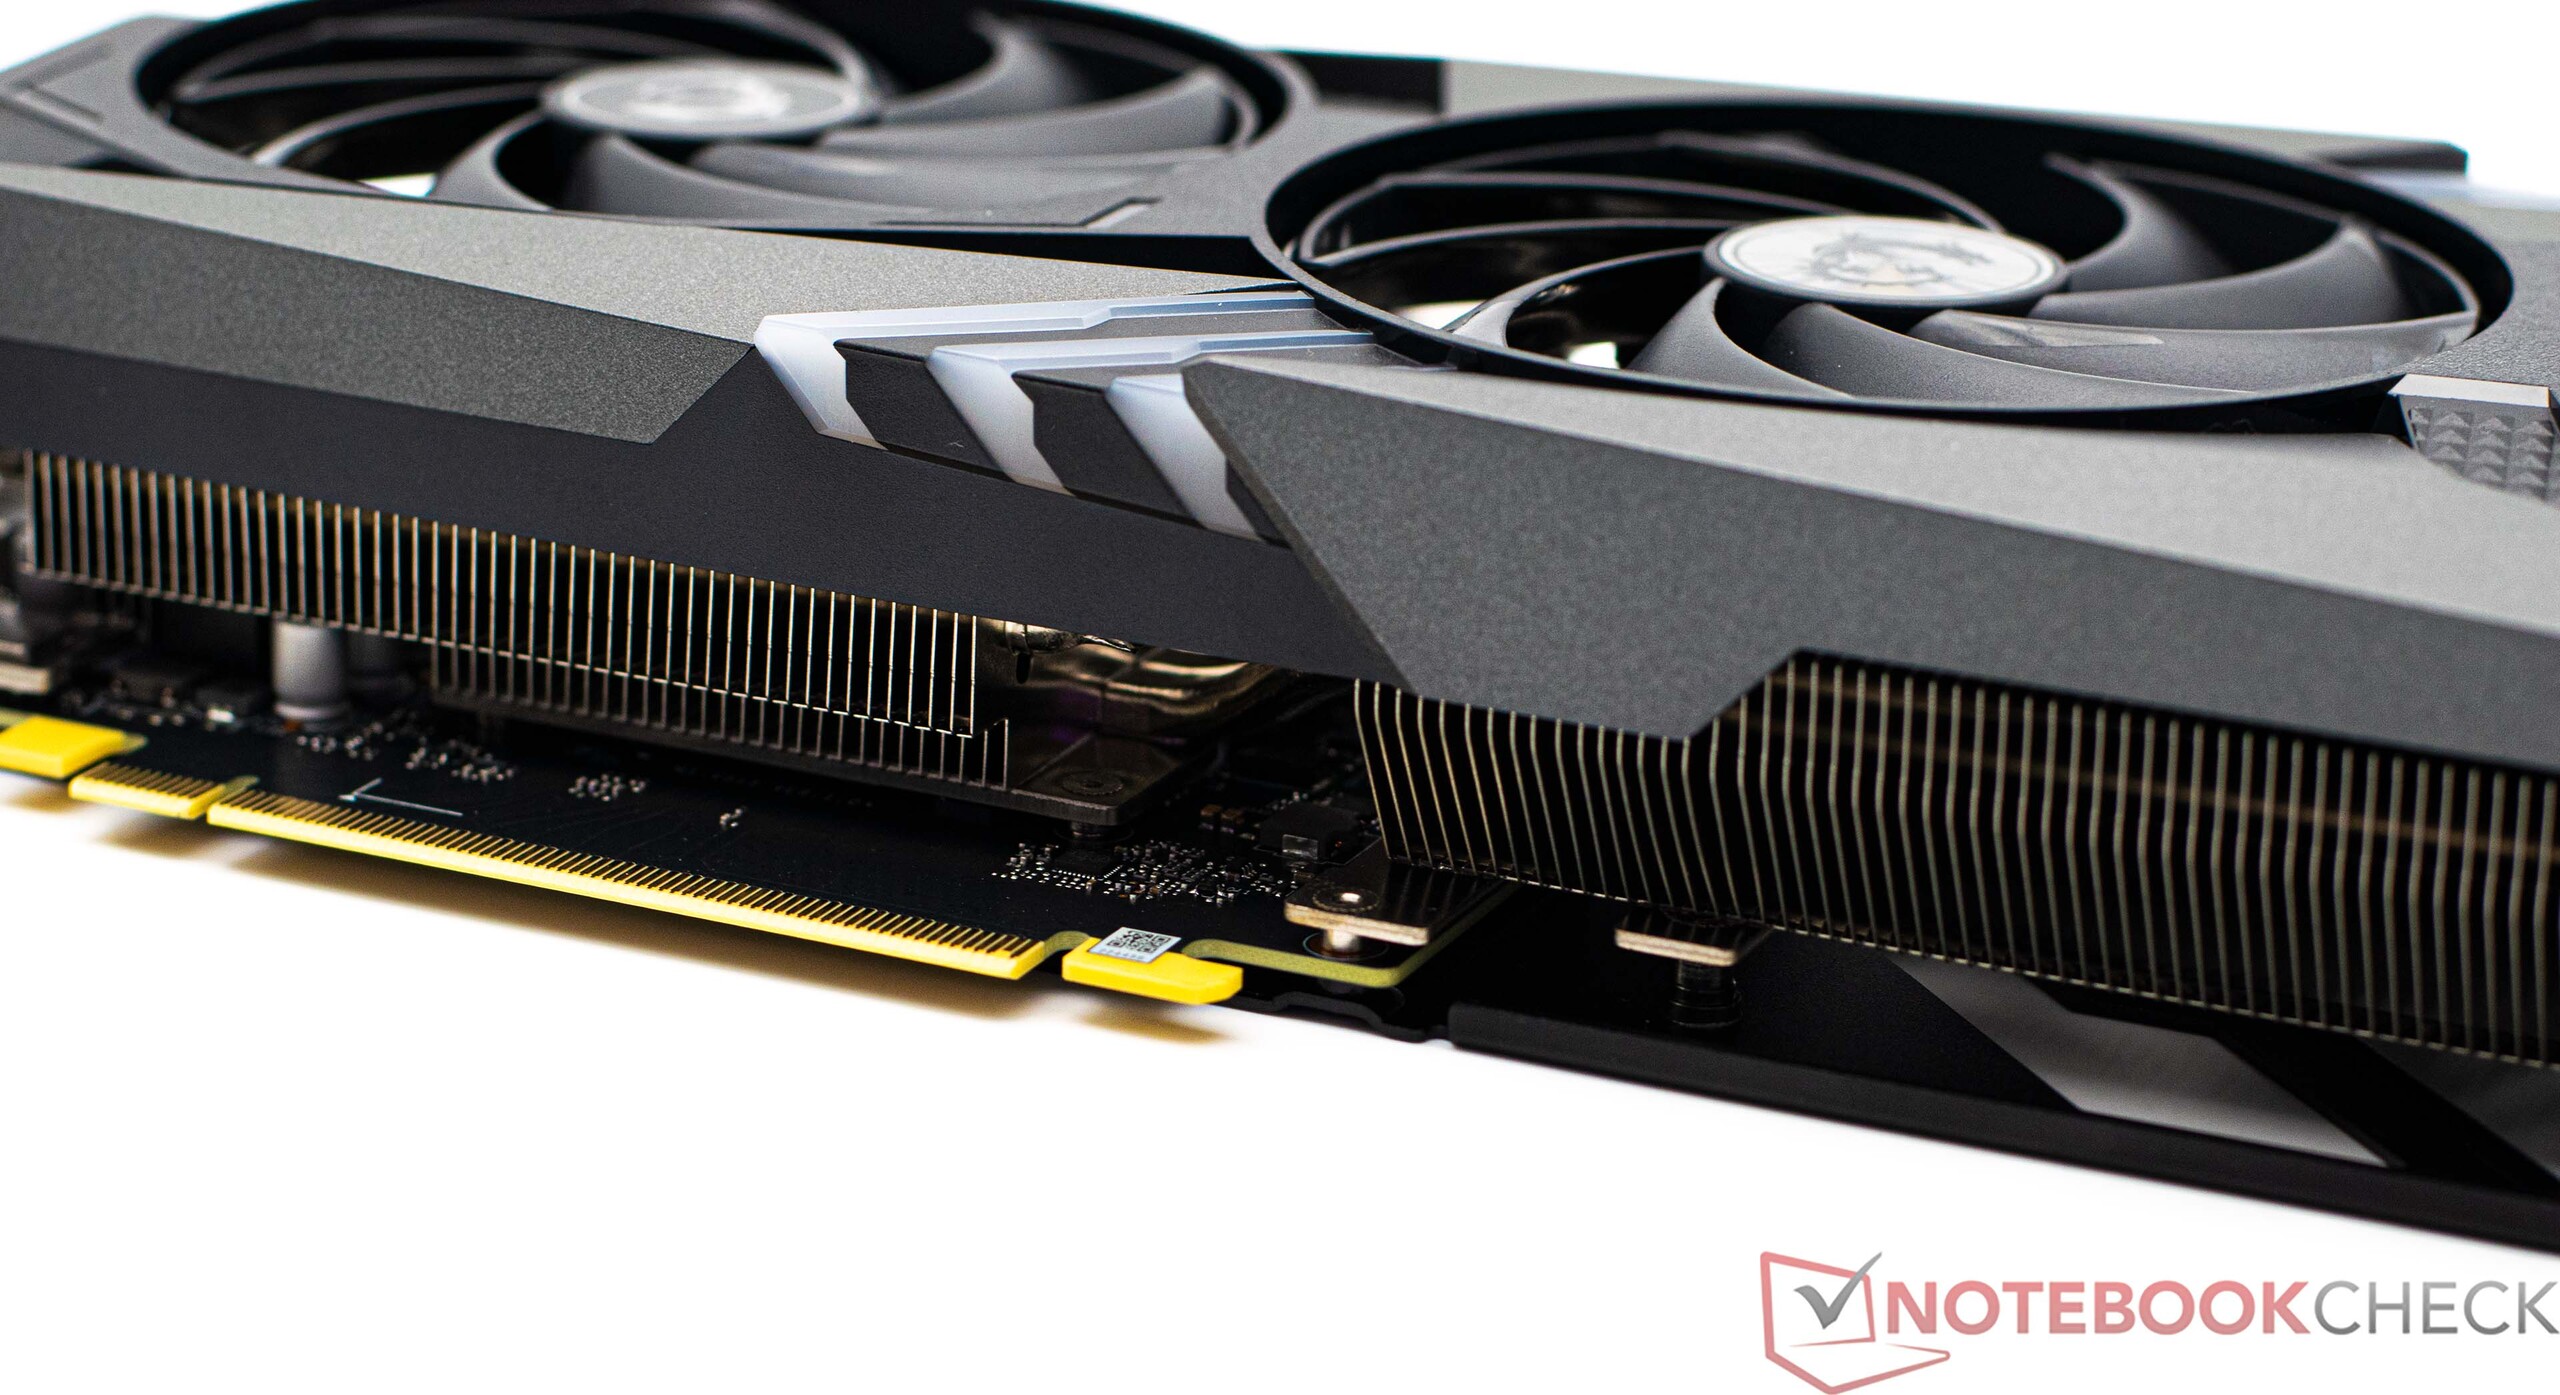
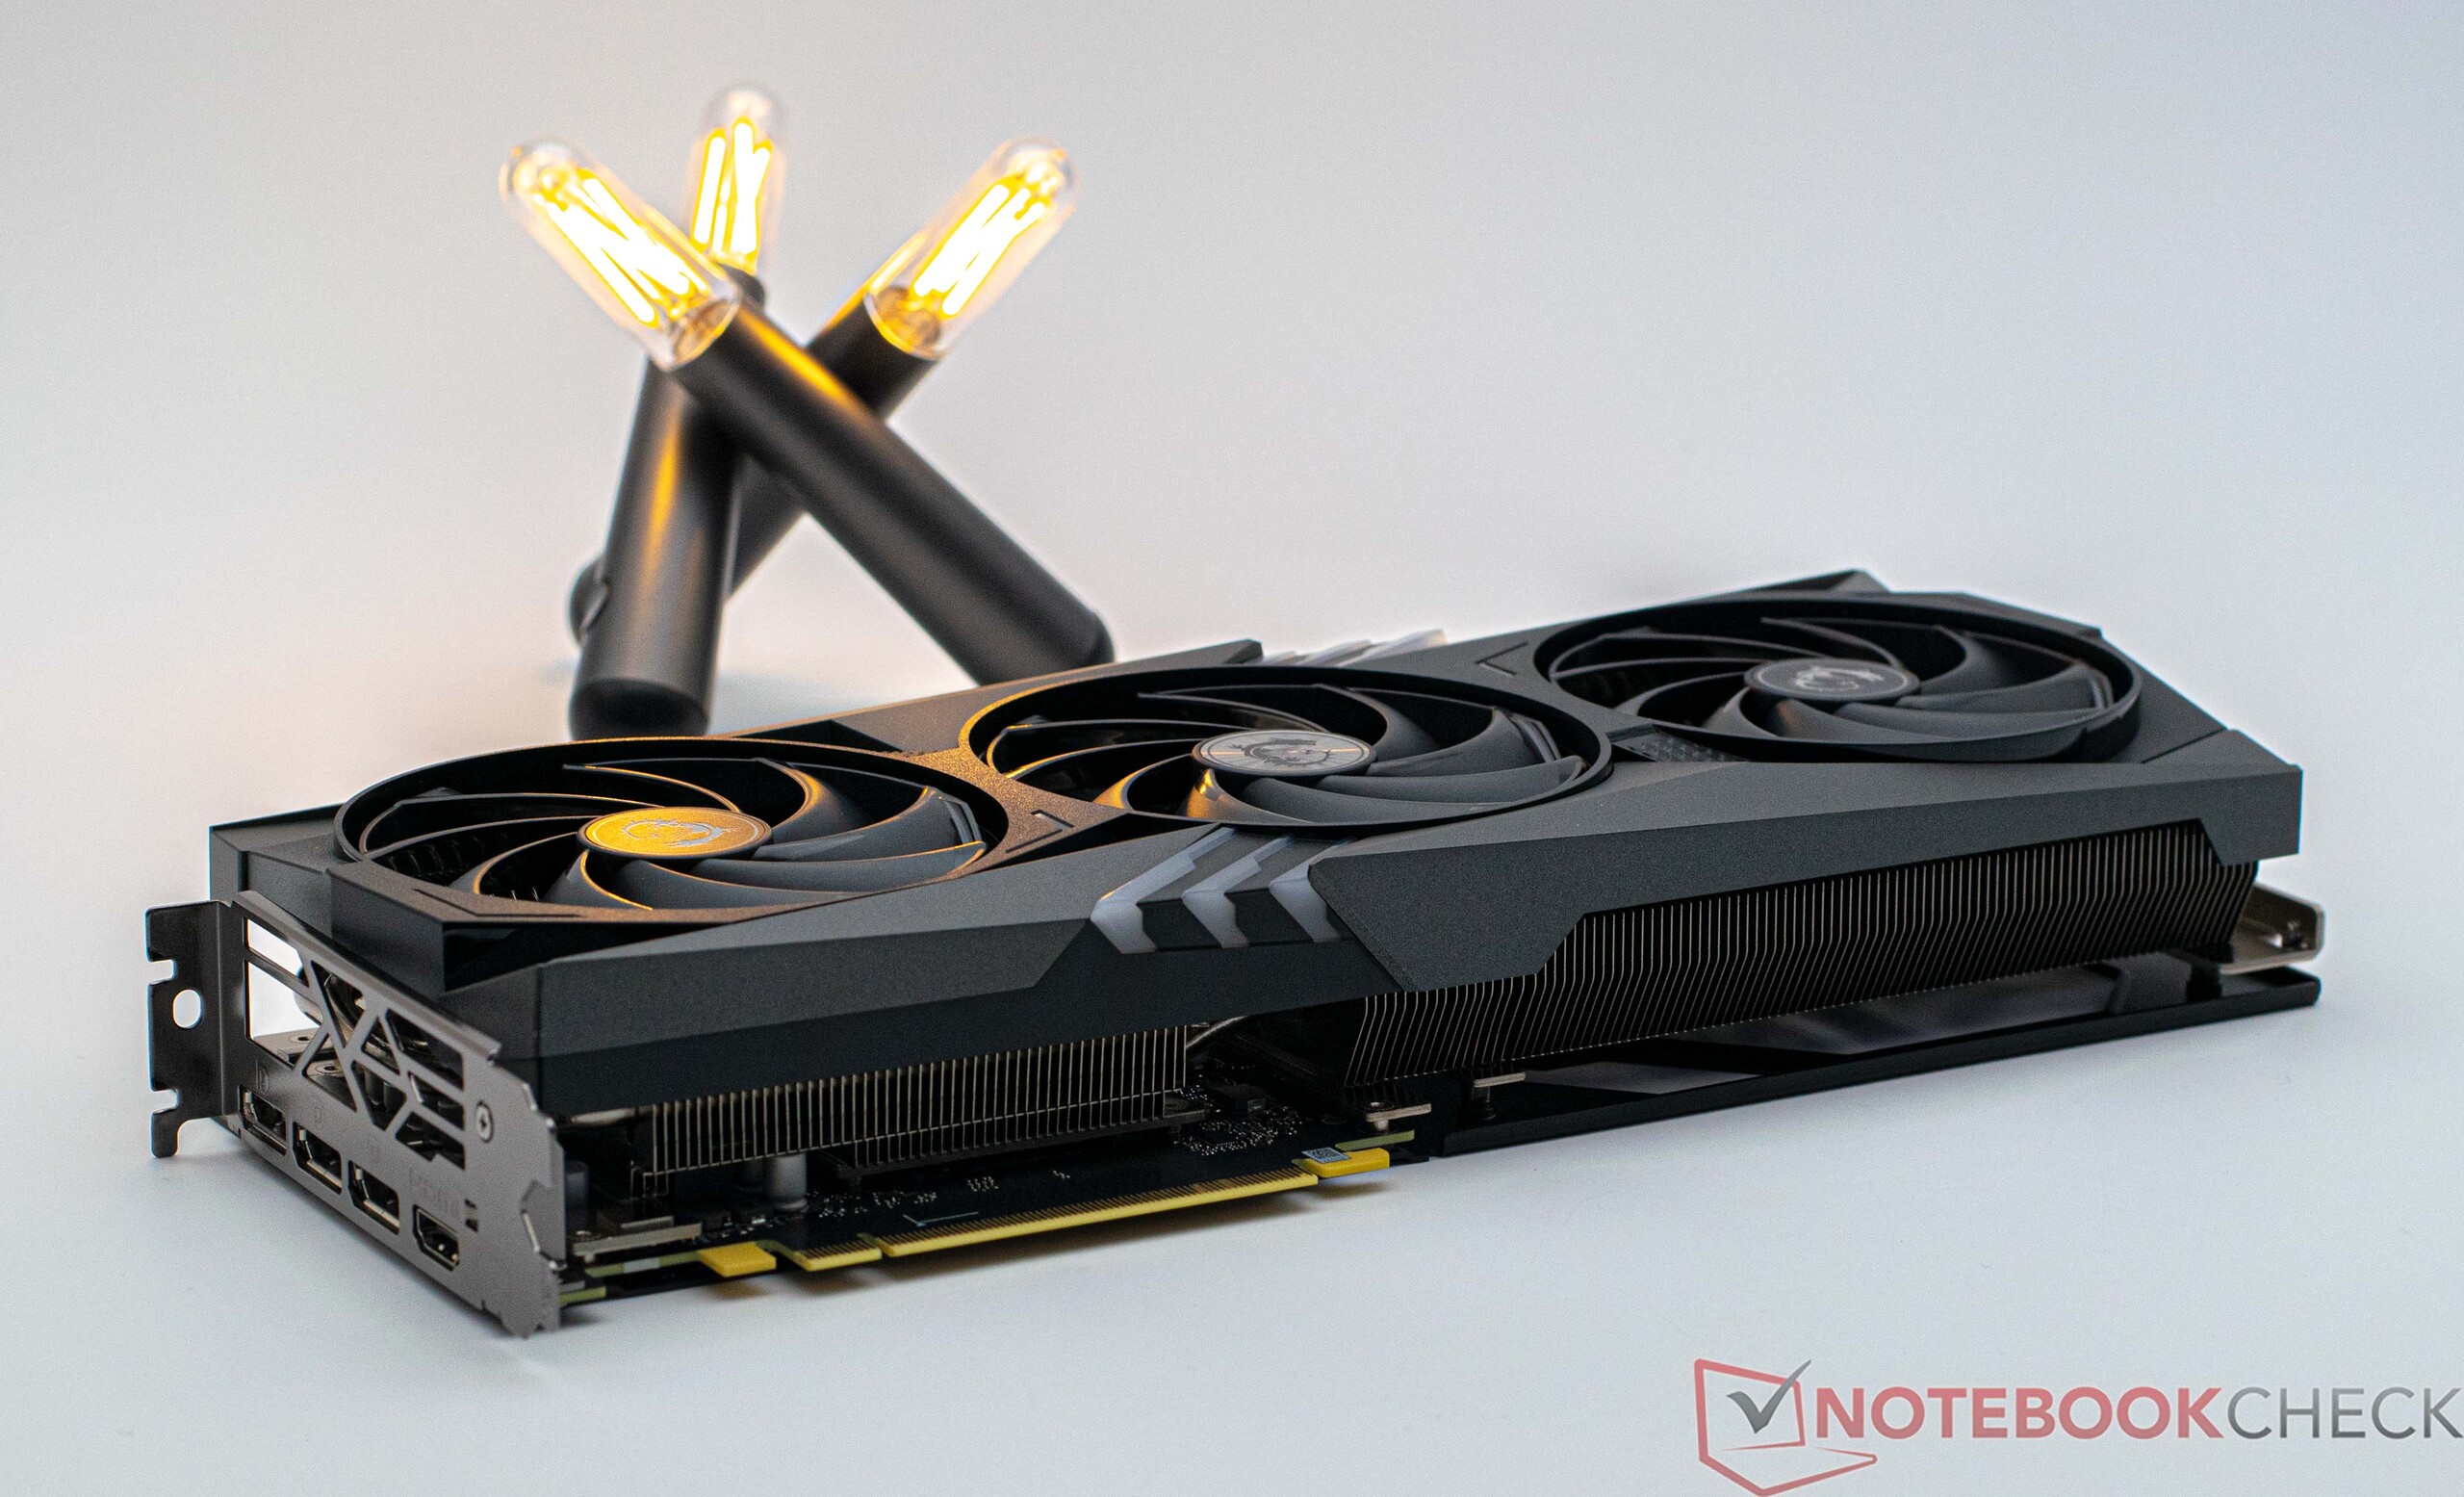
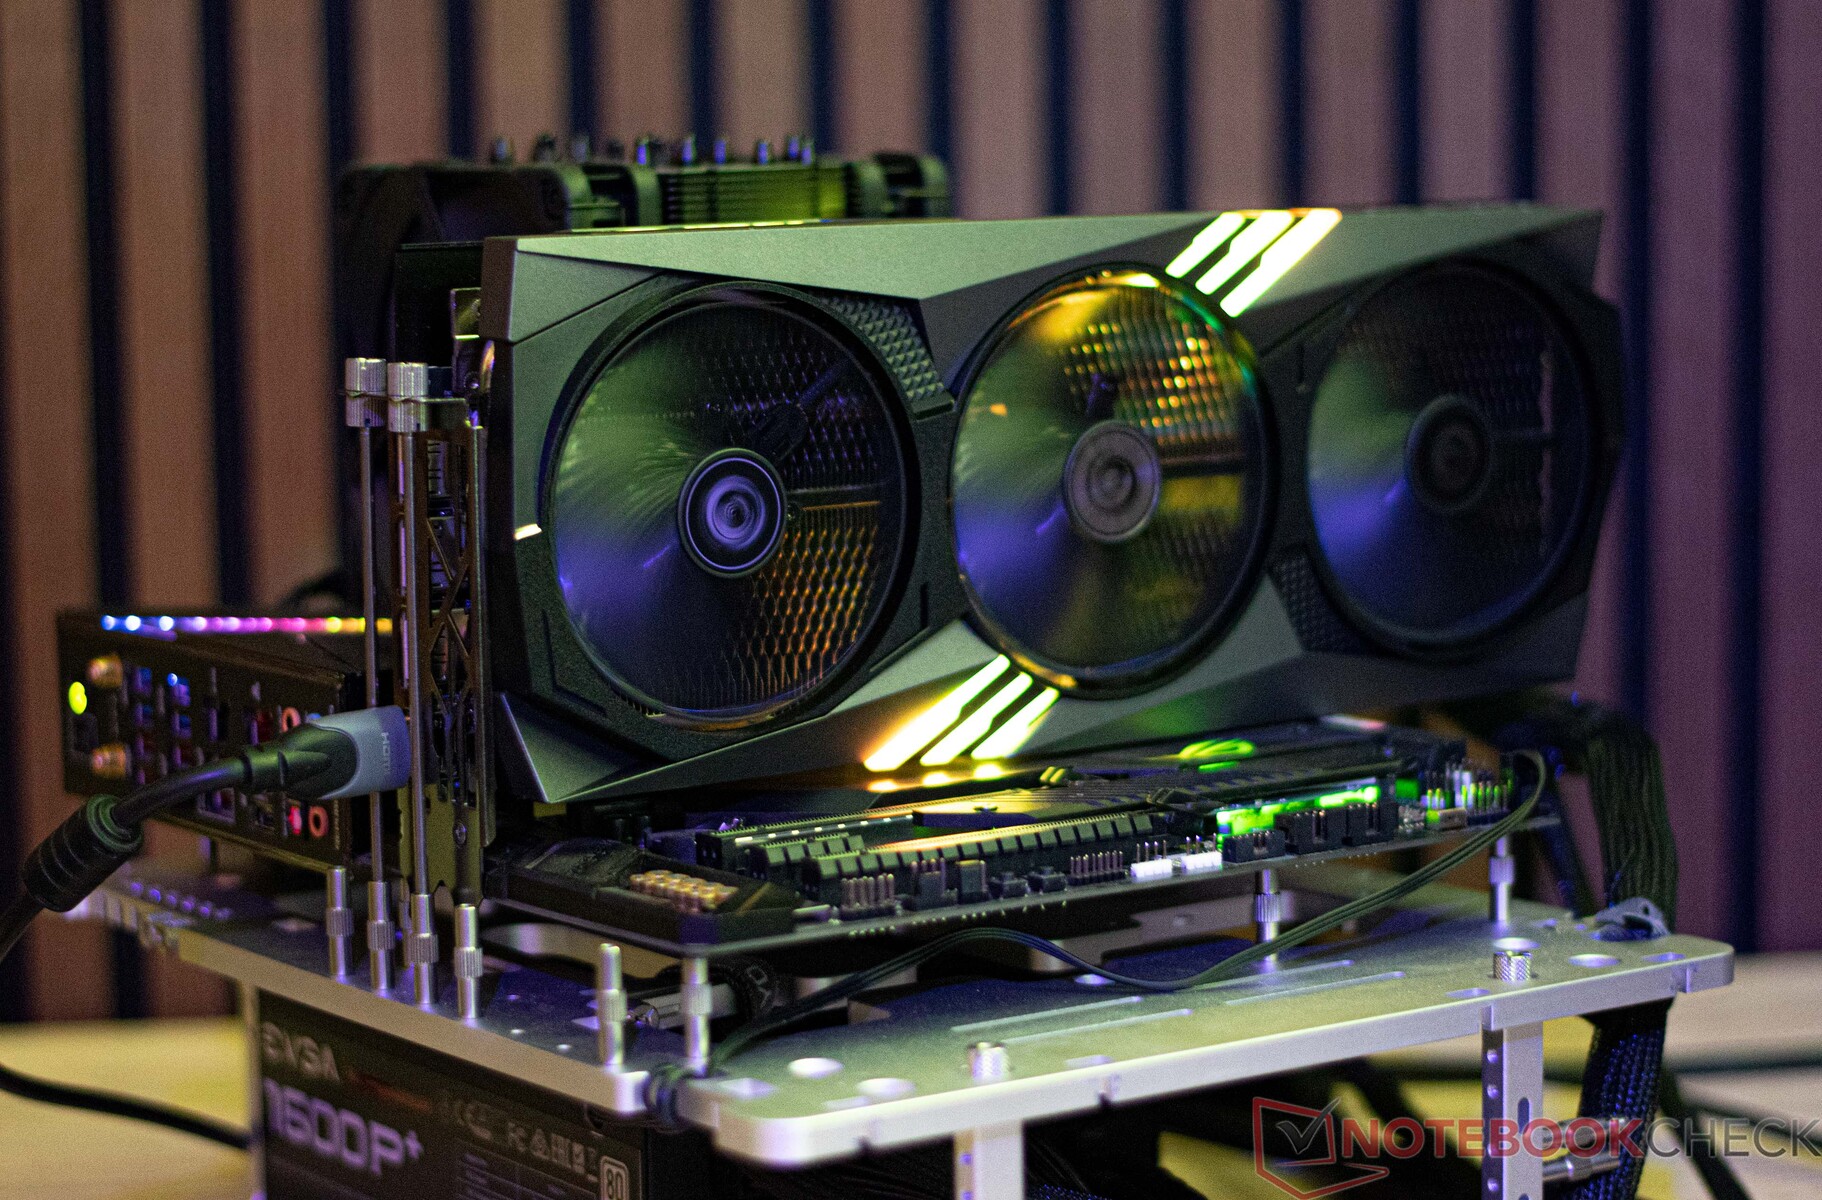
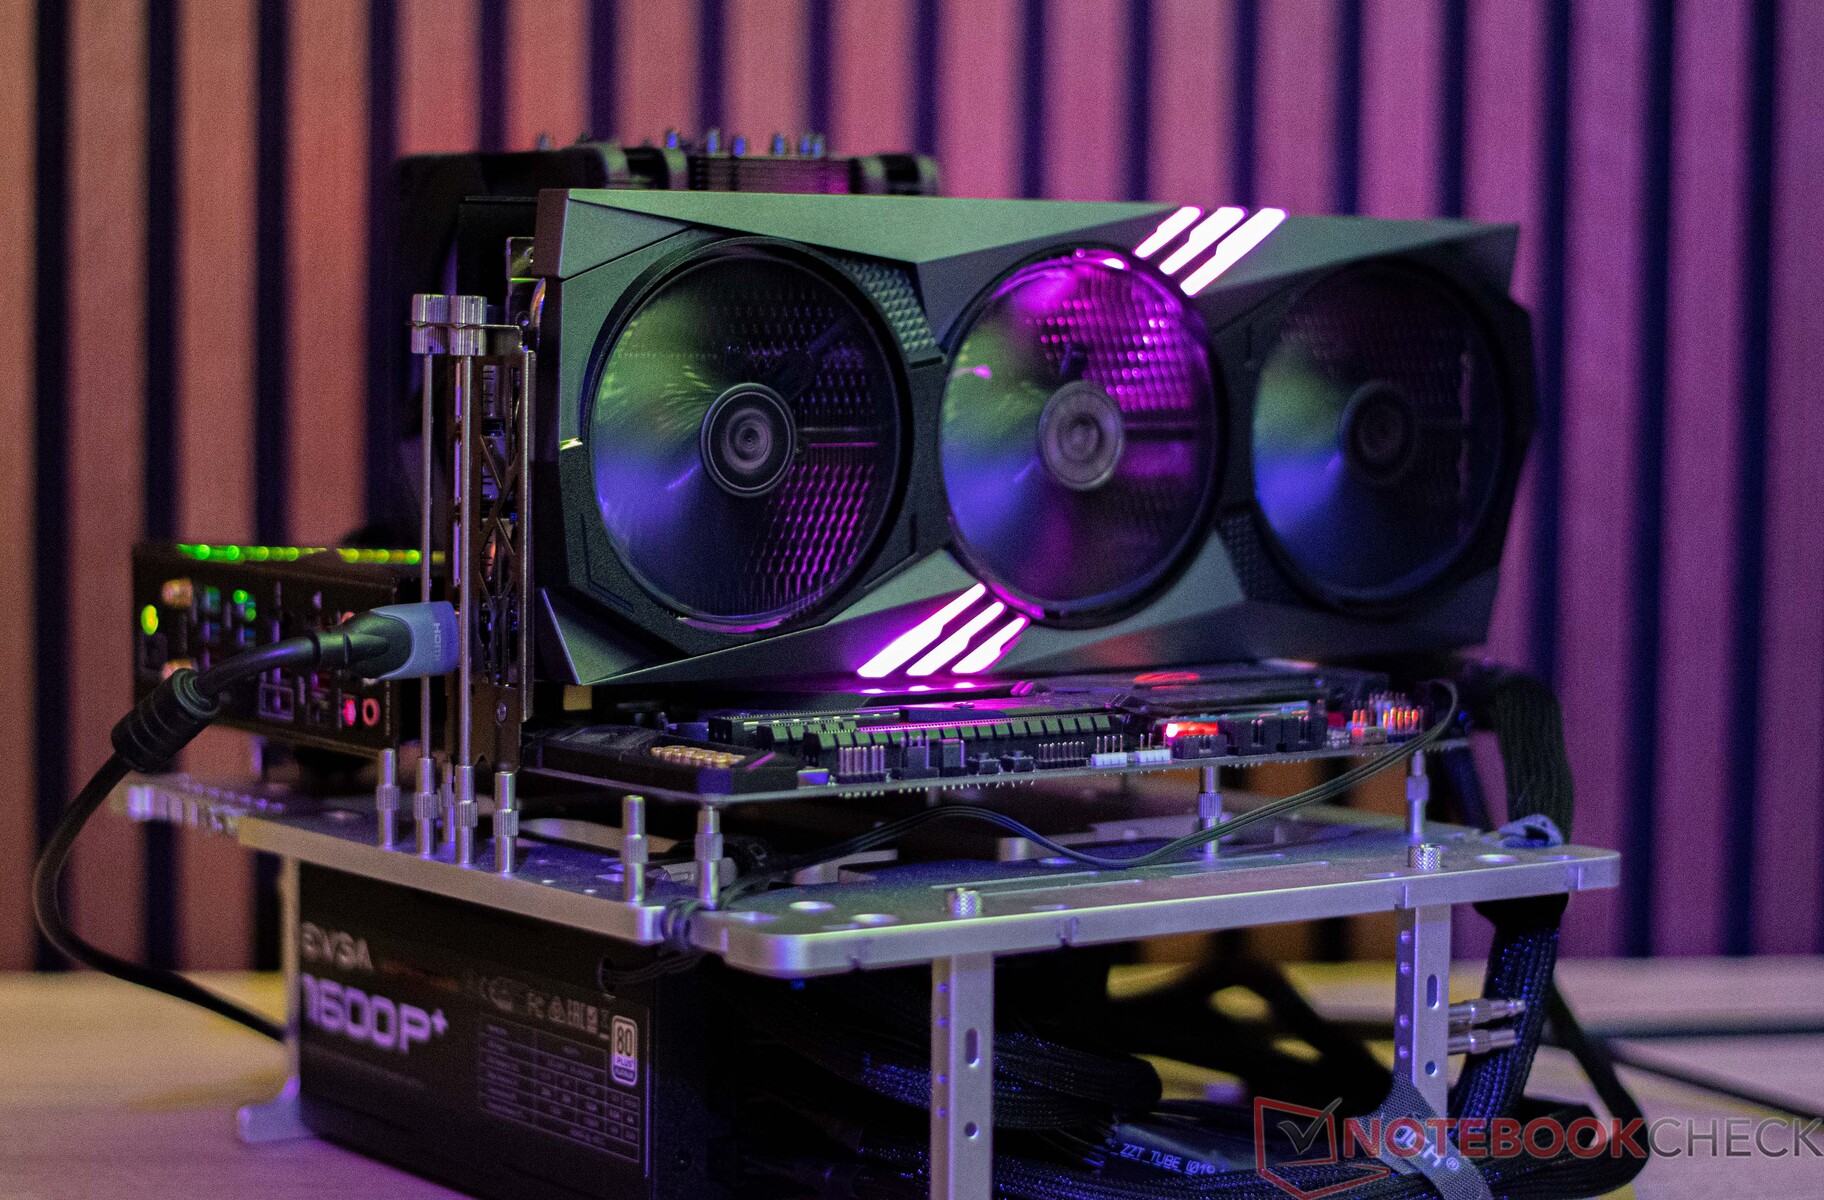
En esta ocasión, nuestra muestra de prueba de la GeForce RTX 4060 Ti está fabricada por MSI. Para ser precisos, se trata del modelo tope de gama del fabricante, concretamente la versión Gaming X Trio. A pesar de su bajo consumo de sólo 160 vatios, el sistema de refrigeración integrado es extremadamente grande, lo que promete un funcionamiento muy silencioso. De hecho, su tamaño es incluso mayor que el de nuestra GeForce RTX 4090 de Palit. En anchura, la MSI GeForce RTX 4060 Ti ocupa 2,5 ranuras y 3 ventiladores proporcionan aire fresco a la enorme unidad de refrigeración.
No es ningún secreto que Nvidia ha actuado un poco tacaño en el pasado cuando se trataba de VRAM dentro de sus tarjetas de gama media. Por ejemplo, la Nvidia GeForce RTX 3060 Ti sólo tenía 8 GB. Ahora, la GeForce RTX 4060 Ti también solo tiene 8 GB. Sin embargo, ya han anunciado modelos de 16 GB y deberían llegar al mercado muy pronto. Pero, ¿hasta qué punto es importante una VRAM grande? Al fin y al cabo, se supone que la GeForce RTX 4060 Ti solo cubre los juegos a 1.080p. La zona de 1.440p la cubren los modelos que incorporan el chip RTX 4070 y los dos modelos de gama alta, la RTX 4080 y la RTX 4090, se encargan de los juegos UHD.
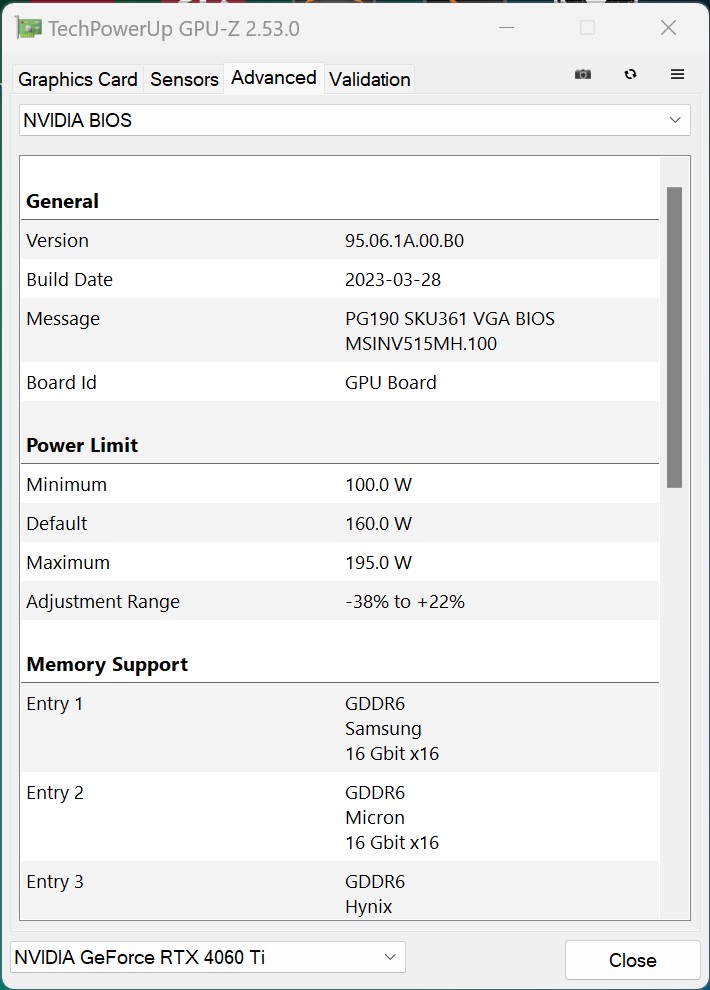
Como ya se ha mencionado, sus dimensiones de 33,8 cm ya son extremadamente grandes y estas requerirán la carcasa adecuada. Al mismo tiempo, su PCB (placa de circuito impreso) mide solo la mitad. El bajo consumo de la GPU no sobrecarga la fuente de alimentación. Nuestra muestra de prueba viene con un conector de alimentación PCIe de 6+2 pines. El modelo de Nvidia, la Founders Edition, viene con una conexión 12VHPWR.
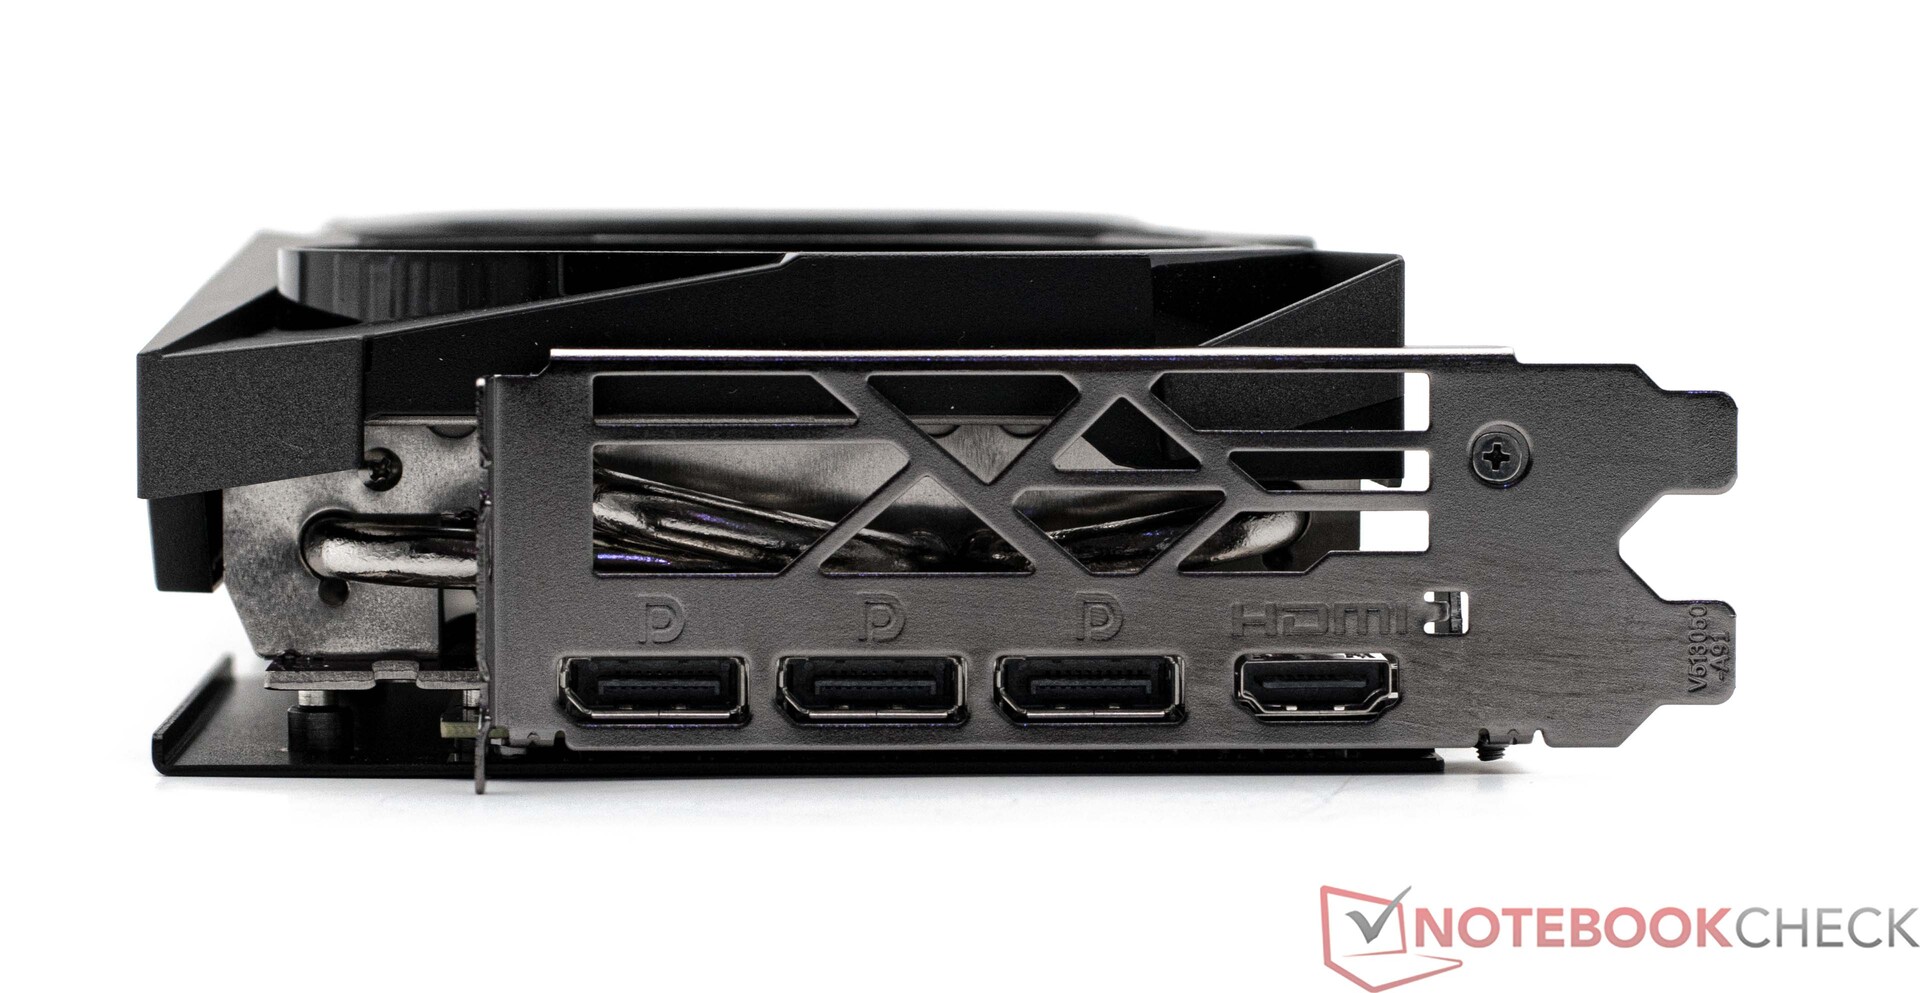
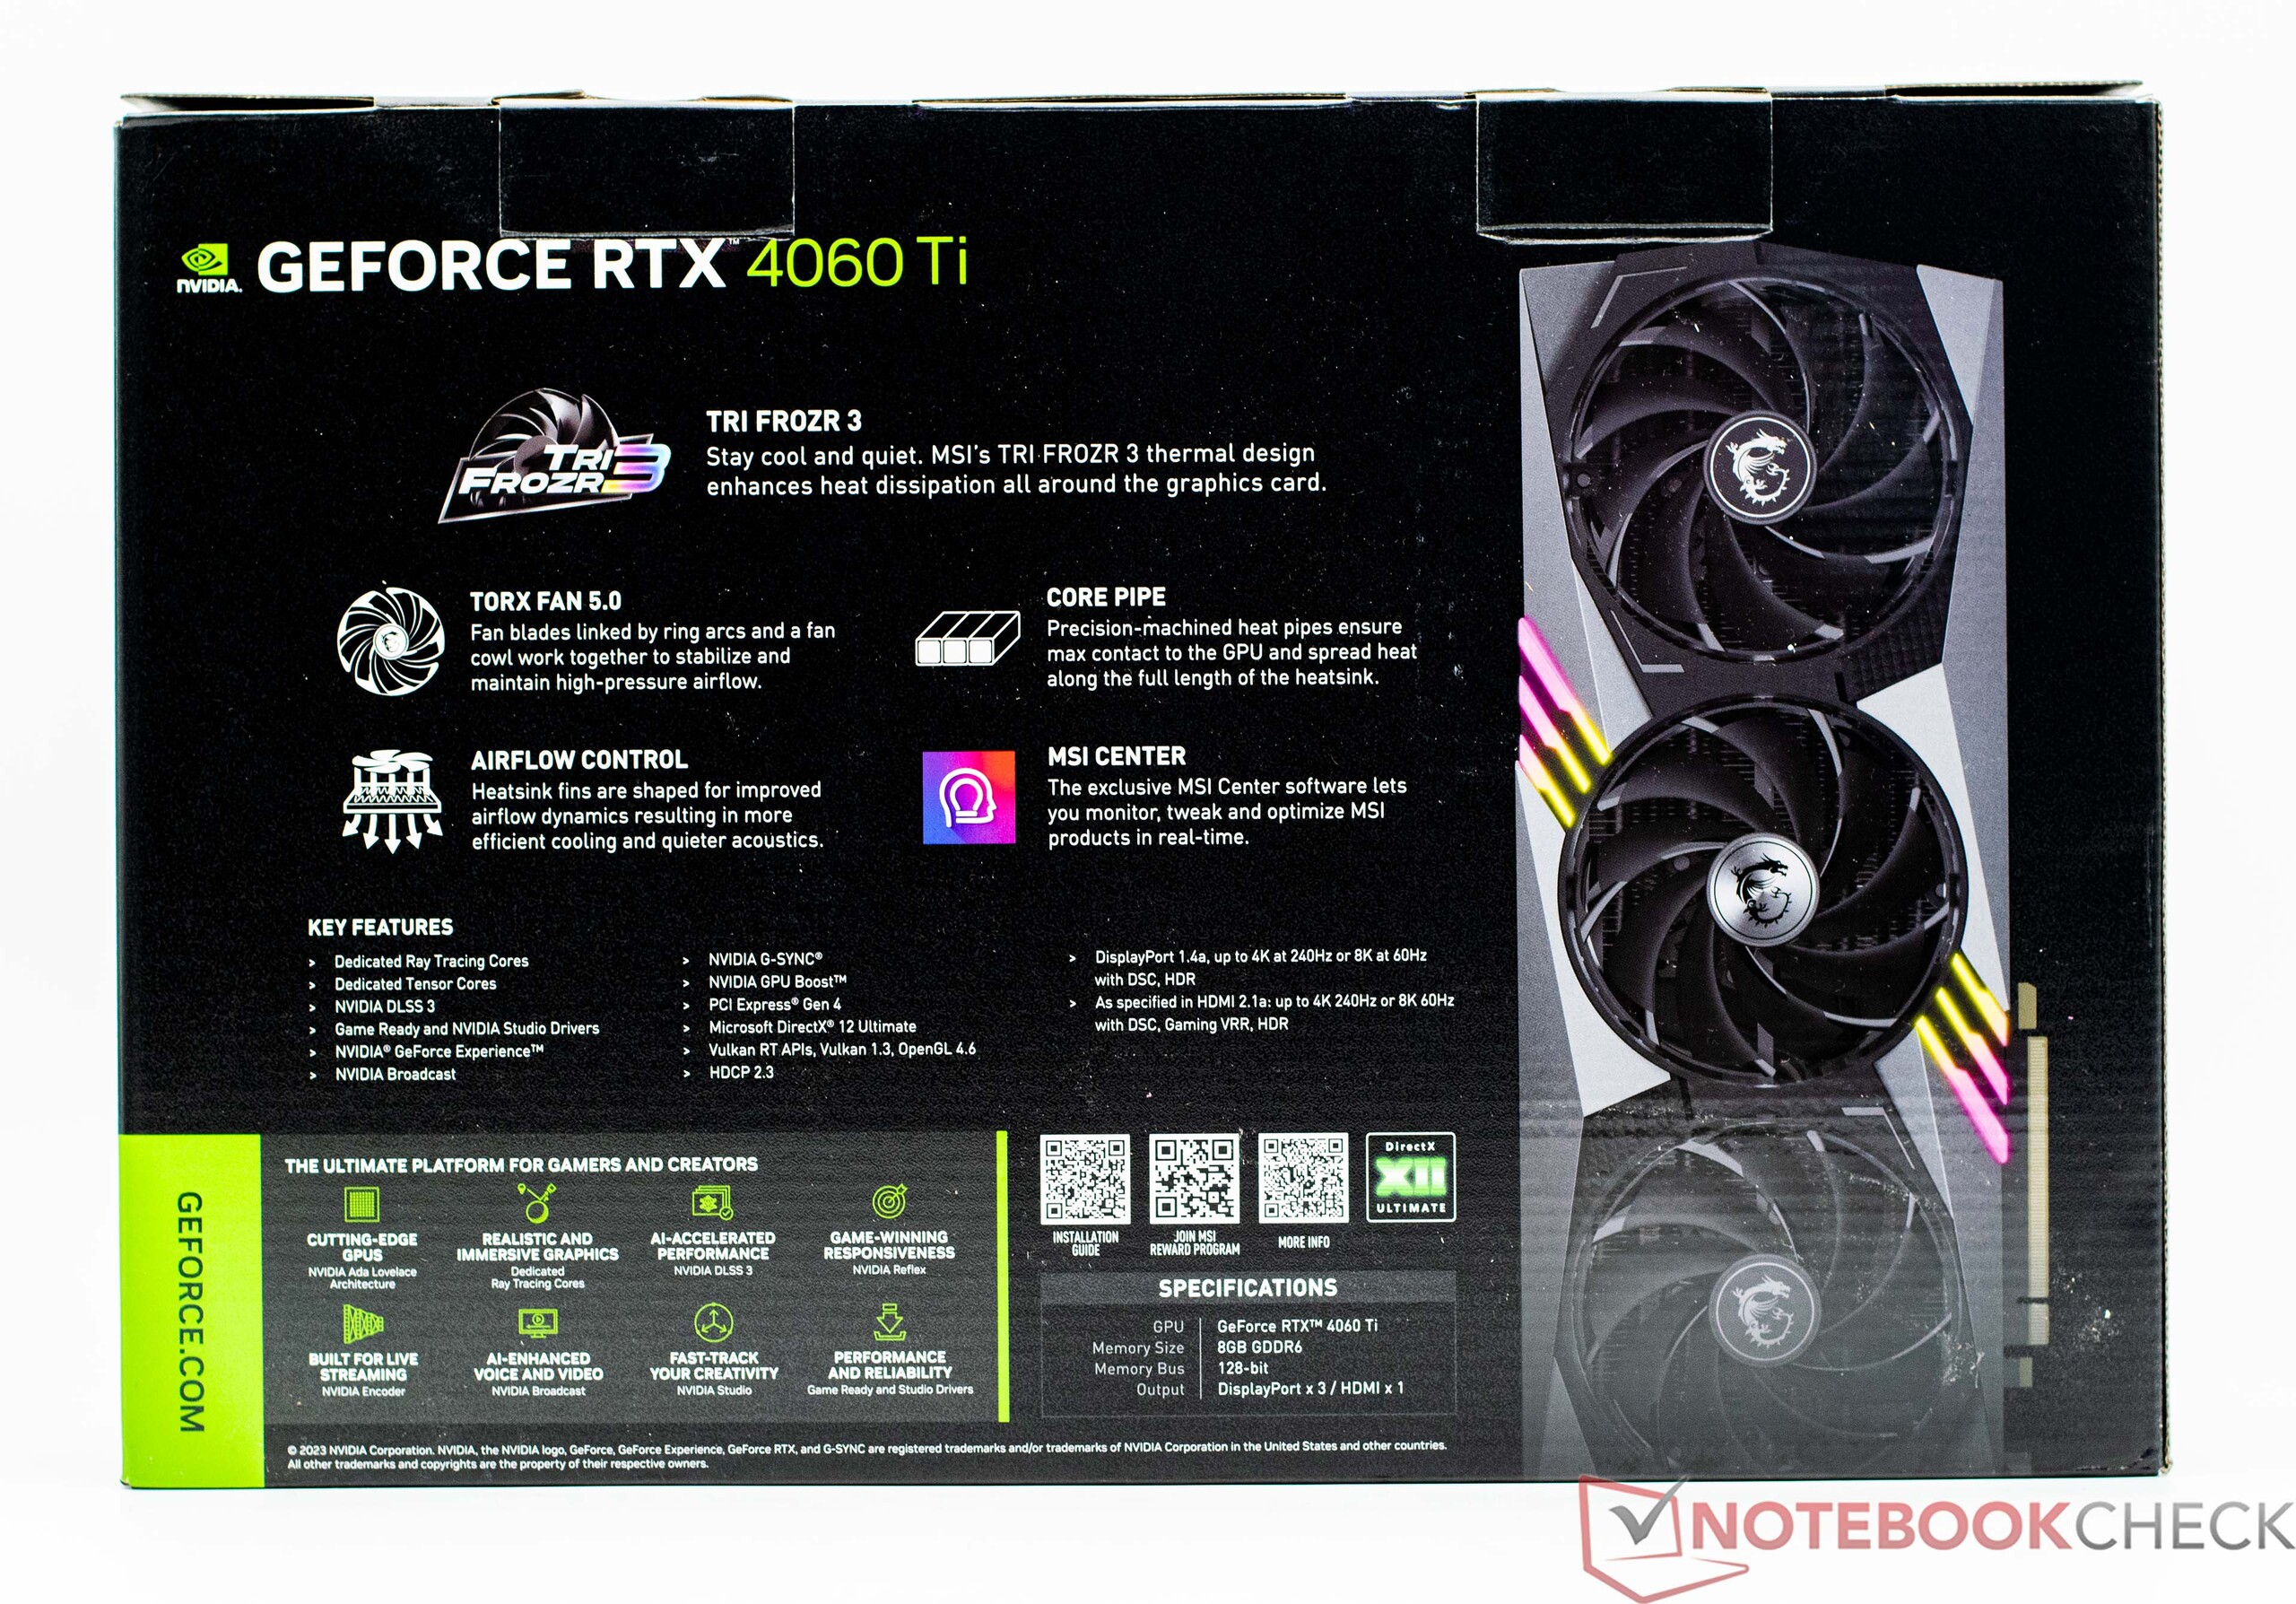
Ambas conexiones externas siguen el estándar típico. Sigue sin contar con DisplayPort 2.1. En el lado positivo, pero sí tiene 1 HDMI 2.1a y 3 puertos DisplayPort 1.4a, que deberían ser más que suficientes para la mayoría de los usuarios.
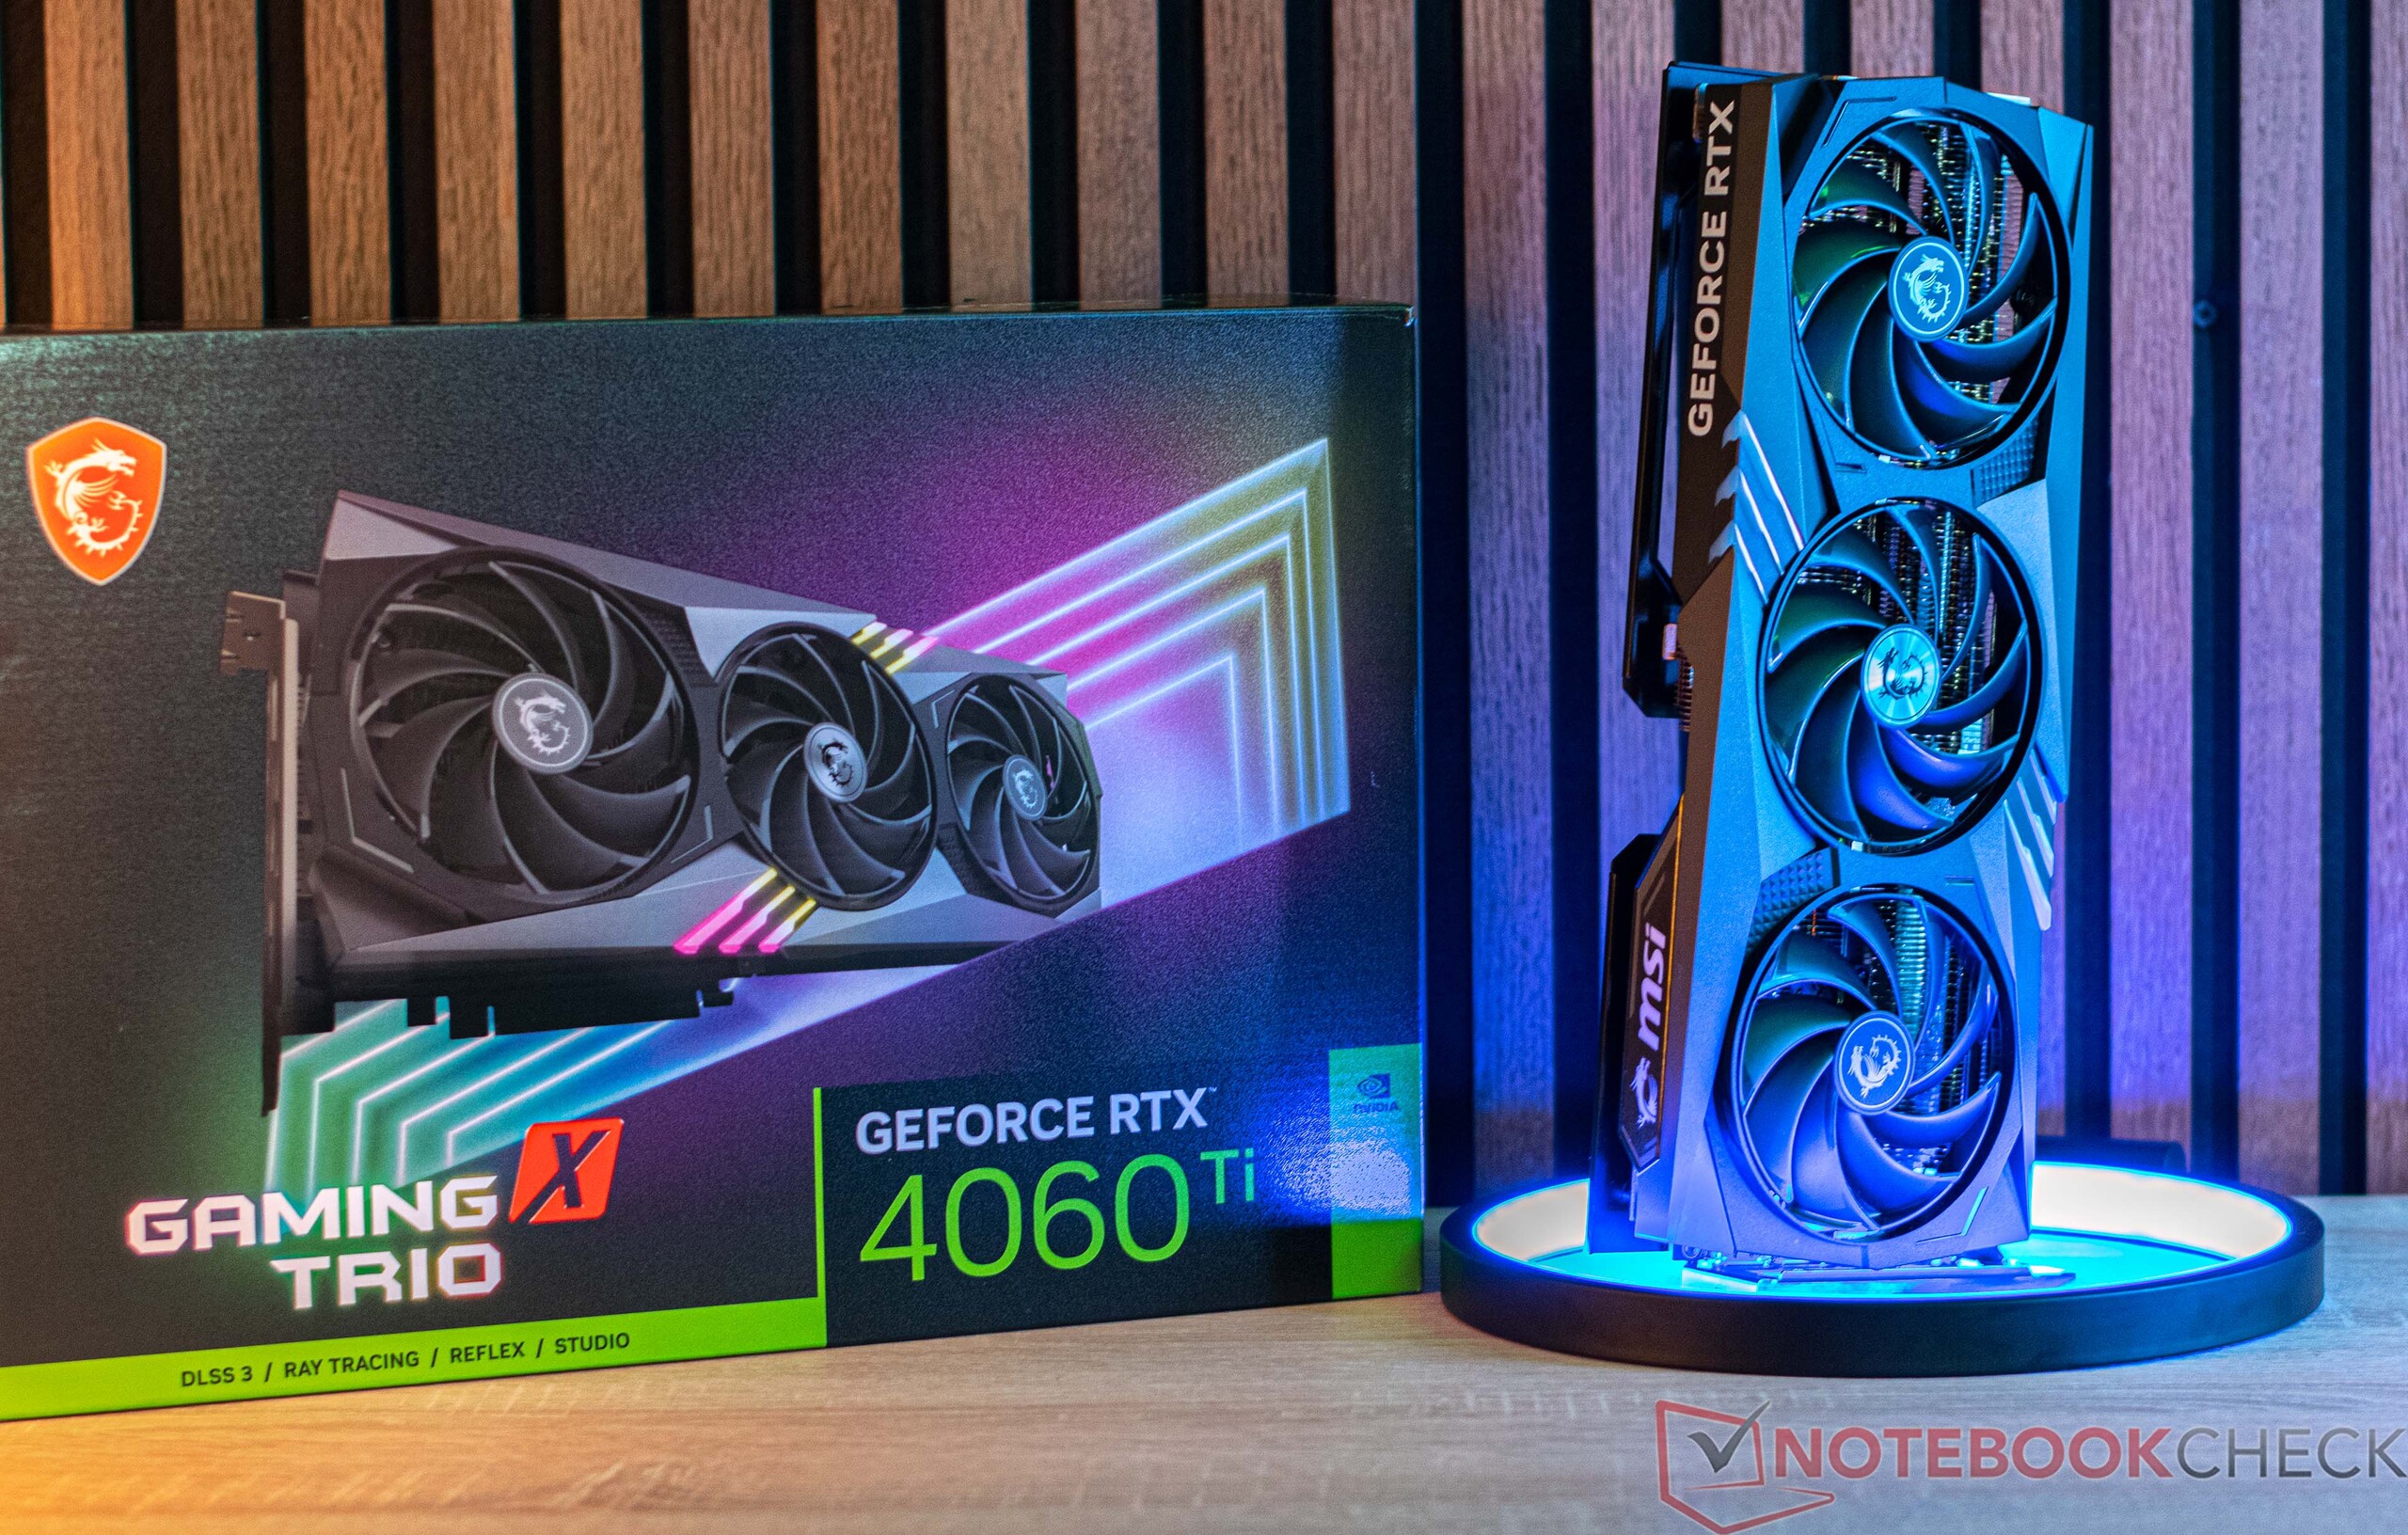
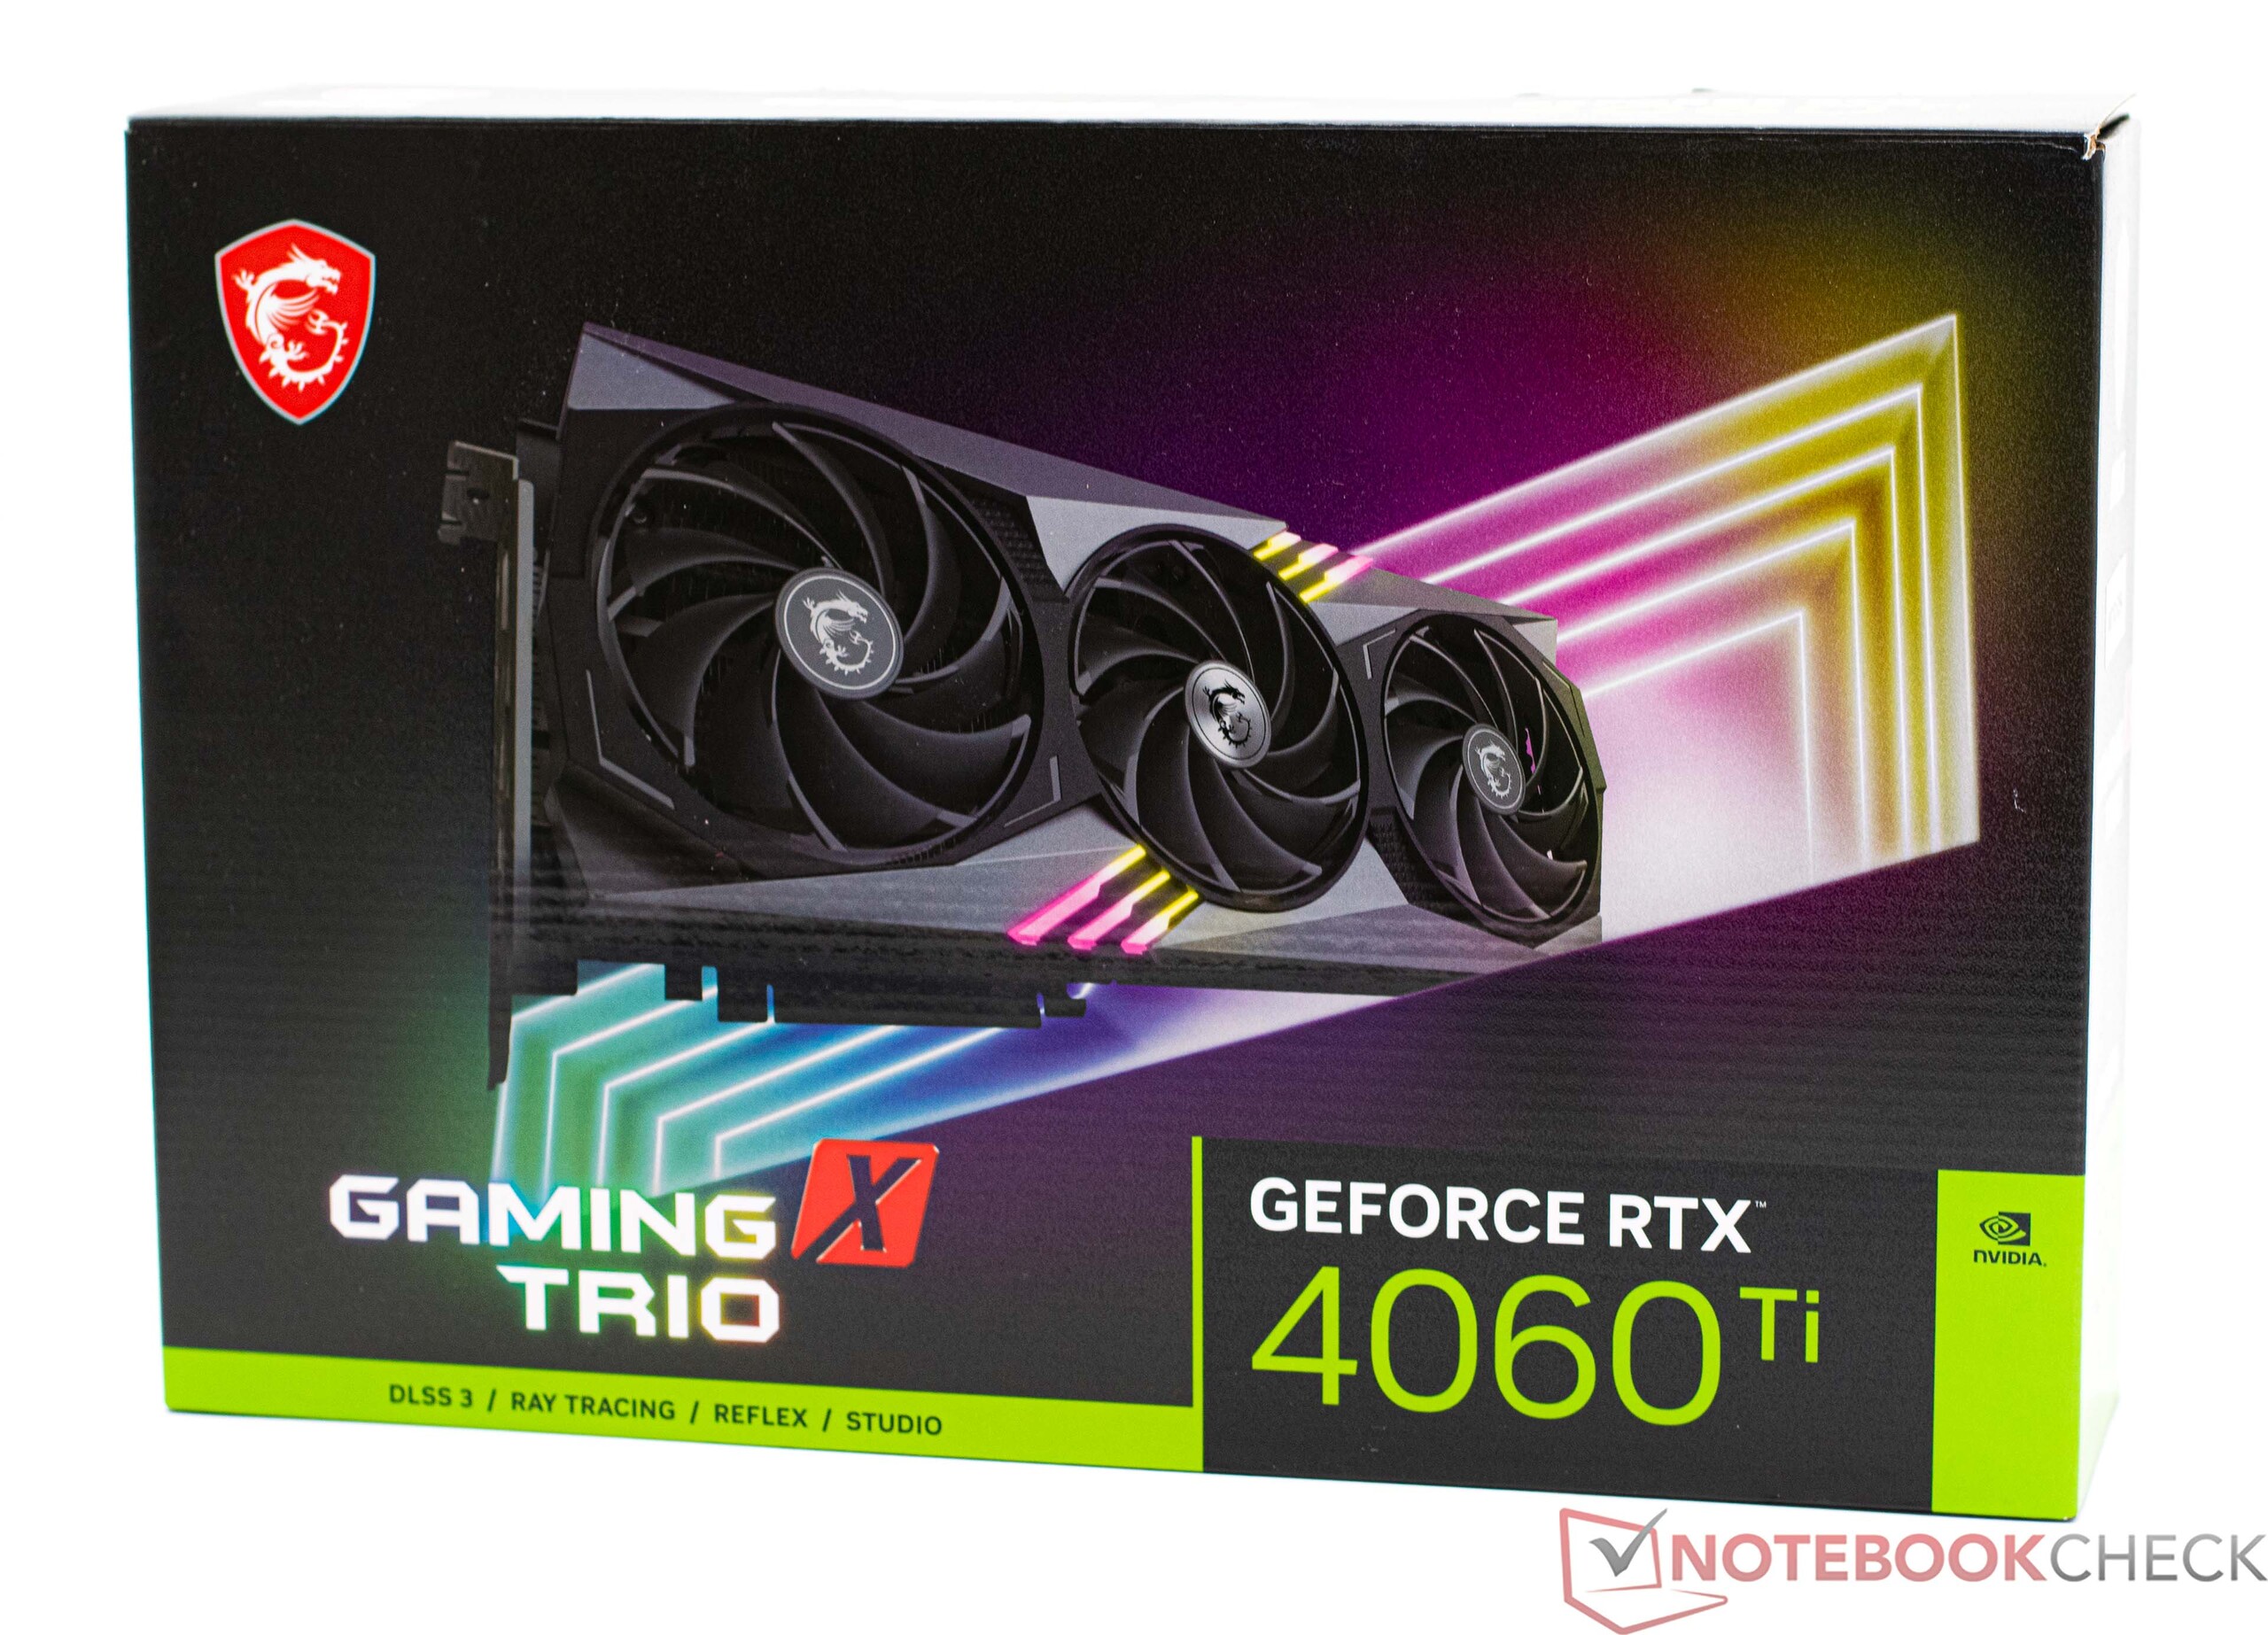
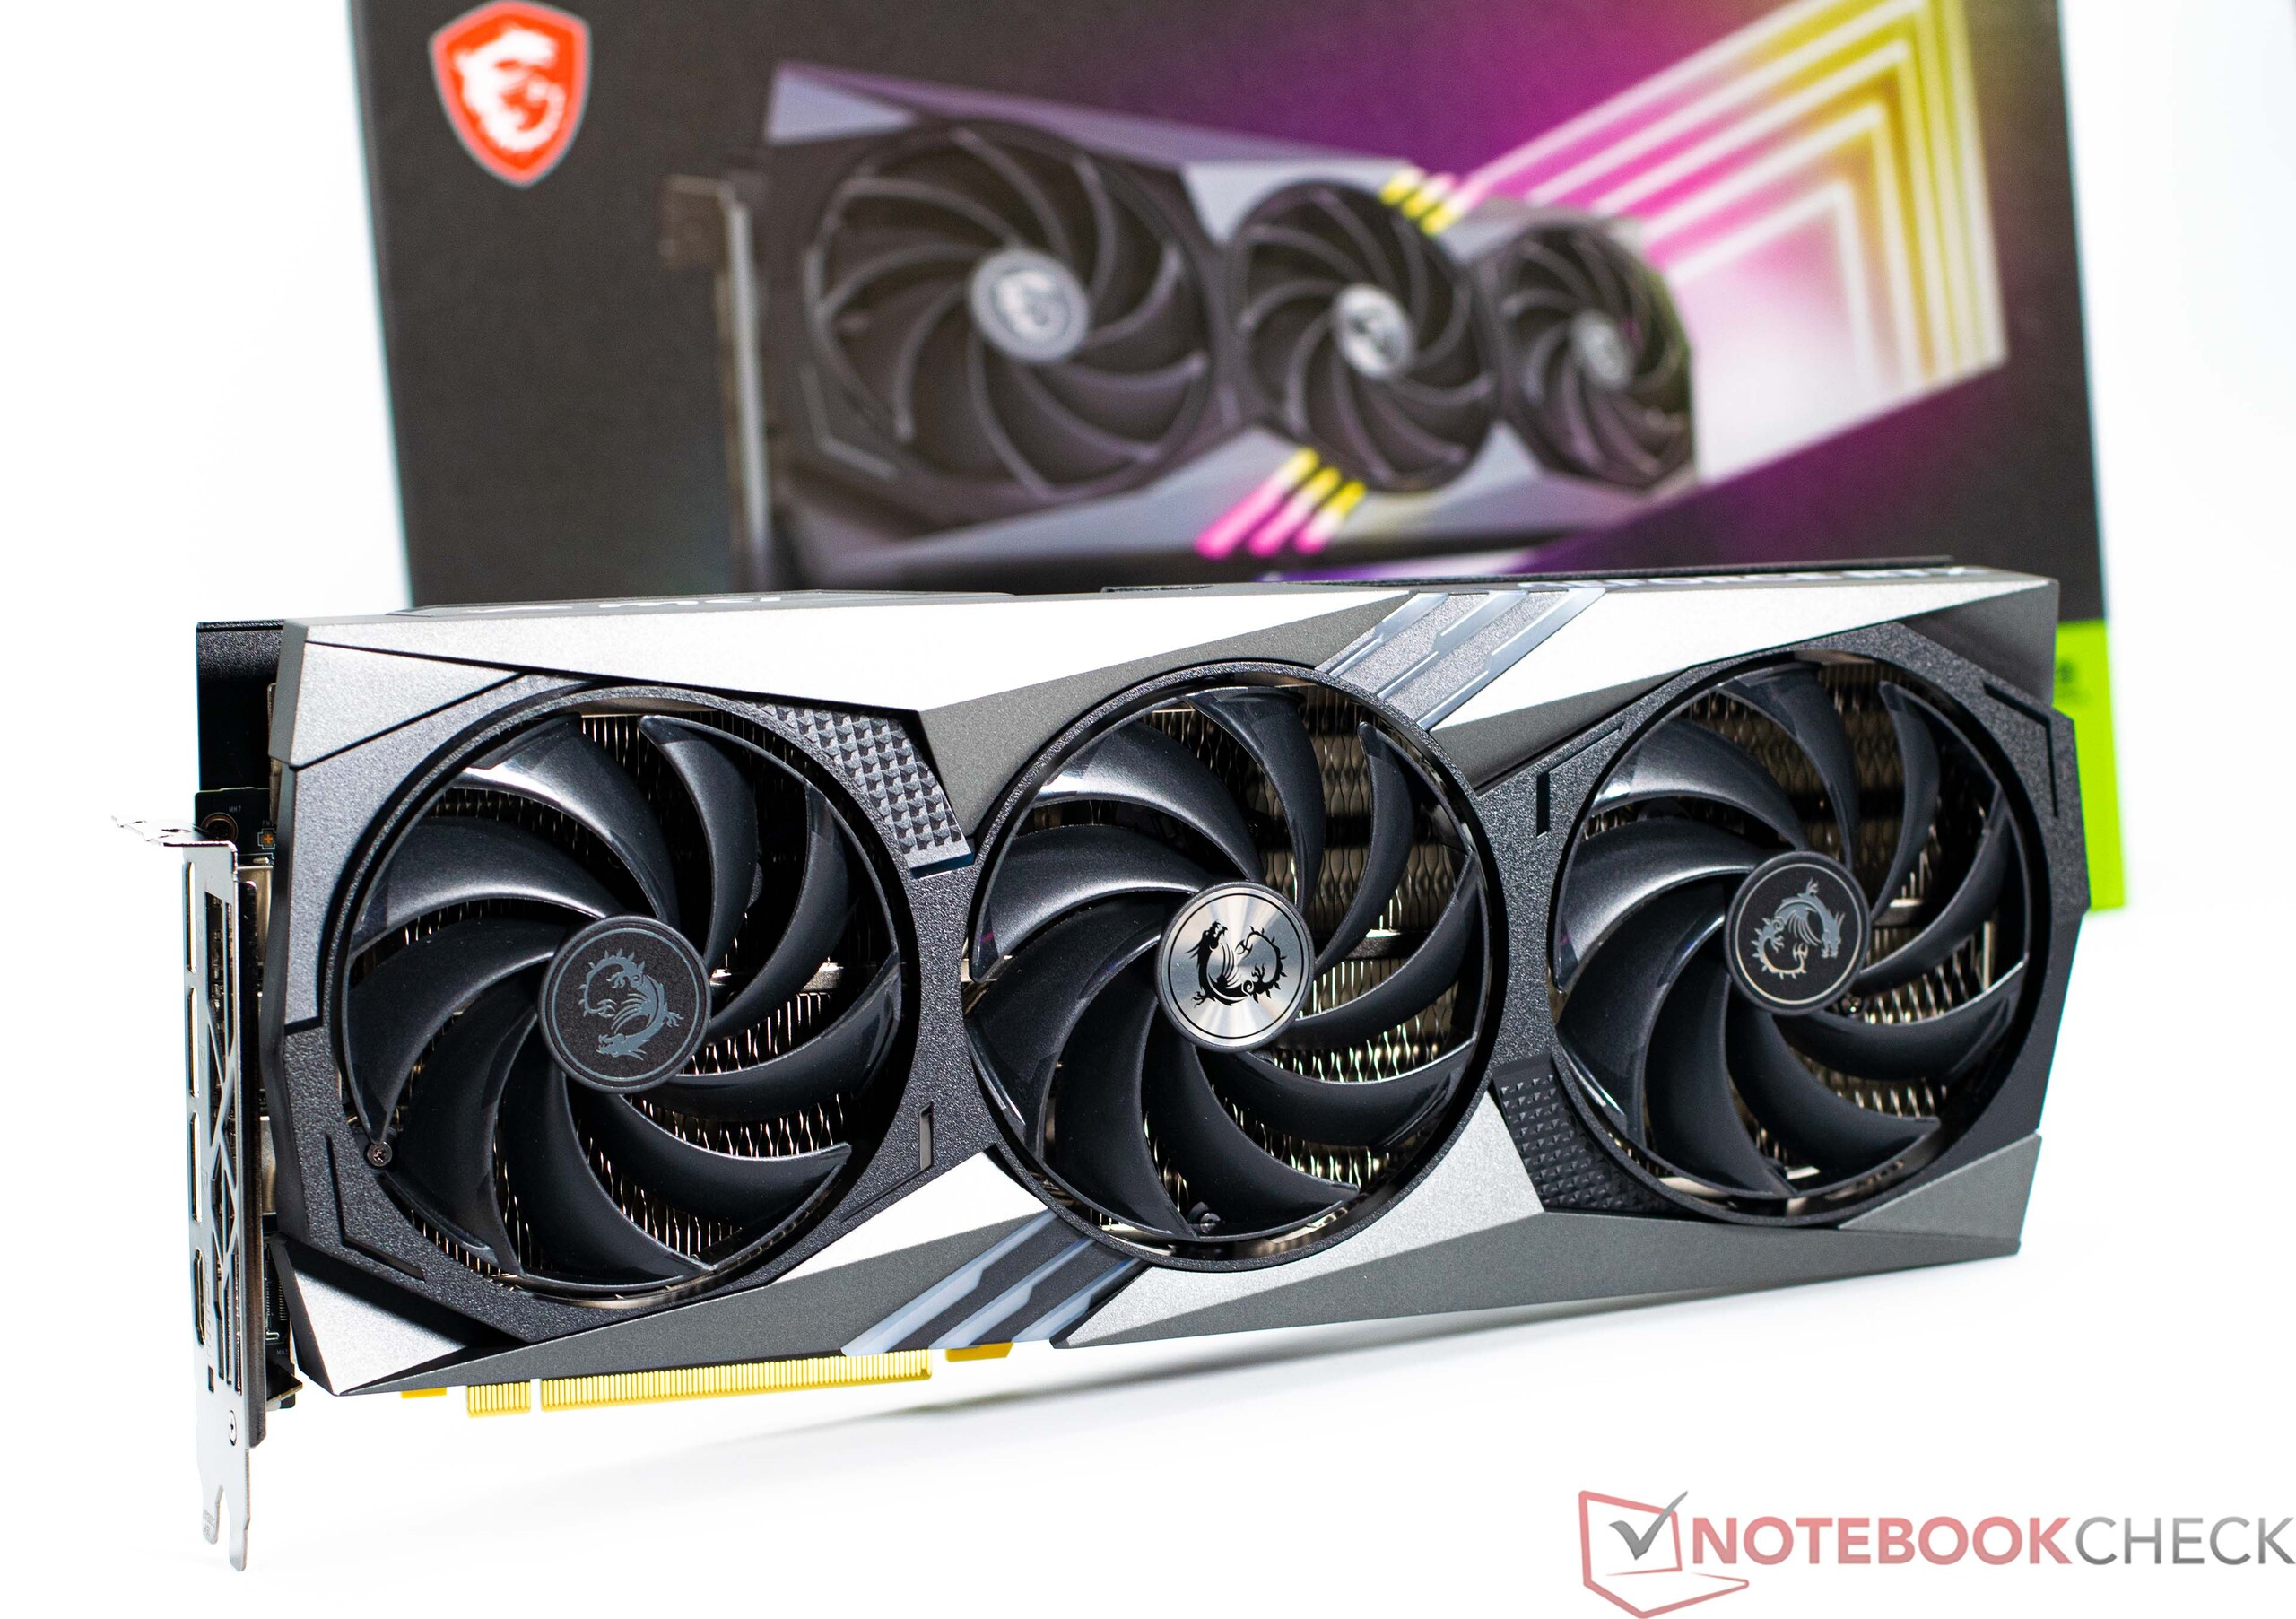
La MSI GeForce RTX 4060 Ti Gaming X Trio 8G en detalle

GeForce comparación de especificaciones de tarjetas gráficas
| Características | RTX 4090 | RTX 4080 | RTX 4070 Ti | RTX 4070 | RTX 4060 Ti | RTX 3070 | RTX 3060 Ti |
| Chip | AD102 | AD103 | AD104 | AD104 | AD106 | GA104 | GA104 |
| Proceso FinFET | TSMC 4N | TSMC 4N | TSMC 4N | TSMC 4N | TSMC4N | 8 nm | 8 nm |
| Núcleos CUDA | 16.384 | 9.728 | 7.680 | 5.888 | 4.352 | 5.888 | 4.864 |
| Unidades de texturas | 512 | 304 | 240 | 184 | 136 | 184 | 152 |
| Núcleos tensoriales | 512 4ª Gen. | 304 4ª Gen. | 240 4ª Gen. | 184 4ª Gen. | 136 4ª Gen. | 184 3ª Gen. | 152 3ª Gen. |
| Núcleos RT | 128 | 76 | 60 | 46 | 34 | 46 | 38 |
| Reloj base de la GPU | 2.235 MHz | 2.205 MHz | 2.310 MHz | 1.920 MHz | 2.310 MHz | 1.500 MHz | 1.410 MHz |
| Reloj de refuerzo de la GPU | 2.520 MHz | 2.505 MHz | 2.610 MHz | 2.475 MHz | 2.535 MHz | 1.725 MHz | 1.665 MHz |
| Bus de memoria | 384 Bit | 256 Bit | 192 Bit | 192 Bit | 128 Bit | 256 Bit | 256 Bit |
| Ancho de banda de memoria | 1.008 GB/s | 716,8 GB/s | 504,2 GB/s | 504,2 GB/s | 288 GB/s | 448 GB/s | 448 GB/s |
| Memoria de vídeo | 24 GB GDDR6X | 16 GB GDDR6X | 12 GB GDDR6 | 12 GB GDDR6X | 8GB GDDR6 | 8 GB GDDR6 | 8 GB GDDR6 |
| Consumo de energía | 450 W | 320 W | 285 W | 215 W | 160 W | 220 W | 200 W |
Infos about our test system
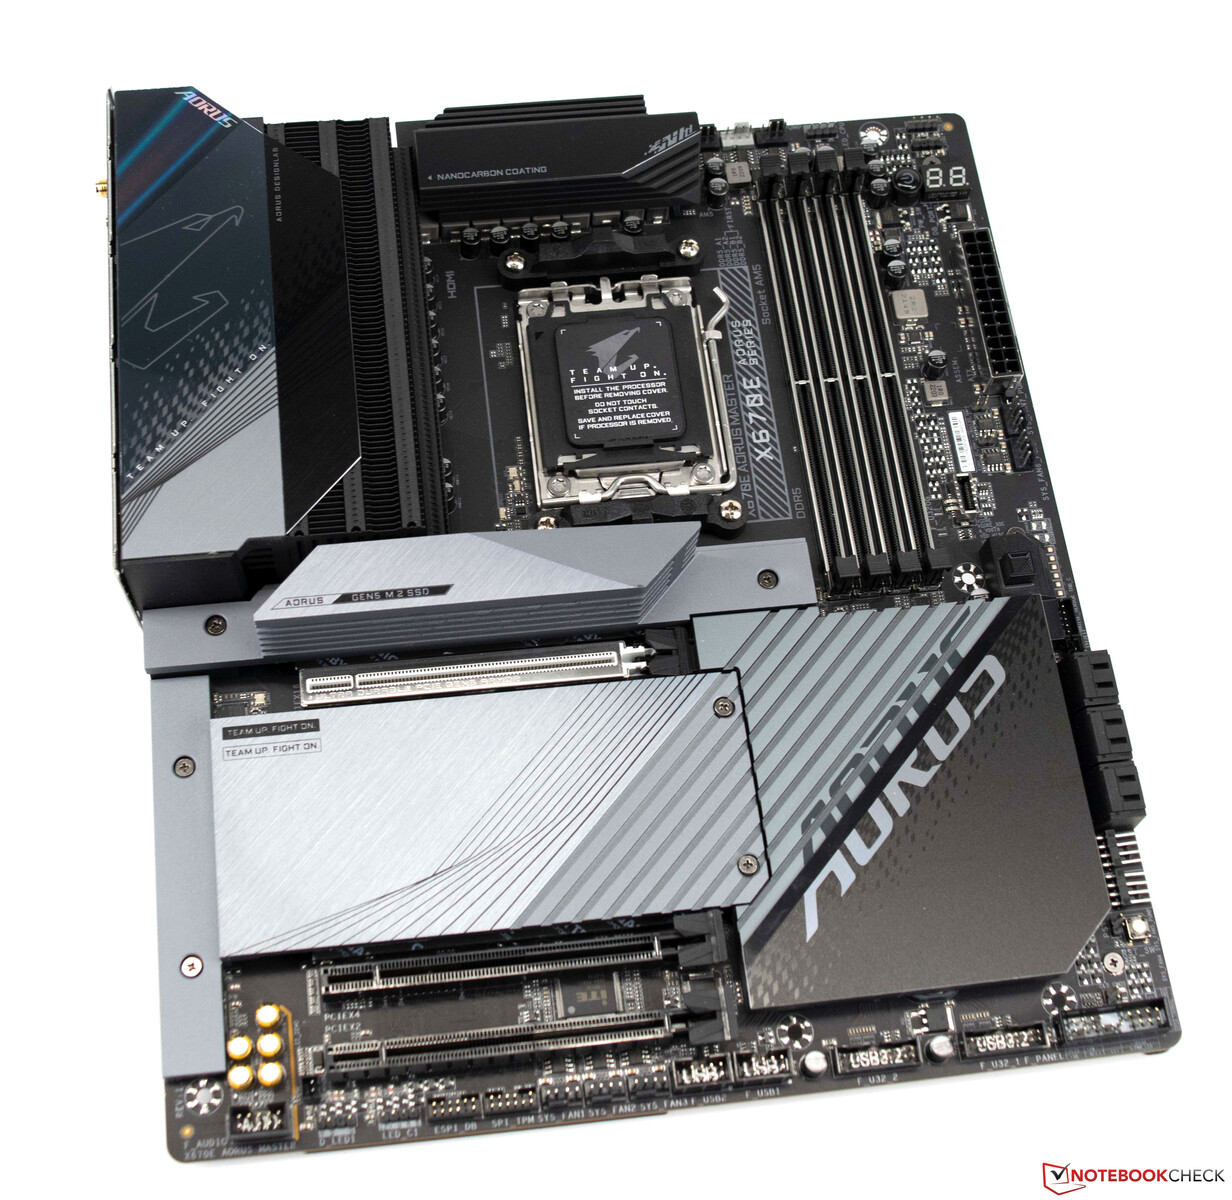
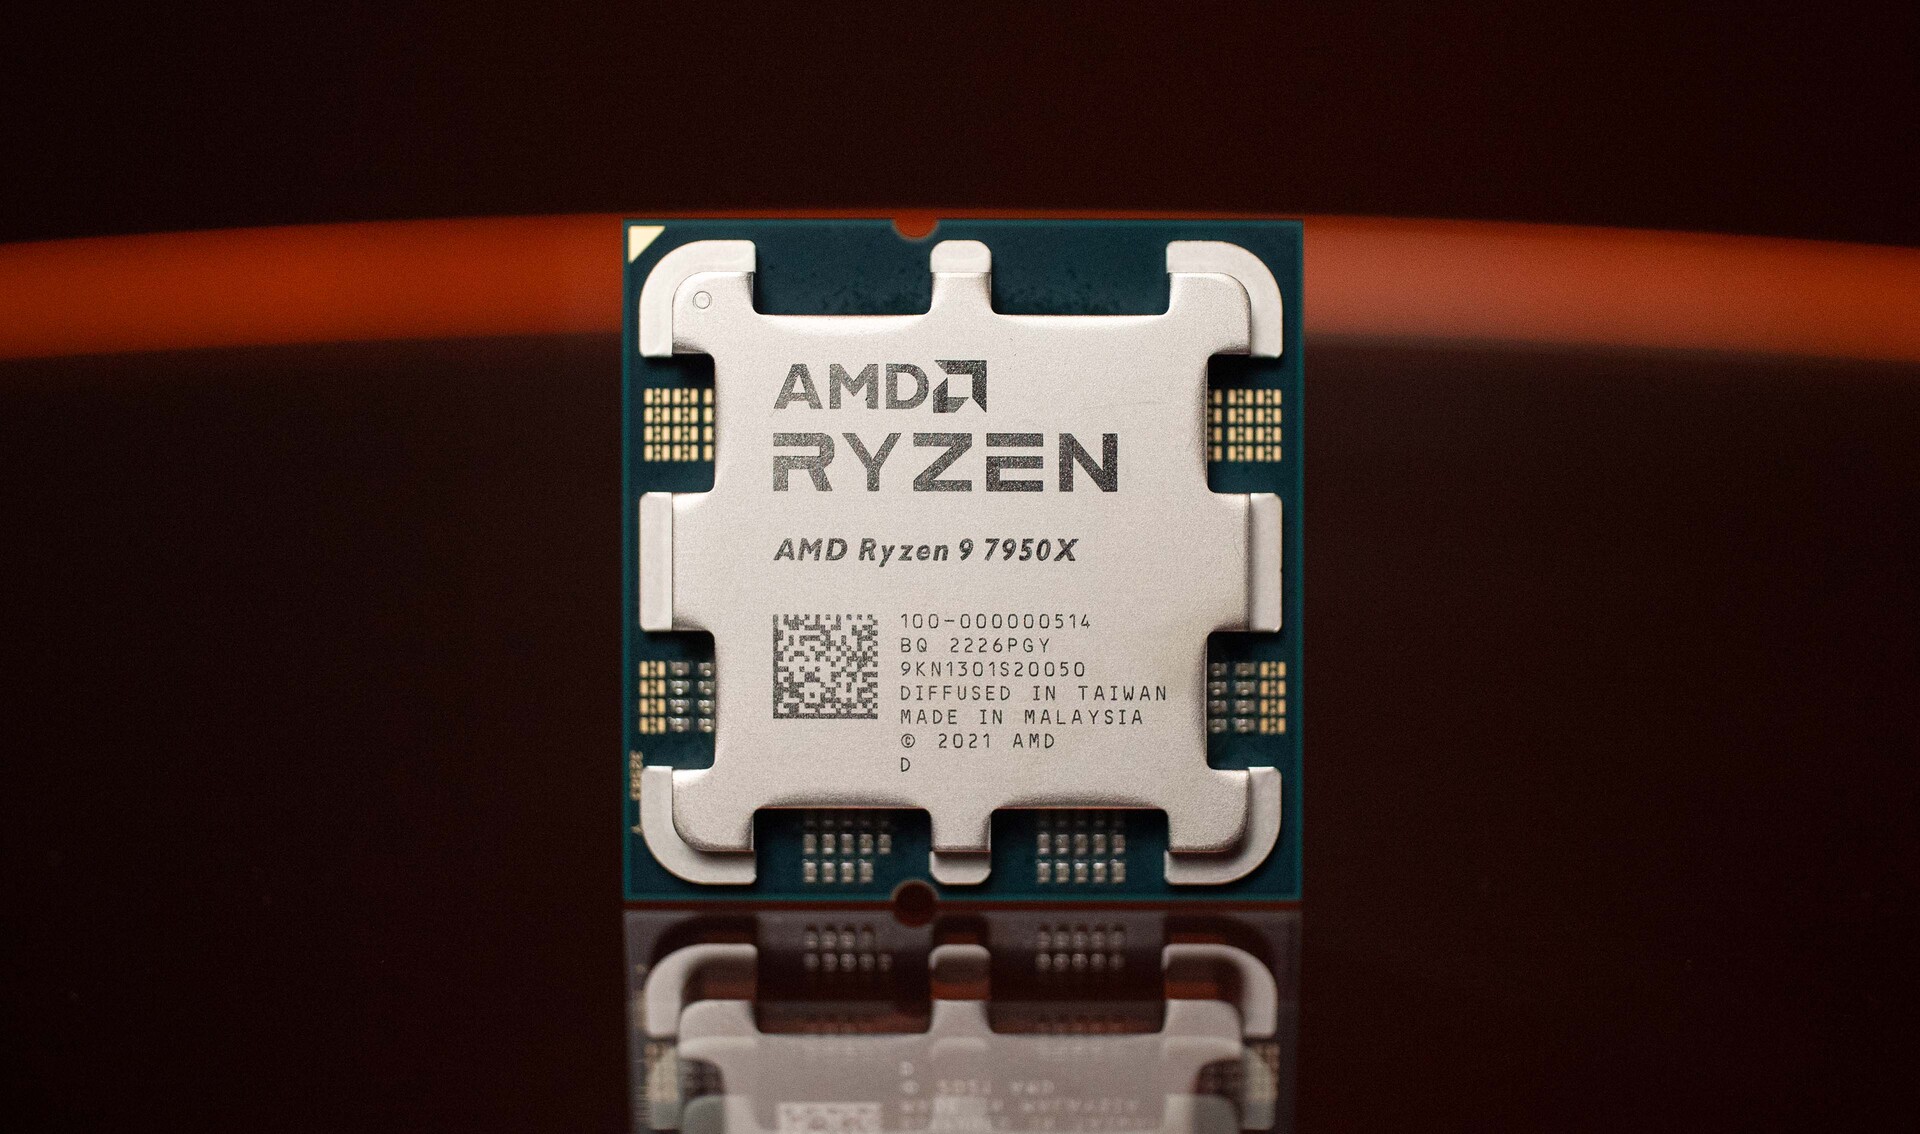
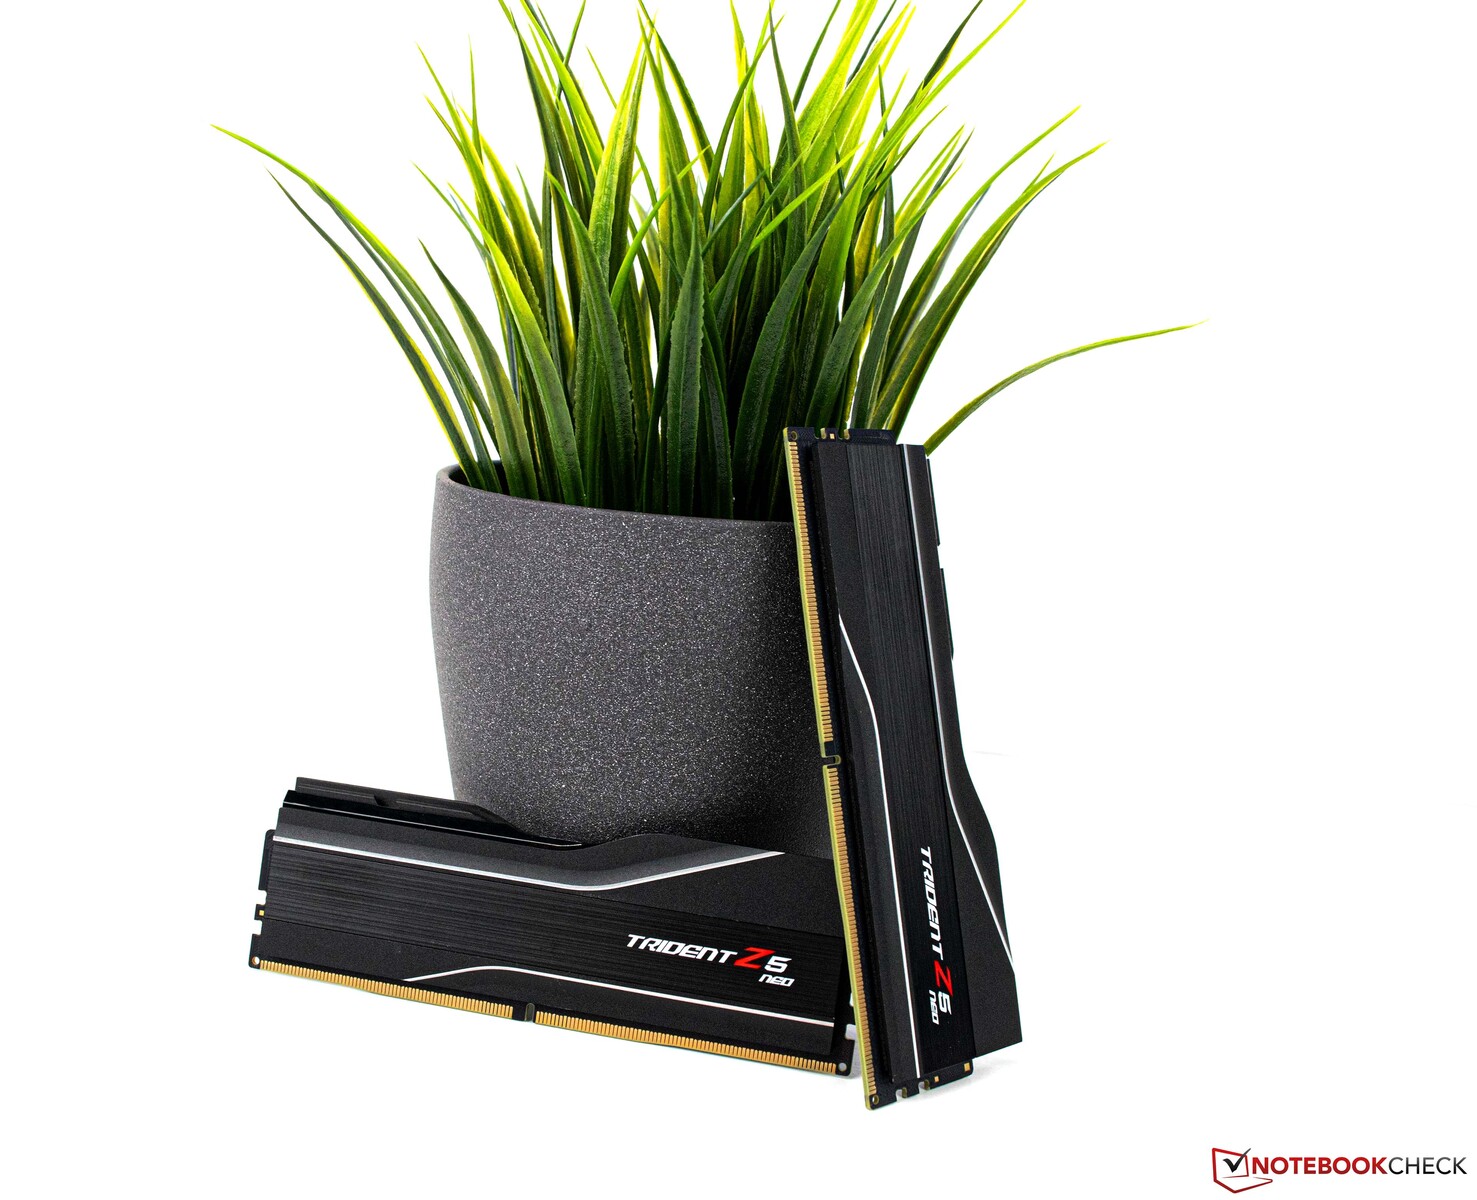
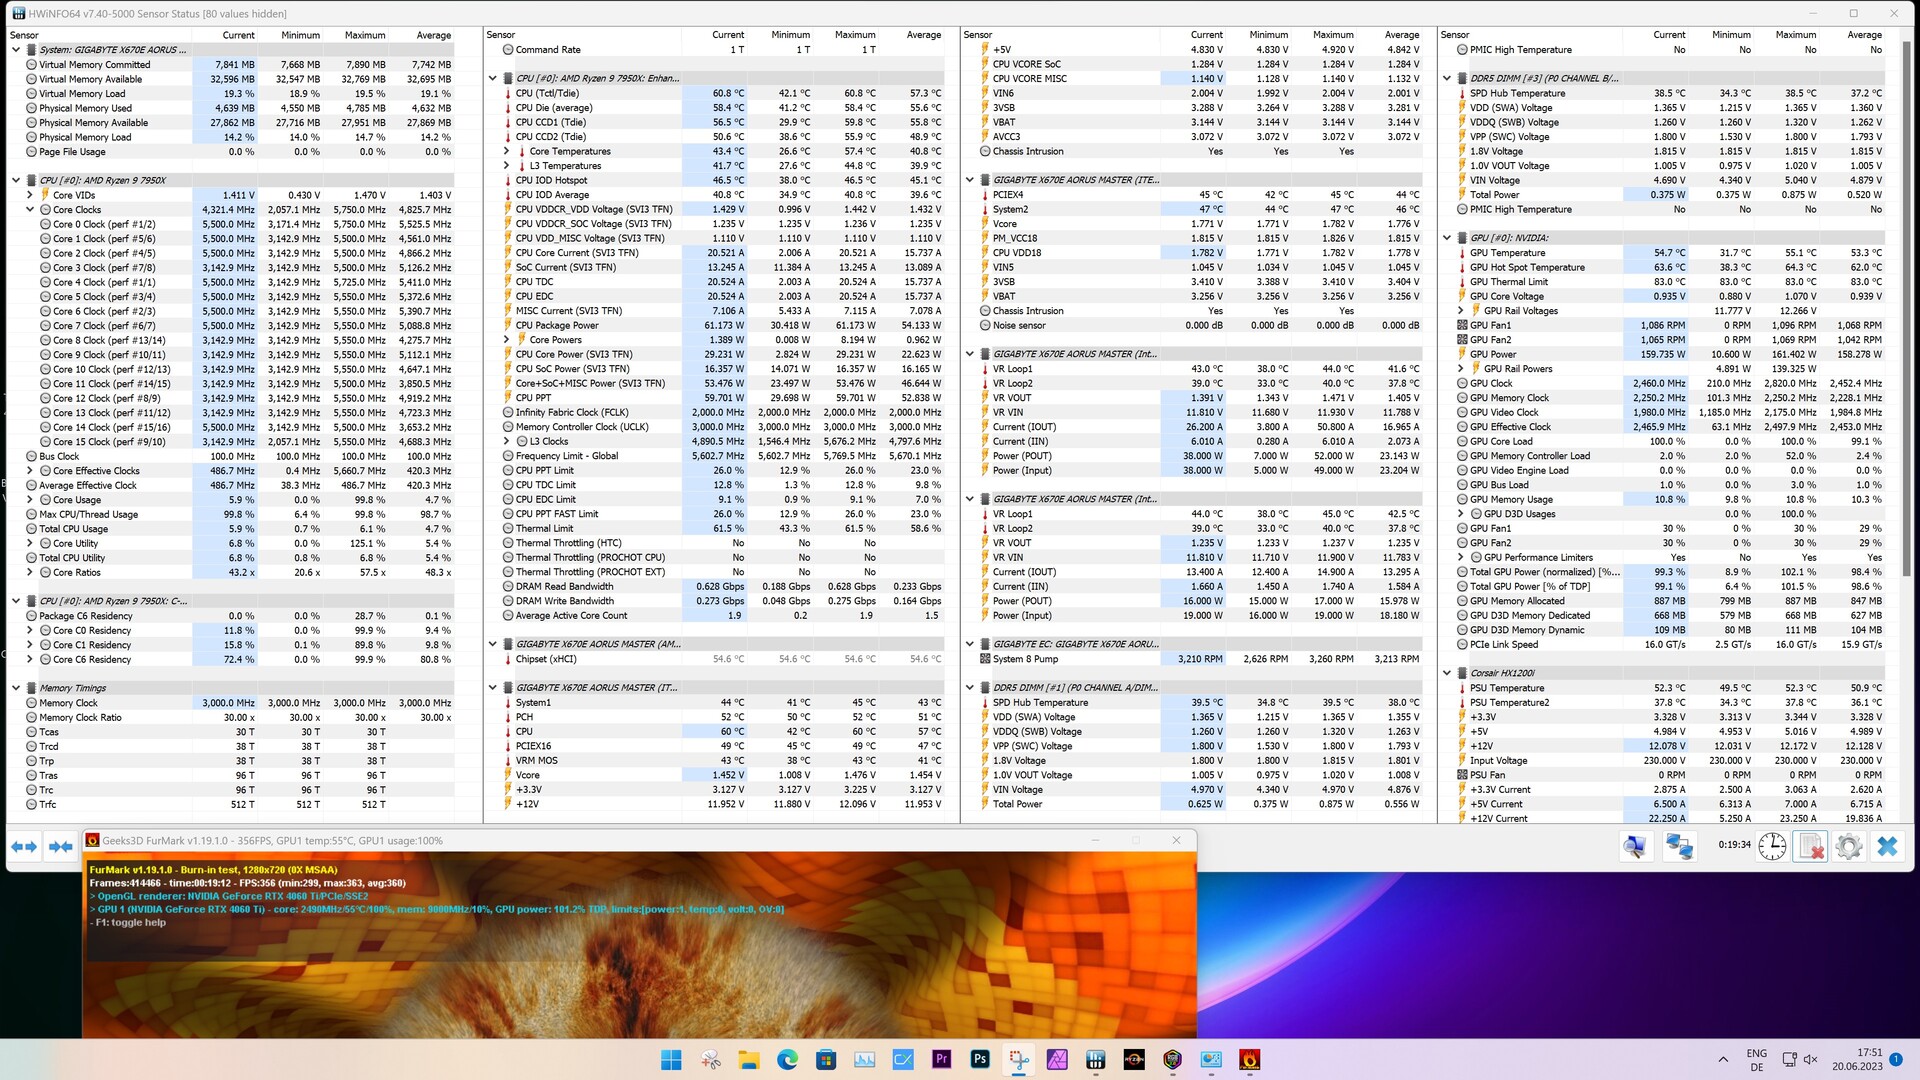
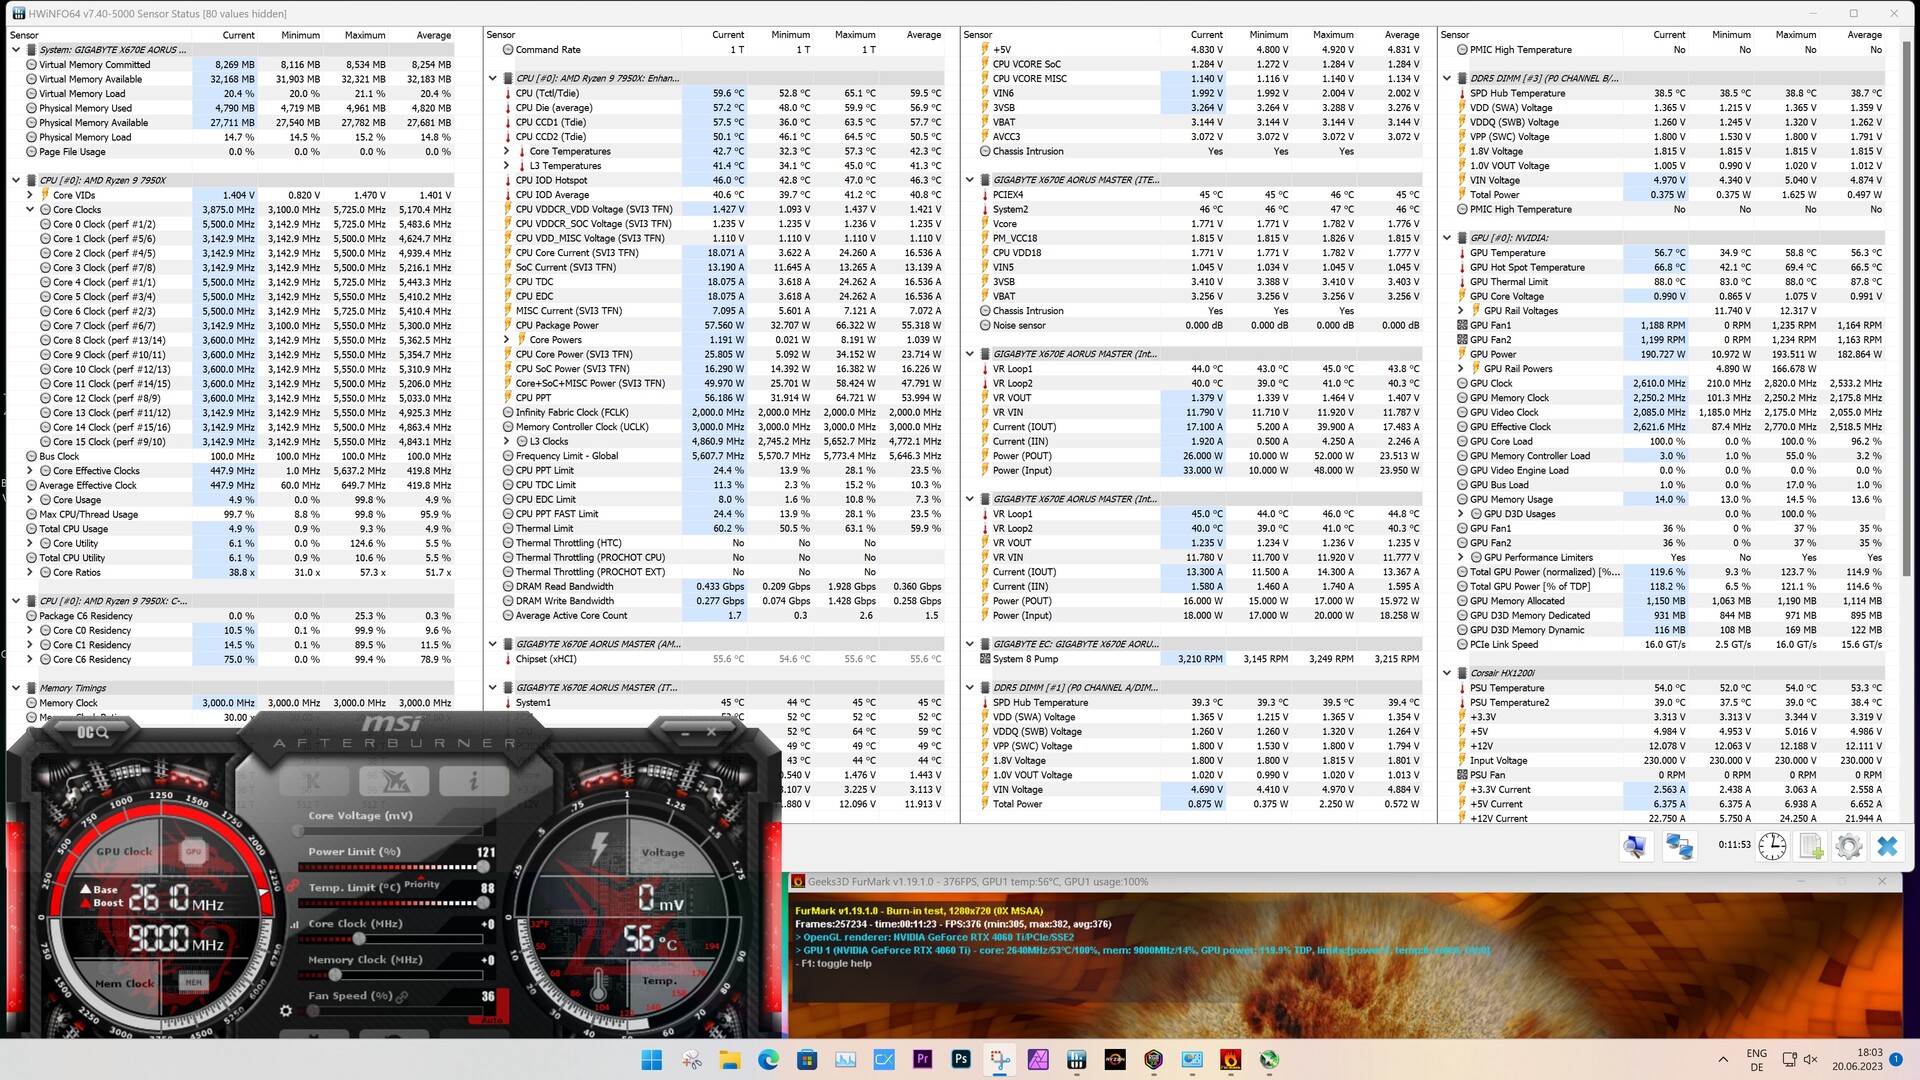
Una plataforma AMD actual basada en el Gigabyte X670E Aorus Master nos sirve de sistema de pruebas. La CPU (AMD Ryzen 9 7950X) ofrece un rendimiento excelente, y estamos usando la solución AiO Deepcool LT720 como unidad de refrigeración. La RAM de 32 GB es de G.Skill y funciona con el perfil EXPO correspondiente. Como monitor utilizamos el Gigabyte M32U.
El sistema de pruebas en detalle
Hemos utilizado este sistema para las siguientes pruebas de rendimiento:
- Lian-Li O11 Dynamic
- AMD Ryzen 9 7950X
- Gigabyte X670E Aorus Master, BIOS: F11
- Deepcool LT720
- Fuente de alimentación Corsair HX1200i
- G.Skill Trident Z5 Neo DDR5-6000 2x 16 GB, EXPO (DDR5-6000 CL30-38-38-96)
- Corsair MP600, 2 TB
- Crucial MX500, 2 TB
- Microsoft Windows 11 Professional 64-Bit (Versión 22H2)
Detalles del MSI GeForce RTX 4060 Ti Gaming X Trio 8G
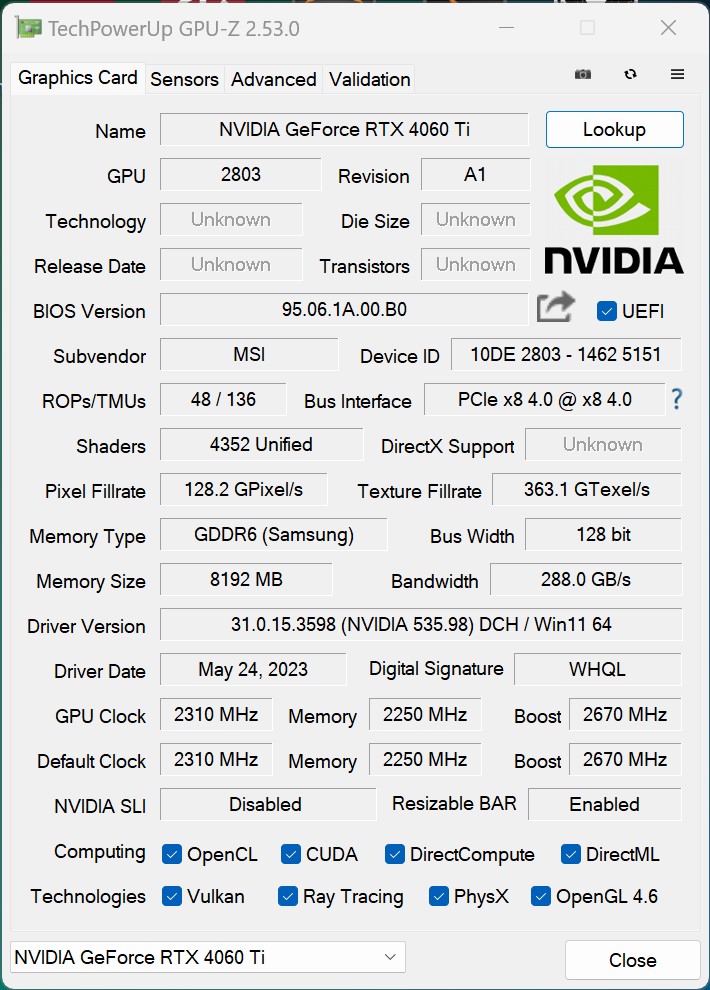
A diferencia de la Founders Edition de la Nvidia GeForce RTX 4060 Ti, la MSI GeForce RTX 4060 Ti Gaming X Trio 8G ofrece velocidades de reloj boost muy superiores. MSI declara velocidades de hasta 2.670 MHz, 135 MHz más que el modelo de referencia de Nvidia. No hay cambios en la VRAM en comparación con la Founders Edition. Aunque, su ancho de banda ahora se reduce a la mitad en comparación con una Nvidia GeForce RTX 3060 Tide 128 bits. En consecuencia, su ancho de banda de memoria es ahora también mucho menor a 288 GB / s. Descubriremos en nuestras pruebas lo que esto significa en la práctica.
Puntos de referencia sintéticos
En nuestras pruebas sintéticas, la MSI GeForce RTX 4060 Ti Gaming X Trio 8G rindió sólo un 8 por ciento mejor que laNvidia GeForce RTX 3060 Ti. En lo que respecta a su rendimiento real, el modelo de gama media solo fue capaz de diferenciarse ligeramente de la generación anterior. No vimos el mismo aumento de rendimiento que con laNvidia GeForce RTX 3090a laNvidia GeForce RTX 4090. Su menor cantidad de shaders así como su menor conexión de almacenamiento impidieron que la GPU tuviera un mejor rendimiento. Su diferencia del 30% respecto a laGeForce RTX 4070es bastante considerable y un salto de rendimiento hasta el nivel de unaGeForce RTX 3070 Tihabría sido un paso mucho más útil. En comparación con laSapphire Pulse Radeon RX 6750 XT de AMDde AMD, que tiene 12 GB de VRAM, nuestro modelo de pruebas era sólo un 10% más lento.
| Performance rating - Percent | |
| Palit GeForce RTX 4090 GameRock OC | |
| AMD Radeon RX 7900 XTX | |
| KFA2 GeForce RTX 4080 SG | |
| AMD Radeon RX 7900 XT | |
| KFA2 GeForce RTX 4070 Ti EX Gamer | |
| NVIDIA GeForce RTX 3090 Founders Edition | |
| KFA2 GeForce RTX 3080 SG | |
| KFA2 GeForce RTX 4070 EX Gamer | |
| Nvidia Titan RTX | |
| KFA2 GeForce RTX 3070 Ti SG | |
| Sapphire Pulse Radeon RX 6750 XT | |
| MSI GeForce RTX 4060 Ti Gaming X Trio 8G | |
| NVIDIA GeForce RTX 3060 Ti FE | |
| Nvidia GeForce RTX 2070 Super | |
| Sapphire Nitro+ Radeon RX 6650 XT | |
| Nvidia GeForce RTX 2060 Super | |
| KFA2 GeForce GTX 1660 Super | |
| PNY GeForce GTX 1660 | |
| LuxMark v2.0 64Bit | |
| Room GPUs-only | |
| NVIDIA GeForce RTX 4090 | |
| NVIDIA GeForce RTX 4080 | |
| NVIDIA GeForce RTX 4070 Ti | |
| NVIDIA GeForce RTX 4070 | |
| NVIDIA GeForce RTX 3090 | |
| NVIDIA GeForce RTX 3080 12 GB | |
| AMD Radeon RX 7900 XTX | |
| AMD Radeon RX 6950 XT | |
| NVIDIA Titan RTX | |
| NVIDIA GeForce RTX 4060 Ti 8G | |
| NVIDIA GeForce RTX 3070 Ti | |
| AMD Radeon RX 7900 XT | |
| NVIDIA GeForce RTX 3060 Ti | |
| AMD Radeon RX 6750 XT | |
| AMD Radeon RX 6650 XT | |
| Sala GPUs-only | |
| AMD Radeon RX 6950 XT | |
| NVIDIA GeForce RTX 4090 | |
| NVIDIA GeForce RTX 4080 | |
| NVIDIA GeForce RTX 4070 Ti | |
| AMD Radeon RX 7900 XTX | |
| NVIDIA GeForce RTX 3090 | |
| NVIDIA GeForce RTX 4070 | |
| NVIDIA GeForce RTX 3080 12 GB | |
| AMD Radeon RX 7900 XT | |
| NVIDIA GeForce RTX 4060 Ti 8G | |
| NVIDIA GeForce RTX 3070 Ti | |
| NVIDIA Titan RTX | |
| NVIDIA GeForce RTX 3060 Ti | |
| AMD Radeon RX 6750 XT | |
| AMD Radeon RX 6650 XT | |
| Photoshop PugetBench | |
| GPU Score | |
| AMD Radeon RX 6750 XT | |
| AMD Radeon RX 7900 XT | |
| AMD Radeon RX 7900 XTX | |
| NVIDIA GeForce RTX 4080 | |
| NVIDIA GeForce RTX 3070 Ti | |
| NVIDIA GeForce RTX 4090 | |
| NVIDIA GeForce RTX 2060 Super (Desktop) | |
| NVIDIA GeForce RTX 2070 Super (Desktop) | |
| NVIDIA GeForce GTX 1660 (Desktop) | |
| NVIDIA Titan RTX | |
| AMD Radeon RX 6950 XT | |
| AMD Radeon RX 6650 XT | |
| NVIDIA GeForce RTX 4060 Ti 8G | |
| NVIDIA GeForce RTX 4070 | |
| NVIDIA GeForce RTX 4070 Ti | |
| NVIDIA GeForce RTX 3080 12 GB | |
| Overall Score | |
| AMD Radeon RX 7900 XT | |
| AMD Radeon RX 6750 XT | |
| AMD Radeon RX 7900 XTX | |
| NVIDIA GeForce RTX 3070 Ti | |
| NVIDIA GeForce RTX 4080 | |
| NVIDIA GeForce RTX 4090 | |
| NVIDIA GeForce RTX 2060 Super (Desktop) | |
| NVIDIA GeForce RTX 2070 Super (Desktop) | |
| NVIDIA GeForce GTX 1660 (Desktop) | |
| NVIDIA GeForce RTX 4060 Ti 8G | |
| NVIDIA GeForce RTX 4070 | |
| NVIDIA Titan RTX | |
| NVIDIA GeForce RTX 4070 Ti | |
| AMD Radeon RX 6950 XT | |
| AMD Radeon RX 6650 XT | |
| NVIDIA GeForce RTX 3080 12 GB | |
| Premiere Pro PugetBench | |
| GPU 0.9 | |
| NVIDIA GeForce RTX 4090 | |
| NVIDIA GeForce RTX 4080 | |
| NVIDIA GeForce RTX 3080 12 GB | |
| NVIDIA GeForce RTX 4070 Ti | |
| NVIDIA GeForce RTX 4070 | |
| AMD Radeon RX 7900 XTX | |
| NVIDIA GeForce RTX 3070 Ti | |
| NVIDIA Titan RTX | |
| AMD Radeon RX 7900 XT | |
| AMD Radeon RX 6950 XT | |
| NVIDIA GeForce RTX 4060 Ti 8G | |
| NVIDIA GeForce RTX 2070 Super (Desktop) | |
| NVIDIA GeForce RTX 2060 Super (Desktop) | |
| AMD Radeon RX 6750 XT | |
| AMD Radeon RX 6650 XT | |
| NVIDIA GeForce GTX 1660 (Desktop) | |
| Overall Score 0.9 | |
| NVIDIA GeForce RTX 4090 | |
| NVIDIA GeForce RTX 4070 | |
| NVIDIA GeForce RTX 4080 | |
| NVIDIA Titan RTX | |
| NVIDIA GeForce RTX 4070 Ti | |
| NVIDIA GeForce RTX 4060 Ti 8G | |
| NVIDIA GeForce RTX 2060 Super (Desktop) | |
| AMD Radeon RX 7900 XTX | |
| NVIDIA GeForce RTX 2070 Super (Desktop) | |
| NVIDIA GeForce RTX 3070 Ti | |
| AMD Radeon RX 7900 XT | |
| AMD Radeon RX 6750 XT | |
| NVIDIA GeForce GTX 1660 (Desktop) | |
| NVIDIA GeForce RTX 3080 12 GB | |
| AMD Radeon RX 6950 XT | |
| AMD Radeon RX 6650 XT | |
| Affinity Photo 2 - Combined (Single / Multi GPU) | |
| NVIDIA GeForce RTX 4070 | |
| NVIDIA GeForce RTX 4070 Ti | |
| NVIDIA GeForce RTX 4090 | |
| NVIDIA GeForce RTX 4080 | |
| NVIDIA GeForce RTX 2070 Super (Desktop) | |
| NVIDIA GeForce RTX 3070 Ti | |
| NVIDIA GeForce RTX 2060 Super (Desktop) | |
| AMD Radeon RX 6750 XT | |
| NVIDIA GeForce RTX 4060 Ti 8G | |
| NVIDIA Titan RTX | |
| NVIDIA GeForce GTX 1660 (Desktop) | |
| NVIDIA GeForce GTX 1660 Super (Desktop) | |
| AMD Radeon RX 7900 XTX | |
| AMD Radeon RX 7900 XT | |
Usos profesionales
En el ámbito de los usos profesionales, nuestra MSI GeForce RTX 4060 Ti Gaming X Trio puede cerrar el paso a laNvidia GeForce RTX 3070 Tiligeramente. Sin embargo, en comparación con laNvidia GeForce RTX 4070se aprecia una diferencia mucho mayor entre ambas. LaNvidia Titan RTXes un gran ejemplo de lo que puede conseguir una tarjeta gráfica profesional. Este modelo logró casi los mismos resultados en pruebas sintéticas que nuestra muestra de prueba, pero aquí, se encuentra un enorme 200 por ciento por delante. Como resultado, no recomendaríamos usar laNvidia GeForce RTX 4060 Tien un entorno profesional.
| NVIDIA GeForce RTX 4060 Ti 8G R9 7950X | NVIDIA GeForce RTX 3060 Ti R9 5950X | NVIDIA GeForce RTX 3070 Ti R9 7950X | NVIDIA GeForce RTX 4070 R9 7950X | NVIDIA GeForce RTX 4070 Ti R9 7950X | NVIDIA GeForce RTX 4080 R9 7950X | NVIDIA GeForce RTX 4090 R9 7950X | AMD Radeon RX 7900 XT R9 7950X | AMD Radeon RX 7900 XTX R9 7950X | NVIDIA GeForce RTX 3080 12 GB R9 5900X | NVIDIA GeForce GTX 1660 (Desktop) R9 7950X | NVIDIA GeForce GTX 1660 Super (Desktop) R9 7950X | NVIDIA GeForce RTX 2060 Super (Desktop) R9 7950X | NVIDIA GeForce RTX 2070 Super (Desktop) R9 7950X | NVIDIA Titan RTX R9 7950X | Media de la clase | |
|---|---|---|---|---|---|---|---|---|---|---|---|---|---|---|---|---|
| SPECviewperf 12 | -20% | 8% | 26% | 50% | 74% | 91% | 414% | 462% | -12% | -48% | -43% | -28% | -15% | 262% | 13% | |
| 1900x1060 3ds Max (3dsmax-05) (fps) | 287 | 252 -12% | 330 15% | 382 33% | 436 52% | 502 75% | 571 99% | 502 75% | 553 93% | 334 16% | 153 -47% | 167 -42% | 220 -23% | 247 -14% | 315 10% | 206 ? -28% |
| 1900x1060 Catia (catia-04) (fps) | 128 | 109 -15% | 136 6% | 161 26% | 192 50% | 221 73% | 257 101% | 481 276% | 536 319% | 79.1 -38% | 65.1 -49% | 68 -47% | 84.5 -34% | 114 -11% | 332 159% | 113.6 ? -11% |
| 1900x1060 Creo (creo-01) (fps) | 75.4 | 57.8 -23% | 72.6 -4% | 89.1 18% | 99.4 32% | 110 46% | 115 53% | 176 133% | 187 148% | 74.4 -1% | 46.1 -39% | 45.5 -40% | 58.8 -22% | 65.7 -13% | 197 161% | 66.6 ? -12% |
| 1900x1060 Energy (energy-01) (fps) | 23 | 13.9 -40% | 18 -22% | 31.7 38% | 48 109% | 58.8 156% | 54.7 138% | 72.4 215% | 85.2 270% | 17.2 -25% | 6.31 -73% | 8.38 -64% | 11.6 -50% | 12.4 -46% | 28.8 25% | 16.9 ? -27% |
| 1900x1060 Maya (maya-04) (fps) | 254 | 197 -22% | 279 10% | 284 12% | 287 13% | 309 22% | 317 25% | 347 37% | 367 44% | 139 -45% | 131 -48% | 149 -41% | 200 -21% | 225 -11% | 260 2% | 117.7 ? -54% |
| 1900x1060 Medical (medical-01) (fps) | 110 | 59.4 -46% | 106 -4% | 132 20% | 157 43% | 171 55% | 119 8% | 288 162% | 347 215% | 40.3 -63% | 36 -67% | 38.2 -65% | 49.5 -55% | 55.9 -49% | 101 -8% | 59.2 ? -46% |
| 1900x1060 Showcase (showcase-01) (fps) | 120 | 144 20% | 199 66% | 190 58% | 244 103% | 333 178% | 457 281% | 278 132% | 322 168% | 226 88% | 65 -46% | 85.2 -29% | 121 1% | 135 13% | 197 64% | 103.7 ? -14% |
| 1900x1060 Siemens NX (snx-02) (fps) | 14.7 | 12.3 -16% | 14.7 0% | 16.4 12% | 19 29% | 21.6 47% | 27.1 84% | 373 2437% | 400 2621% | 12 -18% | 9.41 -36% | 9.38 -36% | 10.1 -31% | 13.9 -5% | 283 1825% | 60.9 ? 314% |
| 1900x1060 Solidworks (sw-03) (fps) | 95.7 | 71.1 -26% | 101 6% | 109 14% | 118 23% | 113 18% | 126 32% | 342 257% | 360 276% | 73.8 -23% | 69.3 -28% | 70.7 -26% | 79.7 -17% | 95.1 -1% | 207 116% | 89.4 ? -7% |
| SPECviewperf 13 | -17% | 6% | 27% | 51% | 80% | 117% | 401% | 452% | 12% | -50% | -46% | -29% | -15% | 247% | 35% | |
| 3ds Max (3dsmax-06) (fps) | 289 | 252 -13% | 330 14% | 381 32% | 433 50% | 497 72% | 563 95% | 506 75% | 564 95% | 334 16% | 153 -47% | 166 -43% | 218 -25% | 247 -15% | 321 11% | 196.9 ? -32% |
| Catia (catia-05) (fps) | 188 | 161 -14% | 201 7% | 241 28% | 290 54% | 340 81% | 402 114% | 728 287% | 825 339% | 206 10% | 90.3 -52% | 94.9 -50% | 119 -37% | 163 -13% | 534 184% | 211 ? 12% |
| Creo (creo-02) (fps) | 299 | 225 -25% | 286 -4% | 375 25% | 455 52% | 529 77% | 552 85% | 567 90% | 613 105% | 324 8% | 138 -54% | 141 -53% | 203 -32% | 240 -20% | 386 29% | 216 ? -28% |
| Energy (energy-02) (fps) | 45.7 | 25.6 -44% | 30 -34% | 54.2 19% | 72.8 59% | 92.6 103% | 126 176% | 147 222% | 187 309% | 37.6 -18% | 9.93 -78% | 11.3 -75% | 21.9 -52% | 23.8 -48% | 51.8 13% | 39.7 ? -13% |
| Maya (maya-05) (fps) | 396 | 344 -13% | 437 10% | 510 29% | 591 49% | 678 71% | 715 81% | 670 69% | 735 86% | 460 16% | 194 -51% | 214 -46% | 291 -27% | 344 -13% | 499 26% | 278 ? -30% |
| Medical (medical-02) (fps) | 92.9 | 72.2 -22% | 83.6 -10% | 112 21% | 132 42% | 150 61% | 186 100% | 237 155% | 263 183% | 102 10% | 40.5 -56% | 40.7 -56% | 54.2 -42% | 63.7 -31% | 92 -1% | 88.4 ? -5% |
| Showcase (showcase-02) (fps) | 120 | 145 21% | 198 65% | 191 59% | 244 103% | 334 178% | 455 279% | 279 133% | 323 169% | 228 90% | 64.9 -46% | 85.3 -29% | 122 2% | 135 13% | 198 65% | 126.2 ? 5% |
| Siemens NX (snx-03) (fps) | 26.4 | 22.3 -16% | 26.4 0% | 29.5 12% | 34.1 29% | 39 48% | 49.1 86% | 675 2457% | 725 2646% | 26.3 0% | 16.9 -36% | 16.9 -36% | 18.2 -31% | 25 -5% | 512 1839% | 136.6 ? 417% |
| Solidworks (sw-04) (fps) | 137 | 99.6 -27% | 146 7% | 157 15% | 168 23% | 179 31% | 186 36% | 307 124% | 323 136% | 108 -21% | 102 -26% | 104 -24% | 119 -13% | 136 -1% | 218 59% | 124.1 ? -9% |
| SPECviewperf 2020 | -19% | 11% | 31% | 57% | 86% | 140% | 430% | 490% | 20% | -50% | -48% | -30% | -19% | 300% | 57% | |
| 3840x2160 Siemens NX (snx-04) (fps) | 20.3 | 18.2 -10% | 22.2 9% | 23.9 18% | 27.5 35% | 31.9 57% | 41.3 103% | 476 2245% | 514 2432% | 21.8 7% | 12.7 -37% | 12.7 -37% | 14 -31% | 19.8 -2% | 375 1747% | 88.3 ? 335% |
| 3840x2160 Medical (medical-03) (fps) | 17.7 | 11.4 -36% | 16.3 -8% | 22.2 25% | 26.9 52% | 32.2 82% | 45.9 159% | 53.9 205% | 62.3 252% | 18.8 6% | 7.48 -58% | 7.41 -58% | 10.3 -42% | 12 -32% | 16.5 -7% | 24 ? 36% |
| 3840x2160 Maya (maya-06) (fps) | 226 | 215 -5% | 290 28% | 305 35% | 372 65% | 447 98% | 498 120% | 401 77% | 481 113% | 314 39% | 106 -53% | 118 -48% | 162 -28% | 185 -18% | 274 21% | 221 ? -2% |
| 3840x2160 Energy (energy-03) (fps) | 44.9 | 14.5 -68% | 39.1 -13% | 57.6 28% | 75.7 69% | 90.4 101% | 141 214% | 99.6 122% | 129 187% | 37.2 -17% | 12.5 -72% | 13.7 -69% | 22.9 -49% | 17.8 -60% | 93.9 109% | 50 ? 11% |
| 3840x2160 Creo (creo-03) (fps) | 96.1 | 76.6 -20% | 99.3 3% | 112 17% | 121 26% | 128 33% | 133 38% | 173 80% | 187 95% | 90 -6% | 55.2 -43% | 57.7 -40% | 77.2 -20% | 85.8 -11% | 135 40% | 78.3 ? -19% |
| 3840x2160 CATIA (catia-06) (fps) | 39.2 | 37.9 -3% | 48 22% | 51.6 32% | 61.2 56% | 75.5 93% | 95.3 143% | 113 188% | 127 224% | 53.7 37% | 19.2 -51% | 21 -46% | 30.5 -22% | 36.7 -6% | 90.9 132% | 48.9 ? 25% |
| 3840x2160 3ds Max (3dsmax-07) (fps) | 74.5 | 80.1 8% | 99 33% | 122 64% | 147 97% | 179 140% | 228 206% | 143 92% | 167 124% | 128 72% | 45.5 -39% | 48.3 -35% | 63.1 -15% | 69.7 -6% | 118 58% | 85 ? 14% |
| Media total (Programa/Opciones) | -19% /
-19% | 8% /
8% | 28% /
28% | 53% /
53% | 80% /
80% | 116% /
114% | 415% /
414% | 468% /
466% | 7% /
6% | -49% /
-49% | -46% /
-45% | -29% /
-29% | -16% /
-16% | 270% /
267% | 35% /
33% |
Puntos de referencia para juegos
Según Nvidia, los jugadores que juegan principalmente en 1.920 x 1.080 usando configuraciones de detalle altas a máximas son el principal mercado objetivo de la compañía. Esto no está completamente cubierto por la GeForce RTX 4060 Ti si echas un vistazo al resumen de todos los juegos que probamos. Pero, se puede discutir hasta que las vacas vuelvan a casa, ya que ¿qué significa realmente una alta velocidad de fotogramas? Si fijamos el límite en 60 FPS, la GPU sigue estando en verde. Sin embargo, si lo fijamos en 144 FPS, los resultados son totalmente diferentes. En general, el rendimiento en juegos de la MSI GeForce RTX 4060 Ti Gaming X Trio no está nada mal y actualmente está bien preparada para actuar como tarjeta gráfica para juegos a 1.080p. En nuestra prueba, no hubo ningún juego que la MSI GeForce RTX 4060 Ti Gaming X Trio no pudiera manejar. Aunque, medimos la caída ocasional de la velocidad de fotogramas. Un ejemplo sería A Plague Tale Requiem. Aquí, medimos una media relativamente buena de 67 FPS en 1.080p y con el preajuste Ultra. Al mismo tiempo, también medimos caídas de hasta 37 FPS, lo que significa que no se puede hablar de un juego fluido. Hay que diferenciar entre distintos géneros de juegos, ya que no lo hará tan bien ejecutando shooters online de altos FPS comparado con un juego más típico basado en una historia.
En comparación con sus competidores, la MSI GeForce RTX 4060 Ti Gaming X Trio lo hizo comparativamente bien y siempre compitió con la Sapphire Pulse Radeon RX 6750 XT especialmente. Incluso en 1.440p, donde los 8 GB de VRAM de la GeForce RTX 4060 Ti se agotan lentamente, la tarjeta gráfica fue capaz de seguir el ritmo de sus competidoras AMD, a pesar de que estas muestran mucho más espacio para las texturas gracias a sus 12 GB de VRAM.
| F1 2021 | |
| 2560x1440 Ultra High Preset + Raytracing AA:T AF:16x | |
| Palit GeForce RTX 4090 GameRock OC (874931) | |
| KFA2 GeForce RTX 4080 SG (874931) | |
| AMD Radeon RX 7900 XTX (874931) | |
| KFA2 GeForce RTX 4070 Ti EX Gamer (874931) | |
| AMD Radeon RX 7900 XT (874931) | |
| NVIDIA GeForce RTX 3090 Founders Edition (874931) | |
| KFA2 GeForce RTX 4070 EX Gamer (874931) | |
| KFA2 GeForce RTX 3080 SG (874931) | |
| KFA2 GeForce RTX 3070 Ti SG (874931) | |
| MSI GeForce RTX 4060 Ti Gaming X Trio 8G (874931) | |
| Nvidia Titan RTX (874931) | |
| Sapphire Pulse Radeon RX 6750 XT (874931) | |
| Nvidia GeForce RTX 2070 Super (874931) | |
| KFA2 GeForce GTX 1660 Super (874931) | |
| Sapphire Nitro+ Radeon RX 6650 XT (874931) | |
| PNY GeForce GTX 1660 (874931) | |
| Nvidia GeForce RTX 2060 Super (874931) | |
| 1920x1080 Ultra High Preset + Raytracing AA:T AF:16x | |
| Palit GeForce RTX 4090 GameRock OC (874931) | |
| AMD Radeon RX 7900 XTX (874931) | |
| KFA2 GeForce RTX 4080 SG (874931) | |
| KFA2 GeForce RTX 4070 Ti EX Gamer (874931) | |
| AMD Radeon RX 7900 XT (874931) | |
| NVIDIA GeForce RTX 3090 Founders Edition (874931) | |
| KFA2 GeForce RTX 4070 EX Gamer (874931) | |
| KFA2 GeForce RTX 3080 SG (874931) | |
| KFA2 GeForce RTX 3070 Ti SG (874931) | |
| MSI GeForce RTX 4060 Ti Gaming X Trio 8G (874931) | |
| Nvidia Titan RTX (874931) | |
| Sapphire Pulse Radeon RX 6750 XT (874931) | |
| Nvidia GeForce RTX 2070 Super (874931) | |
| Sapphire Nitro+ Radeon RX 6650 XT (874931) | |
| KFA2 GeForce GTX 1660 Super (874931) | |
| Nvidia GeForce RTX 2060 Super (874931) | |
| PNY GeForce GTX 1660 (874931) | |
| F1 22 | |
| 2560x1440 Ultra High Preset AA:T AF:16x | |
| Palit GeForce RTX 4090 GameRock OC (923662) | |
| KFA2 GeForce RTX 4080 SG (939134) | |
| AMD Radeon RX 7900 XTX (939134) | |
| KFA2 GeForce RTX 4070 Ti EX Gamer (959964) | |
| AMD Radeon RX 7900 XT (939134) | |
| NVIDIA GeForce RTX 3090 Founders Edition (923650) | |
| KFA2 GeForce RTX 4070 EX Gamer (959964) | |
| KFA2 GeForce GTX 1660 Super (928484) | |
| PNY GeForce GTX 1660 (928484) | |
| KFA2 GeForce RTX 3070 Ti SG (939134) | |
| Nvidia Titan RTX (923650) | |
| MSI GeForce RTX 4060 Ti Gaming X Trio 8G (959964) | |
| Sapphire Pulse Radeon RX 6750 XT (959964) | |
| Nvidia GeForce RTX 2070 Super (923662) | |
| Nvidia GeForce RTX 2060 Super (923662) | |
| Sapphire Nitro+ Radeon RX 6650 XT | |
| 1920x1080 Ultra High Preset AA:T AF:16x | |
| Palit GeForce RTX 4090 GameRock OC | |
| KFA2 GeForce RTX 4080 SG (939134) | |
| AMD Radeon RX 7900 XTX (939134) | |
| KFA2 GeForce RTX 4070 Ti EX Gamer (959964) | |
| NVIDIA GeForce RTX 3090 Founders Edition (923650) | |
| AMD Radeon RX 7900 XT (939134) | |
| KFA2 GeForce RTX 4070 EX Gamer (959964) | |
| KFA2 GeForce GTX 1660 Super (928484) | |
| KFA2 GeForce RTX 3070 Ti SG (939134) | |
| PNY GeForce GTX 1660 (928484) | |
| Nvidia Titan RTX (923650) | |
| MSI GeForce RTX 4060 Ti Gaming X Trio 8G (959964) | |
| Sapphire Pulse Radeon RX 6750 XT (959964) | |
| Nvidia GeForce RTX 2070 Super (923662) | |
| Nvidia GeForce RTX 2060 Super (923662) | |
| Sapphire Nitro+ Radeon RX 6650 XT | |
| Cyberpunk 2077 1.6 | |
| 2560x1440 Ultra Preset | |
| Palit GeForce RTX 4090 GameRock OC (1.6) | |
| AMD Radeon RX 7900 XTX (1.61) | |
| KFA2 GeForce RTX 4080 SG (1.61) | |
| AMD Radeon RX 7900 XT (1.61) | |
| KFA2 GeForce RTX 4070 Ti EX Gamer | |
| KFA2 GeForce RTX 4070 EX Gamer | |
| KFA2 GeForce RTX 3070 Ti SG (1.61) | |
| Sapphire Pulse Radeon RX 6750 XT | |
| MSI GeForce RTX 4060 Ti Gaming X Trio 8G | |
| Nvidia GeForce RTX 2070 Super (1.6) | |
| Sapphire Nitro+ Radeon RX 6650 XT | |
| Nvidia GeForce RTX 2060 Super (1.6) | |
| KFA2 GeForce GTX 1660 Super (1.6) | |
| PNY GeForce GTX 1660 (1.6) | |
| 1920x1080 Ultra Preset | |
| Palit GeForce RTX 4090 GameRock OC (1.6) | |
| AMD Radeon RX 7900 XTX (1.61) | |
| KFA2 GeForce RTX 4080 SG (1.61) | |
| AMD Radeon RX 7900 XT (1.61) | |
| KFA2 GeForce RTX 4070 Ti EX Gamer | |
| KFA2 GeForce RTX 4070 EX Gamer | |
| KFA2 GeForce RTX 3070 Ti SG (1.61) | |
| MSI GeForce RTX 4060 Ti Gaming X Trio 8G | |
| Sapphire Pulse Radeon RX 6750 XT | |
| Sapphire Nitro+ Radeon RX 6650 XT | |
| Nvidia GeForce RTX 2070 Super (1.6) | |
| Nvidia GeForce RTX 2060 Super (1.6) | |
| KFA2 GeForce GTX 1660 Super (1.6) | |
| PNY GeForce GTX 1660 (1.6) | |
| A Plague Tale Requiem | |
| 2560x1440 Ultra Preset | |
| Palit GeForce RTX 4090 GameRock OC | |
| AMD Radeon RX 7900 XTX | |
| KFA2 GeForce RTX 4080 SG | |
| AMD Radeon RX 7900 XT | |
| KFA2 GeForce RTX 4070 Ti EX Gamer | |
| KFA2 GeForce RTX 4070 EX Gamer | |
| KFA2 GeForce RTX 3070 Ti SG | |
| Nvidia Titan RTX | |
| MSI GeForce RTX 4060 Ti Gaming X Trio 8G | |
| Sapphire Pulse Radeon RX 6750 XT | |
| Nvidia GeForce RTX 2070 Super | |
| Nvidia GeForce RTX 2060 Super | |
| KFA2 GeForce GTX 1660 Super | |
| PNY GeForce GTX 1660 | |
| 1920x1080 Ultra Preset | |
| Palit GeForce RTX 4090 GameRock OC | |
| KFA2 GeForce RTX 4080 SG | |
| AMD Radeon RX 7900 XTX | |
| AMD Radeon RX 7900 XT | |
| KFA2 GeForce RTX 4070 Ti EX Gamer | |
| KFA2 GeForce RTX 4070 EX Gamer | |
| KFA2 GeForce RTX 3070 Ti SG | |
| Nvidia Titan RTX | |
| MSI GeForce RTX 4060 Ti Gaming X Trio 8G | |
| Sapphire Pulse Radeon RX 6750 XT | |
| Nvidia GeForce RTX 2070 Super | |
| Nvidia GeForce RTX 2060 Super | |
| KFA2 GeForce GTX 1660 Super | |
| PNY GeForce GTX 1660 | |
| Need for Speed Unbound | |
| 2560x1440 Ultra Preset | |
| Palit GeForce RTX 4090 GameRock OC | |
| KFA2 GeForce RTX 4080 SG | |
| AMD Radeon RX 7900 XTX | |
| AMD Radeon RX 7900 XT | |
| KFA2 GeForce RTX 3070 Ti SG | |
| Nvidia Titan RTX | |
| Nvidia GeForce RTX 2070 Super | |
| Nvidia GeForce RTX 2060 Super | |
| KFA2 GeForce GTX 1660 Super | |
| PNY GeForce GTX 1660 | |
| 1920x1080 Ultra Preset | |
| Palit GeForce RTX 4090 GameRock OC | |
| AMD Radeon RX 7900 XTX | |
| KFA2 GeForce RTX 4080 SG | |
| AMD Radeon RX 7900 XT | |
| KFA2 GeForce RTX 3070 Ti SG | |
| Nvidia Titan RTX | |
| Nvidia GeForce RTX 2070 Super | |
| Nvidia GeForce RTX 2060 Super | |
| KFA2 GeForce GTX 1660 Super | |
| PNY GeForce GTX 1660 | |
| Spider-Man Miles Morales | |
| 2560x1440 Very High Preset AA:T | |
| KFA2 GeForce RTX 4080 SG | |
| Palit GeForce RTX 4090 GameRock OC | |
| AMD Radeon RX 7900 XTX | |
| KFA2 GeForce RTX 4070 Ti EX Gamer | |
| AMD Radeon RX 7900 XT | |
| KFA2 GeForce RTX 4070 EX Gamer | |
| KFA2 GeForce RTX 3070 Ti SG | |
| Nvidia Titan RTX | |
| MSI GeForce RTX 4060 Ti Gaming X Trio 8G | |
| Sapphire Pulse Radeon RX 6750 XT | |
| Nvidia GeForce RTX 2070 Super | |
| Nvidia GeForce RTX 2060 Super | |
| PNY GeForce GTX 1660 | |
| KFA2 GeForce GTX 1660 Super | |
| 1920x1080 Very High Preset AA:T | |
| Palit GeForce RTX 4090 GameRock OC | |
| KFA2 GeForce RTX 4070 Ti EX Gamer | |
| AMD Radeon RX 7900 XTX | |
| KFA2 GeForce RTX 4070 EX Gamer | |
| KFA2 GeForce RTX 4080 SG | |
| AMD Radeon RX 7900 XT | |
| KFA2 GeForce RTX 3070 Ti SG | |
| Nvidia Titan RTX | |
| MSI GeForce RTX 4060 Ti Gaming X Trio 8G | |
| Sapphire Pulse Radeon RX 6750 XT | |
| Nvidia GeForce RTX 2070 Super | |
| Nvidia GeForce RTX 2060 Super | |
| KFA2 GeForce GTX 1660 Super | |
| PNY GeForce GTX 1660 | |
| God of War | |
| 2560x1440 Ultra Preset | |
| Palit GeForce RTX 4090 GameRock OC | |
| AMD Radeon RX 7900 XTX | |
| AMD Radeon RX 7900 XT | |
| KFA2 GeForce RTX 4080 SG | |
| NVIDIA GeForce RTX 3090 Founders Edition | |
| KFA2 GeForce RTX 4070 EX Gamer | |
| Nvidia Titan RTX | |
| KFA2 GeForce RTX 3080 SG | |
| KFA2 GeForce RTX 3070 Ti SG | |
| Sapphire Pulse Radeon RX 6750 XT | |
| MSI GeForce RTX 4060 Ti Gaming X Trio 8G | |
| Nvidia GeForce RTX 2070 Super | |
| Sapphire Nitro+ Radeon RX 6650 XT | |
| Nvidia GeForce RTX 2060 Super | |
| KFA2 GeForce GTX 1660 Super | |
| PNY GeForce GTX 1660 | |
| 1920x1080 Ultra Preset | |
| Palit GeForce RTX 4090 GameRock OC | |
| AMD Radeon RX 7900 XTX | |
| AMD Radeon RX 7900 XT | |
| KFA2 GeForce RTX 4080 SG | |
| NVIDIA GeForce RTX 3090 Founders Edition | |
| KFA2 GeForce RTX 4070 EX Gamer | |
| Nvidia Titan RTX | |
| KFA2 GeForce RTX 3080 SG | |
| KFA2 GeForce RTX 3070 Ti SG | |
| Sapphire Pulse Radeon RX 6750 XT | |
| MSI GeForce RTX 4060 Ti Gaming X Trio 8G | |
| Nvidia GeForce RTX 2070 Super | |
| Sapphire Nitro+ Radeon RX 6650 XT | |
| Nvidia GeForce RTX 2060 Super | |
| KFA2 GeForce GTX 1660 Super | |
| PNY GeForce GTX 1660 | |
| The Quarry | |
| 2560x1440 Ultra Preset | |
| Palit GeForce RTX 4090 GameRock OC | |
| KFA2 GeForce RTX 4080 SG | |
| AMD Radeon RX 7900 XTX | |
| AMD Radeon RX 7900 XT | |
| KFA2 GeForce RTX 4070 Ti EX Gamer | |
| NVIDIA GeForce RTX 3090 Founders Edition | |
| KFA2 GeForce RTX 4070 EX Gamer | |
| KFA2 GeForce RTX 3070 Ti SG | |
| Nvidia Titan RTX | |
| MSI GeForce RTX 4060 Ti Gaming X Trio 8G | |
| Sapphire Pulse Radeon RX 6750 XT | |
| Nvidia GeForce RTX 2070 Super | |
| Sapphire Nitro+ Radeon RX 6650 XT | |
| Nvidia GeForce RTX 2060 Super | |
| KFA2 GeForce GTX 1660 Super | |
| PNY GeForce GTX 1660 | |
| 1920x1080 Ultra Preset | |
| Palit GeForce RTX 4090 GameRock OC | |
| KFA2 GeForce RTX 4080 SG | |
| AMD Radeon RX 7900 XTX | |
| AMD Radeon RX 7900 XT | |
| KFA2 GeForce RTX 4070 Ti EX Gamer | |
| NVIDIA GeForce RTX 3090 Founders Edition | |
| KFA2 GeForce RTX 4070 EX Gamer | |
| KFA2 GeForce RTX 3070 Ti SG | |
| Nvidia Titan RTX | |
| MSI GeForce RTX 4060 Ti Gaming X Trio 8G | |
| Sapphire Pulse Radeon RX 6750 XT | |
| Nvidia GeForce RTX 2070 Super | |
| Sapphire Nitro+ Radeon RX 6650 XT | |
| Nvidia GeForce RTX 2060 Super | |
| KFA2 GeForce GTX 1660 Super | |
| PNY GeForce GTX 1660 | |
| GRID Legends | |
| 2560x1440 Ultra Preset | |
| AMD Radeon RX 7900 XTX (643827) | |
| Palit GeForce RTX 4090 GameRock OC (591708) | |
| AMD Radeon RX 7900 XT (643827) | |
| KFA2 GeForce RTX 4080 SG (643827) | |
| KFA2 GeForce RTX 4070 Ti EX Gamer (712825) | |
| NVIDIA GeForce RTX 3090 Founders Edition (591708) | |
| KFA2 GeForce RTX 3070 Ti SG (643827) | |
| KFA2 GeForce RTX 4070 EX Gamer (712825) | |
| Sapphire Pulse Radeon RX 6750 XT (712825) | |
| Nvidia Titan RTX (591708) | |
| MSI GeForce RTX 4060 Ti Gaming X Trio 8G (800660) | |
| Sapphire Nitro+ Radeon RX 6650 XT | |
| Nvidia GeForce RTX 2070 Super (591708) | |
| Nvidia GeForce RTX 2060 Super (623651) | |
| KFA2 GeForce GTX 1660 Super (623651) | |
| PNY GeForce GTX 1660 (623651) | |
| 1920x1080 Ultra Preset | |
| AMD Radeon RX 7900 XTX (643827) | |
| AMD Radeon RX 7900 XT (643827) | |
| Palit GeForce RTX 4090 GameRock OC (591708) | |
| KFA2 GeForce RTX 4080 SG (643827) | |
| KFA2 GeForce RTX 4070 Ti EX Gamer (712825) | |
| NVIDIA GeForce RTX 3090 Founders Edition (591708) | |
| KFA2 GeForce RTX 4070 EX Gamer (712825) | |
| Sapphire Pulse Radeon RX 6750 XT (712825) | |
| KFA2 GeForce RTX 3070 Ti SG (643827) | |
| Nvidia Titan RTX (591708) | |
| MSI GeForce RTX 4060 Ti Gaming X Trio 8G (800660) | |
| Sapphire Nitro+ Radeon RX 6650 XT | |
| Nvidia GeForce RTX 2070 Super (591708) | |
| Nvidia GeForce RTX 2060 Super (623651) | |
| KFA2 GeForce GTX 1660 Super (623651) | |
| PNY GeForce GTX 1660 (623651) | |
| Final Fantasy XV Benchmark | |
| 1920x1080 High Quality | |
| Palit GeForce RTX 4090 GameRock OC (1.3) | |
| KFA2 GeForce RTX 4080 SG (1.3) | |
| AMD Radeon RX 7900 XTX (1.3) | |
| KFA2 GeForce RTX 4070 Ti EX Gamer (1.3) | |
| AMD Radeon RX 7900 XT (1.3) | |
| NVIDIA GeForce RTX 3090 Founders Edition (1.3) | |
| KFA2 GeForce RTX 4070 EX Gamer (1.3) | |
| KFA2 GeForce RTX 3080 SG (1.3) | |
| Nvidia Titan RTX (1.3) | |
| KFA2 GeForce RTX 3070 Ti SG (1.3) | |
| MSI GeForce RTX 4060 Ti Gaming X Trio 8G (1.3) | |
| Sapphire Pulse Radeon RX 6750 XT (1.3) | |
| Nvidia GeForce RTX 2070 Super (1.3) | |
| Sapphire Nitro+ Radeon RX 6650 XT (1.3) | |
| Nvidia GeForce RTX 2060 Super (1.3) | |
| KFA2 GeForce GTX 1660 Super (1.3) | |
| PNY GeForce GTX 1660 (1.3) | |
| 2560x1440 High Quality | |
| Palit GeForce RTX 4090 GameRock OC (1.3) | |
| KFA2 GeForce RTX 4080 SG (1.3) | |
| AMD Radeon RX 7900 XTX (1.3) | |
| KFA2 GeForce RTX 4070 Ti EX Gamer (1.3) | |
| AMD Radeon RX 7900 XT (1.3) | |
| NVIDIA GeForce RTX 3090 Founders Edition (1.3) | |
| KFA2 GeForce RTX 4070 EX Gamer (1.3) | |
| KFA2 GeForce RTX 3080 SG (1.3) | |
| KFA2 GeForce RTX 3070 Ti SG (1.3) | |
| Nvidia Titan RTX (1.3) | |
| MSI GeForce RTX 4060 Ti Gaming X Trio 8G (1.3) | |
| Sapphire Pulse Radeon RX 6750 XT (1.3) | |
| Nvidia GeForce RTX 2070 Super (1.3) | |
| Sapphire Nitro+ Radeon RX 6650 XT (1.3) | |
| Nvidia GeForce RTX 2060 Super (1.3) | |
| KFA2 GeForce GTX 1660 Super (1.3) | |
| PNY GeForce GTX 1660 (1.3) | |
Trazado de rayos, DLSS y FG (generación de fotogramas)
Con el lanzamiento de Ada Lovelace, Nvidia ha mejorado sus funciones de trazado de rayos y DLSS: la 3ª versión de DLSS se encuentra actualmente de forma exclusiva en las GPU RTX 4000. Esto significa que el MSI GeForce RTX 4060 Ti Gaming X Trio también se beneficia de estas nuevas características y Frame Generation puede magia hasta velocidades de fotogramas más altas en la pantalla. Sin embargo, esto primero tiene que ser implementado en todos los juegos y en el futuro, es probable que sean más y más optimizado para esta función. Sin duda, una función que los propietarios de GeForce RTX 4060 Ti podrán aprovechar en el futuro para conseguir frecuencias de cuadro jugables. Si la potencia de cálculo de la tarjeta gráfica no es suficiente para esto en el futuro, entonces se puede utilizar DLSS y FG para resolver el problema. Aquí, podemos utilizar de nuevo A Plague Tale Requiem como ejemplo. Conseguimos unos buenos 50 FPS en UHD con DLSS y FG activados. Sin estas funciones, sólo conseguimos 25 FPS, lo que no es suficiente para disfrutar del juego.
Las funciones de trazado de rayos de la GPU están más o menos al mismo nivel que unaNvidia GeForce RTX 2080 Ti. Con la función activada, sin embargo, hay que tener en cuenta una mayor caída del rendimiento. Aun así, a menudo medimos una media de 60 FPS. AMD, con suRadeon RX 6750 XTsimplemente no puede seguir el ritmo.
| Spider-Man Miles Morales - 1920x0180 Very High Preset + Ray-Tracing AA:T | |
| Palit GeForce RTX 4090 GameRock OC | |
| KFA2 GeForce RTX 4080 SG | |
| KFA2 GeForce RTX 4070 Ti EX Gamer | |
| AMD Radeon RX 7900 XTX | |
| AMD Radeon RX 7900 XT | |
| KFA2 GeForce RTX 4070 EX Gamer | |
| KFA2 GeForce RTX 3070 Ti SG | |
| MSI GeForce RTX 4060 Ti Gaming X Trio 8G | |
| Nvidia Titan RTX | |
| Sapphire Pulse Radeon RX 6750 XT | |
| Nvidia GeForce RTX 2070 Super | |
| Nvidia GeForce RTX 2060 Super | |
| Metro Exodus - 1920x1080 Ultra Quality DXR AF:16x | |
| Palit GeForce RTX 4090 GameRock OC | |
| KFA2 GeForce RTX 4080 SG | |
| AMD Radeon RX 7900 XTX | |
| KFA2 GeForce RTX 4070 Ti EX Gamer | |
| AMD Radeon RX 7900 XT | |
| NVIDIA GeForce RTX 3090 Founders Edition | |
| KFA2 GeForce RTX 4070 EX Gamer | |
| KFA2 GeForce RTX 3080 SG | |
| KFA2 GeForce RTX 3070 Ti SG | |
| Nvidia Titan RTX | |
| MSI GeForce RTX 4060 Ti Gaming X Trio 8G | |
| NVIDIA GeForce RTX 3060 Ti FE | |
| Sapphire Pulse Radeon RX 6750 XT | |
| Nvidia GeForce RTX 2070 Super | |
| Nvidia GeForce RTX 2060 Super | |
| Far Cry 6 - 1920x1080 Ultra Graphics Quality + HD Textures + DXR AA:T | |
| AMD Radeon RX 7900 XTX | |
| AMD Radeon RX 7900 XT | |
| KFA2 GeForce RTX 4070 Ti EX Gamer | |
| Palit GeForce RTX 4090 GameRock OC | |
| KFA2 GeForce RTX 4070 EX Gamer | |
| NVIDIA GeForce RTX 3090 Founders Edition | |
| KFA2 GeForce RTX 4080 SG | |
| Nvidia Titan RTX | |
| Sapphire Pulse Radeon RX 6750 XT | |
| MSI GeForce RTX 4060 Ti Gaming X Trio 8G | |
| KFA2 GeForce RTX 3070 Ti SG | |
| Nvidia GeForce RTX 2070 Super | |
| Nvidia GeForce RTX 2060 Super | |
| Cyberpunk 2077 1.6 | |
| 3840x2160 Ray Tracing Ultra Preset (DLSS off) | |
| Palit GeForce RTX 4090 GameRock OC (1.6) | |
| KFA2 GeForce RTX 4080 SG (1.61) | |
| KFA2 GeForce RTX 4070 Ti EX Gamer | |
| AMD Radeon RX 7900 XTX (1.61) | |
| KFA2 GeForce RTX 4070 EX Gamer | |
| AMD Radeon RX 7900 XT (1.61) | |
| Sapphire Pulse Radeon RX 6750 XT | |
| KFA2 GeForce RTX 3070 Ti SG (1.61) | |
| Nvidia GeForce RTX 2070 Super (1.6) | |
| MSI GeForce RTX 4060 Ti Gaming X Trio 8G | |
| 1920x1080 Ray Tracing Ultra Preset (DLSS off) | |
| Palit GeForce RTX 4090 GameRock OC (1.6) | |
| KFA2 GeForce RTX 4080 SG (1.61) | |
| KFA2 GeForce RTX 4070 Ti EX Gamer | |
| AMD Radeon RX 7900 XTX (1.61) | |
| KFA2 GeForce RTX 4070 EX Gamer | |
| AMD Radeon RX 7900 XT (1.61) | |
| MSI GeForce RTX 4060 Ti Gaming X Trio 8G | |
| KFA2 GeForce RTX 3070 Ti SG (1.61) | |
| Nvidia GeForce RTX 2070 Super (1.6) | |
| Sapphire Pulse Radeon RX 6750 XT | |
| Nvidia GeForce RTX 2060 Super (1.6) | |
| The Callisto Protocol - 1920x1080 Ultra Preset (without FSR Upscaling) + Full Ray-Tracing | |
| AMD Radeon RX 7900 XTX | |
| KFA2 GeForce RTX 4070 Ti EX Gamer | |
| Palit GeForce RTX 4090 GameRock OC | |
| AMD Radeon RX 7900 XT | |
| KFA2 GeForce RTX 4080 SG | |
| KFA2 GeForce RTX 4070 EX Gamer | |
| MSI GeForce RTX 4060 Ti Gaming X Trio 8G | |
| KFA2 GeForce RTX 3070 Ti SG | |
| Nvidia Titan RTX | |
| Nvidia GeForce RTX 2070 Super | |
| Nvidia GeForce RTX 2060 Super | |
| Sapphire Pulse Radeon RX 6750 XT | |
| PNY GeForce GTX 1660 | |
| KFA2 GeForce GTX 1660 Super | |
| Guardians of the Galaxy - 1920x1080 Ultra Preset + Ultra Ray-Tracing | |
| KFA2 GeForce RTX 4070 Ti EX Gamer | |
| AMD Radeon RX 7900 XTX | |
| KFA2 GeForce RTX 4070 EX Gamer | |
| AMD Radeon RX 7900 XT | |
| MSI GeForce RTX 4060 Ti Gaming X Trio 8G | |
| Nvidia Titan RTX | |
| Nvidia GeForce RTX 2070 Super | |
| Sapphire Pulse Radeon RX 6750 XT | |
| Nvidia GeForce RTX 2060 Super | |
| A Plague Tale Requiem | |
| 3840x2160 Ultra DLSS Quality + Frame Generation | |
| KFA2 GeForce RTX 4070 Ti EX Gamer | |
| KFA2 GeForce RTX 4070 EX Gamer | |
| MSI GeForce RTX 4060 Ti Gaming X Trio 8G | |
| 3840x2160 Ultra DLSS Quality | |
| KFA2 GeForce RTX 4070 Ti EX Gamer | |
| KFA2 GeForce RTX 4070 EX Gamer | |
| MSI GeForce RTX 4060 Ti Gaming X Trio 8G | |
| Control | |
| 1920x1080 High Quality Preset & High Ray Tracing Preset (DX12) | |
| Palit GeForce RTX 4090 GameRock OC | |
| KFA2 GeForce RTX 4080 SG | |
| AMD Radeon RX 7900 XTX | |
| KFA2 GeForce RTX 4070 Ti EX Gamer | |
| AMD Radeon RX 7900 XT | |
| KFA2 GeForce RTX 3080 SG | |
| KFA2 GeForce RTX 4070 EX Gamer | |
| Nvidia Titan RTX | |
| MSI GeForce RTX 4060 Ti Gaming X Trio 8G | |
| NVIDIA GeForce RTX 3060 Ti FE | |
| Sapphire Pulse Radeon RX 6750 XT | |
| Nvidia GeForce RTX 2070 Super | |
| Nvidia GeForce RTX 2060 Super | |
| Sapphire Nitro+ Radeon RX 6650 XT | |
| 3840x2160 High Quality Preset & High Ray Tracing Preset (DX12) | |
| KFA2 GeForce RTX 4070 Ti EX Gamer | |
| KFA2 GeForce RTX 4070 EX Gamer | |
| MSI GeForce RTX 4060 Ti Gaming X Trio 8G | |
| Sapphire Pulse Radeon RX 6750 XT | |
| 3840x2160 High Quality, High Ray Tracing, DLSS | |
| KFA2 GeForce RTX 4070 Ti EX Gamer | |
| KFA2 GeForce RTX 4070 EX Gamer | |
| MSI GeForce RTX 4060 Ti Gaming X Trio 8G | |
| The Last of Us - 3840x2160 Ultra Preset + Quality DLSS | |
| Palit GeForce RTX 4090 GameRock OC | |
| KFA2 GeForce RTX 4070 Ti EX Gamer | |
| KFA2 GeForce RTX 4070 EX Gamer | |
| Nvidia Titan RTX | |
| MSI GeForce RTX 4060 Ti Gaming X Trio 8G | |
| Nvidia GeForce RTX 2070 Super | |
| bajo | medio | alto | ultra | QHD | 4K DLSS | 4K | |
|---|---|---|---|---|---|---|---|
| GTA V (2015) | 187.8 | 187.8 | 187.5 | 144.2 | 103.4 | 103.2 | |
| The Witcher 3 (2015) | 706.6 | 475.7 | 276.9 | 140.5 | 78.5 | ||
| Dota 2 Reborn (2015) | 297.3 | 262 | 257.4 | 228.4 | 165.8 | ||
| Final Fantasy XV Benchmark (2018) | 236 | 193.5 | 133.8 | 95.5 | 52.7 | ||
| X-Plane 11.11 (2018) | 218 | 196.2 | 149.1 | 126.2 | |||
| Far Cry 5 (2018) | 238 | 200 | 193 | 180 | 136 | 68 | |
| Strange Brigade (2018) | 697 | 351 | 276 | 239 | 154 | 80.1 | |
| Shadow of the Tomb Raider (2018) | 342 | 225 | 204 | 184 | 121.2 | 58.7 | |
| Far Cry New Dawn (2019) | 197 | 173 | 166 | 147 | 127 | 70 | |
| Metro Exodus (2019) | 311 | 173.6 | 130.8 | 101.8 | 80.1 | 49.3 | |
| Control (2019) | 239.9 | 162.4 | 120.2 | 75.2 | 43.5 | 37.3 | |
| Borderlands 3 (2019) | 241 | 206 | 157.3 | 123.5 | 85.2 | 43.7 | |
| F1 2020 (2020) | 548 | 426 | 342 | 232 | 177.8 | 97 | |
| F1 2021 (2021) | 671 | 471 | 359 | 179.8 | 128.9 | 67.2 | |
| Far Cry 6 (2021) | 233 | 190.4 | 163.2 | 145 | 102.5 | 21.4 | |
| Guardians of the Galaxy (2021) | 201 | 196 | 195 | 187 | 129 | 67 | |
| God of War (2022) | 178.3 | 146.2 | 116.4 | 85 | 69.9 | 46.6 | |
| GRID Legends (2022) | 243 | 218 | 194.6 | 164.2 | 137.3 | 84.7 | |
| Cyberpunk 2077 1.6 (2022) | 176.6 | 137.6 | 115.7 | 100.5 | 60.2 | 25.3 | |
| Ghostwire Tokyo (2022) | 235 | 224 | 221 | 207 | 128.8 | 58.3 | |
| Tiny Tina's Wonderlands (2022) | 303 | 237 | 155.3 | 119.7 | 81.1 | 36.9 | |
| F1 22 (2022) | 358 | 346 | 258 | 89.6 | 56.5 | 28.2 | |
| The Quarry (2022) | 228 | 167.4 | 137.2 | 108.8 | 72.3 | 23 | |
| A Plague Tale Requiem (2022) | 151.5 | 117 | 88.3 | 66.8 | 47.4 | 50.8 | 25.2 |
| Uncharted Legacy of Thieves Collection (2022) | 113.6 | 109.8 | 102.9 | 99.4 | 70.7 | 30.3 | |
| Spider-Man Miles Morales (2022) | 154.4 | 149.1 | 141.9 | 131.7 | 96.6 | 54.8 | |
| The Callisto Protocol (2022) | 232.1 | 178 | 167.8 | 103.6 | 79.5 | 48.8 | |
| High On Life (2023) | 346 | 225 | 167.3 | 139 | 78.3 | 32.3 | |
| The Witcher 3 v4 (2023) | 278 | 226 | 187.3 | 151.8 | 98.9 | 52.4 | |
| Dead Space Remake (2023) | 128.5 | 122.9 | 106.2 | 105.5 | 65.9 | 32 | |
| Hogwarts Legacy (2023) | 177.5 | 135.1 | 108 | 85 | 54.7 | 30.8 | |
| Returnal (2023) | 136 | 129 | 116 | 101 | 73 | 41 | |
| Atomic Heart (2023) | 264 | 202 | 116 | 93.7 | 69.5 | 38.9 | |
| Company of Heroes 3 (2023) | 293.5 | 243.8 | 180.6 | 179.6 | 133.6 | 72.3 | |
| Sons of the Forest (2023) | 118.1 | 109.9 | 105.6 | 103.1 | 81.9 | 49.6 | |
| Resident Evil 4 Remake (2023) | 207 | 135.7 | 150.4 | 98.6 | 69.1 | 37.9 | |
| The Last of Us (2023) | 126.1 | 102.1 | 89.6 | 74.6 | 46.5 | 36.5 | 19.6 |
| Dead Island 2 (2023) | 289 | 263 | 224 | 162.5 | 110.5 | 56.9 | |
| Star Wars Jedi Survivor (2023) | 114.2 | 98.6 | 91.3 | 84.7 | 54.4 | 25.7 | |
| Diablo 4 (2023) | 341 | 290 | 256 | 217 | 138.8 | 92.8 | 66 |
Las emisiones de MSI GeForce RTX 4060 Ti Gaming X Trio 8G's
Emisiones sonoras
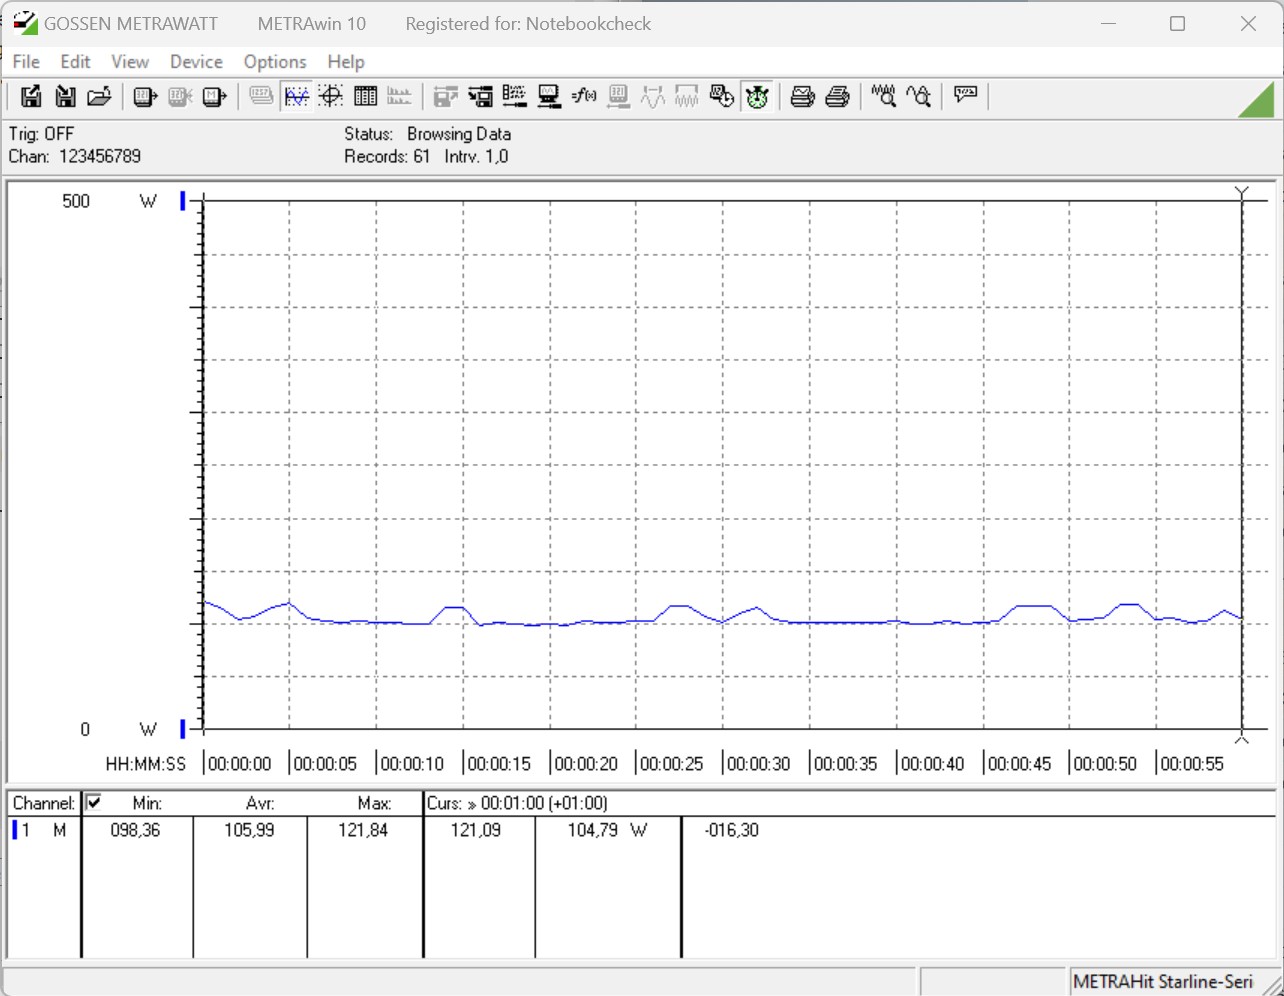
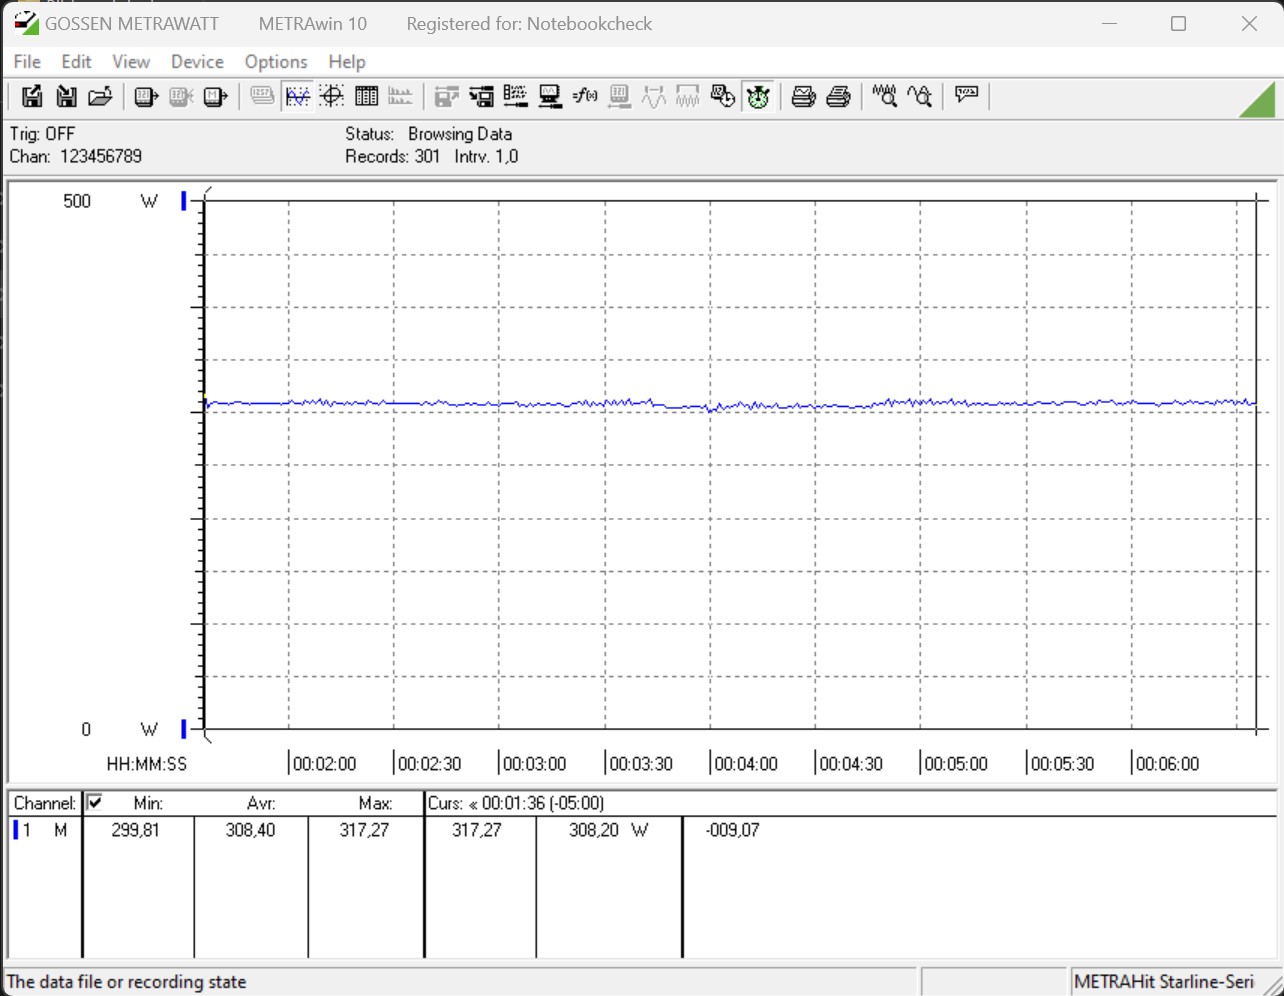
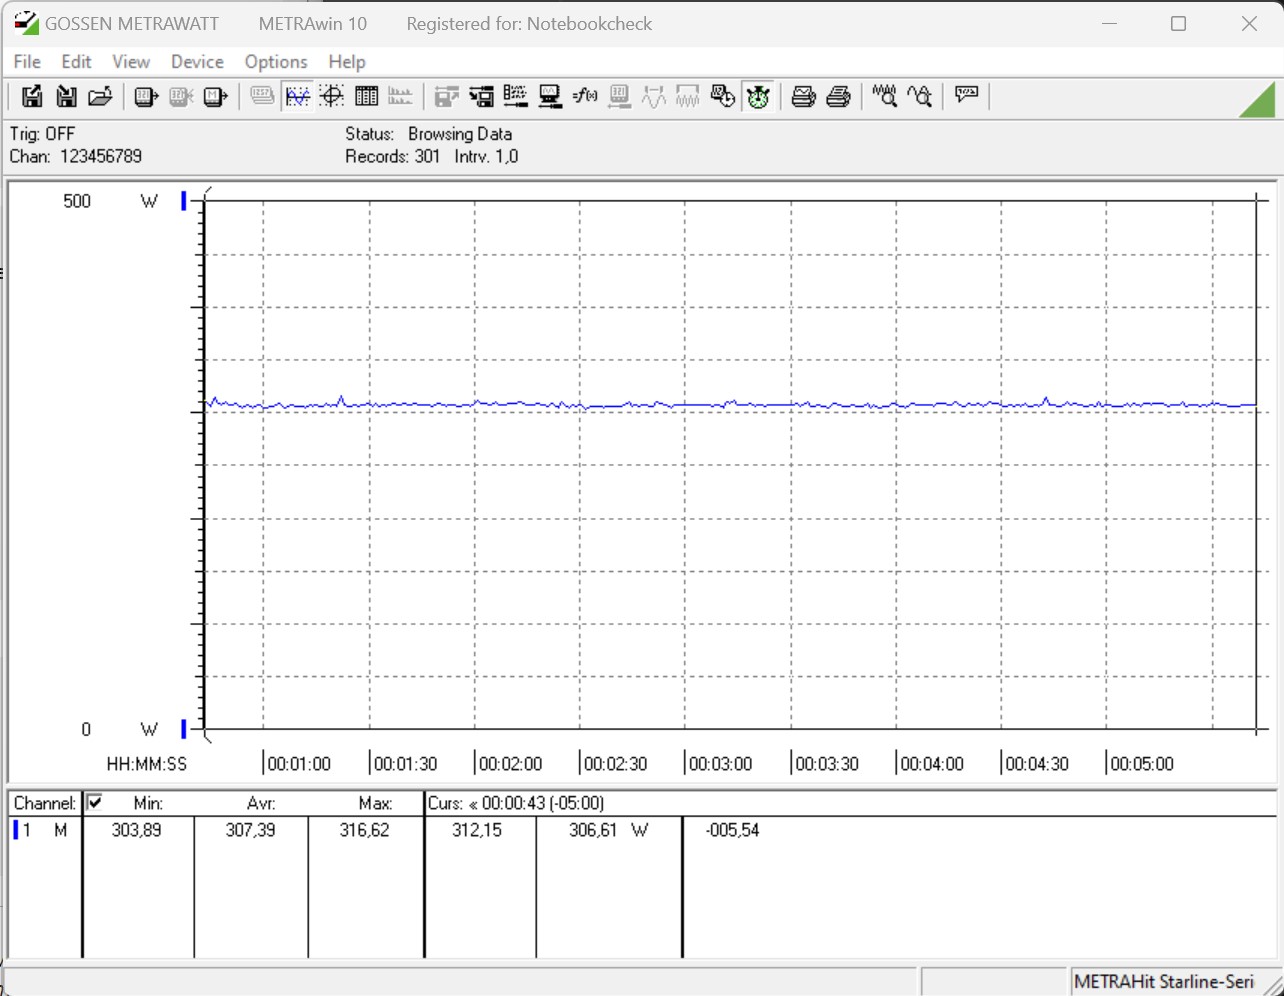
Para medir las emisiones de ruido del MSI GeForce RTX 4060 Ti Gaming X Trio 8G, lo usamos abierto y sin refrigeración adicional de CPU o fuente de alimentación. En modo inactivo y con poca carga, el modelo que probamos era efectivamente silencioso. Incluso cuando los ventiladores de 100 milímetros empezaron a trabajar, la tarjeta gráfica seguía siendo extremadamente silenciosa. En nuestra prueba de estrés, medimos sólo 31 dB(A) y una velocidad de rotación del ventilador de sólo 1.100 rotaciones por minuto. Cuando elevamos el objetivo de potencia al 121%, los ventiladores trabajaron a 1.310 rotaciones por minuto y sus emisiones de ruido de 32,5 dB(A) seguían siendo increíblemente silenciosas.
Ruido
| Ocioso |
| 30.1 / 30.1 / 30.1 dB(A) |
| Carga |
| 30.15 / 31 dB(A) |
 | ||
30 dB silencioso 40 dB(A) audible 50 dB(A) ruidosamente alto |
||
min: | ||
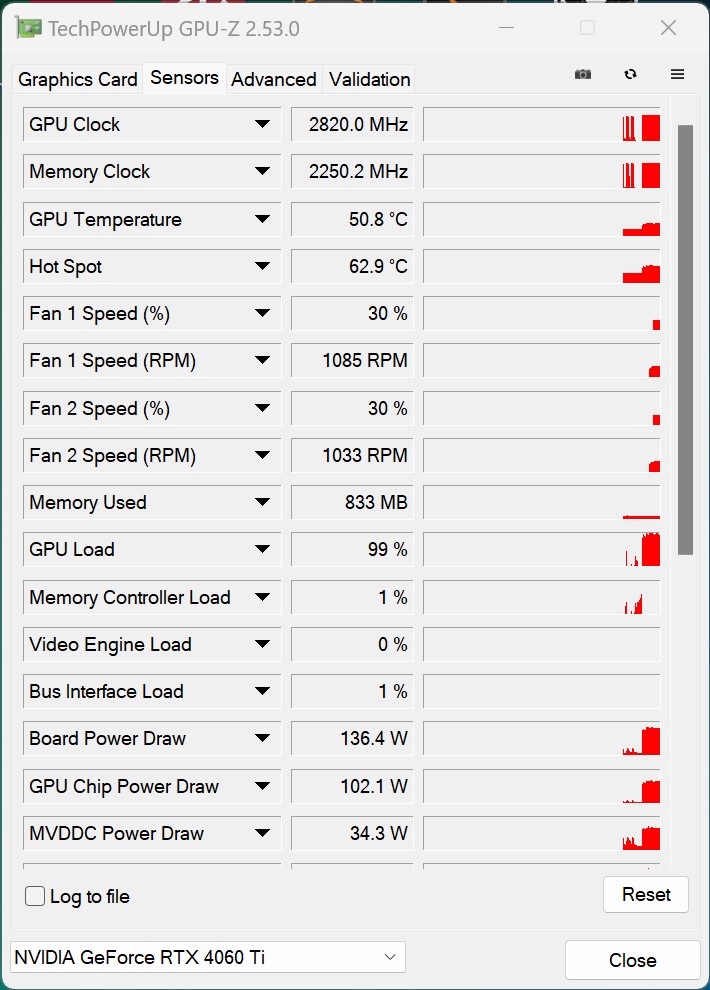
Temperaturas y consumo de energía
MSI ha dotado a la GeForce RTX 4060 Ti Gaming X Trio 8G de un refrigerador extremadamente grande con tres ventiladores axiales. Teniendo en cuenta su consumo de energía de 160 vatios (PT 100%) como máximo, puede que el fabricante haya exagerado un poco. MSI no ha cambiado nada en lo que respecta al límite de potencia de este modelo superior y, en su lugar, se ha mantenido cerca de las directrices de Nvidia. Sin embargo, puedes cambiar manualmente el objetivo de potencia hasta en un 21%, lo que significa que la tarjeta gráfica usa hasta 195 vatios. Tanto en nuestra prueba de estrés como en nuestras pruebas de juego, el límite de potencia de la tarjeta gráfica se alcanzó con facilidad. Todo nuestro sistema de pruebas, excluyendo el monitor, consume unos 300 vatios. Esto hace que la MSI GeForce RTX 4060 Ti Gaming X Trio 8G 90 vatios más frugal que laSapphire Pulse Radeon RX 6750 XTen el mismo sistema de pruebas. Esto, de nuevo, demuestra lo eficiente que es realmente esta tarjeta gráfica. Así, según el fabricante, sólo necesita una fuente de alimentación de 550 vatios.
Los problemas de temperatura son ajenos a la MSI GeForce RTX 4060 Ti Gaming X Trio 8G, por supuesto debido a su refrigerador extremadamente grande. Sólo medimos una temperatura de hotspot de 64 °C como mucho, y las temperaturas medias del chip durante la prueba de estrés fueron de 54,7 °C.
| Power Consumption / The Witcher 3 ultra (external Monitor) | |
| AMD Radeon RX 7900 XTX (Idle: 86.5 W) | |
| NVIDIA GeForce RTX 3090 Founders Edition | |
| Palit GeForce RTX 4090 GameRock OC | |
| KFA2 GeForce RTX 3080 SG | |
| KFA2 GeForce RTX 4080 SG (Idle: 86.4 W) | |
| AMD Radeon RX 7900 XT (Idle: 84.6 W) | |
| KFA2 GeForce RTX 3070 Ti SG (Idle: 88.9 W) | |
| KFA2 GeForce RTX 4070 Ti EX Gamer | |
| Sapphire Pulse Radeon RX 6750 XT | |
| NVIDIA GeForce RTX 3060 Ti Founders Edition (Idle: 111.39 W) | |
| KFA2 GeForce RTX 4070 EX Gamer | |
| Sapphire Nitro+ Radeon RX 6650 XT | |
| MSI GeForce RTX 4060 Ti Gaming X Trio 8G | |
| Power Consumption / FurMark 1.19 GPU Stress Test (external Monitor) | |
| Palit GeForce RTX 4090 GameRock OC | |
| AMD Radeon RX 7900 XTX (Idle: 86.5 W) | |
| NVIDIA GeForce RTX 3090 Founders Edition | |
| AMD Radeon RX 7900 XT (Idle: 84.6 W) | |
| KFA2 GeForce RTX 3080 SG | |
| KFA2 GeForce RTX 3070 Ti SG (Idle: 88.9 W) | |
| KFA2 GeForce RTX 4080 SG (Idle: 86.4 W) | |
| KFA2 GeForce RTX 4070 Ti EX Gamer | |
| Sapphire Pulse Radeon RX 6750 XT | |
| NVIDIA GeForce RTX 3060 Ti Founders Edition (Idle: 111.39 W) | |
| Sapphire Nitro+ Radeon RX 6650 XT | |
| KFA2 GeForce RTX 4070 EX Gamer | |
| MSI GeForce RTX 4060 Ti Gaming X Trio 8G | |
| Power Consumption / Witcher 3 ultra Efficiency (external Monitor) | |
| Palit GeForce RTX 4090 GameRock OC | |
| KFA2 GeForce RTX 4080 SG | |
| AMD Radeon RX 7900 XT | |
| AMD Radeon RX 7900 XTX | |
| KFA2 GeForce RTX 4070 Ti EX Gamer | |
| KFA2 GeForce RTX 4070 EX Gamer | |
| MSI GeForce RTX 4060 Ti Gaming X Trio 8G | |
| Sapphire Pulse Radeon RX 6750 XT | |
| NVIDIA GeForce RTX 3090 Founders Edition | |
| KFA2 GeForce RTX 3070 Ti SG | |
| KFA2 GeForce RTX 3080 SG | |
| Sapphire Nitro+ Radeon RX 6650 XT | |
| NVIDIA GeForce RTX 3060 Ti Founders Edition | |
* ... más pequeño es mejor
Power consumption with external monitor
Pro
Contra
Veredicto - Muy silencioso y muy frugal
En este análisis, echamos un vistazo más de cerca a la MSI GeForce RTX 4060 Ti Gaming X Trio 8G, otra tarjeta gráfica pensada para atraer a las masas. El aumento de rendimiento de las tarjetas gráficas Ada Lovelace fue enorme, pero sus desventajas en forma de conexión de almacenamiento y unidades de procesamiento hacen que la GeForce RTX 4060 Ti rinda solo marginalmente mejor que unaNvidia GeForce RTX 3060 Ti. Sin embargo, vemos cumplido su objetivo de crear una tarjeta gráfica hecha para juegos a 1.080p. Al mismo tiempo, la Nvidia GeForce RTX 4060 Ti queda bastante por detrás de la Nvidia GeForce RTX 4070, lo que nos lleva a preguntarnos si Nvidia cerrará esta brecha con otro modelo en algún momento. Pronto habrá versiones de la RTX 4060 Ti con 16 GB de VRAM. Aunque, por el momento, no suponemos que estas vayan a suponer un gran aumento del rendimiento en comparación con el modelo de 8 GB.
El modelo de MSI nos impresionó durante nuestras pruebas con sus excelentes tasas de emisión. La tarjeta gráfica funciona constantemente de forma casi silenciosa y los problemas de temperatura son ajenos al componente. A su vez, la tarjeta gráfica cuenta con una enorme unidad de refrigeración - incluso más grande en longitud que nuestraPalit GeForce RTX 4090 Gamerock OC. Hay que tener esto en cuenta a la hora de comprar, ya que la MSI GeForce RTX 4060 Ti Gaming X Trio 8G no cabrá en todas las carcasas de PC. Su rendimiento es generalmente bueno, aunque, usted tiene que lidiar con algunos cuadros caídos de vez en cuando debido a los bajos FPS que se producen cuando se utiliza el preajuste Ultra.
La MSI GeForce RTX 4060 Ti Gaming X Trio 8G es perfecta si buscas construir un PC extremadamente silencioso. El bajo consumo de energía de la tarjeta gráfica no afectará a tu cartera, pero actualmente, sus 8 GB de RAM son un poco difíciles de comercializar.
¿Para quién es una tarjeta gráfica interesante? Es una pregunta difícil y, sobre todo, depende de tus preferencias personales. Sólo parcialmente llamaríamos a la Nvidia GeForce RTX 4060 Ti a prueba de futuro. Al menos Nvidia no se ha deshecho de características exclusivas como DLSS 3.0 y FG (Frame Generation). Este es un punto que habla en favor de la tarjeta gráfica cuando se trata de su vida útil.
En cuanto al precio, la MSI GeForce RTX 4060 Ti Gaming X Trio 8G puede situarse en el extremo superior de los modelos GeForce RTX 4060 Ti. No es de extrañar, ya que el fabricante siempre ha cobrado un poco más por sus modelos de gama alta. Actualmente, se puede adquirir por unos 699 dólares. Tendrás que invertir al menos otros 100 dólares en unaNvidia GeForce RTX 4070y AMD cobra al menos 450 dólares por suRadeon RX 6750 XT. Puedes encontrar modelos alternativos más baratos de Nvidia GeForce RTX 4060 Ti por unos 350 $.
Precio y disponibilidad
Actualmente, puedes comprar la MSI GeForce RTX 4060 Ti Gaming X Trio 8G en muchas tiendas online, como Amazon, por 699 dólares.
Transparencia
La selección de los dispositivos que se van a reseñar corre a cargo de nuestro equipo editorial. La muestra de prueba fue proporcionada al autor en calidad de préstamo por el fabricante o el minorista a los efectos de esta reseña. El prestamista no tuvo ninguna influencia en esta reseña, ni el fabricante recibió una copia de la misma antes de su publicación. No había ninguna obligación de publicar esta reseña. Como empresa de medios independiente, Notebookcheck no está sujeta a la autoridad de fabricantes, minoristas o editores.
Así es como prueba Notebookcheck
Cada año, Notebookcheck revisa de forma independiente cientos de portátiles y smartphones utilizando procedimientos estandarizados para asegurar que todos los resultados son comparables. Hemos desarrollado continuamente nuestros métodos de prueba durante unos 20 años y hemos establecido los estándares de la industria en el proceso. En nuestros laboratorios de pruebas, técnicos y editores experimentados utilizan equipos de medición de alta calidad. Estas pruebas implican un proceso de validación en varias fases. Nuestro complejo sistema de clasificación se basa en cientos de mediciones y puntos de referencia bien fundamentados, lo que mantiene la objetividad.
