Notebookcheck Logo

Análisis de NVIDIA GeForce RTX 3060 Ti Founders Edition: El buque insignia de los juegos Ultra 1440p y 4K austeros por 400 dólares

Para el resto de nosotros. La NVIDIA RTX 3060 Ti continúa la tradición de Ampere de destilar el rendimiento de la gama alta de la generación anterior a precios más bajos. La RTX 3060 Ti es la sucesora de la RTX 2060 Super, pero su objetivo es ser la tarjeta de referencia para los juegos de 1440p Ultra, ofreciendo esencialmente el rendimiento de la RTX 2080 Super por 400 dólares. Probamos la NVIDIA RTX 3060 Ti Founders Edition para ver si realmente es así.

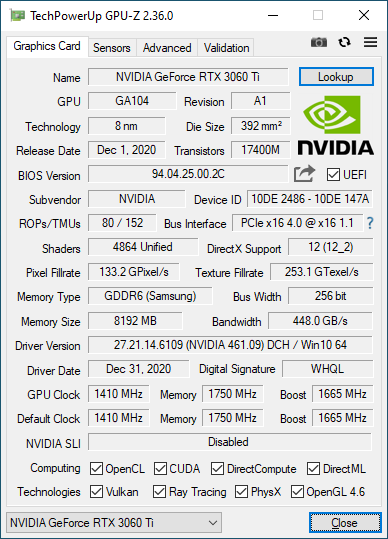
Ya en diciembre de 2020, NVIDIA anunció oficialmente la GeForce RTX 3060 Ti dirigida a la gran mayoría de los jugadores de 1080p y 1440p. La RTX 3060 Ti se basa en la misma GPU GA104 de 8 nm que la RTX 3070, pero solo permite 4.864 núcleos CUDA.

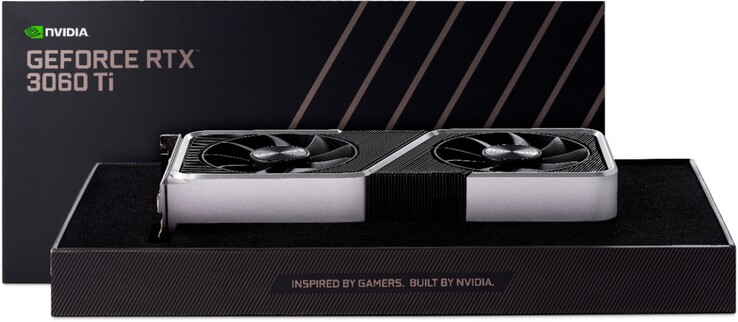
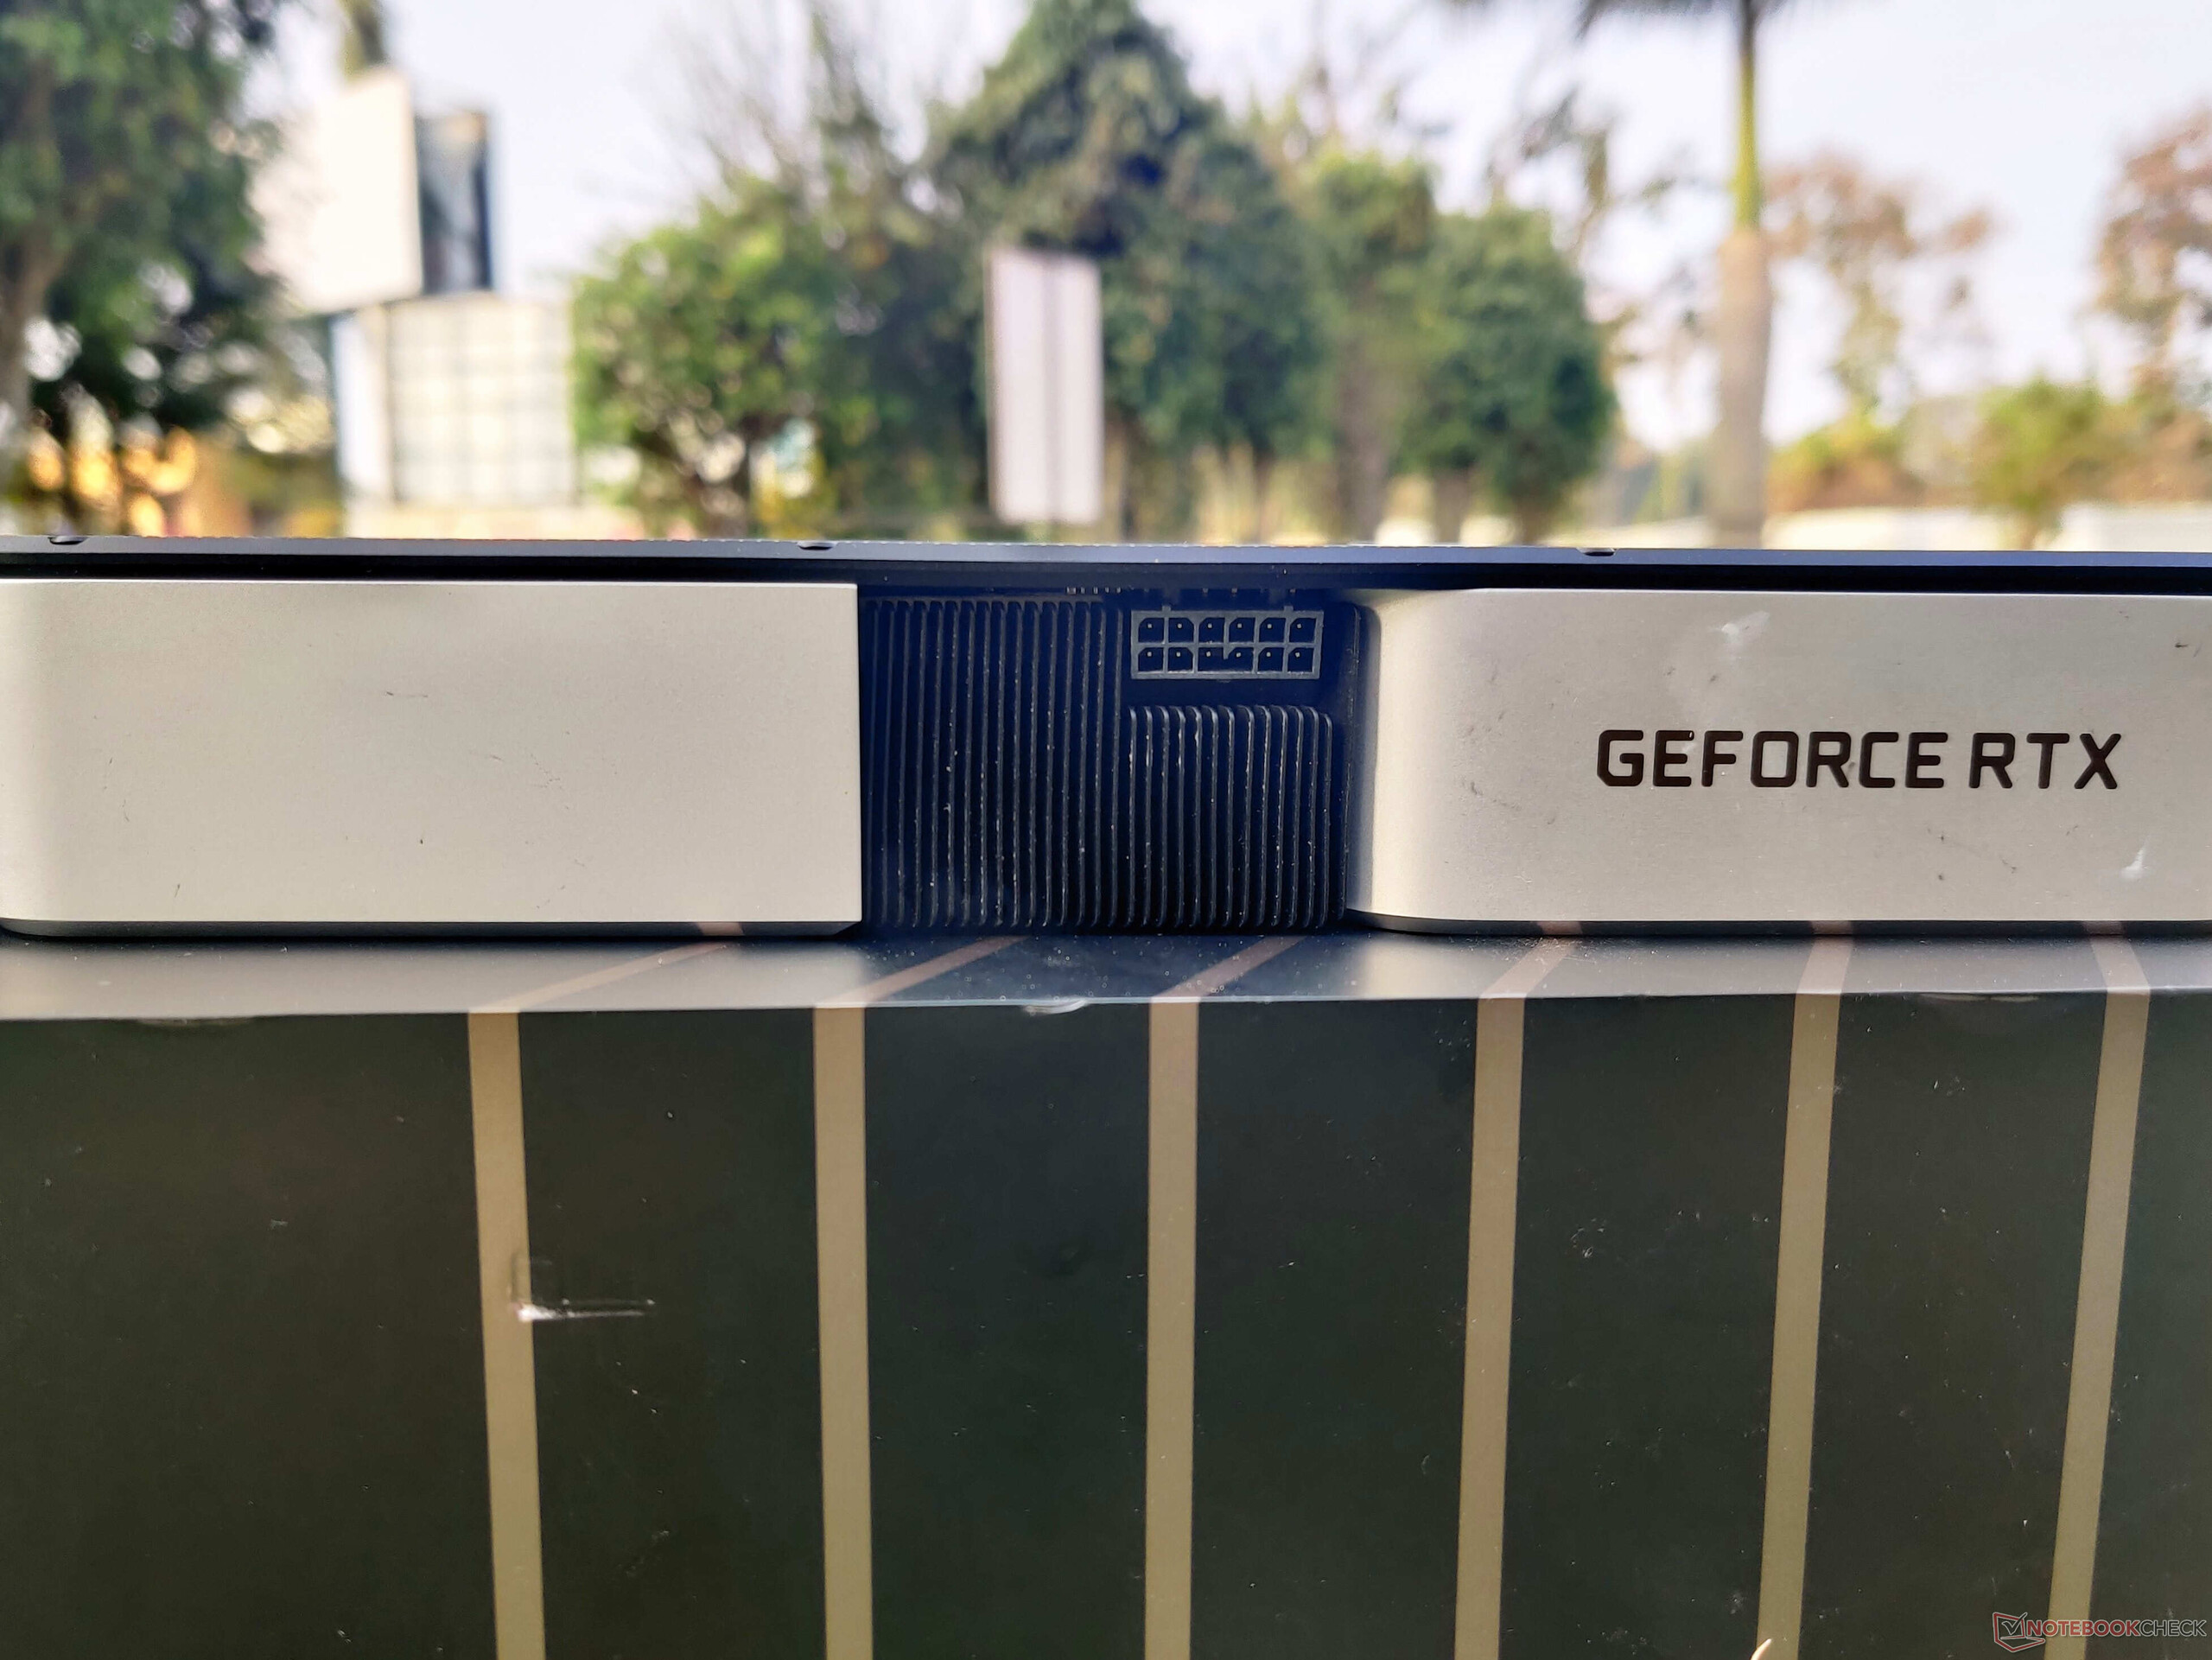
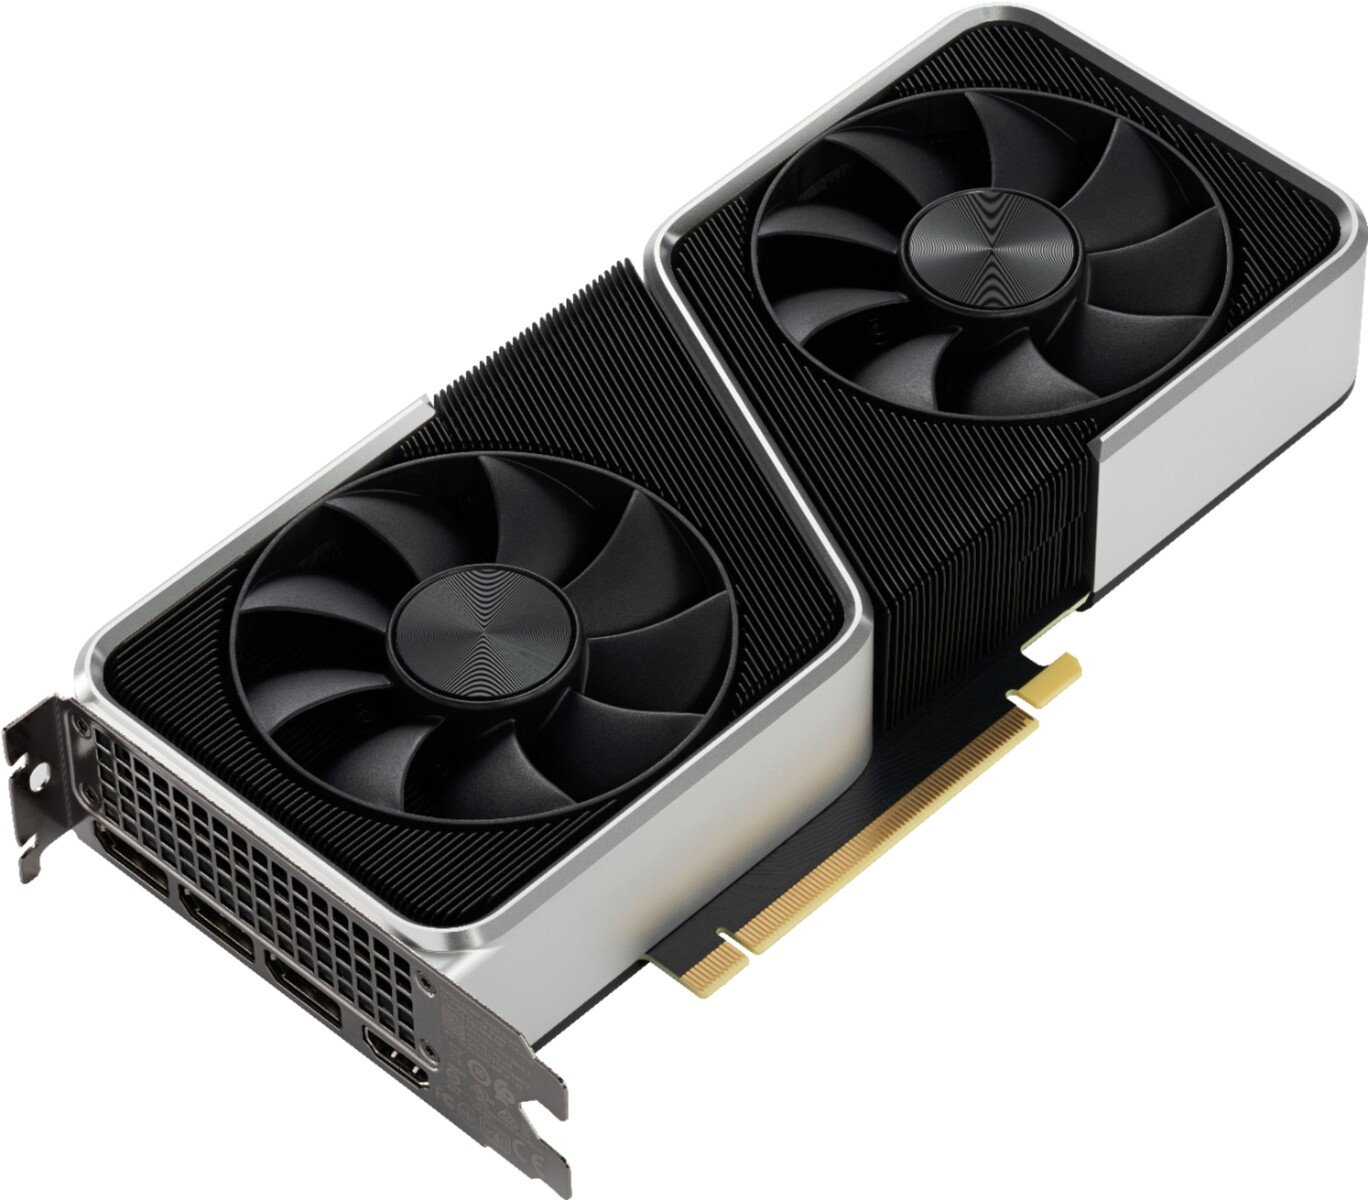
Tenemos con nosotros la tarjeta RTX 3060 Ti Founders Edition (FE) de NVIDIA para su análisis. La RTX 3060 Ti FE tiene un diseño similar al del resto de tarjetas Ampere FE, incluyendo el uso de un conector de alimentación Molex MicroFit 3.0 de 12 pines. Sin embargo, a diferencia de las demás tarjetas Ampere FE, se puede ver un acabado metálico plateado brillante que le da un aspecto premium.

Con un precio de 400 dólares, la RTX 3060 Ti puede considerarse la sucesora espiritual de la RTX 2060 Super. Sin embargo, la tarjeta ofrece un rendimiento superior al de la RTX 2080 Super por 300 dólares menos, lo que la convierte en una posible ganga en más de un sentido para los jugadores de 1440p Ultra y 1080p de alta frecuencia de refresco.

En este análisis, ponemos a prueba la RTX 3060 Ti FE y evaluamos si realmente ofrece el rendimiento que NVIDIA afirma que ofrece por su dinero

Comparación de la RTX 3060 Ti con otras GPUs NVIDIA

Especificaciones RTX3090 RTX3080 FE RTX3070 FE RTX3060 Ti FE Titan RTX RTX2080 Ti RTX2080 Super RTX2070 Super TITANX Pascal
Chip GA102 GA102 GA104 GA104 TU102 TU102 TU104 TU104 GP102
Proceso FinFET 8 nm 8 nm 8nm 12 nm 12 nm 12 nm 16 nm
CUDA cores 10,496 8,704 5,888 4,864 4,608 4,352 3,072 2,560 3,584
Textureunits 328 272 184 152 288 272 192 160 224
Núcleos de tensor 328 3ª Gen. 272 3ª Gen. 184 3ª Gen. 1523ª Gen. 576 2ª Gen. 544 2ª Gen. 384 2ª Gen. 320 2ª Gen. -
RTcores 82 68 46 38 72 68 48 40 -
Reloj base de la GPU 1.395 MHz 1.440 MHz 1.500 MHz 1.410 MHz 1.350 MHz 1.650 MHz 1.605 MHz 1.417 MHz
Reloj de refuerzo de la GPU 1.695 MHz 1.710 MHz 1.750 MHz 1.665 MHz 1.770 MHz 1.545 MHz 1.815 MHz 1.770 MHz 1.531 MHz
Memorybus 384-bit 320-bit 256-bit 256-bit 384-bit 352-bit 256-bit 256-bit 384-bit
Ancho de banda de la memoria 936 GB/s 760 GB/s 448 GB/s 448GB/s 672 GB/s 616 GB/s 495,9 GB/s 448 GB/s 480,4 GB/s
Memoria de vídeo 24 GB GDDR6X 10 GB GDDR6X 8 GB GDDR6 8GB GDDR6 24 GB GDDR6 11 GB GDDR6 8 GB GDDR6 12 GB GDDR5X
Consumo de energía 350 W 320 W 220 W 200W 280 W 250 W 250 W 215 W 250 W

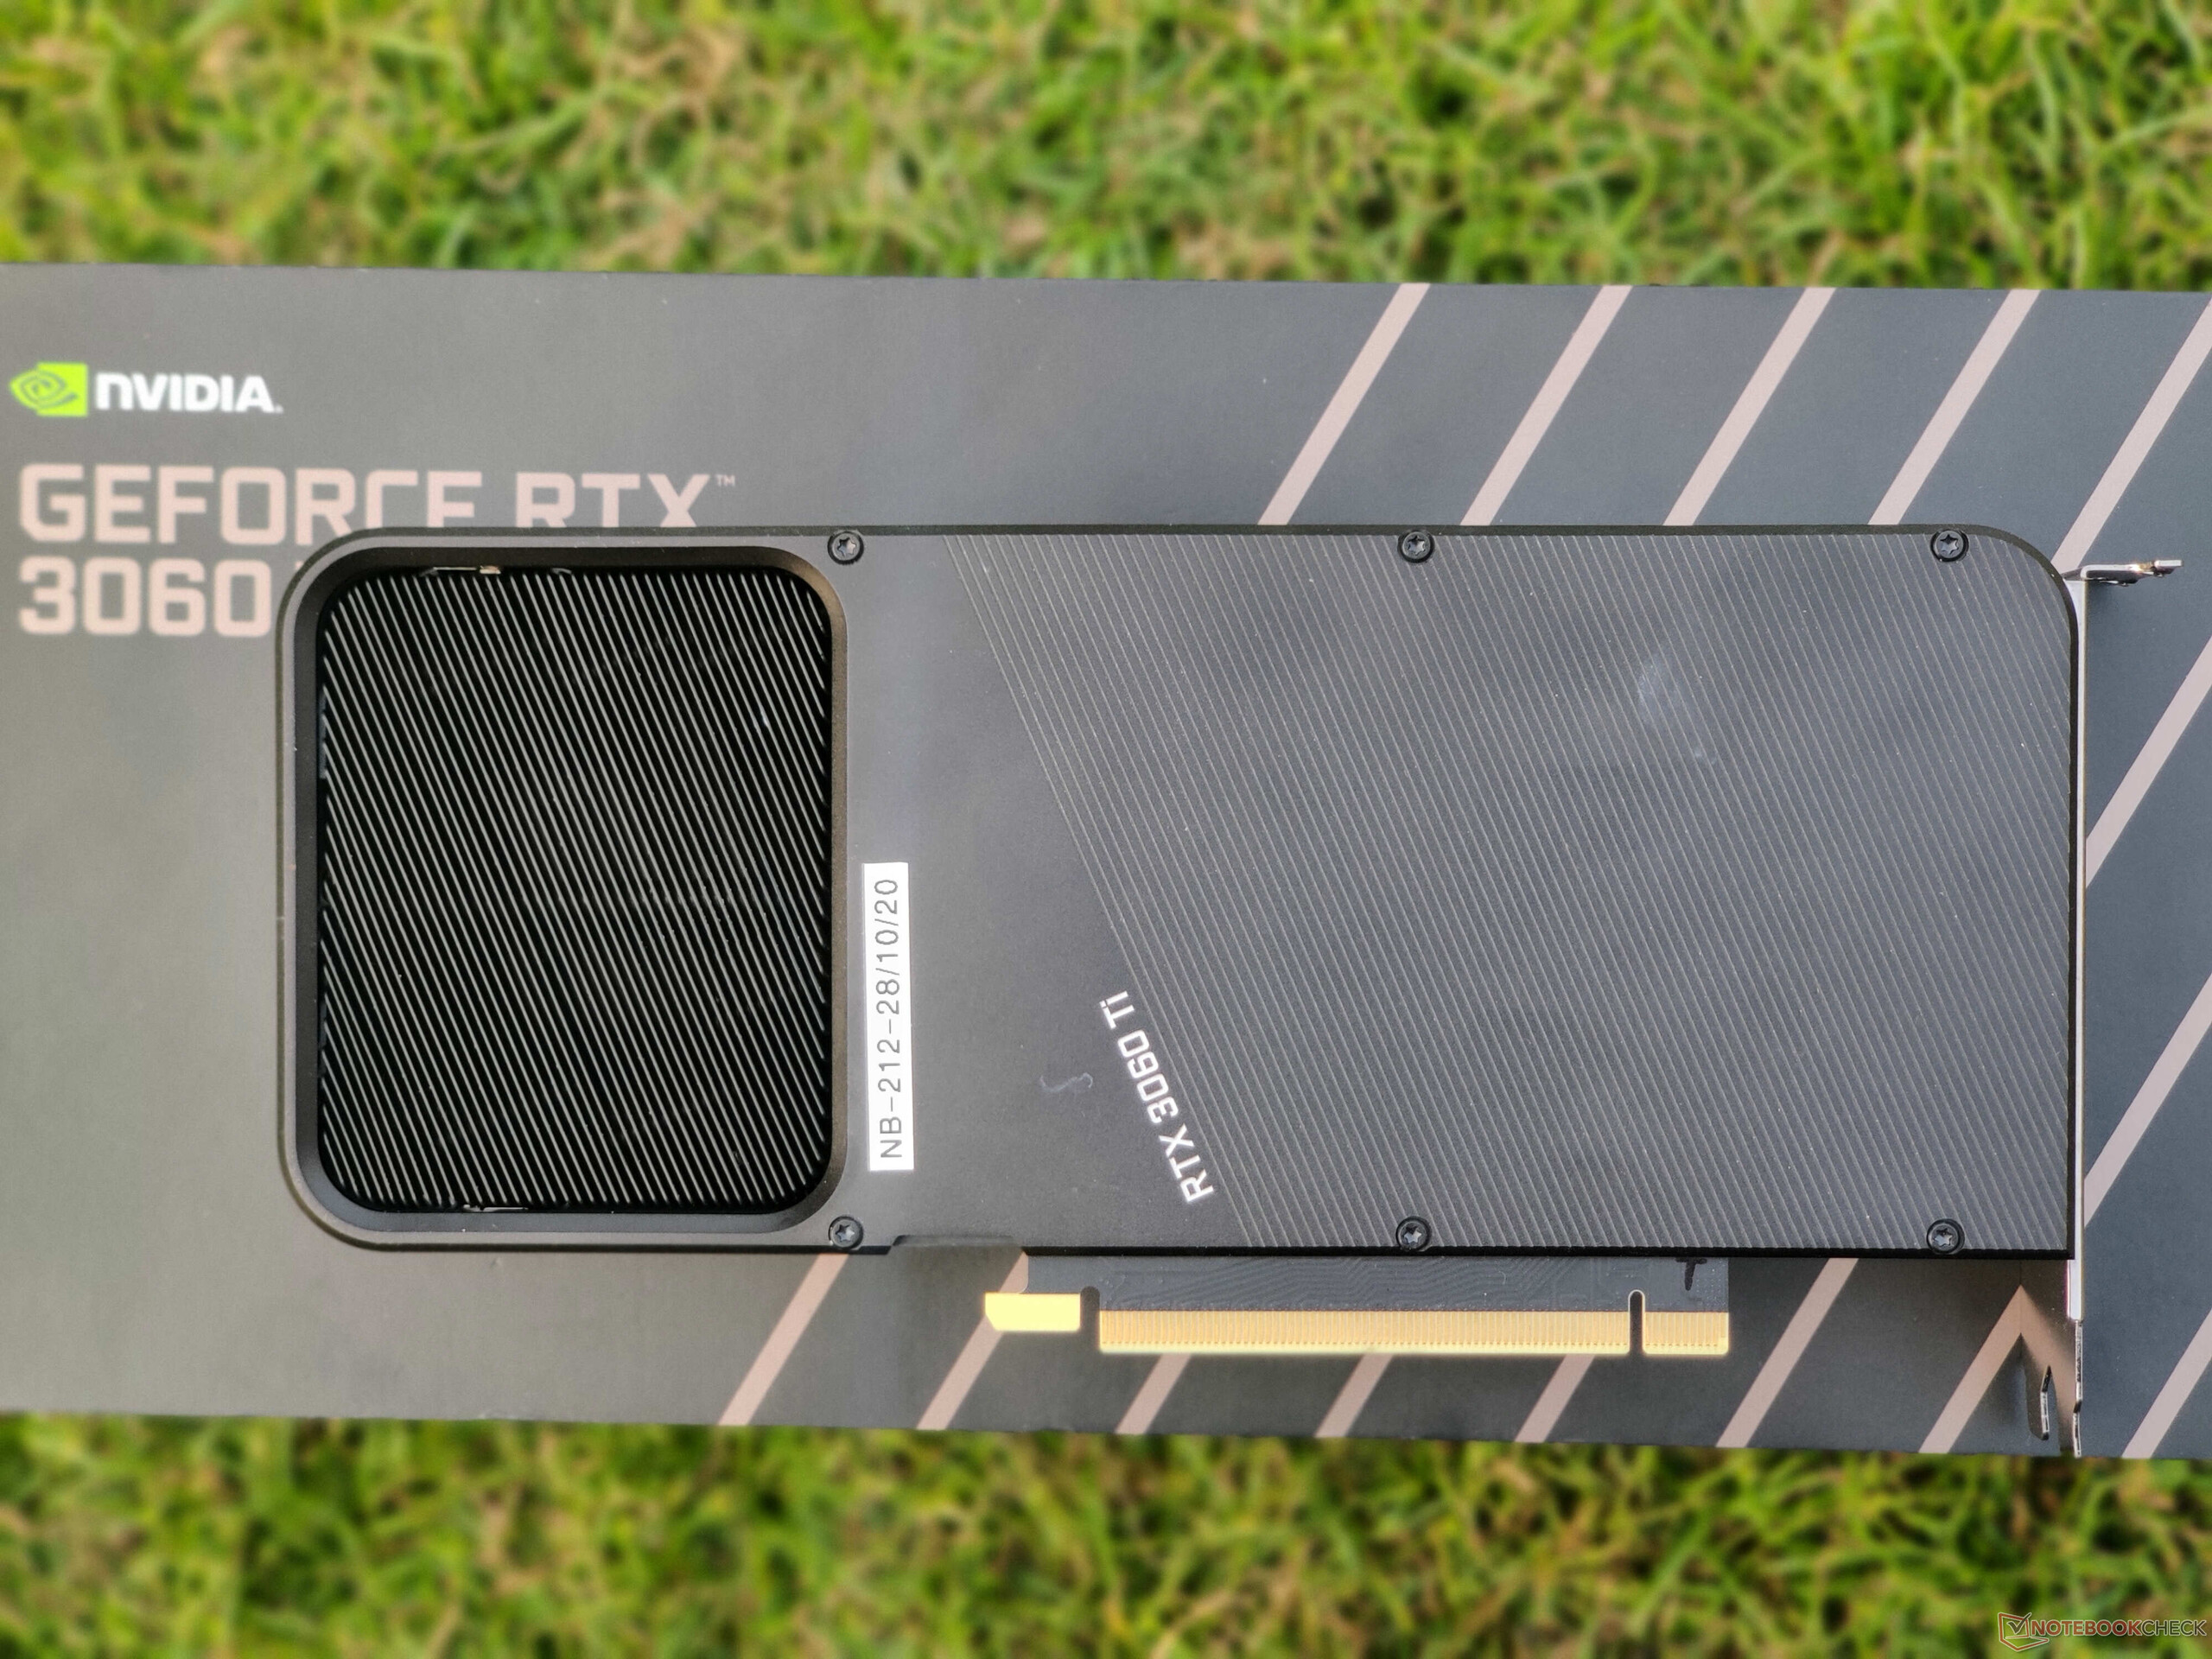
Un recorrido por la NVIDIA GeForce RTX 3060 Ti Founders Edition

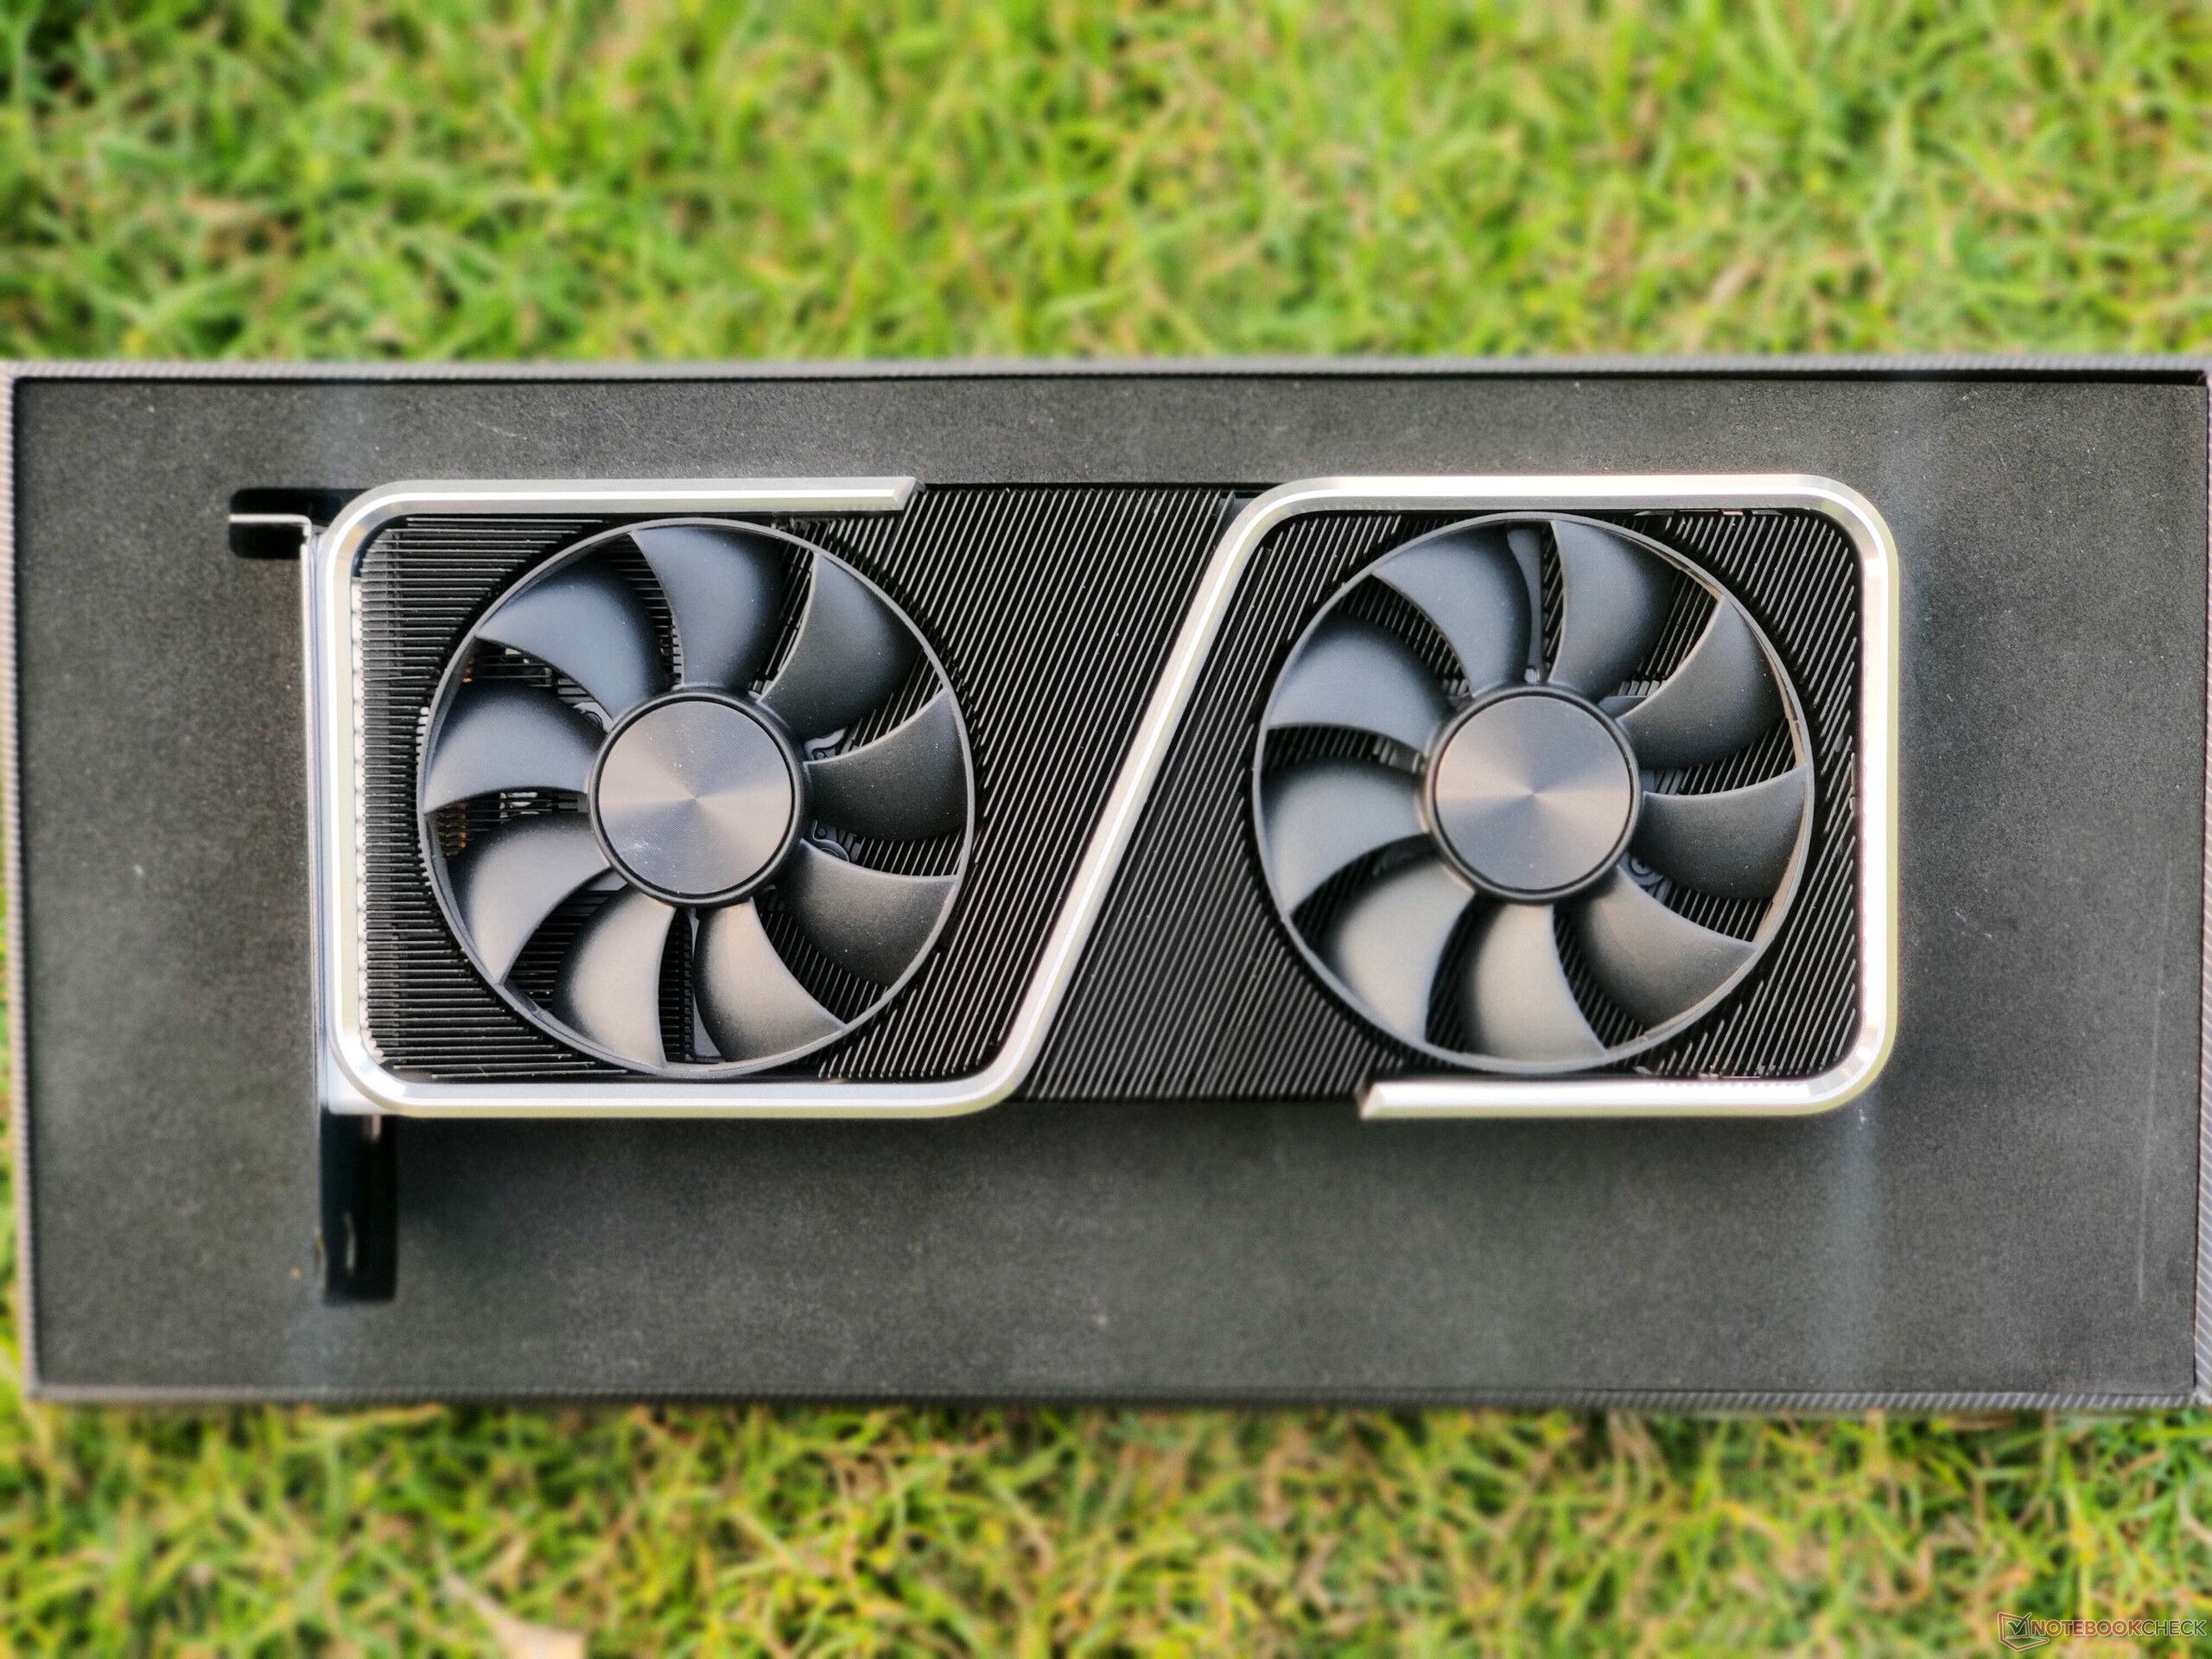
La RTX 3060 Ti Founders Edition incorpora el nuevo lenguaje de diseño de NVIDIA, que ayuda a una mejor disipación del calor y a un bajo nivel de ruido, al menos en comparación con las tarjetas FE de la generación anterior. La tarjeta tiene un aspecto bastante discreto, pero el marco de metal plateado brillante le da un aspecto de primera calidad. Está bien construida, sin torsiones, crujidos ni cubiertas de plástico endebles

Al igual que el resto de las tarjetas NVIDIA Ampere Founders Edition, la RTX 3060 Ti FE también viene con un conector de alimentación Molex MicroFit 3.0 de 12 pines que está situado hacia el centro. NVIDIA incluye un conector de 8 a 12 pines en la caja

El conector de 12 pines parece un poco redundante aquí y es un punto negativo en el frente de la estética (por no hablar de los problemas de gestión de cables), ya que la RTX 3060 Ti consume menos de 300 W y se puede hacer fácilmente con el conector estándar de 8 pines de la fuente de alimentación.

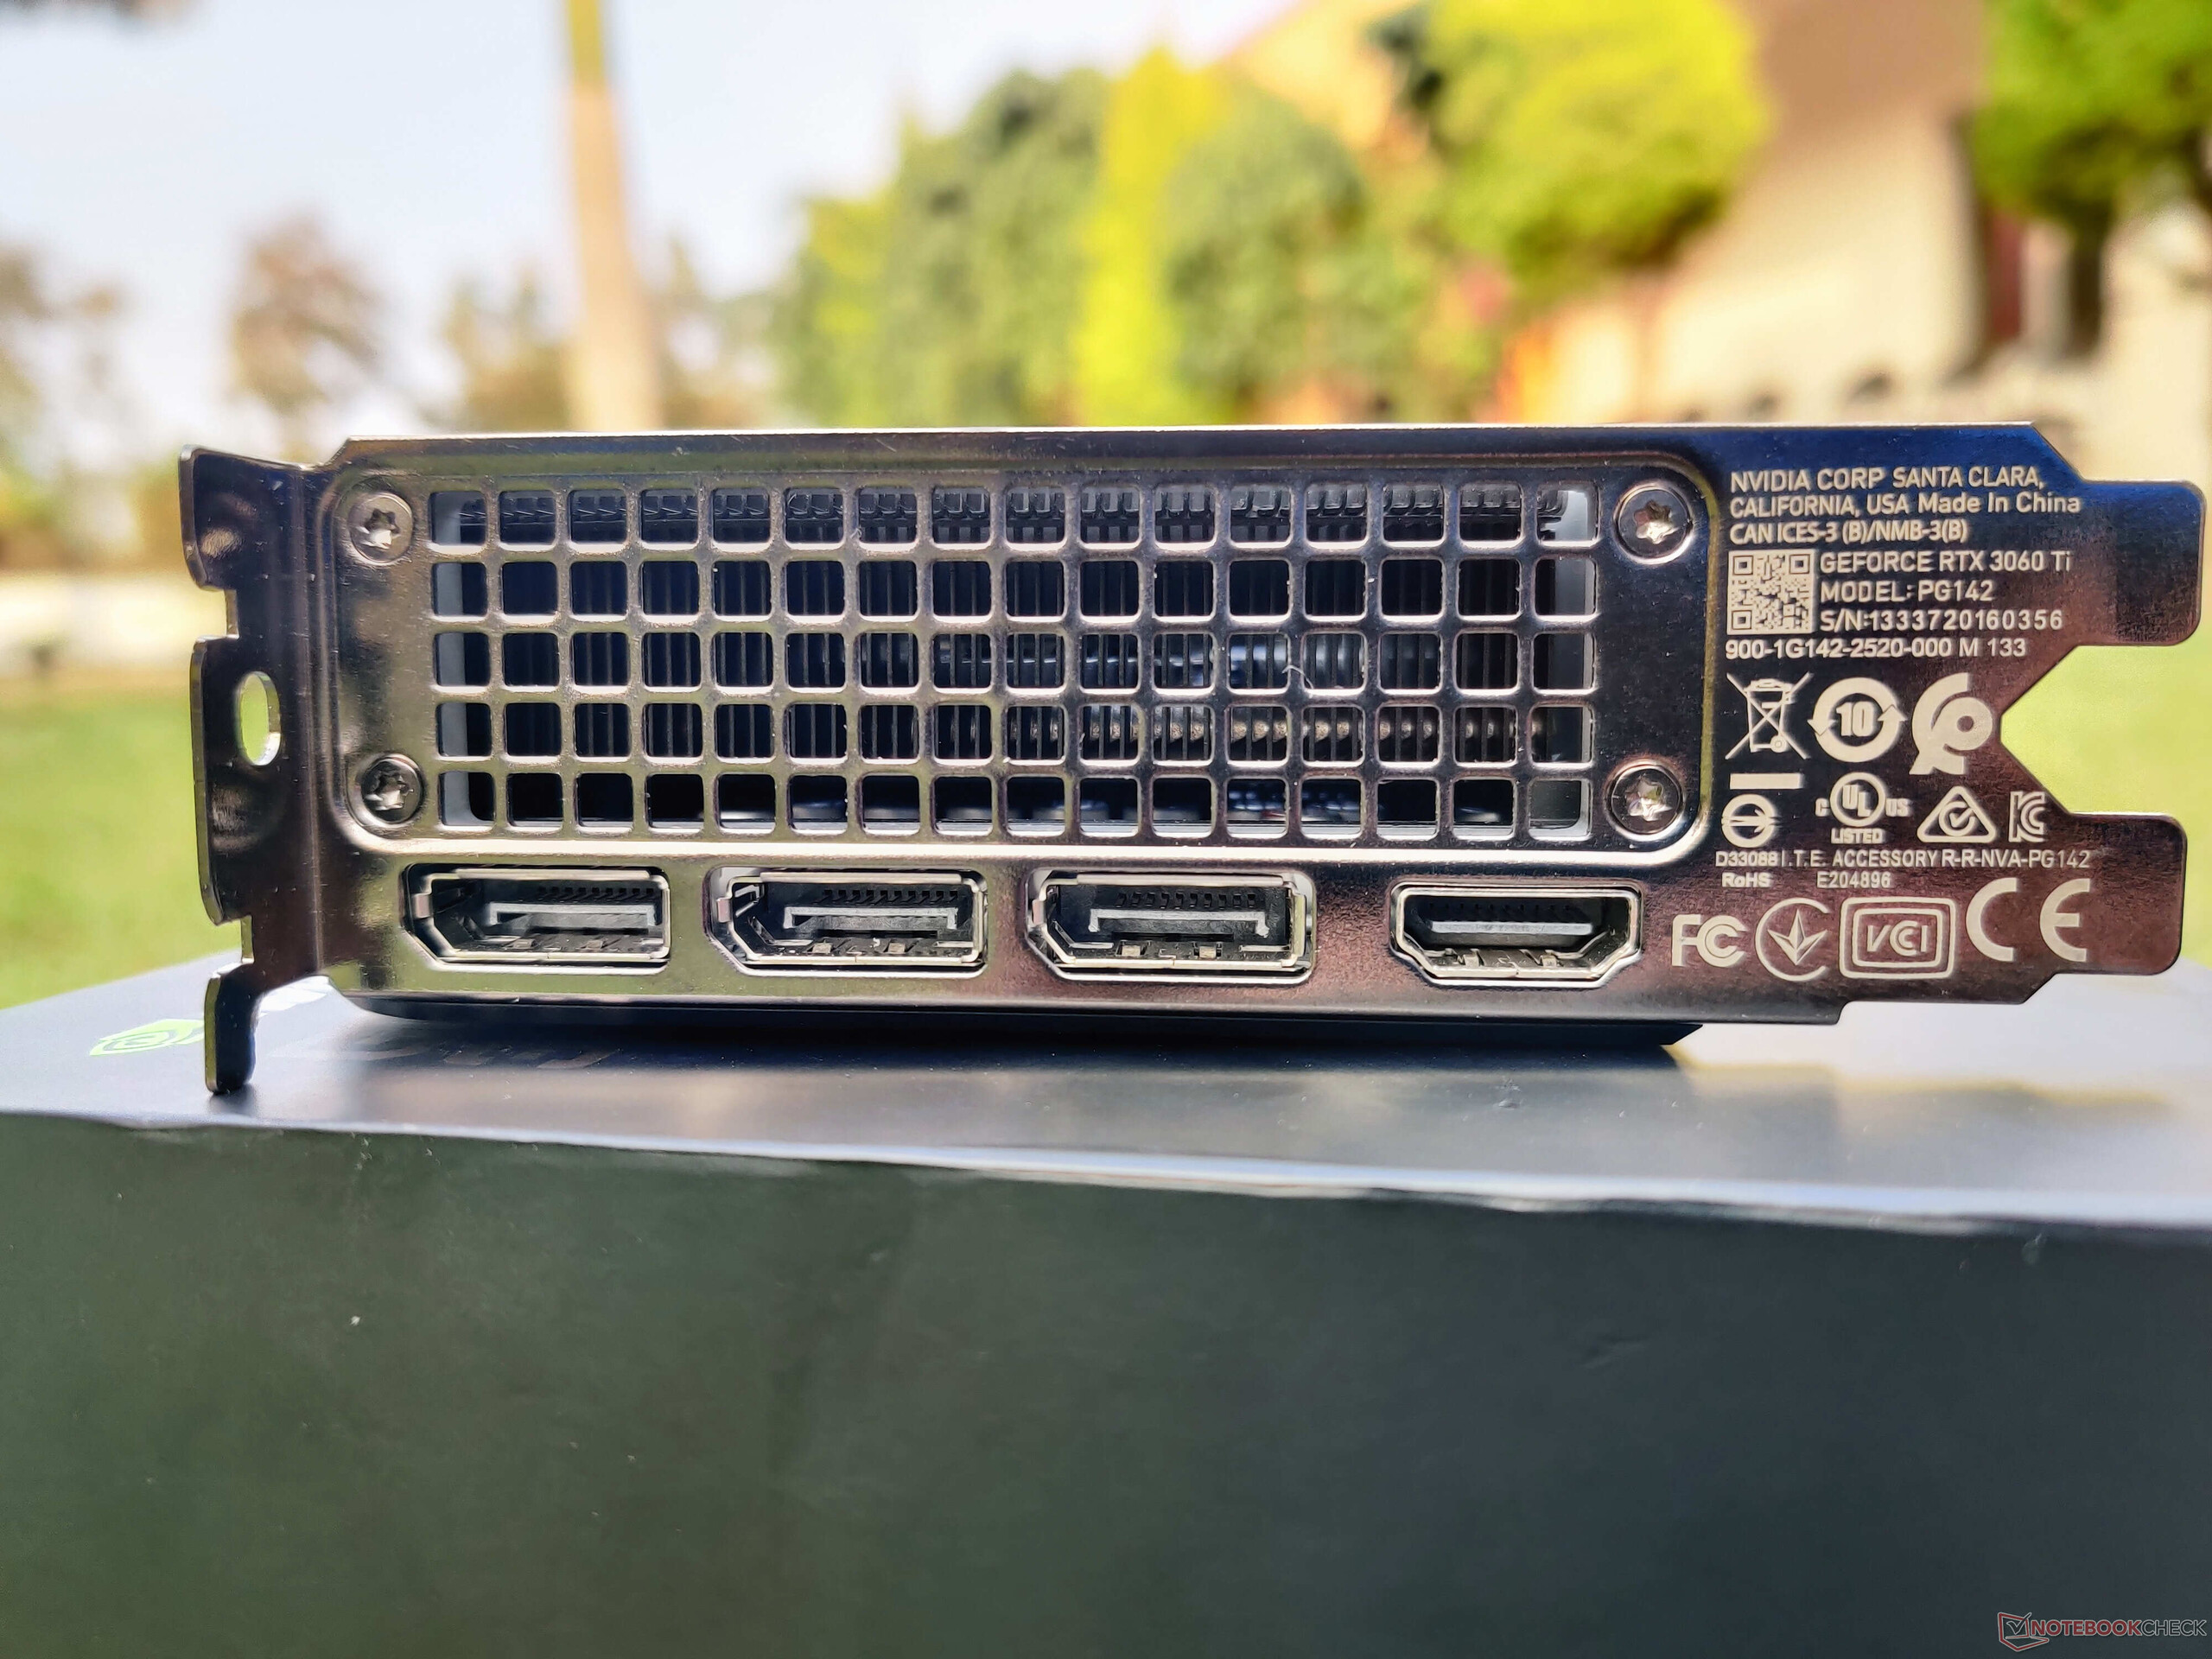
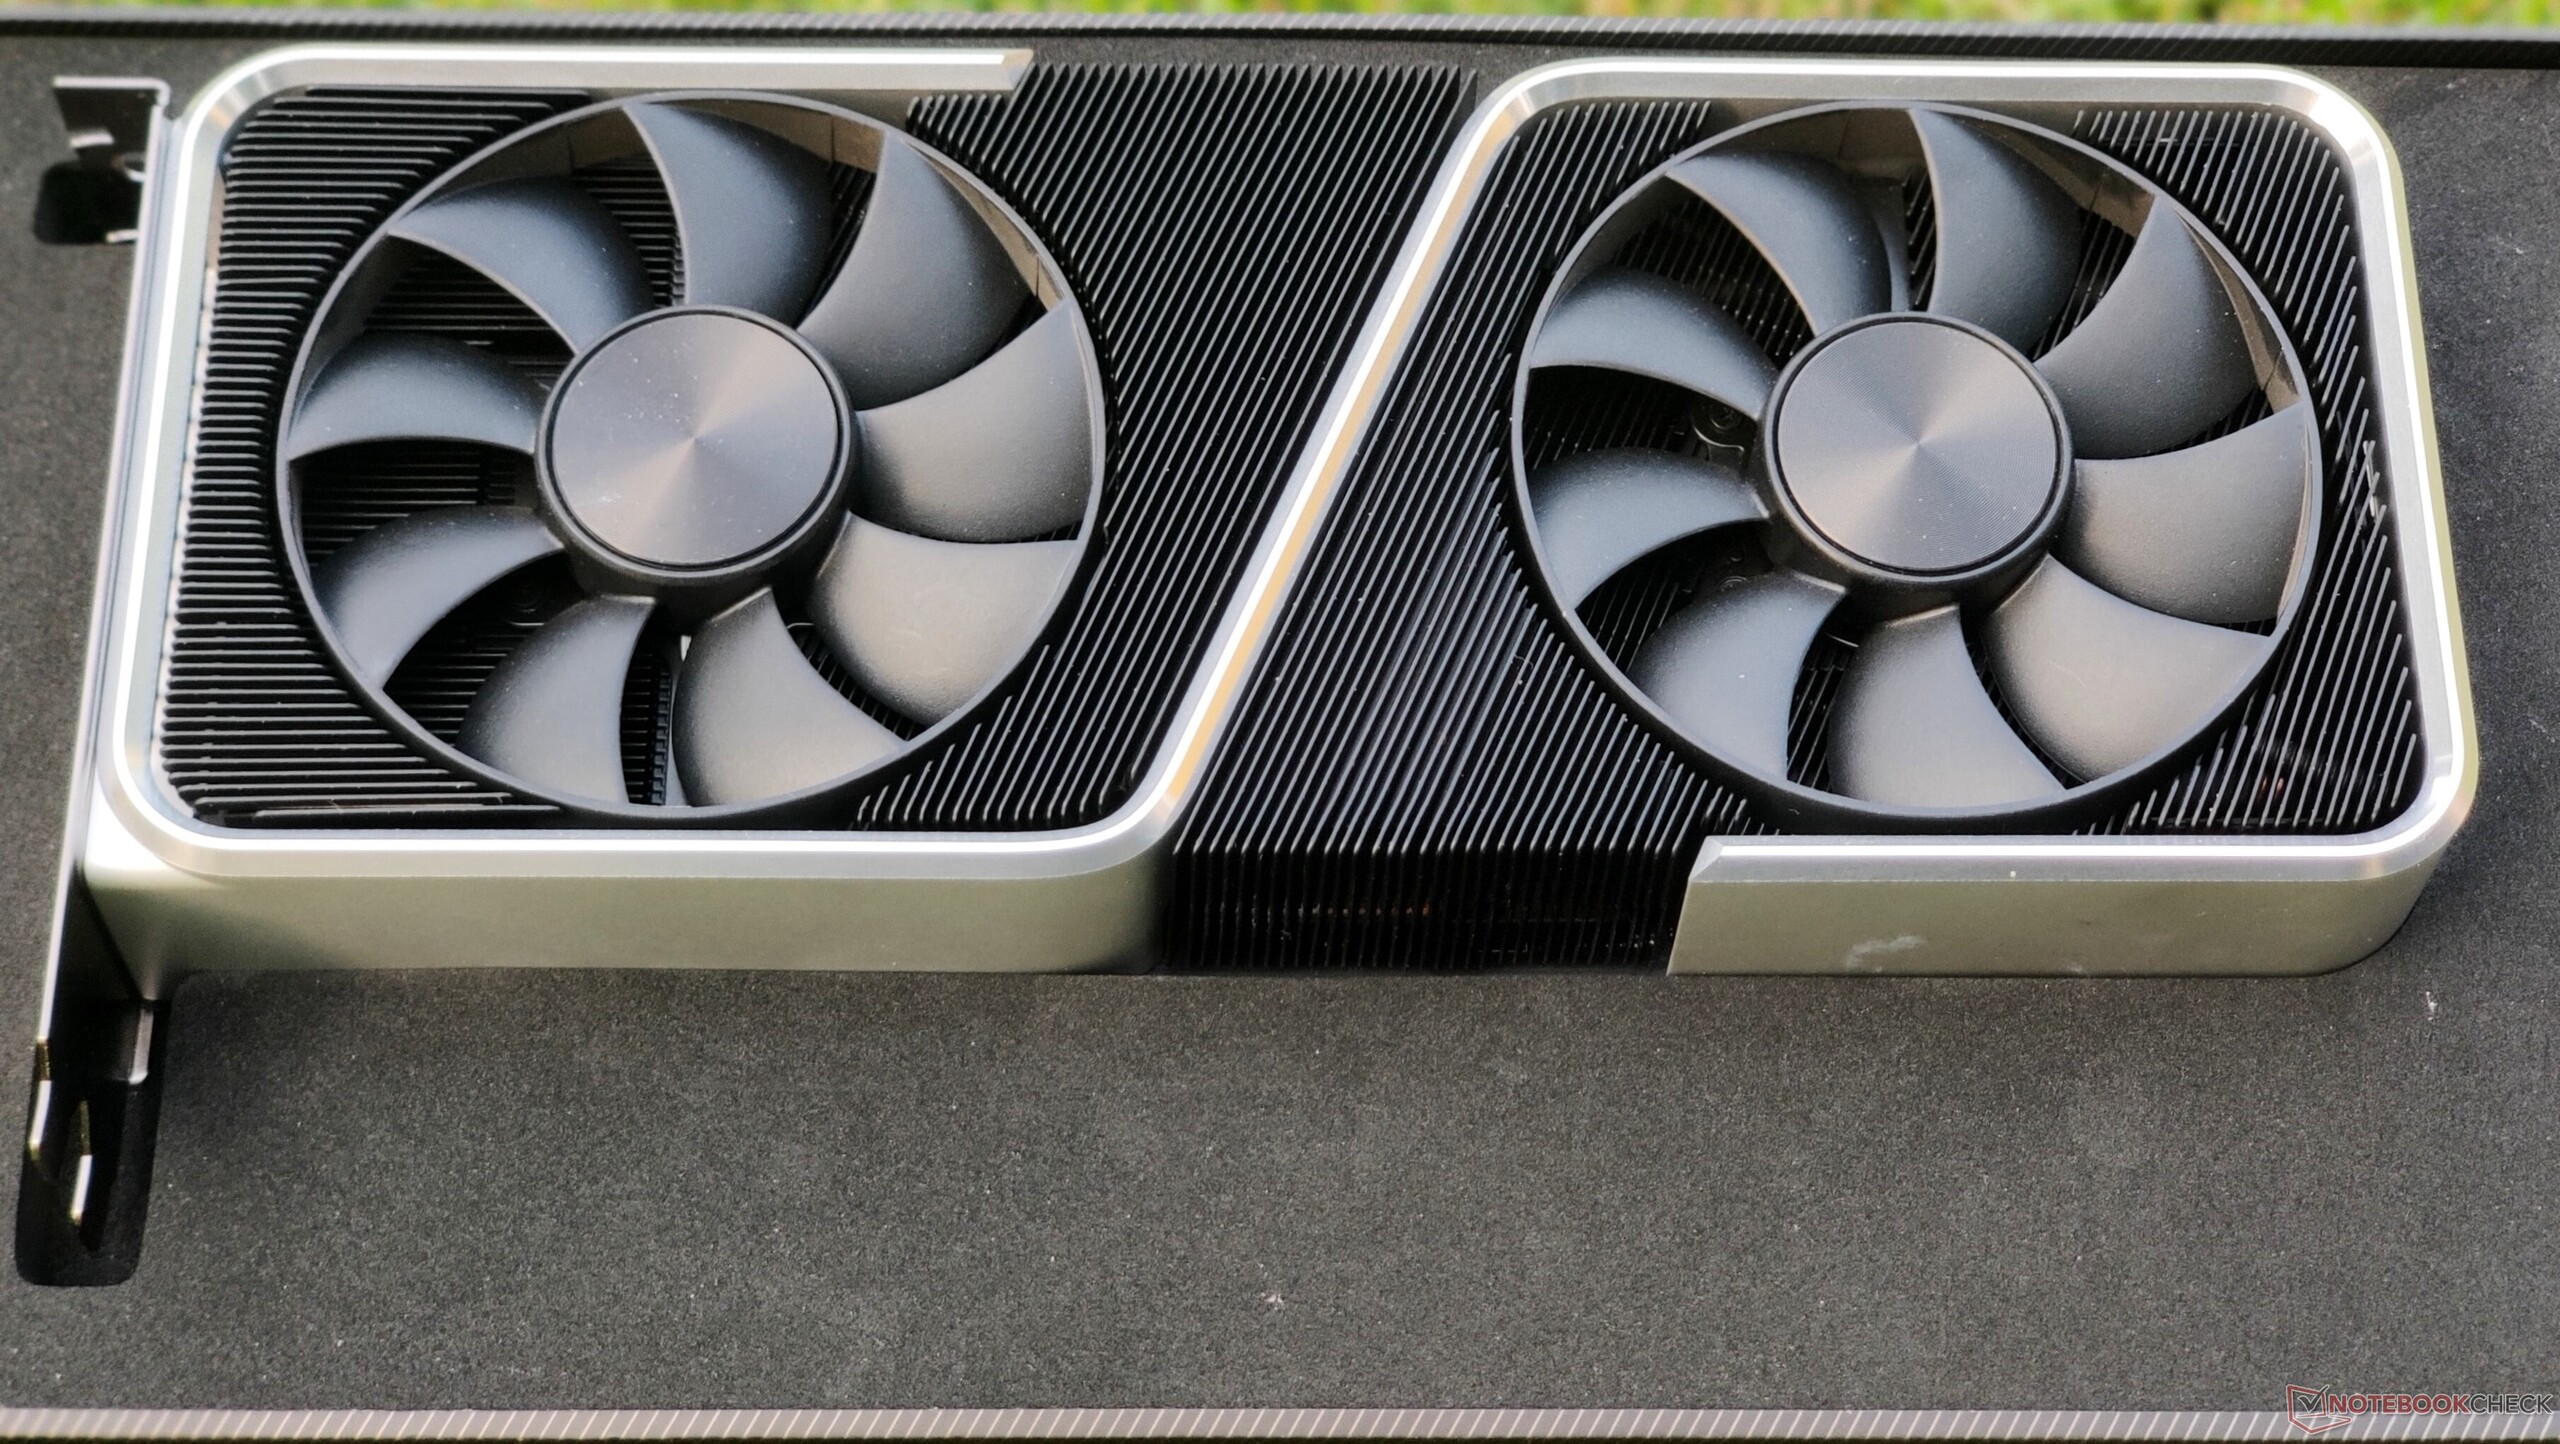
Las opciones de conectividad son estándar e incluyen tres puertos DisplayPort 1.4a y un HDMI 2.1. Los ventiladores dobles de 9 aspas ofrecen una refrigeración eficaz y tienen un perfil de ruido muy bueno bajo carga, como veremos más adelante en el análisis. La placa posterior metálica no sólo ayuda a protegerla, sino que también cuenta con un par de almohadillas térmicas para disipar el calor de los VRM de la memoria situados en la parte posterior de la PCB.

La NVIDIA GeForce RTX 3060 Ti Founders Edition se vende por 399,99 dólares (₹35.900) y tiene tres años de garantía.

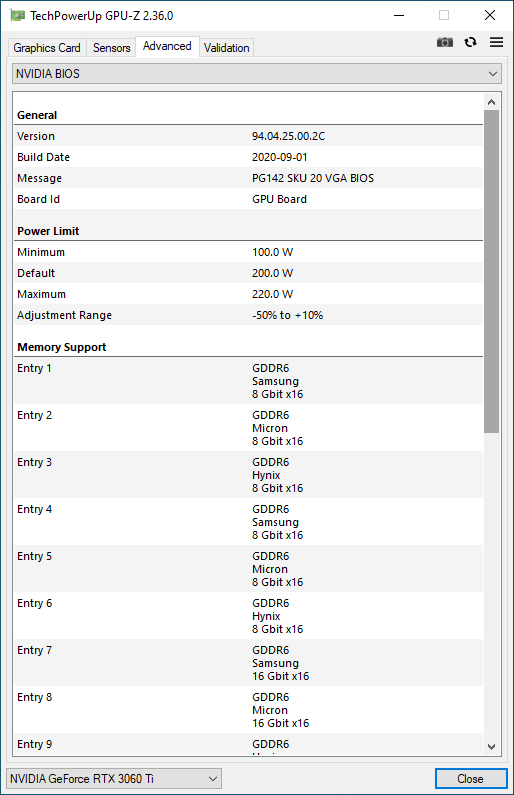
La RTX 3060 Ti FE ofrece un reloj base de 1.410 MHz y puede aumentar hasta 1.665 MHz. Es posible aumentar el objetivo de potencia de 200 W en otros 20 W. Dado que la tarjeta carece de cualquier forma de adorno RGB, la energía adicional es utilizada principalmente por la propia GPU. Dicho esto, el margen real de overclocking no es mucho.

La RTX 3060 Ti ofrece 8 GB de VRAM GDDR6 en un bus de memoria de 256 bits con un ancho de banda máximo de 448 GB/s. Aunque esto puede parecer poco en comparación con las ofertas de gama alta de NVIDIA y todas las tarjetas Radeon RX 6000 de AMD hasta ahora, dadas las capacidades de la RTX 3060 Ti, los 8 GB de VRAM deberían ser adecuados a menos que te dediques a las aplicaciones profesionales o a las cargas de trabajo de computación que puedan requerir una memoria de vídeo de trabajo más alta. No nos encontramos con ningún problema de limitación de memoria durante la totalidad de nuestras pruebas

El banco de pruebas

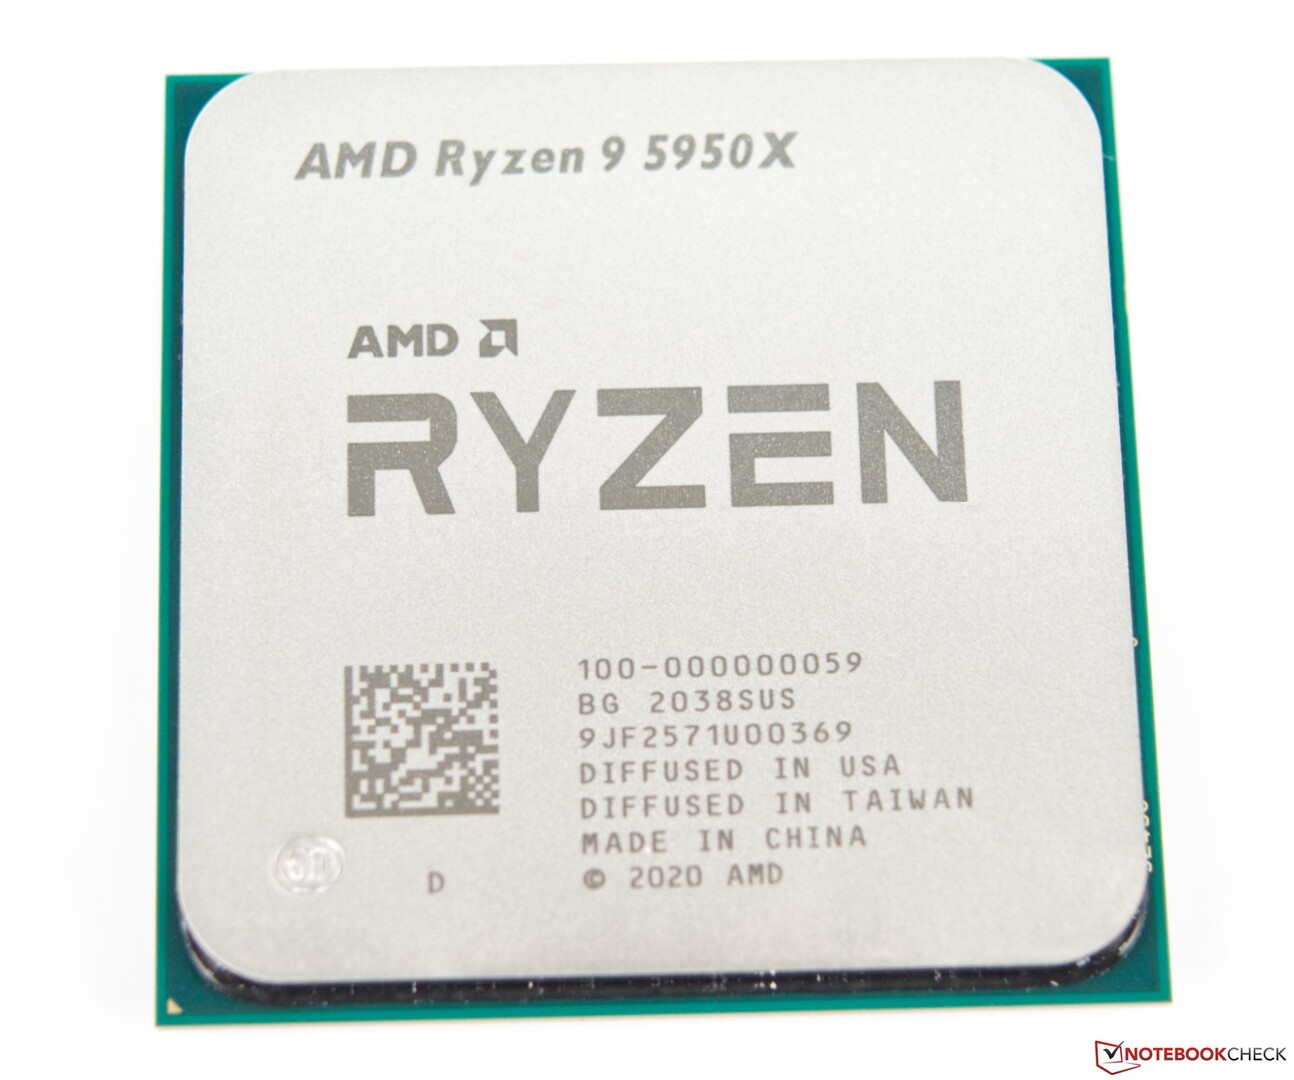
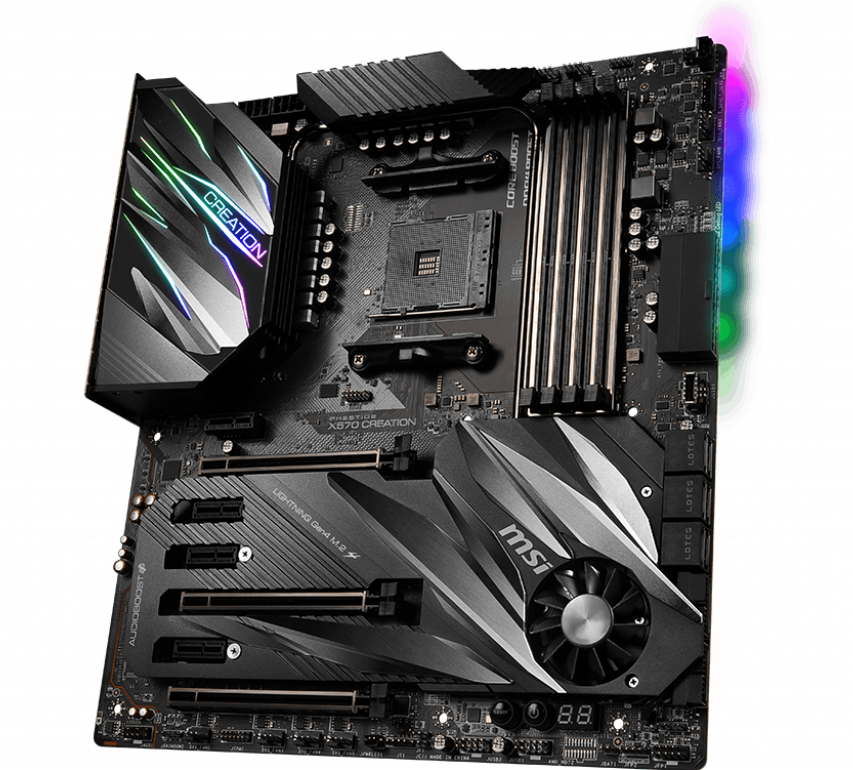
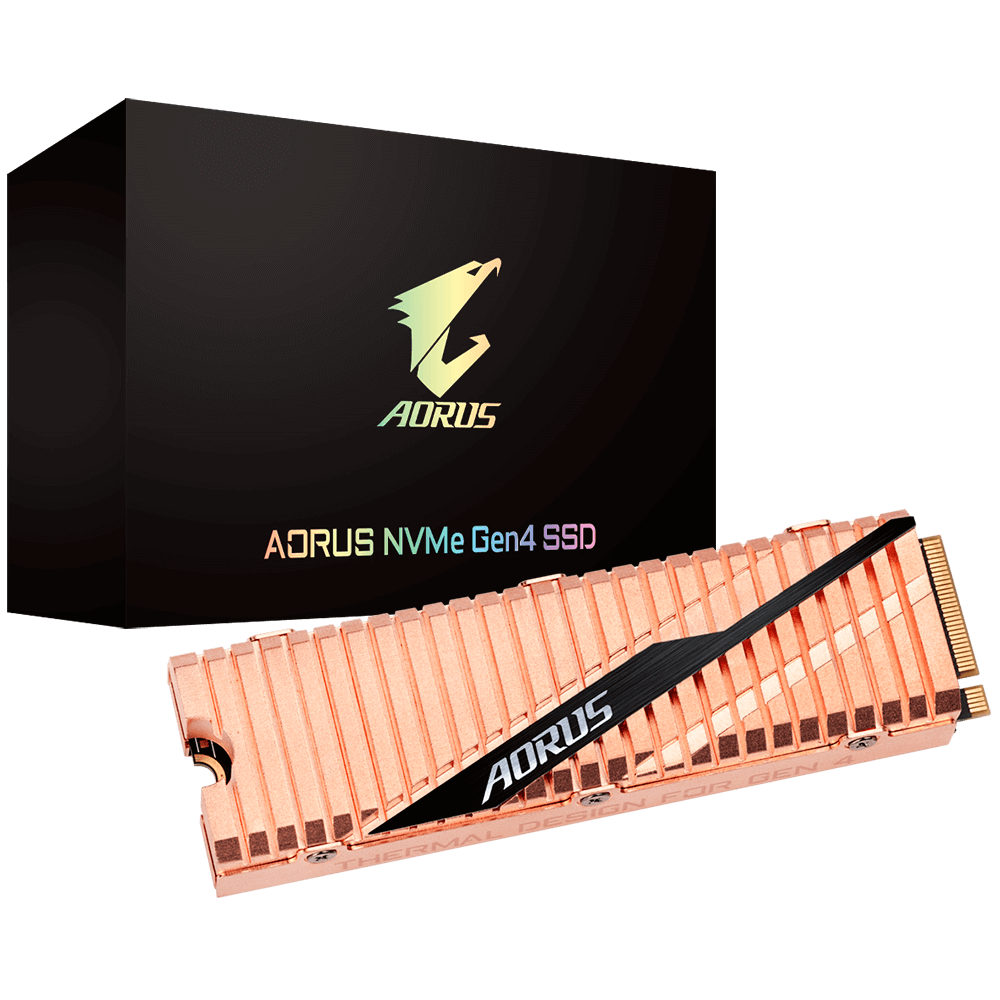
Nuestro banco de pruebas está compuesto por un procesador AMD Ryzen 9 5950X de 16 núcleos y 32 hilos, una placa base MSI Prestige X570 Creation, 32 GB (16 GB x2) de RAM G.SKILL Trident Z Neo DDR4-3200 (tiempos 16-19-19-39), y un SSD Gigabyte Aorus NVMe Gen4 de 1 TB

Se instaló Windows 10 20H2 con las últimas actualizaciones acumulativas (Build 19041.746) en el SSD PCIe Aorus NVMe Gen4, mientras que se utilizaron dos SSD Crucial MX500 SATA de 1 TB para ejecutar pruebas y juegos.

Un refrigerador Corsair iCUE H115i Elite Capellix AIO ayudó a mantener fresco el gigantesco Ryzen 9 5950X. Todo el equipo estaba alojado en una caja Corsair iCUE 4000X RGB con una fuente de alimentación Thermaltake Toughpower 850 W 80 Plus Gold. Realizamos todas las pruebas con la caja cerrada para representar el uso típico.

La RTX 3060 Ti FE se emparejó con un televisor inteligente OnePlus U Series 55U1 que funcionaba a 4K 60 Hz. La salida de color se configuró en RGB de 32 bits en el panel de control de NVIDIA, mientras que el escalado del escritorio de Windows se configuró al 100%.

Nos gustaría dar las gracias a AMD por proporcionar la CPU Ryzen 9 5950X, a Corsair por el refrigerador iCUE Elite Capellix AIO y la carcasa iCUE 4000X, y a OnePlus por el televisor 4K de la serie U 55U1

CPU AMD Ryzen 9 5950X
Placa base MSI Prestige X570 Creation. (Fuente de la imagen: MSI)
SSD Gigabyte Aorus NVMe Gen4. (Fuente de la imagen: Gigabyte)
Memoria RAM G.SKILL Trident Z Neo DDR4-3600. (Fuente de la imagen: G.SKILL)

Puntos de referencia sintéticos

El rendimiento de la RTX 3060 Ti está en la misma línea que el de una RTX 2080 Super y puede ser hasta un 32% más rápido que el de una RTX 2060 Super, mientras que queda por detrás de la RTX 3070 en un 10% en las pruebas de 3DMark.

También se observa una tendencia similar en los benchmarks Unigine Heaven y Valley. Vemos que la diferencia de rendimiento entre las tarjetas es mayor en las pruebas DirectX que en las OpenGL. Mientras que la RTX 3060 Ti es sólo un 8% más rápida que la RTX 2080 Super en Heaven 4.0 DirectX, Valley 1.0 DirectX lleva esta diferencia a un significativo 27%. La Superposición Unigine muestra que la RTX 3060 Ti es entre un 12% y un 14% más lenta que la RTX 3070, pero prácticamente empata con la media de la RTX 2080 Super en todas las pruebas, excepto en la de 720p bajo

3DMark
2560x1440 Time Spy Graphics
MSI GeForce RTX 3090 Suprim X
NVIDIA GeForce RTX 3090, R9 5900X
19571 Points +69%
Average NVIDIA GeForce RTX 3090
  (18685 - 20433, n=16)
19254 Points +66%
MSI GeForce RTX 3080 Gaming X Trio
NVIDIA GeForce RTX 3080, R9 5900X
17604 Points +52%
AMD Radeon RX 6800 XT
AMD Radeon RX 6800 XT, R9 5950X
17603 Points +52%
Average NVIDIA GeForce RTX 3080
  (17467 - 17604, n=2)
17536 Points +51%
AMD Ryzen 9 5900X
NVIDIA Titan RTX, R9 5900X
15283 Points +32%
KFA2 GeForce RTX 2080 Ti EX
NVIDIA GeForce RTX 2080 Ti (Desktop), R9 3900X
13744 Points +19%
Zotac Gaming GeForce RTX 3070 Twin Edge
NVIDIA GeForce RTX 3070, R9 5950X
13024 Points +12%
Average NVIDIA GeForce RTX 3070
  (11043 - 13579, n=7)
12616 Points +9%
NVIDIA GeForce RTX 3060 Ti FE
NVIDIA GeForce RTX 3060 Ti, R9 5950X
11590 Points
Nvidia GeForce RTX 2080 Super
NVIDIA GeForce RTX 2080 Super (Desktop), R7 2700X
11477 Points -1%
Average NVIDIA GeForce RTX 2080 Super (Desktop)
  (11313 - 11542, n=4)
11439 Points -1%
Nvidia GeForce RTX 2070 Super
NVIDIA GeForce RTX 2070 Super (Desktop), R7 2700X
10094 Points -13%
Average NVIDIA GeForce RTX 2070 Super (Desktop)
  (9564 - 10094, n=8)
9846 Points -15%
Nvidia GeForce RTX 2060 Super
NVIDIA GeForce RTX 2060 Super (Desktop), R7 2700X
8795 Points -24%
AMD Radeon RX 5700 XT
AMD Radeon RX 5700 XT (Desktop), R7 2700X
8673 Points -25%
Average NVIDIA GeForce RTX 2060 Super (Desktop)
  (8396 - 8795, n=7)
8631 Points -26%
KFA 2 GeForce GTX 1660 Super
NVIDIA GeForce GTX 1660 Super (Desktop), R9 3900X
6021 Points -48%
KFA2 GeForce GTX 1650 Super EX One Click OC
NVIDIA GeForce GTX 1650 Super (Desktop), R9 5900X
4632 Points -60%
3840x2160 Fire Strike Ultra Graphics
AMD Radeon RX 6800 XT
AMD Radeon RX 6800 XT, R9 5950X
12626 Points +77%
MSI GeForce RTX 3090 Suprim X
NVIDIA GeForce RTX 3090, R9 5900X
12371 Points +74%
Average NVIDIA GeForce RTX 3090
  (11613 - 12587, n=13)
12305 Points +73%
Average NVIDIA GeForce RTX 3080
  (10645 - 10793, n=2)
10719 Points +50%
MSI GeForce RTX 3080 Gaming X Trio
NVIDIA GeForce RTX 3080, R9 5900X
10645 Points +49%
AMD Ryzen 9 5900X
NVIDIA Titan RTX, R9 5900X
8649 Points +21%
Average NVIDIA GeForce RTX 3070
  (8043 - 8483, n=5)
8250 Points +16%
Zotac Gaming GeForce RTX 3070 Twin Edge
NVIDIA GeForce RTX 3070, R9 5950X
8043 Points +13%
KFA2 GeForce RTX 2080 Ti EX
NVIDIA GeForce RTX 2080 Ti (Desktop), R9 3900X
7925 Points +11%
NVIDIA GeForce RTX 3060 Ti FE
NVIDIA GeForce RTX 3060 Ti, R9 5950X
7126 Points
Average NVIDIA GeForce RTX 2080 Super (Desktop)
  (6500 - 6700, n=3)
6585 Points -8%
Nvidia GeForce RTX 2080 Super
NVIDIA GeForce RTX 2080 Super (Desktop), R7 2700X
6500 Points -9%
AMD Radeon RX 5700 XT
AMD Radeon RX 5700 XT (Desktop), R7 2700X
5955 Points -16%
Nvidia GeForce RTX 2070 Super
NVIDIA GeForce RTX 2070 Super (Desktop), R7 2700X
5786 Points -19%
Average NVIDIA GeForce RTX 2070 Super (Desktop)
  (2290 - 5882, n=7)
5313 Points -25%
Nvidia GeForce RTX 2060 Super
NVIDIA GeForce RTX 2060 Super (Desktop), R7 2700X
5175 Points -27%
Average NVIDIA GeForce RTX 2060 Super (Desktop)
  (5067 - 5224, n=6)
5164 Points -28%
KFA 2 GeForce GTX 1660 Super
NVIDIA GeForce GTX 1660 Super (Desktop), R9 3900X
3088 Points -57%
KFA2 GeForce GTX 1650 Super EX One Click OC
NVIDIA GeForce GTX 1650 Super (Desktop), R9 5900X
2186 Points -69%
Fire Strike Extreme Graphics
AMD Radeon RX 6800 XT
AMD Radeon RX 6800 XT, R9 5950X
25015 Points +80%
Average NVIDIA GeForce RTX 3090
  (22075 - 24730, n=13)
23822 Points +71%
MSI GeForce RTX 3090 Suprim X
NVIDIA GeForce RTX 3090, R9 5900X
23114 Points +66%
Average NVIDIA GeForce RTX 3080
  (20007 - 20861, n=2)
20434 Points +47%
MSI GeForce RTX 3080 Gaming X Trio
NVIDIA GeForce RTX 3080, R9 5900X
20007 Points +44%
AMD Ryzen 9 5900X
NVIDIA Titan RTX, R9 5900X
17176 Points +24%
Average NVIDIA GeForce RTX 3070
  (15503 - 16276, n=5)
15859 Points +14%
KFA2 GeForce RTX 2080 Ti EX
NVIDIA GeForce RTX 2080 Ti (Desktop), R9 3900X
15603 Points +12%
Zotac Gaming GeForce RTX 3070 Twin Edge
NVIDIA GeForce RTX 3070, R9 5950X
15503 Points +12%
NVIDIA GeForce RTX 3060 Ti FE
NVIDIA GeForce RTX 3060 Ti, R9 5950X
13898 Points
Average NVIDIA GeForce RTX 2080 Super (Desktop)
  (12968 - 13551, n=3)
13172 Points -5%
Nvidia GeForce RTX 2080 Super
NVIDIA GeForce RTX 2080 Super (Desktop), R7 2700X
12968 Points -7%
AMD Radeon RX 5700 XT
AMD Radeon RX 5700 XT (Desktop), R7 2700X
12209 Points -12%
Average NVIDIA GeForce RTX 2070 Super (Desktop)
  (11382 - 12044, n=7)
11850 Points -15%
Nvidia GeForce RTX 2070 Super
NVIDIA GeForce RTX 2070 Super (Desktop), R7 2700X
11634 Points -16%
Average NVIDIA GeForce RTX 2060 Super (Desktop)
  (10182 - 10726, n=6)
10498 Points -24%
Nvidia GeForce RTX 2060 Super
NVIDIA GeForce RTX 2060 Super (Desktop), R7 2700X
10481 Points -25%
KFA 2 GeForce GTX 1660 Super
NVIDIA GeForce GTX 1660 Super (Desktop), R9 3900X
6935 Points -50%
KFA2 GeForce GTX 1650 Super EX One Click OC
NVIDIA GeForce GTX 1650 Super (Desktop), R9 5900X
5135 Points -63%
1920x1080 Fire Strike Graphics
AMD Radeon RX 6800 XT
AMD Radeon RX 6800 XT, R9 5950X
49735 Points +77%
Average NVIDIA GeForce RTX 3090
  (41298 - 49282, n=16)
46854 Points +66%
MSI GeForce RTX 3090 Suprim X
NVIDIA GeForce RTX 3090, R9 5900X
42688 Points +52%
Average NVIDIA GeForce RTX 3080
  (37604 - 40910, n=2)
39257 Points +39%
MSI GeForce RTX 3080 Gaming X Trio
NVIDIA GeForce RTX 3080, R9 5900X
37604 Points +34%
AMD Ryzen 9 5900X
NVIDIA Titan RTX, R9 5900X
34722 Points +23%
KFA2 GeForce RTX 2080 Ti EX
NVIDIA GeForce RTX 2080 Ti (Desktop), R9 3900X
32081 Points +14%
Zotac Gaming GeForce RTX 3070 Twin Edge
NVIDIA GeForce RTX 3070, R9 5950X
31252 Points +11%
Average NVIDIA GeForce RTX 3070
  (20357 - 33270, n=7)
28949 Points +3%
NVIDIA GeForce RTX 3060 Ti FE
NVIDIA GeForce RTX 3060 Ti, R9 5950X
28145 Points
Average NVIDIA GeForce RTX 2080 Super (Desktop)
  (26824 - 28968, n=4)
27647 Points -2%
Nvidia GeForce RTX 2080 Super
NVIDIA GeForce RTX 2080 Super (Desktop), R7 2700X
27075 Points -4%
AMD Radeon RX 5700 XT
AMD Radeon RX 5700 XT (Desktop), R7 2700X
25383 Points -10%
Average NVIDIA GeForce RTX 2070 Super (Desktop)
  (22819 - 25799, n=8)
24645 Points -12%
Nvidia GeForce RTX 2070 Super
NVIDIA GeForce RTX 2070 Super (Desktop), R7 2700X
24151 Points -14%
Nvidia GeForce RTX 2060 Super
NVIDIA GeForce RTX 2060 Super (Desktop), R7 2700X
21970 Points -22%
Average NVIDIA GeForce RTX 2060 Super (Desktop)
  (20522 - 22764, n=7)
21970 Points -22%
KFA 2 GeForce GTX 1660 Super
NVIDIA GeForce GTX 1660 Super (Desktop), R9 3900X
15498 Points -45%
KFA2 GeForce GTX 1650 Super EX One Click OC
NVIDIA GeForce GTX 1650 Super (Desktop), R9 5900X
11688 Points -58%
Unigine Heaven 4.0
Extreme Preset DX11
Average NVIDIA GeForce RTX 3090
  (272 - 315, n=10)
299 fps +59%
MSI GeForce RTX 3090 Suprim X
NVIDIA GeForce RTX 3090, R9 5900X
283.5 fps +50%
MSI GeForce RTX 3080 Gaming X Trio
NVIDIA GeForce RTX 3080, R9 5900X
252.5 fps +34%
AMD Radeon RX 6800 XT
AMD Radeon RX 6800 XT, R9 5950X
247.9 fps +31%
Average NVIDIA GeForce RTX 3080
  (233 - 253, n=2)
243 fps +29%
AMD Ryzen 9 5900X
NVIDIA Titan RTX, R9 5900X
237.1 fps +26%
KFA2 GeForce RTX 2080 Ti EX
NVIDIA GeForce RTX 2080 Ti (Desktop), R9 3900X
215.2 fps +14%
Zotac Gaming GeForce RTX 3070 Twin Edge
NVIDIA GeForce RTX 3070, R9 5950X
213.7 fps +13%
Average NVIDIA GeForce RTX 3070
  (196.4 - 214, n=5)
206 fps +9%
NVIDIA GeForce RTX 3060 Ti FE
NVIDIA GeForce RTX 3060 Ti, R9 5950X
188.6 (43.6min - 434.5max) fps
Nvidia GeForce RTX 2080 Super
NVIDIA GeForce RTX 2080 Super (Desktop), R7 2700X
175.2 fps -7%
Average NVIDIA GeForce RTX 2080 Super (Desktop)
  ()
175.2 fps -7%
Average NVIDIA GeForce RTX 2070 Super (Desktop)
  (160.1 - 172.3, n=4)
167.1 fps -11%
Nvidia GeForce RTX 2070 Super
NVIDIA GeForce RTX 2070 Super (Desktop), R7 2700X
160.1 fps -15%
Average NVIDIA GeForce RTX 2060 Super (Desktop)
  (140.4 - 146.1, n=4)
143.3 fps -24%
Nvidia GeForce RTX 2060 Super
NVIDIA GeForce RTX 2060 Super (Desktop), R7 2700X
141.7 fps -25%
AMD Radeon RX 5700 XT
AMD Radeon RX 5700 XT (Desktop), R7 2700X
132.5 fps -30%
KFA 2 GeForce GTX 1660 Super
NVIDIA GeForce GTX 1660 Super (Desktop), R9 3900X
98.3 fps -48%
KFA2 GeForce GTX 1650 Super EX One Click OC
NVIDIA GeForce GTX 1650 Super (Desktop), R9 5900X
71.9 fps -62%
Extreme Preset OpenGL
MSI GeForce RTX 3090 Suprim X
NVIDIA GeForce RTX 3090, R9 5900X
273.7 fps +59%
Average NVIDIA GeForce RTX 3090
  (188.2 - 284, n=9)
268 fps +56%
MSI GeForce RTX 3080 Gaming X Trio
NVIDIA GeForce RTX 3080, R9 5900X
243.2 fps +41%
Average NVIDIA GeForce RTX 3080
  (232 - 243, n=2)
238 fps +38%
AMD Ryzen 9 5900X
NVIDIA Titan RTX, R9 5900X
215.1 fps +25%
KFA2 GeForce RTX 2080 Ti EX
NVIDIA GeForce RTX 2080 Ti (Desktop), R9 3900X
204.4 fps +19%
AMD Radeon RX 6800 XT
AMD Radeon RX 6800 XT, R9 5950X
204 fps +18%
Average NVIDIA GeForce RTX 3070
  (187.5 - 196.1, n=4)
192.5 fps +12%
NVIDIA GeForce RTX 3060 Ti FE
NVIDIA GeForce RTX 3060 Ti, R9 5950X
172.3 (11.4min - 371.5max) fps
Nvidia GeForce RTX 2080 Super
NVIDIA GeForce RTX 2080 Super (Desktop), R7 2700X
167.5 fps -3%
Average NVIDIA GeForce RTX 2080 Super (Desktop)
  ()
167.5 fps -3%
Average NVIDIA GeForce RTX 2070 Super (Desktop)
  (153.5 - 157.1, n=4)
155.4 fps -10%
Nvidia GeForce RTX 2070 Super
NVIDIA GeForce RTX 2070 Super (Desktop), R7 2700X
153.5 fps -11%
Average NVIDIA GeForce RTX 2060 Super (Desktop)
  (132.3 - 133.9, n=4)
133.1 fps -23%
Nvidia GeForce RTX 2060 Super
NVIDIA GeForce RTX 2060 Super (Desktop), R7 2700X
132.3 fps -23%
AMD Radeon RX 5700 XT
AMD Radeon RX 5700 XT (Desktop), R7 2700X
110.2 fps -36%
KFA 2 GeForce GTX 1660 Super
NVIDIA GeForce GTX 1660 Super (Desktop), R9 3900X
92.2 fps -46%
KFA2 GeForce GTX 1650 Super EX One Click OC
NVIDIA GeForce GTX 1650 Super (Desktop), R9 5900X
68.9 fps -60%
Unigine Valley 1.0
1920x1080 Extreme HD DirectX AA:x8
Average NVIDIA GeForce RTX 3090
  (184.2 - 245, n=10)
223 fps +46%
MSI GeForce RTX 3090 Suprim X
NVIDIA GeForce RTX 3090, R9 5900X
196 fps +28%
AMD Radeon RX 6800 XT
AMD Radeon RX 6800 XT, R9 5950X
190.6 fps +24%
MSI GeForce RTX 3080 Gaming X Trio
NVIDIA GeForce RTX 3080, R9 5900X
181.8 fps +19%
AMD Ryzen 9 5900X
NVIDIA Titan RTX, R9 5900X
180.1 fps +18%
Average NVIDIA GeForce RTX 3080
  (176.2 - 181.8, n=2)
179 fps +17%
Zotac Gaming GeForce RTX 3070 Twin Edge
NVIDIA GeForce RTX 3070, R9 5950X
168.1 fps +10%
Average NVIDIA GeForce RTX 3070
  (155.1 - 168.5, n=5)
161.2 fps +5%
KFA2 GeForce RTX 2080 Ti EX
NVIDIA GeForce RTX 2080 Ti (Desktop), R9 3900X
159.4 fps +4%
NVIDIA GeForce RTX 3060 Ti FE
NVIDIA GeForce RTX 3060 Ti, R9 5950X
153.2 (48.2min - 297.9max) fps
Average NVIDIA GeForce RTX 2070 Super (Desktop)
  (113.7 - 127.4, n=4)
122.5 fps -20%
Nvidia GeForce RTX 2080 Super
NVIDIA GeForce RTX 2080 Super (Desktop), R7 2700X
120.2 fps -22%
Average NVIDIA GeForce RTX 2080 Super (Desktop)
  ()
120.2 fps -22%
Nvidia GeForce RTX 2070 Super
NVIDIA GeForce RTX 2070 Super (Desktop), R7 2700X
113.7 fps -26%
Average NVIDIA GeForce RTX 2060 Super (Desktop)
  (106.9 - 114.1, n=4)
111.3 fps -27%
Nvidia GeForce RTX 2060 Super
NVIDIA GeForce RTX 2060 Super (Desktop), R7 2700X
106.9 fps -30%
AMD Radeon RX 5700 XT
AMD Radeon RX 5700 XT (Desktop), R7 2700X
106.3 fps -31%
KFA 2 GeForce GTX 1660 Super
NVIDIA GeForce GTX 1660 Super (Desktop), R9 3900X
77.6 fps -49%
KFA2 GeForce GTX 1650 Super EX One Click OC
NVIDIA GeForce GTX 1650 Super (Desktop), R9 5900X
54.1 fps -65%
1920x1080 Extreme HD Preset OpenGL AA:x8
Average NVIDIA GeForce RTX 3090
  (158.8 - 211, n=9)
201 fps +51%
MSI GeForce RTX 3090 Suprim X
NVIDIA GeForce RTX 3090, R9 5900X
187.8 fps +41%
MSI GeForce RTX 3080 Gaming X Trio
NVIDIA GeForce RTX 3080, R9 5900X
172 fps +29%
Average NVIDIA GeForce RTX 3080
  (163.8 - 172, n=2)
167.9 fps +26%
AMD Ryzen 9 5900X
NVIDIA Titan RTX, R9 5900X
158.5 fps +19%
AMD Radeon RX 6800 XT
AMD Radeon RX 6800 XT, R9 5950X
158.2 fps +19%
KFA2 GeForce RTX 2080 Ti EX
NVIDIA GeForce RTX 2080 Ti (Desktop), R9 3900X
145.1 fps +9%
Average NVIDIA GeForce RTX 3070
  (140.2 - 144.9, n=4)
142.7 fps +7%
NVIDIA GeForce RTX 3060 Ti FE
NVIDIA GeForce RTX 3060 Ti, R9 5950X
132.9 (48.3min - 236.1max) fps
Nvidia GeForce RTX 2080 Super
NVIDIA GeForce RTX 2080 Super (Desktop), R7 2700X
114.5 fps -14%
Average NVIDIA GeForce RTX 2080 Super (Desktop)
  ()
114.5 fps -14%
Average NVIDIA GeForce RTX 2070 Super (Desktop)
  (105.6 - 112, n=4)
109.5 fps -18%
Nvidia GeForce RTX 2070 Super
NVIDIA GeForce RTX 2070 Super (Desktop), R7 2700X
105.6 fps -21%
Average NVIDIA GeForce RTX 2060 Super (Desktop)
  (97.6 - 101.5, n=4)
99.5 fps -25%
Nvidia GeForce RTX 2060 Super
NVIDIA GeForce RTX 2060 Super (Desktop), R7 2700X
98.3 fps -26%
AMD Radeon RX 5700 XT
AMD Radeon RX 5700 XT (Desktop), R7 2700X
89.1 fps -33%
KFA 2 GeForce GTX 1660 Super
NVIDIA GeForce GTX 1660 Super (Desktop), R9 3900X
70.4 fps -47%
KFA2 GeForce GTX 1650 Super EX One Click OC
NVIDIA GeForce GTX 1650 Super (Desktop), R9 5900X
51.1 fps -62%
Unigine Superposition
7680x4320 8k Optimized
MSI GeForce RTX 3090 Suprim X
NVIDIA GeForce RTX 3090, R9 5900X
7521 Points +85%
Average NVIDIA GeForce RTX 3090
  (6969 - 7521, n=10)
7160 Points +77%
MSI GeForce RTX 3080 Gaming X Trio
NVIDIA GeForce RTX 3080, R9 5900X
6346 Points +56%
Average NVIDIA GeForce RTX 3080
  (6243 - 6346, n=2)
6295 Points +55%
AMD Ryzen 9 5900X
NVIDIA Titan RTX, R9 5900X
5402 Points +33%
AMD Radeon RX 6800 XT
AMD Radeon RX 6800 XT, R9 5950X
5256 Points +30%
Average NVIDIA GeForce RTX 3070
  (4587 - 4695, n=5)
4624 Points +14%
Zotac Gaming GeForce RTX 3070 Twin Edge
NVIDIA GeForce RTX 3070, R9 5950X
4602 Points +13%
NVIDIA GeForce RTX 3060 Ti FE
NVIDIA GeForce RTX 3060 Ti, R9 5950X
4056 Points
Average NVIDIA GeForce RTX 2080 Super (Desktop)
  ()
3989 Points -2%
Average NVIDIA GeForce RTX 2070 Super (Desktop)
  (3419 - 3435, n=3)
3429 Points -15%
Average NVIDIA GeForce RTX 2060 Super (Desktop)
  (2873 - 2914, n=3)
2900 Points -29%
KFA 2 GeForce GTX 1660 Super
NVIDIA GeForce GTX 1660 Super (Desktop), R9 3900X
1964 Points -52%
KFA2 GeForce GTX 1650 Super EX One Click OC
NVIDIA GeForce GTX 1650 Super (Desktop), R9 5900X
1087 Points -73%
3840x2160 4k Optimized
MSI GeForce RTX 3090 Suprim X
NVIDIA GeForce RTX 3090, R9 5900X
16868 Points +83%
Average NVIDIA GeForce RTX 3090
  (15794 - 16868, n=10)
16352 Points +77%
MSI GeForce RTX 3080 Gaming X Trio
NVIDIA GeForce RTX 3080, R9 5900X
14243 Points +54%
Average NVIDIA GeForce RTX 3080
  (13984 - 14243, n=2)
14114 Points +53%
AMD Radeon RX 6800 XT
AMD Radeon RX 6800 XT, R9 5950X
13471 Points +46%
AMD Ryzen 9 5900X
NVIDIA Titan RTX, R9 5900X
12186 Points +32%
Zotac Gaming GeForce RTX 3070 Twin Edge
NVIDIA GeForce RTX 3070, R9 5950X
10704 Points +16%
Average NVIDIA GeForce RTX 3070
  (10544 - 10755, n=5)
10667 Points +16%
Average NVIDIA GeForce RTX 2080 Super (Desktop)
  ()
9338 Points +1%
NVIDIA GeForce RTX 3060 Ti FE
NVIDIA GeForce RTX 3060 Ti, R9 5950X
9224 Points
Average NVIDIA GeForce RTX 2070 Super (Desktop)
  (8096 - 8111, n=3)
8101 Points -12%
Average NVIDIA GeForce RTX 2060 Super (Desktop)
  (6747 - 6863, n=3)
6811 Points -26%
KFA 2 GeForce GTX 1660 Super
NVIDIA GeForce GTX 1660 Super (Desktop), R9 3900X
4755 Points -48%
KFA2 GeForce GTX 1650 Super EX One Click OC
NVIDIA GeForce GTX 1650 Super (Desktop), R9 5900X
3724 Points -60%
1920x1080 1080p Extreme
MSI GeForce RTX 3090 Suprim X
NVIDIA GeForce RTX 3090, R9 5900X
12694 Points +78%
Average NVIDIA GeForce RTX 3090
  (11806 - 12694, n=10)
12227 Points +71%
MSI GeForce RTX 3080 Gaming X Trio
NVIDIA GeForce RTX 3080, R9 5900X
10822 Points +52%
Average NVIDIA GeForce RTX 3080
  (10572 - 10822, n=2)
10697 Points +50%
AMD Radeon RX 6800 XT
AMD Radeon RX 6800 XT, R9 5950X
10046 Points +41%
AMD Ryzen 9 5900X
NVIDIA Titan RTX, R9 5900X
9056 Points +27%
Average NVIDIA GeForce RTX 3070
  (8276 - 8507, n=5)
8354 Points +17%
Zotac Gaming GeForce RTX 3070 Twin Edge
NVIDIA GeForce RTX 3070, R9 5950X
8336 Points +17%
NVIDIA GeForce RTX 3060 Ti FE
NVIDIA GeForce RTX 3060 Ti, R9 5950X
7142 Points
Average NVIDIA GeForce RTX 2080 Super (Desktop)
  ()
7080 Points -1%
Average NVIDIA GeForce RTX 2070 Super (Desktop)
  (6161 - 6178, n=3)
6169 Points -14%
Average NVIDIA GeForce RTX 2060 Super (Desktop)
  (5049 - 5143, n=3)
5105 Points -29%
KFA 2 GeForce GTX 1660 Super
NVIDIA GeForce GTX 1660 Super (Desktop), R9 3900X
3171 Points -56%
KFA2 GeForce GTX 1650 Super EX One Click OC
NVIDIA GeForce GTX 1650 Super (Desktop), R9 5900X
2305 Points -68%
1920x1080 1080p High
Average NVIDIA GeForce RTX 3090
  (23626 - 27207, n=10)
25978 Points +68%
MSI GeForce RTX 3090 Suprim X
NVIDIA GeForce RTX 3090, R9 5900X
25953 Points +68%
AMD Radeon RX 6800 XT
AMD Radeon RX 6800 XT, R9 5950X
22265 Points +44%
MSI GeForce RTX 3080 Gaming X Trio
NVIDIA GeForce RTX 3080, R9 5900X
21912 Points +42%
Average NVIDIA GeForce RTX 3080
  (21333 - 21912, n=2)
21623 Points +40%
AMD Ryzen 9 5900X
NVIDIA Titan RTX, R9 5900X
20315 Points +31%
Zotac Gaming GeForce RTX 3070 Twin Edge
NVIDIA GeForce RTX 3070, R9 5950X
17491 Points +13%
Average NVIDIA GeForce RTX 3070
  (17054 - 17491, n=5)
17312 Points +12%
Average NVIDIA GeForce RTX 2080 Super (Desktop)
  ()
15558 Points +1%
NVIDIA GeForce RTX 3060 Ti FE
NVIDIA GeForce RTX 3060 Ti, R9 5950X
15479 Points
Average NVIDIA GeForce RTX 2070 Super (Desktop)
  (13655 - 13832, n=3)
13765 Points -11%
Average NVIDIA GeForce RTX 2060 Super (Desktop)
  (11421 - 11785, n=3)
11649 Points -25%
KFA 2 GeForce GTX 1660 Super
NVIDIA GeForce GTX 1660 Super (Desktop), R9 3900X
8212 Points -47%
KFA2 GeForce GTX 1650 Super EX One Click OC
NVIDIA GeForce GTX 1650 Super (Desktop), R9 5900X
6468 Points -58%
1280x720 720p Low
Average NVIDIA GeForce RTX 3090
  (33329 - 54879, n=9)
45093 Points +17%
AMD Ryzen 9 5900X
NVIDIA Titan RTX, R9 5900X
40994 Points +7%
Zotac Gaming GeForce RTX 3070 Twin Edge
NVIDIA GeForce RTX 3070, R9 5950X
39277 Points +2%
Average NVIDIA GeForce RTX 2070 Super (Desktop)
  (26742 - 45424, n=3)
38495 Points 0%
NVIDIA GeForce RTX 3060 Ti FE
NVIDIA GeForce RTX 3060 Ti, R9 5950X
38414 Points
AMD Radeon RX 6800 XT
AMD Radeon RX 6800 XT, R9 5950X
36452 Points -5%
Average NVIDIA GeForce RTX 2060 Super (Desktop)
  (26634 - 40961, n=3)
35859 Points -7%
Average NVIDIA GeForce RTX 3070
  (27330 - 40007, n=5)
34576 Points -10%
MSI GeForce RTX 3090 Suprim X
NVIDIA GeForce RTX 3090, R9 5900X
33329 Points -13%
MSI GeForce RTX 3080 Gaming X Trio
NVIDIA GeForce RTX 3080, R9 5900X
32183 Points -16%
Average NVIDIA GeForce RTX 3080
  (30851 - 32183, n=2)
31517 Points -18%
Average NVIDIA GeForce RTX 2080 Super (Desktop)
  ()
26907 Points -30%
KFA 2 GeForce GTX 1660 Super
NVIDIA GeForce GTX 1660 Super (Desktop), R9 3900X
25313 Points -34%
KFA2 GeForce GTX 1650 Super EX One Click OC
NVIDIA GeForce GTX 1650 Super (Desktop), R9 5900X
22323 Points -42%
3DMark 11 Performance
33117 puntos
3DMark Cloud Gate Standard Score
66922 puntos
3DMark Fire Strike Score
27043 puntos
3DMark Fire Strike Extreme Score
13790 puntos
3DMark Time Spy Score
11520 puntos
ayuda

Puntos de referencia informáticos

La RTX 3060 Ti FE ofrece un rendimiento computacional decente, con un 25% más de puntuación en ComputeMark en comparación con la media de la RTX 2080 Super. LuxMark también muestra beneficios decentes con la RTX 3060 Ti FE siendo solo un 6% más lenta que la media de la RTX 3070.

ComputeMark v2.1
1024x600 Normal, QJuliaRayTrace
Average NVIDIA GeForce RTX 3090
  (16403 - 18223, n=9)
17439 Points +73%
MSI GeForce RTX 3090 Suprim X
NVIDIA GeForce RTX 3090, R9 5900X
17058 Points +69%
MSI GeForce RTX 3080 Gaming X Trio
NVIDIA GeForce RTX 3080, R9 5900X
15508 Points +54%
Average NVIDIA GeForce RTX 3080
  (14718 - 15508, n=2)
15113 Points +50%
Average NVIDIA GeForce RTX 3070
  (11510 - 11816, n=3)
11665 Points +16%
AMD Radeon RX 6800 XT
AMD Radeon RX 6800 XT, R9 5950X
11304 Points +12%
NVIDIA GeForce RTX 3060 Ti FE
NVIDIA GeForce RTX 3060 Ti, R9 5950X
10072 Points
KFA2 GeForce RTX 2080 Ti EX
NVIDIA GeForce RTX 2080 Ti (Desktop), R9 3900X
9104 Points -10%
Nvidia GeForce RTX 2080 Super
NVIDIA GeForce RTX 2080 Super (Desktop), R7 2700X
7258 Points -28%
Average NVIDIA GeForce RTX 2080 Super (Desktop)
  ()
7258 Points -28%
Average NVIDIA GeForce RTX 2070 Super (Desktop)
  (6155 - 6158, n=2)
6157 Points -39%
Nvidia GeForce RTX 2070 Super
NVIDIA GeForce RTX 2070 Super (Desktop), R7 2700X
6155 Points -39%
AMD Radeon RX 5700 XT
AMD Radeon RX 5700 XT (Desktop), R7 2700X
5761 Points -43%
Nvidia GeForce RTX 2060 Super
NVIDIA GeForce RTX 2060 Super (Desktop), R7 2700X
5271 Points -48%
Average NVIDIA GeForce RTX 2060 Super (Desktop)
  (5270 - 5271, n=2)
5271 Points -48%
KFA 2 GeForce GTX 1660 Super
NVIDIA GeForce GTX 1660 Super (Desktop), R9 3900X
3656 Points -64%
KFA2 GeForce GTX 1650 Super EX One Click OC
NVIDIA GeForce GTX 1650 Super (Desktop), R9 5900X
3419 Points -66%
1024x600 Normal, Mandel Scalar
MSI GeForce RTX 3090 Suprim X
NVIDIA GeForce RTX 3090, R9 5900X
11197 Points +84%
Average NVIDIA GeForce RTX 3090
  (10650 - 11564, n=9)
11171 Points +84%
AMD Radeon RX 6800 XT
AMD Radeon RX 6800 XT, R9 5950X
10018 Points +65%
MSI GeForce RTX 3080 Gaming X Trio
NVIDIA GeForce RTX 3080, R9 5900X
9938 Points +63%
Average NVIDIA GeForce RTX 3080
  (9554 - 9938, n=2)
9746 Points +60%
Average NVIDIA GeForce RTX 3070
  (7042 - 7314, n=3)
7169 Points +18%
NVIDIA GeForce RTX 3060 Ti FE
NVIDIA GeForce RTX 3060 Ti, R9 5950X
6087 Points
KFA2 GeForce RTX 2080 Ti EX
NVIDIA GeForce RTX 2080 Ti (Desktop), R9 3900X
5679 Points -7%
AMD Radeon RX 5700 XT
AMD Radeon RX 5700 XT (Desktop), R7 2700X
4869 Points -20%
Nvidia GeForce RTX 2080 Super
NVIDIA GeForce RTX 2080 Super (Desktop), R7 2700X
4525 Points -26%
Average NVIDIA GeForce RTX 2080 Super (Desktop)
  ()
4525 Points -26%
Nvidia GeForce RTX 2070 Super
NVIDIA GeForce RTX 2070 Super (Desktop), R7 2700X
3782 Points -38%
Average NVIDIA GeForce RTX 2070 Super (Desktop)
  (3748 - 3782, n=2)
3765 Points -38%
Nvidia GeForce RTX 2060 Super
NVIDIA GeForce RTX 2060 Super (Desktop), R7 2700X
3185 Points -48%
Average NVIDIA GeForce RTX 2060 Super (Desktop)
  (3169 - 3185, n=2)
3177 Points -48%
KFA 2 GeForce GTX 1660 Super
NVIDIA GeForce GTX 1660 Super (Desktop), R9 3900X
2149 Points -65%
KFA2 GeForce GTX 1650 Super EX One Click OC
NVIDIA GeForce GTX 1650 Super (Desktop), R9 5900X
1984 Points -67%
1024x600 Normal, Mandel Vector
Average NVIDIA GeForce RTX 3090
  (8038 - 10097, n=9)
9437 Points +97%
AMD Radeon RX 6800 XT
AMD Radeon RX 6800 XT, R9 5950X
8399 Points +76%
MSI GeForce RTX 3090 Suprim X
NVIDIA GeForce RTX 3090, R9 5900X
8341 Points +74%
MSI GeForce RTX 3080 Gaming X Trio
NVIDIA GeForce RTX 3080, R9 5900X
7540 Points +58%
Average NVIDIA GeForce RTX 3080
  (7148 - 7540, n=2)
7344 Points +54%
Average NVIDIA GeForce RTX 3070
  (5364 - 6266, n=3)
5707 Points +19%
NVIDIA GeForce RTX 3060 Ti FE
NVIDIA GeForce RTX 3060 Ti, R9 5950X
4782 Points
KFA2 GeForce RTX 2080 Ti EX
NVIDIA GeForce RTX 2080 Ti (Desktop), R9 3900X
4695 Points -2%
AMD Radeon RX 5700 XT
AMD Radeon RX 5700 XT (Desktop), R7 2700X
4246 Points -11%
Nvidia GeForce RTX 2080 Super
NVIDIA GeForce RTX 2080 Super (Desktop), R7 2700X
3835 Points -20%
Average NVIDIA GeForce RTX 2080 Super (Desktop)
  ()
3835 Points -20%
Nvidia GeForce RTX 2070 Super
NVIDIA GeForce RTX 2070 Super (Desktop), R7 2700X
3358 Points -30%
Average NVIDIA GeForce RTX 2070 Super (Desktop)
  (3348 - 3358, n=2)
3353 Points -30%
Average NVIDIA GeForce RTX 2060 Super (Desktop)
  (2939 - 2948, n=2)
2944 Points -38%
Nvidia GeForce RTX 2060 Super
NVIDIA GeForce RTX 2060 Super (Desktop), R7 2700X
2939 Points -39%
KFA 2 GeForce GTX 1660 Super
NVIDIA GeForce GTX 1660 Super (Desktop), R9 3900X
2169 Points -55%
KFA2 GeForce GTX 1650 Super EX One Click OC
NVIDIA GeForce GTX 1650 Super (Desktop), R9 5900X
2060 Points -57%
1024x600 Normal, Fluid 2DTexArr
MSI GeForce RTX 3090 Suprim X
NVIDIA GeForce RTX 3090, R9 5900X
4560 Points +74%
Average NVIDIA GeForce RTX 3090
  (4344 - 4608, n=9)
4497 Points +72%
MSI GeForce RTX 3080 Gaming X Trio
NVIDIA GeForce RTX 3080, R9 5900X
4159 Points +59%
Average NVIDIA GeForce RTX 3080
  (4087 - 4159, n=2)
4123 Points +57%
AMD Radeon RX 6800 XT
AMD Radeon RX 6800 XT, R9 5950X
3947 Points +51%
KFA2 GeForce RTX 2080 Ti EX
NVIDIA GeForce RTX 2080 Ti (Desktop), R9 3900X
3444 Points +32%
Average NVIDIA GeForce RTX 3070
  (2666 - 2706, n=3)
2692 Points +3%
Nvidia GeForce RTX 2080 Super
NVIDIA GeForce RTX 2080 Super (Desktop), R7 2700X
2655 Points +1%
Average NVIDIA GeForce RTX 2080 Super (Desktop)
  ()
2655 Points +1%
NVIDIA GeForce RTX 3060 Ti FE
NVIDIA GeForce RTX 3060 Ti, R9 5950X
2619 Points
Average NVIDIA GeForce RTX 2070 Super (Desktop)
  (2331 - 2354, n=2)
2343 Points -11%
Nvidia GeForce RTX 2070 Super
NVIDIA GeForce RTX 2070 Super (Desktop), R7 2700X
2331 Points -11%
Average NVIDIA GeForce RTX 2060 Super (Desktop)
  (2064 - 2101, n=2)
2083 Points -20%
Nvidia GeForce RTX 2060 Super
NVIDIA GeForce RTX 2060 Super (Desktop), R7 2700X
2064 Points -21%
AMD Radeon RX 5700 XT
AMD Radeon RX 5700 XT (Desktop), R7 2700X
1960 Points -25%
KFA 2 GeForce GTX 1660 Super
NVIDIA GeForce GTX 1660 Super (Desktop), R9 3900X
1488 Points -43%
KFA2 GeForce GTX 1650 Super EX One Click OC
NVIDIA GeForce GTX 1650 Super (Desktop), R9 5900X
1015 Points -61%
1024x600 Normal, Fluid 3DTex
Average NVIDIA GeForce RTX 3090
  (5246 - 5520, n=9)
5444 Points +103%
MSI GeForce RTX 3090 Suprim X
NVIDIA GeForce RTX 3090, R9 5900X
5391 Points +101%
AMD Radeon RX 6800 XT
AMD Radeon RX 6800 XT, R9 5950X
5154 Points +92%
MSI GeForce RTX 3080 Gaming X Trio
NVIDIA GeForce RTX 3080, R9 5900X
4450 Points +66%
Average NVIDIA GeForce RTX 3080
  (4417 - 4450, n=2)
4434 Points +65%
KFA2 GeForce RTX 2080 Ti EX
NVIDIA GeForce RTX 2080 Ti (Desktop), R9 3900X
3589 Points +34%
Average NVIDIA GeForce RTX 3070
  (2749 - 2791, n=3)
2772 Points +3%
Nvidia GeForce RTX 2080 Super
NVIDIA GeForce RTX 2080 Super (Desktop), R7 2700X
2736 Points +2%
Average NVIDIA GeForce RTX 2080 Super (Desktop)
  ()
2736 Points +2%
NVIDIA GeForce RTX 3060 Ti FE
NVIDIA GeForce RTX 3060 Ti, R9 5950X
2685 Points
Average NVIDIA GeForce RTX 2070 Super (Desktop)
  (2456 - 2486, n=2)
2471 Points -8%
Nvidia GeForce RTX 2070 Super
NVIDIA GeForce RTX 2070 Super (Desktop), R7 2700X
2456 Points -9%
AMD Radeon RX 5700 XT
AMD Radeon RX 5700 XT (Desktop), R7 2700X
2349 Points -13%
Average NVIDIA GeForce RTX 2060 Super (Desktop)
  (2289 - 2290, n=2)
2290 Points -15%
Nvidia GeForce RTX 2060 Super
NVIDIA GeForce RTX 2060 Super (Desktop), R7 2700X
2289 Points -15%
KFA 2 GeForce GTX 1660 Super
NVIDIA GeForce GTX 1660 Super (Desktop), R9 3900X
1636 Points -39%
KFA2 GeForce GTX 1650 Super EX One Click OC
NVIDIA GeForce GTX 1650 Super (Desktop), R9 5900X
1032 Points -62%
1024x600 Normal, Score
Average NVIDIA GeForce RTX 3090
  (44948 - 49118, n=8)
47736 Points +82%
MSI GeForce RTX 3090 Suprim X
NVIDIA GeForce RTX 3090, R9 5900X
46547 Points +77%
MSI GeForce RTX 3080 Gaming X Trio
NVIDIA GeForce RTX 3080, R9 5900X
41594 Points +58%
Average NVIDIA GeForce RTX 3080
  (39924 - 41594, n=2)
40759 Points +55%
AMD Radeon RX 6800 XT
AMD Radeon RX 6800 XT, R9 5950X
38823 Points +48%
Average NVIDIA GeForce RTX 3070
  (29330 - 30581, n=3)
30004 Points +14%
KFA2 GeForce RTX 2080 Ti EX
NVIDIA GeForce RTX 2080 Ti (Desktop), R9 3900X
26510 Points +1%
NVIDIA GeForce RTX 3060 Ti FE
NVIDIA GeForce RTX 3060 Ti, R9 5950X
26245 Points
Nvidia GeForce RTX 2080 Super
NVIDIA GeForce RTX 2080 Super (Desktop), R7 2700X
21009 Points -20%
Average NVIDIA GeForce RTX 2080 Super (Desktop)
  ()
21009 Points -20%
AMD Radeon RX 5700 XT
AMD Radeon RX 5700 XT (Desktop), R7 2700X
19184 Points -27%
Average NVIDIA GeForce RTX 2070 Super (Desktop)
  (18083 - 18095, n=2)
18089 Points -31%
Nvidia GeForce RTX 2070 Super
NVIDIA GeForce RTX 2070 Super (Desktop), R7 2700X
18083 Points -31%
Average NVIDIA GeForce RTX 2060 Super (Desktop)
  (15749 - 15776, n=2)
15763 Points -40%
Nvidia GeForce RTX 2060 Super
NVIDIA GeForce RTX 2060 Super (Desktop), R7 2700X
15749 Points -40%
KFA 2 GeForce GTX 1660 Super
NVIDIA GeForce GTX 1660 Super (Desktop), R9 3900X
11098 Points -58%
KFA2 GeForce GTX 1650 Super EX One Click OC
NVIDIA GeForce GTX 1650 Super (Desktop), R9 5900X
9510 Points -64%
LuxMark v2.0 64Bit
Room GPUs-only
Average NVIDIA GeForce RTX 3090
  (5727 - 5974, n=8)
5881 Samples/s +45%
MSI GeForce RTX 3090 Suprim X
NVIDIA GeForce RTX 3090, R9 5900X
5727 Samples/s +42%
MSI GeForce RTX 3080 Gaming X Trio
NVIDIA GeForce RTX 3080, R9 5900X
5198 Samples/s +28%
Average NVIDIA GeForce RTX 3080
  (5112 - 5198, n=2)
5155 Samples/s +27%
AMD Radeon RX 6800 XT
AMD Radeon RX 6800 XT, R9 5950X
5057 Samples/s +25%
KFA2 GeForce RTX 2080 Ti EX
NVIDIA GeForce RTX 2080 Ti (Desktop), R9 3900X
4429 Samples/s +9%
NVIDIA GeForce RTX 3060 Ti FE
NVIDIA GeForce RTX 3060 Ti, R9 5950X
4046 Samples/s
Average NVIDIA GeForce RTX 3070
  (2187 - 4293, n=3)
3588 Samples/s -11%
Nvidia GeForce RTX 2080 Super
NVIDIA GeForce RTX 2080 Super (Desktop), R7 2700X
3430 Samples/s -15%
Average NVIDIA GeForce RTX 2080 Super (Desktop)
  ()
3430 Samples/s -15%
Nvidia GeForce RTX 2070 Super
NVIDIA GeForce RTX 2070 Super (Desktop), R7 2700X
3404 Samples/s -16%
Average NVIDIA GeForce RTX 2070 Super (Desktop)
  ()
3404 Samples/s -16%
Average NVIDIA GeForce RTX 2060 Super (Desktop)
  (3274 - 3278, n=2)
3276 Samples/s -19%
Nvidia GeForce RTX 2060 Super
NVIDIA GeForce RTX 2060 Super (Desktop), R7 2700X
3274 Samples/s -19%
KFA 2 GeForce GTX 1660 Super
NVIDIA GeForce GTX 1660 Super (Desktop), R9 3900X
2286 Samples/s -43%
AMD Radeon RX 5700 XT
AMD Radeon RX 5700 XT (Desktop), R7 2700X
2104 Samples/s -48%
KFA2 GeForce GTX 1650 Super EX One Click OC
NVIDIA GeForce GTX 1650 Super (Desktop), R9 5900X
1405 Samples/s -65%
Sala GPUs-only
AMD Radeon RX 6800 XT
AMD Radeon RX 6800 XT, R9 5950X
28023 Samples/s +211%
Average NVIDIA GeForce RTX 3090
  (14590 - 15088, n=8)
14908 Samples/s +65%
MSI GeForce RTX 3090 Suprim X
NVIDIA GeForce RTX 3090, R9 5900X
14590 Samples/s +62%
MSI GeForce RTX 3080 Gaming X Trio
NVIDIA GeForce RTX 3080, R9 5900X
12980 Samples/s +44%
Average NVIDIA GeForce RTX 3080
  (12797 - 12980, n=2)
12889 Samples/s +43%
Average NVIDIA GeForce RTX 3070
  (10096 - 10115, n=3)
10107 Samples/s +12%
KFA2 GeForce RTX 2080 Ti EX
NVIDIA GeForce RTX 2080 Ti (Desktop), R9 3900X
9999 Samples/s +11%
NVIDIA GeForce RTX 3060 Ti FE
NVIDIA GeForce RTX 3060 Ti, R9 5950X
9010 Samples/s
Nvidia GeForce RTX 2080 Super
NVIDIA GeForce RTX 2080 Super (Desktop), R7 2700X
7878 Samples/s -13%
Average NVIDIA GeForce RTX 2080 Super (Desktop)
  ()
7878 Samples/s -13%
Nvidia GeForce RTX 2070 Super
NVIDIA GeForce RTX 2070 Super (Desktop), R7 2700X
7594 Samples/s -16%
Average NVIDIA GeForce RTX 2070 Super (Desktop)
  ()
7594 Samples/s -16%
Average NVIDIA GeForce RTX 2060 Super (Desktop)
  (6980 - 7010, n=2)
6995 Samples/s -22%
Nvidia GeForce RTX 2060 Super
NVIDIA GeForce RTX 2060 Super (Desktop), R7 2700X
6980 Samples/s -23%
AMD Radeon RX 5700 XT
AMD Radeon RX 5700 XT (Desktop), R7 2700X
6188 Samples/s -31%
KFA 2 GeForce GTX 1660 Super
NVIDIA GeForce GTX 1660 Super (Desktop), R9 3900X
4490 Samples/s -50%
KFA2 GeForce GTX 1650 Super EX One Click OC
NVIDIA GeForce GTX 1650 Super (Desktop), R9 5900X
2972 Samples/s -67%
Geekbench 5.5
OpenCL Score
Average NVIDIA GeForce RTX 3090
  (199930 - 224611, n=19)
214008 Points +74%
MSI GeForce RTX 3090 Suprim X
NVIDIA GeForce RTX 3090, R9 5900X
212914 Points +73%
Average NVIDIA GeForce RTX 3080
  (164477 - 192091, n=2)
178284 Points +45%
MSI GeForce RTX 3080 Gaming X Trio
NVIDIA GeForce RTX 3080, R9 5900X
164477 Points +34%
AMD Radeon RX 6800 XT
AMD Radeon RX 6800 XT, R9 5950X
159072 Points +29%
AMD Ryzen 9 5900X
NVIDIA Titan RTX, R9 5900X
149070 Points +21%
Average NVIDIA GeForce RTX 3070
  (134961 - 138625, n=4)
136574 Points +11%
NVIDIA GeForce RTX 3060 Ti FE
NVIDIA GeForce RTX 3060 Ti, R9 5950X
123036 Points
Average NVIDIA GeForce RTX 2080 Super (Desktop)
  (118695 - 127035, n=3)
122884 Points 0%
Average NVIDIA GeForce RTX 2070 Super (Desktop)
  (102914 - 132850, n=2)
117882 Points -4%
Average NVIDIA GeForce RTX 2060 Super (Desktop)
  ()
88698 Points -28%
KFA2 GeForce GTX 1650 Super EX One Click OC
NVIDIA GeForce GTX 1650 Super (Desktop), R9 5900X
54745 Points -56%
Vulkan Score
Average NVIDIA GeForce RTX 3090
  (62516 - 168974, n=19)
128422 Points +45%
NVIDIA GeForce RTX 3060 Ti FE
NVIDIA GeForce RTX 3060 Ti, R9 5950X
88442 Points
MSI GeForce RTX 3080 Gaming X Trio
NVIDIA GeForce RTX 3080, R9 5900X
83486 Points -6%
AMD Radeon RX 6800 XT
AMD Radeon RX 6800 XT, R9 5950X
81098 Points -8%
Average NVIDIA GeForce RTX 3080
  (76596 - 83486, n=2)
80041 Points -9%
Average NVIDIA GeForce RTX 2080 Super (Desktop)
  (62324 - 91321, n=3)
78667 Points -11%
Average NVIDIA GeForce RTX 2070 Super (Desktop)
  (76596 - 80530, n=2)
78563 Points -11%
AMD Ryzen 9 5900X
NVIDIA Titan RTX, R9 5900X
76596 Points -13%
Average NVIDIA GeForce RTX 3070
  (27460 - 107958, n=4)
71908 Points -19%
Average NVIDIA GeForce RTX 2060 Super (Desktop)
  ()
65260 Points -26%
MSI GeForce RTX 3090 Suprim X
NVIDIA GeForce RTX 3090, R9 5900X
62516 Points -29%
KFA2 GeForce GTX 1650 Super EX One Click OC
NVIDIA GeForce GTX 1650 Super (Desktop), R9 5900X
0 Points -100%

Aplicaciones profesionales

Las tarjetas GeForce no están realmente destinadas a cargas de trabajo profesionales como las aplicaciones de CAD/CAM, energía, automoción o medicina. Esta limitación proviene principalmente del controlador, ya que lo ideal sería que NVIDIA quisiera que los profesionales de estos campos utilizaran la gama Quadro. La Titan RTX, sin embargo, consigue mantener su propio terreno en las pruebas SPECviewperf a pesar de funcionar con los controladores normales GeForce

Si echamos un vistazo a las pruebas SPECviewperf 12 y 13, vemos que la RTX 3060 Ti queda significativamente por detrás de una Quadro RTX 5000 (portátil) en cargas de trabajo profesionales especializadas, a pesar de que esta última es esencialmente un chip RTX 2080 TU104. Sin embargo, quienes trabajen en proyectos de 3D Studio Max y Maya encontrarán que la RTX 3060 Ti tiene un rendimiento decente.

SPECviewperf 2020 pareció algo exigente para la RTX 3060 Ti FE, ya que es un benchmark 4K. La RTX 3080 y la RTX 3090 muestran ventajas evidentes, pero la AMD Radeon RX 6800 XT es claramente la GPU convencional con mejor rendimiento cuando se trata de aplicaciones profesionales

NVIDIA GeForce RTX 3060 Ti Founders Edition
NVIDIA GeForce RTX 3060 Ti, R9 5950X
MSI GeForce RTX 3080 Gaming X Trio
NVIDIA GeForce RTX 3080, R9 5900X
MSI GeForce RTX 3090 Suprim X
NVIDIA GeForce RTX 3090, R9 5900X
Nvidia GeForce RTX 2080 Super
GeForce RTX 2080 Super (Desktop), R7 2700X
AMD Ryzen 9 5900X
NVIDIA Titan RTX, R9 5900X
AMD Radeon RX 6800 XT
Radeon RX 6800 XT, R9 5950X
Acer ConceptD 9 Pro
Quadro RTX 5000 (Laptop), i9-9980HK
SPECviewperf 12
1%
20%
-9%
312%
80%
296%
1900x1060 Solidworks (sw-03)
71.1
66
-7%
72.3
2%
70.8
0%
174.9
146%
150
111%
230.1
224%
1900x1060 Siemens NX (snx-02)
12.3
12.85
4%
14.91
21%
12.26
0%
273.2
2121%
45.07
266%
258.1
1998%
1900x1060 Showcase (showcase-01)
144
180
25%
236
64%
143.6
0%
191.1
33%
223
55%
126.4
-12%
1900x1060 Medical (medical-01)
59.4
36.93
-38%
42.91
-28%
45
-24%
90.7
53%
77.3
30%
109.3
84%
1900x1060 Maya (maya-04)
197
146
-26%
184
-7%
134.8
-32%
188.3
-4%
118
-40%
179
-9%
1900x1060 Energy (energy-01)
13.9
16.35
18%
20.41
47%
13.09
-6%
28.31
104%
28.39
104%
26
87%
1900x1060 Creo (creo-01)
57.8
65.6
13%
75.4
30%
52.7
-9%
173
199%
119
106%
172.1
198%
1900x1060 Catia (catia-04)
109
116
6%
134
23%
104.2
-4%
262.7
141%
238
118%
220
102%
1900x1060 3ds Max (3dsmax-05)
252
276
10%
322
28%
225.8
-10%
292.6
16%
167
-34%
235.8
-6%
SPECviewperf 13
25%
36%
-3%
290%
91%
270%
Solidworks (sw-04)
99.6
96.5
-3%
95.3
-4%
99.6
0%
196.4
97%
193
94%
203.8
105%
Siemens NX (snx-03)
22.3
24.26
9%
27.03
21%
21.94
-2%
493.4
2113%
81.4
265%
465.3
1987%
Showcase (showcase-02)
145
204
41%
241
66%
144.5
0%
190.5
31%
232
60%
127.1
-12%
Medical (medical-02)
72.2
99
37%
105
45%
71.6
-1%
90.8
26%
130
80%
133.4
85%
Maya (maya-05)
344
440
28%
469
36%
328.7
-4%
458
33%
348
1%
340.8
-1%
Energy (energy-02)
25.6
37.87
48%
45.21
77%
23.78
-7%
52
103%
58.4
128%
57.3
124%
Creo (creo-02)
225
295
31%
316
40%
220.1
-2%
346.5
54%
276
23%
319.8
42%
Catia (catia-05)
161
190
18%
206
28%
157.7
-2%
374.8
133%
412
156%
338.9
110%
3ds Max (3dsmax-06)
252
294
17%
298
18%
227.8
-10%
291.3
16%
284
13%
232.2
-8%
SPECviewperf 2020
58%
85%
300%
107%
3840x2160 Solidworks (solidworks-05)
109
158
45%
180
65%
153
40%
108
-1%
3840x2160 Siemens NX (snx-04)
18.2
19.8
9%
22.6
24%
347
1807%
81.7
349%
3840x2160 Medical (medical-03)
11.4
18.47
62%
21.19
86%
16.42
44%
27.84
144%
3840x2160 Maya (maya-06)
215
293
36%
330
53%
257
20%
224
4%
3840x2160 Energy (energy-03)
14.5
51.7
257%
61.1
321%
58.2
301%
60.8
319%
3840x2160 Creo (creo-03)
76.6
77.6
1%
85.1
11%
113
48%
65
-15%
3840x2160 CATIA (catia-06)
37.9
50
32%
56.6
49%
78.2
106%
42.4
12%
3840x2160 3ds Max (3dsmax-07)
80.1
100
25%
135
69%
108
35%
114
42%
Media total (Programa/Opciones)
28% / 27%
47% / 46%
-6% / -6%
301% / 301%
93% / 92%
283% / 283%

Puntos de referencia del juego

De entrada, la RTX 3060 Ti FE rinde muy bien hasta la resolución QHD Ultra en la mayoría de los juegos. Los jugadores de eSports que prefieren una mayor tasa de fotogramas que la resolución también podrán hacer un buen uso de esta tarjeta a 1080p para manejar monitores con altas tasas de refresco. También es posible jugar a 60 fps+ en 4K Ultra en varios títulos como Battlefield V, Far Cry New Dawn, Doom Eternal, y F1 2020. Una buena mayoría de los títulos también se pueden llevar a 60 fps+ en 4K ajustando la configuración del juego sin comprometer mucho la fidelidad visual.

El rendimiento del trazado de rayos (RT) está dentro del 7% de una RTX 3070 media siempre que el juego no utilice RT para la iluminación global, como demuestran los resultados de Call of Duty: Black Ops Cold War y Watch Dogs Legion 1080p Ultra ray tracing benchmarks. Este delta de rendimiento se duplica en los juegos que emplean ampliamente la iluminación global por trazado de rayos, como Metro: Exodus y Cyberpunk 2077

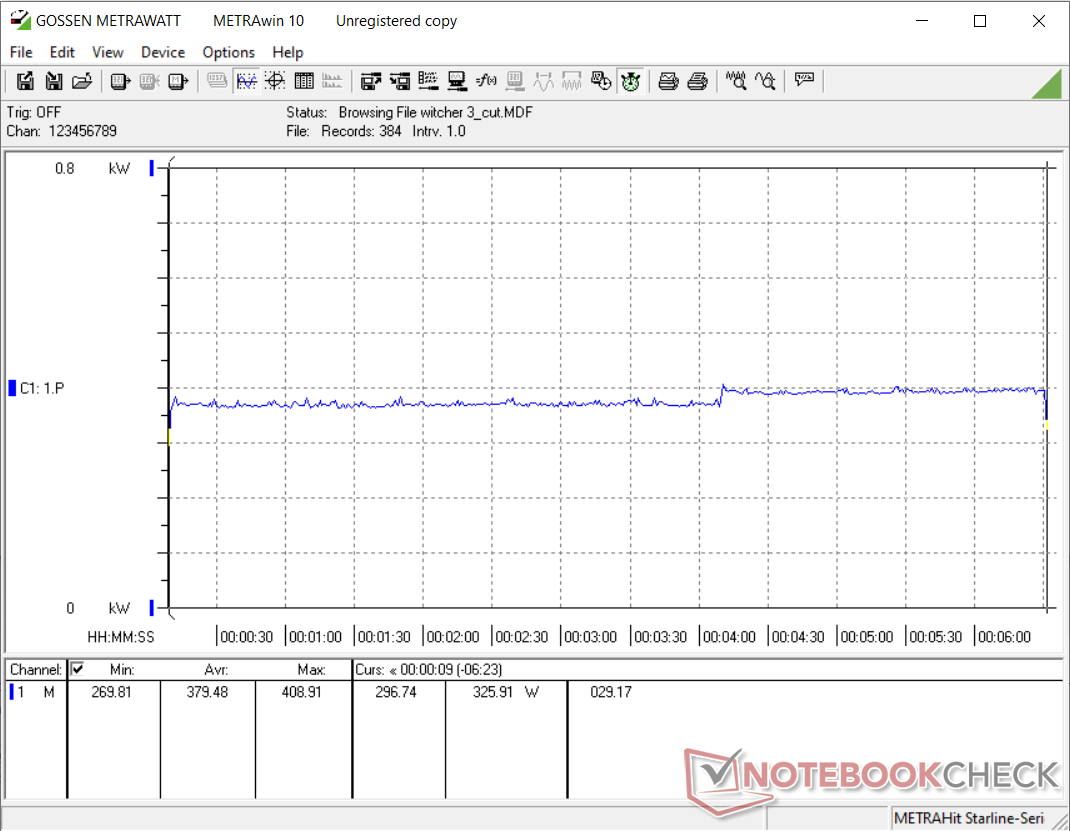
En El Witcher 3 Ultra, la RTX 3060 Ti FE se muestra bastante estable en general. Vemos que los fotogramas bajan unos 5 fps pasada la mitad de la gráfica, pero la experiencia general no se ve muy afectada. Esto indica que la refrigeración de la tarjeta está a la altura y es capaz de evitar el ahogo térmico

0102030405060708090100110Tooltip
NVIDIA GeForce RTX 3060 Ti Founders Edition NVIDIA GeForce RTX 3060 Ti, R9 5950X: Ø108.8 (103-113)
The Witcher 3
1920x1080 Ultra Graphics & Postprocessing (HBAO+)
Average NVIDIA GeForce RTX 3090
  (160 - 192.6, n=16)
179.9 fps +65%
MSI GeForce RTX 3090 Suprim X
NVIDIA GeForce RTX 3090, R9 5900X
160 (140min - 184max) fps +47%
AMD Radeon RX 6800 XT
AMD Radeon RX 6800 XT, R9 5950X
160 (138min - 179max) fps +47%
Average NVIDIA GeForce RTX 3080
  (145 - 152, n=2)
148.5 fps +36%
MSI GeForce RTX 3080 Gaming X Trio
NVIDIA GeForce RTX 3080, R9 5900X
145 (123min - 154max) fps +33%
AMD Ryzen 9 5900X
NVIDIA Titan RTX, R9 5900X
141 (127min - 154max) fps +29%
KFA2 GeForce RTX 2080 Ti EX
NVIDIA GeForce RTX 2080 Ti (Desktop), R9 3900X
135 (118min - 158max) fps +24%
Zotac Gaming GeForce RTX 3070 Twin Edge
NVIDIA GeForce RTX 3070, R9 5950X
123 (120min, 121P1 - 126max) fps +13%
Nvidia GeForce RTX 2080 Super
NVIDIA GeForce RTX 2080 Super (Desktop), R7 2700X
109 (81min - 123max) fps 0%
NVIDIA GeForce RTX 3060 Ti FE
NVIDIA GeForce RTX 3060 Ti, R9 5950X
109 (103min, 105P1 - 113max) fps
Average NVIDIA GeForce RTX 2080 Super (Desktop)
  ()
109 fps 0%
Average NVIDIA GeForce RTX 3070
  (52.8 - 132.2, n=7)
106.1 fps -3%
Average NVIDIA GeForce RTX 2070 Super (Desktop)
  (95.6 - 109.6, n=6)
100.9 fps -7%
Nvidia GeForce RTX 2070 Super
NVIDIA GeForce RTX 2070 Super (Desktop), R7 2700X
97 (83min - 109max) fps -11%
AMD Radeon RX 5700 XT
AMD Radeon RX 5700 XT (Desktop), R7 2700X
92 (79min - 99max) fps -16%
Average NVIDIA GeForce RTX 2060 Super (Desktop)
  (79 - 91.1, n=5)
84.8 fps -22%
Nvidia GeForce RTX 2060 Super
NVIDIA GeForce RTX 2060 Super (Desktop), R7 2700X
79 (67min - 89max) fps -28%
KFA 2 GeForce GTX 1660 Super
NVIDIA GeForce GTX 1660 Super (Desktop), R9 3900X
59.5 (53min - 68max) fps -45%
KFA2 GeForce GTX 1650 Super EX One Click OC
NVIDIA GeForce GTX 1650 Super (Desktop), R9 5900X
43.6 fps -60%
3840x2160 High Graphics & Postprocessing (Nvidia HairWorks Off)
Average NVIDIA GeForce RTX 3090
  (128 - 160.2, n=12)
151.5 fps +86%
MSI GeForce RTX 3090 Suprim X
NVIDIA GeForce RTX 3090, R9 5900X
128 (117min - 138max) fps +57%
Average NVIDIA GeForce RTX 3080
  (114 - 115, n=2)
114.5 fps +41%
MSI GeForce RTX 3080 Gaming X Trio
NVIDIA GeForce RTX 3080, R9 5900X
114 (106min - 122max) fps +40%
AMD Radeon RX 6800 XT
AMD Radeon RX 6800 XT, R9 5950X
110 (97min - 117max) fps +35%
AMD Ryzen 9 5900X
NVIDIA Titan RTX, R9 5900X
104 (97min - 112max) fps +28%
KFA2 GeForce RTX 2080 Ti EX
NVIDIA GeForce RTX 2080 Ti (Desktop), R9 3900X
96 (87min - 109max) fps +18%
Zotac Gaming GeForce RTX 3070 Twin Edge
NVIDIA GeForce RTX 3070, R9 5950X
89.6 (81min, 81P1 - 96max) fps +10%
Average NVIDIA GeForce RTX 3070
  (84 - 93.9, n=5)
89.3 fps +10%
NVIDIA GeForce RTX 3060 Ti FE
NVIDIA GeForce RTX 3060 Ti, R9 5950X
81.3 (74min, 74.57P1 - 88max) fps
Nvidia GeForce RTX 2080 Super
NVIDIA GeForce RTX 2080 Super (Desktop), R7 2700X
79 (71min - 87max) fps -3%
Average NVIDIA GeForce RTX 2080 Super (Desktop)
  ()
79 fps -3%
Nvidia GeForce RTX 2070 Super
NVIDIA GeForce RTX 2070 Super (Desktop), R7 2700X
68 (61min - 74max) fps -16%
Average NVIDIA GeForce RTX 2070 Super (Desktop)
  (65.5 - 71, n=5)
68 fps -16%
Average NVIDIA GeForce RTX 2060 Super (Desktop)
  (57 - 61, n=4)
58.8 fps -28%
Nvidia GeForce RTX 2060 Super
NVIDIA GeForce RTX 2060 Super (Desktop), R7 2700X
57 (51min - 62max) fps -30%
AMD Radeon RX 5700 XT
AMD Radeon RX 5700 XT (Desktop), R7 2700X
52.1 (47min - 57max) fps -36%
KFA 2 GeForce GTX 1660 Super
NVIDIA GeForce GTX 1660 Super (Desktop), R9 3900X
40 (36min - 44max) fps -51%
KFA2 GeForce GTX 1650 Super EX One Click OC
NVIDIA GeForce GTX 1650 Super (Desktop), R9 5900X
29.5 fps -64%
3840x2160 Ultra Graphics & Postprocessing (HBAO+)
Average NVIDIA GeForce RTX 3090
  (85.4 - 98.5, n=8)
93.4 fps +75%
MSI GeForce RTX 3080 Gaming X Trio
NVIDIA GeForce RTX 3080, R9 5900X
85.7 (80min - 93max) fps +60%
MSI GeForce RTX 3090 Suprim X
NVIDIA GeForce RTX 3090, R9 5900X
85.4 (79min - 92max) fps +60%
Average NVIDIA GeForce RTX 3080
  (78 - 85.7, n=2)
81.9 fps +53%
KFA2 GeForce RTX 2080 Ti EX
NVIDIA GeForce RTX 2080 Ti (Desktop), R9 3900X
65 (59min - 71max) fps +21%
Average NVIDIA GeForce RTX 3070
  (59 - 60.3, n=2)
59.7 fps +12%
Zotac Gaming GeForce RTX 3070 Twin Edge
NVIDIA GeForce RTX 3070, R9 5950X
59 (53min, 53.59P1 - 64max) fps +10%
Nvidia GeForce RTX 2080 Super
NVIDIA GeForce RTX 2080 Super (Desktop), R7 2700X
55.2 (49min - 61max) fps +3%
Average NVIDIA GeForce RTX 2080 Super (Desktop)
  (55.2 - 55.2, n=2)
55.2 fps +3%
NVIDIA GeForce RTX 3060 Ti FE
NVIDIA GeForce RTX 3060 Ti, R9 5950X
53.5 (49min, 49P1 - 57max) fps
Average NVIDIA GeForce RTX 2070 Super (Desktop)
  (46.3 - 49.3, n=4)
47.4 fps -11%
Nvidia GeForce RTX 2070 Super
NVIDIA GeForce RTX 2070 Super (Desktop), R7 2700X
46.3 (41min - 50max) fps -13%
AMD Radeon RX 5700 XT
AMD Radeon RX 5700 XT (Desktop), R7 2700X
39.7 (35min - 43max) fps -26%
Average NVIDIA GeForce RTX 2060 Super (Desktop)
  (38.4 - 42.3, n=4)
39.6 fps -26%
Nvidia GeForce RTX 2060 Super
NVIDIA GeForce RTX 2060 Super (Desktop), R7 2700X
38.4 (32min - 42max) fps -28%
KFA 2 GeForce GTX 1660 Super
NVIDIA GeForce GTX 1660 Super (Desktop), R9 3900X
27 (24min - 31max) fps -50%
Shadow of the Tomb Raider
3840x2160 Highest Preset AA:T
Average NVIDIA GeForce RTX 3090
  (89.3 - 99.7, n=12)
96.4 fps +72%
MSI GeForce RTX 3090 Suprim X
NVIDIA GeForce RTX 3090, R9 5900X
95.6 fps +71%
MSI GeForce RTX 3080 Gaming X Trio
NVIDIA GeForce RTX 3080, R9 5900X
87.9 fps +57%
Average NVIDIA GeForce RTX 3080
  (83.9 - 87.9, n=2)
85.9 fps +53%
AMD Radeon RX 6800 XT
AMD Radeon RX 6800 XT, R9 5950X
79.6 fps +42%
AMD Ryzen 9 5900X
NVIDIA Titan RTX, R9 5900X
66.3 fps +18%
Average NVIDIA GeForce RTX 3070
  (61 - 63.5, n=4)
62.3 fps +11%
Zotac Gaming GeForce RTX 3070 Twin Edge
NVIDIA GeForce RTX 3070, R9 5950X
62 fps +11%
KFA2 GeForce RTX 2080 Ti EX
NVIDIA GeForce RTX 2080 Ti (Desktop), R9 3900X
60 fps +7%
NVIDIA GeForce RTX 3060 Ti FE
NVIDIA GeForce RTX 3060 Ti, R9 5950X
56 fps
Nvidia GeForce RTX 2080 Super
NVIDIA GeForce RTX 2080 Super (Desktop), R7 2700X
49 fps -12%
Average NVIDIA GeForce RTX 2080 Super (Desktop)
  (49 - 49, n=2)
49 fps -12%
Average NVIDIA GeForce RTX 2070 Super (Desktop)
  (43 - 47.9, n=5)
45.5 fps -19%
Nvidia GeForce RTX 2070 Super
NVIDIA GeForce RTX 2070 Super (Desktop), R7 2700X
43 fps -23%
Average NVIDIA GeForce RTX 2060 Super (Desktop)
  (36 - 40.2, n=4)
38.2 fps -32%
AMD Radeon RX 5700 XT
AMD Radeon RX 5700 XT (Desktop), R7 2700X
38 fps -32%
Nvidia GeForce RTX 2060 Super
NVIDIA GeForce RTX 2060 Super (Desktop), R7 2700X
36 fps -36%
KFA 2 GeForce GTX 1660 Super
NVIDIA GeForce GTX 1660 Super (Desktop), R9 3900X
26 fps -54%
KFA2 GeForce GTX 1650 Super EX One Click OC
NVIDIA GeForce GTX 1650 Super (Desktop), R9 5900X
19 fps -66%
2560x1440 Highest Preset AA:T
Average NVIDIA GeForce RTX 3090
  (137 - 172.3, n=12)
165.6 fps +61%
MSI GeForce RTX 3090 Suprim X
NVIDIA GeForce RTX 3090, R9 5900X
162 fps +57%
MSI GeForce RTX 3080 Gaming X Trio
NVIDIA GeForce RTX 3080, R9 5900X
152 fps +48%
Average NVIDIA GeForce RTX 3080
  (147 - 152, n=2)
149.5 fps +45%
AMD Radeon RX 6800 XT
AMD Radeon RX 6800 XT, R9 5950X
148 fps +44%
AMD Ryzen 9 5900X
NVIDIA Titan RTX, R9 5900X
120 fps +17%
Zotac Gaming GeForce RTX 3070 Twin Edge
NVIDIA GeForce RTX 3070, R9 5950X
114 fps +11%
Average NVIDIA GeForce RTX 3070
  (108 - 116, n=4)
113.2 fps +10%
KFA2 GeForce RTX 2080 Ti EX
NVIDIA GeForce RTX 2080 Ti (Desktop), R9 3900X
108 fps +5%
NVIDIA GeForce RTX 3060 Ti FE
NVIDIA GeForce RTX 3060 Ti, R9 5950X
103 fps
Average NVIDIA GeForce RTX 2080 Super (Desktop)
  (91 - 92, n=2)
91.5 fps -11%
Nvidia GeForce RTX 2080 Super
NVIDIA GeForce RTX 2080 Super (Desktop), R7 2700X
91 fps -12%
Average NVIDIA GeForce RTX 2070 Super (Desktop)
  (81 - 89.6, n=5)
85.4 fps -17%
Nvidia GeForce RTX 2070 Super
NVIDIA GeForce RTX 2070 Super (Desktop), R7 2700X
81 fps -21%
AMD Radeon RX 5700 XT
AMD Radeon RX 5700 XT (Desktop), R7 2700X
76 fps -26%
Average NVIDIA GeForce RTX 2060 Super (Desktop)
  (69 - 75.7, n=4)
72.3 fps -30%
Nvidia GeForce RTX 2060 Super
NVIDIA GeForce RTX 2060 Super (Desktop), R7 2700X
69 fps -33%
KFA 2 GeForce GTX 1660 Super
NVIDIA GeForce GTX 1660 Super (Desktop), R9 3900X
53 fps -49%
KFA2 GeForce GTX 1650 Super EX One Click OC
NVIDIA GeForce GTX 1650 Super (Desktop), R9 5900X
40 fps -61%
1920x1080 Highest Preset AA:T
Average NVIDIA GeForce RTX 3090
  (145 - 240, n=14)
204 fps +41%
AMD Radeon RX 6800 XT
AMD Radeon RX 6800 XT, R9 5950X
194 fps +34%
MSI GeForce RTX 3090 Suprim X
NVIDIA GeForce RTX 3090, R9 5900X
188 fps +30%
Average NVIDIA GeForce RTX 3080
  (177 - 185, n=2)
181 fps +25%
MSI GeForce RTX 3080 Gaming X Trio
NVIDIA GeForce RTX 3080, R9 5900X
177 fps +22%
AMD Ryzen 9 5900X
NVIDIA Titan RTX, R9 5900X
166 fps +14%
Average NVIDIA GeForce RTX 3070
  (138 - 160, n=4)
151.3 fps +4%
Zotac Gaming GeForce RTX 3070 Twin Edge
NVIDIA GeForce RTX 3070, R9 5950X
150 fps +3%
NVIDIA GeForce RTX 3060 Ti FE
NVIDIA GeForce RTX 3060 Ti, R9 5950X
145 fps
KFA2 GeForce RTX 2080 Ti EX
NVIDIA GeForce RTX 2080 Ti (Desktop), R9 3900X
130 fps -10%
Average NVIDIA GeForce RTX 2070 Super (Desktop)
  (104 - 131.1, n=5)
119.7 fps -17%
Average NVIDIA GeForce RTX 2080 Super (Desktop)
  (110 - 118, n=2)
114 fps -21%
Nvidia GeForce RTX 2080 Super
NVIDIA GeForce RTX 2080 Super (Desktop), R7 2700X
110 fps -24%
AMD Radeon RX 5700 XT
AMD Radeon RX 5700 XT (Desktop), R7 2700X
110 fps -24%
Average NVIDIA GeForce RTX 2060 Super (Desktop)
  (96 - 111.4, n=4)
105.2 fps -27%
Nvidia GeForce RTX 2070 Super
NVIDIA GeForce RTX 2070 Super (Desktop), R7 2700X
104 fps -28%
Nvidia GeForce RTX 2060 Super
NVIDIA GeForce RTX 2060 Super (Desktop), R7 2700X
96 fps -34%
KFA 2 GeForce GTX 1660 Super
NVIDIA GeForce GTX 1660 Super (Desktop), R9 3900X
80 fps -45%
KFA2 GeForce GTX 1650 Super EX One Click OC
NVIDIA GeForce GTX 1650 Super (Desktop), R9 5900X
63 fps -57%
Borderlands 3
3840x2160 Badass Overall Quality (DX11)
MSI GeForce RTX 3090 Suprim X
NVIDIA GeForce RTX 3090, R9 5900X
73.4 fps +91%
Average NVIDIA GeForce RTX 3090
  (68 - 75.3, n=12)
72.8 fps +90%
MSI GeForce RTX 3080 Gaming X Trio
NVIDIA GeForce RTX 3080, R9 5900X
61.9 fps +61%
Average NVIDIA GeForce RTX 3080
  (61.5 - 61.9, n=2)
61.7 fps +61%
AMD Radeon RX 6800 XT
AMD Radeon RX 6800 XT, R9 5950X
53.6 fps +40%
AMD Ryzen 9 5900X
NVIDIA Titan RTX, R9 5900X
46.7 fps +22%
Zotac Gaming GeForce RTX 3070 Twin Edge
NVIDIA GeForce RTX 3070, R9 5950X
44.5 fps +16%
Average NVIDIA GeForce RTX 3070
  (42.7 - 46.3, n=5)
44.3 fps +15%
KFA2 GeForce RTX 2080 Ti EX
NVIDIA GeForce RTX 2080 Ti (Desktop), R9 3900X
43.6 fps +14%
NVIDIA GeForce RTX 3060 Ti FE
NVIDIA GeForce RTX 3060 Ti, R9 5950X
38.4 fps
Average NVIDIA GeForce RTX 2080 Super (Desktop)
  ()
35.9 fps -7%
Average NVIDIA GeForce RTX 2070 Super (Desktop)
  (29.5 - 32.7, n=5)
31.3 fps -18%
Average NVIDIA GeForce RTX 2060 Super (Desktop)
  (26.3 - 27.8, n=4)
27.3 fps -29%
KFA 2 GeForce GTX 1660 Super
NVIDIA GeForce GTX 1660 Super (Desktop), R9 3900X
12 fps -69%
KFA2 GeForce GTX 1650 Super EX One Click OC
NVIDIA GeForce GTX 1650 Super (Desktop), R9 5900X
7.87 fps -80%
2560x1440 Badass Overall Quality (DX11)
Average NVIDIA GeForce RTX 3090
  (105 - 131.6, n=12)
123.2 fps +75%
MSI GeForce RTX 3090 Suprim X
NVIDIA GeForce RTX 3090, R9 5900X
117 fps +67%
Average NVIDIA GeForce RTX 3080
  (95.7 - 103, n=2)
99.4 fps +42%
MSI GeForce RTX 3080 Gaming X Trio
NVIDIA GeForce RTX 3080, R9 5900X
95.7 fps +36%
AMD Radeon RX 6800 XT
AMD Radeon RX 6800 XT, R9 5950X
93.6 fps +33%
AMD Ryzen 9 5900X
NVIDIA Titan RTX, R9 5900X
84.7 fps +21%
Zotac Gaming GeForce RTX 3070 Twin Edge
NVIDIA GeForce RTX 3070, R9 5950X
79 fps +13%
KFA2 GeForce RTX 2080 Ti EX
NVIDIA GeForce RTX 2080 Ti (Desktop), R9 3900X
78 fps +11%
Average NVIDIA GeForce RTX 3070
  (75.1 - 82.9, n=5)
77.7 fps +11%
NVIDIA GeForce RTX 3060 Ti FE
NVIDIA GeForce RTX 3060 Ti, R9 5950X
70.2 fps
Average NVIDIA GeForce RTX 2080 Super (Desktop)
  ()
65.5 fps -7%
Average NVIDIA GeForce RTX 2070 Super (Desktop)
  (53.7 - 60.3, n=5)
57.3 fps -18%
Average NVIDIA GeForce RTX 2060 Super (Desktop)
  (48.8 - 51.7, n=4)
50.2 fps -28%
KFA 2 GeForce GTX 1660 Super
NVIDIA GeForce GTX 1660 Super (Desktop), R9 3900X
33 fps -53%
KFA2 GeForce GTX 1650 Super EX One Click OC
NVIDIA GeForce GTX 1650 Super (Desktop), R9 5900X
23.3 fps -67%
1920x1080 Badass Overall Quality (DX11)
Average NVIDIA GeForce RTX 3090
  (117 - 165, n=12)
149.1 fps +55%
MSI GeForce RTX 3090 Suprim X
NVIDIA GeForce RTX 3090, R9 5900X
135 fps +41%
Average NVIDIA GeForce RTX 3080
  (117 - 128, n=2)
122.5 fps +28%
AMD Radeon RX 6800 XT
AMD Radeon RX 6800 XT, R9 5950X
120 fps +25%
AMD Ryzen 9 5900X
NVIDIA Titan RTX, R9 5900X
118 fps +23%
MSI GeForce RTX 3080 Gaming X Trio
NVIDIA GeForce RTX 3080, R9 5900X
117 fps +22%
Zotac Gaming GeForce RTX 3070 Twin Edge
NVIDIA GeForce RTX 3070, R9 5950X
104 fps +8%
KFA2 GeForce RTX 2080 Ti EX
NVIDIA GeForce RTX 2080 Ti (Desktop), R9 3900X
101.3 fps +6%
Average NVIDIA GeForce RTX 3070
  (95.3 - 108.9, n=5)
100.6 fps +5%
NVIDIA GeForce RTX 3060 Ti FE
NVIDIA GeForce RTX 3060 Ti, R9 5950X
96 fps
Average NVIDIA GeForce RTX 2080 Super (Desktop)
  ()
91 fps -5%
Average NVIDIA GeForce RTX 2070 Super (Desktop)
  (74.3 - 86, n=5)
80.9 fps -16%
Average NVIDIA GeForce RTX 2060 Super (Desktop)
  (68.6 - 74.1, n=4)
71.2 fps -26%
KFA 2 GeForce GTX 1660 Super
NVIDIA GeForce GTX 1660 Super (Desktop), R9 3900X
50 fps -48%
KFA2 GeForce GTX 1650 Super EX One Click OC
NVIDIA GeForce GTX 1650 Super (Desktop), R9 5900X
39.8 fps -59%
Call of Duty Black Ops Cold War
1920x1080 Highest Settings + Ultra Ray Tracing
AMD Ryzen 9 5900X
NVIDIA Titan RTX, R9 5900X
119 fps +79%
Average NVIDIA GeForce RTX 3090
  (88.3 - 89, n=2)
88.7 fps +33%
MSI GeForce RTX 3090 Suprim X
NVIDIA GeForce RTX 3090, R9 5900X
88.3 (22.4min, 29.5P0.1, 44.8P1 - 267max) fps +33%
MSI GeForce RTX 3080 Gaming X Trio
NVIDIA GeForce RTX 3080, R9 5900X
81.9 (17.3min, 30.1P0.1, 42.6P1 - 248max) fps +23%
Average NVIDIA GeForce RTX 3080
  ()
81.9 fps +23%
Zotac Gaming GeForce RTX 3070 Twin Edge
NVIDIA GeForce RTX 3070, R9 5950X
70.1 (23.8min, 27.5P0.1, 42.6P1 - 217max) fps +5%
NVIDIA GeForce RTX 3060 Ti FE
NVIDIA GeForce RTX 3060 Ti, R9 5950X
66.5 (32.4min, 39.6P0.1, 45.3P1 - 224max) fps
Average NVIDIA GeForce RTX 3070
  (49.8 - 70.1, n=3)
62.8 fps -6%
Average NVIDIA GeForce RTX 2080 Super (Desktop)
  ()
59 fps -11%
Average NVIDIA GeForce RTX 2070 Super (Desktop)
  ()
55.6 fps -16%
Average NVIDIA GeForce RTX 2060 Super (Desktop)
  ()
44.7 fps -33%
AMD Radeon RX 6800 XT
AMD Radeon RX 6800 XT, R9 5950X
21.8 (8.8min, 9.61P0.1, 16.2P1 - 49.5max) fps -67%
3840x2160 Highest Settings
MSI GeForce RTX 3090 Suprim X
NVIDIA GeForce RTX 3090, R9 5900X
76.1 (42.1min, 58.7P0.1, 61.9P1 - 221max) fps +69%
Average NVIDIA GeForce RTX 3090
  (74.6 - 76.1, n=2)
75.4 fps +68%
MSI GeForce RTX 3080 Gaming X Trio
NVIDIA GeForce RTX 3080, R9 5900X
65.6 (13.8min, 17.5P0.1, 51.4P1 - 229max) fps +46%
Average NVIDIA GeForce RTX 3080
  ()
65.6 fps +46%
AMD Radeon RX 6800 XT
AMD Radeon RX 6800 XT, R9 5950X
64 (10.8min, 11.6P0.1, 50.8P1 - 159max) fps +43%
Average NVIDIA GeForce RTX 3070
  (43.8 - 74, n=3)
56 fps +25%
AMD Ryzen 9 5900X
NVIDIA Titan RTX, R9 5900X
52.9 fps +18%
NVIDIA GeForce RTX 3060 Ti FE
NVIDIA GeForce RTX 3060 Ti, R9 5950X
44.9 (17.1min, 19.2P0.1, 34.5P1 - 84.4max) fps
Zotac Gaming GeForce RTX 3070 Twin Edge
NVIDIA GeForce RTX 3070, R9 5950X
43.8 (16.7min, 17.4P0.1, 33.8P1 - 80.3max) fps -2%
Average NVIDIA GeForce RTX 2080 Super (Desktop)
  (38 - 44.5, n=2)
41.3 fps -8%
Average NVIDIA GeForce RTX 2070 Super (Desktop)
  ()
37.6 fps -16%
Average NVIDIA GeForce RTX 2060 Super (Desktop)
  ()
17.3 fps -61%
KFA2 GeForce GTX 1650 Super EX One Click OC
NVIDIA GeForce GTX 1650 Super (Desktop), R9 5900X
2 fps -96%
2560x1440 Highest Settings
Average NVIDIA GeForce RTX 3090
  (122 - 124.7, n=2)
123.4 fps +50%
MSI GeForce RTX 3090 Suprim X
NVIDIA GeForce RTX 3090, R9 5900X
122 (54.5min, 84.4P0.1, 93.9P1 - 258max) fps +49%
MSI GeForce RTX 3080 Gaming X Trio
NVIDIA GeForce RTX 3080, R9 5900X
104 (19.1min, 20.4P0.1, 77.7P1 - 258max) fps +27%
Average NVIDIA GeForce RTX 3080
  ()
104 fps +27%
Average NVIDIA GeForce RTX 3070
  (83 - 107, n=3)
93.2 fps +14%
Zotac Gaming GeForce RTX 3070 Twin Edge
NVIDIA GeForce RTX 3070, R9 5950X
89.5 (40.5min, 65.1P0.1, 70.3P1 - 219max) fps +9%
AMD Ryzen 9 5900X
NVIDIA Titan RTX, R9 5900X
87.6 fps +7%
NVIDIA GeForce RTX 3060 Ti FE
NVIDIA GeForce RTX 3060 Ti, R9 5950X
82.1 (38.4min, 57P0.1, 63.5P1 - 233max) fps
AMD Radeon RX 6800 XT
AMD Radeon RX 6800 XT, R9 5950X
80.4 (16.5min, 31.8P0.1, 64.3P1 - 285max) fps -2%
Average NVIDIA GeForce RTX 2070 Super (Desktop)
  ()
67.7 fps -18%
Average NVIDIA GeForce RTX 2080 Super (Desktop)
  (51 - 77.6, n=2)
64.3 fps -22%
Average NVIDIA GeForce RTX 2060 Super (Desktop)
  ()
53.2 fps -35%
KFA2 GeForce GTX 1650 Super EX One Click OC
NVIDIA GeForce GTX 1650 Super (Desktop), R9 5900X
26 fps -68%
1920x1080 Highest Settings
Average NVIDIA GeForce RTX 3090
  (161 - 161.1, n=2)
161.1 fps +46%
MSI GeForce RTX 3090 Suprim X
NVIDIA GeForce RTX 3090, R9 5900X
161 (59.8min, 96.1P0.1, 111P1 - 312max) fps +46%
AMD Ryzen 9 5900X
NVIDIA Titan RTX, R9 5900X
144 fps +31%
AMD Radeon RX 6800 XT
AMD Radeon RX 6800 XT, R9 5950X
144 (58.7min, 90.7P0.1, 105P1 - 365max) fps +31%
MSI GeForce RTX 3080 Gaming X Trio
NVIDIA GeForce RTX 3080, R9 5900X
127 (21.9min, 24.4P0.1, 83.5P1 - 285max) fps +15%
Average NVIDIA GeForce RTX 3080
  ()
127 fps +15%
Zotac Gaming GeForce RTX 3070 Twin Edge
NVIDIA GeForce RTX 3070, R9 5950X
120 (49.7min, 76.4P0.1, 85.7P1 - 245max) fps +9%
Average NVIDIA GeForce RTX 3070
  (95.7 - 122, n=3)
112.6 fps +2%
NVIDIA GeForce RTX 3060 Ti FE
NVIDIA GeForce RTX 3060 Ti, R9 5950X
110 (46.1min, 67.8P0.1, 79.3P1 - 288max) fps
Average NVIDIA GeForce RTX 2070 Super (Desktop)
  ()
92.7 fps -16%
Average NVIDIA GeForce RTX 2080 Super (Desktop)
  (59 - 106, n=2)
82.5 fps -25%
Average NVIDIA GeForce RTX 2060 Super (Desktop)
  ()
73 fps -34%
KFA2 GeForce GTX 1650 Super EX One Click OC
NVIDIA GeForce GTX 1650 Super (Desktop), R9 5900X
37 fps -66%
Watch Dogs Legion
1920x1080 Ultra Preset + Ultra Ray Tracing (DX12)
MSI GeForce RTX 3090 Suprim X
NVIDIA GeForce RTX 3090, R9 5900X
78.2 (53.58min, 63.39P1 - 115.63max) fps +62%
Average NVIDIA GeForce RTX 3090
  (75.7 - 78.2, n=2)
77 fps +59%
AMD Radeon RX 6800 XT
AMD Radeon RX 6800 XT, R9 5950X
71.4 (47.71min, 55.63P1 - 113.42max) fps +48%
MSI GeForce RTX 3080 Gaming X Trio
NVIDIA GeForce RTX 3080, R9 5900X
71.3 (24.22min, 56.02P1 - 112.08max) fps +48%
Average NVIDIA GeForce RTX 3080
  (70.9 - 71.3, n=2)
71.1 fps +47%
Average NVIDIA GeForce RTX 3070
  (51.7 - 61, n=4)
55.1 fps +14%
Zotac Gaming GeForce RTX 3070 Twin Edge
NVIDIA GeForce RTX 3070, R9 5950X
51.7 (15.03min, 25.28P1 - 71.97max) fps +7%
NVIDIA GeForce RTX 3060 Ti FE
NVIDIA GeForce RTX 3060 Ti, R9 5950X
48.3 (26.43min, 38.03P1 - 84.29max) fps
Average NVIDIA GeForce RTX 2080 Super (Desktop)
  ()
45.4 fps -6%
Average NVIDIA GeForce RTX 2070 Super (Desktop)
  ()
39.2 fps -19%
Average NVIDIA GeForce RTX 2060 Super (Desktop)
  ()
33.7 fps -30%
KFA 2 GeForce GTX 1660 Super
NVIDIA GeForce GTX 1660 Super (Desktop), R9 3900X
11.7 (7.26min, 8.31P1 - 16.29max) fps -76%
3840x2160 Ultra Preset (DX12)
MSI GeForce RTX 3090 Suprim X
NVIDIA GeForce RTX 3090, R9 5900X
60.3 (34.68min, 51.05P1 - 78.14max) fps +83%
Average NVIDIA GeForce RTX 3090
  (57.6 - 60.3, n=2)
59 fps +79%
Average NVIDIA GeForce RTX 3080
  (53.5 - 54.1, n=2)
53.8 fps +63%
MSI GeForce RTX 3080 Gaming X Trio
NVIDIA GeForce RTX 3080, R9 5900X
53.5 (33.98min, 42.85P1 - 79.6max) fps +62%
AMD Radeon RX 6800 XT
AMD Radeon RX 6800 XT, R9 5950X
49.3 (32.85min, 41.54P1 - 76.12max) fps +49%
Zotac Gaming GeForce RTX 3070 Twin Edge
NVIDIA GeForce RTX 3070, R9 5950X
38.9 (22.74min, 31.31P1 - 54.01max) fps +18%
Average NVIDIA GeForce RTX 3070
  (37 - 39.2, n=4)
38 fps +15%
Average NVIDIA GeForce RTX 2080 Super (Desktop)
  ()
34.4 fps +4%
NVIDIA GeForce RTX 3060 Ti FE
NVIDIA GeForce RTX 3060 Ti, R9 5950X
33 (17.58min, 22.09P1 - 51.23max) fps
Average NVIDIA GeForce RTX 2070 Super (Desktop)
  ()
29.2 fps -12%
Average NVIDIA GeForce RTX 2060 Super (Desktop)
  ()
24.7 fps -25%
KFA 2 GeForce GTX 1660 Super
NVIDIA GeForce GTX 1660 Super (Desktop), R9 3900X
12.3 (6.74min, 8.44P1 - 72.77max) fps -63%
KFA2 GeForce GTX 1650 Super EX One Click OC
NVIDIA GeForce GTX 1650 Super (Desktop), R9 5900X
8.09 (4.22min, 5.13P1 - 78.77max) fps -75%
2560x1440 Ultra Preset (DX12)
MSI GeForce RTX 3090 Suprim X
NVIDIA GeForce RTX 3090, R9 5900X
89.7 (59.87min, 73.02P1 - 132.92max) fps +52%
Average NVIDIA GeForce RTX 3090
  (88.3 - 89.7, n=2)
89 fps +51%
AMD Radeon RX 6800 XT
AMD Radeon RX 6800 XT, R9 5950X
84.5 (58.88min, 69.45P1 - 137.16max) fps +43%
Average NVIDIA GeForce RTX 3080
  (81.1 - 81.6, n=2)
81.4 fps +38%
MSI GeForce RTX 3080 Gaming X Trio
NVIDIA GeForce RTX 3080, R9 5900X
81.1 (46.24min, 61.45P1 - 140.66max) fps +37%
Average NVIDIA GeForce RTX 3070
  (65.3 - 67, n=4)
66.1 fps +12%
Zotac Gaming GeForce RTX 3070 Twin Edge
NVIDIA GeForce RTX 3070, R9 5950X
65.3 (41.29min, 53.17P1 - 88.97max) fps +10%
NVIDIA GeForce RTX 3060 Ti FE
NVIDIA GeForce RTX 3060 Ti, R9 5950X
59.1 (34.72min, 48.11P1 - 97.67max) fps
Average NVIDIA GeForce RTX 2080 Super (Desktop)
  ()
57.3 fps -3%
Average NVIDIA GeForce RTX 2070 Super (Desktop)
  ()
51.4 fps -13%
Average NVIDIA GeForce RTX 2060 Super (Desktop)
  ()
43.7 fps -26%
KFA 2 GeForce GTX 1660 Super
NVIDIA GeForce GTX 1660 Super (Desktop), R9 3900X
23.5 (14.14min, 15.64P1 - 42max) fps -60%
KFA2 GeForce GTX 1650 Super EX One Click OC
NVIDIA GeForce GTX 1650 Super (Desktop), R9 5900X
14.3 (6.88min, 8.73P1 - 63.4max) fps -76%
1920x1080 Ultra Preset (DX12)
AMD Radeon RX 6800 XT
AMD Radeon RX 6800 XT, R9 5950X
112 (75.12min, 87.97P1 - 181.69max) fps +46%
Average NVIDIA GeForce RTX 3090
  (103 - 107, n=2)
105 fps +37%
MSI GeForce RTX 3090 Suprim X
NVIDIA GeForce RTX 3090, R9 5900X
103 (30.26min, 75.96P1 - 155.81max) fps +34%
Average NVIDIA GeForce RTX 3080
  (99.3 - 103, n=2)
101.2 fps +32%
MSI GeForce RTX 3080 Gaming X Trio
NVIDIA GeForce RTX 3080, R9 5900X
99.3 (13.98min, 73.29P1 - 167.32max) fps +30%
Zotac Gaming GeForce RTX 3070 Twin Edge
NVIDIA GeForce RTX 3070, R9 5950X
84.9 (55.86min, 67.74P1 - 127.49max) fps +11%
Average NVIDIA GeForce RTX 3070
  (79 - 89, n=4)
84.7 fps +11%
NVIDIA GeForce RTX 3060 Ti FE
NVIDIA GeForce RTX 3060 Ti, R9 5950X
76.6 (48.47min, 62.15P1 - 115.84max) fps
Average NVIDIA GeForce RTX 2080 Super (Desktop)
  ()
75.4 fps -2%
Average NVIDIA GeForce RTX 2070 Super (Desktop)
  ()
68.3 fps -11%
Average NVIDIA GeForce RTX 2060 Super (Desktop)
  ()
59.1 fps -23%
KFA 2 GeForce GTX 1660 Super
NVIDIA GeForce GTX 1660 Super (Desktop), R9 3900X
31.4 (16.64min, 21.23P1 - 82max) fps -59%
KFA2 GeForce GTX 1650 Super EX One Click OC
NVIDIA GeForce GTX 1650 Super (Desktop), R9 5900X
20.9 (10.71min, 12.73P1 - 75.52max) fps -73%
Metro Exodus
1920x1080 Ultra Quality DXR AF:16x
MSI GeForce RTX 3090 Suprim X
NVIDIA GeForce RTX 3090, R9 5900X
116 (59.68min - 166.06max) fps +64%
Average NVIDIA GeForce RTX 3090
  (68.6 - 122.2, n=12)
111.4 fps +57%
MSI GeForce RTX 3080 Gaming X Trio
NVIDIA GeForce RTX 3080, R9 5900X
102 (54.36min - 150.53max) fps +44%
Average NVIDIA GeForce RTX 3080
  (91.5 - 102, n=2)
96.8 fps +37%
AMD Ryzen 9 5900X
NVIDIA Titan RTX, R9 5900X
87.9 (49.32min - 136.76max) fps +24%
AMD Radeon RX 6800 XT
AMD Radeon RX 6800 XT, R9 5950X
85.5 (52.71min - 120.38max) fps +21%
Zotac Gaming GeForce RTX 3070 Twin Edge
NVIDIA GeForce RTX 3070, R9 5950X
82.1 (47.4min - 134.03max) fps +16%
Average NVIDIA GeForce RTX 3070
  (80.4 - 83, n=5)
81.6 fps +15%
KFA2 GeForce RTX 2080 Ti EX
NVIDIA GeForce RTX 2080 Ti (Desktop), R9 3900X
78.6 (43min - 115max) fps +11%
NVIDIA GeForce RTX 3060 Ti FE
NVIDIA GeForce RTX 3060 Ti, R9 5950X
70.8 (38.7min - 118.79max) fps
Nvidia GeForce RTX 2080 Super
NVIDIA GeForce RTX 2080 Super (Desktop), R7 2700X
65 (37.62min - 97.62max) fps -8%
Average NVIDIA GeForce RTX 2080 Super (Desktop)
  ()
65 fps -8%
Average NVIDIA GeForce RTX 2070 Super (Desktop)
  (56.3 - 62.1, n=4)
58.5 fps -17%
Nvidia GeForce RTX 2070 Super
NVIDIA GeForce RTX 2070 Super (Desktop), R7 2700X
57.5 (34min - 85max) fps -19%
Average NVIDIA GeForce RTX 2060 Super (Desktop)
  (50 - 53.3, n=3)
51.1 fps -28%
Nvidia GeForce RTX 2060 Super
NVIDIA GeForce RTX 2060 Super (Desktop), R7 2700X
50.1 (30min - 72max) fps -29%
3840x2160 Ultra Quality AF:16x
MSI GeForce RTX 3090 Suprim X
NVIDIA GeForce RTX 3090, R9 5900X
76.3 (45.25min - 131.44max) fps +79%
Average NVIDIA GeForce RTX 3090
  (70.6 - 77.3, n=12)
75 fps +76%
MSI GeForce RTX 3080 Gaming X Trio
NVIDIA GeForce RTX 3080, R9 5900X
65.9 (38.48min - 122.03max) fps +54%
Average NVIDIA GeForce RTX 3080
  (64.1 - 65.9, n=2)
65 fps +52%
AMD Radeon RX 6800 XT
AMD Radeon RX 6800 XT, R9 5950X
56.3 (40.14min - 64.28max) fps +32%
AMD Ryzen 9 5900X
NVIDIA Titan RTX, R9 5900X
54.9 (34.88min - 89.73max) fps +29%
Average NVIDIA GeForce RTX 3070
  (48.3 - 49.7, n=5)
48.9 fps +15%
Zotac Gaming GeForce RTX 3070 Twin Edge
NVIDIA GeForce RTX 3070, R9 5950X
48.3 (29.65min - 105.2max) fps +13%
KFA2 GeForce RTX 2080 Ti EX
NVIDIA GeForce RTX 2080 Ti (Desktop), R9 3900X
47.5 (31min - 69max) fps +11%
NVIDIA GeForce RTX 3060 Ti FE
NVIDIA GeForce RTX 3060 Ti, R9 5950X
42.7 (25.98min - 91.32max) fps
Average NVIDIA GeForce RTX 2080 Super (Desktop)
  (40 - 40.4, n=2)
40.2 fps -6%
Nvidia GeForce RTX 2080 Super
NVIDIA GeForce RTX 2080 Super (Desktop), R7 2700X
40 (25.84min - 59.35max) fps -6%
Average NVIDIA GeForce RTX 2070 Super (Desktop)
  (35 - 38.1, n=5)
36.8 fps -14%
Nvidia GeForce RTX 2070 Super
NVIDIA GeForce RTX 2070 Super (Desktop), R7 2700X
35 (23min - 51max) fps -18%
Average NVIDIA GeForce RTX 2060 Super (Desktop)
  (29.7 - 32.2, n=4)
30.9 fps -28%
Nvidia GeForce RTX 2060 Super
NVIDIA GeForce RTX 2060 Super (Desktop), R7 2700X
29.7 (20min - 42max) fps -30%
AMD Radeon RX 5700 XT
AMD Radeon RX 5700 XT (Desktop), R7 2700X
29.6 (20.7min - 36.64max) fps -31%
KFA 2 GeForce GTX 1660 Super
NVIDIA GeForce GTX 1660 Super (Desktop), R9 3900X
21 (13min - 29max) fps -51%
KFA2 GeForce GTX 1650 Super EX One Click OC
NVIDIA GeForce GTX 1650 Super (Desktop), R9 5900X
16.1 (9.6min - 26.07max) fps -62%
2560x1440 Ultra Quality AF:16x
Average NVIDIA GeForce RTX 3090
  (102 - 118.2, n=12)
113.2 fps +71%
MSI GeForce RTX 3090 Suprim X
NVIDIA GeForce RTX 3090, R9 5900X
112 (58.69min - 182.42max) fps +69%
MSI GeForce RTX 3080 Gaming X Trio
NVIDIA GeForce RTX 3080, R9 5900X
97.4 (51.56min - 162.47max) fps +47%
Average NVIDIA GeForce RTX 3080
  (92.2 - 97.4, n=2)
94.8 fps +43%
AMD Radeon RX 6800 XT
AMD Radeon RX 6800 XT, R9 5950X
94.6 (55.44min - 143.68max) fps +43%
AMD Ryzen 9 5900X
NVIDIA Titan RTX, R9 5900X
84.9 (46.03min - 152.65max) fps +28%
Average NVIDIA GeForce RTX 3070
  (74.4 - 78.3, n=5)
75.8 fps +15%
Zotac Gaming GeForce RTX 3070 Twin Edge
NVIDIA GeForce RTX 3070, R9 5950X
75.4 (39.91min - 127.26max) fps +14%
KFA2 GeForce RTX 2080 Ti EX
NVIDIA GeForce RTX 2080 Ti (Desktop), R9 3900X
71.9 (40min - 108max) fps +9%
NVIDIA GeForce RTX 3060 Ti FE
NVIDIA GeForce RTX 3060 Ti, R9 5950X
66.2 (36.92min - 129.84max) fps
Average NVIDIA GeForce RTX 2080 Super (Desktop)
  (61 - 65, n=2)
63 fps -5%
Nvidia GeForce RTX 2080 Super
NVIDIA GeForce RTX 2080 Super (Desktop), R7 2700X
61 (35.51min - 95.82max) fps -8%
Average NVIDIA GeForce RTX 2070 Super (Desktop)
  (54.3 - 61.9, n=5)
57.6 fps -13%
AMD Radeon RX 5700 XT
AMD Radeon RX 5700 XT (Desktop), R7 2700X
54.5 (31.85min - 78.06max) fps -18%
Nvidia GeForce RTX 2070 Super
NVIDIA GeForce RTX 2070 Super (Desktop), R7 2700X
54.3 (32min - 83max) fps -18%
Average NVIDIA GeForce RTX 2060 Super (Desktop)
  (46 - 52.2, n=4)
49 fps -26%
Nvidia GeForce RTX 2060 Super
NVIDIA GeForce RTX 2060 Super (Desktop), R7 2700X
46.5 (28min - 69max) fps -30%
KFA 2 GeForce GTX 1660 Super
NVIDIA GeForce GTX 1660 Super (Desktop), R9 3900X
32 (19min - 47max) fps -52%
KFA2 GeForce GTX 1650 Super EX One Click OC
NVIDIA GeForce GTX 1650 Super (Desktop), R9 5900X
28.5 (16.88min - 51.46max) fps -57%
1920x1080 Ultra Quality AF:16x
Average NVIDIA GeForce RTX 3090
  (108 - 145, n=12)
135.3 fps +59%
MSI GeForce RTX 3090 Suprim X
NVIDIA GeForce RTX 3090, R9 5900X
132 (72.24min - 199.88max) fps +55%
MSI GeForce RTX 3080 Gaming X Trio
NVIDIA GeForce RTX 3080, R9 5900X
116 (56.76min - 185.19max) fps +37%
AMD Radeon RX 6800 XT
AMD Radeon RX 6800 XT, R9 5950X
115 (64.52min - 181.92max) fps +35%
Average NVIDIA GeForce RTX 3080
  (111 - 116, n=2)
113.5 fps +34%
AMD Ryzen 9 5900X
NVIDIA Titan RTX, R9 5900X
106 (52.66min - 176.55max) fps +25%
Average NVIDIA GeForce RTX 3070
  (91.3 - 97.7, n=5)
93.9 fps +11%
Zotac Gaming GeForce RTX 3070 Twin Edge
NVIDIA GeForce RTX 3070, R9 5950X
93.6 (45.01min - 161.08max) fps +10%
KFA2 GeForce RTX 2080 Ti EX
NVIDIA GeForce RTX 2080 Ti (Desktop), R9 3900X
89.7 (46min - 140max) fps +6%
NVIDIA GeForce RTX 3060 Ti FE
NVIDIA GeForce RTX 3060 Ti, R9 5950X
84.9 (43.89min - 144.89max) fps
Average NVIDIA GeForce RTX 2080 Super (Desktop)
  (76 - 82, n=2)
79 fps -7%
Nvidia GeForce RTX 2080 Super
NVIDIA GeForce RTX 2080 Super (Desktop), R7 2700X
76 (38.54min - 122.4max) fps -10%
Average NVIDIA GeForce RTX 2070 Super (Desktop)
  (67.8 - 79.1, n=5)
72.3 fps -15%
Nvidia GeForce RTX 2070 Super
NVIDIA GeForce RTX 2070 Super (Desktop), R7 2700X
67.8 (36min - 110max) fps -20%
Average NVIDIA GeForce RTX 2060 Super (Desktop)
  (58 - 67.4, n=4)
62.3 fps -27%
AMD Radeon RX 5700 XT
AMD Radeon RX 5700 XT (Desktop), R7 2700X
61 (36.09min - 86.1max) fps -28%
Nvidia GeForce RTX 2060 Super
NVIDIA GeForce RTX 2060 Super (Desktop), R7 2700X
58.9 (32min - 92max) fps -31%
KFA 2 GeForce GTX 1660 Super
NVIDIA GeForce GTX 1660 Super (Desktop), R9 3900X
41 (23min - 61max) fps -52%
KFA2 GeForce GTX 1650 Super EX One Click OC
NVIDIA GeForce GTX 1650 Super (Desktop), R9 5900X
36.6 (20.42min - 76.72max) fps -57%
Cyberpunk 2077 1.0
1920x1080 Ray Tracing Ultra Preset (DLSS off)
Average NVIDIA GeForce RTX 3090
  (59.6 - 65.4, n=2)
62.5 fps +73%
MSI GeForce RTX 3080 Gaming X Trio
NVIDIA GeForce RTX 3080, R9 5900X
56.6 (20.9min, 44.1P0.1, 48.3P1 - 98.2max) fps +56%
Average NVIDIA GeForce RTX 3080
  ()
56.6 fps +56%
Average NVIDIA GeForce RTX 3070
  (41.9 - 42.3, n=2)
42.1 fps +16%
Zotac Gaming GeForce RTX 3070 Twin Edge
NVIDIA GeForce RTX 3070, R9 5950X
41.9 (20.3min, 32.1P0.1, 35.3P1 - 74max) fps +16%
AMD Ryzen 9 5900X
NVIDIA Titan RTX, R9 5900X
40.4 fps +12%
NVIDIA GeForce RTX 3060 Ti FE
NVIDIA GeForce RTX 3060 Ti, R9 5950X
36.2 (20.3min, 29.8P0.1, 31.6P1 - 68.1max) fps
Average NVIDIA GeForce RTX 2080 Super (Desktop)
  ()
33 fps -9%
Average NVIDIA GeForce RTX 2070 Super (Desktop)
  ()
28.9 fps -20%
Average NVIDIA GeForce RTX 2060 Super (Desktop)
  ()
21.3 fps -41%
3840x2160 Ultra Preset
Average NVIDIA GeForce RTX 3090
  (41.5 - 45.3, n=2)
43.4 fps +80%
MSI GeForce RTX 3080 Gaming X Trio
NVIDIA GeForce RTX 3080, R9 5900X
38.9 (20.9min, 31.3P0.1, 34.3P1 - 86.6max) fps +61%
Average NVIDIA GeForce RTX 3080
  ()
38.9 fps +61%
AMD Ryzen 9 5900X
NVIDIA Titan RTX, R9 5900X
30.9 fps +28%
Average NVIDIA GeForce RTX 3070
  (26.6 - 27.9, n=2)
27.3 fps +13%
Zotac Gaming GeForce RTX 3070 Twin Edge
NVIDIA GeForce RTX 3070, R9 5950X
26.6 (19min, 20.8P0.1, 23.4P1 - 46.6max) fps +10%
NVIDIA GeForce RTX 3060 Ti FE
NVIDIA GeForce RTX 3060 Ti, R9 5950X
24.1 (16.8min, 19.8P0.1, 21.8P1 - 27.1max) fps
Average NVIDIA GeForce RTX 2080 Super (Desktop)
  ()
24.1 fps 0%
Average NVIDIA GeForce RTX 2070 Super (Desktop)
  ()
21.5 fps -11%
Average NVIDIA GeForce RTX 2060 Super (Desktop)
  (17.3 - 17.5, n=2)
17.4 fps -28%
KFA2 GeForce GTX 1650 Super EX One Click OC
NVIDIA GeForce GTX 1650 Super (Desktop), R9 5900X
7 fps -71%
2560x1440 Ultra Preset
Average NVIDIA GeForce RTX 3090
  (78.1 - 85.3, n=2)
81.7 fps +70%
MSI GeForce RTX 3080 Gaming X Trio
NVIDIA GeForce RTX 3080, R9 5900X
72.5 (22.2min, 46.6P0.1, 57.1P1 - 159max) fps +51%
Average NVIDIA GeForce RTX 3080
  ()
72.5 fps +51%
AMD Ryzen 9 5900X
NVIDIA Titan RTX, R9 5900X
58.4 fps +22%
Average NVIDIA GeForce RTX 3070
  (53.7 - 54.8, n=2)
54.3 fps +13%
Zotac Gaming GeForce RTX 3070 Twin Edge
NVIDIA GeForce RTX 3070, R9 5950X
53.7 (20min, 39.9P0.1, 45.2P1 - 102max) fps +12%
Average NVIDIA GeForce RTX 2080 Super (Desktop)
  ()
49.1 fps +2%
NVIDIA GeForce RTX 3060 Ti FE
NVIDIA GeForce RTX 3060 Ti, R9 5950X
48 (21.3min, 34.3P0.1, 41.9P1 - 94.6max) fps
Average NVIDIA GeForce RTX 2070 Super (Desktop)
  ()
43.7 fps -9%
Average NVIDIA GeForce RTX 2060 Super (Desktop)
  (35.3 - 35.7, n=2)
35.5 fps -26%
KFA2 GeForce GTX 1650 Super EX One Click OC
NVIDIA GeForce GTX 1650 Super (Desktop), R9 5900X
18 fps -62%
1920x1080 Ultra Preset
Average NVIDIA GeForce RTX 3090
  (108 - 109.7, n=2)
108.9 fps +48%
MSI GeForce RTX 3080 Gaming X Trio
NVIDIA GeForce RTX 3080, R9 5900X
103 (23.3min, 60.3P0.1, 75.7P1 - 176max) fps +40%
Average NVIDIA GeForce RTX 3080
  ()
103 fps +40%
AMD Ryzen 9 5900X
NVIDIA Titan RTX, R9 5900X
82.3 fps +12%
Average NVIDIA GeForce RTX 3070
  (80.6 - 81, n=2)
80.8 fps +10%
Zotac Gaming GeForce RTX 3070 Twin Edge
NVIDIA GeForce RTX 3070, R9 5950X
80.6 (19.6min, 58.2P0.1, 65.3P1 - 111max) fps +10%
NVIDIA GeForce RTX 3060 Ti FE
NVIDIA GeForce RTX 3060 Ti, R9 5950X
73.6 (21.2min, 53.8P0.1, 61.6P1 - 102max) fps
Average NVIDIA GeForce RTX 2080 Super (Desktop)
  ()
72.1 fps -2%
Average NVIDIA GeForce RTX 2070 Super (Desktop)
  ()
65.4 fps -11%
Average NVIDIA GeForce RTX 2060 Super (Desktop)
  (52.1 - 54.2, n=2)
53.2 fps -28%
KFA2 GeForce GTX 1650 Super EX One Click OC
NVIDIA GeForce GTX 1650 Super (Desktop), R9 5900X
30 fps -59%
bajo medio alto ultraQHD4K
The Witcher 3 (2015) 479 342 218 109 81.3
Shadow of the Tomb Raider (2018) 185 157 153 145 103 56
Forza Horizon 4 (2018) 246 200 196 173 150 103
Assassin´s Creed Odyssey (2018) 142 121 104 75 65 45
Battlefield V (2018) 181 145 124 114 97.9 64.9
Far Cry New Dawn (2019) 123 111 108 99 94 65
Metro Exodus (2019) 193 139 105 84.9 66.2 42.7
The Division 2 (2019) 225 172 142 109 77.3 43.7
Anno 1800 (2019) 134 135 94.1 54.2 40.6 34.4
Total War: Three Kingdoms (2019) 367.4 195.6 127.3 92.8 59 28.8
Control (2019) 240 147 110 71.9 36.1
Borderlands 3 (2019) 172 149 118 96 70.2 38.4
Red Dead Redemption 2 (2019) 170 154 108 69.9 57.3 37.5
Doom Eternal (2020) 508 320 283 274 219 122
Gears Tactics (2020) 332.3 208.8 162.4 128.9 91.9 49.4
F1 2020 (2020) 369 252 174 135 80
Horizon Zero Dawn (2020) 181 139 122 109 92 53
Mafia Definitive Edition (2020) 159 130 124 90.1 49.7
FIFA 21 (2020) 242 247 230
Watch Dogs Legion (2020) 124 122 109 76.6 59.1 33
Assassin´s Creed Valhalla (2020) 126 95 81 74 60 40
Call of Duty Black Ops Cold War (2020) 243 133 123 110 82.1 44.9
Immortals Fenyx Rising (2020) 166 119 110 101 84 57
Cyberpunk 2077 1.0 (2020) 122 101 85.2 73.6 48 24.1

Emisiones

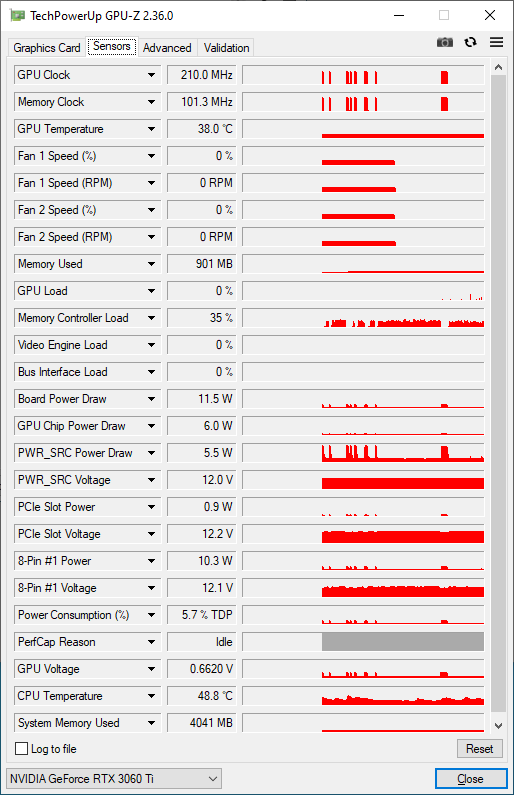
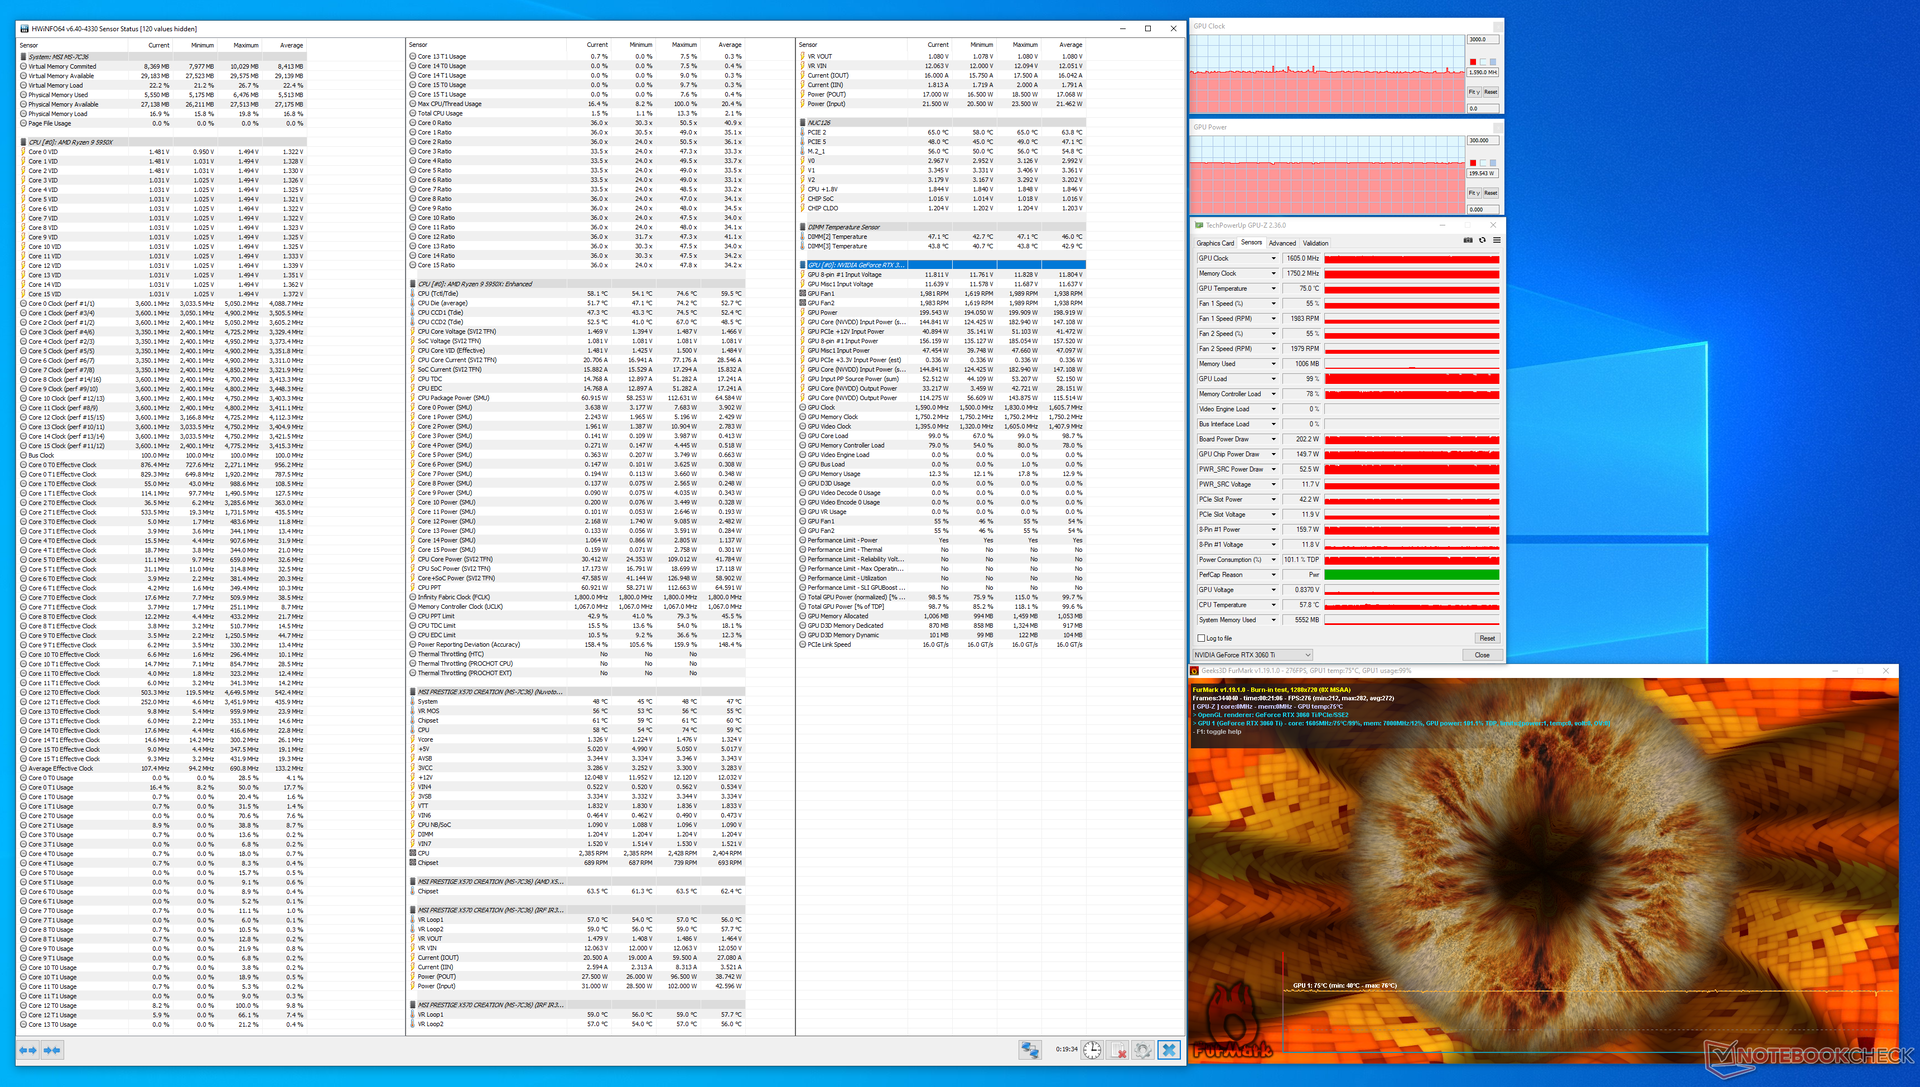
Gracias a la mejora del diseño del refrigerador de NVIDIA, la RTX 3060 Ti FE se comporta muy bien bajo estrés. Durante la prueba de estrés de FurMark, observamos que el núcleo de la GPU mantenía una temperatura constante de 75 °C y el consumo de energía de la placa estaba en el TGP nominal de 200 W.

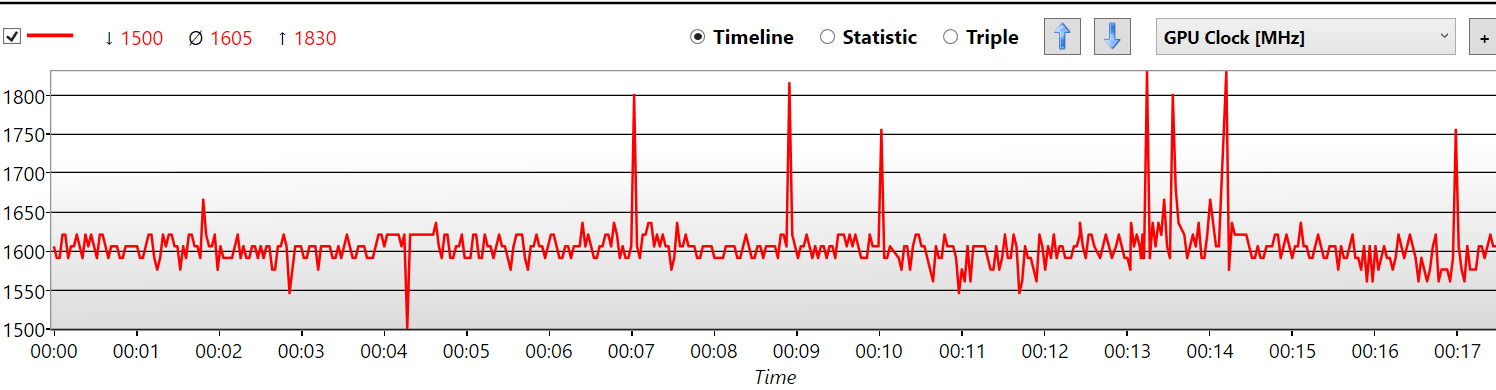
Durante la mayor parte de la prueba de estrés, la RTX 3060 Ti FE funciona cerca de su reloj boost nominal de 1.665 MHz, aunque observamos picos ocasionales de hasta 1.830 MHz

Utilizamos FurMark stress para determinar los niveles de temperatura y ruido. El consumo total del sistema se determinó mientras se estresaba con FurMark y The Witcher 3 a 1080p Ultra preestablecido

Estrés de FurMark
Estrés de FurMark
Relojes de refuerzo de la GPU durante el estrés de FurMark

Temperatura

Mapa de calor de la NVIDIA RTX 3060 Ti FE

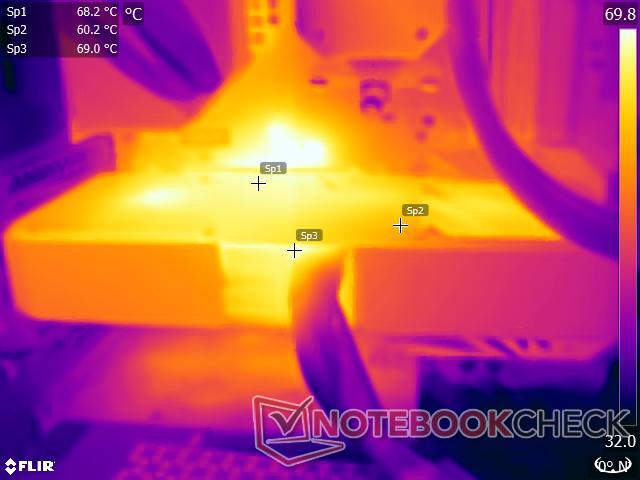
Aunque el nuevo sistema de refrigeración de NVIDIA ofrece un rendimiento adecuado para evitar que la tarjeta se ralentice, la propia tarjeta tiende a calentarse considerablemente bajo carga. Durante la prueba de estrés de FurMark, observamos que las temperaturas superficiales cerca de la GPU y de la fuente de alimentación se acercaban a los 70 °C

Esto es de esperar, ya que el propio núcleo de la GPU puede alcanzar los 75 °C bajo carga y la construcción metálica sólo sirve para transmitir gran parte de este calor a la superficie

La zona cercana a la salida del ventilador trasero también está bastante caliente a 60 °C, como se puede ver en el mapa de calor. Dicho esto, la GPU está en reposo entre los 38 °C y los 42 °C durante los cuales los ventiladores se detienen por completo

Consumo de energía

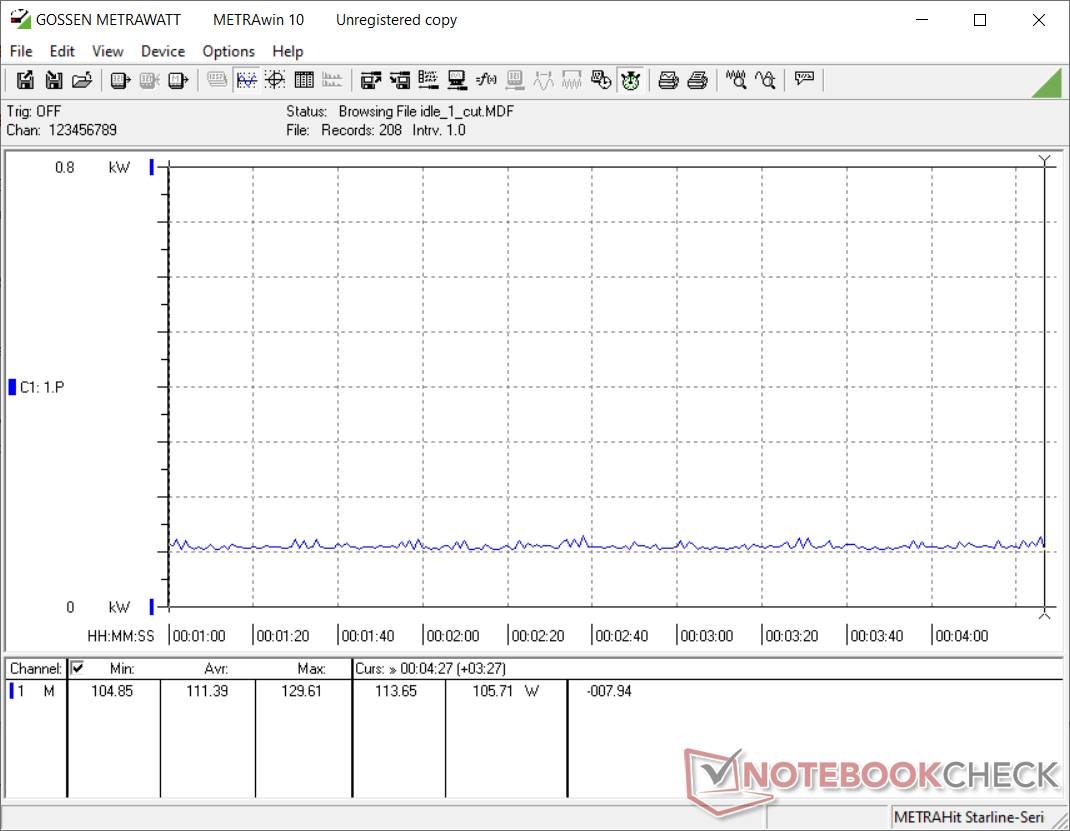
Nuestro banco de pruebas consume unos 111 W en reposo con toda la iluminación RGB apagada y un total de cinco ventiladores (tres Corsair SP de 120 mm para la caja y dos Corsair ML de 120 mm para el radiador) y la bomba Elite Capellix AIO funcionando en un perfil equilibrado.

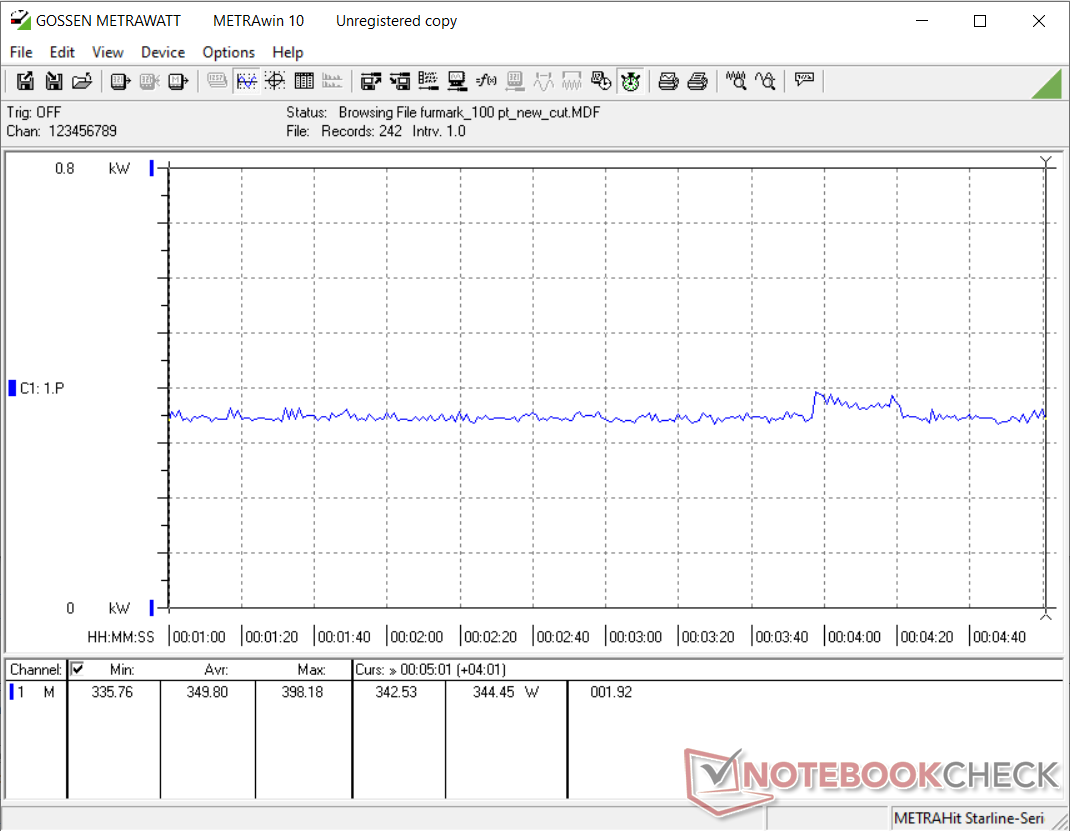
Observamos un consumo medio total del sistema de 350 W y 379 W durante el estrés de FurMark y The Witcher 3 Ultra, respectivamente

Como se puede ver en los gráficos de consumo de energía que aparecen a continuación, se observa un ligero aumento en el consumo de energía cerca de la marca de 4 minutos. Esto podría deberse al aumento momentáneo del reloj boost que hemos descrito antes

En general, la RTX 3060 Ti FE es más o menos económica en comparación con la media de la RTX 2080 Super en términos de consumo energético

Consumo de energía del sistema - En reposo
Consumo de energía del sistema - FurMark stress
Consumo de energía del sistema - El preajuste Witcher 3 1080p Ultra
Power Consumption
1280x720 FurMark 1.19 GPU Stress Test (external Monitor)
MSI GeForce RTX 3090 Suprim X
NVIDIA GeForce RTX 3090, R9 5900X (Idle: 105.9 W)
551 (521min - 582max) Watt * -57%
Average NVIDIA GeForce RTX 3080
  (Idle: 492 - 505, n=2 W)
499 Watt * -43%
MSI GeForce RTX 3080 Gaming X Trio
NVIDIA GeForce RTX 3080, R9 5900X (Idle: 103 W)
492 (485min - 514max) Watt * -41%
Average NVIDIA GeForce RTX 3090
  (Idle: 281 - 551, n=8 W)
469 Watt * -34%
AMD Radeon RX 6800 XT
AMD Radeon RX 6800 XT, R9 5950X (Idle: 99.5 W)
447.9 (413min - 484max) Watt * -28%
KFA2 GeForce RTX 2080 Ti EX
NVIDIA GeForce RTX 2080 Ti (Desktop), R9 3900X (Idle: 100.5 W)
400.8 (354min - 432max) Watt * -15%
Zotac Gaming GeForce RTX 3070 Twin Edge
NVIDIA GeForce RTX 3070, R9 5950X (Idle: 114.96 W)
393 (384min, 385P1 - 406max) Watt * -12%
Zotac Gaming GeForce RTX 3070 Twin Edge
NVIDIA GeForce RTX 3070, R9 5950X (Idle: 114.96 W)
375 (365min, 366P1 - 421max) Watt * -7%
Nvidia GeForce RTX 2080 Super
NVIDIA GeForce RTX 2080 Super (Desktop), R7 2700X (Idle: 78.87 W)
376.8 (331min - 409max) Watt * -8%
Average NVIDIA GeForce RTX 2080 Super (Desktop)
  (Idle: 328 - 414, n=4 W)
362 Watt * -3%
NVIDIA GeForce RTX 3060 Ti FE
NVIDIA GeForce RTX 3060 Ti, R9 5950X (Idle: 111.39 W)
350 (336min, 336P1 - 398max) Watt *
Average NVIDIA GeForce RTX 3070
  (Idle: 281 - 393, n=6 W)
348 Watt * +1%
Average NVIDIA GeForce RTX 2070 Super (Desktop)
  (Idle: 280 - 358, n=6 W)
329 Watt * +6%
AMD Radeon RX 5700 XT
AMD Radeon RX 5700 XT (Desktop), R7 2700X (239 fps, Idle: 69.8 W)
326.6 (313min - 351max) Watt * +7%
Nvidia GeForce RTX 2070 Super
NVIDIA GeForce RTX 2070 Super (Desktop), R7 2700X (283 fps, Idle: 80.5 W)
326 (315min - 348max) Watt * +7%
Average NVIDIA GeForce RTX 2060 Super (Desktop)
  (Idle: 235 - 315, n=5 W)
290 Watt * +17%
Nvidia GeForce RTX 2060 Super
NVIDIA GeForce RTX 2060 Super (Desktop), R7 2700X (237 fps, Idle: 77.12 W)
281.4 (275min - 321max) Watt * +20%
KFA 2 GeForce GTX 1660 Super
NVIDIA GeForce GTX 1660 Super (Desktop), R9 3900X (Idle: 84.76 W)
247.6 (241min - 322max) Watt * +29%
KFA2 GeForce GTX 1650 Super EX One Click OC
NVIDIA GeForce GTX 1650 Super (Desktop), R9 5900X (Idle: 86.5 W)
228.7 (223min - 271max) Watt * +35%
1920x1080 The Witcher 3 ultra (external Monitor)
MSI GeForce RTX 3090 Suprim X
NVIDIA GeForce RTX 3090, R9 5900X (Idle: 105.9 W)
597 (577min - 618max) Watt * -58%
Average NVIDIA GeForce RTX 3090
  (Idle: 464 - 597, n=17 W)
524 Watt * -38%
AMD Radeon RX 6800 XT
AMD Radeon RX 6800 XT, R9 5950X (Idle: 99.5 W)
505 (389min - 543max) Watt * -33%
Average NVIDIA GeForce RTX 3080
  (Idle: 498 - 505, n=2 W)
502 Watt * -32%
MSI GeForce RTX 3080 Gaming X Trio
NVIDIA GeForce RTX 3080, R9 5900X (Idle: 103 W)
498.3 (487min - 523max) Watt * -31%
AMD Ryzen 9 5900X
NVIDIA Titan RTX, R9 5900X (Idle: 78.1 W)
439.6 (419min - 497max) Watt * -16%
KFA2 GeForce RTX 2080 Ti EX
NVIDIA GeForce RTX 2080 Ti (Desktop), R9 3900X (Idle: 100.5 W)
438.8 (431min - 463max) Watt * -16%
Zotac Gaming GeForce RTX 3070 Twin Edge
NVIDIA GeForce RTX 3070, R9 5950X (Idle: 114.96 W)
406 (397min, 399P1 - 421max) Watt * -7%
Average NVIDIA GeForce RTX 3070
  (Idle: 317 - 550, n=5 W)
401 Watt * -6%
Nvidia GeForce RTX 2080 Super
NVIDIA GeForce RTX 2080 Super (Desktop), R7 2700X (Idle: 78.87 W)
382.8 (360min - 410max) Watt * -1%
NVIDIA GeForce RTX 3060 Ti FE
NVIDIA GeForce RTX 3060 Ti, R9 5950X (Idle: 111.39 W)
379 (270min, 364P1 - 409max) Watt *
Average NVIDIA GeForce RTX 2080 Super (Desktop)
  (Idle: 336 - 416, n=5 W)
363 Watt * +4%
AMD Radeon RX 5700 XT
AMD Radeon RX 5700 XT (Desktop), R7 2700X (Idle: 69.8 W)
348.7 (341min - 359max) Watt * +8%
Nvidia GeForce RTX 2070 Super
NVIDIA GeForce RTX 2070 Super (Desktop), R7 2700X (96.8 fps, Idle: 80.5 W)
344.7 (335min - 370max) Watt * +9%
Average NVIDIA GeForce RTX 2070 Super (Desktop)
  (Idle: 296 - 377, n=6 W)
342 Watt * +10%
Average NVIDIA GeForce RTX 2060 Super (Desktop)
  (Idle: 246 - 331, n=5 W)
304 Watt * +20%
Nvidia GeForce RTX 2060 Super
NVIDIA GeForce RTX 2060 Super (Desktop), R7 2700X (82.7 fps, Idle: 77.12 W)
298.2 (293min - 322max) Watt * +21%
KFA 2 GeForce GTX 1660 Super
NVIDIA GeForce GTX 1660 Super (Desktop), R9 3900X (Idle: 84.76 W)
260.4 (255min - 277max) Watt * +31%
KFA2 GeForce GTX 1650 Super EX One Click OC
NVIDIA GeForce GTX 1650 Super (Desktop), R9 5900X (Idle: 86.5 W)
240.7 (237min - 247max) Watt * +36%

* ... más pequeño es mejor
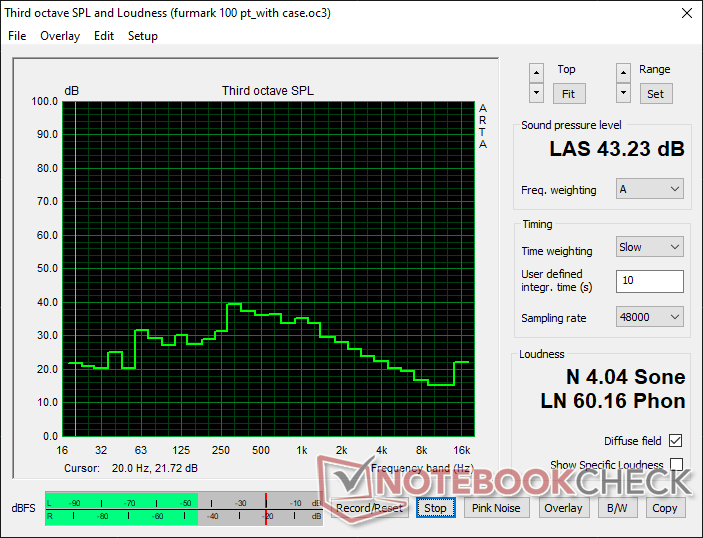
Niveles de ruido

Una de las ventajas del nuevo mecanismo de refrigeración de NVIDIA es que los niveles de ruido de los ventiladores se mantienen bien controlados

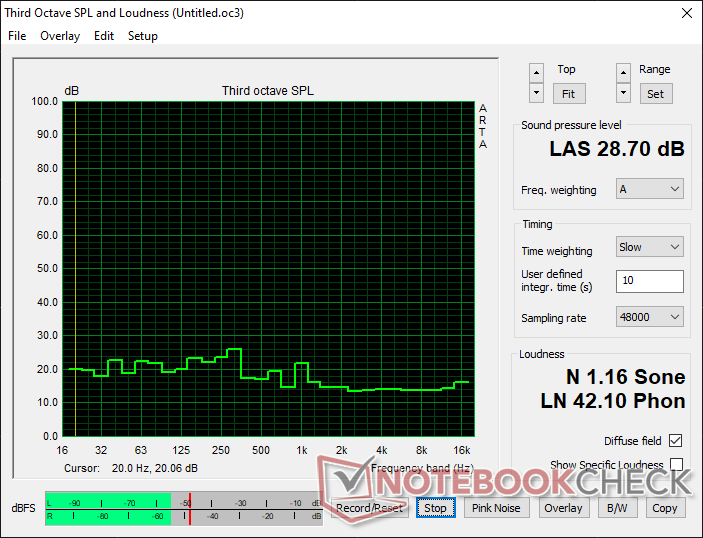
Dado que NVIDIA ha implementado un modo de parada completa del ventilador con las tarjetas Ampere FE, el nivel de presión sonora (SPL) en reposo es más o menos el mismo que el valor ambiental de 28,70 db(A) a una distancia de 20 cm de la caja cerrada.

El SPL aumentó a 43,23 db(A) durante las pruebas de estrés de FurMark, lo que es muy tolerable sobre todo cuando la carcasa está cerrada. Es posible ajustar más la curva del ventilador usando utilidades de terceros como MSI Afterburner

Niveles de ruido - En reposo con los ventiladores de la caja apagados
Niveles de ruido - FurMark stress con los ventiladores de la caja apagados

Pro

+ Robusta construcción metálica
+ Aspecto de primera calidad
+ Placa trasera de metal
+ Rendimiento a la par o ligeramente superior a la RTX 2080 Super
+ Soporte de trazado de rayos y DLSS 2.0 en juegos compatibles
+ Rendimiento decente en programas 3D profesionales
+ Mínimas caídas de fotogramas en estrés prolongado
+ Parada completa del ventilador en reposo
+ Niveles de ruido decentes bajo estrés

Contra

- El conector de 12 pines parece redundante
- Espacio de overclocking limitado
- Sólo 8 GB de VRAM
- Mayor temperatura superficial bajo carga
- El consumo de energía es sólo ligeramente mejor que el de la RTX 2080 Super
- Existencias muy limitadas

Veredicto

NVIDIA GeForce RTX 3060 Ti Founders Edition. Unidad de revisión por cortesía de NVIDIA India.

La NVIDIA GeForce RTX 3060 Ti Founders Edition hace muchas cosas bien. La tarjeta tiene un aspecto y un tacto de primera calidad, está bien construida y ocupa un espacio relativamente compacto de 2 ranuras. El único inconveniente es el conector de alimentación de 12 pines situado en el centro, que no añade ninguna funcionalidad, sino que hace que la gestión de los cables sea más complicada

El nuevo mecanismo de refrigeración de NVIDIA ofrece una clara ventaja y, con el sistema completo de parada de ventiladores, la Founders Edition puede ser potencialmente una mejor ganga en comparación con las variantes de placa base (AiB). Observamos una reducción del consumo de energía (aunque sólo marginal) en comparación con la RTX 2080 Super, junto con niveles de ruido manejables bajo carga, lo cual es un avance bienvenido

La NVIDIA GeForce RTX 3060 Ti Founders Edition ofrece el rendimiento de la RTX 2080 Super por 399,99 dólares (₹35.900) y con un consumo energético 50 W menor. Tiene el potencial de ser una de las GPU más populares de esta generación, pero las continuas limitaciones de suministro siguen mermando las perspectivas de comprar una al precio de venta al público.

La RTX 3060 Ti FE debería ser tu tarjeta preferida si juegas principalmente a resoluciones 1080p Ultra y QHD Ultra. Es posible jugar a 4K sin problemas con algunos ajustes visuales. Las mejoras en el rendimiento del trazado de rayos (RT) respecto a la RTX 2080 Super no son muy significativas. Dicho esto, DLSS 2.0 debería ser capaz de ofrecer una inyección de fuerza en los títulos compatibles para conseguir fotogramas jugables con RT activado

La tarjeta también es capaz de ofrecer un rendimiento de cálculo y modelado 3D decente, pero no es realmente adecuada para flujos de trabajo profesionales de CAD/CAM, medicina, automoción o energía

NVIDIA ha conseguido ofrecer el rendimiento de la RTX 2080 Super y un poco más por 300 dólares menos y con un TGP 50 W inferior. Los que vengan de una GTX 1070 encontrarán que la RTX 3060 Ti FE ofrece la mejor ganga a precios MSRP. Sin embargo, los compradores que puedan ampliar un poco su presupuesto también pueden echar un vistazo a la RTX 3070 FE si puede conseguirse por 499 dólares MSRP.

Precio y disponibilidad

La disponibilidad de la NVIDIA GeForce RTX 3060 Ti Founders Edition, incluida la de las tarjetas asociadas, es incierta en el momento de escribir este análisis. Actualmente, sólo Best Buy tiene esta tarjeta a un precio de 399,99 dólares. Como es lógico, está completamente agotada en el momento de la publicación. Recomendamos estar atentos al enlace indicado, ya que se espera que las existencias se repongan periódicamente

Pricecompare

Please share our article, every link counts!
> Análisis y pruebas de ordenadores portátiles y móviles teléfonos > Análisis > Análisis de NVIDIA GeForce RTX 3060 Ti Founders Edition: El buque insignia de los juegos Ultra 1440p y 4K austeros por 400 dólares
Vaidyanathan Subramaniam, 2021-02- 6 (Update: 2021-02- 6)