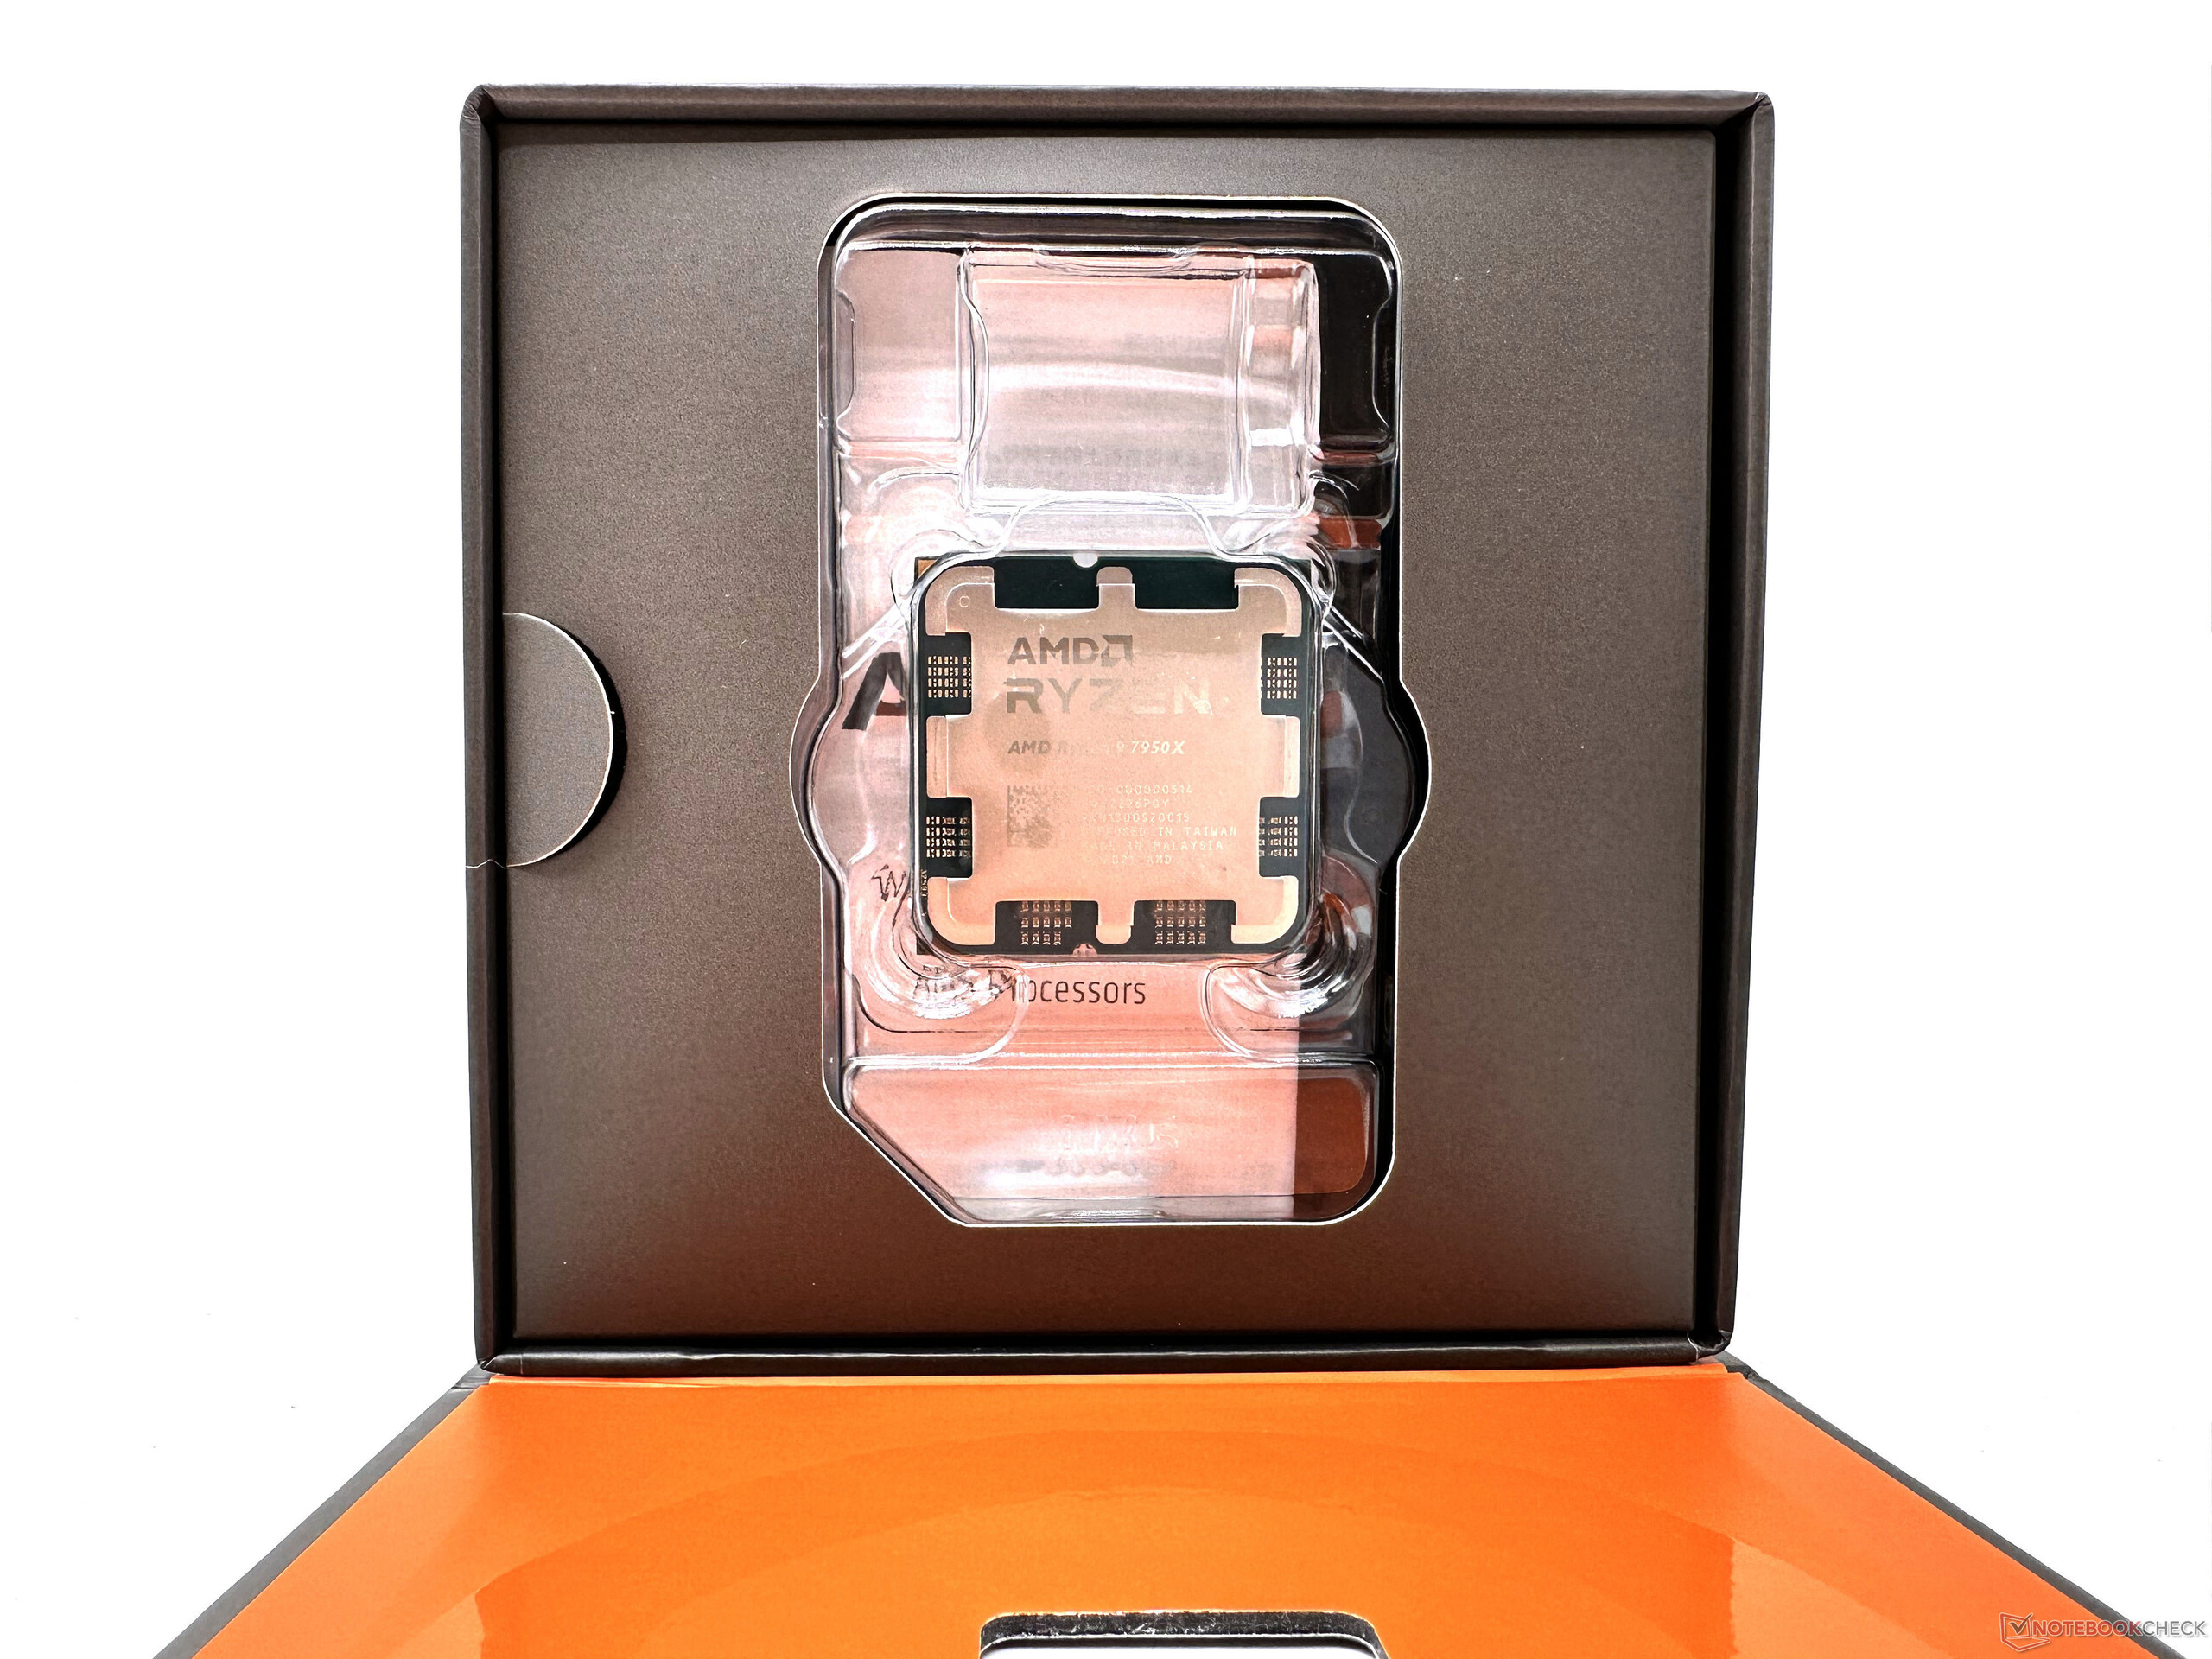
Análisis de AMD Ryzen 9 7950X y AMD Ryzen 7 7700X: Rendimiento superlativo y aumento de la eficiencia que hacen que Raptor Lake sea una carrera por el dinero
Después de haber mantenido la plataforma AM4 durante más de media década, Zen 4 marca el primer cambio generacional de AMD hacia una nueva era de la informática para PC. La línea Raphael Zen 4, que cuenta con cuatro SKUs hasta el momento, trae consigo soporte nativo para las tecnologías DDR5 y PCIe Gen 5. Además, los procesadores Zen 4 incorporan soporte para instrucciones AVX-512, una iGPU RDNA 2 integrada y la promesa de mayores ganancias de IPC y eficiencia energética.
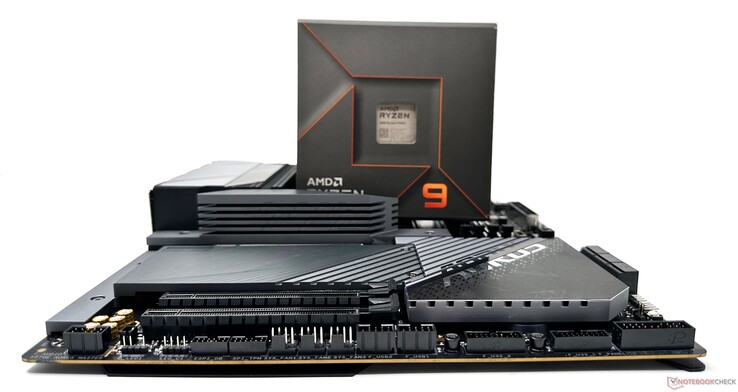
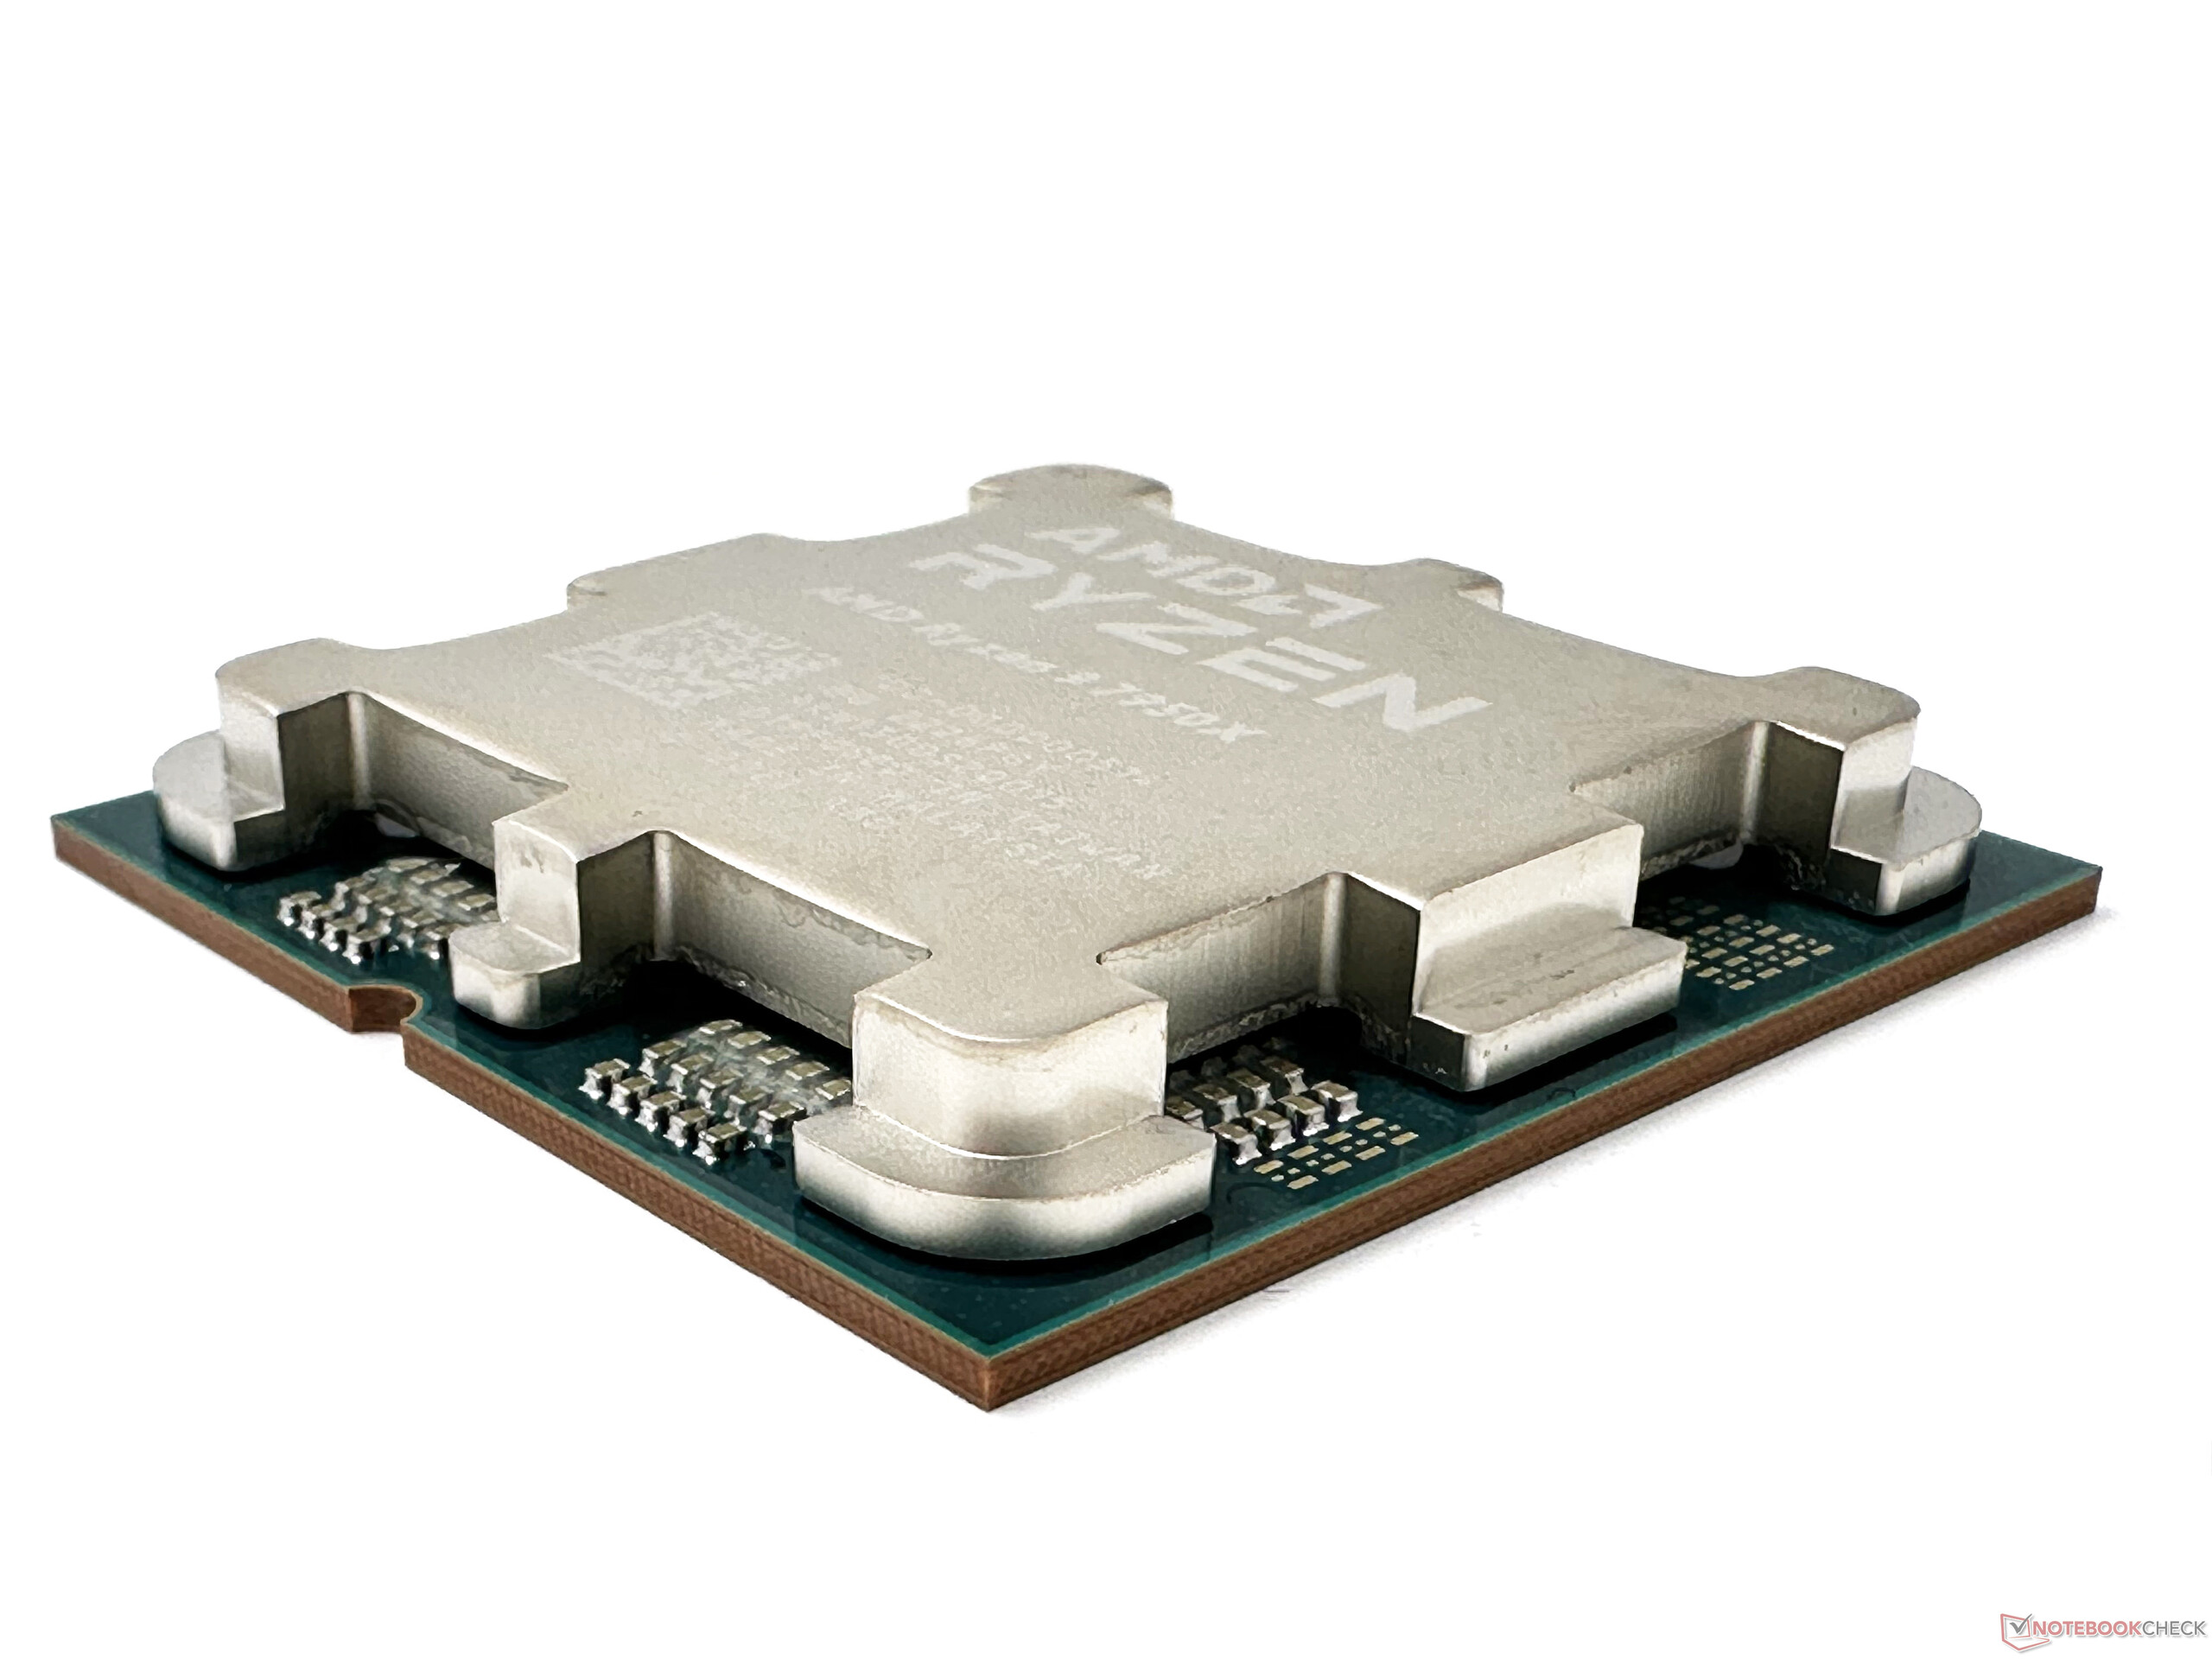
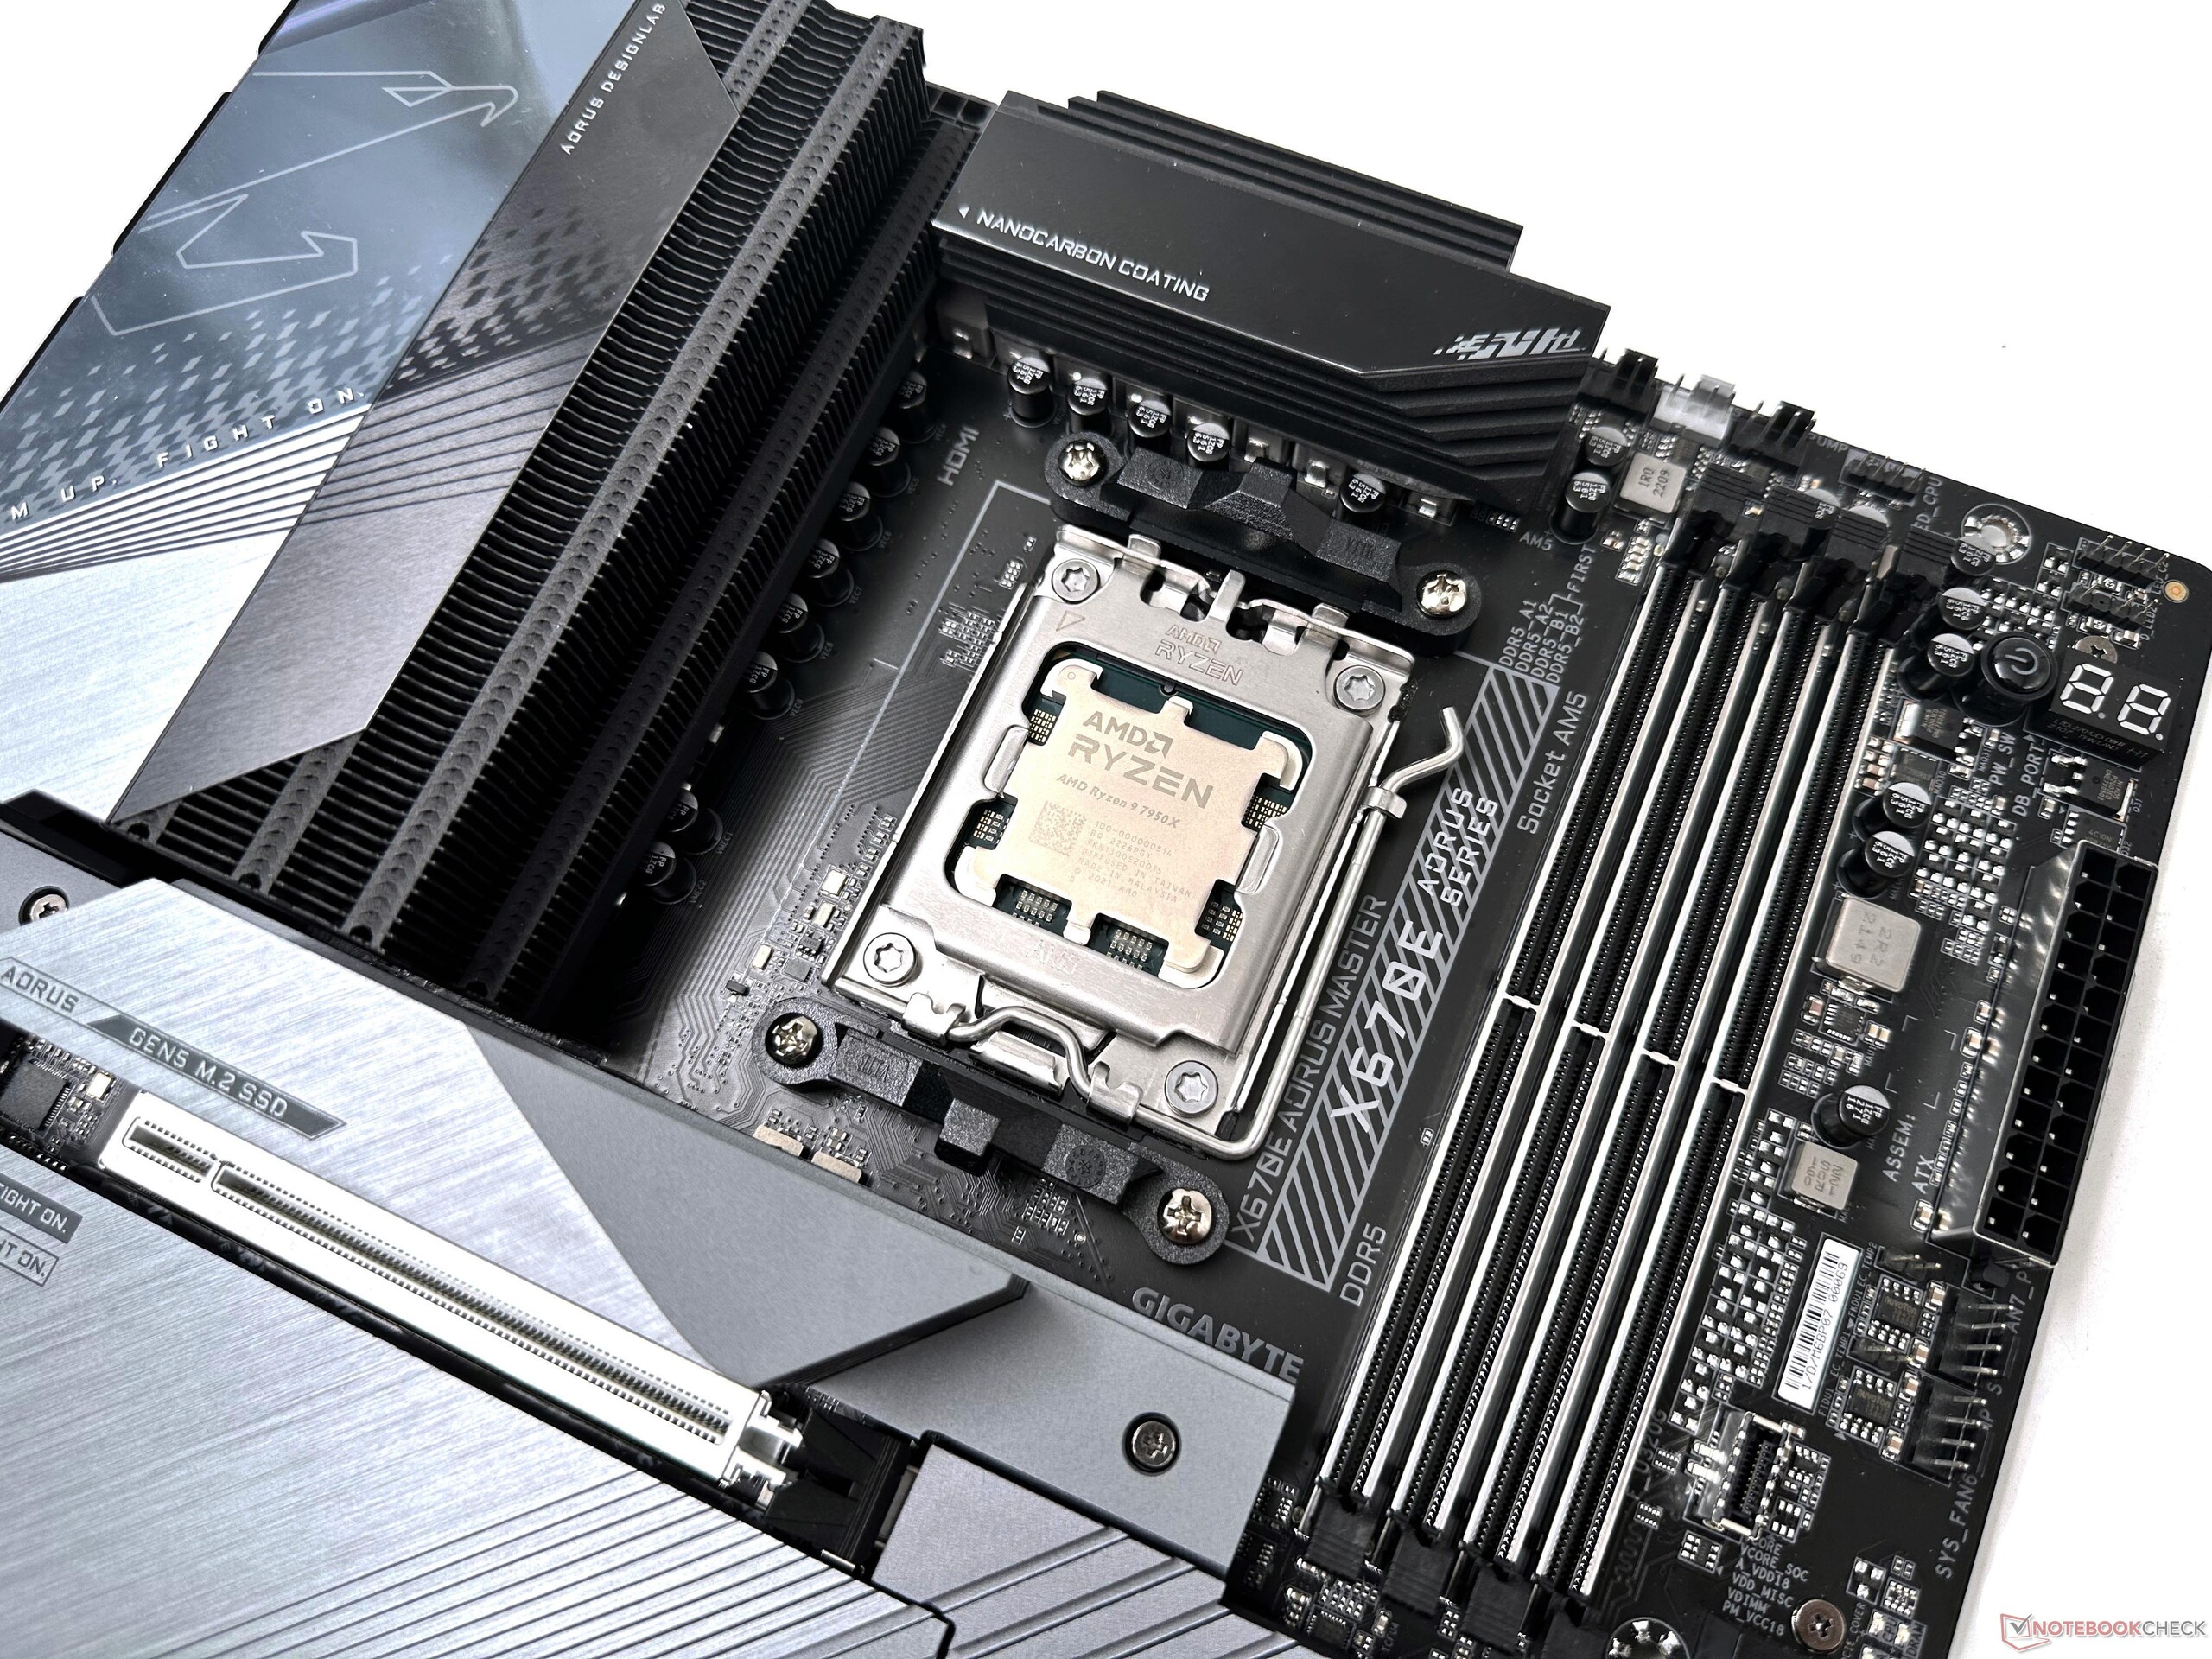
La serie Zen 4 Ryzen 7000 requiere nuevas placas base con socket AM5con las placas insignia X670E que incluso cuentan con conjuntos de chips de doble ROM21 encadenados. El nuevo zócalo LGA 1718 permite aumentar los límites de potencia hasta 230 W PPT, lo que puede acomodar CPUs de hasta 170 W TDP.
Los troqueles del complejo núcleo (CCD) de Zen 4 se fabrican en el nodo TSMC de 5 nm, mientras que el troquel de E/S, que alberga la iGPU RDNA 2 de 2 CPU, los carriles PCIe Gen 5 y el controlador de memoria DDR5, utiliza TSMC de 6 nm. A diferencia de Intel Raptor Lakeque admite tanto DDR4 como DDR5, el AM5 sólo admite memoria DDR5
Aunque esto aporta varias ventajas de ingeniería, hay un contratiempo a corto plazo para el consumidor, ya que los precios de la DDR5 siguen siendo más altos que los de la DDR4
Con AM4, los usuarios tenían que configurar la estructura, el controlador de memoria y los relojes de memoria para que funcionaran en una proporción de 1:1:1, lo que significaba que la memoria RAM DDR4-3600 era el punto óptimo para Ryzen 5000. En Ryzen 7000, el reloj de la estructura puede configurarse en Auto, mientras que el controlador de memoria y los relojes de la memoria pueden funcionar en una proporción de 1:1
AMD recomienda la memoria RAM DDR5-6000 como el punto óptimo para Ryzen 7000. Los usuarios pueden elegir entre los perfiles EXPO predeterminados, que es básicamente la forma libre de derechos de AMD de definir el OC de la memoria con un solo clic, similar en muchos aspectos al XMP de Intel. Nuestra plataforma de pruebas tardó un tiempo inusualmente largo en ajustarse a los nuevos perfiles EXPO, pero las nuevas actualizaciones de la BIOS deberían permitir cambios más rápidos.
Anteriormente hemos revisado el AMD Ryzen 9 7900X y el Ryzen 5 7600X y salimos bastante impresionados con lo que ofrecen. En este análisis, completamos la actual pila de Zen 4 Ryzen 7000 probando el Ryzen 9 7950X y el Ryzen 7 7700X en detalle. Ahora que la línea Raptor Lake de Intel también está disponible, las comparaciones se vuelven aún más interesantes.

Una visión general de los procesadores de escritorio AMD 'Raphael' Zen 4 Ryzen 7000
| SKU | Núcleos/Hilos | Reloj base | Turbo Clock | Caché L2 | Caché L3 | TDP | PPT | Precio de lanzamiento |
|---|---|---|---|---|---|---|---|---|
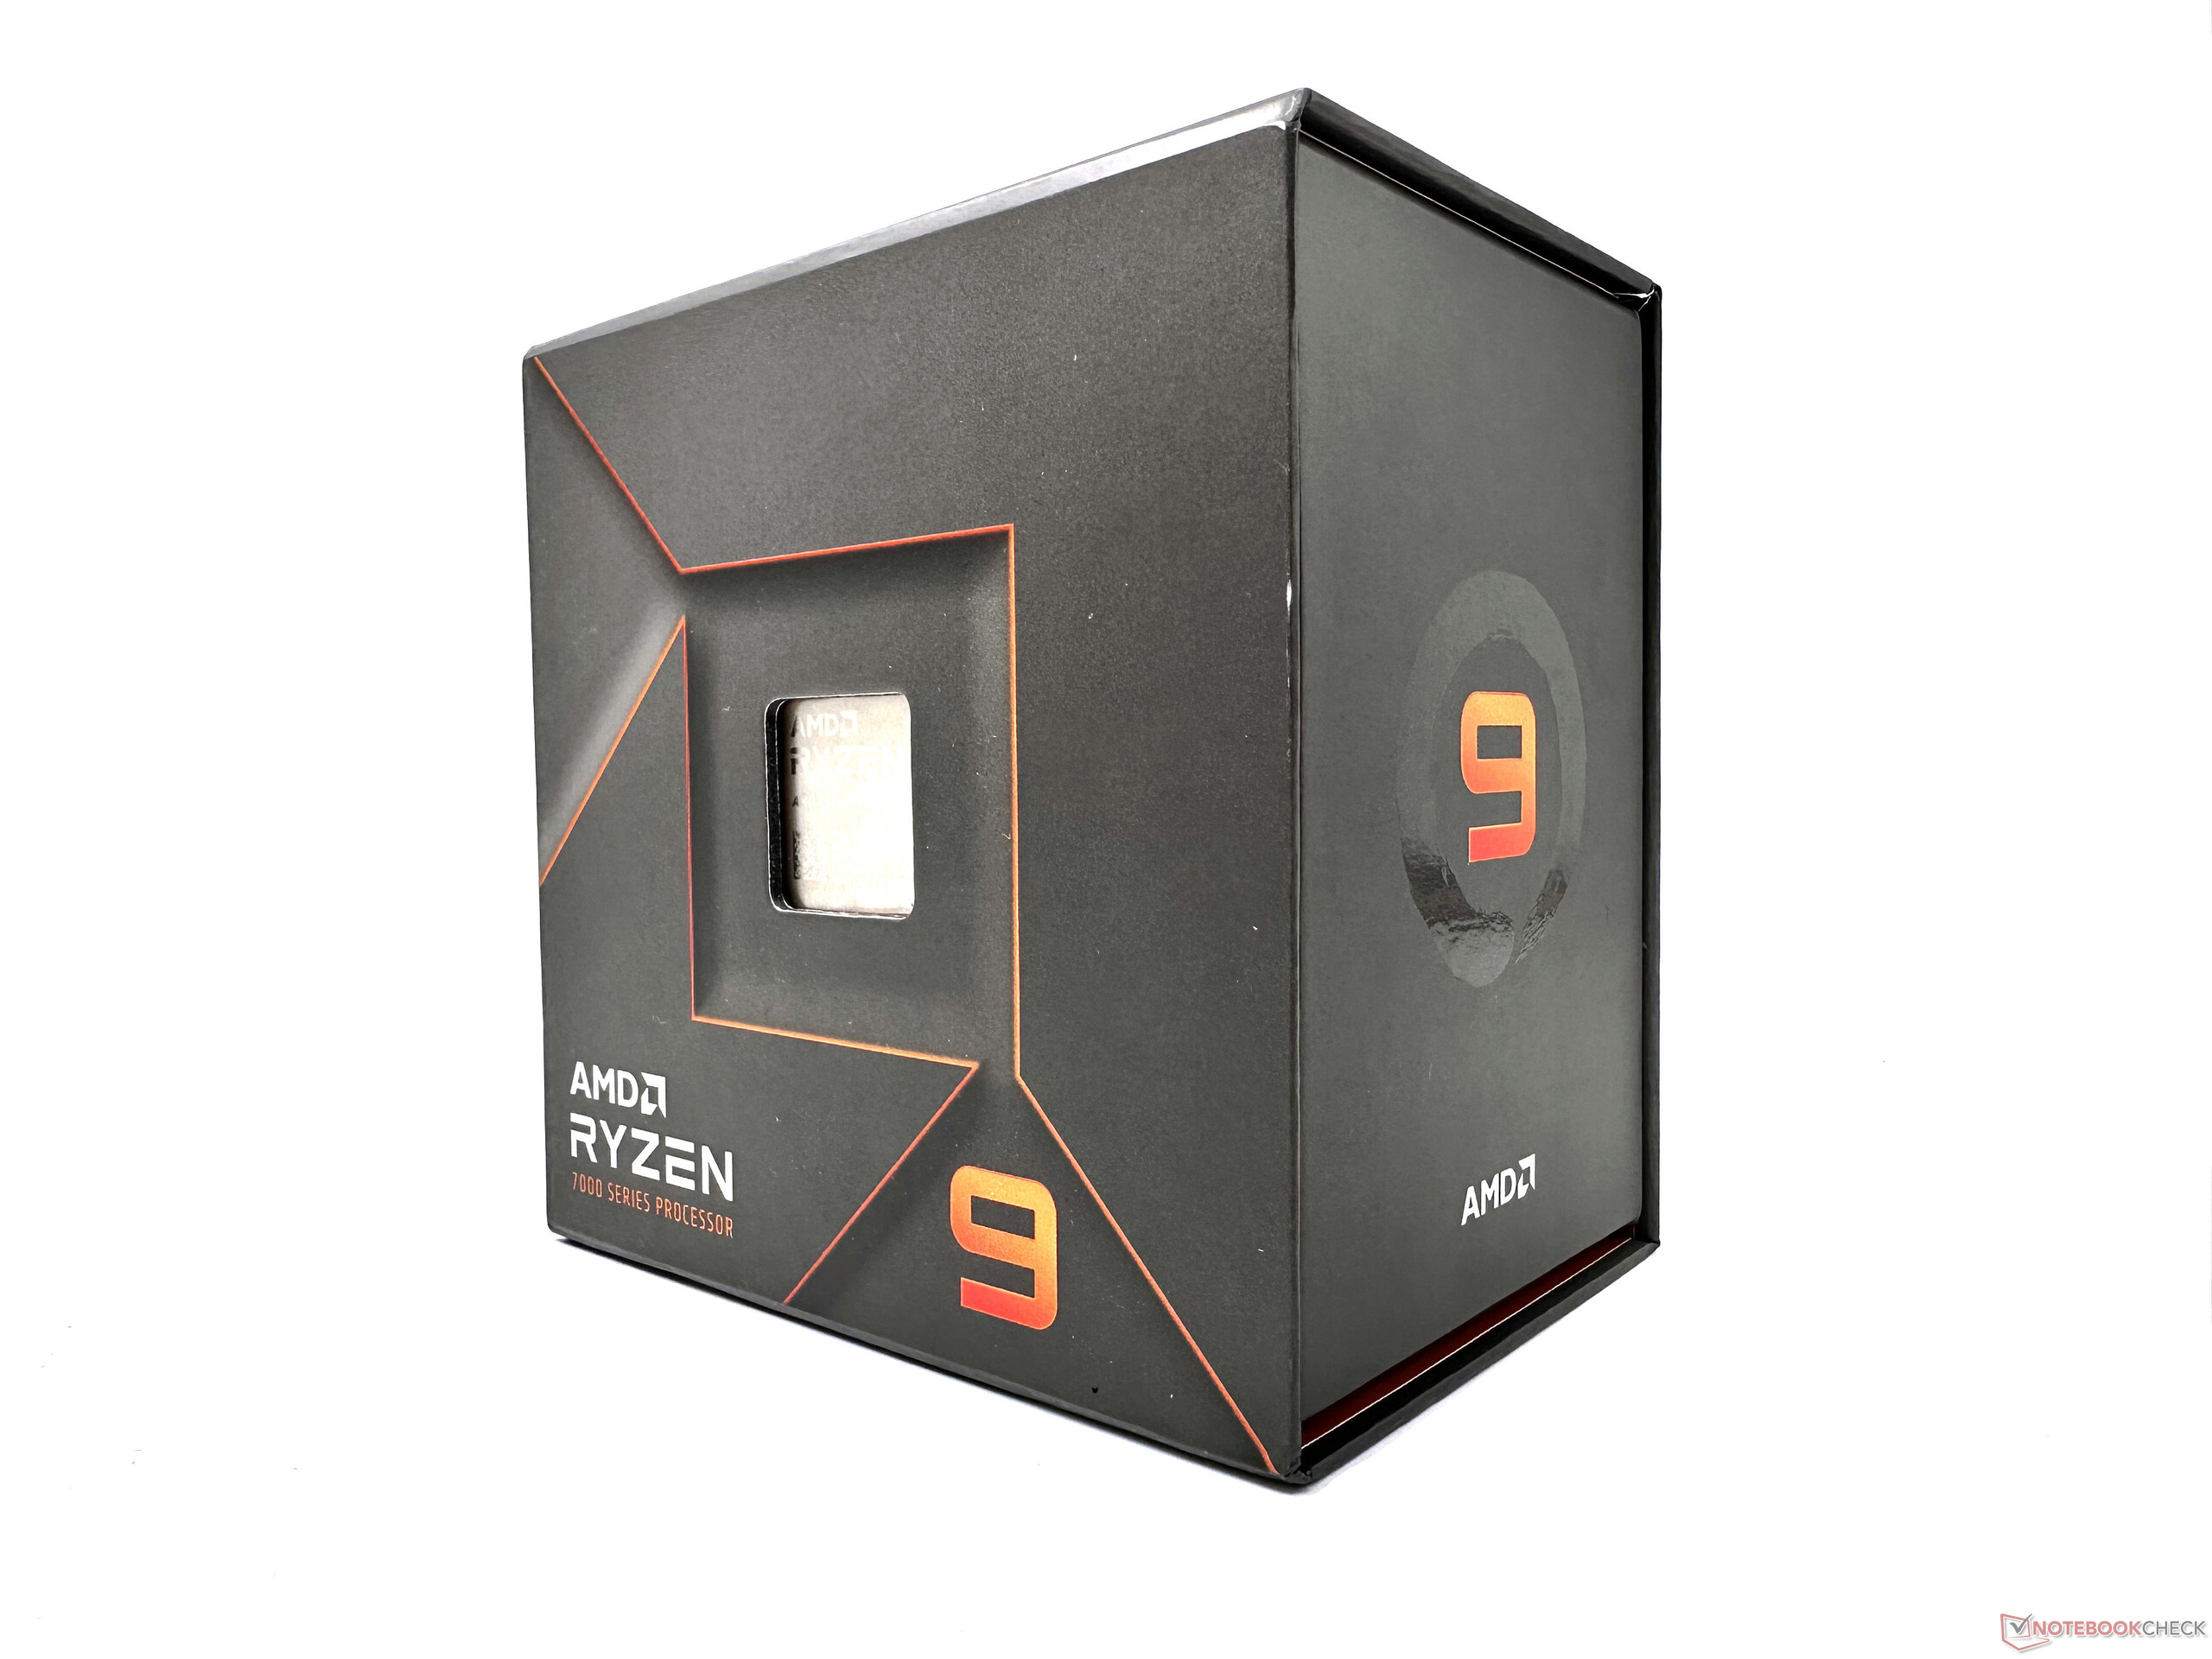
| Ryzen 97950X | 16/32 | 4,5 GHz | 5,7 GHz | 16x 1 MB | 64 MB | 170 W | 230 W | US$699 / €849 |
| Ryzen 9 7900X | 12/24 | 4,7 GHz | 5,6 GHz | 12x 1 MB | 64 MB | 170 W | 230 W | 549 dólares / 669 euros |
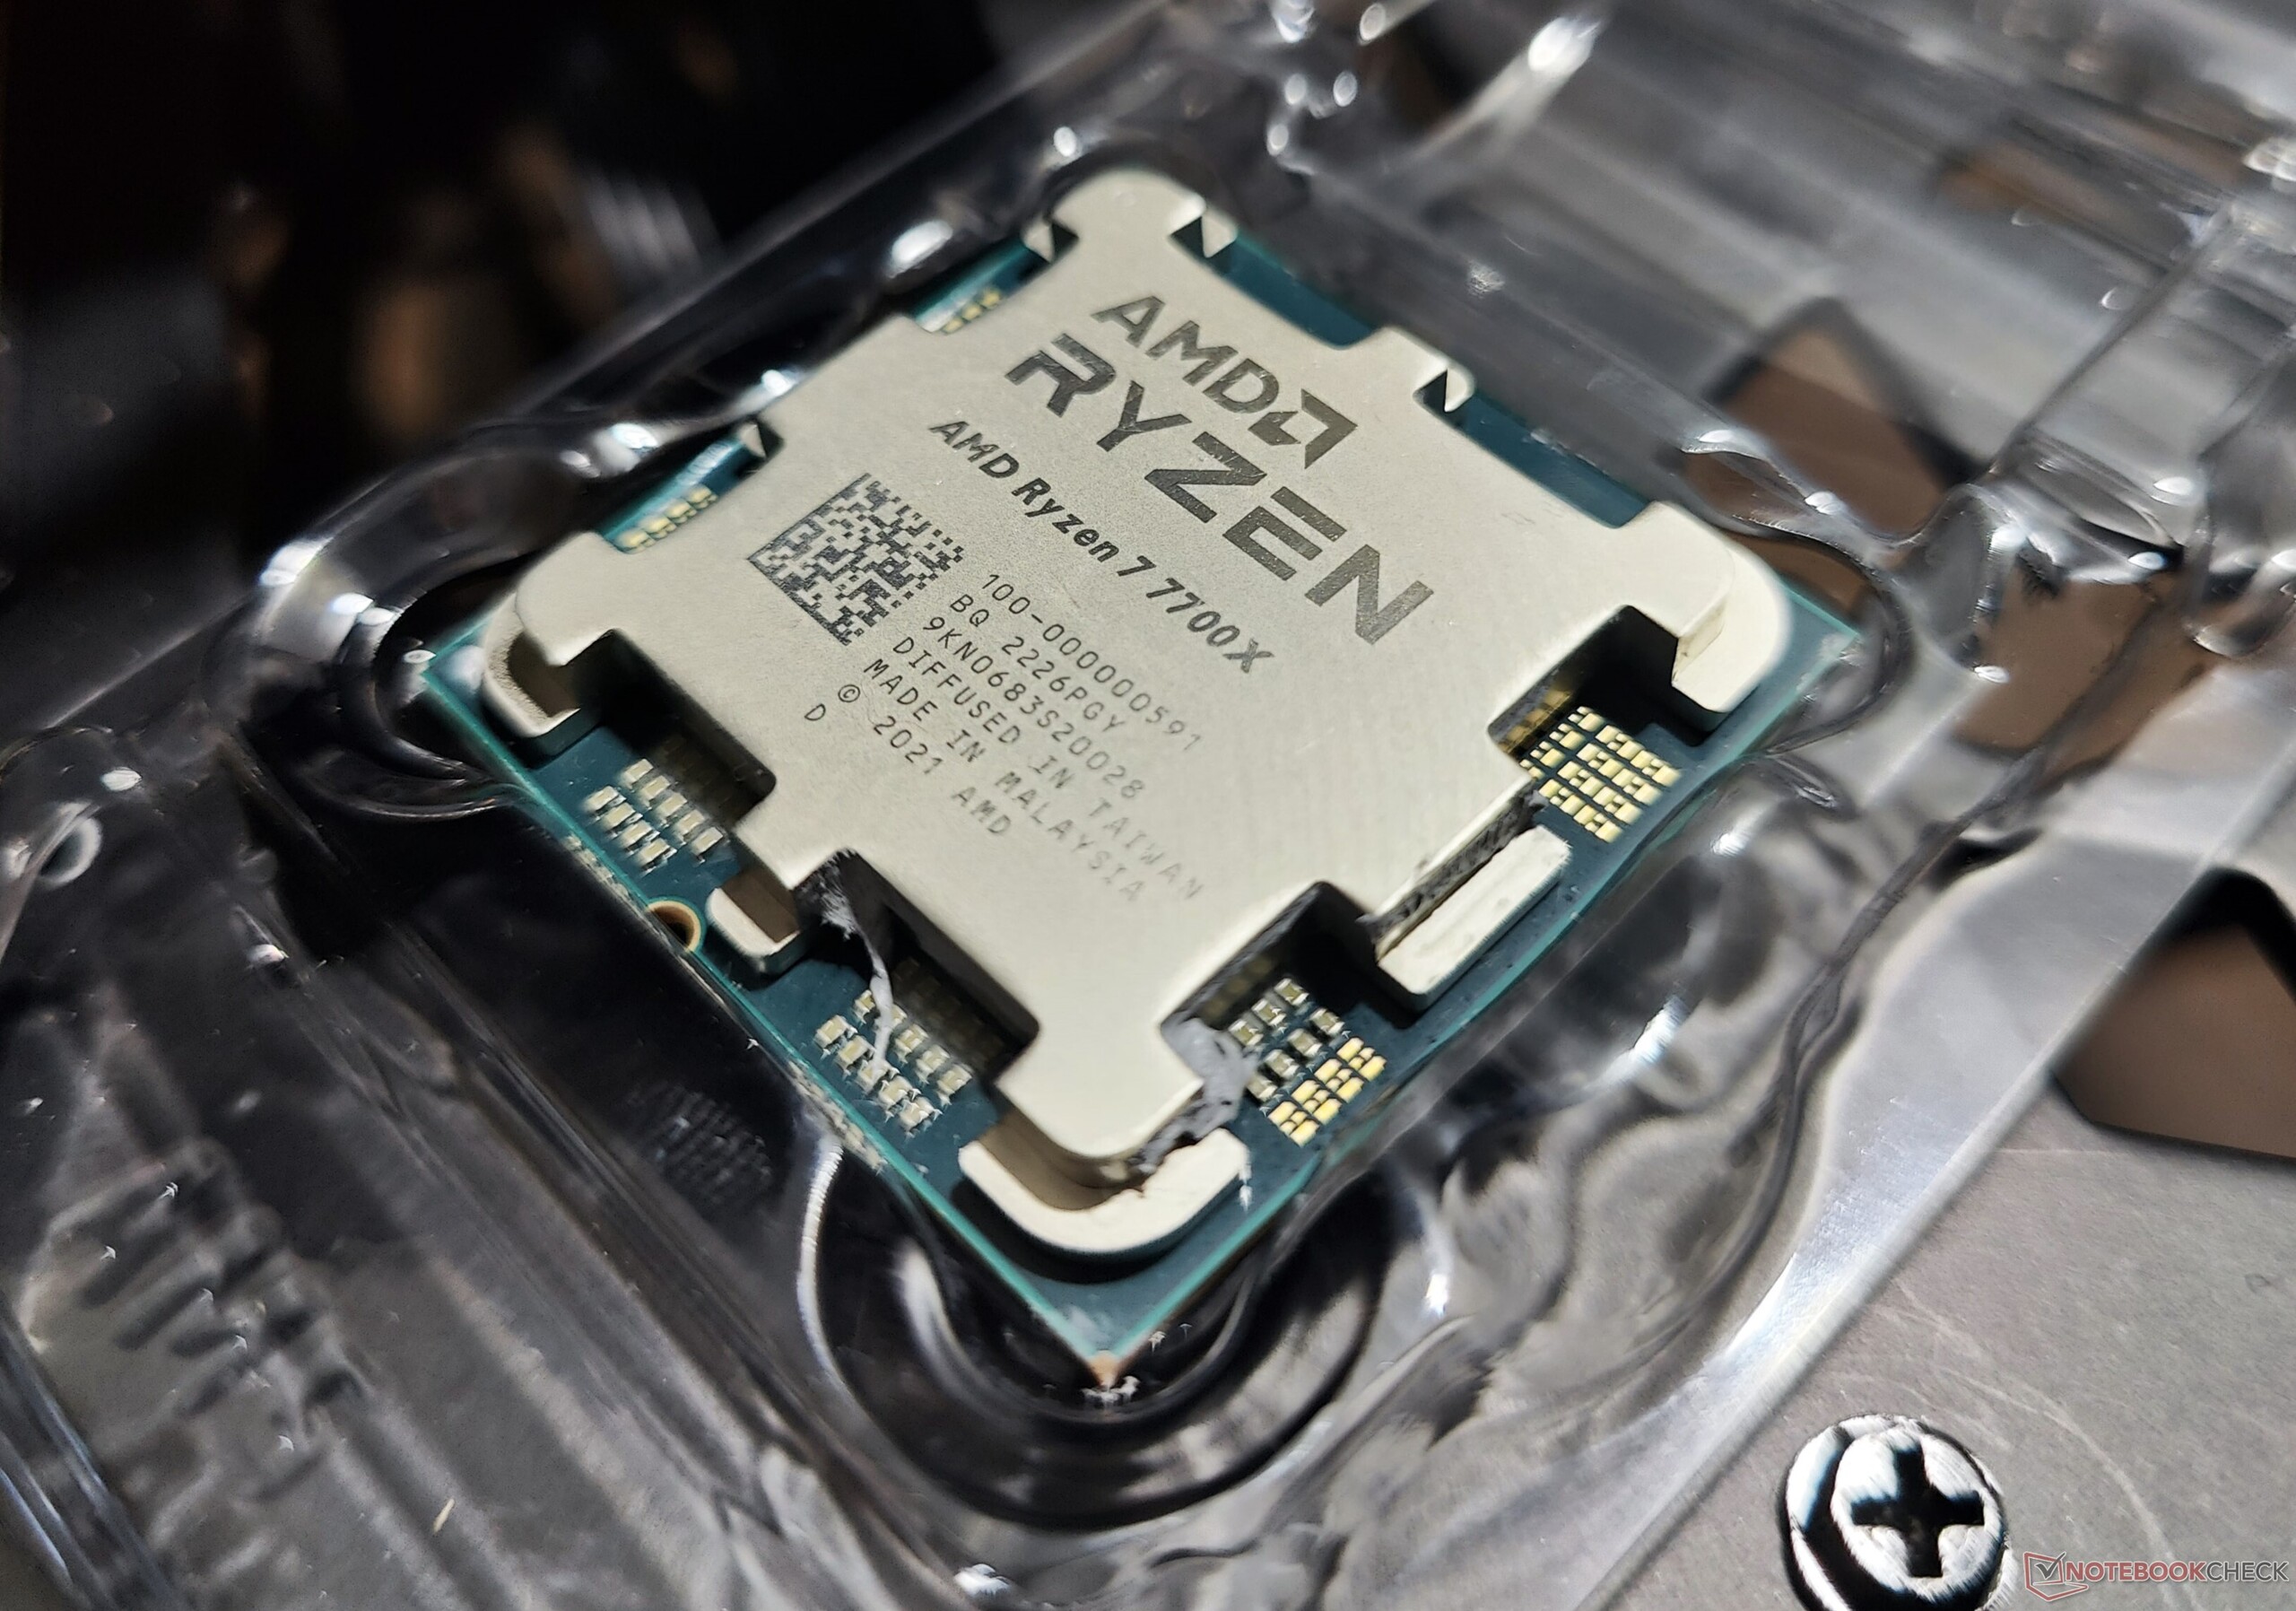
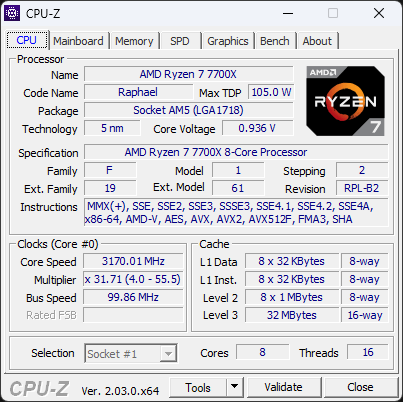
| Ryzen 77700X | 8/16 | 4,5 GHz | 5,4 GHz | 8x 1 MB | 32 MB | 105 W | 142 W | US$399 / €479 |
| Ryzen 5 7600X | 6/12 | 4,7 GHz | 5,3 GHz | 6x 1 MB | 32 MB | 105 W | 142 W | US$299 / €359 |
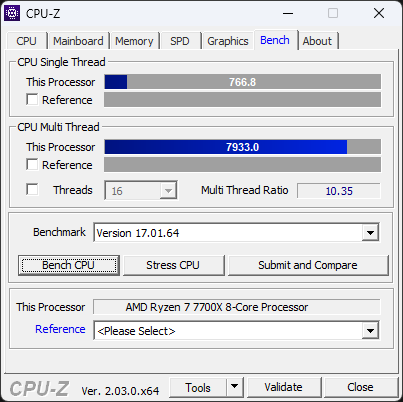
El banco de pruebas: Zen 4 se empareja con la RTX 3090
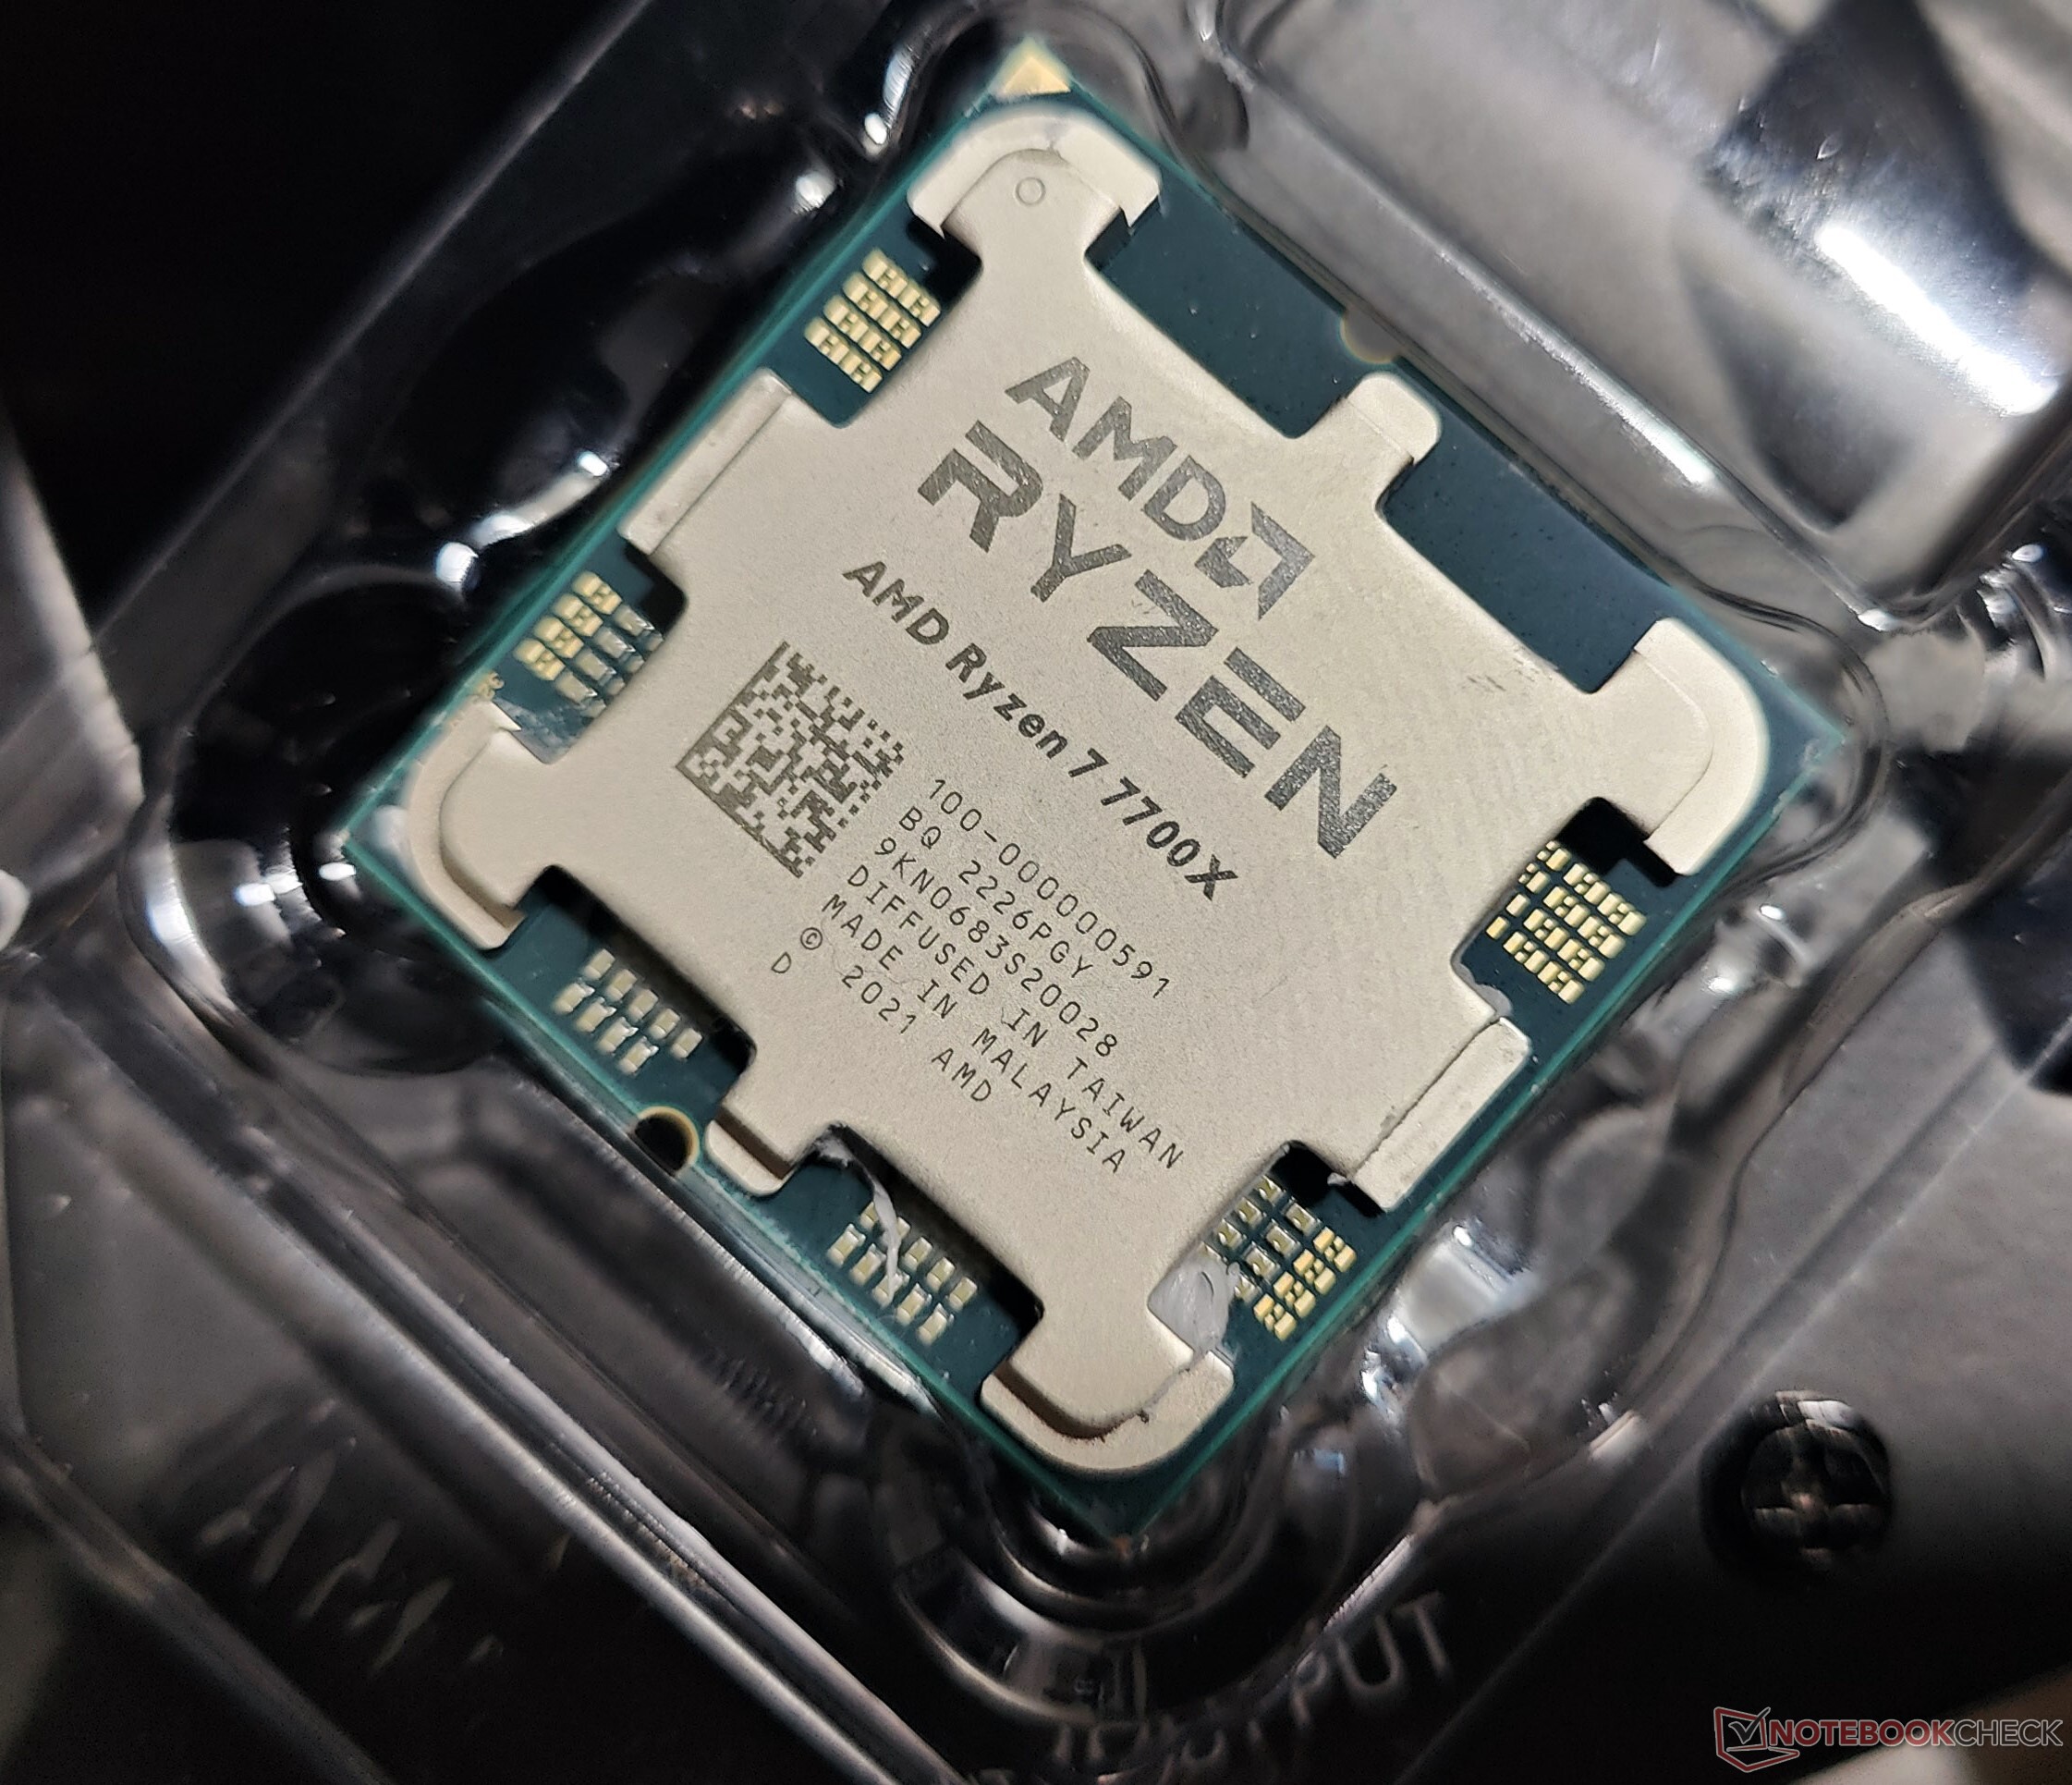
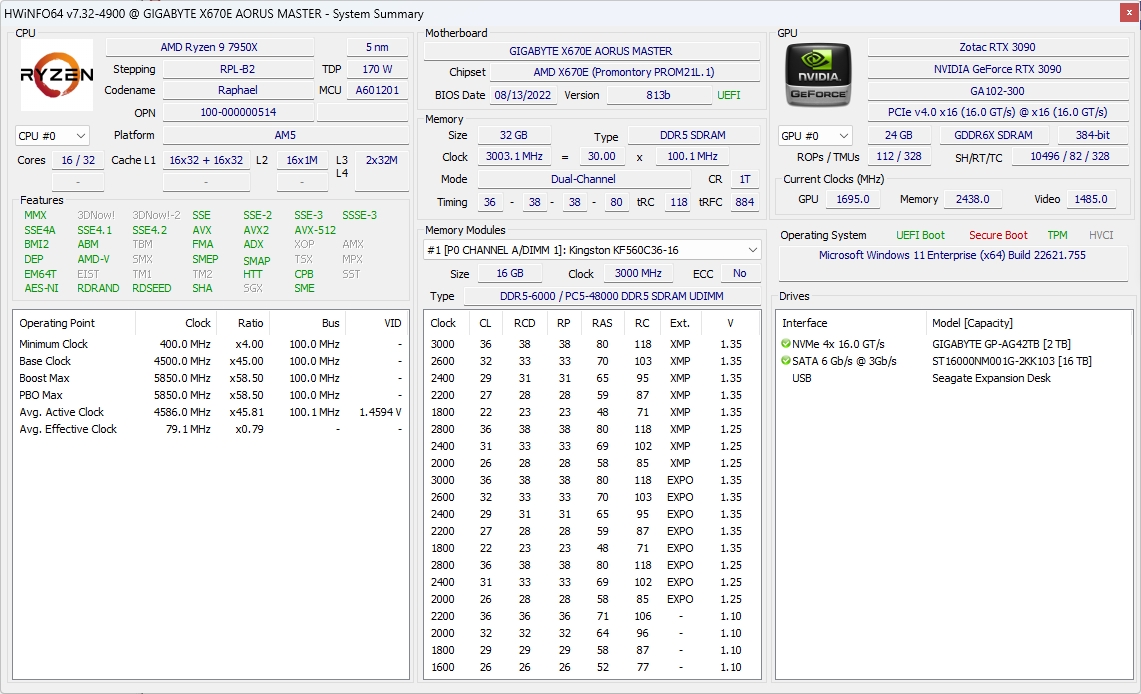
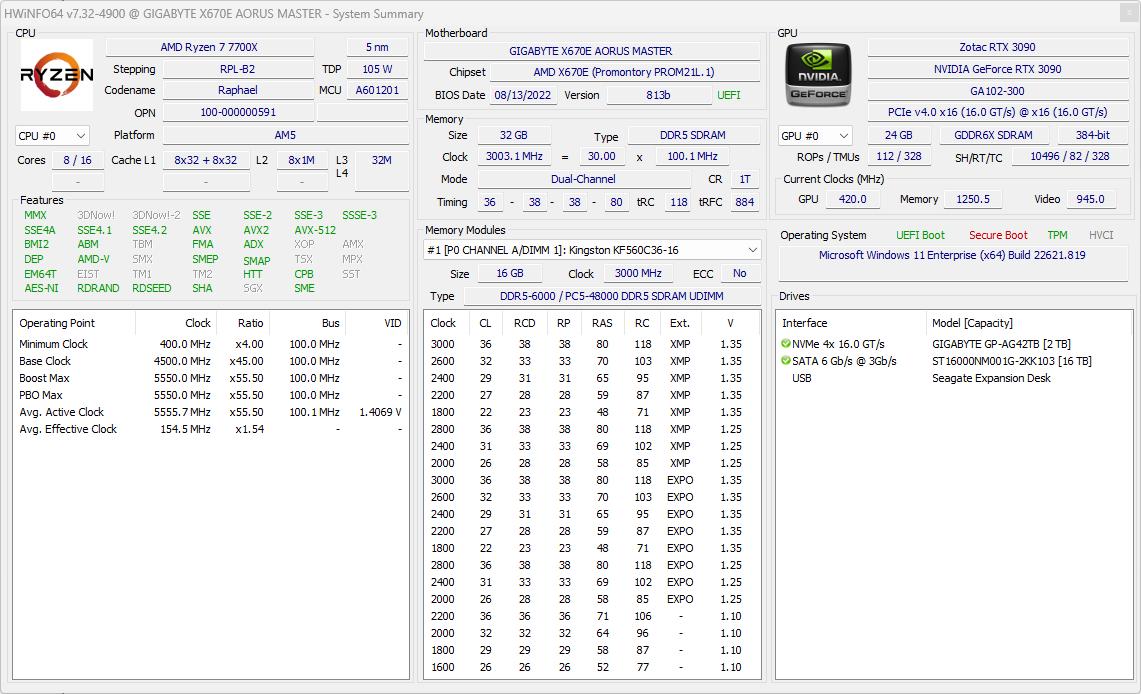
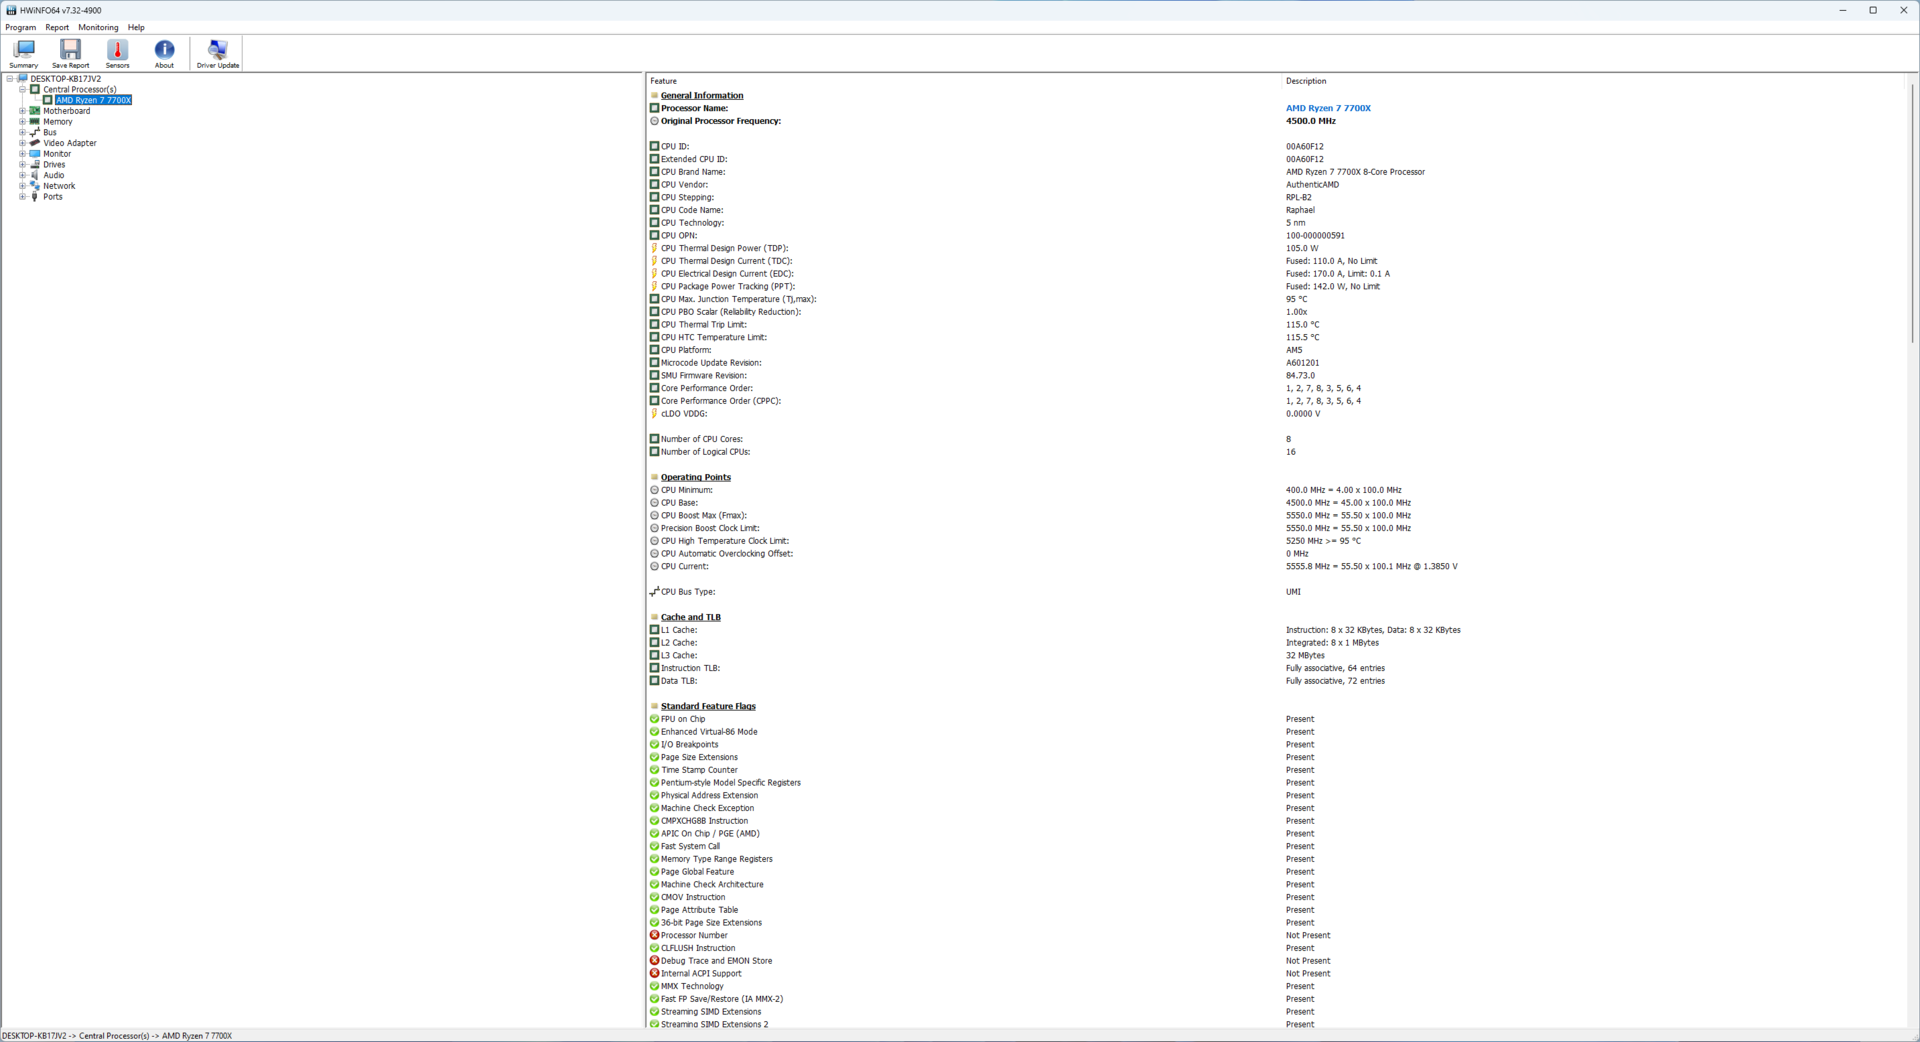
Hemos utilizado los siguientes componentes para probar el Ryzen 7 7700X y el Ryzen 9 7950X
- Banco de pruebas Cooler MasterFrame 700
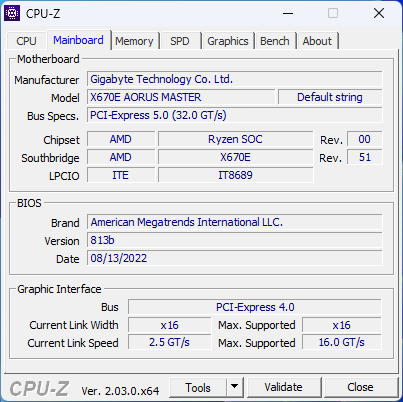
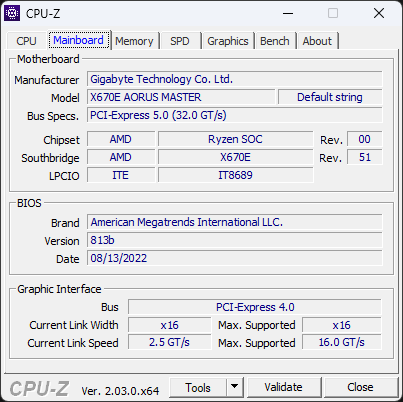
- Placa base Gigabyte X670E Aorus Master con BIOS de referencia versión 813b
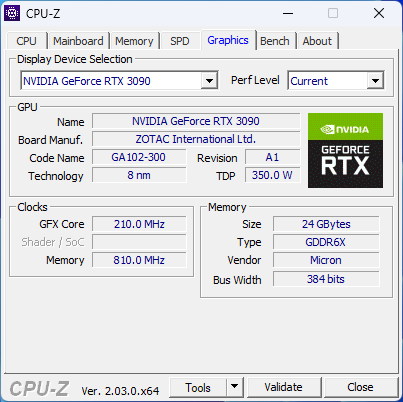
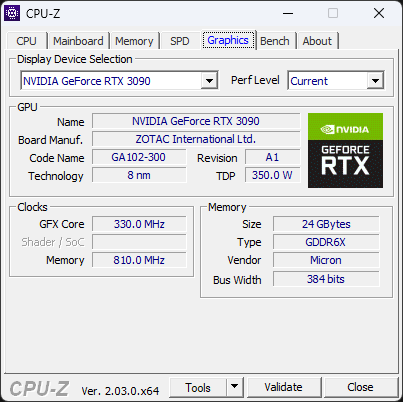
- Zotac Gaming GeForce RTX 3090 GPU Trinity
- SSD Gigabyte Aorus Gen 4 de 2 TB NVMe para pruebas y juegos
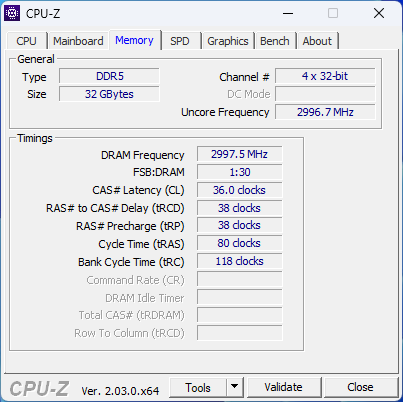
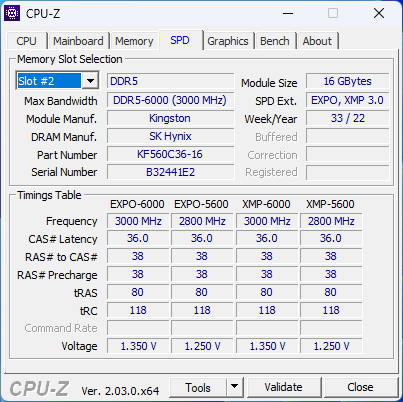
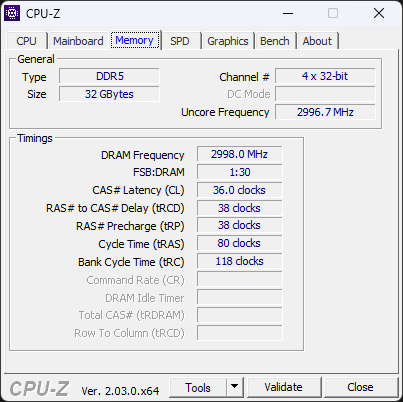
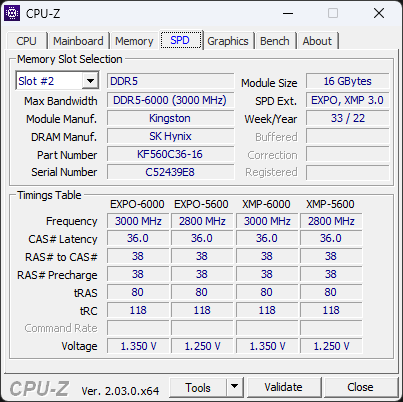
- 2x 16 GB de memoria RAM Kingston Fury Beast DDR5-6000 con timings 36-38-38-80 a 1,35 V
- Monitor Gigabyte M28U 4K 144 Hz
- Refrigerador Cooler MasterLiquid ML360L V2 ARGB AIO
- Fuente de alimentación totalmente modular Cooler Master MVE Gold 1250 V2
Nos gustaría dar las gracias a AMD por suministrar las CPUs Ryzen 7 7700X y Ryzen 9 7950X, la placa base X670E Aorus Master y el kit de memoria DDR5 de Kingston. También nos gustaría dar las gracias a Zotac por la GPU RTX 3090 Trinity, a Gigabyte por el monitor M28U y el SSD Aorus NVMe, y finalmente a Cooler Master por el banco de pruebas, el refrigerador AIO y la fuente de alimentación.
Benchmarks de CPUs: Competencia despiadada con Raptor Lake
Mientras que las puntuaciones acumuladas muestran que los buques insignia de Intel y AMD están empatados, las pruebas individuales muestran algunas diferencias. Por ejemplo, el Ryzen 9 7950X es aproximadamente un 11% más lento en Cinebench R23 de un solo núcleo en comparación con el Core i9-13900K.
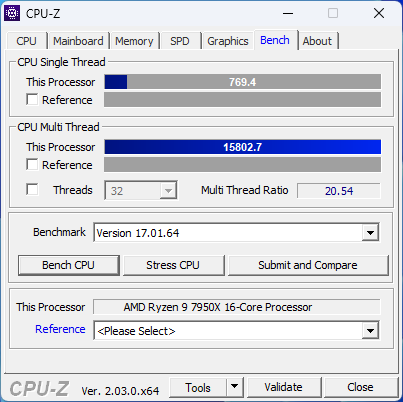
AMD Ryzen 9 7950X
La diferencia entre el Ryzen 9 7950X y el Core i9-13900K no es muy significativa en las pruebas Cinebench R20, Cinebench R15 y Geekbench de un solo núcleo.
El Ryzen 9 7950X sí aventaja en un 20% al Core i9-13900K en TrueCrypt y es capaz de vencer al buque insignia de Raptor Lake por poco en HWBOT x264 4K y 7-Zip multi. En la mayoría de los demás casos, el rendimiento del Ryzen 9 7950X y del Core i9-13900K es prácticamente idéntico.
El Core i9-13900K parece tener una ligera ventaja en las ejecuciones multinúcleo, pero los resultados generales están en línea con lo que consideraríamos variaciones entre ejecuciones
AMD Ryzen 7 7700X
Resulta interesante que el Ryzen 7 7700X de 8C/16T pueda aventajar al Core i5-13600K de 14C/20T en las puntuaciones acumuladas en todas las pruebas. Mientras que tanto el Core i5-13600K como el Ryzen 7 7700X muestran un rendimiento casi idéntico en un solo núcleo, el primero puede aventajar hasta en un 24% en las pruebas multinúcleo de Cinebench
Los procesadores Ryzen 7000 en general parecen rendir mejor que sus homólogos de Intel en la prueba de un solo núcleo de 7-Zip, y el Ryzen 7 7700X supera al Core i5-13600K hasta en un 23%. El Ryzen 7 7700X también fue el que menos tiempo tardó entre todas las CPUs en comparación en nuestra prueba de conversión de 20 documentos PDF de LibreOffice.
* ... más pequeño es mejor
En general, tanto el Ryzen 9 7950X como el Ryzen 7 7700X rinden admirablemente en nuestro conjunto de pruebas de CPU. La CPU de 16 núcleos del buque insignia de AMD Zen 4 empata con el Core i9-13900K de Intel Raptor Lake en el rendimiento general de la CPU, mientras que la diferencia entre el Ryzen 7 7700X y el Core i5-13600K está muy dentro del margen de error.
El Ryzen 9 7950X ofrece una decente mejora del 29% en el rendimiento acumulado de la CPU respecto al Ryzen 9 5950X. Los usuarios que se actualicen desde el Alder Lake Core i9-12900K encontrarán una ganancia sustancial del 36% en el rendimiento general, con los beneficios en gran medida con respecto a las cargas de trabajo multihilo.
El Ryzen 7 7700X es capaz de posicionarse cómodamente por delante del Core i9-12900K de un solo núcleo, lo que lo convierte en una buena propuesta de valor para los flujos de trabajo de un solo hilo como los juegos.
Cinebench R15 Multi Loop
AMD no suministra un refrigerador en la caja ni para el Ryzen 9 7950X ni para el Ryzen 7 7700X, así que tendrás que confiar en una opción de terceros capaz. Los procesadores Ryzen 7000 han recibido algunas críticas por su TjMax de 95 °C, pero AMD asegura que no es un problema
Según la compañía, los chips de la serie Ryzen 7000 están diseñados para funcionar a una TjMax de 95 °C las 24 horas del día sin riesgo de sufrir daños. Esta temperatura máxima de funcionamiento segura permite que el algoritmo de refuerzo Precision Boost Overdrive exprima el máximo rendimiento del procesador. Es posible anular esto a valores aún más altos (hasta un máximo de 115 °C) o cambiar al modo Eco para un funcionamiento más frío (más sobre esto en breve).
Tanto el Ryzen 9 7950X como el Ryzen 7 7700X ofrecen un funcionamiento bien sostenido y sin aceleración gracias al excelente rendimiento de refrigeración del Cooler MasterLiquid ML360L V2 ARGB AIO.
Rendimiento del sistema: Aumento significativo de la productividad con respecto a Zen 3
El Ryzen 9 7950X y el Ryzen 7 7700X no tienen reparos en ejecutar la mayoría de las aplicaciones de productividad. En las pruebas AIDA64, el Ryzen 9 7950X lidera sistemáticamente las tablas, a menudo con una ventaja significativa sobre el Core i9-13900K. Una situación similar se ve con el Ryzen 7 7700X y el Core i5-13600K también. La prueba CPU PhotoWorxx, sin embargo, ve un dominio de Intel.
PCMark 10 no se ejecutó en la configuración por defecto del Ryzen 7 7700X por alguna razón, aunque pudimos ejecutar la prueba en el modo Eco del procesador. Por lo tanto, no incluimos el 7700X en la siguiente tabla.
CrossMark, por otro lado, ve al Ryzen 9 7950X casi a la par con el Core i9-13900K, lo que también es el caso del par Ryzen 7 7700X y Core i5-13600K.
Al igual que lo que habíamos visto antes con los benchmarks de CPU, la serie Ryzen 7000 presenta ganancias significativas de generación en generación también en las pruebas de productividad. Por ejemplo, el Ryzen 9 7950X muestra un enorme aumento del 69% en las puntuaciones generales de CrossMark, al tiempo que muestra una abrumadora ventaja de rendimiento en la mayoría de las pruebas de CPU de AIDA64.
En las pruebas de CPU de 3DMark, el Core i9-13900K tiene una ligera ventaja sobre el Ryzen 9 7950X en Fire Strike Physics, mientras que el Ryzen 7 7700X y el Core i5-13600K están empatados. Time Spy En la prueba de CPU, los procesadores Intel llevan la delantera en general, y el Ryzen 9 7950X queda por detrás del Core i9-13900K en un 18%.
| PCMark 10 Score | 10153 puntos | |
ayuda | ||
* ... más pequeño es mejor
Modo Eco: el Ryzen 9 7950X de 65 W supera al Core i9-12900K
El modo Eco es básicamente el lenguaje de AMD para ejecutar la CPU a un TDP más bajo. Con Zen 4, la compañía está promoviendo un ahorro sustancial de energía con poco impacto en el rendimiento. Los valores de TDP ofrecidos dependen de la referencia: una CPU de 170 W puede configurarse para funcionar a 105 W o 65 W, mientras que un chip de 105 W puede reducirse a 65 W
Nuestra placa Gigabyte X670E Aorus Master de prueba sólo pudo funcionar con la BIOS de referencia 813b de AMD. Esto significa que nuestra configuración no ofrecía una opción de un solo clic para activar el modo Eco, aunque las unidades de venta deberían poder actualizarse a versiones más recientes que ofrecen un enfoque más directo. También puedes activar estos ajustes desde la última versión de Ryzen Master.
No obstante, utilizamos los siguientes valores proporcionados por AMD en la configuración PBO del firmware para habilitar los TDP correspondientes
- 65 W TDP = 88.000 PPT; 75.000 TDC; 150.000 EDC
- 105 W TDP = 142.000 PPT; 110.000 TDC; 170.000 EDC
- 170 W TDP = 230.000 PPT; 160.000 TDC; 225.000 EDC
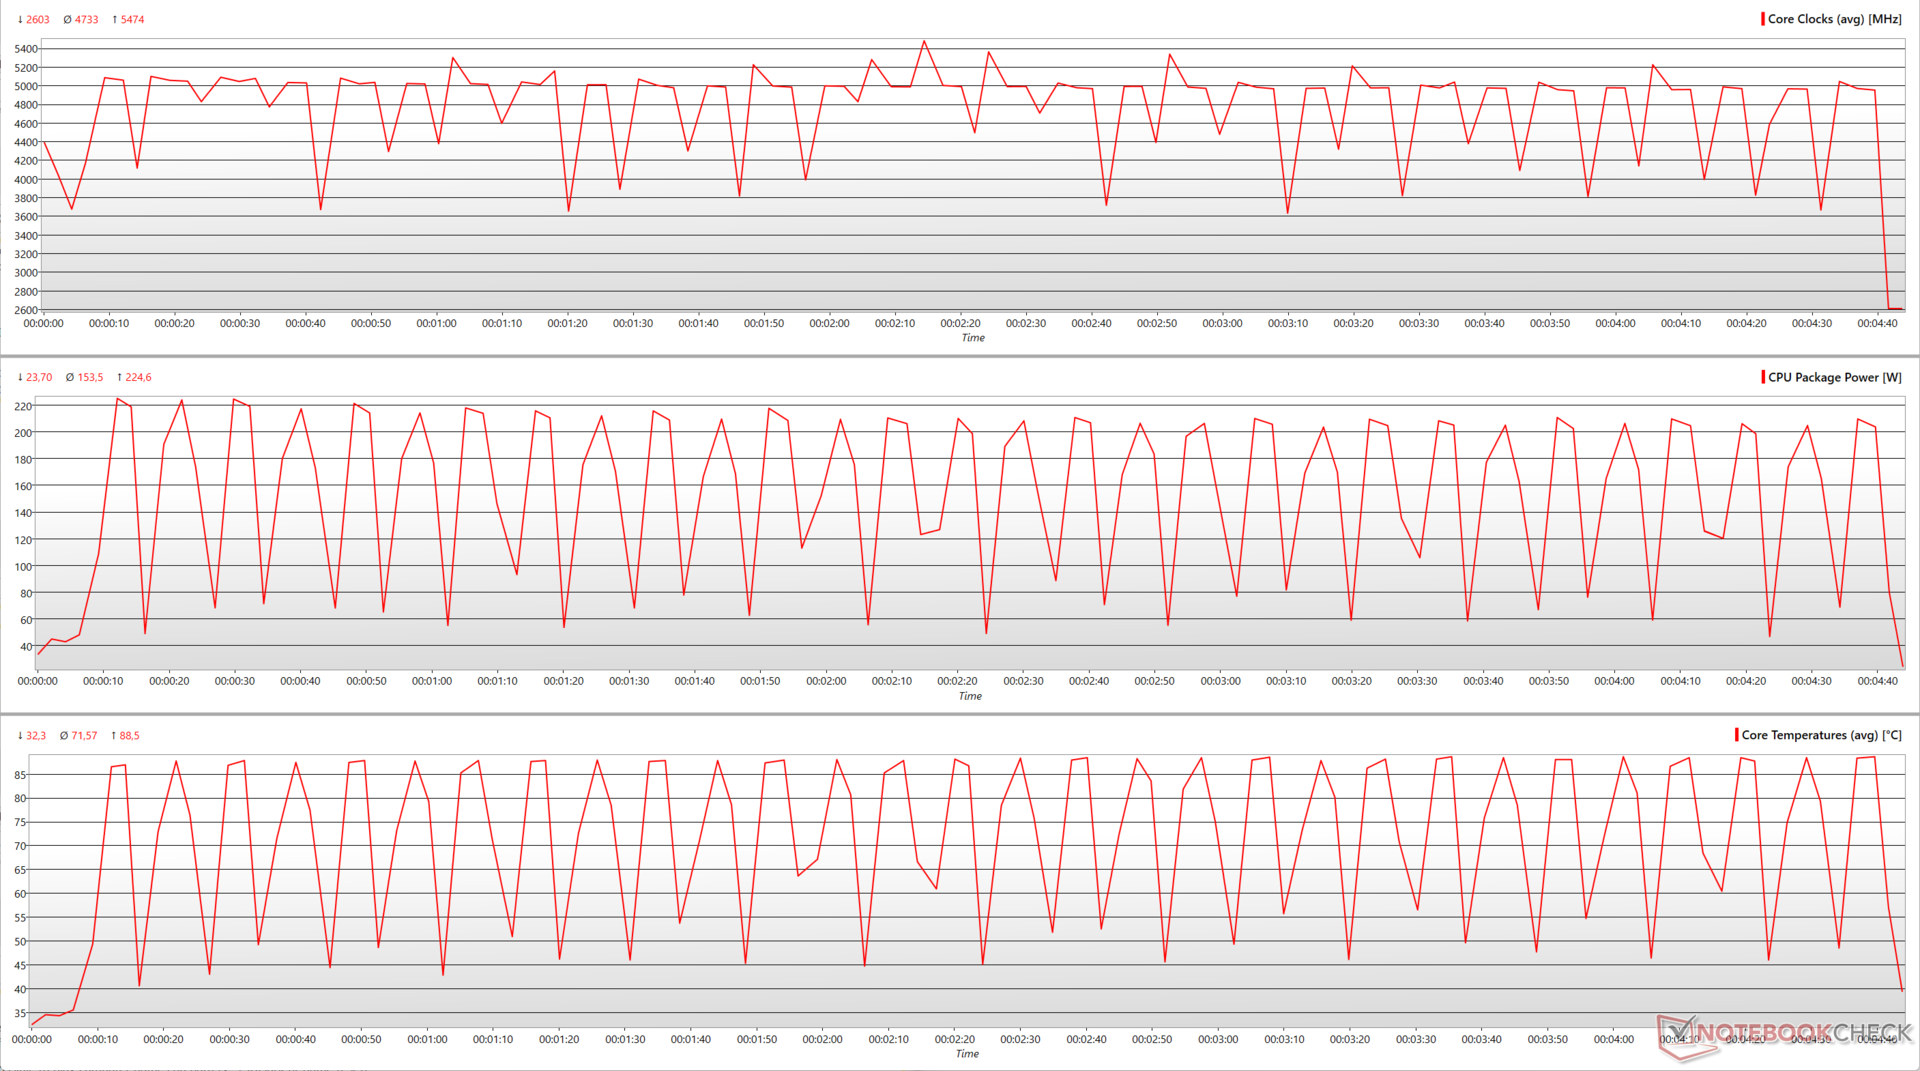
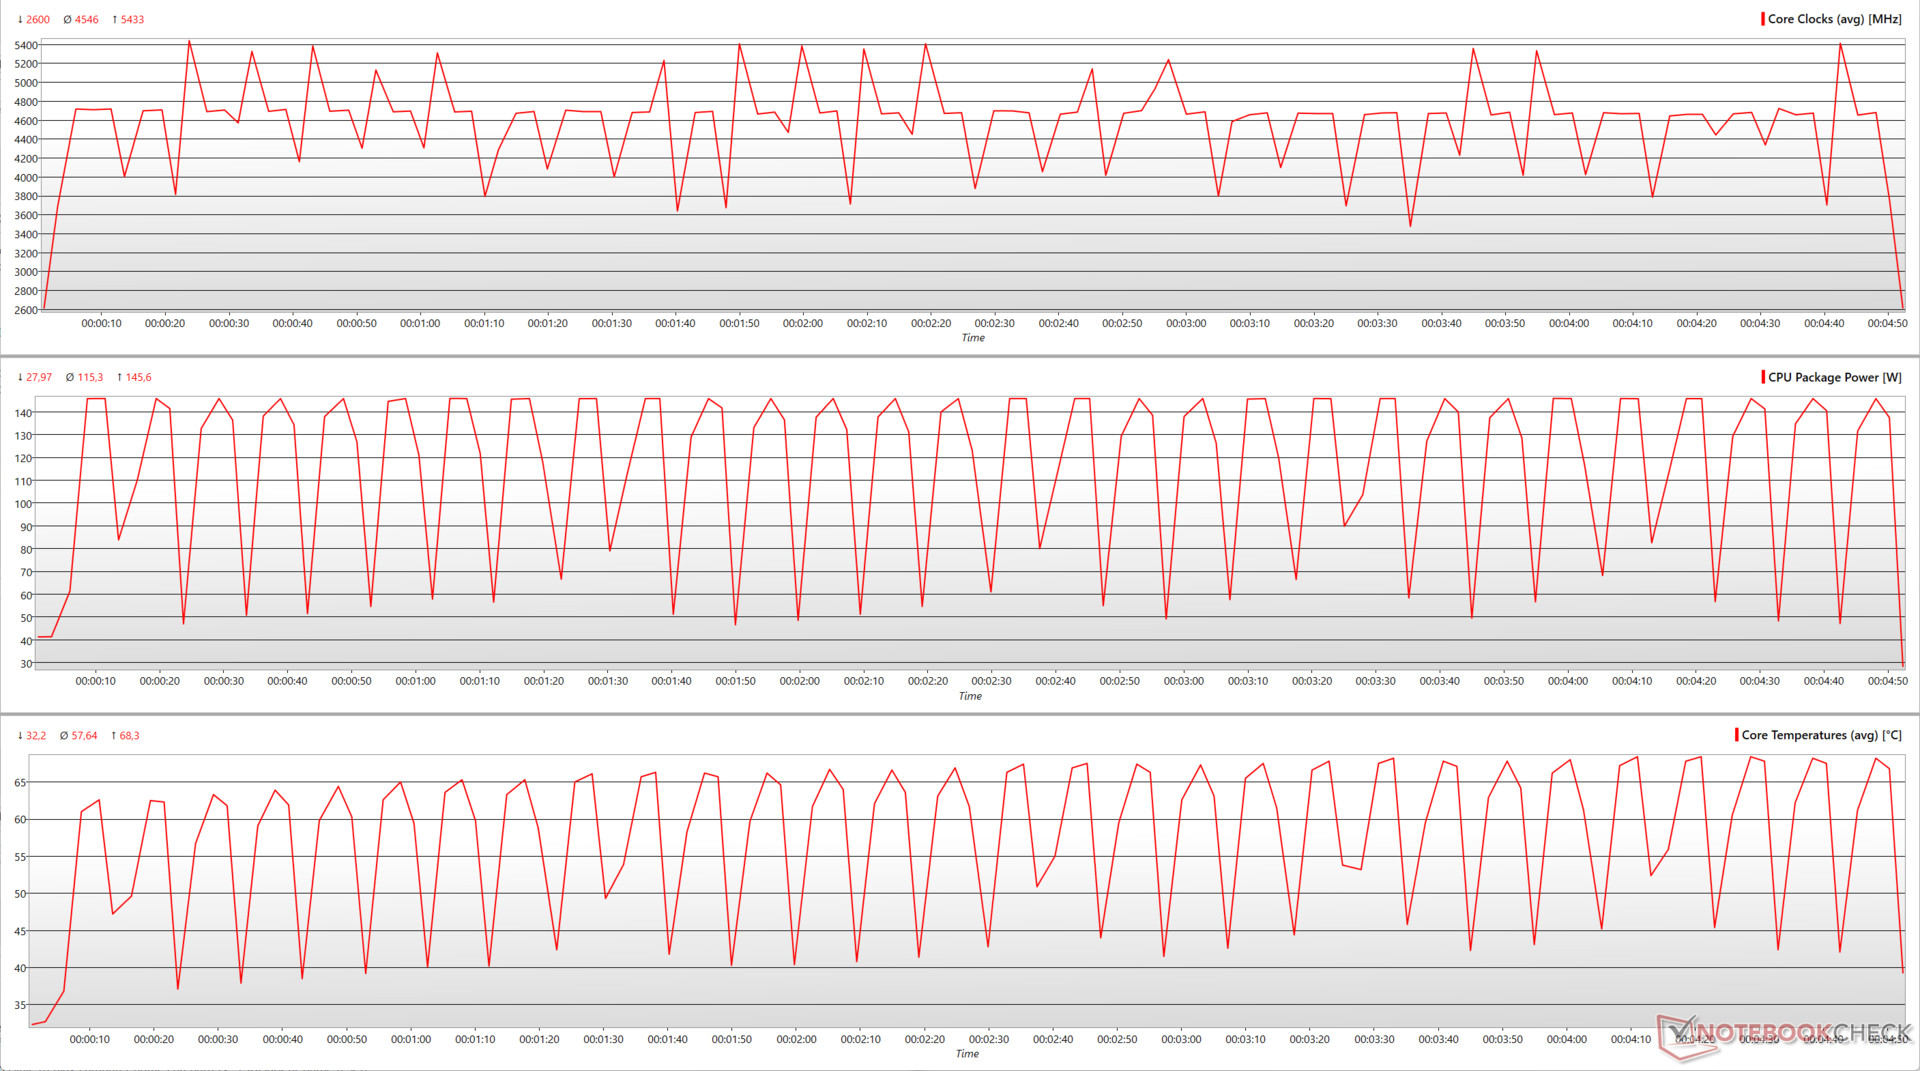
Vemos inmediatamente los beneficios de reducir el TDP del Ryzen 9 7950X en la prueba Cinebench R15 de 30 núcleos. Con un TDP de 105 W, el Ryzen 9 7950X pierde apenas un 7% de rendimiento, con una ligera caída en el impulso máximo de 5,47 GHz a 5,43 GHz. Las temperaturas máximas del núcleo también experimentan un descenso significativo del 22%, de 88,5 °C a 68,3 °C.
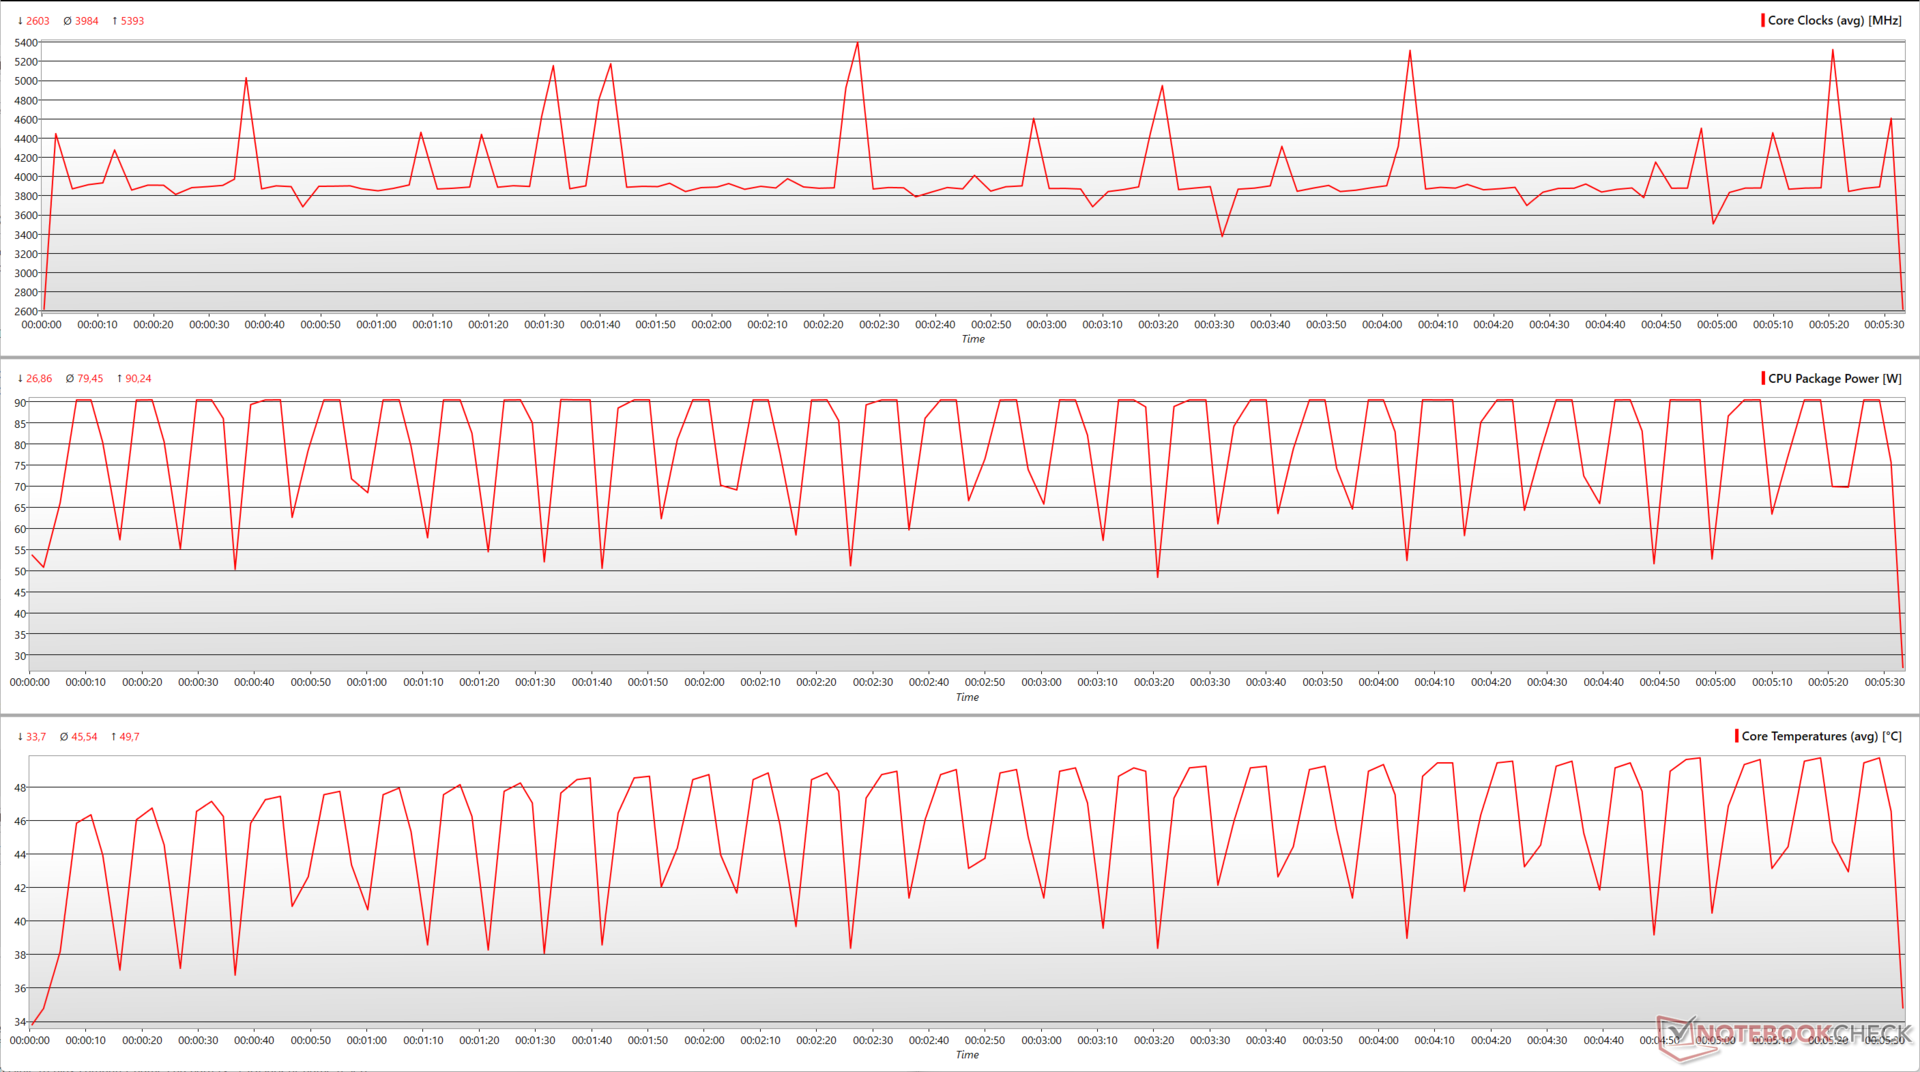
Con 65 W, el Ryzen 9 7950X pierde alrededor de un 22,4% de su rendimiento en el benchmark, dada la marcada reducción de los relojes del núcleo. Sin embargo, el procesador tiene ahora una temperatura de núcleo mucho más baja, de apenas unos 50 °C, con una potencia máxima del paquete de apenas 90 W.
| Ryzen 9 7950X TDP | CB R15 Puntuación multinúcleo | Reloj de núcleo medio (GHz) | Reloj de núcleo máx. Core Clock (GHz) | Max. Potencia del paquete (W) | Temperatura máxima del núcleo (°C) Temperatura del núcleo (°C) |
|---|---|---|---|---|---|
| 170 W | 6.236 | 4,77 | 5,47 | 224,6 | 88,5 |
| 105 W | 5.800 (-7%) | 4,54 -(4,82%) | 5,43 (-0,73%) | 145,6 (-35,17%) | 68,3 (-22,82%) |
| 65 W | 4.836 (-22,4%) | 3,98 (-16,56%) | 5,39 (-1,46%) | 90,24 (-59,82%) | 49,7 (-43,84%) |
El golpe de rendimiento general al pasar de 170 W a 105 W es insignificante en su mayor parte, aunque las cargas de trabajo multinúcleo muy intensivas pueden sufrir un golpe ligeramente mayor. La diferencia entre 170 W y 65 W es más perceptible, con una reducción acumulada del 9% en las pruebas.
Tasas de fotogramas en El Witcher 3 a 1080p Ultra no parece verse afectado por la reducción del TDP. Sí notamos fps medios marginalmente más altos en los TDPs más bajos, pero los valores de fps máximos fueron más bajos comparados con el TDP por defecto.
| Performance rating - Percent | |
| Intel Core i9-13900K | |
| AMD Ryzen 9 7950X | |
| AMD Ryzen 9 7950X ECO 105 W | |
| AMD Ryzen 9 7900X | |
| AMD Ryzen 9 7950X ECO 65 W | |
| Intel Core i9-12900K | |
| Intel Core i5-13600K | |
| AMD Ryzen 7 7700X | |
| AMD Ryzen 7 7700X ECO 65 W | |
| AMD Ryzen 9 5950X | |
| AMD Ryzen 5 7600X | |
| AMD Ryzen 9 5900X | |
| Intel Core i5-12600K | |
| AMD Ryzen 7 5800X | |
| AMD Ryzen 7 5800X3D | |
| AMD Ryzen 5 5600X | |
| Cinebench R23 | |
| Single Core | |
| Intel Core i9-13900K | |
| AMD Ryzen 9 7900X | |
| AMD Ryzen 9 7950X | |
| Intel Core i5-13600K | |
| AMD Ryzen 9 7950X ECO 65 W | |
| AMD Ryzen 9 7950X ECO 105 W | |
| Intel Core i9-12900K | |
| AMD Ryzen 7 7700X ECO 65 W | |
| AMD Ryzen 7 7700X | |
| AMD Ryzen 5 7600X | |
| Intel Core i5-12600K | |
| AMD Ryzen 9 5950X | |
| AMD Ryzen 9 5900X | |
| AMD Ryzen 7 5800X | |
| AMD Ryzen 5 5600X | |
| AMD Ryzen 7 5800X3D | |
| Multi Core | |
| Intel Core i9-13900K | |
| AMD Ryzen 9 7950X | |
| AMD Ryzen 9 7950X ECO 105 W | |
| AMD Ryzen 9 7950X ECO 65 W | |
| AMD Ryzen 9 7900X | |
| AMD Ryzen 9 5950X | |
| Intel Core i9-12900K | |
| Intel Core i5-13600K | |
| AMD Ryzen 9 5900X | |
| AMD Ryzen 7 7700X | |
| AMD Ryzen 7 7700X ECO 65 W | |
| Intel Core i5-12600K | |
| AMD Ryzen 5 7600X | |
| AMD Ryzen 7 5800X | |
| AMD Ryzen 7 5800X3D | |
| AMD Ryzen 5 5600X | |
| Cinebench R20 | |
| CPU (Single Core) | |
| Intel Core i9-13900K | |
| AMD Ryzen 9 7900X | |
| AMD Ryzen 9 7950X | |
| AMD Ryzen 9 7950X ECO 65 W | |
| AMD Ryzen 9 7950X ECO 105 W | |
| Intel Core i5-13600K | |
| AMD Ryzen 7 7700X ECO 65 W | |
| AMD Ryzen 7 7700X | |
| Intel Core i9-12900K | |
| AMD Ryzen 5 7600X | |
| Intel Core i5-12600K | |
| AMD Ryzen 9 5950X | |
| AMD Ryzen 9 5900X | |
| AMD Ryzen 7 5800X | |
| AMD Ryzen 5 5600X | |
| AMD Ryzen 7 5800X3D | |
| CPU (Multi Core) | |
| Intel Core i9-13900K | |
| AMD Ryzen 9 7950X | |
| AMD Ryzen 9 7950X ECO 105 W | |
| AMD Ryzen 9 7950X ECO 65 W | |
| AMD Ryzen 9 7900X | |
| AMD Ryzen 9 5950X | |
| Intel Core i9-12900K | |
| Intel Core i5-13600K | |
| AMD Ryzen 9 5900X | |
| AMD Ryzen 7 7700X | |
| AMD Ryzen 7 7700X ECO 65 W | |
| Intel Core i5-12600K | |
| AMD Ryzen 7 5800X | |
| AMD Ryzen 5 7600X | |
| AMD Ryzen 7 5800X3D | |
| AMD Ryzen 5 5600X | |
| Cinebench R15 | |
| CPU Single 64Bit | |
| Intel Core i9-13900K | |
| AMD Ryzen 9 7900X | |
| AMD Ryzen 9 7950X | |
| AMD Ryzen 9 7950X ECO 105 W | |
| AMD Ryzen 7 7700X ECO 65 W | |
| AMD Ryzen 5 7600X | |
| AMD Ryzen 9 7950X ECO 65 W | |
| AMD Ryzen 7 7700X | |
| Intel Core i5-13600K | |
| Intel Core i9-12900K | |
| Intel Core i5-12600K | |
| AMD Ryzen 9 5950X | |
| AMD Ryzen 9 5900X | |
| AMD Ryzen 7 5800X | |
| AMD Ryzen 5 5600X | |
| AMD Ryzen 7 5800X3D | |
| CPU Multi 64Bit | |
| AMD Ryzen 9 7950X | |
| Intel Core i9-13900K | |
| AMD Ryzen 9 7950X ECO 105 W | |
| AMD Ryzen 9 7900X | |
| AMD Ryzen 9 7950X ECO 65 W | |
| AMD Ryzen 9 5950X | |
| Intel Core i9-12900K | |
| AMD Ryzen 9 5900X | |
| Intel Core i5-13600K | |
| AMD Ryzen 7 7700X | |
| AMD Ryzen 7 7700X ECO 65 W | |
| AMD Ryzen 7 5800X | |
| Intel Core i5-12600K | |
| AMD Ryzen 5 7600X | |
| AMD Ryzen 7 5800X3D | |
| AMD Ryzen 5 5600X | |
| Blender - v2.79 BMW27 CPU | |
| AMD Ryzen 5 5600X | |
| AMD Ryzen 7 5800X3D | |
| AMD Ryzen 5 7600X | |
| AMD Ryzen 7 5800X | |
| Intel Core i5-12600K | |
| AMD Ryzen 7 7700X ECO 65 W | |
| AMD Ryzen 7 7700X | |
| AMD Ryzen 9 5900X | |
| Intel Core i5-13600K | |
| Intel Core i9-12900K | |
| AMD Ryzen 9 5950X | |
| AMD Ryzen 9 7900X | |
| AMD Ryzen 9 7950X ECO 65 W | |
| AMD Ryzen 9 7950X ECO 105 W | |
| AMD Ryzen 9 7950X | |
| Intel Core i9-13900K | |
| Geekbench 5.5 | |
| Single-Core | |
| Intel Core i9-13900K | |
| AMD Ryzen 9 7900X | |
| AMD Ryzen 9 7950X ECO 65 W | |
| AMD Ryzen 9 7950X ECO 105 W | |
| AMD Ryzen 9 7950X | |
| AMD Ryzen 7 7700X | |
| AMD Ryzen 7 7700X ECO 65 W | |
| AMD Ryzen 5 7600X | |
| Intel Core i9-12900K | |
| Intel Core i5-13600K | |
| Intel Core i5-12600K | |
| AMD Ryzen 9 5950X | |
| AMD Ryzen 9 5900X | |
| AMD Ryzen 7 5800X | |
| AMD Ryzen 5 5600X | |
| AMD Ryzen 7 5800X3D | |
| Multi-Core | |
| Intel Core i9-13900K | |
| AMD Ryzen 9 7950X | |
| AMD Ryzen 9 7950X ECO 105 W | |
| AMD Ryzen 9 7950X ECO 65 W | |
| AMD Ryzen 9 7900X | |
| Intel Core i9-12900K | |
| AMD Ryzen 9 5950X | |
| Intel Core i5-13600K | |
| AMD Ryzen 7 7700X | |
| AMD Ryzen 7 7700X ECO 65 W | |
| AMD Ryzen 9 5900X | |
| Intel Core i5-12600K | |
| AMD Ryzen 5 7600X | |
| AMD Ryzen 7 5800X | |
| AMD Ryzen 7 5800X3D | |
| AMD Ryzen 5 5600X | |
| HWBOT x265 Benchmark v2.2 - 4k Preset | |
| AMD Ryzen 9 7950X | |
| Intel Core i9-13900K | |
| AMD Ryzen 9 7950X ECO 105 W | |
| AMD Ryzen 9 7900X | |
| AMD Ryzen 9 7950X ECO 65 W | |
| AMD Ryzen 9 5950X | |
| Intel Core i5-12600K | |
| Intel Core i9-12900K | |
| Intel Core i5-13600K | |
| AMD Ryzen 7 7700X | |
| AMD Ryzen 9 5900X | |
| AMD Ryzen 7 7700X ECO 65 W | |
| AMD Ryzen 5 7600X | |
| AMD Ryzen 7 5800X | |
| AMD Ryzen 7 5800X3D | |
| AMD Ryzen 5 5600X | |
| R Benchmark 2.5 - Overall mean | |
| AMD Ryzen 7 5800X3D | |
| AMD Ryzen 5 5600X | |
| AMD Ryzen 9 5950X | |
| AMD Ryzen 9 5900X | |
| AMD Ryzen 7 5800X | |
| Intel Core i5-12600K | |
| Intel Core i9-12900K | |
| Intel Core i5-13600K | |
| AMD Ryzen 7 7700X ECO 65 W | |
| AMD Ryzen 9 7950X | |
| AMD Ryzen 9 7950X ECO 65 W | |
| AMD Ryzen 9 7950X ECO 105 W | |
| AMD Ryzen 7 7700X | |
| AMD Ryzen 5 7600X | |
| AMD Ryzen 9 7900X | |
| Intel Core i9-13900K | |
| LibreOffice - 20 Documents To PDF | |
| Intel Core i5-12600K | |
| AMD Ryzen 7 5800X3D | |
| AMD Ryzen 9 5900X | |
| AMD Ryzen 9 5950X | |
| AMD Ryzen 5 5600X | |
| AMD Ryzen 7 5800X | |
| Intel Core i9-12900K | |
| AMD Ryzen 5 7600X | |
| Intel Core i9-13900K | |
| AMD Ryzen 9 7950X | |
| Intel Core i5-13600K | |
| AMD Ryzen 9 7900X | |
| AMD Ryzen 7 7700X ECO 65 W | |
| AMD Ryzen 7 7700X | |
| AMD Ryzen 9 7950X ECO 65 W | |
| AMD Ryzen 9 7950X ECO 105 W | |
| The Witcher 3 - 1920x1080 Ultra Graphics & Postprocessing (HBAO+) | |
| AMD Ryzen 7 5800X3D | |
| AMD Ryzen 9 7900X | |
| AMD Ryzen 5 7600X | |
| Intel Core i5-13600K | |
| Intel Core i9-13900K | |
| AMD Ryzen 9 7950X ECO 105 W | |
| AMD Ryzen 9 7950X ECO 65 W | |
| AMD Ryzen 9 7950X | |
| AMD Ryzen 7 7700X | |
| AMD Ryzen 7 7700X ECO 65 W | |
| Intel Core i5-12600K | |
| AMD Ryzen 9 5900X | |
| AMD Ryzen 9 5950X | |
| AMD Ryzen 7 5800X | |
| AMD Ryzen 5 5600X | |
| Intel Core i9-12900K | |
* ... más pequeño es mejor
| Ryzen 7 7700X TDP | CB R15 Puntuación multinúcleo | Reloj de núcleo medio (GHz) | Reloj de núcleo máx. Core Clock (GHz) | Max. Potencia del paquete (W) | Temperatura máxima del núcleo (°C) Temperatura del núcleo (°C) |
|---|---|---|---|---|---|
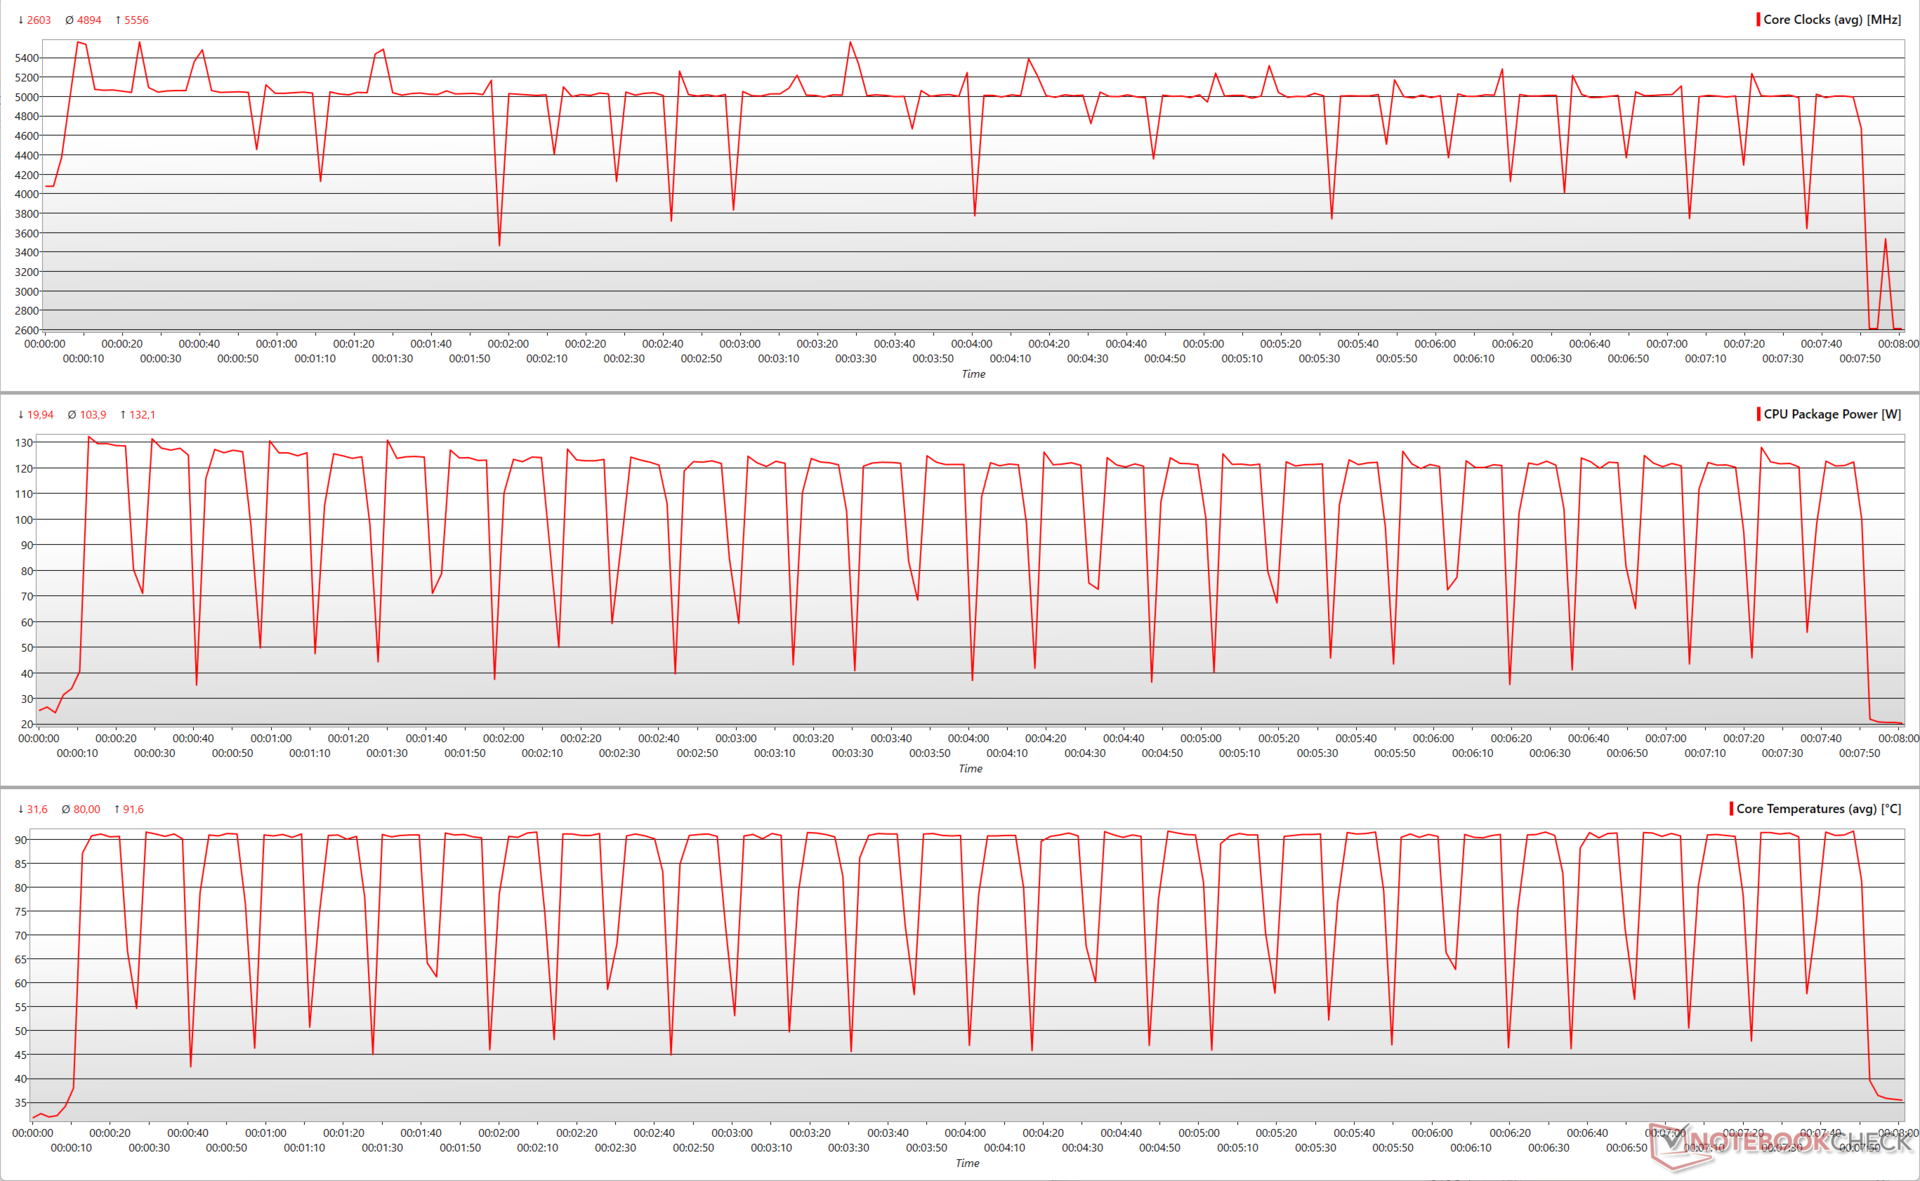
| 105 W | 3191 | 4,89 | 5,55 | 132,1 | 91,6 |
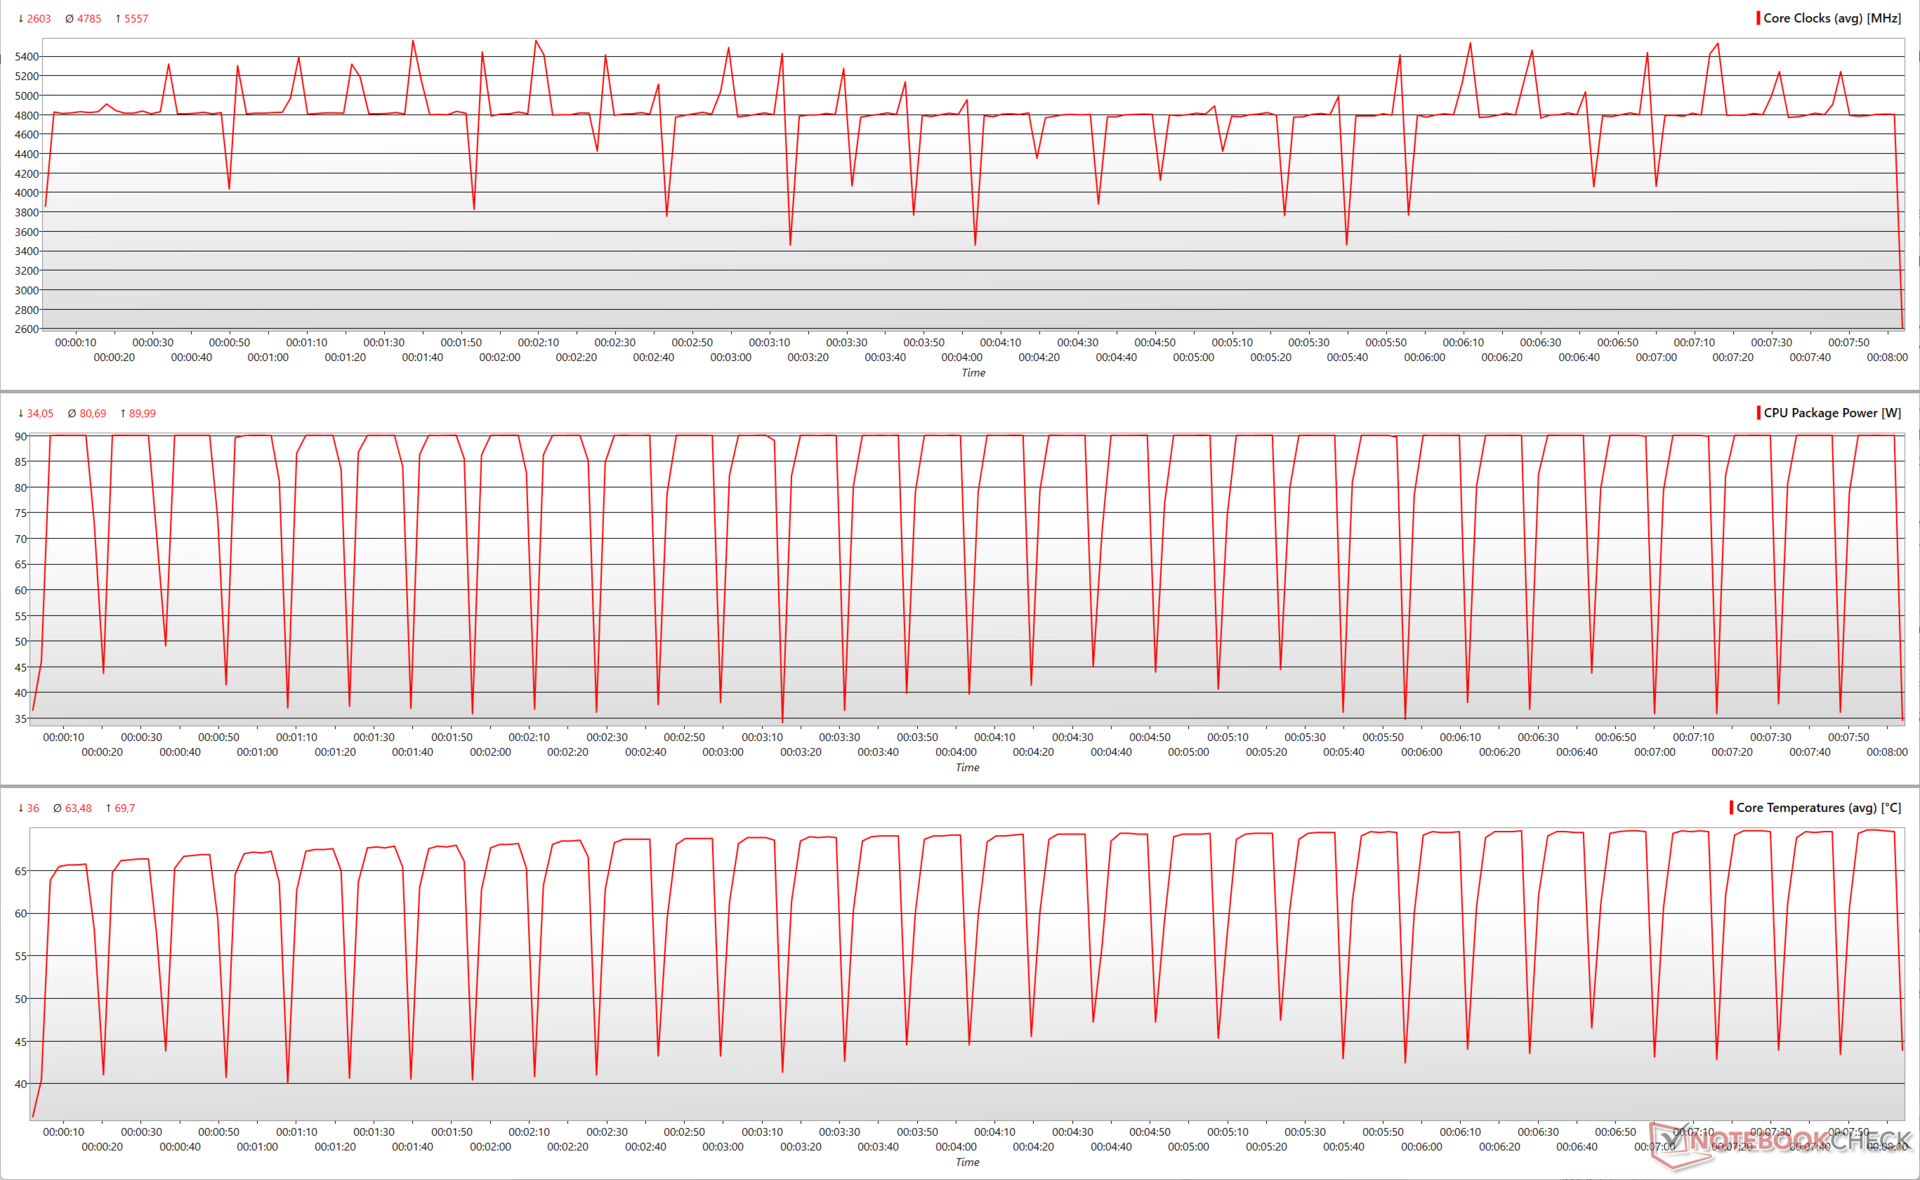
| 65 W | 3036 (-4,85%) | 4,78 (-2,24%) | 5,55 | 90 (-31,86%) | 69,7 (-23,9%) |
La reducción a 65 W desde los 105 W del Ryzen 7 7700X es menos drástica, con sólo una reducción cercana al 5% en las puntuaciones multinúcleo de Cinebench R15. Aunque vemos una ligera reducción en la velocidad media de los núcleos, la velocidad máxima sigue alcanzando los 5.55 GHz durante la ejecución
La temperatura máxima del núcleo a 65 W se acerca ahora a los 70 °C, lo que supone una reducción del 24% respecto a la configuración por defecto, que puede dar lugar a temperaturas cercanas a los 92 °C.
En conjunto, el Ryzen 7 7700X no pierde mucho si funciona a un TDP de 65 W. El Witcher 3 a 1080p Ultra vuelve a ver cuadros marginalmente más altos a 1080p Ultra, pero esto puede considerarse dentro del margen de error.
En general, el Ryzen 9 7950X a 65 W sigue siendo un 14% más rápido que un Core i9-12900K funcionando a un PL1=PL2 de 241 W, lo cual es una eficiencia excelente. En comparación con el Core i9-13900K, el Ryzen 9 7950X queda rezagado apenas un 5% con 105 W.
Del mismo modo, el Ryzen 7 7700X a 65 W prácticamente empata con el Ryzen 9 5950X funcionando con el TDP predeterminado de 105 W (142 W PL2), mientras que sólo es un 6% más lento que el Core i5-13600K predeterminado (125 W PL1, 181 W PL2).
Recomendamos ejecutar el Ryzen 9 7950X y el Ryzen 7 7700X en modo Eco a menos que necesites liberar toda la potencia bruta de estos procesadores para flujos de trabajo exigentes.
rendimiento en 3D y en juegos: Una competición reñida con los mejores de Intel
El Ryzen 9 7950X y el Ryzen 7 7700X muestran ligeros retrocesos en el rendimiento de la GPU en 3DMark en comparación con el Ryzen 5 7600X y el Ryzen 9 7900X. Sin embargo, el rendimiento está a la par con el del Core i5-13600K y el Core i9-13900K.
| Performance rating - Percent | |
| AMD Ryzen 5 7600X | |
| AMD Ryzen 9 7900X | |
| Intel Core i5-13600K | |
| Intel Core i9-13900K | |
| AMD Ryzen 9 7950X | |
| AMD Ryzen 7 7700X | |
| 3DMark | |
| 1920x1080 Fire Strike Graphics | |
| AMD Ryzen 5 7600X | |
| AMD Ryzen 9 7900X | |
| Intel Core i5-13600K | |
| Intel Core i9-13900K | |
| AMD Ryzen 9 7950X | |
| AMD Ryzen 7 7700X | |
| 2560x1440 Time Spy Graphics | |
| AMD Ryzen 9 7900X | |
| AMD Ryzen 5 7600X | |
| Intel Core i9-13900K | |
| Intel Core i5-13600K | |
| AMD Ryzen 7 7700X | |
| AMD Ryzen 9 7950X | |
| 3DMark 11 - 1280x720 Performance GPU | |
| AMD Ryzen 5 7600X | |
| AMD Ryzen 9 7900X | |
| Intel Core i5-13600K | |
| Intel Core i9-13900K | |
| AMD Ryzen 9 7950X | |
| AMD Ryzen 7 7700X | |
| 3DMark 11 Performance | 48825 puntos | |
| 3DMark Fire Strike Score | 42285 puntos | |
| 3DMark Time Spy Score | 18279 puntos | |
ayuda | ||
No es frecuente que las CPU de Intel y AMD compitan codo con codo en los juegos. Tanto el Ryzen 9 7950X como el Ryzen 7 7700X son excelentes CPUs para juegos, especialmente cuando se combinan con GPUs rápidas como la serie GeForce RTX 30 o la serie Radeon RX 6000 y superiores. La diferencia de rendimiento acumulado entre Intel Raptor Lake y las correspondientes CPUs AMD Zen 4 parece insignificante.
Dicho esto, los juegos individuales pueden favorecer a una plataforma sobre la otra. Por ejemplo, vemos que el Ryzen 9 7950X supera en un 21% al Core i9-13900K en Final Fantasy XV 1080p High, mientras que este último supera al 7950X en un 13% en Far Cry 5 a 1080p Ultra. El Ryzen 9 7900Xpor otro lado, aventaja al Ryzen 9 7950X en un 7% en The Witcher 3 a 1080p Ultra
En general, tanto el Ryzen 9 7950X como el Ryzen 7 7700X están a la par en juegos. Si eres principalmente un jugador, puedes ahorrar una buena cantidad de dinero optando por el Ryzen 7 7700X o incluso el Ryzen 5 7600X.
| Performance rating - Percent | |
| Intel Core i9-13900K | |
| AMD Ryzen 9 7900X | |
| AMD Ryzen 5 7600X | |
| Media de la clase Desktop | |
| AMD Ryzen 9 7950X | |
| AMD Ryzen 7 7700X | |
| Intel Core i5-13600K | |
| The Witcher 3 | |
| 1920x1080 Ultra Graphics & Postprocessing (HBAO+) | |
| Media de la clase Desktop (7.8 - 369, n=48, últimos 2 años) | |
| AMD Ryzen 9 7900X | |
| AMD Ryzen 5 7600X | |
| Intel Core i5-13600K | |
| Intel Core i9-13900K | |
| AMD Ryzen 9 7950X | |
| AMD Ryzen 7 7700X | |
| 1024x768 Low Graphics & Postprocessing | |
| AMD Ryzen 9 7900X | |
| Intel Core i9-13900K | |
| AMD Ryzen 7 7700X | |
| AMD Ryzen 5 7600X | |
| AMD Ryzen 9 7950X | |
| Media de la clase Desktop (39.3 - 841, n=30, últimos 2 años) | |
| Intel Core i5-13600K | |
| GTA V | |
| 1920x1080 Highest AA:4xMSAA + FX AF:16x | |
| Intel Core i9-13900K | |
| AMD Ryzen 9 7900X | |
| AMD Ryzen 7 7700X | |
| AMD Ryzen 9 7950X | |
| AMD Ryzen 5 7600X | |
| Intel Core i5-13600K | |
| Media de la clase Desktop (9.61 - 172.5, n=13, últimos 2 años) | |
| 1920x1080 Lowest Settings possible | |
| AMD Ryzen 9 7950X | |
| AMD Ryzen 7 7700X | |
| Intel Core i9-13900K | |
| Intel Core i5-13600K | |
| AMD Ryzen 9 7900X | |
| AMD Ryzen 5 7600X | |
| Media de la clase Desktop (61.3 - 188.2, n=13, últimos 2 años) | |
| Cyberpunk 2077 1.6 | |
| 3840x2160 Ultra Preset | |
| AMD Ryzen 9 7950X | |
| AMD Ryzen 7 7700X | |
| AMD Ryzen 9 7900X | |
| AMD Ryzen 5 7600X | |
| 2560x1440 Ultra Preset | |
| AMD Ryzen 9 7950X | |
| AMD Ryzen 7 7700X | |
| AMD Ryzen 9 7900X | |
| AMD Ryzen 5 7600X | |
| 1920x1080 Ultra Preset | |
| AMD Ryzen 9 7900X | |
| AMD Ryzen 7 7700X | |
| AMD Ryzen 9 7950X | |
| AMD Ryzen 5 7600X | |
| F1 22 | |
| 3840x2160 Ultra High Preset AA:T AF:16x | |
| Media de la clase Desktop (31.1 - 113.3, n=14, últimos 2 años) | |
| AMD Ryzen 5 7600X | |
| AMD Ryzen 9 7900X | |
| Intel Core i5-13600K | |
| AMD Ryzen 9 7950X | |
| AMD Ryzen 7 7700X | |
| Intel Core i9-13900K | |
| 2560x1440 Ultra High Preset AA:T AF:16x | |
| Media de la clase Desktop (64.1 - 194.3, n=14, últimos 2 años) | |
| AMD Ryzen 5 7600X | |
| Intel Core i5-13600K | |
| AMD Ryzen 7 7700X | |
| AMD Ryzen 9 7900X | |
| AMD Ryzen 9 7950X | |
| Intel Core i9-13900K | |
| 1920x1080 Ultra High Preset AA:T AF:16x | |
| Media de la clase Desktop (100.2 - 219, n=14, últimos 2 años) | |
| Intel Core i5-13600K | |
| AMD Ryzen 9 7950X | |
| AMD Ryzen 7 7700X | |
| AMD Ryzen 5 7600X | |
| AMD Ryzen 9 7900X | |
| Intel Core i9-13900K | |
| Far Cry 6 | |
| 3840x2160 Ultra Graphics Quality + HD Textures AA:T | |
| Media de la clase Desktop (31.7 - 190.9, n=16, últimos 2 años) | |
| Intel Core i9-13900K | |
| Intel Core i5-13600K | |
| AMD Ryzen 9 7950X | |
| AMD Ryzen 7 7700X | |
| 2560x1440 Ultra Graphics Quality + HD Textures AA:T | |
| Media de la clase Desktop (106.2 - 248, n=16, últimos 2 años) | |
| AMD Ryzen 9 7950X | |
| Intel Core i9-13900K | |
| Intel Core i5-13600K | |
| AMD Ryzen 7 7700X | |
| 1920x1080 Ultra Graphics Quality + HD Textures AA:T | |
| Media de la clase Desktop (134.7 - 254, n=16, últimos 2 años) | |
| Intel Core i9-13900K | |
| Intel Core i5-13600K | |
| AMD Ryzen 9 7950X | |
| AMD Ryzen 7 7700X | |
| Borderlands 3 | |
| 3840x2160 Badass Overall Quality (DX11) | |
| Media de la clase Desktop (76.7 - 168, n=13, últimos 2 años) | |
| AMD Ryzen 9 7900X | |
| AMD Ryzen 5 7600X | |
| Intel Core i5-13600K | |
| Intel Core i9-13900K | |
| AMD Ryzen 9 7950X | |
| AMD Ryzen 7 7700X | |
| 2560x1440 Badass Overall Quality (DX11) | |
| Media de la clase Desktop (129.5 - 223, n=13, últimos 2 años) | |
| AMD Ryzen 9 7900X | |
| AMD Ryzen 5 7600X | |
| Intel Core i9-13900K | |
| Intel Core i5-13600K | |
| AMD Ryzen 9 7950X | |
| AMD Ryzen 7 7700X | |
| 1920x1080 Badass Overall Quality (DX11) | |
| Media de la clase Desktop (6.4 - 248, n=14, últimos 2 años) | |
| AMD Ryzen 9 7900X | |
| Intel Core i9-13900K | |
| AMD Ryzen 5 7600X | |
| Intel Core i5-13600K | |
| AMD Ryzen 9 7950X | |
| AMD Ryzen 7 7700X | |
AMD Ryzen 9 7950X with Nvidia GeForce RTX 3090
| bajo | medio | alto | ultra | QHD | 4K | |
|---|---|---|---|---|---|---|
| GTA V (2015) | 187.8 | 187.8 | 187.3 | 155.4 | 150.1 | 181.9 |
| The Witcher 3 (2015) | 703 | 551 | 358 | 175.2 | 150.9 | |
| Dota 2 Reborn (2015) | 293.2 | 259.3 | 248.5 | 222.3 | 208.1 | |
| Final Fantasy XV Benchmark (2018) | 235 | 229 | 229 | 142.4 | 86.8 | |
| X-Plane 11.11 (2018) | 216 | 187.9 | 141 | 122.5 | ||
| Far Cry 5 (2018) | 216 | 196 | 189 | 176 | 169 | 105 |
| Strange Brigade (2018) | 694 | 503 | 404 | 351 | 265 | 158.1 |
| Shadow of the Tomb Raider (2018) | 304 | 255 | 247 | 232 | 169 | 96 |
| Far Cry New Dawn (2019) | 176 | 160 | 156 | 142 | 139 | 105 |
| Metro Exodus (2019) | 281 | 215 | 170.4 | 137 | 112.5 | 73.5 |
| Borderlands 3 (2019) | 219 | 201 | 179.4 | 156.3 | 126.3 | 72.6 |
| F1 2021 (2021) | 619 | 542 | 436 | 225 | 172.8 | 101.8 |
| Far Cry 6 (2021) | 205 | 189 | 169 | 151 | 134 | 84 |
| Forza Horizon 5 (2021) | 337 | 223 | 202 | 129 | 114 | 84 |
| Cyberpunk 2077 1.6 (2022) | 209 | 175.6 | 149.8 | 137.5 | 93.1 | 46.5 |
| Tiny Tina's Wonderlands (2022) | 349 | 289 | 209 | 165.9 | 122 | 69 |
| F1 22 (2022) | 412 | 424 | 355 | 127.9 | 83.3 | 42 |
AMD Ryzen 7 7700X with Nvidia GeForce RTX 3090
| bajo | medio | alto | ultra | QHD | 4K | |
|---|---|---|---|---|---|---|
| GTA V (2015) | 187.8 | 187.6 | 186.4 | 155.8 | 148.3 | 180 |
| The Witcher 3 (2015) | 726 | 529 | 344 | 172.4 | 148.3 | |
| Dota 2 Reborn (2015) | 292.3 | 256.4 | 249.8 | 231.1 | 203.5 | |
| Final Fantasy XV Benchmark (2018) | 237 | 237 | 178.3 | 138.4 | 84.3 | |
| X-Plane 11.11 (2018) | 224 | 190.7 | 145.9 | 124 | ||
| Far Cry 5 (2018) | 233 | 201 | 194 | 177 | 168 | 104 |
| Strange Brigade (2018) | 797 | 509 | 404 | 352 | 263 | 157.6 |
| Shadow of the Tomb Raider (2018) | 307 | 252 | 240 | 223 | 168 | 96 |
| Far Cry New Dawn (2019) | 192 | 169 | 162 | 144 | 138 | 104 |
| Metro Exodus (2019) | 317 | 219 | 171.6 | 136.6 | 112.1 | 73.3 |
| Borderlands 3 (2019) | 230 | 197.3 | 174.9 | 153 | 122.6 | 70.3 |
| F1 2021 (2021) | 663 | 543 | 453 | 222 | 169.3 | 101.1 |
| Far Cry 6 (2021) | 196 | 183 | 163 | 149 | 127 | 82 |
| Forza Horizon 5 (2021) | 295 | 205 | 193 | 129 | 114 | 84 |
| Cyberpunk 2077 1.6 (2022) | 205 | 172.1 | 151.3 | 137.7 | 92.8 | 46.2 |
| Tiny Tina's Wonderlands (2022) | 359 | 287 | 204 | 161.8 | 118.8 | 67.5 |
| F1 22 (2022) | 400 | 415 | 352 | 127.2 | 83.9 | 42 |
Consumo de energía: Aumento sustancial de la eficiencia multinúcleo en modo Eco
El Zen 4 de AMD 'Raphael' parece ser bastante eficiente en cuanto a energía en comparación con la competencia de Raptor Lake. El consumo total del sistema en la prueba multinúcleo de Cinebench R15 con el sistema basado en Ryzen 9 7950X es un 24% menor en comparación con el PC con Core i9-13900K, aunque también es un 12% mayor en comparación con el Core i9-12900K.
La configuración basada en el Ryzen 7 7700X consume un 16% menos de energía en Cinebench R15 multinúcleo en comparación con el Core i5-13600K y es más o menos similar a un sistema alimentado por el Ryzen 9 5900X.
El modo Eco también ayuda a conseguir un aumento significativo de la eficiencia energética. En el caso del Ryzen 9 7950X, las ejecuciones de 105 W y 65 W son un 29% y un 47% más eficientes, respectivamente, que el TDP de 170 W por defecto en Cinebench R15 multi-core.
Del mismo modo, el Ryzen 7700X de 65 W puede permitirse una eficiencia un 17% mayor en el mismo benchmark en comparación con el TDP operativo de 105 W por defecto de la CPU.
Dado que el rendimiento de un solo núcleo no se ve relativamente afectado por el cambio de TDP, no parece haber ninguna ventaja perceptible en cuanto a la eficiencia para los juegos, como se ve en las tablas de eficiencia de The Witcher 3 1080p Ultra. Dicho esto, el funcionamiento de estos chips con un TDP más bajo da lugar a una reducción del consumo de energía en general.
Power Consumption: External Monitor
| Power Consumption / Cinebench R15 Multi Efficiency (external Monitor) | |
| AMD Ryzen 9 7950X ECO 65 W, NVIDIA GeForce RTX 3090 | |
| Media de la clase Desktop (13.7 - 41.2, n=14, últimos 2 años) | |
| AMD Ryzen 9 7950X ECO 105 W, NVIDIA GeForce RTX 3090 | |
| AMD Ryzen 9 5950X, NVIDIA Titan RTX | |
| AMD Ryzen 9 7950X, NVIDIA GeForce RTX 3090 | |
| Medio NVIDIA GeForce RTX 3090 (11.7 - 25.2, n=13) | |
| AMD Ryzen 9 5900X, NVIDIA Titan RTX | |
| AMD Ryzen 9 7900X, NVIDIA GeForce RTX 3090 | |
| AMD Ryzen 7 7700X ECO 65 W, NVIDIA GeForce RTX 3090 | |
| AMD Ryzen 7 7700X, NVIDIA GeForce RTX 3090 | |
| Intel Core i9-13900K, NVIDIA GeForce RTX 3090 | |
| Intel Core i5-13600K, NVIDIA GeForce RTX 3090 | |
| Intel Core i9-12900K, NVIDIA Titan RTX | |
| Intel Core i5-12600K, NVIDIA Titan RTX | |
| AMD Ryzen 7 5800X, NVIDIA Titan RTX | |
| AMD Ryzen 5 7600X, NVIDIA GeForce RTX 3090 | |
| AMD Ryzen 5 5600X, NVIDIA Titan RTX | |
| AMD Ryzen 7 5800X3D, NVIDIA GeForce RTX 3090 Ti | |
| Power Consumption / Witcher 3 ultra Efficiency (external Monitor) | |
| Media de la clase Desktop (0.113 - 0.653, n=44, últimos 2 años) | |
| Intel Core i5-13600K, NVIDIA GeForce RTX 3090 | |
| AMD Ryzen 5 7600X, NVIDIA GeForce RTX 3090 | |
| Intel Core i5-12600K, NVIDIA Titan RTX | |
| Medio NVIDIA GeForce RTX 3090 (0.268 - 0.3954, n=15) | |
| AMD Ryzen 7 5800X3D, NVIDIA GeForce RTX 3090 Ti | |
| AMD Ryzen 5 5600X, NVIDIA Titan RTX | |
| AMD Ryzen 9 7900X, NVIDIA GeForce RTX 3090 | |
| Intel Core i9-13900K, NVIDIA GeForce RTX 3090 | |
| AMD Ryzen 7 7700X, NVIDIA GeForce RTX 3090 | |
| AMD Ryzen 7 5800X, NVIDIA Titan RTX | |
| AMD Ryzen 9 7950X ECO 105 W, NVIDIA GeForce RTX 3090 | |
| AMD Ryzen 9 7950X ECO 65 W, NVIDIA GeForce RTX 3090 | |
| AMD Ryzen 9 7950X, NVIDIA GeForce RTX 3090 | |
| AMD Ryzen 7 7700X ECO 65 W, NVIDIA GeForce RTX 3090 | |
| AMD Ryzen 9 5900X, NVIDIA Titan RTX | |
| AMD Ryzen 9 5950X, NVIDIA Titan RTX | |
| Intel Core i9-12900K, NVIDIA Titan RTX | |
* ... más pequeño es mejor
Pro
Contra
Veredicto: No te puedes equivocar con el Zen 4

2022 ha resultado ser un año muy interesante para los entusiastas del PC. Hemos visto a Nvidia y AMD presentar sus arquitecturas de GPU Ada Lovelace y RDNA 3, mientras que Intel y AMD se enfrentan con sus líneas Raptor Lake y Zen 4 Raphael.
El AMD Ryzen 9 7950X es una opción convincente para quien busque una CPU de sobremesa insignia que potencie sus proyectos creativos y no suponga un cuello de botella en los juegos. El Ryzen 9 7950X rinde a la par que el Core i9-13900K en las pruebas generales de CPU. Individualmente, algunas pruebas favorecen al buque insignia Raptor Lake, pero las diferencias no son tan drásticas como para ser percibidas en el mundo real.
Comparativamente, el Ryzen 7 7700X queda por detrás del Ryzen 9 7950X en un 25%. Sin embargo, este chip de 8C/16T puede rendir mejor que un Core i5-13600K o incluso un Core i9-12900Klo que merece ser apreciado.
El AMD Ryzen 9 7950X y el Ryzen 7 7700X presentan una mejora sustancial respecto a Zen 3 y garantizan que las ofertas de Raptor Lake de Intel no queden sin respuesta. La opción de aprovechar el modo Eco sin penalizaciones significativas de rendimiento es la guinda del pastel."
Tanto el Ryzen 9 7950X como el Ryzen 7 7700X son excelentes para la productividad general. El Ryzen 9 7950X parece ser una mejor opción en comparación con el Core i9-13900K, si su flujo de trabajo incluye una gran cantidad de matemáticas en coma flotante, como lo demuestran nuestras pruebas AIDA64.
El modo Eco es quizás el mejor punto de venta de esta generación de CPUs AMD. El hecho de que puedas obtener una ganancia bastante significativa con un Ryzen 9 7950X de 65 W sobre un Core i9-12900K de 241 W no es nada para burlarse. Los usuarios que busquen una mayor eficiencia energética para los flujos de trabajo menos exigentes encontrarán que el funcionamiento del Ryzen 9 7950X a 65 W puede ser hasta un 47% más eficiente que con los ajustes de fábrica.
El Ryzen 7 7700X ya es un chip bastante eficiente por sí mismo, pero reducir el TDP a 65 W sigue suponiendo un ahorro de energía palpable. Los jugadores no tienen que preocuparse por perder mucho rendimiento con TDPs más bajos, ya que el rendimiento de un solo núcleo no se ve afectado.
El zócalo AM4 ha sido sustituido por la nueva plataforma AM5, que trae consigo soporte nativo para DDR5 y PCIe Gen 5. A diferencia de Intel, AMD ha optado por hacer de AM5 una plataforma exclusiva para DDR5. La DDR5 tiene un precio elevado por ahora, y pasará un tiempo antes de que el precio se estabilice y sea comparable al de la DDR4.
También hay que tener en cuenta el coste de la actualización de la placa base: las placas base X670 suelen rondar los 400 dólares, y los modelos X670E más cargados llegan a superar los 1.200 dólares sólo por la placa. La buena noticia, sin embargo, es que lo más probable es que tu actual sistema de refrigeración se adapte y que la plataforma sea compatible al menos hasta 2025.
Con el Ryzen 9 7950X y el Ryzen 7 7700X, y también con el Ryzen 9 7900X y Ryzen 5 7600XaMD ha disipado los temores de que los chips Zen 4 "Raphael" no estén a la altura de los Raptor Lake de Intel. Zen 4 presenta una actualización convincente, a pesar de la inversión inicial en la plataforma AM5.
La inminente llegada de los Ryzen 7000 X3D en los próximos meses presenta una perspectiva aún más atractiva, y sólo puede mejorar a partir de aquí.
Precio y disponibilidad
Intel parece tener una ventaja con los precios de lanzamiento esta vez. El Core i9-13900K se lanzó a 589 dólares, pero actualmente se vende a 660 dólares. El AMD Ryzen 9 7950X, por otro lado, se lanzó a 699 dólares, pero ahora puedes conseguir el monstruo de 16C/32T por 574 dólares en Best Buy y Newegg. El precio en la tienda Amazon USsin embargo, parece haber aumentado a 748 dólares
En la India, el Ryzen 9 7950X se lanzó con un precio de venta al público de 67.999 euros, pero ahora está disponible por 62.749 euros en Amazon India y por unos ₹58.000 en otros minoristas.
El AMD Ryzen 7 7700X también está disponible a un precio reducido de 350 dólares en Best Buy y Newegg. En la India, la CPU tenía un precio de lanzamiento de ₹39.499, pero puede conseguirse por unos ₹34.000 en Amazon India y otras tiendas.
Price comparison

