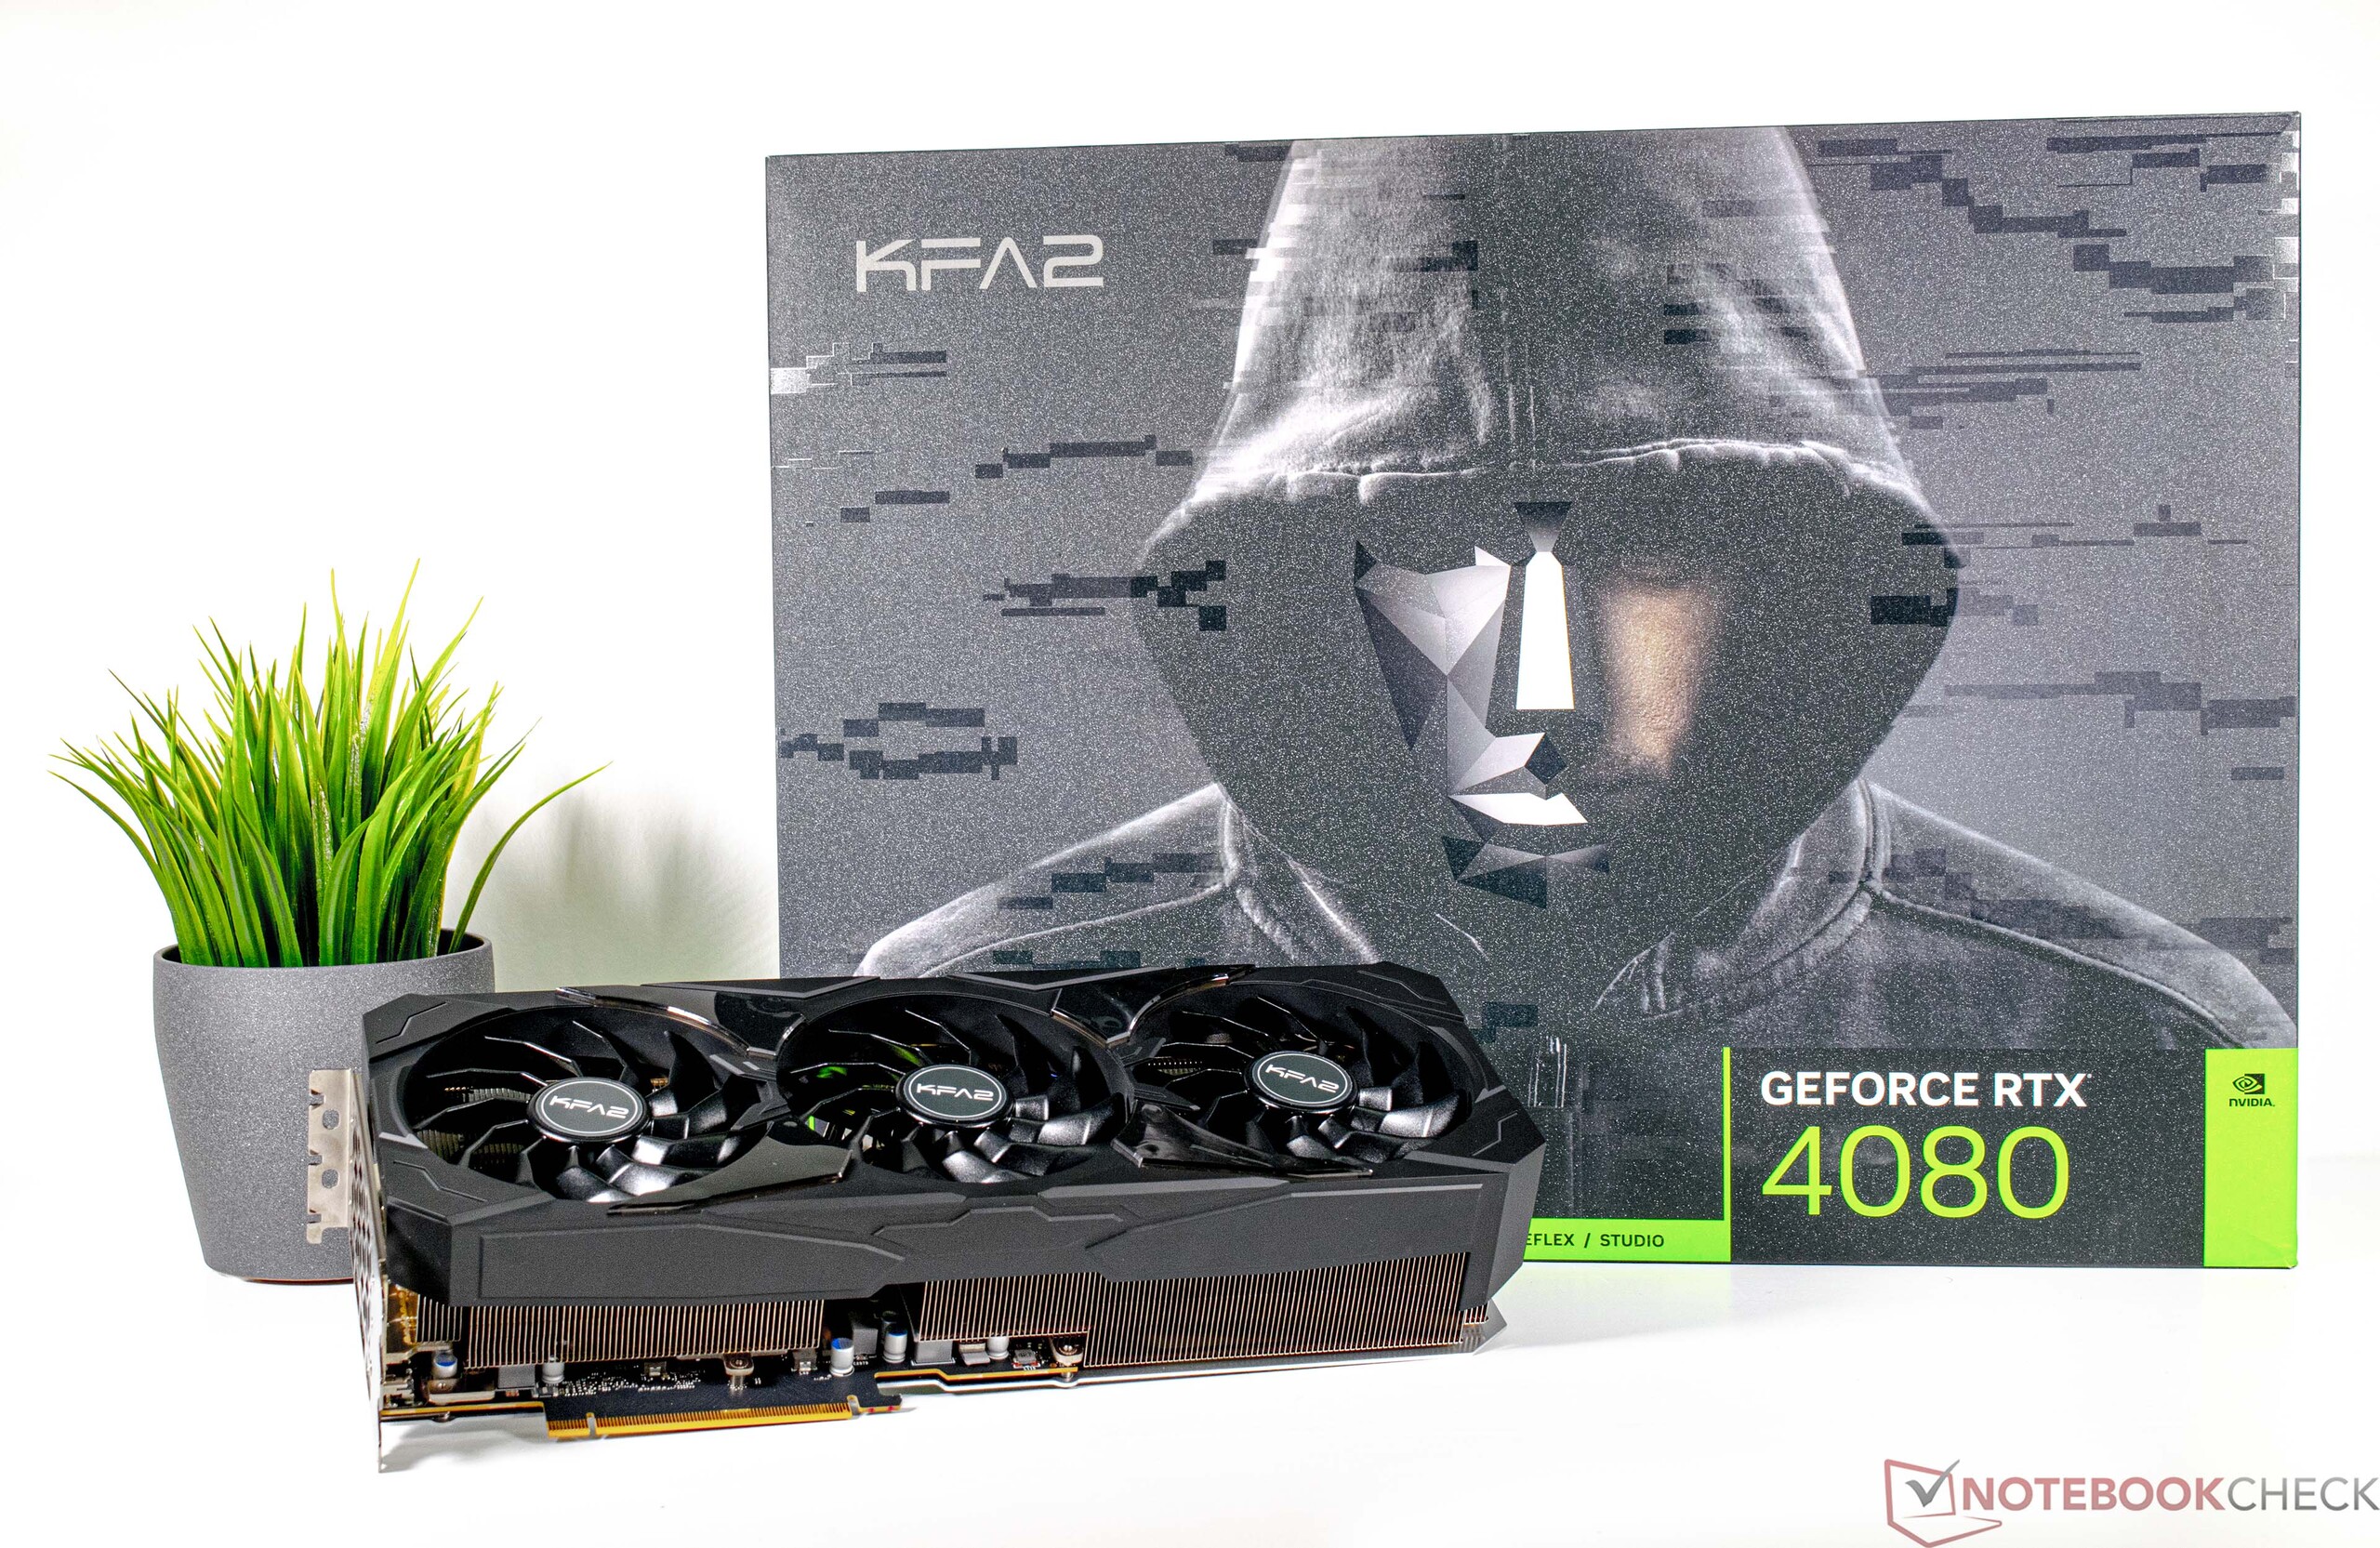
KFA2 GeForce Análisis de la GPU de sobremesa RTX 4080 SG: Un gran rendimiento a un precio cuestionable

Después de que recientemente revisáramos la KFA2 GeForce RTX 4090 SGha llegado el momento de que la más pequeña KFA2 GeForce RTX 4080 SG muestre lo que tiene bajo el capó. A diferencia de la gama Ampere, el segundo modelo más rápido de la generación actual se basa en un chip gráfico distinto al del modelo de gama alta. Utiliza la GPU AD103, que es sustancialmente más pequeña y, por tanto, más barata de producir que la AD102. Sin embargo, el menor coste de producción no se refleja plenamente en el precio actual. Este es un tema ampliamente debatido, y nosotros también creemos que los precios deben reducirse significativamente para que las últimas tarjetas gráficas no acaben convirtiéndose en calentadores de estanterías. El PVP de la GeForce RTX 4080 se ha más que duplicado en comparación con su predecesora (GeForce RTX 3080). Por el momento vamos a dejar aquí nuestra crítica a los precios. A partir de ahora, nos centraremos en el rendimiento y las características de la KFA2 GeForce RTX 4080 SG y hablaremos de lo bien que se comporta este modelo, especialmente en comparación con Las GPU RDNA3 de AMD.
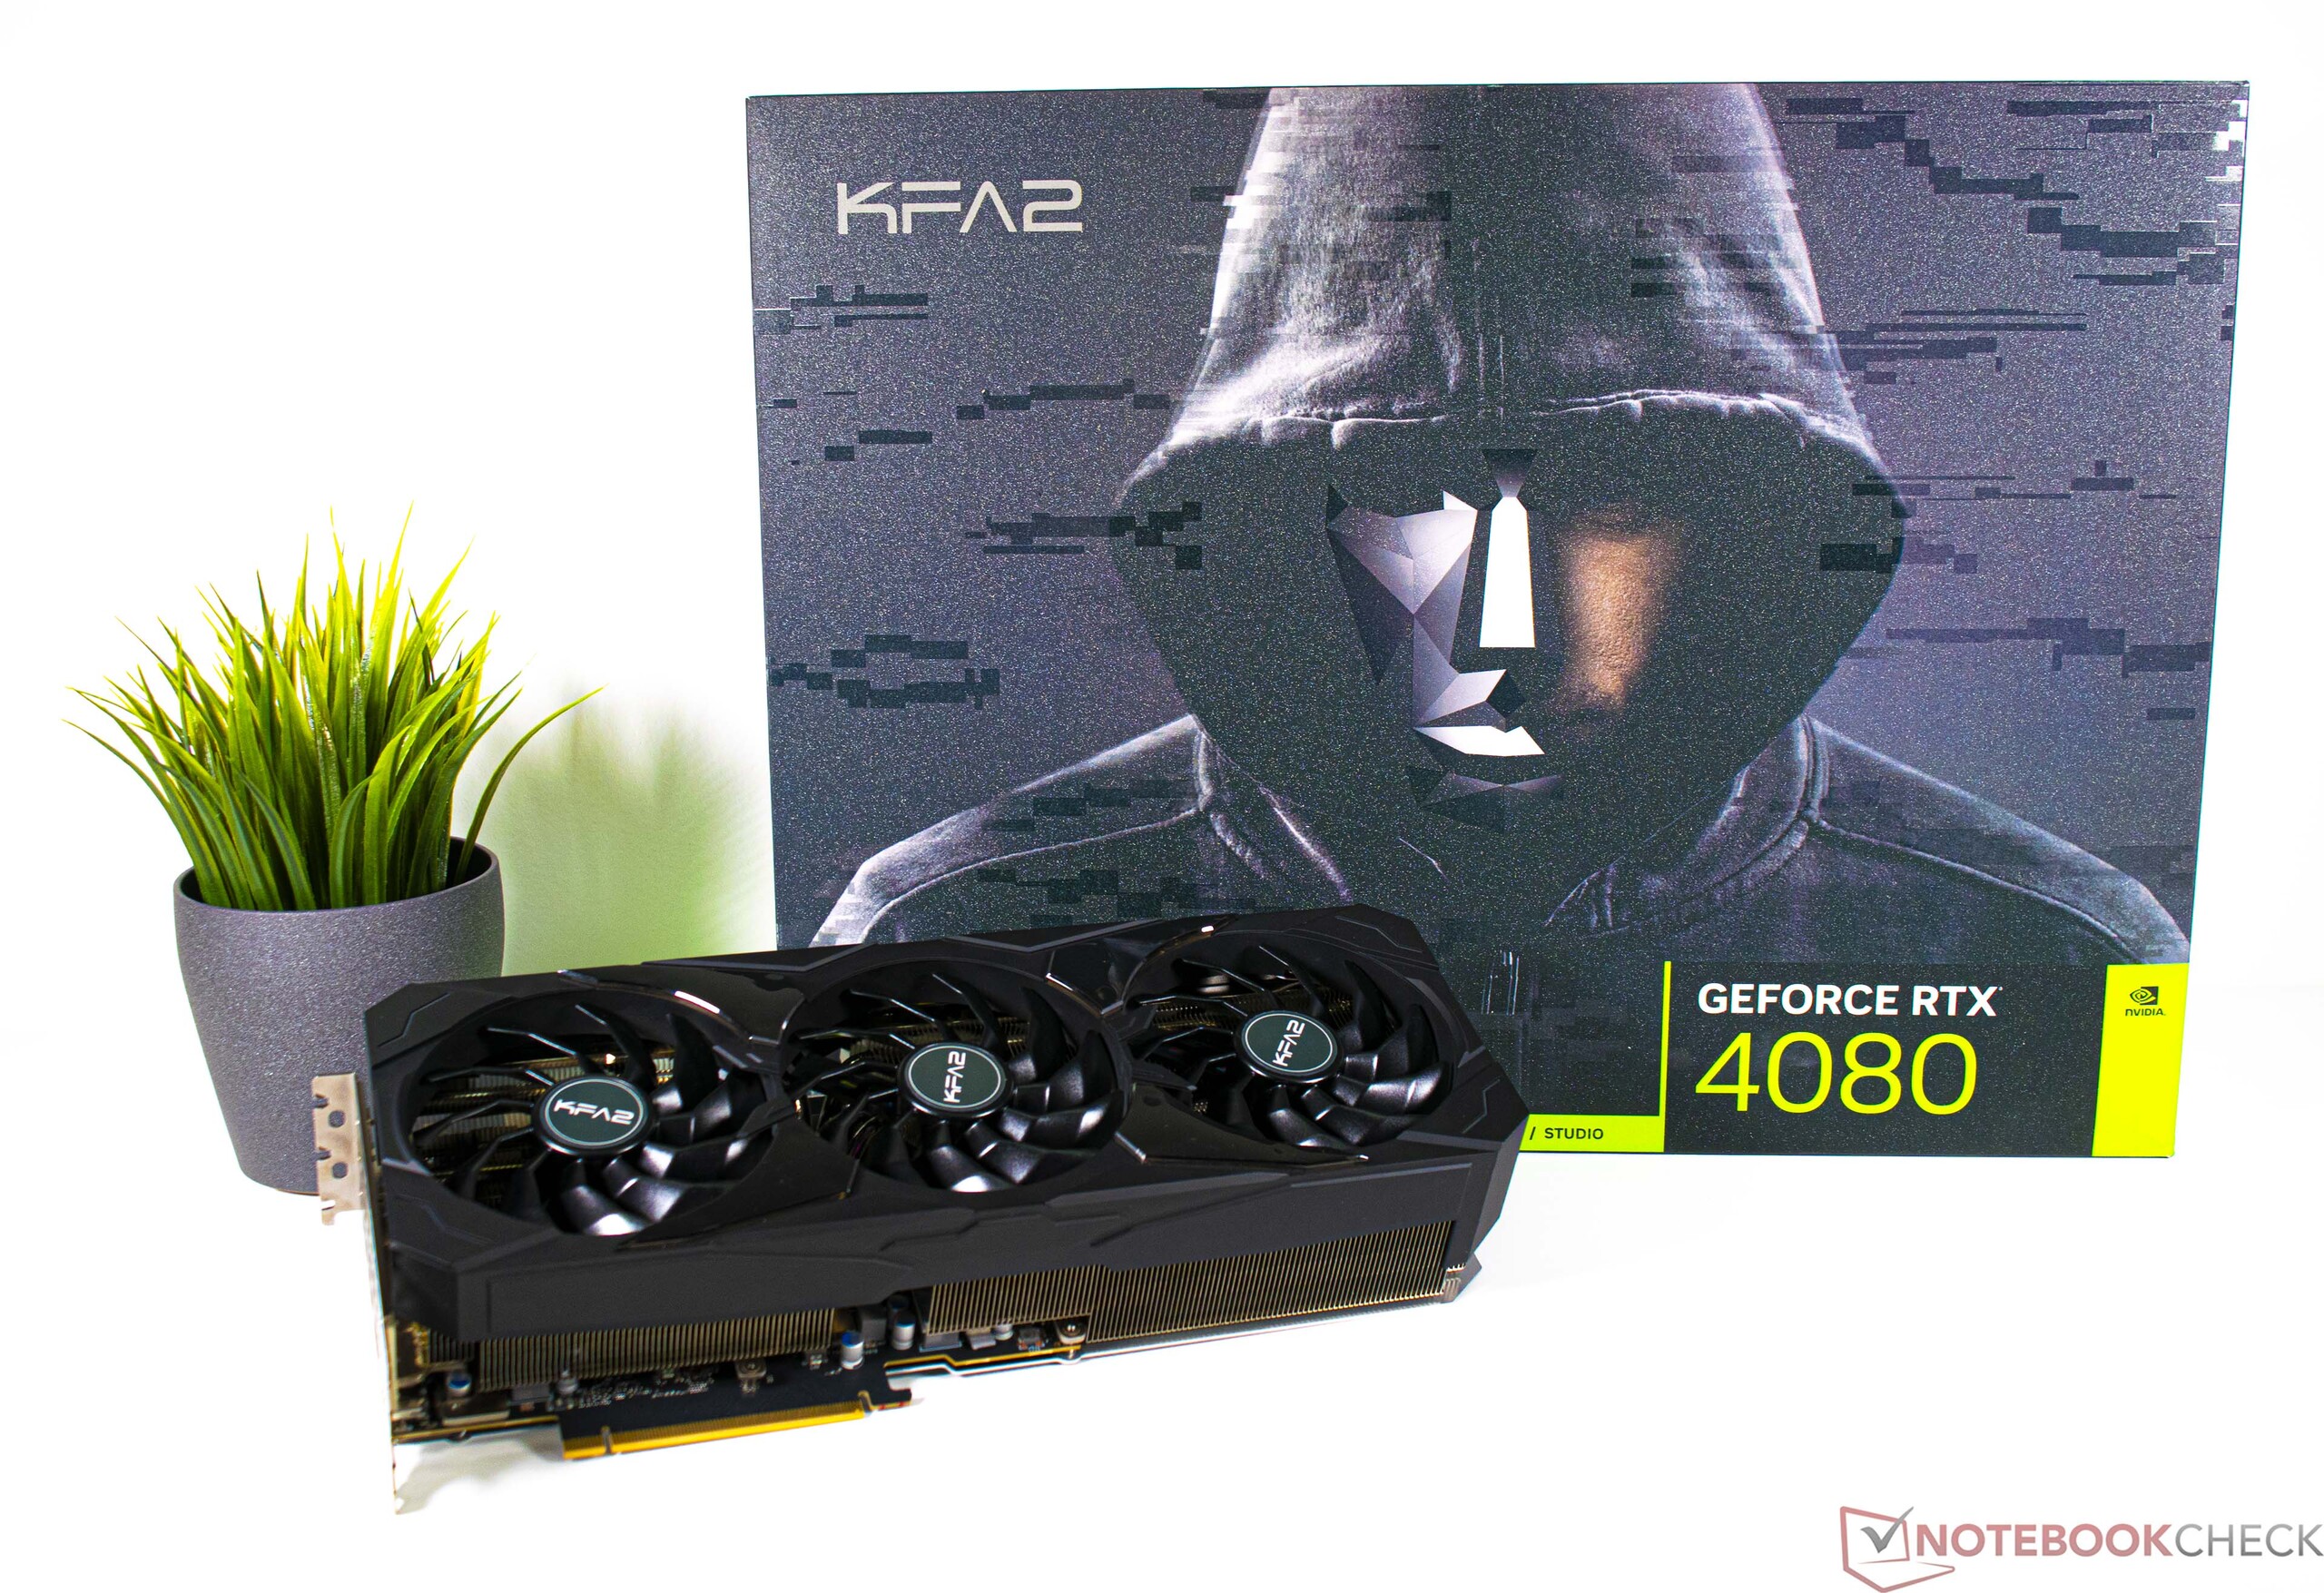
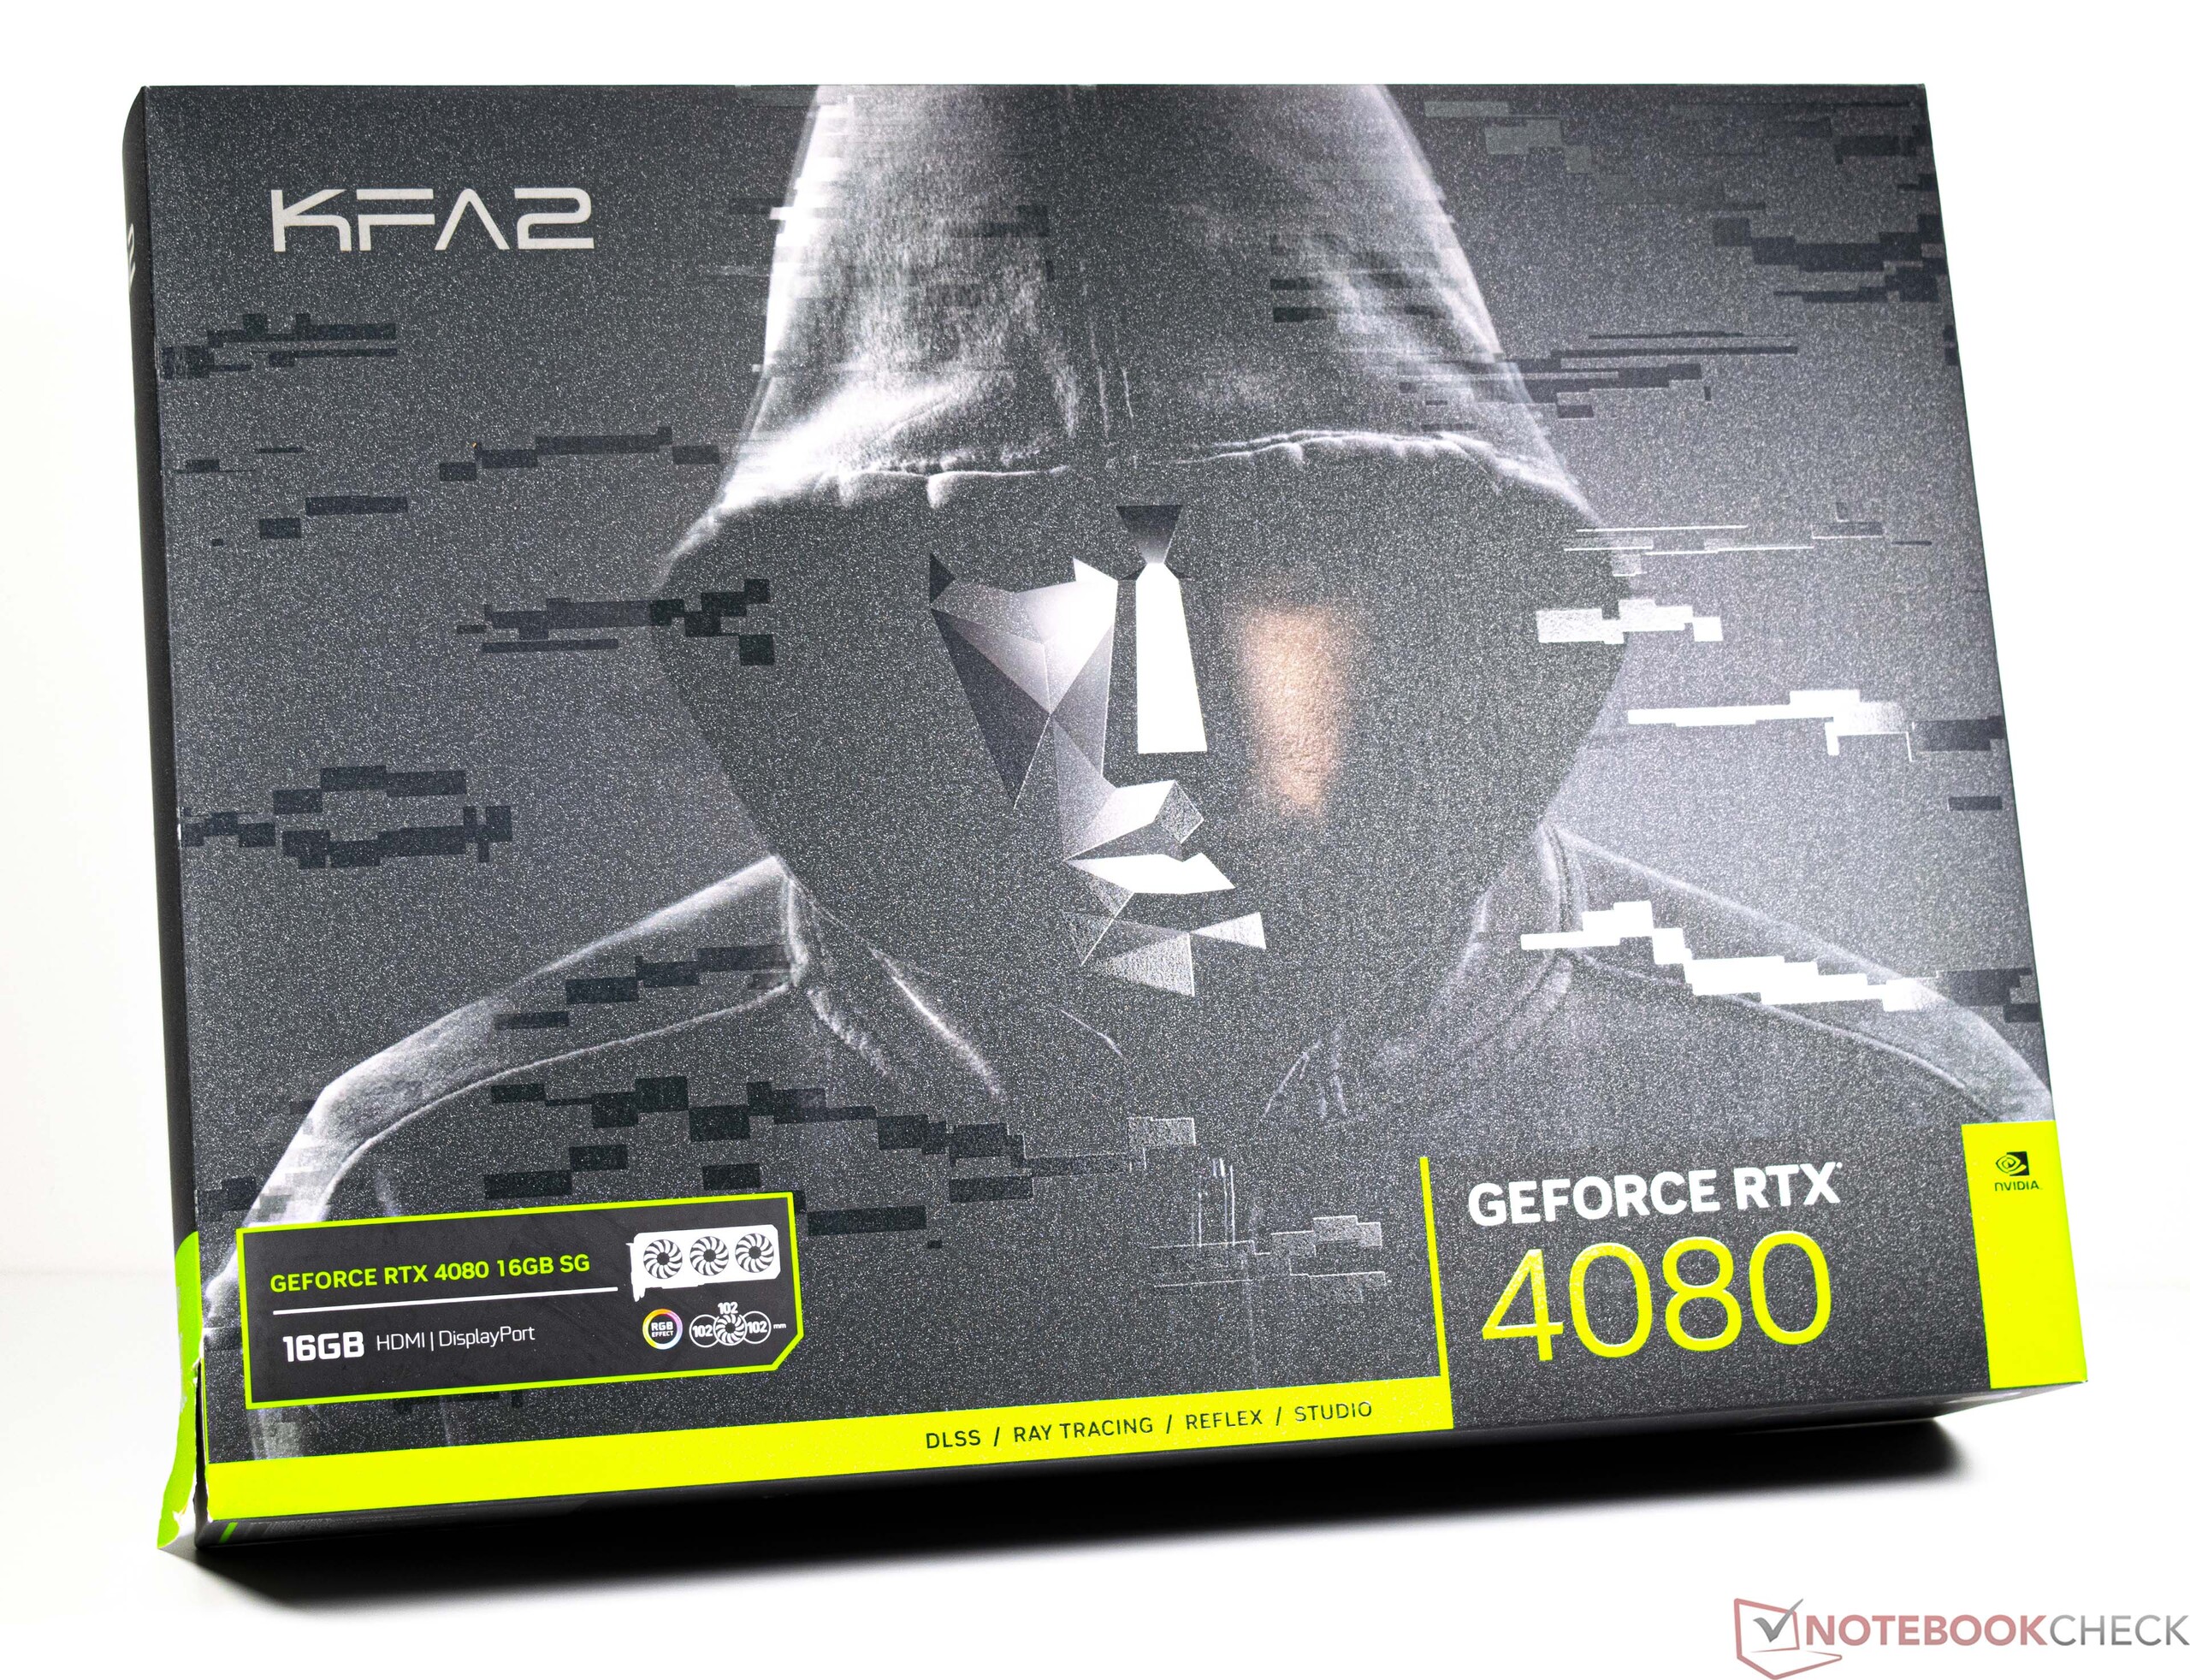
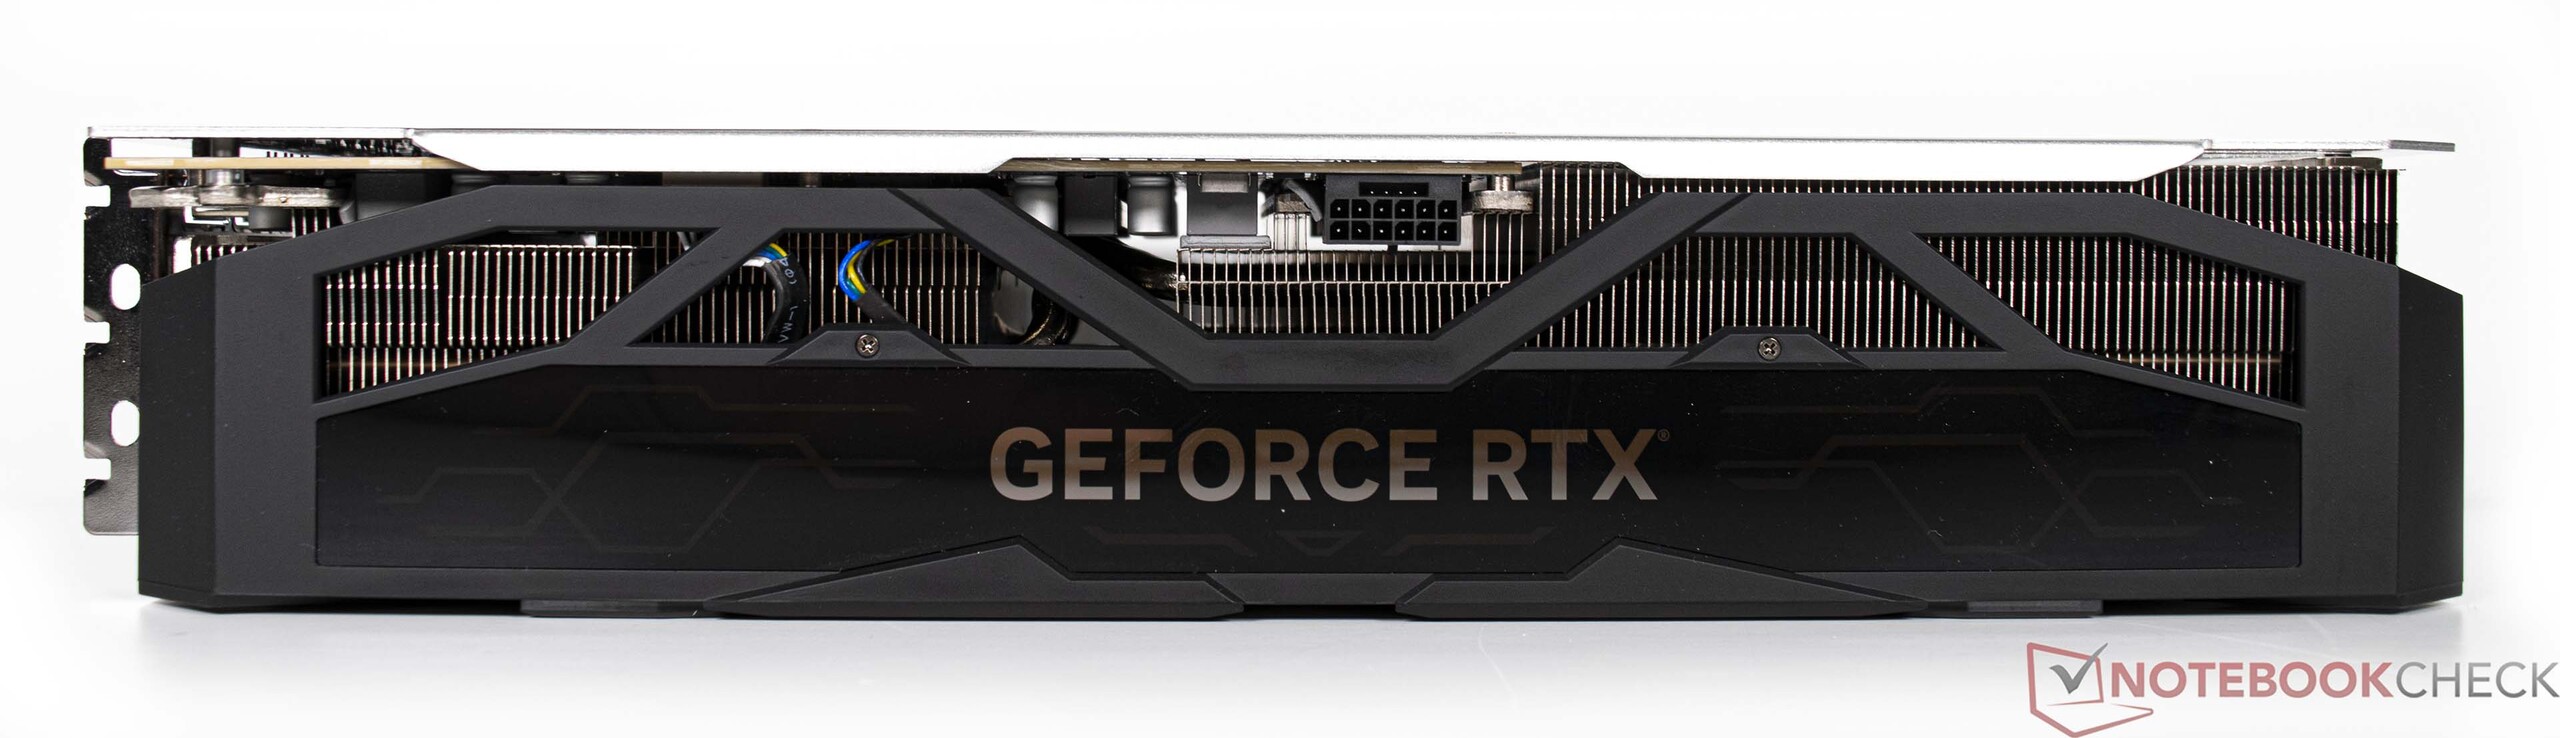
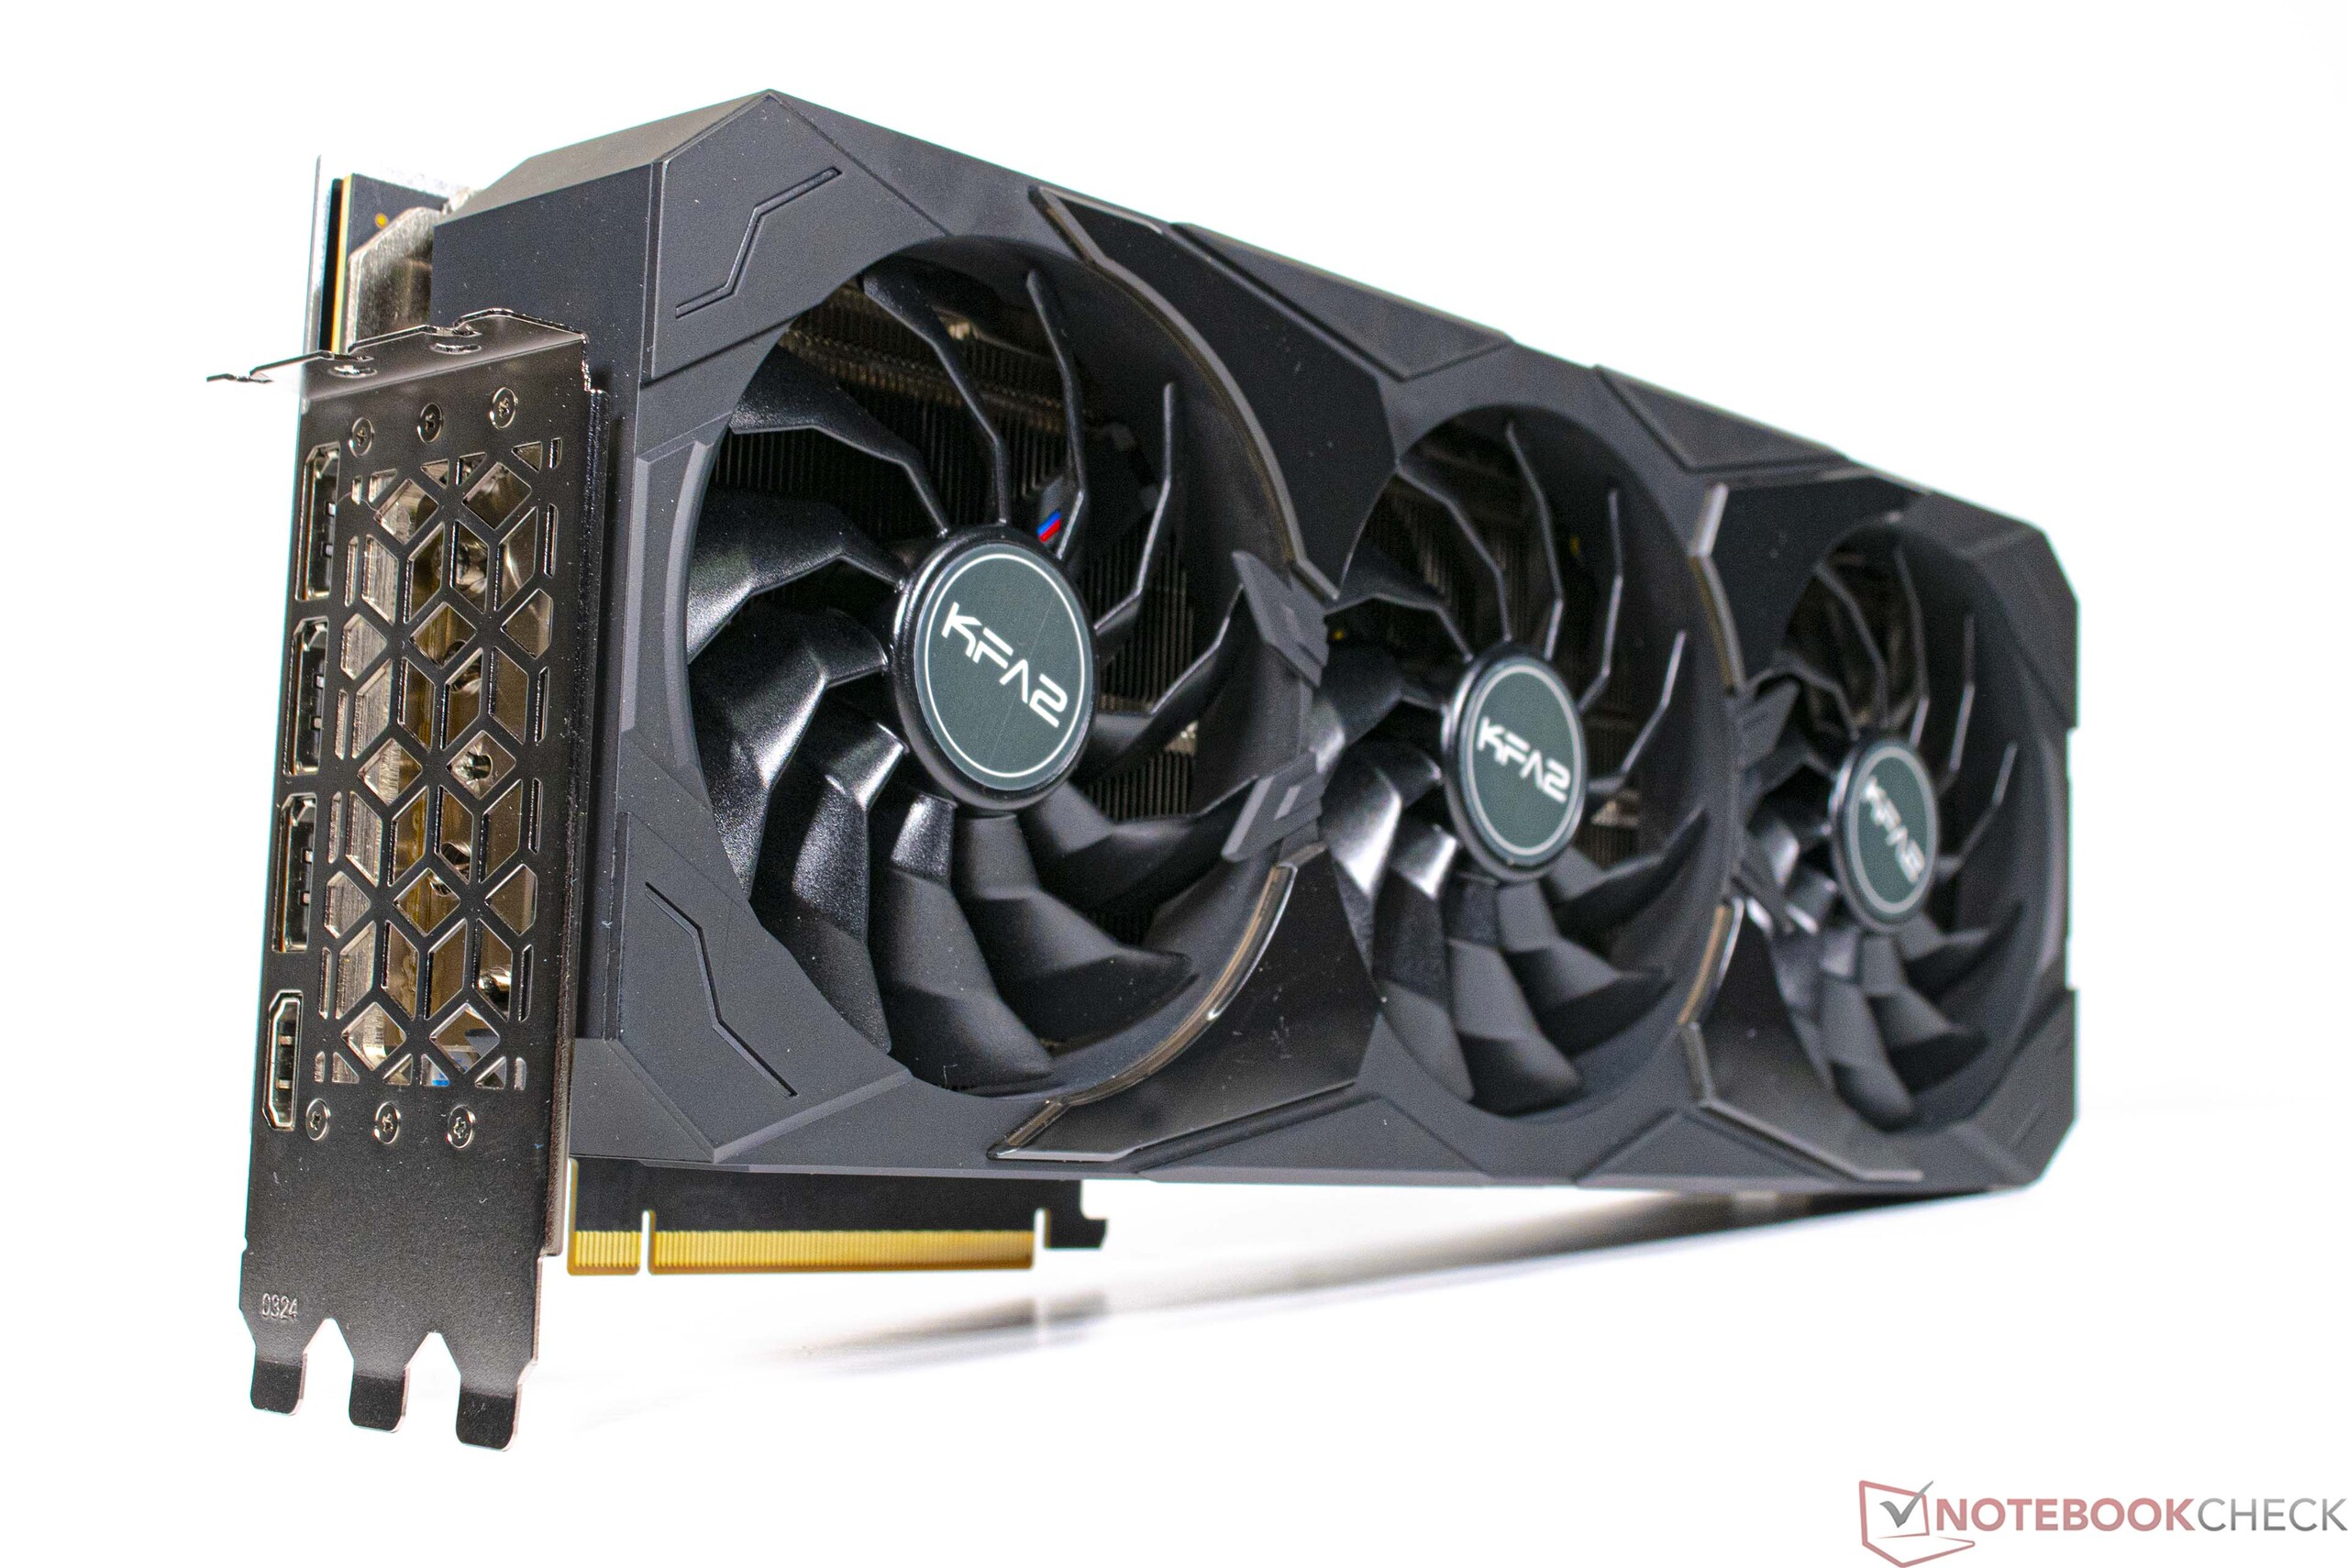
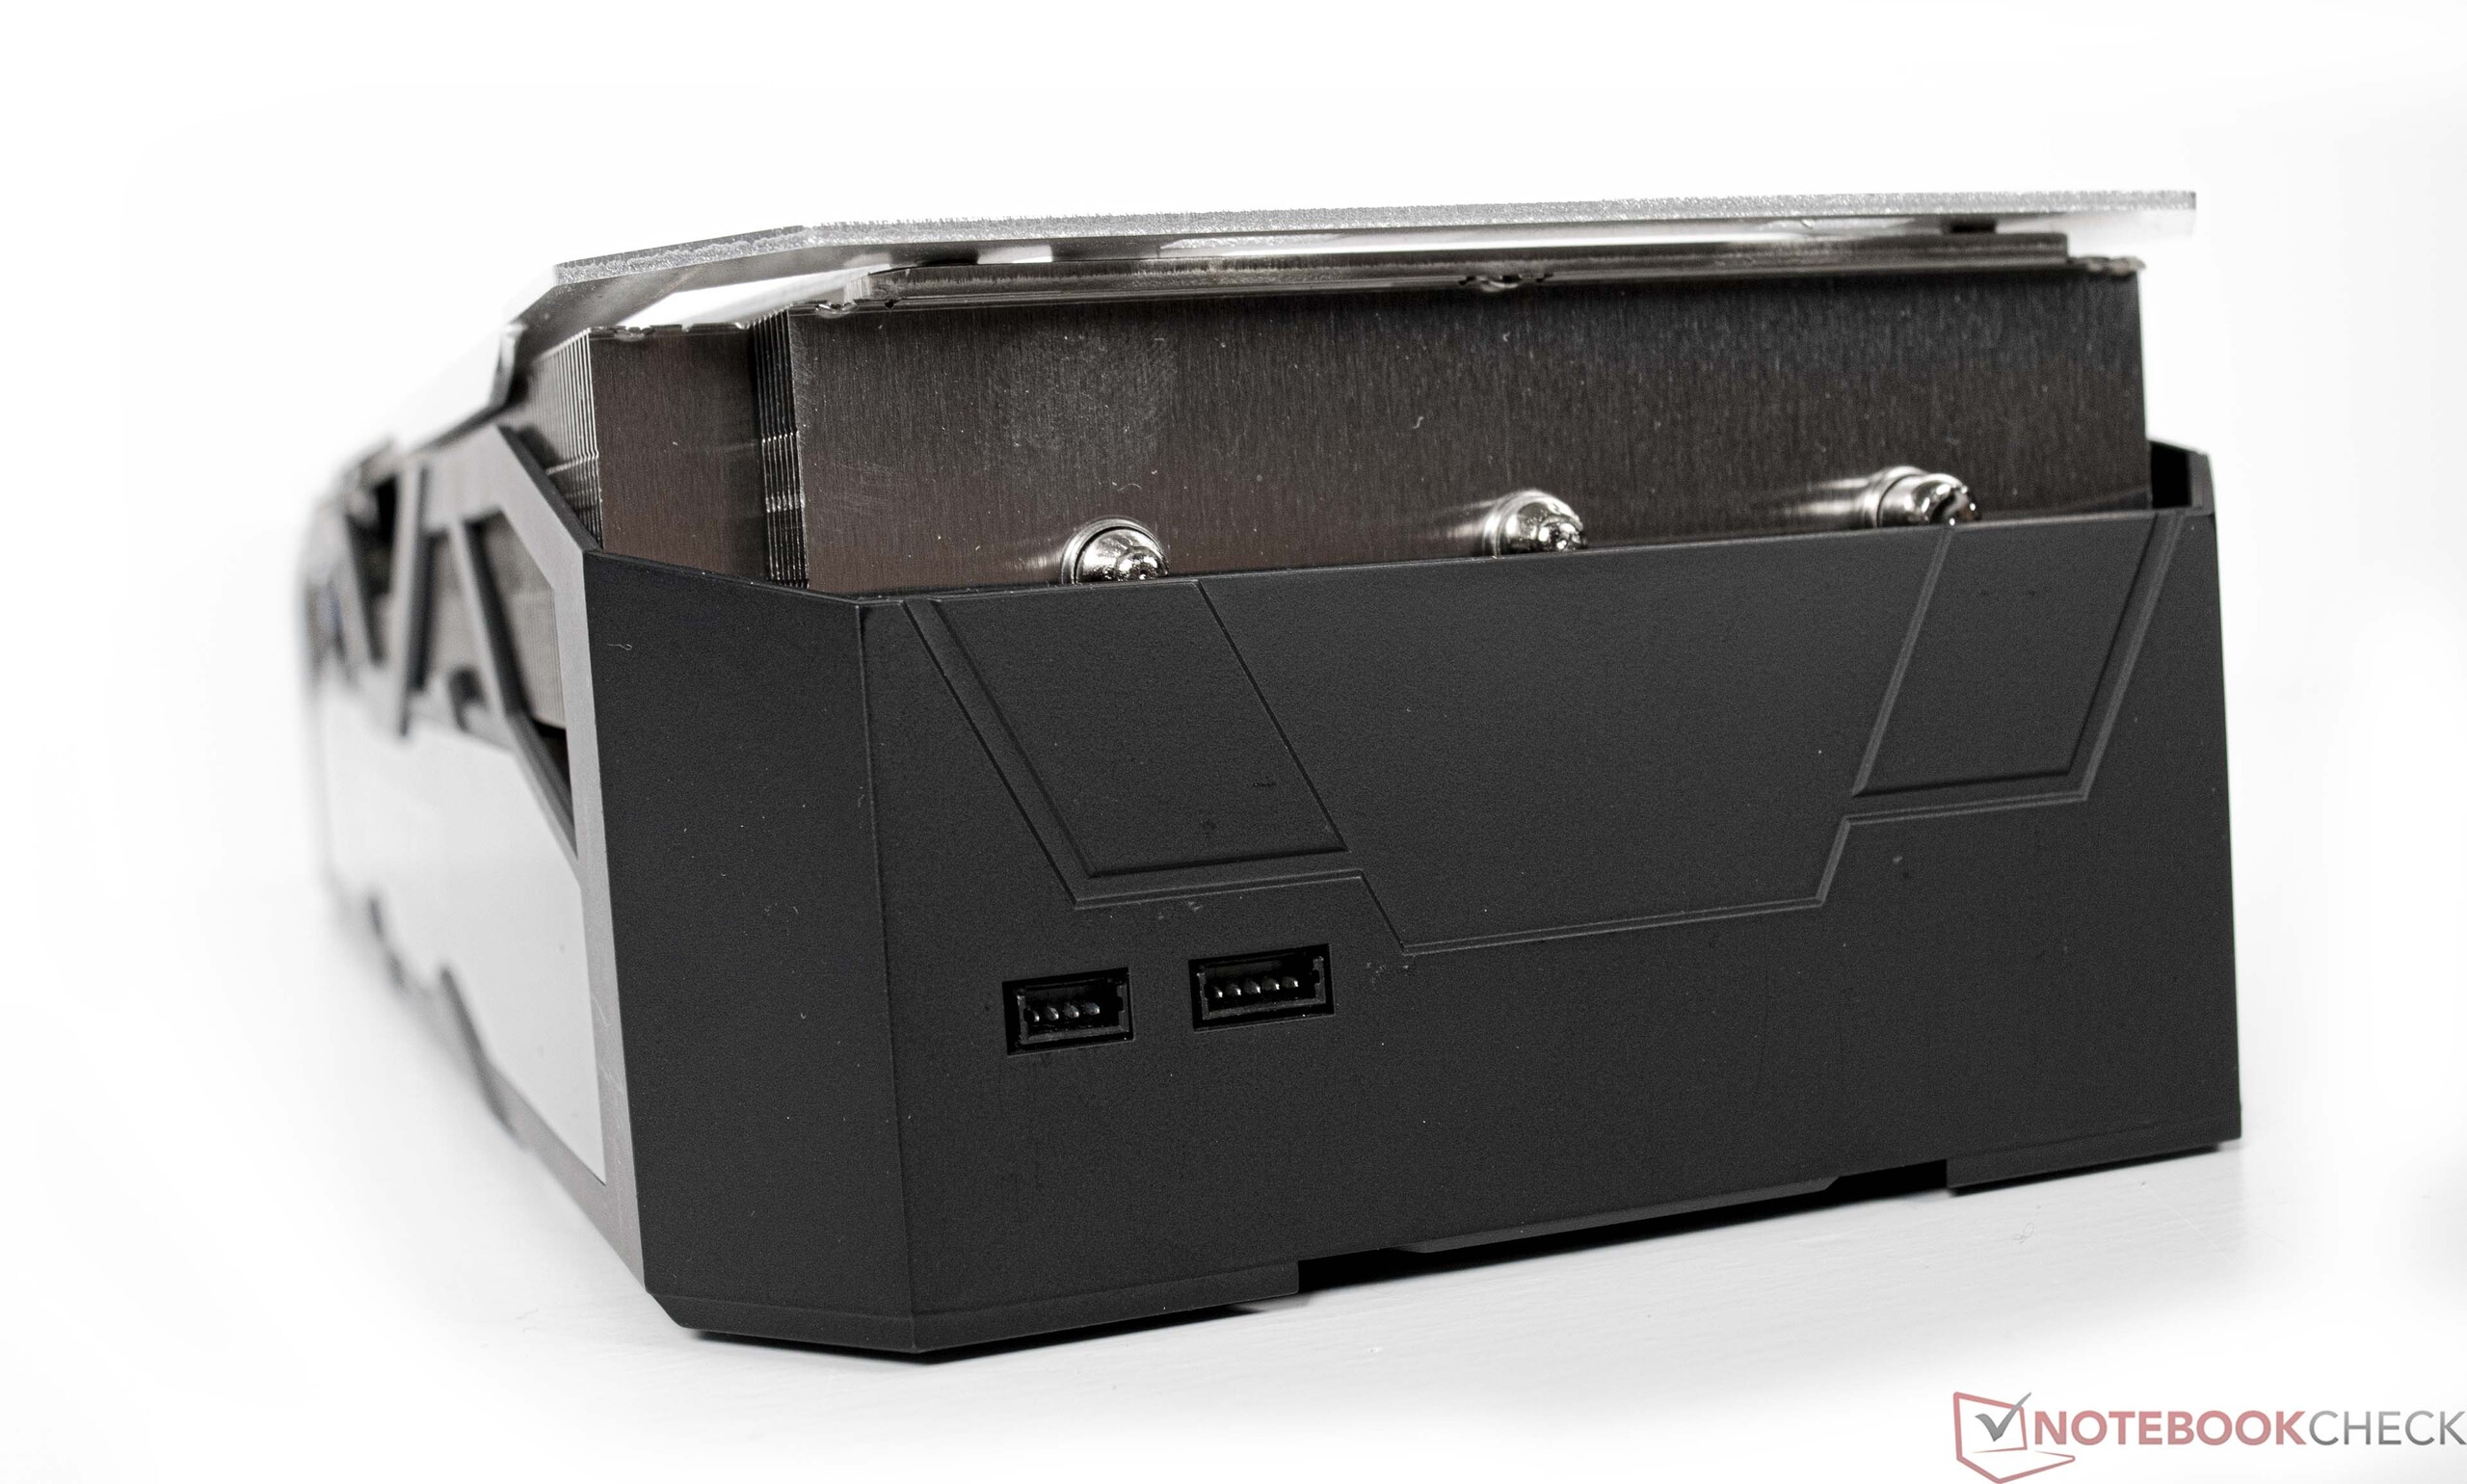
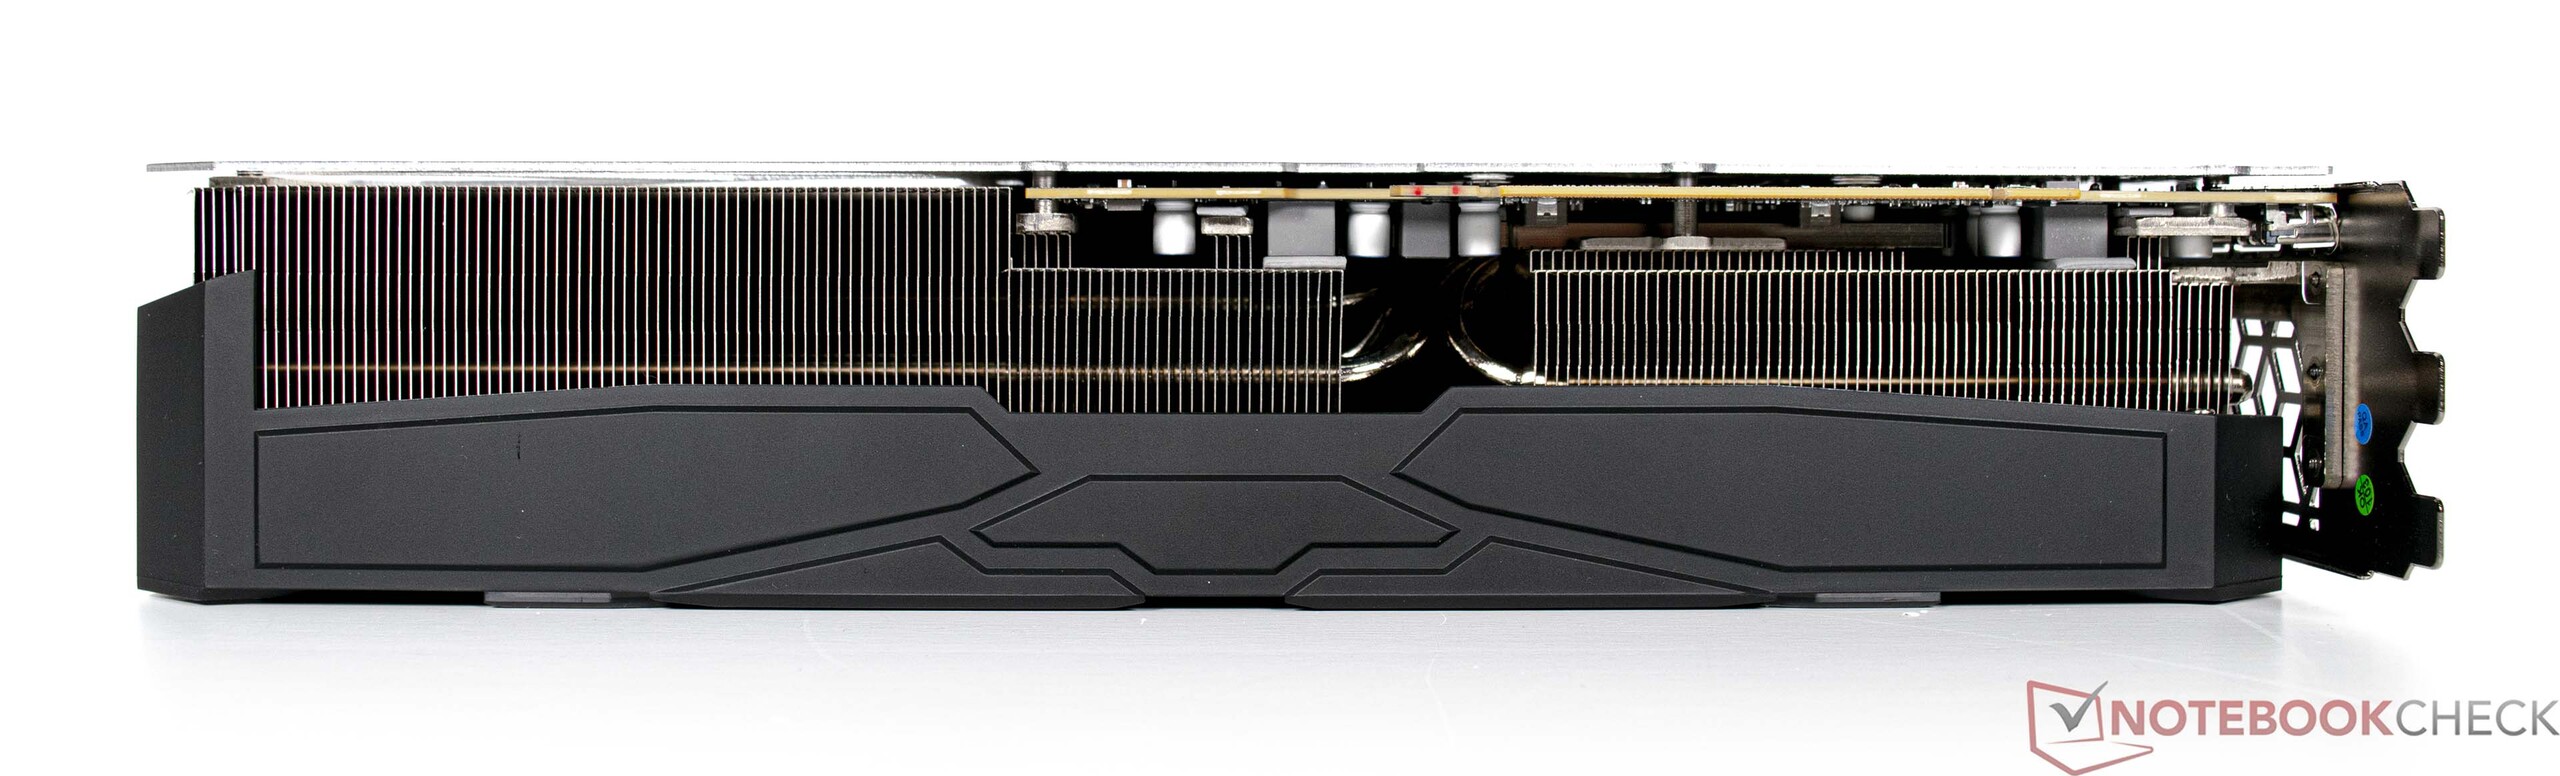
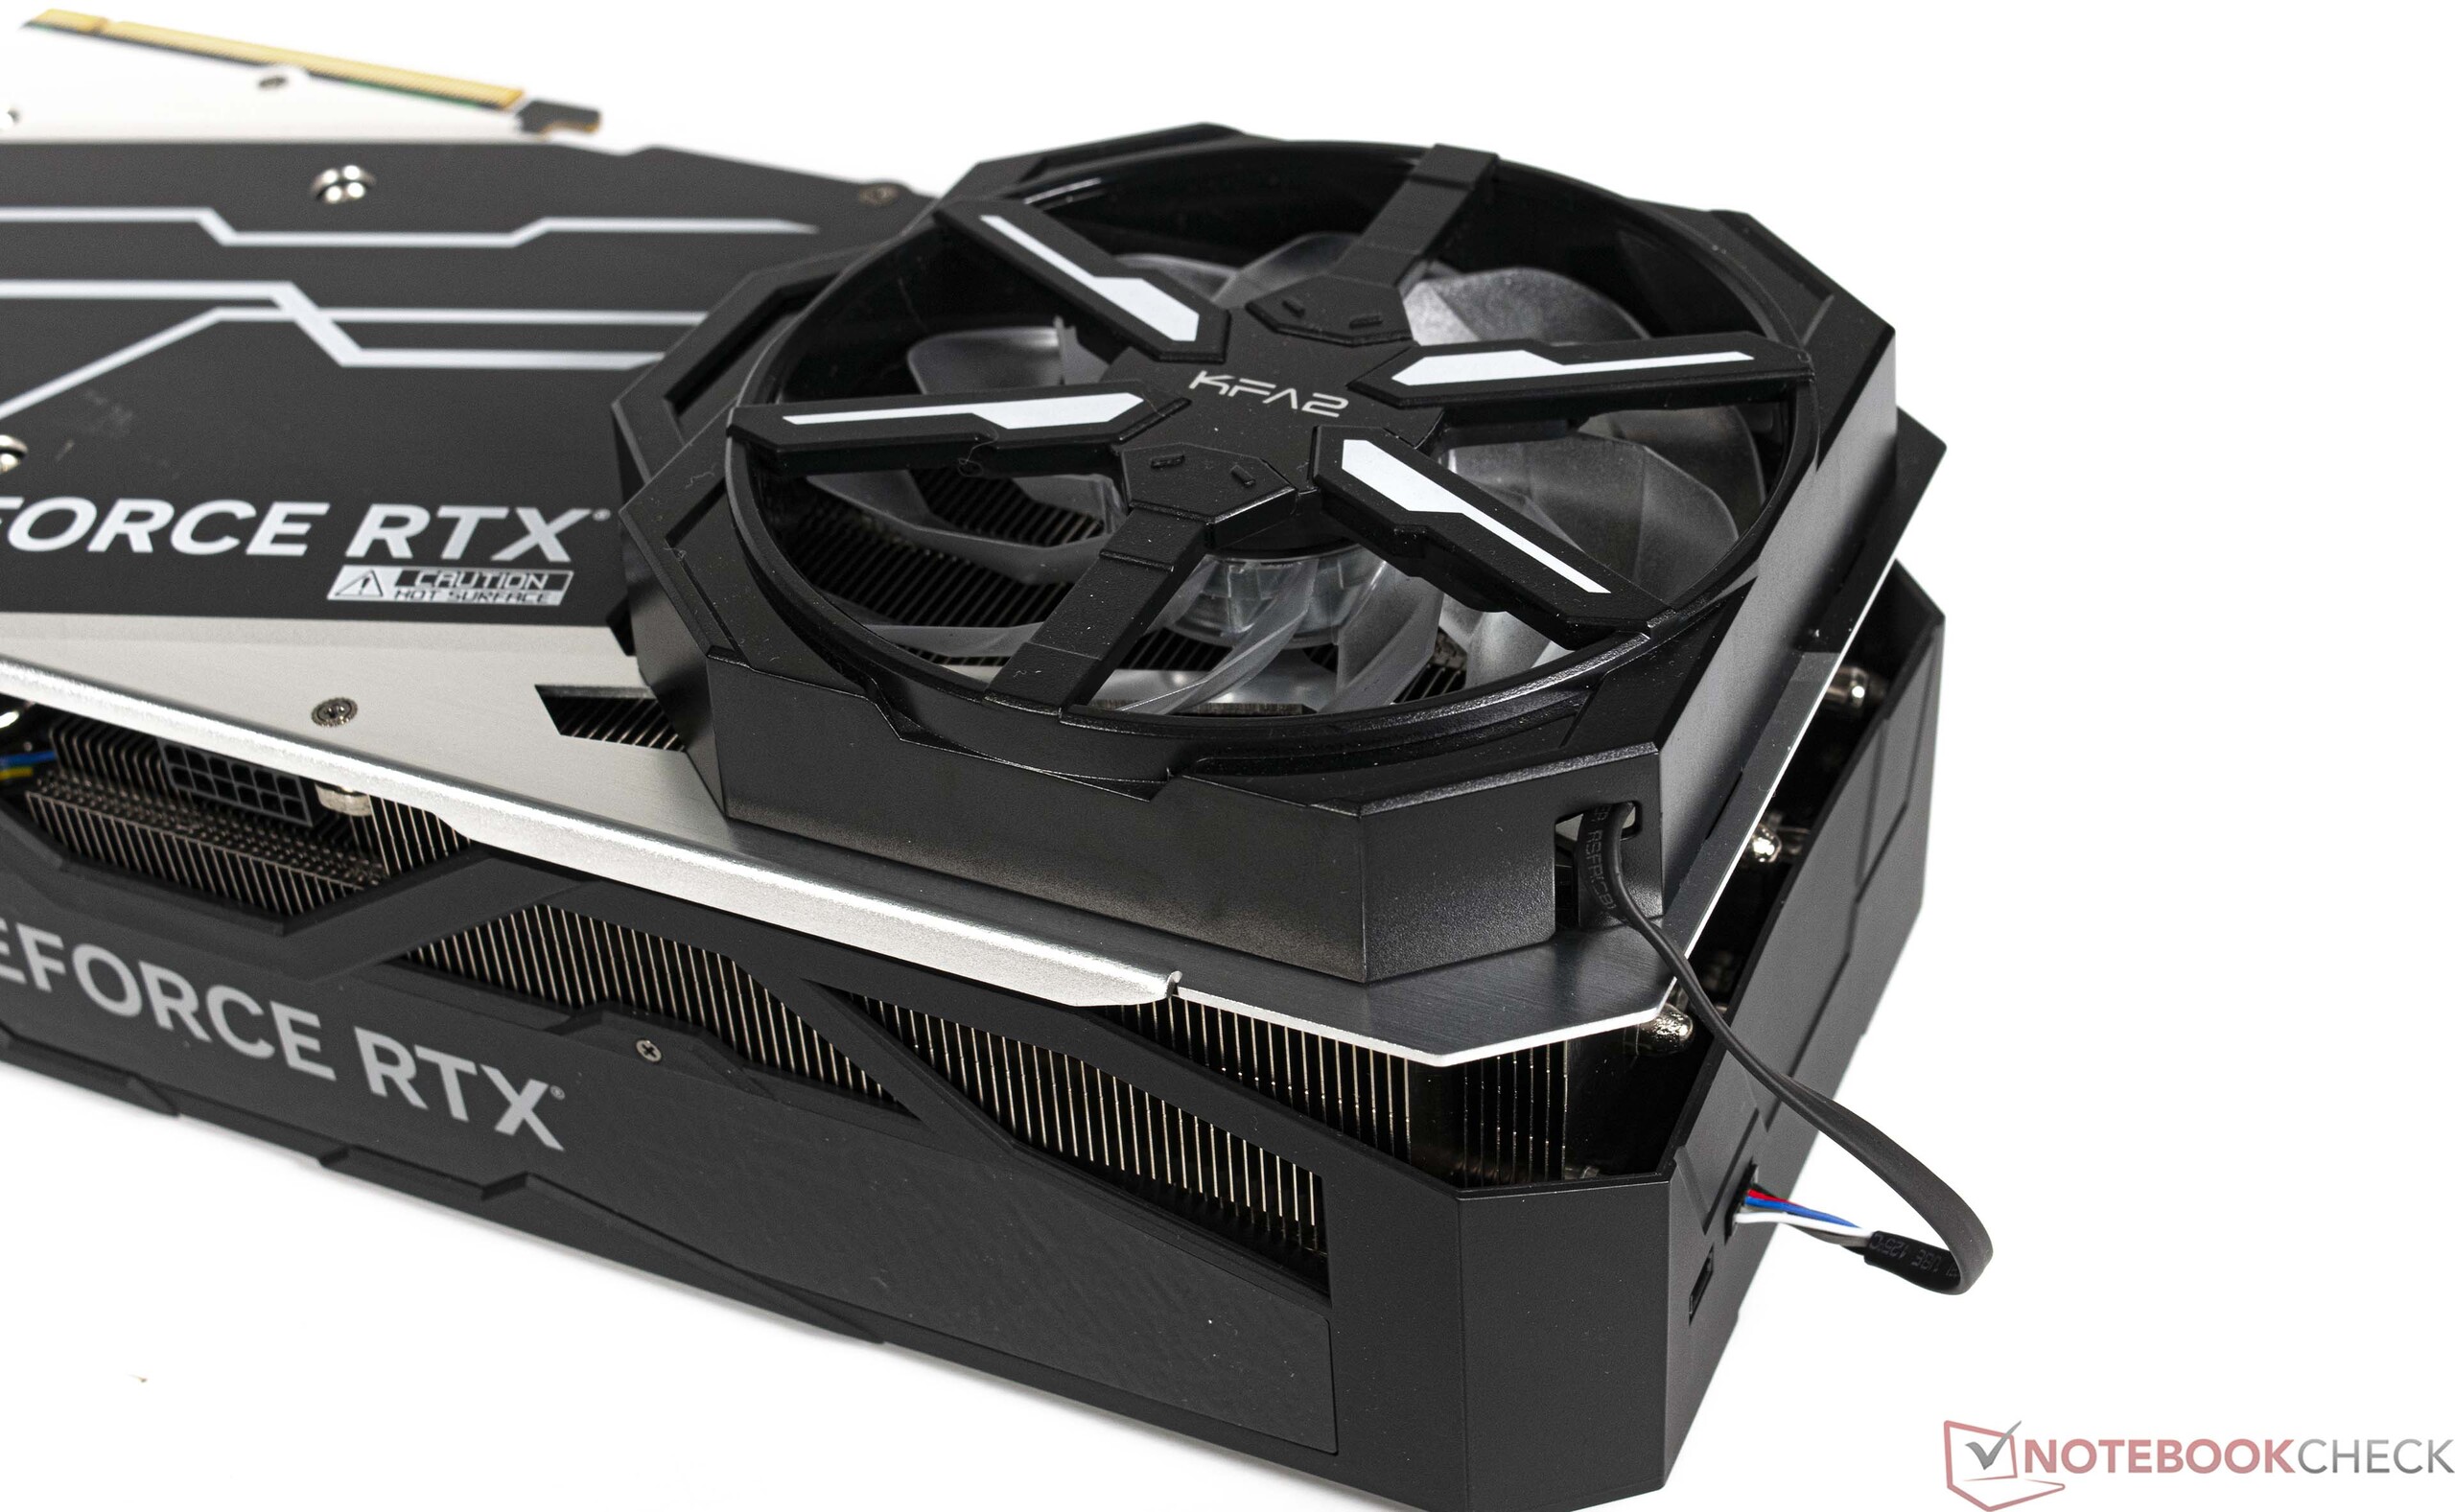
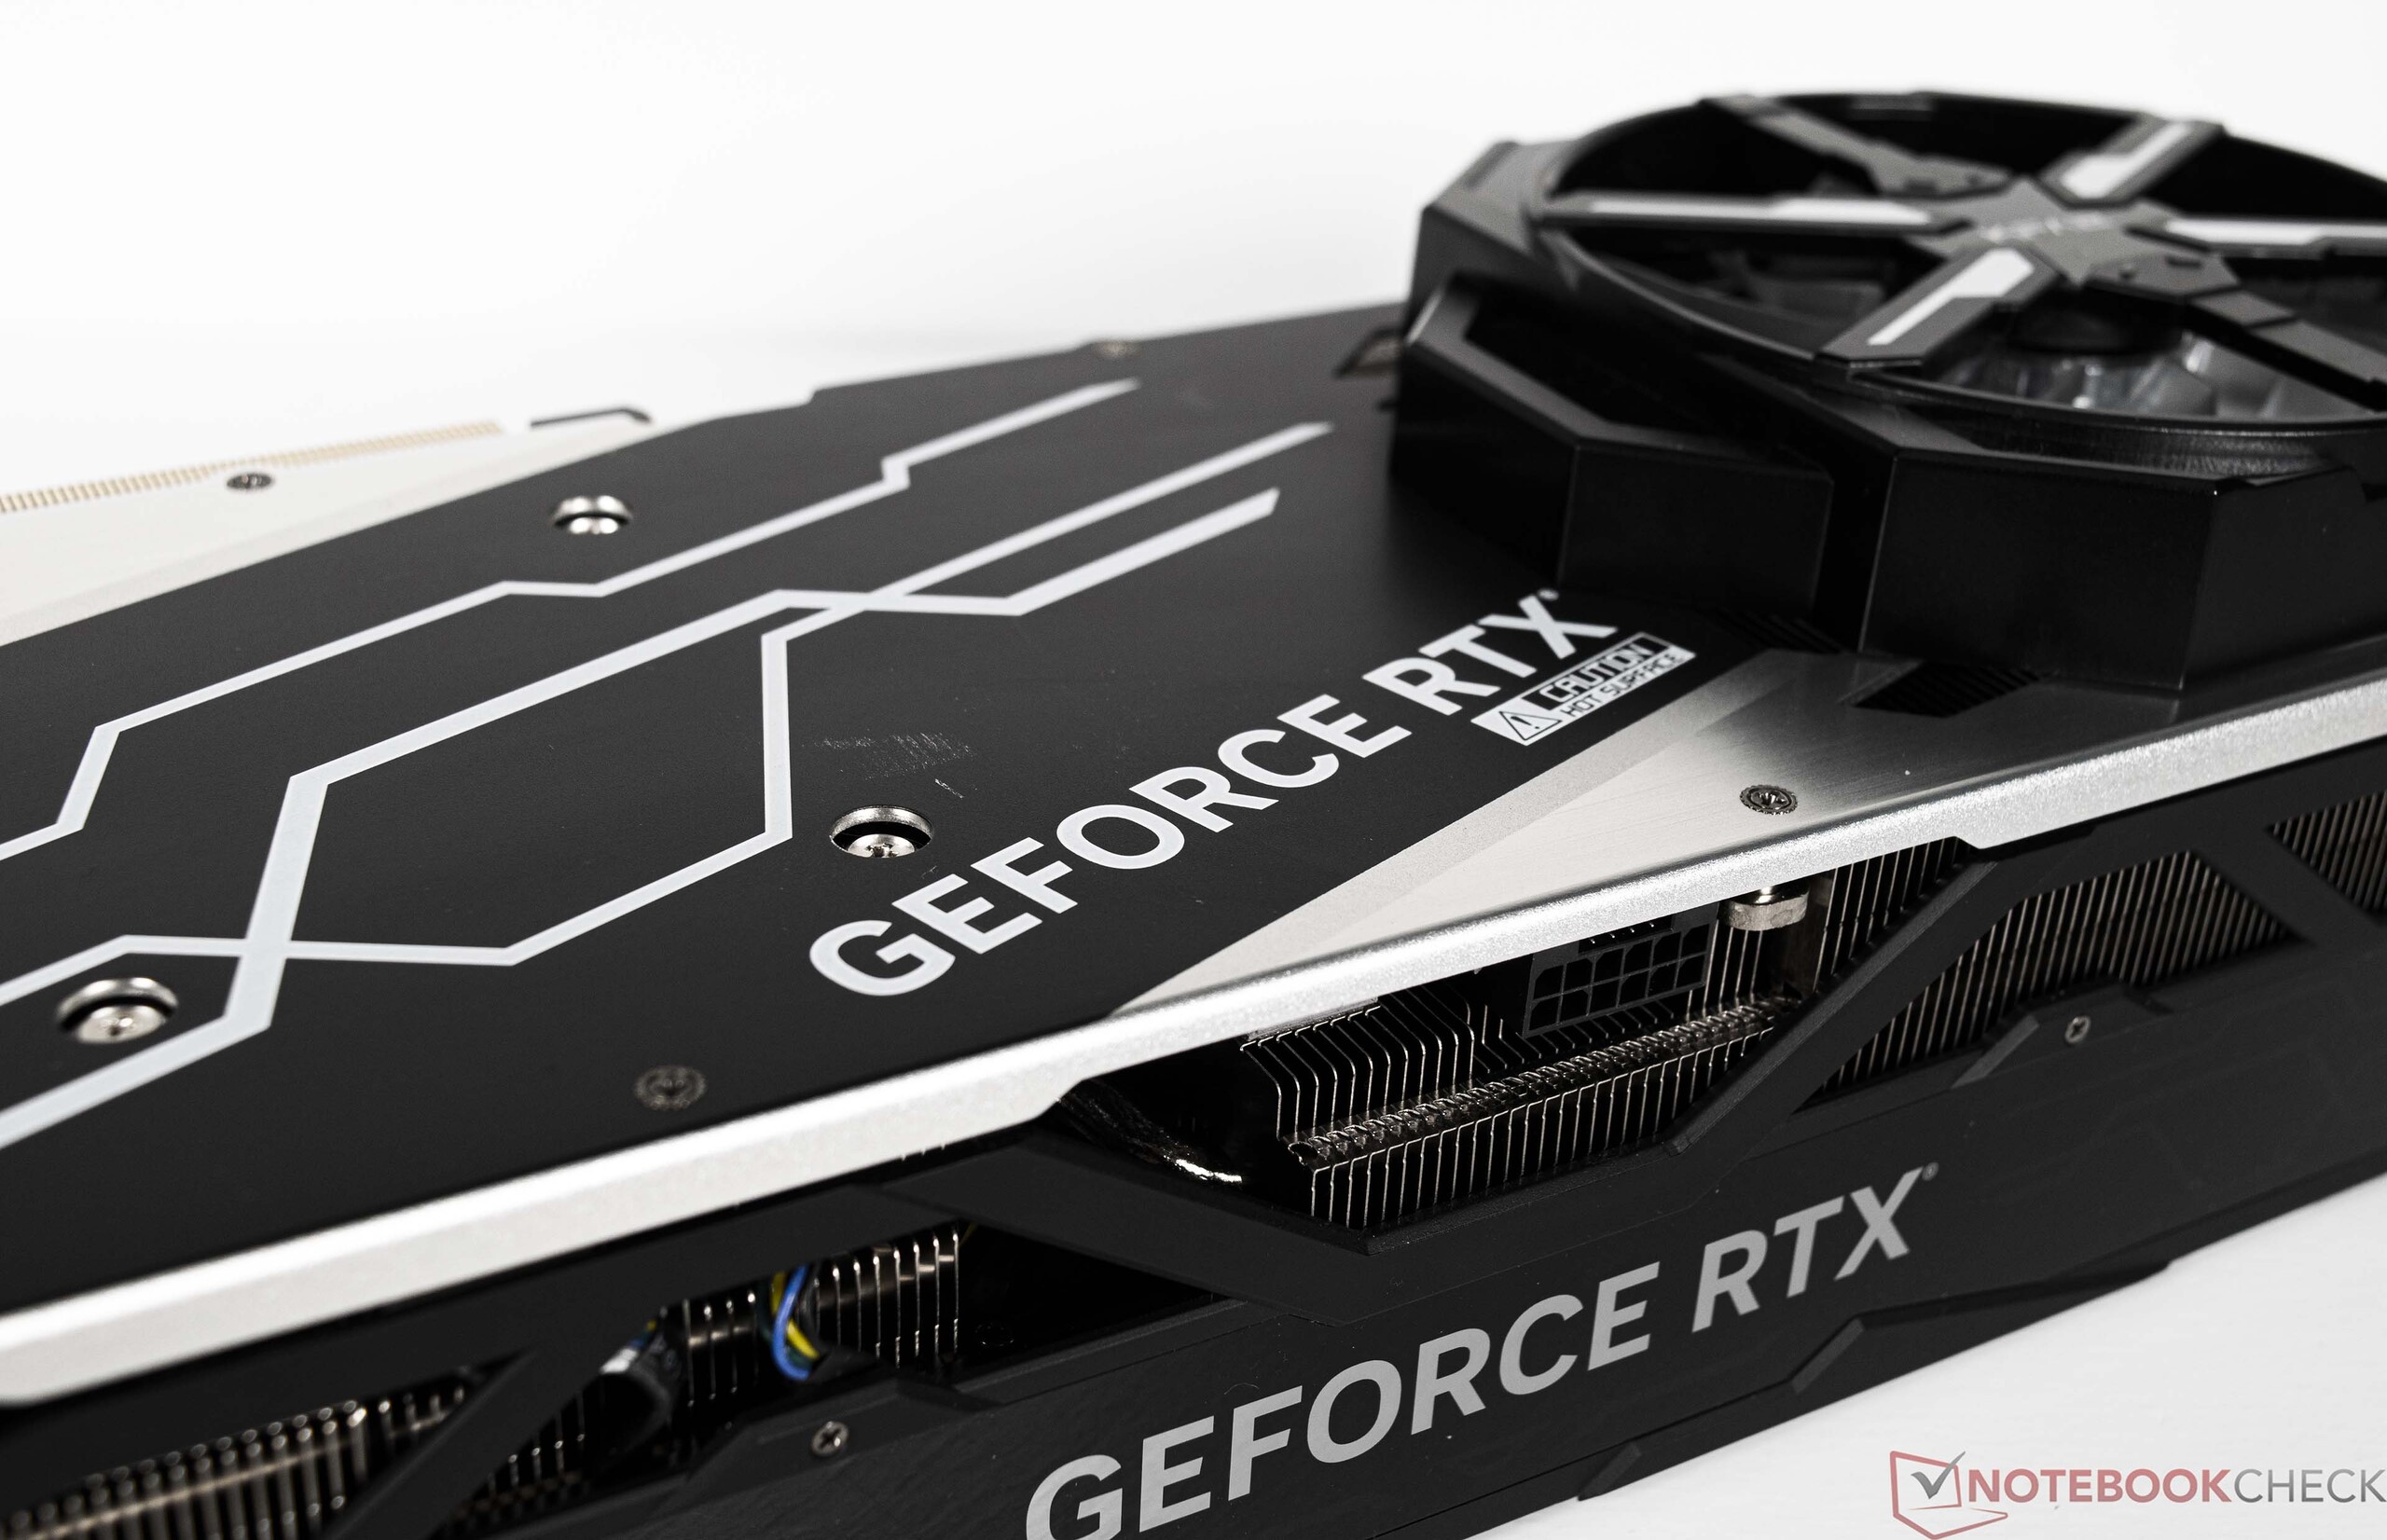
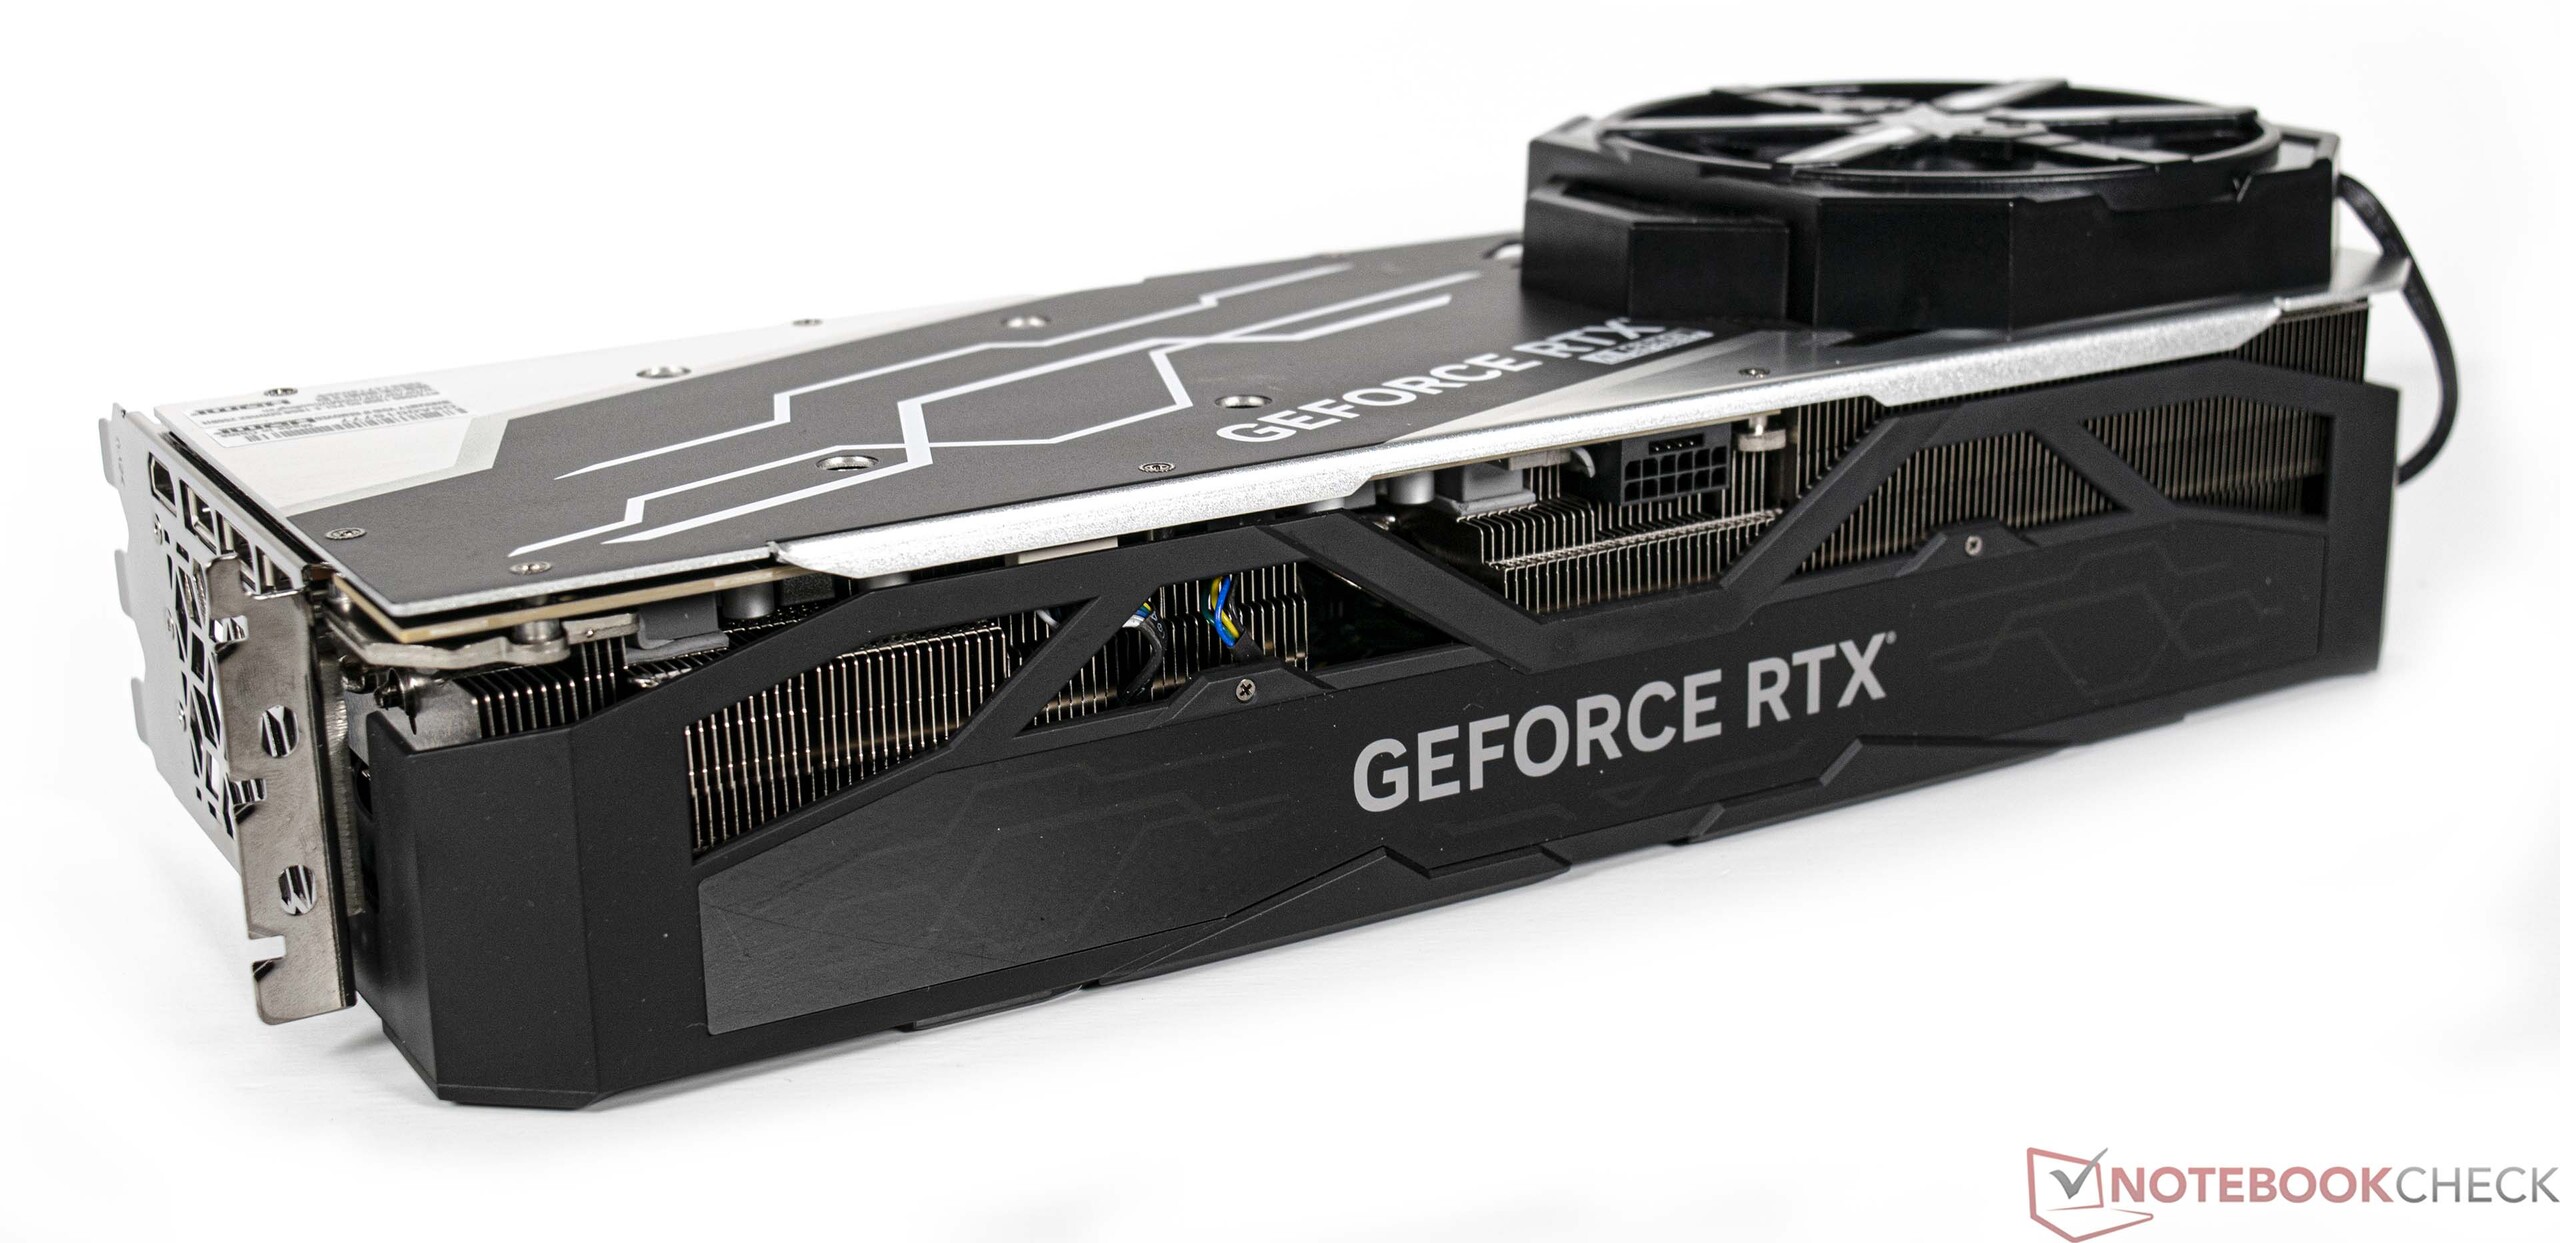
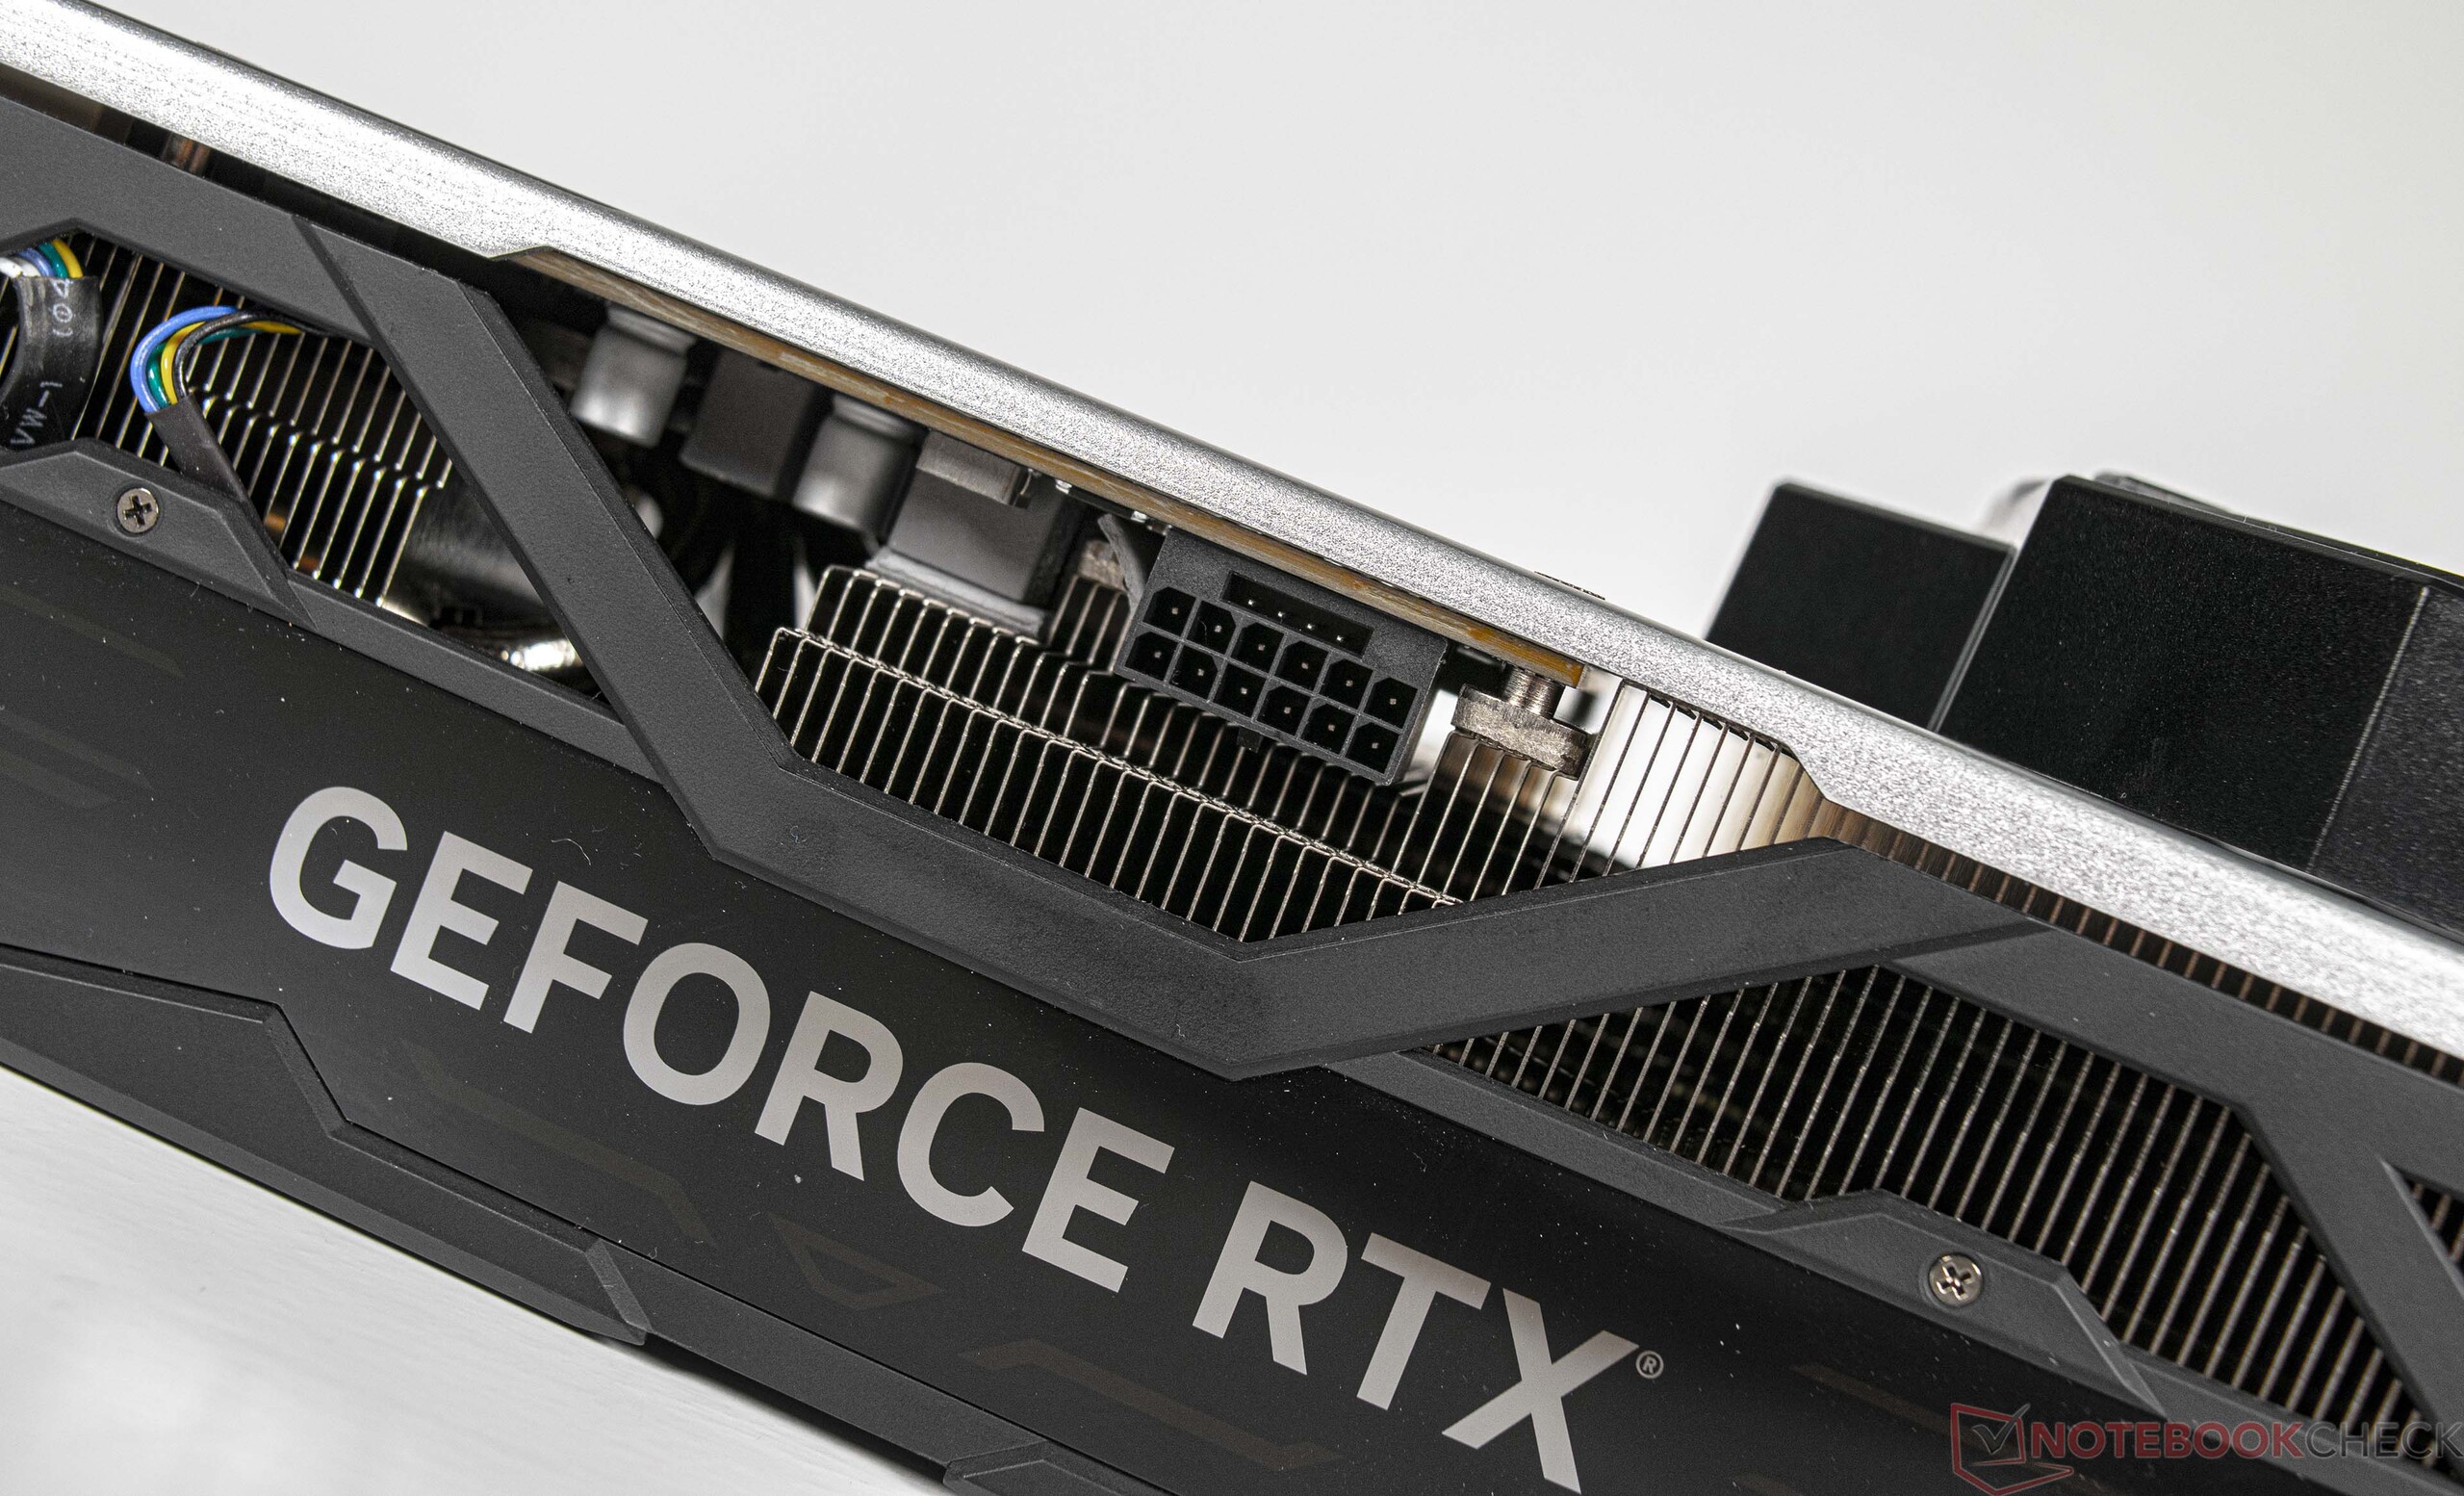
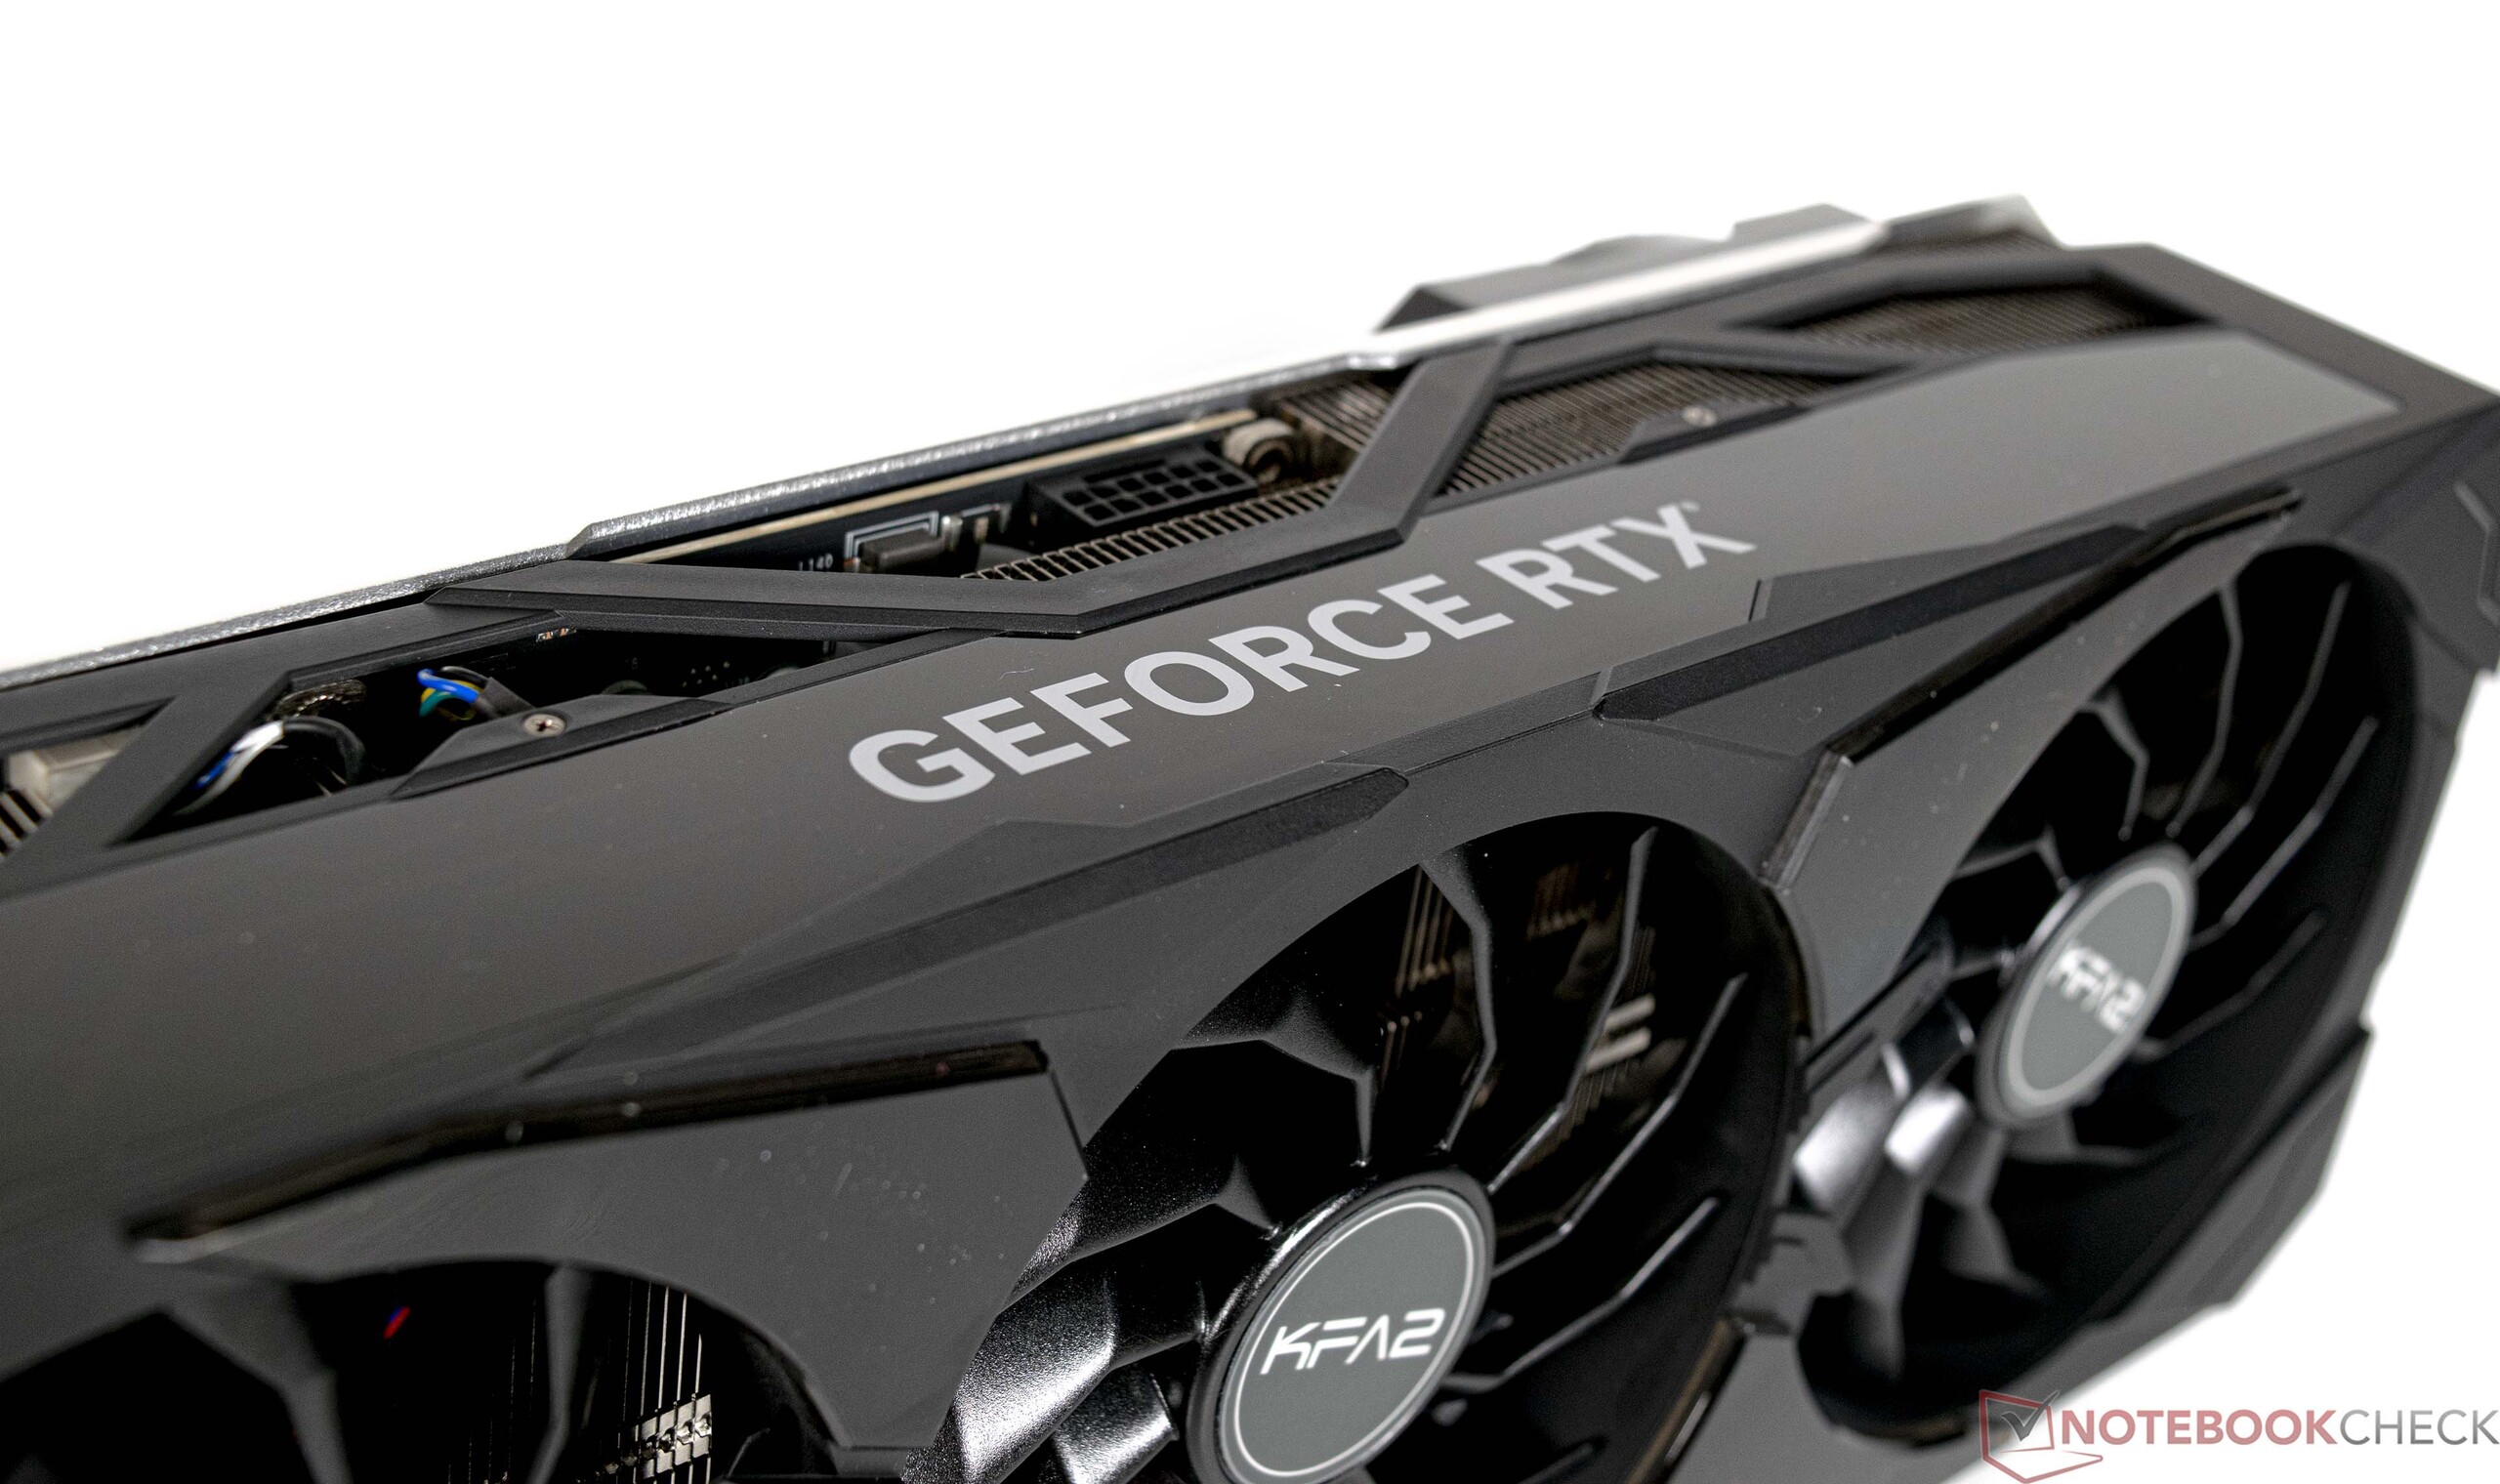
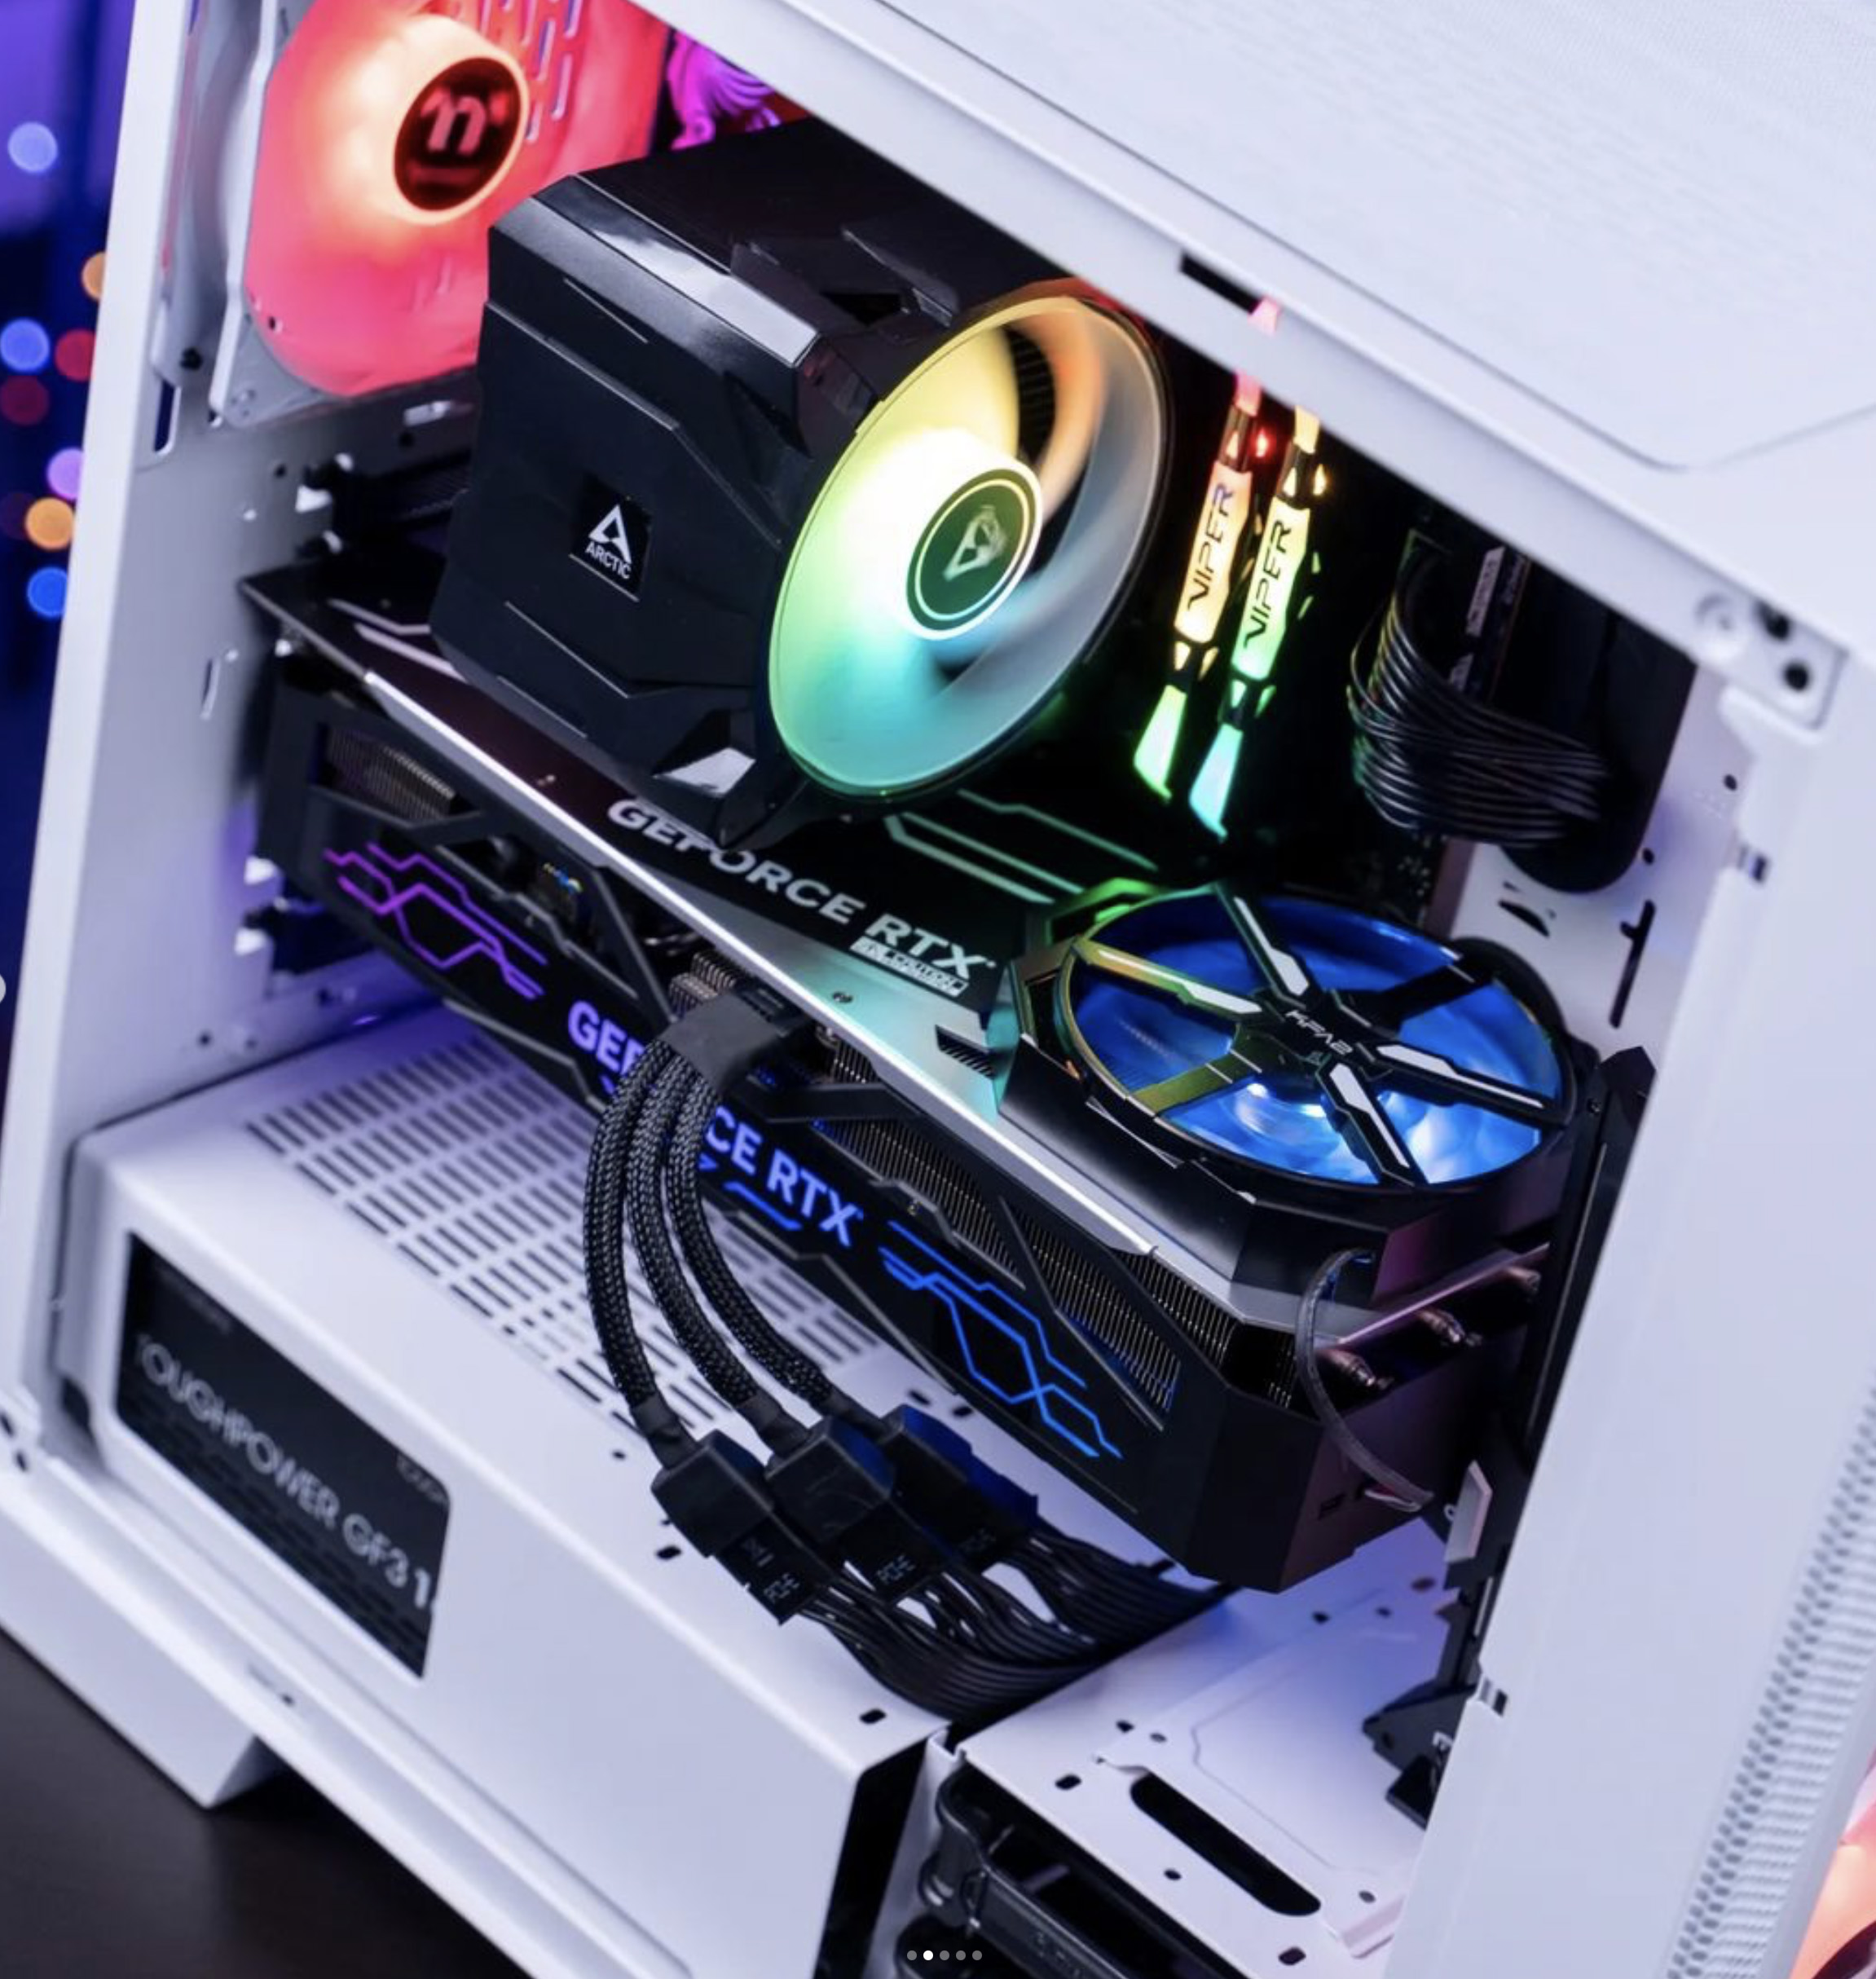
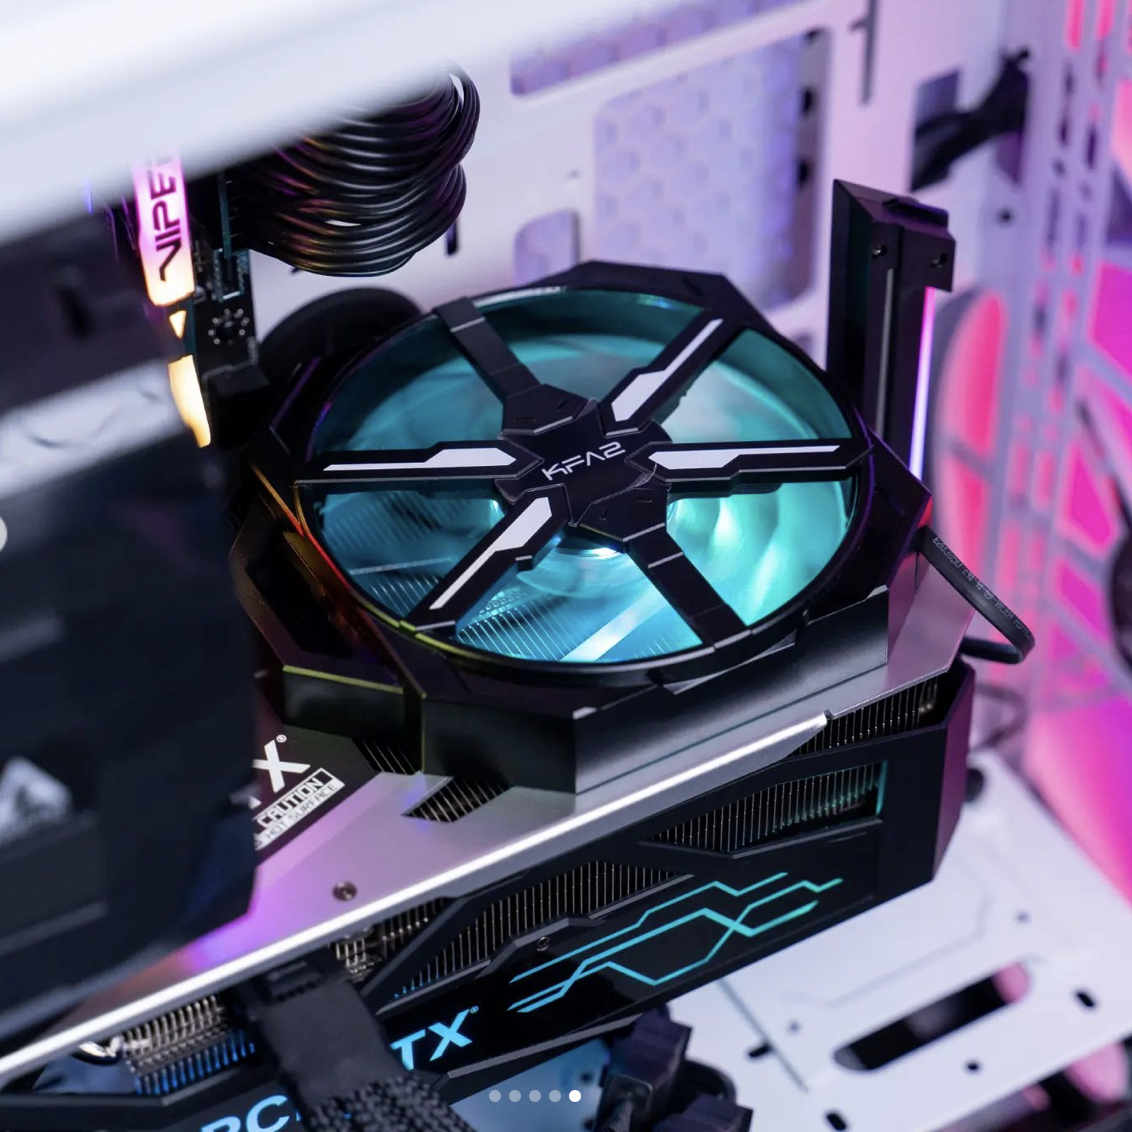
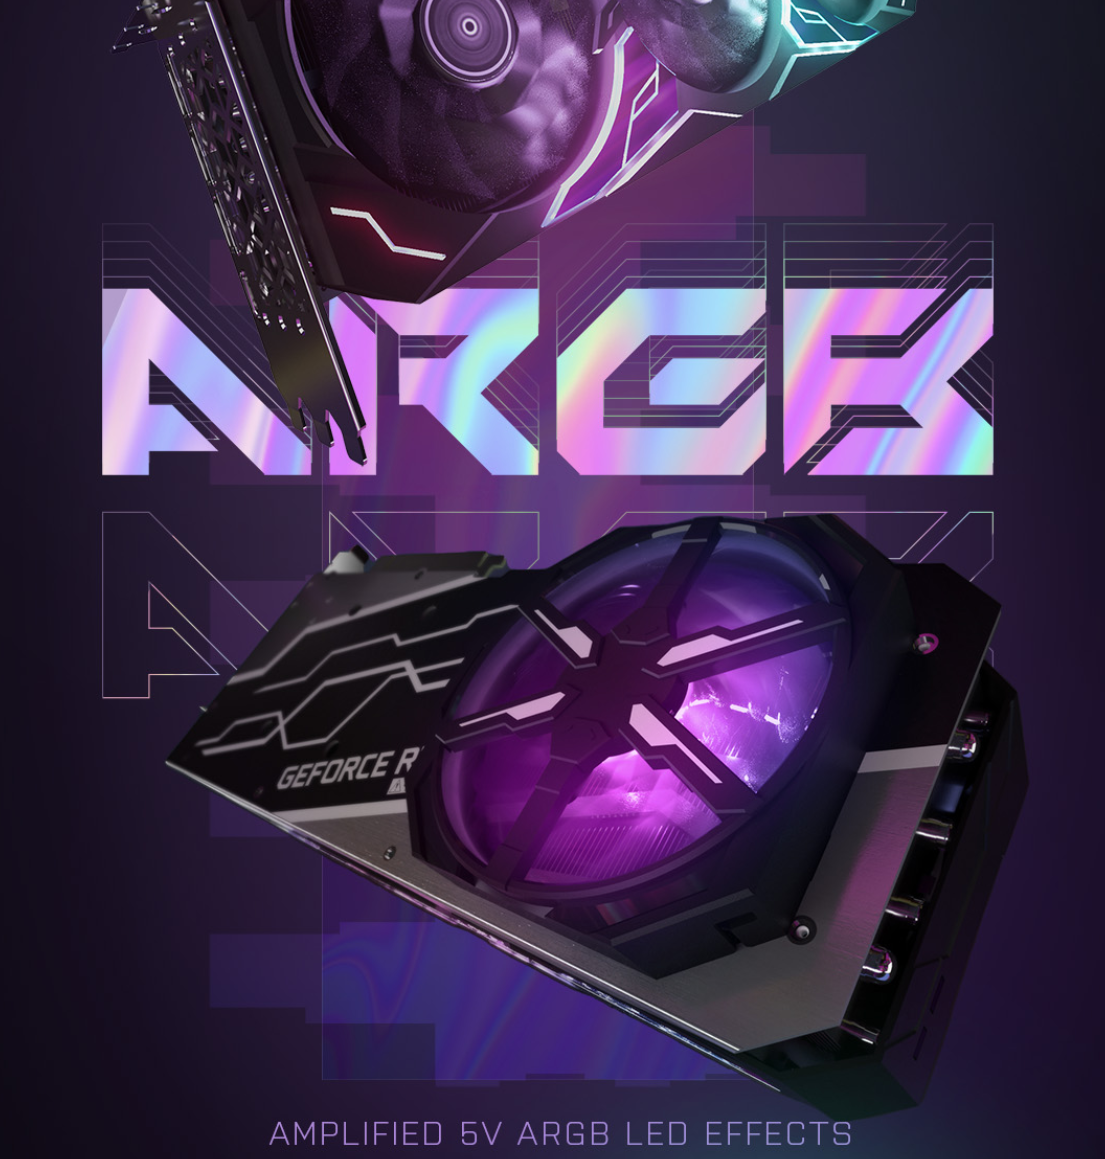
Aunque KFA2 suele ser uno de los fabricantes con los precios más bajos, la empresa se considera competidora de otros fabricantes que ofrecen tarjetas más caras, como Asus con su serie Strix y MSI con sus modelos Suprim-X. Por desgracia, no hemos podido comparar las distintas tarjetas cara a cara porque aún no hemos tenido en nuestras manos ningún modelo de Asus o MSI. Sin embargo, podemos decir que la KFA2 GeForce RTX 4080 SG tiene el mismo nivel de acabado que la KFA2 GeForce RTX 4090 SG. A pesar de tener una potencia nominal mucho menor que el modelo superior, la KFA2 GeForce RTX 4080 SG está equipada con un enorme refrigerador de cuatro ranuras. También cuenta con un montón de iluminación RGB que llama la atención sobre la tarjeta. Como todos los modelos actuales de la serie RTX 40, la RTX 4080 se alimenta a través del nuevo conector 12VHPWR. KFA2 no ha hecho nada diferente aquí y ha incluido un adaptador apropiado de 3x6+2 pines PCIe a 12VHPWR.
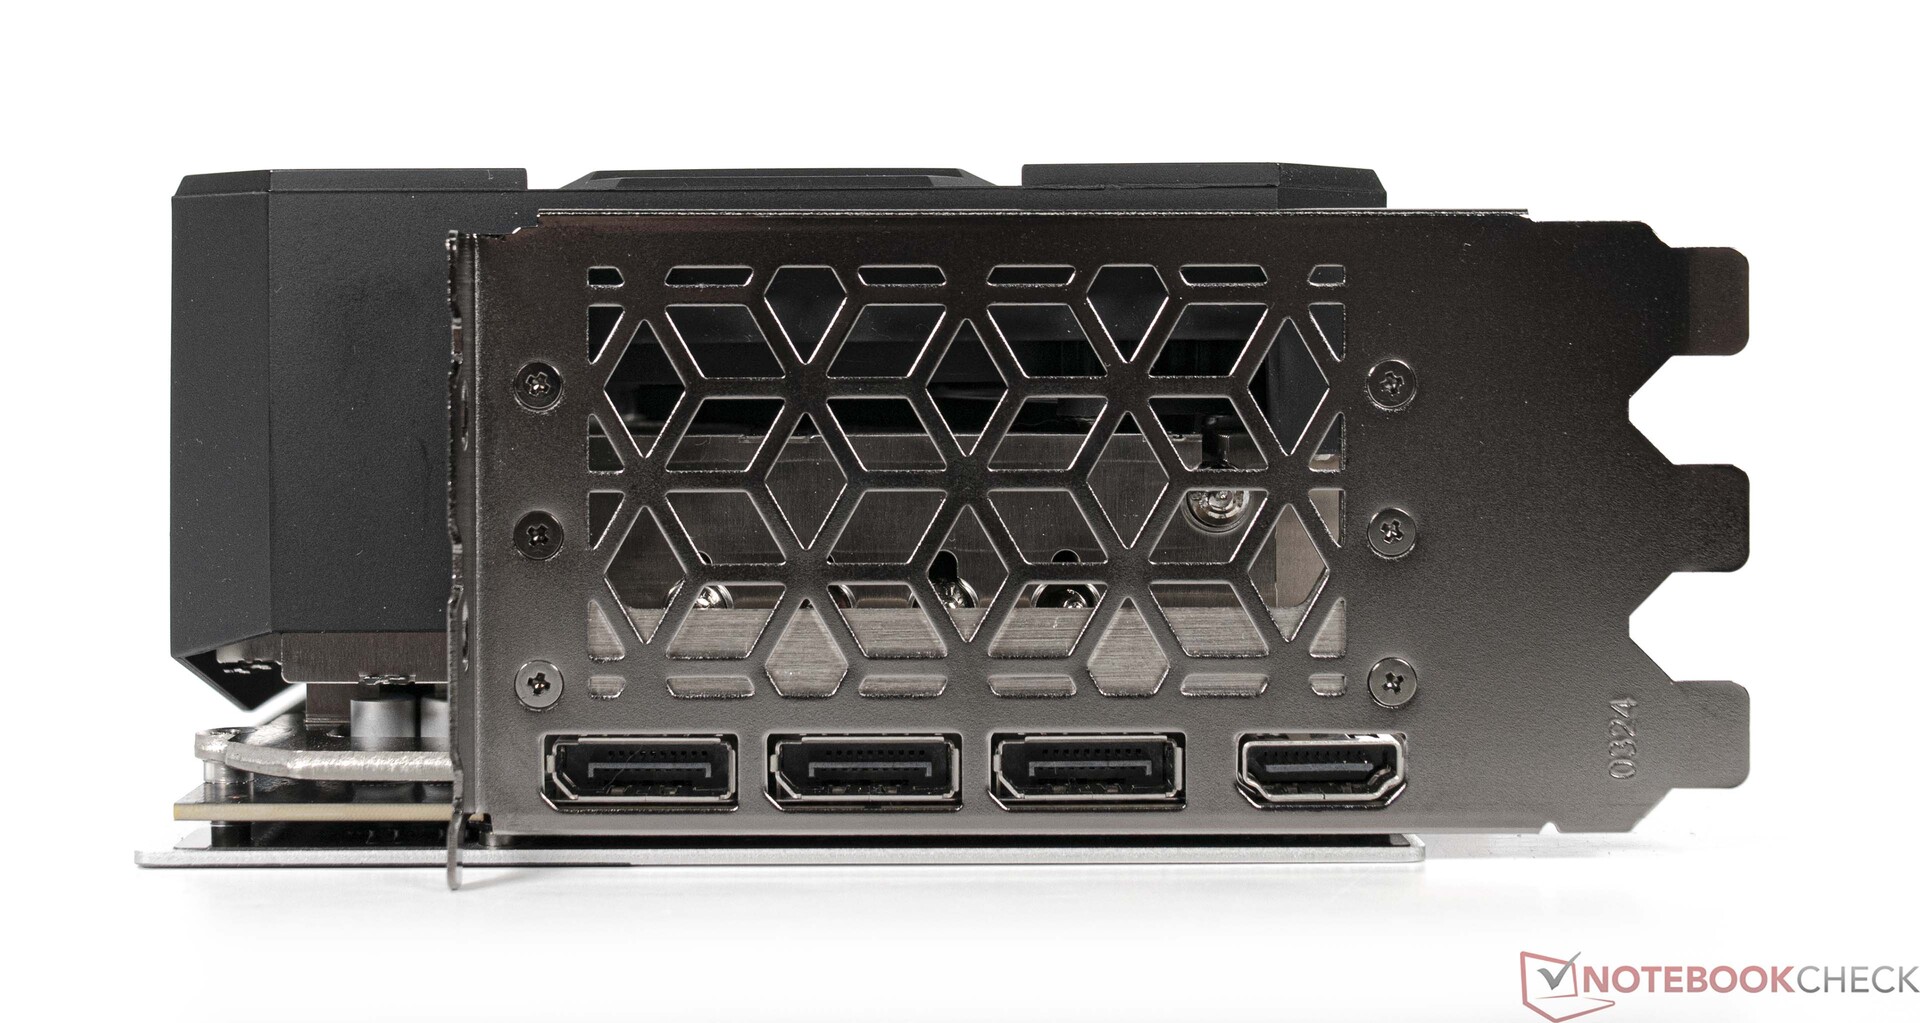
En el exterior, la KFA2 GeForce RTX 4080 SG cuenta con 1x puerto HDMI 2.1a y 3x DisplayPort 1.4a.

Comparación de especificaciones de GPU
| Especificación | RTX 4090 (FE) | RTX 4080 | KFA2 RTX 4080 | RTX 3090 Ti | RTX 3090 (FE) | RTX 3080 Ti (FE) | RTX 3080 (FE) | Titan RTX |
| Chip | AD102 | AD103 | AD103 | GA102 | GA102 | GA102 | GA102 | TU102 |
| Proceso FinFET | 4 nm | 4 nm | 4 nm | 8 nm | 8 nm | 8 nm | 8 nm | 12 nm |
| Núcleos CUDA | 16.384 | 9.728 | 9.728 | 10.752 | 10.496 | 10.240 | 8.704 | 4.608 |
| Unidades de textura | 512 | 304 | 304 | 336 | 328 | 320 | 272 | 288 |
| Núcleos de tensor | 512 4. Gen. | 304 4. Gen. Gen. | 304 4. Gen. Gen. | 336 3. Gen. | 328 3. Gen. Gen. | 320 3. Gen. Gen. | 272 3. Gen. Gen. | 576 2. Gen. |
| Núcleos RT | 128 | 76 | 76 | 84 | 82 | 80 | 68 | 72 |
| Reloj base de la GPU | 2.235 MHz | 2.205 MHz | 2.205 MHz | 1.560 MHz | 1.395 MHz | 1.365 MHz | 1.440 MHz | 1.350 MHz |
| Reloj de refuerzo de la GPU | 2.520 MHz | 2.505 MHz | 2.565 MHz | 1.860 MHz | 1.695 MHz | 1.665 MHz | 1.710 MHz | 1.770 MHz |
| Bus de memoria | 384 bits | 256 bits | 256 bits | 384 bits | 384 bits | 384 bits | 320 bits | 384 bits |
| Ancho de banda de memoria | 1.008 GB/s | 716,8 GB/s | 716,8 GB/s | 1.008 GB/s | 936 GB/s | 912,4 GB/s | 760 GB/s | 672 GB/s |
| Memoria de vídeo | 24 GB GDDR6X | 16 GB GDDR6X | 16 GB GDDR6X | 24 GB GDDR6X | 24 GB GDDR6X | 12 GB GDDR6X | 10 GB GDDR6X | 24 GB GDDR6 |
| Consumo de energía | 450 W | 320 W | 320 W | 450 W | 350 W | 350 W | 320 W | 280 W |
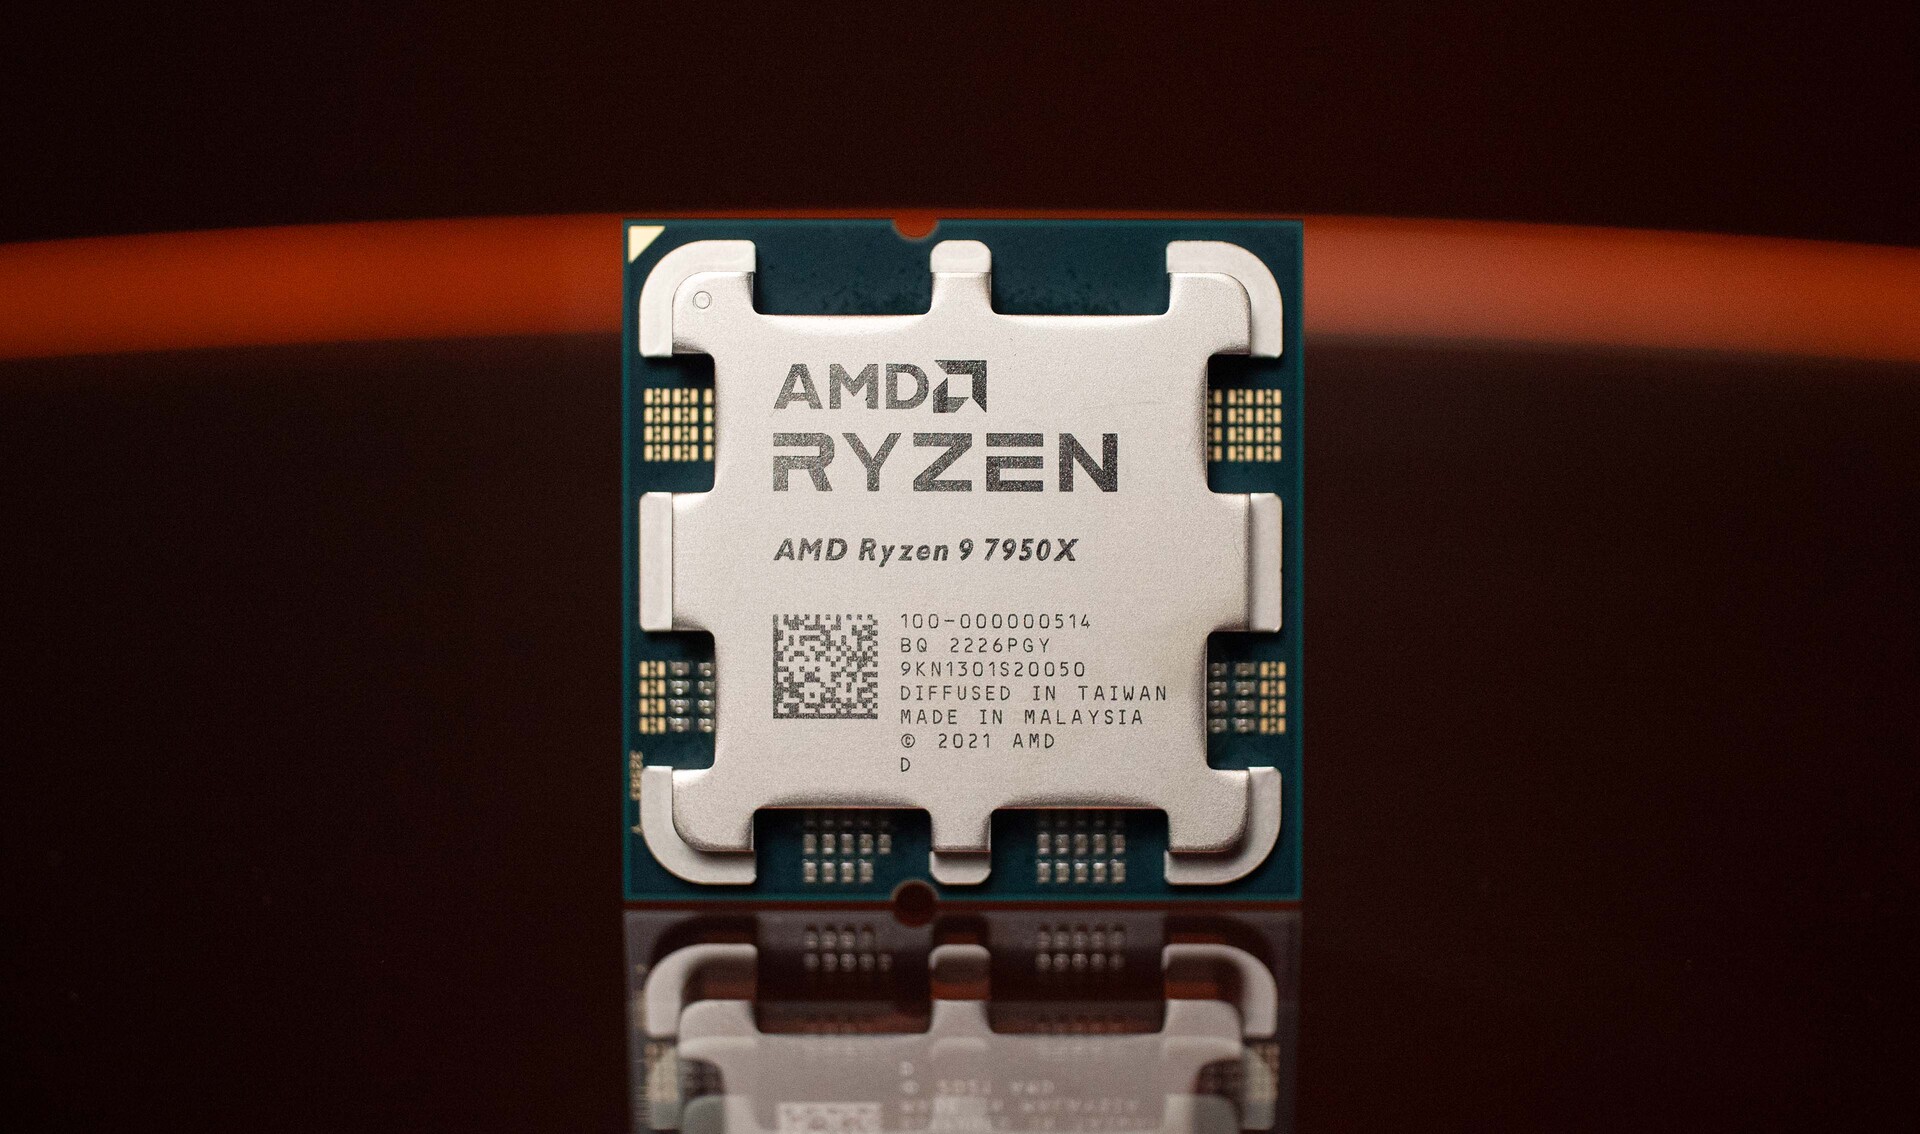
Nuestro sistema de prueba se basa en AMD Ryzen 9 7950X
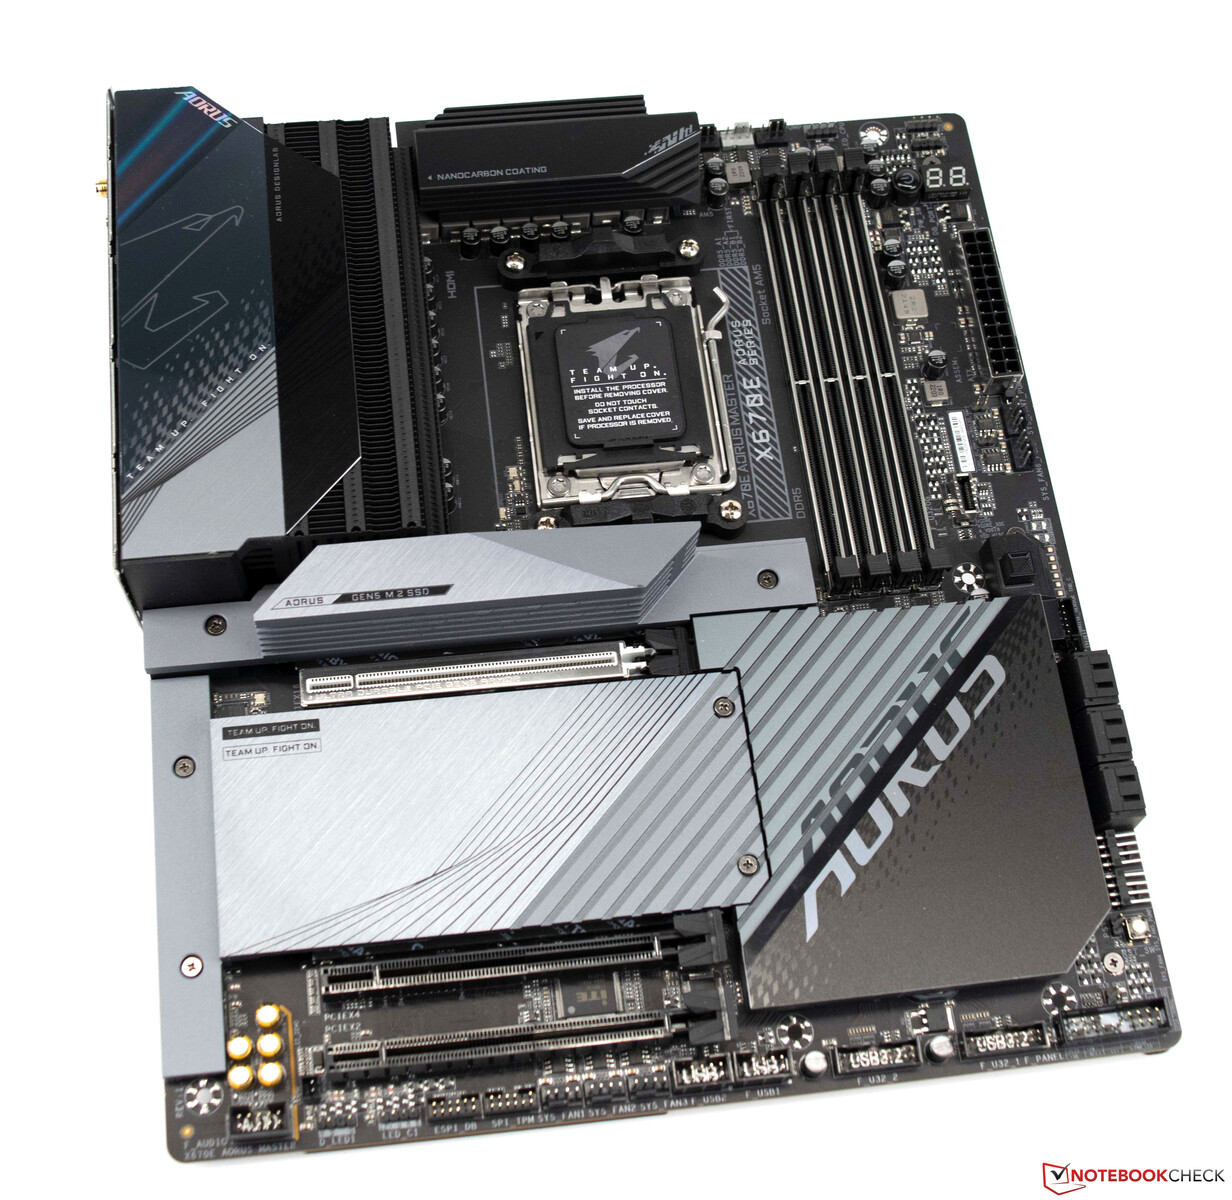
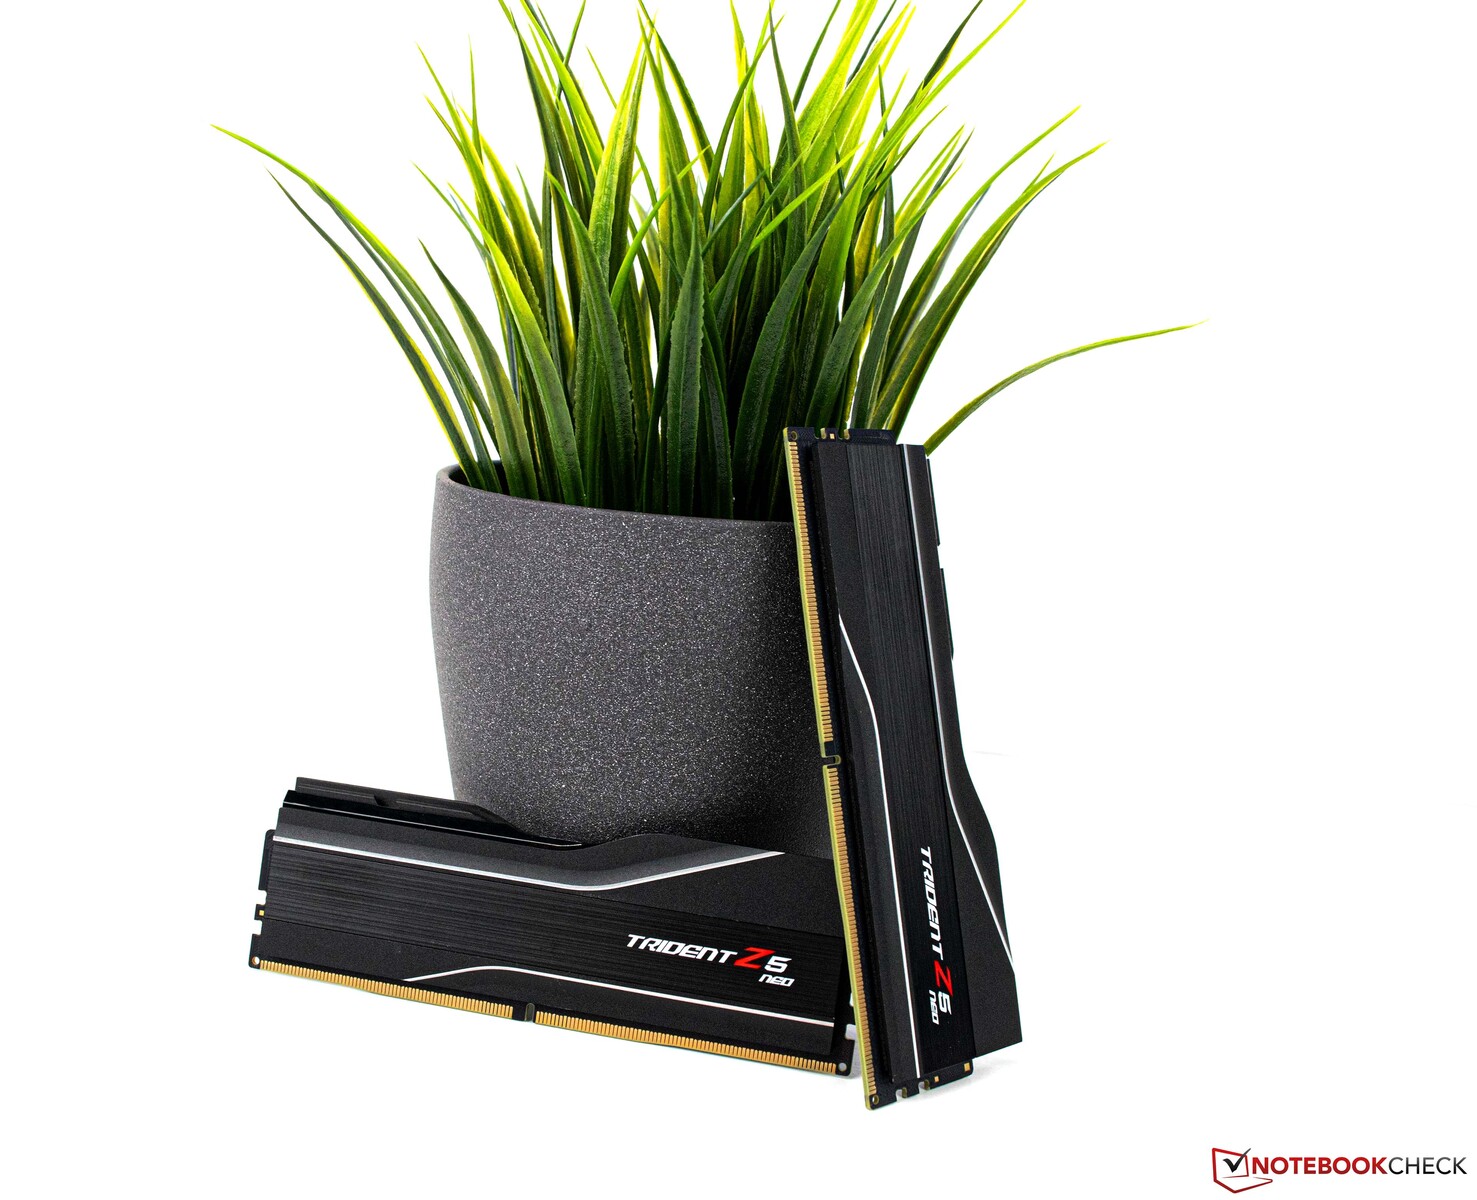
Nuestro sistema de prueba cuenta con una placa base Gigabyte X670E Aorus Master emparejada con una CPU AMD de alto rendimiento (Ryzen 9 7950X), que se refrigera con una solución AIO de Alphacool (Alphacool Eisbaer Aurora 360 mm). El sistema tiene 32 GB de memoria G.Skill funcionando con un perfil EXPO adecuado y está conectado a un monitor Gigabyte M32U.
Especificaciones detalladas del sistema de pruebas
Hemos utilizado el siguiente sistema para los benchmarks y pruebas de este análisis:
- Lian-Li O11 Dynamic
- AMD Ryzen 9 7950X
- Gigabyte X670E Aorus Master, BIOS: F8a
- Alphacool Eisbear 360 AIO
- Fuente de alimentación Corsair RM 1000x
- G.Skill Trident Z5 Neo DDR5-6000 2x 16 GB, EXPO (DDR5-6000 CL30-38-38-96)
- Corsair MP600 2 TB
- Crucial MX500 2 TB
- Microsoft Windows 11 Professional 64-Bit (Versión 22H2)
Detalles de la KFA2 GeForce RTX 4080 SG
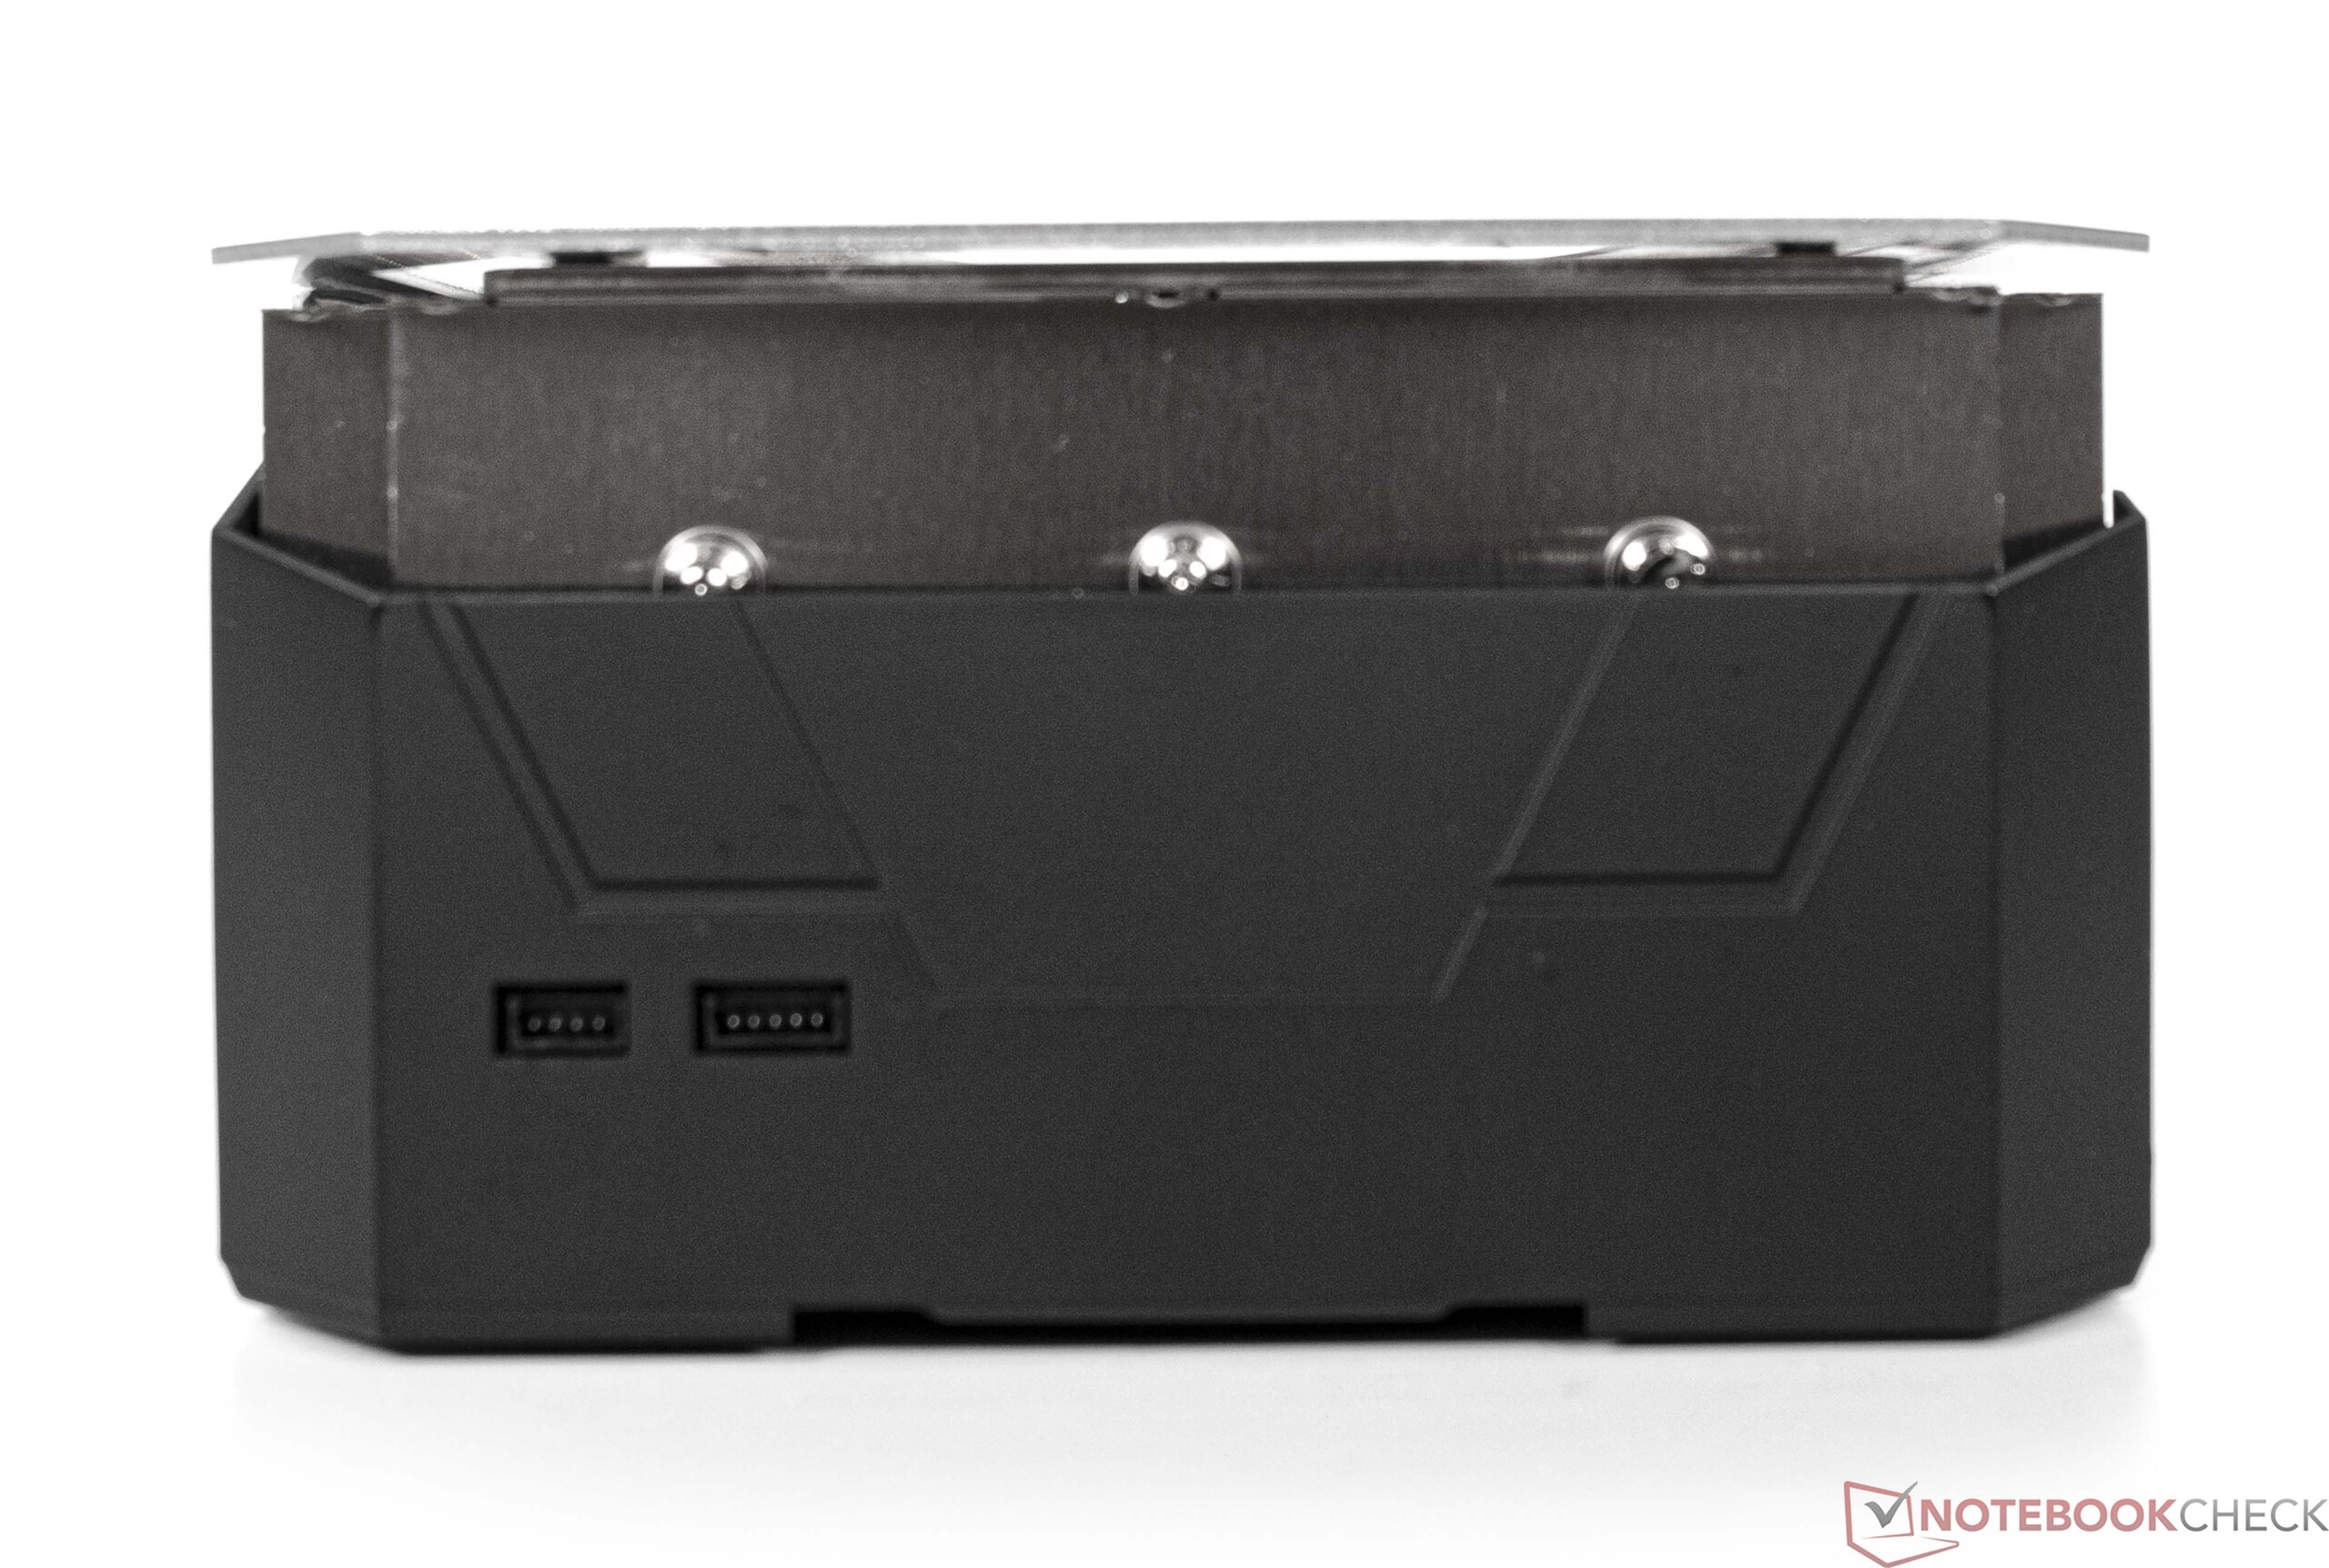
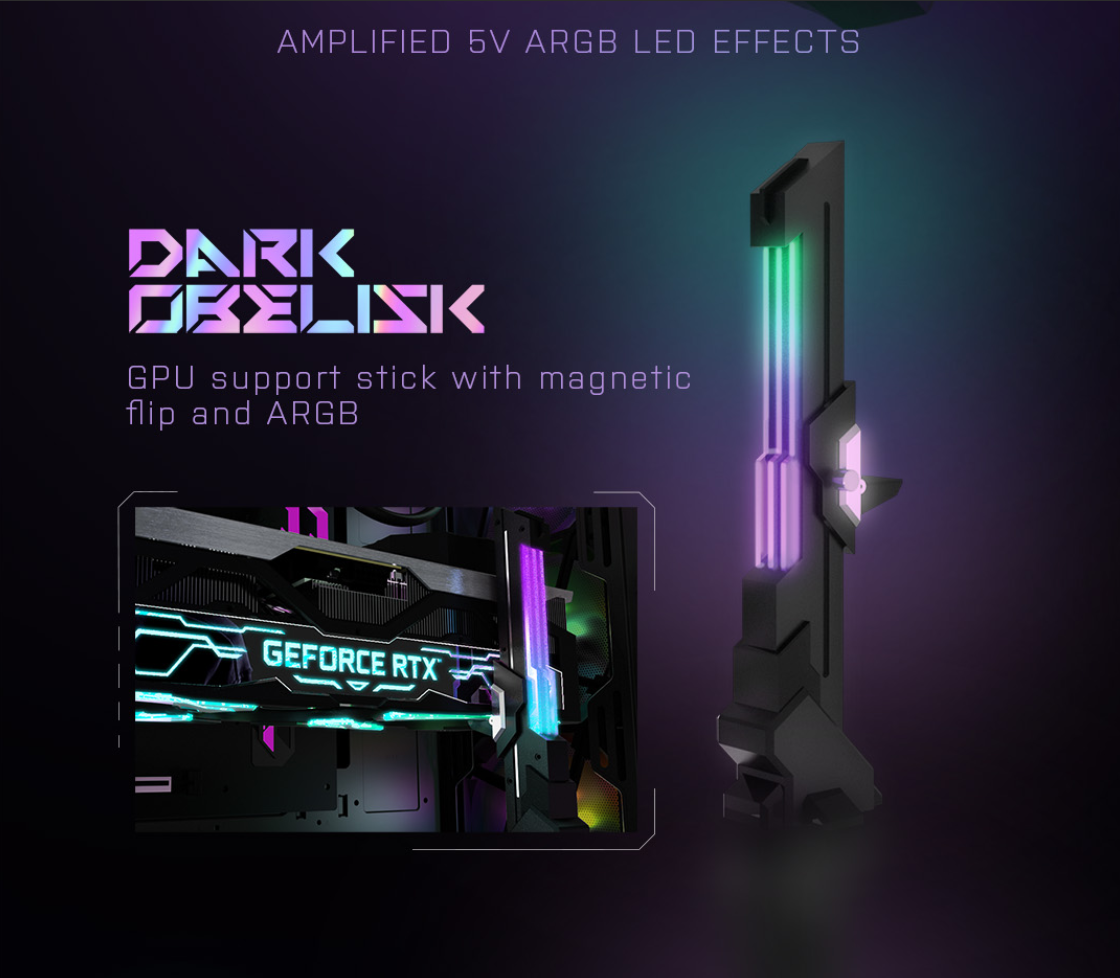
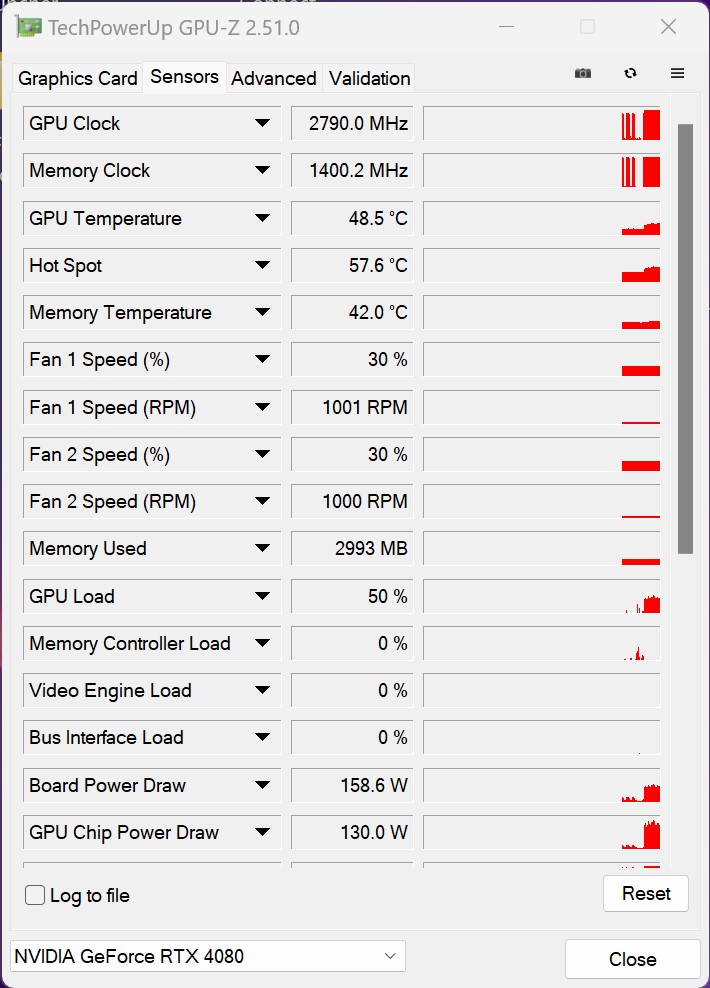
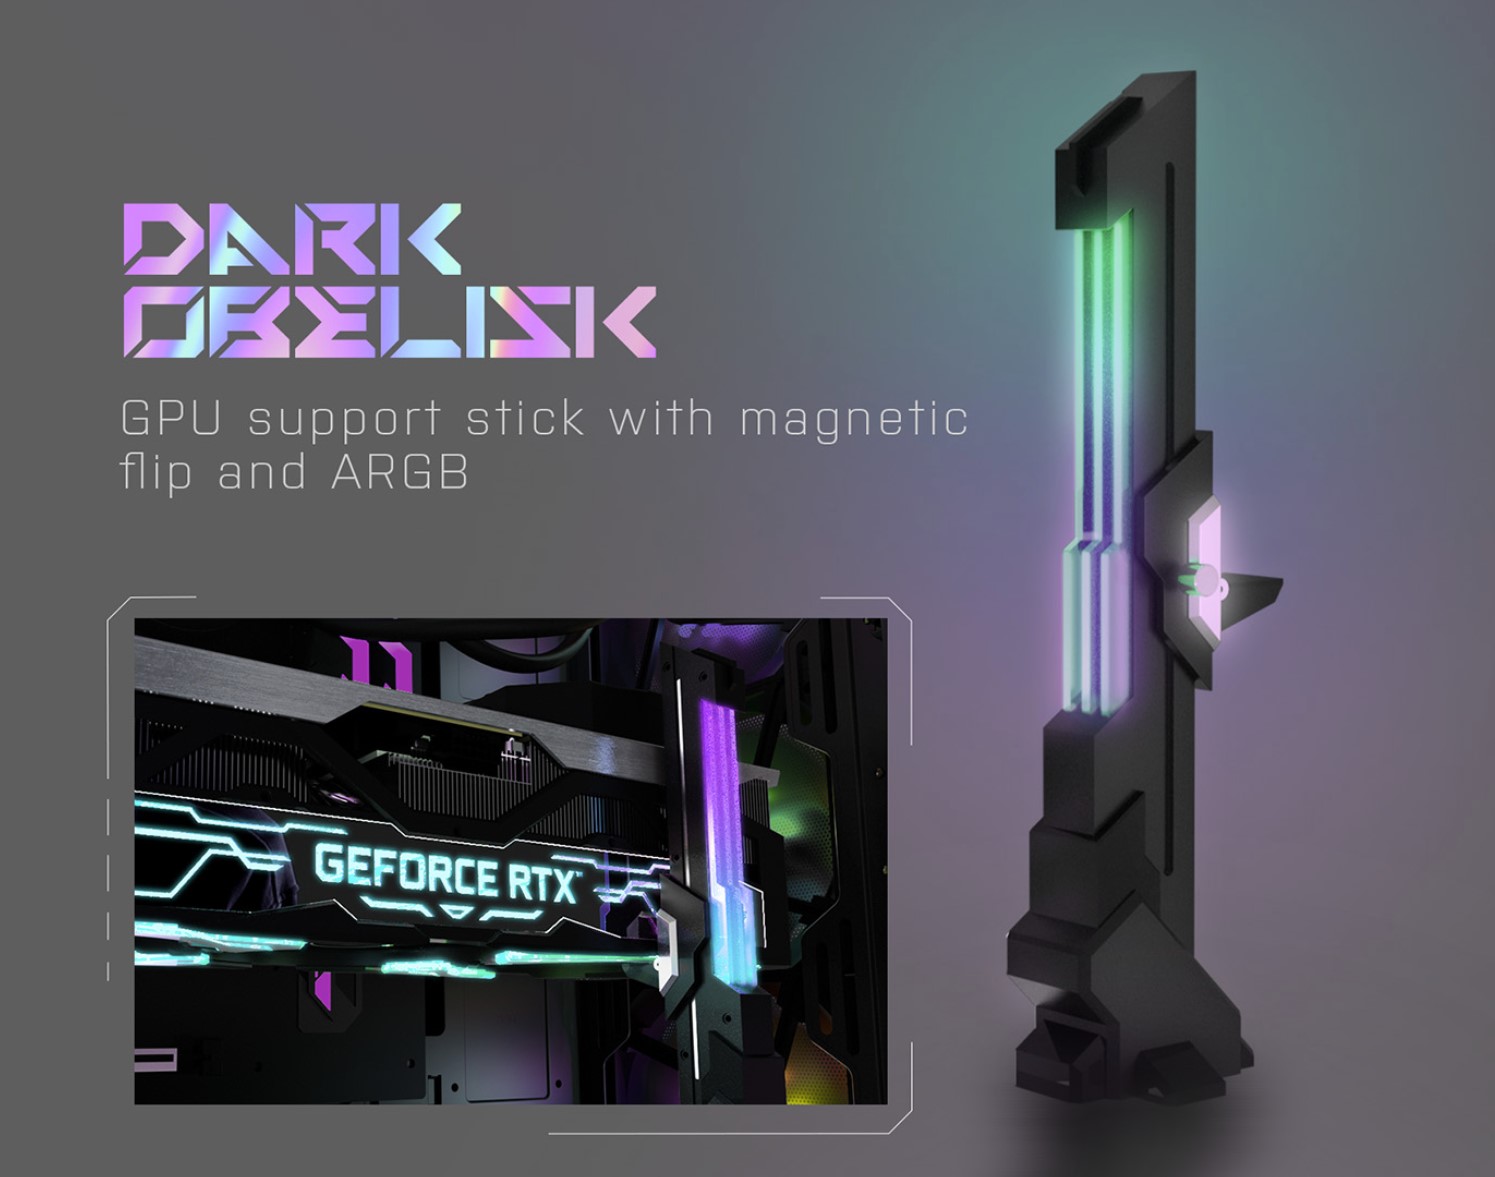
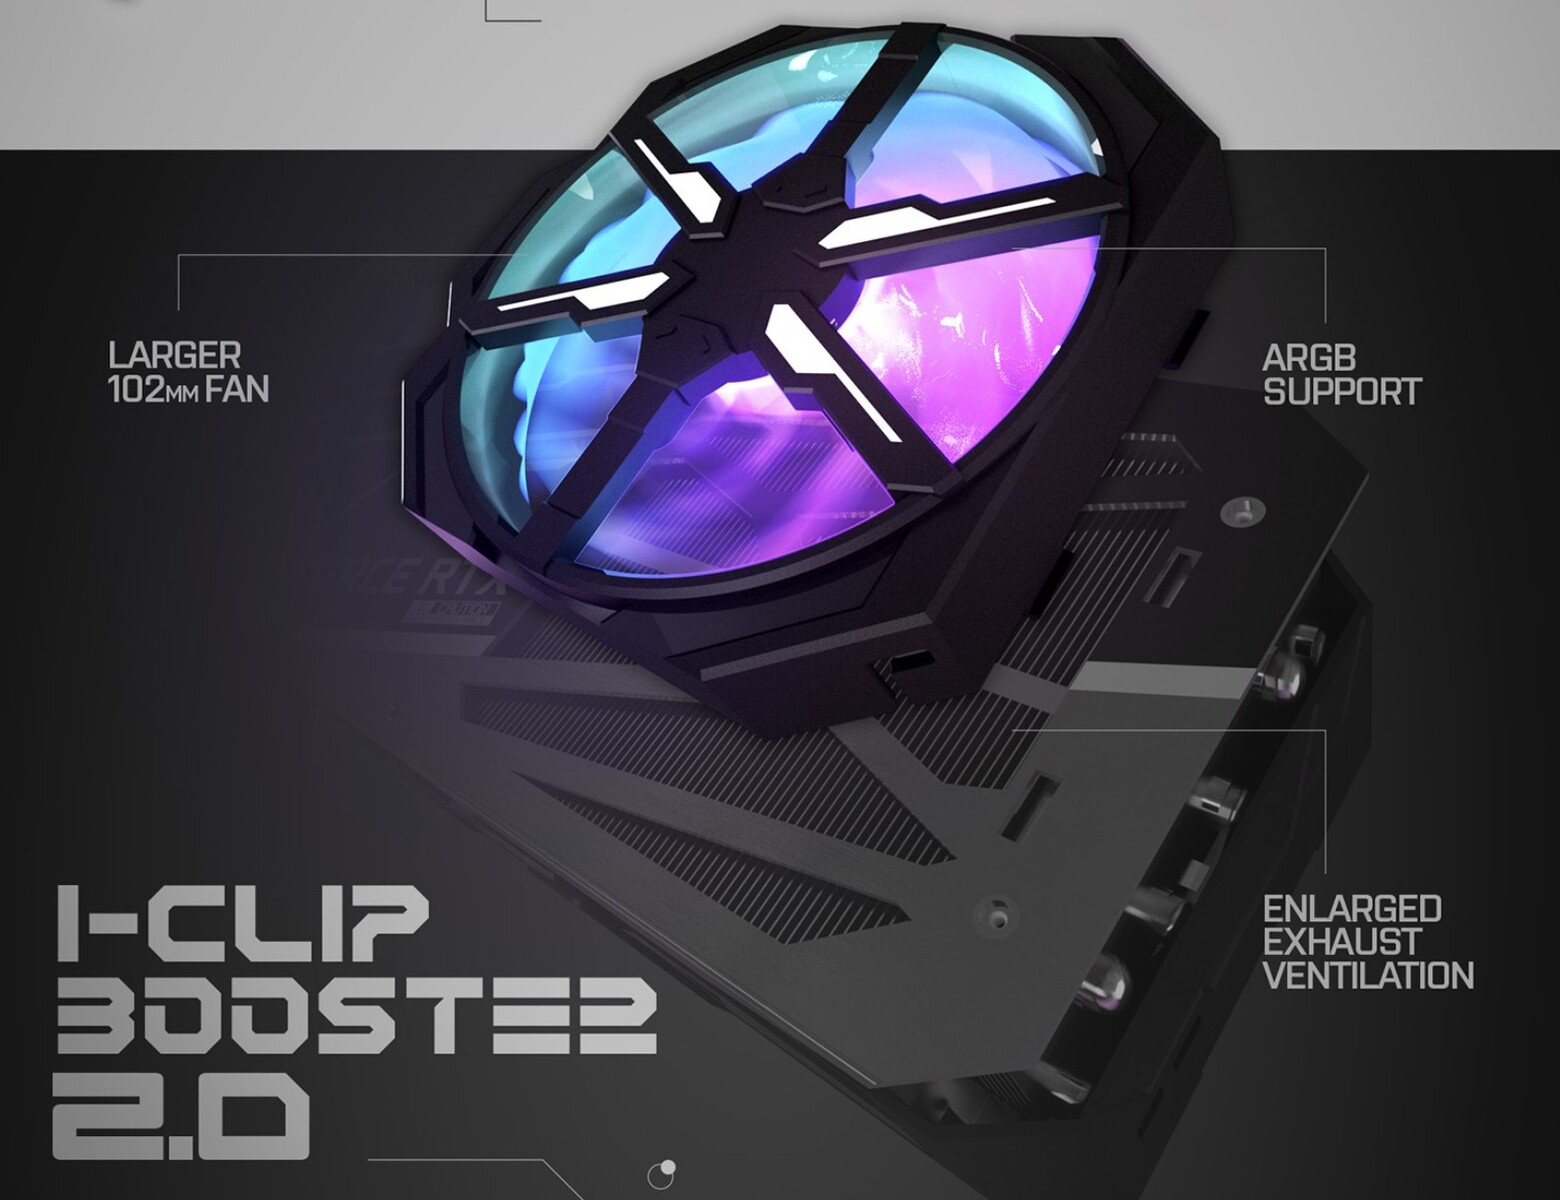
KFA2 ha dotado a la GeForce RTX 4080 SG de una velocidad de reloj ligeramente superior a la especificada por Nvidia: para ser exactos, la velocidad de reloj máxima se ha incrementado en 60 MHz. Pero esto es irrelevante en la práctica, porque hemos conseguido alcanzar velocidades más altas durante nuestras pruebas. De media, vimos velocidades de reloj de la GPU de aproximadamente 2,8 GHz durante los juegos. La ligera herramienta Xtreme Tuner permite controlar los ventiladores y la iluminación de la tarjeta gráfica. Para nuestras pruebas, sin embargo, no hicimos ningún cambio en la configuración predeterminada. La función 1-Click OC que suele encontrarse en los modelos KFA2 es más bien una función de adorno. En aplicaciones reales, aumentar la velocidad de la GPU en sólo 15 MHz apenas supone diferencia alguna. Esperamos que esta función aporte mucho más en el futuro. Aparte de la propia tarjeta gráfica, en la caja también encontrarás un ventilador opcional diseñado para montarse en la parte posterior de la tarjeta. Lástima que el ventilador sea incompatible con nuestra placa base, lo que nos impide utilizarlo en nuestro análisis. La empresa también ha incluido un soporte para GPU (ARGB Dark Obelisk). Este elemento está equipado con iluminación RGB integrada y por lo tanto va bien con el diseño general de la KFA2 GeForce RTX 4080 SG.
Puntos de referencia sintéticos
En las pruebas sintéticas, la KFA2 GeForce RTX 4080 SG ofreció exactamente el mismo nivel de rendimiento que la Founders Edition de Nvidia. La tarjeta KFA2 fue capaz de superar a una AMD Radeon RX 7900 XT en un once por ciento. La GPU insignia de AMD, la Radeon RX 7900 XTX, está dentro del mismo rango de rendimiento y es sólo insignificantemente más rápida que nuestra unidad de análisis. Después de ver un enorme salto de rendimiento desde la GeForce RTX 3090 a la RTX 4090, observamos una ganancia de rendimiento similar al comparar la RTX 4080 con la RTX 3080 Ti. En conjunto, la arquitectura Ada Lovelace de Nvidia ofrece un 26% más de rendimiento que Ampere.
En términos de rendimiento de cálculo, Nvidia lleva claramente las de ganar a veces, mientras que AMD es decididamente mejor en otros casos. Por eso, quienes busquen sobre todo un alto rendimiento de cálculo deben considerar cuidadosamente qué programas de software van a utilizar y qué tarjeta gráfica tiene ventaja en esas aplicaciones concretas. Por tanto, no podemos recomendar definitivamente un producto concreto en este sentido.
| Performance rating - Percent | |
| Palit GeForce RTX 4090 GameRock OC | |
| KFA2 GeForce RTX 4090 SG | |
| AMD Radeon RX 7900 XTX | |
| NVIDIA GeForce RTX 4080 Founders Edition | |
| KFA2 GeForce RTX 4080 SG | |
| AMD Radeon RX 7900 XT | |
| MSI Radeon RX 6950 XT Gaming X Trio | |
| ASUS TUF Gaming GeForce RTX 3080 Ti OC | |
| NVIDIA GeForce RTX 3090 Founders Edition | |
| Sapphire AMD Radeon RX 6950 XT Nitro+ Pure | |
| KFA2 GeForce RTX 3080 SG | |
| Nvidia Titan RTX | |
| Unigine Heaven 4.0 | |
| Extreme Preset DX11 | |
| Palit GeForce RTX 4090 GameRock OC | |
| KFA2 GeForce RTX 4090 SG | |
| KFA2 GeForce RTX 4080 SG | |
| NVIDIA GeForce RTX 4080 Founders Edition | |
| AMD Radeon RX 7900 XTX | |
| AMD Radeon RX 7900 XT | |
| MSI Radeon RX 6950 XT Gaming X Trio | |
| ASUS TUF Gaming GeForce RTX 3080 Ti OC | |
| NVIDIA GeForce RTX 3090 Founders Edition | |
| Sapphire AMD Radeon RX 6950 XT Nitro+ Pure | |
| KFA2 GeForce RTX 3080 SG | |
| Nvidia Titan RTX | |
| Extreme Preset OpenGL | |
| Palit GeForce RTX 4090 GameRock OC | |
| KFA2 GeForce RTX 4090 SG | |
| KFA2 GeForce RTX 4080 SG | |
| AMD Radeon RX 7900 XTX | |
| NVIDIA GeForce RTX 4080 Founders Edition | |
| AMD Radeon RX 7900 XT | |
| ASUS TUF Gaming GeForce RTX 3080 Ti OC | |
| NVIDIA GeForce RTX 3090 Founders Edition | |
| MSI Radeon RX 6950 XT Gaming X Trio | |
| KFA2 GeForce RTX 3080 SG | |
| Sapphire AMD Radeon RX 6950 XT Nitro+ Pure | |
| Nvidia Titan RTX | |
| Unigine Valley 1.0 | |
| 1920x1080 Extreme HD DirectX AA:x8 | |
| NVIDIA GeForce RTX 4080 Founders Edition | |
| KFA2 GeForce RTX 4090 SG | |
| Palit GeForce RTX 4090 GameRock OC | |
| AMD Radeon RX 7900 XTX | |
| KFA2 GeForce RTX 4080 SG | |
| AMD Radeon RX 7900 XT | |
| MSI Radeon RX 6950 XT Gaming X Trio | |
| ASUS TUF Gaming GeForce RTX 3080 Ti OC | |
| NVIDIA GeForce RTX 3090 Founders Edition | |
| Sapphire AMD Radeon RX 6950 XT Nitro+ Pure | |
| KFA2 GeForce RTX 3080 SG | |
| Nvidia Titan RTX | |
| 1920x1080 Extreme HD Preset OpenGL AA:x8 | |
| Palit GeForce RTX 4090 GameRock OC | |
| KFA2 GeForce RTX 4090 SG | |
| NVIDIA GeForce RTX 4080 Founders Edition | |
| AMD Radeon RX 7900 XTX | |
| KFA2 GeForce RTX 4080 SG | |
| AMD Radeon RX 7900 XT | |
| ASUS TUF Gaming GeForce RTX 3080 Ti OC | |
| NVIDIA GeForce RTX 3090 Founders Edition | |
| MSI Radeon RX 6950 XT Gaming X Trio | |
| KFA2 GeForce RTX 3080 SG | |
| Sapphire AMD Radeon RX 6950 XT Nitro+ Pure | |
| Nvidia Titan RTX | |
| 3DMark 11 | |
| 1280x720 Performance GPU | |
| Palit GeForce RTX 4090 GameRock OC | |
| KFA2 GeForce RTX 4090 SG | |
| KFA2 GeForce RTX 4080 SG | |
| NVIDIA GeForce RTX 4080 Founders Edition | |
| AMD Radeon RX 7900 XTX | |
| AMD Radeon RX 7900 XT | |
| MSI Radeon RX 6950 XT Gaming X Trio | |
| Sapphire AMD Radeon RX 6950 XT Nitro+ Pure | |
| NVIDIA GeForce RTX 3090 Founders Edition | |
| ASUS TUF Gaming GeForce RTX 3080 Ti OC | |
| KFA2 GeForce RTX 3080 SG | |
| Nvidia Titan RTX | |
| 1280x720 Performance | |
| Palit GeForce RTX 4090 GameRock OC | |
| KFA2 GeForce RTX 4090 SG | |
| KFA2 GeForce RTX 4080 SG | |
| NVIDIA GeForce RTX 4080 Founders Edition | |
| AMD Radeon RX 7900 XTX | |
| AMD Radeon RX 7900 XT | |
| MSI Radeon RX 6950 XT Gaming X Trio | |
| ASUS TUF Gaming GeForce RTX 3080 Ti OC | |
| NVIDIA GeForce RTX 3090 Founders Edition | |
| Nvidia Titan RTX | |
| Sapphire AMD Radeon RX 6950 XT Nitro+ Pure | |
| KFA2 GeForce RTX 3080 SG | |
Compute benchmarks and professional applications
| LuxMark v2.0 64Bit | |
| Sala GPUs-only | |
| AMD Radeon RX 6950 XT | |
| NVIDIA GeForce RTX 4090 | |
| NVIDIA GeForce RTX 4090 | |
| NVIDIA GeForce RTX 4080 | |
| KFA2 GeForce RTX 4080 SG | |
| NVIDIA GeForce RTX 3080 Ti | |
| AMD Radeon RX 7900 XTX | |
| NVIDIA GeForce RTX 3090 | |
| NVIDIA GeForce RTX 3080 12 GB | |
| AMD Radeon RX 7900 XT | |
| AMD Radeon RX 6950 XT | |
| NVIDIA Titan RTX | |
| Room GPUs-only | |
| NVIDIA GeForce RTX 4090 | |
| NVIDIA GeForce RTX 4090 | |
| NVIDIA GeForce RTX 4080 | |
| KFA2 GeForce RTX 4080 SG | |
| NVIDIA GeForce RTX 3090 | |
| NVIDIA GeForce RTX 3080 Ti | |
| NVIDIA GeForce RTX 3080 12 GB | |
| AMD Radeon RX 7900 XTX | |
| AMD Radeon RX 6950 XT | |
| NVIDIA Titan RTX | |
| AMD Radeon RX 7900 XT | |
| AMD Radeon RX 6950 XT | |
| Blender - v3.3 Classroom CUDA | |
| NVIDIA Titan RTX | |
| NVIDIA GeForce RTX 3080 Ti | |
| Geekbench 5.5 | |
| OpenCL Score | |
| NVIDIA GeForce RTX 4090 | |
| NVIDIA GeForce RTX 4090 | |
| KFA2 GeForce RTX 4080 SG | |
| NVIDIA GeForce RTX 4080 | |
| NVIDIA GeForce RTX 3090 | |
| NVIDIA GeForce RTX 3080 12 GB | |
| AMD Radeon RX 6950 XT | |
| NVIDIA Titan RTX | |
| Vulkan Score 5.5 | |
| NVIDIA GeForce RTX 4090 | |
| NVIDIA GeForce RTX 4090 | |
| NVIDIA Titan RTX | |
| NVIDIA GeForce RTX 3090 | |
| AMD Radeon RX 6950 XT | |
| NVIDIA GeForce RTX 3080 12 GB | |
| V-Ray 5 Benchmark | |
| GPU CUDA | |
| NVIDIA GeForce RTX 4090 | |
| NVIDIA GeForce RTX 4090 | |
| KFA2 GeForce RTX 4080 SG | |
| NVIDIA GeForce RTX 4080 | |
| NVIDIA GeForce RTX 3090 | |
| NVIDIA GeForce RTX 3080 Ti | |
| NVIDIA GeForce RTX 3080 12 GB | |
| AMD Radeon RX 6950 XT | |
| GPU RTX | |
| NVIDIA GeForce RTX 4090 | |
| NVIDIA GeForce RTX 4090 | |
| KFA2 GeForce RTX 4080 SG | |
| NVIDIA GeForce RTX 4080 | |
| NVIDIA GeForce RTX 3090 | |
| NVIDIA GeForce RTX 3080 Ti | |
| Affinity Photo 2 - Combined (Single / Multi GPU) | |
| NVIDIA GeForce RTX 4090 | |
| KFA2 GeForce RTX 4080 SG | |
| NVIDIA GeForce RTX 3080 Ti | |
| NVIDIA Titan RTX | |
| AMD Radeon RX 6950 XT | |
| AMD Radeon RX 7900 XTX | |
| AMD Radeon RX 7900 XT | |
* ... más pequeño es mejor
Puntos de referencia para juegos
Como el KFA2 GeForce RTX 4090 SGla KFA2 GeForce RTX 4080 SG ofrece un rendimiento de juego inmensamente alto que sólo despliega sus músculos a 2160p. Ni que decir tiene que el modelo puede manejar 1440p muy cómodamente, y la CPU es un factor menos limitante que con la RTX 4090 más rápida. Los competidores de AMD no le plantan mucha batalla a la KFA2 GeForce RTX 4080 SG, a pesar de que algunos juegos funcionan mejor con tarjetas gráficas AMD. Por otro lado, también hay juegos que funcionan mucho mejor en las GPU Nvidia. Una vez activadas las funciones de trazado de rayos, las tarjetas Nvidia aventajan aún más a las nuevas tarjetas gráficas RDNA3. Sin DLSS, incluso las GPU Nvidia más rápidas tienen problemas con el trazado de rayos a altas resoluciones. Como demuestra Cyberpunk 2077, tendrás que conformarte con 1080p cuando DLSS esté desactivado
En cualquier caso, hay que tener en cuenta que DLSS 3.0 está disponible exclusivamente en las nuevas GPU de la serie GeForce RTX 40. AMD tiene preparada una función similar en forma del estándar abierto FSR, que también puede utilizarse con las GPU Nvidia. En última instancia, depende de los desarrolladores de juegos integrar estas funciones en sus juegos. Puedes consultar la lista de juegos compatibles con DLSS 3.0 o que lo serán en el futuro en https://www.nvidia.com/en-us/geforce/news/dlss3-supports-over-35-games-apps/ .
| GTA V - 3840x2160 High/On (Advanced Graphics Off) AA:FX AF:8x | |
| Palit GeForce RTX 4090 GameRock OC | |
| NVIDIA GeForce RTX 4080 Founders Edition | |
| AMD Radeon RX 7900 XTX | |
| KFA2 GeForce RTX 4080 SG | |
| ASUS TUF Gaming GeForce RTX 3080 Ti OC | |
| NVIDIA GeForce RTX 3090 Founders Edition | |
| MSI Radeon RX 6950 XT Gaming X Trio | |
| AMD Radeon RX 7900 XT | |
| Sapphire AMD Radeon RX 6950 XT Nitro+ Pure | |
| KFA2 GeForce RTX 3080 SG | |
| Nvidia Titan RTX | |
| The Witcher 3 - 3840x2160 High Graphics & Postprocessing (Nvidia HairWorks Off) | |
| Palit GeForce RTX 4090 GameRock OC | |
| NVIDIA GeForce RTX 4080 Founders Edition | |
| KFA2 GeForce RTX 4080 SG | |
| AMD Radeon RX 7900 XTX | |
| AMD Radeon RX 7900 XT | |
| NVIDIA GeForce RTX 3090 Founders Edition | |
| ASUS TUF Gaming GeForce RTX 3080 Ti OC | |
| MSI Radeon RX 6950 XT Gaming X Trio | |
| Sapphire AMD Radeon RX 6950 XT Nitro+ Pure | |
| KFA2 GeForce RTX 3080 SG | |
| AMD Radeon RX 6900 XT | |
| Nvidia Titan RTX | |
| Final Fantasy XV Benchmark - 3840x2160 High Quality | |
| Palit GeForce RTX 4090 GameRock OC | |
| KFA2 GeForce RTX 4080 SG | |
| NVIDIA GeForce RTX 4080 Founders Edition | |
| AMD Radeon RX 7900 XTX | |
| NVIDIA GeForce RTX 3090 Founders Edition | |
| ASUS TUF Gaming GeForce RTX 3080 Ti OC | |
| Sapphire AMD Radeon RX 6950 XT Nitro+ Pure | |
| MSI Radeon RX 6950 XT Gaming X Trio | |
| AMD Radeon RX 7900 XT | |
| KFA2 GeForce RTX 3080 SG | |
| Nvidia Titan RTX | |
| Strange Brigade - 3840x2160 ultra AA:ultra AF:16 | |
| Palit GeForce RTX 4090 GameRock OC | |
| KFA2 GeForce RTX 4080 SG | |
| MSI Radeon RX 6950 XT Gaming X Trio | |
| AMD Radeon RX 7900 XT | |
| AMD Radeon RX 7900 XTX | |
| Sapphire AMD Radeon RX 6950 XT Nitro+ Pure | |
| NVIDIA GeForce RTX 3090 Founders Edition | |
| ASUS TUF Gaming GeForce RTX 3080 Ti OC | |
| KFA2 GeForce RTX 3080 SG | |
| Nvidia Titan RTX | |
| Far Cry 5 - 3840x2160 Ultra Preset AA:T | |
| Palit GeForce RTX 4090 GameRock OC | |
| AMD Radeon RX 7900 XTX | |
| NVIDIA GeForce RTX 4080 Founders Edition | |
| KFA2 GeForce RTX 4080 SG | |
| AMD Radeon RX 7900 XT | |
| MSI Radeon RX 6950 XT Gaming X Trio | |
| Sapphire AMD Radeon RX 6950 XT Nitro+ Pure | |
| ASUS TUF Gaming GeForce RTX 3080 Ti OC | |
| NVIDIA GeForce RTX 3090 Founders Edition | |
| KFA2 GeForce RTX 3080 SG | |
| Nvidia Titan RTX | |
| Far Cry New Dawn - 3840x2160 Ultra Preset | |
| Palit GeForce RTX 4090 GameRock OC | |
| AMD Radeon RX 7900 XTX | |
| KFA2 GeForce RTX 4080 SG | |
| AMD Radeon RX 7900 XT | |
| MSI Radeon RX 6950 XT Gaming X Trio | |
| Sapphire AMD Radeon RX 6950 XT Nitro+ Pure | |
| ASUS TUF Gaming GeForce RTX 3080 Ti OC | |
| NVIDIA GeForce RTX 3090 Founders Edition | |
| AMD Radeon RX 6900 XT | |
| KFA2 GeForce RTX 3080 SG | |
| Nvidia Titan RTX | |
| Far Cry 6 - 3840x2160 Ultra Graphics Quality + HD Textures AA:T | |
| Palit GeForce RTX 4090 GameRock OC | |
| AMD Radeon RX 7900 XTX | |
| NVIDIA GeForce RTX 4080 Founders Edition | |
| KFA2 GeForce RTX 4080 SG | |
| AMD Radeon RX 7900 XT | |
| MSI Radeon RX 6950 XT Gaming X Trio | |
| Sapphire AMD Radeon RX 6950 XT Nitro+ Pure | |
| ASUS TUF Gaming GeForce RTX 3080 Ti OC | |
| NVIDIA GeForce RTX 3090 Founders Edition | |
| Nvidia Titan RTX | |
| KFA2 GeForce RTX 3080 SG | |
| Metro Exodus - 3840x2160 Ultra Quality AF:16x | |
| Palit GeForce RTX 4090 GameRock OC | |
| NVIDIA GeForce RTX 4080 Founders Edition | |
| KFA2 GeForce RTX 4080 SG | |
| AMD Radeon RX 7900 XTX | |
| AMD Radeon RX 7900 XT | |
| MSI Radeon RX 6950 XT Gaming X Trio | |
| ASUS TUF Gaming GeForce RTX 3080 Ti OC | |
| NVIDIA GeForce RTX 3090 Founders Edition | |
| Sapphire AMD Radeon RX 6950 XT Nitro+ Pure | |
| AMD Radeon RX 6900 XT | |
| KFA2 GeForce RTX 3080 SG | |
| Nvidia Titan RTX | |
| F1 2020 - 3840x2160 Ultra High Preset AA:T AF:16x | |
| Palit GeForce RTX 4090 GameRock OC | |
| KFA2 GeForce RTX 4080 SG | |
| AMD Radeon RX 7900 XTX | |
| AMD Radeon RX 7900 XT | |
| MSI Radeon RX 6950 XT Gaming X Trio | |
| Sapphire AMD Radeon RX 6950 XT Nitro+ Pure | |
| ASUS TUF Gaming GeForce RTX 3080 Ti OC | |
| NVIDIA GeForce RTX 3090 Founders Edition | |
| AMD Radeon RX 6900 XT | |
| AMD Radeon RX 6900 XT | |
| KFA2 GeForce RTX 3080 SG | |
| Nvidia Titan RTX | |
| F1 2021 - 3840x2160 Ultra High Preset + Raytracing AA:T AF:16x | |
| Palit GeForce RTX 4090 GameRock OC | |
| KFA2 GeForce RTX 4080 SG | |
| NVIDIA GeForce RTX 4080 Founders Edition | |
| AMD Radeon RX 7900 XTX | |
| AMD Radeon RX 7900 XT | |
| ASUS TUF Gaming GeForce RTX 3080 Ti OC | |
| NVIDIA GeForce RTX 3090 Founders Edition | |
| MSI Radeon RX 6950 XT Gaming X Trio | |
| Sapphire AMD Radeon RX 6950 XT Nitro+ Pure | |
| KFA2 GeForce RTX 3080 SG | |
| Nvidia Titan RTX | |
| F1 22 - 3840x2160 Ultra High Preset AA:T AF:16x | |
| Palit GeForce RTX 4090 GameRock OC | |
| NVIDIA GeForce RTX 4080 Founders Edition | |
| KFA2 GeForce RTX 4080 SG | |
| AMD Radeon RX 7900 XTX | |
| AMD Radeon RX 7900 XT | |
| ASUS TUF Gaming GeForce RTX 3080 Ti OC | |
| NVIDIA GeForce RTX 3090 Founders Edition | |
| MSI Radeon RX 6950 XT Gaming X Trio | |
| Sapphire AMD Radeon RX 6950 XT Nitro+ Pure | |
| Nvidia Titan RTX | |
| Borderlands 3 - 3840x2160 Badass Overall Quality (DX11) | |
| Palit GeForce RTX 4090 GameRock OC | |
| NVIDIA GeForce RTX 4080 Founders Edition | |
| KFA2 GeForce RTX 4080 SG | |
| AMD Radeon RX 7900 XTX | |
| AMD Radeon RX 7900 XT | |
| ASUS TUF Gaming GeForce RTX 3080 Ti OC | |
| NVIDIA GeForce RTX 3090 Founders Edition | |
| MSI Radeon RX 6950 XT Gaming X Trio | |
| KFA2 GeForce RTX 3080 SG | |
| Sapphire AMD Radeon RX 6950 XT Nitro+ Pure | |
| AMD Radeon RX 6900 XT | |
| AMD Radeon RX 6900 XT | |
| Nvidia Titan RTX | |
| Metro Exodus - 1920x1080 Ultra Quality DXR AF:16x | |
| NVIDIA GeForce RTX 4090 | |
| NVIDIA GeForce RTX 4080 | |
| AMD Radeon RX 7900 XTX | |
| NVIDIA GeForce RTX 4080 | |
| AMD Radeon RX 7900 XT | |
| NVIDIA GeForce RTX 3080 Ti | |
| NVIDIA GeForce RTX 3090 | |
| AMD Radeon RX 6950 XT | |
| Far Cry 6 - 1920x1080 Ultra Graphics Quality + HD Textures + DXR AA:T | |
| NVIDIA GeForce RTX 4080 | |
| AMD Radeon RX 7900 XTX | |
| AMD Radeon RX 7900 XT | |
| NVIDIA GeForce RTX 4090 | |
| AMD Radeon RX 6950 XT | |
| NVIDIA GeForce RTX 3080 Ti | |
| NVIDIA GeForce RTX 4080 | |
| NVIDIA GeForce RTX 3090 | |
| AMD Radeon RX 6800 | |
| AMD Radeon RX 6950 XT | |
| Cyberpunk 2077 1.6 | |
| 3840x2160 Ray Tracing Ultra Preset (DLSS off) | |
| NVIDIA GeForce RTX 4090 (1.6) | |
| NVIDIA GeForce RTX 4080 (1.6) | |
| NVIDIA GeForce RTX 4080 (1.61) | |
| NVIDIA GeForce RTX 3090 (1.6) | |
| AMD Radeon RX 7900 XTX (1.61) | |
| NVIDIA GeForce RTX 3080 Ti (1.61) | |
| AMD Radeon RX 7900 XT (1.61) | |
| AMD Radeon RX 6950 XT (1.61) | |
| AMD Radeon RX 6800 (1.61) | |
| 1920x1080 Ray Tracing Ultra Preset (DLSS off) | |
| NVIDIA GeForce RTX 4090 (1.6) | |
| NVIDIA GeForce RTX 4080 (1.6) | |
| NVIDIA GeForce RTX 4080 (1.61) | |
| NVIDIA GeForce RTX 3080 Ti (1.61) | |
| NVIDIA GeForce RTX 3090 (1.6) | |
| AMD Radeon RX 7900 XTX (1.61) | |
| AMD Radeon RX 7900 XT (1.61) | |
| AMD Radeon RX 6950 XT (1.61) | |
| AMD Radeon RX 6800 (1.61) | |
| Control - 1920x1080 High Quality Preset & High Ray Tracing Preset (DX12) | |
| NVIDIA GeForce RTX 4090 | |
| NVIDIA GeForce RTX 4080 | |
| NVIDIA GeForce RTX 4080 | |
| AMD Radeon RX 7900 XTX | |
| NVIDIA GeForce RTX 3080 Ti | |
| AMD Radeon RX 7900 XT | |
| AMD Radeon RX 6950 XT | |
| AMD Radeon RX 6950 XT | |
| Ghostwire Tokyo - 1920x1080 Highest Settings + Maximum Ray Tracing | |
| NVIDIA GeForce RTX 4090 | |
| NVIDIA GeForce RTX 4080 | |
| NVIDIA GeForce RTX 4080 | |
| AMD Radeon RX 7900 XTX | |
| NVIDIA GeForce RTX 3080 Ti | |
| AMD Radeon RX 7900 XT | |
| AMD Radeon RX 6950 XT | |
| The Callisto Protocol - 1920x1080 Ultra Preset (without FSR Upscaling) + Full Ray-Tracing | |
| AMD Radeon RX 7900 XTX | |
| NVIDIA GeForce RTX 4090 | |
| AMD Radeon RX 7900 XT | |
| NVIDIA GeForce RTX 4080 | |
| AMD Radeon RX 6950 XT | |
| NVIDIA GeForce RTX 3080 Ti | |
| AMD Radeon RX 6800 | |
| Spider-Man Miles Morales - 1920x0180 Very High Preset + Ray-Tracing AA:T | |
| NVIDIA GeForce RTX 4090 | |
| NVIDIA GeForce RTX 4080 | |
| AMD Radeon RX 7900 XTX | |
| NVIDIA GeForce RTX 3080 Ti | |
| AMD Radeon RX 7900 XT | |
| AMD Radeon RX 6950 XT | |
| AMD Radeon RX 6800 | |
| bajo | medio | alto | ultra | QHD | 4K DLSS | 4K | |
|---|---|---|---|---|---|---|---|
| GTA V (2015) | 188.1 | 188 | 187.7 | 164.3 | 159.2 | 183.9 | |
| The Witcher 3 (2015) | 811 | 719 | 549 | 268 | 202 | ||
| Dota 2 Reborn (2015) | 287.8 | 256.8 | 247.1 | 228.6 | 221.7 | ||
| Final Fantasy XV Benchmark (2018) | 236 | 235 | 225 | 195.7 | 116.9 | ||
| X-Plane 11.11 (2018) | 219 | 193.6 | 149.4 | 124.9 | |||
| Far Cry 5 (2018) | 239 | 209 | 203 | 188 | 185 | 139 | |
| Strange Brigade (2018) | 681 | 548 | 531 | 482 | 390 | 195.1 | |
| Shadow of the Tomb Raider (2018) | 334 | 299 | 304 | 288 | 241 | 132.2 | |
| Far Cry New Dawn (2019) | 196 | 173 | 166 | 150 | 149 | 130 | |
| Metro Exodus (2019) | 300 | 256 | 212 | 177.7 | 153.7 | 103.9 | |
| Control (2019) | 240 | 240 | 235 | 162 | 82.4 | ||
| Borderlands 3 (2019) | 239 | 203 | 189.9 | 187.2 | 163.2 | 95.2 | |
| F1 2020 (2020) | 552 | 478 | 463 | 396 | 332 | 201 | |
| F1 2021 (2021) | 656 | 606 | 514 | 256 | 240 | 144.3 | |
| Far Cry 6 (2021) | 205 | 177.3 | 161.6 | 155 | 150.6 | 107 | |
| Forza Horizon 5 (2021) | 302 | 242 | 238 | 177 | 164 | 124 | |
| God of War (2022) | 274 | 271 | 229 | 164.9 | 136.3 | 95.3 | |
| GRID Legends (2022) | 318 | 287 | 254 | 237 | 233 | 163.3 | |
| Cyberpunk 2077 1.6 (2022) | 216 | 213 | 201 | 190.1 | 129.1 | 63.4 | |
| Ghostwire Tokyo (2022) | 294 | 283 | 252 | 124.6 | |||
| Tiny Tina's Wonderlands (2022) | 385 | 320 | 269 | 226 | 165.8 | 89 | |
| F1 22 (2022) | 423 | 411 | 384 | 172.8 | 113.8 | 57.9 | |
| The Quarry (2022) | 376 | 291 | 249 | 207 | 149 | 79.2 | |
| FIFA 23 (2022) | 278 | 274 | 274 | 274 | 272 | 218 | |
| A Plague Tale Requiem (2022) | 174.1 | 172.5 | 153.9 | 127 | 95.4 | 54.4 | |
| Uncharted Legacy of Thieves Collection (2022) | 145.5 | 144.7 | 142.1 | 140.4 | 125.6 | 77.7 | |
| Call of Duty Modern Warfare 2 2022 (2022) | 317 | 286 | 230 | 219 | 170 | 158 | 112 |
| Spider-Man Miles Morales (2022) | 198.6 | 180.3 | 178.2 | 157.3 | 202 | 103.9 | |
| The Callisto Protocol (2022) | 231 | 213 | 172 | 171 | 138 | 85 | |
| Need for Speed Unbound (2022) | 177.8 | 171.4 | 160.4 | 140.3 | 137.8 | 104.5 |
Emisiones de la KFA2 GeForce RTX 4080 SG
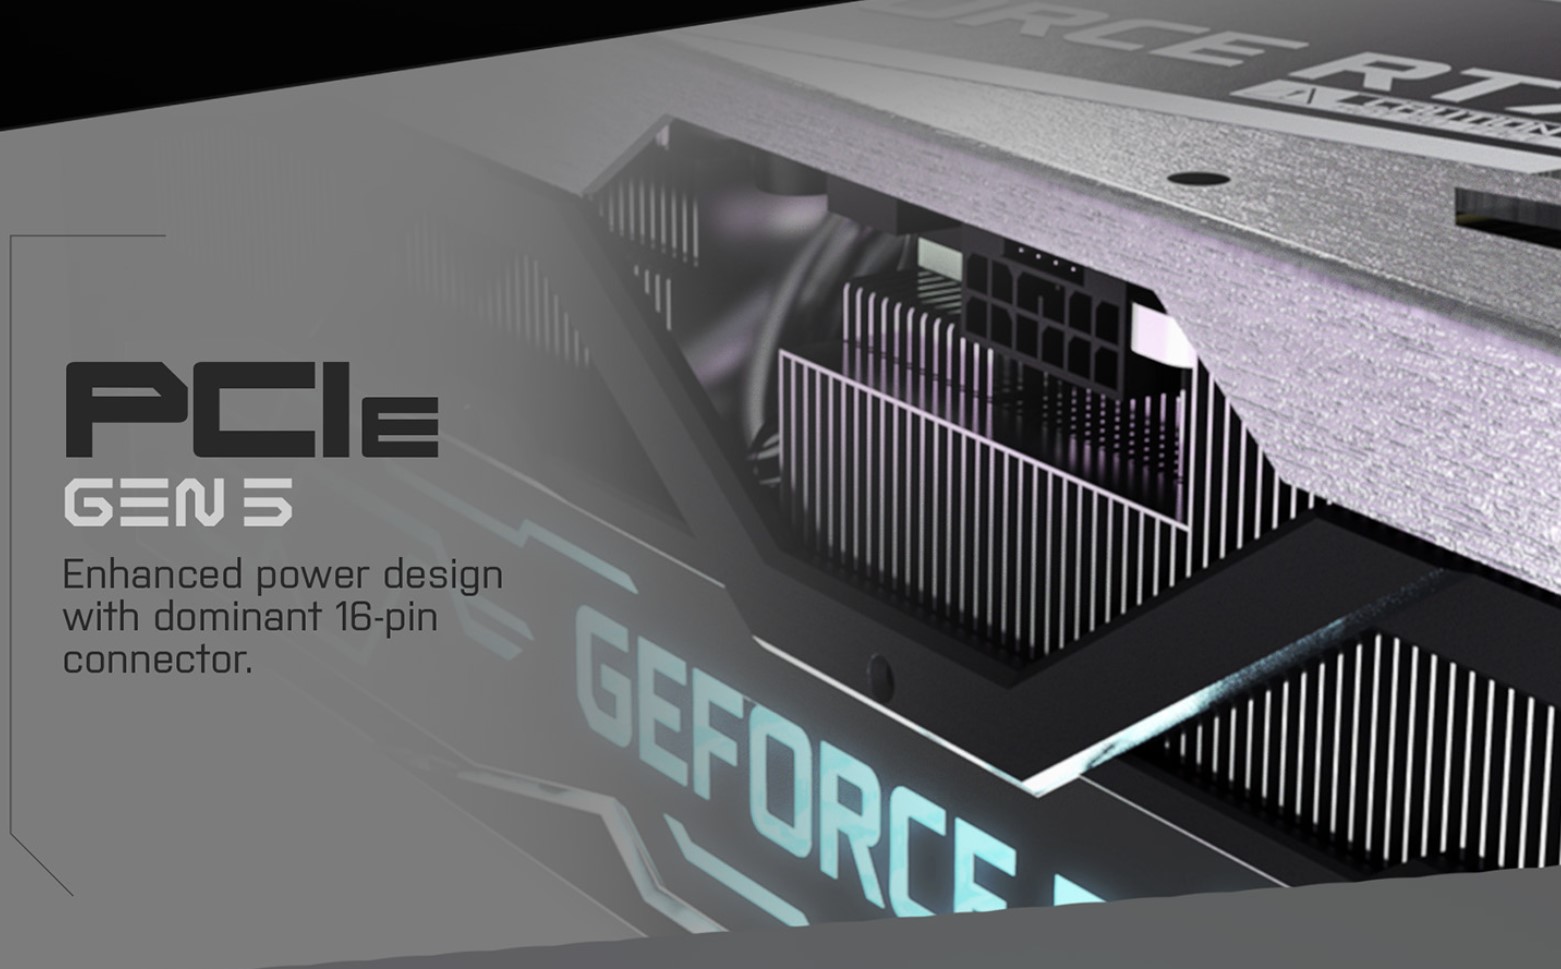
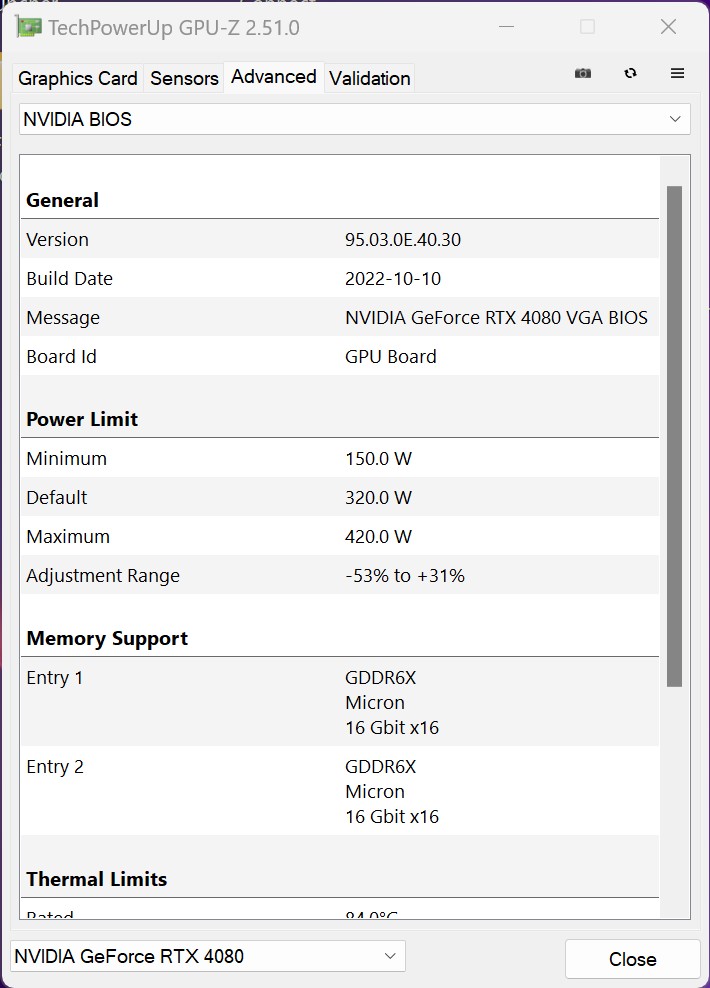
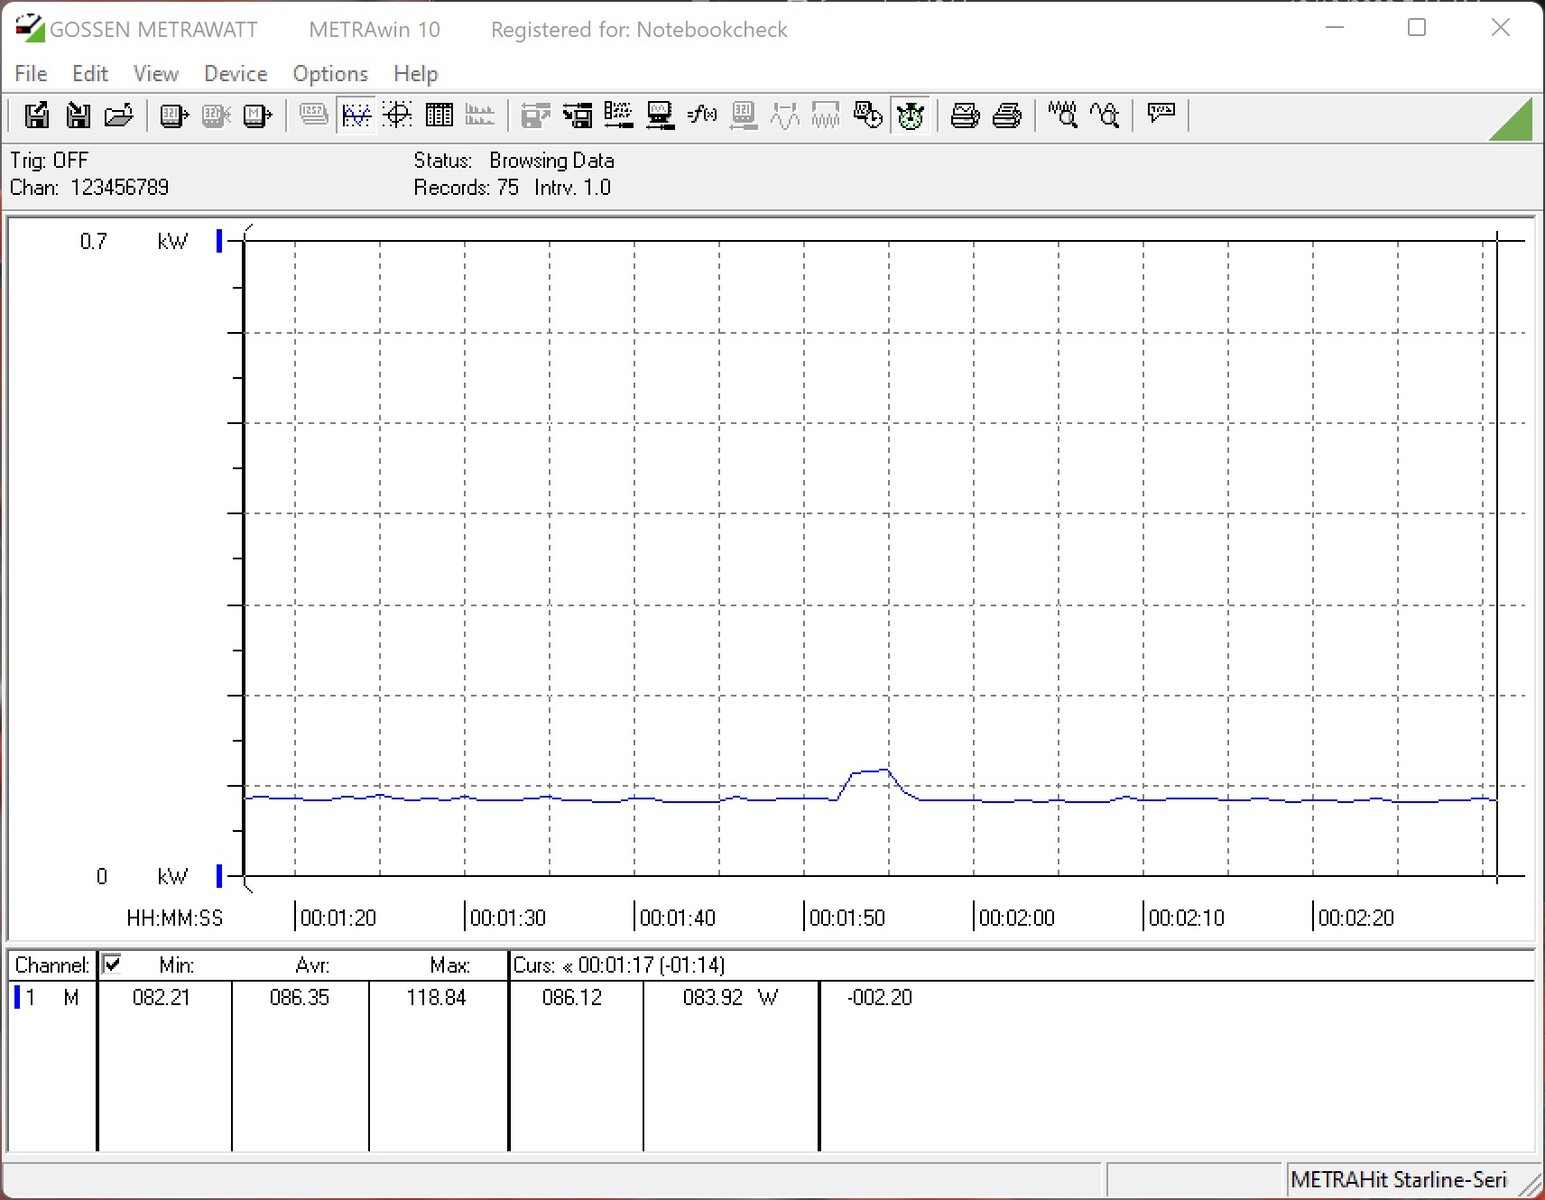
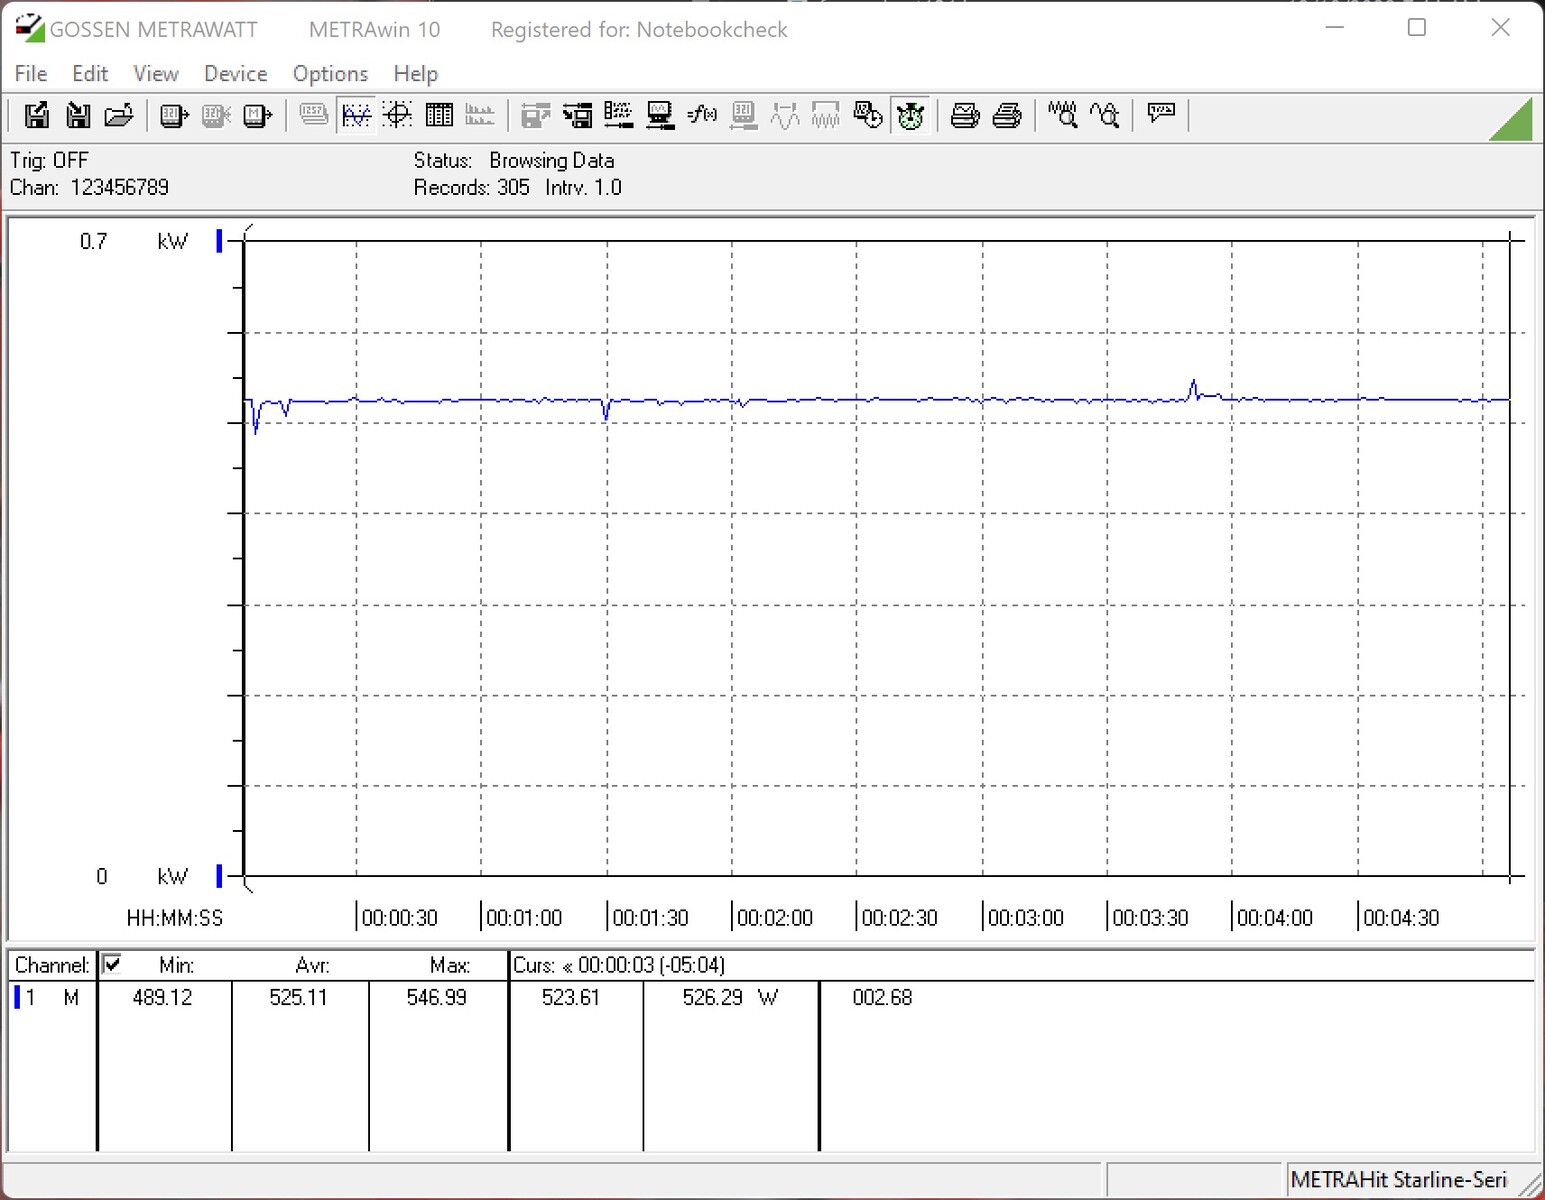
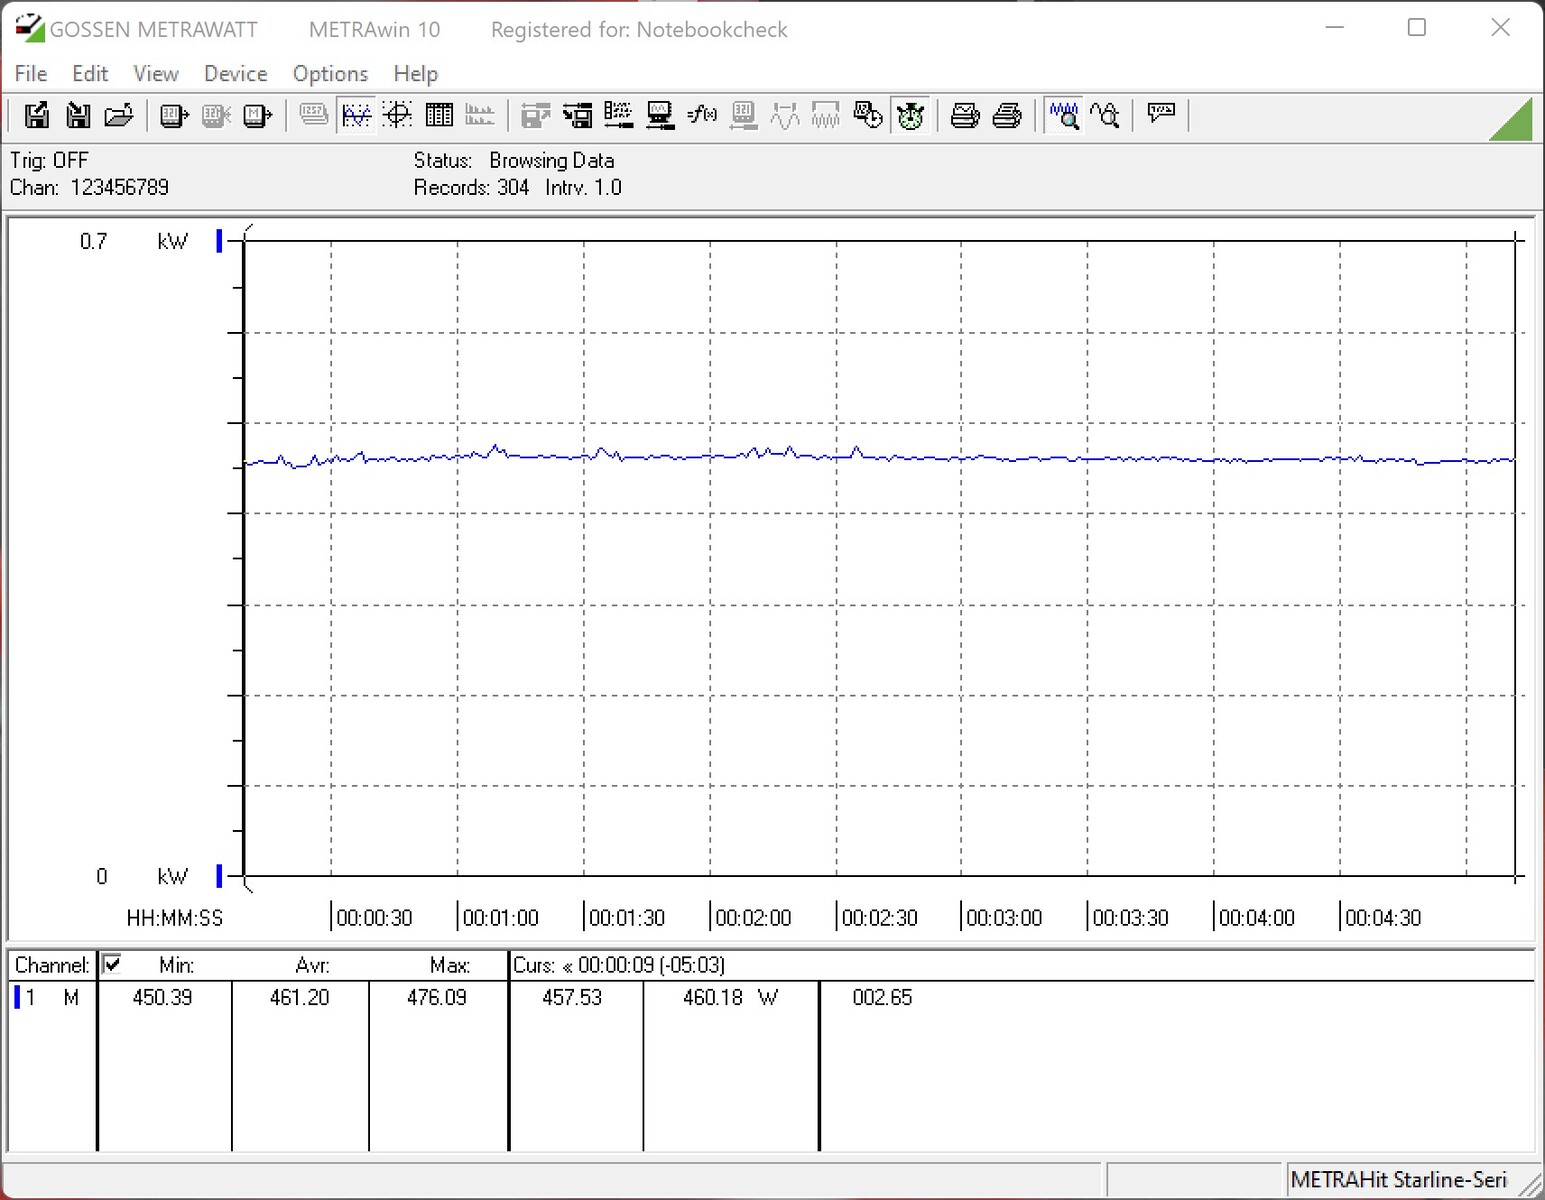
La KFA2 GeForce RTX 4080 SG consume 320 vatios, el mismo nivel que una tarjeta Nvidia Founders Edition. A pesar de que su consumo de energía se ha mantenido sin cambios en comparación con una tarjeta GeForce RTX 3080la RTX 4080 superó considerablemente a su predecesora en nuestras pruebas. La eficiencia energética ha mejorado por un margen impresionante con Ada Lovelace y el nodo de 4 nm. El objetivo de potencia de la KFA2 GeForce RTX 4080 SG puede aumentarse hasta un 31%, lo que permite que la tarjeta gráfica consuma por sí sola hasta 420 vatios de potencia. Utilizando el conector 12VHPWR (incluido en la caja como adaptador con conectores PCIe de 3x6+2 pines), el consumo de energía de la GPU sigue estando dentro de los límites permitidos. Para evitar problemas con la alimentación, recomendamos utilizar tres cables distintos para conectar la tarjeta a la fuente de alimentación
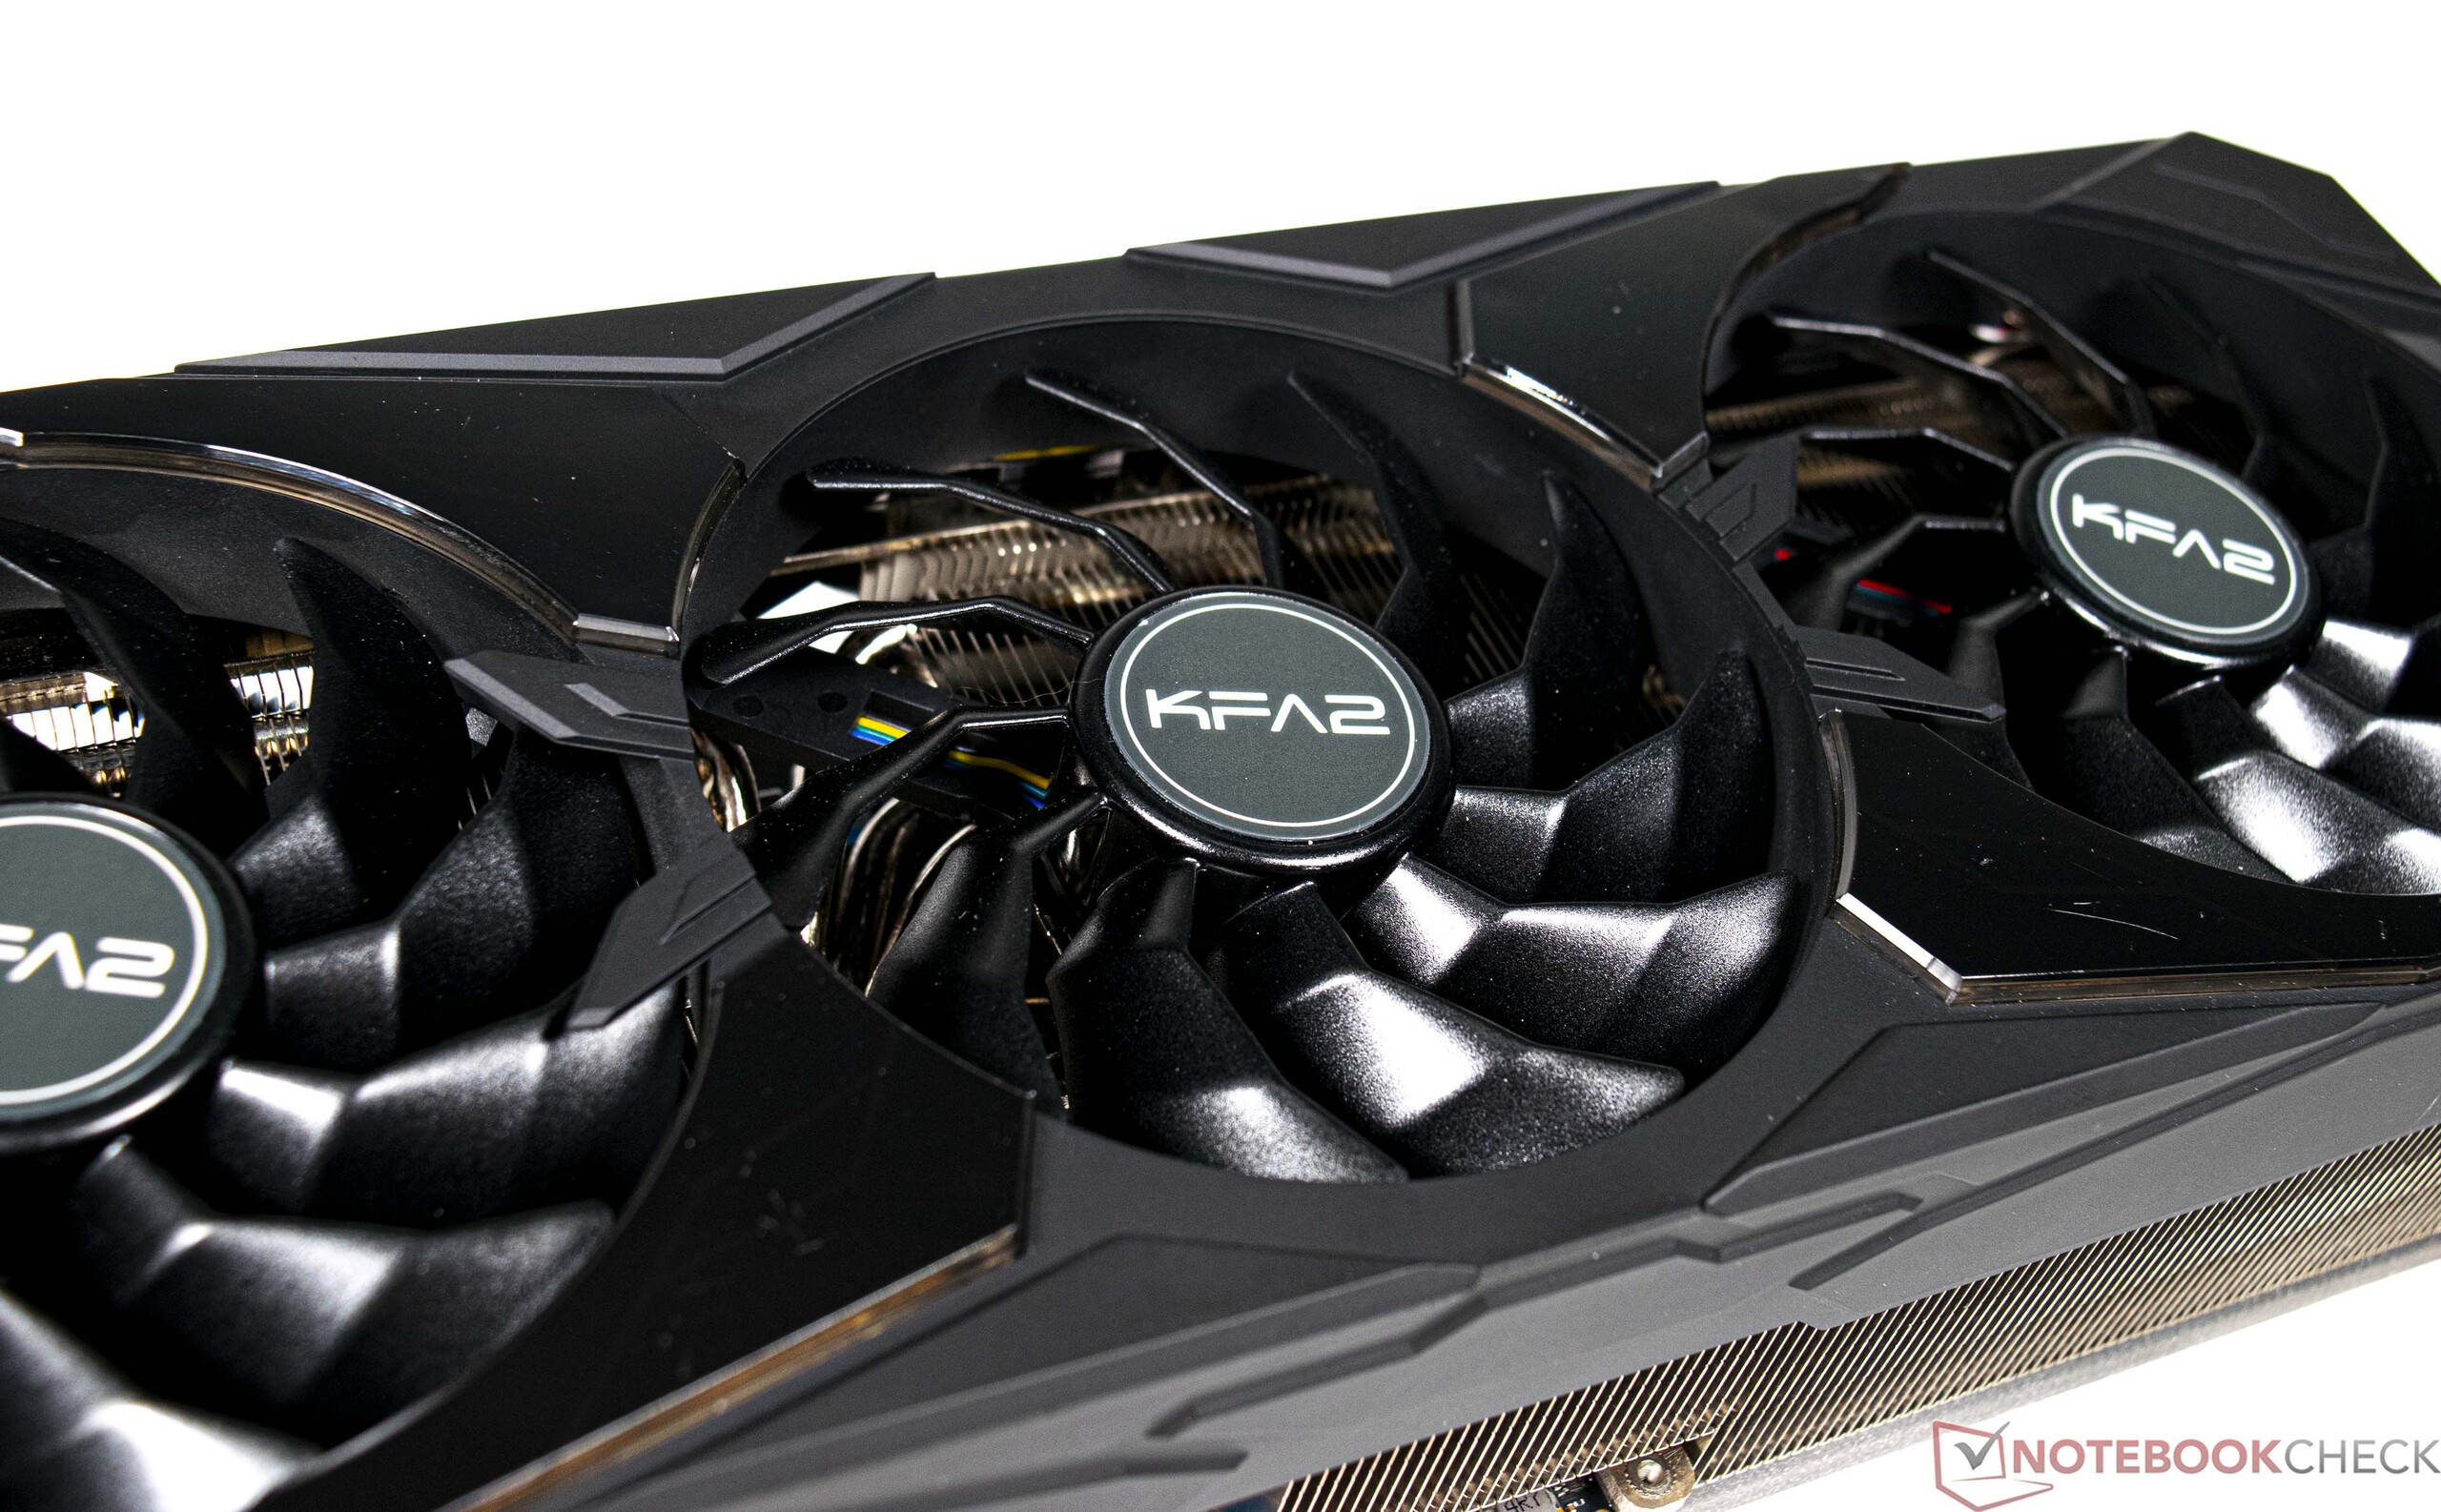
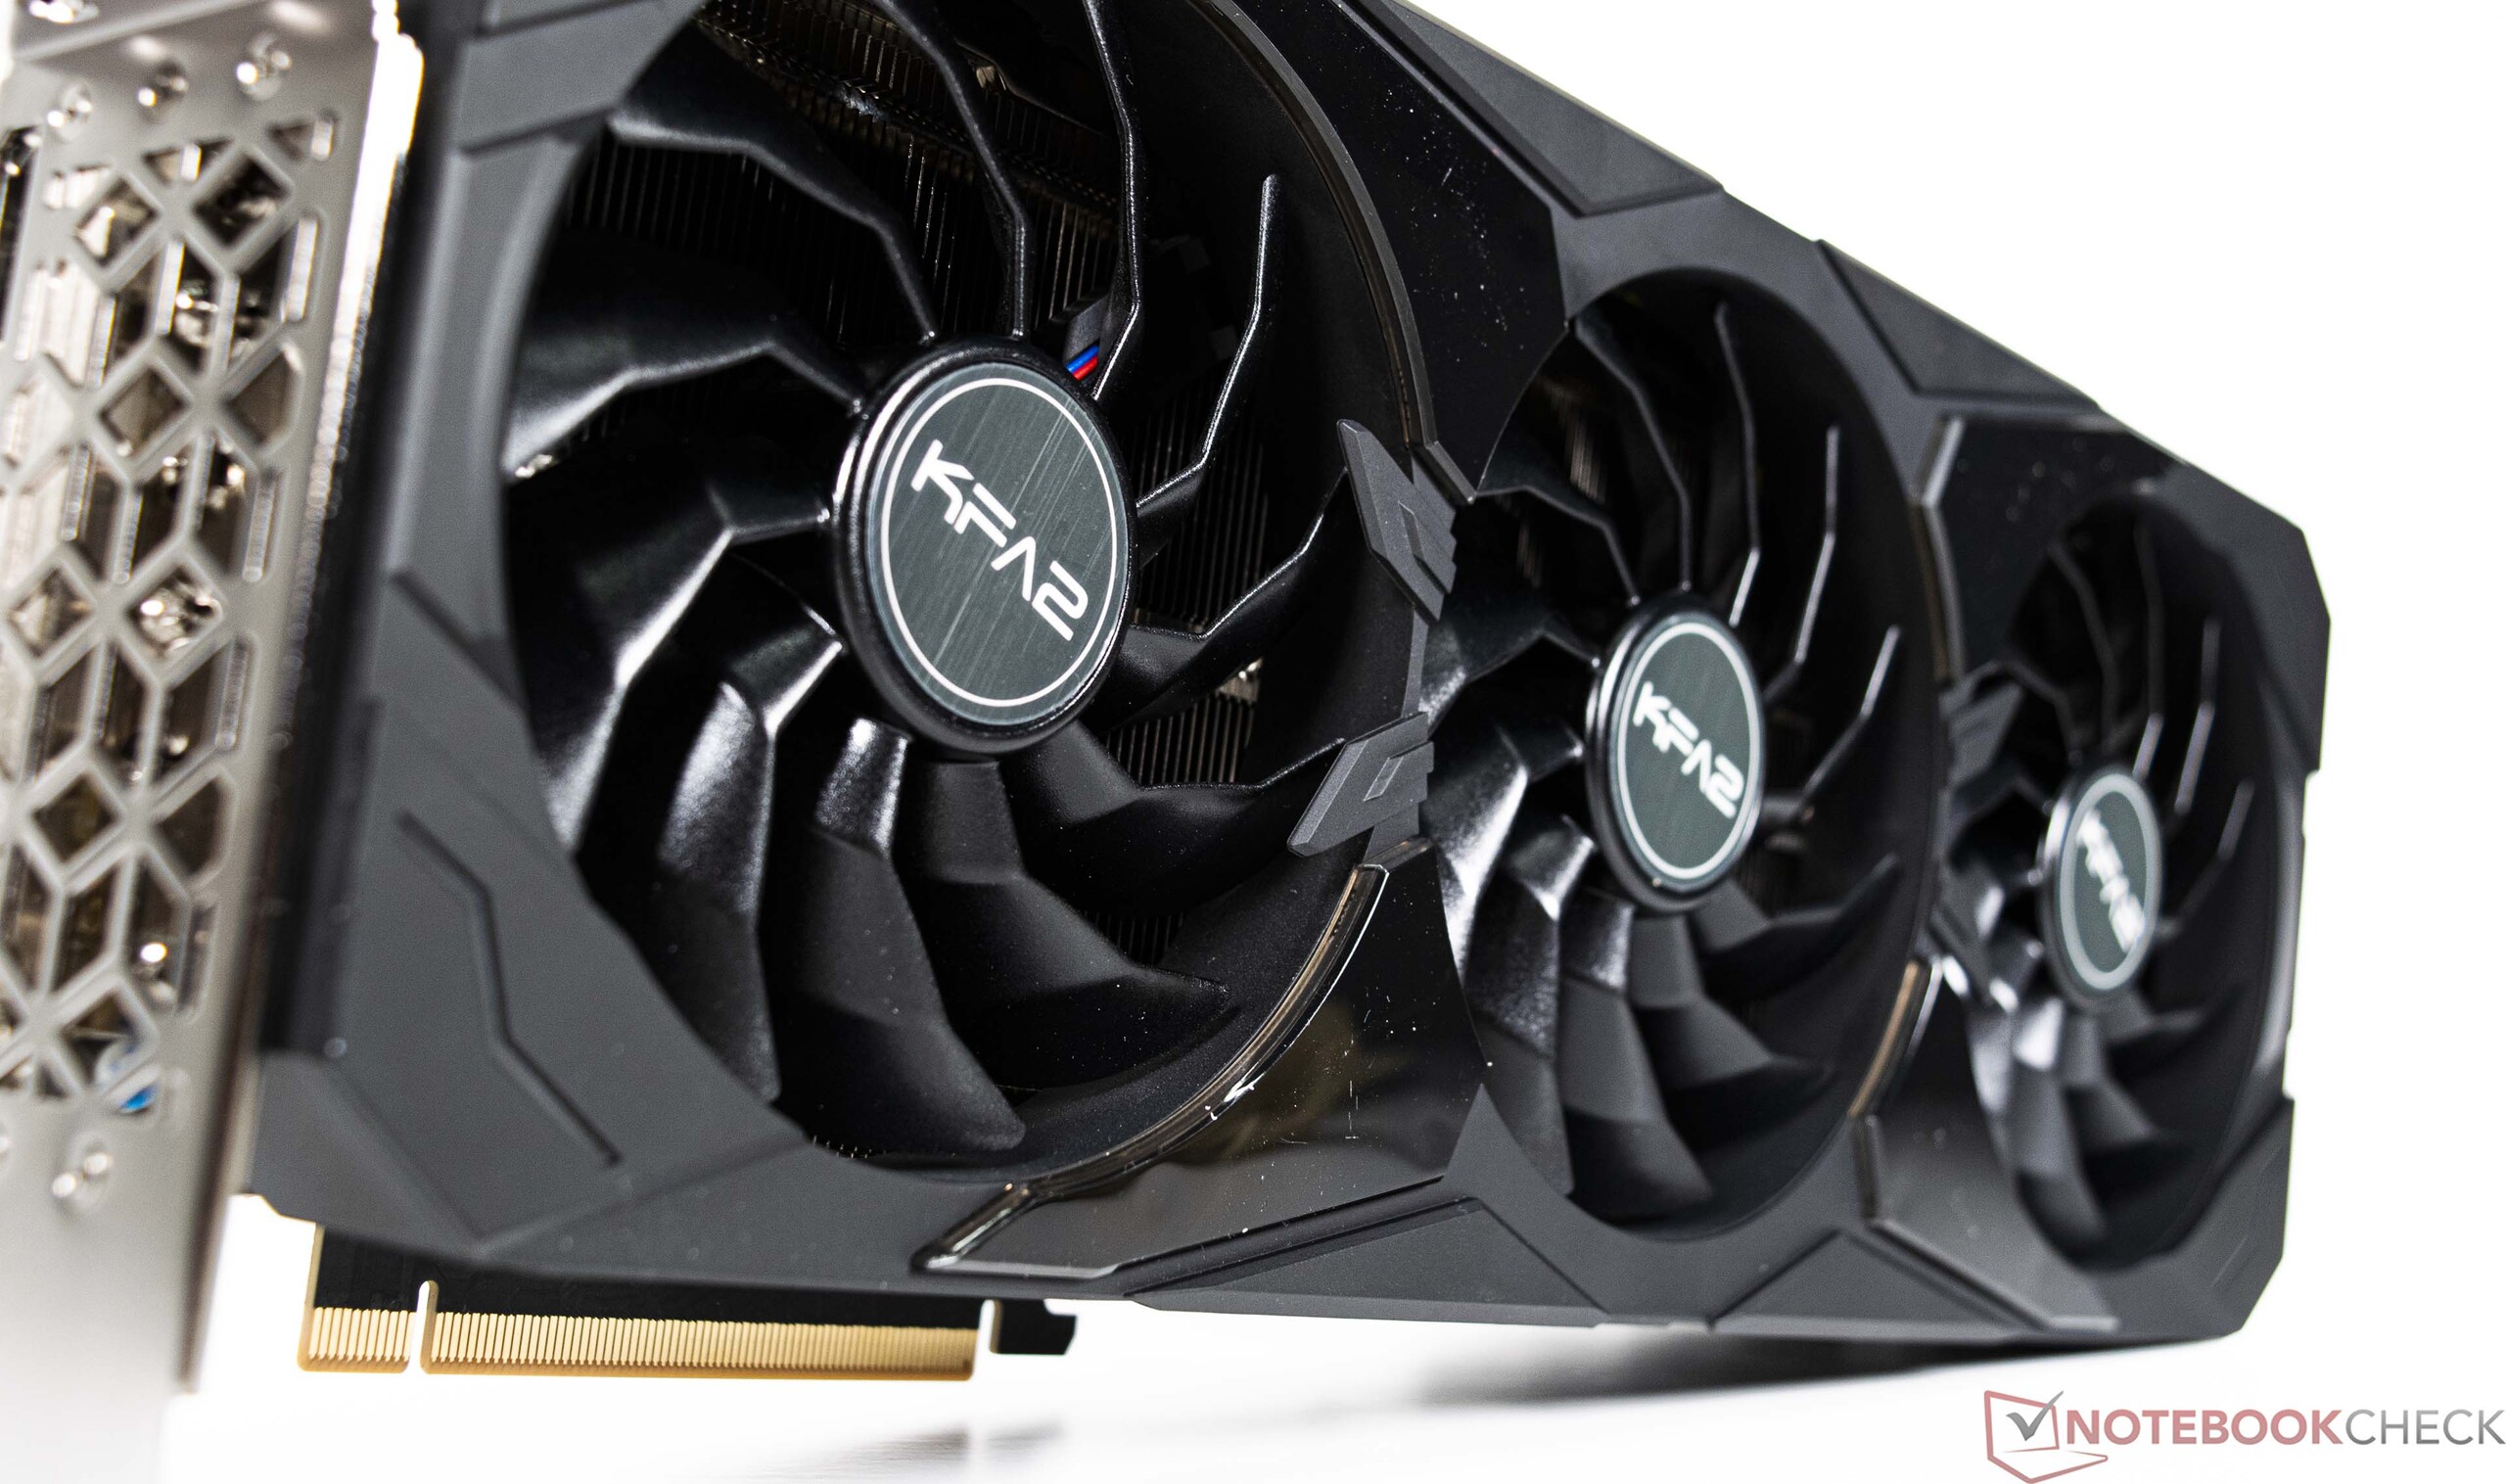
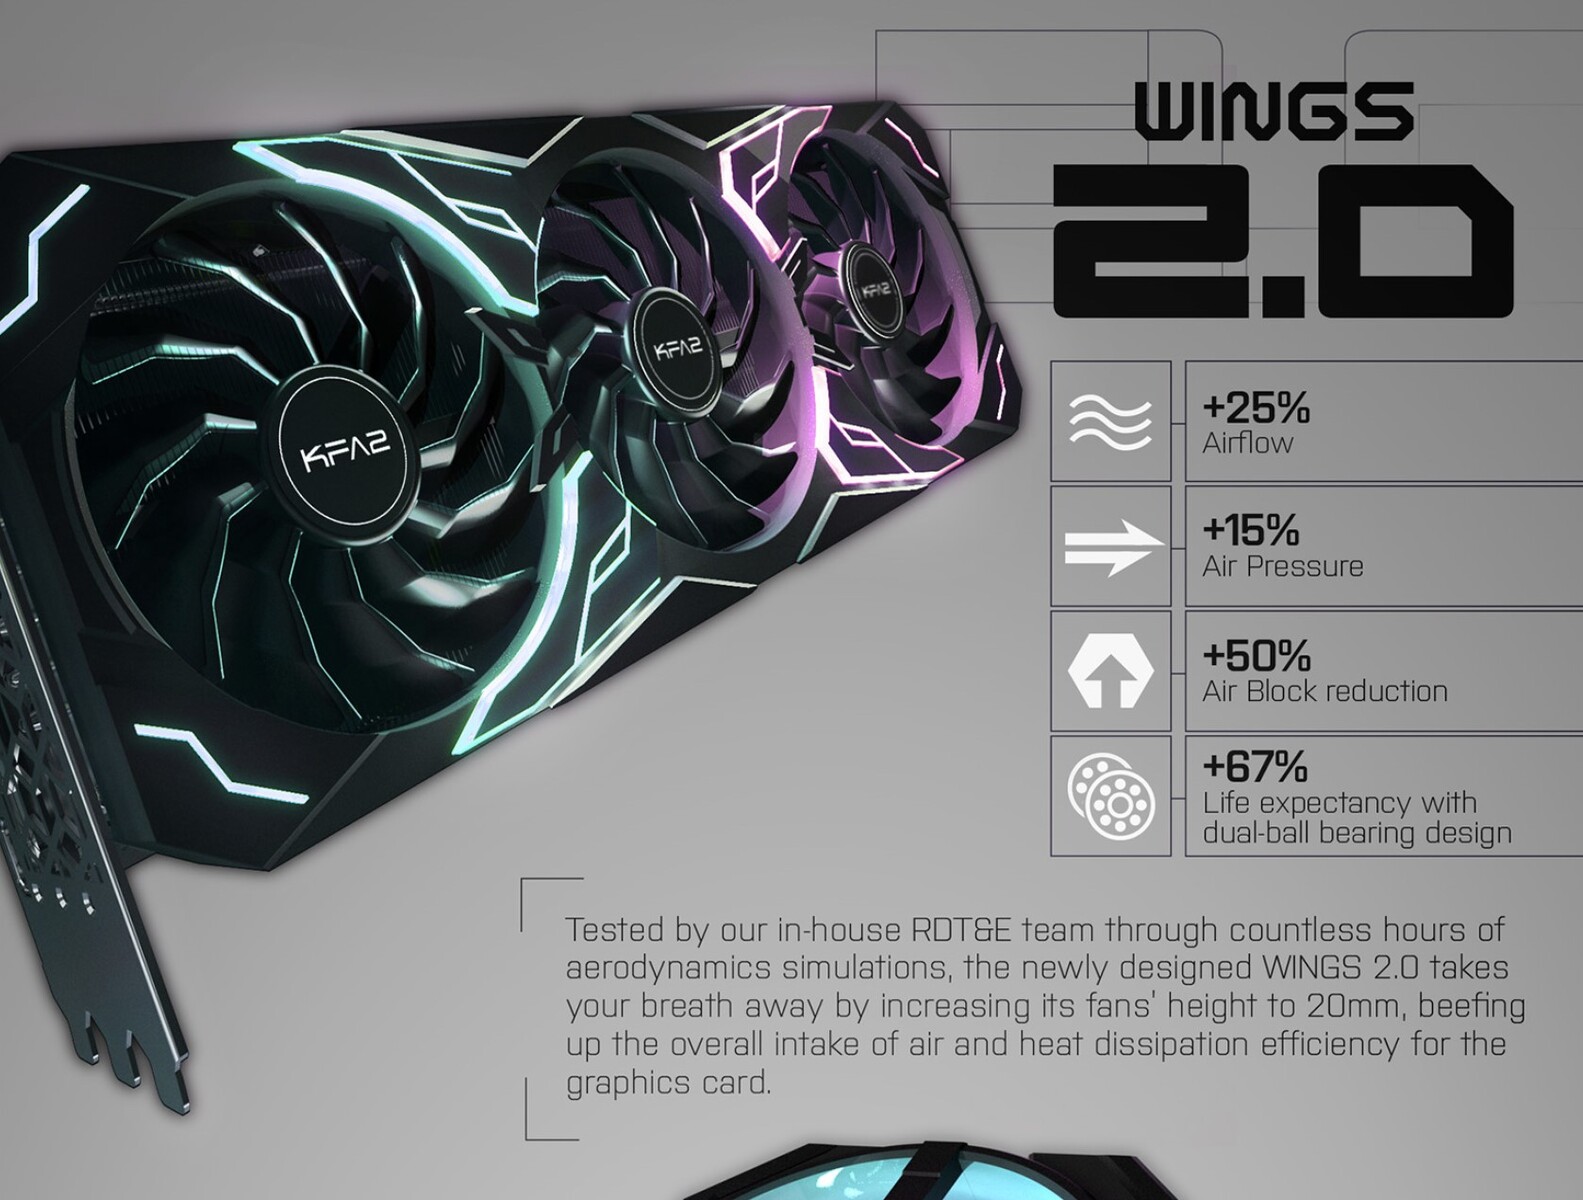
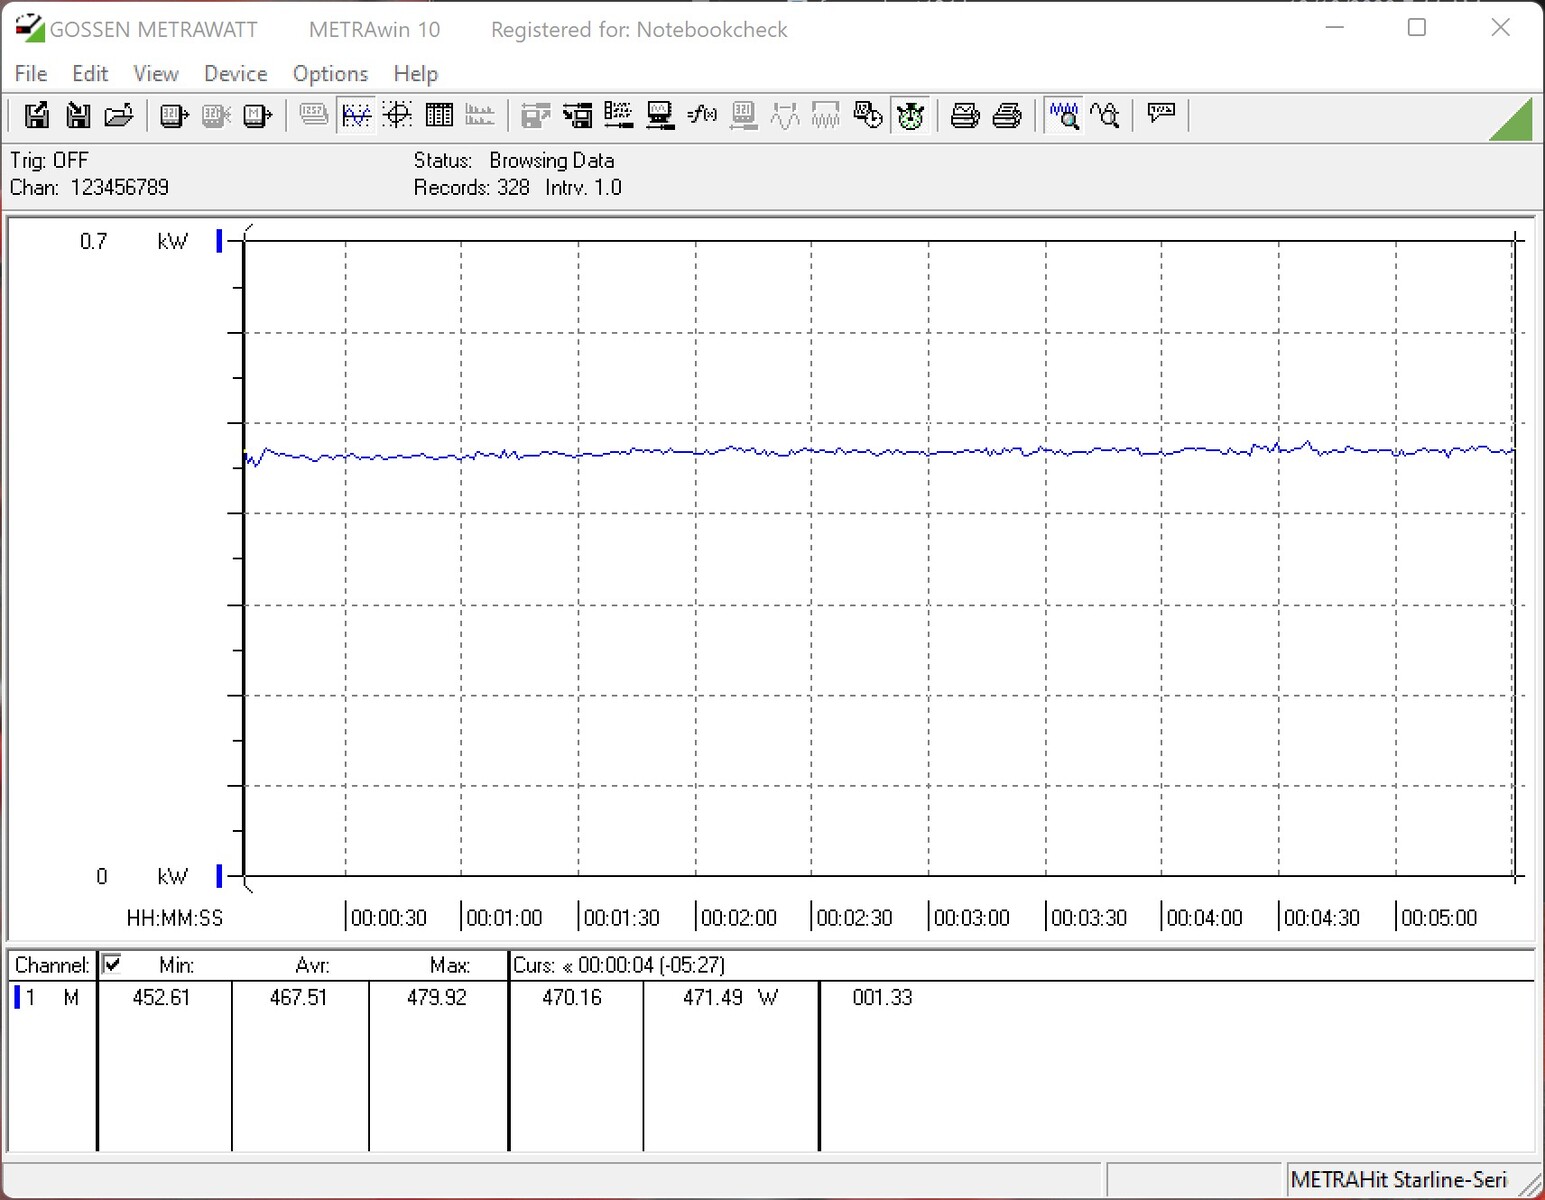
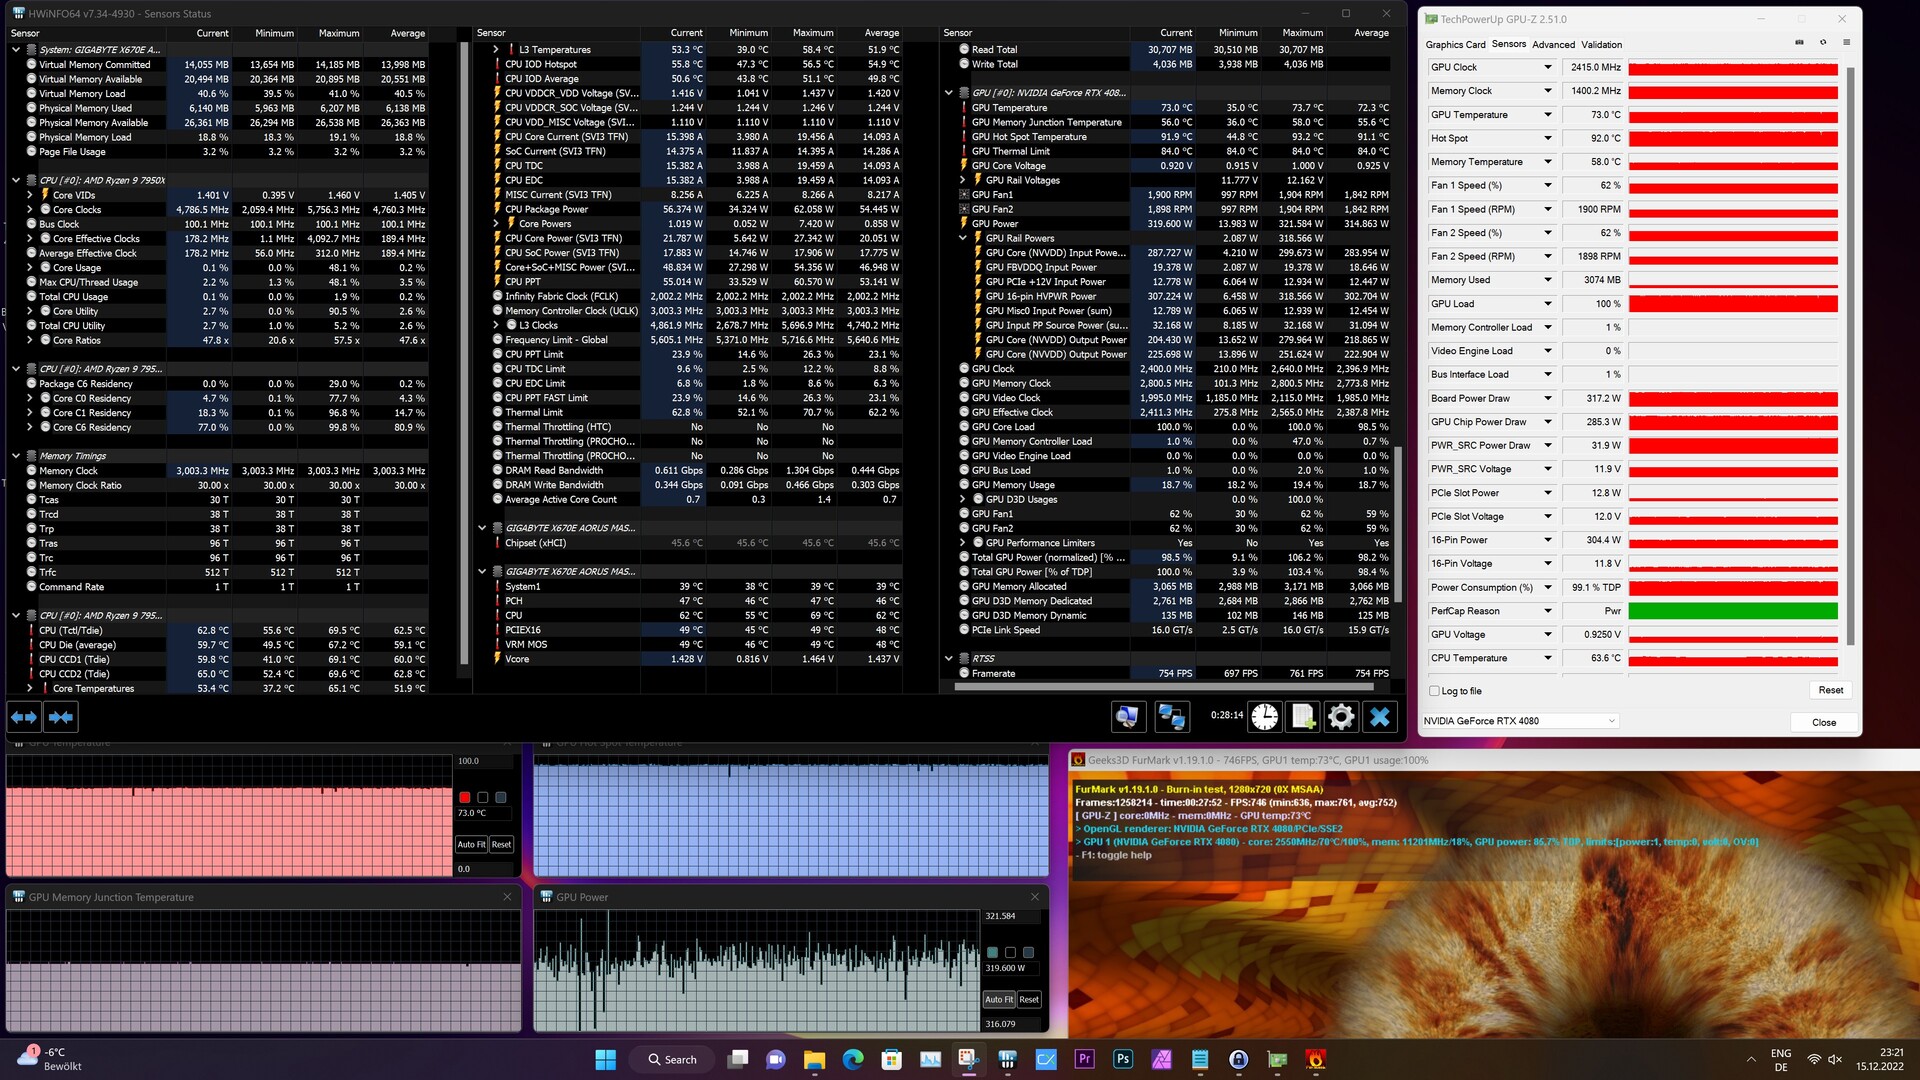
Durante la prueba de estrés, la KFA2 GeForce RTX 4080 SG alcanzó los 320 vatios sin esfuerzo, y registramos una temperatura de la GPU de unos 74°C (165°F). Sin embargo, la temperatura del punto caliente de la GPU alcanzó los 93 °C bajo carga. La VRAM se mantuvo asombrosamente fría, a 58°C. La tarjeta KFA2 cuenta con un enorme disipador térmico con tres ventiladores axiales de 102 mm para disipar el calor. Opcionalmente, se puede instalar otro ventilador de 102 mm en la parte posterior de la tarjeta. Por desgracia, no pudimos probarlo por incompatibilidad con nuestra placa base. Los ventiladores generaban un zumbido silencioso que aún podía oírse con la caja del ordenador cerrada (42 dB(A) de ruido según nuestras mediciones). Cuando aumentamos el límite de potencia, los niveles de ruido de la GPU subieron a 43 dB(A). Durante los juegos (The Witcher 3, 1080p, Ultra preset), nuestra configuración produjo unos agradables 36 dB(A) de ruido. Tampoco notamos ningún molesto zumbido de la bobina
En términos de consumo de energía, la KFA2 GeForce RTX 4080 SG deja una buena impresión y está codo con codo con la AMD Radeon RX 7900 XT - una tarjeta que ofrece un rendimiento significativamente menor. La KFA GeForce RTX 3080 SG, que analizamos anteriormente, requería más energía bajo carga. En comparación con la KFA2 GeForce RTX 4090 SG, la tarjeta gráfica más pequeña de Ada Lovelace consume un 30% menos de energía bajo carga. No obstante, cabe mencionar que la RTX 4090 tiene una potencia nominal de 450 vatios y ofrece un rendimiento sustancialmente superior
El fabricante recomienda utilizar una fuente de alimentación de 750 vatios. Esta recomendación se basa en un sistema con un AMD Ryzen 9 5900X. Pero si tu sistema tiene un procesador Ryzen 9 Serie 7000 o un procesador Intel Raptor Lake, debes tener en cuenta el mayor consumo de energía de estas CPU bajo carga. Por lo tanto, recomendamos combinar la tarjeta gráfica con una fuente de alimentación de 850 vatios.
Ruido
| Ocioso |
| 30.9 / 30.9 / 30.9 dB(A) |
| Carga |
| 31 / 42.1 dB(A) |
 | ||
30 dB silencioso 40 dB(A) audible 50 dB(A) ruidosamente alto |
||
min: | ||
| Power Consumption / The Witcher 3 ultra (external Monitor) | |
| MSI Radeon RX 6950 XT Gaming X Trio (Idle: 79.6 W) | |
| Sapphire AMD Radeon RX 6950 XT Nitro+ Pure | |
| AMD Ryzen 7 5800X3D (Idle: 102 W) | |
| KFA2 GeForce RTX 4090 SG | |
| AMD Radeon RX 7900 XTX (Idle: 86.5 W) | |
| NVIDIA GeForce RTX 3090 Founders Edition | |
| ASUS TUF Gaming GeForce RTX 3080 Ti OC (Idle: 78.2 W) | |
| KFA2 GeForce RTX 3080 SG | |
| AMD Radeon RX 6900 XT (Idle: 99.15 W) | |
| KFA2 GeForce RTX 4080 SG (Idle: 86.4 W) | |
| AMD Radeon RX 7900 XT (Idle: 84.6 W) | |
| Power Consumption / FurMark 1.19 GPU Stress Test (external Monitor) | |
| KFA2 GeForce RTX 4090 SG | |
| MSI Radeon RX 6950 XT Gaming X Trio (Idle: 79.6 W) | |
| Sapphire AMD Radeon RX 6950 XT Nitro+ Pure | |
| AMD Radeon RX 7900 XTX (Idle: 86.5 W) | |
| NVIDIA GeForce RTX 3090 Founders Edition | |
| ASUS TUF Gaming GeForce RTX 3080 Ti OC (Idle: 78.2 W) | |
| AMD Radeon RX 7900 XT (Idle: 84.6 W) | |
| KFA2 GeForce RTX 3080 SG | |
| KFA2 GeForce RTX 4080 SG (Idle: 86.4 W) | |
| AMD Radeon RX 6900 XT (Idle: 99.15 W) | |
* ... más pequeño es mejor
Power consumption with external monitor
Pro
Contra
Veredicto - Gran rendimiento y mucho RGB

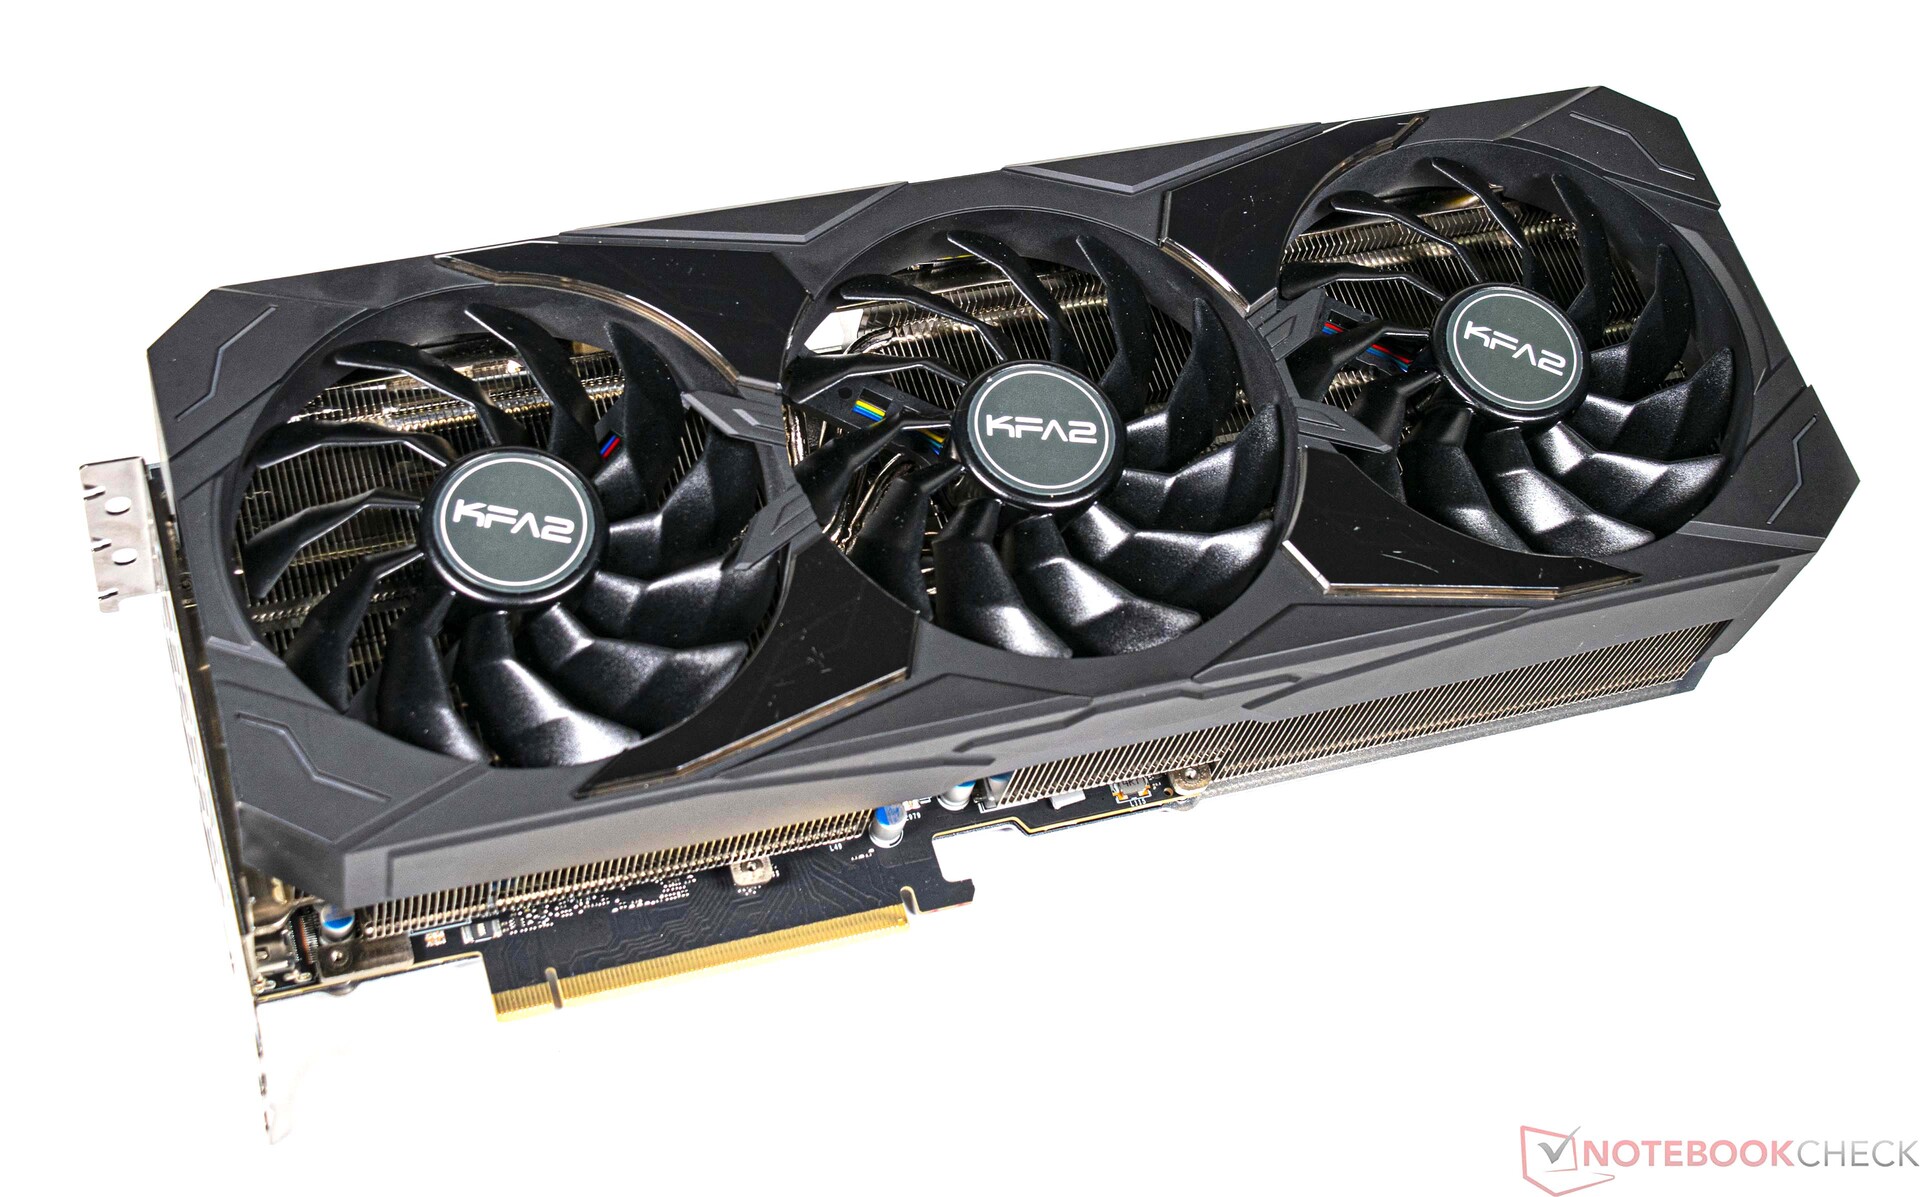
La KFA2 GeForce RTX 4080 SG es en todos los sentidos una tarjeta gráfica extremadamente rápida y adecuada para ejecutar juegos exigentes sin compromiso. En comparación con la GeForce RTX 3080la tarjeta es capaz de ofrecer un rendimiento sustancialmente mayor con el mismo consumo de energía. Las ventajas de la nueva generación de GPU son especialmente evidentes cuando se activa el trazado de rayos. Junto con DLSS 3.0 (incluida la generación de fotogramas), incluso los juegos nuevos pueden ejecutarse sin problemas a 2160p con los efectos de trazado de rayos activados. Por desgracia, para alcanzar este nivel de rendimiento se necesita una GeForce RTX 4080 o RTX 4090. Los usuarios de GPU Nvidia más antiguas se quedan fuera de juego
El modelo KFA2 de este análisis cuenta con un diseño especialmente desarrollado y un enorme refrigerador que funcionó estupendamente bien durante nuestro análisis. Incluso es capaz de enfriar la tarjeta silenciosamente en aplicaciones 2D gracias a su modo de parada del ventilador. La GPU requiere mucha energía y tiene una potencia nominal de 320 vatios, pero este consumo sigue estando dentro de un rango razonable. En nuestra opinión, aumentar constantemente el consumo de energía no es el camino correcto
La KFA2 GeForce RTX 4080 SG es una gran tarjeta gráfica y nos ha impresionado por su alto rendimiento en juegos. La amplia gama de iluminación RGB llama la atención sobre el enorme refrigerador.
La tarjeta gráfica se alimenta a través de un conector 12VHPWR. Puede haber división de opiniones sobre este conector, pero aún no hemos encontrado ningún problema con él. El único problema es que creemos que el conector 12VHPWR está colocado en un lugar poco óptimo. Debido a lo mucho que sobresale la tarjeta gráfica por encima de la ranura PCIe, hay que asignar suficiente espacio al gran cable adaptador para que no se enrosque justo al lado de la GPU. Esto podría causar problemas de espacio en muchas cajas de ordenador
La KFA2 GeForce RTX 4080 SG compite con

