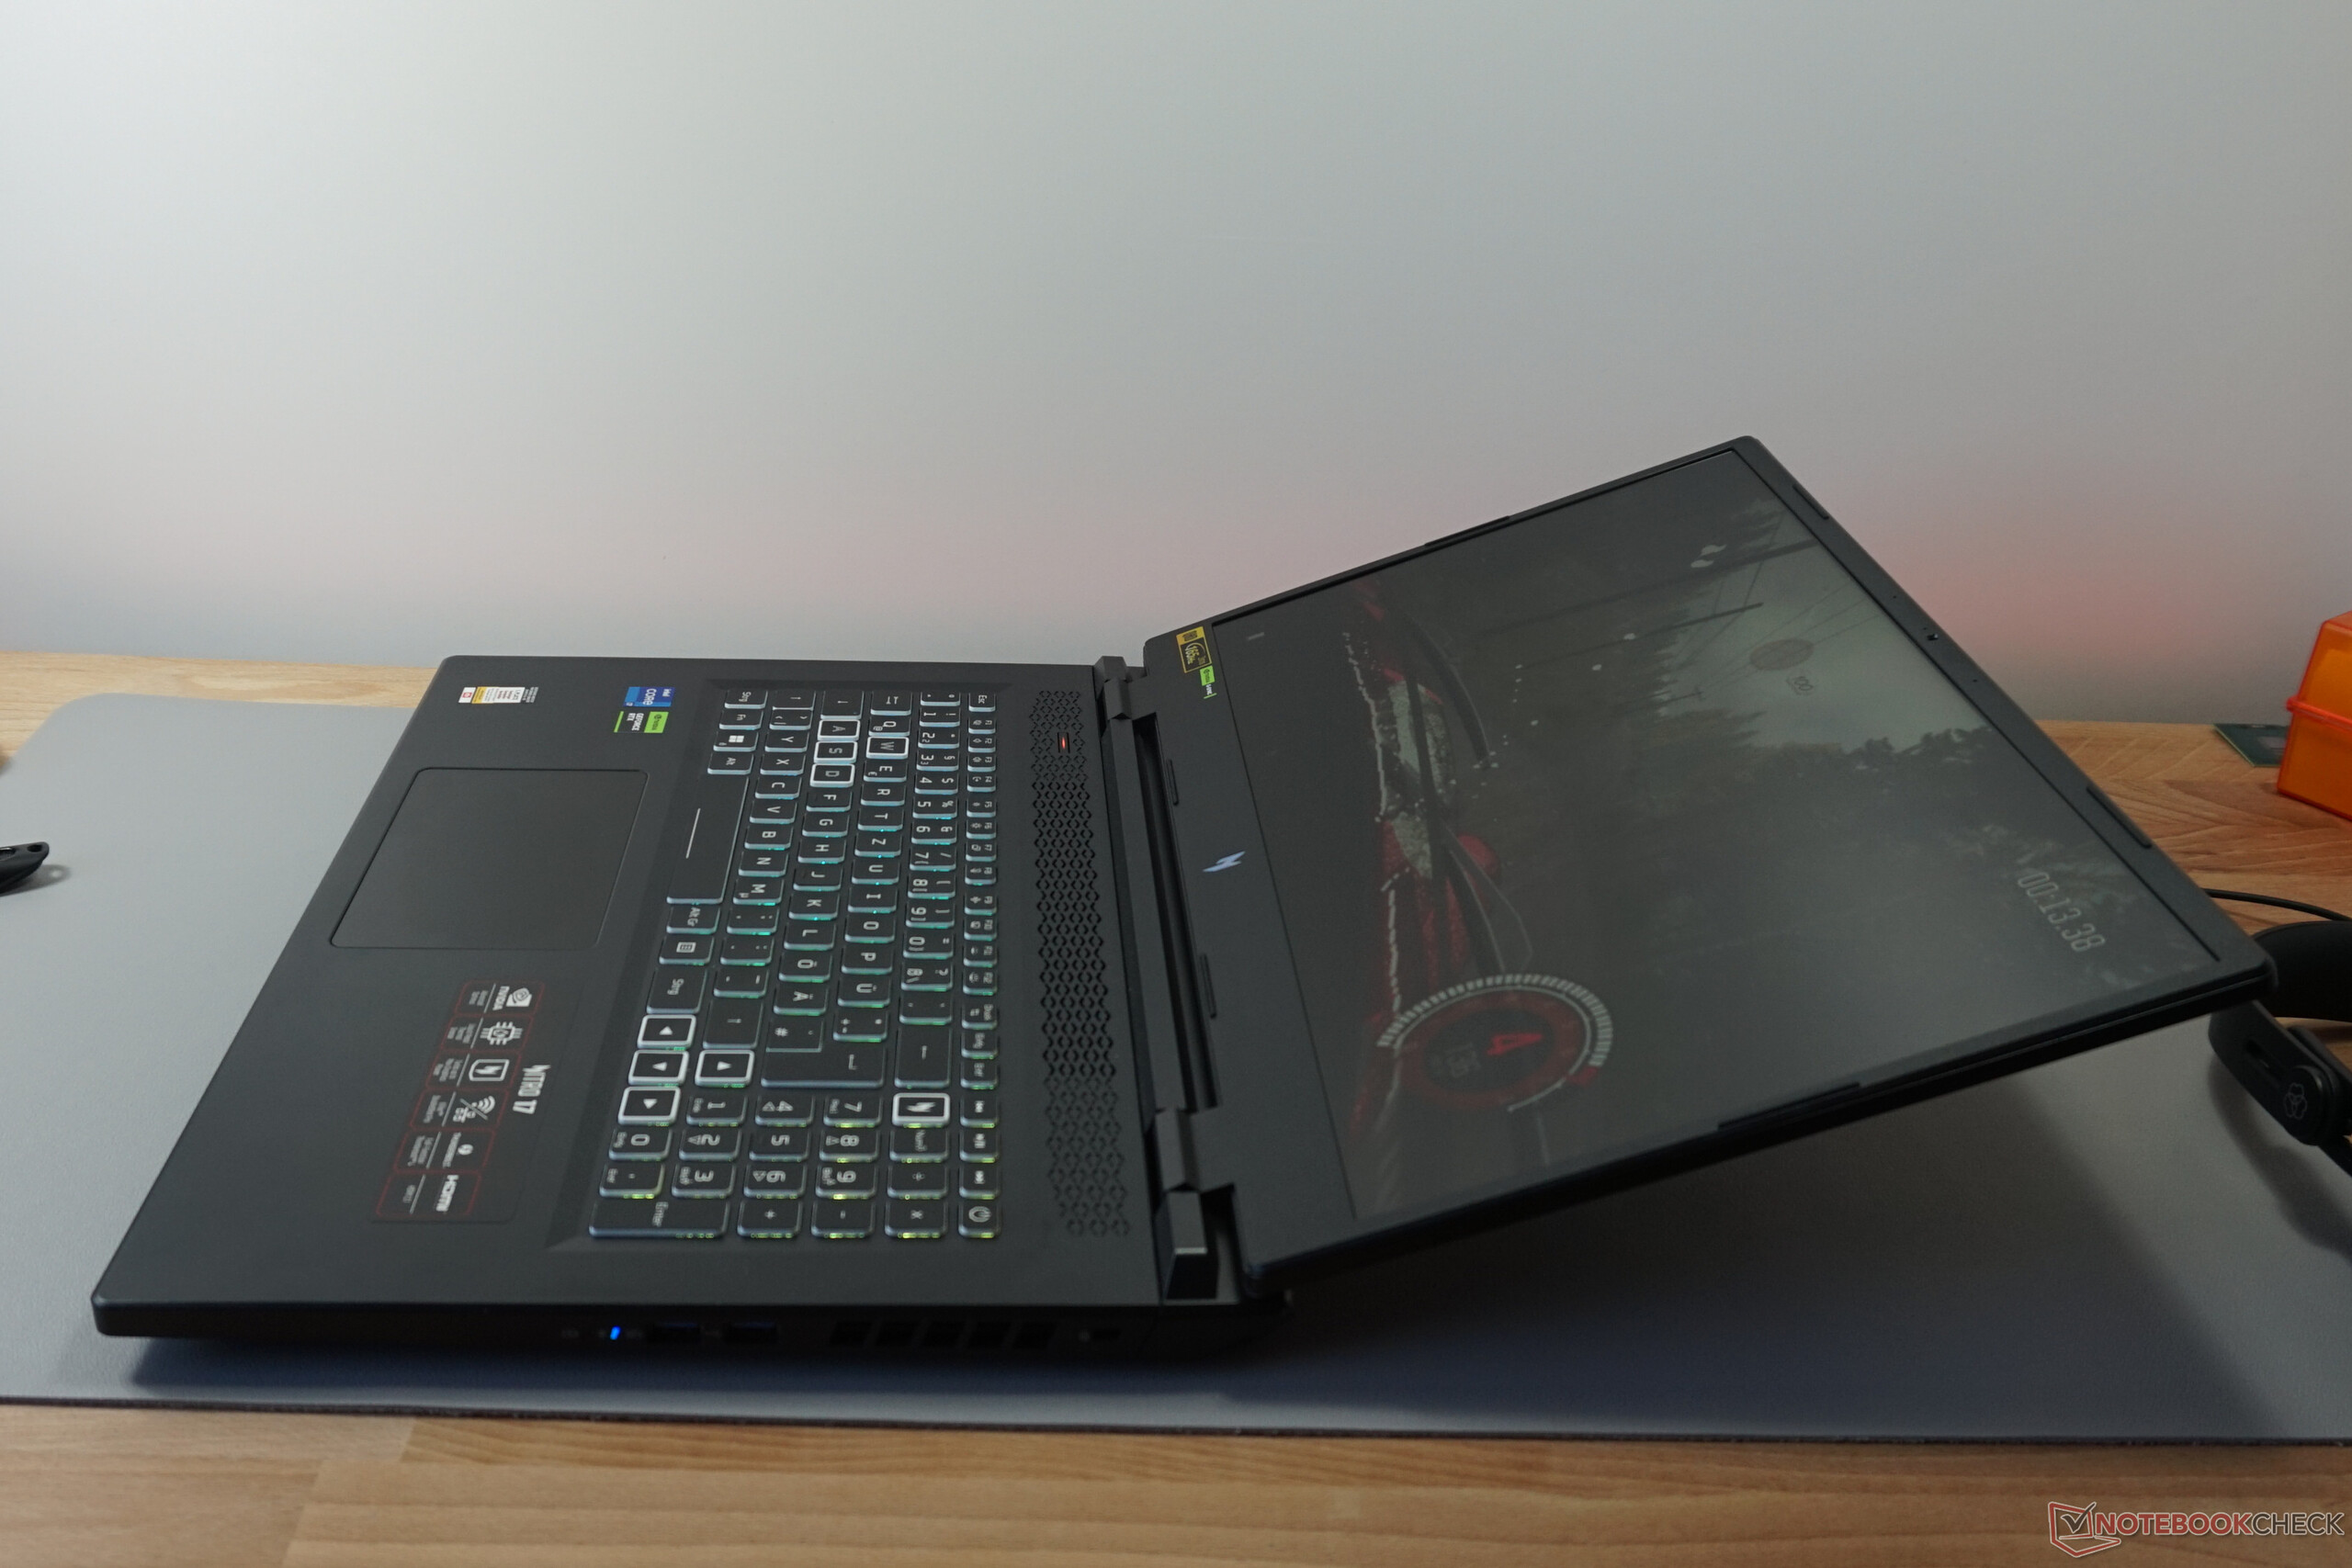
Análisis del Acer Nitro 17 Ryzen edition: El portátil de juegos QHD con una RTX 4070
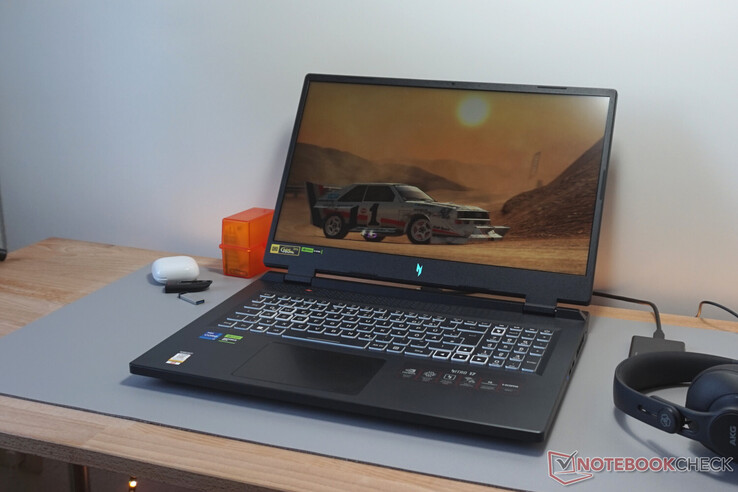
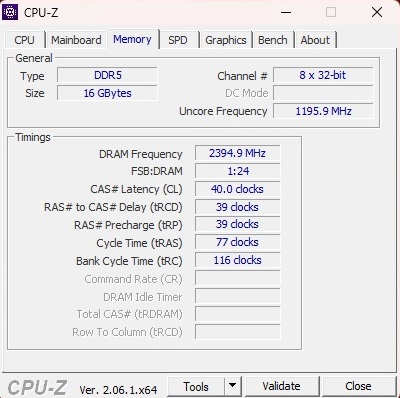
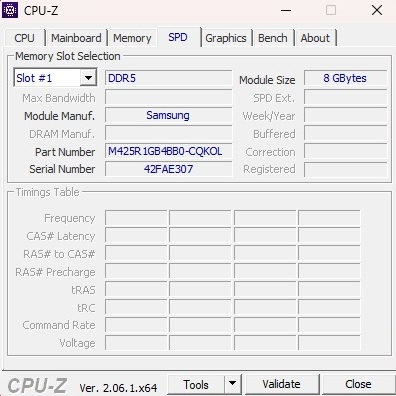
Tras probar previamente un modelo con elCore i7-13700HyGeForce RTX 4060ahora echamos un vistazo al hermano de precio similar del portátil, el AN17-41-R9LN con un procesador AMD y una ligeramente más potenteGeForce RTX 4070(también 8 GB de VRAM GDDR6). Al igual que la versión Intel, se usa como pantalla un panel QHD 16:9 con una frecuencia de refresco de 165 Hz y una resolución de 2.560 x 1.440 píxeles. Además, hay instaladas 2 memorias RAM DDR5-4800 de 8 GB y un SSD NVMe de 1 TB. Tampoco hay sorpresas en su sistema operativo con el portátil con Windows 11 Home instalado.
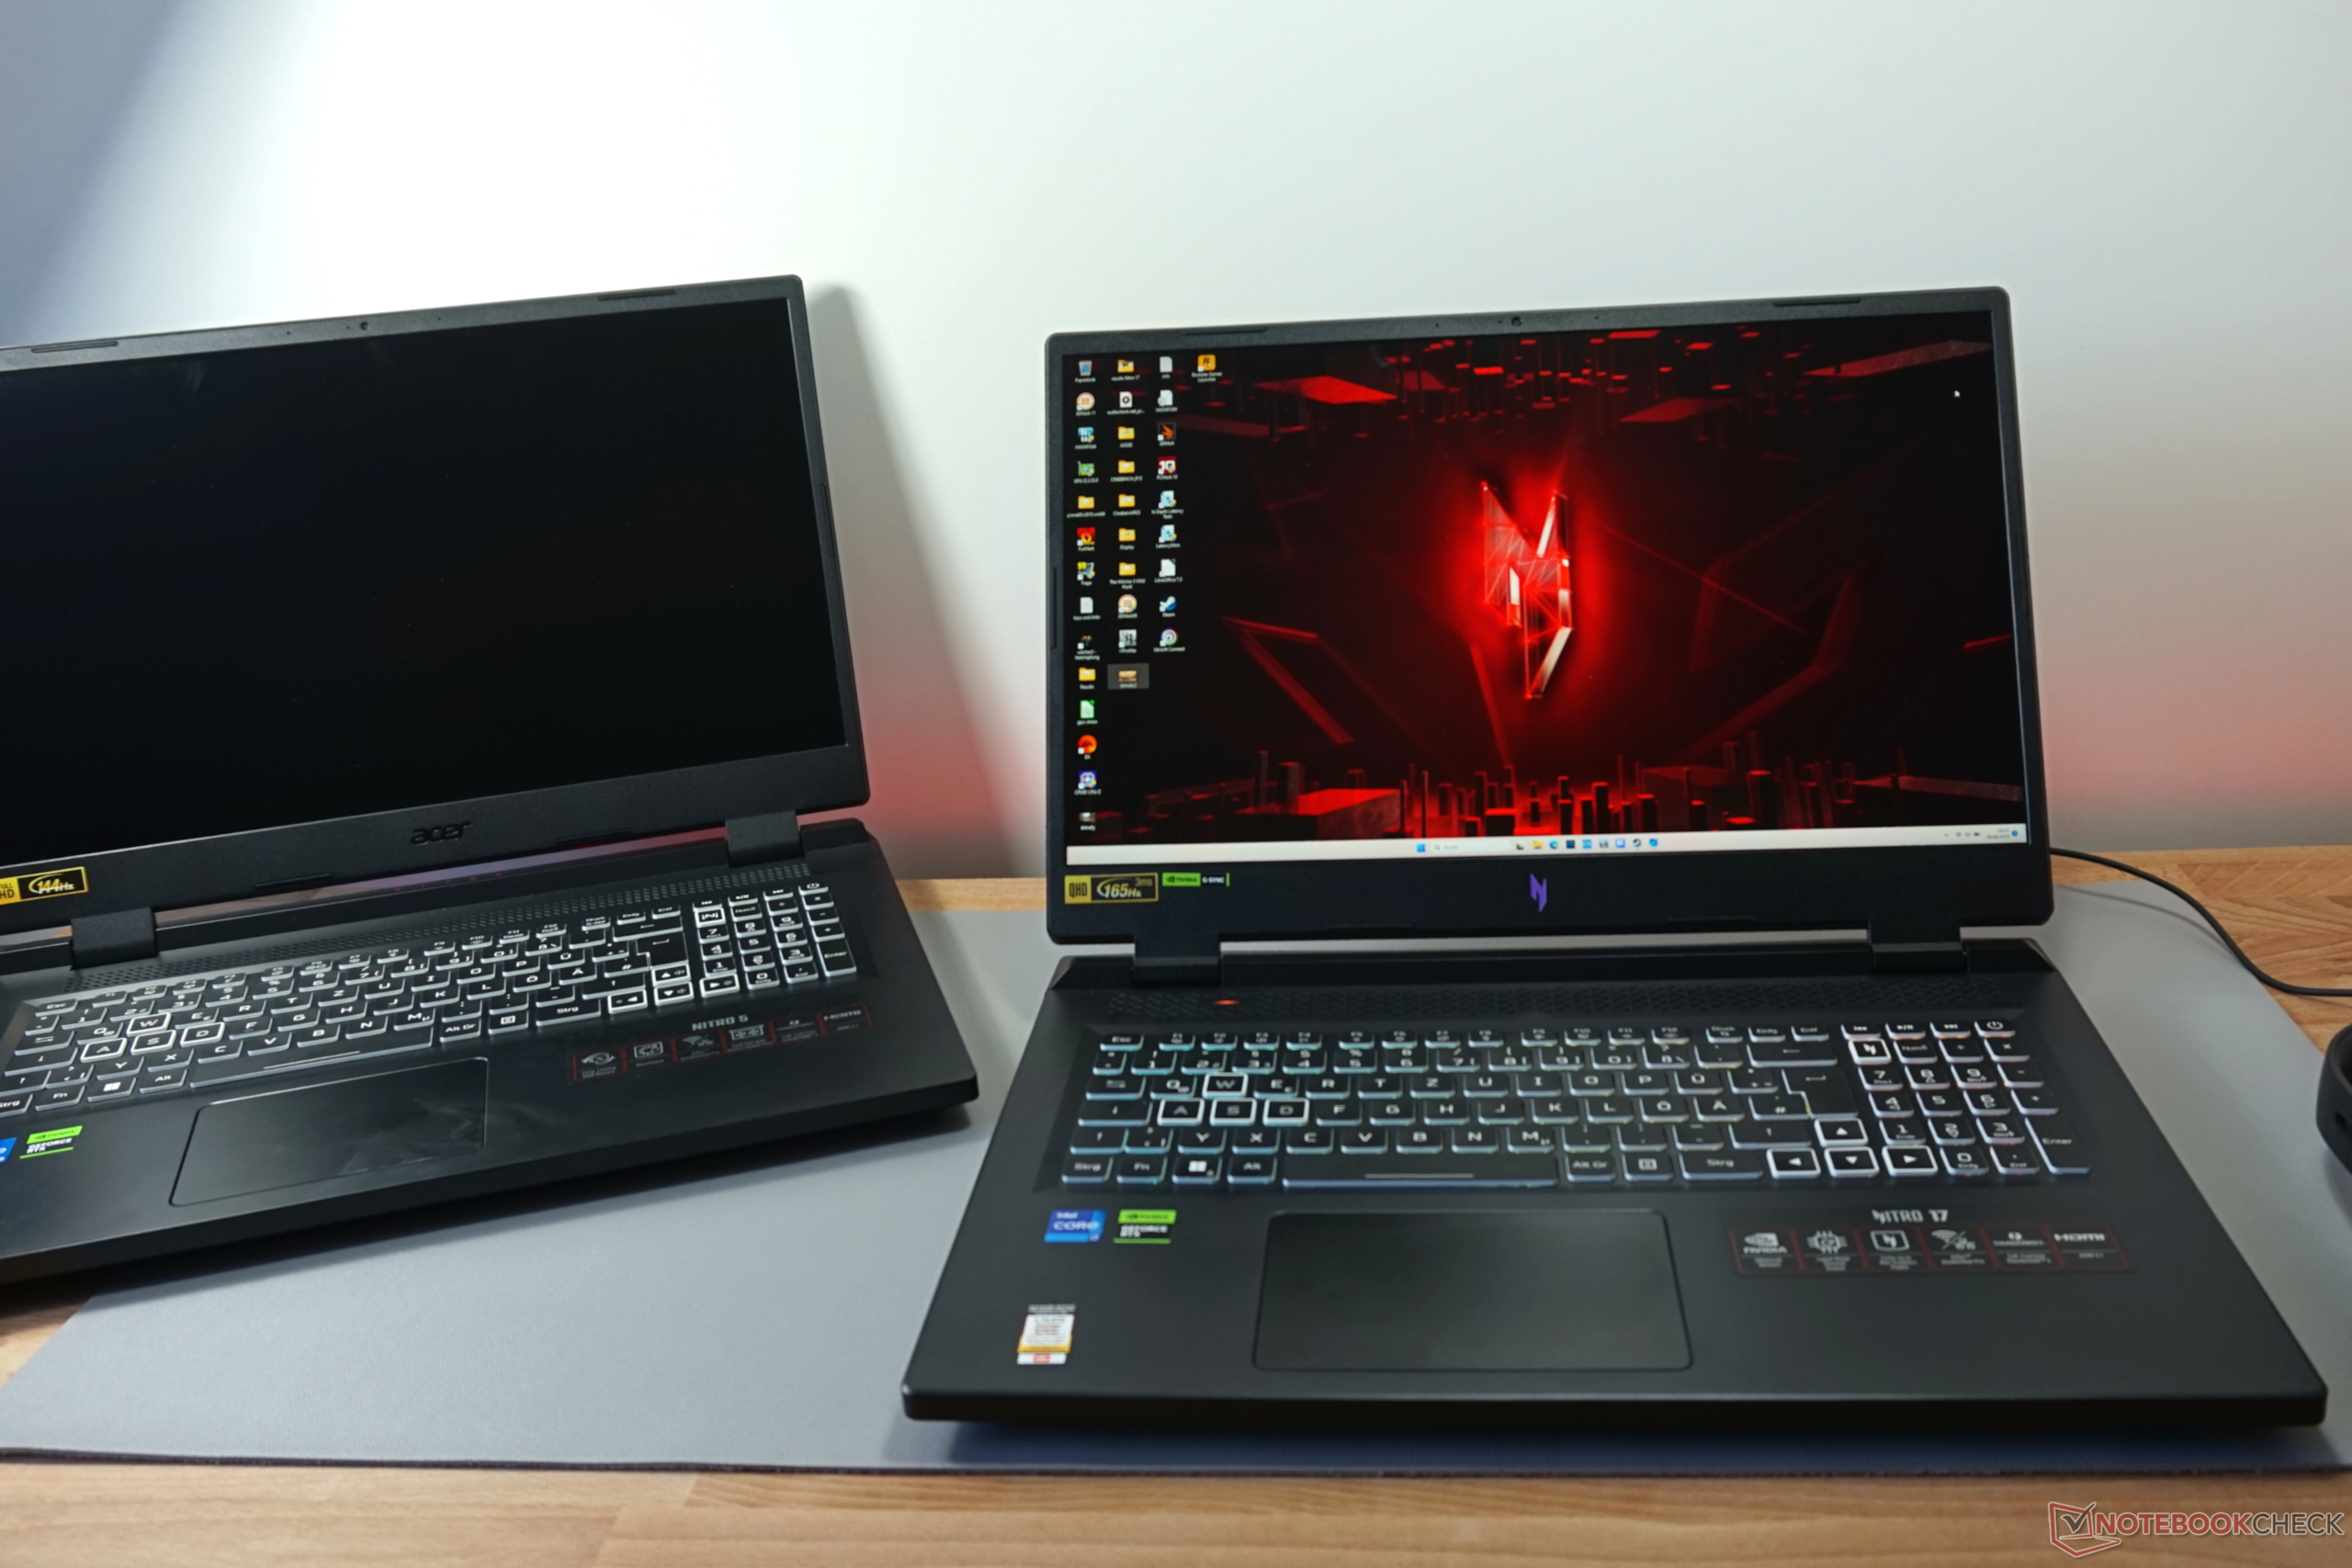
Entre los competidores del Nitro 17 se encuentran otros portátiles gaming de 17 pulgadas con una RTX 4070, como elMSI Pulse 17 B13VGKy elSchenker XMG Focus 17 (E23)o el Asus ROG Strix G17 G713PI- todos los cuales se pueden encontrar en las tablas como dispositivos de comparación.
Posibles contendientes en la comparación
Valoración | Fecha | Modelo | Peso | Altura | Tamaño | Resolución | Precio |
|---|---|---|---|---|---|---|---|
| 86.9 % v7 (old) | 09/2023 | Acer Nitro 17 AN17-41-R9LN R7 7735HS, GeForce RTX 4070 Laptop GPU | 3 kg | 29 mm | 17.30" | 2560x1440 | |
| 87.2 % v7 (old) | 07/2023 | Acer Nitro 17 AN17-51-71ER i7-13700H, GeForce RTX 4060 Laptop GPU | 3 kg | 30.3 mm | 17.30" | 2560x1440 | |
| 86.3 % v7 (old) | 07/2023 | MSI Pulse 17 B13VGK i7-13700H, GeForce RTX 4070 Laptop GPU | 2.7 kg | 27.2 mm | 17.30" | 1920x1080 | |
| 85.9 % v7 (old) | 06/2023 | Schenker XMG Focus 17 (E23) i9-13900HX, GeForce RTX 4070 Laptop GPU | 2.9 kg | 29.3 mm | 17.30" | 2560x1440 | |
| 88.4 % v7 (old) | 04/2023 | Asus ROG Strix G17 G713PI R9 7945HX, GeForce RTX 4070 Laptop GPU | 2.8 kg | 30.7 mm | 17.30" | 2560x1440 |
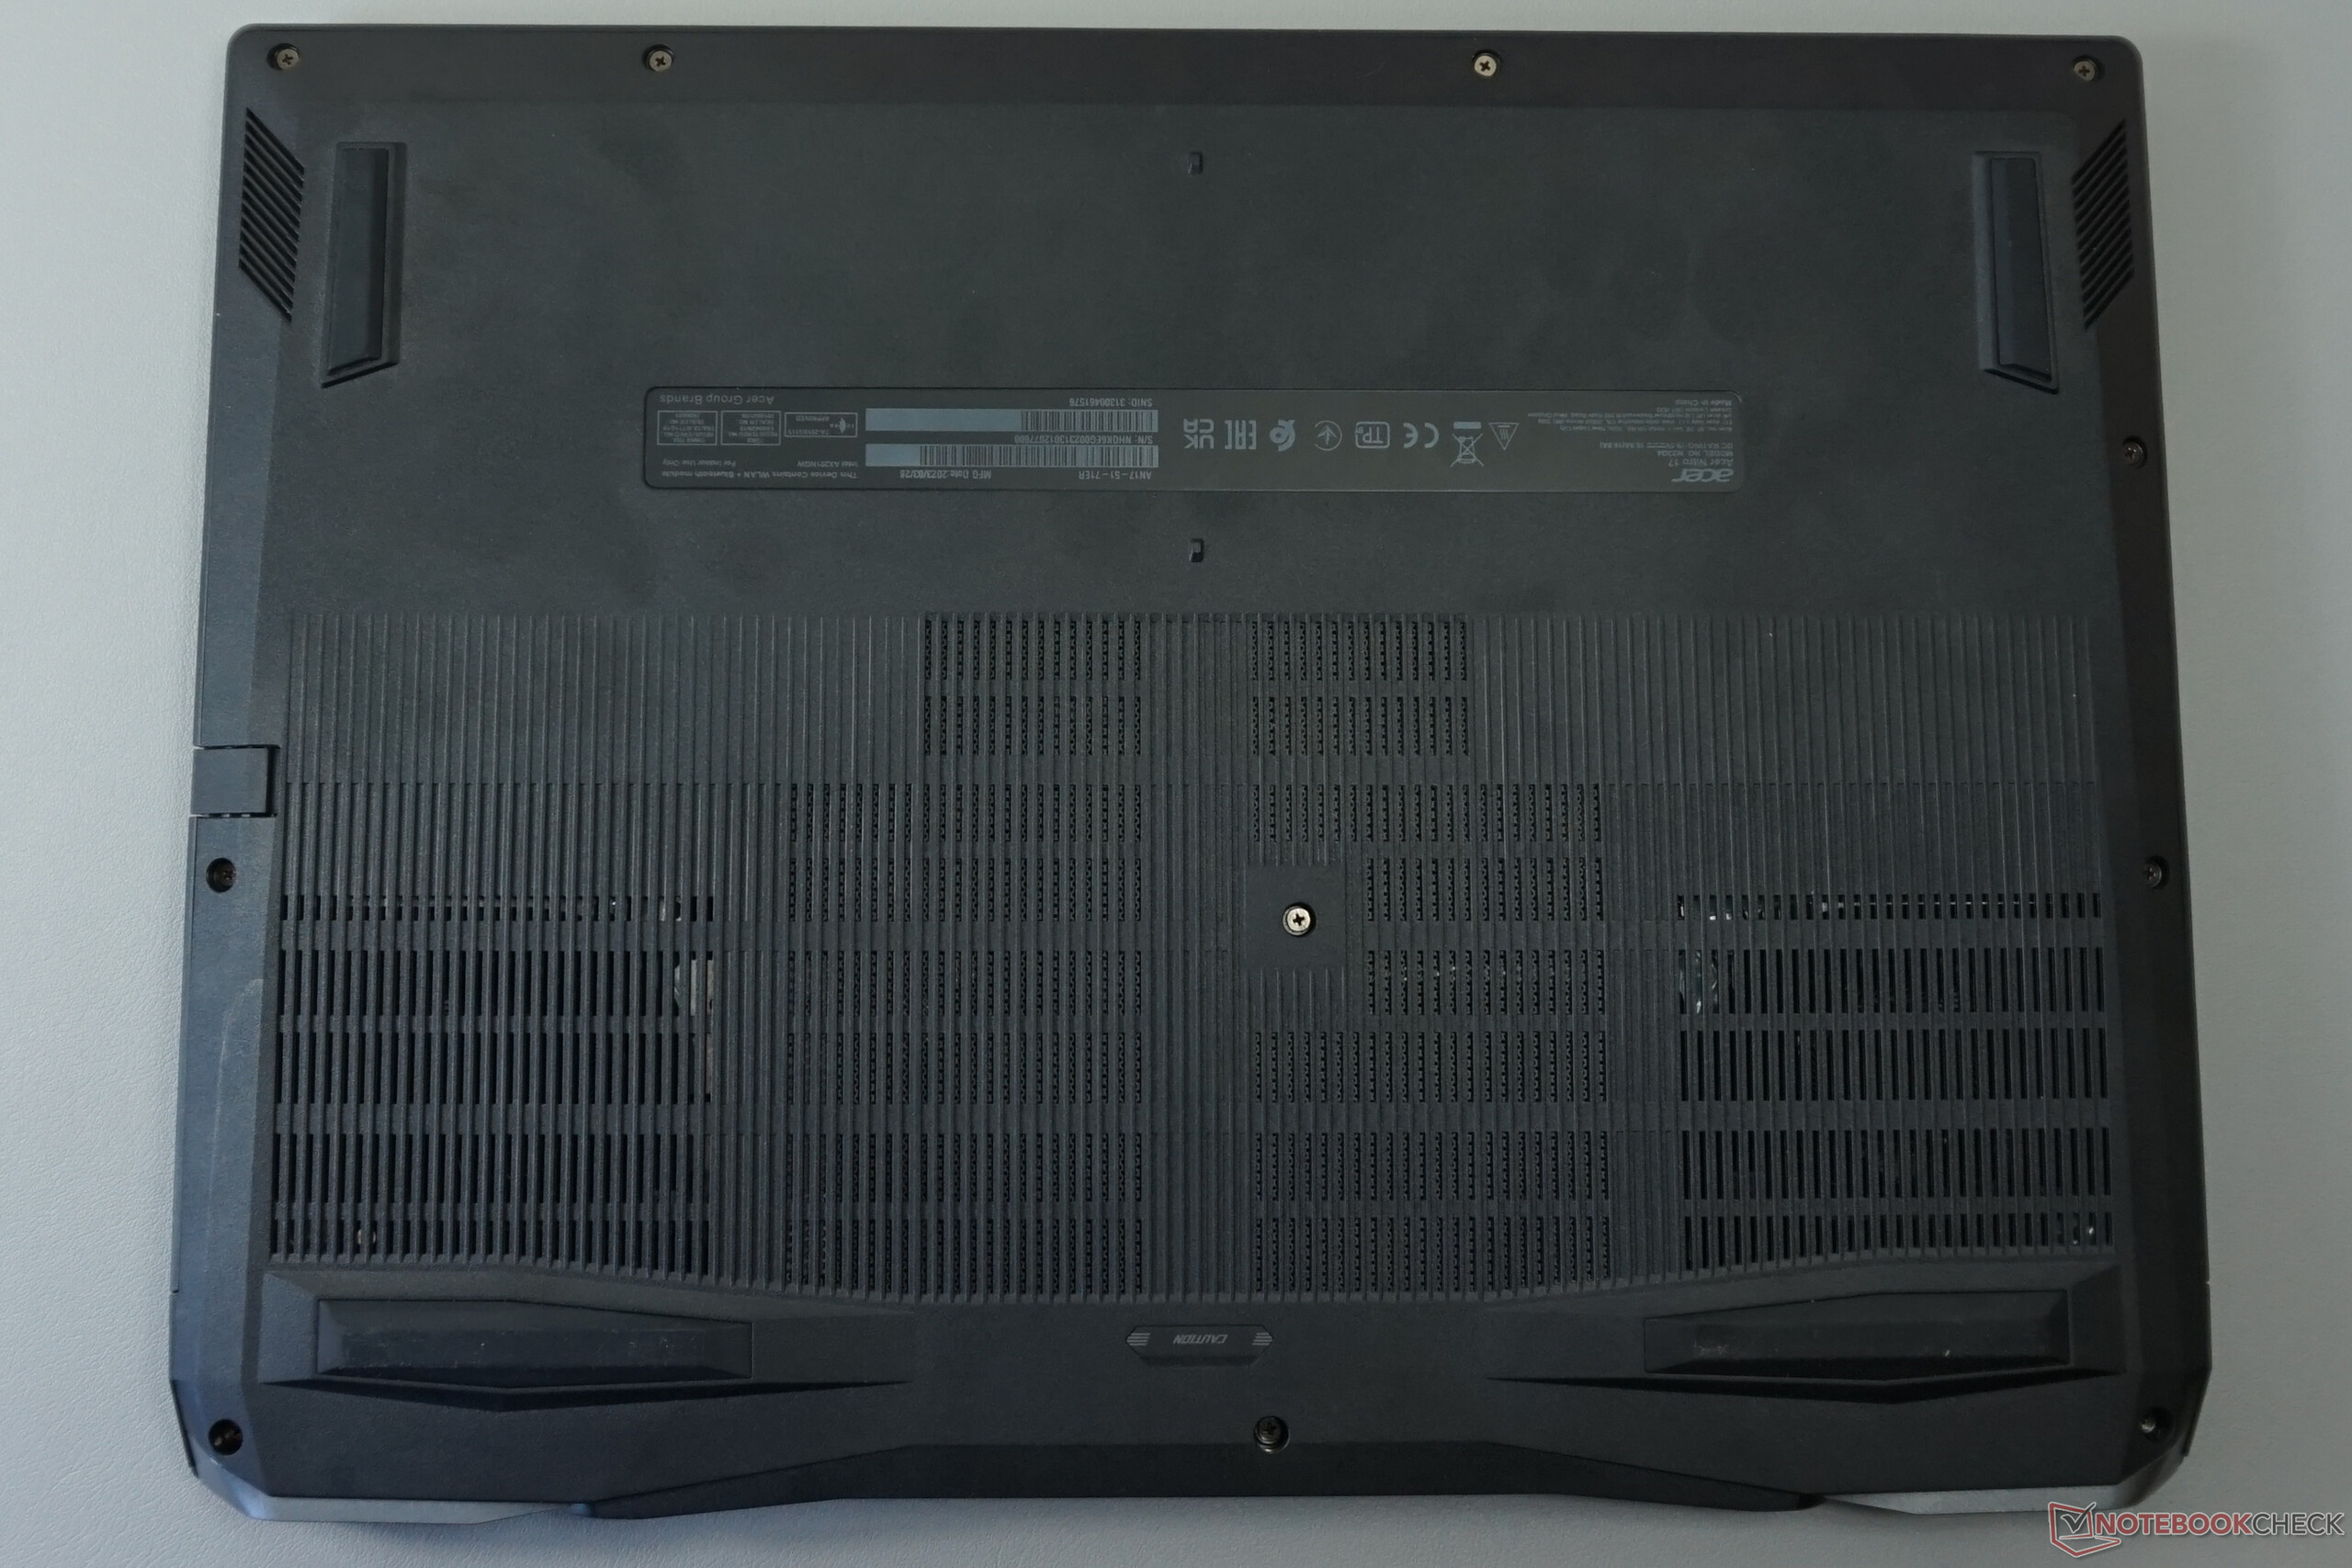
Dado que la carcasa del dispositivo es idéntica a la de su homólogo Intel aparte de sus opciones de conectividad (la variante AMD no tiene un puerto Thunderbolt 4 y en su lugar tiene 2x USB 4), no profundizaremos más en su carcasa, características y dispositivos de entrada en este artículo. Puede encontrar la información correspondiente en el análisis del AN17-51-71ER.
Lector de tarjetas SD
| SD Card Reader | |
| average JPG Copy Test (av. of 3 runs) | |
| Media de la clase Gaming (20.9 - 210, n=54, últimos 2 años) | |
| Schenker XMG Focus 17 (E23) | |
| Acer Nitro 17 AN17-41-R9LN (AV PRO microSD 128 GB V60) | |
| Acer Nitro 17 AN17-51-71ER | |
| maximum AS SSD Seq Read Test (1GB) | |
| Media de la clase Gaming (25.5 - 261, n=51, últimos 2 años) | |
| Schenker XMG Focus 17 (E23) | |
| Acer Nitro 17 AN17-41-R9LN (AV PRO microSD 128 GB V60) | |
| Acer Nitro 17 AN17-51-71ER | |
Comunicación
Cámara web


Mostrar
El modelo AMD cuenta con la misma pantalla QHD que la versión Intel, lo que agradecemos por sus buenos resultados de medición y valores de imagen.
| |||||||||||||||||||||||||
iluminación: 88 %
Brillo con batería: 350 cd/m²
Contraste: 1000:1 (Negro: 0.35 cd/m²)
ΔE ColorChecker Calman: 2.03 | ∀{0.5-29.43 Ø4.73}
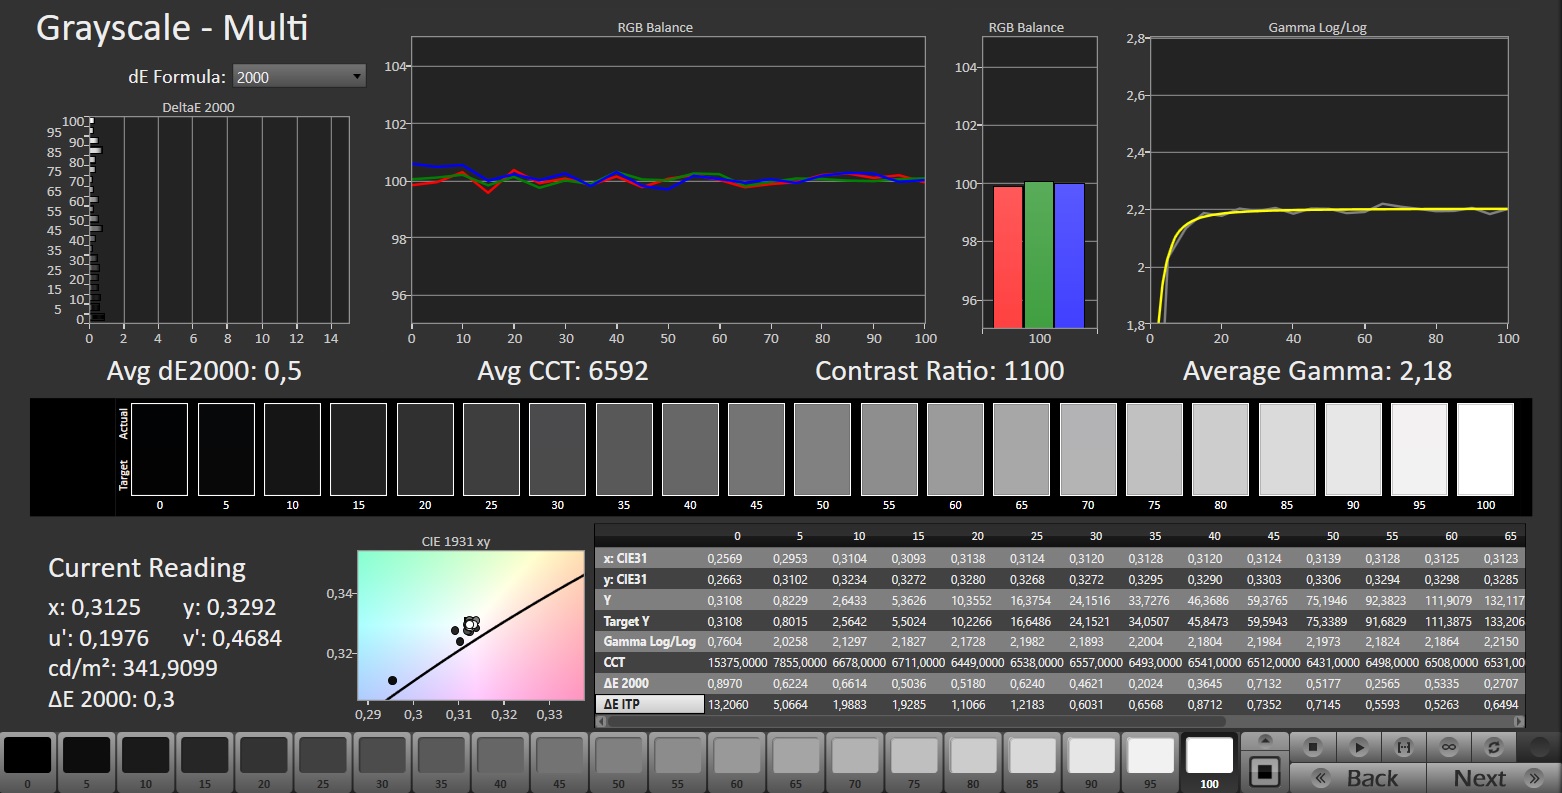
calibrated: 0.56
ΔE Greyscale Calman: 2.4 | ∀{0.09-98 Ø4.97}
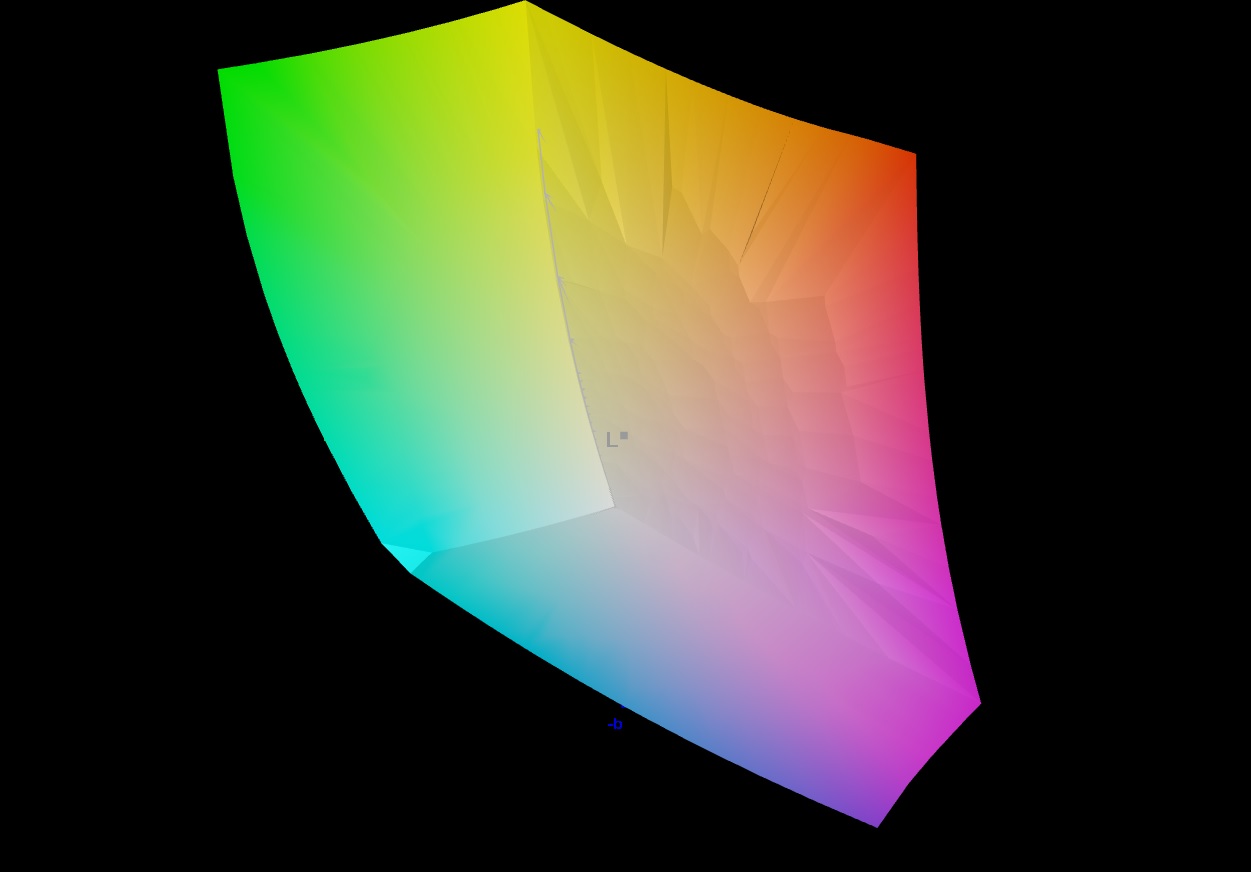
86% AdobeRGB 1998 (Argyll 3D)
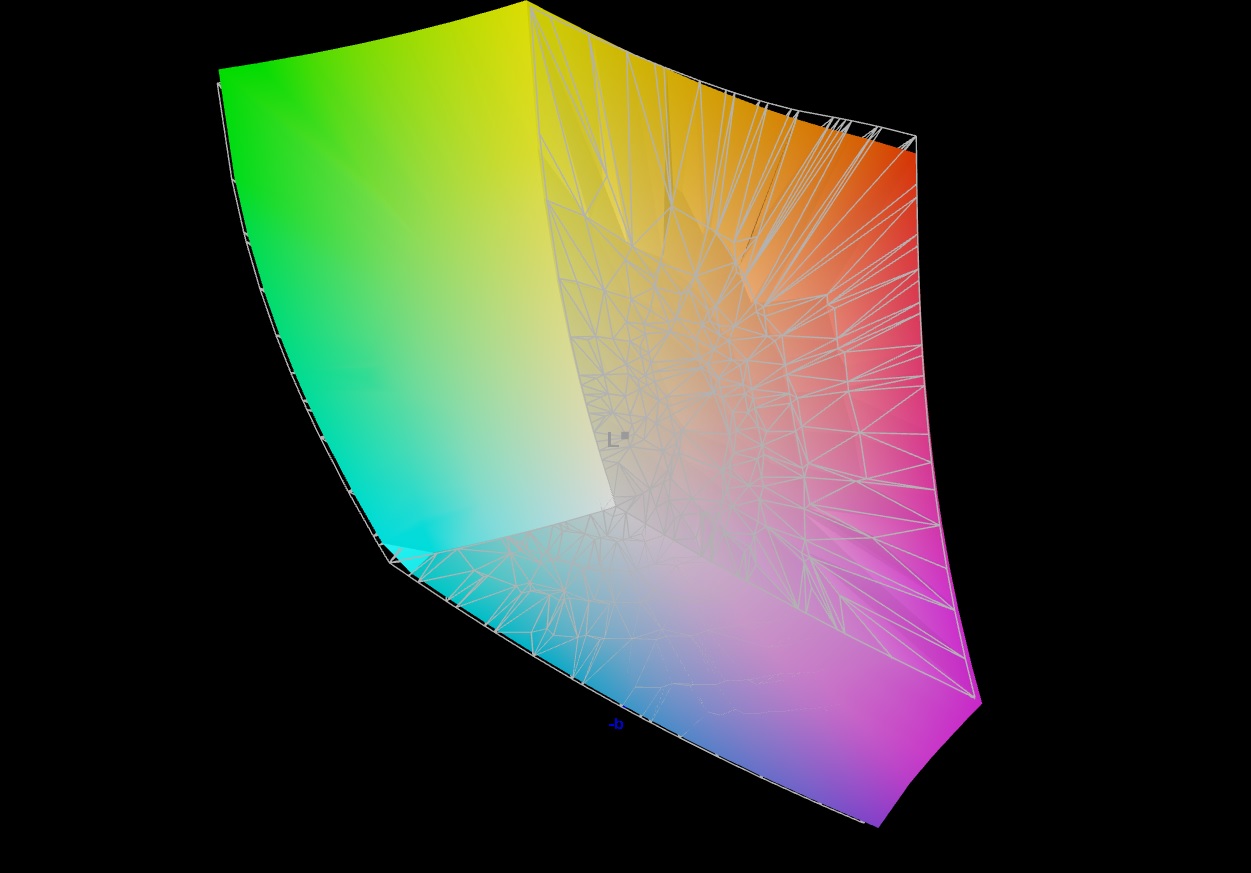
100% sRGB (Argyll 3D)
98% Display P3 (Argyll 3D)
Gamma: 2.071
CCT: 6961 K
| Acer Nitro 17 AN17-41-R9LN NE173QHM-NY6 (BOE0B7C), IPS, 2560x1440, 17.3" | Acer Nitro 17 AN17-51-71ER BOE0B7C NE173QHM-NY6, , 2560x1440, 17.3" | MSI Pulse 17 B13VGK AU Optronics B173HAN04.9, IPS, 1920x1080, 17.3" | Schenker XMG Focus 17 (E23) BOE09F9 NE173QHM-NZ1, IPS, 2560x1440, 17.3" | Asus ROG Strix G17 G713PI BOE0B69, IPS, 2560x1440, 17.3" | |
|---|---|---|---|---|---|
| Display | 0% | -53% | -1% | 0% | |
| Display P3 Coverage (%) | 98 | 98.3 0% | 38.4 -61% | 96.6 -1% | 98.3 0% |
| sRGB Coverage (%) | 100 | 100 0% | 57.5 -43% | 99.9 0% | 100 0% |
| AdobeRGB 1998 Coverage (%) | 86 | 85.7 0% | 39.7 -54% | 84.5 -2% | 85.9 0% |
| Response Times | 2% | -146% | -21% | 32% | |
| Response Time Grey 50% / Grey 80% * (ms) | 14.3 ? | 14.8 ? -3% | 31.2 ? -118% | 16.4 ? -15% | 5.3 ? 63% |
| Response Time Black / White * (ms) | 8.6 ? | 8 ? 7% | 23.6 ? -174% | 10.8 ? -26% | 8.6 ? -0% |
| PWM Frequency (Hz) | |||||
| Screen | -86% | -112% | -7% | 11% | |
| Brightness middle (cd/m²) | 350 | 361 3% | 254 -27% | 349 0% | 327 -7% |
| Brightness (cd/m²) | 337 | 326 -3% | 250 -26% | 318 -6% | 320 -5% |
| Brightness Distribution (%) | 88 | 87 -1% | 91 3% | 82 -7% | 89 1% |
| Black Level * (cd/m²) | 0.35 | 0.6 -71% | 0.14 60% | 0.56 -60% | 0.38 -9% |
| Contrast (:1) | 1000 | 602 -40% | 1814 81% | 623 -38% | 861 -14% |
| Colorchecker dE 2000 * | 2.03 | 3.83 -89% | 4.52 -123% | 1.08 47% | 1.01 50% |
| Colorchecker dE 2000 max. * | 5.02 | 5.71 -14% | 21.22 -323% | 3.05 39% | 4.01 20% |
| Colorchecker dE 2000 calibrated * | 0.56 | 3.48 -521% | 4.52 -707% | 1.08 -93% | 0.41 27% |
| Greyscale dE 2000 * | 2.4 | 3.29 -37% | 1 58% | 1.14 52% | 1.6 33% |
| Gamma | 2.071 106% | 2.29 96% | 2.44 90% | 2.41 91% | 2.168 101% |
| CCT | 6961 93% | 6679 97% | 6502 100% | 6687 97% | 6659 98% |
| Media total (Programa/Opciones) | -28% /
-55% | -104% /
-104% | -10% /
-8% | 14% /
11% |
* ... más pequeño es mejor
Su panel IPS puede que no sea el más brillante con 337 cd/m² de media, pero mientras permanezcas en interiores, sus niveles de brillo están bien. Sus tiempos de reacción, valor de negro (0.35 cd/m²) y contraste (1.000:1) también demuestran que no hay razón para que el portátil se esconda de sus competidores - aunque, aún hay un poco de margen de mejora.
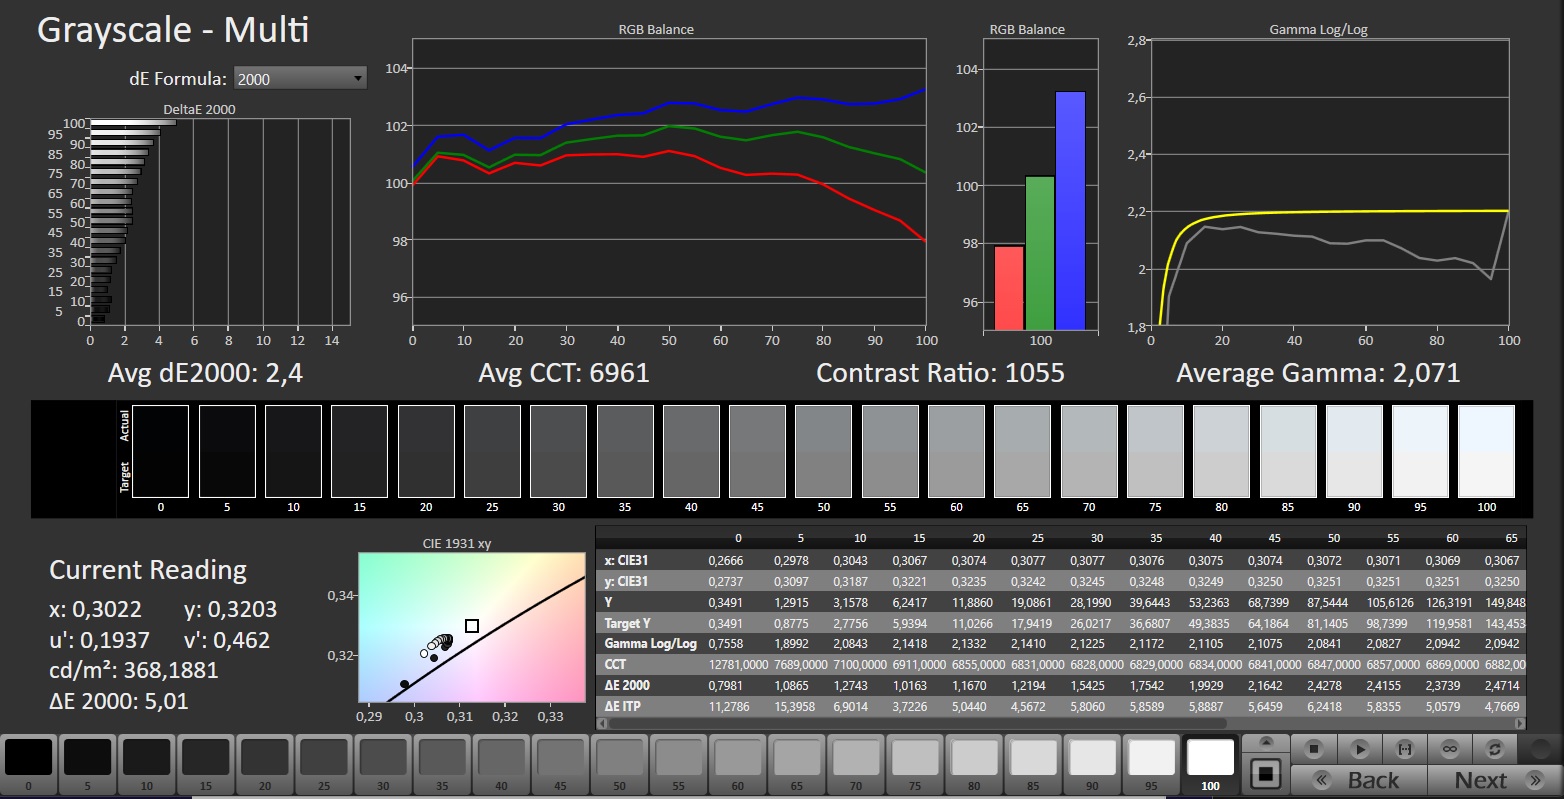
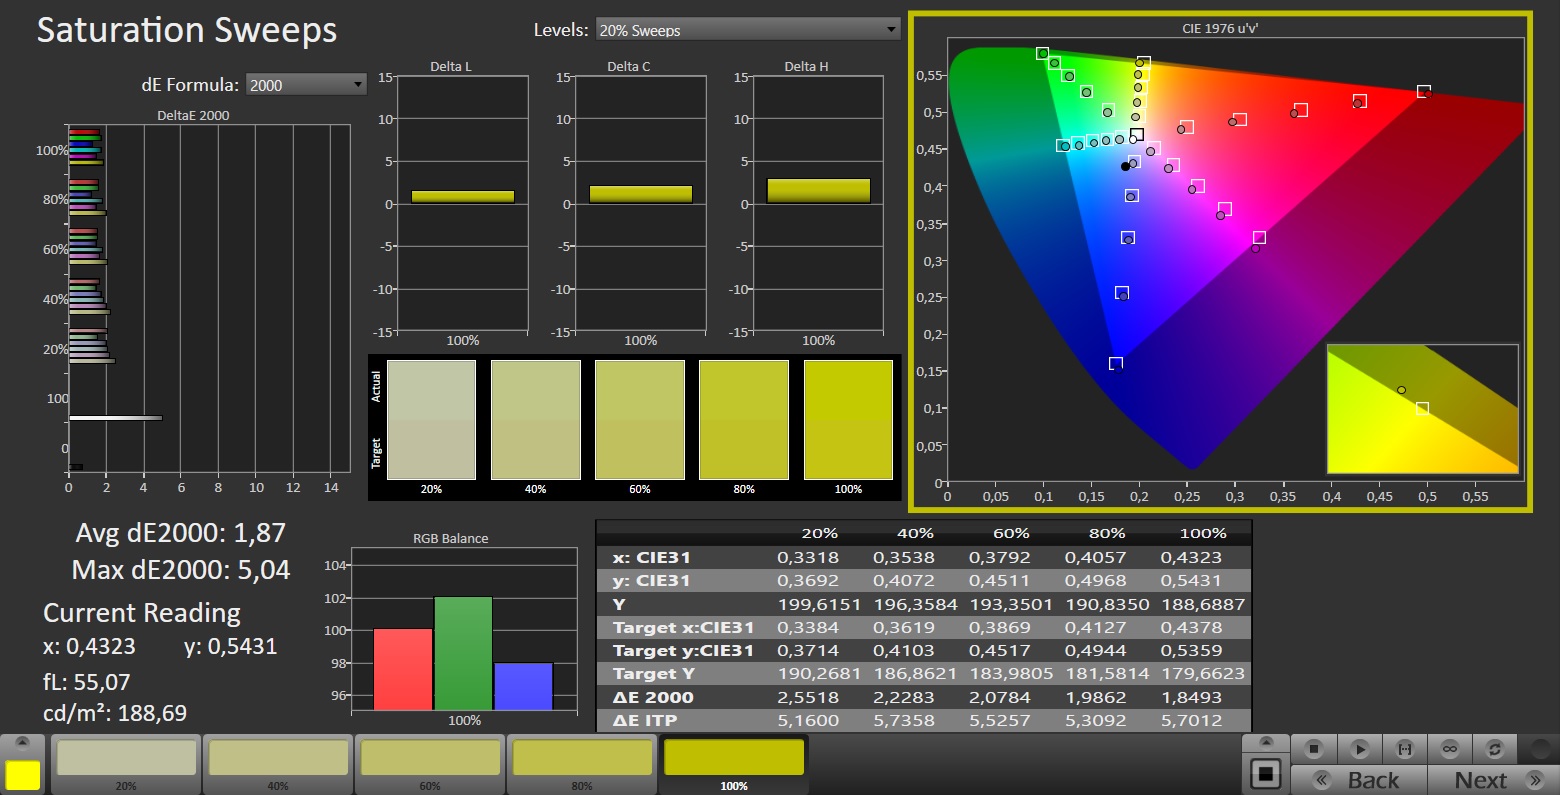
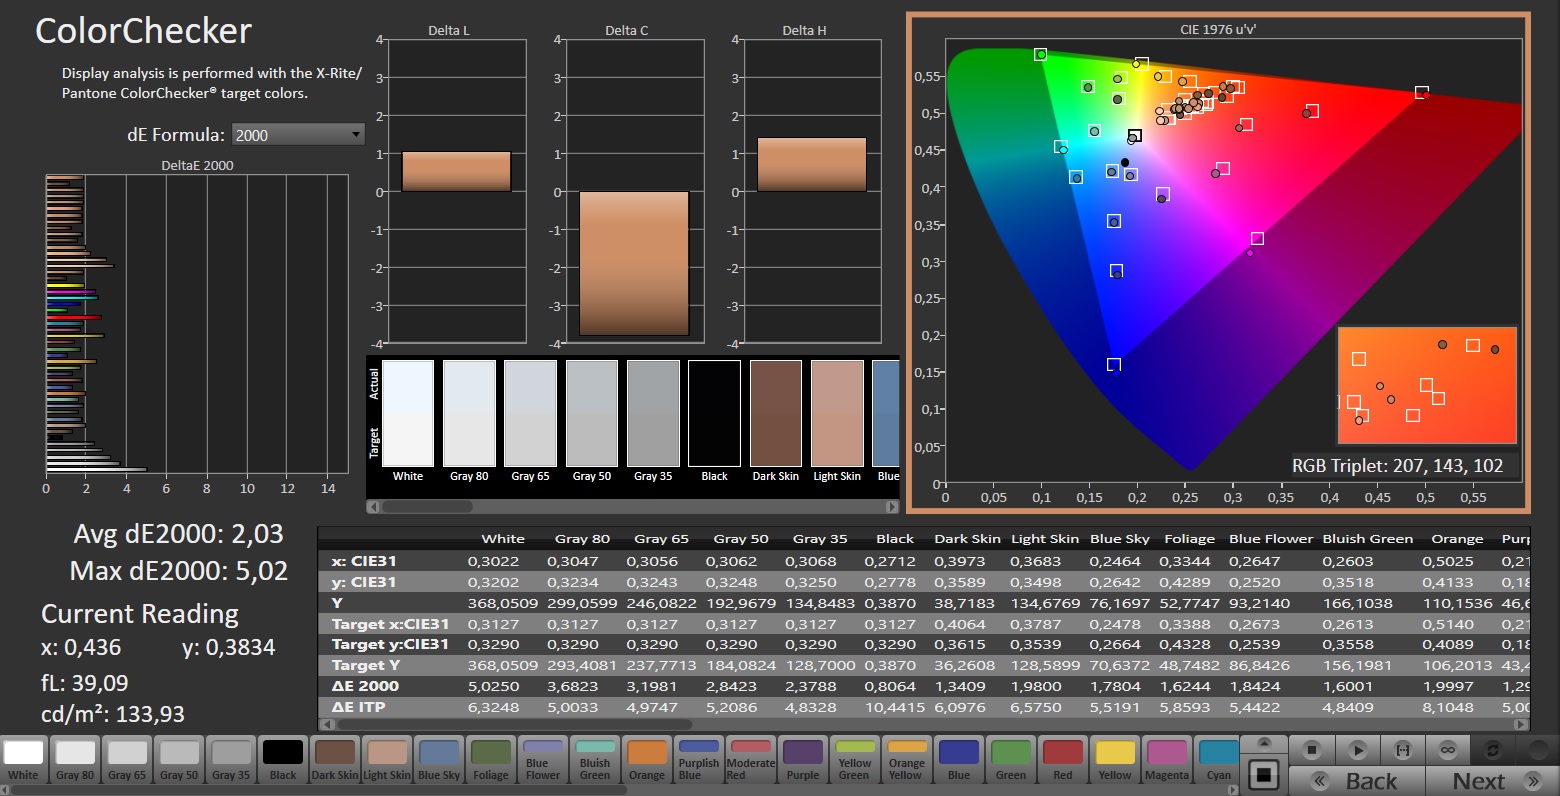
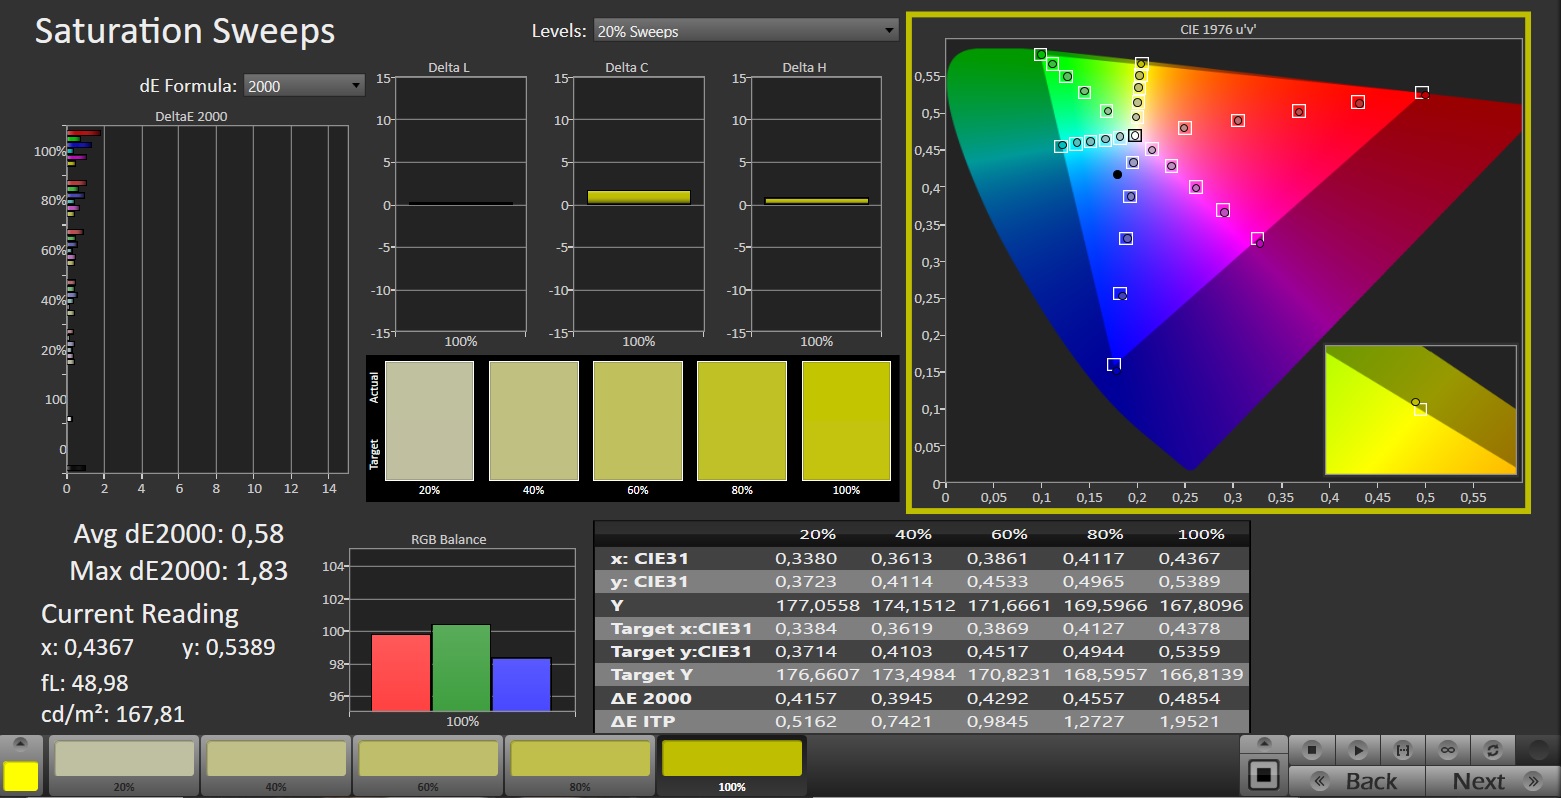
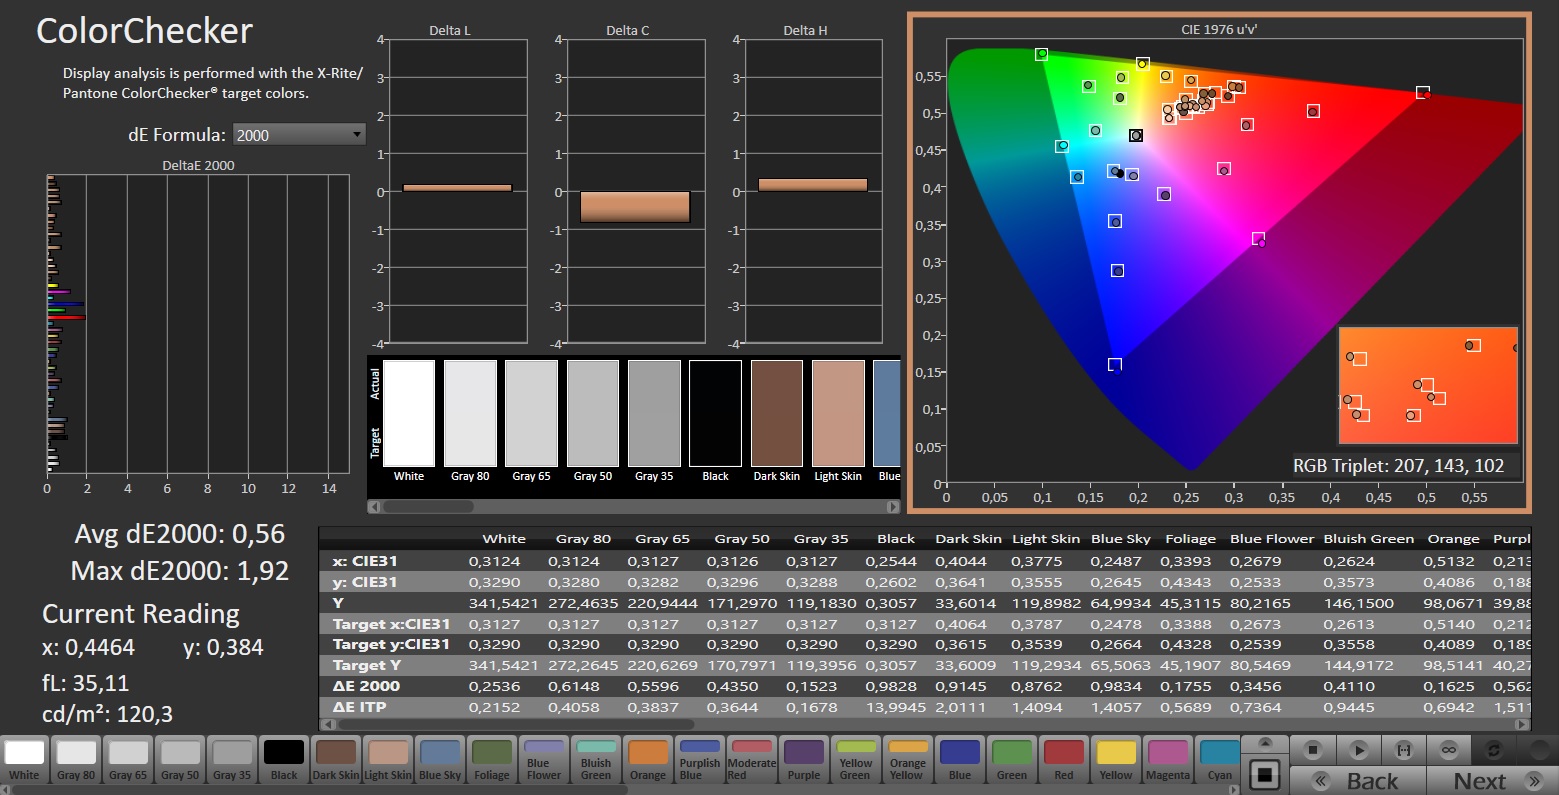
Para un portátil de juegos, sus espacios de color (100 % sRGB, 98 % P3 y 86 % AdobeRGB) son inusualmente buenos. Su precisión de color también es buena y no requiere mucho calibrado.

Los ángulos de visión del portátil son los típicos de un panel IPS, así que bastante buenos. Por desgracia, nuestro dispositivo de pruebas tuvo un pequeño problema de sangrado de pantalla en los bordes del display.
Tiempos de respuesta del display
| ↔ Tiempo de respuesta de Negro a Blanco | ||
|---|---|---|
| 8.6 ms ... subida ↗ y bajada ↘ combinada | ↗ 3.8 ms subida | 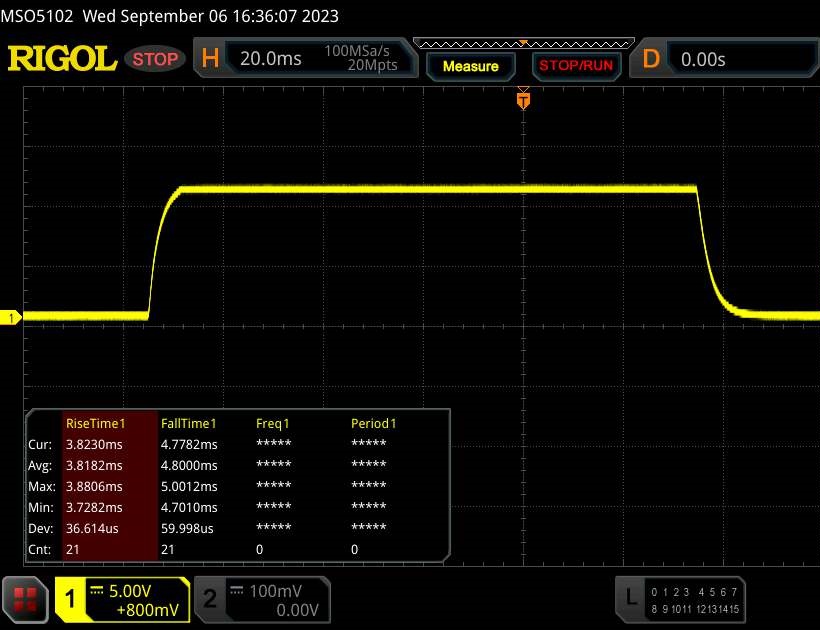 |
| ↘ 4.8 ms bajada | ||
| La pantalla mostró tiempos de respuesta rápidos en nuestros tests y debería ser adecuada para juegos. En comparación, todos los dispositivos de prueba van de ##min### (mínimo) a 240 (máximo) ms. » 24 % de todos los dispositivos son mejores. Esto quiere decir que el tiempo de respuesta medido es mejor que la media (19.9 ms) de todos los dispositivos testados. | ||
| ↔ Tiempo de respuesta 50% Gris a 80% Gris | ||
| 14.3 ms ... subida ↗ y bajada ↘ combinada | ↗ 7.1 ms subida | 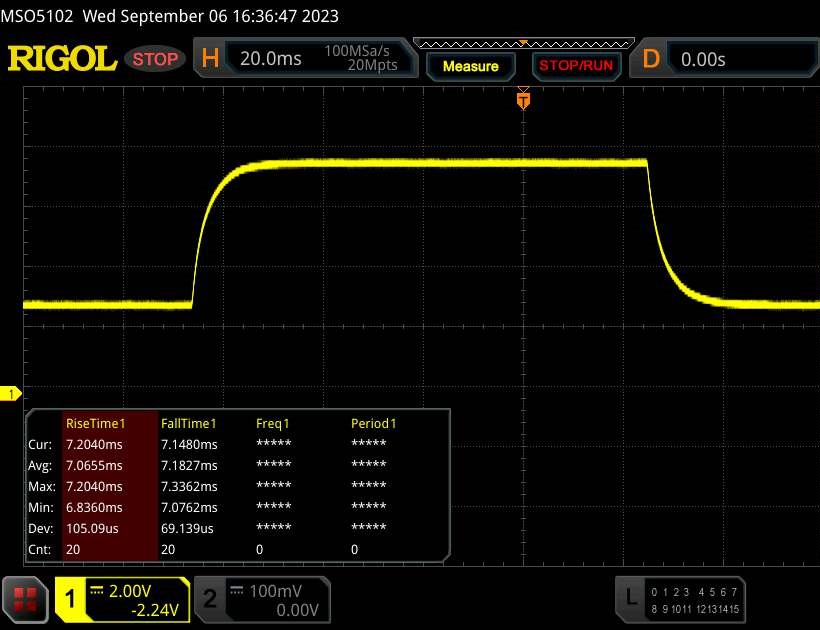 |
| ↘ 7.2 ms bajada | ||
| La pantalla mostró buenos tiempos de respuesta en nuestros tests pero podría ser demasiado lenta para los jugones competitivos. En comparación, todos los dispositivos de prueba van de ##min### (mínimo) a 636 (máximo) ms. » 28 % de todos los dispositivos son mejores. Esto quiere decir que el tiempo de respuesta medido es mejor que la media (31.1 ms) de todos los dispositivos testados. | ||
Parpadeo de Pantalla / PWM (Pulse-Width Modulation)
| Parpadeo de Pantalla / PWM no detectado | 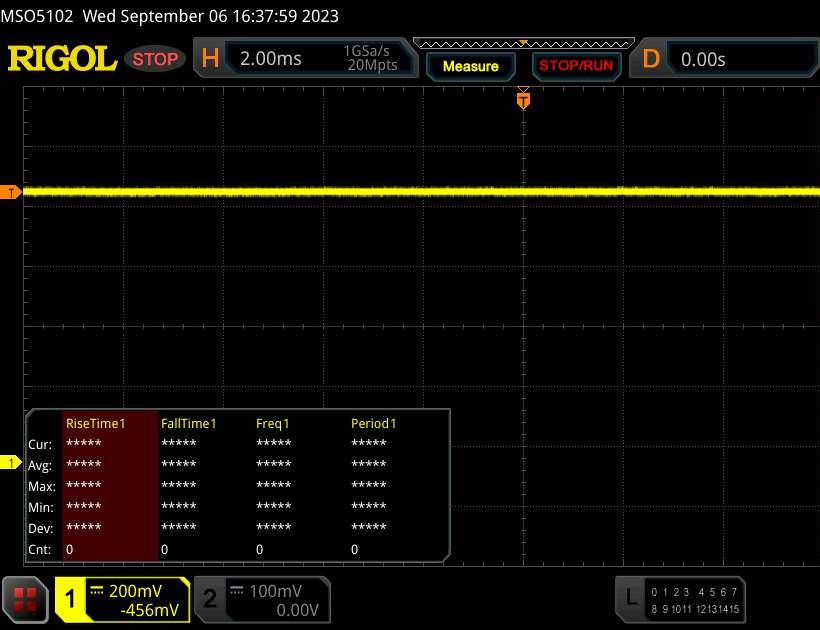 | ||
Comparación: 52 % de todos los dispositivos testados no usaron PWM para atenuar el display. Si se usó, medimos una media de 7784 (mínimo: 5 - máxmo: 343500) Hz. | |||
Rendimiento
Aunque elRyzen 7 7735HStiene que conformarse con la antigua arquitectura Zen 3+ (algunos modelos 7000 ya usan Zen 4), seguiríamos contando al Nitro 17 AN17-41-R9LN en el campo de la gama media alta. Sus 16 GB RAM y 1 TB SSD ya no son un punto fuerte en el año 2023, pero siguen siendo adecuados.
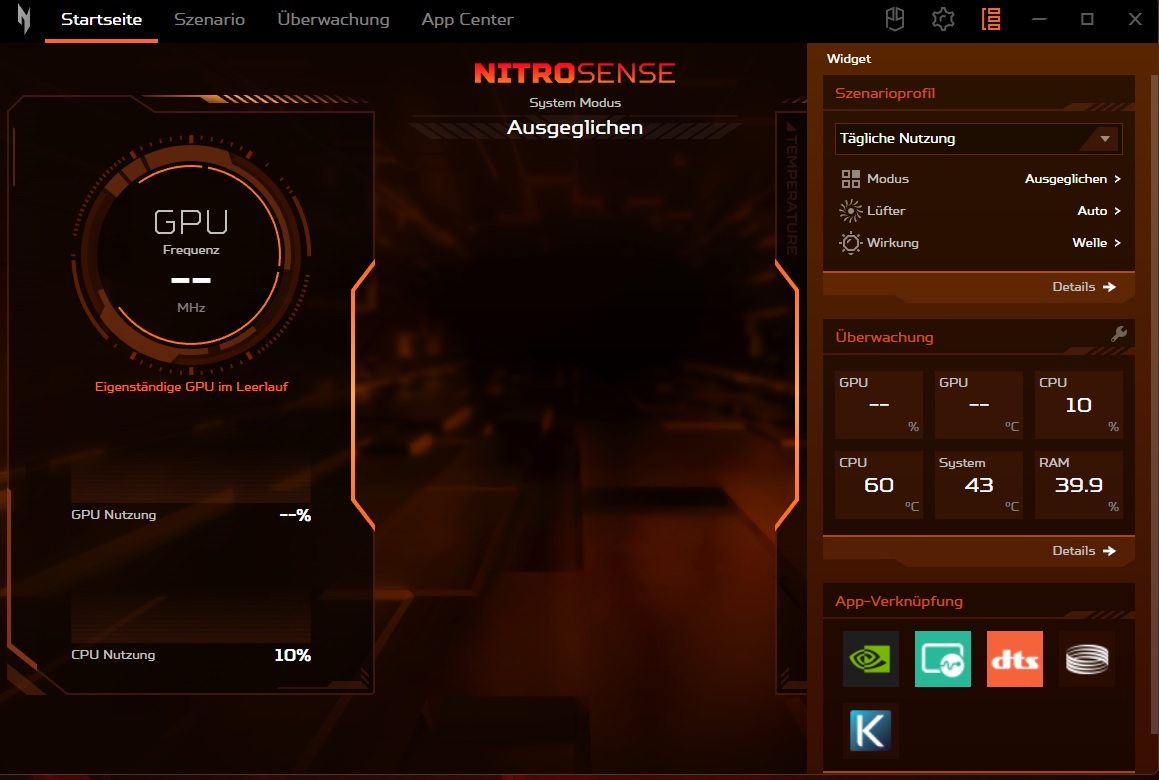
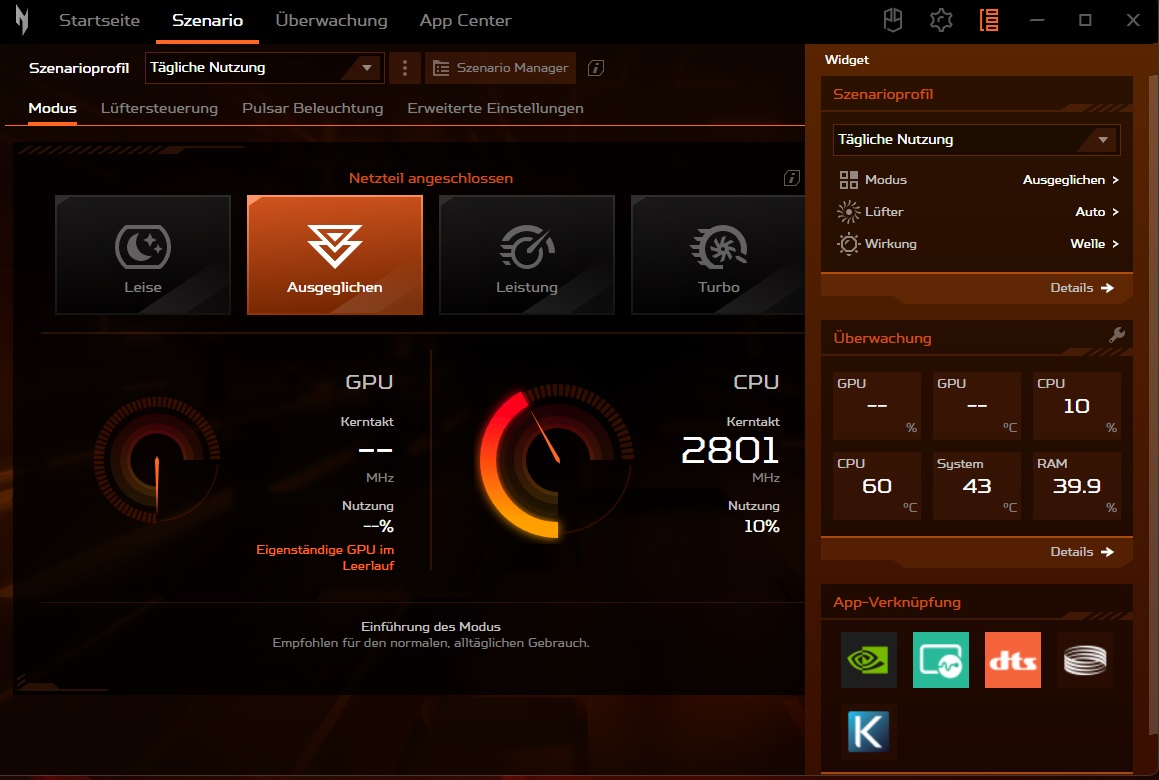
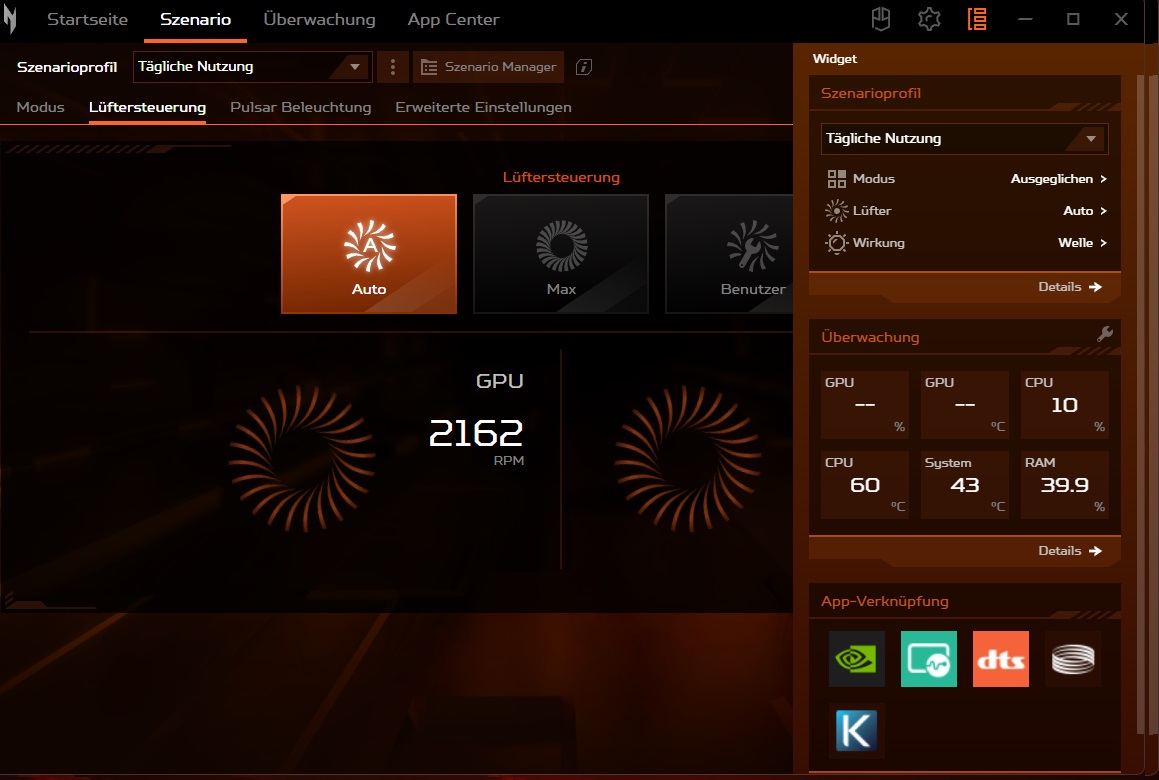
Condiciones de ensayo
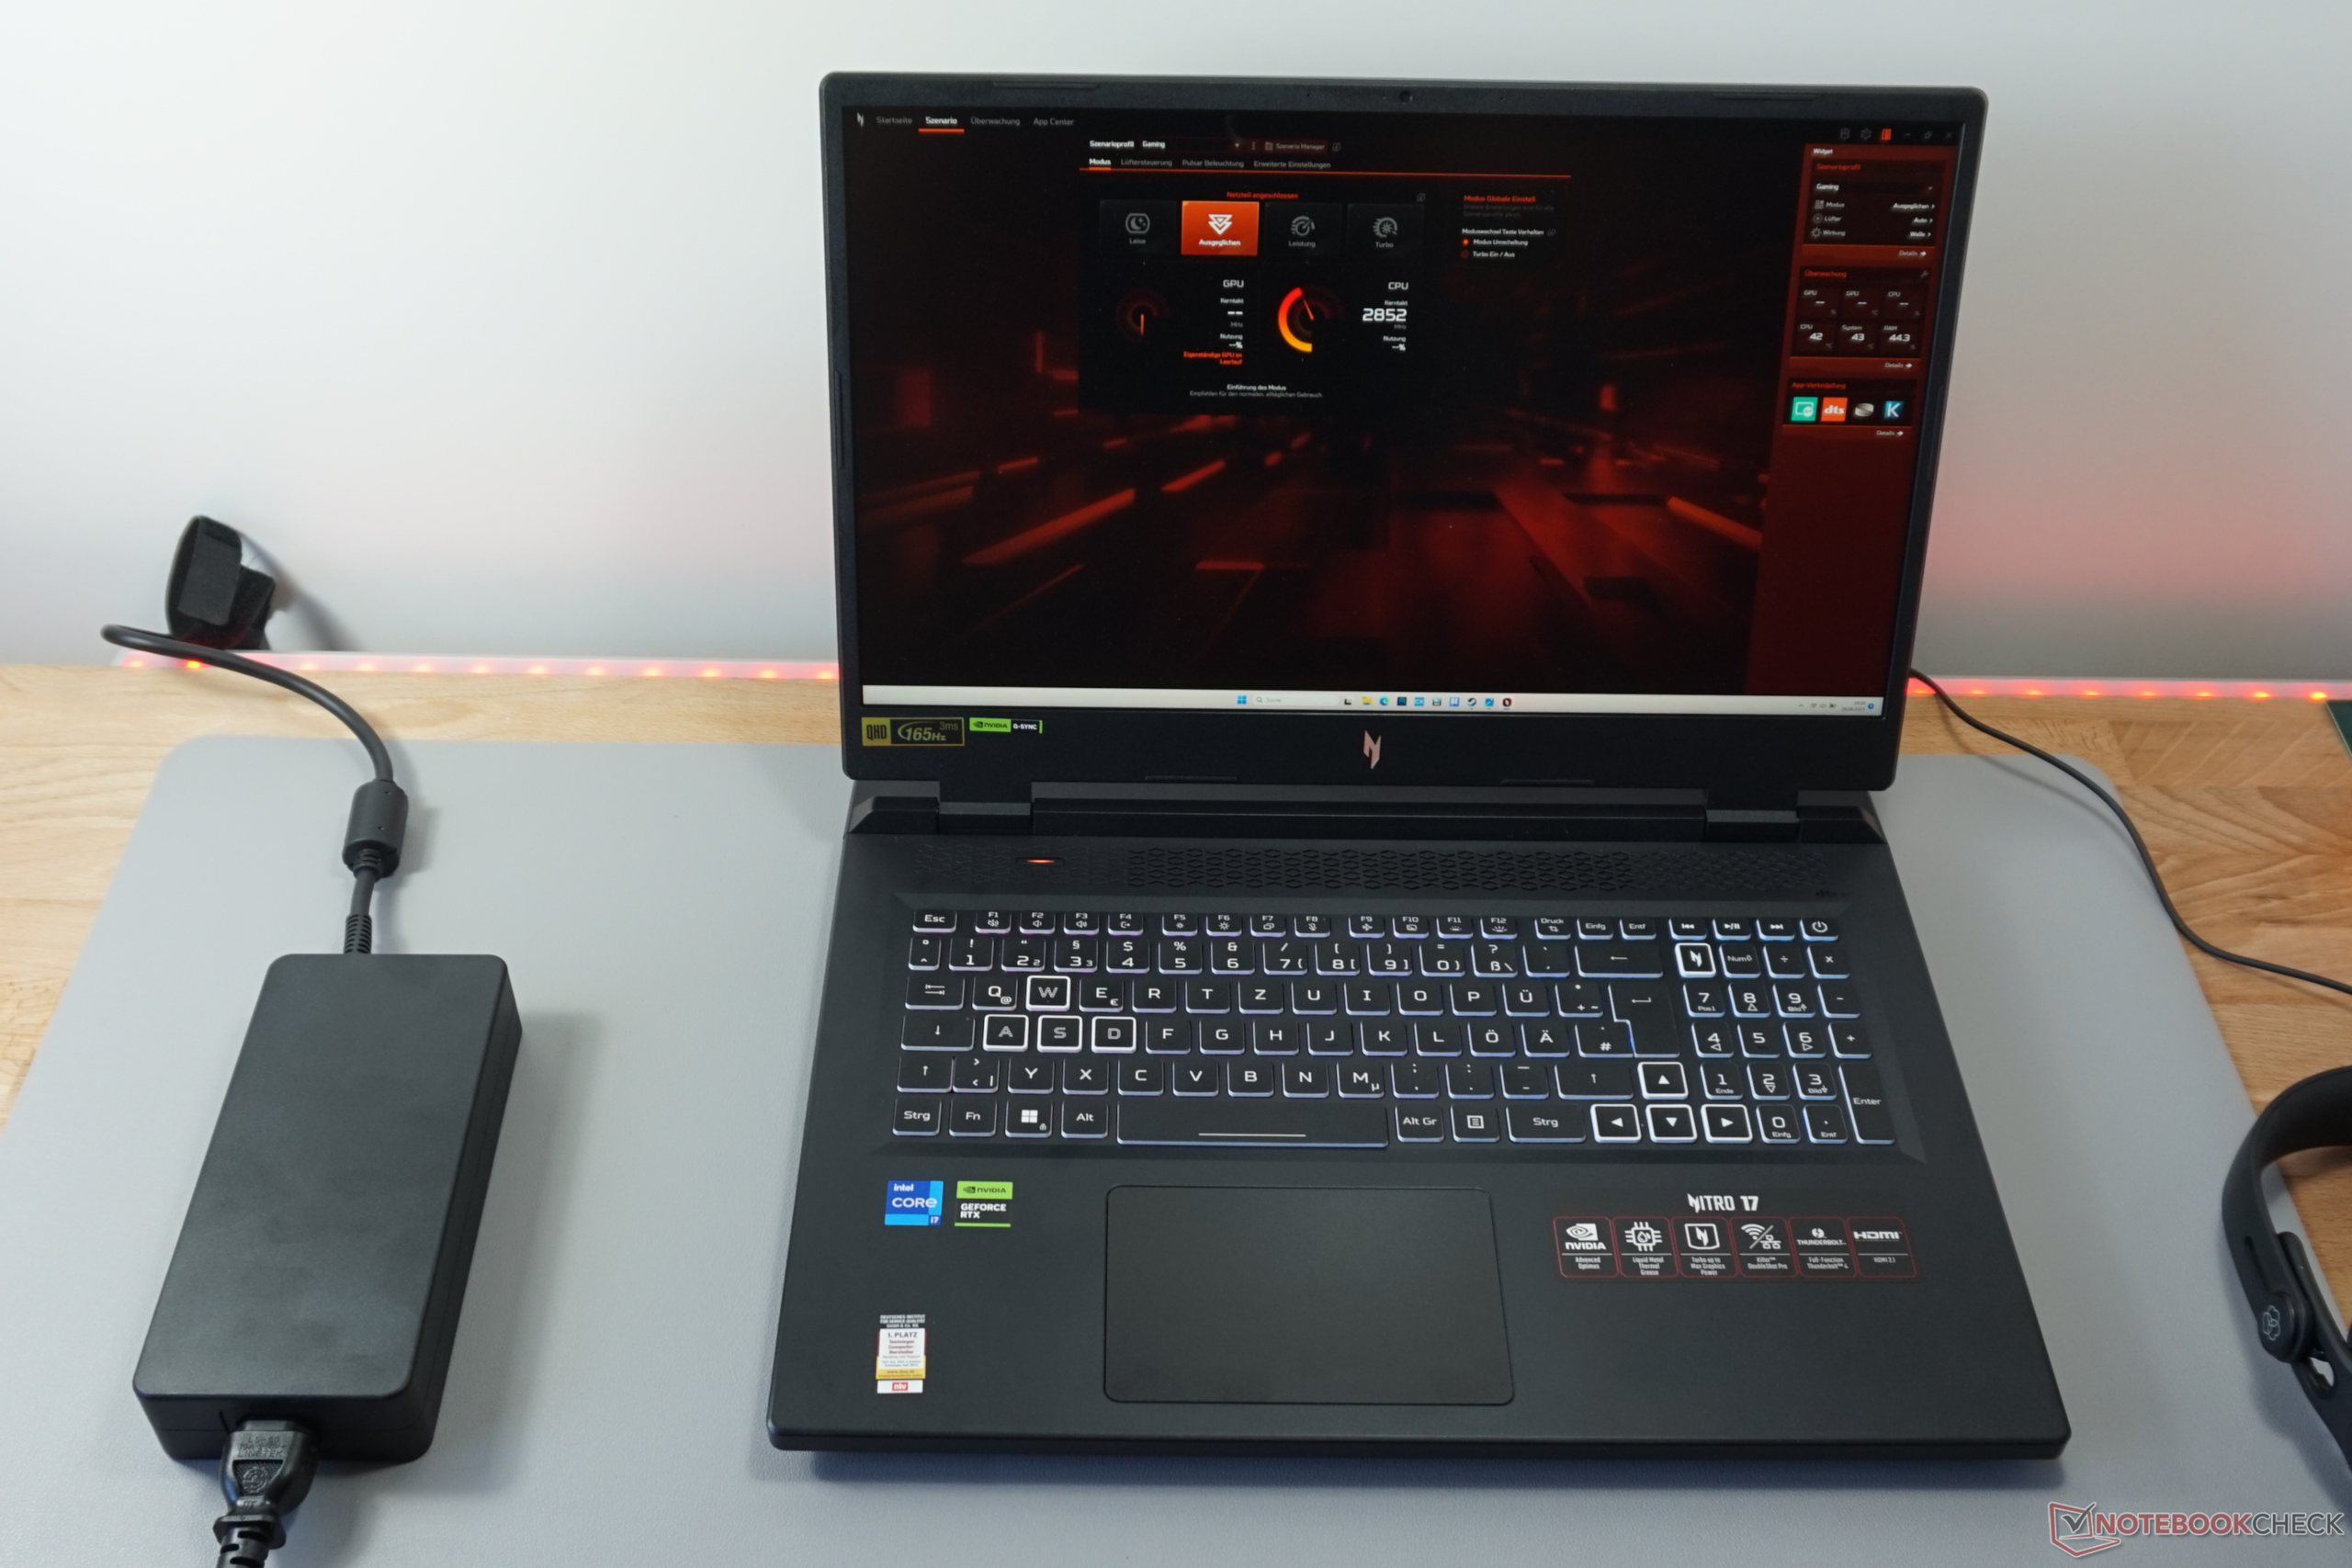
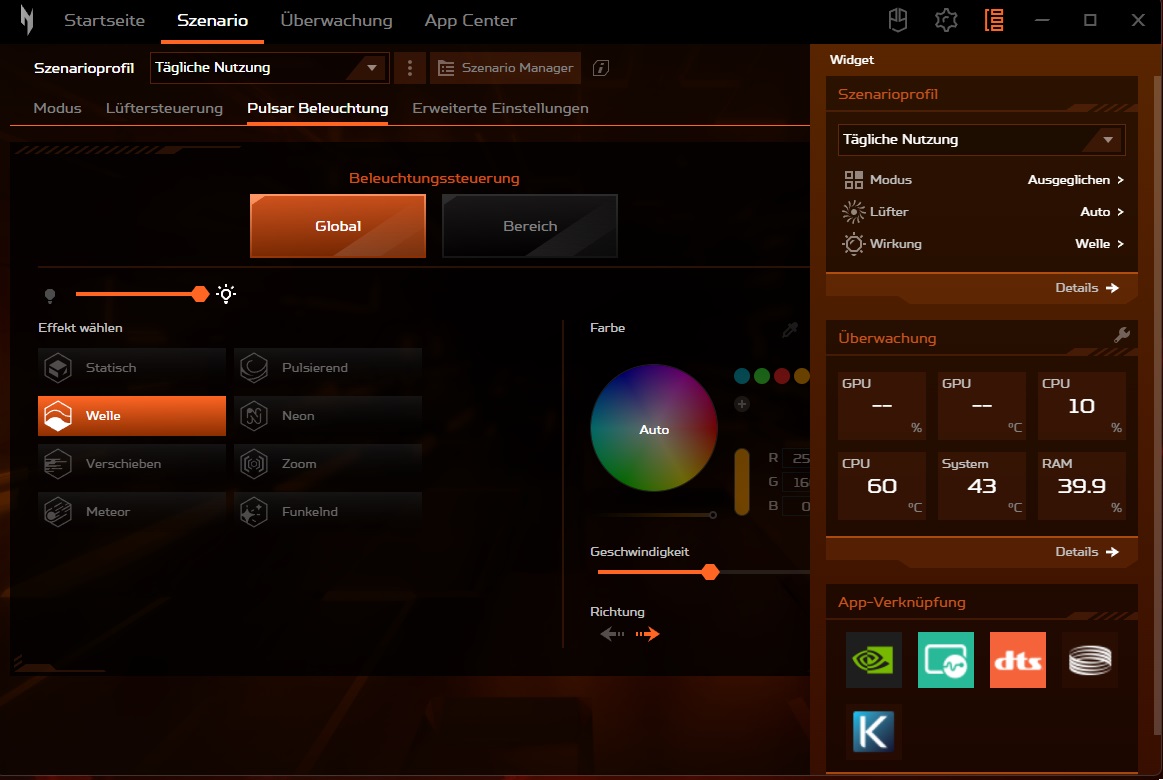
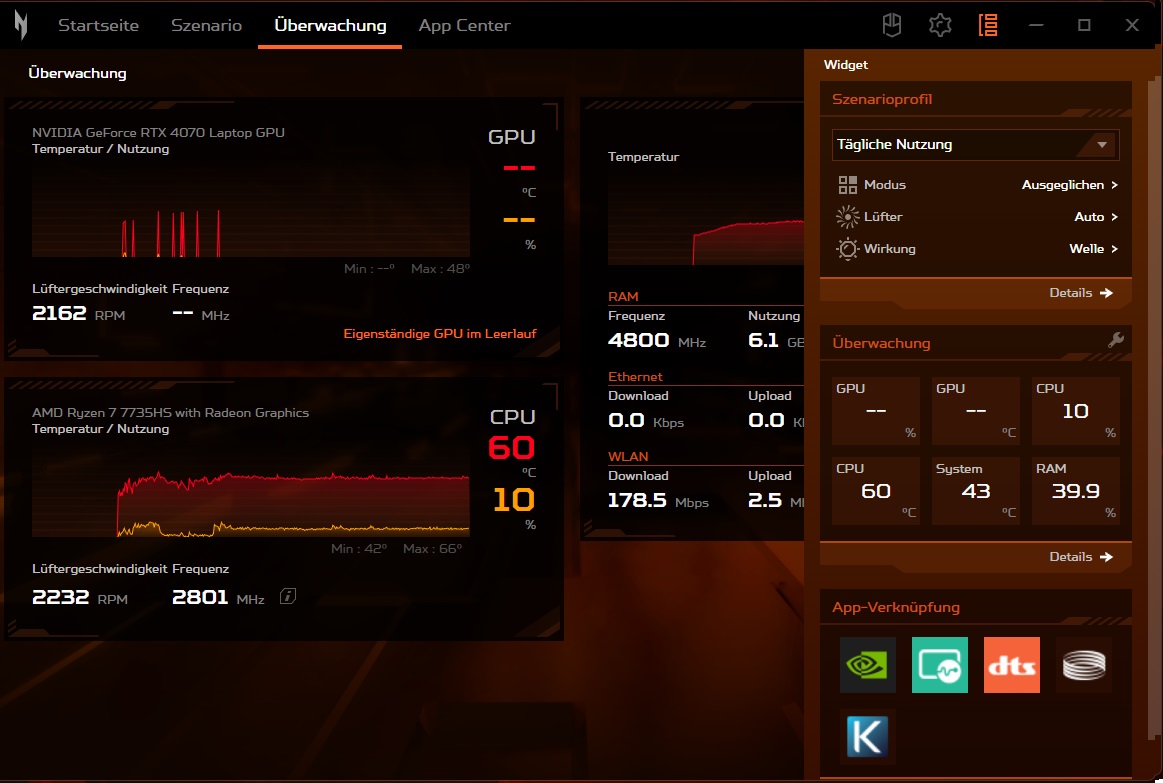
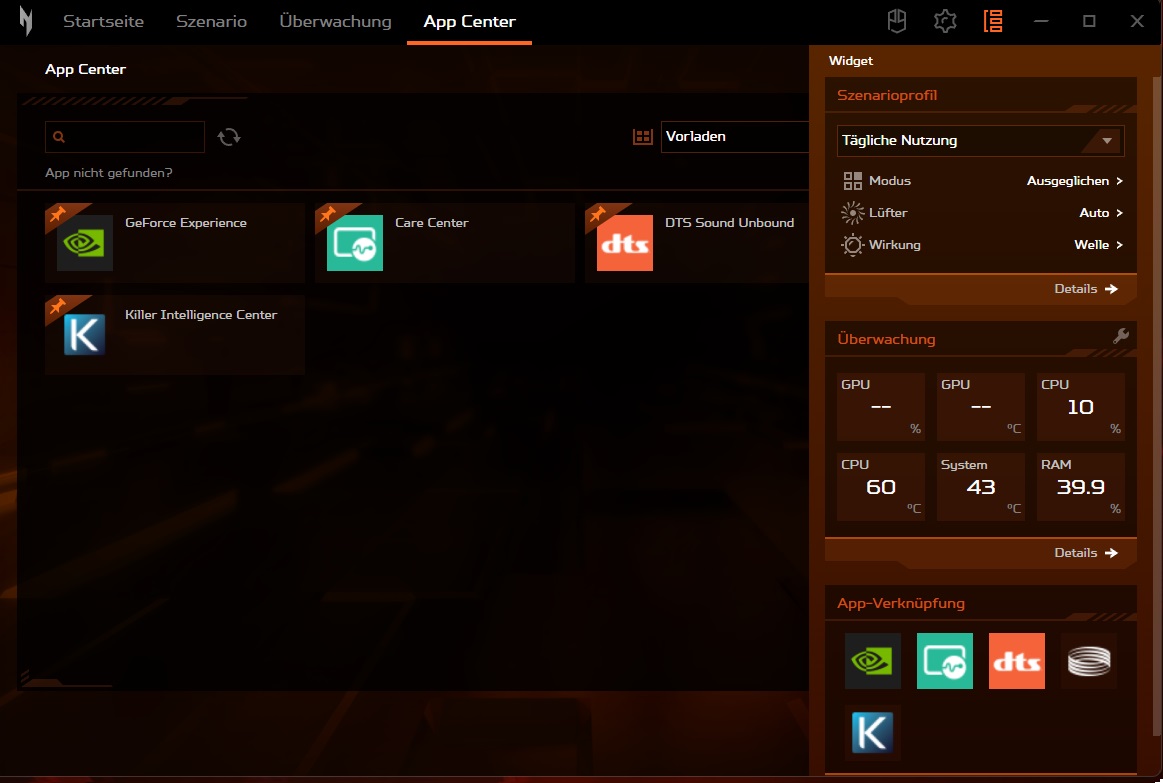
Acer ha preinstalado una herramienta llamada Nitro Sense, con la que se pueden hacer numerosos cambios en el sistema (por ejemplo, la iluminación del teclado). Los diferentes modos de rendimiento son especialmente importantes para el uso diario. Como no se pudo determinar un aumento real de la tasa de frames a partir de las aplicaciones 3D, pero las emisiones de ruido aumentaron significativamente, realizamos todas las mediciones en el modo Equilibrado, que representa el punto dulce, por así decirlo. El control del ventilador siempre estuvo en modo automático.
| Witcher 3 (FHD/Ultra) | Silencioso | Equilibrado | Rendimiento | Turbo |
|---|---|---|---|---|
| Rendimiento | 60 - 100 fps | ~110 fps | ~111 fps | ~112 fps |
| Ruido | ~38 dB(A) | ~44 dB(A) | ~54 dB(A) | ~61 dB(A) |
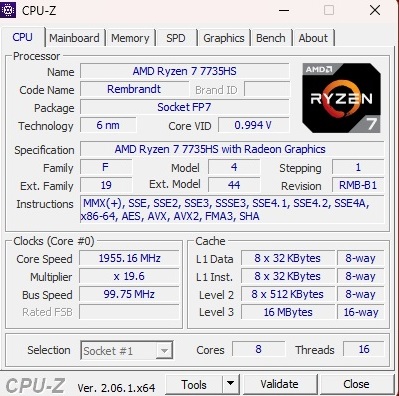
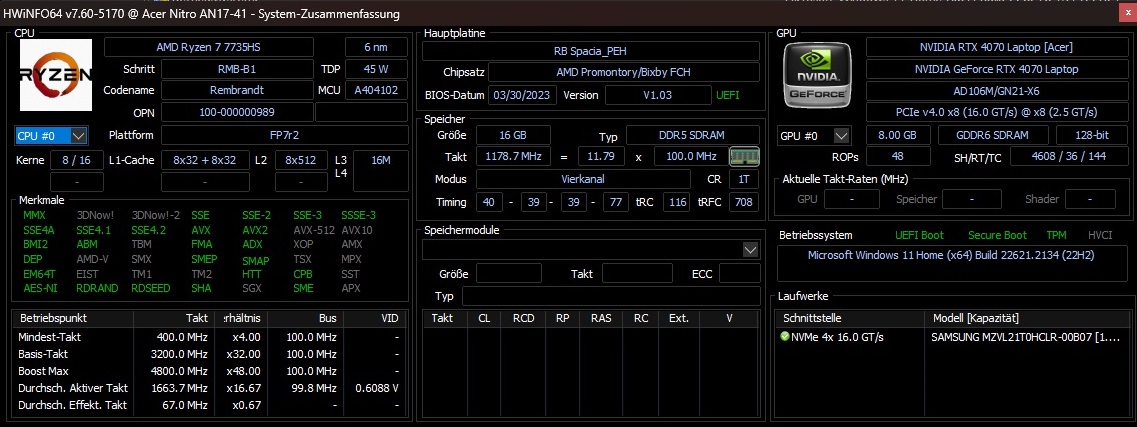
Procesador
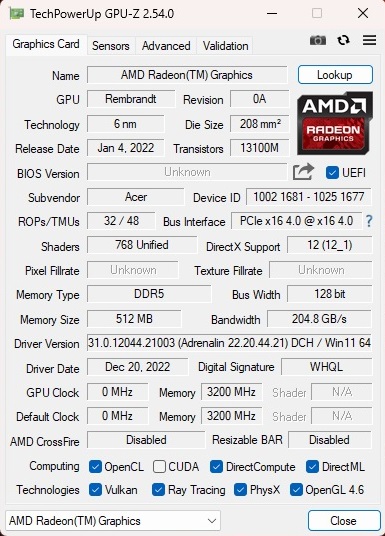
El Ryzen 7 7735HS es un procesador octa-core que tiene 16 MB de caché L3 y puede procesar hasta 16 hilos a la vez gracias a SMT. AMD ha indicado que el modelo de 6 nm tiene una velocidad de reloj de 3,2 a 4,75 GHz bajo carga, lo que no es ni poco ni mucho. Una de sus mayores ventajas es su iGPU comparativamente potente. Durante tareas poco exigentes (el dispositivo soporta Advanced Optimus), sólo laRadeon 680M integrada en el procesador está activa, lo que puede competir con GPUs más antiguas de gama básica y en parte también de gama media.
El Ryzen 7 7735HS lo hizo bien pero no excesivamente durante las pruebas. Su rendimiento fue (como era de esperar) ligeramente peor que el de su (más caro) competidor Intel, el Core i7-13700H, que cuenta con 14 núcleos y puede procesar 20 hilos simultáneamente. En comparación con unCore i9-13900HXo unRyzen 9 7945HXcon arquitectura Zen 4, el 7735HS no tuvo ninguna oportunidad y lo hizo bastante peor. Aún así, el rendimiento de la CPU se mantuvo muy consistente según nuestro bucle Cinebench - esto no puede decirse del resto de portátiles.
Cinebench R15 Multi continuous test
* ... más pequeño es mejor
AIDA64: FP32 Ray-Trace | FPU Julia | CPU SHA3 | CPU Queen | FPU SinJulia | FPU Mandel | CPU AES | CPU ZLib | FP64 Ray-Trace | CPU PhotoWorxx
| Performance rating | |
| Asus ROG Strix G17 G713PI | |
| Media de la clase Gaming | |
| Schenker XMG Focus 17 (E23) | |
| Acer Nitro 17 AN17-51-71ER | |
| MSI Pulse 17 B13VGK | |
| Acer Nitro 17 AN17-41-R9LN | |
| Medio AMD Ryzen 7 7735HS | |
| AIDA64 / FP32 Ray-Trace | |
| Asus ROG Strix G17 G713PI | |
| Media de la clase Gaming (10227 - 85542, n=107, últimos 2 años) | |
| Schenker XMG Focus 17 (E23) | |
| MSI Pulse 17 B13VGK | |
| Acer Nitro 17 AN17-51-71ER | |
| Acer Nitro 17 AN17-41-R9LN | |
| Medio AMD Ryzen 7 7735HS (11831 - 17161, n=16) | |
| AIDA64 / FPU Julia | |
| Asus ROG Strix G17 G713PI | |
| Media de la clase Gaming (51376 - 238426, n=107, últimos 2 años) | |
| Schenker XMG Focus 17 (E23) | |
| Acer Nitro 17 AN17-41-R9LN | |
| Medio AMD Ryzen 7 7735HS (75370 - 105483, n=16) | |
| MSI Pulse 17 B13VGK | |
| Acer Nitro 17 AN17-51-71ER | |
| AIDA64 / CPU SHA3 | |
| Asus ROG Strix G17 G713PI | |
| Media de la clase Gaming (2180 - 9817, n=107, últimos 2 años) | |
| Schenker XMG Focus 17 (E23) | |
| Acer Nitro 17 AN17-51-71ER | |
| MSI Pulse 17 B13VGK | |
| Acer Nitro 17 AN17-41-R9LN | |
| Medio AMD Ryzen 7 7735HS (2499 - 3494, n=16) | |
| AIDA64 / CPU Queen | |
| Asus ROG Strix G17 G713PI | |
| Schenker XMG Focus 17 (E23) | |
| Media de la clase Gaming (49785 - 173351, n=98, últimos 2 años) | |
| Acer Nitro 17 AN17-41-R9LN | |
| Acer Nitro 17 AN17-51-71ER | |
| Medio AMD Ryzen 7 7735HS (87486 - 108729, n=15) | |
| MSI Pulse 17 B13VGK | |
| AIDA64 / FPU SinJulia | |
| Asus ROG Strix G17 G713PI | |
| Media de la clase Gaming (4424 - 33636, n=107, últimos 2 años) | |
| Schenker XMG Focus 17 (E23) | |
| Acer Nitro 17 AN17-41-R9LN | |
| Medio AMD Ryzen 7 7735HS (11233 - 13097, n=16) | |
| MSI Pulse 17 B13VGK | |
| Acer Nitro 17 AN17-51-71ER | |
| AIDA64 / FPU Mandel | |
| Asus ROG Strix G17 G713PI | |
| Media de la clase Gaming (25115 - 128721, n=107, últimos 2 años) | |
| Acer Nitro 17 AN17-41-R9LN | |
| Schenker XMG Focus 17 (E23) | |
| Medio AMD Ryzen 7 7735HS (41400 - 58232, n=16) | |
| MSI Pulse 17 B13VGK | |
| Acer Nitro 17 AN17-51-71ER | |
| AIDA64 / CPU AES | |
| Asus ROG Strix G17 G713PI | |
| Acer Nitro 17 AN17-51-71ER | |
| Media de la clase Gaming (39258 - 247074, n=107, últimos 2 años) | |
| Schenker XMG Focus 17 (E23) | |
| MSI Pulse 17 B13VGK | |
| Medio AMD Ryzen 7 7735HS (44013 - 137629, n=16) | |
| Acer Nitro 17 AN17-41-R9LN | |
| AIDA64 / CPU ZLib | |
| Asus ROG Strix G17 G713PI | |
| Schenker XMG Focus 17 (E23) | |
| Media de la clase Gaming (574 - 2531, n=107, últimos 2 años) | |
| Acer Nitro 17 AN17-51-71ER | |
| MSI Pulse 17 B13VGK | |
| Acer Nitro 17 AN17-41-R9LN | |
| Medio AMD Ryzen 7 7735HS (651 - 906, n=16) | |
| AIDA64 / FP64 Ray-Trace | |
| Asus ROG Strix G17 G713PI | |
| Media de la clase Gaming (5509 - 45446, n=107, últimos 2 años) | |
| Schenker XMG Focus 17 (E23) | |
| MSI Pulse 17 B13VGK | |
| Acer Nitro 17 AN17-51-71ER | |
| Acer Nitro 17 AN17-41-R9LN | |
| Medio AMD Ryzen 7 7735HS (1459 - 9094, n=16) | |
| AIDA64 / CPU PhotoWorxx | |
| Schenker XMG Focus 17 (E23) | |
| Media de la clase Gaming (12271 - 89891, n=107, últimos 2 años) | |
| MSI Pulse 17 B13VGK | |
| Acer Nitro 17 AN17-51-71ER | |
| Asus ROG Strix G17 G713PI | |
| Acer Nitro 17 AN17-41-R9LN | |
| Medio AMD Ryzen 7 7735HS (17524 - 30542, n=16) | |
Rendimiento del sistema
El rendimiento del sistema del portátil fue lo bastante bueno como para situarse en algún punto intermedio entre los dispositivos de la comparación. 7.240 puntos en PCMark 10 lo convierten en un sistema ágil y capaz en todos los aspectos.
CrossMark: Overall | Productivity | Creativity | Responsiveness
| PCMark 10 / Score | |
| Media de la clase Gaming (5828 - 11574, n=94, últimos 2 años) | |
| MSI Pulse 17 B13VGK | |
| Asus ROG Strix G17 G713PI | |
| Acer Nitro 17 AN17-41-R9LN | |
| Medio AMD Ryzen 7 7735HS, NVIDIA GeForce RTX 4070 Laptop GPU (7220 - 7240, n=2) | |
| Acer Nitro 17 AN17-51-71ER | |
| Schenker XMG Focus 17 (E23) | |
| PCMark 10 / Essentials | |
| Asus ROG Strix G17 G713PI | |
| Acer Nitro 17 AN17-41-R9LN | |
| Media de la clase Gaming (8810 - 12600, n=98, últimos 2 años) | |
| Medio AMD Ryzen 7 7735HS, NVIDIA GeForce RTX 4070 Laptop GPU (10579 - 10690, n=2) | |
| MSI Pulse 17 B13VGK | |
| Acer Nitro 17 AN17-51-71ER | |
| Schenker XMG Focus 17 (E23) | |
| PCMark 10 / Productivity | |
| Asus ROG Strix G17 G713PI | |
| MSI Pulse 17 B13VGK | |
| Media de la clase Gaming (6845 - 18766, n=96, últimos 2 años) | |
| Schenker XMG Focus 17 (E23) | |
| Medio AMD Ryzen 7 7735HS, NVIDIA GeForce RTX 4070 Laptop GPU (8893 - 9146, n=2) | |
| Acer Nitro 17 AN17-41-R9LN | |
| Acer Nitro 17 AN17-51-71ER | |
| PCMark 10 / Digital Content Creation | |
| Media de la clase Gaming (7602 - 19657, n=96, últimos 2 años) | |
| Acer Nitro 17 AN17-51-71ER | |
| MSI Pulse 17 B13VGK | |
| Acer Nitro 17 AN17-41-R9LN | |
| Medio AMD Ryzen 7 7735HS, NVIDIA GeForce RTX 4070 Laptop GPU (10558 - 10834, n=2) | |
| Schenker XMG Focus 17 (E23) | |
| Asus ROG Strix G17 G713PI | |
| CrossMark / Overall | |
| Asus ROG Strix G17 G713PI | |
| Schenker XMG Focus 17 (E23) | |
| Media de la clase Gaming (1366 - 2409, n=96, últimos 2 años) | |
| MSI Pulse 17 B13VGK | |
| Acer Nitro 17 AN17-51-71ER | |
| Medio AMD Ryzen 7 7735HS, NVIDIA GeForce RTX 4070 Laptop GPU (n=1) | |
| CrossMark / Productivity | |
| Asus ROG Strix G17 G713PI | |
| Schenker XMG Focus 17 (E23) | |
| Media de la clase Gaming (1386 - 2254, n=96, últimos 2 años) | |
| MSI Pulse 17 B13VGK | |
| Acer Nitro 17 AN17-51-71ER | |
| Medio AMD Ryzen 7 7735HS, NVIDIA GeForce RTX 4070 Laptop GPU (n=1) | |
| CrossMark / Creativity | |
| Asus ROG Strix G17 G713PI | |
| Schenker XMG Focus 17 (E23) | |
| Media de la clase Gaming (1343 - 2729, n=96, últimos 2 años) | |
| MSI Pulse 17 B13VGK | |
| Acer Nitro 17 AN17-51-71ER | |
| Medio AMD Ryzen 7 7735HS, NVIDIA GeForce RTX 4070 Laptop GPU (n=1) | |
| CrossMark / Responsiveness | |
| MSI Pulse 17 B13VGK | |
| Schenker XMG Focus 17 (E23) | |
| Media de la clase Gaming (1226 - 2334, n=96, últimos 2 años) | |
| Asus ROG Strix G17 G713PI | |
| Acer Nitro 17 AN17-51-71ER | |
| Medio AMD Ryzen 7 7735HS, NVIDIA GeForce RTX 4070 Laptop GPU (n=1) | |
| PCMark 10 Score | 7240 puntos | |
ayuda | ||
| AIDA64 / Memory Copy | |
| Schenker XMG Focus 17 (E23) | |
| Media de la clase Gaming (21750 - 129946, n=107, últimos 2 años) | |
| MSI Pulse 17 B13VGK | |
| Acer Nitro 17 AN17-51-71ER | |
| Asus ROG Strix G17 G713PI | |
| Acer Nitro 17 AN17-41-R9LN | |
| Medio AMD Ryzen 7 7735HS (30324 - 52012, n=16) | |
| AIDA64 / Memory Read | |
| Schenker XMG Focus 17 (E23) | |
| Media de la clase Gaming (22956 - 118858, n=107, últimos 2 años) | |
| MSI Pulse 17 B13VGK | |
| Acer Nitro 17 AN17-51-71ER | |
| Asus ROG Strix G17 G713PI | |
| Acer Nitro 17 AN17-41-R9LN | |
| Medio AMD Ryzen 7 7735HS (33938 - 51856, n=16) | |
| AIDA64 / Memory Write | |
| Media de la clase Gaming (22297 - 135096, n=107, últimos 2 años) | |
| Schenker XMG Focus 17 (E23) | |
| Acer Nitro 17 AN17-51-71ER | |
| MSI Pulse 17 B13VGK | |
| Asus ROG Strix G17 G713PI | |
| Acer Nitro 17 AN17-41-R9LN | |
| Medio AMD Ryzen 7 7735HS (33175 - 55284, n=16) | |
| AIDA64 / Memory Latency | |
| Acer Nitro 17 AN17-51-71ER | |
| Media de la clase Gaming (75.3 - 259, n=107, últimos 2 años) | |
| MSI Pulse 17 B13VGK | |
| Medio AMD Ryzen 7 7735HS (78.2 - 109.8, n=16) | |
| Schenker XMG Focus 17 (E23) | |
| Acer Nitro 17 AN17-41-R9LN | |
| Asus ROG Strix G17 G713PI | |
* ... más pequeño es mejor
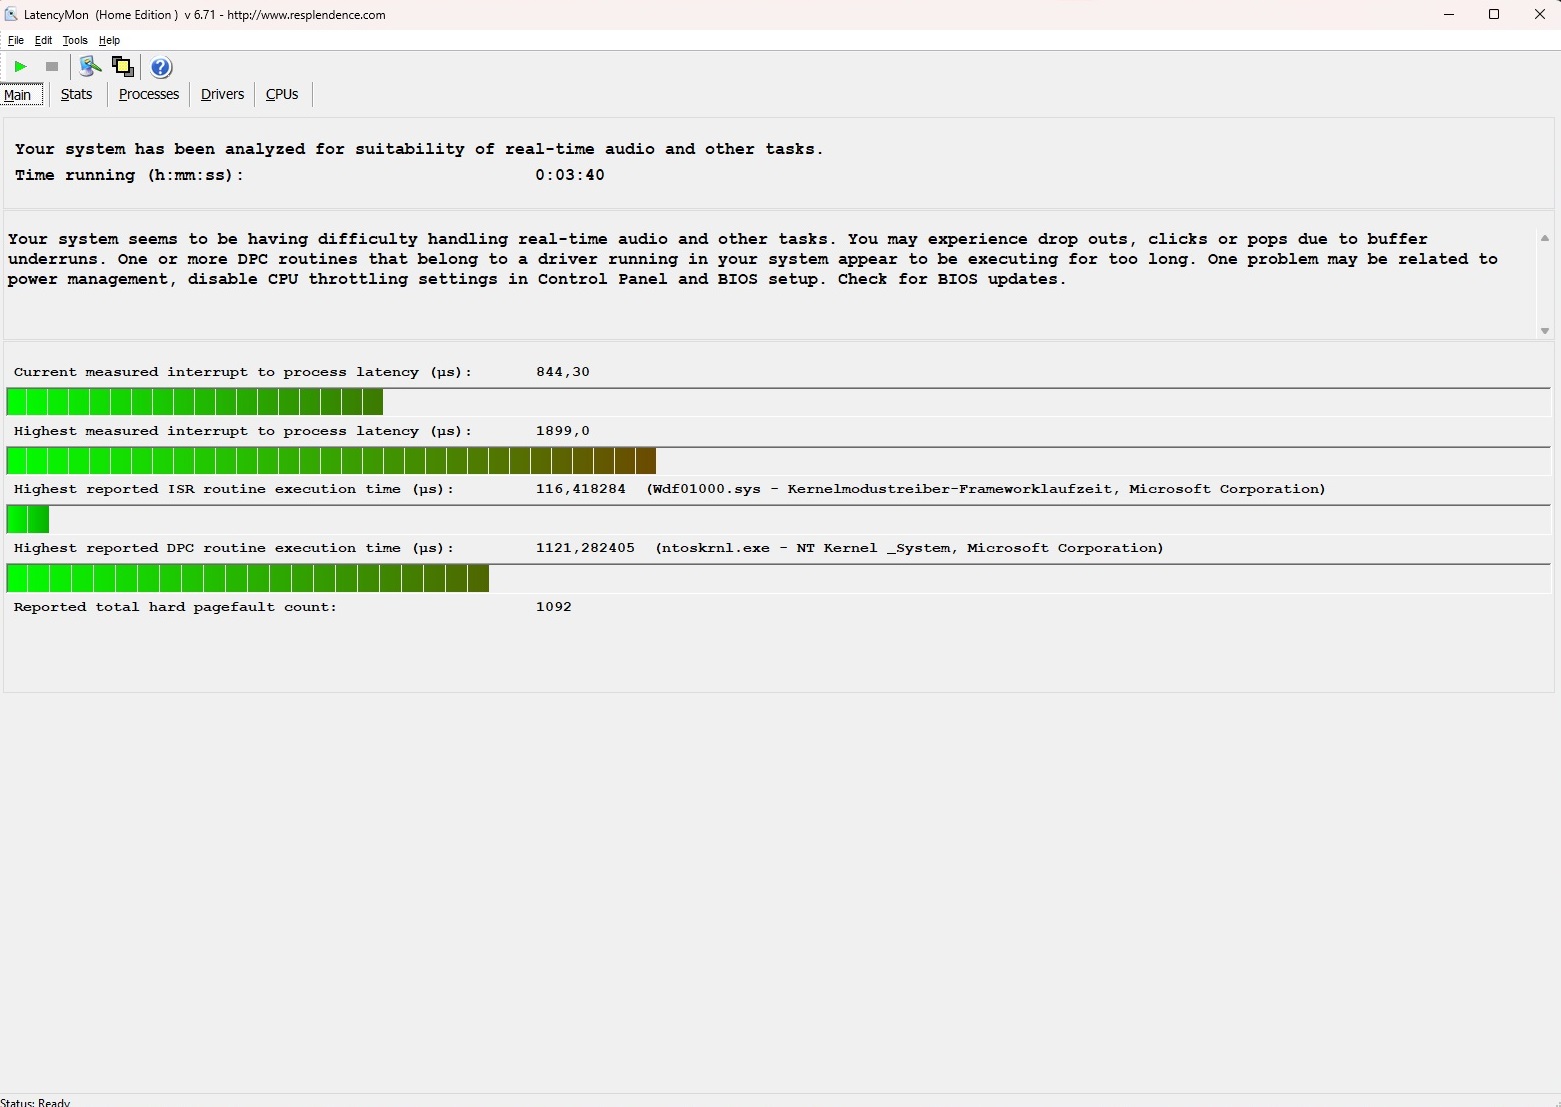
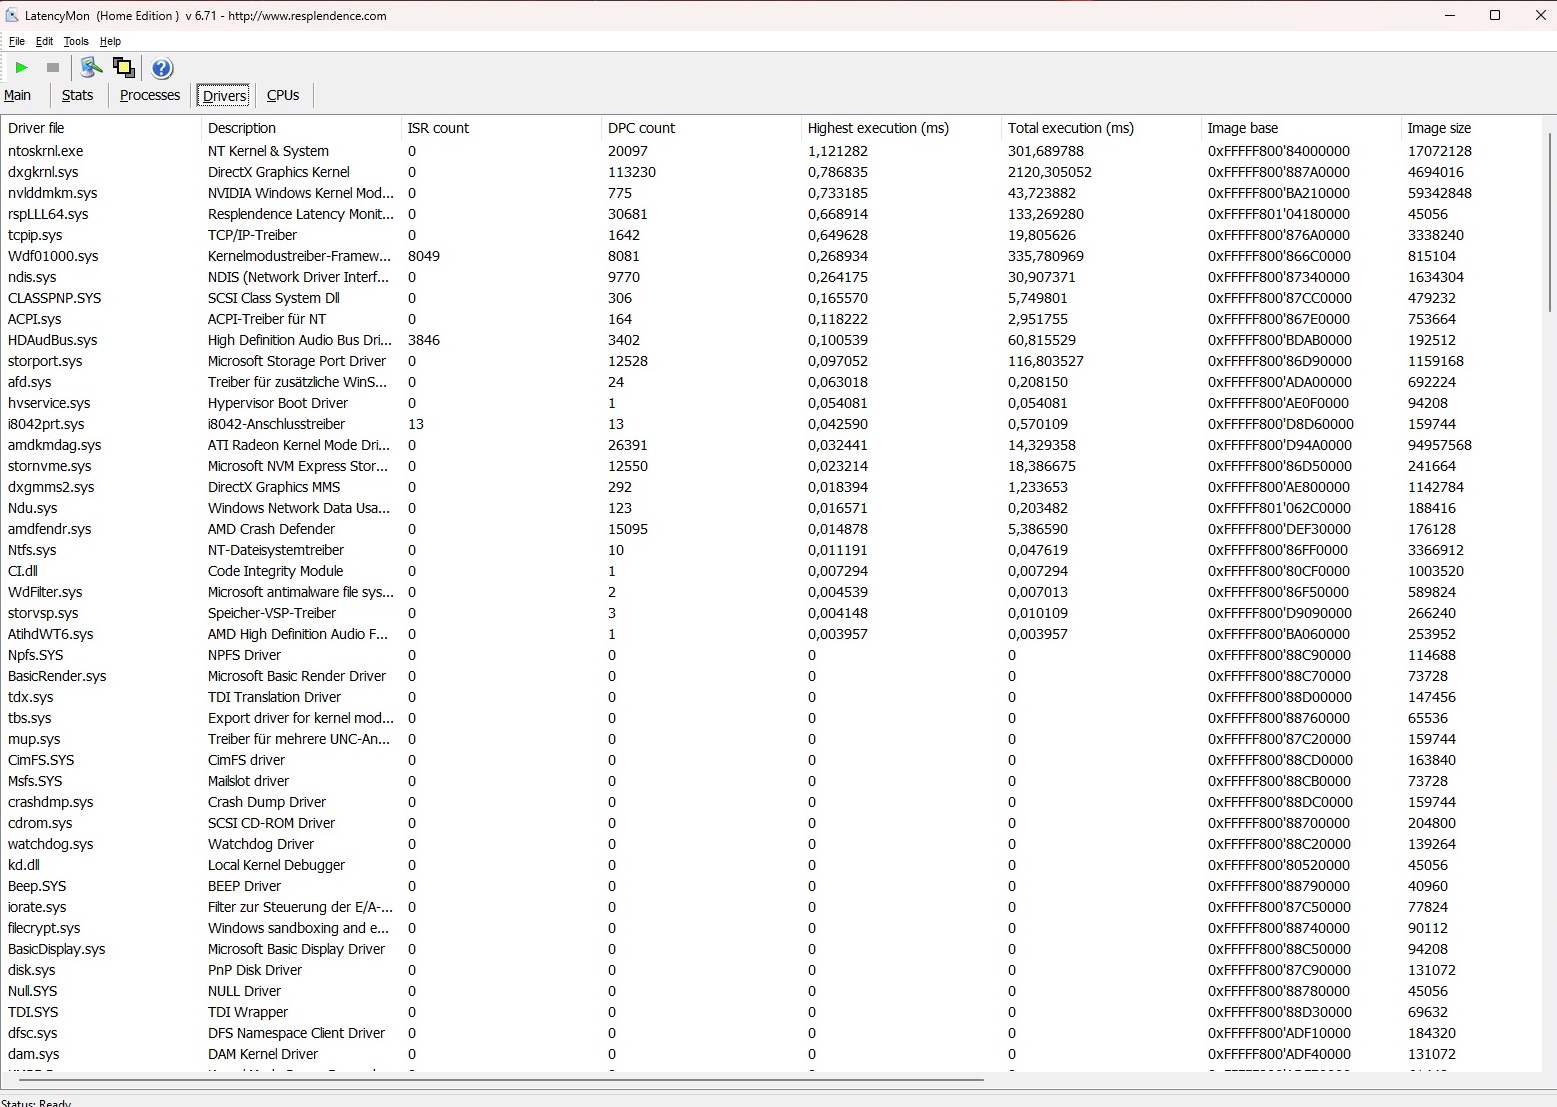
Latencia del CPD
El Nitro 17 tiene que aceptar críticas por sus altas latencias. Según la herramienta LatencyMon, el portátil es sólo condicionalmente adecuado para la edición de vídeo y audio en tiempo real en su estado de entrega.
| DPC Latencies / LatencyMon - interrupt to process latency (max), Web, Youtube, Prime95 | |
| Acer Nitro 17 AN17-41-R9LN | |
| Asus ROG Strix G17 G713PI | |
| Acer Nitro 17 AN17-51-71ER | |
| MSI Pulse 17 B13VGK | |
| Schenker XMG Focus 17 (E23) | |
* ... más pequeño es mejor
Dispositivos de almacenamiento
El portátil está equipado con una unidad NVMe de Samsung. El modelo PM9A1 dio muy buenos resultados en la prueba AS SSD, así como en sus tasas de lectura y escritura. Por desgracia, su rendimiento bajó considerablemente tras un rato y luego siguió siendo muy inestable (ver DiskSpd-Loop).

* ... más pequeño es mejor
Reading continuous performance: DiskSpd Read Loop, Queue Depth 8
Tarjeta gráfica
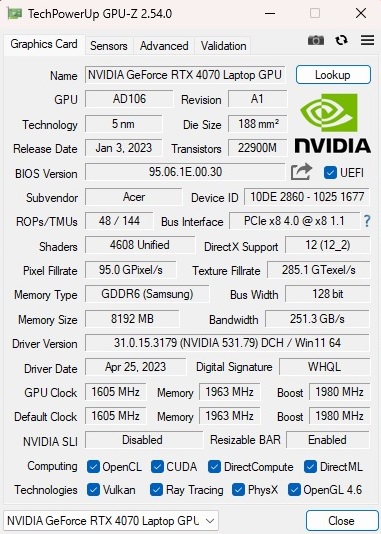
La GeForce RTX 4070 de la generación Ada Lovelace de Nvidia se encarga de los cálculos gráficos complejos. Debido a su limitada RAM (8 GB GDDR6) y su interfaz relativamente estrecha (128 bits), clasificaríamos este portátil de juego como un dispositivo de gama media-alta y no de gama alta. La RTX 4070 tiene un TGP de 140 vatios, que es el máximo para este chip gráfico.
Sus resultados en las pruebas comparativas fueron relativamente poco espectaculares, ya que el rendimiento de la GPU del Nitro 17 es más o menos el mismo que la media de la RTX 4070. Su victoria en rendimiento sobre el modelo RTX 4060 es limitada, como puede verse en nuestra tabla.
| 3DMark Performance rating - Percent | |
| Media de la clase Gaming | |
| Schenker XMG Focus 17 (E23) -1! | |
| Asus ROG Strix G17 G713PI -1! | |
| MSI Pulse 17 B13VGK | |
| Medio NVIDIA GeForce RTX 4070 Laptop GPU | |
| Acer Nitro 17 AN17-41-R9LN | |
| Acer Nitro 17 AN17-51-71ER -1! | |
| 3DMark 11 Performance | 30265 puntos | |
| 3DMark Ice Storm Standard Score | 215395 puntos | |
| 3DMark Cloud Gate Standard Score | 59285 puntos | |
| 3DMark Fire Strike Score | 25639 puntos | |
| 3DMark Time Spy Score | 10950 puntos | |
ayuda | ||
* ... más pequeño es mejor
Rendimiento de juego
La situación es similar cuando se trata de juegos. Aquí también su rendimiento fue similar a la media determinada anteriormente, y la RTX 4070 apenas lo hizo mejor que la RTX 4060 en algunos casos.
| The Witcher 3 - 1920x1080 Ultra Graphics & Postprocessing (HBAO+) | |
| Media de la clase Gaming (95 - 240, n=8, últimos 2 años) | |
| Asus ROG Strix G17 G713PI | |
| Schenker XMG Focus 17 (E23) | |
| Medio NVIDIA GeForce RTX 4070 Laptop GPU (69.8 - 133.7, n=57) | |
| Acer Nitro 17 AN17-41-R9LN | |
| MSI Pulse 17 B13VGK | |
| Acer Nitro 17 AN17-51-71ER | |
Si te limitas a la resolución Full HD, es decir, 1.920 x 1.080 píxeles, incluso juegos exigentes como Immortals of Aveum pueden ejecutarse con el máximo nivel de detalle y alcanzar al menos 40 FPS. La mayoría de los juegos funcionan a más de 60 FPS en FHD. La RTX 4070 también es lo bastante potente para la resolución QHD nativa con algunas excepciones, y la frecuencia de refresco de 165 Hz de la pantalla rara vez se utiliza.
| Armored Core 6 - 2560x1440 Maximum Preset | |
| XMG Pro 15 E23 | |
| Medio NVIDIA GeForce RTX 4070 Laptop GPU (76.2 - 85, n=2) | |
| Acer Nitro 17 AN17-41-R9LN | |
| Media de la clase Gaming (n=1últimos 2 años) | |
| Immortals of Aveum - 2560x1440 Ultra AF:16x | |
| XMG Pro 15 E23 | |
| Medio NVIDIA GeForce RTX 4070 Laptop GPU (32 - 35, n=2) | |
| Acer Nitro 17 AN17-41-R9LN | |
| Atlas Fallen - 2560x1440 Very High Preset | |
| XMG Pro 15 E23 | |
| Medio NVIDIA GeForce RTX 4070 Laptop GPU (80.6 - 89.5, n=2) | |
| Acer Nitro 17 AN17-41-R9LN | |
| Baldur's Gate 3 - 2560x1440 Ultra Preset AA:T | |
| Media de la clase Gaming (56.5 - 175.5, n=84, últimos 2 años) | |
| Medio NVIDIA GeForce RTX 4070 Laptop GPU (54.4 - 89.6, n=25) | |
| XMG Pro 15 E23 | |
| Acer Nitro 17 AN17-41-R9LN | |
| Ratchet & Clank Rift Apart - 2560x1440 Very High Preset AA:T | |
| XMG Pro 15 E23 | |
| Medio NVIDIA GeForce RTX 4070 Laptop GPU (48.7 - 49.1, n=3) | |
| Acer Nitro 17 AN17-41-R9LN | |
| Sons of the Forest - 2560x1440 Ultra Preset AA:T | |
| Medio NVIDIA GeForce RTX 4070 Laptop GPU (61 - 69.5, n=2) | |
| Acer Nitro 17 AN17-41-R9LN | |
| Atomic Heart - 2560x1440 Atomic Preset | |
| Medio NVIDIA GeForce RTX 4070 Laptop GPU (51.6 - 58.9, n=3) | |
| Acer Nitro 17 AN17-41-R9LN | |
Hemos probado cómo se comportaba el rendimiento 3D durante un periodo de unos 60 minutos con ayuda de The Witcher 3 (FHD/Ultra). En la siguiente tabla puedes ver que no hubo caídas de la tasa de fotogramas.
Witcher 3 FPS diagram
| bajo | medio | alto | ultra | QHD | |
|---|---|---|---|---|---|
| GTA V (2015) | 168.5 | 152.8 | 94.4 | ||
| The Witcher 3 (2015) | 110 | ||||
| Dota 2 Reborn (2015) | 135.8 | 122.8 | 114.5 | 108.3 | |
| Final Fantasy XV Benchmark (2018) | 144.4 | 106.3 | |||
| X-Plane 11.11 (2018) | 106.3 | 98 | 78.4 | ||
| Strange Brigade (2018) | 278 | 225 | 195 | ||
| Atomic Heart (2023) | 132.5 | 95 | 74.2 | 51.6 | |
| Sons of the Forest (2023) | 73.3 | 71.9 | 71.1 | 61 | |
| Ratchet & Clank Rift Apart (2023) | 72.3 | 60.2 | 56.3 | 48.7 | |
| Atlas Fallen (2023) | 124.7 | 119.9 | 105.3 | 80.6 | |
| Immortals of Aveum (2023) | 57.1 | 46.9 | 32 | ||
| Armored Core 6 (2023) | 92.1 | 91.1 | 87.2 | 76.2 | |
| Baldur's Gate 3 (2023) | 113.9 | 95.3 | 94.4 | 62.5 |
Emisiones
Emisiones sonoras
Mientras que los niveles de emisión de ruido eran bastante incómodos en los modos Rendimiento (54 dB) y Turbo (61 dB), los ventiladores seguían siendo audibles en el modo Equilibrado (44 dB), pero no de forma incómoda. Esto significa que recomendaríamos usar esta configuración. En modo inactivo, el portátil de 17 pulgadas se comporta bastante silencioso. Los ventiladores están completamente apagados o sólo se oye un sutil silbido. Los ventiladores raramente giran demasiado rápido.
Ruido
| Ocioso |
| 25 / 27 / 29 dB(A) |
| Carga |
| 42 / 45 dB(A) |
 | ||
30 dB silencioso 40 dB(A) audible 50 dB(A) ruidosamente alto |
||
min: | ||
| Acer Nitro 17 AN17-41-R9LN R7 7735HS, GeForce RTX 4070 Laptop GPU | Acer Nitro 17 AN17-51-71ER i7-13700H, GeForce RTX 4060 Laptop GPU | MSI Pulse 17 B13VGK i7-13700H, GeForce RTX 4070 Laptop GPU | Schenker XMG Focus 17 (E23) i9-13900HX, GeForce RTX 4070 Laptop GPU | Asus ROG Strix G17 G713PI R9 7945HX, GeForce RTX 4070 Laptop GPU | |
|---|---|---|---|---|---|
| Noise | -4% | 7% | -10% | -5% | |
| apagado / medio ambiente * (dB) | 24 | 24 -0% | 24 -0% | 24 -0% | 25 -4% |
| Idle Minimum * (dB) | 25 | 24 4% | 24 4% | 24 4% | 26 -4% |
| Idle Average * (dB) | 27 | 24 11% | 24 11% | 24 11% | 29 -7% |
| Idle Maximum * (dB) | 29 | 32.32 -11% | 24 17% | 26.47 9% | 30 -3% |
| Load Average * (dB) | 42 | 35.18 16% | 32.49 23% | 55.72 -33% | 46 -10% |
| Witcher 3 ultra * (dB) | 44 | 54.78 -25% | 46.51 -6% | 57.94 -32% | 46 -5% |
| Load Maximum * (dB) | 45 | 54.78 -22% | 46.51 -3% | 57.94 -29% | 47 -4% |
* ... más pequeño es mejor
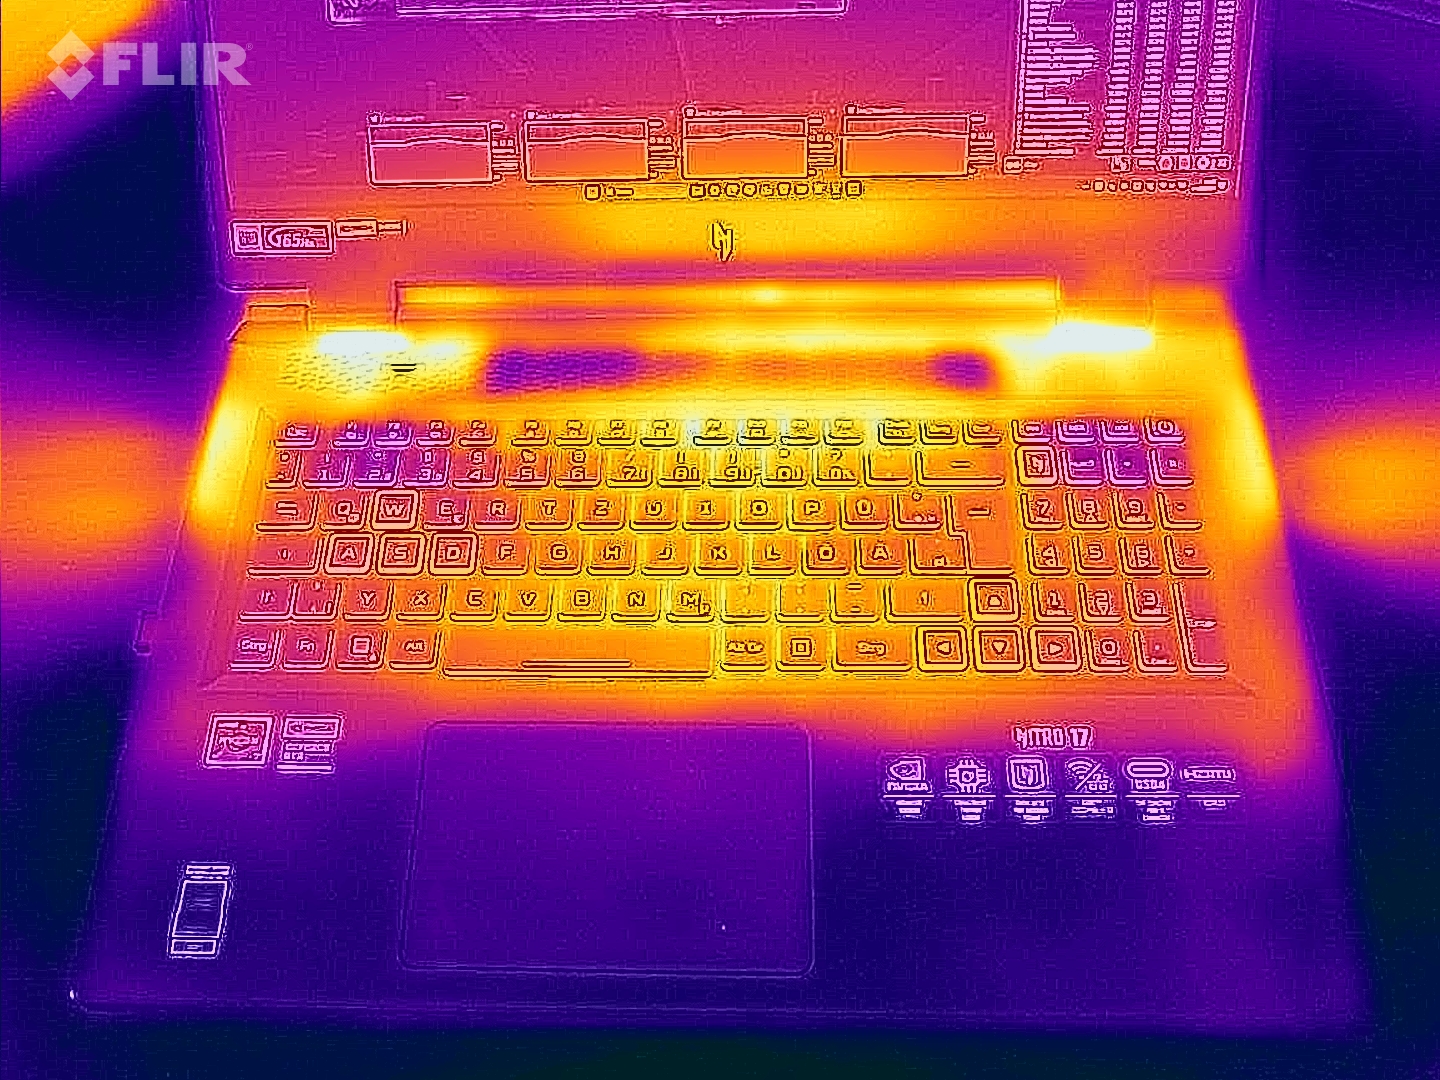
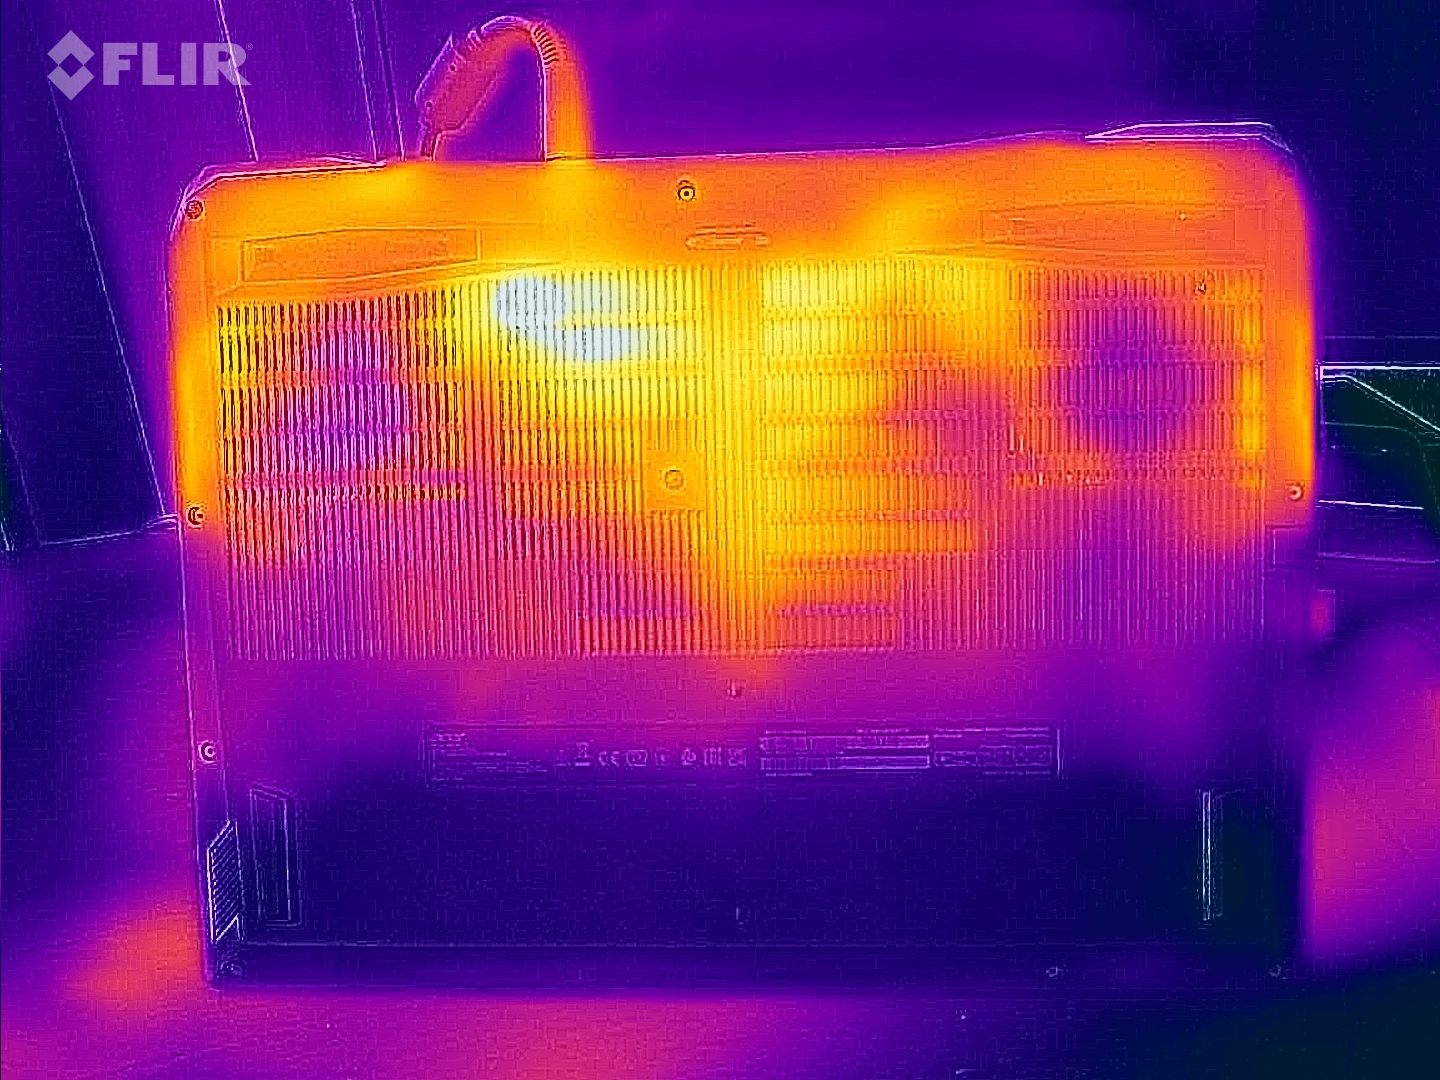
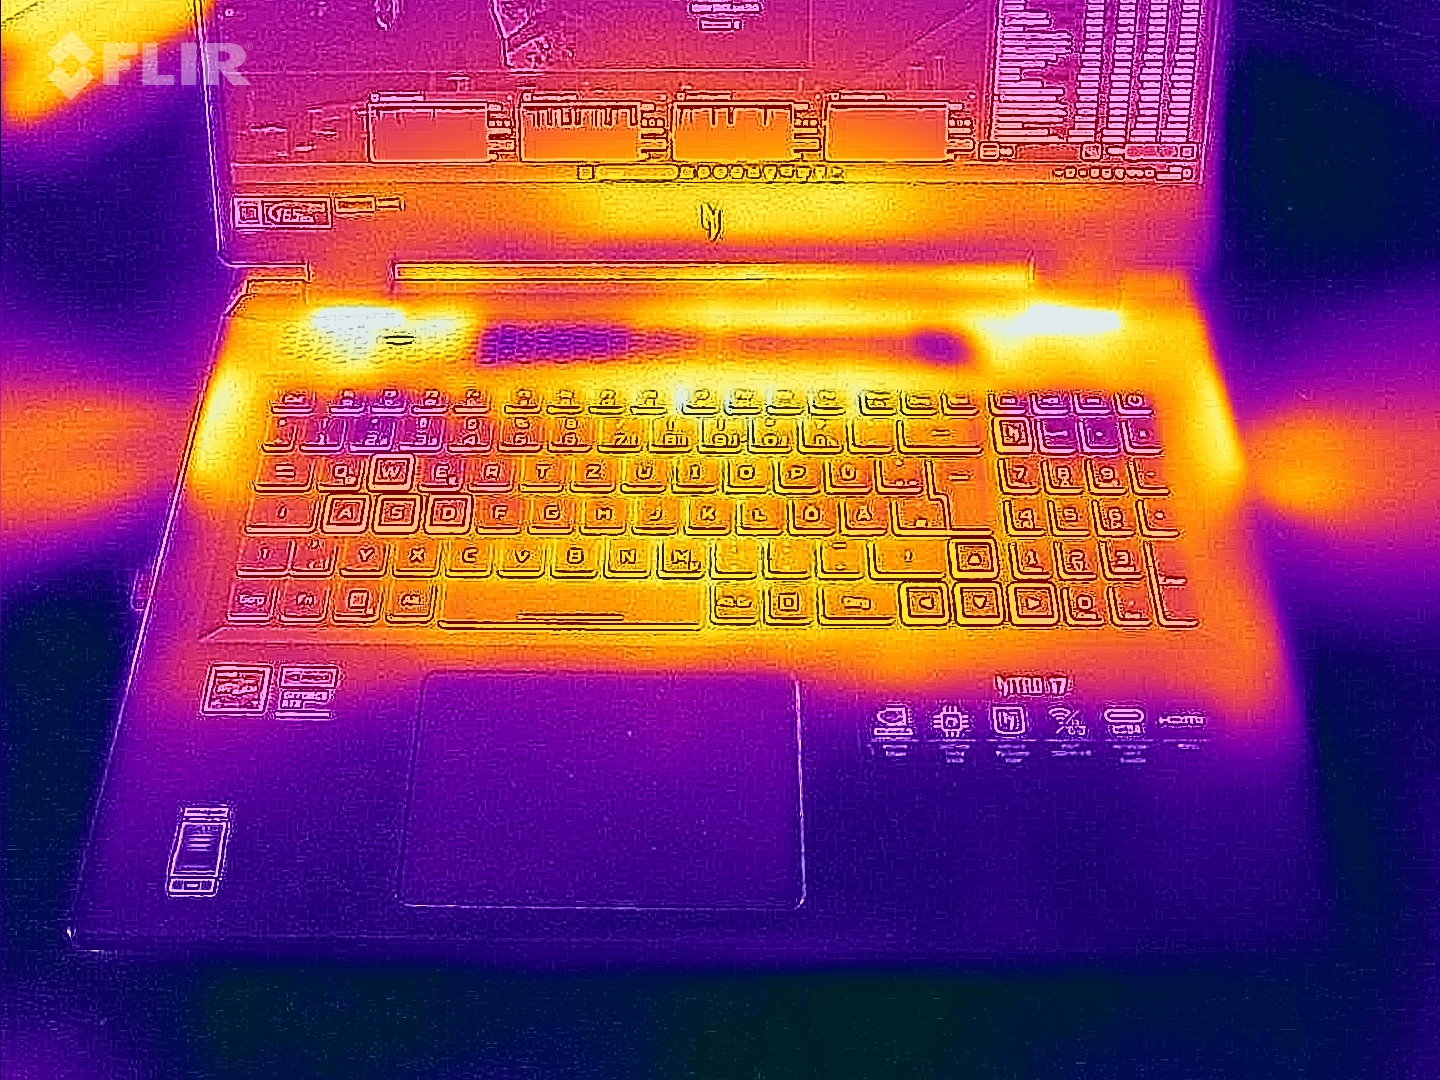
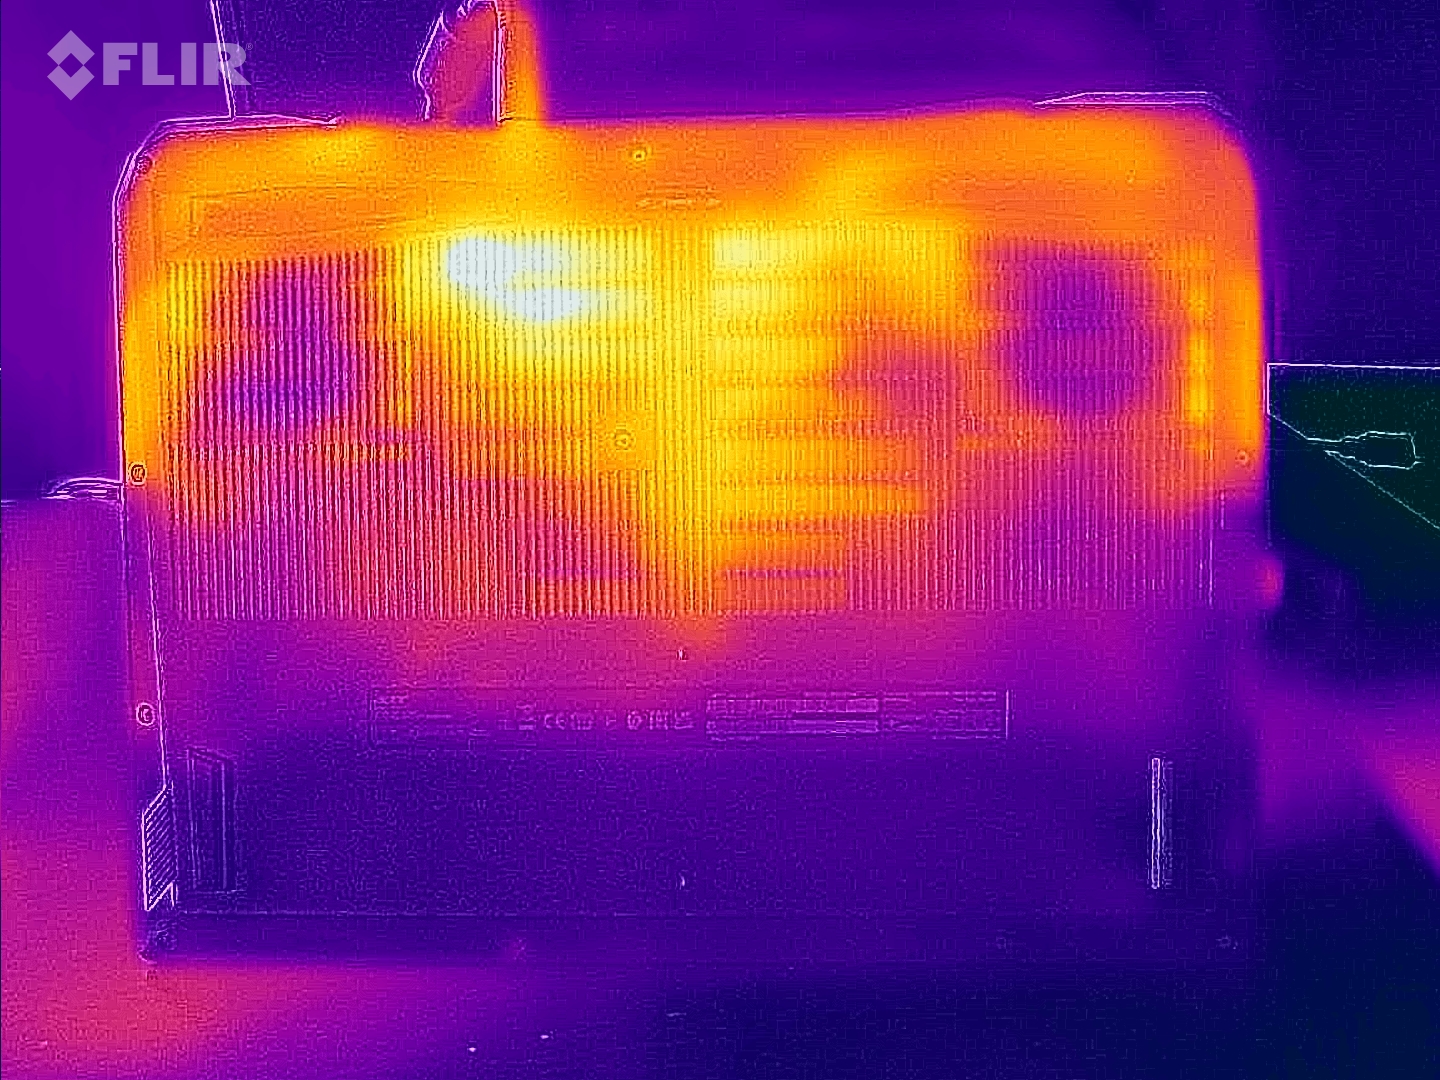
Temperatura
Las temperaturas del portátil son similares a las de sus competidores. Durante la Witcher 3 prueba de juegos, notamos un máximo de 46 °C en la parte superior de la carcasa y un máximo de 55 °C en la parte inferior. En modo inactivo, toda la carcasa se mantiene bastante fresca. La mayoría de las veces medimos temperaturas por debajo de los 30 °C.
(-) La temperatura máxima en la parte superior es de 47 °C / 117 F, frente a la media de 40.4 °C / 105 F, que oscila entre 21.2 y 68.8 °C para la clase Gaming.
(-) El fondo se calienta hasta un máximo de 53 °C / 127 F, frente a la media de 43.2 °C / 110 F
(+) En reposo, la temperatura media de la parte superior es de 28.4 °C / 83# F, frente a la media del dispositivo de 33.9 °C / 93 F.
(-) Jugando a The Witcher 3, la temperatura media de la parte superior es de 38.1 °C / 101 F, frente a la media del dispositivo de 33.9 °C / 93 F.
(+) Los reposamanos y el panel táctil alcanzan como máximo la temperatura de la piel (34 °C / 93.2 F) y, por tanto, no están calientes.
(-) La temperatura media de la zona del reposamanos de dispositivos similares fue de 28.8 °C / 83.8 F (-5.2 °C / -9.4 F).
| Acer Nitro 17 AN17-41-R9LN AMD Ryzen 7 7735HS, NVIDIA GeForce RTX 4070 Laptop GPU | Acer Nitro 17 AN17-51-71ER Intel Core i7-13700H, NVIDIA GeForce RTX 4060 Laptop GPU | MSI Pulse 17 B13VGK Intel Core i7-13700H, NVIDIA GeForce RTX 4070 Laptop GPU | Schenker XMG Focus 17 (E23) Intel Core i9-13900HX, NVIDIA GeForce RTX 4070 Laptop GPU | Asus ROG Strix G17 G713PI AMD Ryzen 9 7945HX, NVIDIA GeForce RTX 4070 Laptop GPU | |
|---|---|---|---|---|---|
| Heat | -3% | -1% | -13% | 4% | |
| Maximum Upper Side * (°C) | 47 | 46 2% | 48 -2% | 50 -6% | 42 11% |
| Maximum Bottom * (°C) | 53 | 51 4% | 50 6% | 56 -6% | 41 23% |
| Idle Upper Side * (°C) | 30 | 34 -13% | 30 -0% | 37 -23% | 33 -10% |
| Idle Bottom * (°C) | 31 | 33 -6% | 33 -6% | 36 -16% | 34 -10% |
* ... más pequeño es mejor
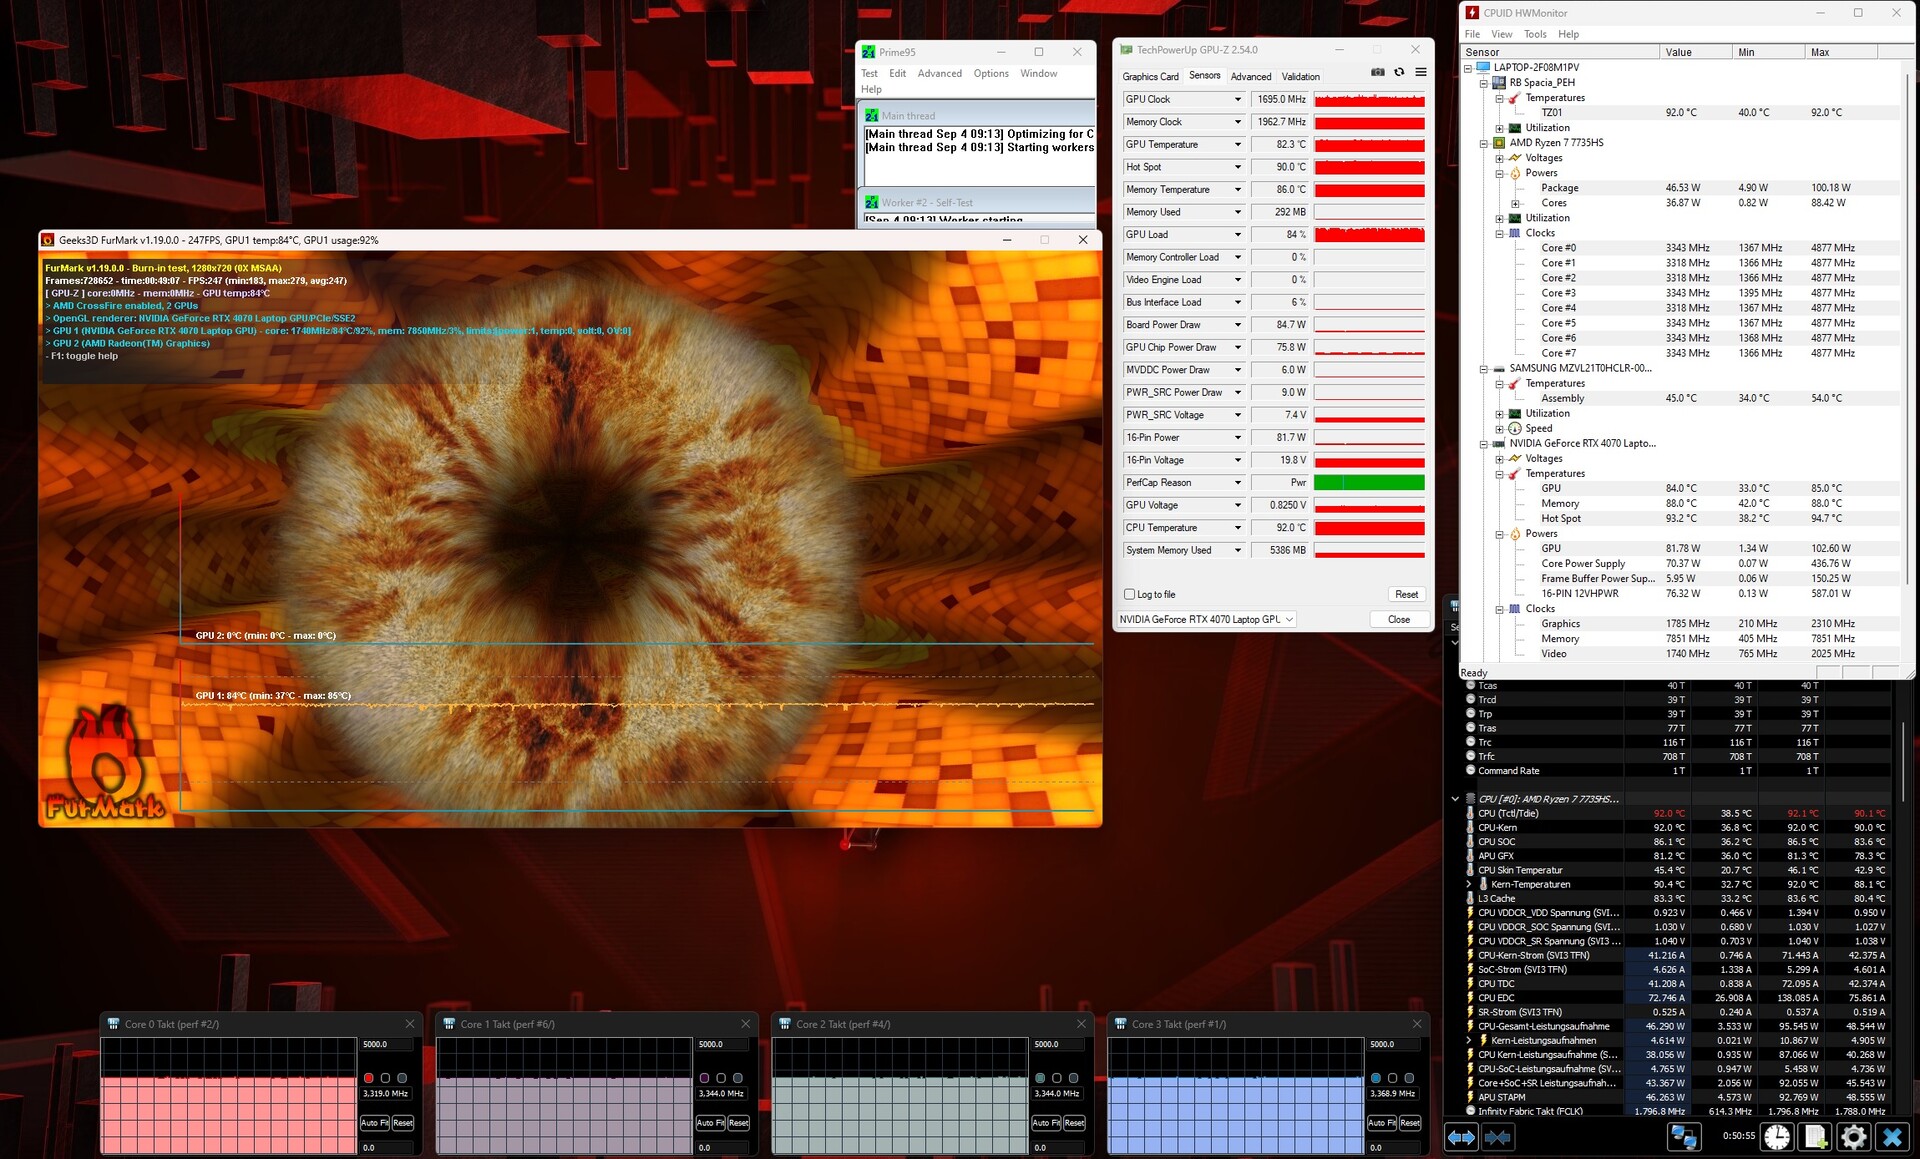
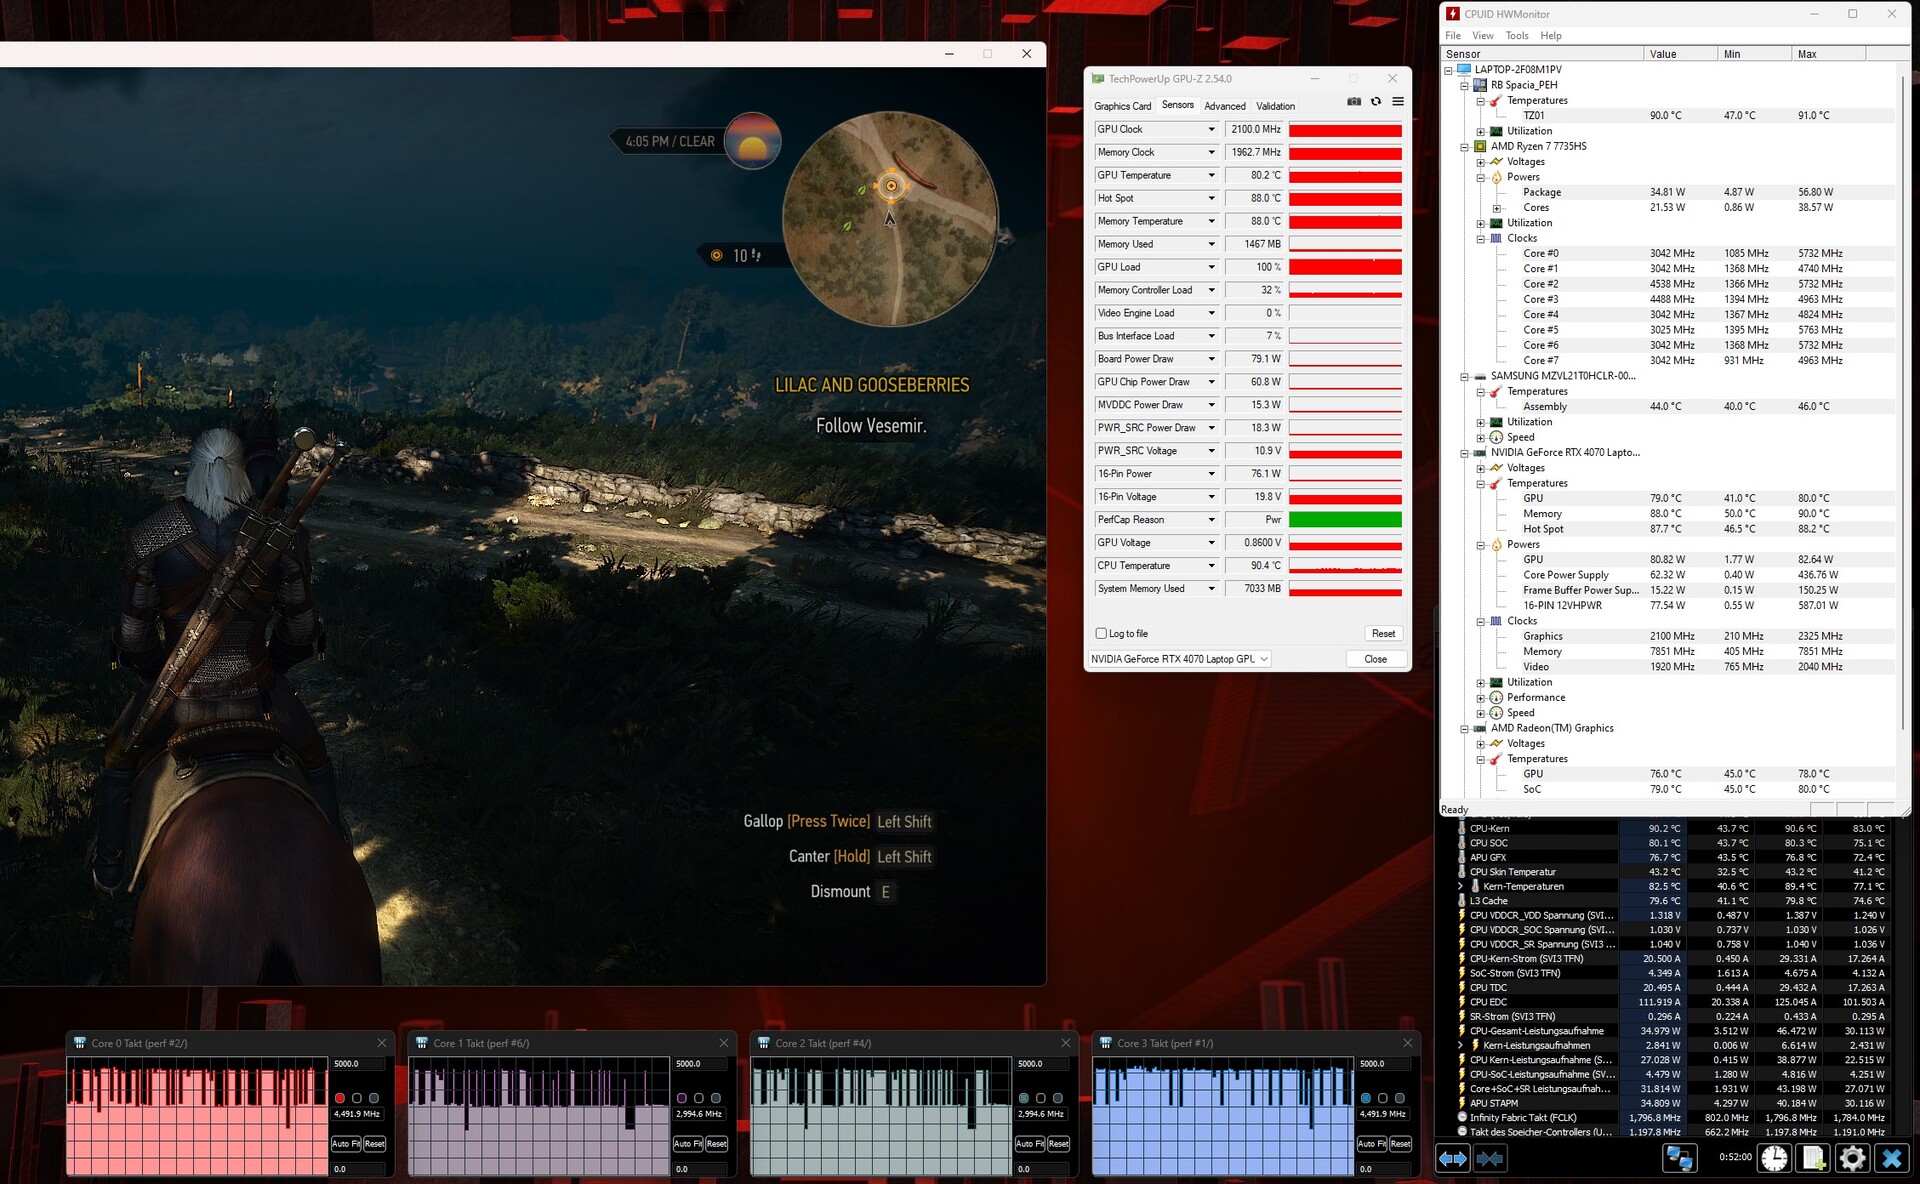
Prueba de esfuerzo
La prueba de estrés usando las herramientas Furmark & Prime95 acabó sin sorpresas desagradables. Mientras que el Ryzen 7 7735HS se estabilizó a unos 3.3 GHz (pero se calentó bastante a unos 90 °C), la RTX 4070 se encontró cómoda a 1700 MHz y poco más de 80 °C.
Altavoces
Acer Nitro 17 AN17-41-R9LN análisis de audio
(+) | los altavoces pueden reproducir a un volumen relativamente alto (#83 dB)
Graves 100 - 315 Hz
(-) | casi sin bajos - de media 28.6% inferior a la mediana
(±) | la linealidad de los graves es media (14.2% delta a frecuencia anterior)
Medios 400 - 2000 Hz
(+) | medios equilibrados - a sólo 1.4% de la mediana
(+) | los medios son lineales (4% delta a la frecuencia anterior)
Altos 2 - 16 kHz
(+) | máximos equilibrados - a sólo 4.3% de la mediana
(+) | los máximos son lineales (3.3% delta a la frecuencia anterior)
Total 100 - 16.000 Hz
(±) | la linealidad del sonido global es media (17.7% de diferencia con la mediana)
En comparación con la misma clase
» 52% de todos los dispositivos probados de esta clase eran mejores, 10% similares, 38% peores
» El mejor tuvo un delta de 6%, la media fue 18%, el peor fue ###max##%
En comparación con todos los dispositivos probados
» 35% de todos los dispositivos probados eran mejores, 8% similares, 57% peores
» El mejor tuvo un delta de 4%, la media fue 24%, el peor fue ###max##%
MSI Pulse 17 B13VGK análisis de audio
(+) | los altavoces pueden reproducir a un volumen relativamente alto (#85.01 dB)
Graves 100 - 315 Hz
(±) | lubina reducida - en promedio 13.2% inferior a la mediana
(±) | la linealidad de los graves es media (12.3% delta a frecuencia anterior)
Medios 400 - 2000 Hz
(±) | medias más altas - de media 9.4% más altas que la mediana
(+) | los medios son lineales (5.7% delta a la frecuencia anterior)
Altos 2 - 16 kHz
(+) | máximos equilibrados - a sólo 2.9% de la mediana
(+) | los máximos son lineales (6.7% delta a la frecuencia anterior)
Total 100 - 16.000 Hz
(±) | la linealidad del sonido global es media (15.8% de diferencia con la mediana)
En comparación con la misma clase
» 37% de todos los dispositivos probados de esta clase eran mejores, 7% similares, 56% peores
» El mejor tuvo un delta de 6%, la media fue 18%, el peor fue ###max##%
En comparación con todos los dispositivos probados
» 24% de todos los dispositivos probados eran mejores, 5% similares, 71% peores
» El mejor tuvo un delta de 4%, la media fue 24%, el peor fue ###max##%
Gestión de la energía
Consumo de energía
Las tasas de consumo de energía del portátil fueron como era de esperar. De 10 a 16 vatios de consumo en inactivo y de 79 a 220 vatios de consumo en carga también podrían provenir de un dispositivo con un i7-13700H. No podemos entender por qué Acer incluye una voluminosa fuente de alimentación de 330 vatios con el portátil. Un modelo más compacto de 230 vatios habría funcionado igual de bien.
| Off / Standby | |
| Ocioso | |
| Carga |
|
Clave:
min: | |
| Acer Nitro 17 AN17-41-R9LN R7 7735HS, GeForce RTX 4070 Laptop GPU | Acer Nitro 17 AN17-51-71ER i7-13700H, GeForce RTX 4060 Laptop GPU | MSI Pulse 17 B13VGK i7-13700H, GeForce RTX 4070 Laptop GPU | Schenker XMG Focus 17 (E23) i9-13900HX, GeForce RTX 4070 Laptop GPU | Asus ROG Strix G17 G713PI R9 7945HX, GeForce RTX 4070 Laptop GPU | Media de la clase Gaming | |
|---|---|---|---|---|---|---|
| Power Consumption | -3% | 12% | -71% | -50% | -42% | |
| Idle Minimum * (Watt) | 10 | 8.3 17% | 9 10% | 17 -70% | 15 -50% | 13.2 ? -32% |
| Idle Average * (Watt) | 11 | 13.5 -23% | 10.2 7% | 18 -64% | 20 -82% | 18.9 ? -72% |
| Idle Maximum * (Watt) | 16 | 14.8 7% | 10.8 32% | 25.8 -61% | 29 -81% | 24.3 ? -52% |
| Load Average * (Watt) | 79 | 77 3% | 72 9% | 178 -125% | 121 -53% | 108.3 ? -37% |
| Witcher 3 ultra * (Watt) | 147.5 | 154 -4% | 130 12% | 265 -80% | 179.8 -22% | |
| Load Maximum * (Watt) | 220 | 263 -20% | 221 -0% | 275 -25% | 246 -12% | 254 ? -15% |
* ... más pequeño es mejor
Power consumption Witcher 3 / stress test
Power consumption with external monitor
Tiempos de ejecución
Una batería de 90 Wh de capacidad compite con sus rivales de MSI (Pulse 17) y Asus (Strix G17). Gracias a su potente batería y a la conmutación gráfica integrada, cabe esperar buenos tiempos de ejecución de este portátil. Curiosamente, las tasas son significativamente inferiores a las de su homólogo Intel. En nuestro test WLAN real con el brillo de pantalla reducido a 150 cd/m², la edición AMD sólo duró algo menos de 5 horas en vez de 8 (sospechamos de mecanismos de ahorro de energía defectuosos o subóptimos en modo batería).
| Acer Nitro 17 AN17-41-R9LN R7 7735HS, GeForce RTX 4070 Laptop GPU, 90 Wh | Acer Nitro 17 AN17-51-71ER i7-13700H, GeForce RTX 4060 Laptop GPU, 90 Wh | MSI Pulse 17 B13VGK i7-13700H, GeForce RTX 4070 Laptop GPU, 90 Wh | Schenker XMG Focus 17 (E23) i9-13900HX, GeForce RTX 4070 Laptop GPU, 73 Wh | Asus ROG Strix G17 G713PI R9 7945HX, GeForce RTX 4070 Laptop GPU, 90 Wh | Media de la clase Gaming | |
|---|---|---|---|---|---|---|
| Duración de Batería | 58% | 73% | -25% | -17% | 35% | |
| WiFi v1.3 (h) | 5.2 | 8.2 58% | 9 73% | 3.9 -25% | 4.3 -17% | 7.04 ? 35% |
| H.264 (h) | 6.9 | 3.1 | 2.8 | 8.26 ? | ||
| Witcher 3 ultra (h) | 2.5 | 1 | 1.1 | |||
| Load (h) | 2.2 | 1 | 1.47 ? |
Pro
Contra
Veredicto
En general, el Nitro 17 AN17-41-R9LN de Acer es un impresionante portátil de 17 pulgadas para juegos. Su combinación de CPU AMD (Ryzen 7 7735HS) y una GPU Nvidia (GeForce RTX 4070) crea una armonía bastante agradable que es suficiente para ejecutar la mayoría de los juegos en su resolución nativa de 2.560 x 1.440 con la configuración máxima. Aunque no es el más preparado para el futuro debido a sus escasos 8 GB de VRAM.
Por lo demás, el fabricante ha conseguido un buen portátil para juegos. Sus opciones de conectividad y dispositivos de entrada deberían ser suficientes para la mayoría de compradores. Un display QHD colorido y relativamente rápido completa la configuración.
Las emisiones de ruido del portátil dependen, como siempre, del modo que se use. En nuestra prueba, la configuración "equilibrada" mostró el mejor compromiso entre rendimiento y ruido.
Acer podría mejorar un poco la carcasa y la calidad de sonido del Nitro 17. A su sistema integrado 2.0 le faltan muchos graves. Las latencias del portátil y la duración de la batería (considerablemente más corta que en la versión Intel) también resultan ser problemas que el fabricante podría resolver.
A pesar de su rendimiento CPU más débil y apenas mejor rendimiento 3D comparado con el modelo RTX 4060 basado en Intel, seguiríamos recomendando ir a por el modelo AMD, ya que se sabe que la mayoría de juegos están limitados por la GPU.
Una alternativa igual o ligeramente mejor podría ser el Asus ROG Strix G17 G713PI que también cuenta con una RTX 4070 - pero también tiene instalado un Ryzen 9 7945HX que es una CPU más moderna y considerablemente más rápida. A su vez, también cuesta más.
Precio y disponibilidad
El Acer Nitro 17 AN17-41-R9LN con un Ryzen 7 7735HS, GeForce RTX 4070 y una pantalla QHD se puede encontrar en Amazon por unos 1.900 dólares.
Acer Nitro 17 AN17-41-R9LN
- 09/07/2023 v7 (old)
Florian Glaser
Transparencia
La selección de los dispositivos que se van a reseñar corre a cargo de nuestro equipo editorial. La muestra de prueba fue proporcionada al autor en calidad de préstamo por el fabricante o el minorista a los efectos de esta reseña. El prestamista no tuvo ninguna influencia en esta reseña, ni el fabricante recibió una copia de la misma antes de su publicación. No había ninguna obligación de publicar esta reseña. Como empresa de medios independiente, Notebookcheck no está sujeta a la autoridad de fabricantes, minoristas o editores.
Así es como prueba Notebookcheck
Cada año, Notebookcheck revisa de forma independiente cientos de portátiles y smartphones utilizando procedimientos estandarizados para asegurar que todos los resultados son comparables. Hemos desarrollado continuamente nuestros métodos de prueba durante unos 20 años y hemos establecido los estándares de la industria en el proceso. En nuestros laboratorios de pruebas, técnicos y editores experimentados utilizan equipos de medición de alta calidad. Estas pruebas implican un proceso de validación en varias fases. Nuestro complejo sistema de clasificación se basa en cientos de mediciones y puntos de referencia bien fundamentados, lo que mantiene la objetividad.Price comparison

