Análisis del Schenker XMG Focus 17 (E23): El portátil gaming con RTX 4070 no escatima en rendimiento
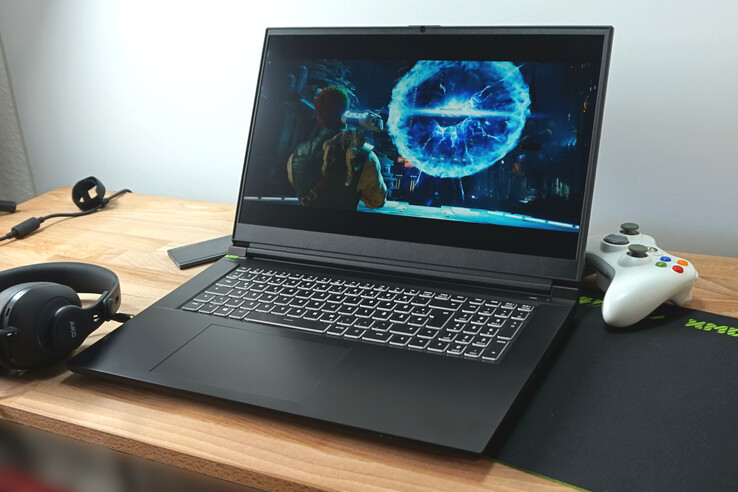
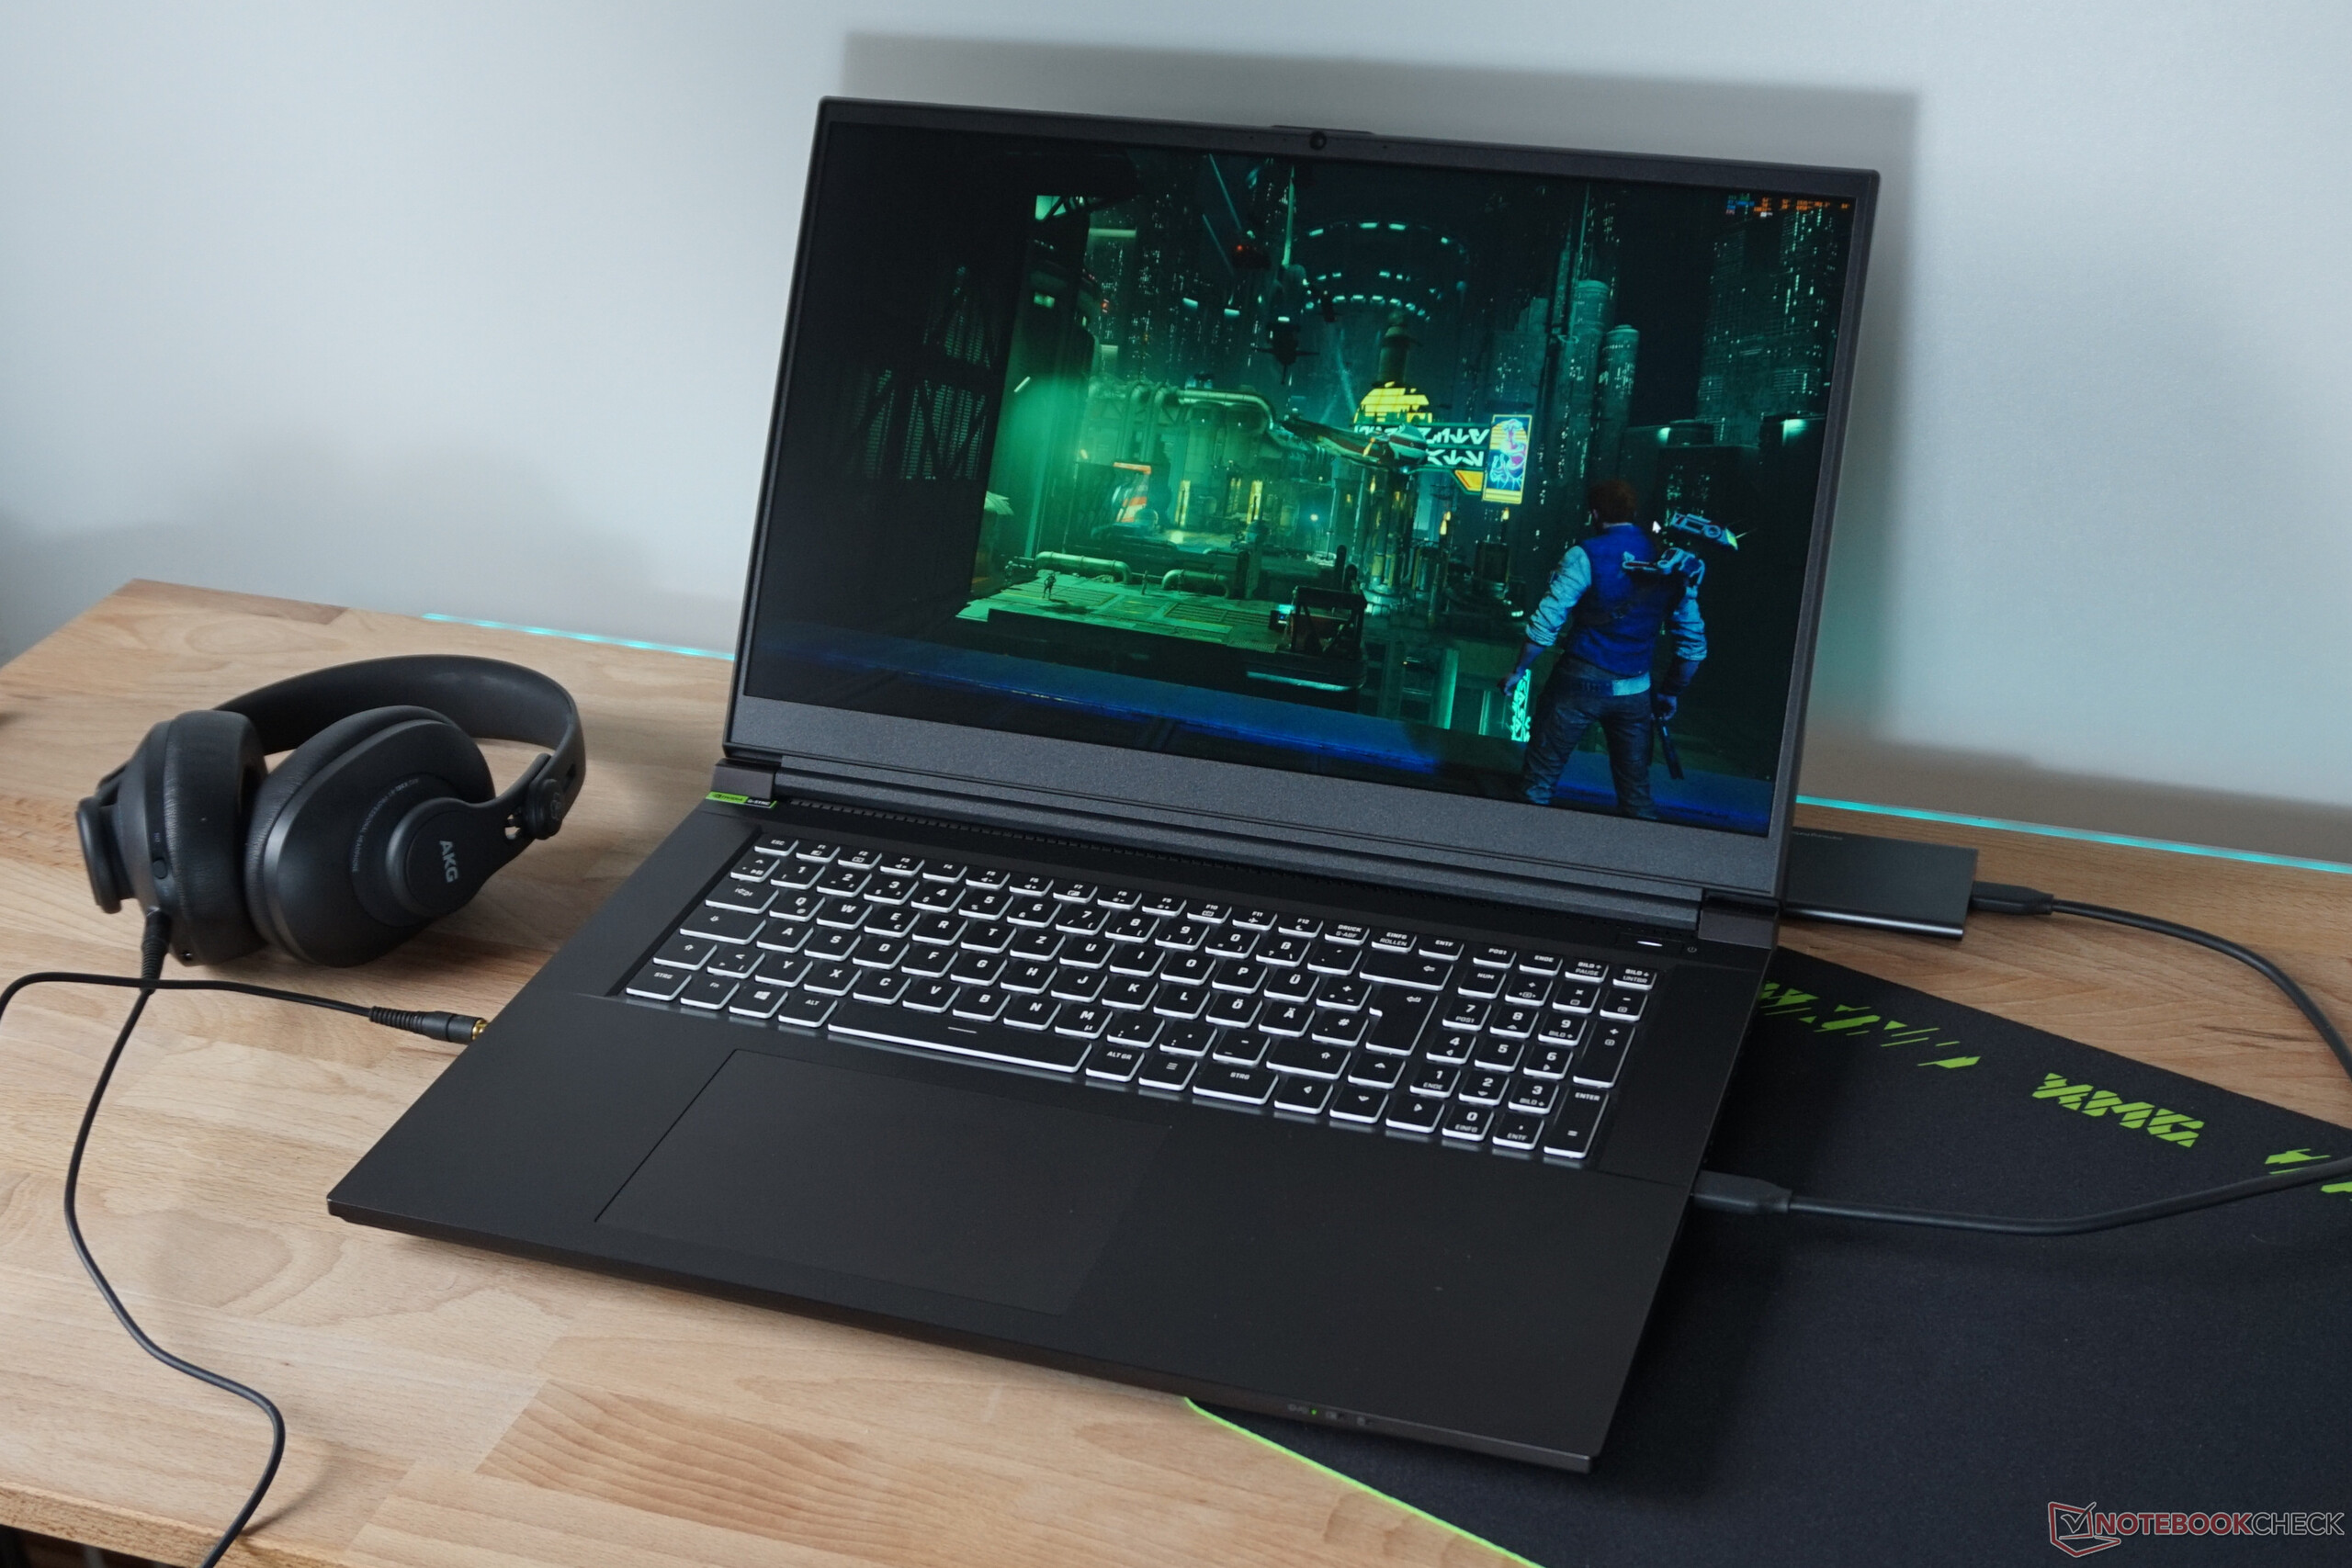
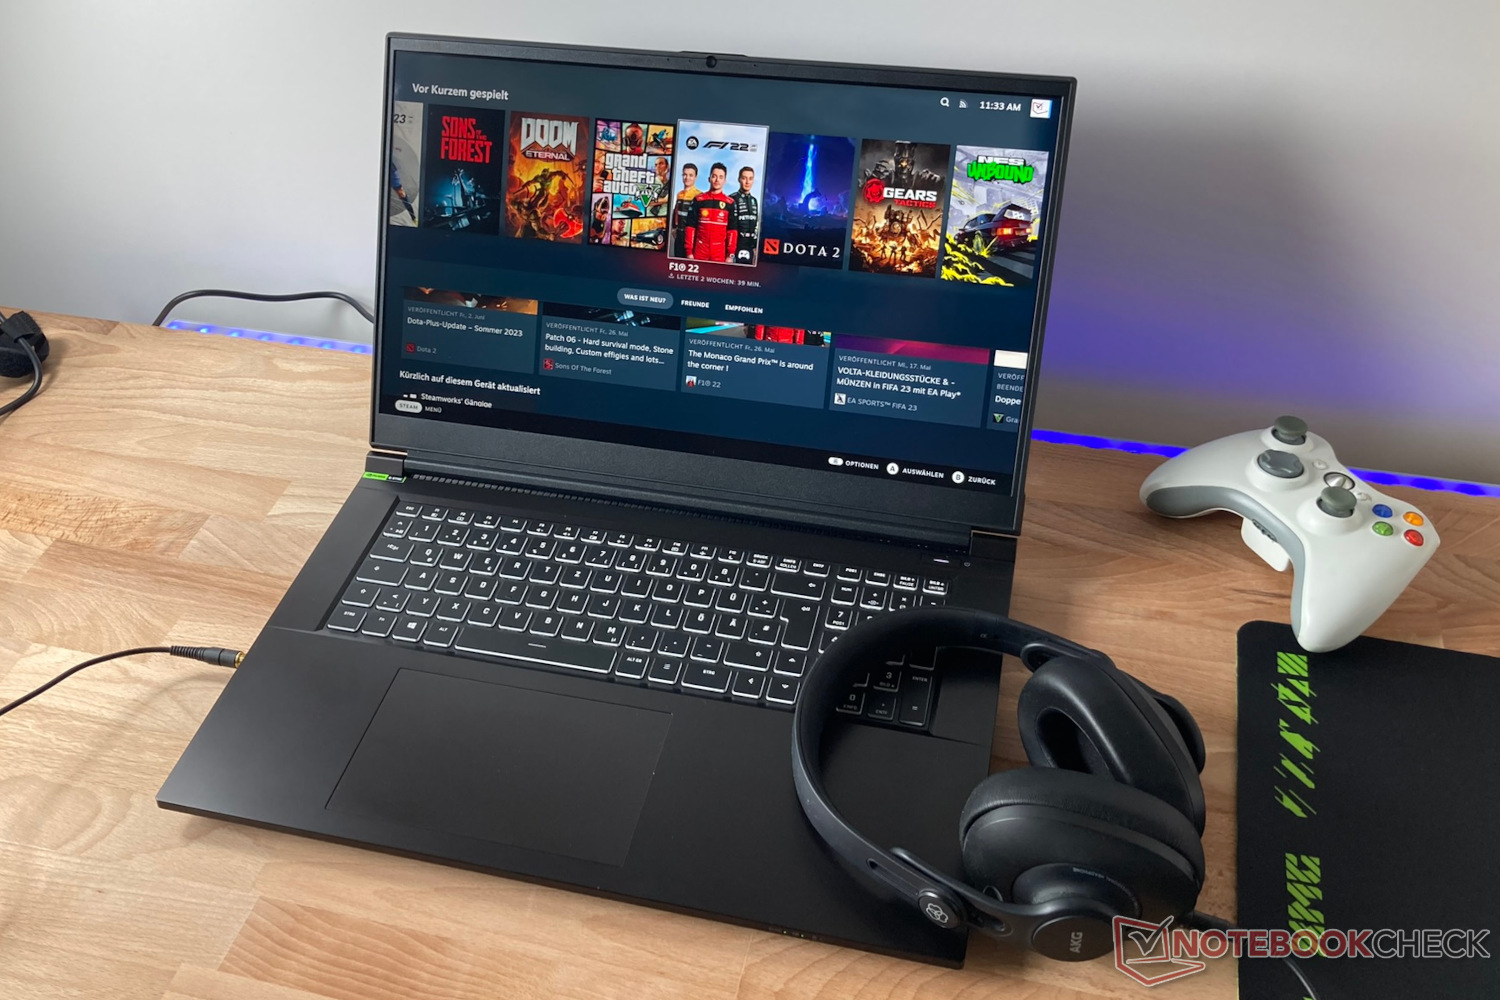
El portátil para juegos Schenker XMG Focus 17 E23 (barebone: NP70SNE-G) se centra en lo esencial. Con el extraordinario procesador procesador i9 y opcionalmente unaRTX 4050, 4060o 4070hay rendimiento suficiente para los juegos. La pantalla también ofrece 240 Hz y una cantidad suficiente de píxeles.
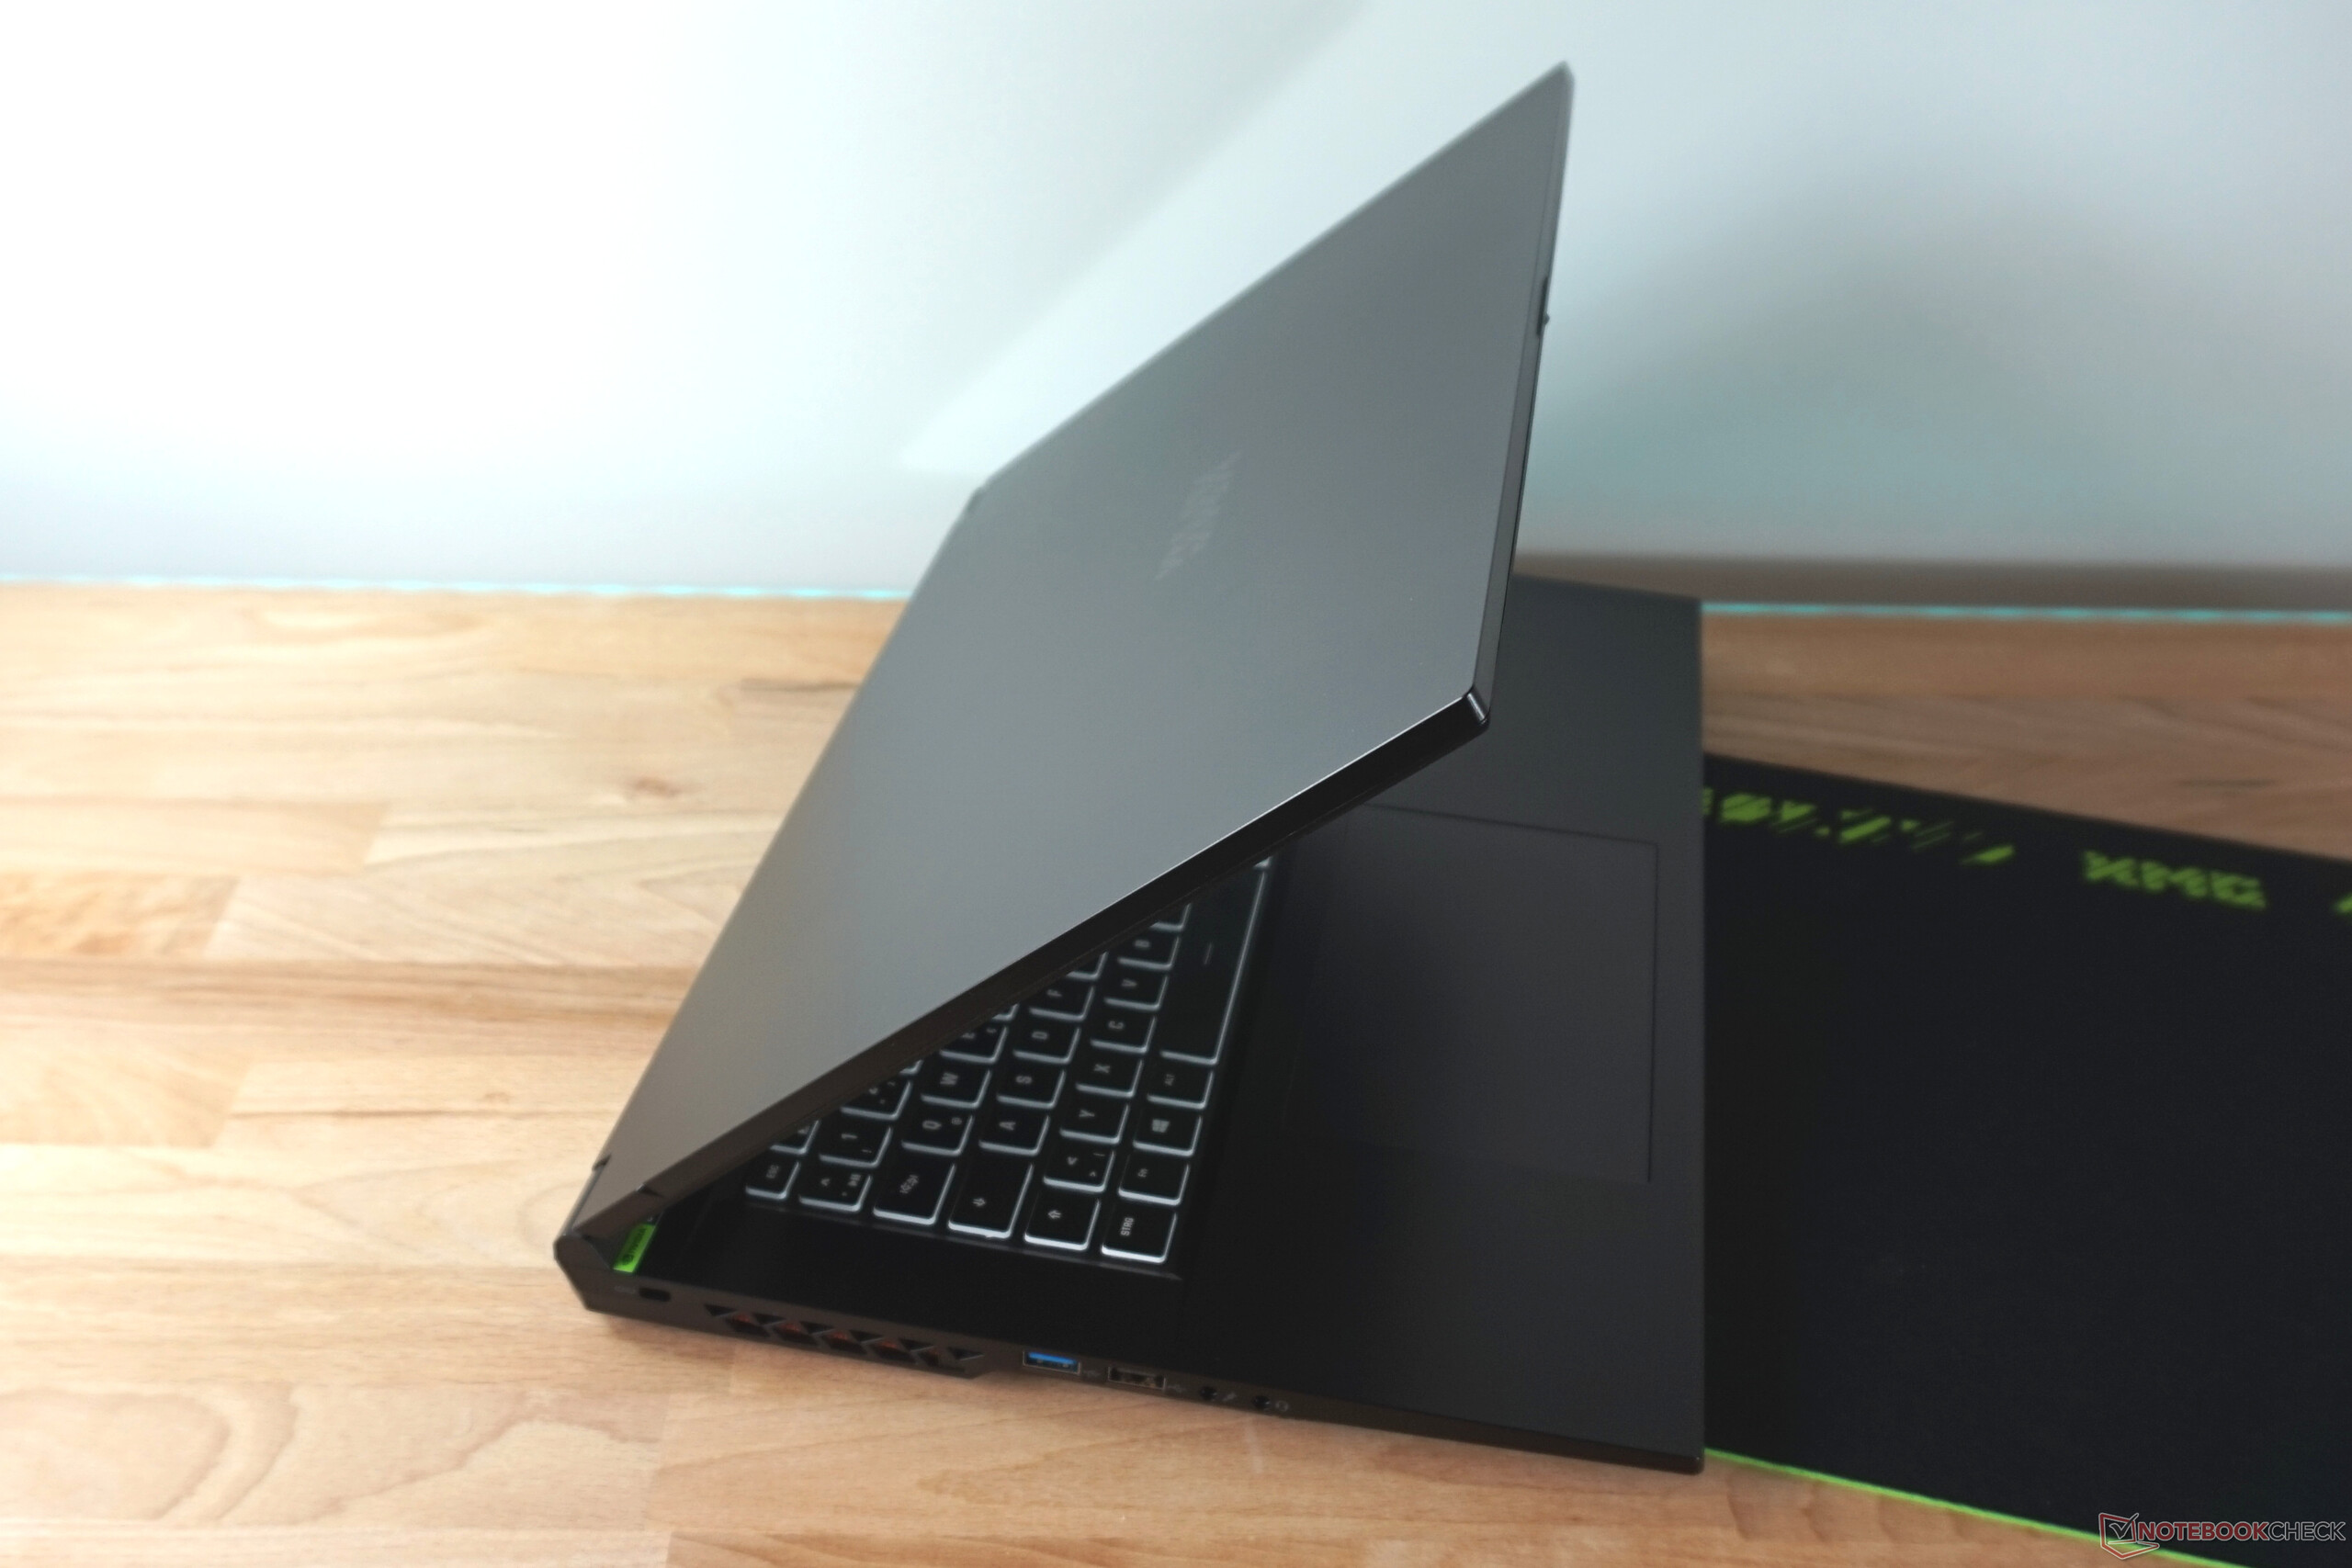
Sin embargo, no hay extras extraordinarios, características especiales o el mejor diseño. La carcasa ha cambiado respecto a nuestro último análisis del XMG Focus 17 (Clevo NP70HK)de 2021, por lo que en este artículo se puede encontrar información más detallada sobre la carcasa, la construcción y el equipamiento. Aparte del rendimiento en juegos, el portátil también es bastante modesto. A cambio, se queda muy por debajo de los 2.000 euros (dependiendo de la configuración) y no es mucho más caro en la configuración superior que probamos.
Los rivales como el Medion Erazer Major X20 o el Lenovo Legion Pro 5 toman caminos similares y utilizan hardware comparable. Sin embargo, no ahorran de forma tan consistente como el portátil de Schenker, como muestra nuestra detallada actualización de pruebas.
Posibles contendientes en la comparación
Valoración | Fecha | Modelo | Peso | Altura | Tamaño | Resolución | Precio |
|---|---|---|---|---|---|---|---|
| 85.9 % v7 (old) | 06/2023 | Schenker XMG Focus 17 (E23) i9-13900HX, GeForce RTX 4070 Laptop GPU | 2.9 kg | 29.3 mm | 17.30" | 2560x1440 | |
| 88.4 % v7 (old) | 05/2023 | Lenovo Legion Pro 5 16ARX8 R7 7745HX, GeForce RTX 4070 Laptop GPU | 2.5 kg | 26.8 mm | 16.00" | 2560x1600 | |
| 89 % v7 (old) | 04/2023 | Medion Erazer Major X20 i9-13900HX, GeForce RTX 4070 Laptop GPU | 2.4 kg | 29 mm | 16.00" | 2560x1600 | |
| 87.6 % v7 (old) | 09/2022 | Schenker XMG Neo 17 M22 R9 6900HX, GeForce RTX 3080 Ti Laptop GPU | 2.8 kg | 27 mm | 17.00" | 2560x1600 | |
| 85.4 % v7 (old) | 03/2023 | HP Omen 17-ck2097ng i9-13900HX, GeForce RTX 4080 Laptop GPU | 2.8 kg | 27 mm | 17.30" | 2560x1440 | |
| 84.6 % v7 (old) | 05/2023 | Medion Erazer Defender P40 i7-13700HX, GeForce RTX 4060 Laptop GPU | 2.9 kg | 33 mm | 17.30" | 2560x1440 |
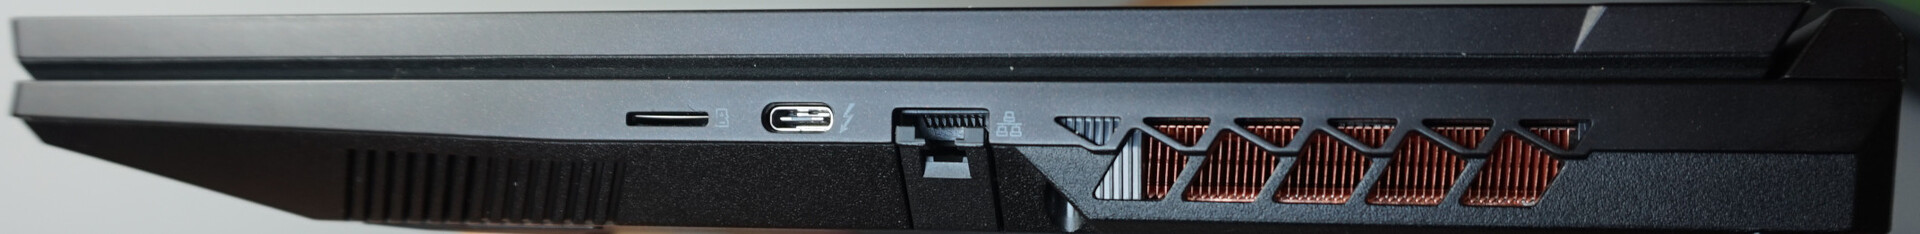
Equipamiento: desde TB4 hasta USB 2.0
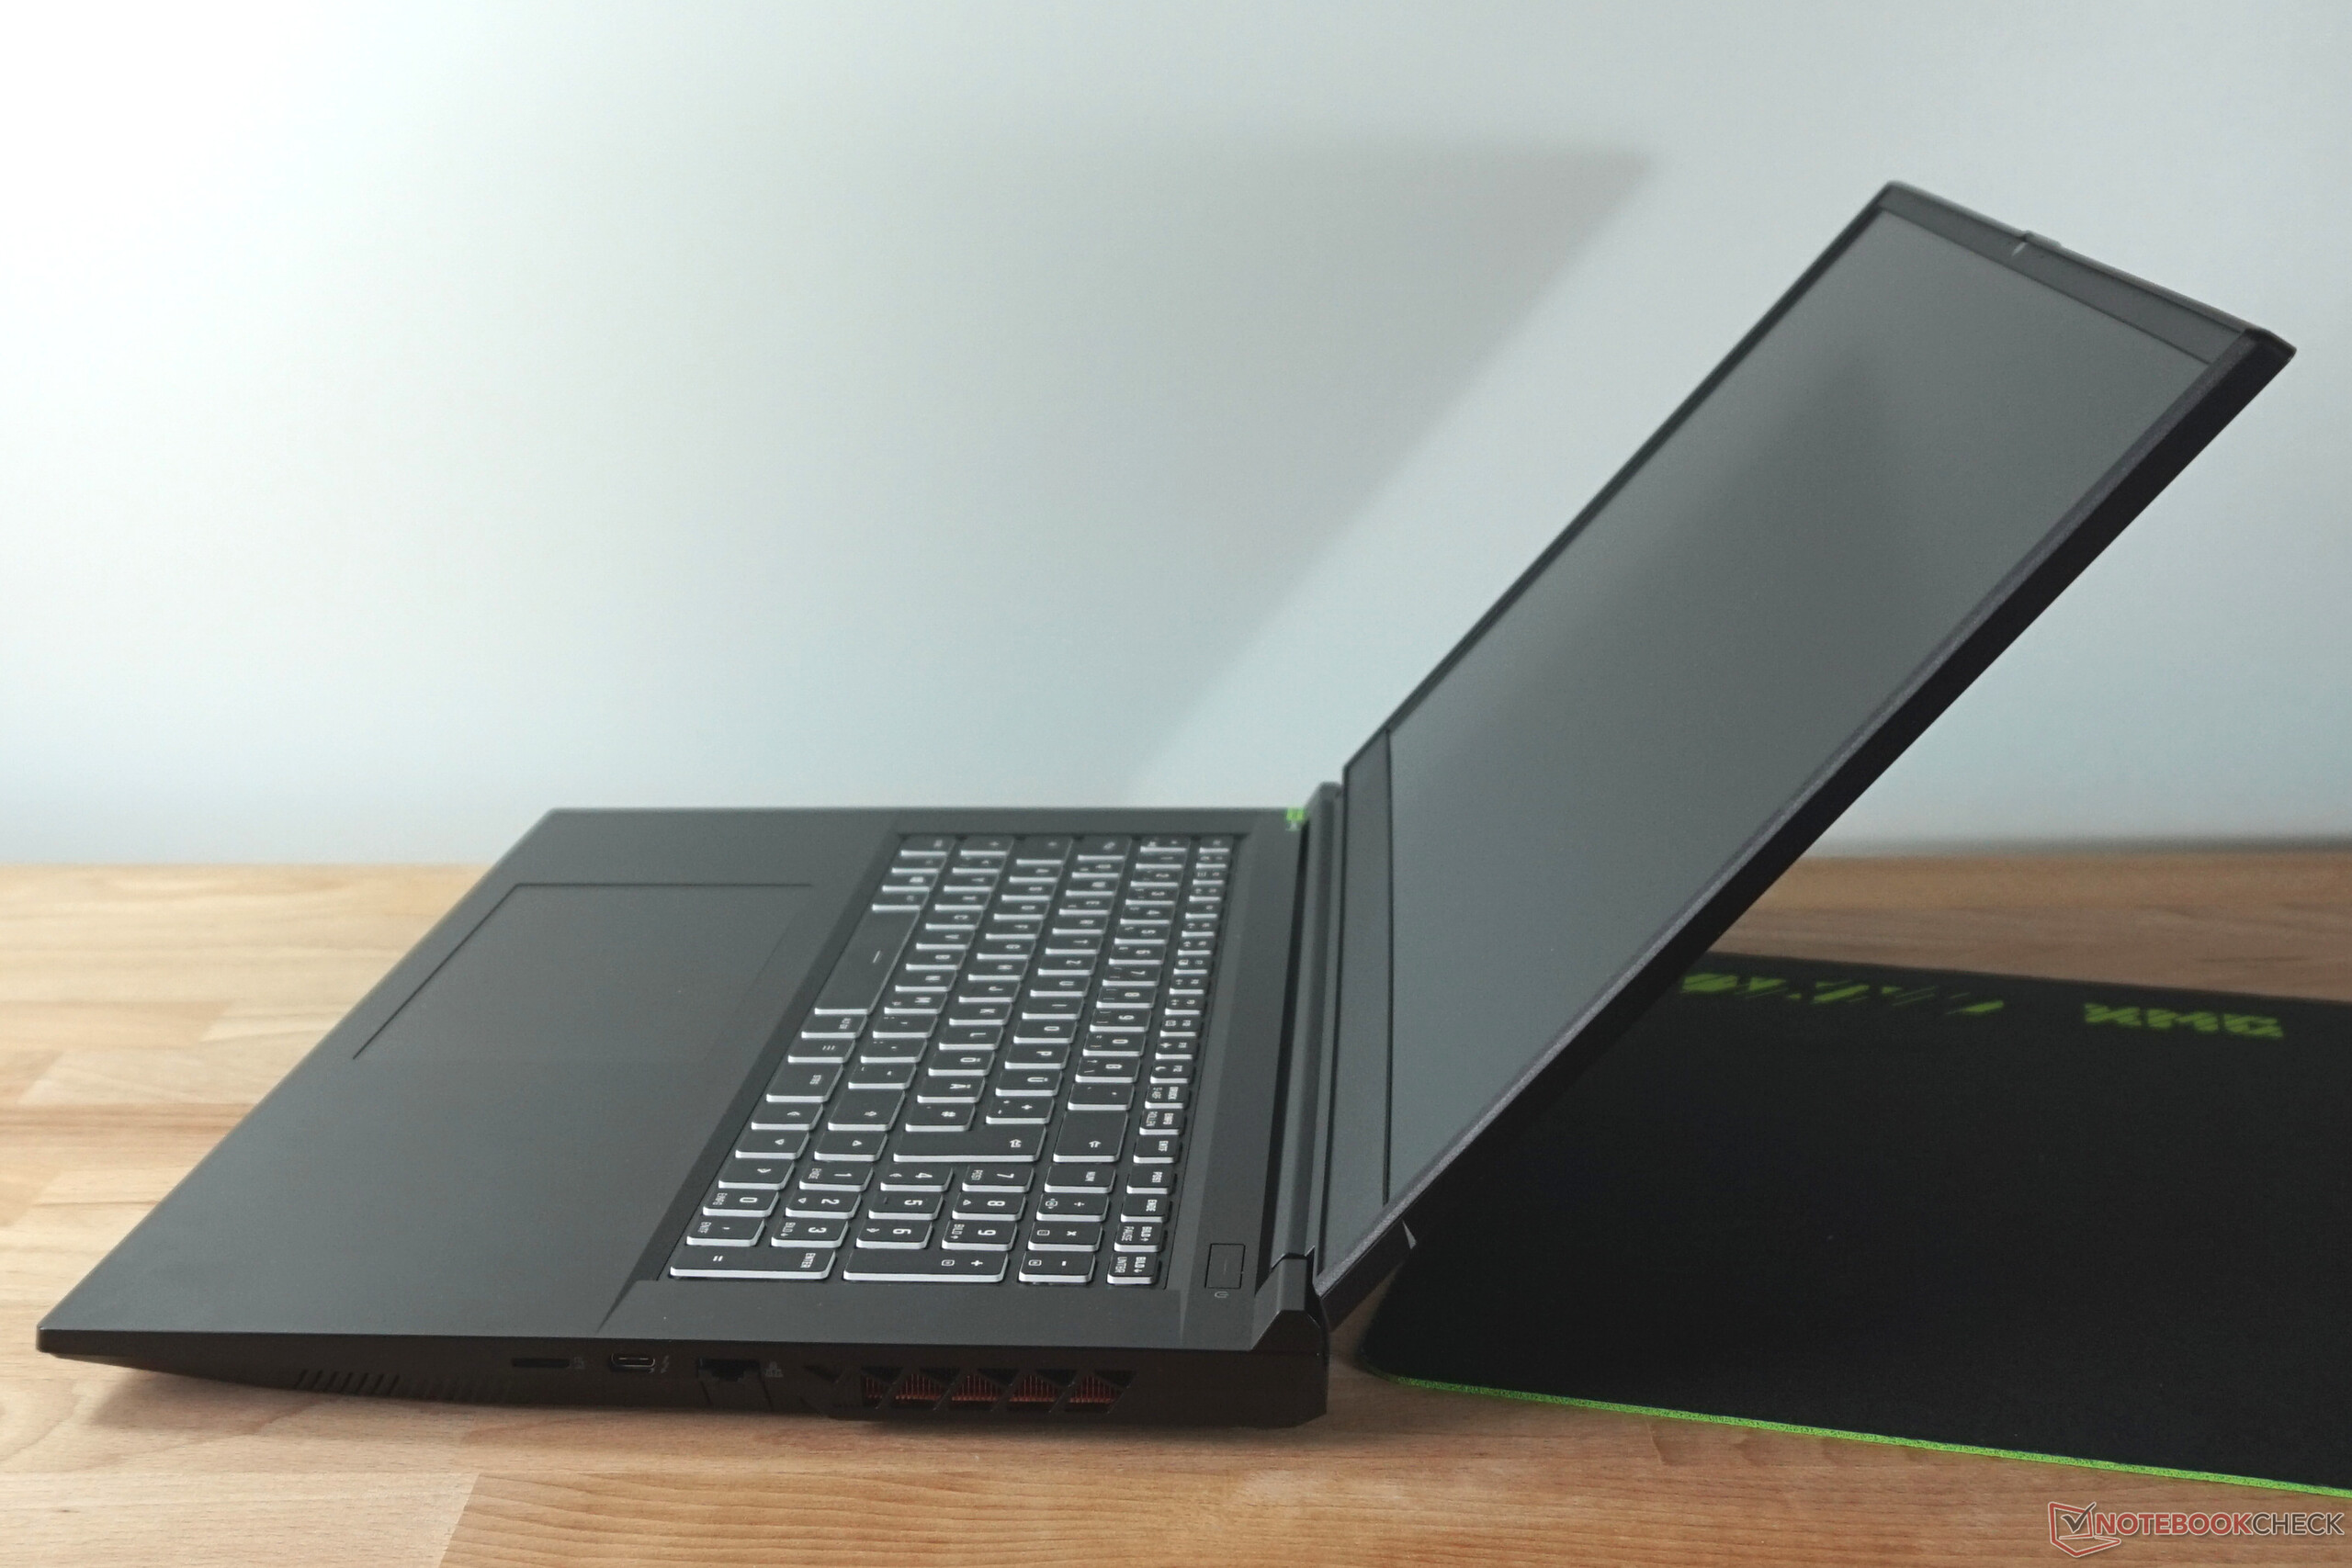
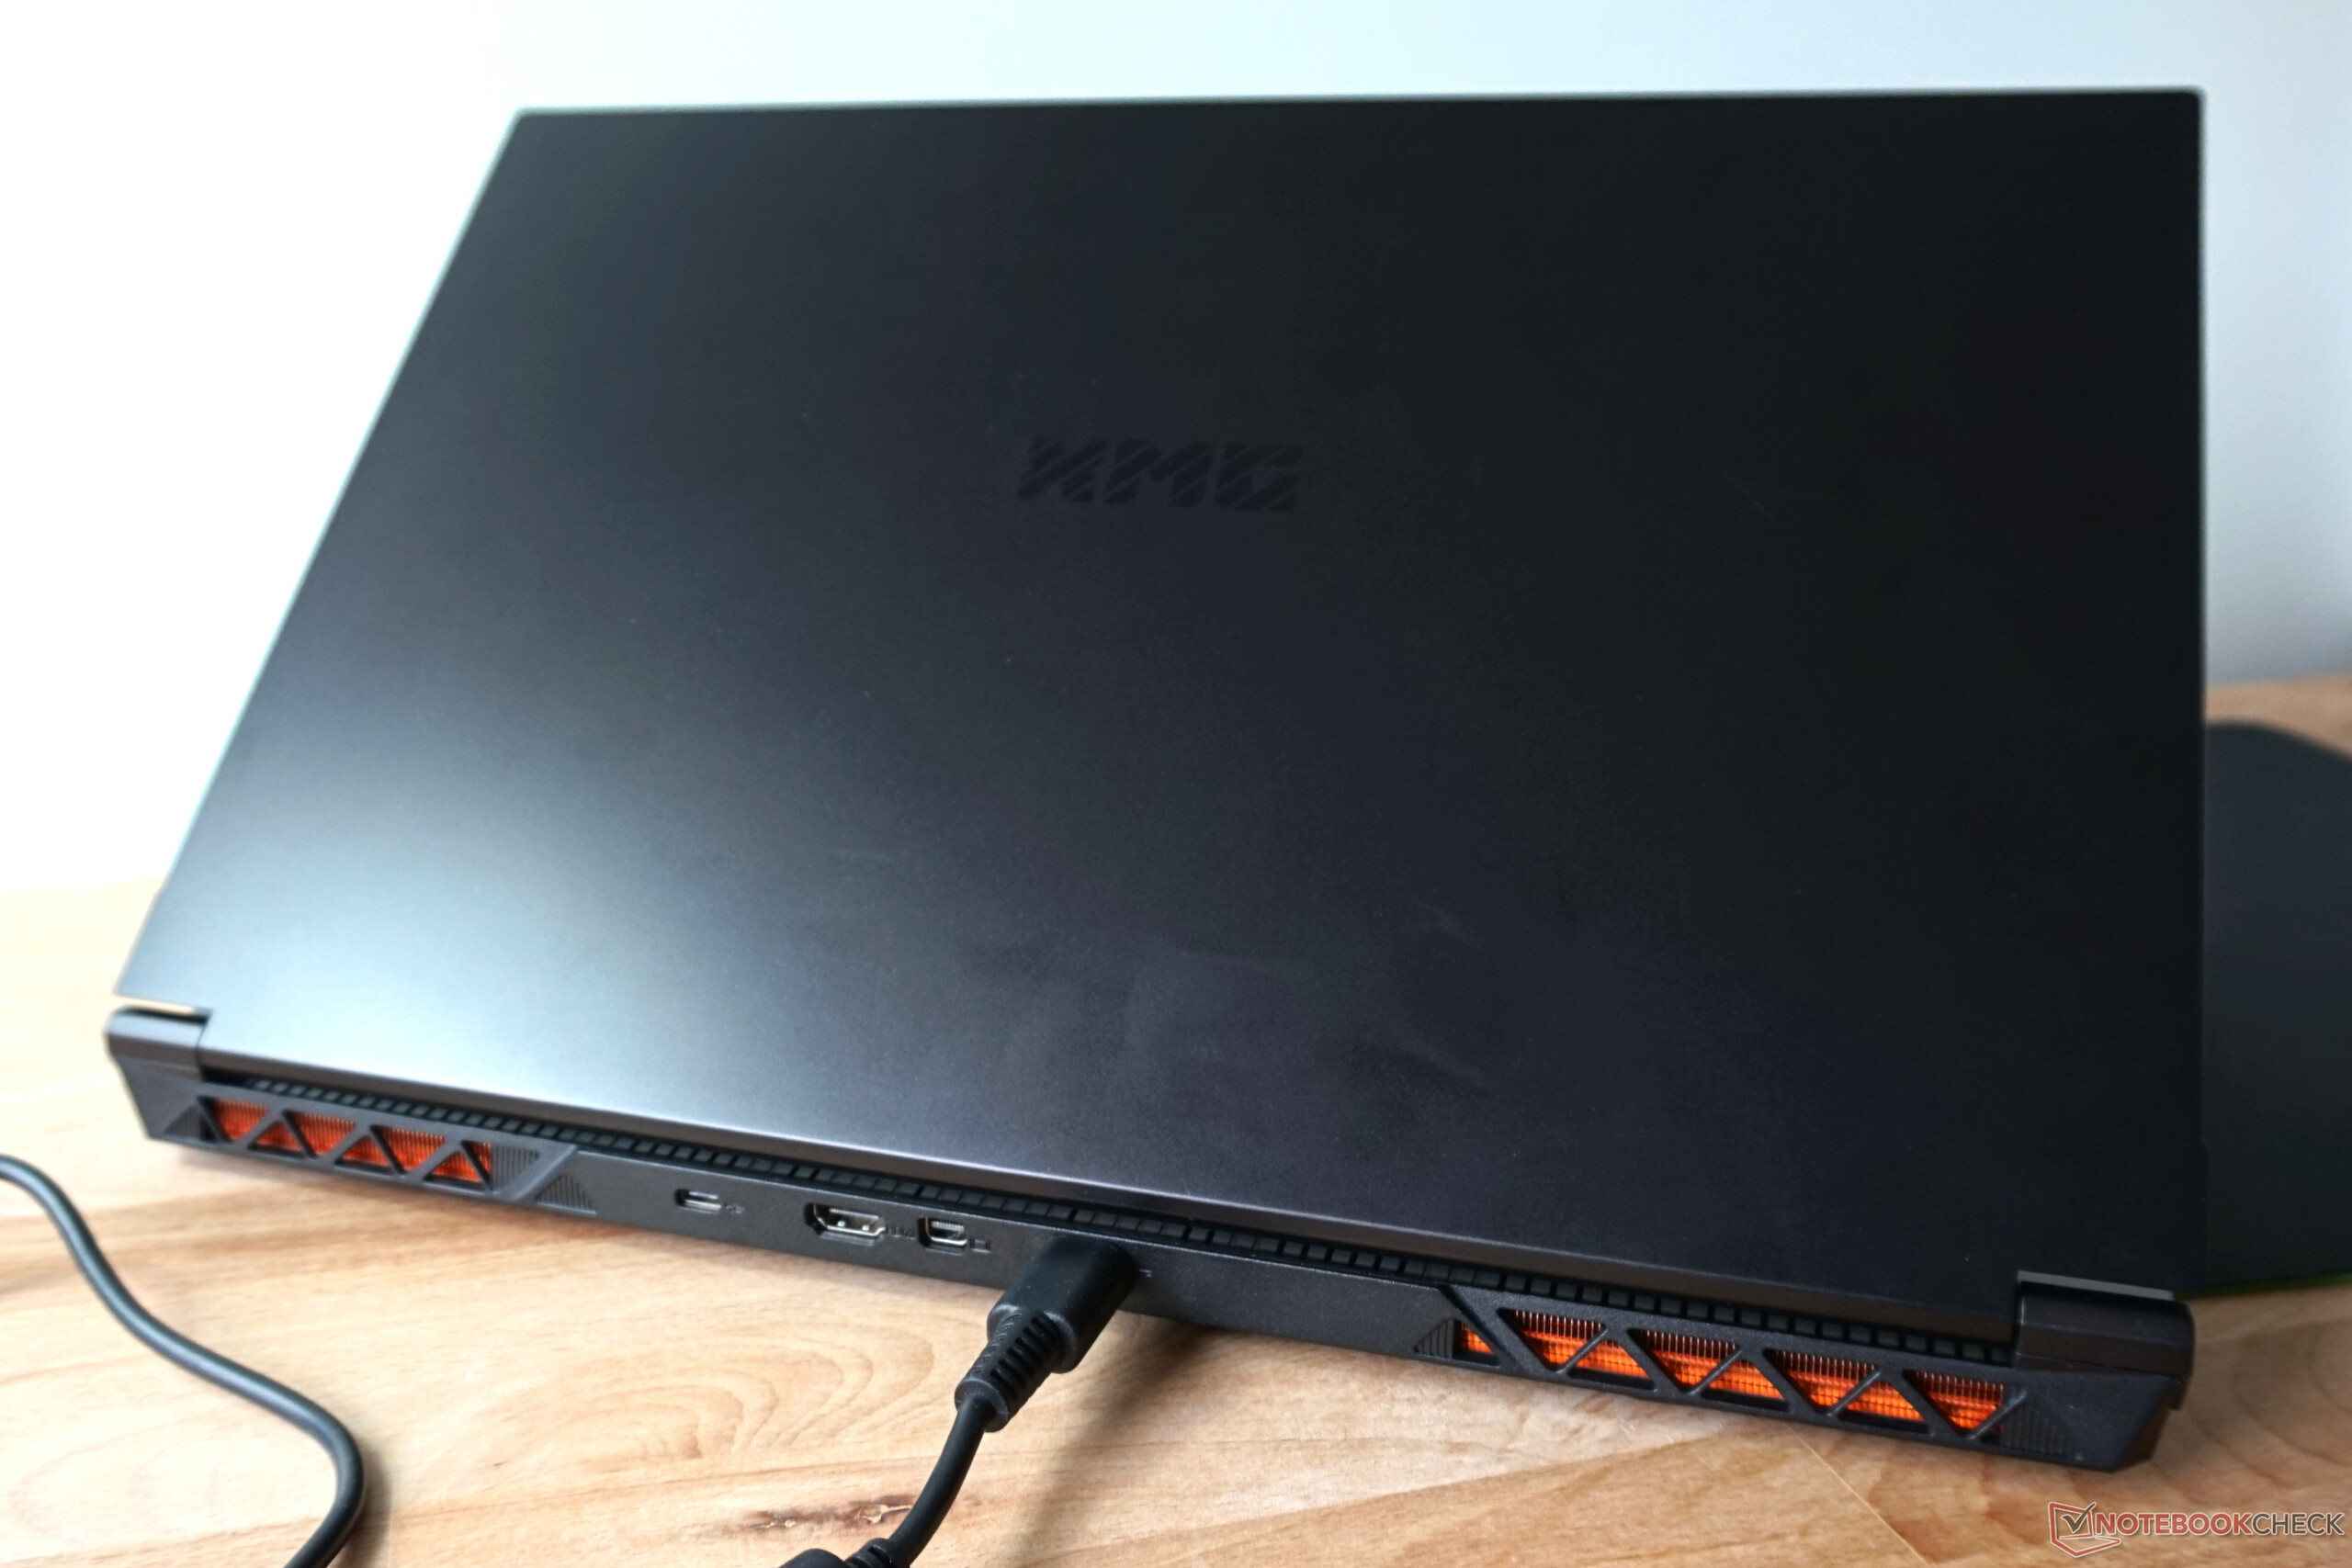
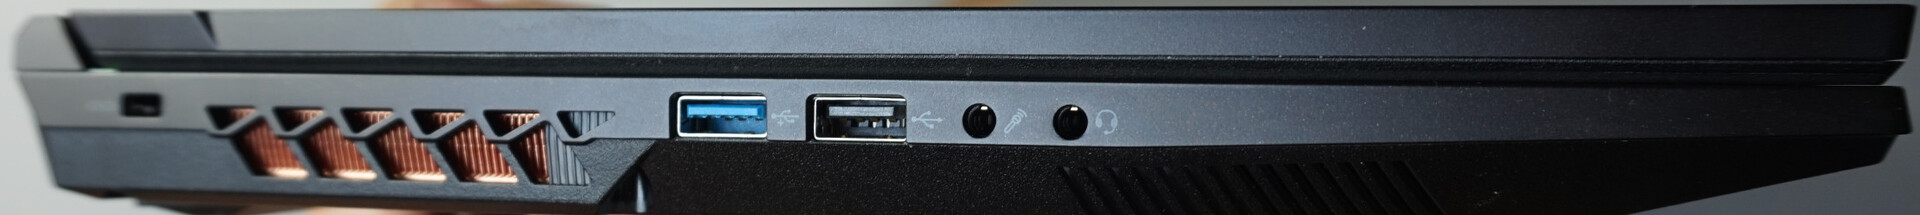
Comparado con el predecesor, hay muchas similitudes en los puertos, pero afortunadamente unas cuantas actualizaciones. Sigue habiendo un puerto USB 2.0, que debería ser suficiente para un ratón o una impresora. También se ha mantenido el Mini-DP.
El sencillo conector USB-C se ha movido a la trasera y ofrece tasas de hasta 10 Gbit/s, pero no soporta ni PD ni DP. Thunderbolt 4 está a la derecha, pero por desgracia ya no hay puerto USB-A. Además, la ranura para tarjetas se ha reducido a microSD en la versión actual, lo que limita la versatilidad considerablemente.

Lector de tarjetas SD
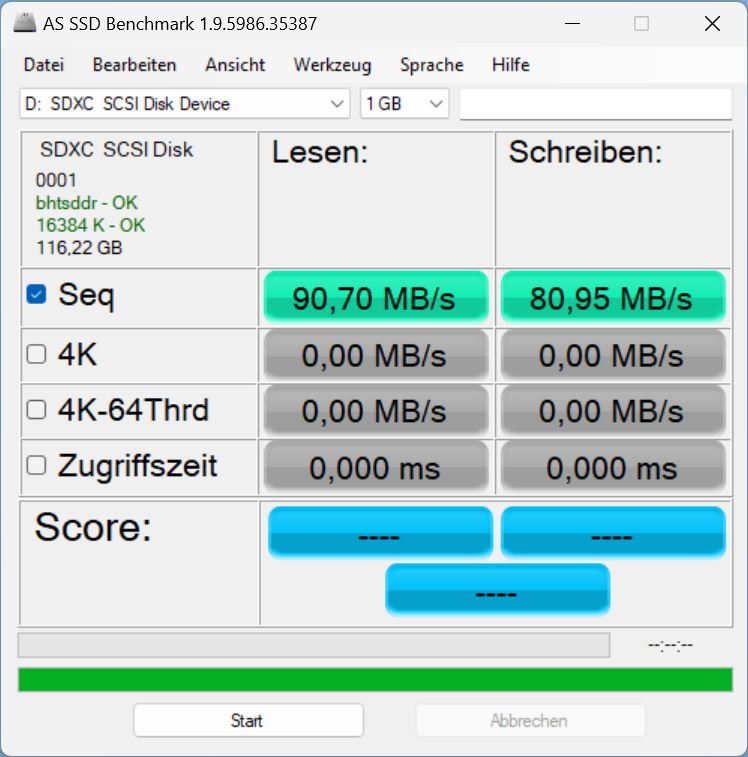
Nuestras mediciones con la tarjeta de referencia AV PRO V60 microSD de 128 GB no están a la altura de la media, pero en parte son un poco mejores que las de la competencia. Es suficiente para copiar unos miles de fotos en pocos minutos.
| SD Card Reader | |
| average JPG Copy Test (av. of 3 runs) | |
| Media de la clase Gaming (20.9 - 210, n=54, últimos 2 años) | |
| Medion Erazer Defender P40 (AV PRO microSD 128 GB V60) | |
| Schenker XMG Focus 17 (E23) | |
| Medion Erazer Major X20 (AV PRO microSD 128 GB V60) | |
| HP Omen 17-ck2097ng (AV PRO microSD 128 GB V60) | |
| Schenker XMG Neo 17 M22 (AV PRO microSD 128 GB V60) | |
| maximum AS SSD Seq Read Test (1GB) | |
| Media de la clase Gaming (25.5 - 261, n=51, últimos 2 años) | |
| Medion Erazer Defender P40 (AV PRO microSD 128 GB V60) | |
| Schenker XMG Focus 17 (E23) | |
| Medion Erazer Major X20 (AV PRO microSD 128 GB V60) | |
| HP Omen 17-ck2097ng (AV PRO microSD 128 GB V60) | |
Comunicación
El módulo WLAN Intel AX211 cumple las expectativas. Sin embargo, las tasas medias típicas sólo se alcanzan en una red de 6 GHz en nuestras mediciones e incluso se superan ligeramente. La ligera debilidad a 5 GHz se explica muy probablemente por influencias interferentes de redes inalámbricas vecinas, que naturalmente no pudimos desactivar en la prueba.

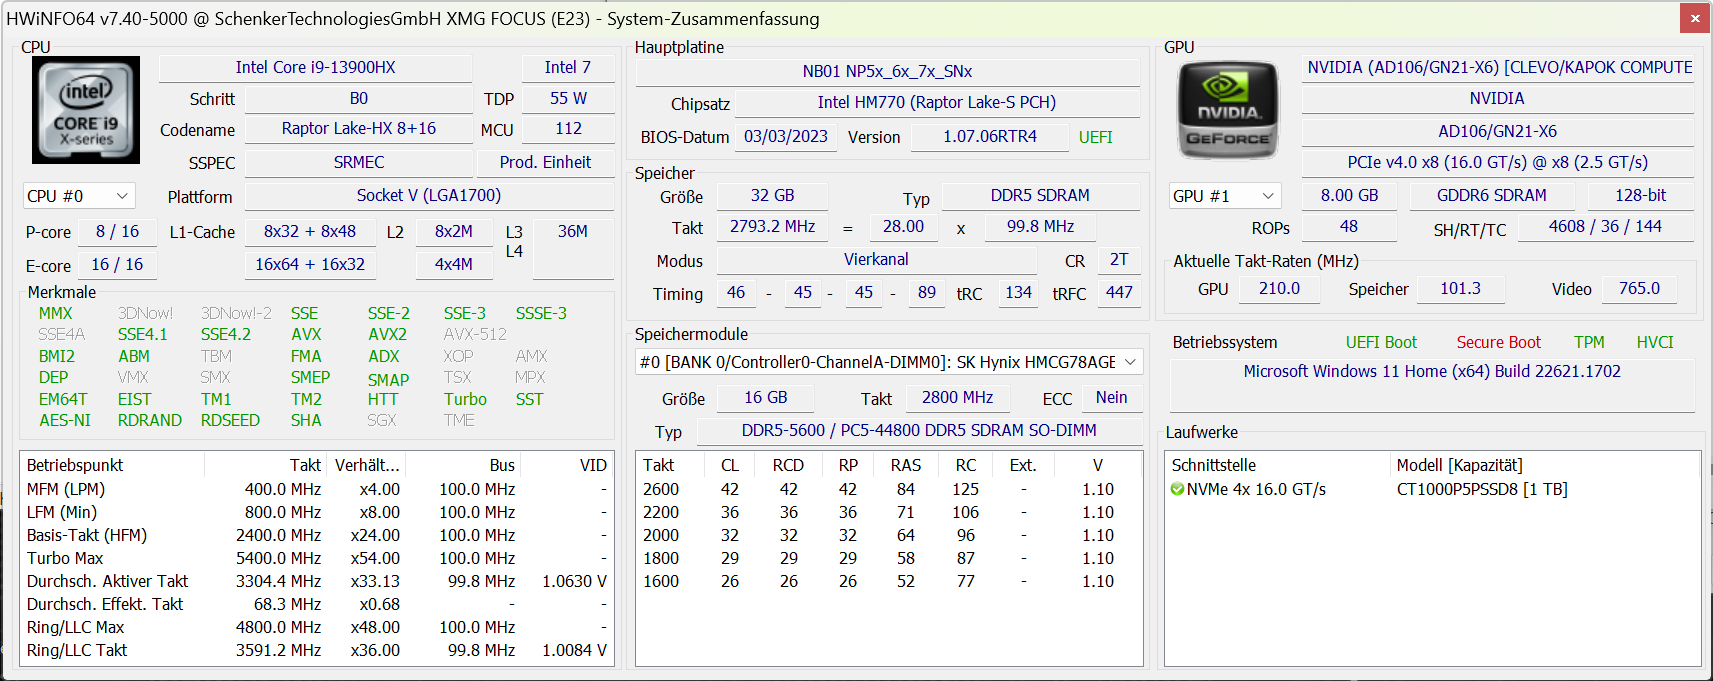
 GeForce RTX 4070 Laptop GPU, i9-13900HX, Crucial P5 Plus 1TB CT1000P5PSSD8")
 GeForce RTX 4070 Laptop GPU, i9-13900HX, Crucial P5 Plus 1TB CT1000P5PSSD8")
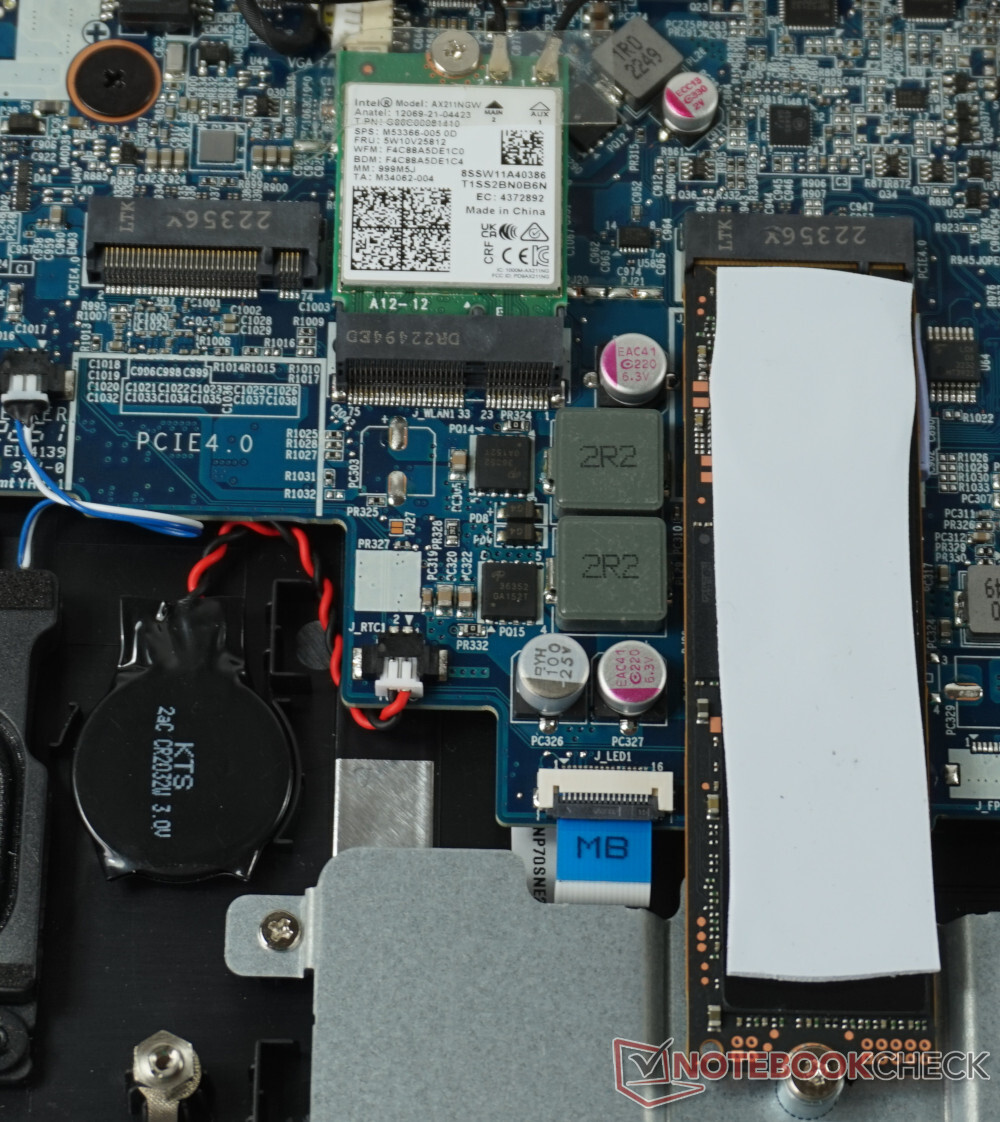
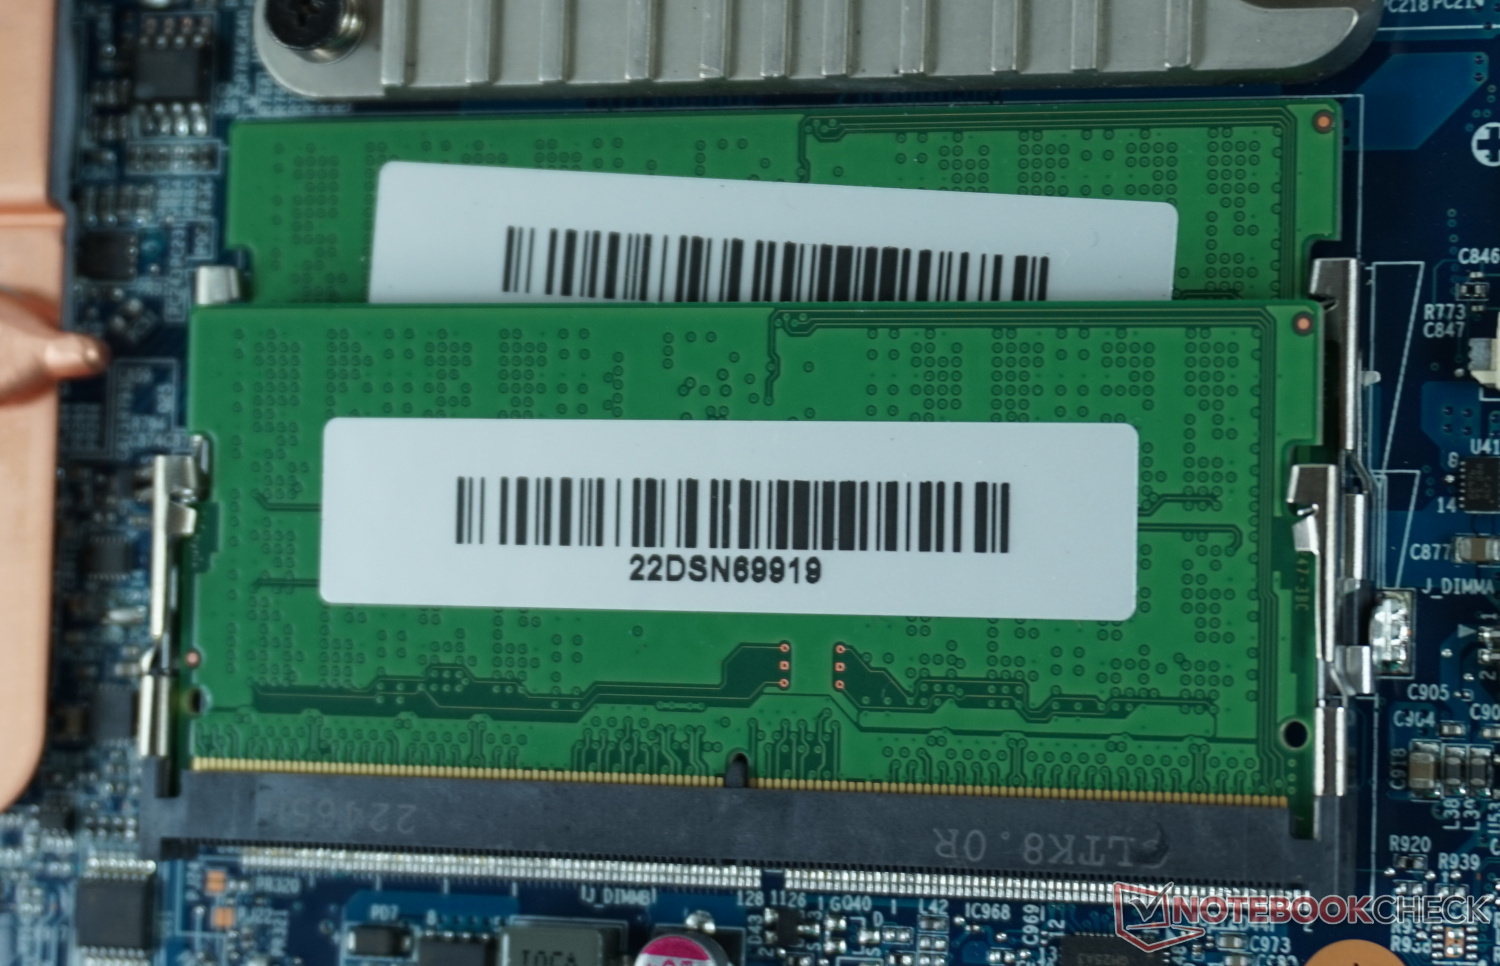
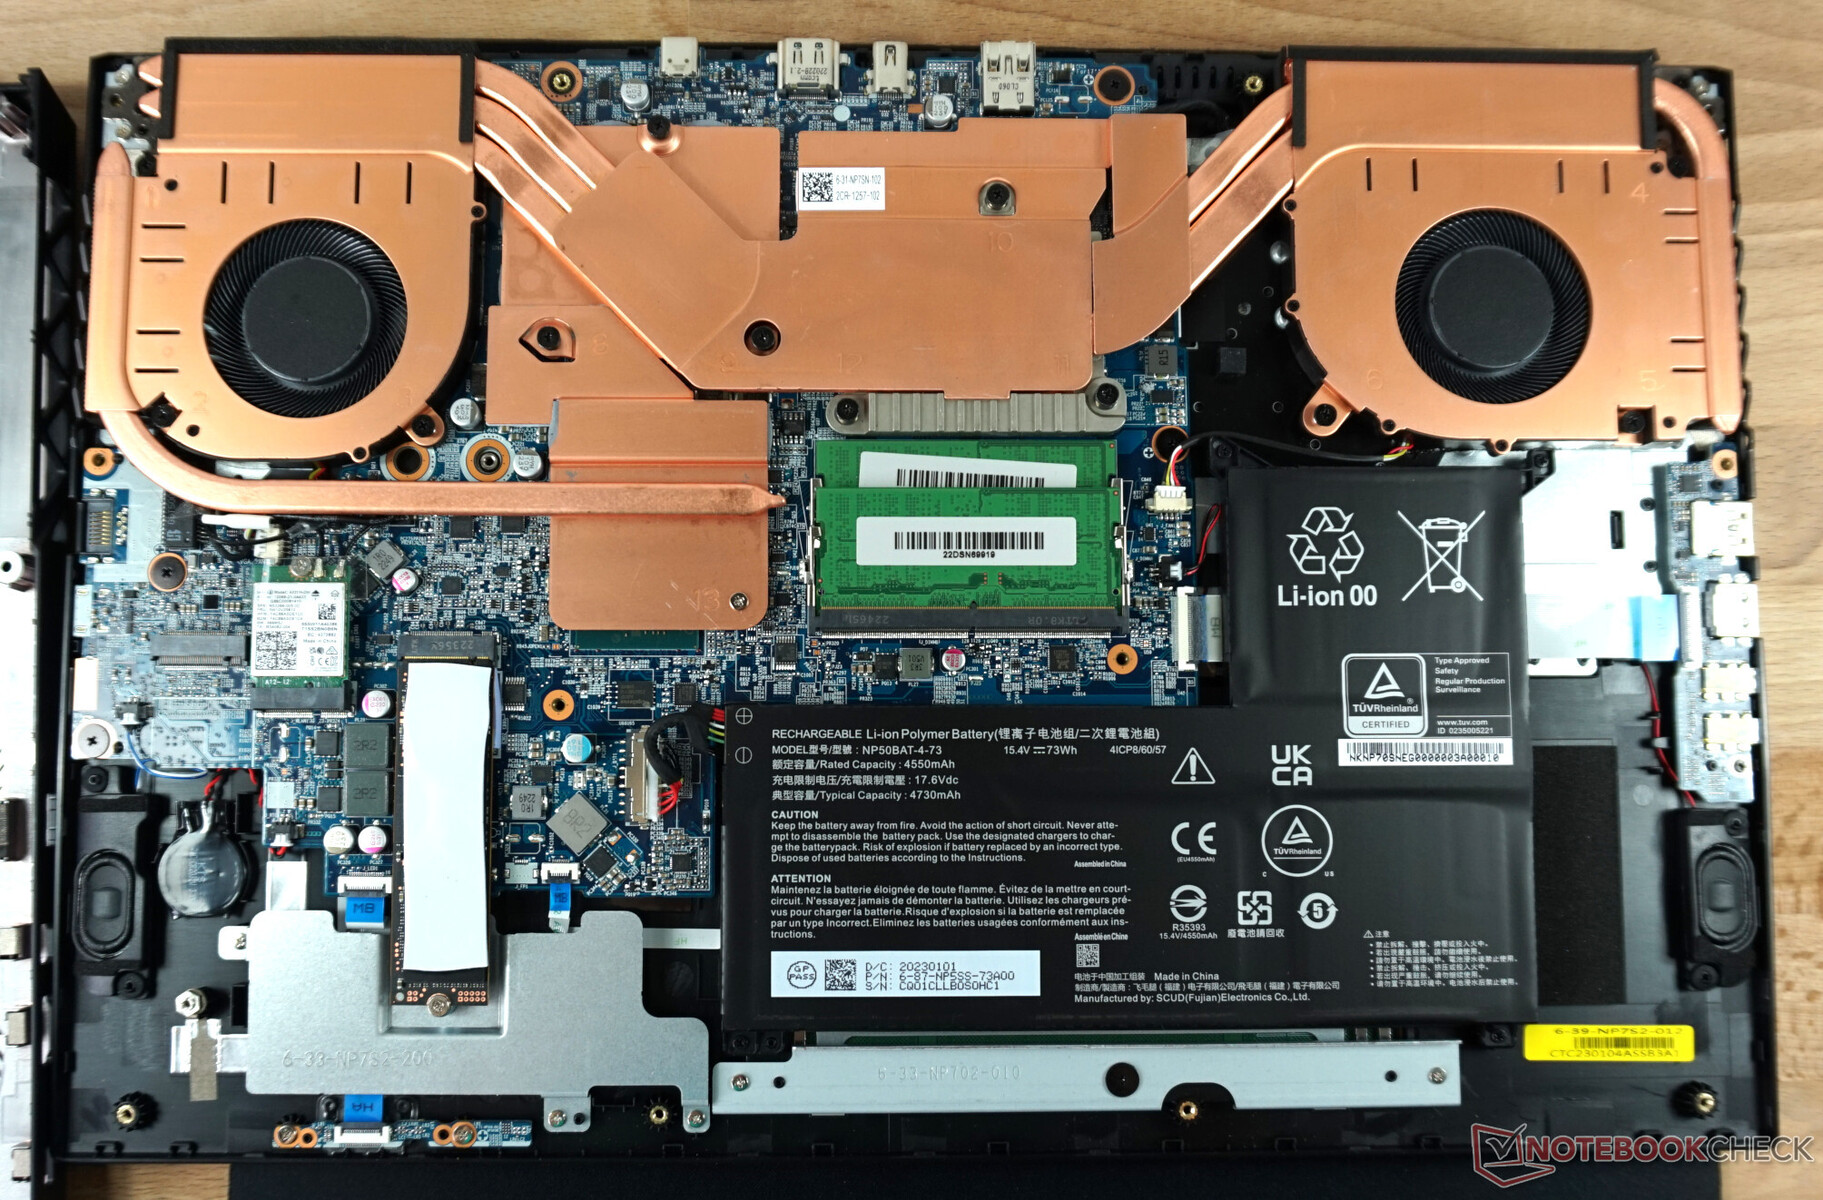
Mantenimiento
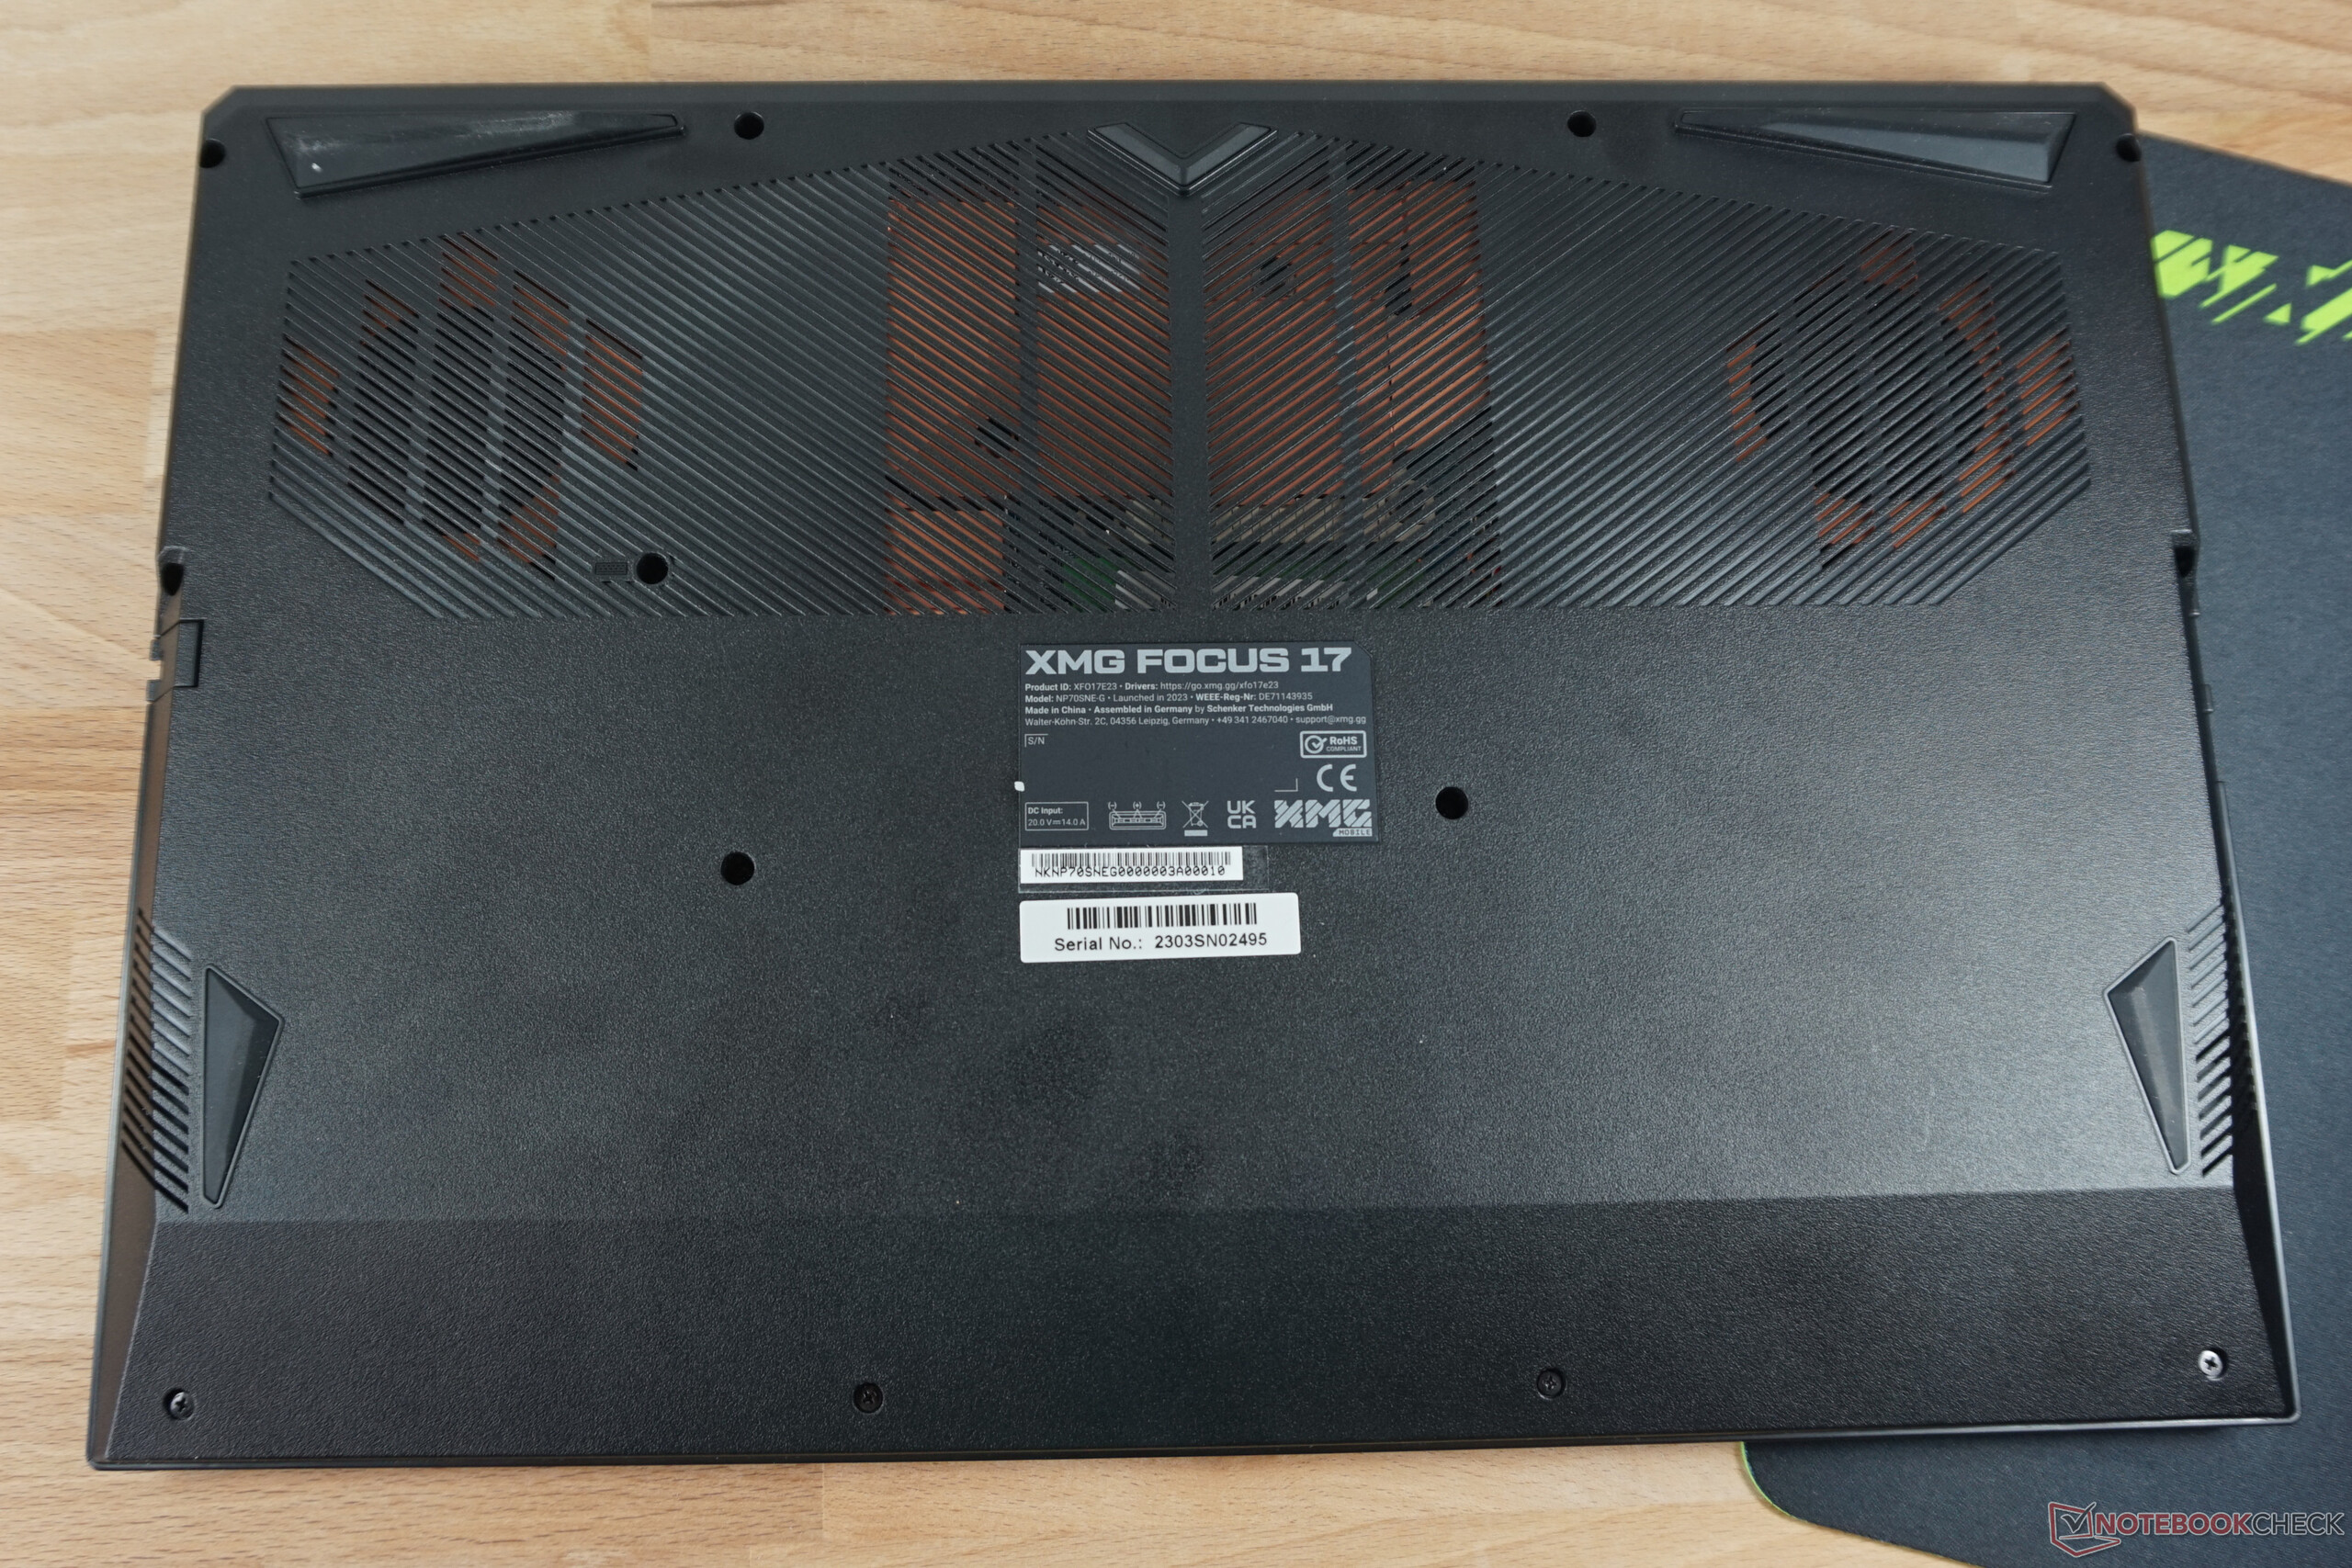
Cambios considerables con vistas al XMG Focus 17 de 2021 se han realizado en el interior. Todos los elementos de refrigeración son ahora de cobre y el aire puede salir por ambos lados. El anticuado puerto SATA para un SSD de 2,5 pulgadas ha desaparecido. En su lugar, hay una segunda ranura para un SSD M.2 NVMe.
Como era de esperar de Schenker, el acceso a los componentes es sencillo. Tras soltar doce tornillos idénticos, se puede sacar la parte inferior con poco esfuerzo empezando por la refrigeración trasera. RAM, SSD, módulo WLAN, y batería son fácilmente accesibles y reemplazables.
Pantalla - Colores fuertes, contrastes escasos en el portátil para juegos XMG

El panel IPS mate del XMG Focus 17 cumple las expectativas de un portátil gaming sólido pero no sobresaliente. La resolución QHD se hace notar en la gran diagonal de 17,3 pulgadas/ Además, la tasa de refresco de 240 Hz asegura latencias bajas incluso cuando no se alcanza la tasa de frames en los juegos.
No convencen del todo los tiempos de respuesta, que no son óptimos con más de 10 ms, pero aceptables. El pobre nivel de negro impide un mejor contraste. Se aprecia una neblina gris en escenas muy oscuras con una iluminación mínima en la habitación. Con un ratio de 623:1 medido por nosotros, el contraste aquí es sólo algo menos de la mitad del valor del Medion Erazer Defender P40 o HP Omen 17-ck. El sangrado de pantalla también es claramente visible.
La iluminación podría ser un poco más uniforme, y el brillo de 320 cd/m² un poco más alto. Así, los índices de visualización están por debajo de la media en comparación con muchos modelos de precio similar.
| |||||||||||||||||||||||||
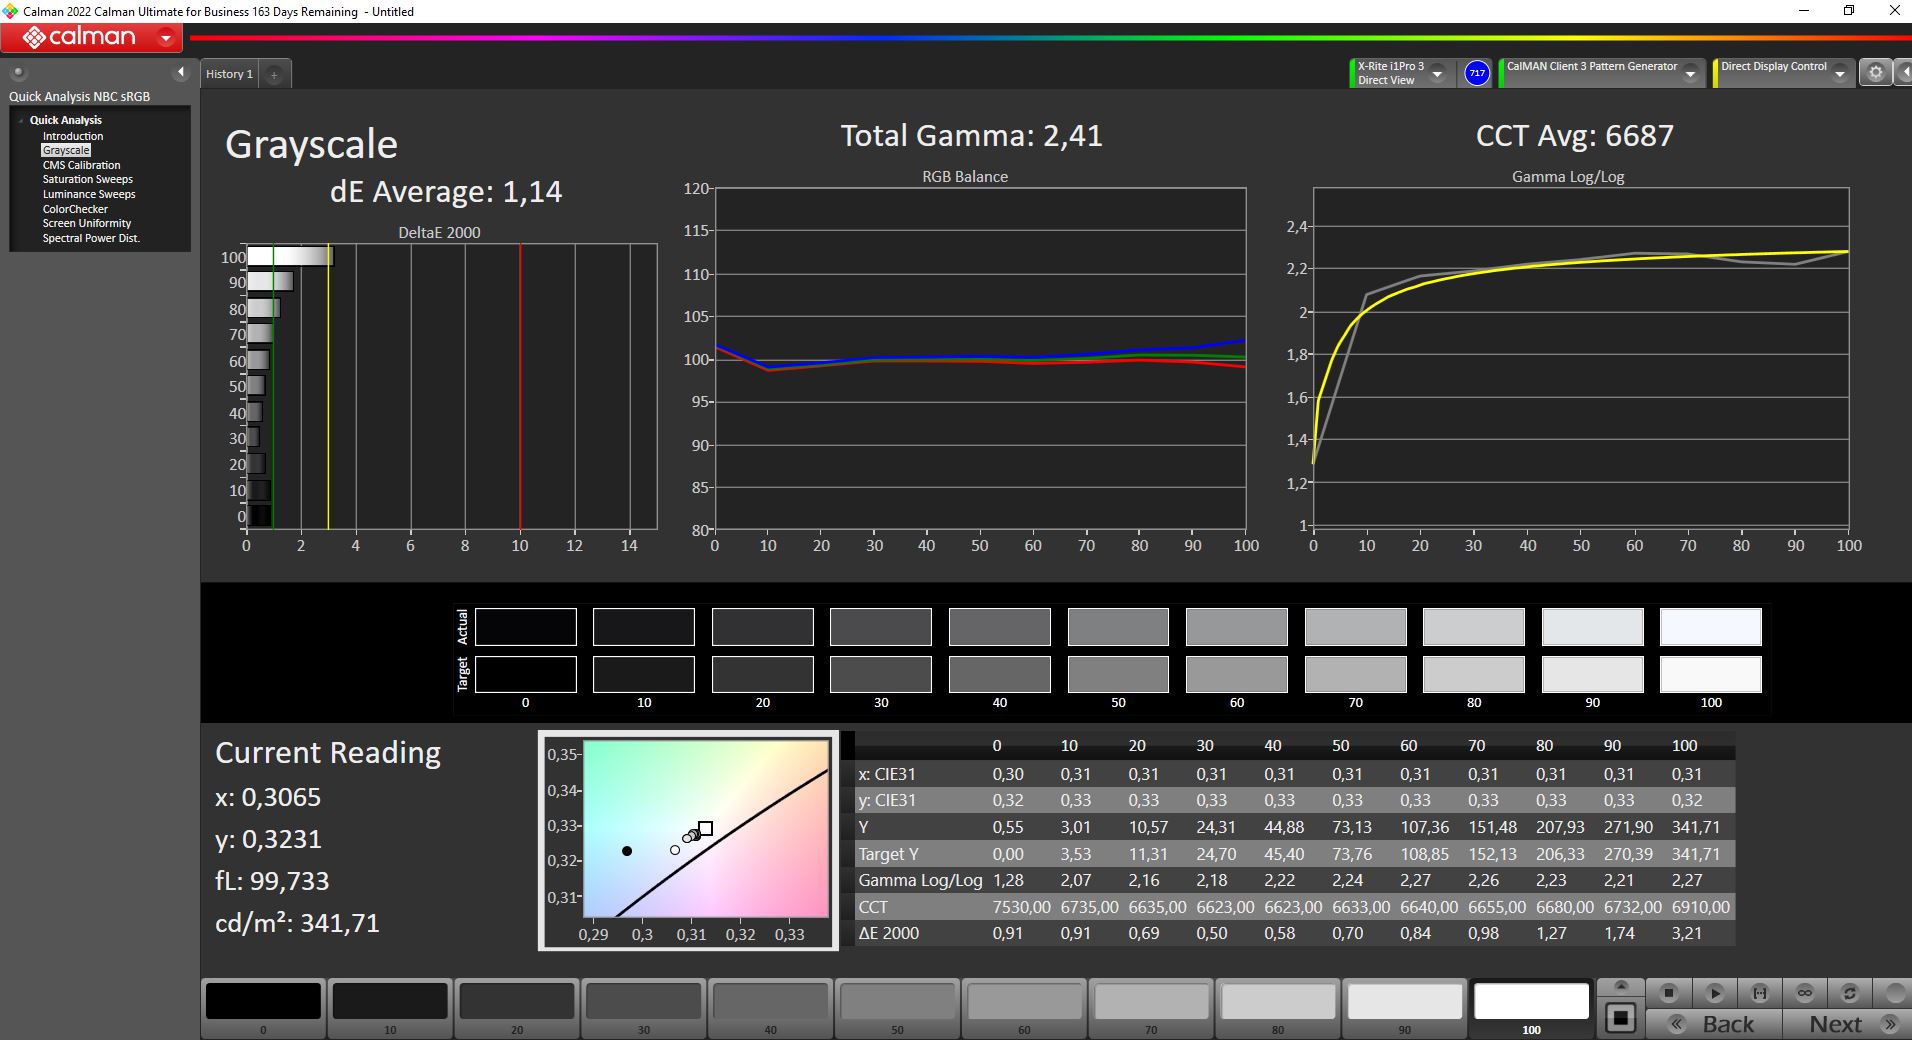
iluminación: 82 %
Brillo con batería: 349 cd/m²
Contraste: 623:1 (Negro: 0.56 cd/m²)
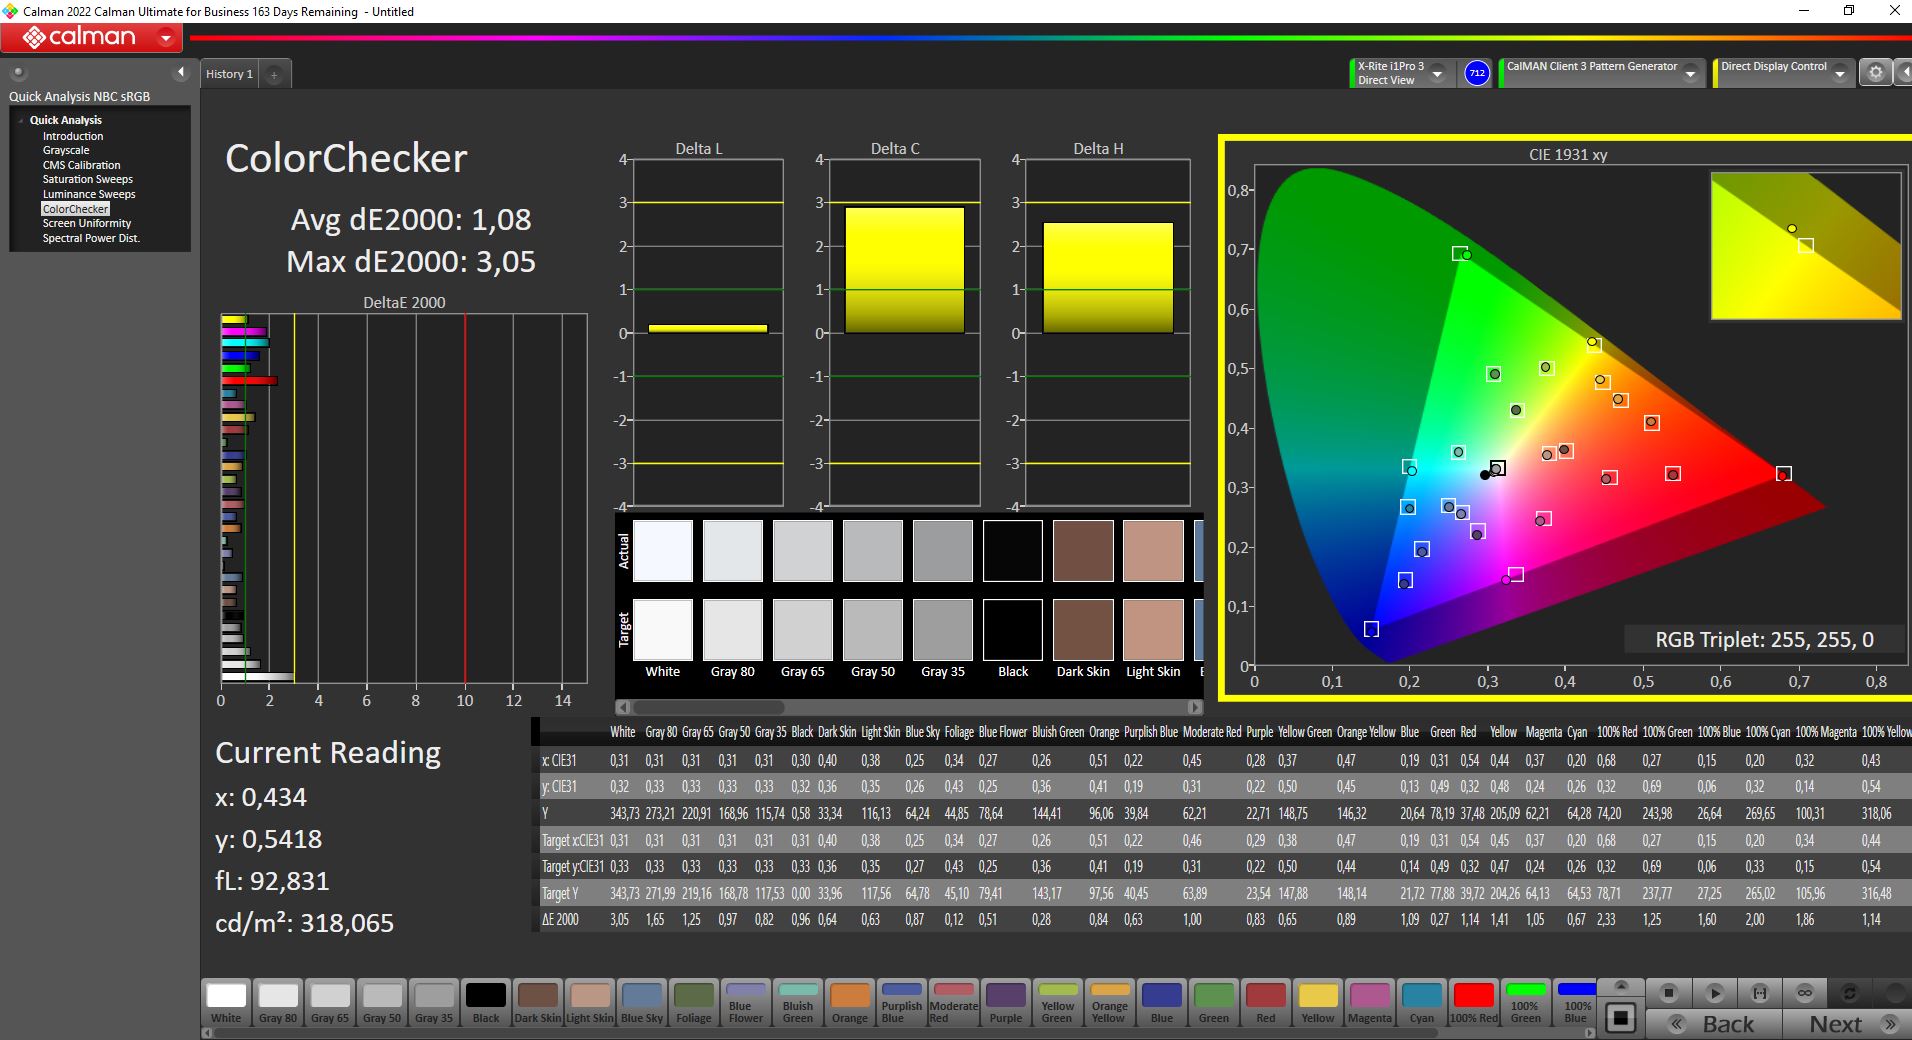
ΔE ColorChecker Calman: 1.08 | ∀{0.5-29.43 Ø4.71}
calibrated: 1.08
ΔE Greyscale Calman: 1.14 | ∀{0.09-98 Ø4.96}
84.5% AdobeRGB 1998 (Argyll 3D)
99.9% sRGB (Argyll 3D)
96.6% Display P3 (Argyll 3D)
Gamma: 2.41
CCT: 6687 K
| Schenker XMG Focus 17 (E23) BOE09F9 NE173QHM-NZ1, IPS, 2560x1440, 17.3" | Lenovo Legion Pro 5 16ARX8 CSOT T3 MNG007DA1-Q, IPS, 2560x1600, 16" | Medion Erazer Major X20 BOE CQ NE160QDM-NZ1, IPS, 2560x1600, 16" | Schenker XMG Neo 17 M22 BOE0A99, IPS, 2560x1600, 17" | HP Omen 17-ck2097ng BOE BOE09BF, IPS, 2560x1440, 17.3" | Medion Erazer Defender P40 BOE CQ NE173QHM-NZ3, IPS, 2560x1440, 17.3" | |
|---|---|---|---|---|---|---|
| Display | -14% | -15% | -16% | -17% | -16% | |
| Display P3 Coverage (%) | 96.6 | 70.4 -27% | 69.4 -28% | 69 -29% | 67.4 -30% | 68.3 -29% |
| sRGB Coverage (%) | 99.9 | 99.6 0% | 98 -2% | 99.8 0% | 97.6 -2% | 98.1 -2% |
| AdobeRGB 1998 Coverage (%) | 84.5 | 72.6 -14% | 70.9 -16% | 69.6 -18% | 69.6 -18% | 69.8 -17% |
| Response Times | 37% | 26% | 39% | 12% | 15% | |
| Response Time Grey 50% / Grey 80% * (ms) | 16.4 ? | 7 ? 57% | 13.1 ? 20% | 10.8 ? 34% | 15.6 ? 5% | 14.6 ? 11% |
| Response Time Black / White * (ms) | 10.8 ? | 9.1 ? 16% | 7.3 ? 32% | 6.1 ? 44% | 8.9 ? 18% | 8.7 ? 19% |
| PWM Frequency (Hz) | ||||||
| Screen | 21% | -23% | 9% | -7% | 11% | |
| Brightness middle (cd/m²) | 349 | 355.3 2% | 374 7% | 415 19% | 371 6% | 364 4% |
| Brightness (cd/m²) | 318 | 340 7% | 357 12% | 399 25% | 350 10% | 343 8% |
| Brightness Distribution (%) | 82 | 91 11% | 92 12% | 90 10% | 90 10% | 86 5% |
| Black Level * (cd/m²) | 0.56 | 0.32 43% | 0.33 41% | 0.43 23% | 0.32 43% | 0.28 50% |
| Contrast (:1) | 623 | 1110 78% | 1133 82% | 965 55% | 1159 86% | 1300 109% |
| Colorchecker dE 2000 * | 1.08 | 1.13 -5% | 2.43 -125% | 1.44 -33% | 1.74 -61% | 1.67 -55% |
| Colorchecker dE 2000 max. * | 3.05 | 2.78 9% | 3.97 -30% | 2.33 24% | 3.59 -18% | 2.78 9% |
| Colorchecker dE 2000 calibrated * | 1.08 | 0.32 70% | 1.4 -30% | 0.89 18% | 1.01 6% | 1.14 -6% |
| Greyscale dE 2000 * | 1.14 | 1.4 -23% | 3.1 -172% | 1.8 -58% | 2.8 -146% | 1.4 -23% |
| Gamma | 2.41 91% | 2.24 98% | 2.191 100% | 2.132 103% | 2.19 100% | 2.091 105% |
| CCT | 6687 97% | 6372 102% | 6194 105% | 6327 103% | 6474 100% | 6568 99% |
| Media total (Programa/Opciones) | 15% /
16% | -4% /
-14% | 11% /
8% | -4% /
-7% | 3% /
6% |
* ... más pequeño es mejor
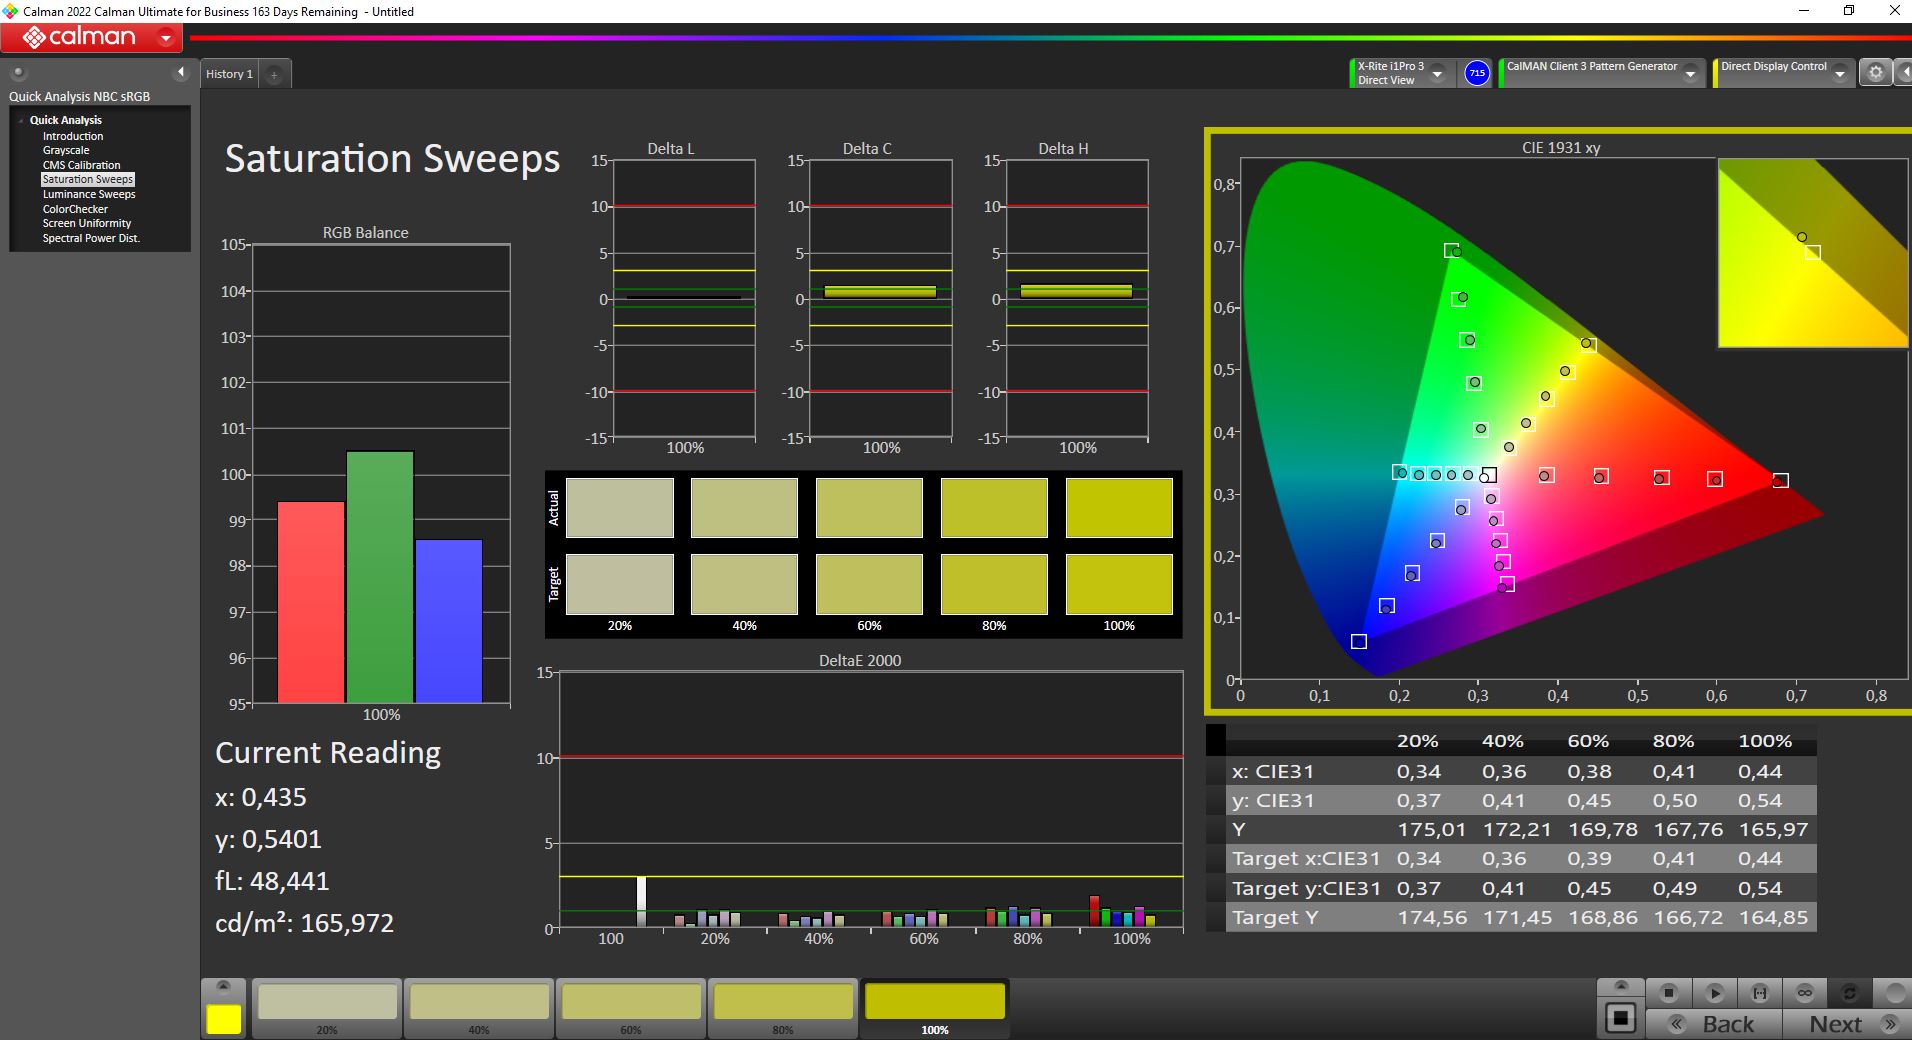
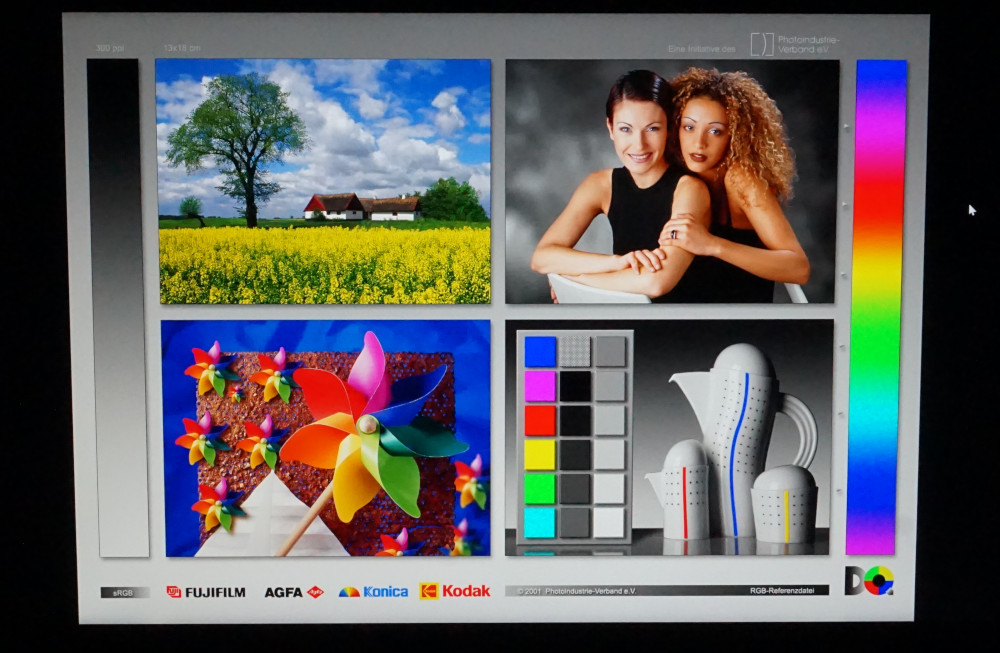
La reproducción del color es muy buena. El espacio de color sRGB utilizado para juegos y la mayoría de aplicaciones no profesionales está básicamente cubierto por completo. Incluso DCI-P3 se puede representar en gran medida. Por tanto, la reproducción del color está por encima de la media.
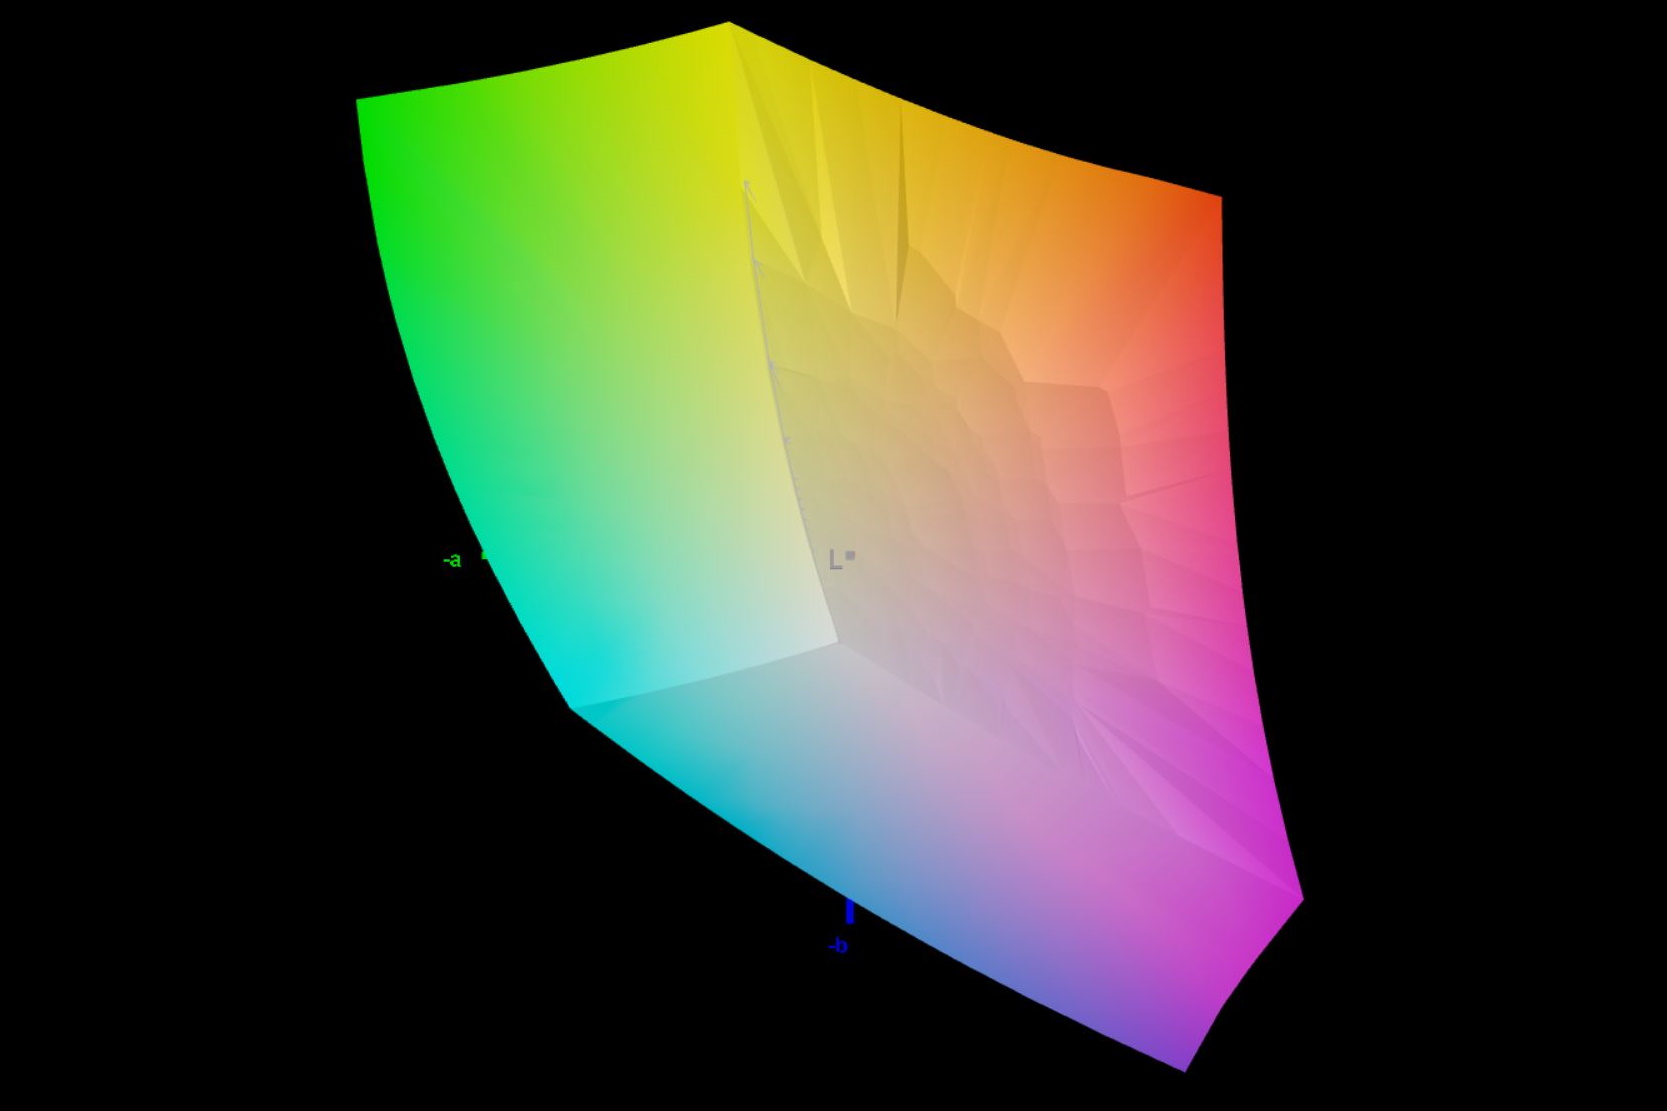
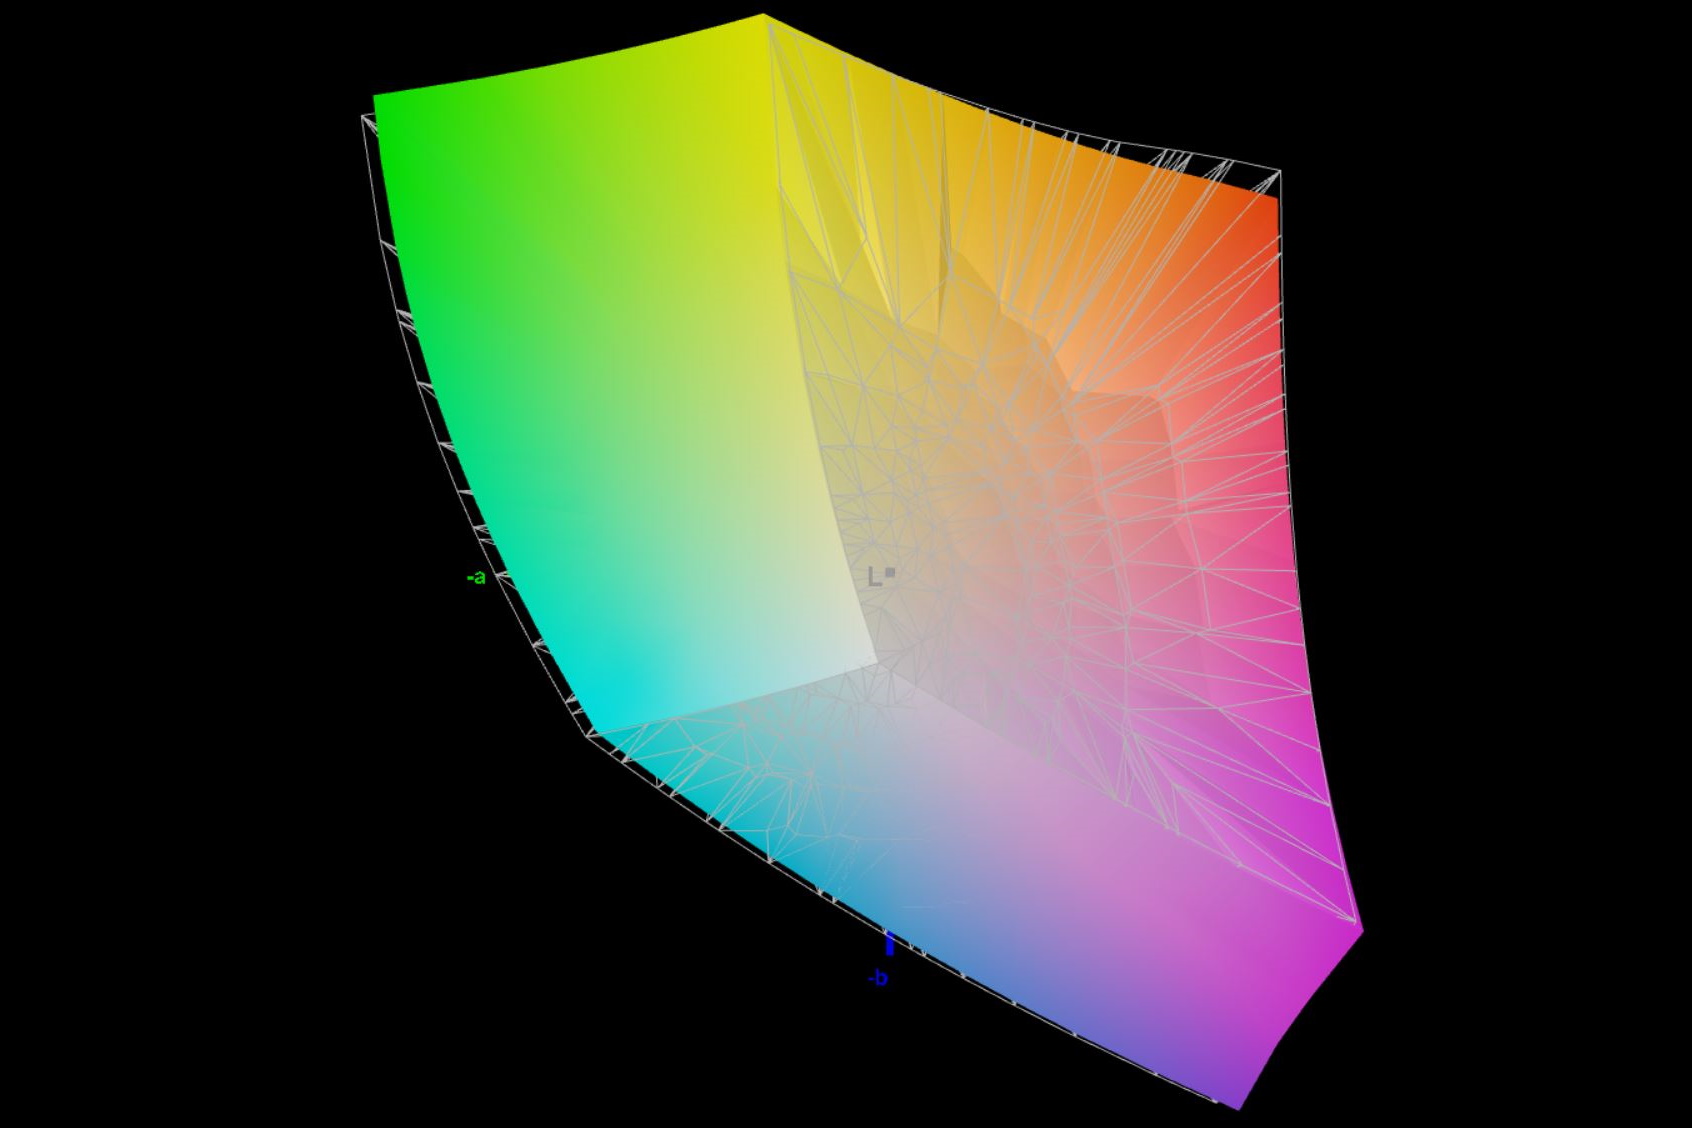
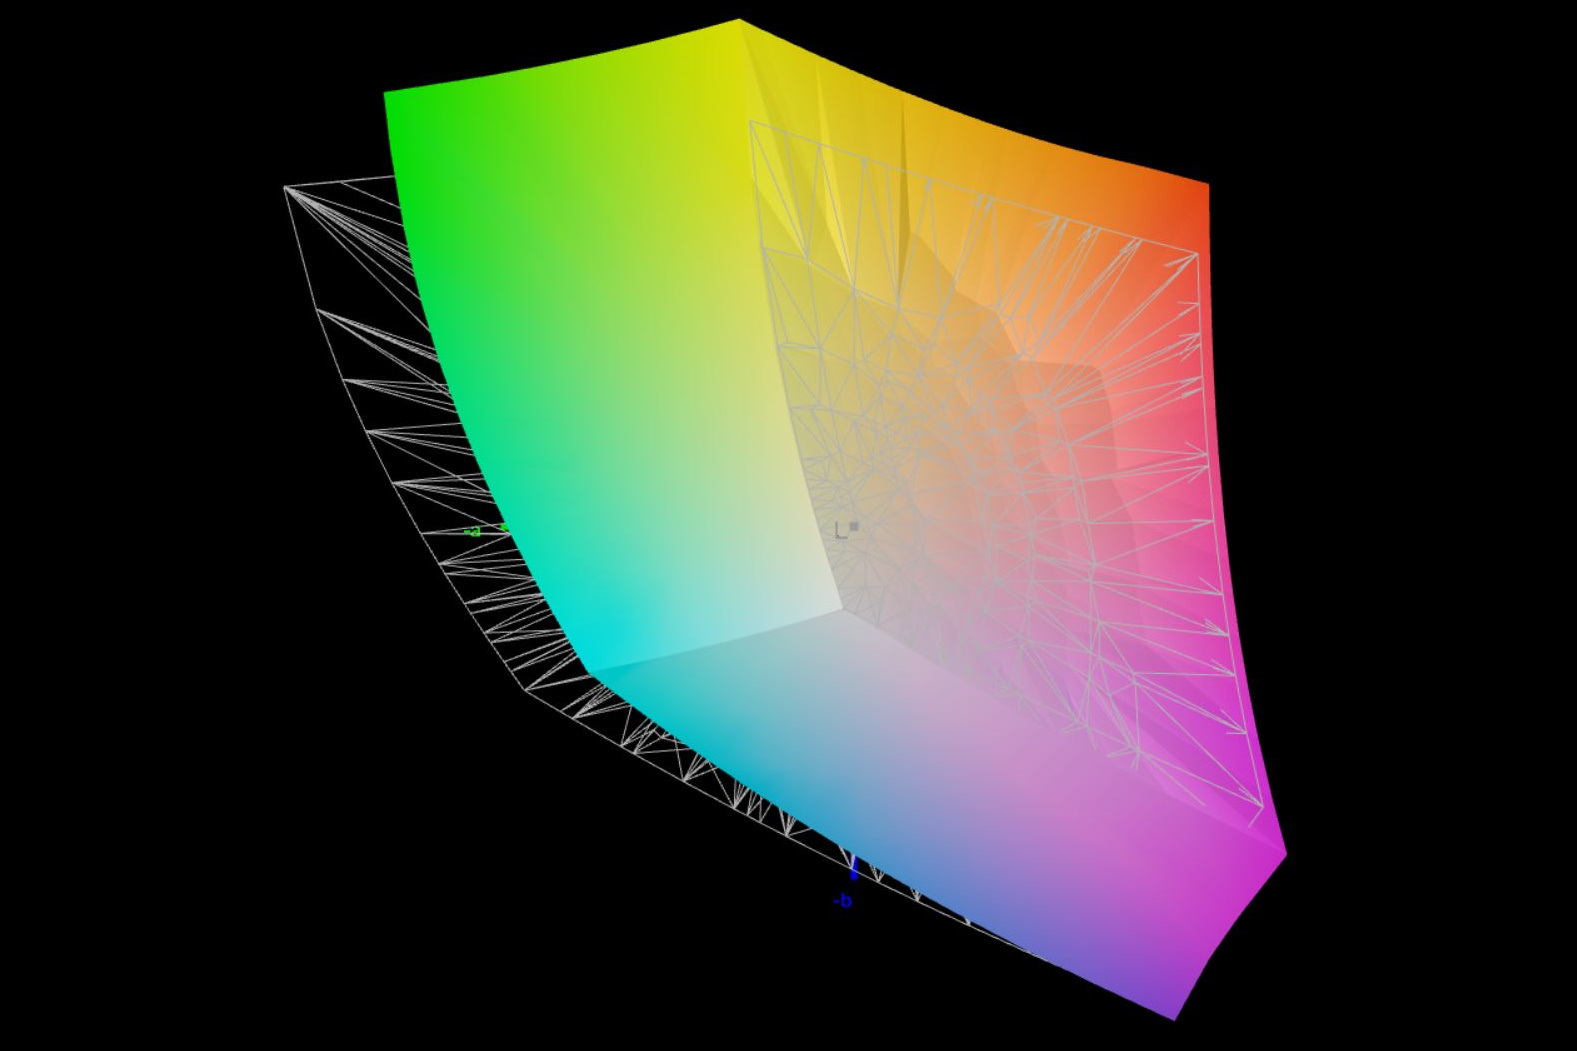
Destacan las bajas desviaciones de color medidas sin calibración previa. Incluso la DeltaE máxima determinada de algo menos de 3 significa que no se detectan diferencias a simple vista. De este modo, no es necesario ajustar posteriormente la pantalla para obtener una visualización óptima.
Tiempos de respuesta del display
| ↔ Tiempo de respuesta de Negro a Blanco | ||
|---|---|---|
| 10.8 ms ... subida ↗ y bajada ↘ combinada | ↗ 4.6 ms subida | 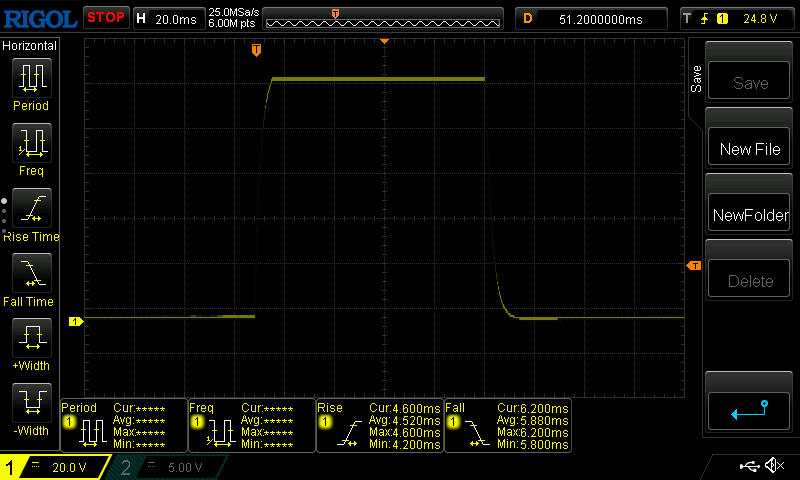 |
| ↘ 6.2 ms bajada | ||
| La pantalla mostró buenos tiempos de respuesta en nuestros tests pero podría ser demasiado lenta para los jugones competitivos. En comparación, todos los dispositivos de prueba van de ##min### (mínimo) a 240 (máximo) ms. » 29 % de todos los dispositivos son mejores. Esto quiere decir que el tiempo de respuesta medido es mejor que la media (19.8 ms) de todos los dispositivos testados. | ||
| ↔ Tiempo de respuesta 50% Gris a 80% Gris | ||
| 16.4 ms ... subida ↗ y bajada ↘ combinada | ↗ 7.4 ms subida | 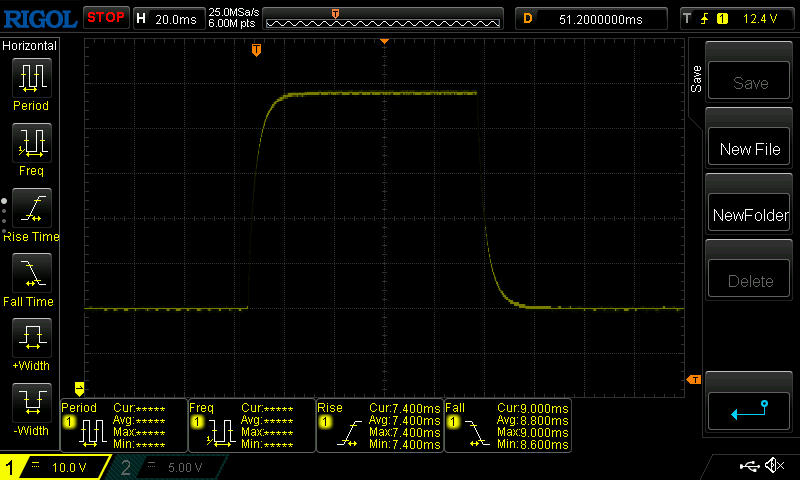 |
| ↘ 9 ms bajada | ||
| La pantalla mostró buenos tiempos de respuesta en nuestros tests pero podría ser demasiado lenta para los jugones competitivos. En comparación, todos los dispositivos de prueba van de ##min### (mínimo) a 636 (máximo) ms. » 31 % de todos los dispositivos son mejores. Esto quiere decir que el tiempo de respuesta medido es mejor que la media (31 ms) de todos los dispositivos testados. | ||
Parpadeo de Pantalla / PWM (Pulse-Width Modulation)
| Parpadeo de Pantalla / PWM no detectado | 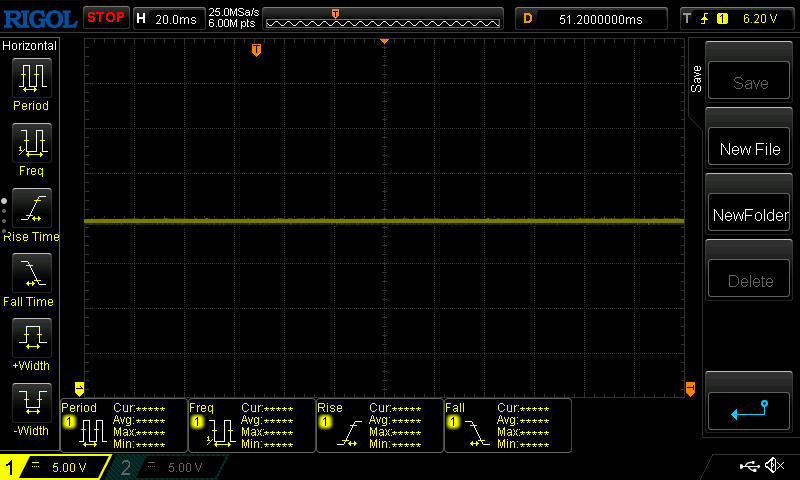 | ||
Comparación: 52 % de todos los dispositivos testados no usaron PWM para atenuar el display. Si se usó, medimos una media de 7757 (mínimo: 5 - máxmo: 343500) Hz. | |||
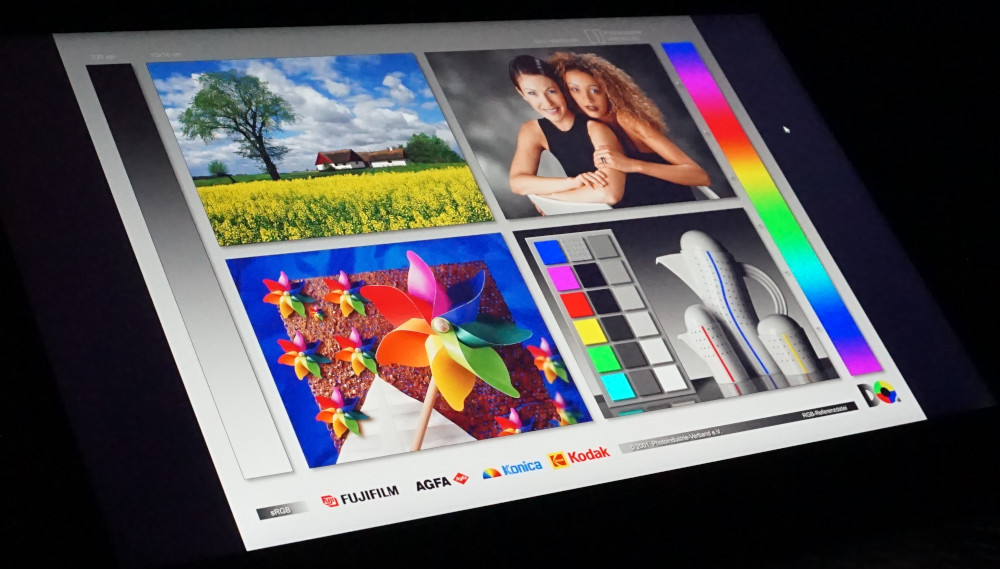
Con sólo 350 cd/m², la visibilidad en exteriores se resiente considerablemente. Los colores aún pueden reconocerse bien en un lugar sombreado. Sin embargo, si cae un poco más de luz sobre la pantalla, como mucho se pueden reconocer bien los textos. Lo mismo ocurre en un día nublado.
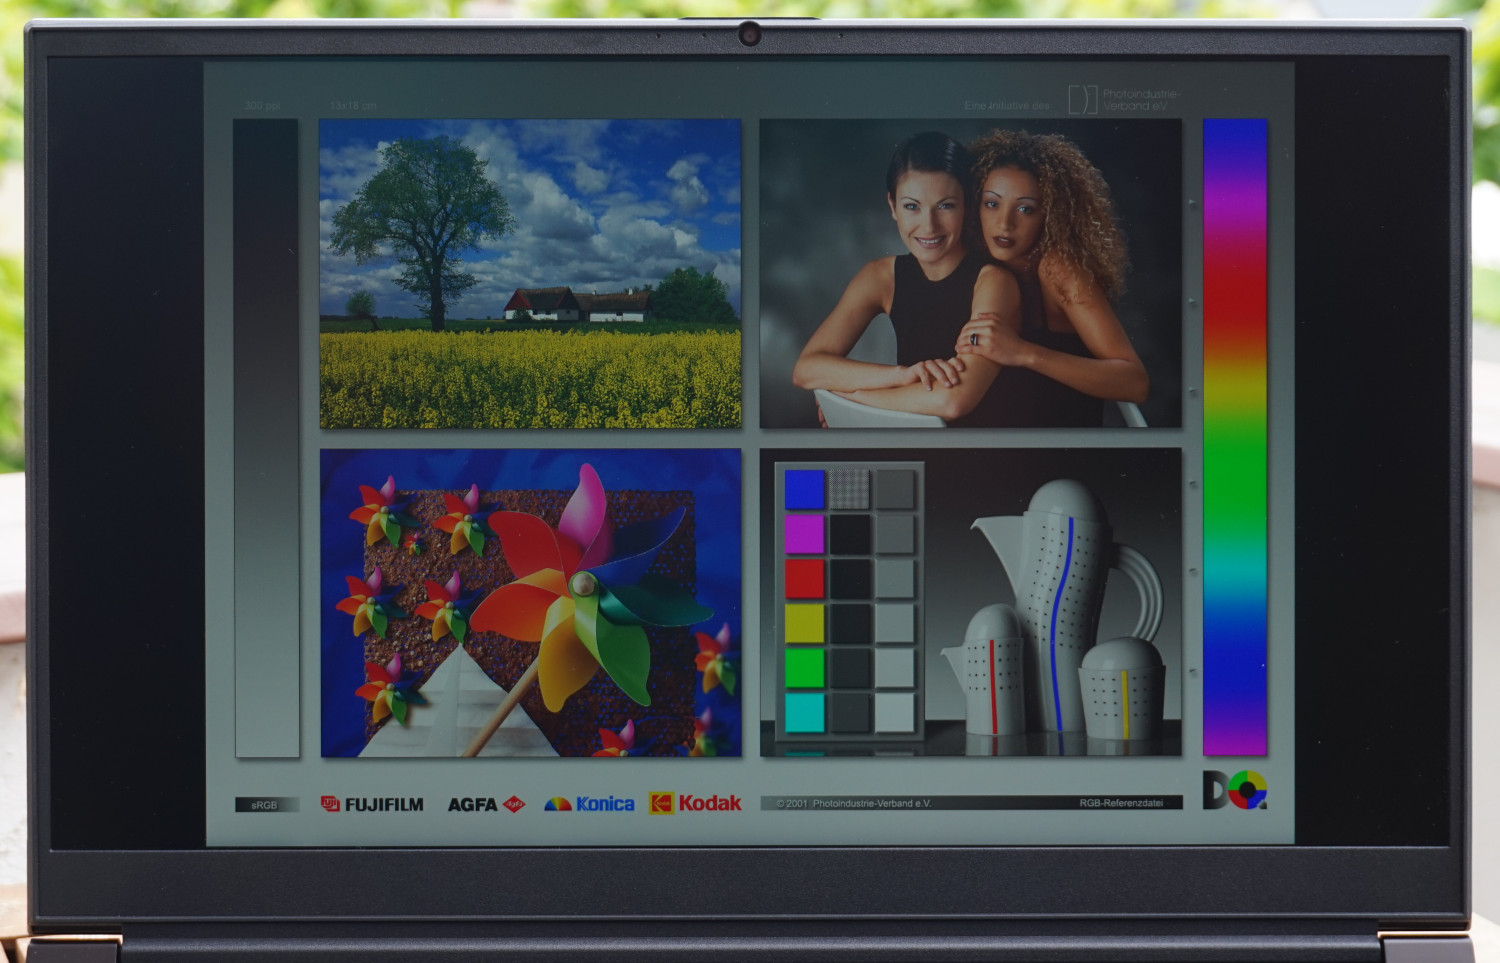
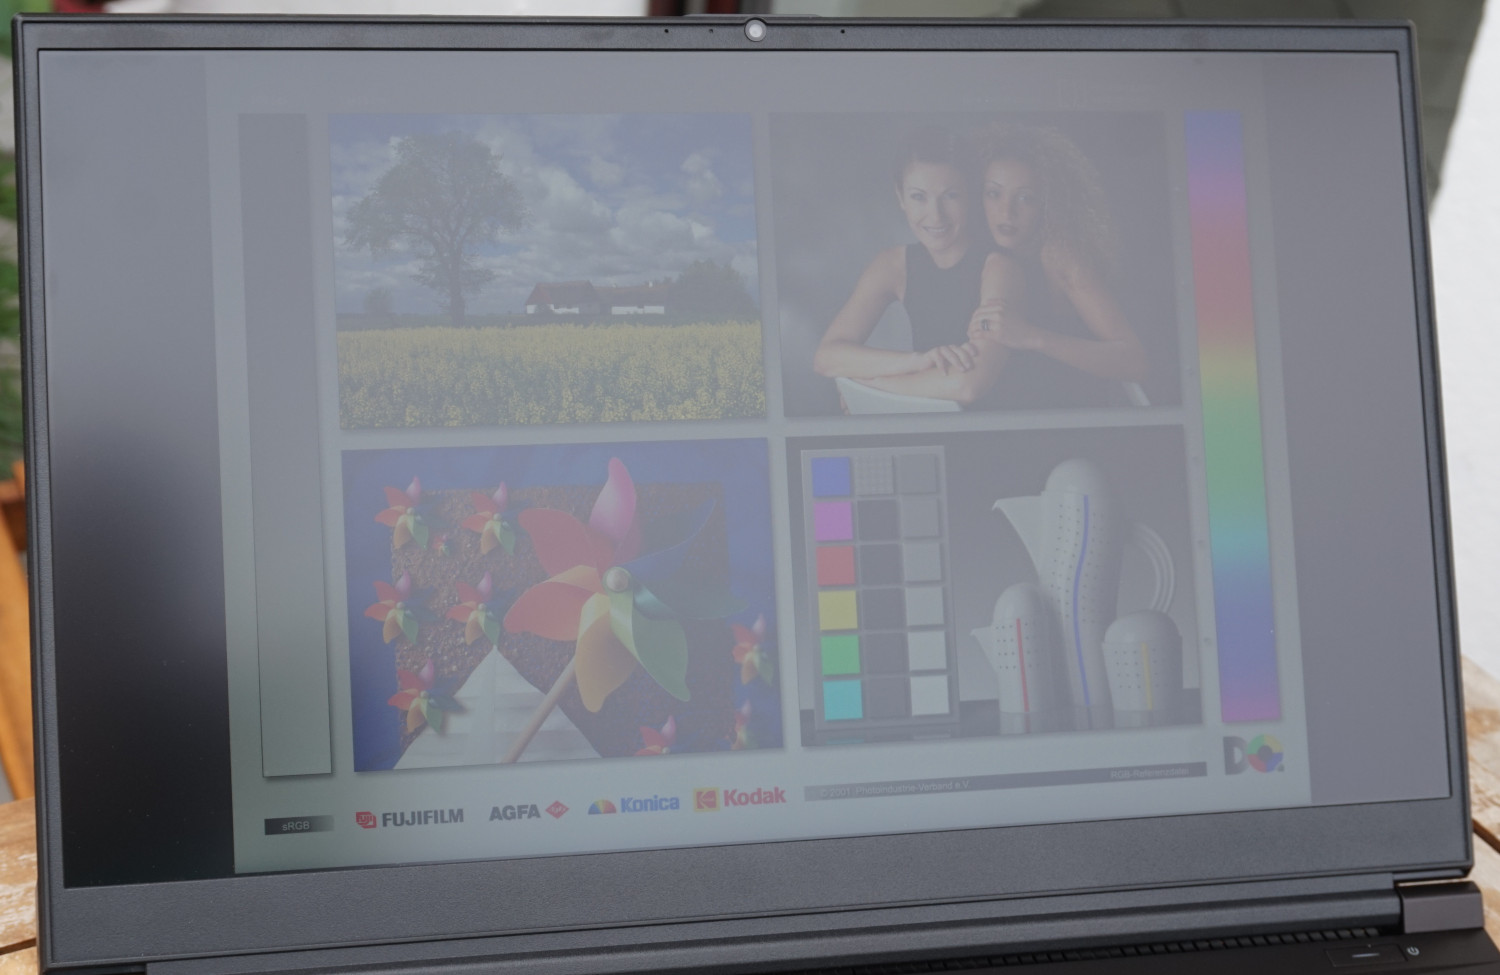
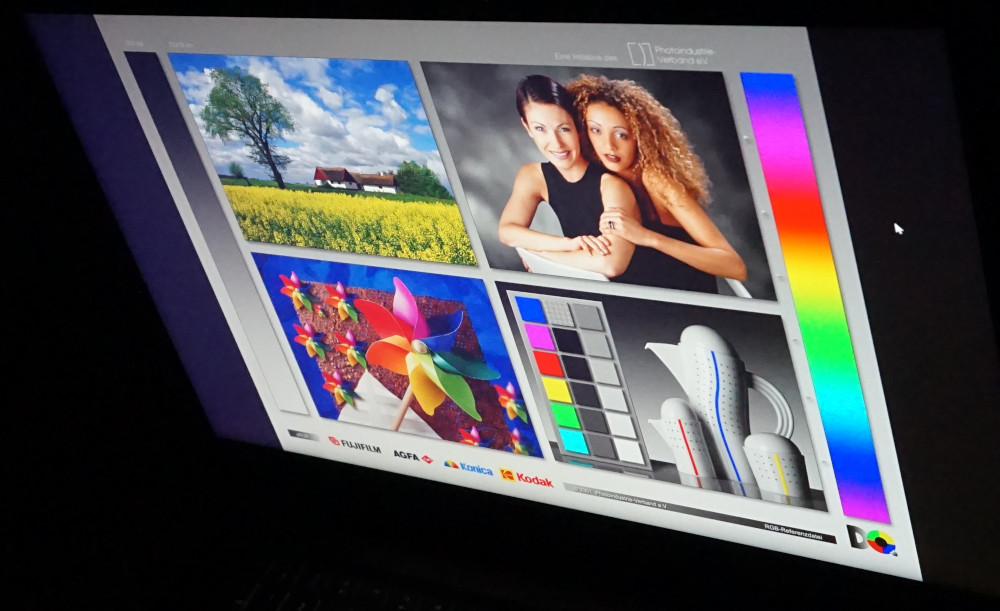
La reproducción del color desde diferentes ángulos de visión es previsiblemente buena. El panel IPS no revela cambios de color y el brillo también permanece casi constante, incluso desde un ángulo agudo.
Rendimiento - Juego sólido con el Focus 17
Especialmente la potente Nvidia Geforce RTX 4070 determina las posibilidades de aplicación del Focus 17 E23. La GPU ofrece mucho rendimiento emparejado con suficiente VRAM para títulos actuales que pueden jugarse mayormente a la resolución nativa QHD y casi todos los detalles. Esto también debería aplicarse a los próximos juegos en un futuro próximo.
Al mismo tiempo, se garantiza una buena velocidad de trabajo gracias al Intel Core i9-13900HX. Las aplicaciones complejas se pueden procesar rápidamente. La multitarea no plantea problemas ni siquiera en un alto grado. Sin embargo, el rendimiento de la CPU es secundario en el mejor de los casos en un portátil para juegos.
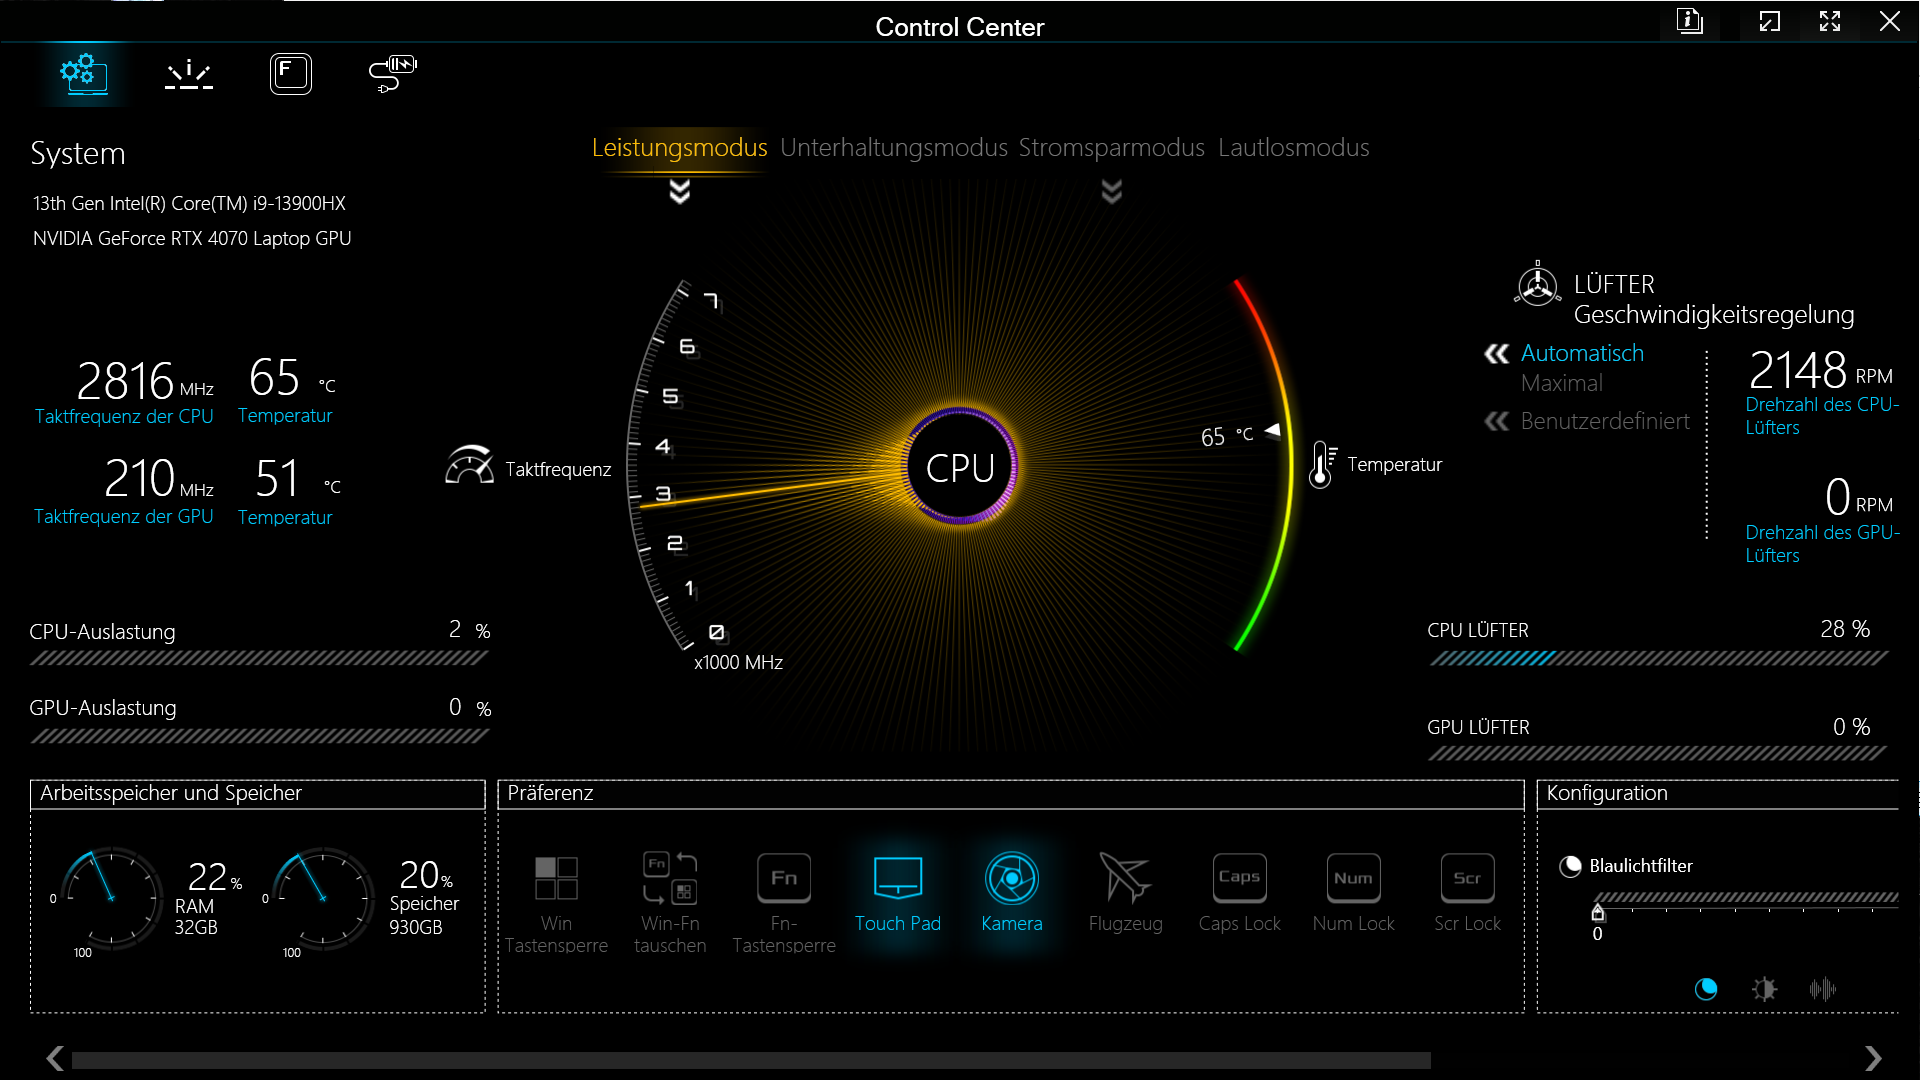
Condiciones de la prueba
Se pueden seleccionar cuatro modos de rendimiento predefinidos en el ControlCenter preinstalado. Siempre usamos el "Modo Rendimiento" para nuestras pruebas y benchmarks, que asegura las mayores velocidades de ventilador y el máximo suministro de energía a la GPU y la CPU.
Los valores son mínimamente más débiles en el "Modo Entretenimiento". Sólo el rendimiento de la CPU se reduce ligeramente aquí, por lo que apenas cabe esperar efectos notables en los juegos. el "Modo silencioso", por otro lado, restringe considerablemente el rendimiento del sistema, pero el desarrollo del ruido se desvanece en el fondo, aunque no desaparezca por completo. Los juegos menos exigentes siguen siendo jugables incluso en este modo. Entre otros, Witcher 3 alcanza más de 60 fps en los ajustes más altos y en Full HD.
El "modo de ahorro de energía" desactiva por completo el chip gráfico dedicado y es, según el estado actual de las cosas, obligatorio para lograr una duración de la batería medianamente aceptable, al menos en el sistema que probamos.
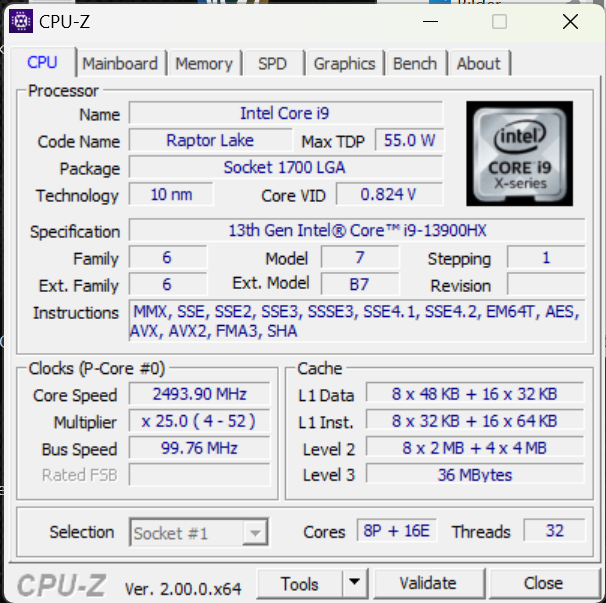
Procesador
Lo indican un total de 32 hilos y 36 MB de caché de nivel 3, así como una velocidad de reloj máxima de 5,4 GHz: El Intel Core i9-13900HX es actualmente una de las mejores CPU móviles. Se utiliza de forma óptima para aplicaciones multitarea y de cálculo intensivo y deja atrás a su predecesor Intel Core i9-12900HX o a un AMD Ryzen 7 7745HX detrás.
En el XMG Focus 17, la CPU recibe hasta 162 W durante fracciones de segundo. Al menos 135 W pueden alimentarse durante medio minuto. Desafortunadamente, la refrigeración no puede hacer frente al elevado desarrollo de calor. En el Medion Erazer Major X20, el procesador idéntico se mantiene estable al máximo rendimiento. En el Focus 17, el rendimiento cae más de un 20% en la prueba Cinebench R15. Sin embargo, el i9 del HP Omen 17-ck2097ng pierde incluso un 30%, por lo que el comportamiento general parece aceptable.
El hecho de que el procesador esté algo sobredimensionado se hace evidente cuando miramos al "Modo Entretenimiento". El ventilador sigue siendo ruidoso aquí también, aunque la fuente de alimentación se reduce de 135 W a 55 W. Al mismo tiempo, no medimos ninguna reducción de rendimiento seria, especialmente en juegos. Esto se debe a que la CPU sólo puede funcionar de forma suficientemente estable con este consumo de energía a largo plazo. En consecuencia, el modo de energía sólo tiene efecto durante cargas a corto plazo.
Sólo se conceden 15 W en los modos silencioso y de ahorro de energía y 30 W durante periodos cortos.
Encontrará más mediciones, datos comparativos e información en nuestra Lista de pruebas de CPU.
Cinebench R15 Multi loop
Cinebench R23: Multi Core | Single Core
Cinebench R20: CPU (Multi Core) | CPU (Single Core)
Cinebench R15: CPU Multi 64Bit | CPU Single 64Bit
Blender: v2.79 BMW27 CPU
7-Zip 18.03: 7z b 4 | 7z b 4 -mmt1
Geekbench 5.5: Multi-Core | Single-Core
HWBOT x265 Benchmark v2.2: 4k Preset
LibreOffice : 20 Documents To PDF
R Benchmark 2.5: Overall mean
| CPU Performance rating | |
| Medio Intel Core i9-13900HX | |
| Medion Erazer Major X20 | |
| HP Omen 17-ck2097ng | |
| Schenker XMG Focus 17 (E23) | |
| Media de la clase Gaming | |
| MSI Titan GT77 12UHS | |
| Lenovo Legion Pro 5 16ARX8 | |
| Medion Erazer Defender P40 | |
| Schenker XMG Neo 17 M22 | |
| Cinebench R23 / Multi Core | |
| Medio Intel Core i9-13900HX (24270 - 32623, n=23) | |
| Medion Erazer Major X20 | |
| Schenker XMG Focus 17 (E23) | |
| HP Omen 17-ck2097ng | |
| Media de la clase Gaming (10488 - 42661, n=107, últimos 2 años) | |
| MSI Titan GT77 12UHS | |
| Medion Erazer Defender P40 | |
| Lenovo Legion Pro 5 16ARX8 | |
| Schenker XMG Neo 17 M22 | |
| Cinebench R23 / Single Core | |
| HP Omen 17-ck2097ng | |
| Medio Intel Core i9-13900HX (1867 - 2105, n=20) | |
| Medion Erazer Major X20 | |
| Media de la clase Gaming (1166 - 2415, n=107, últimos 2 años) | |
| Schenker XMG Focus 17 (E23) | |
| MSI Titan GT77 12UHS | |
| Lenovo Legion Pro 5 16ARX8 | |
| Medion Erazer Defender P40 | |
| Schenker XMG Neo 17 M22 | |
| Cinebench R20 / CPU (Multi Core) | |
| Medio Intel Core i9-13900HX (9152 - 12541, n=21) | |
| Medion Erazer Major X20 | |
| Media de la clase Gaming (4029 - 16433, n=106, últimos 2 años) | |
| Schenker XMG Focus 17 (E23) | |
| HP Omen 17-ck2097ng | |
| MSI Titan GT77 12UHS | |
| Medion Erazer Defender P40 | |
| Lenovo Legion Pro 5 16ARX8 | |
| Schenker XMG Neo 17 M22 | |
| Cinebench R20 / CPU (Single Core) | |
| HP Omen 17-ck2097ng | |
| Medio Intel Core i9-13900HX (722 - 810, n=21) | |
| Media de la clase Gaming (442 - 913, n=106, últimos 2 años) | |
| Medion Erazer Major X20 | |
| Schenker XMG Focus 17 (E23) | |
| MSI Titan GT77 12UHS | |
| Lenovo Legion Pro 5 16ARX8 | |
| Medion Erazer Defender P40 | |
| Schenker XMG Neo 17 M22 | |
| Cinebench R15 / CPU Multi 64Bit | |
| Medio Intel Core i9-13900HX (3913 - 4970, n=22) | |
| Schenker XMG Focus 17 (E23) | |
| Medion Erazer Major X20 | |
| HP Omen 17-ck2097ng | |
| Media de la clase Gaming (1578 - 6330, n=105, últimos 2 años) | |
| MSI Titan GT77 12UHS | |
| Medion Erazer Defender P40 | |
| Lenovo Legion Pro 5 16ARX8 | |
| Schenker XMG Neo 17 M22 | |
| Cinebench R15 / CPU Single 64Bit | |
| HP Omen 17-ck2097ng | |
| Medion Erazer Major X20 | |
| Media de la clase Gaming (188.8 - 350, n=106, últimos 2 años) | |
| Lenovo Legion Pro 5 16ARX8 | |
| Medio Intel Core i9-13900HX (247 - 304, n=22) | |
| Schenker XMG Focus 17 (E23) | |
| MSI Titan GT77 12UHS | |
| Schenker XMG Neo 17 M22 | |
| Medion Erazer Defender P40 | |
| Blender / v2.79 BMW27 CPU | |
| Schenker XMG Neo 17 M22 | |
| Medion Erazer Defender P40 | |
| Lenovo Legion Pro 5 16ARX8 | |
| HP Omen 17-ck2097ng | |
| Media de la clase Gaming (79 - 330, n=104, últimos 2 años) | |
| MSI Titan GT77 12UHS | |
| Schenker XMG Focus 17 (E23) | |
| Medio Intel Core i9-13900HX (101 - 153, n=22) | |
| Medion Erazer Major X20 | |
| 7-Zip 18.03 / 7z b 4 | |
| Medion Erazer Major X20 | |
| Medio Intel Core i9-13900HX (90675 - 127283, n=21) | |
| Schenker XMG Focus 17 (E23) | |
| HP Omen 17-ck2097ng | |
| Media de la clase Gaming (33491 - 148086, n=105, últimos 2 años) | |
| MSI Titan GT77 12UHS | |
| Lenovo Legion Pro 5 16ARX8 | |
| Medion Erazer Defender P40 | |
| Schenker XMG Neo 17 M22 | |
| 7-Zip 18.03 / 7z b 4 -mmt1 | |
| Lenovo Legion Pro 5 16ARX8 | |
| HP Omen 17-ck2097ng | |
| Medion Erazer Major X20 | |
| Medio Intel Core i9-13900HX (6340 - 7177, n=21) | |
| Schenker XMG Focus 17 (E23) | |
| Media de la clase Gaming (4199 - 7436, n=105, últimos 2 años) | |
| MSI Titan GT77 12UHS | |
| Schenker XMG Neo 17 M22 | |
| Medion Erazer Defender P40 | |
| Geekbench 5.5 / Multi-Core | |
| HP Omen 17-ck2097ng | |
| Medio Intel Core i9-13900HX (17614 - 21075, n=22) | |
| Medion Erazer Major X20 | |
| Schenker XMG Focus 17 (E23) | |
| Media de la clase Gaming (6460 - 28263, n=105, últimos 2 años) | |
| MSI Titan GT77 12UHS | |
| Medion Erazer Defender P40 | |
| Lenovo Legion Pro 5 16ARX8 | |
| Schenker XMG Neo 17 M22 | |
| Geekbench 5.5 / Single-Core | |
| HP Omen 17-ck2097ng | |
| Media de la clase Gaming (986 - 2474, n=105, últimos 2 años) | |
| Lenovo Legion Pro 5 16ARX8 | |
| Medion Erazer Major X20 | |
| Medio Intel Core i9-13900HX (1345 - 2093, n=22) | |
| Schenker XMG Focus 17 (E23) | |
| MSI Titan GT77 12UHS | |
| Medion Erazer Defender P40 | |
| Schenker XMG Neo 17 M22 | |
| HWBOT x265 Benchmark v2.2 / 4k Preset | |
| Medio Intel Core i9-13900HX (23.5 - 34.4, n=22) | |
| Medion Erazer Major X20 | |
| Media de la clase Gaming (11.5 - 44.4, n=105, últimos 2 años) | |
| Schenker XMG Focus 17 (E23) | |
| MSI Titan GT77 12UHS | |
| HP Omen 17-ck2097ng | |
| Lenovo Legion Pro 5 16ARX8 | |
| Medion Erazer Defender P40 | |
| Schenker XMG Neo 17 M22 | |
| LibreOffice / 20 Documents To PDF | |
| Schenker XMG Neo 17 M22 | |
| Schenker XMG Focus 17 (E23) | |
| Medion Erazer Defender P40 | |
| Media de la clase Gaming (33.2 - 88.8, n=105, últimos 2 años) | |
| HP Omen 17-ck2097ng | |
| Medio Intel Core i9-13900HX (32.8 - 51.1, n=21) | |
| Medion Erazer Major X20 | |
| MSI Titan GT77 12UHS | |
| Lenovo Legion Pro 5 16ARX8 | |
| R Benchmark 2.5 / Overall mean | |
| Medion Erazer Defender P40 | |
| Schenker XMG Neo 17 M22 | |
| Media de la clase Gaming (0.3439 - 0.759, n=106, últimos 2 años) | |
| Schenker XMG Focus 17 (E23) | |
| Lenovo Legion Pro 5 16ARX8 | |
| MSI Titan GT77 12UHS | |
| Medio Intel Core i9-13900HX (0.375 - 0.4564, n=22) | |
| Medion Erazer Major X20 | |
| HP Omen 17-ck2097ng | |
* ... más pequeño es mejor
AIDA64: FP32 Ray-Trace | FPU Julia | CPU SHA3 | CPU Queen | FPU SinJulia | FPU Mandel | CPU AES | CPU ZLib | FP64 Ray-Trace | CPU PhotoWorxx
| Performance rating | |
| Media de la clase Gaming | |
| Medio Intel Core i9-13900HX | |
| Medion Erazer Major X20 | |
| Schenker XMG Focus 17 (E23) | |
| Lenovo Legion Pro 5 16ARX8 | |
| HP Omen 17-ck2097ng | |
| Schenker XMG Neo 17 M22 | |
| Medion Erazer Defender P40 | |
| AIDA64 / FP32 Ray-Trace | |
| Media de la clase Gaming (10227 - 85542, n=105, últimos 2 años) | |
| Lenovo Legion Pro 5 16ARX8 | |
| Medion Erazer Major X20 | |
| Medio Intel Core i9-13900HX (17589 - 27615, n=22) | |
| Schenker XMG Focus 17 (E23) | |
| HP Omen 17-ck2097ng | |
| Schenker XMG Neo 17 M22 | |
| Medion Erazer Defender P40 | |
| AIDA64 / FPU Julia | |
| Media de la clase Gaming (51376 - 238426, n=105, últimos 2 años) | |
| Medion Erazer Major X20 | |
| Medio Intel Core i9-13900HX (88686 - 137015, n=22) | |
| Lenovo Legion Pro 5 16ARX8 | |
| Schenker XMG Focus 17 (E23) | |
| Schenker XMG Neo 17 M22 | |
| HP Omen 17-ck2097ng | |
| Medion Erazer Defender P40 | |
| AIDA64 / CPU SHA3 | |
| Media de la clase Gaming (2180 - 10115, n=105, últimos 2 años) | |
| Medion Erazer Major X20 | |
| Medio Intel Core i9-13900HX (4362 - 7029, n=22) | |
| Schenker XMG Focus 17 (E23) | |
| Lenovo Legion Pro 5 16ARX8 | |
| HP Omen 17-ck2097ng | |
| Schenker XMG Neo 17 M22 | |
| Medion Erazer Defender P40 | |
| AIDA64 / CPU Queen | |
| Schenker XMG Focus 17 (E23) | |
| HP Omen 17-ck2097ng | |
| Medion Erazer Major X20 | |
| Medio Intel Core i9-13900HX (125644 - 141385, n=22) | |
| Lenovo Legion Pro 5 16ARX8 | |
| Media de la clase Gaming (49785 - 173351, n=90, últimos 2 años) | |
| Medion Erazer Defender P40 | |
| Schenker XMG Neo 17 M22 | |
| AIDA64 / FPU SinJulia | |
| Lenovo Legion Pro 5 16ARX8 | |
| Medion Erazer Major X20 | |
| Medio Intel Core i9-13900HX (12334 - 17179, n=22) | |
| Media de la clase Gaming (4424 - 33636, n=105, últimos 2 años) | |
| Schenker XMG Focus 17 (E23) | |
| Schenker XMG Neo 17 M22 | |
| HP Omen 17-ck2097ng | |
| Medion Erazer Defender P40 | |
| AIDA64 / FPU Mandel | |
| Media de la clase Gaming (25115 - 128721, n=105, últimos 2 años) | |
| Lenovo Legion Pro 5 16ARX8 | |
| Medion Erazer Major X20 | |
| Medio Intel Core i9-13900HX (43850 - 69202, n=22) | |
| Schenker XMG Neo 17 M22 | |
| Schenker XMG Focus 17 (E23) | |
| HP Omen 17-ck2097ng | |
| Medion Erazer Defender P40 | |
| AIDA64 / CPU AES | |
| Medio Intel Core i9-13900HX (89413 - 237881, n=22) | |
| Schenker XMG Neo 17 M22 | |
| Medion Erazer Major X20 | |
| Media de la clase Gaming (39258 - 247074, n=105, últimos 2 años) | |
| Schenker XMG Focus 17 (E23) | |
| HP Omen 17-ck2097ng | |
| Medion Erazer Defender P40 | |
| Lenovo Legion Pro 5 16ARX8 | |
| AIDA64 / CPU ZLib | |
| Medion Erazer Major X20 | |
| Medio Intel Core i9-13900HX (1284 - 1958, n=22) | |
| Schenker XMG Focus 17 (E23) | |
| Media de la clase Gaming (574 - 2531, n=105, últimos 2 años) | |
| HP Omen 17-ck2097ng | |
| Lenovo Legion Pro 5 16ARX8 | |
| Medion Erazer Defender P40 | |
| Schenker XMG Neo 17 M22 | |
| AIDA64 / FP64 Ray-Trace | |
| Media de la clase Gaming (5509 - 45446, n=105, últimos 2 años) | |
| Lenovo Legion Pro 5 16ARX8 | |
| Medion Erazer Major X20 | |
| Medio Intel Core i9-13900HX (9481 - 15279, n=22) | |
| Schenker XMG Focus 17 (E23) | |
| HP Omen 17-ck2097ng | |
| Schenker XMG Neo 17 M22 | |
| Medion Erazer Defender P40 | |
| AIDA64 / CPU PhotoWorxx | |
| HP Omen 17-ck2097ng | |
| Schenker XMG Focus 17 (E23) | |
| Medio Intel Core i9-13900HX (42994 - 51994, n=22) | |
| Media de la clase Gaming (12271 - 89891, n=105, últimos 2 años) | |
| Medion Erazer Major X20 | |
| Medion Erazer Defender P40 | |
| Schenker XMG Neo 17 M22 | |
| Lenovo Legion Pro 5 16ARX8 | |
Rendimiento del sistema
Muchos núcleos de procesador, mucha RAM con acceso rápido y un SSD veloz impulsan el sistema en cualquier situación. Incluso un juego en pausa en segundo plano sólo se ralentiza un poco. Desde la multitarea extensiva con software de edición de vídeo abierto hasta innumerables pestañas del navegador, casi nada causa serios problemas al Focus 17.
Aunque está relativamente lejos en el campo de los rivales con hardware similar, no obstante logra una calificación más que sólida que promete un rendimiento más que suficiente para tareas exigentes.
CrossMark: Overall | Productivity | Creativity | Responsiveness
| PCMark 10 / Score | |
| Media de la clase Gaming (5828 - 12414, n=93, últimos 2 años) | |
| Lenovo Legion Pro 5 16ARX8 | |
| HP Omen 17-ck2097ng | |
| Medion Erazer Major X20 | |
| Medio Intel Core i9-13900HX, NVIDIA GeForce RTX 4070 Laptop GPU (6956 - 8153, n=3) | |
| Schenker XMG Neo 17 M22 | |
| Schenker XMG Focus 17 (E23) | |
| Medion Erazer Defender P40 | |
| PCMark 10 / Essentials | |
| HP Omen 17-ck2097ng | |
| Medion Erazer Major X20 | |
| Lenovo Legion Pro 5 16ARX8 | |
| Medio Intel Core i9-13900HX, NVIDIA GeForce RTX 4070 Laptop GPU (9865 - 11653, n=3) | |
| Media de la clase Gaming (8810 - 11935, n=97, últimos 2 años) | |
| Schenker XMG Focus 17 (E23) | |
| Medion Erazer Defender P40 | |
| Schenker XMG Neo 17 M22 | |
| PCMark 10 / Productivity | |
| Media de la clase Gaming (6845 - 25323, n=95, últimos 2 años) | |
| Lenovo Legion Pro 5 16ARX8 | |
| HP Omen 17-ck2097ng | |
| Medion Erazer Major X20 | |
| Medion Erazer Defender P40 | |
| Medio Intel Core i9-13900HX, NVIDIA GeForce RTX 4070 Laptop GPU (9470 - 9850, n=3) | |
| Schenker XMG Neo 17 M22 | |
| Schenker XMG Focus 17 (E23) | |
| PCMark 10 / Digital Content Creation | |
| Media de la clase Gaming (7602 - 19954, n=95, últimos 2 años) | |
| Lenovo Legion Pro 5 16ARX8 | |
| Medio Intel Core i9-13900HX, NVIDIA GeForce RTX 4070 Laptop GPU (9776 - 13370, n=3) | |
| Medion Erazer Major X20 | |
| HP Omen 17-ck2097ng | |
| Schenker XMG Neo 17 M22 | |
| Schenker XMG Focus 17 (E23) | |
| Medion Erazer Defender P40 | |
| CrossMark / Overall | |
| Schenker XMG Focus 17 (E23) | |
| Lenovo Legion Pro 5 16ARX8 | |
| HP Omen 17-ck2097ng | |
| Media de la clase Gaming (1366 - 2409, n=94, últimos 2 años) | |
| Medio Intel Core i9-13900HX, NVIDIA GeForce RTX 4070 Laptop GPU (1842 - 2029, n=3) | |
| Medion Erazer Major X20 | |
| Medion Erazer Defender P40 | |
| Schenker XMG Neo 17 M22 | |
| CrossMark / Productivity | |
| Lenovo Legion Pro 5 16ARX8 | |
| Schenker XMG Focus 17 (E23) | |
| Media de la clase Gaming (1386 - 2254, n=94, últimos 2 años) | |
| HP Omen 17-ck2097ng | |
| Medio Intel Core i9-13900HX, NVIDIA GeForce RTX 4070 Laptop GPU (1700 - 1872, n=3) | |
| Medion Erazer Major X20 | |
| Schenker XMG Neo 17 M22 | |
| Medion Erazer Defender P40 | |
| CrossMark / Creativity | |
| Schenker XMG Focus 17 (E23) | |
| Media de la clase Gaming (1343 - 2786, n=94, últimos 2 años) | |
| HP Omen 17-ck2097ng | |
| Medio Intel Core i9-13900HX, NVIDIA GeForce RTX 4070 Laptop GPU (2088 - 2316, n=3) | |
| Lenovo Legion Pro 5 16ARX8 | |
| Medion Erazer Major X20 | |
| Medion Erazer Defender P40 | |
| Schenker XMG Neo 17 M22 | |
| CrossMark / Responsiveness | |
| HP Omen 17-ck2097ng | |
| Lenovo Legion Pro 5 16ARX8 | |
| Schenker XMG Focus 17 (E23) | |
| Media de la clase Gaming (1226 - 2334, n=94, últimos 2 años) | |
| Medio Intel Core i9-13900HX, NVIDIA GeForce RTX 4070 Laptop GPU (1557 - 1752, n=3) | |
| Medion Erazer Major X20 | |
| Medion Erazer Defender P40 | |
| Schenker XMG Neo 17 M22 | |
| PCMark 10 Score | 6956 puntos | |
ayuda | ||
| AIDA64 / Memory Copy | |
| HP Omen 17-ck2097ng | |
| Schenker XMG Focus 17 (E23) | |
| Medio Intel Core i9-13900HX (67716 - 79193, n=22) | |
| Media de la clase Gaming (21750 - 129946, n=105, últimos 2 años) | |
| Medion Erazer Major X20 | |
| Medion Erazer Defender P40 | |
| Schenker XMG Neo 17 M22 | |
| Lenovo Legion Pro 5 16ARX8 | |
| AIDA64 / Memory Read | |
| HP Omen 17-ck2097ng | |
| Schenker XMG Focus 17 (E23) | |
| Medio Intel Core i9-13900HX (73998 - 88462, n=22) | |
| Media de la clase Gaming (22956 - 118858, n=105, últimos 2 años) | |
| Medion Erazer Major X20 | |
| Medion Erazer Defender P40 | |
| Schenker XMG Neo 17 M22 | |
| Lenovo Legion Pro 5 16ARX8 | |
| AIDA64 / Memory Write | |
| HP Omen 17-ck2097ng | |
| Media de la clase Gaming (22297 - 135096, n=105, últimos 2 años) | |
| Schenker XMG Focus 17 (E23) | |
| Medio Intel Core i9-13900HX (65472 - 77045, n=22) | |
| Medion Erazer Major X20 | |
| Medion Erazer Defender P40 | |
| Schenker XMG Neo 17 M22 | |
| Lenovo Legion Pro 5 16ARX8 | |
| AIDA64 / Memory Latency | |
| Media de la clase Gaming (75.3 - 259, n=105, últimos 2 años) | |
| Medion Erazer Defender P40 | |
| Schenker XMG Focus 17 (E23) | |
| Schenker XMG Neo 17 M22 | |
| Medion Erazer Major X20 | |
| Lenovo Legion Pro 5 16ARX8 | |
| Medio Intel Core i9-13900HX (75.3 - 91.1, n=22) | |
| HP Omen 17-ck2097ng | |
* ... más pequeño es mejor
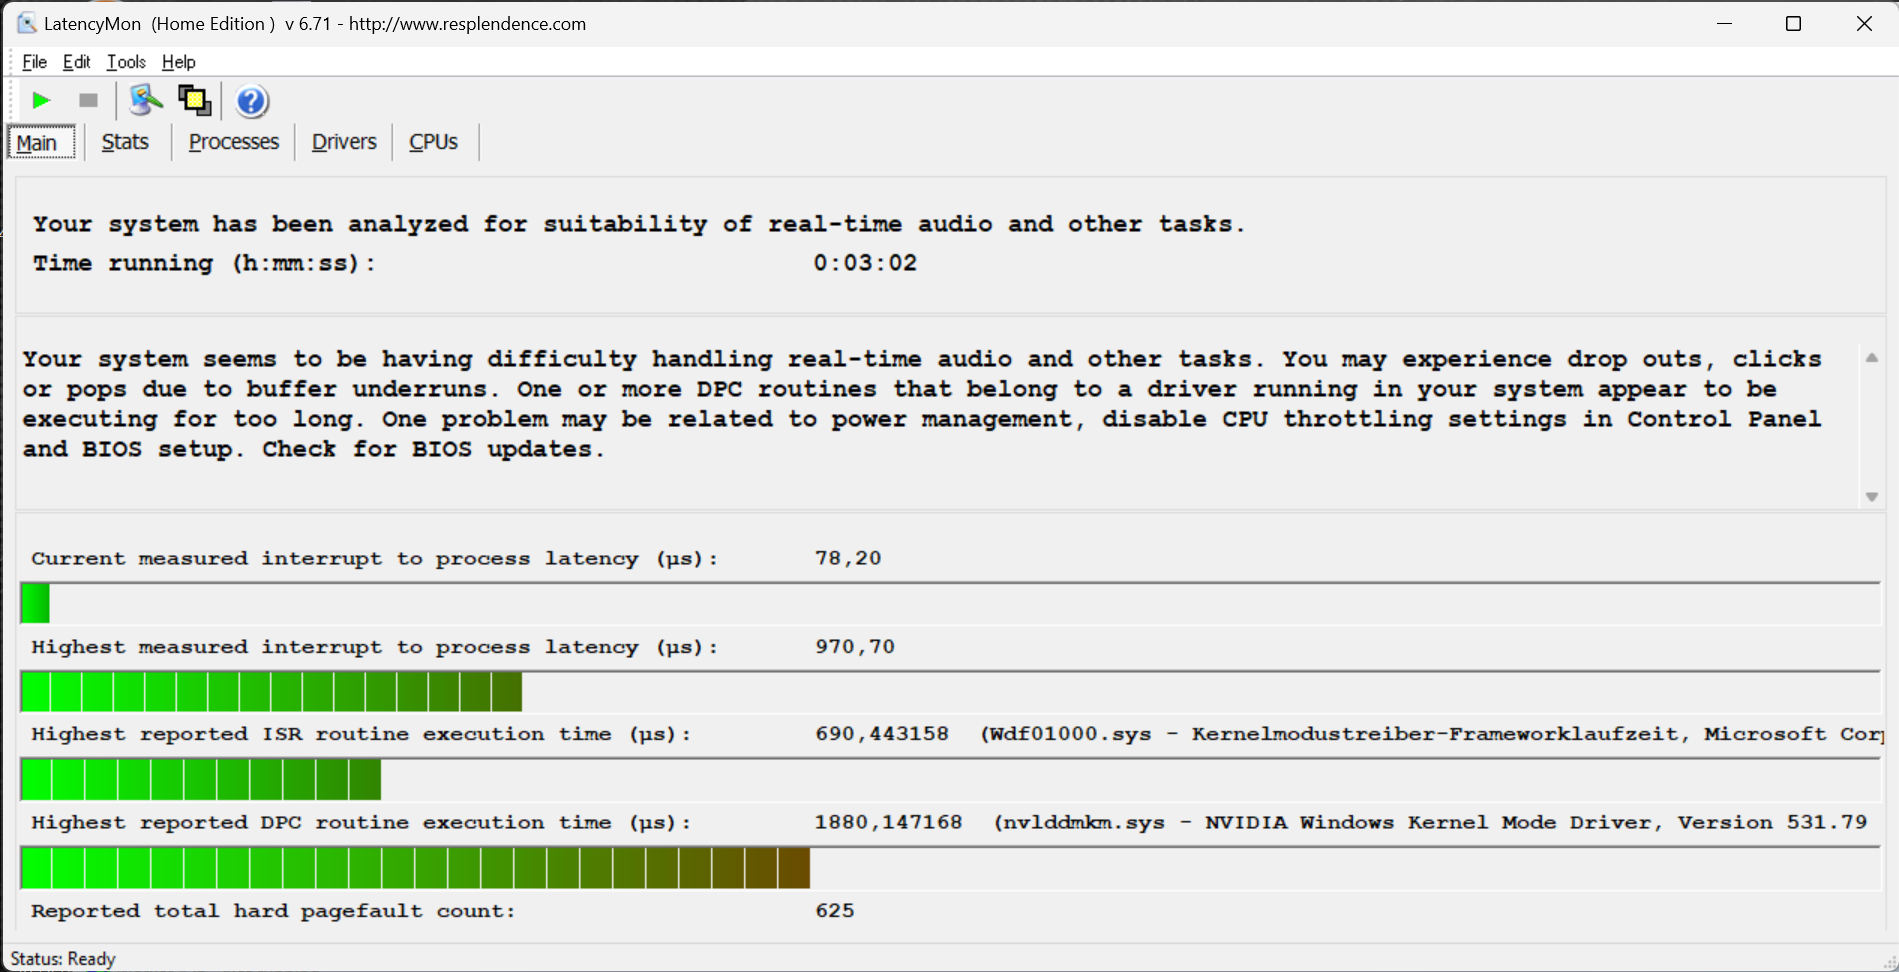
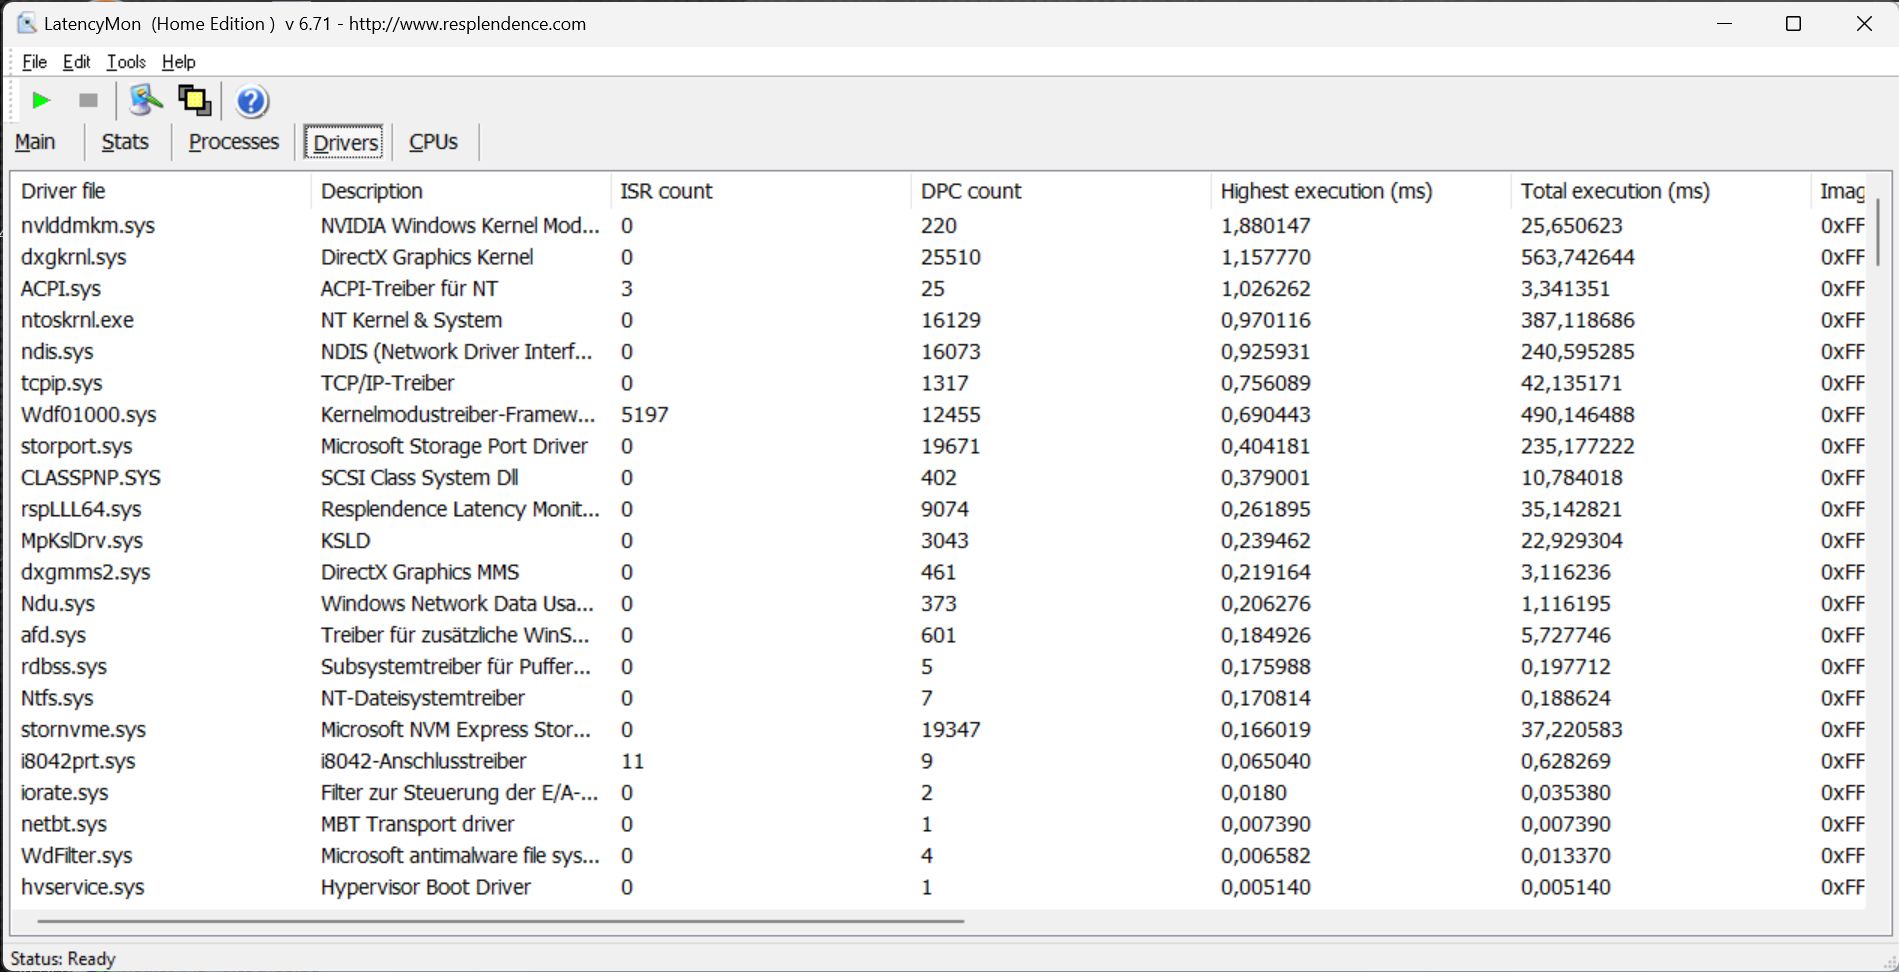
Latencias del CPD
Otros portátiles para juegos con la misma CPU rinden mucho peor que el XMG Focus 17. No logra un resultado óptimo, pero debería funcionar satisfactoriamente en la mayoría de tareas en las que se necesita un proceso fluido. Puede hacerlo incluso mejor, pero sólo debería ser de importancia secundaria para la mayoría de usuarios.
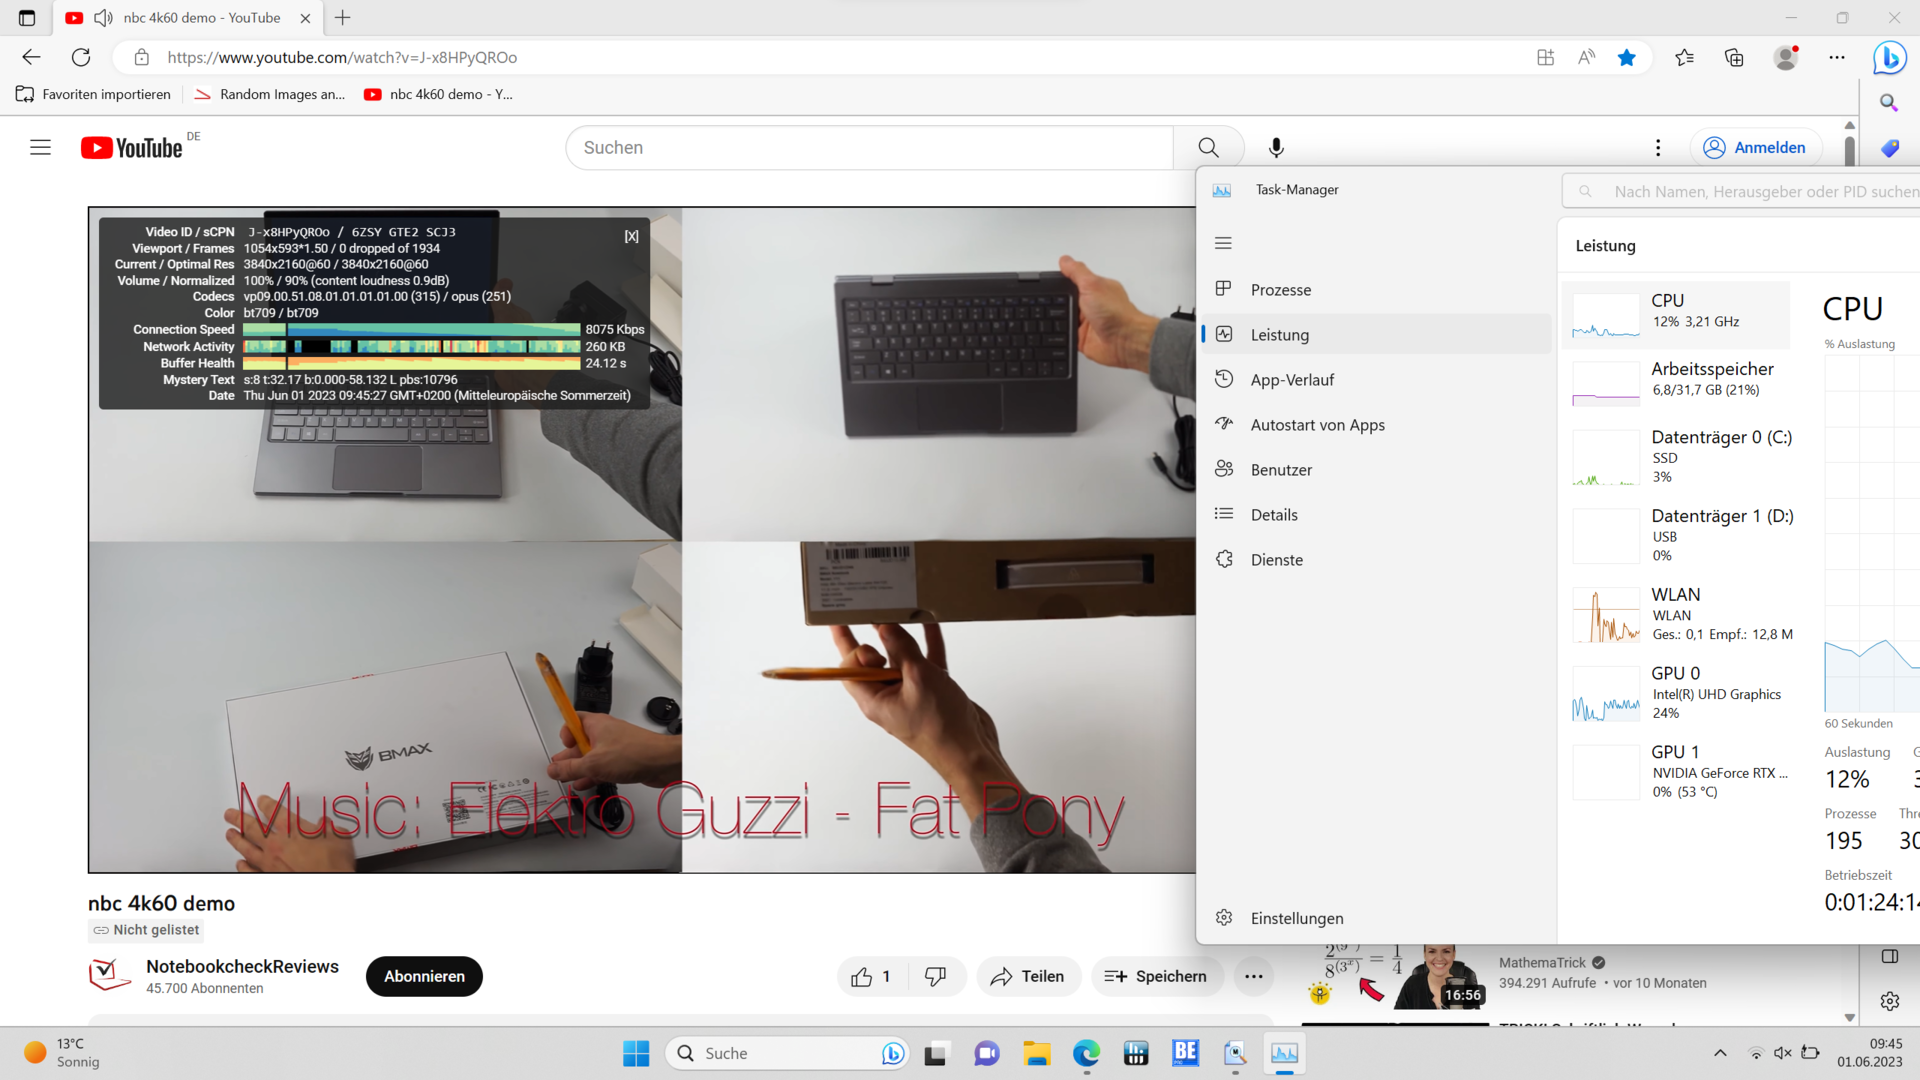
Las mayores dificultades las causa el controlador de la tarjeta gráfica de Nvidia, que esperemos que mejore mediante una actualización en el futuro. También digno de alabanza, y de ninguna manera la norma, es la fluida reproducción de vídeo en 4K sin caídas de frames. Así, la presente build y el driver del equipo parecen armonizar.
| DPC Latencies / LatencyMon - interrupt to process latency (max), Web, Youtube, Prime95 | |
| Schenker XMG Neo 17 M22 | |
| Medion Erazer Defender P40 | |
| HP Omen 17-ck2097ng | |
| Medion Erazer Major X20 | |
| Schenker XMG Focus 17 (E23) | |
| Lenovo Legion Pro 5 16ARX8 | |
* ... más pequeño es mejor
Almacenamiento masivo
El SSD M.2 Crucial P5 Plus instalado no es un modelo premium. Sin embargo, logra buenas tasas de transferencia via PCIe 4.0 y permanece muy estable en el test a largo plazo, lo que se debe a la refrigeración adicional en la placa base del portátil de juego.
Por tanto, no cabe esperar obstrucciones o retrasos durante la carga, ejecución de programas, etc. del almacenamiento masivo.

* ... más pequeño es mejor
Continuous reading: DiskSpd Read Loop, Queue Depth 8
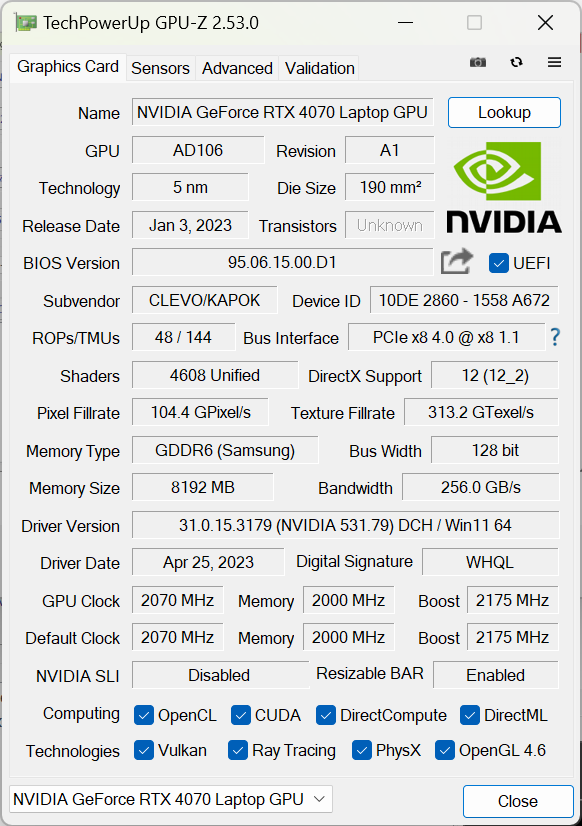
Tarjeta gráfica
Sólo unas pocas GPU son más rápidas que la Nvidia GeForce RTX 4070, que puede clasificarse con razón en la gama media alta. Ofrece 4.608 sombreadores, 144 núcleos de tensor para Nvidia DLSS y 36 núcleos de trazado de rayos. Eso es suficiente para tareas exigentes y juegos complejos al máximo nivel de detalle. Sólo la VRAM es un poco justa con 8 GB. Sin embargo, esto sólo debería causar problemas cuando se conecta un monitor 4K. En pruebas aleatorias individuales en la resolución QHD nativa de la pantalla, nunca se ocuparon más de 7 GB en juegos actuales
En el Focus 17 E23, el chip gráfico puede consumir un máximo de 140 W, desviando 25 W del procesador como aumento dinámico. Esto corresponde a la configuración típica de la RTX 4070 en un portátil de juegos. Sin embargo, los benchmarks sintéticos que realizamos se quedan un poco cortos porque el alto consumo de energía no puede mantenerse en el tiempo.
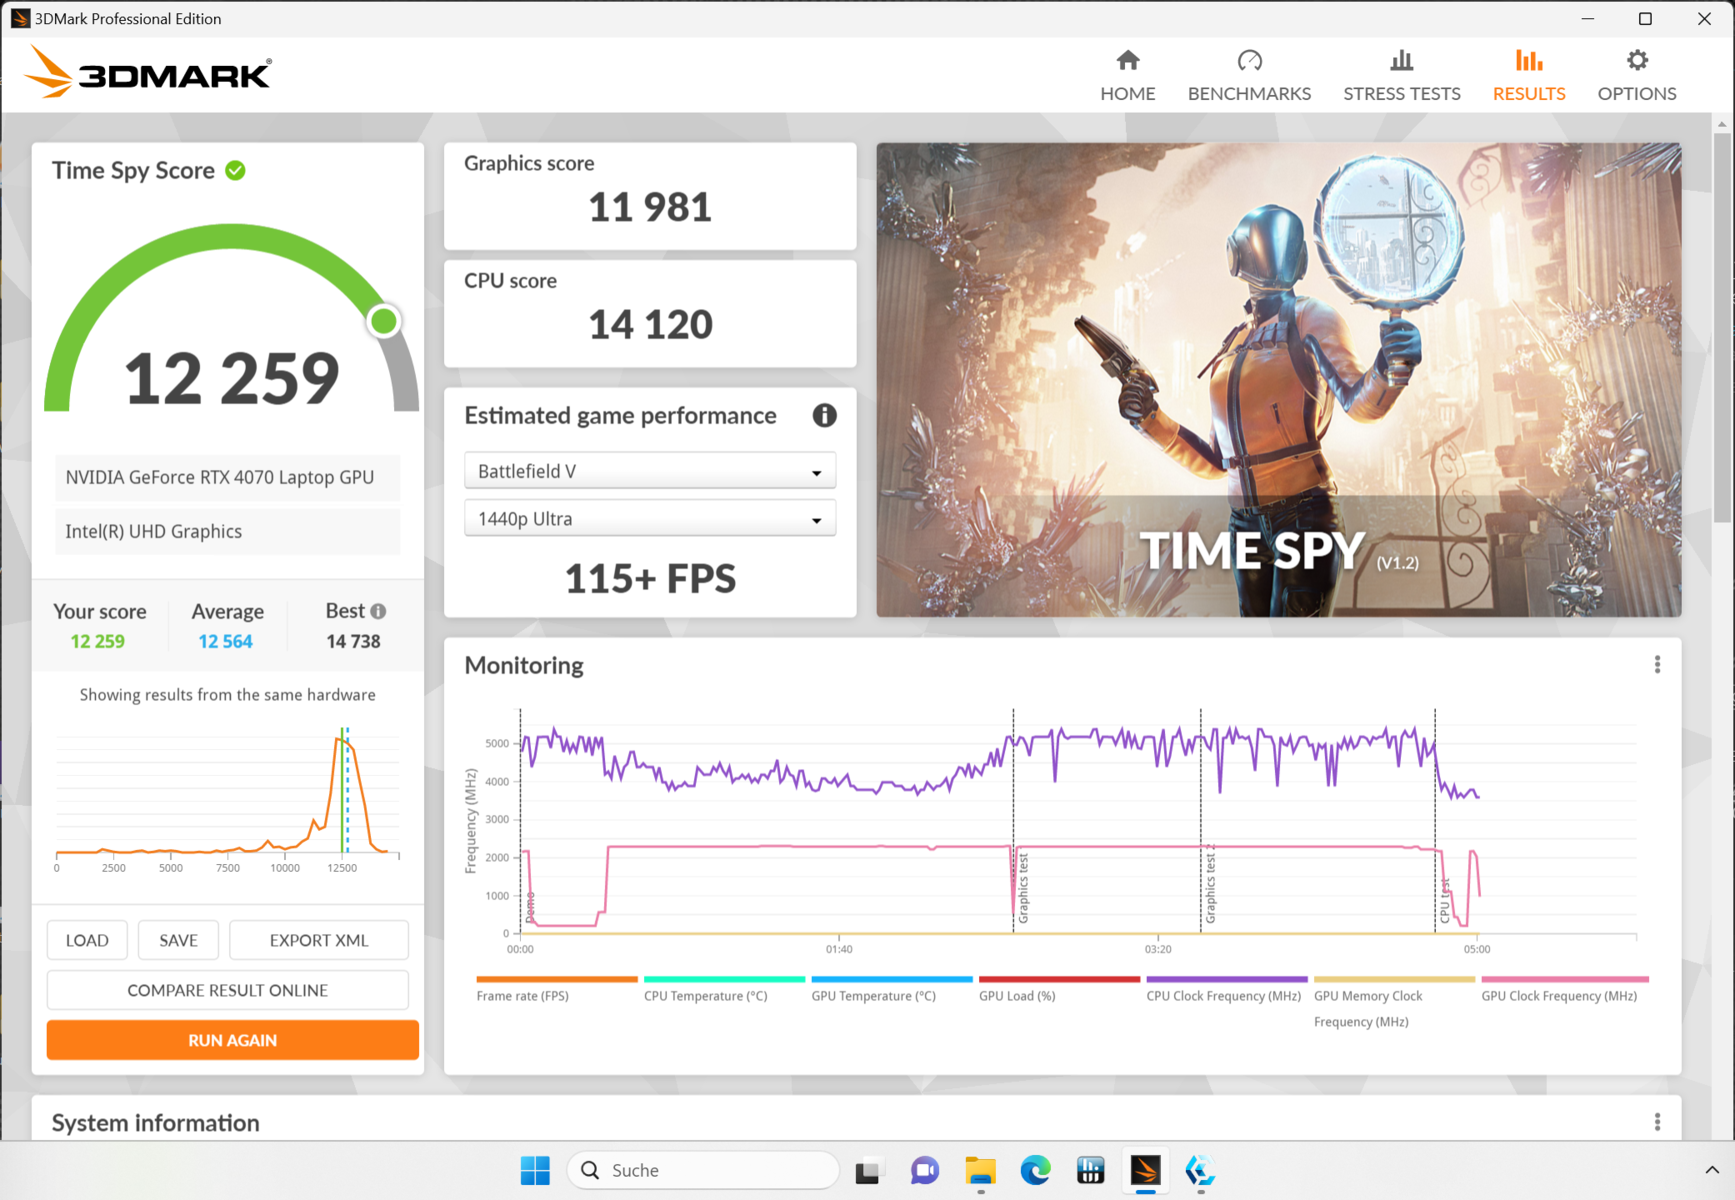
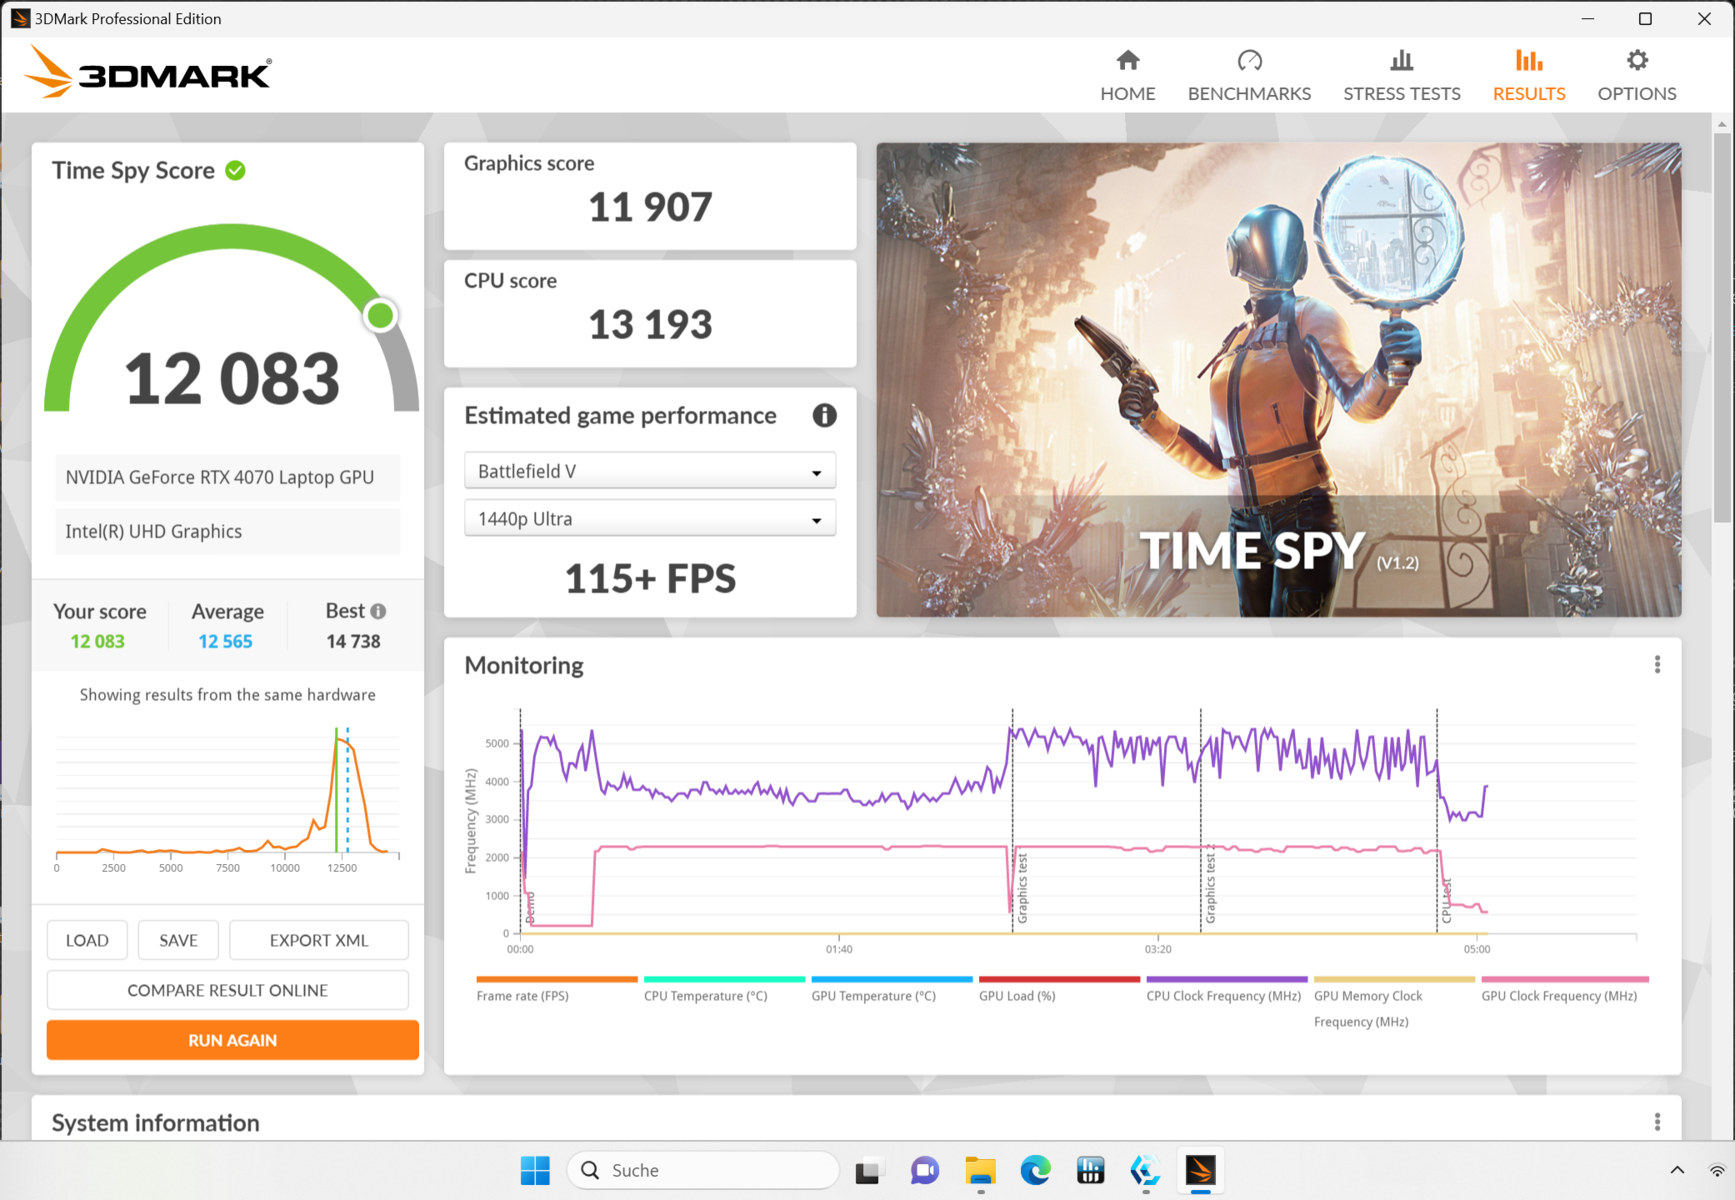
Tanto en las puntuaciones 3DMark como en los juegos, el Focus 17 siempre queda por detrás de un Medion Erazer Major X20 casi idénticamente equipado o del Lenovo Legion Pro 5 con una CPU diferente. Aparentemente, el gran i9-13900HX con los correspondientes requisitos de refrigeración también dificulta más que ayuda en las aplicaciones gráficas. Además del Legion Pro, se puede mencionar como ejemplo el Asus ROG Strix G18 con la RTX 4070 pero la más pequeña i7-13650HX, que logra aproximadamente las mismas tasas de rendimiento.
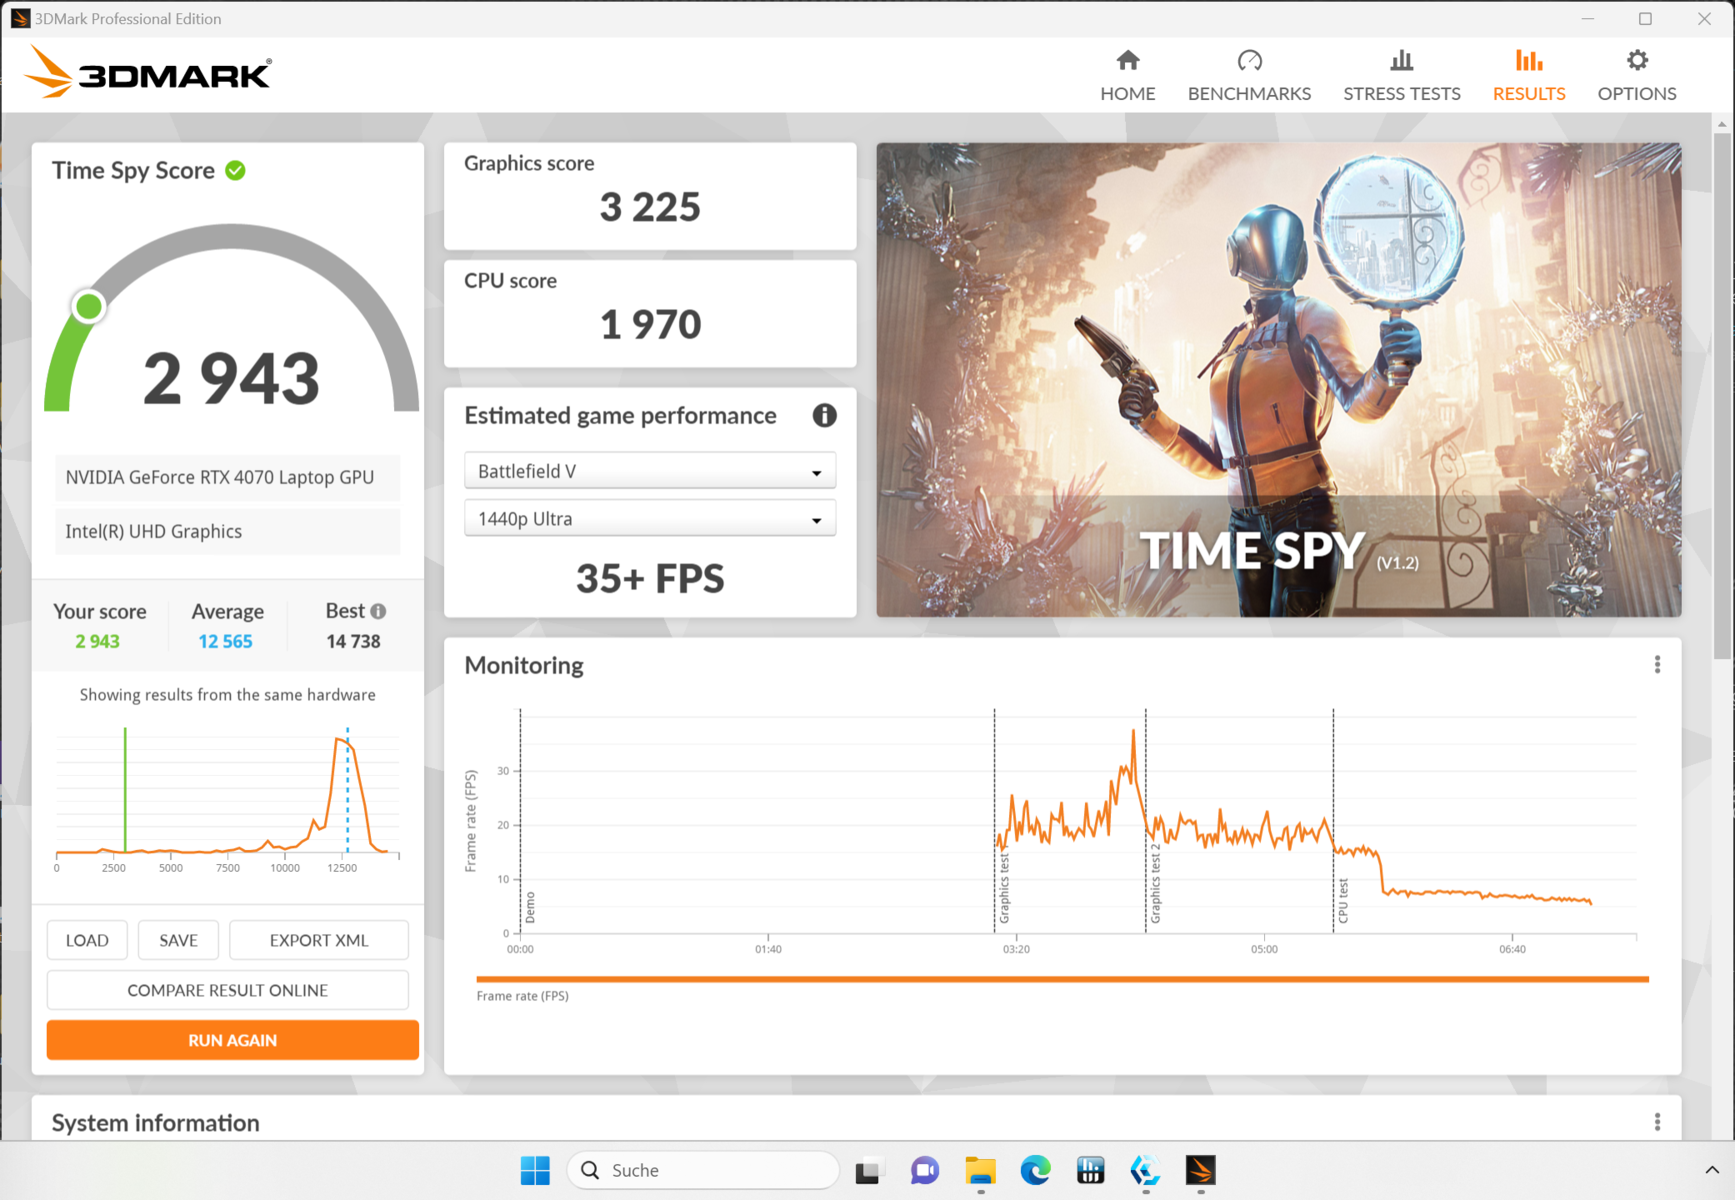
Además, los modos de rendimiento aún no parecen maduros. Comparando los resultados en el benchmark Time Spy, los modos de rendimiento y entretenimiento están casi a la par. Incluso en los juegos individuales que probamos, la diferencia en los FPS medidos fue mínima. El modo silencioso, que al menos funciona muy silenciosamente, por otro lado, cae demasiado significativamente. Los 2.943 puntos alcanzados también los consigue la AMD Radeon 780M, un chip gráfico integrado
Puedes encontrar más pruebas y datos de rendimiento en nuestra lista de pruebas de GPU Tarjetas gráficas moviles - lista de Benchmarks (nueva) .
| 3DMark 11 Performance | 33424 puntos | |
| 3DMark Cloud Gate Standard Score | 58621 puntos | |
| 3DMark Fire Strike Score | 25541 puntos | |
| 3DMark Time Spy Score | 12339 puntos | |
ayuda | ||
* ... más pequeño es mejor
Rendimiento de juego
Todos los juegos que probamos alcanzan tasas de imágenes por segundo al menos satisfactorias. Las tasas sólo están por debajo de 60 fps en juegos actuales y bastante exigentes al máximo nivel de detalle y resolución QHD. Por tanto, el hardware debería ser suficiente para juegos futuros durante bastante tiempo. La mayoría de los juegos son jugables con 100 fps o más cuando se renuncia a algunos detalles y se usa la resolución Full HD
El XMG Focus 17 se sitúa entre nuestros rivales seleccionados con idénticas GPUs en los juegos para los que hay tasas de comparación disponibles. También está más o menos a la par con un MSI Titan GT77 con una RTX 3080 Ti, que costaba casi el doble cuando salió a la venta el año pasado. Los portátiles gaming con la GPU predecesora RTX 3070 pueden verse superados en más de un 10% dependiendo del modelo.
Dado que la CPU se estresa menos en los juegos que en muchos otros benchmarks, la refrigeración algo débil no importa tanto. Sólo la GPU tiene que disipar mucho calor, mientras que el rendimiento del procesador puede ralentizarse sin pérdidas significativas de frame rate. Así, el portátil XMG no muestra ninguna debilidad en juegos, aunque unos pocos puntos porcentuales más a plena carga parecen realistas.
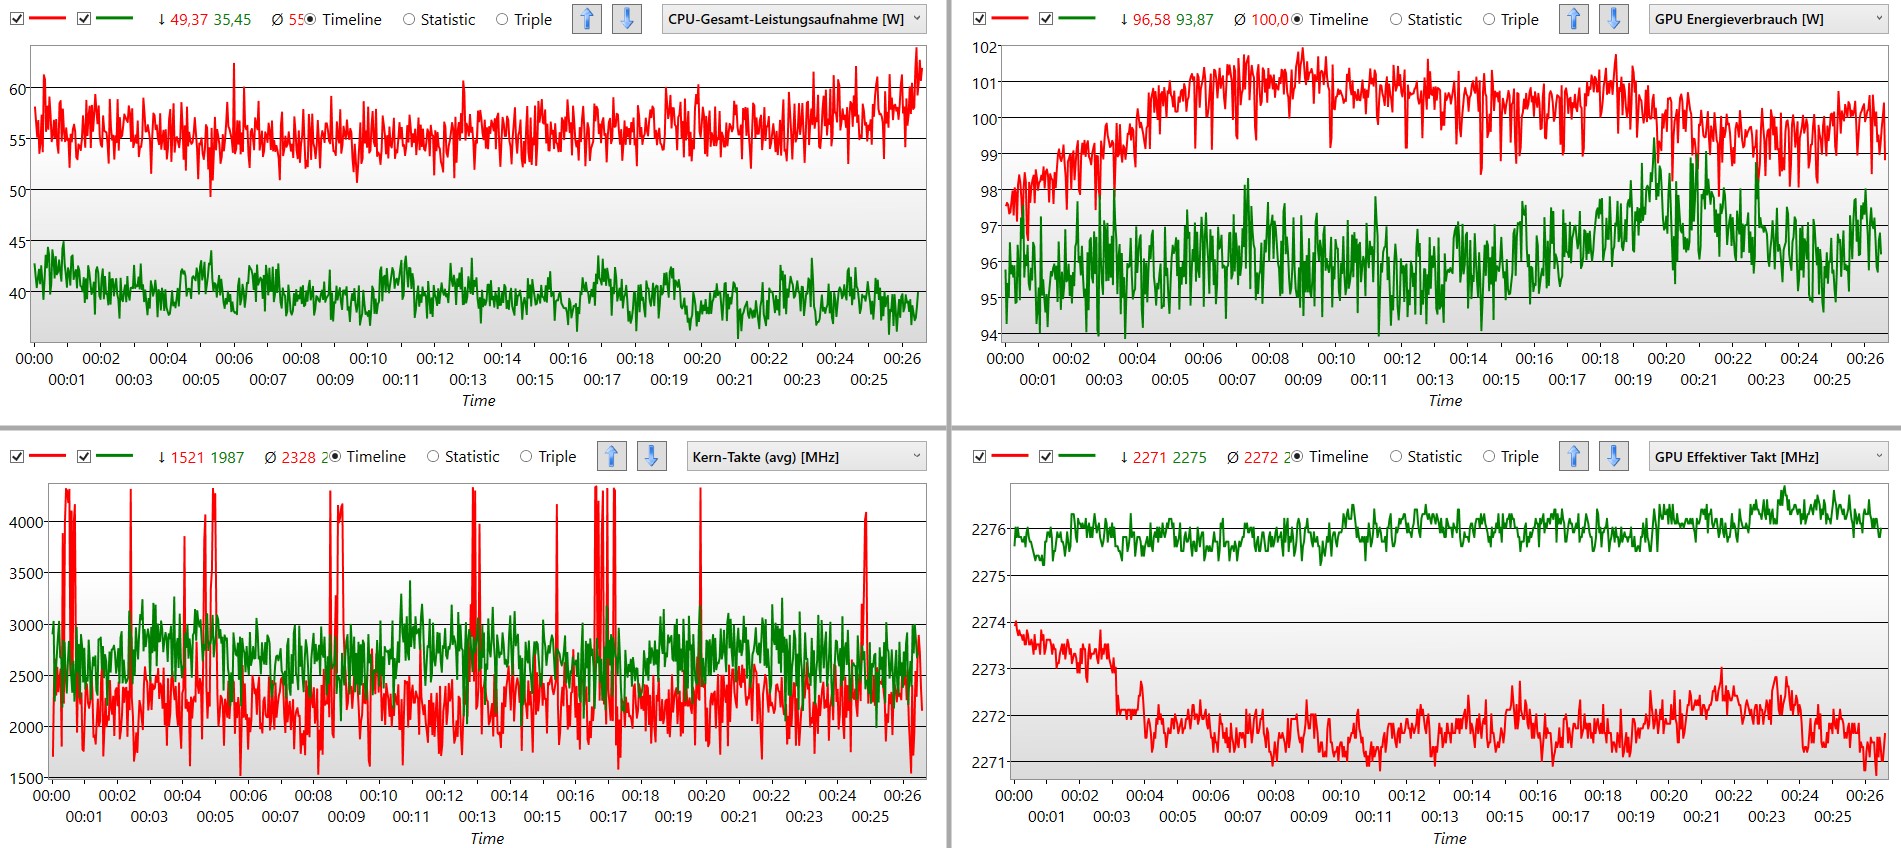
Entre otras cosas, el máximo posible de 140 W que puede consumir la GPU casi nunca se alcanza. Pudimos provocar un único pico de medición de 143 W en un escenario especial de nuestra prueba de estrés. Por lo demás, el consumo medio en juegos es de 100 W, lo que vuelve a estar muy por debajo de los 115 W que debería consumir el chip gráfico incluso sin boost dinámico.
Todo indica que el sistema de refrigeración no consigue disipar el calor residual con suficiente rapidez. Schenker XMG ha demostrado a menudo que un ventilador de portátil también puede manejar el consumo máximo del chip gráfico de forma permanente - ver por ejemplo el XMG Neo 16 E23.
| Star Wars Jedi Survivor | |
| 1920x1080 Epic Preset | |
| Lenovo Legion Pro 5 16ARX8 | |
| Schenker XMG Focus 17 (E23) | |
| Medio NVIDIA GeForce RTX 4070 Laptop GPU (61.5 - 80.1, n=8) | |
| Medion Erazer Defender P40 | |
| 2560x1440 Epic Preset | |
| Lenovo Legion Pro 5 16ARX8 | |
| Medio NVIDIA GeForce RTX 4070 Laptop GPU (39.5 - 51.1, n=8) | |
| Schenker XMG Focus 17 (E23) | |
| Medion Erazer Defender P40 | |
La prueba de resistencia con Witcher 3 no depara sorpresas. Esto debe entenderse como algo completamente positivo. No se observan caídas de rendimiento ni ralentización constante. Las fluctuaciones típicas pueden explicarse por el cambio de hora en el juego. En consecuencia, no se debería observar una disminución de la velocidad de fotogramas en otros juegos con el paso del tiempo.
En la prueba de resistencia del juego, pudimos comprobar una vez más cómo se comportan los modos de entretenimiento y rendimiento. En el modo de entretenimiento, el sistema requiere casi 20 W menos, mientras que la GPU tiene una velocidad de reloj mayor que en el modo de rendimiento. El comportamiento de la CPU parece más regular y, por lo general, la velocidad de reloj (verde) también es ligeramente superior en comparación con el modo de rendimiento. Con un menor consumo de energía y un desarrollo del ruido ligeramente inferior, también medimos una tasa de frames idéntica.
Witcher 3 FPS chart
| bajo | medio | alto | ultra | QHD | |
|---|---|---|---|---|---|
| GTA V (2015) | 180.8 | 117.4 | 88.5 | ||
| The Witcher 3 (2015) | 226 | 115 | |||
| Dota 2 Reborn (2015) | 177.3 | 164.5 | |||
| Final Fantasy XV Benchmark (2018) | 114.8 | 81.3 | |||
| X-Plane 11.11 (2018) | 123 | ||||
| Far Cry 5 (2018) | 145 | 136 | 112 | ||
| Strange Brigade (2018) | 247 | 211 | 135.2 | ||
| Cyberpunk 2077 1.6 (2022) | 100.7 | 102.3 | 63.9 | ||
| F1 22 (2022) | 211 | 77.8 | 49 | ||
| Hogwarts Legacy (2023) | 86 | 71 | 50 | ||
| Star Wars Jedi Survivor (2023) | 79 | 73 | 45 |
Emisiones - El Focus 17 puede ser silencioso
Emisiones sonoras
El Focus 17 es uno de los representantes más ruidosos de su gremio. Es claramente audible con unos 58 dB, incluso a través de una puerta cerrada. Sin embargo, elMedion Erazer Defender P40 demuestra que puede ser aún más ruidoso. A pesar del chip gráfico más pequeño, alcanza claramente más de 60 dB.
Las revoluciones del ventilador durante el uso normal del portátil lejos de la carga permanente son llamativas. La refrigeración se pone en marcha sin razón aparente. Unos segundos después, la velocidad se reduce de nuevo. Por otro lado, la velocidad permanece constante durante los juegos, por lo que se oye un ruido permanente, pero sin cambios de velocidad molestos.
Medimos unos decibelios menos en Witcher 3 en modo entretenimiento, lo que es bastante perceptible. Por cierto, los fps permanecen constantes. En "modo silencioso", 15 dB menos son medibles, lo que se siente como un tercio del volumen original. El portátil es audible entonces, pero apenas molesta incluso en un entorno silencioso. Aún medimos un poco menos de la mitad de la tasa de frames en Witcher 3. El juego aún es jugable a 60 fps en la configuración de detalles más alta, lo que probablemente es cierto para muchos títulos no muy exigentes o ligeramente más antiguos que entonces también son jugables tan silenciosos como un susurro.
Ruido
| Ocioso |
| 24 / 24 / 26.47 dB(A) |
| Carga |
| 55.72 / 57.94 dB(A) |
 | ||
30 dB silencioso 40 dB(A) audible 50 dB(A) ruidosamente alto |
||
min: | ||
| Schenker XMG Focus 17 (E23) GeForce RTX 4070 Laptop GPU, i9-13900HX, Crucial P5 Plus 1TB CT1000P5PSSD8 | Lenovo Legion Pro 5 16ARX8 GeForce RTX 4070 Laptop GPU, R7 7745HX, Samsung PM9A1 MZVL21T0HCLR | Medion Erazer Major X20 GeForce RTX 4070 Laptop GPU, i9-13900HX, Phison E18-1TB-PHISON-SSD-B47R | Schenker XMG Neo 17 M22 GeForce RTX 3080 Ti Laptop GPU, R9 6900HX, Samsung SSD 980 Pro 1TB MZ-V8P1T0BW | HP Omen 17-ck2097ng GeForce RTX 4080 Laptop GPU, i9-13900HX, SK hynix PC801 HFS001TEJ9X101N | Medion Erazer Defender P40 GeForce RTX 4060 Laptop GPU, i7-13700HX, Phison PS5021-E21 1TB | |
|---|---|---|---|---|---|---|
| Noise | 11% | -3% | -8% | -5% | -7% | |
| apagado / medio ambiente * (dB) | 24 | 23.2 3% | 24 -0% | 26 -8% | 24 -0% | 25 -4% |
| Idle Minimum * (dB) | 24 | 23.2 3% | 25 -4% | 26 -8% | 31 -29% | 26 -8% |
| Idle Average * (dB) | 24 | 23.2 3% | 29 -21% | 29 -21% | 32 -33% | 27 -13% |
| Idle Maximum * (dB) | 26.47 | 26.2 1% | 31 -17% | 40 -51% | 33 -25% | 32 -21% |
| Load Average * (dB) | 55.72 | 31.4 44% | 50 10% | 47 16% | 45 19% | 53 5% |
| Witcher 3 ultra * (dB) | 57.94 | 48.4 16% | 53 9% | 52 10% | 45 22% | 56 3% |
| Load Maximum * (dB) | 57.94 | 53.8 7% | 57 2% | 54 7% | 50 14% | 64 -10% |
* ... más pequeño es mejor
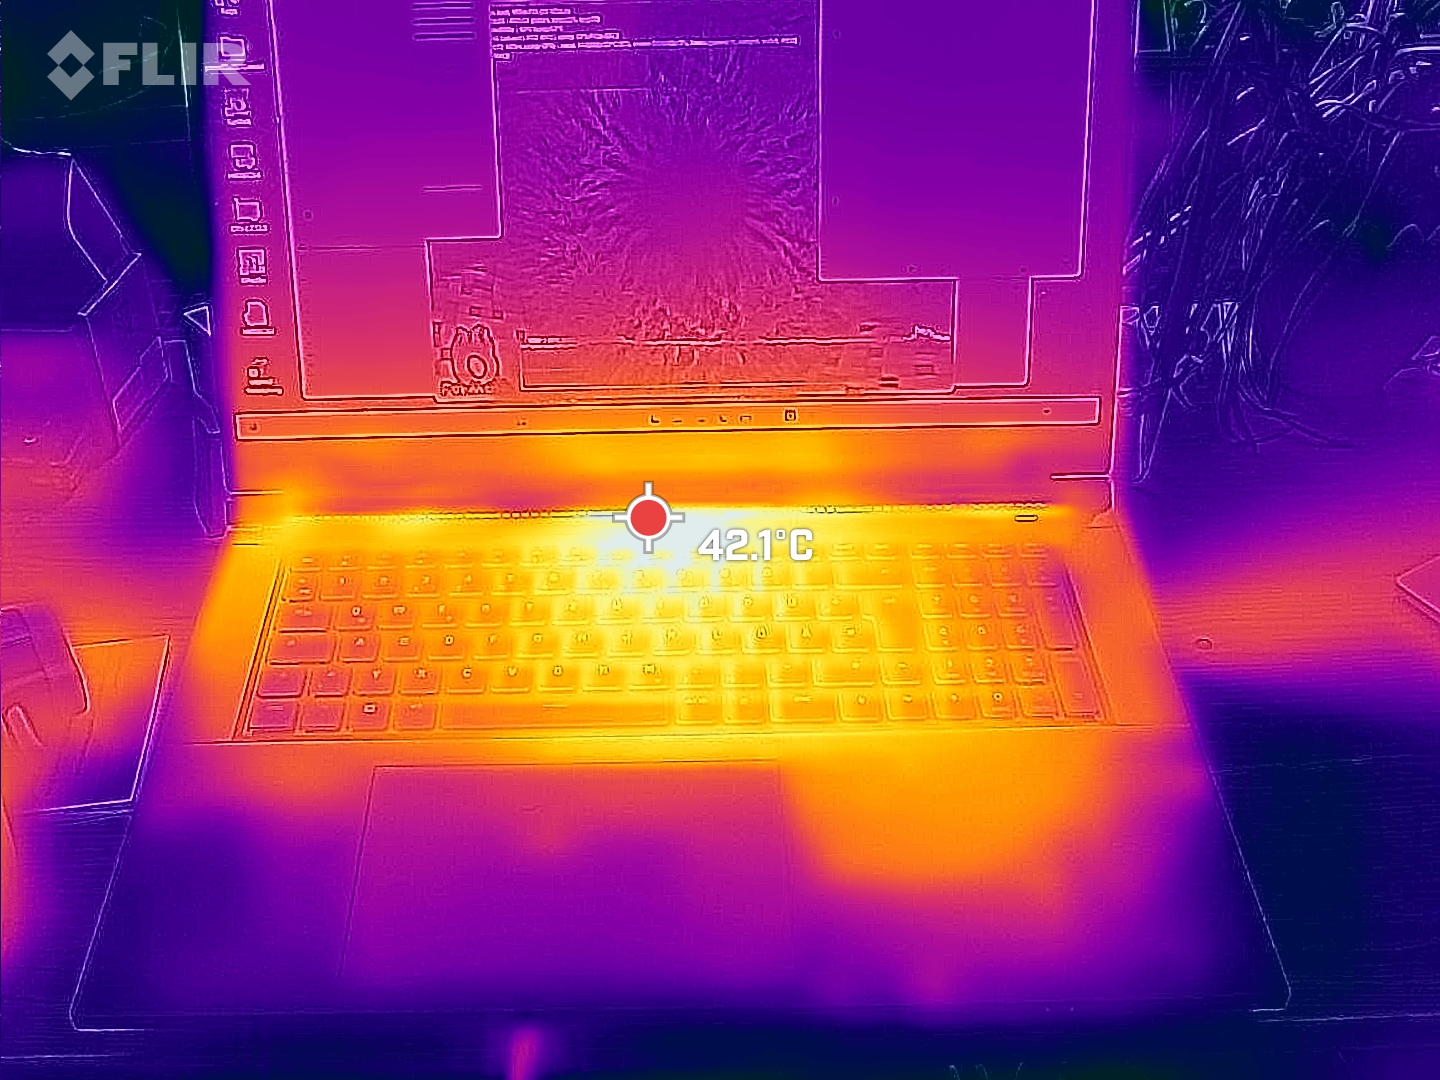
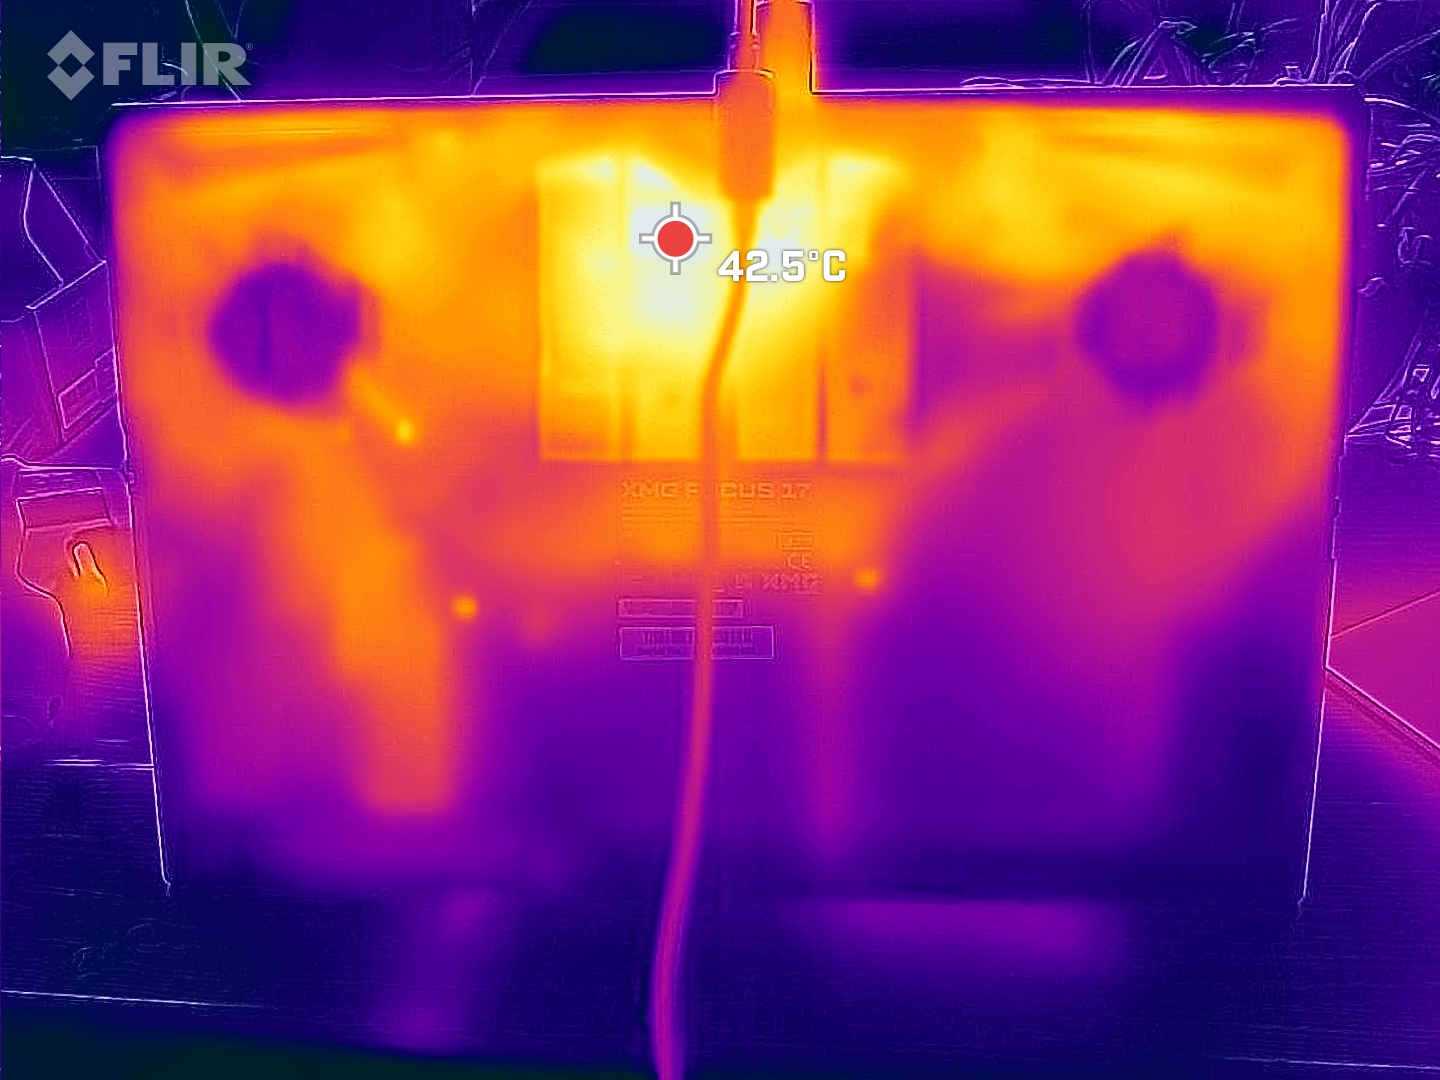
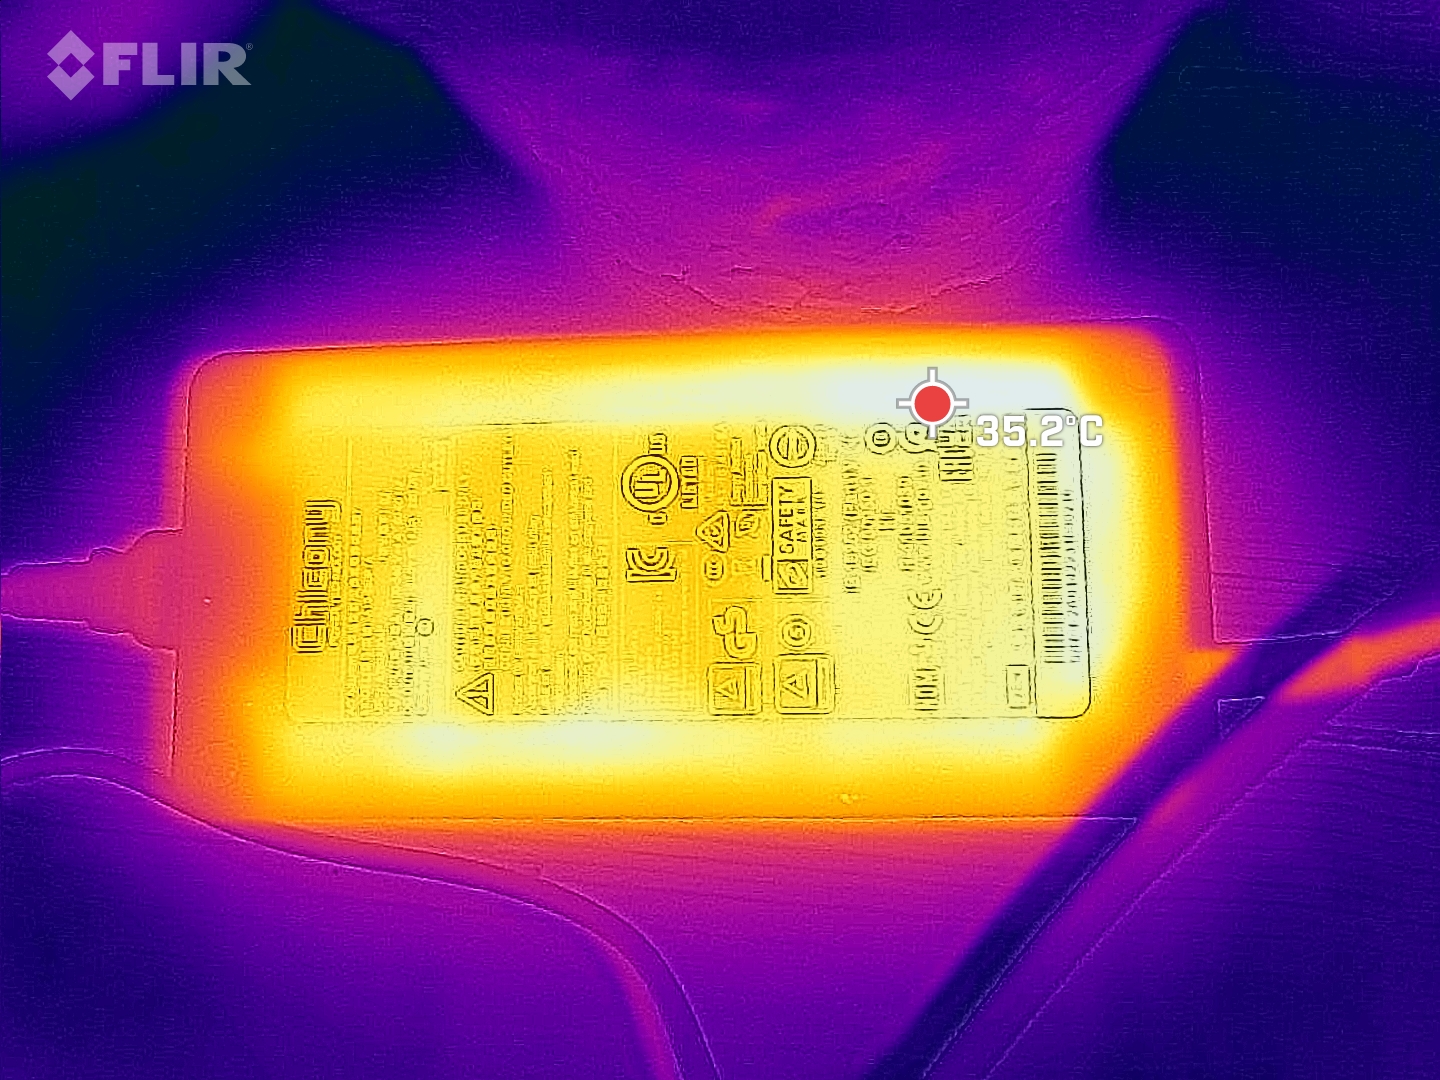
Temperatura
Los reposamanos son cálidos, pero en ningún caso calientes (medimos un máximo de 36 °C). Sin embargo, la temperatura ya es de 42 °C en la zona clave, y sigue siendo de 40 °C a la derecha del centro. A la izquierda, el portátil de juegos se mantiene un poco más fresco. Esto puede ser molesto, especialmente en días calurosos al teclear y jugar.
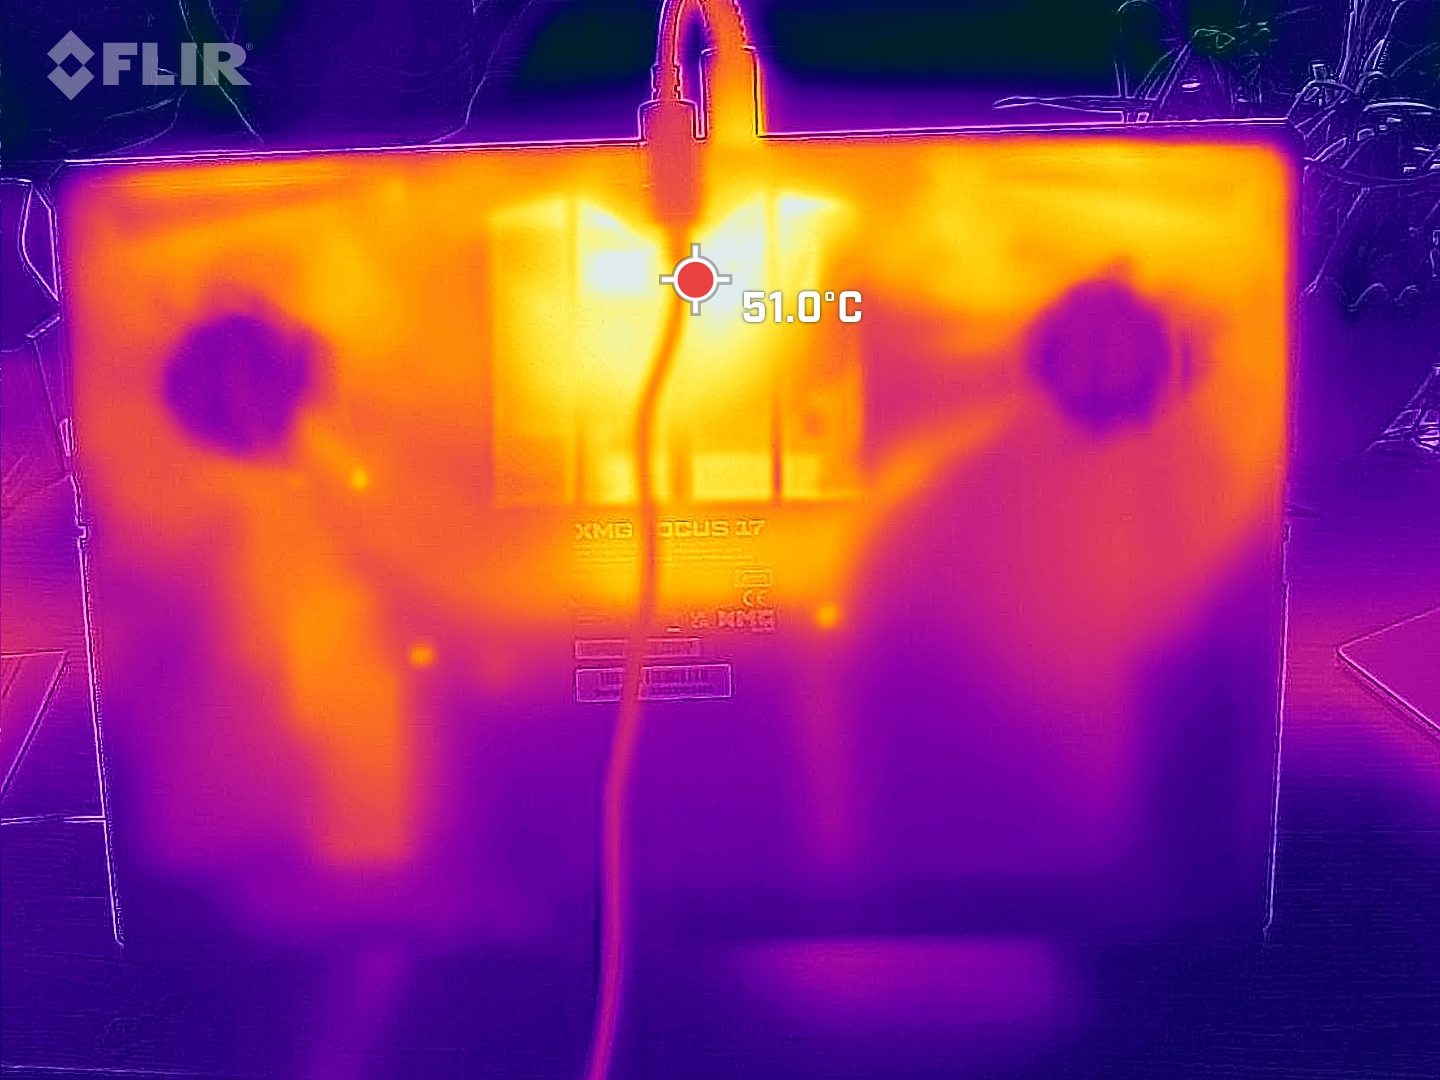
La parte inferior se calienta incluso sin carga significativa, por lo que el XMG Focus 17 E23 sólo debería usarse sobre una superficie plana y dura.
(-) La temperatura máxima en la parte superior es de 50 °C / 122 F, frente a la media de 40.4 °C / 105 F, que oscila entre 21.2 y 68.8 °C para la clase Gaming.
(-) El fondo se calienta hasta un máximo de 56 °C / 133 F, frente a la media de 43.2 °C / 110 F
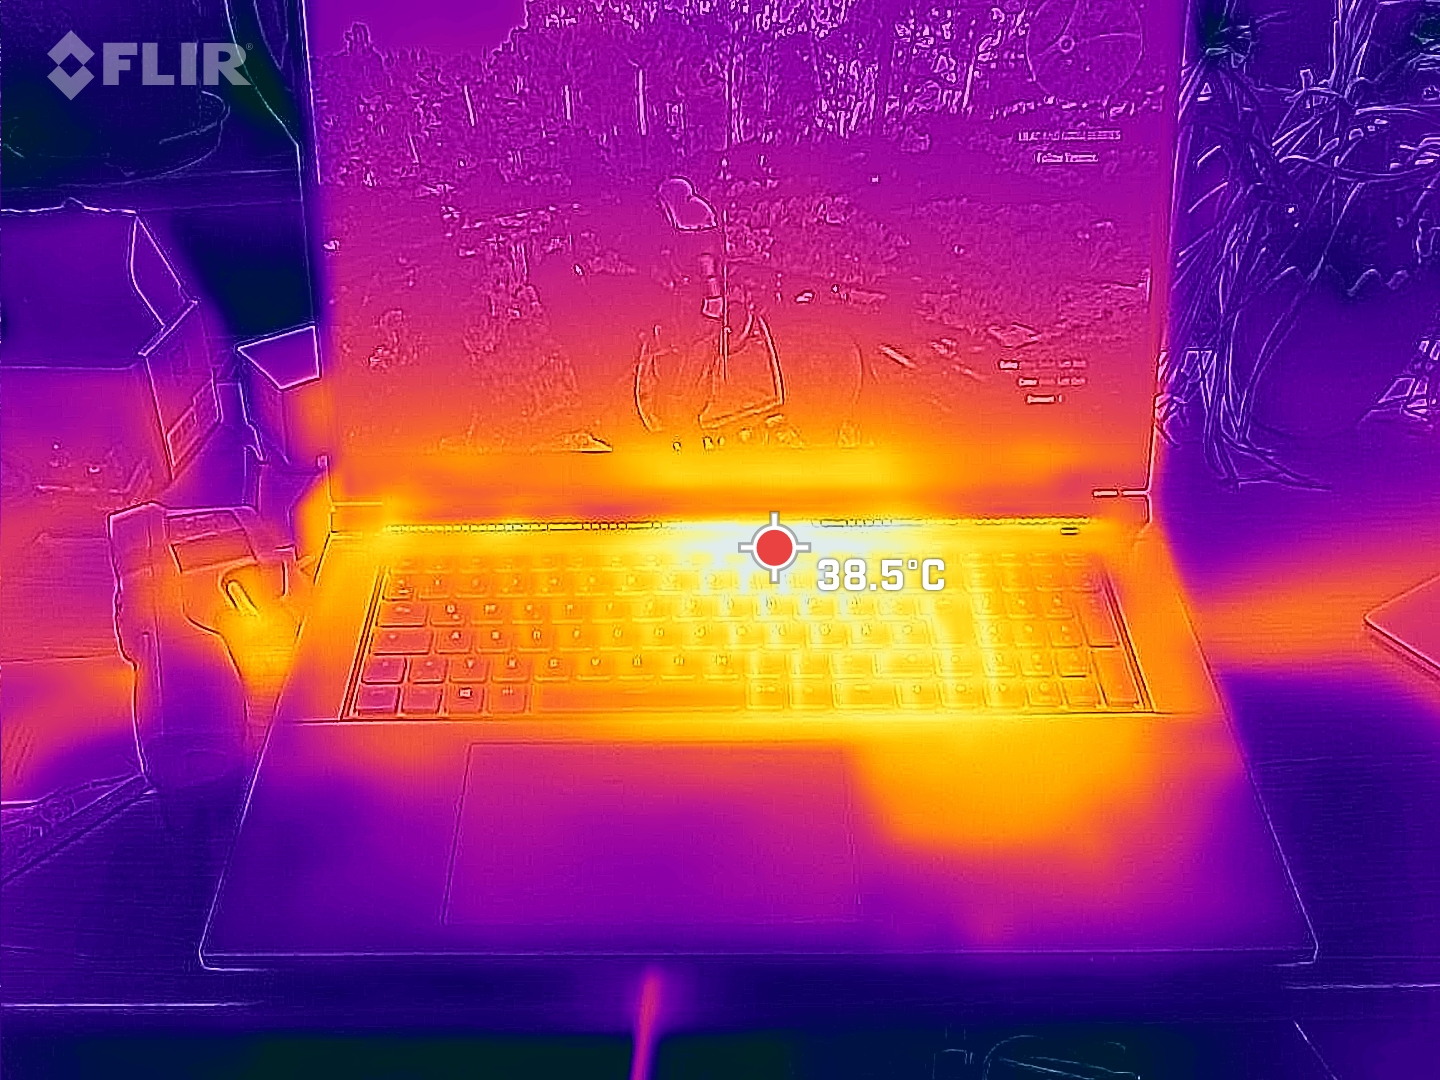
(+) En reposo, la temperatura media de la parte superior es de 30.9 °C / 88# F, frente a la media del dispositivo de 33.9 °C / 93 F.
(±) Jugando a The Witcher 3, la temperatura media de la parte superior es de 36.8 °C / 98 F, frente a la media del dispositivo de 33.9 °C / 93 F.
(±) El reposamanos y el touchpad pueden calentarse mucho al tacto con un máximo de 37 °C / 98.6 F.
(-) La temperatura media de la zona del reposamanos de dispositivos similares fue de 28.8 °C / 83.8 F (-8.2 °C / -14.8 F).
| Schenker XMG Focus 17 (E23) Intel Core i9-13900HX, NVIDIA GeForce RTX 4070 Laptop GPU | Lenovo Legion Pro 5 16ARX8 AMD Ryzen 7 7745HX, NVIDIA GeForce RTX 4070 Laptop GPU | Medion Erazer Major X20 Intel Core i9-13900HX, NVIDIA GeForce RTX 4070 Laptop GPU | Schenker XMG Neo 17 M22 AMD Ryzen 9 6900HX, NVIDIA GeForce RTX 3080 Ti Laptop GPU | HP Omen 17-ck2097ng Intel Core i9-13900HX, NVIDIA GeForce RTX 4080 Laptop GPU | Medion Erazer Defender P40 Intel Core i7-13700HX, NVIDIA GeForce RTX 4060 Laptop GPU | |
|---|---|---|---|---|---|---|
| Heat | 20% | 4% | 9% | 23% | 19% | |
| Maximum Upper Side * (°C) | 50 | 41.8 16% | 46 8% | 49 2% | 41 18% | 42 16% |
| Maximum Bottom * (°C) | 56 | 41.4 26% | 49 12% | 52 7% | 51 9% | 45 20% |
| Idle Upper Side * (°C) | 37 | 29 22% | 37 -0% | 30 19% | 24 35% | 28 24% |
| Idle Bottom * (°C) | 36 | 30.4 16% | 38 -6% | 33 8% | 25 31% | 30 17% |
* ... más pequeño es mejor
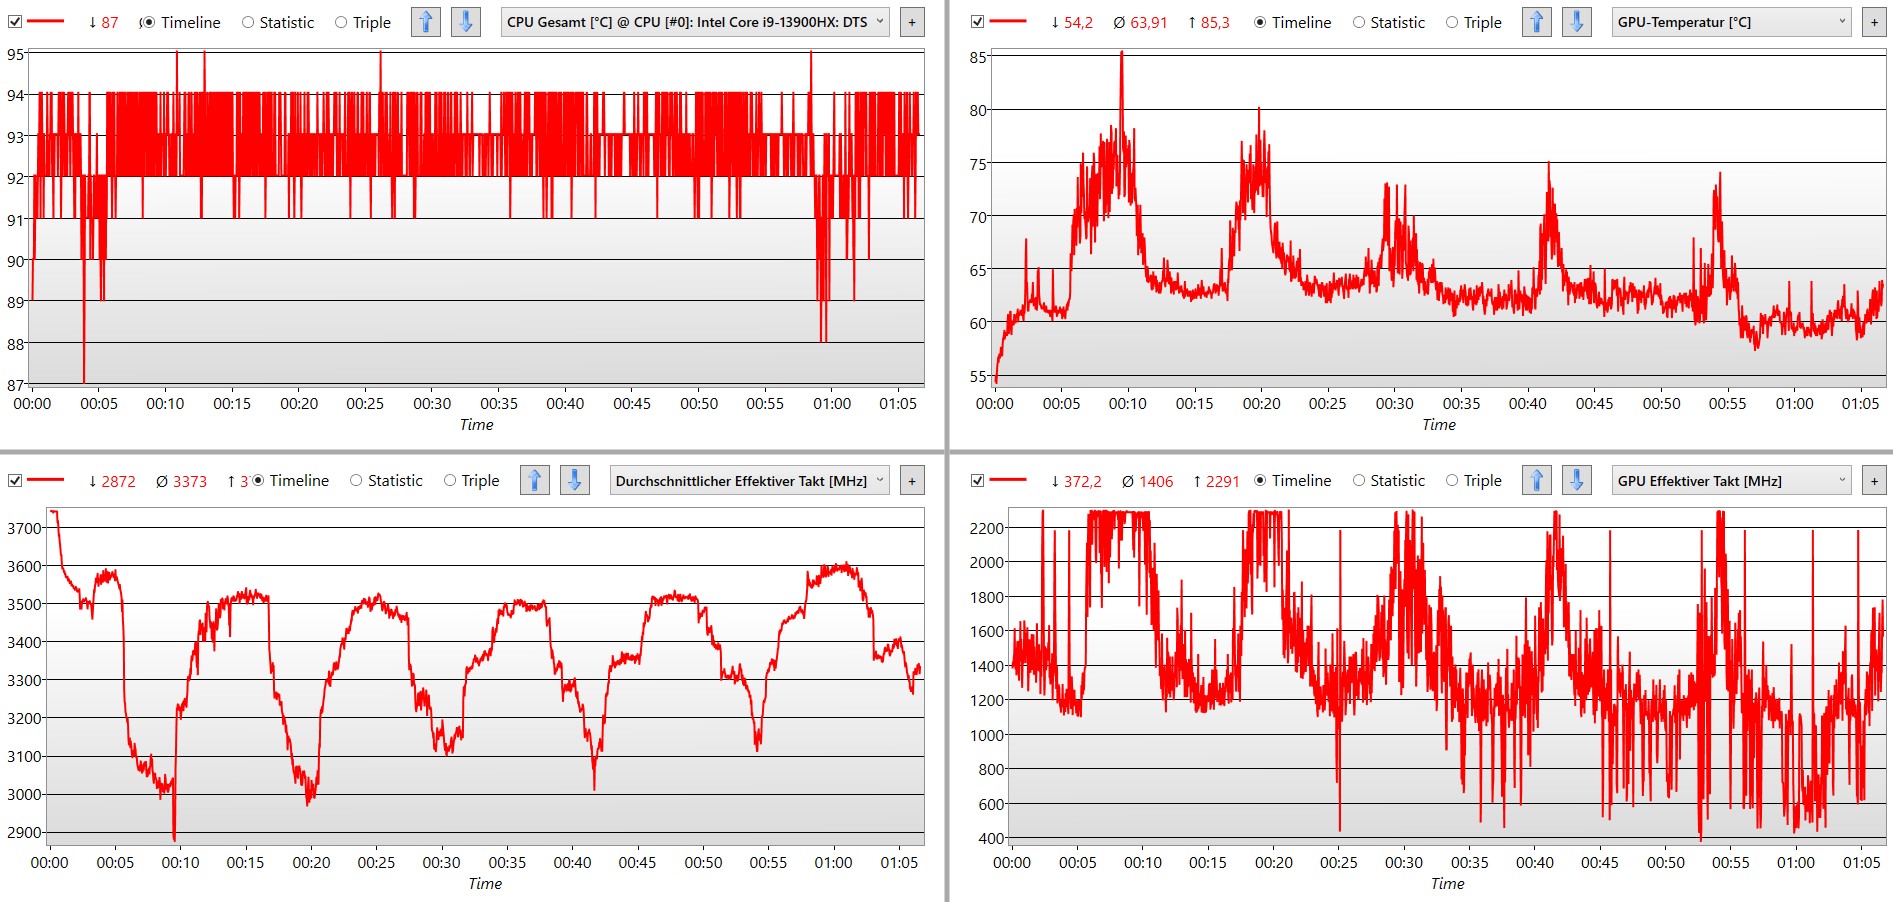
Prueba de esfuerzo
En nuestra prueba de estrés con Prime95 y Furmark, la CPU alcanza temperaturas superiores a los 95 °C. La GPU, por otro lado, no se aprovecha al máximo y ronda entre los 60 y 75 °C. La fuente de alimentación está limitada en esta situación extrema y ronda los 200 W para la GPU y la CPU juntas, mientras que 240 W serían teóricamente posibles. Además, esto sólo dura unos segundos antes de que la fuente de alimentación y la velocidad de reloj se reduzcan significativamente.
La refrigeración no puede mantener permanentemente el rendimiento máximo, como ocurre por ejemplo en el XMG Neo 16 E23 es el caso.
Altavoz
La reproducción del sonido es suficientemente potente para un portátil. No hay nada de lo que quejarse, especialmente en las frecuencias bajas y los agudos. El habla y los efectos típicos de los juegos de acción se reproducen bien.
En música o incluso en películas, la falta de calidad de sonido y la falta de medios bajos y bajos altos, que se nota claramente en nuestras mediciones, también se puede oír. Para estas tareas, apenas se puede evitar el uso de altavoces externos o auriculares.
Schenker XMG Focus 17 (E23) análisis de audio
(±) | la sonoridad del altavoz es media pero buena (78.08 dB)
Graves 100 - 315 Hz
(-) | casi sin bajos - de media 33.5% inferior a la mediana
(+) | el bajo es lineal (6.1% delta a la frecuencia anterior)
Medios 400 - 2000 Hz
(±) | medios reducidos - de media 7.2% inferior a la mediana
(±) | la linealidad de los medios es media (9.5% delta respecto a la frecuencia anterior)
Altos 2 - 16 kHz
(+) | máximos equilibrados - a sólo 4.4% de la mediana
(+) | los máximos son lineales (5.2% delta a la frecuencia anterior)
Total 100 - 16.000 Hz
(±) | la linealidad del sonido global es media (26.9% de diferencia con la mediana)
En comparación con la misma clase
» 93% de todos los dispositivos probados de esta clase eran mejores, 2% similares, 5% peores
» El mejor tuvo un delta de 6%, la media fue 18%, el peor fue ###max##%
En comparación con todos los dispositivos probados
» 82% de todos los dispositivos probados eran mejores, 4% similares, 14% peores
» El mejor tuvo un delta de 4%, la media fue 23%, el peor fue ###max##%
Apple MacBook Pro 16 2021 M1 Pro análisis de audio
(+) | los altavoces pueden reproducir a un volumen relativamente alto (#84.7 dB)
Graves 100 - 315 Hz
(+) | buen bajo - sólo 3.8% lejos de la mediana
(+) | el bajo es lineal (5.2% delta a la frecuencia anterior)
Medios 400 - 2000 Hz
(+) | medios equilibrados - a sólo 1.3% de la mediana
(+) | los medios son lineales (2.1% delta a la frecuencia anterior)
Altos 2 - 16 kHz
(+) | máximos equilibrados - a sólo 1.9% de la mediana
(+) | los máximos son lineales (2.7% delta a la frecuencia anterior)
Total 100 - 16.000 Hz
(+) | el sonido global es lineal (4.6% de diferencia con la mediana)
En comparación con la misma clase
» 0% de todos los dispositivos probados de esta clase eran mejores, 0% similares, 100% peores
» El mejor tuvo un delta de 5%, la media fue 17%, el peor fue ###max##%
En comparación con todos los dispositivos probados
» 0% de todos los dispositivos probados eran mejores, 0% similares, 100% peores
» El mejor tuvo un delta de 4%, la media fue 23%, el peor fue ###max##%
Gestión de la energía: la CPU de un portátil para juegos es muy exigente
Consumo de energía
El consumo de energía es claramente demasiado alto cuando no hay procesos en marcha. Especialmente los rivales con procesadores AMD, como el XMG Neo 17 M22 se las apañan con menos de la mitad de potencia.
El Focus 17 tampoco es frugal bajo carga. Necesita un tercio más de potencia para una tasa de frames idéntica en Witcher 3 que el Lenovo Legion Pro 5. Esto no es eficiente y explica en gran medida por qué el Legion es sólo la mitad de ruidoso.
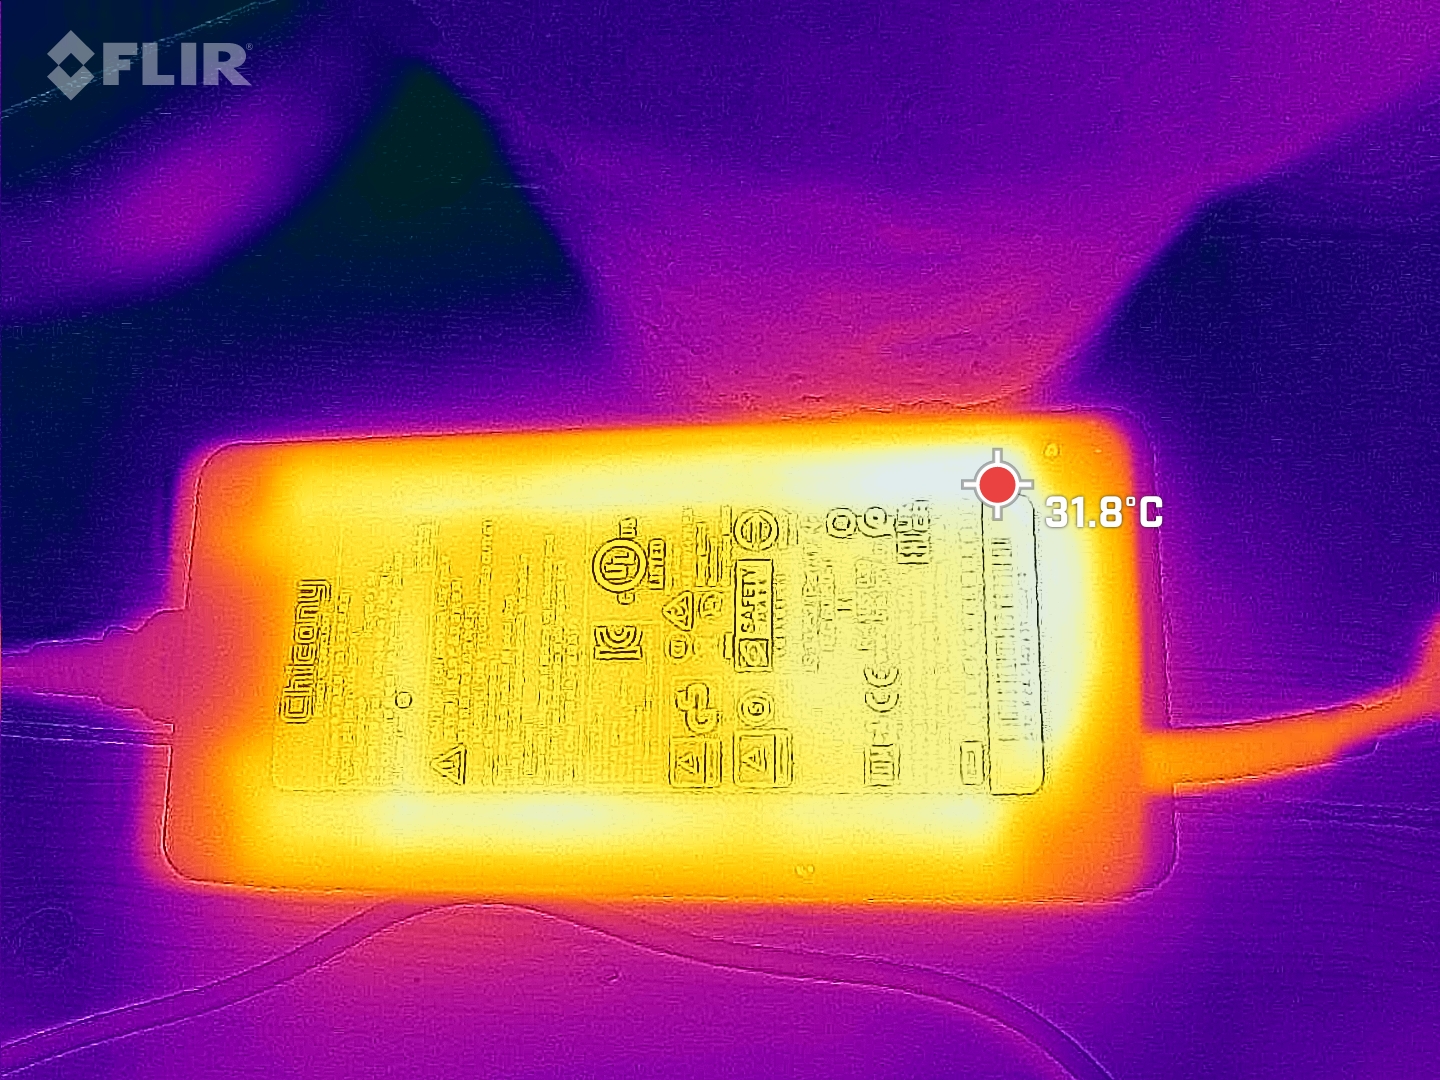
La fuente de alimentación de 280 vatios es al menos lo suficientemente grande, nunca se sobrecarga y siempre debería proporcionar energía suficiente para cargar la batería.
| Off / Standby | |
| Ocioso | |
| Carga |
|
Clave:
min: | |
| Schenker XMG Focus 17 (E23) i9-13900HX, GeForce RTX 4070 Laptop GPU, Crucial P5 Plus 1TB CT1000P5PSSD8, IPS, 2560x1440, 17.3" | Lenovo Legion Pro 5 16ARX8 R7 7745HX, GeForce RTX 4070 Laptop GPU, Samsung PM9A1 MZVL21T0HCLR, IPS, 2560x1600, 16" | Schenker XMG Neo 17 M22 R9 6900HX, GeForce RTX 3080 Ti Laptop GPU, Samsung SSD 980 Pro 1TB MZ-V8P1T0BW, IPS, 2560x1600, 17" | HP Omen 17-ck2097ng i9-13900HX, GeForce RTX 4080 Laptop GPU, SK hynix PC801 HFS001TEJ9X101N, IPS, 2560x1440, 17.3" | Medion Erazer Defender P40 i7-13700HX, GeForce RTX 4060 Laptop GPU, Phison PS5021-E21 1TB, IPS, 2560x1440, 17.3" | MSI Titan GT77 12UHS i9-12900HX, GeForce RTX 3080 Ti Laptop GPU, Samsung PM9A1 MZVL21T0HCLR, IPS-Level, 1920x1080, 17.3" | Medio NVIDIA GeForce RTX 4070 Laptop GPU | Media de la clase Gaming | |
|---|---|---|---|---|---|---|---|---|
| Power Consumption | 17% | 31% | 5% | 31% | -29% | 18% | 13% | |
| Idle Minimum * (Watt) | 17 | 8.1 52% | 7 59% | 16 6% | 8 53% | 30.21 -78% | 13.2 ? 22% | 13 ? 24% |
| Idle Average * (Watt) | 18 | 15.9 12% | 11 39% | 20 -11% | 12 33% | 32.42 -80% | 18.2 ? -1% | 19 ? -6% |
| Idle Maximum * (Watt) | 25.8 | 37.2 -44% | 17 34% | 26 -1% | 18 30% | 33.7 -31% | 24.6 ? 5% | 24.6 ? 5% |
| Load Average * (Watt) | 178 | 90.9 49% | 92 48% | 135 24% | 101 43% | 125.09 30% | 97 ? 46% | 110.7 ? 38% |
| Witcher 3 ultra * (Watt) | 265 | 189.6 28% | 221 17% | 215 19% | 180.8 32% | 256 3% | ||
| Load Maximum * (Watt) | 275 | 263.5 4% | 306 -11% | 299 -9% | 284 -3% | 321.88 -17% | 221 ? 20% | 259 ? 6% |
* ... más pequeño es mejor
Power consumption Witcher 3 / Stress test
Power consumption external monitor
Duración de la batería
El elevado consumo de energía sin carga va acompañado de una escasa autonomía de la batería. Ni siquiera en modo de ahorro de energía se alcanzan las 4 horas. Otros 20 min más se logran en modo silencioso, lo que no era de esperar a la vista de la dGPU activada. Si se saca el enchufe en modo rendimiento y Advanced Optimus está activo, la duración no llega a las 2 h en nuestro test WLAN con llamadas a internet alternas.
XMG ha informado a este respecto que el modo de ahorro de energía no funciona actualmente como se desea. Podemos confirmarlo a la vista de los resultados de nuestras pruebas. Una actualización debería remediar definitivamente la situación.
| Schenker XMG Focus 17 (E23) i9-13900HX, GeForce RTX 4070 Laptop GPU, 73 Wh | Lenovo Legion Pro 5 16ARX8 R7 7745HX, GeForce RTX 4070 Laptop GPU, 80 Wh | Medion Erazer Major X20 i9-13900HX, GeForce RTX 4070 Laptop GPU, 62.3 Wh | Schenker XMG Neo 17 M22 R9 6900HX, GeForce RTX 3080 Ti Laptop GPU, 99 Wh | HP Omen 17-ck2097ng i9-13900HX, GeForce RTX 4080 Laptop GPU, 83 Wh | Medion Erazer Defender P40 i7-13700HX, GeForce RTX 4060 Laptop GPU, 73 Wh | Media de la clase Gaming | |
|---|---|---|---|---|---|---|---|
| Duración de Batería | 3% | 18% | 122% | 6% | 72% | 125% | |
| H.264 (h) | 3.1 | 4.2 35% | 6.6 113% | 3.7 19% | 5.7 84% | 8.32 ? 168% | |
| WiFi v1.3 (h) | 3.9 | 4 3% | 3.9 0% | 9 131% | 3.6 -8% | 6.2 59% | 7.11 ? 82% |
| Witcher 3 ultra (h) | 1 |
Pro
Contra
Veredicto: el mejor para jugar, con algunos inconvenientes
No cabe duda del rendimiento del sistema. El Focus 17 se sitúa entre los competidores más fuertes. Sólo la refrigeración no del todo convincente impide una mejor puntuación. No parece estar ajustada con precisión para el Intel Core i9 en particular. No obstante, probablemente no haya ningún juego actual que sea demasiado exigente para la resolución QHD de la pantalla de colores precisos.
Centrado en el rendimiento para juegos: El potente hardware se encuentra en el Focus 17 E23 con un equipamiento por debajo de la media.
Si el portátil no tiene que ser capaz de más, el XMG Focus con el foco en el rendimiento de juego, que ya se predice en el nombre. Por lo demás, la valoración resulta bastante floja en comparación con la competencia (casi universalmente más cara).
El teclado sólo ofrece unos pocos ajustes de color, siempre para todas las teclas. Como en el predecesor, el touchpad no convence, pero de todos modos apenas se usará para jugar. La duración de la batería es demasiado corta y sólo medianamente aceptable en modo estricto de ahorro de energía. Los altavoces suenan mediocres. Además, la ventilación es más ruidosa que la media, mientras que los componentes consumen demasiada energía para el rendimiento comprobado. Además, USB 2.0 ya no parece actual y Mini-DisplayPort se puede encontrar en los cascos VR, por ejemplo, pero USB-C con soporte DP sería más variable.
A cambio, el precio es correspondientemente atractivo. La relación calidad-precio es buena. Si Schenker también logra ajustar los modos de rendimiento aparentemente inacabados a través de una actualización software, algunos defectos como la corta duración de batería o el mal comportamiento del ventilador podrían mitigarse significativamente.
Se puede obtener más rendimiento de componentes comparables, por ejemplo, con el XMG Neo 16 E23 (equipado con la RTX 4090). Aproximadamente tan rápido y silencioso como el XMG Focus 17 es el Lenovo Legion Pro 5 16 Gen8. Sin embargo, ambos portátiles de juego son también notablemente más caros con su mejor equipamiento en general.
Precio y disponibilidad
Schenker XMG Focus 17 (E23)
- 06/04/2023 v7 (old)
Mario Petzold
Transparencia
La selección de los dispositivos que se van a reseñar corre a cargo de nuestro equipo editorial. La muestra de prueba fue proporcionada al autor en calidad de préstamo por el fabricante o el minorista a los efectos de esta reseña. El prestamista no tuvo ninguna influencia en esta reseña, ni el fabricante recibió una copia de la misma antes de su publicación. No había ninguna obligación de publicar esta reseña. Como empresa de medios independiente, Notebookcheck no está sujeta a la autoridad de fabricantes, minoristas o editores.
Así es como prueba Notebookcheck
Cada año, Notebookcheck revisa de forma independiente cientos de portátiles y smartphones utilizando procedimientos estandarizados para asegurar que todos los resultados son comparables. Hemos desarrollado continuamente nuestros métodos de prueba durante unos 20 años y hemos establecido los estándares de la industria en el proceso. En nuestros laboratorios de pruebas, técnicos y editores experimentados utilizan equipos de medición de alta calidad. Estas pruebas implican un proceso de validación en varias fases. Nuestro complejo sistema de clasificación se basa en cientos de mediciones y puntos de referencia bien fundamentados, lo que mantiene la objetividad.Price comparison
