Análisis del silencioso portátil Nitro 17 de Acer: La RTX 4060, perfectamente configurada
El Acer Nitro 17 AN17-51-71ER es un sólido portátil para juegos de gama media. Con un Intel Core i7 en lugar de un i9, sólo cuatro zonas en el teclado RGB y mucho plástico, los compromisos son necesarios, pero ayudan a mantener el PVP por debajo de los 2000 dólares.
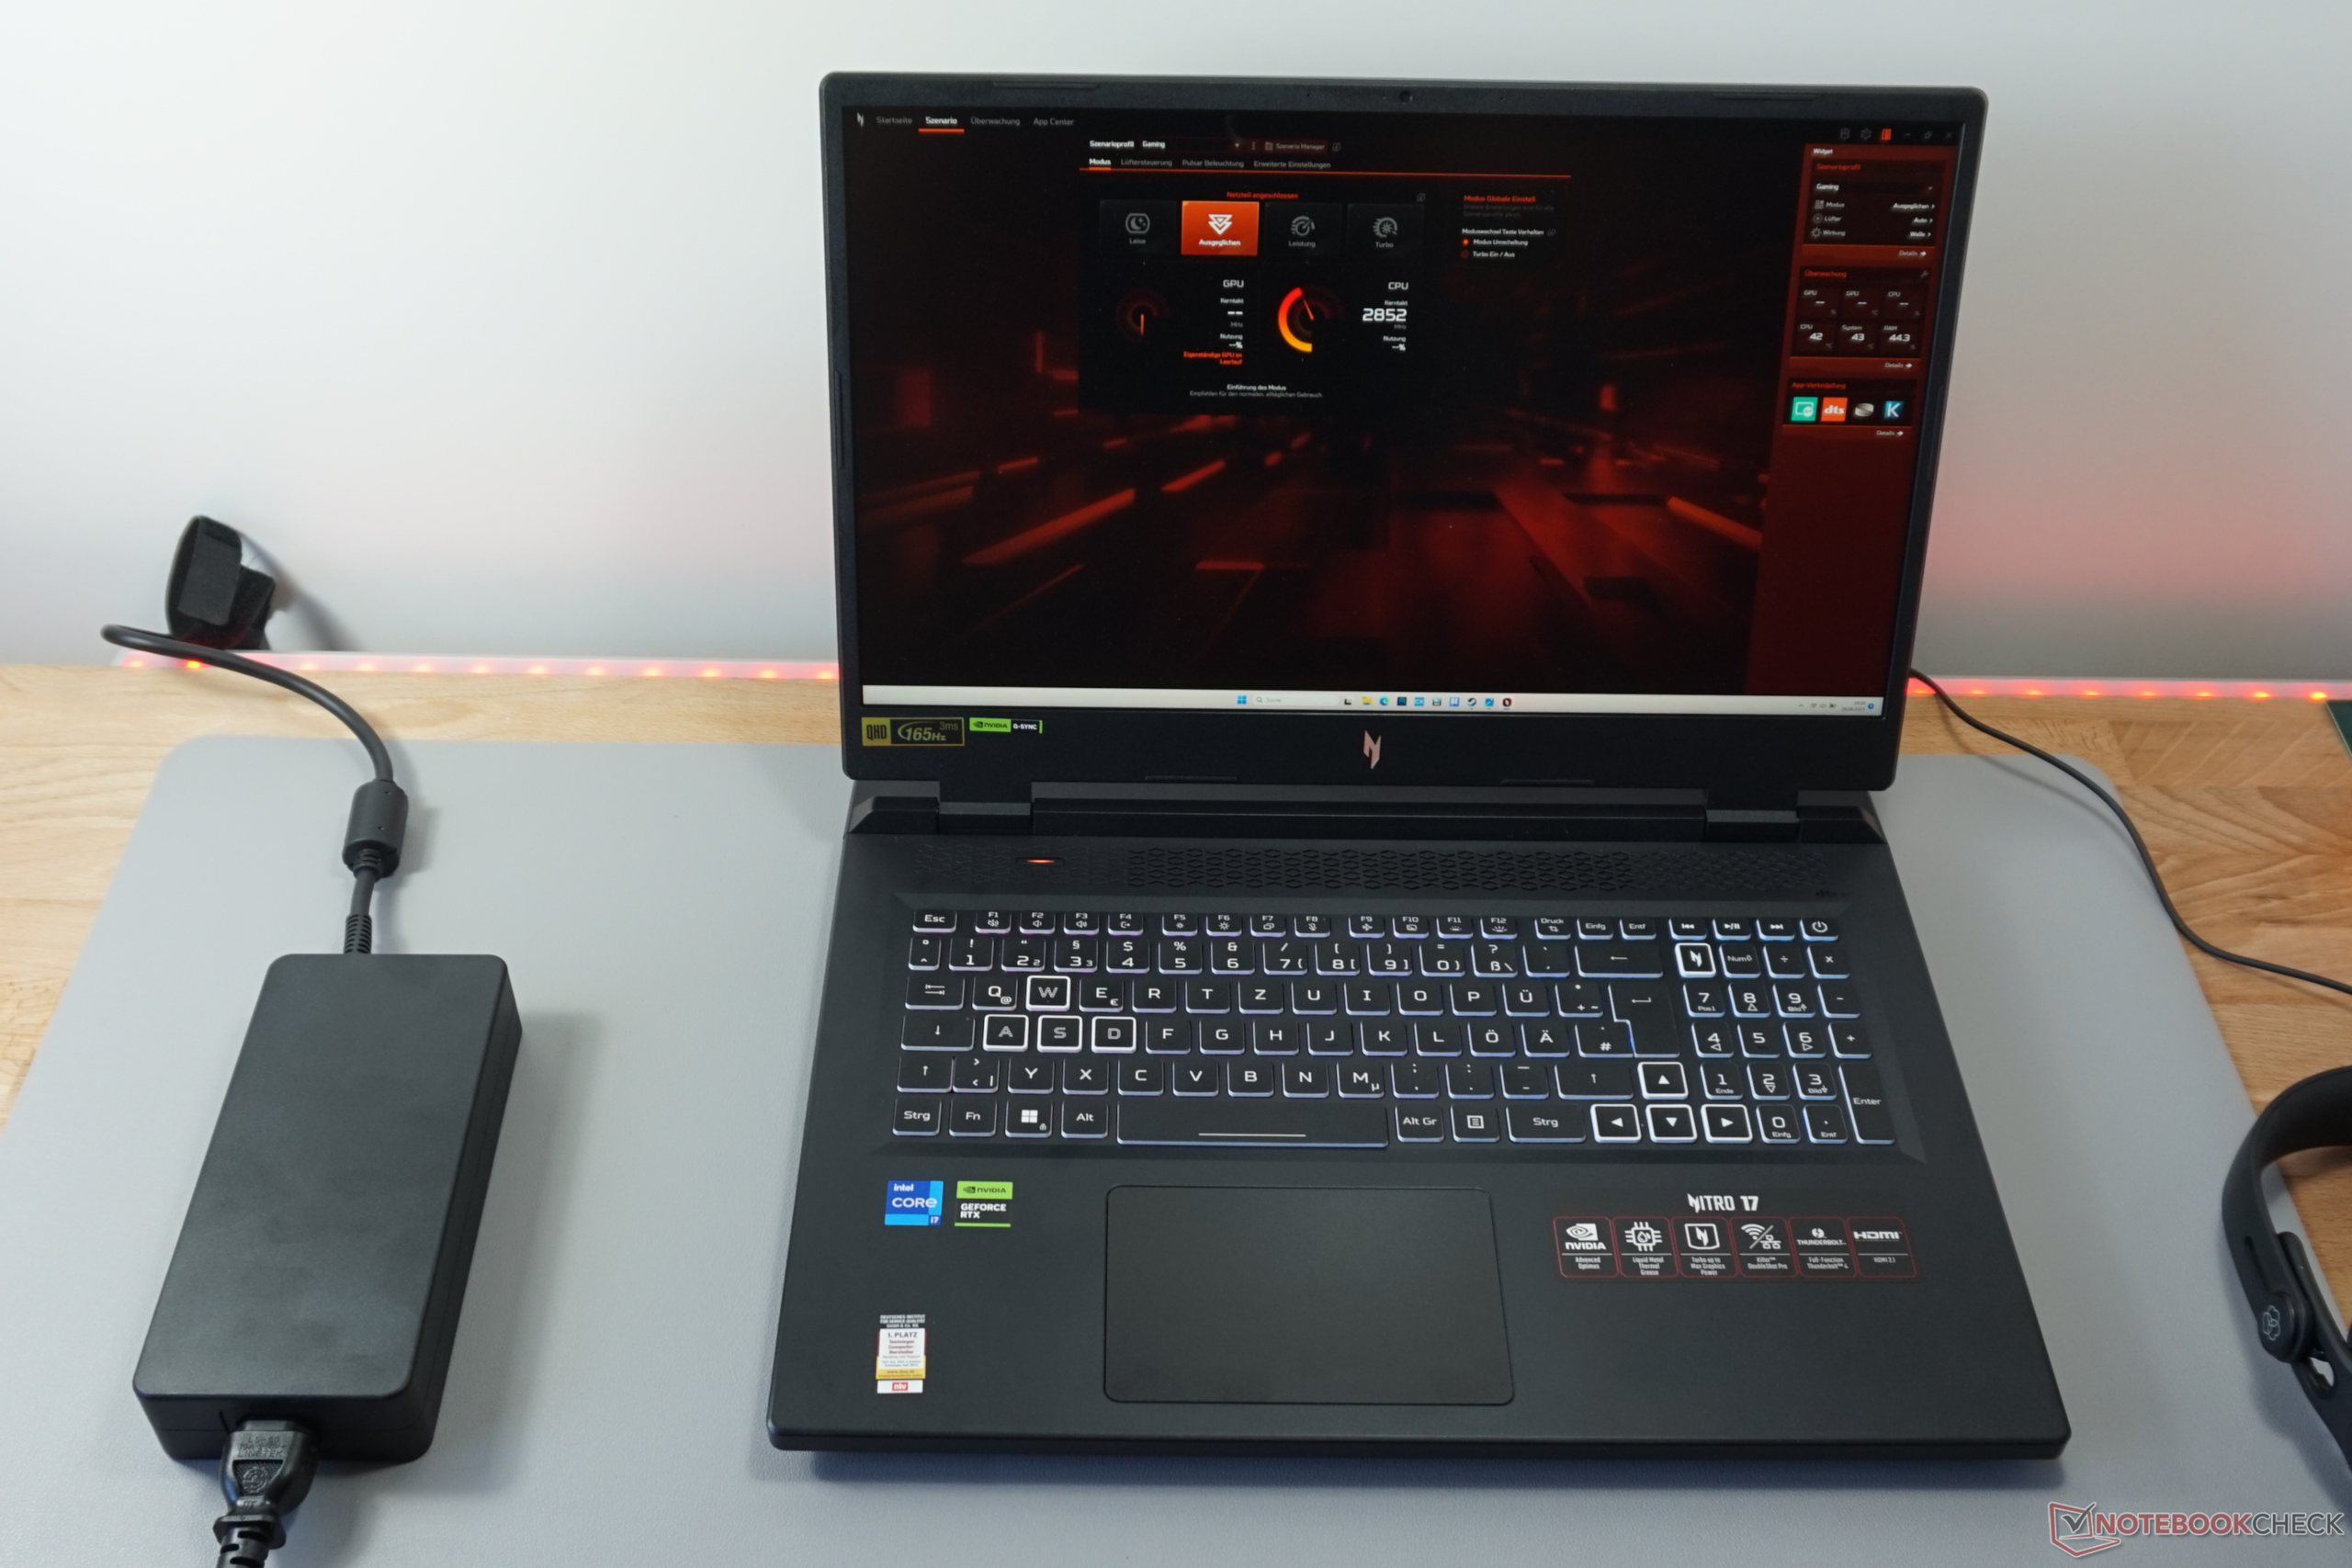
A cambio, Acer publicita el portátil como poseedor de velocidades de fotogramas estables del tipo de las que cabe esperar de un dispositivo de la serie Nvidia GeForce RTX 4000 bien configurado. Casi aún más crucial es la refrigeración supuestamente perfecta. Cuatro salidas de aire, refrigeración por metal líquido y un software de control fácil de usar constituyen una sólida base para ello.
Afortunadamente, algunas molestas debilidades encontradas en su predecesor directo, elAcer Nitro 5 AN517ya no se ven por ninguna parte. No se echarán de menos.
Nuestro análisis revela lo bien que el Nitro 17 se enfrenta a competidores como elMedion Erazer Defender P40 o elLenovo Legion Pro 5. Ambos portátiles comparten especificaciones similares a las de nuestro dispositivo de análisis y vienen equipados con un procesadorRTX 4060 con un TGP máximo de 140 vatios. Del mismo modo, la refrigeración tendrá que demostrar su valía en la prueba.
Posibles contendientes en la comparación
Valoración | Fecha | Modelo | Peso | Altura | Tamaño | Resolución | Precio |
|---|---|---|---|---|---|---|---|
| 87.2 % v7 (old) | 07/2023 | Acer Nitro 17 AN17-51-71ER i7-13700H, GeForce RTX 4060 Laptop GPU | 3 kg | 30.3 mm | 17.30" | 2560x1440 | |
| 87.9 % v7 (old) | 05/2023 | Lenovo Legion Pro 5 16IRX8 i7-13700HX, GeForce RTX 4060 Laptop GPU | 2.5 kg | 26.8 mm | 16.00" | 2560x1600 | |
| 86.9 % v7 (old) | 06/2023 | Asus TUF Gaming A16 FA617XS R9 7940HS, Radeon RX 7600S | 2.2 kg | 22.1 mm | 16.00" | 1920x1200 | |
| 85.9 % v7 (old) | 06/2023 | Schenker XMG Focus 17 (E23) i9-13900HX, GeForce RTX 4070 Laptop GPU | 2.9 kg | 29.3 mm | 17.30" | 2560x1440 | |
| 84.6 % v7 (old) | 05/2023 | Medion Erazer Defender P40 i7-13700HX, GeForce RTX 4060 Laptop GPU | 2.9 kg | 33 mm | 17.30" | 2560x1440 | |
| 83.9 % v7 (old) | 11/2022 | Acer Nitro 5 AN515-46-R1A1 R7 6800H, GeForce RTX 3070 Ti Laptop GPU | 2.5 kg | 26.8 mm | 15.60" | 1920x1080 | |
| 83.2 % v7 (old) | 01/2023 | MSI Pulse GL76 12UGK i7-12700H, GeForce RTX 3070 Laptop GPU | 2.6 kg | 24.2 mm | 17.30" | 1920x1080 |
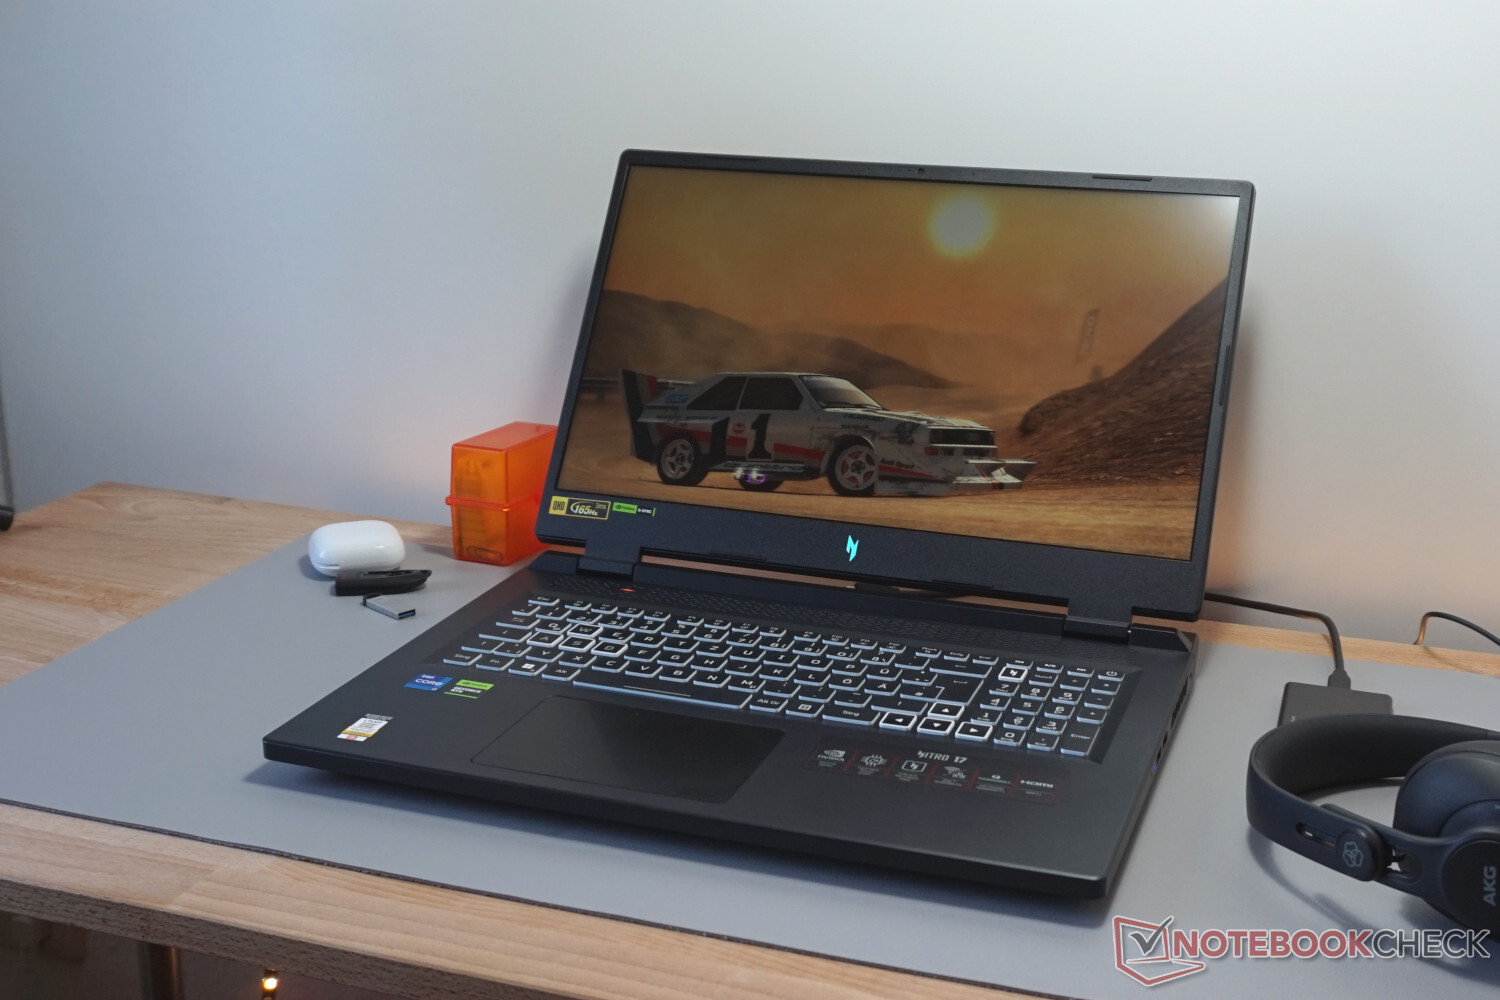
Maletín - Un portátil sobredimensionado de 17 pulgadas
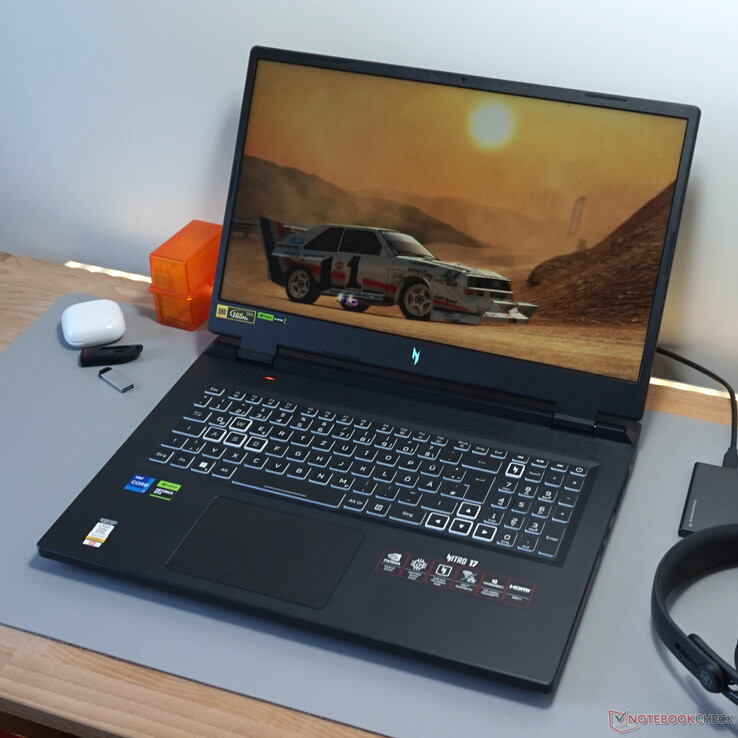
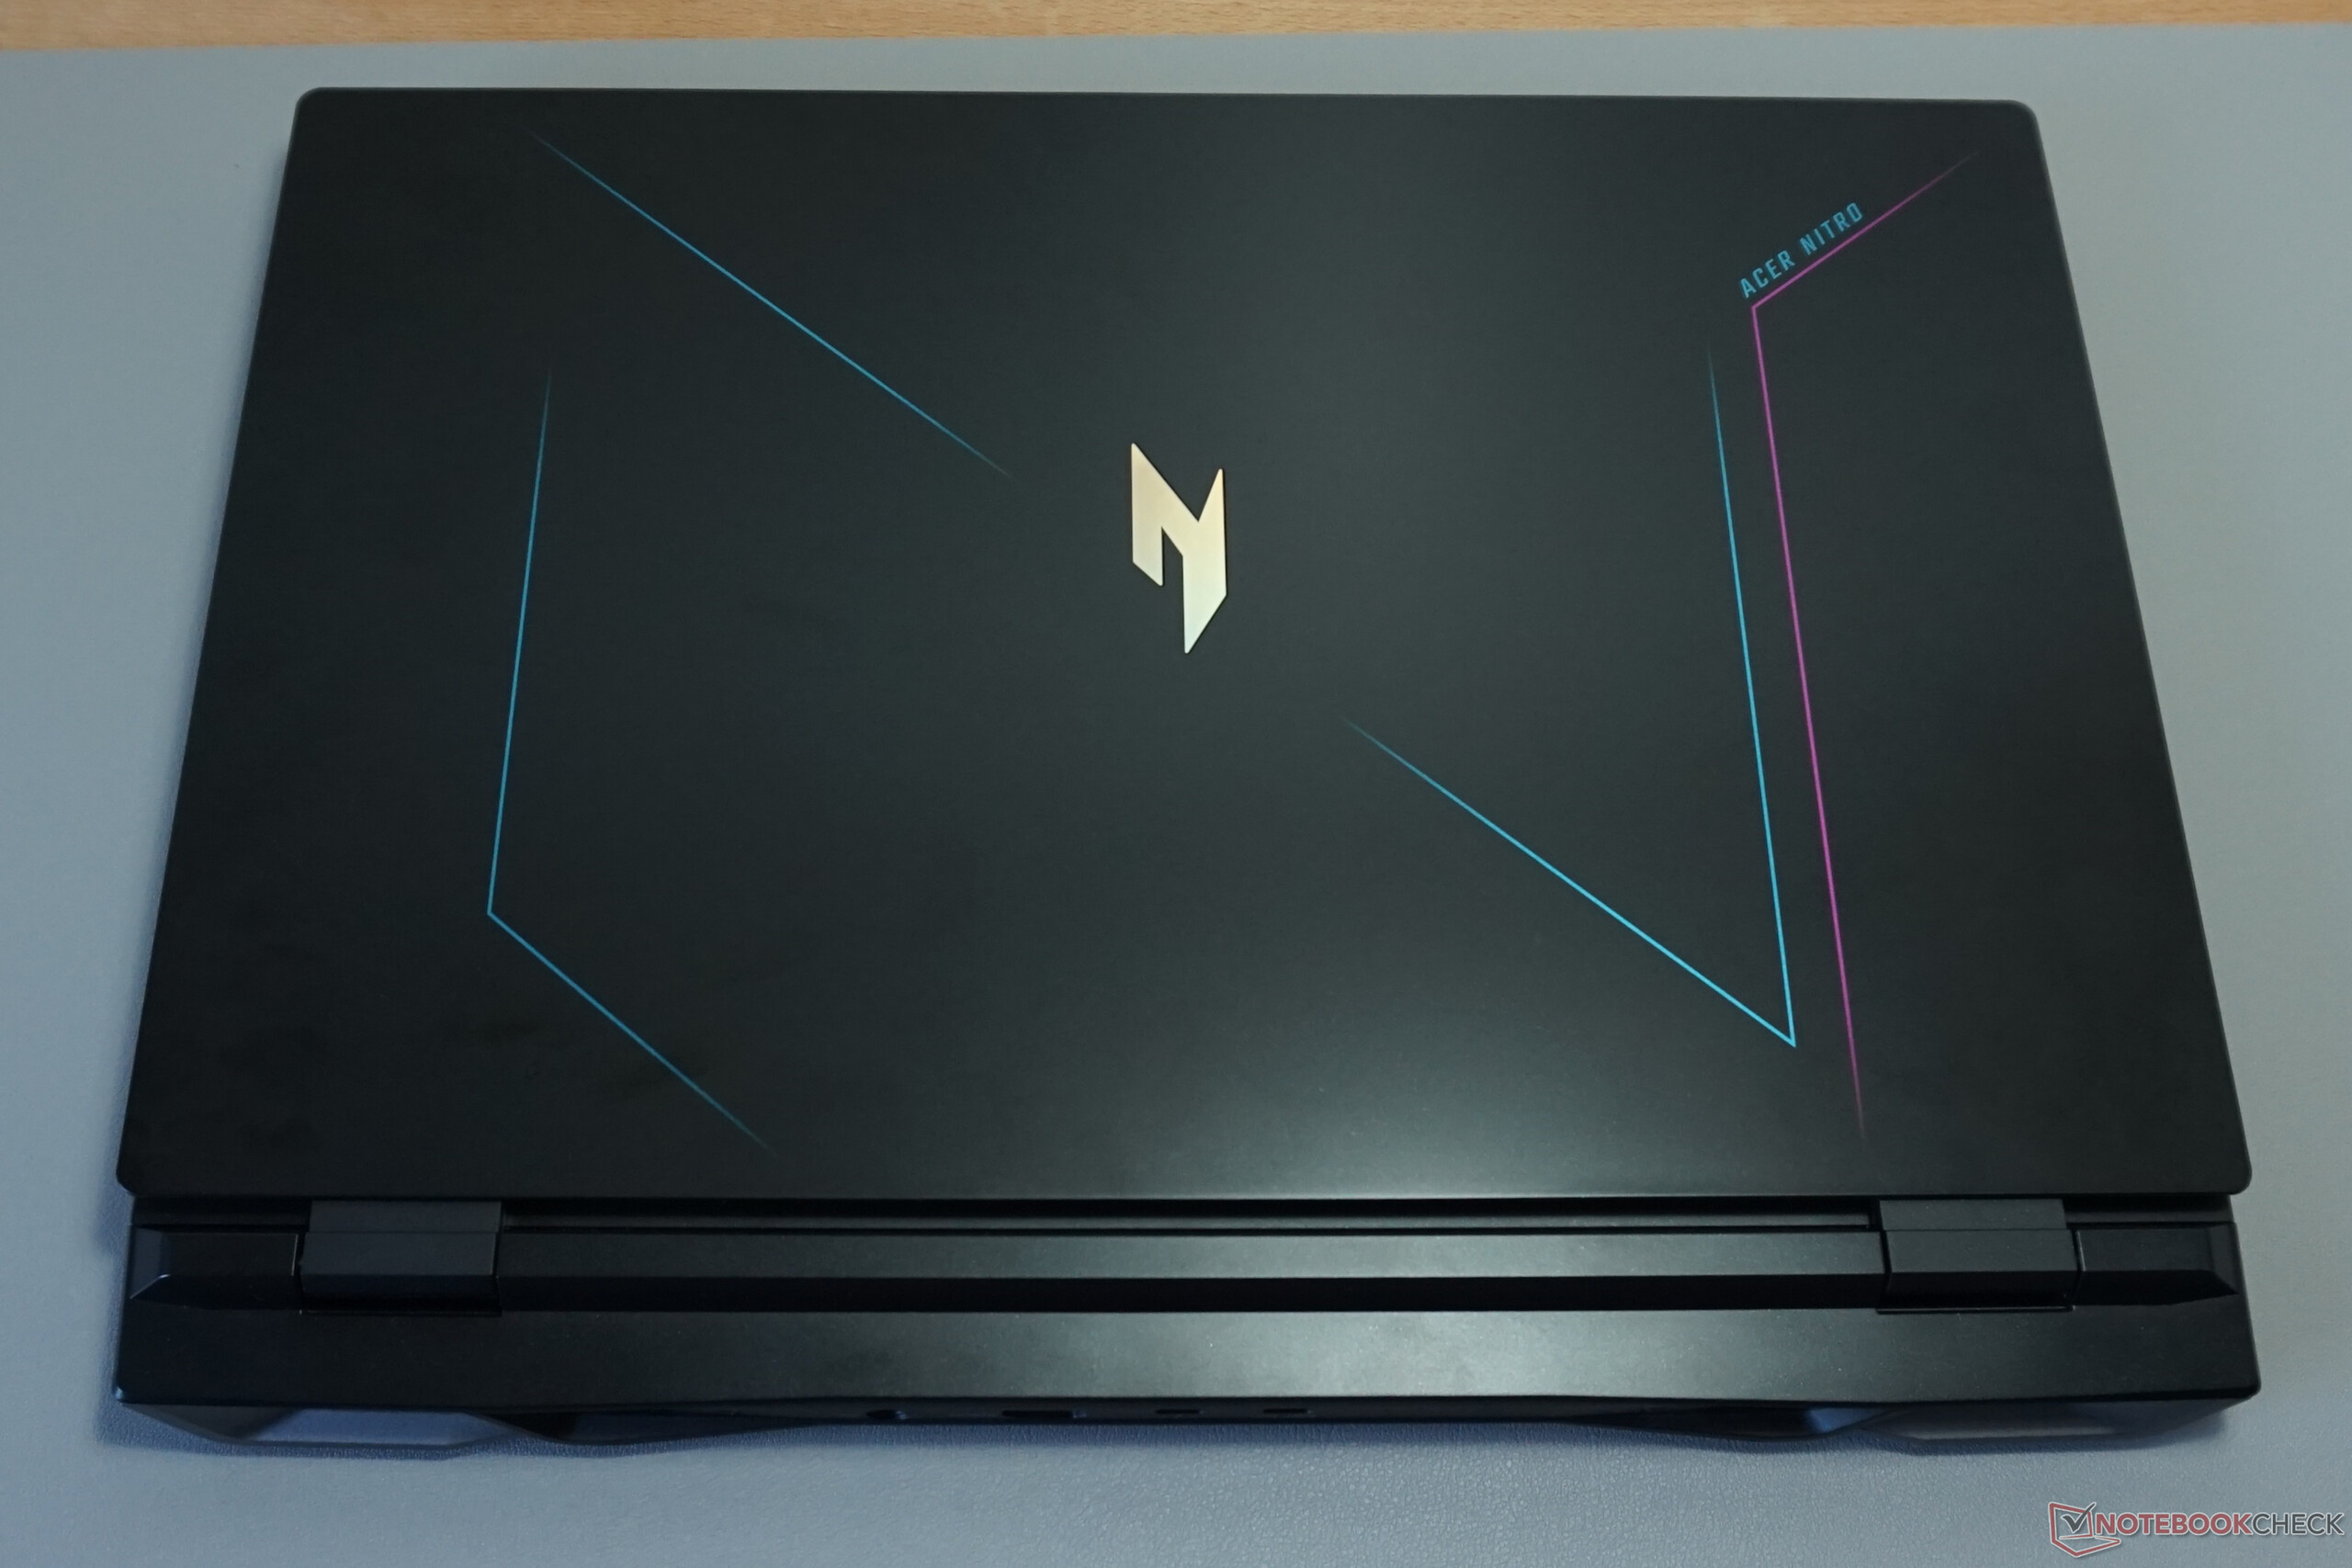
La "N" iridiscente tanto en la tapa como debajo de la pantalla delatan las credenciales de juego del Acer Nitro 17. Además, hay algunos pequeños detalles de color, pero eso es todo. Además, hay algunos pequeños acentos de color, pero eso es todo. La búsqueda de efectos de iluminación LED o elementos coloridos y destacados en la elegante carcasa de plástico termina en vano.
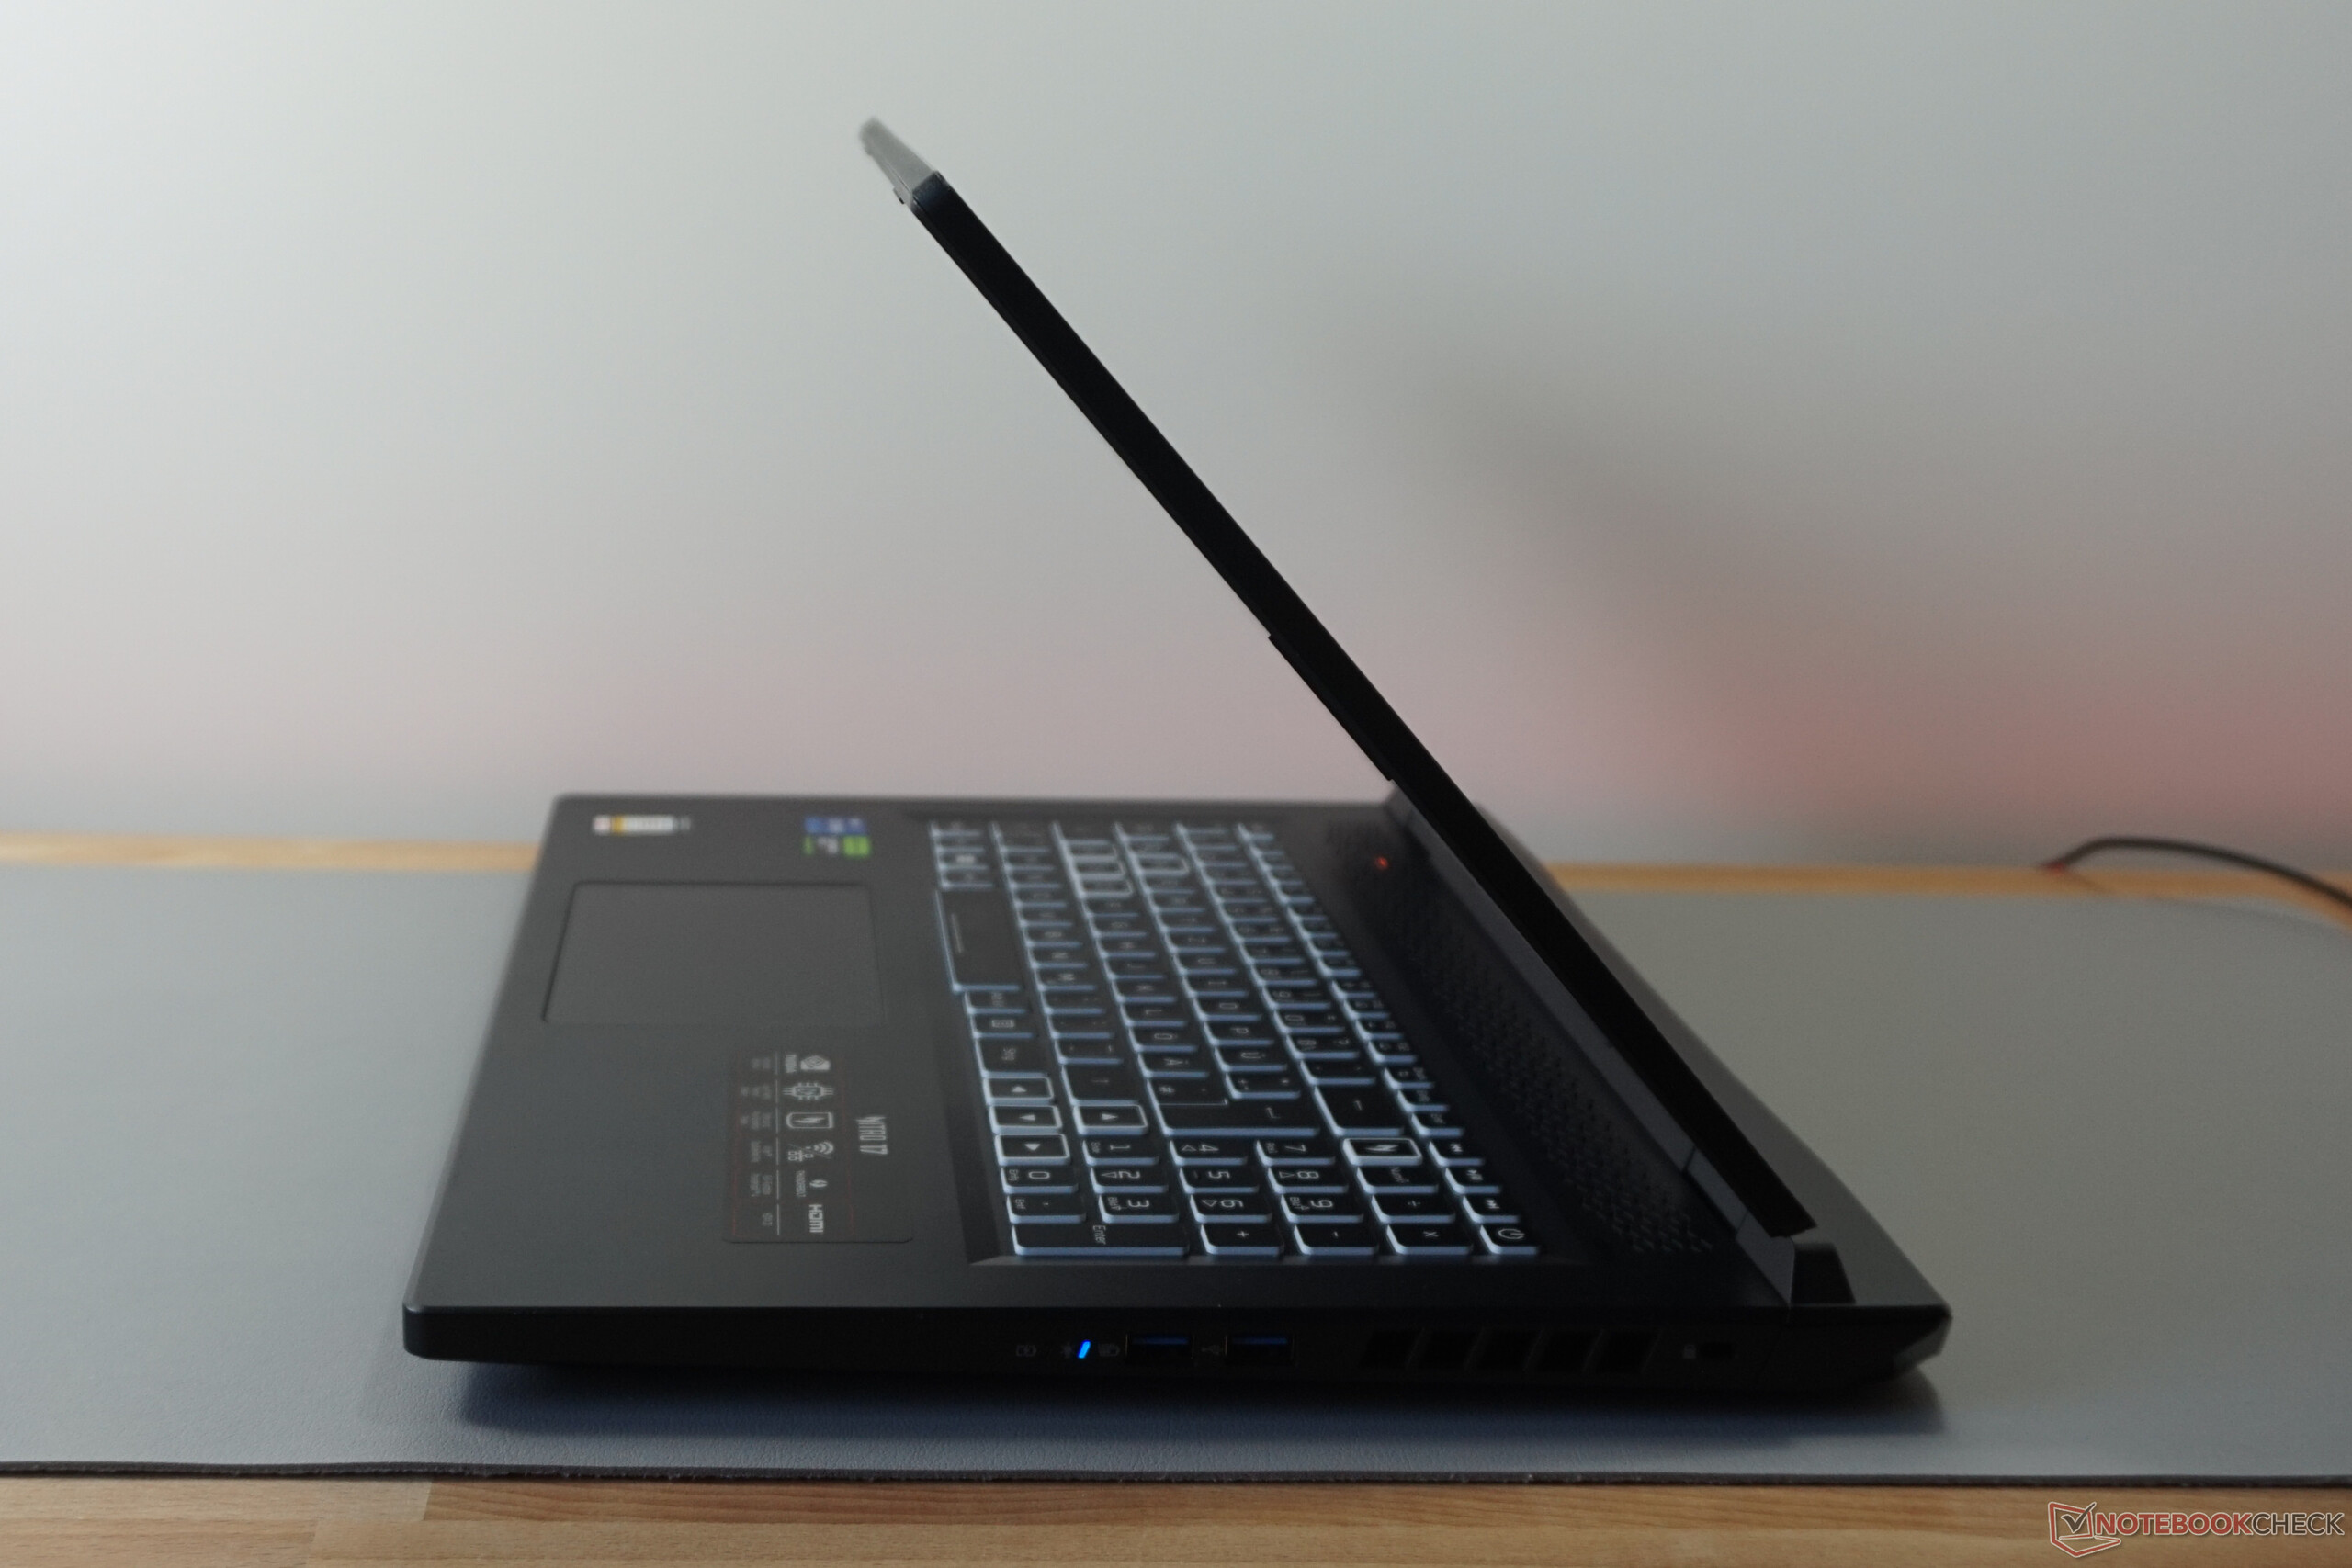
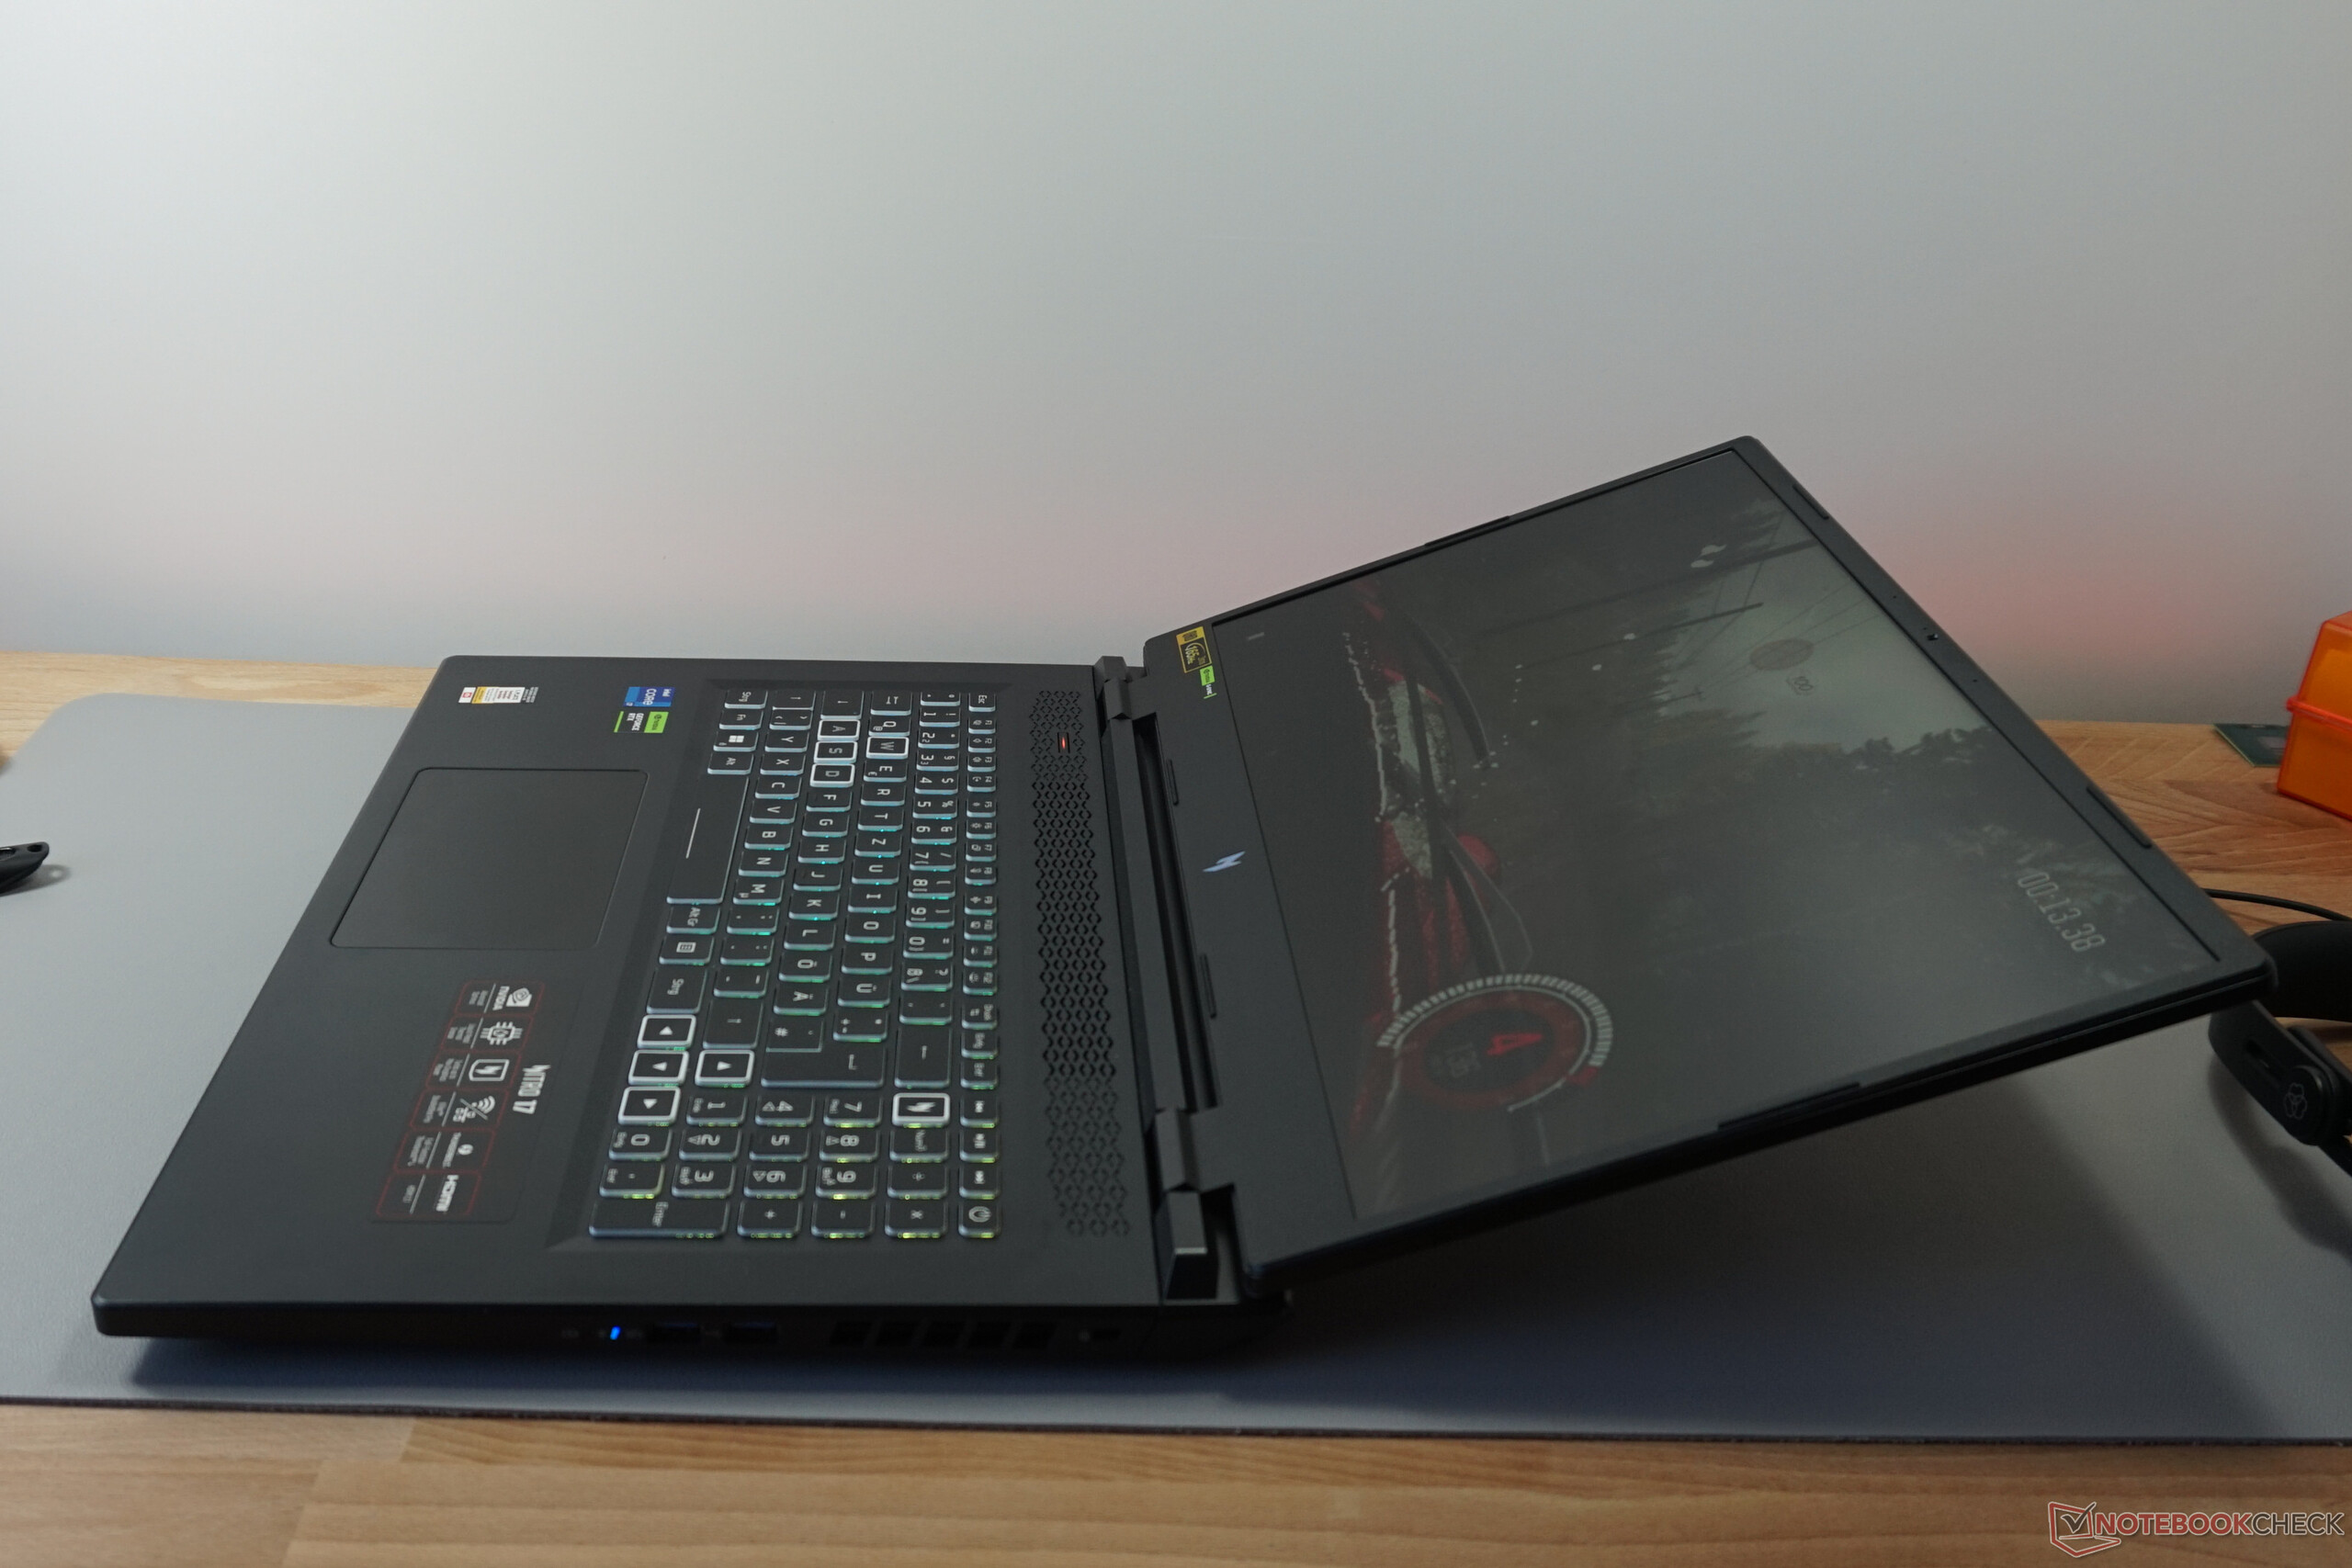
La falta de componentes metálicos no resta robustez al dispositivo. La carcasa no se dobla, sólo se puede retorcer mínimamente y, del mismo modo, tampoco se pueden extraer ruidos de ella. Además, el marco de la pantalla sólo puede doblarse ligeramente. La pantalla permanece estable al levantarla o moverla y puede abrirse en un ángulo de más de 150°. Todo parece estar bien organizado.
Al mismo tiempo, el portátil de Acer es pesado y realmente grande. Incluso entre las máquinas de 17 pulgadas, es difícil encontrar otro modelo que sea más grueso. Comparado con su ya grande predecesor, el Acer Nitro 517se han añadido algunos milímetros. Como se vio en el modelo de la generación anterior, la gran refrigeración hace sentir su presencia. El portátil también sigue engordando. Hay que cargar con casi 4,3 kg, ya que la fuente de alimentación pesa 1,2 kg.
Características - No hay quejas con el Nitro 17
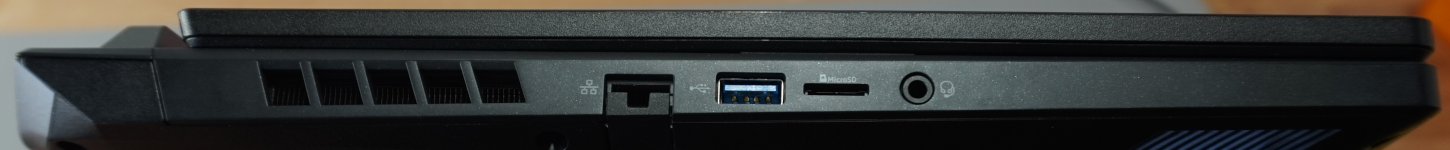
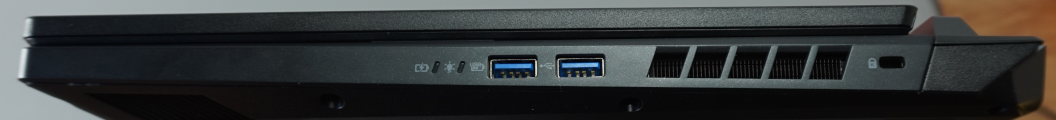
Aunque las críticas a su predecesor estaban justificadas por no tener un lector de tarjetas o un segundo puerto USB-C, el Acer Nitro 17 lo hace todo bien. Todas las salidas de vídeo, incluyendo Thunderbolt 4, USB-C con soporte DisplayPort y HDMI, se encuentran en la trasera del dispositivo. A izquierda y derecha del portátil, tenemos puertos USB-A. Los dos puertos de la derecha permiten incluso 10 Gbit/s, lo que es suficiente para, entre otras cosas, memorias USB rápidas y muchos SSD portátiles.
Es un misterio por qué el lector de tarjetas es sólo una variante microSD, ya que hay espacio más que suficiente para una mayor. Al puerto LAN también le habría gustado llegar a 2,5 Gbit/s en lugar de sólo 1 Gbit/s. Para la calidad y el precio, la selección de puertos del Acer Nitro 17 está absolutamente bien. La cantidad y el rendimiento de los mismos deberían ajustarse a la tarea, independientemente del escenario de aplicación.

Lector de tarjetas SD
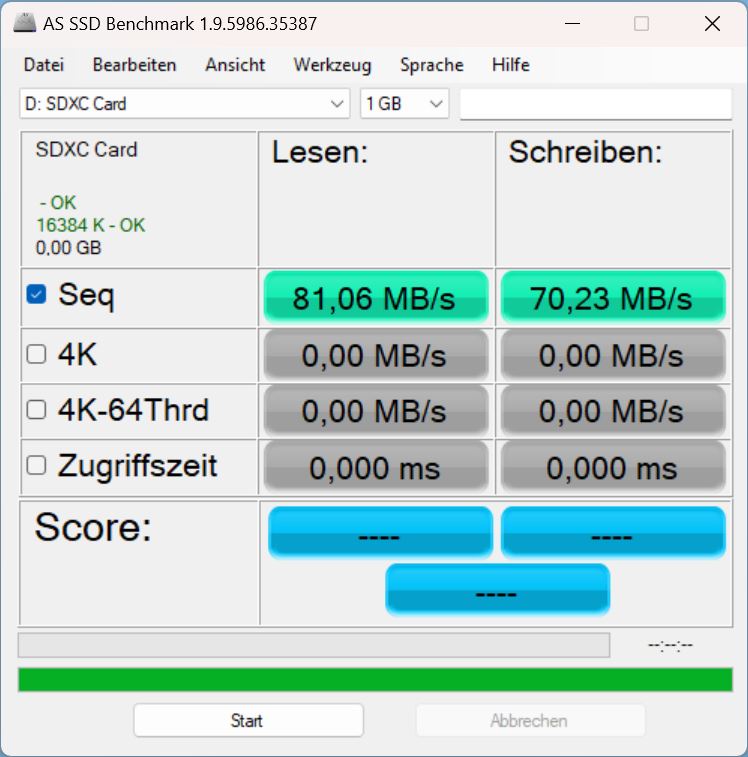
Obtuvimos mediciones muy por debajo de la media con la tarjeta de referencia AV PRO microSD 128 GB V60. El lector de tarjetas microSD integrado es hasta un tercio más lento que la media de los portátiles de juego.
Para una tarjeta de 32 GB eso significa que hay un tiempo de espera adicional de más de 2 minutos al leer datos.
| SD Card Reader | |
| average JPG Copy Test (av. of 3 runs) | |
| Media de la clase Gaming (20.9 - 210, n=54, últimos 2 años) | |
| Medion Erazer Defender P40 (AV PRO microSD 128 GB V60) | |
| Schenker XMG Focus 17 (E23) | |
| Acer Nitro 17 AN17-51-71ER | |
| maximum AS SSD Seq Read Test (1GB) | |
| Media de la clase Gaming (25.5 - 261, n=51, últimos 2 años) | |
| Medion Erazer Defender P40 (AV PRO microSD 128 GB V60) | |
| Schenker XMG Focus 17 (E23) | |
| Acer Nitro 17 AN17-51-71ER | |
Comunicación
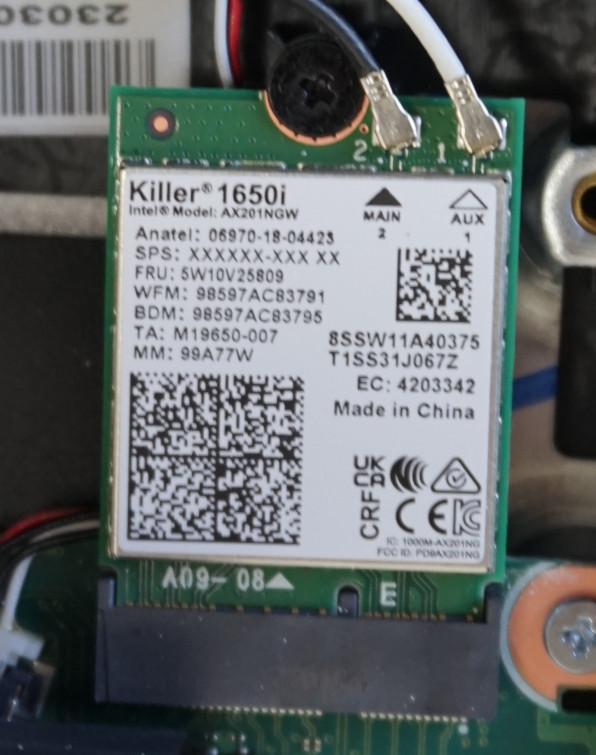
El módulo WLAN, para el que comprobamos los resultados esperados, no tiene críticas. Sin embargo, Wi-Fi 6E no está a bordo, lo que significa que múltiples redes solapadas resultarán en una considerable reducción del ancho de banda.
Cámara web
La cámara HD básica es suficiente para videollamadas poco exigentes, aunque la baja resolución es evidente para el receptor. Las fuertes desviaciones de color que medimos se debieron a la buena función de brillo de la cámara. Se adapta rápidamente a las condiciones de luz cambiantes y ofrece imágenes de buena calidad, incluso con poca luz, pero no es lo ideal y recomendamos recurrir a una cámara externa.
Del mismo modo, el micrófono hace su trabajo satisfactoriamente. El sonido se graba a un volumen constante y se oye fácilmente tanto a distintas distancias como en múltiples direcciones del habla. Sin embargo, al ajustar el volumen, es difícil ignorar el tono metálico y las ligeras distorsiones.


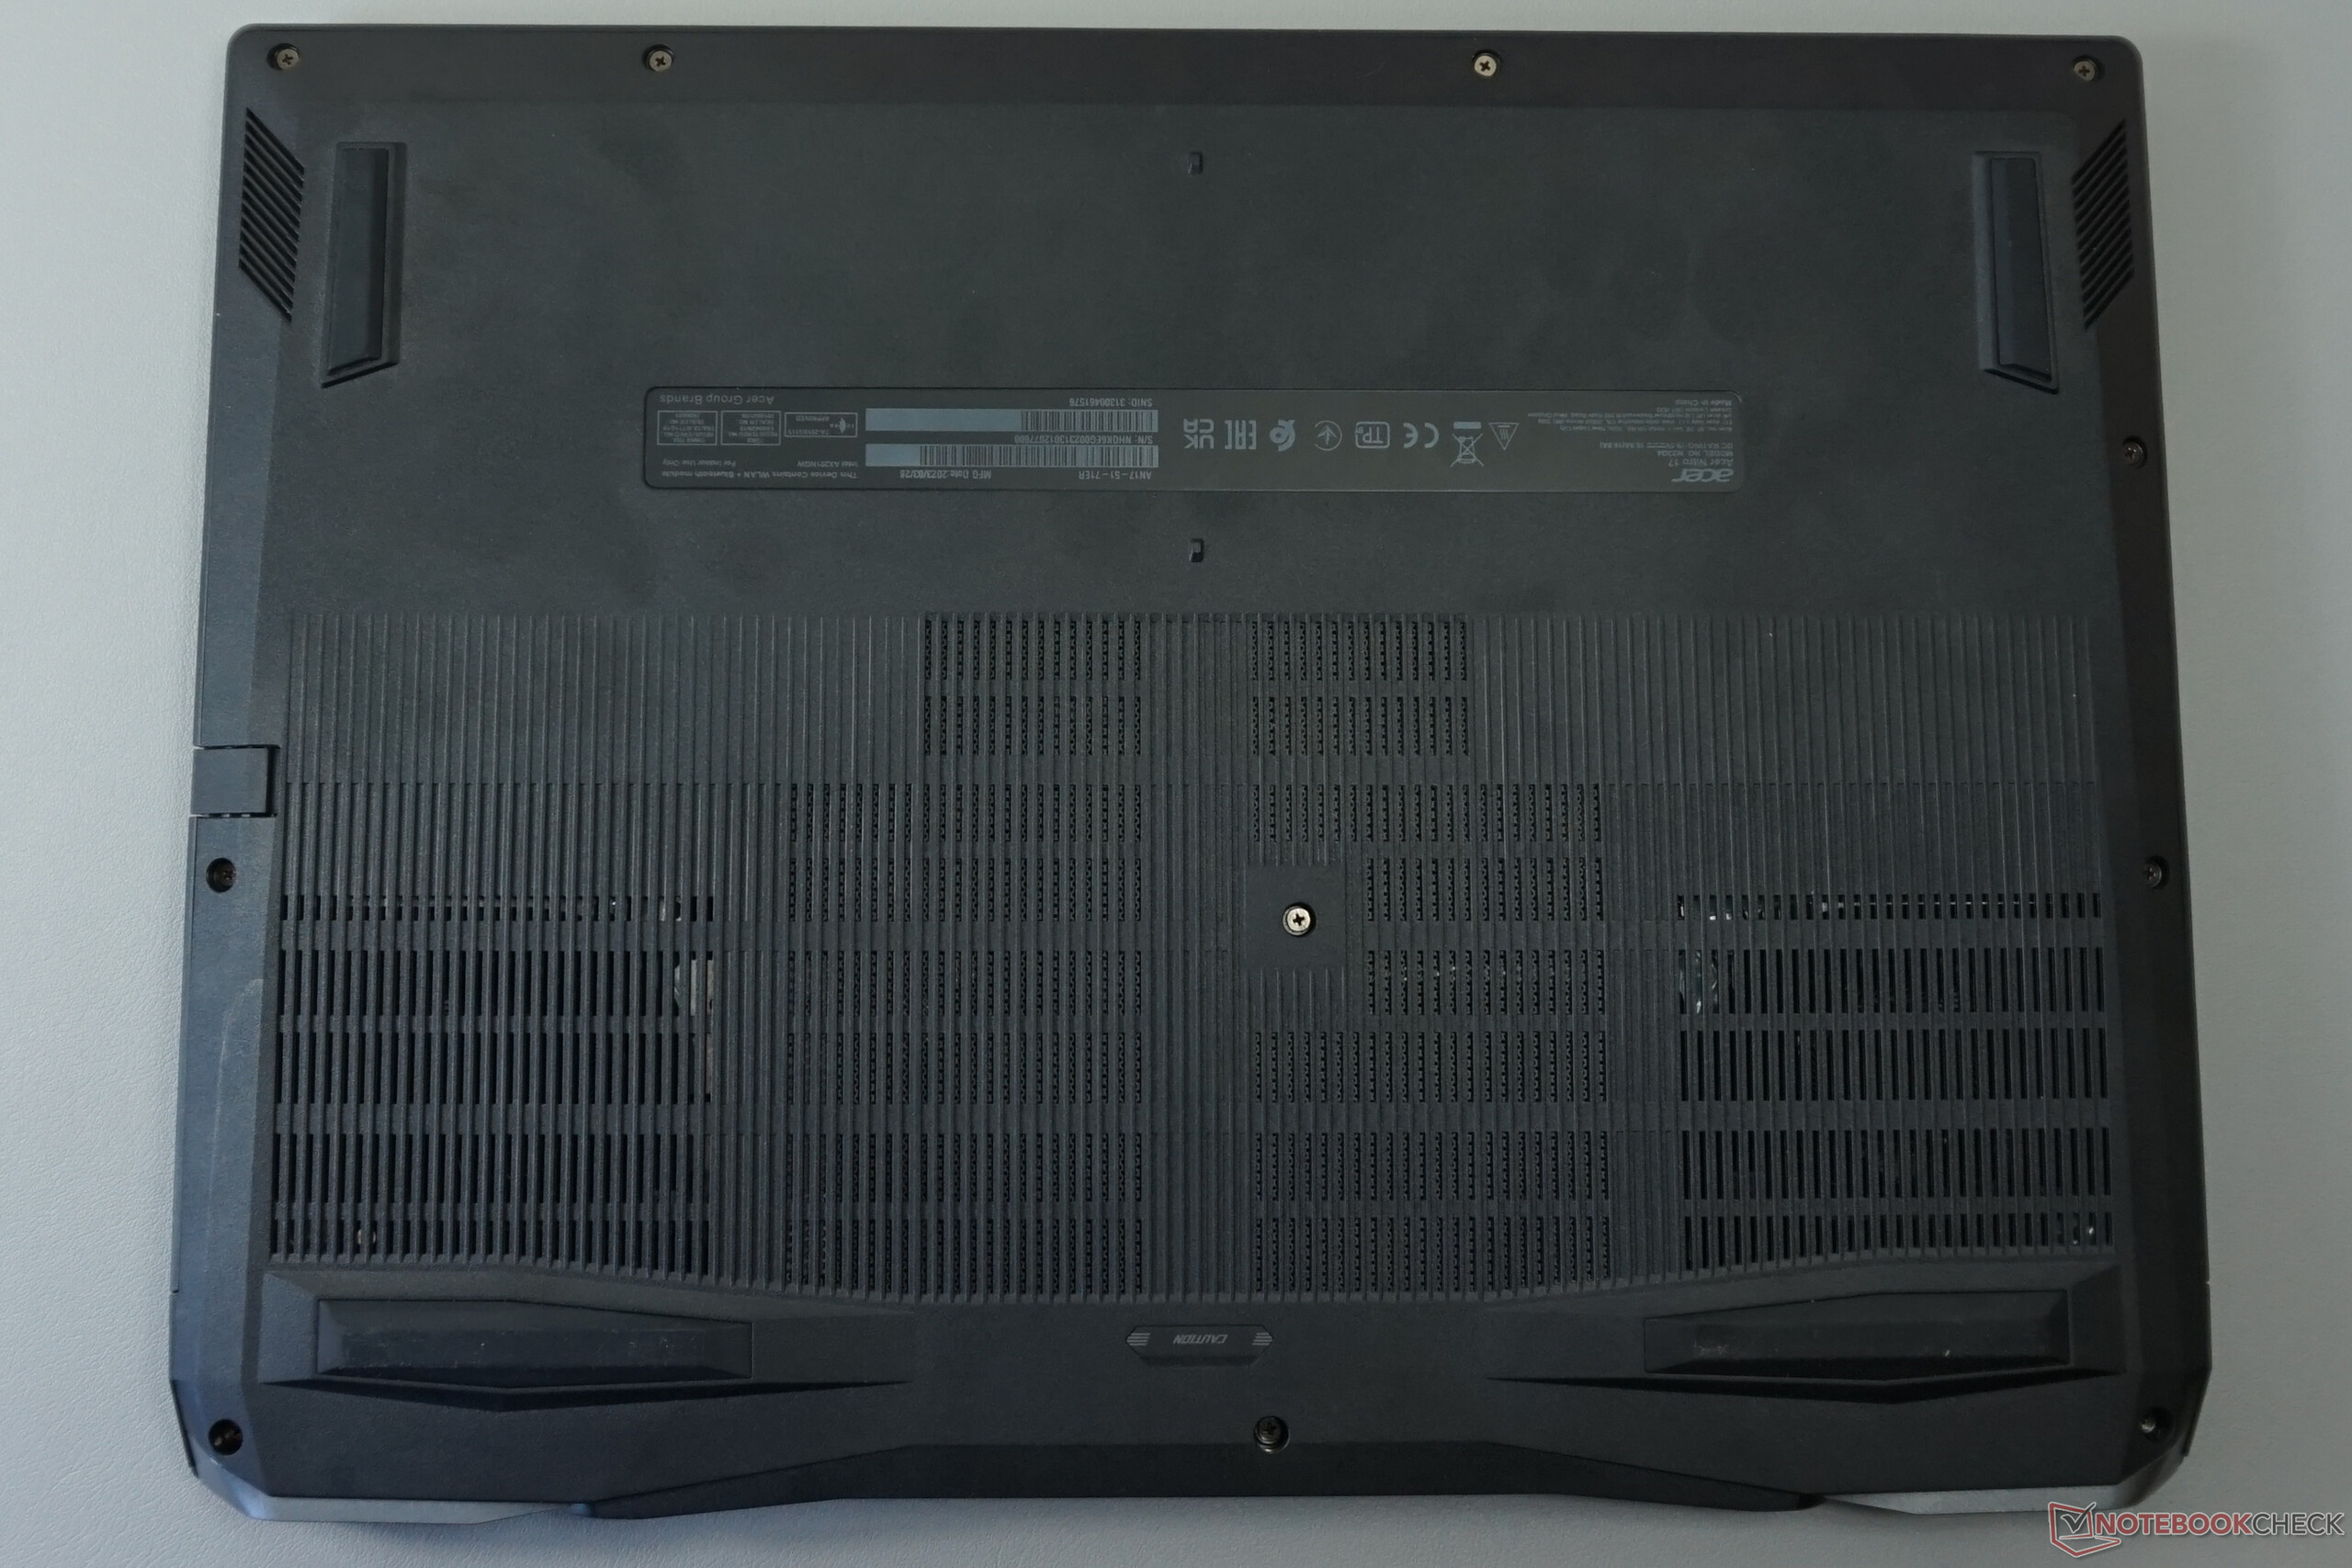
Mantenimiento
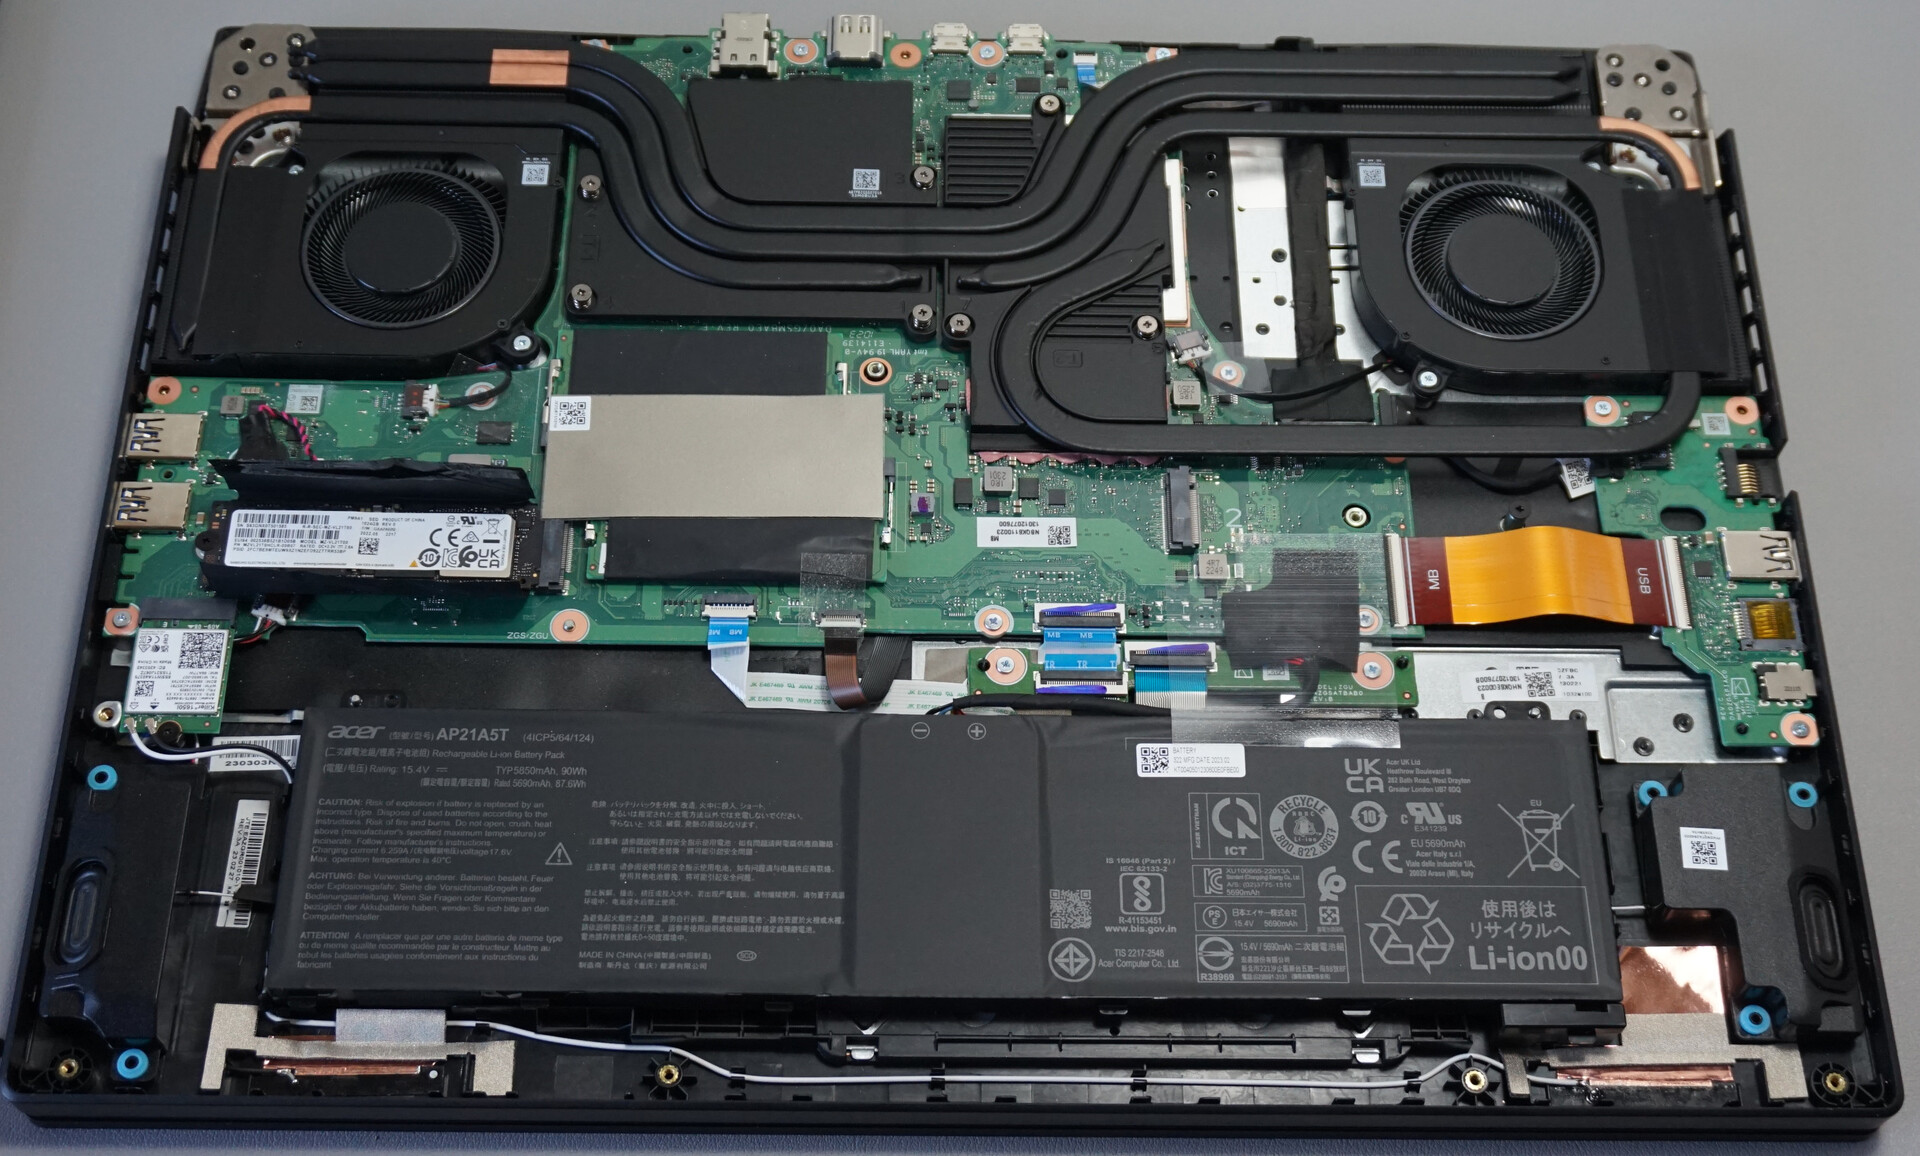
Hay que retirar once tornillos de estrella de fácil acceso, lo que permite arrancar la placa base con poca resistencia. El mejor lugar para empezar parece ser la consola de conexión trasera, ya que hay muy pocos clips de plástico que aseguran adicionalmente la base. No se necesitan herramientas adicionales.
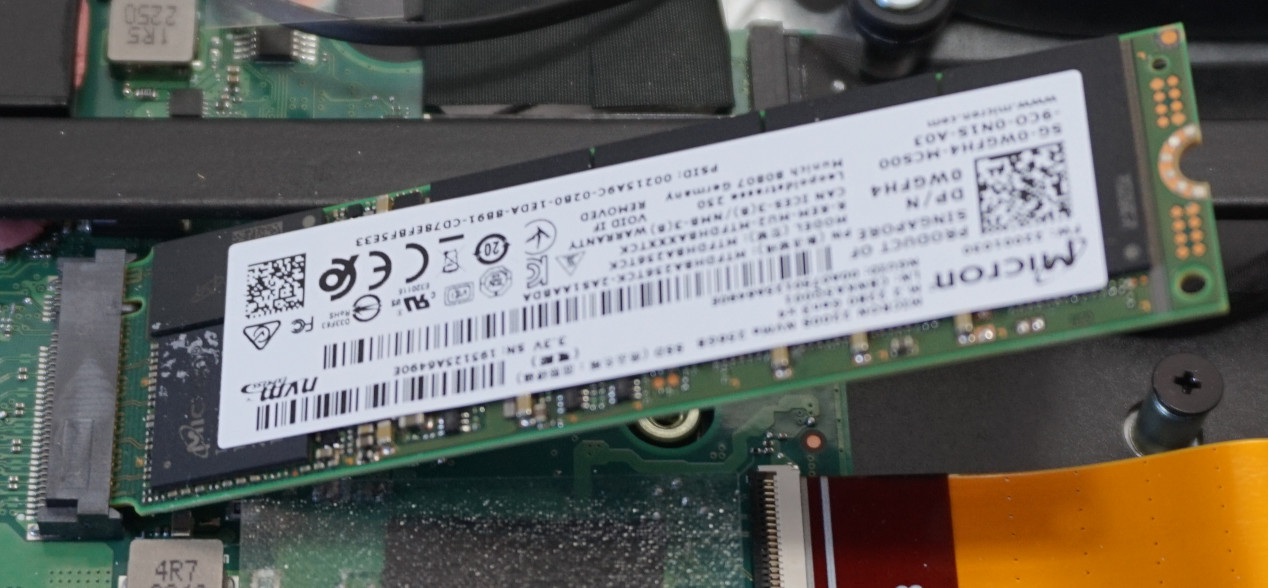
El interior es bastante espacioso, lo que no es sorprendente teniendo en cuenta el espacio que ofrece. Hay una ranura para un SSD M.2 NVMe adicional. WLAN, el primer SSD y RAM son tan fácilmente accesibles como la batería y también se pueden intercambiar relativamente sin esfuerzo.
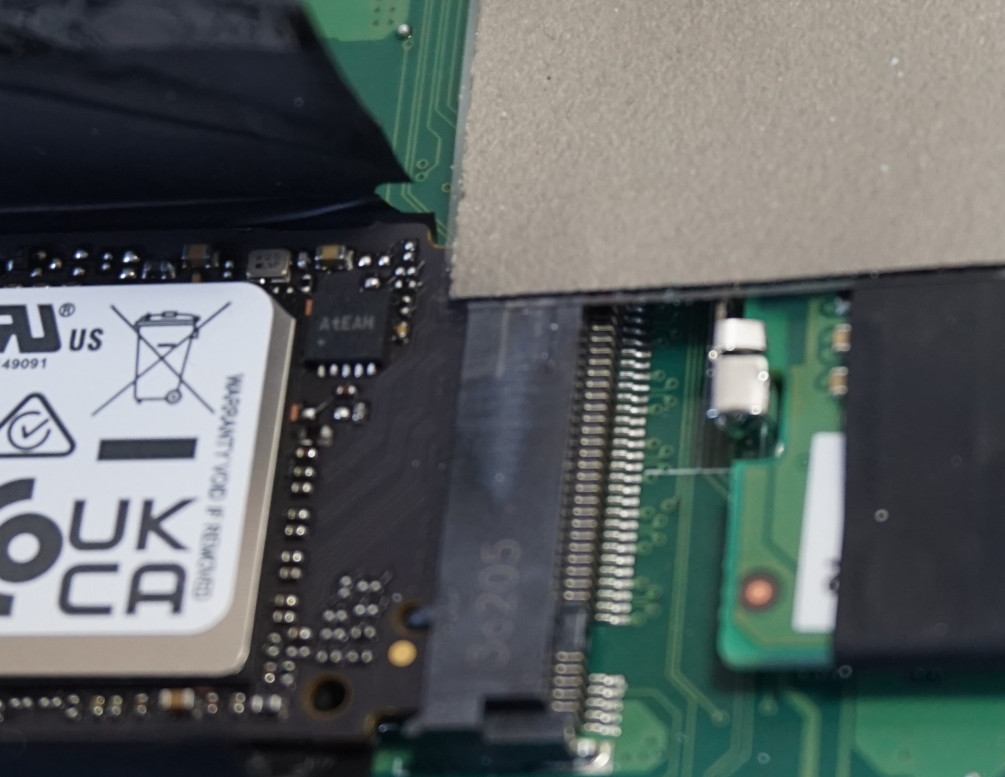
Lo que se nota comparado con el predecesor es la falta de disipadores adicionales sobre la ranura SSD. Además, la almohadilla de refrigeración de la RAM en nuestro dispositivo de pruebas está pegada sobre el conector de almacenamiento masivo. Esto influyó en nuestro test de estrés y puede verse más abajo. Por el contrario, las pruebas de juego no se ven afectadas por esto.
Dispositivos de entrada - Hecho para un portátil de juegos
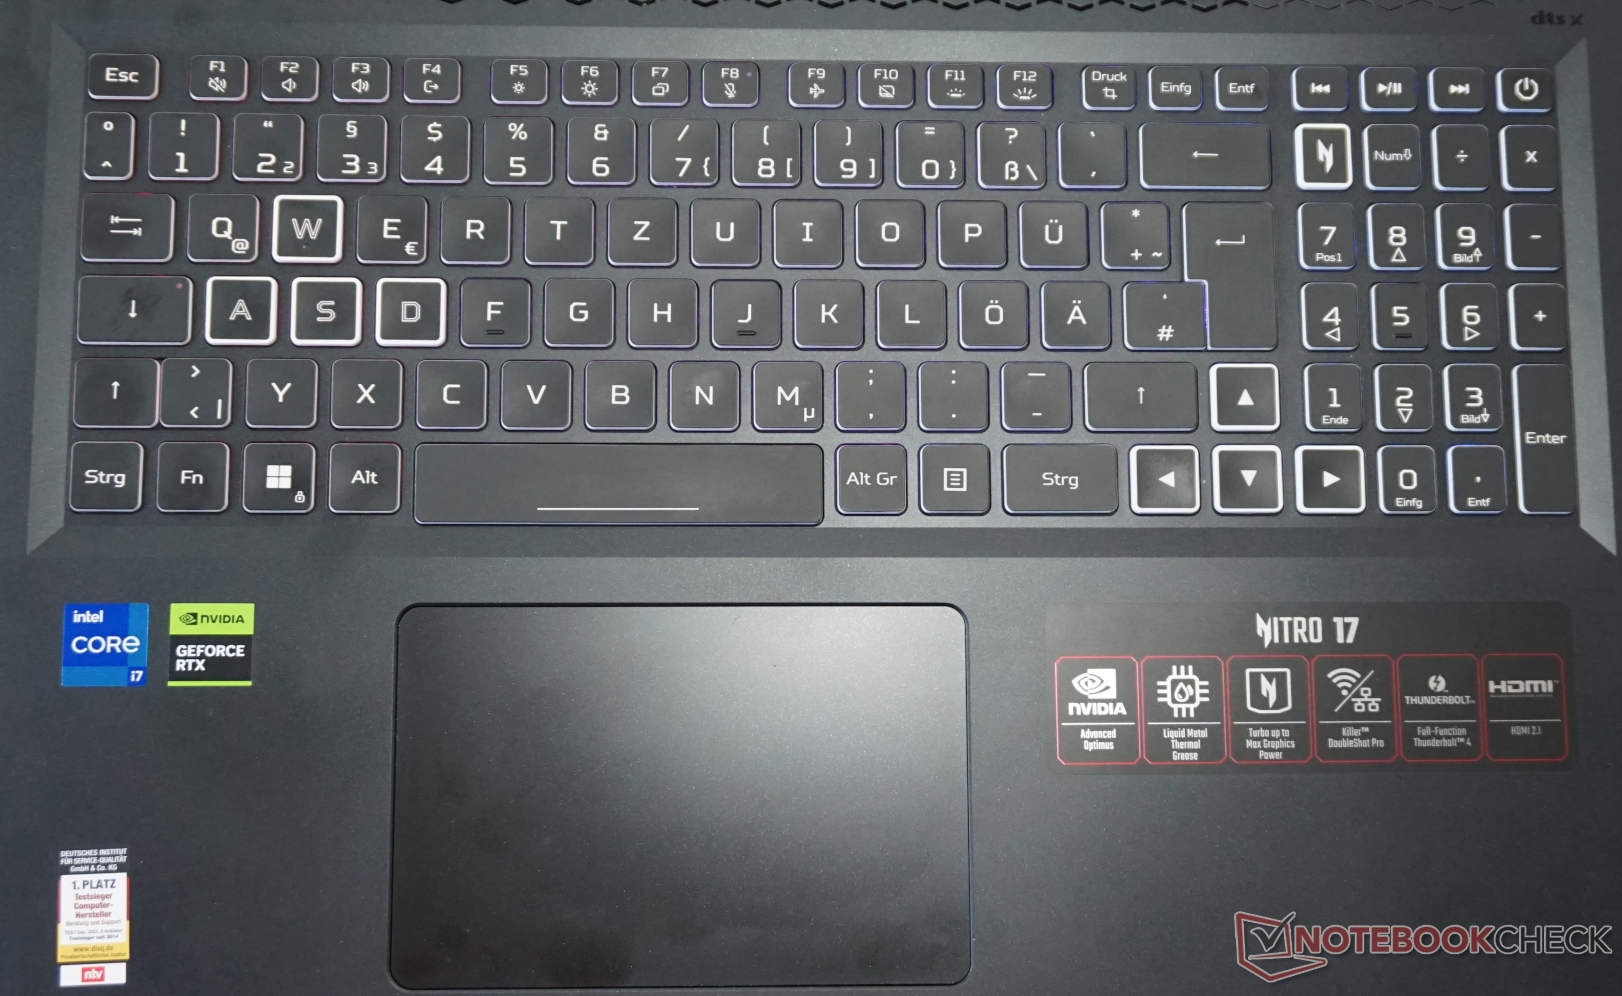
El típico teclado de cúpula de goma y formato plano causó el tipo de impresión muy positiva que se asocia a un dispositivo de entrada de este tipo. El recorrido de las teclas de 1,4 mm (nuestra medición) garantiza una experiencia de escritura agradable, pero la resistencia podría ser un poco más firme. Dado que el marco del teclado sólo se flexiona mínimamente cuando se aplica una presión de tecleo enérgica, las sesiones de tecleo sostenidas no son un problema.
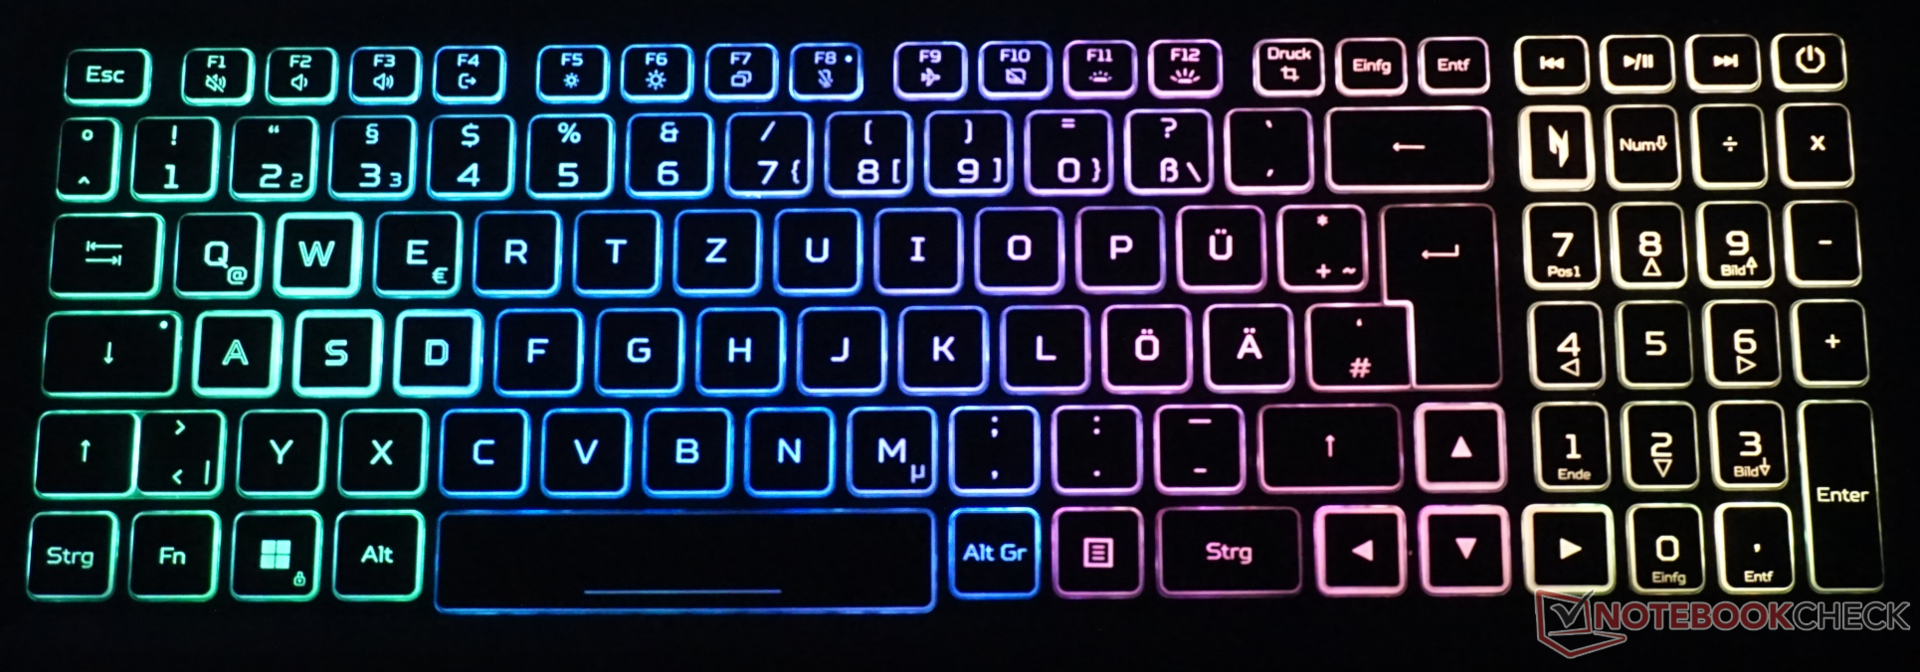
Los lados blancos de las teclas son visualmente llamativos y su alto contraste realmente los hace destacar. Además, las teclas "WASD", las teclas de flecha y la tecla especial para el software NitroSense tienen un resaltado adicional. La iluminación de las teclas es uniforme, pero las opciones de personalización se limitan a cuatro zonas y unos pocos efectos. La amplia gama de colores hace que se vean bastante bien.
Por el contrario, el touchpad es una decepción. Con casi 8 x 12 cm, está bien proporcionado pero su precisión así como los puntos de presión de las teclas ocultas en la zona inferior son poco impresionantes. Además, notamos un ligero ruido al colocar y levantar los dedos. Por lo tanto, recomendamos utilizar un ratón independiente.
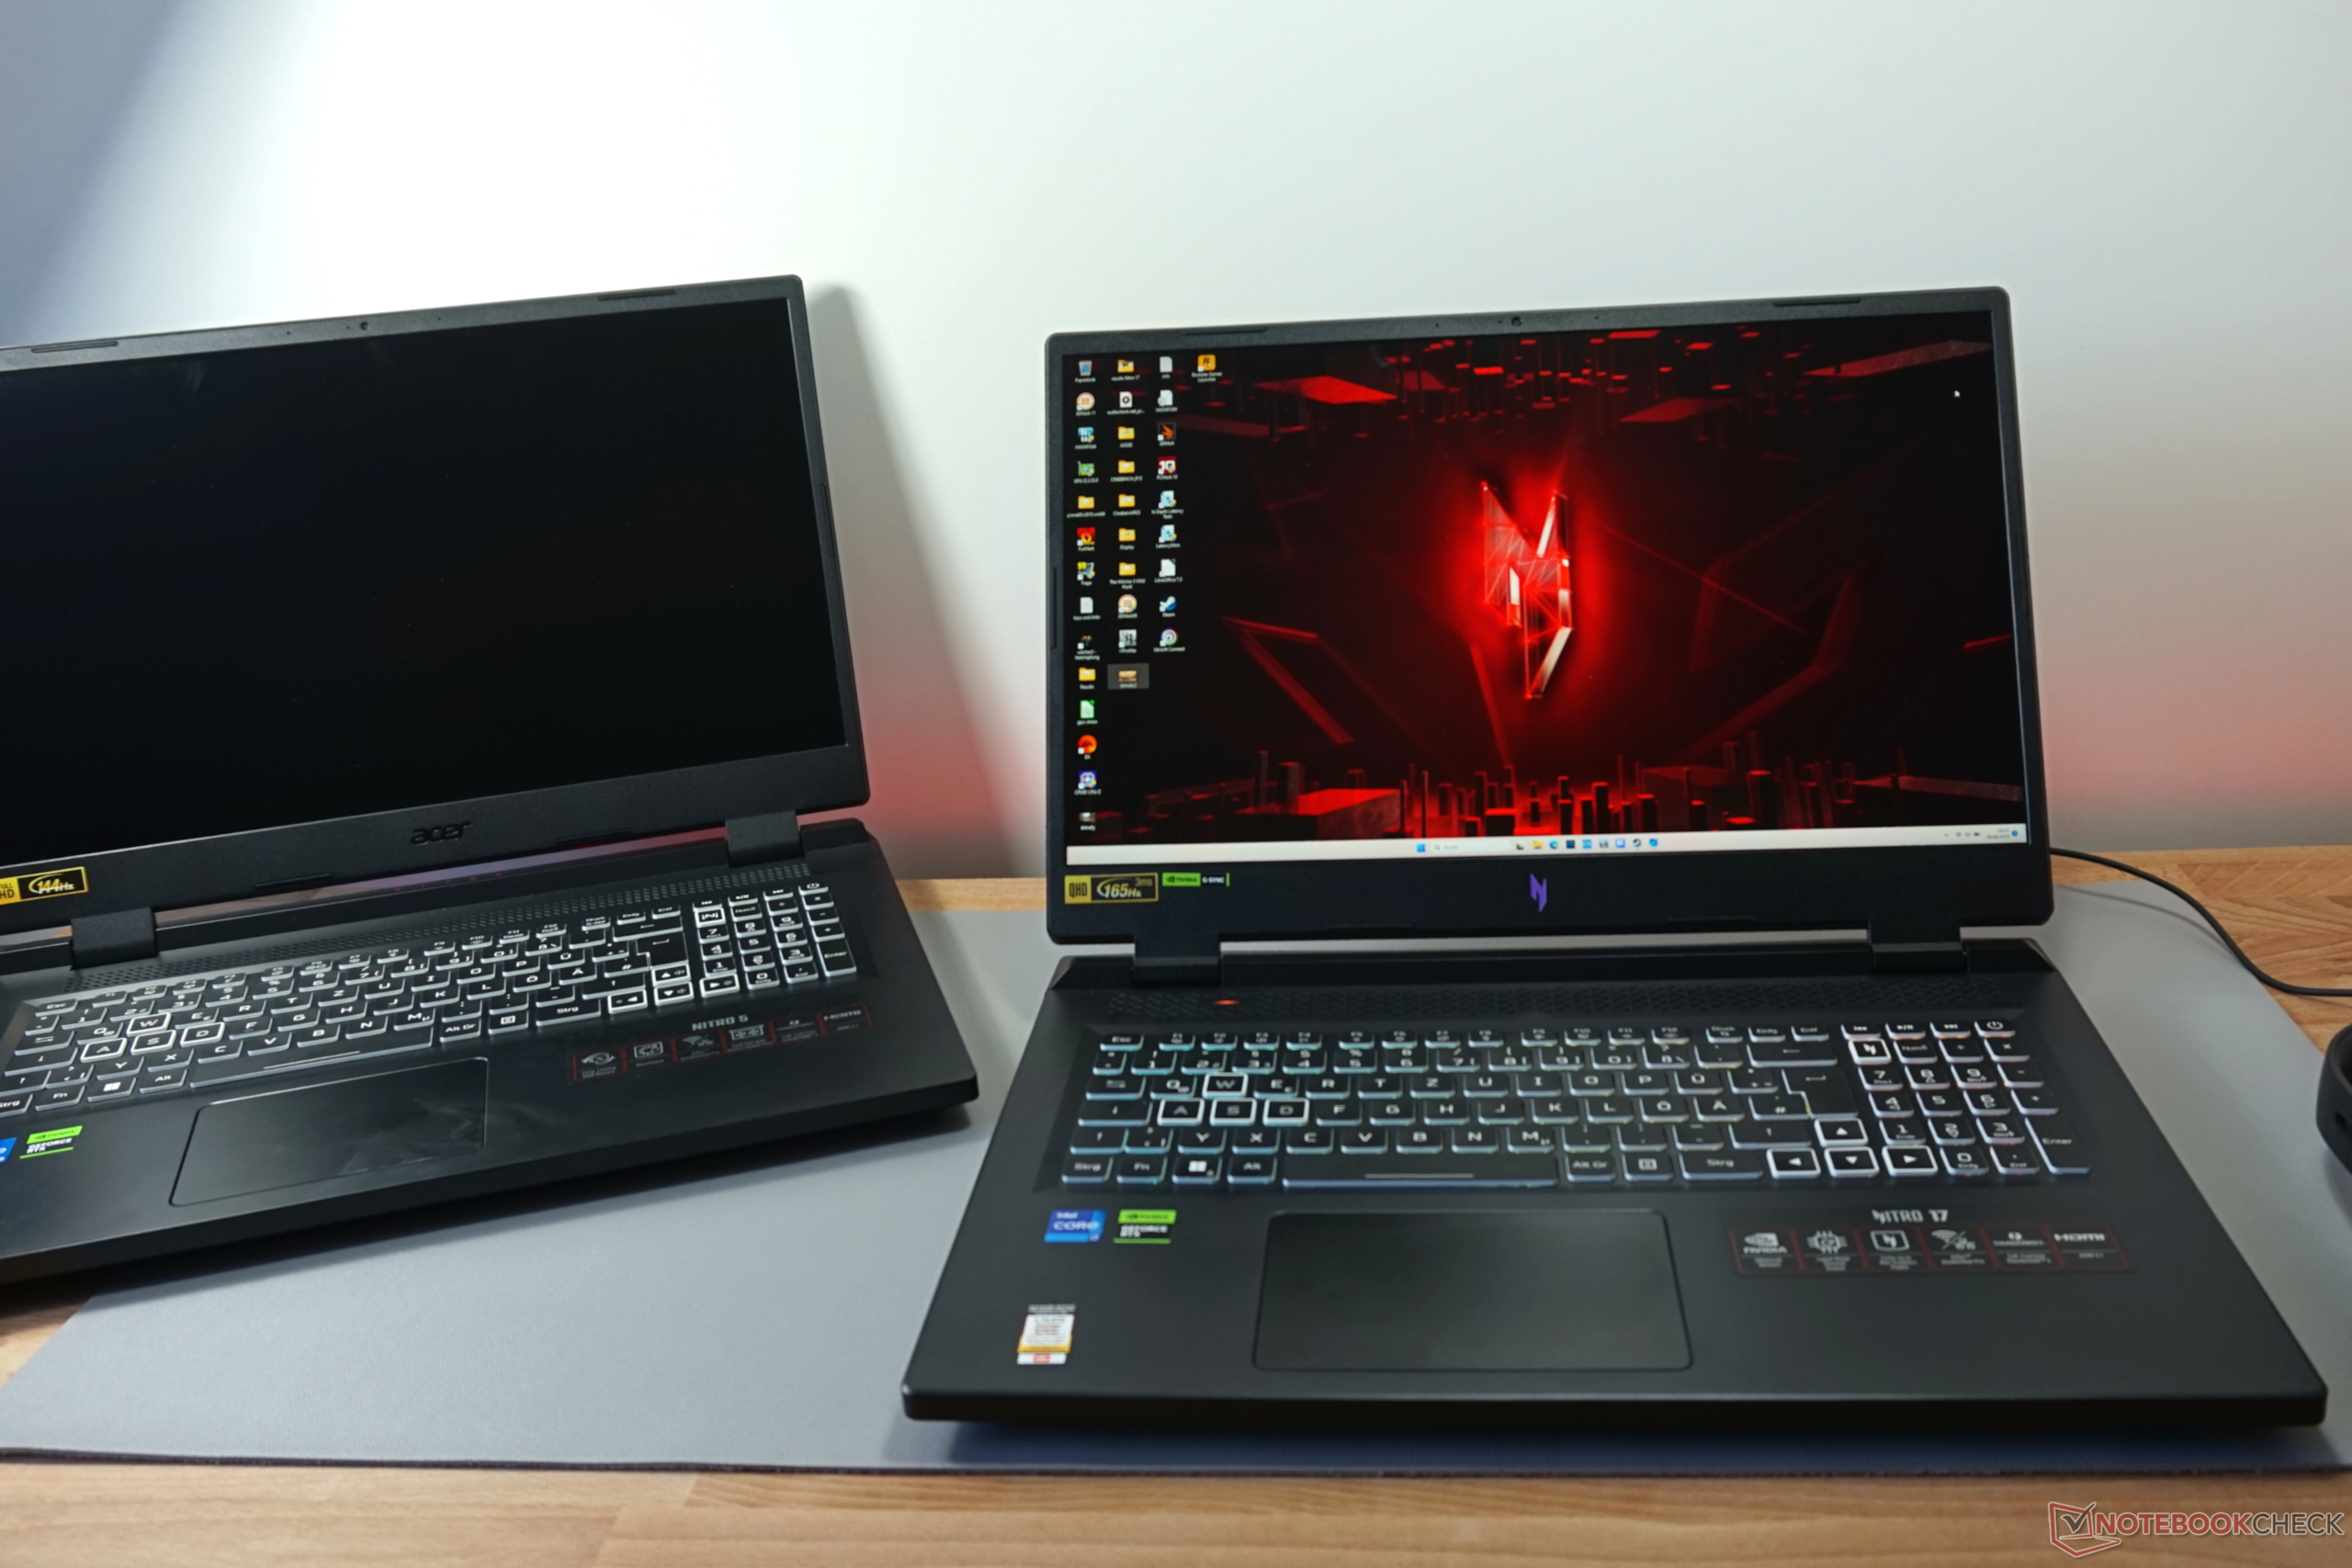
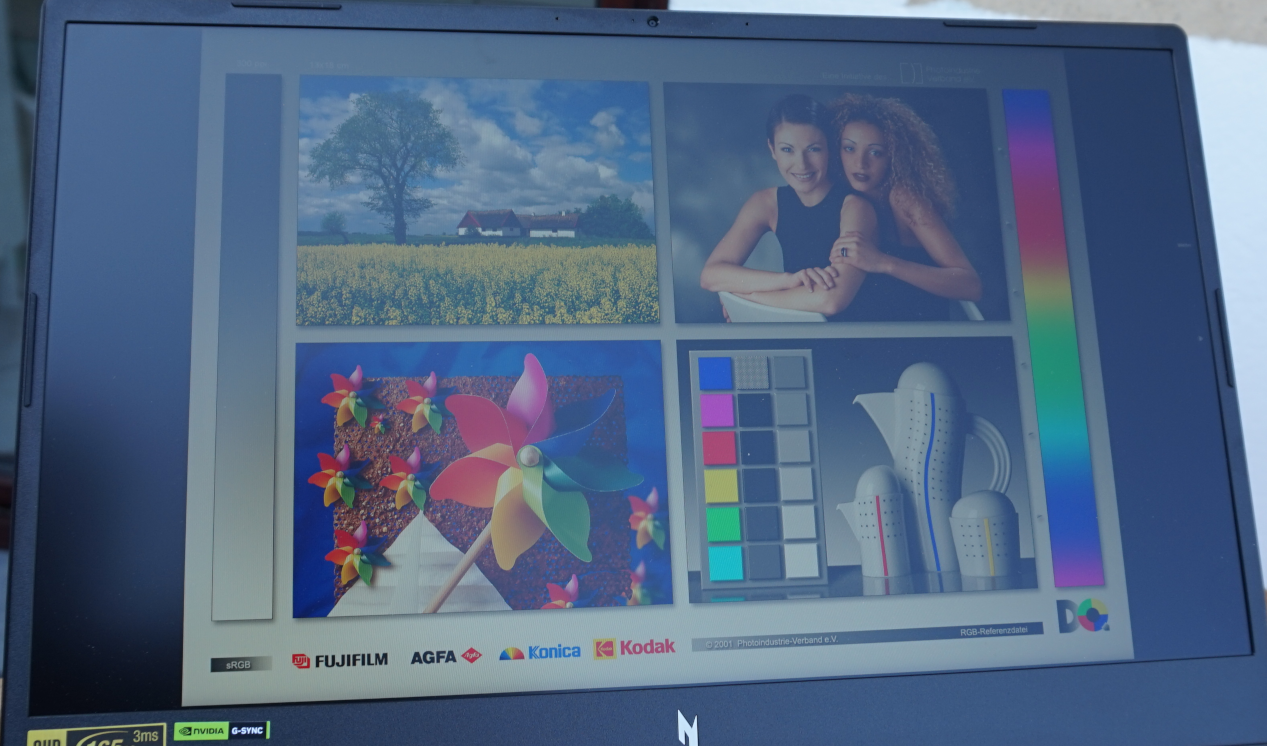
Pantalla - Con todo, es ideal para jugar

Ya no se puede decir que el panel IPS del Nitro 17 posea las debilidades latentes vistas en el modelo de la generación anterior modelo de la generación anterior. Se requiere un gran esfuerzo para poder distinguir píxeles individuales en la pantalla de 17,3 pulgadas y resolución QHD. El trabajo normal también se puede hacer en el dispositivo sin tener que aumentar el tamaño ni del texto ni de los símbolos.
La frecuencia de imagen de 165 Hz también es perfecta para jugar. Los tiempos de respuesta también son muy decentes. Además, la pantalla muestra colores fuertes y vibrantes que se reproducen con precisión incluso sin necesidad de calibrado. Con 360 cd/m², el brillo es más que suficiente para un uso de sobremesa.
Sin embargo, el contraste podría ser mejor y parece pobre debido a un valor de nivel de negro de sólo 600:1. Esto se nota especialmente en una habitación completamente oscura. Un fondo negro siempre está ligeramente iluminado y hay sangrado de pantalla visible en la parte superior derecha de la pantalla.
Por supuesto, es posible encontrar pantallas con más colores, más fotogramas por segundo y mayor densidad de píxeles pero, para un portátil de juegos de gama media, los valores de imagen son muy coherentes.
| |||||||||||||||||||||||||
iluminación: 87 %
Brillo con batería: 360 cd/m²
Contraste: 602:1 (Negro: 0.6 cd/m²)
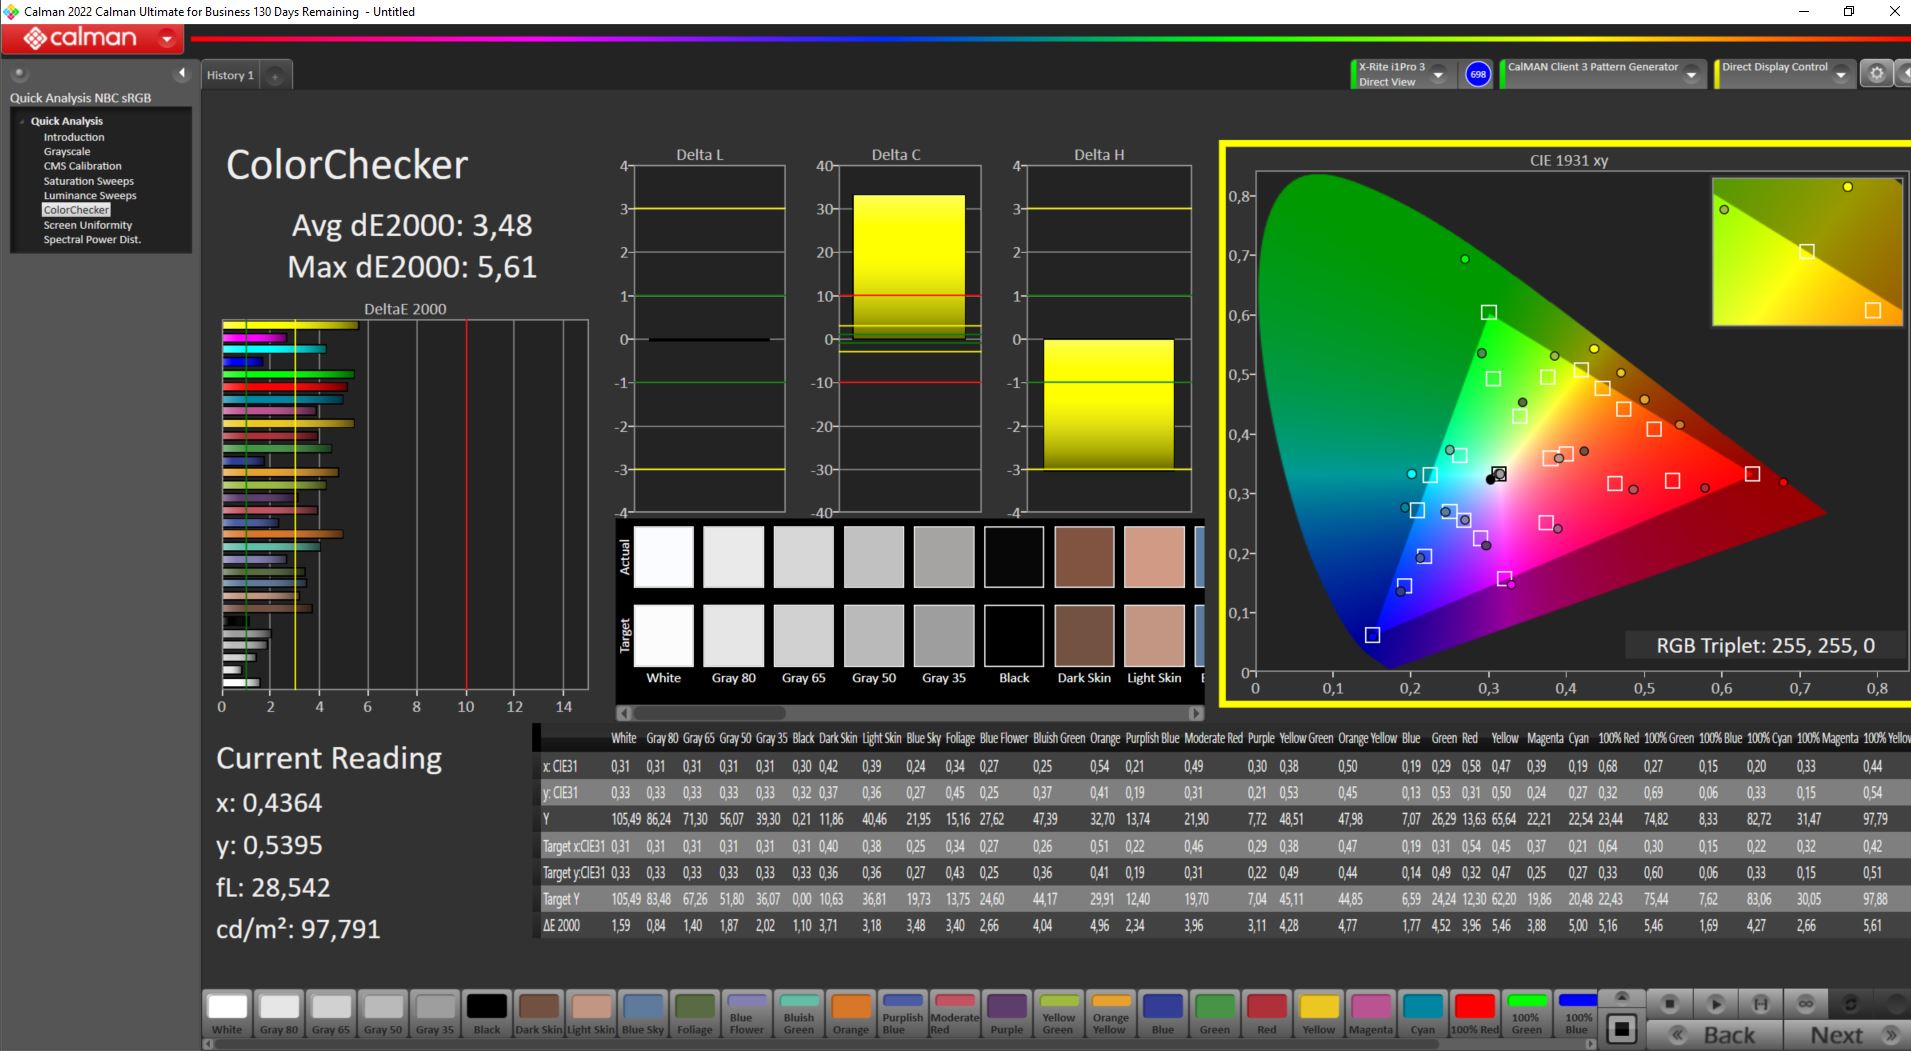
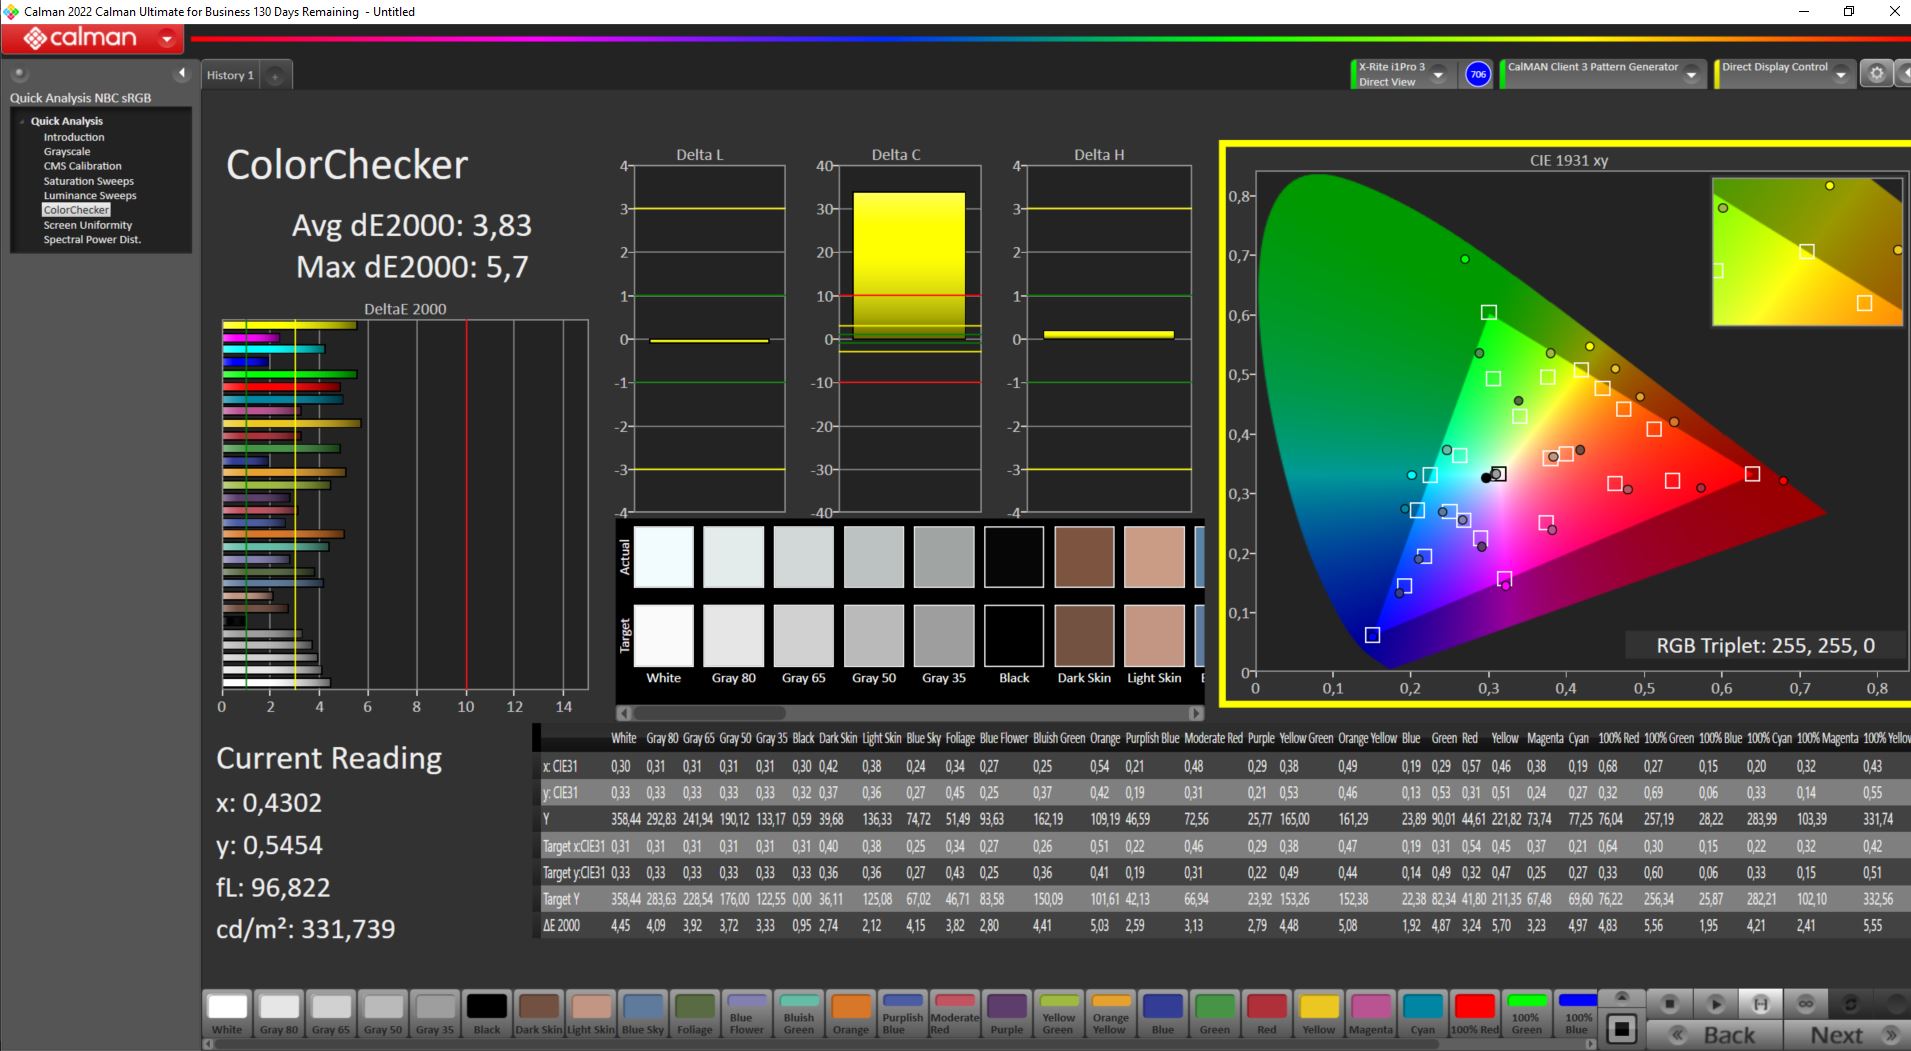
ΔE ColorChecker Calman: 3.83 | ∀{0.5-29.43 Ø4.71}
calibrated: 3.48
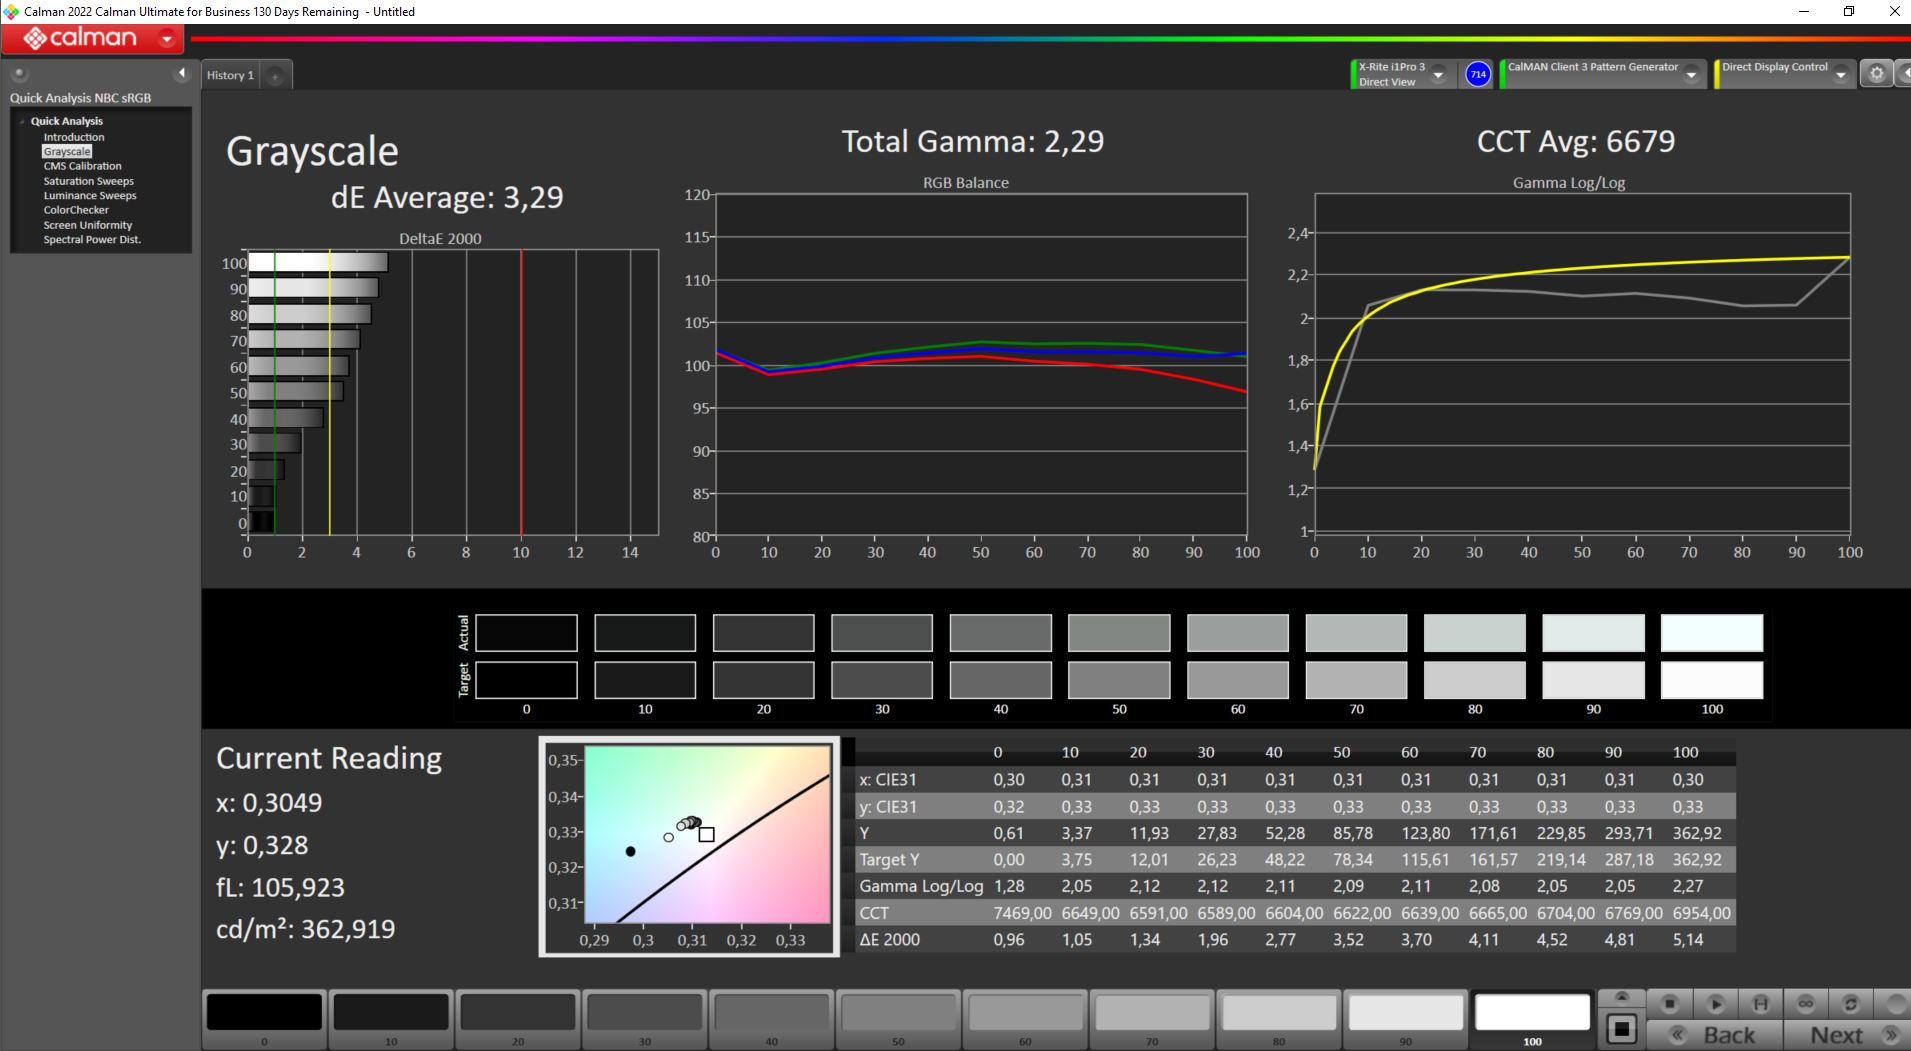
ΔE Greyscale Calman: 3.29 | ∀{0.09-98 Ø4.96}
85.7% AdobeRGB 1998 (Argyll 3D)
100% sRGB (Argyll 3D)
98.3% Display P3 (Argyll 3D)
Gamma: 2.29
CCT: 6679 K
| Acer Nitro 17 AN17-51-71ER BOE0B7C NE173QHM-NY6, , 2560x1440, 17.3" | Lenovo Legion Pro 5 16IRX8 AU Optronics B160QAN03.1, IPS, 2560x1600, 16" | Asus TUF Gaming A16 FA617XS BOE NE160WUM-NX2, IPS, 1920x1200, 16" | Schenker XMG Focus 17 (E23) BOE09F9 NE173QHM-NZ1, IPS, 2560x1440, 17.3" | Medion Erazer Defender P40 BOE CQ NE173QHM-NZ3, IPS, 2560x1440, 17.3" | Acer Nitro 5 AN515-46-R1A1 AU Optronics B156HAN12.H, IPS, 1920x1080, 15.6" | MSI Pulse GL76 12UGK Sharp LQ173M1JW08, IPS, 1920x1080, 17.3" | |
|---|---|---|---|---|---|---|---|
| Display | -14% | -17% | -1% | -17% | -17% | -14% | |
| Display P3 Coverage (%) | 98.3 | 71.2 -28% | 69.3 -30% | 96.6 -2% | 68.3 -31% | 68.8 -30% | 71.9 -27% |
| sRGB Coverage (%) | 100 | 98.8 -1% | 97.3 -3% | 99.9 0% | 98.1 -2% | 98.1 -2% | 99.9 0% |
| AdobeRGB 1998 Coverage (%) | 85.7 | 73.3 -14% | 70.7 -18% | 84.5 -1% | 69.8 -19% | 69.7 -19% | 73.7 -14% |
| Response Times | -14% | -15% | -23% | -4% | 6% | 15% | |
| Response Time Grey 50% / Grey 80% * (ms) | 14.8 ? | 14.5 ? 2% | 15.6 ? -5% | 16.4 ? -11% | 14.6 ? 1% | 13 ? 12% | 4.6 ? 69% |
| Response Time Black / White * (ms) | 8 ? | 10.4 ? -30% | 10 ? -25% | 10.8 ? -35% | 8.7 ? -9% | 8 ? -0% | 11.2 ? -40% |
| PWM Frequency (Hz) | |||||||
| Screen | 41% | 41% | 28% | 45% | 19% | 4% | |
| Brightness middle (cd/m²) | 361 | 405.7 12% | 301 -17% | 349 -3% | 364 1% | 327 -9% | 337.7 -6% |
| Brightness (cd/m²) | 326 | 368 13% | 294 -10% | 318 -2% | 343 5% | 320 -2% | 331 2% |
| Brightness Distribution (%) | 87 | 87 0% | 94 8% | 82 -6% | 86 -1% | 93 7% | 82 -6% |
| Black Level * (cd/m²) | 0.6 | 0.38 37% | 0.21 65% | 0.56 7% | 0.28 53% | 0.24 60% | 0.31 48% |
| Contrast (:1) | 602 | 1068 77% | 1433 138% | 623 3% | 1300 116% | 1363 126% | 1089 81% |
| Colorchecker dE 2000 * | 3.83 | 1.65 57% | 1.79 53% | 1.08 72% | 1.67 56% | 3.26 15% | 4.12 -8% |
| Colorchecker dE 2000 max. * | 5.71 | 4.2 26% | 3.48 39% | 3.05 47% | 2.78 51% | 8.73 -53% | 8.89 -56% |
| Colorchecker dE 2000 calibrated * | 3.48 | 0.53 85% | 1.2 66% | 1.08 69% | 1.14 67% | 0.87 75% | 0.98 72% |
| Greyscale dE 2000 * | 3.29 | 1.2 64% | 2.5 24% | 1.14 65% | 1.4 57% | 4.87 -48% | 6.3 -91% |
| Gamma | 2.29 96% | 2.3 96% | 2.265 97% | 2.41 91% | 2.091 105% | 2.3 96% | 2.48 89% |
| CCT | 6679 97% | 6453 101% | 6157 106% | 6687 97% | 6568 99% | 7070 92% | 6542 99% |
| Media total (Programa/Opciones) | 4% /
21% | 3% /
20% | 1% /
15% | 8% /
25% | 3% /
9% | 2% /
2% |
* ... más pequeño es mejor
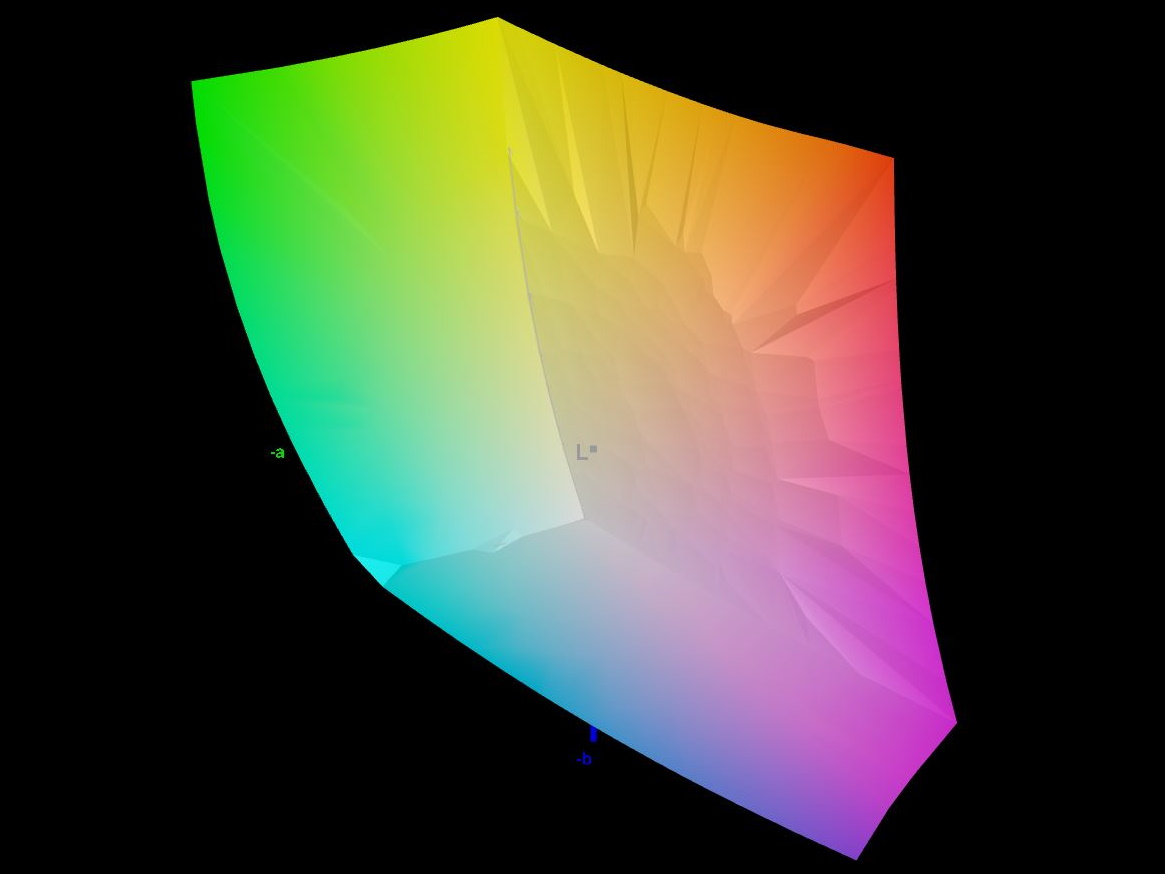
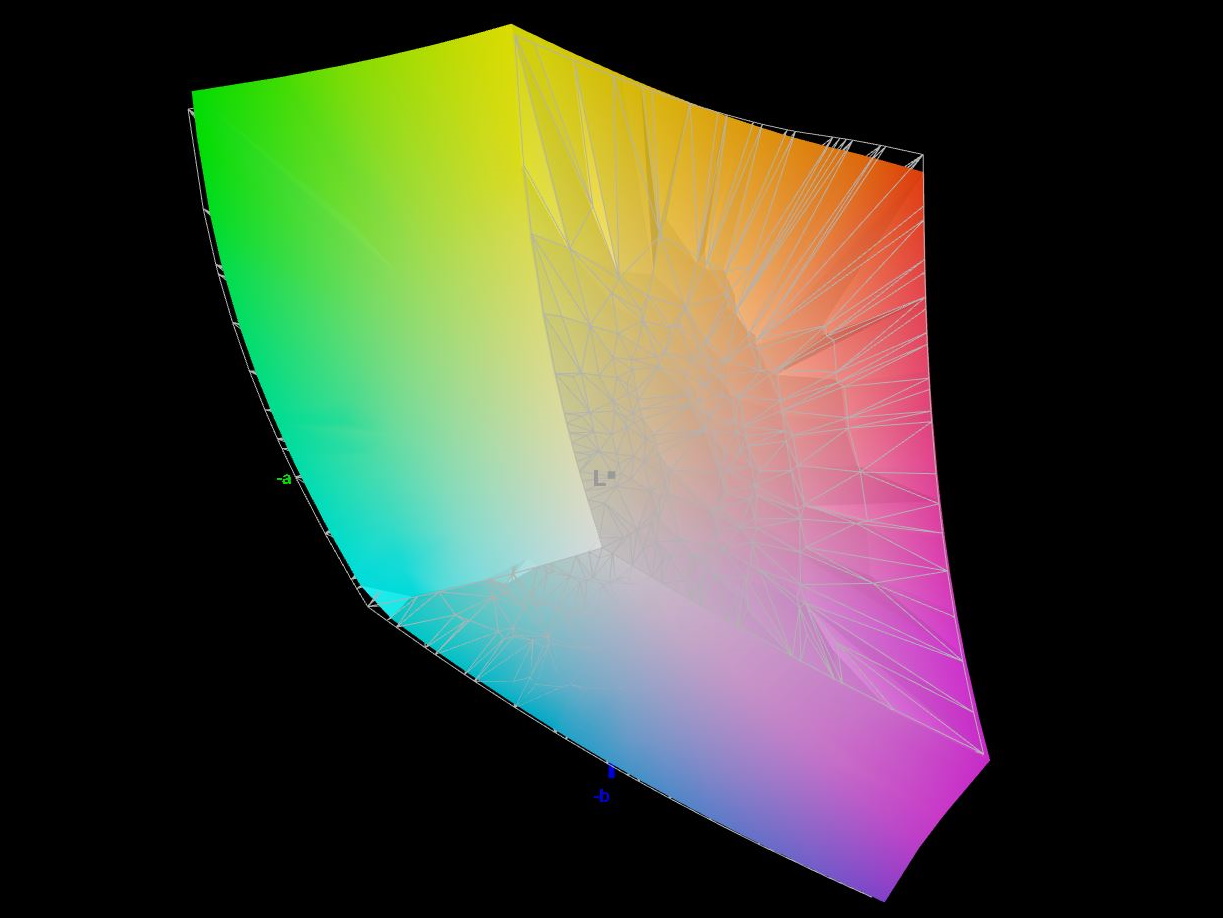
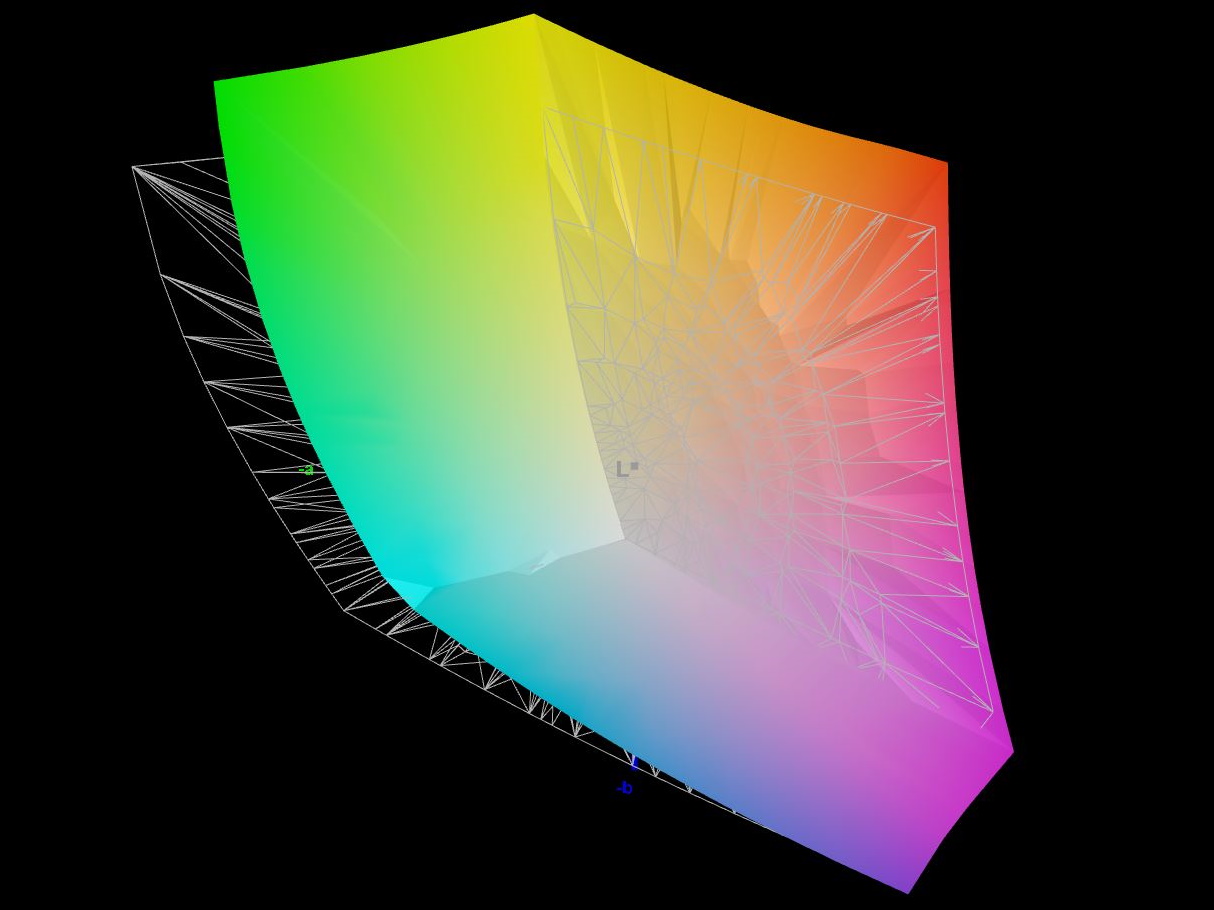
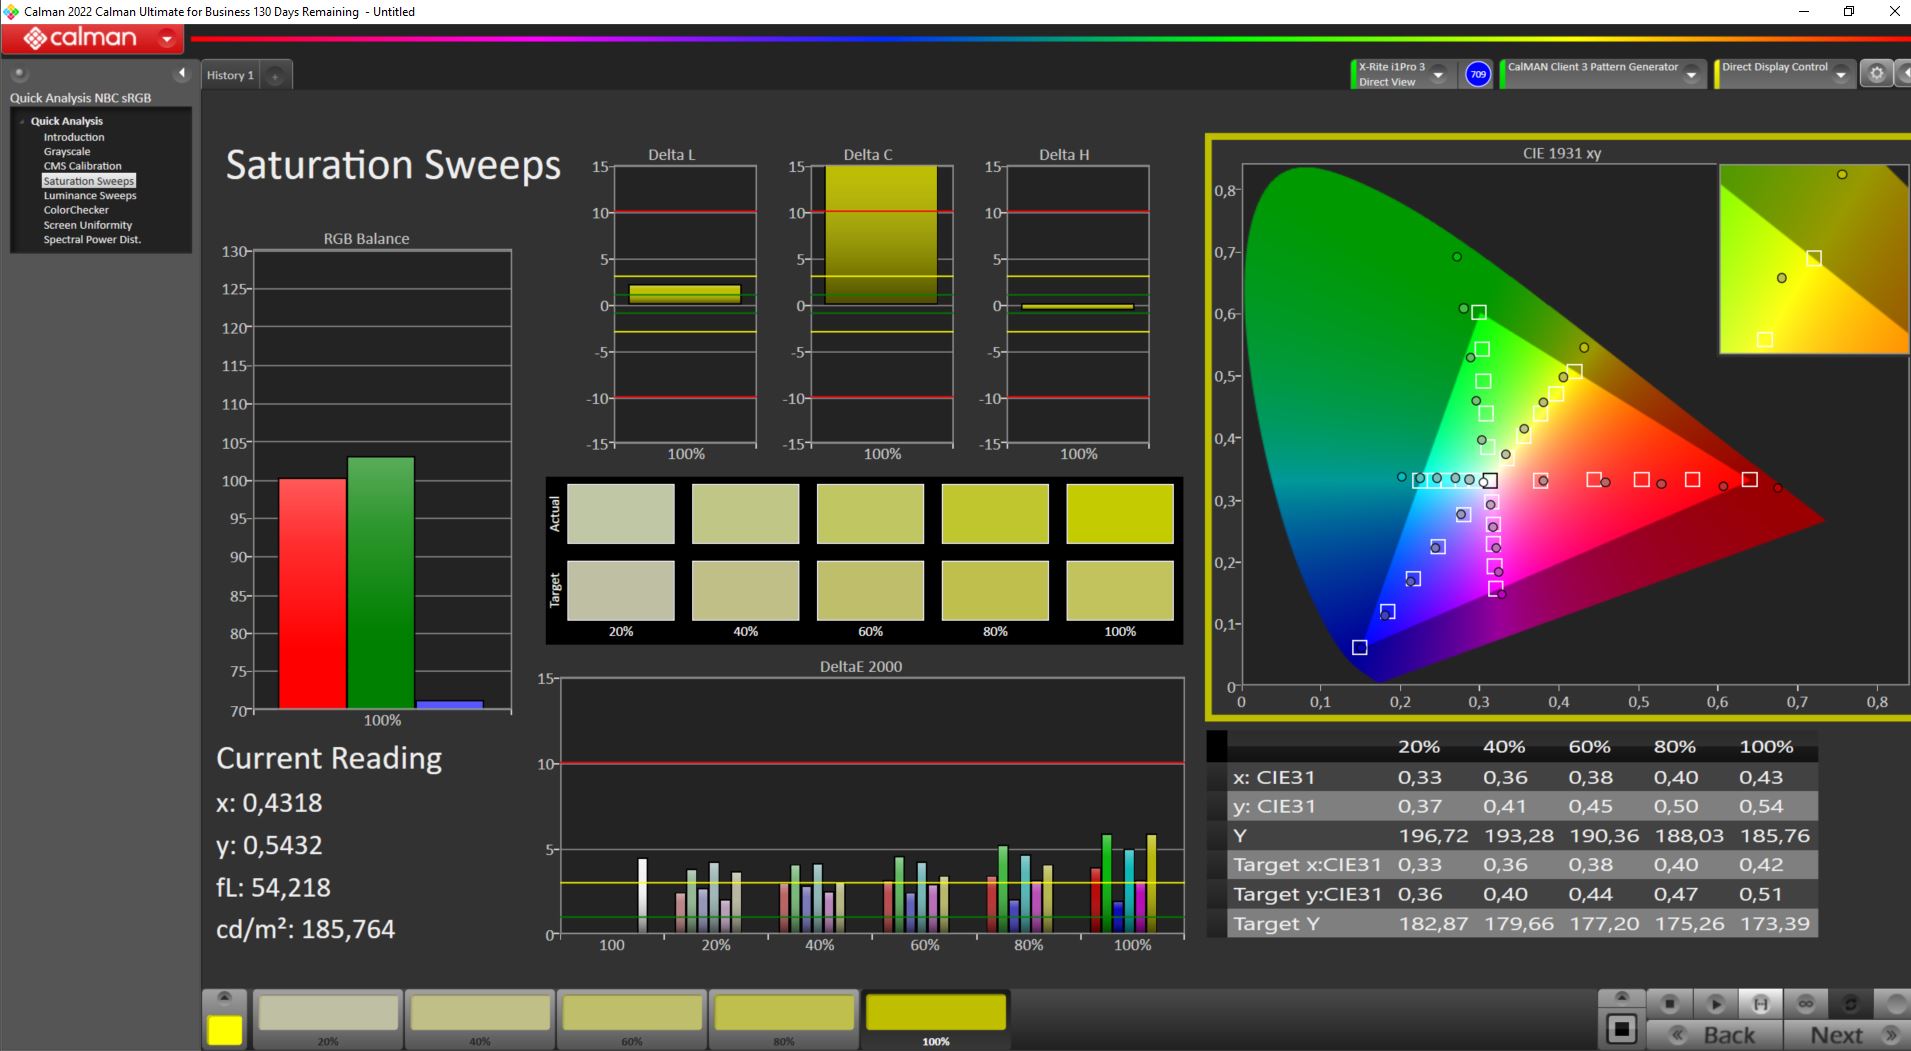
En términos de reproducción del color, el Acer Nitro 17 hace un trabajo excelente. El espacio de color sRGB -importante para los juegos- se cubre por completo. Incluso DCI P3, que se usa en la producción de películas, se reproduce casi por completo.
En comparación con portátiles similares enfocados a juegos, estos resultados son excelentes.
Tras reducir el brillo al 50 %, el nivel de negro de 0,21 (en lugar de 0,59), es mucho mejor. Al hacerlo, el contraste también aumenta hasta casi 900:1. Especialmente por la noche, cuando el brillo total no suele ser imprescindible, la reproducción de la imagen mejora en consecuencia. Incluso la desviación de color DeltaE de 3,5 es menor que a pleno brillo.
Medimos una desviación DelatE de 3,8 respecto a la reproducción cromática deseada. Una calibración no produjo más mejoras. Aunque los ojos bien entrenados pueden distinguir discrepancias, especialmente en los tonos amarillos y naranjas, no hay nada malo en la reproducción del color.
Mientras el usuario no utilice el dispositivo para la edición profesional de fotos o vídeos, la pantalla reproduce los colores de forma muy natural.


Tiempos de respuesta del display
| ↔ Tiempo de respuesta de Negro a Blanco | ||
|---|---|---|
| 8 ms ... subida ↗ y bajada ↘ combinada | ↗ 3.4 ms subida | 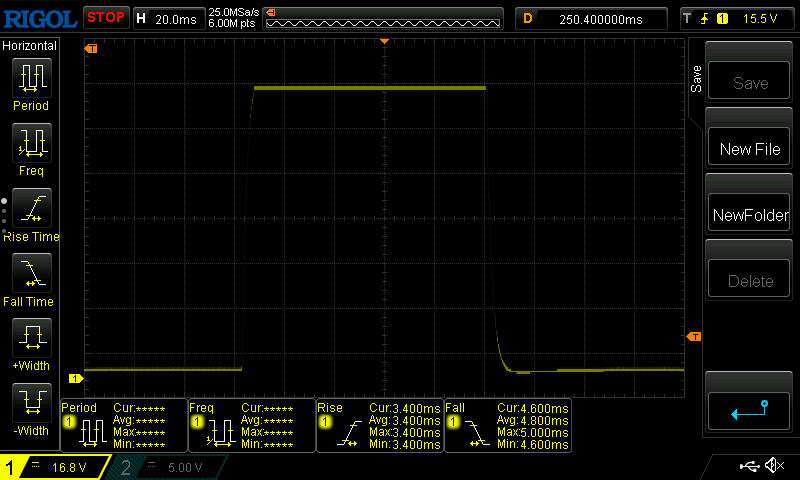 |
| ↘ 4.6 ms bajada | ||
| La pantalla mostró tiempos de respuesta rápidos en nuestros tests y debería ser adecuada para juegos. En comparación, todos los dispositivos de prueba van de ##min### (mínimo) a 240 (máximo) ms. » 22 % de todos los dispositivos son mejores. Esto quiere decir que el tiempo de respuesta medido es mejor que la media (19.8 ms) de todos los dispositivos testados. | ||
| ↔ Tiempo de respuesta 50% Gris a 80% Gris | ||
| 14.8 ms ... subida ↗ y bajada ↘ combinada | ↗ 7 ms subida | 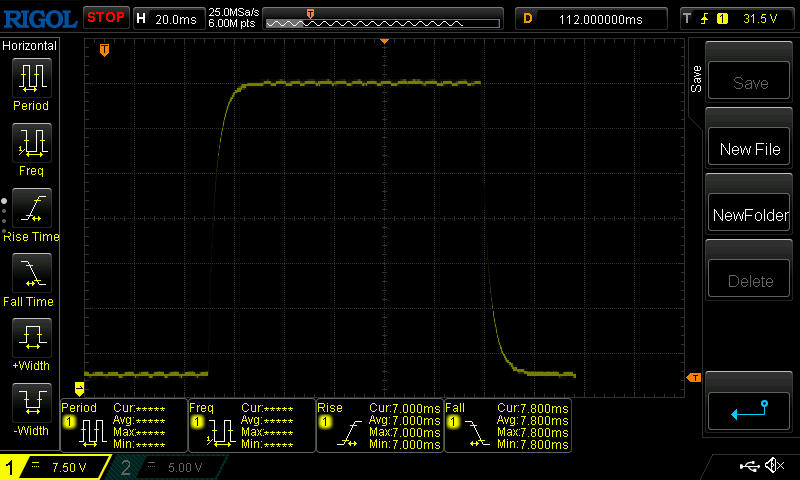 |
| ↘ 7.8 ms bajada | ||
| La pantalla mostró buenos tiempos de respuesta en nuestros tests pero podría ser demasiado lenta para los jugones competitivos. En comparación, todos los dispositivos de prueba van de ##min### (mínimo) a 636 (máximo) ms. » 29 % de todos los dispositivos son mejores. Esto quiere decir que el tiempo de respuesta medido es mejor que la media (31 ms) de todos los dispositivos testados. | ||
Parpadeo de Pantalla / PWM (Pulse-Width Modulation)
| Parpadeo de Pantalla / PWM no detectado | 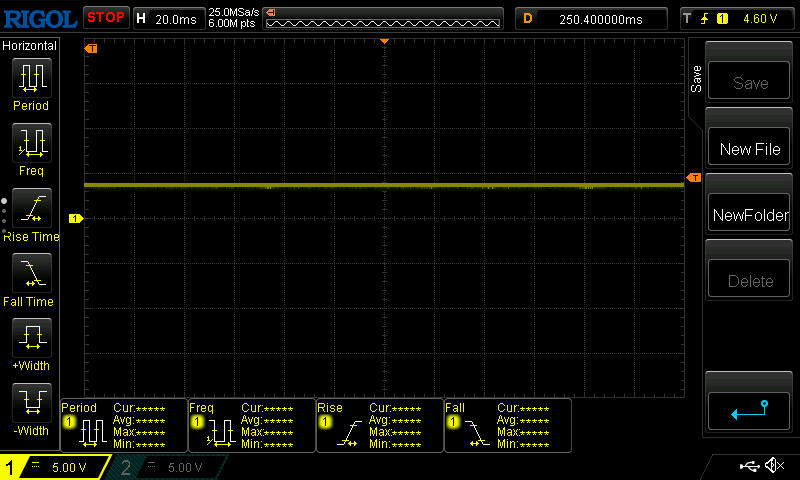 | ||
Comparación: 52 % de todos los dispositivos testados no usaron PWM para atenuar el display. Si se usó, medimos una media de 7754 (mínimo: 5 - máxmo: 343500) Hz. | |||
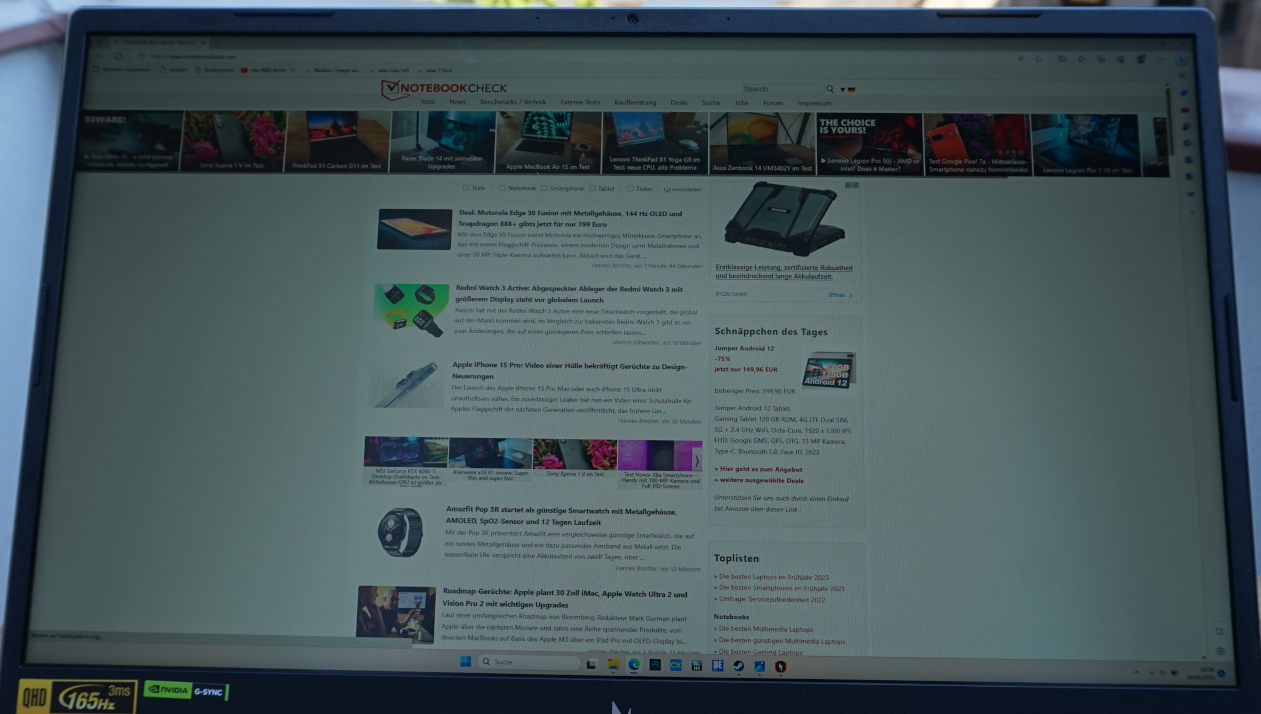
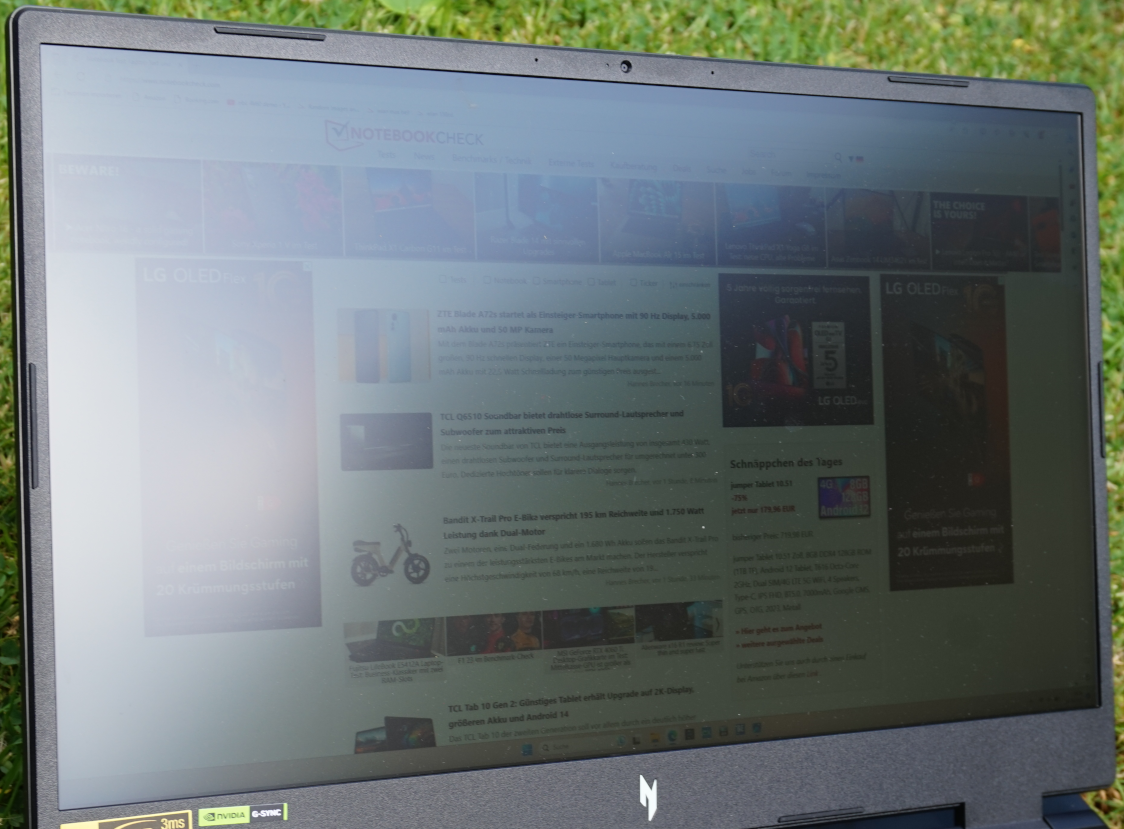
Al aire libre, en un balcón o en una zona sombreada del jardín, el texto e incluso las fotos son legibles. Por supuesto, los colores no aparecen, como sería de desear. Como era de esperar, no se ve mucho a la luz del sol, pero el texto es legible... lo justo.
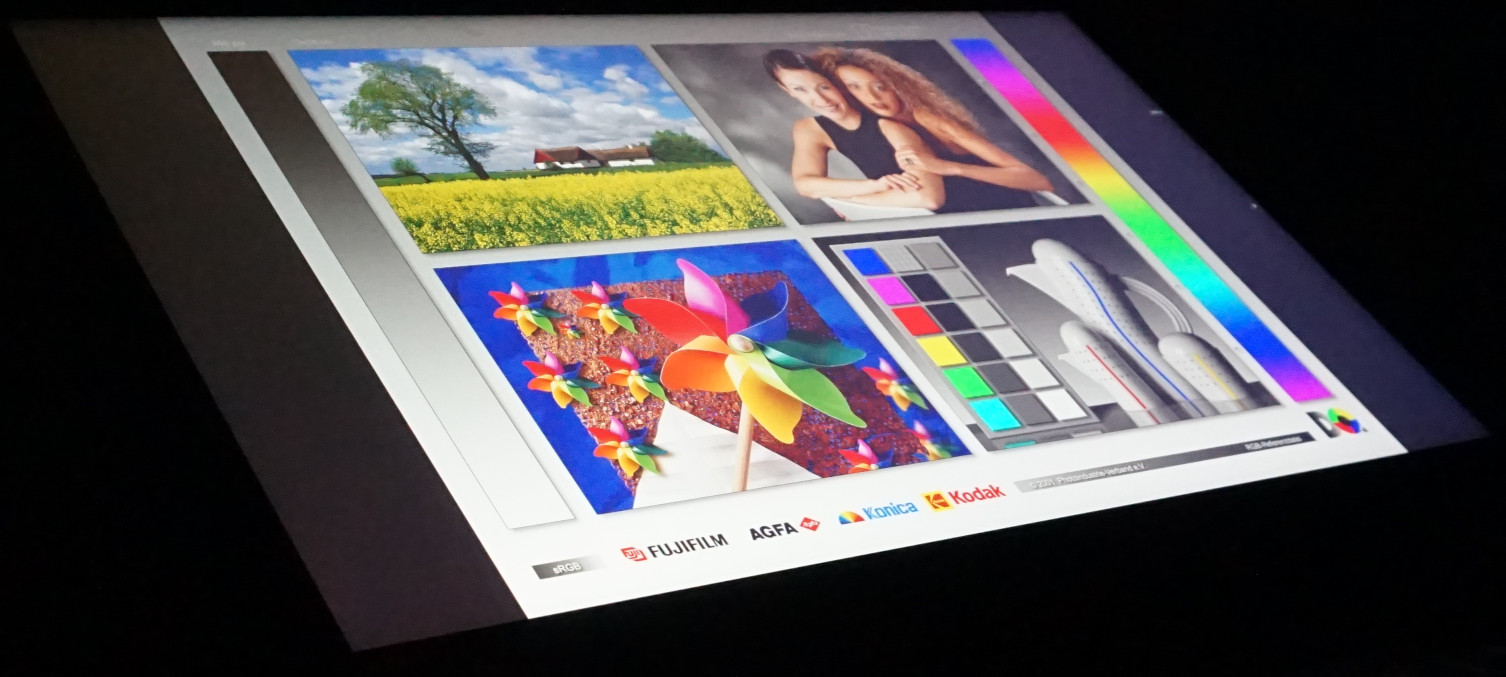
Incluso desde un ángulo agudo, no se aprecian desviaciones de color. Una ligera neblina gris cubre la imagen desde un ángulo de unos 45°.

Rendimiento - El Nitro 17 se sitúa en el medio del paquete de juegos
Con la 13ª generación del Intel Core i7 (Raptor Lake)y laNvidia GeForce RTX 4060la mayoría de juegos actuales son jugables a la resolución QHD nativa de la pantalla, pero con algunas limitaciones aquí y allá. Mientras tus exigencias no sean demasiado altas, el portátil de juego ofrecerá un gran entretenimiento durante bastante tiempo.
Además de nuestro modelo de pruebas, hay otras variantes del Nitro 17 disponibles con el procesador Intel Core i5-13500H o eli7-13700Hasí como laRTX 4050 o unaRTX 4060. Los títulos actuales deberían poder jugarse fácilmente con el modelo de menor especificación, aunque en Full HD.
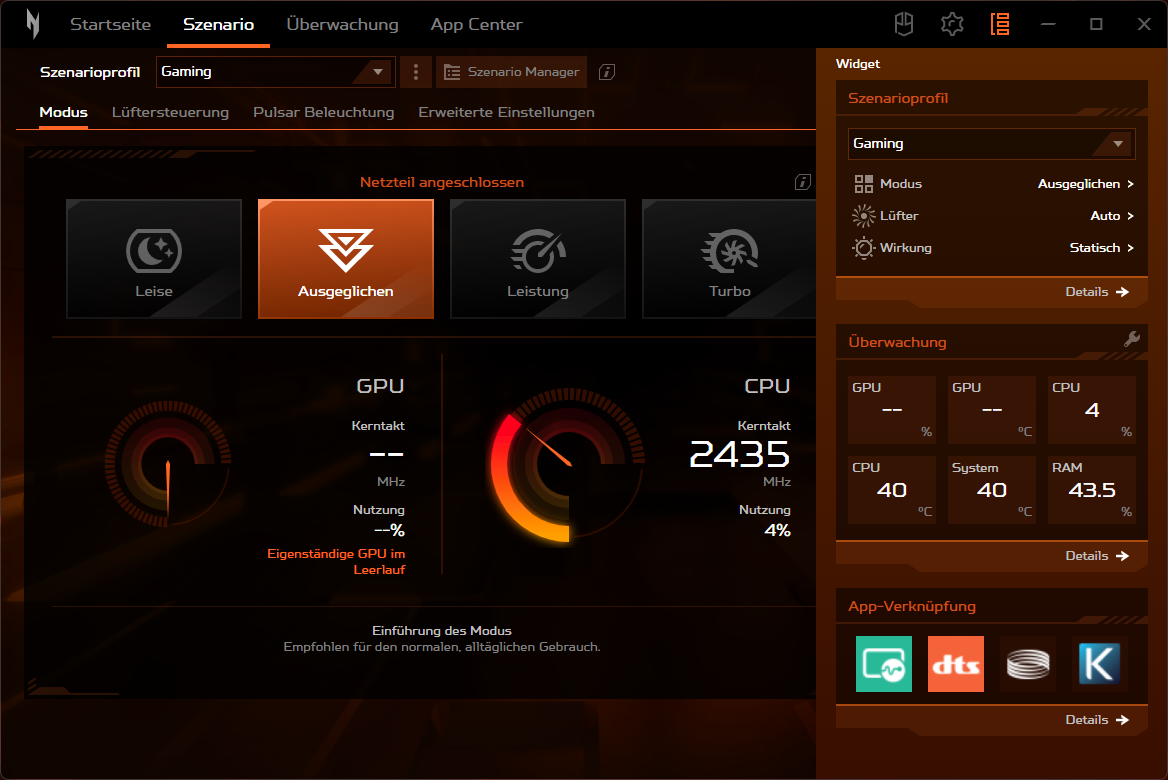
Condiciones de la prueba
El software NitroSense permite definir varios escenarios. Mientras que el comportamiento de la CPU y la GPU se ajusta a cuatro posibles modos de funcionamiento, el comportamiento del ventilador, la iluminación de las teclas y el perfil de sonido pueden seleccionarse en consecuencia.
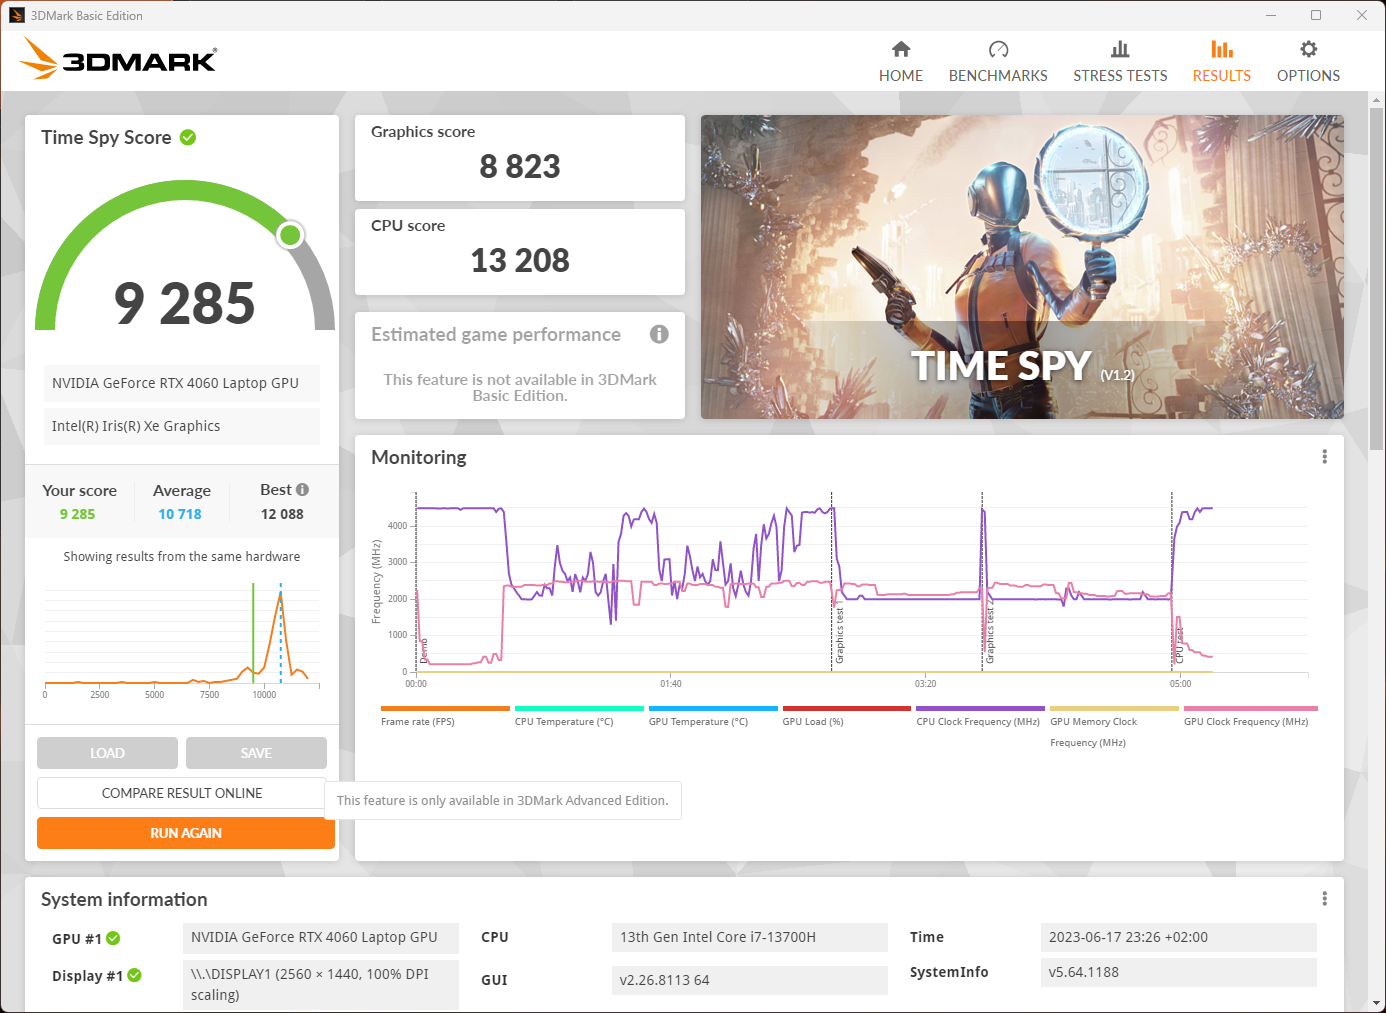
Para una determinación realista de los benchmarks, seleccionamos el modo "Rendimiento". Acer lo recomienda en sus instrucciones para un funcionamiento óptimo, también durante largos periodos de tiempo. El ruido del ventilador en "Turbo" es mucho más fuerte. En nuestras pruebas, pudimos lograr resultados casi idénticos en los modos "Equilibrado" y "Rendimiento" con aproximadamente la mitad del nivel de ruido. Sin embargo, la caída de rendimiento en "Silencioso" es considerable mientras que los ventiladores siguen siendo audibles, como mínimo.
Esto significa que el modo de funcionamiento equilibrado debería ser ideal para la mayoría de los escenarios de aplicación. El sonido en los juegos, a través de los altavoces integrados, es perfectamente audible y el ruido del ventilador no es particularmente molesto.
| Turbo | Rendimiento | Equilibrado | Silencioso | |
| CPU PL2 | 115 vatios | 115 vatios | 115 vatios | 115 vatios |
| CPU PL1 | 100 vatios | 80 vatios | 70 vatios | 45 vatios |
| Volumen (Time Spy) | 58 dB | 55 dB | 43 dB | 38 dB |
| Puntuación (Time Spy) | 11,042 | 10,759 | 10,608 | 4,210 |
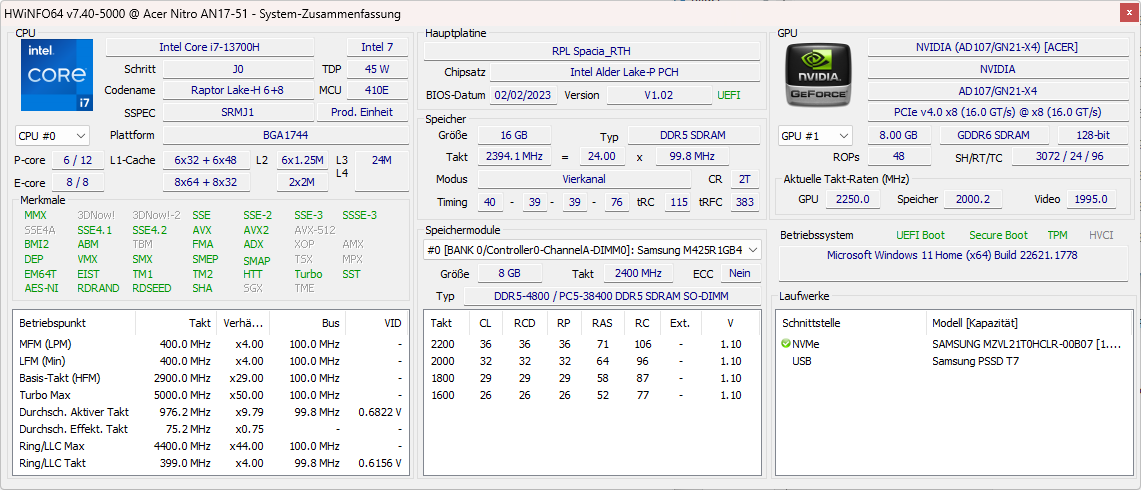
Procesador
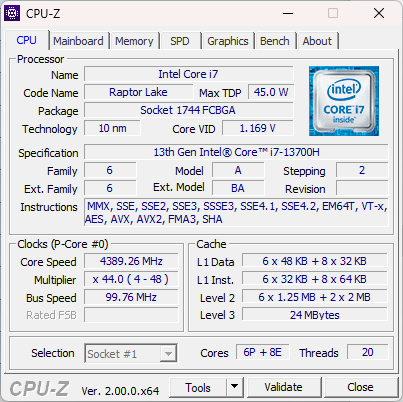
Con elIntel Core i7-13700el Acer Nitro 17 ha optado por una CPU muy potente pero no superlativa. Su diseño se corresponde en gran medida con el de su predecesor, el i7-12700H con seis núcleos de rendimiento y ocho de eficiencia que hacen un total de 20 hilos. La caché también ha mantenido el mismo tamaño. En cambio, la velocidad de reloj ha experimentado una ligera mejora, pasando de 4,7 a 5,0 GHz.
Otros portátiles para juegos pueden recurrir a una CPU con mejores especificaciones, por ejemplo, el Intel Core i7-13700HX. Sin embargo, eso significa que la refrigeración tiene que hacerse bien. Por ejemplo, unMedion Erazer Defender P40 comenzó nuestro bucle continuo de CineBench R15 con unos valores un 10 % mejores, pero quedó empatado tras la segunda ejecución. Al final, el Nitro 17 fue casi un 20 % mejor. En este sentido, el rendimiento continuo está a un nivel impresionantemente alto.
Por el contrario, para muchos procesos y tareas, la potencia disponible durante un breve espacio de tiempo es lo que cuenta. En este sentido, eli7-13700H es potente para una CPU móvil, pero queda por detrás de los procesadores AMD de 7ª generación o incluso de los modelos Intel de la serie "HX". Una imagen similar surgió cuando se trató del rendimiento de un solo núcleo. Estar limitado a 115 vatios en lugar de los 157 vatios de la serie "HX" impide obtener mejores resultados. Además, en el modo "Rendimiento" se produce una reducción repentina del consumo de energía, lo que explica los resultados inferiores a la media en este ámbito. Sin embargo, en lo que respecta a la clasificación para juegos, esto no juega un papel decisivo.
Puedes encontrar más información y datos de medición en nuestra Lista de pruebas de CPU.
Cinebench R15 Multi Continuous Test
Cinebench R23: Multi Core | Single Core
Cinebench R20: CPU (Multi Core) | CPU (Single Core)
Cinebench R15: CPU Multi 64Bit | CPU Single 64Bit
Blender: v2.79 BMW27 CPU
7-Zip 18.03: 7z b 4 | 7z b 4 -mmt1
Geekbench 5.5: Multi-Core | Single-Core
HWBOT x265 Benchmark v2.2: 4k Preset
LibreOffice : 20 Documents To PDF
R Benchmark 2.5: Overall mean
| CPU Performance rating | |
| Schenker XMG Focus 17 (E23) | |
| Media de la clase Gaming | |
| Lenovo Legion Pro 5 16IRX8 | |
| Asus TUF Gaming A16 FA617XS | |
| Medion Erazer Defender P40 | |
| MSI Pulse GL76 12UGK | |
| Medio Intel Core i7-13700H | |
| Acer Nitro 17 AN17-51-71ER | |
| Acer Nitro 5 AN515-46-R1A1 | |
| Cinebench R23 / Multi Core | |
| Schenker XMG Focus 17 (E23) | |
| Media de la clase Gaming (10488 - 42661, n=107, últimos 2 años) | |
| Medion Erazer Defender P40 | |
| Lenovo Legion Pro 5 16IRX8 | |
| Acer Nitro 17 AN17-51-71ER | |
| MSI Pulse GL76 12UGK | |
| Asus TUF Gaming A16 FA617XS | |
| Medio Intel Core i7-13700H (5890 - 20034, n=29) | |
| Acer Nitro 5 AN515-46-R1A1 | |
| Cinebench R23 / Single Core | |
| Media de la clase Gaming (1166 - 2415, n=107, últimos 2 años) | |
| Schenker XMG Focus 17 (E23) | |
| Medio Intel Core i7-13700H (1323 - 1914, n=29) | |
| Asus TUF Gaming A16 FA617XS | |
| MSI Pulse GL76 12UGK | |
| Medion Erazer Defender P40 | |
| Lenovo Legion Pro 5 16IRX8 | |
| Acer Nitro 17 AN17-51-71ER | |
| Acer Nitro 5 AN515-46-R1A1 | |
| Cinebench R20 / CPU (Multi Core) | |
| Media de la clase Gaming (4029 - 16433, n=106, últimos 2 años) | |
| Schenker XMG Focus 17 (E23) | |
| Medion Erazer Defender P40 | |
| Acer Nitro 17 AN17-51-71ER | |
| Lenovo Legion Pro 5 16IRX8 | |
| Asus TUF Gaming A16 FA617XS | |
| MSI Pulse GL76 12UGK | |
| Medio Intel Core i7-13700H (2322 - 7674, n=29) | |
| Acer Nitro 5 AN515-46-R1A1 | |
| Cinebench R20 / CPU (Single Core) | |
| Media de la clase Gaming (442 - 913, n=106, últimos 2 años) | |
| Schenker XMG Focus 17 (E23) | |
| Asus TUF Gaming A16 FA617XS | |
| Medio Intel Core i7-13700H (508 - 741, n=29) | |
| MSI Pulse GL76 12UGK | |
| Lenovo Legion Pro 5 16IRX8 | |
| Medion Erazer Defender P40 | |
| Acer Nitro 5 AN515-46-R1A1 | |
| Acer Nitro 17 AN17-51-71ER | |
| Cinebench R15 / CPU Multi 64Bit | |
| Schenker XMG Focus 17 (E23) | |
| Media de la clase Gaming (1578 - 6330, n=105, últimos 2 años) | |
| Lenovo Legion Pro 5 16IRX8 | |
| Medion Erazer Defender P40 | |
| Acer Nitro 17 AN17-51-71ER | |
| MSI Pulse GL76 12UGK | |
| Asus TUF Gaming A16 FA617XS | |
| Medio Intel Core i7-13700H (905 - 2982, n=29) | |
| Acer Nitro 5 AN515-46-R1A1 | |
| Cinebench R15 / CPU Single 64Bit | |
| Media de la clase Gaming (188.8 - 350, n=106, últimos 2 años) | |
| Schenker XMG Focus 17 (E23) | |
| Asus TUF Gaming A16 FA617XS | |
| Lenovo Legion Pro 5 16IRX8 | |
| Medio Intel Core i7-13700H (213 - 278, n=29) | |
| MSI Pulse GL76 12UGK | |
| Acer Nitro 5 AN515-46-R1A1 | |
| Medion Erazer Defender P40 | |
| Acer Nitro 17 AN17-51-71ER | |
| Blender / v2.79 BMW27 CPU | |
| Acer Nitro 5 AN515-46-R1A1 | |
| Medio Intel Core i7-13700H (169 - 555, n=29) | |
| Medion Erazer Defender P40 | |
| MSI Pulse GL76 12UGK | |
| Asus TUF Gaming A16 FA617XS | |
| Acer Nitro 17 AN17-51-71ER | |
| Lenovo Legion Pro 5 16IRX8 | |
| Media de la clase Gaming (79 - 330, n=104, últimos 2 años) | |
| Schenker XMG Focus 17 (E23) | |
| 7-Zip 18.03 / 7z b 4 | |
| Schenker XMG Focus 17 (E23) | |
| Media de la clase Gaming (33491 - 148086, n=105, últimos 2 años) | |
| Lenovo Legion Pro 5 16IRX8 | |
| Medion Erazer Defender P40 | |
| Acer Nitro 17 AN17-51-71ER | |
| Asus TUF Gaming A16 FA617XS | |
| MSI Pulse GL76 12UGK | |
| Acer Nitro 5 AN515-46-R1A1 | |
| Medio Intel Core i7-13700H (27322 - 76344, n=29) | |
| 7-Zip 18.03 / 7z b 4 -mmt1 | |
| Schenker XMG Focus 17 (E23) | |
| Asus TUF Gaming A16 FA617XS | |
| Media de la clase Gaming (4199 - 7436, n=105, últimos 2 años) | |
| Medio Intel Core i7-13700H (4825 - 6238, n=29) | |
| Acer Nitro 5 AN515-46-R1A1 | |
| Lenovo Legion Pro 5 16IRX8 | |
| MSI Pulse GL76 12UGK | |
| Medion Erazer Defender P40 | |
| Acer Nitro 17 AN17-51-71ER | |
| Geekbench 5.5 / Multi-Core | |
| Schenker XMG Focus 17 (E23) | |
| Media de la clase Gaming (6460 - 28263, n=105, últimos 2 años) | |
| Medion Erazer Defender P40 | |
| Lenovo Legion Pro 5 16IRX8 | |
| Acer Nitro 17 AN17-51-71ER | |
| Asus TUF Gaming A16 FA617XS | |
| MSI Pulse GL76 12UGK | |
| Medio Intel Core i7-13700H (6165 - 14215, n=29) | |
| Acer Nitro 5 AN515-46-R1A1 | |
| Geekbench 5.5 / Single-Core | |
| Media de la clase Gaming (986 - 2474, n=105, últimos 2 años) | |
| Asus TUF Gaming A16 FA617XS | |
| Schenker XMG Focus 17 (E23) | |
| Medio Intel Core i7-13700H (1362 - 1919, n=29) | |
| Lenovo Legion Pro 5 16IRX8 | |
| MSI Pulse GL76 12UGK | |
| Medion Erazer Defender P40 | |
| Acer Nitro 5 AN515-46-R1A1 | |
| Acer Nitro 17 AN17-51-71ER | |
| HWBOT x265 Benchmark v2.2 / 4k Preset | |
| Media de la clase Gaming (11.5 - 44.4, n=105, últimos 2 años) | |
| Schenker XMG Focus 17 (E23) | |
| Lenovo Legion Pro 5 16IRX8 | |
| Medion Erazer Defender P40 | |
| Asus TUF Gaming A16 FA617XS | |
| Acer Nitro 17 AN17-51-71ER | |
| MSI Pulse GL76 12UGK | |
| Acer Nitro 5 AN515-46-R1A1 | |
| Medio Intel Core i7-13700H (6.72 - 21.2, n=29) | |
| LibreOffice / 20 Documents To PDF | |
| Acer Nitro 17 AN17-51-71ER | |
| Schenker XMG Focus 17 (E23) | |
| Acer Nitro 5 AN515-46-R1A1 | |
| Medion Erazer Defender P40 | |
| Media de la clase Gaming (33.2 - 88.8, n=105, últimos 2 años) | |
| Medio Intel Core i7-13700H (31.3 - 62.4, n=29) | |
| MSI Pulse GL76 12UGK | |
| Asus TUF Gaming A16 FA617XS | |
| Lenovo Legion Pro 5 16IRX8 | |
| R Benchmark 2.5 / Overall mean | |
| Acer Nitro 17 AN17-51-71ER | |
| Medion Erazer Defender P40 | |
| Acer Nitro 5 AN515-46-R1A1 | |
| Lenovo Legion Pro 5 16IRX8 | |
| MSI Pulse GL76 12UGK | |
| Medio Intel Core i7-13700H (0.4308 - 0.607, n=29) | |
| Media de la clase Gaming (0.3439 - 0.759, n=106, últimos 2 años) | |
| Asus TUF Gaming A16 FA617XS | |
| Schenker XMG Focus 17 (E23) | |
* ... más pequeño es mejor
AIDA64: FP32 Ray-Trace | FPU Julia | CPU SHA3 | CPU Queen | FPU SinJulia | FPU Mandel | CPU AES | CPU ZLib | FP64 Ray-Trace | CPU PhotoWorxx
| Performance rating | |
| Media de la clase Gaming | |
| Schenker XMG Focus 17 (E23) | |
| Asus TUF Gaming A16 FA617XS | |
| Lenovo Legion Pro 5 16IRX8 | |
| Acer Nitro 17 AN17-51-71ER | |
| Acer Nitro 5 AN515-46-R1A1 | |
| MSI Pulse GL76 12UGK | |
| Medion Erazer Defender P40 | |
| Medio Intel Core i7-13700H | |
| AIDA64 / FP32 Ray-Trace | |
| Media de la clase Gaming (10227 - 85542, n=105, últimos 2 años) | |
| Asus TUF Gaming A16 FA617XS | |
| Schenker XMG Focus 17 (E23) | |
| Lenovo Legion Pro 5 16IRX8 | |
| Acer Nitro 17 AN17-51-71ER | |
| MSI Pulse GL76 12UGK | |
| Acer Nitro 5 AN515-46-R1A1 | |
| Medion Erazer Defender P40 | |
| Medio Intel Core i7-13700H (4986 - 18908, n=29) | |
| AIDA64 / FPU Julia | |
| Media de la clase Gaming (51376 - 238426, n=105, últimos 2 años) | |
| Asus TUF Gaming A16 FA617XS | |
| Schenker XMG Focus 17 (E23) | |
| Lenovo Legion Pro 5 16IRX8 | |
| Acer Nitro 5 AN515-46-R1A1 | |
| Acer Nitro 17 AN17-51-71ER | |
| MSI Pulse GL76 12UGK | |
| Medion Erazer Defender P40 | |
| Medio Intel Core i7-13700H (25360 - 92359, n=29) | |
| AIDA64 / CPU SHA3 | |
| Media de la clase Gaming (2180 - 10115, n=105, últimos 2 años) | |
| Schenker XMG Focus 17 (E23) | |
| Lenovo Legion Pro 5 16IRX8 | |
| Asus TUF Gaming A16 FA617XS | |
| Acer Nitro 17 AN17-51-71ER | |
| MSI Pulse GL76 12UGK | |
| Medion Erazer Defender P40 | |
| Acer Nitro 5 AN515-46-R1A1 | |
| Medio Intel Core i7-13700H (1339 - 4224, n=29) | |
| AIDA64 / CPU Queen | |
| Schenker XMG Focus 17 (E23) | |
| Asus TUF Gaming A16 FA617XS | |
| Media de la clase Gaming (49785 - 173351, n=90, últimos 2 años) | |
| Lenovo Legion Pro 5 16IRX8 | |
| Medion Erazer Defender P40 | |
| Acer Nitro 5 AN515-46-R1A1 | |
| MSI Pulse GL76 12UGK | |
| Acer Nitro 17 AN17-51-71ER | |
| Medio Intel Core i7-13700H (59324 - 107159, n=29) | |
| AIDA64 / FPU SinJulia | |
| Asus TUF Gaming A16 FA617XS | |
| Media de la clase Gaming (4424 - 33636, n=105, últimos 2 años) | |
| Schenker XMG Focus 17 (E23) | |
| Lenovo Legion Pro 5 16IRX8 | |
| Acer Nitro 5 AN515-46-R1A1 | |
| Acer Nitro 17 AN17-51-71ER | |
| Medion Erazer Defender P40 | |
| MSI Pulse GL76 12UGK | |
| Medio Intel Core i7-13700H (4800 - 11050, n=29) | |
| AIDA64 / FPU Mandel | |
| Media de la clase Gaming (25115 - 128721, n=105, últimos 2 años) | |
| Asus TUF Gaming A16 FA617XS | |
| Acer Nitro 5 AN515-46-R1A1 | |
| Schenker XMG Focus 17 (E23) | |
| Lenovo Legion Pro 5 16IRX8 | |
| Acer Nitro 17 AN17-51-71ER | |
| MSI Pulse GL76 12UGK | |
| Medion Erazer Defender P40 | |
| Medio Intel Core i7-13700H (12321 - 45118, n=29) | |
| AIDA64 / CPU AES | |
| Acer Nitro 17 AN17-51-71ER | |
| MSI Pulse GL76 12UGK | |
| Acer Nitro 5 AN515-46-R1A1 | |
| Media de la clase Gaming (39258 - 247074, n=105, últimos 2 años) | |
| Schenker XMG Focus 17 (E23) | |
| Lenovo Legion Pro 5 16IRX8 | |
| Asus TUF Gaming A16 FA617XS | |
| Medio Intel Core i7-13700H (28769 - 151254, n=29) | |
| Medion Erazer Defender P40 | |
| AIDA64 / CPU ZLib | |
| Schenker XMG Focus 17 (E23) | |
| Media de la clase Gaming (574 - 2531, n=105, últimos 2 años) | |
| Lenovo Legion Pro 5 16IRX8 | |
| Acer Nitro 17 AN17-51-71ER | |
| MSI Pulse GL76 12UGK | |
| Asus TUF Gaming A16 FA617XS | |
| Medion Erazer Defender P40 | |
| Medio Intel Core i7-13700H (389 - 1215, n=29) | |
| Acer Nitro 5 AN515-46-R1A1 | |
| AIDA64 / FP64 Ray-Trace | |
| Media de la clase Gaming (5509 - 45446, n=105, últimos 2 años) | |
| Asus TUF Gaming A16 FA617XS | |
| Schenker XMG Focus 17 (E23) | |
| Lenovo Legion Pro 5 16IRX8 | |
| Acer Nitro 17 AN17-51-71ER | |
| MSI Pulse GL76 12UGK | |
| Acer Nitro 5 AN515-46-R1A1 | |
| Medion Erazer Defender P40 | |
| Medio Intel Core i7-13700H (2540 - 10135, n=29) | |
| AIDA64 / CPU PhotoWorxx | |
| Schenker XMG Focus 17 (E23) | |
| Media de la clase Gaming (12271 - 89891, n=105, últimos 2 años) | |
| Medio Intel Core i7-13700H (12872 - 52727, n=29) | |
| Acer Nitro 17 AN17-51-71ER | |
| Lenovo Legion Pro 5 16IRX8 | |
| Medion Erazer Defender P40 | |
| Asus TUF Gaming A16 FA617XS | |
| Acer Nitro 5 AN515-46-R1A1 | |
| MSI Pulse GL76 12UGK | |
Rendimiento del sistema
Al navegar por Internet, crear, renderizar y mucho más, el rendimiento se mantiene constantemente alto. Los tiempos de espera son cortos y los procesos de carga, la instalación o desinstalación de programas no presentan al sistema ningún problema en particular. En cuanto a las puntuaciones PCMark y CrossMark, parece haber una ligera ventaja al usar el modo equilibrado. La baja producción de calor como resultado del consumo de energía limitado durante la carga repetida, realmente muestra sus ventajas. Esto significa que este procesador incluso logra situarse notablemente por encima de los valores que registramos en todos nuestros probados i7-13700Hprobados.
CrossMark: Overall | Productivity | Creativity | Responsiveness
| PCMark 10 / Score | |
| Media de la clase Gaming (5828 - 12414, n=93, últimos 2 años) | |
| Asus TUF Gaming A16 FA617XS | |
| Lenovo Legion Pro 5 16IRX8 | |
| MSI Pulse GL76 12UGK | |
| Acer Nitro 17 AN17-51-71ER (Ausgeglichen) | |
| Medio Intel Core i7-13700H, NVIDIA GeForce RTX 4060 Laptop GPU (7157 - 7661, n=5) | |
| Acer Nitro 17 AN17-51-71ER | |
| Schenker XMG Focus 17 (E23) | |
| Medion Erazer Defender P40 | |
| Acer Nitro 5 AN515-46-R1A1 | |
| PCMark 10 / Essentials | |
| MSI Pulse GL76 12UGK | |
| Lenovo Legion Pro 5 16IRX8 | |
| Asus TUF Gaming A16 FA617XS | |
| Medio Intel Core i7-13700H, NVIDIA GeForce RTX 4060 Laptop GPU (10179 - 11200, n=5) | |
| Media de la clase Gaming (8810 - 11935, n=97, últimos 2 años) | |
| Acer Nitro 17 AN17-51-71ER (Ausgeglichen) | |
| Acer Nitro 5 AN515-46-R1A1 | |
| Acer Nitro 17 AN17-51-71ER | |
| Schenker XMG Focus 17 (E23) | |
| Medion Erazer Defender P40 | |
| PCMark 10 / Productivity | |
| Media de la clase Gaming (6845 - 25323, n=95, últimos 2 años) | |
| Asus TUF Gaming A16 FA617XS | |
| Acer Nitro 17 AN17-51-71ER (Ausgeglichen) | |
| MSI Pulse GL76 12UGK | |
| Medion Erazer Defender P40 | |
| Schenker XMG Focus 17 (E23) | |
| Medio Intel Core i7-13700H, NVIDIA GeForce RTX 4060 Laptop GPU (8238 - 10249, n=5) | |
| Lenovo Legion Pro 5 16IRX8 | |
| Acer Nitro 5 AN515-46-R1A1 | |
| Acer Nitro 17 AN17-51-71ER | |
| PCMark 10 / Digital Content Creation | |
| Media de la clase Gaming (7602 - 19954, n=95, últimos 2 años) | |
| Lenovo Legion Pro 5 16IRX8 | |
| Asus TUF Gaming A16 FA617XS | |
| Acer Nitro 17 AN17-51-71ER | |
| MSI Pulse GL76 12UGK | |
| Medio Intel Core i7-13700H, NVIDIA GeForce RTX 4060 Laptop GPU (10308 - 11862, n=5) | |
| Acer Nitro 17 AN17-51-71ER (Ausgeglichen) | |
| Schenker XMG Focus 17 (E23) | |
| Medion Erazer Defender P40 | |
| Acer Nitro 5 AN515-46-R1A1 | |
| CrossMark / Overall | |
| Schenker XMG Focus 17 (E23) | |
| Media de la clase Gaming (1366 - 2409, n=94, últimos 2 años) | |
| MSI Pulse GL76 12UGK | |
| Medion Erazer Defender P40 | |
| Asus TUF Gaming A16 FA617XS | |
| Medio Intel Core i7-13700H, NVIDIA GeForce RTX 4060 Laptop GPU (1629 - 1849, n=5) | |
| Lenovo Legion Pro 5 16IRX8 | |
| Acer Nitro 17 AN17-51-71ER (Ausgeglichen) | |
| Acer Nitro 17 AN17-51-71ER | |
| Acer Nitro 5 AN515-46-R1A1 | |
| CrossMark / Productivity | |
| Schenker XMG Focus 17 (E23) | |
| Media de la clase Gaming (1386 - 2254, n=94, últimos 2 años) | |
| MSI Pulse GL76 12UGK | |
| Asus TUF Gaming A16 FA617XS | |
| Medion Erazer Defender P40 | |
| Medio Intel Core i7-13700H, NVIDIA GeForce RTX 4060 Laptop GPU (1561 - 1743, n=5) | |
| Lenovo Legion Pro 5 16IRX8 | |
| Acer Nitro 17 AN17-51-71ER (Ausgeglichen) | |
| Acer Nitro 17 AN17-51-71ER | |
| Acer Nitro 5 AN515-46-R1A1 | |
| CrossMark / Creativity | |
| Schenker XMG Focus 17 (E23) | |
| Media de la clase Gaming (1343 - 2786, n=94, últimos 2 años) | |
| Medion Erazer Defender P40 | |
| Asus TUF Gaming A16 FA617XS | |
| MSI Pulse GL76 12UGK | |
| Medio Intel Core i7-13700H, NVIDIA GeForce RTX 4060 Laptop GPU (1691 - 2064, n=5) | |
| Acer Nitro 17 AN17-51-71ER (Ausgeglichen) | |
| Lenovo Legion Pro 5 16IRX8 | |
| Acer Nitro 17 AN17-51-71ER | |
| Acer Nitro 5 AN515-46-R1A1 | |
| CrossMark / Responsiveness | |
| MSI Pulse GL76 12UGK | |
| Schenker XMG Focus 17 (E23) | |
| Media de la clase Gaming (1226 - 2334, n=94, últimos 2 años) | |
| Lenovo Legion Pro 5 16IRX8 | |
| Acer Nitro 17 AN17-51-71ER | |
| Medion Erazer Defender P40 | |
| Medio Intel Core i7-13700H, NVIDIA GeForce RTX 4060 Laptop GPU (1381 - 1656, n=5) | |
| Acer Nitro 17 AN17-51-71ER (Ausgeglichen) | |
| Asus TUF Gaming A16 FA617XS | |
| Acer Nitro 5 AN515-46-R1A1 | |
| PCMark 10 Score | 7157 puntos | |
ayuda | ||
| AIDA64 / Memory Copy | |
| Schenker XMG Focus 17 (E23) | |
| Media de la clase Gaming (21750 - 129946, n=105, últimos 2 años) | |
| Medio Intel Core i7-13700H (24334 - 78081, n=29) | |
| Asus TUF Gaming A16 FA617XS | |
| Lenovo Legion Pro 5 16IRX8 | |
| Acer Nitro 17 AN17-51-71ER | |
| Medion Erazer Defender P40 | |
| Acer Nitro 5 AN515-46-R1A1 | |
| MSI Pulse GL76 12UGK | |
| AIDA64 / Memory Read | |
| Schenker XMG Focus 17 (E23) | |
| Media de la clase Gaming (22956 - 118858, n=105, últimos 2 años) | |
| Lenovo Legion Pro 5 16IRX8 | |
| Medion Erazer Defender P40 | |
| Acer Nitro 17 AN17-51-71ER | |
| Medio Intel Core i7-13700H (23681 - 79656, n=29) | |
| Asus TUF Gaming A16 FA617XS | |
| Acer Nitro 5 AN515-46-R1A1 | |
| MSI Pulse GL76 12UGK | |
| AIDA64 / Memory Write | |
| Media de la clase Gaming (22297 - 135096, n=105, últimos 2 años) | |
| Schenker XMG Focus 17 (E23) | |
| Asus TUF Gaming A16 FA617XS | |
| Medio Intel Core i7-13700H (22986 - 99898, n=29) | |
| Lenovo Legion Pro 5 16IRX8 | |
| Acer Nitro 17 AN17-51-71ER | |
| Medion Erazer Defender P40 | |
| Acer Nitro 5 AN515-46-R1A1 | |
| MSI Pulse GL76 12UGK | |
| AIDA64 / Memory Latency | |
| Acer Nitro 17 AN17-51-71ER | |
| Media de la clase Gaming (75.3 - 259, n=105, últimos 2 años) | |
| Medio Intel Core i7-13700H (82.4 - 136.8, n=29) | |
| MSI Pulse GL76 12UGK | |
| Medion Erazer Defender P40 | |
| Schenker XMG Focus 17 (E23) | |
| Asus TUF Gaming A16 FA617XS | |
| Acer Nitro 5 AN515-46-R1A1 | |
| Lenovo Legion Pro 5 16IRX8 | |
* ... más pequeño es mejor
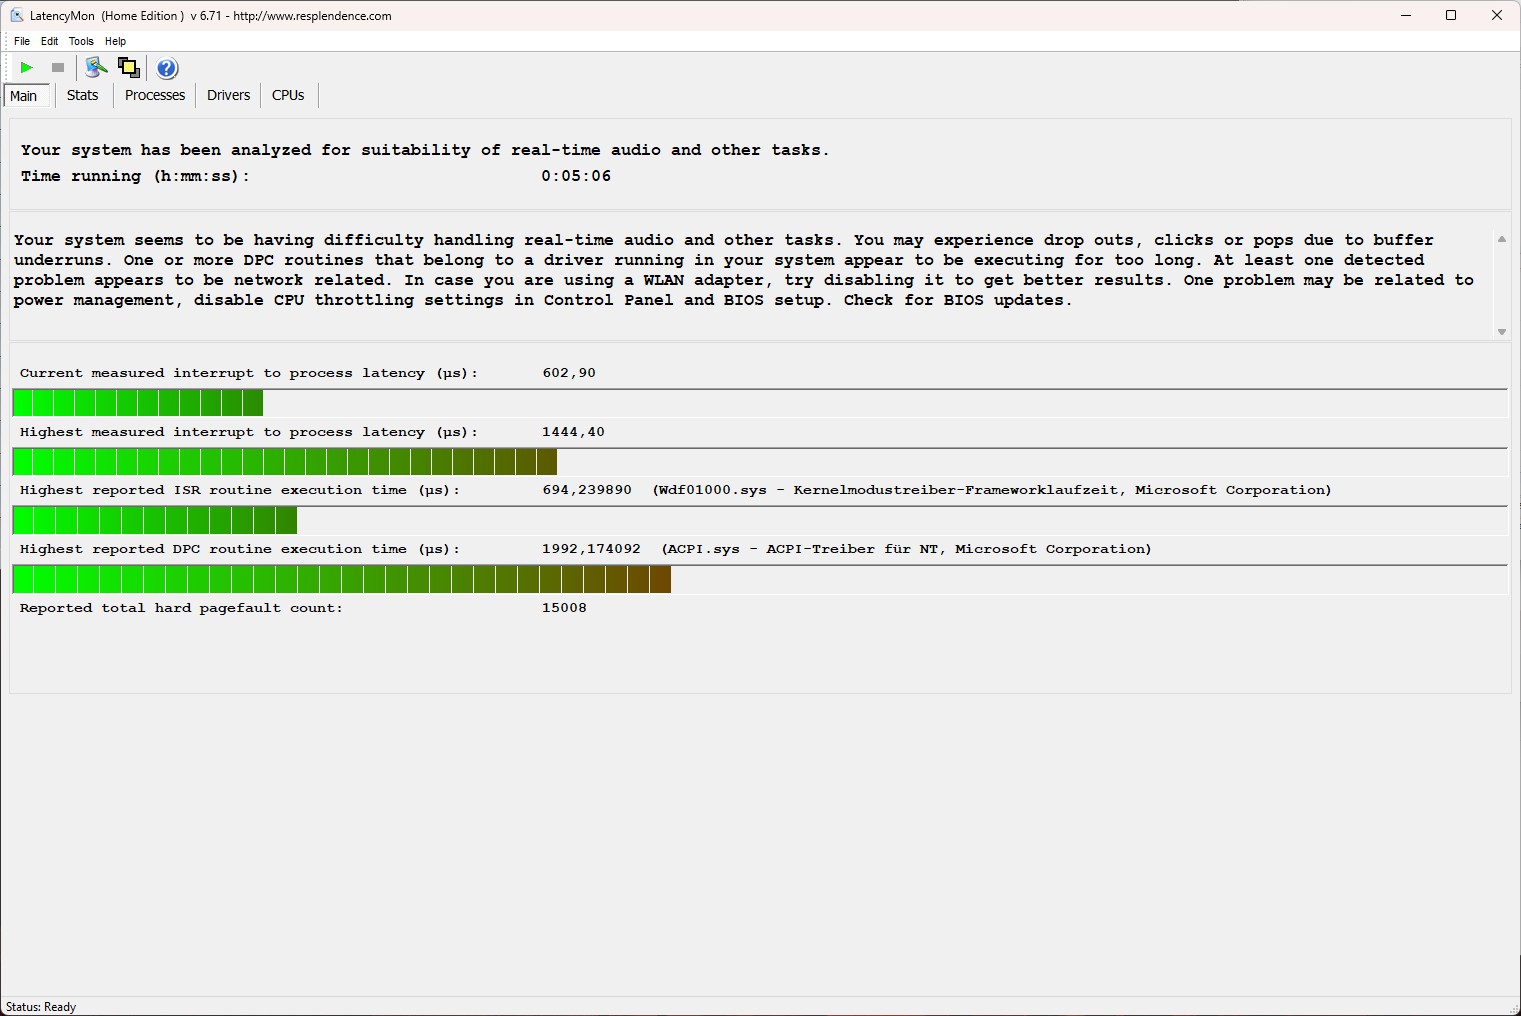
Latencias del CPD
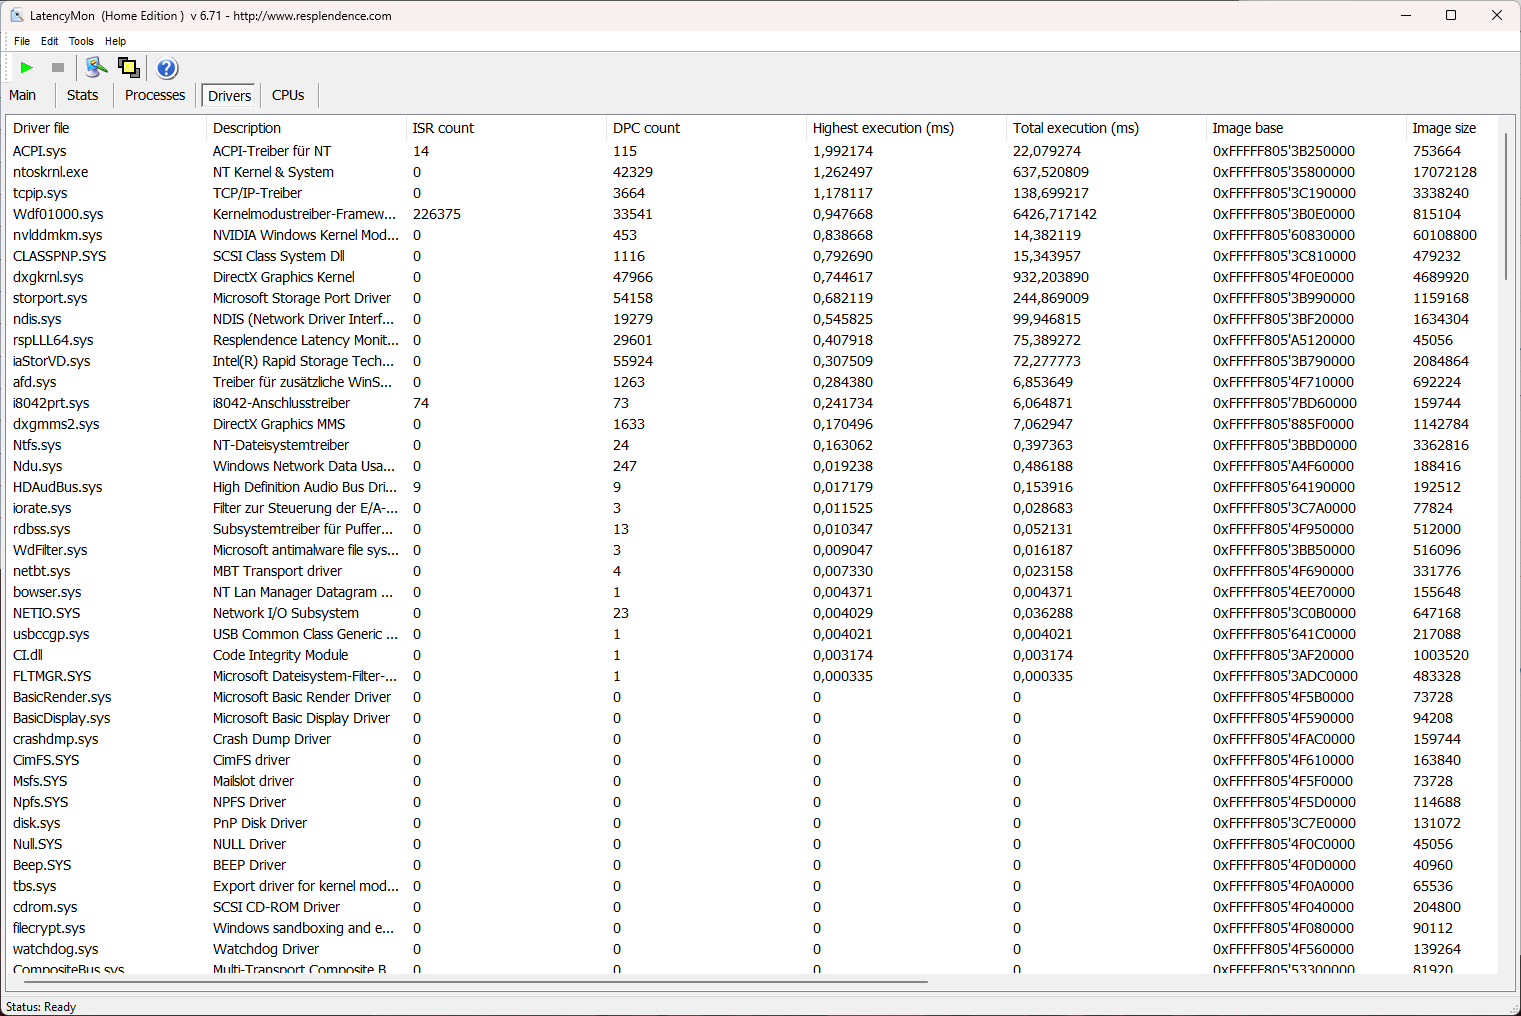
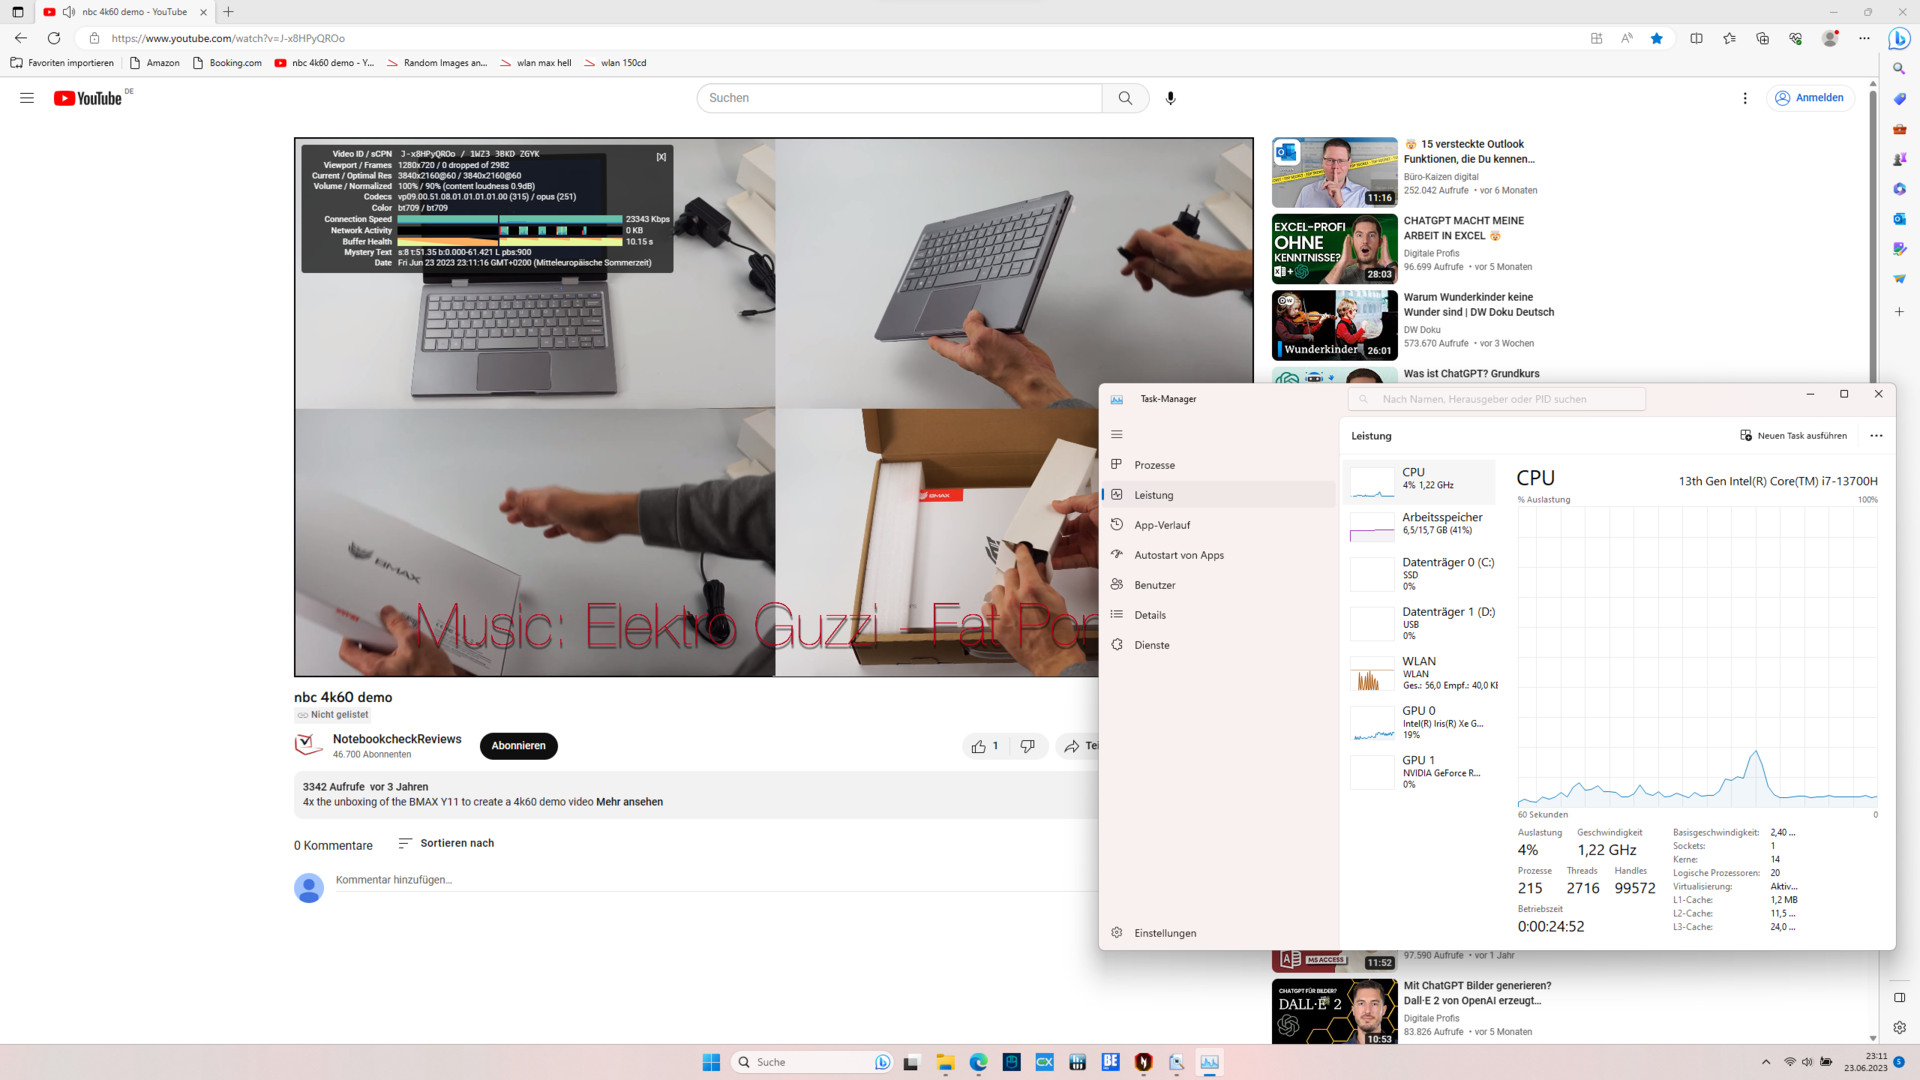
El Nitro 17 no es necesariamente adecuado para la edición de audio en tiempo real, pero aún así fue capaz de manejarlo con un mínimo de fallos. En general, los resultados fueron buenos. Además, en lo que respecta a la reproducción de vídeo 4K, no pudimos detectar ninguna pérdida de fotogramas.
Las actualizaciones de drivers y los cambios de software podrían mejorar o empeorar significativamente el rendimiento en comparación con nuestros resultados.
| DPC Latencies / LatencyMon - interrupt to process latency (max), Web, Youtube, Prime95 | |
| Acer Nitro 5 AN515-46-R1A1 | |
| Medion Erazer Defender P40 | |
| Acer Nitro 17 AN17-51-71ER | |
| Asus TUF Gaming A16 FA617XS | |
| Schenker XMG Focus 17 (E23) | |
| MSI Pulse GL76 12UGK | |
| Lenovo Legion Pro 5 16IRX8 | |
* ... más pequeño es mejor
Almacenamiento masivo
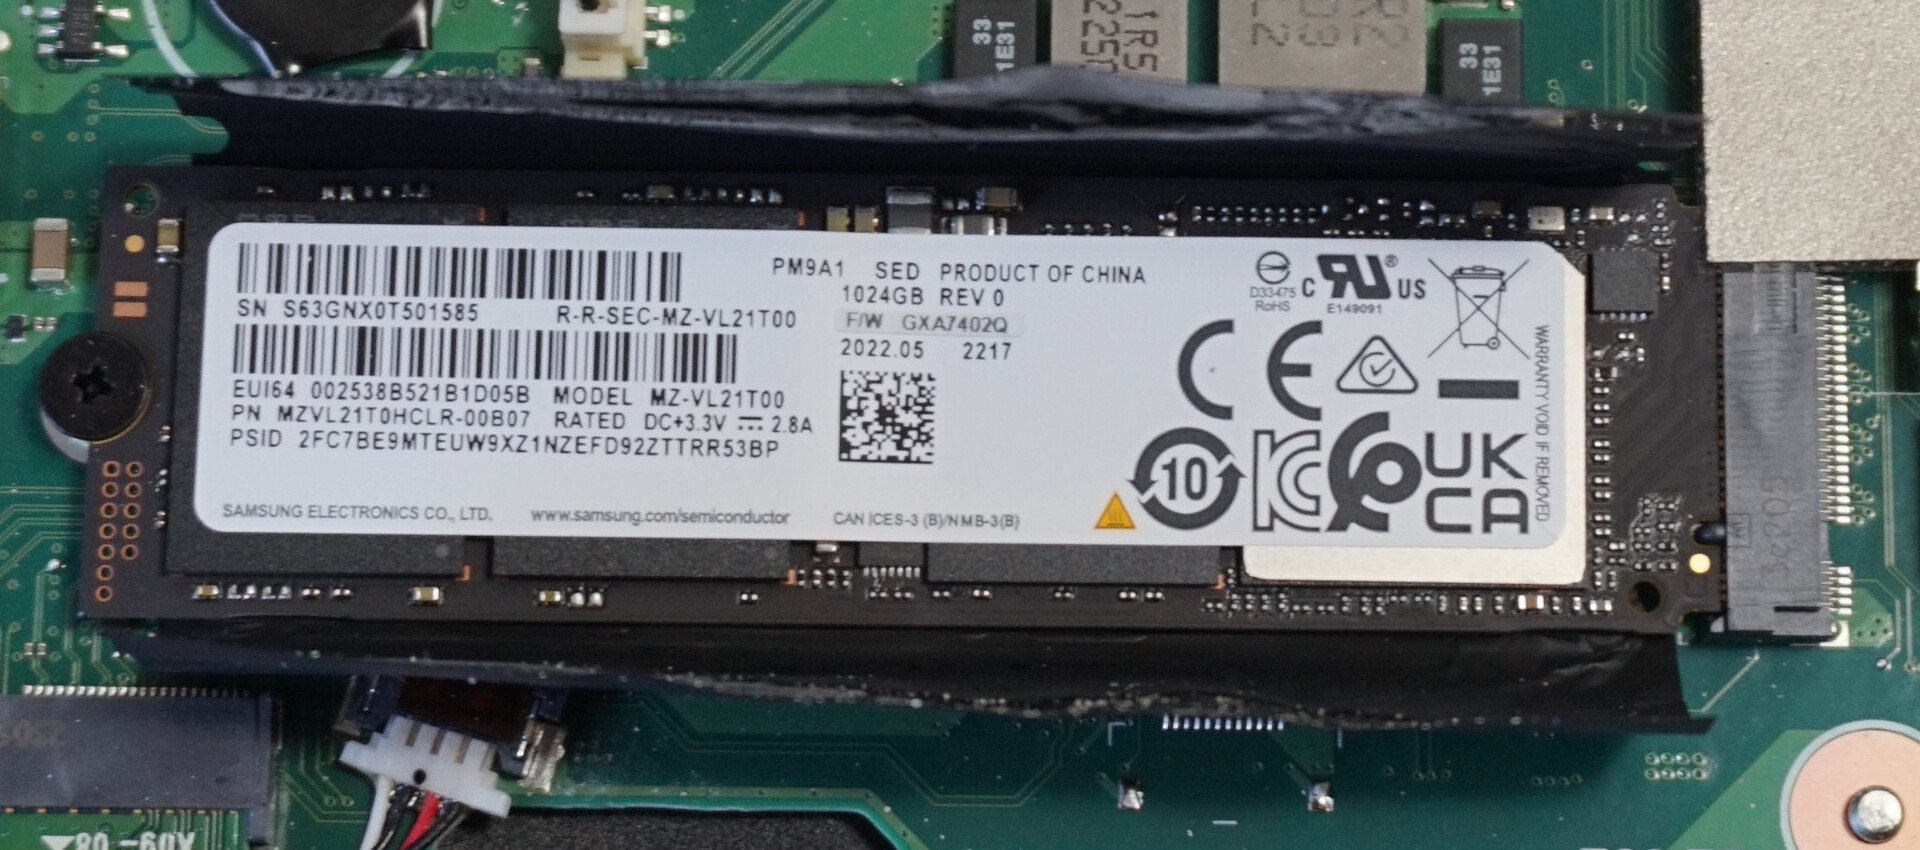
En nuestras pruebas de rendimiento, la SSD PCIe 4.0 de Samsung arrojó unos resultados impresionantes, situándose a bastante distancia de la competencia, especialmente en lo que se refiere a las velocidades de lectura y escritura de bloques de 4 kbit.
Por el contrario, el resultado de la prueba de resistencia de lectura secuencial fue realmente pobre. Tras unas velocidades de transferencia inicialmente aceptables, los valores cayeron a menos de 500 MB/s (línea roja), lo que representa una fracción del posible rendimiento teórico. La retirada de la almohadilla de refrigeración de la RAM -que llegaba hasta el controlador del SSD en nuestro dispositivo de pruebas- supuso una mejora del 50 % (línea negra). Si los ventiladores se ponen al máximo, el SSD se comporta finalmente como cabría esperar (línea amarilla).
La comparación con elLenovo Legion Pro 5 muestra cómo debería ir la prueba. La refrigeración, que se encontraba en la placa base del predecesor, falta aquí y es algo que se refleja claramente en nuestros resultados.
Sin embargo, esto parece tener una influencia insignificante en el rendimiento de juego. Al menos, no pudimos determinar desviaciones dignas de mención, en comparación con competidores equipados con hardware similar.

| Acer Nitro 17 AN17-51-71ER Samsung PM9A1 MZVL21T0HCLR | Lenovo Legion Pro 5 16IRX8 SK hynix PC801 HFS512GEJ9X115N | Asus TUF Gaming A16 FA617XS Micron 2400 MTFDKBA512QFM | Schenker XMG Focus 17 (E23) Crucial P5 Plus 1TB CT1000P5PSSD8 | Medion Erazer Defender P40 Phison PS5021-E21 1TB | Acer Nitro 5 AN515-46-R1A1 Micron 3400 1TB MTFDKBA1T0TFH | MSI Pulse GL76 12UGK Micron 3400 1TB MTFDKBA1T0TFH | Medio Samsung PM9A1 MZVL21T0HCLR | Media de la clase Gaming | |
|---|---|---|---|---|---|---|---|---|---|
| Drive Performance rating | |||||||||
| Percent (pt) | 87.1 | 84.5 -3% | 41.6 -52% | 72.3 -17% | 74.9 -14% | 72.1 -17% | 78.4 -10% | 73.9 -15% | 74.7 -14% |
| DiskSpd | -6% | -50% | -11% | -7% | -11% | -1% | -11% | -8% | |
| seq read (MB/s) | 3670 | 5346 46% | 2253 -39% | 3510 -4% | 2501 -32% | 3770 3% | 3889 6% | 3766 ? 3% | 3556 ? -3% |
| seq write (MB/s) | 4284 | 1495 -65% | 1671 -61% | 3961 -8% | 4675 9% | 4216 -2% | 4579 7% | 3581 ? -16% | 3957 ? -8% |
| seq q8 t1 read (MB/s) | 5276 | 7127 35% | 4294 -19% | 6520 24% | 5009 -5% | 6689 27% | 6697 27% | 6483 ? 23% | 7552 ? 43% |
| seq q8 t1 write (MB/s) | 5114 | 4903 -4% | 1773 -65% | 4907 -4% | 4797 -6% | 4664 -9% | 4956 -3% | 4810 ? -6% | 5961 ? 17% |
| 4k q1 t1 read (MB/s) | 70.6 | 65.9 -7% | 32.8 -54% | 53.6 -24% | 51.1 -28% | 59.5 -16% | 69.8 -1% | 76.5 ? 8% | 70.3 ? 0% |
| 4k q1 t1 write (MB/s) | 267 | 328 23% | 132 -51% | 205 -23% | 281 5% | 151.1 -43% | 263 -1% | 188.5 ? -29% | 195.9 ? -27% |
| 4k q32 t16 read (MB/s) | 3726 | 2889 -22% | 1705 -54% | 2835 -24% | 3335 -10% | 2819 -24% | 2861 -23% | 2586 ? -31% | 2264 ? -39% |
| 4k q32 t16 write (MB/s) | 3355 | 1457 -57% | 1585 -53% | 2664 -21% | 3737 11% | 2670 -20% | 2700 -20% | 1959 ? -42% | 1832 ? -45% |
| AS SSD | -7% | -94% | -22% | -17% | -20% | -31% | -20% | -18% | |
| Score Total (Points) | 8345 | 9125 9% | 4261 -49% | 6631 -21% | 7599 -9% | 7145 -14% | 7307 -12% | 6892 ? -17% | 6872 ? -18% |
| Score Read (Points) | 3277 | 3235 -1% | 1830 -44% | 2593 -21% | 2625 -20% | 2804 -14% | 2792 -15% | 2433 ? -26% | 2248 ? -31% |
| Score Write (Points) | 3417 | 4288 25% | 1604 -53% | 2674 -22% | 3618 6% | 2979 -13% | 3117 -9% | 3284 ? -4% | 3547 ? 4% |
| Seq Read (MB/s) | 4853 | 5856.12 21% | 3690.93 -24% | 3344 -31% | 3667.76 -24% | 4920.82 1% | 4843.81 0% | 4901 ? 1% | 5591 ? 15% |
| Seq Write (MB/s) | 4373 | 4750.28 9% | 1633.49 -63% | 4175 -5% | 3884.67 -11% | 3550.64 -19% | 4200.32 -4% | 3334 ? -24% | 3972 ? -9% |
| 4K Read (MB/s) | 73.43 | 77.12 5% | 42.75 -42% | 53.4 -27% | 63.89 -13% | 56.67 -23% | 67.56 -8% | 72.4 ? -1% | 71.1 ? -3% |
| 4K Write (MB/s) | 234.6 | 276.66 18% | 118.17 -50% | 177.9 -24% | 207.32 -12% | 135.96 -42% | 213.7 -9% | 186 ? -21% | 215 ? -8% |
| 4K-64 Read (MB/s) | 2718 | 2572.63 -5% | 1429.83 -47% | 2205 -19% | 2194.79 -19% | 2254.97 -17% | 2240.41 -18% | 1871 ? -31% | 1618 ? -40% |
| 4K-64 Write (MB/s) | 2745 | 3536.78 29% | 1411.25 -49% | 2078 -24% | 3021.8 10% | 2488.35 -9% | 2483.08 -10% | 2764 ? 1% | 2935 ? 7% |
| Access Time Read * (ms) | 0.044 | 0.058 | 0.03 | 0.08 | 0.057 | 0.038 | 0.0377 ? | 0.06364 ? | |
| Access Time Write * (ms) | 0.019 | 0.053 -179% | 0.118 -521% | 0.023 -21% | 0.033 -74% | 0.029 -53% | 0.061 -221% | 0.03431 ? -81% | 0.03794 ? -100% |
| Media total (Programa/Opciones) | -5% /
-6% | -65% /
-73% | -17% /
-17% | -13% /
-12% | -16% /
-16% | -14% /
-17% | -15% /
-16% | -13% /
-14% |
* ... más pequeño es mejor
Continuous performance Read: DiskSpd Read Loop, Queue Depth 8
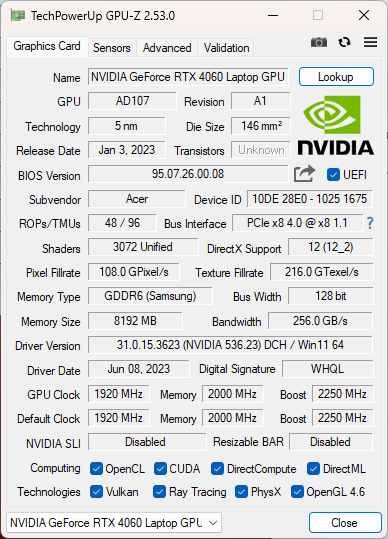
Tarjeta gráfica
LaRTX 4060es una GPU de gama media que puede competir sin problemas con la generación anterior de GPUsRTX 3070 Ti. Esto es notable, ya que el número de sombreadores, así como los diversos núcleos para el trazado de rayos o los cálculos de tensor se han reducido en algo cercano al 50 %. Con 8 GB, solo la VRAM se ha mantenido igual y podría ser un poco escasa, especialmente cuando se trata de resoluciones 4K, al menos para títulos de juegos individuales.
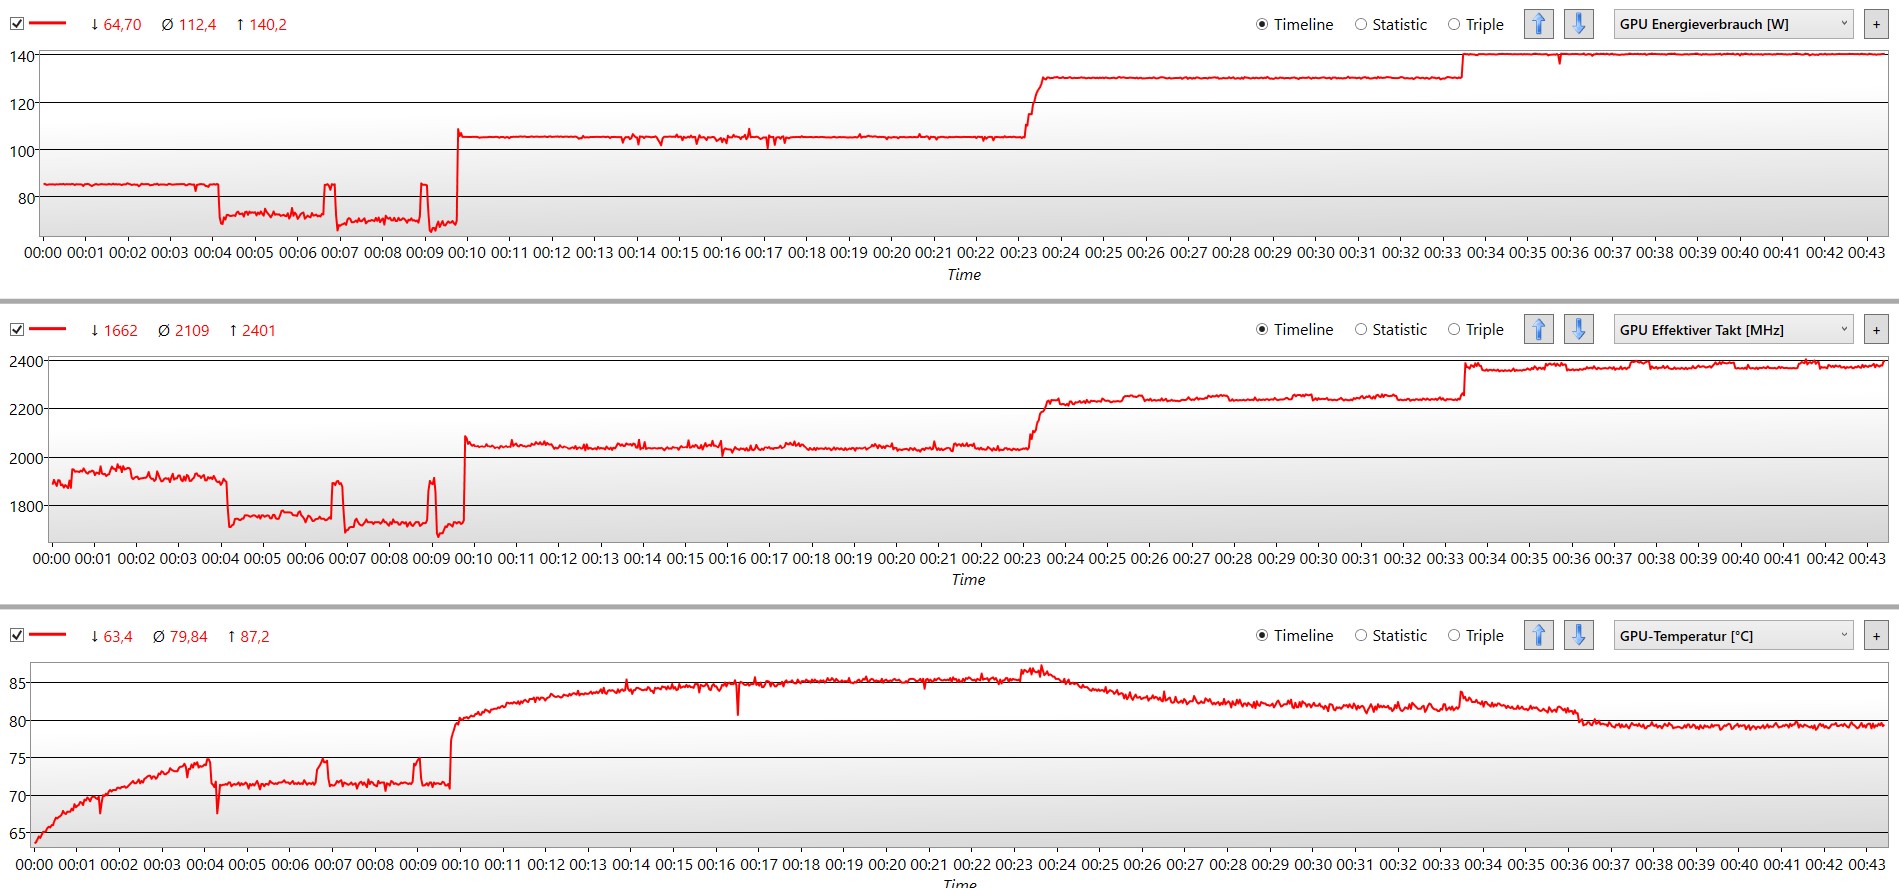
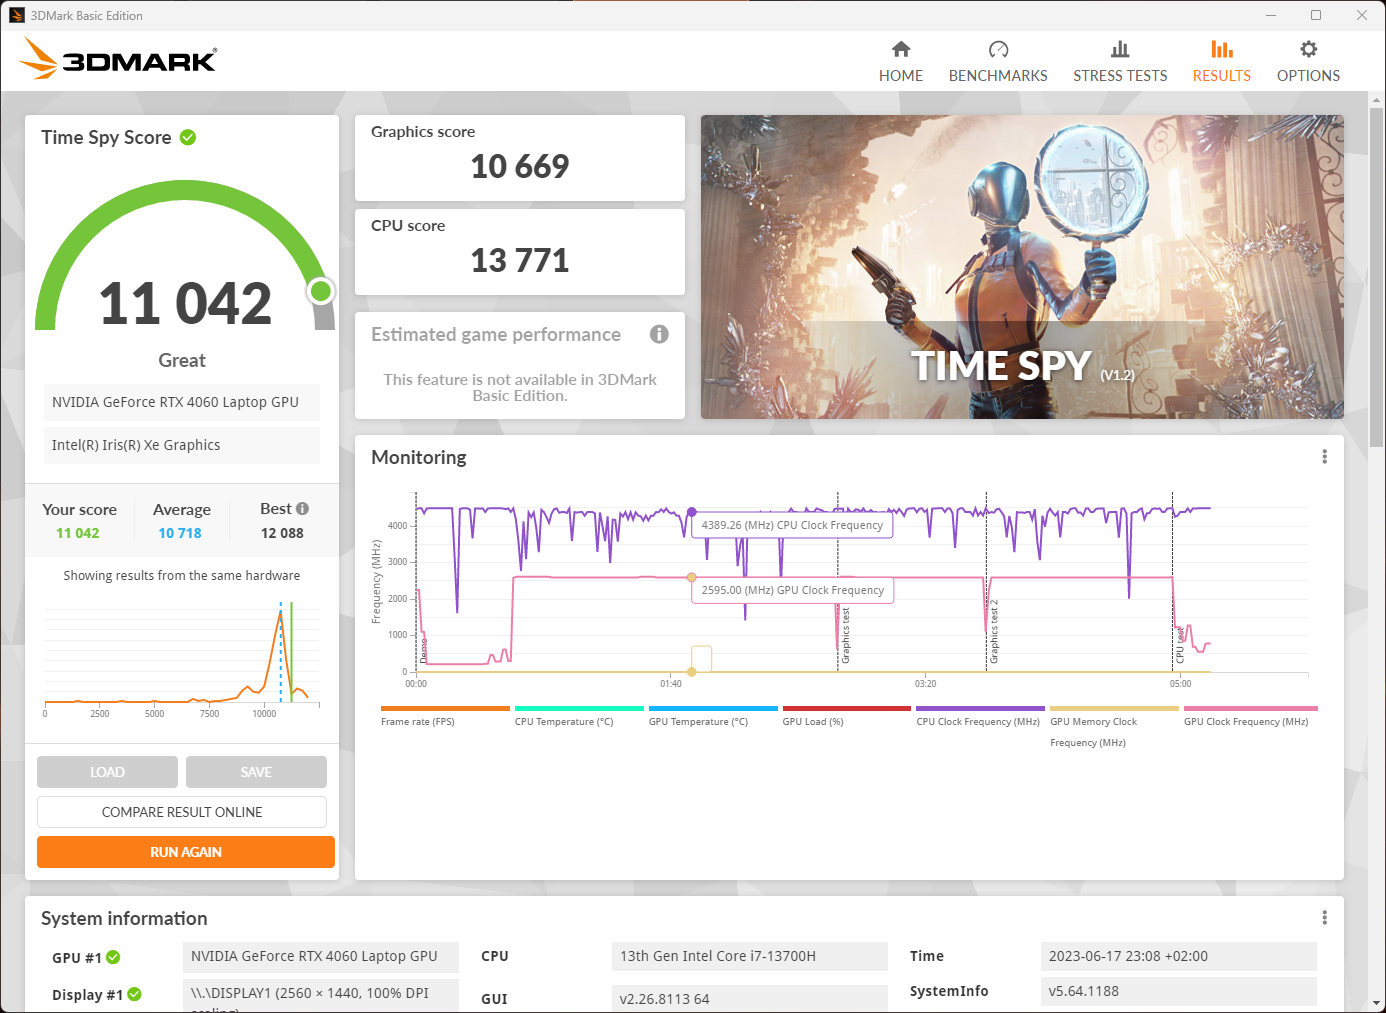
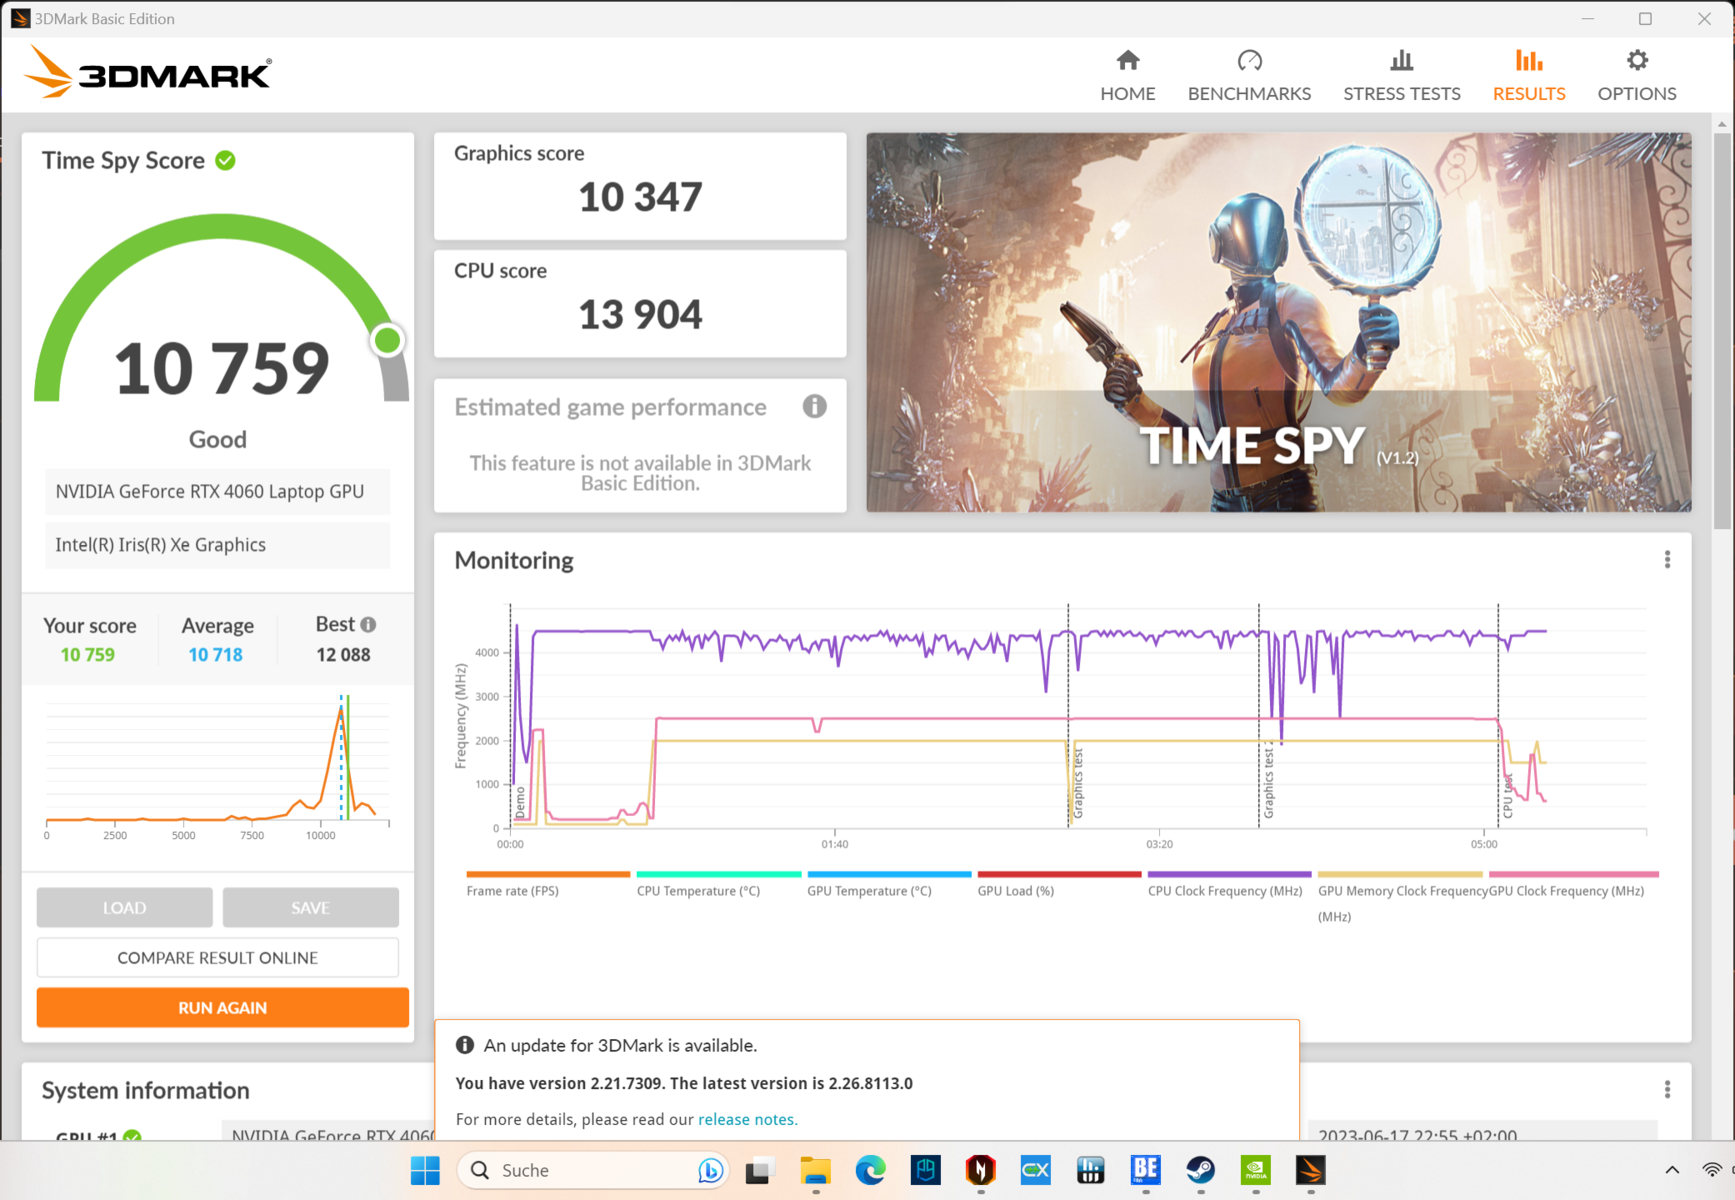
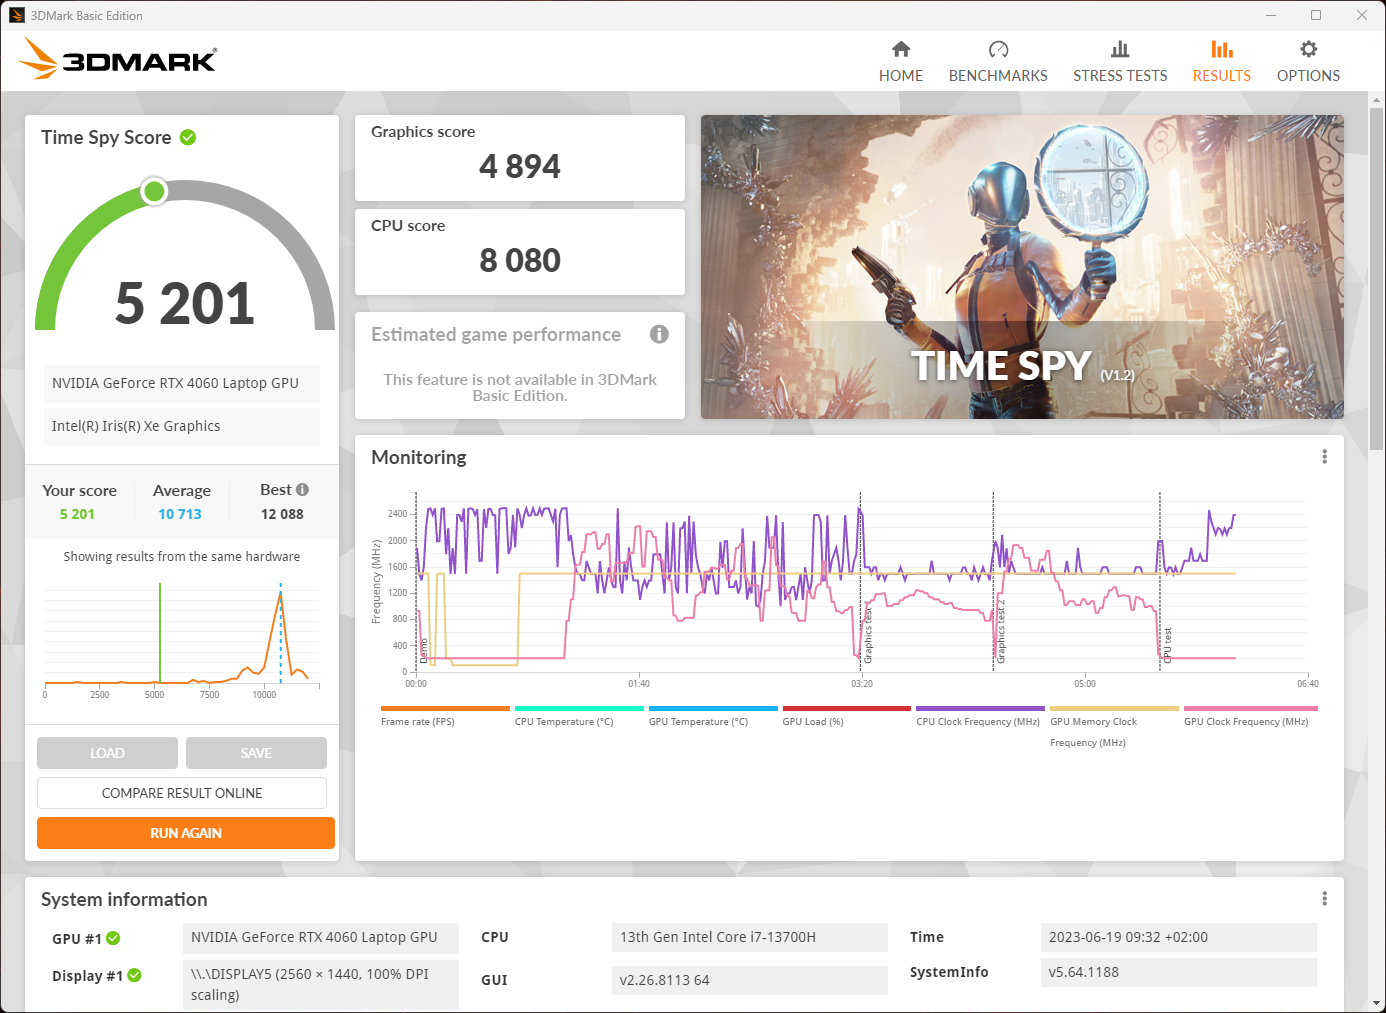
El chip gráfico del Acer Nitro 17 recibe un máximo de 140 vatios, de los que 25 se desvían del procesador como refuerzo dinámico. El gráfico de la derecha muestra que el valor en el modo "Turbo" también es estable a largo plazo. En los demás modos, el consumo de energía se reduce. En "Silencioso", se necesitan 85 vatios. En modo "Equilibrado", se permiten 105 vatios y en "Rendimiento", se accede a un máximo de 130 vatios. En el diagrama falta el modo batería. Posteriormente registramos 15 vatios que son suficientes incluso para The Witcher 3 con los ajustes de detalle más altos.
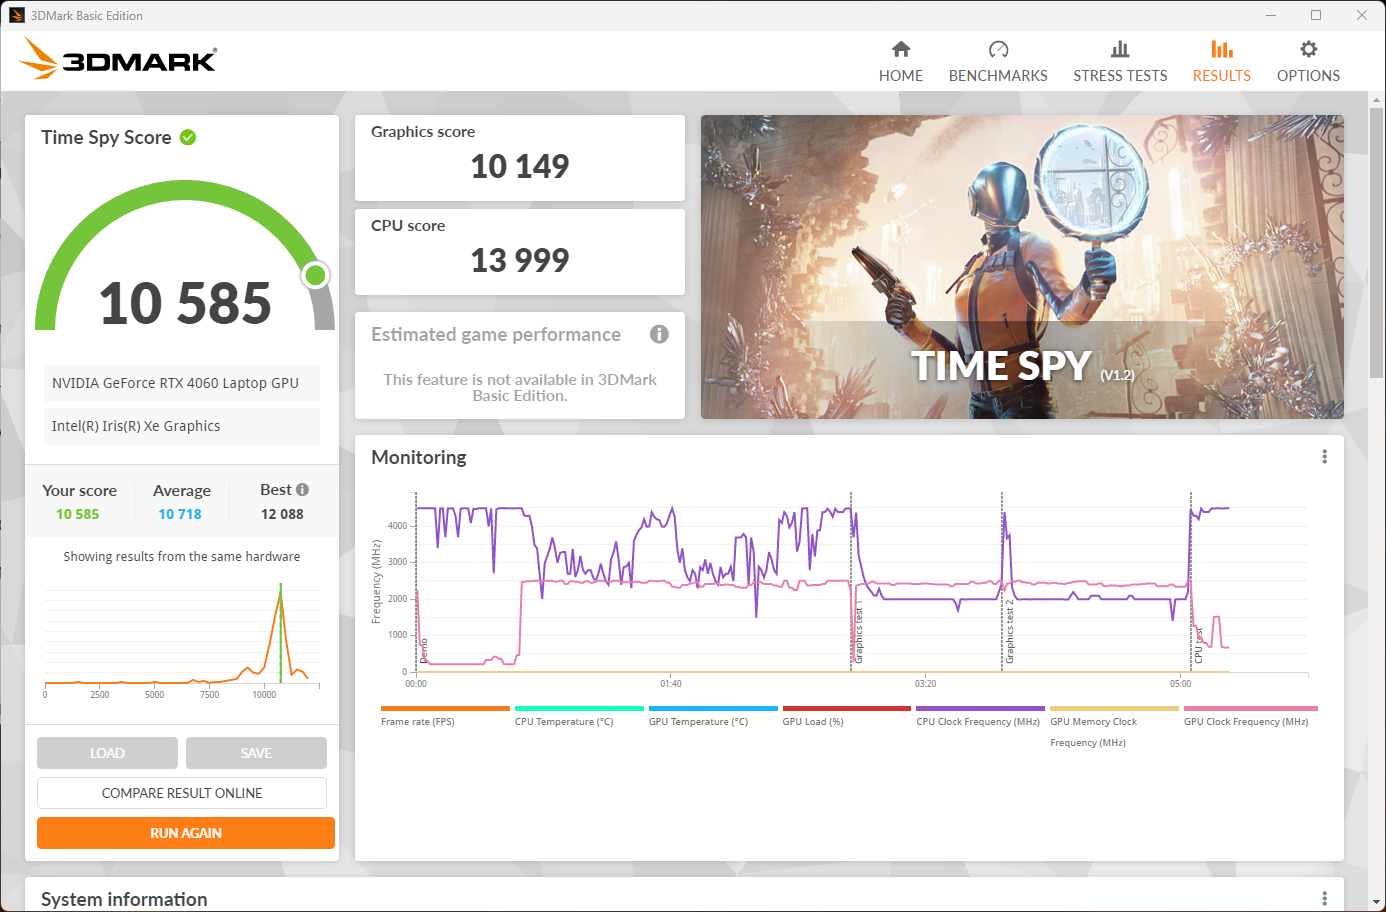
El 3DMark se llevó a cabo con una alimentación máxima de 130 vatios (modo "Rendimiento") y se situó a un nivel comparable al de competidores como elErazer Defender P40 o Legion Pro 5 con una GPU idéntica. También en este ámbito, los resultados del modo equilibrado son parcialmente mejores que los registrados en el modo de rendimiento a pesar de que la tarjeta gráfica sólo se alimenta con 105 vatios. Como el procesador al mismo tiempo no es completamente responsable de la producción de calor, la GPU puede funcionar de forma fiable en este modo a máxima potencia. Por el contrario, en el modo "Rendimiento", cuando se alcanza la temperatura crítica, la velocidad de reloj se limita durante un breve periodo y eso es algo que no ocurre tan rápidamente en el modo equilibrado.
En un extenso análisis de sobre las actuales GPU Nvidia RTX-4000destacamos que la GPURTX 4050y RTX 4060apenas experimentan un aumento de rendimiento cuando el consumo de energía se incrementa por encima de los 100 vatios.
Puedes encontrar más pruebas e información en nuestra Lista de pruebas de GPU.
| 3DMark Performance rating - Percent | |
| Media de la clase Gaming | |
| Schenker XMG Focus 17 (E23) | |
| Acer Nitro 5 AN515-46-R1A1 | |
| Medion Erazer Defender P40 | |
| Acer Nitro 17 AN17-51-71ER | |
| Acer Nitro 17 AN17-51-71ER | |
| Medio NVIDIA GeForce RTX 4060 Laptop GPU | |
| Asus TUF Gaming A16 FA617XS | |
| Lenovo Legion Pro 5 16IRX8 -1! | |
| MSI Pulse GL76 12UGK -1! | |
| 3DMark 11 - 1280x720 Performance GPU | |
| Media de la clase Gaming (21841 - 80022, n=104, últimos 2 años) | |
| Schenker XMG Focus 17 (E23) | |
| Lenovo Legion Pro 5 16IRX8 | |
| Acer Nitro 5 AN515-46-R1A1 | |
| Medion Erazer Defender P40 | |
| Acer Nitro 17 AN17-51-71ER (Ausgeglichen) | |
| Acer Nitro 17 AN17-51-71ER | |
| Medio NVIDIA GeForce RTX 4060 Laptop GPU (28136 - 38912, n=57) | |
| MSI Pulse GL76 12UGK | |
| Asus TUF Gaming A16 FA617XS | |
| 3DMark 11 Performance | 31129 puntos | |
| 3DMark Cloud Gate Standard Score | 61140 puntos | |
| 3DMark Fire Strike Score | 23561 puntos | |
| 3DMark Time Spy Score | 10759 puntos | |
ayuda | ||
* ... más pequeño es mejor
Rendimiento de juego
En cuanto al rendimiento en juegos, no hay grandes sorpresas. Una vez más, con su CPU más potente, elMedion Erazer Defender P40sale perdiendo. Es probable que haya una diferencia más significativa con el Acer Nitro 5 AN515con su RTX 3070 Ti. Una vez más, en juegos nuevos como F1 22, ambos portátiles de juego se ven cara a cara. Apenas determinamos diferencias entre los modos equilibrado y de rendimiento. Hubo más o menos un empate en la puntuación 3DMark. En Witcher 3, el modo equilibrado quedó por detrás en un 2%. F1 22 lo hizo alrededor de un 5% peor.
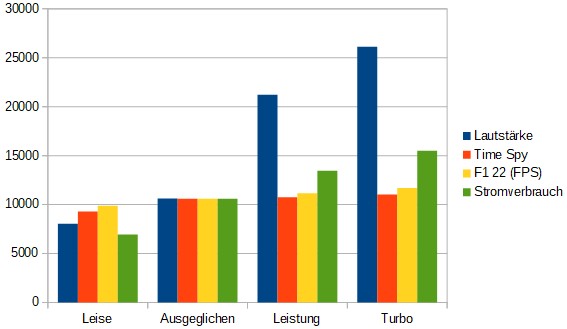
Además, en el gráfico de la derecha, también añadimos el consumo de energía del sistema y el nivel de ruido registrado en relación con la ganancia de rendimiento. Para ello, se normalizaron todos los valores en el resultado del modo equilibrado de 3DMark Time Spy y la escala logarítmica del nivel de ruido se convirtió en valores lineales. De ello se desprende que una mejora mínima del rendimiento es más agradable para los oídos que la factura de la luz. Como ya mencionamos en nuestro análisis de tarjetas gráficas, se ve claramente que la maximización del TGP de la RTX 4060 es responsable de más emisiones, pero no de tanta potencia adicional.
| The Witcher 3 - 1920x1080 Ultra Graphics & Postprocessing (HBAO+) | |
| Media de la clase Gaming (104.7 - 240, n=7, últimos 2 años) | |
| Schenker XMG Focus 17 (E23) | |
| Acer Nitro 5 AN515-46-R1A1 | |
| Lenovo Legion Pro 5 16IRX8 | |
| Acer Nitro 17 AN17-51-71ER | |
| Medion Erazer Defender P40 | |
| Asus TUF Gaming A16 FA617XS | |
| MSI Pulse GL76 12UGK | |
| Strange Brigade - 1920x1080 ultra AA:ultra AF:16 | |
| Media de la clase Gaming (76.3 - 458, n=87, últimos 2 años) | |
| Schenker XMG Focus 17 (E23) | |
| Acer Nitro 17 AN17-51-71ER | |
| Medion Erazer Defender P40 | |
| Acer Nitro 5 AN515-46-R1A1 | |
| MSI Pulse GL76 12UGK | |
| Asus TUF Gaming A16 FA617XS | |
| Hogwarts Legacy | |
| 1920x1080 High Preset AA:High T | |
| Schenker XMG Focus 17 (E23) | |
| Medio NVIDIA GeForce RTX 4060 Laptop GPU (70.8 - 107.7, n=6) | |
| Acer Nitro 17 AN17-51-71ER | |
| Asus TUF Gaming A16 FA617XS | |
| 1920x1080 Ultra Preset AA:High T | |
| Media de la clase Gaming (n=1últimos 2 años) | |
| Medio NVIDIA GeForce RTX 4060 Laptop GPU (61.9 - 91.9, n=6) | |
| Schenker XMG Focus 17 (E23) | |
| Acer Nitro 17 AN17-51-71ER | |
| Asus TUF Gaming A16 FA617XS | |
En la prueba de resistencia de Witcher 3, el rendimiento del sistema se mantuvo estable. Las fluctuaciones se deben al ciclo diurno y nocturno del juego. Las tasas de fps registradas en modo equilibrado son casi idénticas. Esto supera, por ejemplo, al Medion Erazer Defender P40que consume más energía.
Se aprecia una tendencia mínima hacia valores decrecientes en el modo equilibrado (verde). La limitación de la velocidad de los ventiladores asegura una ligera caída de la tasa de fotogramas en el transcurso de una hora. Al final, incluso en el modo de ahorro de energía, los valores están bastante por encima de los 80fps.
Witcher 3 FPS diagram
| bajo | medio | alto | ultra | QHD | |
|---|---|---|---|---|---|
| GTA V (2015) | 177.8 | 114.1 | |||
| The Witcher 3 (2015) | 210 | 105 | |||
| Dota 2 Reborn (2015) | 153.4 | 135.7 | |||
| Final Fantasy XV Benchmark (2018) | 103.3 | 73.7 | |||
| X-Plane 11.11 (2018) | 111.7 | ||||
| Far Cry 5 (2018) | 151 | 142 | 101 | ||
| Strange Brigade (2018) | 227 | 195.2 | 129.3 | ||
| Cyberpunk 2077 1.6 (2022) | 86.4 | 79.4 | 49.1 | ||
| F1 22 (2022) | 198.4 | 64.2 | 40.9 | ||
| Hogwarts Legacy (2023) | 76 | 65 | 45 | ||
| Star Wars Jedi Survivor (2023) | 66 | 60 | 39 |
Emisiones - Juegos también en entornos silenciosos
Emisiones sonoras
En el modo de rendimiento, el ruido del ventilador es fuerte y tiende a ser insoportable en el modo turbo. Permaneciendo, como hicimos, en el modo de rendimiento, un par decente de auriculares hará el trabajo de suprimir el ruido permanente. No observamos ningún quejido espontáneo ni cambios frecuentes de velocidad del ventilador.
De hecho, el Nitro 17 nunca es completamente silencioso. Incluso en modo batería, los ventiladores son ocasionalmente audibles y se vuelven un poco más ruidosos cuando se selecciona "Equilibrado". El ruido que se oye aquí está muy por debajo del volumen de la habitación y puede ser fácilmente ahogado por los altavoces integrados. Siempre es posible jugar a niveles de rendimiento bastante aceptables, incluso en entornos silenciosos y sin auriculares.
Ruido
| Ocioso |
| 24 / 24 / 32.32 dB(A) |
| Carga |
| 35.18 / 54.78 dB(A) |
 | ||
30 dB silencioso 40 dB(A) audible 50 dB(A) ruidosamente alto |
||
min: | ||
| Acer Nitro 17 AN17-51-71ER GeForce RTX 4060 Laptop GPU, i7-13700H, Samsung PM9A1 MZVL21T0HCLR | Lenovo Legion Pro 5 16IRX8 GeForce RTX 4060 Laptop GPU, i7-13700HX, SK hynix PC801 HFS512GEJ9X115N | Asus TUF Gaming A16 FA617XS Radeon RX 7600S, R9 7940HS, Micron 2400 MTFDKBA512QFM | Schenker XMG Focus 17 (E23) GeForce RTX 4070 Laptop GPU, i9-13900HX, Crucial P5 Plus 1TB CT1000P5PSSD8 | Medion Erazer Defender P40 GeForce RTX 4060 Laptop GPU, i7-13700HX, Phison PS5021-E21 1TB | Acer Nitro 5 AN515-46-R1A1 GeForce RTX 3070 Ti Laptop GPU, R7 6800H, Micron 3400 1TB MTFDKBA1T0TFH | MSI Pulse GL76 12UGK GeForce RTX 3070 Laptop GPU, i7-12700H, Micron 3400 1TB MTFDKBA1T0TFH | |
|---|---|---|---|---|---|---|---|
| Noise | 6% | -2% | -7% | -13% | -16% | -3% | |
| apagado / medio ambiente * (dB) | 24 | 23 4% | 25 -4% | 24 -0% | 25 -4% | 25 -4% | 24.1 -0% |
| Idle Minimum * (dB) | 24 | 23.1 4% | 25 -4% | 24 -0% | 26 -8% | 25 -4% | 26.9 -12% |
| Idle Average * (dB) | 24 | 23.1 4% | 26 -8% | 24 -0% | 27 -13% | 28.6 -19% | 26.9 -12% |
| Idle Maximum * (dB) | 32.32 | 26.6 18% | 28 13% | 26.47 18% | 32 1% | 44.3 -37% | 27 16% |
| Load Average * (dB) | 35.18 | 34.7 1% | 43 -22% | 55.72 -58% | 53 -51% | 47.6 -35% | 43.8 -25% |
| Witcher 3 ultra * (dB) | 54.78 | 47.6 13% | 51 7% | 57.94 -6% | 56 -2% | 44.7 18% | |
| Load Maximum * (dB) | 54.78 | 54.8 -0% | 53 3% | 57.94 -6% | 64 -17% | 53.6 2% | 58.3 -6% |
* ... más pequeño es mejor
Temperatura
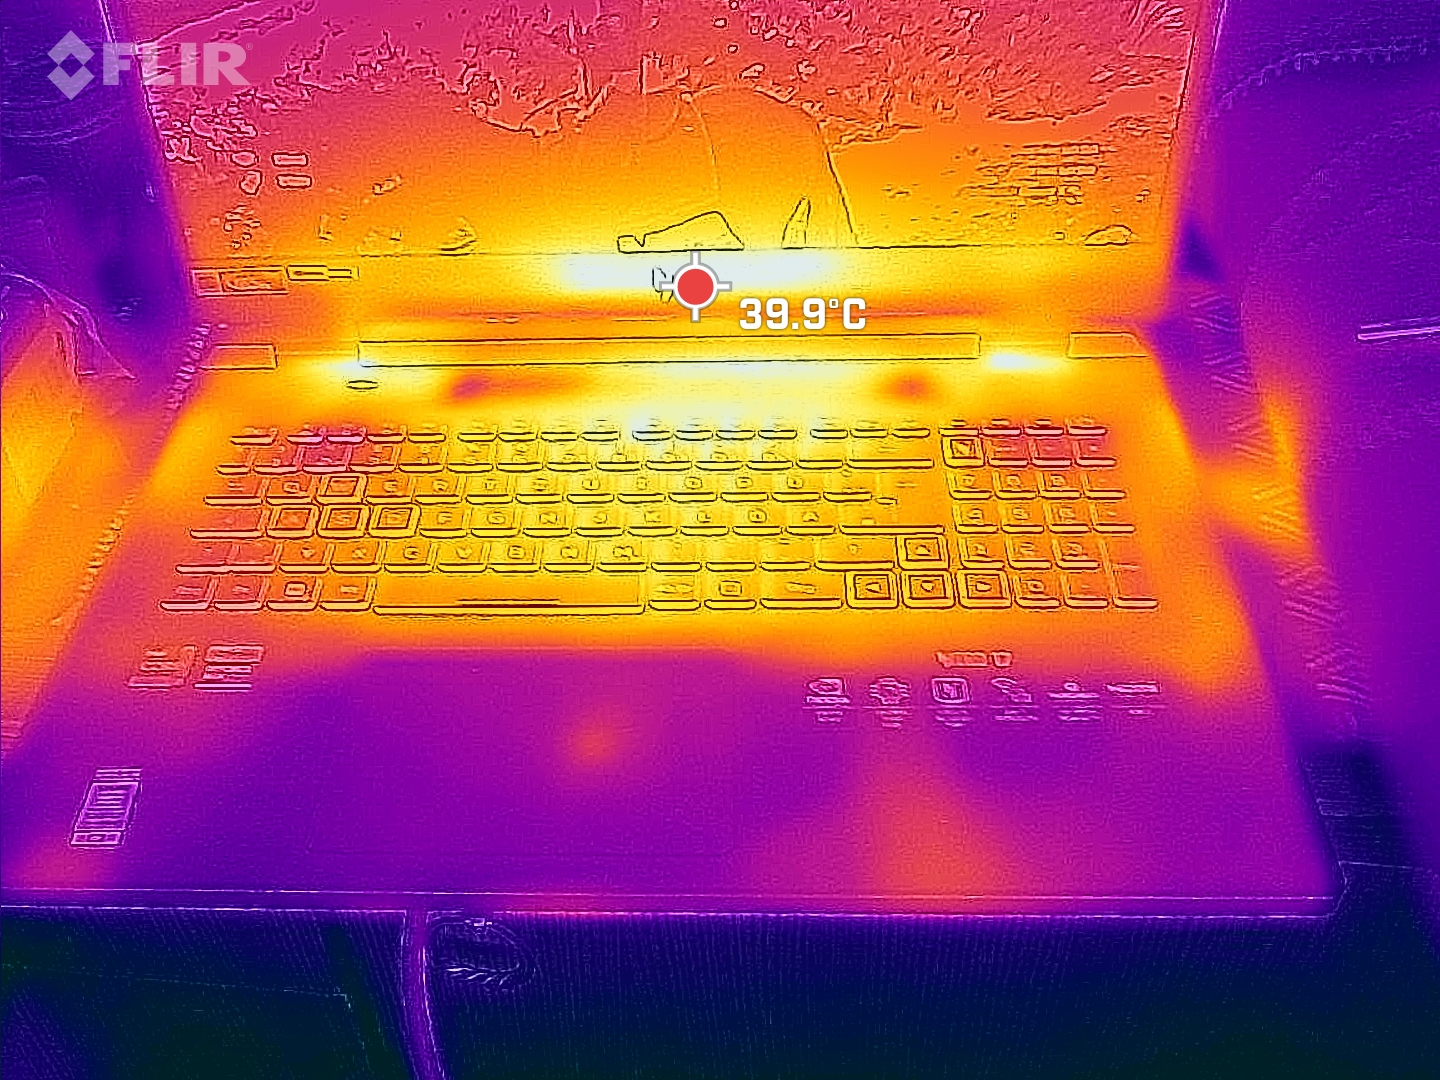
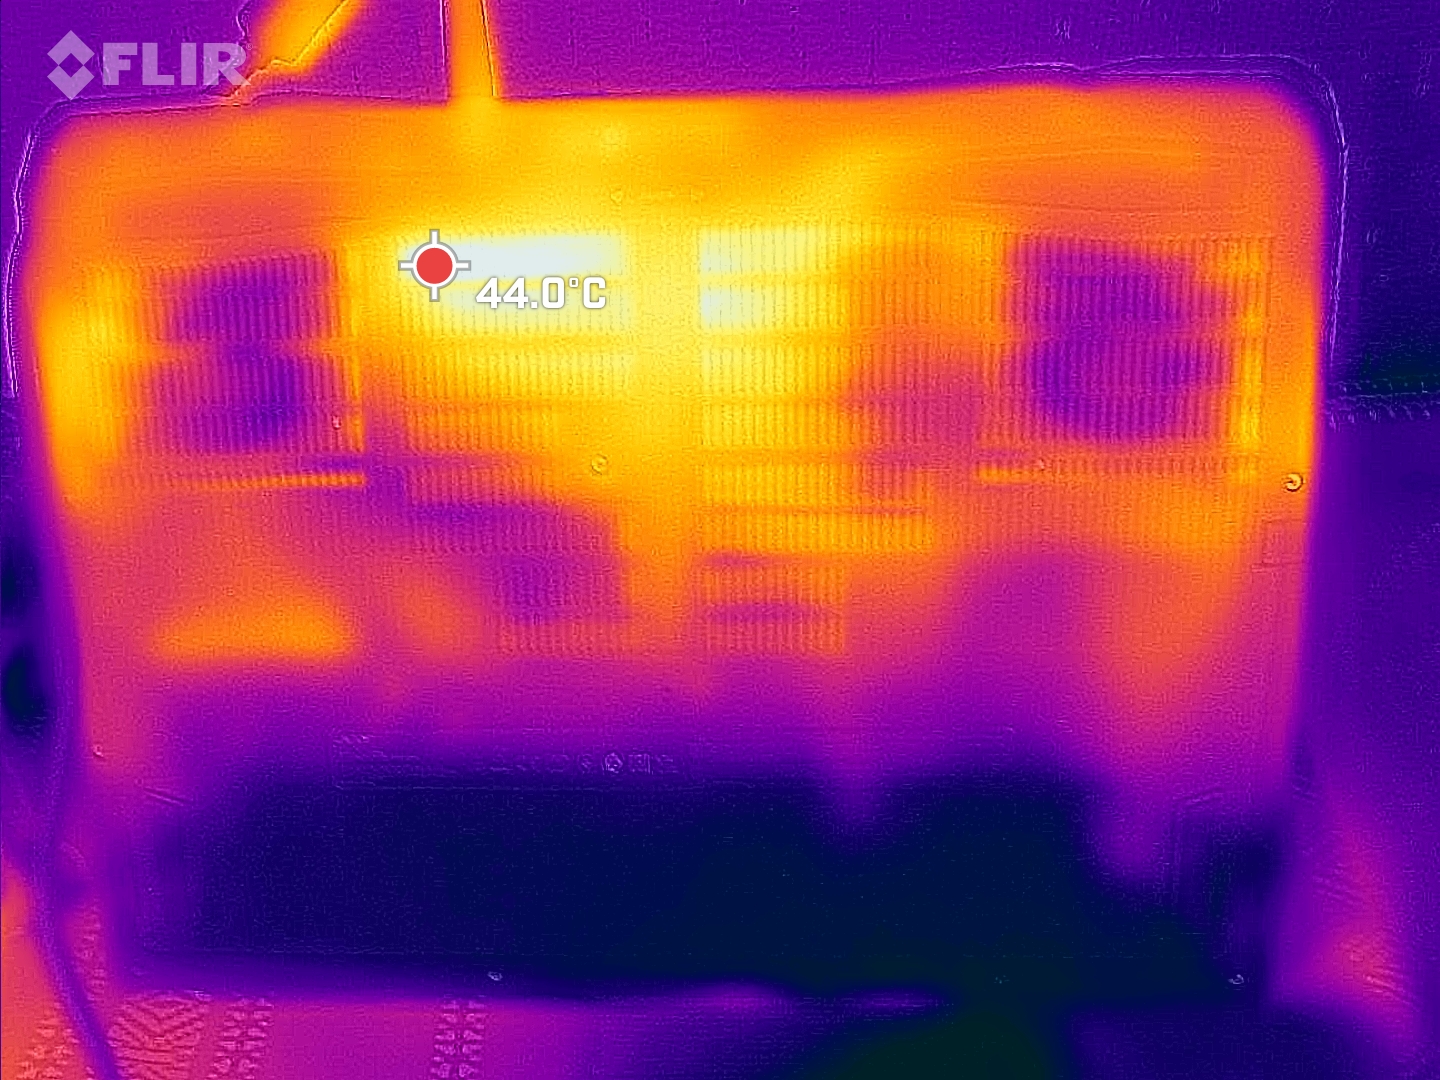
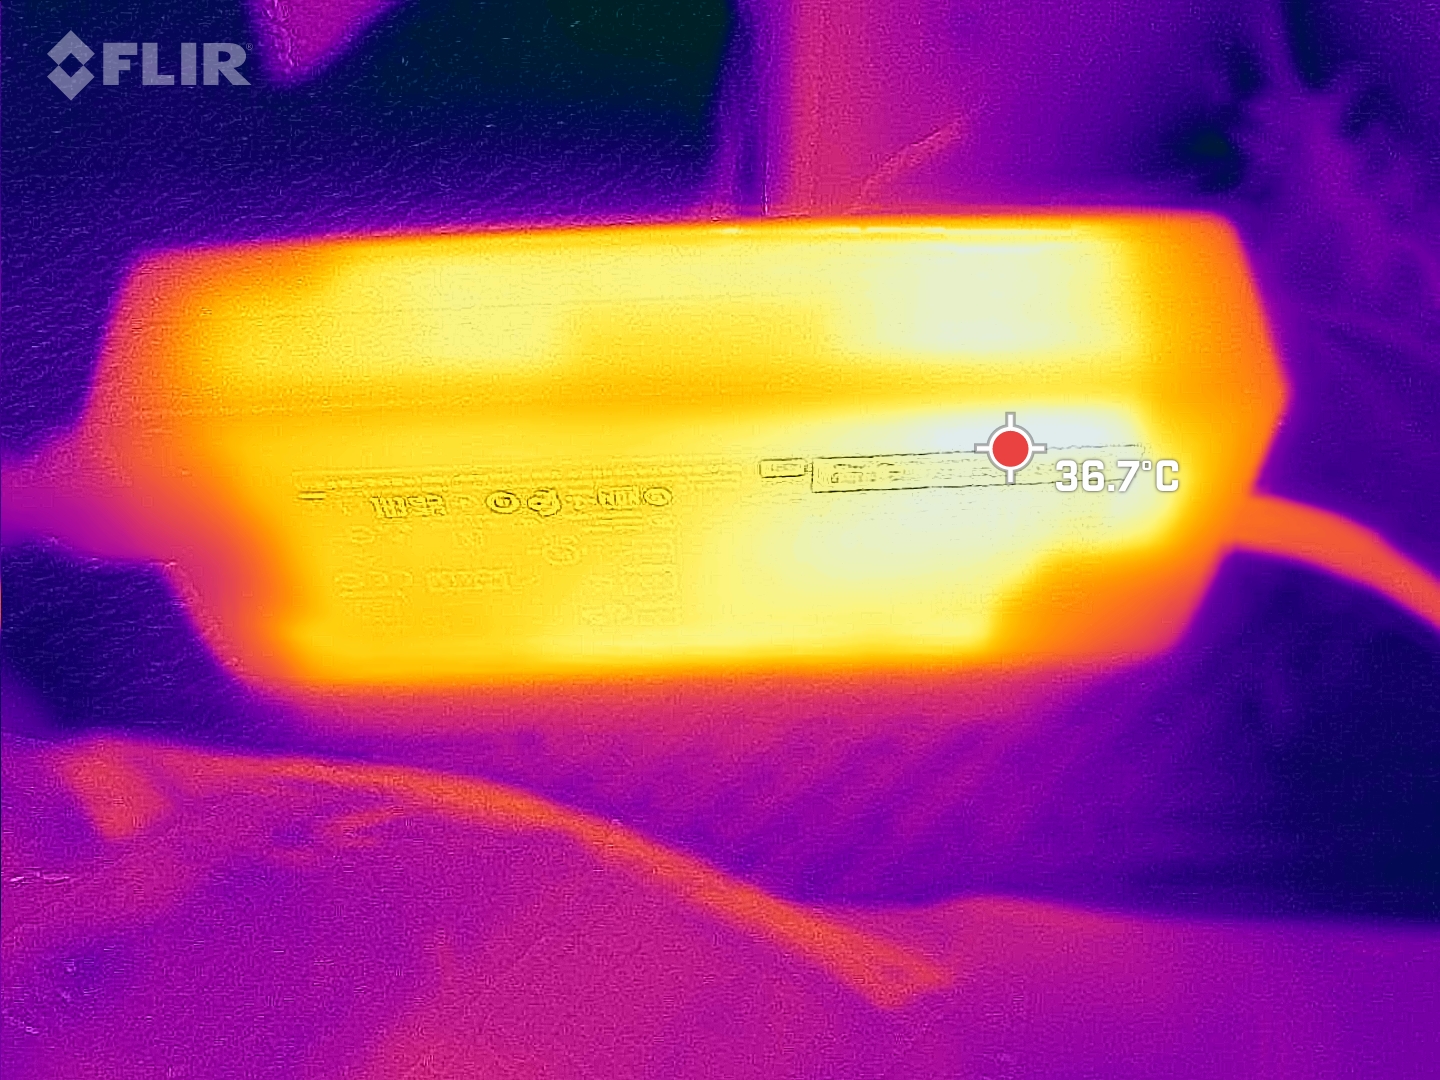
En el centro del teclado, medimos más de 40 °C y las temperaturas subieron un poco más en la parte inferior del dispositivo. Cuando se juega, no se puede decir que sea una experiencia agradable y el portátil sólo debería usarse sobre una superficie dura. Esto también se aplica a tareas poco exigentes. Incluso en esta área, una considerable producción de calor es tangible.
El modo "Equilibrado" no mejora las cosas. Con estos ajustes, incluso medimos una temperatura más alta que cuando usamos los modos más rápido y más fuerte. Lo único que ayuda en días calurosos es aumentar manualmente (y muy fácilmente) la velocidad del ventilador usando NitroSense.
(-) La temperatura máxima en la parte superior es de 46 °C / 115 F, frente a la media de 40.4 °C / 105 F, que oscila entre 21.2 y 68.8 °C para la clase Gaming.
(-) El fondo se calienta hasta un máximo de 51 °C / 124 F, frente a la media de 43.2 °C / 110 F
(+) En reposo, la temperatura media de la parte superior es de 31.2 °C / 88# F, frente a la media del dispositivo de 33.9 °C / 93 F.
(-) Jugando a The Witcher 3, la temperatura media de la parte superior es de 38.2 °C / 101 F, frente a la media del dispositivo de 33.9 °C / 93 F.
(+) Los reposamanos y el panel táctil alcanzan como máximo la temperatura de la piel (33 °C / 91.4 F) y, por tanto, no están calientes.
(-) La temperatura media de la zona del reposamanos de dispositivos similares fue de 28.8 °C / 83.8 F (-4.2 °C / -7.6 F).
| Acer Nitro 17 AN17-51-71ER Intel Core i7-13700H, NVIDIA GeForce RTX 4060 Laptop GPU | Lenovo Legion Pro 5 16IRX8 Intel Core i7-13700HX, NVIDIA GeForce RTX 4060 Laptop GPU | Asus TUF Gaming A16 FA617XS AMD Ryzen 9 7940HS, AMD Radeon RX 7600S | Schenker XMG Focus 17 (E23) Intel Core i9-13900HX, NVIDIA GeForce RTX 4070 Laptop GPU | Medion Erazer Defender P40 Intel Core i7-13700HX, NVIDIA GeForce RTX 4060 Laptop GPU | Acer Nitro 5 AN515-46-R1A1 AMD Ryzen 7 6800H, NVIDIA GeForce RTX 3070 Ti Laptop GPU | MSI Pulse GL76 12UGK Intel Core i7-12700H, NVIDIA GeForce RTX 3070 Laptop GPU | |
|---|---|---|---|---|---|---|---|
| Heat | 5% | 3% | -9% | 12% | 4% | 1% | |
| Maximum Upper Side * (°C) | 46 | 42.8 7% | 53 -15% | 50 -9% | 42 9% | 48.1 -5% | 44.2 4% |
| Maximum Bottom * (°C) | 51 | 50 2% | 48 6% | 56 -10% | 45 12% | 49.7 3% | 45.2 11% |
| Idle Upper Side * (°C) | 34 | 29.6 13% | 30 12% | 37 -9% | 28 18% | 30 12% | 35.4 -4% |
| Idle Bottom * (°C) | 33 | 34 -3% | 30 9% | 36 -9% | 30 9% | 31.7 4% | 35 -6% |
* ... más pequeño es mejor
Prueba de esfuerzo
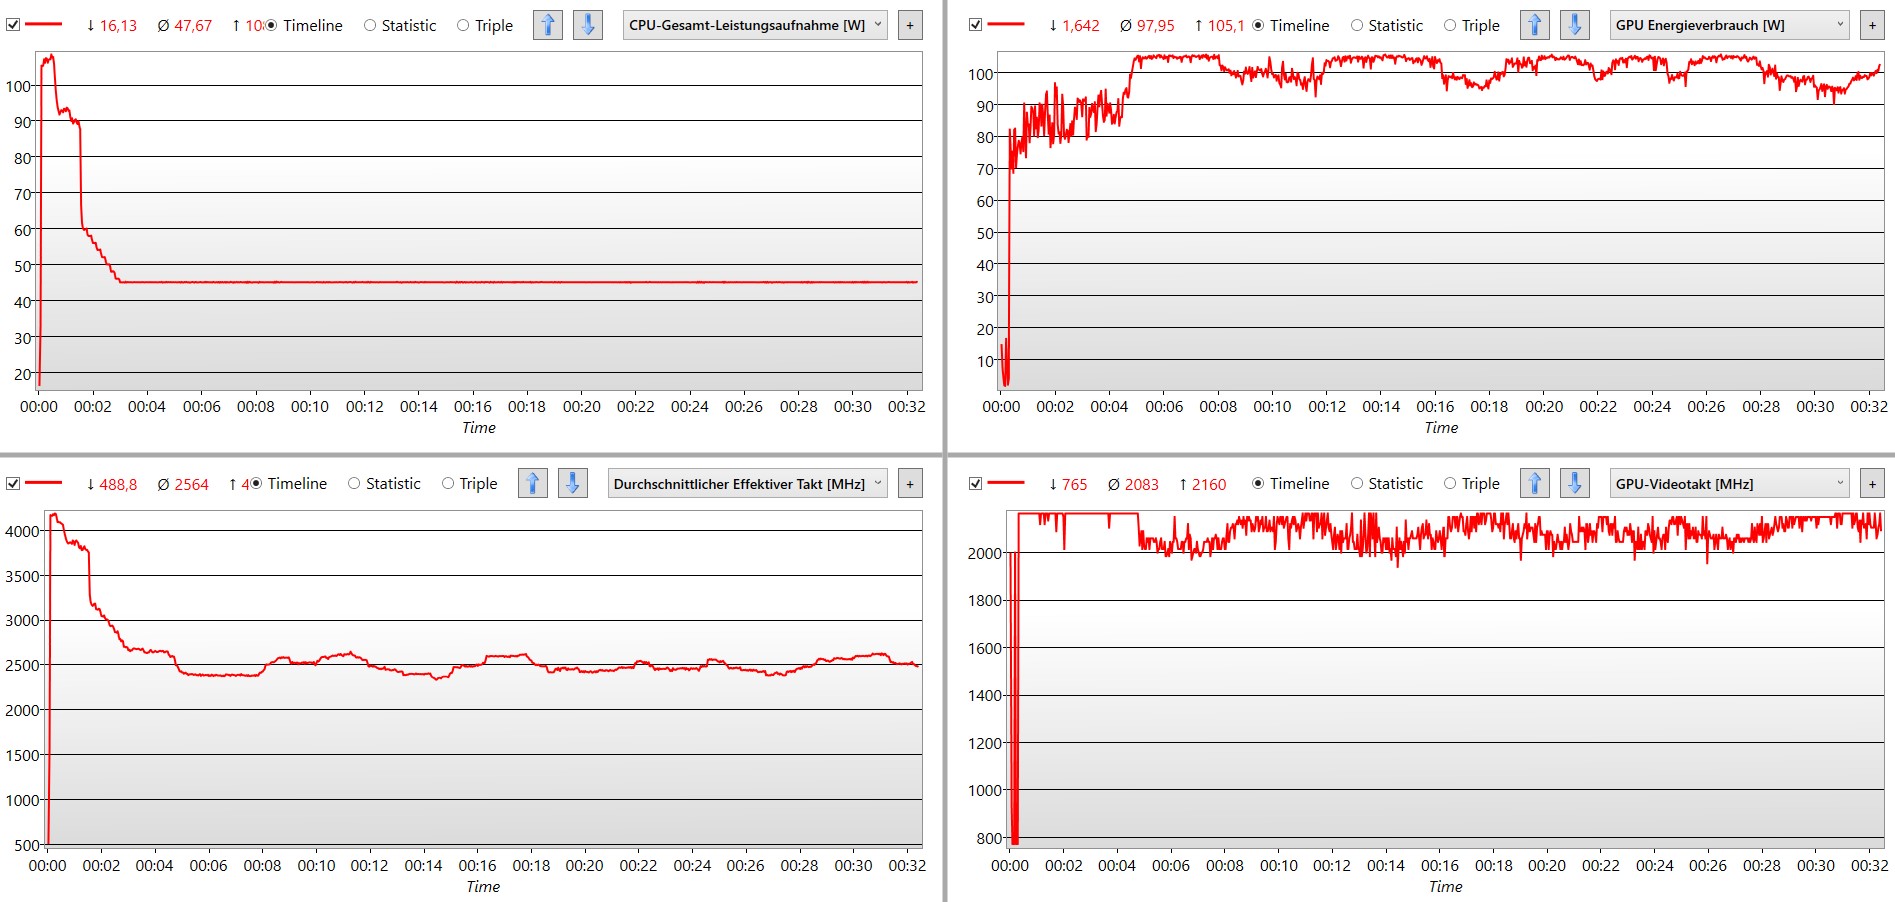
Si se requiere el máximo rendimiento del sistema, el consumo de energía del procesador aumenta a más de 100 vatios durante un breve periodo de tiempo y luego desciende permanentemente a 45 vatios. Al poco tiempo, la velocidad de reloj tampoco supera los 2,5 GHz.
Por el contrario, el chip gráfico se alimenta permanentemente con 105 vatios. Teniendo en cuenta el suministro máximo de 130 vatios en modo "Rendimiento" y menos el boost dinámico -del que la CPU no puede prescindir en la prueba de estrés-, esto representa la carga máxima posible. Las velocidades de reloj también se mantienen en un nivel alto pero estable y sólo se sitúan mínimamente por debajo de su máximo teórico. Esto hace que el Acer Nitro 17 esté bien equipado para manejar tareas gráficamente intensivas, incluso en uso continuo.
Al mismo tiempo, las temperaturas de los componentes se mantienen por debajo de los 90 °C.
Altavoces
Los pequeños altavoces estéreo del Nitro 17 reproducen bien los sonidos graves profundos, para tratarse de un portátil. Asimismo, las voces suenan bien y se oyen con precisión y gran detalle. Esto significa que los rangos de frecuencia más importantes para los juegos están bien cubiertos.
Incluso la música se puede escuchar en el portátil, aunque los medios bajos y los graves altos carezcan de potencia. El resultado es que la música rock y las pistas basadas en guitarra o batería resultan poco emocionantes.
Acer Nitro 17 AN17-51-71ER análisis de audio
(±) | la sonoridad del altavoz es media pero buena (79.1 dB)
Graves 100 - 315 Hz
(-) | casi sin bajos - de media 22% inferior a la mediana
(-) | los graves no son lineales (16.5% delta a la frecuencia anterior)
Medios 400 - 2000 Hz
(±) | medias más altas - de media 5.2% más altas que la mediana
(+) | los medios son lineales (4.1% delta a la frecuencia anterior)
Altos 2 - 16 kHz
(+) | máximos equilibrados - a sólo 1.6% de la mediana
(+) | los máximos son lineales (5.5% delta a la frecuencia anterior)
Total 100 - 16.000 Hz
(±) | la linealidad del sonido global es media (16.9% de diferencia con la mediana)
En comparación con la misma clase
» 44% de todos los dispositivos probados de esta clase eran mejores, 11% similares, 44% peores
» El mejor tuvo un delta de 6%, la media fue 18%, el peor fue ###max##%
En comparación con todos los dispositivos probados
» 30% de todos los dispositivos probados eran mejores, 8% similares, 62% peores
» El mejor tuvo un delta de 4%, la media fue 23%, el peor fue ###max##%
Apple MacBook Pro 16 2021 M1 Pro análisis de audio
(+) | los altavoces pueden reproducir a un volumen relativamente alto (#84.7 dB)
Graves 100 - 315 Hz
(+) | buen bajo - sólo 3.8% lejos de la mediana
(+) | el bajo es lineal (5.2% delta a la frecuencia anterior)
Medios 400 - 2000 Hz
(+) | medios equilibrados - a sólo 1.3% de la mediana
(+) | los medios son lineales (2.1% delta a la frecuencia anterior)
Altos 2 - 16 kHz
(+) | máximos equilibrados - a sólo 1.9% de la mediana
(+) | los máximos son lineales (2.7% delta a la frecuencia anterior)
Total 100 - 16.000 Hz
(+) | el sonido global es lineal (4.6% de diferencia con la mediana)
En comparación con la misma clase
» 0% de todos los dispositivos probados de esta clase eran mejores, 0% similares, 100% peores
» El mejor tuvo un delta de 5%, la media fue 17%, el peor fue ###max##%
En comparación con todos los dispositivos probados
» 0% de todos los dispositivos probados eran mejores, 0% similares, 100% peores
» El mejor tuvo un delta de 4%, la media fue 23%, el peor fue ###max##%
Gestión de la energía: Acer Nitro 17 cuenta con un hardware eficiente
Consumo de energía
En reposo, el Nitro 17 es muy económico, con un mínimo de 8 vatios y un máximo de 15. Otros portátiles para juegos como el Schenker XMG Focus 17 (E23)consumen continuamente más de 17 vatios. La prueba Witcher 3 puso de manifiesto la eficiencia del componente. Por ejemplo, elMedion Erazer Defender P40 requiere casi 30 vatios adicionales, pero sólo puede gestionar frecuencias de cuadro inferiores.
Medimos un máximo de 263 vatios, lo que significa que la monstruosa y pesada fuente de alimentación de 330 vatios es más que suficiente.
| Off / Standby | |
| Ocioso | |
| Carga |
|
Clave:
min: | |
| Acer Nitro 17 AN17-51-71ER i7-13700H, GeForce RTX 4060 Laptop GPU, Samsung PM9A1 MZVL21T0HCLR, , 2560x1440, 17.3" | Lenovo Legion Pro 5 16IRX8 i7-13700HX, GeForce RTX 4060 Laptop GPU, SK hynix PC801 HFS512GEJ9X115N, IPS, 2560x1600, 16" | Asus TUF Gaming A16 FA617XS R9 7940HS, Radeon RX 7600S, Micron 2400 MTFDKBA512QFM, IPS, 1920x1200, 16" | Schenker XMG Focus 17 (E23) i9-13900HX, GeForce RTX 4070 Laptop GPU, Crucial P5 Plus 1TB CT1000P5PSSD8, IPS, 2560x1440, 17.3" | Medion Erazer Defender P40 i7-13700HX, GeForce RTX 4060 Laptop GPU, Phison PS5021-E21 1TB, IPS, 2560x1440, 17.3" | MSI Pulse GL76 12UGK i7-12700H, GeForce RTX 3070 Laptop GPU, Micron 3400 1TB MTFDKBA1T0TFH, IPS, 1920x1080, 17.3" | Medio NVIDIA GeForce RTX 4060 Laptop GPU | Media de la clase Gaming | |
|---|---|---|---|---|---|---|---|---|
| Power Consumption | -80% | 10% | -70% | -11% | -24% | -19% | -41% | |
| Idle Minimum * (Watt) | 8.3 | 24.5 -195% | 7 16% | 17 -105% | 8 4% | 12.4 -49% | 11.5 ? -39% | 13 ? -57% |
| Idle Average * (Watt) | 13.5 | 29.2 -116% | 10 26% | 18 -33% | 12 11% | 13.1 3% | 16 ? -19% | 19 ? -41% |
| Idle Maximum * (Watt) | 14.8 | 34.3 -132% | 15 -1% | 25.8 -74% | 18 -22% | 25.3 -71% | 20.3 ? -37% | 24.6 ? -66% |
| Load Average * (Watt) | 77 | 98.7 -28% | 86 -12% | 178 -131% | 101 -31% | 105.4 -37% | 92.9 ? -21% | 110.7 ? -44% |
| Witcher 3 ultra * (Watt) | 154 | 178.6 -16% | 160.6 -4% | 265 -72% | 180.8 -17% | 150 3% | ||
| Load Maximum * (Watt) | 263 | 249.6 5% | 172 35% | 275 -5% | 284 -8% | 240.5 9% | 210 ? 20% | 259 ? 2% |
* ... más pequeño es mejor
Power consumption Witcher 3 / stress test
Power consumption with an external monitor
Duración de la batería
En lo que respecta a la duración de la batería, el bajo consumo en reposo se hace notar. Para un portátil de juegos, el Acer Nitro 17 tiene una gran resistencia, ya que logró más de 8 horas en la prueba Wi-Fi con sitios web que cambiaban constantemente. Sin embargo, aumentar el brillo al máximo reduce la duración de la batería en unas 2 horas.
Al jugar en modo batería, el Nitro obtuvo una buena puntuación. En lugar de simplemente apagar la GPU y abrumar completamente al procesador con un juego, el portátil de Acer se ayuda a sí mismo a un máximo de 25 vatios y a la GPU a 15 vatios. Esto significa que pudimos jugar al probado The Witcher 3 durante casi 2,5 horas antes de que el portátil se rindiera.
| Acer Nitro 17 AN17-51-71ER i7-13700H, GeForce RTX 4060 Laptop GPU, 90 Wh | Lenovo Legion Pro 5 16IRX8 i7-13700HX, GeForce RTX 4060 Laptop GPU, 80 Wh | Asus TUF Gaming A16 FA617XS R9 7940HS, Radeon RX 7600S, 90 Wh | Medion Erazer Defender P40 i7-13700HX, GeForce RTX 4060 Laptop GPU, 73 Wh | Acer Nitro 5 AN515-46-R1A1 R7 6800H, GeForce RTX 3070 Ti Laptop GPU, 57.5 Wh | MSI Pulse GL76 12UGK i7-12700H, GeForce RTX 3070 Laptop GPU, 90 Wh | Media de la clase Gaming | |
|---|---|---|---|---|---|---|---|
| Duración de Batería | -59% | 66% | -21% | -23% | -28% | 4% | |
| H.264 (h) | 6.9 | 12.4 80% | 5.7 -17% | 5.7 -17% | 8.32 ? 21% | ||
| WiFi v1.3 (h) | 8.2 | 3.4 -59% | 12.4 51% | 6.2 -24% | 5.8 -29% | 5.9 -28% | 7.11 ? -13% |
| Witcher 3 ultra (h) | 2.5 |
Pro
Contra
Veredicto - El Nitro 17 no tiene ningún punto débil
Especialmente si se compara con su predecesor, elAcer Nitro 5 AN517-5552- un dispositivo que analizamos el año pasado-, el Acer Nitro 17 ha introducido grandes mejoras. La reproducción del color, el ruido máximo del ventilador y la selección de puertos son ahora competitivos.
En particular, el modo equilibrado demuestra de forma impresionante el efecto positivo de reducir ligeramente el consumo de energía. El ruido del ventilador baja a un nivel tolerable y el consumo de energía se reduce. Esto significa que puedes jugar sin auriculares ni ruidos molestos. Las tasas de frames y los benchmarks sintéticos apenas bajan. Sin embargo, con estos ajustes, nuestros sensores midieron las temperaturas más altas.
Buenos resultados en las pruebas, ventiladores silenciosos y especificaciones sólidas: el Acer Nitro 17 es un dispositivo de gama media perfecto.
Por supuesto, tiene algunos defectos (innecesarios). La muy pobre webcam ya no está actualizada. Sin un elemento de refrigeración pasivo, el SSD alcanza rápidamente sus límites. Aunque no es posible detectar ninguna influencia en el rendimiento de juego, el constante aumento de temperatura del portátil debería tener un impacto negativo en la vida útil del dispositivo. Además, el Acer Nitro 17 es más pesado y más grande que la mayoría de los otros portátiles de juego con una pantalla de tamaño similar.
Cualquiera que busque más potencia con componentes comparables debería echar un vistazo alLenovo Legion Pro 5 16IRX8una alternativa buena pero también más ruidosa, ya que este portátil también es más delgado y ligero. Ya no es el más joven de la clase, pero sigue a la par en la mayoría de los juegos, el (normalmente) más baratoAcer Nitro AN517-41-R5Z7con la RTX 3070.
Precio y disponibilidad
Tanto nuestro modelo de análisis Acer Nitro 17 AN17-51-71ER como la variante más pequeña del Acer Nitro 17 AN17-51-59VT con un Intel Core i5-13500H y una RTX 4050 no están disponibles actualmente en EE.UU. en la tienda online de Acer, Amazon y Best Buy. Sin embargo, nuestro modelo de pruebas puede conseguirse en la tienda Acer del Reino Unido por 1599.99£.
Acer Nitro 17 AN17-51-71ER
- 09/07/2023 v7 (old)
Mario Petzold
Transparencia
La selección de los dispositivos que se van a reseñar corre a cargo de nuestro equipo editorial. La muestra de prueba fue proporcionada al autor en calidad de préstamo por el fabricante o el minorista a los efectos de esta reseña. El prestamista no tuvo ninguna influencia en esta reseña, ni el fabricante recibió una copia de la misma antes de su publicación. No había ninguna obligación de publicar esta reseña. Como empresa de medios independiente, Notebookcheck no está sujeta a la autoridad de fabricantes, minoristas o editores.
Así es como prueba Notebookcheck
Cada año, Notebookcheck revisa de forma independiente cientos de portátiles y smartphones utilizando procedimientos estandarizados para asegurar que todos los resultados son comparables. Hemos desarrollado continuamente nuestros métodos de prueba durante unos 20 años y hemos establecido los estándares de la industria en el proceso. En nuestros laboratorios de pruebas, técnicos y editores experimentados utilizan equipos de medición de alta calidad. Estas pruebas implican un proceso de validación en varias fases. Nuestro complejo sistema de clasificación se basa en cientos de mediciones y puntos de referencia bien fundamentados, lo que mantiene la objetividad.Price comparison

