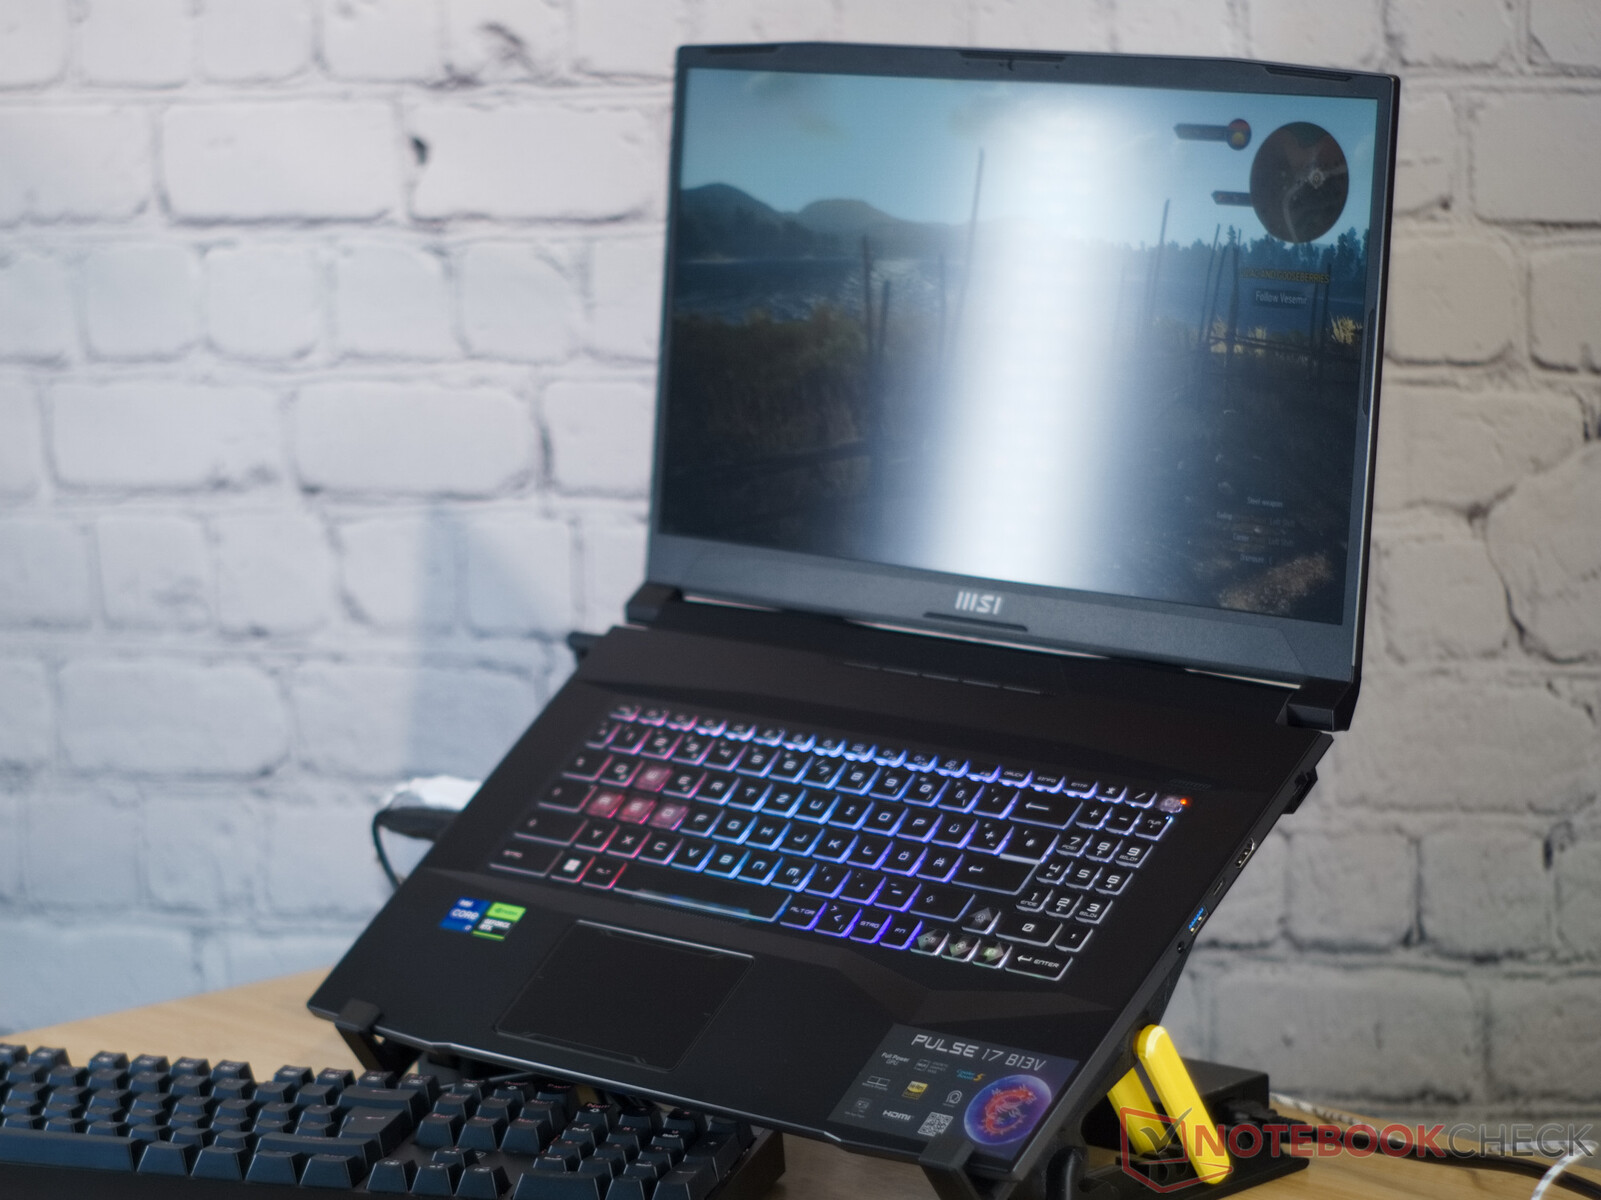
Análisis del portátil para juegos MSI Pulse 17 B13V: Con alas silenciosas
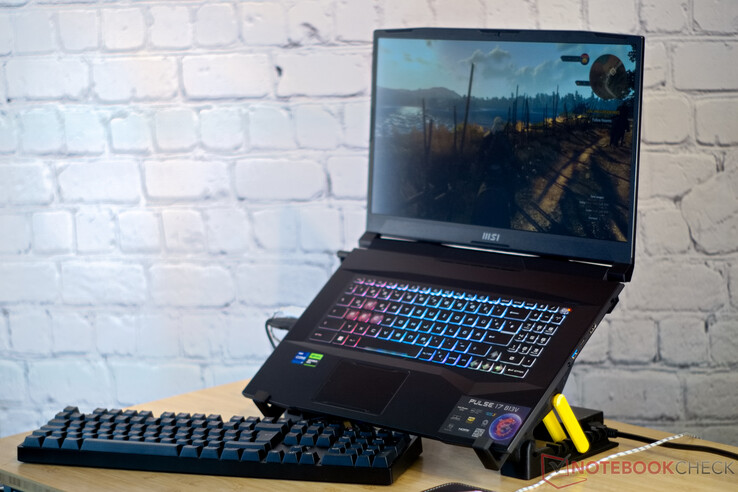
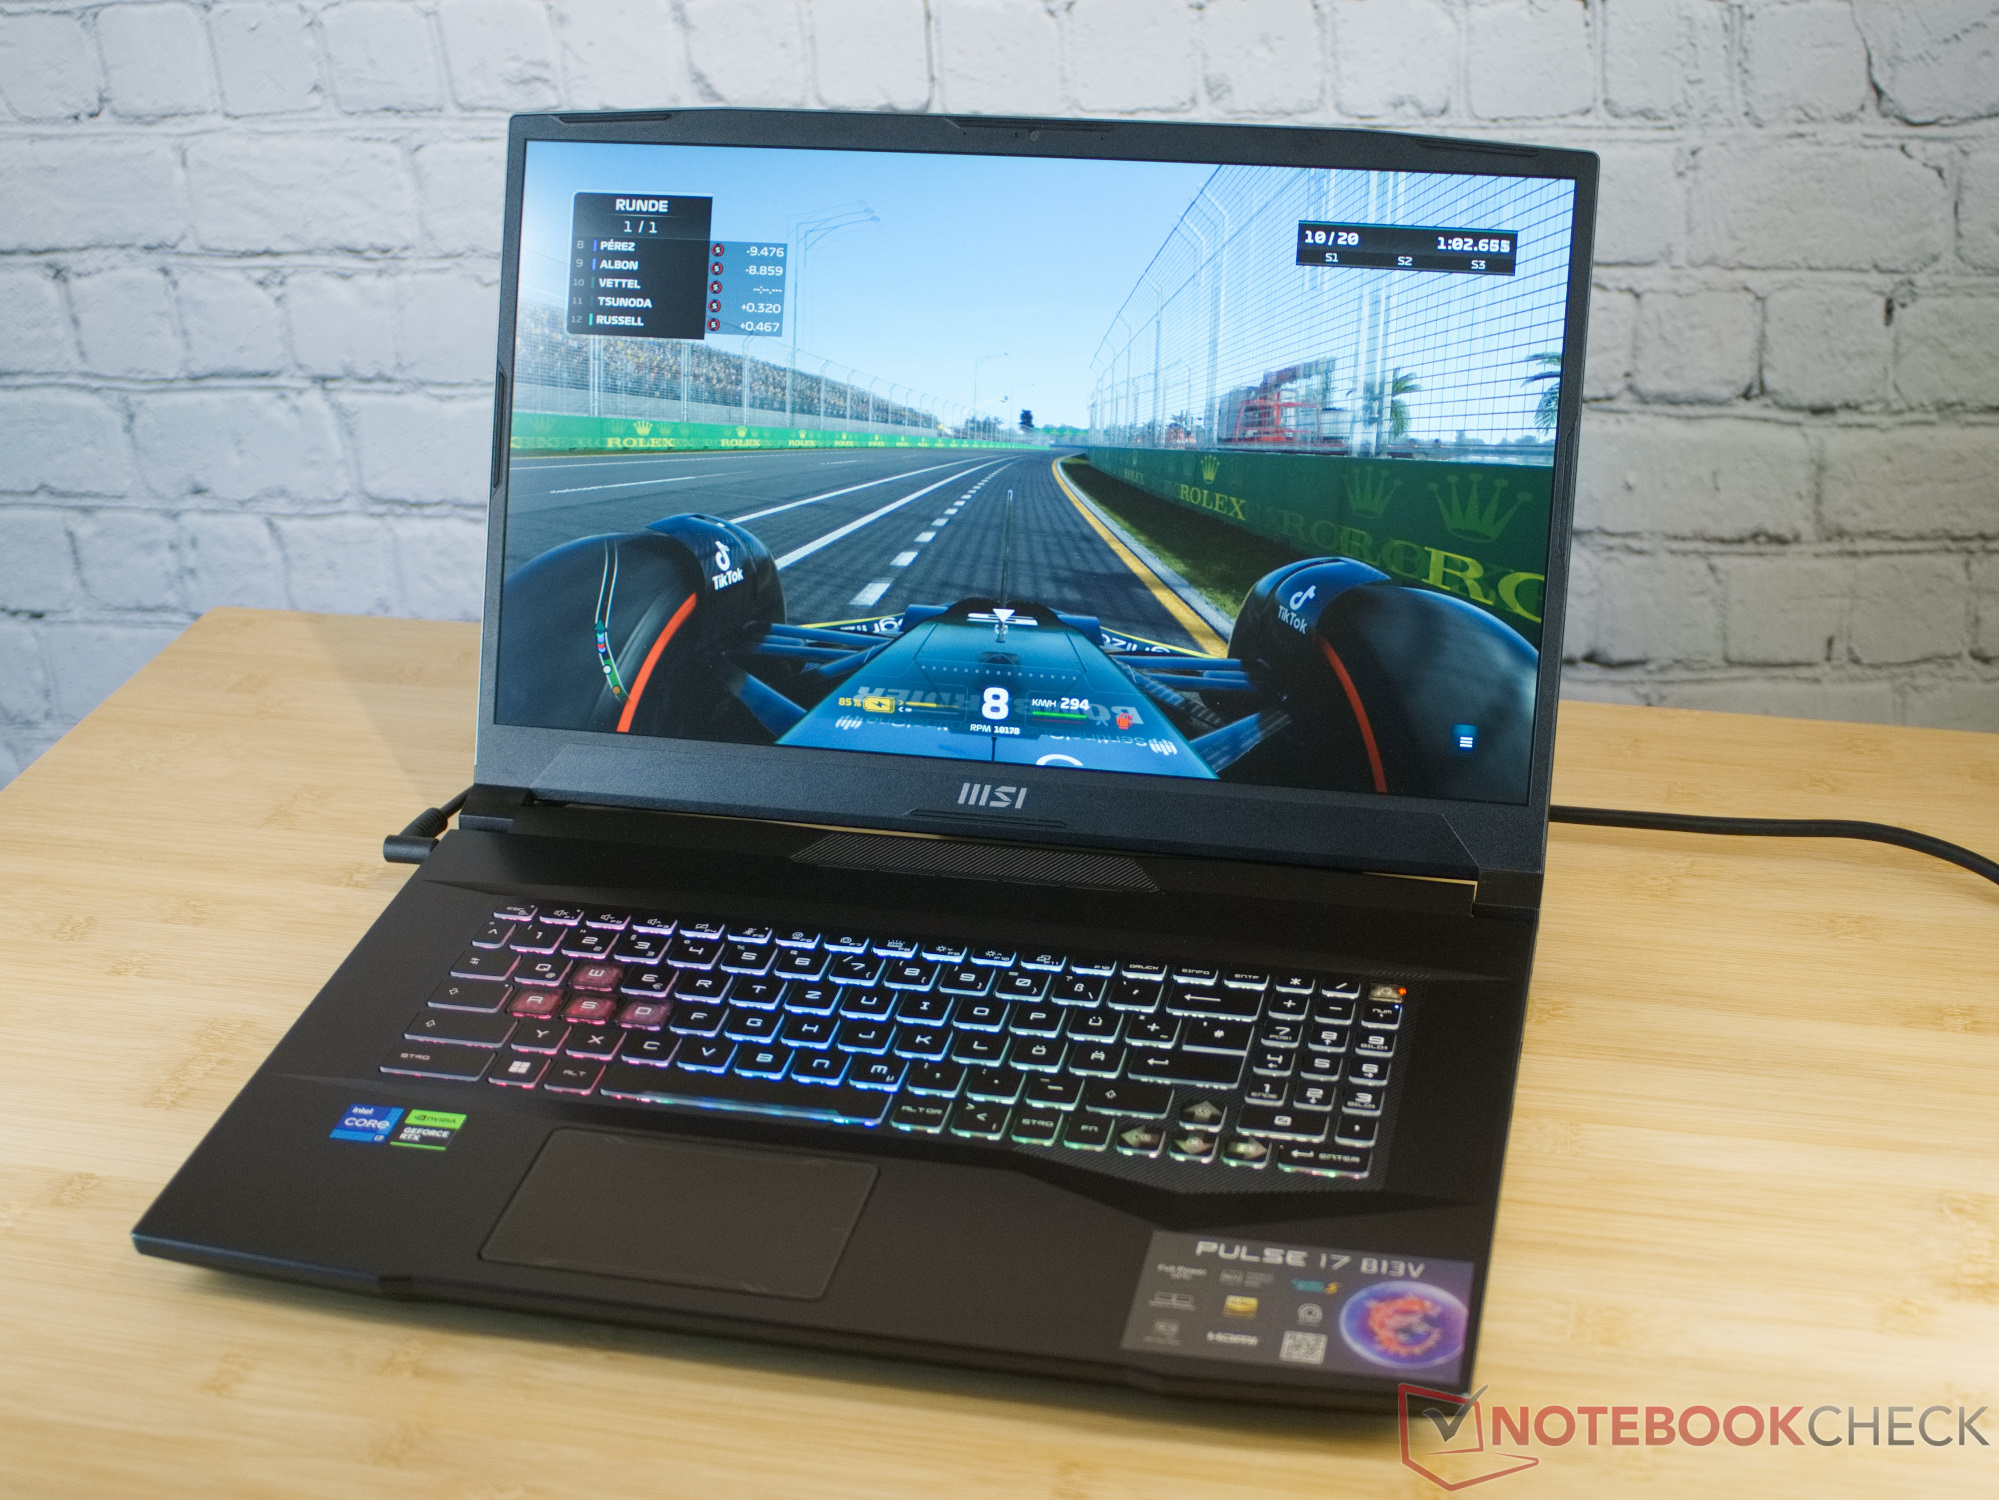
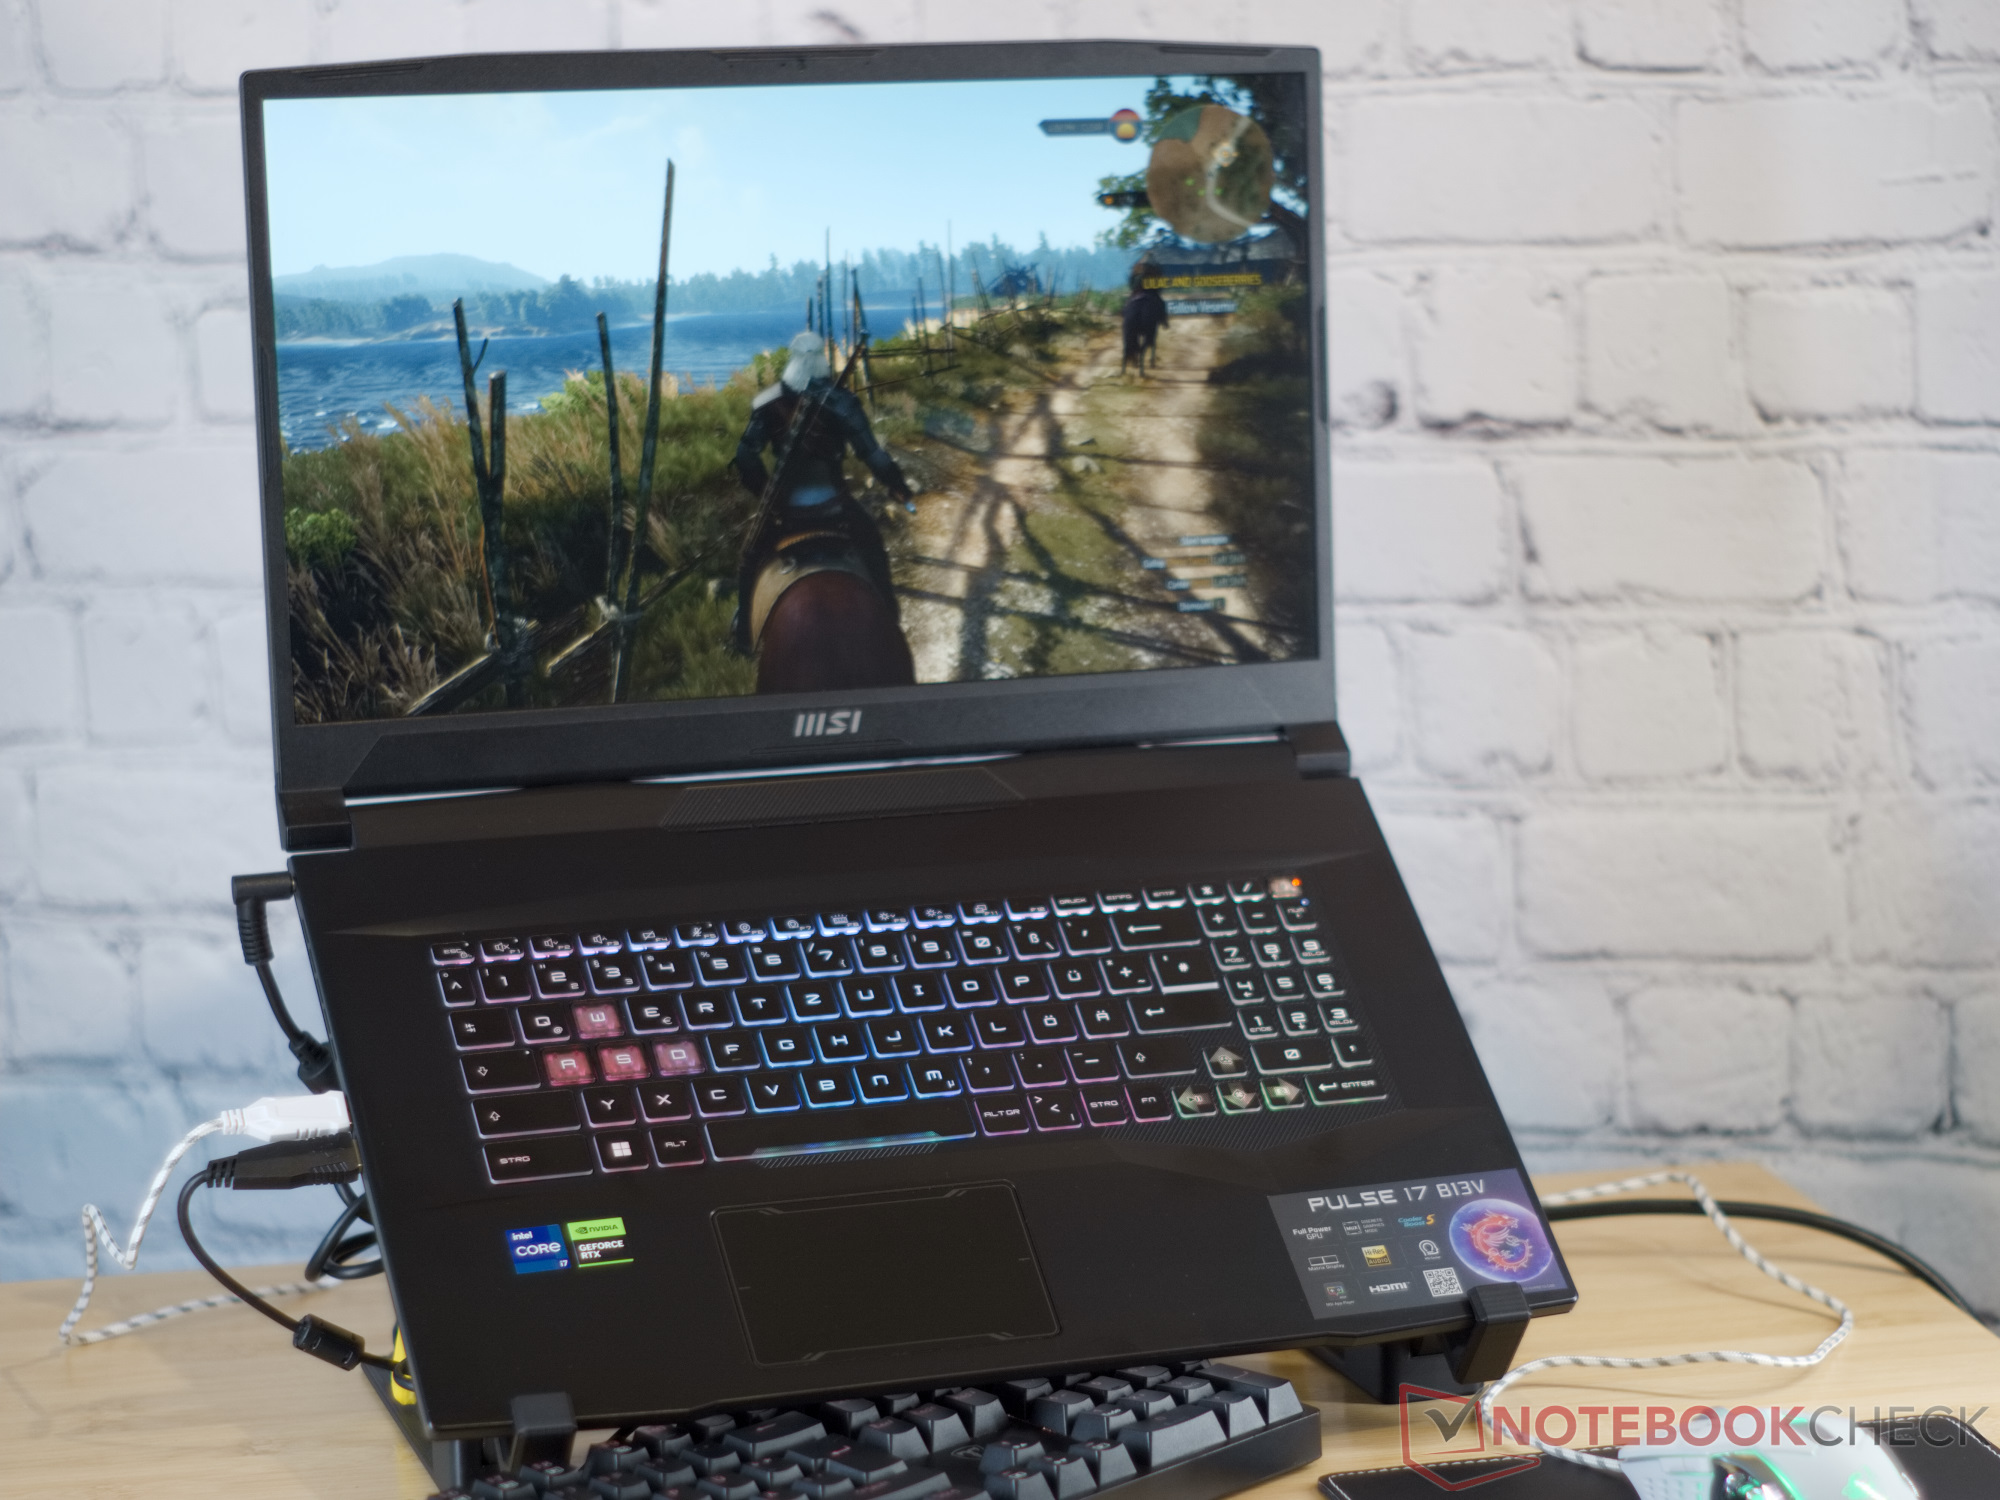
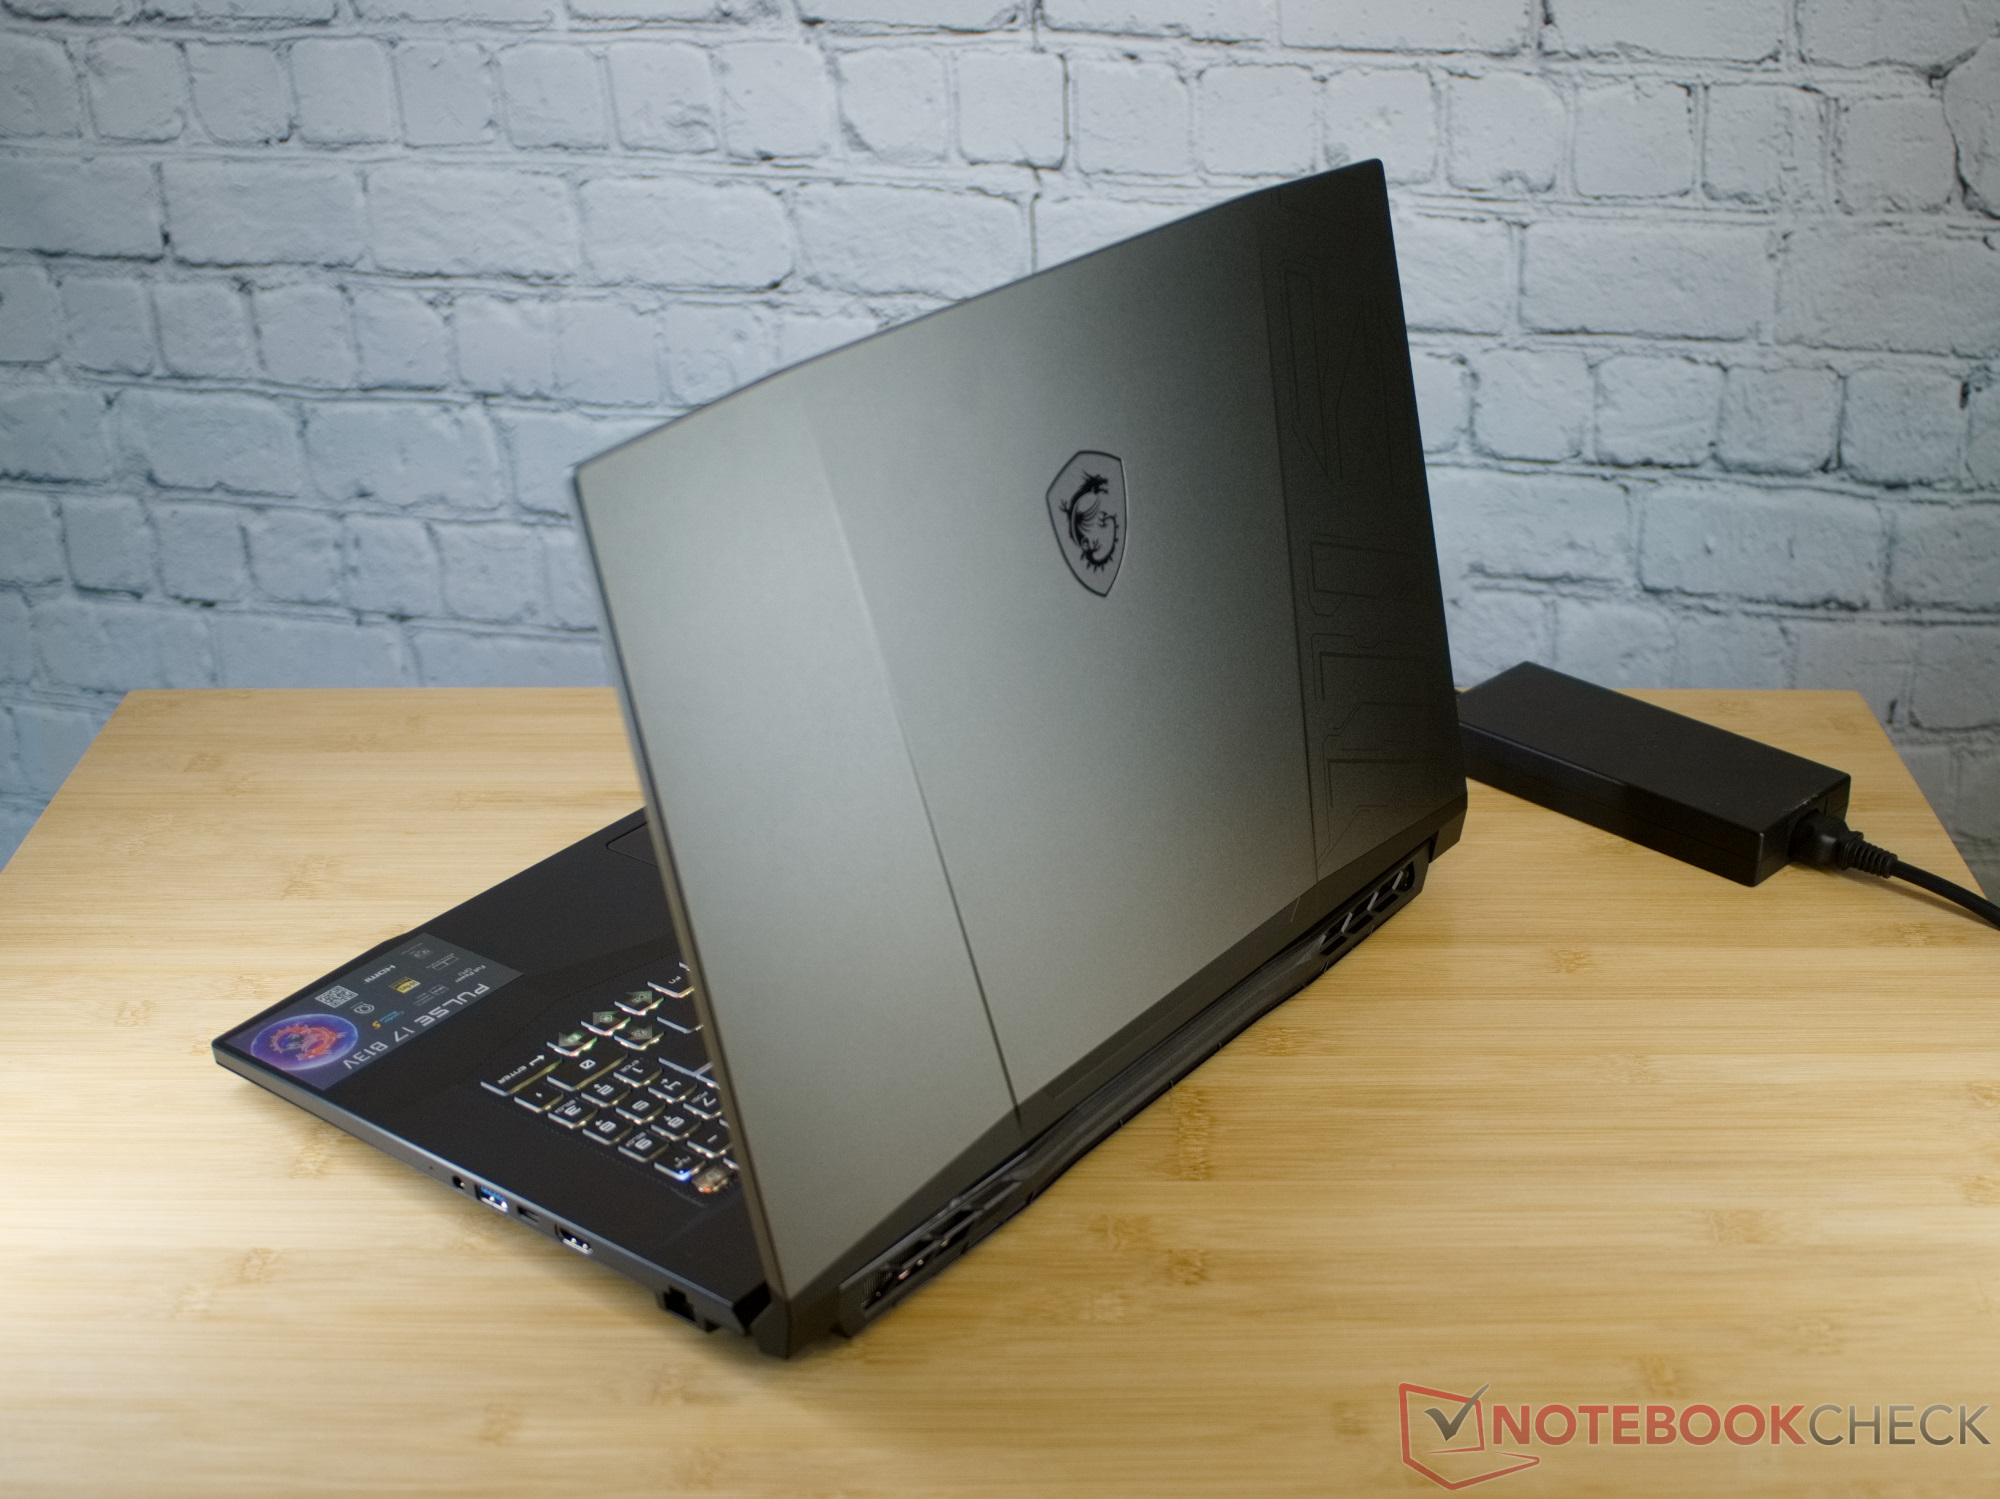
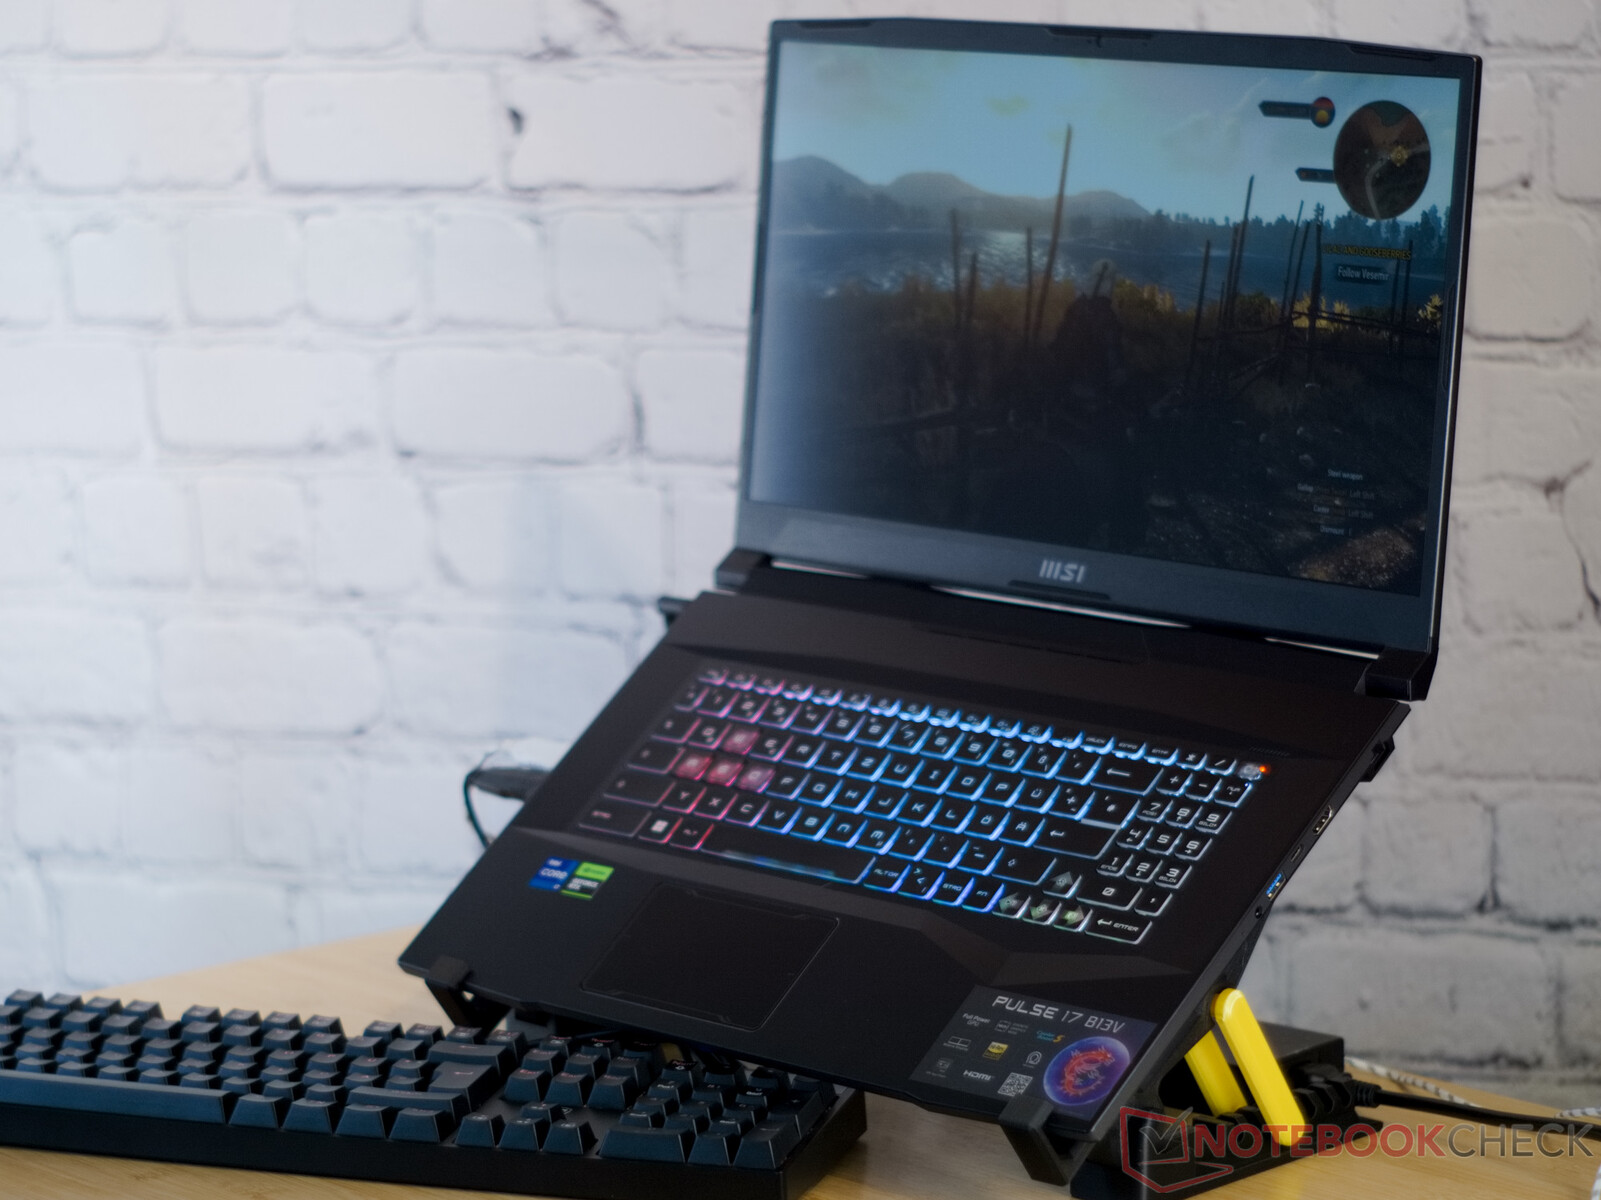
Con el MSI Pulse 17, el dragón rojo trae un portátil para juegos cuyo exterior recuerda un poco a la ciencia ficción. Esta impresión resulta de la tapa de la pantalla hecha de aluminio anodizado, muchos bordes y esquinas, e incluso la rejilla de panal en la parte inferior del portátil de 17 pulgadas. Pero en el interior del portátil corren componentes actuales, y nuestra unidad de pruebas está equipada con un Intel Core i7-13700Hy Nvidia GeForce RTX 4070. Cuando probamos el predecesor a principios de añoel rendimiento del portátil fue convincente. Pero también notamos que el Pulse GL76 carecía de G-Sync, MUX, Advanced Optimus y soporte Thunderbolt. El nivel de ruido de los ventiladores del portátil de juego también dio motivos de queja.
Ahora MSI ha rediseñado el portátil de forma significativa, introduciendo muchas mejoras por todas partes, además del nuevo diseño, las generaciones de chips, y el críptico nombre. Con esto, el potente dispositivo sube significativamente en nuestras valoraciones. Comparamos el portátil con el Asus ROG Strix G17 G713PIy elMSI Katana 17 B13VFKy el Schenker XMG Focus 17 (E23).
Posibles contendientes en la comparación
Valoración | Fecha | Modelo | Peso | Altura | Tamaño | Resolución | Precio |
|---|---|---|---|---|---|---|---|
| 86.3 % v7 (old) | 07/2023 | MSI Pulse 17 B13VGK i7-13700H, GeForce RTX 4070 Laptop GPU | 2.7 kg | 27.2 mm | 17.30" | 1920x1080 | |
| 83.2 % v7 (old) | 01/2023 | MSI Pulse GL76 12UGK i7-12700H, GeForce RTX 3070 Laptop GPU | 2.6 kg | 24.2 mm | 17.30" | 1920x1080 | |
| 82.1 % v7 (old) | 02/2023 | MSI Katana 17 B13VFK i7-13620H, GeForce RTX 4060 Laptop GPU | 2.8 kg | 25.2 mm | 17.30" | 1920x1080 | |
| 87.2 % v7 (old) | 07/2023 | Acer Nitro 17 AN17-51-71ER i7-13700H, GeForce RTX 4060 Laptop GPU | 3 kg | 30.3 mm | 17.30" | 2560x1440 | |
| 85.9 % v7 (old) | 06/2023 | Schenker XMG Focus 17 (E23) i9-13900HX, GeForce RTX 4070 Laptop GPU | 2.9 kg | 29.3 mm | 17.30" | 2560x1440 | |
| 88.4 % v7 (old) | 04/2023 | Asus ROG Strix G17 G713PI R9 7945HX, GeForce RTX 4070 Laptop GPU | 2.8 kg | 30.7 mm | 17.30" | 2560x1440 |
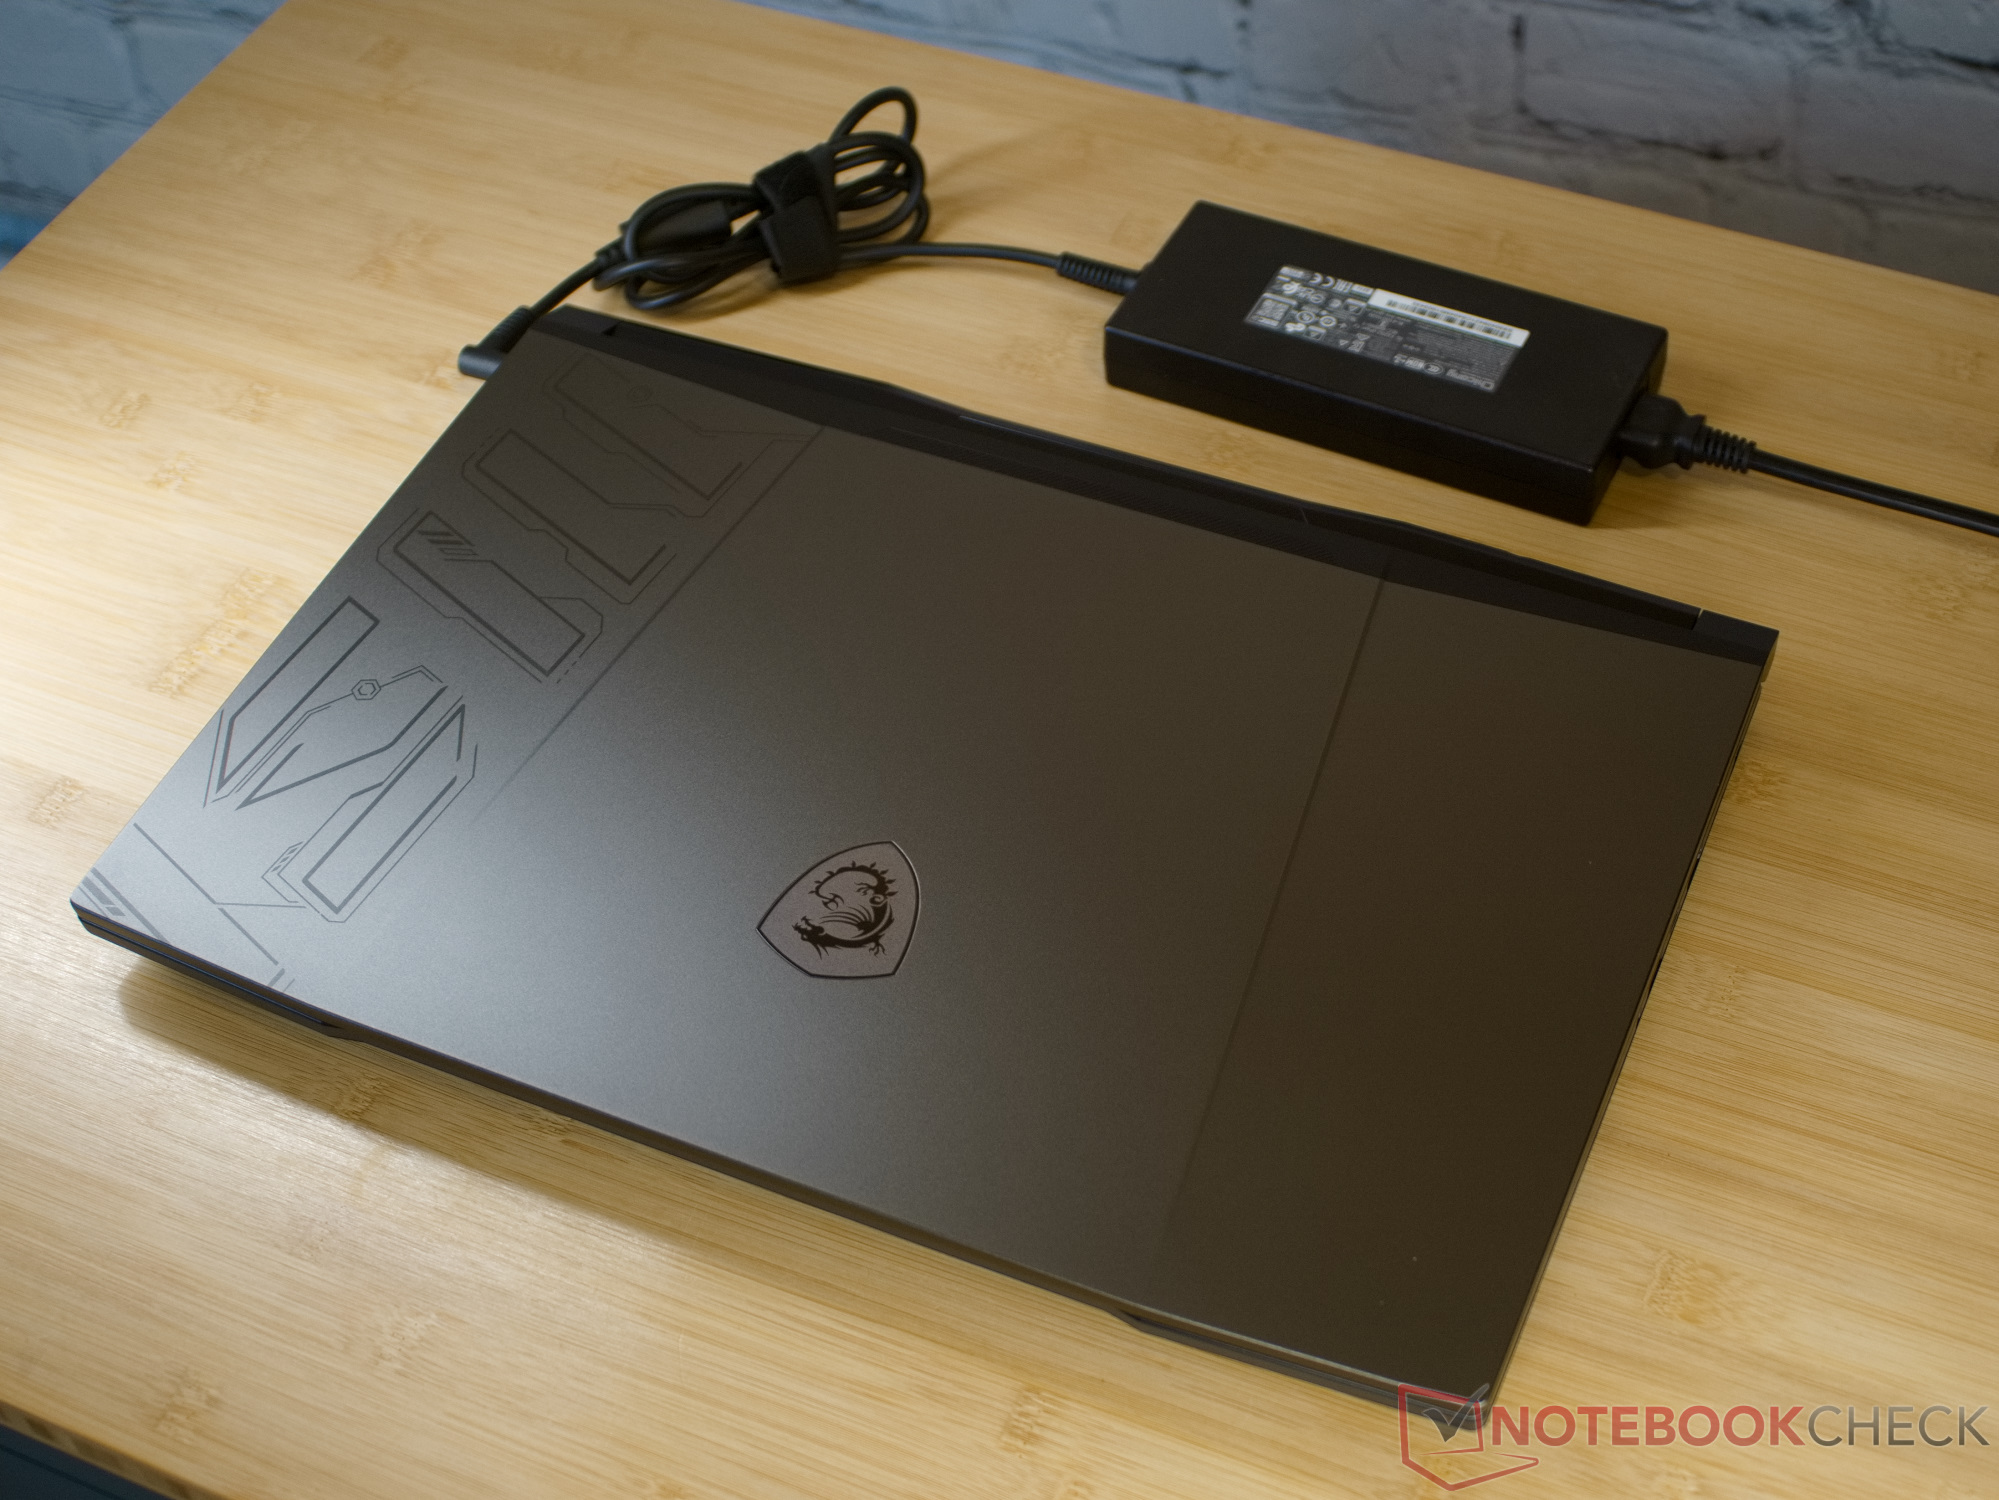
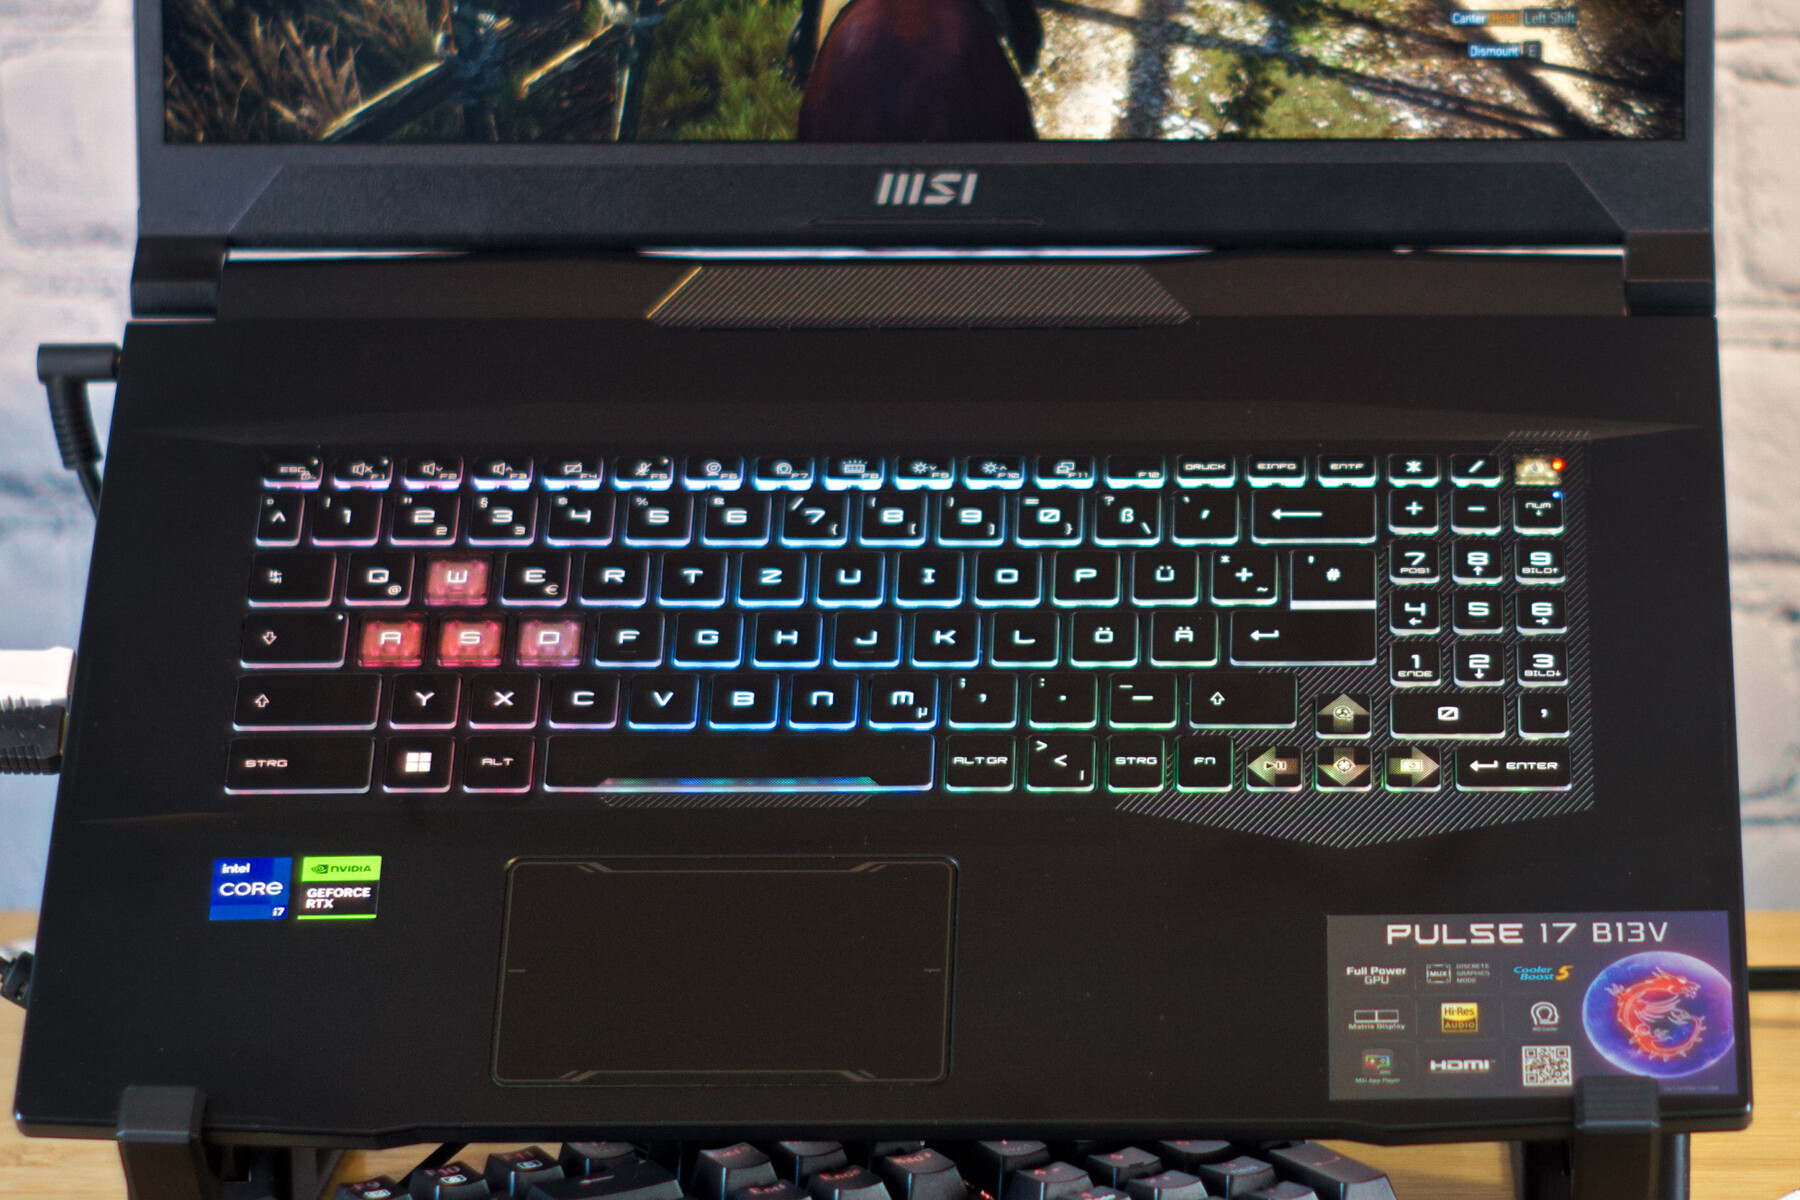
Estuche - Tapa expositora de aluminio con aspecto de ciencia ficción
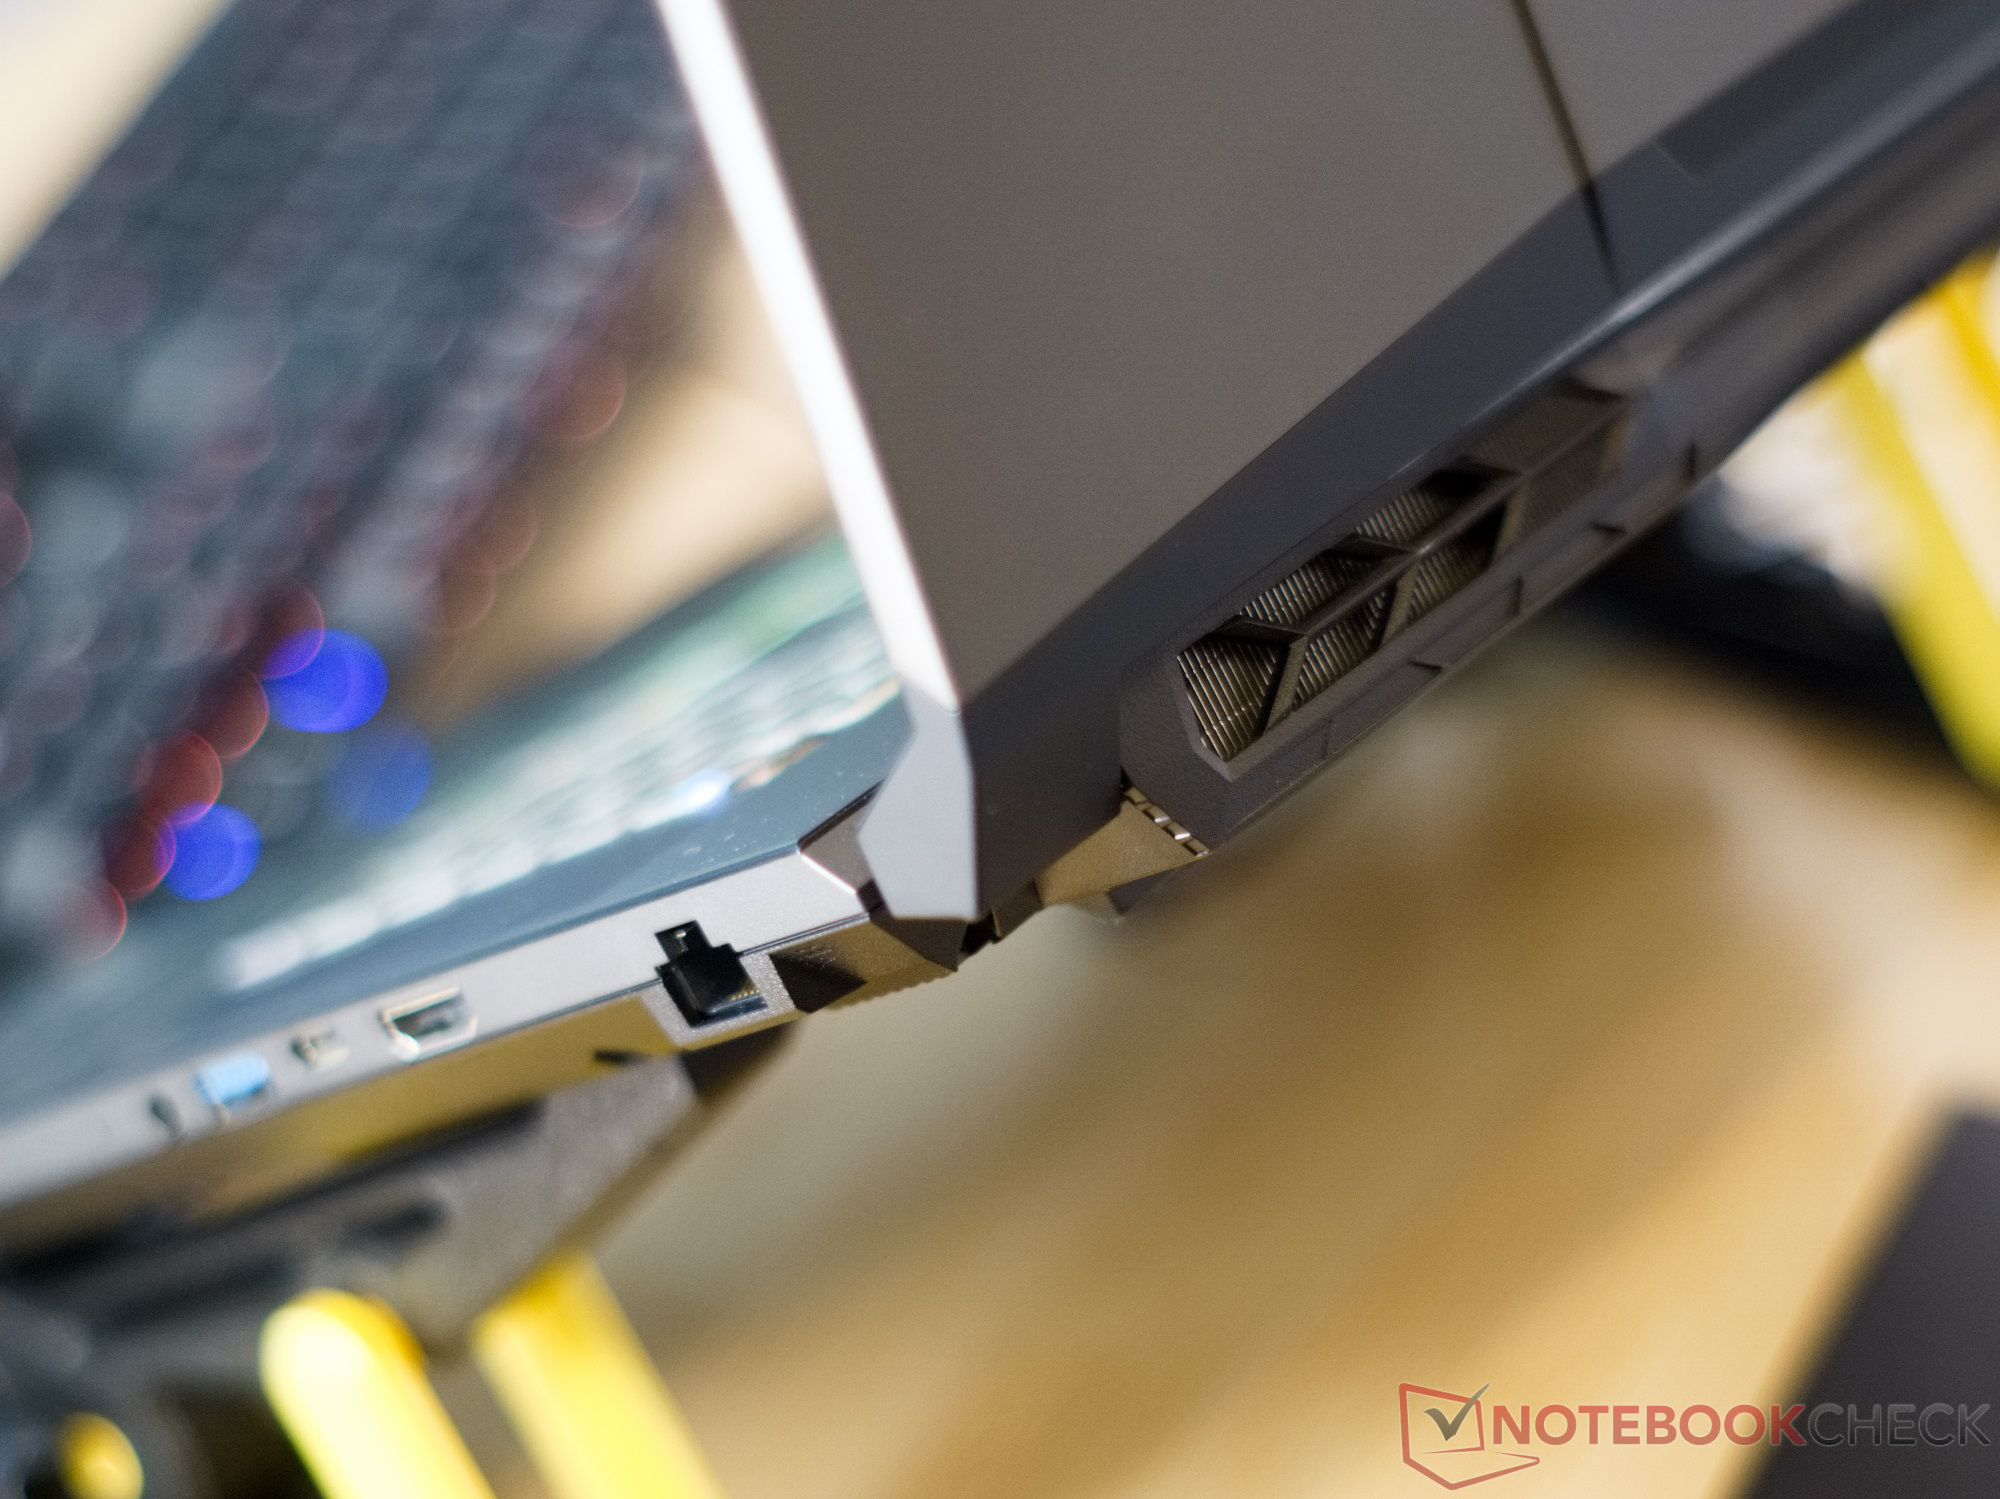
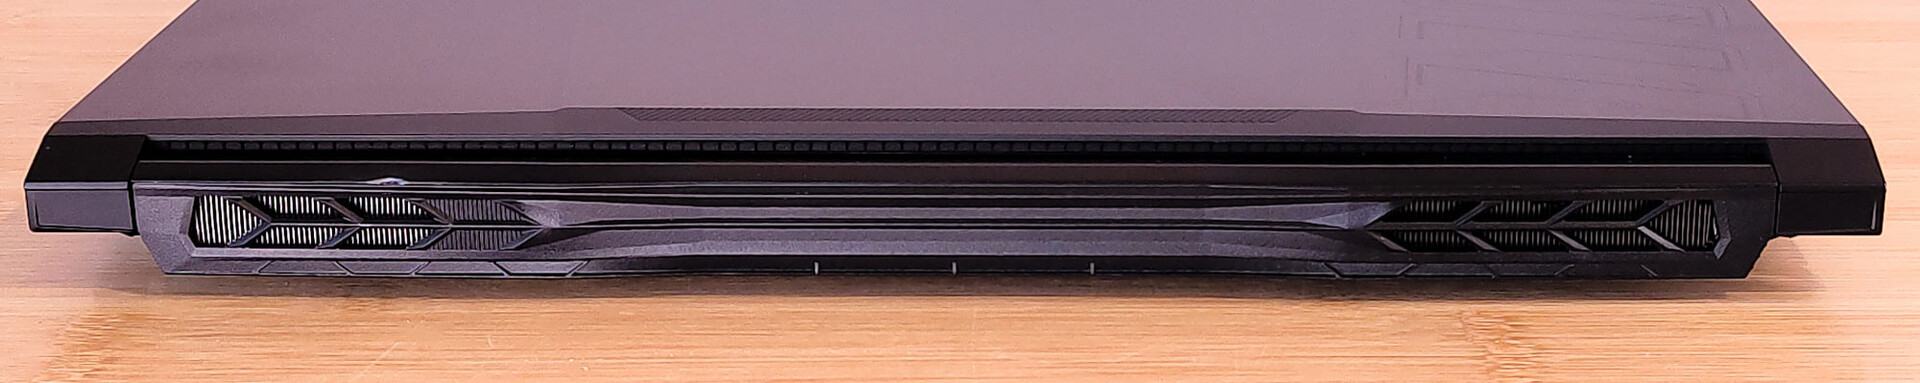
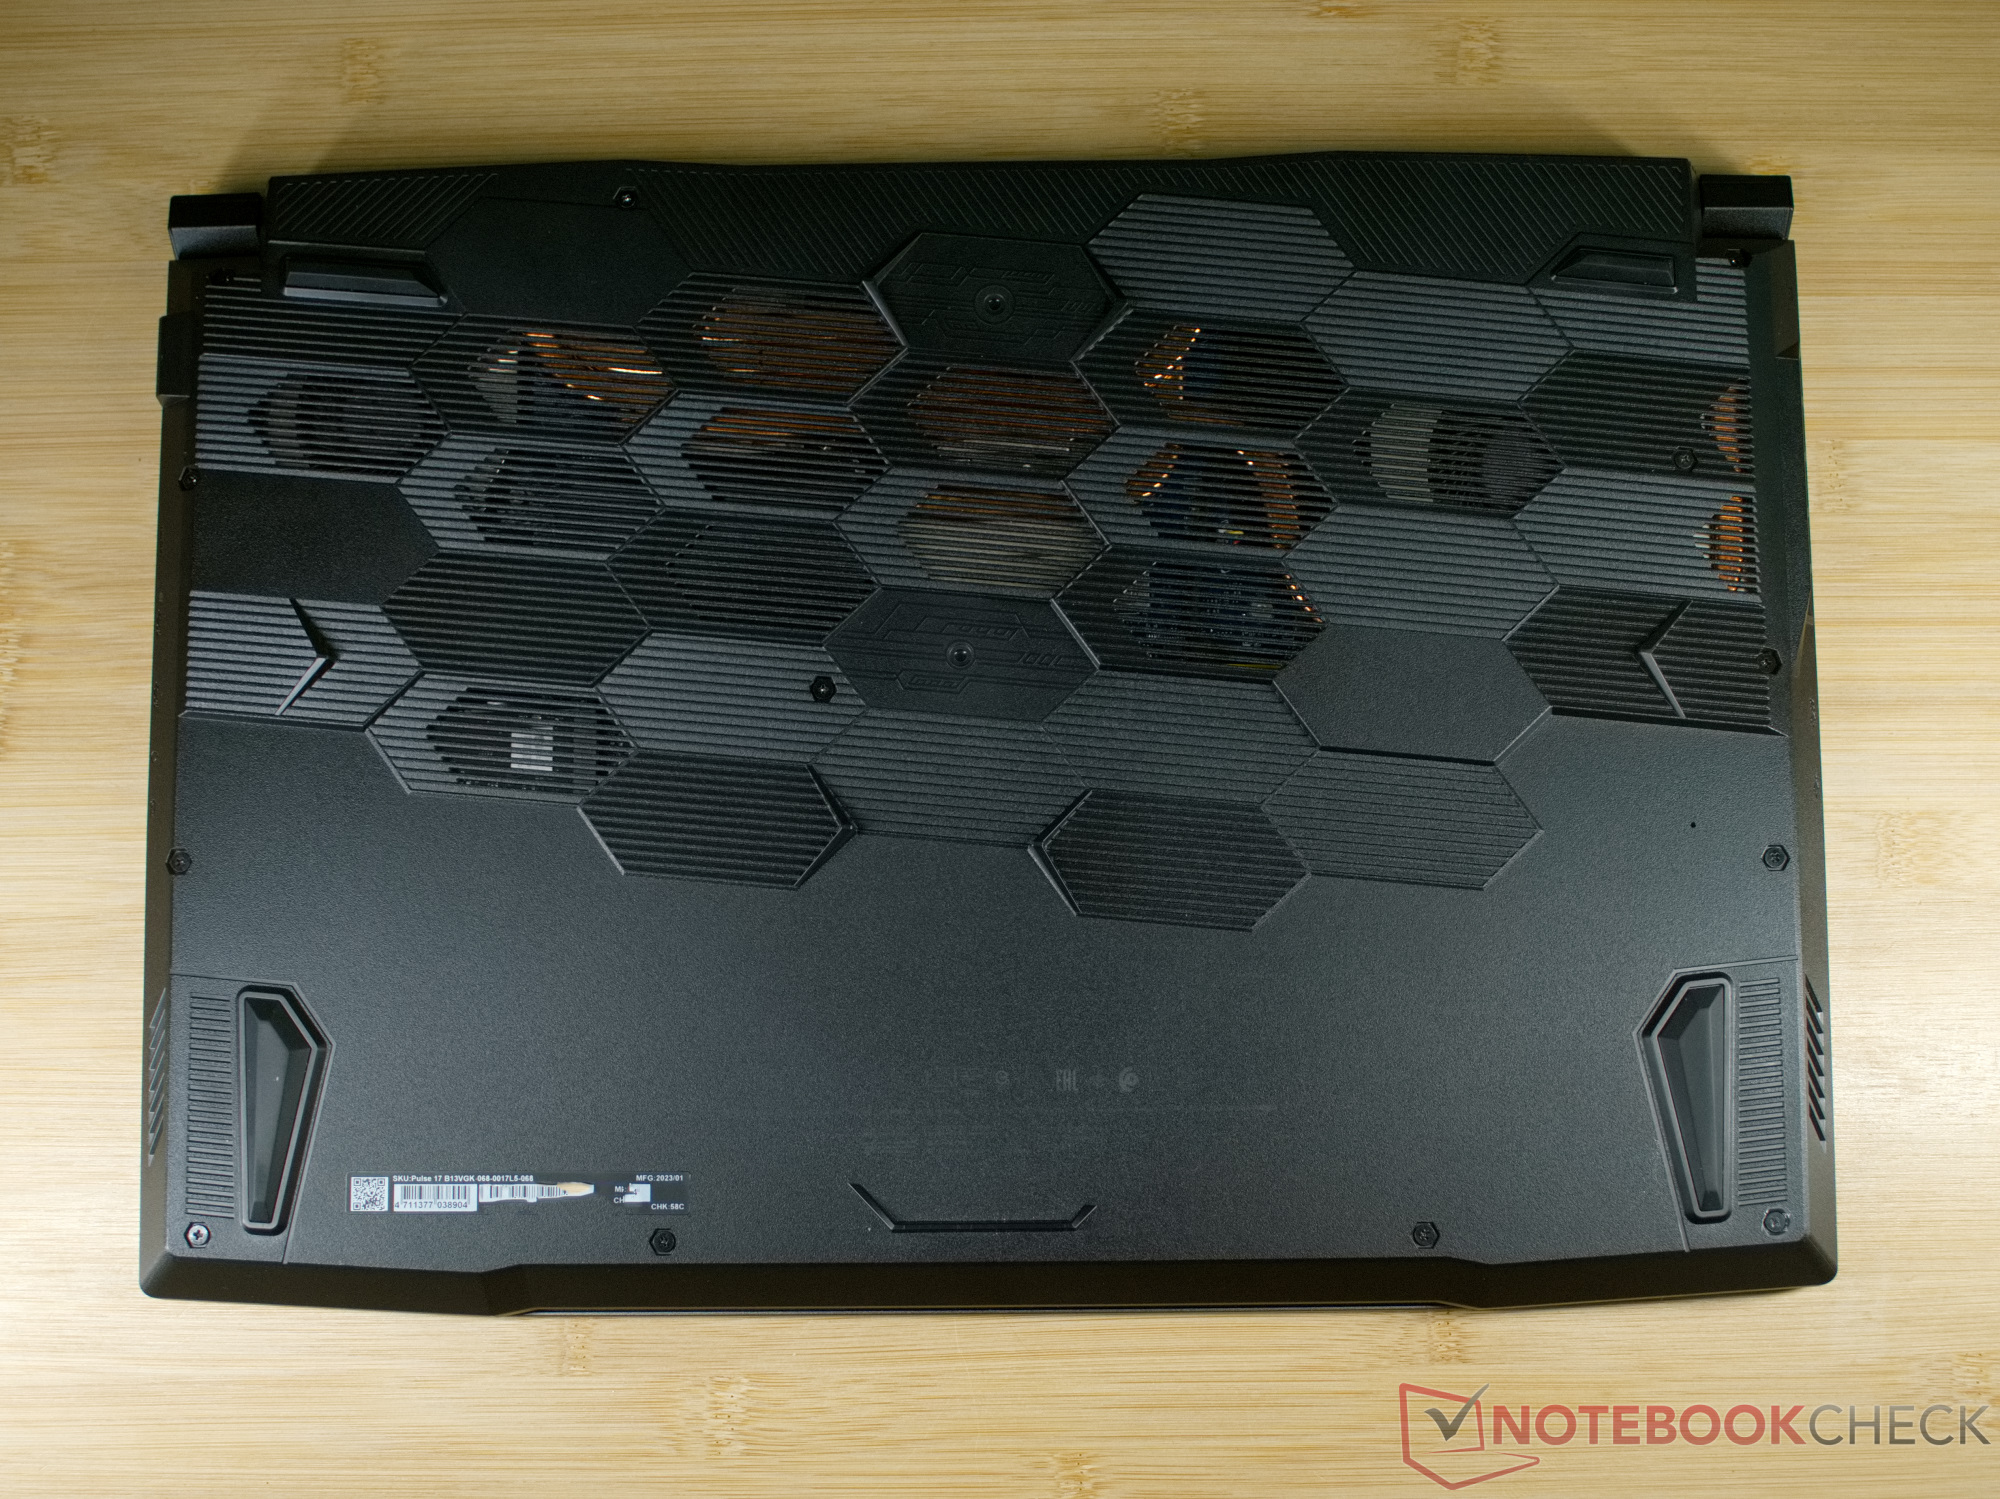
Casi todos los portátiles para juegos actuales de MSI están diseñados con un concepto similar. Una y otra vez, MSI utiliza las líneas agresivas en la tapa de la pantalla, así como las bisagras afiladas y el patrón de nido de abeja en la parte inferior de la carcasa. En el Pulse 17, la tapa de aluminio de la pantalla está adornada con algunos bordes que le dan un toque adicional de ciencia ficción al portátil. Debajo de la tapa, el tema futurista continúa con MSI añadiendo también muchos elementos de diseño aquí.
Al mismo tiempo, la carcasa del MSI Pulse 17 es bastante robusta, pero el gran tamaño del portátil también significa que aún es posible deformar o presionar ligeramente los elementos de plástico. Sin embargo, el Pulse 17 se presenta como un dispositivo sólido en general. La gran pantalla puede abrirse 180º y es capaz de mantener su posición hasta cierto punto. Las bisagras son casi demasiado fáciles de mover, y unas ligeras vibraciones o golpecitos en la pantalla ya la moverán un poco.
Con un peso de 2.7 kg, el MSI Pulse 17 es el más ligero entre sus competidores de tamaño similar. Sólo el modelo predecesor pesa menos. Aparte de eso, los portátiles de juego actuales de nuestra comparación difieren bastante poco en términos de cómo llenan la bolsa.
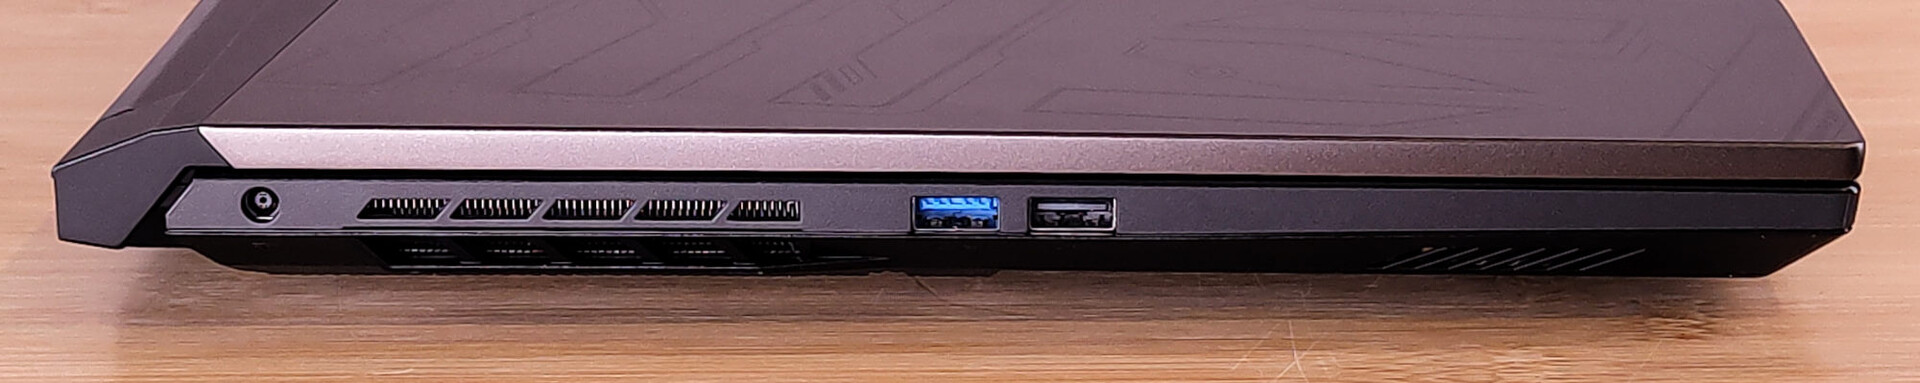
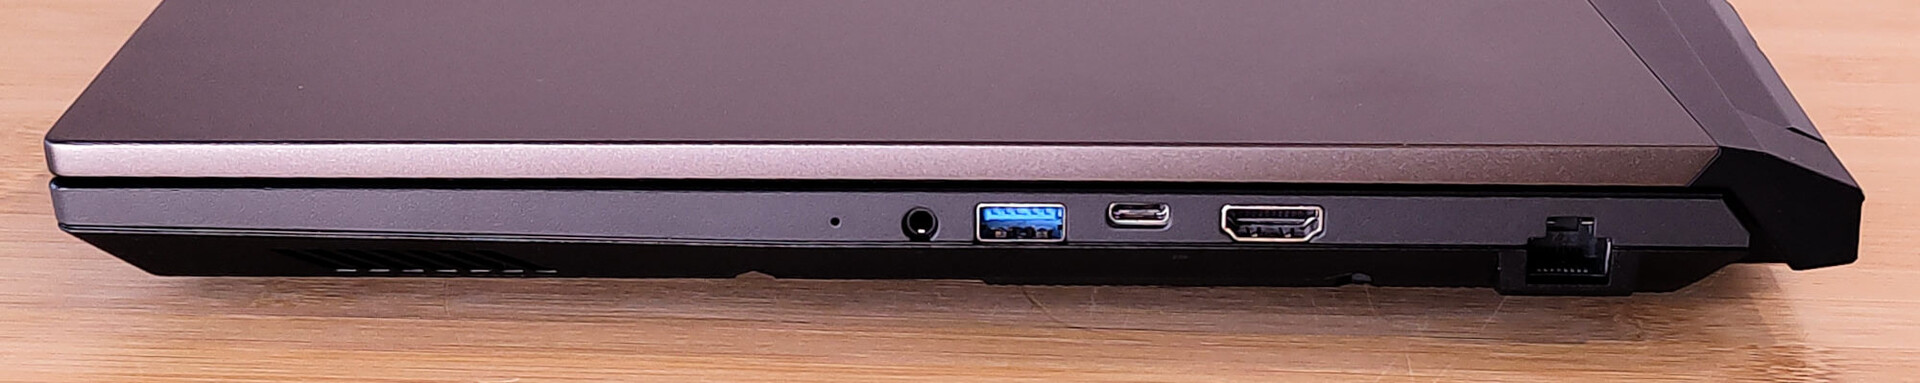
Equipo - Sin Thunderbolt y sólo USB 3.2 Gen 1
El hecho de que el Pulse ofrezca dos conexiones USB en cada lado es un diseño inteligente, que permite a los usuarios diestros y zurdos mantener sus cables fuera del camino. Uno de los puertos USB del lado derecho es una conexión USB-C, pero por desgracia solo admite transferencia de datos y DisplayPort.
Comunicación
Con Gigabit LAN y WiFi 6 del módulo Intel AX201, el Pulse 17 no está realmente al día en términos de tecnología de red. Por otro lado, nuestra unidad de pruebas muestra que también son posibles velocidades de transferencia altas y estables en la red de 5 GHz.
Cámara web
La webcam del MSI Pulse 17 también es de todo menos moderna. Ofrece resolución HD y produce imágenes bastante borrosas con fuertes desviaciones cromáticas en los bordes contrastados.


Accesorios
Aparte de la documentación habitual, una pegatina con el dragón rojo y el cargador para el portátil, no encontramos ningún accesorio adicional en la caja.
Mantenimiento
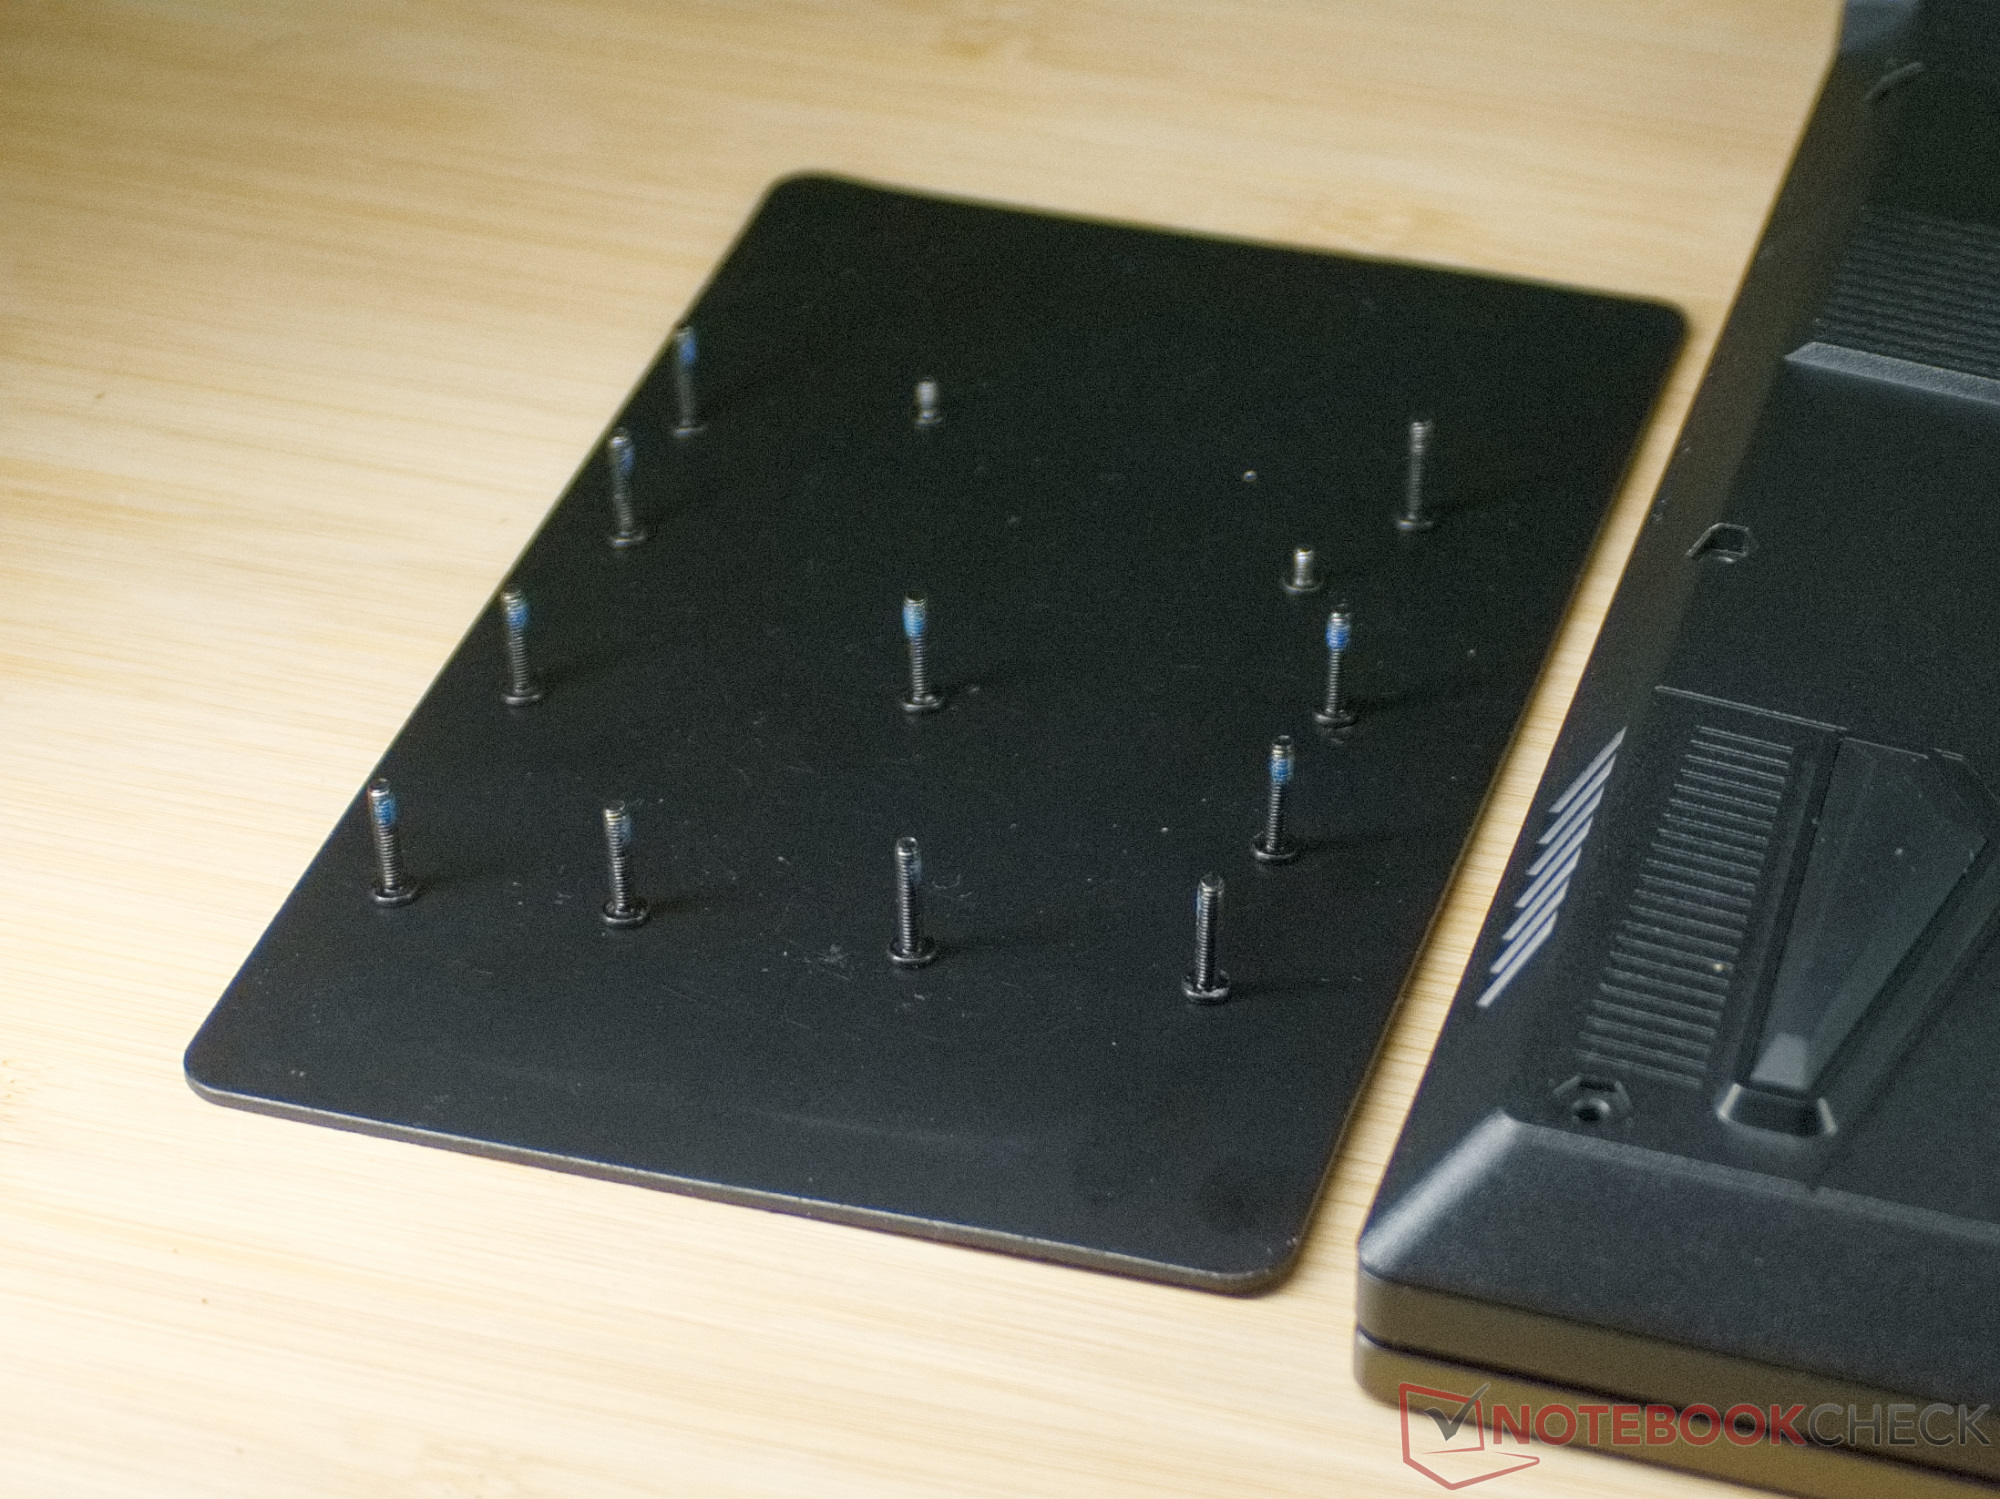
Uno de los 13 tornillos Phillips PH0 que sujetan la parte inferior de la carcasa está protegido por un precinto adhesivo en nuestra unidad de pruebas. Aunque MSI enfatiza repetidamente que esto no es relevante para la garantía, algunos vendedores podrían protestar si el precinto se rompe en una carcasa en garantía.
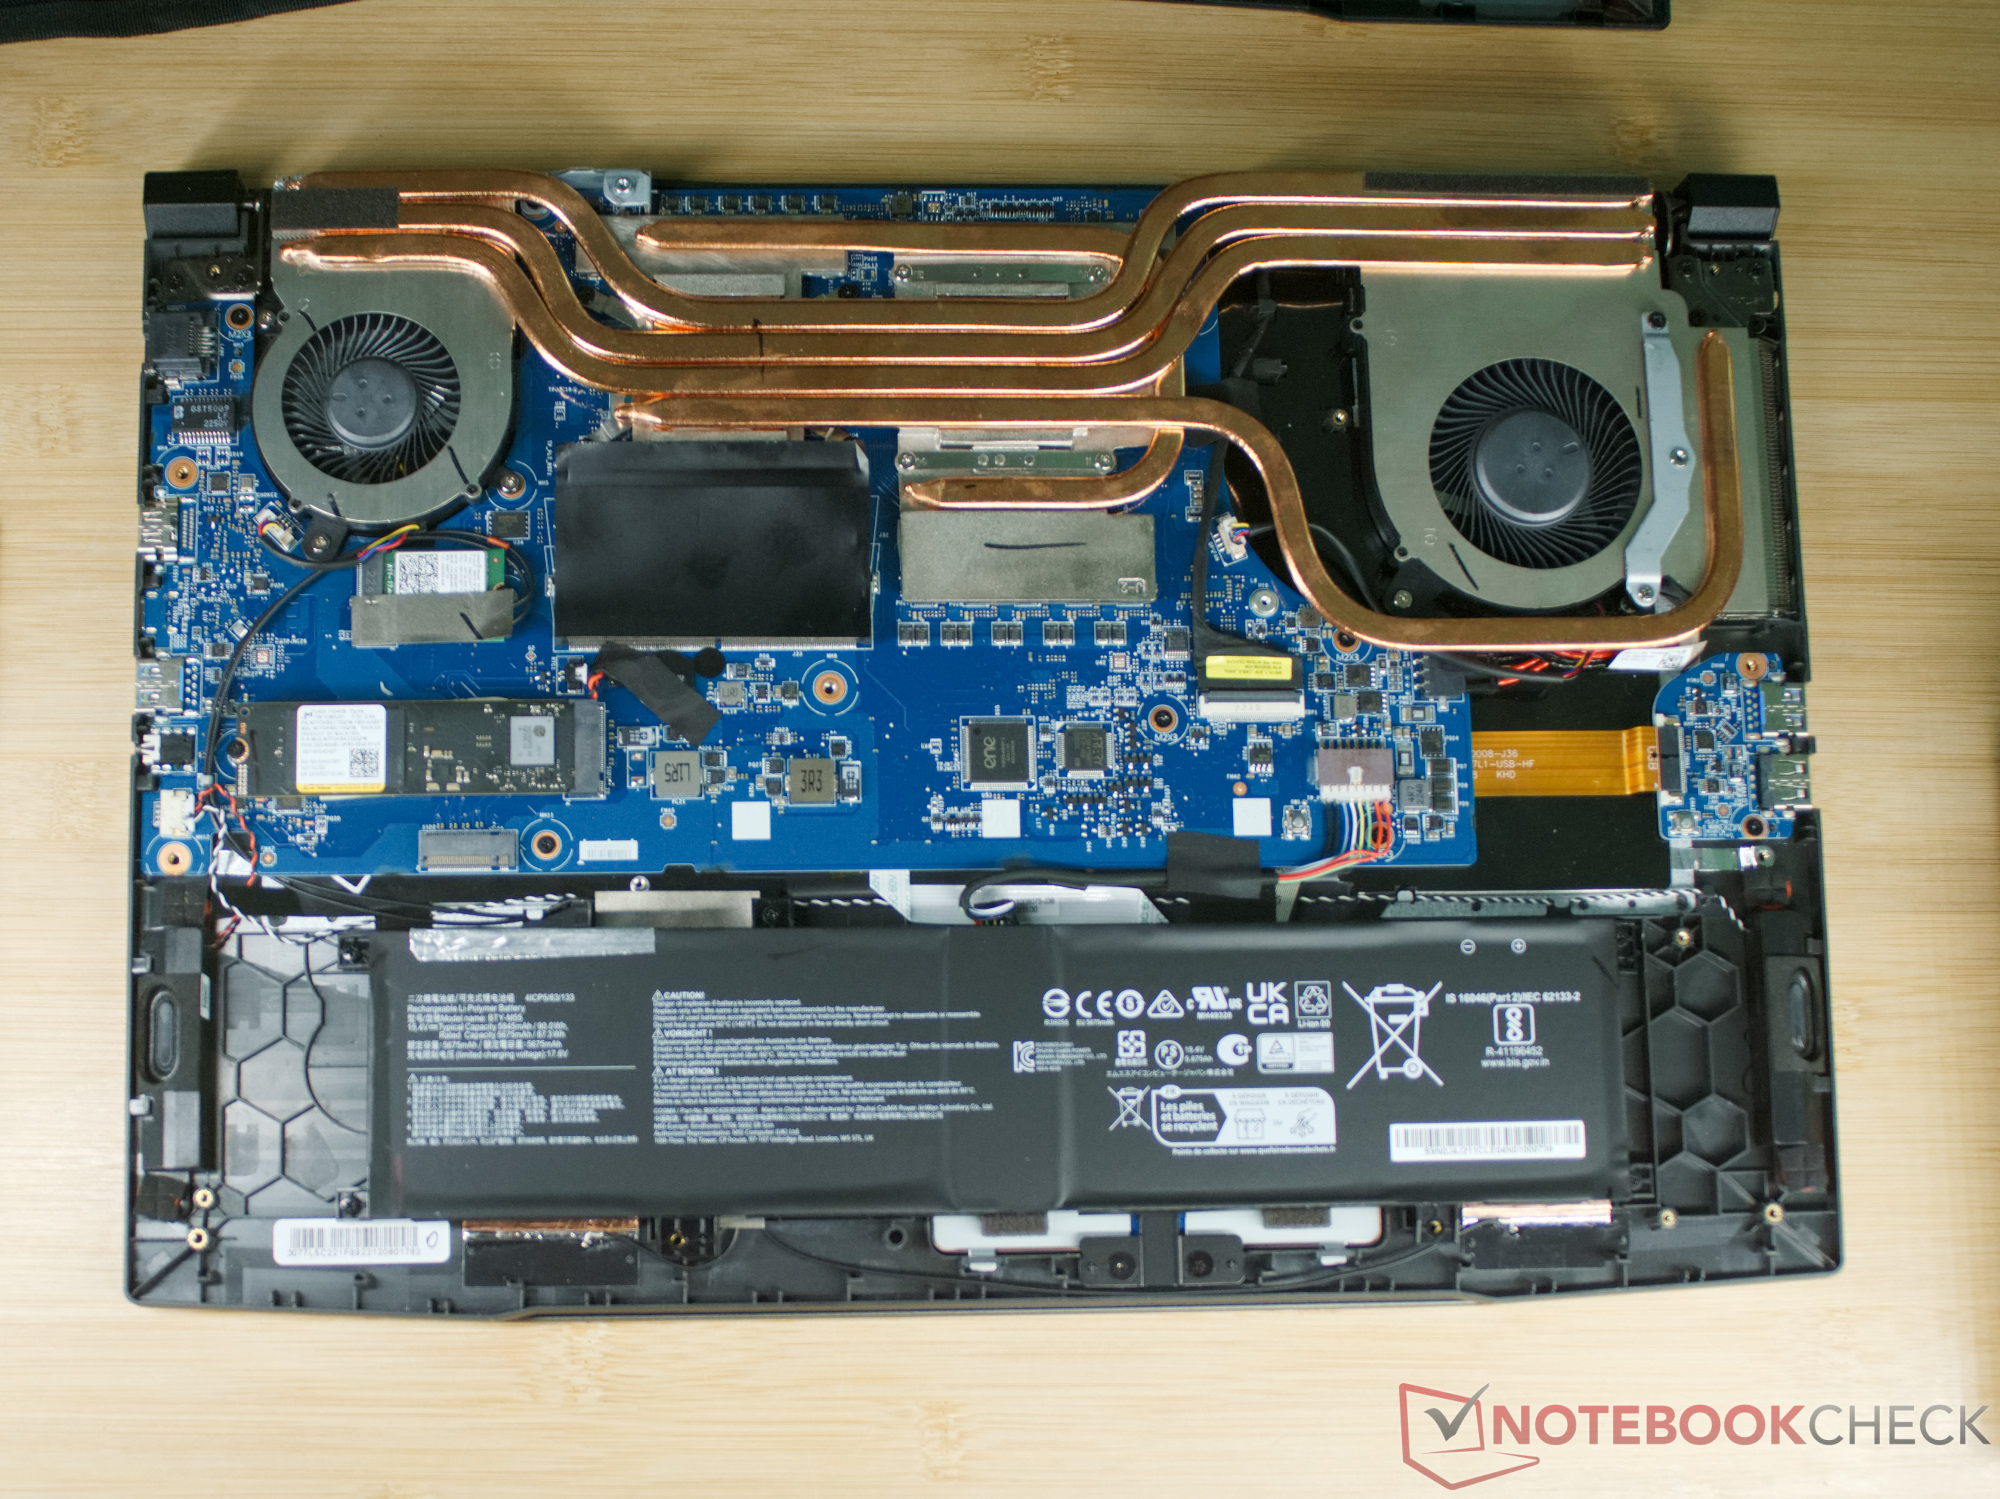
Al retirar los 13 tornillos, también deberías marcar su posición, ya que dos de los tornillos son significativamente más cortos. La cubierta inferior también está asegurada por varios clips, pero estos se pueden abrir fácilmente con una herramienta de palanca de plástico, lo que le permite levantar la cubierta inferior después.
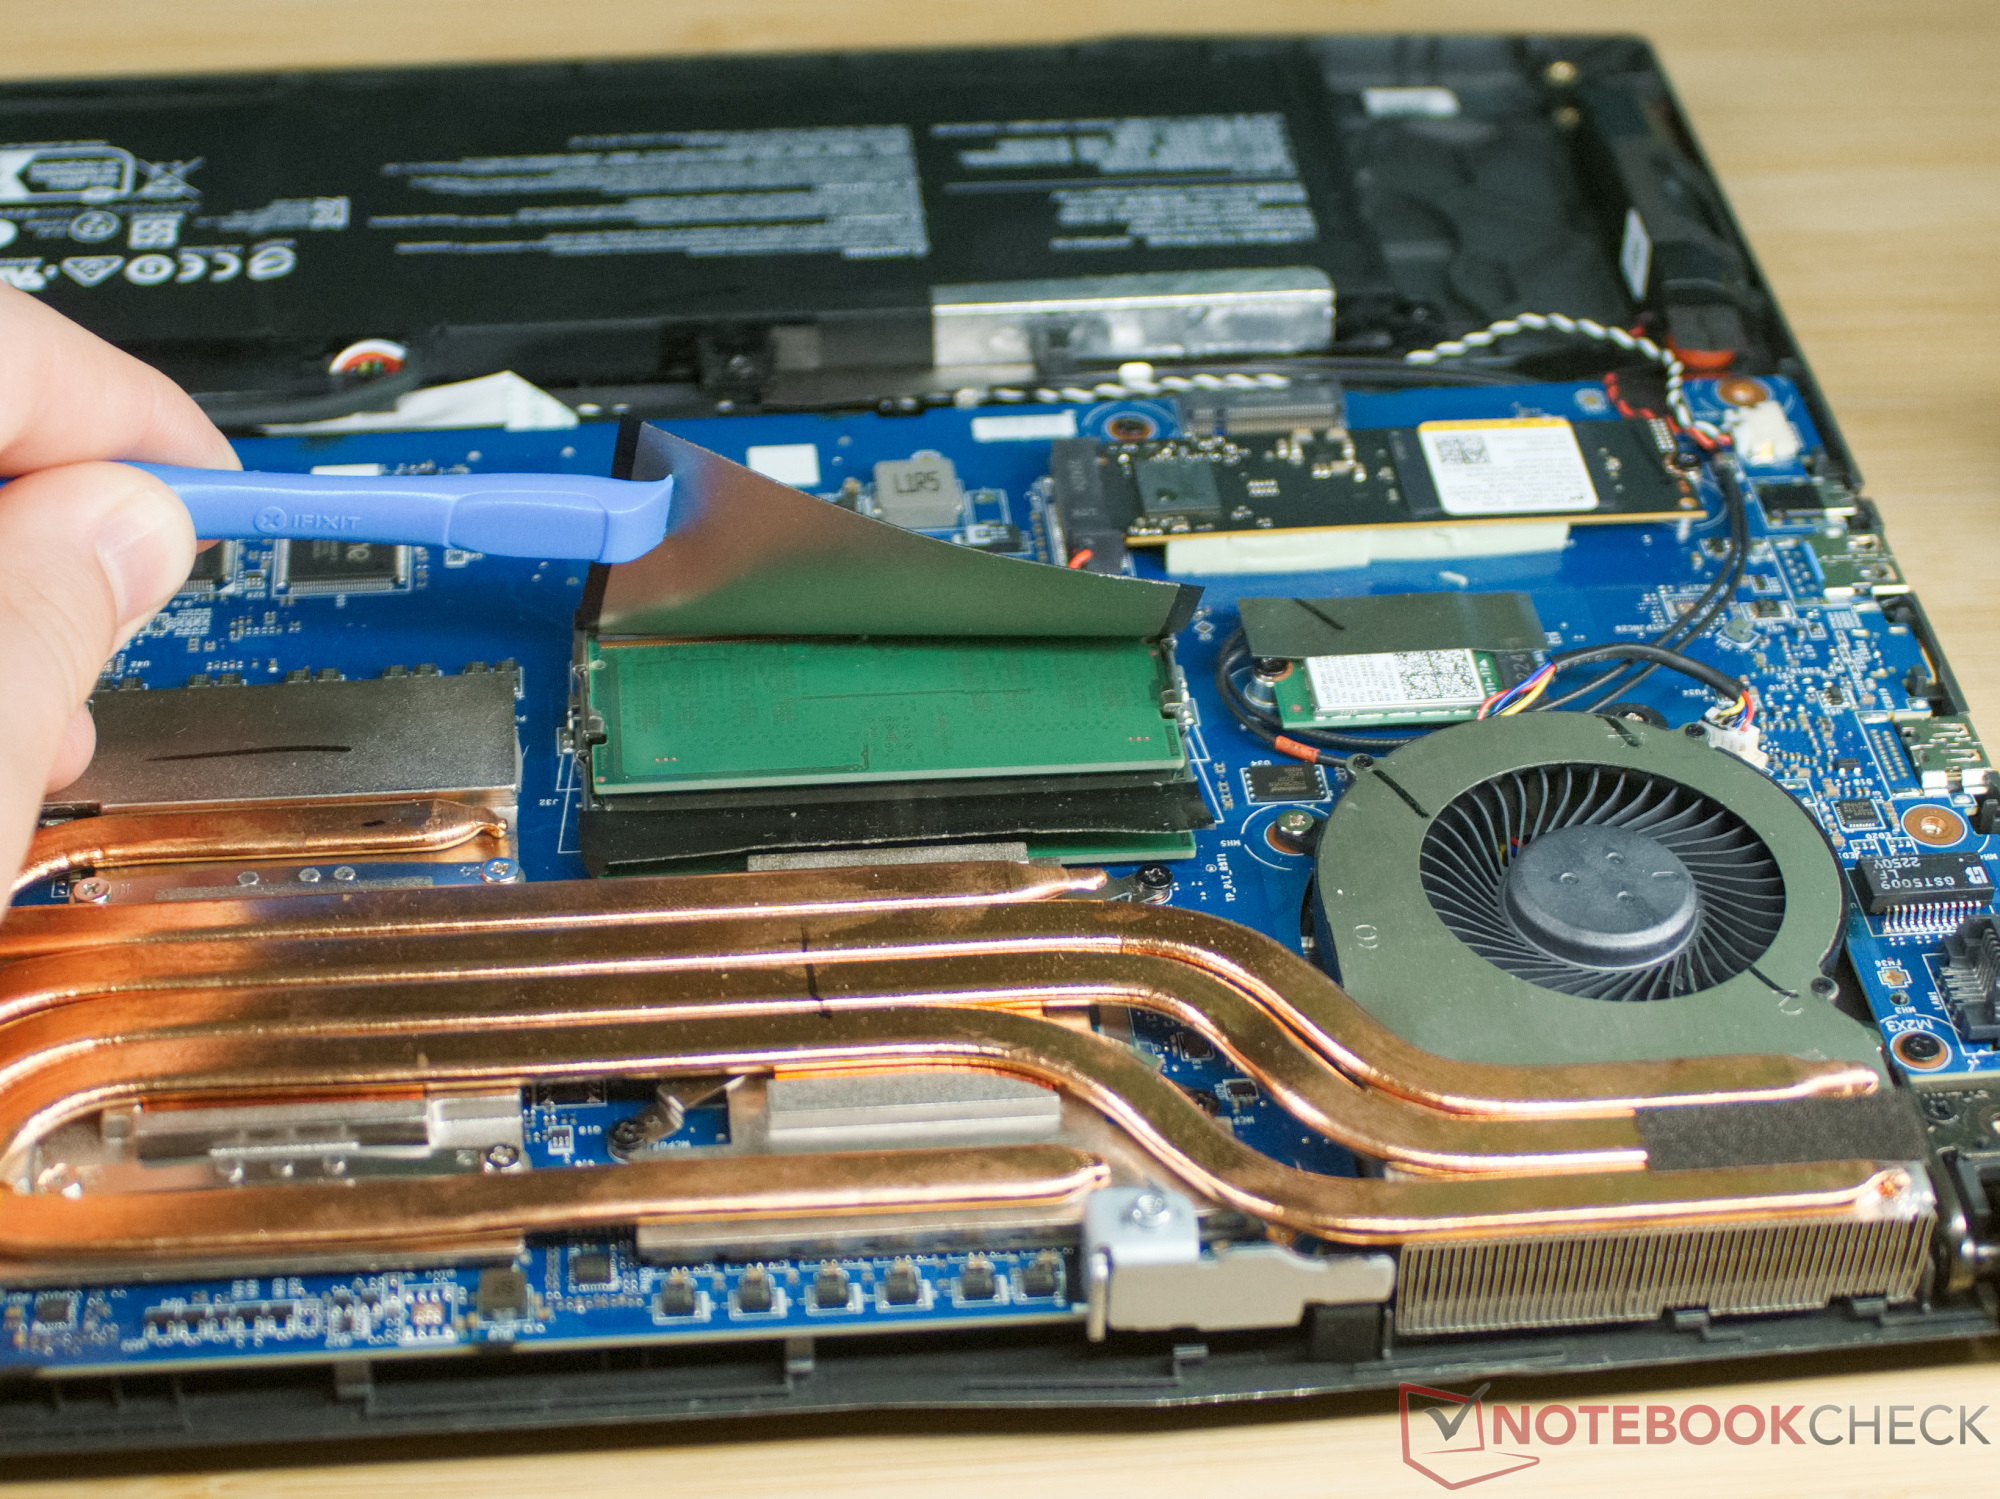
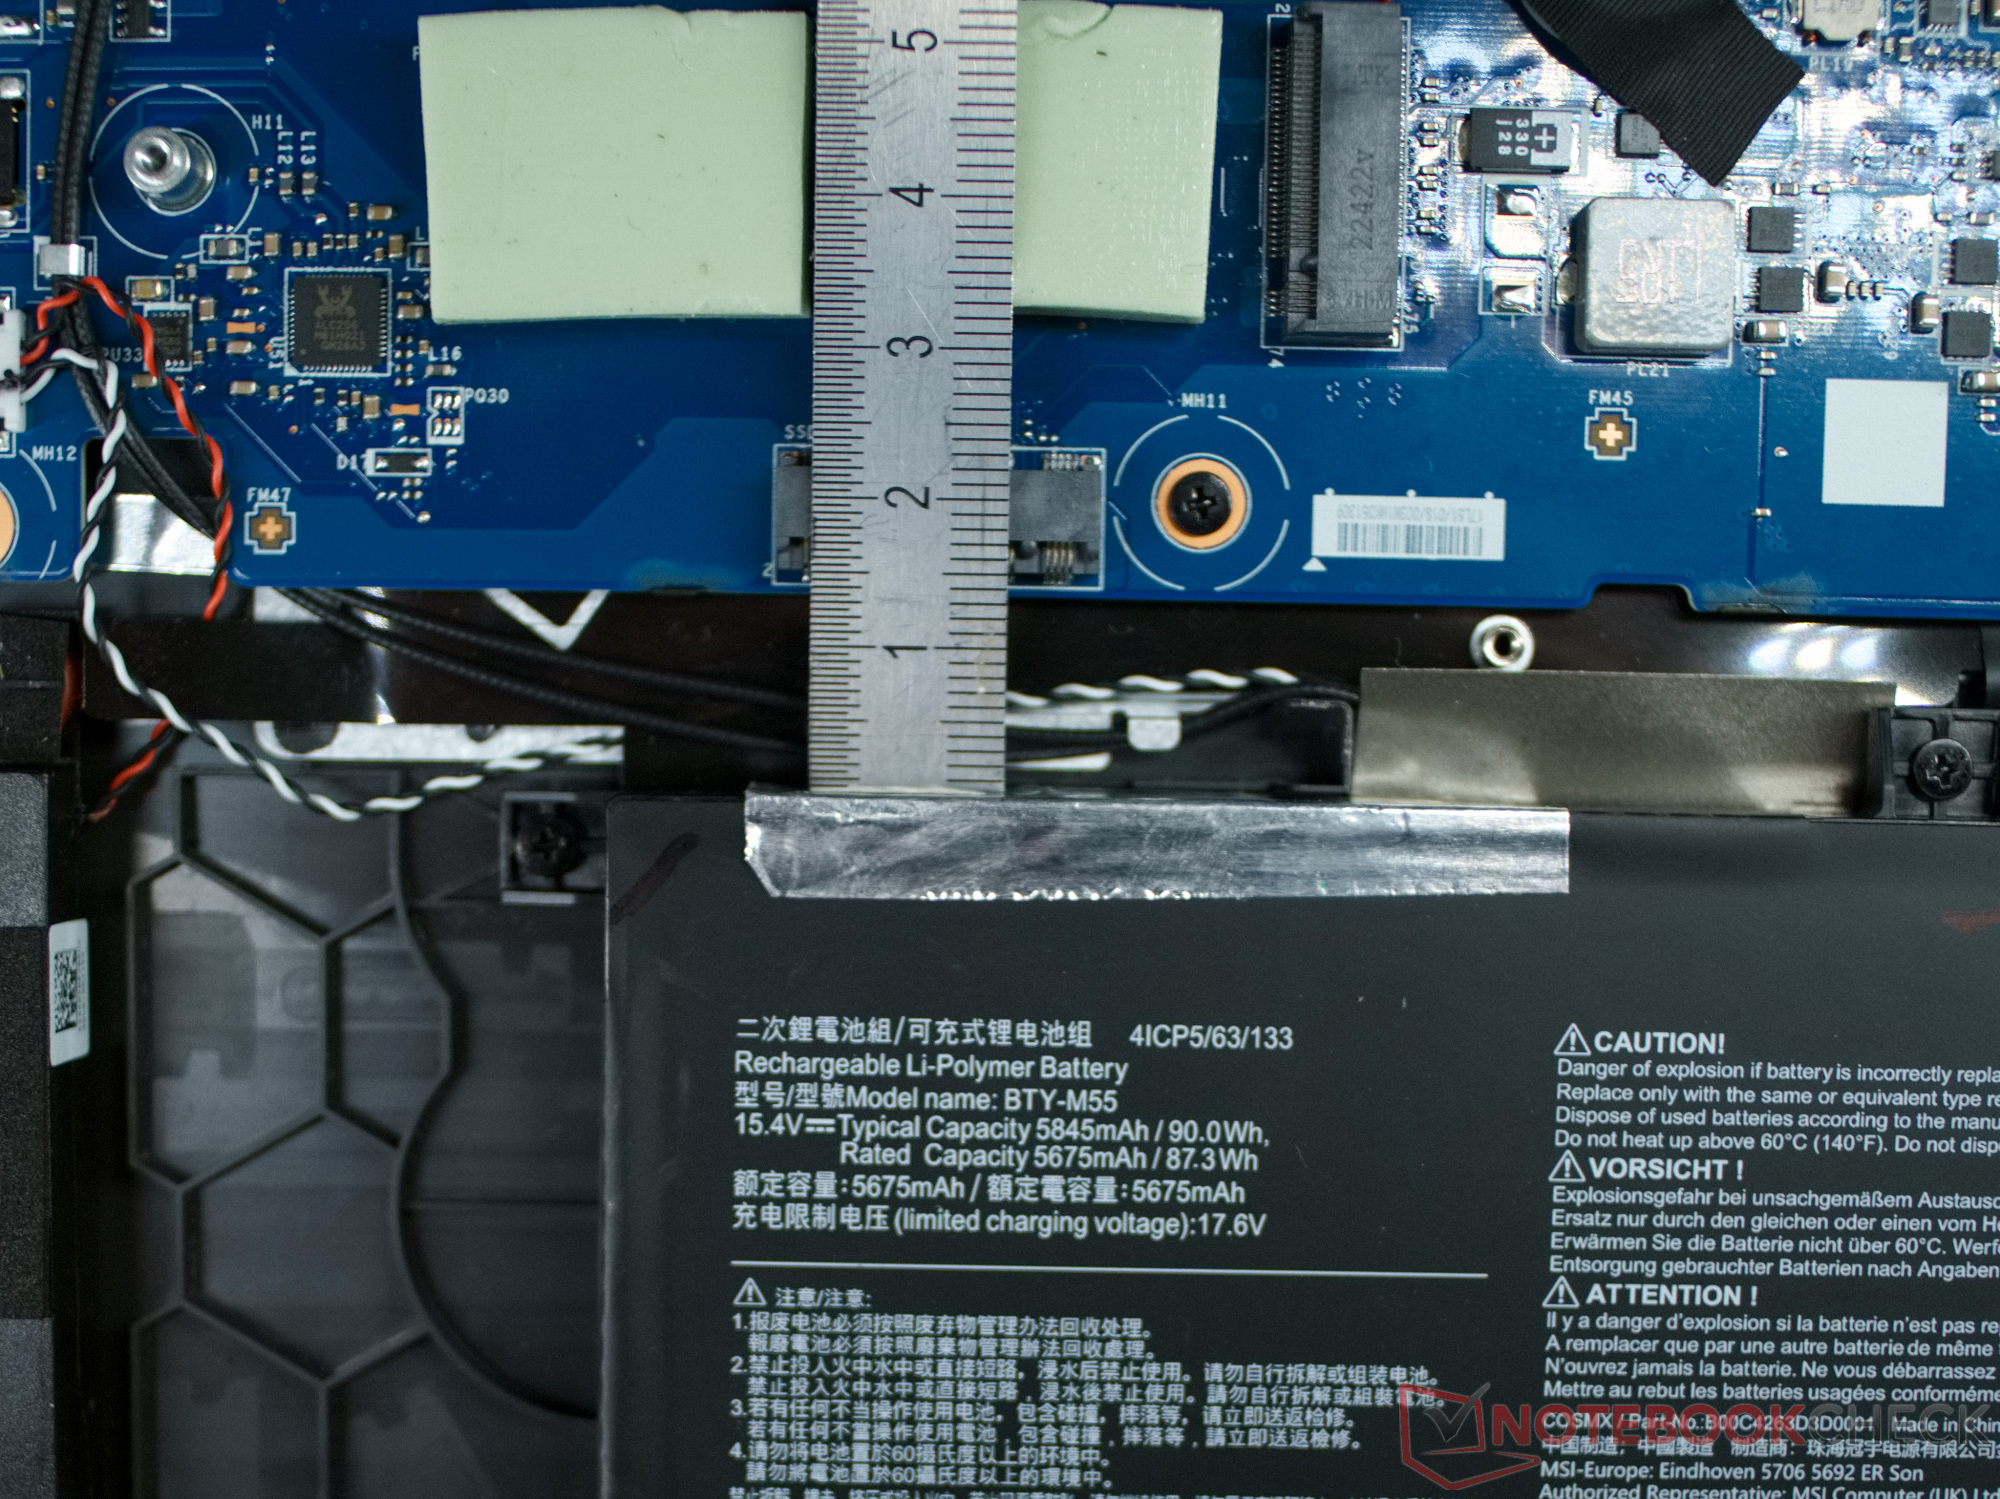
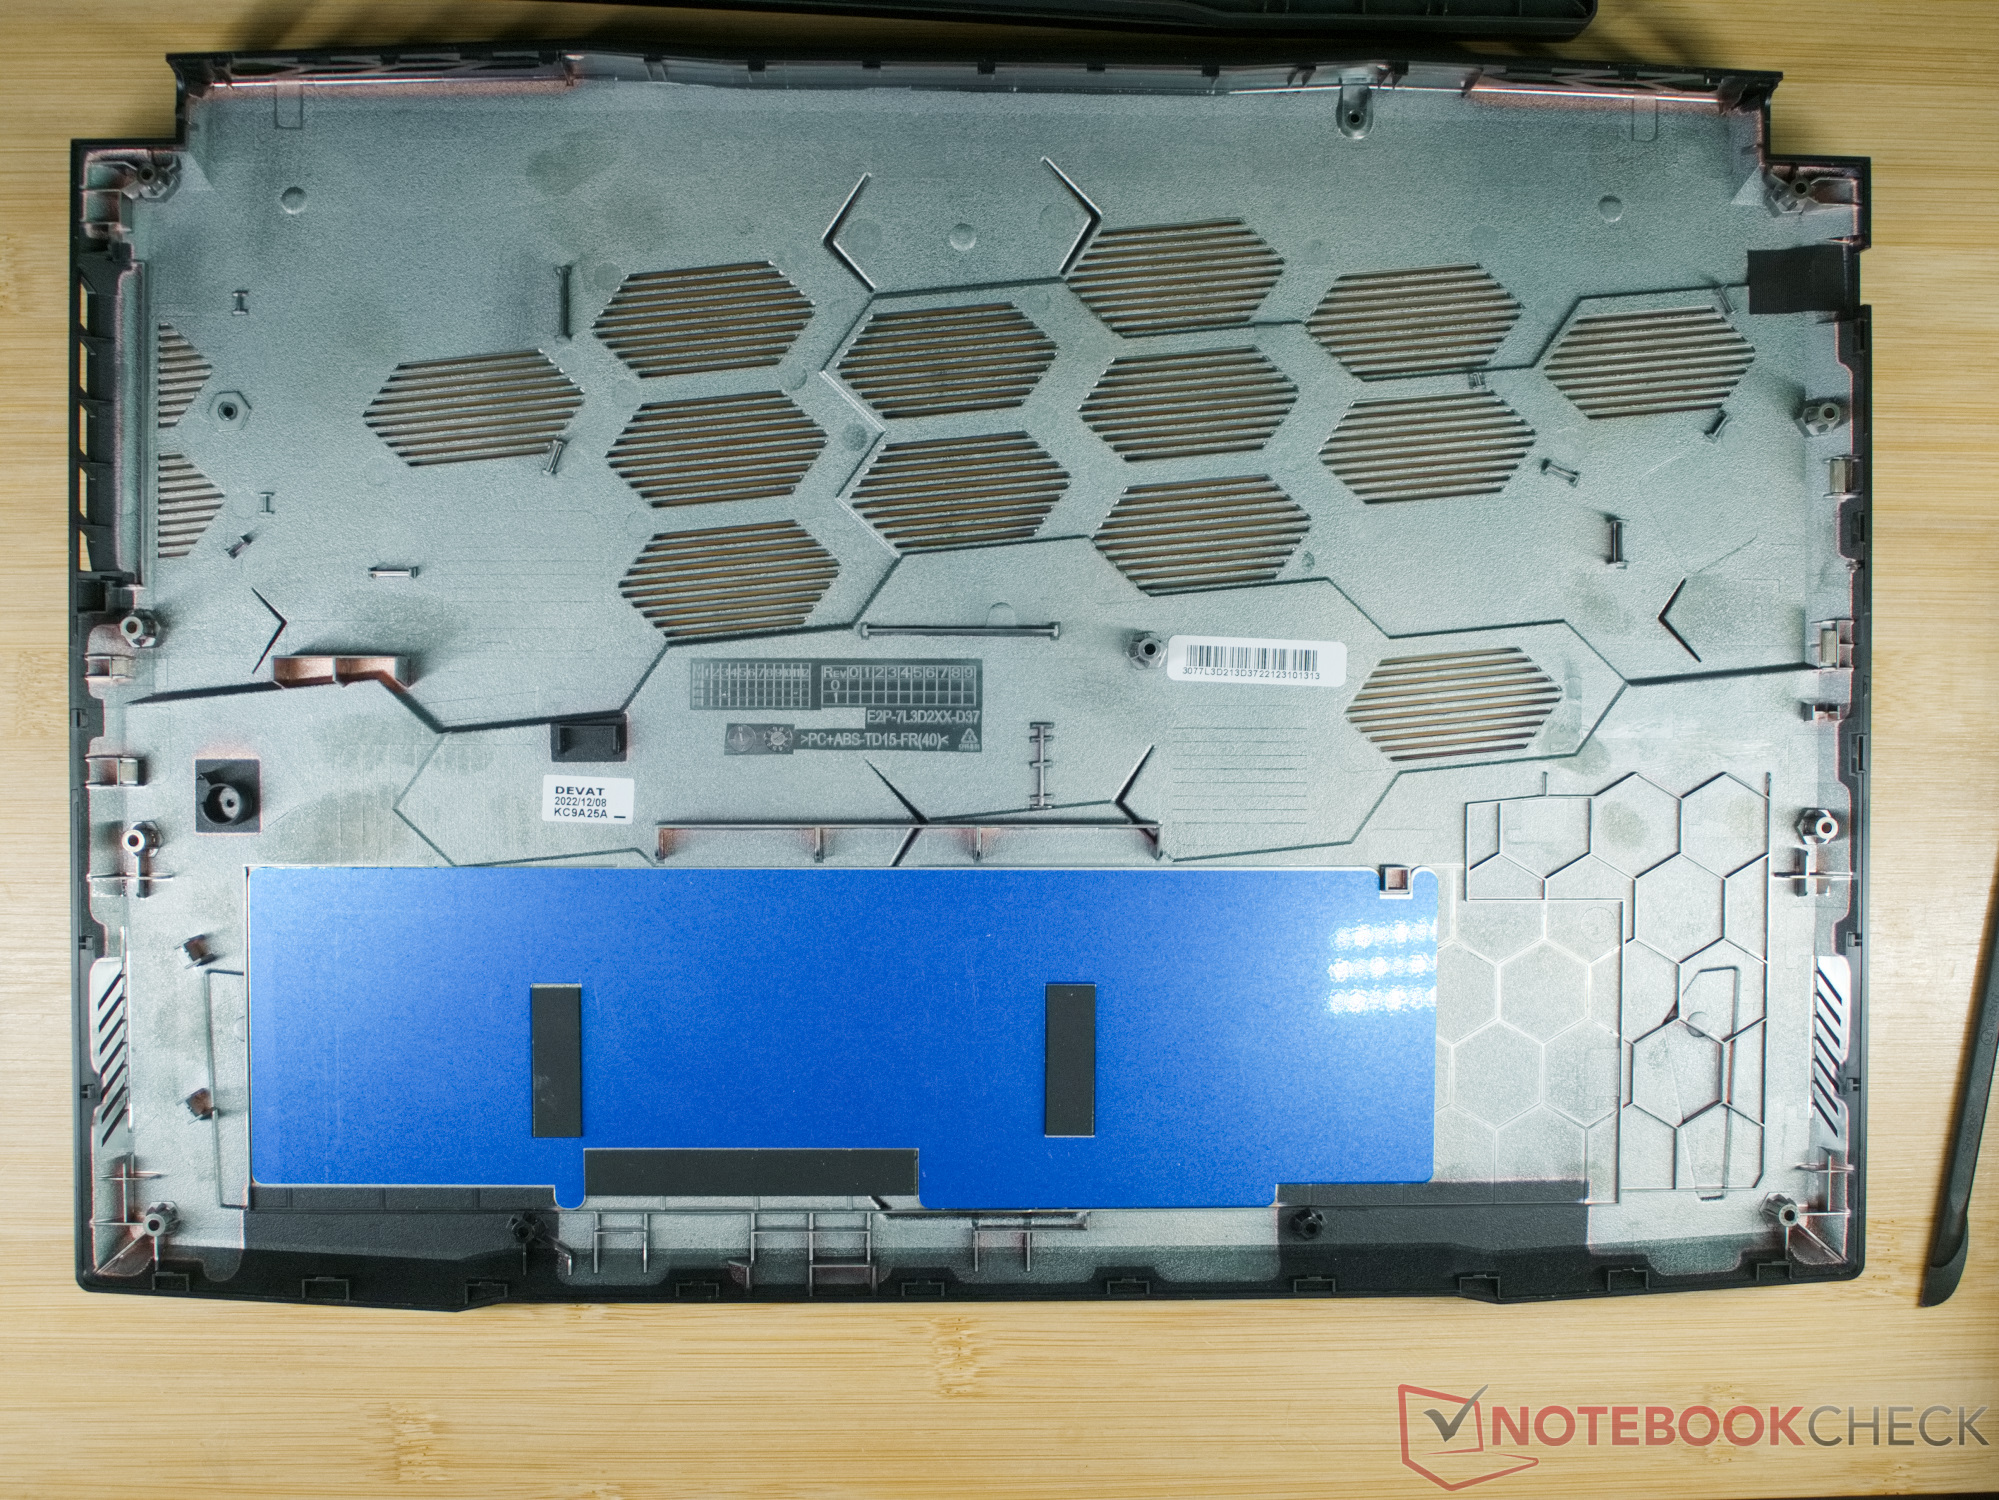
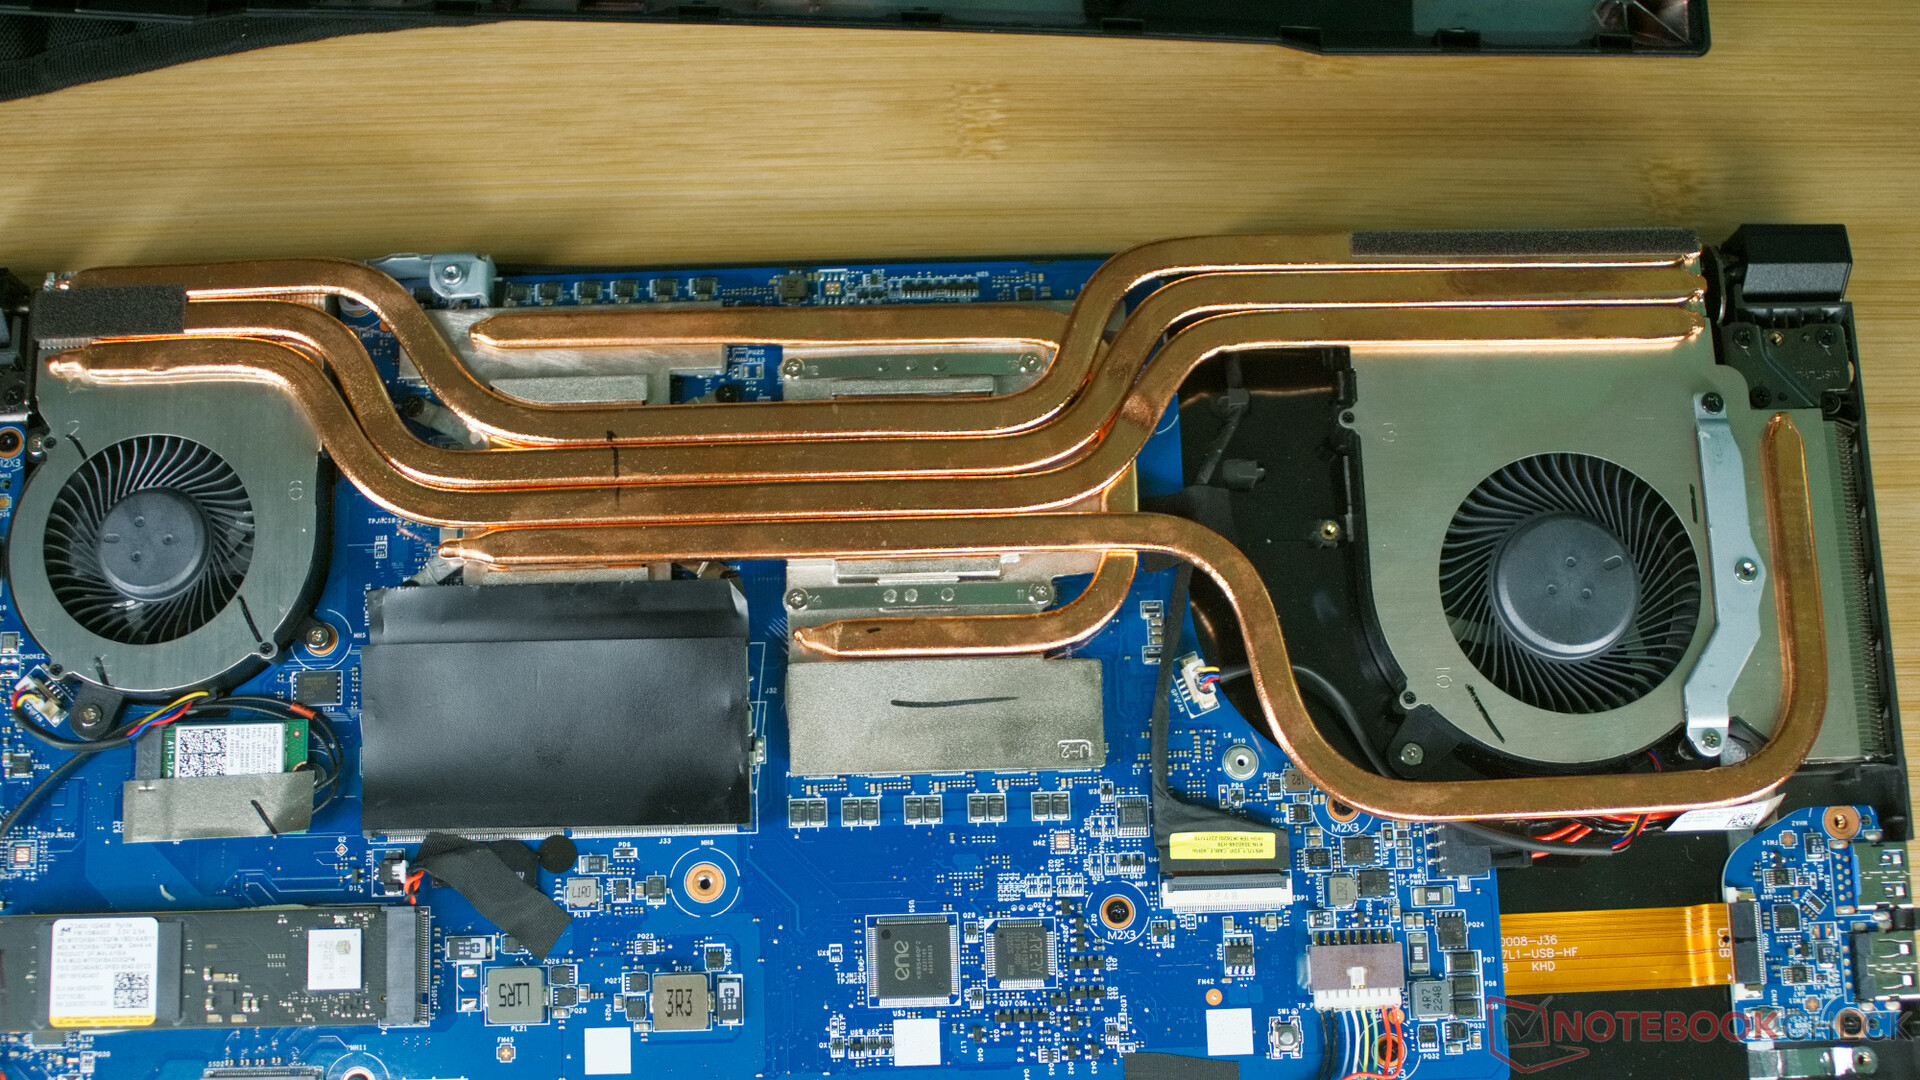
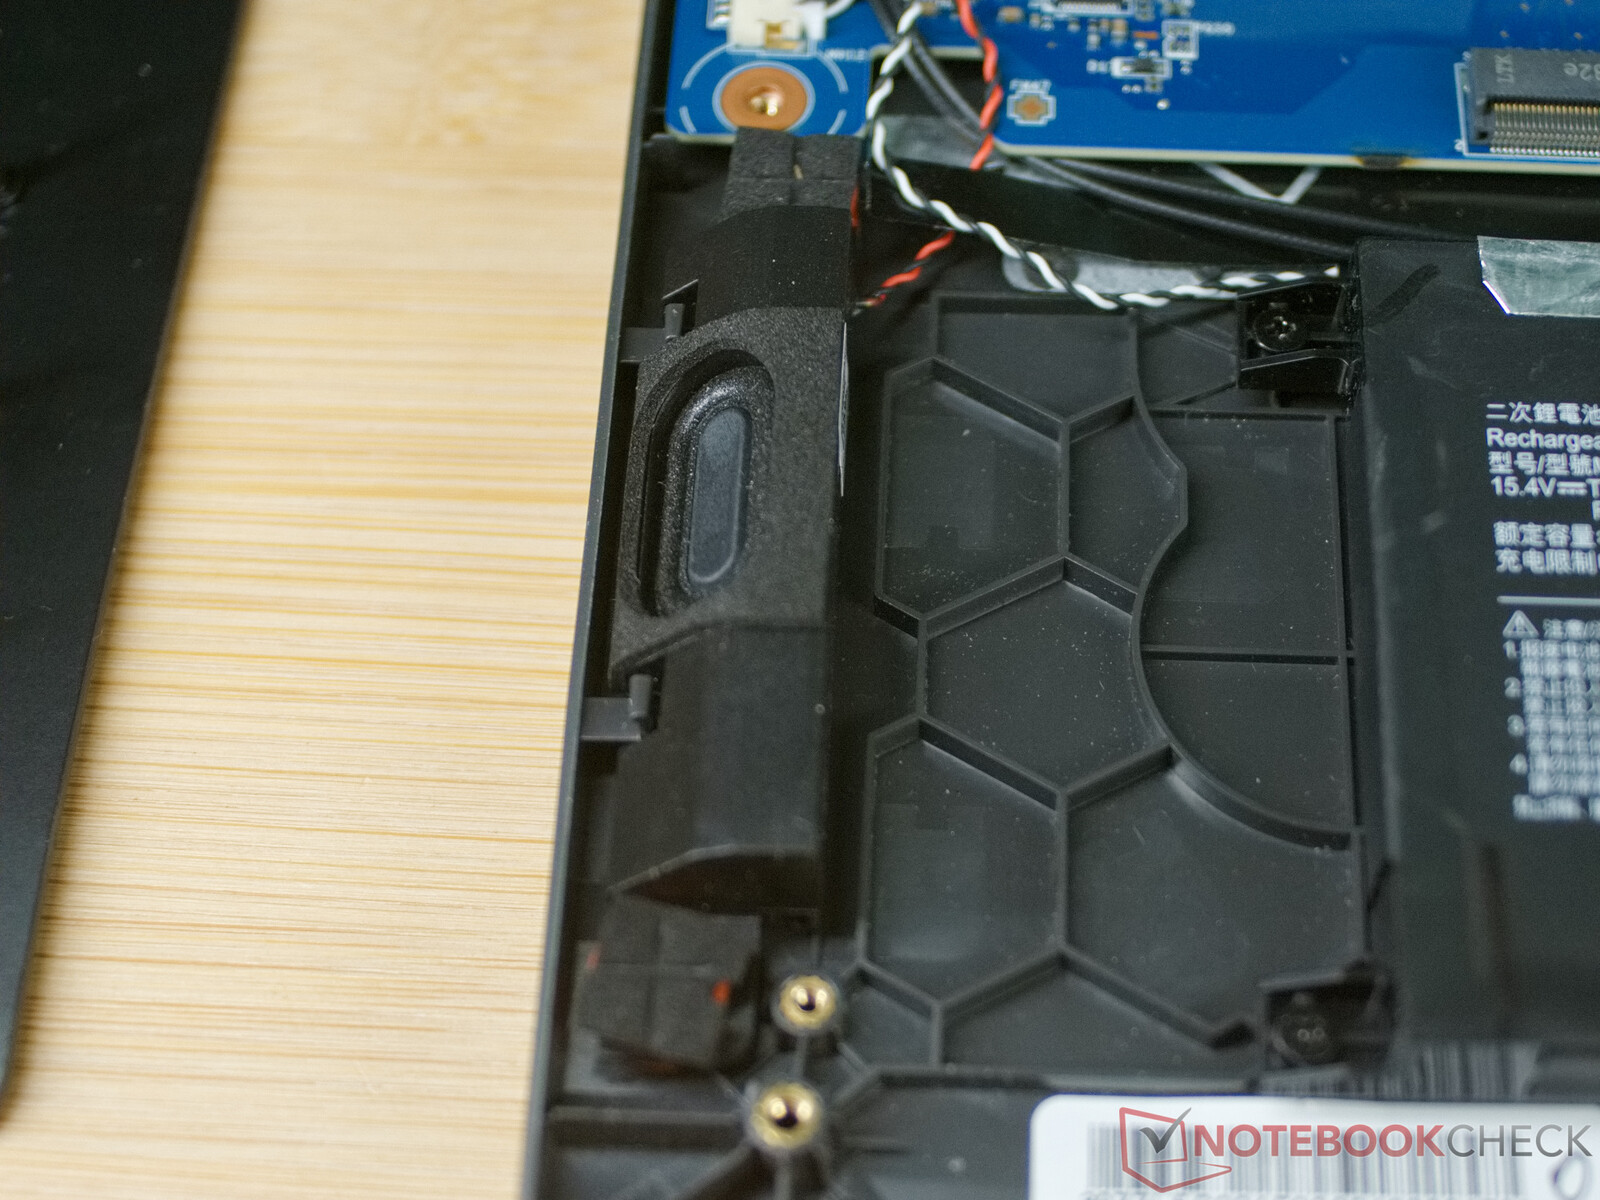
Dentro del portátil, encontramos una construcción bastante modular, por lo que la RAM, el SSD NVMe, y la WLAN/Modul pueden reemplazarse rápidamente. La batería, los altavoces, y la placa con las dos conexiones USB también pueden reemplazarse fácilmente. Sin embargo, aquellos a los que les guste quitar regularmente el polvo entre los ventiladores y las aletas de refrigeración tienen que desmontar todo el sistema de refrigeración para poder hacerlo.
El portátil también ofrece una segunda ranura M.2 PCIe, pero por desgracia está bloqueada por la batería. Así que probablemente sólo puedas instalar un segundo SSD con una solución que use adaptadores y cables.
Garantía
MSI ofrece una garantía de 24 meses a los compradores de Europa.
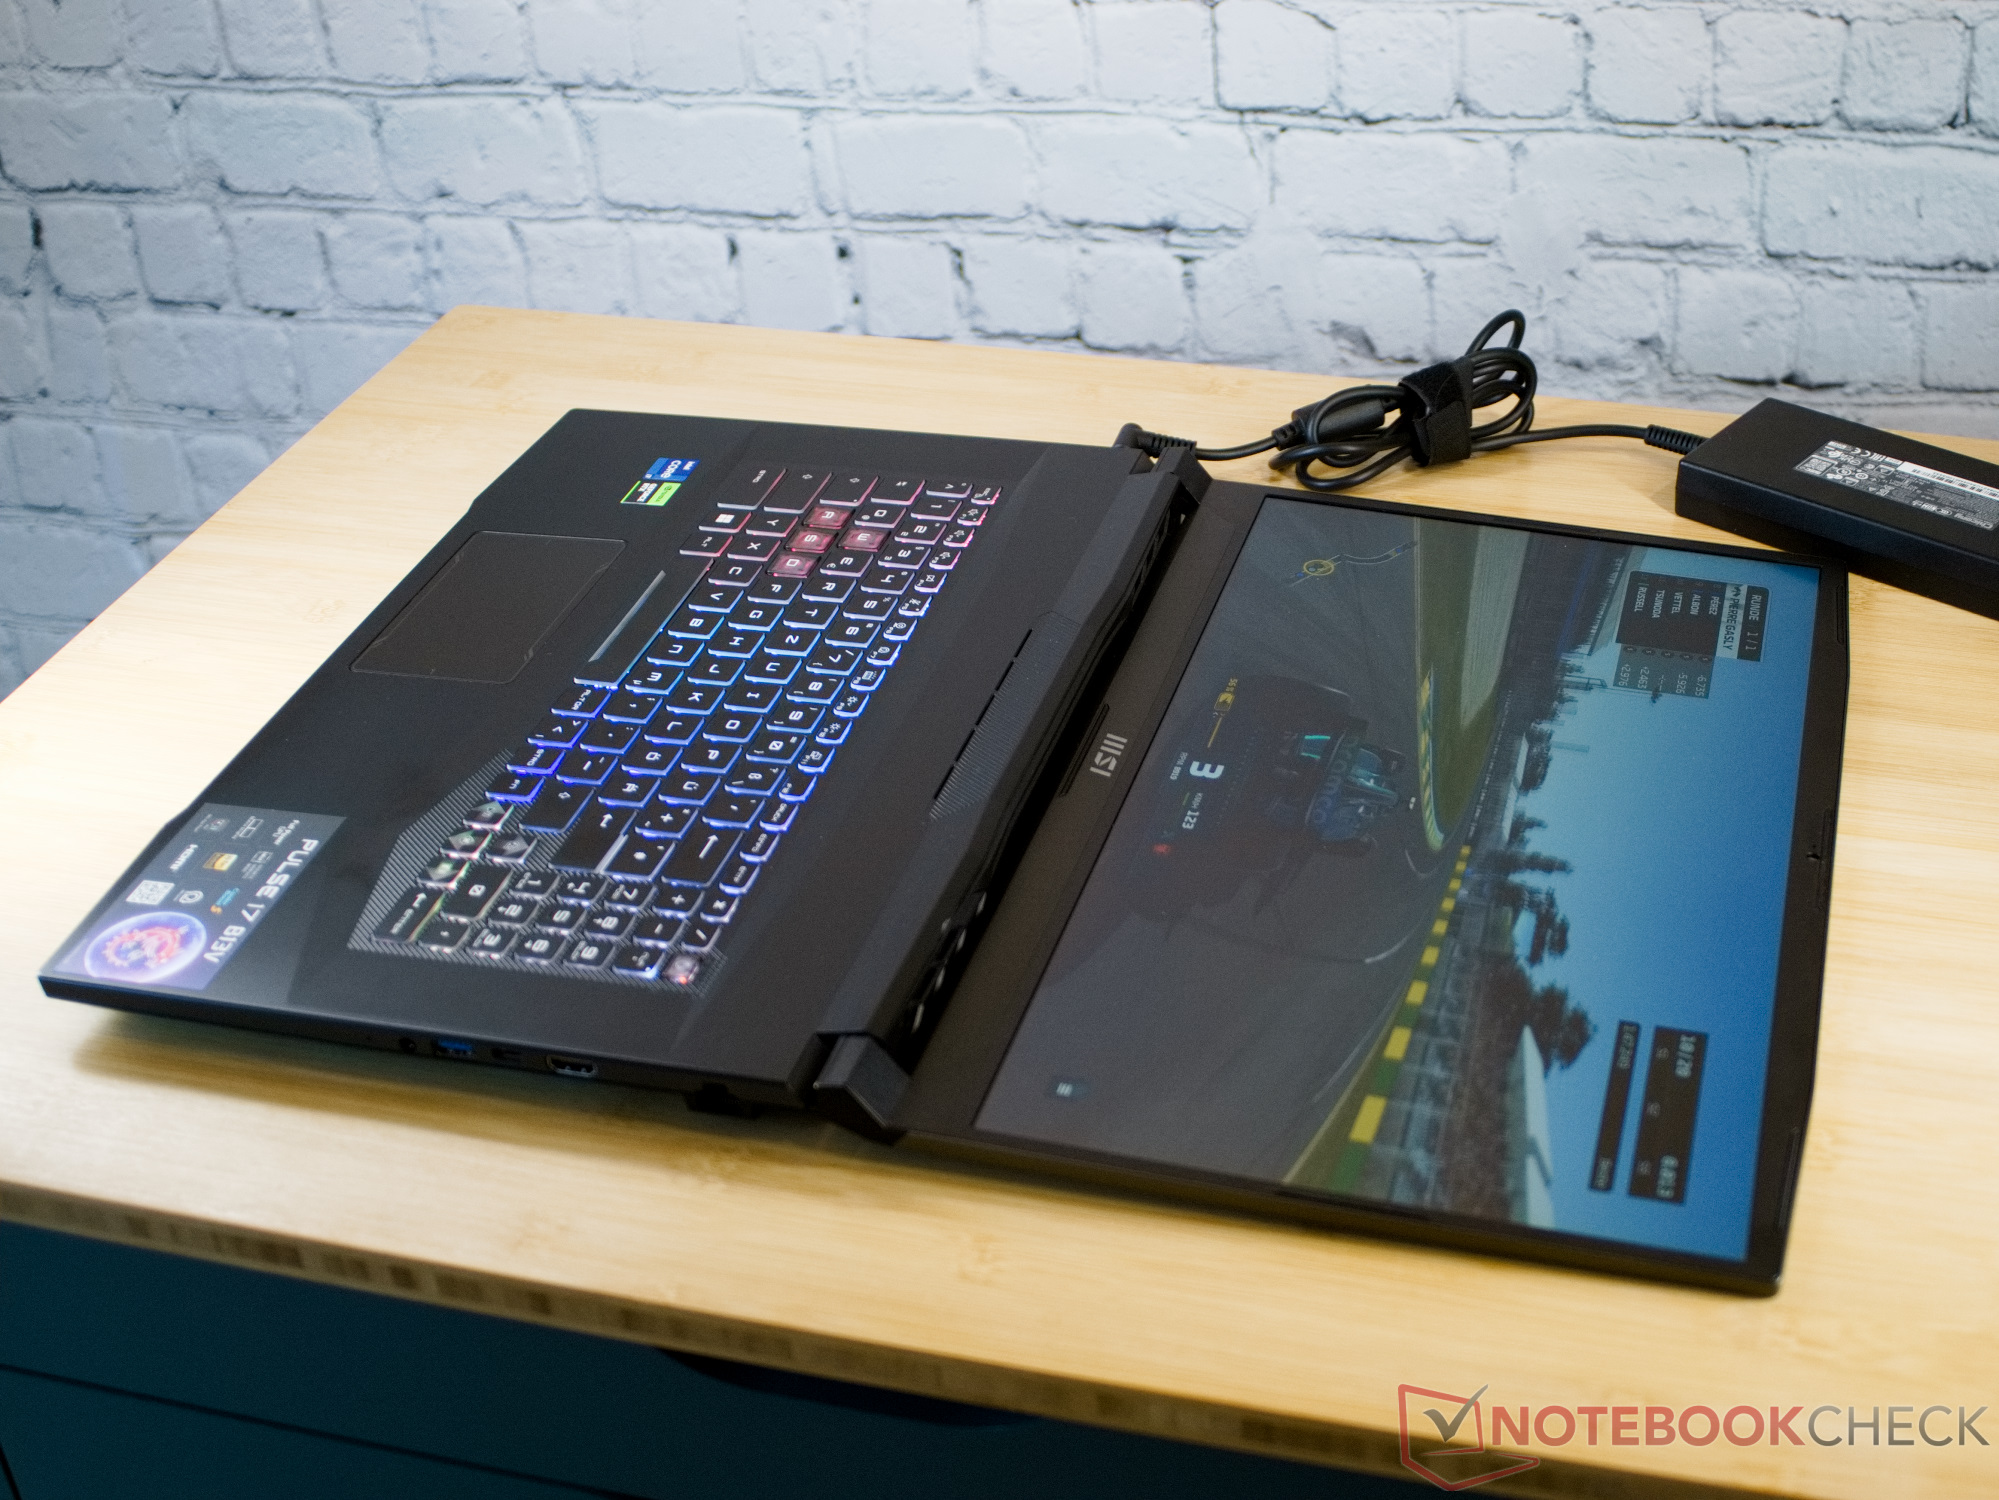
Input Devices - Four RGB zones and a small touchpad in the MSI Pulse
Teclado
El MSI Control Center permite controlar la iluminación de fondo RGB del teclado MSI Pluse 17. El fabricante también permite utilizar software de terceros para cambiar los colores y efectos de las cuatro zonas de iluminación del teclado. El fabricante también permite usar software de terceros para cambiar los colores y efectos en las cuatro zonas de iluminación del teclado. Las teclas transparentes W, A, S y D destacan especialmente aquí. El teclado ofrece una buena respuesta háptica y un recorrido de tecla de unos 1,2 mm.
Panel táctil
El touchpad del Pulse 17 es relativamente pequeño, pero esto también significa que no estorba con las palmas al jugar. Con su superficie lisa, teclas nítidas y gran precisión, funciona bien en general.
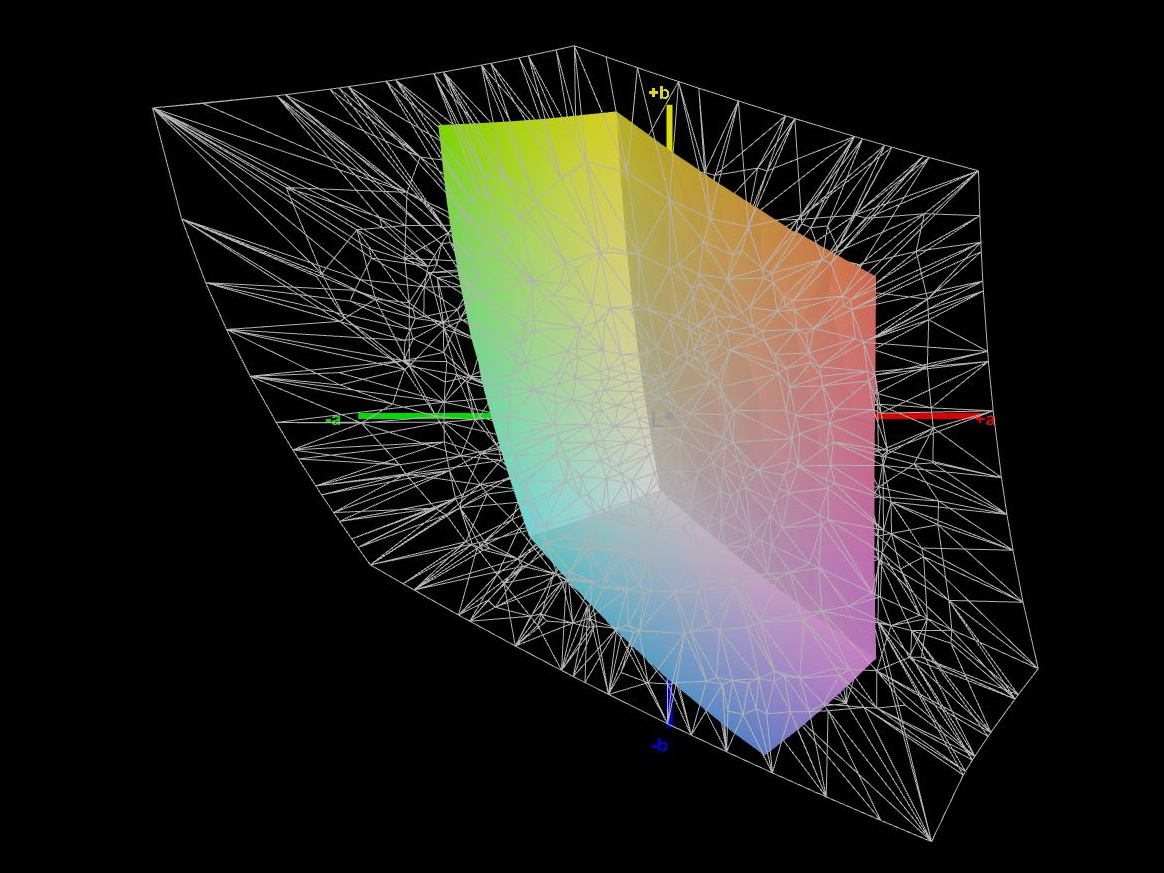
Pantalla - Menos del 60% de cobertura sRGB
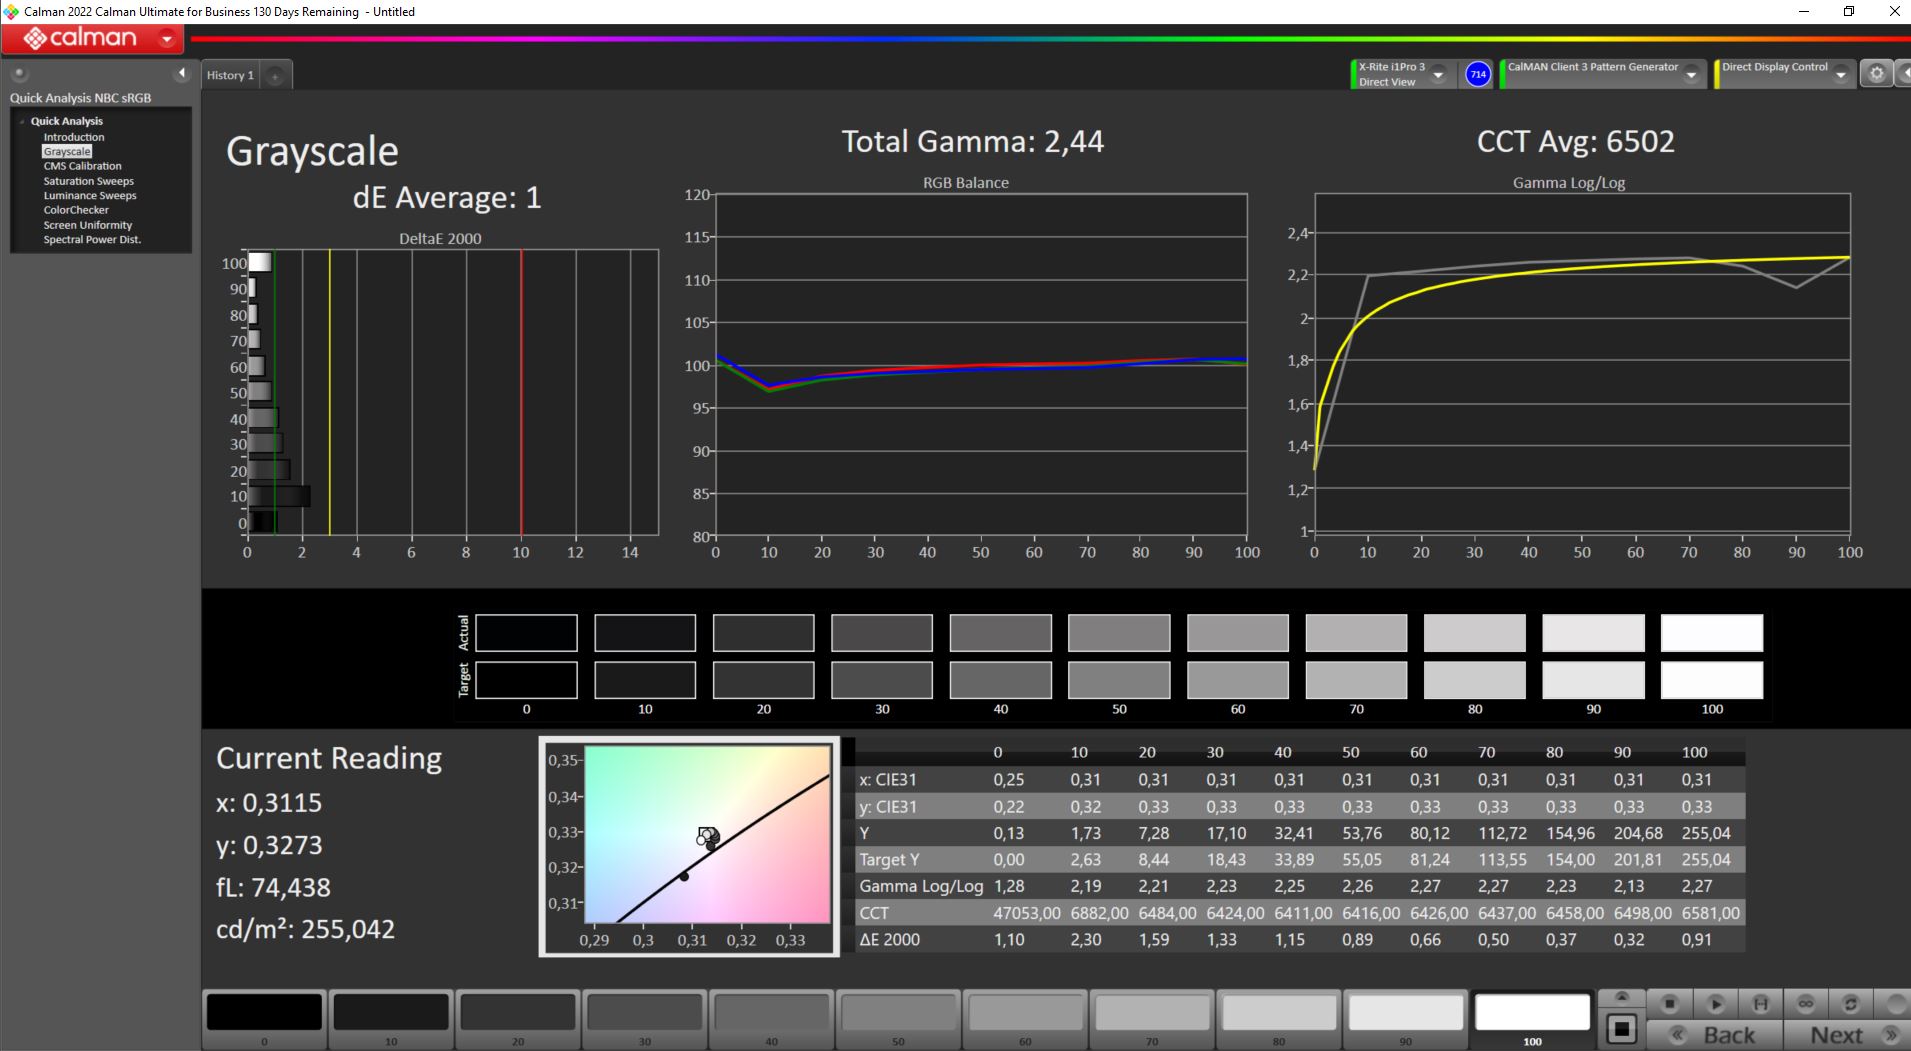
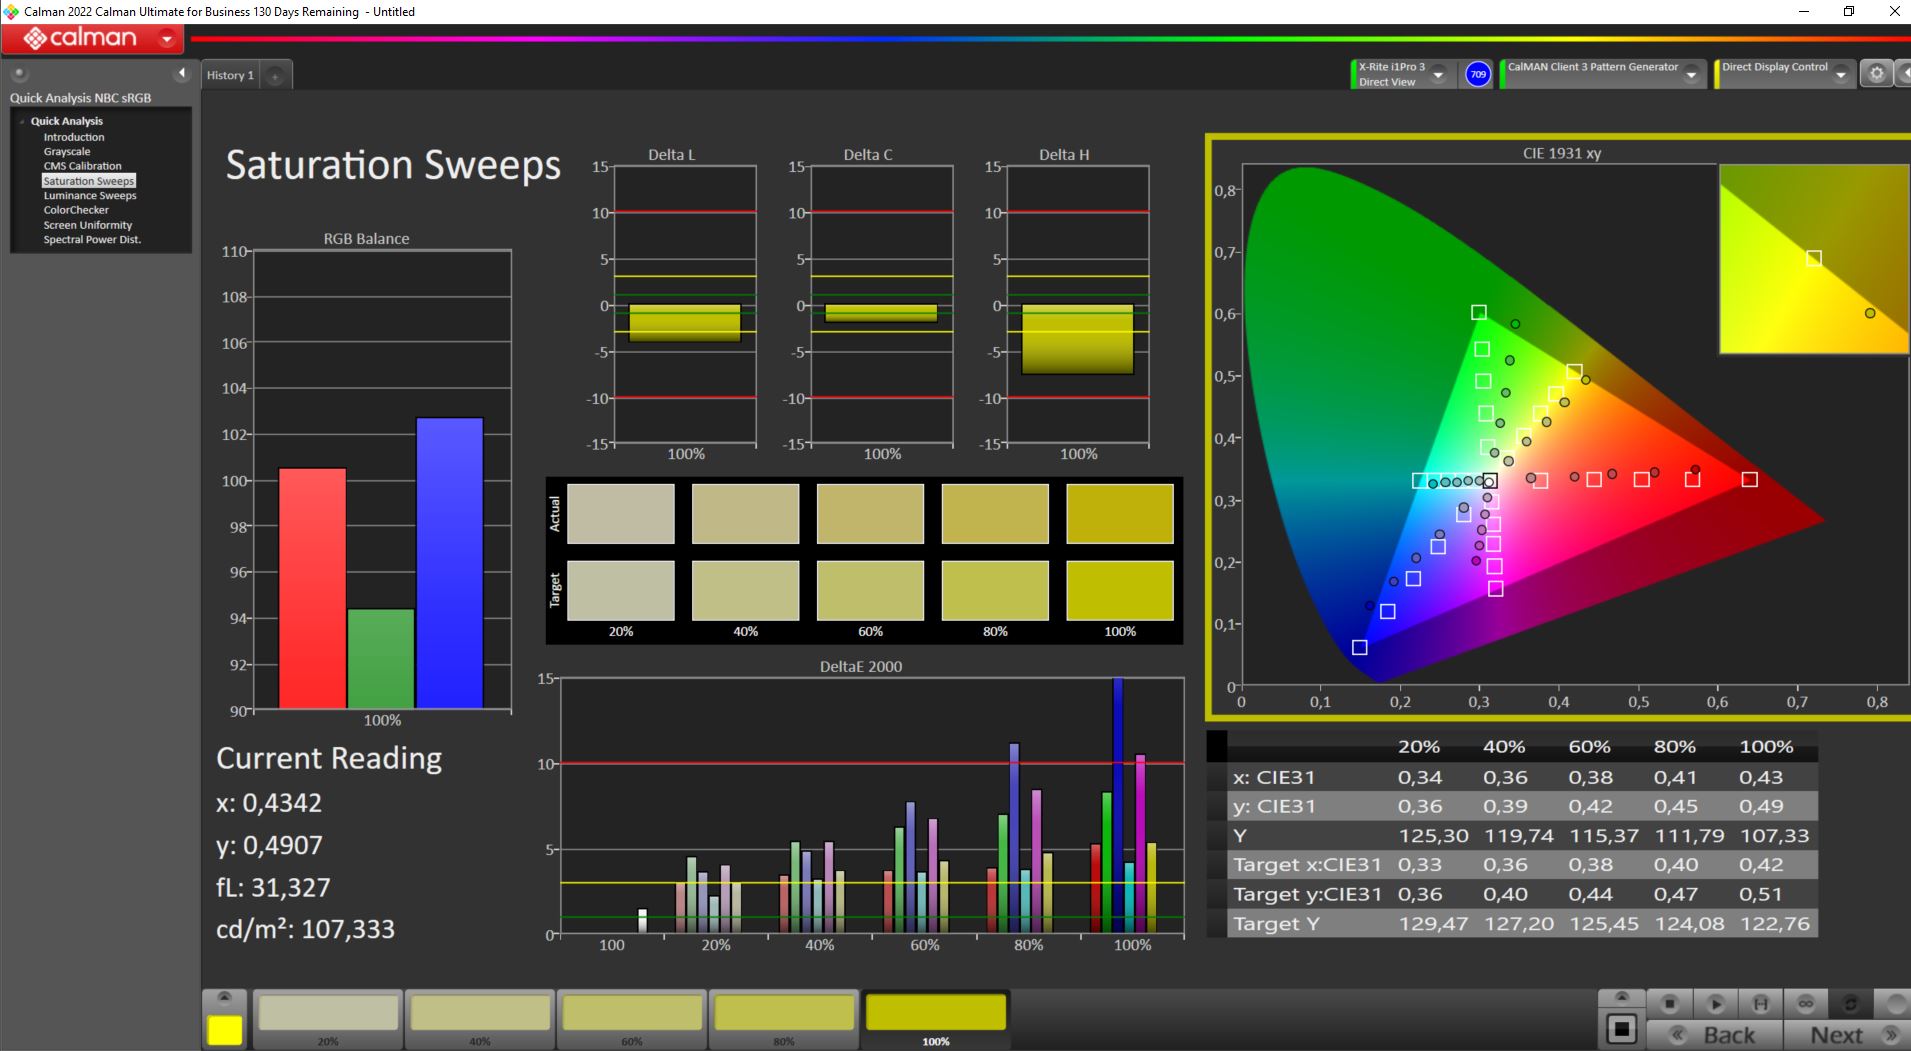
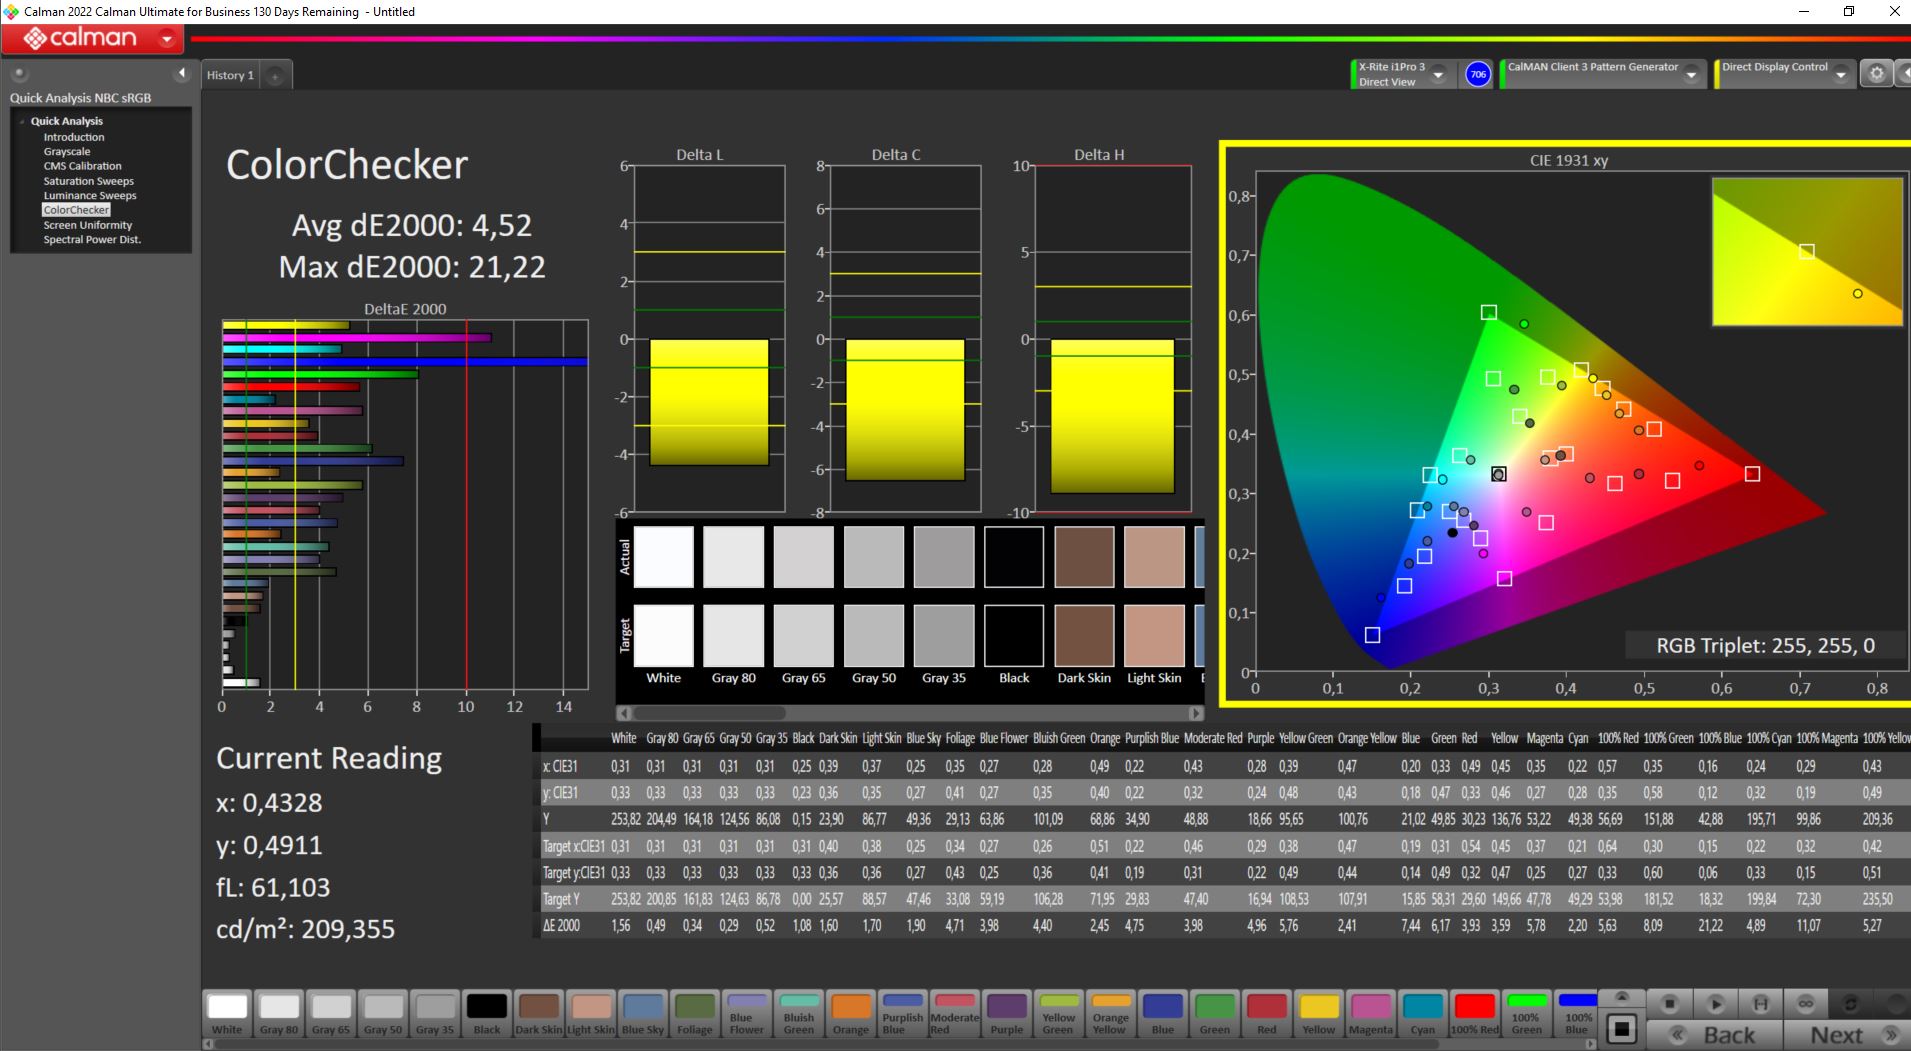
En un portátil de juegos, la pantalla debe ser muy sensible, cubrir completamente el espacio de color sRGB, y ofrecer un alto contraste. De estos, solo un alto ratio de contraste habla por la pantalla del MSI Pulse. Aunque la pantalla mate no es particularmente brillante con un brillo medio de 250 cd/m², el bajo valor de negro asegura el alto ratio de contraste. La distribución del brillo no es particularmente uniforme, pero al menos no notamos halos de luz visibles.
Esto significa que la pantalla del Pulse 17 es significativamente peor que la del Pulse GL76. Los tiempos de respuesta casi se han duplicado en comparación, llegando a ser casi 6 veces más lentos a veces, y el número de colores visualizables se ha reducido a casi la mitad. Así que MSI ha realizado un downgrade significativo de la pantalla.
| |||||||||||||||||||||||||
iluminación: 91 %
Brillo con batería: 253 cd/m²
Contraste: 1814:1 (Negro: 0.14 cd/m²)
ΔE ColorChecker Calman: 4.52 | ∀{0.5-29.43 Ø4.71}
calibrated: 4.52
ΔE Greyscale Calman: 1 | ∀{0.09-98 Ø4.96}
39.7% AdobeRGB 1998 (Argyll 3D)
57.5% sRGB (Argyll 3D)
38.4% Display P3 (Argyll 3D)
Gamma: 2.44
CCT: 6502 K
| MSI Pulse 17 B13VGK AU Optronics B173HAN04.9, IPS, 1920x1080, 17.3" | MSI Pulse GL76 12UGK Sharp LQ173M1JW08, IPS, 1920x1080, 17.3" | MSI Katana 17 B13VFK B173HAN04.9, IPS LED, 1920x1080, 17.3" | Acer Nitro 17 AN17-51-71ER BOE0B7C NE173QHM-NY6, , 2560x1440, 17.3" | Schenker XMG Focus 17 (E23) BOE09F9 NE173QHM-NZ1, IPS, 2560x1440, 17.3" | Asus ROG Strix G17 G713PI BOE0B69, IPS, 2560x1440, 17.3" | |
|---|---|---|---|---|---|---|
| Display | 82% | 6% | 115% | 113% | 115% | |
| Display P3 Coverage (%) | 38.4 | 71.9 87% | 40.8 6% | 98.3 156% | 96.6 152% | 98.3 156% |
| sRGB Coverage (%) | 57.5 | 99.9 74% | 61 6% | 100 74% | 99.9 74% | 100 74% |
| AdobeRGB 1998 Coverage (%) | 39.7 | 73.7 86% | 42.2 6% | 85.7 116% | 84.5 113% | 85.9 116% |
| Response Times | 69% | -8% | 60% | 51% | 74% | |
| Response Time Grey 50% / Grey 80% * (ms) | 31.2 ? | 4.6 ? 85% | 33 ? -6% | 14.8 ? 53% | 16.4 ? 47% | 5.3 ? 83% |
| Response Time Black / White * (ms) | 23.6 ? | 11.2 ? 53% | 26 ? -10% | 8 ? 66% | 10.8 ? 54% | 8.6 ? 64% |
| PWM Frequency (Hz) | ||||||
| Screen | -55% | -13% | -50% | -10% | 2% | |
| Brightness middle (cd/m²) | 254 | 337.7 33% | 267 5% | 361 42% | 349 37% | 327 29% |
| Brightness (cd/m²) | 250 | 331 32% | 256 2% | 326 30% | 318 27% | 320 28% |
| Brightness Distribution (%) | 91 | 82 -10% | 93 2% | 87 -4% | 82 -10% | 89 -2% |
| Black Level * (cd/m²) | 0.14 | 0.31 -121% | 0.21 -50% | 0.6 -329% | 0.56 -300% | 0.38 -171% |
| Contrast (:1) | 1814 | 1089 -40% | 1271 -30% | 602 -67% | 623 -66% | 861 -53% |
| Colorchecker dE 2000 * | 4.52 | 4.12 9% | 4.7 -4% | 3.83 15% | 1.08 76% | 1.01 78% |
| Colorchecker dE 2000 max. * | 21.22 | 8.89 58% | 20.4 4% | 5.71 73% | 3.05 86% | 4.01 81% |
| Colorchecker dE 2000 calibrated * | 4.52 | 0.98 78% | 4.5 -0% | 3.48 23% | 1.08 76% | 0.41 91% |
| Greyscale dE 2000 * | 1 | 6.3 -530% | 1.5 -50% | 3.29 -229% | 1.14 -14% | 1.6 -60% |
| Gamma | 2.44 90% | 2.48 89% | 2.12 104% | 2.29 96% | 2.41 91% | 2.168 101% |
| CCT | 6502 100% | 6542 99% | 6552 99% | 6679 97% | 6687 97% | 6659 98% |
| Media total (Programa/Opciones) | 32% /
-8% | -5% /
-9% | 42% /
1% | 51% /
25% | 64% /
37% |
* ... más pequeño es mejor
Los espacios de color AdobeRGB y DisplayP3 sólo están cubiertos en menos de un 40%, e incluso sRGB no está cubierto en un 60% por el Pulse 17.
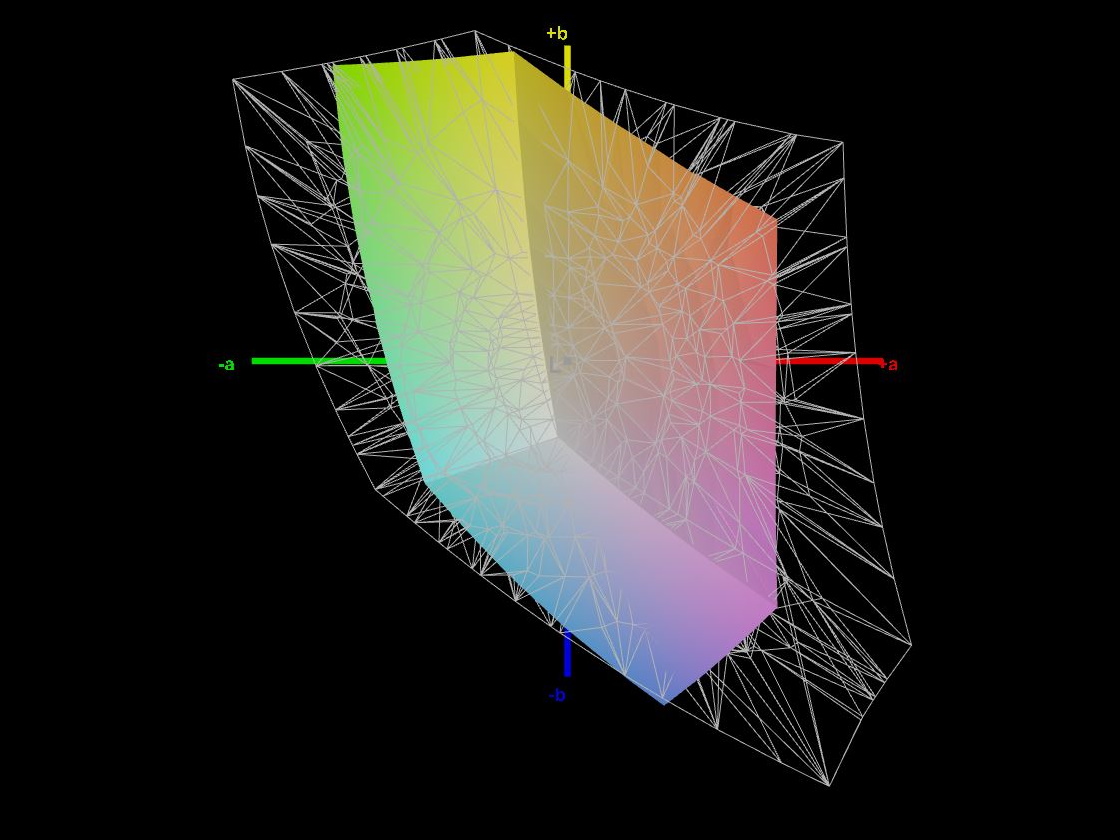
Al menos, la prueba Calman muestra un buen resultado en la visualización de la escala de grises. Sin embargo, la evaluación de la precisión de la reproducción del color con el Calman ColorChecker revela claramente los límites de la pantalla. Con sólo el 60% del espacio de color sRGB, la pantalla carece claramente de grandes partes de los colores, terminando correspondientemente lejos de la escala de color en los colores rojo, verde y azul. El resultado es una desviación máxima del color de ΔΕ 21,22. Se trata de una desviación máxima muy alta que no alcanza ninguno de nuestros otros portátiles de comparación. Pero la pantalla lo hace ligeramente mejor en las desviaciones medias de color. Sin embargo, una calibración adicional no cambia el resultado, por lo que incluso el MSI Katanaacaba con menores desviaciones de color usando nuestro perfil ICC.
Tiempos de respuesta del display
| ↔ Tiempo de respuesta de Negro a Blanco | ||
|---|---|---|
| 23.6 ms ... subida ↗ y bajada ↘ combinada | ↗ 12.2 ms subida | 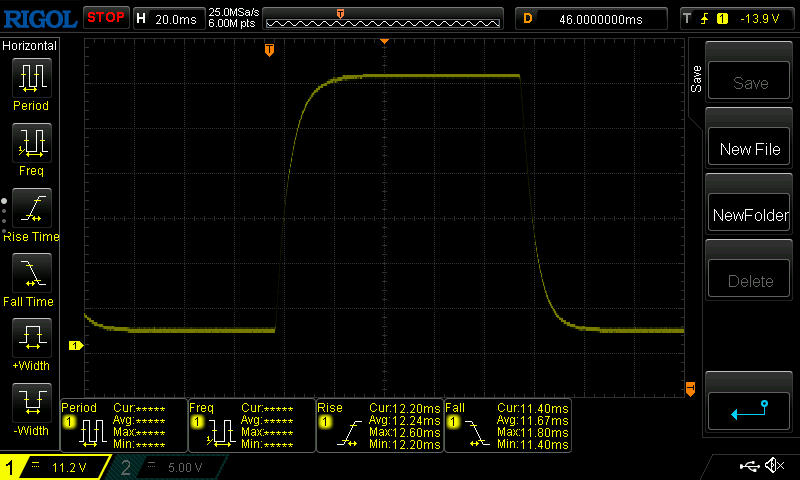 |
| ↘ 11.4 ms bajada | ||
| La pantalla mostró buenos tiempos de respuesta en nuestros tests pero podría ser demasiado lenta para los jugones competitivos. En comparación, todos los dispositivos de prueba van de ##min### (mínimo) a 240 (máximo) ms. » 54 % de todos los dispositivos son mejores. Eso quiere decir que el tiempo de respuesta es peor que la media (19.8 ms) de todos los dispositivos testados. | ||
| ↔ Tiempo de respuesta 50% Gris a 80% Gris | ||
| 31.2 ms ... subida ↗ y bajada ↘ combinada | ↗ 14.2 ms subida | 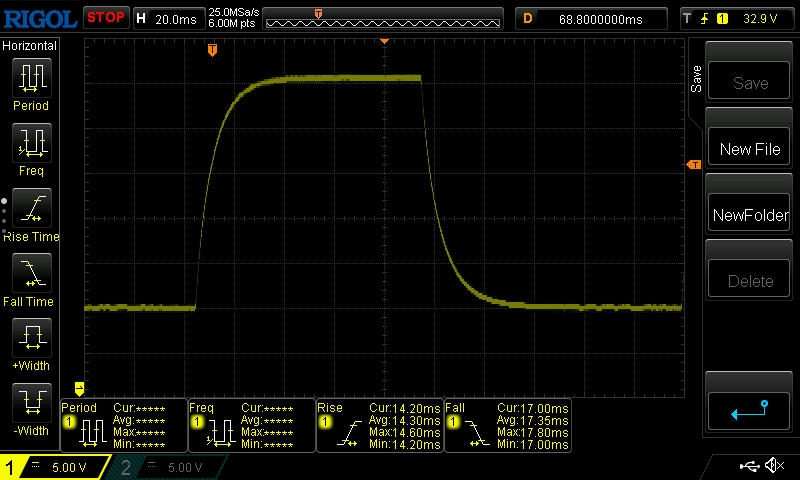 |
| ↘ 17 ms bajada | ||
| La pantalla mostró tiempos de respuesta lentos en nuestros tests y podría ser demasiado lenta para los jugones. En comparación, todos los dispositivos de prueba van de ##min### (mínimo) a 636 (máximo) ms. » 42 % de todos los dispositivos son mejores. Eso quiere decir que el tiempo de respuesta es similar al dispositivo testado medio (31 ms). | ||
Parpadeo de Pantalla / PWM (Pulse-Width Modulation)
| Parpadeo de Pantalla / PWM no detectado | 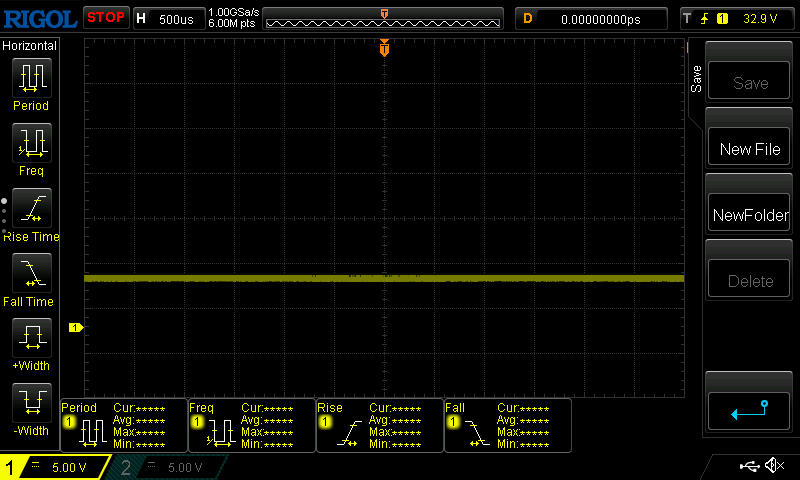 | ||
Comparación: 52 % de todos los dispositivos testados no usaron PWM para atenuar el display. Si se usó, medimos una media de 7757 (mínimo: 5 - máxmo: 343500) Hz. | |||
Los ángulos de visión del panel IPS del Pulse 17 son bastante estables en cuanto a la reproducción del color, pero pierden significativamente en brillo con el aumento del ángulo. Al usarlo en exteriores, el portátil sólo convence hasta cierto punto, ya que el display no es lo bastante brillante como para ser visible a plena luz del sol. Incluso con la iluminación de nuestro estudio, queda rápidamente claro que el display es bastante oscuro, y la superficie mate sigue mostrando una cantidad relativamente grande de reflejos.

Rendimiento - Intel Core i7-13700H muy potente
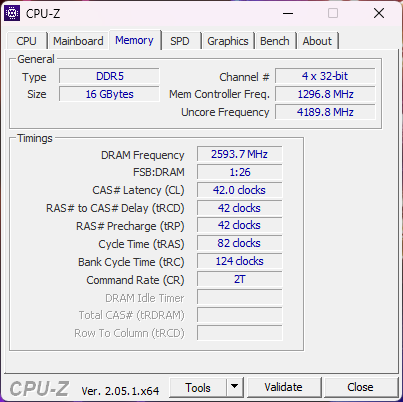
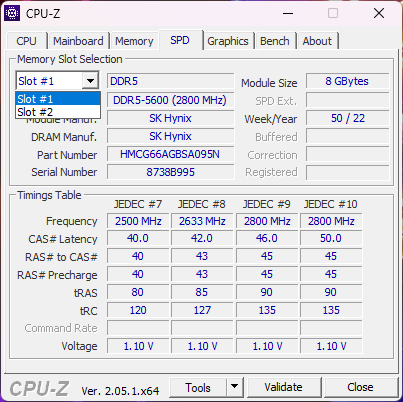
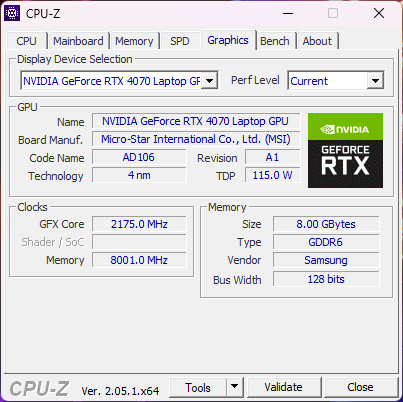
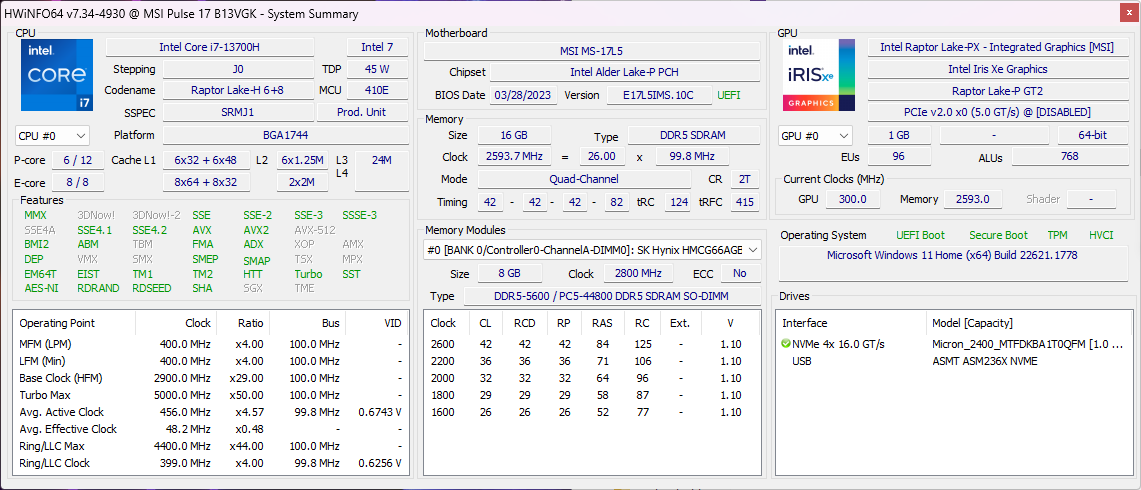
El MSI Pulse 17 B13V está disponible en dos configuraciones de equipo que sólo difieren en términos de su GPU. Mientras que nuestra unidad de pruebas utiliza unaNvidia GeForce RTX 4070la otra configuración viene con una RTX 4060. Como procesador, el Intel Core i7-13700H. Le acompañan 16 GB de RAM DDR5-5200 y un SSD de 1 TB de capacidad. Con una configuración de hardware tan potente, nuestra unidad de pruebas es apta para jugar a resoluciones superiores a Full HD.
Control de potencia y condiciones de prueba
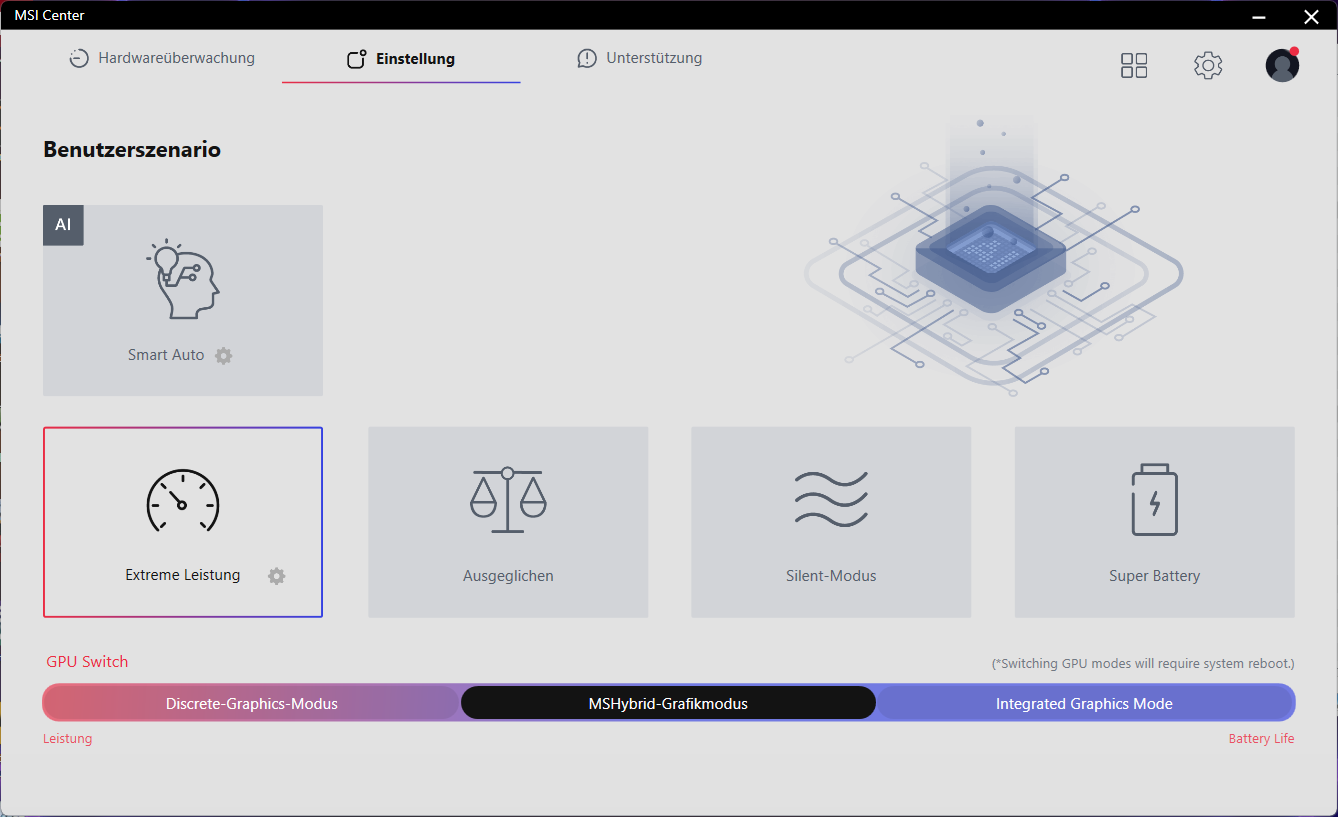
MSI ofrece tres perfiles de rendimiento y un modo de ahorro de batería en el Pulse 17. Además, también puedes usar el modo AI de MSI. Cuando la CPU funciona sola, es capaz de usar un PL1 de 90 vatios en modo Rendimiento Extremo, con un potente rendimiento boost (PL2) de 140 vatios. En el modo Equilibrado, PL1 y PL2 se sitúan en 70 y 120 vatios respectivamente. El modo Quiet Operation, en el que los ventiladores no son audibles, funciona a 30 vatios sin boost.
Pero lo más interesante para un portátil de juegos es el rendimiento durante el juego. En los tres modos de rendimiento este apenas difiere en los primeros 10 minutos durante nuestra prueba. Sólo las temperaturas alcanzan valores diferentes. Los modos Rendimiento y Equilibrado aseguran temperaturas constantes de CPU y GPU. En el modo Quiet Operation, las temperaturas suben tanto que el rendimiento se ralentiza, cayendo significativamente tras unos 10 minutos.
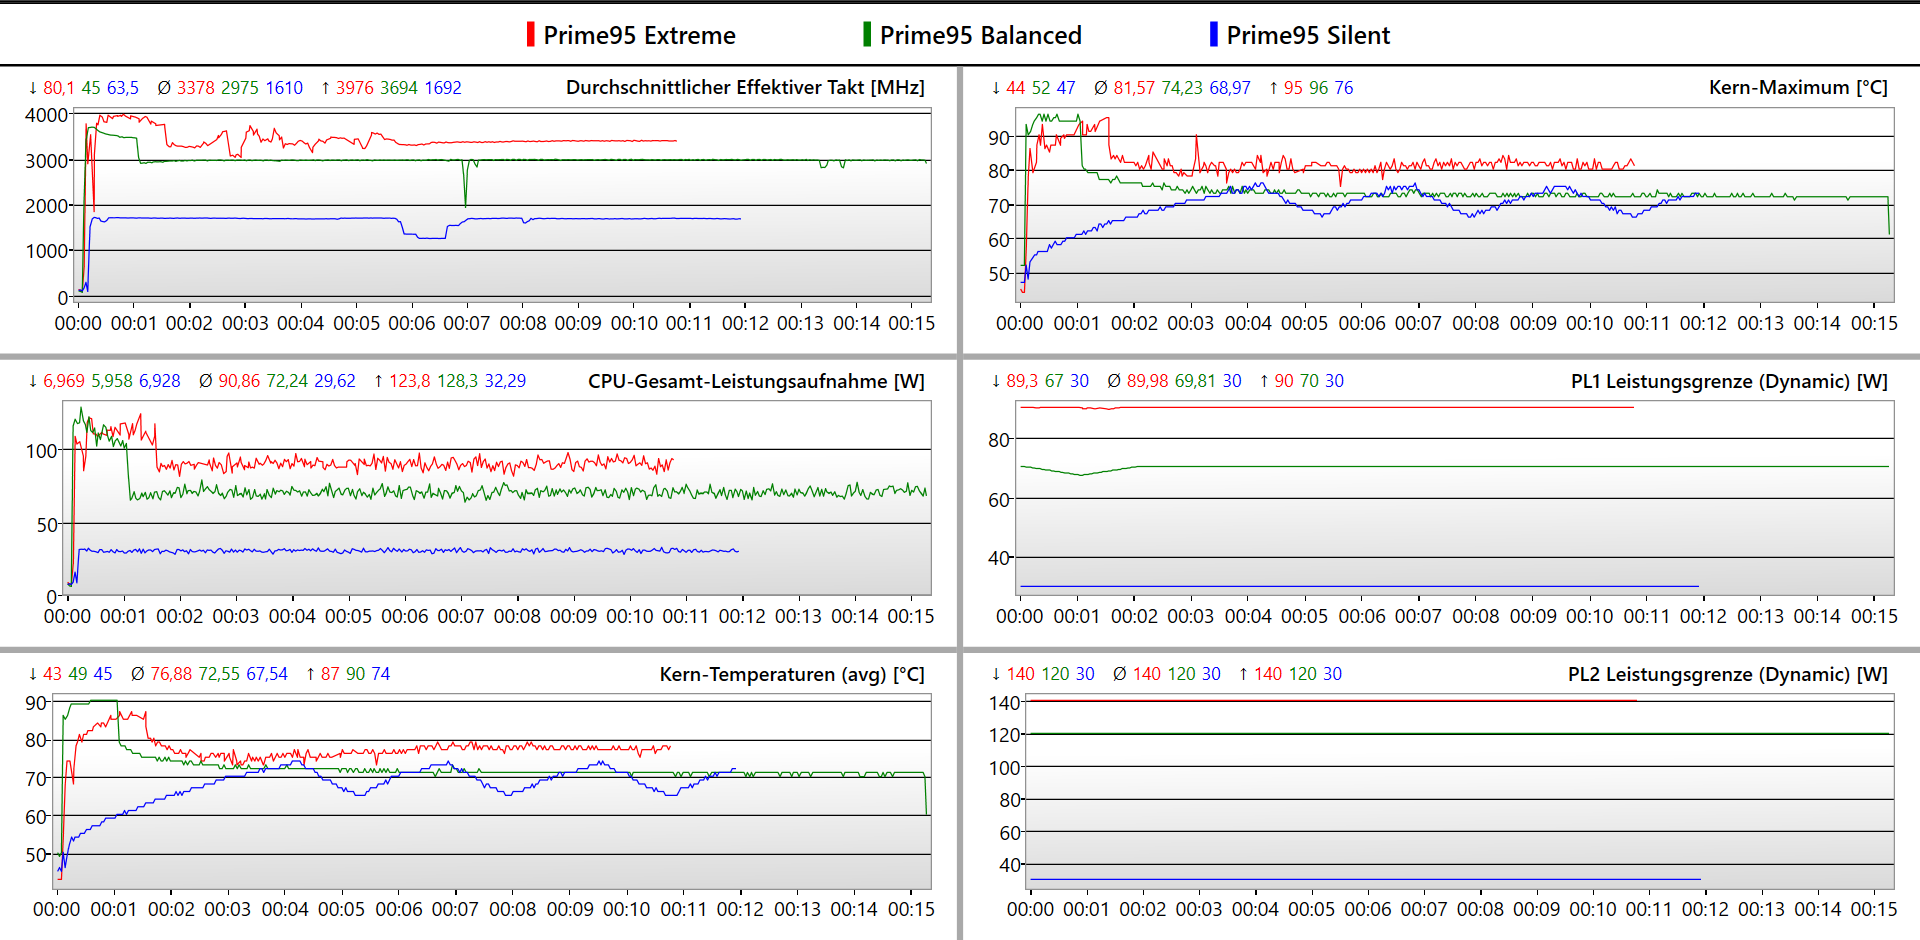
Por tanto, decidimos ejecutar todas las pruebas genéricas en modo Rendimiento y las pruebas de juegos en modo Equilibrado. En todos los juegos probados, también ejecutamos una prueba adicional con los ajustes de calidad más altos en modo Rendimiento. Las velocidades de fotogramas alcanzadas difirieron en menos de un punto porcentual. Esto significa que el modo Rendimiento apenas consigue ventajas en FPS cuando se juega.
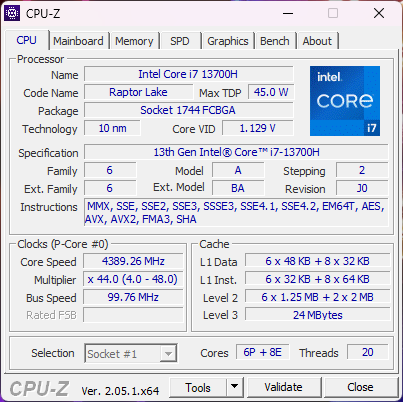
Procesador
Con seis núcleos P y ocho núcleos E, el Intel Core i7-13700H en el Pulse 17 es capaz de manejar 20 hilos. El procesador está dotado de una cantidad relativamente alta de potencia y de este modo es capaz de situarse apenas por delante de los otros dispositivos de comparación con el Core i7. Sin embargo, elXMG Focus 17con unCore i9y el Asus ROG Strix G17con unRyzen 9 superan significativamente a los procesadores i7.
Cinebench R15 Multi Constant Load Test
Cinebench R23: Multi Core | Single Core
Cinebench R20: CPU (Multi Core) | CPU (Single Core)
Cinebench R15: CPU Multi 64Bit | CPU Single 64Bit
Blender: v2.79 BMW27 CPU
7-Zip 18.03: 7z b 4 | 7z b 4 -mmt1
Geekbench 5.5: Multi-Core | Single-Core
HWBOT x265 Benchmark v2.2: 4k Preset
LibreOffice : 20 Documents To PDF
R Benchmark 2.5: Overall mean
| CPU Performance rating | |
| Asus ROG Strix G17 G713PI | |
| Schenker XMG Focus 17 (E23) | |
| Media de la clase Gaming | |
| MSI Pulse 17 B13VGK | |
| MSI Pulse GL76 12UGK | |
| Medio Intel Core i7-13700H | |
| MSI Katana 17 B13VFK | |
| Acer Nitro 17 AN17-51-71ER | |
| Cinebench R23 / Multi Core | |
| Asus ROG Strix G17 G713PI | |
| Schenker XMG Focus 17 (E23) | |
| Media de la clase Gaming (10488 - 42661, n=107, últimos 2 años) | |
| Acer Nitro 17 AN17-51-71ER | |
| MSI Pulse 17 B13VGK | |
| MSI Pulse GL76 12UGK | |
| MSI Katana 17 B13VFK | |
| Medio Intel Core i7-13700H (5890 - 20034, n=29) | |
| Cinebench R23 / Single Core | |
| Media de la clase Gaming (1166 - 2415, n=107, últimos 2 años) | |
| Schenker XMG Focus 17 (E23) | |
| Asus ROG Strix G17 G713PI | |
| MSI Katana 17 B13VFK | |
| Medio Intel Core i7-13700H (1323 - 1914, n=29) | |
| MSI Pulse GL76 12UGK | |
| MSI Pulse 17 B13VGK | |
| Acer Nitro 17 AN17-51-71ER | |
| Cinebench R20 / CPU (Multi Core) | |
| Media de la clase Gaming (4029 - 16433, n=106, últimos 2 años) | |
| Schenker XMG Focus 17 (E23) | |
| Asus ROG Strix G17 G713PI | |
| MSI Pulse 17 B13VGK | |
| Acer Nitro 17 AN17-51-71ER | |
| MSI Pulse GL76 12UGK | |
| MSI Katana 17 B13VFK | |
| Medio Intel Core i7-13700H (2322 - 7674, n=29) | |
| Cinebench R20 / CPU (Single Core) | |
| Media de la clase Gaming (442 - 913, n=106, últimos 2 años) | |
| Schenker XMG Focus 17 (E23) | |
| Asus ROG Strix G17 G713PI | |
| Medio Intel Core i7-13700H (508 - 741, n=29) | |
| MSI Katana 17 B13VFK | |
| MSI Pulse GL76 12UGK | |
| MSI Pulse 17 B13VGK | |
| Acer Nitro 17 AN17-51-71ER | |
| Cinebench R15 / CPU Multi 64Bit | |
| Asus ROG Strix G17 G713PI | |
| Schenker XMG Focus 17 (E23) | |
| Media de la clase Gaming (1578 - 6330, n=105, últimos 2 años) | |
| Acer Nitro 17 AN17-51-71ER | |
| MSI Pulse 17 B13VGK | |
| MSI Pulse GL76 12UGK | |
| Medio Intel Core i7-13700H (905 - 2982, n=29) | |
| MSI Katana 17 B13VFK | |
| Cinebench R15 / CPU Single 64Bit | |
| Media de la clase Gaming (188.8 - 350, n=106, últimos 2 años) | |
| Asus ROG Strix G17 G713PI | |
| Schenker XMG Focus 17 (E23) | |
| Medio Intel Core i7-13700H (213 - 278, n=29) | |
| MSI Katana 17 B13VFK | |
| MSI Pulse GL76 12UGK | |
| MSI Pulse 17 B13VGK | |
| Acer Nitro 17 AN17-51-71ER | |
| Blender / v2.79 BMW27 CPU | |
| Medio Intel Core i7-13700H (169 - 555, n=29) | |
| MSI Katana 17 B13VFK | |
| MSI Pulse GL76 12UGK | |
| Acer Nitro 17 AN17-51-71ER | |
| MSI Pulse 17 B13VGK | |
| Media de la clase Gaming (79 - 330, n=104, últimos 2 años) | |
| Schenker XMG Focus 17 (E23) | |
| Asus ROG Strix G17 G713PI | |
| 7-Zip 18.03 / 7z b 4 | |
| Asus ROG Strix G17 G713PI | |
| Schenker XMG Focus 17 (E23) | |
| Media de la clase Gaming (33491 - 148086, n=105, últimos 2 años) | |
| MSI Pulse 17 B13VGK | |
| Acer Nitro 17 AN17-51-71ER | |
| MSI Pulse GL76 12UGK | |
| MSI Katana 17 B13VFK | |
| Medio Intel Core i7-13700H (27322 - 76344, n=29) | |
| 7-Zip 18.03 / 7z b 4 -mmt1 | |
| Asus ROG Strix G17 G713PI | |
| Schenker XMG Focus 17 (E23) | |
| Media de la clase Gaming (4199 - 7436, n=105, últimos 2 años) | |
| Medio Intel Core i7-13700H (4825 - 6238, n=29) | |
| MSI Katana 17 B13VFK | |
| MSI Pulse GL76 12UGK | |
| MSI Pulse 17 B13VGK | |
| Acer Nitro 17 AN17-51-71ER | |
| Geekbench 5.5 / Multi-Core | |
| Asus ROG Strix G17 G713PI | |
| Schenker XMG Focus 17 (E23) | |
| Media de la clase Gaming (6460 - 28263, n=105, últimos 2 años) | |
| MSI Pulse 17 B13VGK | |
| Acer Nitro 17 AN17-51-71ER | |
| MSI Pulse GL76 12UGK | |
| Medio Intel Core i7-13700H (6165 - 14215, n=29) | |
| MSI Katana 17 B13VFK | |
| Geekbench 5.5 / Single-Core | |
| Media de la clase Gaming (986 - 2474, n=105, últimos 2 años) | |
| Asus ROG Strix G17 G713PI | |
| Schenker XMG Focus 17 (E23) | |
| Medio Intel Core i7-13700H (1362 - 1919, n=29) | |
| MSI Katana 17 B13VFK | |
| MSI Pulse 17 B13VGK | |
| MSI Pulse GL76 12UGK | |
| Acer Nitro 17 AN17-51-71ER | |
| HWBOT x265 Benchmark v2.2 / 4k Preset | |
| Asus ROG Strix G17 G713PI | |
| Media de la clase Gaming (11.5 - 44.4, n=105, últimos 2 años) | |
| Schenker XMG Focus 17 (E23) | |
| MSI Pulse 17 B13VGK | |
| Acer Nitro 17 AN17-51-71ER | |
| MSI Pulse GL76 12UGK | |
| MSI Katana 17 B13VFK | |
| Medio Intel Core i7-13700H (6.72 - 21.2, n=29) | |
| LibreOffice / 20 Documents To PDF | |
| MSI Pulse 17 B13VGK | |
| MSI Katana 17 B13VFK | |
| Acer Nitro 17 AN17-51-71ER | |
| Schenker XMG Focus 17 (E23) | |
| Media de la clase Gaming (33.2 - 88.8, n=105, últimos 2 años) | |
| Medio Intel Core i7-13700H (31.3 - 62.4, n=29) | |
| MSI Pulse GL76 12UGK | |
| Asus ROG Strix G17 G713PI | |
| R Benchmark 2.5 / Overall mean | |
| Acer Nitro 17 AN17-51-71ER | |
| MSI Pulse 17 B13VGK | |
| MSI Pulse GL76 12UGK | |
| Medio Intel Core i7-13700H (0.4308 - 0.607, n=29) | |
| MSI Katana 17 B13VFK | |
| Media de la clase Gaming (0.3439 - 0.759, n=106, últimos 2 años) | |
| Schenker XMG Focus 17 (E23) | |
| Asus ROG Strix G17 G713PI | |
* ... más pequeño es mejor
AIDA64: FP32 Ray-Trace | FPU Julia | CPU SHA3 | CPU Queen | FPU SinJulia | FPU Mandel | CPU AES | CPU ZLib | FP64 Ray-Trace | CPU PhotoWorxx
| Performance rating | |
| Asus ROG Strix G17 G713PI | |
| Media de la clase Gaming | |
| Schenker XMG Focus 17 (E23) | |
| Acer Nitro 17 AN17-51-71ER | |
| MSI Pulse 17 B13VGK | |
| MSI Pulse GL76 12UGK | |
| Medio Intel Core i7-13700H | |
| MSI Katana 17 B13VFK | |
| AIDA64 / FP32 Ray-Trace | |
| Asus ROG Strix G17 G713PI | |
| Media de la clase Gaming (10227 - 85542, n=105, últimos 2 años) | |
| Schenker XMG Focus 17 (E23) | |
| MSI Pulse 17 B13VGK | |
| Acer Nitro 17 AN17-51-71ER | |
| MSI Pulse GL76 12UGK | |
| Medio Intel Core i7-13700H (4986 - 18908, n=29) | |
| MSI Katana 17 B13VFK | |
| AIDA64 / FPU Julia | |
| Asus ROG Strix G17 G713PI | |
| Media de la clase Gaming (51376 - 238426, n=105, últimos 2 años) | |
| Schenker XMG Focus 17 (E23) | |
| MSI Pulse 17 B13VGK | |
| Acer Nitro 17 AN17-51-71ER | |
| MSI Pulse GL76 12UGK | |
| Medio Intel Core i7-13700H (25360 - 92359, n=29) | |
| MSI Katana 17 B13VFK | |
| AIDA64 / CPU SHA3 | |
| Asus ROG Strix G17 G713PI | |
| Media de la clase Gaming (2180 - 10115, n=105, últimos 2 años) | |
| Schenker XMG Focus 17 (E23) | |
| Acer Nitro 17 AN17-51-71ER | |
| MSI Pulse 17 B13VGK | |
| MSI Pulse GL76 12UGK | |
| Medio Intel Core i7-13700H (1339 - 4224, n=29) | |
| MSI Katana 17 B13VFK | |
| AIDA64 / CPU Queen | |
| Asus ROG Strix G17 G713PI | |
| Schenker XMG Focus 17 (E23) | |
| Media de la clase Gaming (49785 - 173351, n=90, últimos 2 años) | |
| MSI Pulse GL76 12UGK | |
| Acer Nitro 17 AN17-51-71ER | |
| MSI Pulse 17 B13VGK | |
| Medio Intel Core i7-13700H (59324 - 107159, n=29) | |
| MSI Katana 17 B13VFK | |
| AIDA64 / FPU SinJulia | |
| Asus ROG Strix G17 G713PI | |
| Media de la clase Gaming (4424 - 33636, n=105, últimos 2 años) | |
| Schenker XMG Focus 17 (E23) | |
| MSI Pulse 17 B13VGK | |
| Acer Nitro 17 AN17-51-71ER | |
| MSI Pulse GL76 12UGK | |
| Medio Intel Core i7-13700H (4800 - 11050, n=29) | |
| MSI Katana 17 B13VFK | |
| AIDA64 / FPU Mandel | |
| Asus ROG Strix G17 G713PI | |
| Media de la clase Gaming (25115 - 128721, n=105, últimos 2 años) | |
| Schenker XMG Focus 17 (E23) | |
| MSI Pulse 17 B13VGK | |
| Acer Nitro 17 AN17-51-71ER | |
| MSI Pulse GL76 12UGK | |
| Medio Intel Core i7-13700H (12321 - 45118, n=29) | |
| MSI Katana 17 B13VFK | |
| AIDA64 / CPU AES | |
| Asus ROG Strix G17 G713PI | |
| Acer Nitro 17 AN17-51-71ER | |
| MSI Pulse GL76 12UGK | |
| Media de la clase Gaming (39258 - 247074, n=105, últimos 2 años) | |
| Schenker XMG Focus 17 (E23) | |
| MSI Pulse 17 B13VGK | |
| Medio Intel Core i7-13700H (28769 - 151254, n=29) | |
| MSI Katana 17 B13VFK | |
| AIDA64 / CPU ZLib | |
| Asus ROG Strix G17 G713PI | |
| Schenker XMG Focus 17 (E23) | |
| Media de la clase Gaming (574 - 2531, n=105, últimos 2 años) | |
| Acer Nitro 17 AN17-51-71ER | |
| MSI Pulse 17 B13VGK | |
| MSI Pulse GL76 12UGK | |
| Medio Intel Core i7-13700H (389 - 1215, n=29) | |
| MSI Katana 17 B13VFK | |
| AIDA64 / FP64 Ray-Trace | |
| Asus ROG Strix G17 G713PI | |
| Media de la clase Gaming (5509 - 45446, n=105, últimos 2 años) | |
| Schenker XMG Focus 17 (E23) | |
| MSI Pulse 17 B13VGK | |
| Acer Nitro 17 AN17-51-71ER | |
| MSI Pulse GL76 12UGK | |
| Medio Intel Core i7-13700H (2540 - 10135, n=29) | |
| MSI Katana 17 B13VFK | |
| AIDA64 / CPU PhotoWorxx | |
| Schenker XMG Focus 17 (E23) | |
| Media de la clase Gaming (12271 - 89891, n=105, últimos 2 años) | |
| Medio Intel Core i7-13700H (12872 - 52727, n=29) | |
| MSI Pulse 17 B13VGK | |
| Acer Nitro 17 AN17-51-71ER | |
| MSI Katana 17 B13VFK | |
| Asus ROG Strix G17 G713PI | |
| MSI Pulse GL76 12UGK | |
Rendimiento del sistema
Ejecutamos el benchmark PCMark 10 del rendimiento del sistema dos veces, ya que en la primera ejecución, el MSI Pulse quedó muy por detrás de los potentes resultados que el procesador fue capaz de mostrar en sus benchmarks anteriores. Con sólo 6844 puntos, sólo habría alcanzado el último lugar entre nuestros dispositivos de comparación. Sin embargo, varias actualizaciones más tarde usando Windows Update, el panorama cambia drásticamente.
El portátil de juego se sitúa ahora apenas por delante de los dispositivos de comparación. El único valor atípico claro se da en la sección Essentials del banco de pruebas. Sospechamos que la culpa es del relativamente lento SSD de nuestra unidad de pruebas, ya que la sección Essentials pone especial énfasis en los tiempos de acceso de datos y programas.
El CrossMark de CPU pesada pinta un cuadro similar con los dispositivos de comparación con Core i9y Ryzen 9logrando situarse significativamente por delante.
CrossMark: Overall | Productivity | Creativity | Responsiveness
| PCMark 10 / Score | |
| Media de la clase Gaming (5828 - 12414, n=93, últimos 2 años) | |
| MSI Pulse 17 B13VGK | |
| MSI Pulse GL76 12UGK | |
| Asus ROG Strix G17 G713PI | |
| Medio Intel Core i7-13700H, NVIDIA GeForce RTX 4070 Laptop GPU (7158 - 7956, n=8) | |
| MSI Katana 17 B13VFK | |
| Acer Nitro 17 AN17-51-71ER | |
| Schenker XMG Focus 17 (E23) | |
| PCMark 10 / Essentials | |
| Asus ROG Strix G17 G713PI | |
| MSI Pulse GL76 12UGK | |
| MSI Katana 17 B13VFK | |
| Medio Intel Core i7-13700H, NVIDIA GeForce RTX 4070 Laptop GPU (10252 - 11449, n=8) | |
| Media de la clase Gaming (8810 - 11935, n=97, últimos 2 años) | |
| MSI Pulse 17 B13VGK | |
| Acer Nitro 17 AN17-51-71ER | |
| Schenker XMG Focus 17 (E23) | |
| PCMark 10 / Productivity | |
| Media de la clase Gaming (6845 - 25323, n=95, últimos 2 años) | |
| Asus ROG Strix G17 G713PI | |
| MSI Pulse 17 B13VGK | |
| MSI Pulse GL76 12UGK | |
| Schenker XMG Focus 17 (E23) | |
| Medio Intel Core i7-13700H, NVIDIA GeForce RTX 4070 Laptop GPU (8501 - 10769, n=8) | |
| MSI Katana 17 B13VFK | |
| Acer Nitro 17 AN17-51-71ER | |
| PCMark 10 / Digital Content Creation | |
| Media de la clase Gaming (7602 - 19954, n=95, últimos 2 años) | |
| Acer Nitro 17 AN17-51-71ER | |
| MSI Pulse 17 B13VGK | |
| MSI Pulse GL76 12UGK | |
| Medio Intel Core i7-13700H, NVIDIA GeForce RTX 4070 Laptop GPU (10358 - 12908, n=8) | |
| MSI Katana 17 B13VFK | |
| Schenker XMG Focus 17 (E23) | |
| Asus ROG Strix G17 G713PI | |
| CrossMark / Overall | |
| Asus ROG Strix G17 G713PI | |
| Schenker XMG Focus 17 (E23) | |
| Media de la clase Gaming (1366 - 2409, n=94, últimos 2 años) | |
| MSI Pulse 17 B13VGK | |
| Medio Intel Core i7-13700H, NVIDIA GeForce RTX 4070 Laptop GPU (1768 - 2073, n=6) | |
| MSI Katana 17 B13VFK | |
| MSI Pulse GL76 12UGK | |
| Acer Nitro 17 AN17-51-71ER | |
| CrossMark / Productivity | |
| Asus ROG Strix G17 G713PI | |
| Schenker XMG Focus 17 (E23) | |
| Media de la clase Gaming (1386 - 2254, n=94, últimos 2 años) | |
| MSI Pulse 17 B13VGK | |
| Medio Intel Core i7-13700H, NVIDIA GeForce RTX 4070 Laptop GPU (1645 - 2006, n=6) | |
| MSI Pulse GL76 12UGK | |
| MSI Katana 17 B13VFK | |
| Acer Nitro 17 AN17-51-71ER | |
| CrossMark / Creativity | |
| Asus ROG Strix G17 G713PI | |
| Schenker XMG Focus 17 (E23) | |
| Media de la clase Gaming (1343 - 2786, n=94, últimos 2 años) | |
| MSI Pulse 17 B13VGK | |
| Medio Intel Core i7-13700H, NVIDIA GeForce RTX 4070 Laptop GPU (1936 - 2137, n=6) | |
| MSI Katana 17 B13VFK | |
| MSI Pulse GL76 12UGK | |
| Acer Nitro 17 AN17-51-71ER | |
| CrossMark / Responsiveness | |
| MSI Pulse GL76 12UGK | |
| MSI Pulse 17 B13VGK | |
| Schenker XMG Focus 17 (E23) | |
| Medio Intel Core i7-13700H, NVIDIA GeForce RTX 4070 Laptop GPU (1451 - 2202, n=6) | |
| MSI Katana 17 B13VFK | |
| Media de la clase Gaming (1226 - 2334, n=94, últimos 2 años) | |
| Asus ROG Strix G17 G713PI | |
| Acer Nitro 17 AN17-51-71ER | |
| PCMark 10 Score | 7796 puntos | |
ayuda | ||
| AIDA64 / Memory Copy | |
| Schenker XMG Focus 17 (E23) | |
| Media de la clase Gaming (21750 - 129946, n=105, últimos 2 años) | |
| Medio Intel Core i7-13700H (24334 - 78081, n=29) | |
| MSI Pulse 17 B13VGK | |
| Acer Nitro 17 AN17-51-71ER | |
| MSI Katana 17 B13VFK | |
| Asus ROG Strix G17 G713PI | |
| MSI Pulse GL76 12UGK | |
| AIDA64 / Memory Read | |
| Schenker XMG Focus 17 (E23) | |
| Media de la clase Gaming (22956 - 118858, n=105, últimos 2 años) | |
| MSI Pulse 17 B13VGK | |
| Acer Nitro 17 AN17-51-71ER | |
| Medio Intel Core i7-13700H (23681 - 79656, n=29) | |
| MSI Katana 17 B13VFK | |
| Asus ROG Strix G17 G713PI | |
| MSI Pulse GL76 12UGK | |
| AIDA64 / Memory Write | |
| Media de la clase Gaming (22297 - 135096, n=105, últimos 2 años) | |
| Schenker XMG Focus 17 (E23) | |
| Medio Intel Core i7-13700H (22986 - 99898, n=29) | |
| Acer Nitro 17 AN17-51-71ER | |
| MSI Pulse 17 B13VGK | |
| Asus ROG Strix G17 G713PI | |
| MSI Katana 17 B13VFK | |
| MSI Pulse GL76 12UGK | |
| AIDA64 / Memory Latency | |
| Acer Nitro 17 AN17-51-71ER | |
| Media de la clase Gaming (75.3 - 259, n=105, últimos 2 años) | |
| MSI Katana 17 B13VFK | |
| MSI Pulse 17 B13VGK | |
| Medio Intel Core i7-13700H (82.4 - 136.8, n=29) | |
| MSI Pulse GL76 12UGK | |
| Schenker XMG Focus 17 (E23) | |
| Asus ROG Strix G17 G713PI | |
* ... más pequeño es mejor
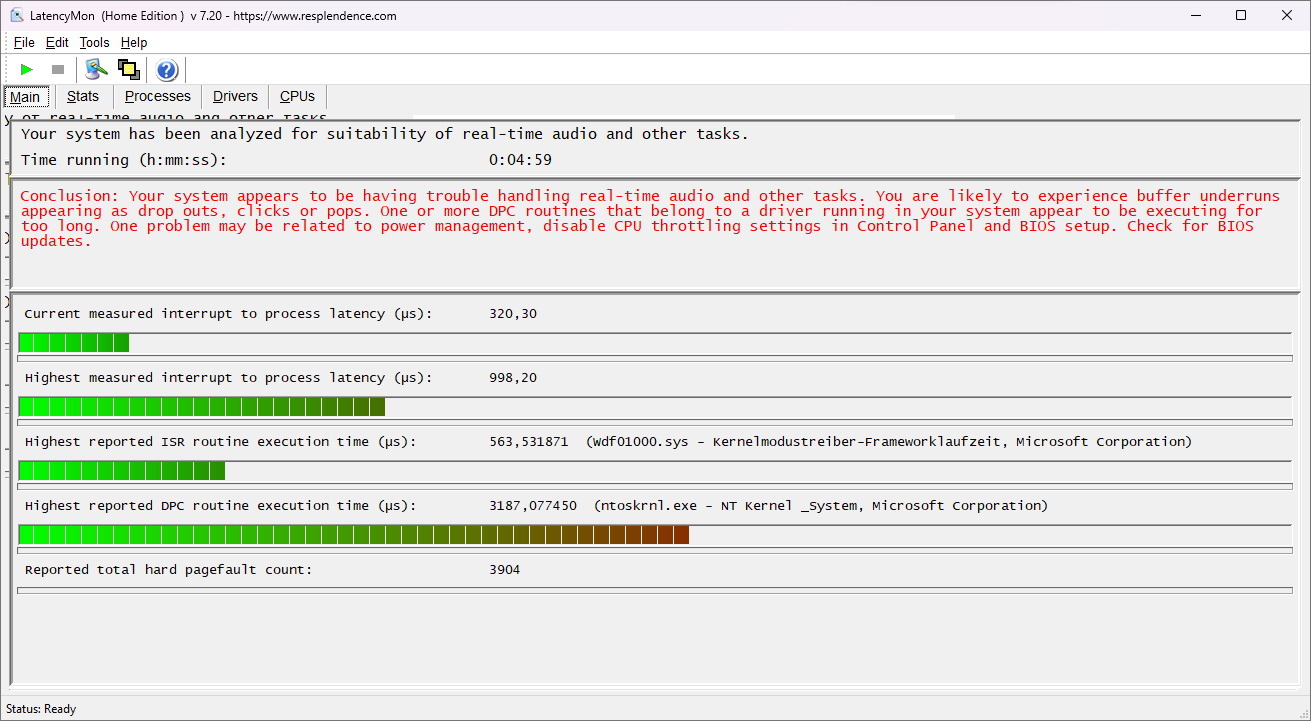
Latencias del CPD
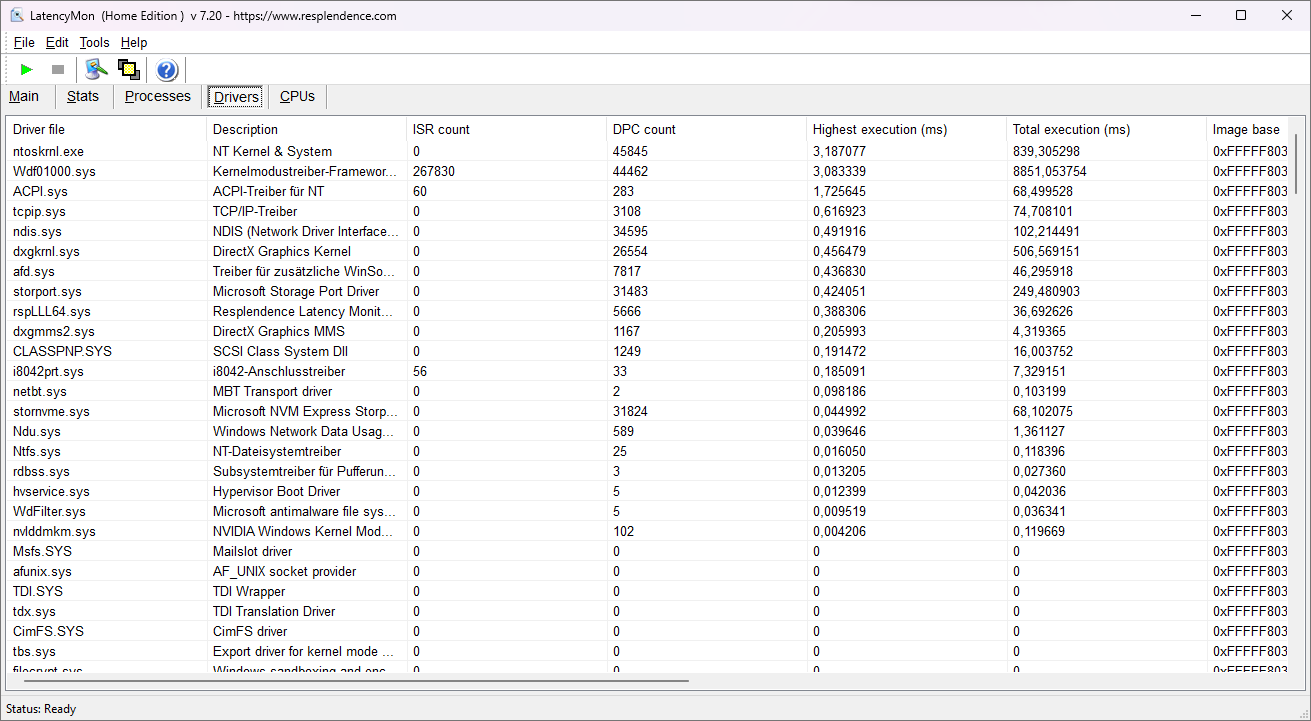
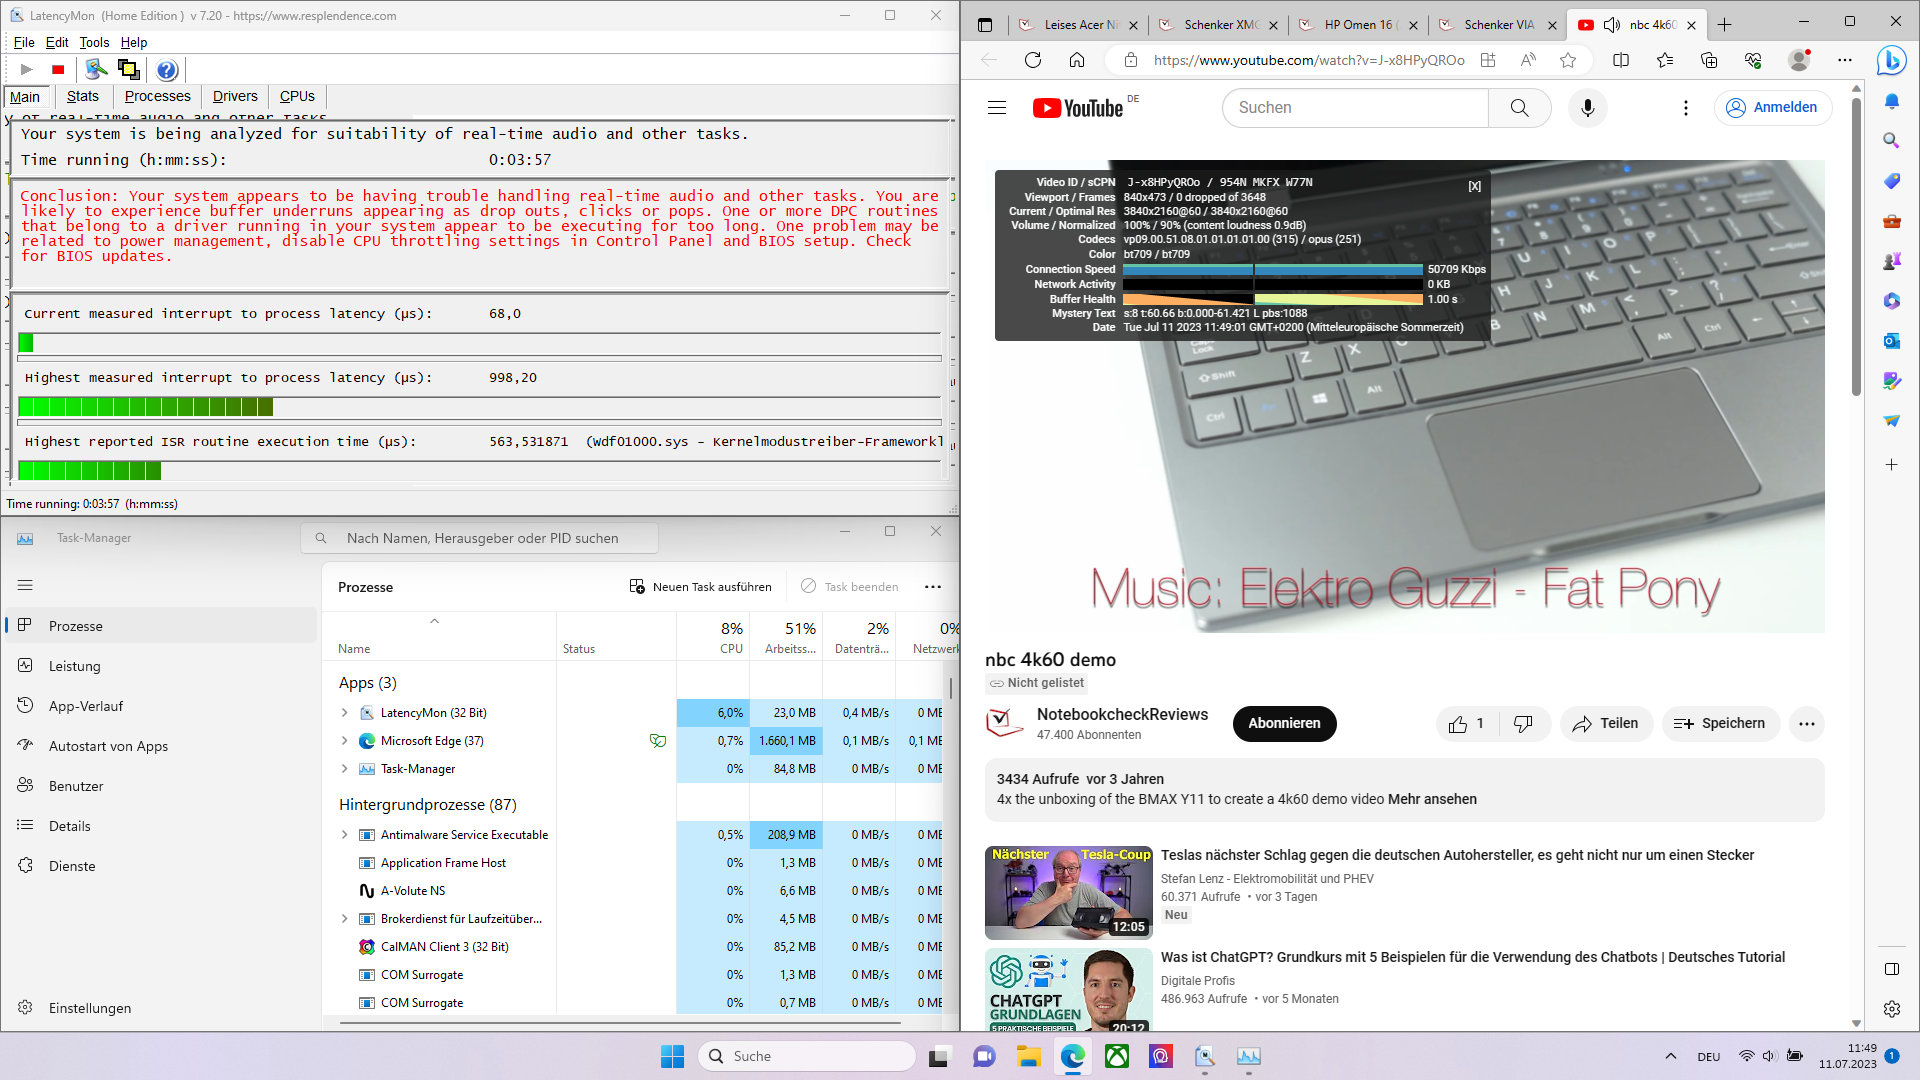
En las latencias DPC, LatencyMon determina que el portátil de juegos con las actualizaciones disponibles en el momento de la prueba no es adecuado para el procesamiento de audio en tiempo real. Aparentemente, el problema radica aquí en el Kernel de Windows.
| DPC Latencies / LatencyMon - interrupt to process latency (max), Web, Youtube, Prime95 | |
| MSI Katana 17 B13VFK | |
| Asus ROG Strix G17 G713PI | |
| Acer Nitro 17 AN17-51-71ER | |
| MSI Pulse 17 B13VGK | |
| Schenker XMG Focus 17 (E23) | |
| MSI Pulse GL76 12UGK | |
* ... más pequeño es mejor
Solución de almacenamiento
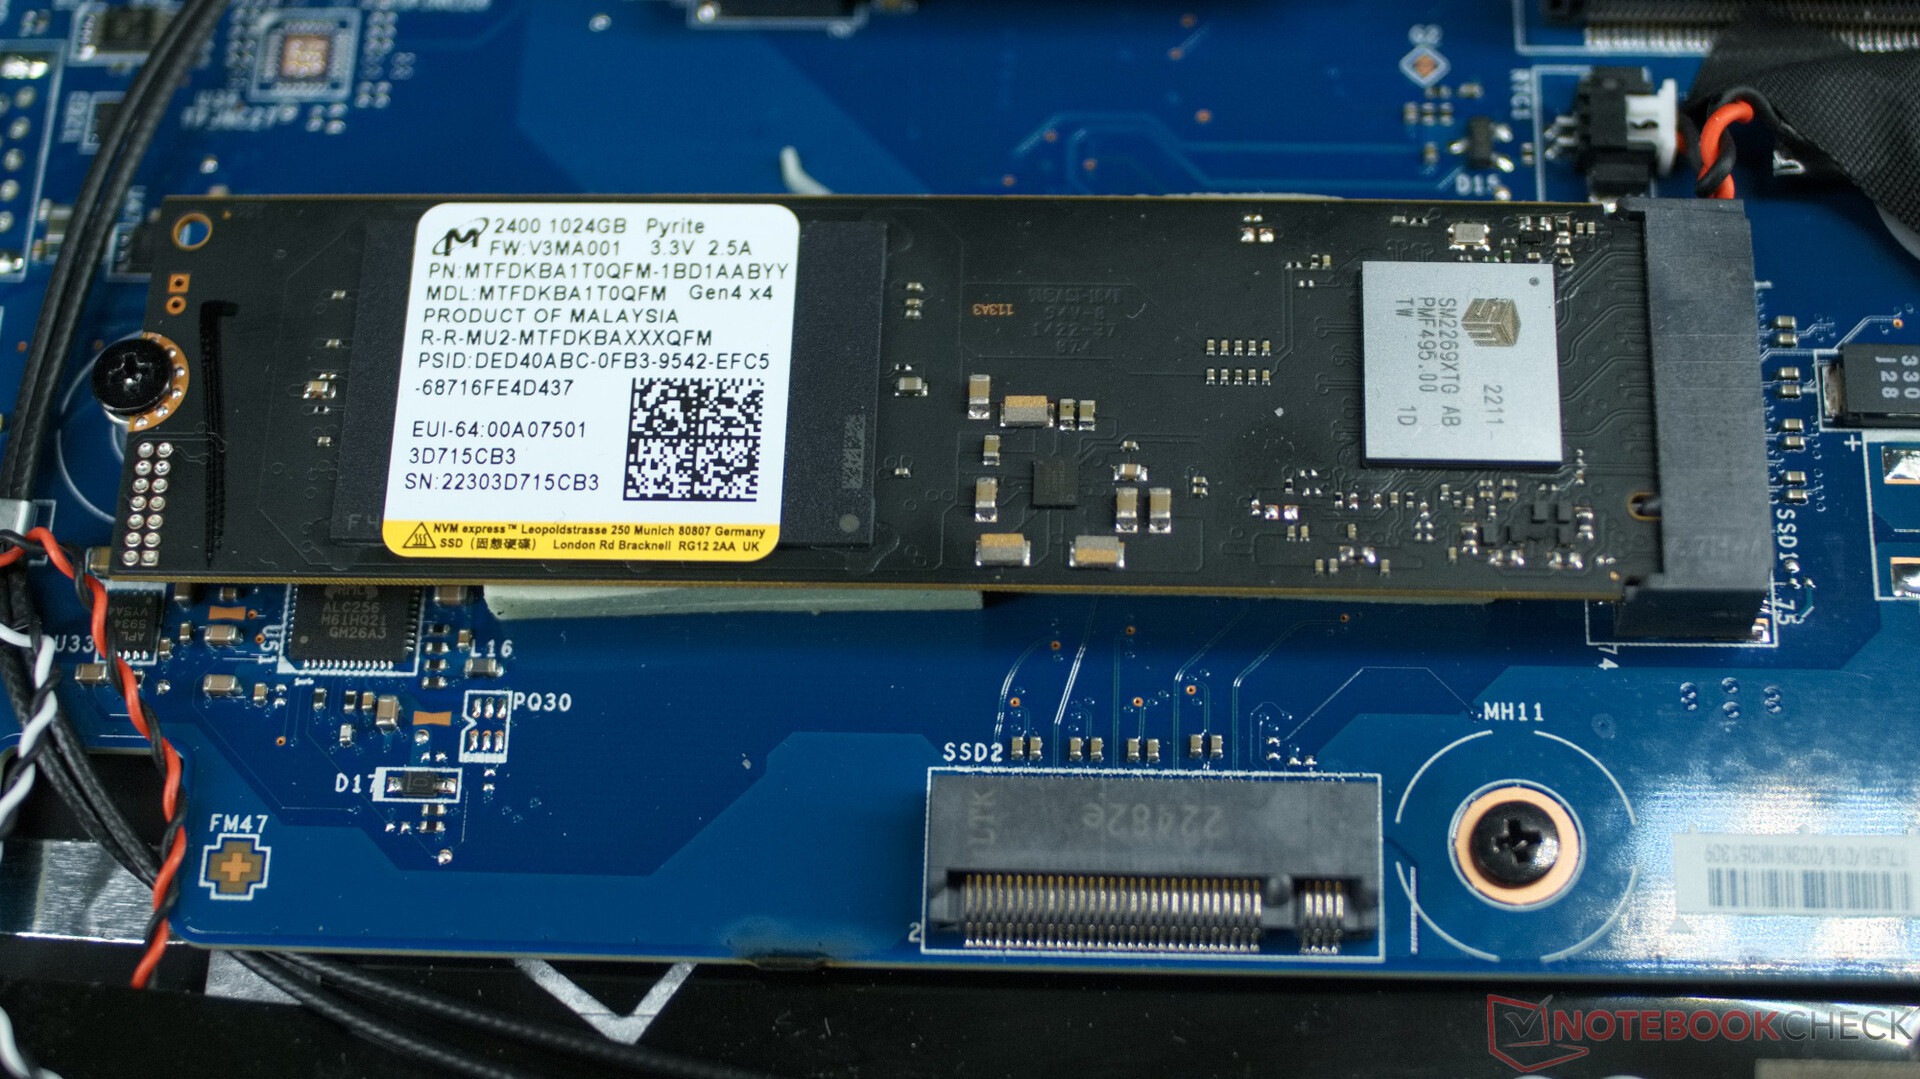
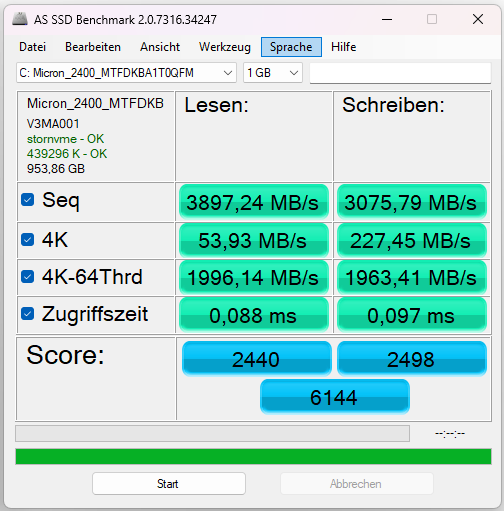
EnSSD NVMe Micron 2400 de nuestra unidad de pruebas ofrece una capacidad de 1 Terabyte. Su velocidad está en la media entre los portátiles de juego y también puede mantenerse constante en el MSI Pulse 17 durante periodos de tiempo más largos sin problemas.

* ... más pequeño es mejor
Constant Read Performance: DiskSpd Read Loop, Queue Depth 8
Tarjeta gráfica
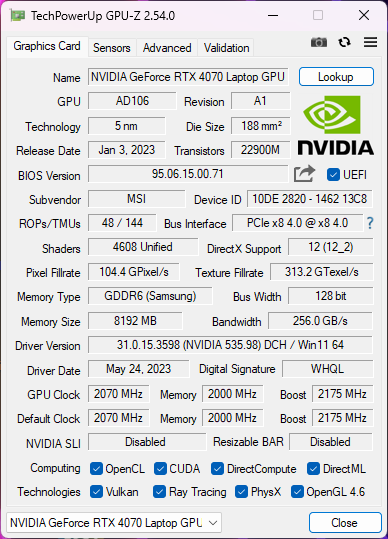
EnNvidia RTX 4070es capaz de funcionar constantemente a unos potentes 100 a 140 vatios en el MSI Pulse 17 sin que las temperaturas del chip se calienten demasiado. Con esto, el chip gráfico ofrece un rendimiento comparativamente alto en las pruebas 3DMark. Esto significa que los juegos Full HD y un ligero raytracing no deberían suponer ningún problema para la tarjeta gráfica, y el chip también domina rápidamente aplicaciones prácticas como el renderizado de gráficos 3D en programas como Blender.
| 3DMark 11 Performance | 34584 puntos | |
| 3DMark Cloud Gate Standard Score | 70329 puntos | |
| 3DMark Fire Strike Score | 27138 puntos | |
| 3DMark Time Spy Score | 12235 puntos | |
ayuda | ||
| Geekbench 6.7 - GPU OpenCL | |
| Media de la clase Gaming (67235 - 253130, n=103, últimos 2 años) | |
| MSI Pulse 17 B13VGK | |
| Medio NVIDIA GeForce RTX 4070 Laptop GPU (85488 - 129836, n=45) | |
* ... más pequeño es mejor
Rendimiento en juegos
ElSchenker XMG Focus 17y Asus ROG Strix G17tienen aquí una ligera ventaja frente al MSI Pulse 17. Ambos portátiles simplemente ofrecen un procesador más rápido, lo que se refleja claramente en las tasas de frames de los juegos con mucha CPU como Dota 2 Reborn. Sin embargo, el Pulse 17 también muestra que el juego Full HD y más con ajustes de alta calidad e incluso raytracing es posible sin bajar de 60 frames por segundo. Al mismo tiempo, el portátil sigue siendo bastante más silencioso que el resto de competidores, y puedes jugar aquí sin ninguna caída de rendimiento en modo equilibrado con un nivel de ruido de sólo 42 dB(A) (medido desde una distancia de 15 cm, ~6 in).
| Performance rating - Percent | |
| Media de la clase Gaming | |
| Asus ROG Strix G17 G713PI | |
| Schenker XMG Focus 17 (E23) | |
| MSI Katana 17 B13VFK | |
| MSI Pulse 17 B13VGK | |
| Acer Nitro 17 AN17-51-71ER | |
| MSI Pulse GL76 12UGK | |
| The Witcher 3 - 1920x1080 Ultra Graphics & Postprocessing (HBAO+) | |
| Media de la clase Gaming (104.7 - 240, n=7, últimos 2 años) | |
| Asus ROG Strix G17 G713PI | |
| Schenker XMG Focus 17 (E23) | |
| MSI Pulse 17 B13VGK | |
| Acer Nitro 17 AN17-51-71ER | |
| MSI Katana 17 B13VFK | |
| MSI Pulse GL76 12UGK | |
| GTA V - 1920x1080 Highest AA:4xMSAA + FX AF:16x | |
| Media de la clase Gaming (48.3 - 186.9, n=94, últimos 2 años) | |
| Schenker XMG Focus 17 (E23) | |
| MSI Pulse 17 B13VGK | |
| Acer Nitro 17 AN17-51-71ER | |
| Asus ROG Strix G17 G713PI | |
| MSI Katana 17 B13VFK | |
| MSI Pulse GL76 12UGK | |
| Final Fantasy XV Benchmark - 1920x1080 High Quality | |
| Media de la clase Gaming (41 - 215, n=95, últimos 2 años) | |
| Schenker XMG Focus 17 (E23) | |
| Asus ROG Strix G17 G713PI | |
| MSI Pulse 17 B13VGK | |
| Acer Nitro 17 AN17-51-71ER | |
| MSI Katana 17 B13VFK | |
| MSI Pulse GL76 12UGK | |
| Strange Brigade - 1920x1080 ultra AA:ultra AF:16 | |
| Media de la clase Gaming (76.3 - 458, n=87, últimos 2 años) | |
| Schenker XMG Focus 17 (E23) | |
| Asus ROG Strix G17 G713PI | |
| MSI Pulse 17 B13VGK | |
| Acer Nitro 17 AN17-51-71ER | |
| MSI Katana 17 B13VFK | |
| MSI Pulse GL76 12UGK | |
| Dota 2 Reborn - 1920x1080 ultra (3/3) best looking | |
| Schenker XMG Focus 17 (E23) | |
| Asus ROG Strix G17 G713PI | |
| MSI Katana 17 B13VFK | |
| Media de la clase Gaming (84.8 - 248, n=107, últimos 2 años) | |
| MSI Pulse 17 B13VGK | |
| Acer Nitro 17 AN17-51-71ER | |
| MSI Pulse GL76 12UGK | |
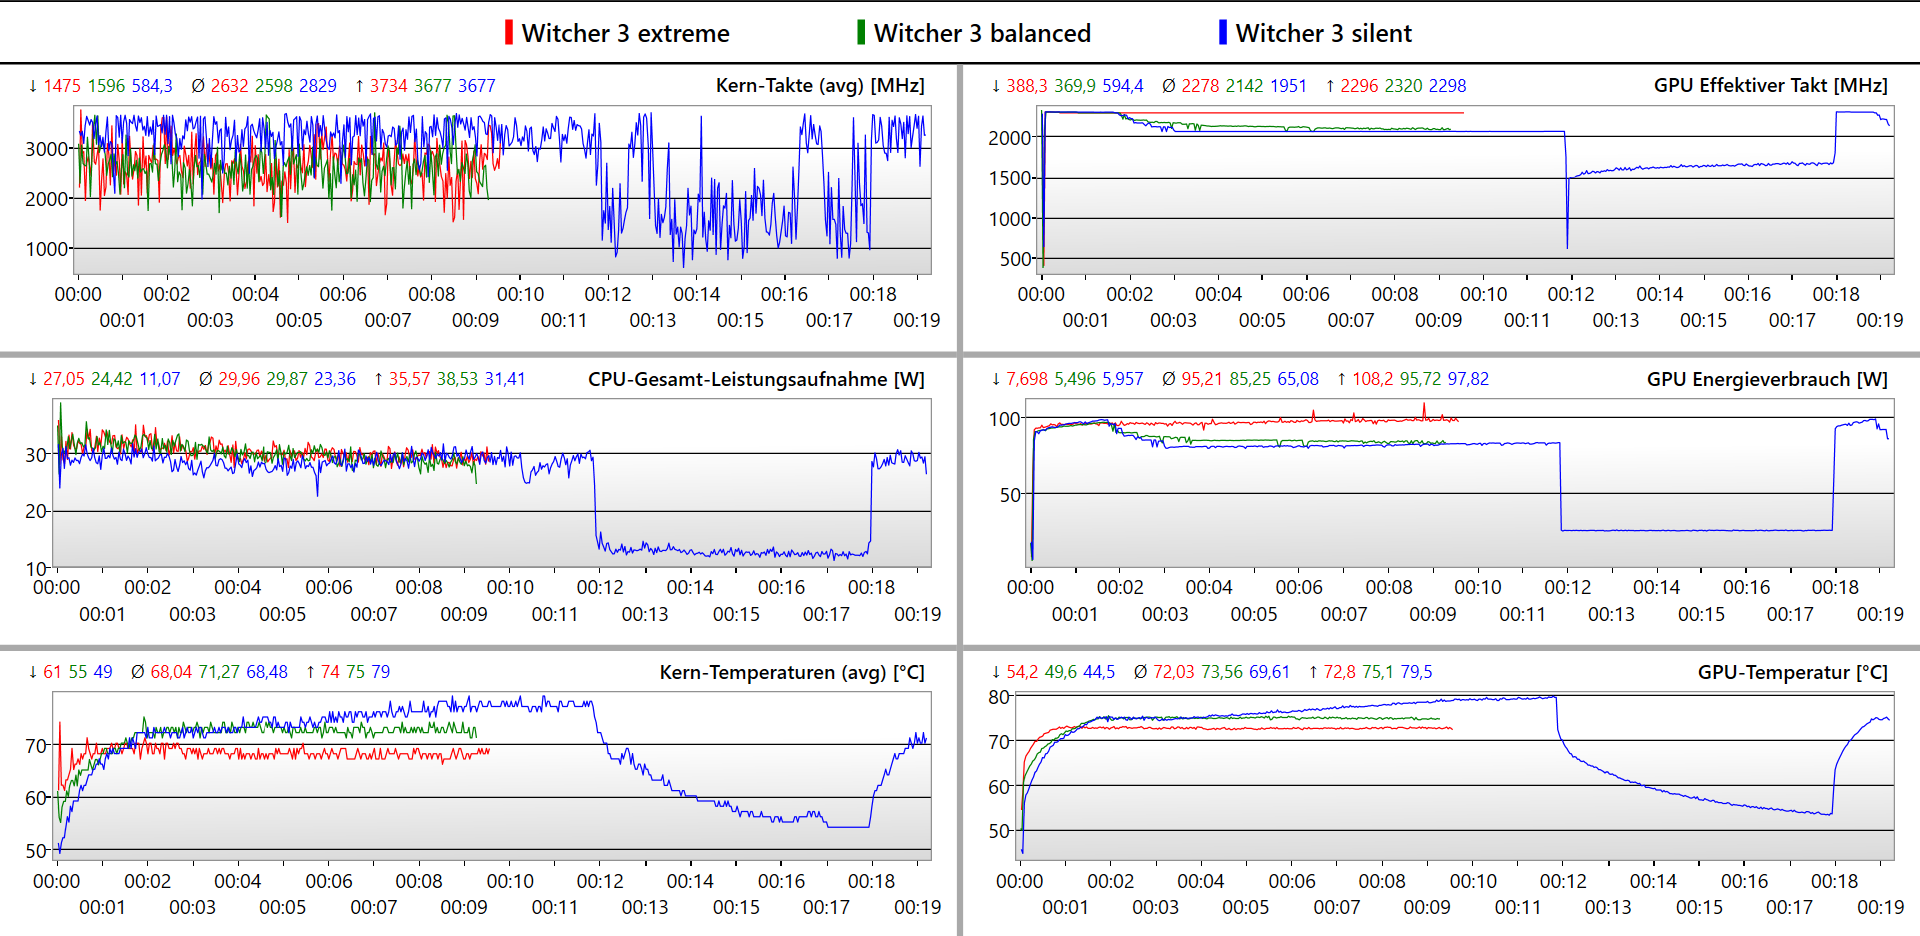
En la prueba de una hora con The Witcher 3, se muestra el rango típico de FPS en el ritmo diurno y nocturno del juego. Aquí no vemos ningún valor atípico significativo.
The Witcher 3 FPS Chart
| bajo | medio | alto | ultra | QHD | 4K | |
|---|---|---|---|---|---|---|
| GTA V (2015) | 184.8 | 182.2 | 176.9 | 116.4 | ||
| The Witcher 3 (2015) | 106.9 | |||||
| Dota 2 Reborn (2015) | 174 | 158 | 146.3 | 138.5 | 132.4 | |
| Final Fantasy XV Benchmark (2018) | 150.5 | 111.9 | 86.2 | 47.5 | ||
| X-Plane 11.11 (2018) | 147.6 | 130.8 | 102 | 102.2 | ||
| Far Cry 5 (2018) | 163 | 154 | 145 | |||
| Strange Brigade (2018) | 468 | 295 | 233 | 202 | ||
| F1 22 (2022) | 239 | 228 | 186.7 | 71 | ||
| F1 23 (2023) | 248 | 251 | 199.2 | 100 |
Emisiones - Ventiladores silenciosos
Emisiones sonoras
El MSI Pulse 17 es extremadamente silencioso para un portátil de juego. Medimos un nivel de ruido máximo de sólo 46.5 dB(A) bajo carga en el modo Rendimiento, y en el modo Equilibrado es incluso hasta 4 dB(A) inferior. Los ventiladores también se oyen con retraso bajo carga. Por ejemplo, sólo se activan poco antes del final del benchmark en nuestra medición bajo cargas medias con PCMark 06.
Ruido
| Ocioso |
| 24 / 24 / 24 dB(A) |
| Carga |
| 32.49 / 46.51 dB(A) |
 | ||
30 dB silencioso 40 dB(A) audible 50 dB(A) ruidosamente alto |
||
min: | ||
| MSI Pulse 17 B13VGK GeForce RTX 4070 Laptop GPU, i7-13700H, Micron 2400 MTFDKBA1T0QFM | MSI Pulse GL76 12UGK GeForce RTX 3070 Laptop GPU, i7-12700H, Micron 3400 1TB MTFDKBA1T0TFH | MSI Katana 17 B13VFK GeForce RTX 4060 Laptop GPU, i7-13620H, Micron 2400 MTFDKBA1T0QFM | Acer Nitro 17 AN17-51-71ER GeForce RTX 4060 Laptop GPU, i7-13700H, Samsung PM9A1 MZVL21T0HCLR | Schenker XMG Focus 17 (E23) GeForce RTX 4070 Laptop GPU, i9-13900HX, Crucial P5 Plus 1TB CT1000P5PSSD8 | Asus ROG Strix G17 G713PI GeForce RTX 4070 Laptop GPU, R9 7945HX, WD PC SN560 SDDPNQE-1T00 | |
|---|---|---|---|---|---|---|
| Noise | -13% | -24% | -11% | -19% | -14% | |
| apagado / medio ambiente * (dB) | 24 | 24.1 -0% | 24.5 -2% | 24 -0% | 24 -0% | 25 -4% |
| Idle Minimum * (dB) | 24 | 26.9 -12% | 24.5 -2% | 24 -0% | 24 -0% | 26 -8% |
| Idle Average * (dB) | 24 | 26.9 -12% | 24.5 -2% | 24 -0% | 24 -0% | 29 -21% |
| Idle Maximum * (dB) | 24 | 27 -13% | 40 -67% | 32.32 -35% | 26.47 -10% | 30 -25% |
| Load Average * (dB) | 32.49 | 43.8 -35% | 48.3 -49% | 35.18 -8% | 55.72 -71% | 46 -42% |
| Witcher 3 ultra * (dB) | 46.51 | 44.7 4% | 56 -20% | 54.78 -18% | 57.94 -25% | 46 1% |
| Load Maximum * (dB) | 46.51 | 58.3 -25% | 59.1 -27% | 54.78 -18% | 57.94 -25% | 47 -1% |
* ... más pequeño es mejor
Temperaturas
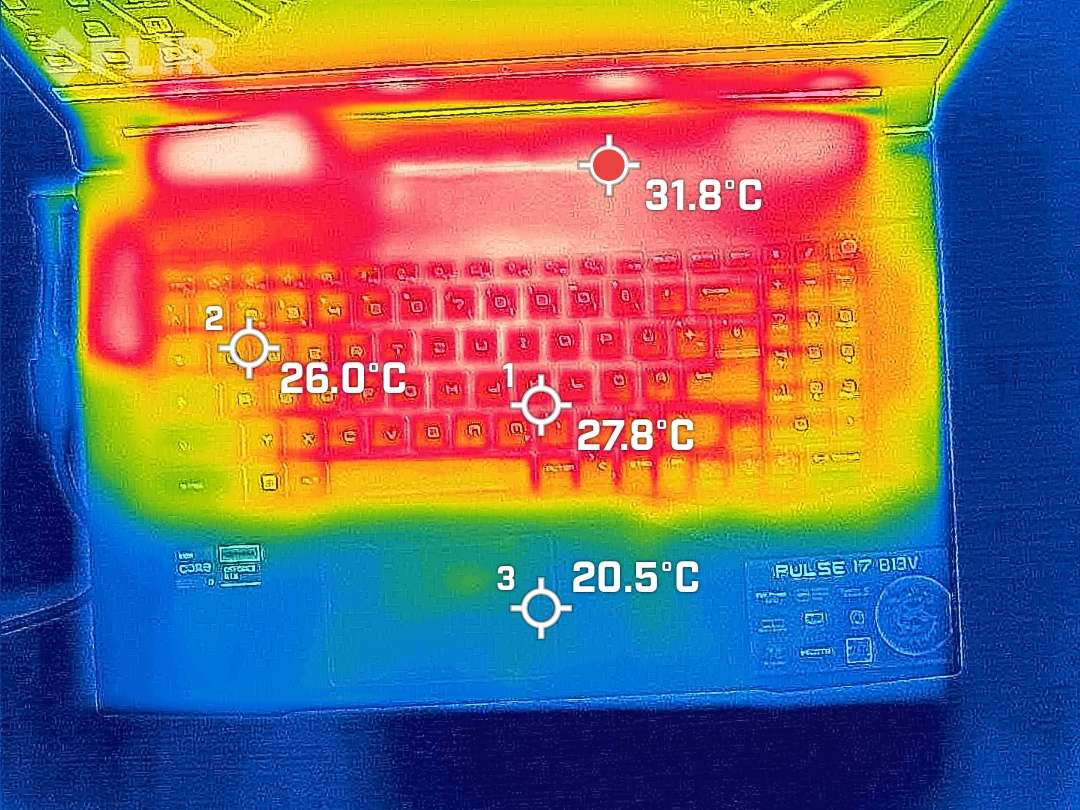
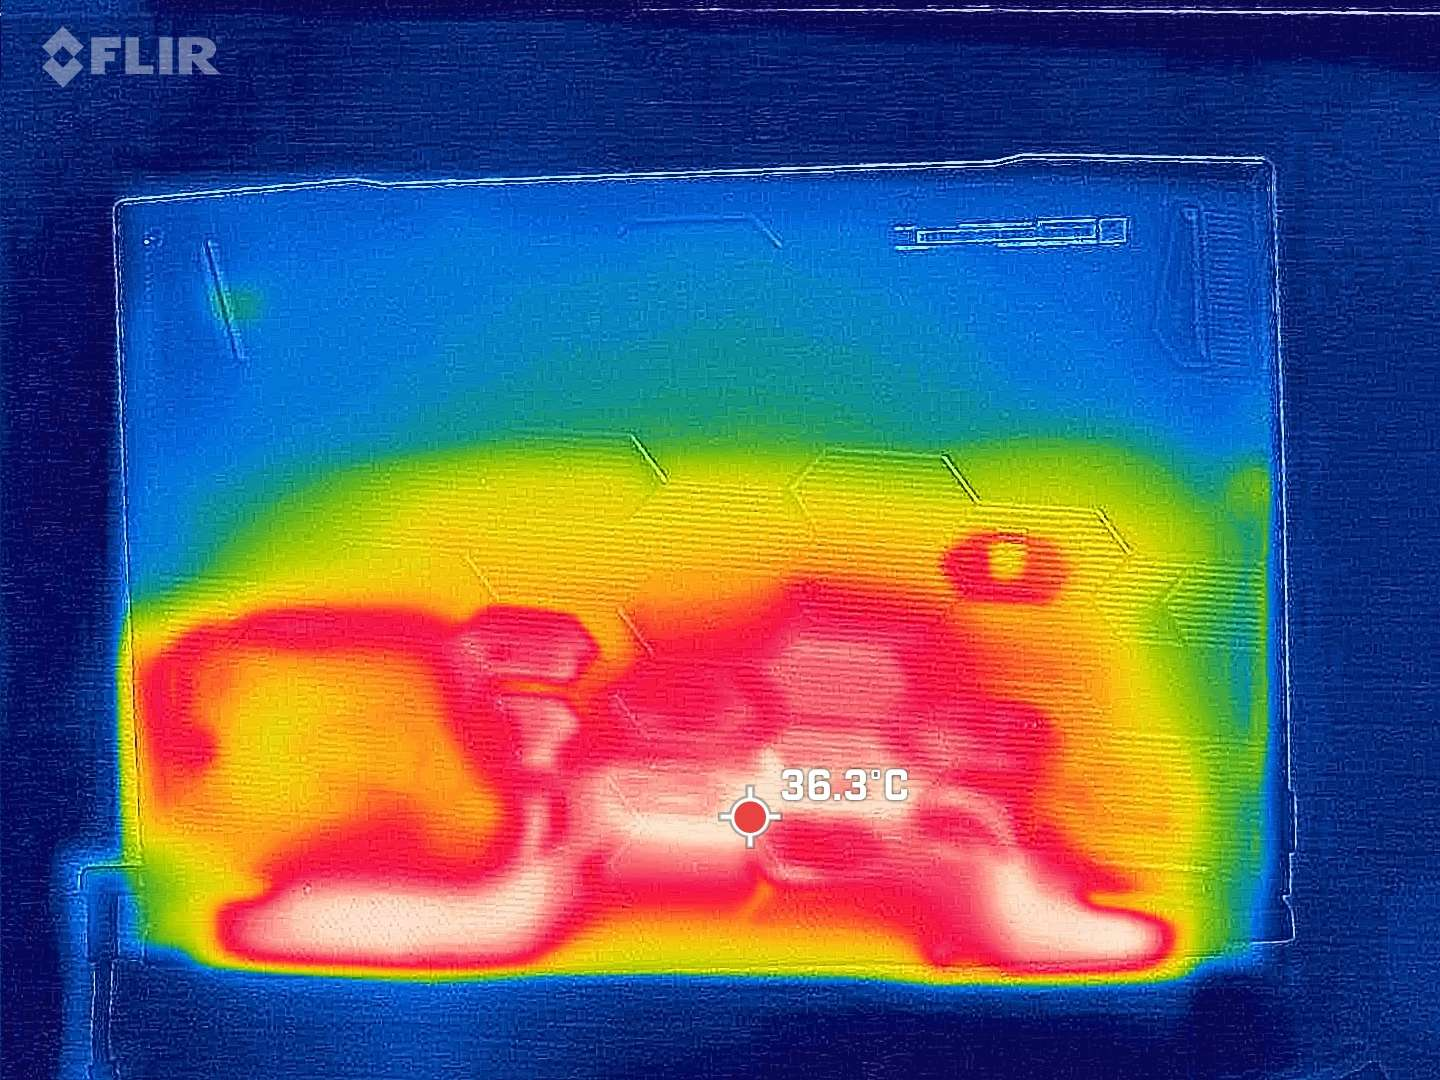
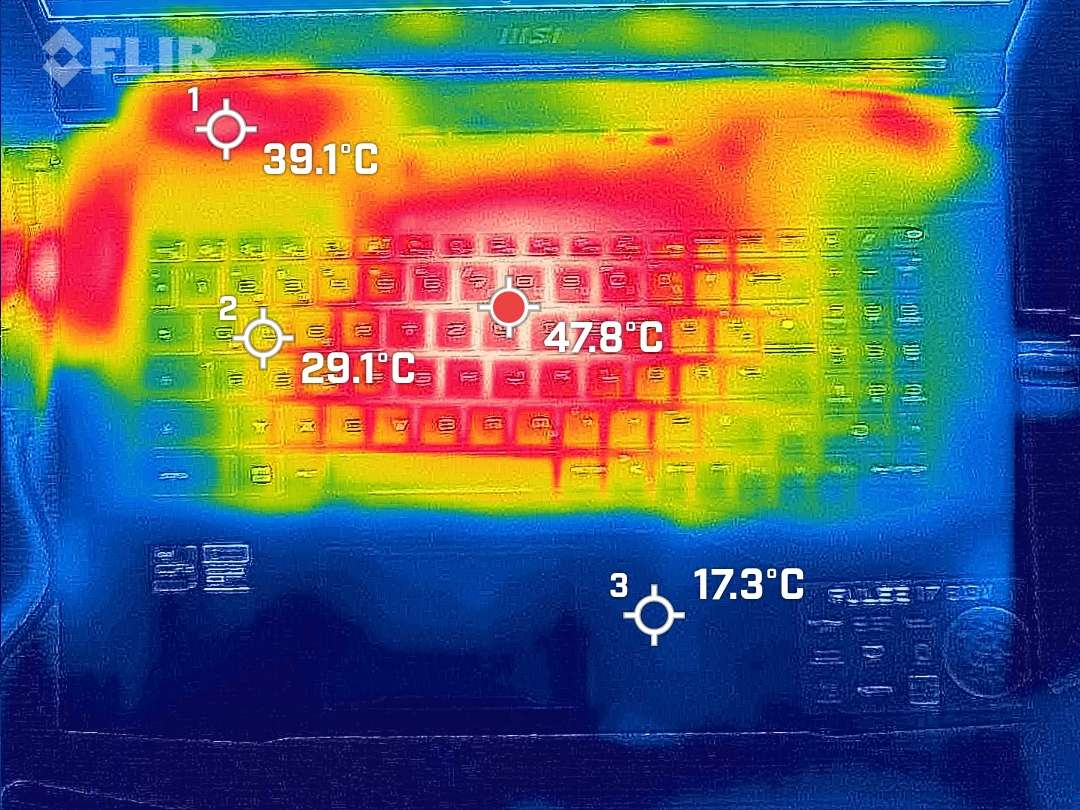
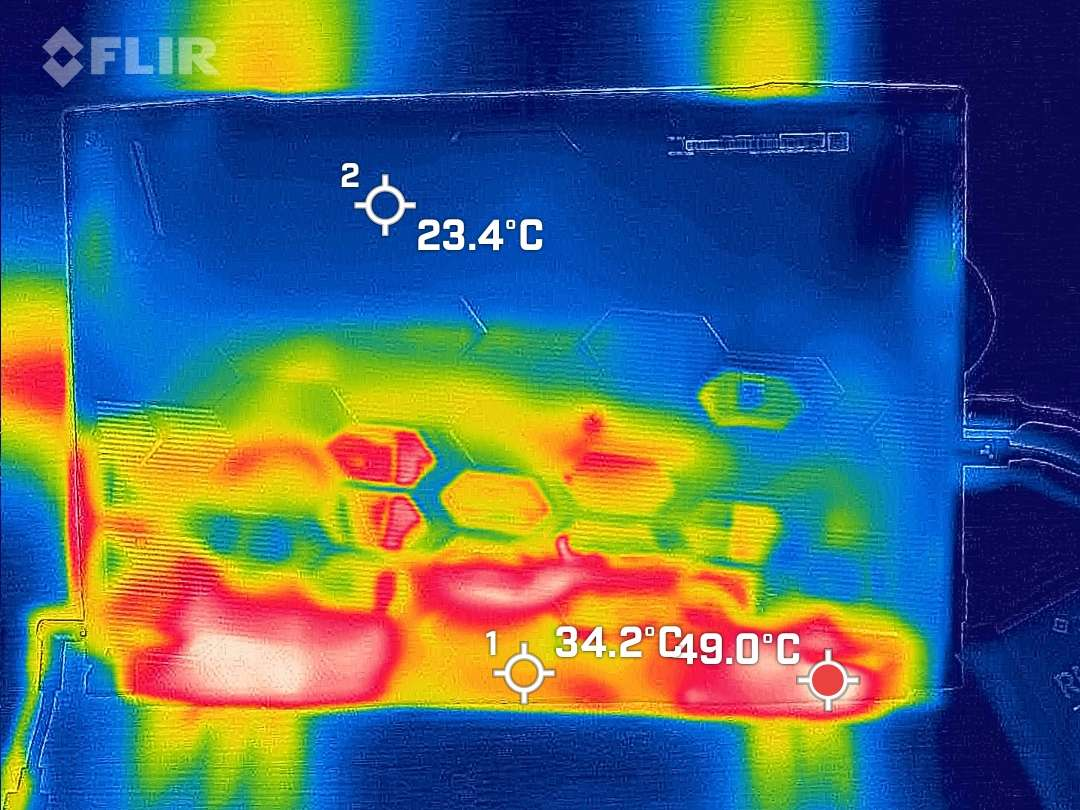
En nuestra unidad de pruebas, las temperaturas superficiales del reposamuñecas se mantienen constantemente frescas y apenas superan la temperatura ambiente. La temperatura máxima del dispositivo es de 48 °C y se reparte en amplias zonas en el borde trasero por encima y por debajo del sistema de refrigeración, así como en el centro del teclado. Sin embargo, las temperaturas se mantienen dentro de rangos tolerables en las zonas importantes para el juego, así como en la parte inferior del portátil de juego de alto rendimiento.
(-) La temperatura máxima en la parte superior es de 48 °C / 118 F, frente a la media de 40.4 °C / 105 F, que oscila entre 21.2 y 68.8 °C para la clase Gaming.
(-) El fondo se calienta hasta un máximo de 50 °C / 122 F, frente a la media de 43.2 °C / 110 F
(+) En reposo, la temperatura media de la parte superior es de 27.8 °C / 82# F, frente a la media del dispositivo de 33.9 °C / 93 F.
(±) Jugando a The Witcher 3, la temperatura media de la parte superior es de 37 °C / 99 F, frente a la media del dispositivo de 33.9 °C / 93 F.
(+) El reposamanos y el panel táctil están a una temperatura inferior a la de la piel, con un máximo de 24 °C / 75.2 F y, por tanto, son fríos al tacto.
(+) La temperatura media de la zona del reposamanos de dispositivos similares fue de 28.8 °C / 83.8 F (+4.8 °C / 8.6 F).
| MSI Pulse 17 B13VGK Intel Core i7-13700H, NVIDIA GeForce RTX 4070 Laptop GPU | |
|---|---|
| Heat | |
| Maximum Upper Side * (°C) | 48 |
| Maximum Bottom * (°C) | 50 |
| Idle Upper Side * (°C) | 30 |
| Idle Bottom * (°C) | 33 |
* ... más pequeño es mejor
Prueba de resistencia
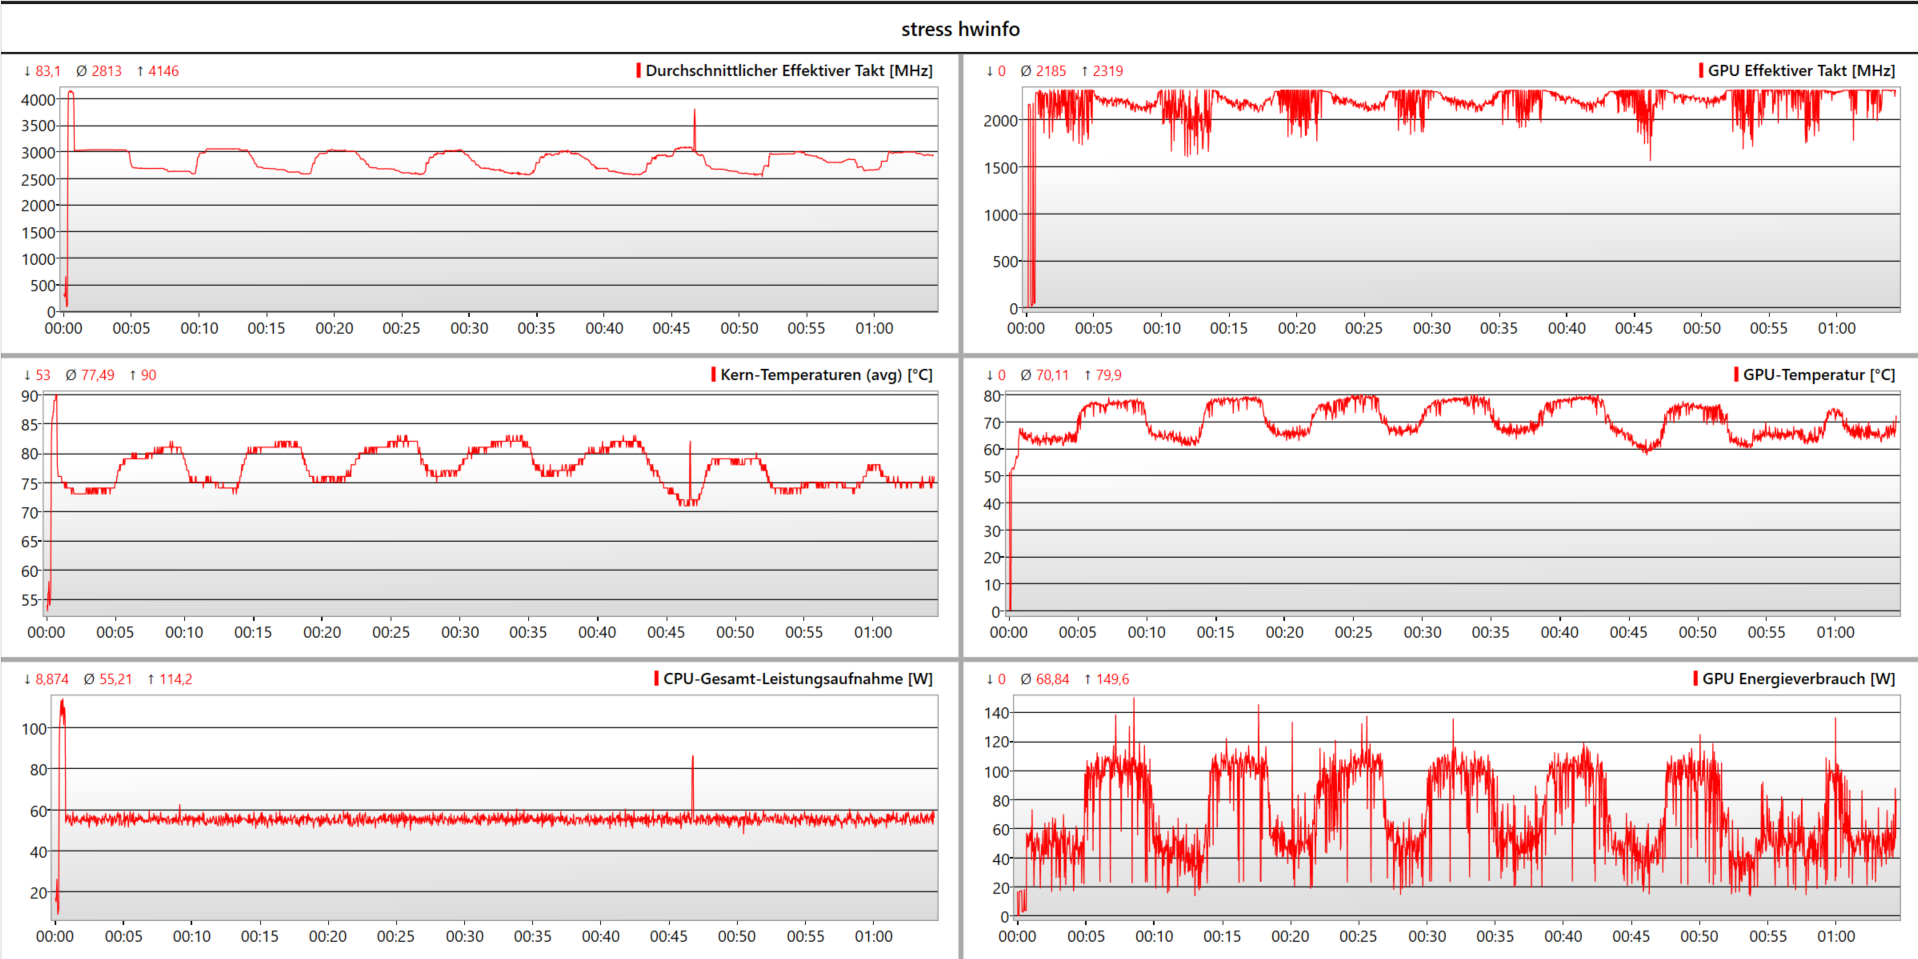
Ejecutamos la prueba de estrés en el casi nuevo MSI Pulse 17. Aparentemente, la temperatura objetivo de la GPU ronda los 80 °C. En cuanto se alcanza este valor, el rendimiento se ralentiza hasta que la GPU se enfría un poco. Esto provoca algunas ondas en nuestro registro de la prueba de estrés con Prime95 y Furmark. Tras su breve fase de aceleración, el Core i7 funciona constantemente a unos 55 vatios. La RTX 4070 tiene que bajar repetidamente de 110 vatios a 50 vatios. En las partes posteriores de nuestro test del MSI Pulse 17, el control de energía del portátil se ha estabilizado significativamente, por lo que podemos asumir algún efecto de aprendizaje aquí.
Altavoces
Los medios sobreacentuados hacen que el MSI Pulse 17 suene un poco metálico. Sin embargo, con hasta 85 dB(A), los pequeños altavoces son relativamente fuertes y fácilmente capaces de ahogar los silenciosos ventiladores de este portátil de juego. A los que no les gusten los altavoces pueden conectar dispositivos externos usando Bluetooth o el puerto de audio de 3,5 mm.
MSI Pulse 17 B13VGK análisis de audio
(+) | los altavoces pueden reproducir a un volumen relativamente alto (#85.01 dB)
Graves 100 - 315 Hz
(±) | lubina reducida - en promedio 13.2% inferior a la mediana
(±) | la linealidad de los graves es media (12.3% delta a frecuencia anterior)
Medios 400 - 2000 Hz
(±) | medias más altas - de media 9.4% más altas que la mediana
(+) | los medios son lineales (5.7% delta a la frecuencia anterior)
Altos 2 - 16 kHz
(+) | máximos equilibrados - a sólo 2.9% de la mediana
(+) | los máximos son lineales (6.7% delta a la frecuencia anterior)
Total 100 - 16.000 Hz
(±) | la linealidad del sonido global es media (15.8% de diferencia con la mediana)
En comparación con la misma clase
» 37% de todos los dispositivos probados de esta clase eran mejores, 7% similares, 56% peores
» El mejor tuvo un delta de 6%, la media fue 18%, el peor fue ###max##%
En comparación con todos los dispositivos probados
» 24% de todos los dispositivos probados eran mejores, 5% similares, 70% peores
» El mejor tuvo un delta de 4%, la media fue 23%, el peor fue ###max##%
Apple MacBook Pro 16 2021 M1 Pro análisis de audio
(+) | los altavoces pueden reproducir a un volumen relativamente alto (#84.7 dB)
Graves 100 - 315 Hz
(+) | buen bajo - sólo 3.8% lejos de la mediana
(+) | el bajo es lineal (5.2% delta a la frecuencia anterior)
Medios 400 - 2000 Hz
(+) | medios equilibrados - a sólo 1.3% de la mediana
(+) | los medios son lineales (2.1% delta a la frecuencia anterior)
Altos 2 - 16 kHz
(+) | máximos equilibrados - a sólo 1.9% de la mediana
(+) | los máximos son lineales (2.7% delta a la frecuencia anterior)
Total 100 - 16.000 Hz
(+) | el sonido global es lineal (4.6% de diferencia con la mediana)
En comparación con la misma clase
» 0% de todos los dispositivos probados de esta clase eran mejores, 0% similares, 100% peores
» El mejor tuvo un delta de 5%, la media fue 17%, el peor fue ###max##%
En comparación con todos los dispositivos probados
» 0% de todos los dispositivos probados eran mejores, 0% similares, 100% peores
» El mejor tuvo un delta de 4%, la media fue 23%, el peor fue ###max##%
Gestión de la energía: la batería de 90 Wh garantiza una larga duración
Consumo de energía
Aunque el consumo máximo del Pulse 17 bajo carga es bastante típico para la clase de portátiles, durante el funcionamiento en reposo e incluso bajo cargas moderadas, nuestra unidad de prueba es inusualmente eficiente para un portátil de juegos.
| Off / Standby | |
| Ocioso | |
| Carga |
|
Clave:
min: | |
| MSI Pulse 17 B13VGK i7-13700H, GeForce RTX 4070 Laptop GPU, Micron 2400 MTFDKBA1T0QFM, IPS, 1920x1080, 17.3" | MSI Pulse GL76 12UGK i7-12700H, GeForce RTX 3070 Laptop GPU, Micron 3400 1TB MTFDKBA1T0TFH, IPS, 1920x1080, 17.3" | MSI Katana 17 B13VFK i7-13620H, GeForce RTX 4060 Laptop GPU, Micron 2400 MTFDKBA1T0QFM, IPS LED, 1920x1080, 17.3" | Acer Nitro 17 AN17-51-71ER i7-13700H, GeForce RTX 4060 Laptop GPU, Samsung PM9A1 MZVL21T0HCLR, , 2560x1440, 17.3" | Schenker XMG Focus 17 (E23) i9-13900HX, GeForce RTX 4070 Laptop GPU, Crucial P5 Plus 1TB CT1000P5PSSD8, IPS, 2560x1440, 17.3" | Asus ROG Strix G17 G713PI R9 7945HX, GeForce RTX 4070 Laptop GPU, WD PC SN560 SDDPNQE-1T00, IPS, 2560x1440, 17.3" | Medio NVIDIA GeForce RTX 4070 Laptop GPU | Media de la clase Gaming | |
|---|---|---|---|---|---|---|---|---|
| Power Consumption | -45% | -26% | -18% | -97% | -75% | -58% | -66% | |
| Idle Minimum * (Watt) | 9 | 12.4 -38% | 12.2 -36% | 8.3 8% | 17 -89% | 15 -67% | 13.2 ? -47% | 13 ? -44% |
| Idle Average * (Watt) | 10.2 | 13.1 -28% | 14.9 -46% | 13.5 -32% | 18 -76% | 20 -96% | 18.2 ? -78% | 19 ? -86% |
| Idle Maximum * (Watt) | 10.8 | 25.3 -134% | 15.8 -46% | 14.8 -37% | 25.8 -139% | 29 -169% | 24.6 ? -128% | 24.6 ? -128% |
| Load Average * (Watt) | 72 | 105.4 -46% | 85.22 -18% | 77 -7% | 178 -147% | 121 -68% | 97 ? -35% | 110.7 ? -54% |
| Witcher 3 ultra * (Watt) | 130 | 150 -15% | 151.1 -16% | 154 -18% | 265 -104% | 179.8 -38% | ||
| Load Maximum * (Watt) | 221 | 240.5 -9% | 212.8 4% | 263 -19% | 275 -24% | 246 -11% | 221 ? -0% | 259 ? -17% |
* ... más pequeño es mejor
Power Consumption The Witcher 3 / Stress Test
Power Consumption With External Monitor
Duración de la batería
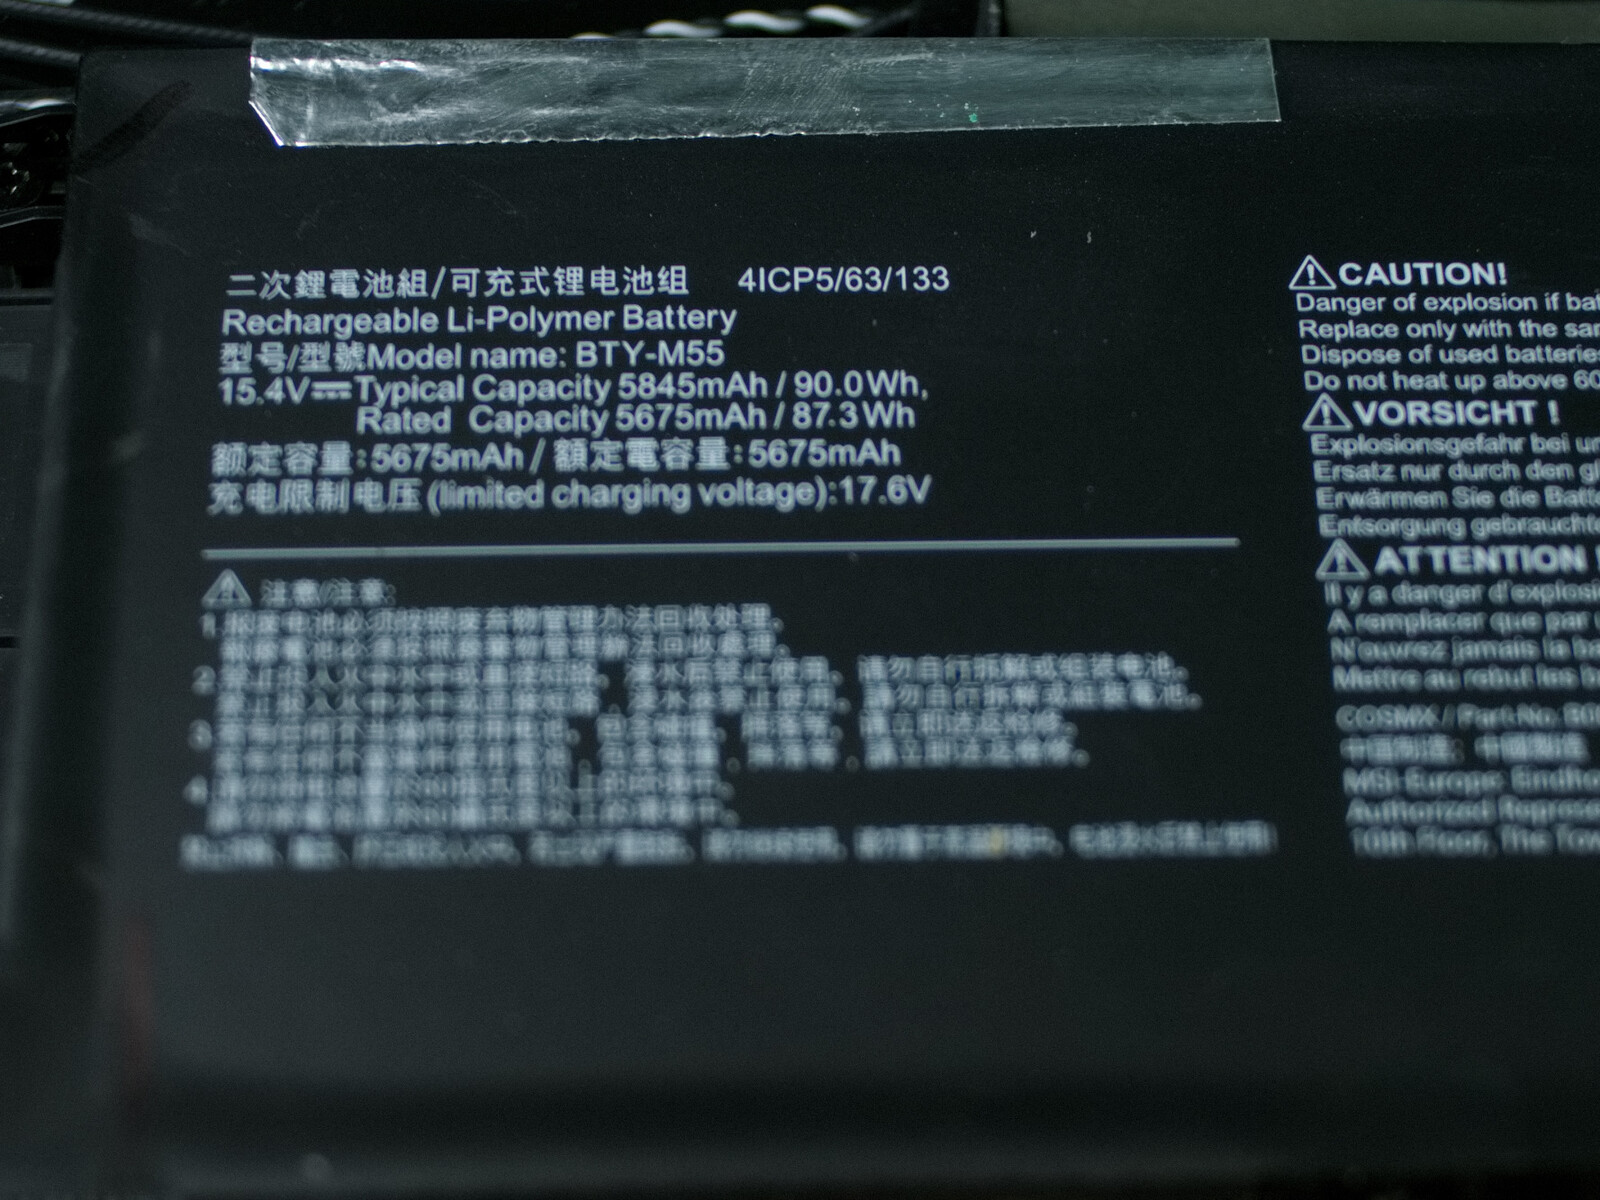
Correspondiendo a nuestras mediciones del consumo de energía, tampoco sorprende que el portátil de juegos dure mucho con su batería de 90-Wh en nuestra prueba de navegación web WiFi, alcanzando casi 9 horas aquí. Incluso bajo carga, la batería dura unas buenas 2 horas.
| MSI Pulse 17 B13VGK i7-13700H, GeForce RTX 4070 Laptop GPU, 90 Wh | MSI Pulse GL76 12UGK i7-12700H, GeForce RTX 3070 Laptop GPU, 90 Wh | MSI Katana 17 B13VFK i7-13620H, GeForce RTX 4060 Laptop GPU, 53.5 Wh | Acer Nitro 17 AN17-51-71ER i7-13700H, GeForce RTX 4060 Laptop GPU, 90 Wh | Schenker XMG Focus 17 (E23) i9-13900HX, GeForce RTX 4070 Laptop GPU, 73 Wh | Asus ROG Strix G17 G713PI R9 7945HX, GeForce RTX 4070 Laptop GPU, 90 Wh | Media de la clase Gaming | |
|---|---|---|---|---|---|---|---|
| Duración de Batería | -20% | -62% | -9% | -57% | -54% | -27% | |
| WiFi v1.3 (h) | 9 | 5.9 -34% | 2.9 -68% | 8.2 -9% | 3.9 -57% | 4.3 -52% | 7.11 ? -21% |
| Load (h) | 2.2 | 2.1 -5% | 1 -55% | 1 -55% | 1.502 ? -32% | ||
| Reader / Idle (h) | 7.3 | 8.27 ? | |||||
| H.264 (h) | 6.9 | 3.1 | 2.8 | 8.32 ? | |||
| Witcher 3 ultra (h) | 2.5 | 1 | 1.1 |
Pro
Contra
Veredicto - Más steam punk que ciencia ficción
En el lado positivo del MSI Pulse 17, hay varios puntos fuertes que hablan en favor del portátil, con un rendimiento óptimo del Core i7y Nvidia GeForce RTX 4070 más potentes. Para lograr esto, el Pulse ni siquiera necesita ventiladores pulsantes, y el portátil es particularmente silencioso para su clase de rendimiento. Otros puntos positivos del portátil para juegos son un teclado decente y una buena colocación de las conexiones externas. La duración de la batería también es excelente para un portátil de juegos.
El Pulse 17 es un portátil para juegos capaz de ofrecer un rendimiento potente con un bajo nivel de ruido. Por otro lado, el dispositivo no acaba de llegar al año 2023 en muchos otros aspectos.
Por desgracia, el portátil también viene con algunas desventajas importantes. Aparte del MSI Katana 17, ningún otro portátil de juegos de nuestra comparativa tiene una pantalla tan mala. El equipo de conexión con puertos USB 2.0 y USB 3.2 Gen 1 lentos y LAN de 1 GBit/s así como la falta de Wi-Fi de 6 GHz tampoco presentan al portátil de juego como un dispositivo de gama alta. Pero lo realmente molesto es el puerto M.2 NVMe bloqueado, ya que el fabricante podría haberlo evitado de dos maneras. Primero, la placa base y la carcasa habrían dejado espacio suficiente para mover el módulo ligeramente a la izquierda para dar algo de espacio a la batería. Y segundo, los carriles PCIe innecesariamente desperdiciados también podrían haberse invertido en un puerto Thunderbolt.
Aunque comparado con el predecesor, el modelo actual ofrece ahora soporte G-Sync, MUX y Advanced Optimus, sigue careciendo de Thunderbolt. Además, el display del predecesor era bastante mejor según nuestras mediciones.
A precios de calle a partir de 2,150 Euros en el momento de nuestro test, hay muchos portátiles (en partes también bastante más asequibles) como alternativa a nuestro modelo de pruebas. El precio que pagas al fabricante por el Asus ROG Stix G17 está al mismo nivel que el del dispositivo MSI de muchos vendedores. Aunque tienes que hacer algunos compromisos importantes en la duración de la batería con el portátil de Asus, por lo demás el Pulse 17 y el ROG Strix G17 son bastante similares en todas las áreas de rendimiento. Por otro lado, la pantalla y el equipo de conexión del ROG Strix son significativamente mejores.
Precio y disponibilidad
El MSI Pulse 17 B13VGK sólo está disponible en unos pocos vendedores en EEUU como Newegg por ~$1963con más vendedores ofreciéndolo en UKAustraliao Canadápor ejemplo.
MSI Pulse 17 B13VGK
- 07/16/2023 v7 (old)
Marc Herter
Transparencia
La selección de los dispositivos que se van a reseñar corre a cargo de nuestro equipo editorial. La muestra de prueba fue proporcionada al autor en calidad de préstamo por el fabricante o el minorista a los efectos de esta reseña. El prestamista no tuvo ninguna influencia en esta reseña, ni el fabricante recibió una copia de la misma antes de su publicación. No había ninguna obligación de publicar esta reseña. Como empresa de medios independiente, Notebookcheck no está sujeta a la autoridad de fabricantes, minoristas o editores.
Así es como prueba Notebookcheck
Cada año, Notebookcheck revisa de forma independiente cientos de portátiles y smartphones utilizando procedimientos estandarizados para asegurar que todos los resultados son comparables. Hemos desarrollado continuamente nuestros métodos de prueba durante unos 20 años y hemos establecido los estándares de la industria en el proceso. En nuestros laboratorios de pruebas, técnicos y editores experimentados utilizan equipos de medición de alta calidad. Estas pruebas implican un proceso de validación en varias fases. Nuestro complejo sistema de clasificación se basa en cientos de mediciones y puntos de referencia bien fundamentados, lo que mantiene la objetividad.Price comparison

