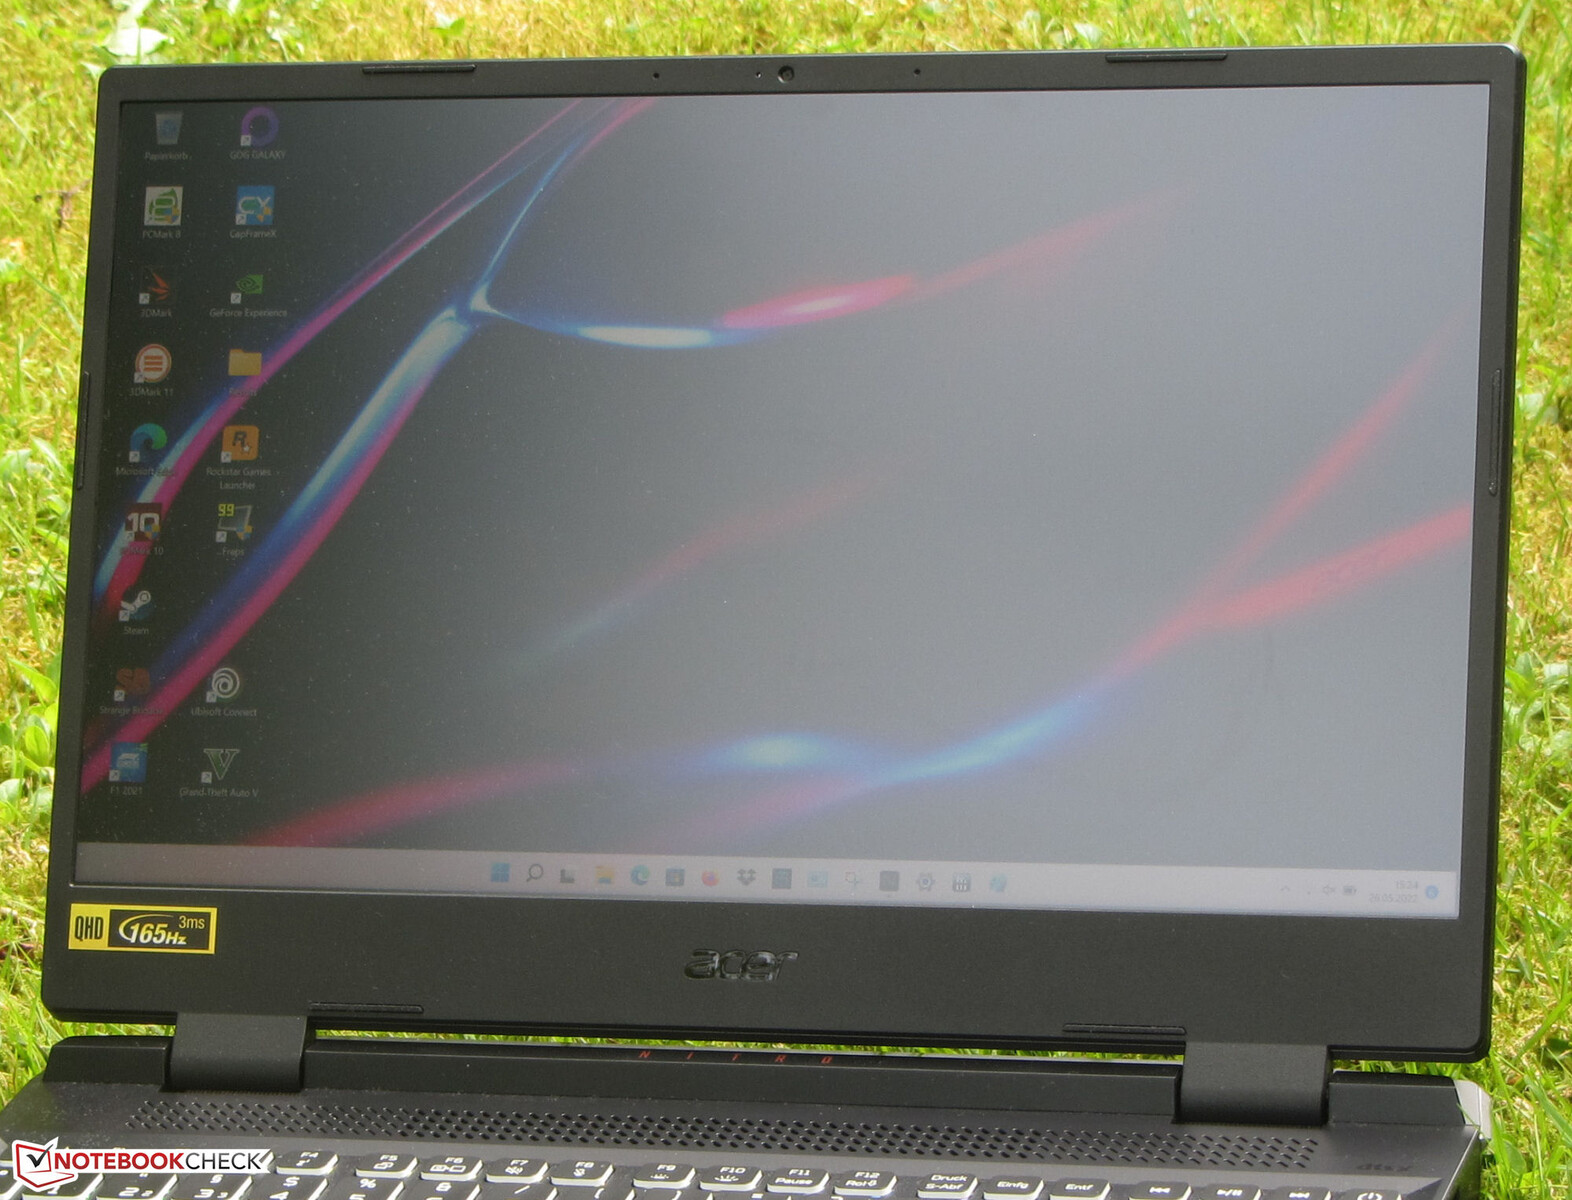
Análisis del Acer Nitro 5 AN515-58: Rápido portátil de juegos QHD

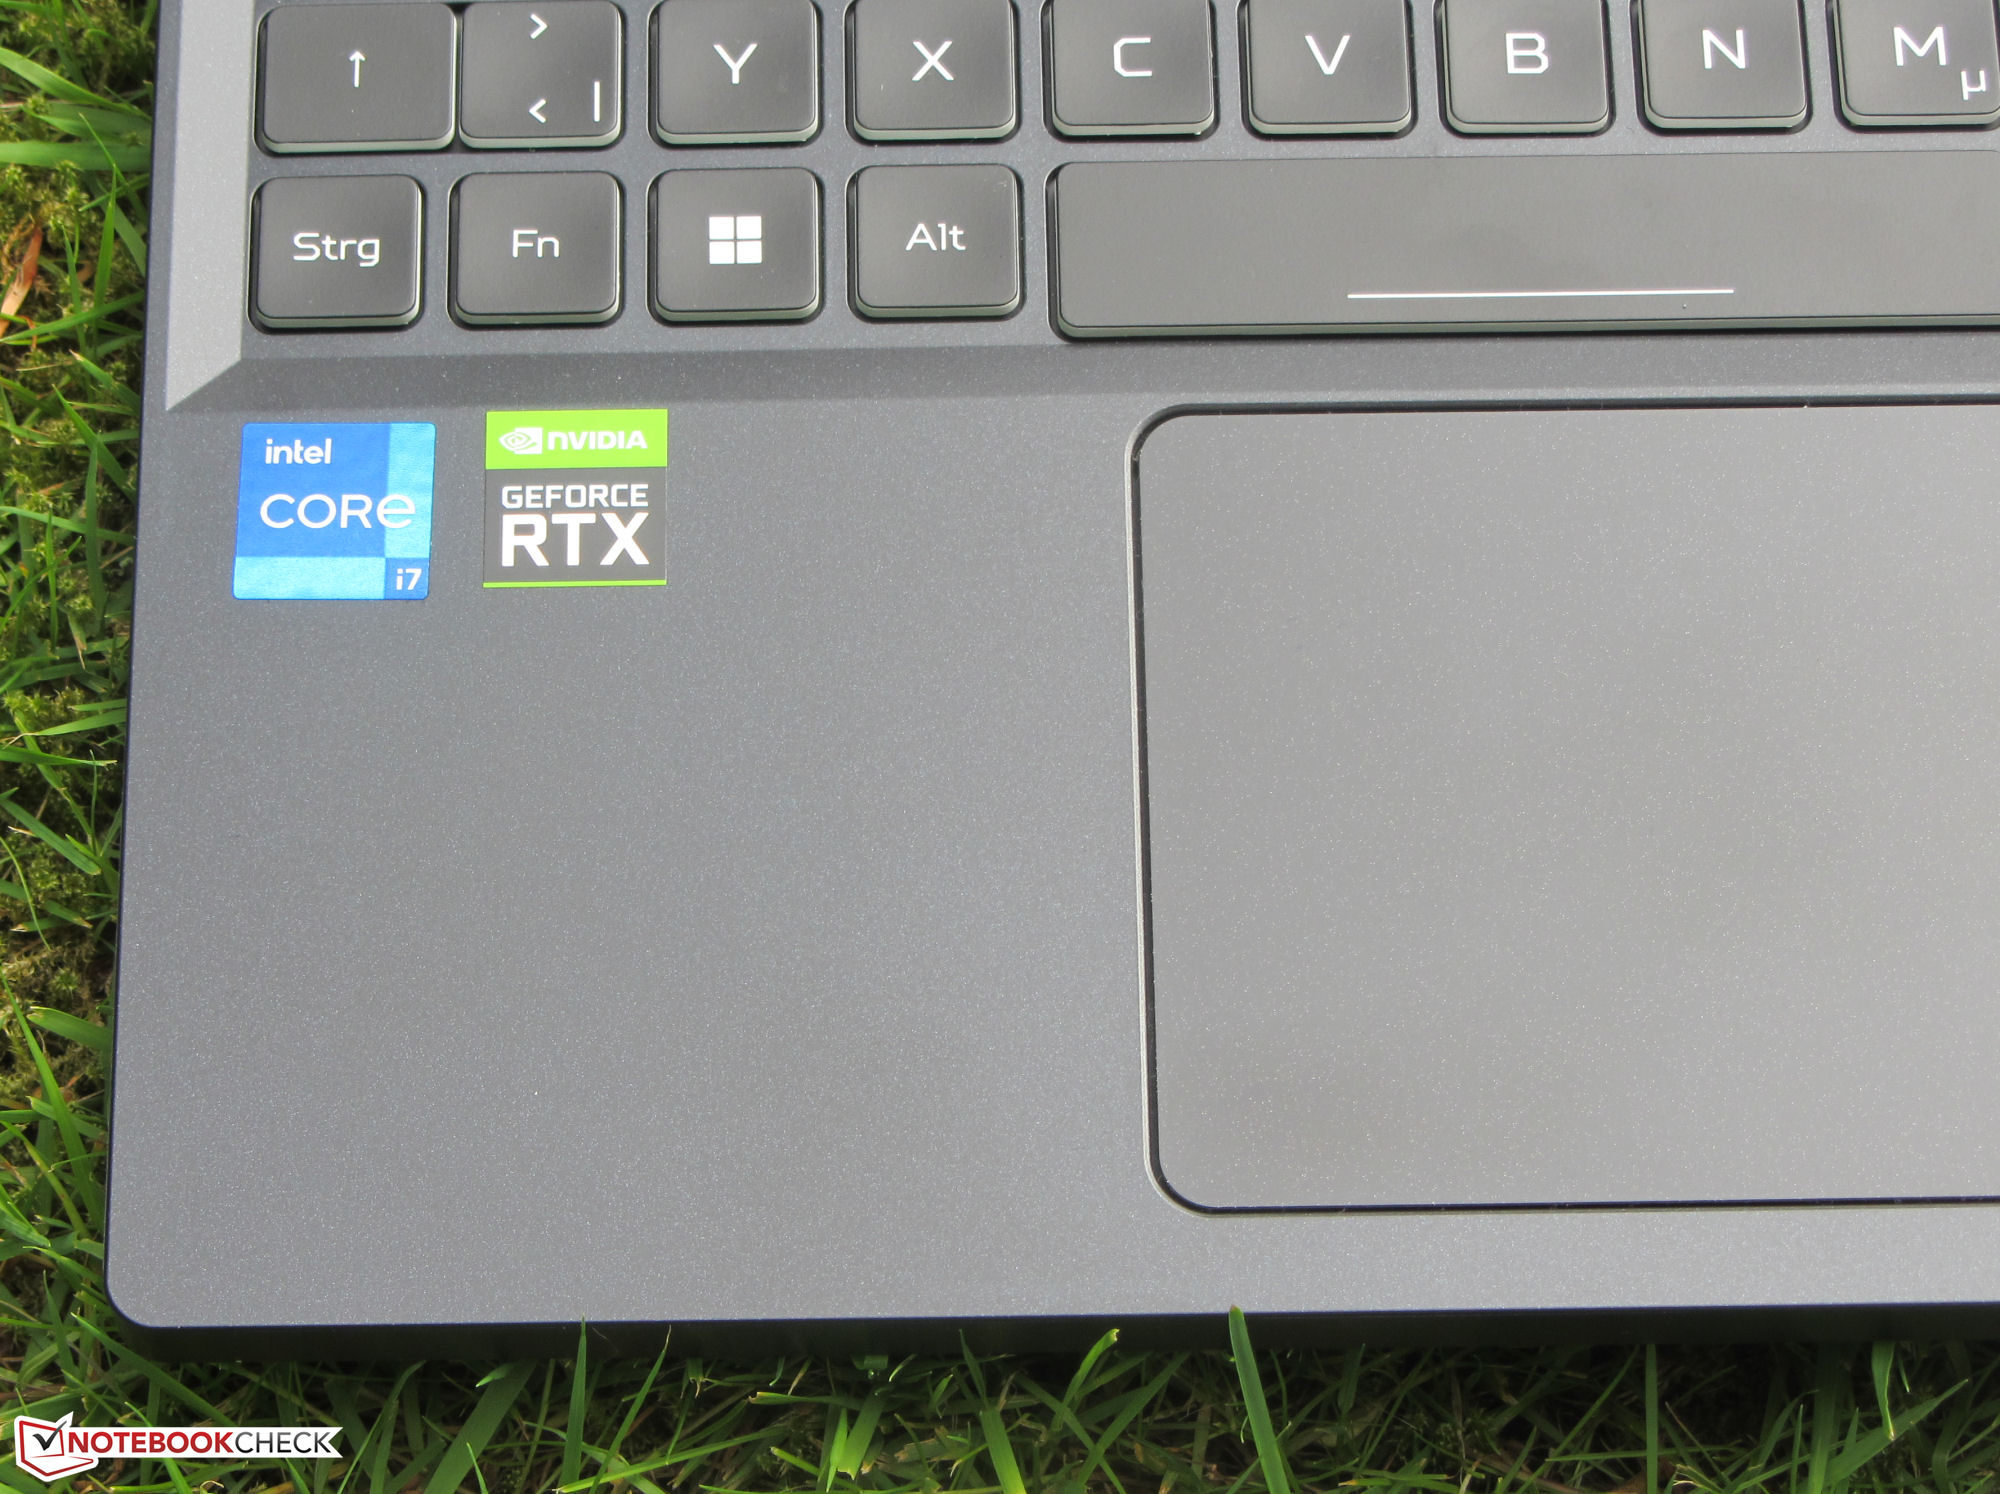
Acer ha introducido un portátil para juegos de gama alta en su línea en forma de Nitro 5 AN515-58, que está impulsado por unCore i7-12700H Y una tarjeta de memoria GeForce RTX 3070 Ti entre los competidores se encuentran dispositivos como el HP Omen 16y el MSI Vector GP66 12UGS y el Lenovo Legion 5 Pro 16 G7.
Posibles contendientes en la comparación
Valoración | Fecha | Modelo | Peso | Altura | Tamaño | Resolución | Precio |
|---|---|---|---|---|---|---|---|
| 84 % v7 (old) | 06/2022 | Acer Nitro 5 AN515-58-72QR i7-12700H, GeForce RTX 3070 Ti Laptop GPU | 2.5 kg | 26.8 mm | 15.60" | 2560x1440 | |
| 86.9 % v7 (old) | 03/2022 | MSI Vector GP66 12UGS i9-12900H, GeForce RTX 3070 Ti Laptop GPU | 2.3 kg | 23.4 mm | 15.60" | 1920x1080 | |
| 85.5 % v7 (old) | 05/2022 | HP Omen 16-b1090ng i7-12700H, GeForce RTX 3070 Ti Laptop GPU | 2.3 kg | 23 mm | 16.10" | 2560x1440 | |
| 88 % v7 (old) | 03/2022 | Lenovo Legion 5 Pro 16 G7 i7 RTX 3070Ti i7-12700H, GeForce RTX 3070 Ti Laptop GPU | 2.6 kg | 26.6 mm | 16.00" | 2560x1600 |
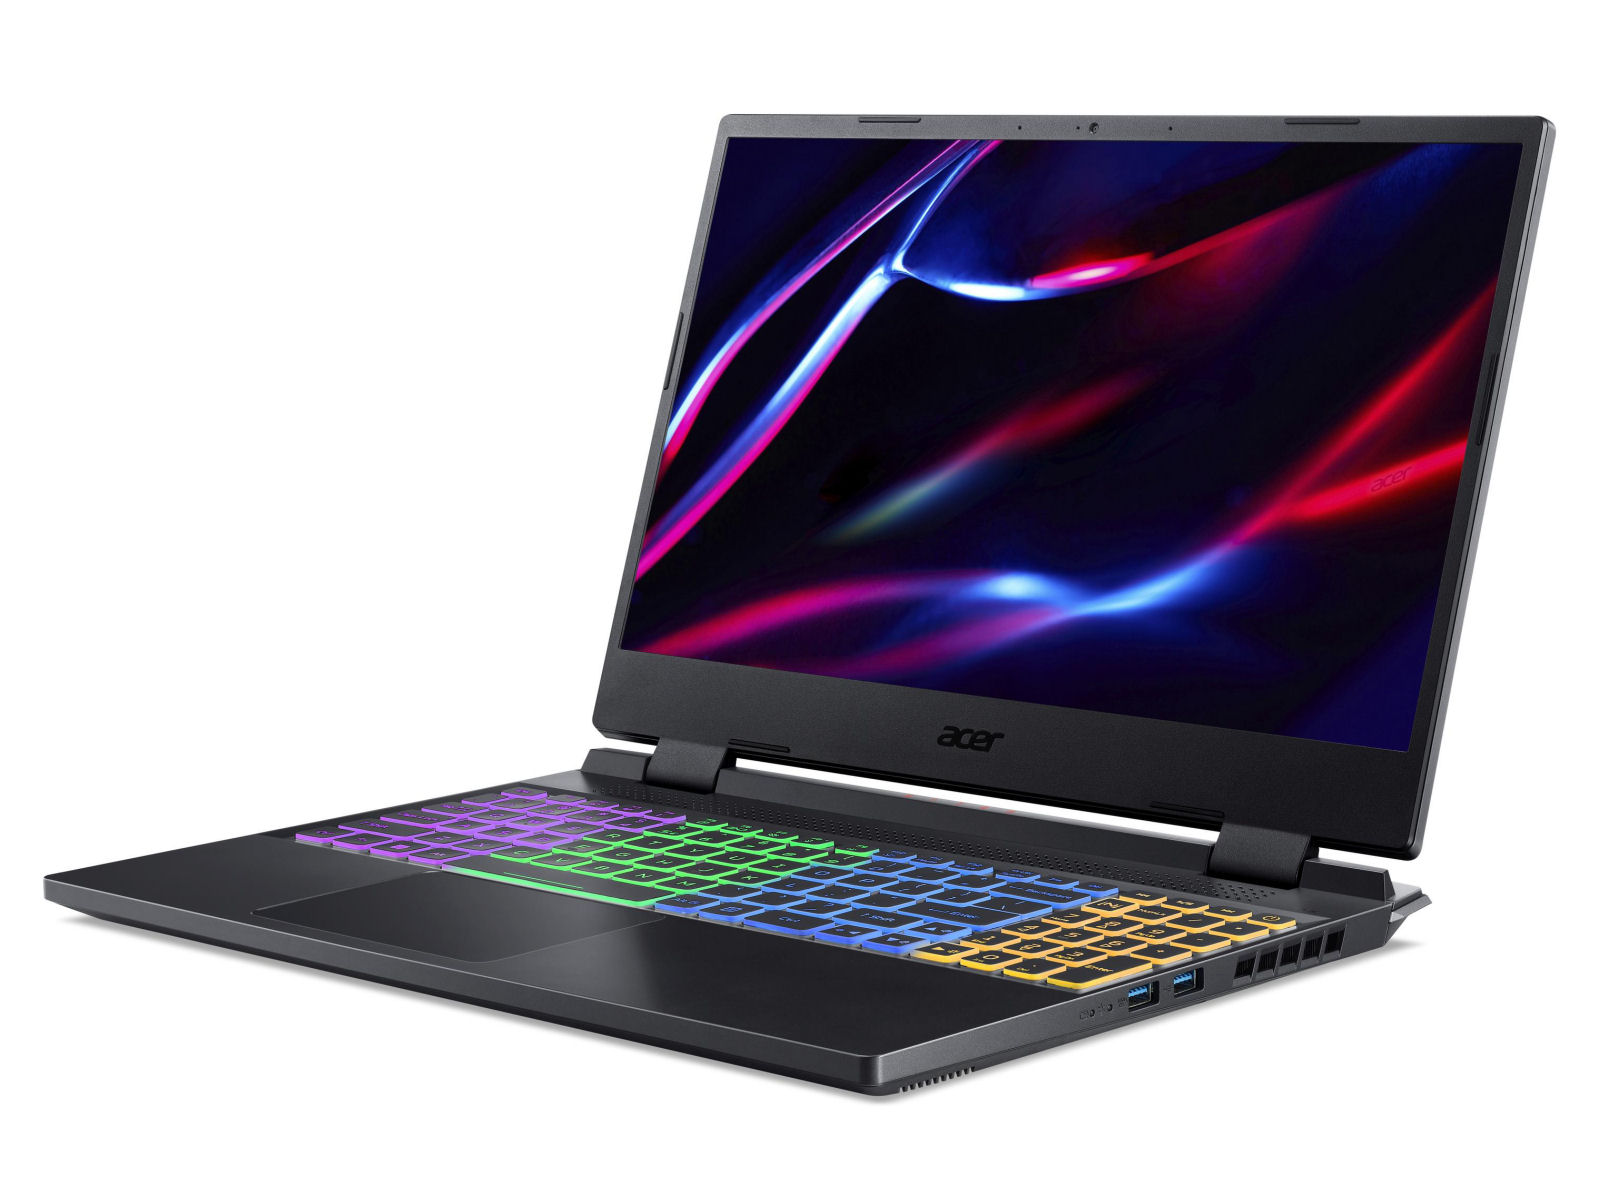
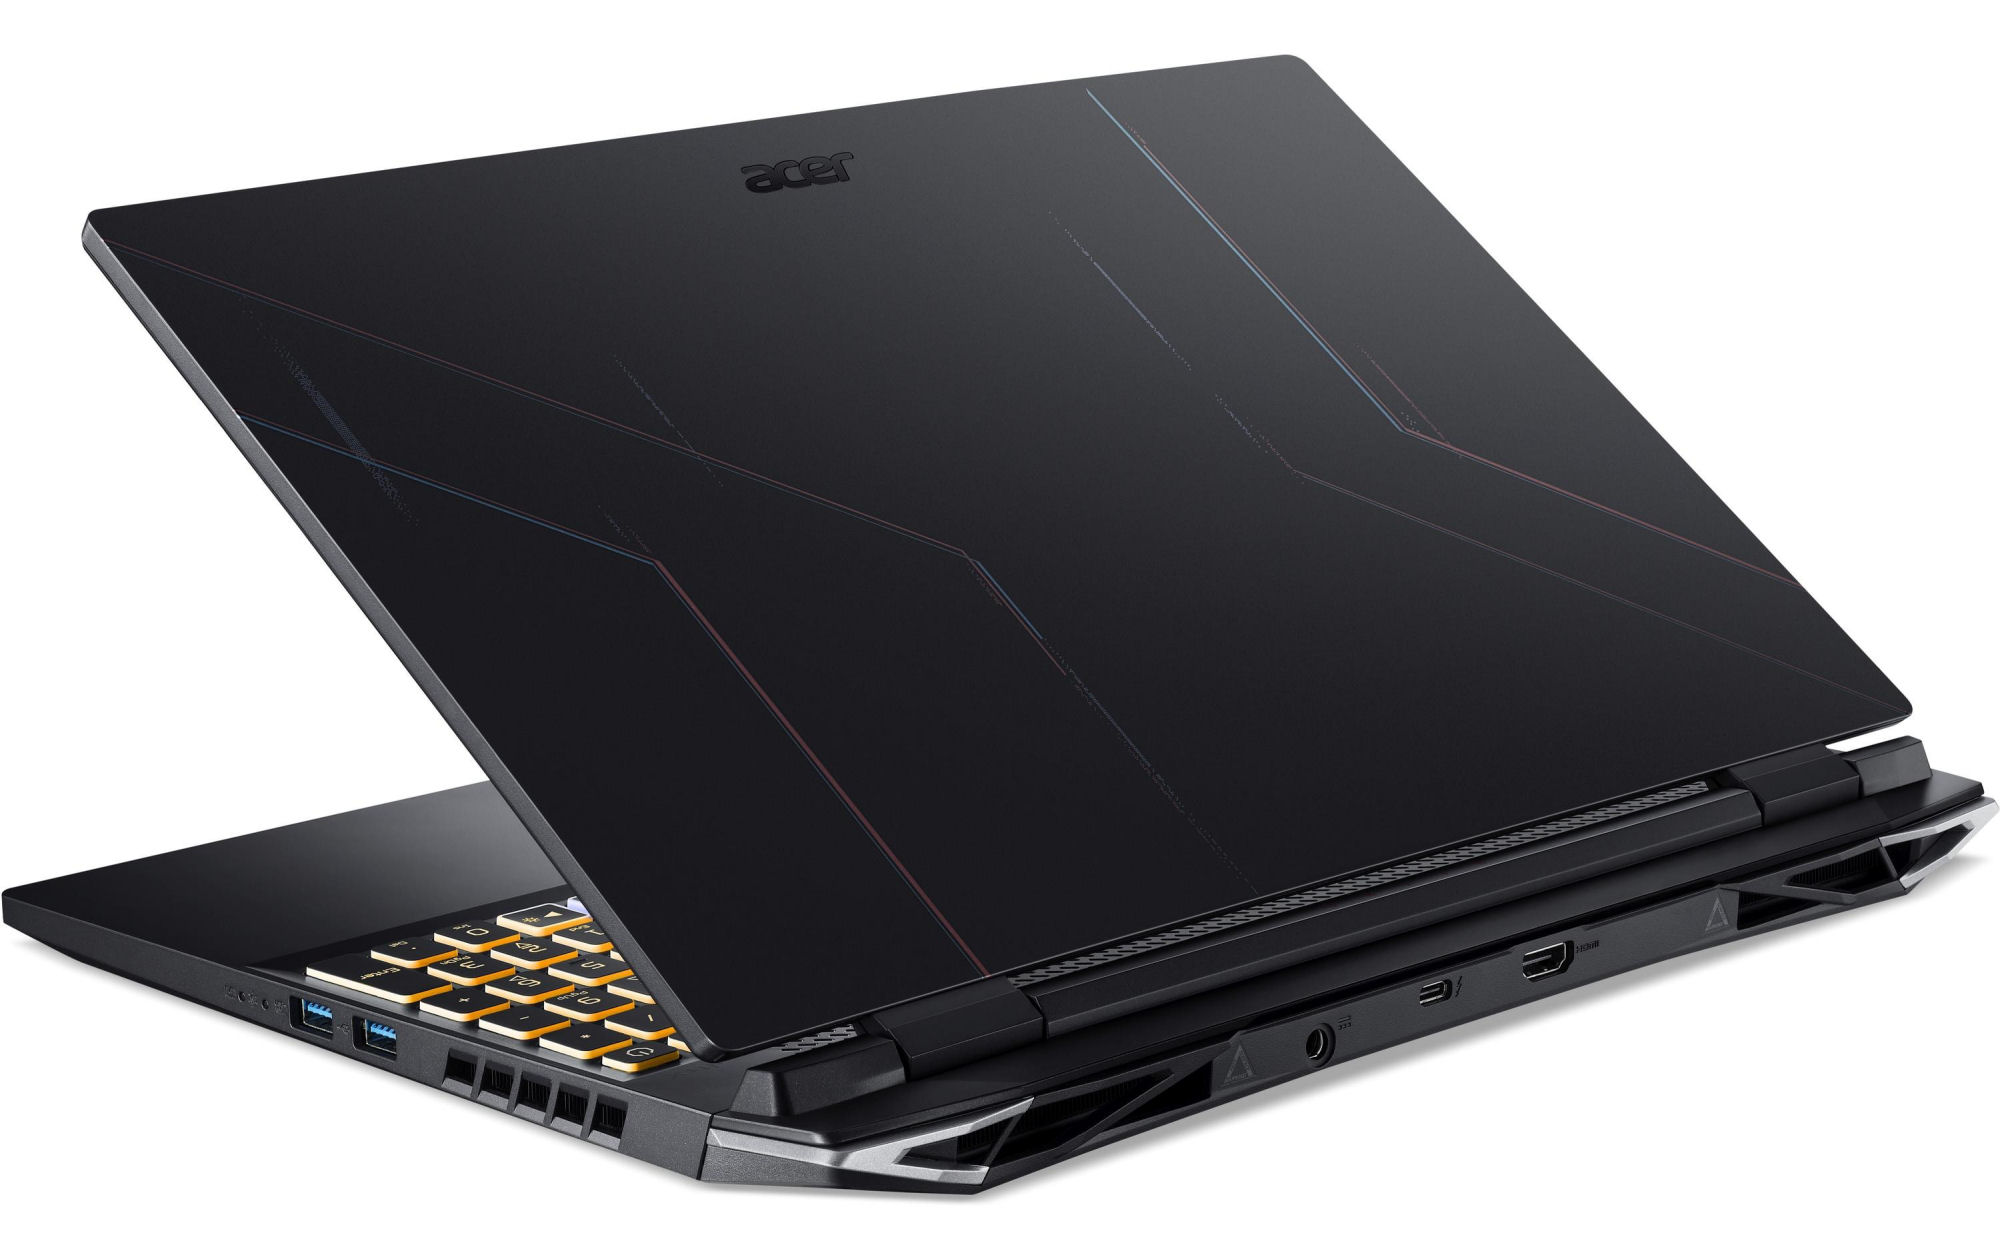
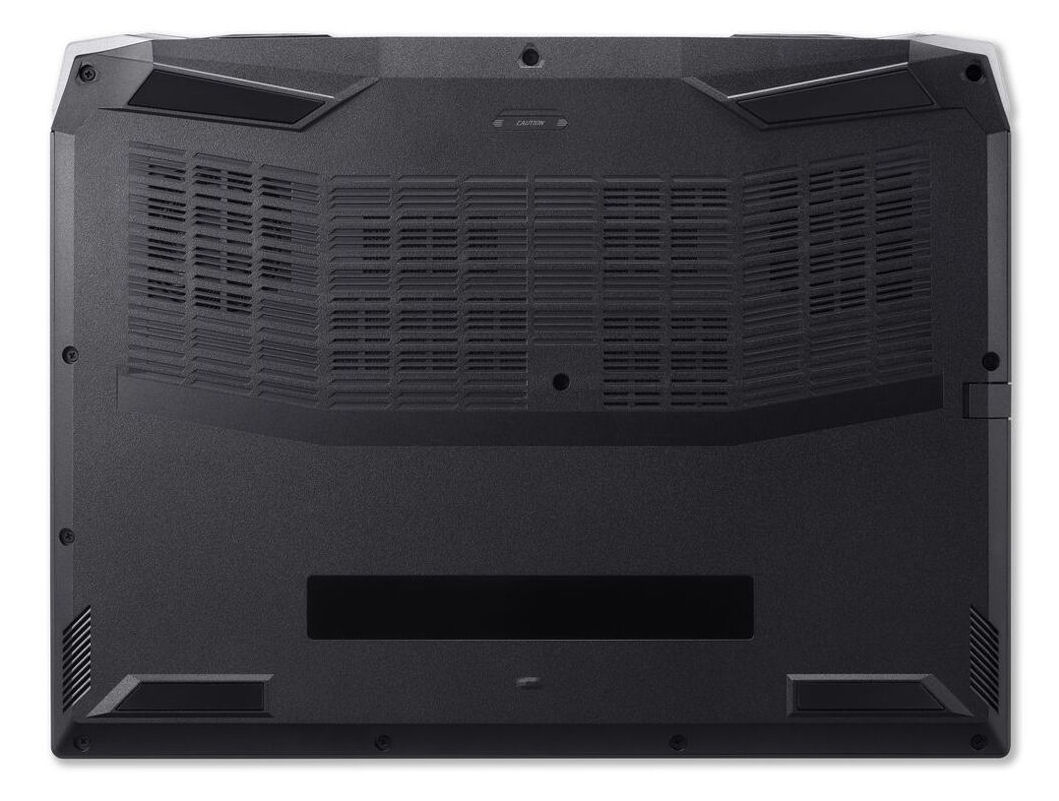
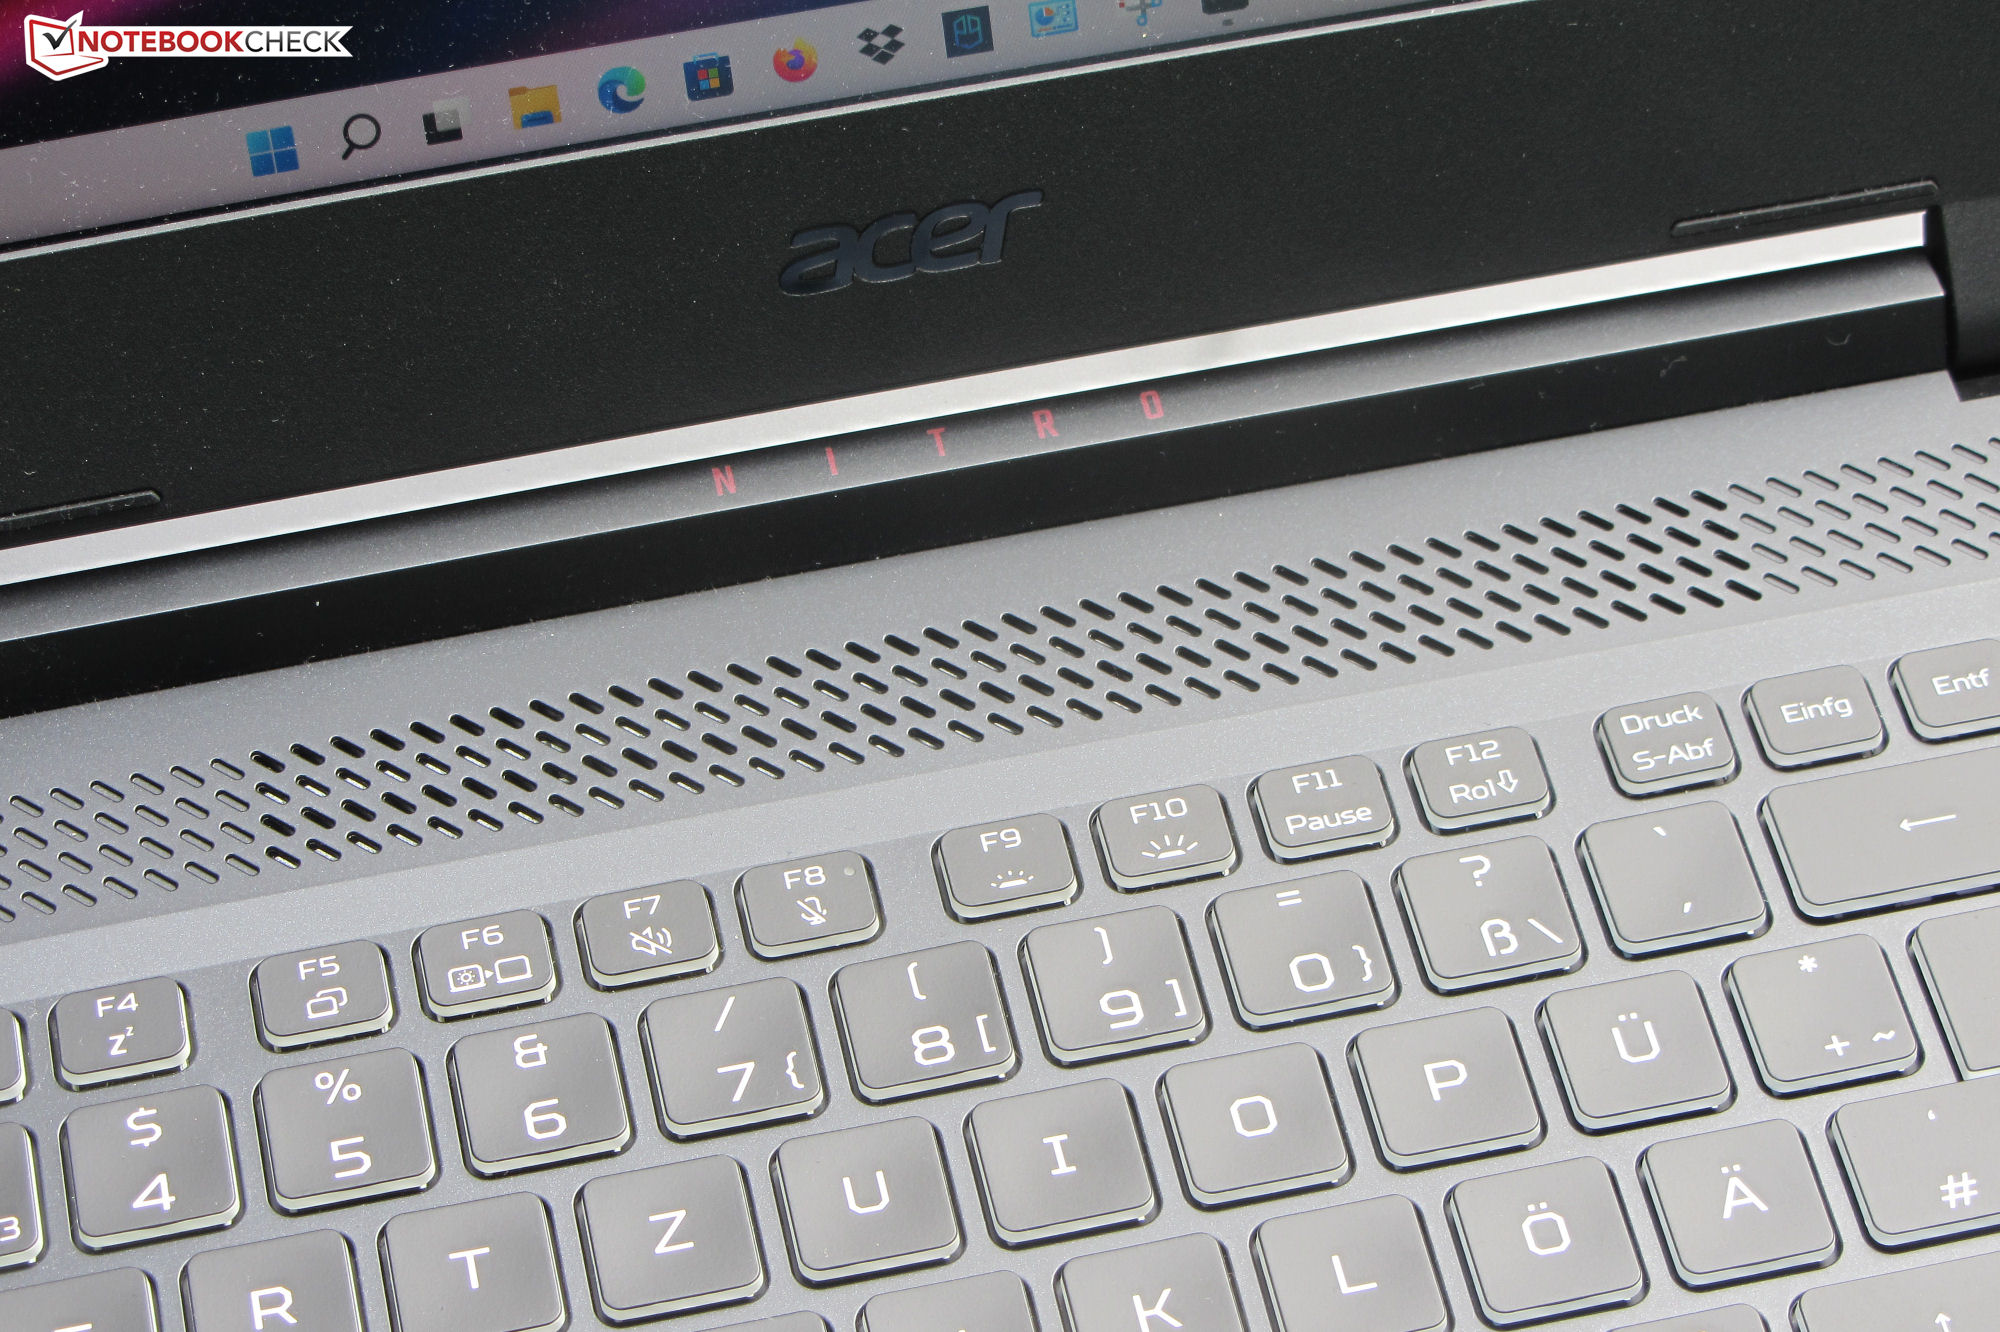
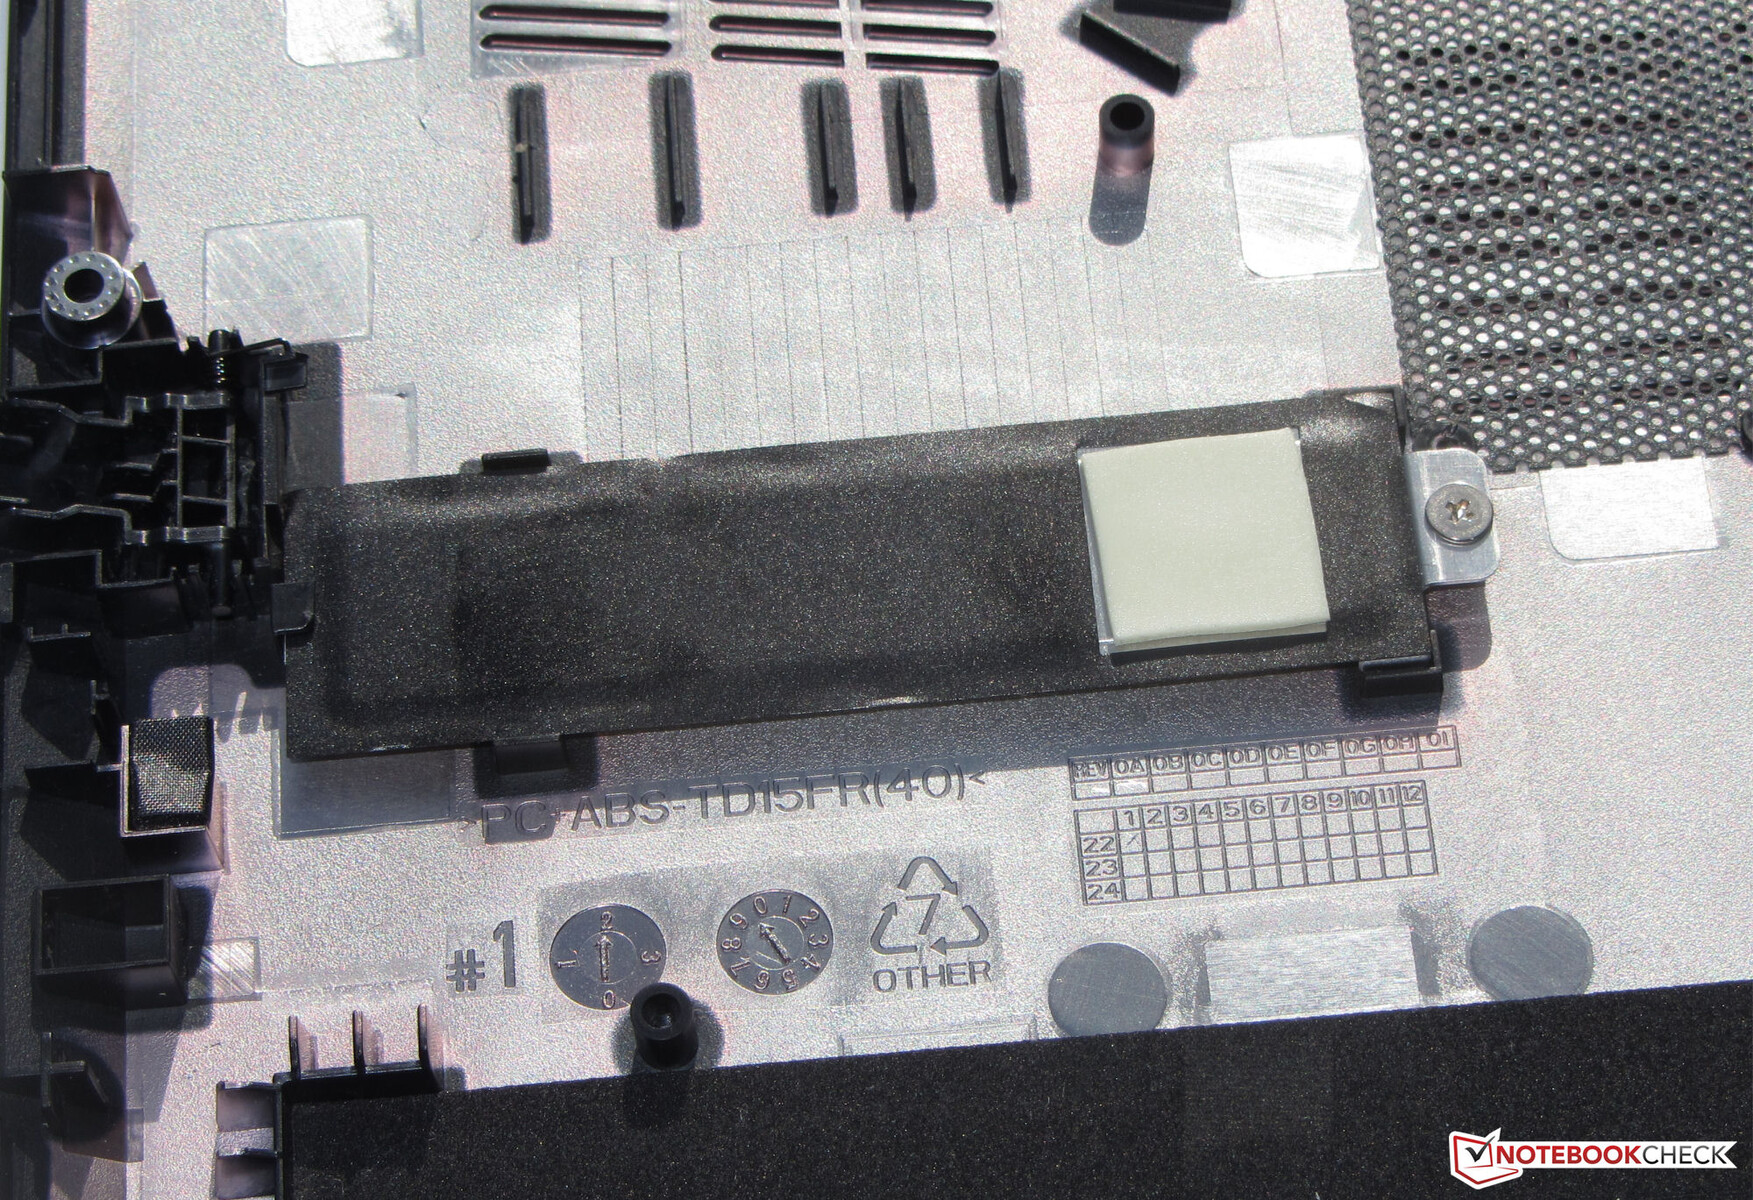
Caja: Acer, en plástico
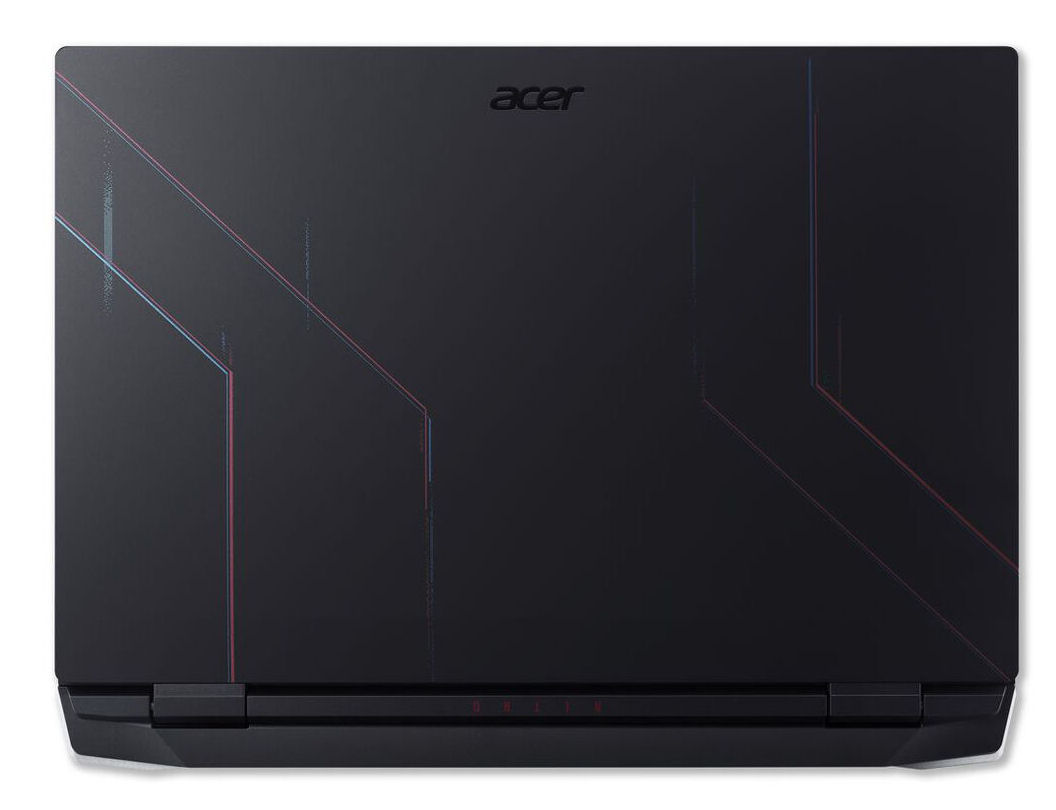
La carcasa del Nitro 5 no parece ofrecer ningún material de alta calidad: todo el chasis es de plástico negro mate. La retroiluminación RGB del teclado y unas finas rayas de colores en la parte posterior de la tapa añaden algo de color. Las superficies lisas del chasis resultan bastante susceptibles a las huellas dactilares. La batería está instalada en el dispositivo (atornillada, no pegada) y se puede acceder al interior tras retirar la carcasa inferior.
No se han detectado defectos de fabricación al examinarlo detenidamente. Todos los huecos son uniformes y no se encontraron salientes de material. La unidad de base se retuerce ligeramente a la torsión, pero se mantiene dentro de unos límites aceptables. La tapa, en cambio, podría estar más ajustada. Las bisagras mantienen la tapa firmemente en posición y el ángulo máximo de apertura es de unos 155 grados. Es posible abrir la tapa con una sola mano.
En términos de peso y tamaño, el Nitro está más o menos a la par con elLenovo Legion 5 Pro. En el campo de la comparación, el Omen 16representa el dispositivo más ligero y compacto.
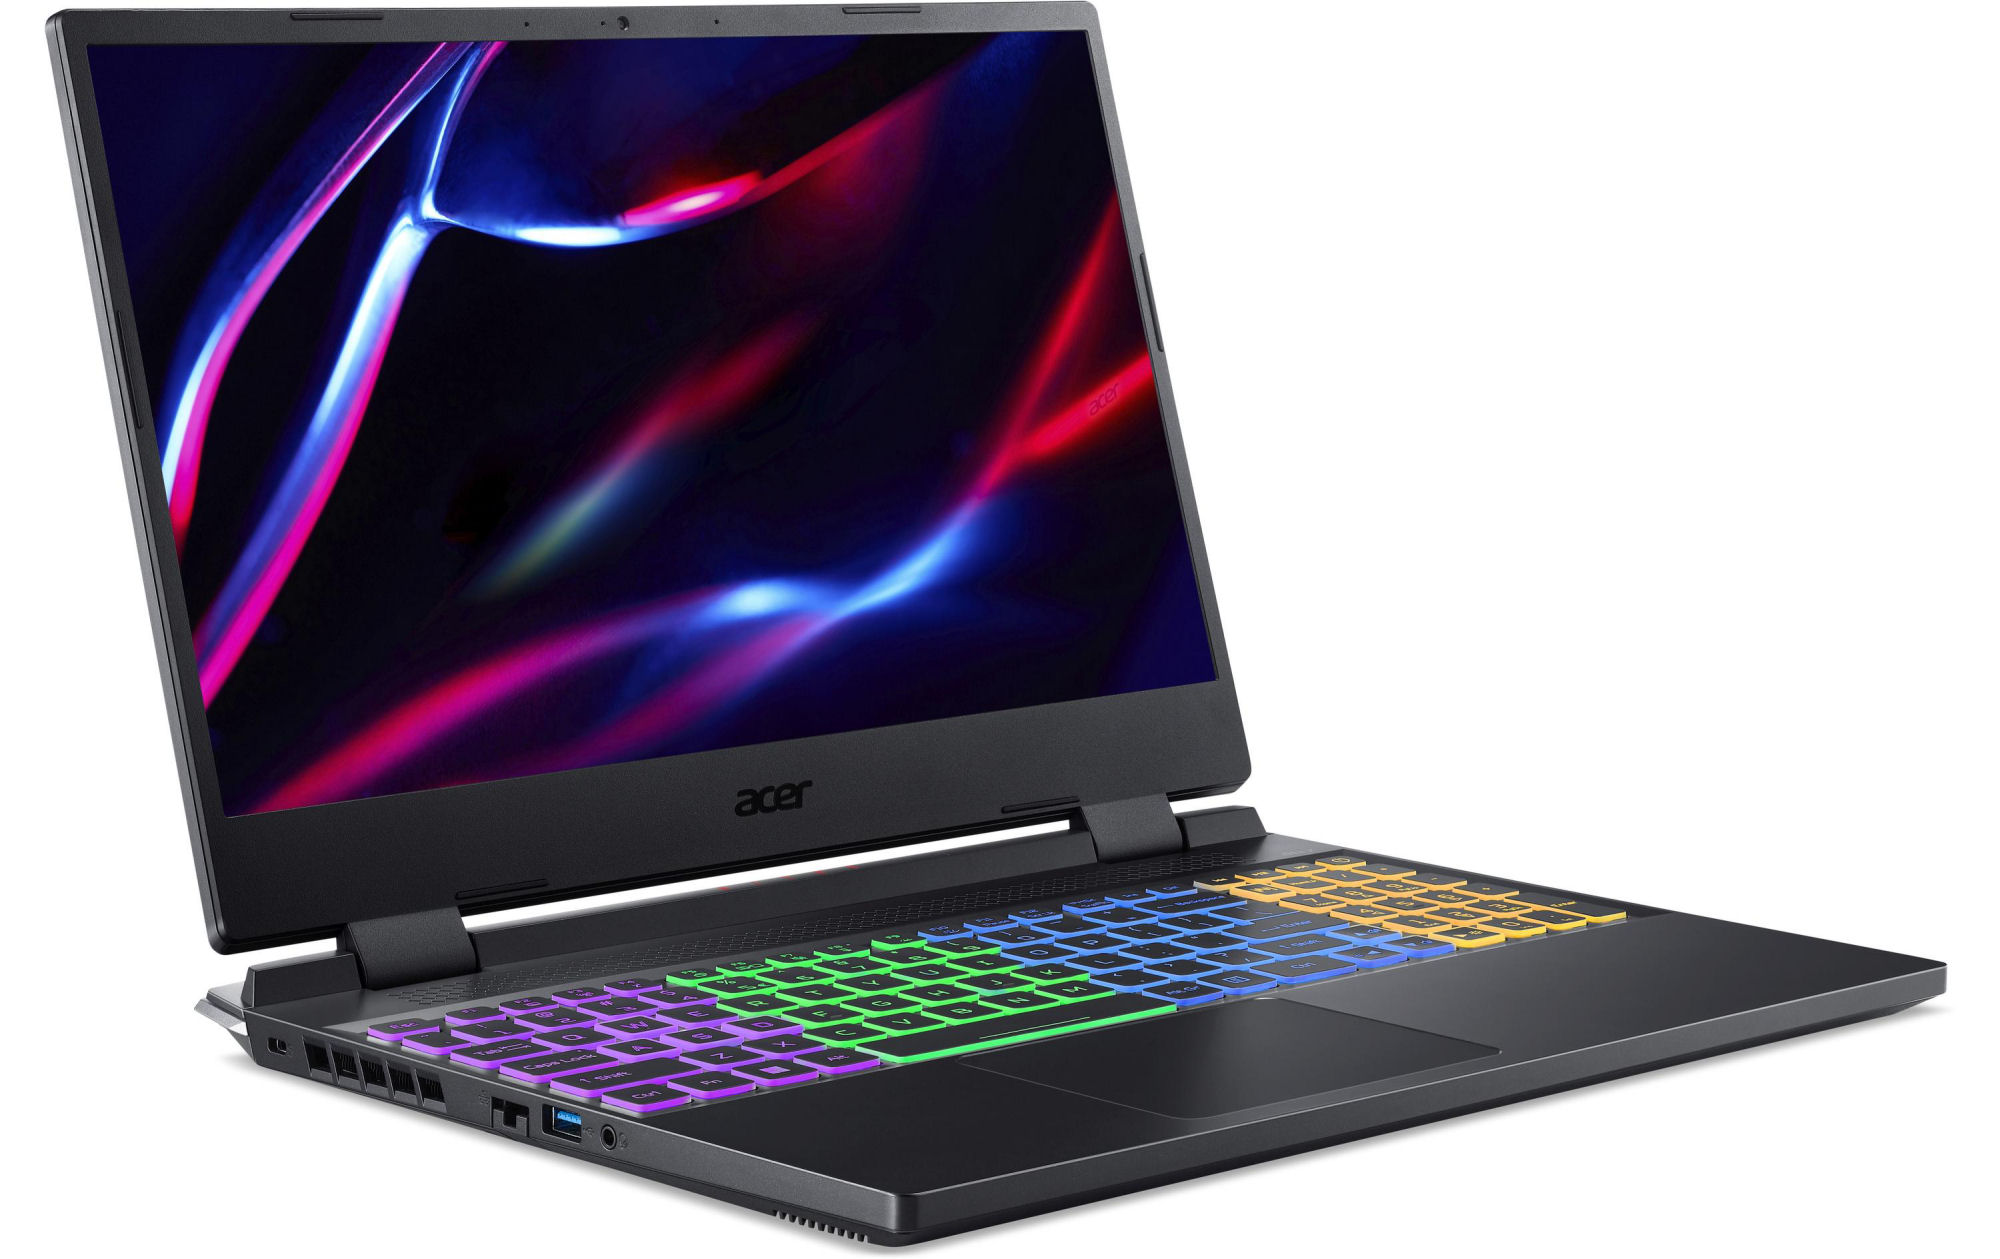
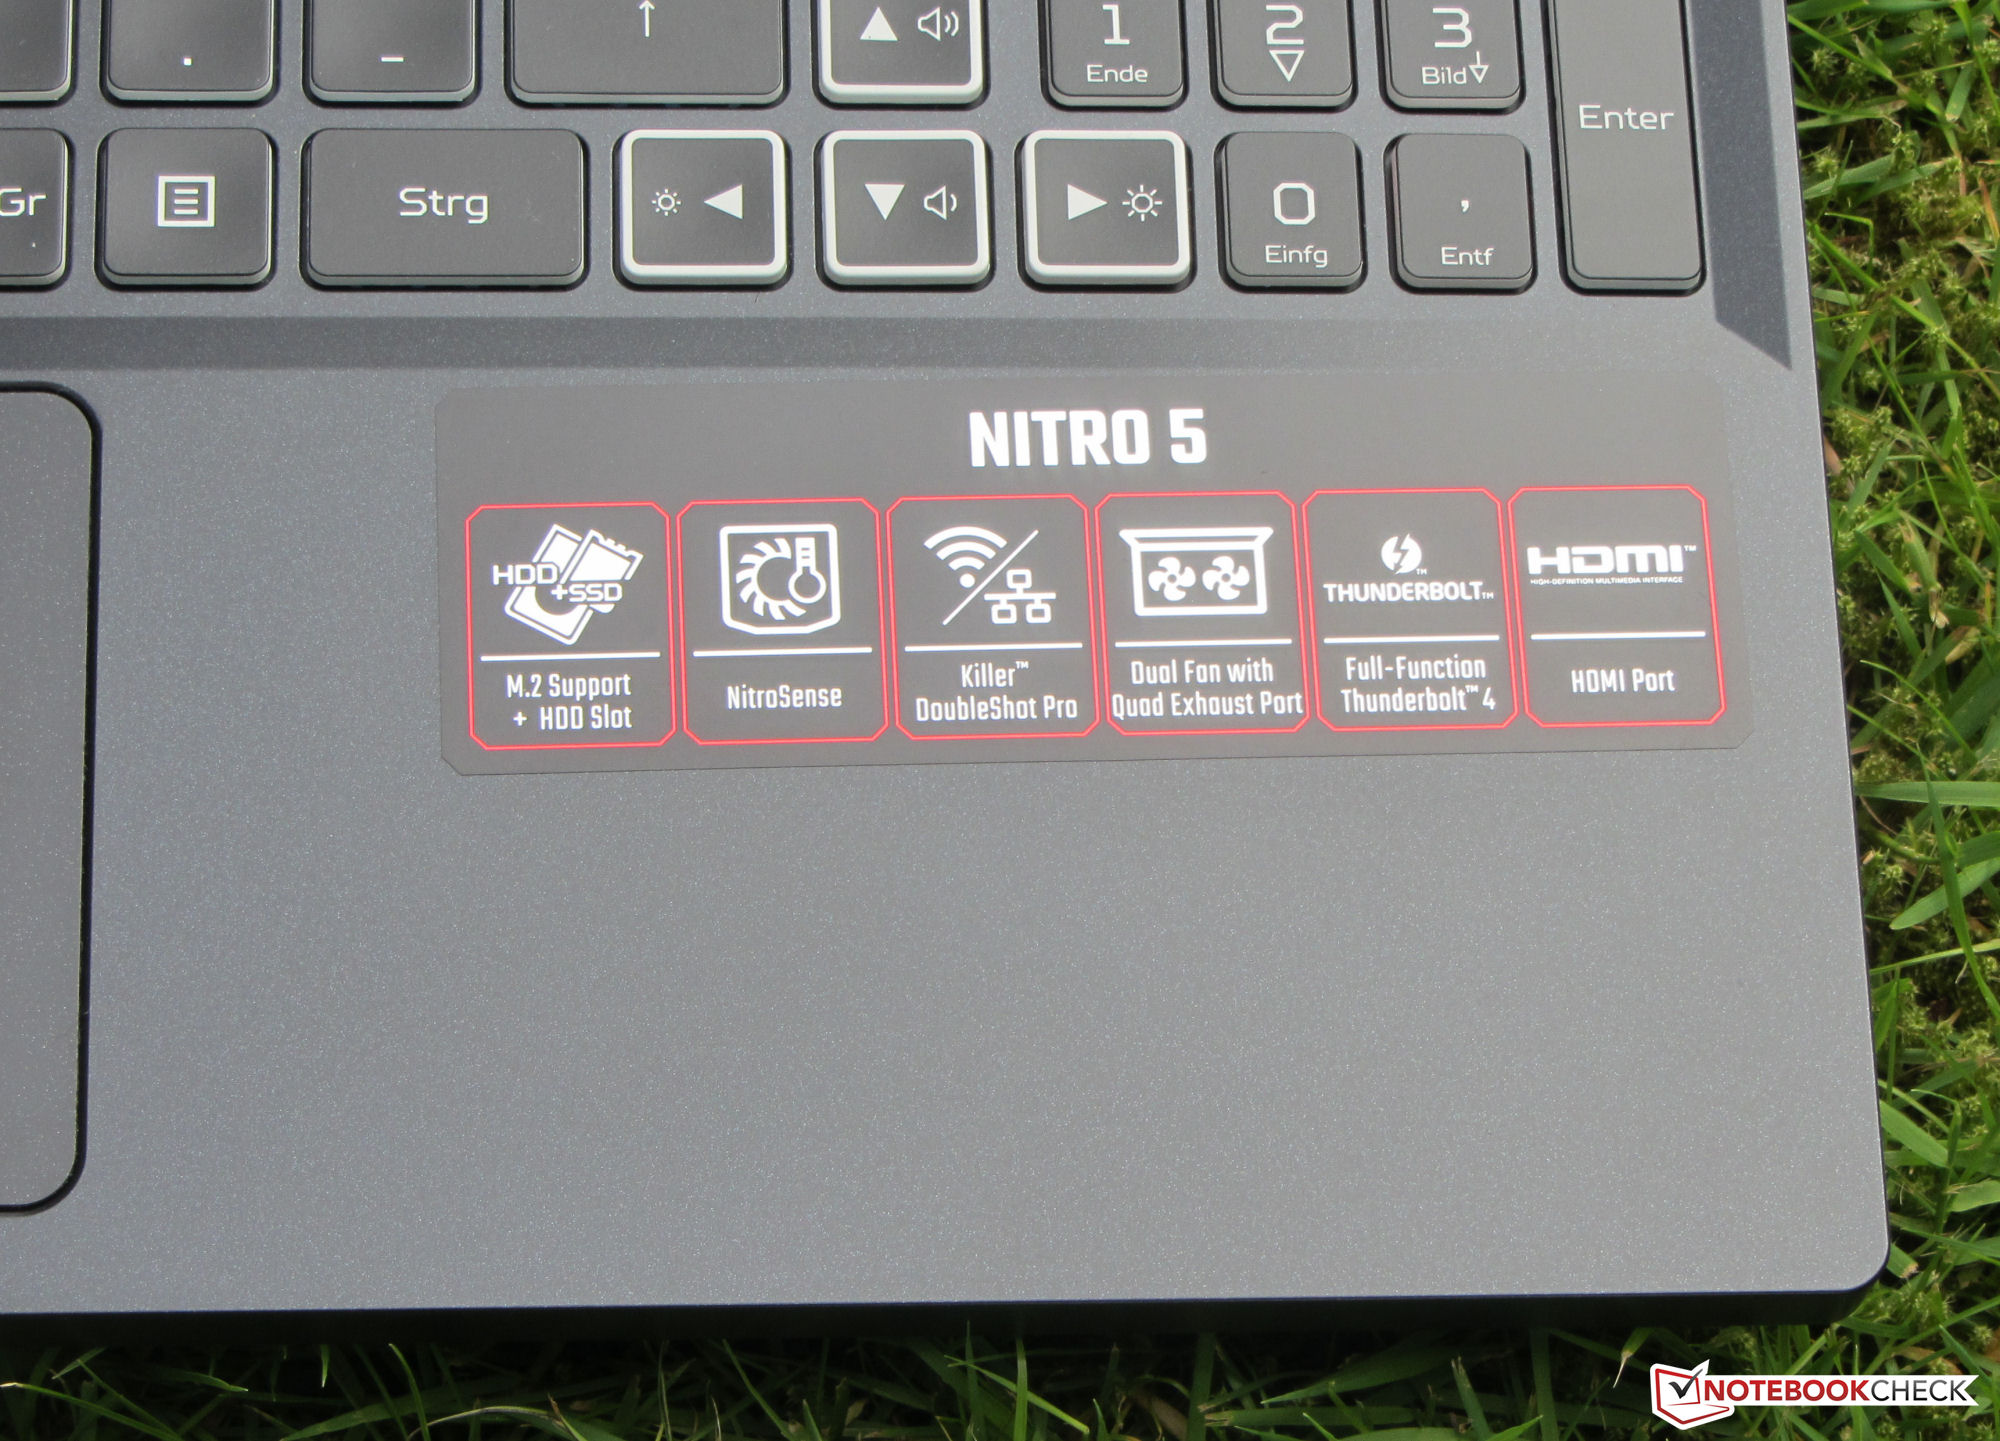
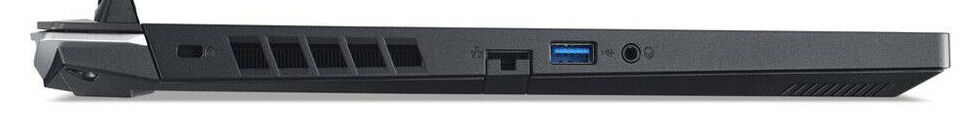
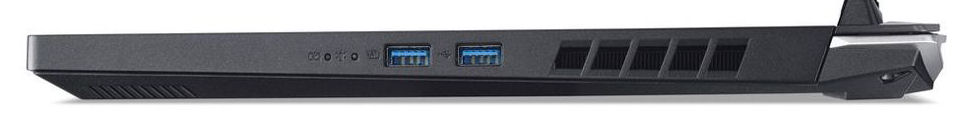
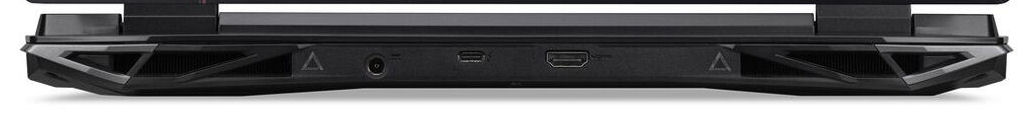
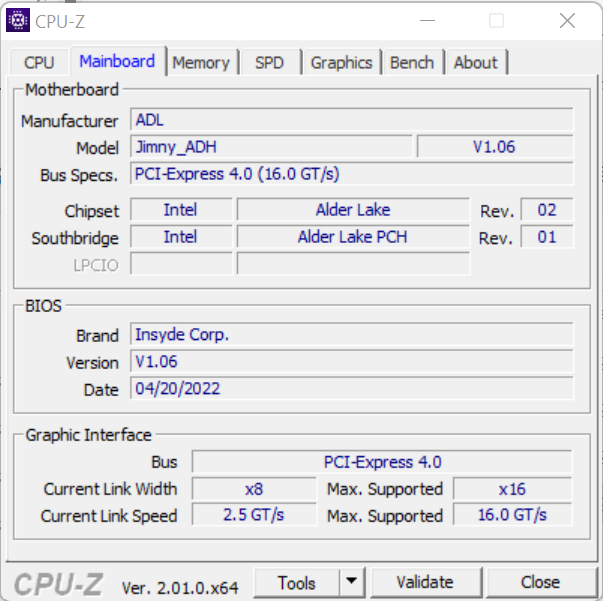
Conectividad: Acer Nitro ofrece Thunderbolt 4
El Nitro cuenta con tres puertos USB-A (2x USB 3.2 Gen 2, 1x USB 3.2 Gen 1) y un puerto USB-C (Thunderbolt 4), de los cuales este último soporta Power Delivery y Displayport. Junto con la ranura HDMI, el portátil ofrece así dos salidas de vídeo. También hay una clavija de audio combinada, un puerto Gigabit Ethernet y una abertura para un cierre de cable. Sólo se echa en falta un lector de tarjetas de memoria.
Comunicación
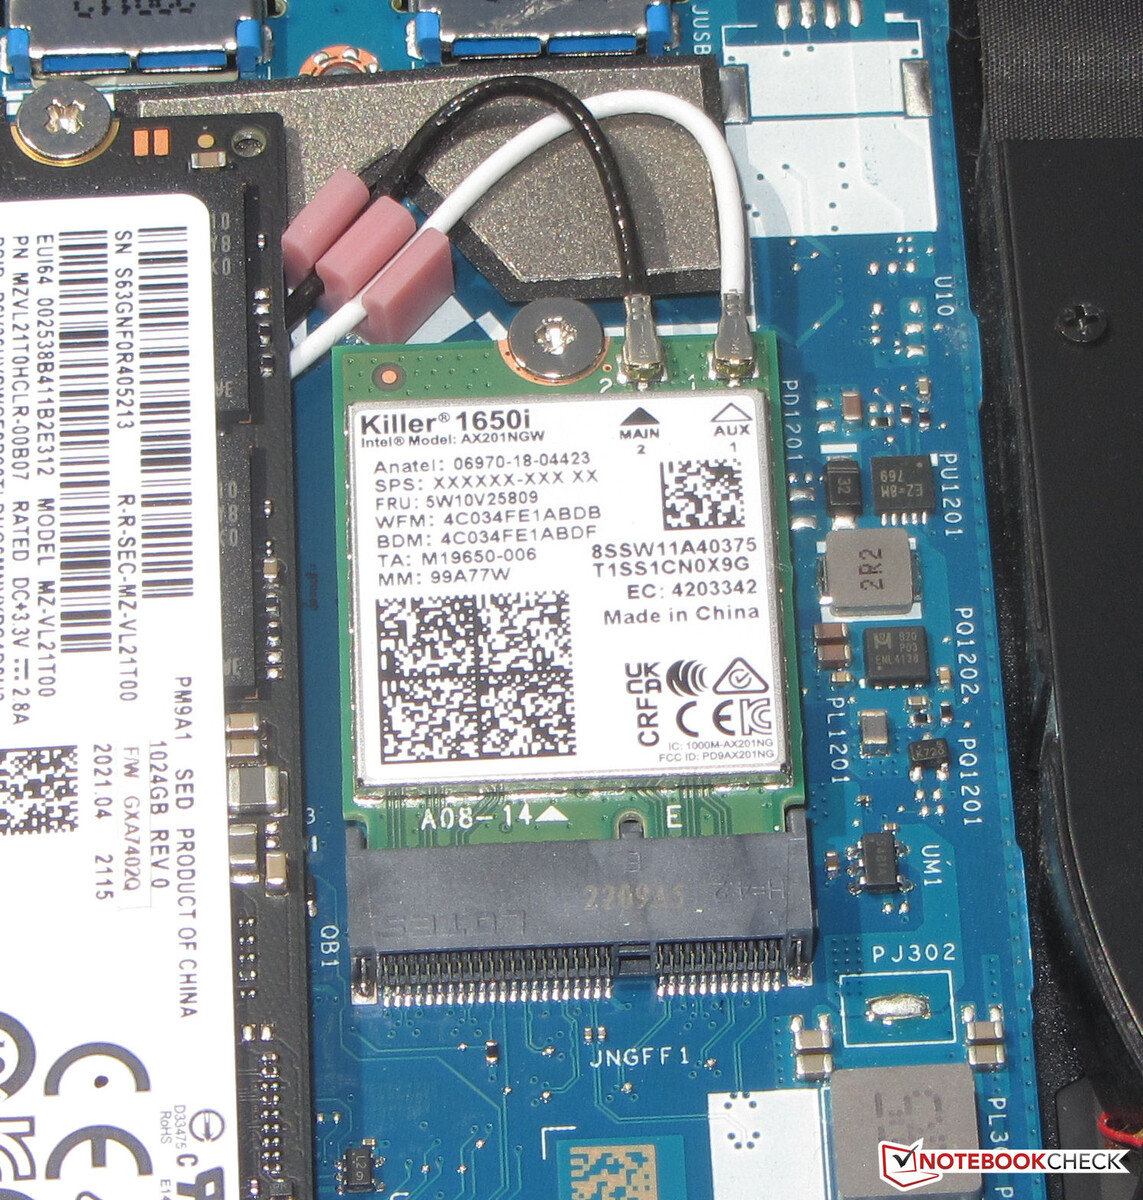
Las tasas de transferencia WLAN determinadas en condiciones óptimas (sin otros dispositivos WLAN en las inmediaciones, corta distancia entre el portátil y el PC servidor) son excelentes y corresponden a las capacidades del chip WiFi (Killer AX1650i = Intel AX201; 802.11 ax). Las conexiones de red por cable funcionan mediante un chip Gigabit Ethernet (Killer E2600).
| Networking | |
| iperf3 transmit AXE11000 | |
| Acer Nitro 5 AN515-58-72QR | |
| Media de la clase Gaming (560 - 1862, n=88, últimos 2 años) | |
| HP Omen 16-b1090ng | |
| iperf3 receive AXE11000 | |
| Acer Nitro 5 AN515-58-72QR | |
| Media de la clase Gaming (680 - 1745, n=88, últimos 2 años) | |
| HP Omen 16-b1090ng | |
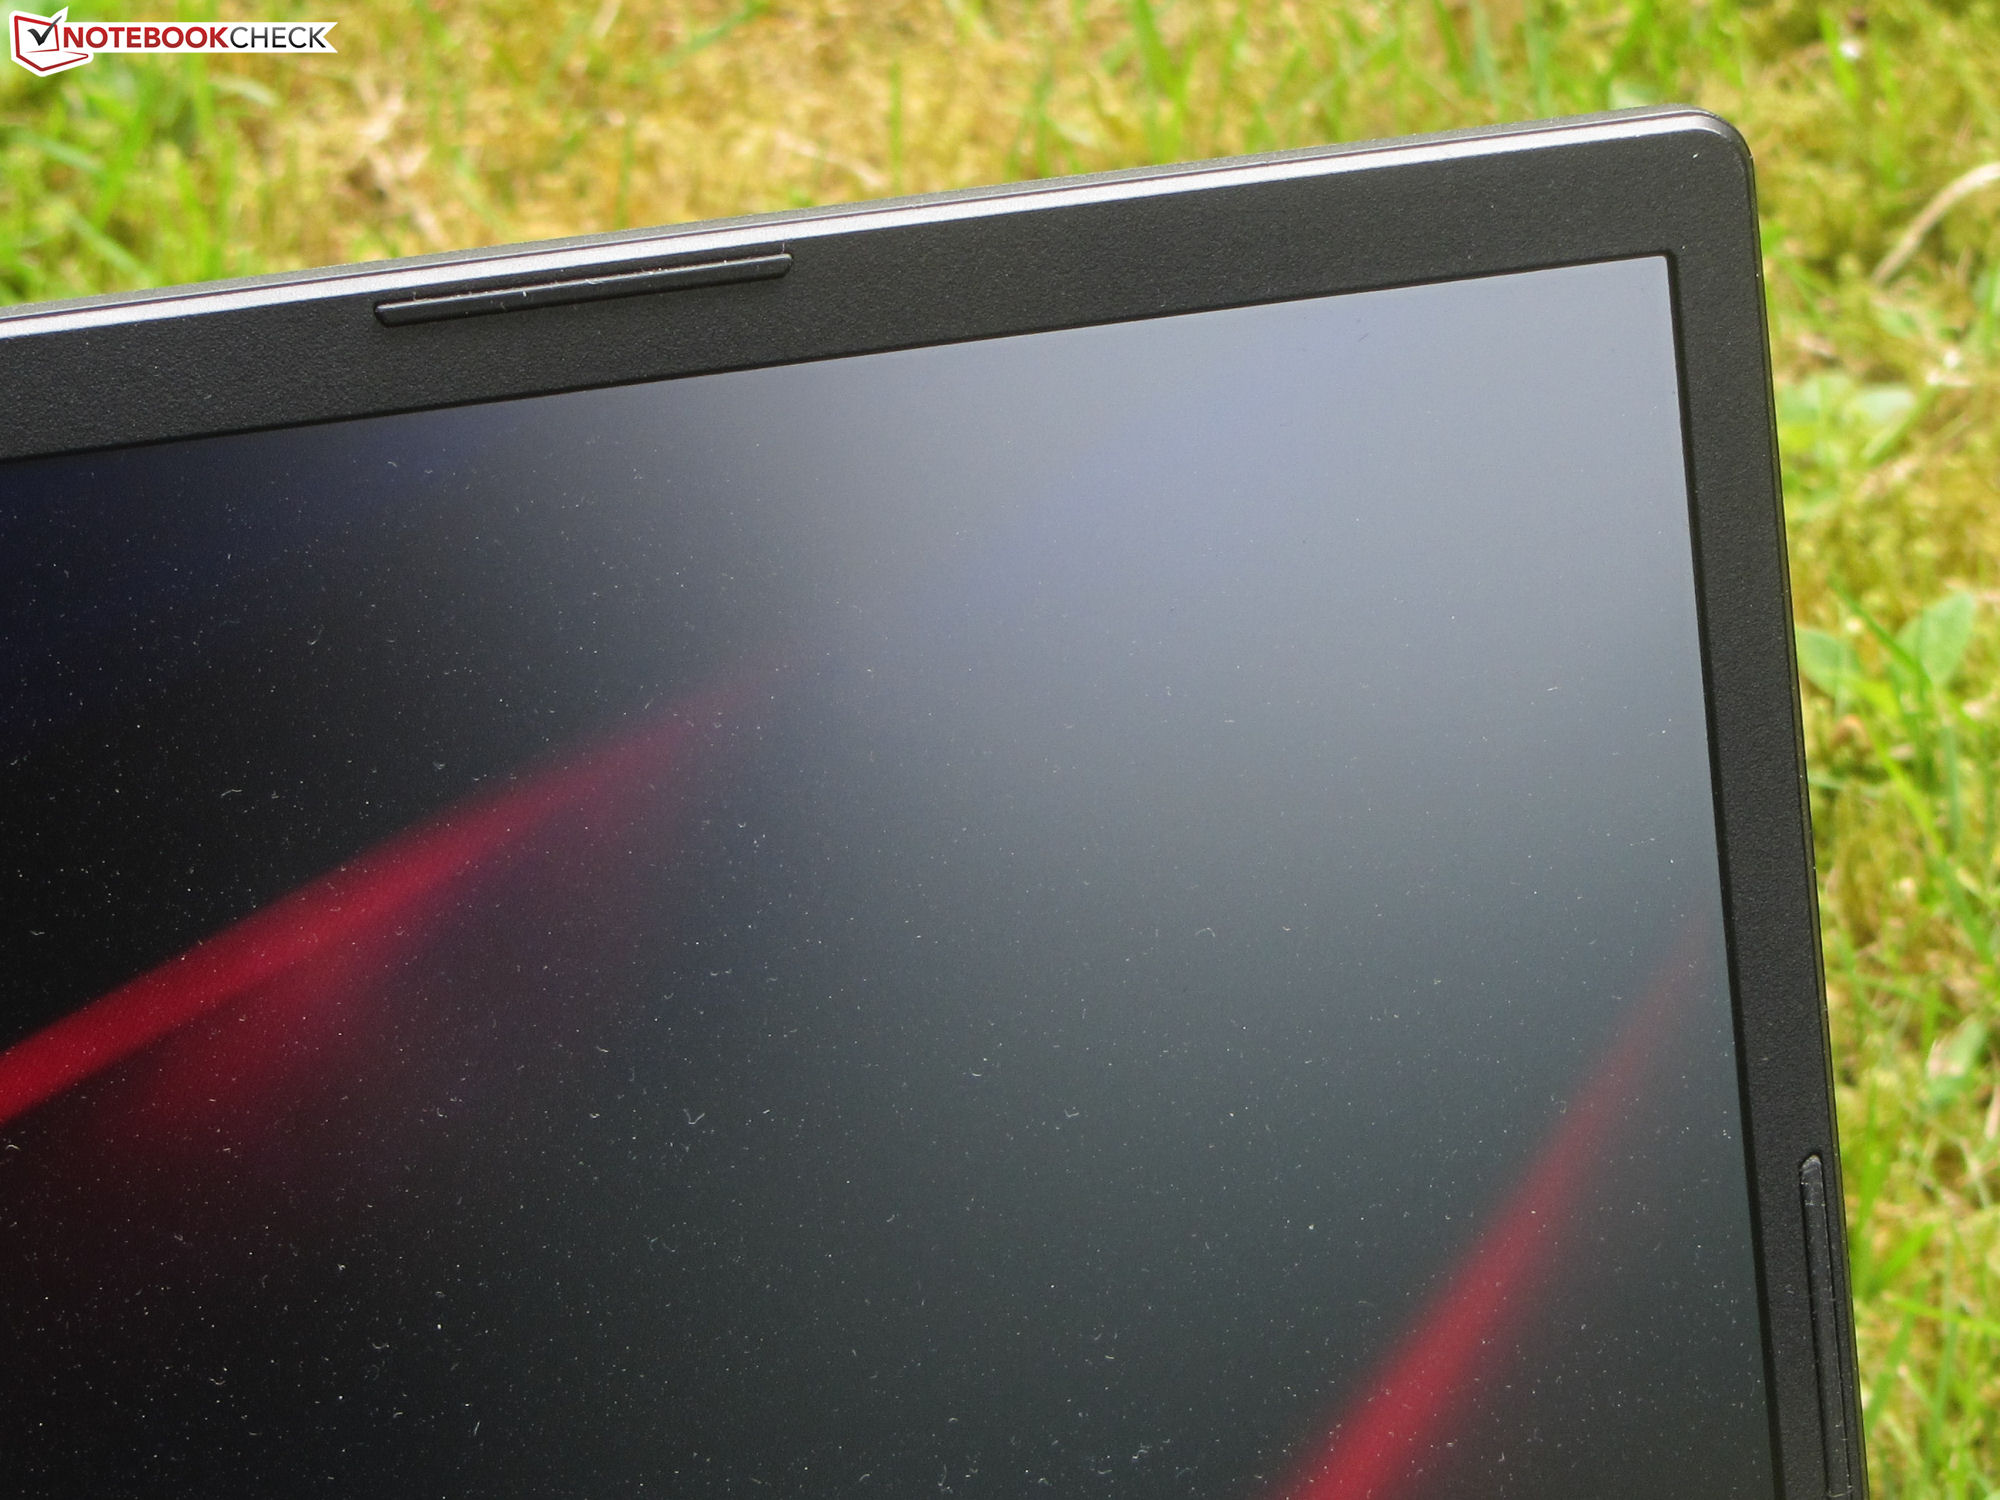
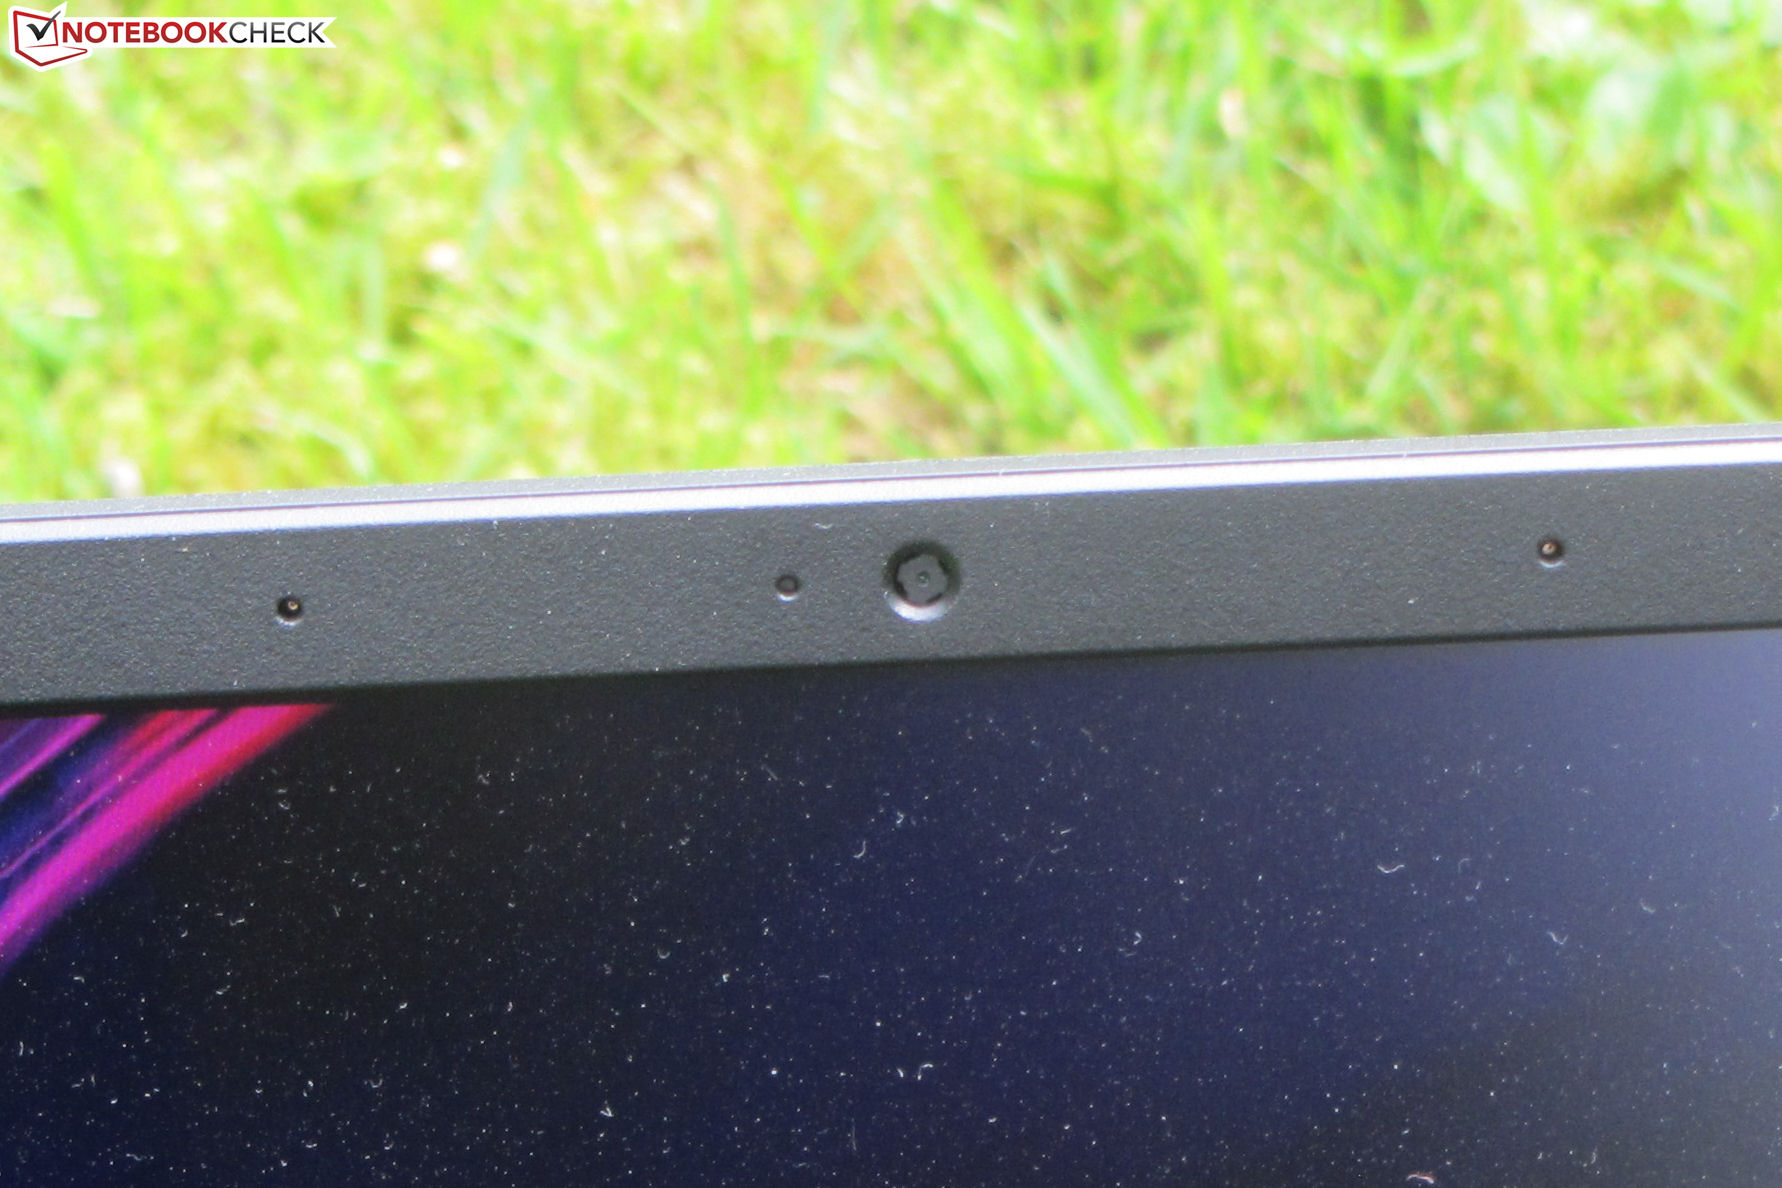
Cámara web
La cámara web (0,9 MP) produce imágenes a una resolución máxima de 1280x720. La precisión del color es un problema: los colores se desvían significativamente del objetivo. No hay obturador mecánico para la cámara.


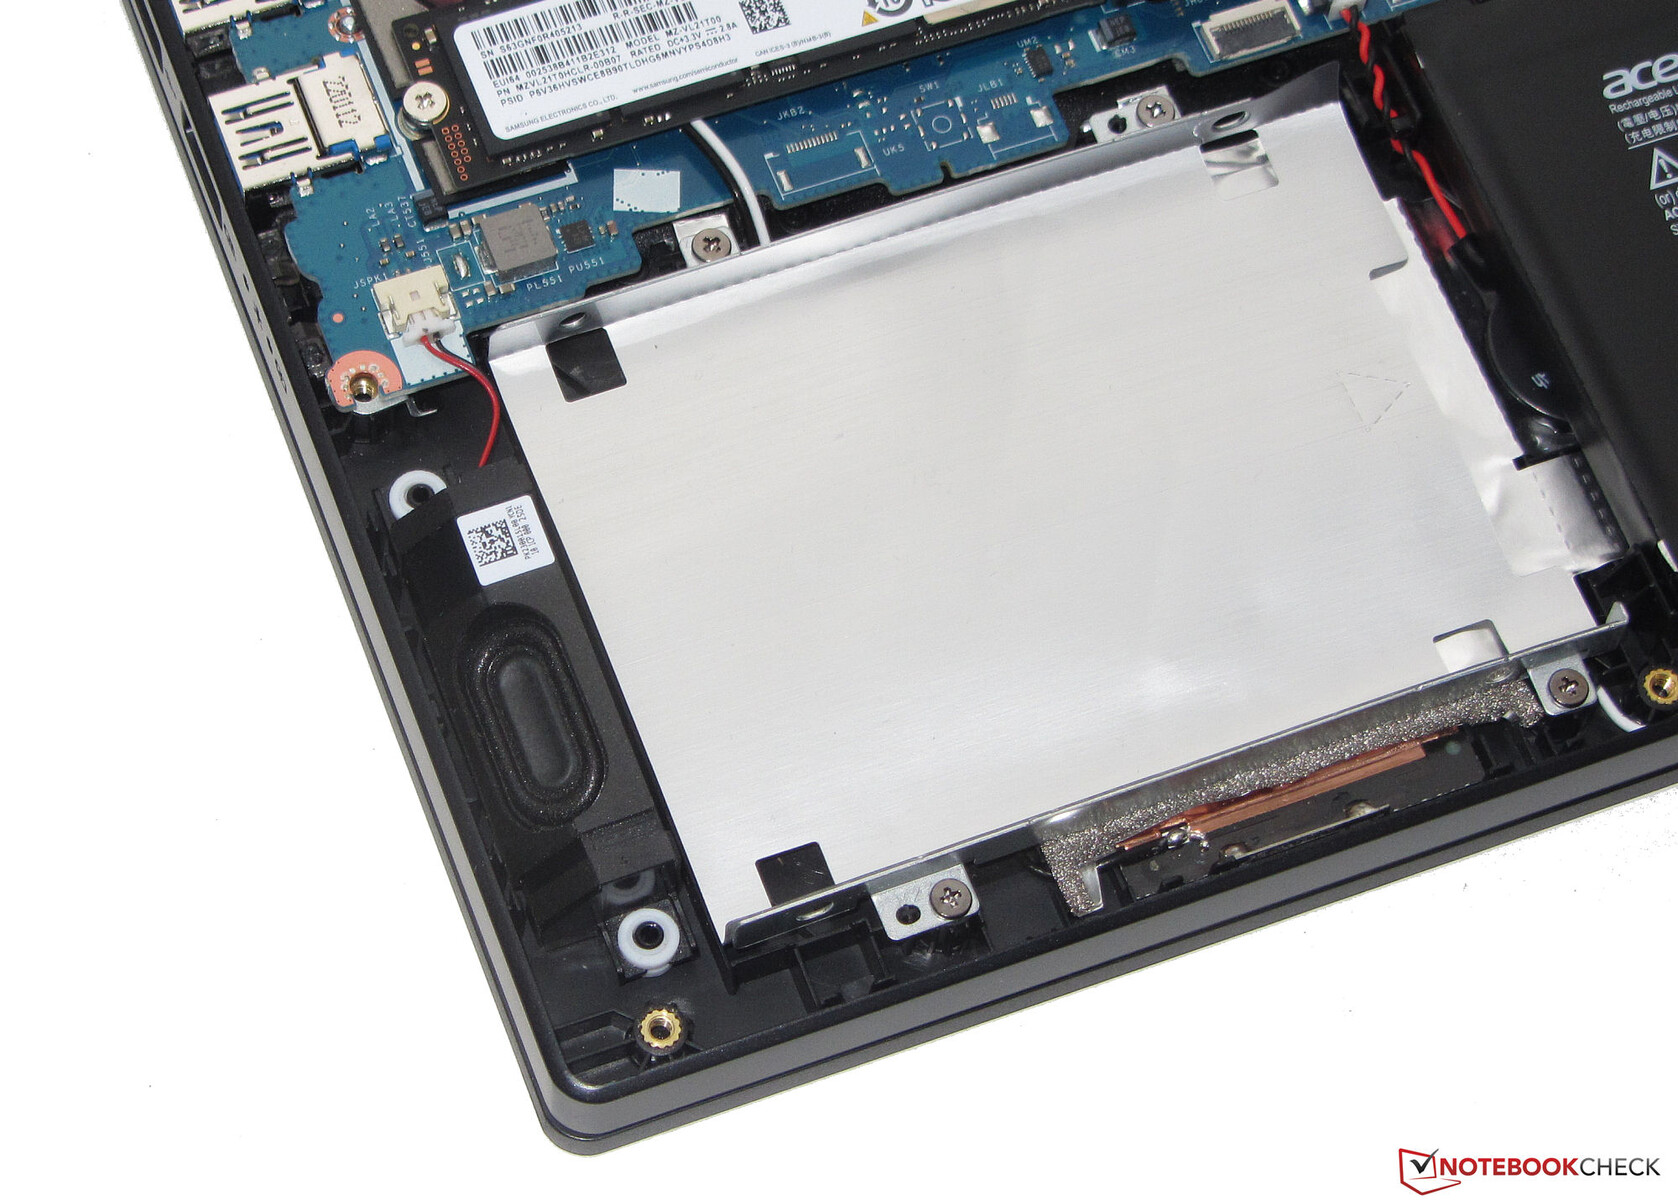
Accesorios
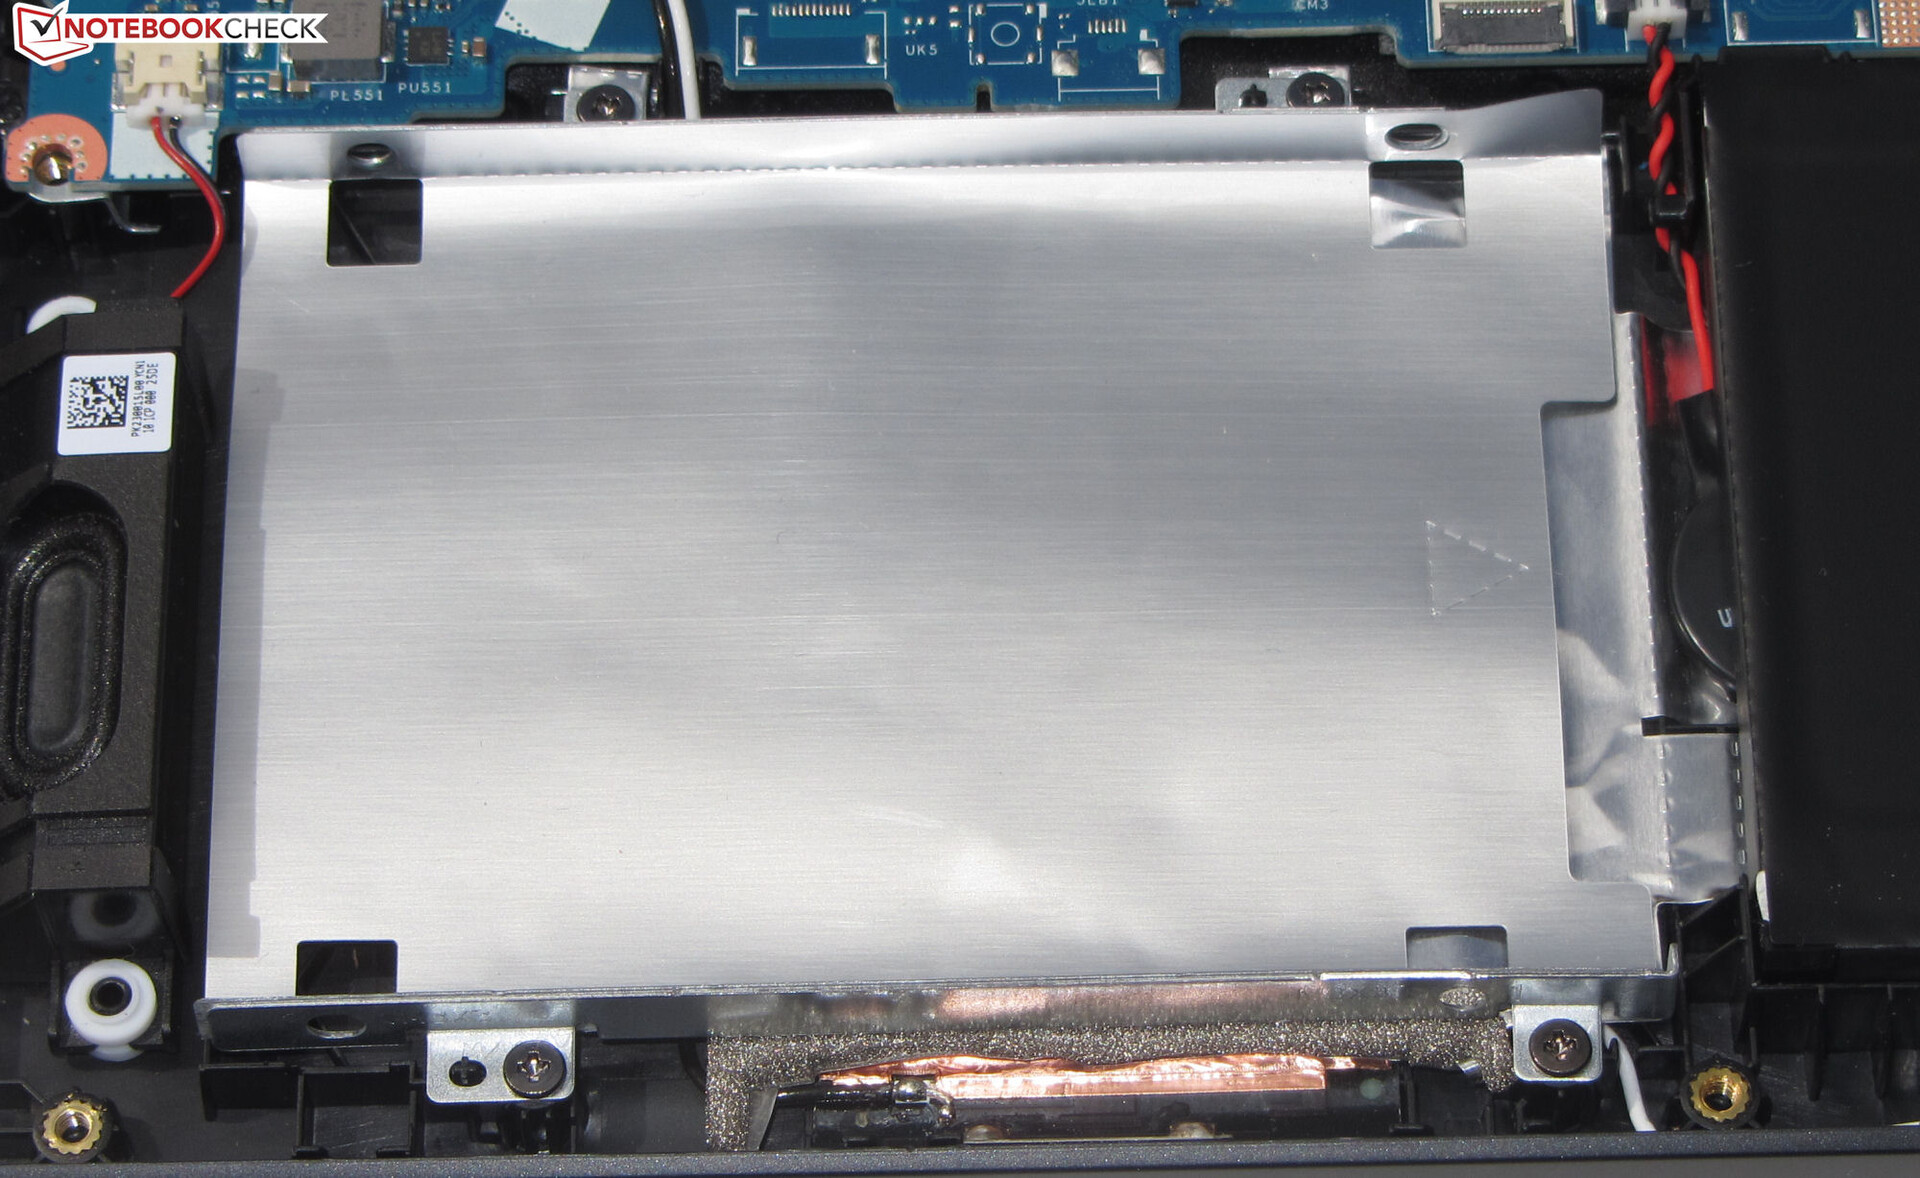
El portátil viene con los documentos habituales: Una guía de inicio rápido e información sobre la garantía. Además, se incluye un cable plano corto con un conector SATA, necesario para la instalación de un dispositivo de almacenamiento de 2,5 pulgadas. El marco de montaje correspondiente ya viene preinstalado dentro del portátil.
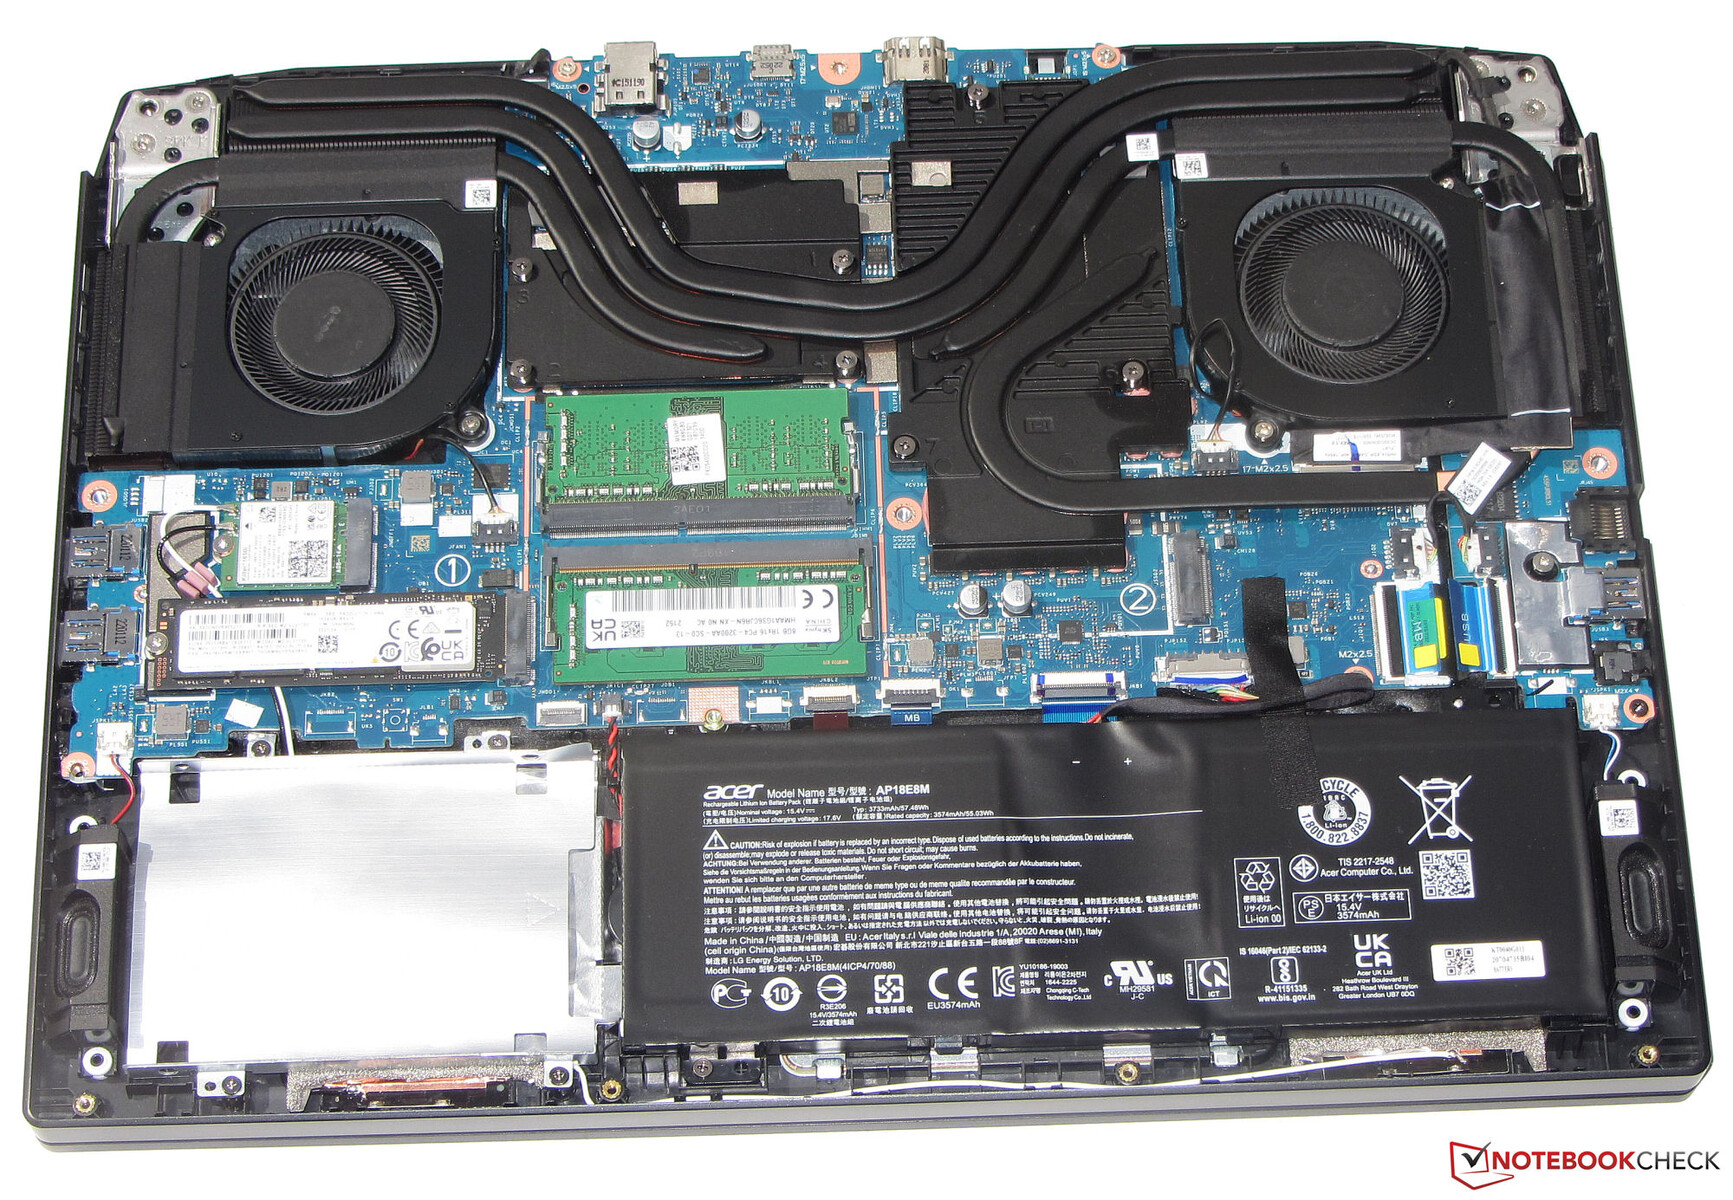
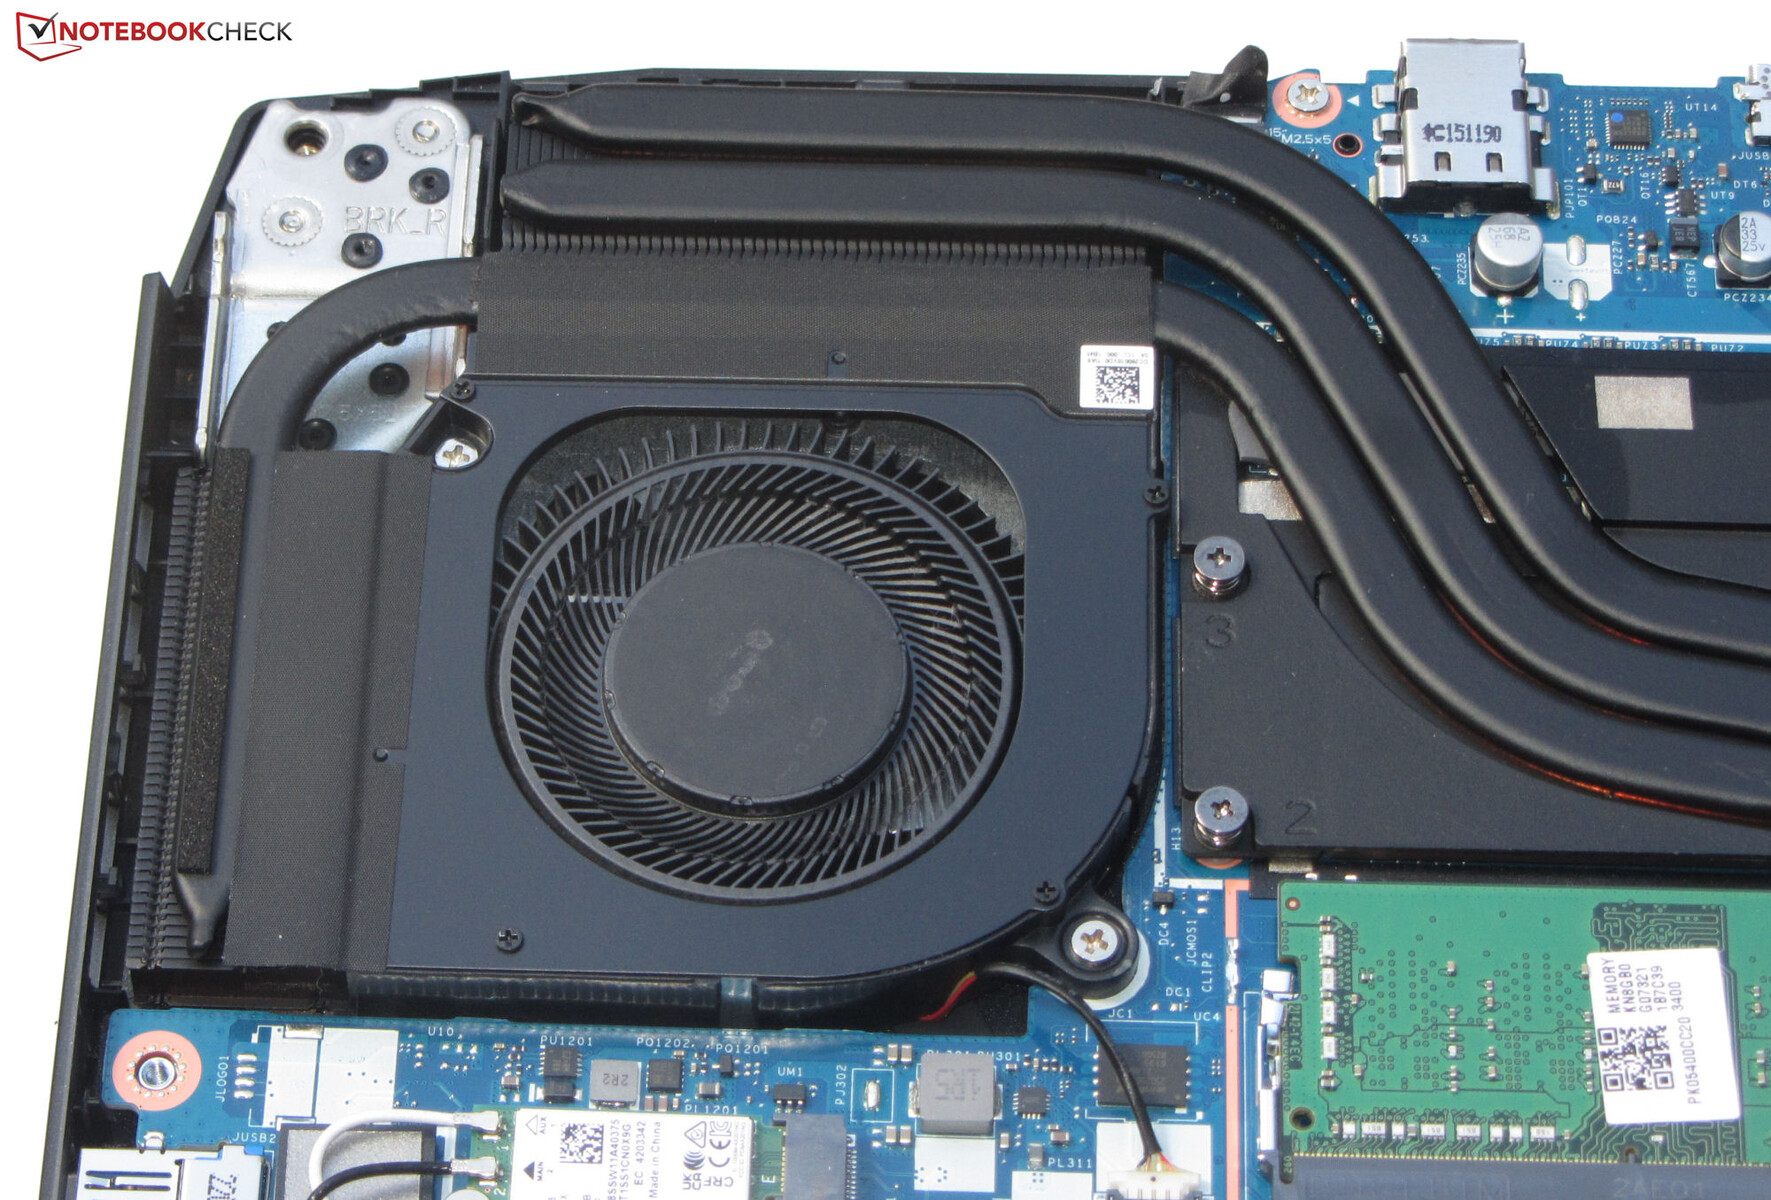
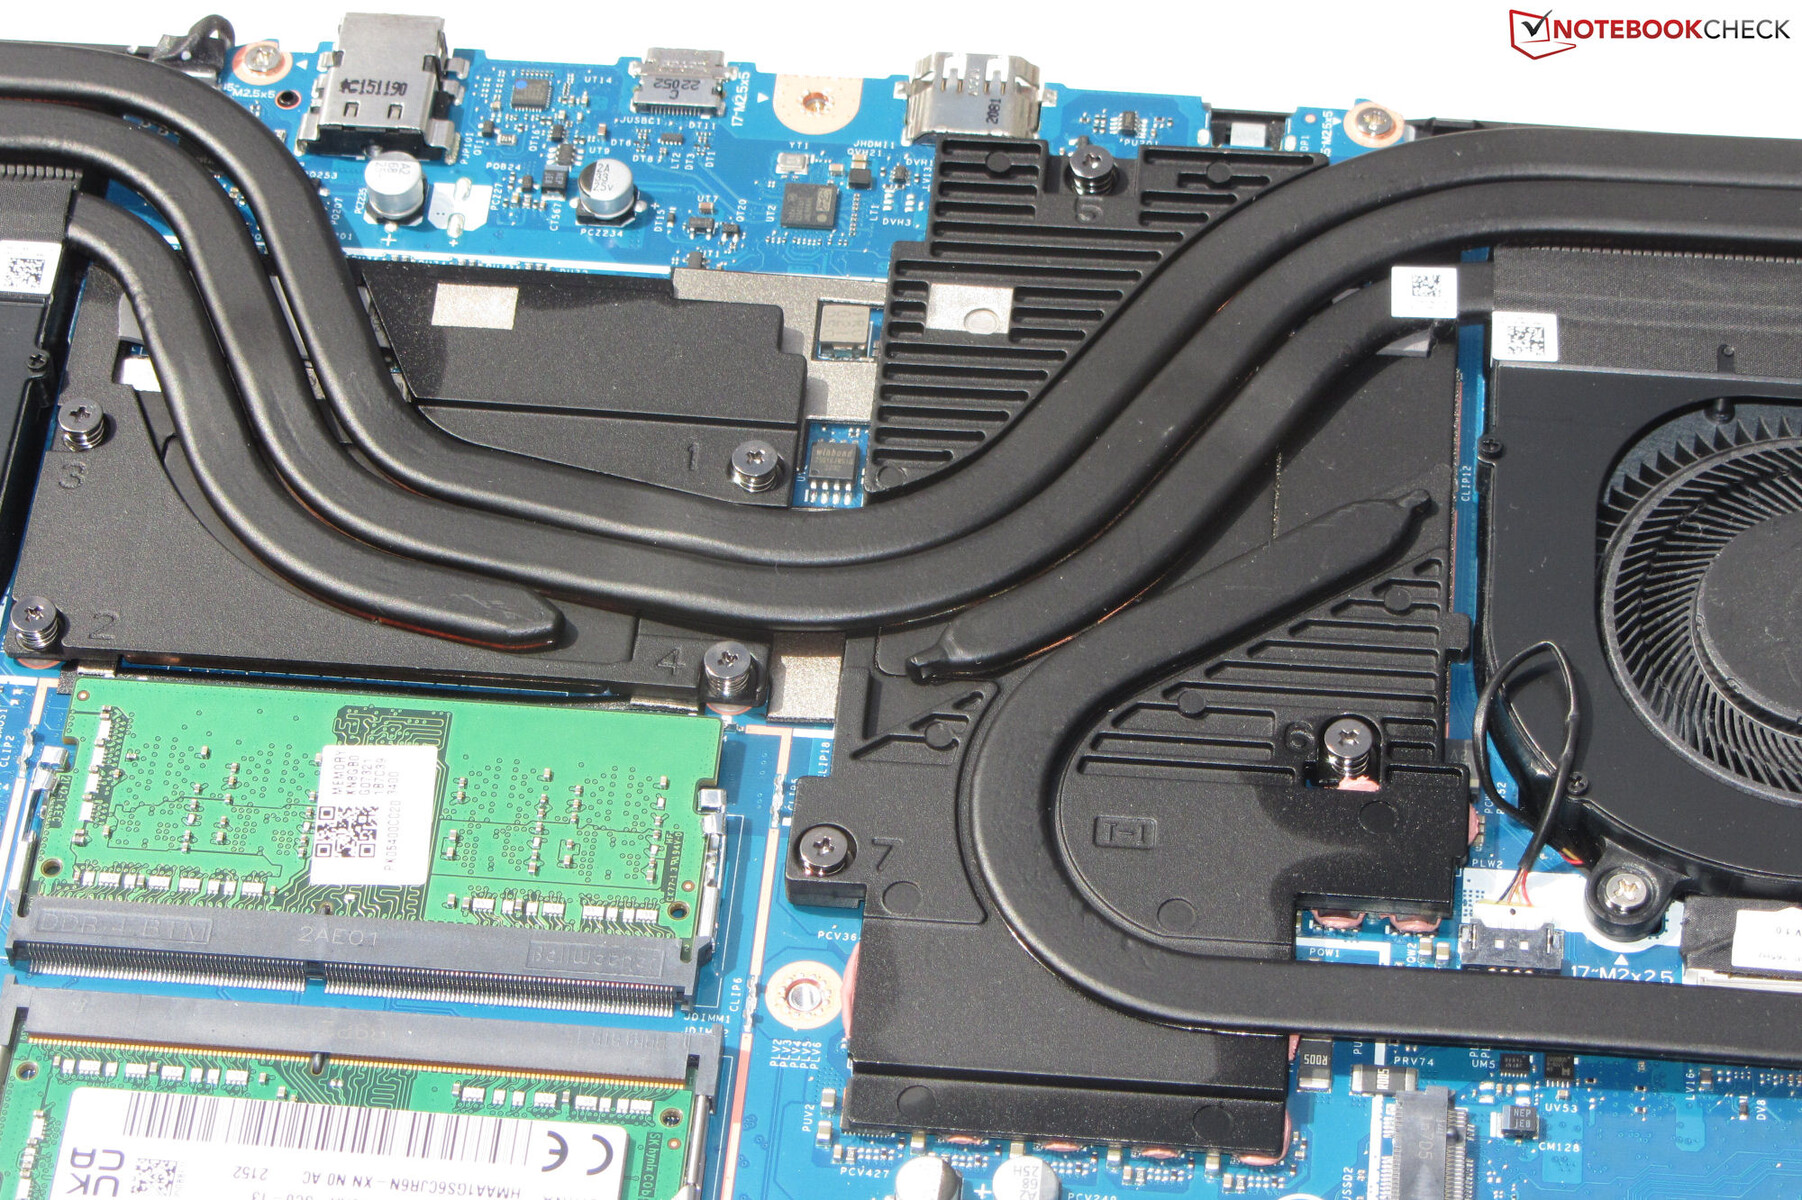
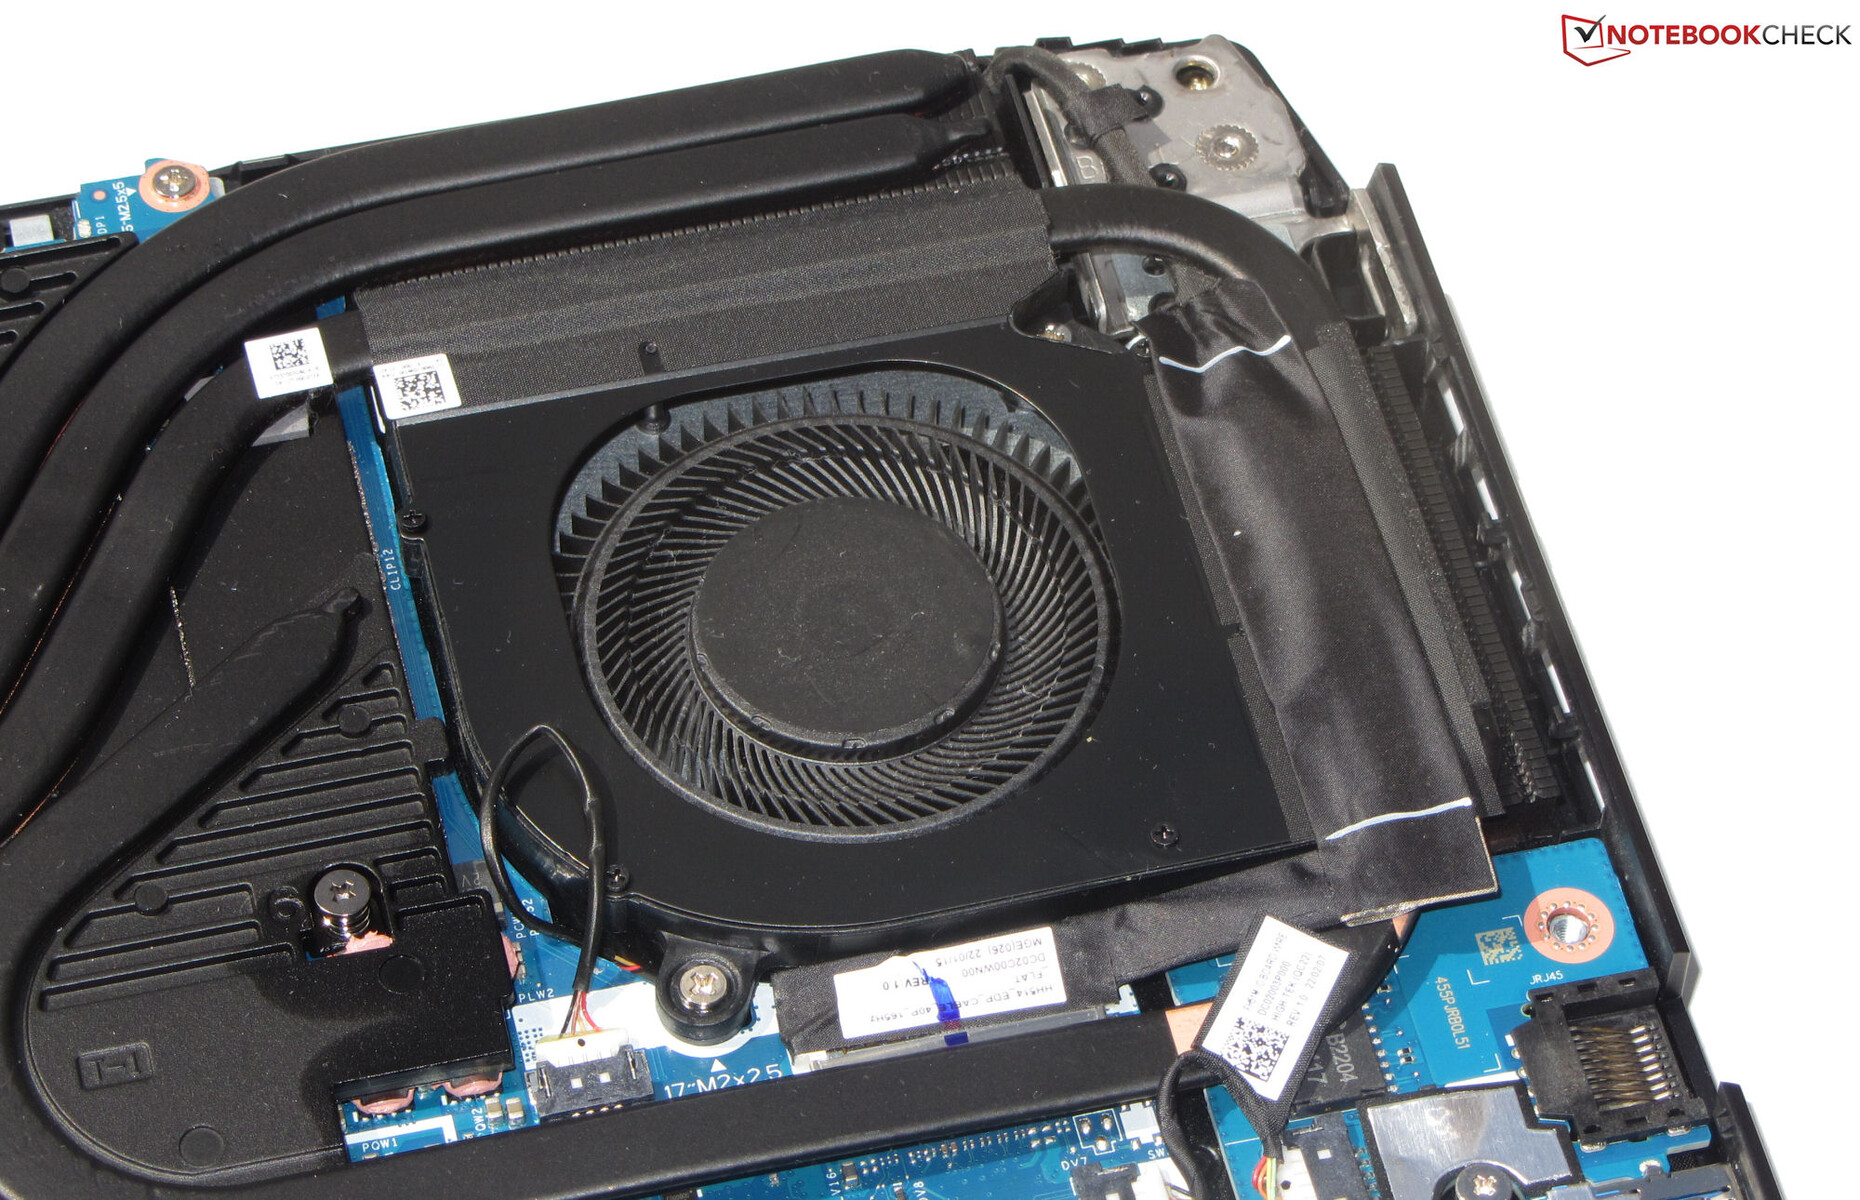
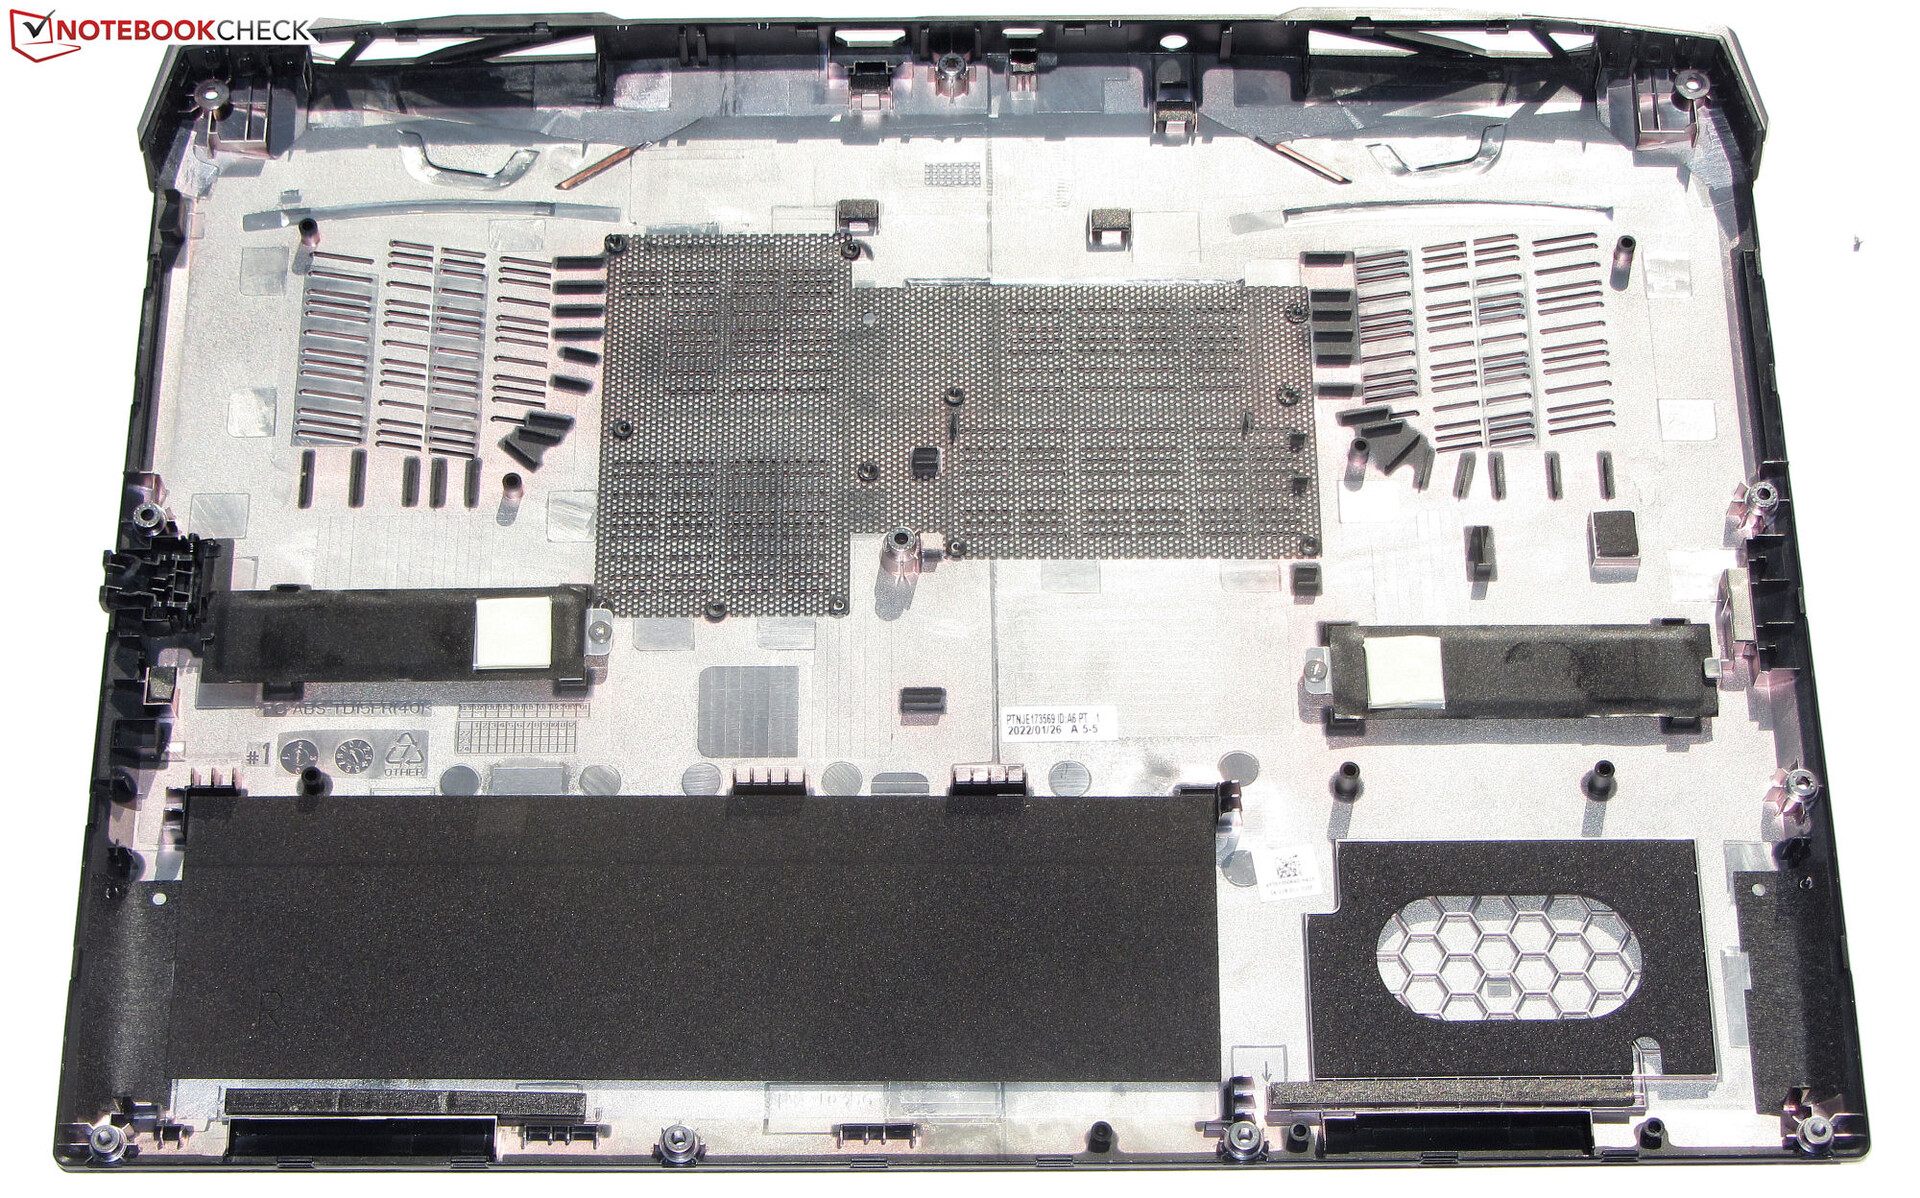
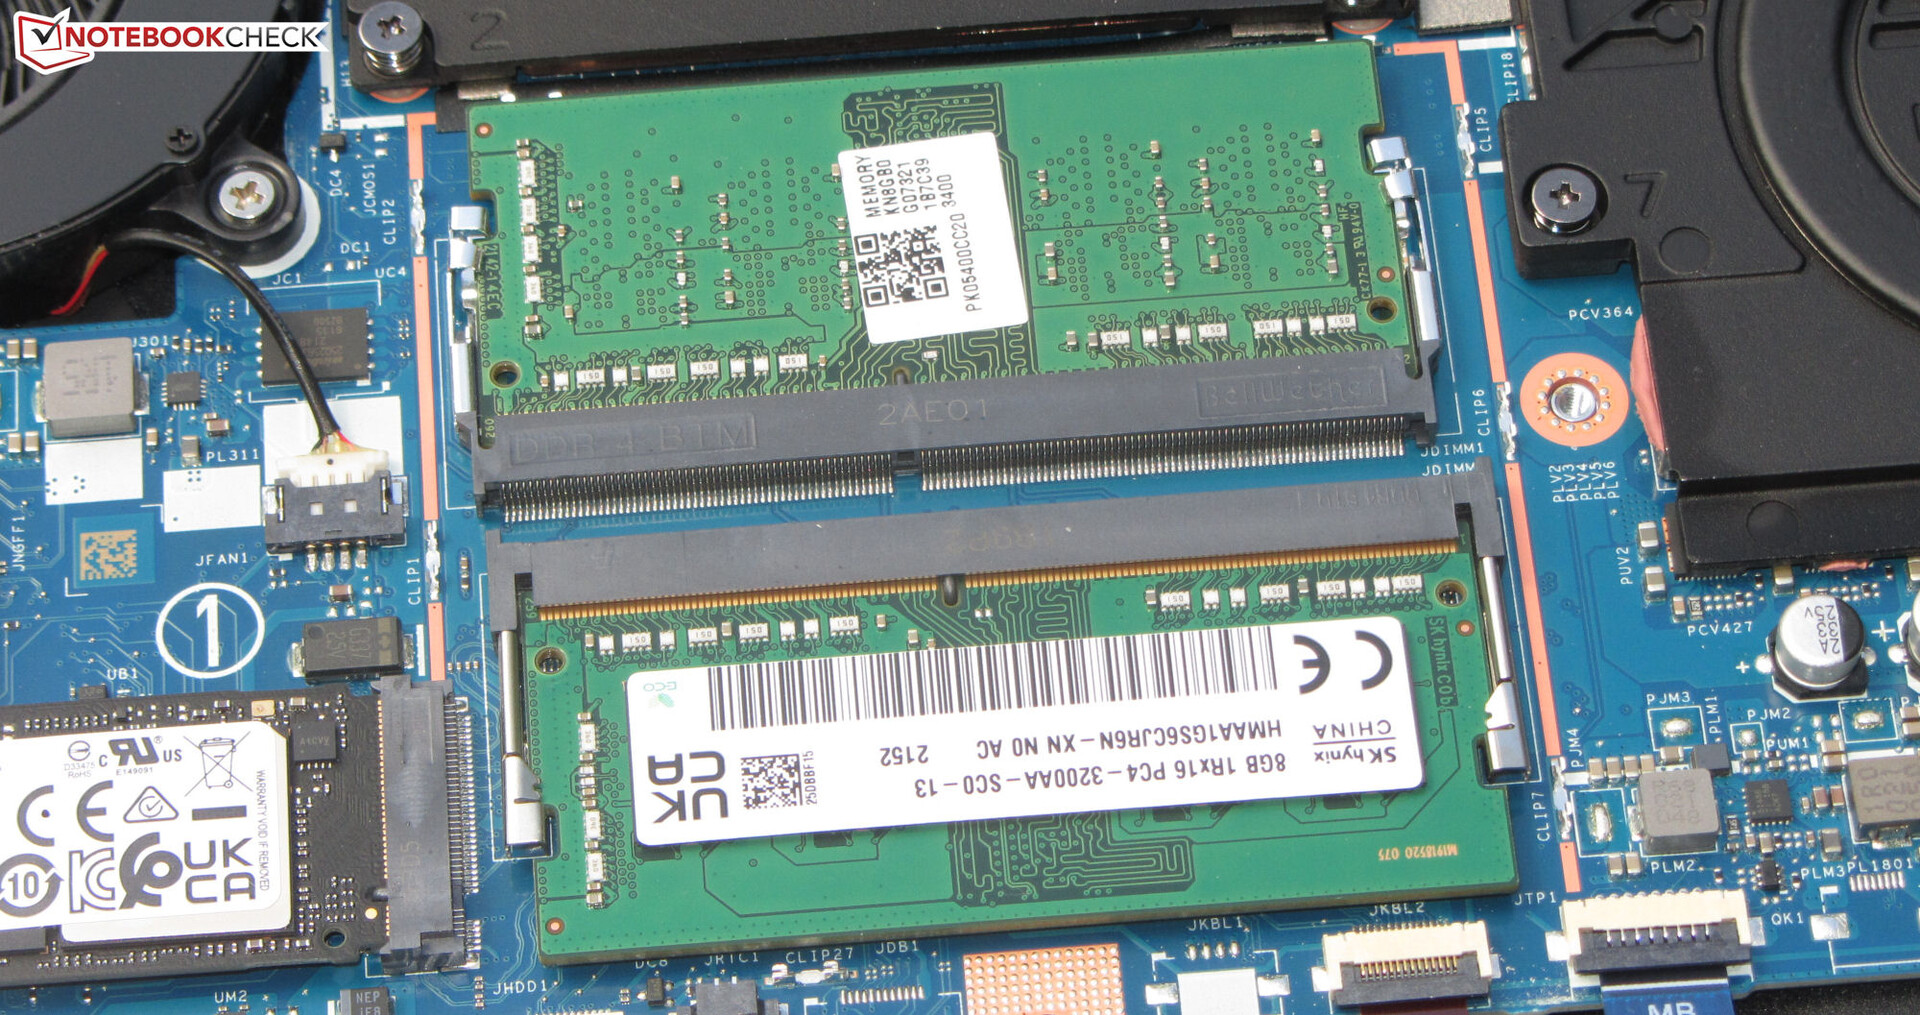
Mantenimiento
Después de retirar todos los tornillos de la parte inferior del aparato, se puede separar la carcasa inferior con una espátula plana. Aquí hay que tener cuidado: La carcasa inferior está bien sujeta. Después, tienes acceso a los bancos de RAM (ambos ocupados), el SSD (PCIe 4), la segunda ranura M.2-2280 (PCIe 4), el marco de montaje de 2,5 pulgadas, el módulo WLAN, los ventiladores, los altavoces y la batería.
Garantía
En Alemania se ofrece una garantía de dos años. La ampliación a tres años de garantía in situ cuesta algo menos de 120 euros. Es posible que esto no se aplique a otros países y regiones de compra, así que asegúrate de comprobar la garantía con tu proveedor
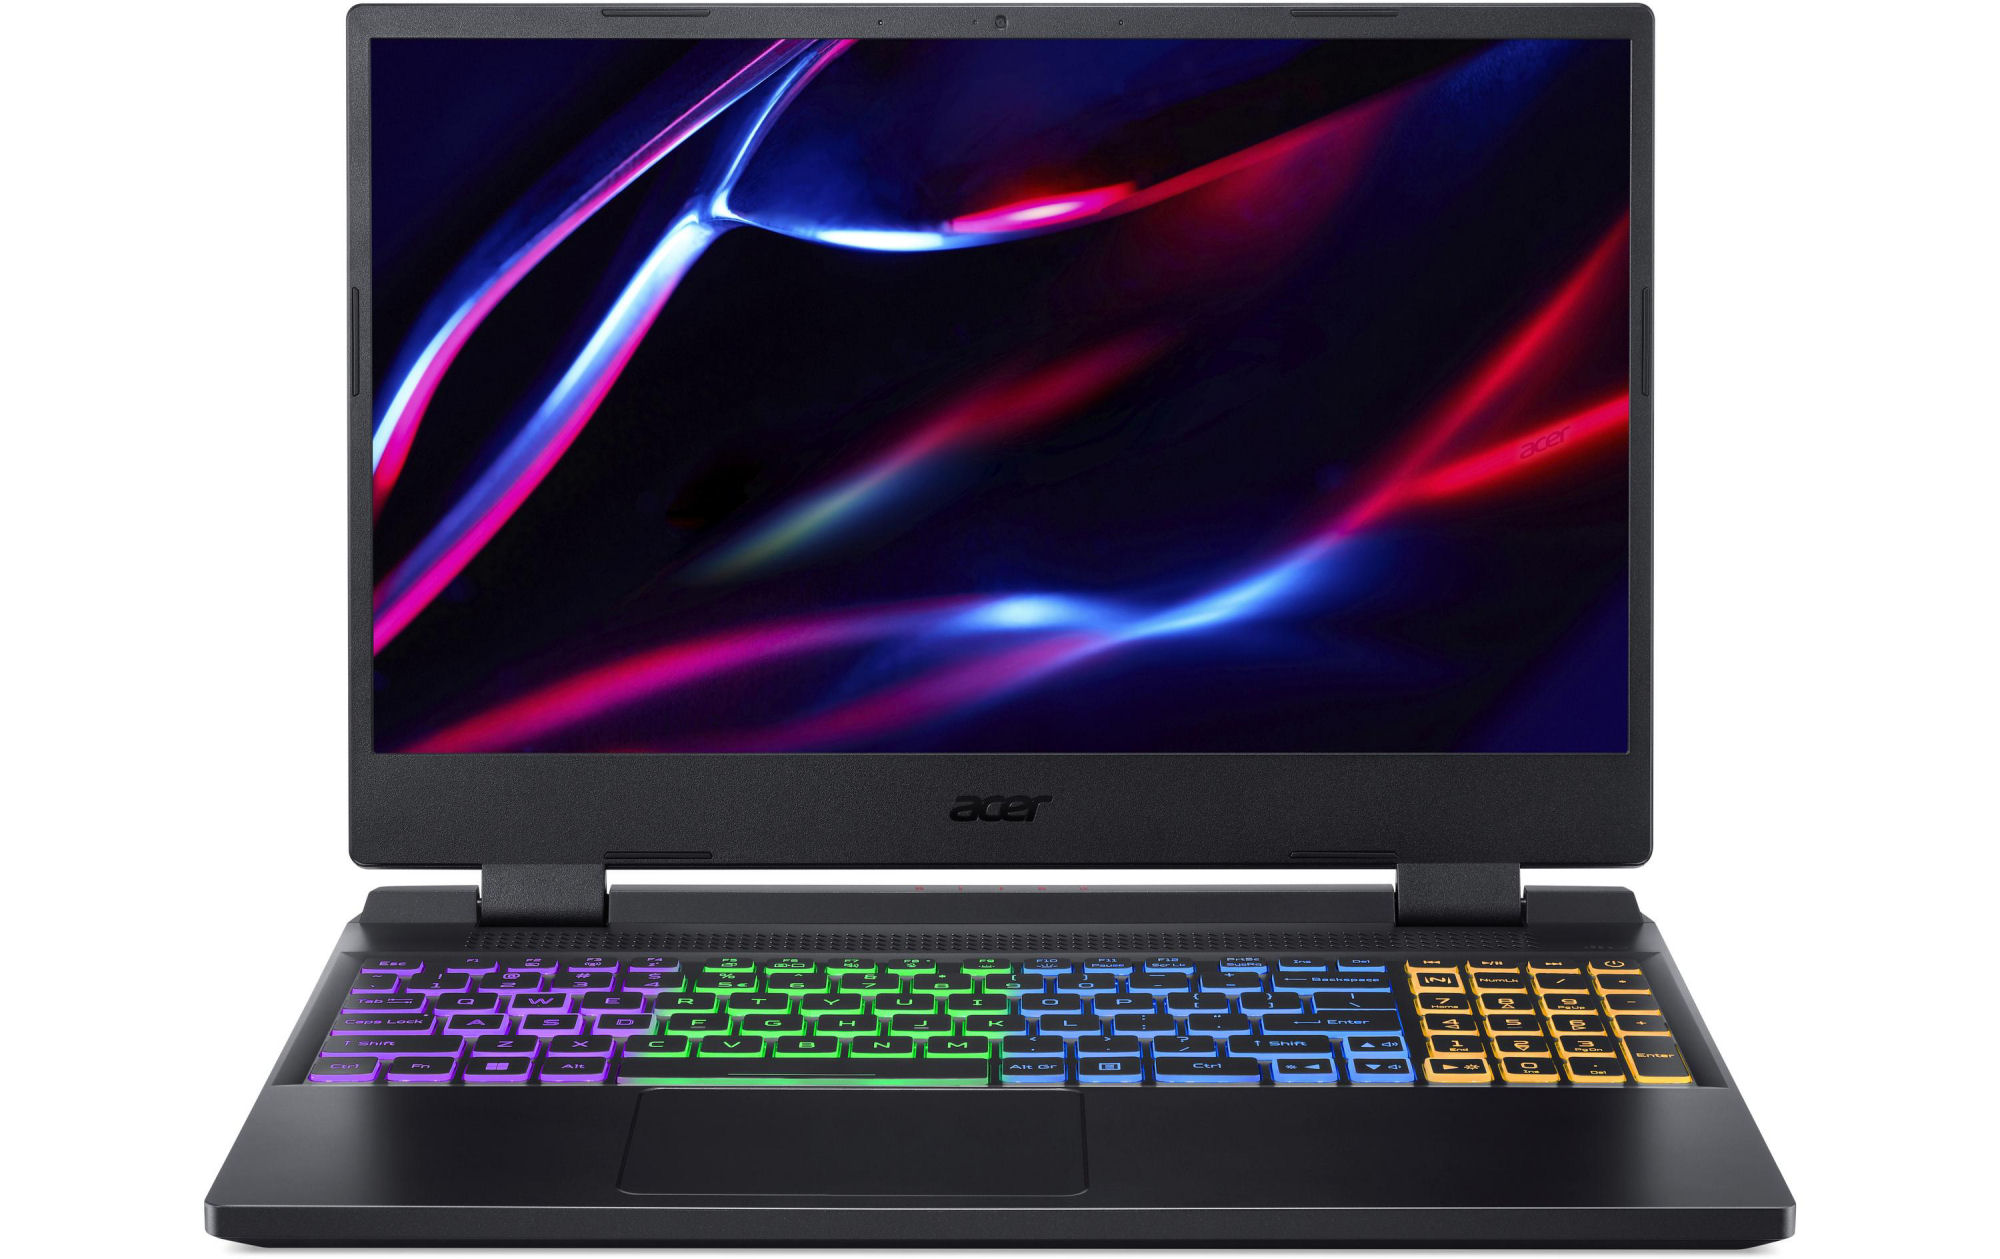
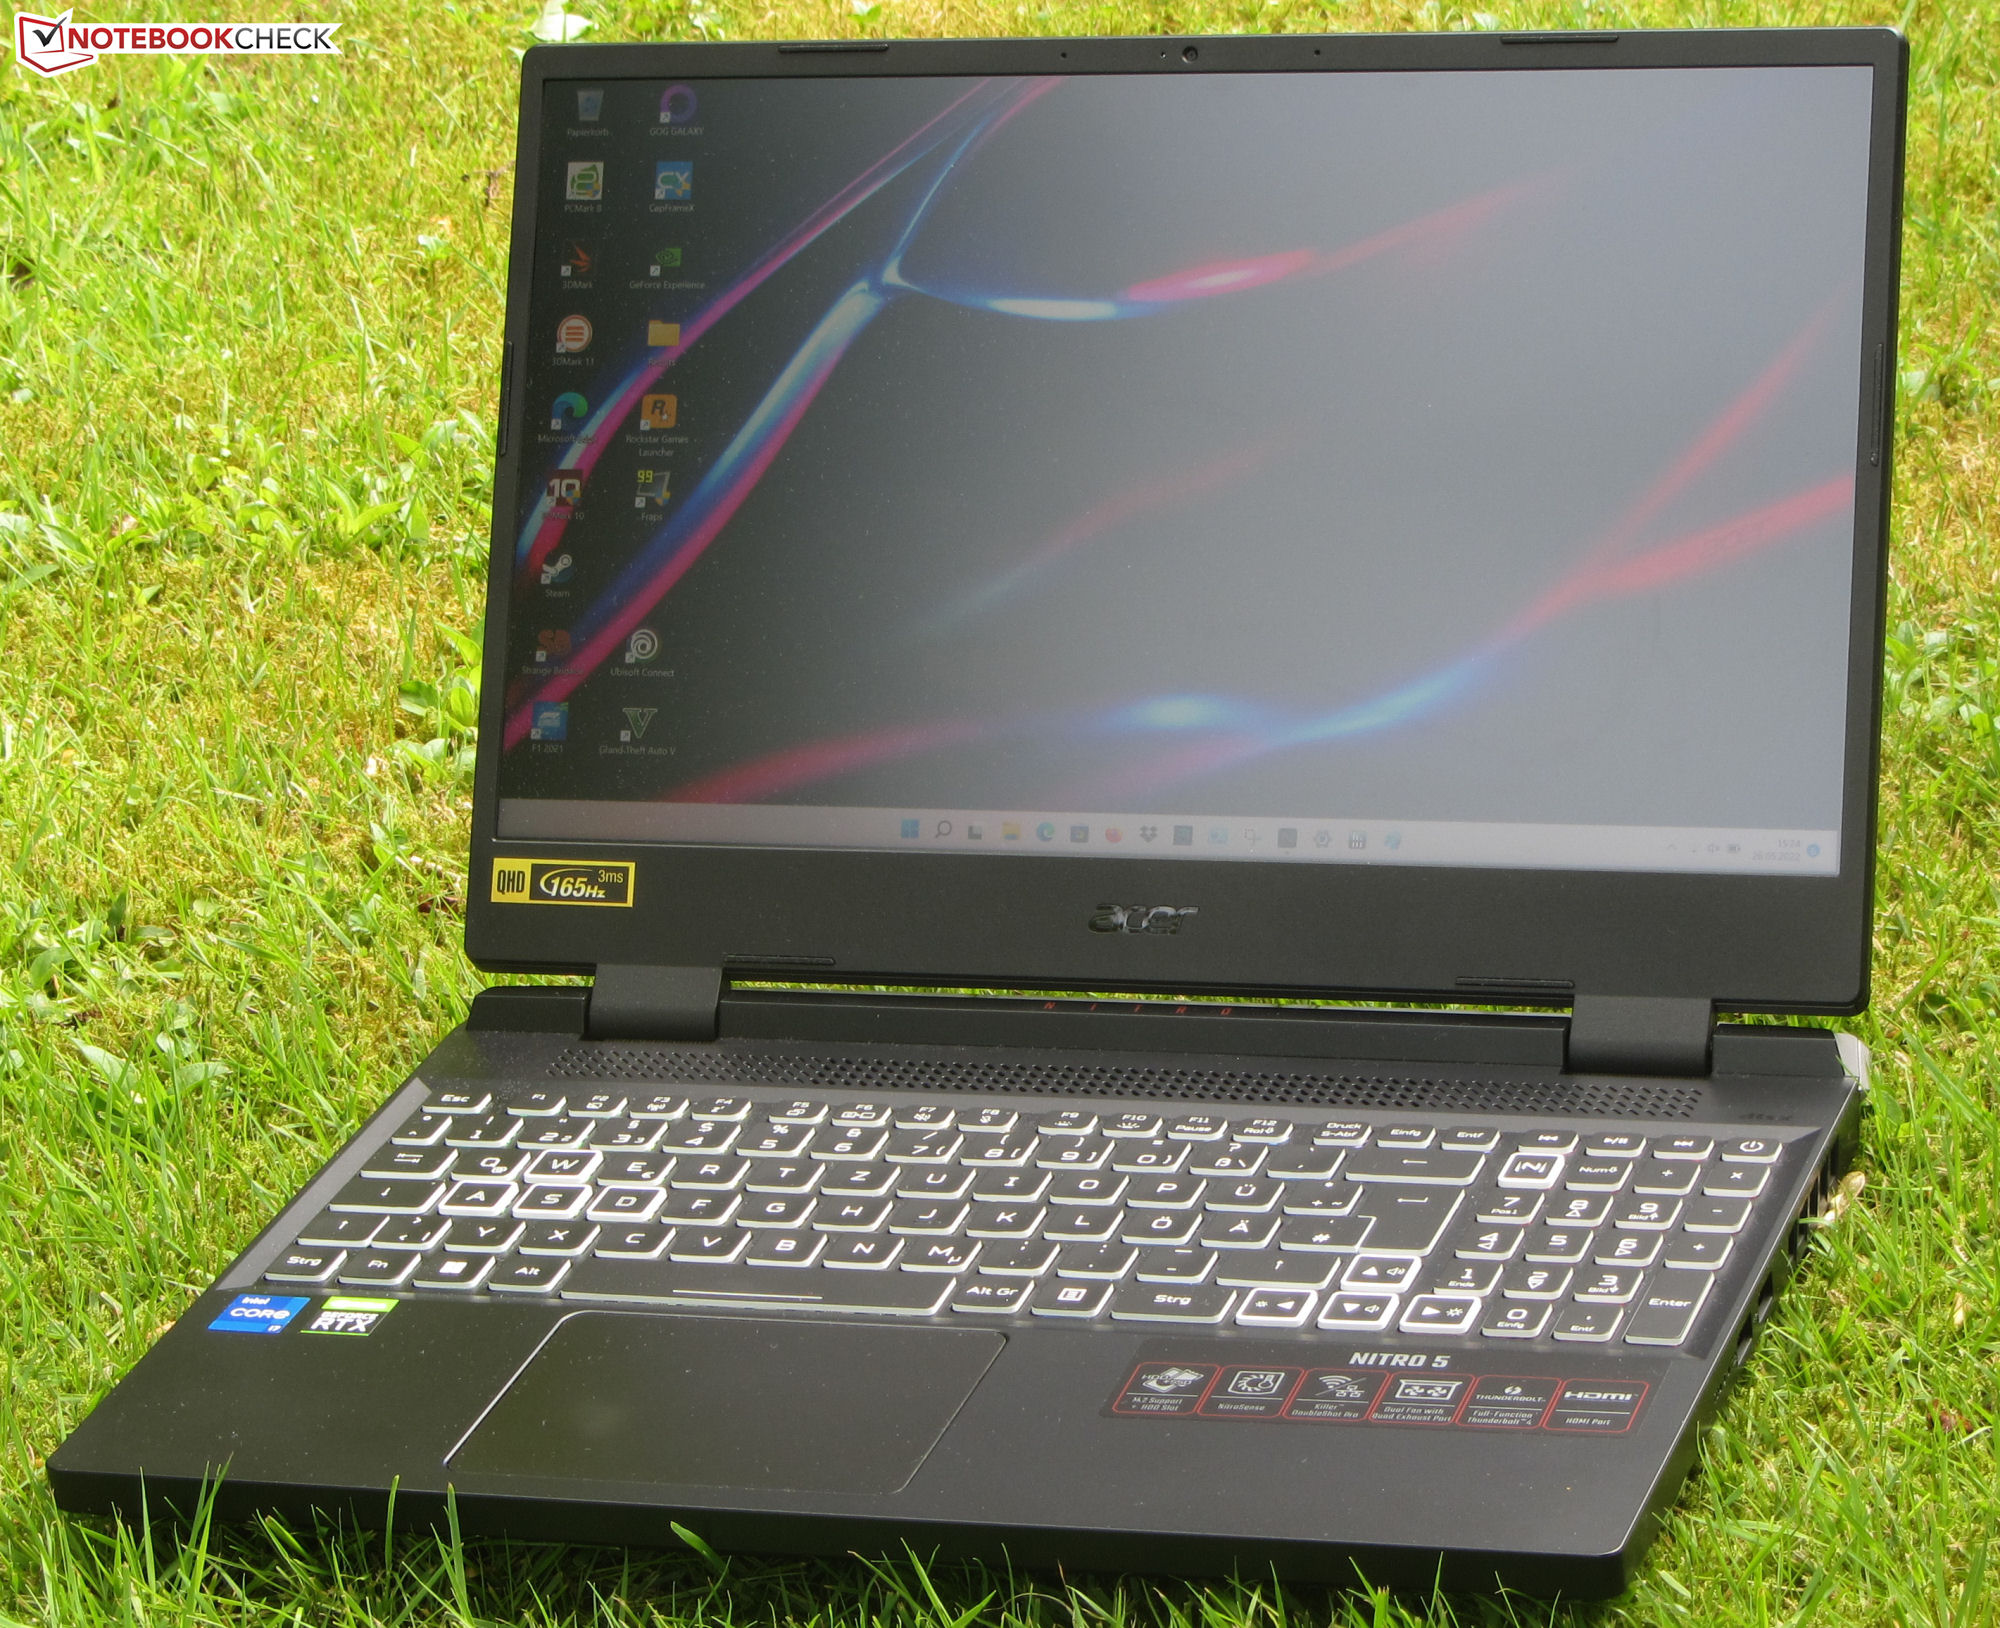
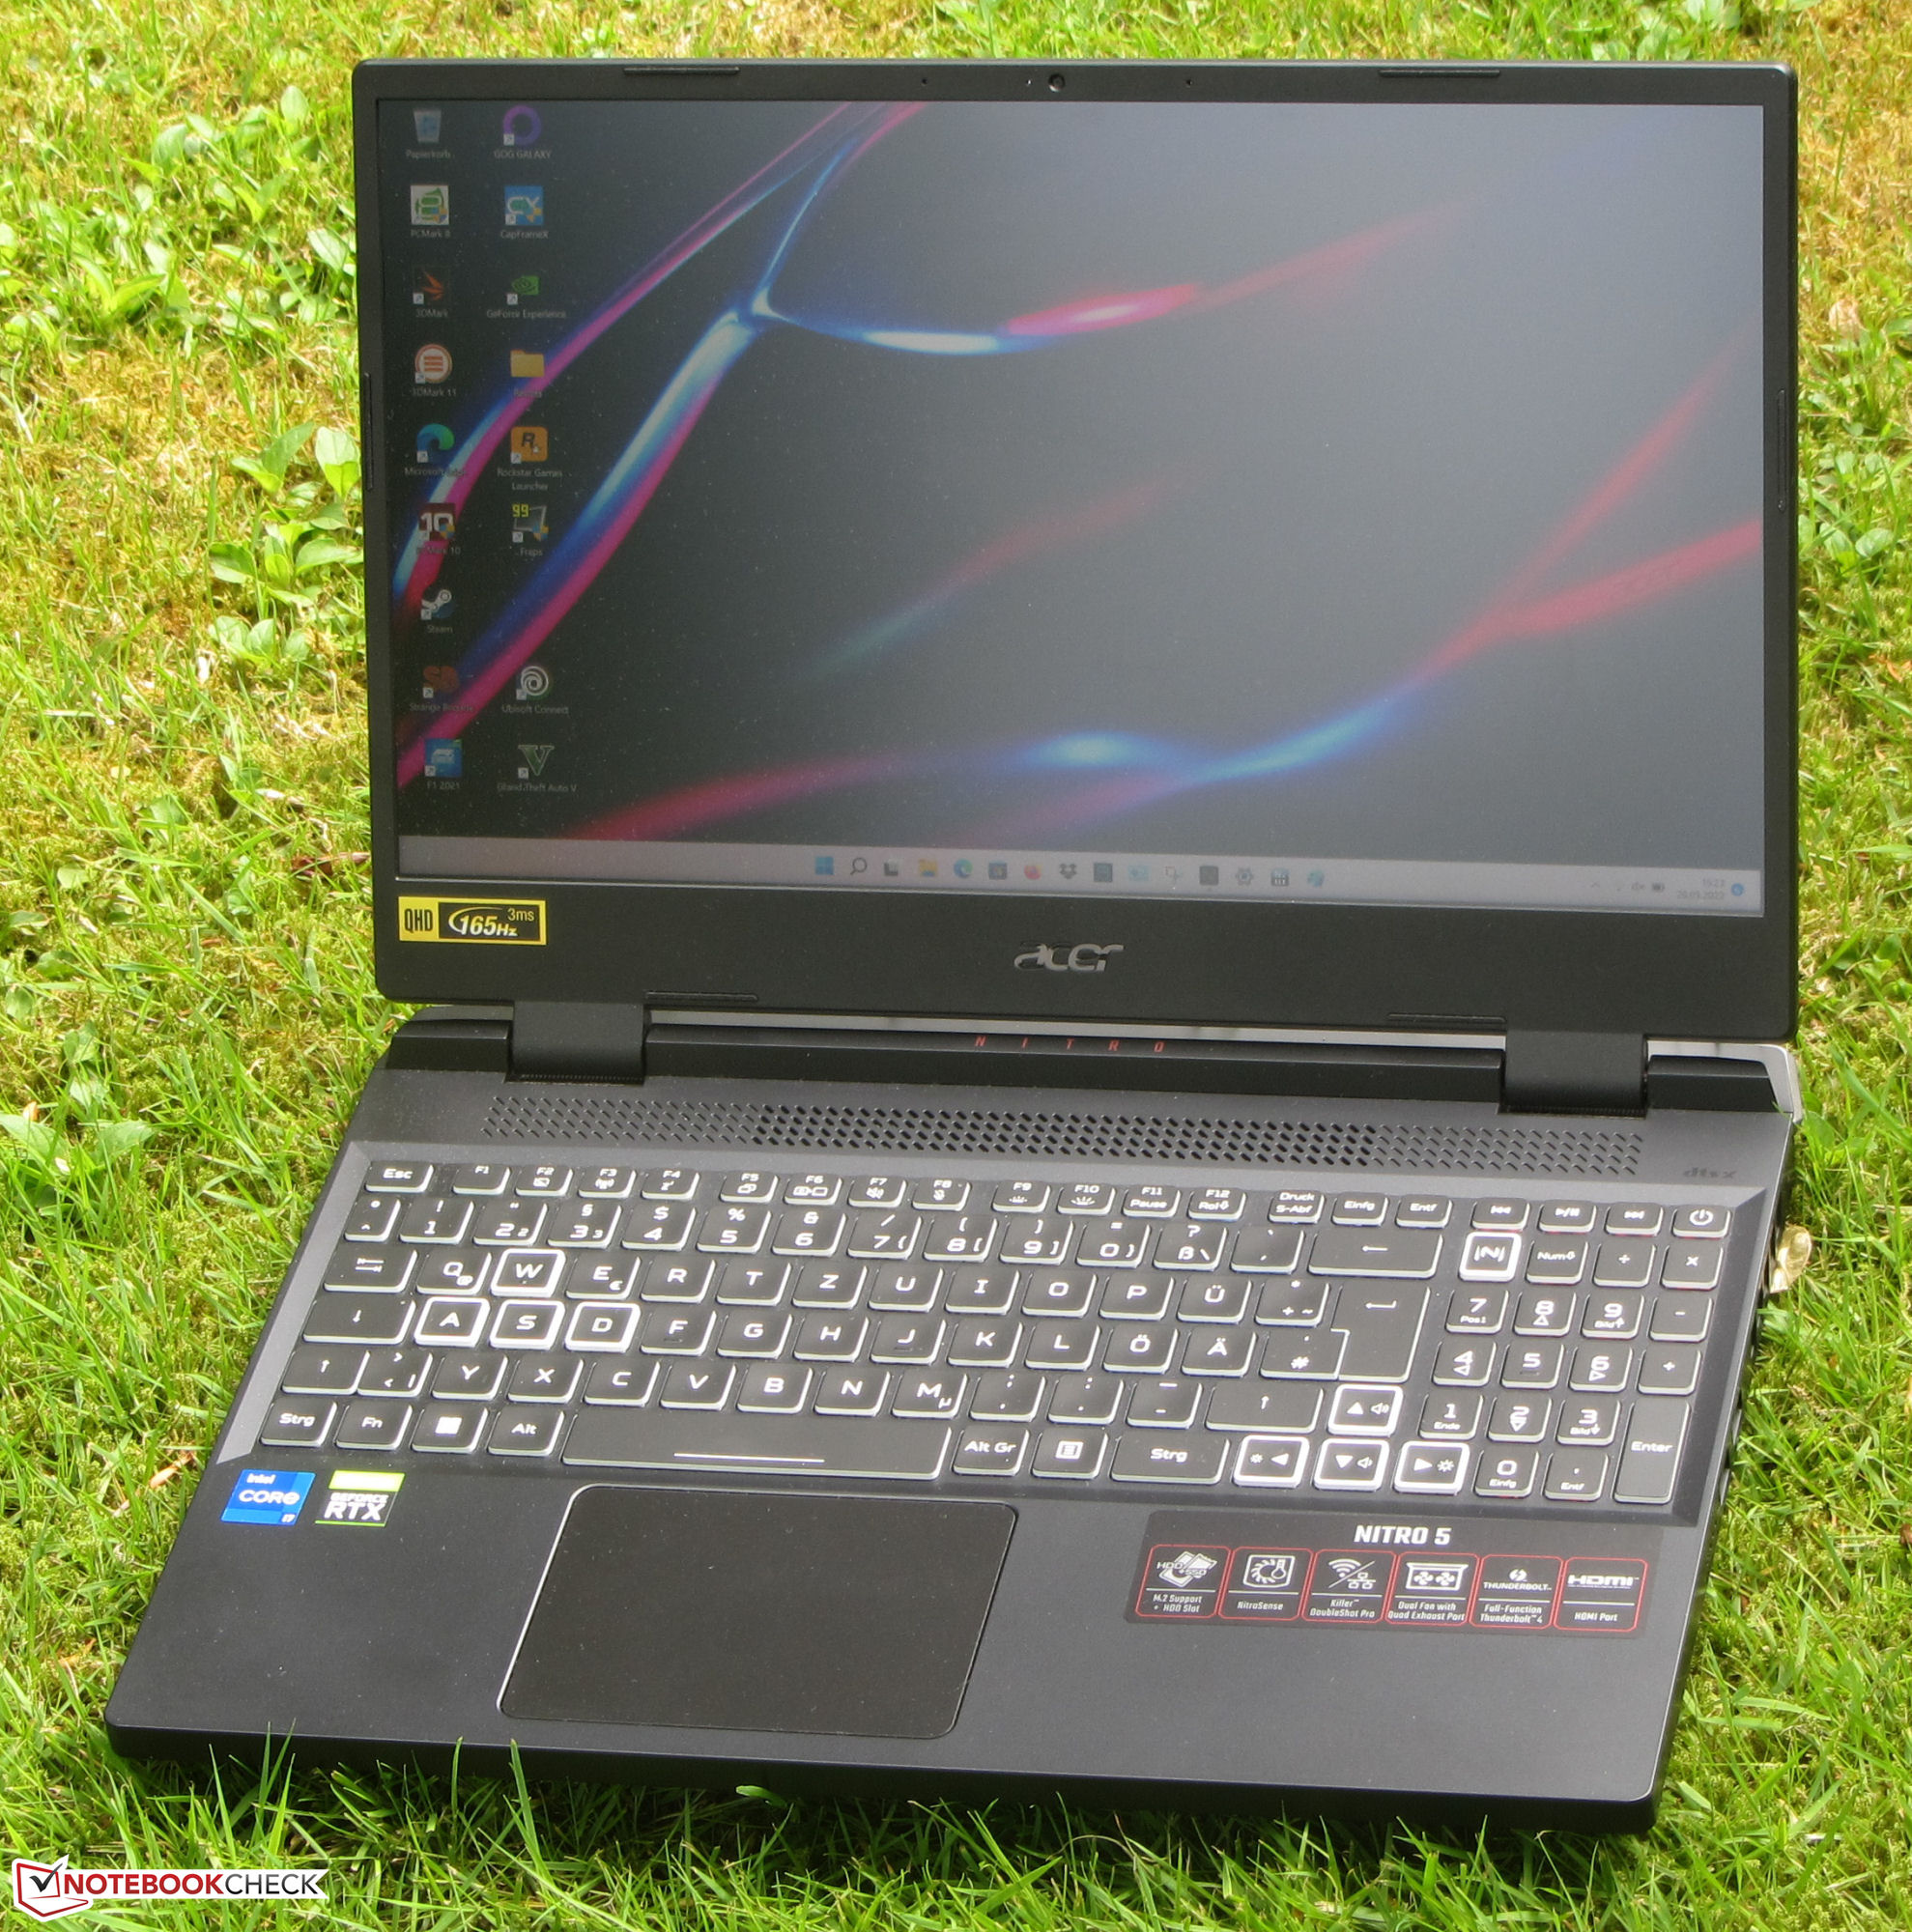
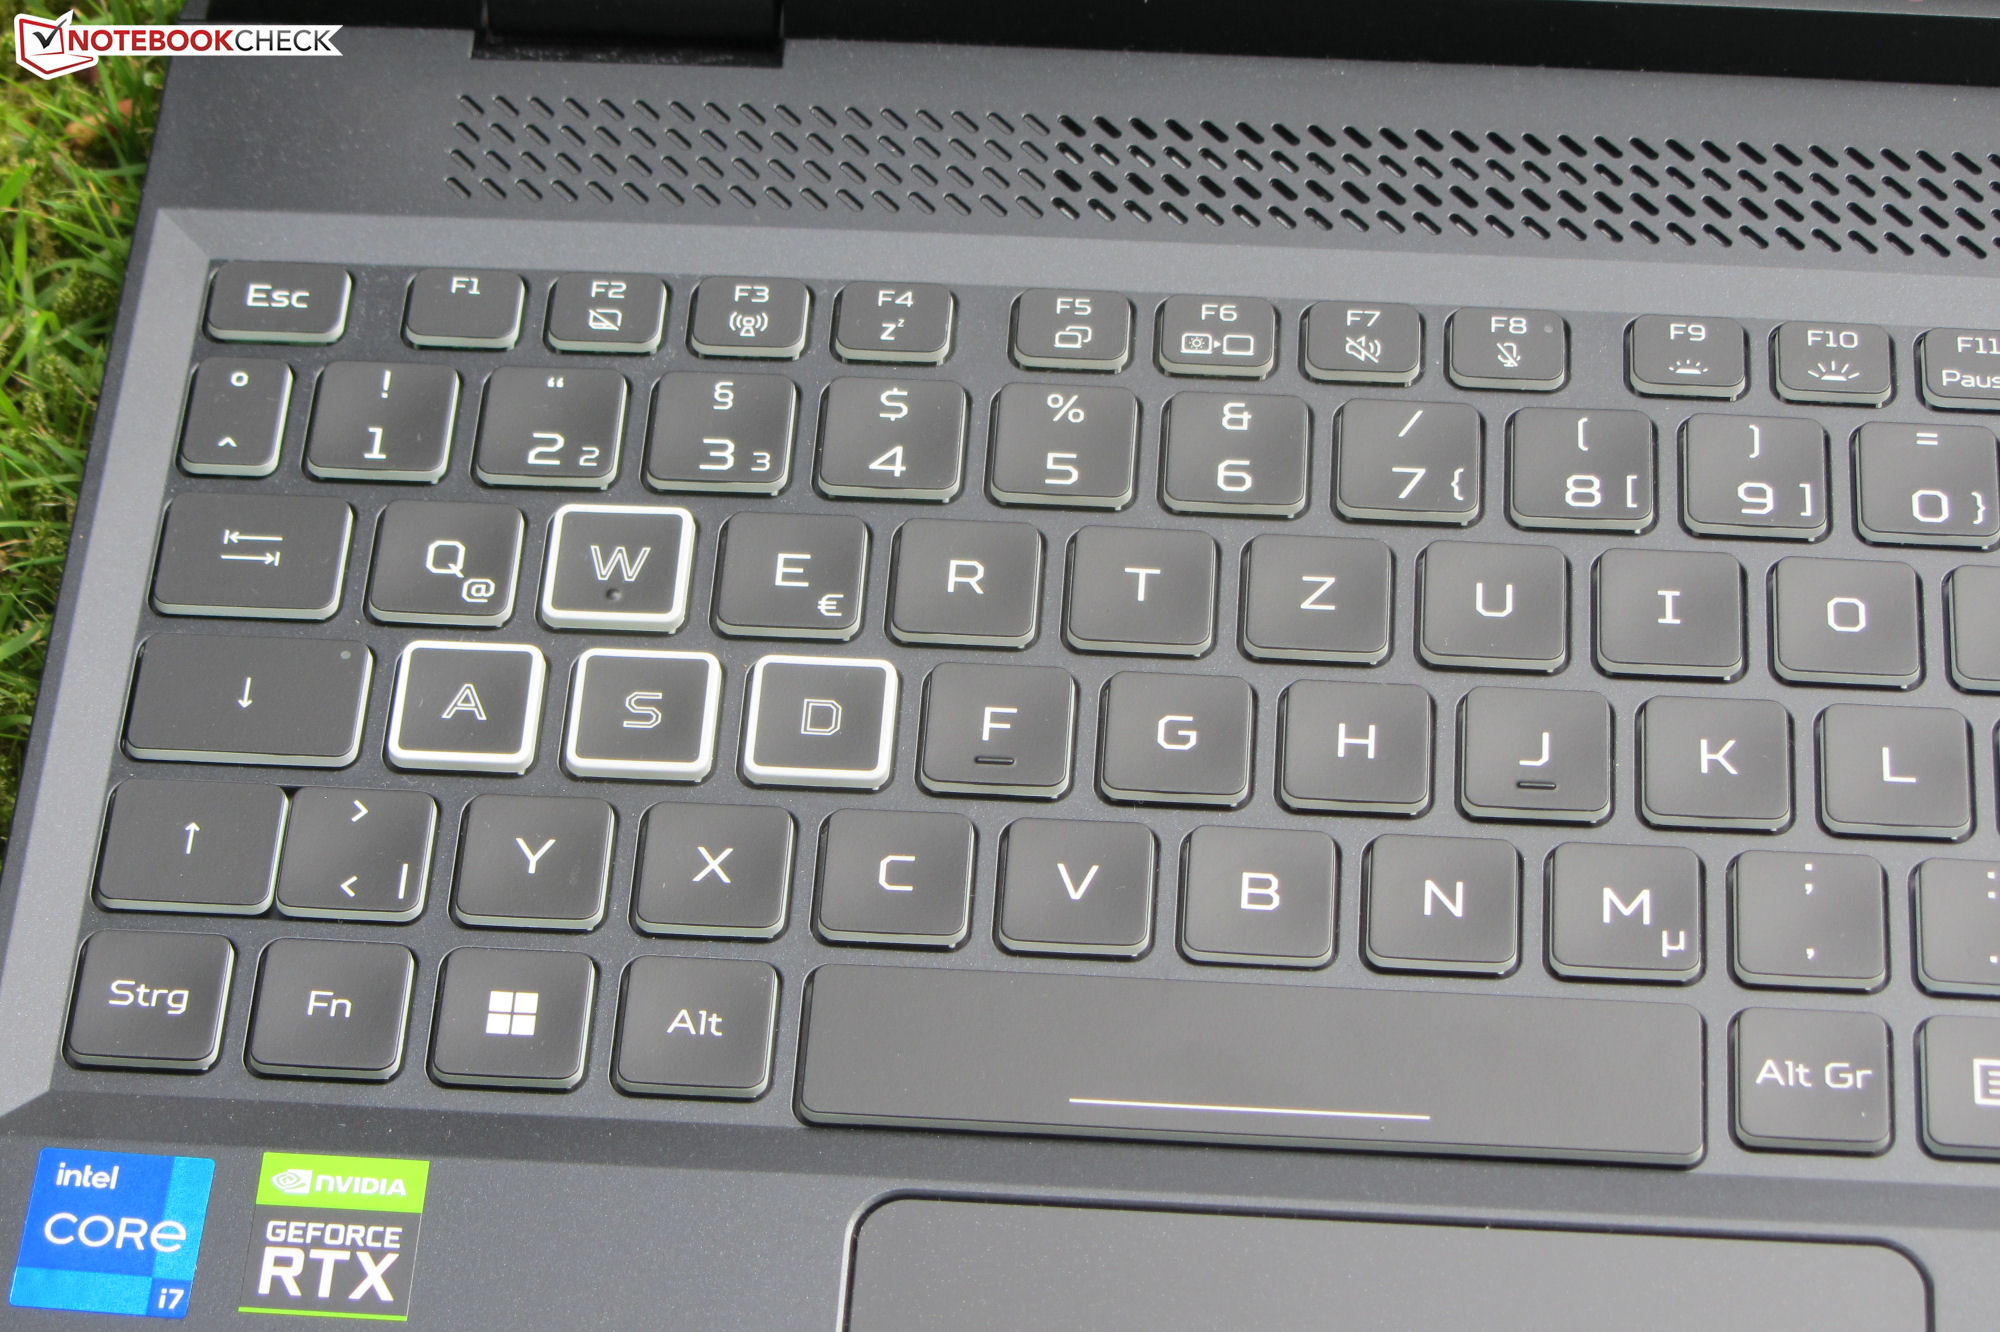
Dispositivos de entrada: El AN515 tiene un teclado con iluminación RGB
Teclado
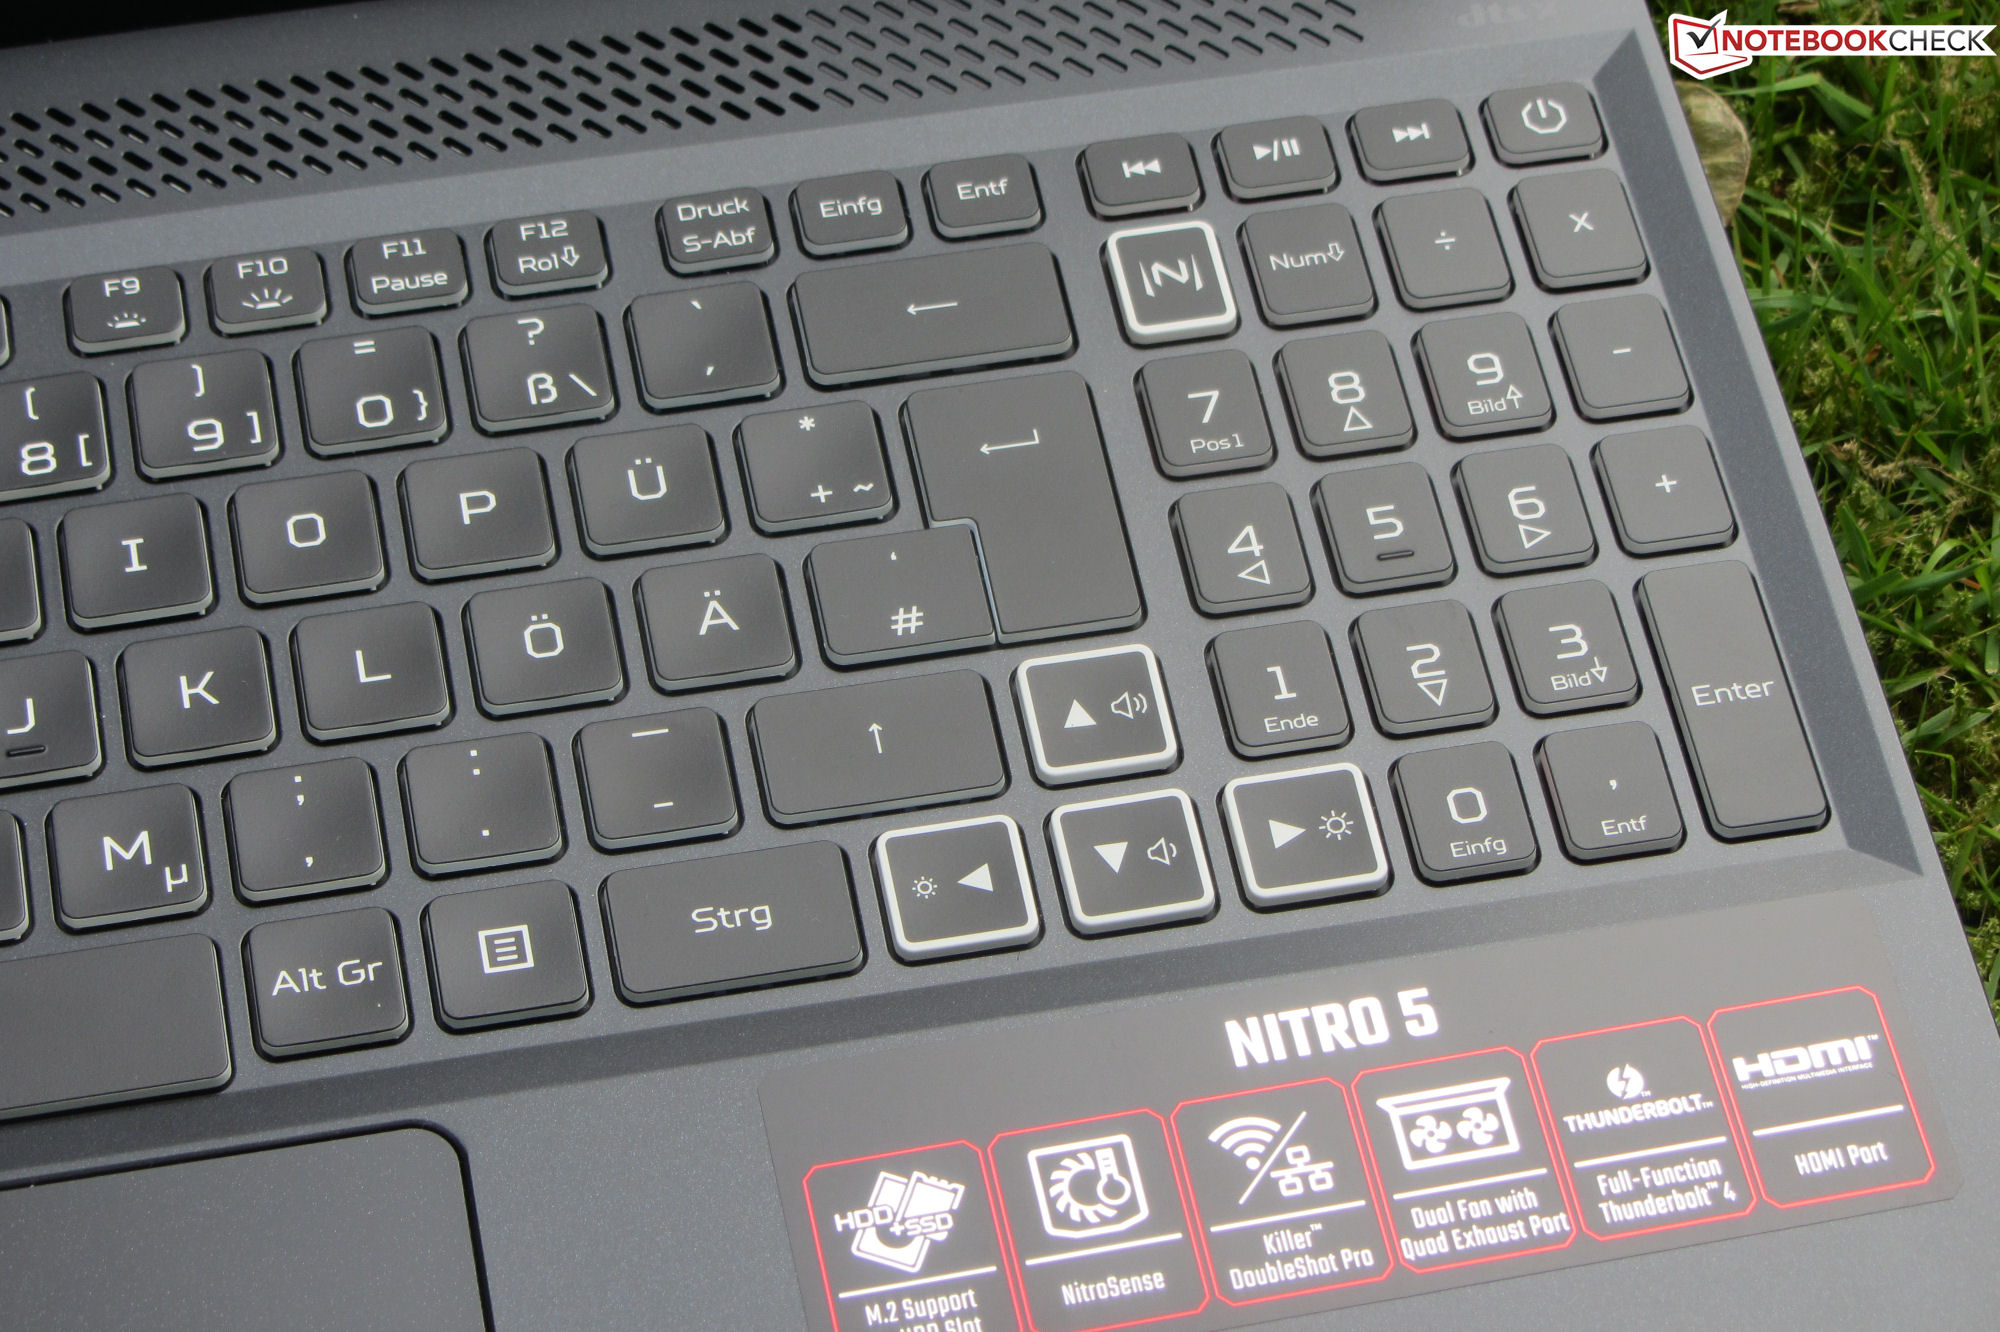
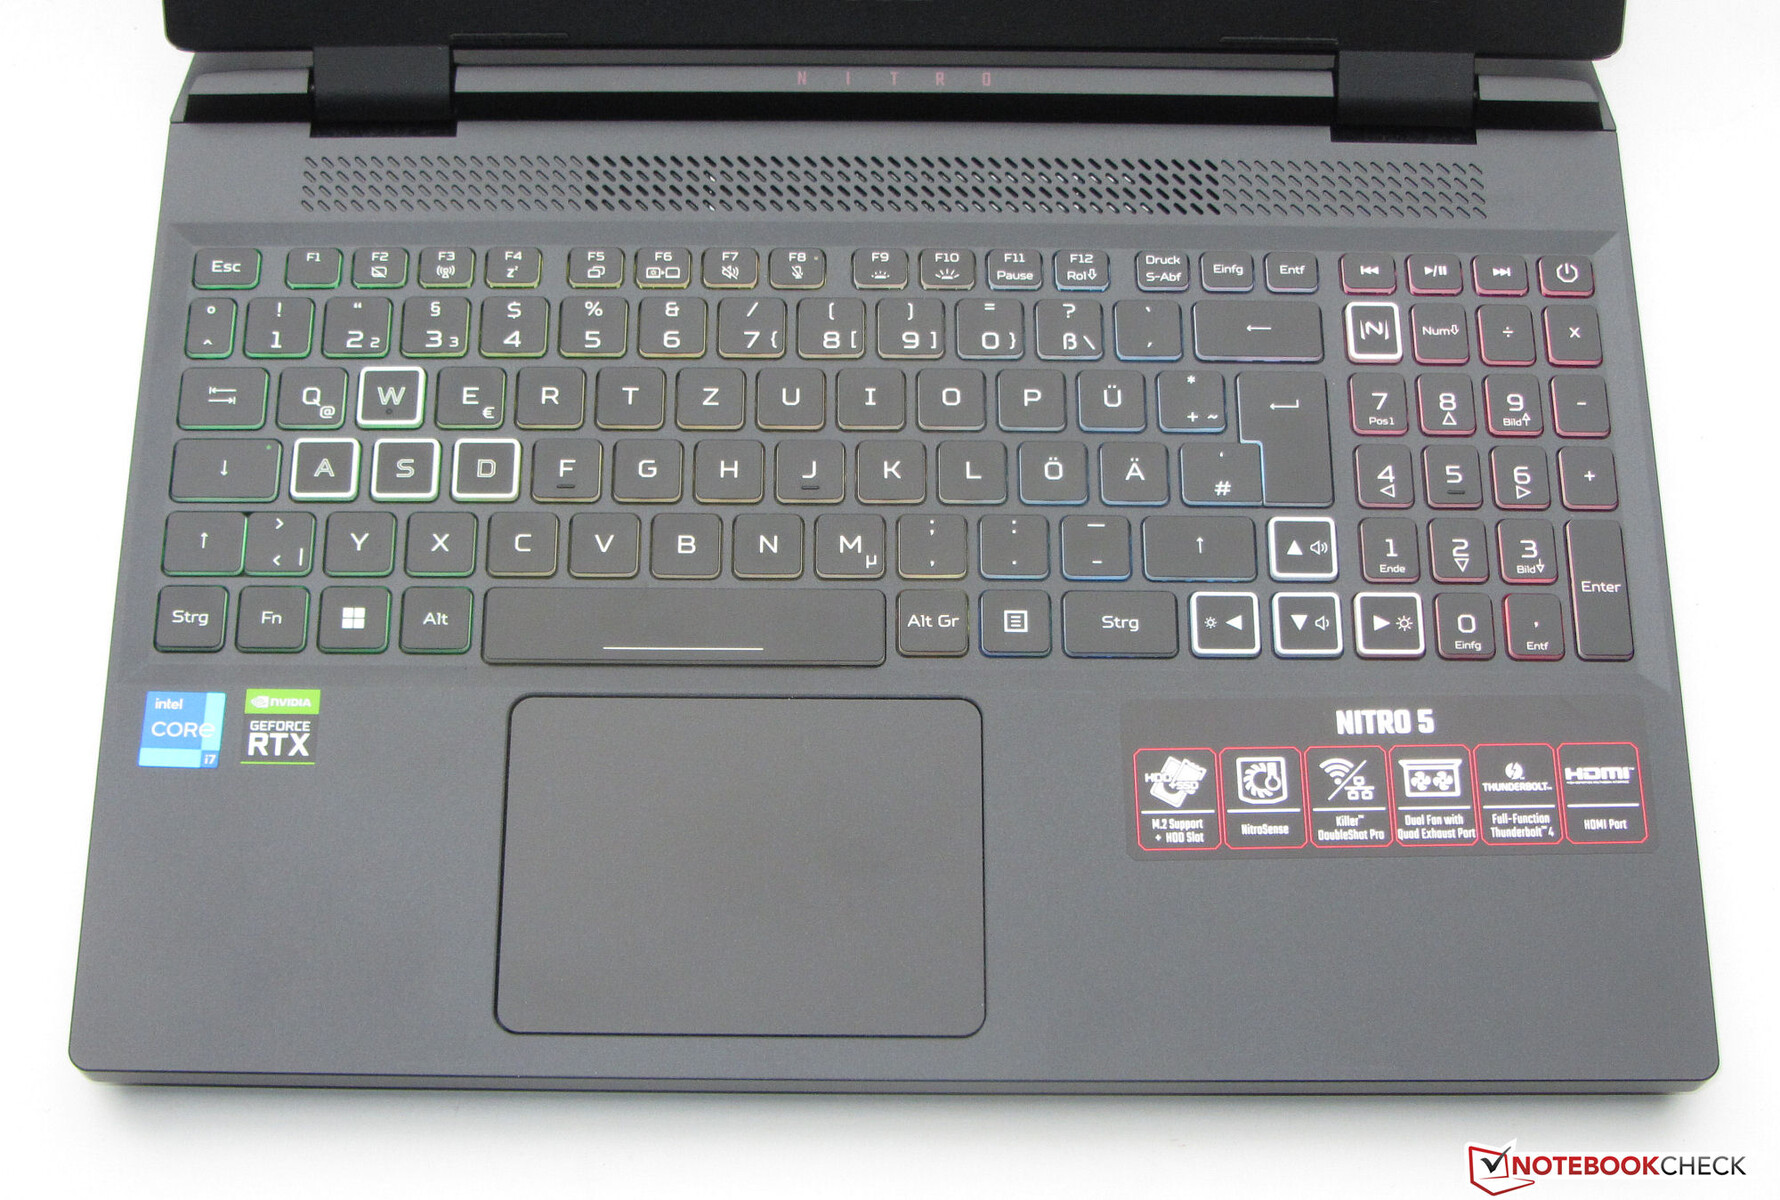
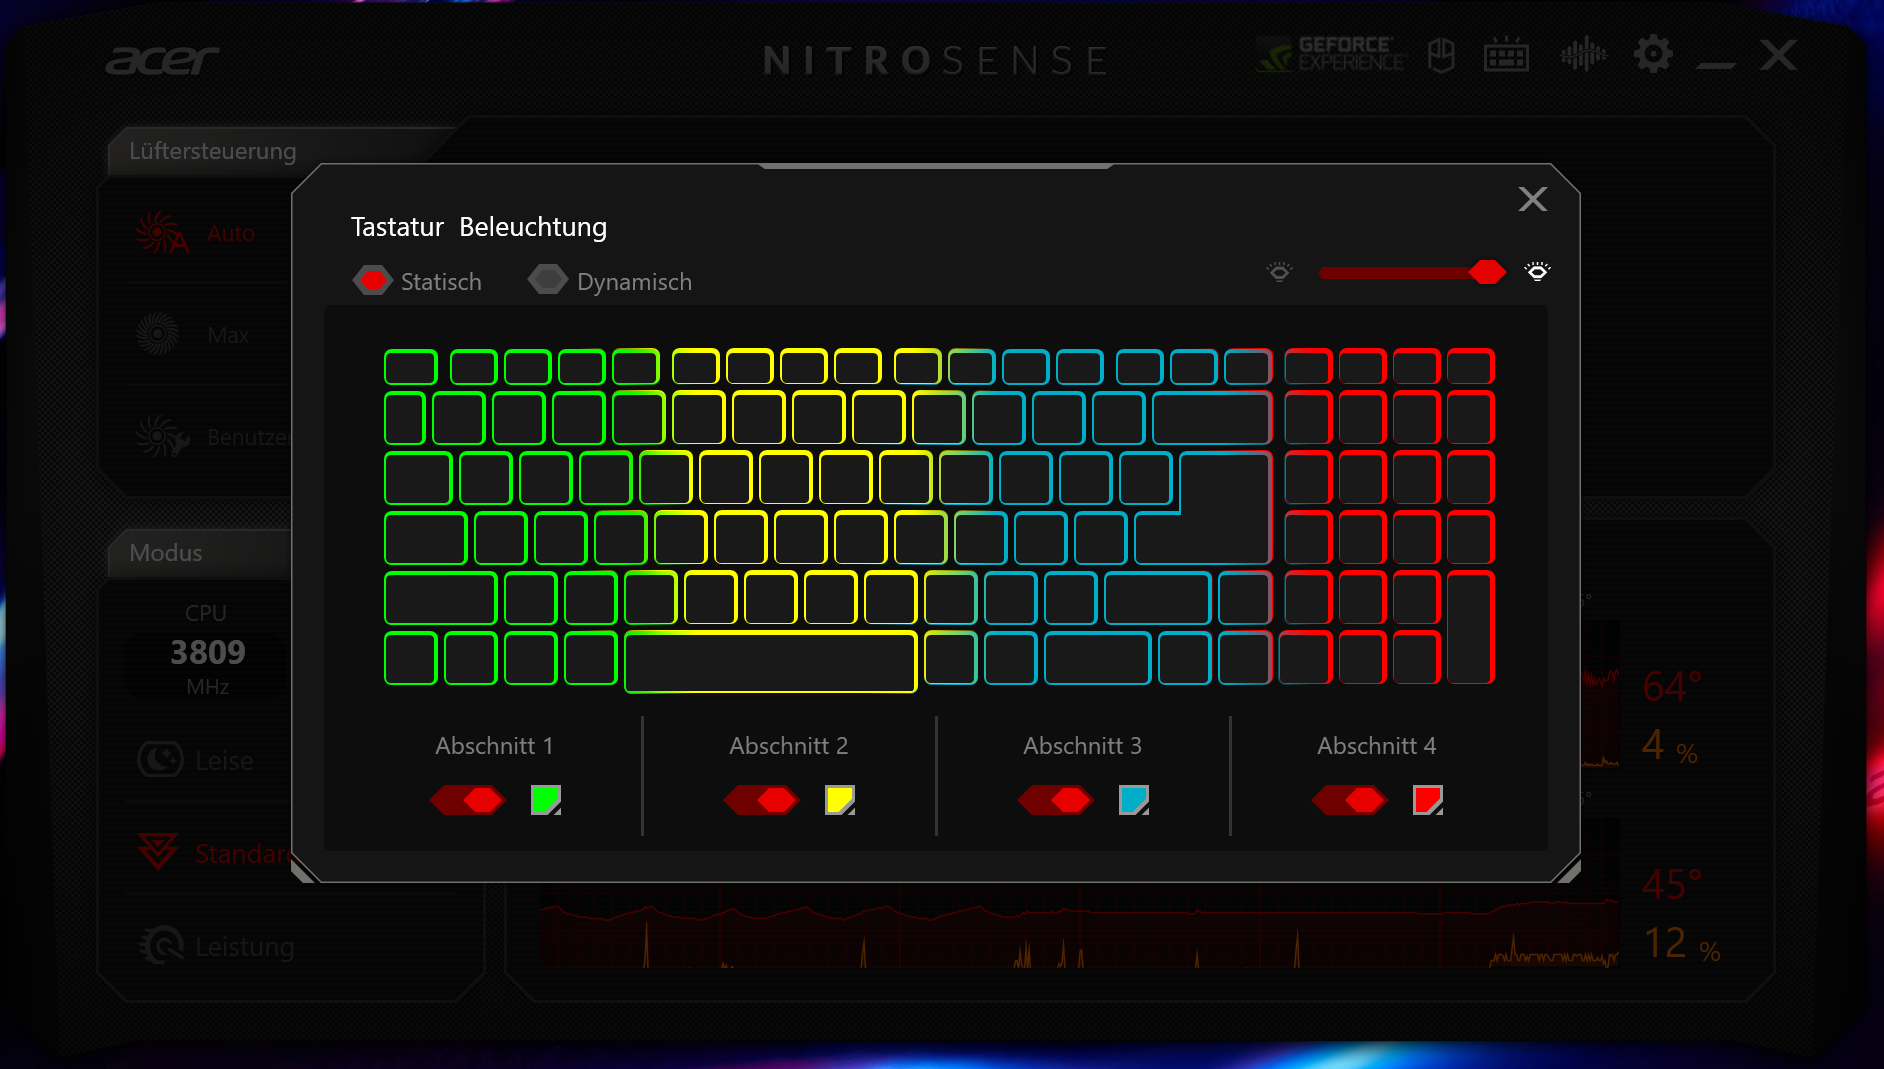
El teclado chiclet iluminado consta de teclas cóncavas (letras, fila de números) y planas (teclas de función, teclado numérico), que ofrecen una caída media y un punto de presión claro. Sin embargo, la resistencia de las teclas podría ser más nítida para nuestro gusto. El teclado cede un poco durante la escritura, pero esto no resultó molesto. La iluminación RGB de cuatro niveles se controla mediante dos teclas de función. En general, Acer ofrece un teclado adecuado para el uso diario.
Teclado táctil
Un clickpad multitáctil (de unos 10,6 x 7,8 cm) sirve como sustituto del ratón. Su superficie lisa permite un fácil deslizamiento del dedo y una buena respuesta de entrada en las esquinas. El recorrido es corto y el punto de presión claro.
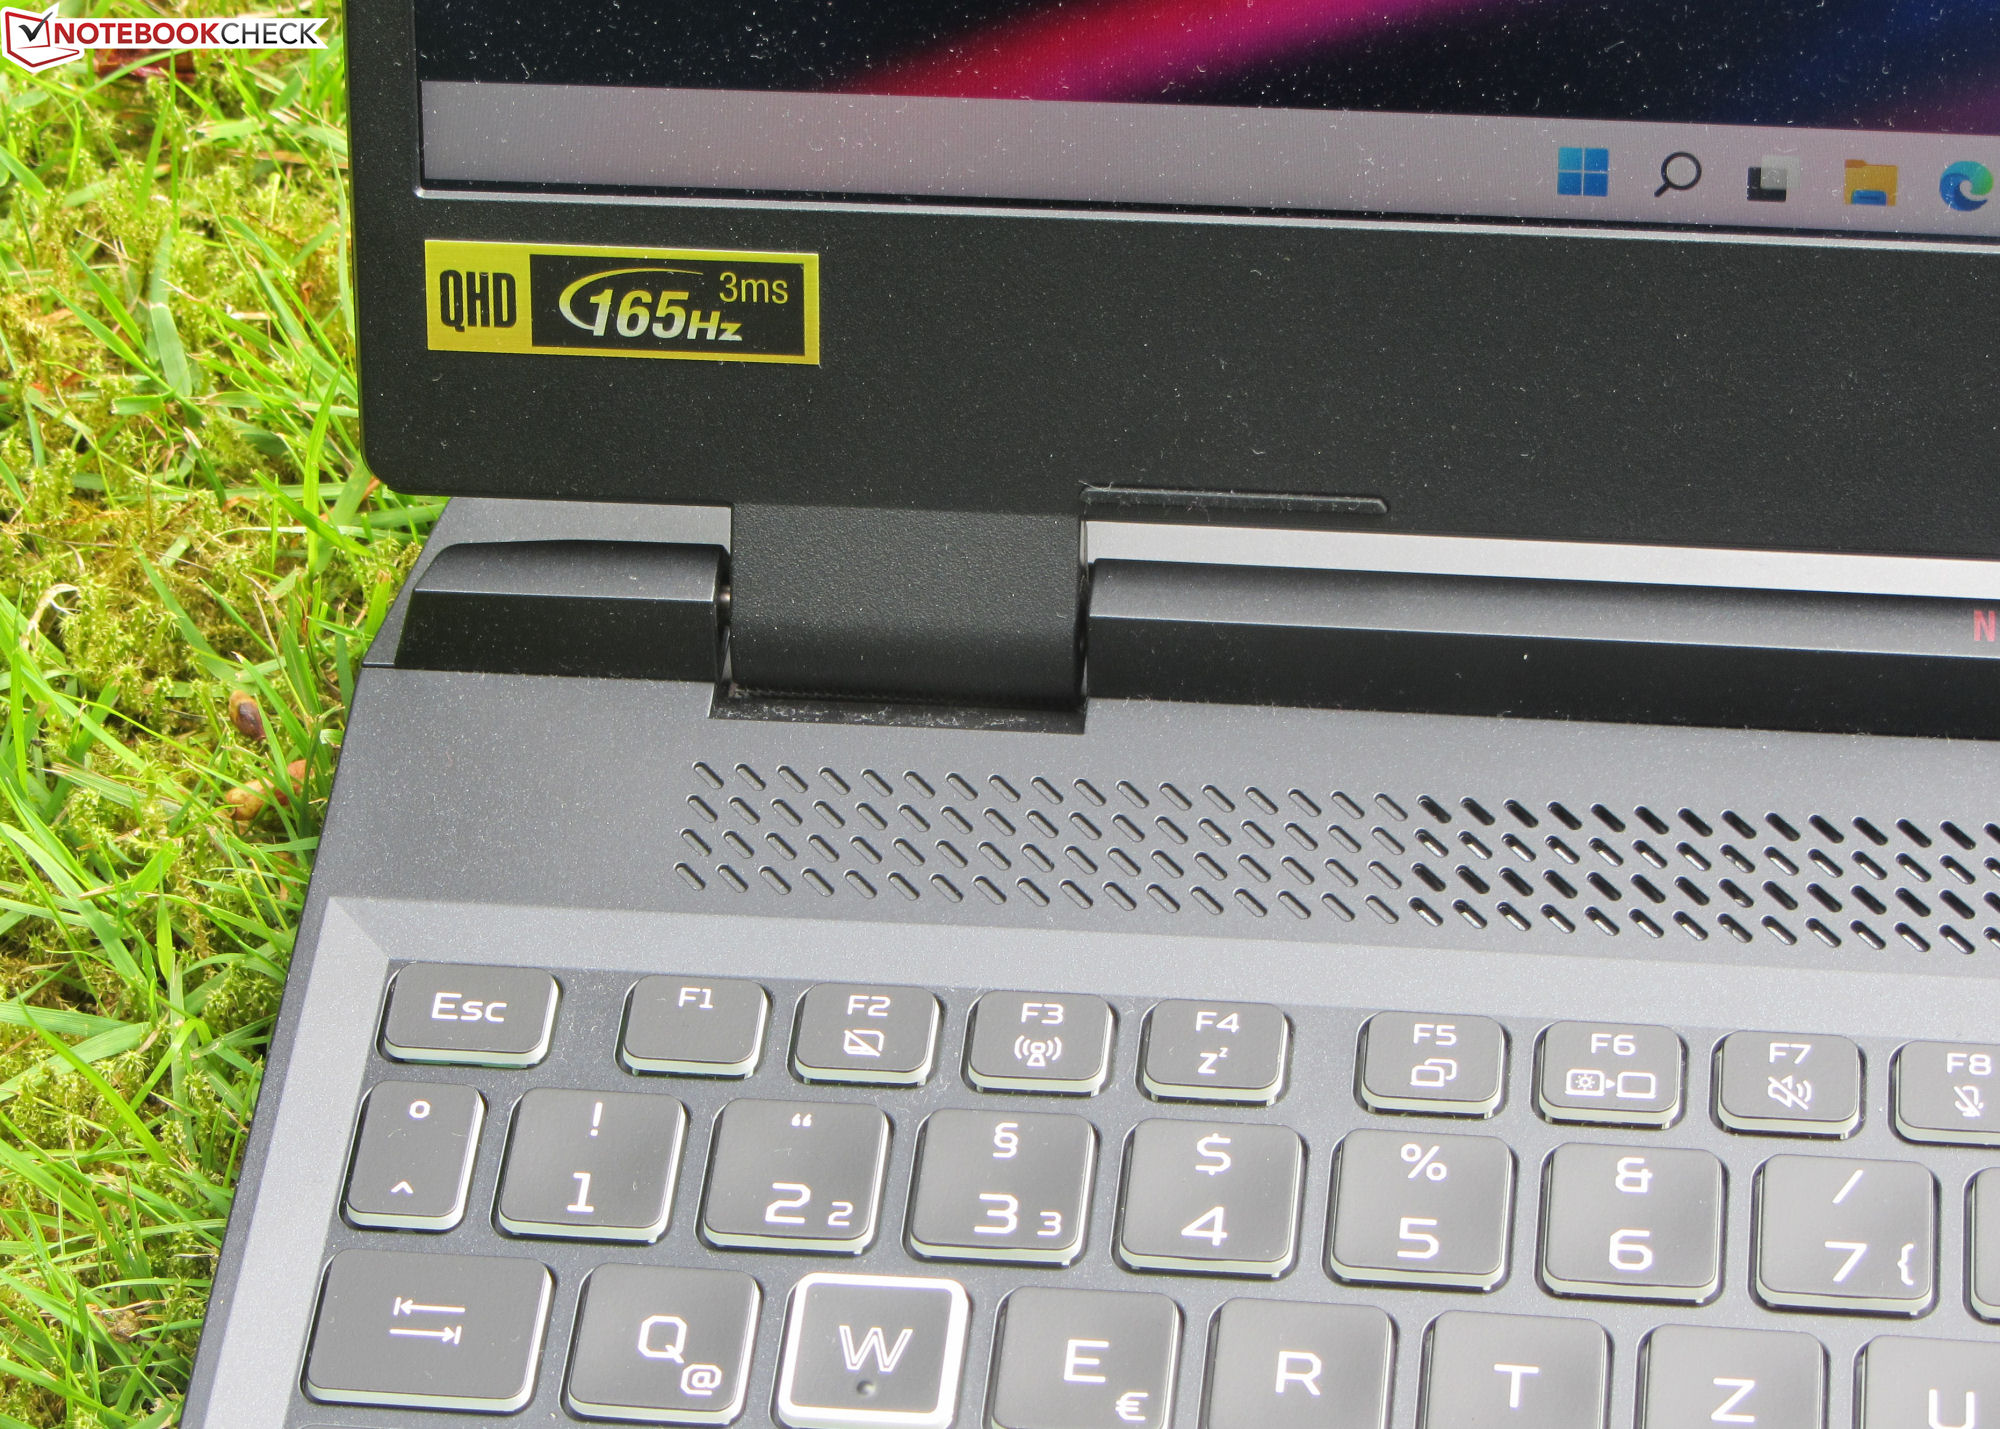
Pantalla: Portátil para juegos con panel QHD
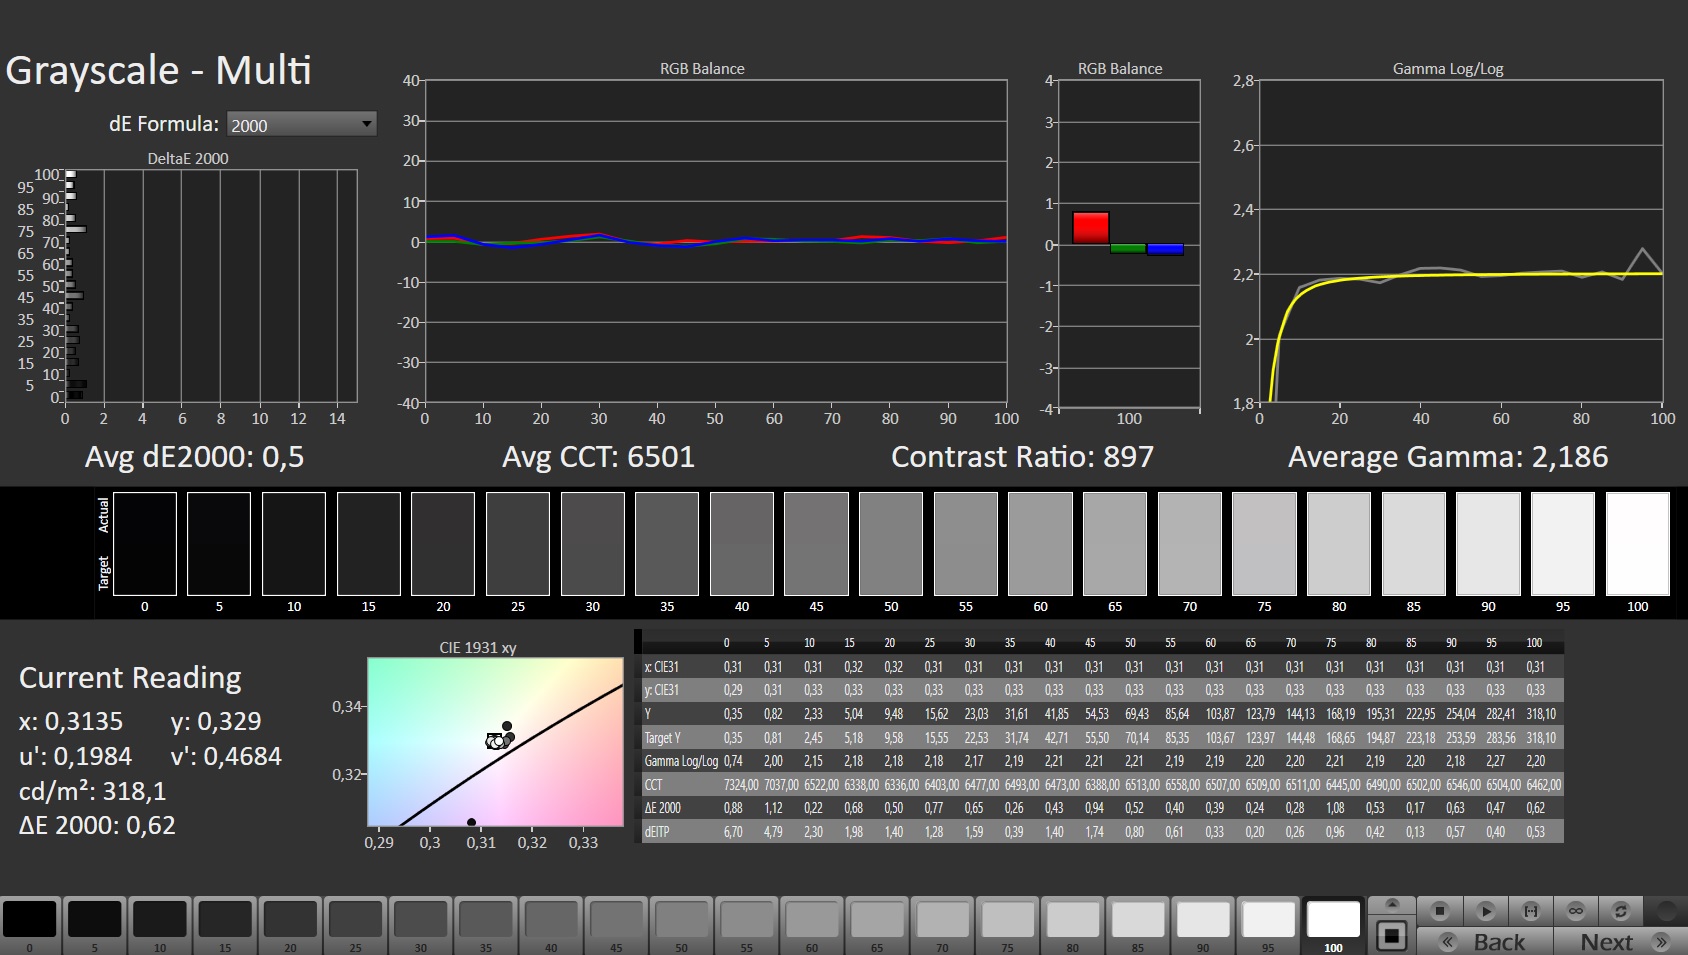
El brillo (303 cd/m²) y la relación de contraste (1145:1) de la pantalla mate de 15,6 pulgadas (2560x1440) cumplen los objetivos respectivos. Un aspecto positivo: El panel incorporado de 165 Hz ofrece tiempos de respuesta cortos y no muestra parpadeo PWM.
| |||||||||||||||||||||||||
iluminación: 86 %
Brillo con batería: 332 cd/m²
Contraste: 1145:1 (Negro: 0.29 cd/m²)
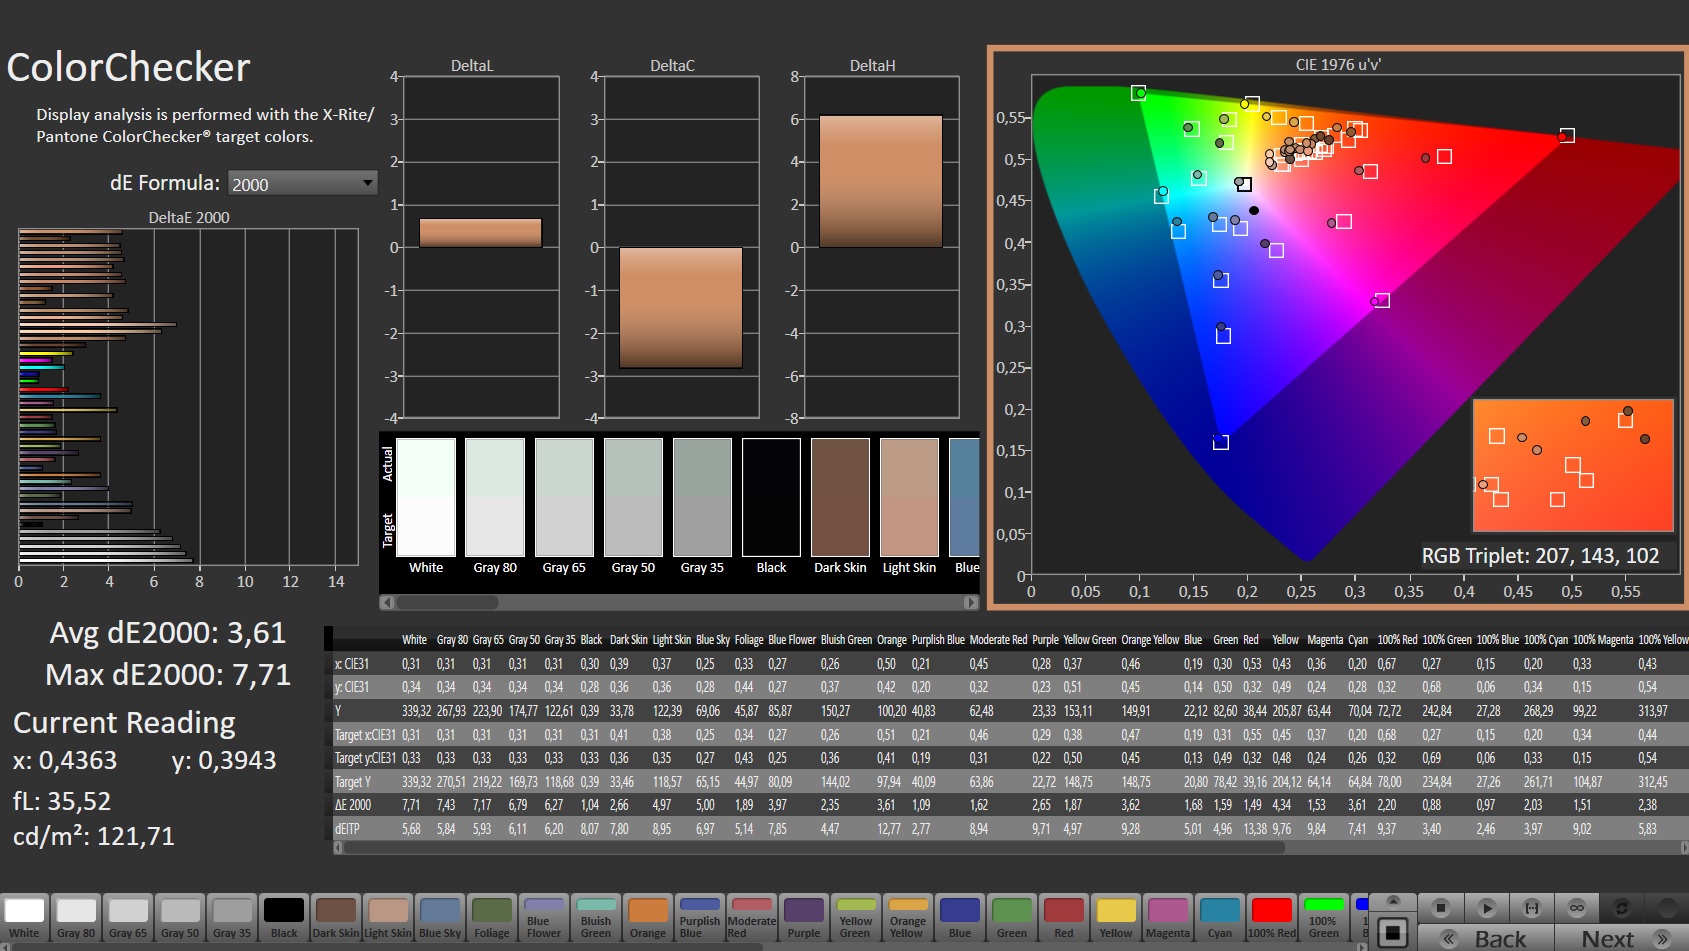
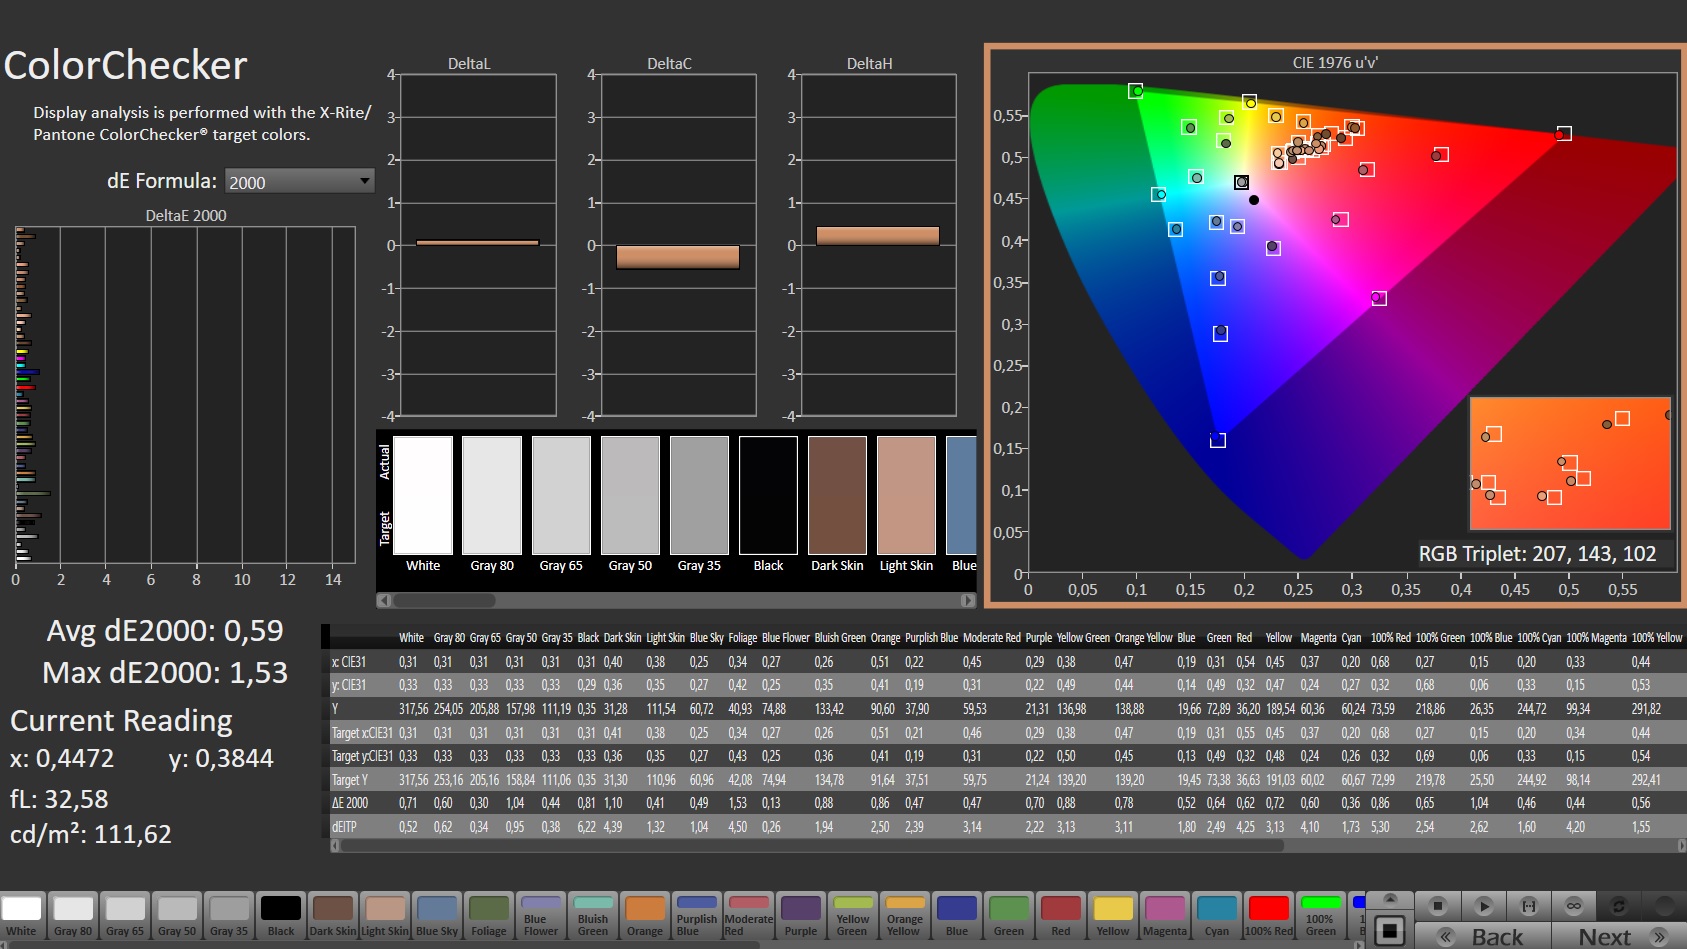
ΔE ColorChecker Calman: 3.61 | ∀{0.5-29.43 Ø4.71}
calibrated: 0.59
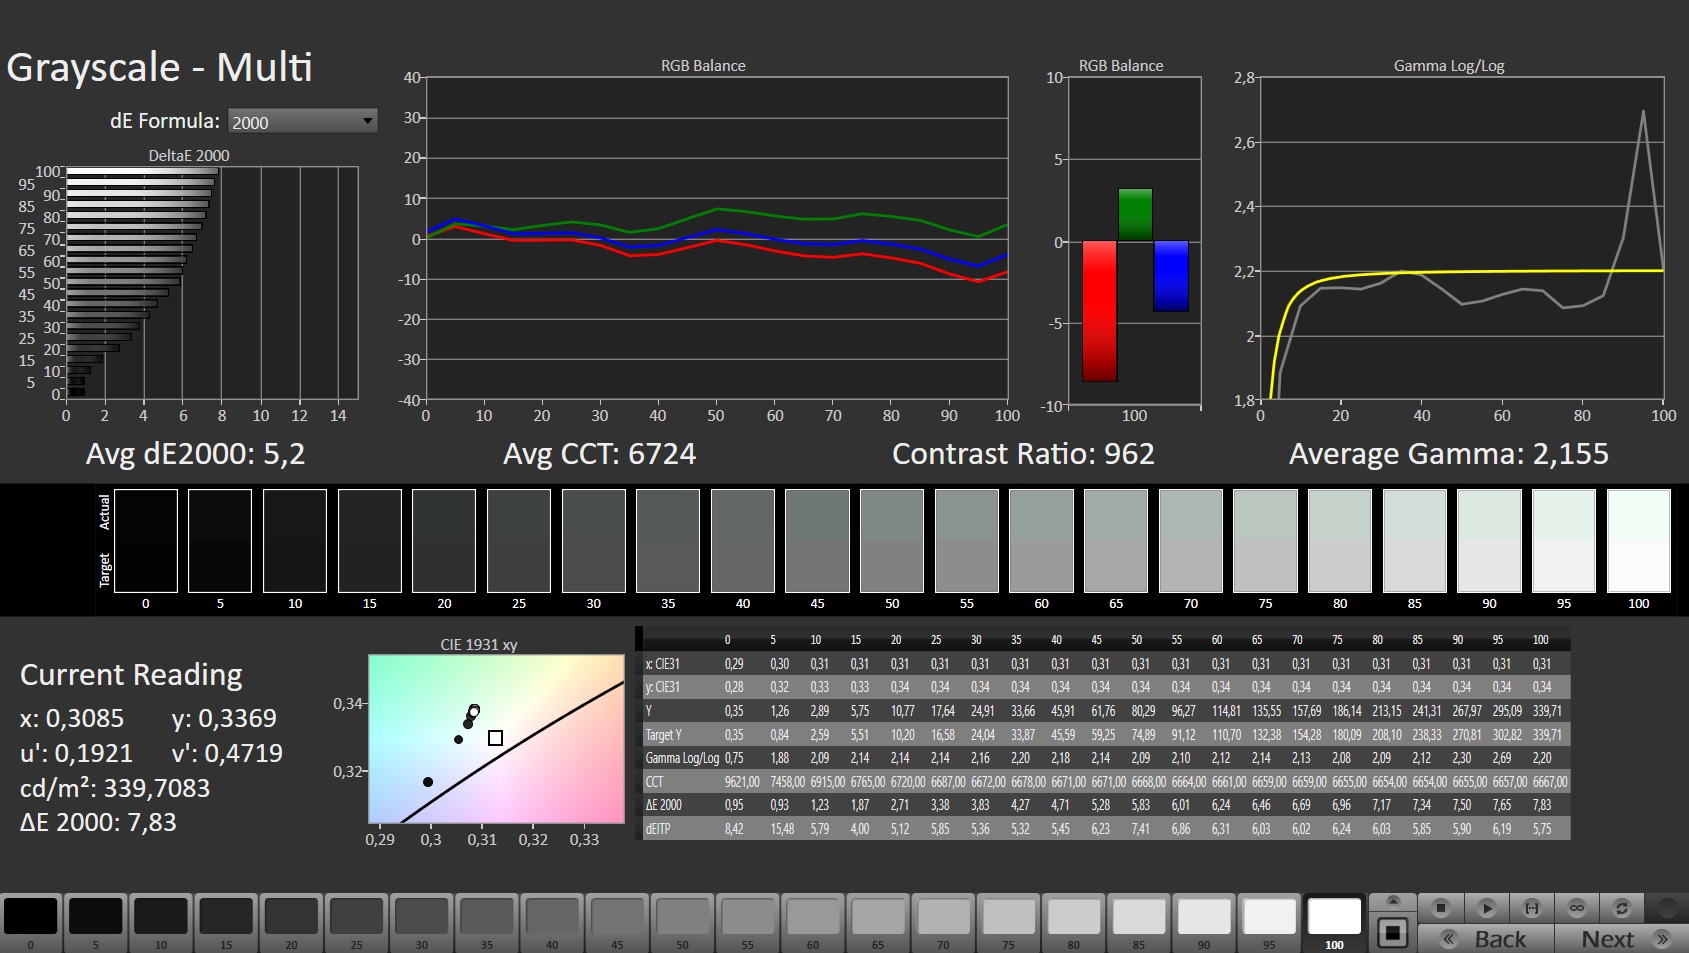
ΔE Greyscale Calman: 5.2 | ∀{0.09-98 Ø4.96}
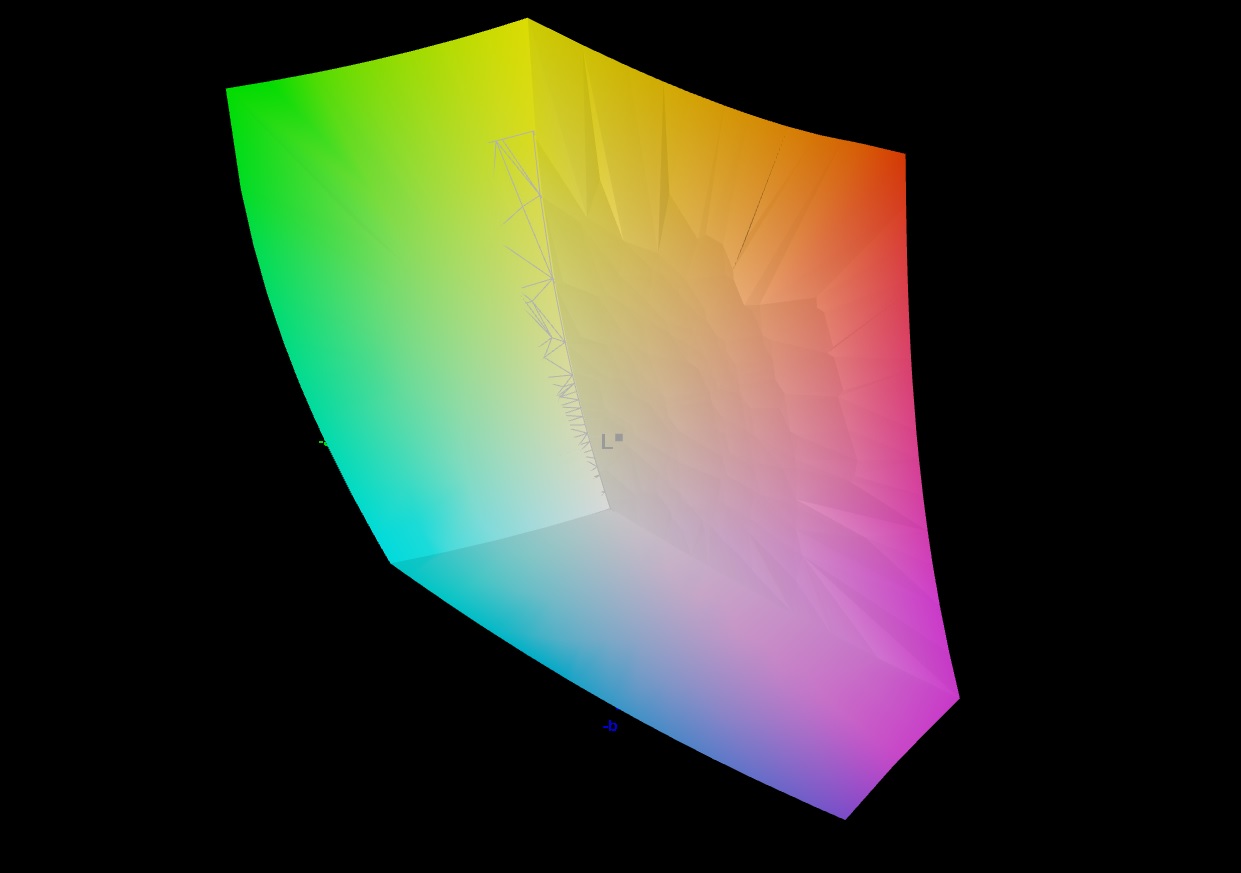
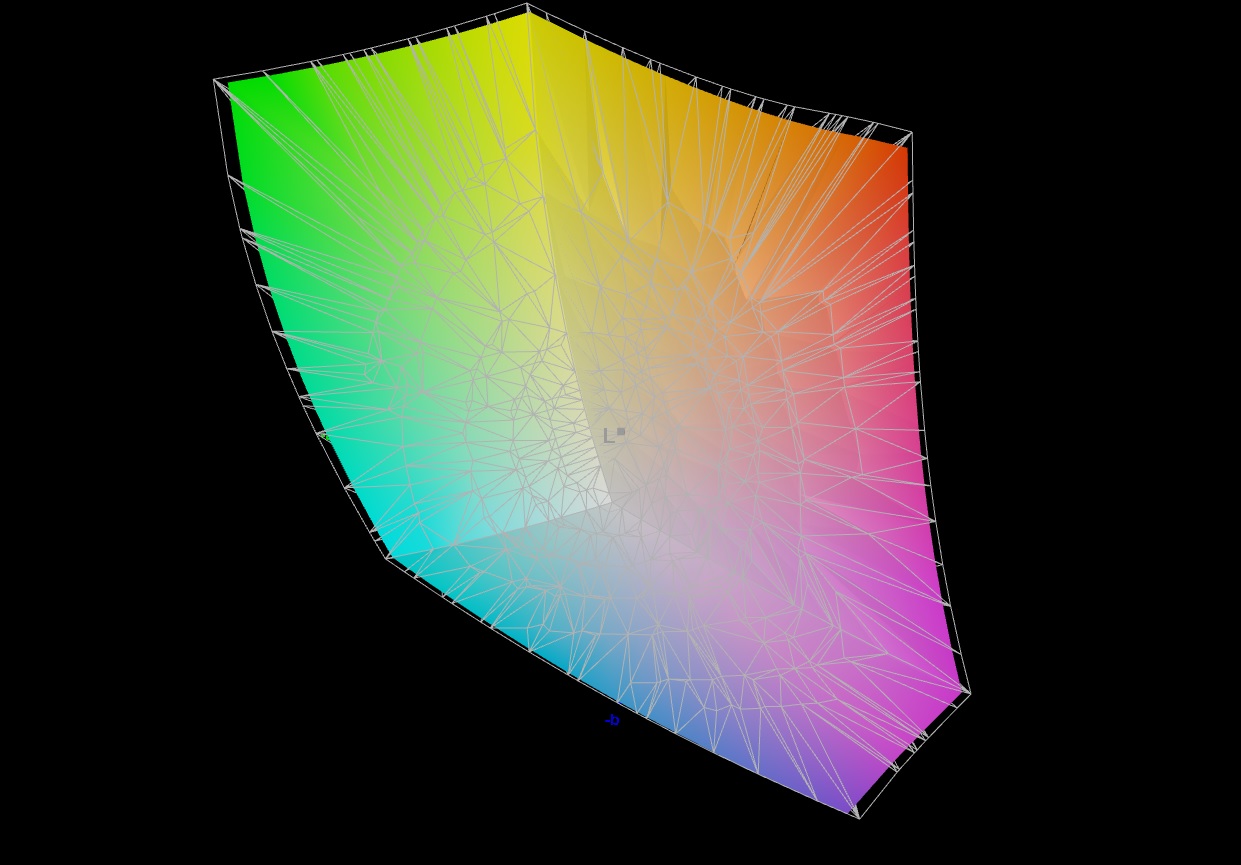
85.2% AdobeRGB 1998 (Argyll 3D)
99.8% sRGB (Argyll 3D)
95.6% Display P3 (Argyll 3D)
Gamma: 2.155
CCT: 6724 K
| Acer Nitro 5 AN515-58-72QR Chi Mei N156KME-GNA, IPS, 2560x1440, 15.6" | MSI Vector GP66 12UGS BOE NE156FHM-NZ3, IPS, 1920x1080, 15.6" | HP Omen 16-b1090ng BOE09E5, IPS, 2560x1440, 16.1" | Lenovo Legion 5 Pro 16 G7 i7 RTX 3070Ti NE160QDM-NY1, IPS, 2560x1600, 16" | |
|---|---|---|---|---|
| Display | -14% | -14% | -16% | |
| Display P3 Coverage (%) | 95.6 | 70.1 -27% | 71 -26% | 68.7 -28% |
| sRGB Coverage (%) | 99.8 | 99.5 0% | 97.9 -2% | 97.6 -2% |
| AdobeRGB 1998 Coverage (%) | 85.2 | 72.1 -15% | 73.3 -14% | 70.9 -17% |
| Response Times | 35% | 8% | 7% | |
| Response Time Grey 50% / Grey 80% * (ms) | 15.7 ? | 5.8 ? 63% | 14.5 ? 8% | 17.6 ? -12% |
| Response Time Black / White * (ms) | 10.2 ? | 9.6 ? 6% | 9.4 ? 8% | 7.6 ? 25% |
| PWM Frequency (Hz) | ||||
| Screen | -2% | -21% | 10% | |
| Brightness middle (cd/m²) | 332 | 353.1 6% | 335 1% | 502 51% |
| Brightness (cd/m²) | 303 | 325 7% | 319 5% | 491 62% |
| Brightness Distribution (%) | 86 | 85 -1% | 90 5% | 91 6% |
| Black Level * (cd/m²) | 0.29 | 0.38 -31% | 0.28 3% | 0.37 -28% |
| Contrast (:1) | 1145 | 929 -19% | 1196 4% | 1357 19% |
| Colorchecker dE 2000 * | 3.61 | 2.24 38% | 4.38 -21% | 2.7 25% |
| Colorchecker dE 2000 max. * | 7.71 | 5 35% | 9.48 -23% | 4.5 42% |
| Colorchecker dE 2000 calibrated * | 0.59 | 1.02 -73% | 1.33 -125% | 1.4 -137% |
| Greyscale dE 2000 * | 5.2 | 4 23% | 7 -35% | 2.7 48% |
| Gamma | 2.155 102% | 2.24 98% | 2.103 105% | 2.44 90% |
| CCT | 6724 97% | 6864 95% | 6244 104% | 6326 103% |
| Media total (Programa/Opciones) | 6% /
1% | -9% /
-15% | 0% /
4% |
* ... más pequeño es mejor
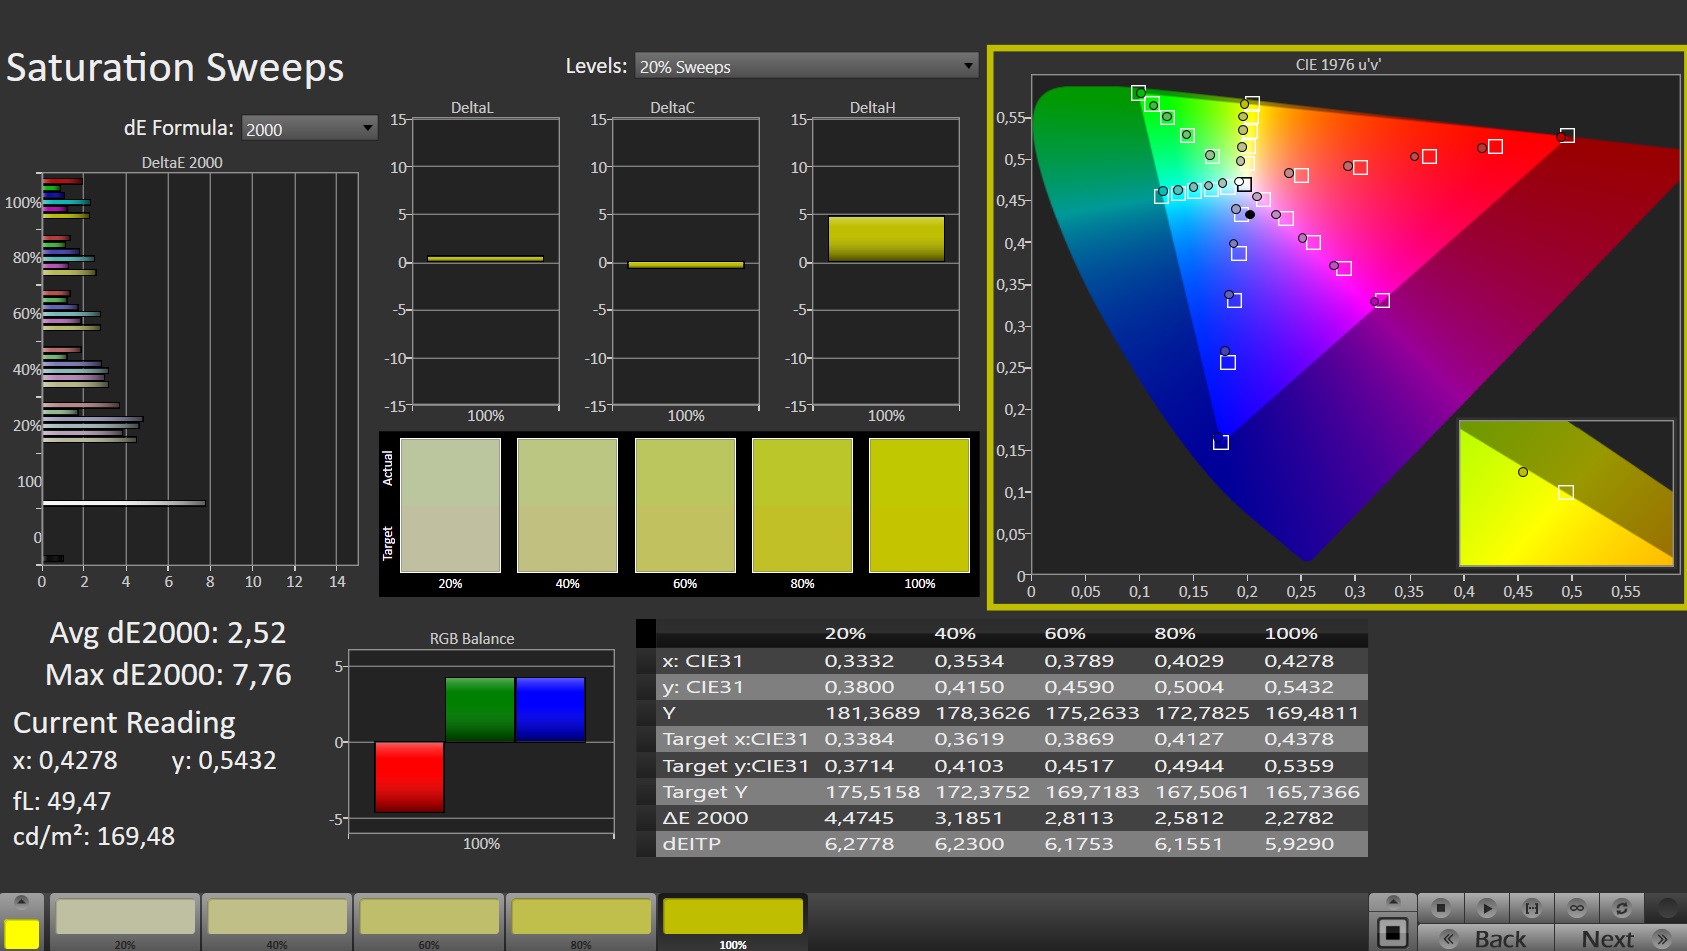
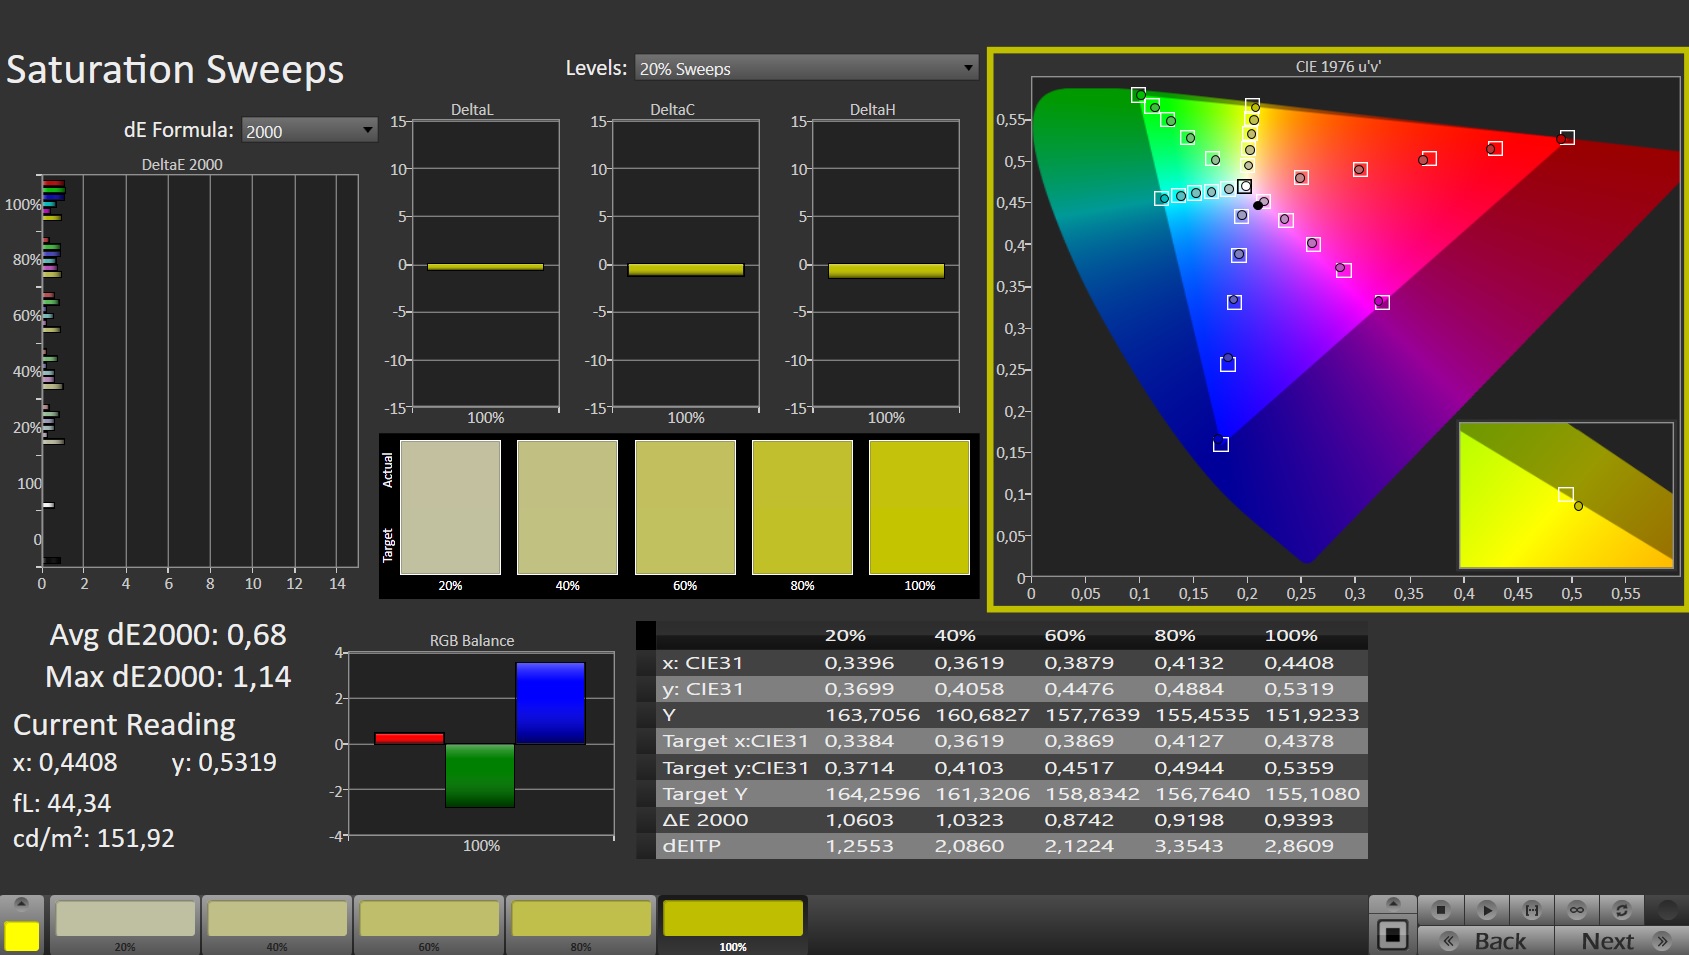
La pantalla muestra los colores de forma bastante decente al sacarla de la caja y la ligera desviación de color no es perceptible. Una calibración aporta mejoras significativas: La pantalla puede reproducir casi completamente los espacios de color sRGB (99,8%) y DCI-P3 (96%), y se reproduce el 85% del espacio de color AdobeRGB.

Tiempos de respuesta del display
| ↔ Tiempo de respuesta de Negro a Blanco | ||
|---|---|---|
| 10.2 ms ... subida ↗ y bajada ↘ combinada | ↗ 6.1 ms subida | 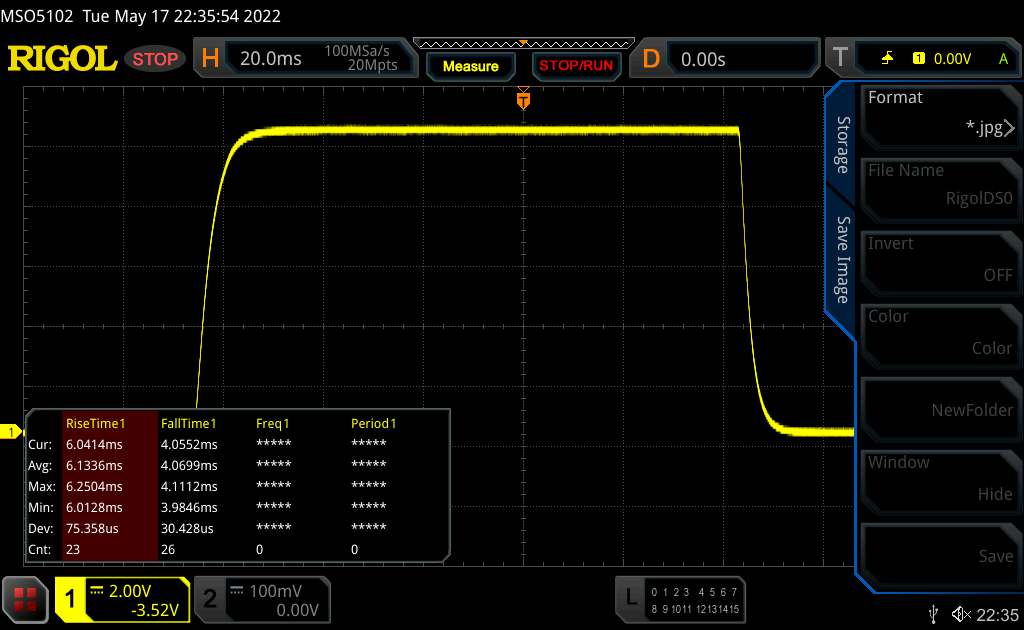 |
| ↘ 4.1 ms bajada | ||
| La pantalla mostró buenos tiempos de respuesta en nuestros tests pero podría ser demasiado lenta para los jugones competitivos. En comparación, todos los dispositivos de prueba van de ##min### (mínimo) a 240 (máximo) ms. » 28 % de todos los dispositivos son mejores. Esto quiere decir que el tiempo de respuesta medido es mejor que la media (19.8 ms) de todos los dispositivos testados. | ||
| ↔ Tiempo de respuesta 50% Gris a 80% Gris | ||
| 15.7 ms ... subida ↗ y bajada ↘ combinada | ↗ 7.5 ms subida | 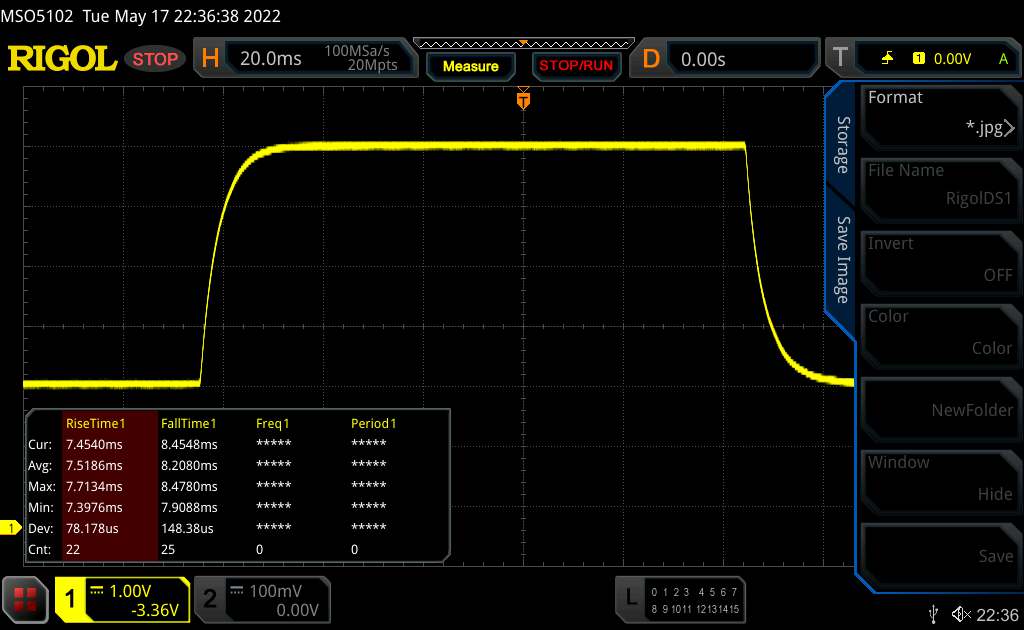 |
| ↘ 8.2 ms bajada | ||
| La pantalla mostró buenos tiempos de respuesta en nuestros tests pero podría ser demasiado lenta para los jugones competitivos. En comparación, todos los dispositivos de prueba van de ##min### (mínimo) a 636 (máximo) ms. » 30 % de todos los dispositivos son mejores. Esto quiere decir que el tiempo de respuesta medido es mejor que la media (31 ms) de todos los dispositivos testados. | ||
Parpadeo de Pantalla / PWM (Pulse-Width Modulation)
| Parpadeo de Pantalla / PWM no detectado | 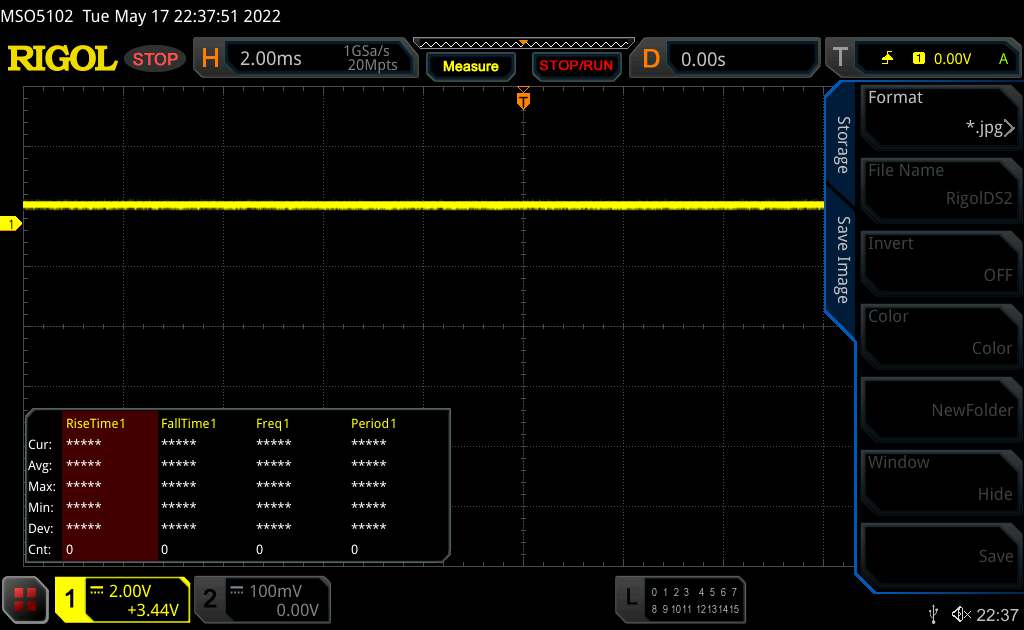 | ||
Comparación: 52 % de todos los dispositivos testados no usaron PWM para atenuar el display. Si se usó, medimos una media de 7754 (mínimo: 5 - máxmo: 343500) Hz. | |||
El panel IPS de ángulo de visión estable puede leerse desde cualquier posición. La lectura de la pantalla en exteriores es posible cuando el sol no brilla demasiado.

Rendimiento: Portátil Nitro con Amps y Alder Lake
Con el Nitro 5, Acer tiene un portátil para juegos de 15,6 pulgadas en su línea que ejecuta todos los juegos actuales sin problemas.

Condiciones de la prueba
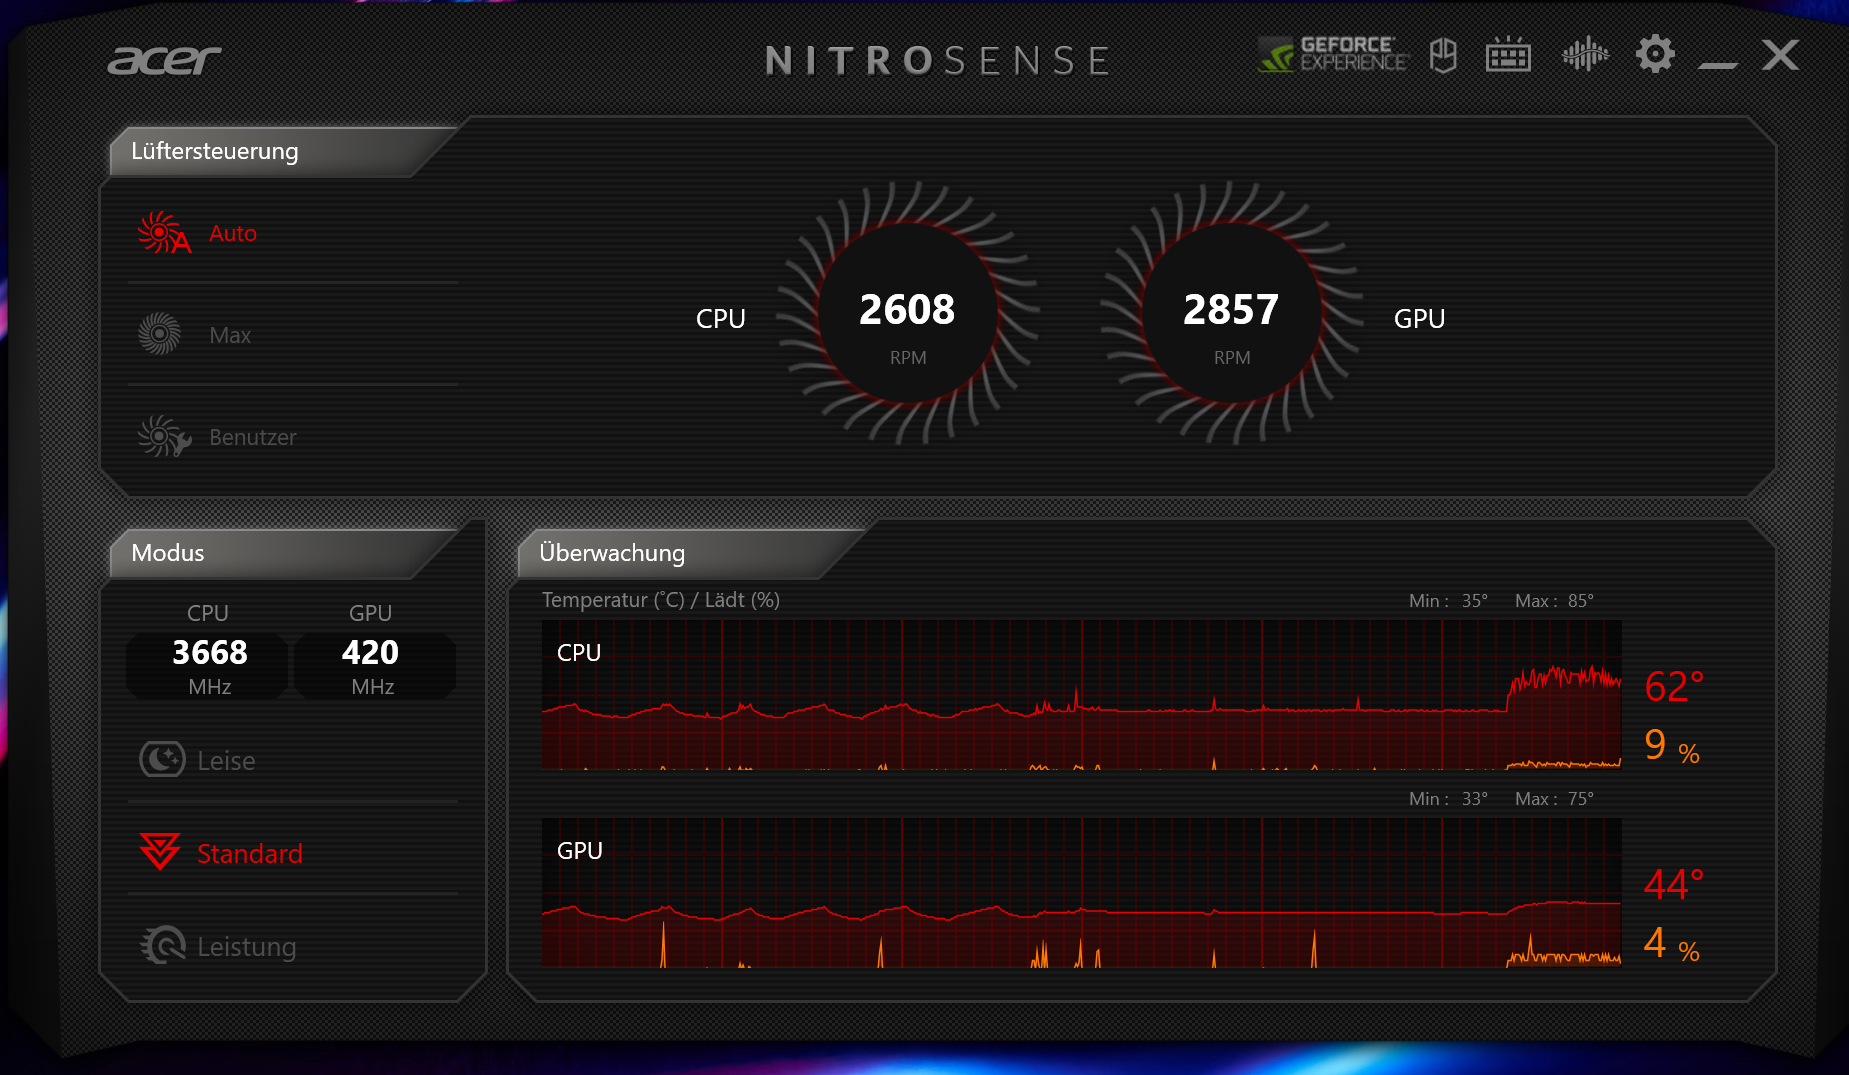
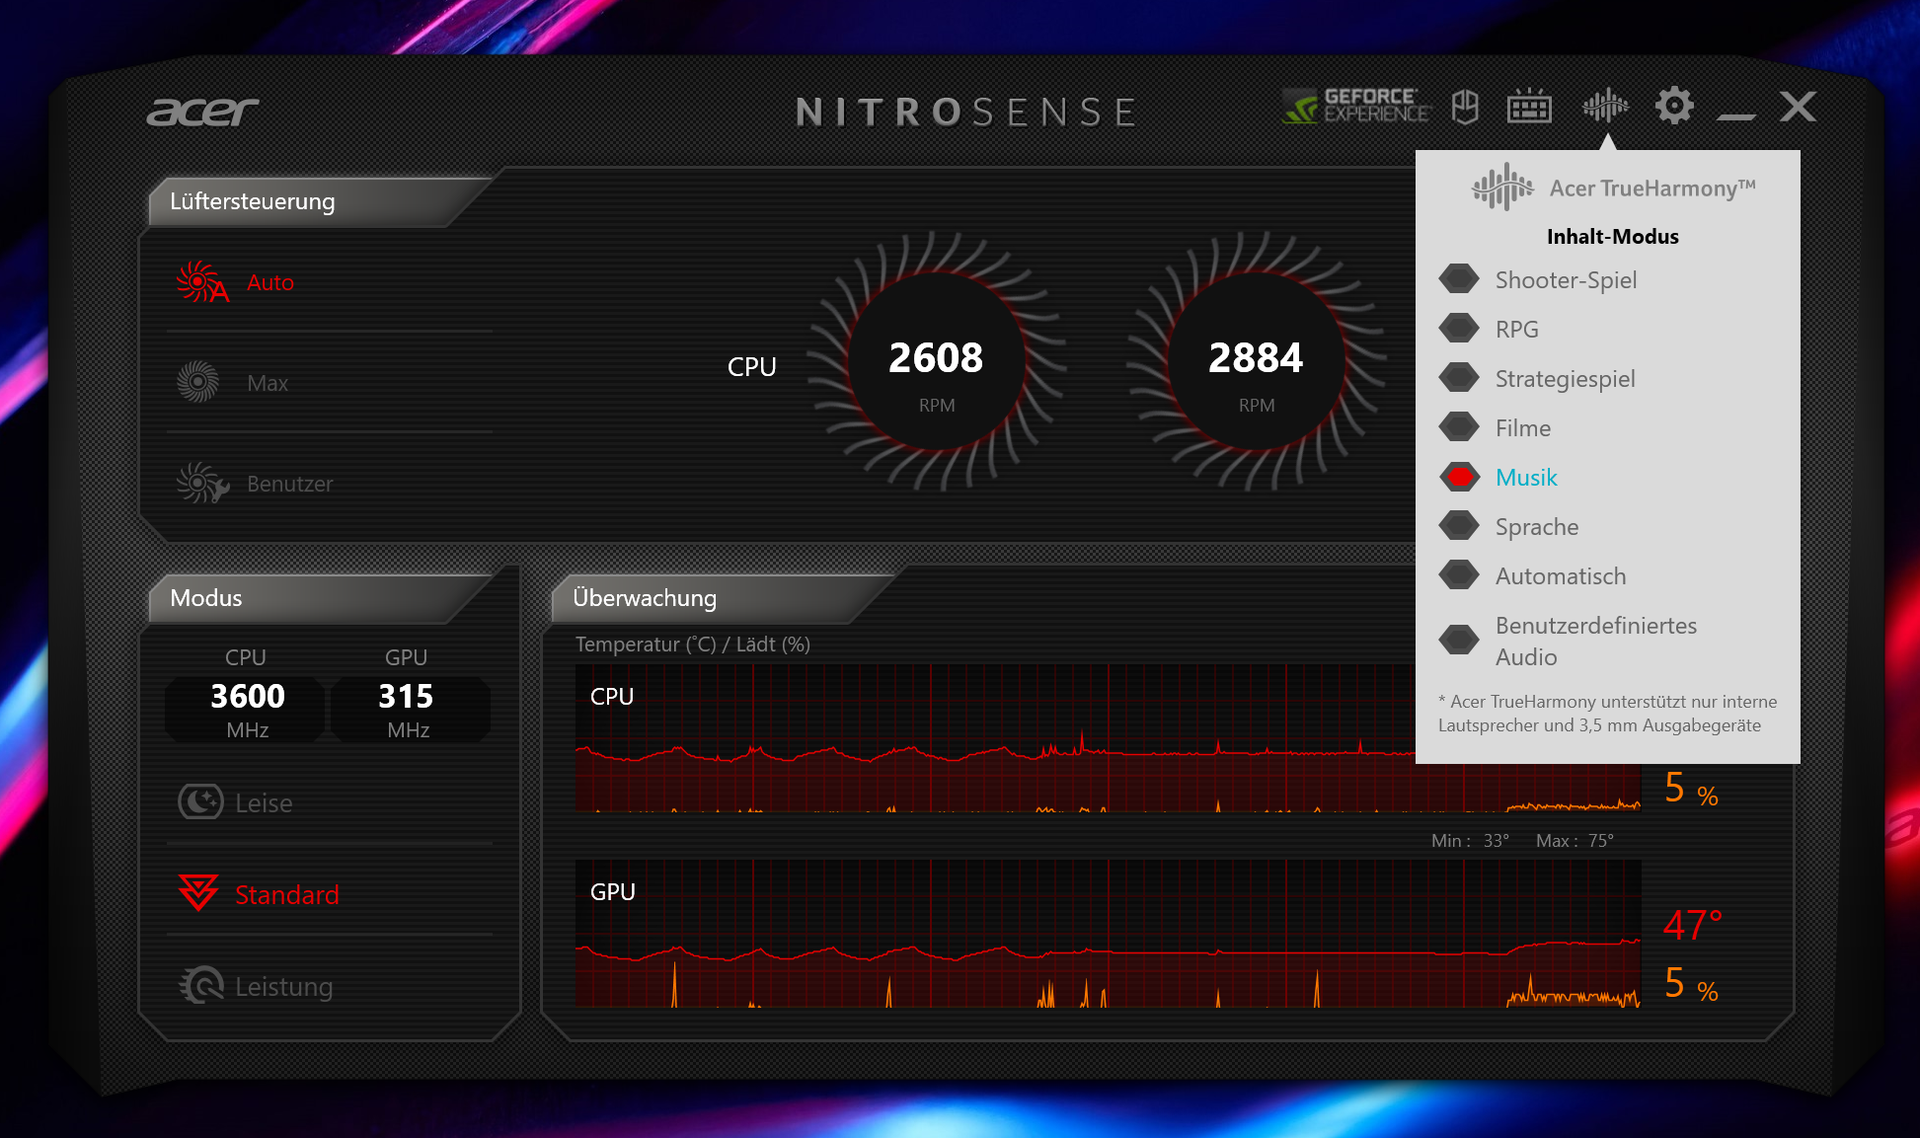
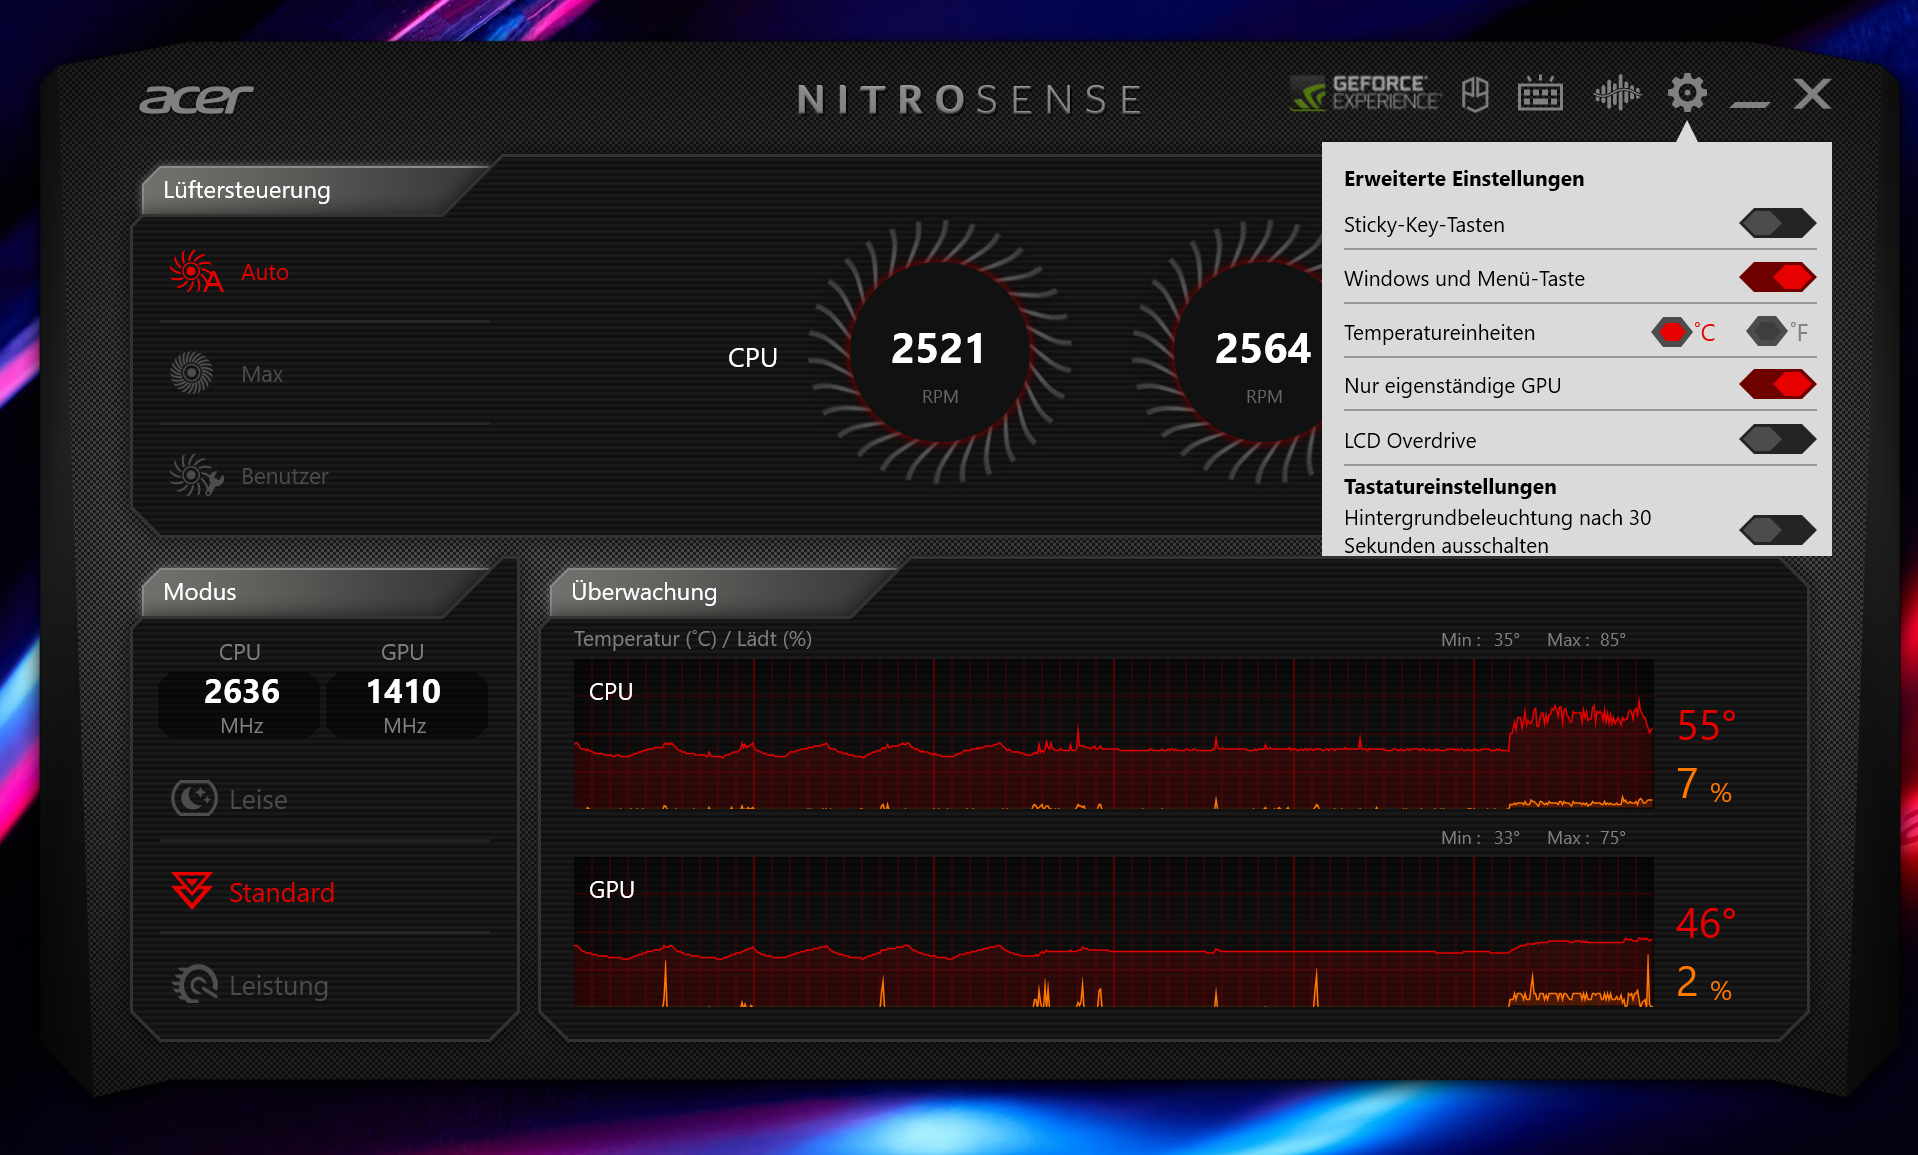
El portátil Acer tiene tres perfiles de rendimiento específicos del fabricante ("Rendimiento", "Estándar", "Silencioso") entre los que el usuario puede elegir a través del software NitroSense preinstalado. El perfil "Rendimiento" sólo se puede utilizar en funcionamiento de red. Las pruebas de la batería se realizaron con el perfil "Silencio" y las pruebas de rendimiento con el perfil "Estándar". También se utilizó el control automático del ventilador.
| Estándar | Leistung | Leise | |
|---|---|---|---|
| Límite de potencia 1 | 80 Watt | 95 Watt | 80 Watt |
| Límite de potencia 2 | 115 Watt | 115 Watt | 115 Watt |
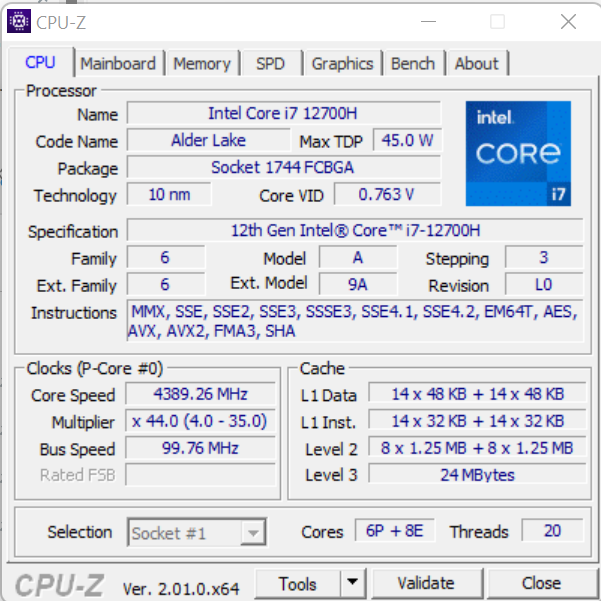
Procesador
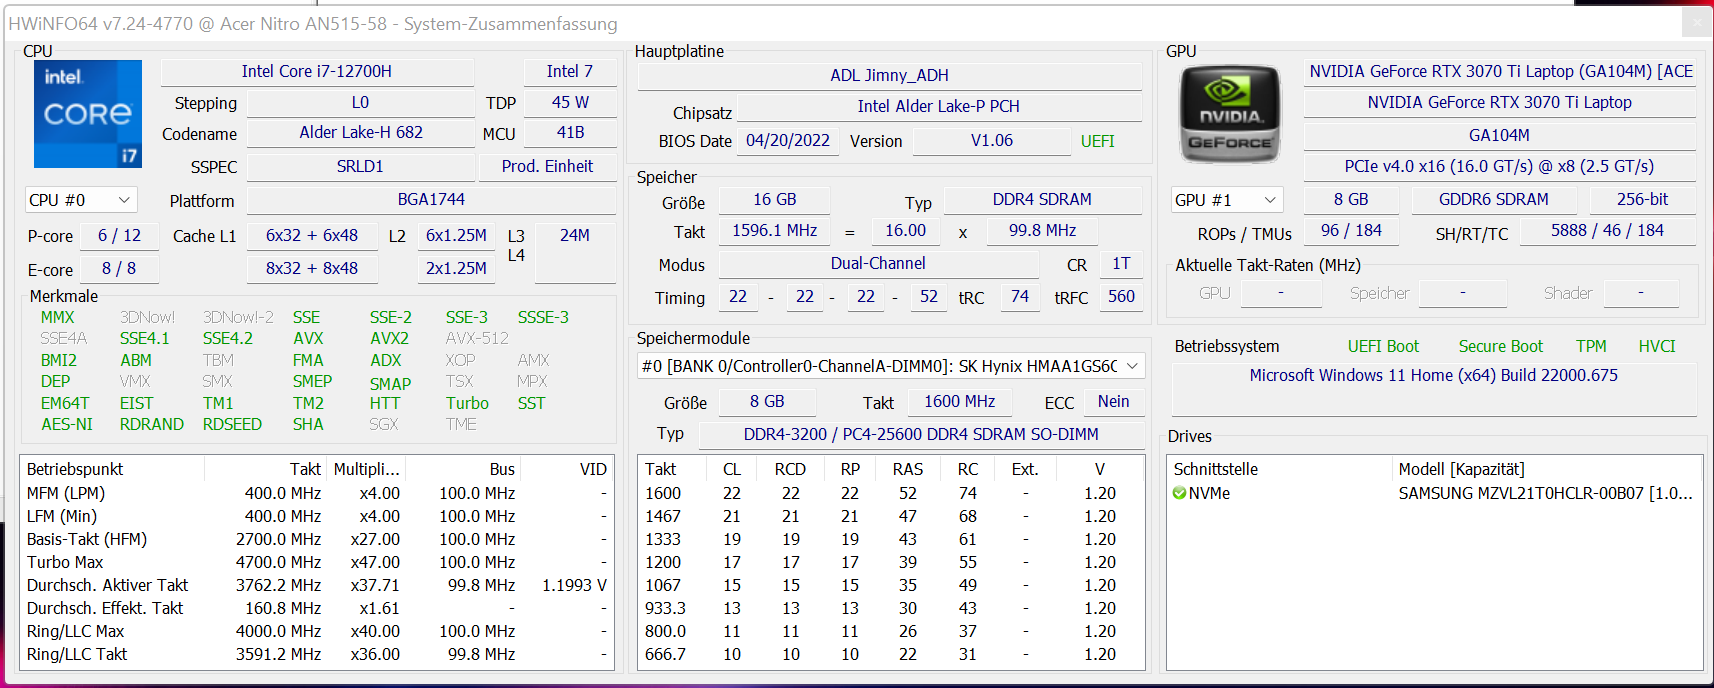
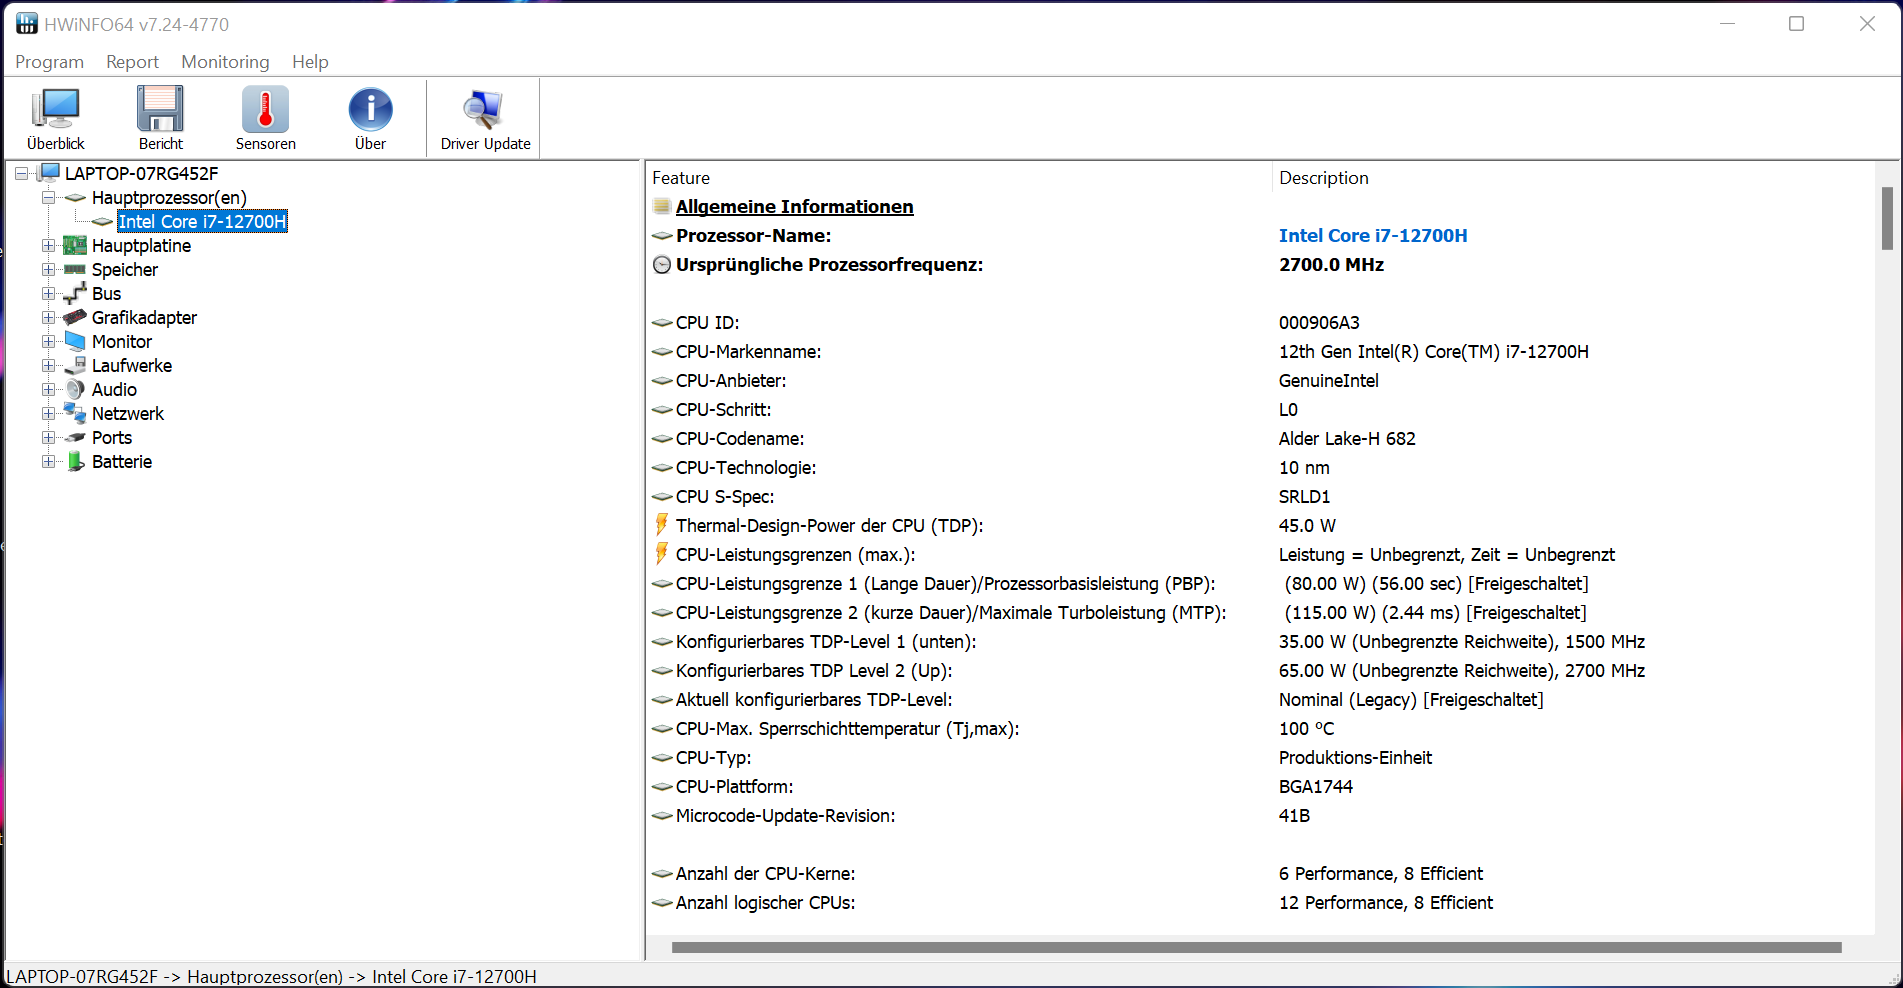
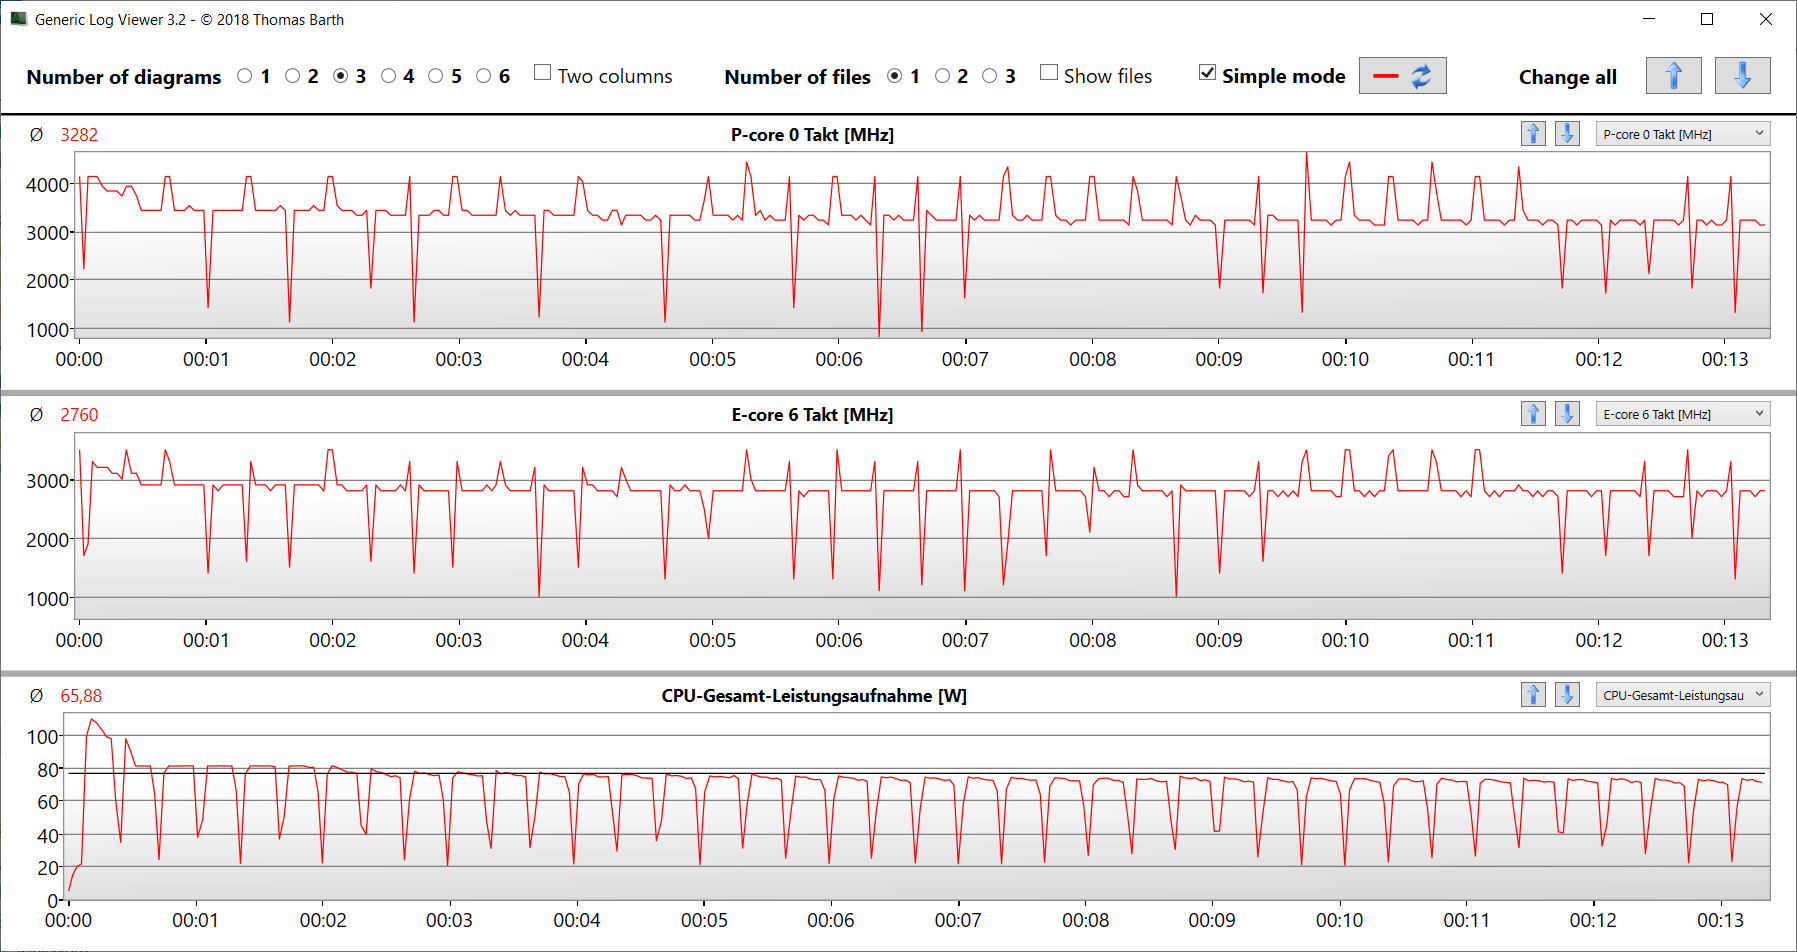
El Core i7-12700H (Alder Lake) consta de seis núcleos de rendimiento (hyperthreading, de 2,4 a 4,7 GHz) y ocho núcleos de eficiencia (sin hyperthreading, de 1,8 a 3,5 GHz). En total, esto da lugar a 20 núcleos lógicos de CPU.
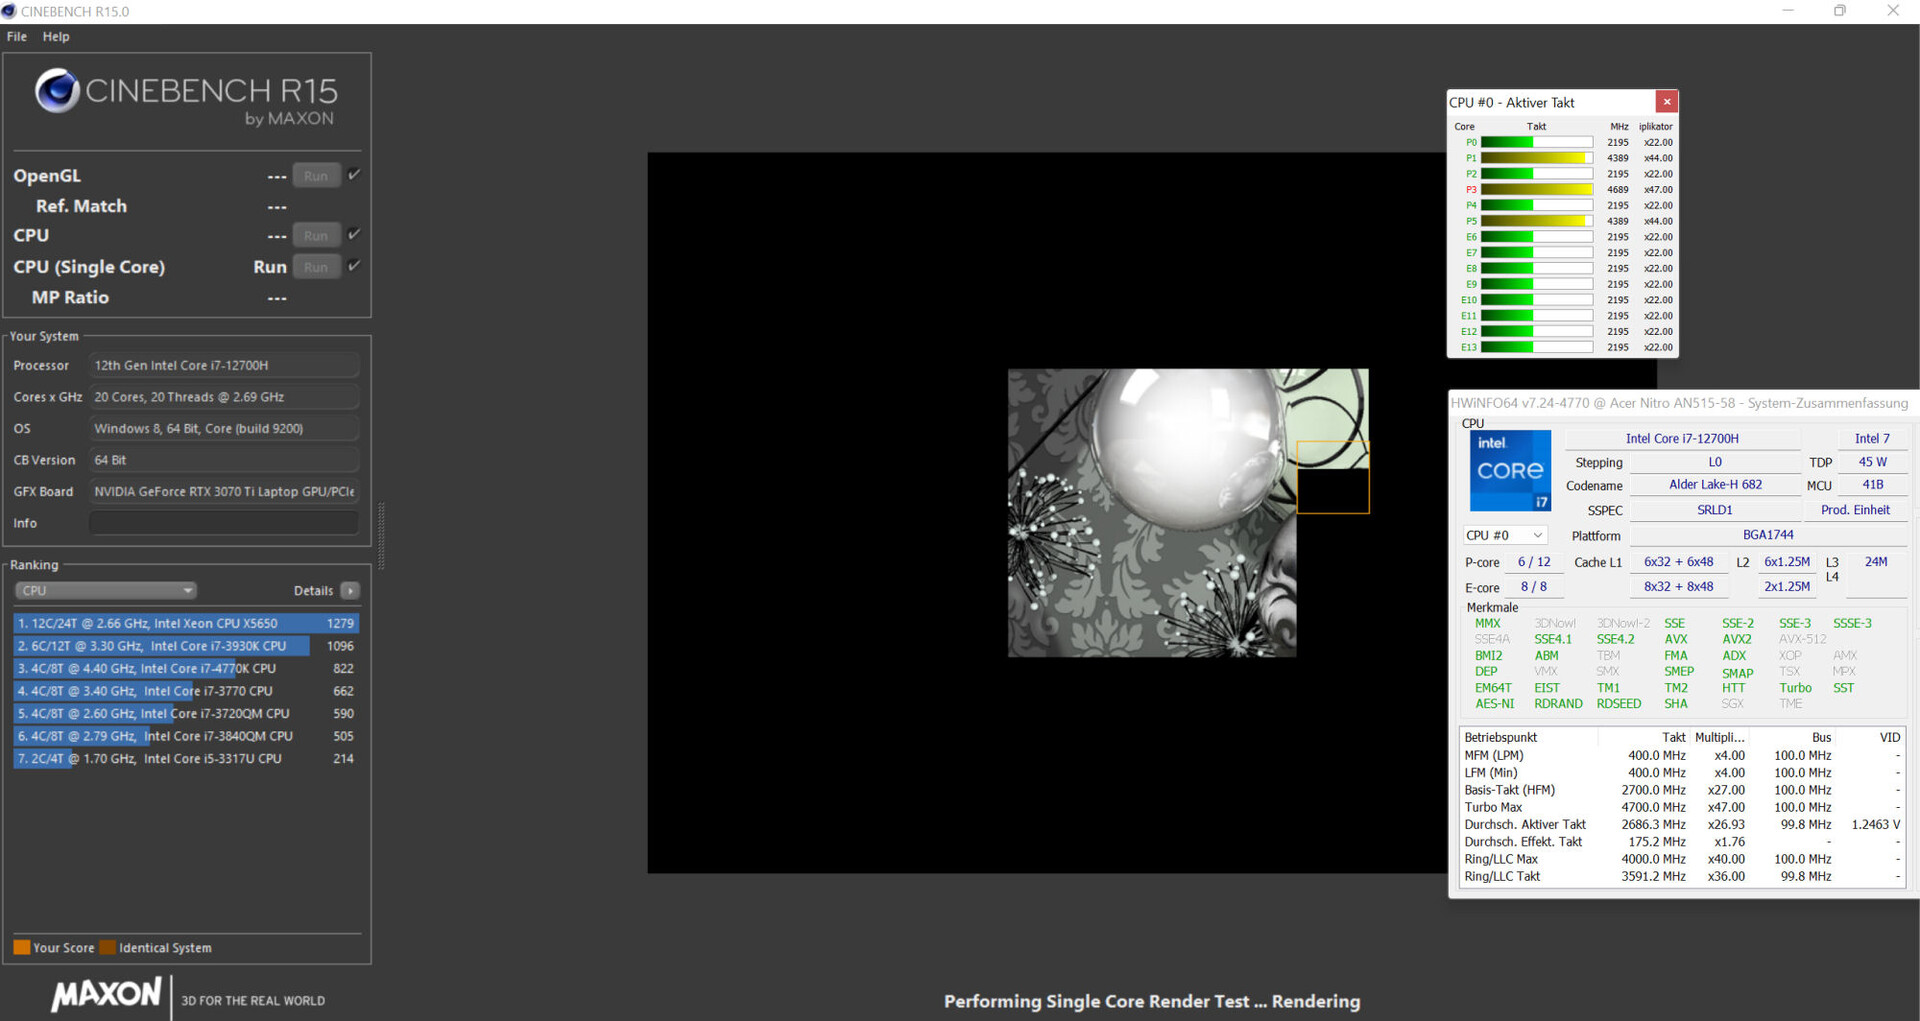
La prueba multihilo del benchmark Cinebench R15 se ejecutó brevemente a altas velocidades de reloj (núcleos P: 4 a 4,1 GHz, núcleos E: 3,2 GHz) antes de bajar ligeramente (núcleos P: 3,5 a 3,9 GHz, núcleos E: 2,9 a 3,1 GHz). La prueba de un solo hilo se realizó a velocidades de 2,2 a 4,7 GHz (núcleos P) y de 1,2 a 3,5 GHz (núcleos E). Las velocidades de reloj fueron significativamente menores en el modo de batería.
En general, los resultados del benchmark son mixtos. En términos de rendimiento multihilo, el Nitro queda por detrás del
Lenovo Legion 5 Pro 16 G7que también está equipado con un procesador 12700H.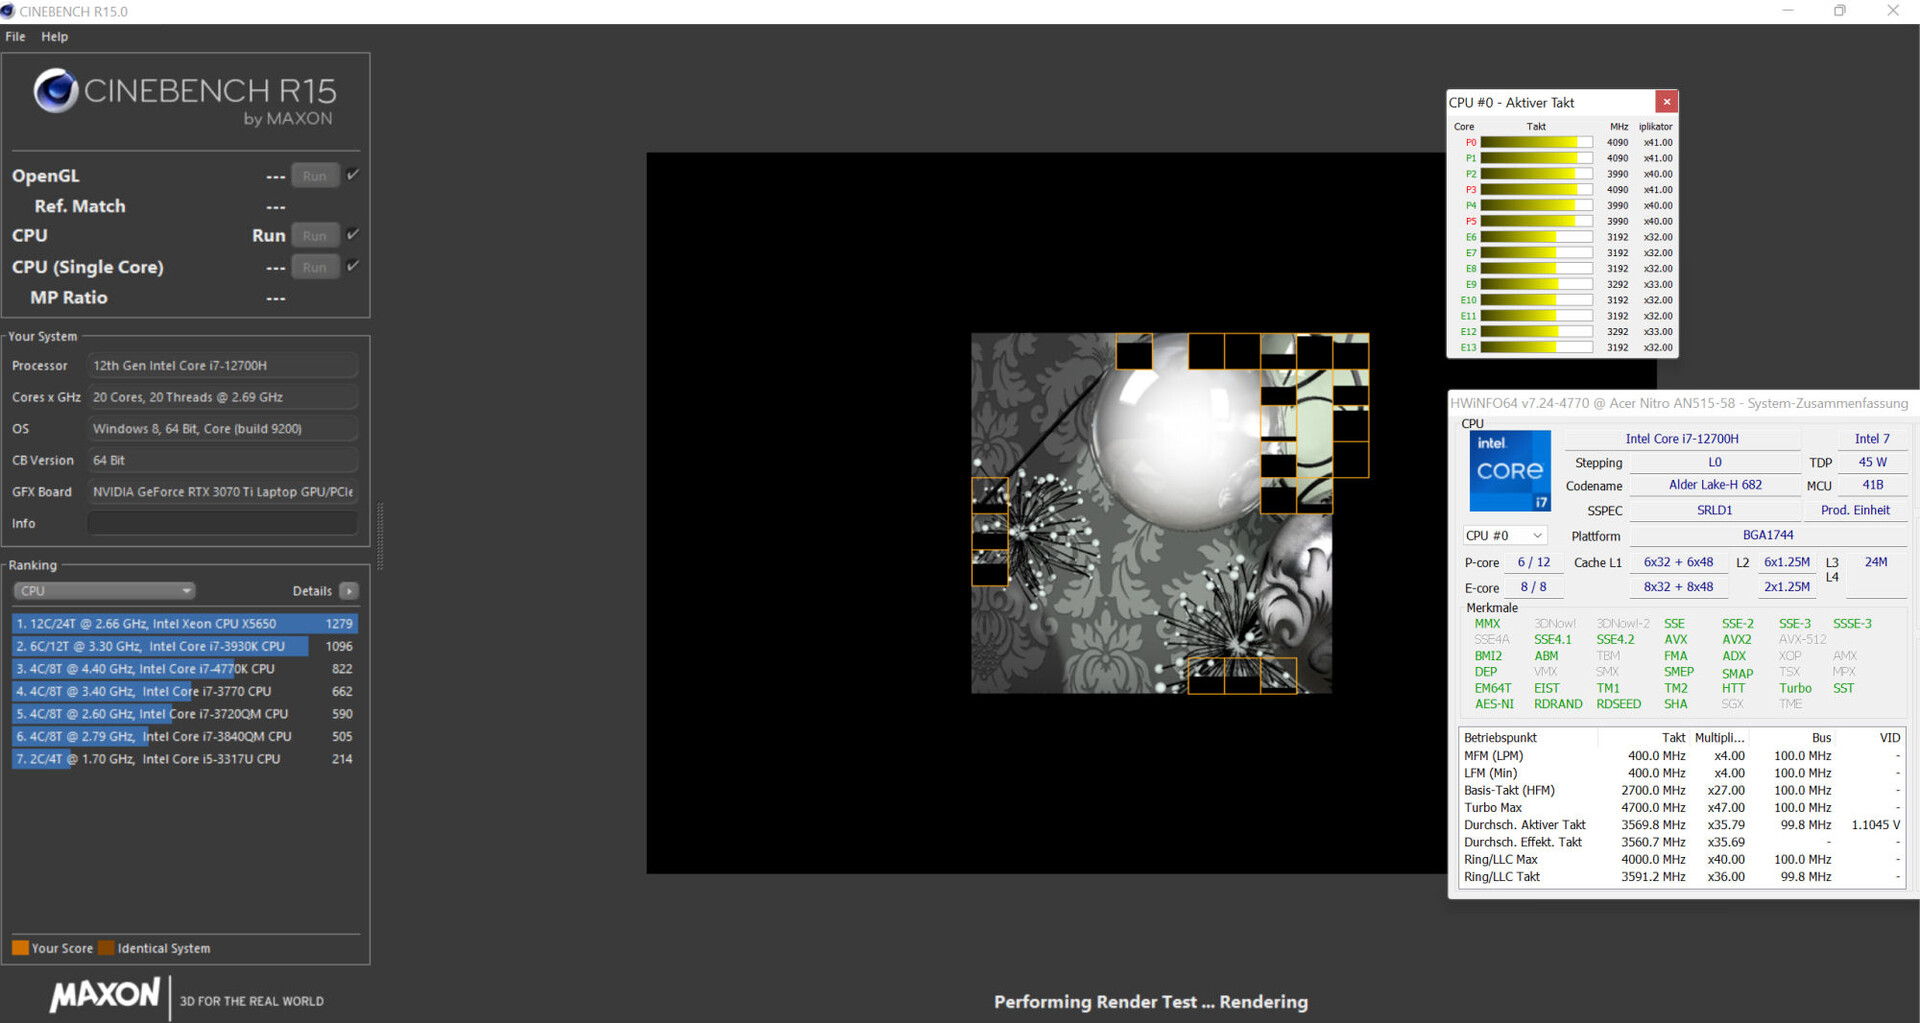
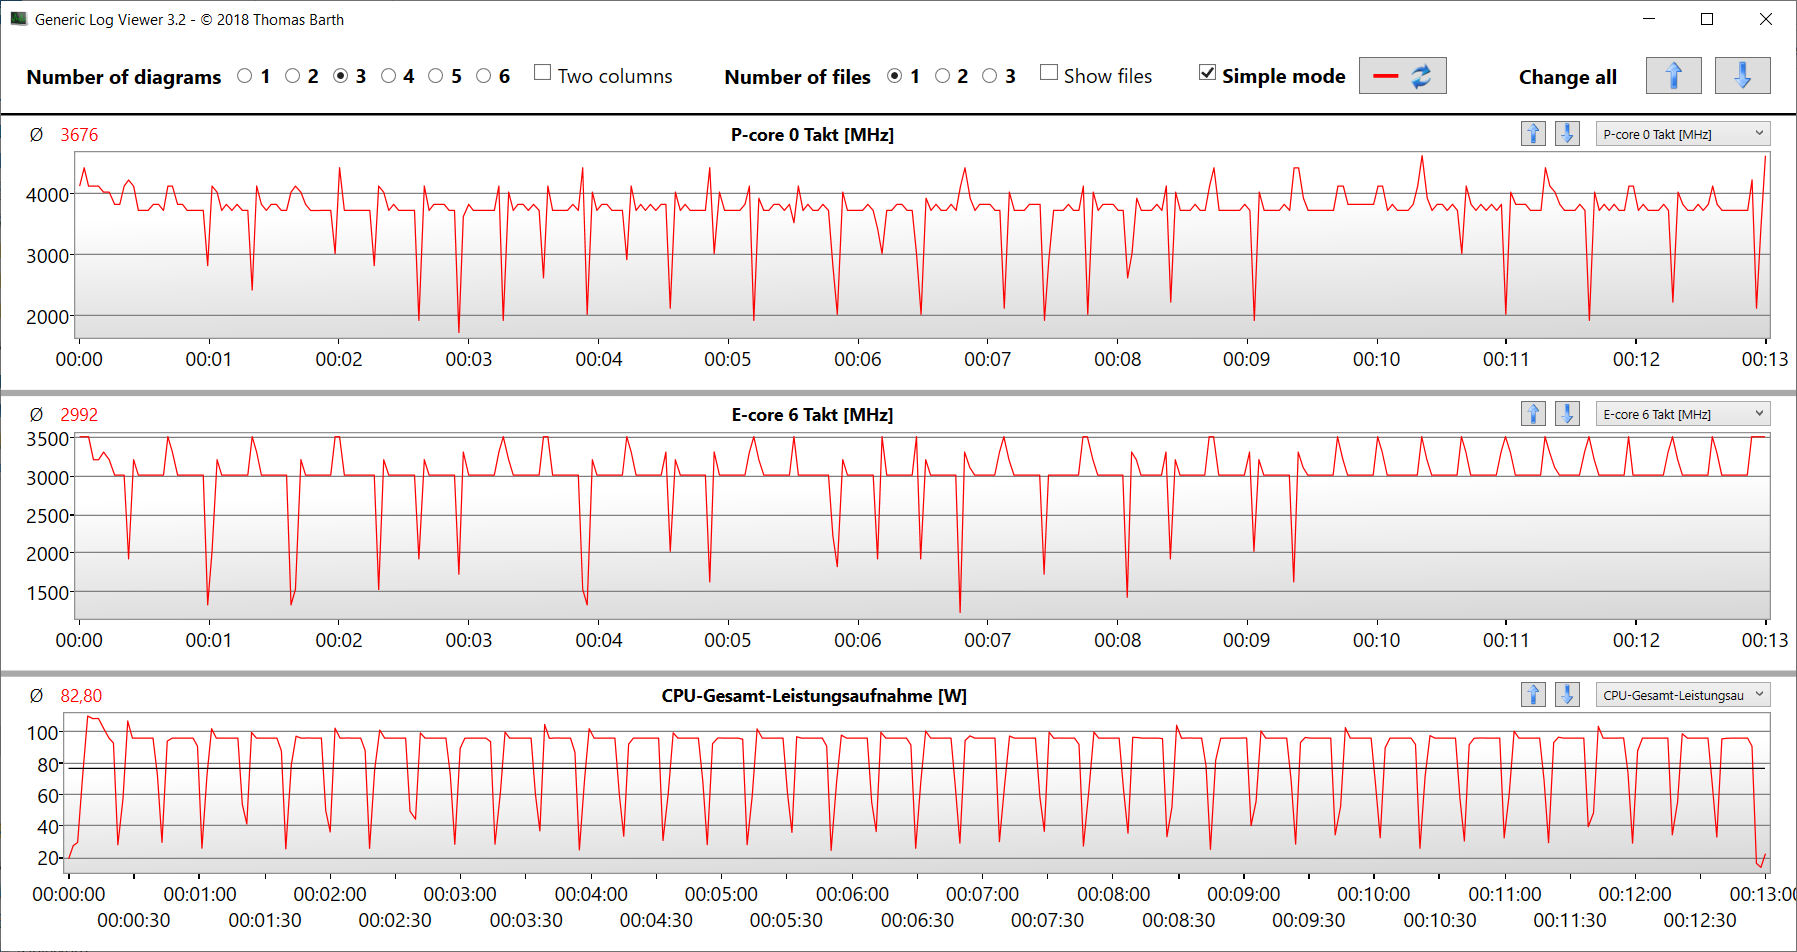
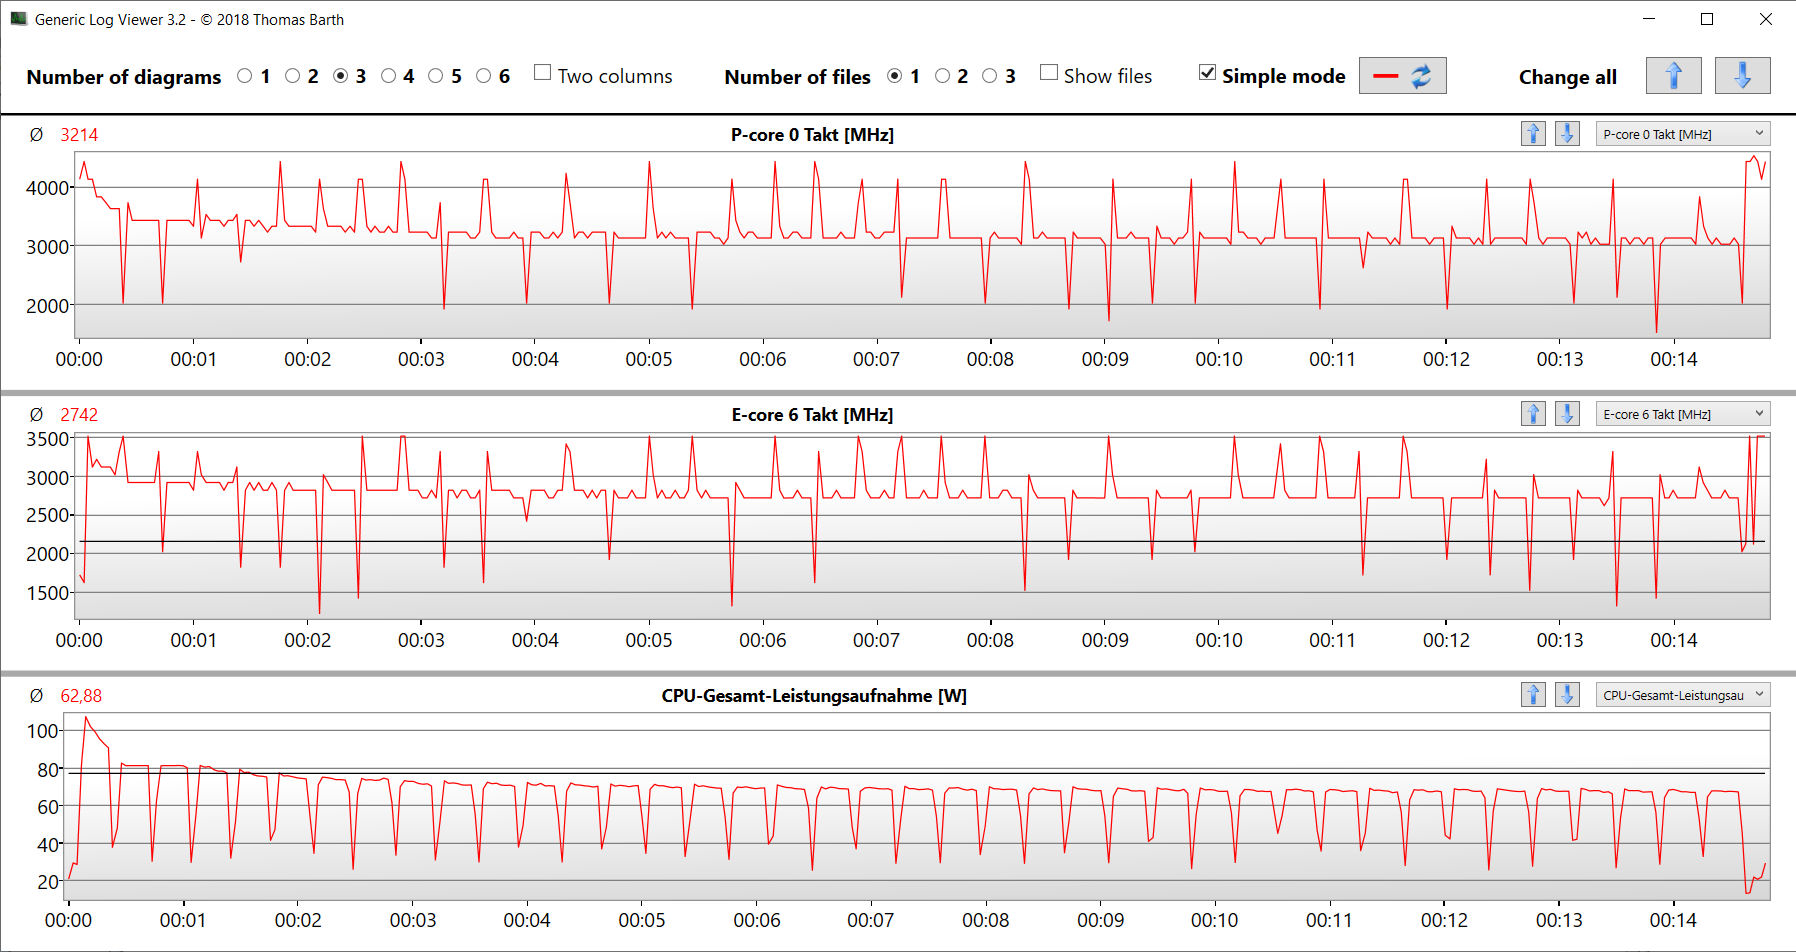
Se comprueba si el Turbo de la CPU se utiliza constantemente en el funcionamiento de la red eléctrica ejecutando la prueba multihilo del benchmark Cinebench R15 en un bucle. En este caso, las altas velocidades de reloj sólo se pueden mantener durante un breve periodo de tiempo. Después, tanto el núcleo P como el E funcionan a velocidades en el rango Turbo medio. El perfil "Rendimiento" provoca un ligero aumento de la potencia de cálculo
Cinebench R15 Multi Loop
| CPU Performance rating - Percent | |
| Media de la clase Gaming | |
| Lenovo Legion 5 Pro 16 G7 i7 RTX 3070Ti | |
| MSI Vector GP66 12UGS | |
| HP Omen 16-b1090ng | |
| Acer Nitro 5 AN515-58-72QR | |
| Acer Nitro 5 AN515-58-72QR | |
| Medio Intel Core i7-12700H | |
| Acer Nitro 5 AN515-58-72QR | |
| HP Omen 16-c0077ng -1! | |
| Cinebench R23 | |
| Multi Core | |
| Media de la clase Gaming (10488 - 42661, n=107, últimos 2 años) | |
| Lenovo Legion 5 Pro 16 G7 i7 RTX 3070Ti | |
| Acer Nitro 5 AN515-58-72QR (Leistung) | |
| MSI Vector GP66 12UGS | |
| Acer Nitro 5 AN515-58-72QR | |
| Acer Nitro 5 AN515-58-72QR (Leise) | |
| HP Omen 16-b1090ng | |
| Medio Intel Core i7-12700H (4032 - 19330, n=64) | |
| HP Omen 16-c0077ng | |
| Single Core | |
| Media de la clase Gaming (1166 - 2415, n=107, últimos 2 años) | |
| MSI Vector GP66 12UGS | |
| Lenovo Legion 5 Pro 16 G7 i7 RTX 3070Ti | |
| Acer Nitro 5 AN515-58-72QR | |
| Acer Nitro 5 AN515-58-72QR (Leise) | |
| HP Omen 16-b1090ng | |
| Acer Nitro 5 AN515-58-72QR (Leistung) | |
| Medio Intel Core i7-12700H (778 - 1826, n=63) | |
| HP Omen 16-c0077ng | |
| Cinebench R20 | |
| CPU (Multi Core) | |
| Media de la clase Gaming (4029 - 16433, n=106, últimos 2 años) | |
| Lenovo Legion 5 Pro 16 G7 i7 RTX 3070Ti | |
| MSI Vector GP66 12UGS | |
| Acer Nitro 5 AN515-58-72QR (Leistung) | |
| Acer Nitro 5 AN515-58-72QR | |
| Acer Nitro 5 AN515-58-72QR (Leise) | |
| Medio Intel Core i7-12700H (1576 - 7407, n=64) | |
| HP Omen 16-b1090ng | |
| HP Omen 16-c0077ng | |
| CPU (Single Core) | |
| Media de la clase Gaming (442 - 913, n=106, últimos 2 años) | |
| MSI Vector GP66 12UGS | |
| Lenovo Legion 5 Pro 16 G7 i7 RTX 3070Ti | |
| HP Omen 16-b1090ng | |
| Acer Nitro 5 AN515-58-72QR | |
| Acer Nitro 5 AN515-58-72QR (Leistung) | |
| Medio Intel Core i7-12700H (300 - 704, n=64) | |
| Acer Nitro 5 AN515-58-72QR (Leise) | |
| HP Omen 16-c0077ng | |
| Cinebench R15 | |
| CPU Multi 64Bit | |
| Media de la clase Gaming (1578 - 6330, n=105, últimos 2 años) | |
| Lenovo Legion 5 Pro 16 G7 i7 RTX 3070Ti | |
| HP Omen 16-b1090ng | |
| Acer Nitro 5 AN515-58-72QR | |
| Acer Nitro 5 AN515-58-72QR (Leise) | |
| Acer Nitro 5 AN515-58-72QR (Leistung) | |
| Medio Intel Core i7-12700H (1379 - 2916, n=70) | |
| MSI Vector GP66 12UGS | |
| HP Omen 16-c0077ng | |
| CPU Single 64Bit | |
| Media de la clase Gaming (188.8 - 350, n=106, últimos 2 años) | |
| MSI Vector GP66 12UGS | |
| Lenovo Legion 5 Pro 16 G7 i7 RTX 3070Ti | |
| Acer Nitro 5 AN515-58-72QR | |
| HP Omen 16-b1090ng | |
| Acer Nitro 5 AN515-58-72QR (Leise) | |
| Acer Nitro 5 AN515-58-72QR (Leistung) | |
| Medio Intel Core i7-12700H (113 - 263, n=65) | |
| HP Omen 16-c0077ng | |
| Blender - v2.79 BMW27 CPU | |
| HP Omen 16-c0077ng | |
| Medio Intel Core i7-12700H (168 - 732, n=63) | |
| Acer Nitro 5 AN515-58-72QR (Leise) | |
| Acer Nitro 5 AN515-58-72QR | |
| MSI Vector GP66 12UGS | |
| Acer Nitro 5 AN515-58-72QR (Leistung) | |
| HP Omen 16-b1090ng | |
| Lenovo Legion 5 Pro 16 G7 i7 RTX 3070Ti | |
| Media de la clase Gaming (79 - 330, n=104, últimos 2 años) | |
| 7-Zip 18.03 | |
| 7z b 4 | |
| Media de la clase Gaming (33491 - 148086, n=105, últimos 2 años) | |
| HP Omen 16-b1090ng | |
| Lenovo Legion 5 Pro 16 G7 i7 RTX 3070Ti | |
| MSI Vector GP66 12UGS | |
| Medio Intel Core i7-12700H (22844 - 73067, n=63) | |
| Acer Nitro 5 AN515-58-72QR | |
| Acer Nitro 5 AN515-58-72QR (Leise) | |
| Acer Nitro 5 AN515-58-72QR (Leistung) | |
| 7z b 4 -mmt1 | |
| Media de la clase Gaming (4199 - 7436, n=105, últimos 2 años) | |
| MSI Vector GP66 12UGS | |
| HP Omen 16-b1090ng | |
| Lenovo Legion 5 Pro 16 G7 i7 RTX 3070Ti | |
| Acer Nitro 5 AN515-58-72QR | |
| Acer Nitro 5 AN515-58-72QR (Leise) | |
| Medio Intel Core i7-12700H (2743 - 5972, n=63) | |
| HP Omen 16-c0077ng | |
| Acer Nitro 5 AN515-58-72QR (Leistung) | |
| Geekbench 5.5 | |
| Multi-Core | |
| Media de la clase Gaming (6460 - 28263, n=105, últimos 2 años) | |
| HP Omen 16-b1090ng | |
| Lenovo Legion 5 Pro 16 G7 i7 RTX 3070Ti | |
| MSI Vector GP66 12UGS | |
| Medio Intel Core i7-12700H (5144 - 13745, n=64) | |
| Acer Nitro 5 AN515-58-72QR | |
| Acer Nitro 5 AN515-58-72QR (Leistung) | |
| Acer Nitro 5 AN515-58-72QR (Leise) | |
| HP Omen 16-c0077ng | |
| Single-Core | |
| Media de la clase Gaming (986 - 2474, n=105, últimos 2 años) | |
| MSI Vector GP66 12UGS | |
| HP Omen 16-b1090ng | |
| Acer Nitro 5 AN515-58-72QR | |
| Lenovo Legion 5 Pro 16 G7 i7 RTX 3070Ti | |
| Medio Intel Core i7-12700H (803 - 1851, n=64) | |
| Acer Nitro 5 AN515-58-72QR (Leistung) | |
| Acer Nitro 5 AN515-58-72QR (Leise) | |
| HP Omen 16-c0077ng | |
| HWBOT x265 Benchmark v2.2 - 4k Preset | |
| Media de la clase Gaming (11.5 - 44.4, n=105, últimos 2 años) | |
| Lenovo Legion 5 Pro 16 G7 i7 RTX 3070Ti | |
| HP Omen 16-b1090ng | |
| MSI Vector GP66 12UGS | |
| Acer Nitro 5 AN515-58-72QR (Leistung) | |
| Acer Nitro 5 AN515-58-72QR | |
| Medio Intel Core i7-12700H (4.67 - 21.8, n=64) | |
| Acer Nitro 5 AN515-58-72QR (Leise) | |
| Acer Nitro 5 AN515-58-72QR (Leise) | |
| HP Omen 16-c0077ng | |
| LibreOffice - 20 Documents To PDF | |
| HP Omen 16-c0077ng | |
| Media de la clase Gaming (33.2 - 88.8, n=105, últimos 2 años) | |
| Medio Intel Core i7-12700H (34.2 - 95.3, n=63) | |
| Acer Nitro 5 AN515-58-72QR (Leistung) | |
| Acer Nitro 5 AN515-58-72QR (Leise) | |
| Lenovo Legion 5 Pro 16 G7 i7 RTX 3070Ti | |
| Acer Nitro 5 AN515-58-72QR | |
| HP Omen 16-b1090ng | |
| MSI Vector GP66 12UGS | |
| R Benchmark 2.5 - Overall mean | |
| HP Omen 16-c0077ng | |
| Acer Nitro 5 AN515-58-72QR (Leistung) | |
| Medio Intel Core i7-12700H (0.4441 - 1.052, n=63) | |
| Acer Nitro 5 AN515-58-72QR (Leise) | |
| Acer Nitro 5 AN515-58-72QR | |
| Lenovo Legion 5 Pro 16 G7 i7 RTX 3070Ti | |
| HP Omen 16-b1090ng | |
| Media de la clase Gaming (0.3439 - 0.759, n=106, últimos 2 años) | |
| MSI Vector GP66 12UGS | |
* ... más pequeño es mejor
AIDA64: FP32 Ray-Trace | FPU Julia | CPU SHA3 | CPU Queen | FPU SinJulia | FPU Mandel | CPU AES | CPU ZLib | FP64 Ray-Trace | CPU PhotoWorxx
| Performance rating | |
| Media de la clase Gaming | |
| HP Omen 16-c0077ng | |
| Lenovo Legion 5 Pro 16 G7 i7 RTX 3070Ti | |
| Medio Intel Core i7-12700H | |
| MSI Vector GP66 12UGS | |
| HP Omen 16-b1090ng | |
| Acer Nitro 5 AN515-58-72QR | |
| Acer Nitro 5 AN515-58-72QR | |
| AIDA64 / FP32 Ray-Trace | |
| Media de la clase Gaming (10227 - 85542, n=105, últimos 2 años) | |
| HP Omen 16-c0077ng (v6.50.5800) | |
| Medio Intel Core i7-12700H (2585 - 17957, n=64) | |
| Lenovo Legion 5 Pro 16 G7 i7 RTX 3070Ti (v6.50.5800) | |
| Acer Nitro 5 AN515-58-72QR (v6.50.5800, Leistung) | |
| Acer Nitro 5 AN515-58-72QR (v6.50.5800) | |
| MSI Vector GP66 12UGS (v6.50.5800) | |
| HP Omen 16-b1090ng (v6.50.5800) | |
| AIDA64 / FPU Julia | |
| Media de la clase Gaming (51376 - 238426, n=105, últimos 2 años) | |
| HP Omen 16-c0077ng (v6.50.5800) | |
| Medio Intel Core i7-12700H (12439 - 90760, n=64) | |
| Lenovo Legion 5 Pro 16 G7 i7 RTX 3070Ti (v6.50.5800) | |
| Acer Nitro 5 AN515-58-72QR (v6.50.5800, Leistung) | |
| Acer Nitro 5 AN515-58-72QR (v6.50.5800) | |
| MSI Vector GP66 12UGS (v6.50.5800) | |
| HP Omen 16-b1090ng (v6.50.5800) | |
| AIDA64 / CPU SHA3 | |
| Media de la clase Gaming (2180 - 10115, n=105, últimos 2 años) | |
| Lenovo Legion 5 Pro 16 G7 i7 RTX 3070Ti (v6.50.5800) | |
| Acer Nitro 5 AN515-58-72QR (v6.50.5800, Leistung) | |
| HP Omen 16-c0077ng (v6.50.5800) | |
| Medio Intel Core i7-12700H (833 - 4242, n=64) | |
| MSI Vector GP66 12UGS (v6.50.5800) | |
| Acer Nitro 5 AN515-58-72QR (v6.50.5800) | |
| HP Omen 16-b1090ng (v6.50.5800) | |
| AIDA64 / CPU Queen | |
| Media de la clase Gaming (49785 - 173351, n=90, últimos 2 años) | |
| MSI Vector GP66 12UGS (v6.50.5800) | |
| HP Omen 16-b1090ng (v6.50.5800) | |
| Lenovo Legion 5 Pro 16 G7 i7 RTX 3070Ti (v6.50.5800) | |
| HP Omen 16-c0077ng (v6.50.5800) | |
| Acer Nitro 5 AN515-58-72QR (v6.50.5800) | |
| Acer Nitro 5 AN515-58-72QR (v6.50.5800, Leistung) | |
| Medio Intel Core i7-12700H (57923 - 103202, n=63) | |
| AIDA64 / FPU SinJulia | |
| Media de la clase Gaming (4424 - 33636, n=105, últimos 2 años) | |
| HP Omen 16-c0077ng (v6.50.5800) | |
| Lenovo Legion 5 Pro 16 G7 i7 RTX 3070Ti (v6.50.5800) | |
| Acer Nitro 5 AN515-58-72QR (v6.50.5800, Leistung) | |
| Acer Nitro 5 AN515-58-72QR (v6.50.5800) | |
| MSI Vector GP66 12UGS (v6.50.5800) | |
| HP Omen 16-b1090ng (v6.50.5800) | |
| Medio Intel Core i7-12700H (3249 - 9939, n=64) | |
| AIDA64 / FPU Mandel | |
| Media de la clase Gaming (25115 - 128721, n=105, últimos 2 años) | |
| HP Omen 16-c0077ng (v6.50.5800) | |
| Medio Intel Core i7-12700H (7135 - 44760, n=64) | |
| Lenovo Legion 5 Pro 16 G7 i7 RTX 3070Ti (v6.50.5800) | |
| Acer Nitro 5 AN515-58-72QR (v6.50.5800, Leistung) | |
| Acer Nitro 5 AN515-58-72QR | |
| MSI Vector GP66 12UGS (v6.50.5800) | |
| HP Omen 16-b1090ng (v6.50.5800) | |
| AIDA64 / CPU AES | |
| HP Omen 16-c0077ng (v6.50.5800) | |
| Media de la clase Gaming (39258 - 247074, n=105, últimos 2 años) | |
| Lenovo Legion 5 Pro 16 G7 i7 RTX 3070Ti (v6.50.5800) | |
| MSI Vector GP66 12UGS (v6.50.5800) | |
| Medio Intel Core i7-12700H (31839 - 144360, n=64) | |
| HP Omen 16-b1090ng (v6.50.5800) | |
| Acer Nitro 5 AN515-58-72QR (v6.50.5800, Leistung) | |
| Acer Nitro 5 AN515-58-72QR (v6.50.5800) | |
| AIDA64 / CPU ZLib | |
| Media de la clase Gaming (574 - 2531, n=105, últimos 2 años) | |
| Lenovo Legion 5 Pro 16 G7 i7 RTX 3070Ti (v6.50.5800) | |
| Acer Nitro 5 AN515-58-72QR (v6.50.5800, Leistung) | |
| MSI Vector GP66 12UGS (v6.50.5800) | |
| Acer Nitro 5 AN515-58-72QR (v6.50.5800) | |
| Medio Intel Core i7-12700H (305 - 1171, n=64) | |
| HP Omen 16-b1090ng (v6.50.5800) | |
| HP Omen 16-c0077ng (v6.50.5800) | |
| AIDA64 / FP64 Ray-Trace | |
| Media de la clase Gaming (5509 - 45446, n=105, últimos 2 años) | |
| HP Omen 16-c0077ng (v6.50.5800) | |
| Medio Intel Core i7-12700H (1437 - 9692, n=64) | |
| Lenovo Legion 5 Pro 16 G7 i7 RTX 3070Ti (v6.50.5800) | |
| Acer Nitro 5 AN515-58-72QR (v6.50.5800, Leistung) | |
| Acer Nitro 5 AN515-58-72QR (v6.50.5800) | |
| MSI Vector GP66 12UGS (v6.50.5800) | |
| HP Omen 16-b1090ng (v6.50.5800) | |
| AIDA64 / CPU PhotoWorxx | |
| Media de la clase Gaming (12271 - 89891, n=105, últimos 2 años) | |
| HP Omen 16-b1090ng (v6.50.5800) | |
| Lenovo Legion 5 Pro 16 G7 i7 RTX 3070Ti (v6.50.5800) | |
| Medio Intel Core i7-12700H (12863 - 52207, n=64) | |
| MSI Vector GP66 12UGS (v6.50.5800) | |
| Acer Nitro 5 AN515-58-72QR (v6.50.5800) | |
| HP Omen 16-c0077ng (v6.50.5800) | |
| Acer Nitro 5 AN515-58-72QR (v6.50.5800, Leistung) | |
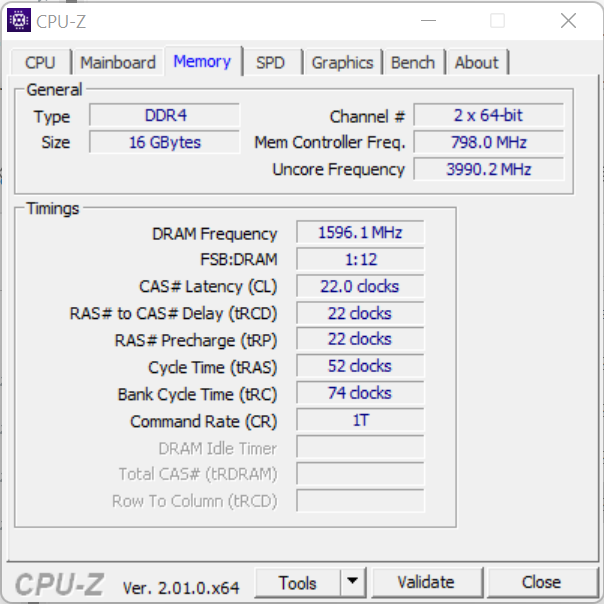
Rendimiento del sistema
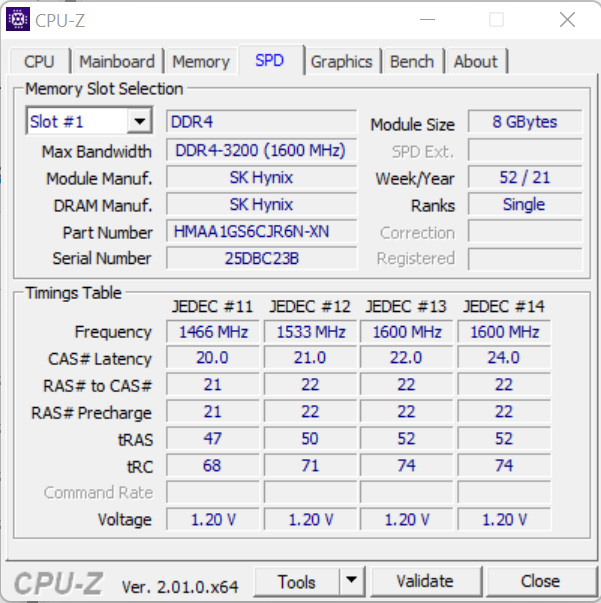
El sistema funciona de forma fluida y sin problemas, y el hardware instalado proporciona una potencia de cálculo más que suficiente para aplicaciones exigentes en cuanto a rendimiento, como juegos, edición de vídeo y procesamiento de imágenes. Las tasas de transferencia de la RAM están en un nivel normal para una memoria DDR4-3200. Los resultados de PCMark también son sólidos.
| PCMark 8 Home Score Accelerated v2 | 5150 puntos | |
| PCMark 8 Creative Score Accelerated v2 | 6975 puntos | |
| PCMark 8 Work Score Accelerated v2 | 6035 puntos | |
| PCMark 10 Score | 6941 puntos | |
ayuda | ||
CrossMark: Overall | Productivity | Creativity | Responsiveness
| PCMark 10 / Score | |
| Media de la clase Gaming (5828 - 12414, n=93, últimos 2 años) | |
| MSI Vector GP66 12UGS | |
| Lenovo Legion 5 Pro 16 G7 i7 RTX 3070Ti | |
| Medio Intel Core i7-12700H, NVIDIA GeForce RTX 3070 Ti Laptop GPU (6941 - 7947, n=11) | |
| HP Omen 16-b1090ng | |
| HP Omen 16-c0077ng | |
| Acer Nitro 5 AN515-58-72QR | |
| PCMark 10 / Essentials | |
| MSI Vector GP66 12UGS | |
| Media de la clase Gaming (8810 - 11935, n=97, últimos 2 años) | |
| Medio Intel Core i7-12700H, NVIDIA GeForce RTX 3070 Ti Laptop GPU (9892 - 10935, n=11) | |
| HP Omen 16-c0077ng | |
| HP Omen 16-b1090ng | |
| Lenovo Legion 5 Pro 16 G7 i7 RTX 3070Ti | |
| Acer Nitro 5 AN515-58-72QR | |
| PCMark 10 / Productivity | |
| Media de la clase Gaming (6845 - 25323, n=95, últimos 2 años) | |
| MSI Vector GP66 12UGS | |
| Lenovo Legion 5 Pro 16 G7 i7 RTX 3070Ti | |
| Medio Intel Core i7-12700H, NVIDIA GeForce RTX 3070 Ti Laptop GPU (9024 - 10638, n=11) | |
| HP Omen 16-b1090ng | |
| HP Omen 16-c0077ng | |
| Acer Nitro 5 AN515-58-72QR | |
| PCMark 10 / Digital Content Creation | |
| Media de la clase Gaming (7602 - 19954, n=95, últimos 2 años) | |
| MSI Vector GP66 12UGS | |
| Lenovo Legion 5 Pro 16 G7 i7 RTX 3070Ti | |
| Medio Intel Core i7-12700H, NVIDIA GeForce RTX 3070 Ti Laptop GPU (10165 - 12546, n=11) | |
| HP Omen 16-b1090ng | |
| HP Omen 16-c0077ng | |
| Acer Nitro 5 AN515-58-72QR | |
| CrossMark / Overall | |
| Media de la clase Gaming (1366 - 2409, n=94, últimos 2 años) | |
| Lenovo Legion 5 Pro 16 G7 i7 RTX 3070Ti | |
| Medio Intel Core i7-12700H, NVIDIA GeForce RTX 3070 Ti Laptop GPU (974 - 2000, n=12) | |
| Acer Nitro 5 AN515-58-72QR | |
| CrossMark / Productivity | |
| Lenovo Legion 5 Pro 16 G7 i7 RTX 3070Ti | |
| Media de la clase Gaming (1386 - 2254, n=94, últimos 2 años) | |
| Medio Intel Core i7-12700H, NVIDIA GeForce RTX 3070 Ti Laptop GPU (907 - 1962, n=12) | |
| Acer Nitro 5 AN515-58-72QR | |
| CrossMark / Creativity | |
| Media de la clase Gaming (1343 - 2786, n=94, últimos 2 años) | |
| Lenovo Legion 5 Pro 16 G7 i7 RTX 3070Ti | |
| Medio Intel Core i7-12700H, NVIDIA GeForce RTX 3070 Ti Laptop GPU (1027 - 2057, n=12) | |
| Acer Nitro 5 AN515-58-72QR | |
| CrossMark / Responsiveness | |
| Lenovo Legion 5 Pro 16 G7 i7 RTX 3070Ti | |
| Medio Intel Core i7-12700H, NVIDIA GeForce RTX 3070 Ti Laptop GPU (1029 - 2142, n=12) | |
| Media de la clase Gaming (1226 - 2334, n=94, últimos 2 años) | |
| Acer Nitro 5 AN515-58-72QR | |
| AIDA64 / Memory Copy | |
| Media de la clase Gaming (21750 - 129946, n=105, últimos 2 años) | |
| HP Omen 16-b1090ng | |
| Medio Intel Core i7-12700H (25615 - 80511, n=64) | |
| Lenovo Legion 5 Pro 16 G7 i7 RTX 3070Ti | |
| MSI Vector GP66 12UGS | |
| Acer Nitro 5 AN515-58-72QR | |
| HP Omen 16-c0077ng | |
| AIDA64 / Memory Read | |
| Media de la clase Gaming (22956 - 118858, n=105, últimos 2 años) | |
| HP Omen 16-b1090ng | |
| Lenovo Legion 5 Pro 16 G7 i7 RTX 3070Ti | |
| Medio Intel Core i7-12700H (25586 - 79442, n=64) | |
| MSI Vector GP66 12UGS | |
| HP Omen 16-c0077ng | |
| Acer Nitro 5 AN515-58-72QR | |
| AIDA64 / Memory Write | |
| Media de la clase Gaming (22297 - 135096, n=105, últimos 2 años) | |
| HP Omen 16-b1090ng | |
| Lenovo Legion 5 Pro 16 G7 i7 RTX 3070Ti | |
| Medio Intel Core i7-12700H (23679 - 88660, n=64) | |
| MSI Vector GP66 12UGS | |
| Acer Nitro 5 AN515-58-72QR | |
| HP Omen 16-c0077ng | |
| AIDA64 / Memory Latency | |
| Media de la clase Gaming (75.3 - 259, n=105, últimos 2 años) | |
| Lenovo Legion 5 Pro 16 G7 i7 RTX 3070Ti | |
| MSI Vector GP66 12UGS | |
| HP Omen 16-b1090ng | |
| HP Omen 16-c0077ng | |
| Medio Intel Core i7-12700H (76.2 - 133.9, n=62) | |
| Acer Nitro 5 AN515-58-72QR | |
| Acer Nitro 5 AN515-58-72QR | |
* ... más pequeño es mejor
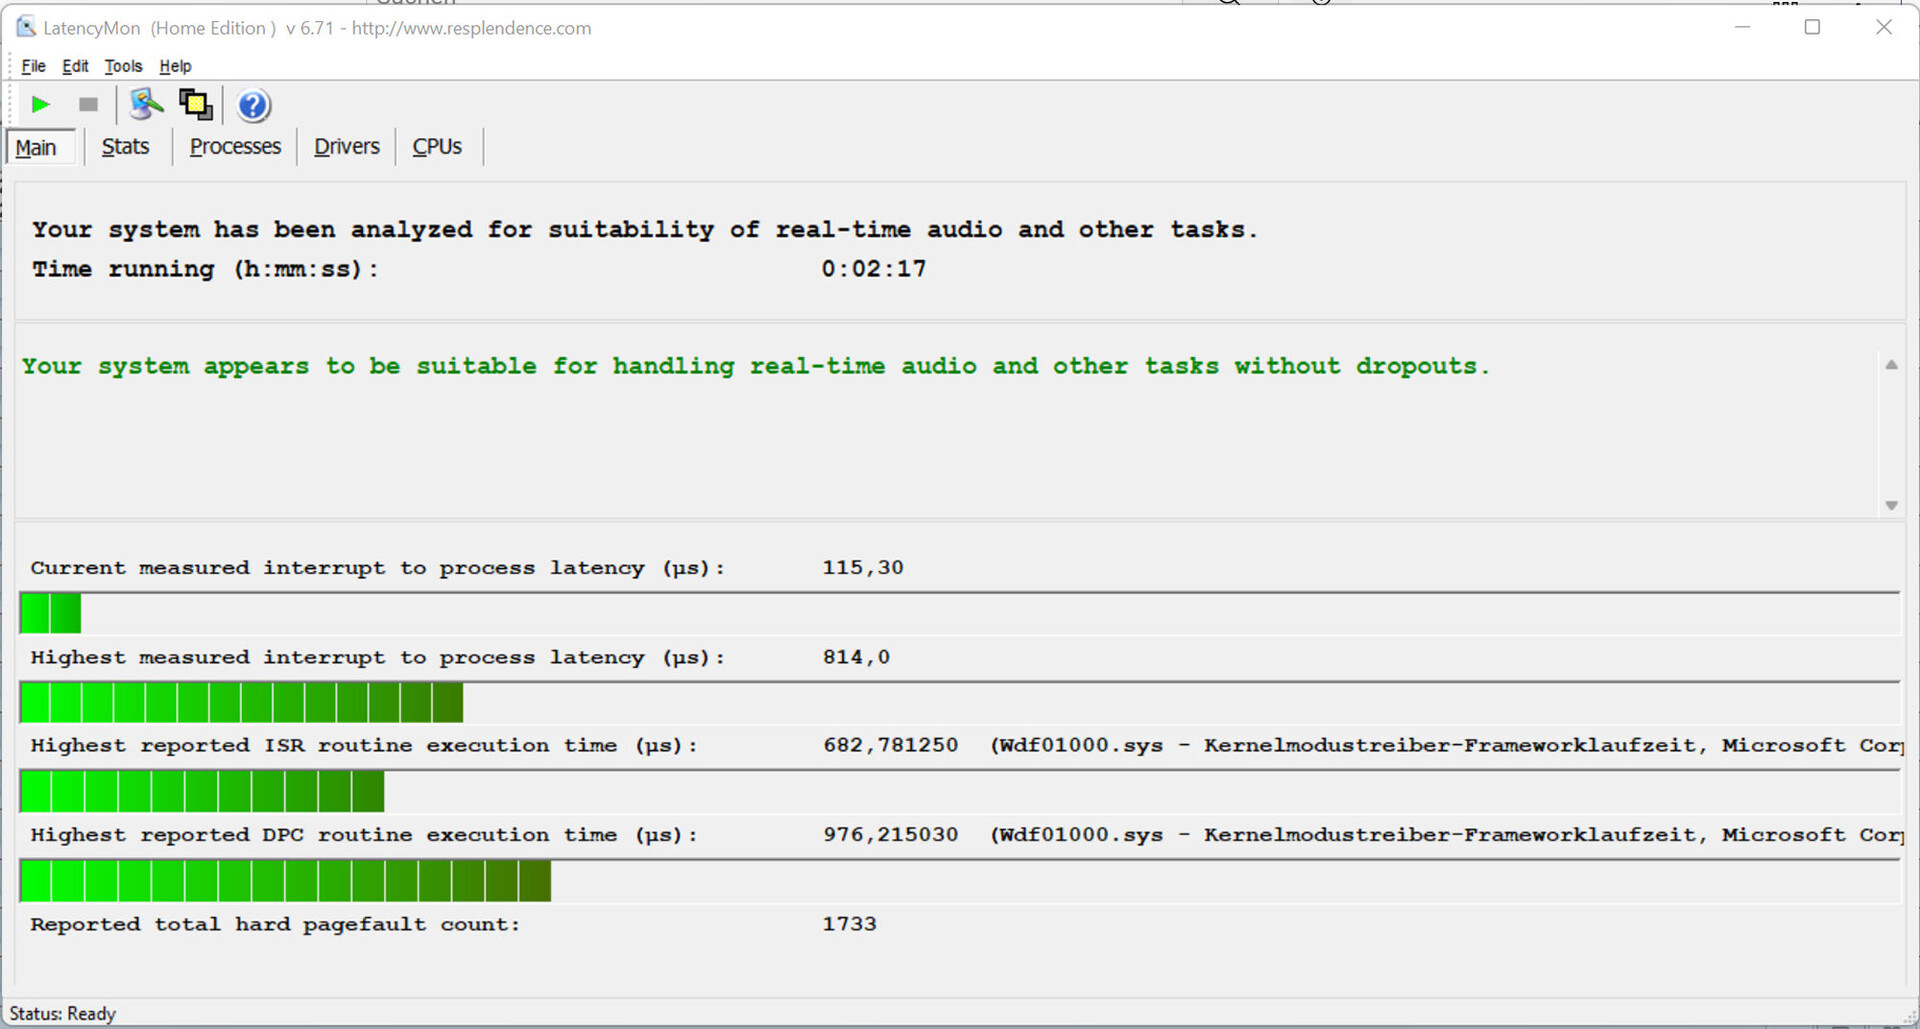
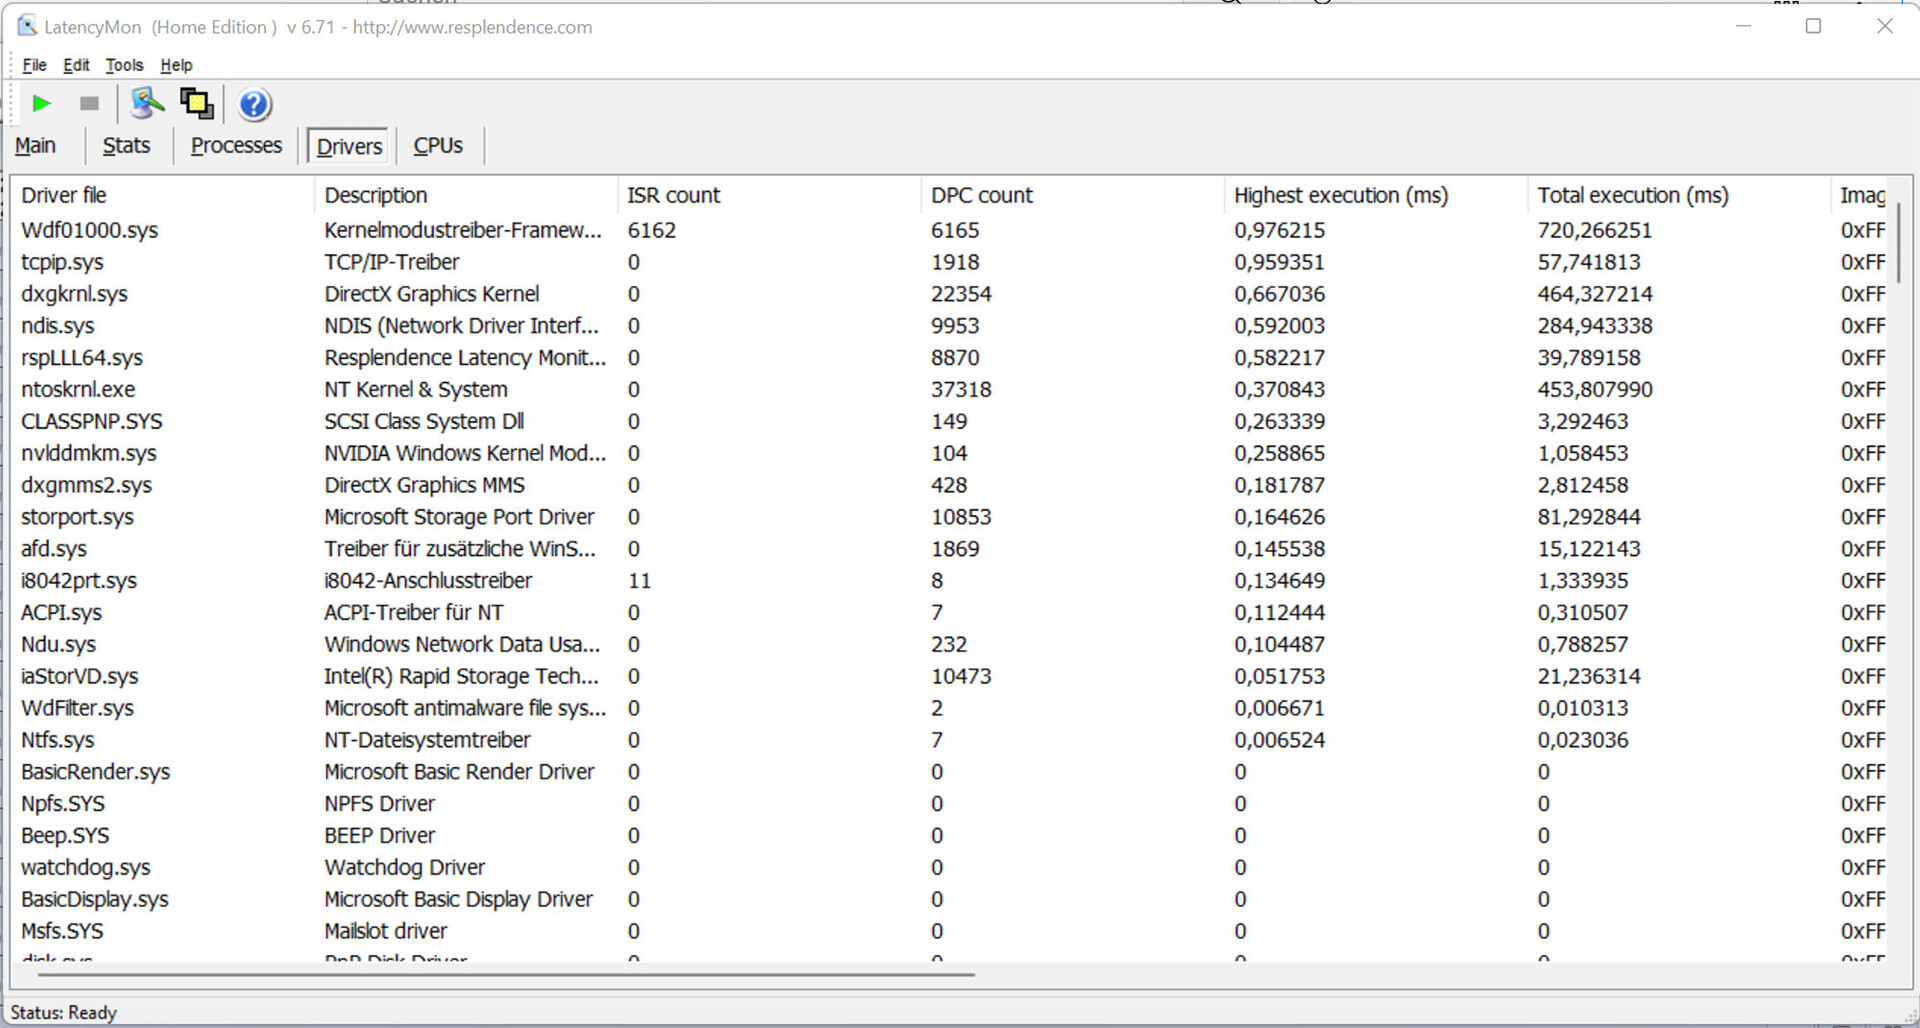
Latencias del CPD
La prueba de monitorización de latencia estandarizada (navegación por Internet, reproducción de vídeo 4k, Prime95 de alta carga) no reveló ninguna anomalía en las latencias del CPD. El sistema parece adecuado para la edición de vídeo y audio en tiempo real. Las futuras actualizaciones de software pueden suponer mejoras o incluso un deterioro
| DPC Latencies / LatencyMon - interrupt to process latency (max), Web, Youtube, Prime95 | |
| MSI Vector GP66 12UGS | |
| HP Omen 16-c0077ng | |
| Acer Nitro 5 AN515-58-72QR | |
| Lenovo Legion 5 Pro 16 G7 i7 RTX 3070Ti | |
| HP Omen 16-b1090ng | |
* ... más pequeño es mejor
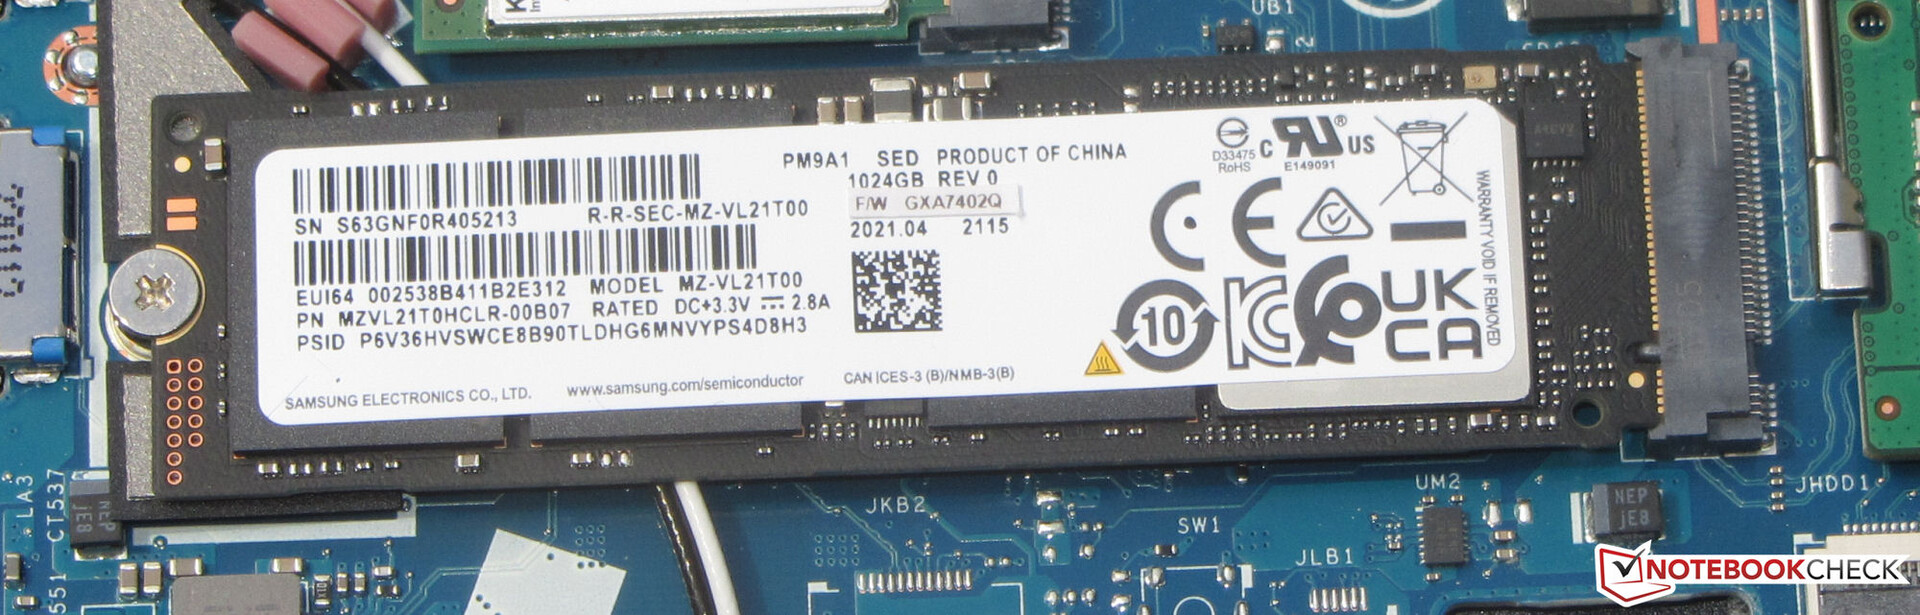
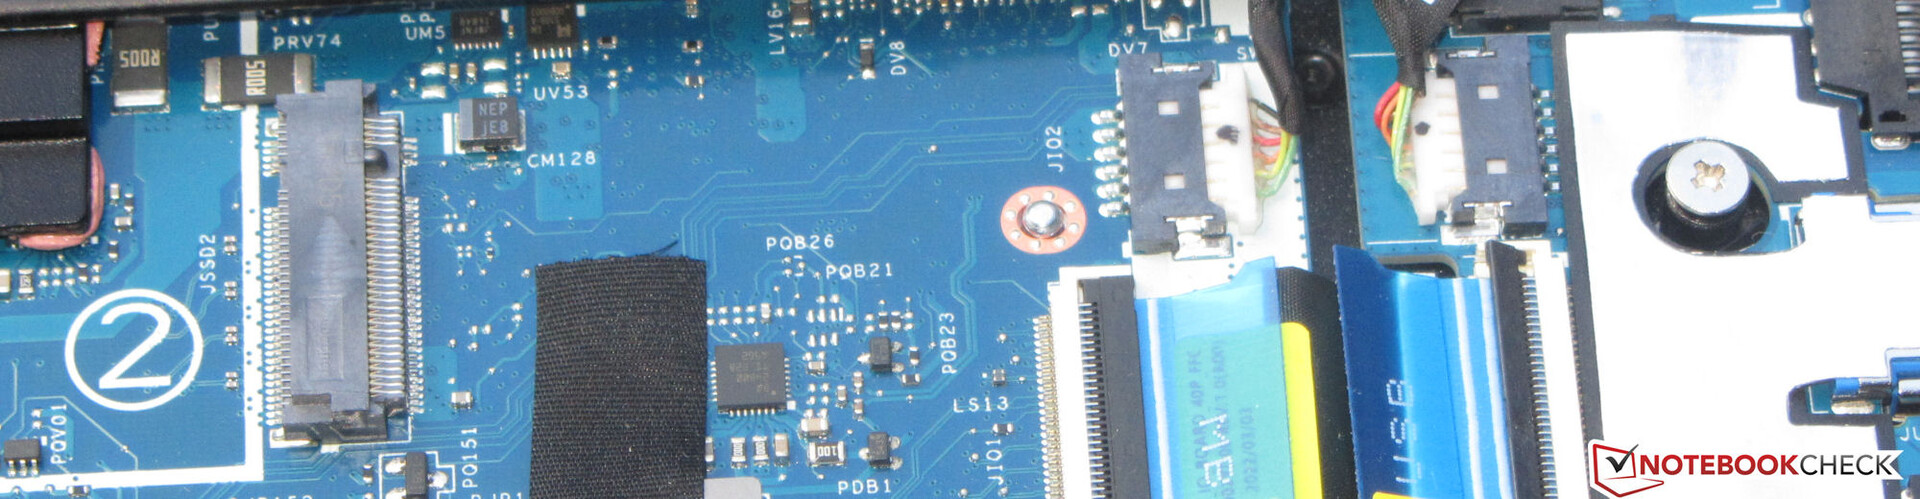
Dispositivos de almacenamiento
Acer equipa el AN515 con un SSD de 1TB (PCIe 4, M.2-2280) de Samsung, que ofrece muy buenas tasas de transferencia. El portátil también ofrece espacio para un segundo SSD PCIe 4, así como para un medio de almacenamiento de 2,5 pulgadas (la ranura SATA y los tornillos están en la caja, mientras que el marco de montaje ya está dentro del portátil).

* ... más pequeño es mejor
Sustained Read Performance: DiskSpd Read Loop, Queue Depth 8
Tarjeta gráfica
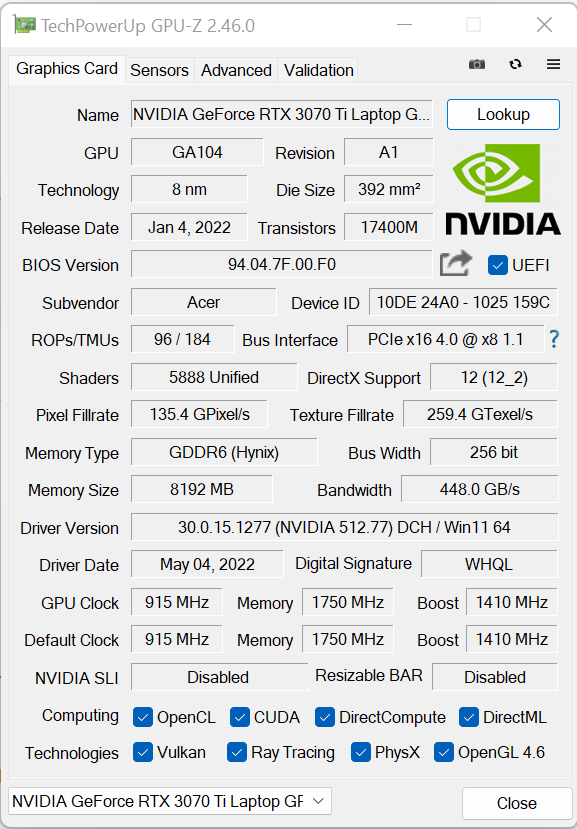
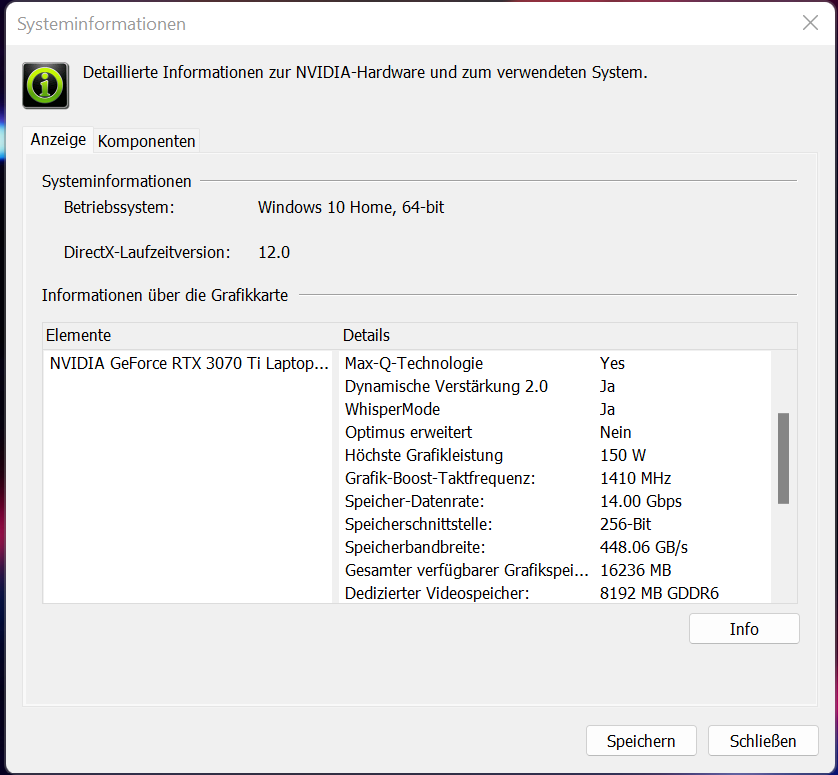
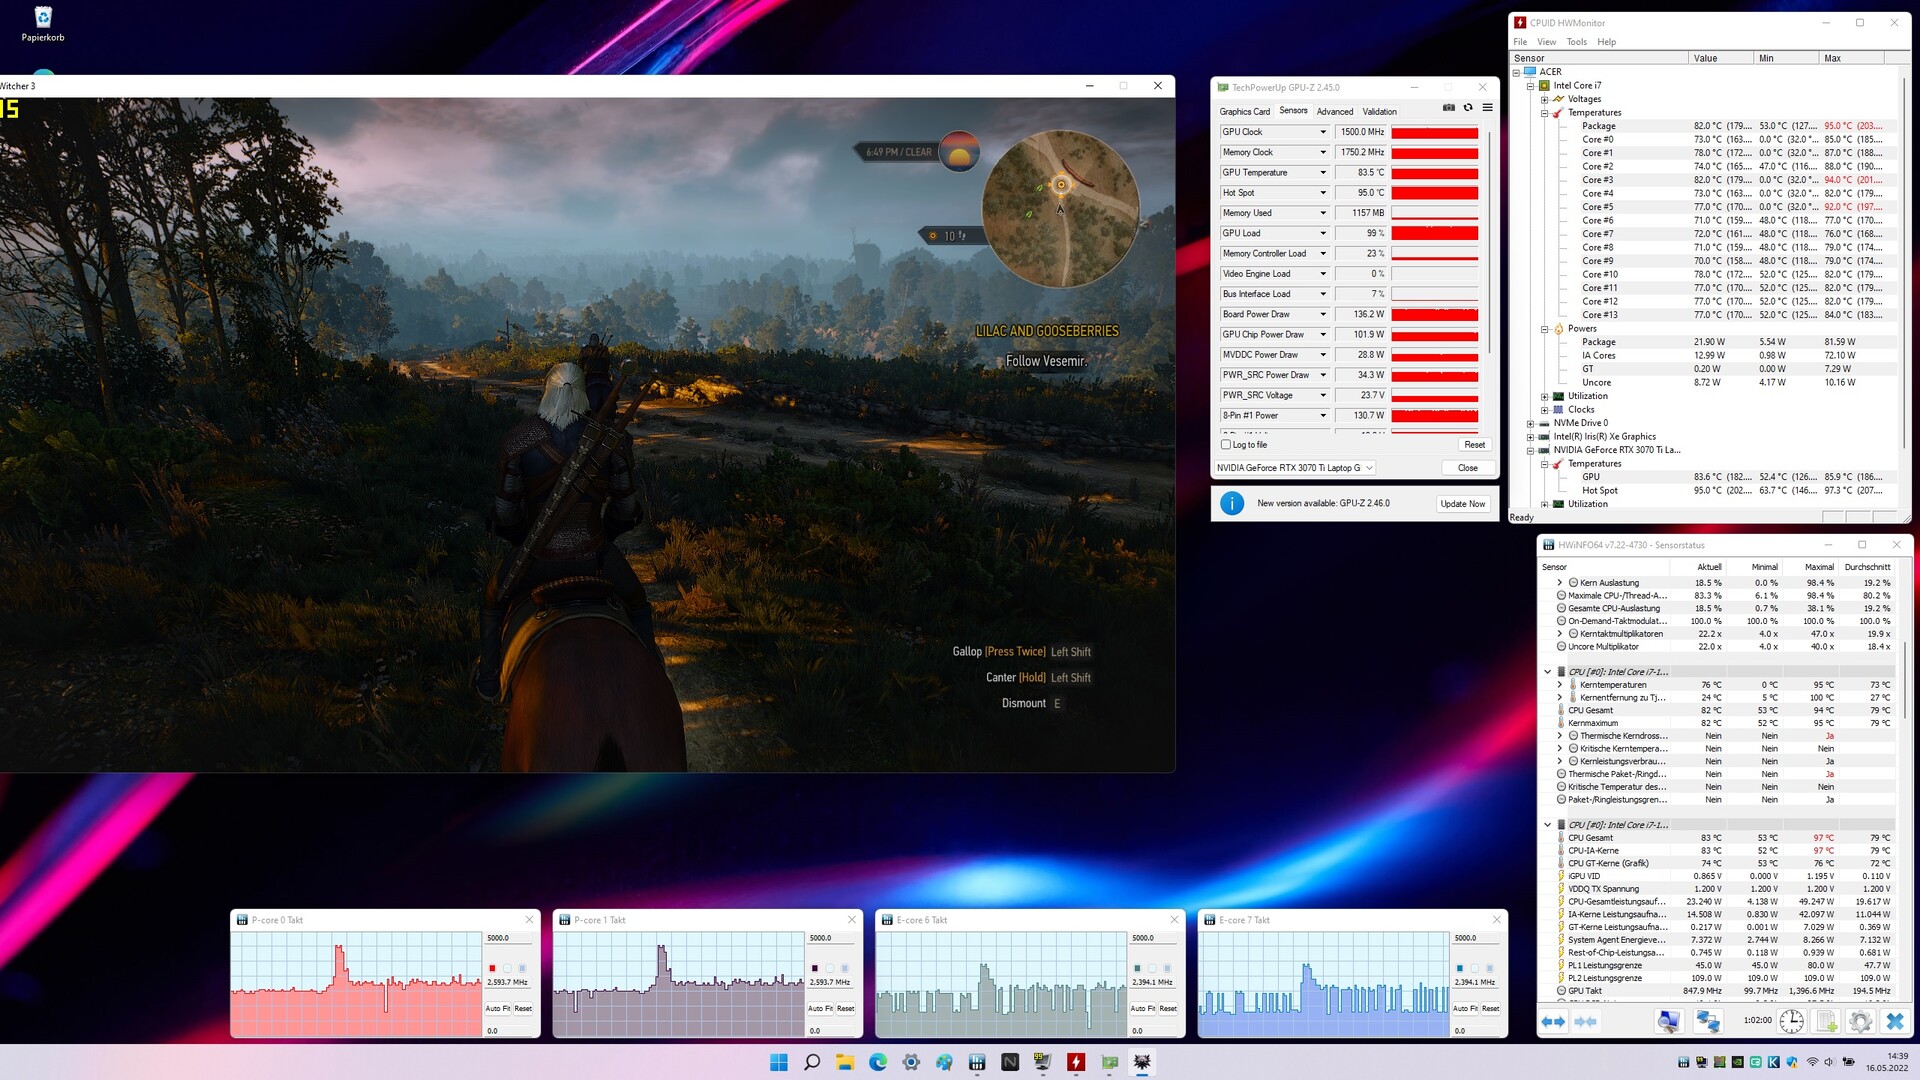
El rendimiento real de una GPU RTX-3000 depende de algunos factores: La refrigeración, la configuración de la memoria y el TGP máximo que elija el fabricante del portátil dentro de los límites establecidos por Nvidia. Acer da como instalada laGeForce RTX 3070 Ti instalada en el portátil un TGP máximo de 150 vatios (125 vatios + 25 vatios de Dynamic Boost). La GPU dispone de una rápida memoria gráfica GDDR6 (8.192 MB).
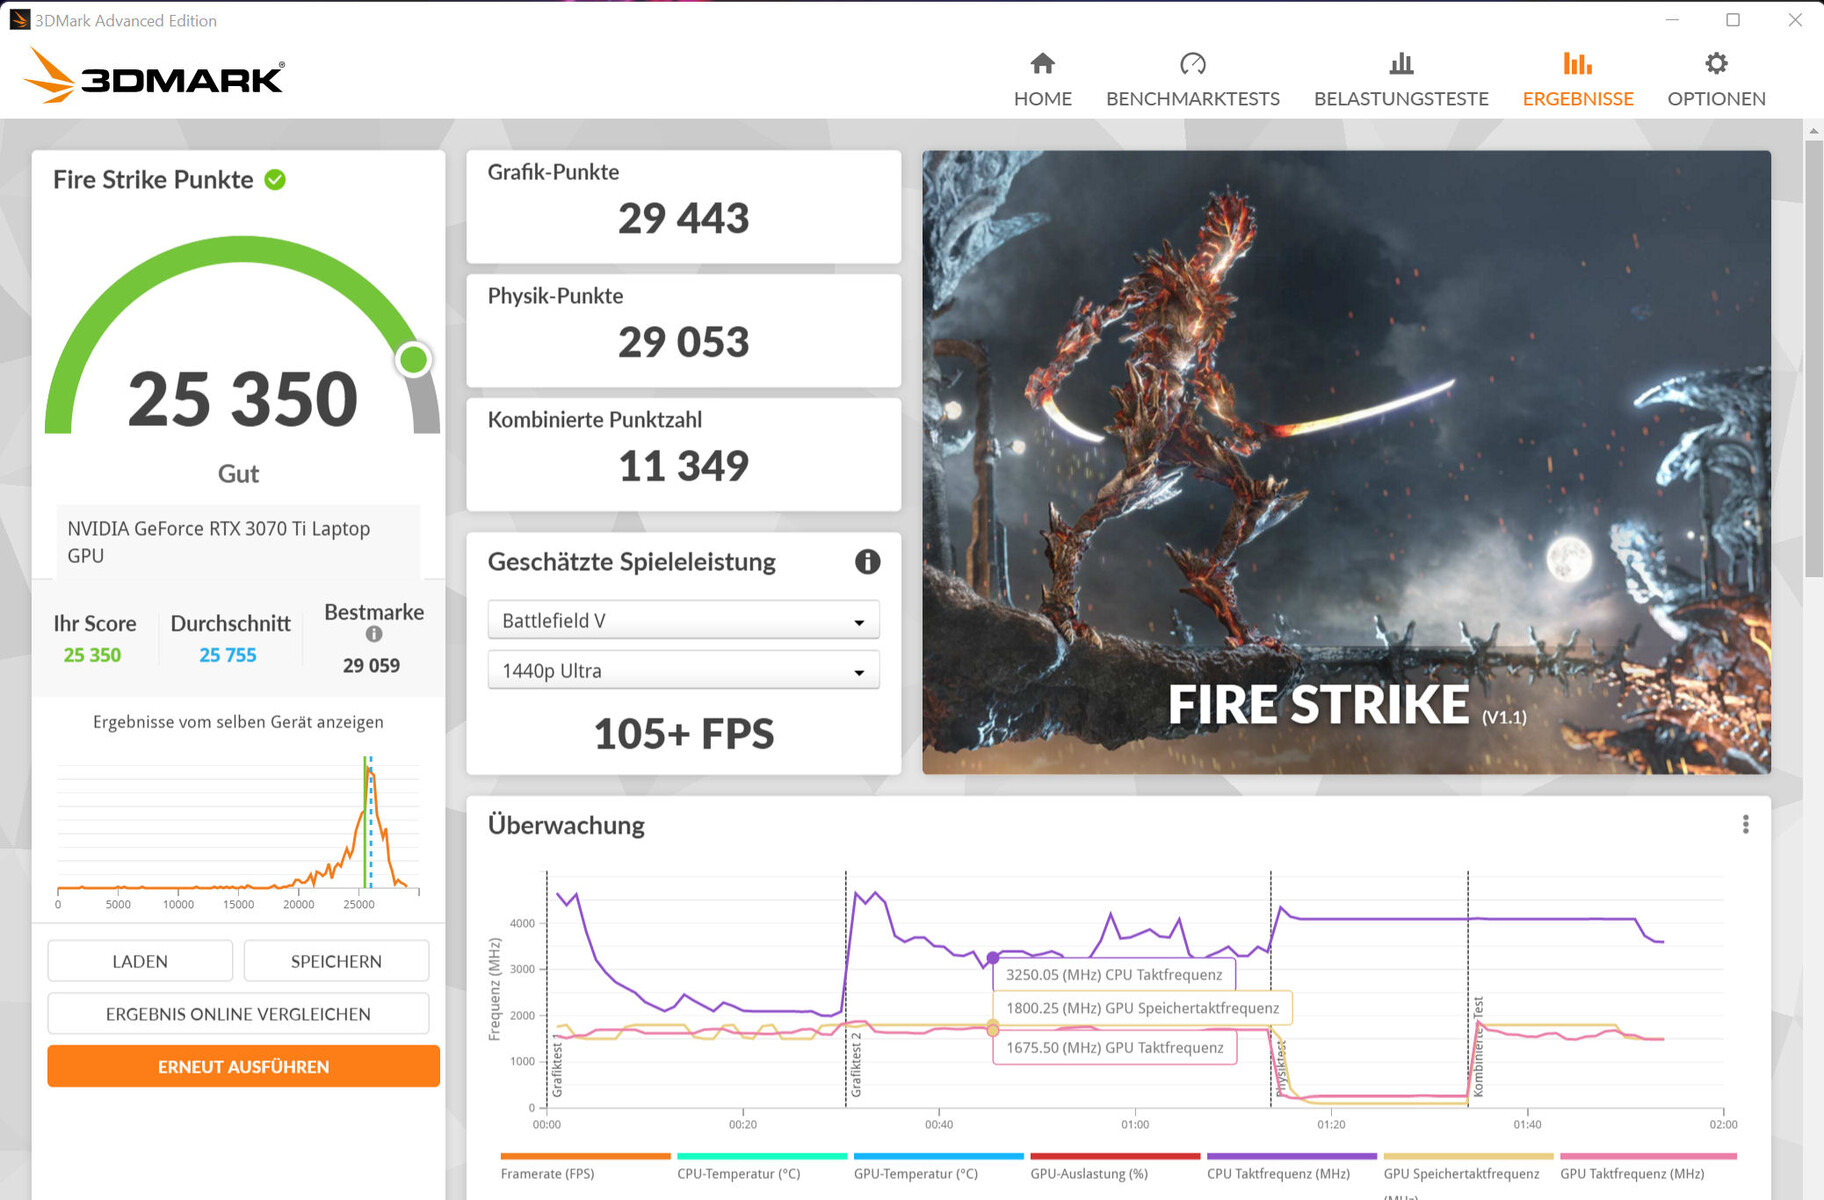
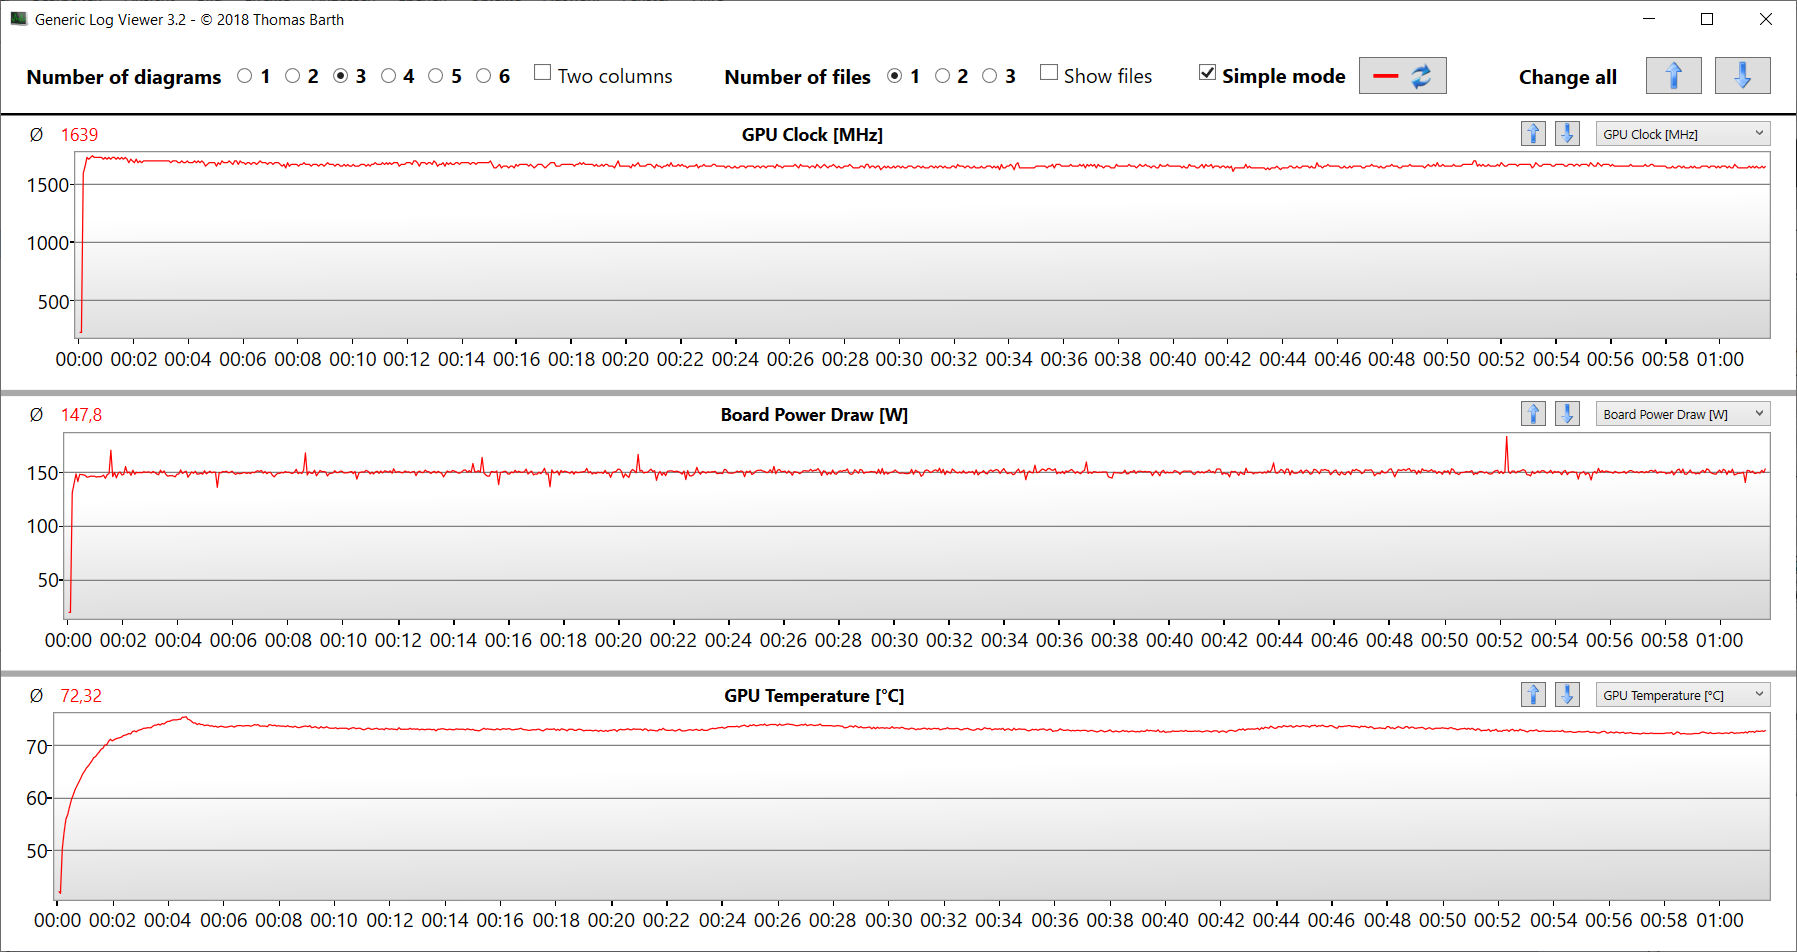
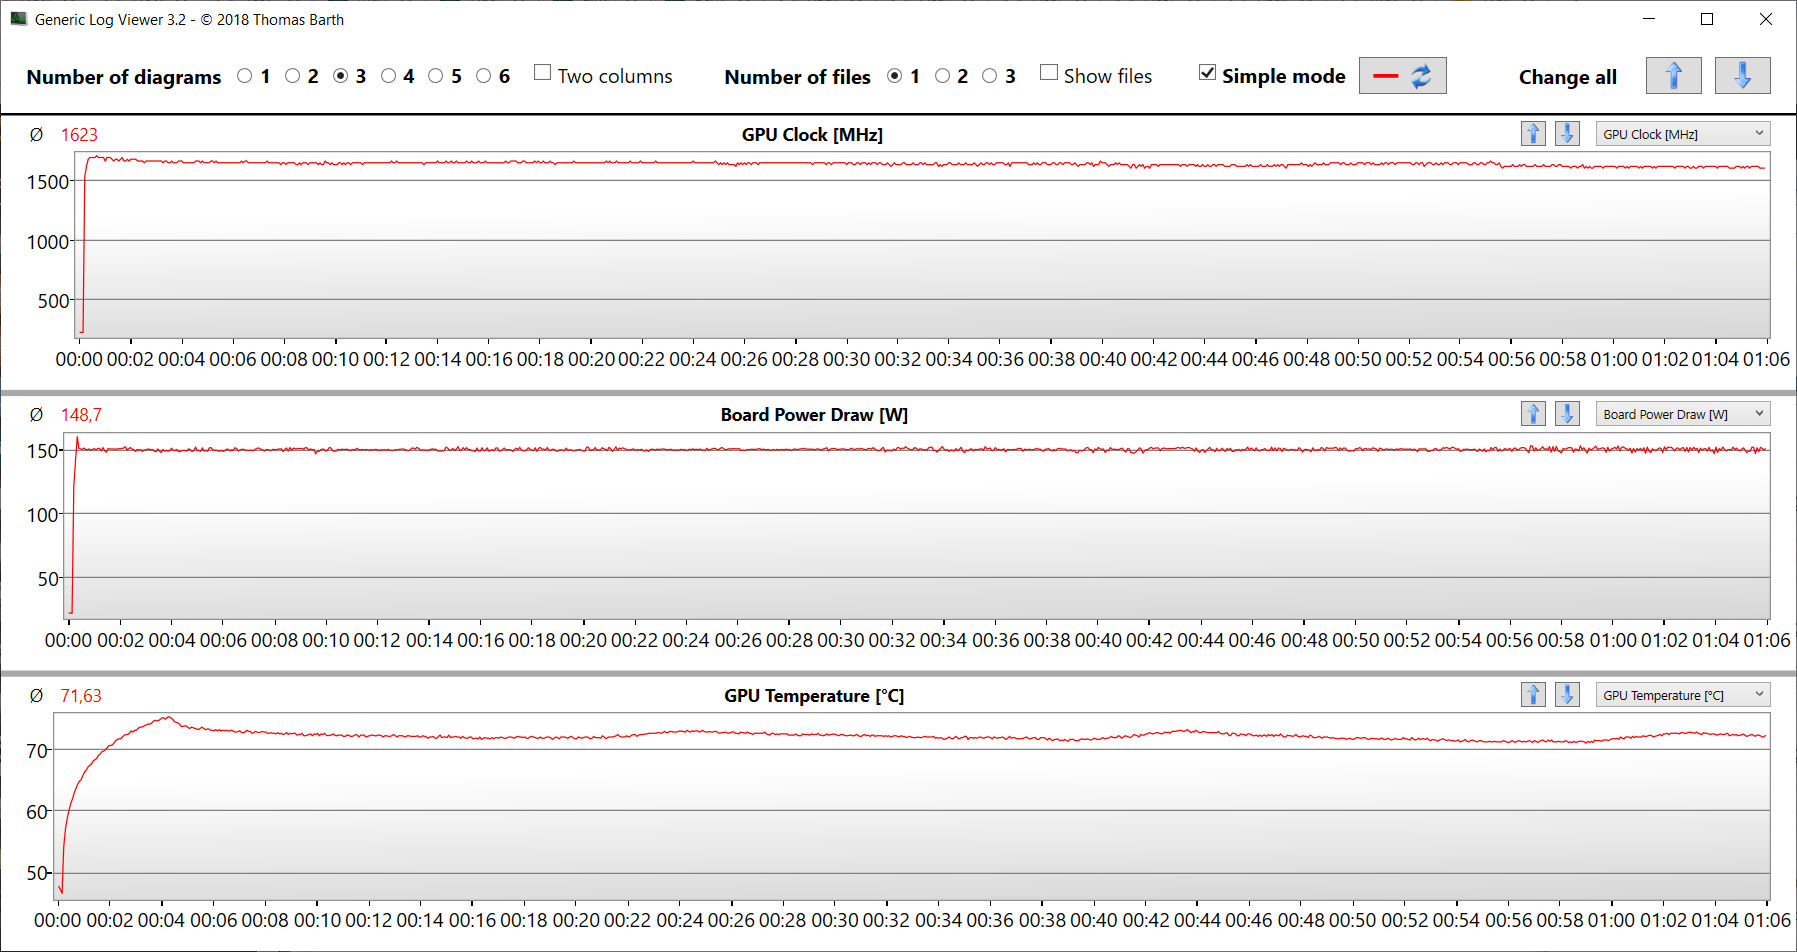
Los resultados del benchmark están, dependiendo del perfil seleccionado, por encima o por debajo de la media de la RTX 3070 Ti determinada previamente. Dynamic Boost no se utiliza del todo con el perfil "Estándar", mientras que el perfil "Rendimiento" hace un uso más intensivo de Dynamic Boost, como muestra la Witcher 3 prueba.
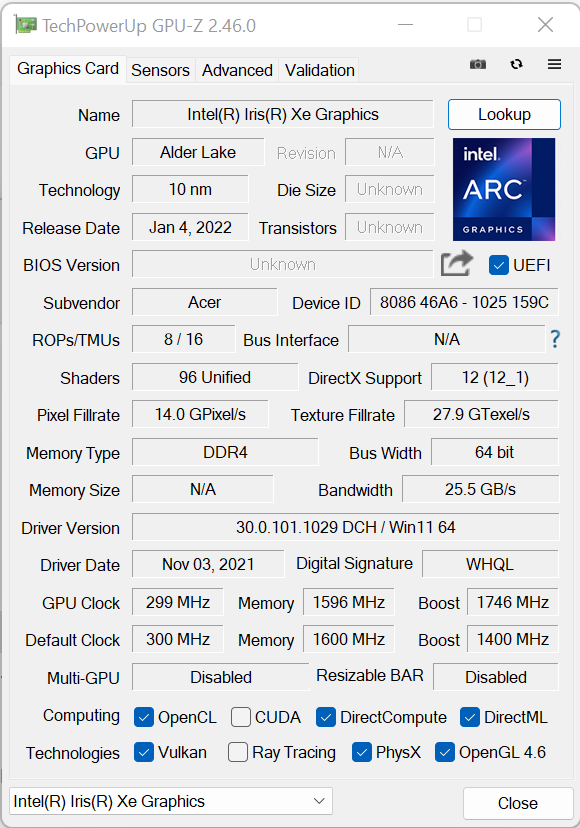
Pero aún hay margen de mejora: El portátil ofrece la opción de salida de imagen directa a través de la GPU GeForce. Para activar esto, la iGPU tiene que ser desactivada - directamente en la BIOS o a través del software NitroSense. En combinación con el perfil "Rendimiento", el rendimiento gráfico aumenta notablemente.
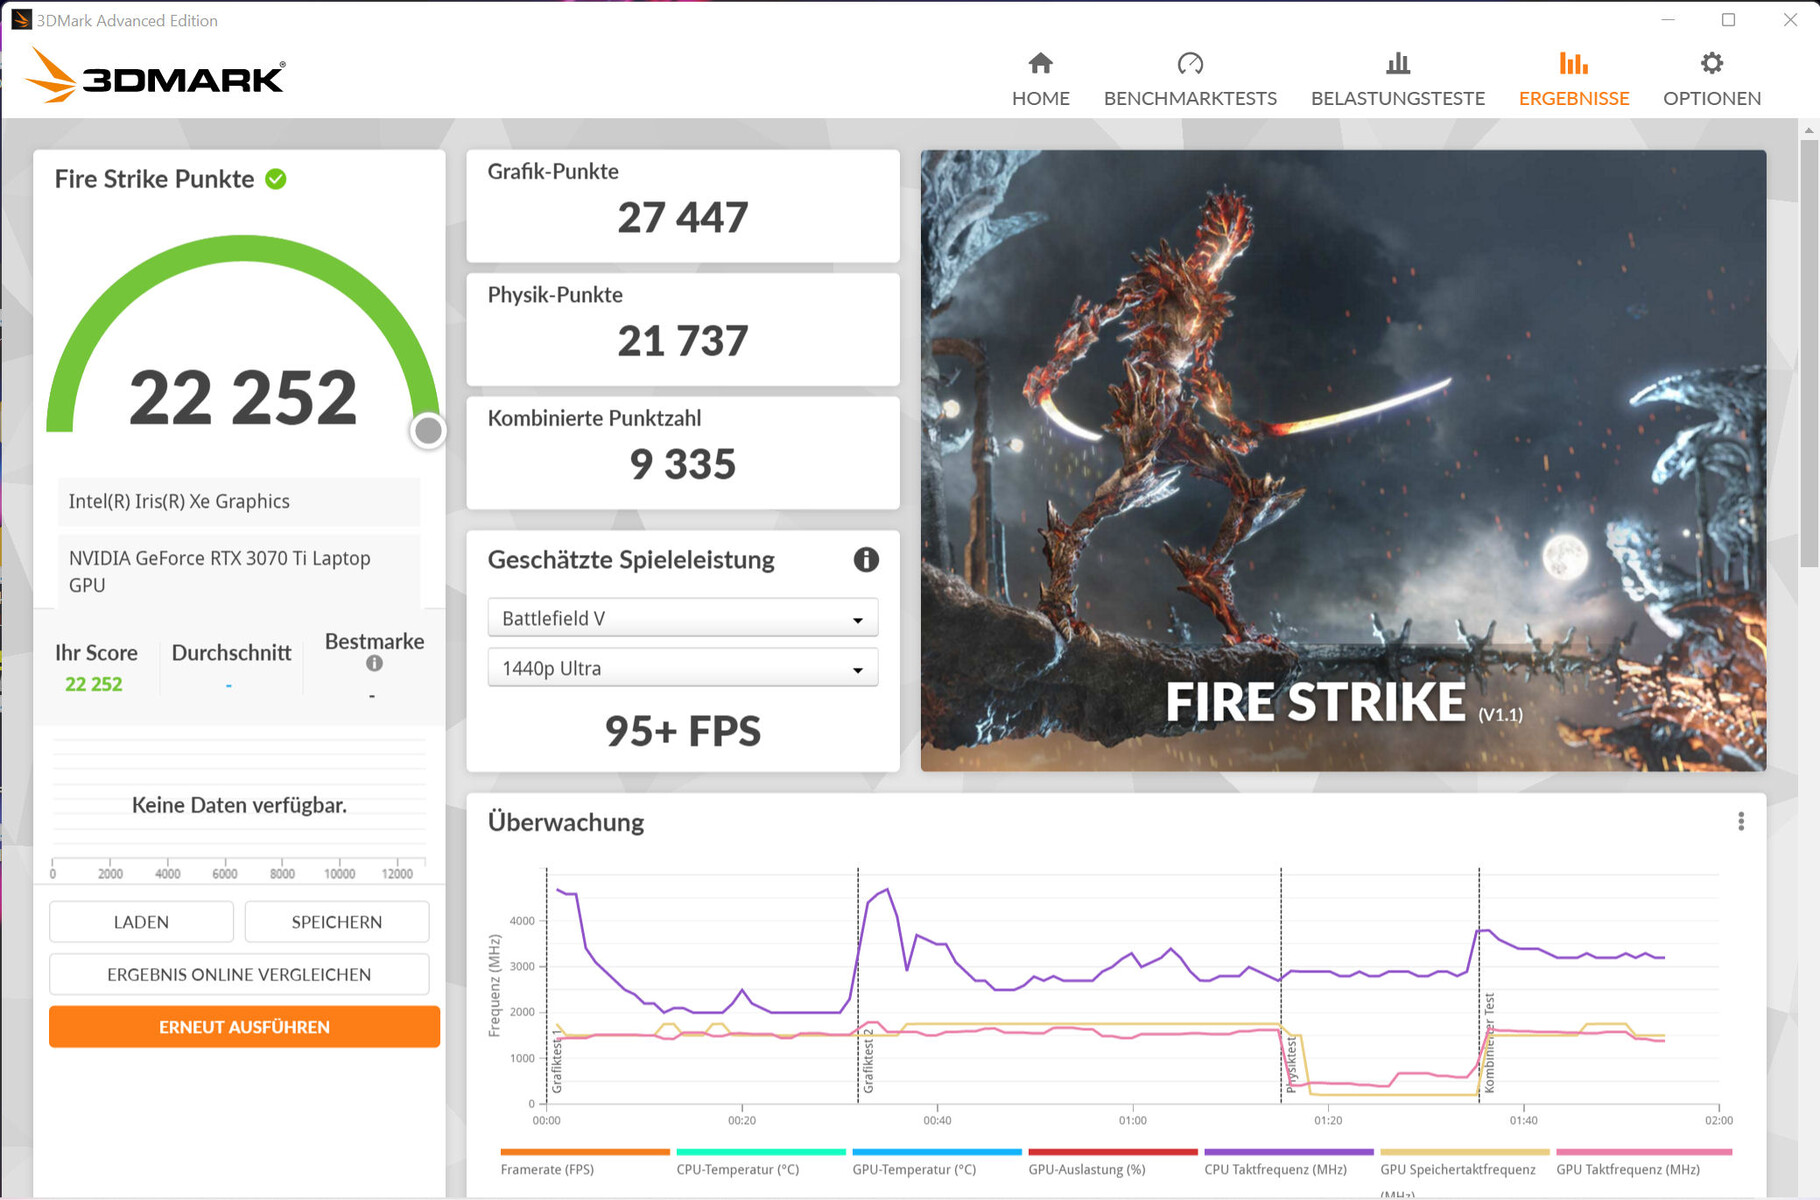


| 3DMark 11 Performance | 27608 puntos | |
| 3DMark Cloud Gate Standard Score | 42815 puntos | |
| 3DMark Fire Strike Score | 22252 puntos | |
| 3DMark Time Spy Score | 10066 puntos | |
ayuda | ||
| 3DMark Performance rating - Percent | |
| Media de la clase Gaming | |
| MSI Vector GP66 12UGS | |
| Acer Nitro 5 AN515-58-72QR | |
| Lenovo Legion 5 Pro 16 G7 i7 RTX 3070Ti -1! | |
| Acer Nitro 5 AN515-58-72QR | |
| Medio NVIDIA GeForce RTX 3070 Ti Laptop GPU | |
| Acer Nitro 5 AN515-58-72QR | |
| HP Omen 16-b1090ng | |
| Acer Nitro 5 AN515-58-72QR | |
| HP Omen 16-c0077ng -1! | |
| 3DMark 11 - 1280x720 Performance GPU | |
| Media de la clase Gaming (21841 - 80022, n=104, últimos 2 años) | |
| MSI Vector GP66 12UGS | |
| Acer Nitro 5 AN515-58-72QR (Leistung) | |
| Acer Nitro 5 AN515-58-72QR (dGPU, Leistung) | |
| Acer Nitro 5 AN515-58-72QR | |
| Medio NVIDIA GeForce RTX 3070 Ti Laptop GPU (13799 - 42569, n=36) | |
| HP Omen 16-b1090ng | |
| Acer Nitro 5 AN515-58-72QR (Leise) | |
| HP Omen 16-c0077ng | |
Rendimiento de los juegos
Todos los juegos actuales se ejecutan con mucha fluidez en resolución QHD con ajustes de altos a máximos. La tasa de imágenes está por debajo de la media de la RTX 3070 Ti en modo estándar. La salida de imagen directa a través de la GPU GeForce en combinación con el perfil "Rendimiento" aumenta la tasa de frames significativamente en algunos casos.
| The Witcher 3 - 1920x1080 Ultra Graphics & Postprocessing (HBAO+) | |
| Media de la clase Gaming (104.7 - 240, n=7, últimos 2 años) | |
| MSI Vector GP66 12UGS | |
| Acer Nitro 5 AN515-58-72QR (Leistung) | |
| Acer Nitro 5 AN515-58-72QR (dGPU, Leistung) | |
| Lenovo Legion 5 Pro 16 G7 i7 RTX 3070Ti | |
| Medio NVIDIA GeForce RTX 3070 Ti Laptop GPU (76.8 - 124.1, n=39) | |
| Acer Nitro 5 AN515-58-72QR | |
| HP Omen 16-b1090ng | |
| Acer Nitro 5 AN515-58-72QR (Leise) | |
| HP Omen 16-c0077ng | |
| Dota 2 Reborn - 1920x1080 ultra (3/3) best looking | |
| MSI Vector GP66 12UGS | |
| Media de la clase Gaming (84.8 - 248, n=107, últimos 2 años) | |
| HP Omen 16-b1090ng | |
| Lenovo Legion 5 Pro 16 G7 i7 RTX 3070Ti | |
| Acer Nitro 5 AN515-58-72QR (dGPU, Leistung) | |
| Medio NVIDIA GeForce RTX 3070 Ti Laptop GPU (68.7 - 160.5, n=38) | |
| Acer Nitro 5 AN515-58-72QR | |
| Acer Nitro 5 AN515-58-72QR (Leise) | |
| Acer Nitro 5 AN515-58-72QR (Leistung) | |
| HP Omen 16-c0077ng | |
| X-Plane 11.11 - 1920x1080 high (fps_test=3) | |
| HP Omen 16-b1090ng | |
| MSI Vector GP66 12UGS | |
| Acer Nitro 5 AN515-58-72QR (dGPU, Leistung) | |
| Lenovo Legion 5 Pro 16 G7 i7 RTX 3070Ti | |
| Media de la clase Gaming (55.5 - 143.5, n=109, últimos 2 años) | |
| Medio NVIDIA GeForce RTX 3070 Ti Laptop GPU (51.6 - 116.9, n=37) | |
| Acer Nitro 5 AN515-58-72QR | |
| Acer Nitro 5 AN515-58-72QR (Leistung) | |
| Acer Nitro 5 AN515-58-72QR (Leise) | |
| HP Omen 16-c0077ng | |
| Final Fantasy XV Benchmark | |
| 1920x1080 High Quality | |
| Media de la clase Gaming (41 - 215, n=95, últimos 2 años) | |
| MSI Vector GP66 12UGS (1.3) | |
| Lenovo Legion 5 Pro 16 G7 i7 RTX 3070Ti (1.3) | |
| Acer Nitro 5 AN515-58-72QR (1.3, dGPU, Leistung) | |
| HP Omen 16-b1090ng | |
| Medio NVIDIA GeForce RTX 3070 Ti Laptop GPU (49.5 - 122.4, n=35) | |
| Acer Nitro 5 AN515-58-72QR (1.3, Leistung) | |
| Acer Nitro 5 AN515-58-72QR (1.3) | |
| HP Omen 16-c0077ng (1.3) | |
| Acer Nitro 5 AN515-58-72QR (1.3, Leise) | |
| 2560x1440 High Quality | |
| Media de la clase Gaming (32.5 - 184.3, n=87, últimos 2 años) | |
| Lenovo Legion 5 Pro 16 G7 i7 RTX 3070Ti (1.3) | |
| Acer Nitro 5 AN515-58-72QR (1.3, dGPU, Leistung) | |
| Medio NVIDIA GeForce RTX 3070 Ti Laptop GPU (57.9 - 93, n=24) | |
| Acer Nitro 5 AN515-58-72QR (1.3, Leistung) | |
| Acer Nitro 5 AN515-58-72QR (1.3) | |
| Acer Nitro 5 AN515-58-72QR (1.3, Leise) | |
| HP Omen 16-c0077ng (1.3) | |
| GTA V | |
| 2560x1440 Highest AA:4xMSAA + FX AF:16x | |
| Media de la clase Gaming (36.9 - 183.9, n=72, últimos 2 años) | |
| Lenovo Legion 5 Pro 16 G7 i7 RTX 3070Ti | |
| Acer Nitro 5 AN515-58-72QR (dGPU, Leistung) | |
| Medio NVIDIA GeForce RTX 3070 Ti Laptop GPU (72.7 - 108.7, n=22) | |
| Acer Nitro 5 AN515-58-72QR (Leistung) | |
| Acer Nitro 5 AN515-58-72QR | |
| Acer Nitro 5 AN515-58-72QR (Leise) | |
| HP Omen 16-c0077ng | |
| 1920x1080 Highest AA:4xMSAA + FX AF:16x | |
| Media de la clase Gaming (48.3 - 186.9, n=94, últimos 2 años) | |
| MSI Vector GP66 12UGS | |
| Lenovo Legion 5 Pro 16 G7 i7 RTX 3070Ti | |
| Acer Nitro 5 AN515-58-72QR (dGPU, Leistung) | |
| HP Omen 16-b1090ng | |
| Medio NVIDIA GeForce RTX 3070 Ti Laptop GPU (44 - 123.9, n=36) | |
| Acer Nitro 5 AN515-58-72QR | |
| Acer Nitro 5 AN515-58-72QR (Leise) | |
| HP Omen 16-c0077ng | |
| Strange Brigade | |
| 2560x1440 ultra AA:ultra AF:16 | |
| Media de la clase Gaming (52.8 - 354, n=76, últimos 2 años) | |
| Acer Nitro 5 AN515-58-72QR (1.47.22.14 D3D12, dGPU, Leistung) | |
| Lenovo Legion 5 Pro 16 G7 i7 RTX 3070Ti | |
| Acer Nitro 5 AN515-58-72QR (1.47.22.14 D3D12, Leistung) | |
| Medio NVIDIA GeForce RTX 3070 Ti Laptop GPU (110.7 - 160.5, n=21) | |
| Acer Nitro 5 AN515-58-72QR (1.47.22.14 D3D12) | |
| Acer Nitro 5 AN515-58-72QR (1.47.22.14 D3D12, Leise) | |
| HP Omen 16-c0077ng | |
| 1920x1080 ultra AA:ultra AF:16 | |
| Media de la clase Gaming (76.3 - 458, n=87, últimos 2 años) | |
| MSI Vector GP66 12UGS (1.47.22.14 D3D12) | |
| Acer Nitro 5 AN515-58-72QR (1.47.22.14 D3D12, dGPU, Leistung) | |
| Lenovo Legion 5 Pro 16 G7 i7 RTX 3070Ti | |
| Acer Nitro 5 AN515-58-72QR (1.47.22.14 D3D12, Leistung) | |
| Medio NVIDIA GeForce RTX 3070 Ti Laptop GPU (109 - 221, n=37) | |
| Acer Nitro 5 AN515-58-72QR (1.47.22.14 D3D12) | |
| HP Omen 16-c0077ng | |
| Acer Nitro 5 AN515-58-72QR (1.47.22.14 D3D12, Leise) | |
| HP Omen 16-b1090ng (1.47.22.14 D3D12) | |
| F1 2021 | |
| 2560x1440 Ultra High Preset + Raytracing AA:T AF:16x | |
| Lenovo Legion 5 Pro 16 G7 i7 RTX 3070Ti (852849) | |
| Acer Nitro 5 AN515-58-72QR (874931, dGPU, Leistung) | |
| Acer Nitro 5 AN515-58-72QR (874931, Leistung) | |
| Medio NVIDIA GeForce RTX 3070 Ti Laptop GPU (47.5 - 99.2, n=11) | |
| Acer Nitro 5 AN515-58-72QR (874931) | |
| Acer Nitro 5 AN515-58-72QR (874931, Leise) | |
| 1920x1080 Ultra High Preset + Raytracing AA:T AF:16x | |
| Lenovo Legion 5 Pro 16 G7 i7 RTX 3070Ti (852849) | |
| Acer Nitro 5 AN515-58-72QR (874931, dGPU, Leistung) | |
| Acer Nitro 5 AN515-58-72QR (874931, Leistung) | |
| Medio NVIDIA GeForce RTX 3070 Ti Laptop GPU (67.3 - 134.2, n=13) | |
| Acer Nitro 5 AN515-58-72QR (874931) | |
| Acer Nitro 5 AN515-58-72QR (874931, Leise) | |
| Far Cry 5 | |
| 2560x1440 Ultra Preset AA:T | |
| Media de la clase Gaming (93 - 149, n=5, últimos 2 años) | |
| Lenovo Legion 5 Pro 16 G7 i7 RTX 3070Ti | |
| Medio NVIDIA GeForce RTX 3070 Ti Laptop GPU (77 - 111, n=15) | |
| Acer Nitro 5 AN515-58-72QR (dGPU, Leistung) | |
| HP Omen 16-c0077ng | |
| Acer Nitro 5 AN515-58-72QR | |
| 1920x1080 Ultra Preset AA:T | |
| MSI Vector GP66 12UGS | |
| Lenovo Legion 5 Pro 16 G7 i7 RTX 3070Ti | |
| Medio NVIDIA GeForce RTX 3070 Ti Laptop GPU (91 - 138, n=25) | |
| Media de la clase Gaming (70 - 151, n=6, últimos 2 años) | |
| Acer Nitro 5 AN515-58-72QR (dGPU, Leistung) | |
| HP Omen 16-c0077ng | |
| Acer Nitro 5 AN515-58-72QR | |
Para determinar si las frecuencias de cuadro se mantienen en gran medida constantes durante periodos de tiempo más largos, ejecutamos el juego The Witcher 3 durante unos 60 minutos en resolución Full HD y con los ajustes de máxima calidad. El personaje del juego no se movió. No se detectaron caídas notables en la velocidad de fotogramas.
Witcher 3 FPS Chart
| bajo | medio | alto | ultra | QHD | |
|---|---|---|---|---|---|
| GTA V (2015) | 180.3 | 176.9 | 152.5 | 95 | 81.8 |
| The Witcher 3 (2015) | 329 | 244 | 162.7 | 99.4 | |
| Dota 2 Reborn (2015) | 161.9 | 145 | 133.3 | 126.8 | |
| Final Fantasy XV Benchmark (2018) | 144.4 | 113.9 | 88.3 | 70.1 | |
| X-Plane 11.11 (2018) | 127.2 | 109.8 | 89.7 | ||
| Far Cry 5 (2018) | 144 | 105 | 99 | 91 | 77 |
| Strange Brigade (2018) | 358 | 231 | 198.2 | 178.3 | 136.7 |
| F1 2021 (2021) | 266 | 208 | 178.3 | 106.2 | 82.6 |
Emisiones: Mucho ruido bajo carga
Ruido
Los dos ventiladores no producen cantidades excesivas de ruido en el uso diario (oficina, internet). A veces incluso se quedan quietos. Bajo carga es una historia diferente: el portátil se vuelve ruidoso con niveles máximos de presión sonora de hasta 53 dB(A) (test de estrés, Witcher 3 prueba). Bajo el perfil "Rendimiento", los ventiladores funcionan a plena potencia constantemente.
La diferencia entre los perfiles "Silencioso" y "Estándar" no es particularmente grande bajo carga - otros portátiles para juegos ofrecen mejores modos silenciosos. Si es necesario, las velocidades del ventilador pueden reducirse a través del software NitroSense. No es posible ajustar manualmente la configuración del ventilador
Ruido
| Ocioso |
| 26 / 29 / 33 dB(A) |
| Carga |
| 47 / 53 dB(A) |
 | ||
30 dB silencioso 40 dB(A) audible 50 dB(A) ruidosamente alto |
||
min: | ||
| Acer Nitro 5 AN515-58-72QR GeForce RTX 3070 Ti Laptop GPU, i7-12700H, Samsung PM9A1 MZVL21T0HCLR | MSI Vector GP66 12UGS GeForce RTX 3070 Ti Laptop GPU, i9-12900H | HP Omen 16-b1090ng GeForce RTX 3070 Ti Laptop GPU, i7-12700H, WDC PC SN810 1TB | Lenovo Legion 5 Pro 16 G7 i7 RTX 3070Ti GeForce RTX 3070 Ti Laptop GPU, i7-12700H, Samsung PM9A1 MZVL21T0HCLR | |
|---|---|---|---|---|
| Noise | 9% | -5% | 2% | |
| apagado / medio ambiente * (dB) | 26 | 22.9 12% | 26 -0% | 24.6 5% |
| Idle Minimum * (dB) | 26 | 23.4 10% | 30 -15% | 28.4 -9% |
| Idle Average * (dB) | 29 | 23.4 19% | 31 -7% | 28.4 2% |
| Idle Maximum * (dB) | 33 | 27.4 17% | 33 -0% | 28.4 14% |
| Load Average * (dB) | 47 | 36 23% | 49 -4% | 49.4 -5% |
| Witcher 3 ultra * (dB) | 53 | 58.2 -10% | 53 -0% | 49.4 7% |
| Load Maximum * (dB) | 53 | 58 -9% | 57 -8% | 54.7 -3% |
* ... más pequeño es mejor
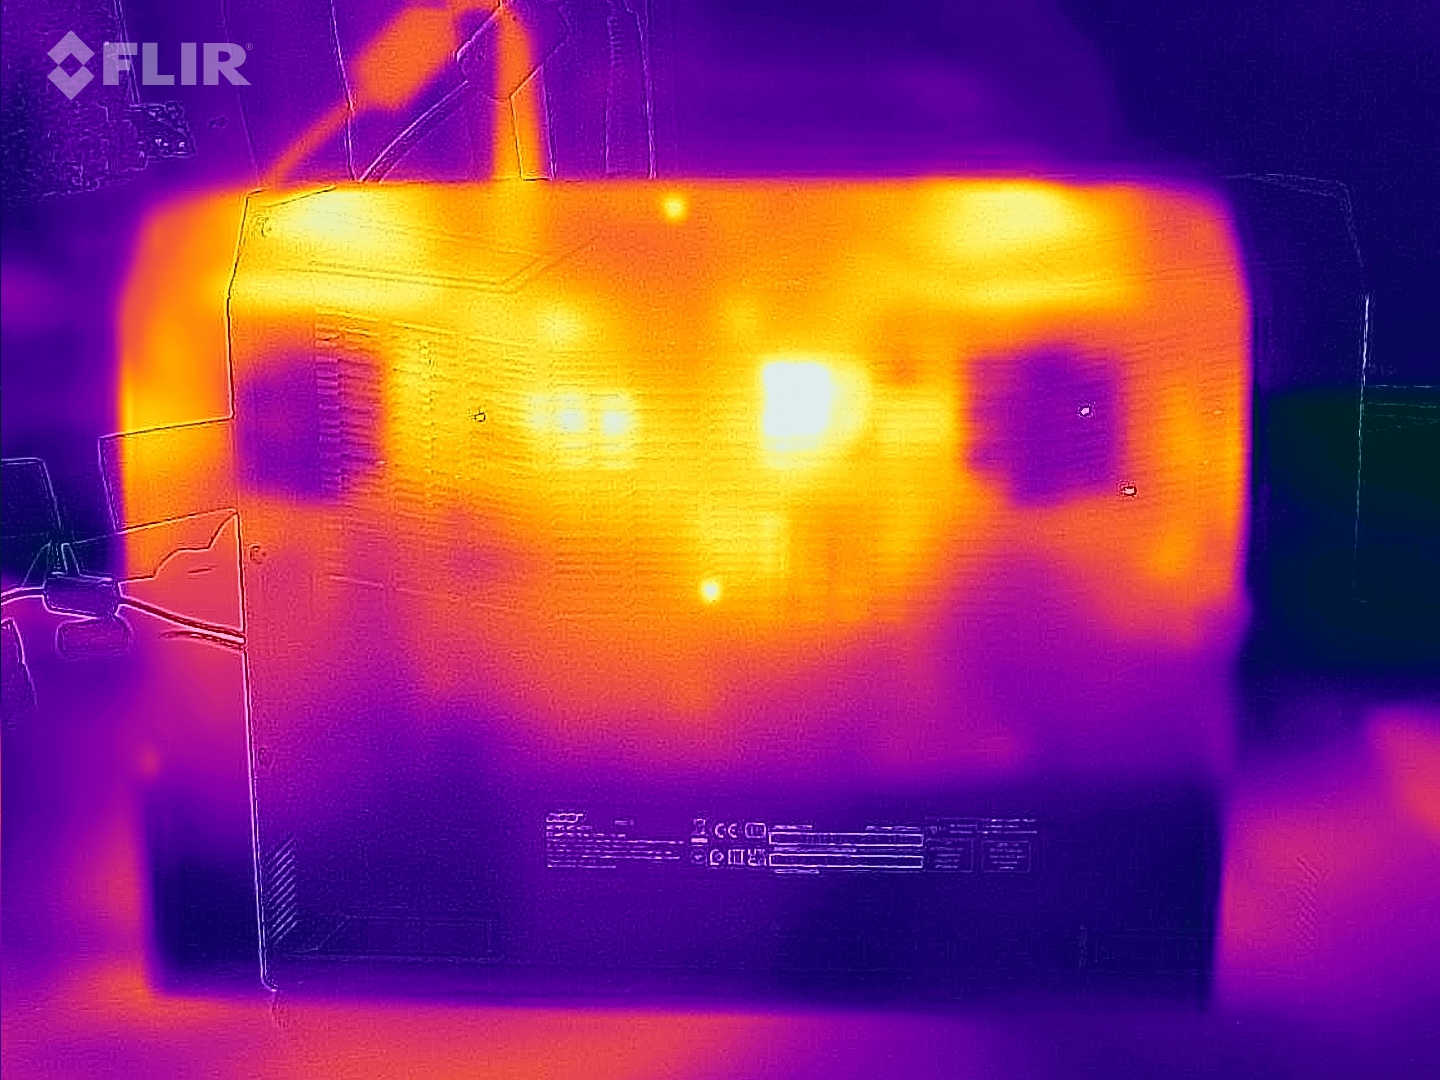
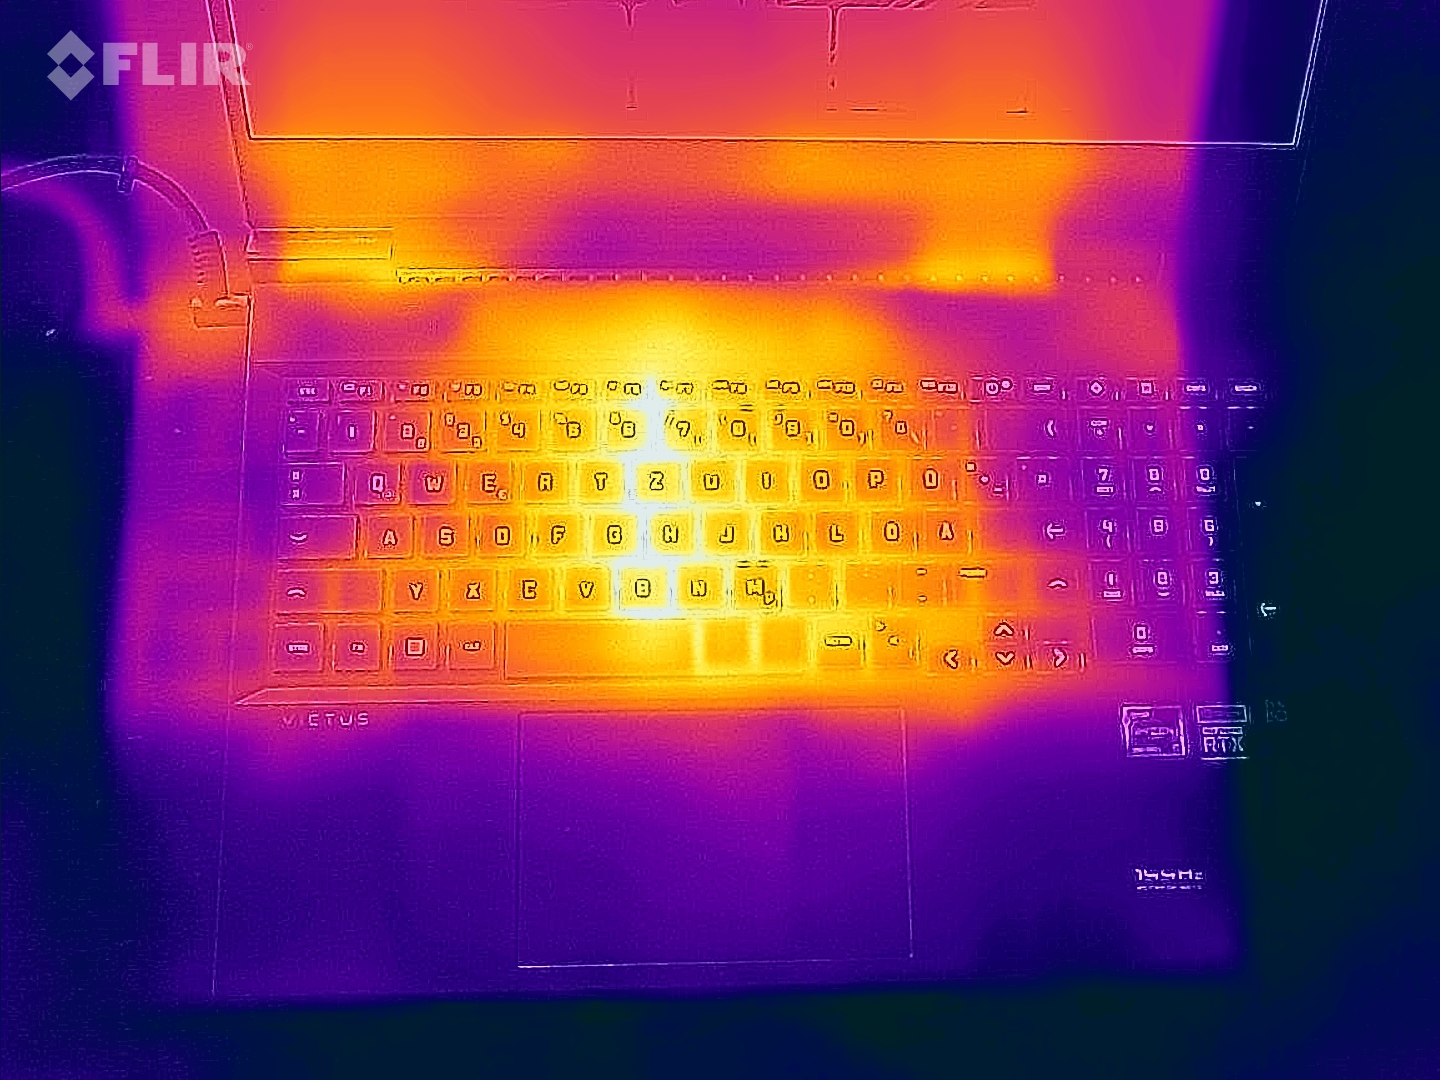
Temperatura
Las temperaturas de la carcasa se mantienen dentro del rango verde en el uso diario (oficina, Internet). El portátil se calienta notablemente bajo carga (test de estrés Witcher 3 test), pero se mantiene dentro de los límites aceptables. Las temperaturas de la CPU alcanzan a veces la zona roja. En consecuencia, el reloj de la CPU cae significativamente en el transcurso de la prueba.
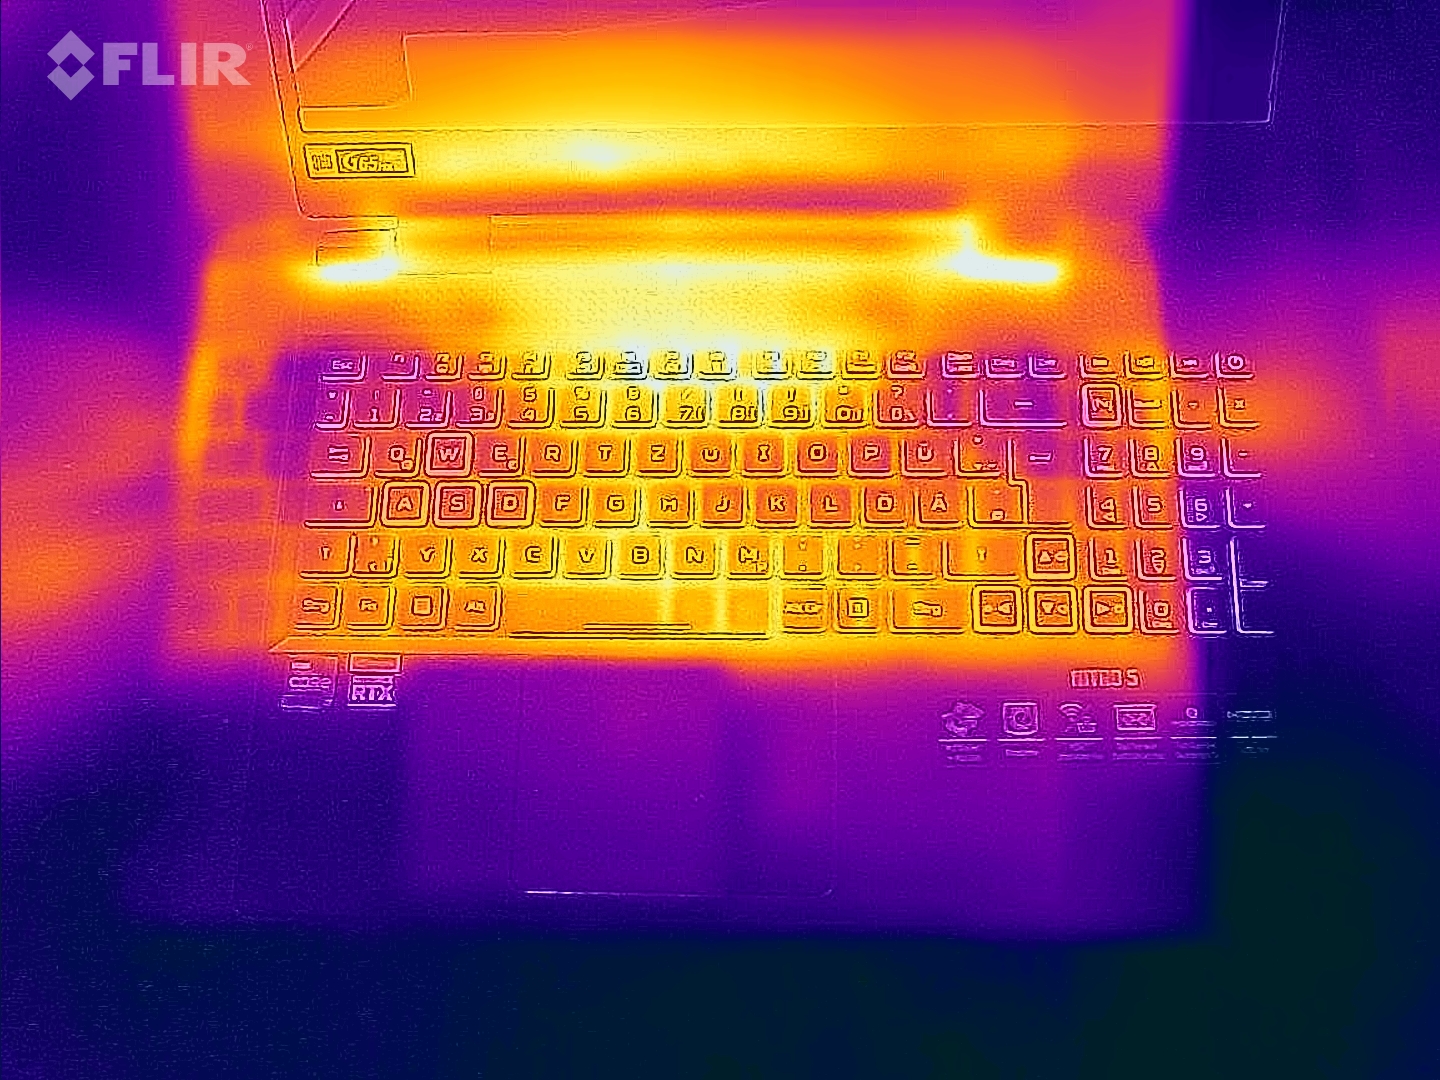
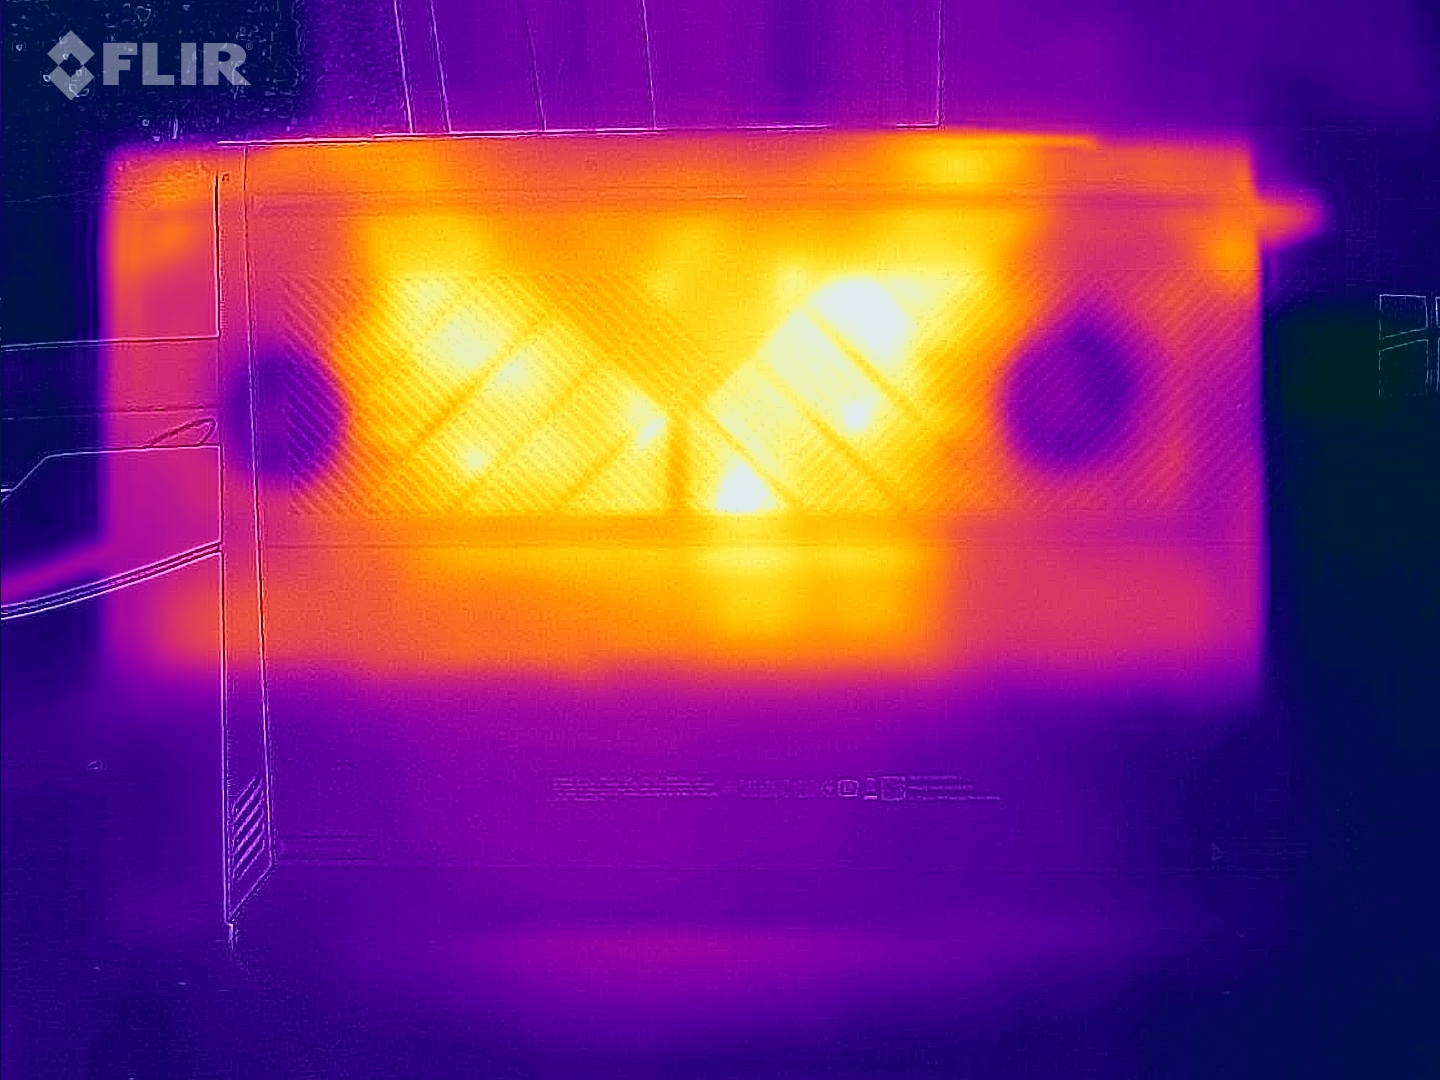
(-) La temperatura máxima en la parte superior es de 48 °C / 118 F, frente a la media de 40.4 °C / 105 F, que oscila entre 21.2 y 68.8 °C para la clase Gaming.
(-) El fondo se calienta hasta un máximo de 51 °C / 124 F, frente a la media de 43.2 °C / 110 F
(+) En reposo, la temperatura media de la parte superior es de 31.3 °C / 88# F, frente a la media del dispositivo de 33.9 °C / 93 F.
(-) Jugando a The Witcher 3, la temperatura media de la parte superior es de 42.4 °C / 108 F, frente a la media del dispositivo de 33.9 °C / 93 F.
(±) El reposamanos y el touchpad pueden calentarse mucho al tacto con un máximo de 38 °C / 100.4 F.
(-) La temperatura media de la zona del reposamanos de dispositivos similares fue de 28.8 °C / 83.8 F (-9.2 °C / -16.6 F).
| Acer Nitro 5 AN515-58-72QR Intel Core i7-12700H, NVIDIA GeForce RTX 3070 Ti Laptop GPU | MSI Vector GP66 12UGS Intel Core i9-12900H, NVIDIA GeForce RTX 3070 Ti Laptop GPU | HP Omen 16-b1090ng Intel Core i7-12700H, NVIDIA GeForce RTX 3070 Ti Laptop GPU | Lenovo Legion 5 Pro 16 G7 i7 RTX 3070Ti Intel Core i7-12700H, NVIDIA GeForce RTX 3070 Ti Laptop GPU | |
|---|---|---|---|---|
| Heat | 4% | 10% | 2% | |
| Maximum Upper Side * (°C) | 48 | 40.2 16% | 41 15% | 45.3 6% |
| Maximum Bottom * (°C) | 51 | 43.8 14% | 62 -22% | 61.2 -20% |
| Idle Upper Side * (°C) | 34 | 34.8 -2% | 25 26% | 28.6 16% |
| Idle Bottom * (°C) | 33 | 37 -12% | 26 21% | 31.4 5% |
* ... más pequeño es mejor
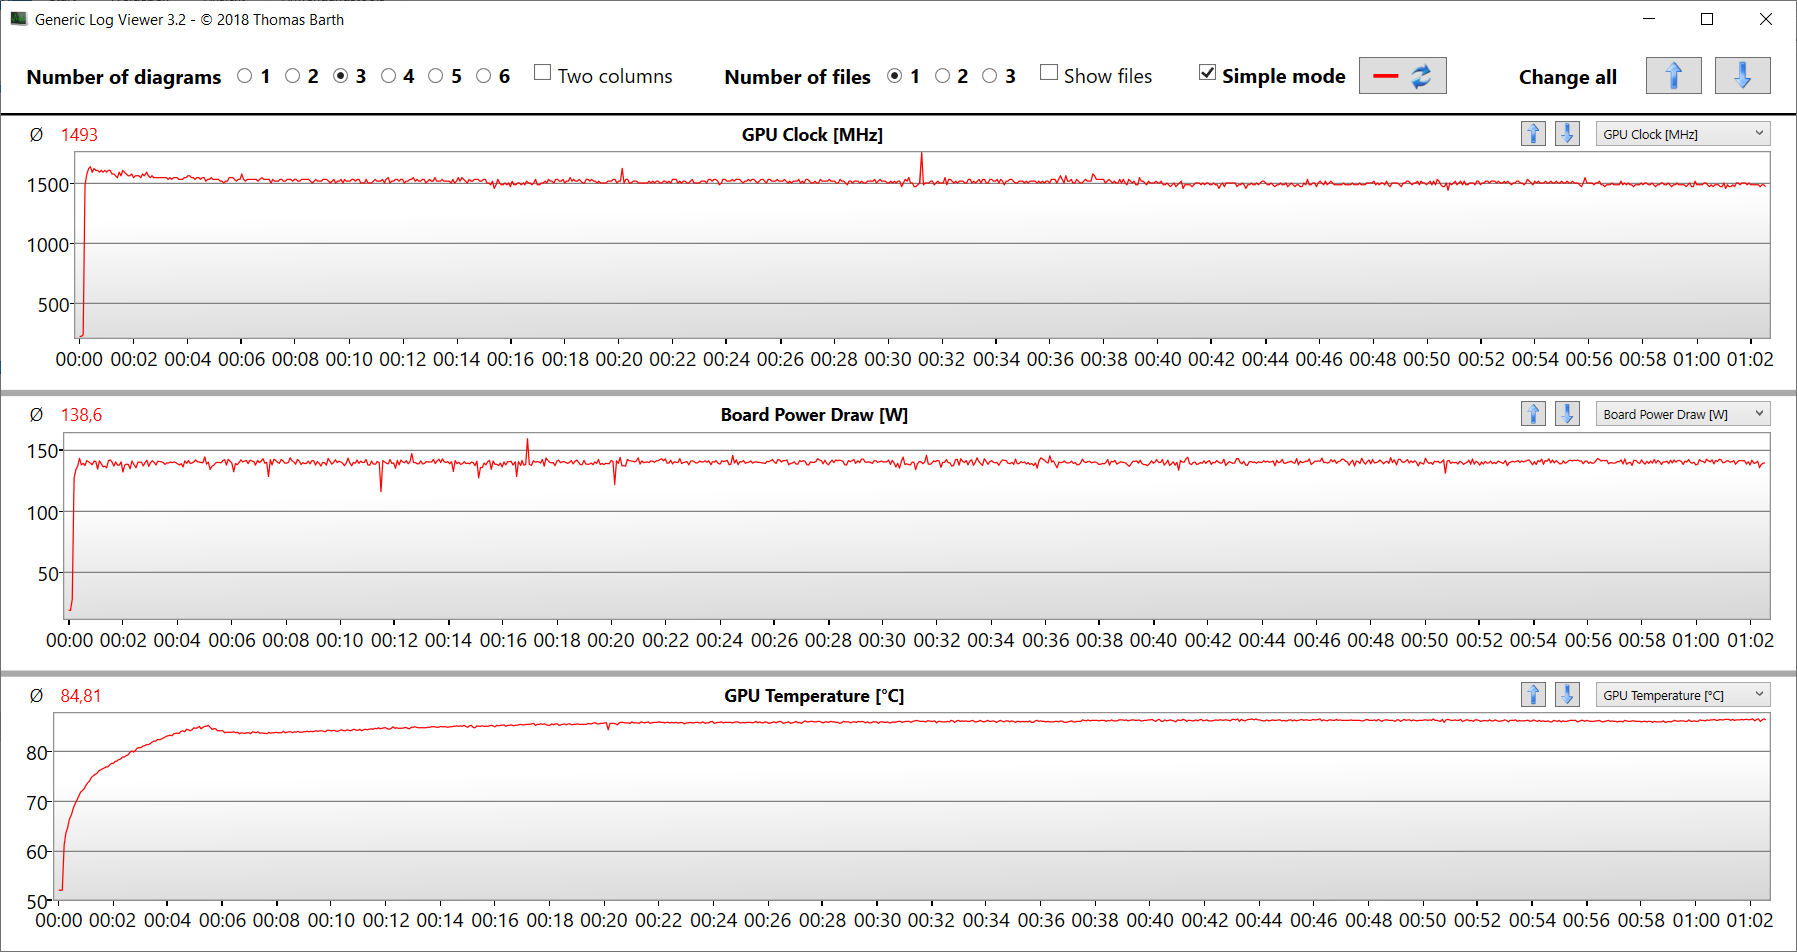
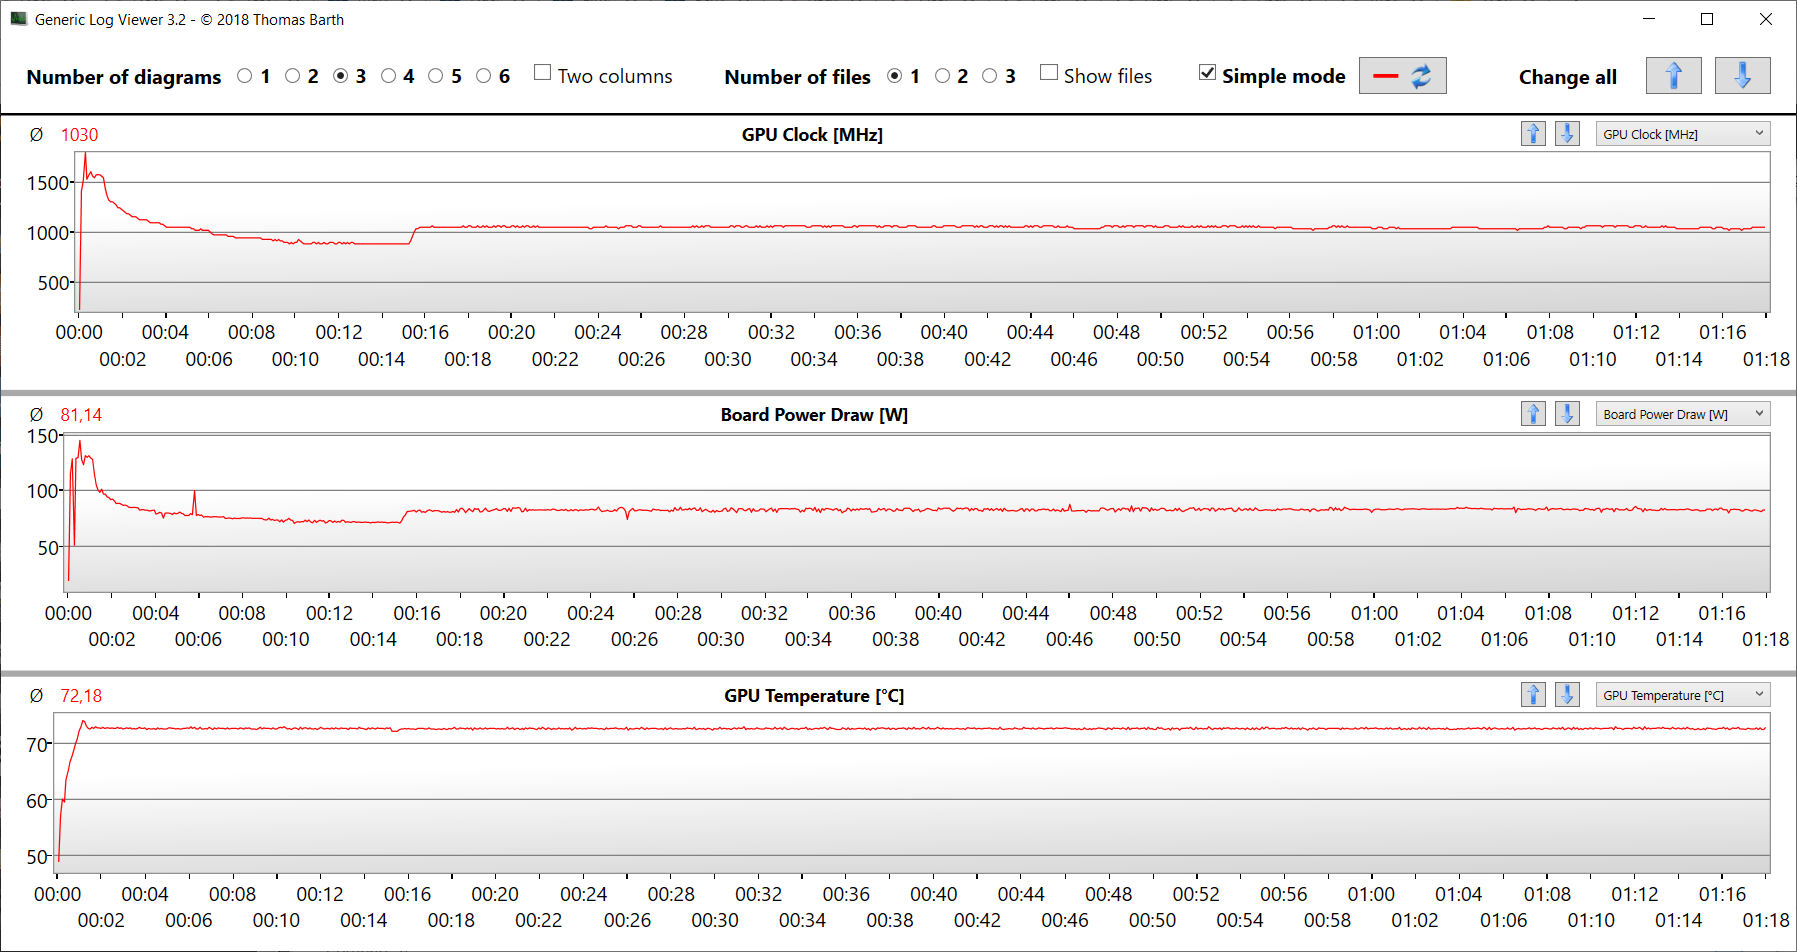
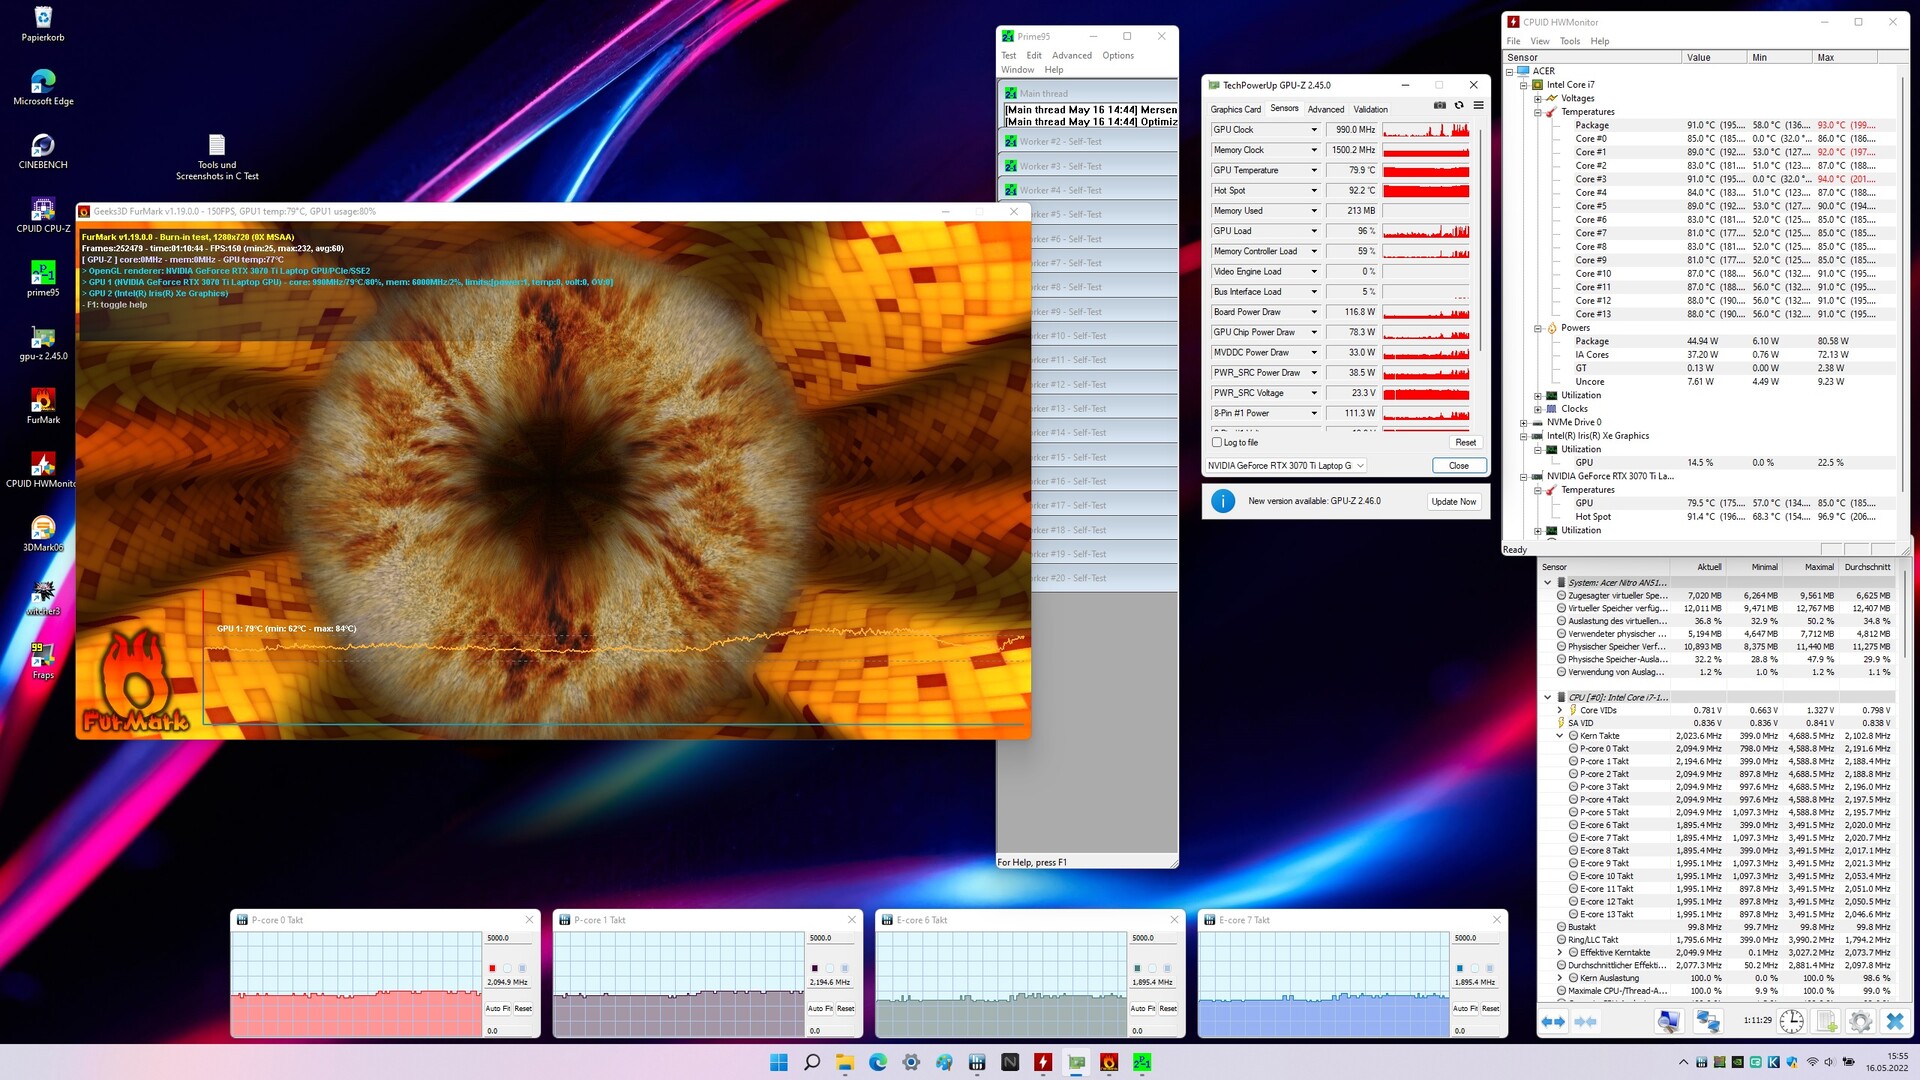
Prueba de esfuerzo
La CPU funcionó a altas velocidades de reloj al principio de la prueba de estrés (Prime95 y Furmark se ejecutan durante al menos una hora) antes de caer posteriormente a 2,1 GHz (núcleos P) y 1,9 GHz (núcleos E). La GPU funcionó a velocidades entre 600 y 1.000 MHz. La prueba de estrés representa un escenario extremo. Utilizamos esta prueba para comprobar si el sistema funciona de forma estable a plena carga.
Altavoces
Los altavoces estéreo producen una calidad de sonido aceptable a la que le vendrían bien más graves. Se recomienda utilizar auriculares o altavoces externos para una mejor experiencia de sonido.
Acer Nitro 5 AN515-58-72QR análisis de audio
(±) | la sonoridad del altavoz es media pero buena (77 dB)
Graves 100 - 315 Hz
(±) | lubina reducida - en promedio 14.4% inferior a la mediana
(±) | la linealidad de los graves es media (12.8% delta a frecuencia anterior)
Medios 400 - 2000 Hz
(+) | medios equilibrados - a sólo 1.2% de la mediana
(+) | los medios son lineales (3.2% delta a la frecuencia anterior)
Altos 2 - 16 kHz
(±) | máximos más altos - de media 5.4% más altos que la mediana
(±) | la linealidad de los máximos es media (10.4% delta a frecuencia anterior)
Total 100 - 16.000 Hz
(±) | la linealidad del sonido global es media (15.8% de diferencia con la mediana)
En comparación con la misma clase
» 37% de todos los dispositivos probados de esta clase eran mejores, 7% similares, 56% peores
» El mejor tuvo un delta de 6%, la media fue 18%, el peor fue ###max##%
En comparación con todos los dispositivos probados
» 24% de todos los dispositivos probados eran mejores, 5% similares, 70% peores
» El mejor tuvo un delta de 4%, la media fue 23%, el peor fue ###max##%
HP Omen 16-b1090ng análisis de audio
(+) | los altavoces pueden reproducir a un volumen relativamente alto (#83 dB)
Graves 100 - 315 Hz
(-) | casi sin bajos - de media 24.4% inferior a la mediana
(±) | la linealidad de los graves es media (13.8% delta a frecuencia anterior)
Medios 400 - 2000 Hz
(+) | medios equilibrados - a sólo 1.9% de la mediana
(+) | los medios son lineales (2.8% delta a la frecuencia anterior)
Altos 2 - 16 kHz
(+) | máximos equilibrados - a sólo 2.2% de la mediana
(+) | los máximos son lineales (3.8% delta a la frecuencia anterior)
Total 100 - 16.000 Hz
(±) | la linealidad del sonido global es media (15.1% de diferencia con la mediana)
En comparación con la misma clase
» 32% de todos los dispositivos probados de esta clase eran mejores, 6% similares, 62% peores
» El mejor tuvo un delta de 6%, la media fue 18%, el peor fue ###max##%
En comparación con todos los dispositivos probados
» 21% de todos los dispositivos probados eran mejores, 4% similares, 75% peores
» El mejor tuvo un delta de 4%, la media fue 23%, el peor fue ###max##%
Gestión de la energía: La duración de la batería no es motivo de alegría
Consumo de energía
El AN515 no revela ninguna anomalía durante el consumo de energía. La prueba de estrés y la Witcher 3 prueba vieron el consumo de energía aumentar hasta 220 vatios y una media de 195 vatios. Mientras que la prueba de Witcher 3 se realizó con un consumo de energía constante, la demanda disminuyó ligeramente en el transcurso de la prueba de estrés. La fuente de alimentación incluida está suficientemente dimensionada con una salida nominal de 280 vatios.
| Off / Standby | |
| Ocioso | |
| Carga |
|
Clave:
min: | |
| Acer Nitro 5 AN515-58-72QR i7-12700H, GeForce RTX 3070 Ti Laptop GPU | MSI Vector GP66 12UGS i9-12900H, GeForce RTX 3070 Ti Laptop GPU | HP Omen 16-b1090ng i7-12700H, GeForce RTX 3070 Ti Laptop GPU | Lenovo Legion 5 Pro 16 G7 i7 RTX 3070Ti i7-12700H, GeForce RTX 3070 Ti Laptop GPU | Medio NVIDIA GeForce RTX 3070 Ti Laptop GPU | Media de la clase Gaming | |
|---|---|---|---|---|---|---|
| Power Consumption | -52% | 19% | -9% | -32% | -25% | |
| Idle Minimum * (Watt) | 7 | 17.5 -150% | 4 43% | 8.6 -23% | 14.2 ? -103% | 13 ? -86% |
| Idle Average * (Watt) | 15 | 20.1 -34% | 10 33% | 17.6 -17% | 19.9 ? -33% | 19 ? -27% |
| Idle Maximum * (Watt) | 24 | 47.3 -97% | 19 21% | 18.5 23% | 26.2 ? -9% | 24.6 ? -3% |
| Load Average * (Watt) | 124 | 107.3 13% | 114 8% | 110 11% | 125.8 ? -1% | 110.7 ? 11% |
| Witcher 3 ultra * (Watt) | 195.1 | 225 -15% | 183.2 6% | 227 -16% | ||
| Load Maximum * (Watt) | 220 | 277.7 -26% | 221 -0% | 294.6 -34% | 248 ? -13% | 259 ? -18% |
* ... más pequeño es mejor
Power Consumption Witcher 3 / Stress Test
Power Consumption with External Monitor
Duración de la batería
El portátil de 15,6 pulgadas logró tiempos de ejecución de 3:54 h en la prueba WLAN (carga de sitios web a través de un script) y 4:43 h en la prueba de vídeo (cortometraje Big Buck Bunny, codificación H.264, FHD, en bucle). Durante ambas pruebas, las funciones de ahorro de energía del portátil se desactivaron y el brillo de la pantalla se ajustó a unos 150 cd/m². Los módulos inalámbricos también se desactivaron para la prueba de vídeo.
La escasa duración se debe a la capacidad relativamente baja de la batería (57,5 Wh). Calculado hasta el vatio-hora, el Nitro ofrece valores de resistencia similares a los del
Omen 16 (83 Wh) y el Legion 5 Pro (80 Wh) en la prueba WLAN del mundo real.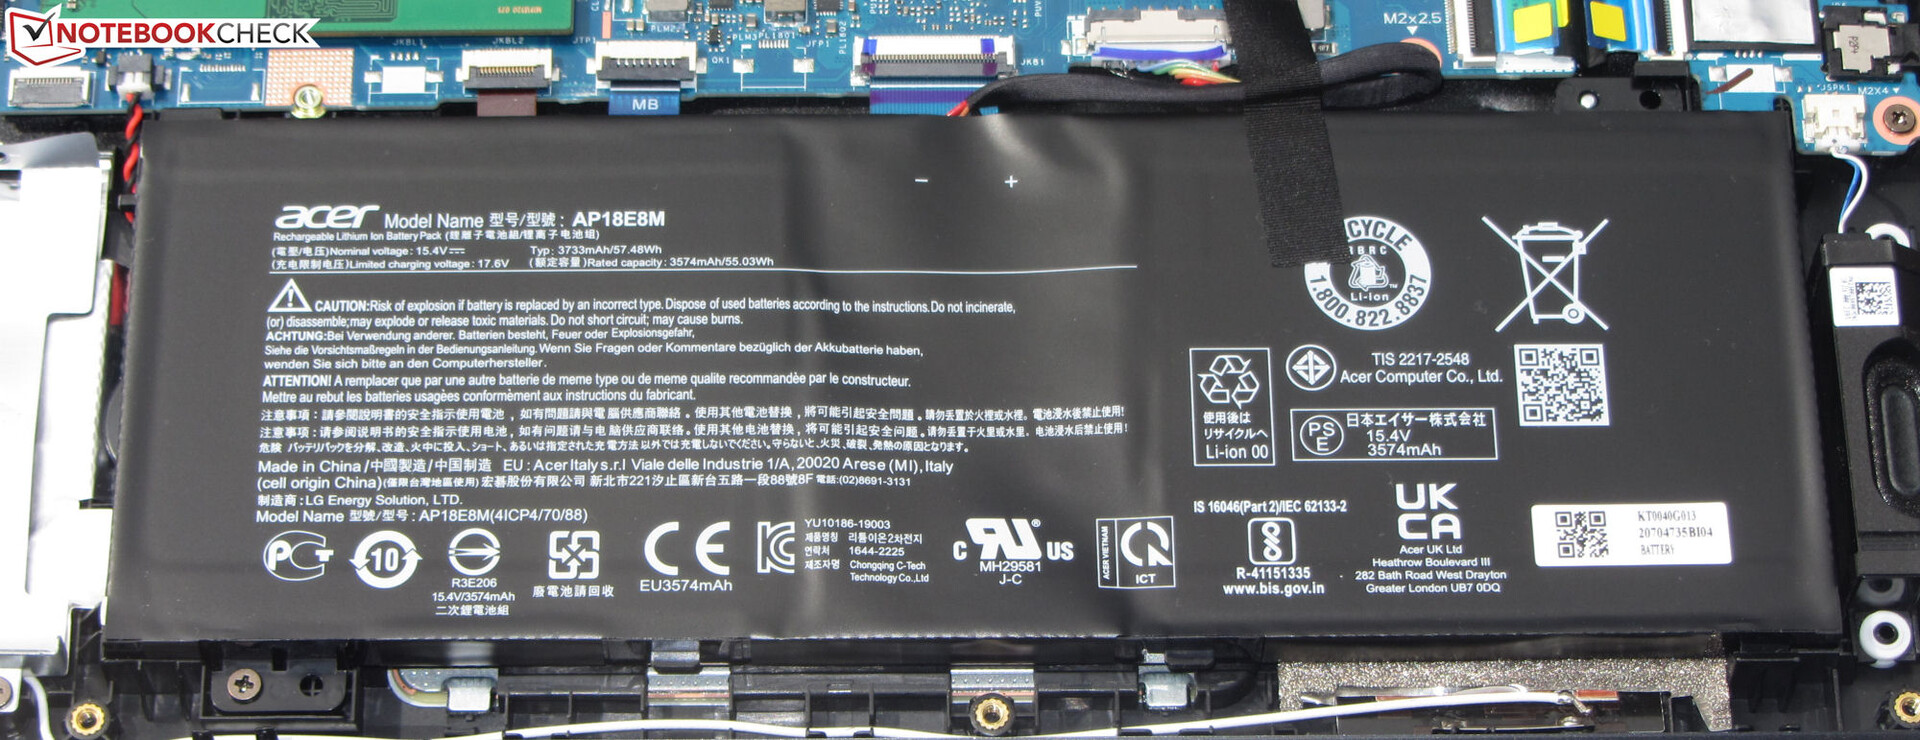
| Acer Nitro 5 AN515-58-72QR i7-12700H, GeForce RTX 3070 Ti Laptop GPU, 57.5 Wh | MSI Vector GP66 12UGS i9-12900H, GeForce RTX 3070 Ti Laptop GPU, 65 Wh | HP Omen 16-b1090ng i7-12700H, GeForce RTX 3070 Ti Laptop GPU, 83 Wh | Lenovo Legion 5 Pro 16 G7 i7 RTX 3070Ti i7-12700H, GeForce RTX 3070 Ti Laptop GPU, 80 Wh | Media de la clase Gaming | |
|---|---|---|---|---|---|
| Duración de Batería | 23% | 60% | 7% | 57% | |
| Reader / Idle (h) | 5.7 | 7.9 39% | 10.1 77% | 8.27 ? 45% | |
| H.264 (h) | 4.7 | 6.3 34% | 8.32 ? 77% | ||
| WiFi v1.3 (h) | 3.9 | 5.7 46% | 5.6 44% | 5.4 38% | 7.11 ? 82% |
| Load (h) | 1.2 | 1 -17% | 1.9 58% | 0.6 -50% | 1.502 ? 25% |
Pro
Contra
Veredicto: un portátil para juegos con éxito

El Nitro 5 es un portátil para juegos muy equilibrado por poco menos de 2400 dólares. A Core-i7-12700H Y un GeForce-RTX-3070-Ti-Laptop Permiten jugar en QHD con ajustes altos o máximos, acompañados de una rápida PCIe-4-SSD (1 TB) y 16 GB de RAM.
Acer ofrece un sólido portátil de juegos QHD con el Nitro 5 AN515-58. Sin embargo, el portátil no está completamente libre de defectos.
La CPU y la GPU pueden trabajar a velocidades de reloj constantemente altas. El portátil se calienta notablemente bajo carga, pero no excesivamente. El desarrollo de ruido está en el nivel habitual de la clase. Una vez más, sin embargo, Acer necesita mejorar el control del ventilador.
La pantalla de 15,6 pulgadas (QHD, IPS, 165 Hz) da una buena impresión en general, pero no se puede decir lo mismo de la duración de la batería. Al menos la batería se puede cargar con un adaptador de corriente universal USB-C (mín. 65 w, 20 V) mientras que la ranura Thunderbolt 4 soporta Power Delivery, eliminando así la necesidad de llevar el voluminoso adaptador de corriente de 280 w.
Una alternativa al Nitro 5 es el Lenovo Legion 5 Pro 16 G7que ofrece un rendimiento ligeramente mejor con la misma combinación CPU-GPU, ofrece una memoria de trabajo DDR5 más rápida y tiene una pantalla 16:10 a bordo. La duración de la batería también es mejor.
Precio y disponibilidad
En Estados Unidos, un modelo hermano (Acer Nitro 5 AN515-58-7853) está disponible actualmente por un precio de 2399,99 dólares a través de Amazon. En contraste con el modelo 72QR revisado anteriormente, esta variante viene con 2TB y 32GB de RAM DDR4.
Acer Nitro 5 AN515-58-72QR
- 06/02/2022 v7 (old)
Sascha Mölck
Price comparison

