Lenovo Legion 5i Pro 16 G7 Análisis: Portátil para juegos ahora con Alder Lake y RTX 3070 Ti
Ya hemos revisado el Legion 5 Pro 16 el año pasado y ahora Lenovo ofrece una versión actualizada de su portátil de 16 pulgadas para juegos. Las actualizaciones se centran en el rendimiento, ya que además de los nuevos procesadores Alder Lake de Intel, también recibe laGeForce RTX 3070 Tide Nvidia, incluyendo Advanced Optimus (MUX dinámico). También tiene soporte para Thunderbolt 4, así como rápidas unidades SSD PCIe 4.0. Hoy echamos un vistazo al modelo 82RF000VGE por 2100 euros, que está equipado con 16 GB DDR5-RAM, 1 TB de almacenamiento PCIe 4.0, y la rápida pantalla de 165 Hz con la resolución WQHD. Este portátil también está disponible en el programa de campus de Lenovo por 1900 euros.
Posibles contendientes en la comparación
Valoración | Fecha | Modelo | Peso | Altura | Tamaño | Resolución | Precio |
|---|---|---|---|---|---|---|---|
| 88 % v7 (old) | 03/2022 | Lenovo Legion 5 Pro 16 G7 i7 RTX 3070Ti i7-12700H, GeForce RTX 3070 Ti Laptop GPU | 2.6 kg | 26.6 mm | 16.00" | 2560x1600 | |
| 86.9 % v7 (old) | 03/2022 | MSI Vector GP66 12UGS i9-12900H, GeForce RTX 3070 Ti Laptop GPU | 2.3 kg | 23.4 mm | 15.60" | 1920x1080 | |
| 86.6 % v7 (old) | 10/2021 | HP Omen 16-b0085ng i7-11800H, GeForce RTX 3070 Laptop GPU | 2.4 kg | 23 mm | 16.10" | 1920x1080 | |
| 82.2 % v7 (old) | 08/2021 | Acer Nitro 5 AN515-45-R1JH R7 5800H, GeForce RTX 3070 Laptop GPU | 2.3 kg | 23.9 mm | 15.60" | 2560x1440 | |
| 85 % v7 (old) | 07/2021 | Asus TUF Gaming A15 FA506QR-AZ061T R7 5800H, GeForce RTX 3070 Laptop GPU | 2.3 kg | 24 mm | 15.60" | 1920x1080 |
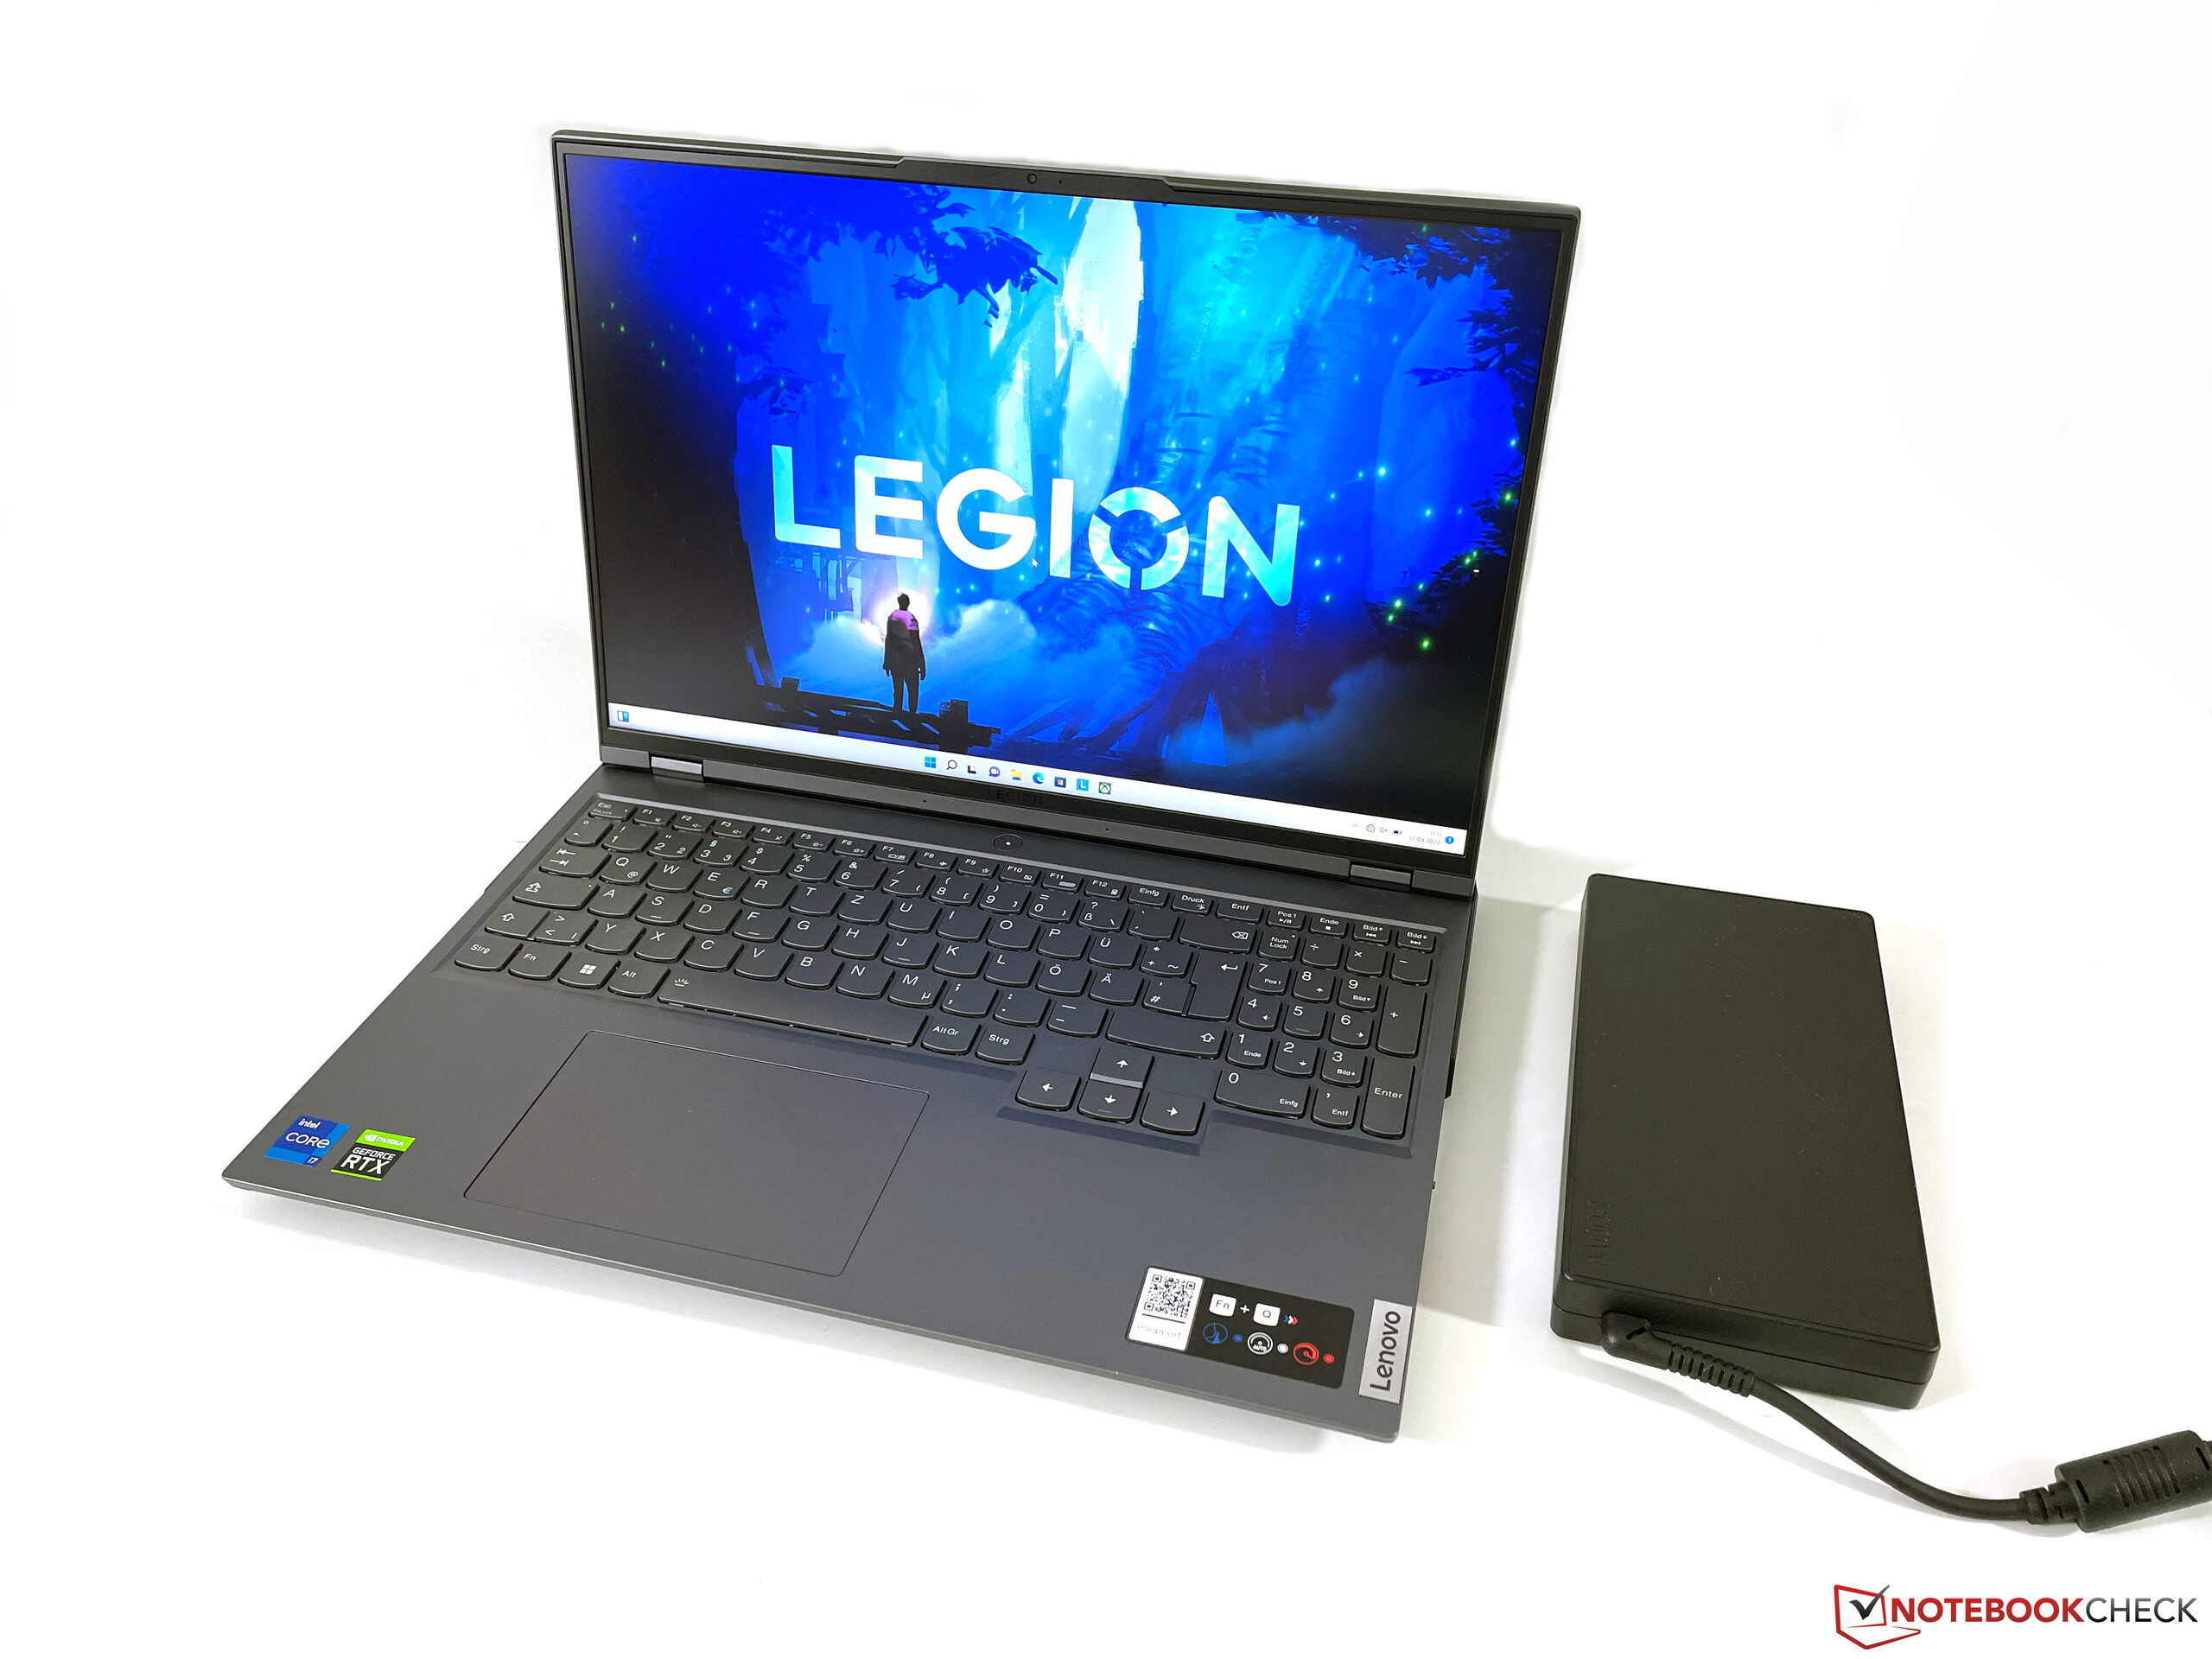
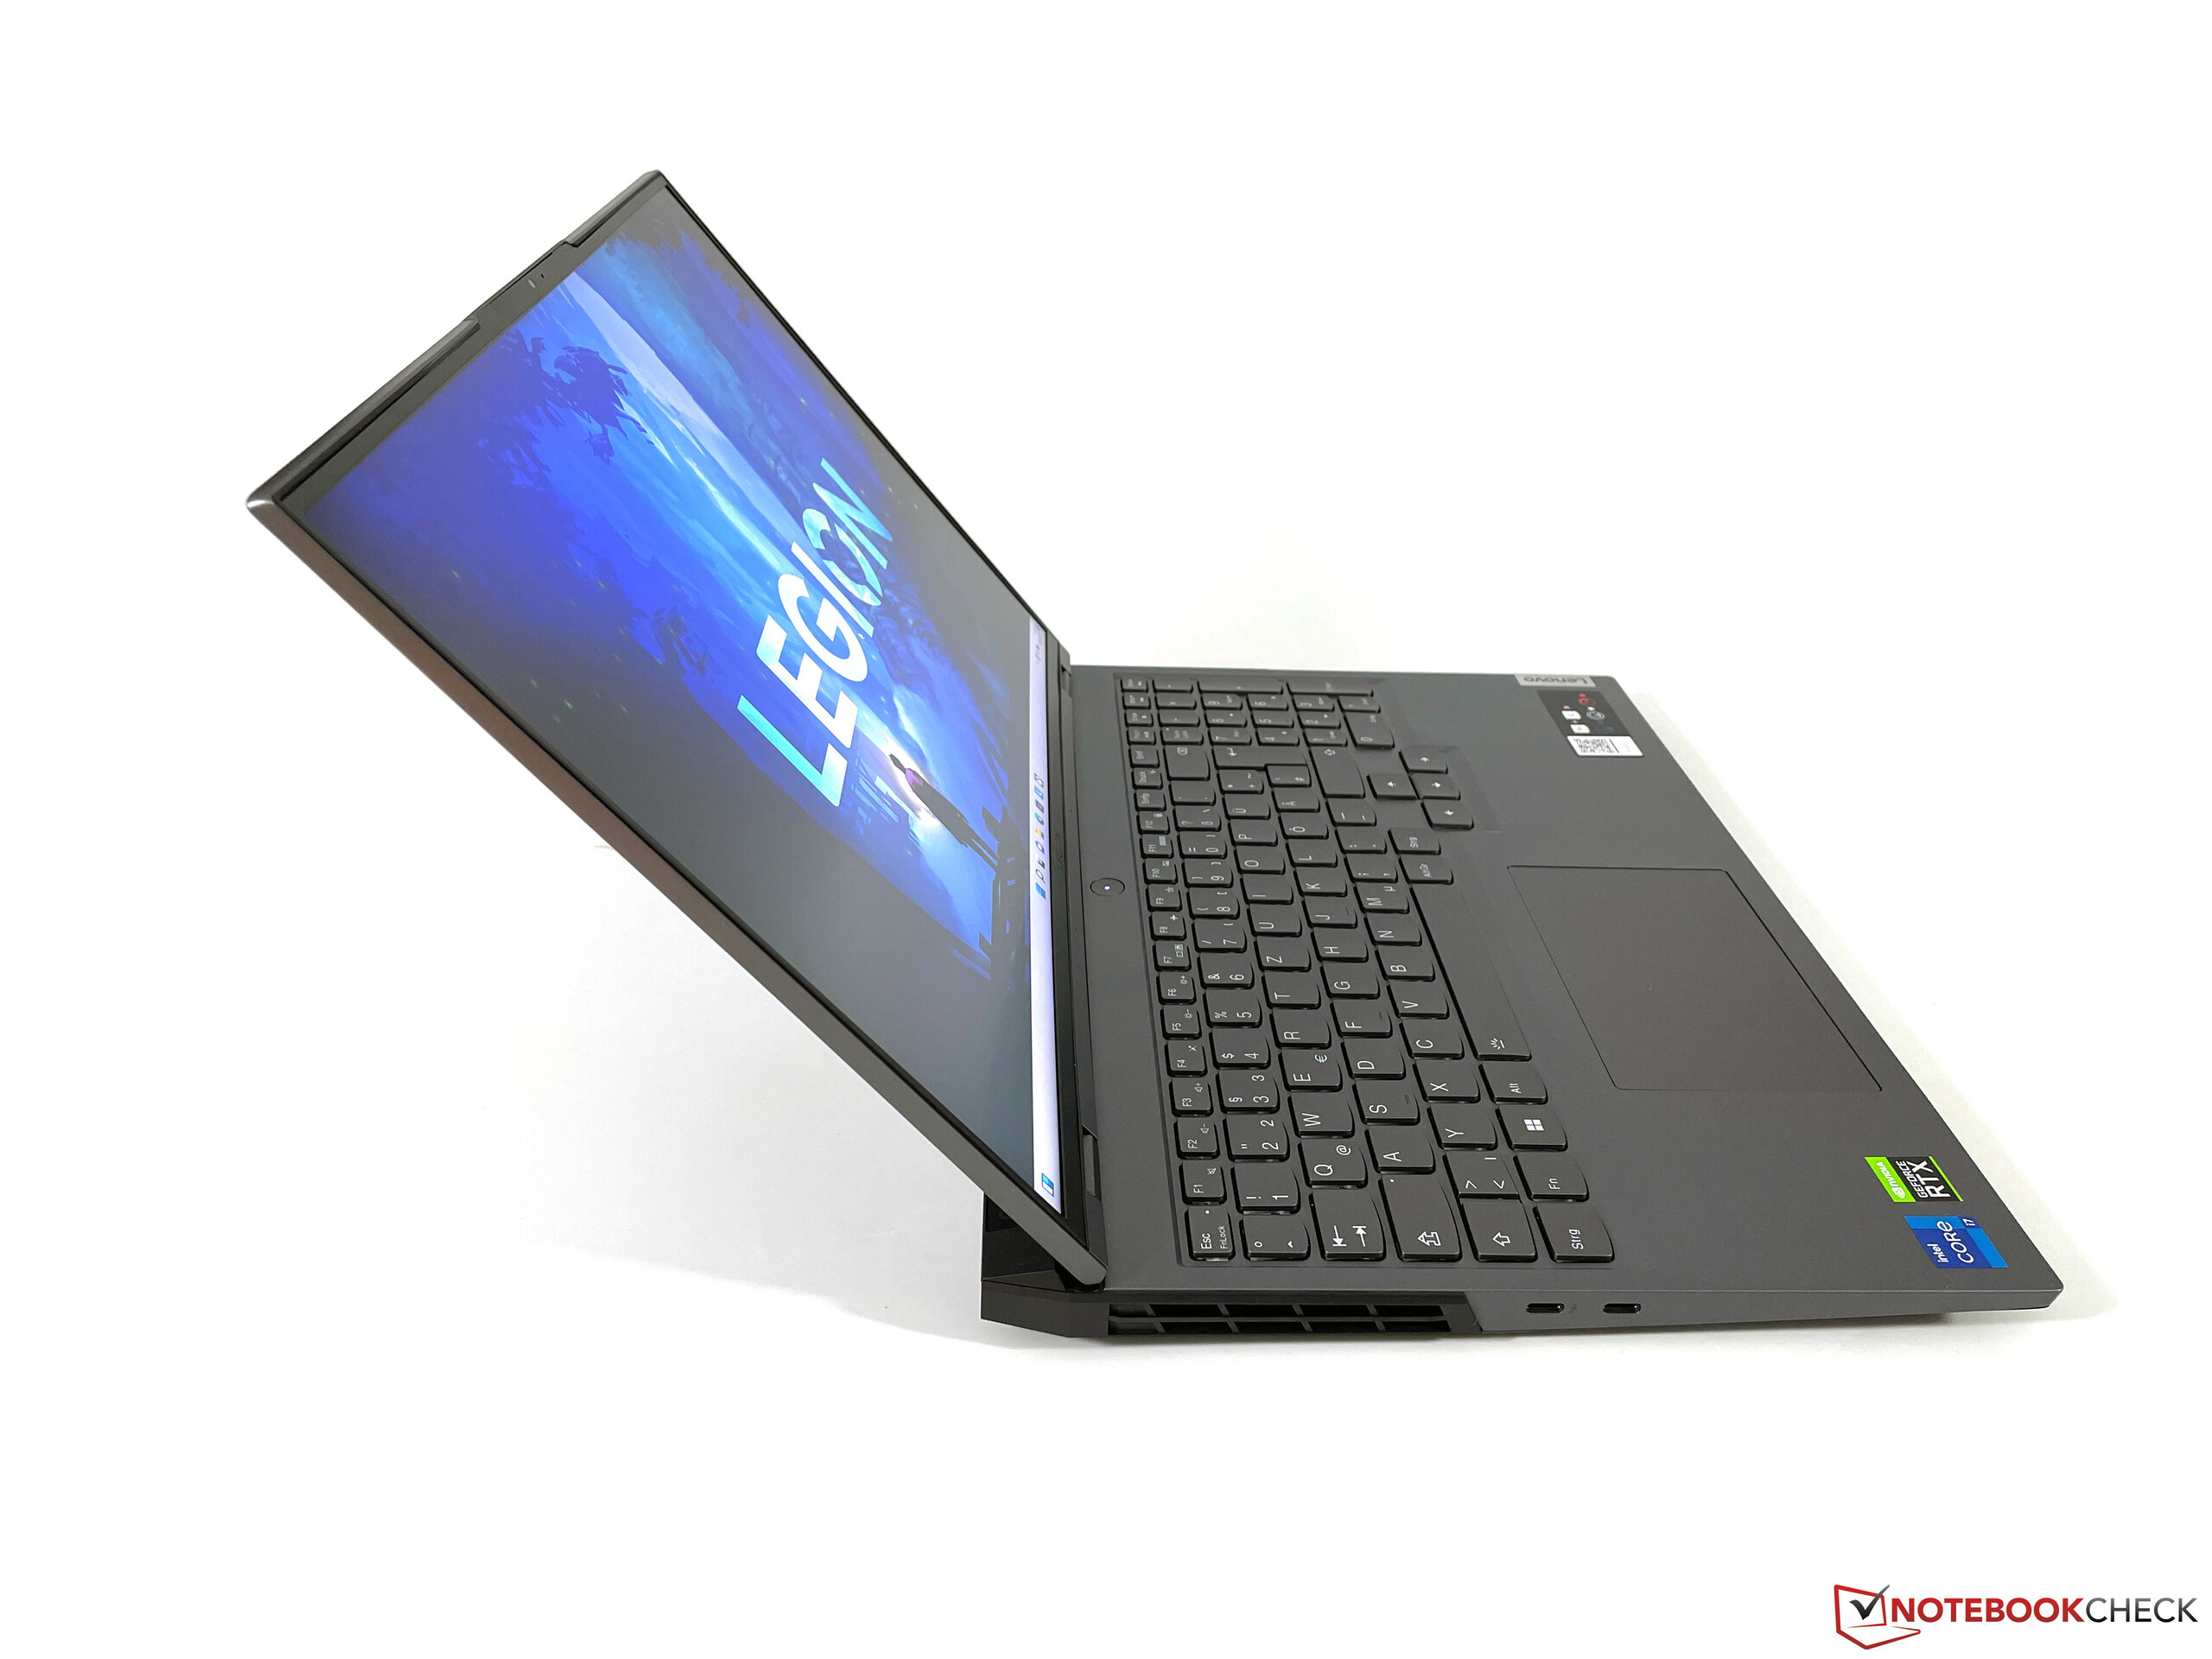
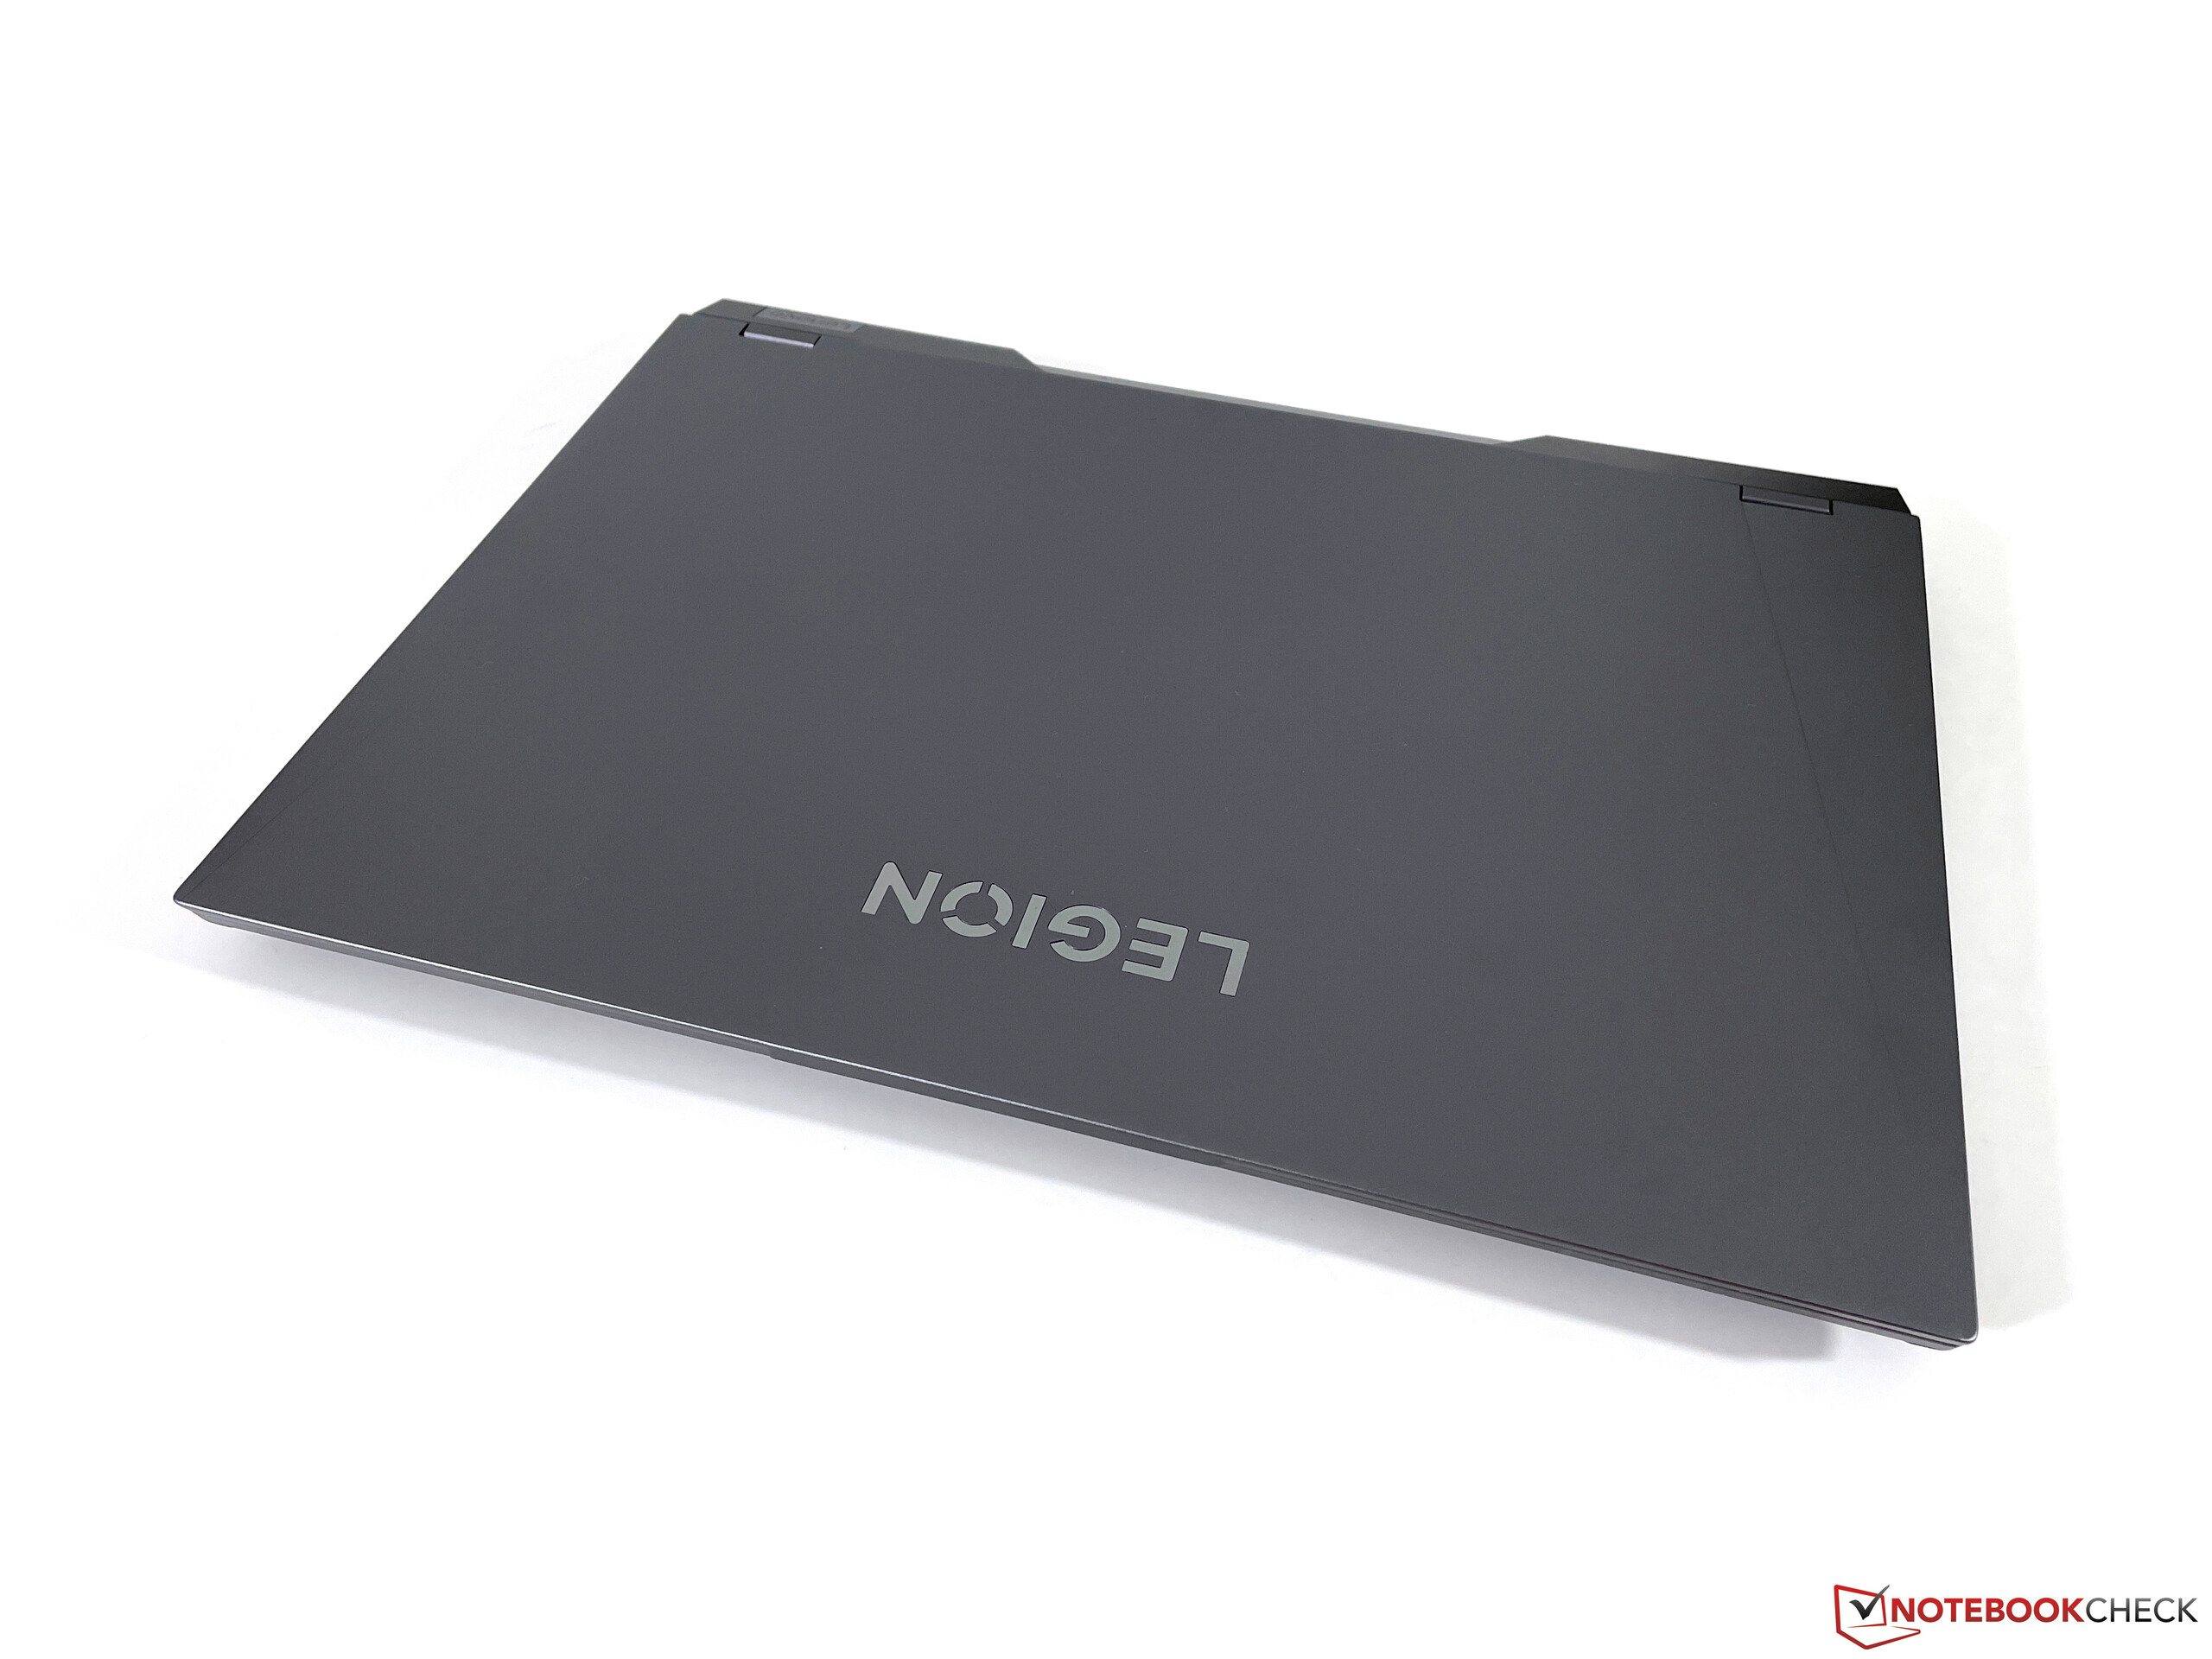
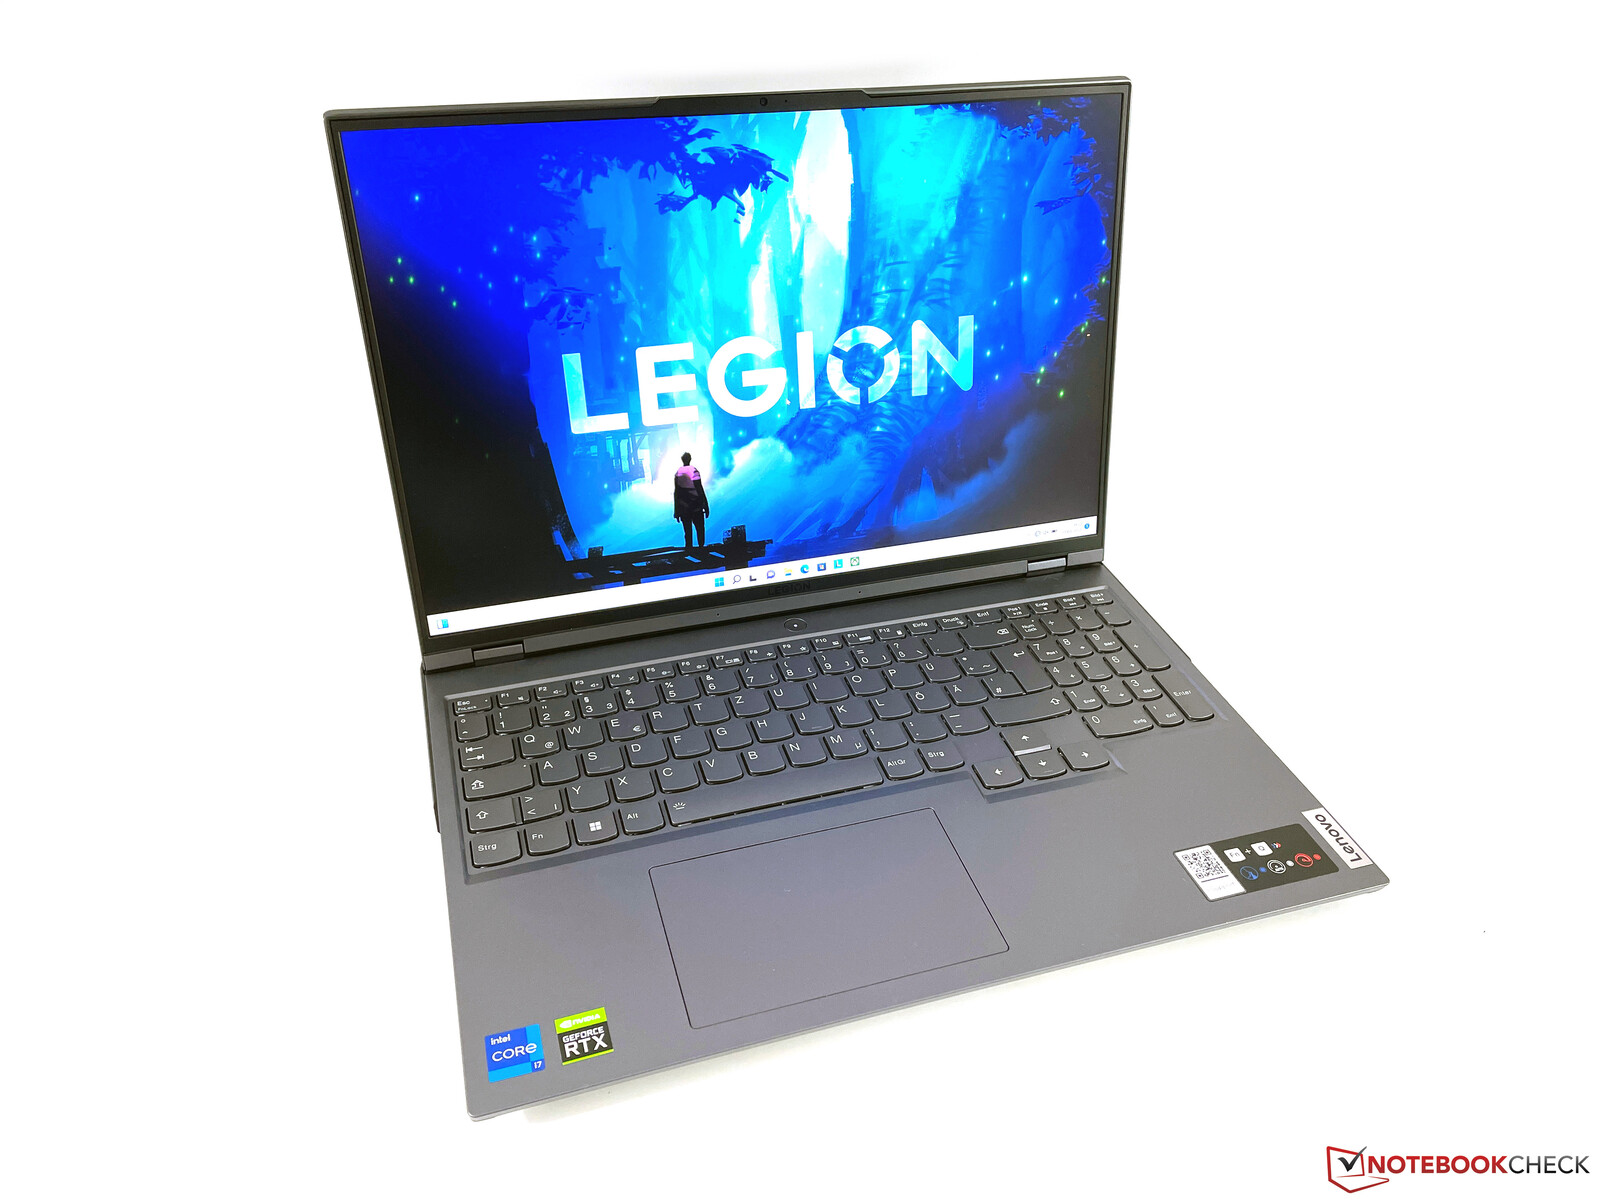
Caso - Legion con pequeños cambios visuales
En comparación con el Legion 5 Pro 16 con la CPU AMD Ryzen 7 que analizamos el año pasado, el chasis sigue siendo básicamente el mismo, pero el diseño de la tapa ha cambiado un poco. En lugar del logo grande e iluminado de Legion, que también estaba impreso en el lateral de la tapa, ahora sólo hay una sutil letra Legion en la parte superior de la tapa. Esto significa que el chasis de dos tonos (gris oscuro y gris claro), que no ofrece ningún elemento de iluminación extenso en el chasis, tiene un aspecto aún más sobrio que antes. Los biseles son muy delgados gracias a la pantalla de relación de aspecto 16:10 y el diseño parece muy moderno. Tampoco se puede criticar la estabilidad.
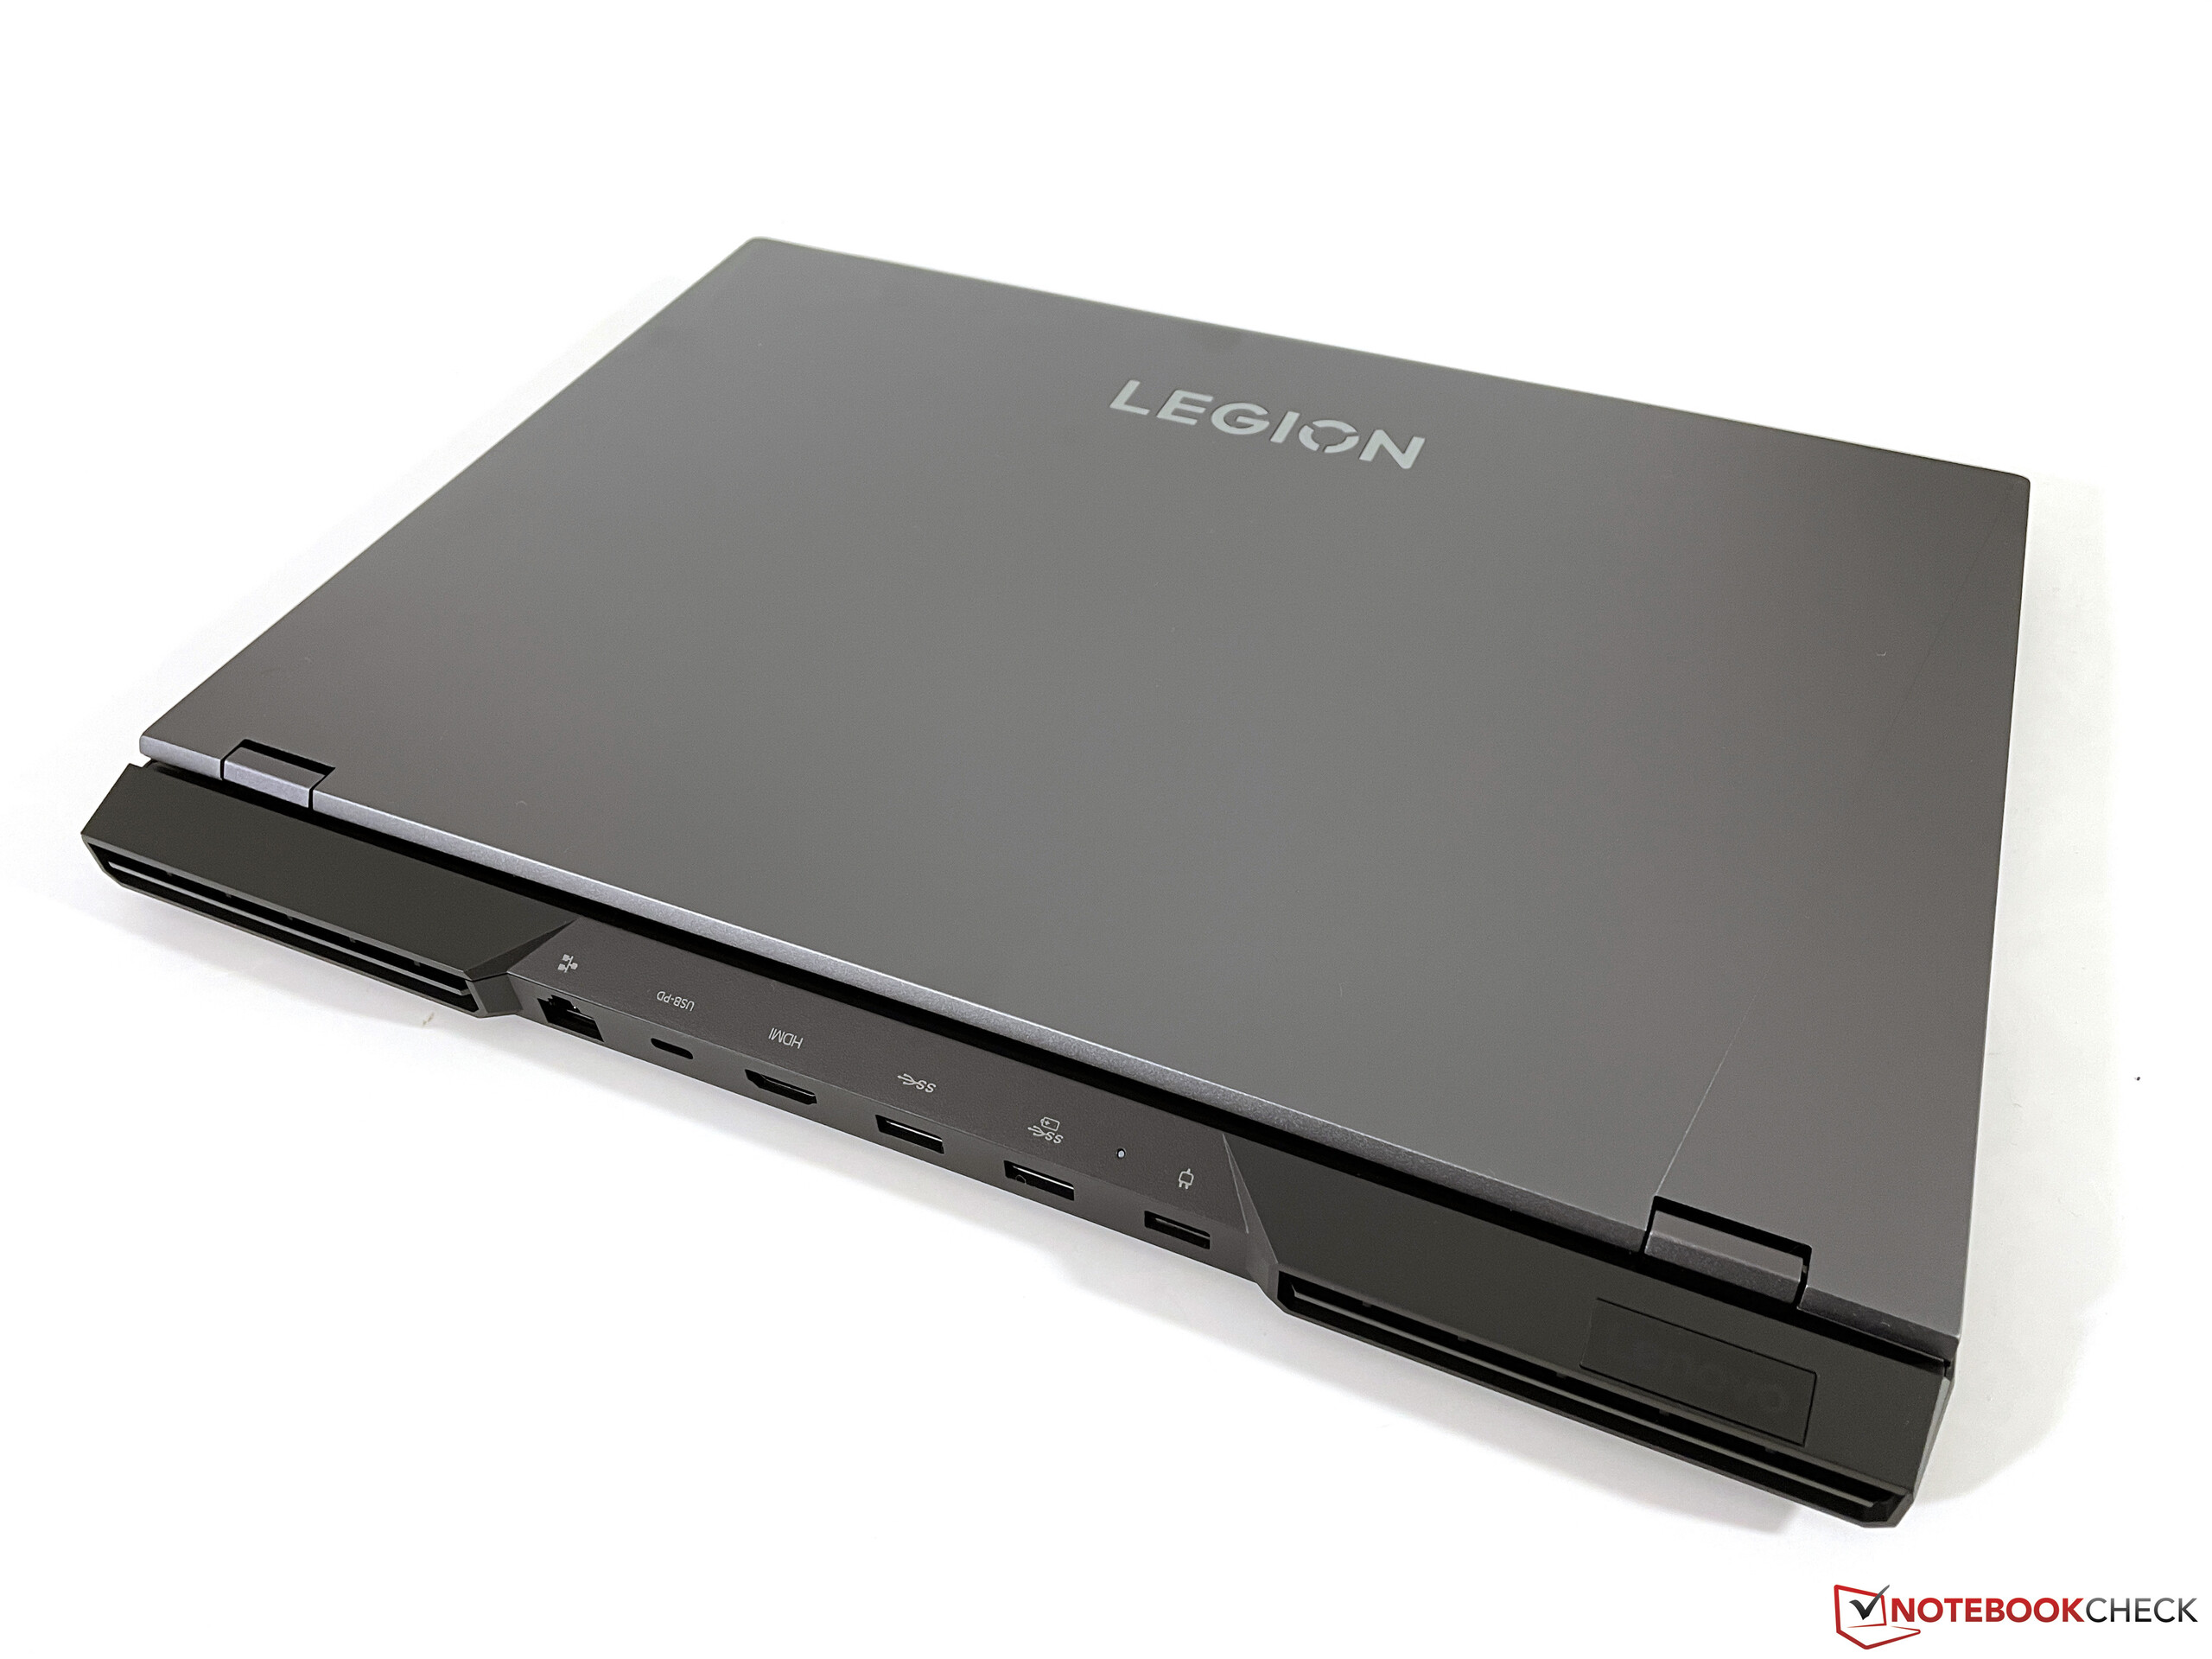
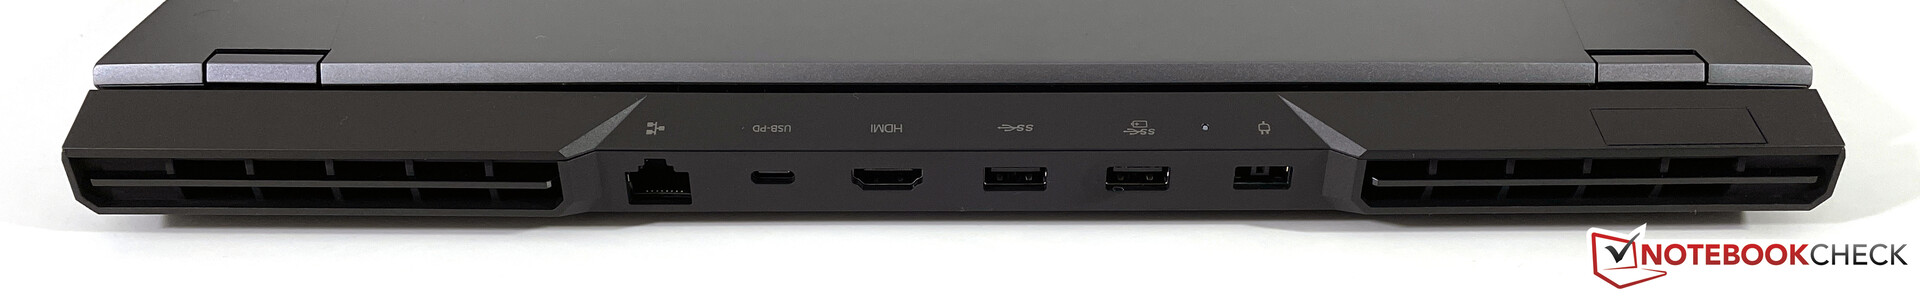
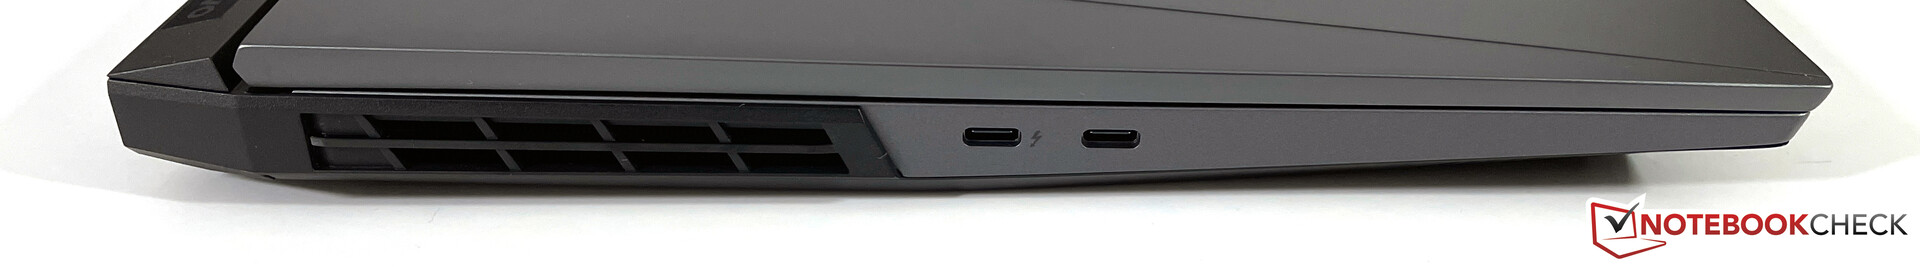
Conectividad - Legion ahora con Thunderbolt 4
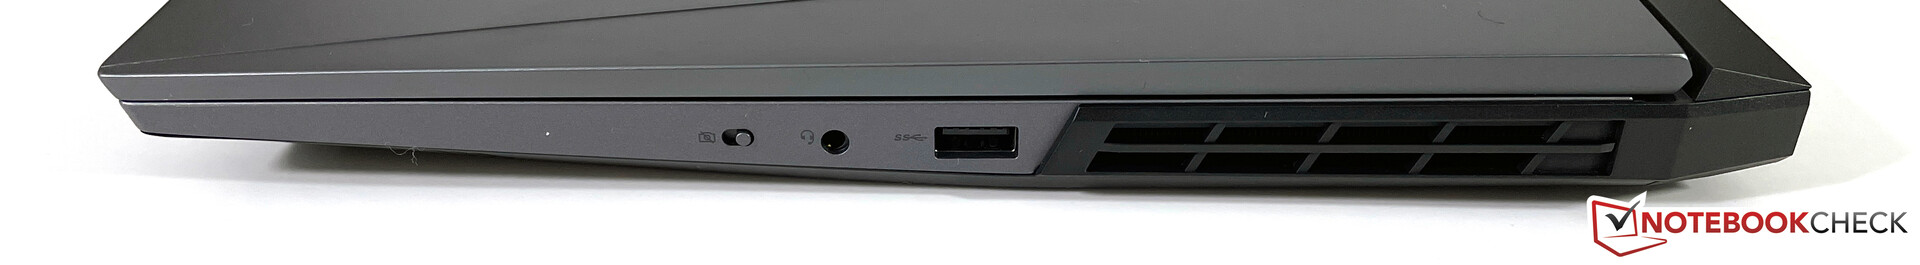
Los puertos, que se distribuyen en los dos laterales y en la parte trasera, son muy similares a los del modelo anterior. Nuestro modelo de pruebas Intel también ofrece soporte Thunderbolt 4 (40 Gbps) para el puerto USB-C del lado izquierdo. Gracias a los pequeños iconos en la parte superior del borde trasero, es muy fácil conectar cables sin girar todo el dispositivo. Uno de los puertos USB-C admite Power Delivery (hasta 135 W), por lo que también puedes cargar el Legion a través de USB-C si es necesario. Lo probamos con una fuente de alimentación de 65W de Lenovo y funcionó, pero el rendimiento estará obviamente limitado en este caso.
Comunicación
Además del puerto Gigabit-Ethernet para redes cableadas, Lenovo implementa un módulo Wi-Fi AX201 de Intel. Soporta el estándar Wi-Fi 6 (802.11ax) así como Bluetooth 5.1, pero no el último estándar Wi-Fi 6E (6 GHz). Nuestra prueba con el router de referencia Netgear Nighthawk AX12 determina excelentes tasas de transferencia y tampoco experimentamos ningún otro problema con la calidad de la señal.
Cámara web
La webcam sigue utilizando un sensor de 720p y la calidad de imagen no es muy buena, incluso en condiciones de buena iluminación. No hay obturador mecánico, sino un E-Shutter con un botón en el lado derecho.


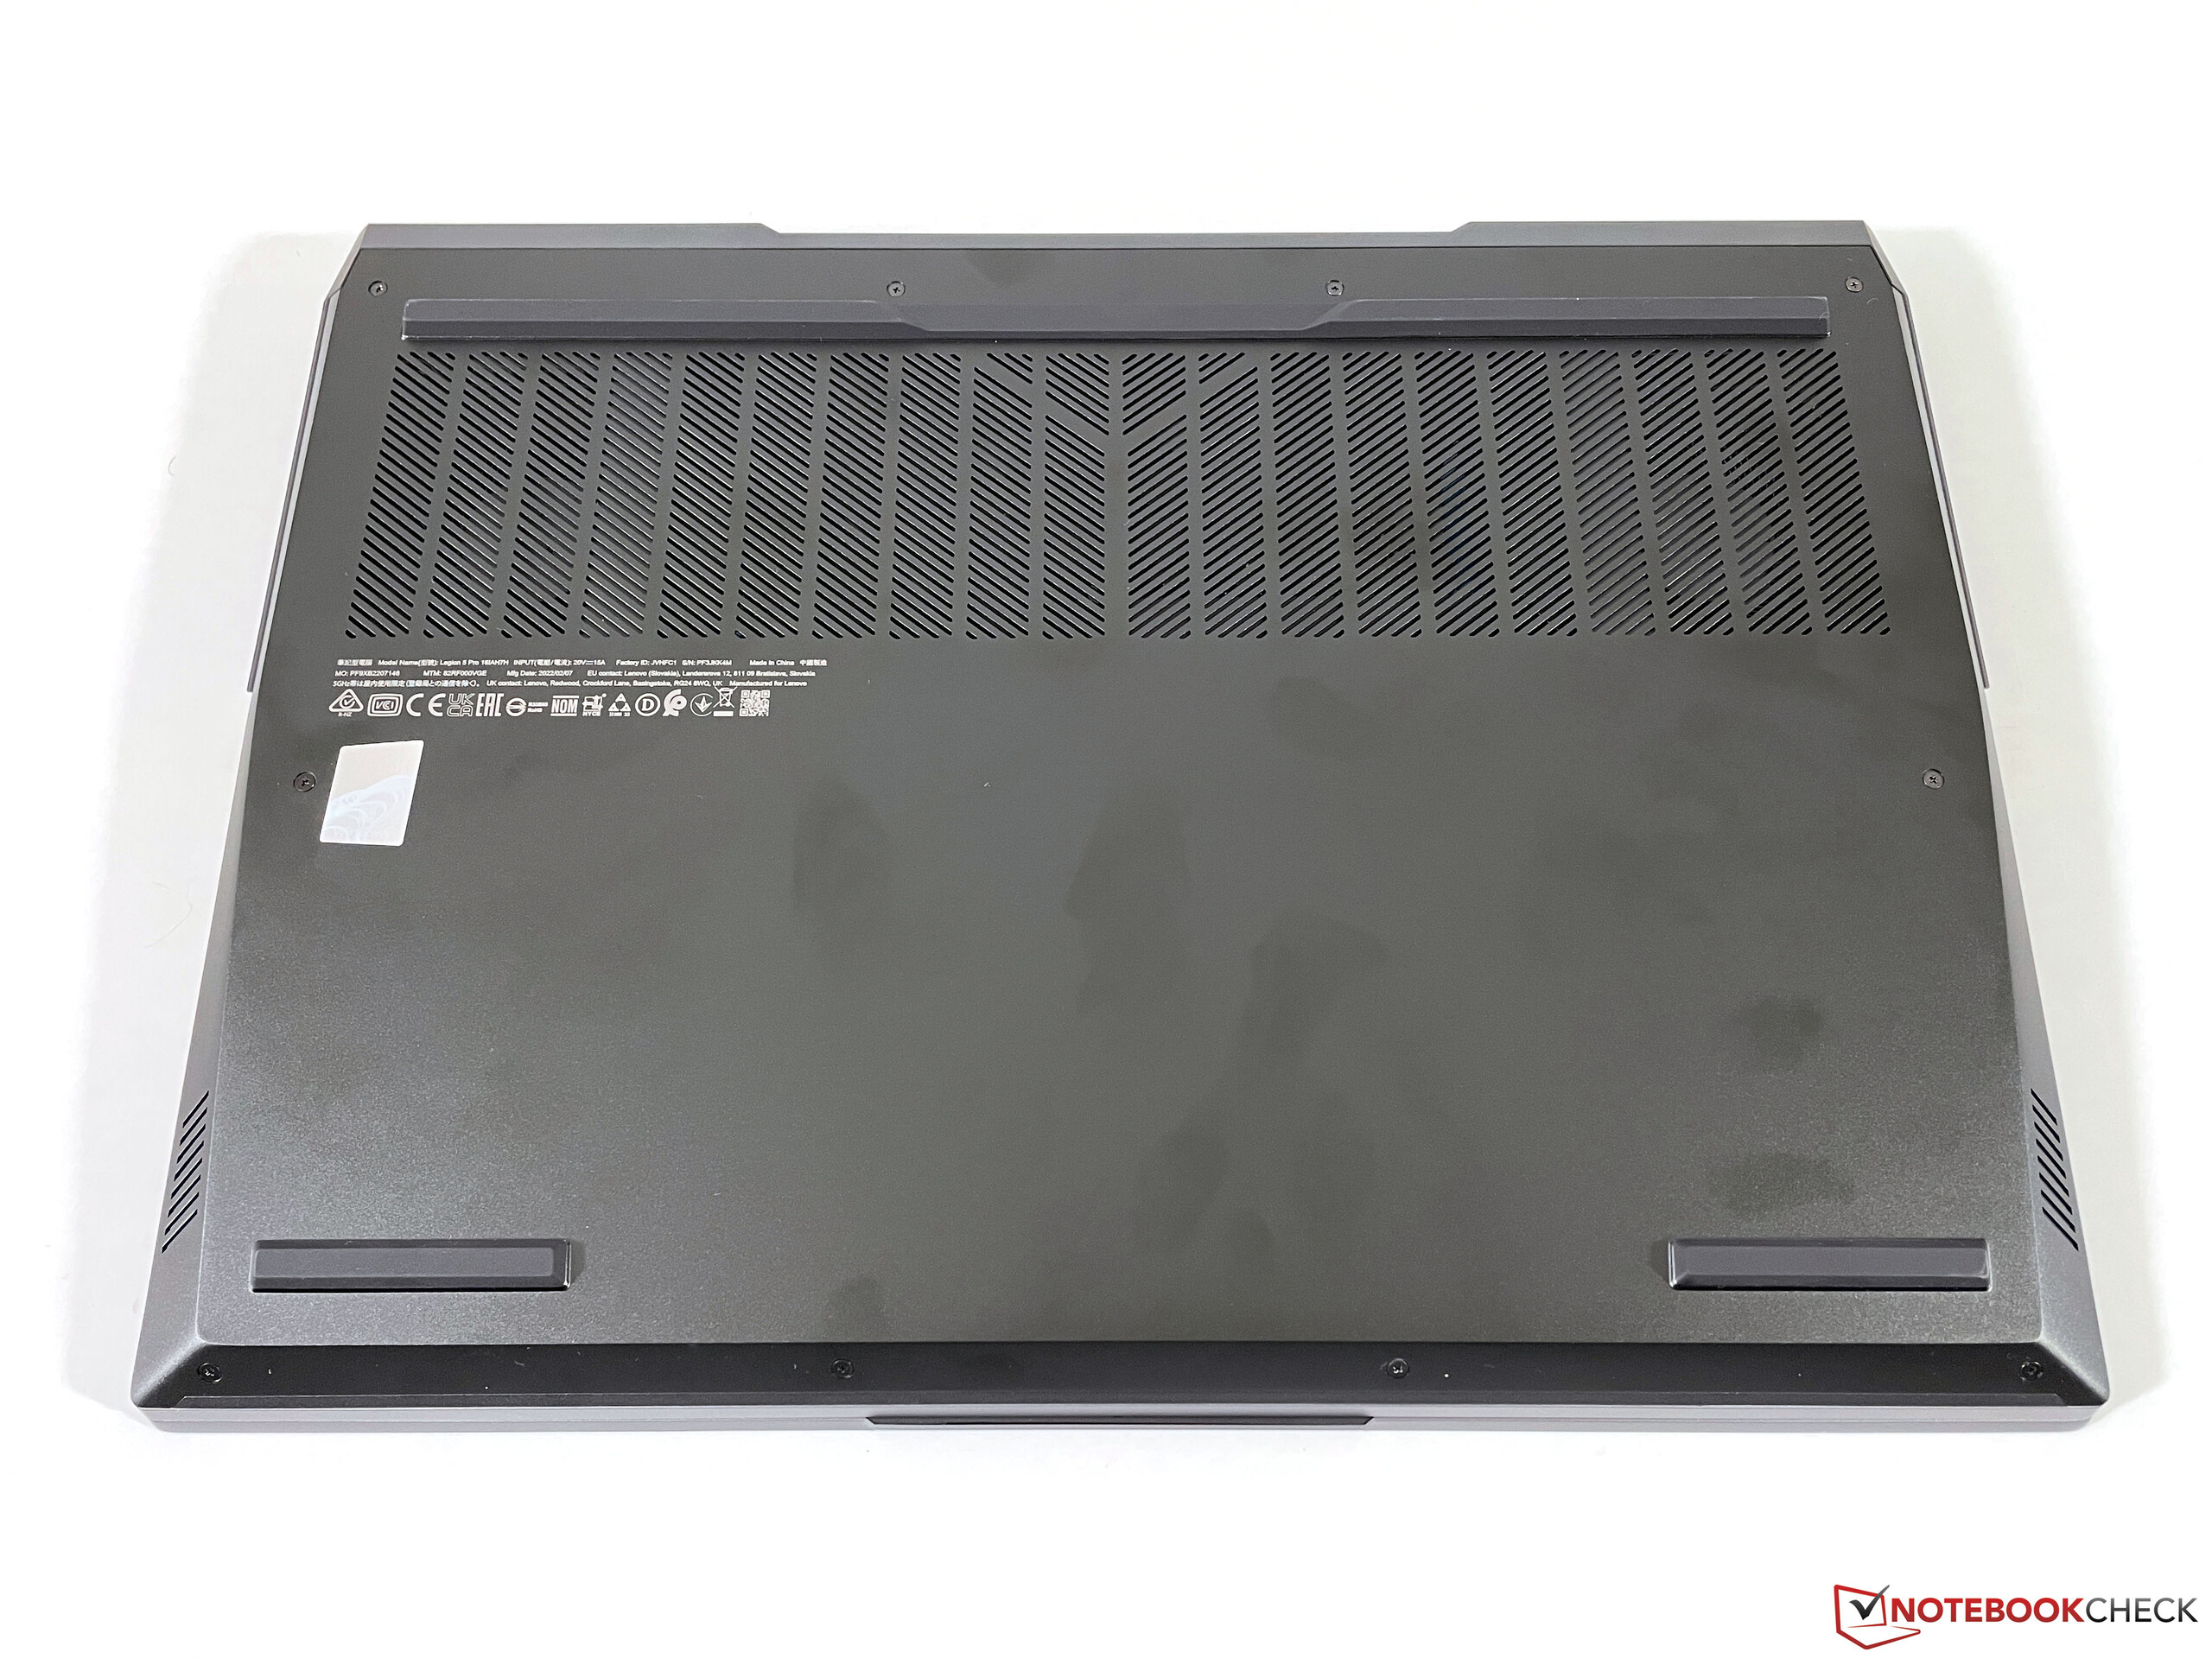
Mantenimiento
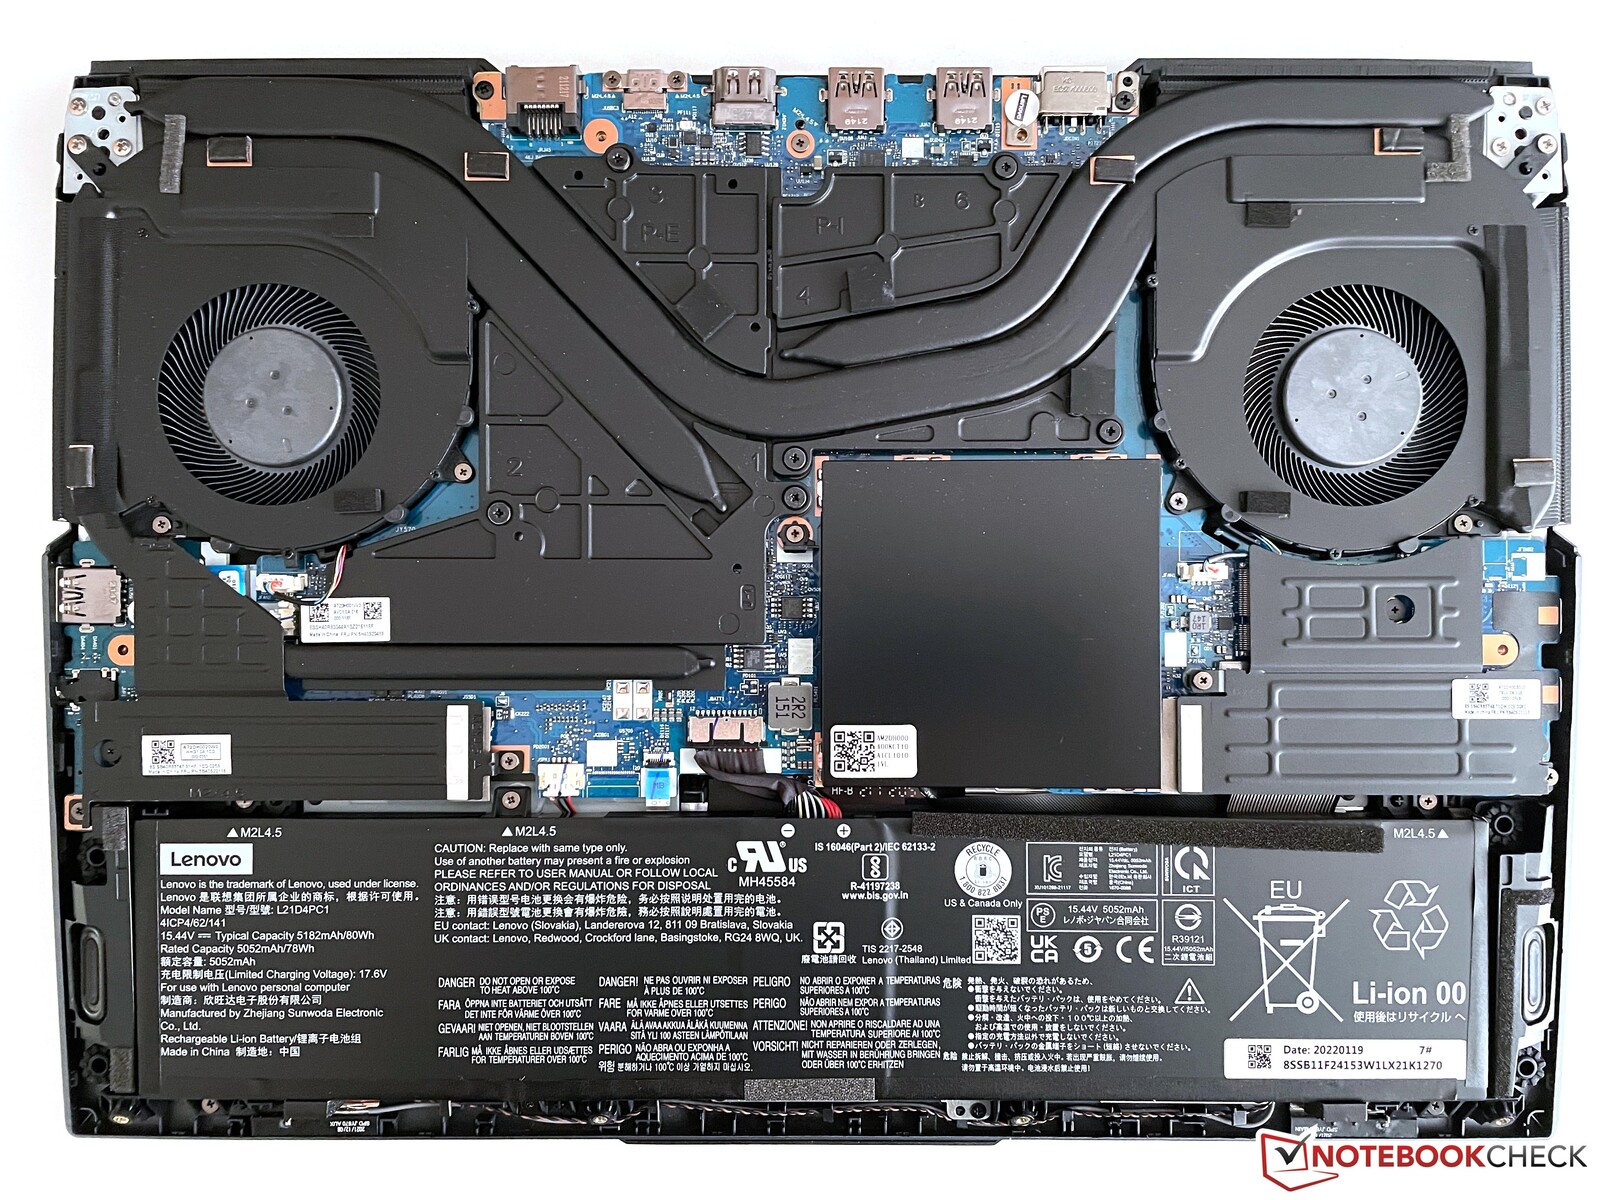
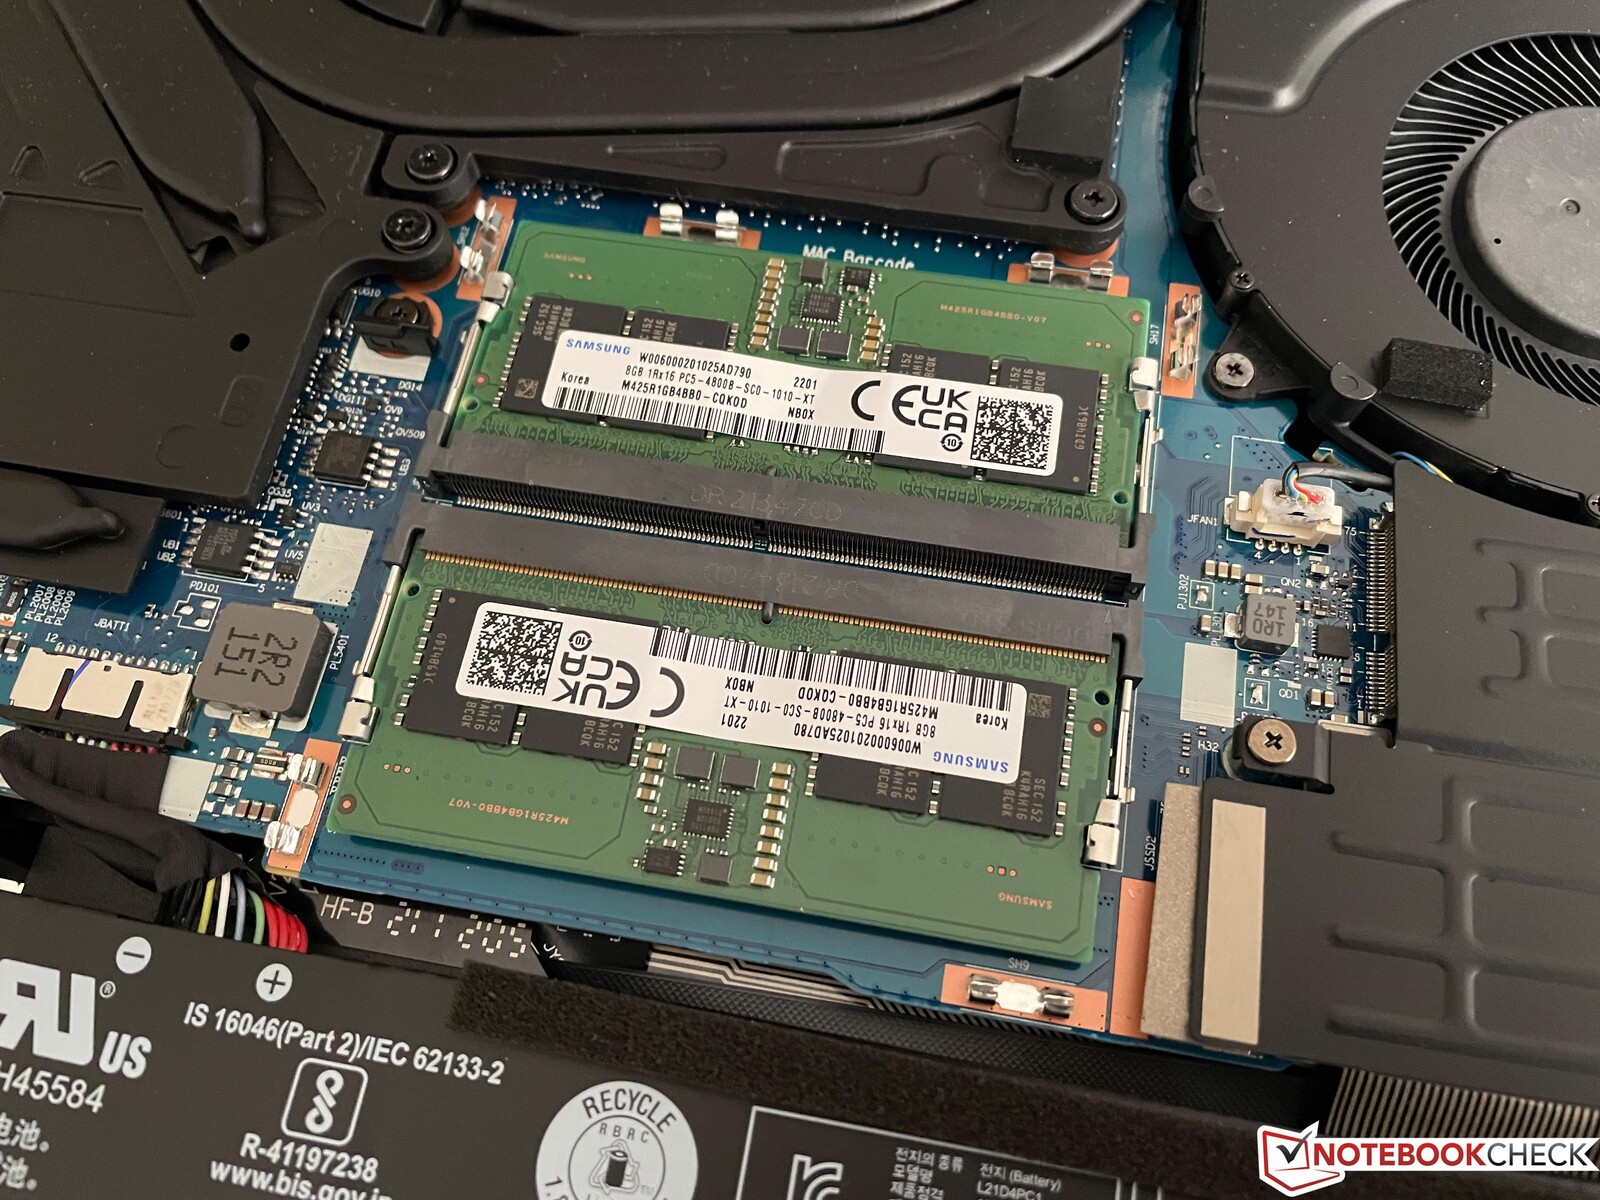
Puedes quitar toda la parte inferior de la unidad base, que está asegurada por 10 tornillos Philips. Hay otras cubiertas (algunas de ellas con tornillos adicionales) para las dos ranuras de RAM, las dos ranuras M.2 así como el módulo Wi-Fi. También puedes limpiar los ventiladores.
Dispositivos de entrada - Lenovo utiliza con un buen teclado
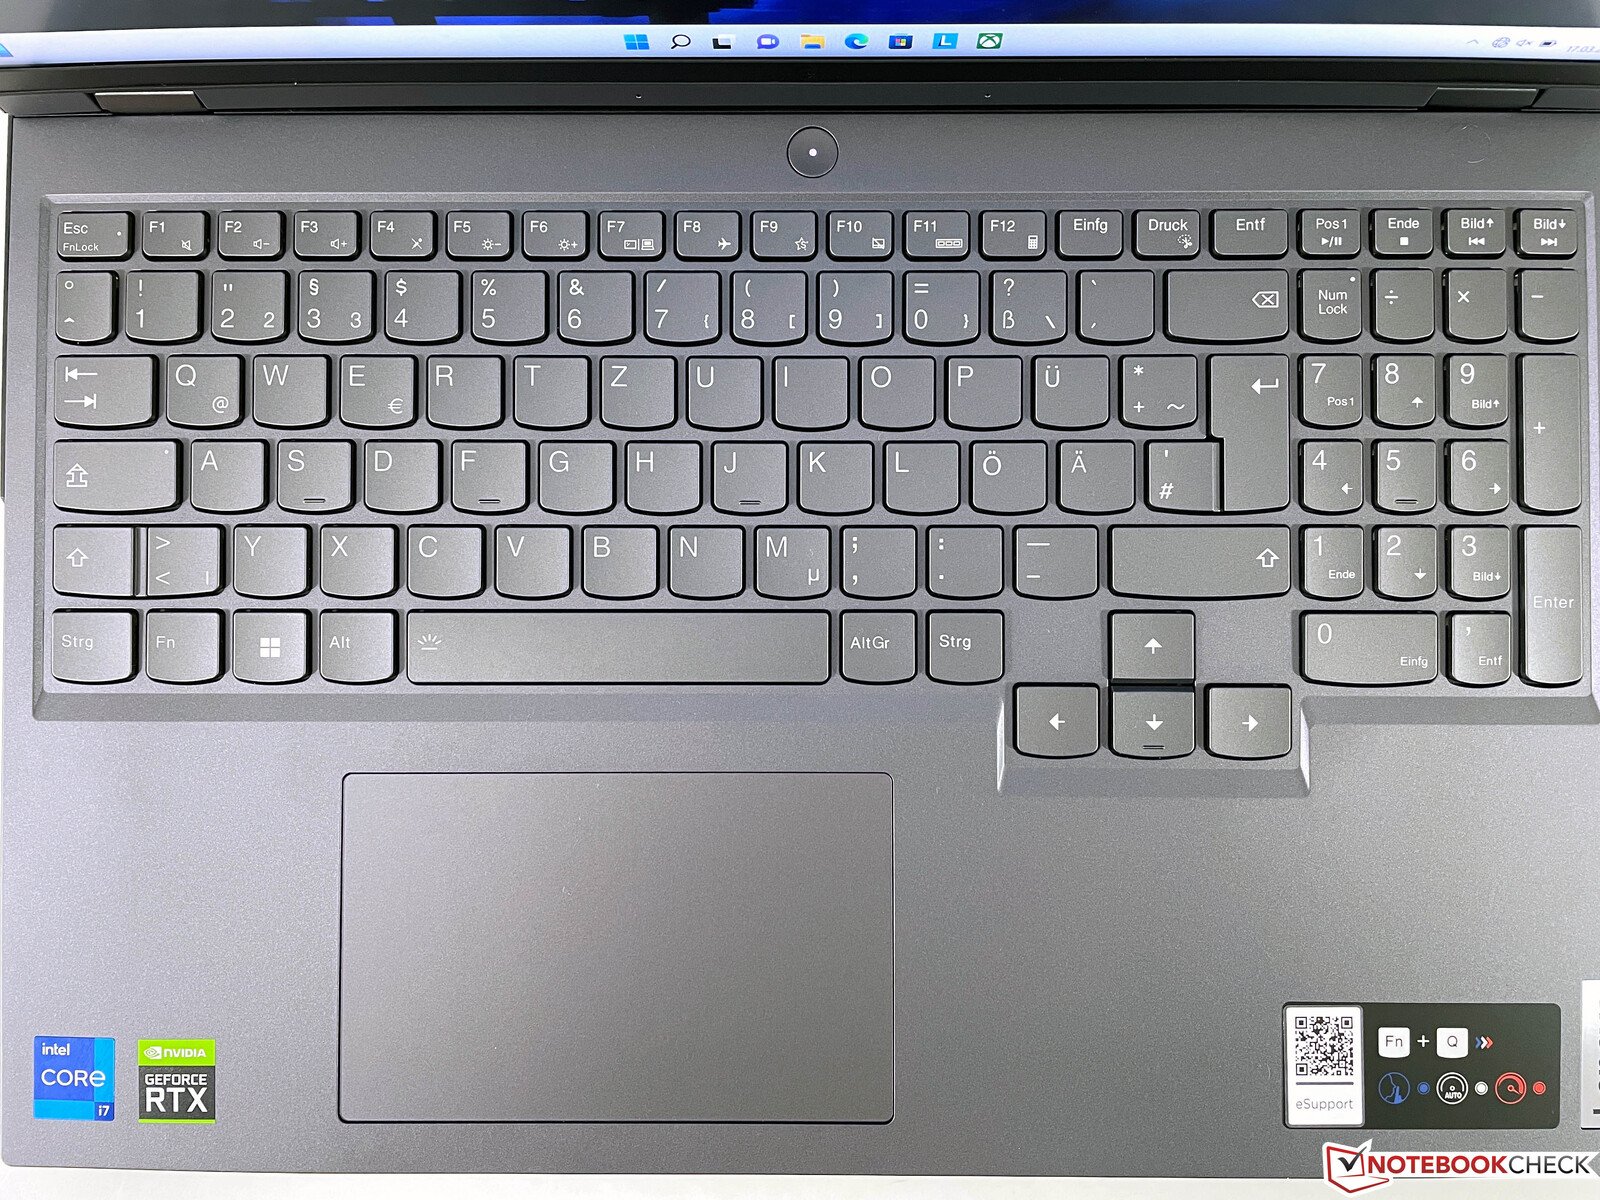
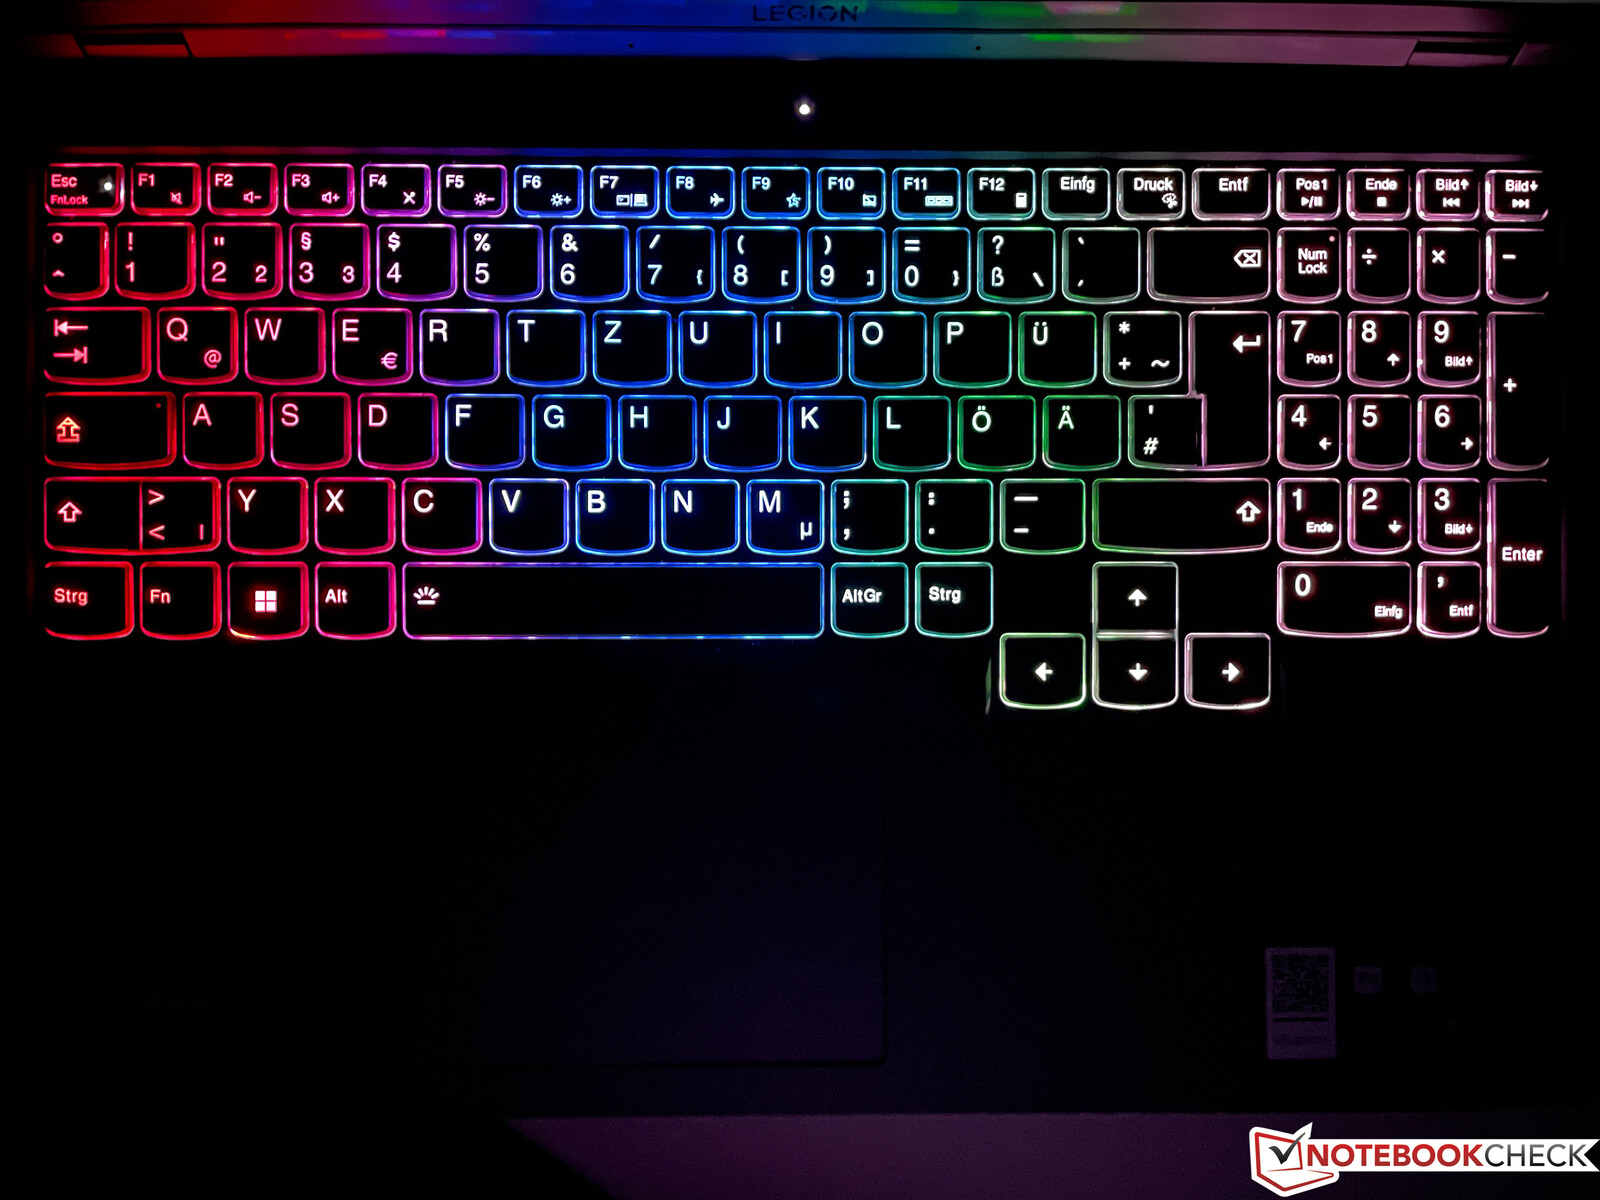
El teclado sigue ofreciendo un generoso recorrido de 1,5 mm y una experiencia de escritura muy cómoda, por lo que se puede utilizar fácilmente el Legion para textos largos. Las teclas de dirección son grandes y están ligeramente aisladas y también hay un teclado numérico dedicado, aunque las teclas son un poco más estrechas. Nuestra unidad de prueba cuenta con una iluminación de 4 zonas y se pueden configurar tres perfiles diferentes (también es posible una iluminación uniforme).
El gran clickpad funciona bien en situaciones cotidianas y los gestos con hasta cuatro dedos se ejecutan muy bien, pero los chasquidos son bastante fuertes. La mayoría de los jugadores probablemente utilizarán un ratón externo de todos modos, así que esto no debería ser un gran problema.
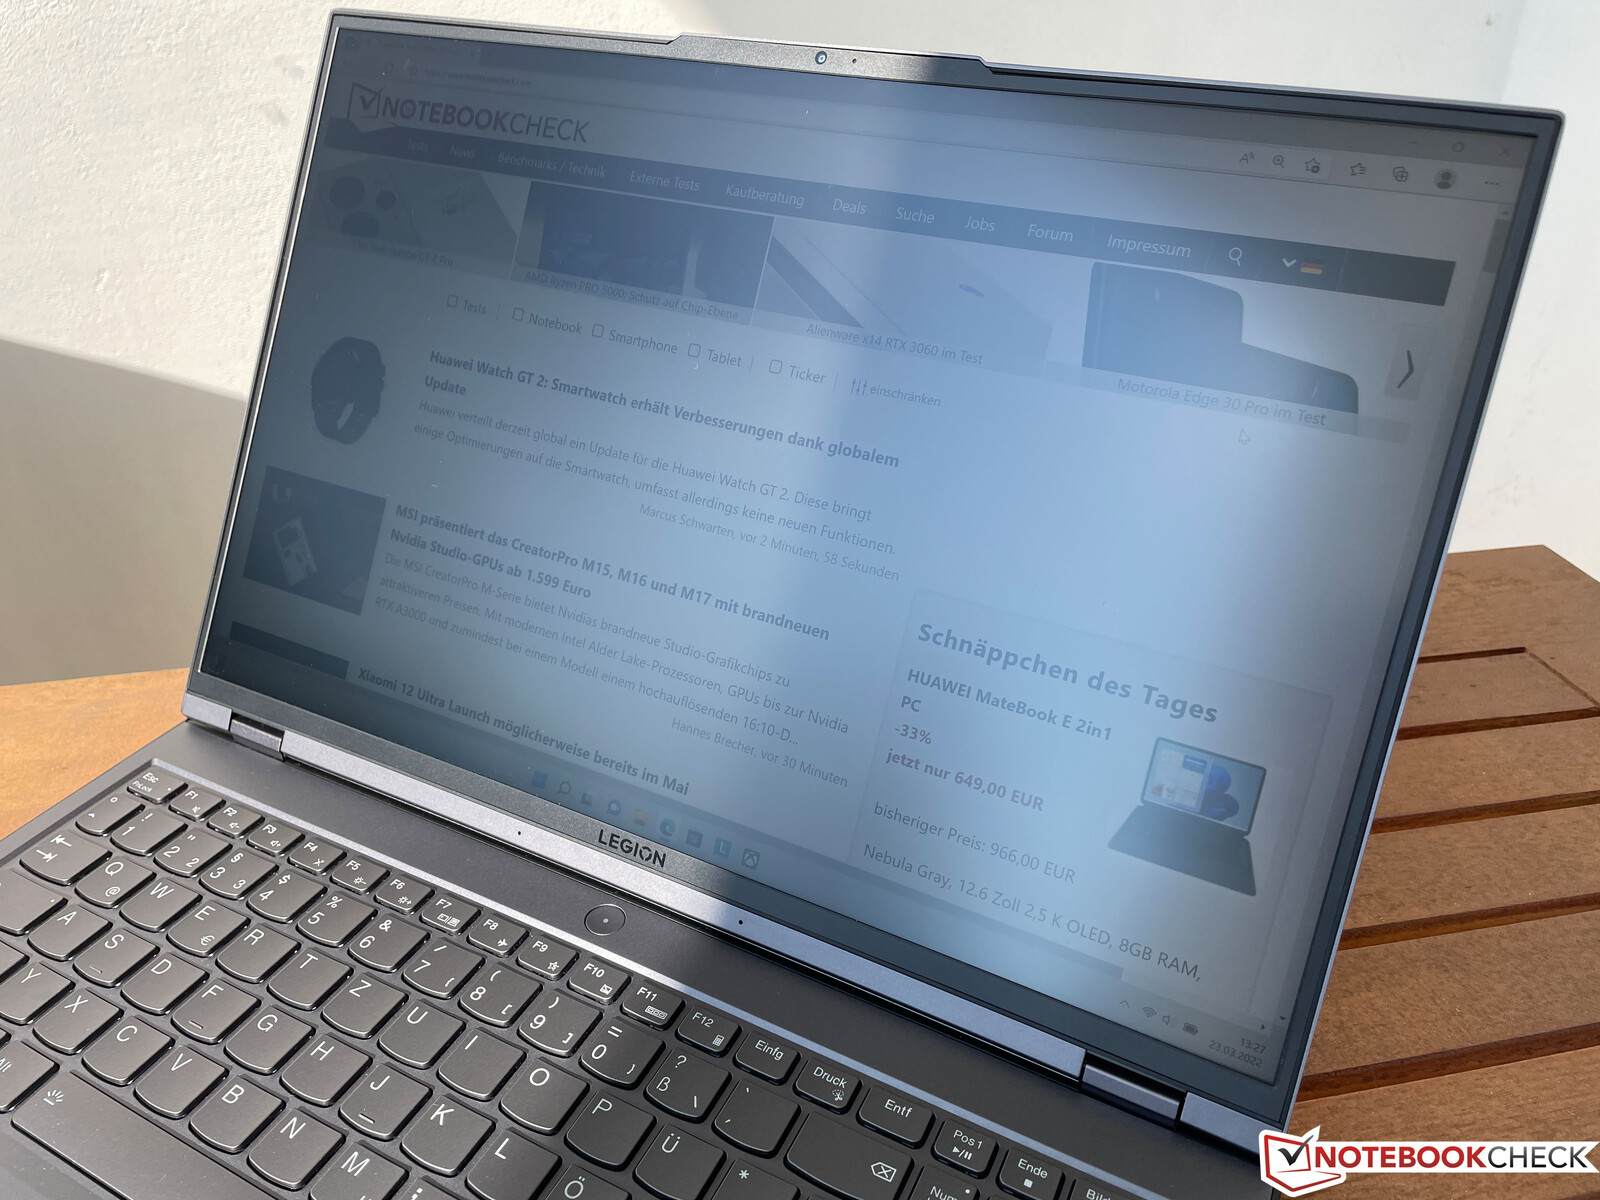
Pantalla - Panel de 165 Hz con resolución WQHD y G-Sync

Las especificaciones básicas de la pantalla de 16 pulgadas son similares a las de nuestra unidad de prueba anterior2560 x 1600 pixels, 16:10, IPS, HDR 400, y una alta tasa de refresco de 165 Hz. Gracias a Advanced Optimus, el sistema soporta ahora gráficos conmutables y G-Sync al mismo tiempo. Nuestra unidad, sin embargo, usa un panel de otro proveedor (BOE). La impresión subjetiva de la imagen sigue siendo excelente con colores nítidos, buen contraste, y la imagen no parece granulada a pesar de la superficie mate. La alta tasa de refresco da como resultado imágenes más suaves y se puede ver claramente el efecto cuando se desplaza por páginas web o documentos.
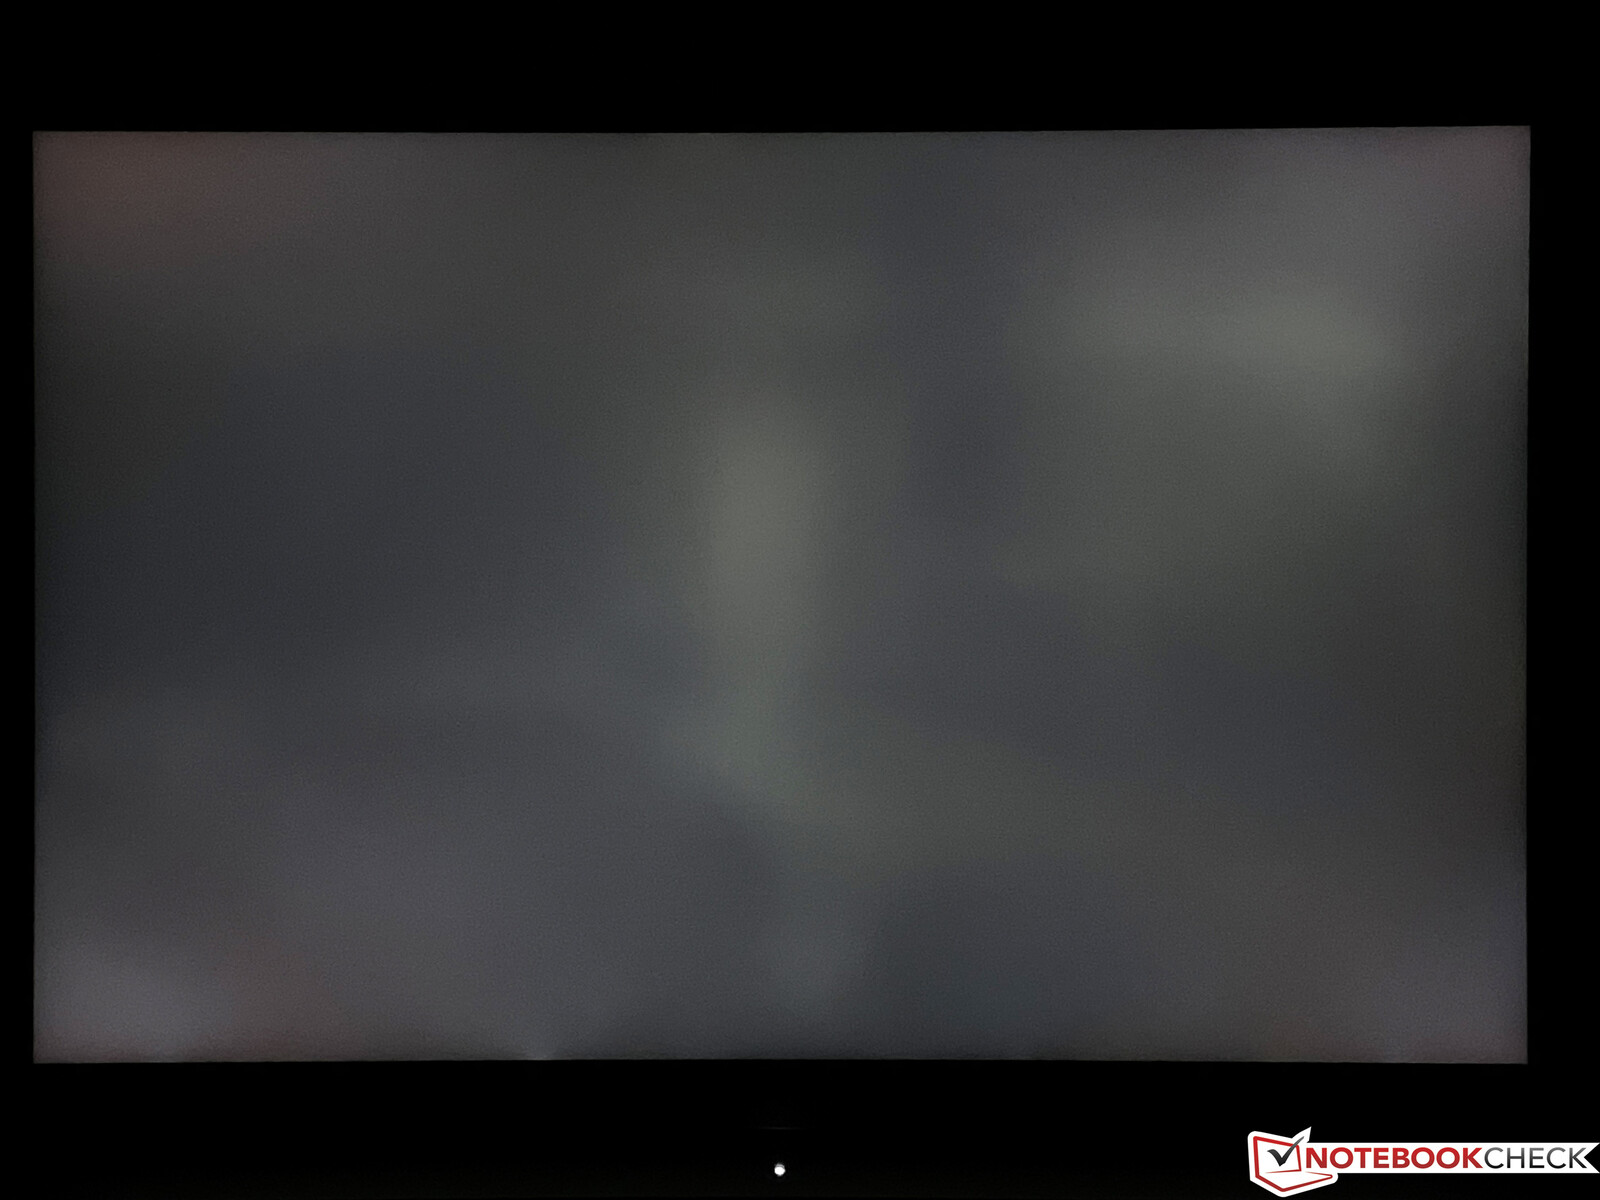
El brillo medio está ligeramente por debajo de los 500 nits, pero el valor de los negros es mejor en comparación con nuestra primera unidad de prueba, lo que resulta en una buena relación de contraste de más de 1300:1. Los tiempos de respuesta son rápidos y tampoco detectamos ningún parpadeo PWM. Hay sangrados de retroiluminación visibles en fondos oscuros y niveles de brillo altos, pero por suerte no son visibles en la práctica.
| |||||||||||||||||||||||||
iluminación: 91 %
Brillo con batería: 503 cd/m²
Contraste: 1357:1 (Negro: 0.37 cd/m²)
ΔE ColorChecker Calman: 2.7 | ∀{0.5-29.43 Ø4.71}
calibrated: 1.4
ΔE Greyscale Calman: 2.7 | ∀{0.09-98 Ø4.96}
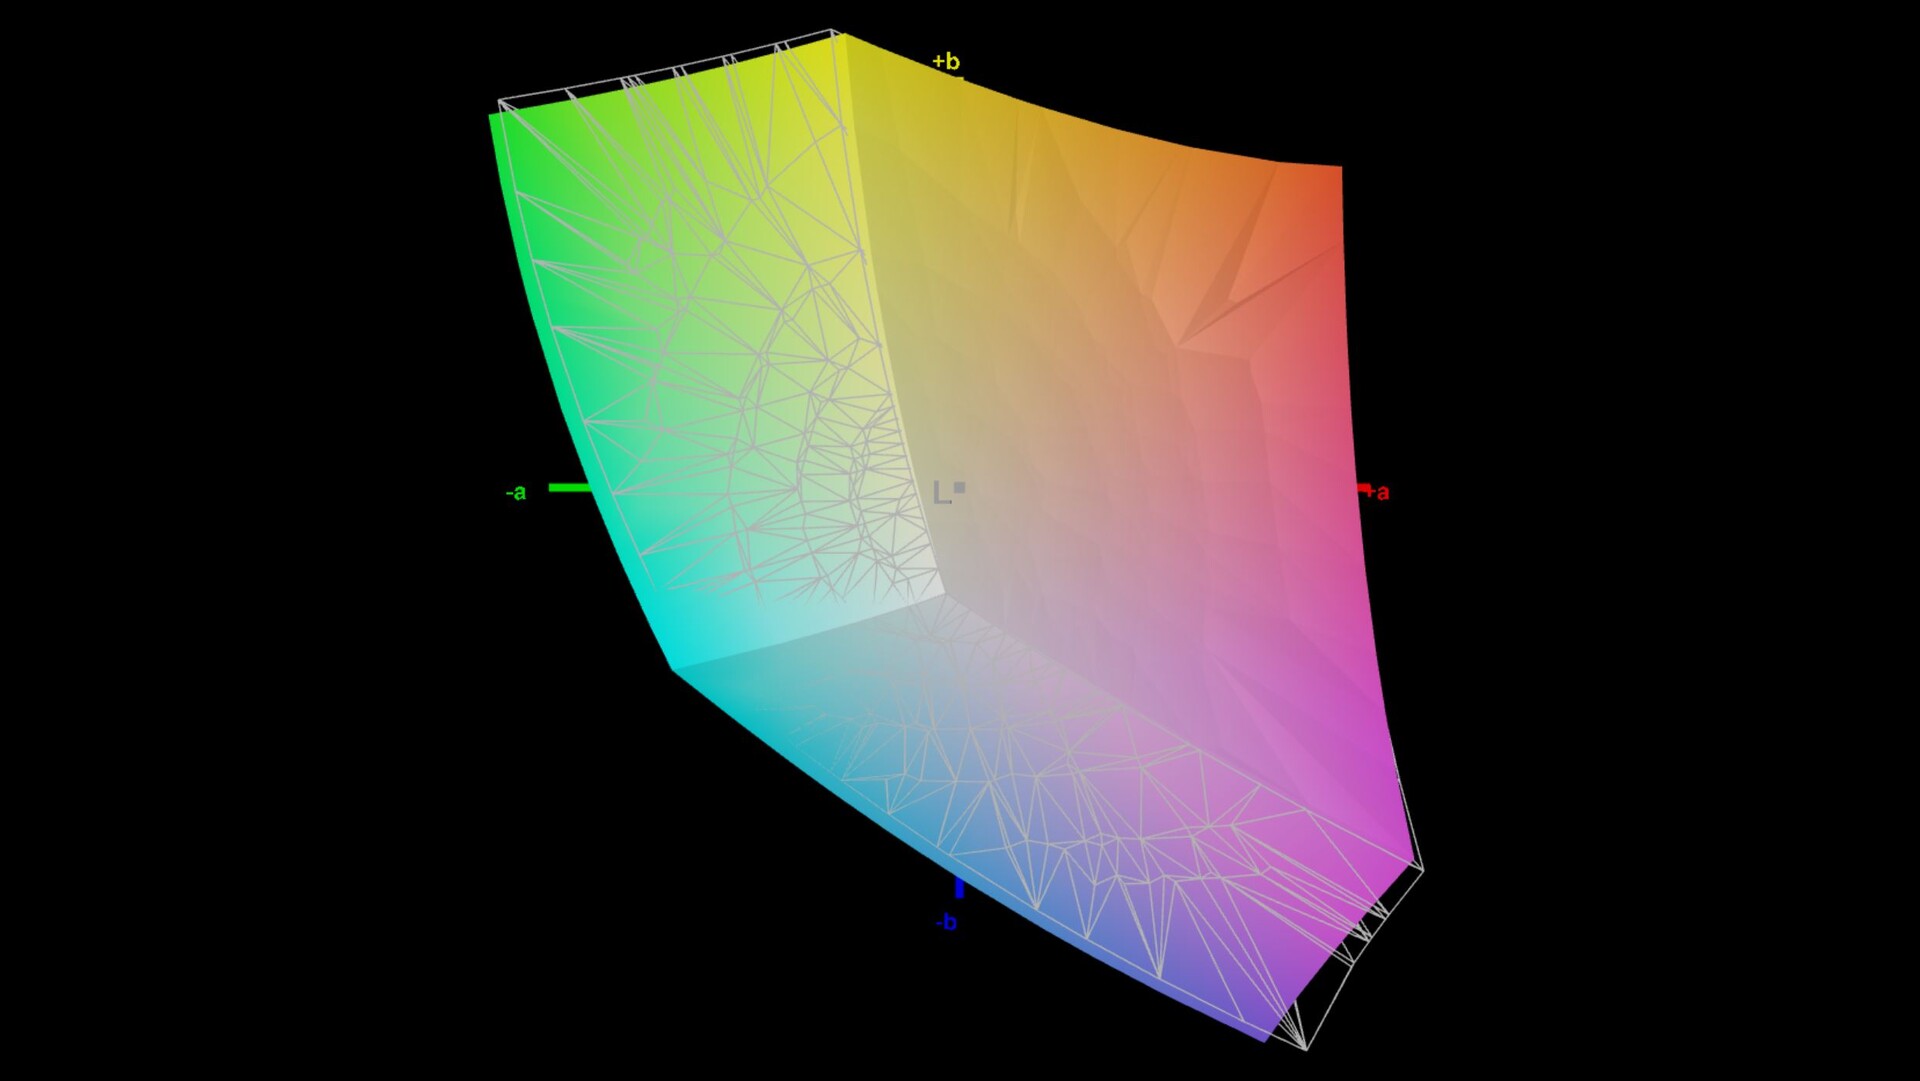
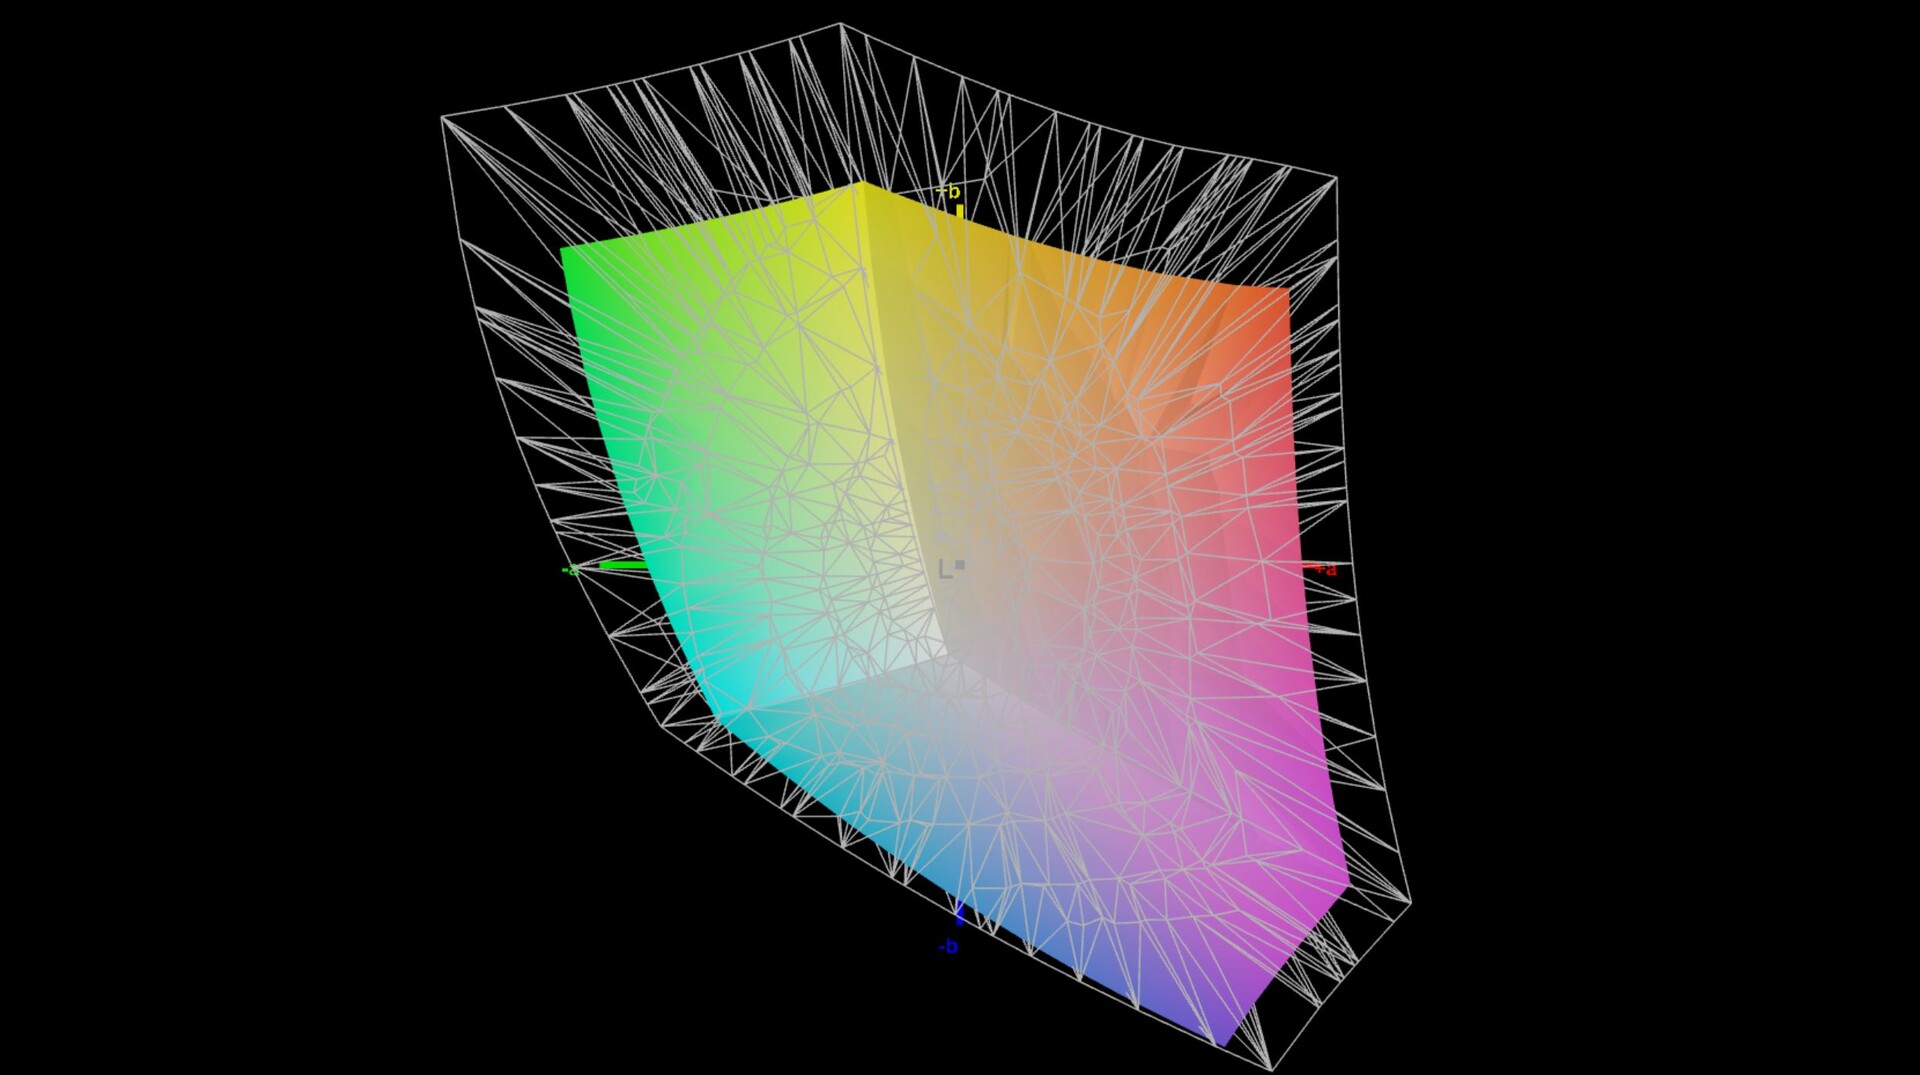
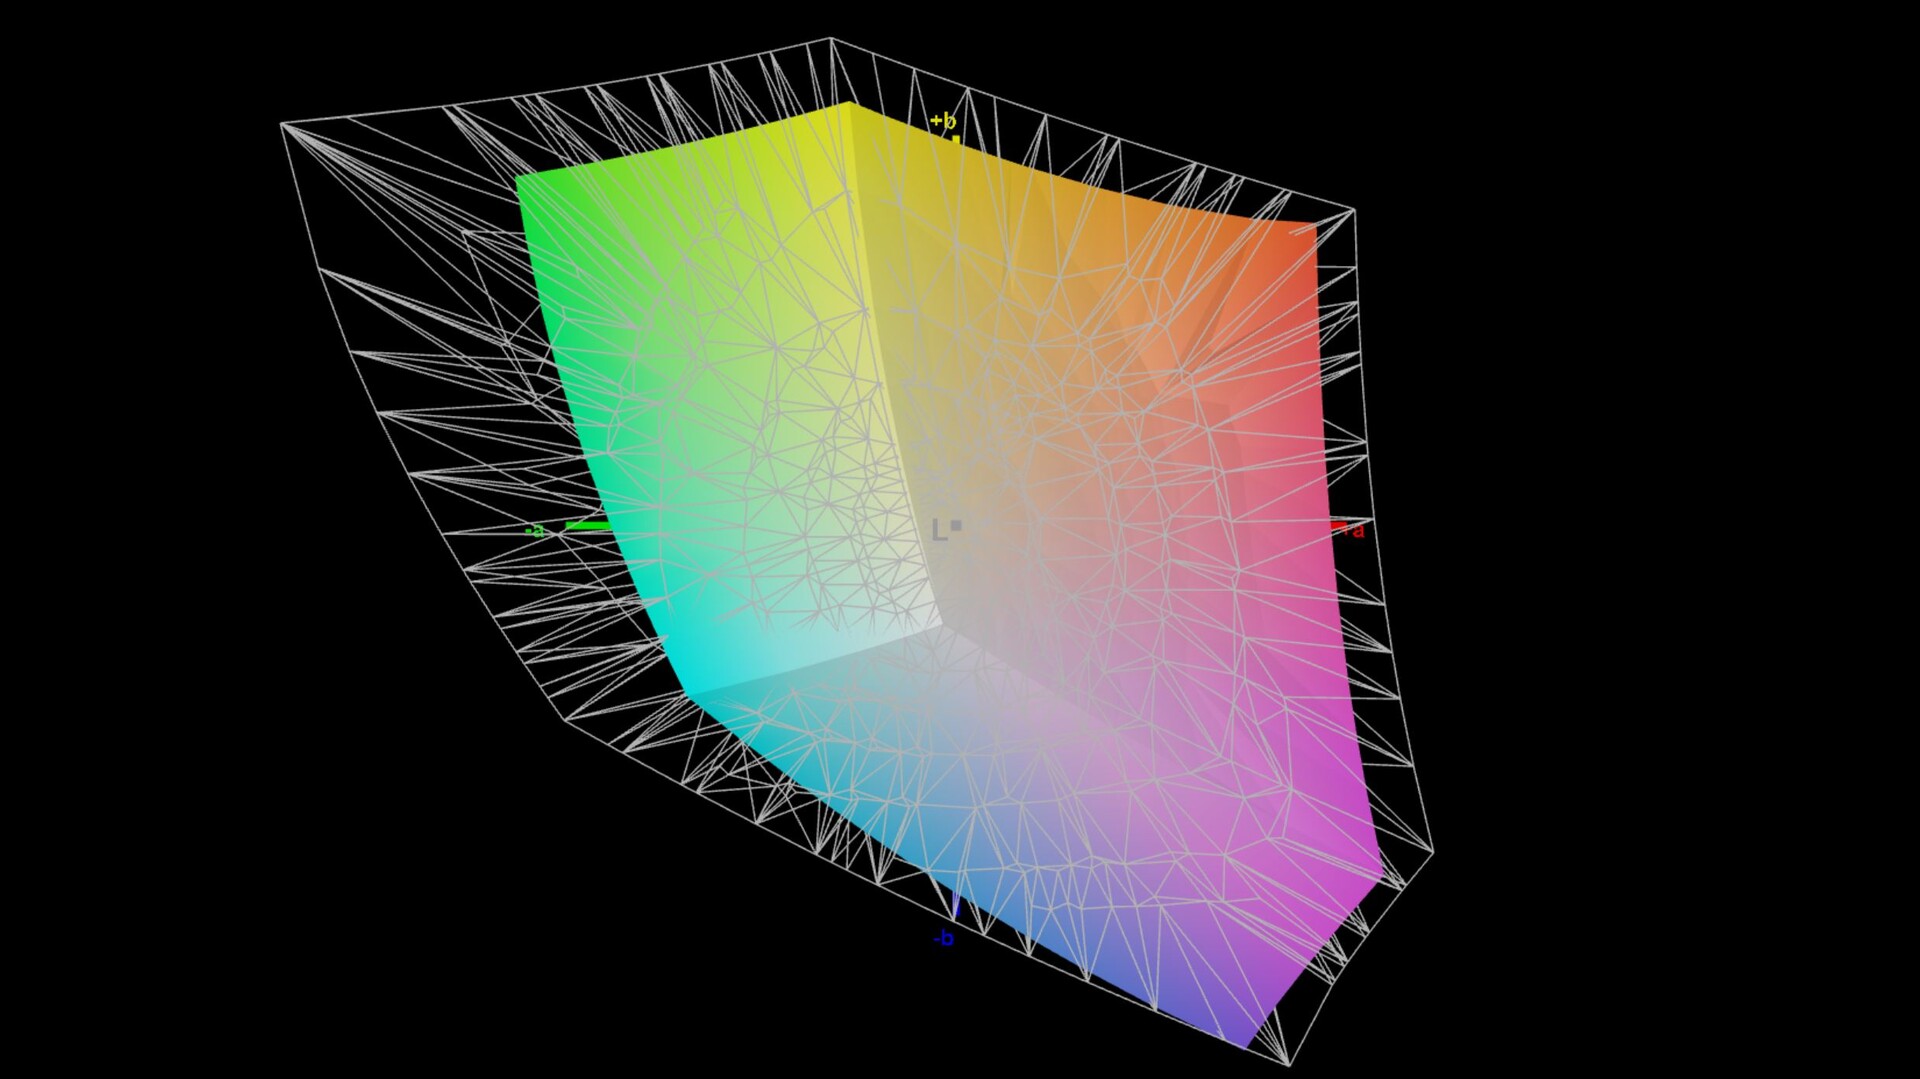
70.9% AdobeRGB 1998 (Argyll 3D)
97.6% sRGB (Argyll 3D)
68.7% Display P3 (Argyll 3D)
Gamma: 2.44
CCT: 6326 K
| Lenovo Legion 5 Pro 16 G7 i7 RTX 3070Ti NE160QDM-NY1, IPS, 2560x1600, 16" | MSI Vector GP66 12UGS BOE NE156FHM-NZ3, IPS, 1920x1080, 15.6" | HP Omen 16-b0085ng BOE09BE, IPS, 1920x1080, 16.1" | Acer Nitro 5 AN515-45-R1JH BOE BOE09B8, IPS, 2560x1440, 15.6" | Asus TUF Gaming A15 FA506QR-AZ061T Sharp SHP1532, IPS, 1920x1080, 15.6" | Lenovo Legion 5 Pro 16ACH6H (82JQ001PGE) CSOT T3 MNG007DA1-1, IPS, 2560x1600, 16" | |
|---|---|---|---|---|---|---|
| Display | 2% | 4% | -3% | 2% | ||
| Display P3 Coverage (%) | 68.7 | 70.1 2% | 72.3 5% | 66.2 -4% | ||
| sRGB Coverage (%) | 97.6 | 99.5 2% | 99.5 2% | 96.3 -1% | 99 1% | |
| AdobeRGB 1998 Coverage (%) | 70.9 | 72.1 2% | 73.8 4% | 67.1 -5% | 73 3% | |
| Response Times | 21% | -4% | 8% | 14% | 43% | |
| Response Time Grey 50% / Grey 80% * (ms) | 17.6 ? | 5.8 ? 67% | 8 ? 55% | 14 ? 20% | 12 ? 32% | 9.2 ? 48% |
| Response Time Black / White * (ms) | 7.6 ? | 9.6 ? -26% | 12.4 ? -63% | 8 ? -5% | 8 ? -5% | 4.8 37% |
| PWM Frequency (Hz) | 1250 ? | |||||
| Screen | -13% | -47% | -49% | 5% | 4% | |
| Brightness middle (cd/m²) | 502 | 353.1 -30% | 405 -19% | 349 -30% | 297 -41% | 551 10% |
| Brightness (cd/m²) | 491 | 325 -34% | 378 -23% | 304 -38% | 268 -45% | 523 7% |
| Brightness Distribution (%) | 91 | 85 -7% | 87 -4% | 79 -13% | 84 -8% | 88 -3% |
| Black Level * (cd/m²) | 0.37 | 0.38 -3% | 0.34 8% | 0.535 -45% | 0.22 41% | 0.54 -46% |
| Contrast (:1) | 1357 | 929 -32% | 1191 -12% | 652 -52% | 1350 -1% | 1020 -25% |
| Colorchecker dE 2000 * | 2.7 | 2.24 17% | 3.7 -37% | 3.11 -15% | 1.36 50% | 1.8 33% |
| Colorchecker dE 2000 max. * | 4.5 | 5 -11% | 7.77 -73% | 9.57 -113% | 3.82 15% | 2.53 44% |
| Colorchecker dE 2000 calibrated * | 1.4 | 1.02 27% | 3.49 -149% | 1.66 -19% | ||
| Greyscale dE 2000 * | 2.7 | 4 -48% | 5.88 -118% | 5 -85% | 1.88 30% | 1.85 31% |
| Gamma | 2.44 90% | 2.24 98% | 2.57 86% | 2.36 93% | 2.48 89% | 2.3 96% |
| CCT | 6326 103% | 6864 95% | 6342 102% | 6976 93% | 6768 96% | 6338 103% |
| Color Space (Percent of AdobeRGB 1998) (%) | 73.76 | 63 | 72.81 | |||
| Color Space (Percent of sRGB) (%) | 99.47 | 99 | 99.41 | |||
| Media total (Programa/Opciones) | 3% /
-5% | -16% /
-30% | -15% /
-30% | 10% /
7% | 16% /
9% |
* ... más pequeño es mejor
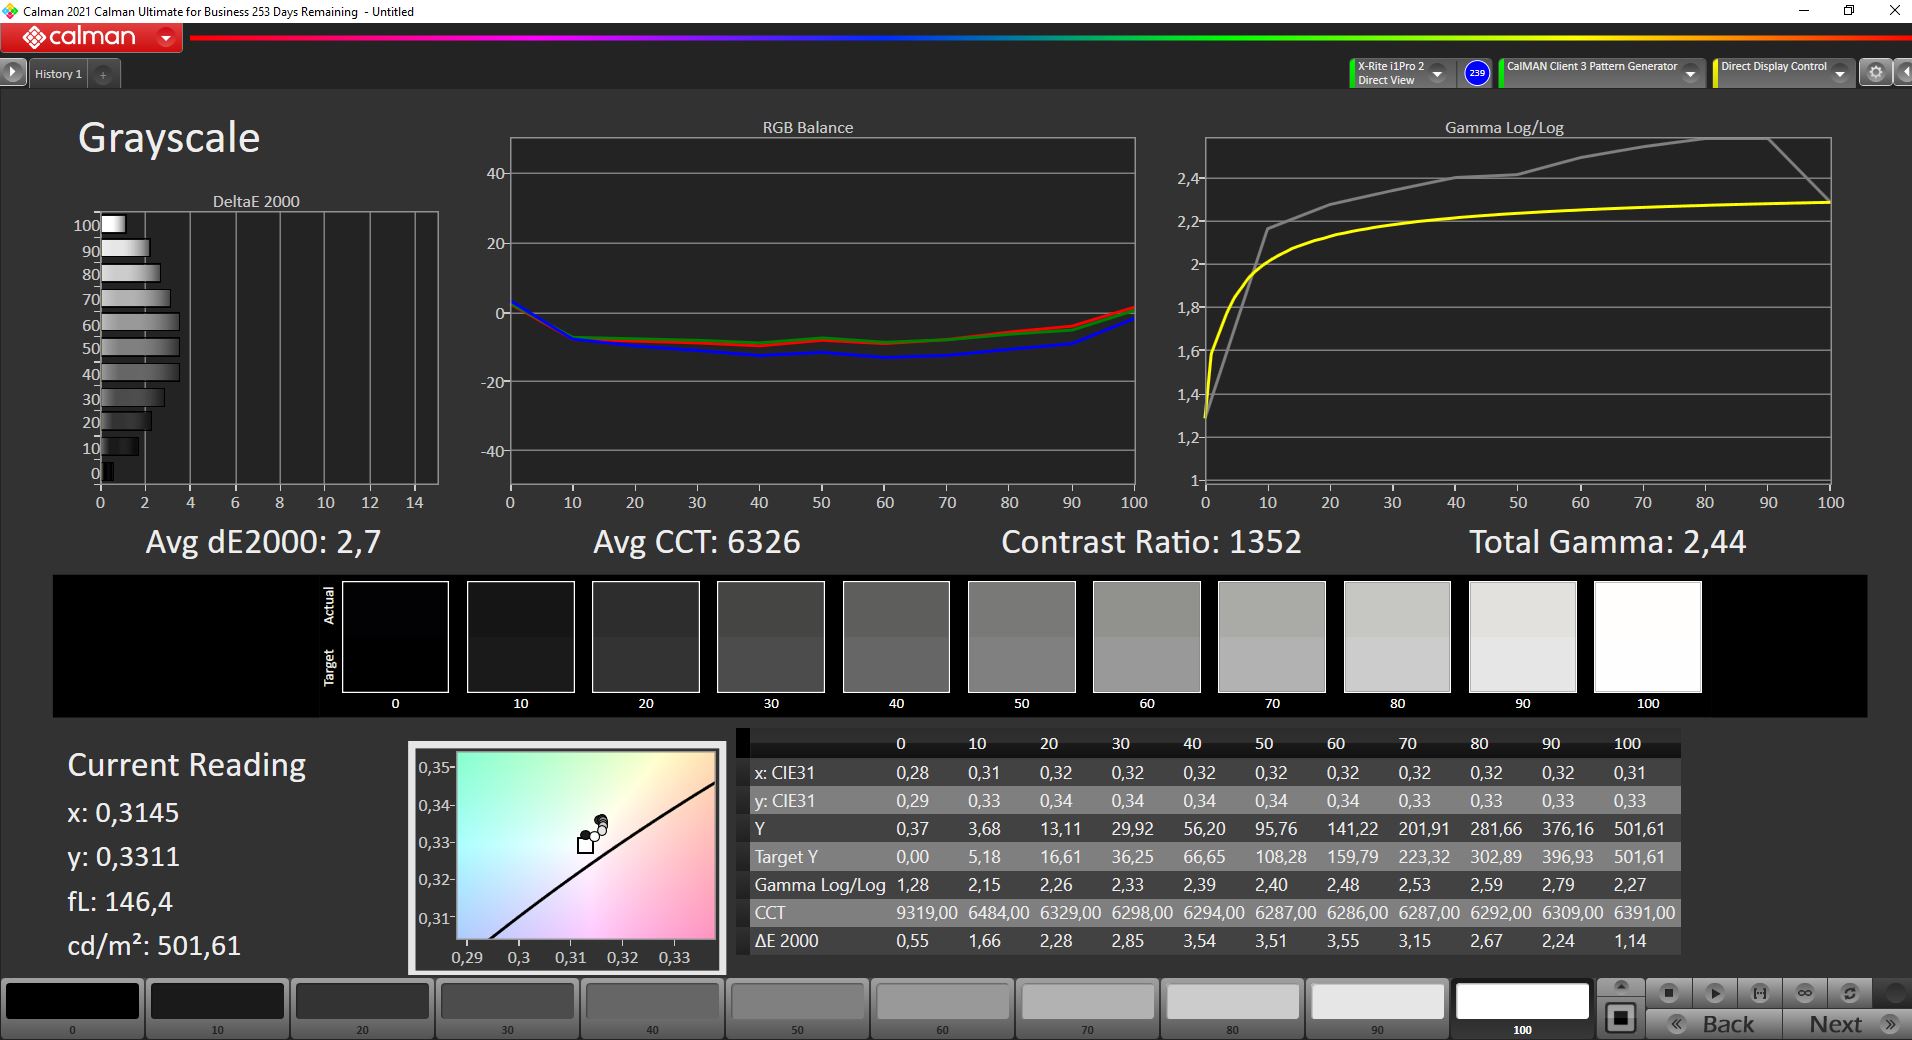
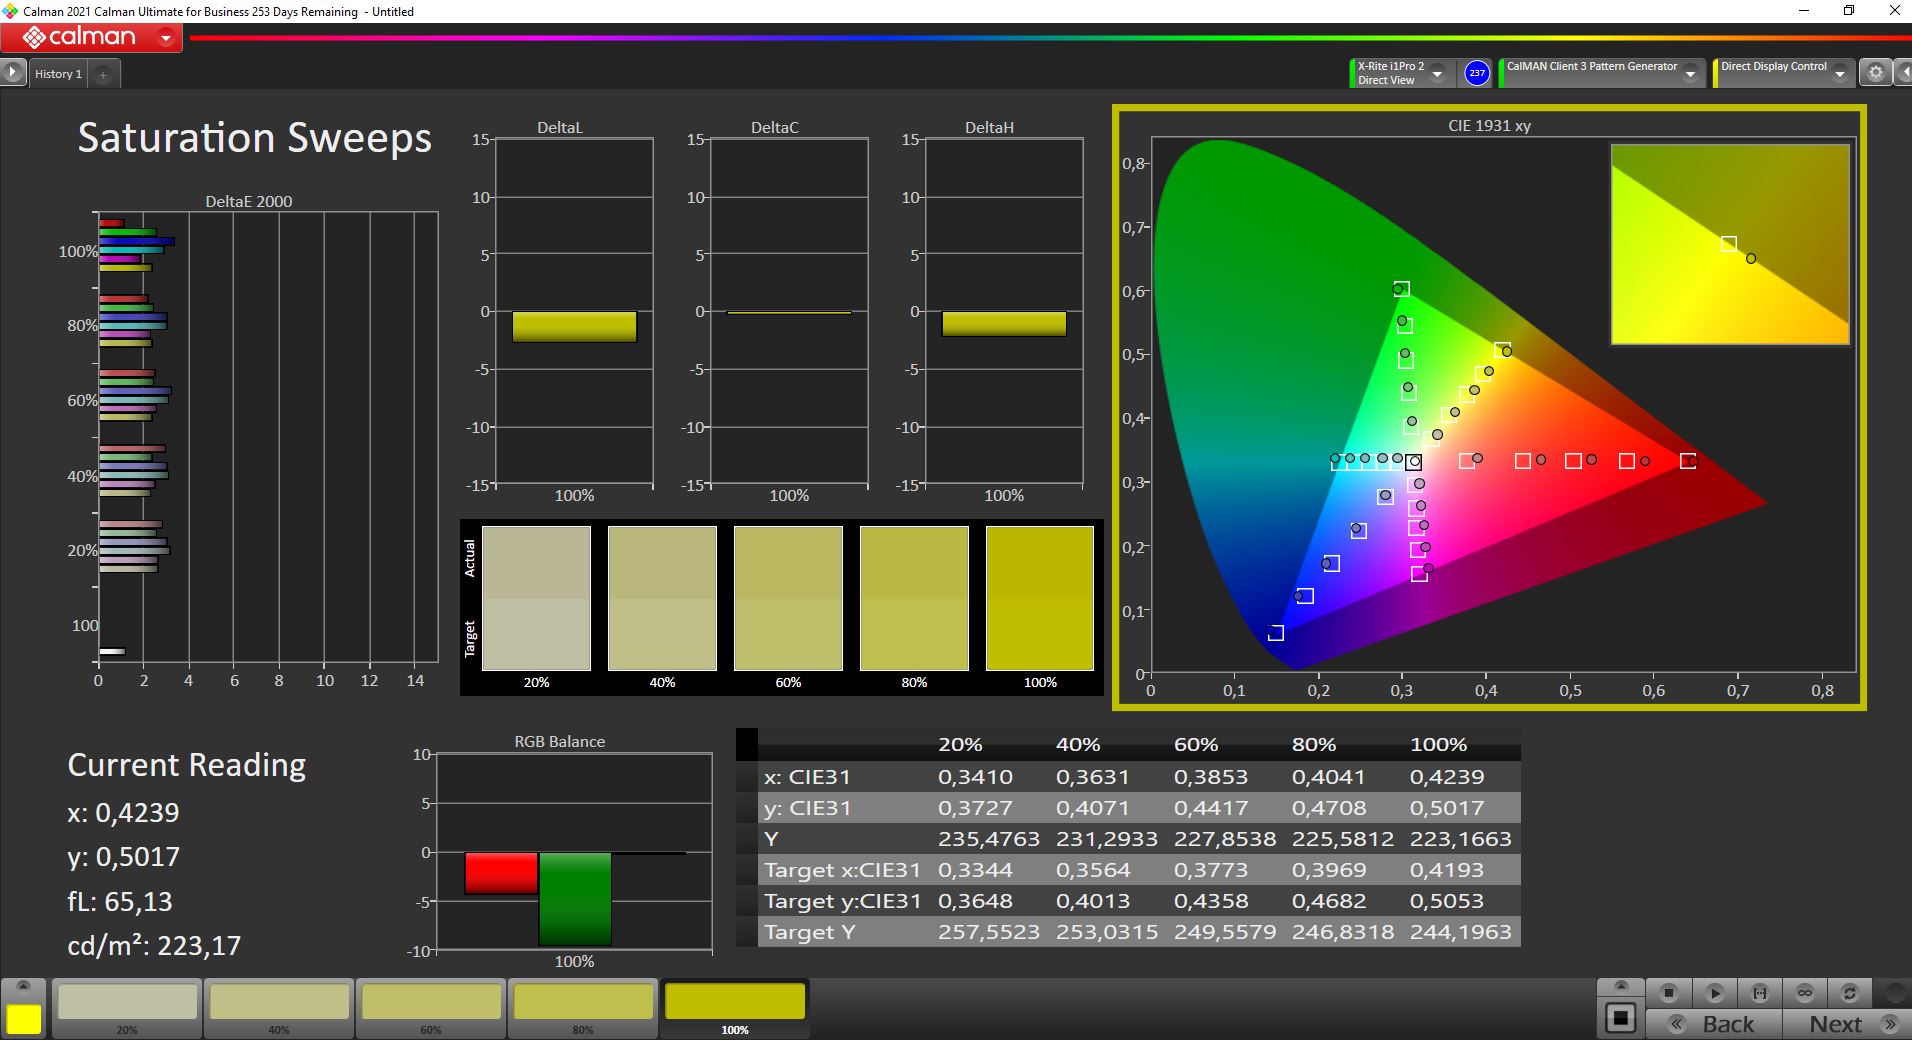
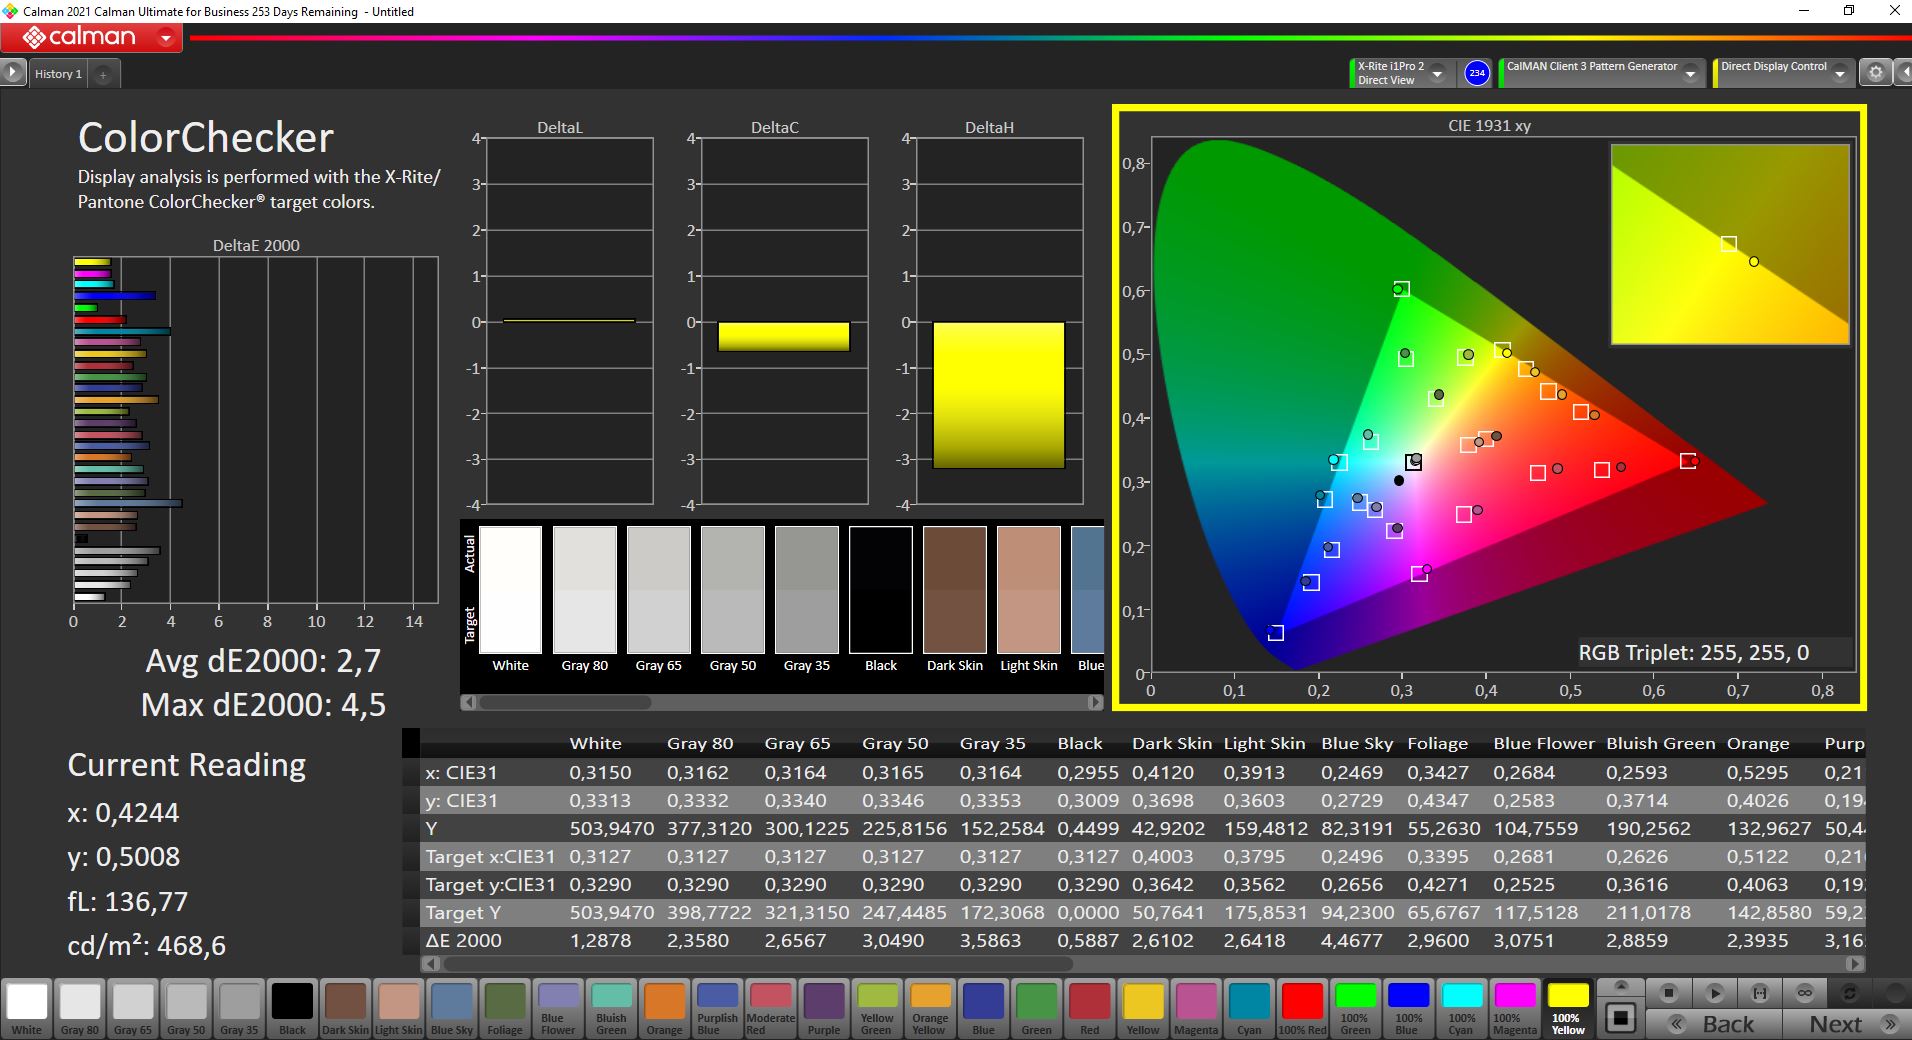

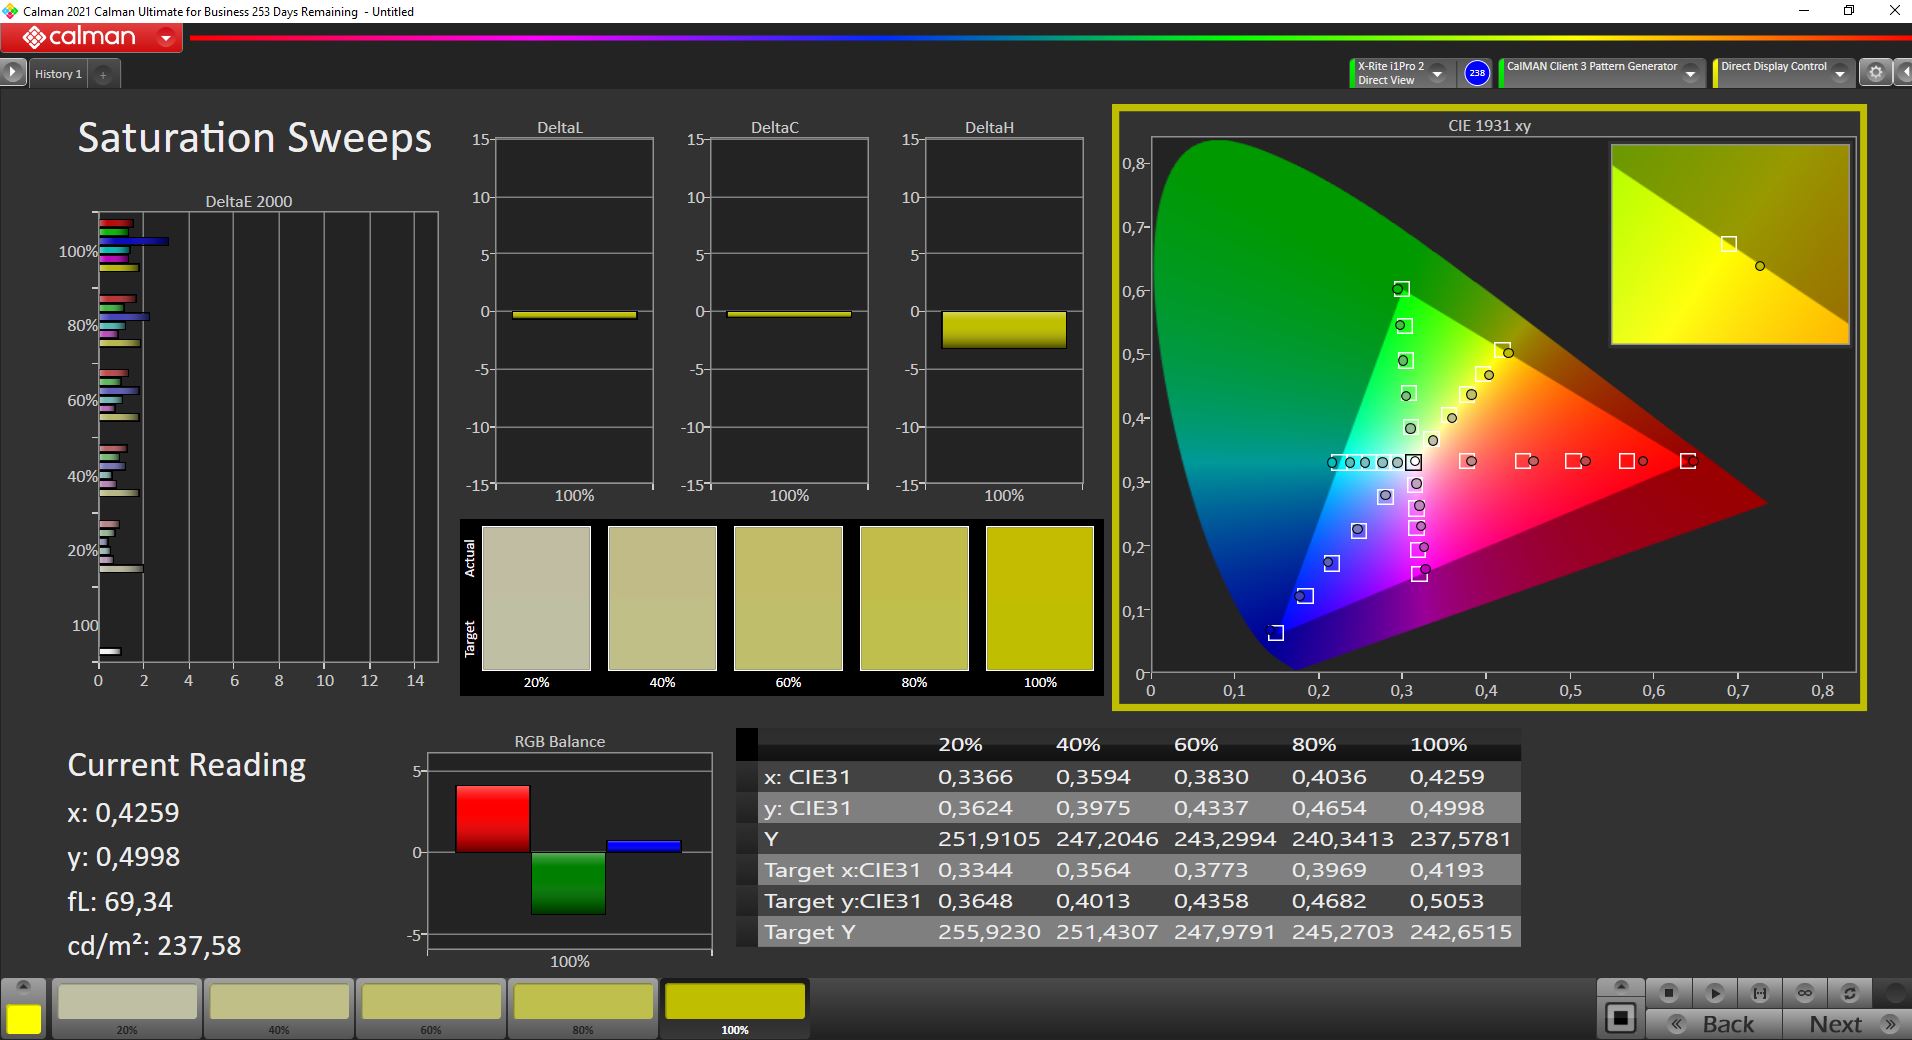
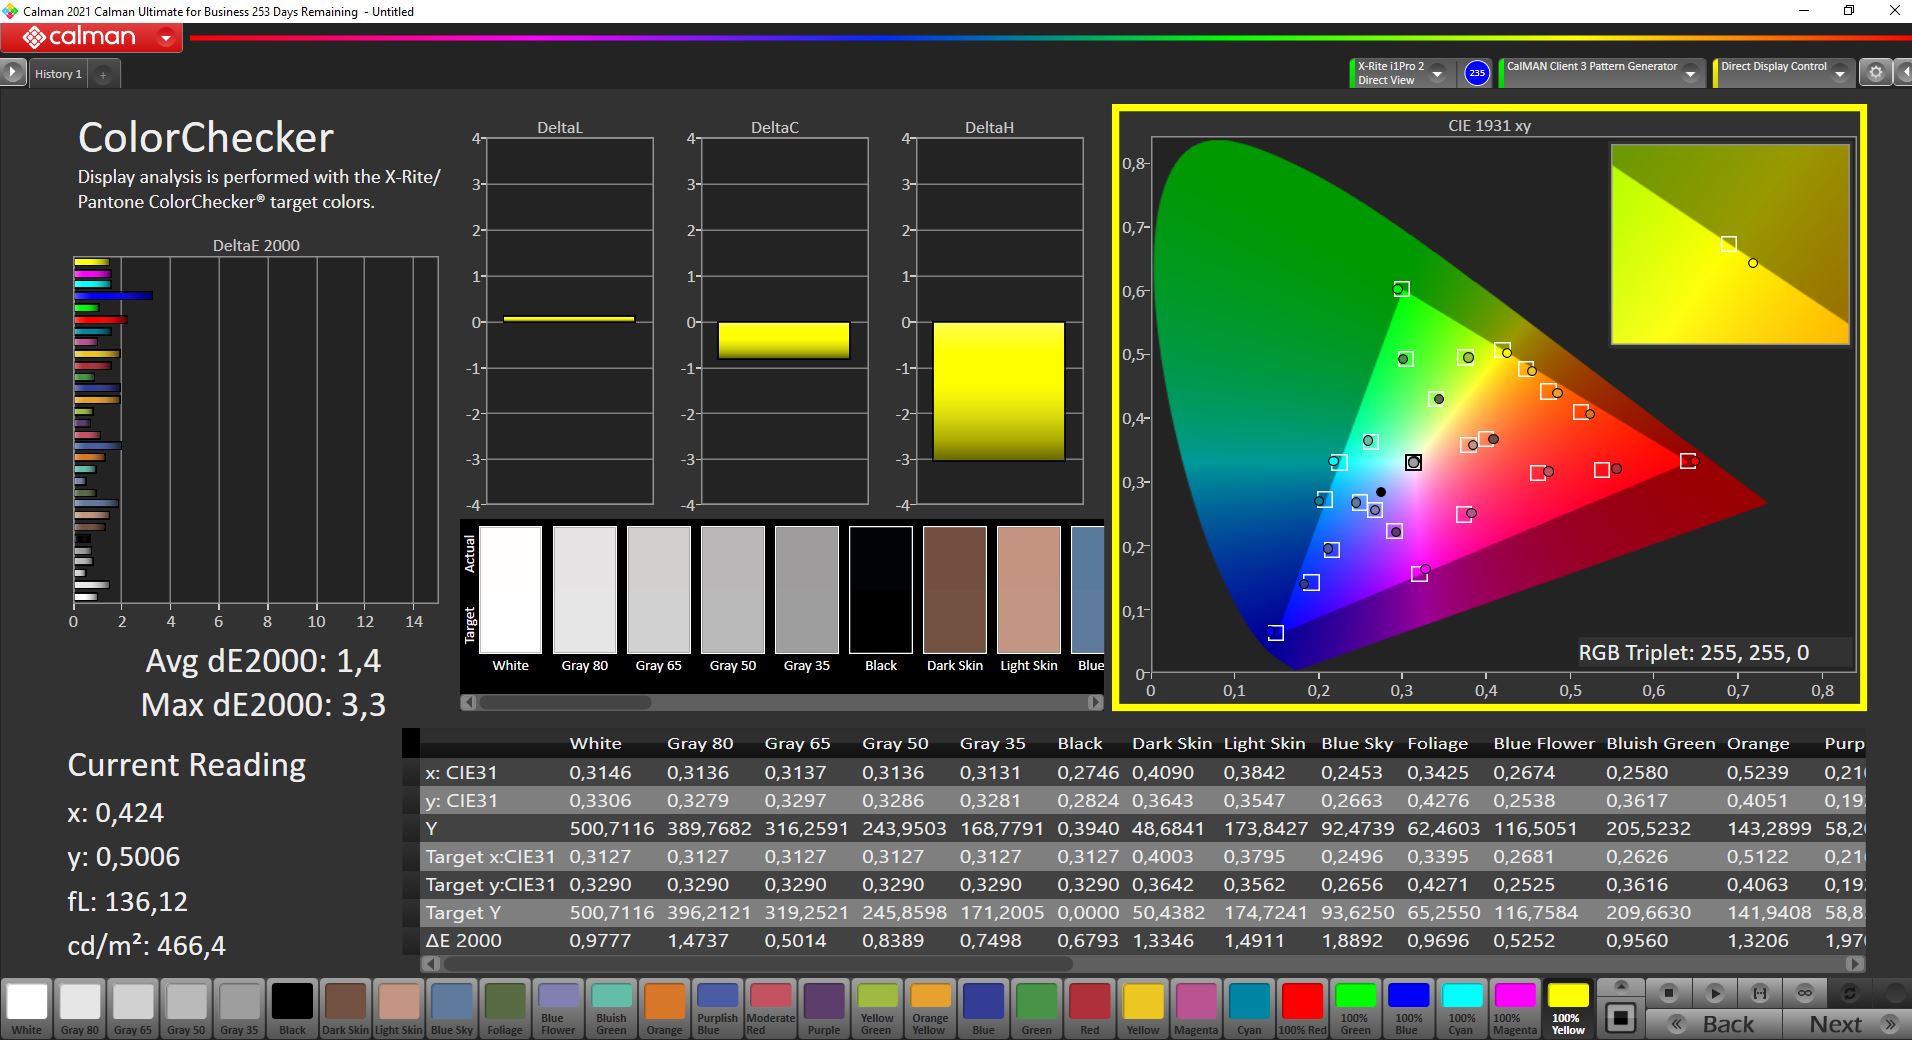
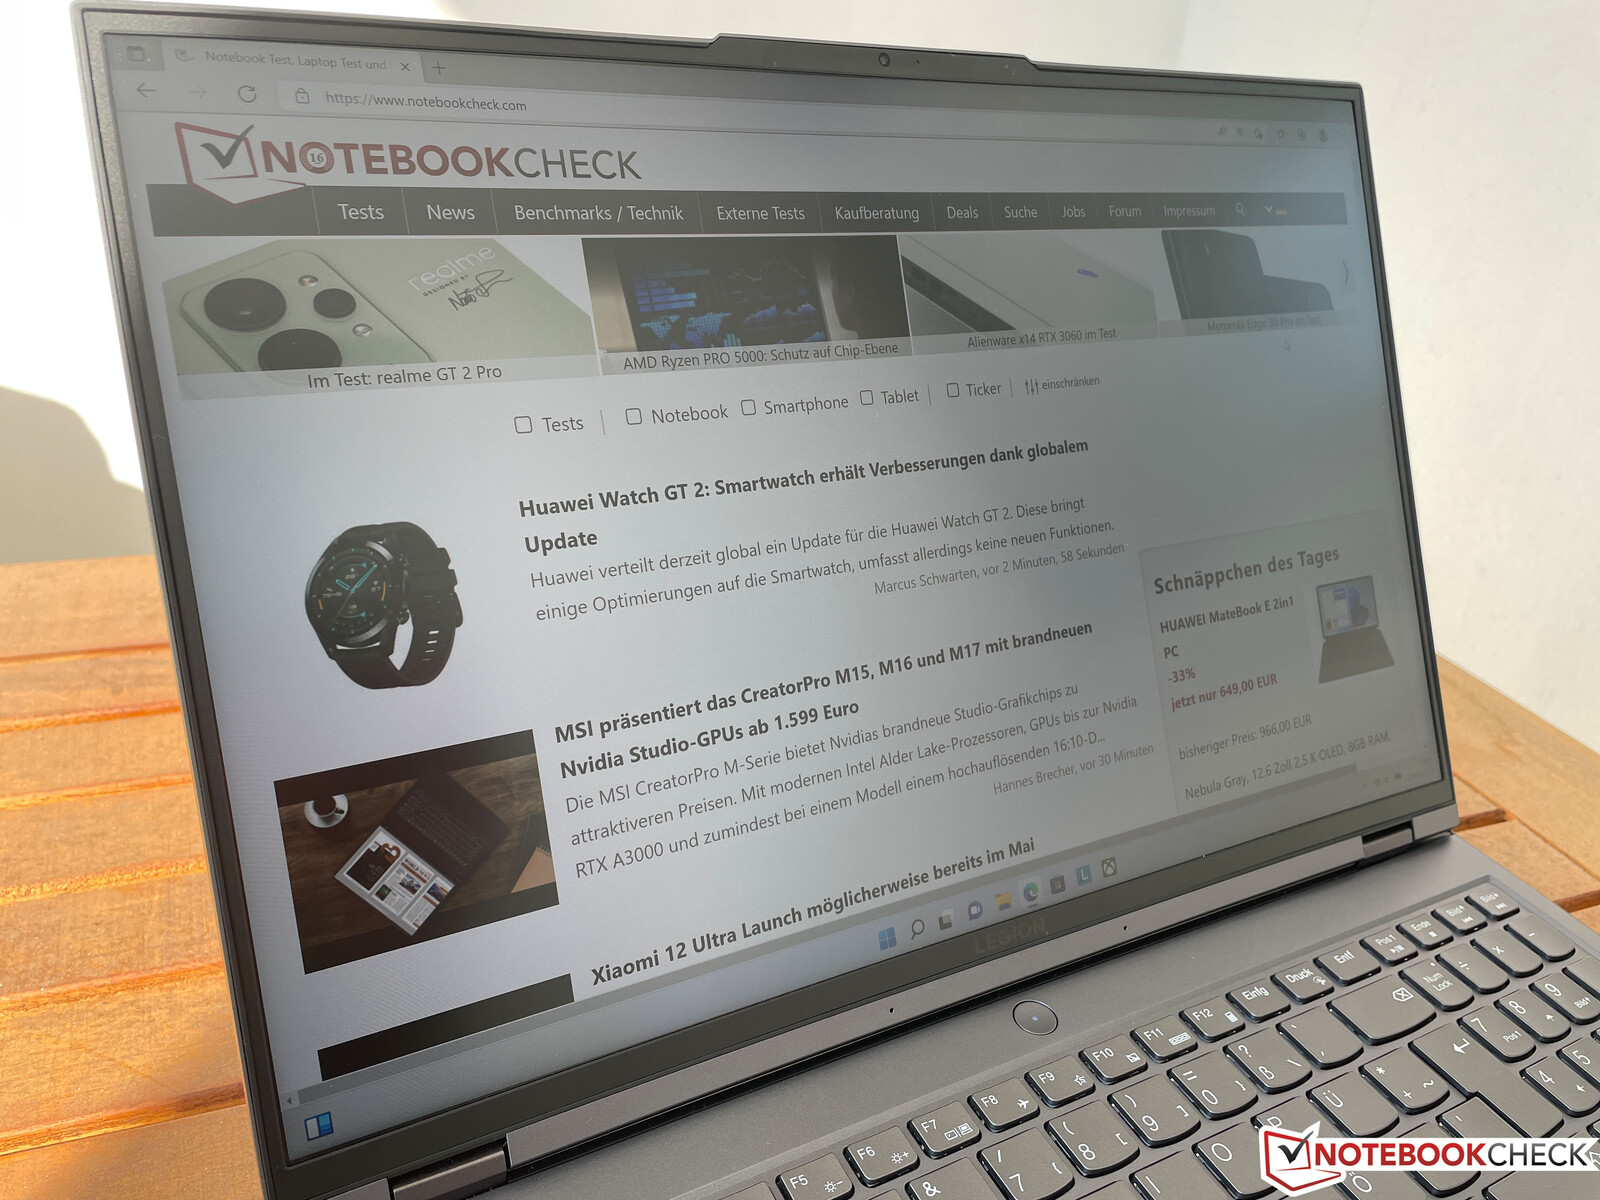
Analizamos el panel con el software profesional CalMAN y la imagen ya es decente desde el primer momento. No hay dominantes de color visibles y casi todos los colores están ya dentro de la desviación objetivo. Nuestra propia calibración (el perfil se puede descargar gratuitamente en el cuadro de arriba) mejora un poco el rendimiento. El panel casi cubre por completo la pequeña gama de colores sRGB, lo que está completamente bien para los juegos. Gracias a las bajas desviaciones de color, también puedes editar imágenes/vídeos.
Tiempos de respuesta del display
| ↔ Tiempo de respuesta de Negro a Blanco | ||
|---|---|---|
| 7.6 ms ... subida ↗ y bajada ↘ combinada | ↗ 2.4 ms subida | 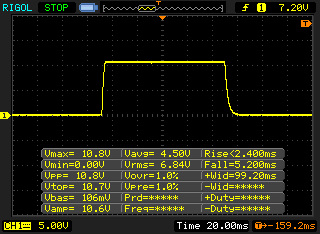 |
| ↘ 5.2 ms bajada | ||
| La pantalla mostró tiempos de respuesta muy rápidos en nuestros tests y debería ser adecuada para juegos frenéticos. En comparación, todos los dispositivos de prueba van de ##min### (mínimo) a 240 (máximo) ms. » 22 % de todos los dispositivos son mejores. Esto quiere decir que el tiempo de respuesta medido es mejor que la media (19.8 ms) de todos los dispositivos testados. | ||
| ↔ Tiempo de respuesta 50% Gris a 80% Gris | ||
| 17.6 ms ... subida ↗ y bajada ↘ combinada | ↗ 9.2 ms subida | 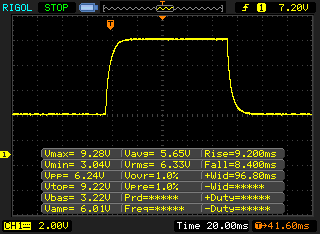 |
| ↘ 8.4 ms bajada | ||
| La pantalla mostró buenos tiempos de respuesta en nuestros tests pero podría ser demasiado lenta para los jugones competitivos. En comparación, todos los dispositivos de prueba van de ##min### (mínimo) a 636 (máximo) ms. » 32 % de todos los dispositivos son mejores. Esto quiere decir que el tiempo de respuesta medido es mejor que la media (31 ms) de todos los dispositivos testados. | ||
Parpadeo de Pantalla / PWM (Pulse-Width Modulation)
| Parpadeo de Pantalla / PWM no detectado | 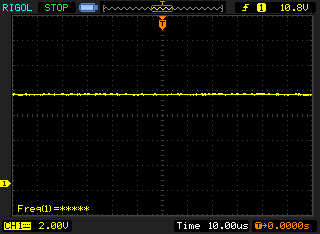 | ||
Comparación: 52 % de todos los dispositivos testados no usaron PWM para atenuar el display. Si se usó, medimos una media de 7754 (mínimo: 5 - máxmo: 343500) Hz. | |||
La estabilidad del ángulo de visión del panel IPS es muy buena. Gracias a la superficie mate y al buen brillo, también es posible usar el Legion 5 Pro 16 en exteriores en entornos más luminosos.
Rendimiento - Alder Lake sin limitaciones
Revisar la configuración
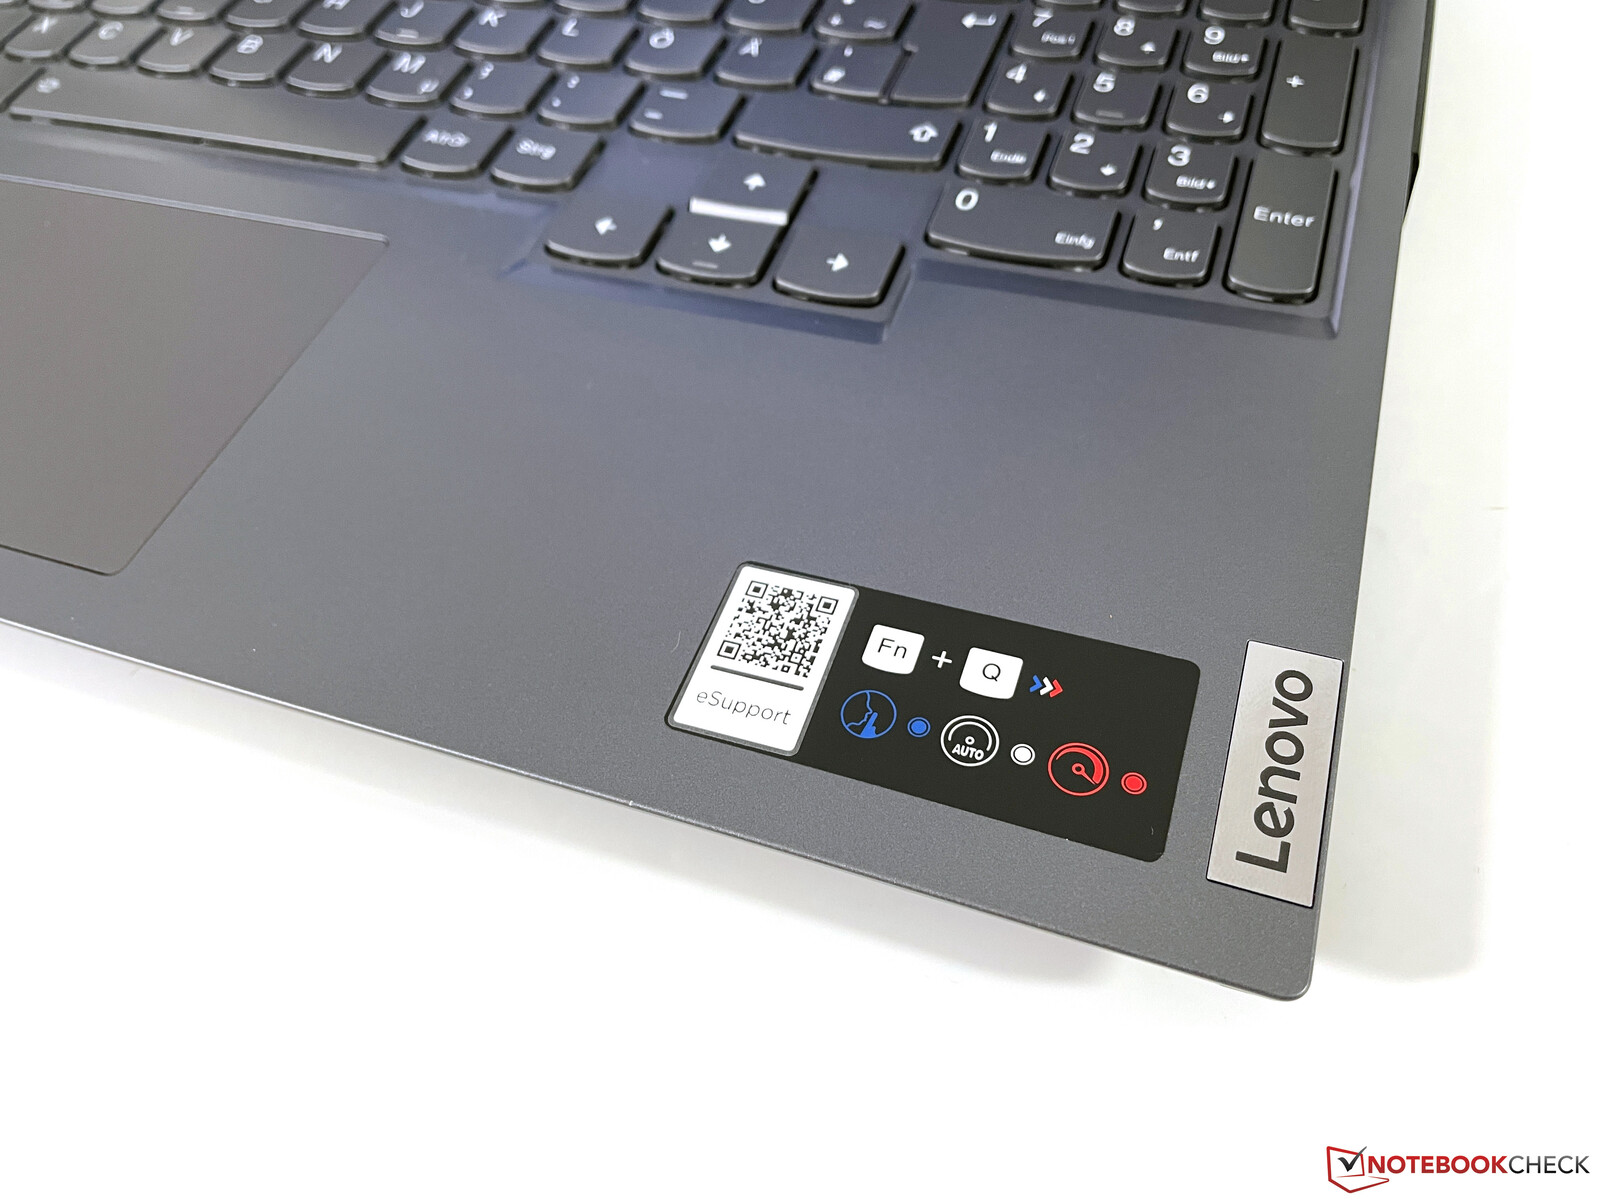
Como es habitual, Lenovo ofrece tres perfiles de energía diferentes en la aplicación Vantage precargada, que pueden seleccionarse por software o cambiarse mediante la combinación de teclas Fn+Q. El color del LED del botón de encendido indica el perfil actual: Azul = modo silencioso, blanco = automático, rojo = rendimiento. El perfil de rendimiento sólo está disponible en la red. Hemos enumerado los diferentes perfiles y los efectos en el rendimiento de la CPU y la GPU en la siguiente tabla.
| Escenario | Silencioso | Auto | Rendimiento |
|---|---|---|---|
| Carga de la CPU | 124/80W | 124/100W | 124/108W |
| Carga de la GPU | 115W | 120W | 150W |
| Prueba de esfuerzo | CPU: 62WGPU : 40W |
CPU: 62WGPU : 100W |
CPU: 62WGPU :125W |
Como en la prueba anterior del Legion 5 Pro 16, vuelve a ser posible desactivar la GPU integrada a través de la app Vantage. Sin embargo, el nuevo modelo soporta Advanced Optimus, por lo que no es realmente necesario. Realizamos las siguientes pruebas y mediciones con los siguientes ajustes: Gráficos híbridos y modo de rendimiento. Si no estás jugando, puedes elegir el modo Silencioso, donde el rendimiento de la CPU sigue siendo muy bueno.
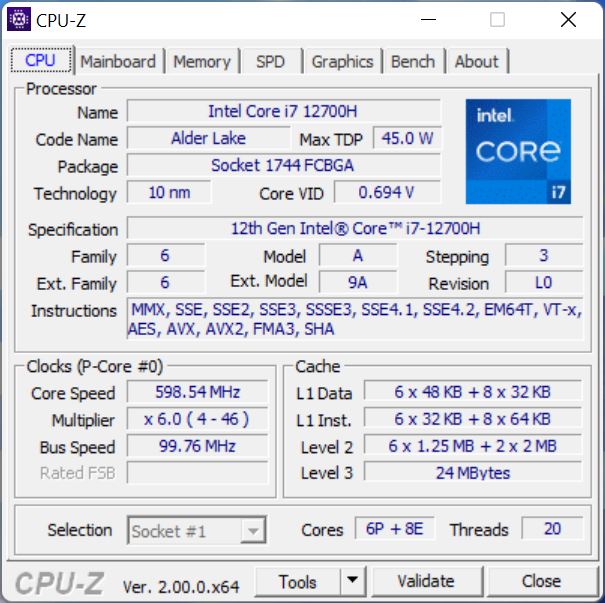
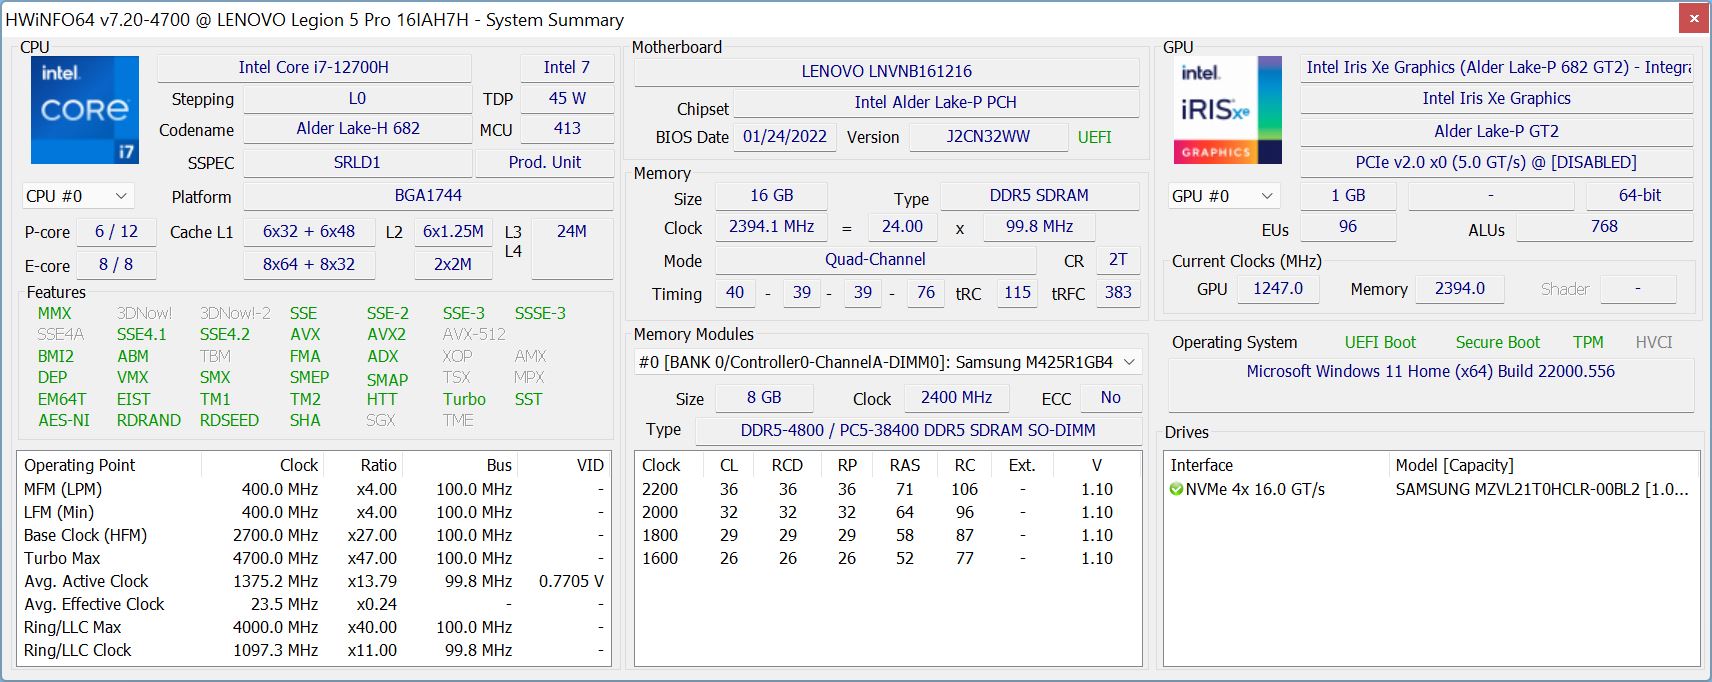
Procesador - Core i7-12700H
Lenovo utiliza el nuevoIntel Core i7-12700Hde la generación Alder Lake, que utiliza una estructura híbrida con 6 núcleos de rendimiento (hasta 4,8 GHz incluyendo hyper threading) así como 8 núcleos de eficiencia (hasta 3,7 GHz). Por tanto, la CPU puede ejecutar hasta 20 hilos simultáneamente. Es una CPU de 45W, al menos en teoría, pero Lenovo no limita el consumo. La carga completa para todos los núcleos resulta en un consumo de 124W y aún podemos ver unos 25W (núcleo IA) en las pruebas de un solo núcleo. La eficiencia no es realmente importante aquí, pero el rendimiento del Legion 5 Pro es excelente y puede ocupar fácilmente el primer puesto dentro de nuestro grupo de comparación e incluso vence alCore i9-12900Hen la pruebaMSI Vector. Este es el caso de las pruebas multinúcleo, pero el i9 se beneficia de su mayor reloj Turbo durante las cargas de trabajo mononúcleo.
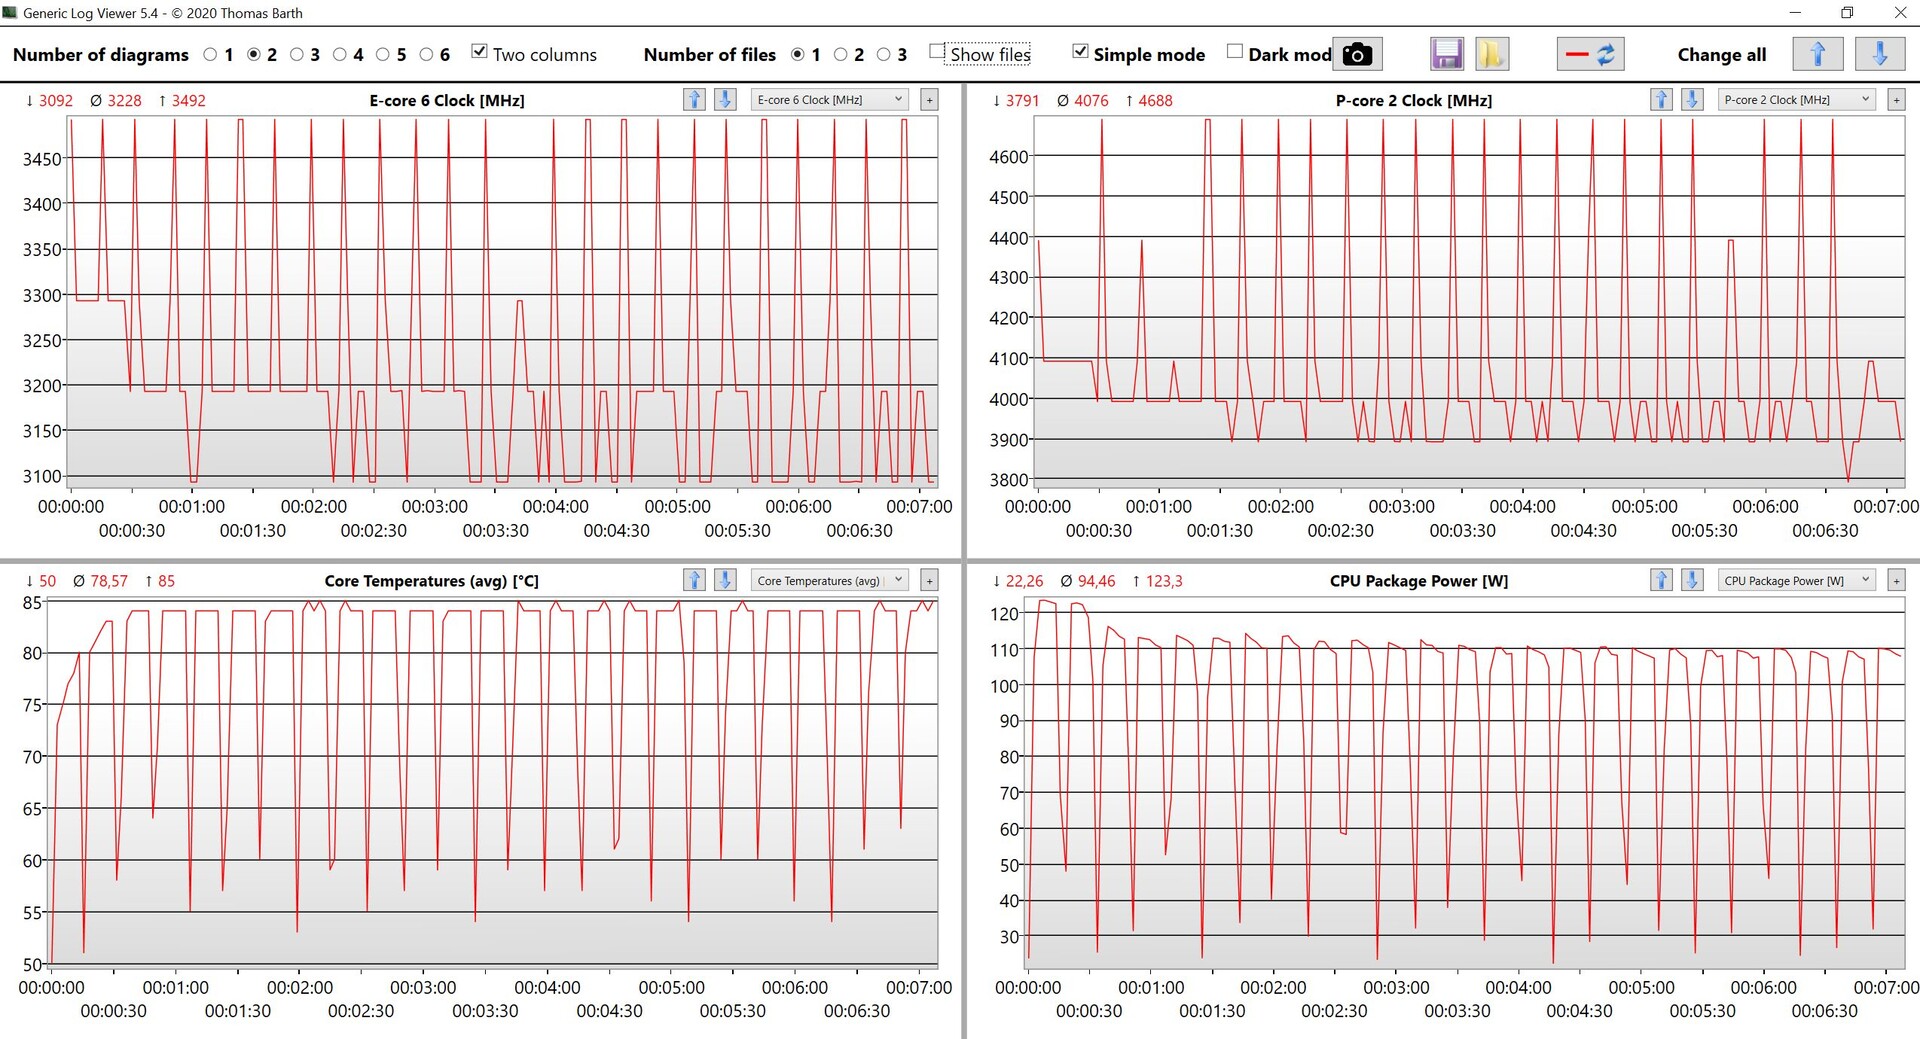
Cinebench R15 Multi Loop
El sistema no puede mantener los 124W completos durante periodos sostenidos y el procesador finalmente se nivela en 108W. La puntuación del CB R15 Multi cae a unos 2700 puntos en el modo Auto y sigue siendo de unos 2450 euros a 80W (modo silencioso). En general, el rendimiento de la CPU es excelente, pero también resulta en un alto consumo de energía.
El rendimiento mononúcleo en batería es idéntico y el procesador aún puede consumir poco más de 110W en las pruebas multinúcleo, que baja a "sólo" unos 90W bajo cargas de trabajo sostenidas. Los benchmarks de CPU de Mire están disponibles aquí.
Cinebench R23: Multi Core | Single Core
Cinebench R20: CPU (Multi Core) | CPU (Single Core)
Cinebench R15: CPU Multi 64Bit | CPU Single 64Bit
Blender: v2.79 BMW27 CPU
7-Zip 18.03: 7z b 4 | 7z b 4 -mmt1
Geekbench 5.5: Multi-Core | Single-Core
HWBOT x265 Benchmark v2.2: 4k Preset
LibreOffice : 20 Documents To PDF
R Benchmark 2.5: Overall mean
| CPU Performance rating | |
| Media de la clase Gaming | |
| Lenovo Legion 5 Pro 16 G7 i7 RTX 3070Ti | |
| MSI Vector GP66 12UGS | |
| Medio Intel Core i7-12700H | |
| HP Omen 16-b0085ng | |
| Asus TUF Gaming A15 FA506QR-AZ061T -2! | |
| Acer Nitro 5 AN515-45-R1JH | |
| Lenovo Legion 5 Pro 16ACH6H (82JQ001PGE) | |
| Cinebench R23 / Multi Core | |
| Media de la clase Gaming (10488 - 42661, n=107, últimos 2 años) | |
| Lenovo Legion 5 Pro 16 G7 i7 RTX 3070Ti | |
| MSI Vector GP66 12UGS | |
| Medio Intel Core i7-12700H (4032 - 19330, n=64) | |
| Lenovo Legion 5 Pro 16ACH6H (82JQ001PGE) | |
| Lenovo Legion 5 Pro 16ACH6H (82JQ001PGE) | |
| HP Omen 16-b0085ng | |
| Acer Nitro 5 AN515-45-R1JH | |
| Cinebench R23 / Single Core | |
| Media de la clase Gaming (1166 - 2415, n=107, últimos 2 años) | |
| MSI Vector GP66 12UGS | |
| Lenovo Legion 5 Pro 16 G7 i7 RTX 3070Ti | |
| Medio Intel Core i7-12700H (778 - 1826, n=63) | |
| HP Omen 16-b0085ng | |
| Acer Nitro 5 AN515-45-R1JH | |
| Lenovo Legion 5 Pro 16ACH6H (82JQ001PGE) | |
| Lenovo Legion 5 Pro 16ACH6H (82JQ001PGE) | |
| Cinebench R20 / CPU (Multi Core) | |
| Media de la clase Gaming (4029 - 16433, n=106, últimos 2 años) | |
| Lenovo Legion 5 Pro 16 G7 i7 RTX 3070Ti | |
| MSI Vector GP66 12UGS | |
| Medio Intel Core i7-12700H (1576 - 7407, n=64) | |
| Lenovo Legion 5 Pro 16ACH6H (82JQ001PGE) | |
| Lenovo Legion 5 Pro 16ACH6H (82JQ001PGE) | |
| HP Omen 16-b0085ng | |
| Acer Nitro 5 AN515-45-R1JH | |
| Asus TUF Gaming A15 FA506QR-AZ061T | |
| Cinebench R20 / CPU (Single Core) | |
| Media de la clase Gaming (442 - 913, n=106, últimos 2 años) | |
| MSI Vector GP66 12UGS | |
| Lenovo Legion 5 Pro 16 G7 i7 RTX 3070Ti | |
| Medio Intel Core i7-12700H (300 - 704, n=64) | |
| HP Omen 16-b0085ng | |
| Asus TUF Gaming A15 FA506QR-AZ061T | |
| Acer Nitro 5 AN515-45-R1JH | |
| Lenovo Legion 5 Pro 16ACH6H (82JQ001PGE) | |
| Lenovo Legion 5 Pro 16ACH6H (82JQ001PGE) | |
| Cinebench R15 / CPU Multi 64Bit | |
| Media de la clase Gaming (1578 - 6330, n=105, últimos 2 años) | |
| Lenovo Legion 5 Pro 16 G7 i7 RTX 3070Ti | |
| Medio Intel Core i7-12700H (1379 - 2916, n=70) | |
| MSI Vector GP66 12UGS | |
| HP Omen 16-b0085ng | |
| Lenovo Legion 5 Pro 16ACH6H (82JQ001PGE) | |
| Asus TUF Gaming A15 FA506QR-AZ061T | |
| Acer Nitro 5 AN515-45-R1JH | |
| Cinebench R15 / CPU Single 64Bit | |
| Media de la clase Gaming (188.8 - 350, n=106, últimos 2 años) | |
| MSI Vector GP66 12UGS | |
| Lenovo Legion 5 Pro 16 G7 i7 RTX 3070Ti | |
| Medio Intel Core i7-12700H (113 - 263, n=65) | |
| Asus TUF Gaming A15 FA506QR-AZ061T | |
| Acer Nitro 5 AN515-45-R1JH | |
| Lenovo Legion 5 Pro 16ACH6H (82JQ001PGE) | |
| Lenovo Legion 5 Pro 16ACH6H (82JQ001PGE) | |
| HP Omen 16-b0085ng | |
| Blender / v2.79 BMW27 CPU | |
| Asus TUF Gaming A15 FA506QR-AZ061T | |
| Acer Nitro 5 AN515-45-R1JH | |
| Lenovo Legion 5 Pro 16ACH6H (82JQ001PGE) | |
| Lenovo Legion 5 Pro 16ACH6H (82JQ001PGE) | |
| HP Omen 16-b0085ng | |
| Medio Intel Core i7-12700H (168 - 732, n=63) | |
| MSI Vector GP66 12UGS | |
| Lenovo Legion 5 Pro 16 G7 i7 RTX 3070Ti | |
| Media de la clase Gaming (79 - 330, n=104, últimos 2 años) | |
| 7-Zip 18.03 / 7z b 4 | |
| Media de la clase Gaming (33491 - 148086, n=105, últimos 2 años) | |
| Lenovo Legion 5 Pro 16 G7 i7 RTX 3070Ti | |
| MSI Vector GP66 12UGS | |
| Medio Intel Core i7-12700H (22844 - 73067, n=63) | |
| Lenovo Legion 5 Pro 16ACH6H (82JQ001PGE) | |
| Lenovo Legion 5 Pro 16ACH6H (82JQ001PGE) | |
| HP Omen 16-b0085ng | |
| Acer Nitro 5 AN515-45-R1JH | |
| Asus TUF Gaming A15 FA506QR-AZ061T | |
| 7-Zip 18.03 / 7z b 4 -mmt1 | |
| Media de la clase Gaming (4199 - 7436, n=105, últimos 2 años) | |
| MSI Vector GP66 12UGS | |
| Lenovo Legion 5 Pro 16 G7 i7 RTX 3070Ti | |
| HP Omen 16-b0085ng | |
| Medio Intel Core i7-12700H (2743 - 5972, n=63) | |
| Asus TUF Gaming A15 FA506QR-AZ061T | |
| Acer Nitro 5 AN515-45-R1JH | |
| Lenovo Legion 5 Pro 16ACH6H (82JQ001PGE) | |
| Lenovo Legion 5 Pro 16ACH6H (82JQ001PGE) | |
| Geekbench 5.5 / Multi-Core | |
| Media de la clase Gaming (6460 - 28263, n=105, últimos 2 años) | |
| Lenovo Legion 5 Pro 16 G7 i7 RTX 3070Ti | |
| MSI Vector GP66 12UGS | |
| Medio Intel Core i7-12700H (5144 - 13745, n=64) | |
| HP Omen 16-b0085ng | |
| Lenovo Legion 5 Pro 16ACH6H (82JQ001PGE) | |
| Lenovo Legion 5 Pro 16ACH6H (82JQ001PGE) | |
| Asus TUF Gaming A15 FA506QR-AZ061T | |
| Acer Nitro 5 AN515-45-R1JH | |
| Geekbench 5.5 / Single-Core | |
| Media de la clase Gaming (986 - 2474, n=105, últimos 2 años) | |
| MSI Vector GP66 12UGS | |
| Lenovo Legion 5 Pro 16 G7 i7 RTX 3070Ti | |
| Medio Intel Core i7-12700H (803 - 1851, n=64) | |
| HP Omen 16-b0085ng | |
| Acer Nitro 5 AN515-45-R1JH | |
| Asus TUF Gaming A15 FA506QR-AZ061T | |
| Lenovo Legion 5 Pro 16ACH6H (82JQ001PGE) | |
| Lenovo Legion 5 Pro 16ACH6H (82JQ001PGE) | |
| HWBOT x265 Benchmark v2.2 / 4k Preset | |
| Media de la clase Gaming (11.5 - 44.4, n=105, últimos 2 años) | |
| Lenovo Legion 5 Pro 16 G7 i7 RTX 3070Ti | |
| MSI Vector GP66 12UGS | |
| HP Omen 16-b0085ng | |
| Medio Intel Core i7-12700H (4.67 - 21.8, n=64) | |
| Lenovo Legion 5 Pro 16ACH6H (82JQ001PGE) | |
| Lenovo Legion 5 Pro 16ACH6H (82JQ001PGE) | |
| Acer Nitro 5 AN515-45-R1JH | |
| Asus TUF Gaming A15 FA506QR-AZ061T | |
| LibreOffice / 20 Documents To PDF | |
| Lenovo Legion 5 Pro 16ACH6H (82JQ001PGE) | |
| Lenovo Legion 5 Pro 16ACH6H (82JQ001PGE) | |
| Acer Nitro 5 AN515-45-R1JH | |
| Media de la clase Gaming (33.2 - 88.8, n=105, últimos 2 años) | |
| Asus TUF Gaming A15 FA506QR-AZ061T | |
| HP Omen 16-b0085ng | |
| Medio Intel Core i7-12700H (34.2 - 95.3, n=63) | |
| Lenovo Legion 5 Pro 16 G7 i7 RTX 3070Ti | |
| MSI Vector GP66 12UGS | |
| R Benchmark 2.5 / Overall mean | |
| Lenovo Legion 5 Pro 16ACH6H (82JQ001PGE) | |
| Lenovo Legion 5 Pro 16ACH6H (82JQ001PGE) | |
| HP Omen 16-b0085ng | |
| Acer Nitro 5 AN515-45-R1JH | |
| Asus TUF Gaming A15 FA506QR-AZ061T | |
| Medio Intel Core i7-12700H (0.4441 - 1.052, n=63) | |
| Lenovo Legion 5 Pro 16 G7 i7 RTX 3070Ti | |
| Media de la clase Gaming (0.3439 - 0.759, n=106, últimos 2 años) | |
| MSI Vector GP66 12UGS | |
* ... más pequeño es mejor
AIDA64: FP32 Ray-Trace | FPU Julia | CPU SHA3 | CPU Queen | FPU SinJulia | FPU Mandel | CPU AES | CPU ZLib | FP64 Ray-Trace | CPU PhotoWorxx
| Performance rating | |
| Media de la clase Gaming | |
| Lenovo Legion 5 Pro 16ACH6H (82JQ001PGE) | |
| Acer Nitro 5 AN515-45-R1JH | |
| Lenovo Legion 5 Pro 16 G7 i7 RTX 3070Ti | |
| Medio Intel Core i7-12700H | |
| MSI Vector GP66 12UGS | |
| Asus TUF Gaming A15 FA506QR-AZ061T | |
| HP Omen 16-b0085ng -9! | |
| AIDA64 / FP32 Ray-Trace | |
| Media de la clase Gaming (10227 - 85542, n=105, últimos 2 años) | |
| Lenovo Legion 5 Pro 16ACH6H (82JQ001PGE) | |
| Lenovo Legion 5 Pro 16ACH6H (82JQ001PGE) | |
| Asus TUF Gaming A15 FA506QR-AZ061T | |
| Acer Nitro 5 AN515-45-R1JH | |
| Medio Intel Core i7-12700H (2585 - 17957, n=64) | |
| Lenovo Legion 5 Pro 16 G7 i7 RTX 3070Ti | |
| MSI Vector GP66 12UGS | |
| AIDA64 / FPU Julia | |
| Media de la clase Gaming (51376 - 238426, n=105, últimos 2 años) | |
| Lenovo Legion 5 Pro 16ACH6H (82JQ001PGE) | |
| Lenovo Legion 5 Pro 16ACH6H (82JQ001PGE) | |
| Acer Nitro 5 AN515-45-R1JH | |
| Asus TUF Gaming A15 FA506QR-AZ061T | |
| Medio Intel Core i7-12700H (12439 - 90760, n=64) | |
| Lenovo Legion 5 Pro 16 G7 i7 RTX 3070Ti | |
| MSI Vector GP66 12UGS | |
| AIDA64 / CPU SHA3 | |
| Media de la clase Gaming (2180 - 10115, n=105, últimos 2 años) | |
| Lenovo Legion 5 Pro 16 G7 i7 RTX 3070Ti | |
| Lenovo Legion 5 Pro 16ACH6H (82JQ001PGE) | |
| Lenovo Legion 5 Pro 16ACH6H (82JQ001PGE) | |
| Medio Intel Core i7-12700H (833 - 4242, n=64) | |
| MSI Vector GP66 12UGS | |
| Acer Nitro 5 AN515-45-R1JH | |
| Asus TUF Gaming A15 FA506QR-AZ061T | |
| AIDA64 / CPU Queen | |
| Media de la clase Gaming (49785 - 173351, n=90, últimos 2 años) | |
| MSI Vector GP66 12UGS | |
| Lenovo Legion 5 Pro 16 G7 i7 RTX 3070Ti | |
| Medio Intel Core i7-12700H (57923 - 103202, n=63) | |
| Acer Nitro 5 AN515-45-R1JH | |
| Asus TUF Gaming A15 FA506QR-AZ061T | |
| Lenovo Legion 5 Pro 16ACH6H (82JQ001PGE) | |
| Lenovo Legion 5 Pro 16ACH6H (82JQ001PGE) | |
| AIDA64 / FPU SinJulia | |
| Media de la clase Gaming (4424 - 33636, n=105, últimos 2 años) | |
| Acer Nitro 5 AN515-45-R1JH | |
| Asus TUF Gaming A15 FA506QR-AZ061T | |
| Lenovo Legion 5 Pro 16ACH6H (82JQ001PGE) | |
| Lenovo Legion 5 Pro 16ACH6H (82JQ001PGE) | |
| Lenovo Legion 5 Pro 16 G7 i7 RTX 3070Ti | |
| MSI Vector GP66 12UGS | |
| Medio Intel Core i7-12700H (3249 - 9939, n=64) | |
| AIDA64 / FPU Mandel | |
| Media de la clase Gaming (25115 - 128721, n=105, últimos 2 años) | |
| Lenovo Legion 5 Pro 16ACH6H (82JQ001PGE) | |
| Lenovo Legion 5 Pro 16ACH6H (82JQ001PGE) | |
| Acer Nitro 5 AN515-45-R1JH | |
| Asus TUF Gaming A15 FA506QR-AZ061T | |
| Medio Intel Core i7-12700H (7135 - 44760, n=64) | |
| Lenovo Legion 5 Pro 16 G7 i7 RTX 3070Ti | |
| MSI Vector GP66 12UGS | |
| AIDA64 / CPU AES | |
| Lenovo Legion 5 Pro 16ACH6H (82JQ001PGE) | |
| Lenovo Legion 5 Pro 16ACH6H (82JQ001PGE) | |
| Acer Nitro 5 AN515-45-R1JH | |
| Media de la clase Gaming (39258 - 247074, n=105, últimos 2 años) | |
| Lenovo Legion 5 Pro 16 G7 i7 RTX 3070Ti | |
| MSI Vector GP66 12UGS | |
| Medio Intel Core i7-12700H (31839 - 144360, n=64) | |
| Asus TUF Gaming A15 FA506QR-AZ061T | |
| AIDA64 / CPU ZLib | |
| Media de la clase Gaming (574 - 2531, n=105, últimos 2 años) | |
| Lenovo Legion 5 Pro 16 G7 i7 RTX 3070Ti | |
| MSI Vector GP66 12UGS | |
| Medio Intel Core i7-12700H (305 - 1171, n=64) | |
| Lenovo Legion 5 Pro 16ACH6H (82JQ001PGE) | |
| Lenovo Legion 5 Pro 16ACH6H (82JQ001PGE) | |
| Asus TUF Gaming A15 FA506QR-AZ061T | |
| Acer Nitro 5 AN515-45-R1JH | |
| HP Omen 16-b0085ng | |
| AIDA64 / FP64 Ray-Trace | |
| Media de la clase Gaming (5509 - 45446, n=105, últimos 2 años) | |
| Asus TUF Gaming A15 FA506QR-AZ061T | |
| Lenovo Legion 5 Pro 16ACH6H (82JQ001PGE) | |
| Lenovo Legion 5 Pro 16ACH6H (82JQ001PGE) | |
| Acer Nitro 5 AN515-45-R1JH | |
| Medio Intel Core i7-12700H (1437 - 9692, n=64) | |
| Lenovo Legion 5 Pro 16 G7 i7 RTX 3070Ti | |
| MSI Vector GP66 12UGS | |
| AIDA64 / CPU PhotoWorxx | |
| Media de la clase Gaming (12271 - 89891, n=105, últimos 2 años) | |
| Lenovo Legion 5 Pro 16 G7 i7 RTX 3070Ti | |
| Medio Intel Core i7-12700H (12863 - 52207, n=64) | |
| MSI Vector GP66 12UGS | |
| Lenovo Legion 5 Pro 16ACH6H (82JQ001PGE) | |
| Lenovo Legion 5 Pro 16ACH6H (82JQ001PGE) | |
| Asus TUF Gaming A15 FA506QR-AZ061T | |
| Acer Nitro 5 AN515-45-R1JH | |
Rendimiento del sistema
La impresión subjetiva de rendimiento es muy buena y los resultados de los benchmarks son estupendos. Teniendo en cuenta el hardware, sin embargo, esto no es realmente sorprendente. El portátil viene con Windows 11 y no experimentamos congelaciones ni retrasos.
CrossMark: Overall | Productivity | Creativity | Responsiveness
| PCMark 10 / Score | |
| Media de la clase Gaming (5828 - 12414, n=93, últimos 2 años) | |
| MSI Vector GP66 12UGS | |
| Lenovo Legion 5 Pro 16 G7 i7 RTX 3070Ti | |
| Medio Intel Core i7-12700H, NVIDIA GeForce RTX 3070 Ti Laptop GPU (6941 - 7947, n=11) | |
| HP Omen 16-b0085ng | |
| Asus TUF Gaming A15 FA506QR-AZ061T | |
| Acer Nitro 5 AN515-45-R1JH | |
| Lenovo Legion 5 Pro 16ACH6H (82JQ001PGE) | |
| PCMark 10 / Essentials | |
| MSI Vector GP66 12UGS | |
| HP Omen 16-b0085ng | |
| Media de la clase Gaming (8810 - 11935, n=97, últimos 2 años) | |
| Medio Intel Core i7-12700H, NVIDIA GeForce RTX 3070 Ti Laptop GPU (9892 - 10935, n=11) | |
| Asus TUF Gaming A15 FA506QR-AZ061T | |
| Acer Nitro 5 AN515-45-R1JH | |
| Lenovo Legion 5 Pro 16 G7 i7 RTX 3070Ti | |
| Lenovo Legion 5 Pro 16ACH6H (82JQ001PGE) | |
| PCMark 10 / Productivity | |
| Media de la clase Gaming (6845 - 25323, n=95, últimos 2 años) | |
| MSI Vector GP66 12UGS | |
| Lenovo Legion 5 Pro 16 G7 i7 RTX 3070Ti | |
| Medio Intel Core i7-12700H, NVIDIA GeForce RTX 3070 Ti Laptop GPU (9024 - 10638, n=11) | |
| Asus TUF Gaming A15 FA506QR-AZ061T | |
| Acer Nitro 5 AN515-45-R1JH | |
| HP Omen 16-b0085ng | |
| Lenovo Legion 5 Pro 16ACH6H (82JQ001PGE) | |
| PCMark 10 / Digital Content Creation | |
| Media de la clase Gaming (7602 - 19954, n=95, últimos 2 años) | |
| MSI Vector GP66 12UGS | |
| Lenovo Legion 5 Pro 16 G7 i7 RTX 3070Ti | |
| Medio Intel Core i7-12700H, NVIDIA GeForce RTX 3070 Ti Laptop GPU (10165 - 12546, n=11) | |
| HP Omen 16-b0085ng | |
| Lenovo Legion 5 Pro 16ACH6H (82JQ001PGE) | |
| Asus TUF Gaming A15 FA506QR-AZ061T | |
| Acer Nitro 5 AN515-45-R1JH | |
| CrossMark / Overall | |
| Media de la clase Gaming (1366 - 2409, n=94, últimos 2 años) | |
| Lenovo Legion 5 Pro 16 G7 i7 RTX 3070Ti | |
| Medio Intel Core i7-12700H, NVIDIA GeForce RTX 3070 Ti Laptop GPU (974 - 2000, n=12) | |
| CrossMark / Productivity | |
| Lenovo Legion 5 Pro 16 G7 i7 RTX 3070Ti | |
| Media de la clase Gaming (1386 - 2254, n=94, últimos 2 años) | |
| Medio Intel Core i7-12700H, NVIDIA GeForce RTX 3070 Ti Laptop GPU (907 - 1962, n=12) | |
| CrossMark / Creativity | |
| Media de la clase Gaming (1343 - 2786, n=94, últimos 2 años) | |
| Lenovo Legion 5 Pro 16 G7 i7 RTX 3070Ti | |
| Medio Intel Core i7-12700H, NVIDIA GeForce RTX 3070 Ti Laptop GPU (1027 - 2057, n=12) | |
| CrossMark / Responsiveness | |
| Lenovo Legion 5 Pro 16 G7 i7 RTX 3070Ti | |
| Medio Intel Core i7-12700H, NVIDIA GeForce RTX 3070 Ti Laptop GPU (1029 - 2142, n=12) | |
| Media de la clase Gaming (1226 - 2334, n=94, últimos 2 años) | |
| PCMark 10 Score | 7555 puntos | |
ayuda | ||
| AIDA64 / Memory Copy | |
| Media de la clase Gaming (21750 - 129946, n=105, últimos 2 años) | |
| Medio Intel Core i7-12700H (25615 - 80511, n=64) | |
| Lenovo Legion 5 Pro 16 G7 i7 RTX 3070Ti | |
| MSI Vector GP66 12UGS | |
| Lenovo Legion 5 Pro 16ACH6H (82JQ001PGE) | |
| Lenovo Legion 5 Pro 16ACH6H (82JQ001PGE) | |
| Asus TUF Gaming A15 FA506QR-AZ061T | |
| Acer Nitro 5 AN515-45-R1JH | |
| AIDA64 / Memory Read | |
| Media de la clase Gaming (22956 - 118858, n=105, últimos 2 años) | |
| Lenovo Legion 5 Pro 16 G7 i7 RTX 3070Ti | |
| Medio Intel Core i7-12700H (25586 - 79442, n=64) | |
| MSI Vector GP66 12UGS | |
| Lenovo Legion 5 Pro 16ACH6H (82JQ001PGE) | |
| Lenovo Legion 5 Pro 16ACH6H (82JQ001PGE) | |
| Asus TUF Gaming A15 FA506QR-AZ061T | |
| Acer Nitro 5 AN515-45-R1JH | |
| AIDA64 / Memory Write | |
| Media de la clase Gaming (22297 - 135096, n=105, últimos 2 años) | |
| Lenovo Legion 5 Pro 16 G7 i7 RTX 3070Ti | |
| Medio Intel Core i7-12700H (23679 - 88660, n=64) | |
| MSI Vector GP66 12UGS | |
| Lenovo Legion 5 Pro 16ACH6H (82JQ001PGE) | |
| Lenovo Legion 5 Pro 16ACH6H (82JQ001PGE) | |
| Acer Nitro 5 AN515-45-R1JH | |
| Asus TUF Gaming A15 FA506QR-AZ061T | |
| AIDA64 / Memory Latency | |
| Media de la clase Gaming (75.3 - 259, n=105, últimos 2 años) | |
| Lenovo Legion 5 Pro 16 G7 i7 RTX 3070Ti | |
| MSI Vector GP66 12UGS | |
| Lenovo Legion 5 Pro 16ACH6H (82JQ001PGE) | |
| Lenovo Legion 5 Pro 16ACH6H (82JQ001PGE) | |
| Asus TUF Gaming A15 FA506QR-AZ061T | |
| Medio Intel Core i7-12700H (76.2 - 133.9, n=62) | |
| Acer Nitro 5 AN515-45-R1JH | |
| HP Omen 16-b0085ng | |
* ... más pequeño es mejor
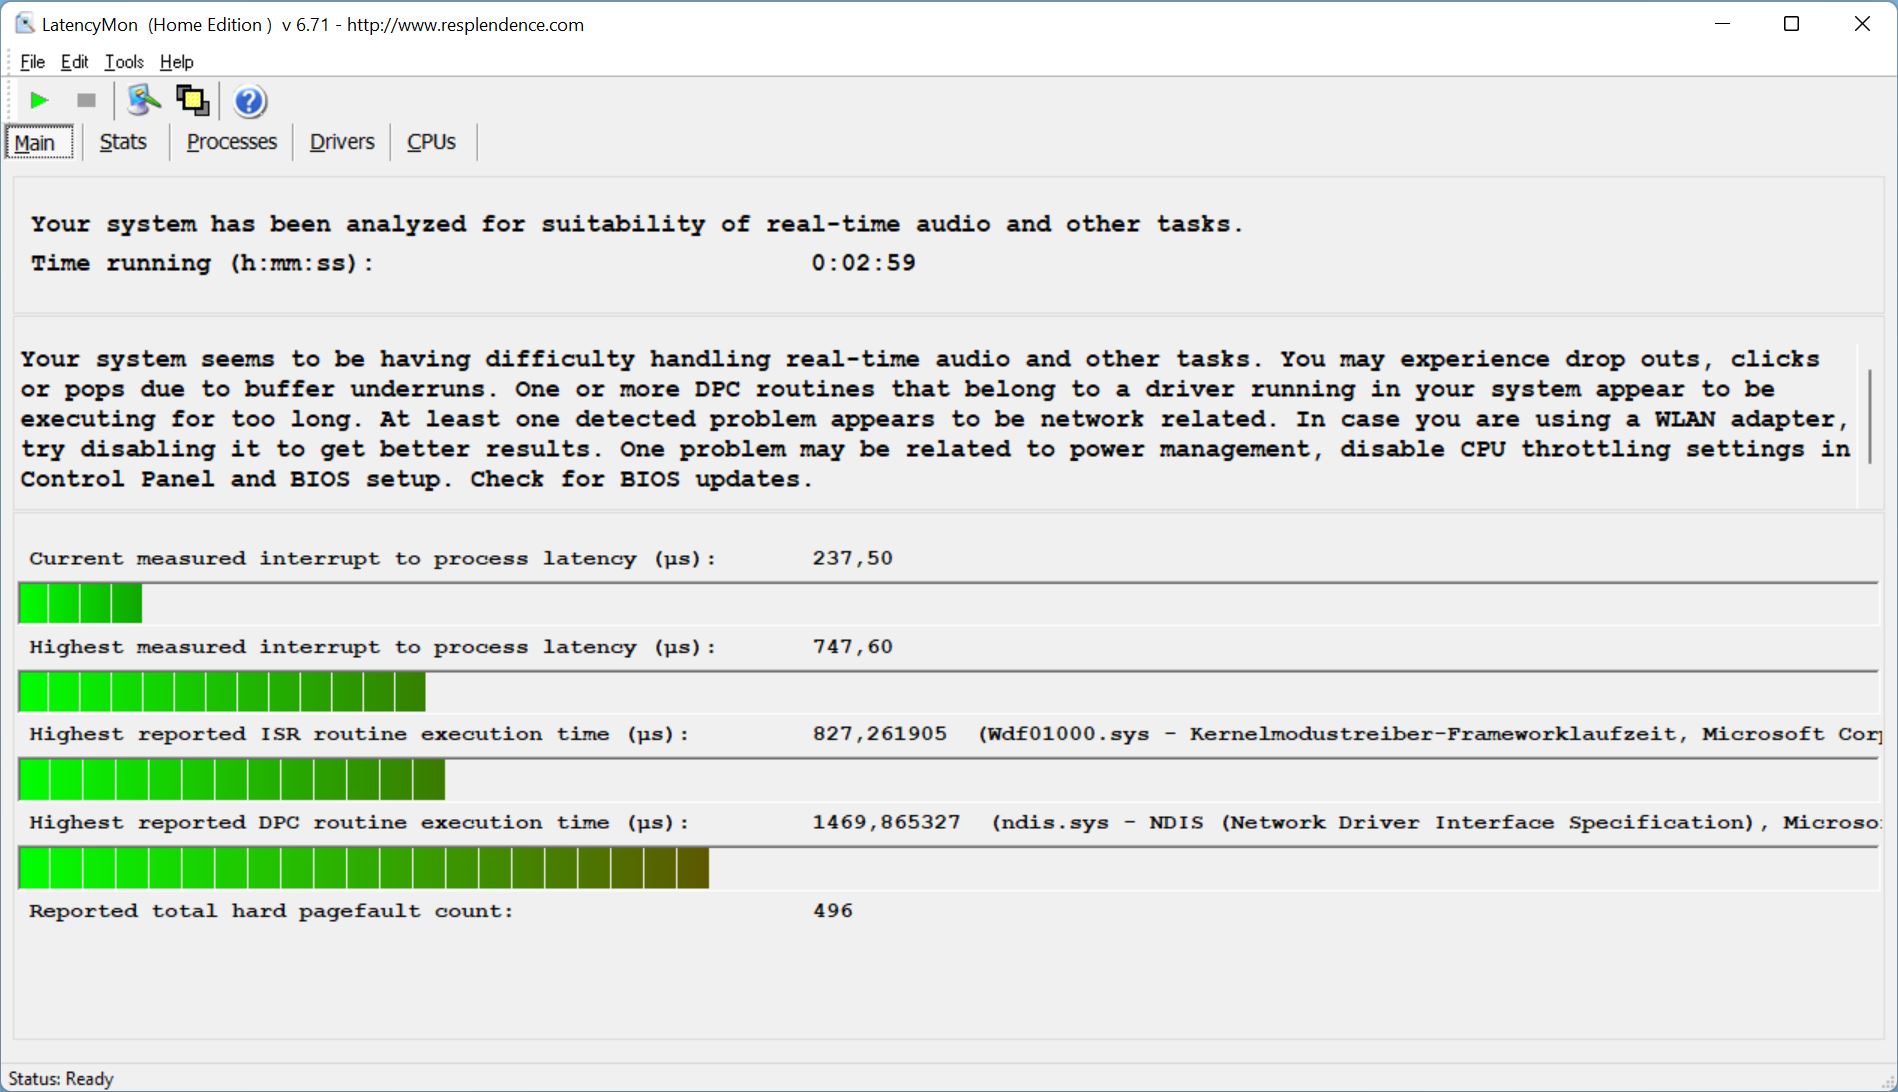
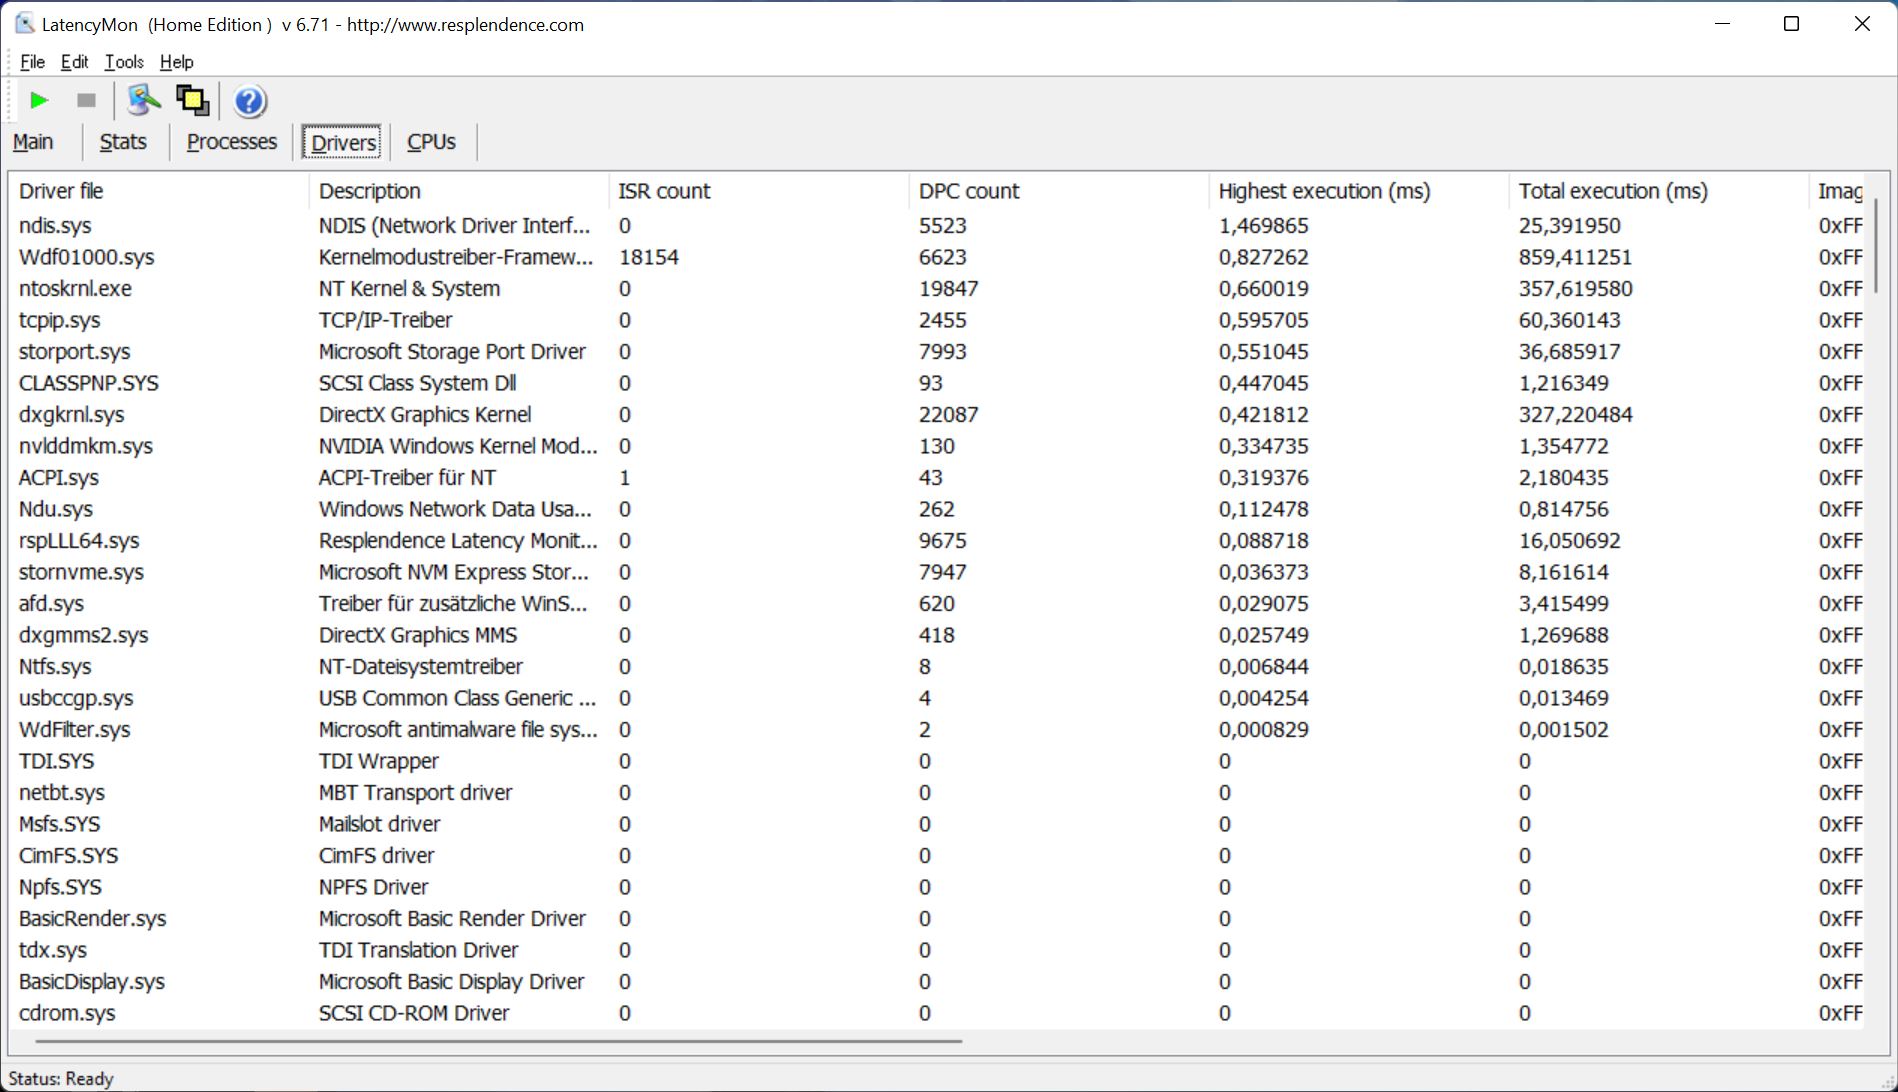
Latencia del CPD
Nuestra prueba de latencia estandarizada revela algunos problemas de controladores con la versión actual de la BIOS, pero la latencia en sí es buena. No hubo caídas de frames durante la reproducción de un vídeo 4K de YouTube.
| DPC Latencies / LatencyMon - interrupt to process latency (max), Web, Youtube, Prime95 | |
| MSI Vector GP66 12UGS | |
| Lenovo Legion 5 Pro 16ACH6H (82JQ001PGE) | |
| Asus TUF Gaming A15 FA506QR-AZ061T | |
| Lenovo Legion 5 Pro 16 G7 i7 RTX 3070Ti | |
| HP Omen 16-b0085ng | |
| Acer Nitro 5 AN515-45-R1JH | |
* ... más pequeño es mejor
Dispositivos de almacenamiento
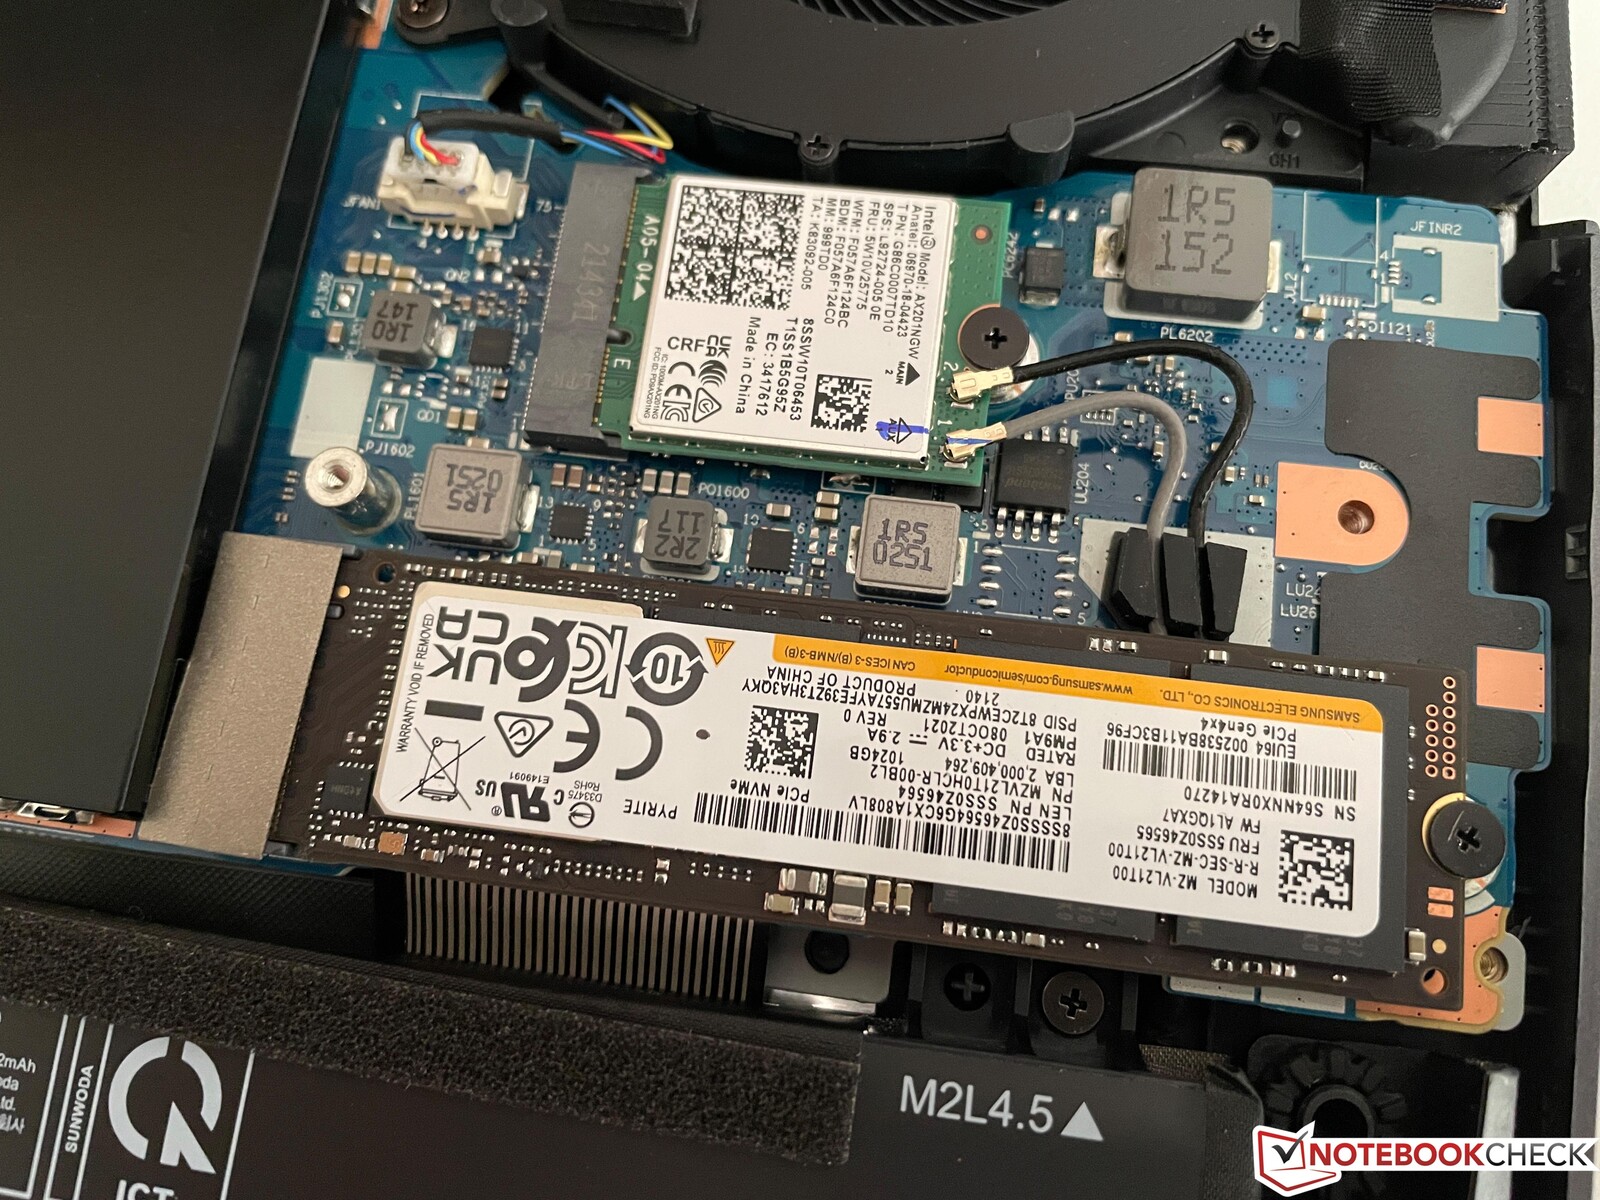
El Legion ofrece dos ranuras M.2-2280, que están ocultas bajo cubiertas adicionales. Por tanto, no hay problema en ampliar la capacidad de almacenamiento. Nuestro modelo de pruebas está equipado con un único SSD PCIe 4.0 de Samsung (PM91A) con una capacidad de almacenamiento de 1 TB. Puedes utilizar 895 GB para tus propios archivos/aplicaciones después de la configuración inicial. El OM91A logra tasas de transferencia muy altas, de más de 6 GB/s, y es una de las unidades más rápidas del mercado. El Legion también se asegura el primer puesto dentro de nuestro grupo de comparación. Hay más pruebas comparativas de SSD disponibles aquí.

* ... más pequeño es mejor
Disk Throttling: DiskSpd Read Loop, Queue Depth 8
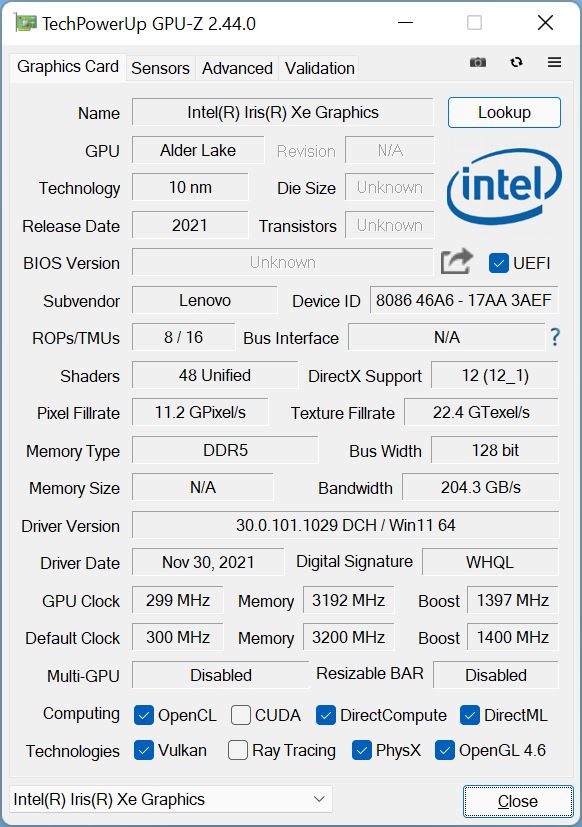
Rendimiento de la GPU - GeForce RTX 3070 Ti
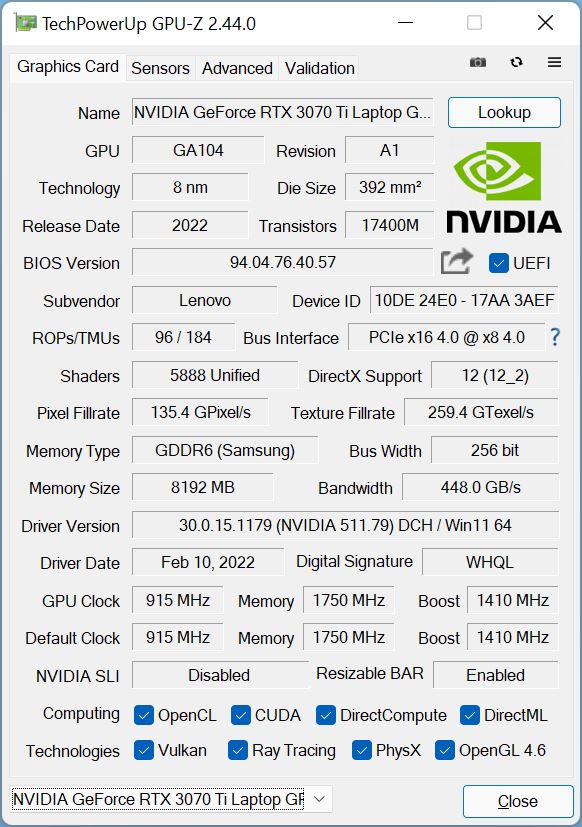
Ya hemos mencionado que el Legion ahora soporta la tecnología Advanced Optimus de Nvidia, que utiliza un MUX dinámico. Esto significa que la iGPU se puede desactivar cuando se maneja la pantalla interna, lo que antes no era posible sin un reinicio. La nuevaGeForce RTX 3070 Tiinterviene automáticamente cuando necesitas más rendimiento. Lenovo usa la versión de 125W de la 3070 Ti con 8 GB de GDDR6-VRAM y un reloj máximo de 1702 MHz, pero la GPU también puede usar 25W de refuerzo dinámico del procesador.
Los resultados del benchmark son muy buenos y están en el nivel esperado, pero elMSI Vector GP66suele ser ligeramente más rápido en los benchmarks. En comparación con el antiguoLegion 5 Pro 16con laRTX 3070la ventaja es de alrededor del 20 por ciento. Enumeramos los resultados de los tres modos de energía en la siguiente tabla.
| Escenario | Silencioso | Auto | Rendimiento |
|---|---|---|---|
| Time Spy Gráficos | 9280 Puntos | 10424 Puntos | 11577 Puntos |
| Time Spy Prueba de esfuerzo | 71,4 % (no superada) | 96,8 % (no superada) | 98 % (superada) |
La RTX 3070 Ti está limitada a sólo 40W en batería, por lo que la caída de rendimiento es mucho mayor en comparación con el procesador. La puntuación de Time Spy Graphics cae a sólo 2670 puntos (-78 %). Consulta nuestra sección de tecnología para ver más pruebas de rendimiento de la GPU.
| 3DMark Fire Strike Score | 26098 puntos | |
| 3DMark Time Spy Score | 11752 puntos | |
ayuda | ||
Rendimiento de los juegos
El rendimiento gaming del Legion 5i Pro 16 es - como se esperaba - muy bueno y el portátil gaming puede manejar fácilmente todos los juegos modernos en la resolución QHD nativa. Cyberpunk 2077 también funciona a algo más de 60 fps, incluso con Ray Tracing. La nuevaRTX 3070 Ties un 15-20 % más rápida de media en comparación con laRTX 3070. Algunos títulos seguirán funcionando sin problemas en el modo silencioso (hay un déficit de rendimiento del 30-40 %) y se beneficia del ruido más silencioso del ventilador.
| F1 2021 | |
| 1920x1080 High Preset AA:T AF:16x | |
| Lenovo Legion 5 Pro 16ACH6H (82JQ001PGE) | |
| Lenovo Legion 5 Pro 16 G7 i7 RTX 3070Ti | |
| Medio NVIDIA GeForce RTX 3070 Ti Laptop GPU (139.2 - 238, n=8) | |
| 1920x1080 Ultra High Preset + Raytracing AA:T AF:16x | |
| Lenovo Legion 5 Pro 16 G7 i7 RTX 3070Ti | |
| Lenovo Legion 5 Pro 16ACH6H (82JQ001PGE) | |
| Medio NVIDIA GeForce RTX 3070 Ti Laptop GPU (67.3 - 134.2, n=13) | |
| 2560x1440 Ultra High Preset + Raytracing AA:T AF:16x | |
| Lenovo Legion 5 Pro 16 G7 i7 RTX 3070Ti | |
| Lenovo Legion 5 Pro 16ACH6H (82JQ001PGE) | |
| Medio NVIDIA GeForce RTX 3070 Ti Laptop GPU (47.5 - 99.2, n=11) | |
| GRID Legends | |
| 1920x1080 High Preset | |
| Medio NVIDIA GeForce RTX 3070 Ti Laptop GPU (148 - 149.1, n=2) | |
| Lenovo Legion 5 Pro 16 G7 i7 RTX 3070Ti | |
| 1920x1080 Ultra Preset | |
| Lenovo Legion 5 Pro 16 G7 i7 RTX 3070Ti | |
| Medio NVIDIA GeForce RTX 3070 Ti Laptop GPU (111.2 - 114, n=2) | |
| 2560x1440 Ultra Preset | |
| Lenovo Legion 5 Pro 16 G7 i7 RTX 3070Ti | |
| Medio NVIDIA GeForce RTX 3070 Ti Laptop GPU (n=1) | |
| Cyberpunk 2077 1.6 | |
| 1920x1080 Ultra Preset | |
| Lenovo Legion 5 Pro 16 G7 i7 RTX 3070Ti | |
| Medio NVIDIA GeForce RTX 3070 Ti Laptop GPU (48.5 - 104, n=13) | |
| 2560x1440 Ultra Preset | |
| Lenovo Legion 5 Pro 16 G7 i7 RTX 3070Ti | |
| Medio NVIDIA GeForce RTX 3070 Ti Laptop GPU (40 - 62, n=10) | |
La GPU también puede consumir 150W durante los juegos, al menos en función de la carga de la CPU (véase el gráfico siguiente). Jugar en batería es un poco problemático porque el rendimiento sufre un gran golpe. Witcher 3 por ejemplo, el rendimiento de la GPU (Ultra preset) cae por debajo de los 30 fps sin el adaptador de corriente. Más benchmarks de juegos están listados aquí.
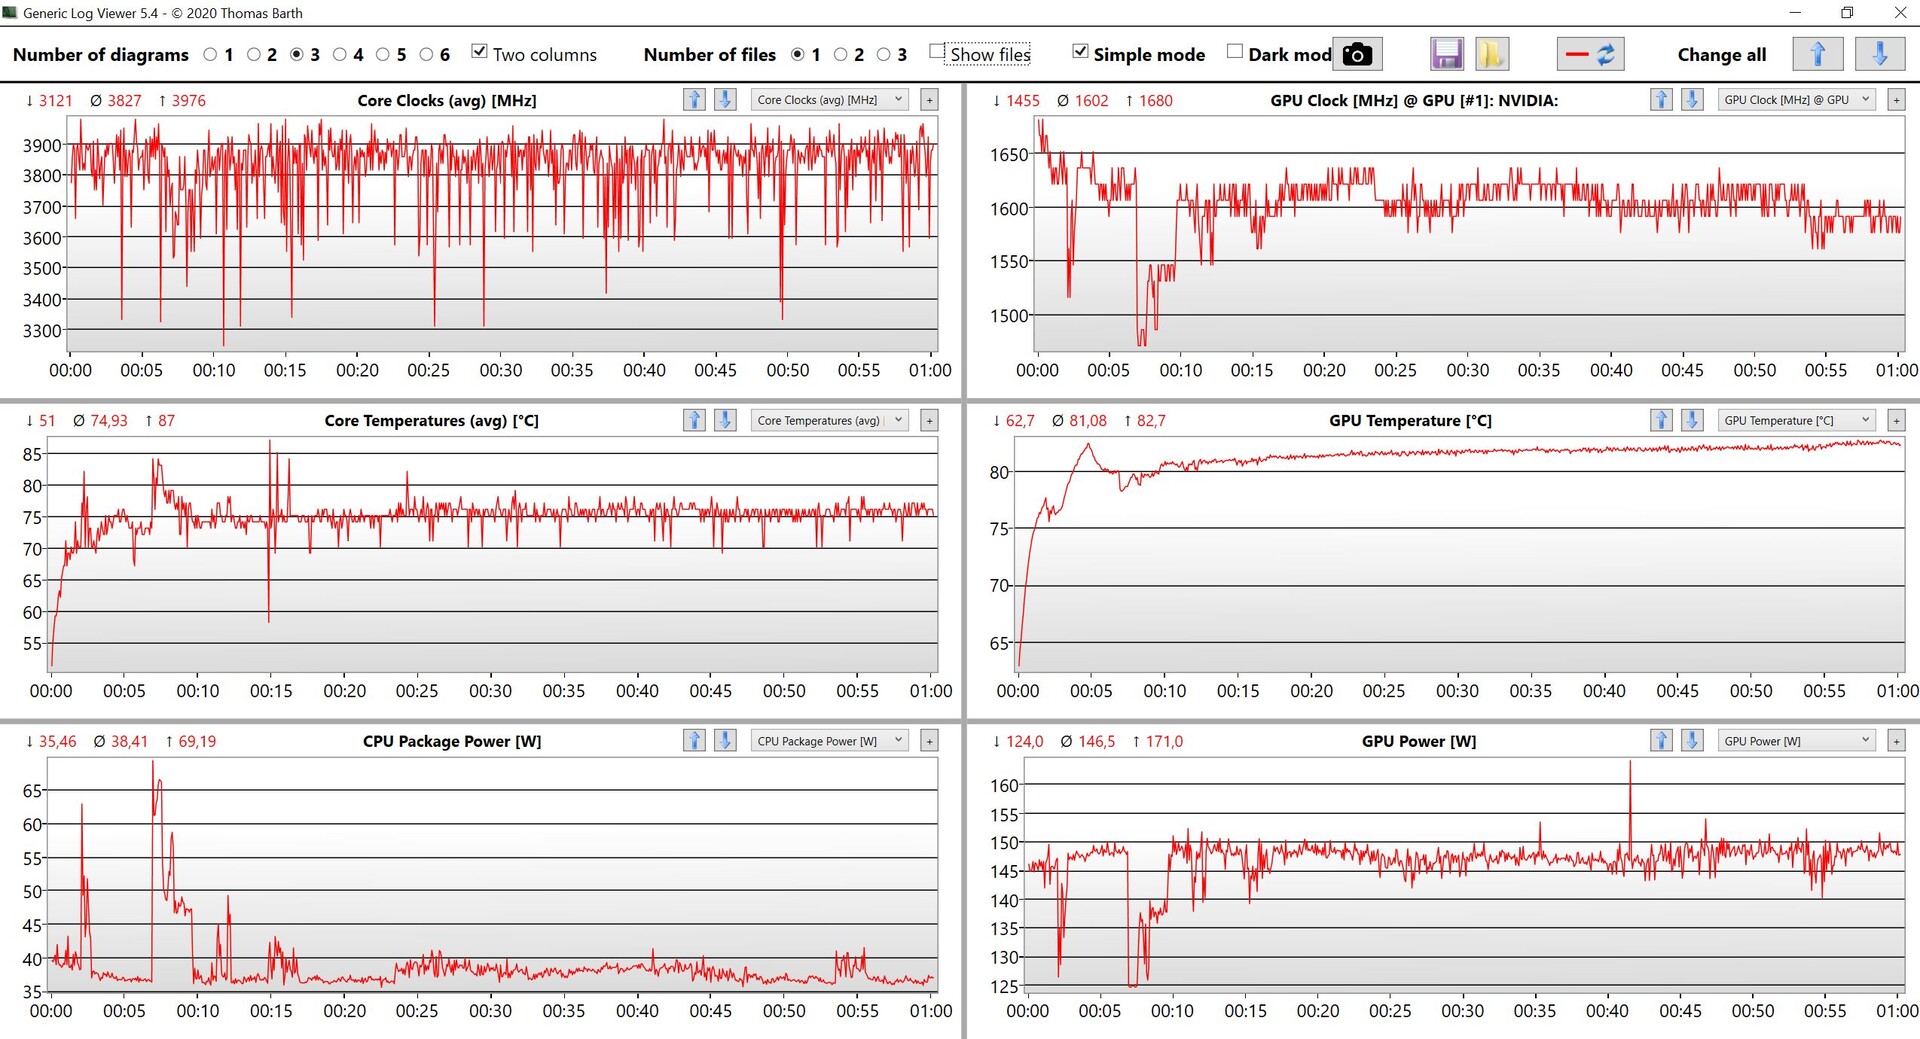
Witcher 3 FPS-Diagramm
| bajo | medio | alto | ultra | QHD | |
|---|---|---|---|---|---|
| GTA V (2015) | 185 | 182 | 171 | 117 | 100 |
| The Witcher 3 (2015) | 417 | 324 | 219 | 103 | |
| Dota 2 Reborn (2015) | 178 | 161 | 152 | 145 | |
| Final Fantasy XV Benchmark (2018) | 205 | 142 | 107 | 82.3 | |
| X-Plane 11.11 (2018) | 144 | 123 | 100 | ||
| Far Cry 5 (2018) | 172 | 137 | 129 | 122 | 108 |
| Strange Brigade (2018) | 453 | 270 | 224 | 199 | 150 |
| F1 2021 (2021) | 365 | 255 | 210 | 130 | 99.2 |
| GRID Legends (2022) | 209 | 169 | 148 | 114 | 99 |
| Cyberpunk 2077 1.6 (2022) | 145 | 123 | 96 | 94 | 62 |
Emisiones - Legion 5i se calienta y hace ruido
Ruido del sistema
Recomendamos el modo silencioso durante las tareas cotidianas, porque los ventiladores estarán desactivados la mayor parte del tiempo y no hay otros sonidos electrónicos como el silbido de la bobina. Los ventiladores están casi siempre funcionando en los otros dos modos, incluso en ralentí. Medimos unos 40 dB(A) cuando juegas con el modo Silencioso, y depende de la carga de la CPU para los otros dos modos. Witcher 3 con un uso bajo de la CPU da como resultado hasta 49 dB(A), mientras que Cyberpunk 2077 da como resultado hasta 54 dB(A), lo que obviamente es claramente audible.
| Escenario | Silencioso | Auto | Rendimiento |
|---|---|---|---|
| Witcher 3 Ultra | 39,1 dB(A) (64 fps) | 49,4 dB(A) (100 fps) | 49,4 dB(A) (103 fps) |
| Cyberpunk 2077 1.5 Ultra QHD | 39,1 dB(A) (35 fps) | 49,4 dB(A) (57 fps) | 54,7 dB(A) (62 fps) |
| Prueba de esfuerzo | 39,1 dB(A) | 49,4 dB(A) | 54,7 dB(A) |
Ruido
| Ocioso |
| 28.4 / 28.4 / 28.4 dB(A) |
| Carga |
| 49.4 / 54.7 dB(A) |
 | ||
30 dB silencioso 40 dB(A) audible 50 dB(A) ruidosamente alto |
||
min: | ||
| Lenovo Legion 5 Pro 16 G7 i7 RTX 3070Ti GeForce RTX 3070 Ti Laptop GPU, i7-12700H, Samsung PM9A1 MZVL21T0HCLR | MSI Vector GP66 12UGS GeForce RTX 3070 Ti Laptop GPU, i9-12900H | HP Omen 16-b0085ng GeForce RTX 3070 Laptop GPU, i7-11800H, Intel Optane Memory H10 with Solid State Storage 32GB + 512GB HBRPEKNX0202A(L/H) | Acer Nitro 5 AN515-45-R1JH GeForce RTX 3070 Laptop GPU, R7 5800H, WDC PC SN530 SDBPNPZ-1T00 | Asus TUF Gaming A15 FA506QR-AZ061T GeForce RTX 3070 Laptop GPU, R7 5800H, SK Hynix HFM001TD3JX013N | Lenovo Legion 5 Pro 16ACH6H (82JQ001PGE) GeForce RTX 3070 Laptop GPU, R7 5800H, WDC PC SN730 SDBPNTY-1T00 | |
|---|---|---|---|---|---|---|
| Noise | 7% | 6% | 4% | 5% | 12% | |
| apagado / medio ambiente * (dB) | 24.6 | 22.9 7% | 23 7% | 25 -2% | 26 -6% | 23 7% |
| Idle Minimum * (dB) | 28.4 | 23.4 18% | 23 19% | 25 12% | 26 8% | 25 12% |
| Idle Average * (dB) | 28.4 | 23.4 18% | 23 19% | 25 12% | 26 8% | 25 12% |
| Idle Maximum * (dB) | 28.4 | 27.4 4% | 34.81 -23% | 32.2 -13% | 27.4 4% | 25 12% |
| Load Average * (dB) | 49.4 | 36 27% | 35.02 29% | 45.8 7% | 46.6 6% | 35.5 28% |
| Witcher 3 ultra * (dB) | 49.4 | 58.2 -18% | 52 -5% | 46.67 6% | ||
| Load Maximum * (dB) | 54.7 | 58 -6% | 56 -2% | 49.1 10% | 49.3 10% | 50.35 8% |
* ... más pequeño es mejor
Temperatura
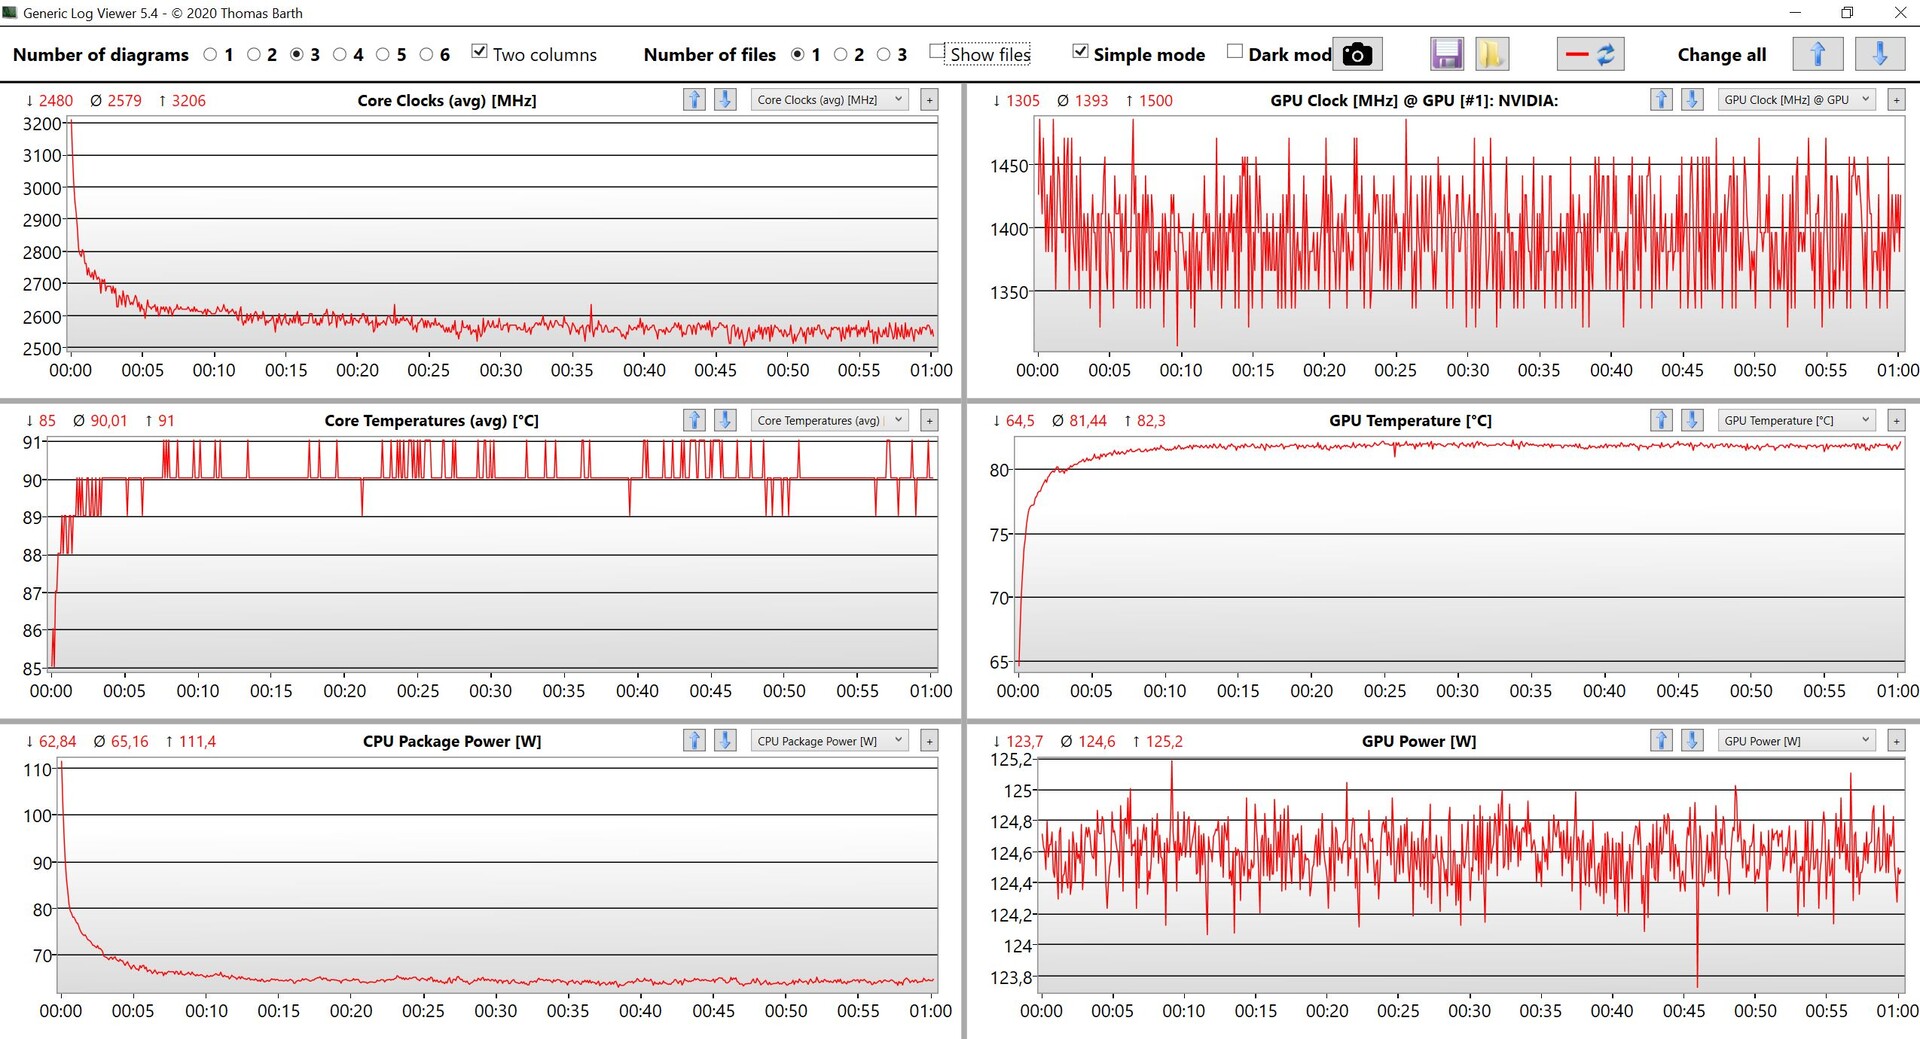
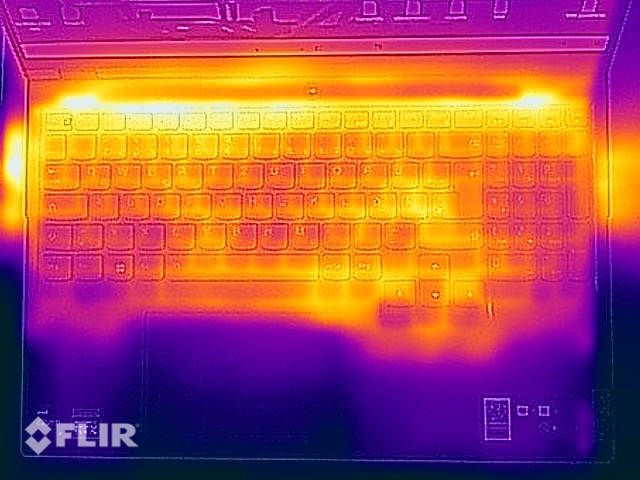
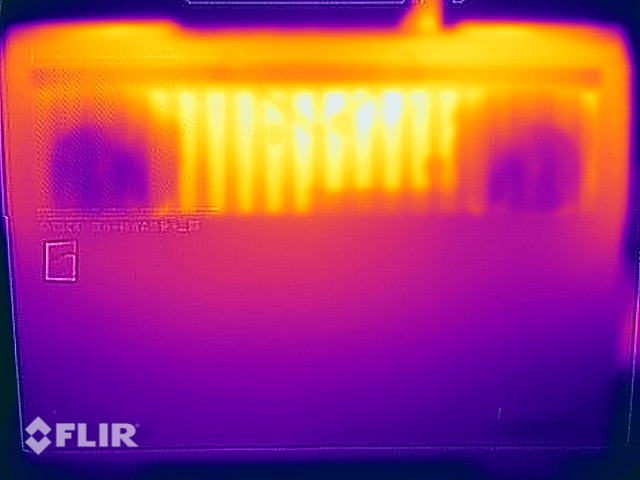
Algunos puntos ya alcanzan más de 30 °C en reposo, pero esto no significa que haya limitaciones en cargas de trabajo ligeras. Sin embargo, podemos medir casi 60 °C en la parte inferior de la unidad base mientras se juega, por lo que no deberías usarlo en tu regazo en este caso. El teclado también se calienta significativamente y tendrás los dedos calientes durante el juego. La GPU funciona a 125W durante el test de estrés y el procesador se nivela rápidamente a 62W.
(-) La temperatura máxima en la parte superior es de 45.3 °C / 114 F, frente a la media de 40.4 °C / 105 F, que oscila entre 21.2 y 68.8 °C para la clase Gaming.
(-) El fondo se calienta hasta un máximo de 61.2 °C / 142 F, frente a la media de 43.2 °C / 110 F
(+) En reposo, la temperatura media de la parte superior es de 26.8 °C / 80# F, frente a la media del dispositivo de 33.9 °C / 93 F.
(±) Jugando a The Witcher 3, la temperatura media de la parte superior es de 37.7 °C / 100 F, frente a la media del dispositivo de 33.9 °C / 93 F.
(±) El reposamanos y el touchpad pueden calentarse mucho al tacto con un máximo de 37.5 °C / 99.5 F.
(-) La temperatura media de la zona del reposamanos de dispositivos similares fue de 28.8 °C / 83.8 F (-8.7 °C / -15.7 F).
| Lenovo Legion 5 Pro 16 G7 i7 RTX 3070Ti Intel Core i7-12700H, NVIDIA GeForce RTX 3070 Ti Laptop GPU | MSI Vector GP66 12UGS Intel Core i9-12900H, NVIDIA GeForce RTX 3070 Ti Laptop GPU | HP Omen 16-b0085ng Intel Core i7-11800H, NVIDIA GeForce RTX 3070 Laptop GPU | Acer Nitro 5 AN515-45-R1JH AMD Ryzen 7 5800H, NVIDIA GeForce RTX 3070 Laptop GPU | Asus TUF Gaming A15 FA506QR-AZ061T AMD Ryzen 7 5800H, NVIDIA GeForce RTX 3070 Laptop GPU | Lenovo Legion 5 Pro 16ACH6H (82JQ001PGE) AMD Ryzen 7 5800H, NVIDIA GeForce RTX 3070 Laptop GPU | |
|---|---|---|---|---|---|---|
| Heat | -0% | -9% | -4% | -11% | -9% | |
| Maximum Upper Side * (°C) | 45.3 | 40.2 11% | 48 -6% | 53.2 -17% | 46.7 -3% | 50 -10% |
| Maximum Bottom * (°C) | 61.2 | 43.8 28% | 55 10% | 58.2 5% | 55.9 9% | 55 10% |
| Idle Upper Side * (°C) | 28.6 | 34.8 -22% | 33 -15% | 29.5 -3% | 37.1 -30% | 34 -19% |
| Idle Bottom * (°C) | 31.4 | 37 -18% | 39 -24% | 31.2 1% | 38.1 -21% | 37 -18% |
* ... más pequeño es mejor
Altavoces
Los dos altavoces estéreo (2W cada uno) están situados en la zona frontal de la unidad base y dirigen el sonido hacia la parte inferior. Lenovo instala la aplicación Nahimic, que ofrece múltiples perfiles y mejora definitivamente el sonido, que es bastante metálico sin el apoyo del software. Sin embargo, el rendimiento de los bajos podría ser mejor. El sistema de altavoces está bien para algo de música de fondo o reproducción de vídeo, pero deberías usar unos auriculares durante los juegos de todos modos ya que los ventiladores son demasiado ruidosos.
Lenovo Legion 5 Pro 16 G7 i7 RTX 3070Ti análisis de audio
(±) | la sonoridad del altavoz es media pero buena (79.1 dB)
Graves 100 - 315 Hz
(-) | casi sin bajos - de media 17.8% inferior a la mediana
(±) | la linealidad de los graves es media (9.9% delta a frecuencia anterior)
Medios 400 - 2000 Hz
(+) | medios equilibrados - a sólo 3.7% de la mediana
(+) | los medios son lineales (3.3% delta a la frecuencia anterior)
Altos 2 - 16 kHz
(+) | máximos equilibrados - a sólo 2.1% de la mediana
(+) | los máximos son lineales (5.8% delta a la frecuencia anterior)
Total 100 - 16.000 Hz
(+) | el sonido global es lineal (14.7% de diferencia con la mediana)
En comparación con la misma clase
» 29% de todos los dispositivos probados de esta clase eran mejores, 7% similares, 64% peores
» El mejor tuvo un delta de 6%, la media fue 18%, el peor fue ###max##%
En comparación con todos los dispositivos probados
» 19% de todos los dispositivos probados eran mejores, 4% similares, 77% peores
» El mejor tuvo un delta de 4%, la media fue 23%, el peor fue ###max##%
HP Omen 16-b0085ng análisis de audio
(+) | los altavoces pueden reproducir a un volumen relativamente alto (#84.4 dB)
Graves 100 - 315 Hz
(-) | casi sin bajos - de media 17.4% inferior a la mediana
(±) | la linealidad de los graves es media (13.9% delta a frecuencia anterior)
Medios 400 - 2000 Hz
(+) | medios equilibrados - a sólo 3.2% de la mediana
(+) | los medios son lineales (2.9% delta a la frecuencia anterior)
Altos 2 - 16 kHz
(+) | máximos equilibrados - a sólo 1.5% de la mediana
(+) | los máximos son lineales (3.9% delta a la frecuencia anterior)
Total 100 - 16.000 Hz
(+) | el sonido global es lineal (12.1% de diferencia con la mediana)
En comparación con la misma clase
» 12% de todos los dispositivos probados de esta clase eran mejores, 4% similares, 84% peores
» El mejor tuvo un delta de 6%, la media fue 18%, el peor fue ###max##%
En comparación con todos los dispositivos probados
» 10% de todos los dispositivos probados eran mejores, 2% similares, 88% peores
» El mejor tuvo un delta de 4%, la media fue 23%, el peor fue ###max##%
Gestión de la energía - Legion 5i Pro con Rapid Charge Pro
Consumo de energía
Medimos un consumo máximo en inactivo de hasta 18W, que sigue estando bien teniendo en cuenta el alto brillo. El consumo máximo durante el test de estrés es de 294W, pero el valor se nivela en torno a los 240W tras unos minutos y también puedes esperar 230-240W durante los juegos. El adaptador de corriente de 300W incluido (1,056 kg) es por tanto suficiente.
| Off / Standby | |
| Ocioso | |
| Carga |
|
Clave:
min: | |
| Lenovo Legion 5 Pro 16 G7 i7 RTX 3070Ti i7-12700H, GeForce RTX 3070 Ti Laptop GPU, Samsung PM9A1 MZVL21T0HCLR, IPS, 2560x1600, 16" | MSI Vector GP66 12UGS i9-12900H, GeForce RTX 3070 Ti Laptop GPU, , IPS, 1920x1080, 15.6" | HP Omen 16-b0085ng i7-11800H, GeForce RTX 3070 Laptop GPU, Intel Optane Memory H10 with Solid State Storage 32GB + 512GB HBRPEKNX0202A(L/H), IPS, 1920x1080, 16.1" | Acer Nitro 5 AN515-45-R1JH R7 5800H, GeForce RTX 3070 Laptop GPU, WDC PC SN530 SDBPNPZ-1T00, IPS, 2560x1440, 15.6" | Asus TUF Gaming A15 FA506QR-AZ061T R7 5800H, GeForce RTX 3070 Laptop GPU, SK Hynix HFM001TD3JX013N, IPS, 1920x1080, 15.6" | Lenovo Legion 5 Pro 16ACH6H (82JQ001PGE) R7 5800H, GeForce RTX 3070 Laptop GPU, WDC PC SN730 SDBPNTY-1T00, IPS, 2560x1600, 16" | Medio NVIDIA GeForce RTX 3070 Ti Laptop GPU | Media de la clase Gaming | |
|---|---|---|---|---|---|---|---|---|
| Power Consumption | -44% | 4% | 18% | 15% | 9% | -24% | -16% | |
| Idle Minimum * (Watt) | 8.6 | 17.5 -103% | 12 -40% | 8.8 -2% | 10.2 -19% | 10.45 -22% | 14.2 ? -65% | 13 ? -51% |
| Idle Average * (Watt) | 17.6 | 20.1 -14% | 18 -2% | 13 26% | 12.8 27% | 14.92 15% | 19.9 ? -13% | 19 ? -8% |
| Idle Maximum * (Watt) | 18.5 | 47.3 -156% | 21 -14% | 14.6 21% | 15 19% | 16.02 13% | 26.2 ? -42% | 24.6 ? -33% |
| Load Average * (Watt) | 110 | 107.3 2% | 94 15% | 133 -21% | 130 -18% | 119.65 -9% | 125.8 ? -14% | 110.7 ? -1% |
| Witcher 3 ultra * (Watt) | 227 | 225 1% | 147 35% | 134 41% | 137 40% | 174.9 23% | ||
| Load Maximum * (Watt) | 294.6 | 277.7 6% | 199 32% | 164 44% | 184 38% | 187.26 36% | 248 ? 16% | 259 ? 12% |
* ... más pequeño es mejor
Power Consumption Witcher 3 / Stress test
Power Consumption external screen
Duración de la batería
La batería de 80Wh no da lugar a duraciones muy largas. A 150 nits (que es el 67 % del brillo máximo de nuestra unidad), nuestro test de vídeo dura poco más de 6 horas y el test Wi-Fi dura entre 4.5 y 5.5 horas dependiendo del brillo. Si se estresa mucho el portátil, la batería se agotará tras 37 minutos.
El dispositivo es compatible con Rapid Charge Pro para tiempos de carga más rápidos. Puedes activar esta función a través del software Vantage y realmente acorta el tiempo de carga notablemente. El modo normal tiene una curva de carga muy lineal y una carga completa tarda 102 minutos. La carga rápida acorta este tiempo en unos 40 minutos y el 80 % de la capacidad ya está disponible tras sólo 22 minutos.
| Lenovo Legion 5 Pro 16 G7 i7 RTX 3070Ti i7-12700H, GeForce RTX 3070 Ti Laptop GPU, 80 Wh | MSI Vector GP66 12UGS i9-12900H, GeForce RTX 3070 Ti Laptop GPU, 65 Wh | HP Omen 16-b0085ng i7-11800H, GeForce RTX 3070 Laptop GPU, 83 Wh | Acer Nitro 5 AN515-45-R1JH R7 5800H, GeForce RTX 3070 Laptop GPU, 57.5 Wh | Asus TUF Gaming A15 FA506QR-AZ061T R7 5800H, GeForce RTX 3070 Laptop GPU, 90 Wh | Lenovo Legion 5 Pro 16ACH6H (82JQ001PGE) R7 5800H, GeForce RTX 3070 Laptop GPU, 80 Wh | Media de la clase Gaming | |
|---|---|---|---|---|---|---|---|
| Duración de Batería | 37% | 53% | 28% | 206% | 24% | 71% | |
| H.264 (h) | 6.3 | 5.4 -14% | 6.9 10% | 8.32 ? 32% | |||
| WiFi v1.3 (h) | 5.4 | 5.7 6% | 7.6 41% | 5.7 6% | 11.4 111% | 7 30% | 7.11 ? 32% |
| Load (h) | 0.6 | 1 67% | 1.4 133% | 1 67% | 2.4 300% | 0.7 17% | 1.502 ? 150% |
| Reader / Idle (h) | 7.9 | 9.2 | 17.4 | 9.1 | 8.27 ? |
Pro
Contra
Veredicto - El portátil para juegos de Lenovo ofrece un alto rendimiento a un precio justo
La séptima generación del Legion 5i Pro 16 recibe un notable aumento de rendimiento. Lenovo sigue usando el mismo chasis, que no usa ningún elemento de iluminación ni ninguna otra característica especial. Ofrece una buena capacidad de refrigeración, muchos puertos y opciones de mantenimiento decentes con dos ranuras RAM y dos ranuras M.2-SSD en su lugar. El panel de 165 Hz también deja una buena impresión y es definitivamente una buena opción para un portátil de juegos
El rendimiento con el nuevo Alder LakeCore i7-12700Hy laGeForce RTX 3070 Ticon valores TDP/TGP altos también es impresionante. Incluso títulos muy exigentes como Cyberpunk 2077 se ejecutan con total fluidez en QHD con Ray Tracing. También tienes un rápido SSD PCIe 4.0 así como Thunderbolt 4, pero no el último estándar Wi-Fi 6E (6 GHz) o un puerto Ethernet de 2.5 Gbps. Sin embargo, esto no debería ser un gran problema
El Lenovo Legion 5i Pro 16 se centra en el rendimiento de juego y combina componentes potentes con una buena pantalla. Es difícil conseguir más rendimiento por unos 2000 euros y el Legion 5i Pro 16 es simplemente un muy buen portátil para juegos
El sistema no está exento de defectos, porque todo el rendimiento se traduce en ventiladores ruidosos así como en altas temperaturas superficiales. Recomendamos el modo silencioso si no estás jugando, y se puede activar fácilmente a través de la combinación de teclas. También puede tener sentido mientras se juega gracias a que el ruido del ventilador es notablemente más silencioso, pero el rendimiento cae un 30-40 %
El MSIVector GP66 de MSItambién usa la nueva RTX 3070 Ti y suele ser algo más rápido mientras se juega, pero también usa una pantalla inferior de 1080p con cifras de brillo inferiores. Todos los demás competidores, como elAcer Nitro 5,Asus TUF Gaming A15oHP Omen 16siguen utilizando la antigua RTX 3070 y son entre un 15 y un 20 % más lentos a la hora de jugar.
Precio y disponibilidad
La tienda online de Lenovo en EE.UU. actualmente sólo lista una versión menos potente del Legion 5i Pro 16 Gen7 con el mismo Core i7-12700H, pero una GeForce RTX 3050 Ti más lenta por 1779 dólares.
Lenovo Legion 5 Pro 16 G7 i7 RTX 3070Ti
- 03/28/2022 v7 (old)
Andreas Osthoff
Price comparison

