Análisis de Acer Nitro 5 AN515-46: potente juego FHD con USB 4
La serie Nitro 5 de Acer se compone de dispositivos para juegos de nivel básico y medio. Los portátiles se sitúan por debajo de la serie Predator, con precios que llegan hasta los 2.500 euros. La unidad de prueba de hoy está disponible a partir de 1.750 euros. Acer ha combinado una APU Ryzen 7-6800H de bajo consumo con una GPU GeForce RTX 3070-Ti (TGP de 150 vatios) para este modelo. En teoría, esto podría dar lugar a un portátil potente con bajas emisiones y una larga duración de la batería. Entre los competidores de este dispositivo se encuentra elSchenker XMG Fusion 15 (Mid 22), elMSI Katana GF66 12UGSy elAsus TUF Dash F15 FX517ZR.
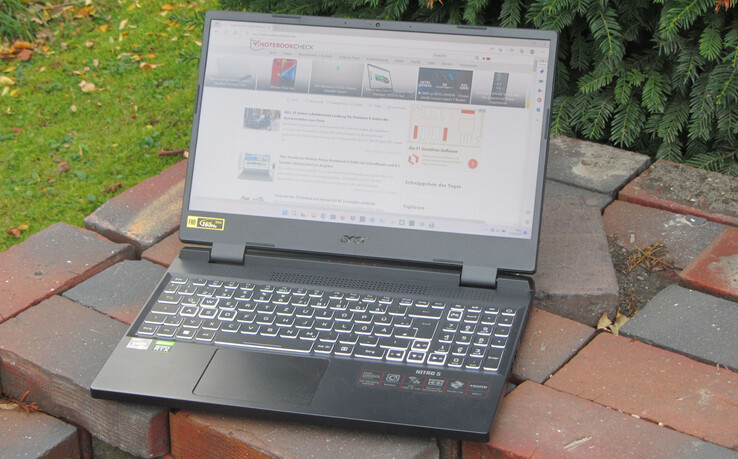
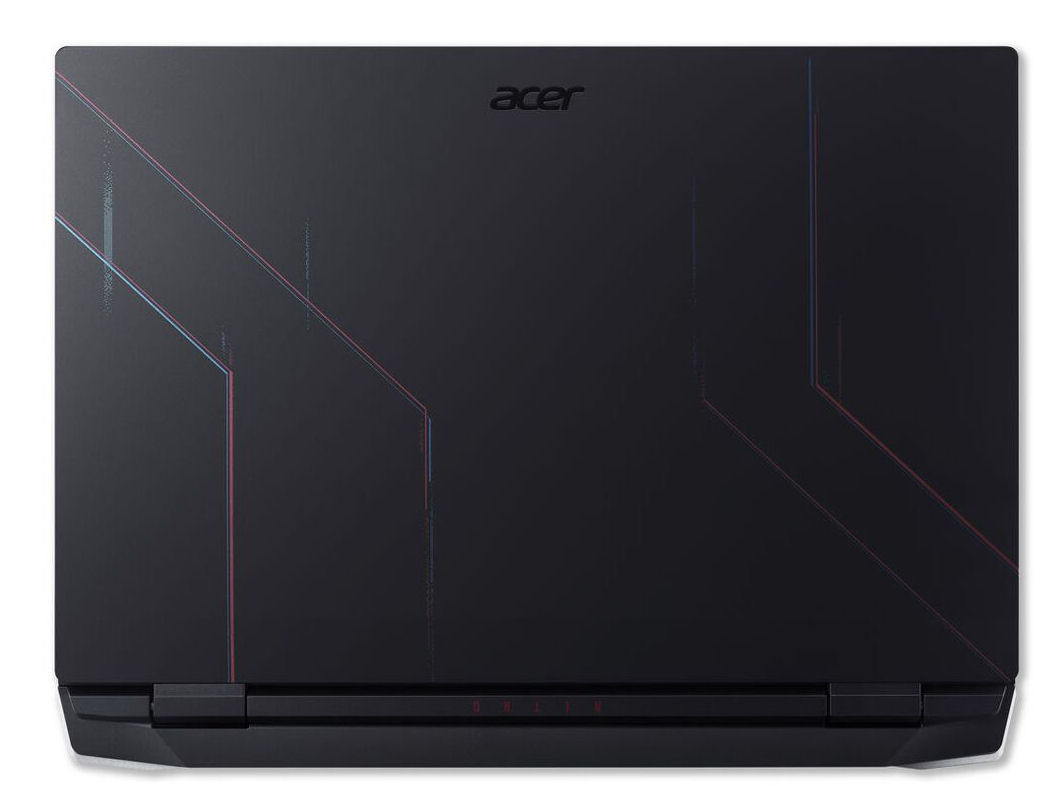
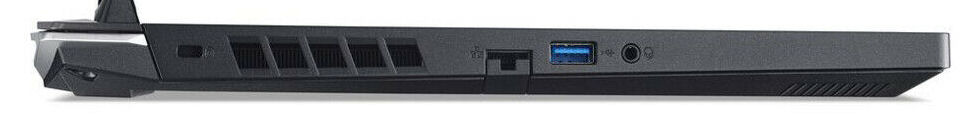
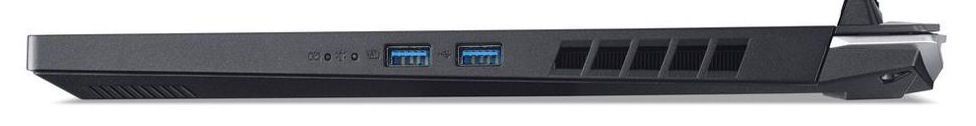
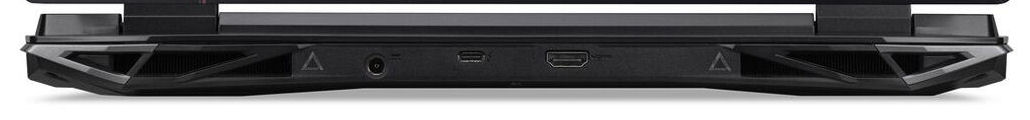
El AN515-58 se ha instalado en la misma carcasa que su hermano basado en Intel, que ya probamos. Para saber más sobre la carcasa, la conectividad y los dispositivos de entrada, consulte nuestro análisis delNitro 5 AN515-58(Core i7, QHD).
Posibles contendientes en la comparación
Valoración | Fecha | Modelo | Peso | Altura | Tamaño | Resolución | Precio |
|---|---|---|---|---|---|---|---|
| 83.9 % v7 (old) | 11/2022 | Acer Nitro 5 AN515-46-R1A1 R7 6800H, GeForce RTX 3070 Ti Laptop GPU | 2.5 kg | 26.8 mm | 15.60" | 1920x1080 | |
| 80.3 % v7 (old) | 06/2022 | MSI Katana GF66 12UGS i7-12700H, GeForce RTX 3070 Ti Laptop GPU | 2.3 kg | 27.5 mm | 15.60" | 1920x1080 | |
| 87.4 % v7 (old) | 08/2022 | Schenker XMG Fusion 15 (Mid 22) i7-11800H, GeForce RTX 3070 Laptop GPU | 1.9 kg | 21.65 mm | 15.60" | 2560x1440 | |
| 85.8 % v7 (old) | 07/2022 | Asus TUF Dash F15 FX517ZR i7-12650H, GeForce RTX 3070 Laptop GPU | 2 kg | 20.7 mm | 15.60" | 2560x1440 |
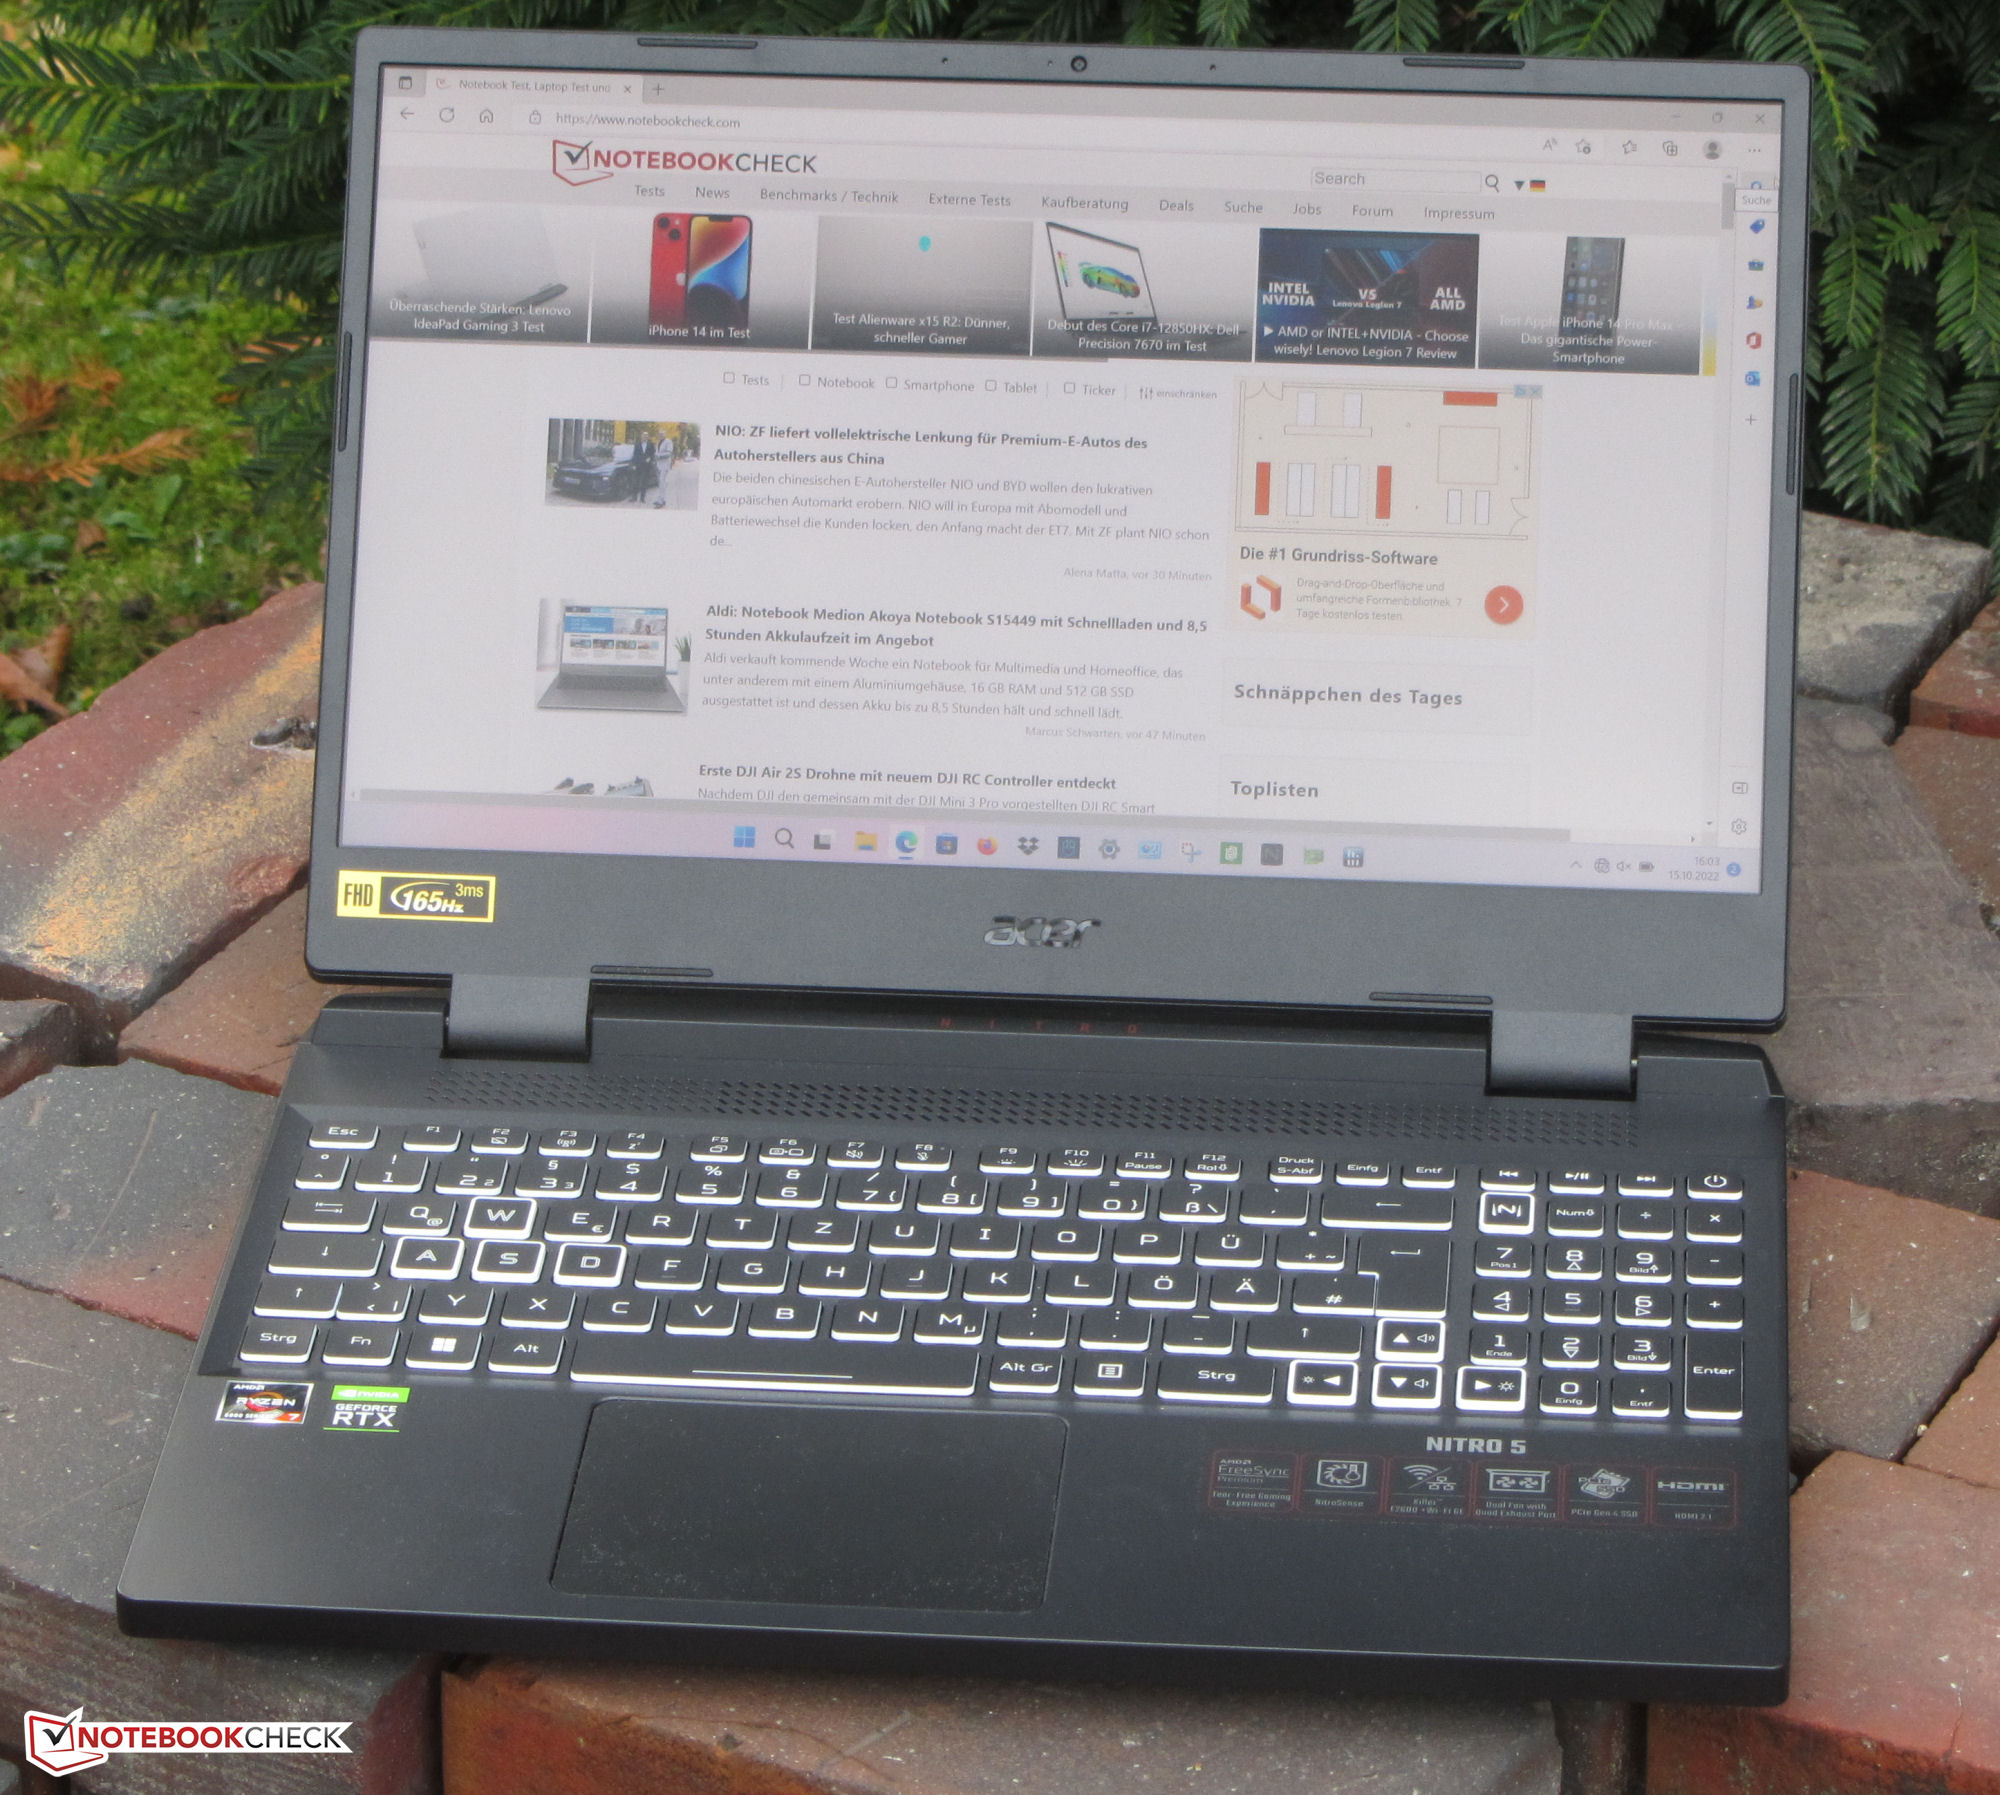
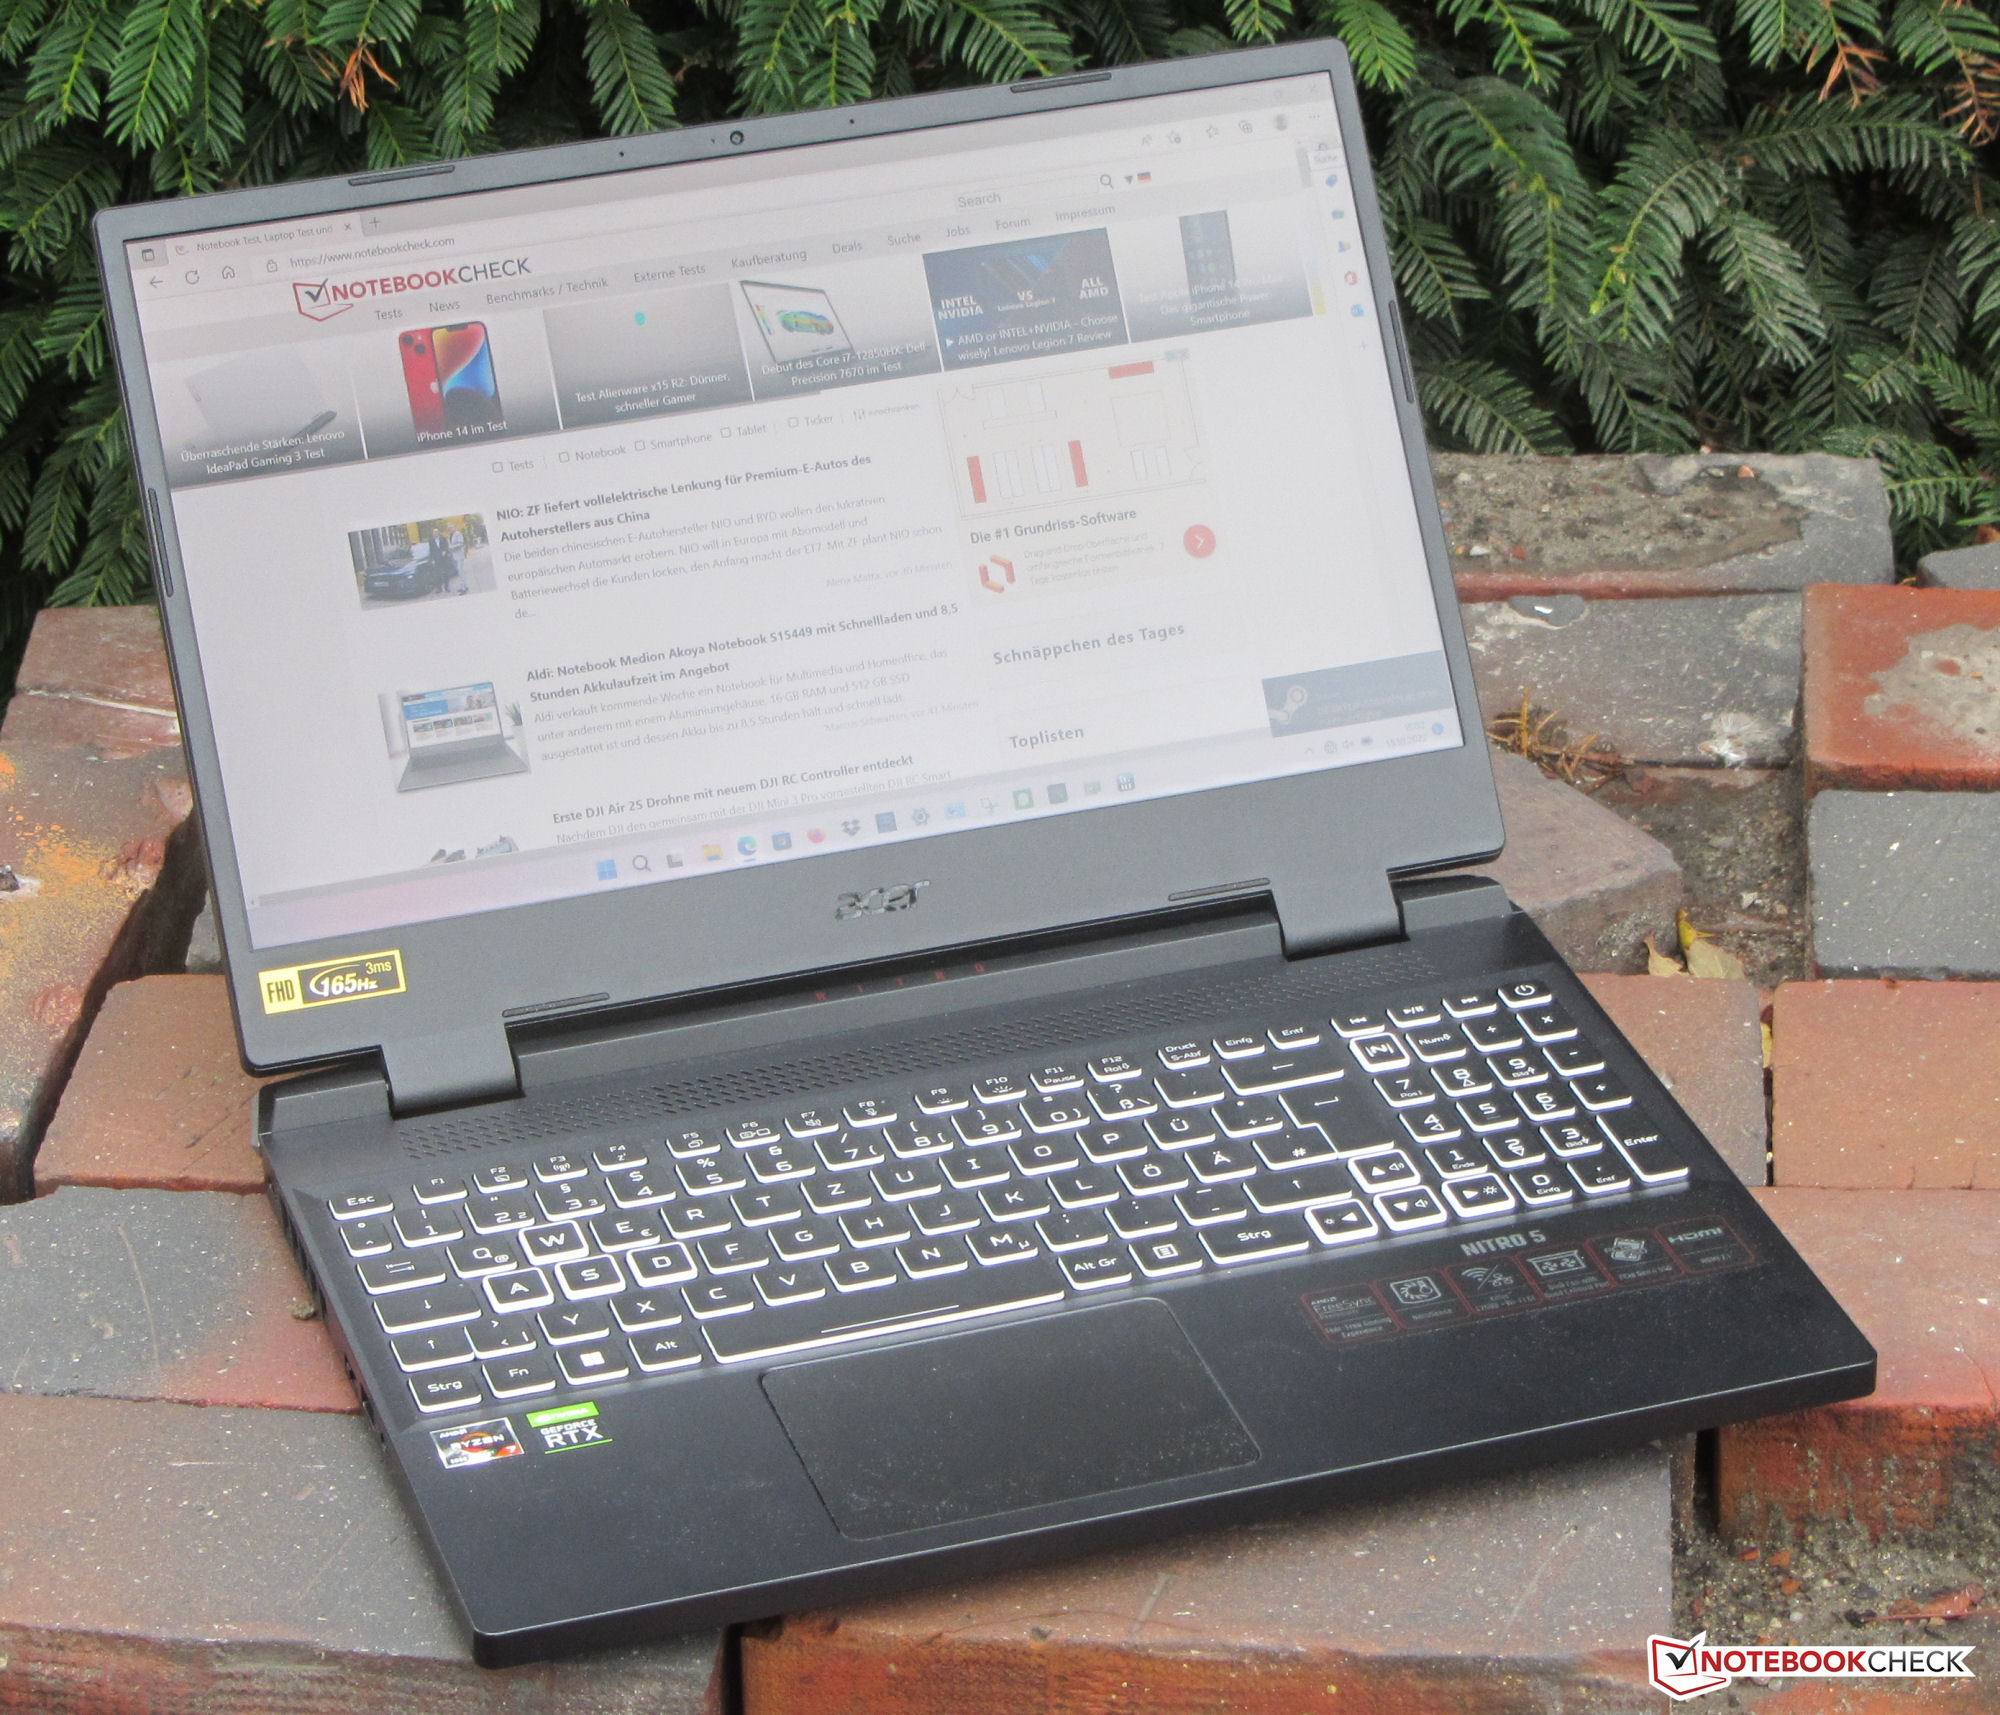
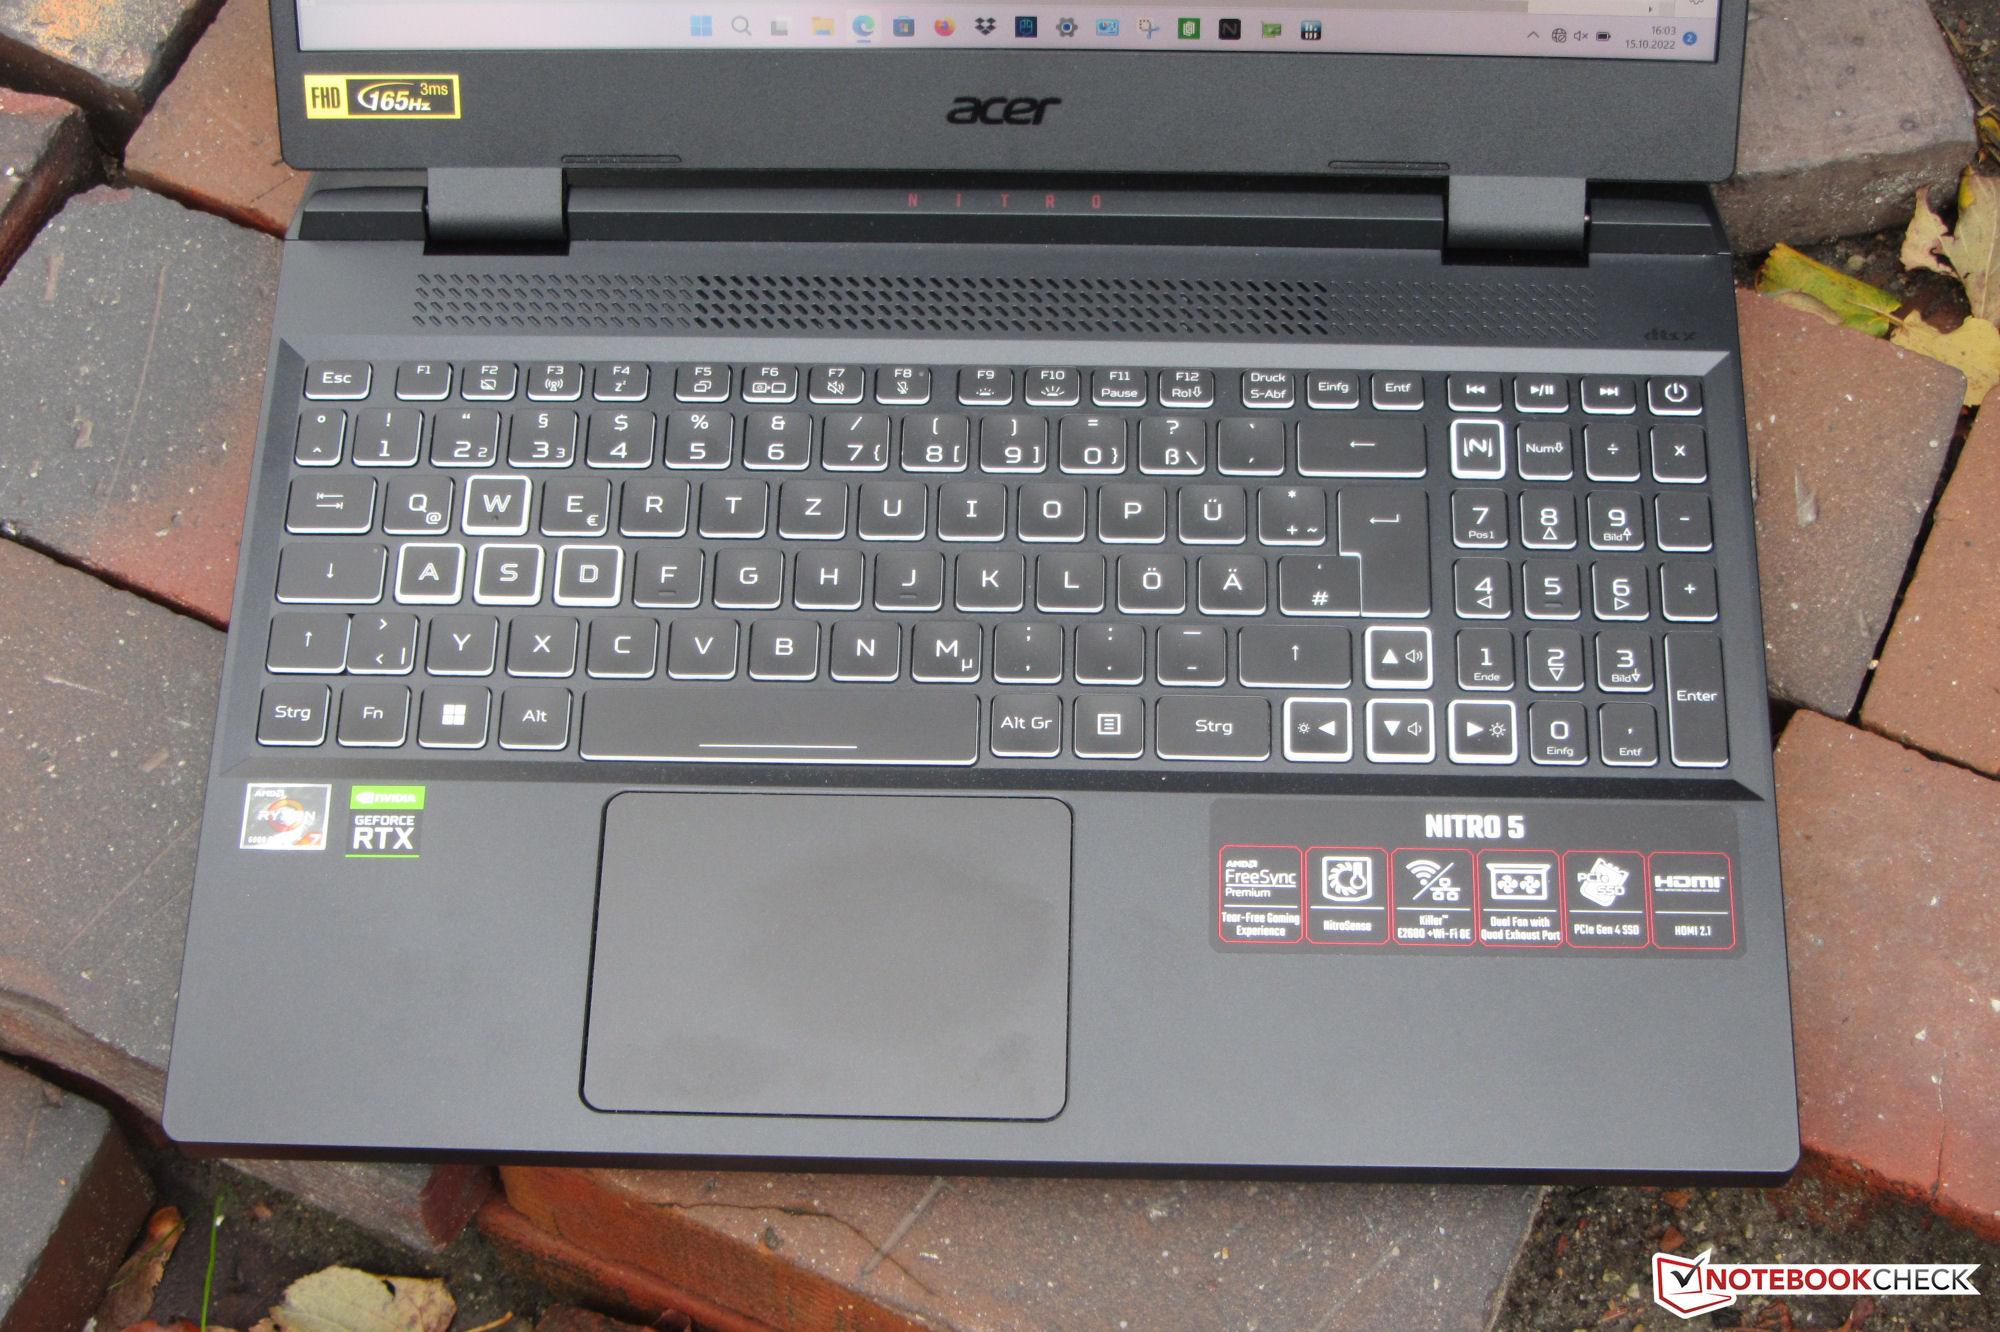


Pantalla: portátil Acer con un panel de 165 Hz
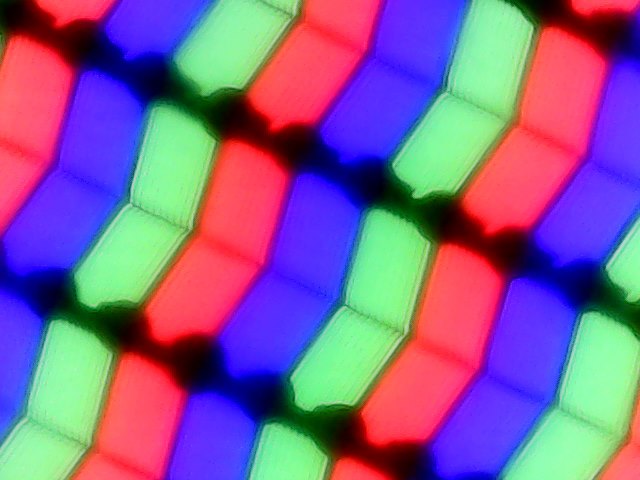
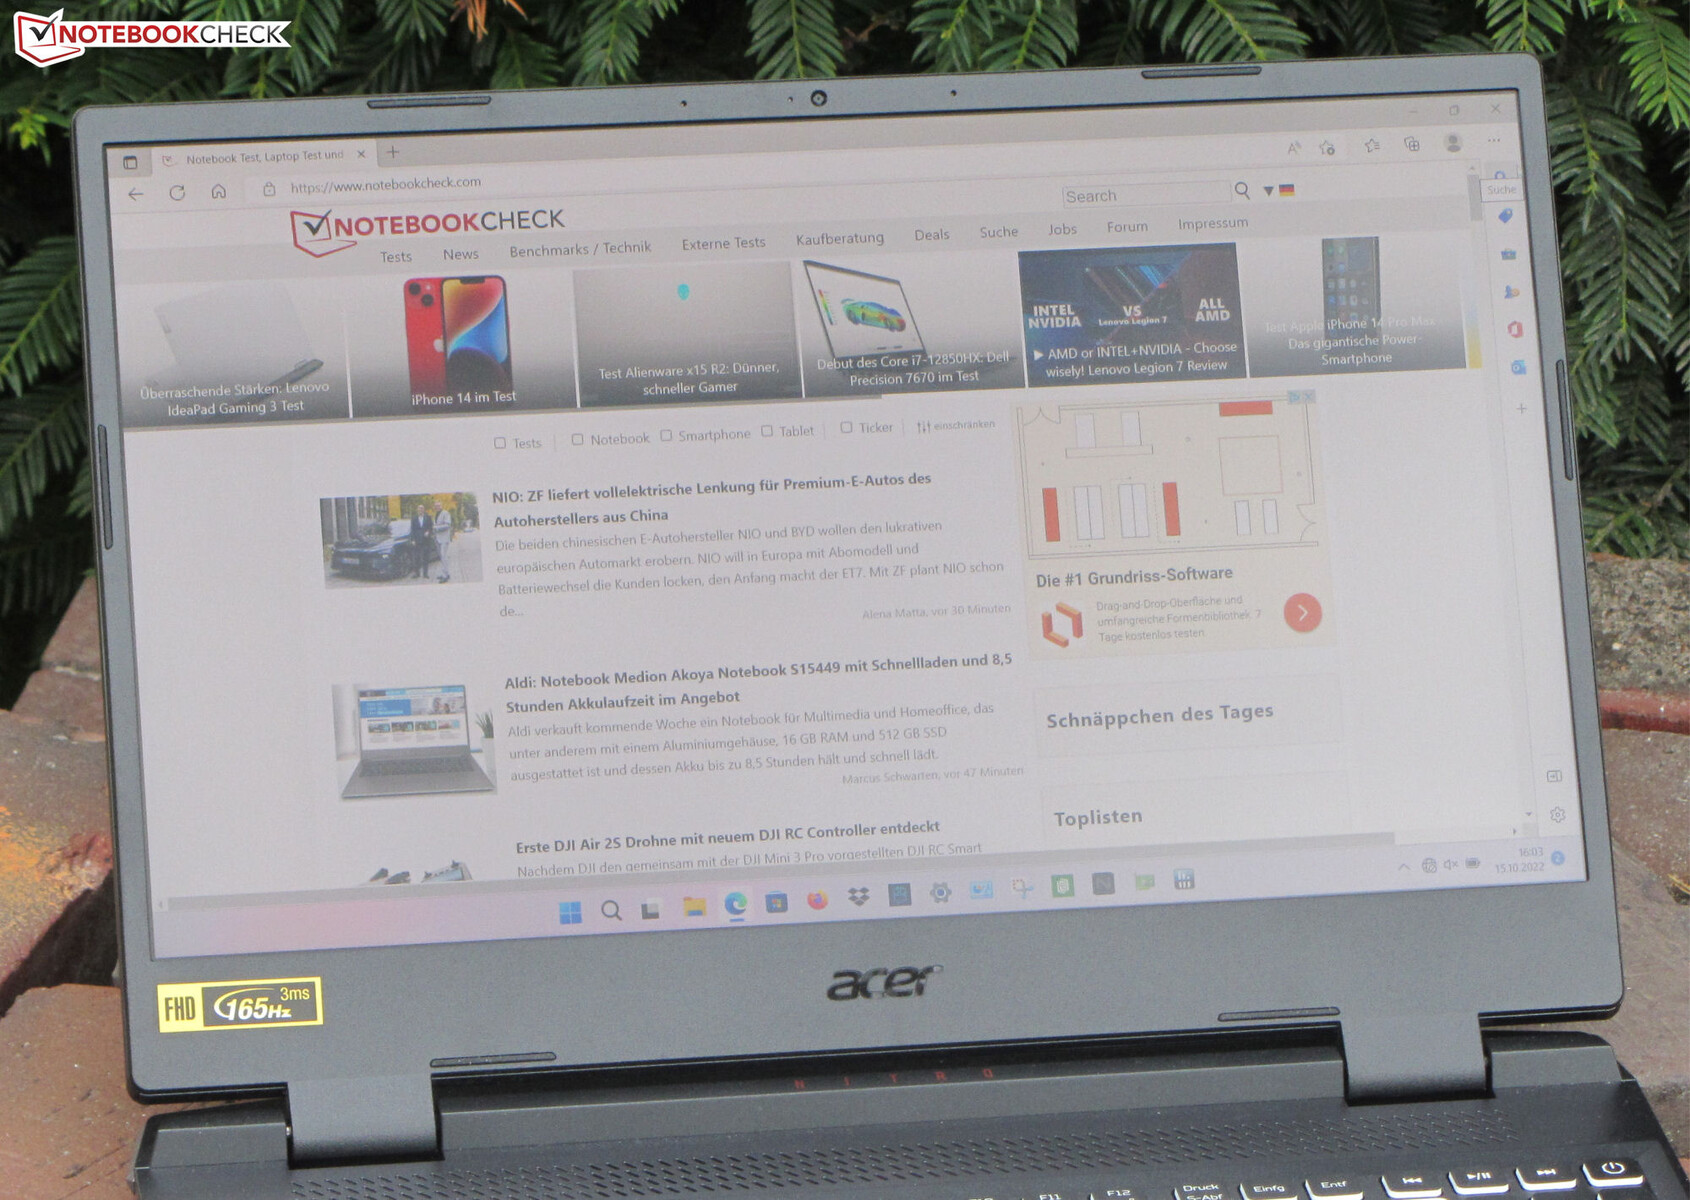
El brillo de la pantalla mate de 15,6 pulgadas (1.920 x 1.080 píxeles) de 320,2 cd/m² cumple nuestros requisitos mínimos (> 300 cd/m²). Su relación de contraste de 1.363:1 es más que adecuada y supera fácilmente a su competencia. El panel de 165 Hz tiene tiempos de respuesta cortos y no utiliza PWM en ningún nivel de brillo.
La pantalla es compatible con la tecnología FreeSync de AMD. El objetivo es crear una imagen lo más fluida posible, especialmente en los juegos de ordenador.
| |||||||||||||||||||||||||
iluminación: 93 %
Brillo con batería: 334 cd/m²
Contraste: 1363:1 (Negro: 0.24 cd/m²)
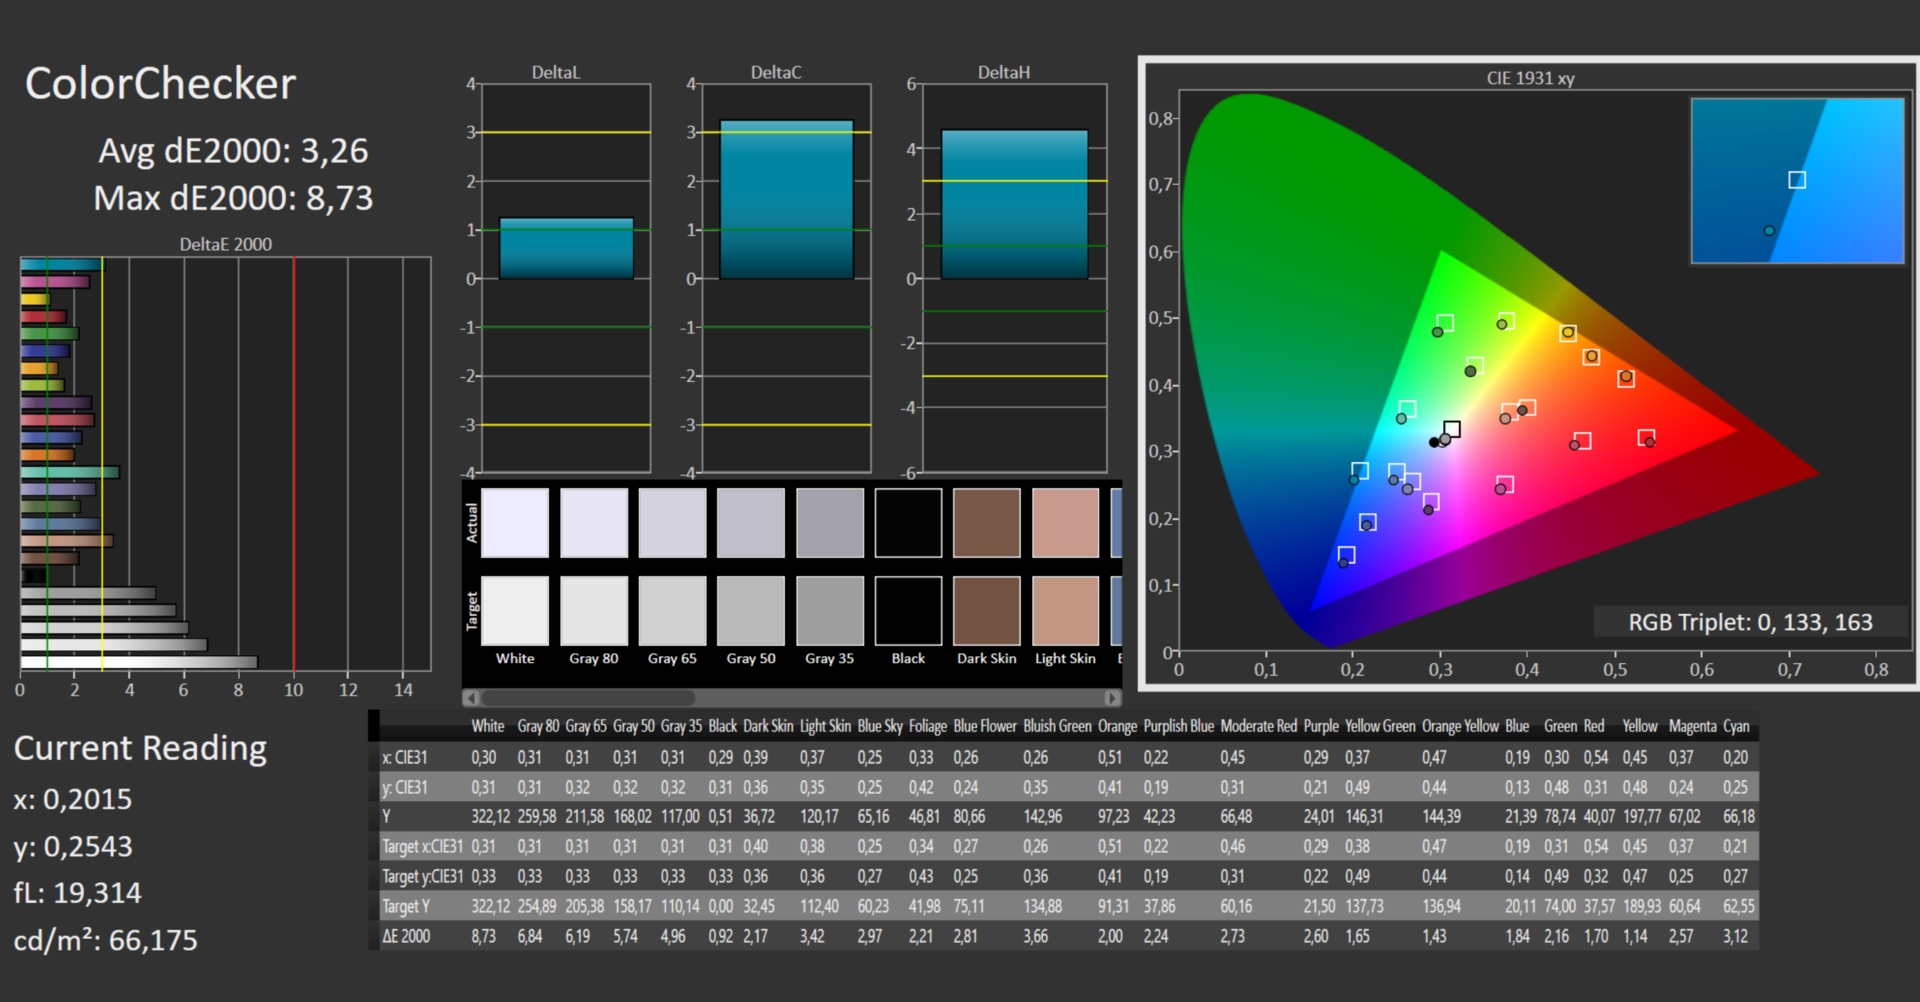
ΔE ColorChecker Calman: 3.26 | ∀{0.5-29.43 Ø4.71}
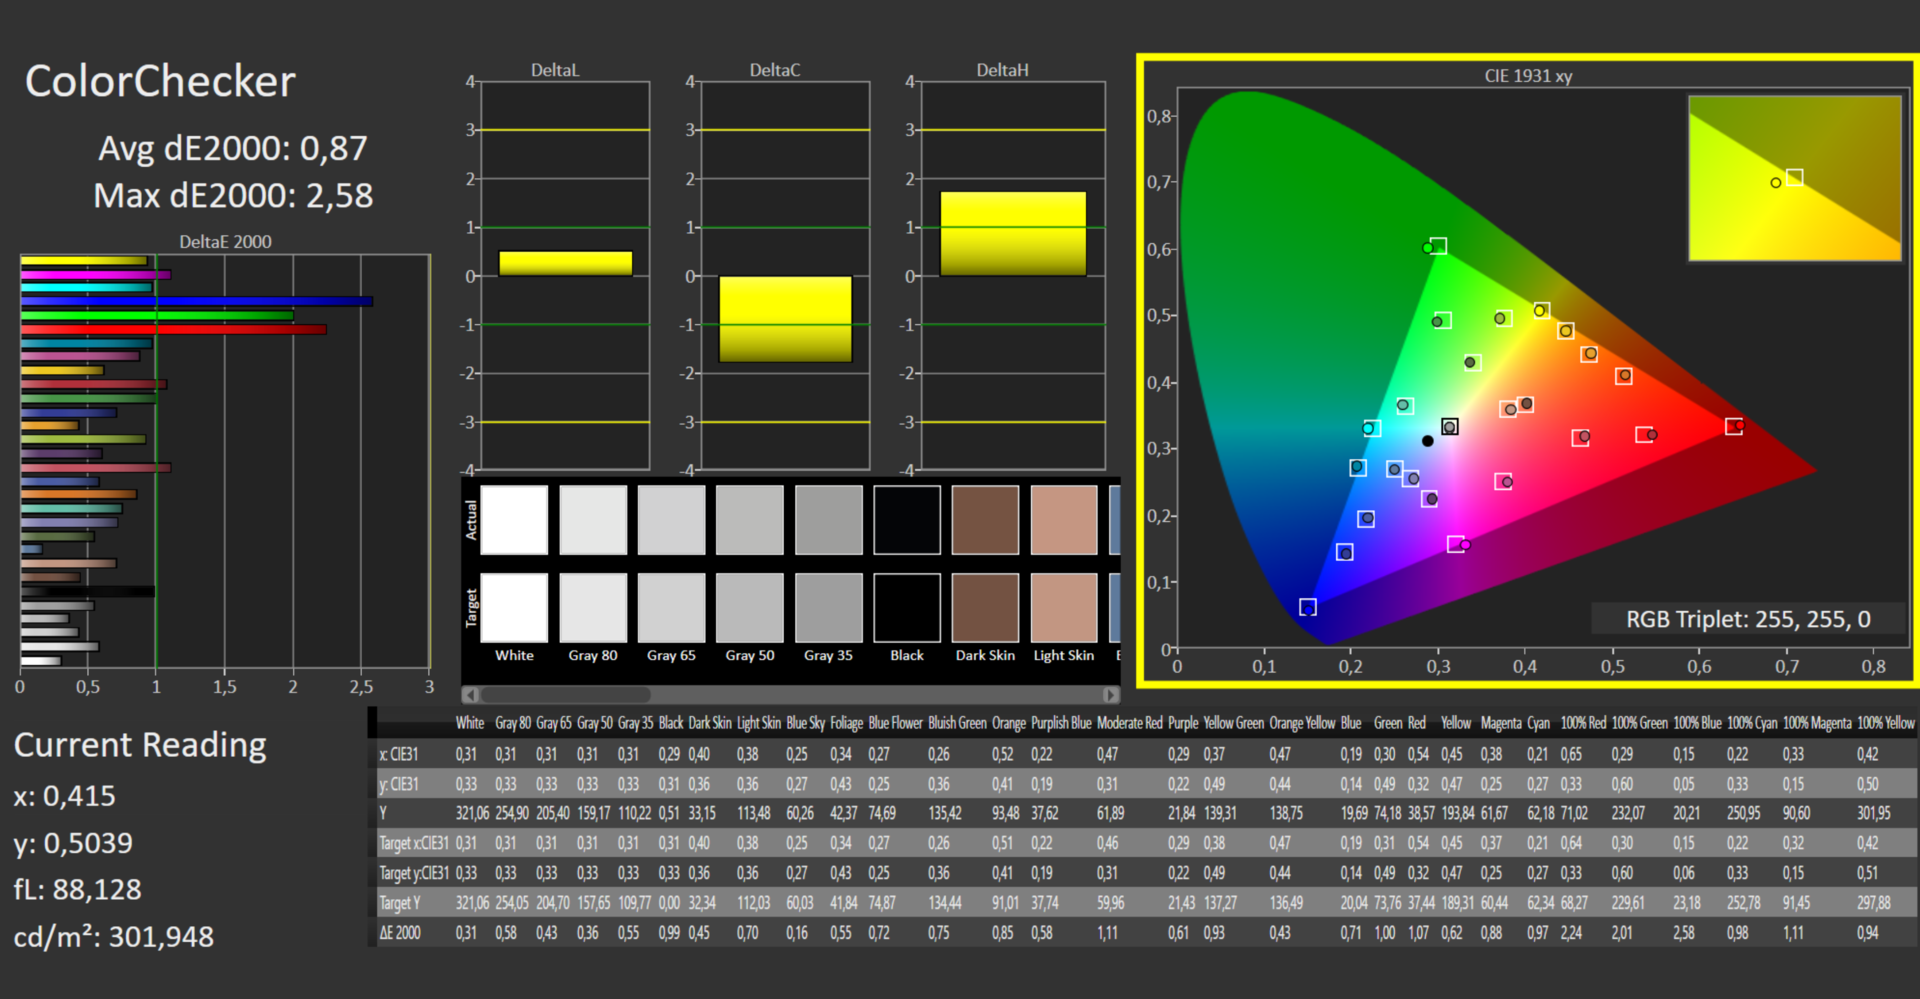
calibrated: 0.87
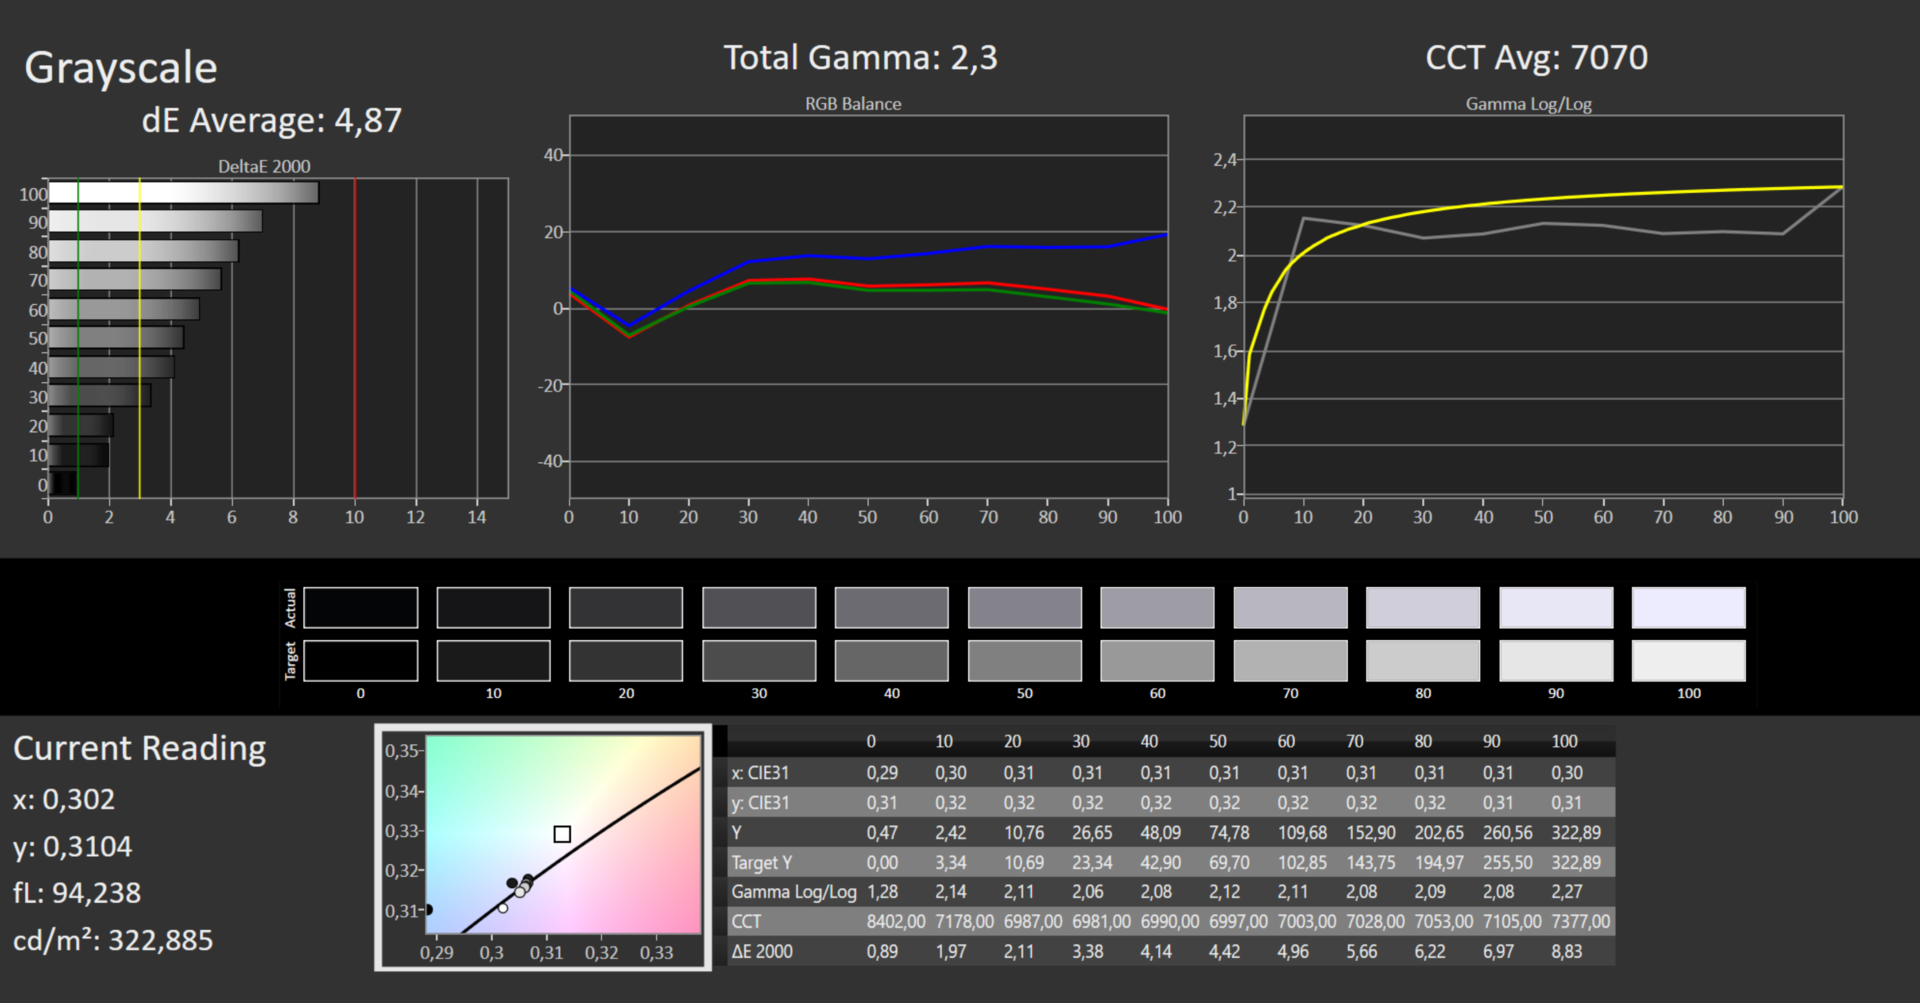
ΔE Greyscale Calman: 4.87 | ∀{0.09-98 Ø4.96}
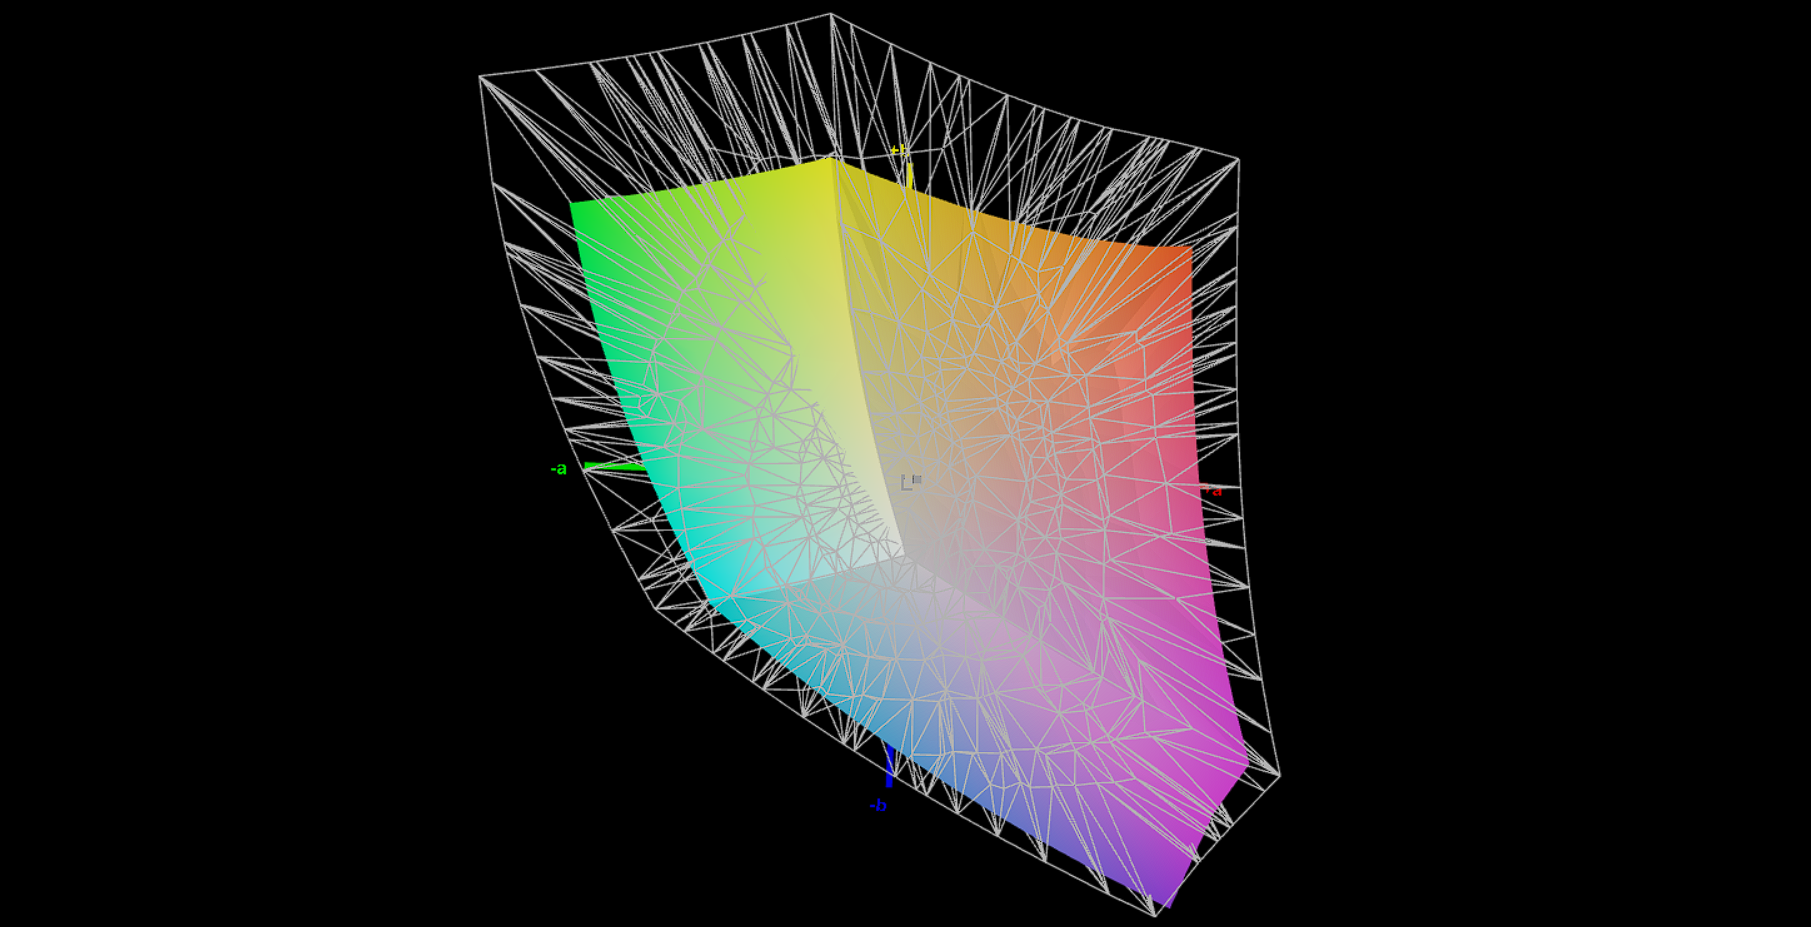
69.7% AdobeRGB 1998 (Argyll 3D)
98.1% sRGB (Argyll 3D)
68.8% Display P3 (Argyll 3D)
Gamma: 2.3
CCT: 7070 K
| Acer Nitro 5 AN515-46-R1A1 AU Optronics B156HAN12.H, IPS, 1920x1080, 15.6" | MSI Katana GF66 12UGS AU Optronics AUOAF90, IPS, 1920x1080, 15.6" | Schenker XMG Fusion 15 (Mid 22) BOE CQ NE156QHM-NY2, IPS, 2560x1440, 15.6" | Asus TUF Dash F15 FX517ZR BOE CQ NE156QHM-NY1, IPS, 2560x1440, 15.6" | Acer Nitro 5 AN515-58-72QR Chi Mei N156KME-GNA, IPS, 2560x1440, 15.6" | |
|---|---|---|---|---|---|
| Display | -42% | -2% | 23% | 21% | |
| Display P3 Coverage (%) | 68.8 | 39.1 -43% | 67.3 -2% | 98.4 43% | 95.6 39% |
| sRGB Coverage (%) | 98.1 | 58.3 -41% | 96.7 -1% | 99.9 2% | 99.8 2% |
| AdobeRGB 1998 Coverage (%) | 69.7 | 40.4 -42% | 68.2 -2% | 85.9 23% | 85.2 22% |
| Response Times | -232% | 12% | 20% | -24% | |
| Response Time Grey 50% / Grey 80% * (ms) | 13 ? | 40 ? -208% | 11.6 ? 11% | 5.6 ? 57% | 15.7 ? -21% |
| Response Time Black / White * (ms) | 8 ? | 28.4 ? -255% | 7 ? 12% | 9.4 ? -18% | 10.2 ? -27% |
| PWM Frequency (Hz) | |||||
| Screen | -55% | -15% | 9% | -2% | |
| Brightness middle (cd/m²) | 327 | 227 -31% | 326 0% | 286 -13% | 332 2% |
| Brightness (cd/m²) | 320 | 225 -30% | 303 -5% | 266 -17% | 303 -5% |
| Brightness Distribution (%) | 93 | 90 -3% | 89 -4% | 87 -6% | 86 -8% |
| Black Level * (cd/m²) | 0.24 | 0.21 12% | 0.33 -38% | 0.25 -4% | 0.29 -21% |
| Contrast (:1) | 1363 | 1081 -21% | 988 -28% | 1144 -16% | 1145 -16% |
| Colorchecker dE 2000 * | 3.26 | 4.19 -29% | 2.73 16% | 2.14 34% | 3.61 -11% |
| Colorchecker dE 2000 max. * | 8.73 | 17.45 -100% | 9.54 -9% | 5.22 40% | 7.71 12% |
| Colorchecker dE 2000 calibrated * | 0.87 | 3.81 -338% | 1.36 -56% | 0.67 23% | 0.59 32% |
| Greyscale dE 2000 * | 4.87 | 2.7 45% | 5.2 -7% | 2.8 43% | 5.2 -7% |
| Gamma | 2.3 96% | 2.208 100% | 2.074 106% | 2.23 99% | 2.155 102% |
| CCT | 7070 92% | 6176 105% | 6911 94% | 7092 92% | 6724 97% |
| Media total (Programa/Opciones) | -110% /
-77% | -2% /
-8% | 17% /
14% | -2% /
-1% |
* ... más pequeño es mejor
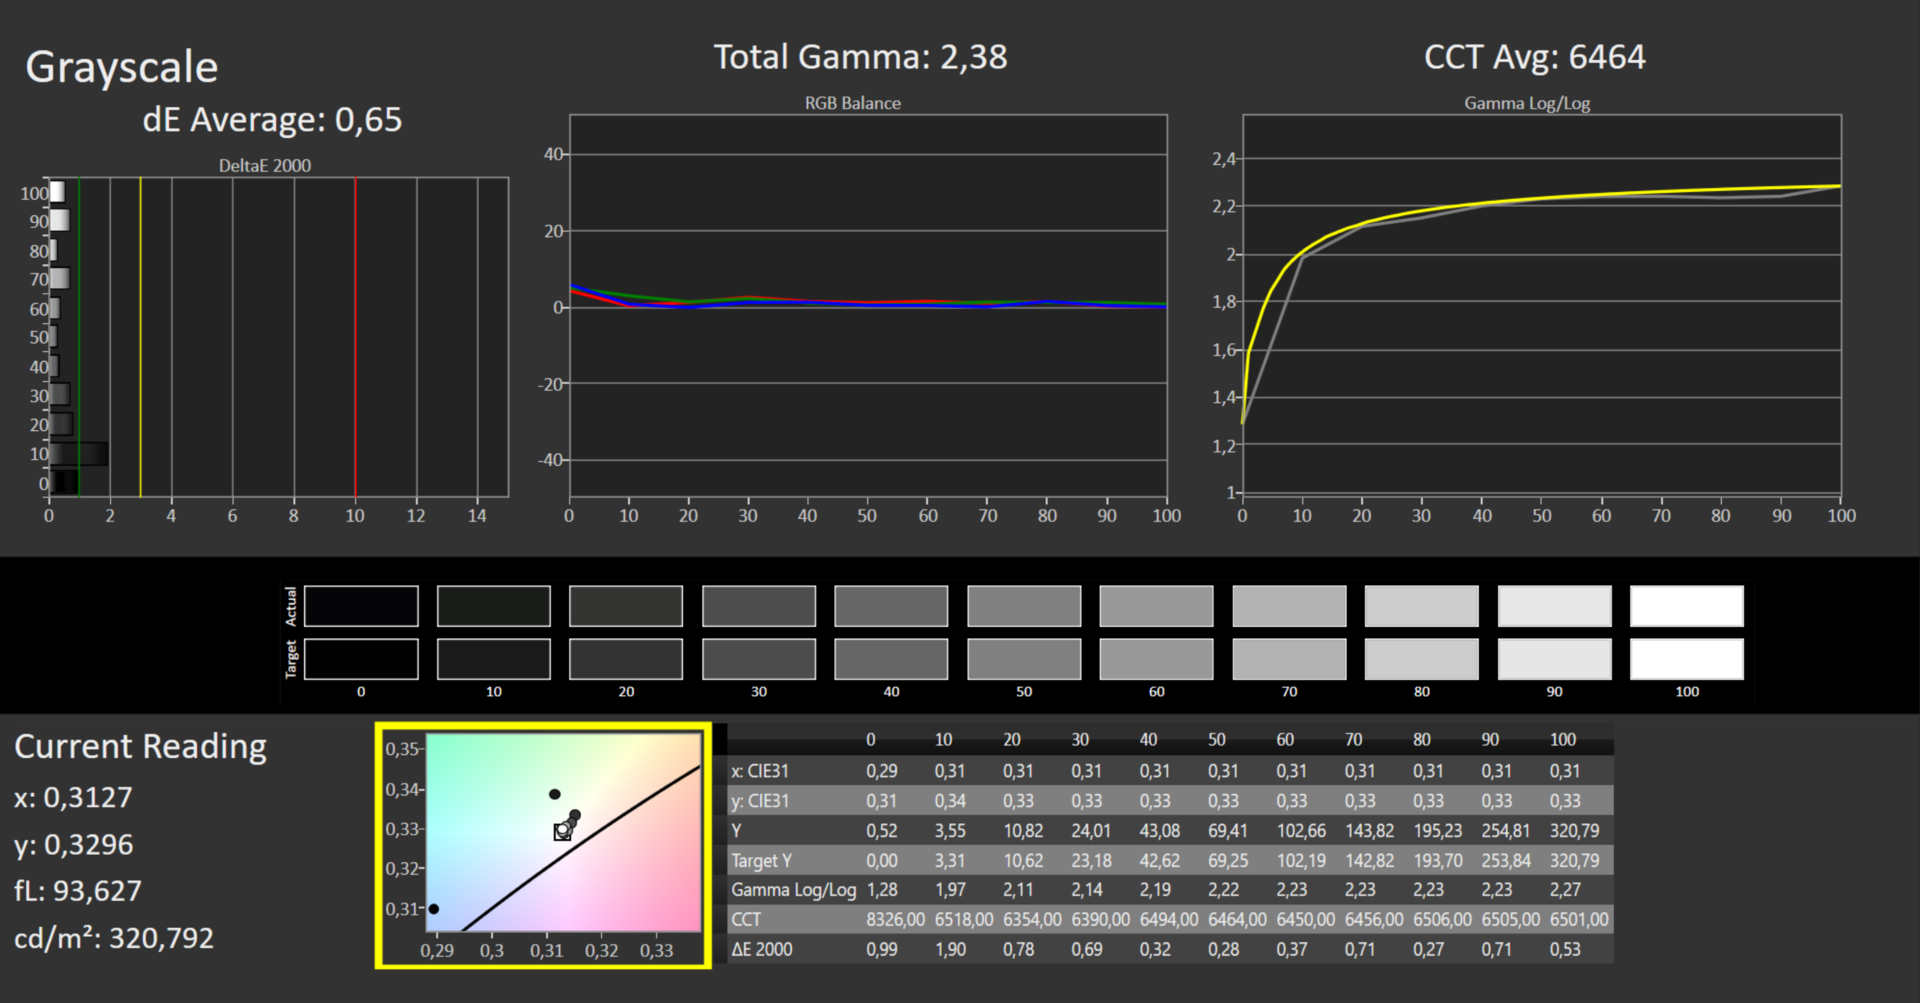
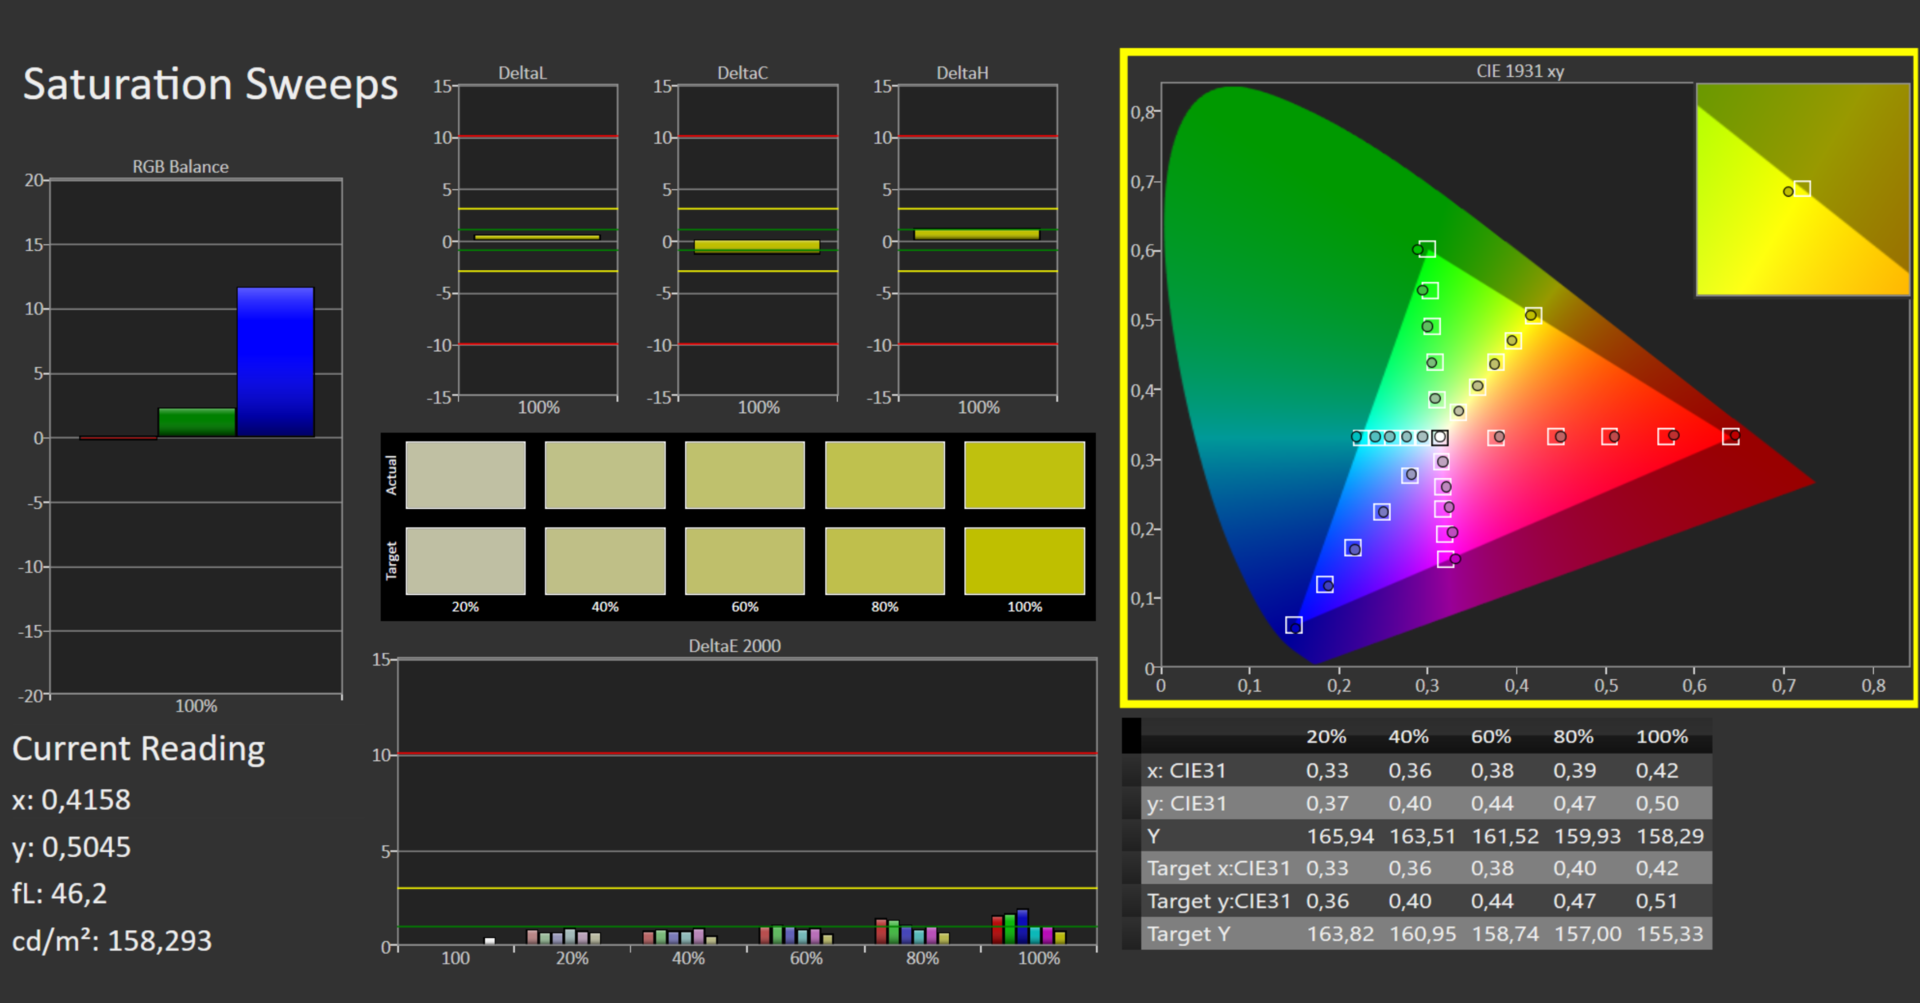
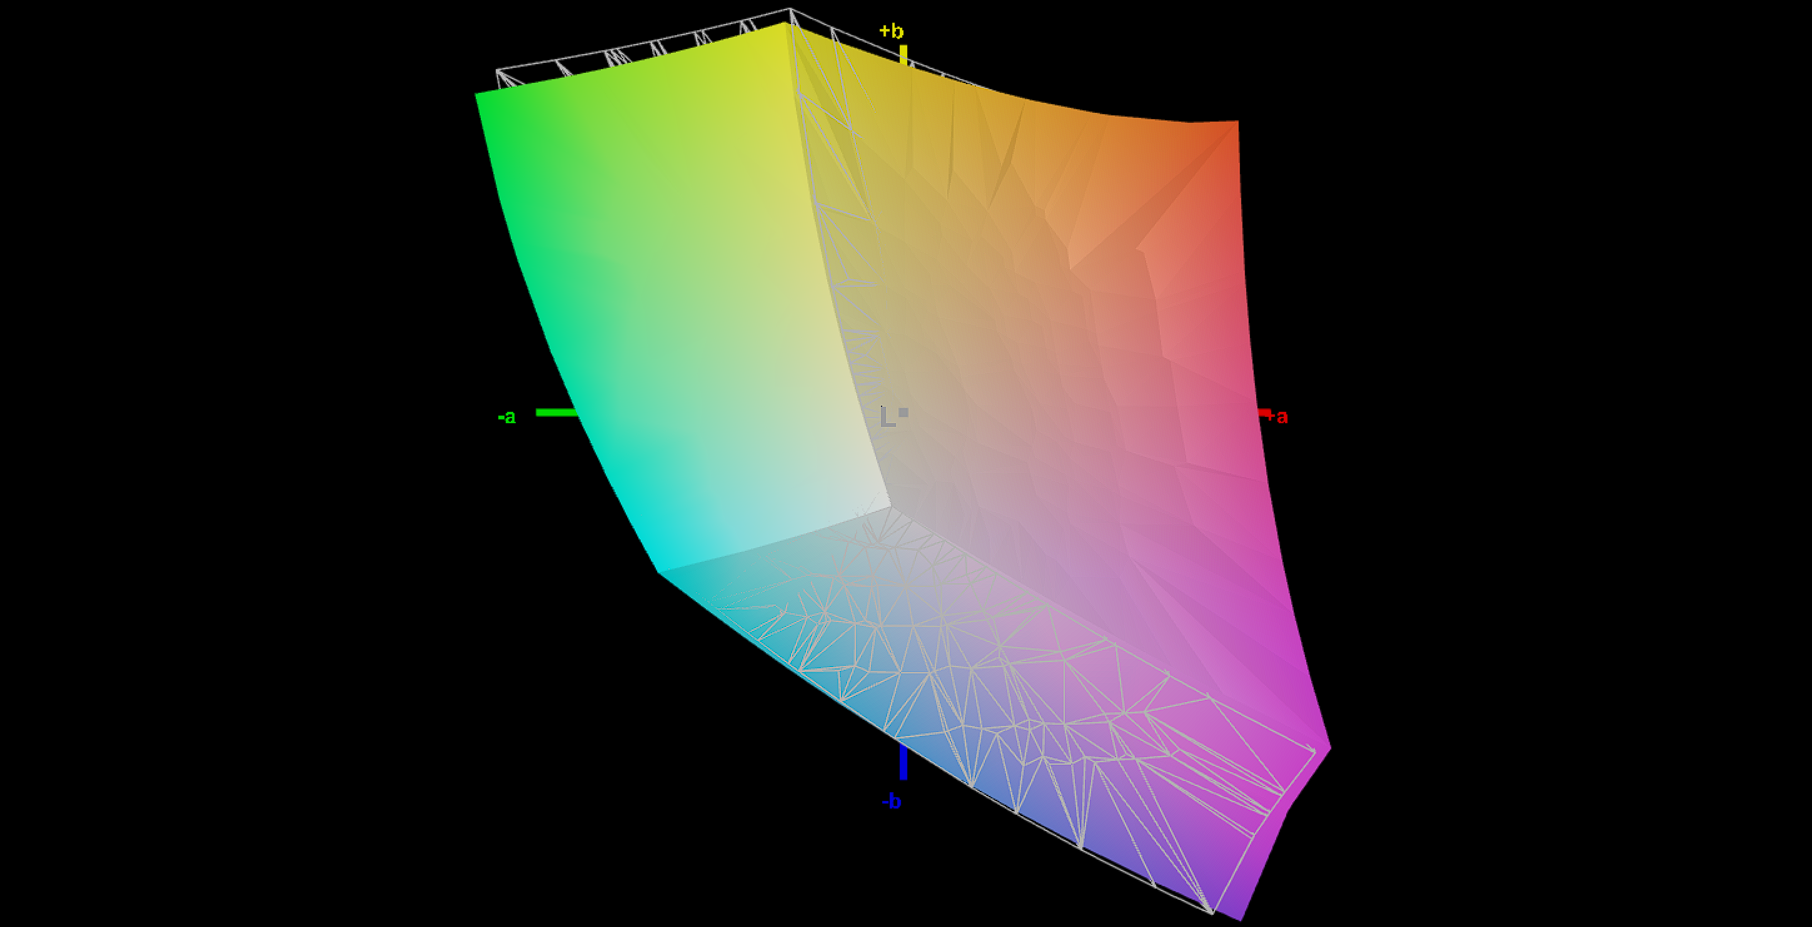
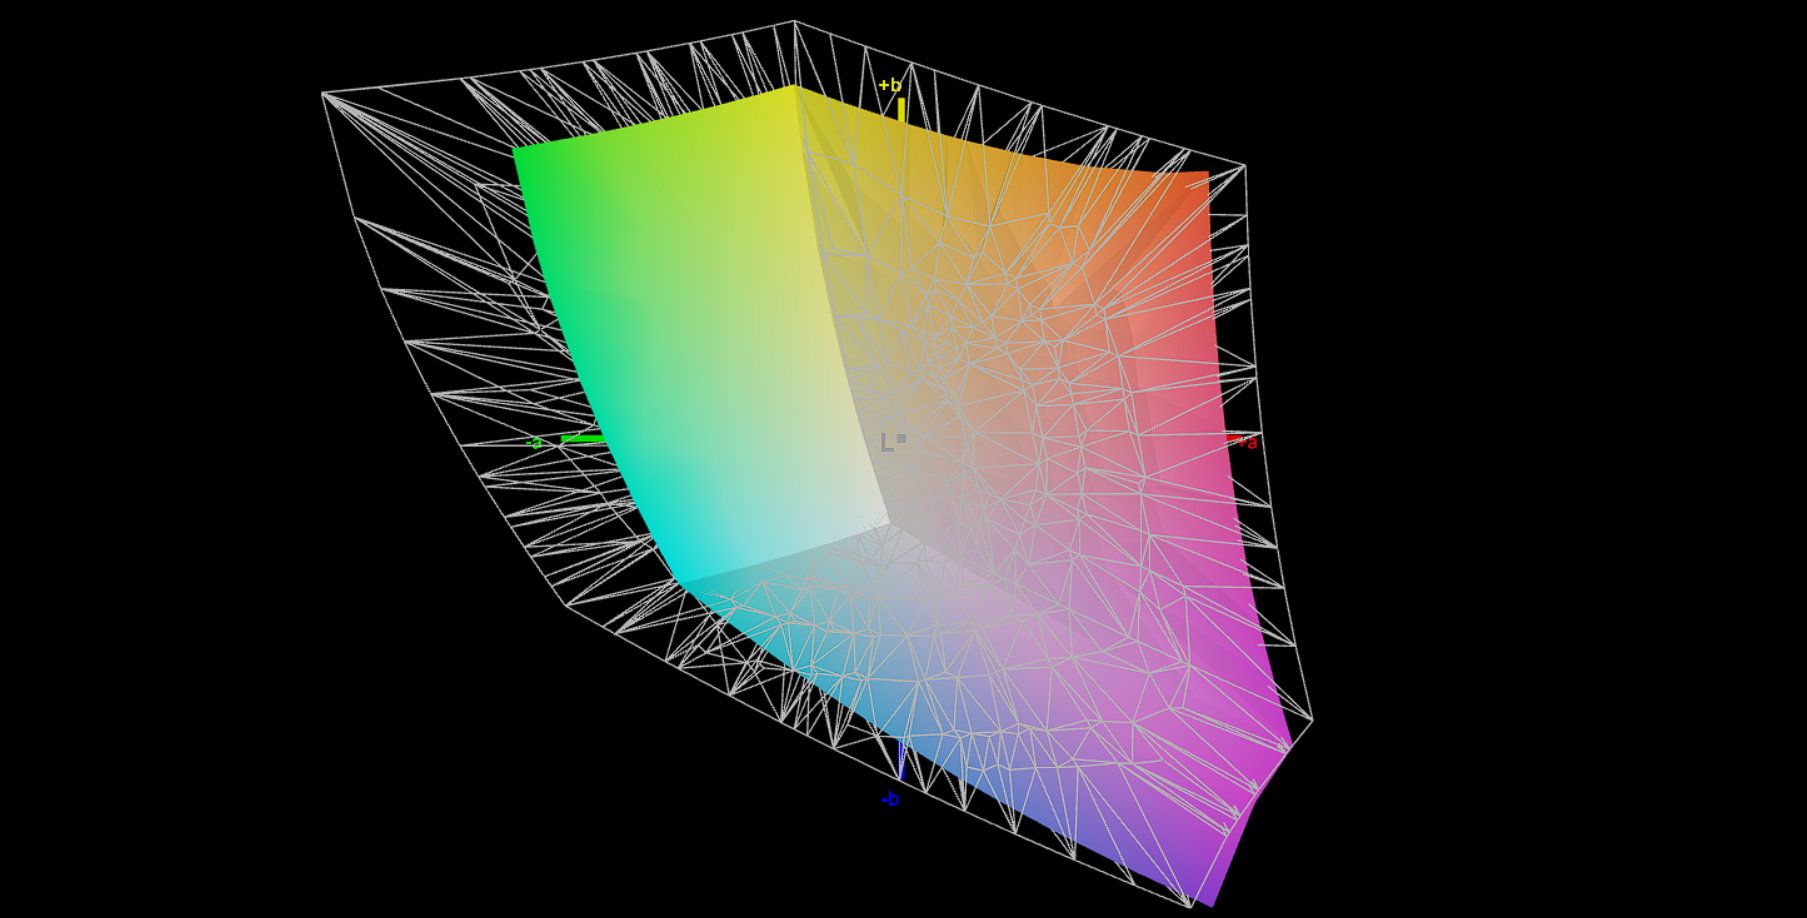
La pantalla muestra los colores bastante bien de fábrica. Medimos una desviación de color de 3,26, que está apenas por encima del valor ideal (DeltaE < 3). Calibrar la pantalla reduce la desviación a 0,87 y hace que las escalas de grises parezcan más uniformes. El panel puede mostrar casi todo el espacio de color sRGB (98,1%) y cubre el 70% de AdobeRGB y el 69% de DCI-P3. El panel QHD del modelo hermano logra una mejor cobertura general del espacio de color.
Puedes descargar y utilizar el perfil de color que hemos creado de forma gratuita. El enlace está en el cuadro de información de arriba.
Tiempos de respuesta del display
| ↔ Tiempo de respuesta de Negro a Blanco | ||
|---|---|---|
| 8 ms ... subida ↗ y bajada ↘ combinada | ↗ 4 ms subida |  |
| ↘ 4 ms bajada | ||
| La pantalla mostró tiempos de respuesta rápidos en nuestros tests y debería ser adecuada para juegos. En comparación, todos los dispositivos de prueba van de ##min### (mínimo) a 240 (máximo) ms. » 22 % de todos los dispositivos son mejores. Esto quiere decir que el tiempo de respuesta medido es mejor que la media (19.8 ms) de todos los dispositivos testados. | ||
| ↔ Tiempo de respuesta 50% Gris a 80% Gris | ||
| 13 ms ... subida ↗ y bajada ↘ combinada | ↗ 6 ms subida |  |
| ↘ 7 ms bajada | ||
| La pantalla mostró buenos tiempos de respuesta en nuestros tests pero podría ser demasiado lenta para los jugones competitivos. En comparación, todos los dispositivos de prueba van de ##min### (mínimo) a 636 (máximo) ms. » 27 % de todos los dispositivos son mejores. Esto quiere decir que el tiempo de respuesta medido es mejor que la media (31 ms) de todos los dispositivos testados. | ||
Parpadeo de Pantalla / PWM (Pulse-Width Modulation)
| Parpadeo de Pantalla / PWM no detectado |  | ||
Comparación: 52 % de todos los dispositivos testados no usaron PWM para atenuar el display. Si se usó, medimos una media de 7754 (mínimo: 5 - máxmo: 343500) Hz. | |||


El panel IPS tiene ángulos de visión estables y se puede leer desde cualquier posición. También puede utilizarse en exteriores, siempre que el sol no sea demasiado brillante.

Actuación - Cuaderno Nitro con Ampere y Rembrandt
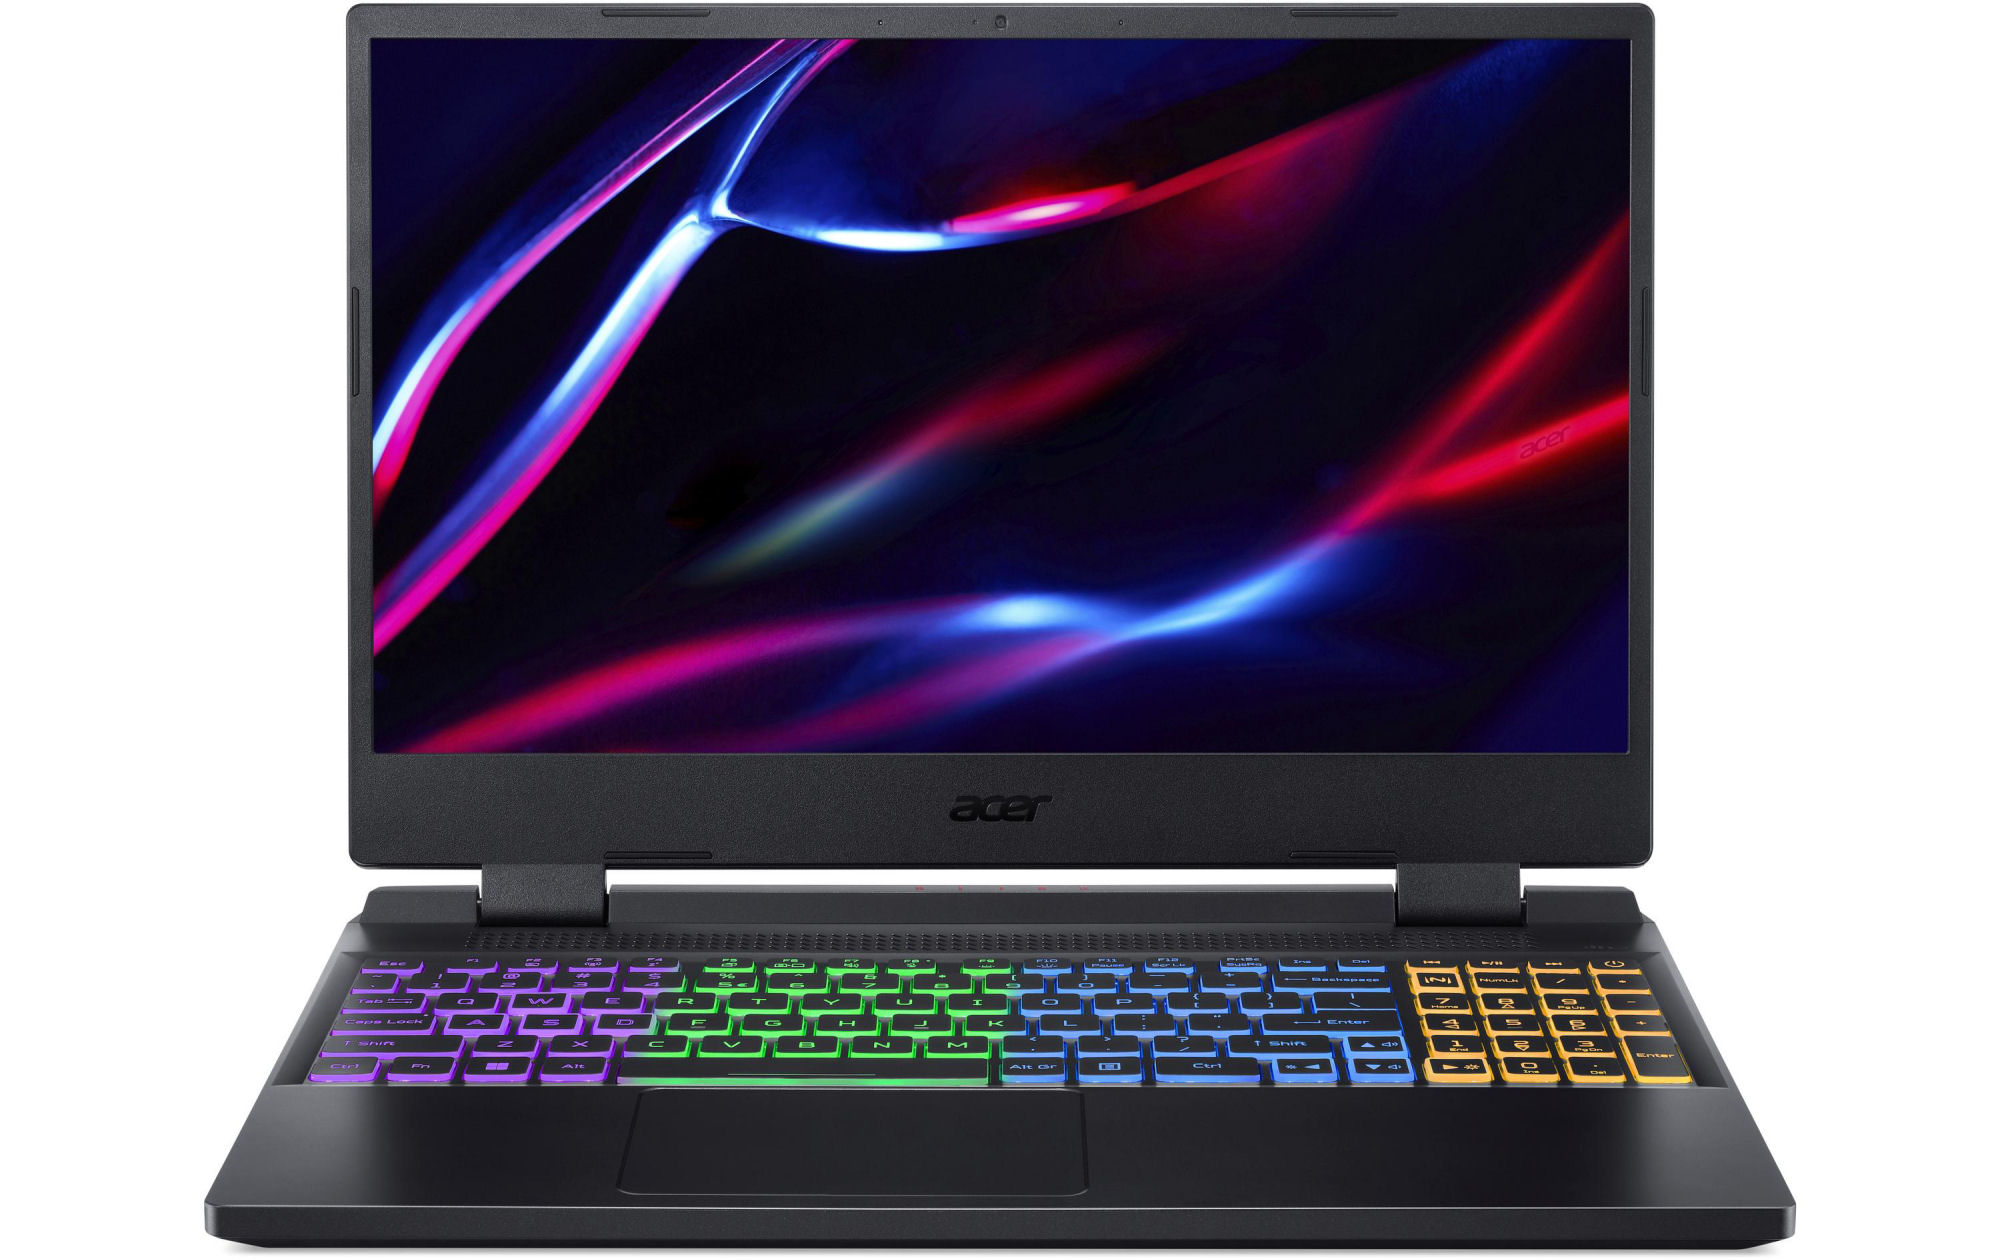
El Acer Nitro 5 AN515 -un portátil para juegos de 15,6 pulgadas- está disponible en toda una gama de configuraciones y puede estar equipado con un procesador Intel o AMD. La configuración básica está disponible actualmente por unos 800 euros (Core i5-11400H, RTX 3050, 8 GB de RAM, SSD de 512 GB, sin Windows). El modelo más caro (Ryzen 9 6900HX, RTX 3070 Ti, 32 GB de RAM, SSD de 1 TB) tiene un precio de 2.400 euros.
Condiciones de la prueba
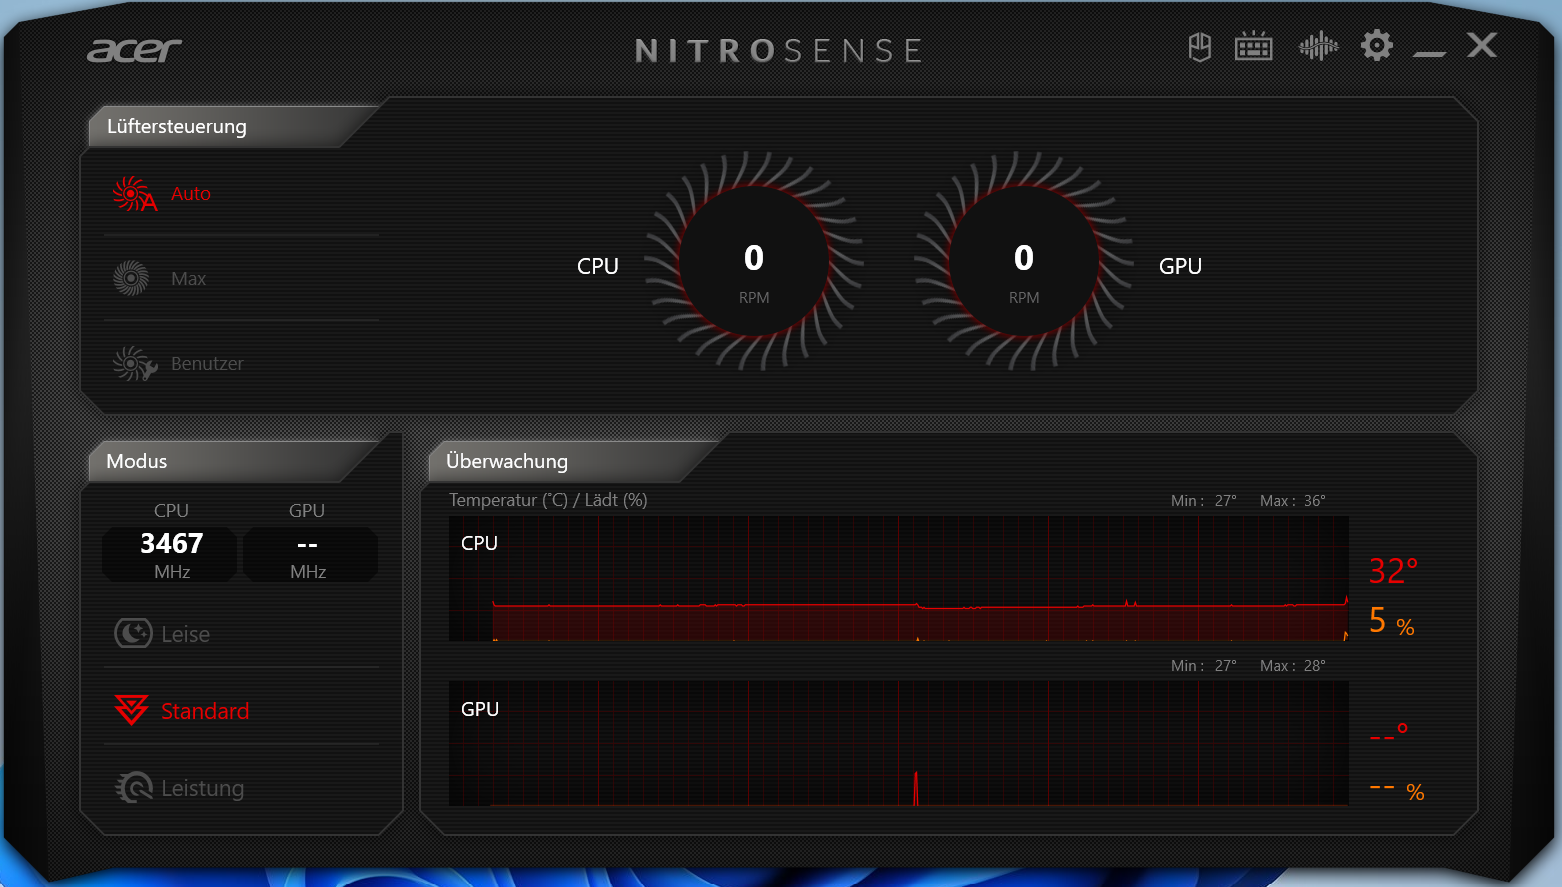
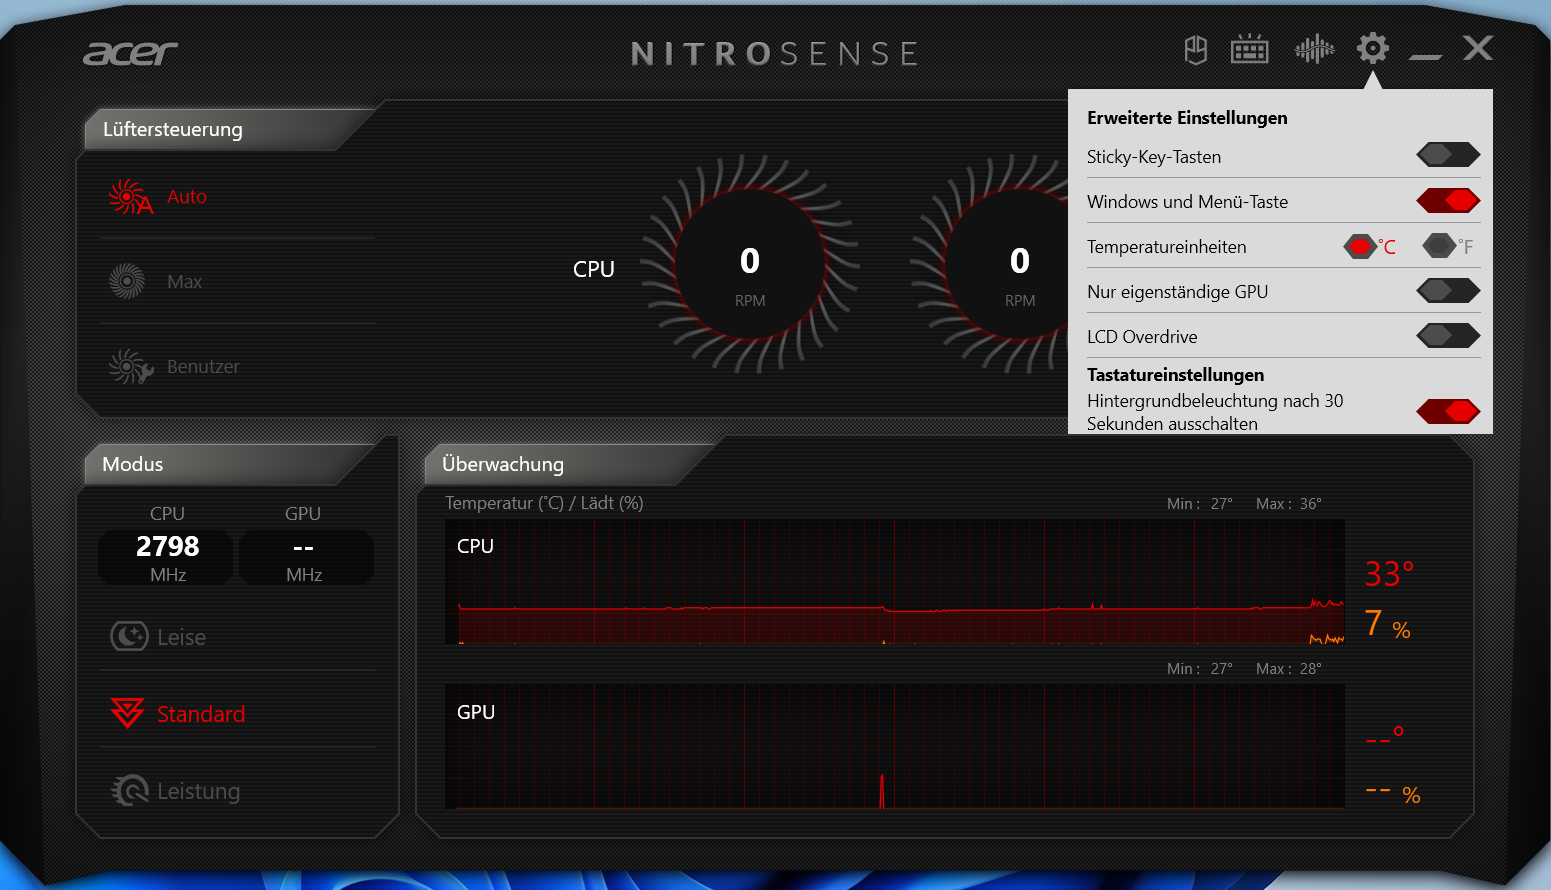
El software NitroSense preinstalado (el centro de control del portátil, ver imágenes) puede utilizarse para cambiar entre los perfiles de rendimiento establecidos por el fabricante ("rendimiento", "estándar" y "silencioso"). Realizamos todas nuestras pruebas con el perfil "estándar" y con el control del ventilador en automático. El rendimiento de la CPU es el mismo en todos los perfiles de rendimiento; el rendimiento de la GPU varía ligeramente.
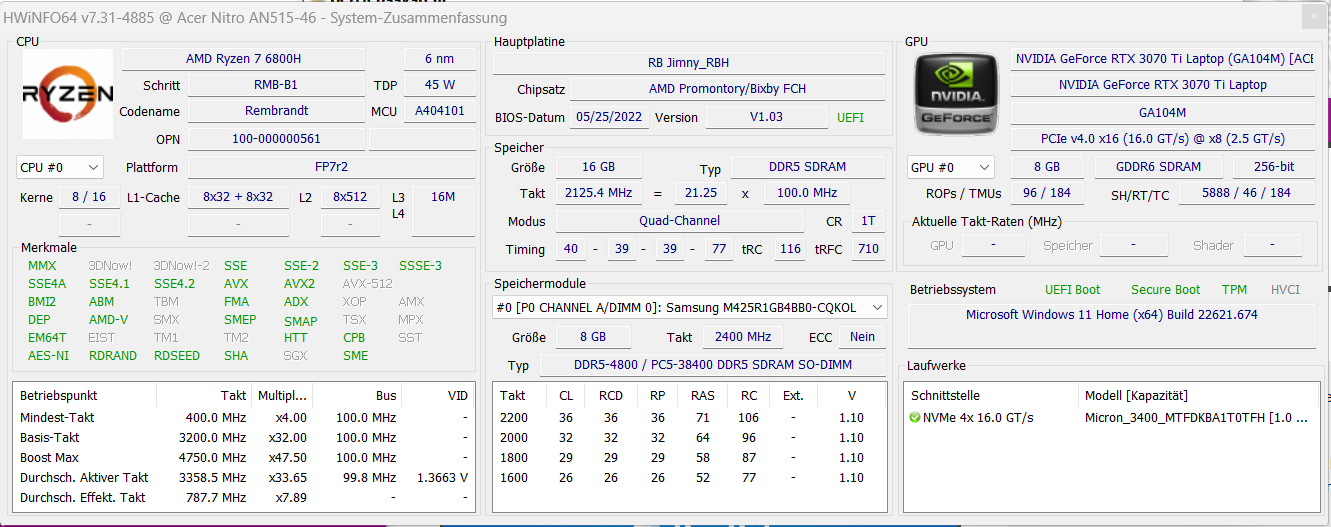
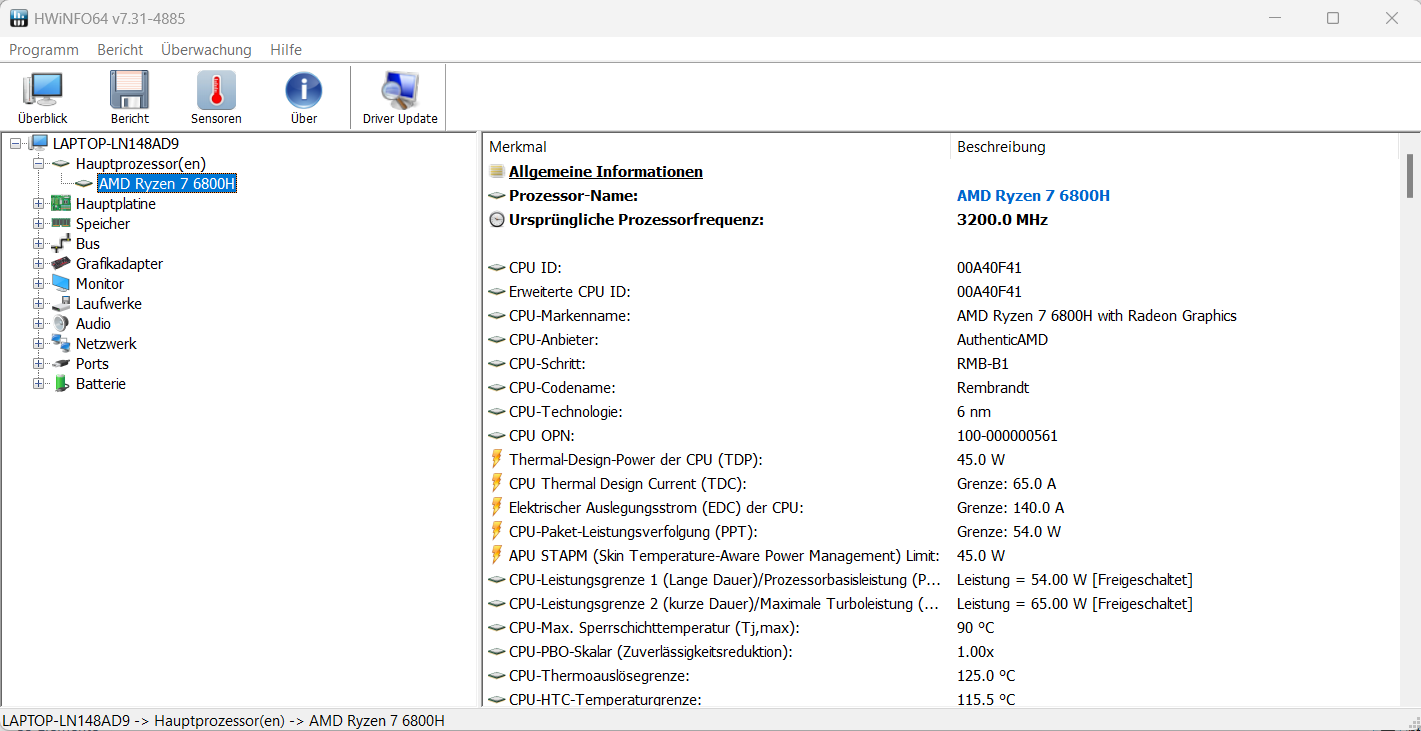
Procesador
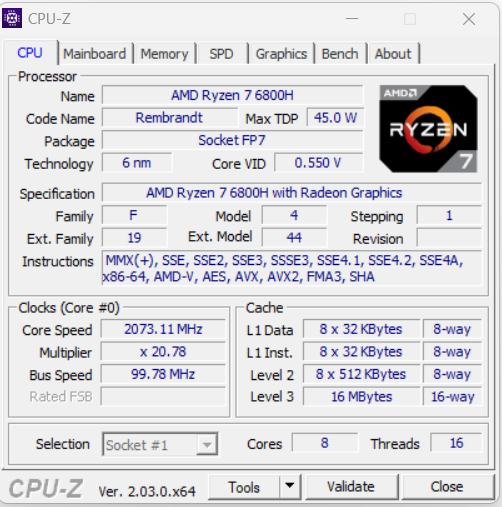
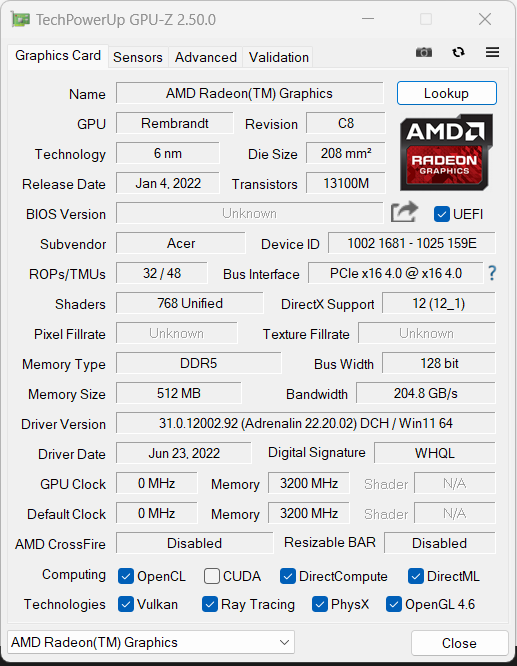
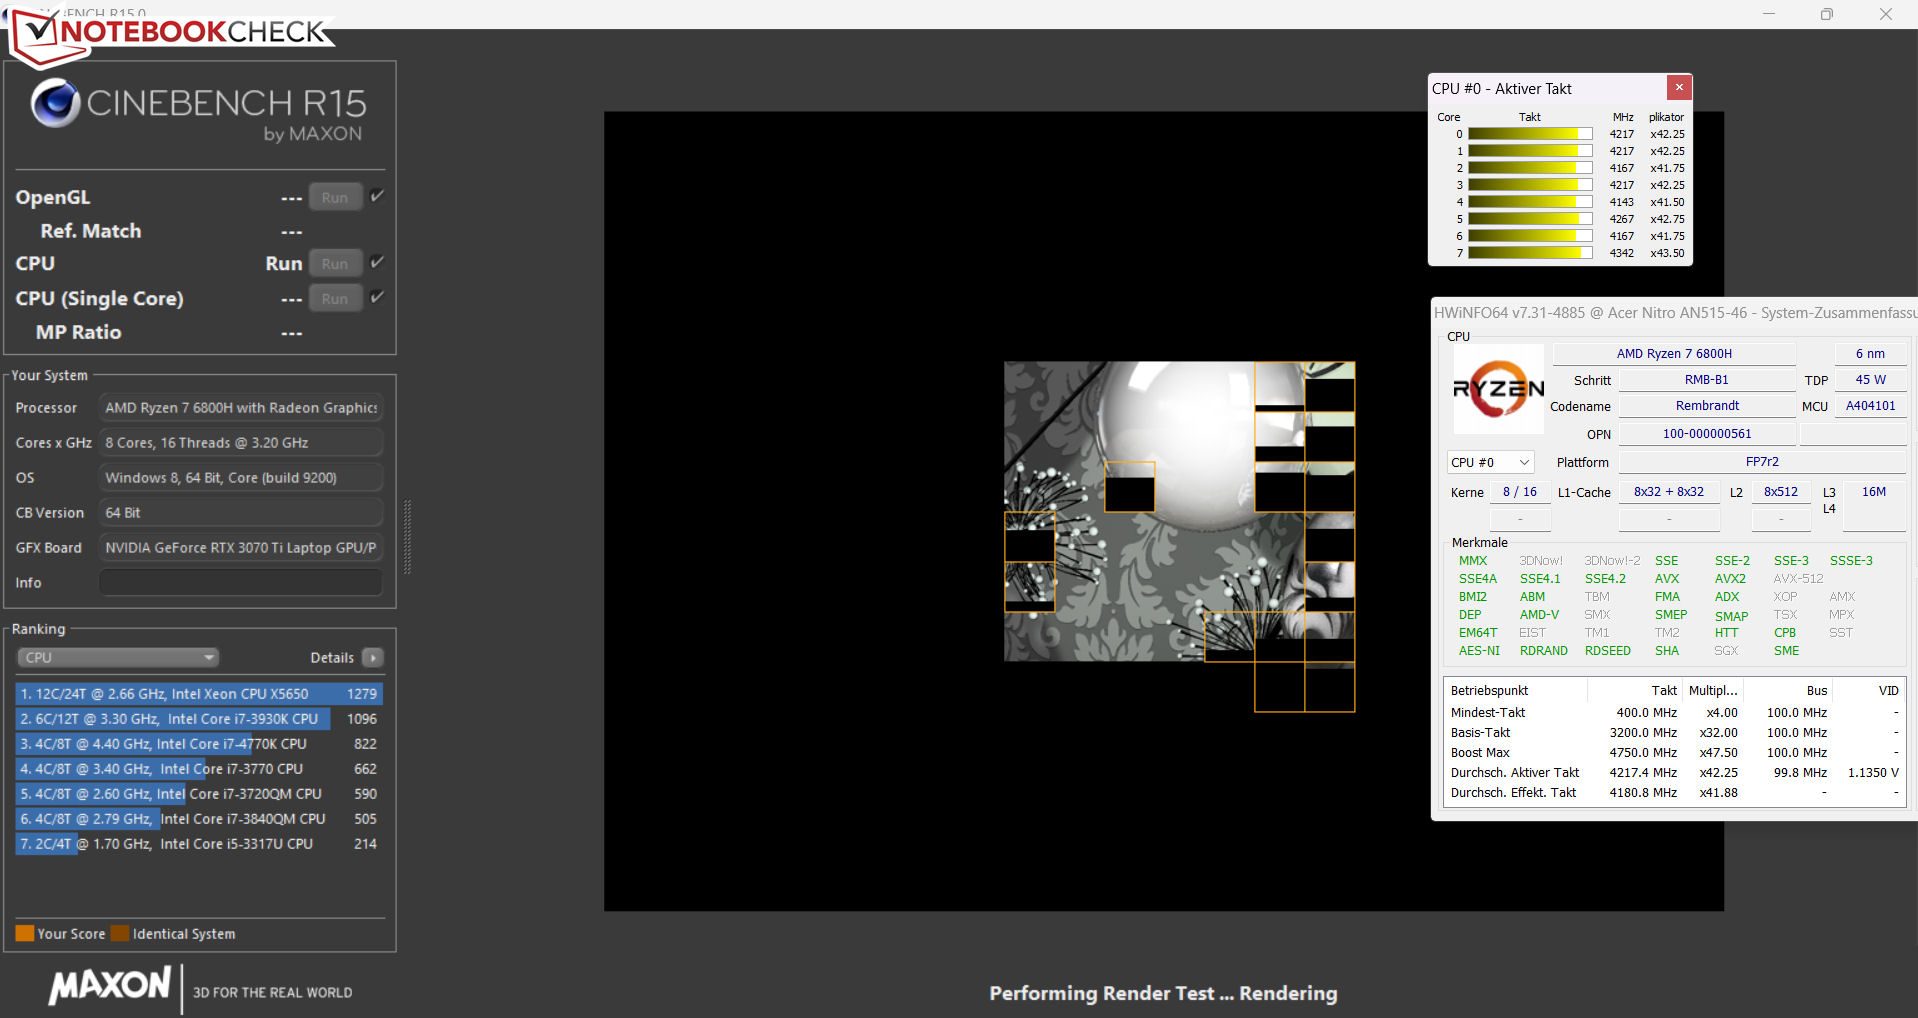
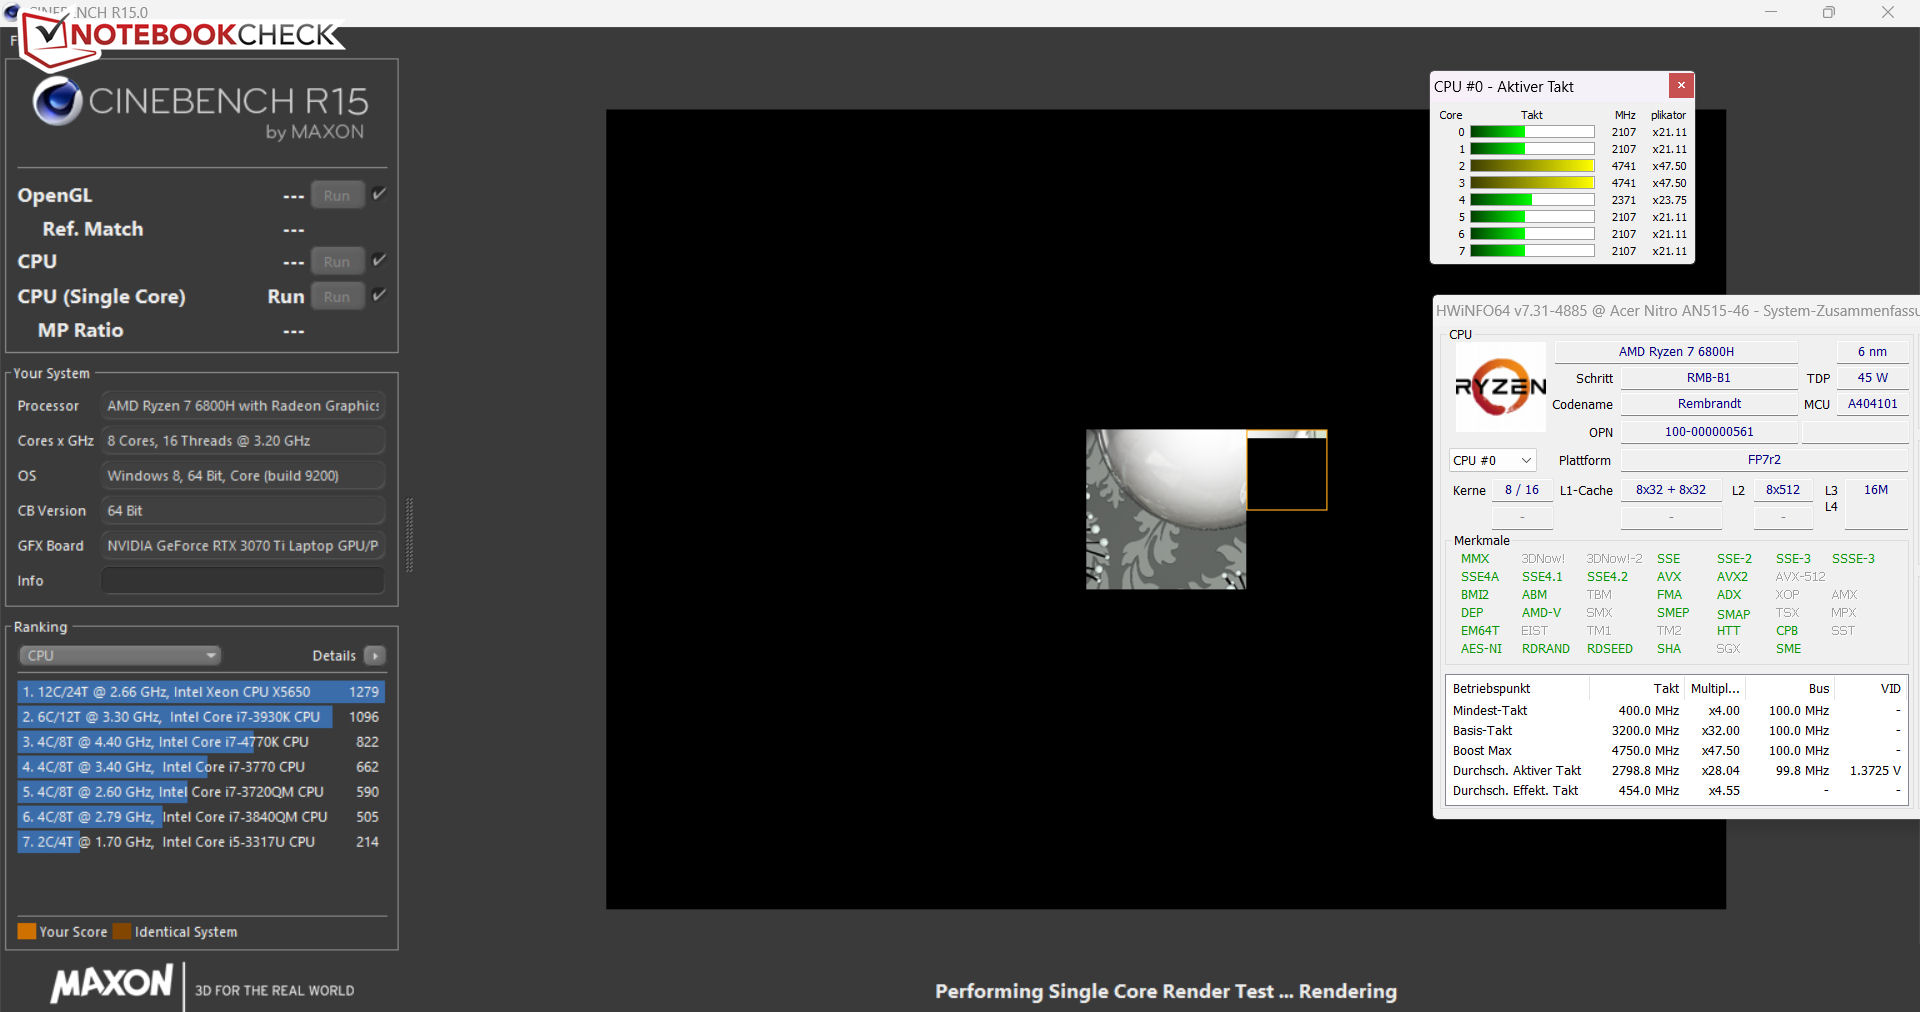
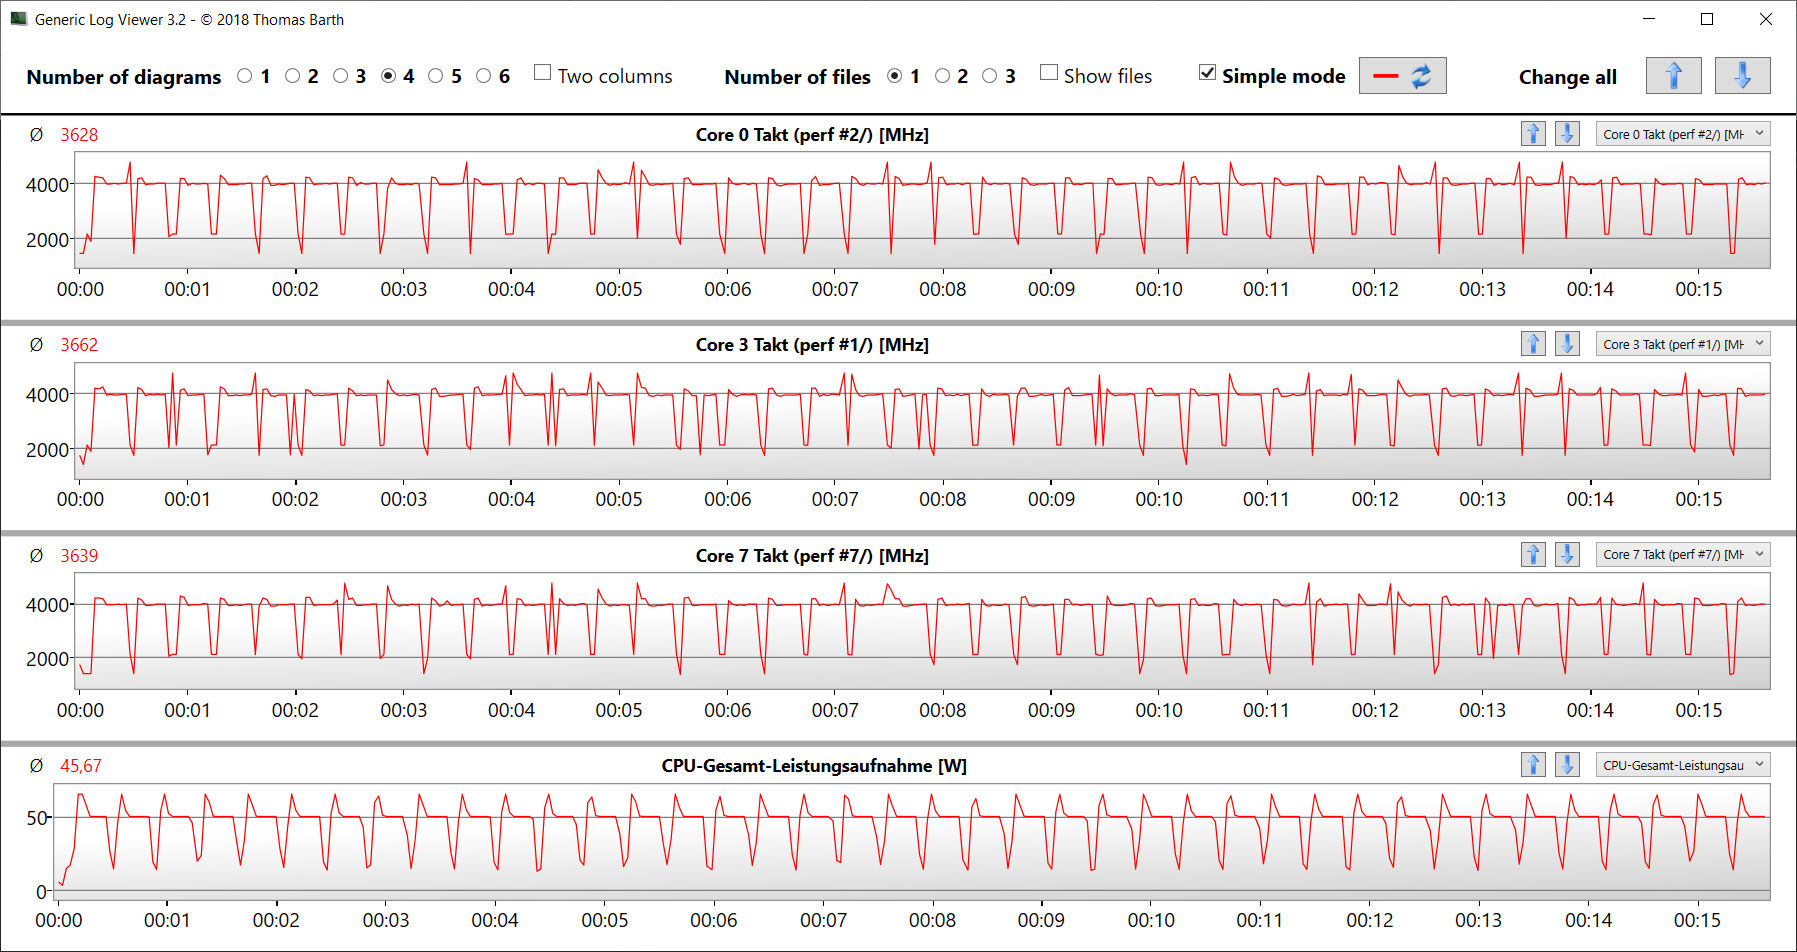
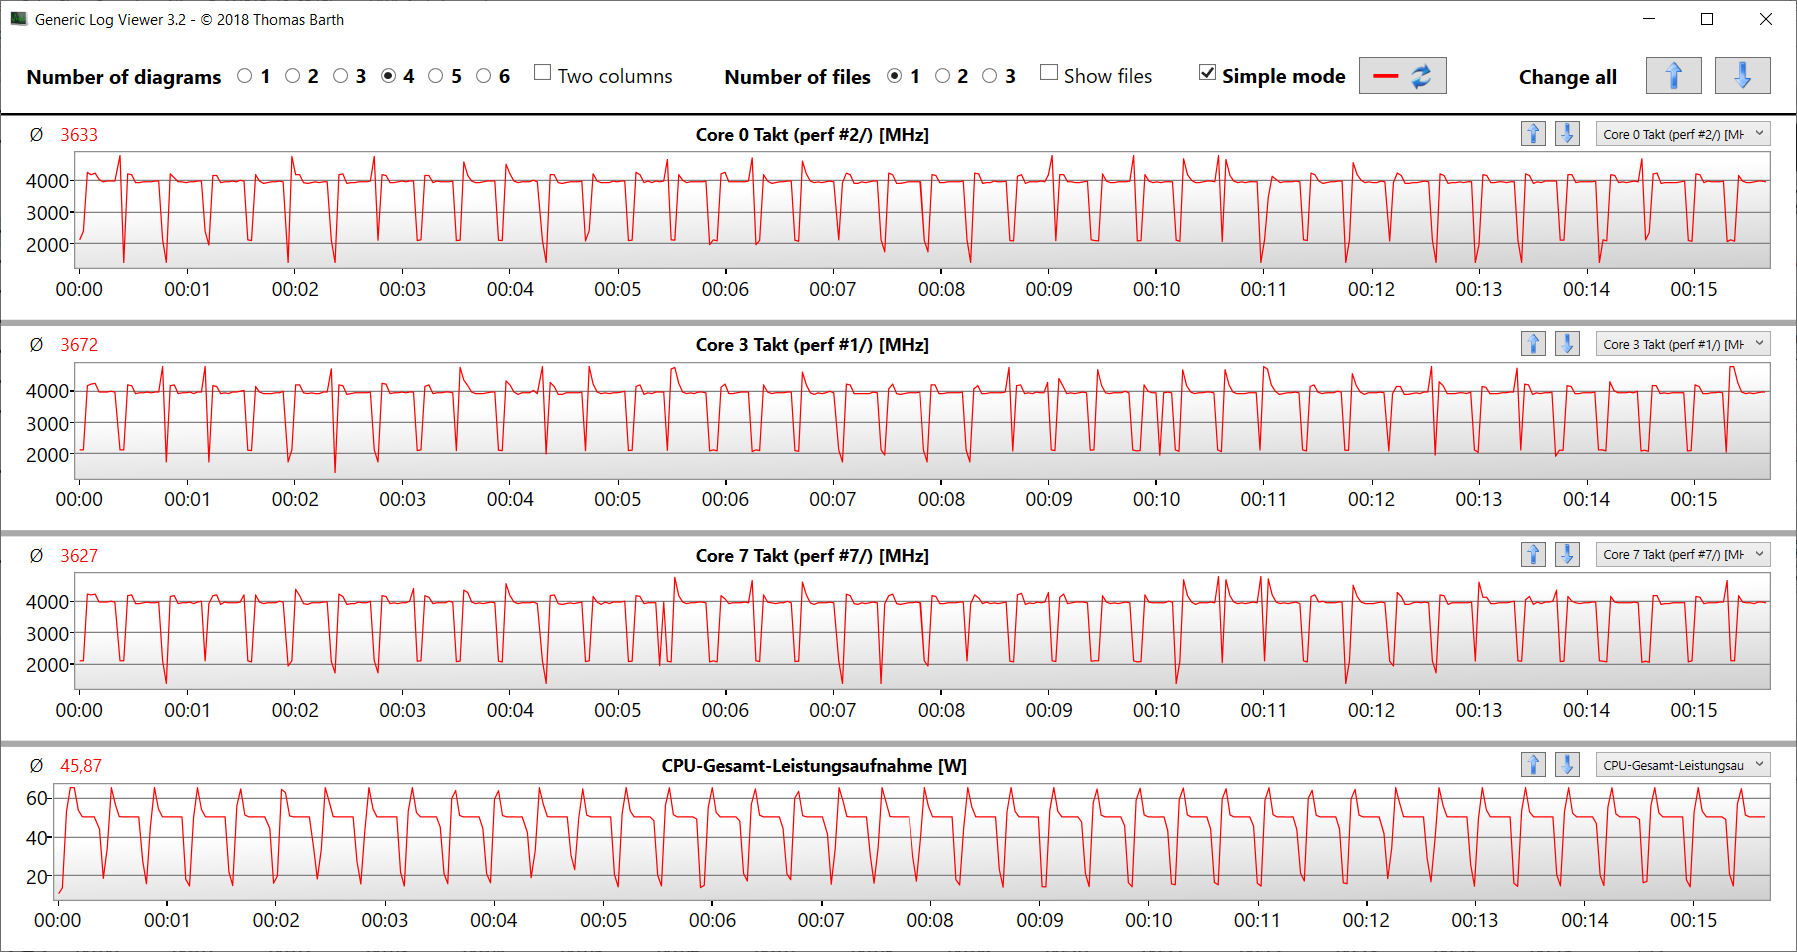
La parte de la CPU de la APU Ryzen 7 6800H (Rembrandt) está formada por un procesador octa-core con una velocidad de reloj básica de 3,2 GHz. La velocidad de reloj puede aumentar hasta 4,75 GHz gracias al turbo. El chip admite el multithreading simultáneo (trabajando dos hilos por núcleo). Los resultados del benchmark de la CPU son los mismos en los tres perfiles de rendimiento.
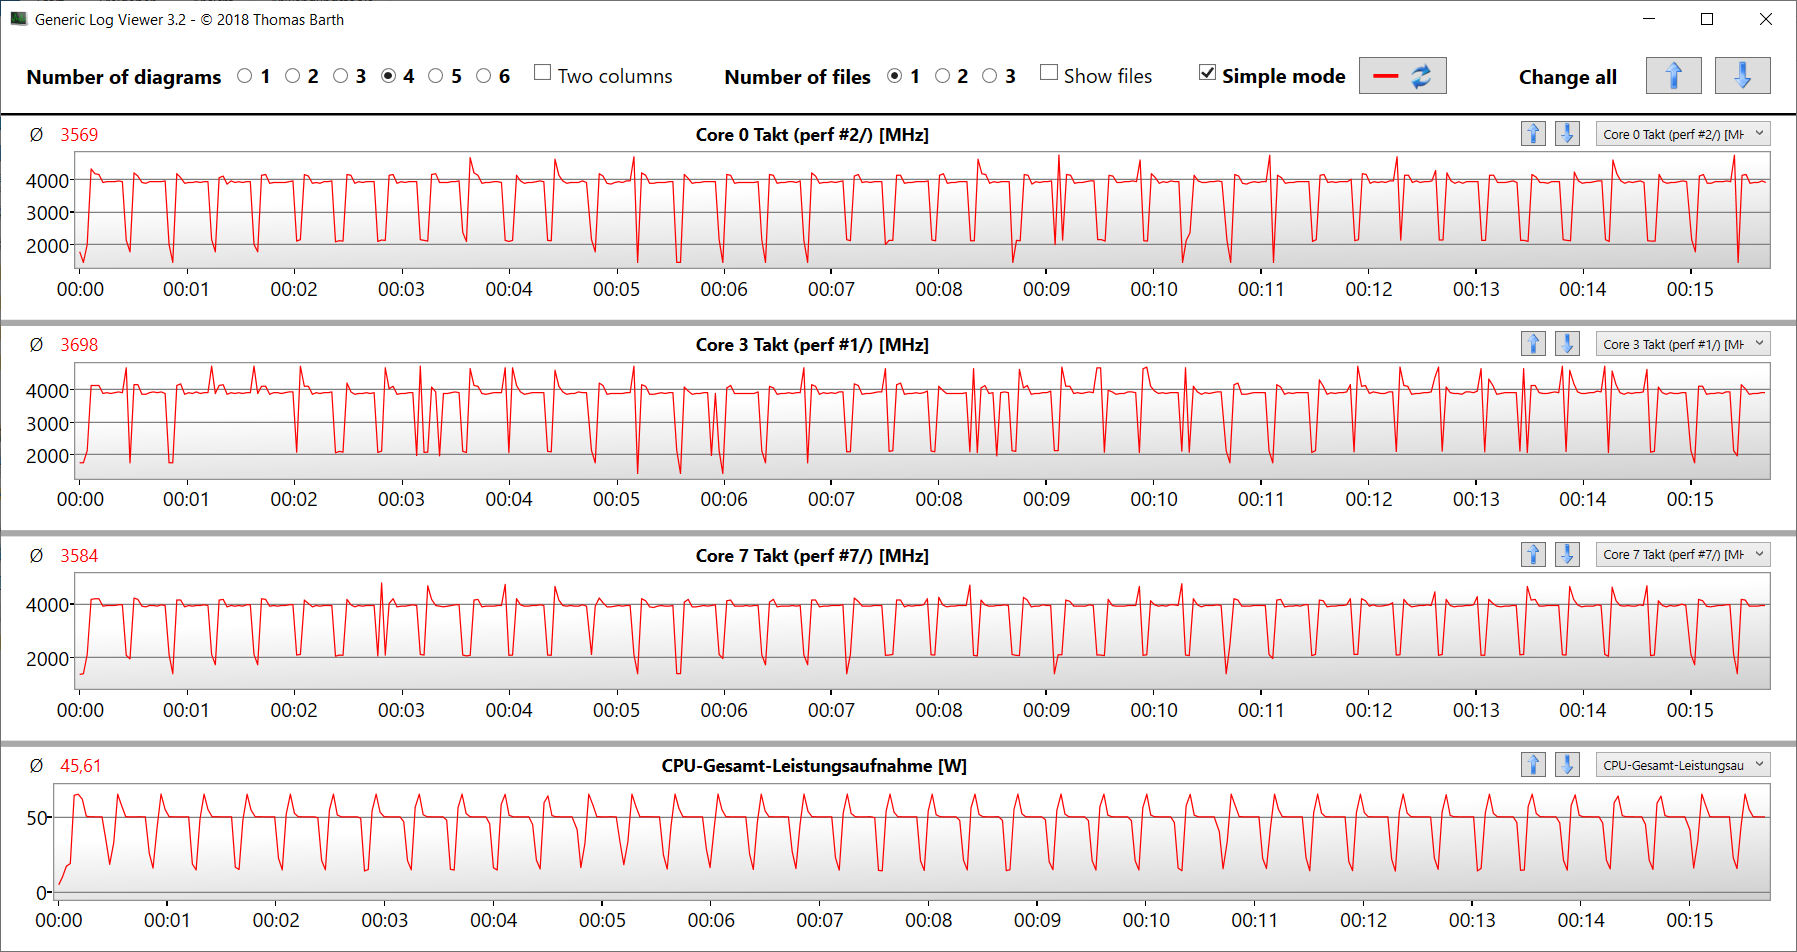
La prueba multihilo Cinebench R15 dio como resultado velocidades de reloj entre 4 y 4,2 GHz. La prueba de un solo hilo se completó con 2 a 4,75 GHz. En batería, la CPU funcionó a 2,5 GHz (multihilo) y de 1,2 a 2,5 GHz (un solo hilo). El benchmark de bucle CB15 confirmó que el turbo de la CPU puede utilizarse de forma continua.
El procesador ofrece un buen rendimiento en general. En ocasiones queda por detrás de las CPUs Intel Alder Lake, especialmente cuando pueden aprovechar sus núcleos de CPU adicionales.
Cinebench R15 Multi Loop
* ... más pequeño es mejor
AIDA64: FP32 Ray-Trace | FPU Julia | CPU SHA3 | CPU Queen | FPU SinJulia | FPU Mandel | CPU AES | CPU ZLib | FP64 Ray-Trace | CPU PhotoWorxx
| Performance rating | |
| Media de la clase Gaming | |
| Acer Nitro 5 AN515-46-R1A1 | |
| Medio AMD Ryzen 7 6800H | |
| Schenker XMG Fusion 15 (Mid 22) | |
| Asus TUF Dash F15 FX517ZR | |
| MSI Katana GF66 12UGS | |
| Acer Nitro 5 AN515-58-72QR | |
| AIDA64 / FP32 Ray-Trace | |
| Media de la clase Gaming (10227 - 85542, n=105, últimos 2 años) | |
| Acer Nitro 5 AN515-46-R1A1 | |
| Medio AMD Ryzen 7 6800H (12876 - 17031, n=8) | |
| Asus TUF Dash F15 FX517ZR | |
| Schenker XMG Fusion 15 (Mid 22) | |
| MSI Katana GF66 12UGS | |
| Acer Nitro 5 AN515-58-72QR | |
| AIDA64 / FPU Julia | |
| Media de la clase Gaming (51376 - 238426, n=105, últimos 2 años) | |
| Acer Nitro 5 AN515-46-R1A1 | |
| Medio AMD Ryzen 7 6800H (82673 - 105987, n=8) | |
| Asus TUF Dash F15 FX517ZR | |
| Schenker XMG Fusion 15 (Mid 22) | |
| Acer Nitro 5 AN515-58-72QR | |
| MSI Katana GF66 12UGS | |
| AIDA64 / CPU SHA3 | |
| Media de la clase Gaming (2180 - 10115, n=105, últimos 2 años) | |
| Schenker XMG Fusion 15 (Mid 22) | |
| Acer Nitro 5 AN515-46-R1A1 | |
| Medio AMD Ryzen 7 6800H (2886 - 3634, n=8) | |
| MSI Katana GF66 12UGS | |
| Acer Nitro 5 AN515-58-72QR | |
| Asus TUF Dash F15 FX517ZR | |
| AIDA64 / CPU Queen | |
| Media de la clase Gaming (49785 - 173351, n=90, últimos 2 años) | |
| Acer Nitro 5 AN515-46-R1A1 | |
| MSI Katana GF66 12UGS | |
| Acer Nitro 5 AN515-58-72QR | |
| Medio AMD Ryzen 7 6800H (75117 - 106322, n=8) | |
| Asus TUF Dash F15 FX517ZR | |
| Schenker XMG Fusion 15 (Mid 22) | |
| AIDA64 / FPU SinJulia | |
| Media de la clase Gaming (4424 - 33636, n=105, últimos 2 años) | |
| Acer Nitro 5 AN515-46-R1A1 | |
| Medio AMD Ryzen 7 6800H (11771 - 13120, n=8) | |
| Acer Nitro 5 AN515-58-72QR | |
| MSI Katana GF66 12UGS | |
| Schenker XMG Fusion 15 (Mid 22) | |
| Asus TUF Dash F15 FX517ZR | |
| AIDA64 / FPU Mandel | |
| Media de la clase Gaming (25115 - 128721, n=105, últimos 2 años) | |
| Acer Nitro 5 AN515-46-R1A1 | |
| Medio AMD Ryzen 7 6800H (45287 - 58327, n=8) | |
| Schenker XMG Fusion 15 (Mid 22) | |
| Asus TUF Dash F15 FX517ZR | |
| Acer Nitro 5 AN515-58-72QR | |
| MSI Katana GF66 12UGS | |
| AIDA64 / CPU AES | |
| Schenker XMG Fusion 15 (Mid 22) | |
| Acer Nitro 5 AN515-46-R1A1 | |
| Medio AMD Ryzen 7 6800H (67816 - 137383, n=8) | |
| Media de la clase Gaming (39258 - 247074, n=105, últimos 2 años) | |
| MSI Katana GF66 12UGS | |
| Asus TUF Dash F15 FX517ZR | |
| Acer Nitro 5 AN515-58-72QR | |
| AIDA64 / CPU ZLib | |
| Media de la clase Gaming (574 - 2531, n=105, últimos 2 años) | |
| Acer Nitro 5 AN515-58-72QR | |
| MSI Katana GF66 12UGS | |
| Asus TUF Dash F15 FX517ZR | |
| Acer Nitro 5 AN515-46-R1A1 | |
| Medio AMD Ryzen 7 6800H (732 - 901, n=8) | |
| Schenker XMG Fusion 15 (Mid 22) | |
| AIDA64 / FP64 Ray-Trace | |
| Media de la clase Gaming (5509 - 45446, n=105, últimos 2 años) | |
| Acer Nitro 5 AN515-46-R1A1 | |
| Medio AMD Ryzen 7 6800H (6917 - 8980, n=8) | |
| Asus TUF Dash F15 FX517ZR | |
| Schenker XMG Fusion 15 (Mid 22) | |
| Acer Nitro 5 AN515-58-72QR | |
| MSI Katana GF66 12UGS | |
| AIDA64 / CPU PhotoWorxx | |
| Media de la clase Gaming (12271 - 89891, n=105, últimos 2 años) | |
| Asus TUF Dash F15 FX517ZR | |
| Medio AMD Ryzen 7 6800H (26496 - 30360, n=8) | |
| Acer Nitro 5 AN515-46-R1A1 | |
| MSI Katana GF66 12UGS | |
| Schenker XMG Fusion 15 (Mid 22) | |
| Acer Nitro 5 AN515-58-72QR | |
Rendimiento del sistema
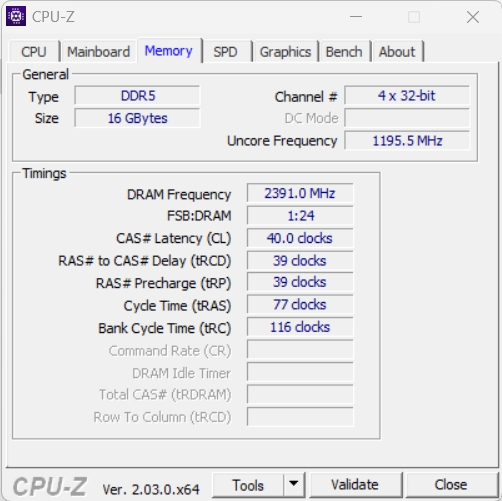
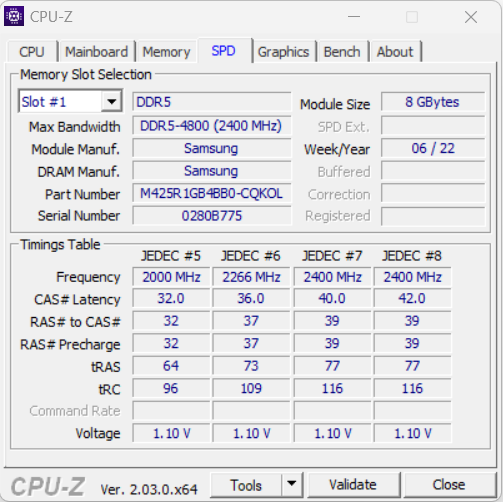
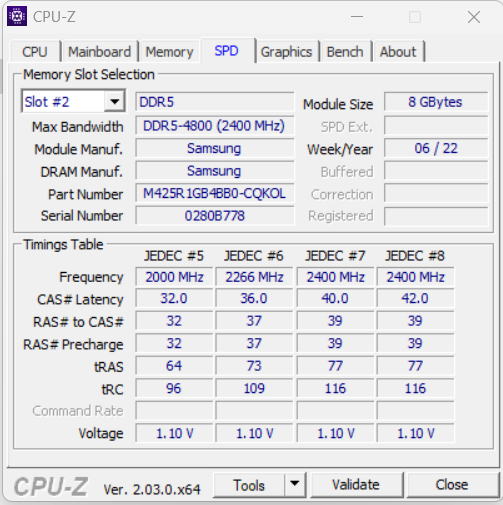
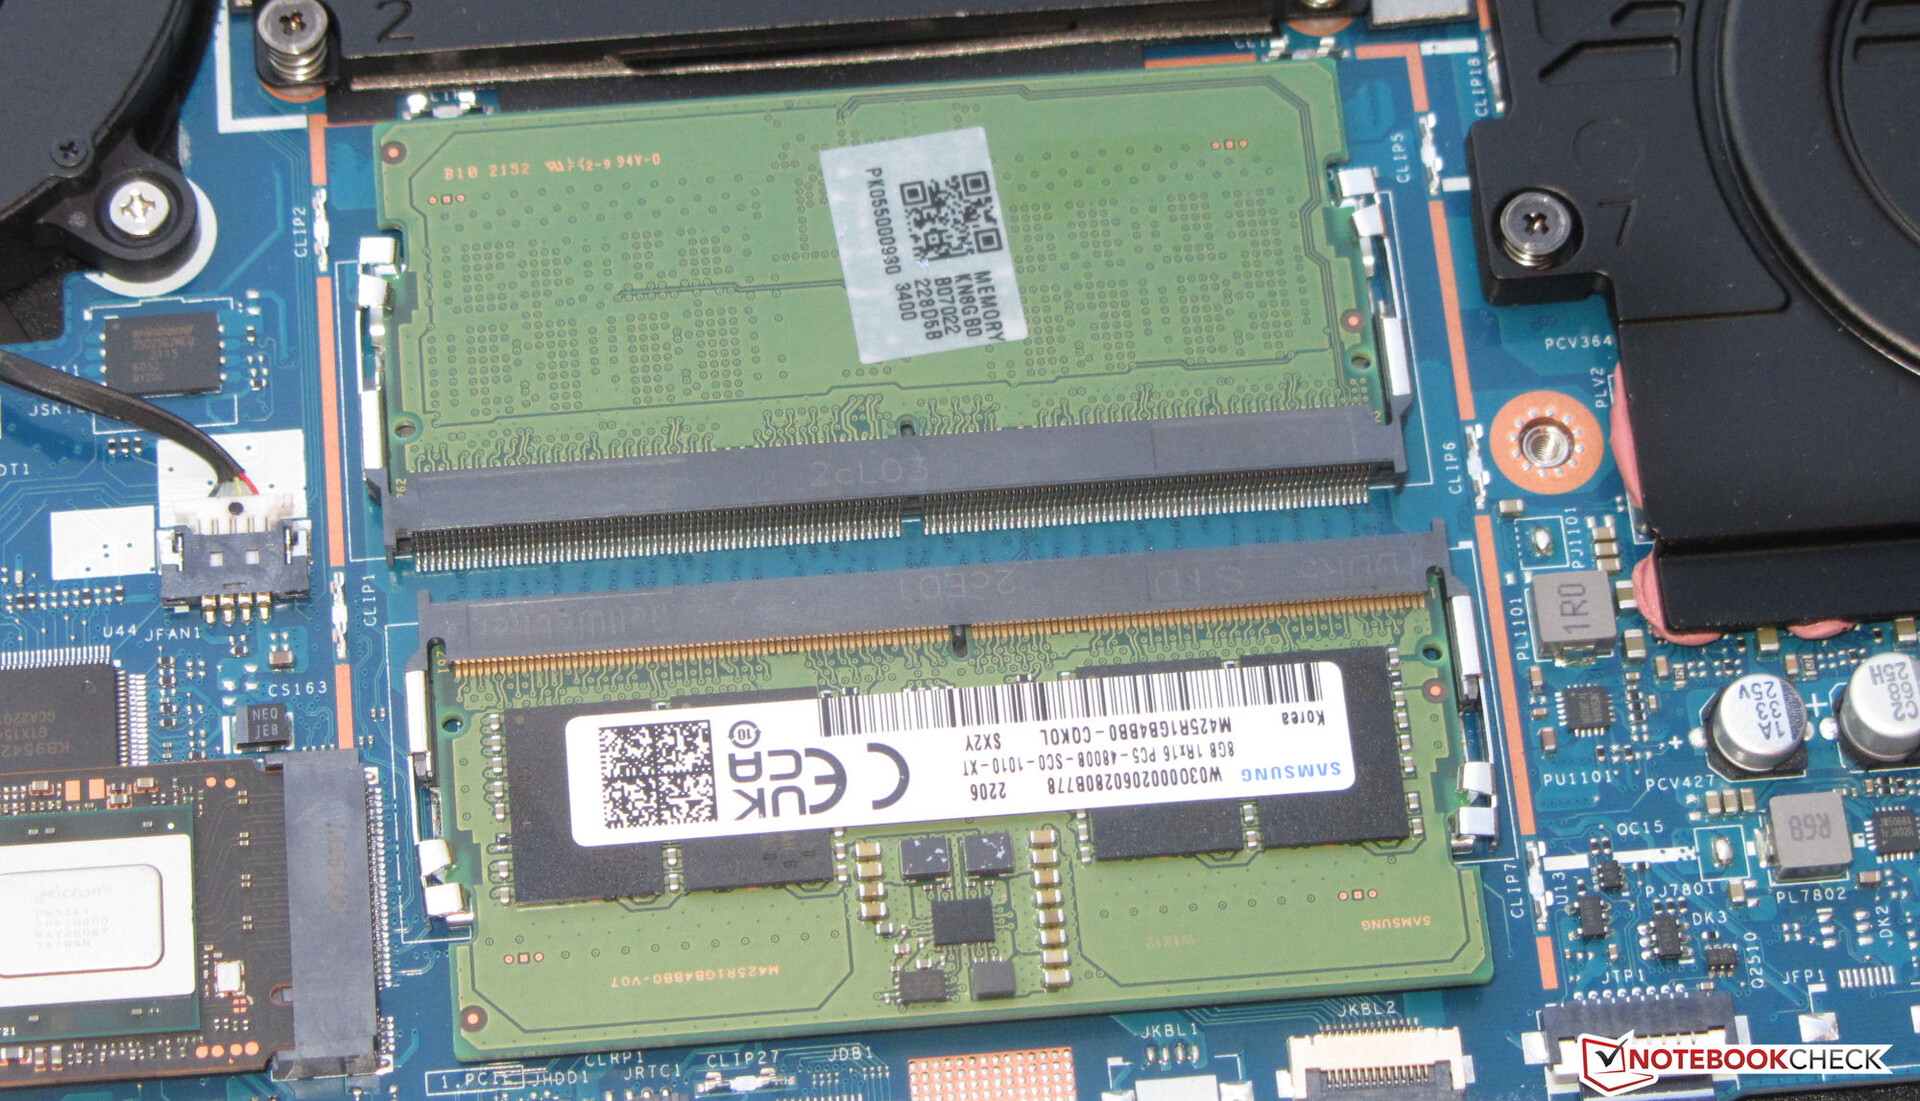
El sistema, muy completo y fluido, ofrece suficiente potencia de cálculo para aplicaciones exigentes como el renderizado, el procesamiento de vídeo y los juegos. Los resultados de PCMark son buenos. Las tasas de transferencia de la RAM (DDR5-4800) son ligeramente inferiores a las de portátiles comparables como el Asus TUF Dash F15.
CrossMark: Overall | Productivity | Creativity | Responsiveness
| PCMark 10 / Score | |
| Media de la clase Gaming (5828 - 12414, n=93, últimos 2 años) | |
| MSI Katana GF66 12UGS | |
| Medio AMD Ryzen 7 6800H, NVIDIA GeForce RTX 3070 Ti Laptop GPU (6783 - 7549, n=2) | |
| Acer Nitro 5 AN515-58-72QR | |
| Asus TUF Dash F15 FX517ZR | |
| Acer Nitro 5 AN515-46-R1A1 | |
| Schenker XMG Fusion 15 (Mid 22) | |
| PCMark 10 / Essentials | |
| Media de la clase Gaming (8810 - 11935, n=97, últimos 2 años) | |
| Medio AMD Ryzen 7 6800H, NVIDIA GeForce RTX 3070 Ti Laptop GPU (10343 - 10472, n=2) | |
| MSI Katana GF66 12UGS | |
| Acer Nitro 5 AN515-46-R1A1 | |
| Asus TUF Dash F15 FX517ZR | |
| Acer Nitro 5 AN515-58-72QR | |
| Schenker XMG Fusion 15 (Mid 22) | |
| PCMark 10 / Productivity | |
| Media de la clase Gaming (6845 - 25323, n=95, últimos 2 años) | |
| MSI Katana GF66 12UGS | |
| Asus TUF Dash F15 FX517ZR | |
| Medio AMD Ryzen 7 6800H, NVIDIA GeForce RTX 3070 Ti Laptop GPU (8991 - 9479, n=2) | |
| Acer Nitro 5 AN515-58-72QR | |
| Acer Nitro 5 AN515-46-R1A1 | |
| Schenker XMG Fusion 15 (Mid 22) | |
| PCMark 10 / Digital Content Creation | |
| Media de la clase Gaming (7602 - 19954, n=95, últimos 2 años) | |
| MSI Katana GF66 12UGS | |
| Medio AMD Ryzen 7 6800H, NVIDIA GeForce RTX 3070 Ti Laptop GPU (9108 - 11759, n=2) | |
| Acer Nitro 5 AN515-58-72QR | |
| Asus TUF Dash F15 FX517ZR | |
| Acer Nitro 5 AN515-46-R1A1 | |
| Schenker XMG Fusion 15 (Mid 22) | |
| CrossMark / Overall | |
| Media de la clase Gaming (1366 - 2409, n=94, últimos 2 años) | |
| MSI Katana GF66 12UGS | |
| Asus TUF Dash F15 FX517ZR | |
| Acer Nitro 5 AN515-58-72QR | |
| Schenker XMG Fusion 15 (Mid 22) | |
| Medio AMD Ryzen 7 6800H, NVIDIA GeForce RTX 3070 Ti Laptop GPU (1522 - 1643, n=2) | |
| Acer Nitro 5 AN515-46-R1A1 | |
| CrossMark / Productivity | |
| MSI Katana GF66 12UGS | |
| Media de la clase Gaming (1386 - 2254, n=94, últimos 2 años) | |
| Acer Nitro 5 AN515-58-72QR | |
| Asus TUF Dash F15 FX517ZR | |
| Schenker XMG Fusion 15 (Mid 22) | |
| Medio AMD Ryzen 7 6800H, NVIDIA GeForce RTX 3070 Ti Laptop GPU (1530 - 1600, n=2) | |
| Acer Nitro 5 AN515-46-R1A1 | |
| CrossMark / Creativity | |
| Media de la clase Gaming (1343 - 2786, n=94, últimos 2 años) | |
| Asus TUF Dash F15 FX517ZR | |
| MSI Katana GF66 12UGS | |
| Acer Nitro 5 AN515-58-72QR | |
| Schenker XMG Fusion 15 (Mid 22) | |
| Medio AMD Ryzen 7 6800H, NVIDIA GeForce RTX 3070 Ti Laptop GPU (1589 - 1746, n=2) | |
| Acer Nitro 5 AN515-46-R1A1 | |
| CrossMark / Responsiveness | |
| MSI Katana GF66 12UGS | |
| Media de la clase Gaming (1226 - 2334, n=94, últimos 2 años) | |
| Acer Nitro 5 AN515-58-72QR | |
| Schenker XMG Fusion 15 (Mid 22) | |
| Asus TUF Dash F15 FX517ZR | |
| Medio AMD Ryzen 7 6800H, NVIDIA GeForce RTX 3070 Ti Laptop GPU (1316 - 1481, n=2) | |
| Acer Nitro 5 AN515-46-R1A1 | |
| PCMark 8 Home Score Accelerated v2 | 5074 puntos | |
| PCMark 8 Work Score Accelerated v2 | 5934 puntos | |
| PCMark 10 Score | 6783 puntos | |
ayuda | ||
| AIDA64 / Memory Copy | |
| Media de la clase Gaming (21750 - 129946, n=105, últimos 2 años) | |
| Asus TUF Dash F15 FX517ZR | |
| Medio AMD Ryzen 7 6800H (48209 - 51186, n=8) | |
| Acer Nitro 5 AN515-46-R1A1 | |
| Schenker XMG Fusion 15 (Mid 22) | |
| MSI Katana GF66 12UGS | |
| Acer Nitro 5 AN515-58-72QR | |
| AIDA64 / Memory Read | |
| Media de la clase Gaming (22956 - 118858, n=105, últimos 2 años) | |
| Asus TUF Dash F15 FX517ZR | |
| Acer Nitro 5 AN515-46-R1A1 | |
| Medio AMD Ryzen 7 6800H (43828 - 51778, n=8) | |
| Schenker XMG Fusion 15 (Mid 22) | |
| MSI Katana GF66 12UGS | |
| Acer Nitro 5 AN515-58-72QR | |
| AIDA64 / Memory Write | |
| Media de la clase Gaming (22297 - 135096, n=105, últimos 2 años) | |
| Asus TUF Dash F15 FX517ZR | |
| Acer Nitro 5 AN515-46-R1A1 | |
| Medio AMD Ryzen 7 6800H (51116 - 55307, n=8) | |
| MSI Katana GF66 12UGS | |
| Schenker XMG Fusion 15 (Mid 22) | |
| Acer Nitro 5 AN515-58-72QR | |
| AIDA64 / Memory Latency | |
| Media de la clase Gaming (75.3 - 259, n=105, últimos 2 años) | |
| MSI Katana GF66 12UGS | |
| Asus TUF Dash F15 FX517ZR | |
| Schenker XMG Fusion 15 (Mid 22) | |
| Acer Nitro 5 AN515-46-R1A1 | |
| Medio AMD Ryzen 7 6800H (83.1 - 104.1, n=8) | |
| Acer Nitro 5 AN515-58-72QR | |
| Acer Nitro 5 AN515-58-72QR | |
* ... más pequeño es mejor
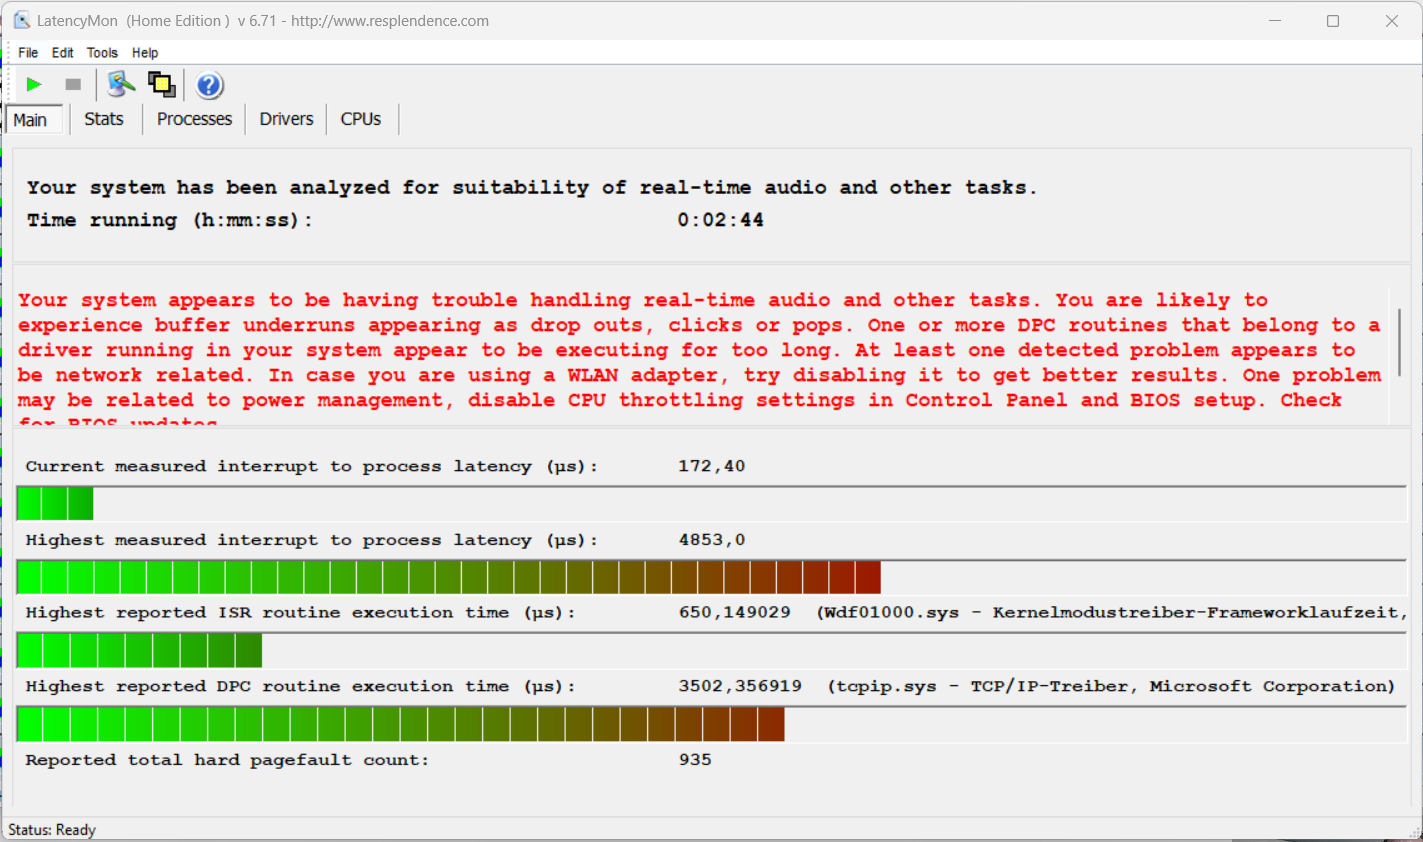
Latencias del CPD
La prueba estandarizada de Latency Monitor (navegación, reproducción de vídeos 4K, ejecución de Prime95 High Load) mostró algunas debilidades en términos de latencias DPC. El sistema no parece adecuado para el procesamiento de vídeo y audio en tiempo real. Las futuras actualizaciones de software podrían mejorar o incluso empeorar esta situación.
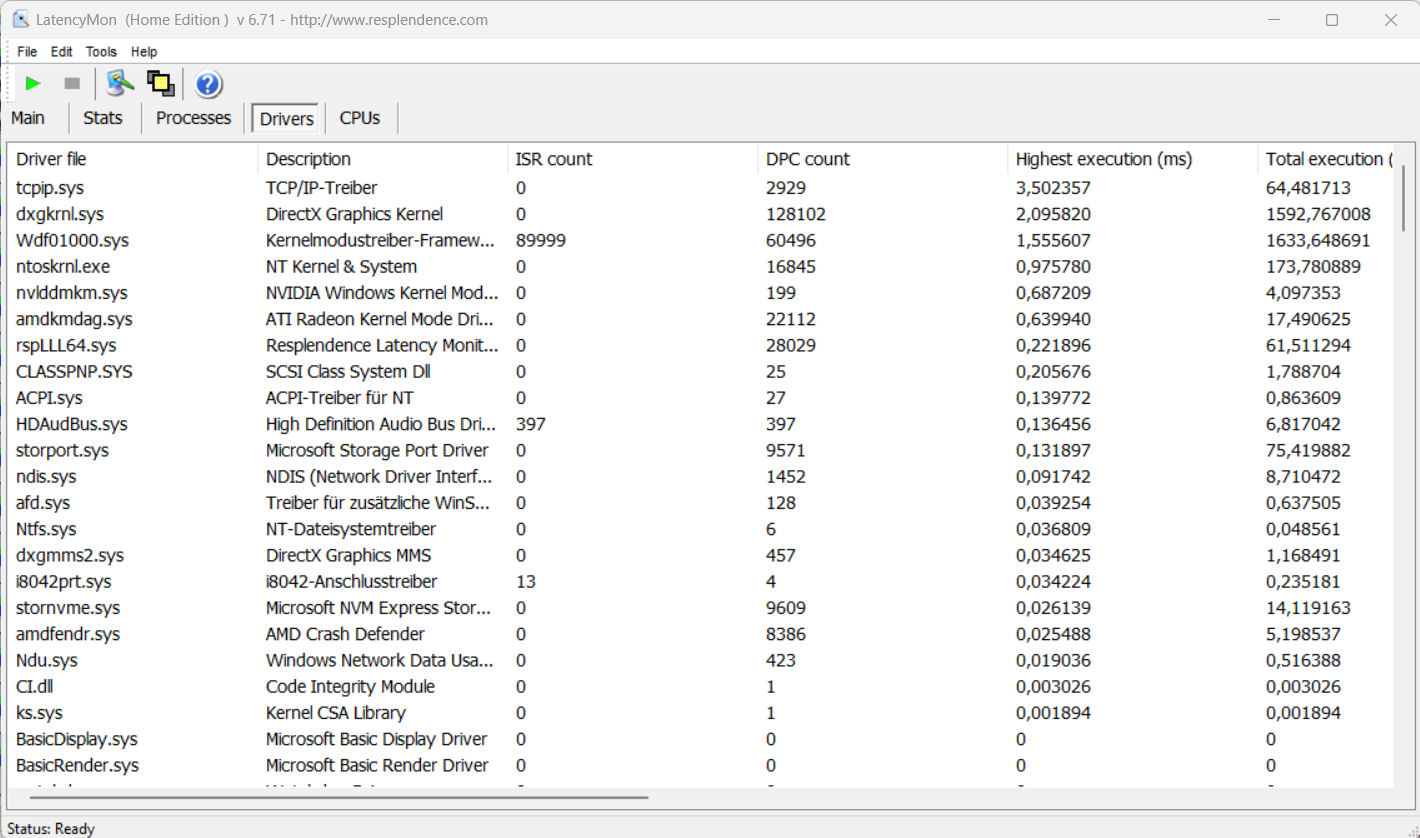
| DPC Latencies / LatencyMon - interrupt to process latency (max), Web, Youtube, Prime95 | |
| Acer Nitro 5 AN515-46-R1A1 | |
| Schenker XMG Fusion 15 (Mid 22) | |
| Acer Nitro 5 AN515-58-72QR | |
| MSI Katana GF66 12UGS | |
| Asus TUF Dash F15 FX517ZR | |
* ... más pequeño es mejor
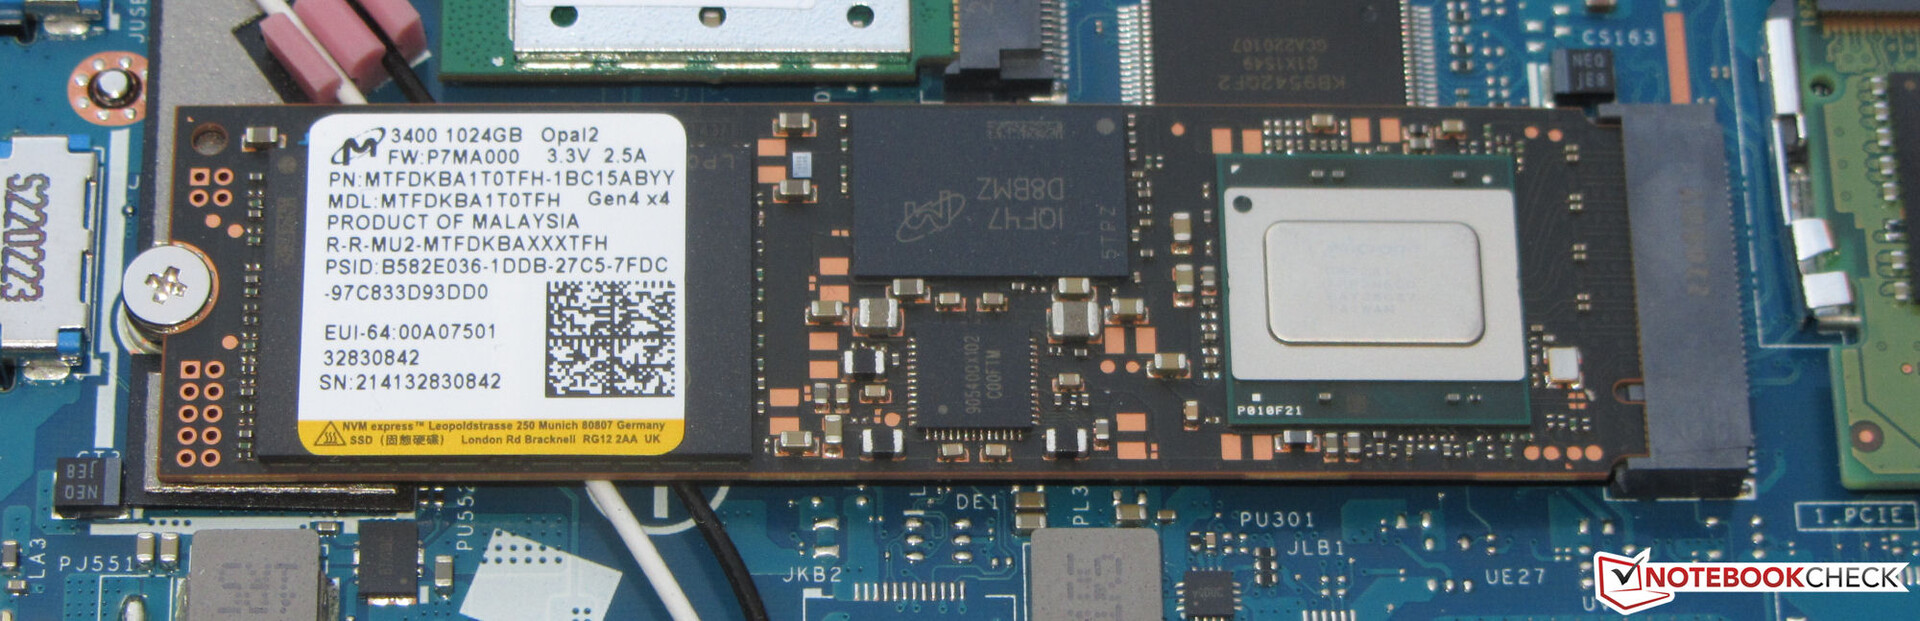
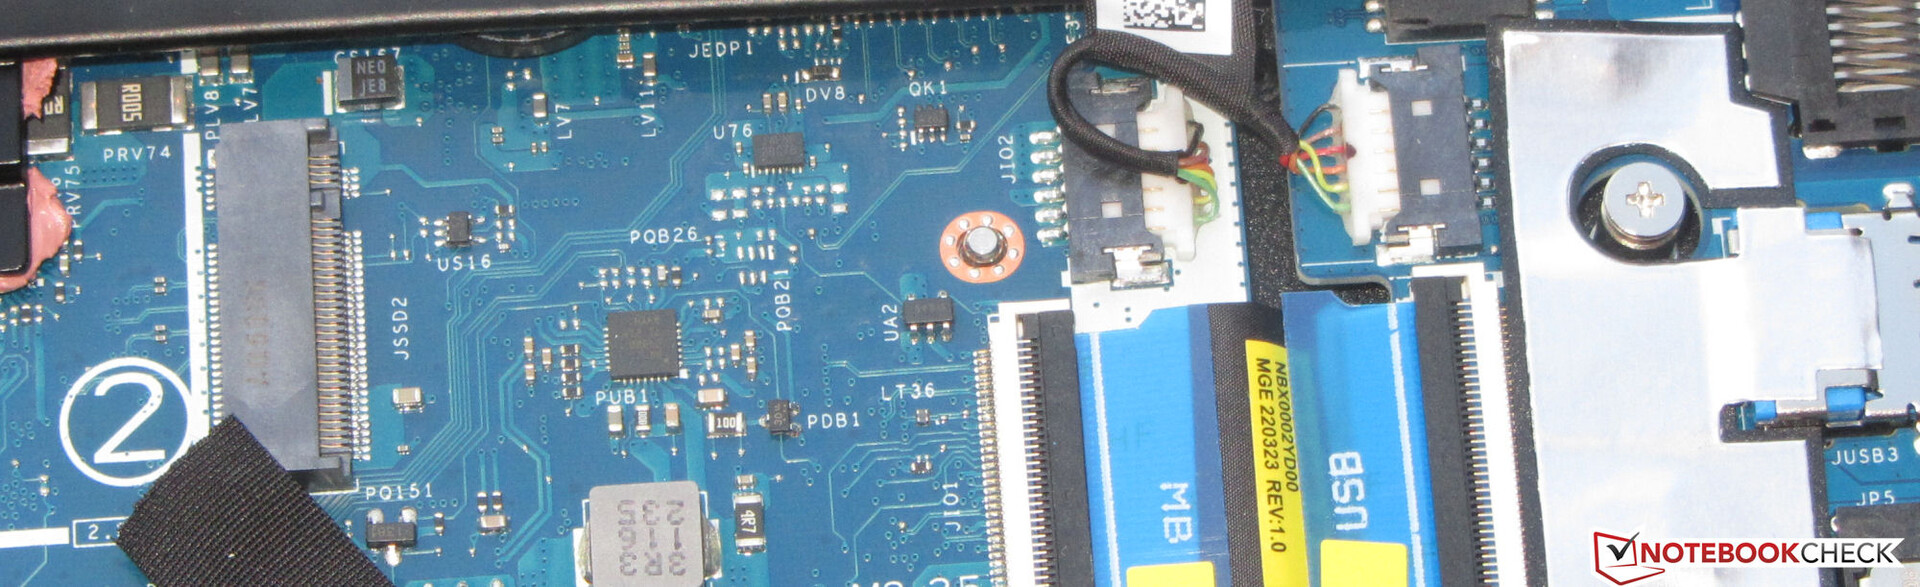
Dispositivo de almacenamiento
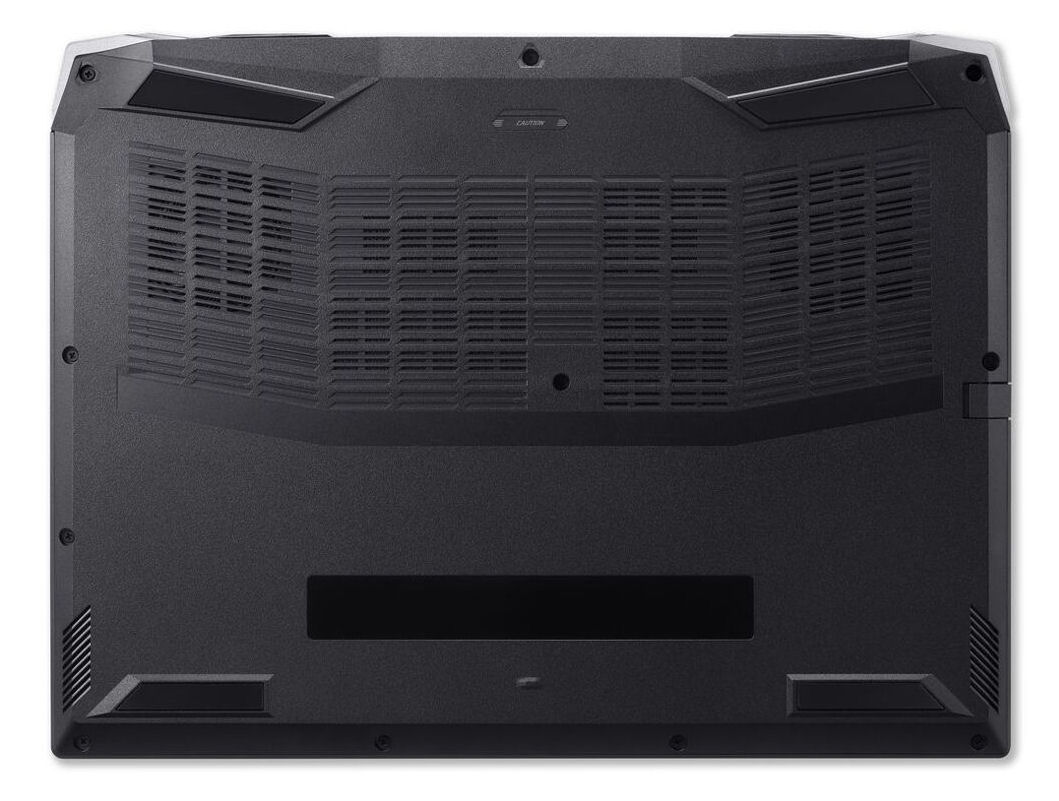
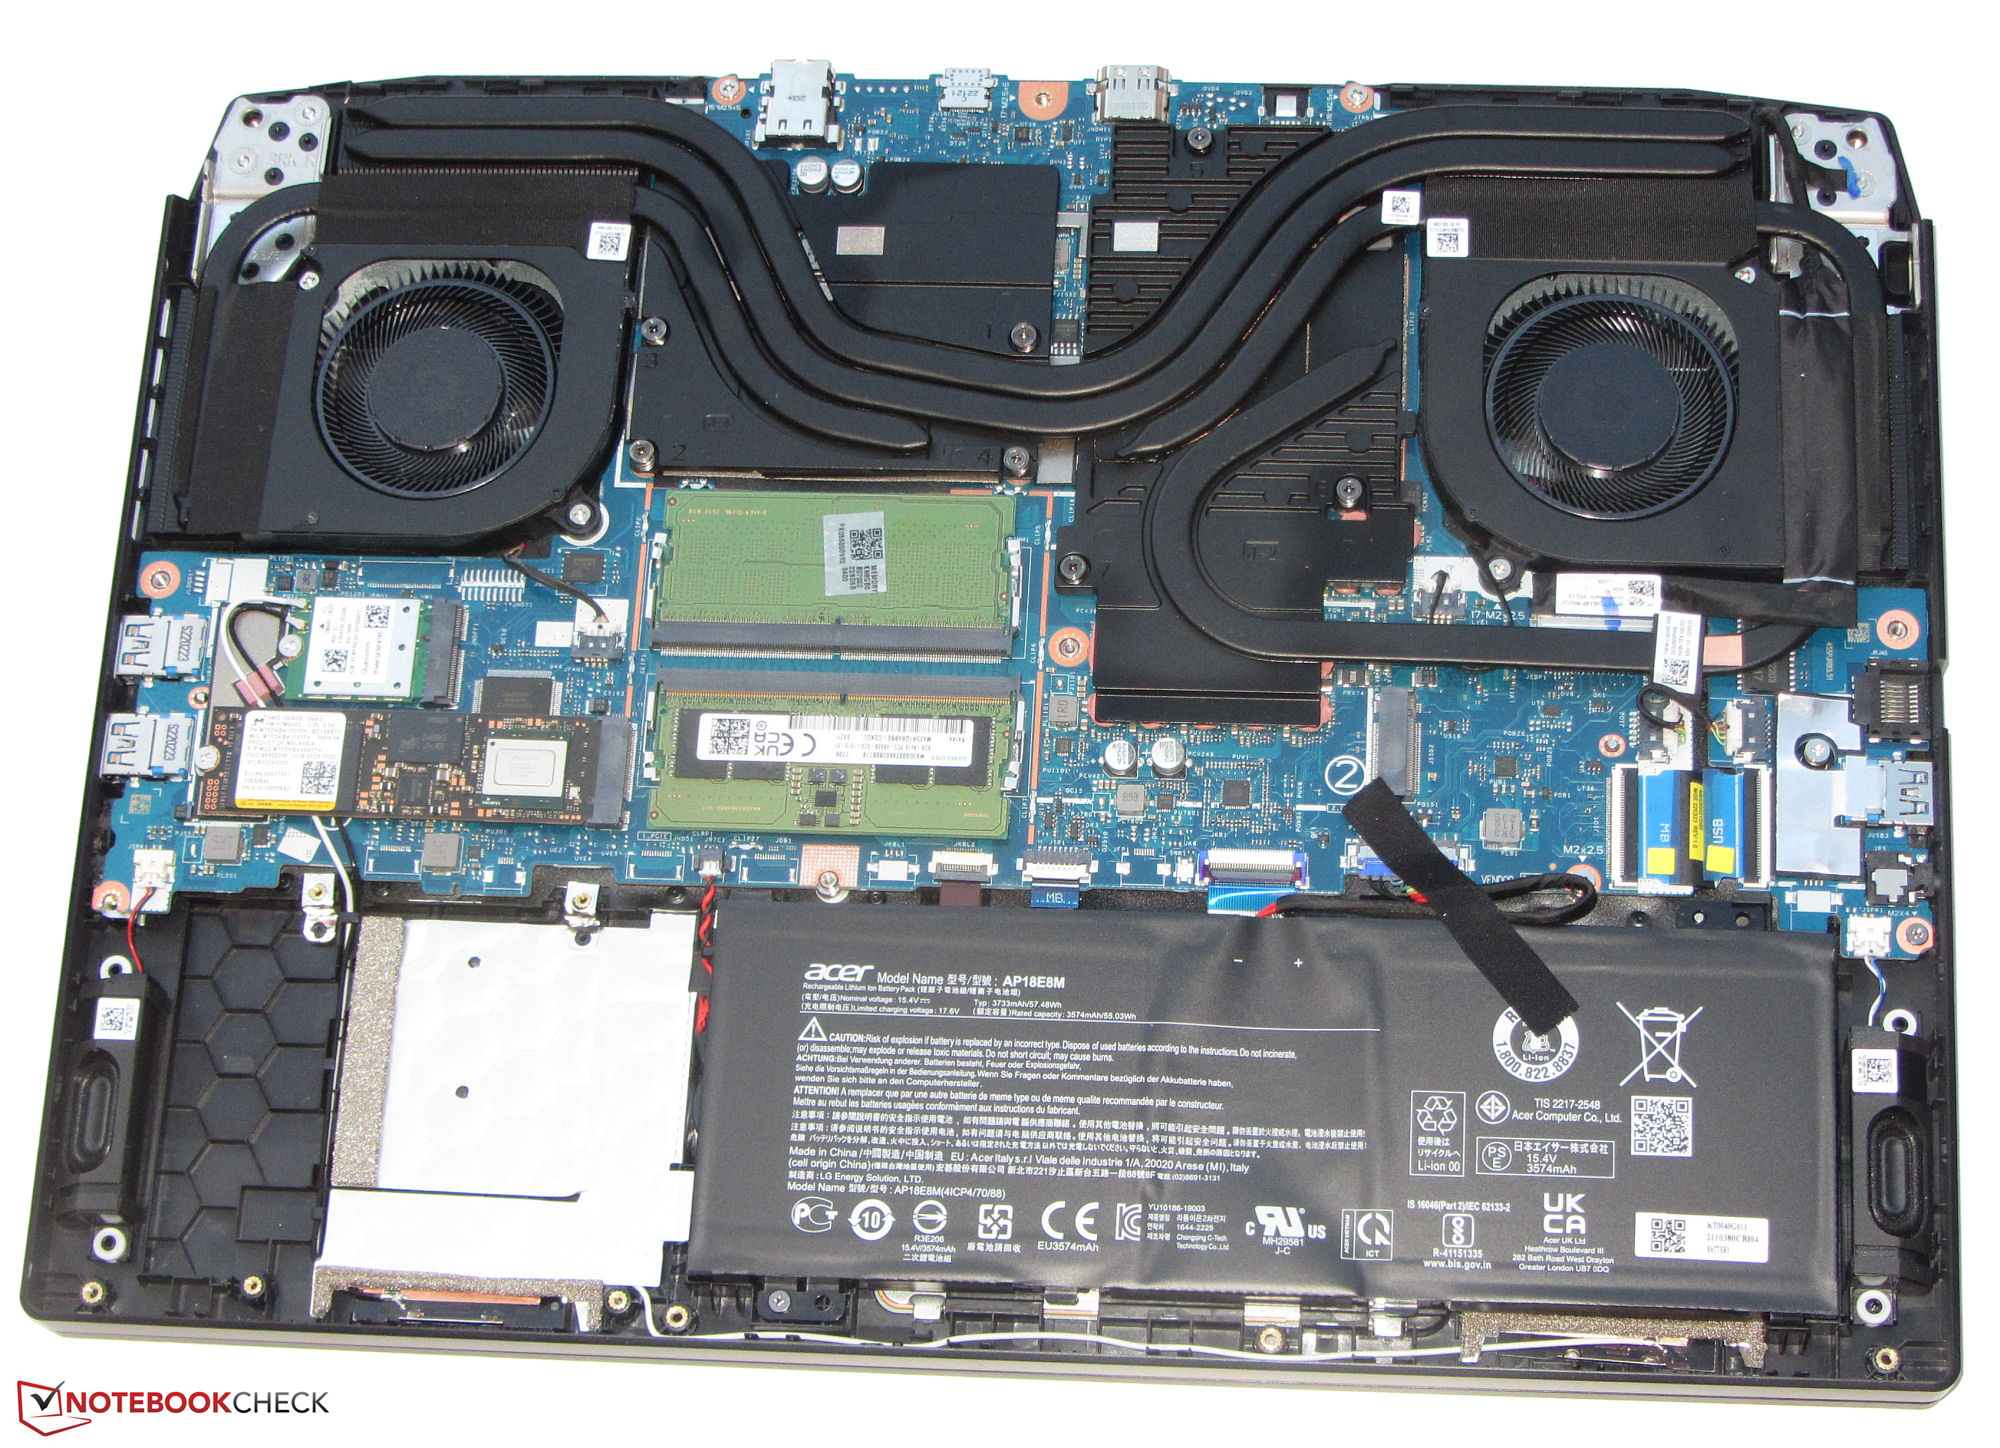
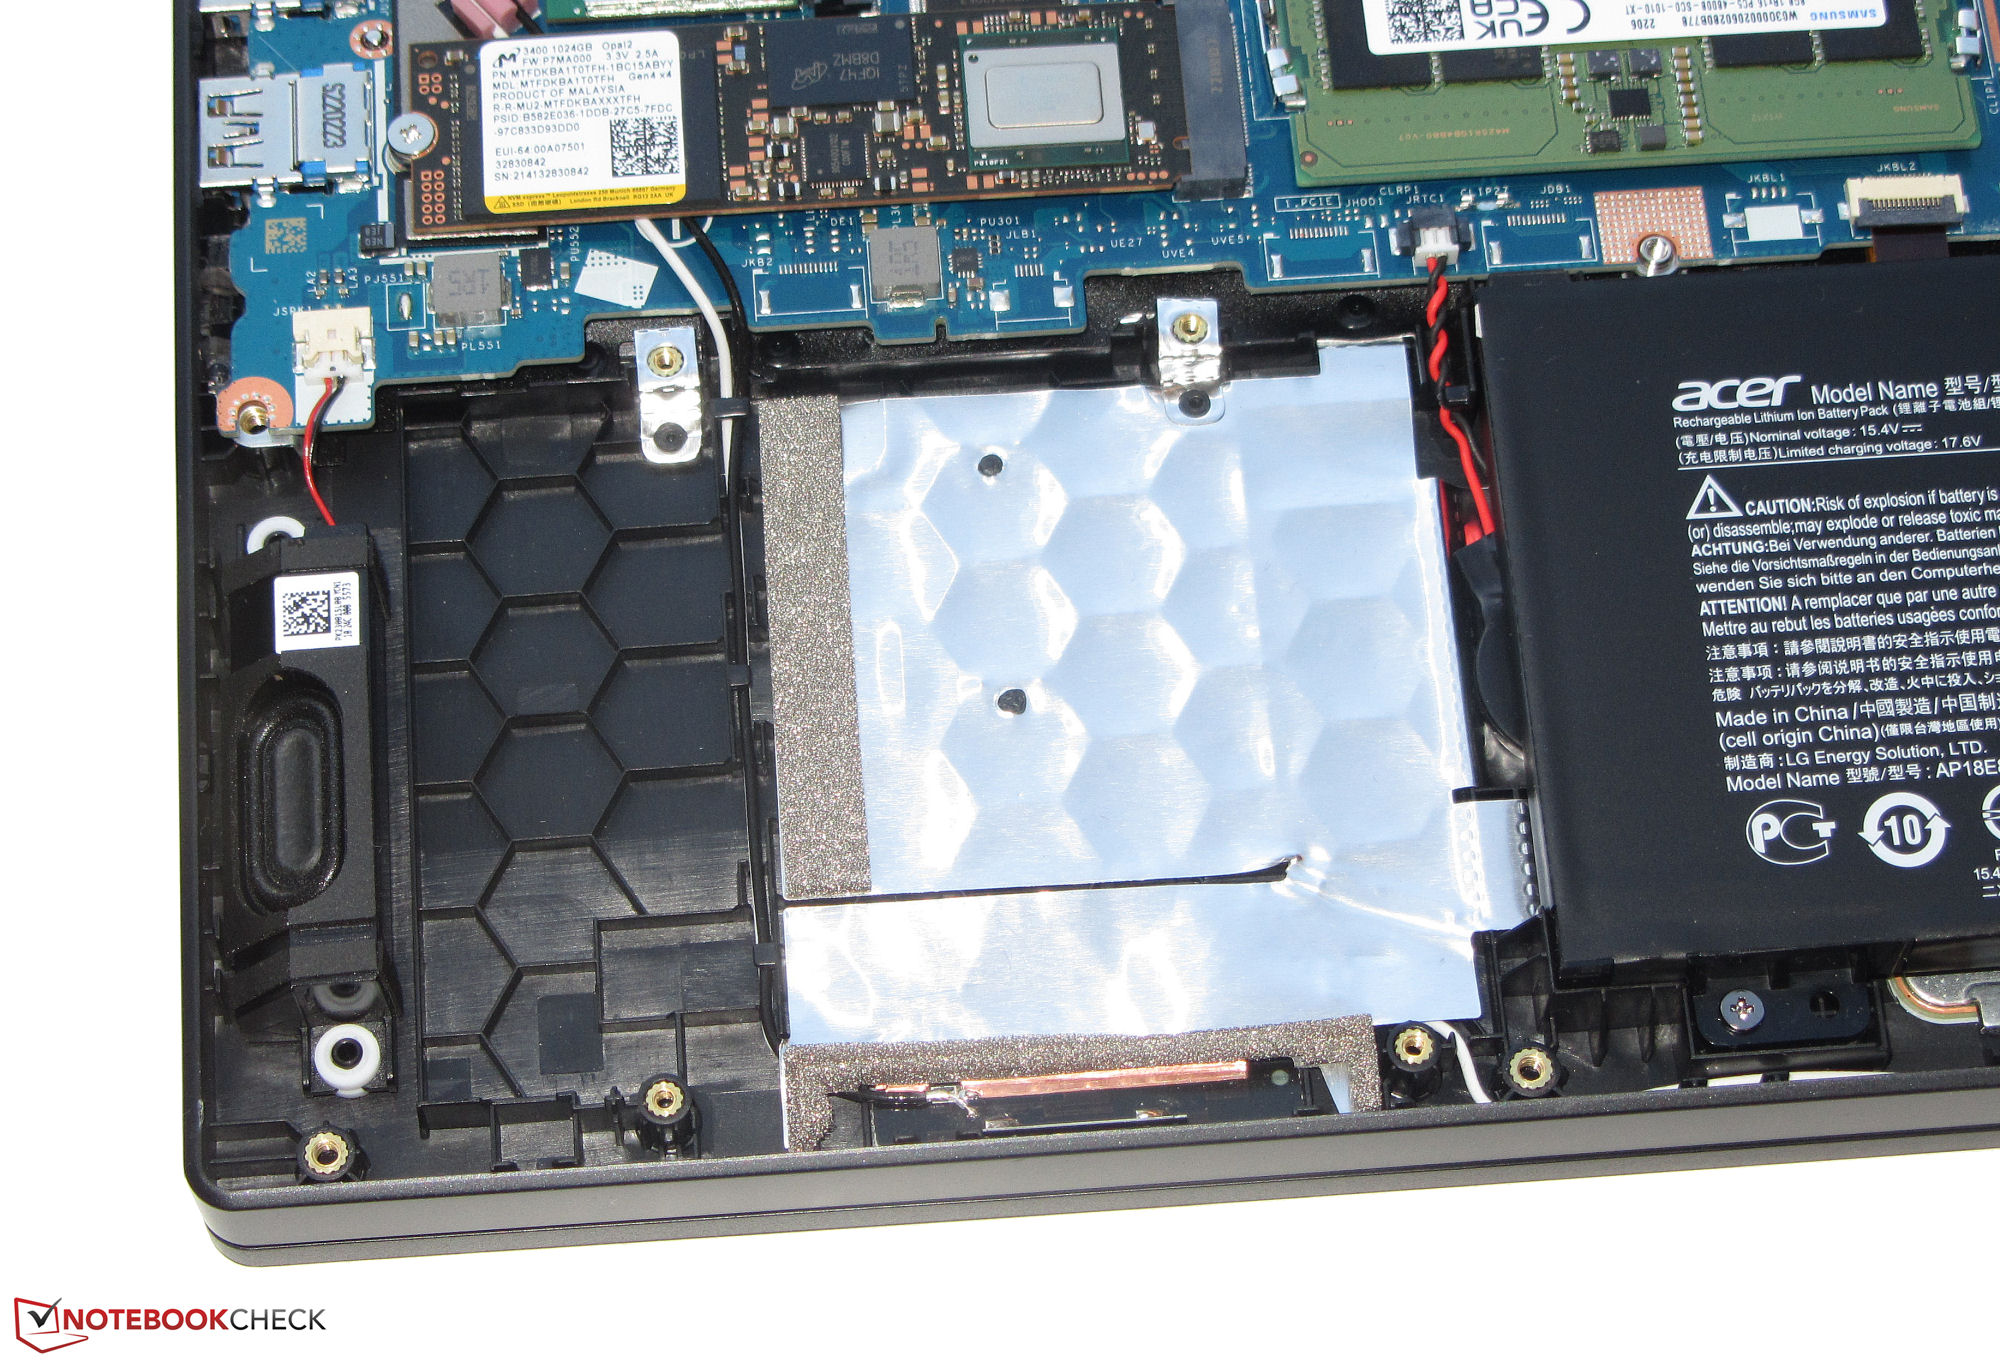
La unidad SSD de 1 TB (PCIe 4, M.2-2280) de Micron tiene muy buenas tasas de transferencia, pero sufre caídas de rendimiento debido al estrangulamiento térmico. El AN515 tiene otra ranura para un segundo SSD PCIe 4. En teoría, el portátil también podría estar equipado con un dispositivo de almacenamiento de 2,5 pulgadas, pero el dispositivo no viene con la ranura SATA necesaria ni con un caddy de unidad adecuado.

* ... más pequeño es mejor
Disk Throttling: DiskSpd Read Loop, Queue Depth 8
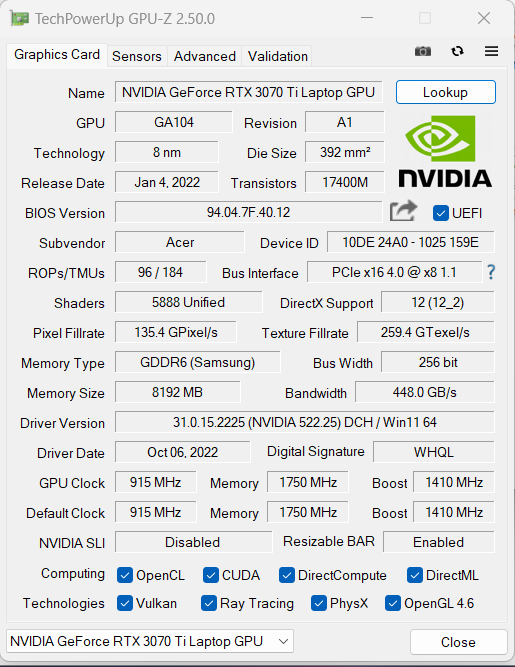
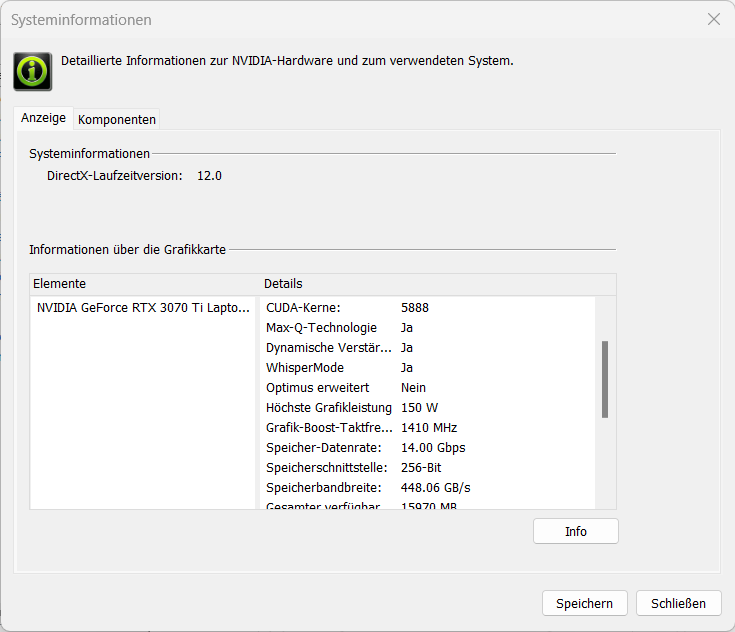
Gráficos
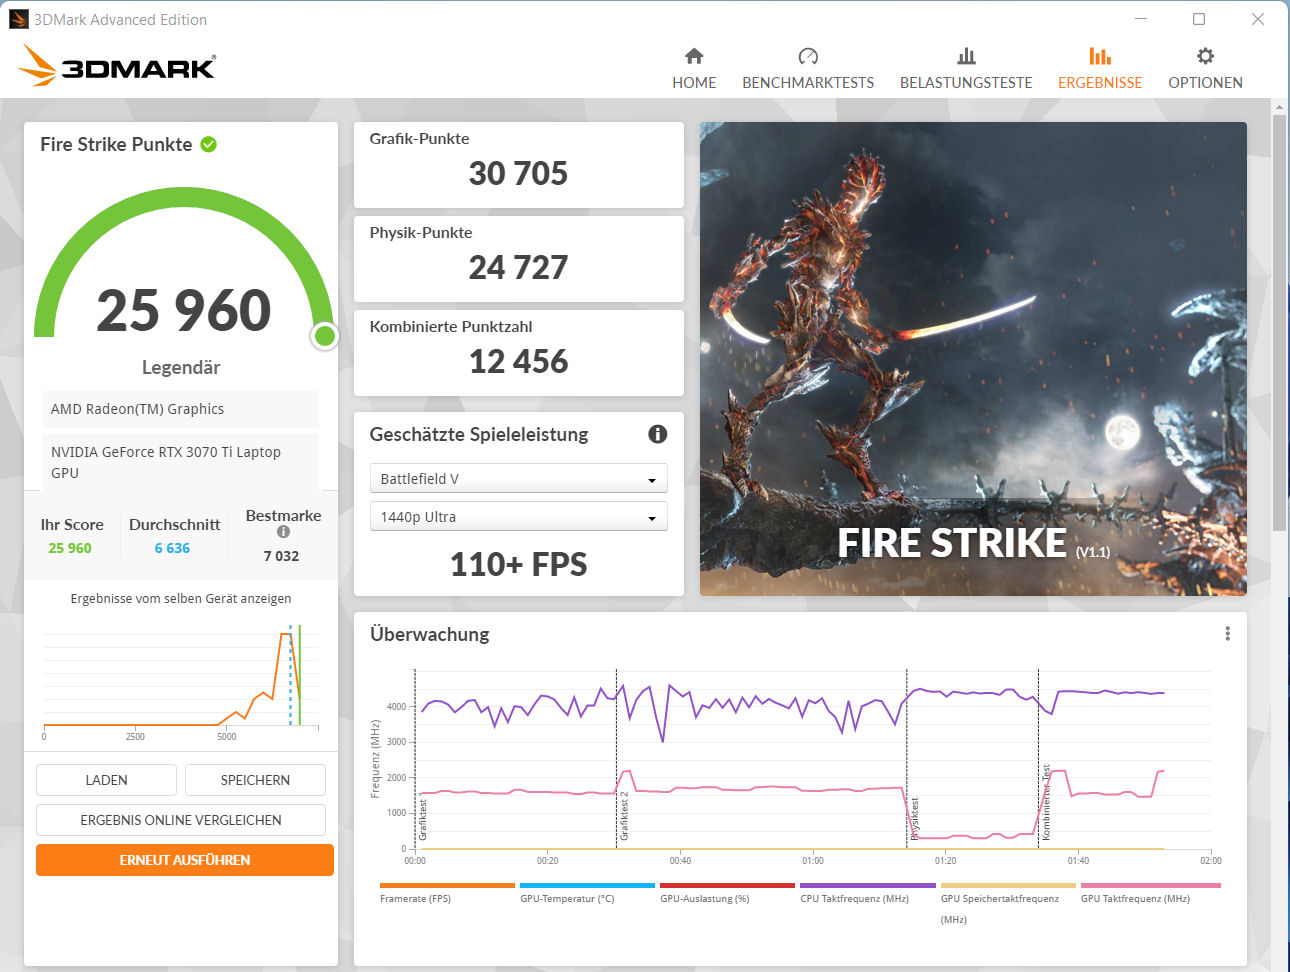
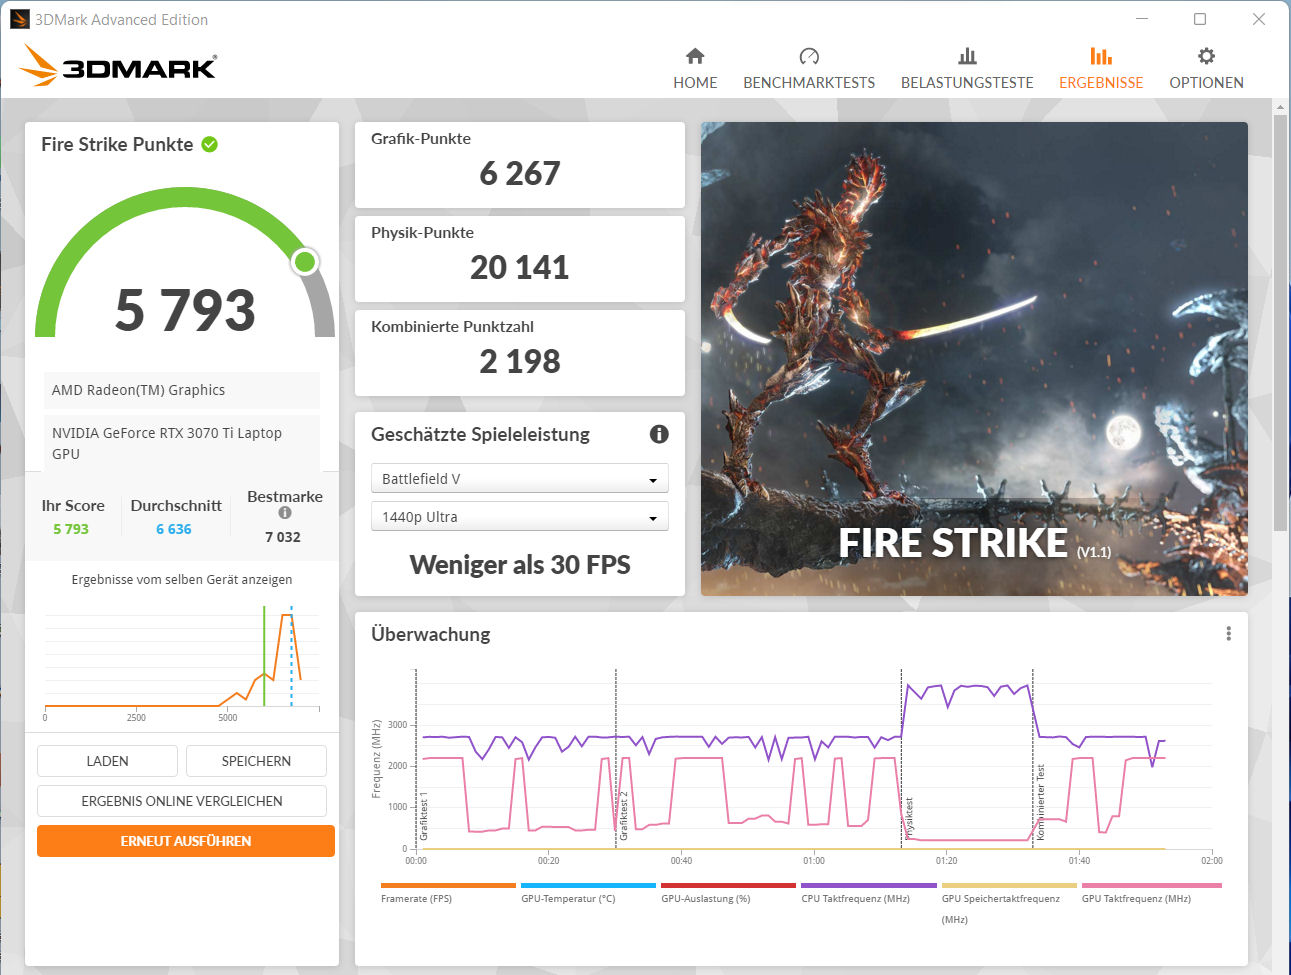
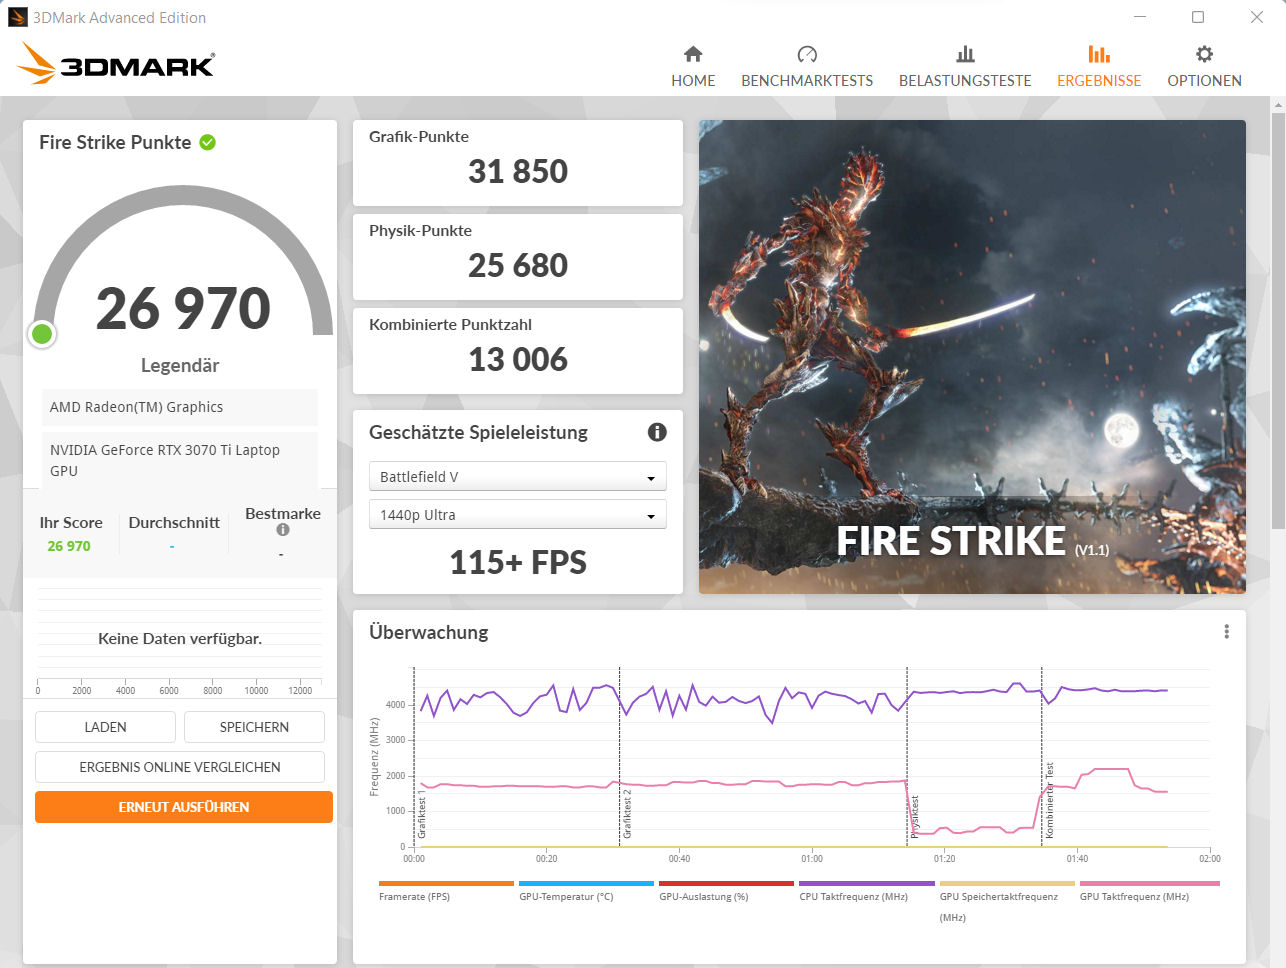
Acer ha dado a la GeForce RTX 3070 Ti (VRAM:8.192 MB GDDR6) un TGP máximo de 150 vatios (125 vatios + 25 vatios de Dynamic Boost). Los resultados de 3DMark están por encima de la media medida hasta ahora para las GPUs RTX 3070 Ti. Las diferencias entre los perfiles de rendimiento son mínimas (Ver Fire Strike capturas de pantalla). El dispositivo hace uso del Dynamic Boost, como puede verse en nuestra prueba Witcher 3
.
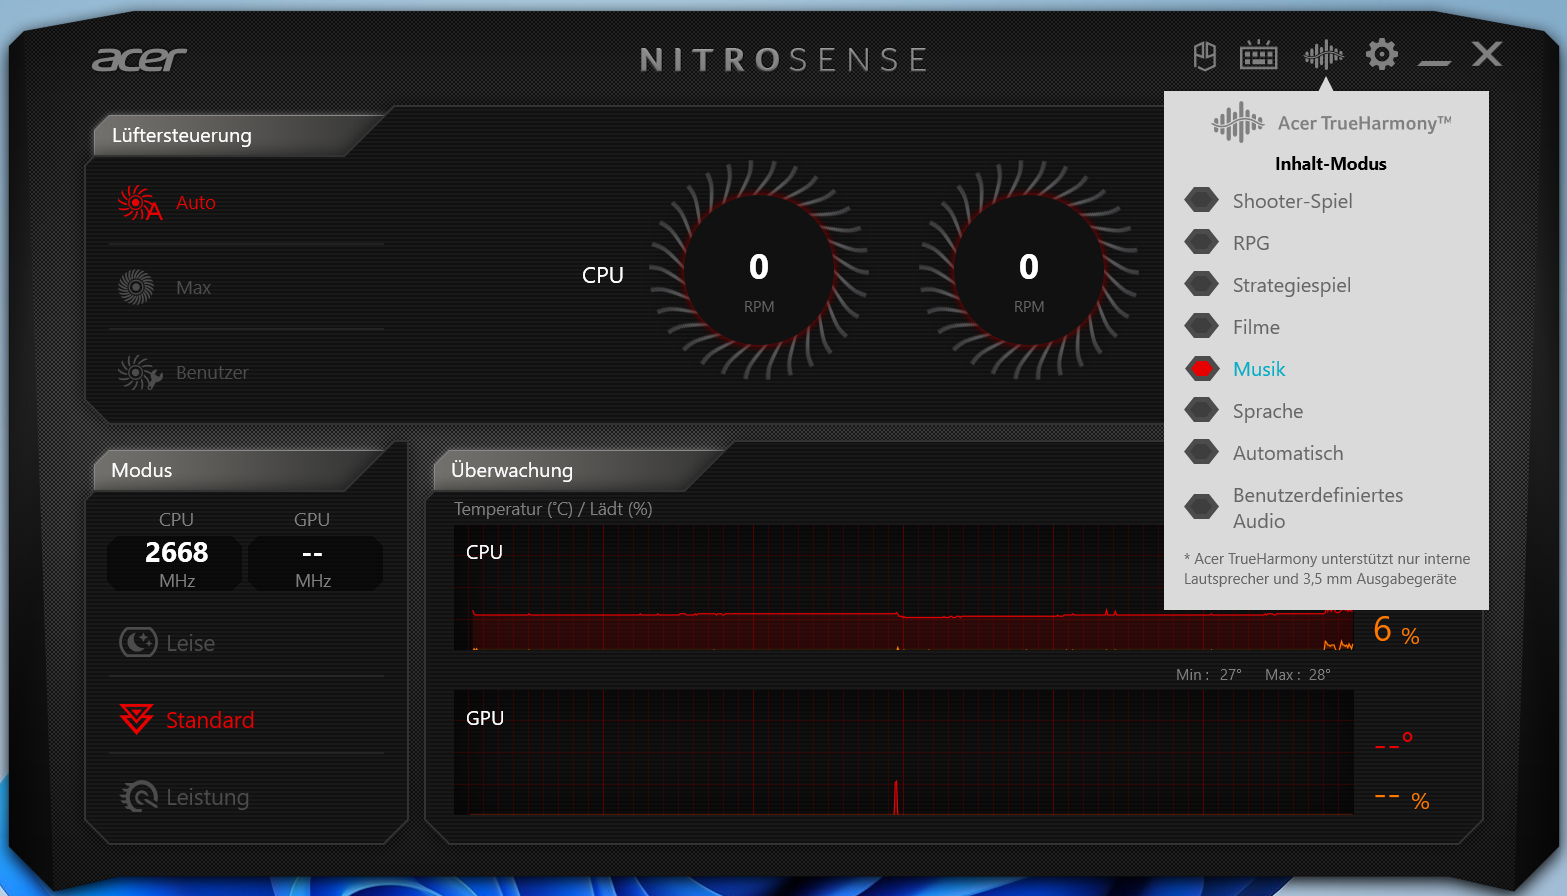
El rendimiento gráfico puede mejorarse ligeramente configurando la salida de imagen directa desde la GPU GeForce. Este cambio se puede hacer en la BIOS o a través del software NitroSense (haga clic en el símbolo de configuración). Acer utiliza MUX Switch y el dispositivo no soporta Advanced Optimus.

| 3DMark Performance rating - Percent | |
| Media de la clase Gaming | |
| Acer Nitro 5 AN515-46-R1A1 | |
| Acer Nitro 5 AN515-46-R1A1 | |
| Medio NVIDIA GeForce RTX 3070 Ti Laptop GPU | |
| Acer Nitro 5 AN515-58-72QR | |
| MSI Katana GF66 12UGS | |
| Schenker XMG Fusion 15 (Mid 22) | |
| Asus TUF Dash F15 FX517ZR | |
| 3DMark 11 - 1280x720 Performance GPU | |
| Media de la clase Gaming (21841 - 80022, n=104, últimos 2 años) | |
| Acer Nitro 5 AN515-46-R1A1 (dGPU) | |
| Acer Nitro 5 AN515-46-R1A1 | |
| Acer Nitro 5 AN515-58-72QR | |
| Medio NVIDIA GeForce RTX 3070 Ti Laptop GPU (13799 - 42569, n=36) | |
| MSI Katana GF66 12UGS | |
| Schenker XMG Fusion 15 (Mid 22) | |
| Asus TUF Dash F15 FX517ZR | |
| 3DMark | |
| 1920x1080 Fire Strike Graphics | |
| Media de la clase Gaming (12242 - 62849, n=115, últimos 2 años) | |
| Acer Nitro 5 AN515-46-R1A1 (dGPU) | |
| Acer Nitro 5 AN515-46-R1A1 | |
| Medio NVIDIA GeForce RTX 3070 Ti Laptop GPU (22612 - 32550, n=37) | |
| Acer Nitro 5 AN515-58-72QR | |
| MSI Katana GF66 12UGS | |
| Schenker XMG Fusion 15 (Mid 22) | |
| Asus TUF Dash F15 FX517ZR | |
| 2560x1440 Time Spy Graphics | |
| Media de la clase Gaming (5012 - 26212, n=115, últimos 2 años) | |
| Acer Nitro 5 AN515-46-R1A1 (dGPU) | |
| Acer Nitro 5 AN515-46-R1A1 | |
| Medio NVIDIA GeForce RTX 3070 Ti Laptop GPU (8142 - 12324, n=37) | |
| Acer Nitro 5 AN515-58-72QR | |
| MSI Katana GF66 12UGS | |
| Schenker XMG Fusion 15 (Mid 22) | |
| Asus TUF Dash F15 FX517ZR | |
| 2560x1440 Port Royal Graphics | |
| Media de la clase Gaming (4395 - 17286, n=71, últimos 2 años) | |
| Acer Nitro 5 AN515-46-R1A1 (dGPU) | |
| Acer Nitro 5 AN515-46-R1A1 | |
| Medio NVIDIA GeForce RTX 3070 Ti Laptop GPU (5091 - 7510, n=23) | |
| Acer Nitro 5 AN515-58-72QR | |
| MSI Katana GF66 12UGS | |
| Schenker XMG Fusion 15 (Mid 22) | |
| Asus TUF Dash F15 FX517ZR | |
| 3DMark 06 Standard Score | 43453 puntos | |
| 3DMark 11 Performance | 28137 puntos | |
| 3DMark Cloud Gate Standard Score | 56030 puntos | |
| 3DMark Fire Strike Score | 25960 puntos | |
| 3DMark Time Spy Score | 11042 puntos | |
ayuda | ||
| Blender | |
| v3.3 Classroom OPTIX/RTX | |
| Asus TUF Dash F15 FX517ZR | |
| Acer Nitro 5 AN515-46-R1A1 (3.3.0) | |
| Acer Nitro 5 AN515-46-R1A1 (3.3.0, dGPU) | |
| Media de la clase Gaming (9 - 32, n=106, últimos 2 años) | |
| v3.3 Classroom CUDA | |
| Asus TUF Dash F15 FX517ZR | |
| Acer Nitro 5 AN515-46-R1A1 (3.3.0) | |
| Acer Nitro 5 AN515-46-R1A1 (3.3.0, dGPU) | |
| Media de la clase Gaming (15 - 228, n=106, últimos 2 años) | |
| v3.3 Classroom CPU | |
| Schenker XMG Fusion 15 (Mid 22) | |
| Asus TUF Dash F15 FX517ZR | |
| Acer Nitro 5 AN515-46-R1A1 (3.3.0) | |
| Acer Nitro 5 AN515-46-R1A1 (3.3.0, dGPU) | |
| Media de la clase Gaming (122 - 565, n=102, últimos 2 años) | |
* ... más pequeño es mejor
Rendimiento de los juegos
El hardware soporta juegos en FHD con la configuración máxima. Las tasas de refresco de los títulos probados suelen estar por encima de la media de la RTX 3070 Ti. La salida de imagen a través de la GPU GeForce aumenta las tasas de frames. La prueba Witcher 3 confirma que las tasas de refresco se mantienen estables durante mucho tiempo.
| The Witcher 3 - 1920x1080 Ultra Graphics & Postprocessing (HBAO+) | |
| Media de la clase Gaming (104.7 - 240, n=7, últimos 2 años) | |
| Acer Nitro 5 AN515-46-R1A1 (dGPU) | |
| Acer Nitro 5 AN515-46-R1A1 | |
| Medio NVIDIA GeForce RTX 3070 Ti Laptop GPU (76.8 - 124.1, n=39) | |
| Acer Nitro 5 AN515-58-72QR | |
| MSI Katana GF66 12UGS | |
| Schenker XMG Fusion 15 (Mid 22) | |
| Asus TUF Dash F15 FX517ZR | |
| Dota 2 Reborn - 1920x1080 ultra (3/3) best looking | |
| Media de la clase Gaming (84.8 - 248, n=107, últimos 2 años) | |
| MSI Katana GF66 12UGS | |
| Medio NVIDIA GeForce RTX 3070 Ti Laptop GPU (68.7 - 160.5, n=38) | |
| Acer Nitro 5 AN515-58-72QR | |
| Schenker XMG Fusion 15 (Mid 22) | |
| Acer Nitro 5 AN515-46-R1A1 (dGPU) | |
| Asus TUF Dash F15 FX517ZR | |
| Acer Nitro 5 AN515-46-R1A1 | |
| X-Plane 11.11 - 1920x1080 high (fps_test=3) | |
| MSI Katana GF66 12UGS | |
| Asus TUF Dash F15 FX517ZR | |
| Media de la clase Gaming (55.5 - 143.5, n=109, últimos 2 años) | |
| Medio NVIDIA GeForce RTX 3070 Ti Laptop GPU (51.6 - 116.9, n=37) | |
| Acer Nitro 5 AN515-58-72QR | |
| Schenker XMG Fusion 15 (Mid 22) | |
| Acer Nitro 5 AN515-46-R1A1 (dGPU) | |
| Acer Nitro 5 AN515-46-R1A1 | |
| Final Fantasy XV Benchmark - 1920x1080 High Quality | |
| Media de la clase Gaming (41 - 215, n=95, últimos 2 años) | |
| Acer Nitro 5 AN515-46-R1A1 (1.3, dGPU) | |
| Acer Nitro 5 AN515-46-R1A1 (1.3) | |
| Medio NVIDIA GeForce RTX 3070 Ti Laptop GPU (49.5 - 122.4, n=35) | |
| Schenker XMG Fusion 15 (Mid 22) (1.3) | |
| MSI Katana GF66 12UGS (1.3) | |
| Acer Nitro 5 AN515-58-72QR (1.3) | |
| Asus TUF Dash F15 FX517ZR (1.3) | |
| GTA V - 1920x1080 Highest AA:4xMSAA + FX AF:16x | |
| Media de la clase Gaming (48.3 - 186.9, n=94, últimos 2 años) | |
| Medio NVIDIA GeForce RTX 3070 Ti Laptop GPU (44 - 123.9, n=36) | |
| Asus TUF Dash F15 FX517ZR | |
| MSI Katana GF66 12UGS | |
| Schenker XMG Fusion 15 (Mid 22) | |
| Acer Nitro 5 AN515-58-72QR | |
| Acer Nitro 5 AN515-46-R1A1 | |
| Acer Nitro 5 AN515-46-R1A1 (dGPU) | |
| Strange Brigade - 1920x1080 ultra AA:ultra AF:16 | |
| Media de la clase Gaming (76.3 - 458, n=87, últimos 2 años) | |
| Acer Nitro 5 AN515-46-R1A1 (1.47.22.14 D3D12, dGPU) | |
| Medio NVIDIA GeForce RTX 3070 Ti Laptop GPU (109 - 221, n=37) | |
| Acer Nitro 5 AN515-58-72QR (1.47.22.14 D3D12) | |
| Acer Nitro 5 AN515-46-R1A1 (1.47.22.14 D3D12) | |
| MSI Katana GF66 12UGS (1.47.22.14 D3D12) | |
| Schenker XMG Fusion 15 (Mid 22) (1.47.22.14 D3D12) | |
| Asus TUF Dash F15 FX517ZR (1.47.22.14 D3D12) | |
| F1 22 - 1920x1080 Ultra High Preset AA:T AF:16x | |
| Acer Nitro 5 AN515-46-R1A1 (923650, dGPU) | |
| Media de la clase Gaming (40.1 - 121.2, n=4, últimos 2 años) | |
| Acer Nitro 5 AN515-46-R1A1 (923662) | |
| Medio NVIDIA GeForce RTX 3070 Ti Laptop GPU (58.1 - 80, n=8) | |
| Far Cry 5 - 1920x1080 Ultra Preset AA:T | |
| Medio NVIDIA GeForce RTX 3070 Ti Laptop GPU (91 - 138, n=25) | |
| MSI Katana GF66 12UGS | |
| Media de la clase Gaming (70 - 151, n=6, últimos 2 años) | |
| Acer Nitro 5 AN515-46-R1A1 (dGPU) | |
| Schenker XMG Fusion 15 (Mid 22) | |
| Acer Nitro 5 AN515-46-R1A1 | |
| Asus TUF Dash F15 FX517ZR | |
| Acer Nitro 5 AN515-58-72QR | |
| Hitman 3 - 1920x1080 Maximum Settings AF:16x | |
| Acer Nitro 5 AN515-46-R1A1 | |
| Medio NVIDIA GeForce RTX 3070 Ti Laptop GPU (138 - 157.7, n=3) | |
| God of War - 1920x1080 Ultra Preset | |
| Acer Nitro 5 AN515-46-R1A1 | |
| Medio NVIDIA GeForce RTX 3070 Ti Laptop GPU (55.1 - 64.3, n=5) | |
| Tiny Tina's Wonderlands - 1920x1080 Badass Preset (DX12) | |
| Media de la clase Gaming (55 - 159.4, n=4, últimos 2 años) | |
| Acer Nitro 5 AN515-46-R1A1 | |
| Medio NVIDIA GeForce RTX 3070 Ti Laptop GPU (89.8 - 93.7, n=4) | |
| Asus TUF Dash F15 FX517ZR | |
| Vampire Bloodhunt - 1920x1080 Ultra Preset | |
| Medio NVIDIA GeForce RTX 3070 Ti Laptop GPU (168.6 - 189.9, n=2) | |
| Acer Nitro 5 AN515-46-R1A1 | |
| The Quarry - 1920x1080 Ultra Preset | |
| Acer Nitro 5 AN515-46-R1A1 | |
| Medio NVIDIA GeForce RTX 3070 Ti Laptop GPU (80 - 81.5, n=2) | |
Witcher 3 FPS diagram
| bajo | medio | alto | ultra | |
|---|---|---|---|---|
| GTA V (2015) | 174.2 | 167.3 | 149.5 | 92.5 |
| The Witcher 3 (2015) | 284 | 237 | 179.4 | 108.5 |
| Dota 2 Reborn (2015) | 130.9 | 120 | 112.1 | 108.5 |
| Final Fantasy XV Benchmark (2018) | 171.8 | 139.9 | 108.6 | |
| X-Plane 11.11 (2018) | 100.3 | 89.3 | 72.3 | |
| Far Cry 5 (2018) | 134 | 116 | 112 | 106 |
| Strange Brigade (2018) | 289 | 212 | 190.3 | 177 |
| Hitman 3 (2021) | 207.9 | 169.1 | 162.1 | 157.7 |
| God of War (2022) | 117.3 | 104.8 | 88.7 | 64.3 |
| Tiny Tina's Wonderlands (2022) | 183.3 | 159.8 | 118.3 | 93.7 |
| Vampire Bloodhunt (2022) | 197.6 | 185.1 | 172.7 | 168.6 |
| F1 22 (2022) | 207 | 205 | 192.3 | 73.2 |
| The Quarry (2022) | 149.6 | 120.7 | 101.5 | 81.5 |
Emisiones: la AN515 sólo se calienta moderadamente
Emisiones acústicas
Durante el uso cotidiano (oficina, internet) y al ralentí, los dos ventiladores permanecen bastante silenciosos e incluso pueden dejar de funcionar ocasionalmente. Aún así, son algo impredecibles y el nivel de ruido puede aumentar hasta 44.3 dB(A). Bajo carga, medimos un máximo de 53,6 dB(A), que es bastante fuerte.
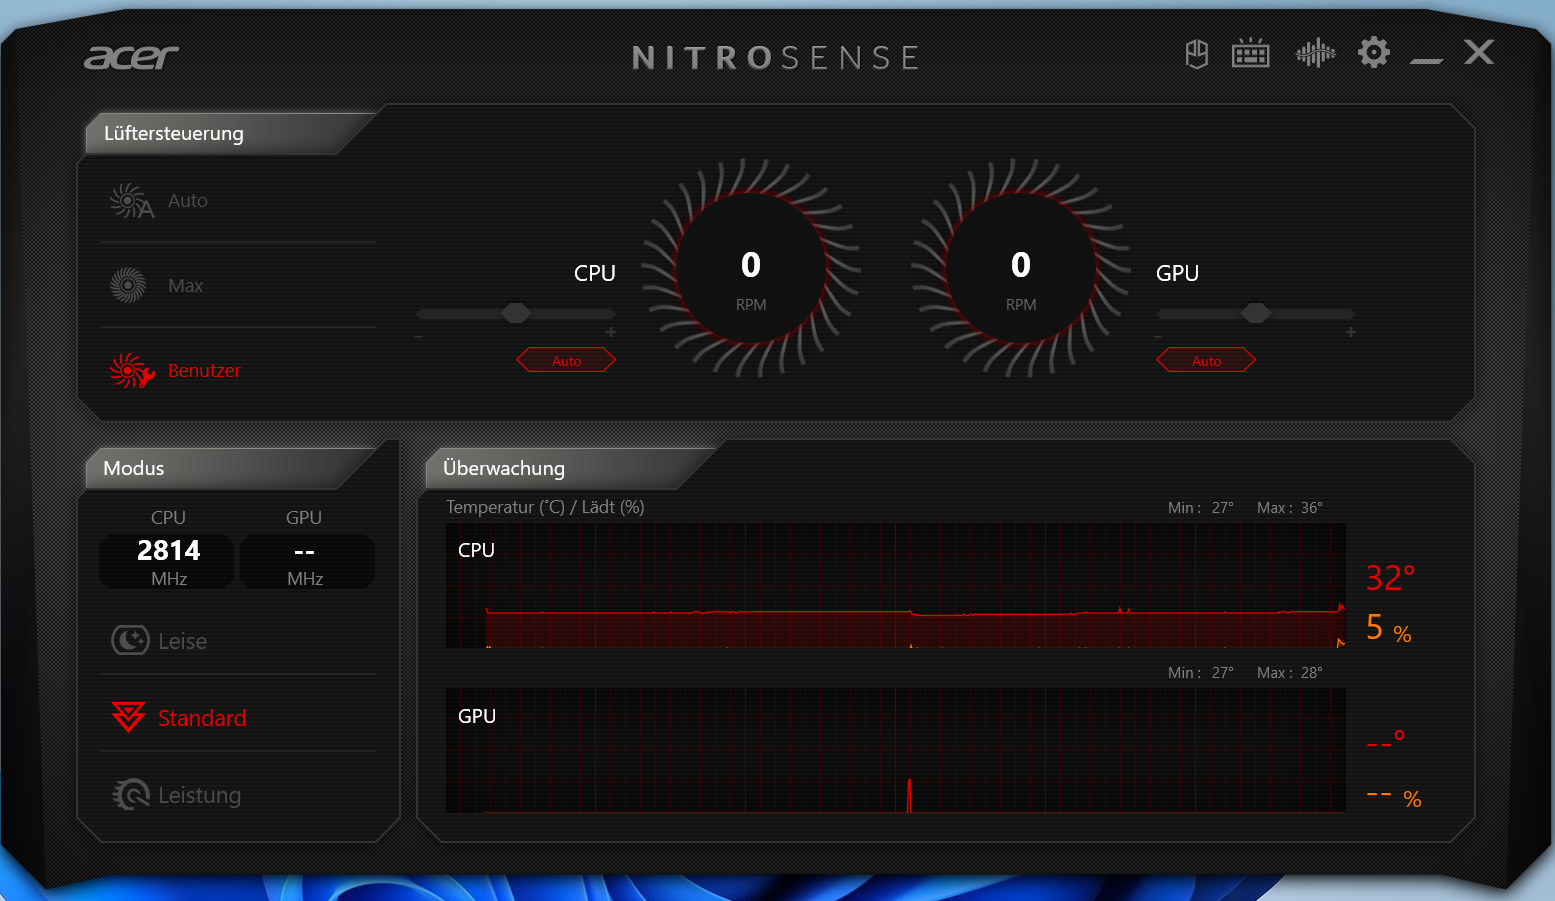
La velocidad del ventilador puede reducirse con la ayuda del software NitroSense del dispositivo, pero la curva del ventilador no puede ajustarse. El desarrollo del ruido es muy similar en los perfiles "silencioso" y "estándar".
Ruido
| Ocioso |
| 25 / 28.6 / 44.3 dB(A) |
| Carga |
| 47.6 / 53.6 dB(A) |
 | ||
30 dB silencioso 40 dB(A) audible 50 dB(A) ruidosamente alto |
||
min: | ||
| Acer Nitro 5 AN515-46-R1A1 GeForce RTX 3070 Ti Laptop GPU, R7 6800H, Micron 3400 1TB MTFDKBA1T0TFH | MSI Katana GF66 12UGS GeForce RTX 3070 Ti Laptop GPU, i7-12700H, Micron 2450 1TB MTFDKBA1T0TFK | Schenker XMG Fusion 15 (Mid 22) GeForce RTX 3070 Laptop GPU, i7-11800H, Samsung SSD 980 Pro 1TB MZ-V8P1T0BW | Asus TUF Dash F15 FX517ZR GeForce RTX 3070 Laptop GPU, i7-12650H, Samsung PM991a MZVLQ1T0HBLB | Acer Nitro 5 AN515-58-72QR GeForce RTX 3070 Ti Laptop GPU, i7-12700H, Samsung PM9A1 MZVL21T0HCLR | |
|---|---|---|---|---|---|
| Noise | 7% | 7% | 2% | 3% | |
| apagado / medio ambiente * (dB) | 25 | 26 -4% | 26 -4% | 26 -4% | 26 -4% |
| Idle Minimum * (dB) | 25 | 27 -8% | 26 -4% | 26 -4% | 26 -4% |
| Idle Average * (dB) | 28.6 | 28 2% | 28 2% | 32 -12% | 29 -1% |
| Idle Maximum * (dB) | 44.3 | 31 30% | 31 30% | 33 26% | 33 26% |
| Load Average * (dB) | 47.6 | 44 8% | 45 5% | 48 -1% | 47 1% |
| Load Maximum * (dB) | 53.6 | 45 16% | 48 10% | 49 9% | 53 1% |
| Witcher 3 ultra * (dB) | 44 | 46 | 47 | 53 |
* ... más pequeño es mejor
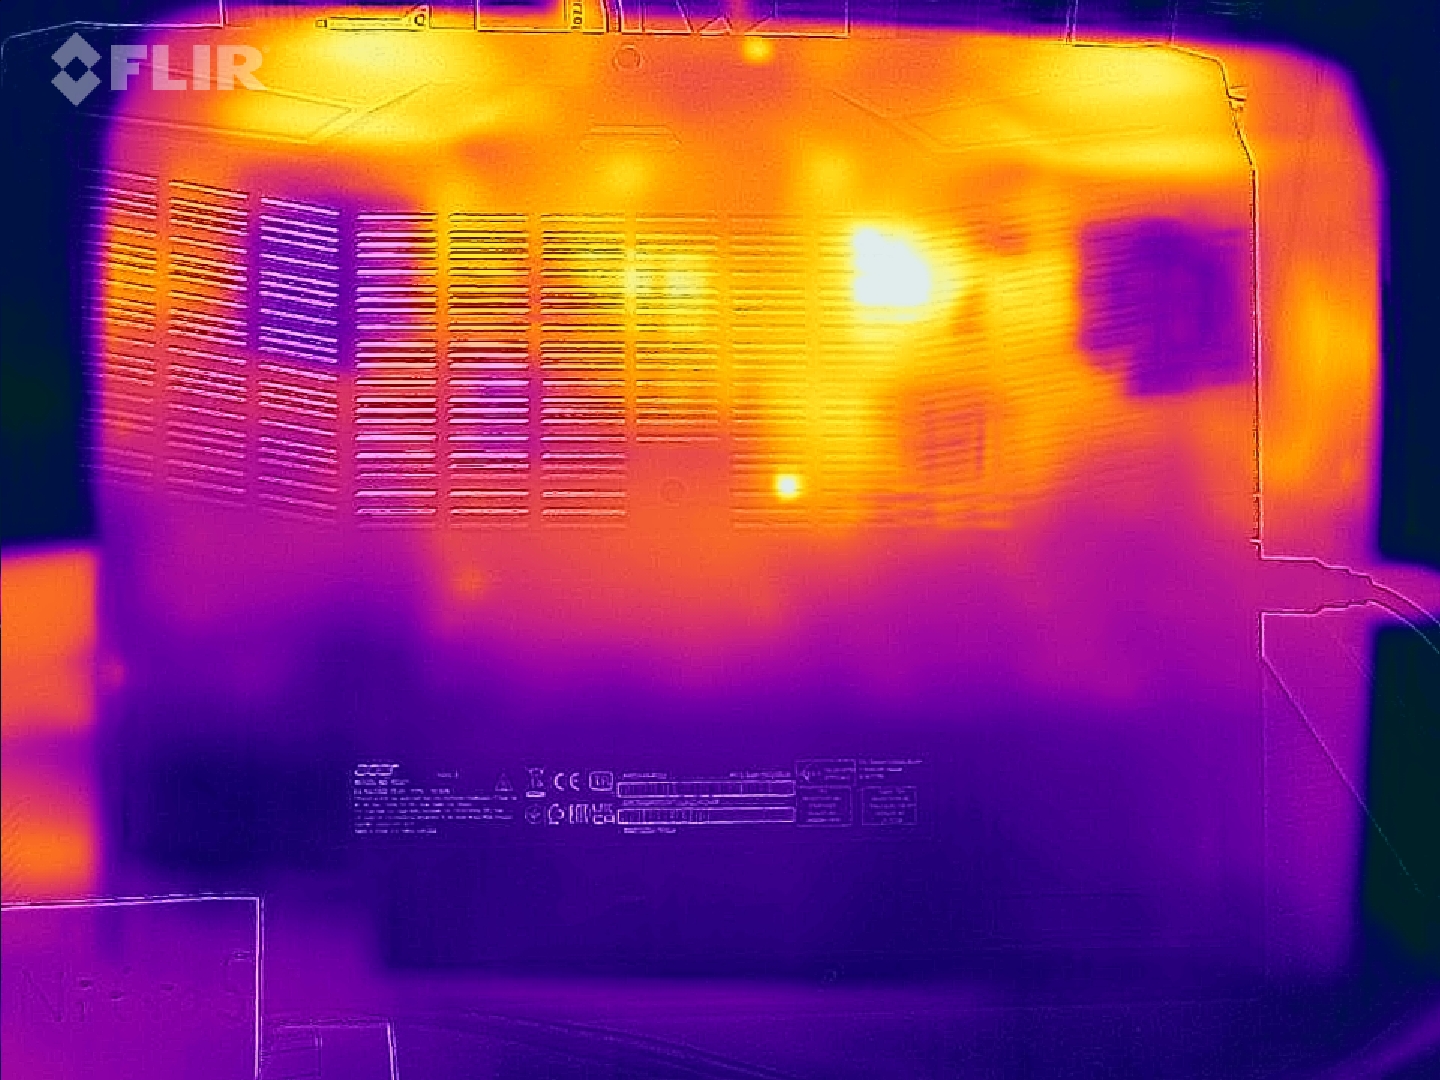
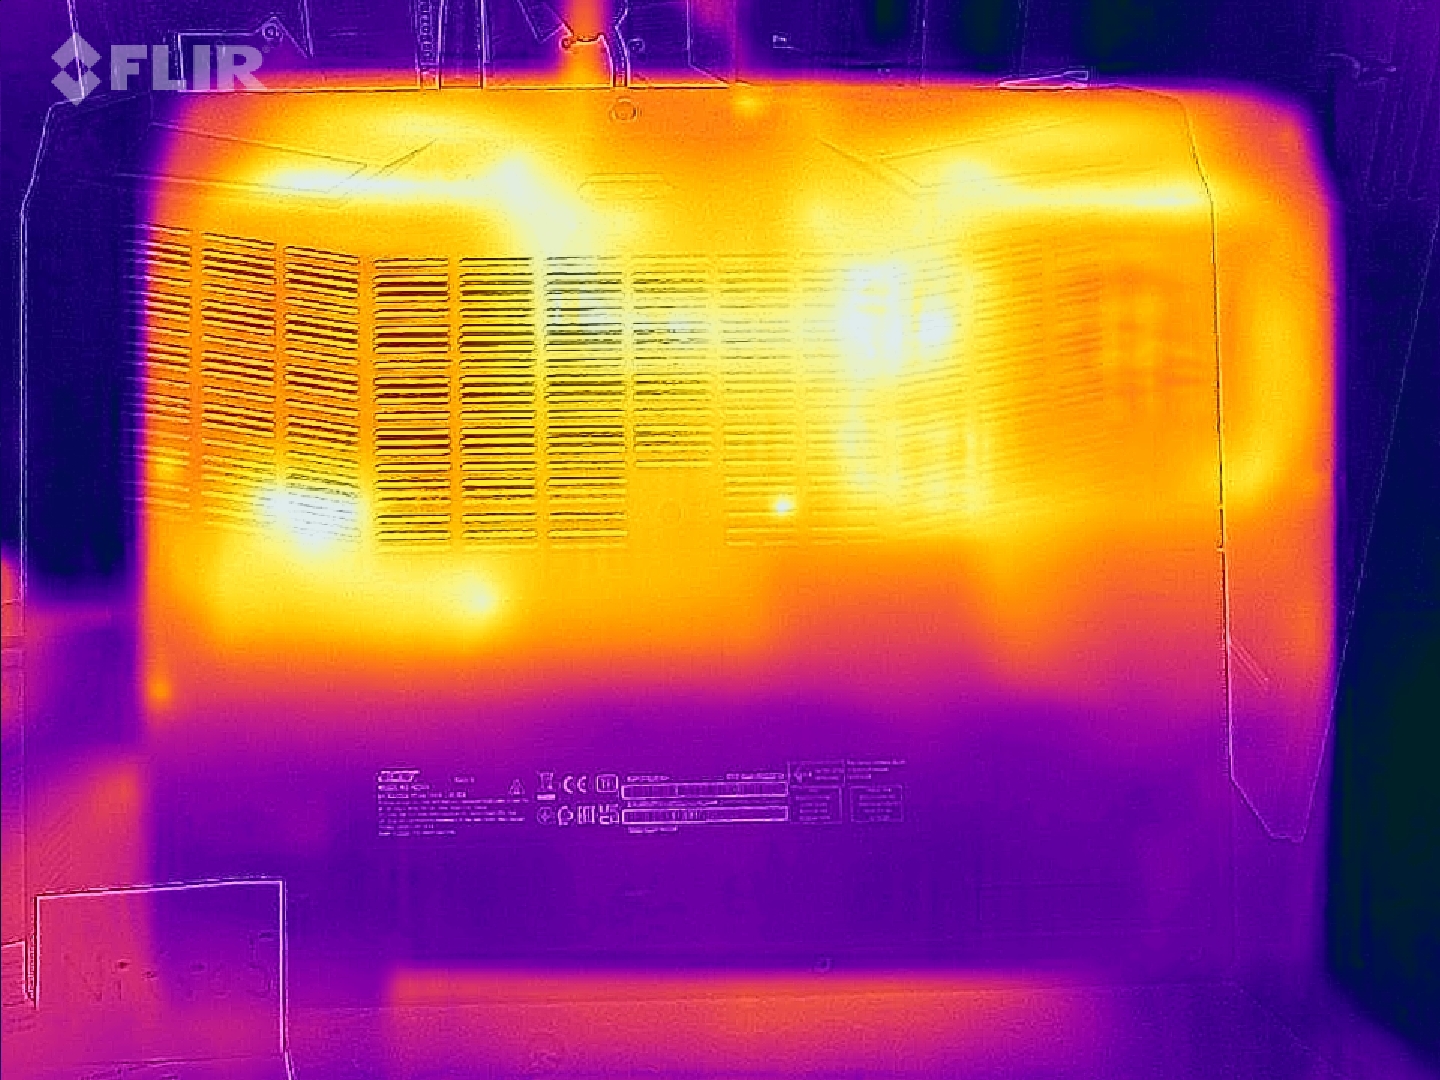
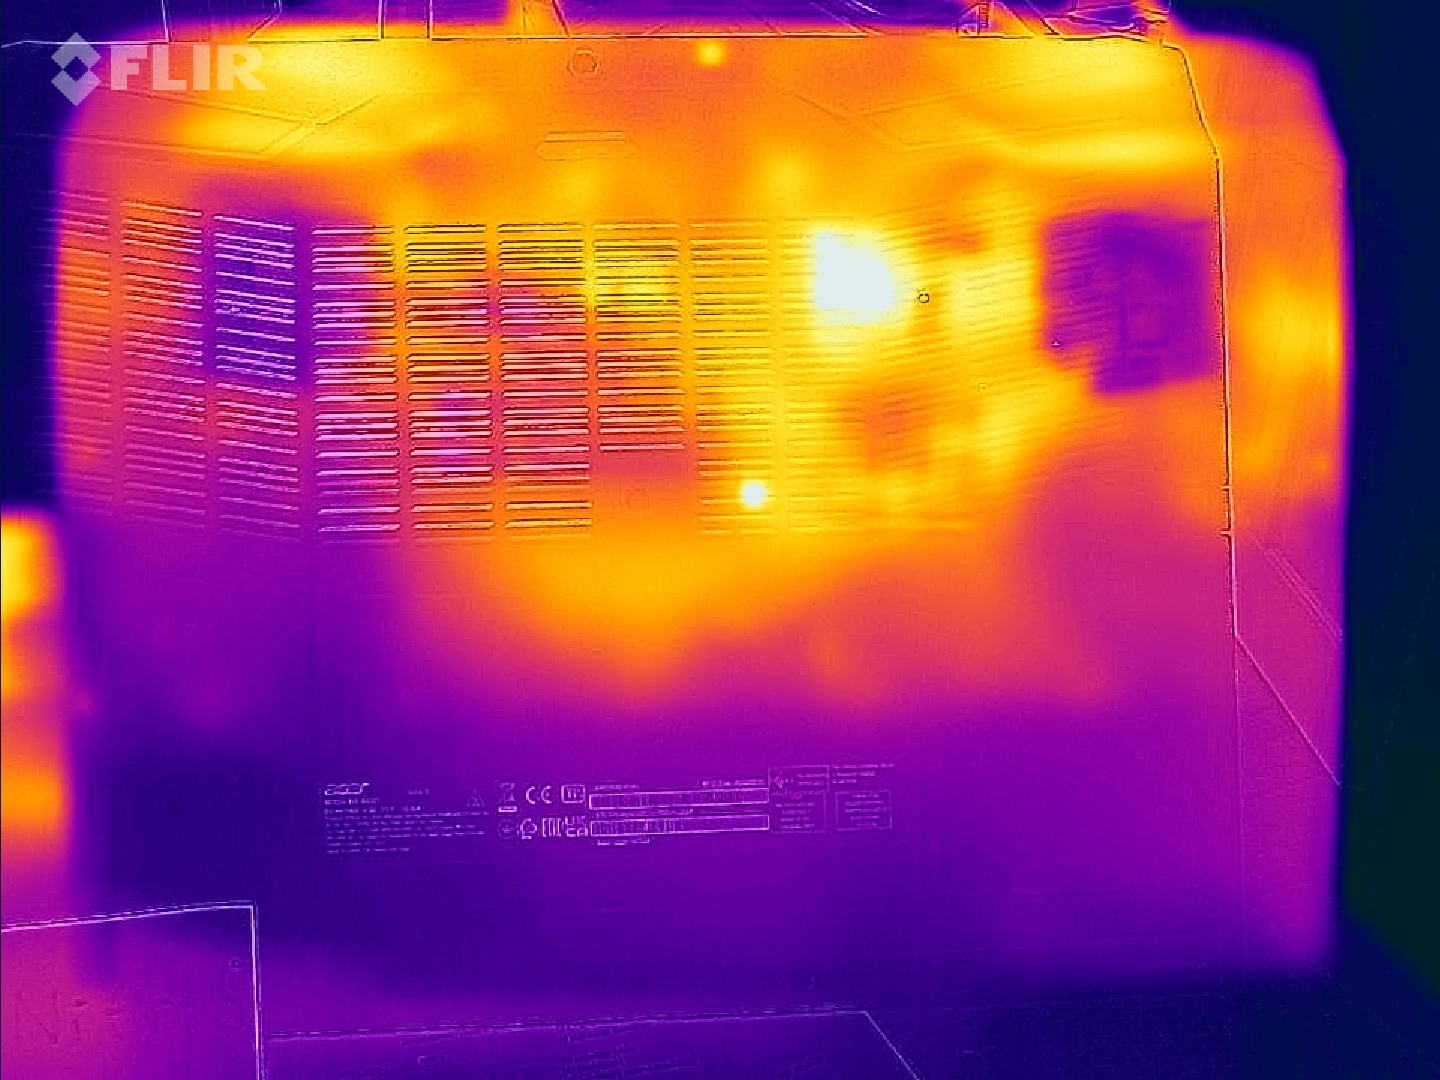
Temperatura
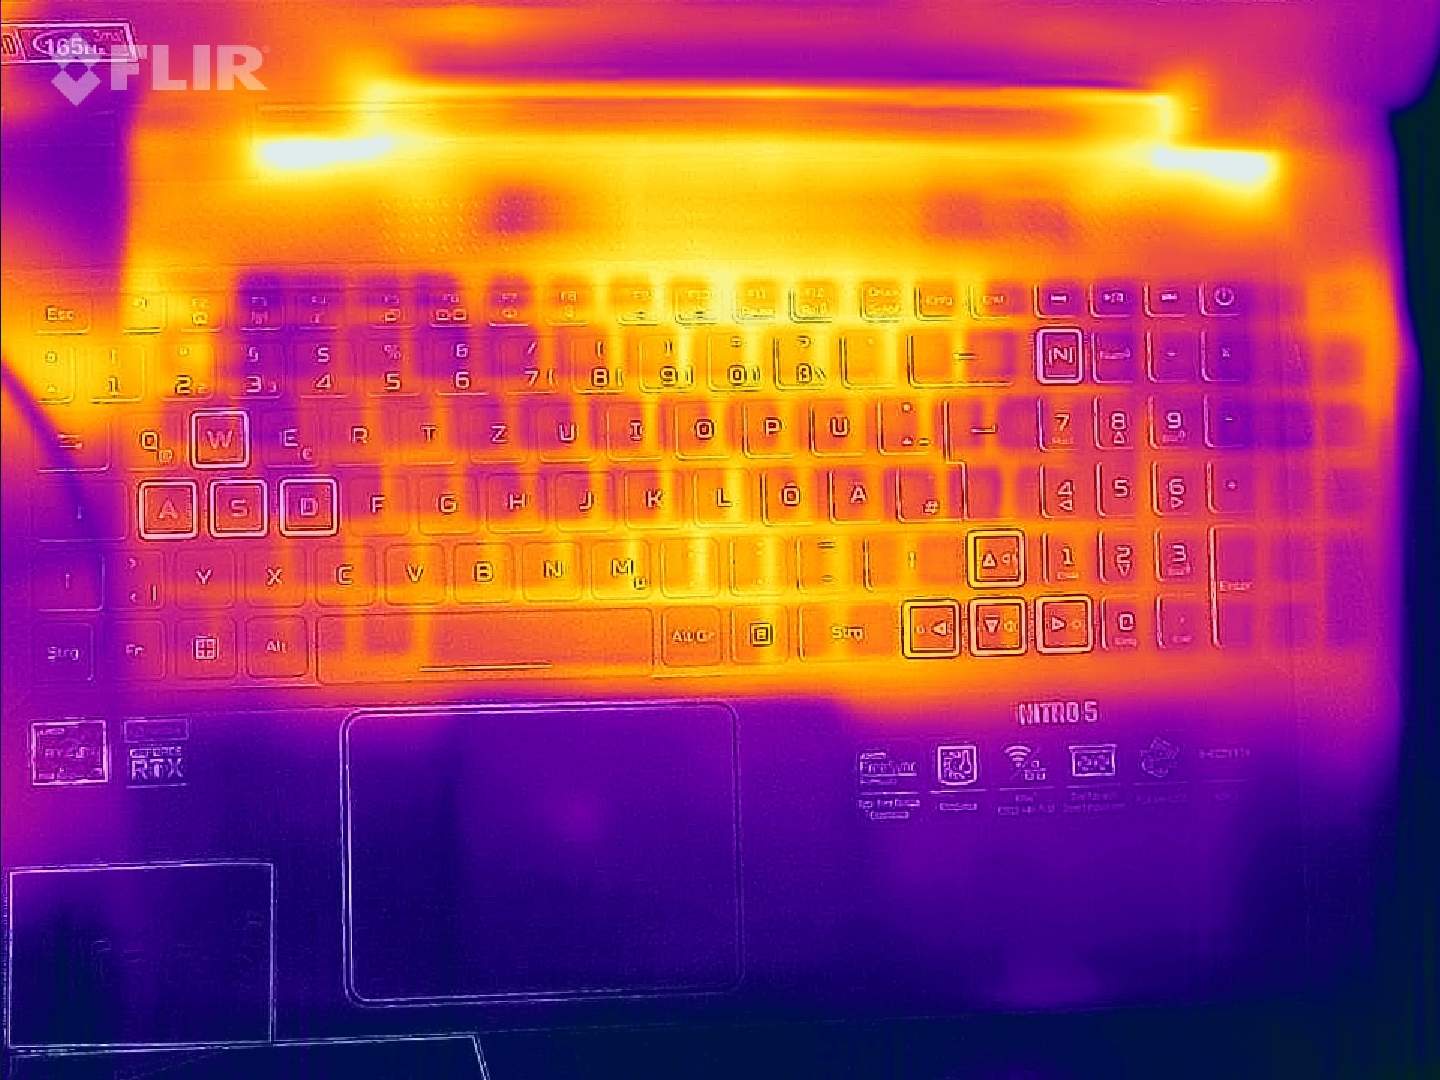
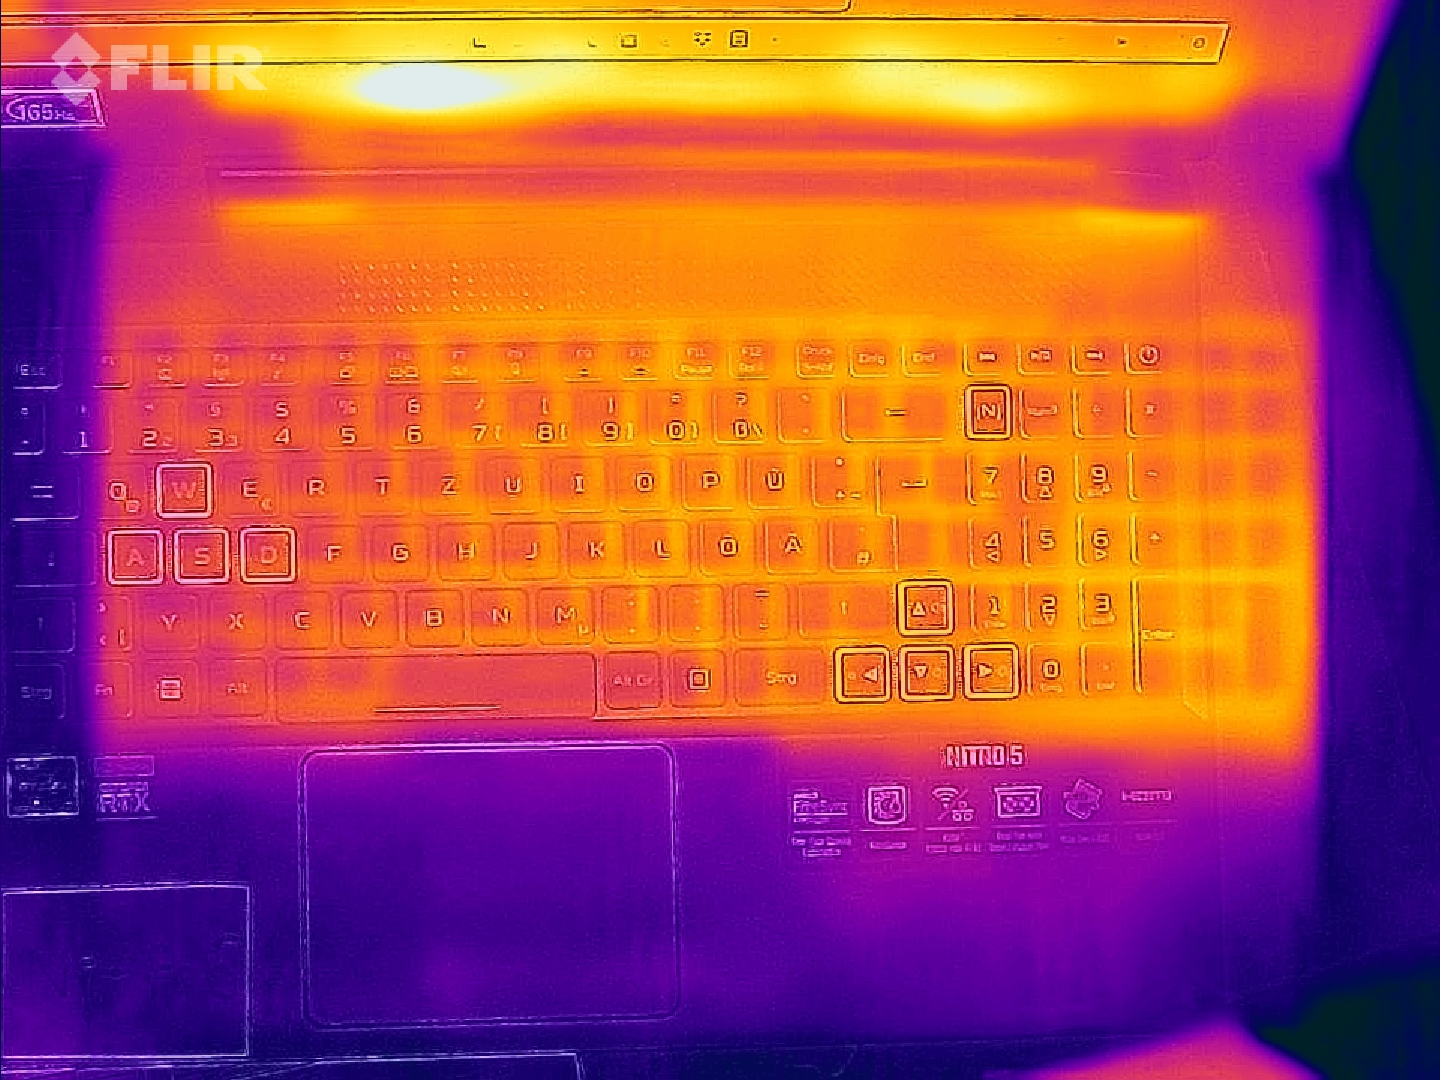
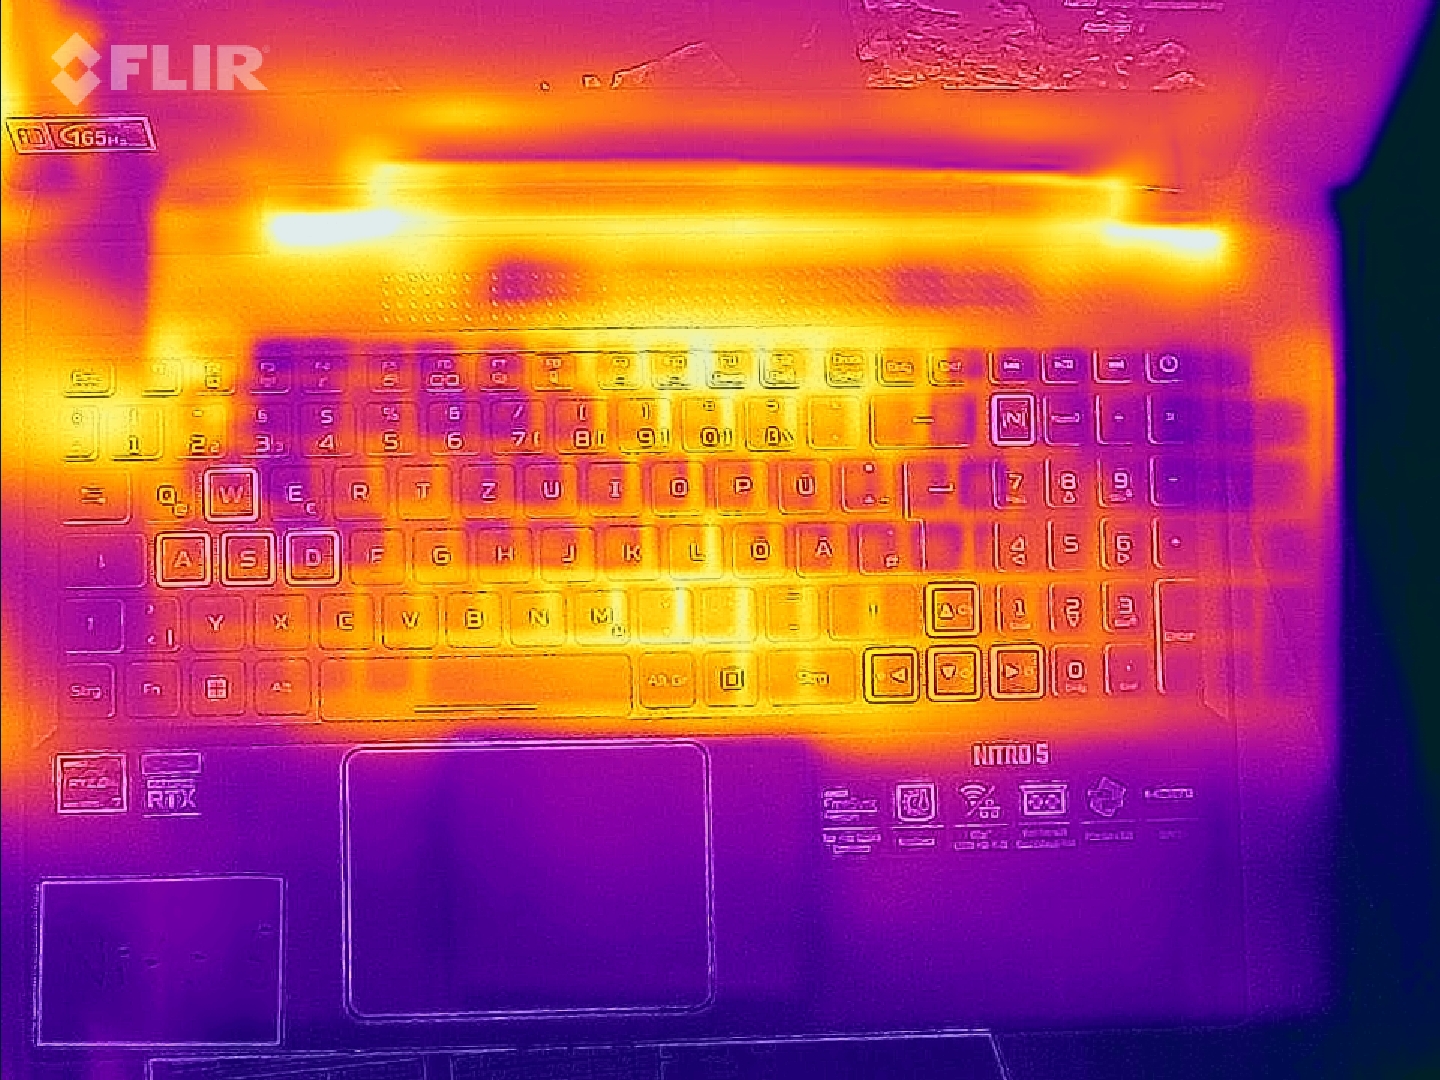
Las temperaturas de la superficie se mantienen aceptables durante el uso diario (oficina, Internet) y sólo aumentan moderadamente bajo carga (prueba de esfuerzo, Witcher 3). Esto es muy diferente del modelo hermano.
(-) La temperatura máxima en la parte superior es de 48.1 °C / 119 F, frente a la media de 40.4 °C / 105 F, que oscila entre 21.2 y 68.8 °C para la clase Gaming.
(-) El fondo se calienta hasta un máximo de 49.7 °C / 121 F, frente a la media de 43.2 °C / 110 F
(+) En reposo, la temperatura media de la parte superior es de 26.4 °C / 80# F, frente a la media del dispositivo de 33.9 °C / 93 F.
(+) Jugando a The Witcher 3, la temperatura media de la parte superior es de 31.8 °C / 89 F, frente a la media del dispositivo de 33.9 °C / 93 F.
(+) El reposamanos y el panel táctil están a una temperatura inferior a la de la piel, con un máximo de 25.2 °C / 77.4 F y, por tanto, son fríos al tacto.
(+) La temperatura media de la zona del reposamanos de dispositivos similares fue de 28.8 °C / 83.8 F (+3.6 °C / 6.4 F).
| Acer Nitro 5 AN515-46-R1A1 AMD Ryzen 7 6800H, NVIDIA GeForce RTX 3070 Ti Laptop GPU | MSI Katana GF66 12UGS Intel Core i7-12700H, NVIDIA GeForce RTX 3070 Ti Laptop GPU | Schenker XMG Fusion 15 (Mid 22) Intel Core i7-11800H, NVIDIA GeForce RTX 3070 Laptop GPU | Asus TUF Dash F15 FX517ZR Intel Core i7-12650H, NVIDIA GeForce RTX 3070 Laptop GPU | Acer Nitro 5 AN515-58-72QR Intel Core i7-12700H, NVIDIA GeForce RTX 3070 Ti Laptop GPU | |
|---|---|---|---|---|---|
| Heat | -25% | -20% | -9% | -5% | |
| Maximum Upper Side * (°C) | 48.1 | 61 -27% | 52 -8% | 52 -8% | 48 -0% |
| Maximum Bottom * (°C) | 49.7 | 55 -11% | 63 -27% | 52 -5% | 51 -3% |
| Idle Upper Side * (°C) | 30 | 43 -43% | 37 -23% | 33 -10% | 34 -13% |
| Idle Bottom * (°C) | 31.7 | 38 -20% | 38 -20% | 36 -14% | 33 -4% |
* ... más pequeño es mejor
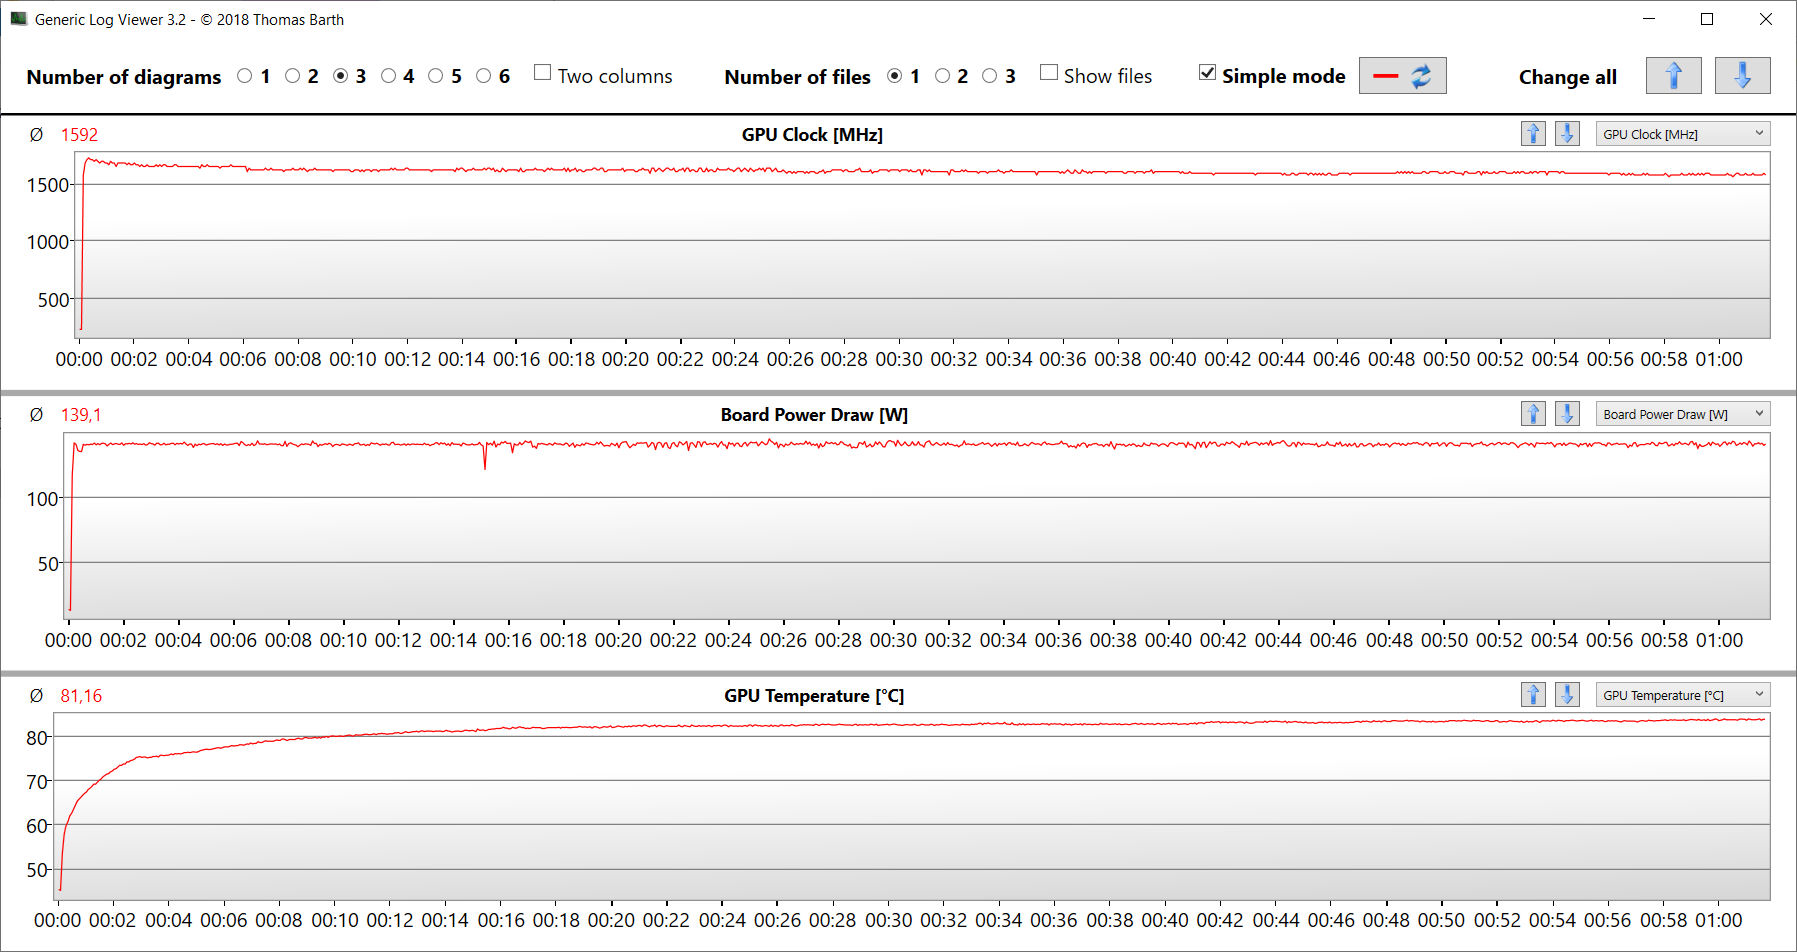
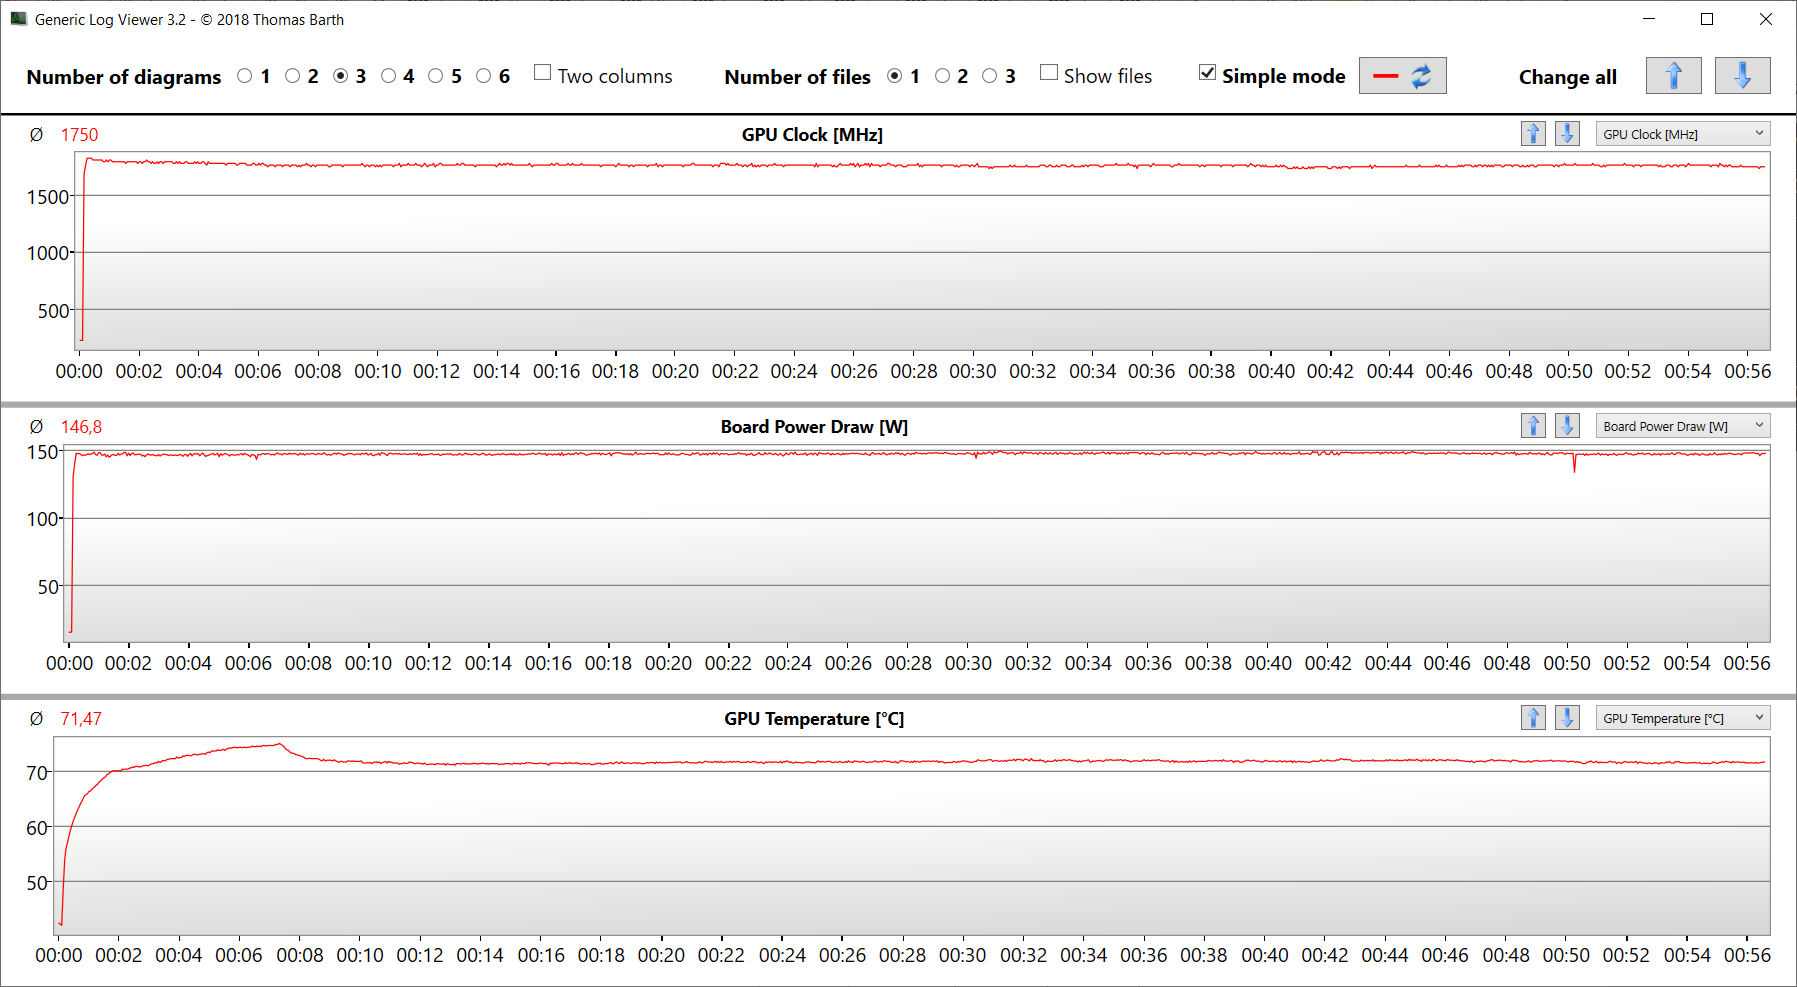
Prueba de esfuerzo
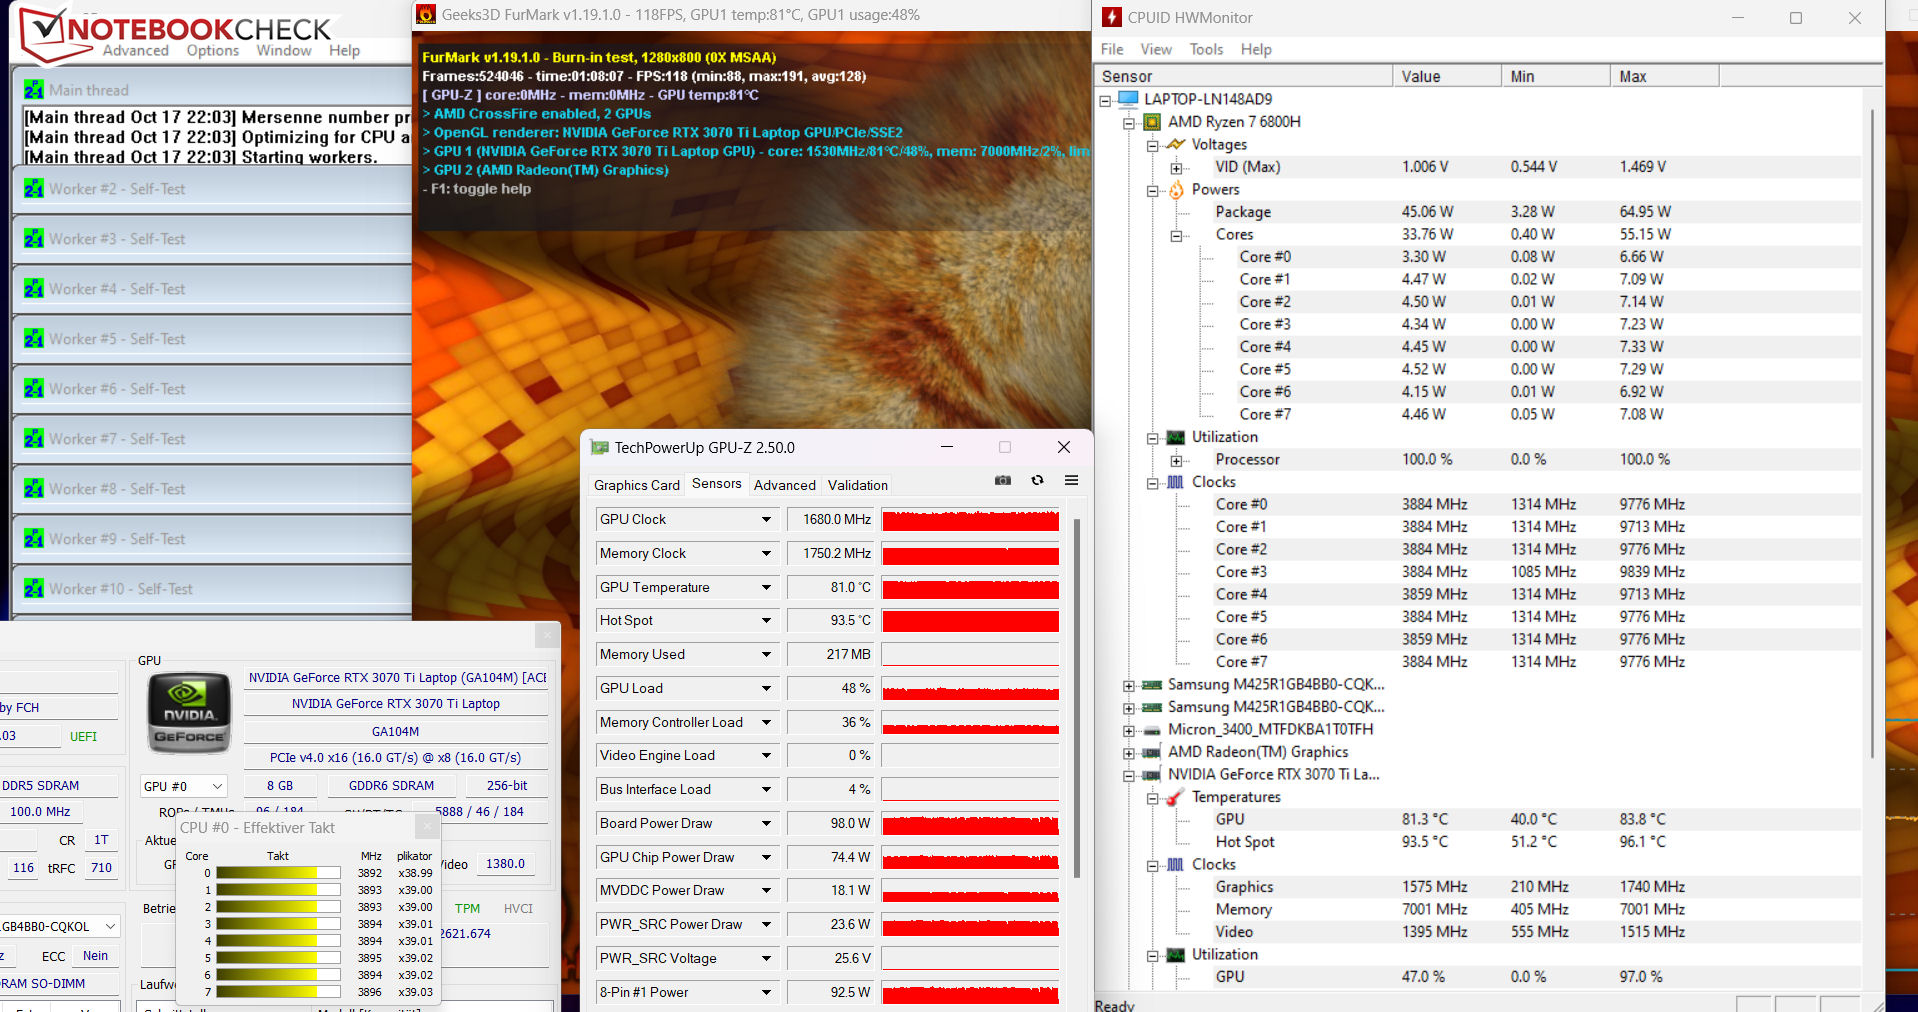
La prueba de estrés (Prime95 y FurMark se activan continuamente) es un escenario extremo que nos permite examinar la estabilidad del sistema bajo carga máxima. La CPU (4,2 a 4,3 GHz) y la GPU (1.000 a 1.600 MHz) comienzan la prueba con velocidades de reloj altas. Mientras que la velocidad de reloj de la CPU desciende ligeramente en el transcurso de la prueba, la velocidad de reloj de la GPU se estabiliza en un nivel alto.
Altavoces
El sonido producido por los altavoces estéreo es adecuado, pero podría beneficiarse de más graves.
Acer Nitro 5 AN515-46-R1A1 análisis de audio
(±) | la sonoridad del altavoz es media pero buena (76.3 dB)
Graves 100 - 315 Hz
(-) | casi sin bajos - de media 23% inferior a la mediana
(±) | la linealidad de los graves es media (14.2% delta a frecuencia anterior)
Medios 400 - 2000 Hz
(+) | medios equilibrados - a sólo 3.1% de la mediana
(+) | los medios son lineales (6.9% delta a la frecuencia anterior)
Altos 2 - 16 kHz
(+) | máximos equilibrados - a sólo 3.4% de la mediana
(+) | los máximos son lineales (6.3% delta a la frecuencia anterior)
Total 100 - 16.000 Hz
(±) | la linealidad del sonido global es media (19.7% de diferencia con la mediana)
En comparación con la misma clase
» 69% de todos los dispositivos probados de esta clase eran mejores, 6% similares, 25% peores
» El mejor tuvo un delta de 6%, la media fue 18%, el peor fue ###max##%
En comparación con todos los dispositivos probados
» 50% de todos los dispositivos probados eran mejores, 7% similares, 43% peores
» El mejor tuvo un delta de 4%, la media fue 23%, el peor fue ###max##%
Schenker XMG Fusion 15 (Mid 22) análisis de audio
(+) | los altavoces pueden reproducir a un volumen relativamente alto (#82 dB)
Graves 100 - 315 Hz
(-) | casi sin bajos - de media 17.6% inferior a la mediana
(±) | la linealidad de los graves es media (12.1% delta a frecuencia anterior)
Medios 400 - 2000 Hz
(+) | medios equilibrados - a sólo 3% de la mediana
(+) | los medios son lineales (3.9% delta a la frecuencia anterior)
Altos 2 - 16 kHz
(+) | máximos equilibrados - a sólo 2.8% de la mediana
(+) | los máximos son lineales (5.5% delta a la frecuencia anterior)
Total 100 - 16.000 Hz
(+) | el sonido global es lineal (13.3% de diferencia con la mediana)
En comparación con la misma clase
» 19% de todos los dispositivos probados de esta clase eran mejores, 5% similares, 76% peores
» El mejor tuvo un delta de 6%, la media fue 18%, el peor fue ###max##%
En comparación con todos los dispositivos probados
» 14% de todos los dispositivos probados eran mejores, 3% similares, 83% peores
» El mejor tuvo un delta de 4%, la media fue 23%, el peor fue ###max##%
Gestión de la energía - Ordenador Acer con una duración de batería decente
Consumo de energía
No notamos ninguna inconsistencia cuando se trata del consumo de energía del AN515. El consumo aumentó hasta 230 vatios y una media de 203 vatios durante la prueba de estrés/Witcher 3, pero se mantuvo estable durante ambas pruebas. El adaptador de CA (salida nominal: 280 vatios) es lo suficientemente grande para cubrir las necesidades de este dispositivo.
| Off / Standby | |
| Ocioso | |
| Carga |
|
Clave:
min: | |
| Acer Nitro 5 AN515-46-R1A1 R7 6800H, GeForce RTX 3070 Ti Laptop GPU, Micron 3400 1TB MTFDKBA1T0TFH, IPS, 1920x1080, 15.6" | MSI Katana GF66 12UGS i7-12700H, GeForce RTX 3070 Ti Laptop GPU, Micron 2450 1TB MTFDKBA1T0TFK, IPS, 1920x1080, 15.6" | Schenker XMG Fusion 15 (Mid 22) i7-11800H, GeForce RTX 3070 Laptop GPU, Samsung SSD 980 Pro 1TB MZ-V8P1T0BW, IPS, 2560x1440, 15.6" | Asus TUF Dash F15 FX517ZR i7-12650H, GeForce RTX 3070 Laptop GPU, Samsung PM991a MZVLQ1T0HBLB, IPS, 2560x1440, 15.6" | Acer Nitro 5 AN515-58-72QR i7-12700H, GeForce RTX 3070 Ti Laptop GPU, Samsung PM9A1 MZVL21T0HCLR, IPS, 2560x1440, 15.6" | Medio NVIDIA GeForce RTX 3070 Ti Laptop GPU | Media de la clase Gaming | |
|---|---|---|---|---|---|---|---|
| Power Consumption | -5% | -25% | -8% | -15% | -56% | -48% | |
| Idle Minimum * (Watt) | 7 | 9 -29% | 12 -71% | 10 -43% | 7 -0% | 14.2 ? -103% | 13 ? -86% |
| Idle Average * (Watt) | 8.9 | 13 -46% | 17 -91% | 14 -57% | 15 -69% | 19.9 ? -124% | 19 ? -113% |
| Idle Maximum * (Watt) | 14.4 | 20 -39% | 24 -67% | 20 -39% | 24 -67% | 26.2 ? -82% | 24.6 ? -71% |
| Load Average * (Watt) | 202 | 100 50% | 106 48% | 122 40% | 124 39% | 125.8 ? 38% | 110.7 ? 45% |
| Witcher 3 ultra * (Watt) | 203 | 149 27% | 159.9 21% | 138.6 32% | 195.1 4% | ||
| Load Maximum * (Watt) | 230 | 212 8% | 208 10% | 189 18% | 220 4% | 248 ? -8% | 259 ? -13% |
* ... más pequeño es mejor
Power consumption Witcher 3 / stress test
Power consumption with an external screen
Duración de la batería
Después del MSI Katana (52 Wh), el Nitro tiene la capacidad de batería más baja dentro de nuestro campo de comparación (57,5 Wh). No obstante, logra una duración de batería decente y puede incluso seguir el ritmo de algunos de sus competidores más generosamente equipados. Supera claramente a su modelo hermano basado en Intel, gracias al procesador AMD más frugal y a la menor resolución de la pantalla.
| Acer Nitro 5 AN515-46-R1A1 R7 6800H, GeForce RTX 3070 Ti Laptop GPU, 57.5 Wh | MSI Katana GF66 12UGS i7-12700H, GeForce RTX 3070 Ti Laptop GPU, 52 Wh | Schenker XMG Fusion 15 (Mid 22) i7-11800H, GeForce RTX 3070 Laptop GPU, 93.48 Wh | Asus TUF Dash F15 FX517ZR i7-12650H, GeForce RTX 3070 Laptop GPU, 76 Wh | Acer Nitro 5 AN515-58-72QR i7-12700H, GeForce RTX 3070 Ti Laptop GPU, 57.5 Wh | Media de la clase Gaming | |
|---|---|---|---|---|---|---|
| Duración de Batería | -26% | 37% | 26% | -26% | 16% | |
| Reader / Idle (h) | 10.5 | 15.5 48% | 10.8 3% | 5.7 -46% | 8.27 ? -21% | |
| H.264 (h) | 5.7 | 7.5 32% | 5.8 2% | 4.7 -18% | 8.32 ? 46% | |
| WiFi v1.3 (h) | 5.8 | 2.4 -59% | 7.4 28% | 7 21% | 3.9 -33% | 7.11 ? 23% |
| Load (h) | 1.3 | 1.4 8% | 1.8 38% | 2.3 77% | 1.2 -8% | 1.502 ? 16% |
Pro
Contra
Veredicto - Un portátil para juegos muy completo
El Nitro 5 está hecho para jugar en FHD con la máxima configuración, gracias a unRyzen 7-6800Hy un portátilGeForce RTX 3070-Ti para portátiles(TGP: 150 W). El rápido SSD PCIe-4 (1 TB) proporciona el espacio de almacenamiento necesario y garantiza tiempos de carga cortos.
El Acer Nitro 5 AN515-46 es un rápido portátil de juegos FHD que no muestra ninguna debilidad seria.
La CPU y la GPU pueden ofrecer frecuencias elevadas de forma consistente. El dispositivo sólo se calienta moderadamente bajo carga. Por desgracia, sus emisiones de ruido no son mejores de lo habitual: el Nitro 5 puede ser bastante ruidoso. El panel mate de 15.6 pulgadas (FHD, IPS, 165 Hz) nos dio una buena impresión.
La duración de la batería del portátil es decente, pero nada fuera de lo común. La batería puede recargarse con un adaptador universal USB-C AC (mín. 65 watts, 20 V) ya que el puerto USB 4 soporta Power Delivery (y DisplayPort). Esto significa que los usuarios no tendrán que llevar necesariamente la pesada fuente de alimentación de 280 W.
¿Qué modelo de Nitro 5 es la mejor opción? Depende de tus necesidades. La versión AMD tiene memoria DDR5, bajos valores de consumo energético y una mejor duración de la batería. También se calienta menos. ElModelo de Intelofrece un mayor rendimiento de la CPU de un solo hilo, Thunderbolt 4 y una mejor pantalla. Pero recuerda: ambas versiones de Nitro están disponibles con un panel FHD o QHD
Algunas alternativas al Nitro son elSchenker XMG Fusion 15 (Mid 22)y elAsus TUF Dash F15. Ambos dispositivos ofrecen un menor rendimiento de la GPU y se calientan notablemente bajo carga. Por otro lado, son más compactos, pesan menos y tienen una mayor duración de la batería. El Fusion ofrece, con diferencia, la mayor duración de la batería.
Precio y disponibilidad
El Acer Nitro 5 AN515-46 está disponible en la web del fabricante por 2200 dólares.
Acer Nitro 5 AN515-46-R1A1
- 10/28/2022 v7 (old)
Sascha Mölck
Price comparison

