Análisis del portátil MSI Vector GP66 12UGS: 150 W TGP GeForce RTX 3070 Ti punto dulce
MSI fue una de las primeras empresas importantes en poner a disposición de los usuarios portátiles para juegos de la 12ª generación de Alder Lake-H a principios del mes pasado. Aunque los nuevos modelos de MSI son casi idénticos visualmente a los de la 11ª generación del año pasado, llevan consigo CPUs y GPUs más rápidas, así como nuevas opciones de pantalla que los entusiastas pueden apreciar.
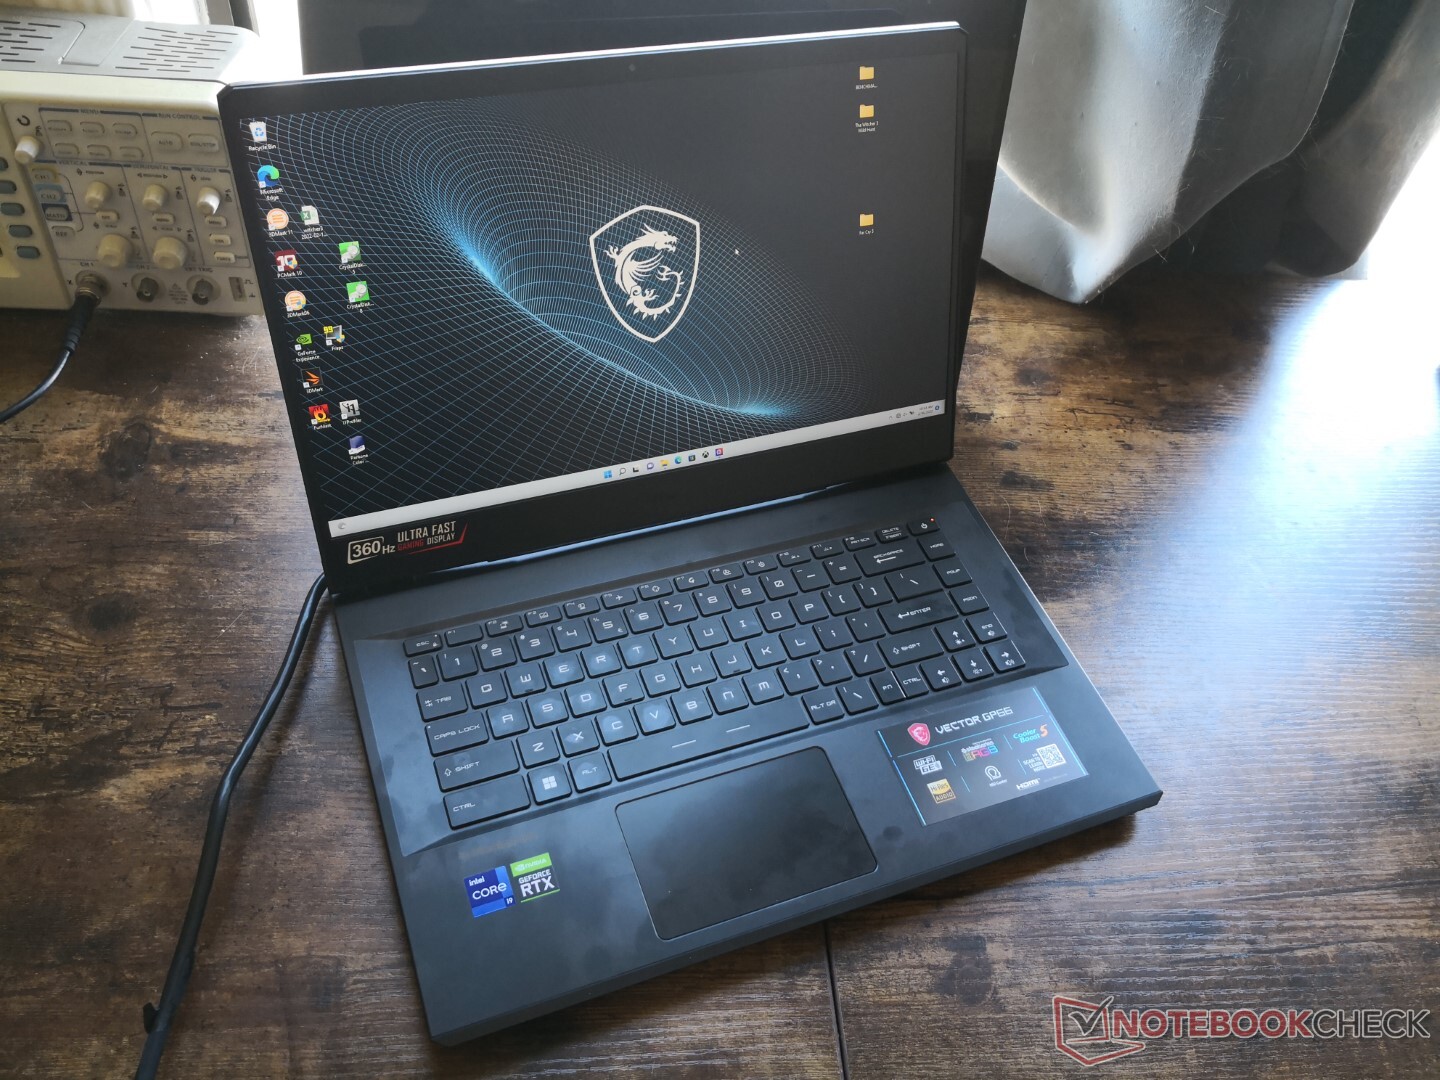
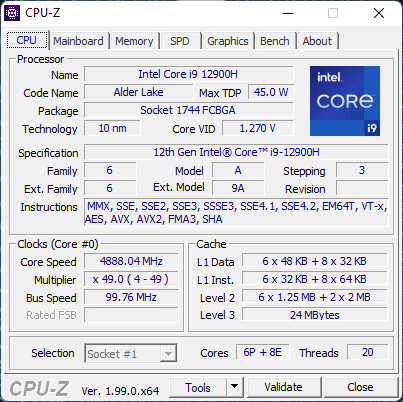
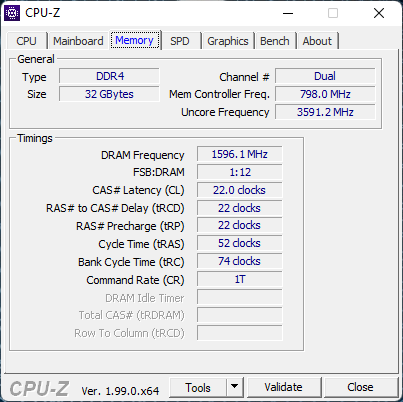
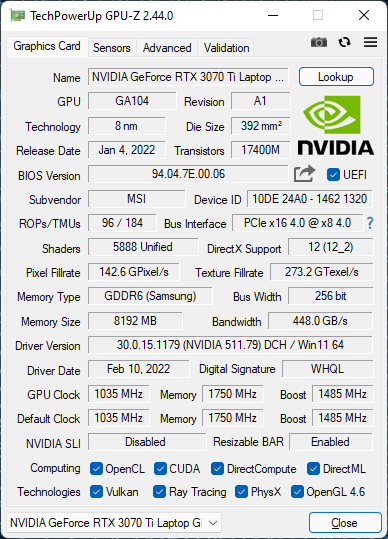
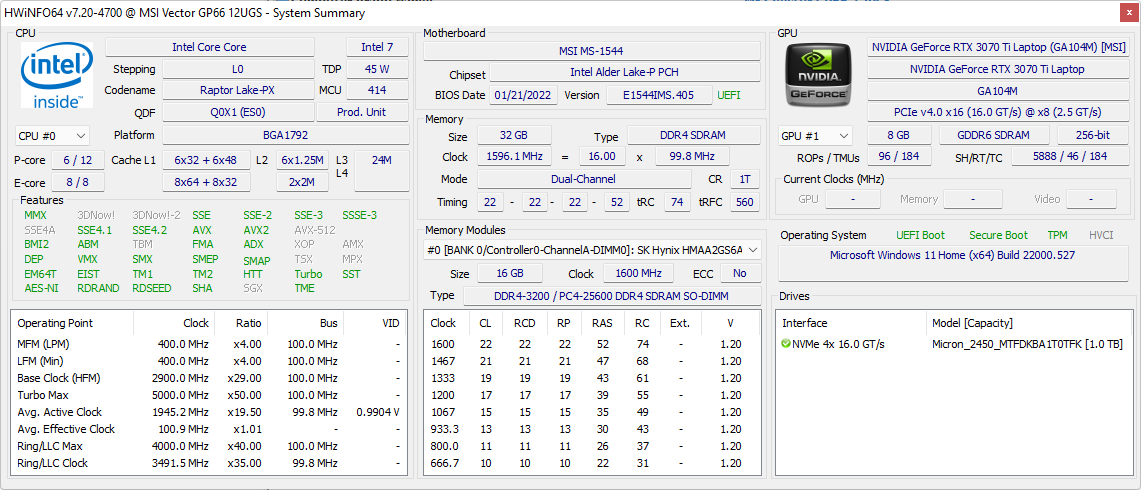
La unidad que analizamos hoy es el Vector GP66, que sucede al GP66 Leopard del año pasado. Nuestra configuración específica con la CPU Core i9-12900H, la GPU GeForce RTX 3070 Ti de 150 W, 32 GB de RAM, pantalla IPS 1080p de 360 Hz y SSD NVMe de 1 TB se puede encontrar online por unos 2400 dólares. Hay otras referencias disponibles con la RTX 3060, RTX 3080, pantalla QHD 165 Hz o FHD 144 Hz, o Core i7-12700H en su lugar.
Las alternativas al MSI Vector incluyen otros portátiles gaming de gama media alta de 15,6 pulgadas como la Serie ROG Strix de Asus, Razer Blade 15 Modelo Base, La serie Dell G15o la serie Lenovo Legion serie S7. El MSI Vector no debe confundirse con el Maingear Vector.
Más opiniones de MSI:
Posibles contendientes en la comparación
Valoración | Fecha | Modelo | Peso | Altura | Tamaño | Resolución | Precio |
|---|---|---|---|---|---|---|---|
| 86.9 % v7 (old) | 03/2022 | MSI Vector GP66 12UGS i9-12900H, GeForce RTX 3070 Ti Laptop GPU | 2.3 kg | 23.4 mm | 15.60" | 1920x1080 | |
| 85.4 % v7 (old) | 12/2021 | MSI GP66 Leopard 11UH-028 i7-11800H, GeForce RTX 3080 Laptop GPU | 2.3 kg | 23.4 mm | 15.60" | 1920x1080 | |
| 79.2 % v7 (old) | 09/2021 | MSI Katana GF66 11UG-220 i7-11800H, GeForce RTX 3070 Laptop GPU | 2.3 kg | 25 mm | 15.60" | 1920x1080 | |
| 85.9 % v7 (old) | 06/2021 | Asus TUF Gaming F15 FX506HM i7-11800H, GeForce RTX 3060 Laptop GPU | 2.3 kg | 24.9 mm | 15.60" | 1920x1080 | |
| 85.5 % v7 (old) | 03/2021 | Razer Blade 15 Base Edition 2021, i7-10750H RTX 3060 i7-10750H, GeForce RTX 3060 Laptop GPU | 2.1 kg | 19.9 mm | 15.60" | 1920x1080 | |
| 84.7 % v7 (old) | 06/2021 | Alienware m15 R5 Ryzen Edition R7 5800H, GeForce RTX 3060 Laptop GPU | 2.5 kg | 22.85 mm | 15.60" | 1920x1080 |
Caso
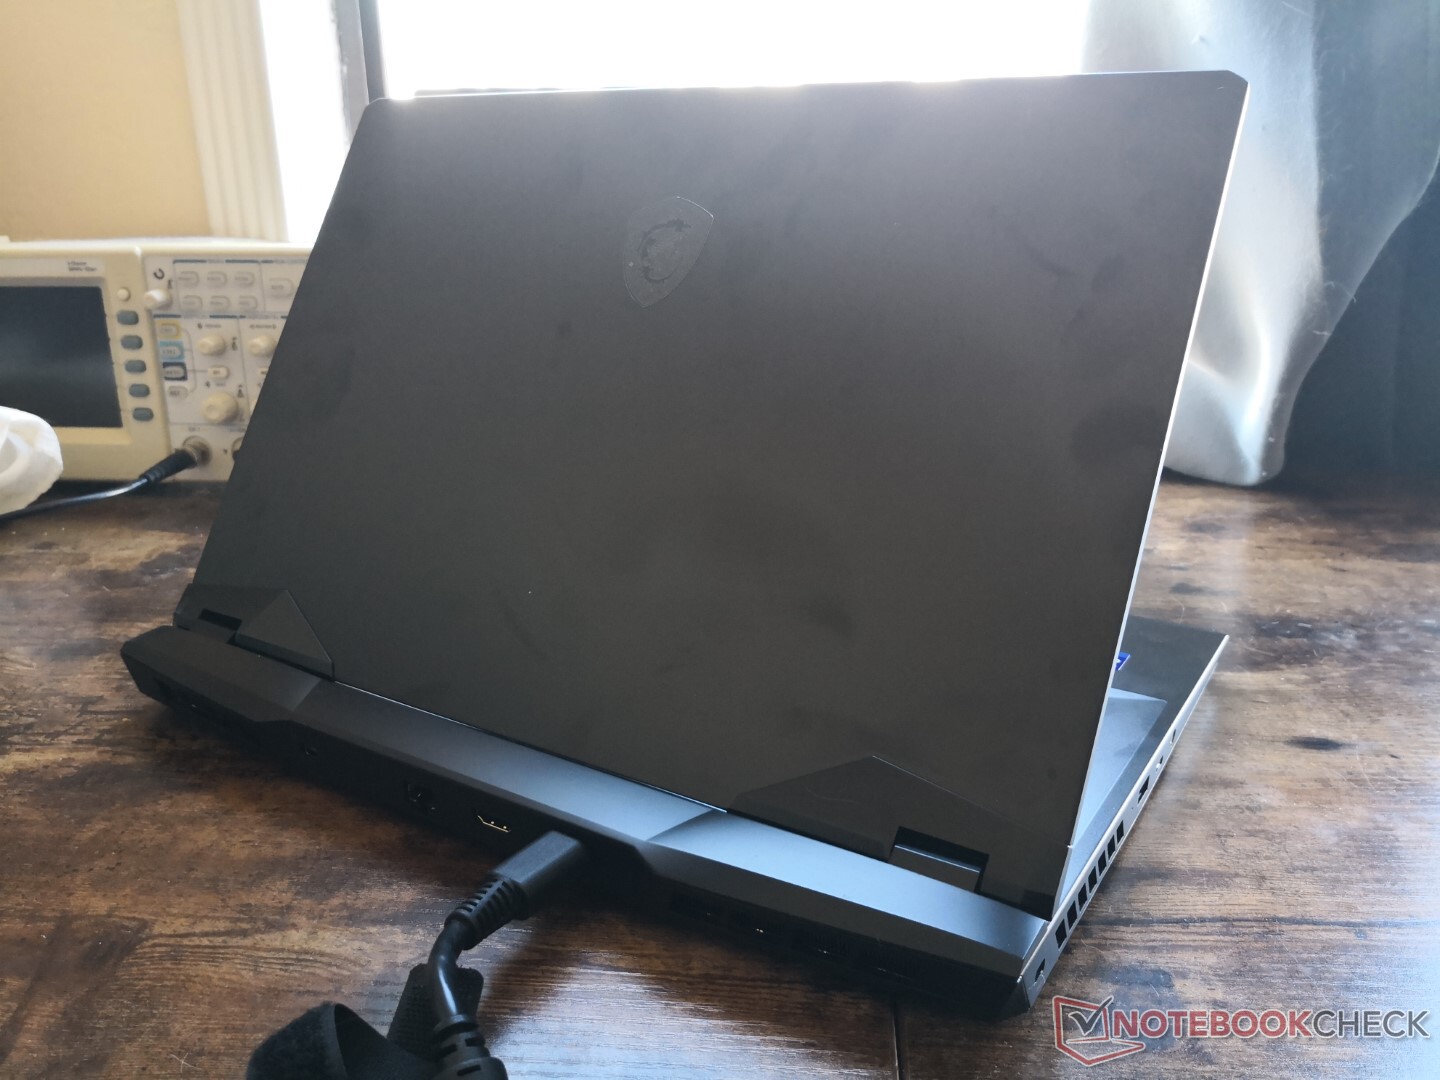
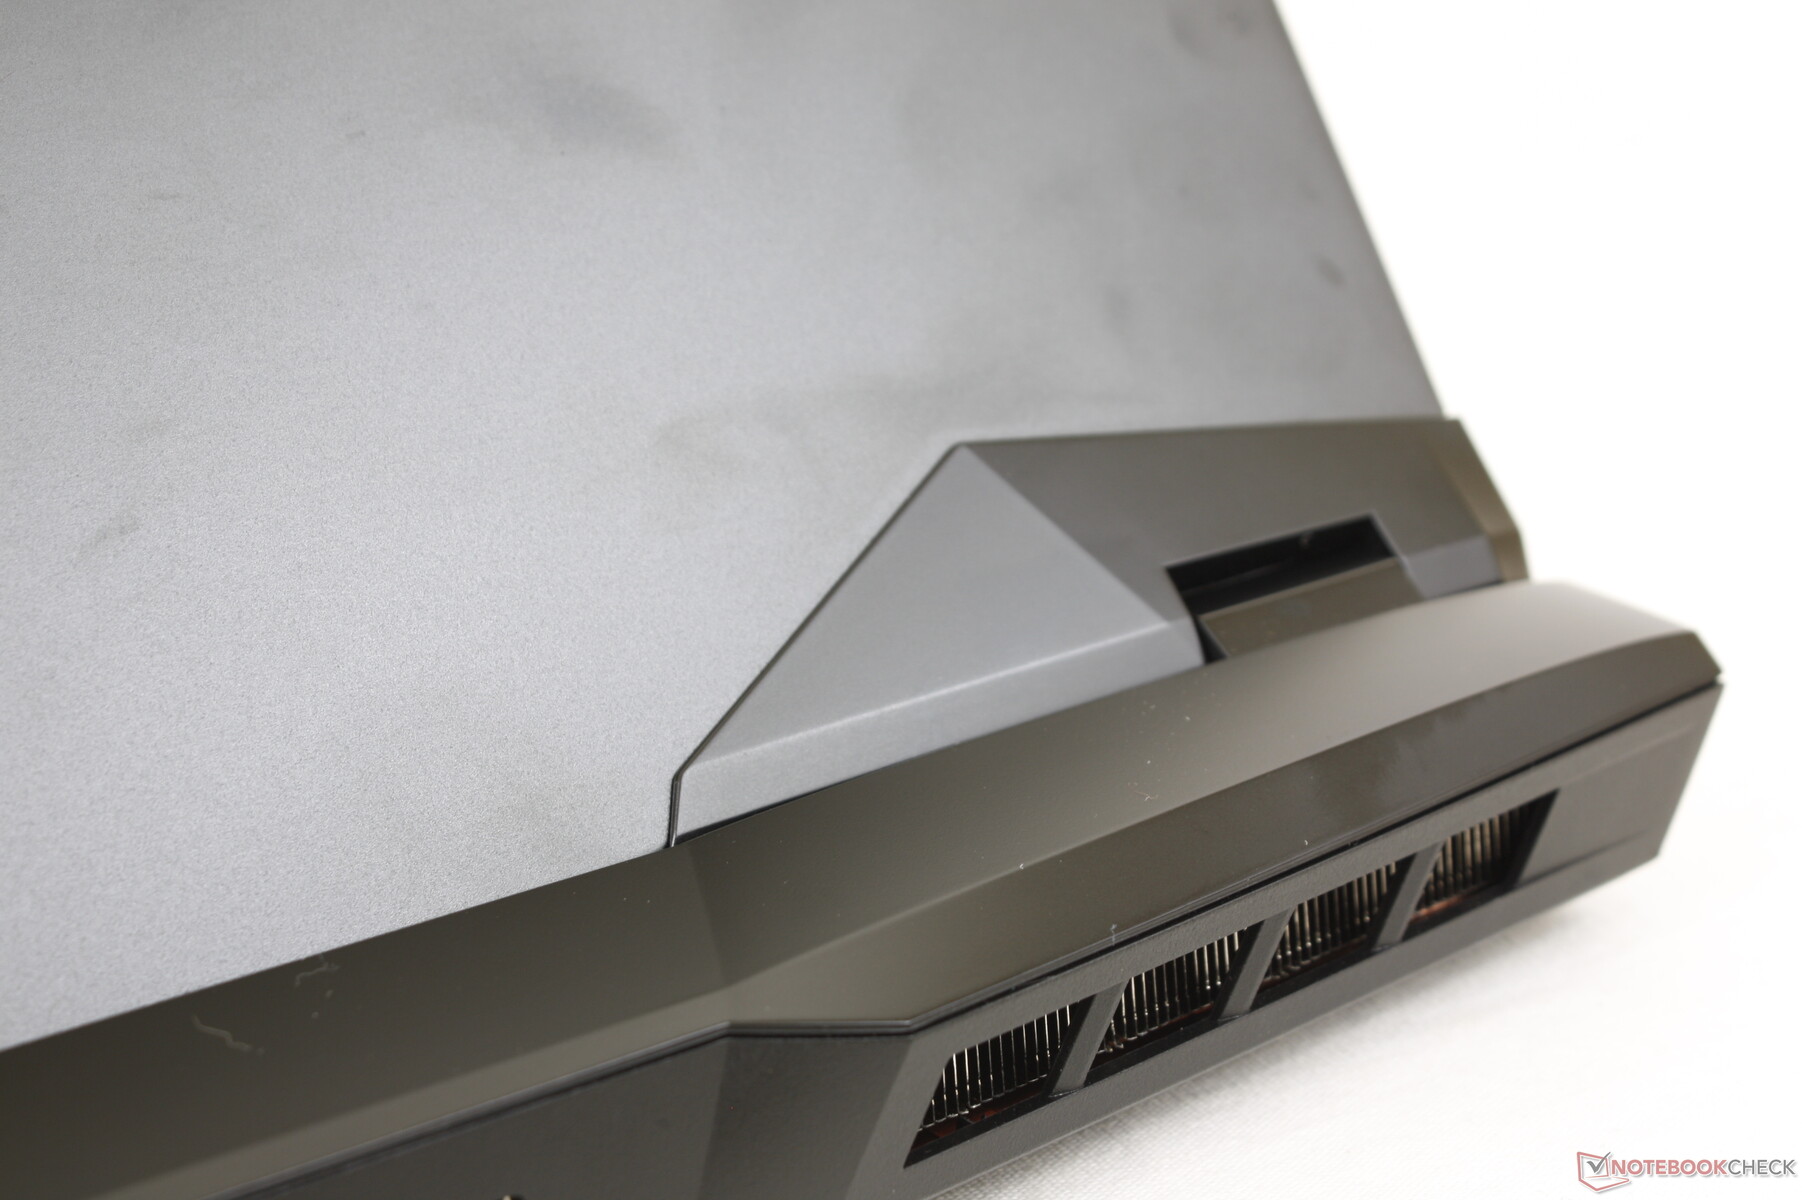
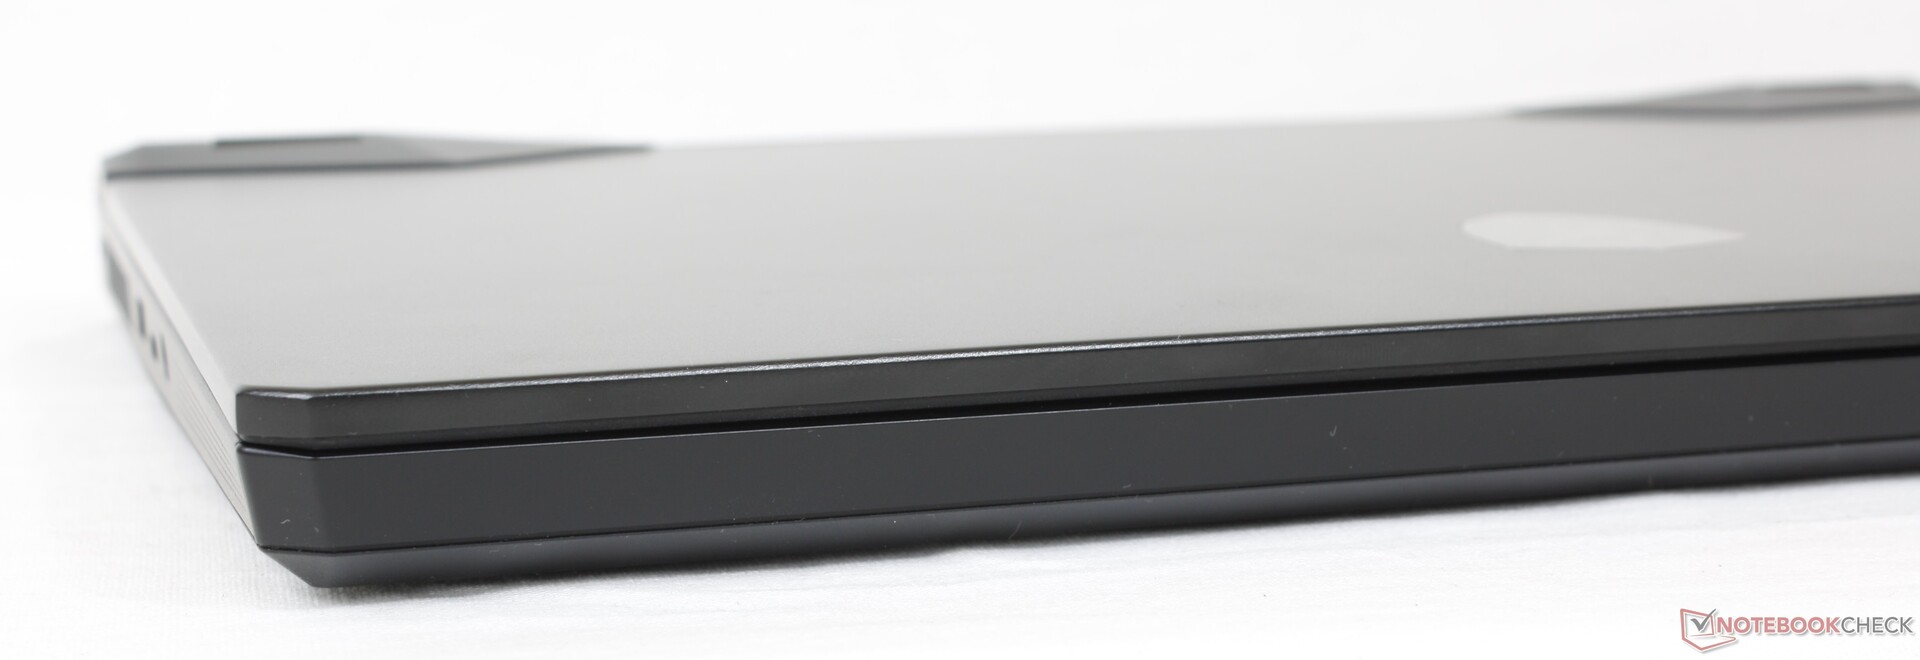
MSI rediseñó su GP66 a principios del año pasado, por lo que aún es demasiado pronto para otro refresco visual. Por tanto, recomendamos consultar nuestros análisis existentes sobre el GP66 con Intel de 10ª generación y GP66 con Intel de 11ª generación ya que la mayoría de nuestros comentarios sobre el chasis siguen siendo válidos para nuestro modelo GP66 12th gen Intel aquí. Sin embargo, todavía hay algunas diferencias menores con respecto a los puertos, que repasaremos en la siguiente sección.
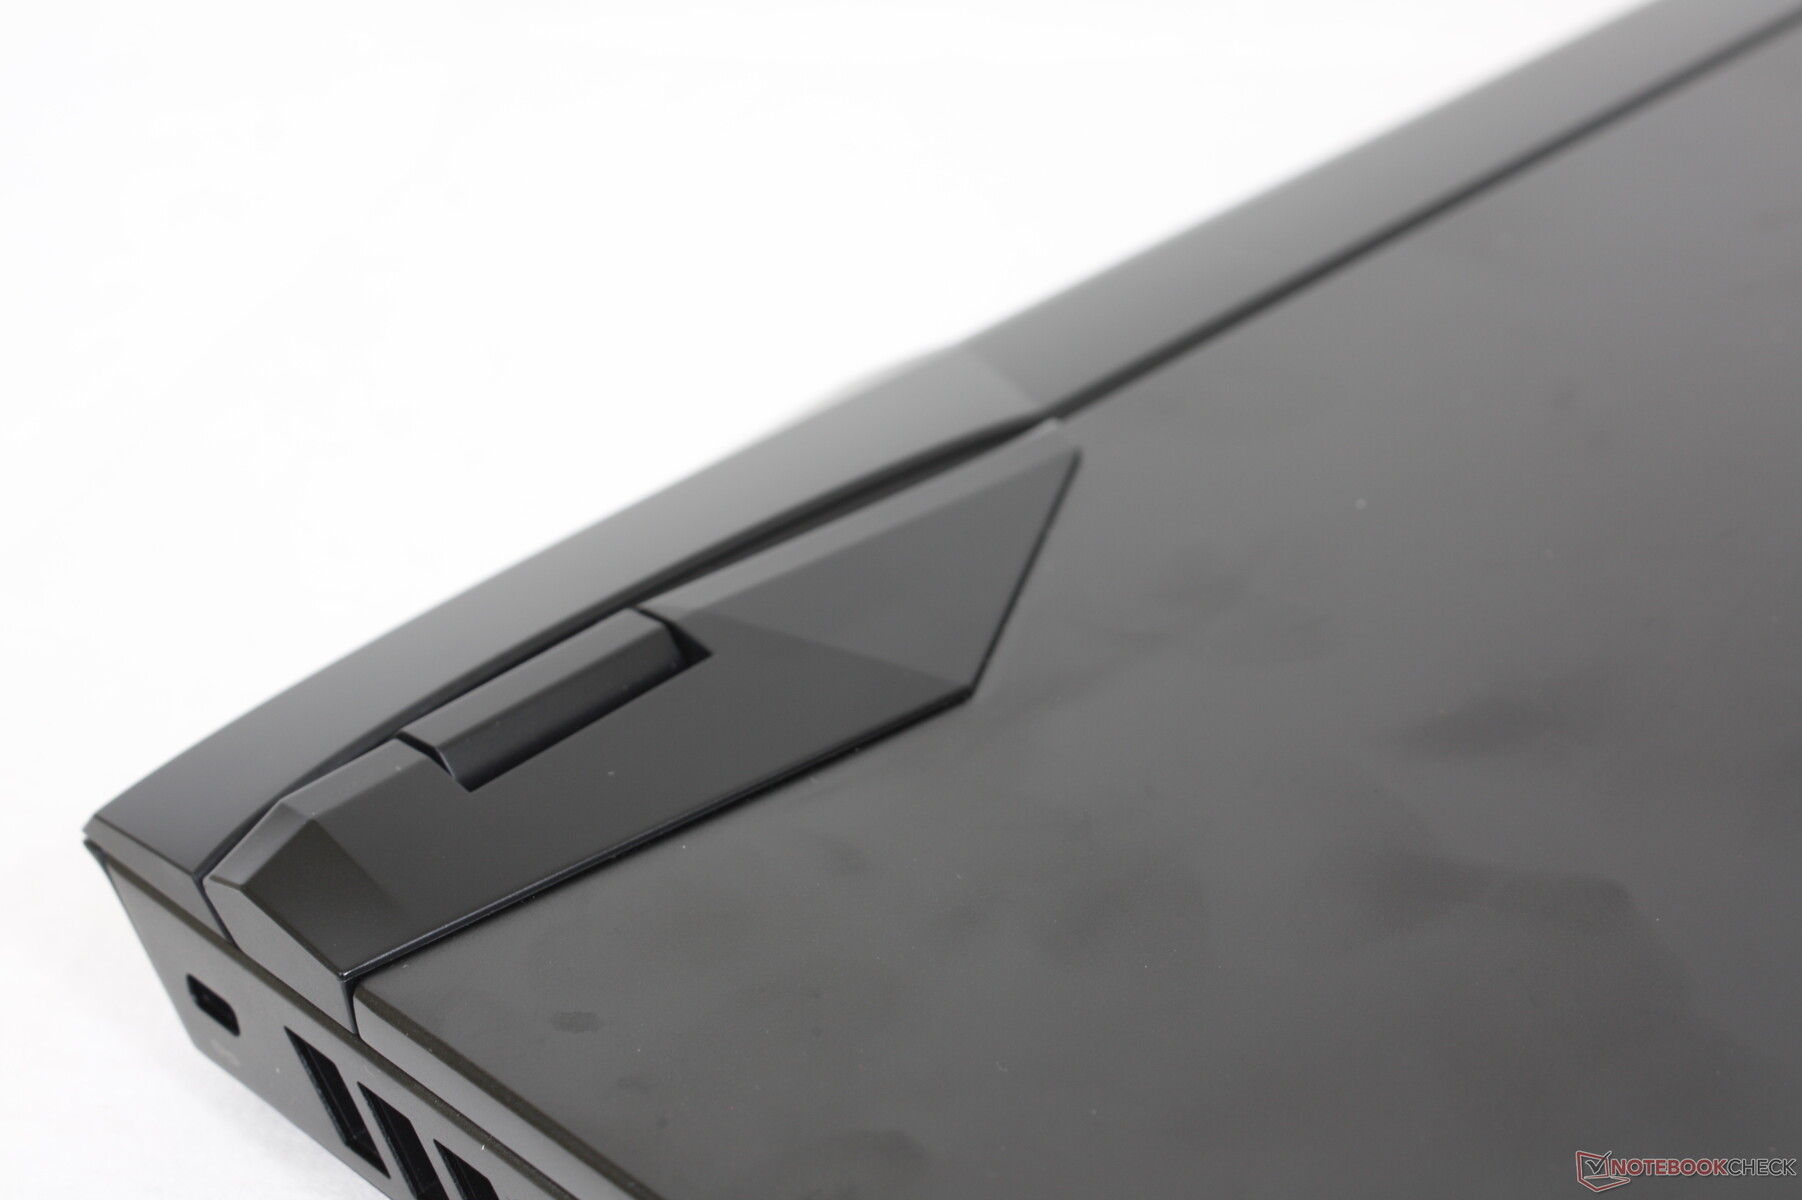
La falta de cambios importantes significa que el Vector GP66 2022 sigue sufriendo los mismos defectos que encontramos en nuestro GP66 Leopard 2021. En particular, la pieza del borde delantero de nuestra unidad a veces se aflojaba y dejaba una primera impresión poco positiva. Por lo demás, el diseño visual es un derivado más elegante y sutil de las grandes series GE o GT.
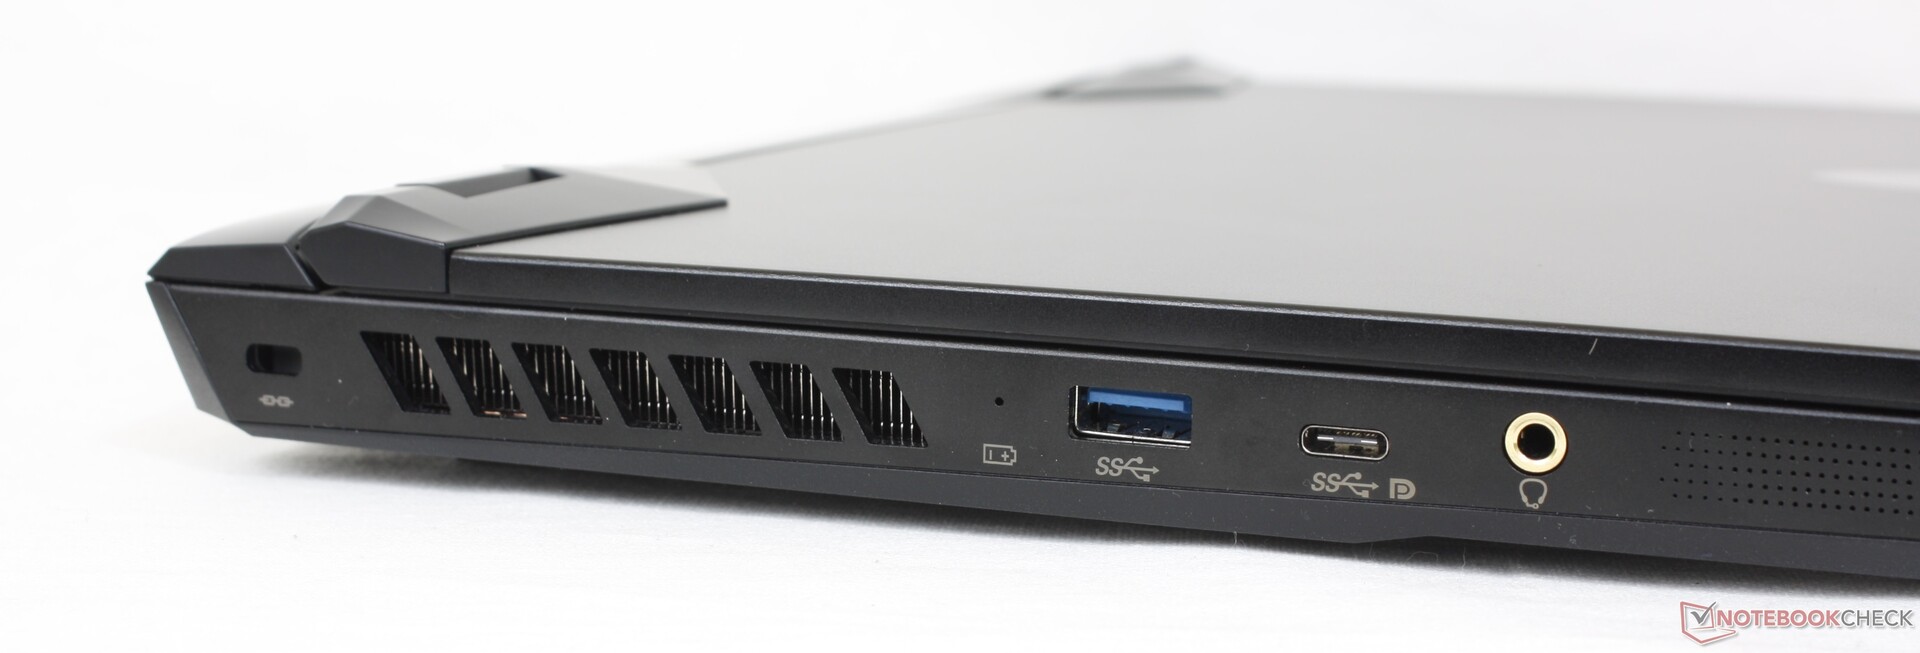
Conectividad
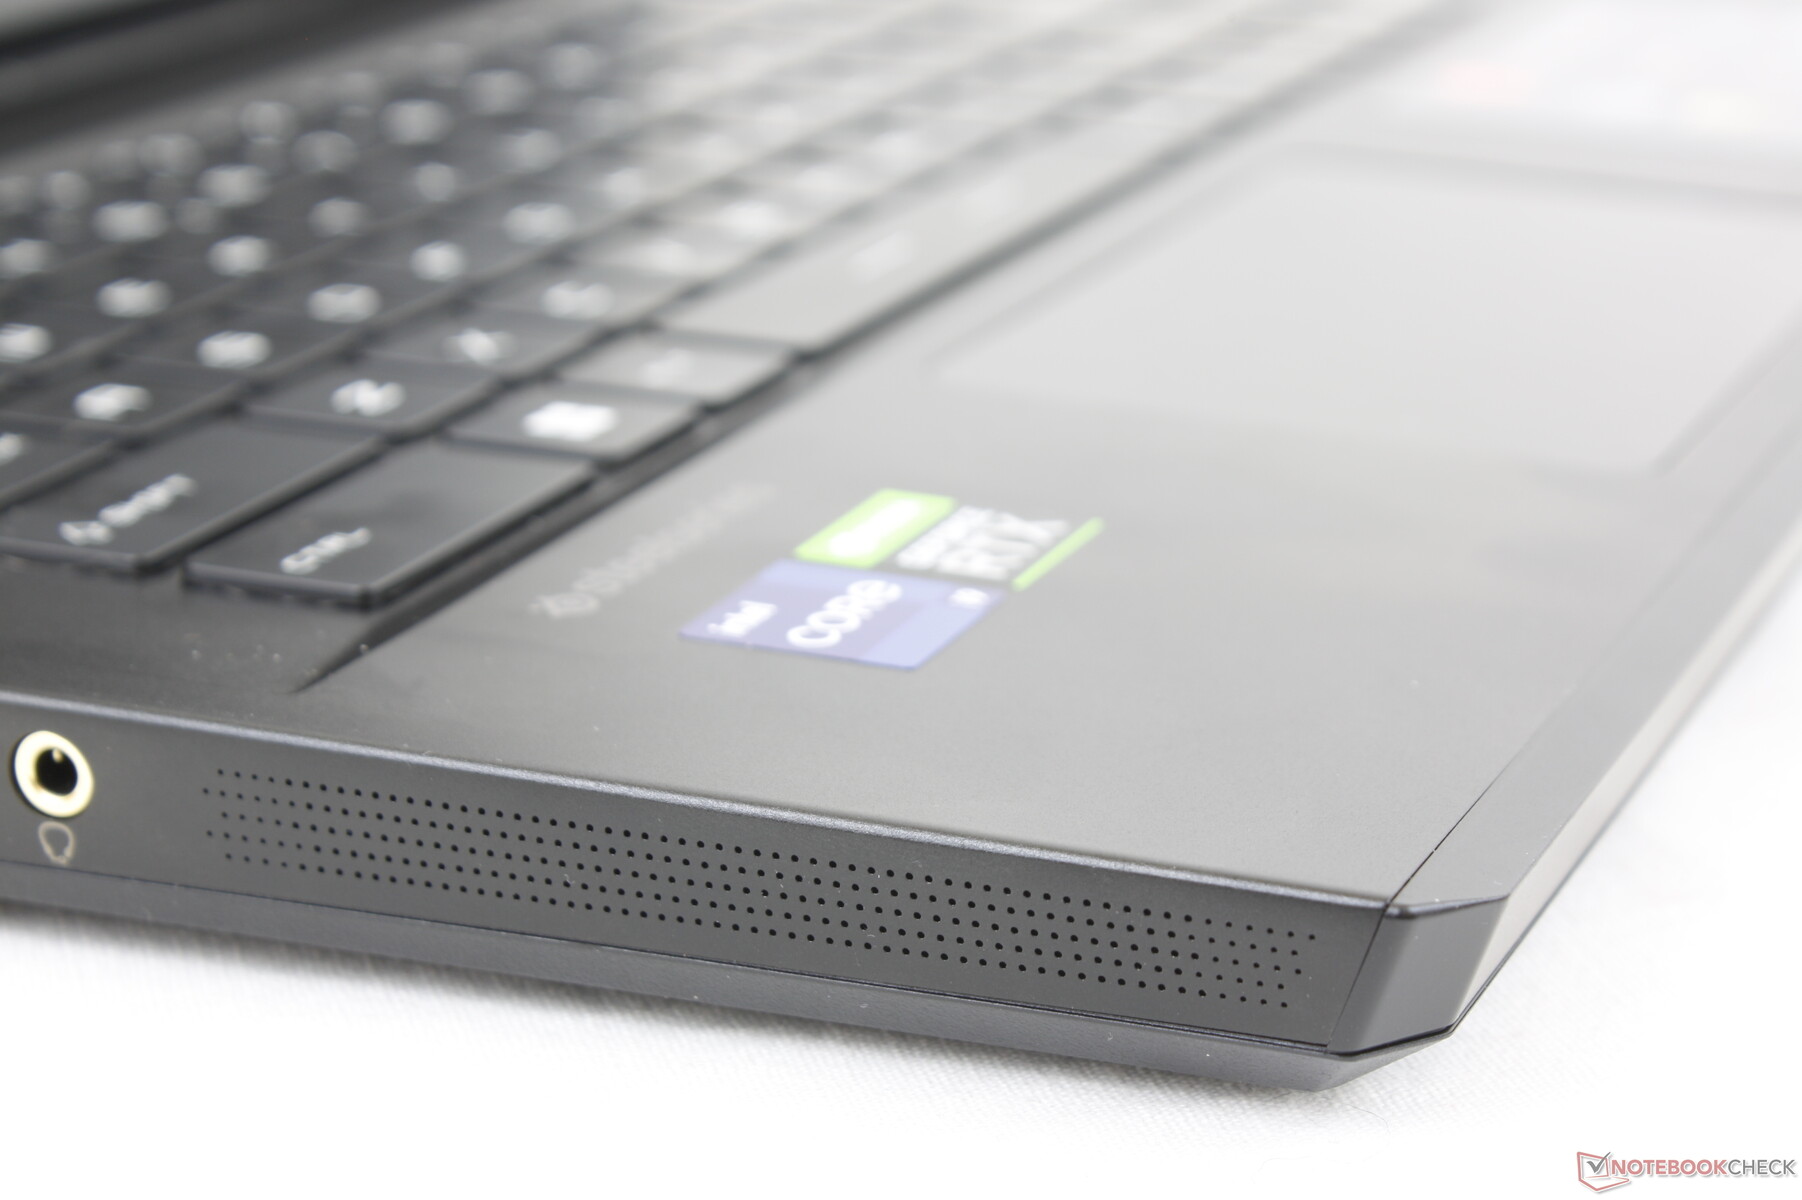
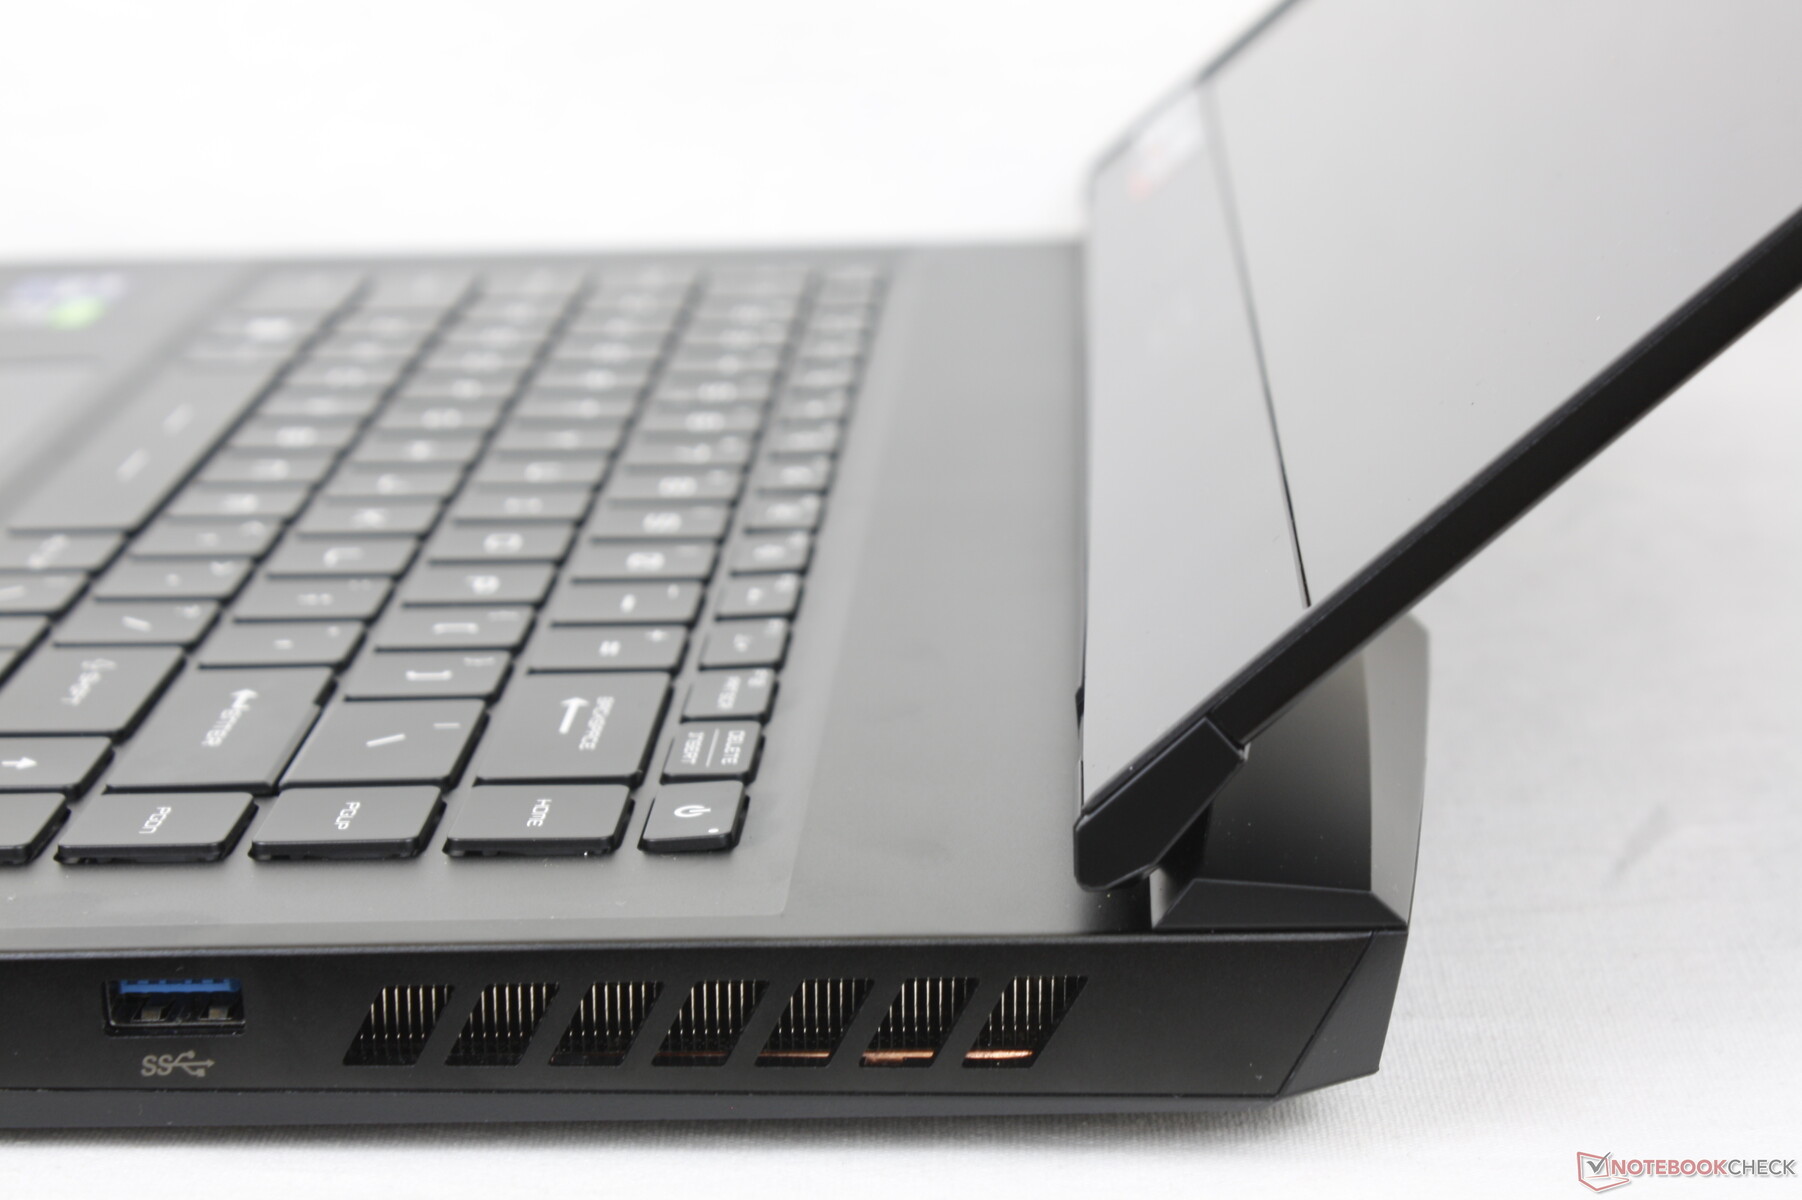
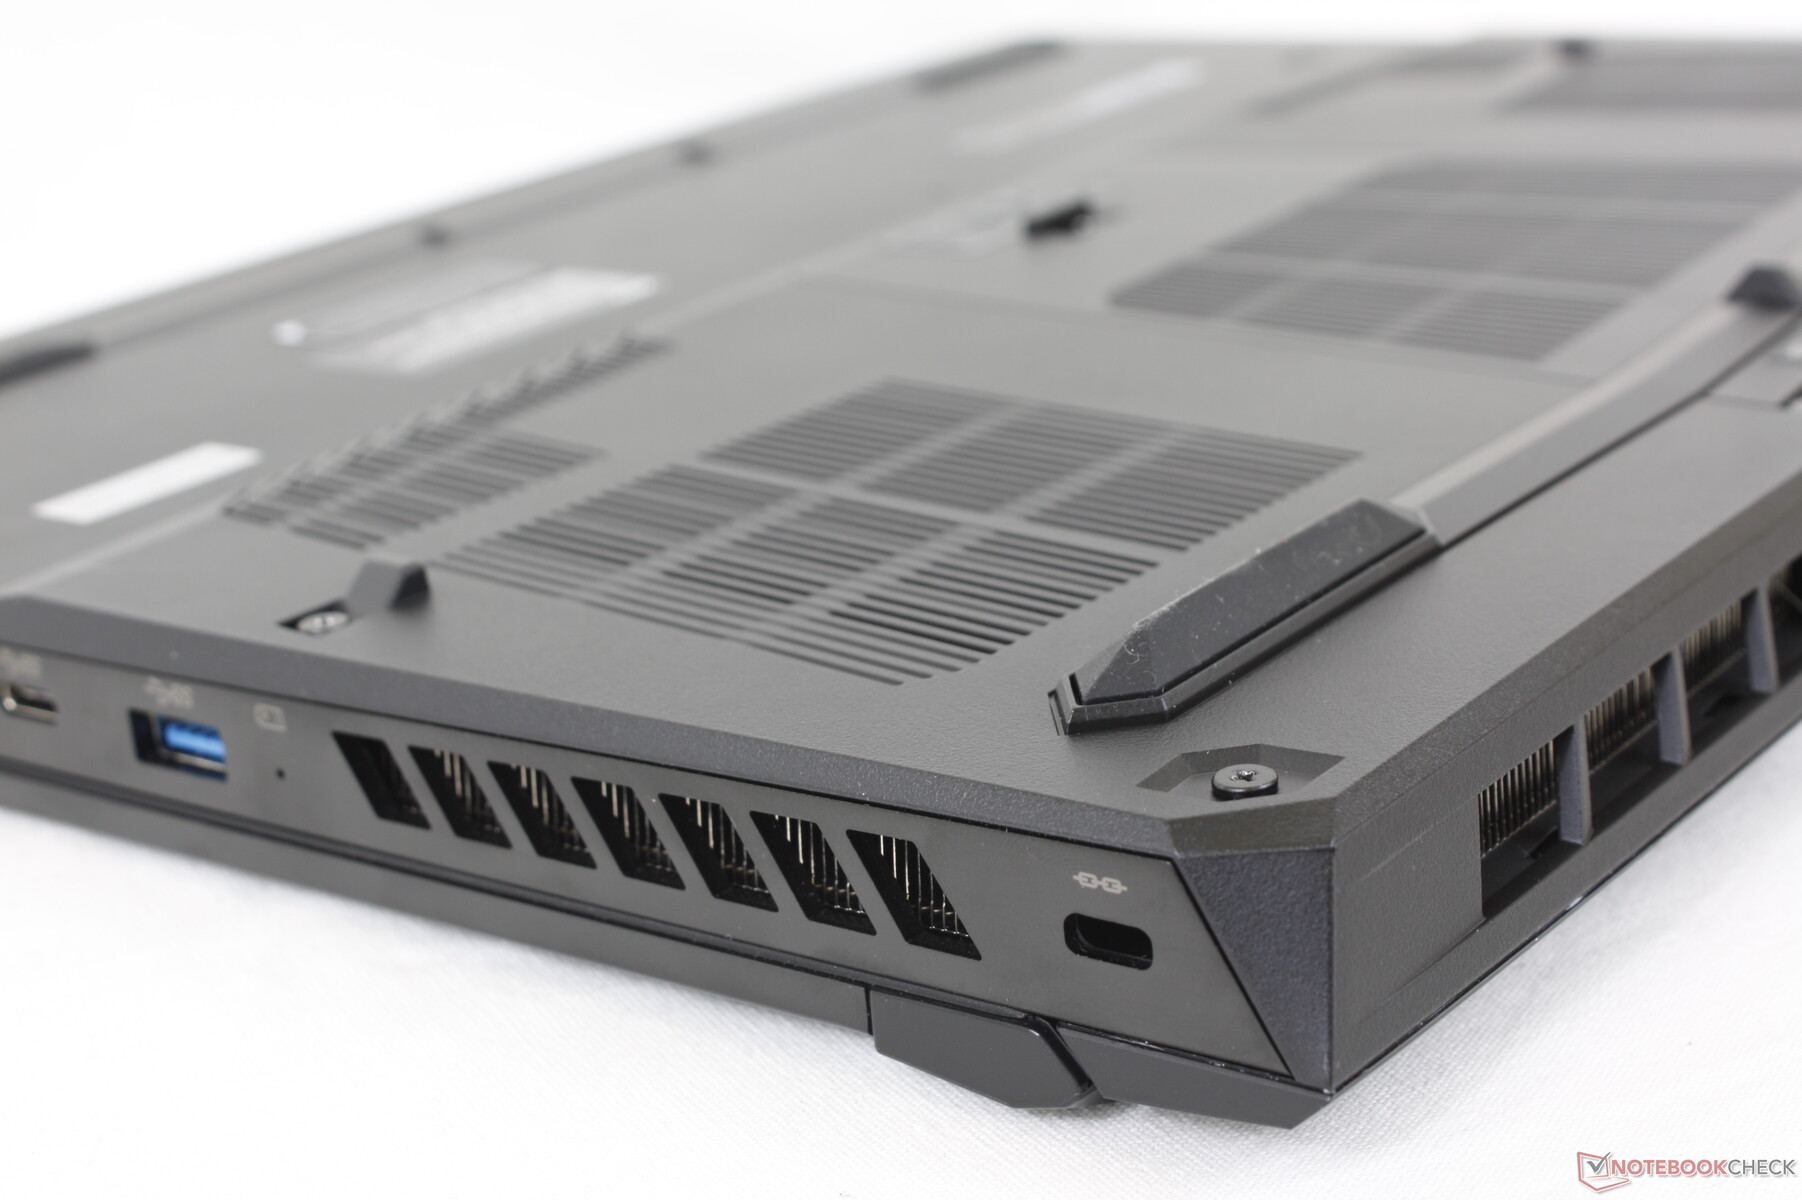
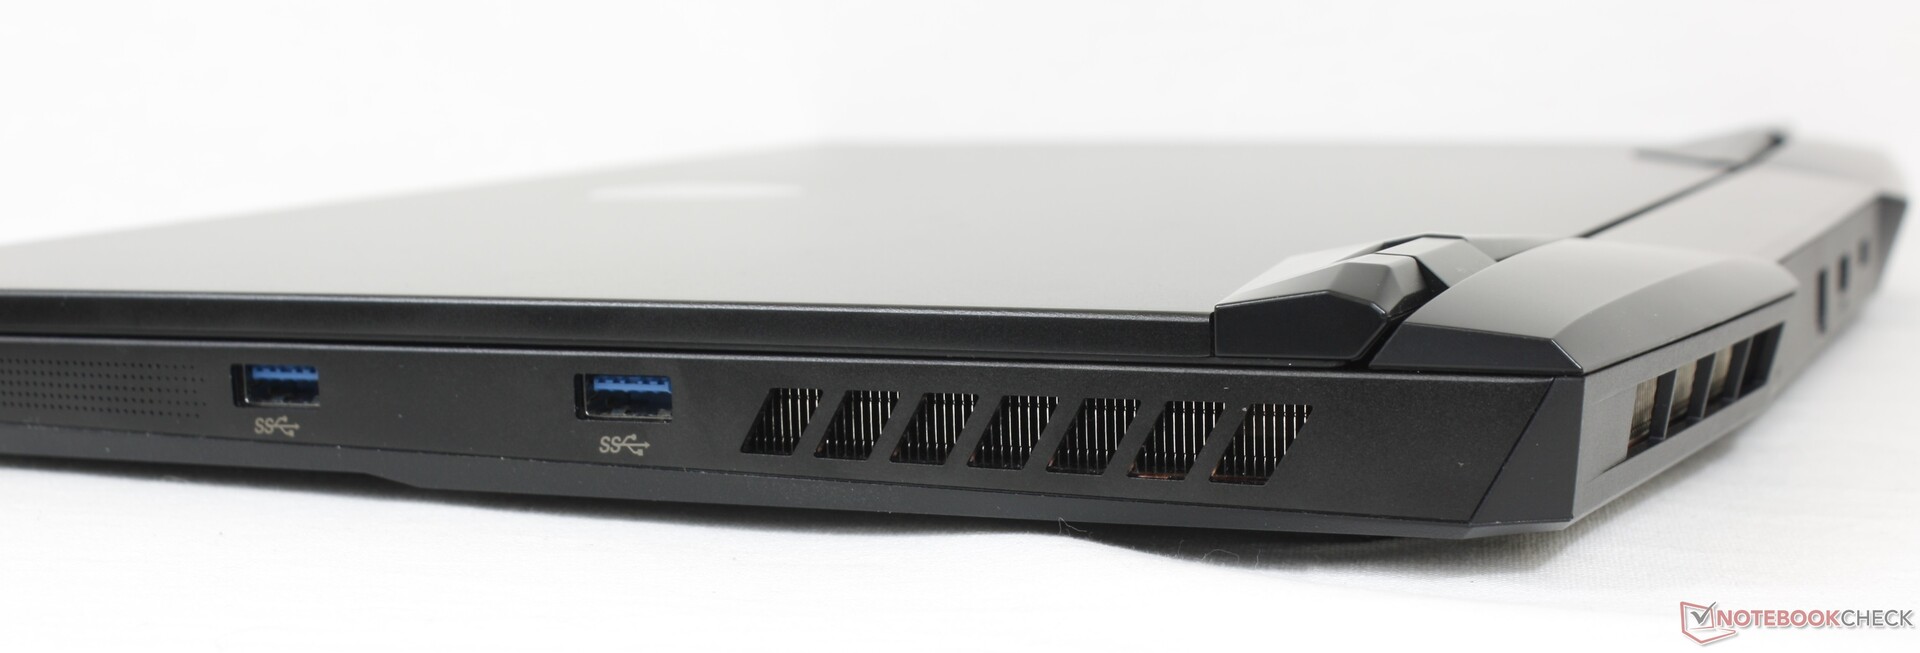
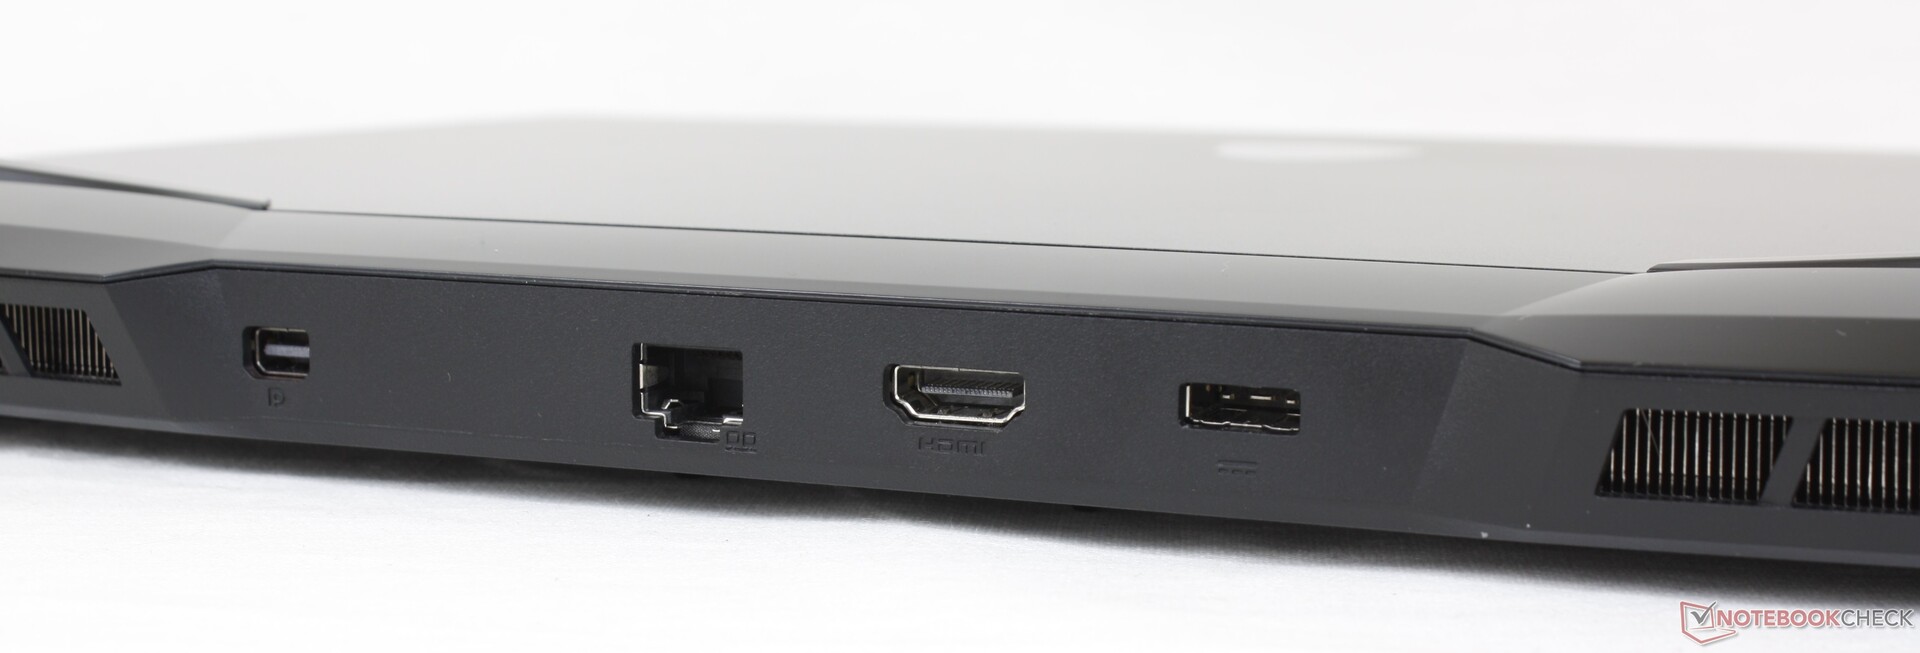
Las opciones de puerto son ligeramente diferentes a las que se ofrecían en el GP66 Leopard. Por un lado, el puerto USB-C que estaba en la parte trasera del GP66 Leopard está ahora en el borde izquierdo para facilitar el acceso. Además, se ha añadido un mini-DisplayPort para aumentar la compatibilidad con los monitores externos que soportan la sincronización adaptativa
Hay que tener en cuenta que el puerto USB-C sigue sin ser compatible con Thunderbolt. Los usuarios tendrán que actualizarse a las series MSI GS, GE o GT, más caras, para obtener dicha característica.
Comunicación
Cámara web
La cámara sigue siendo de 720p y sin soporte para IR o Windows Hello. Los portátiles de MSI siguen utilizando un obturador electrónico en lugar de uno físico, a diferencia de la mayoría de los Ultrabooks o portátiles de empresa.


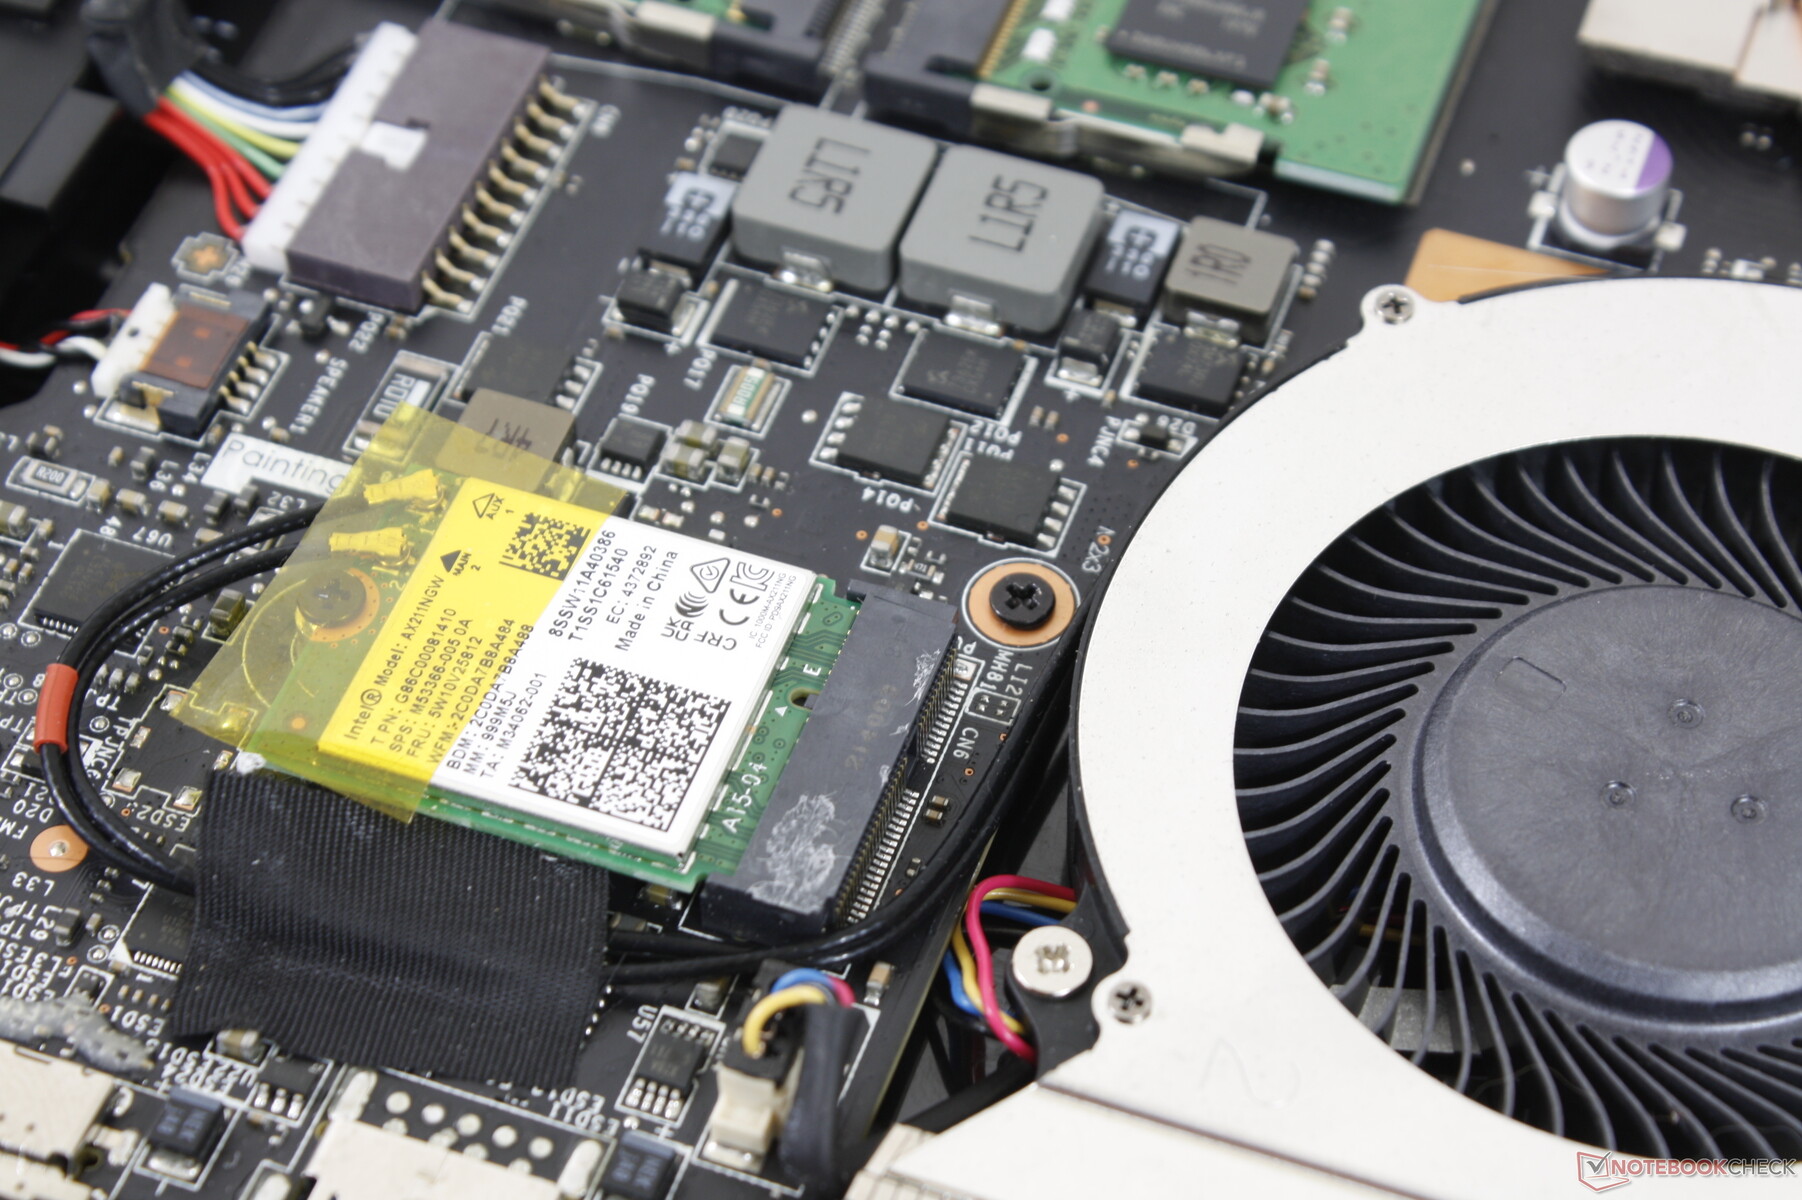
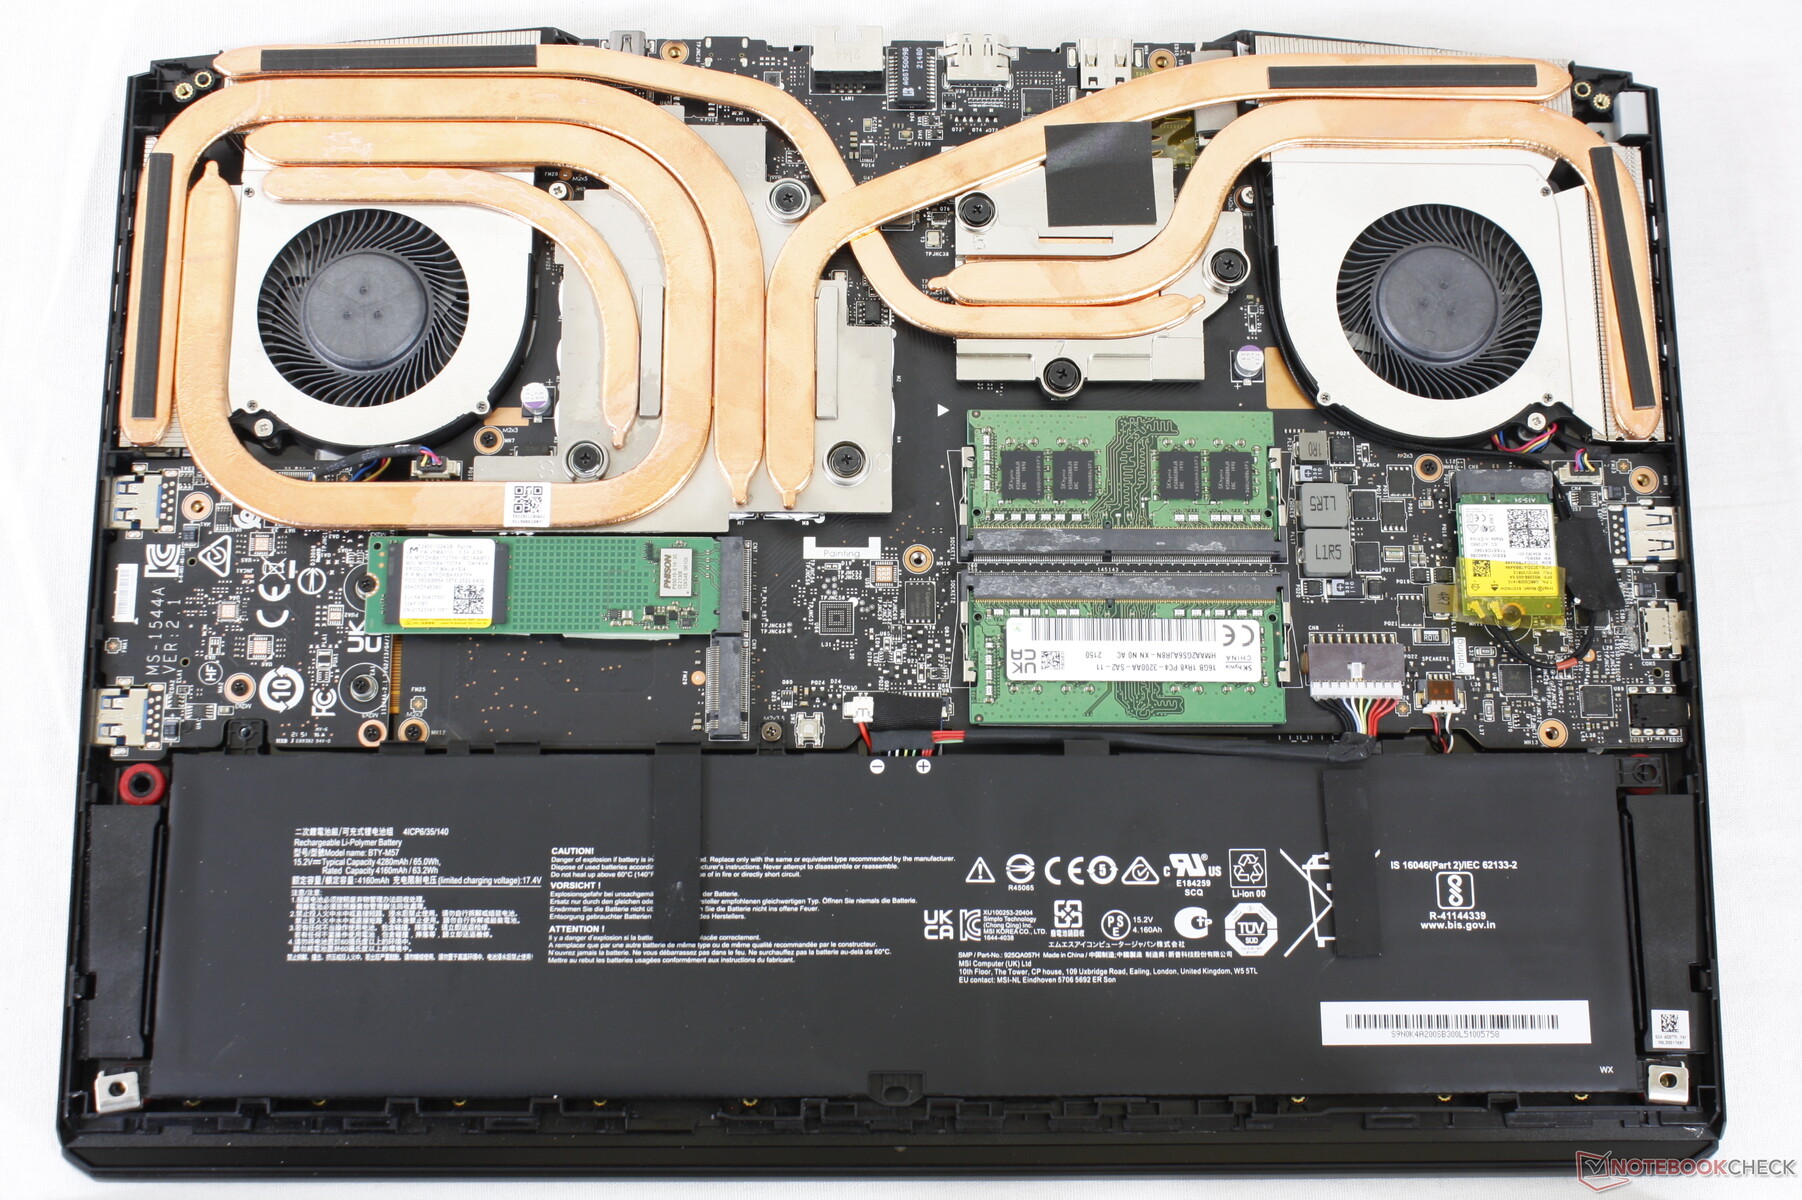
Mantenimiento
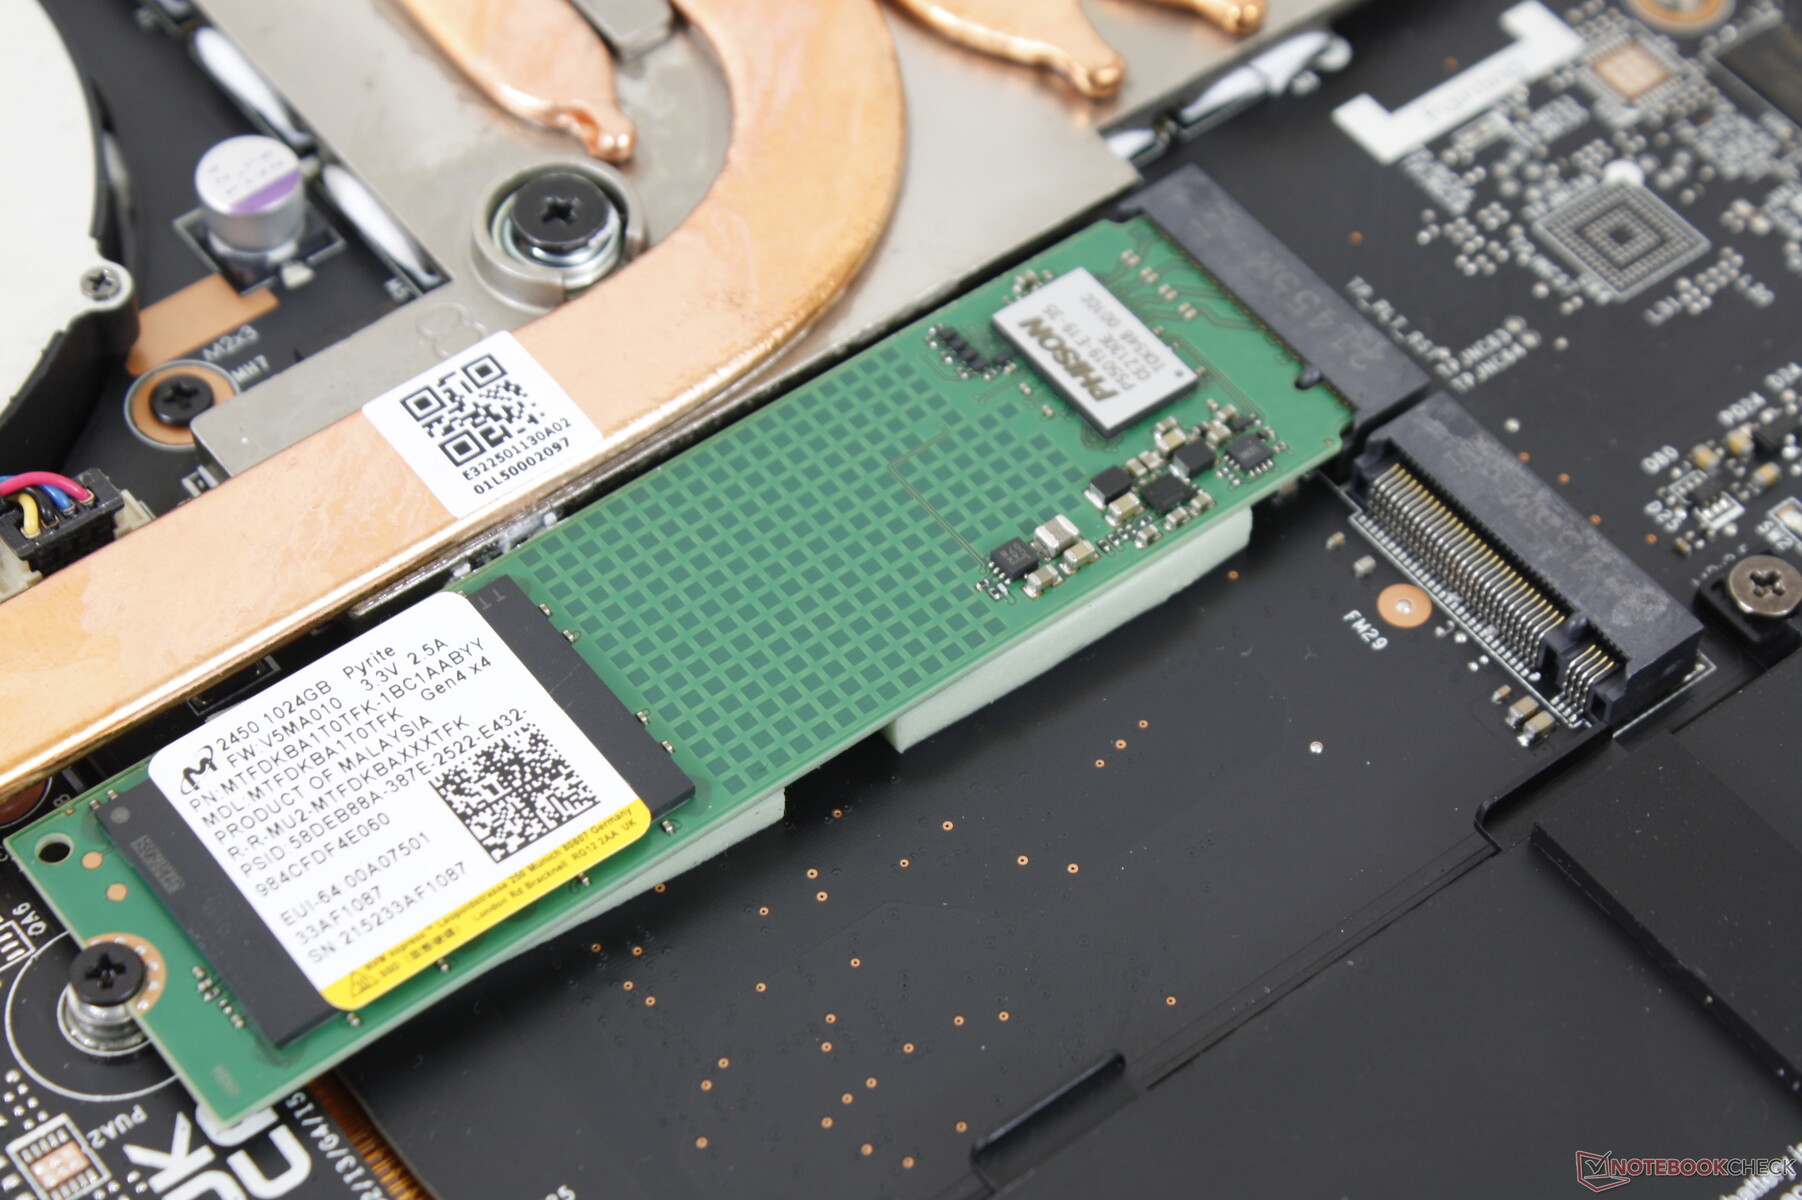
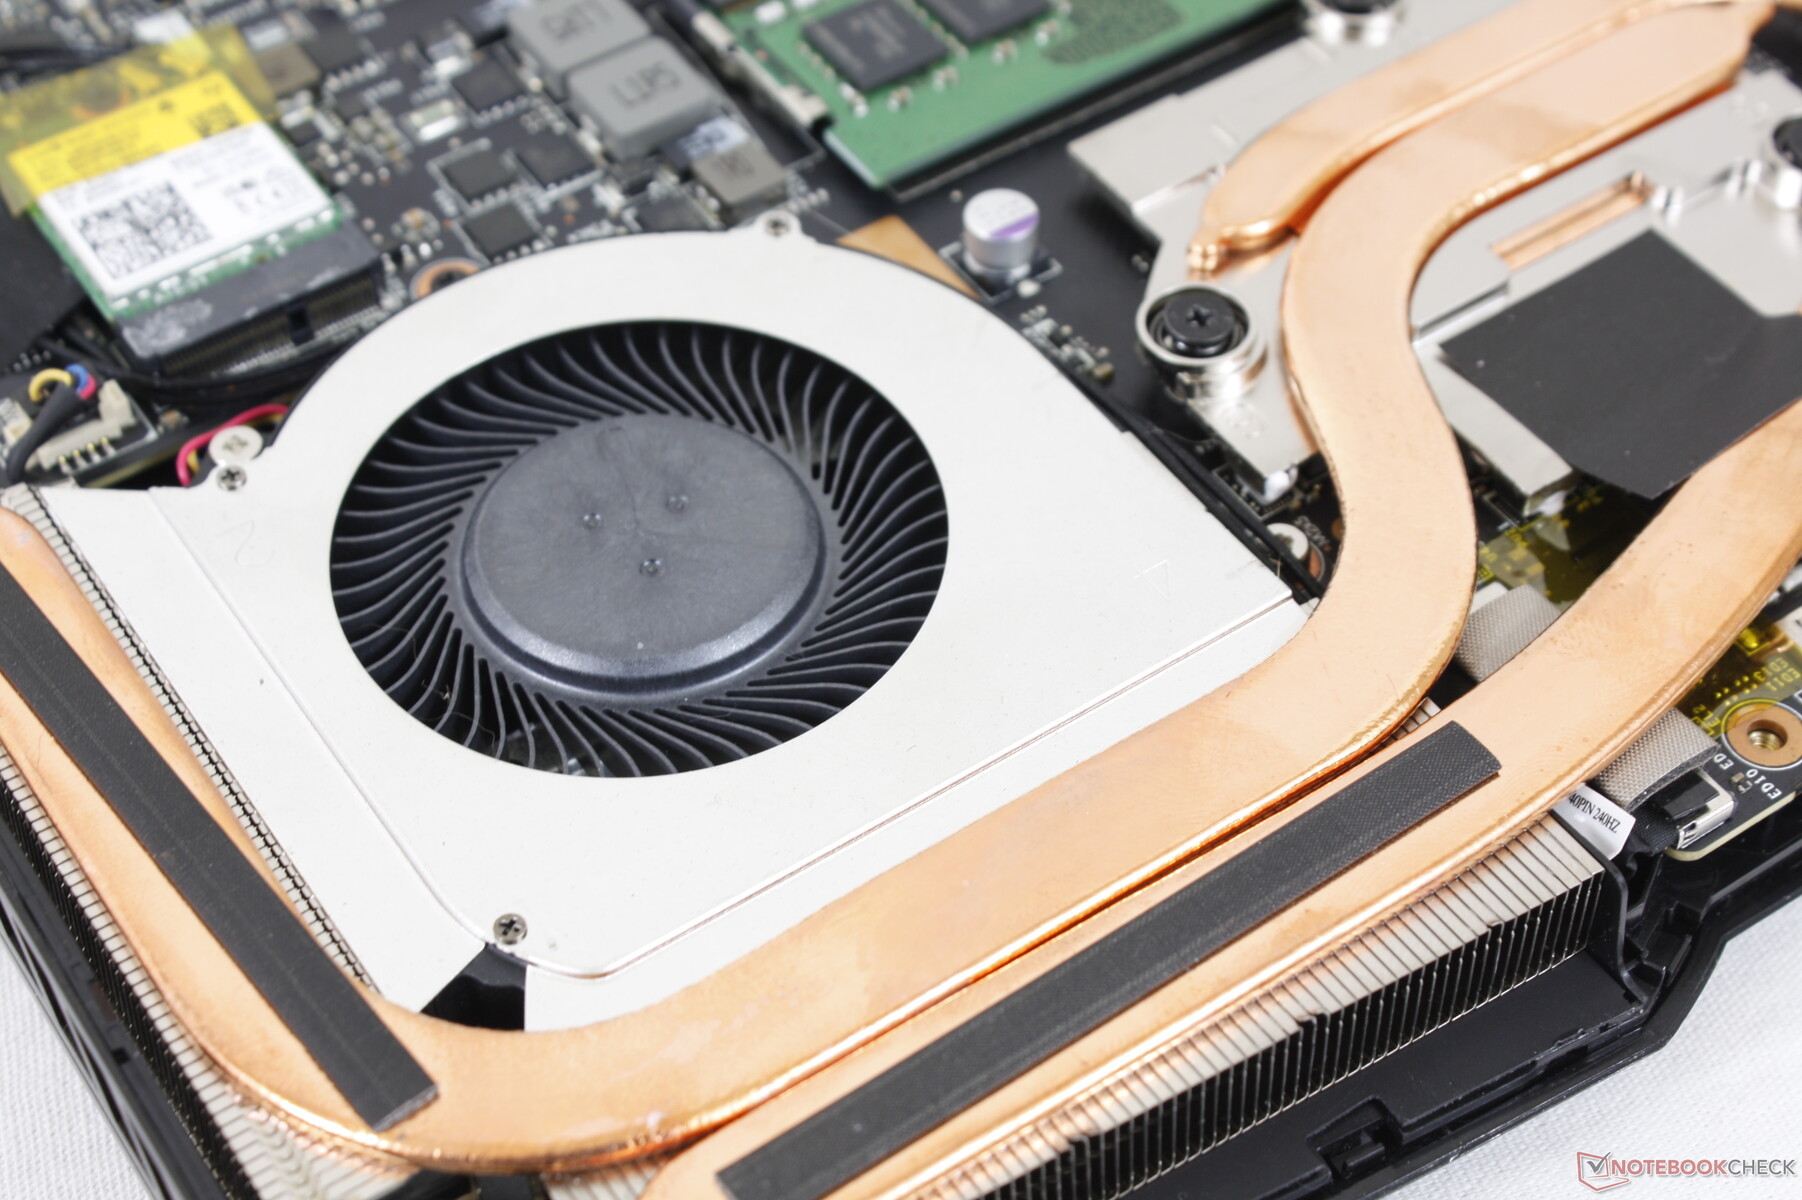
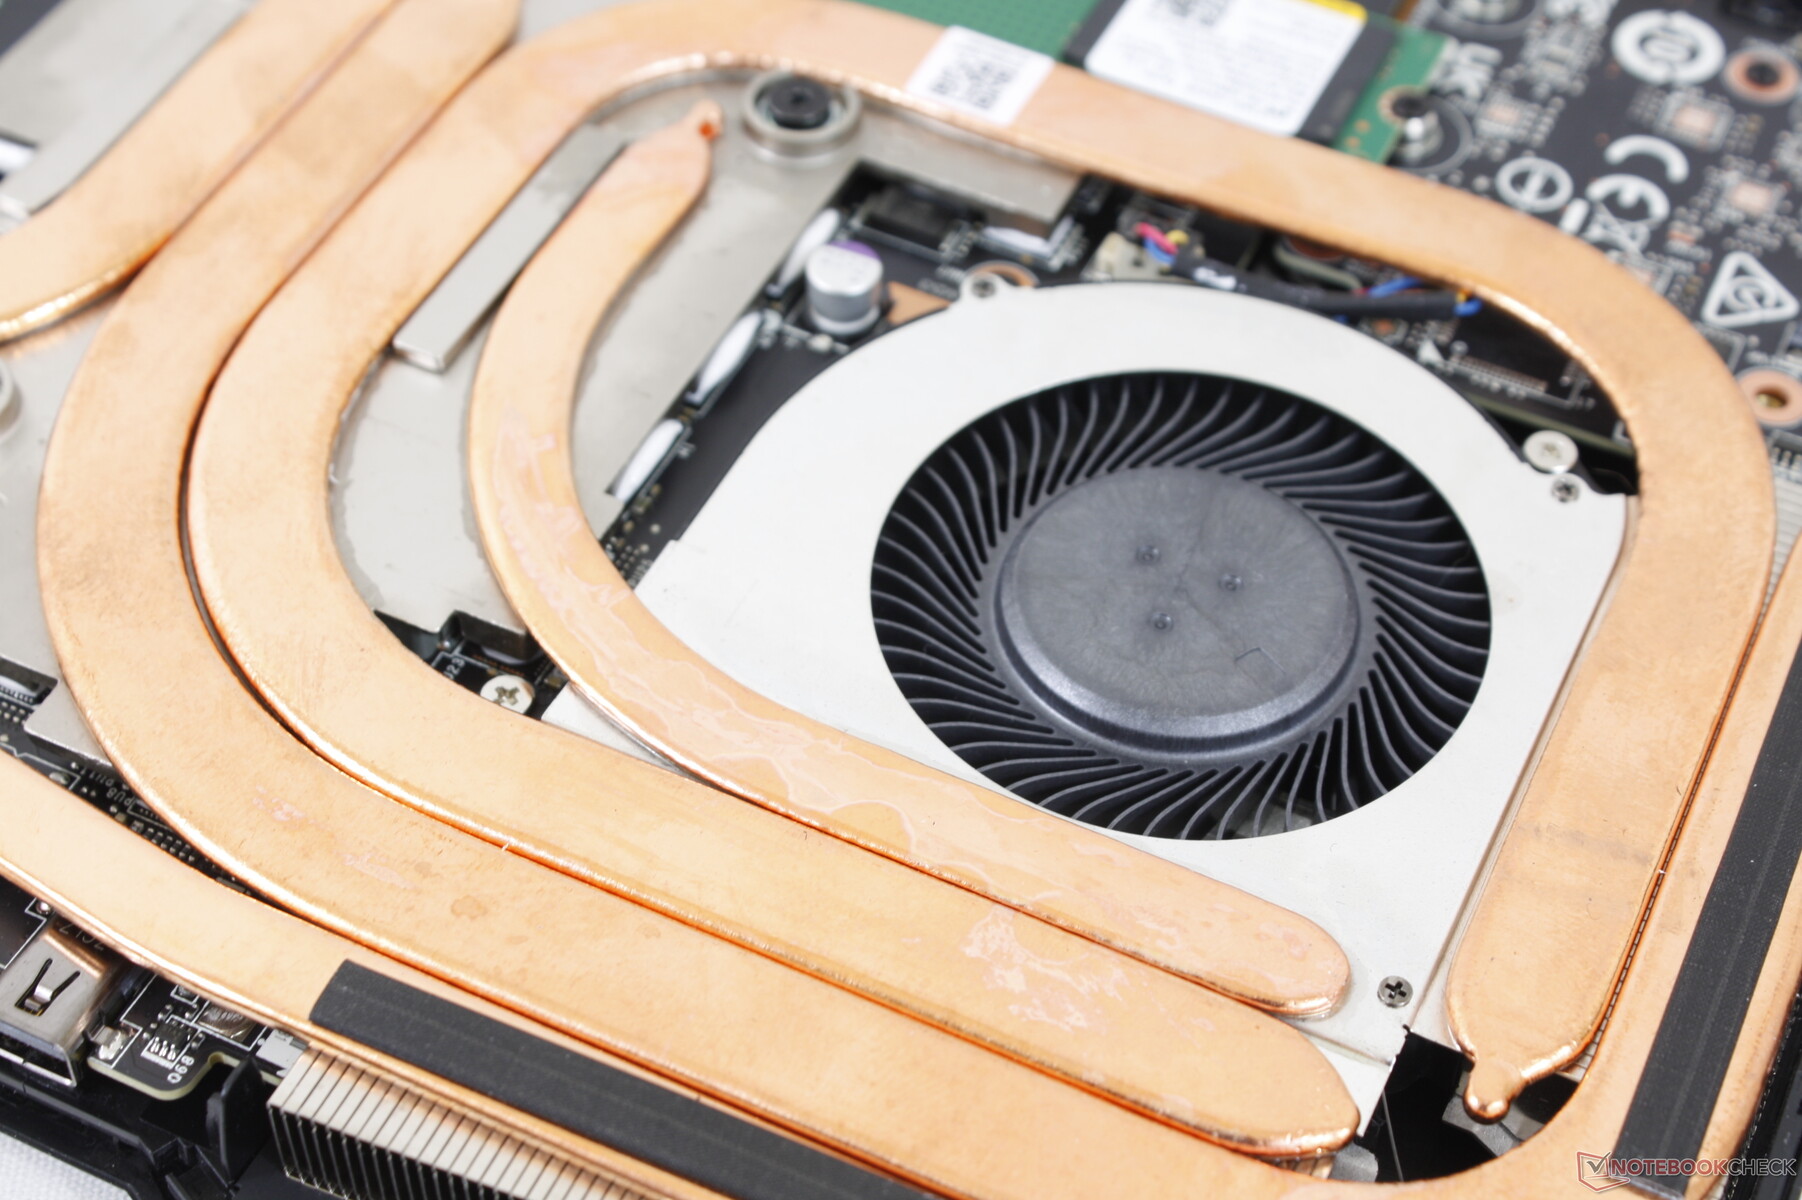
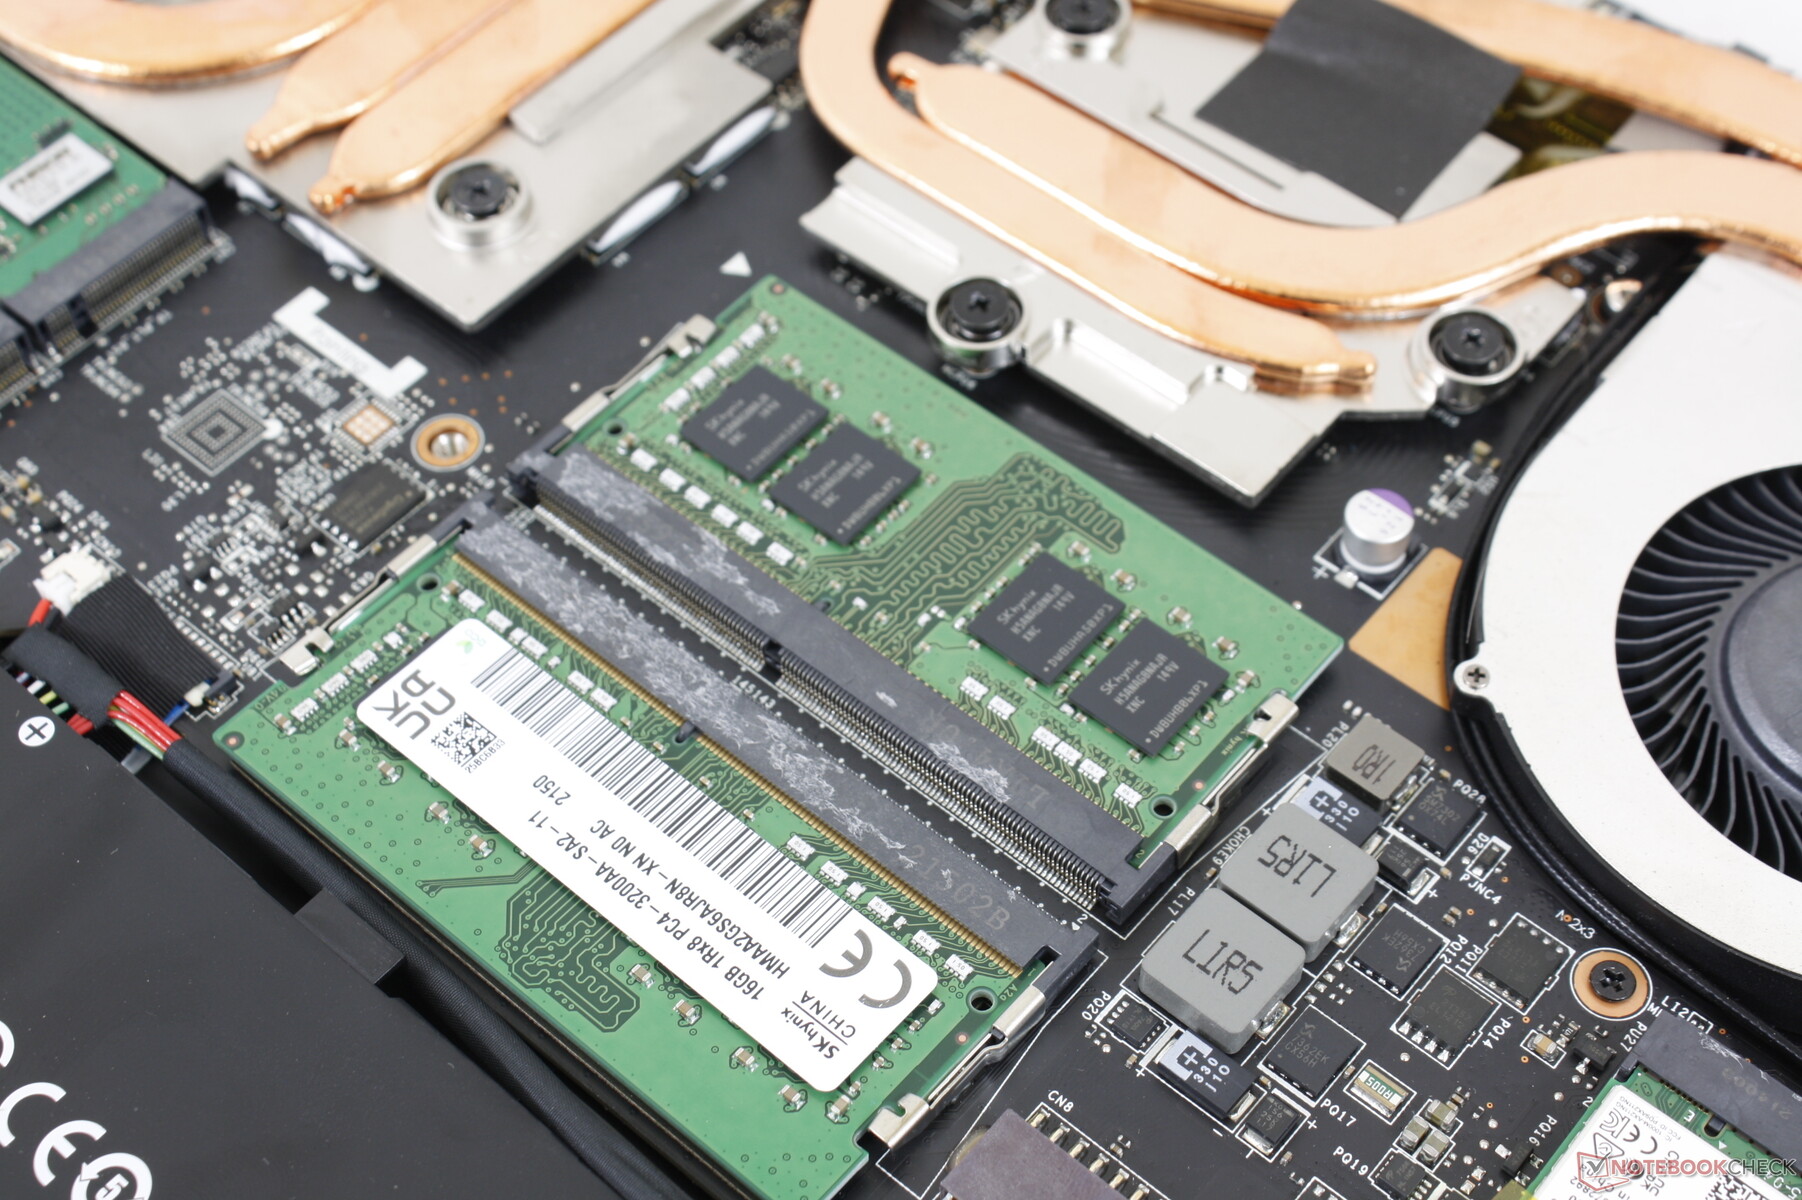
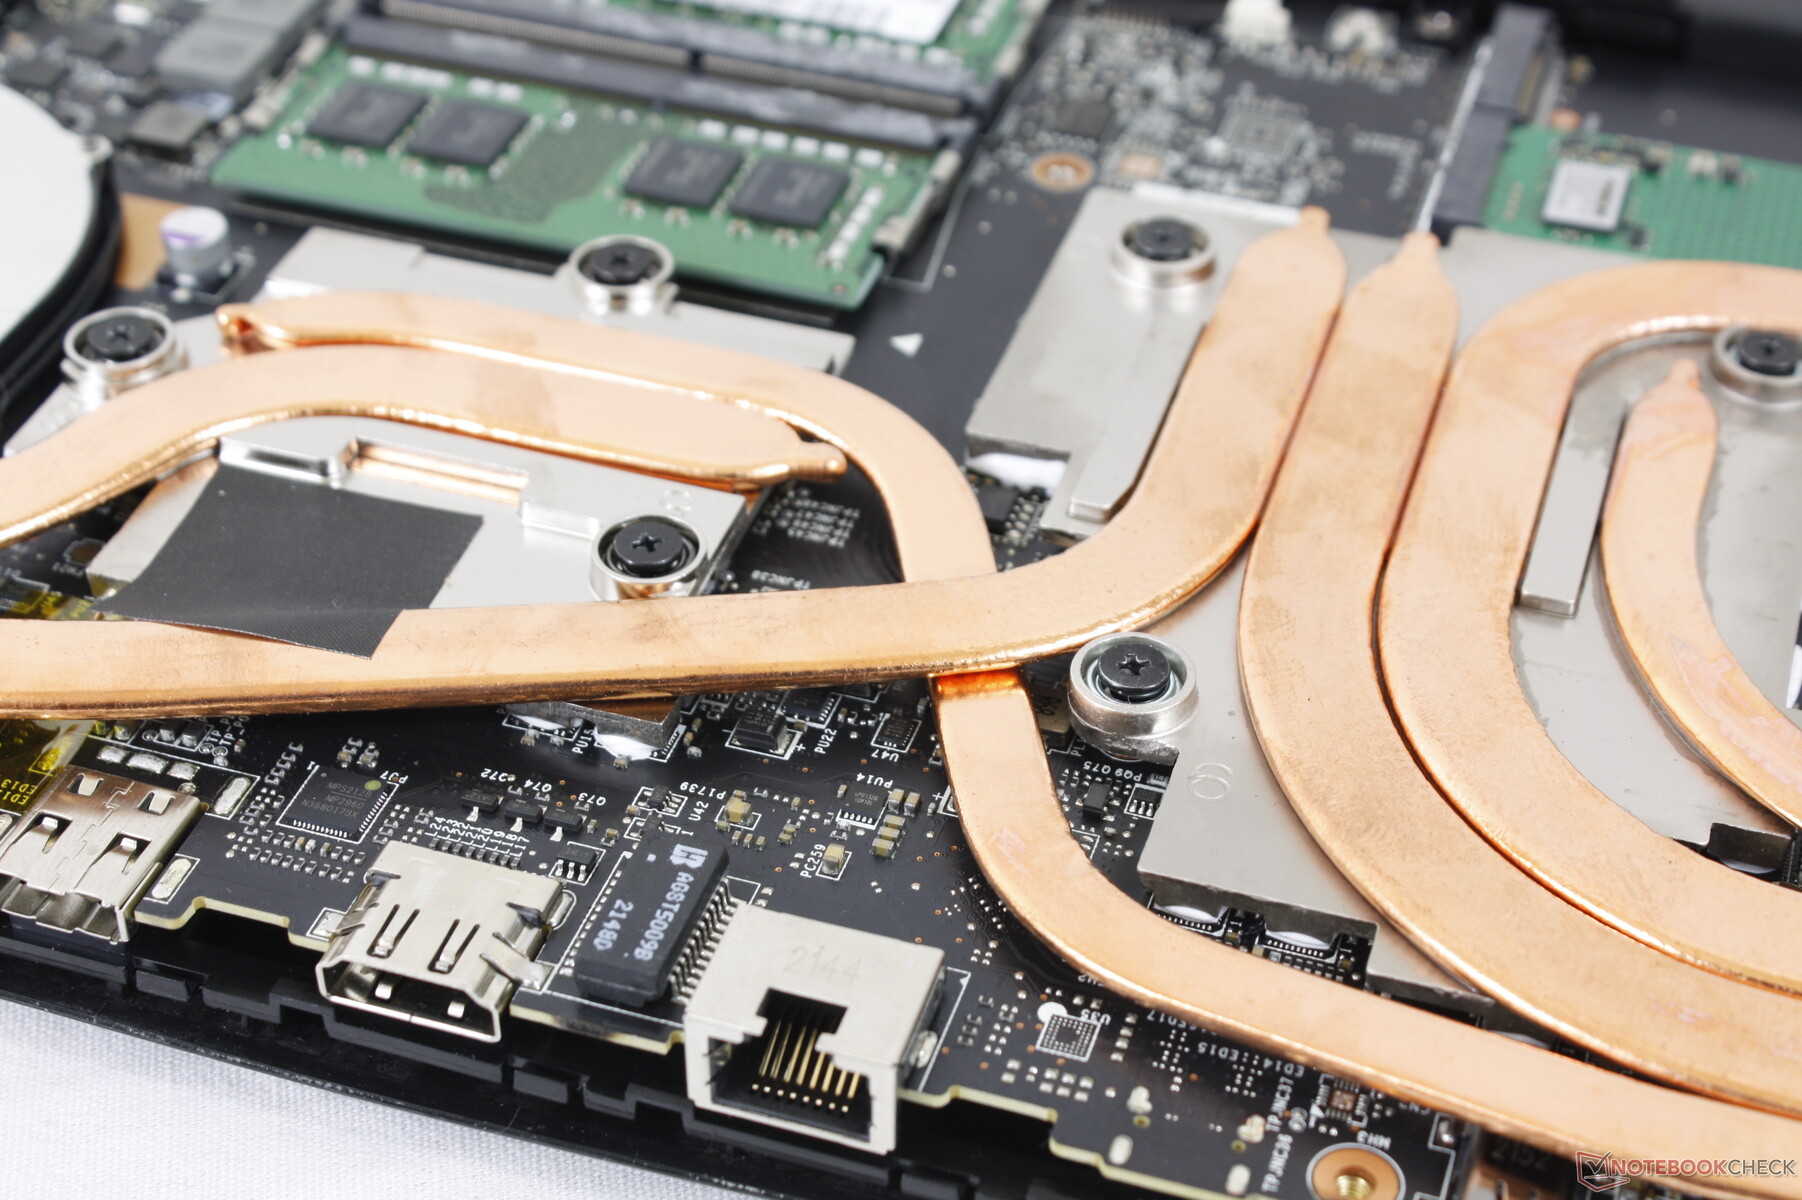
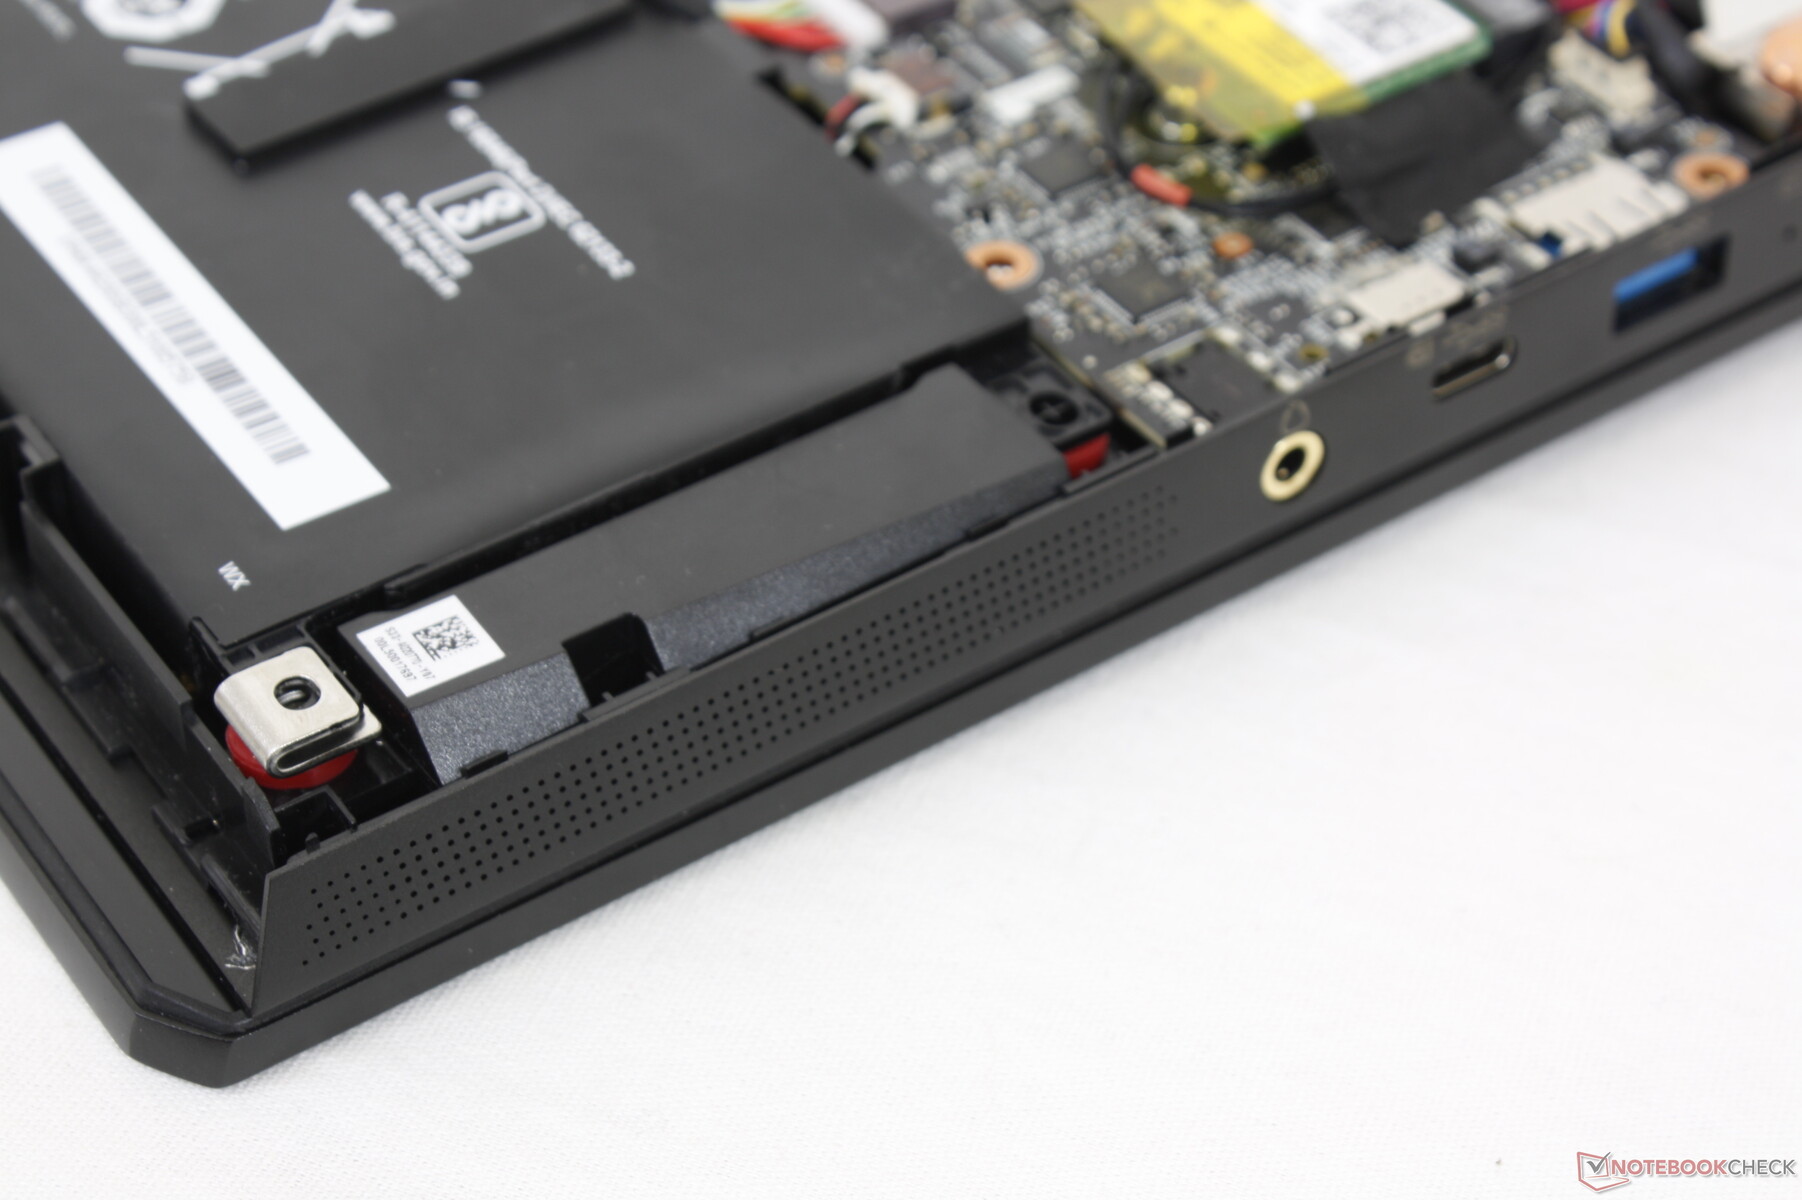
El panel inferior está asegurado por 11 tornillos Philips sin que haya ninguno debajo de ninguna base de goma para facilitar el mantenimiento. Sin embargo, hay que tener en cuenta que hay que romper una pegatina de "sello de fábrica".
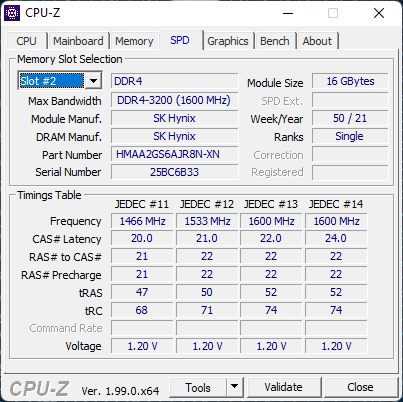
La distribución interna es esencialmente idéntica a la de la GP66 Leopard, como se muestra a continuación. Los usuarios tienen acceso directo a las dos ranuras SODIMM y a las dos ranuras M.2 2280 PCIe4 x4. Los portátiles de gama alta como elGM7AG8P pueden venir con soporte para una memoria RAM DDR5 más rápida.
Accesorios y garantía
No hay más extras en la caja que el adaptador de CA o la documentación. Se aplica la garantía limitada habitual de un año en los Estados Unidos
Dispositivos de entrada
Teclado y panel táctil
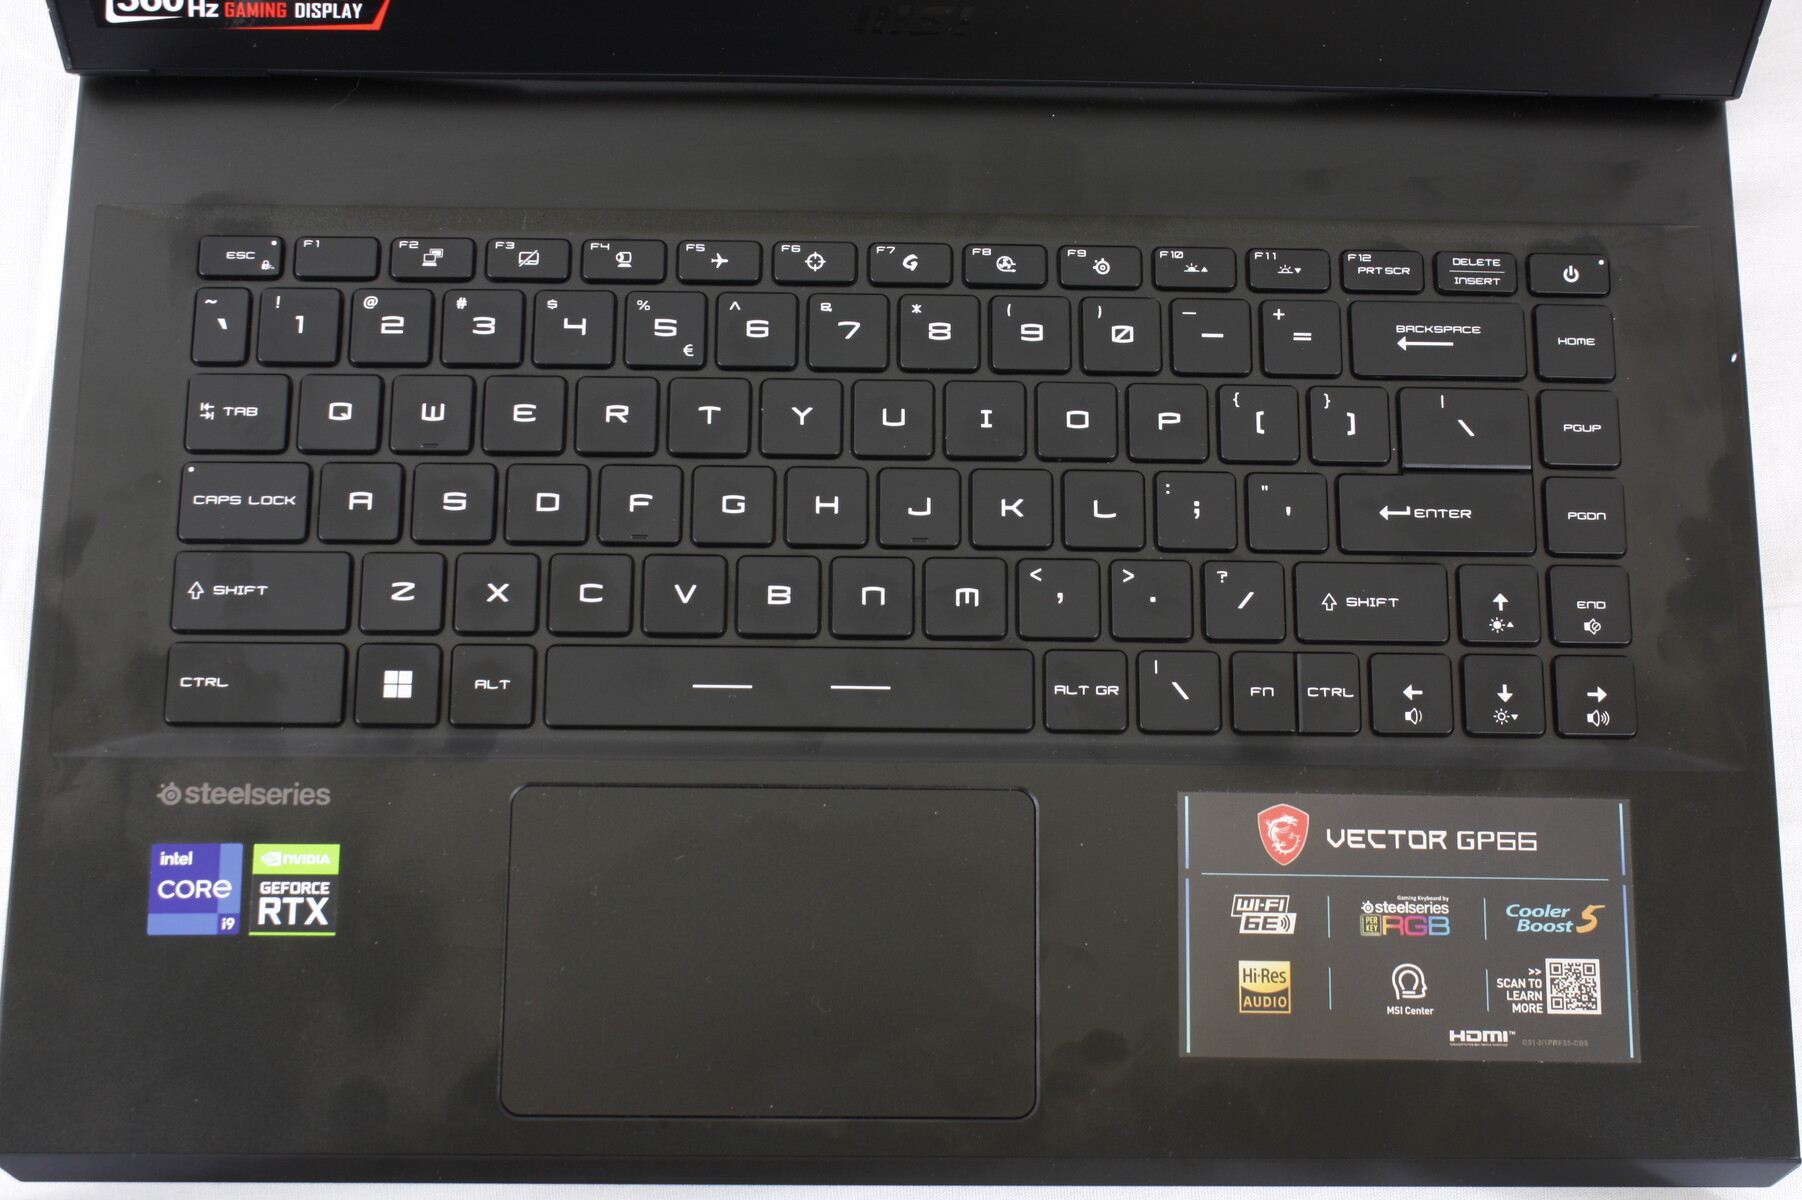
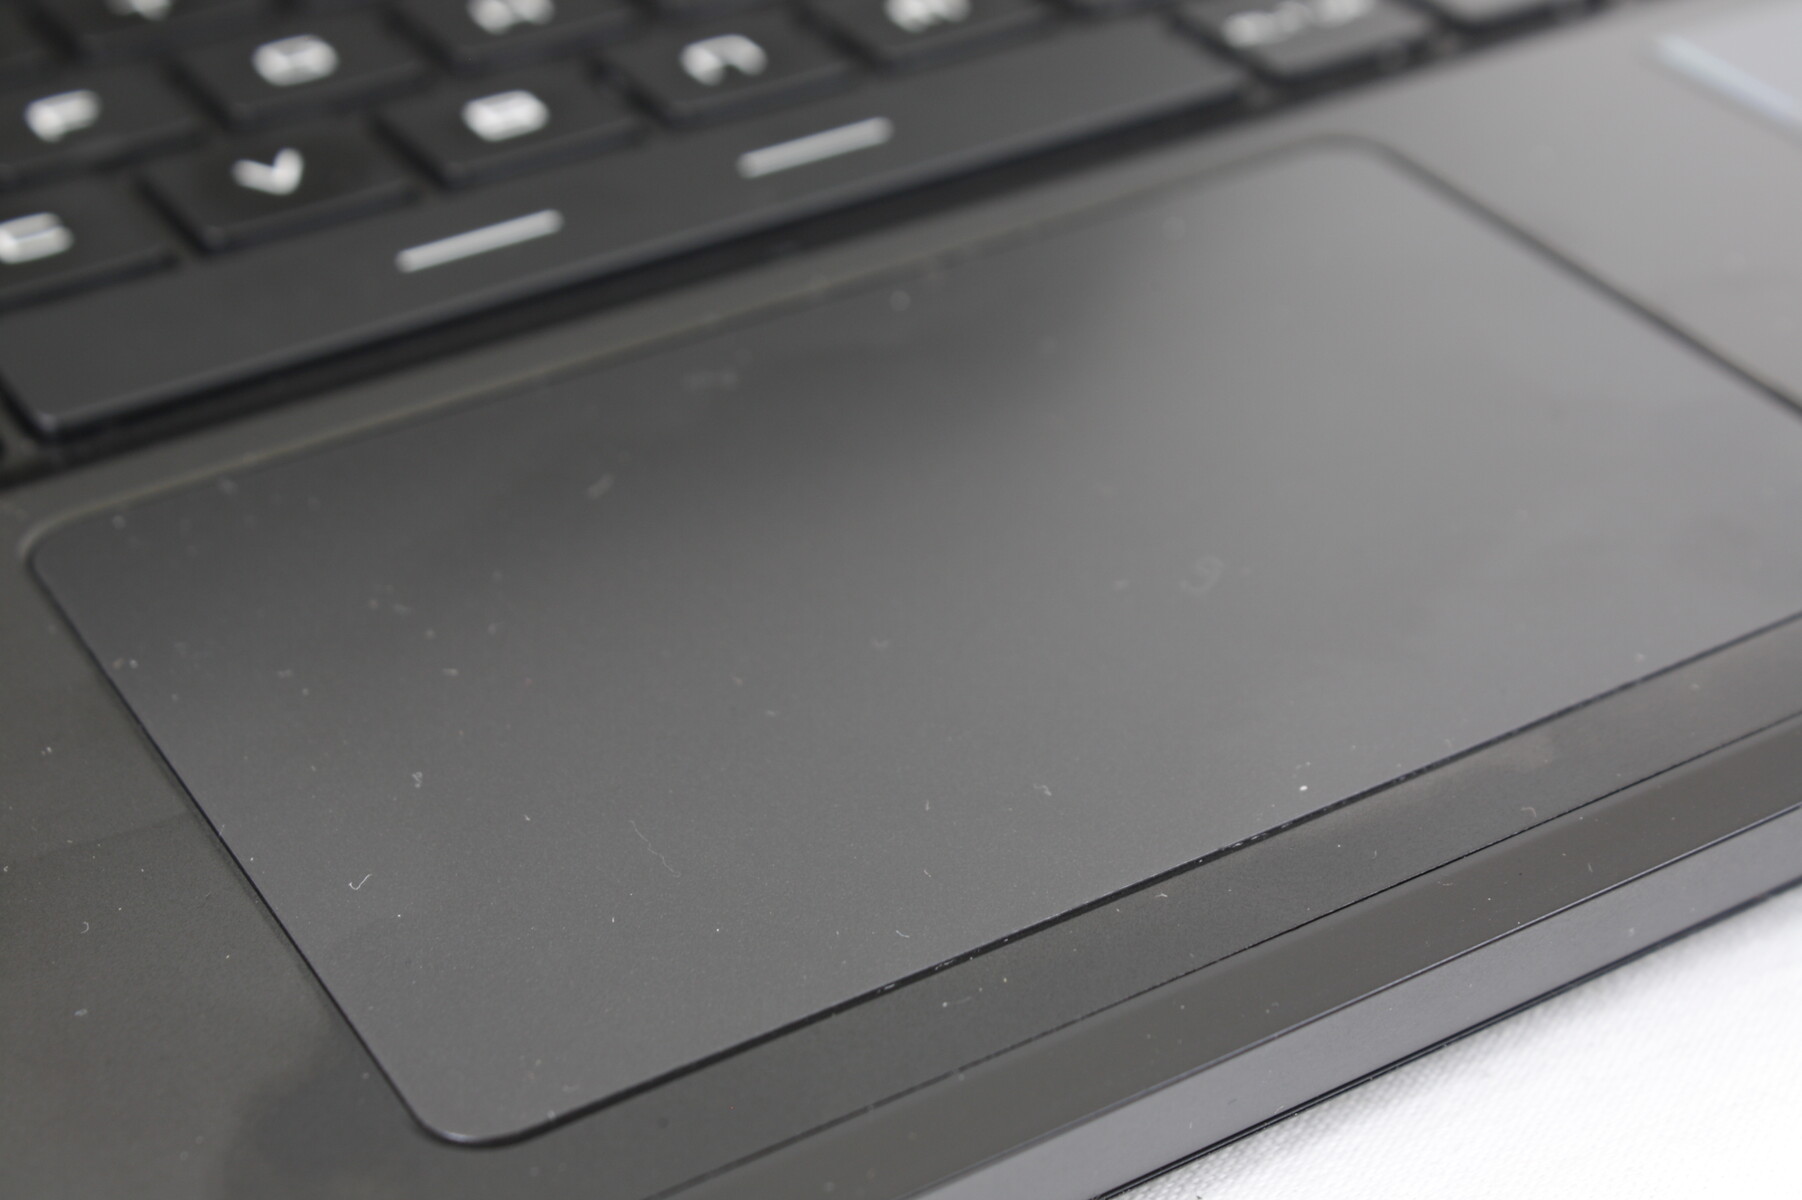
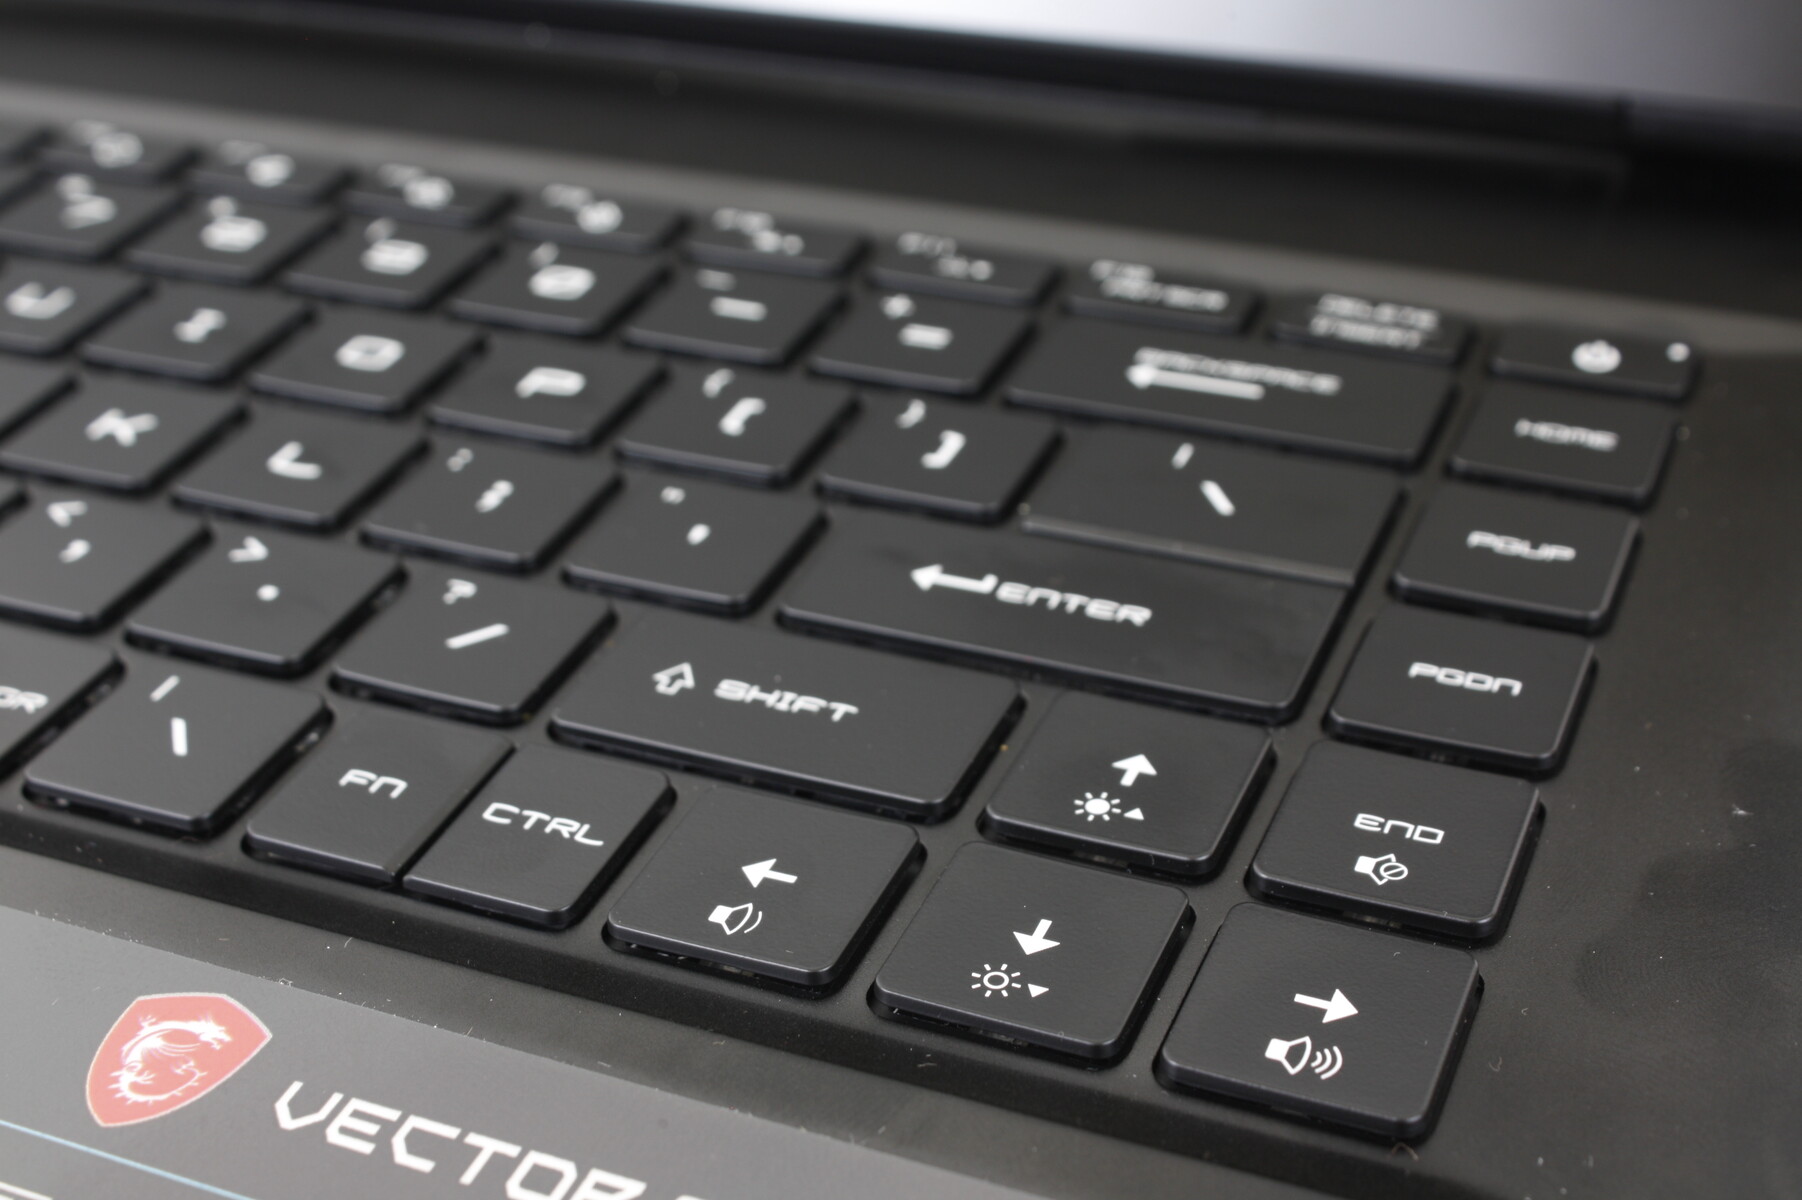
El teclado con iluminación RGB por tecla y el clickpad (10,5 x 6,5 cm) se mantienen sin cambios respecto al original 2020 GP66 Leopard. Aunque la experiencia de tecleo es satisfactoria si no un poco en el lado suave, hacer clic en el clickpad sigue siendo demasiado esponjoso. El control del cursor era más fácil en la antigua GP65 ya que integraba botones físicos de ratón que se eliminaron al pasar al diseño de la GP66.

Mostrar
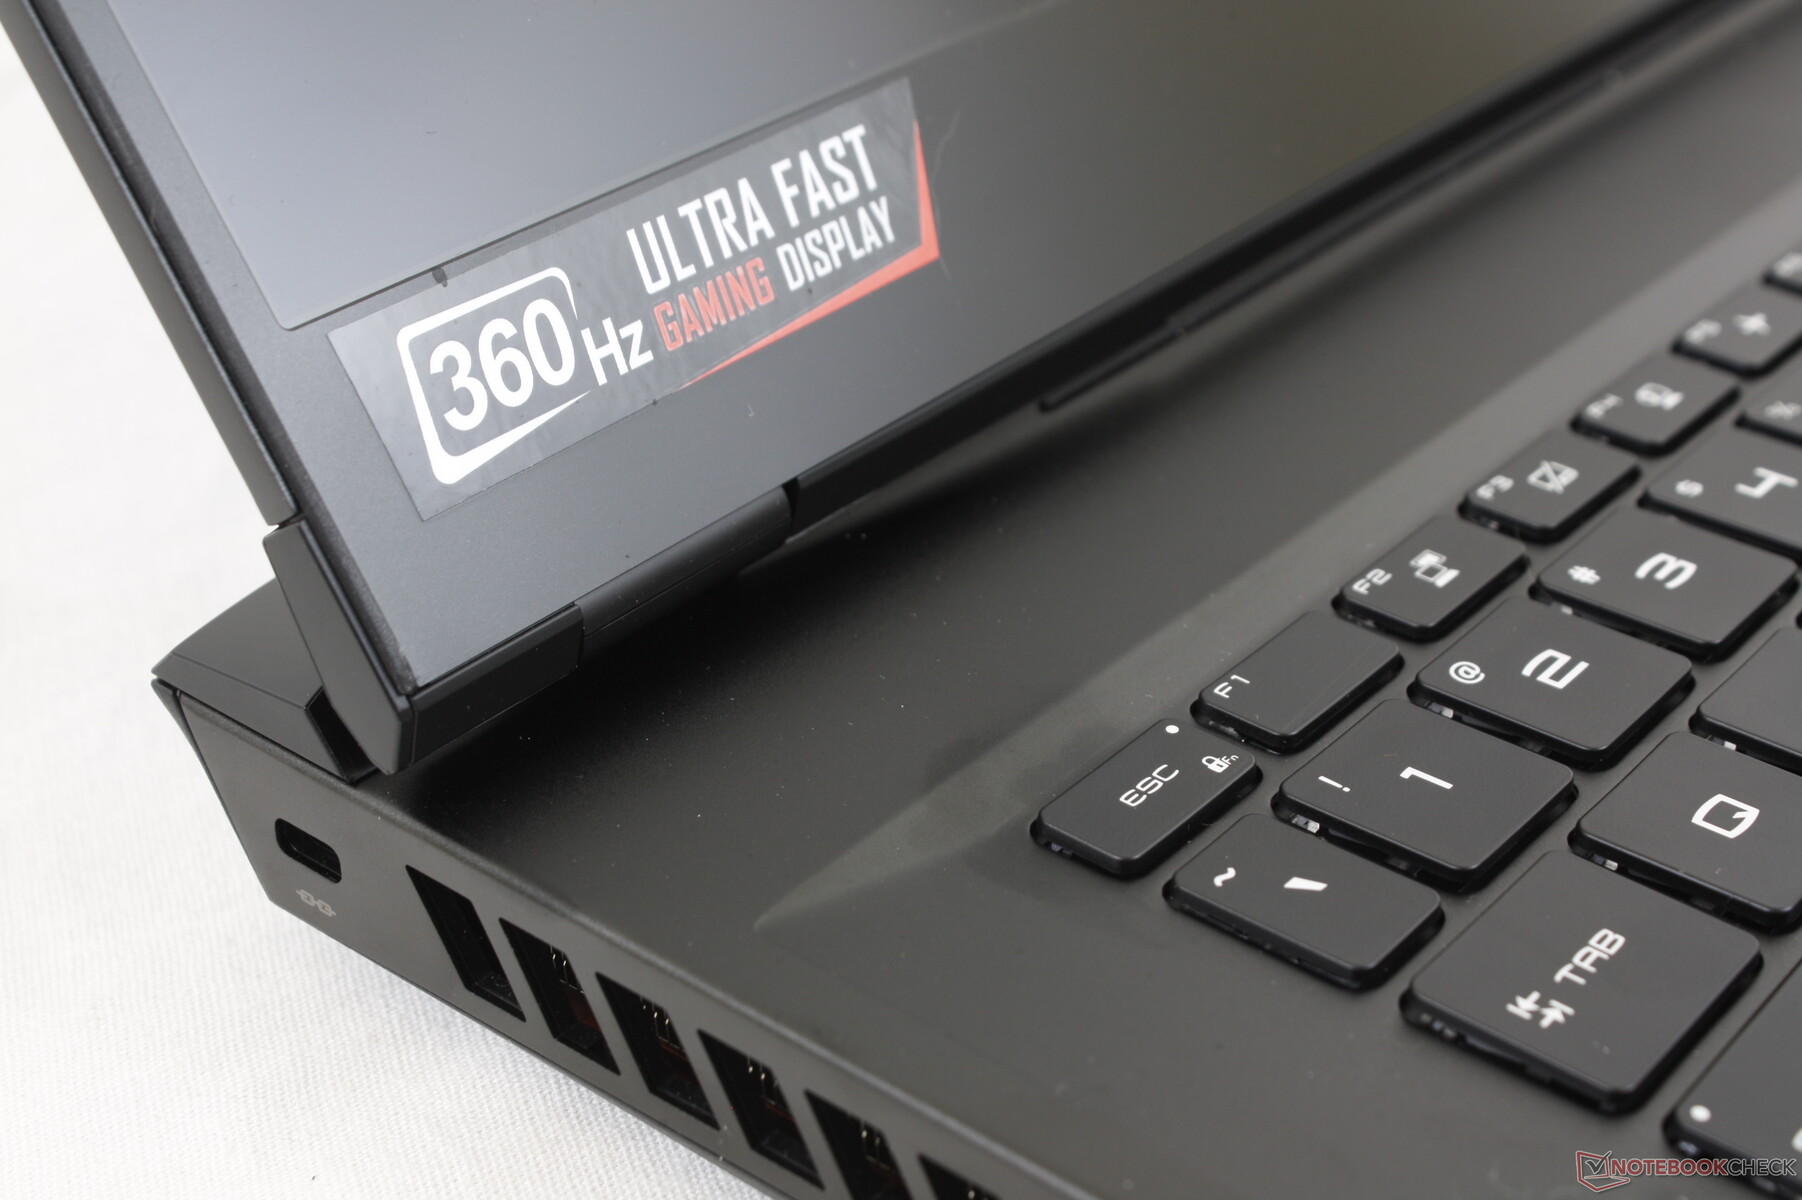
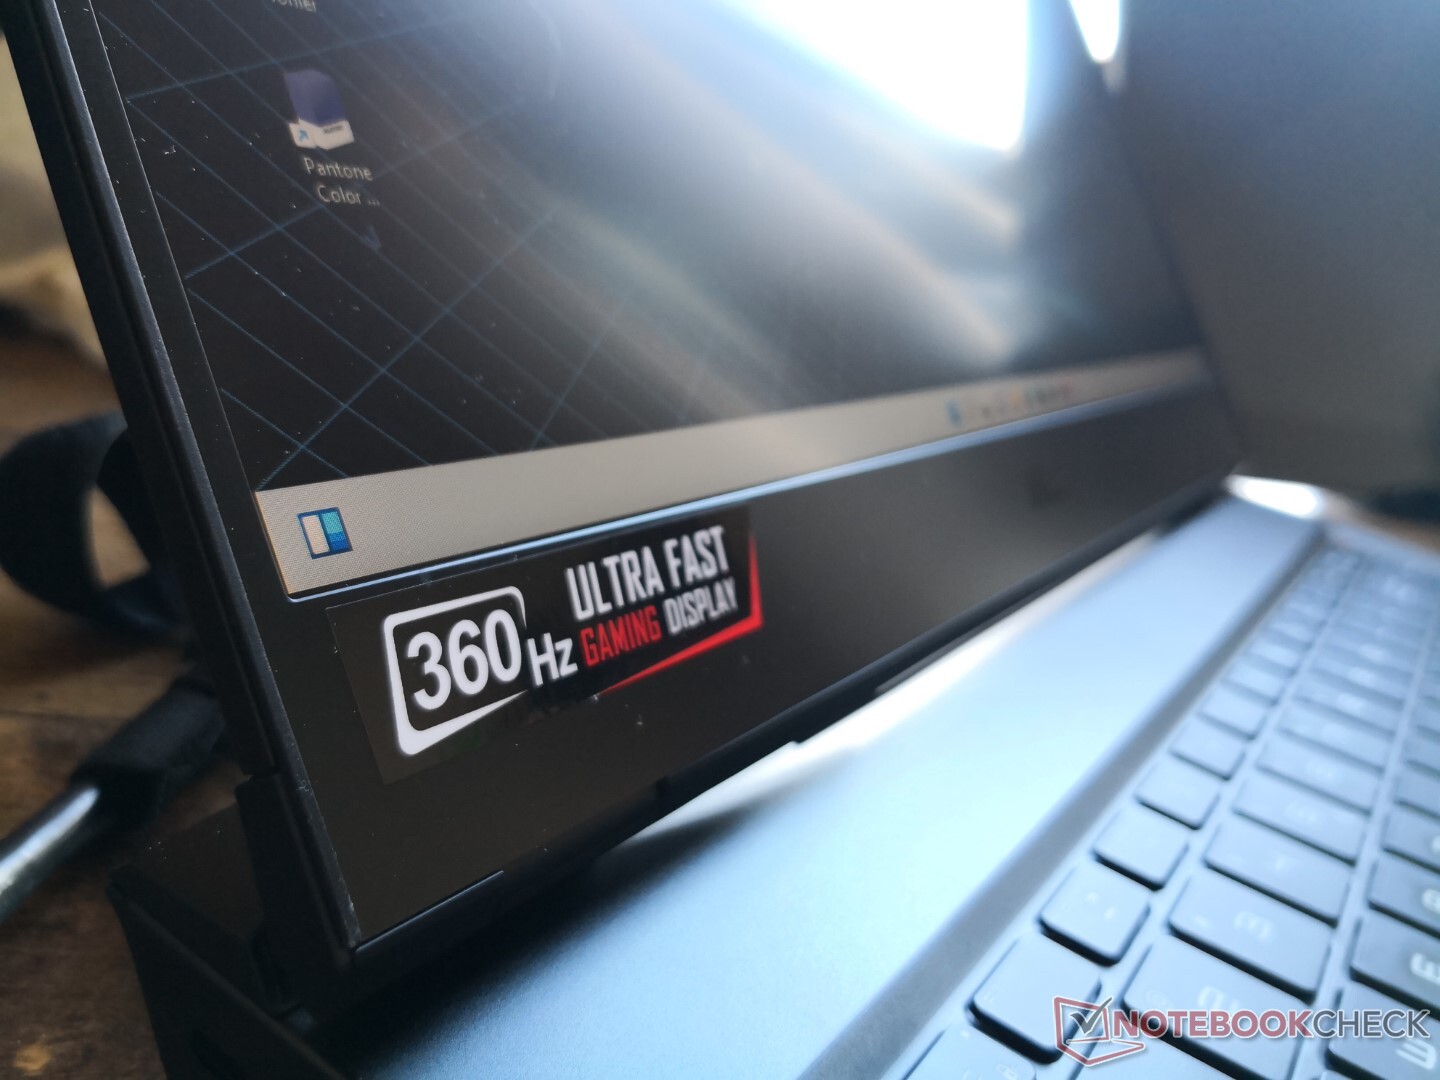
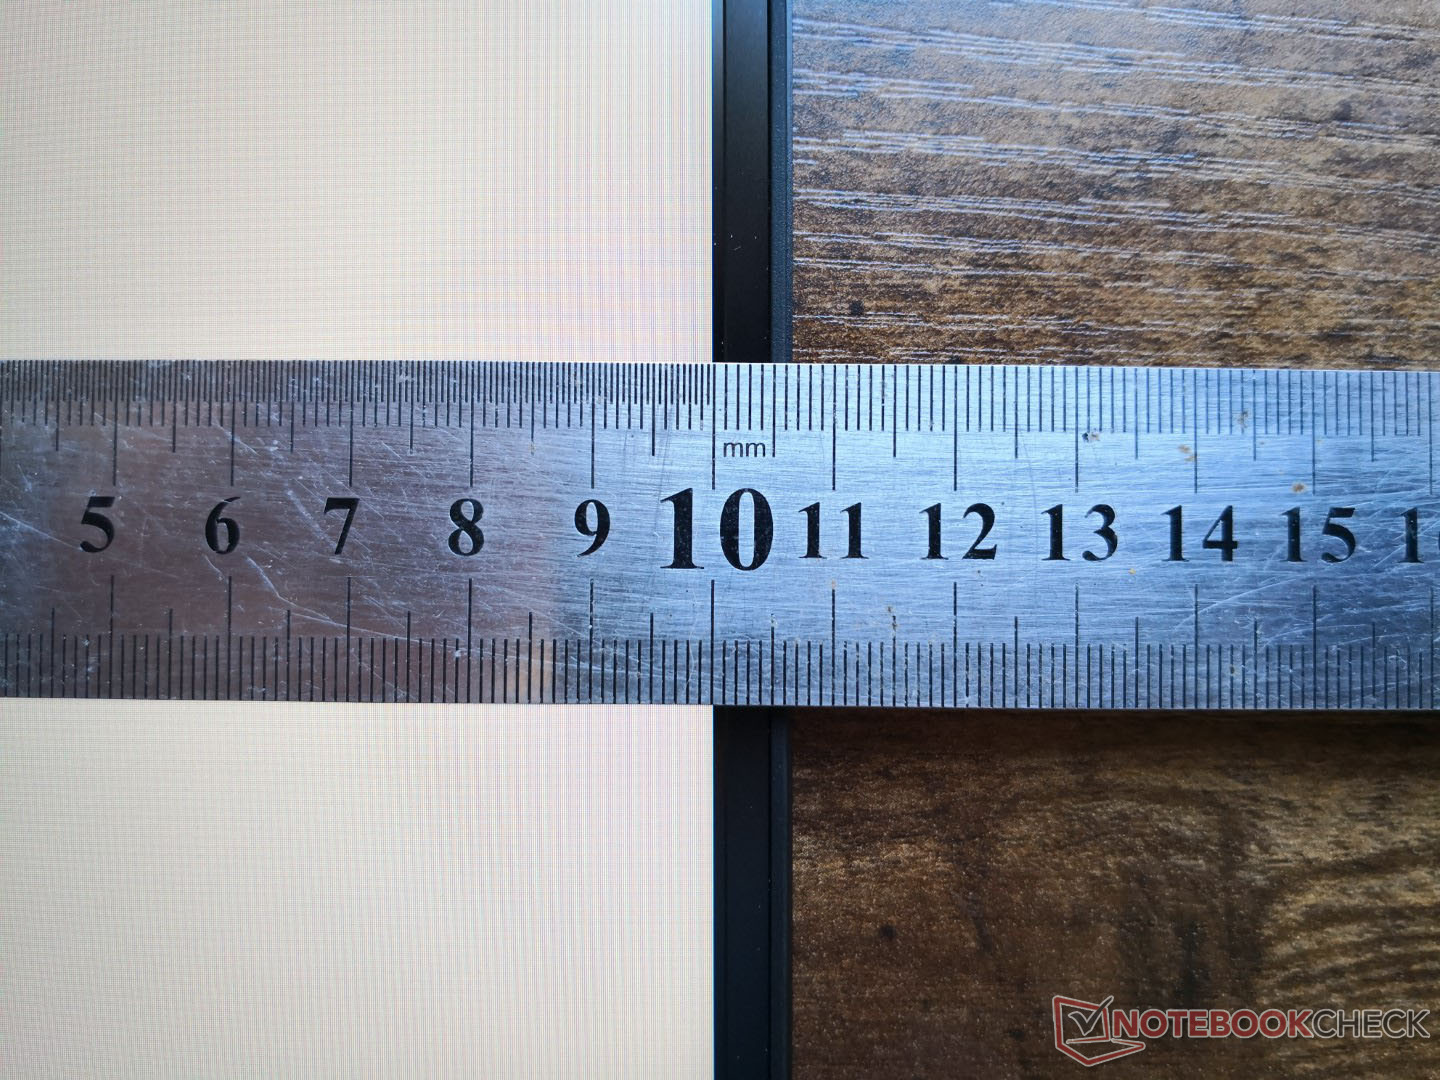
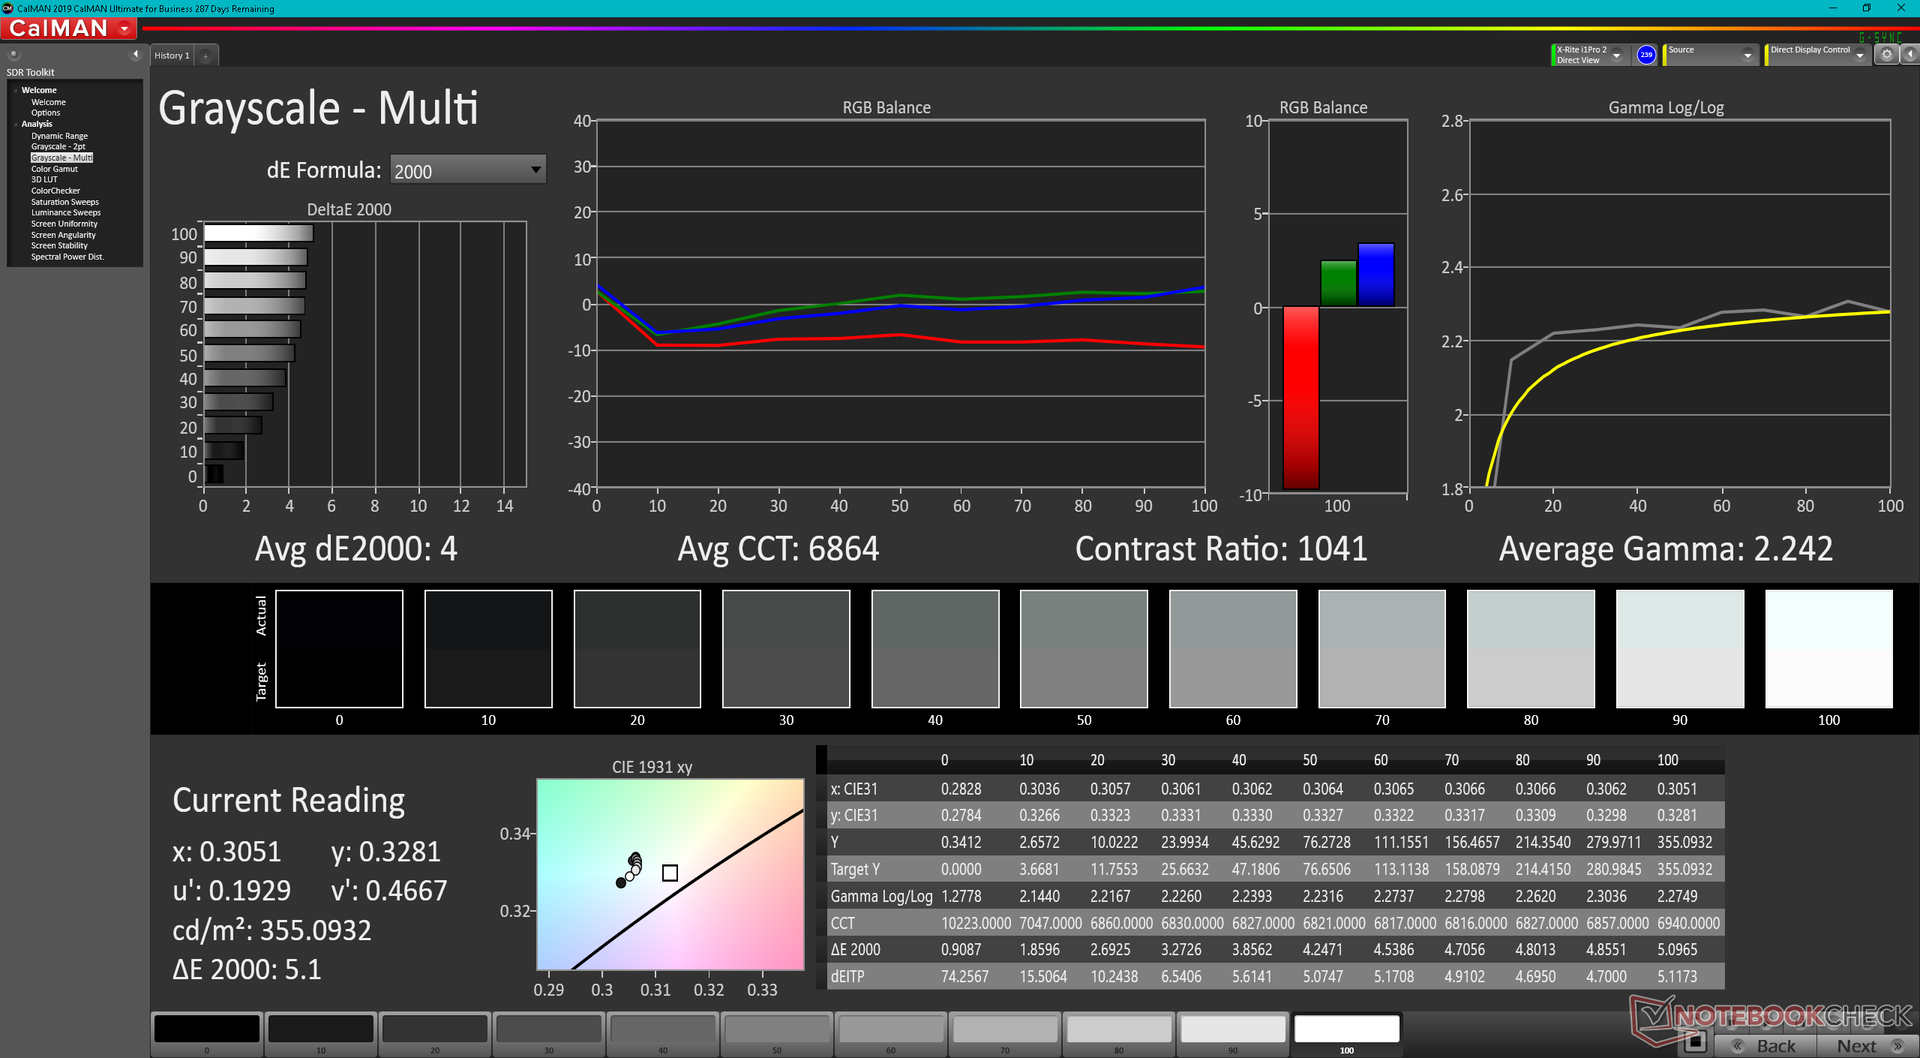
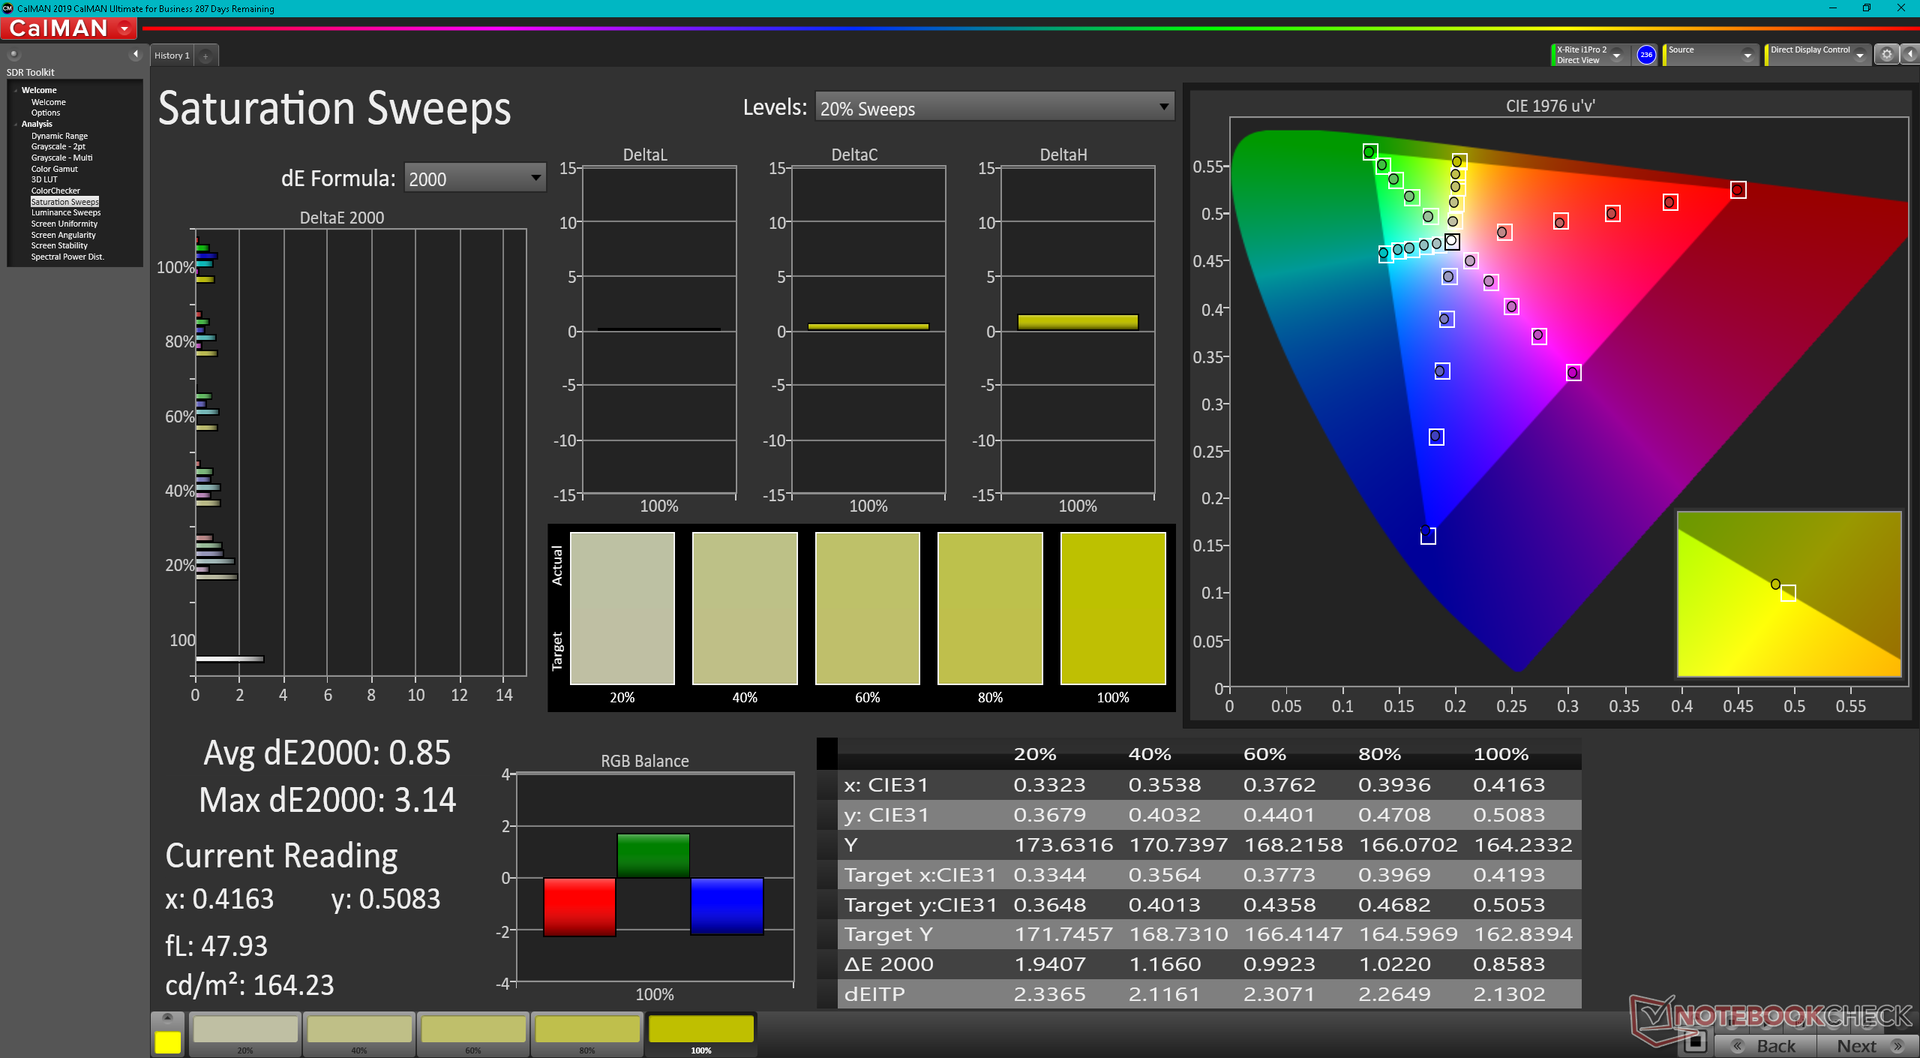
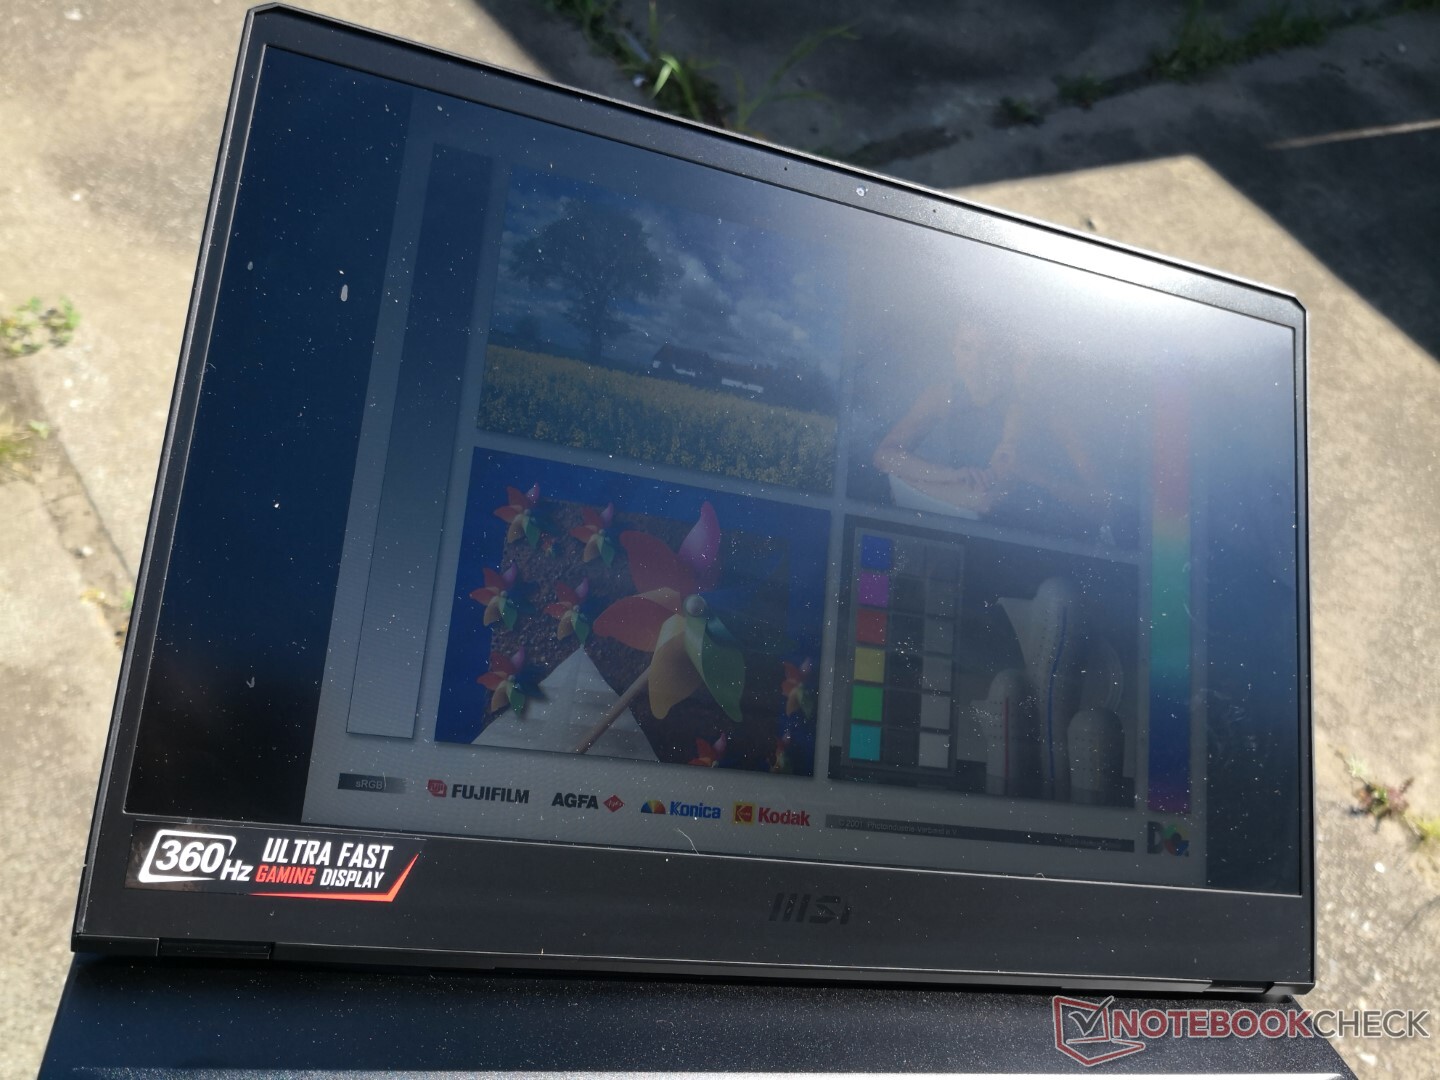
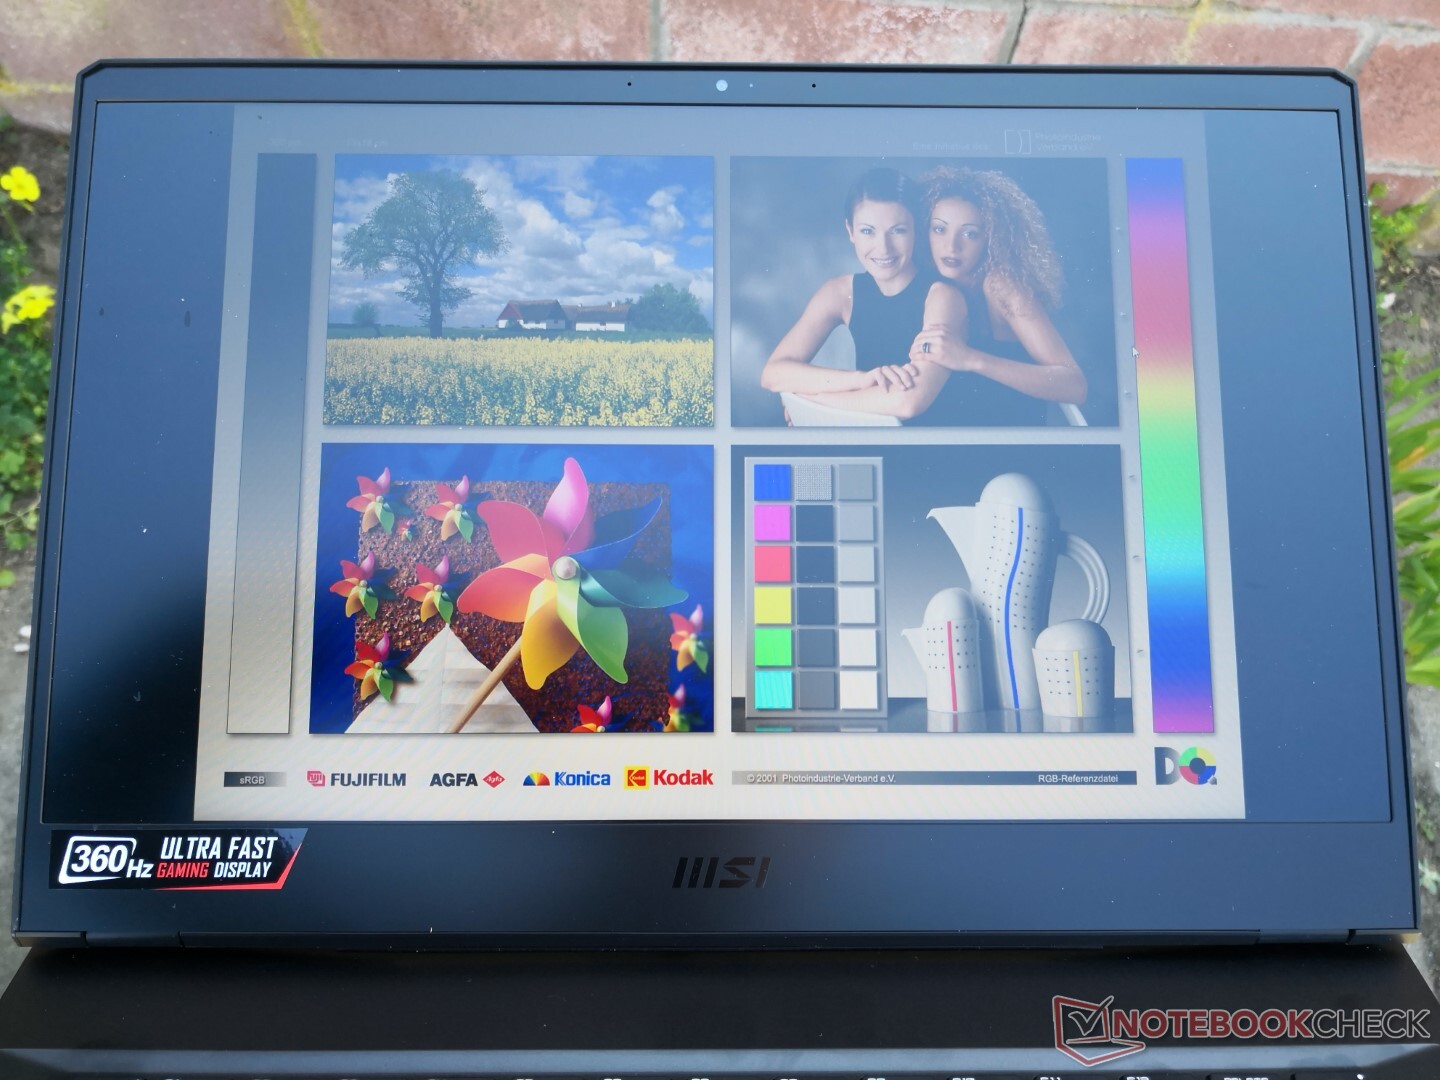
El Vector GP66 es el primer portátil de nuestra base de datos que viene con el panel IPS BOE NE156FHM-NZ3 de 360 Hz en contraste con el panel IPS LG LP156WFG-SPB3 de 144 Hz de nuestro antiguo GP66 Leopard. El panel BOE ofrece tanto frecuencias de actualización más rápidas como tiempos de respuesta de gris a gris, manteniendo la misma cobertura sRGB completa y relación de contraste que el panel LG antes mencionado. El brillo máximo es ligeramente inferior, pero no por márgenes notables. Es un panel de gama alta apto para un PC de juegos de gama media alta.
Hay que tener en cuenta que MSI también ofrece una opción más lenta de 144 Hz en las versiones más baratas del Vector GP66. Los colores en este panel de 144 Hz son significativamente peores con sólo ~60 por ciento de sRGB, por lo que puede ser prudente evitar estas unidades si la calidad de la pantalla es una prioridad.

| |||||||||||||||||||||||||
iluminación: 85 %
Brillo con batería: 353.1 cd/m²
Contraste: 929:1 (Negro: 0.38 cd/m²)
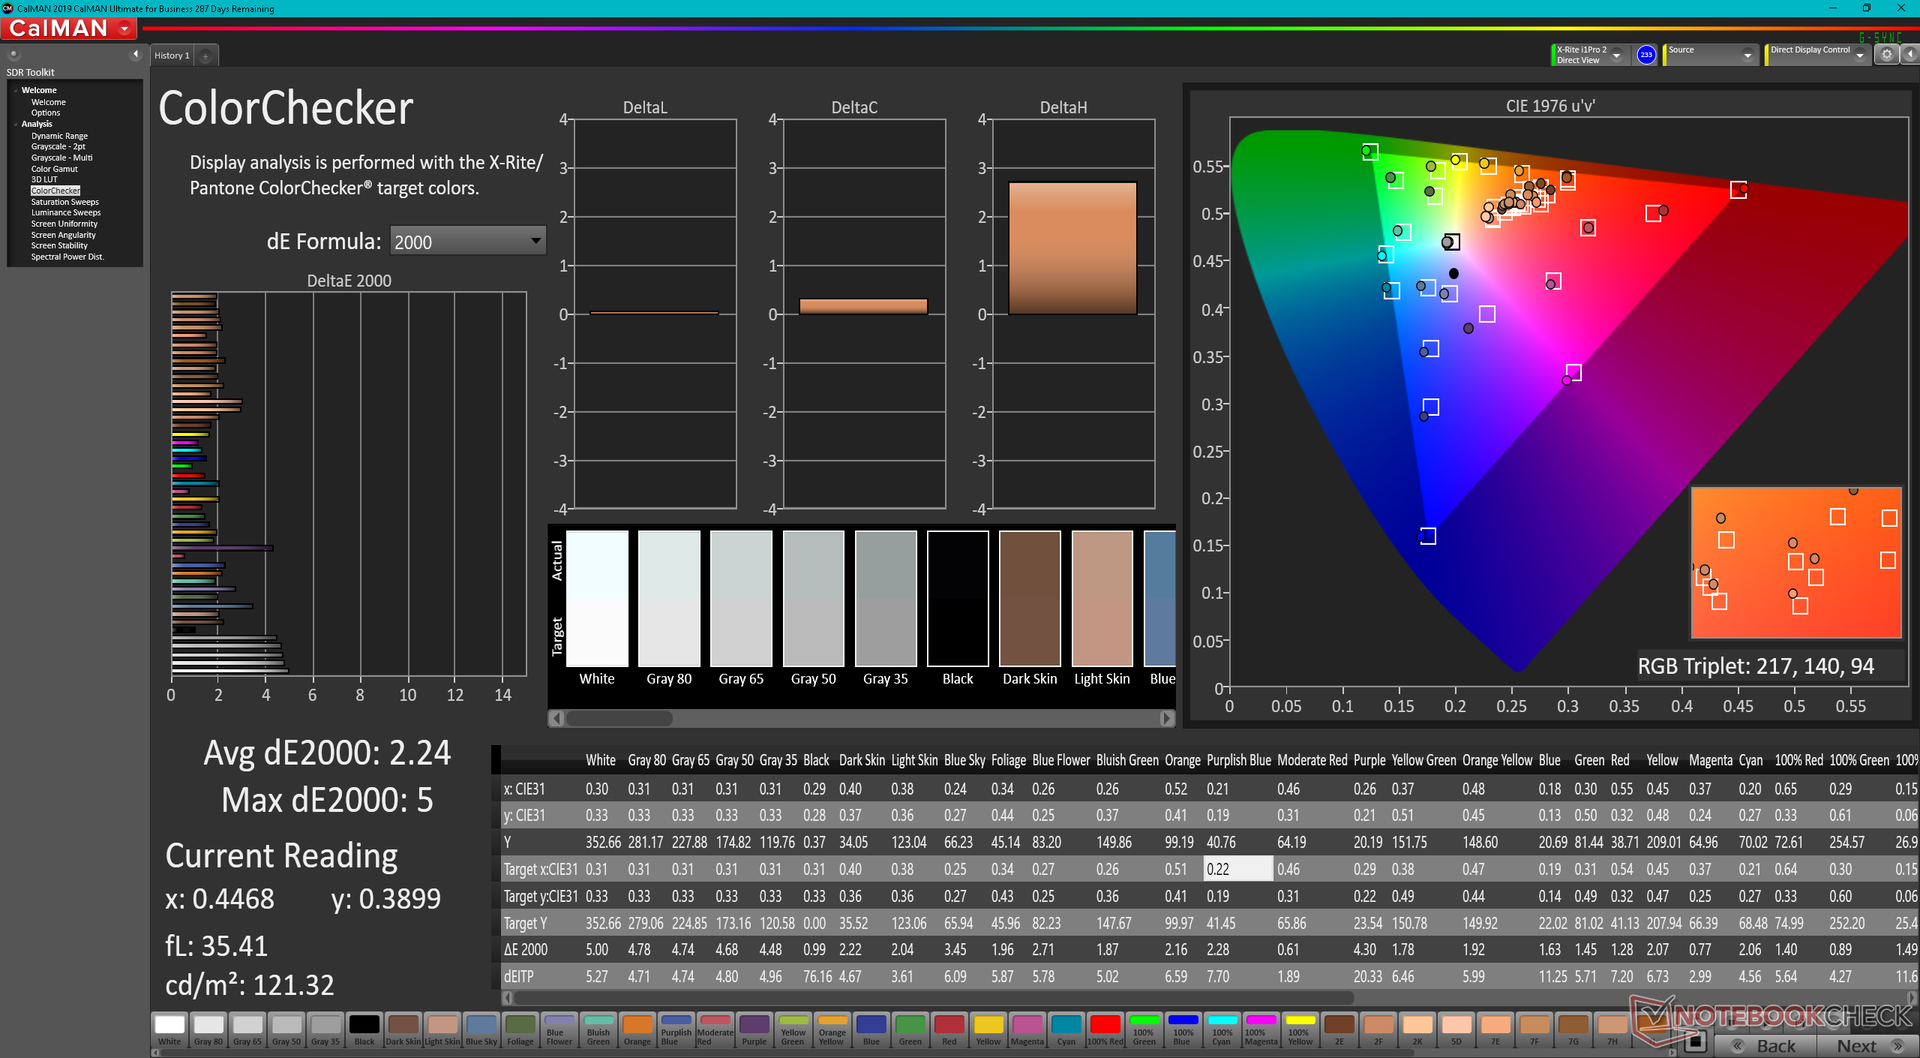
ΔE ColorChecker Calman: 2.24 | ∀{0.5-29.43 Ø4.71}
calibrated: 1.02
ΔE Greyscale Calman: 4 | ∀{0.09-98 Ø4.96}
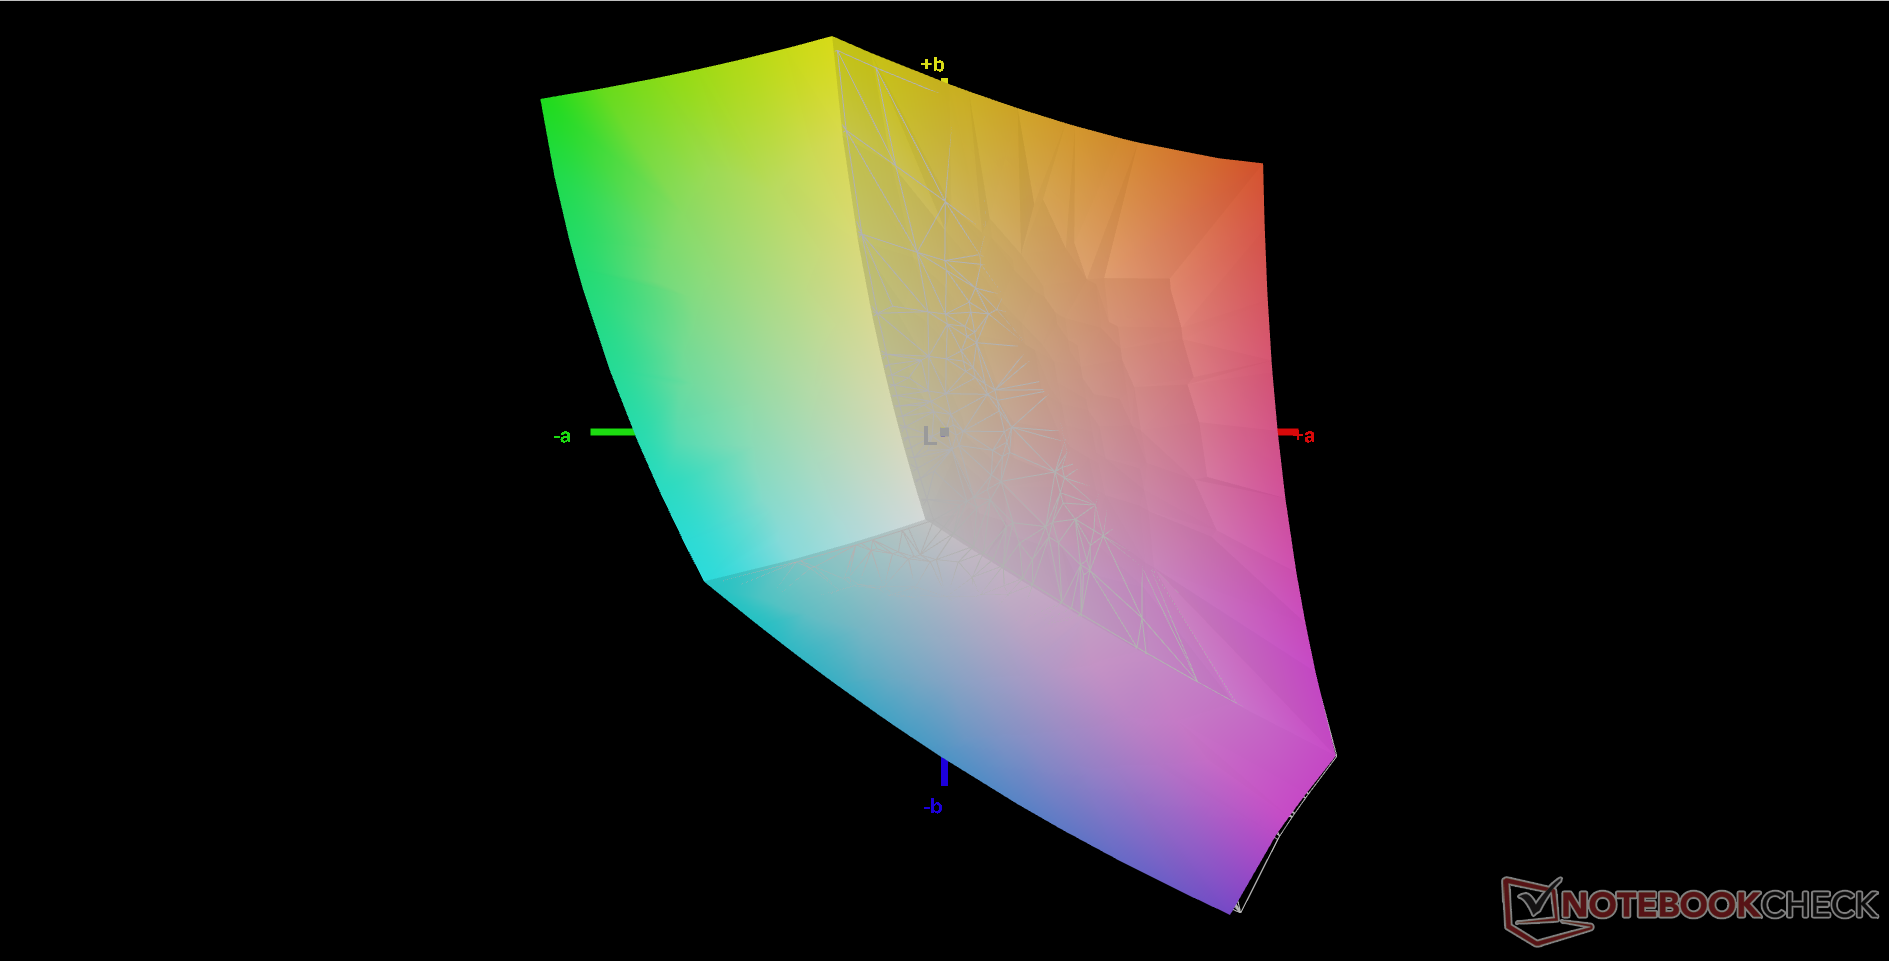
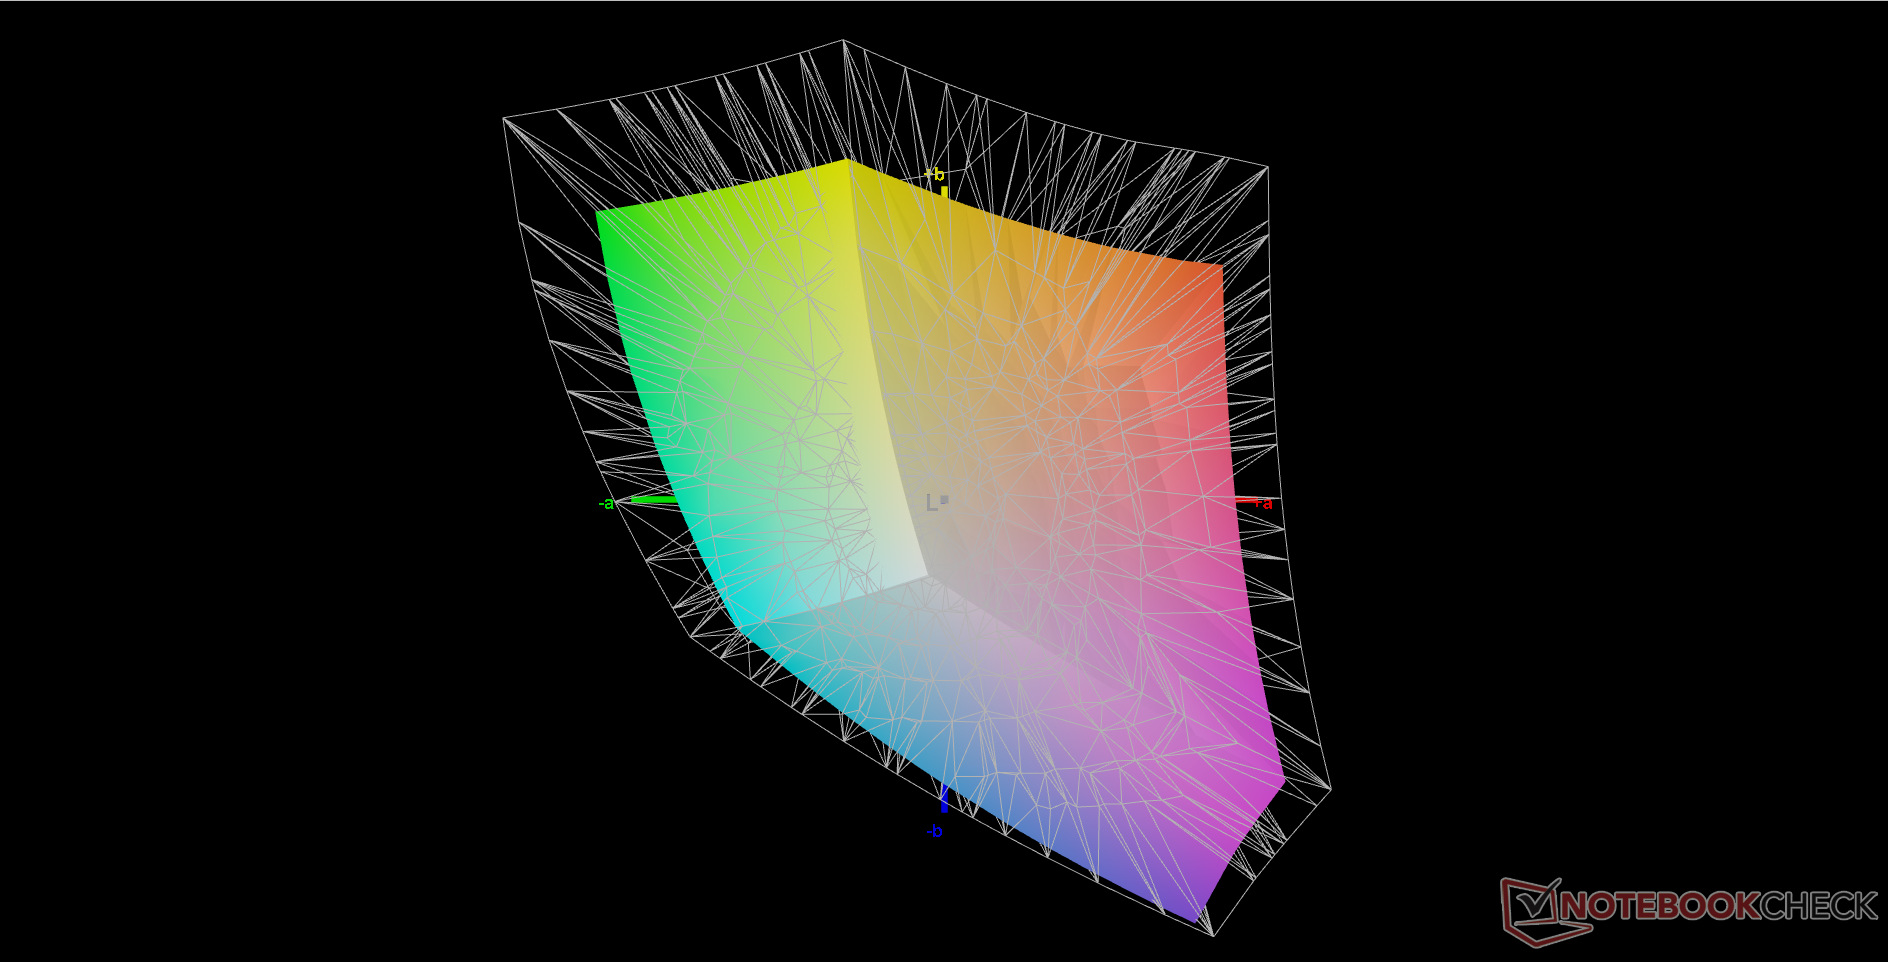
72.1% AdobeRGB 1998 (Argyll 3D)
99.5% sRGB (Argyll 3D)
70.1% Display P3 (Argyll 3D)
Gamma: 2.24
CCT: 6864 K
| MSI Vector GP66 12UGS BOE NE156FHM-NZ3, IPS, 1920x1080, 15.6" | MSI GP66 Leopard 11UH-028 LGD0625 (LP156WFG-SPB3), IPS, 1920x1080, 15.6" | MSI Katana GF66 11UG-220 AU Optronics B156HAN08.0, IPS, 1920x1080, 15.6" | Asus TUF Gaming F15 FX506HM Chi Mei N156HRA-EA1, IPS, 1920x1080, 15.6" | Razer Blade 15 Base Edition 2021, i7-10750H RTX 3060 BOE NV156FHM-N4K, IPS, 1920x1080, 15.6" | Alienware m15 R5 Ryzen Edition B156HAN, IPS, 1920x1080, 15.6" | |
|---|---|---|---|---|---|---|
| Display | -6% | -7% | -39% | -8% | ||
| Display P3 Coverage (%) | 70.1 | 65.2 -7% | 65.4 -7% | 41.9 -40% | 64.3 -8% | |
| sRGB Coverage (%) | 99.5 | 95.8 -4% | 91.3 -8% | 62.9 -37% | 91.8 -8% | |
| AdobeRGB 1998 Coverage (%) | 72.1 | 66 -8% | 66.7 -7% | 43.3 -40% | 65.5 -9% | |
| Response Times | -77% | -23% | -258% | -28% | 22% | |
| Response Time Grey 50% / Grey 80% * (ms) | 5.8 ? | 14 ? -141% | 7.4 ? -28% | 28.4 ? -390% | 8.8 ? -52% | 4 ? 31% |
| Response Time Black / White * (ms) | 9.6 ? | 10.8 ? -13% | 11.2 ? -17% | 21.6 ? -125% | 10 ? -4% | 8.4 ? 12% |
| PWM Frequency (Hz) | 1000 ? | |||||
| Screen | -21% | -30% | -71% | -32% | 2% | |
| Brightness middle (cd/m²) | 353.1 | 390 10% | 307 -13% | 268.3 -24% | 317.2 -10% | 329 -7% |
| Brightness (cd/m²) | 325 | 362 11% | 321 -1% | 257 -21% | 306 -6% | 321 -1% |
| Brightness Distribution (%) | 85 | 87 2% | 83 -2% | 84 -1% | 89 5% | 92 8% |
| Black Level * (cd/m²) | 0.38 | 0.41 -8% | 0.27 29% | 0.34 11% | 0.31 18% | 0.27 29% |
| Contrast (:1) | 929 | 951 2% | 1137 22% | 789 -15% | 1023 10% | 1219 31% |
| Colorchecker dE 2000 * | 2.24 | 2.66 -19% | 4.67 -108% | 5.05 -125% | 4.37 -95% | 2.78 -24% |
| Colorchecker dE 2000 max. * | 5 | 7.14 -43% | 7.53 -51% | 15.43 -209% | 6.62 -32% | 4.88 2% |
| Colorchecker dE 2000 calibrated * | 1.02 | 2.56 -151% | 2.41 -136% | 3.21 -215% | 2.67 -162% | 1.63 -60% |
| Greyscale dE 2000 * | 4 | 3.63 9% | 4.5 -13% | 5.5 -38% | 4.5 -13% | 2.5 37% |
| Gamma | 2.24 98% | 2.57 86% | 2.276 97% | 2.35 94% | 2.4 92% | 2.106 104% |
| CCT | 6864 95% | 6894 94% | 6824 95% | 7392 88% | 7418 88% | 6201 105% |
| Color Space (Percent of AdobeRGB 1998) (%) | 59.2 | 76 | ||||
| Color Space (Percent of sRGB) (%) | 91.4 | 99 | ||||
| Media total (Programa/Opciones) | -35% /
-26% | -20% /
-24% | -123% /
-91% | -23% /
-26% | 12% /
5% |
* ... más pequeño es mejor
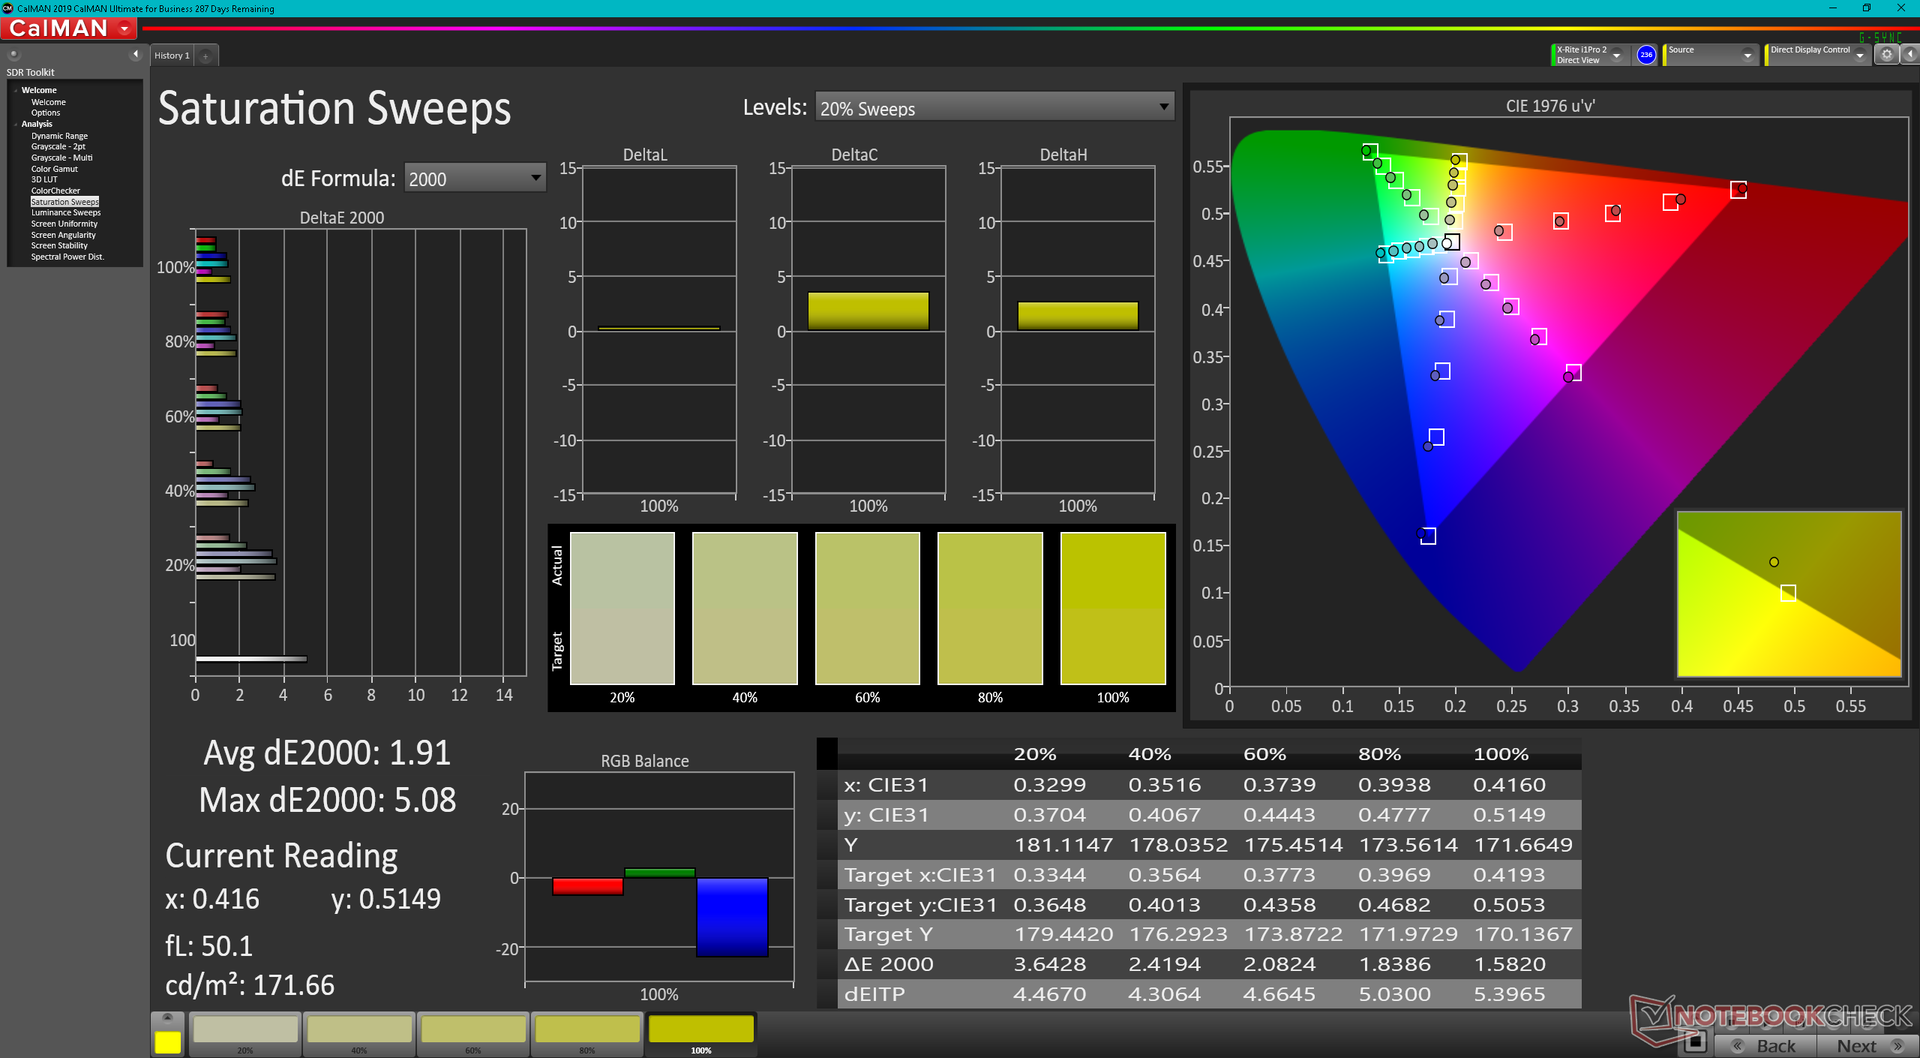
El panel cubre todo el sRGB e incluso un poco más del AdobeRGB en comparación con los paneles del GF66 Katana o el GP66 Leopard. Nos alegramos de ver un panel de alta calidad aquí a diferencia del Chi Mei del Asus TUF Gaming F15 que cubre una gama significativamente más estrecha
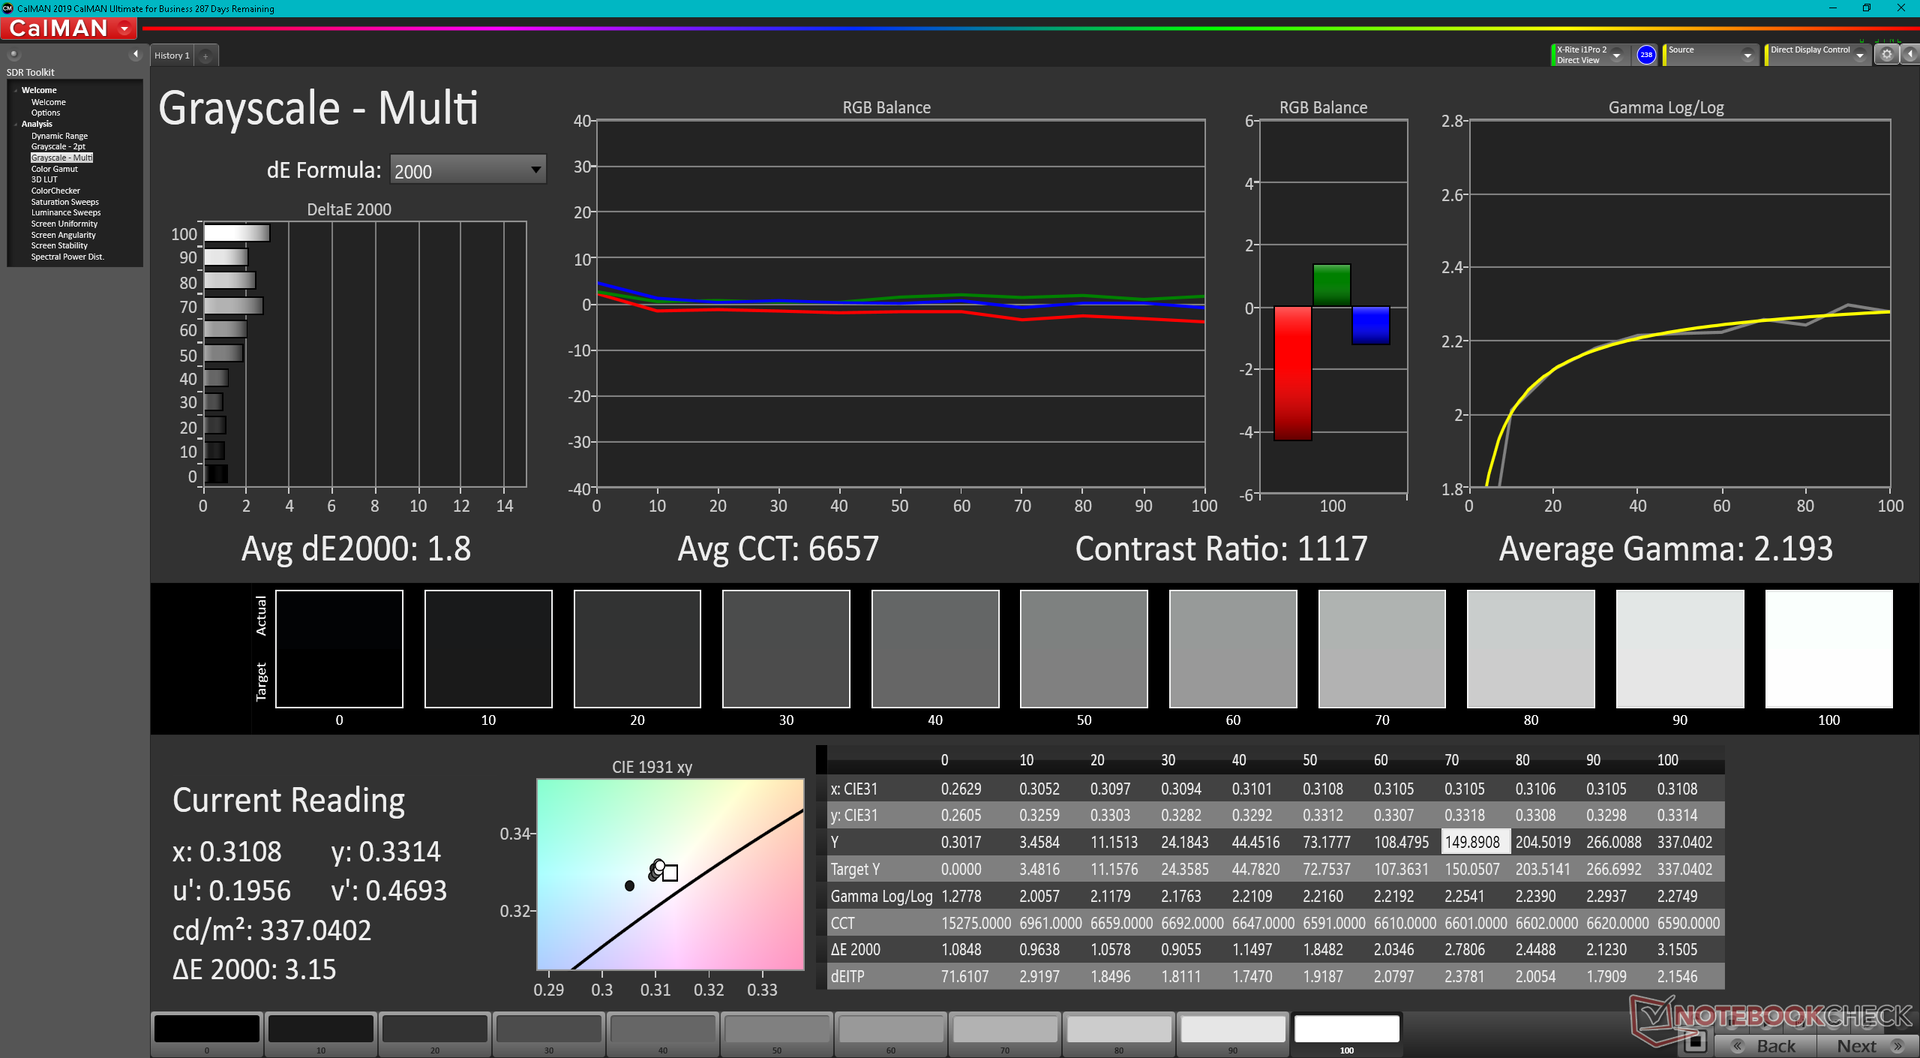
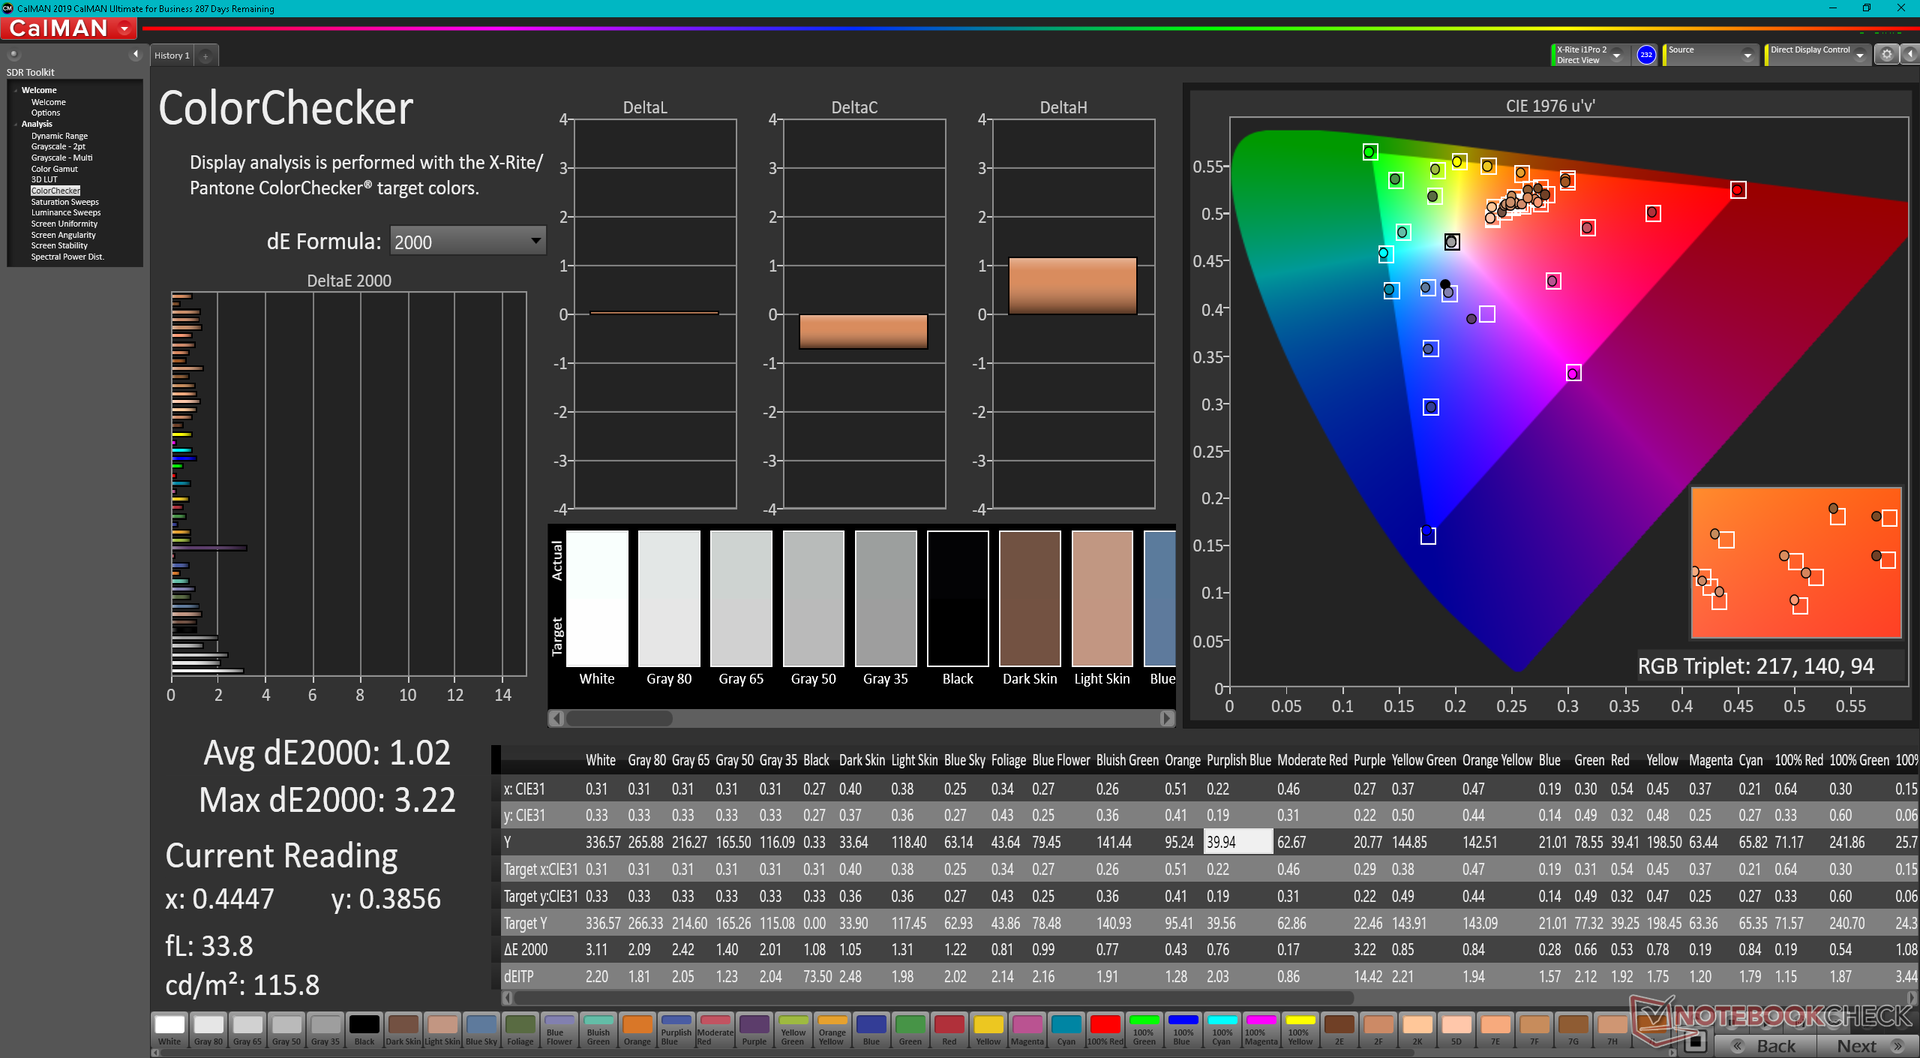
La pantalla está decentemente calibrada desde el principio, aunque su temperatura de color podría ser ligeramente más cálida. Una calibración del colorímetro X-Rite soluciona esto para mejorar los valores medios de escala de grises y color DeltaE de 4 y 2,24 a sólo 1,8 y 1,02, respectivamente
Tiempos de respuesta del display
| ↔ Tiempo de respuesta de Negro a Blanco | ||
|---|---|---|
| 9.6 ms ... subida ↗ y bajada ↘ combinada | ↗ 5.2 ms subida | 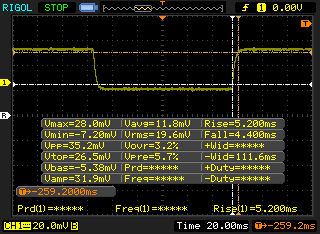 |
| ↘ 4.4 ms bajada | ||
| La pantalla mostró tiempos de respuesta rápidos en nuestros tests y debería ser adecuada para juegos. En comparación, todos los dispositivos de prueba van de ##min### (mínimo) a 240 (máximo) ms. » 26 % de todos los dispositivos son mejores. Esto quiere decir que el tiempo de respuesta medido es mejor que la media (19.8 ms) de todos los dispositivos testados. | ||
| ↔ Tiempo de respuesta 50% Gris a 80% Gris | ||
| 5.8 ms ... subida ↗ y bajada ↘ combinada | ↗ 3.4 ms subida | 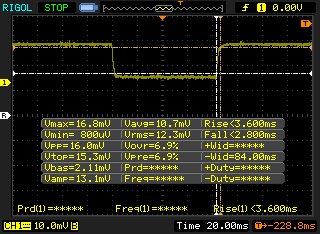 |
| ↘ 2.4 ms bajada | ||
| La pantalla mostró tiempos de respuesta muy rápidos en nuestros tests y debería ser adecuada para juegos frenéticos. En comparación, todos los dispositivos de prueba van de ##min### (mínimo) a 636 (máximo) ms. » 19 % de todos los dispositivos son mejores. Esto quiere decir que el tiempo de respuesta medido es mejor que la media (31 ms) de todos los dispositivos testados. | ||
Parpadeo de Pantalla / PWM (Pulse-Width Modulation)
| Parpadeo de Pantalla / PWM no detectado | 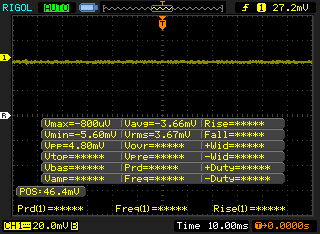 | ||
Comparación: 52 % de todos los dispositivos testados no usaron PWM para atenuar el display. Si se usó, medimos una media de 7754 (mínimo: 5 - máxmo: 343500) Hz. | |||

Rendimiento
Condiciones de la prueba
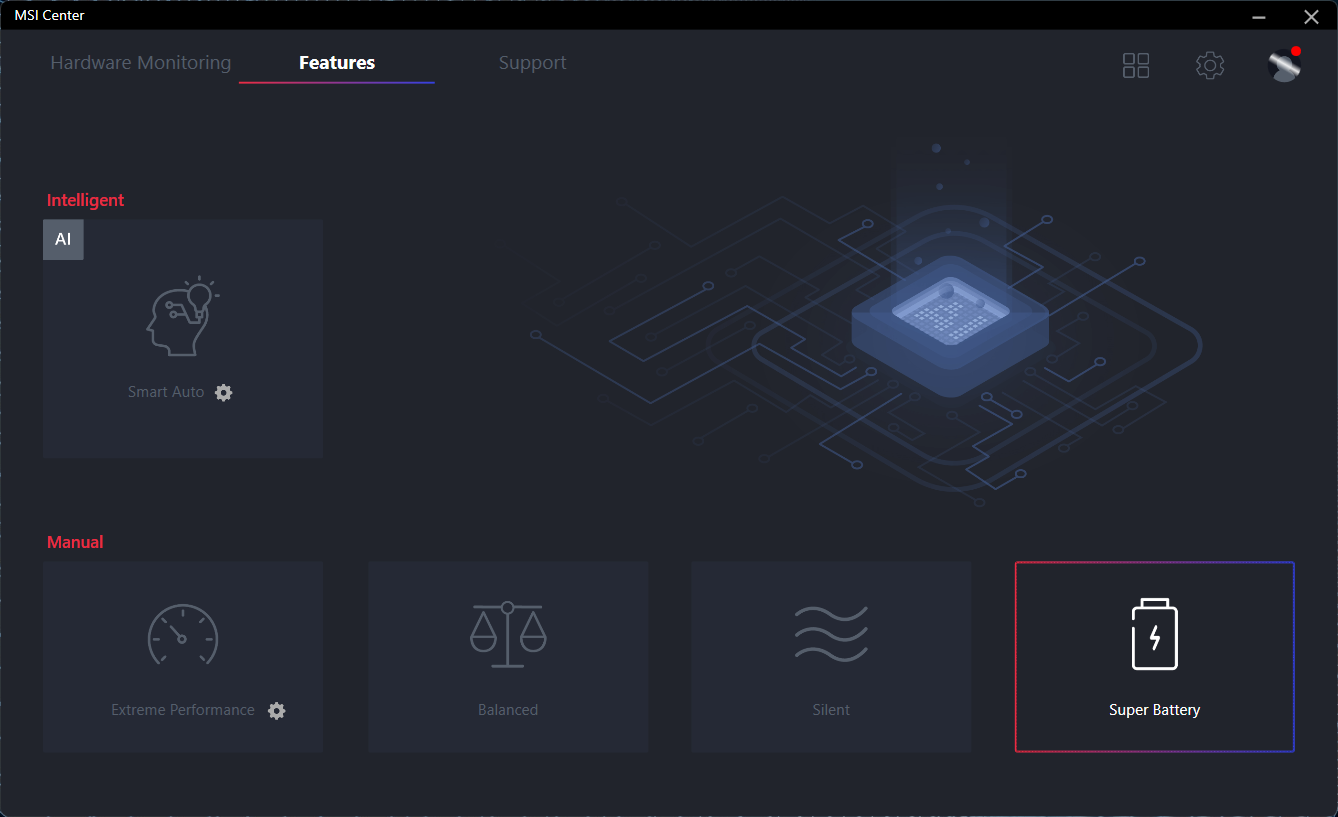
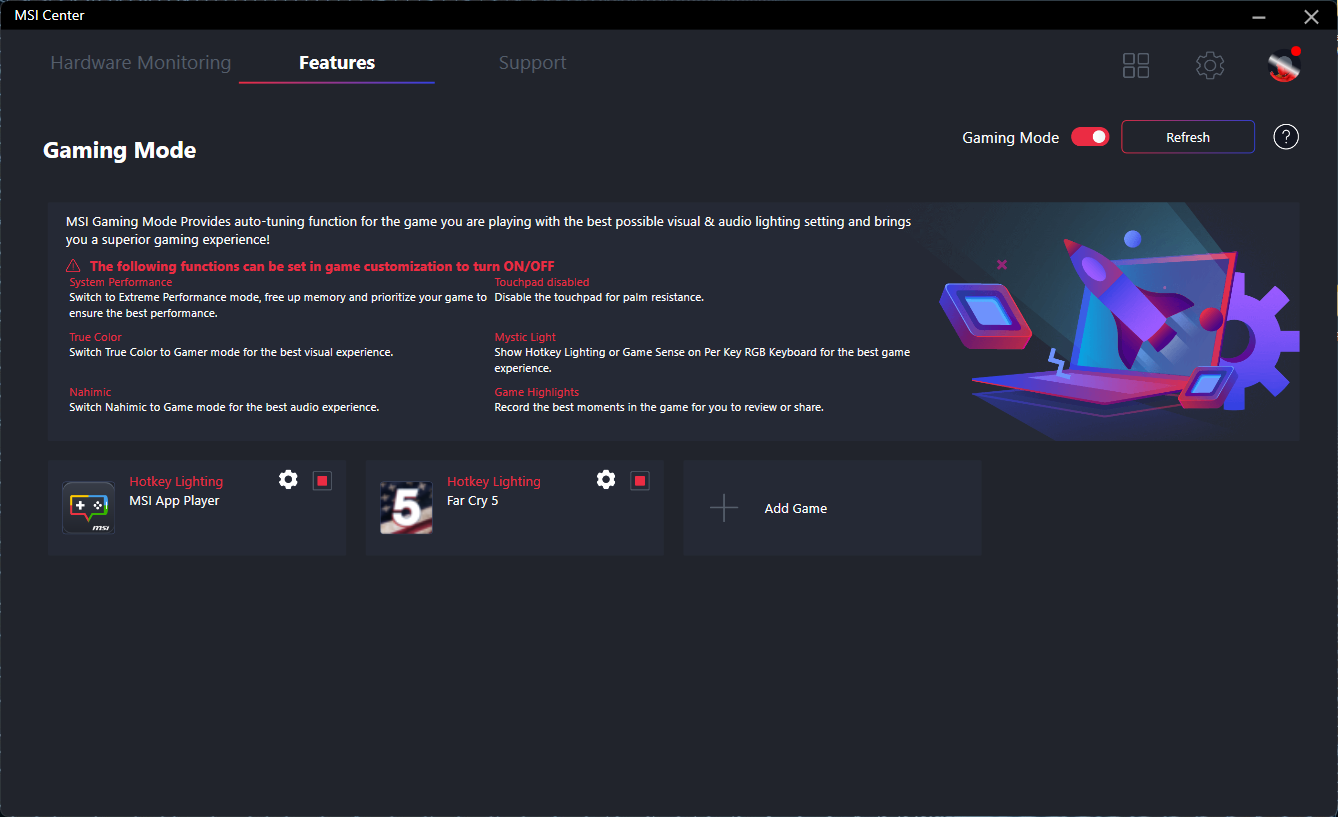
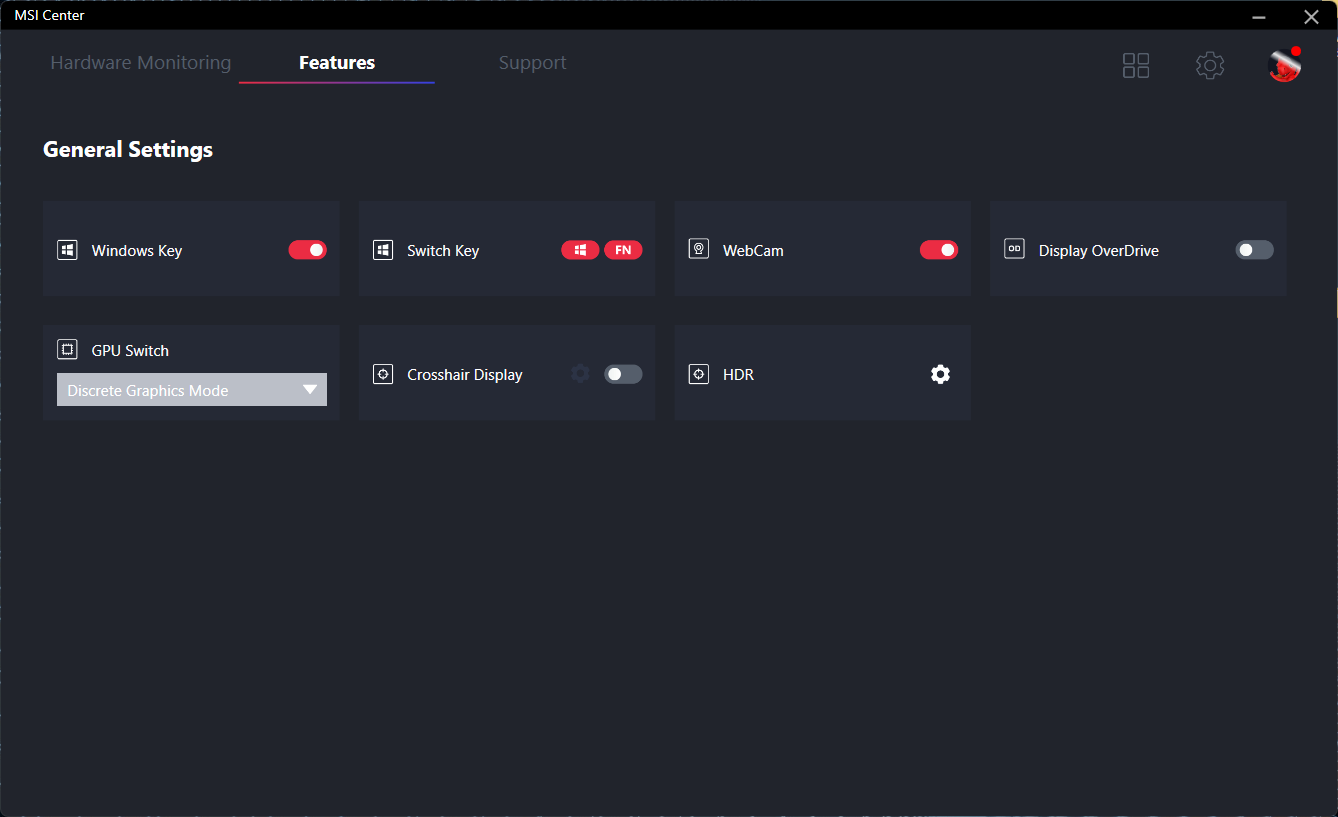
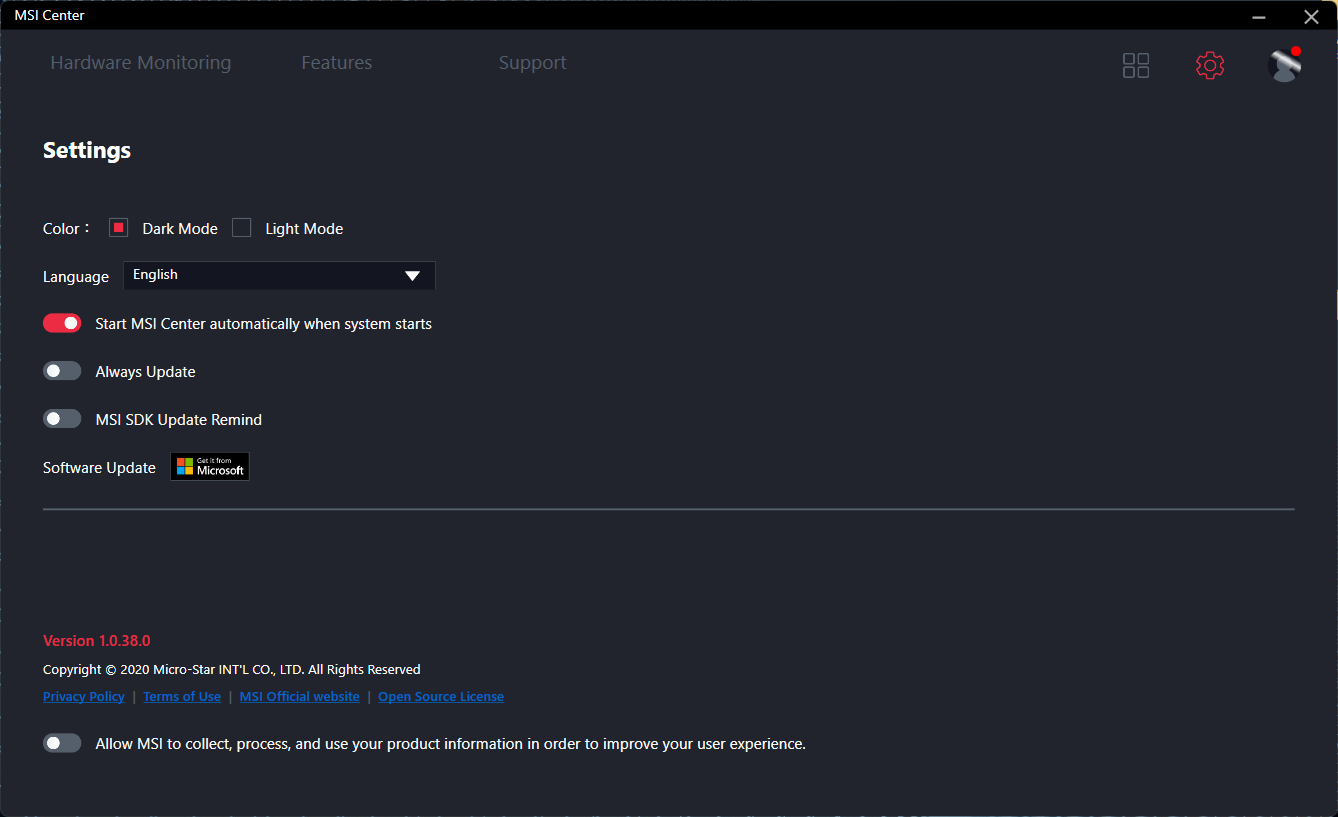
Nuestra unidad se configuró en el modo de Rendimiento Extremo con la GPU discreta activa a través del software MSI Center para obtener las puntuaciones más altas posibles. Recomendamos encarecidamente a los usuarios que se familiaricen con este software ya que muchas características importantes se activan aquí incluyendo MSHybrid, monitorización de hardware, HDR, y otros ajustes de calidad de vida. Para los efectos de iluminación del teclado, los usuarios deben confiar en el software SteelSeries GG preinstalado
Es necesario reiniciar el equipo si se cambia entre los modos MSHybrid y GPU discreta.
Procesador
El Core i9-12900H es aproximadamente un 25% y un 35% más rápido en aplicaciones de un solo hilo y de varios hilos, respectivamente, en comparación con la última generación de Core i7-11800H que se encuentra en el GP66 Leopard. El rendimiento general puede incluso superar al de los ordenadores de sobremesa más exigentes en cuanto a potenciaCore i9-11900K. La serie Zen 3 H de AMD ya era la mejor antes del lanzamiento de la serie Alder Lake-H de Intel.
Puedes encontrar más información sobre los Alder Lake en nuestro resumen de la plataforma aquí.
Cinebench R15 Multi Loop
Cinebench R23: Multi Core | Single Core
Cinebench R15: CPU Multi 64Bit | CPU Single 64Bit
Blender: v2.79 BMW27 CPU
7-Zip 18.03: 7z b 4 | 7z b 4 -mmt1
Geekbench 5.5: Multi-Core | Single-Core
HWBOT x265 Benchmark v2.2: 4k Preset
LibreOffice : 20 Documents To PDF
R Benchmark 2.5: Overall mean
| Cinebench R20 / CPU (Multi Core) | |
| Intel Core i9-12900K | |
| MSI Vector GP66 12UGS | |
| MSI MEG Z590 ACE | |
| Medio Intel Core i9-12900H (2681 - 7471, n=28) | |
| Eurocom Nightsky ARX315 | |
| MSI GP66 Leopard 11UH-028 | |
| HP ZBook Fury 15 G8 | |
| MSI Alpha 15 B5EEK-008 | |
| MSI Delta 15 A5EFK | |
| Alienware m15 R4 | |
| MSI GE65 Raider 9SF-049US | |
| Razer Blade 15 Advanced Model Early 2021 | |
| Cinebench R20 / CPU (Single Core) | |
| Intel Core i9-12900K | |
| MSI Vector GP66 12UGS | |
| Medio Intel Core i9-12900H (624 - 738, n=28) | |
| MSI MEG Z590 ACE | |
| HP ZBook Fury 15 G8 | |
| Eurocom Nightsky ARX315 | |
| MSI GP66 Leopard 11UH-028 | |
| MSI Delta 15 A5EFK | |
| MSI Alpha 15 B5EEK-008 | |
| Alienware m15 R4 | |
| Razer Blade 15 Advanced Model Early 2021 | |
| MSI GE65 Raider 9SF-049US | |
| Cinebench R23 / Multi Core | |
| Intel Core i9-12900K | |
| MSI Vector GP66 12UGS | |
| MSI MEG Z590 ACE | |
| Medio Intel Core i9-12900H (7359 - 19648, n=28) | |
| Eurocom Nightsky ARX315 | |
| MSI GP66 Leopard 11UH-028 | |
| HP ZBook Fury 15 G8 | |
| MSI Alpha 15 B5EEK-008 | |
| MSI Delta 15 A5EFK | |
| Razer Blade 15 Advanced Model Early 2021 | |
| Cinebench R23 / Single Core | |
| Intel Core i9-12900K | |
| MSI Vector GP66 12UGS | |
| Medio Intel Core i9-12900H (1634 - 1930, n=28) | |
| MSI MEG Z590 ACE | |
| HP ZBook Fury 15 G8 | |
| Eurocom Nightsky ARX315 | |
| MSI GP66 Leopard 11UH-028 | |
| MSI Delta 15 A5EFK | |
| MSI Alpha 15 B5EEK-008 | |
| Razer Blade 15 Advanced Model Early 2021 | |
| Cinebench R15 / CPU Multi 64Bit | |
| Intel Core i9-12900K | |
| Medio Intel Core i9-12900H (1395 - 3077, n=28) | |
| MSI Vector GP66 12UGS | |
| MSI MEG Z590 ACE | |
| Eurocom Nightsky ARX315 | |
| MSI Delta 15 A5EFK | |
| MSI GP66 Leopard 11UH-028 | |
| MSI Alpha 15 B5EEK-008 | |
| HP ZBook Fury 15 G8 | |
| MSI GE65 Raider 9SF-049US | |
| Alienware m15 R4 | |
| Razer Blade 15 Advanced Model Early 2021 | |
| Cinebench R15 / CPU Single 64Bit | |
| Intel Core i9-12900K | |
| MSI Vector GP66 12UGS | |
| Medio Intel Core i9-12900H (235 - 277, n=29) | |
| MSI MEG Z590 ACE | |
| Eurocom Nightsky ARX315 | |
| HP ZBook Fury 15 G8 | |
| MSI Delta 15 A5EFK | |
| MSI Alpha 15 B5EEK-008 | |
| MSI GP66 Leopard 11UH-028 | |
| Alienware m15 R4 | |
| Razer Blade 15 Advanced Model Early 2021 | |
| MSI GE65 Raider 9SF-049US | |
| Blender / v2.79 BMW27 CPU | |
| Razer Blade 15 Advanced Model Early 2021 | |
| Alienware m15 R4 | |
| HP ZBook Fury 15 G8 | |
| MSI Alpha 15 B5EEK-008 | |
| MSI GP66 Leopard 11UH-028 | |
| MSI Delta 15 A5EFK | |
| Medio Intel Core i9-12900H (160 - 451, n=28) | |
| Eurocom Nightsky ARX315 | |
| MSI Vector GP66 12UGS | |
| MSI MEG Z590 ACE | |
| Intel Core i9-12900K | |
| 7-Zip 18.03 / 7z b 4 | |
| Intel Core i9-12900K | |
| Eurocom Nightsky ARX315 | |
| MSI Vector GP66 12UGS | |
| MSI MEG Z590 ACE | |
| Medio Intel Core i9-12900H (34684 - 76677, n=28) | |
| MSI Delta 15 A5EFK | |
| MSI Alpha 15 B5EEK-008 | |
| MSI GP66 Leopard 11UH-028 | |
| HP ZBook Fury 15 G8 | |
| Alienware m15 R4 | |
| Razer Blade 15 Advanced Model Early 2021 | |
| 7-Zip 18.03 / 7z b 4 -mmt1 | |
| Intel Core i9-12900K | |
| Eurocom Nightsky ARX315 | |
| MSI MEG Z590 ACE | |
| MSI Vector GP66 12UGS | |
| Medio Intel Core i9-12900H (5302 - 6289, n=28) | |
| HP ZBook Fury 15 G8 | |
| MSI Delta 15 A5EFK | |
| MSI GP66 Leopard 11UH-028 | |
| MSI Alpha 15 B5EEK-008 | |
| Alienware m15 R4 | |
| Razer Blade 15 Advanced Model Early 2021 | |
| Geekbench 5.5 / Multi-Core | |
| Intel Core i9-12900K | |
| MSI Vector GP66 12UGS | |
| Medio Intel Core i9-12900H (8519 - 14376, n=31) | |
| MSI MEG Z590 ACE | |
| Eurocom Nightsky ARX315 | |
| MSI GP66 Leopard 11UH-028 | |
| MSI Delta 15 A5EFK | |
| MSI Alpha 15 B5EEK-008 | |
| Alienware m15 R4 | |
| Razer Blade 15 Advanced Model Early 2021 | |
| Geekbench 5.5 / Single-Core | |
| Intel Core i9-12900K | |
| MSI Vector GP66 12UGS | |
| Medio Intel Core i9-12900H (1631 - 1897, n=31) | |
| MSI MEG Z590 ACE | |
| Eurocom Nightsky ARX315 | |
| MSI GP66 Leopard 11UH-028 | |
| MSI Delta 15 A5EFK | |
| MSI Alpha 15 B5EEK-008 | |
| Alienware m15 R4 | |
| Razer Blade 15 Advanced Model Early 2021 | |
| HWBOT x265 Benchmark v2.2 / 4k Preset | |
| Intel Core i9-12900K | |
| MSI Vector GP66 12UGS | |
| MSI MEG Z590 ACE | |
| Eurocom Nightsky ARX315 | |
| Medio Intel Core i9-12900H (8.05 - 22.5, n=28) | |
| MSI Delta 15 A5EFK | |
| MSI GP66 Leopard 11UH-028 | |
| MSI Alpha 15 B5EEK-008 | |
| HP ZBook Fury 15 G8 | |
| Alienware m15 R4 | |
| Razer Blade 15 Advanced Model Early 2021 | |
| LibreOffice / 20 Documents To PDF | |
| MSI Alpha 15 B5EEK-008 | |
| Razer Blade 15 Advanced Model Early 2021 | |
| MSI Delta 15 A5EFK | |
| HP ZBook Fury 15 G8 | |
| Alienware m15 R4 | |
| MSI GP66 Leopard 11UH-028 | |
| Eurocom Nightsky ARX315 | |
| Medio Intel Core i9-12900H (36.8 - 59.8, n=28) | |
| MSI MEG Z590 ACE | |
| Intel Core i9-12900K | |
| MSI Vector GP66 12UGS | |
| R Benchmark 2.5 / Overall mean | |
| Razer Blade 15 Advanced Model Early 2021 | |
| Alienware m15 R4 | |
| MSI GP66 Leopard 11UH-028 | |
| HP ZBook Fury 15 G8 | |
| MSI Alpha 15 B5EEK-008 | |
| MSI Delta 15 A5EFK | |
| Eurocom Nightsky ARX315 | |
| MSI MEG Z590 ACE | |
| Medio Intel Core i9-12900H (0.4218 - 0.506, n=28) | |
| MSI Vector GP66 12UGS | |
| Intel Core i9-12900K | |
* ... más pequeño es mejor
AIDA64: FP32 Ray-Trace | FPU Julia | CPU SHA3 | CPU Queen | FPU SinJulia | FPU Mandel | CPU AES | CPU ZLib | FP64 Ray-Trace | CPU PhotoWorxx
| Performance rating | |
| MSI GP66 Leopard 11UH-028 | |
| Alienware m15 R5 Ryzen Edition | |
| Medio Intel Core i9-12900H | |
| MSI Vector GP66 12UGS | |
| MSI Katana GF66 11UG-220 -9! | |
| Asus TUF Gaming F15 FX506HM -9! | |
| AIDA64 / FP32 Ray-Trace | |
| MSI GP66 Leopard 11UH-028 | |
| Alienware m15 R5 Ryzen Edition | |
| Medio Intel Core i9-12900H (4074 - 18289, n=29) | |
| MSI Vector GP66 12UGS | |
| AIDA64 / FPU Julia | |
| Alienware m15 R5 Ryzen Edition | |
| MSI GP66 Leopard 11UH-028 | |
| Medio Intel Core i9-12900H (22307 - 93236, n=29) | |
| MSI Vector GP66 12UGS | |
| AIDA64 / CPU SHA3 | |
| MSI GP66 Leopard 11UH-028 | |
| Alienware m15 R5 Ryzen Edition | |
| Medio Intel Core i9-12900H (1378 - 4215, n=29) | |
| MSI Vector GP66 12UGS | |
| AIDA64 / CPU Queen | |
| MSI Vector GP66 12UGS | |
| Medio Intel Core i9-12900H (78172 - 111241, n=28) | |
| Alienware m15 R5 Ryzen Edition | |
| MSI GP66 Leopard 11UH-028 | |
| AIDA64 / FPU SinJulia | |
| Alienware m15 R5 Ryzen Edition | |
| MSI GP66 Leopard 11UH-028 | |
| MSI Vector GP66 12UGS | |
| Medio Intel Core i9-12900H (5709 - 10410, n=29) | |
| AIDA64 / FPU Mandel | |
| Alienware m15 R5 Ryzen Edition | |
| MSI GP66 Leopard 11UH-028 | |
| Medio Intel Core i9-12900H (11257 - 45581, n=29) | |
| MSI Vector GP66 12UGS | |
| AIDA64 / CPU AES | |
| MSI GP66 Leopard 11UH-028 | |
| Alienware m15 R5 Ryzen Edition | |
| MSI Vector GP66 12UGS | |
| Medio Intel Core i9-12900H (31935 - 151546, n=29) | |
| AIDA64 / CPU ZLib | |
| MSI Vector GP66 12UGS | |
| Medio Intel Core i9-12900H (449 - 1193, n=29) | |
| MSI GP66 Leopard 11UH-028 | |
| Alienware m15 R5 Ryzen Edition | |
| Asus TUF Gaming F15 FX506HM | |
| MSI Katana GF66 11UG-220 | |
| AIDA64 / FP64 Ray-Trace | |
| MSI GP66 Leopard 11UH-028 | |
| Alienware m15 R5 Ryzen Edition | |
| Medio Intel Core i9-12900H (2235 - 10511, n=29) | |
| MSI Vector GP66 12UGS | |
| AIDA64 / CPU PhotoWorxx | |
| Medio Intel Core i9-12900H (20960 - 48269, n=30) | |
| MSI Vector GP66 12UGS | |
| MSI GP66 Leopard 11UH-028 | |
| Alienware m15 R5 Ryzen Edition | |
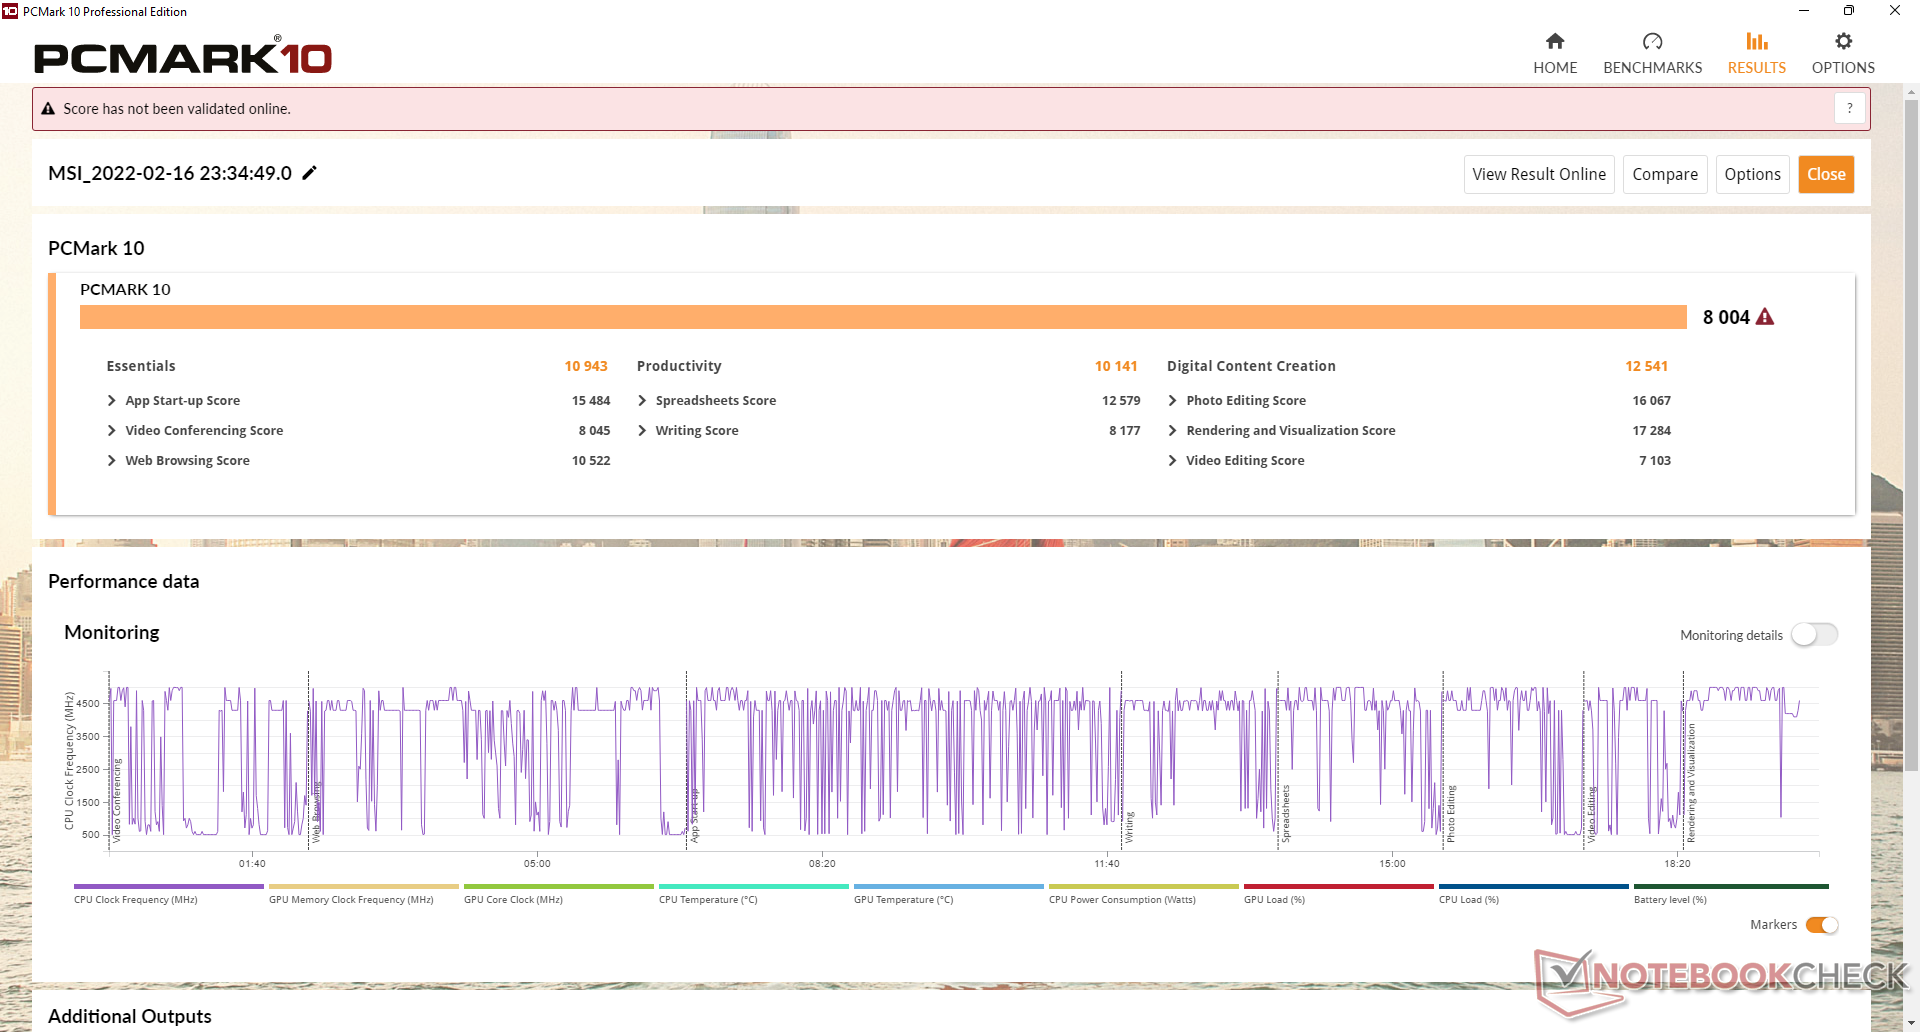
Rendimiento del sistema
Los resultados de PCMark son de los más altos de nuestra base de datos, con algo más de 8000 puntos. ElMSI Raider GE76 equipado con el Core i9-12900HK desbloqueado y la GeForce RTX 3080 Ti más rápida, arrojaría puntuaciones esencialmente idénticas a las de nuestro GP66
Merece la pena señalar que experimentamos problemas de activación y suspensión con nuestra unidad de pruebas, donde la pantalla a veces se quedaba en negro al cambiar entre los modos de la GPU o al entrar en el modo de suspensión. Entonces era necesario reiniciar el equipo.
| PCMark 10 / Score | |
| MSI Vector GP66 12UGS | |
| Medio Intel Core i9-12900H, NVIDIA GeForce RTX 3070 Ti Laptop GPU (7087 - 8072, n=6) | |
| MSI GP66 Leopard 11UH-028 | |
| Asus TUF Gaming F15 FX506HM | |
| MSI Katana GF66 11UG-220 | |
| Alienware m15 R5 Ryzen Edition | |
| Razer Blade 15 Base Edition 2021, i7-10750H RTX 3060 | |
| PCMark 10 / Essentials | |
| MSI Vector GP66 12UGS | |
| Medio Intel Core i9-12900H, NVIDIA GeForce RTX 3070 Ti Laptop GPU (10266 - 11663, n=6) | |
| Asus TUF Gaming F15 FX506HM | |
| MSI GP66 Leopard 11UH-028 | |
| Razer Blade 15 Base Edition 2021, i7-10750H RTX 3060 | |
| Alienware m15 R5 Ryzen Edition | |
| MSI Katana GF66 11UG-220 | |
| PCMark 10 / Productivity | |
| Medio Intel Core i9-12900H, NVIDIA GeForce RTX 3070 Ti Laptop GPU (9402 - 10742, n=6) | |
| MSI Vector GP66 12UGS | |
| MSI Katana GF66 11UG-220 | |
| Alienware m15 R5 Ryzen Edition | |
| Asus TUF Gaming F15 FX506HM | |
| MSI GP66 Leopard 11UH-028 | |
| Razer Blade 15 Base Edition 2021, i7-10750H RTX 3060 | |
| PCMark 10 / Digital Content Creation | |
| MSI Vector GP66 12UGS | |
| Medio Intel Core i9-12900H, NVIDIA GeForce RTX 3070 Ti Laptop GPU (10009 - 12541, n=6) | |
| MSI GP66 Leopard 11UH-028 | |
| MSI Katana GF66 11UG-220 | |
| Asus TUF Gaming F15 FX506HM | |
| Alienware m15 R5 Ryzen Edition | |
| Razer Blade 15 Base Edition 2021, i7-10750H RTX 3060 | |
| PCMark 10 Score | 8004 puntos | |
ayuda | ||
| AIDA64 / Memory Copy | |
| Medio Intel Core i9-12900H (34438 - 74264, n=29) | |
| MSI Vector GP66 12UGS | |
| MSI GP66 Leopard 11UH-028 | |
| Alienware m15 R5 Ryzen Edition | |
| AIDA64 / Memory Read | |
| Medio Intel Core i9-12900H (36365 - 74642, n=29) | |
| MSI GP66 Leopard 11UH-028 | |
| MSI Vector GP66 12UGS | |
| Alienware m15 R5 Ryzen Edition | |
| AIDA64 / Memory Write | |
| Medio Intel Core i9-12900H (32276 - 67858, n=29) | |
| MSI Vector GP66 12UGS | |
| MSI GP66 Leopard 11UH-028 | |
| Alienware m15 R5 Ryzen Edition | |
| AIDA64 / Memory Latency | |
| MSI GP66 Leopard 11UH-028 | |
| MSI Vector GP66 12UGS | |
| Medio Intel Core i9-12900H (74.7 - 118.1, n=28) | |
| Alienware m15 R5 Ryzen Edition | |
| Asus TUF Gaming F15 FX506HM | |
| MSI Katana GF66 11UG-220 | |
| MSI Katana GF66 11UG-220 | |
* ... más pequeño es mejor
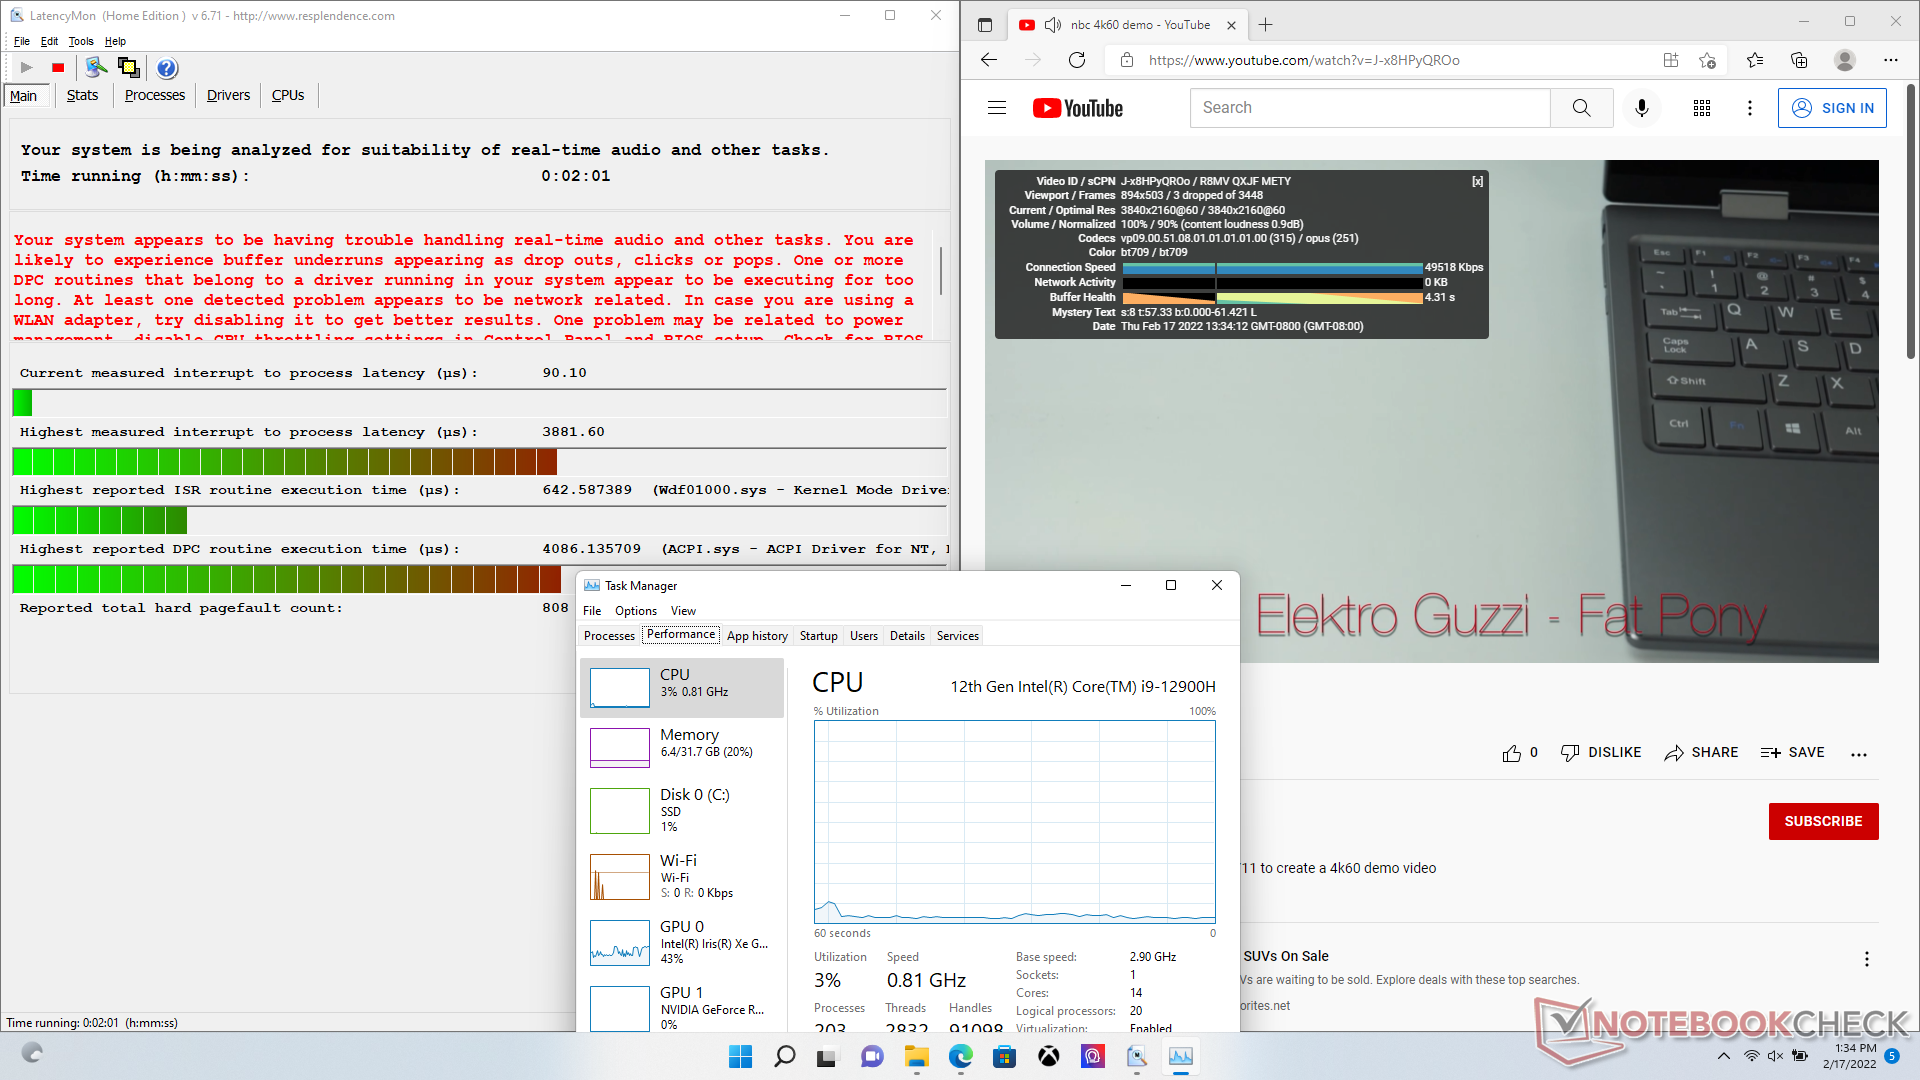
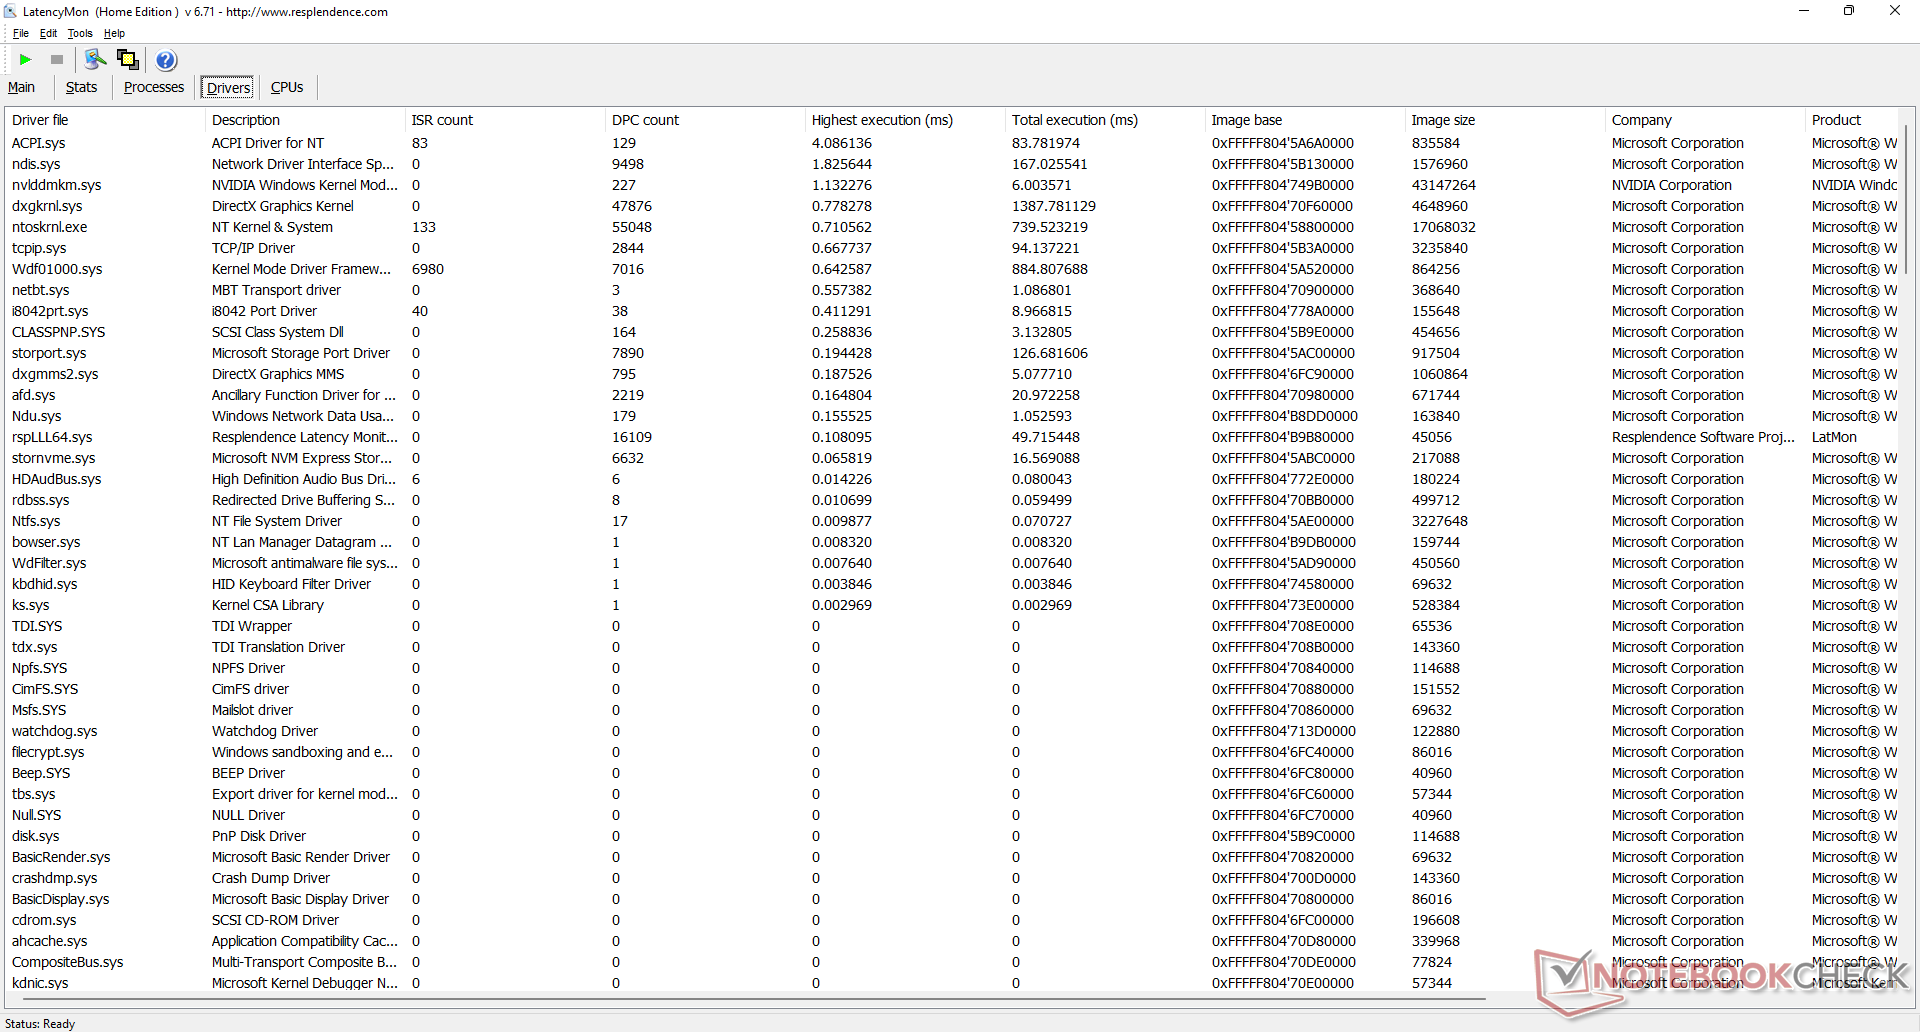
Latencia del CPD
LatencyMon revela problemas de CPD al abrir varias pestañas del navegador en nuestra página de inicio. la reproducción de vídeo 4K a 60 FPS es, por lo demás, fluida, con sólo 3 fotogramas perdidos durante nuestra prueba de vídeo de un minuto de duración.
| DPC Latencies / LatencyMon - interrupt to process latency (max), Web, Youtube, Prime95 | |
| MSI Vector GP66 12UGS | |
| Asus TUF Gaming F15 FX506HM | |
| MSI Katana GF66 11UG-220 | |
| MSI GP66 Leopard 11UH-028 | |
| Razer Blade 15 Base Edition 2021, i7-10750H RTX 3060 | |
| Alienware m15 R5 Ryzen Edition | |
* ... más pequeño es mejor
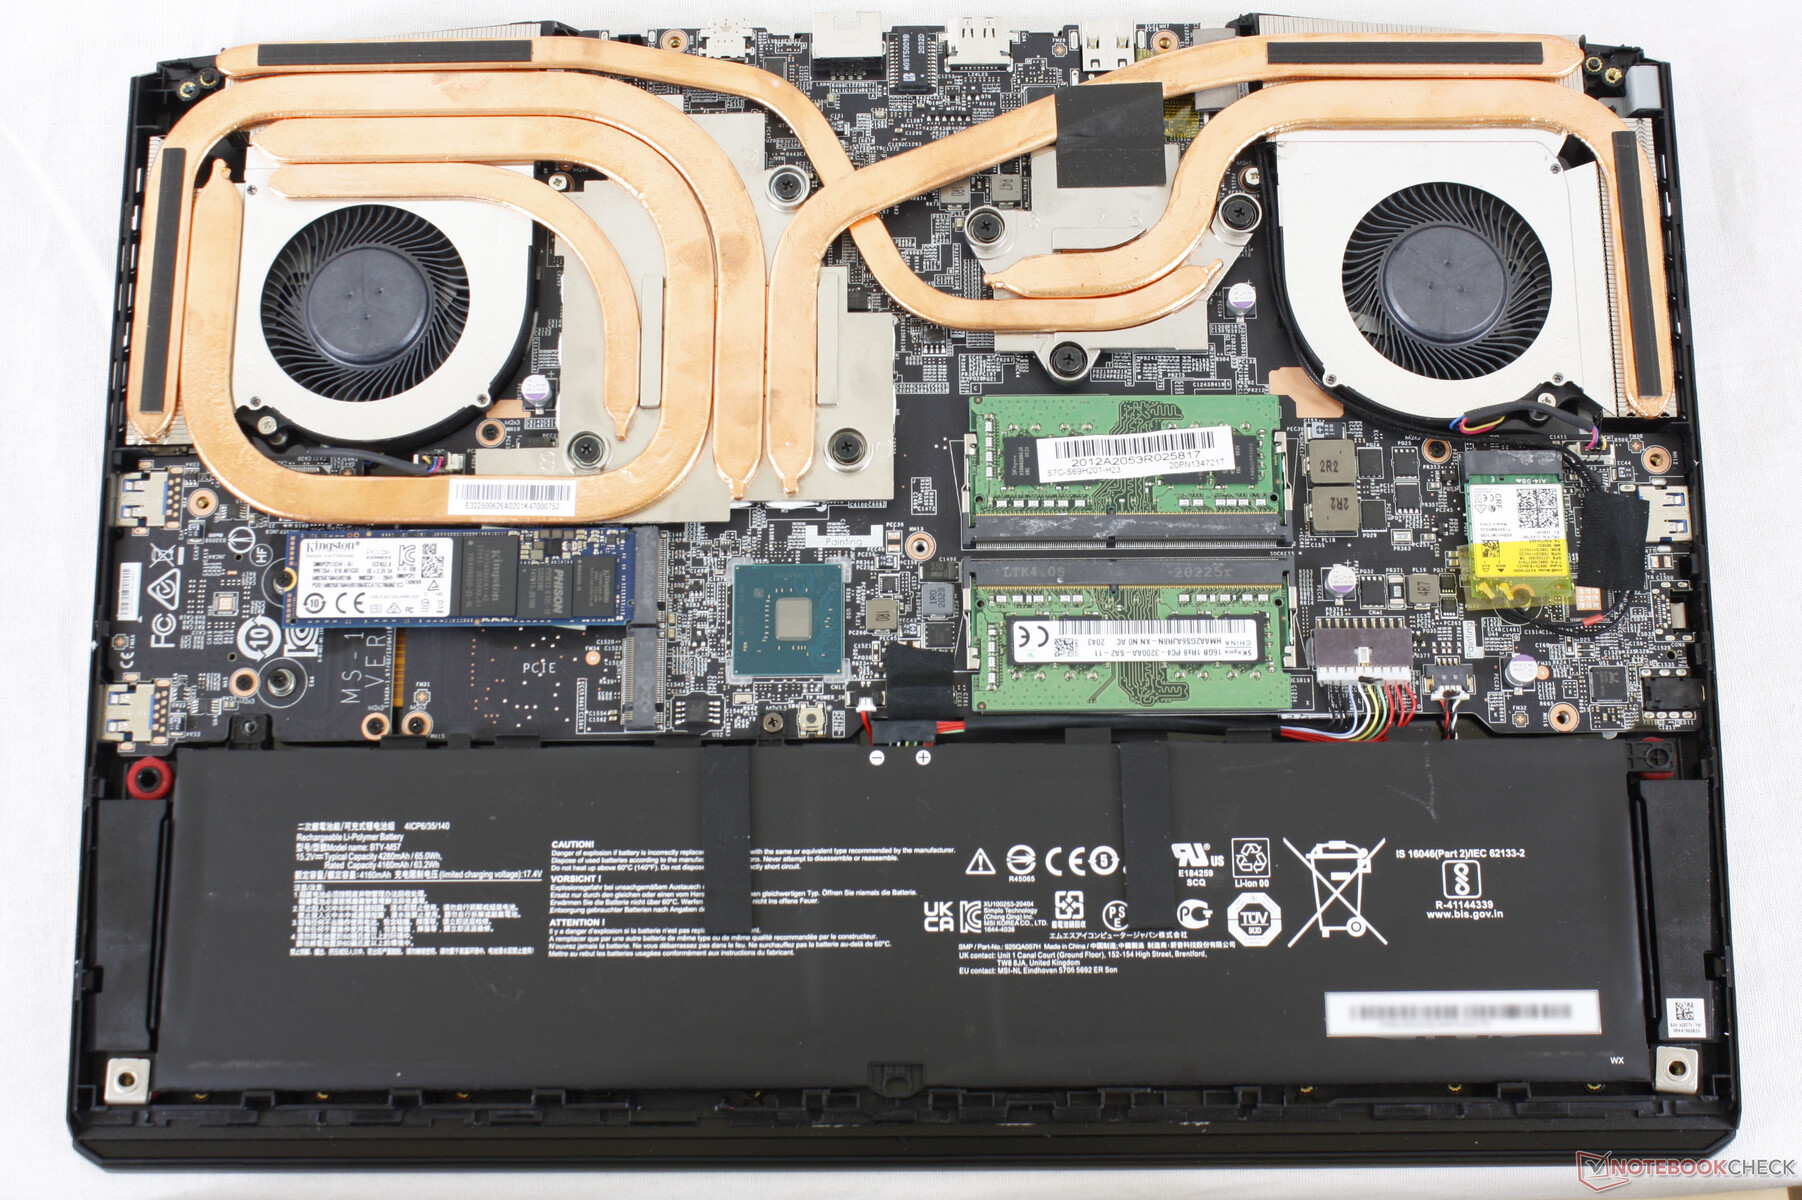
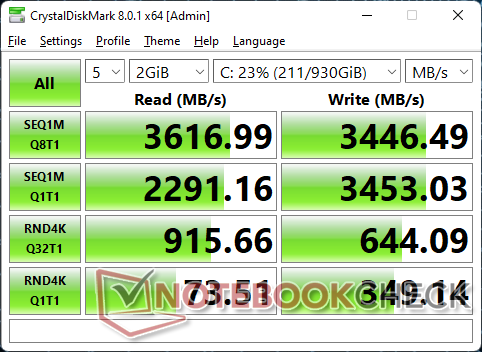
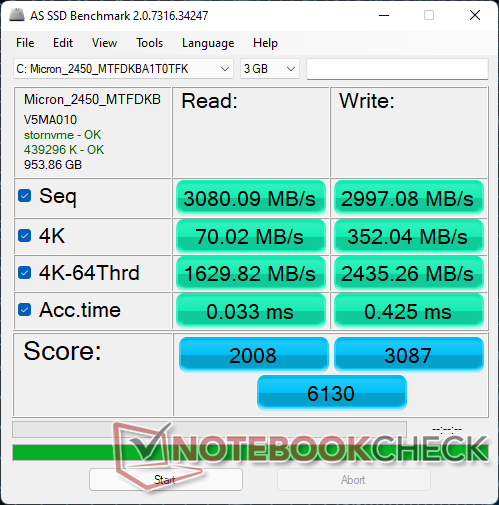
Dispositivos de almacenamiento
Nuestra unidad de prueba viene equipada con el presupuesto 1 TB Micron 2450 MTFDKBA1T0TFK PCIe4 x4 NVMe. A diferencia de muchas otras SSD PCIe4 x4 que pueden alcanzar tasas de transferencia superiores a los 7000 MB/s, la Micron 2450 de 1 TB sólo promete hasta 3500 MB/s de lectura y 3000 MB/s de escritura para ser comparable a la mayoría de las SSD PCIe3 x4. Por supuesto, los usuarios pueden cambiar o instalar una unidad PCIe4 x4 más rápida si lo desean, como la que se incluía en nuestro GP66 Leopard. Los modelos de gama alta de MSI, como las series GT o GS, suelen venir con unidades PCIe4 más rápidas de Samsung
La unidad de nuestra muestra no tuvo problemas para mantener su velocidad máxima de lectura de 3500 MB/s durante periodos prolongados.

* ... más pequeño es mejor
Disk Throttling: DiskSpd Read Loop, Queue Depth 8
Rendimiento de la GPU
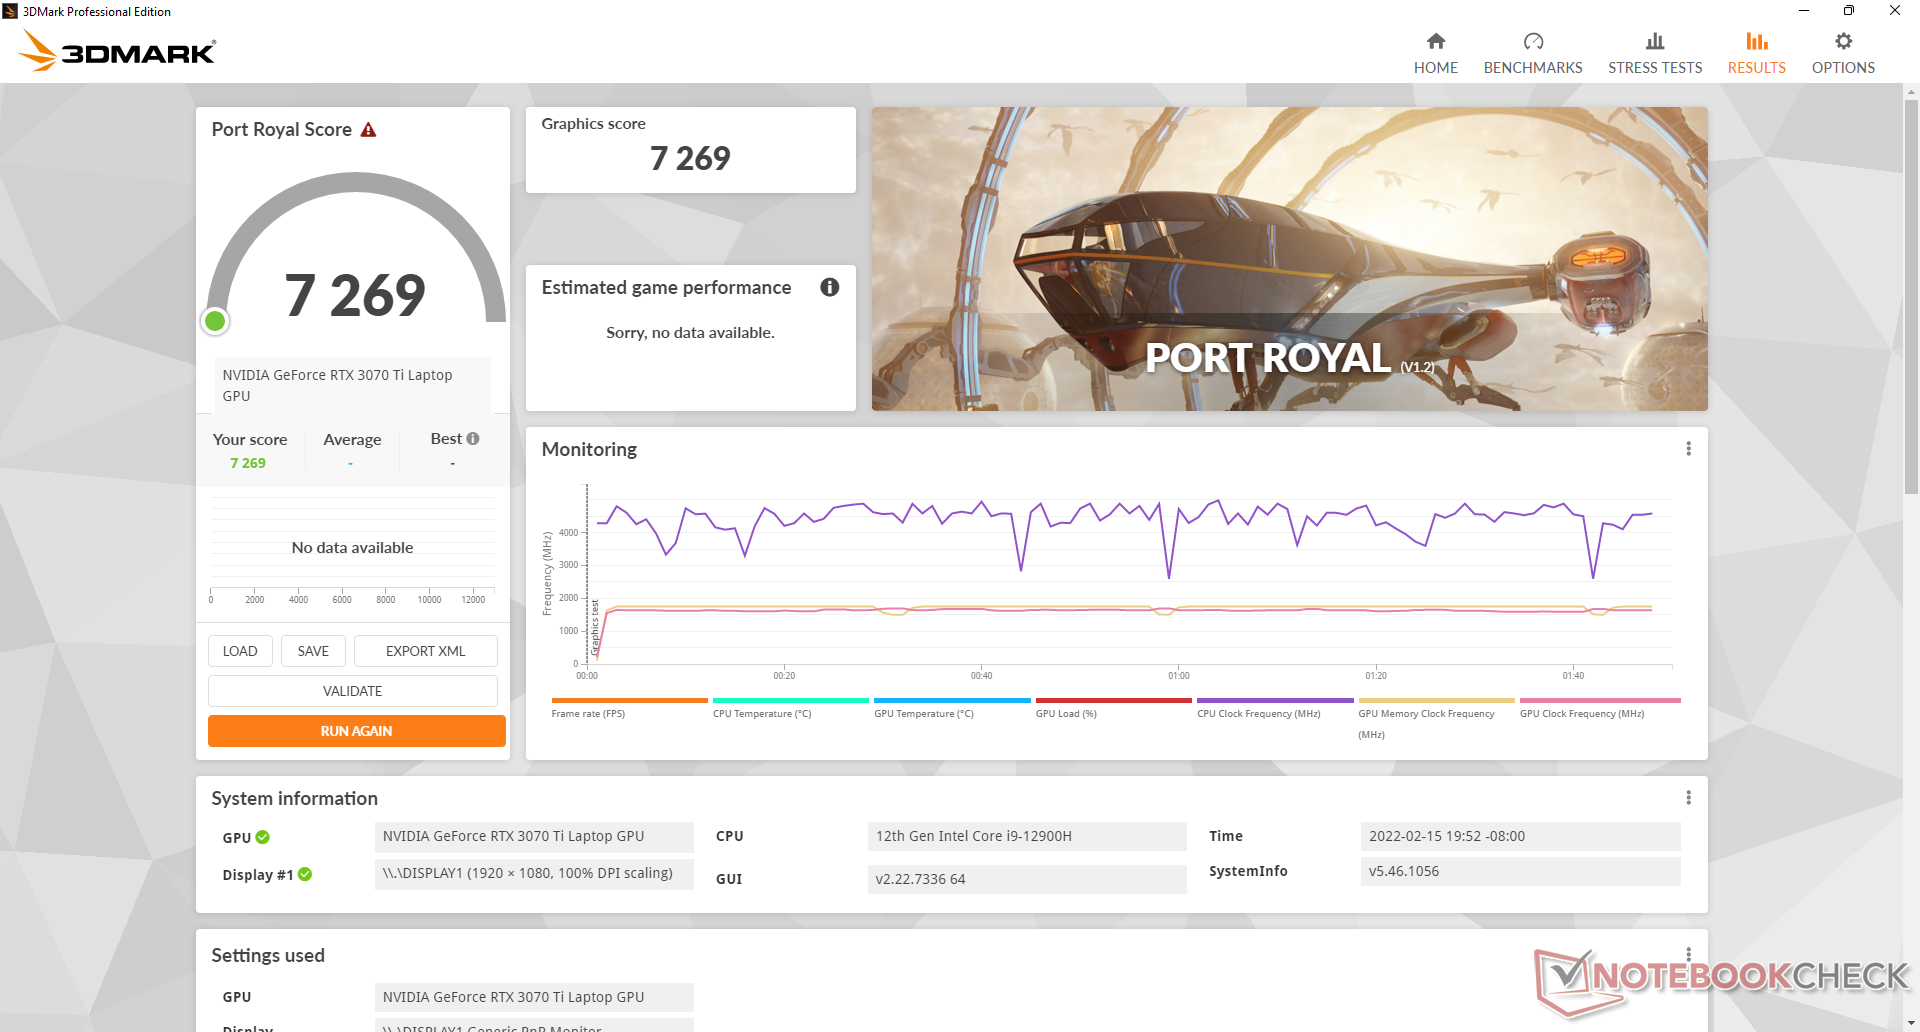
El rendimiento gráfico es solo entre un 5 y un 10 por ciento más lento que el de la móvil GeForce RTX 3080 Ti o entre un 15 y un 20 por ciento más rápido que la móvil GeForce RTX 3070 como se encuentra en el ADATA XPG Xenia 15. Estos resultados sitúan a nuestra GeForce RTX 3070 Ti móvil entre el 5 y el 15 por ciento de la escritorio GeForce RTX 3070.
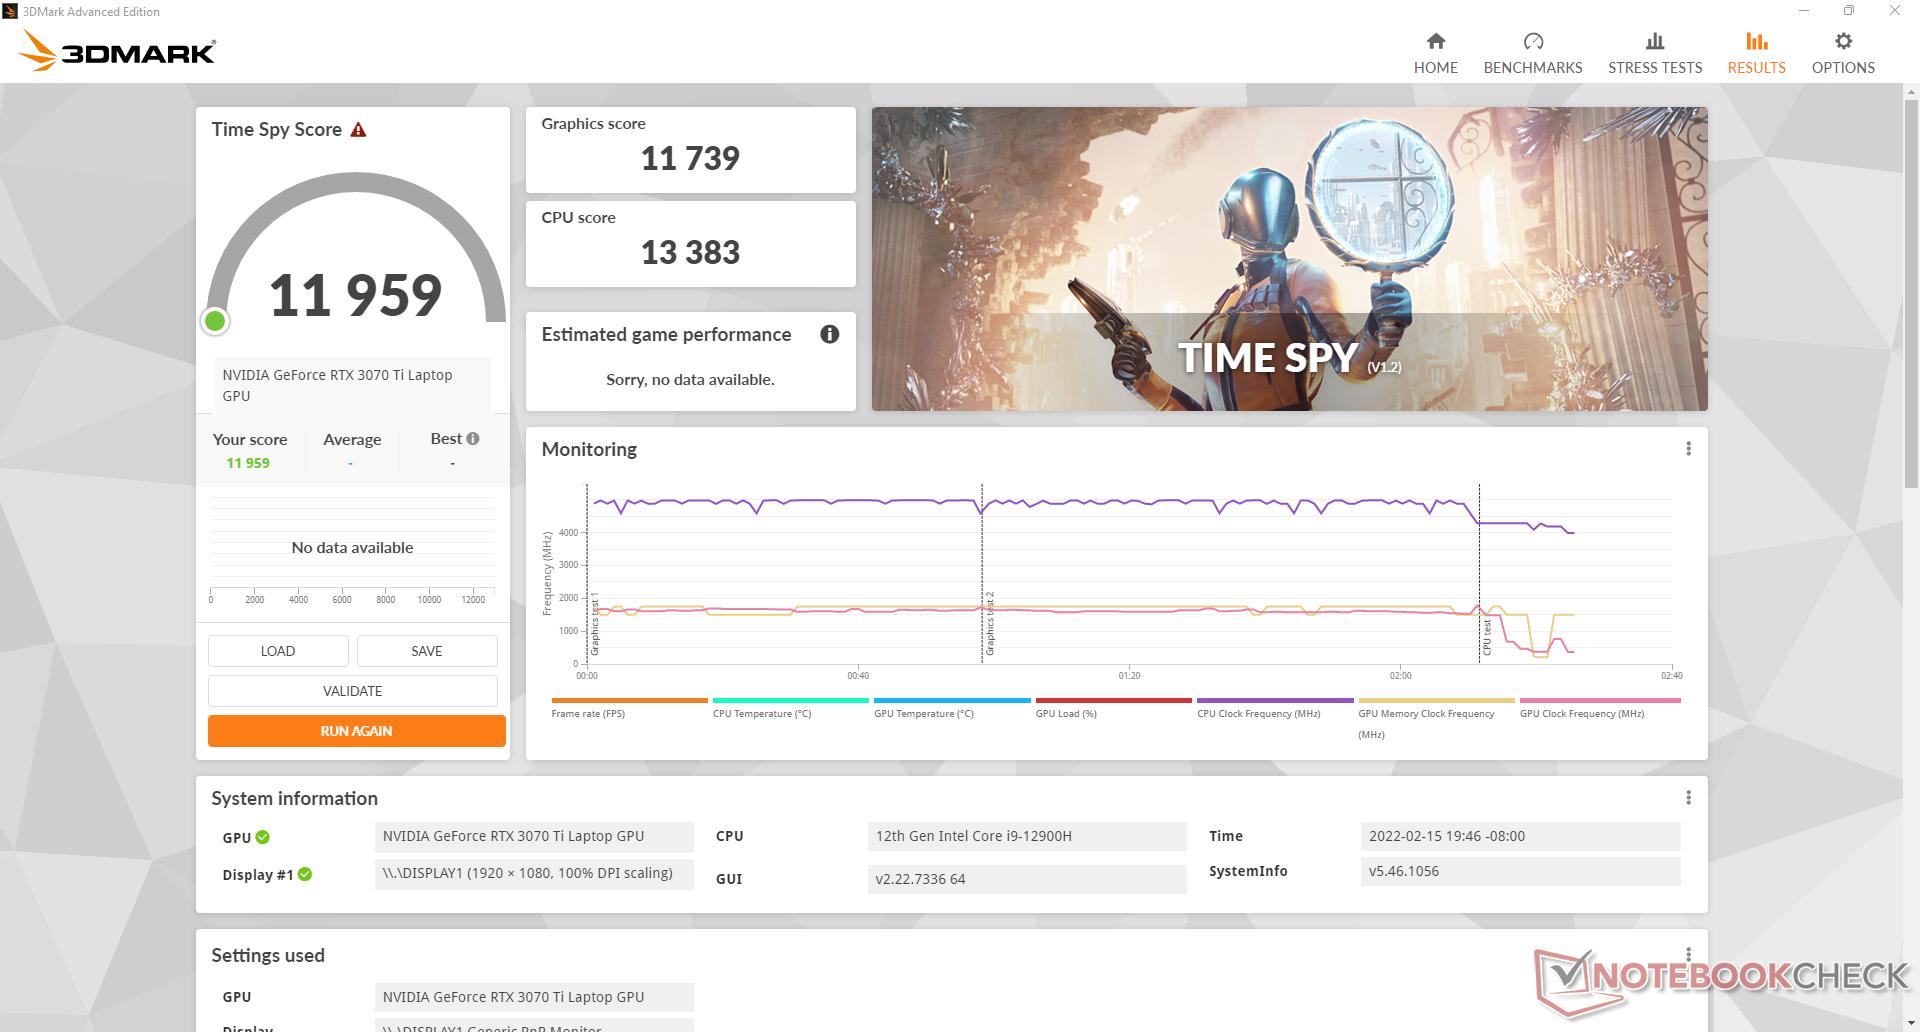
Ejecutar el modo MSHybrid en lugar del modo dGPU no supondrá un déficit de rendimiento. La puntuación de los gráficos de Time Spy en el modo MSHybrid es esencialmente la misma que la puntuación en el modo dGPU (11880 puntos frente a 11739 puntos).
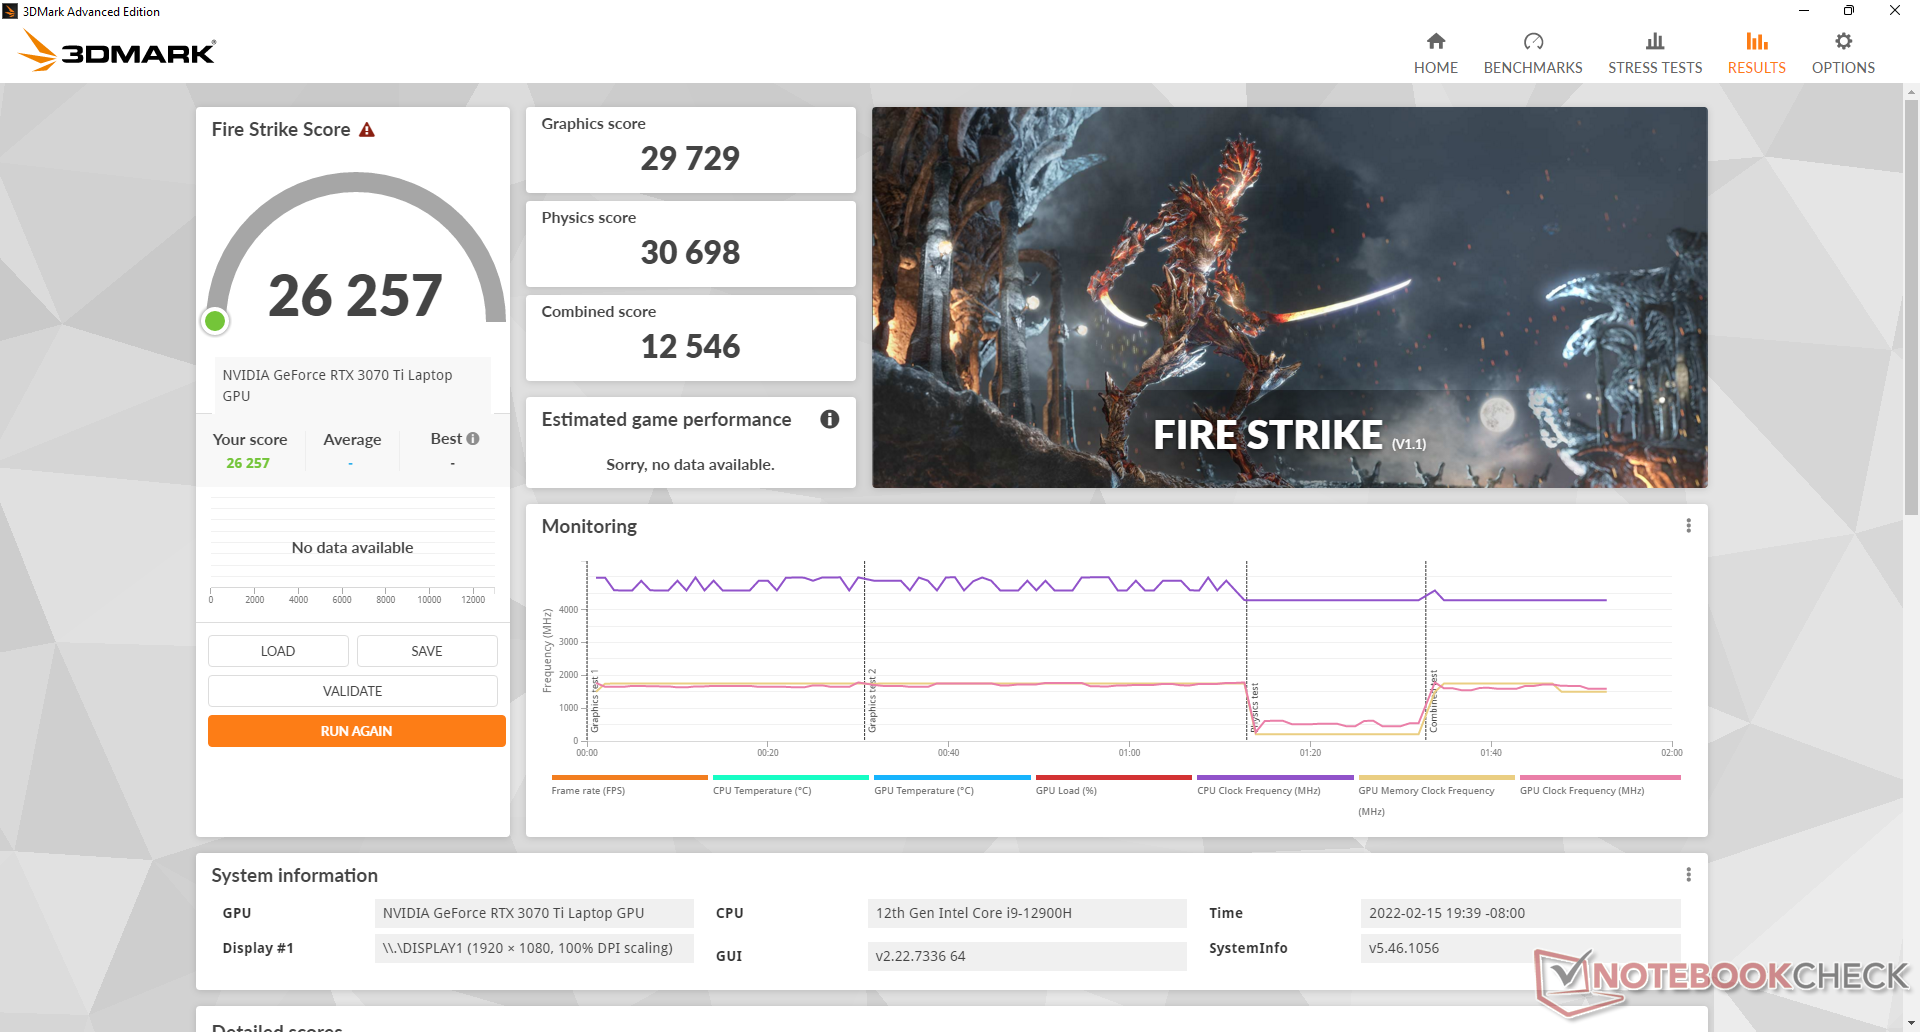
El rendimiento gráfico en el modo equilibrado sólo se reduce en un 4 o 5 por ciento, con la contrapartida de un ruido de ventilador mucho más silencioso y procesadores y superficies más calientes. Nuestra puntuación gráfica en Fire Strike baja a 28508 puntos desde 29729 puntos cuando se ejecuta en modo equilibrado.
Tenga en cuenta que las puntuaciones de 3DMark son hasta un 20 por ciento más rápido que en el MSI GS66 equipada con la misma GeForce RTX 3070 Ti debido al mayor objetivo de TGP de nuestra GP66 (150 W frente a 105 W).
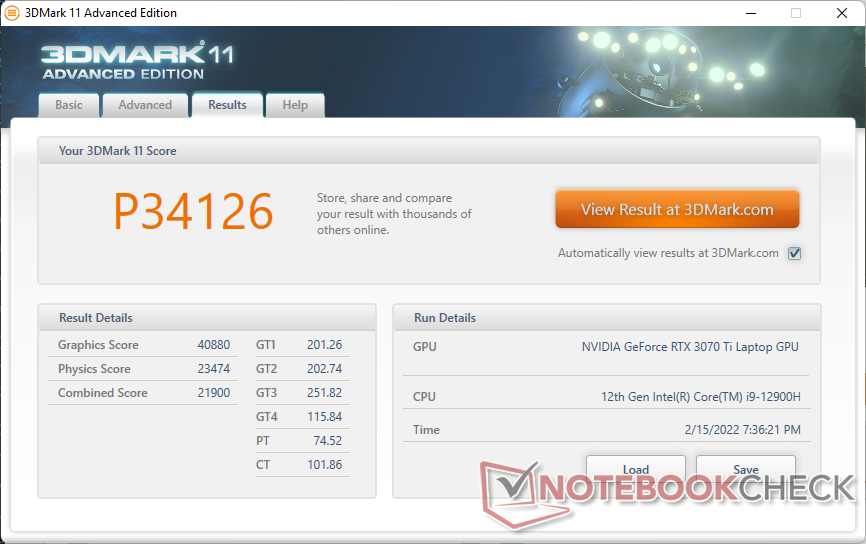
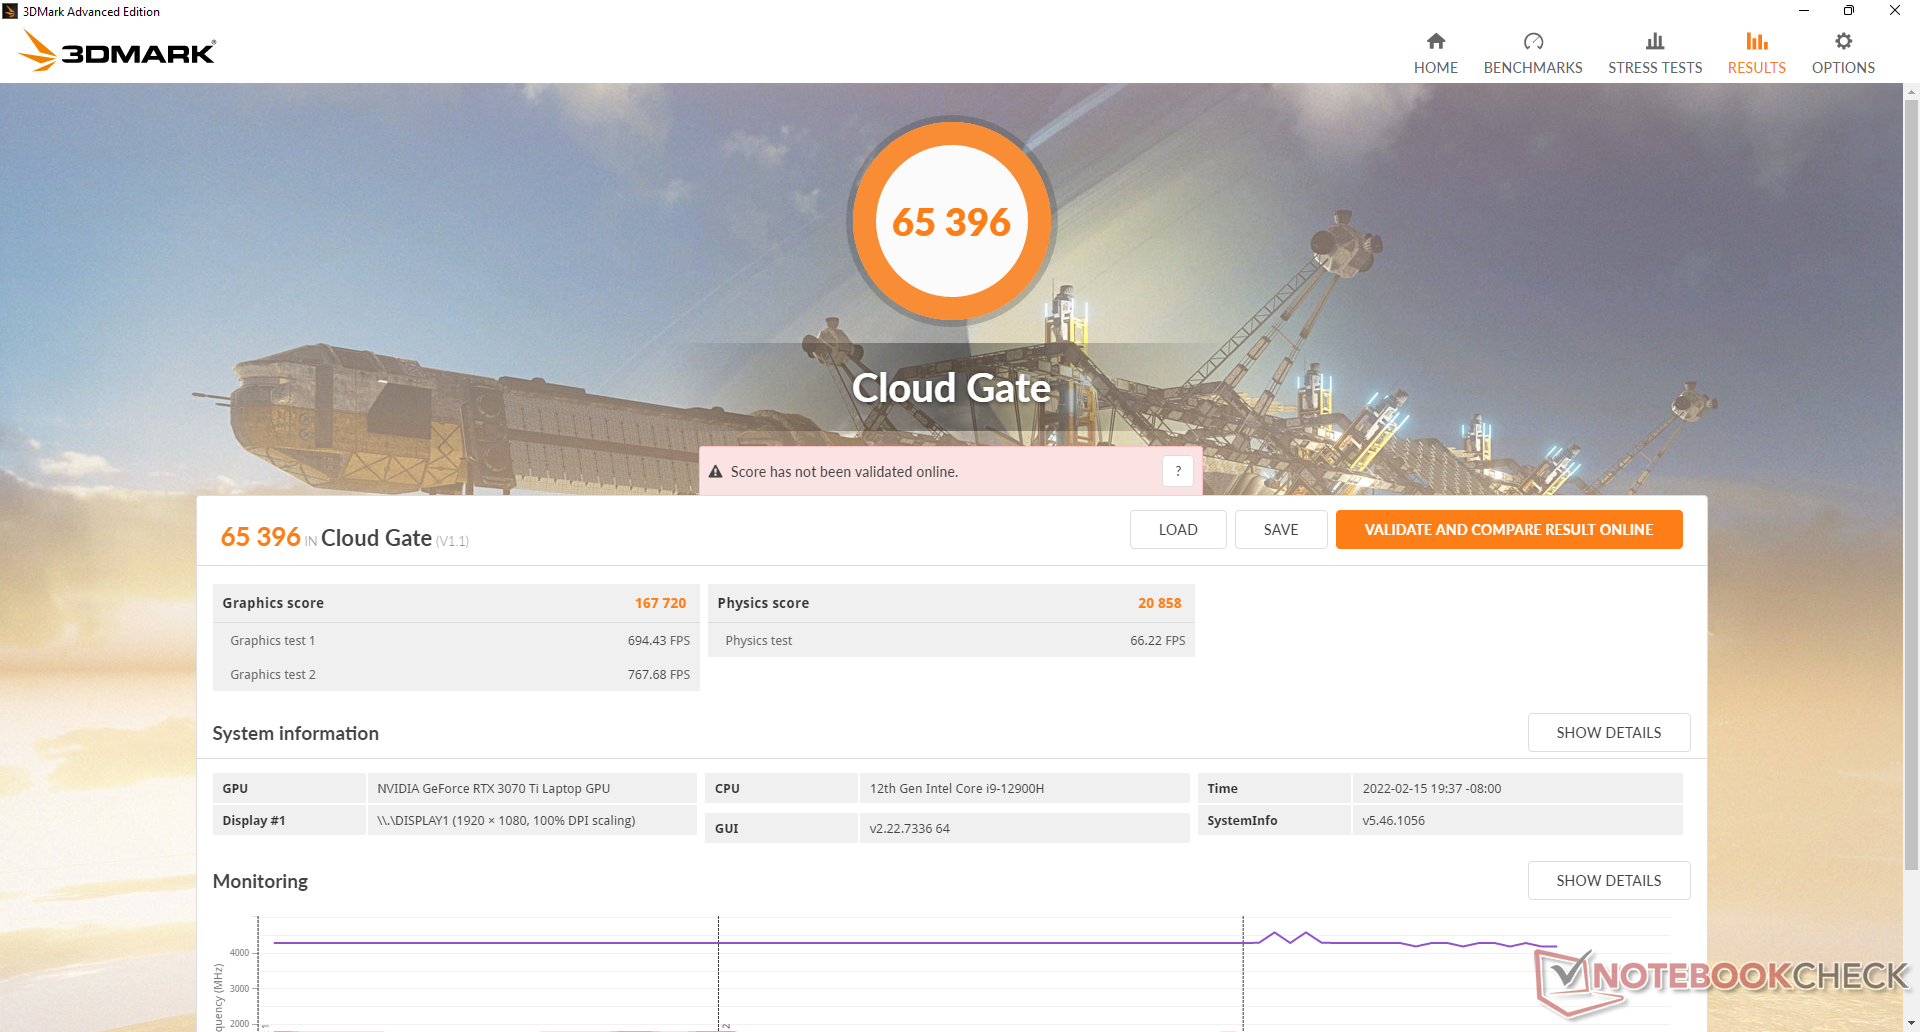
| 3DMark 11 Performance | 34126 puntos | |
| 3DMark Cloud Gate Standard Score | 65396 puntos | |
| 3DMark Fire Strike Score | 26257 puntos | |
| 3DMark Time Spy Score | 11959 puntos | |
ayuda | ||
Witcher 3 FPS Chart
| bajo | medio | alto | ultra | |
|---|---|---|---|---|
| GTA V (2015) | 185 | 184 | 179 | 123 |
| The Witcher 3 (2015) | 492.3 | 360 | 223.9 | 114.6 |
| Dota 2 Reborn (2015) | 185 | 169 | 164 | 155 |
| Final Fantasy XV Benchmark (2018) | 207 | 152 | 115 | |
| X-Plane 11.11 (2018) | 161 | 143 | 112 | |
| Far Cry 5 (2018) | 180 | 152 | 145 | 136 |
| Strange Brigade (2018) | 471 | 298 | 244 | 213 |
Emisiones
Ruido del sistema
El ruido del ventilador depende en gran medida de los cuatro perfiles de energía de MSI Center: Super Battery, Silent, Balanced, y Extreme Performance. Siempre habrá algo de ruido de ventilador en torno a los 26.8 dB(A) contra un fondo silencioso de 24.7 dB(A) incluso cuando se pone en modo Silencioso, pero este nivel es lo bastante bajo como para ser difícil de notar durante el uso diario. Recomendamos este modo si simplemente se navega por la web o se hace streaming de vídeo, ya que los ventiladores pulsarían con mucha menos frecuencia en comparación con los otros dos modos más rápidos
El ruido de los ventiladores en el modo equilibrado es de menos de 40 dB(A), mientras que en el modo de rendimiento extremo es de 58 dB(A). El rendimiento de la GPU será un poco más lento en modo equilibrado, pero el ahorro de ruido es significativo. El rango superior de 50 dB(A) es, en general, más ruidoso que la mayoría de portátiles para juegos que hemos probado.
Ruido
| Ocioso |
| 23.4 / 23.4 / 27.4 dB(A) |
| Carga |
| 36 / 58 dB(A) |
 | ||
30 dB silencioso 40 dB(A) audible 50 dB(A) ruidosamente alto |
||
min: | ||
| MSI Vector GP66 12UGS GeForce RTX 3070 Ti Laptop GPU, i9-12900H | MSI GP66 Leopard 11UH-028 GeForce RTX 3080 Laptop GPU, i7-11800H, Samsung PM9A1 MZVL21T0HCLR | MSI Katana GF66 11UG-220 GeForce RTX 3070 Laptop GPU, i7-11800H, Kingston OM8PDP3512B-AI1 | Asus TUF Gaming F15 FX506HM GeForce RTX 3060 Laptop GPU, i7-11800H, SK Hynix HFM001TD3JX013N | Razer Blade 15 Base Edition 2021, i7-10750H RTX 3060 GeForce RTX 3060 Laptop GPU, i7-10750H, Samsung SSD PM981a MZVLB512HBJQ | Alienware m15 R5 Ryzen Edition GeForce RTX 3060 Laptop GPU, R7 5800H, Toshiba KBG40ZNS512G NVMe | |
|---|---|---|---|---|---|---|
| Noise | 1% | -19% | 7% | -0% | -5% | |
| apagado / medio ambiente * (dB) | 22.9 | 23 -0% | 25 -9% | 24.8 -8% | 25.3 -10% | 24 -5% |
| Idle Minimum * (dB) | 23.4 | 23 2% | 34 -45% | 24.6 -5% | 25.4 -9% | 24 -3% |
| Idle Average * (dB) | 23.4 | 23 2% | 35 -50% | 24.9 -6% | 25.4 -9% | 25 -7% |
| Idle Maximum * (dB) | 27.4 | 30.11 -10% | 36 -31% | 24.9 9% | 25.4 7% | 35 -28% |
| Load Average * (dB) | 36 | 41.86 -16% | 48 -33% | 27.1 25% | 42.5 -18% | 44 -22% |
| Witcher 3 ultra * (dB) | 58.2 | 47.79 18% | 46 21% | 46.4 20% | 42 28% | 48 18% |
| Load Maximum * (dB) | 58 | 53 9% | 49 16% | 49 16% | 52.2 10% | 50 14% |
* ... más pequeño es mejor
Temperatura
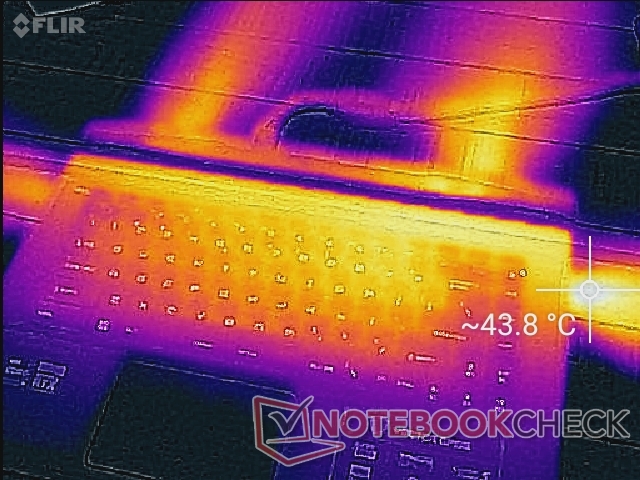
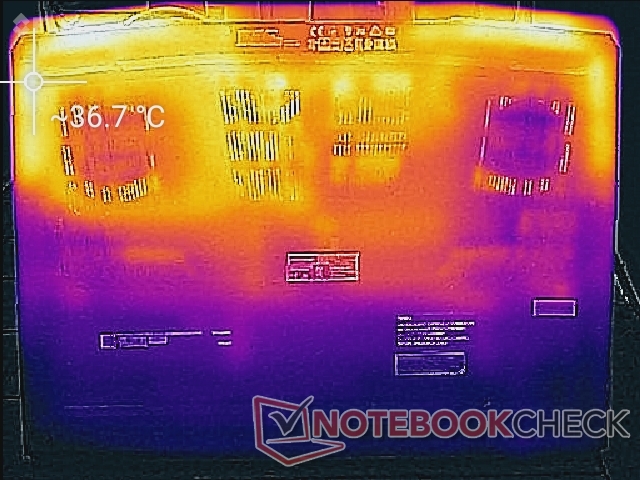
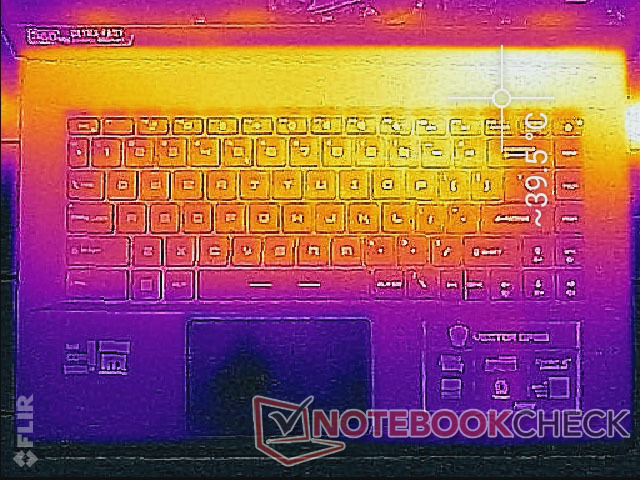
Las temperaturas de la superficie dependen en gran medida de la configuración del perfil de potencia del MSI Center. Cuando está en modo equilibrado, los puntos calientes pueden alcanzar los 49 C comparado con sólo 42 C si está en la configuración de Rendimiento Extremo ya que un techo de RPM del ventilador más alto está ligado al modo de Rendimiento Extremo
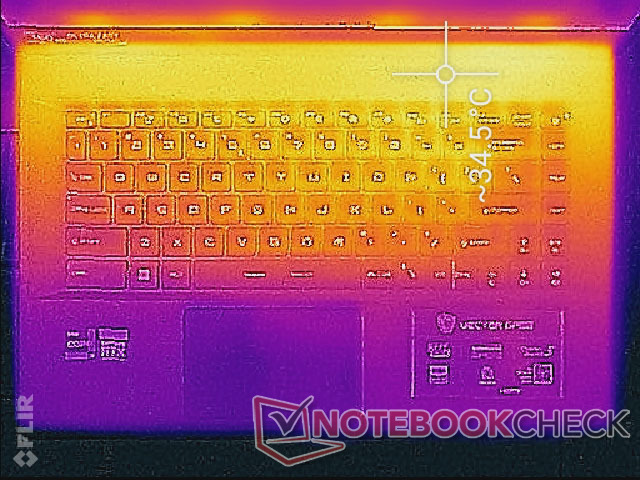
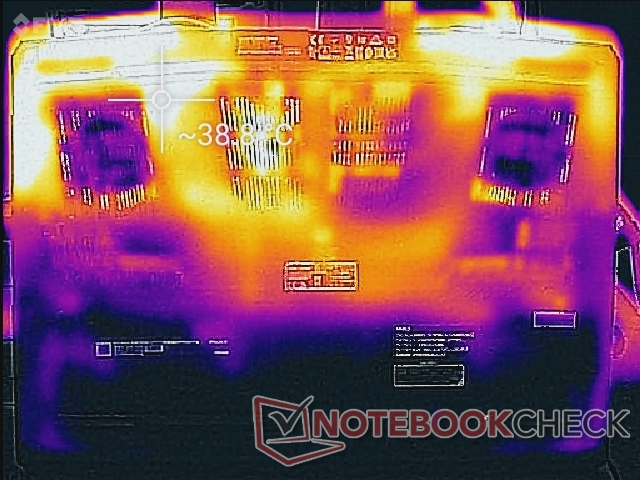
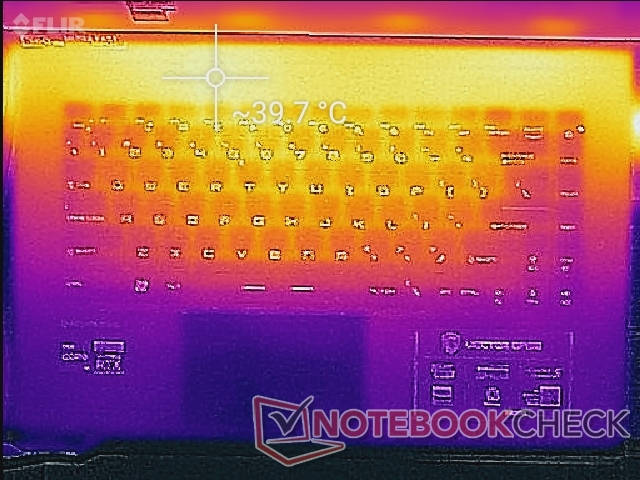
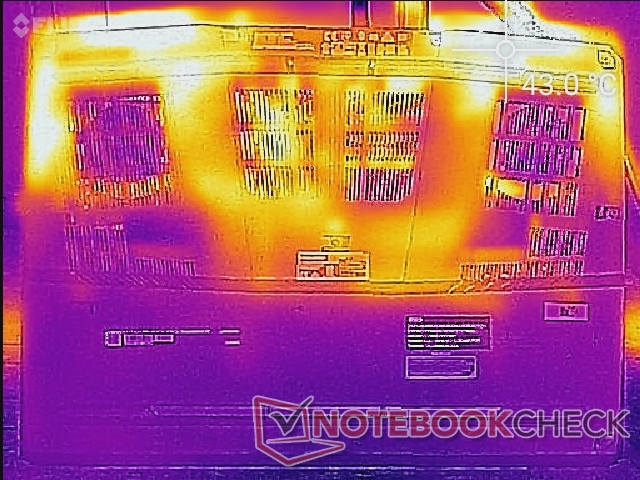
Los puntos calientes se concentran a lo largo de los cuadrantes traseros del chasis como muestran nuestros mapas de temperatura a continuación. Las teclas del teclado y los descansos de las palmas pueden estar calientes pero nunca son molestos o incómodos. El más delgado GS66 o Razer Blade 15 tienen reposamanos y teclados más cálidos en comparación con unos pocos grados de media cada uno.
(±) La temperatura máxima en la parte superior es de 40.2 °C / 104 F, frente a la media de 40.4 °C / 105 F, que oscila entre 21.2 y 68.8 °C para la clase Gaming.
(±) El fondo se calienta hasta un máximo de 43.8 °C / 111 F, frente a la media de 43.2 °C / 110 F
(+) En reposo, la temperatura media de la parte superior es de 29.6 °C / 85# F, frente a la media del dispositivo de 33.9 °C / 93 F.
(+) Jugando a The Witcher 3, la temperatura media de la parte superior es de 30.7 °C / 87 F, frente a la media del dispositivo de 33.9 °C / 93 F.
(+) El reposamanos y el panel táctil están a una temperatura inferior a la de la piel, con un máximo de 24.8 °C / 76.6 F y, por tanto, son fríos al tacto.
(+) La temperatura media de la zona del reposamanos de dispositivos similares fue de 28.8 °C / 83.8 F (+4 °C / 7.2 F).
| MSI Vector GP66 12UGS Intel Core i9-12900H, NVIDIA GeForce RTX 3070 Ti Laptop GPU | MSI GP66 Leopard 11UH-028 Intel Core i7-11800H, NVIDIA GeForce RTX 3080 Laptop GPU | MSI Katana GF66 11UG-220 Intel Core i7-11800H, NVIDIA GeForce RTX 3070 Laptop GPU | Asus TUF Gaming F15 FX506HM Intel Core i7-11800H, NVIDIA GeForce RTX 3060 Laptop GPU | Razer Blade 15 Base Edition 2021, i7-10750H RTX 3060 Intel Core i7-10750H, NVIDIA GeForce RTX 3060 Laptop GPU | Alienware m15 R5 Ryzen Edition AMD Ryzen 7 5800H, NVIDIA GeForce RTX 3060 Laptop GPU | |
|---|---|---|---|---|---|---|
| Heat | -2% | -8% | 8% | -6% | -21% | |
| Maximum Upper Side * (°C) | 40.2 | 49 -22% | 56 -39% | 46.4 -15% | 45.2 -12% | 62 -54% |
| Maximum Bottom * (°C) | 43.8 | 47 -7% | 49 -12% | 45.4 -4% | 48 -10% | 61 -39% |
| Idle Upper Side * (°C) | 34.8 | 31 11% | 36 -3% | 26 25% | 34.4 1% | 36 -3% |
| Idle Bottom * (°C) | 37 | 33 11% | 28 24% | 27.4 26% | 37.2 -1% | 33 11% |
* ... más pequeño es mejor
Prueba de esfuerzo
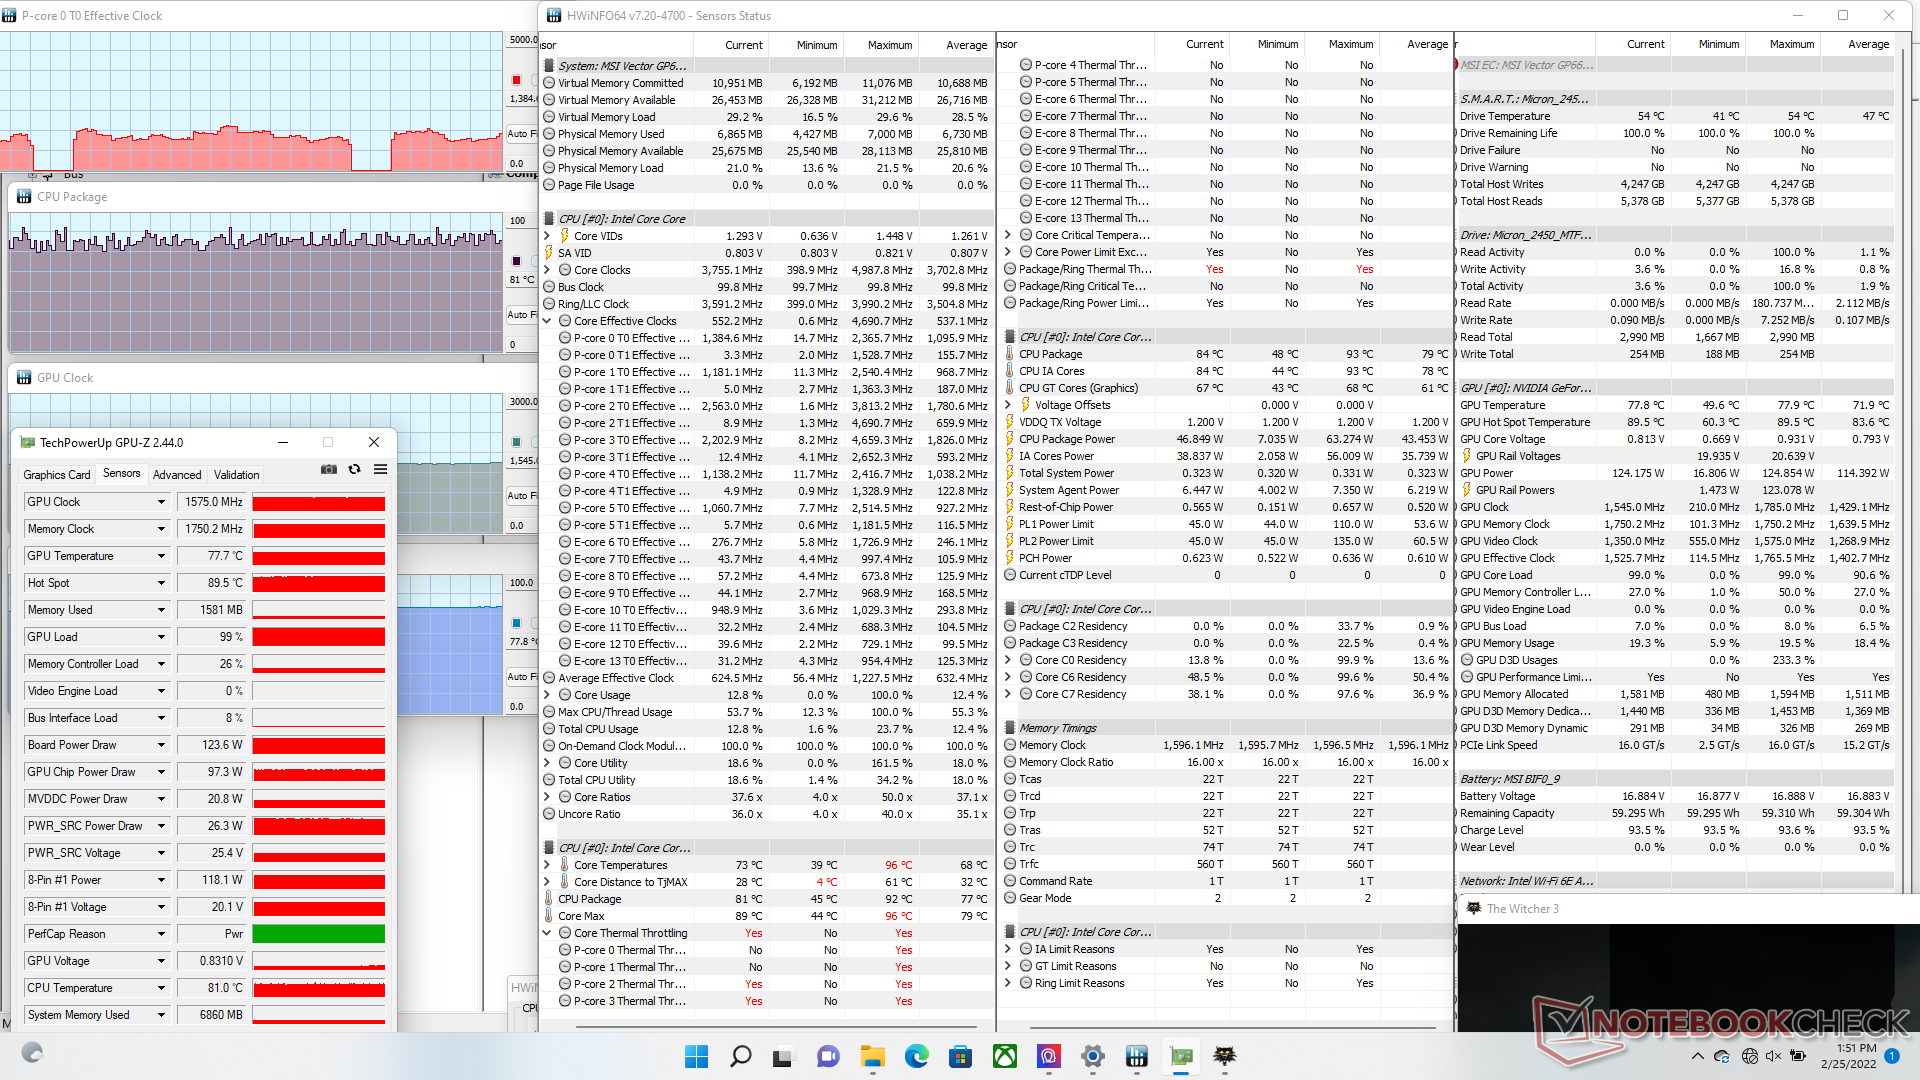
Cuando se estresa con Prime95 en el perfil de Rendimiento Extremo, las velocidades de reloj de la CPU aumentan a 4,2 GHz durante uno o dos segundos antes de caer rápidamente a 3,7 GHz. Después de otro minuto más o menos, las velocidades de reloj caerían aún más a sólo 3 GHz con el fin de mantener una temperatura del núcleo de 90 C. La potencia del paquete de la CPU se dispararía inicialmente a 100 W al iniciar Prime95 antes de caer y estabilizarse en 70 W. La misma CPU Core i9-12900H en el más grande Tecnología Uniwill GM7AG8P funcionaría más rápido (3,2 GHz frente a 3,0 GHz) y más frío (80 C frente a 90 C), respectivamente, y con un TDP estable más alto (75 W frente a 70 W) que el que registramos en nuestro Vector GP66.
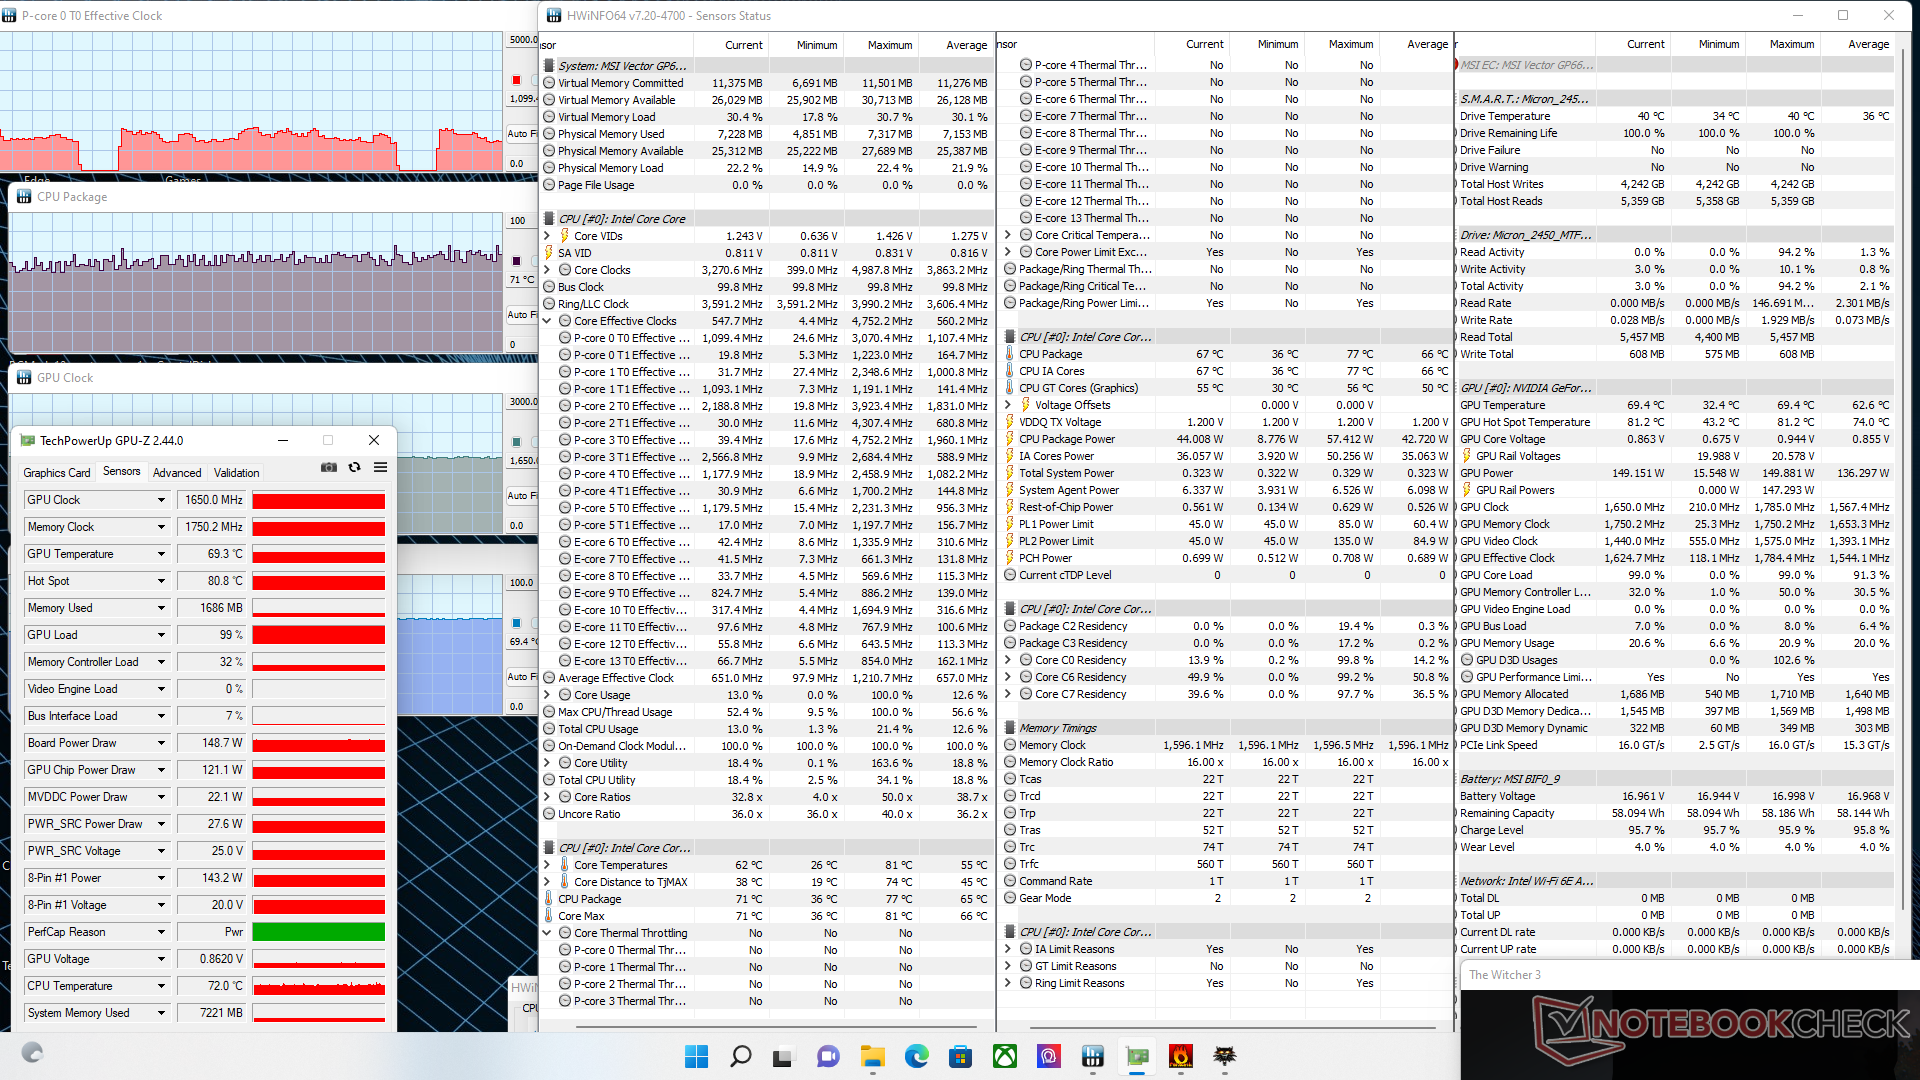
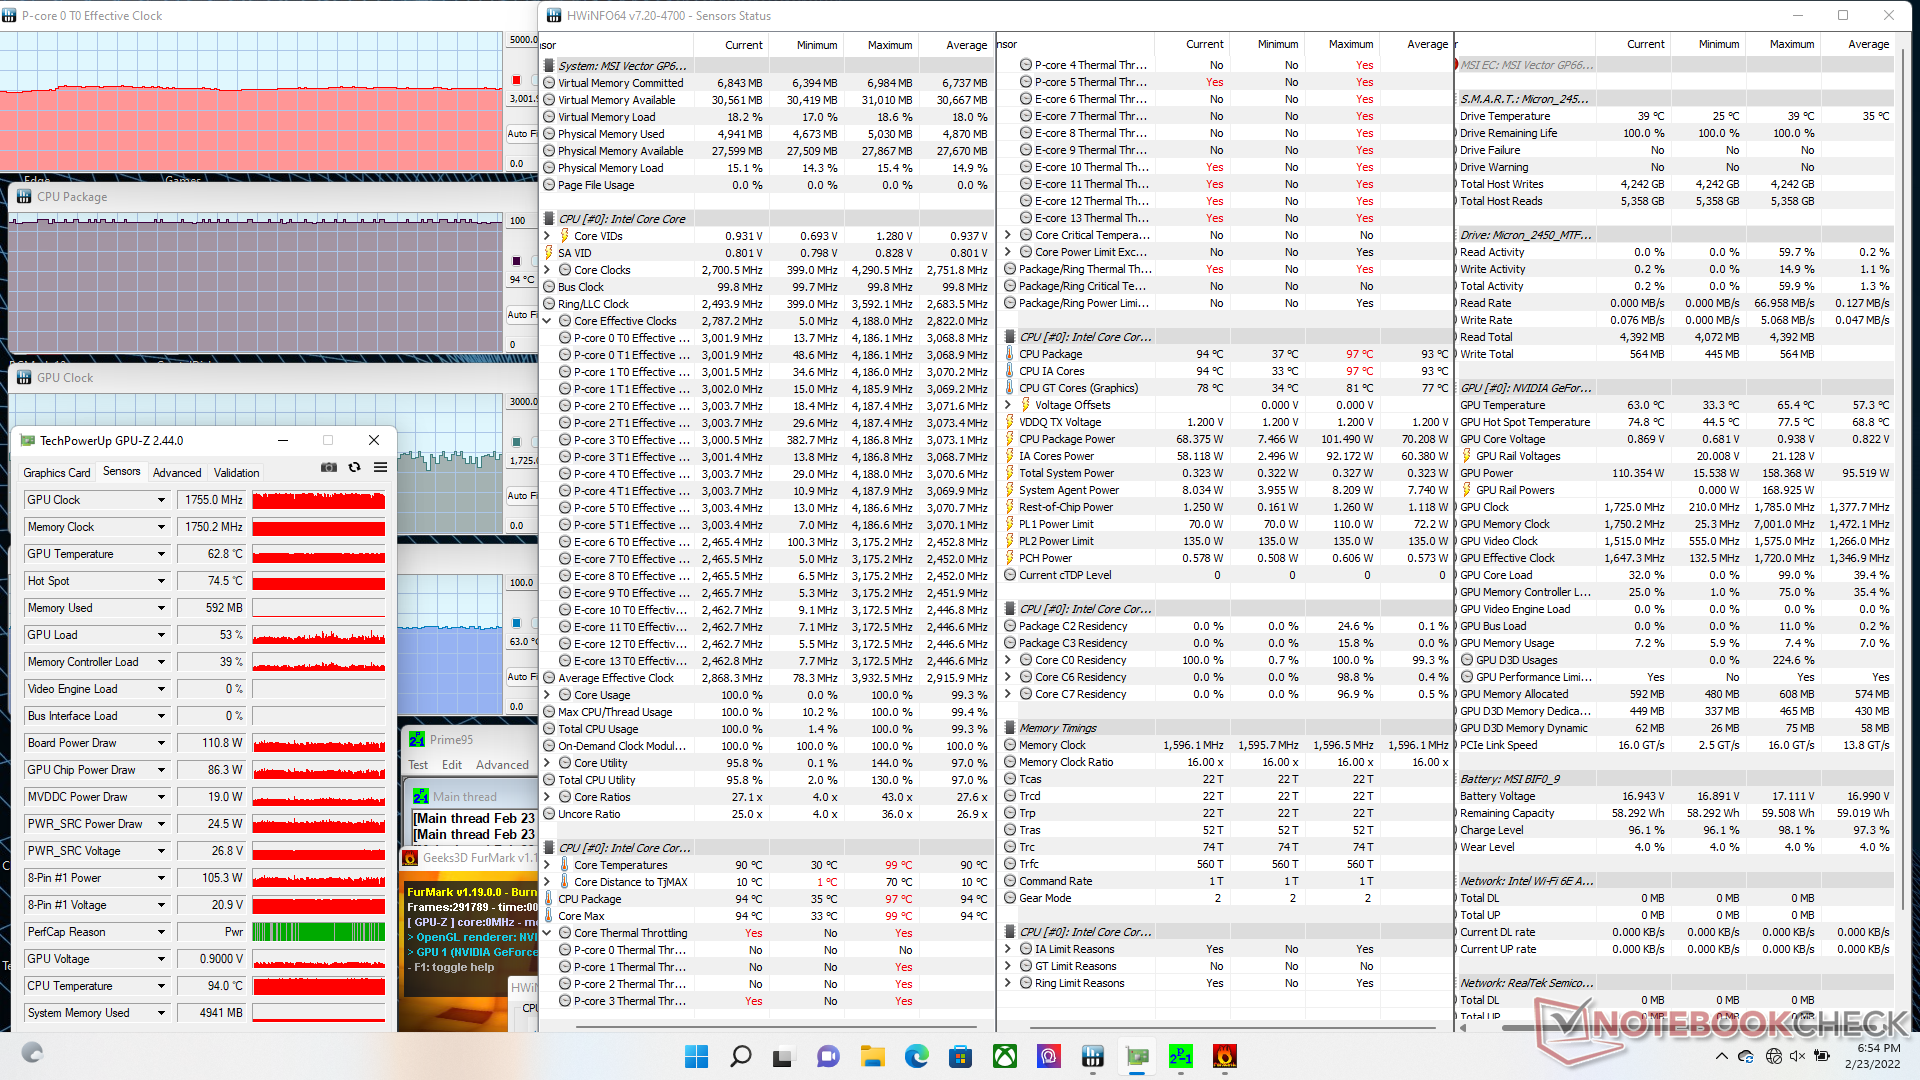
Las temperaturas de la CPU y la GPU se estabilizan en 71 C y 70 C, respectivamente, con el perfil de rendimiento extremo. Si se baja al perfil Equilibrado, las temperaturas de la CPU y la GPU son más altas, 85 C y 78 C respectivamente, y la velocidad de la GPU es ligeramente inferior (1650 MHz frente a 1755 MHz). No obstante, las frecuencias son significativamente más rápidas que las que observamos en el MSI GS66 (1155 MHz), que viene con la misma GPU GeForce RTX 3070 Ti, aunque con un TGP inferior (105 W frente a 150 W).
Funcionar con batería limitará el rendimiento de forma significativa. Un test de Fire Strike en batería arrojaría unos resultados de Física y Gráficos de 10913 puntos y 6061 puntos, respectivamente, comparados con los 30698 y 29729 puntos de la red eléctrica.
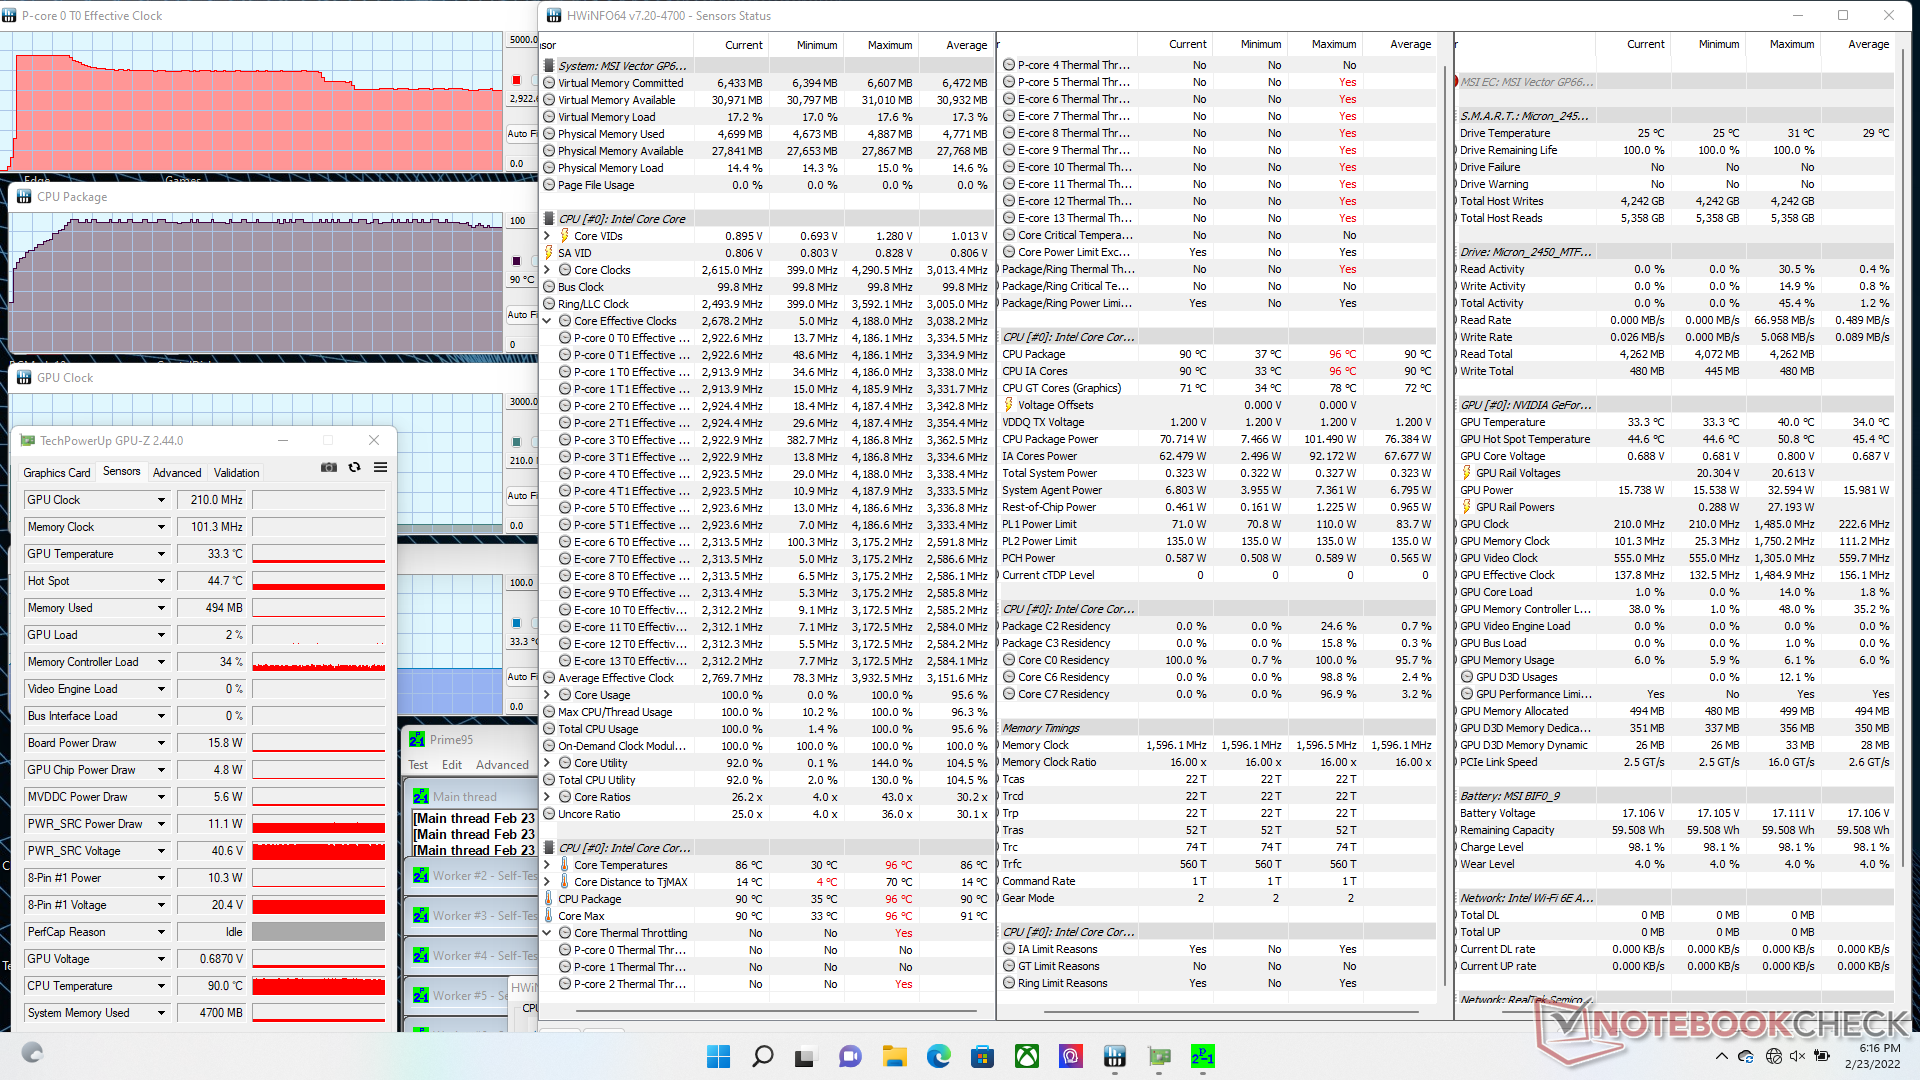
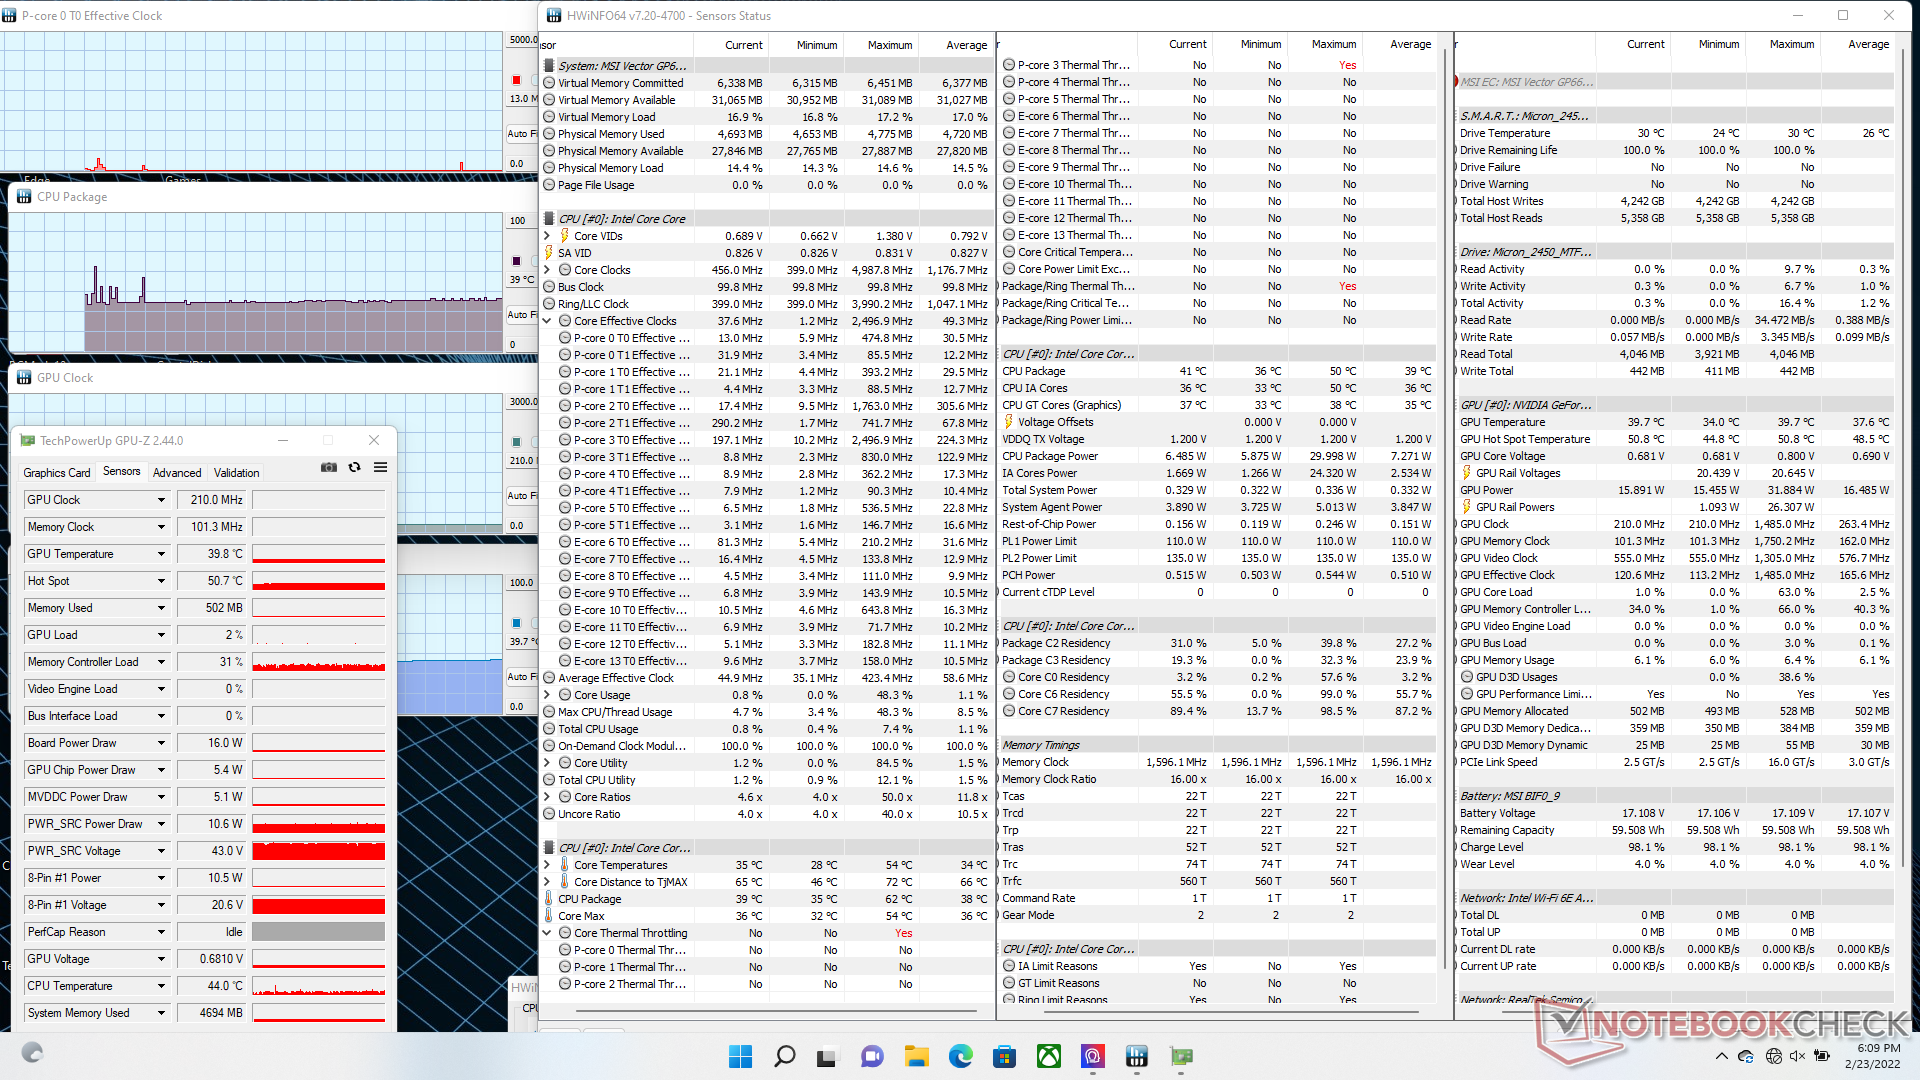
| Reloj de la CPU (GHz) | Reloj de la GPU (MHz) | Temperaturamediadela CPU (°C) | Temperatura media de la GPU (°C) | |
| Sistema en reposo (modo equilibrado) | -- | -- | 39 | 40 |
| Prime95 Stress (modo derendimientoextremo) | 3.0 | -- | 90 | 33 |
| Prime95+ FurMarkStress (modo de rendimiento extremo) | 3.0 | 1755 | 94 | 63 |
| Witcher 3 Estrés (modo de rendimiento extremo) | ~1,0 | 1650 | 71 | 70 |
| Witcher 3 Estrés (modo equilibrado) | ~1,0 | 1515 | 85 | 78 |
Altavoces
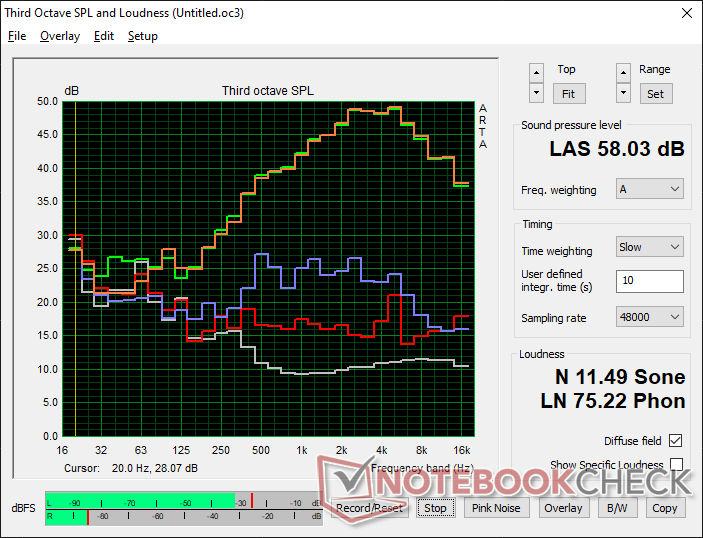
MSI Vector GP66 12UGS análisis de audio
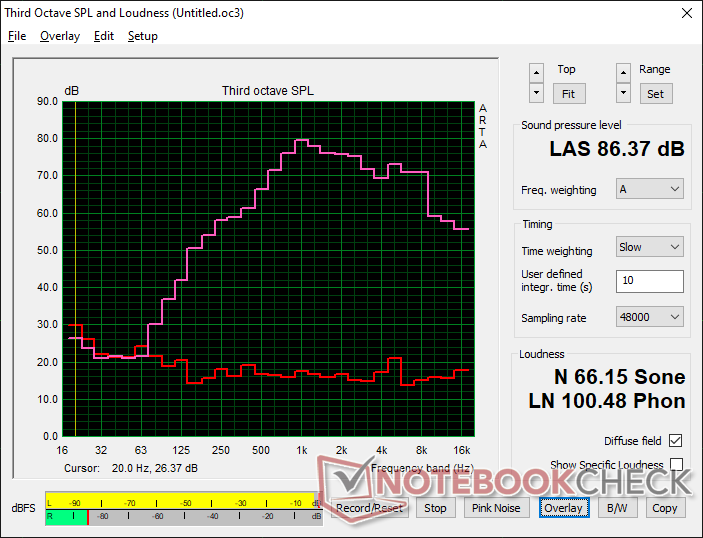
(+) | los altavoces pueden reproducir a un volumen relativamente alto (#86.4 dB)
Graves 100 - 315 Hz
(-) | casi sin bajos - de media 19.2% inferior a la mediana
(±) | la linealidad de los graves es media (9.1% delta a frecuencia anterior)
Medios 400 - 2000 Hz
(±) | medias más altas - de media 6.5% más altas que la mediana
(+) | los medios son lineales (5.8% delta a la frecuencia anterior)
Altos 2 - 16 kHz
(+) | máximos equilibrados - a sólo 3.7% de la mediana
(+) | los máximos son lineales (6.5% delta a la frecuencia anterior)
Total 100 - 16.000 Hz
(±) | la linealidad del sonido global es media (18.1% de diferencia con la mediana)
En comparación con la misma clase
» 57% de todos los dispositivos probados de esta clase eran mejores, 8% similares, 35% peores
» El mejor tuvo un delta de 6%, la media fue 18%, el peor fue ###max##%
En comparación con todos los dispositivos probados
» 39% de todos los dispositivos probados eran mejores, 8% similares, 54% peores
» El mejor tuvo un delta de 4%, la media fue 23%, el peor fue ###max##%
Apple MacBook Pro 16 2021 M1 Pro análisis de audio
(+) | los altavoces pueden reproducir a un volumen relativamente alto (#84.7 dB)
Graves 100 - 315 Hz
(+) | buen bajo - sólo 3.8% lejos de la mediana
(+) | el bajo es lineal (5.2% delta a la frecuencia anterior)
Medios 400 - 2000 Hz
(+) | medios equilibrados - a sólo 1.3% de la mediana
(+) | los medios son lineales (2.1% delta a la frecuencia anterior)
Altos 2 - 16 kHz
(+) | máximos equilibrados - a sólo 1.9% de la mediana
(+) | los máximos son lineales (2.7% delta a la frecuencia anterior)
Total 100 - 16.000 Hz
(+) | el sonido global es lineal (4.6% de diferencia con la mediana)
En comparación con la misma clase
» 0% de todos los dispositivos probados de esta clase eran mejores, 0% similares, 100% peores
» El mejor tuvo un delta de 5%, la media fue 17%, el peor fue ###max##%
En comparación con todos los dispositivos probados
» 0% de todos los dispositivos probados eran mejores, 0% similares, 100% peores
» El mejor tuvo un delta de 4%, la media fue 23%, el peor fue ###max##%
Gestión de la energía
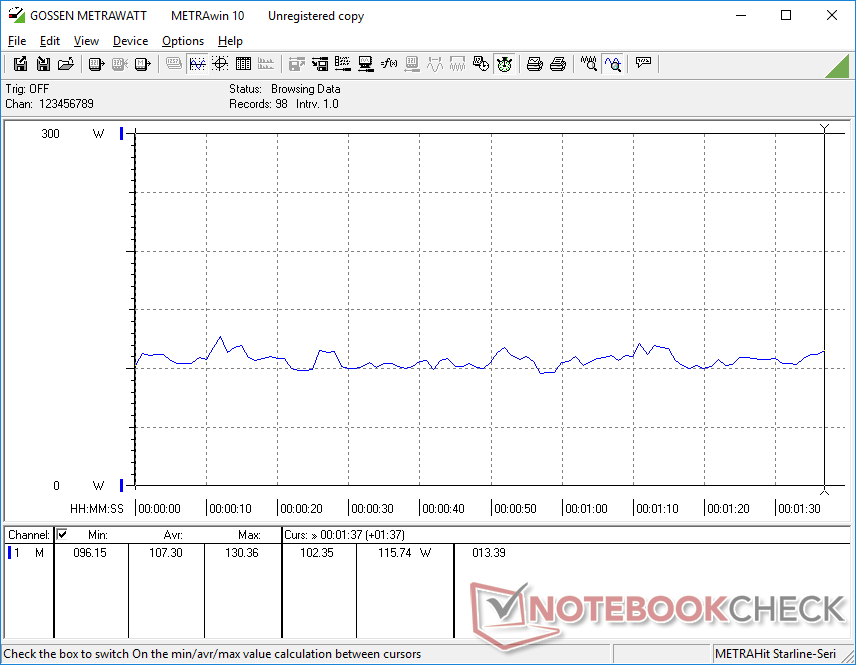
Consumo de energía
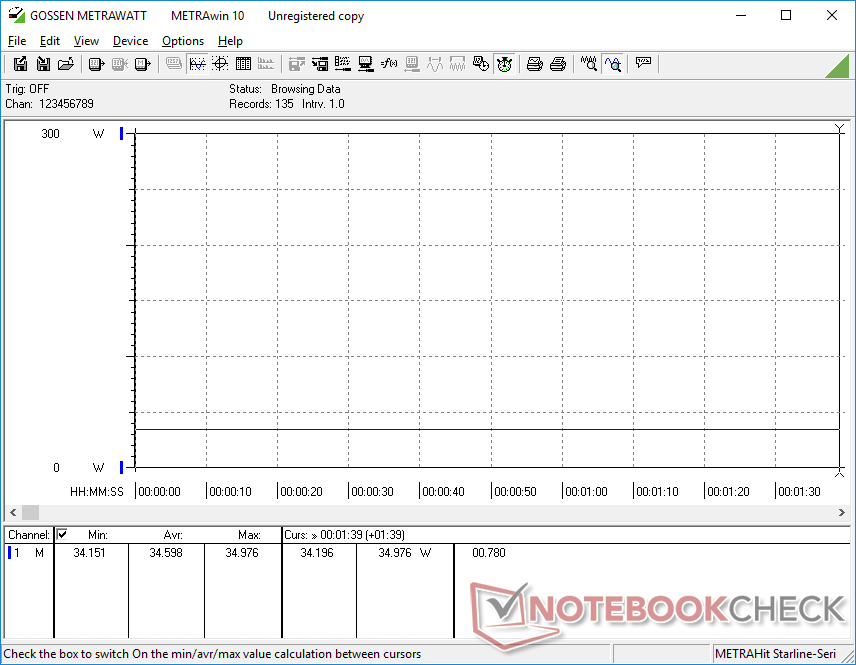
Espera un mayor consumo de energía en general en el Vector GP66 en comparación con el GP66 Leopard del año pasado debido a su mayor tasa de refresco de pantalla nativa (360 Hz frente a 144 Hz), mayores objetivos de PL de la CPU (70 W frente a 45 W) y mayor TGP (150 W frente a 140 W). Ejecutar juegos consumirá unos 20 W más de la toma de corriente para ser más exigente que muchos otros portátiles de juego de 17 pulgadas equipados con gráficos GeForce RTX 3080. Aunque los usuarios están consiguiendo un mayor rendimiento año tras año, especialmente en términos de CPU, el rendimiento por vatio puede no ser mucho mejor.
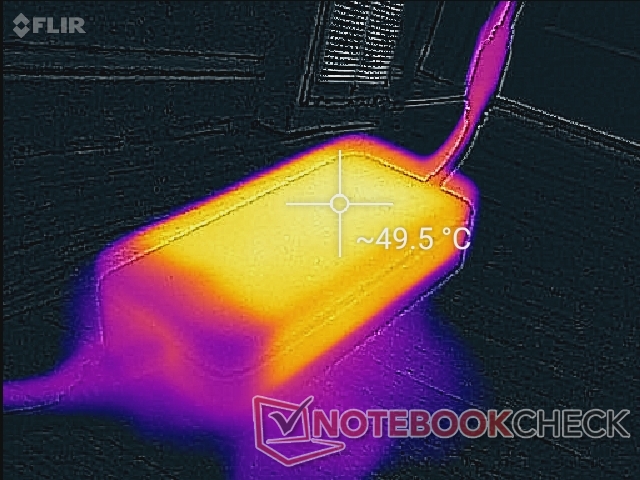
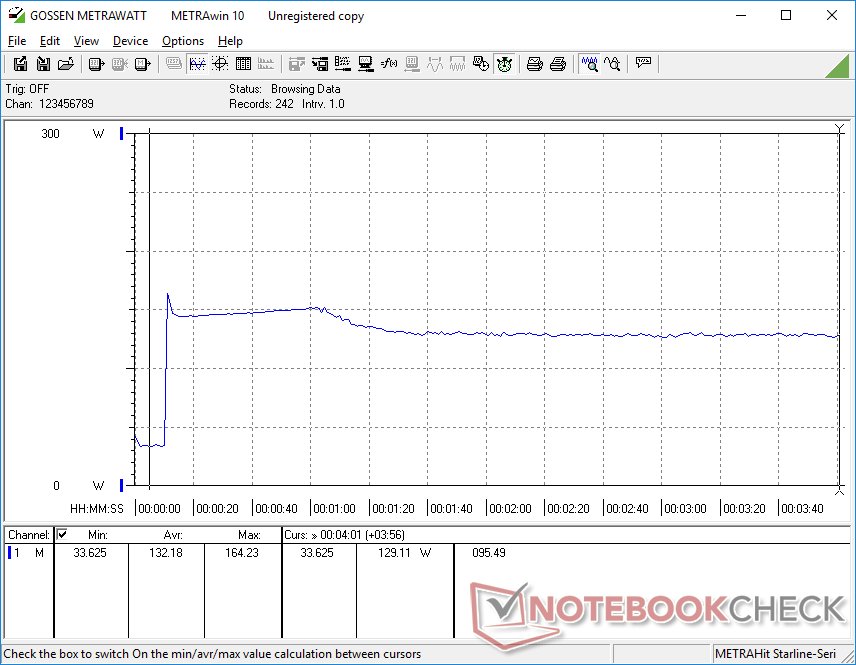
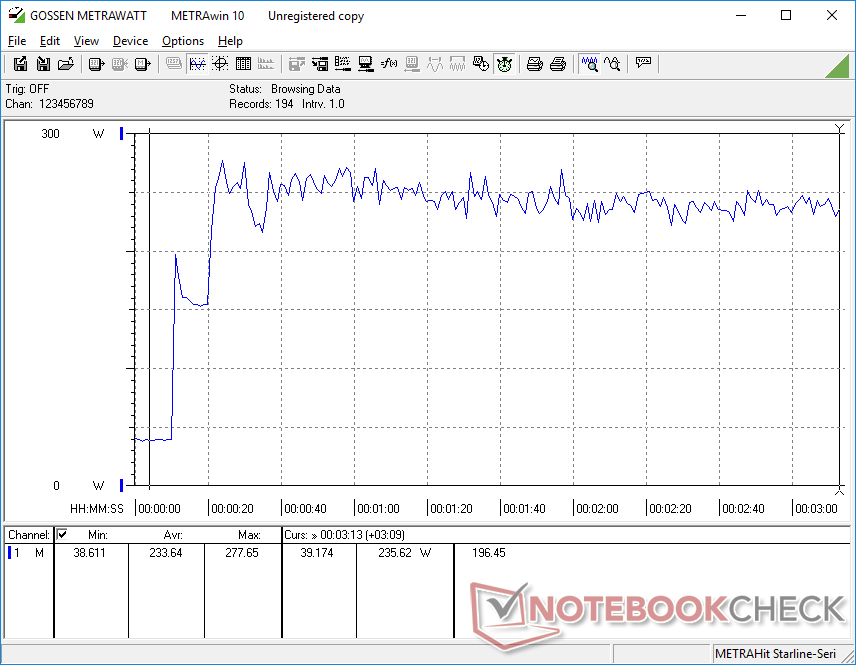
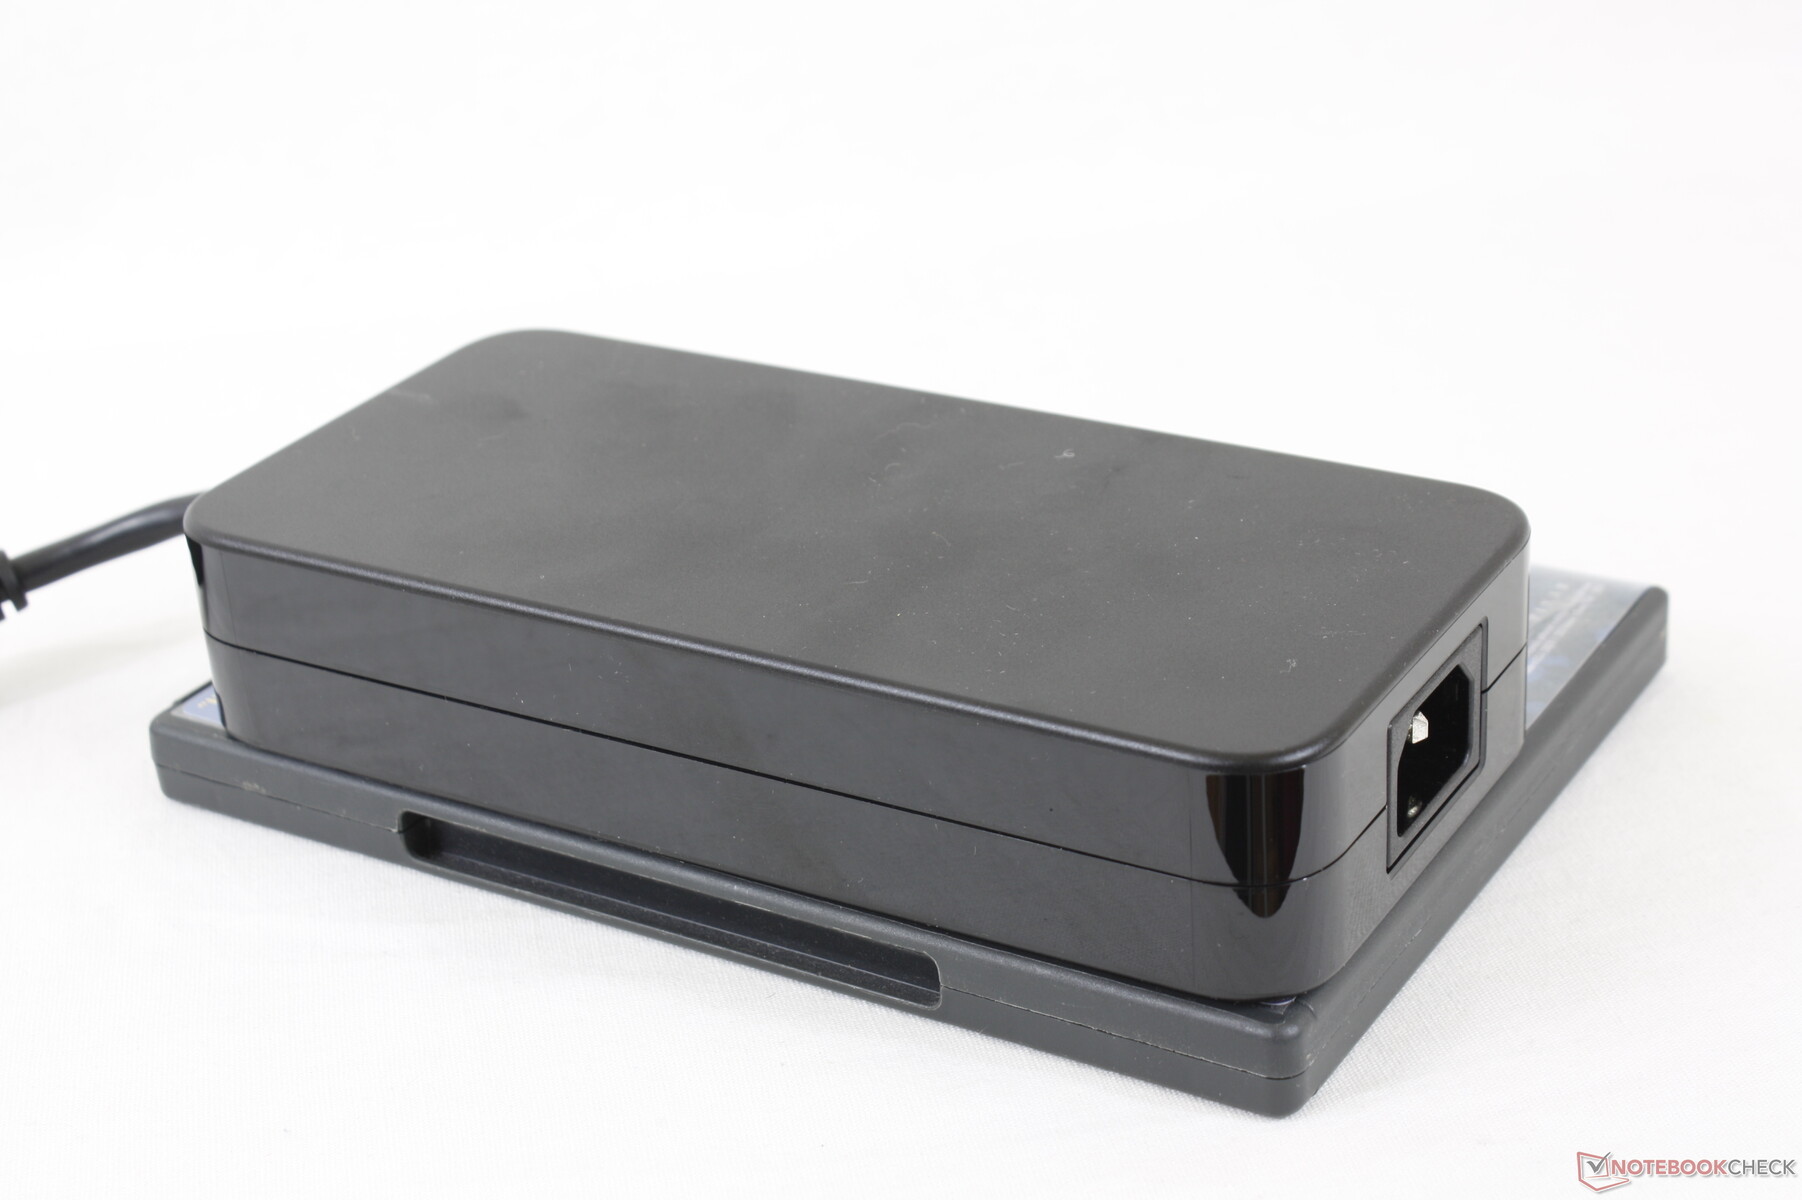
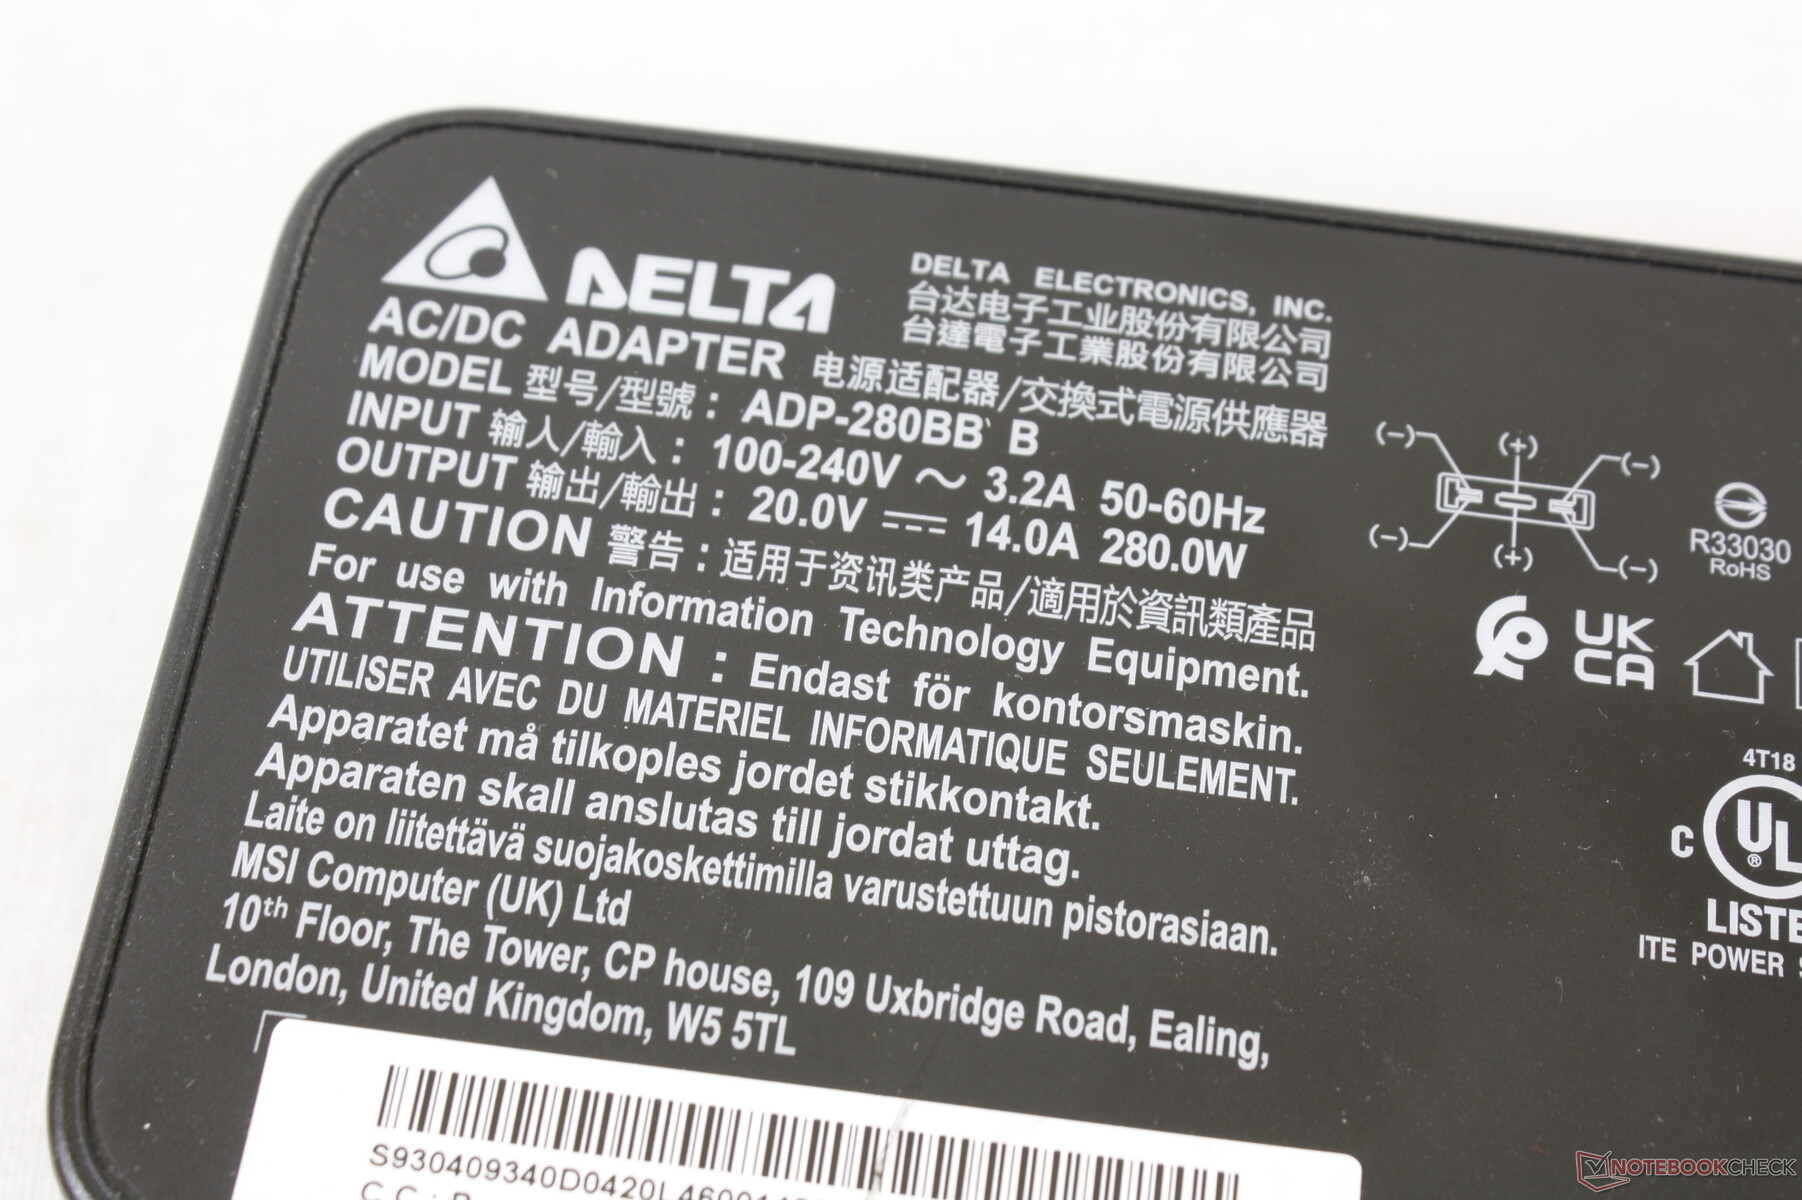
Registramos un consumo máximo temporal de 278 W desde el gran adaptador de CA de 280 W (~18 x 8,5 x 3,5 cm) cuando ejecutamos Prime95 y FurMark simultáneamente. La batería sigue recargándose a un ritmo decente cuando se juega.
| Off / Standby | |
| Ocioso | |
| Carga |
|
Clave:
min: | |
| MSI Vector GP66 12UGS i9-12900H, GeForce RTX 3070 Ti Laptop GPU, , IPS, 1920x1080, 15.6" | MSI GP66 Leopard 11UH-028 i7-11800H, GeForce RTX 3080 Laptop GPU, Samsung PM9A1 MZVL21T0HCLR, IPS, 1920x1080, 15.6" | MSI Katana GF66 11UG-220 i7-11800H, GeForce RTX 3070 Laptop GPU, Kingston OM8PDP3512B-AI1, IPS, 1920x1080, 15.6" | Asus TUF Gaming F15 FX506HM i7-11800H, GeForce RTX 3060 Laptop GPU, SK Hynix HFM001TD3JX013N, IPS, 1920x1080, 15.6" | Razer Blade 15 Base Edition 2021, i7-10750H RTX 3060 i7-10750H, GeForce RTX 3060 Laptop GPU, Samsung SSD PM981a MZVLB512HBJQ, IPS, 1920x1080, 15.6" | Alienware m15 R5 Ryzen Edition R7 5800H, GeForce RTX 3060 Laptop GPU, Toshiba KBG40ZNS512G NVMe, IPS, 1920x1080, 15.6" | |
|---|---|---|---|---|---|---|
| Power Consumption | 24% | 38% | 36% | 28% | 23% | |
| Idle Minimum * (Watt) | 17.5 | 13 26% | 8 54% | 9.5 46% | 11.7 33% | 11 37% |
| Idle Average * (Watt) | 20.1 | 17 15% | 12 40% | 12.1 40% | 16 20% | 14 30% |
| Idle Maximum * (Watt) | 47.3 | 18 62% | 22 53% | 22.5 52% | 29.3 38% | 25 47% |
| Load Average * (Watt) | 107.3 | 96 11% | 98 9% | 99.5 7% | 95.6 11% | 123 -15% |
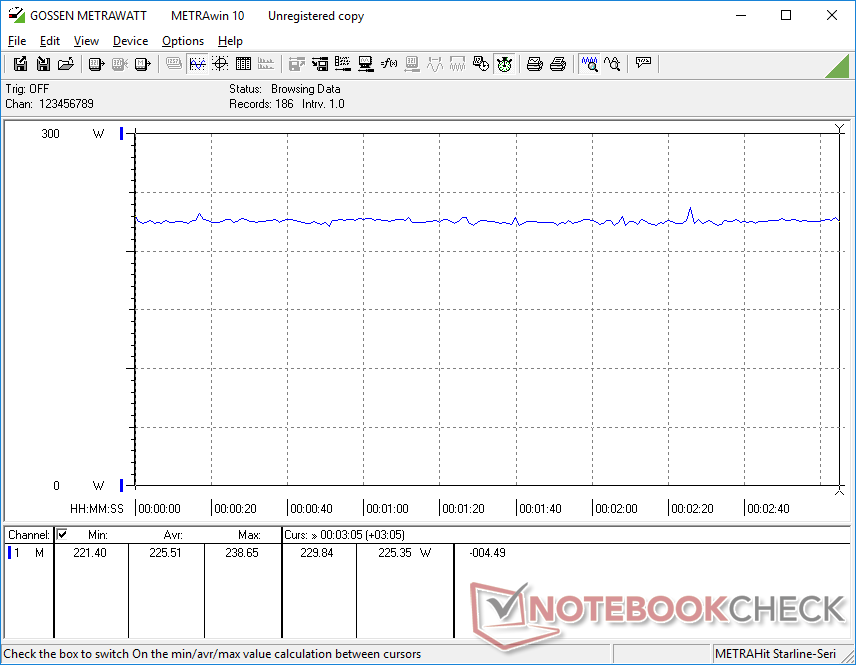
| Witcher 3 ultra * (Watt) | 225 | 207 8% | 152 32% | 157 30% | 141.3 37% | 176 22% |
| Load Maximum * (Watt) | 277.7 | 223 20% | 162 42% | 173.5 38% | 197 29% | 226 19% |
* ... más pequeño es mejor
Power Consumption Witcher 3 / Stresstest
Power Consumption external Monitor
Duración de la batería
La capacidad de la batería es la misma entre el GP66 Vector y el GP66 Leopard del año pasado, con 65 Wh. No obstante, podemos registrar tiempos de funcionamiento WLAN más largos en el modelo más nuevo con algo más de dos horas adicionales. Recomendamos ejecutar el sistema en modo MSHybrid para ampliar la duración de la batería si el modo dGPU no es una prioridad.
La carga desde el vacío hasta la capacidad total con el adaptador de CA incluido tarda unas 2,5 horas, comparado con las 2 horas o más rápidas de la mayoría de otros portátiles. La carga con adaptadores USB-C no es compatible a diferencia de muchas alternativas de Asus o Razer.
| MSI Vector GP66 12UGS i9-12900H, GeForce RTX 3070 Ti Laptop GPU, 65 Wh | MSI GP66 Leopard 11UH-028 i7-11800H, GeForce RTX 3080 Laptop GPU, 65 Wh | MSI Katana GF66 11UG-220 i7-11800H, GeForce RTX 3070 Laptop GPU, 90 Wh | Asus TUF Gaming F15 FX506HM i7-11800H, GeForce RTX 3060 Laptop GPU, 90 Wh | Razer Blade 15 Base Edition 2021, i7-10750H RTX 3060 i7-10750H, GeForce RTX 3060 Laptop GPU, 65 Wh | Alienware m15 R5 Ryzen Edition R7 5800H, GeForce RTX 3060 Laptop GPU, 86 Wh | |
|---|---|---|---|---|---|---|
| Duración de Batería | -9% | 9% | 59% | 11% | 22% | |
| Reader / Idle (h) | 7.9 | 9.1 15% | 11 39% | 7.8 -1% | 14.7 86% | |
| WiFi v1.3 (h) | 5.7 | 3.6 -37% | 5.3 -7% | 7.9 39% | 4.8 -16% | 5.1 -11% |
| Load (h) | 1 | 1.2 20% | 1.2 20% | 2 100% | 1.5 50% | 0.9 -10% |
| H.264 (h) | 3.5 | 8.8 | ||||
| Witcher 3 ultra (h) | 0.8 | 1.6 |
Pro
Contra
Veredicto
La mejora térmica del GP66 respecto al GP65 le han permitido soportar una gráfica TGP más potente de 150 W, en comparación con los ~100 W del Razer Blade 15 o MSI GS66 de la serie MSI. En otras palabras, estás obteniendo una de las mejores versiones de la móvil GeForce RTX 3070 Ti en cualquier portátil de 15,6 pulgadas en este momento debido al mayor techo de TGP de la GP66. El GS66 puede ser más delgado y portátil, pero su GeForce RTX 3070 Ti es también notablemente más lento como consecuencia directa. Para una experiencia más equilibrada, la GP66 sería la mejor opción.
El modo de rendimiento extremo es necesario si quieres exprimir el máximo rendimiento posible de la GPU. Este modo es también el más ruidoso en términos de ruido de los ventiladores, lo que significa que los ventiladores más ruidosos que la media son inevitables si se desea el máximo rendimiento. Si se juega en modo equilibrado, el ruido de los ventiladores se reducirá significativamente a cambio de un pequeño descenso del 5% en el rendimiento gráfico. Este modo nos parece ideal para los jugadores a los que no les gusta usar auriculares o a los que les molestan los portátiles de juego muy ruidosos.
El Vector GP66 equilibra la portabilidad y el rendimiento mejor que la mayoría de los otros portátiles de juego ultradelgados con sus opciones de GPU de 150 W de mayor potencia.
Para futuras revisiones, nos gustaría ver mejoras tanto en el esponjoso clickpad como en la sostenibilidad del rendimiento del SSD PCIe4 x4. El clickpad es una mejora con respecto al antiguo GP65, mientras que la falta de un disipador de calor para el SSD NVMe significa que las tasas de transferencia se ralentizarán tras un breve periodo de uso intensivo.
Precio y disponibilidad
Nuestra configuración exacta, tal y como se ha revisado, está actualmente disponible en Best Buy por $2400 USD.
MSI Vector GP66 12UGS
- 03/03/2022 v7 (old)
Allen Ngo
Price comparison

