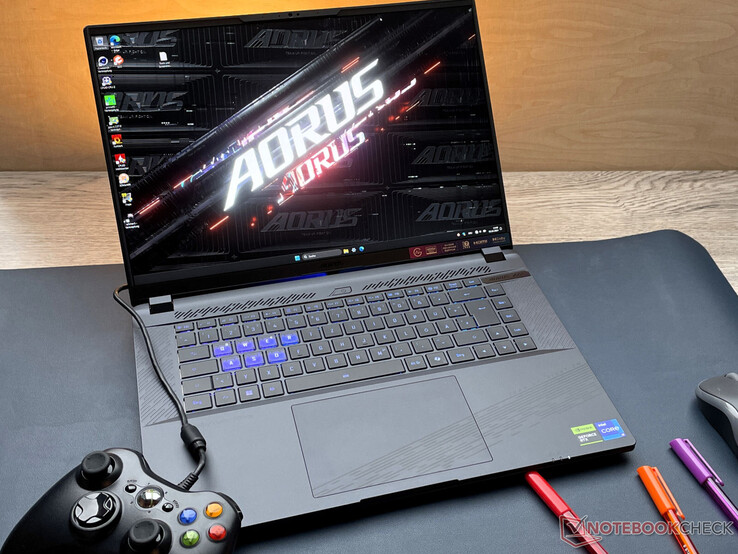
Análisis del Aorus 16X (2024): Core i9 y RTX 4070 por 2.000 dólares
Los juegos, el renderizado y la creación de contenidos se anuncian como los principales puntos fuertes del Aorus 16X ASG. Raptor Lake y Ada Lovelace proporcionan el rendimiento necesario. Entre sus competidores se encuentran equipos como el Alienware m16 R2, HP Omen Transcend 16, XMG Pro 16 Studio (Mid 23), Asus TUF Gaming A17 FA707XI y el Lenovo Legion Pro 5 16IRX9.
Posibles contendientes en la comparación
Valoración | Fecha | Modelo | Peso | Altura | Tamaño | Resolución | Precio |
|---|---|---|---|---|---|---|---|
| 87.4 % v7 (old) | 04/2024 | Aorus 16X 2024 i9-14900HX, GeForce RTX 4070 Laptop GPU | 2.3 kg | 20 mm | 16.00" | 2560x1600 | |
| 90.2 % v7 (old) | 03/2024 | Alienware m16 R2 Ultra 7 155H, GeForce RTX 4070 Laptop GPU | 2.5 kg | 23.5 mm | 16.00" | 2560x1600 | |
| 88.4 % v7 (old) | 02/2024 | HP Omen Transcend 16-u1095ng i9-14900HX, GeForce RTX 4070 Laptop GPU | 2.3 kg | 20 mm | 16.00" | 2560x1600 | |
| 85.6 % v7 (old) | 01/2024 | Asus TUF Gaming A17 FA707XI-NS94 R9 7940HS, GeForce RTX 4070 Laptop GPU | 2.5 kg | 25.4 mm | 17.30" | 1920x1080 | |
| 87.9 % v7 (old) | 10/2023 | Schenker XMG Pro 16 Studio (Mid 23) i9-13900H, GeForce RTX 4070 Laptop GPU | 2.6 kg | 19.9 mm | 16.00" | 2560x1600 | |
| 89.3 % v7 (old) | 04/2024 | Lenovo Legion Pro 5 16IRX9 i9-14900HX, GeForce RTX 4070 Laptop GPU | 2.5 kg | 26.95 mm | 16.00" | 2560x1600 |
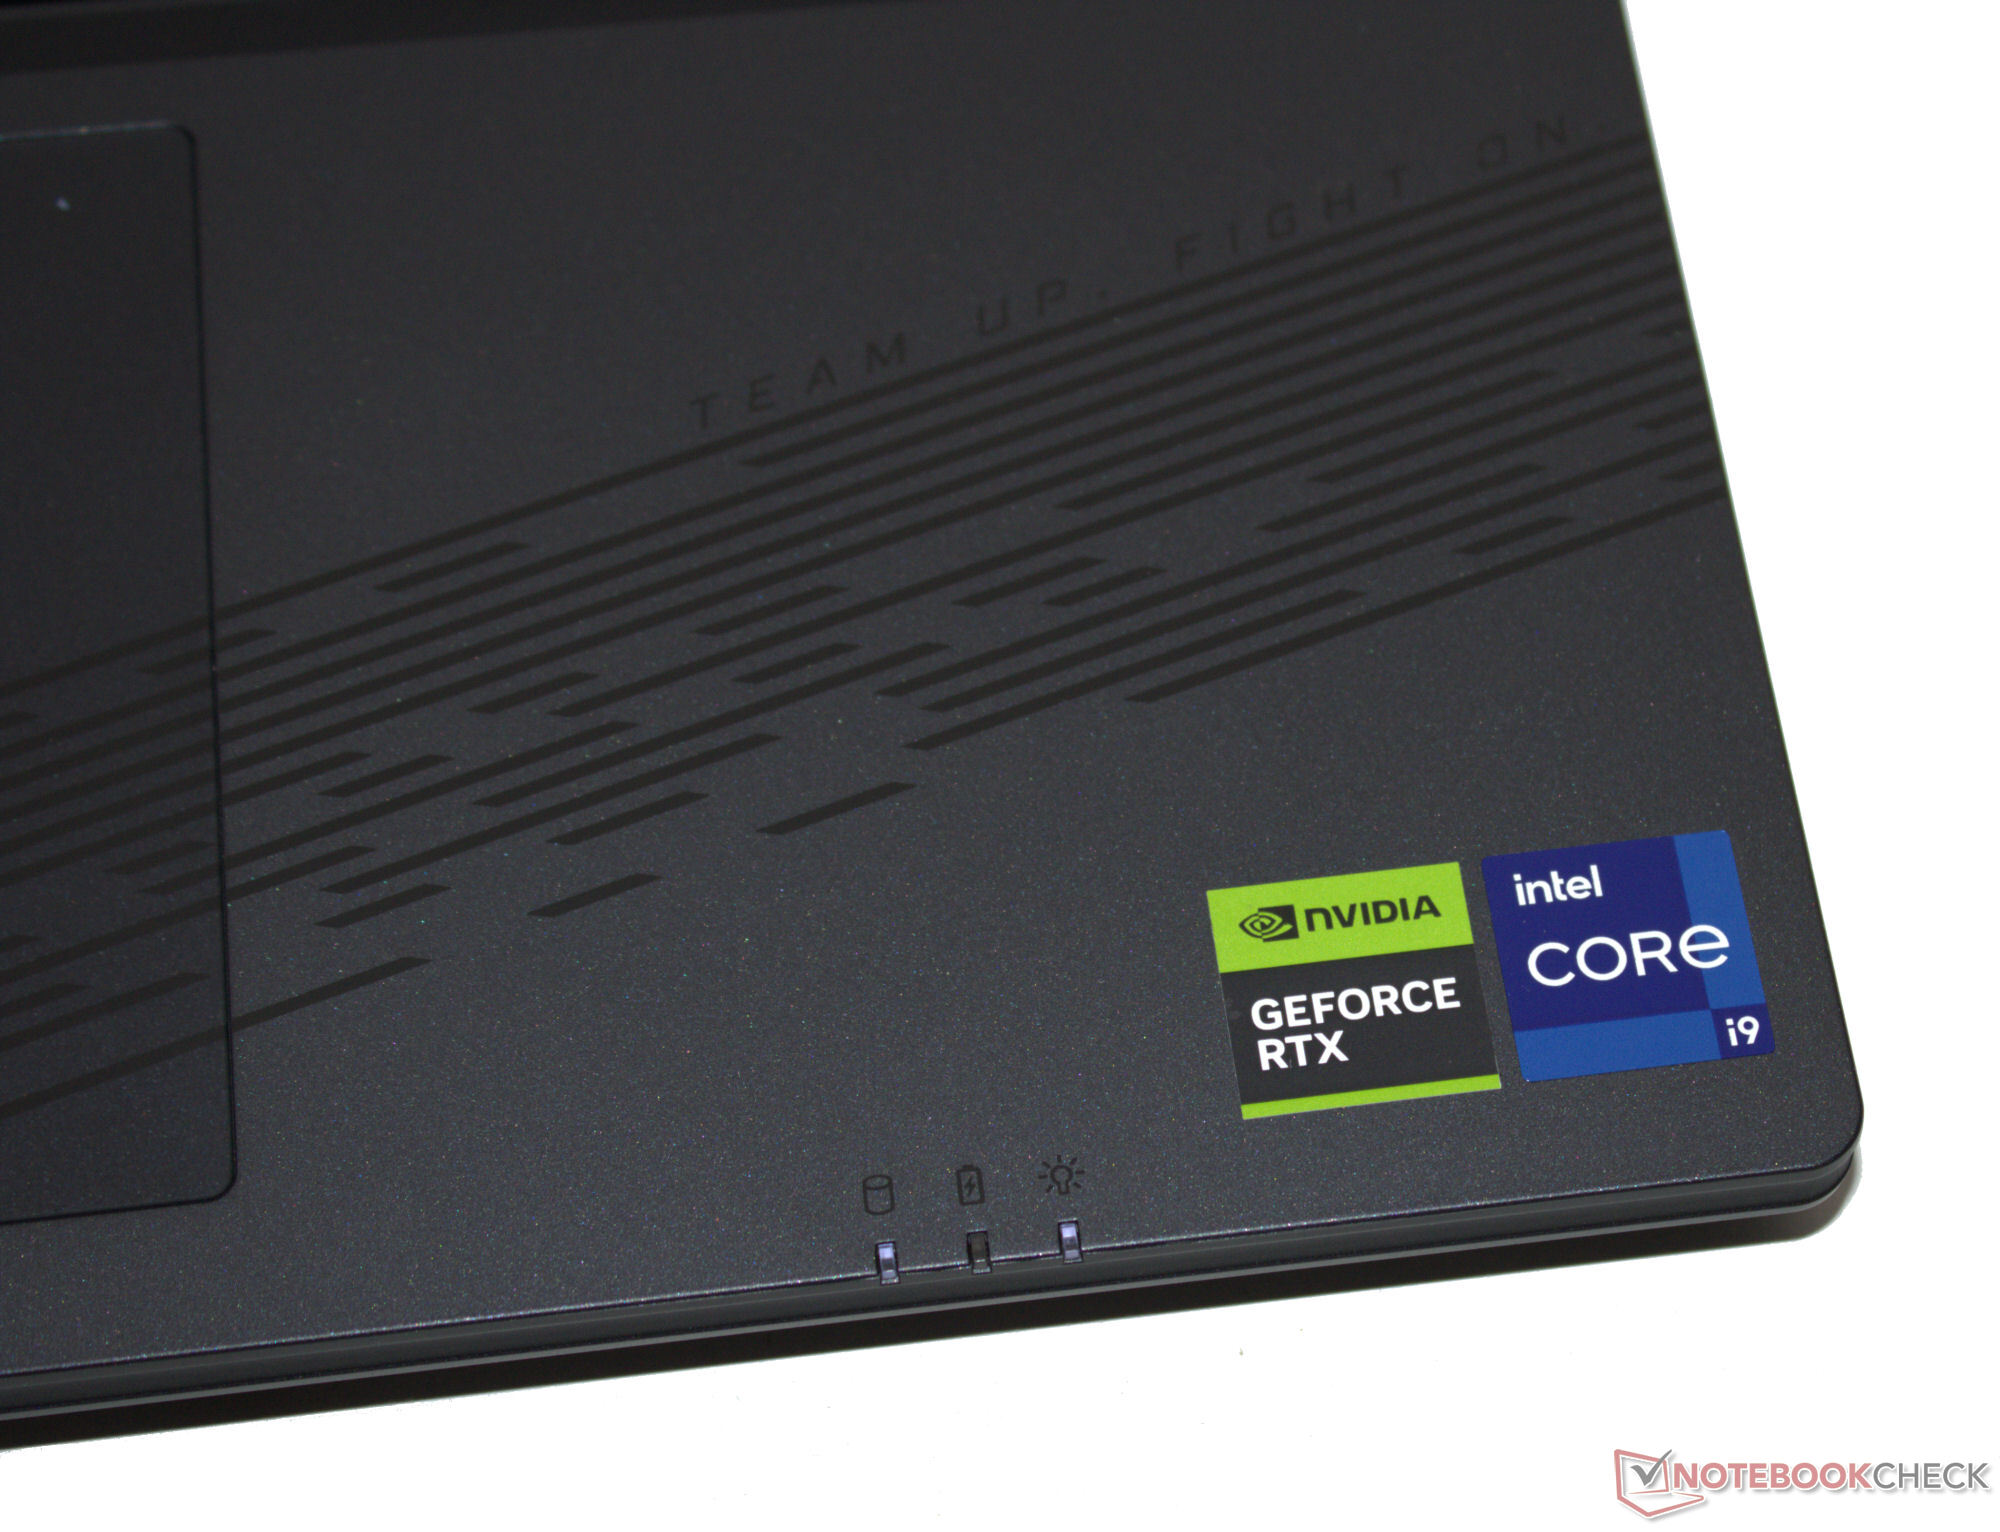
Estuche - Las tiras LED añaden un toque de diversión
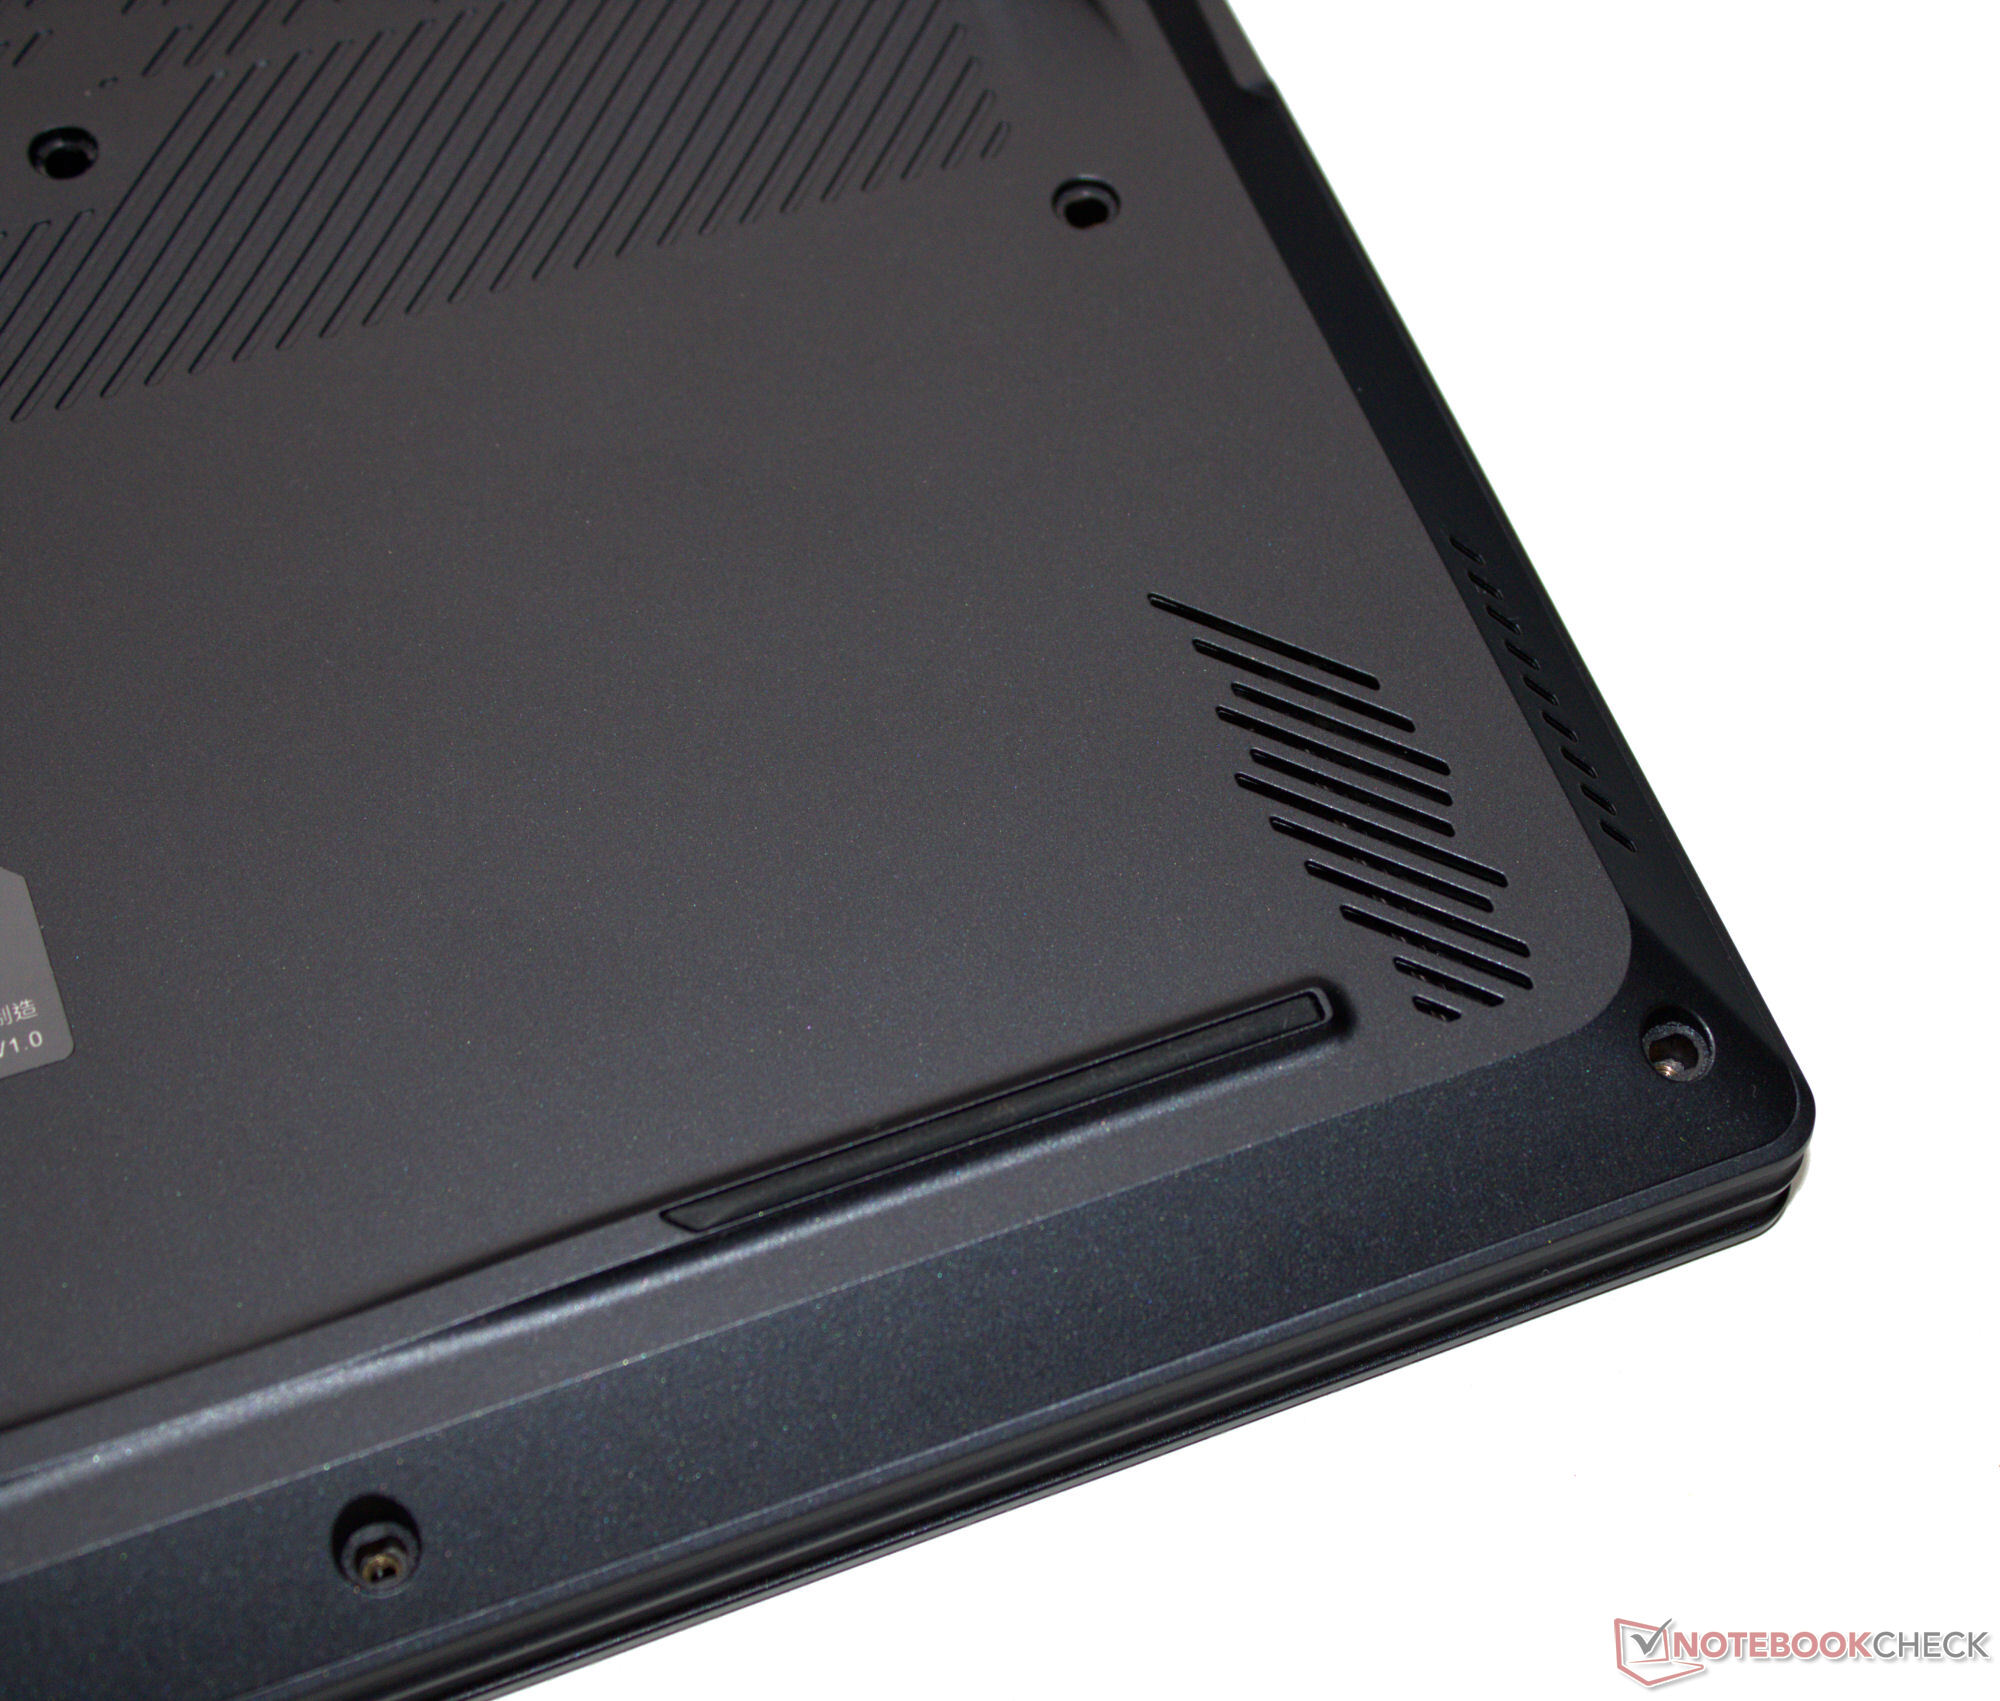
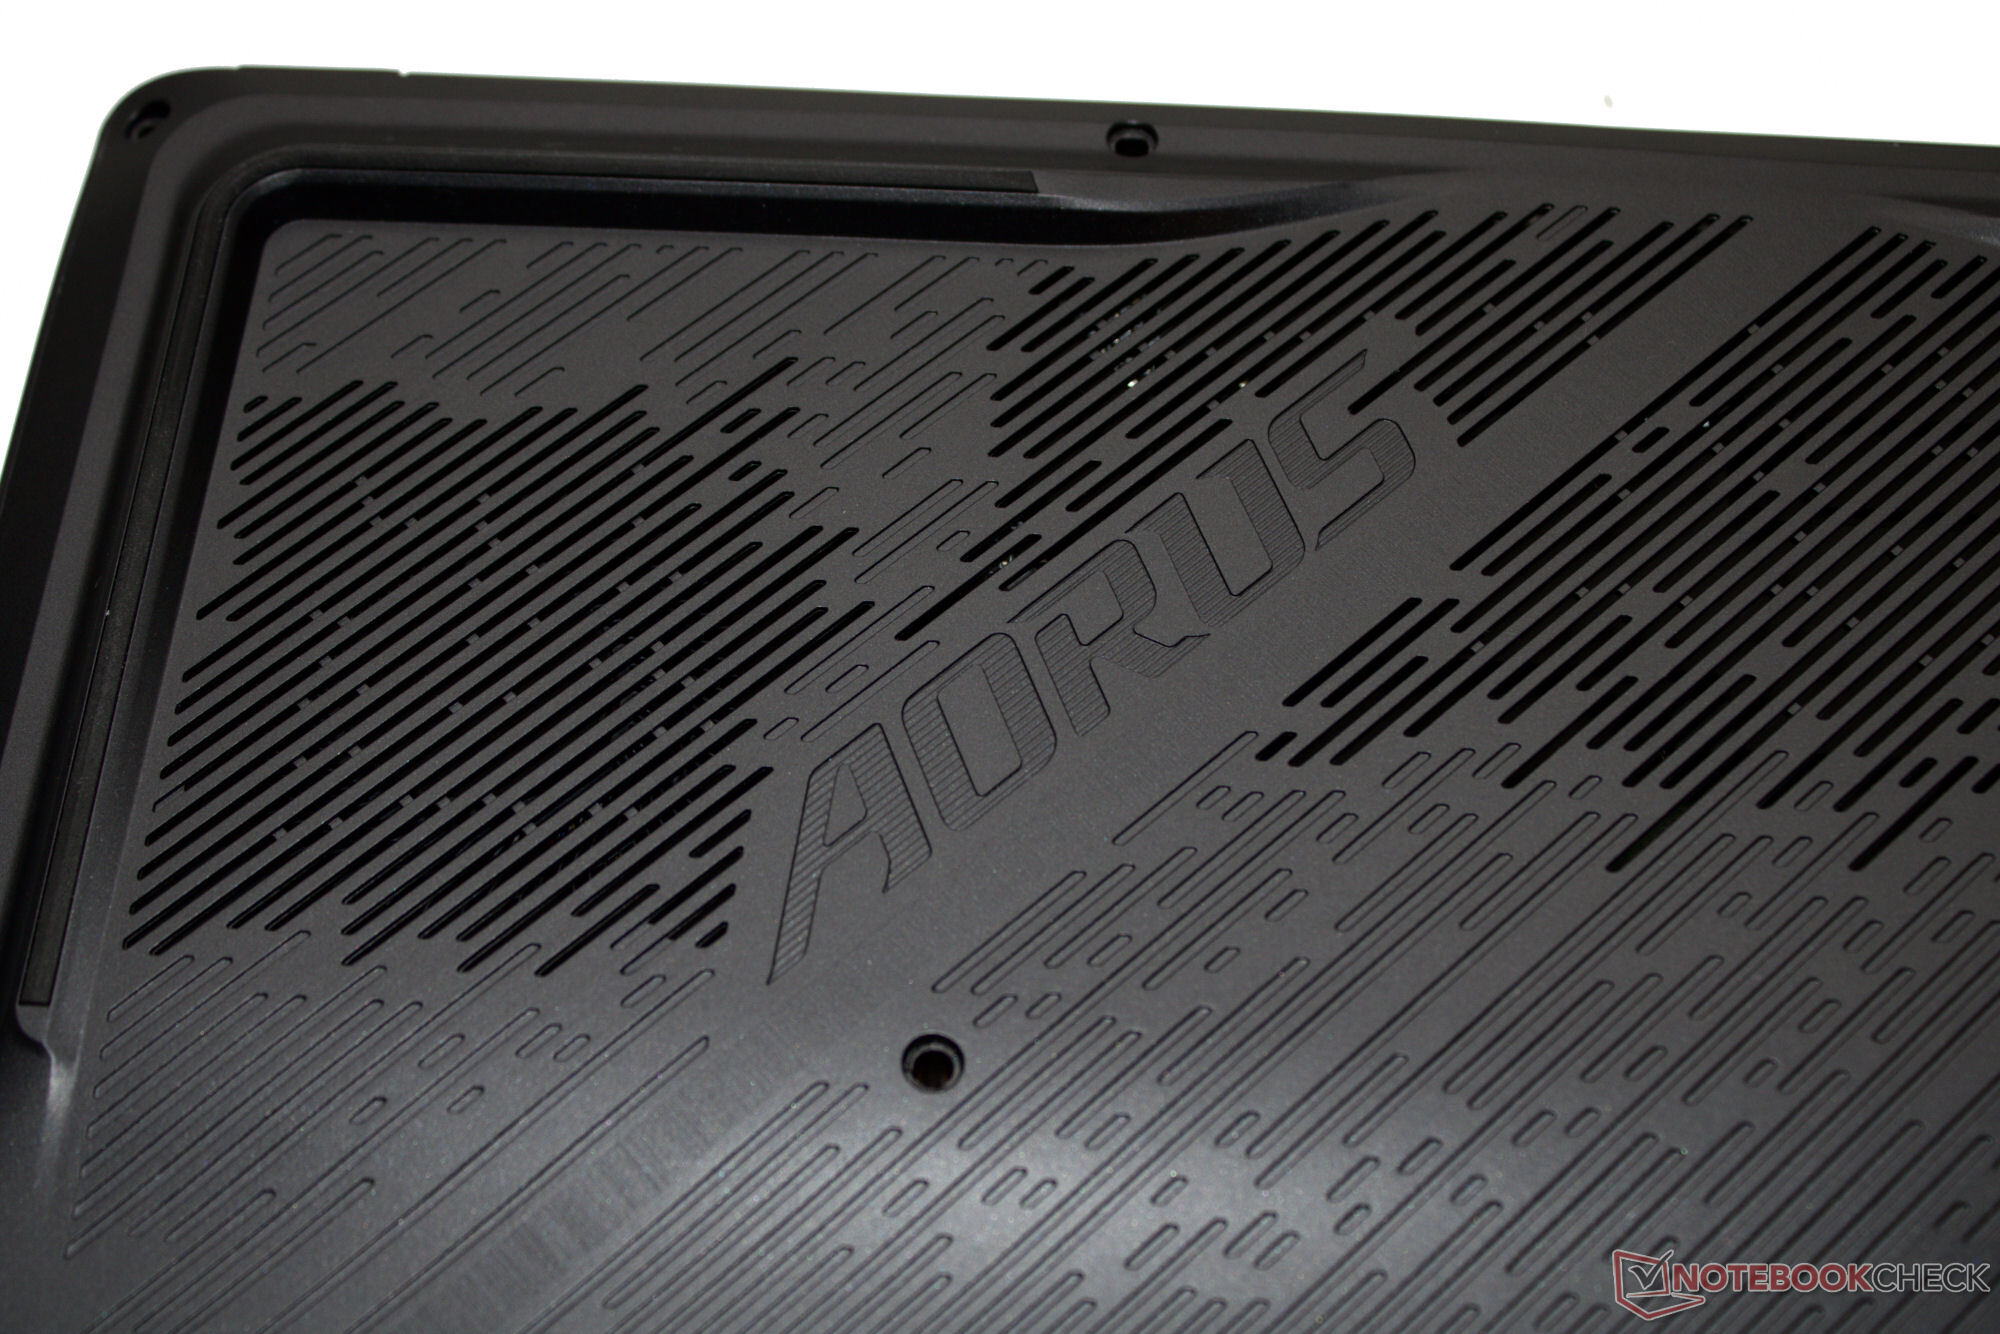
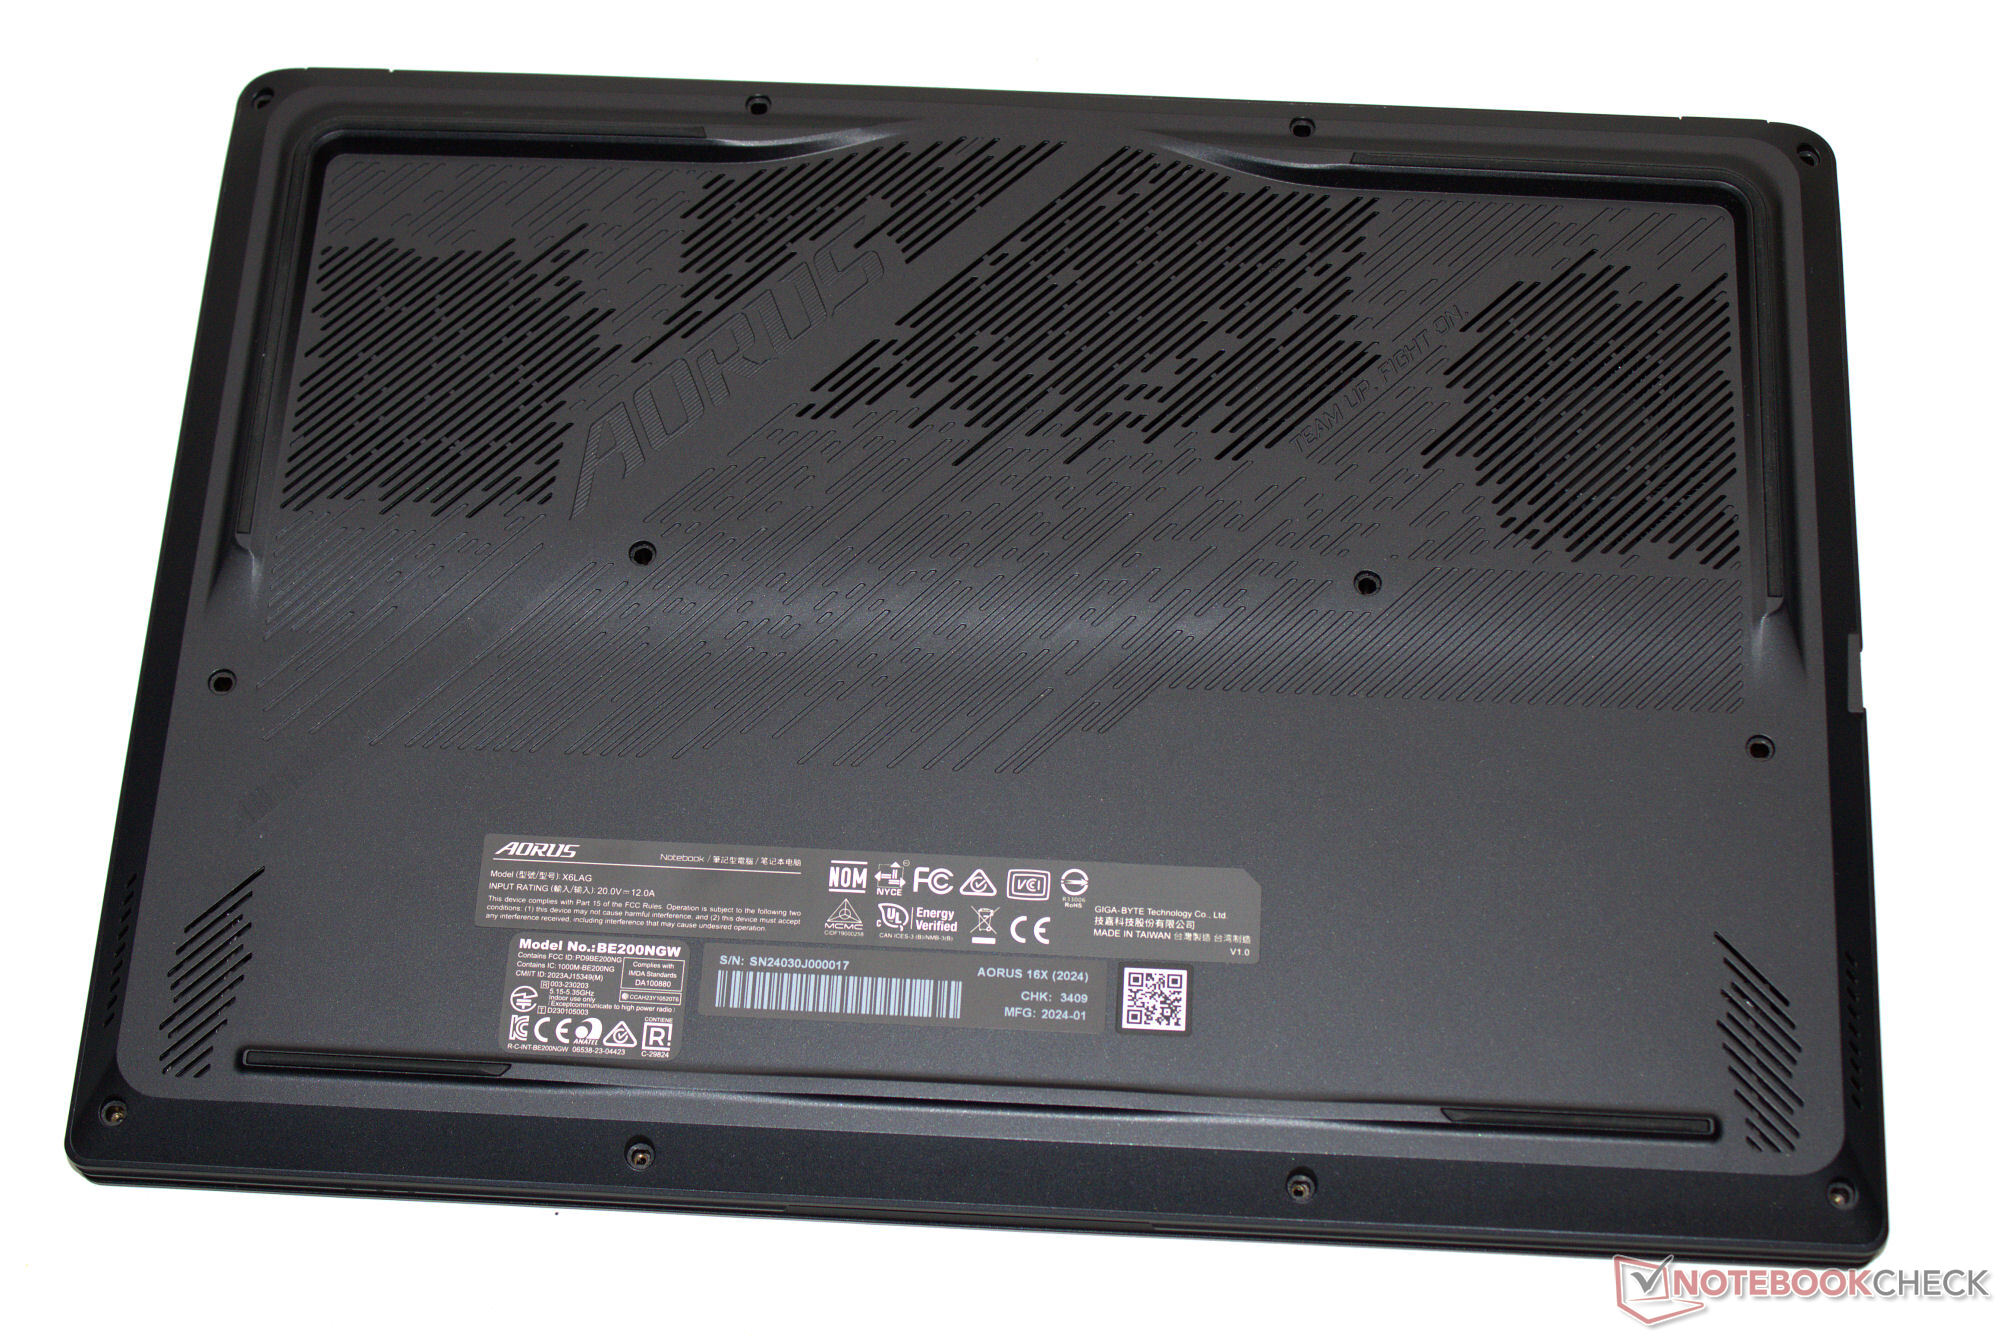
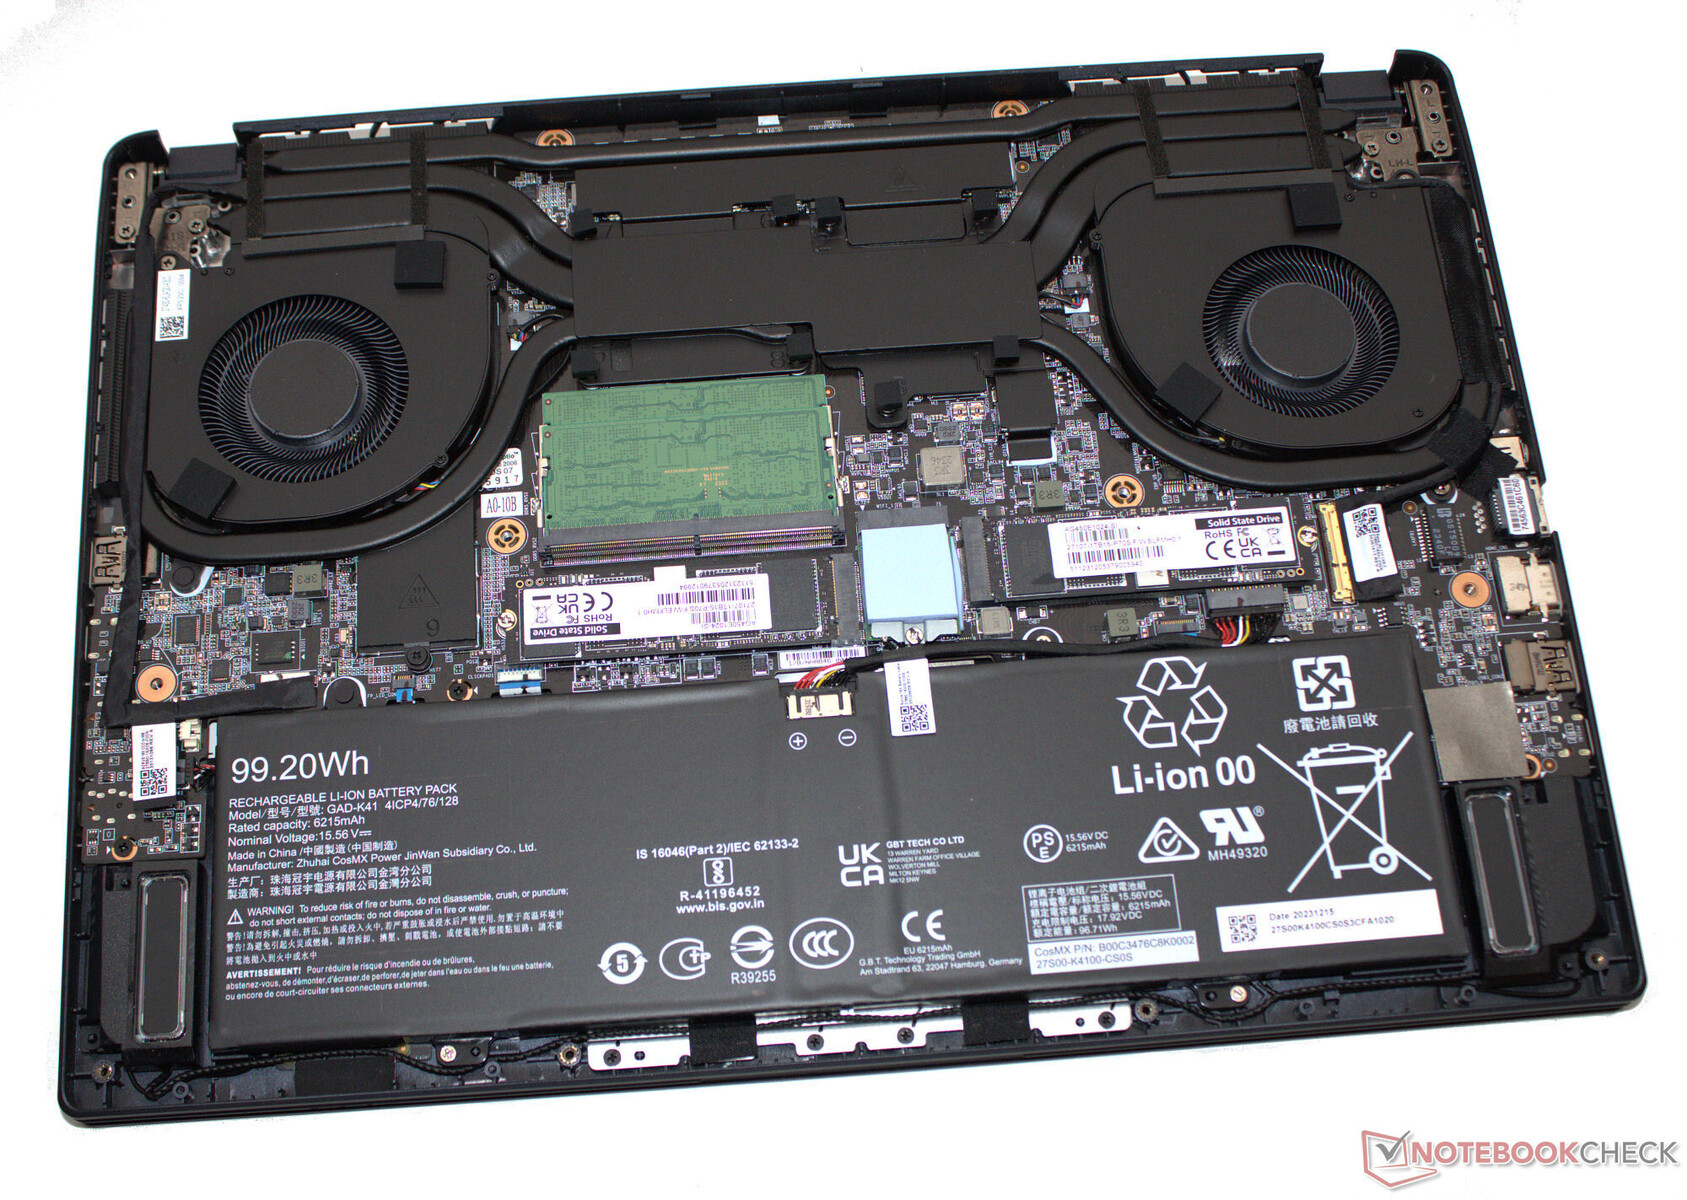
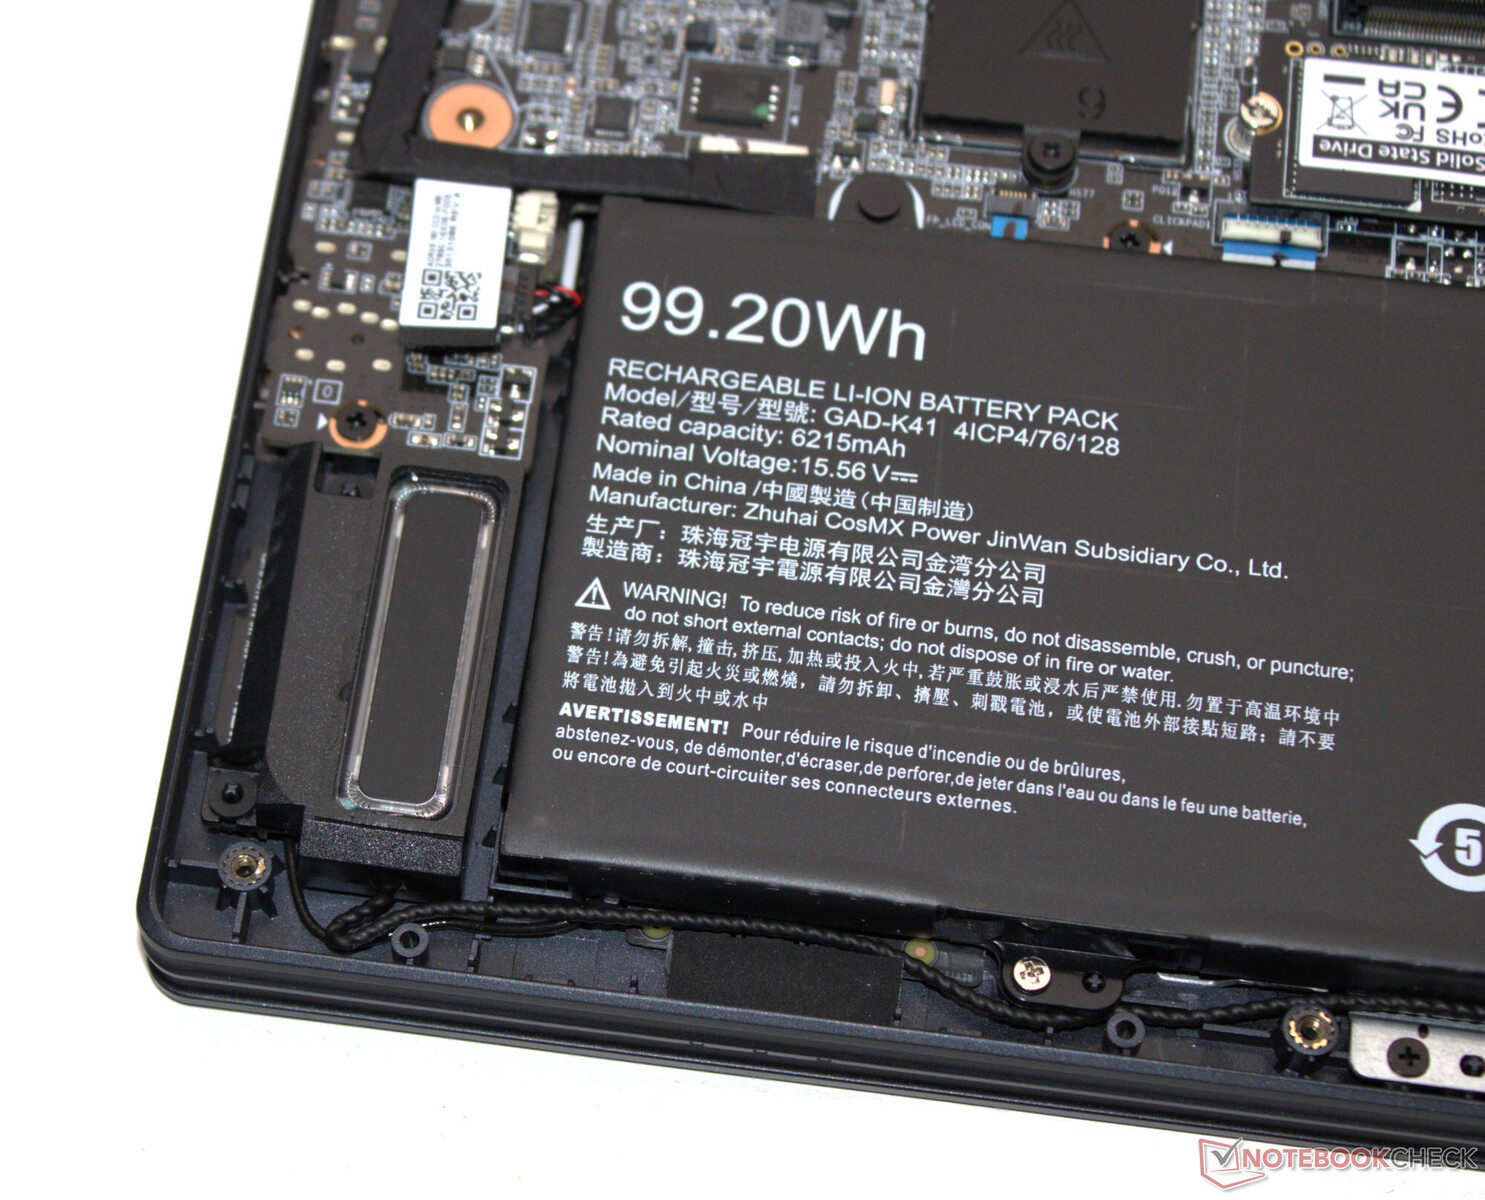
La tecnología del portátil se asienta dentro de una carcasa de color gris oscuro con superficies mate. En total, Gigabyte ha optado por un aspecto más despojado. Además de la retroiluminación del teclado, dos tiras de LED en la parte posterior del dispositivo añaden un poco de diversión colorida a su aspecto. Mientras que la unidad base está fabricada en plástico, la tapa apuesta por el aluminio. Se puede acceder a la batería (atornillada, no pegada), así como al resto de las entrañas del portátil, una vez retirada la parte inferior de la carcasa.
No notamos ningún error de construcción y todos los huecos están bien alineados. La tapa y la unidad base pueden torcerse ligeramente, pero no es nada fuera de lo normal. Las bisagras mantienen la tapa firmemente en su sitio, pero la tapa rebota un poco cuando se ajusta su ángulo. Su ángulo máximo de apertura es de unos 130 grados. Se puede abrir con una sola mano.
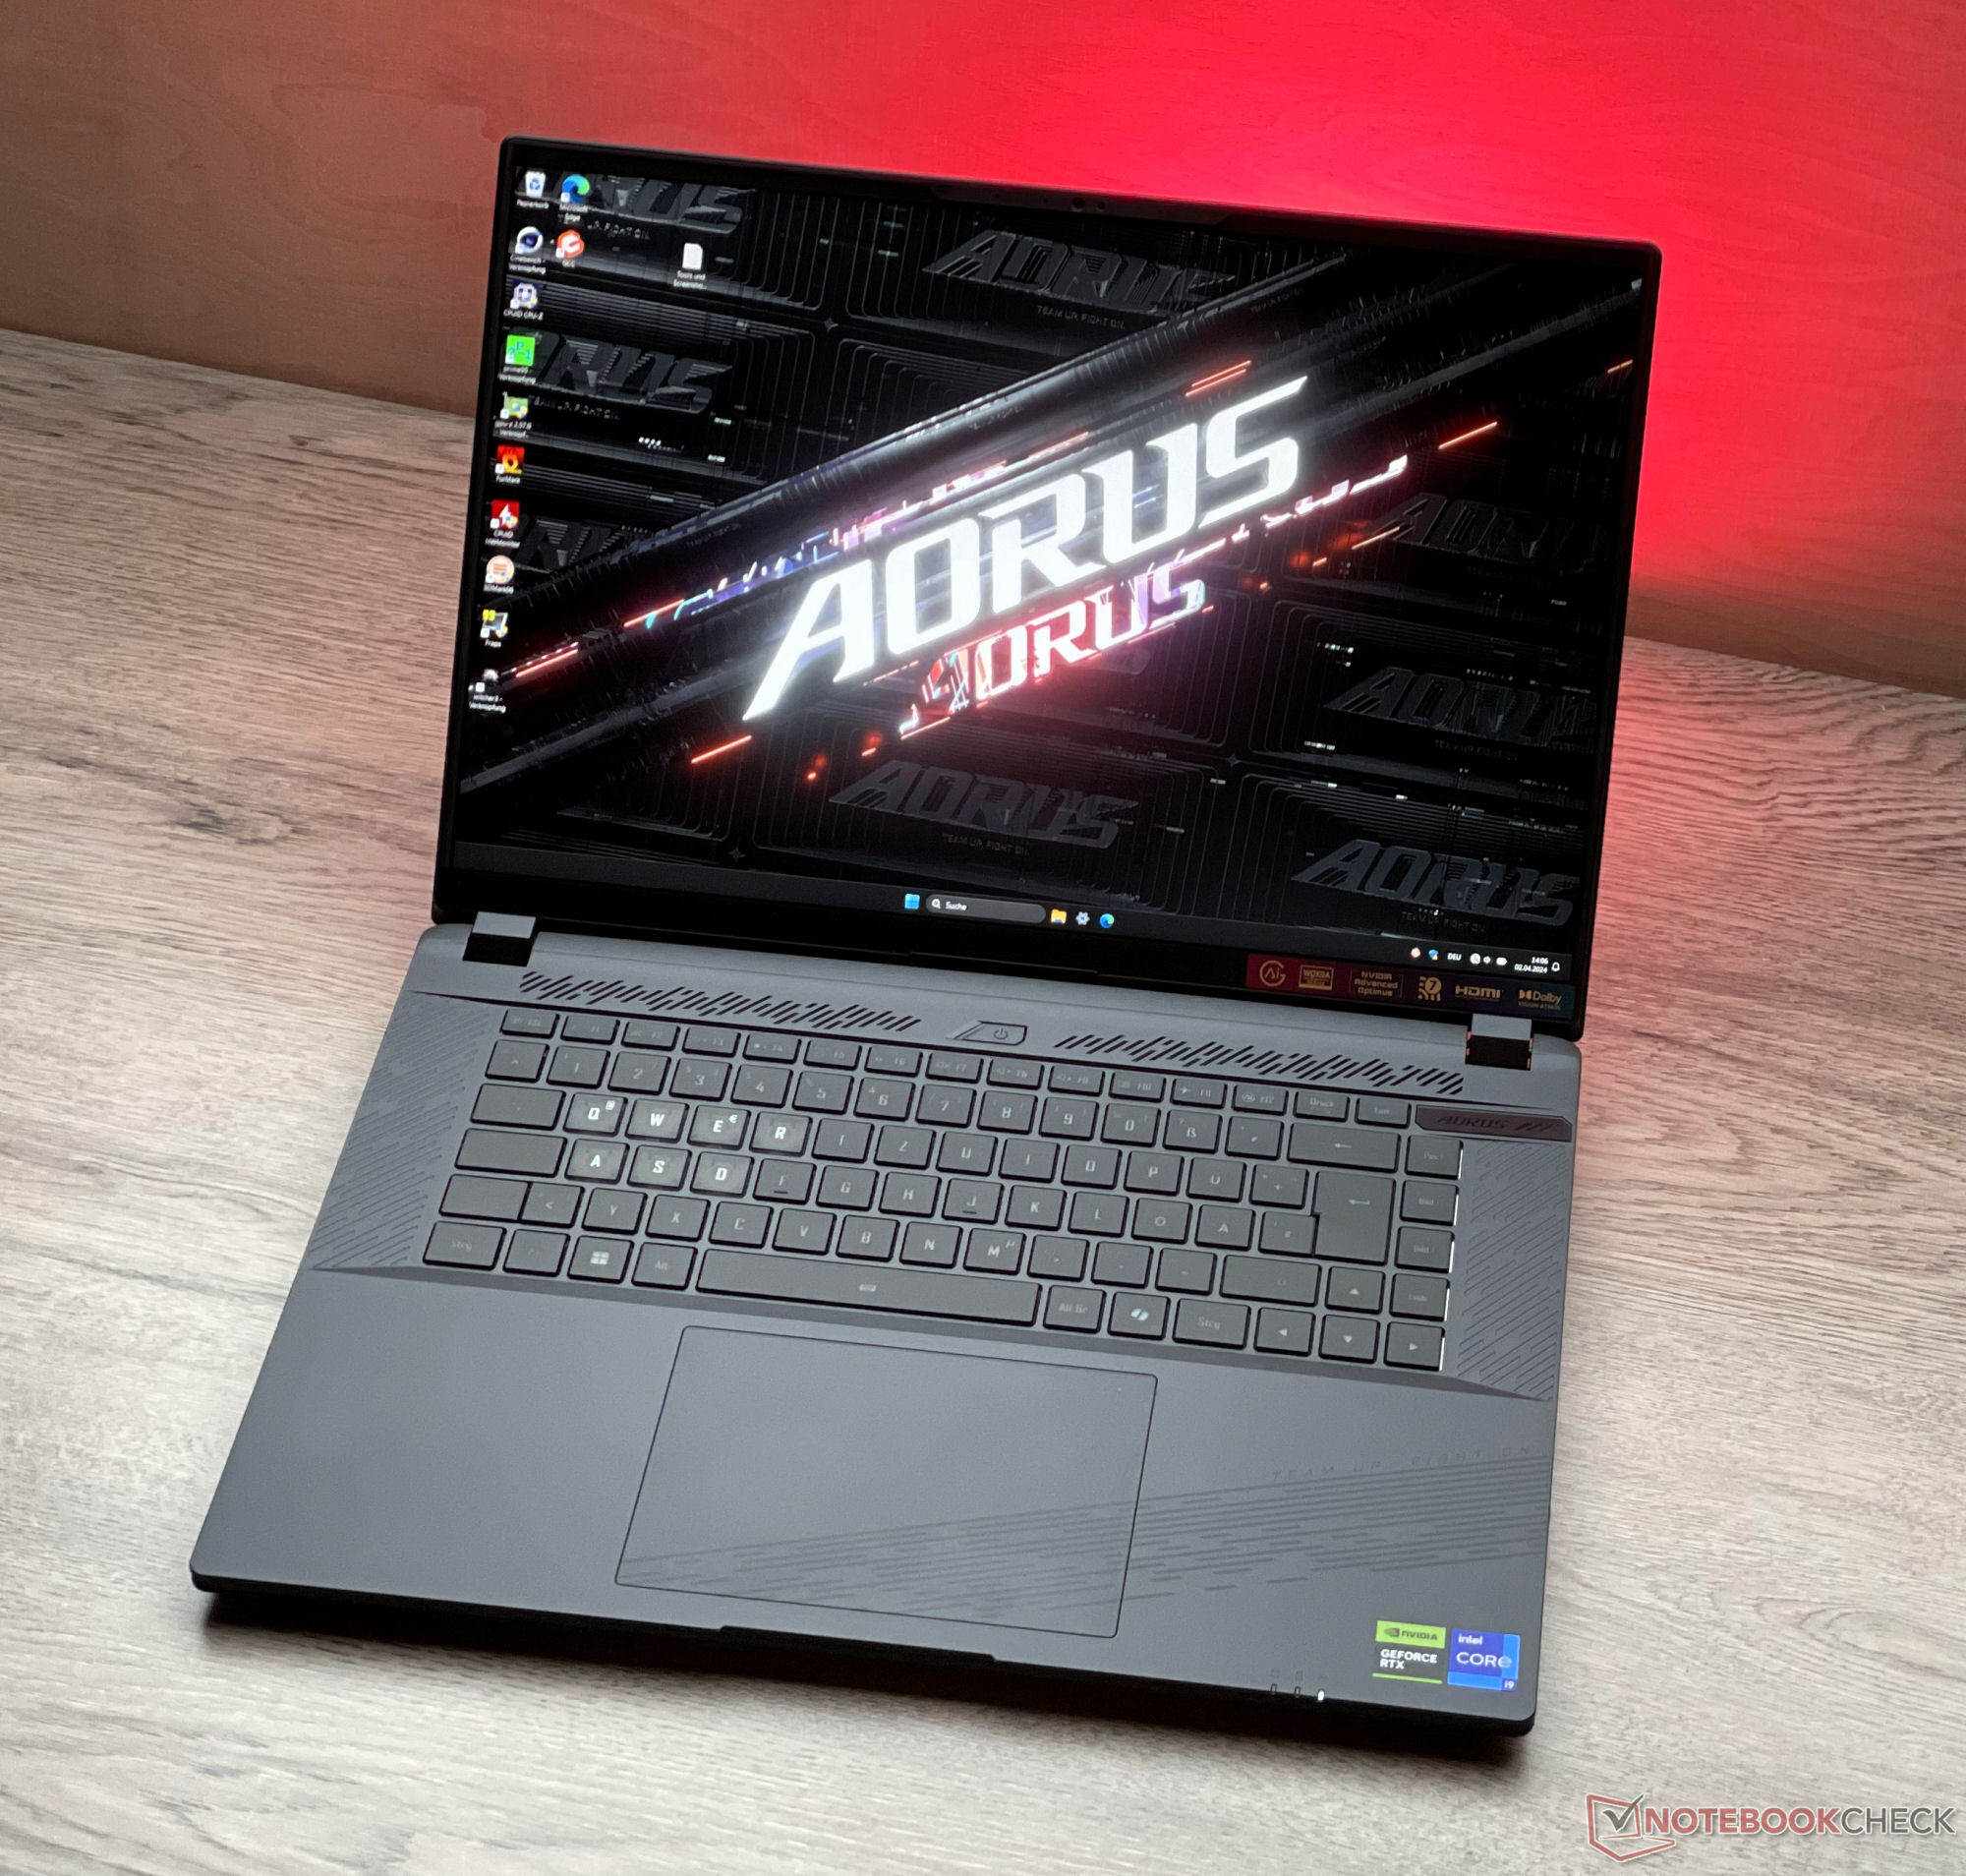
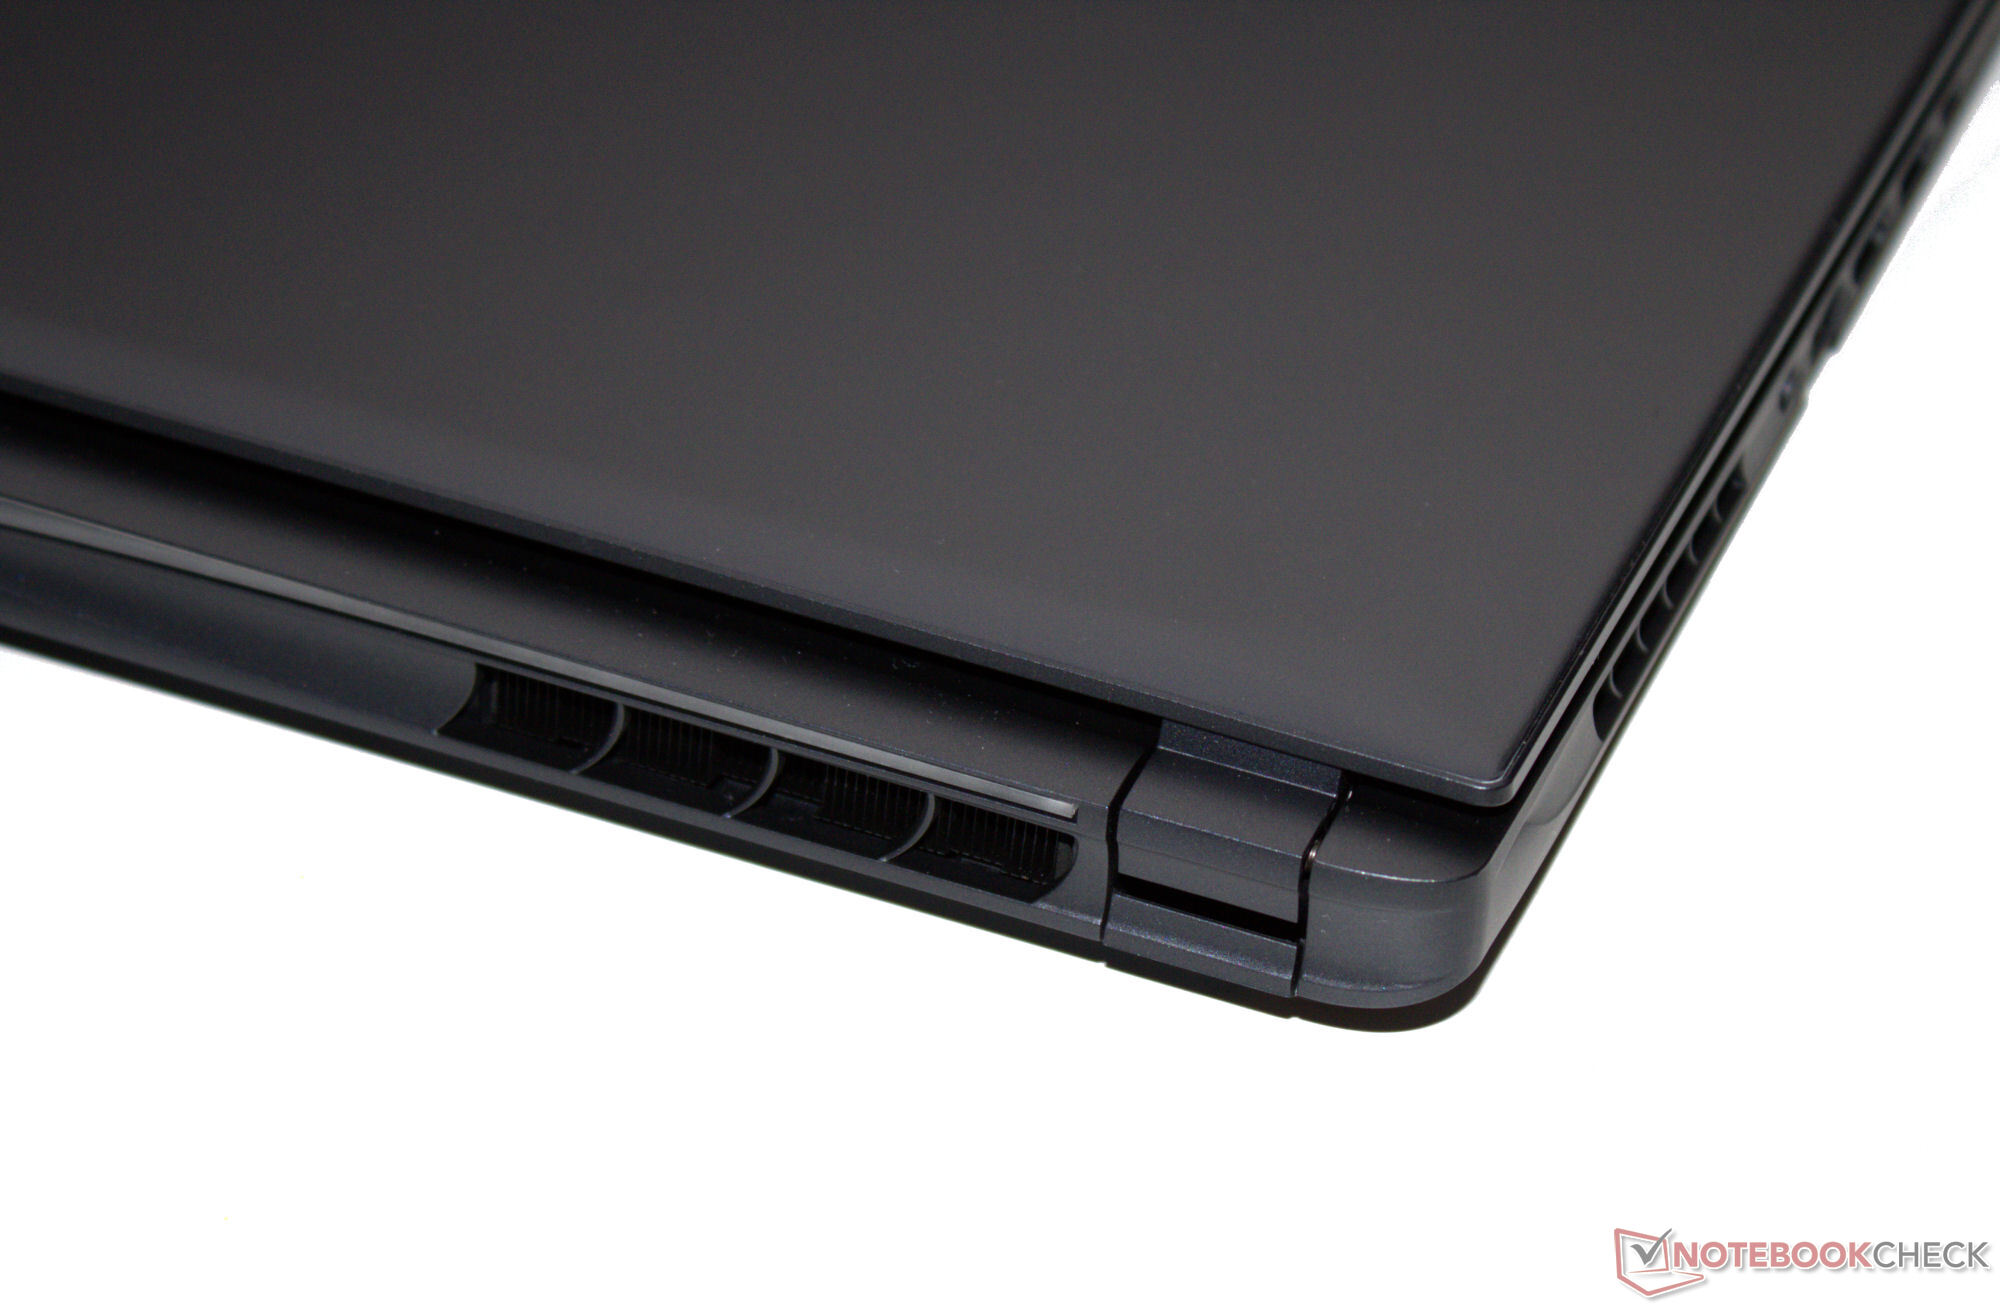
El Aorus 16X es uno de los dispositivos más compactos y ligeros dentro del campo de la comparación.
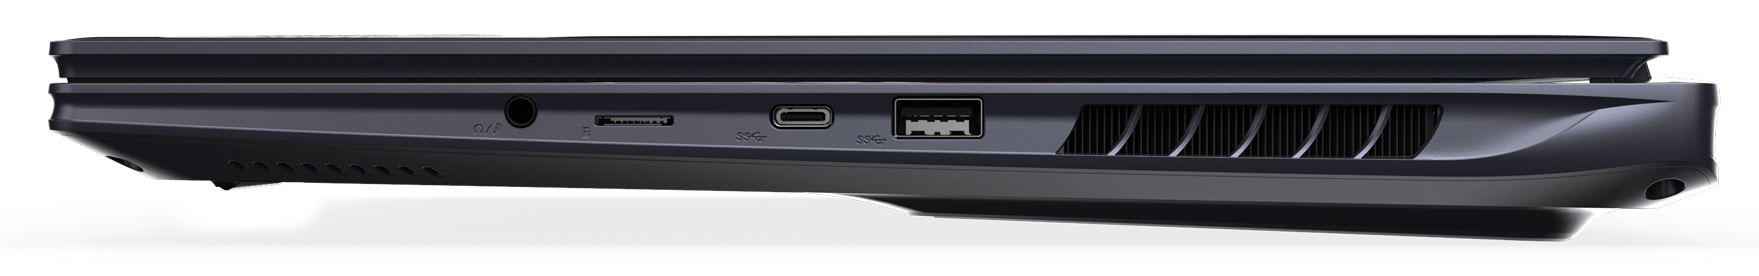
Conectividad - El portátil Gigabyte cuenta con Thunderbolt 4
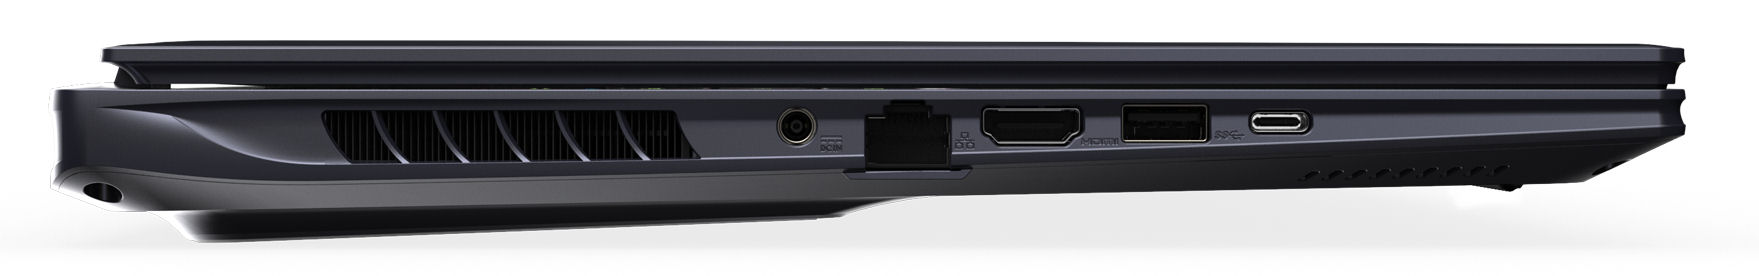
La 16X cuenta con dos puertos USB-A (USB 3.2 Gen 2) y dos puertos USB-C (1x USB 3.2 Gen 2, 1x Thunderbolt 4). El puerto TB4 admite Power Delivery y ambas conexiones USB-C pueden emitir una señal DisplayPort. En total, el portátil está equipado con tres salidas de vídeo (1x HDMI, 2x DP). Una toma de audio y un puerto Gigabit Ethernet completan el paquete.
Gigabyte ha colocado todas las conexiones en el centro de los lados derecho e izquierdo del dispositivo. En general, las zonas próximas al reposamanos permanecen libres de cables.
Lector de tarjetas SD
El lector de tarjetas MicroSD del dispositivo (tarjeta de referencia: AV PRO microSD 128 GB V60) es uno de los modelos más rápidos, ya que alcanza velocidades de transferencia máximas de 186 MB/s (transfiriendo 250 imágenes jpg, cada una de unos 5 MB de tamaño) y 188 MB/s (copiando bloques de datos más grandes).
| SD Card Reader | |
| average JPG Copy Test (av. of 3 runs) | |
| Aorus 16X 2024 (AV PRO microSD 128 GB V60) | |
| Media de la clase Gaming (20.9 - 210, n=54, últimos 2 años) | |
| Schenker XMG Pro 16 Studio (Mid 23) (AV PRO microSD 128 GB V60) | |
| Alienware m16 R2 (AV PRO microSD 128 GB V60) | |
| maximum AS SSD Seq Read Test (1GB) | |
| Alienware m16 R2 (AV PRO microSD 128 GB V60) | |
| Aorus 16X 2024 (AV PRO microSD 128 GB V60) | |
| Media de la clase Gaming (25.5 - 261, n=51, últimos 2 años) | |
| Schenker XMG Pro 16 Studio (Mid 23) (AV PRO microSD 128 GB V60) | |
Comunicación
En condiciones óptimas (sin dispositivos WLAN en las proximidades, corta distancia entre el portátil y el PC servidor), observamos muy buenas velocidades de transmisión de datos WiFi. Es probable que los pobres valores del 16X al enviar datos se deban a problemas con los controladores. El portátil Gigabyte utiliza un chip WiFi 7 (Intel BE200). De las conexiones por cable se encarga un controlador (RTL8168/8111; 1 GBit/s) fabricado por Realtek.
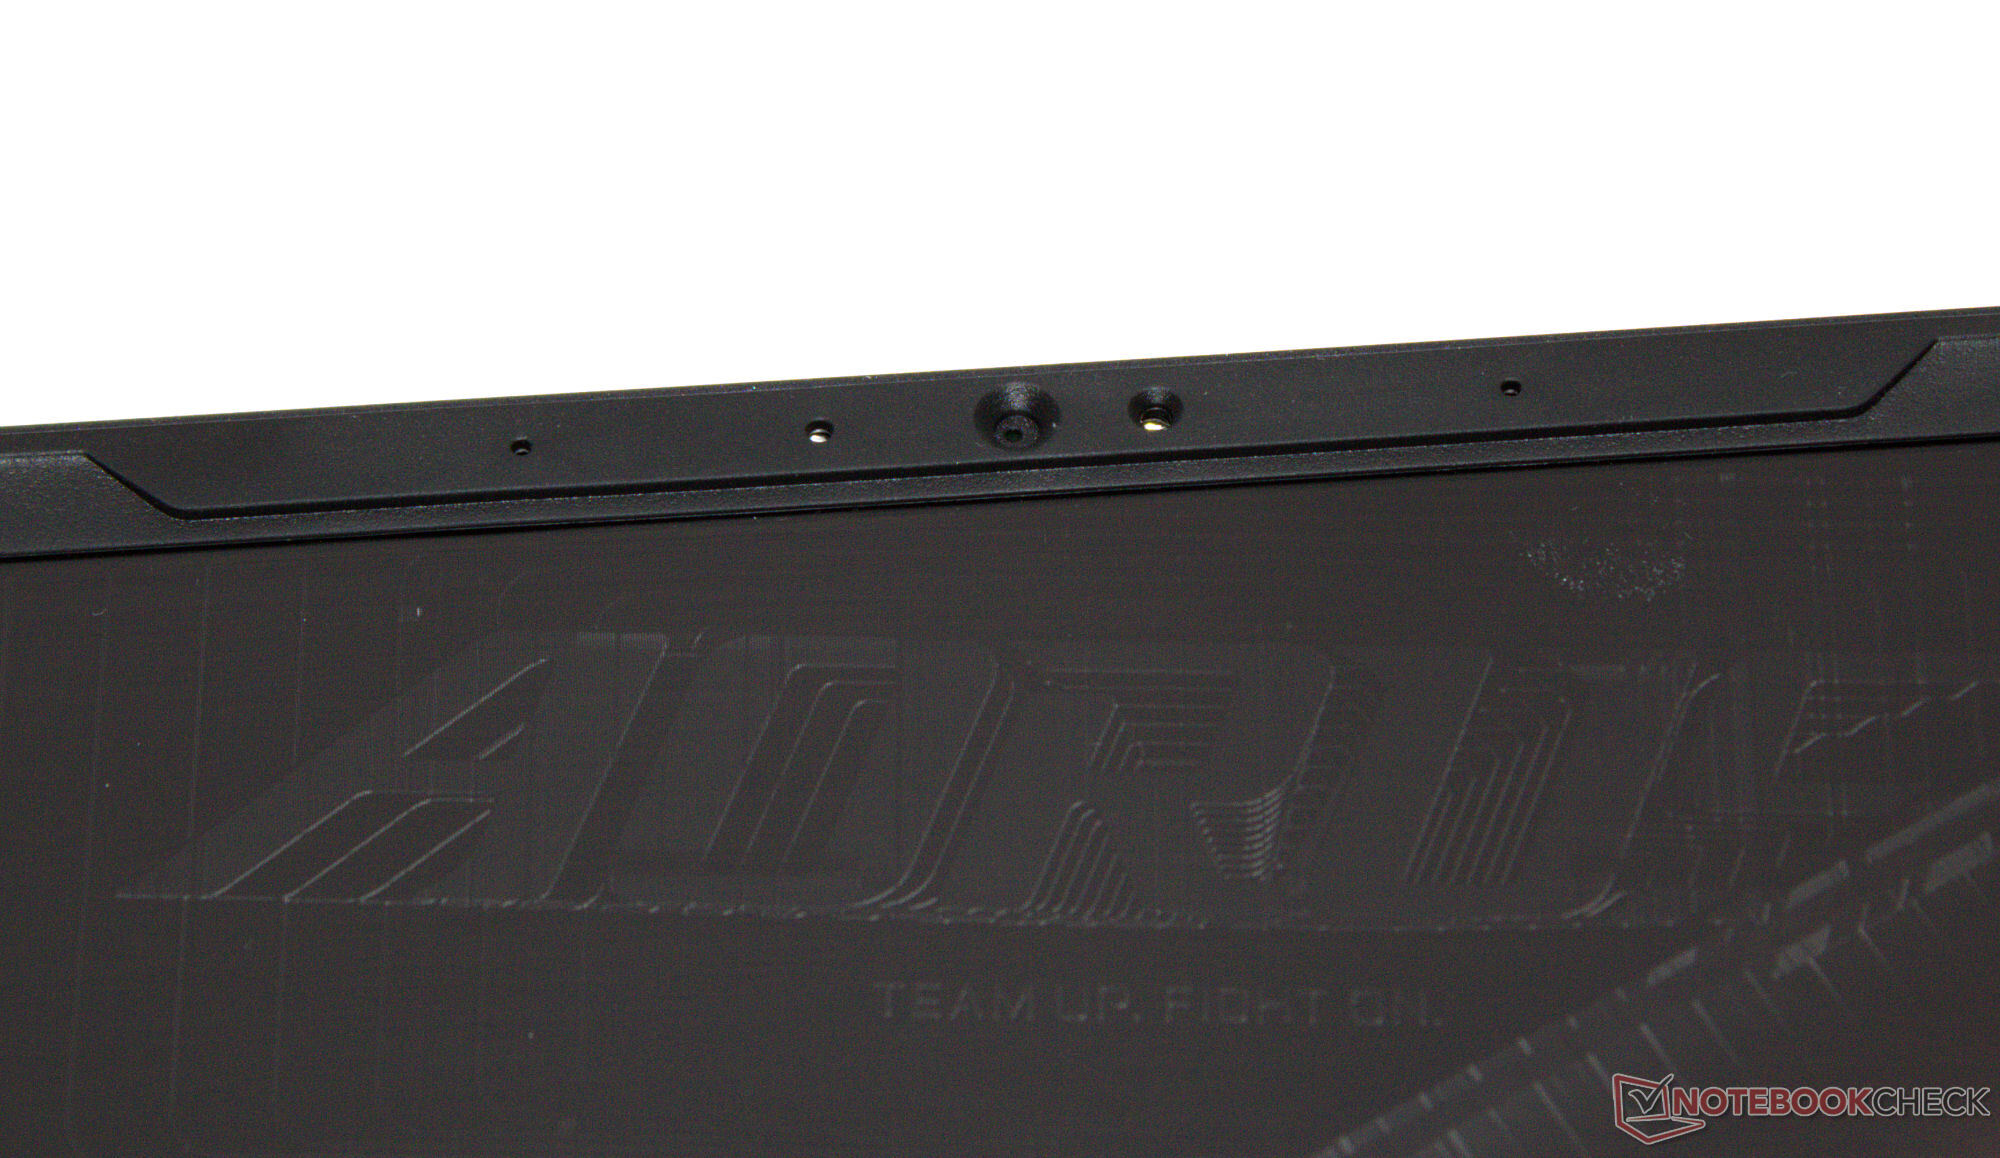
Cámara web
La cámara web (2,1 MP, máx. 1.920 x 1.080 píxeles, IR) sólo ofrece una imagen de calidad media. Donde falla es en la precisión del color: Con una desviación de alrededor de 10, no alcanza el valor objetivo (DeltaE inferior a 3). No obstante, es compatible con Windows Hello. A su vez, no dispone de tapa mecánica.


Accesorios
Aparte de los documentos habituales (guía de inicio rápido e información sobre la garantía), el portátil no incluye ningún accesorio adicional.
Mantenimiento
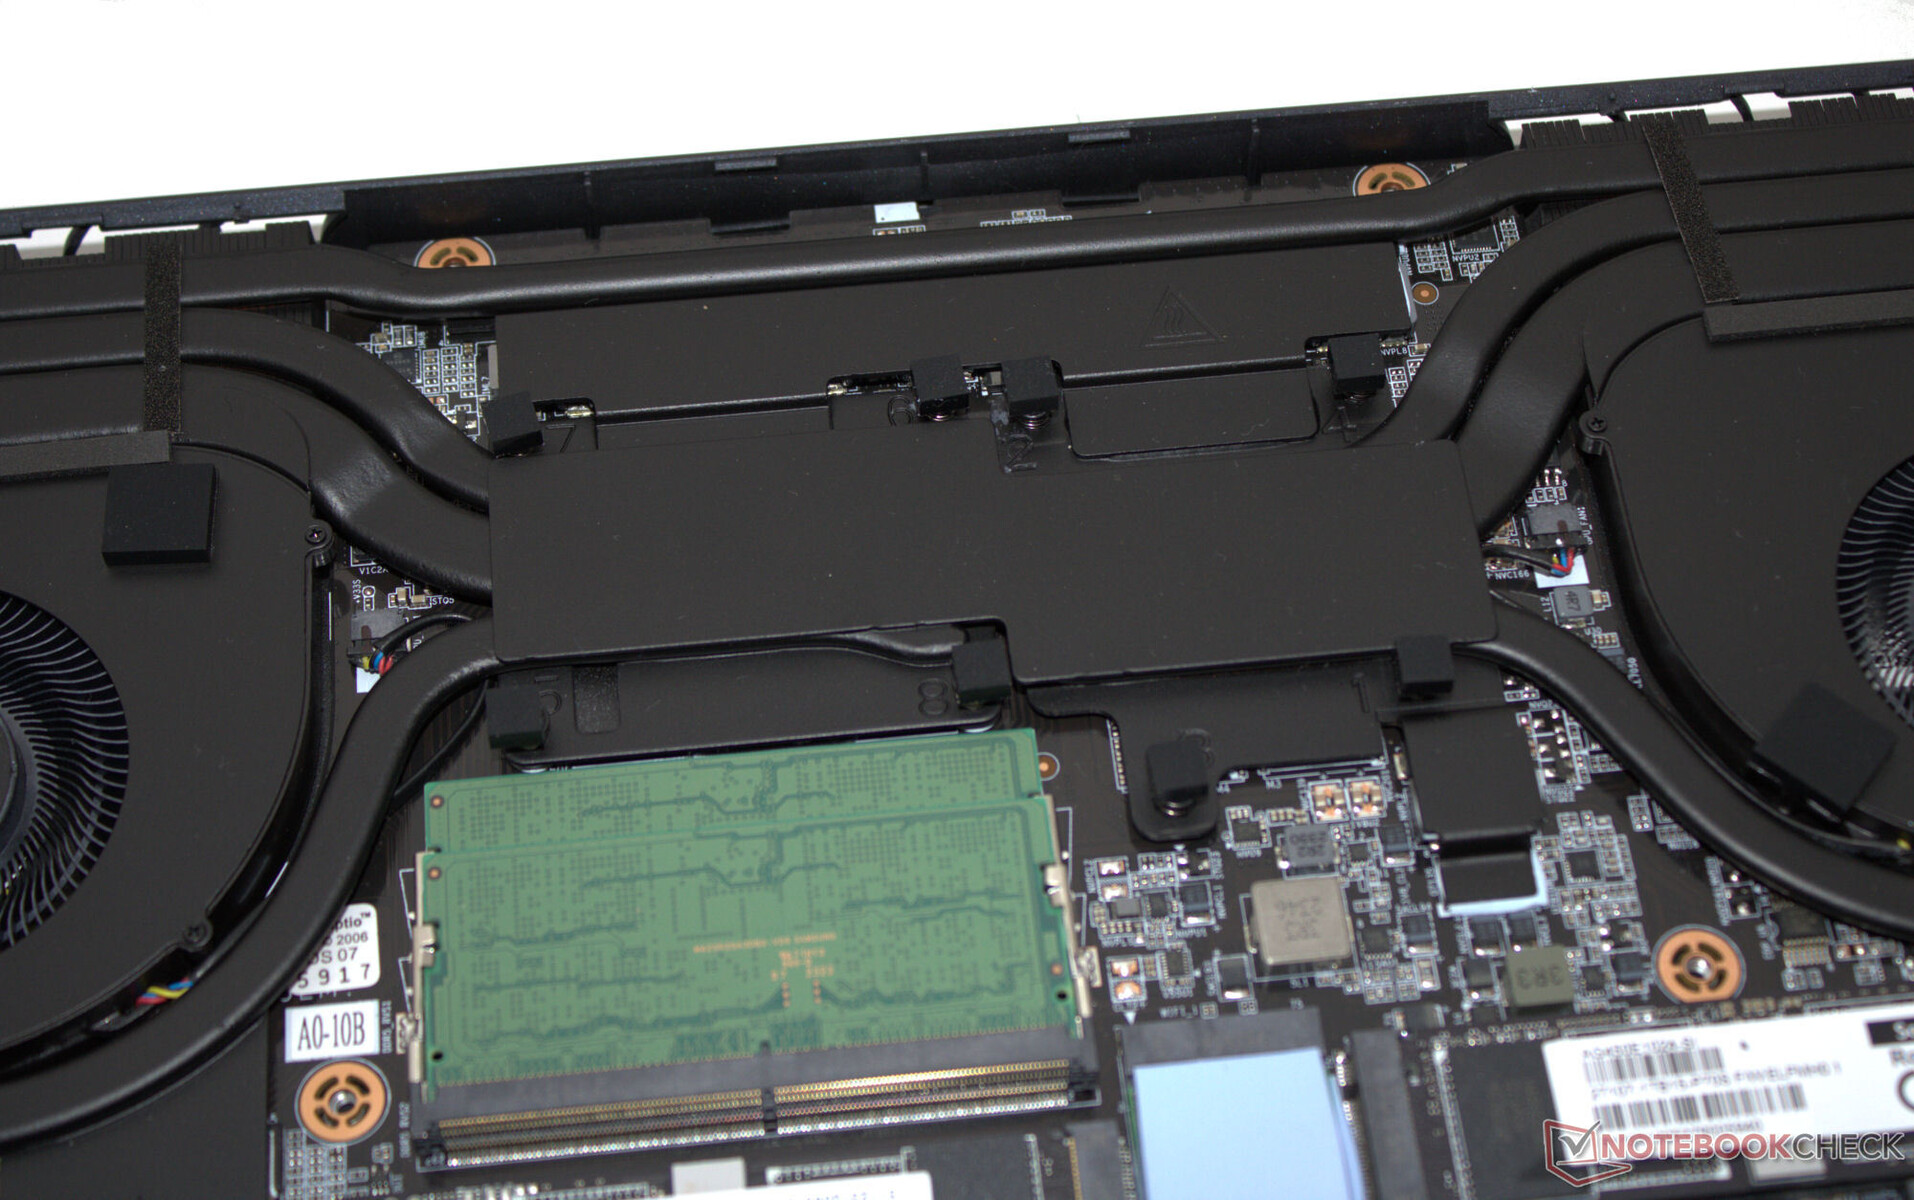
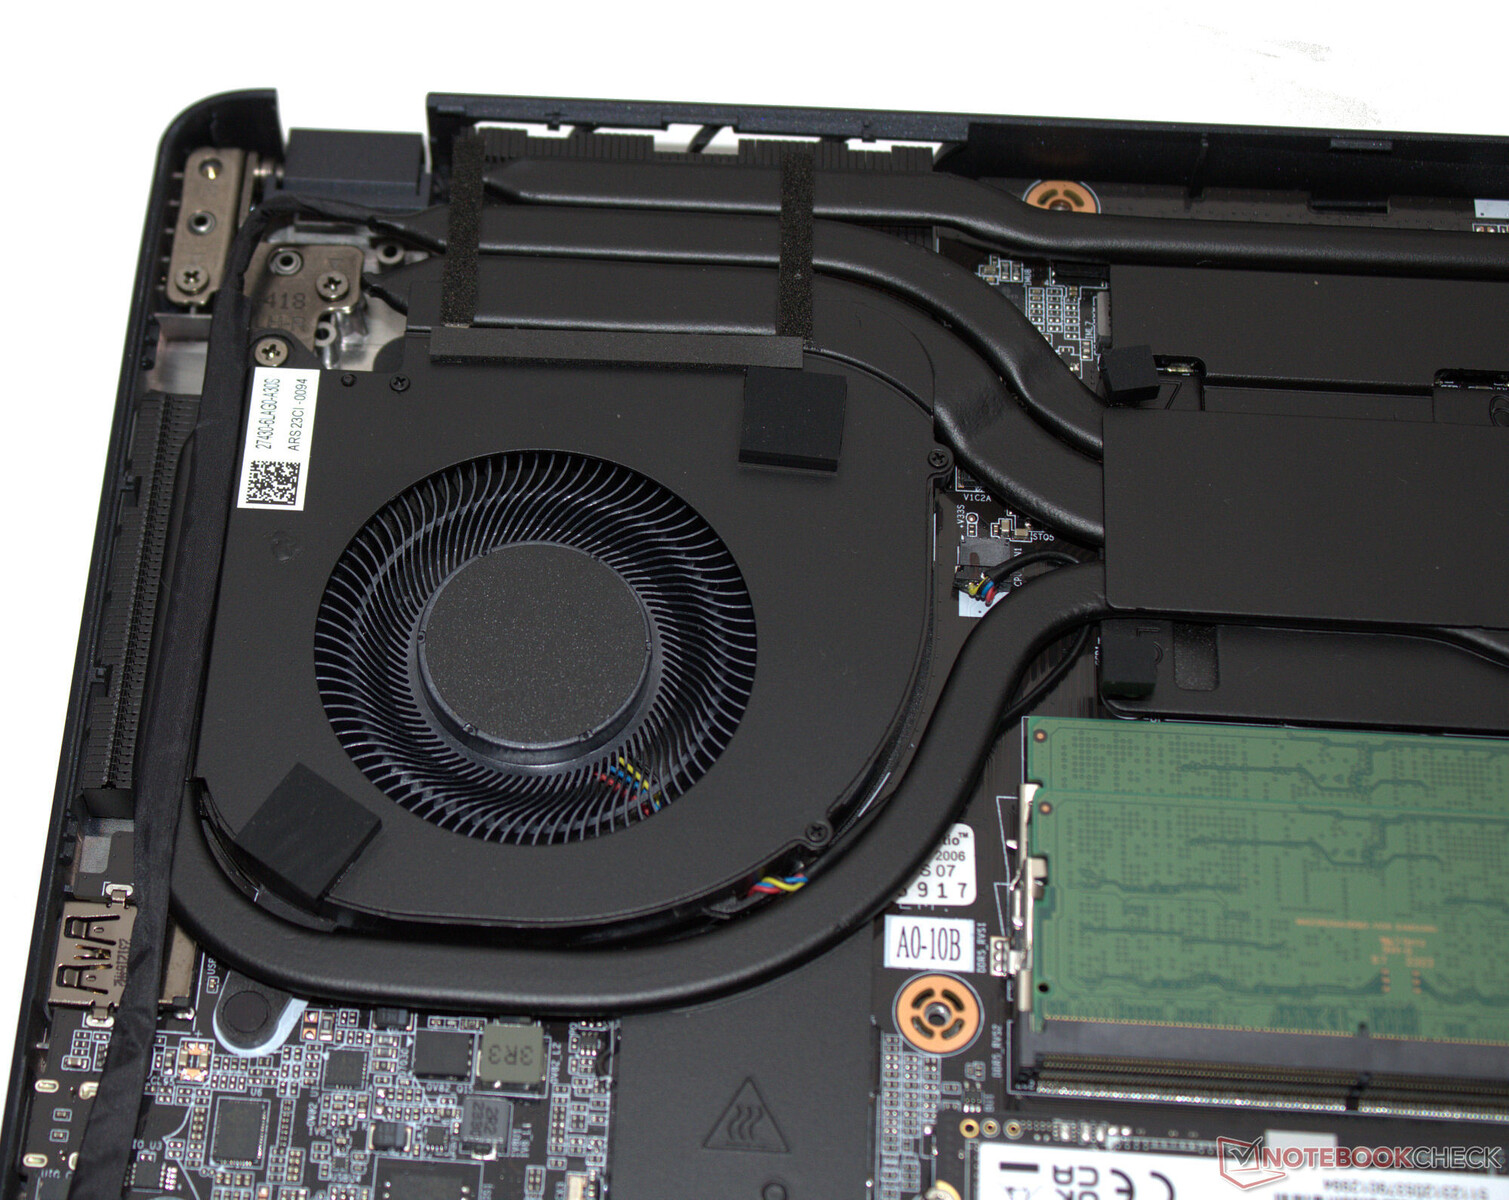
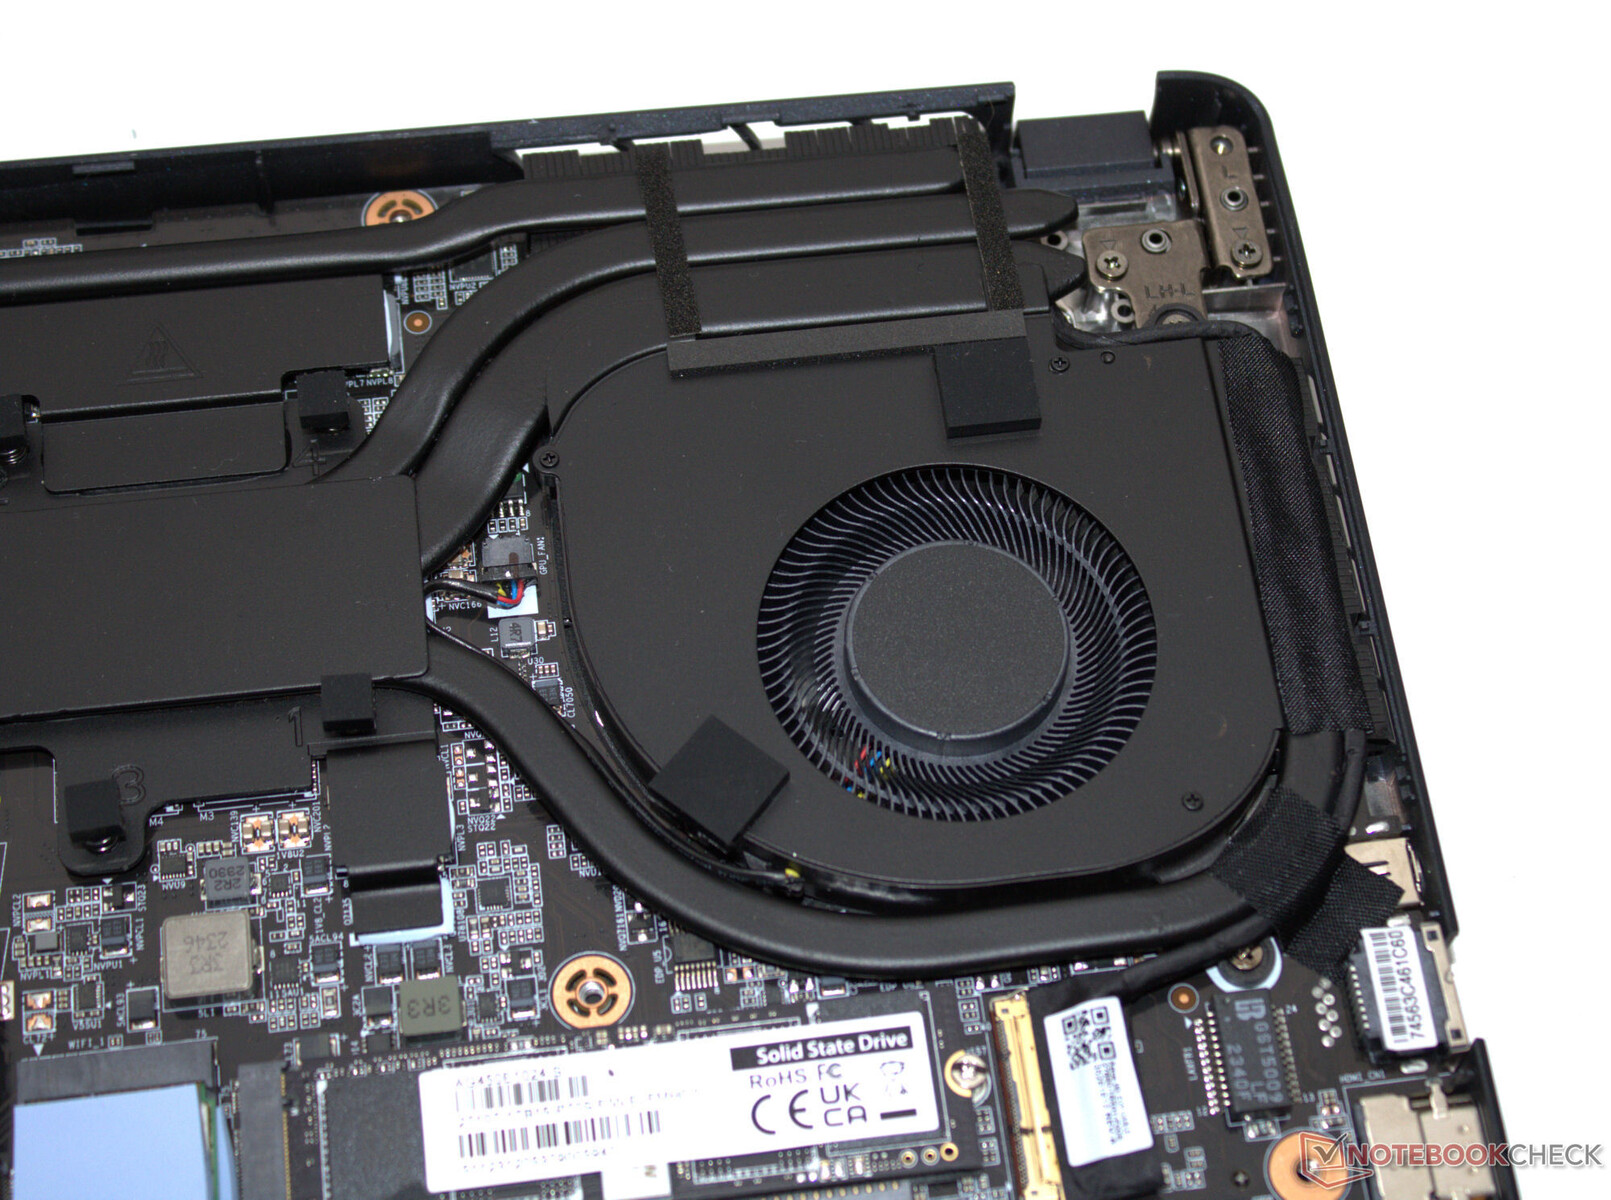
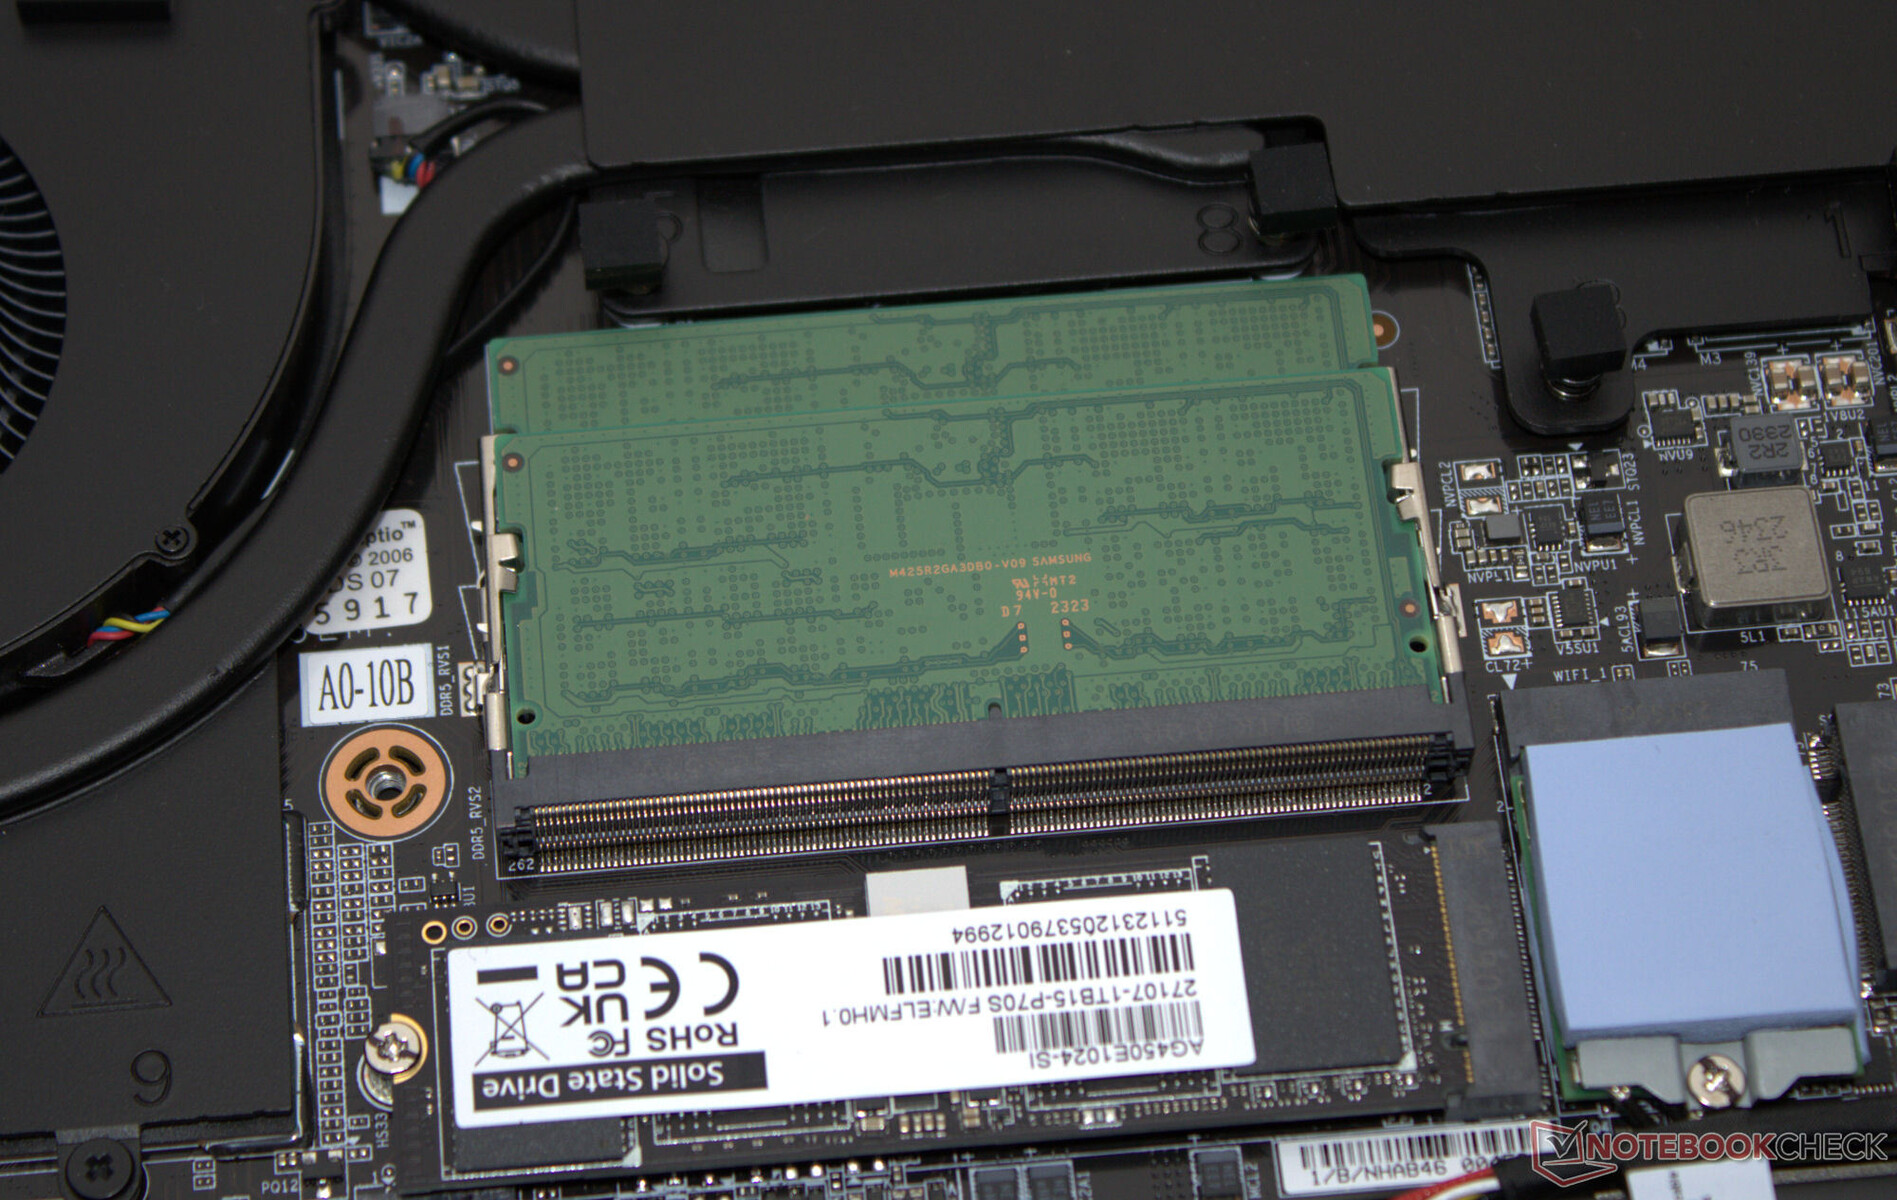
Tras retirar todos los tornillos de la parte inferior del dispositivo, puede utilizar una espátula plana o una púa para ayudar a retirar la parte inferior de la carcasa. Posteriormente, podrá acceder a los bancos de memoria (ambos ocupados), a las dos unidades SSD (PCIe 4, M.2-2280), al módulo WLAN, a los ventiladores, a la batería de la BIOS, así como a la batería normal.
Garantía
El dispositivo de 16 pulgadas está cubierto por una garantía estándar de 12 meses. Las opciones para ampliarla no están disponibles.
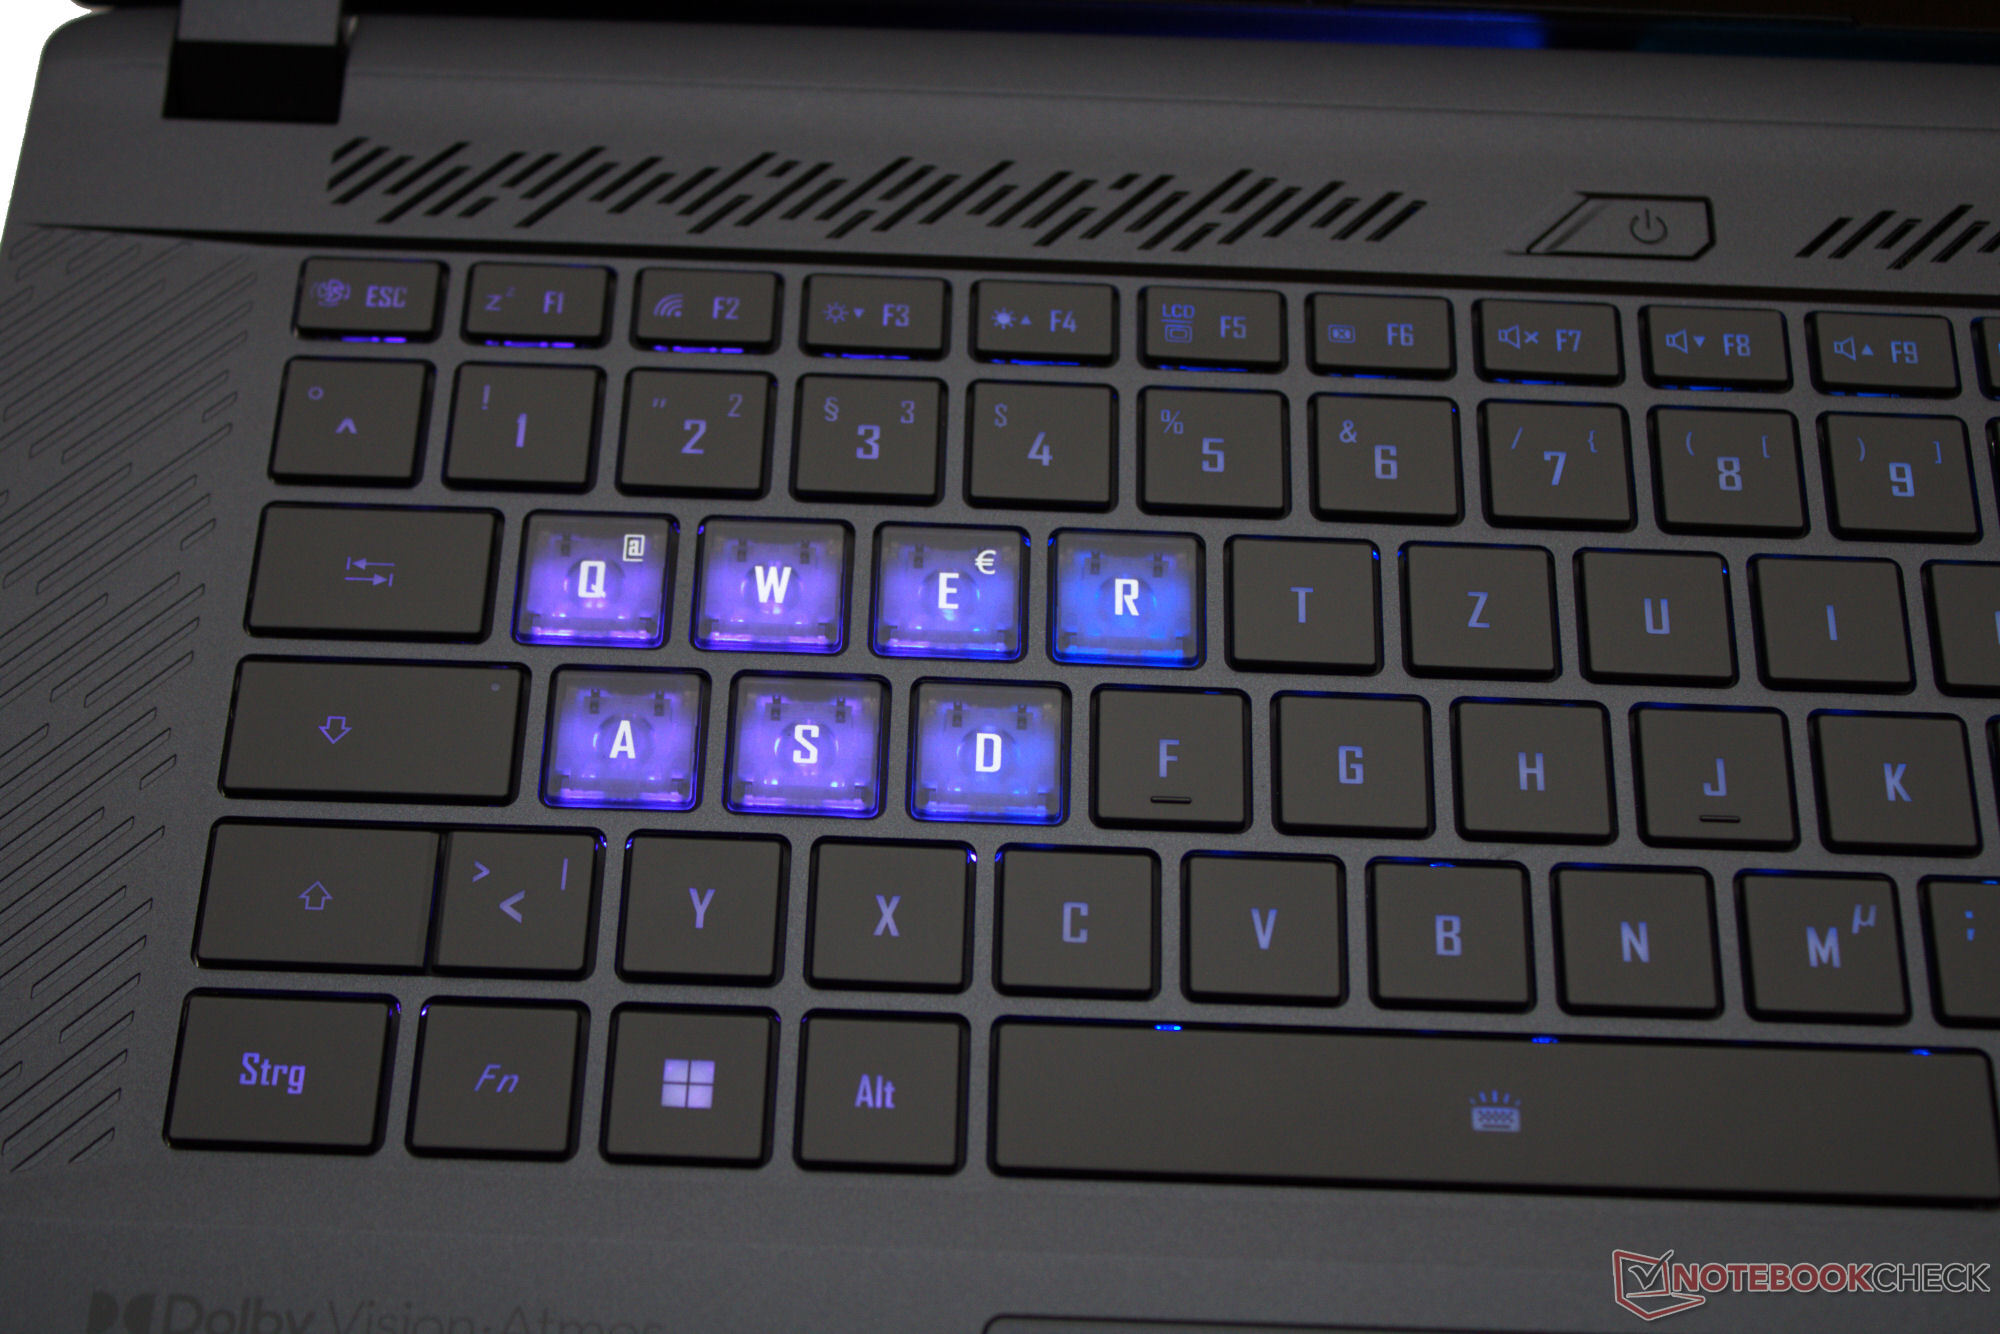
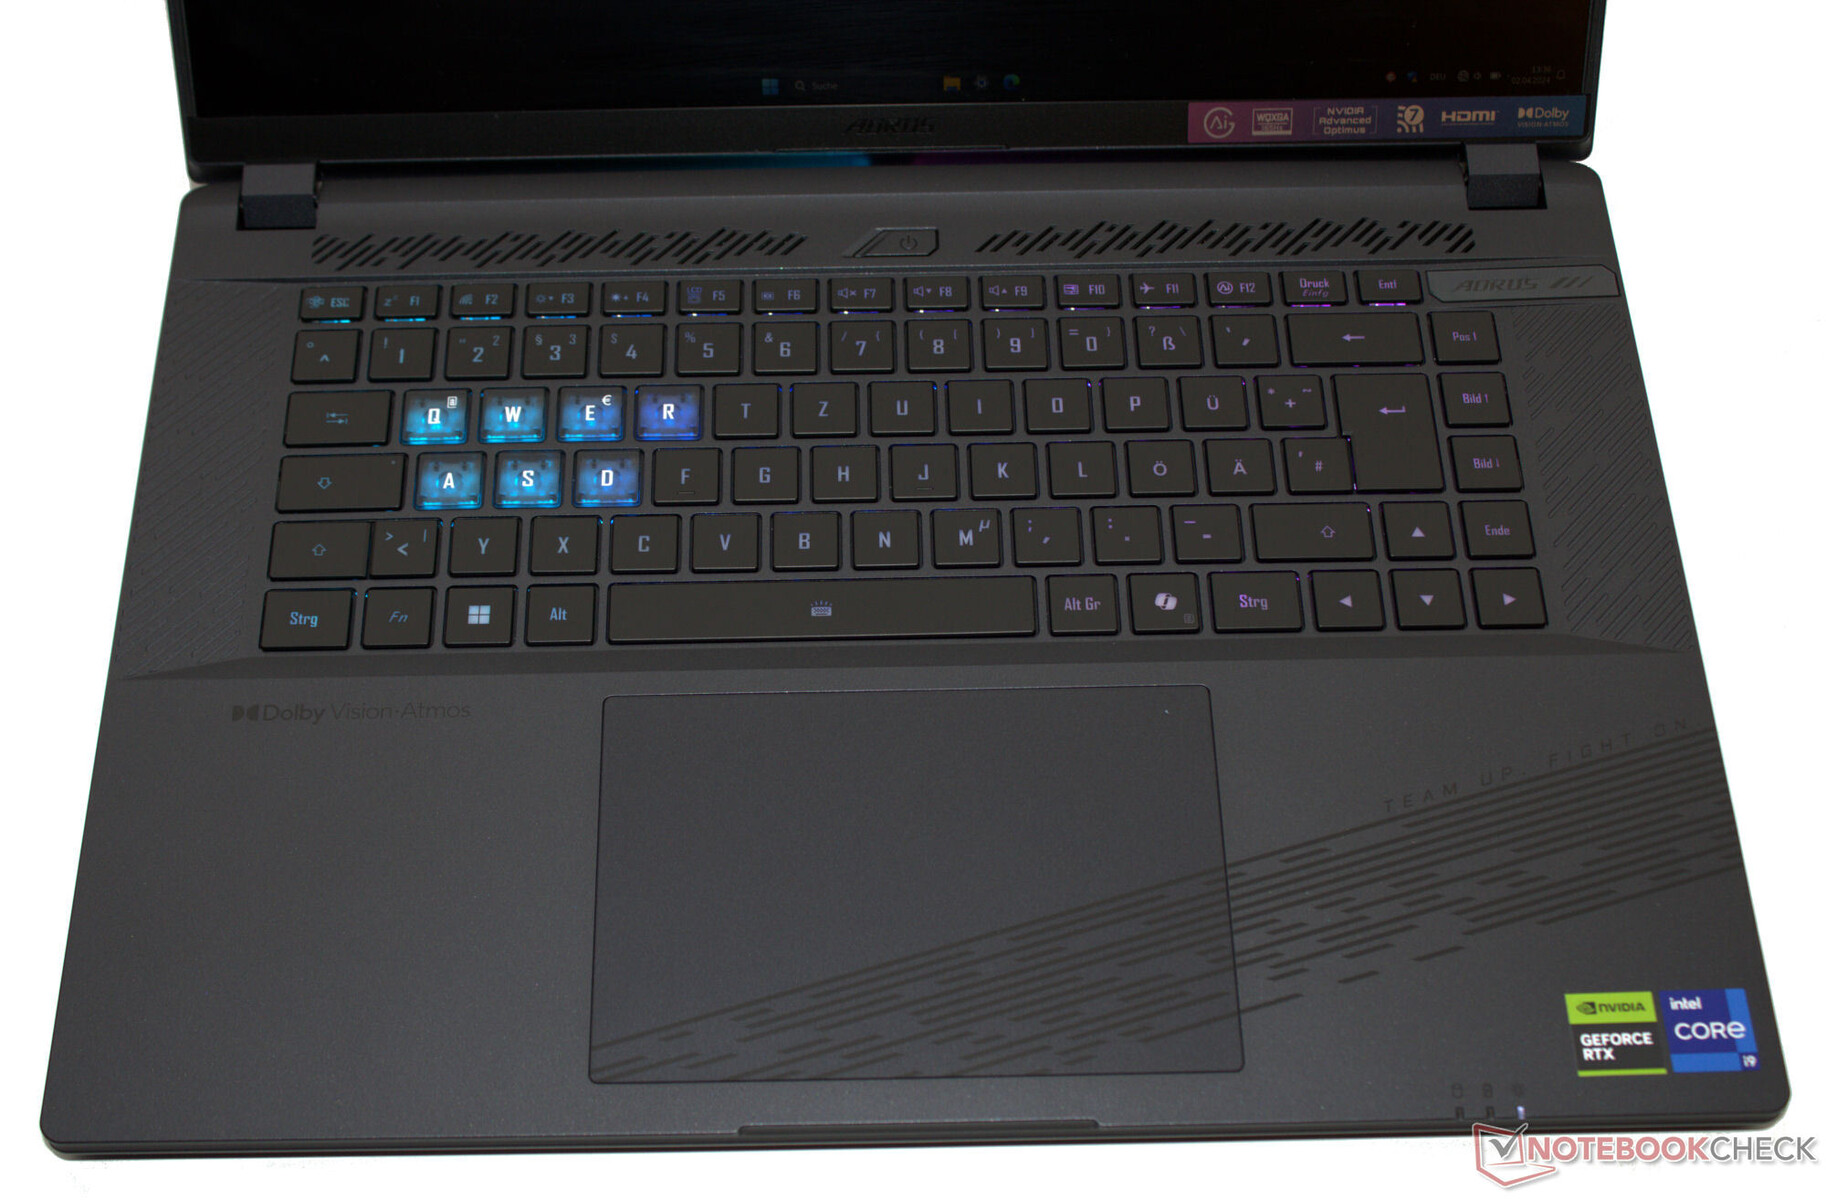
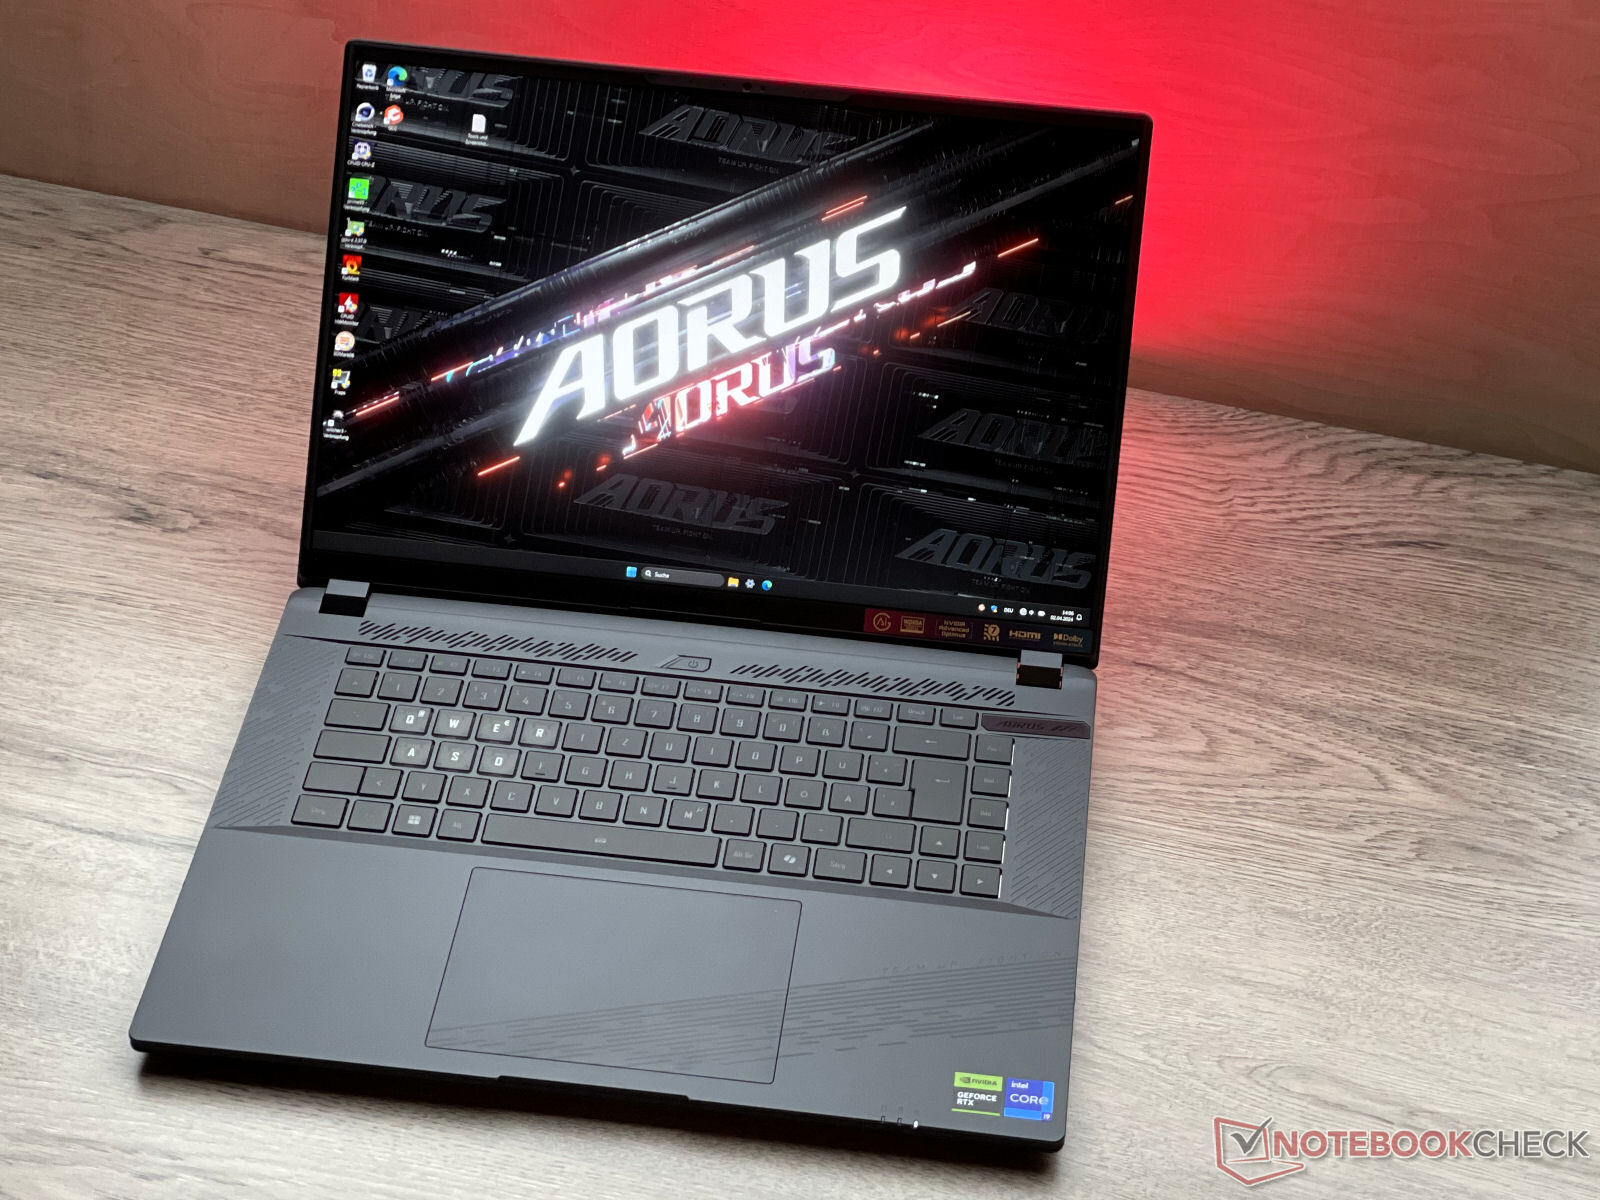
Dispositivos de entrada - El portátil Aorus tiene un teclado retroiluminado
Teclado
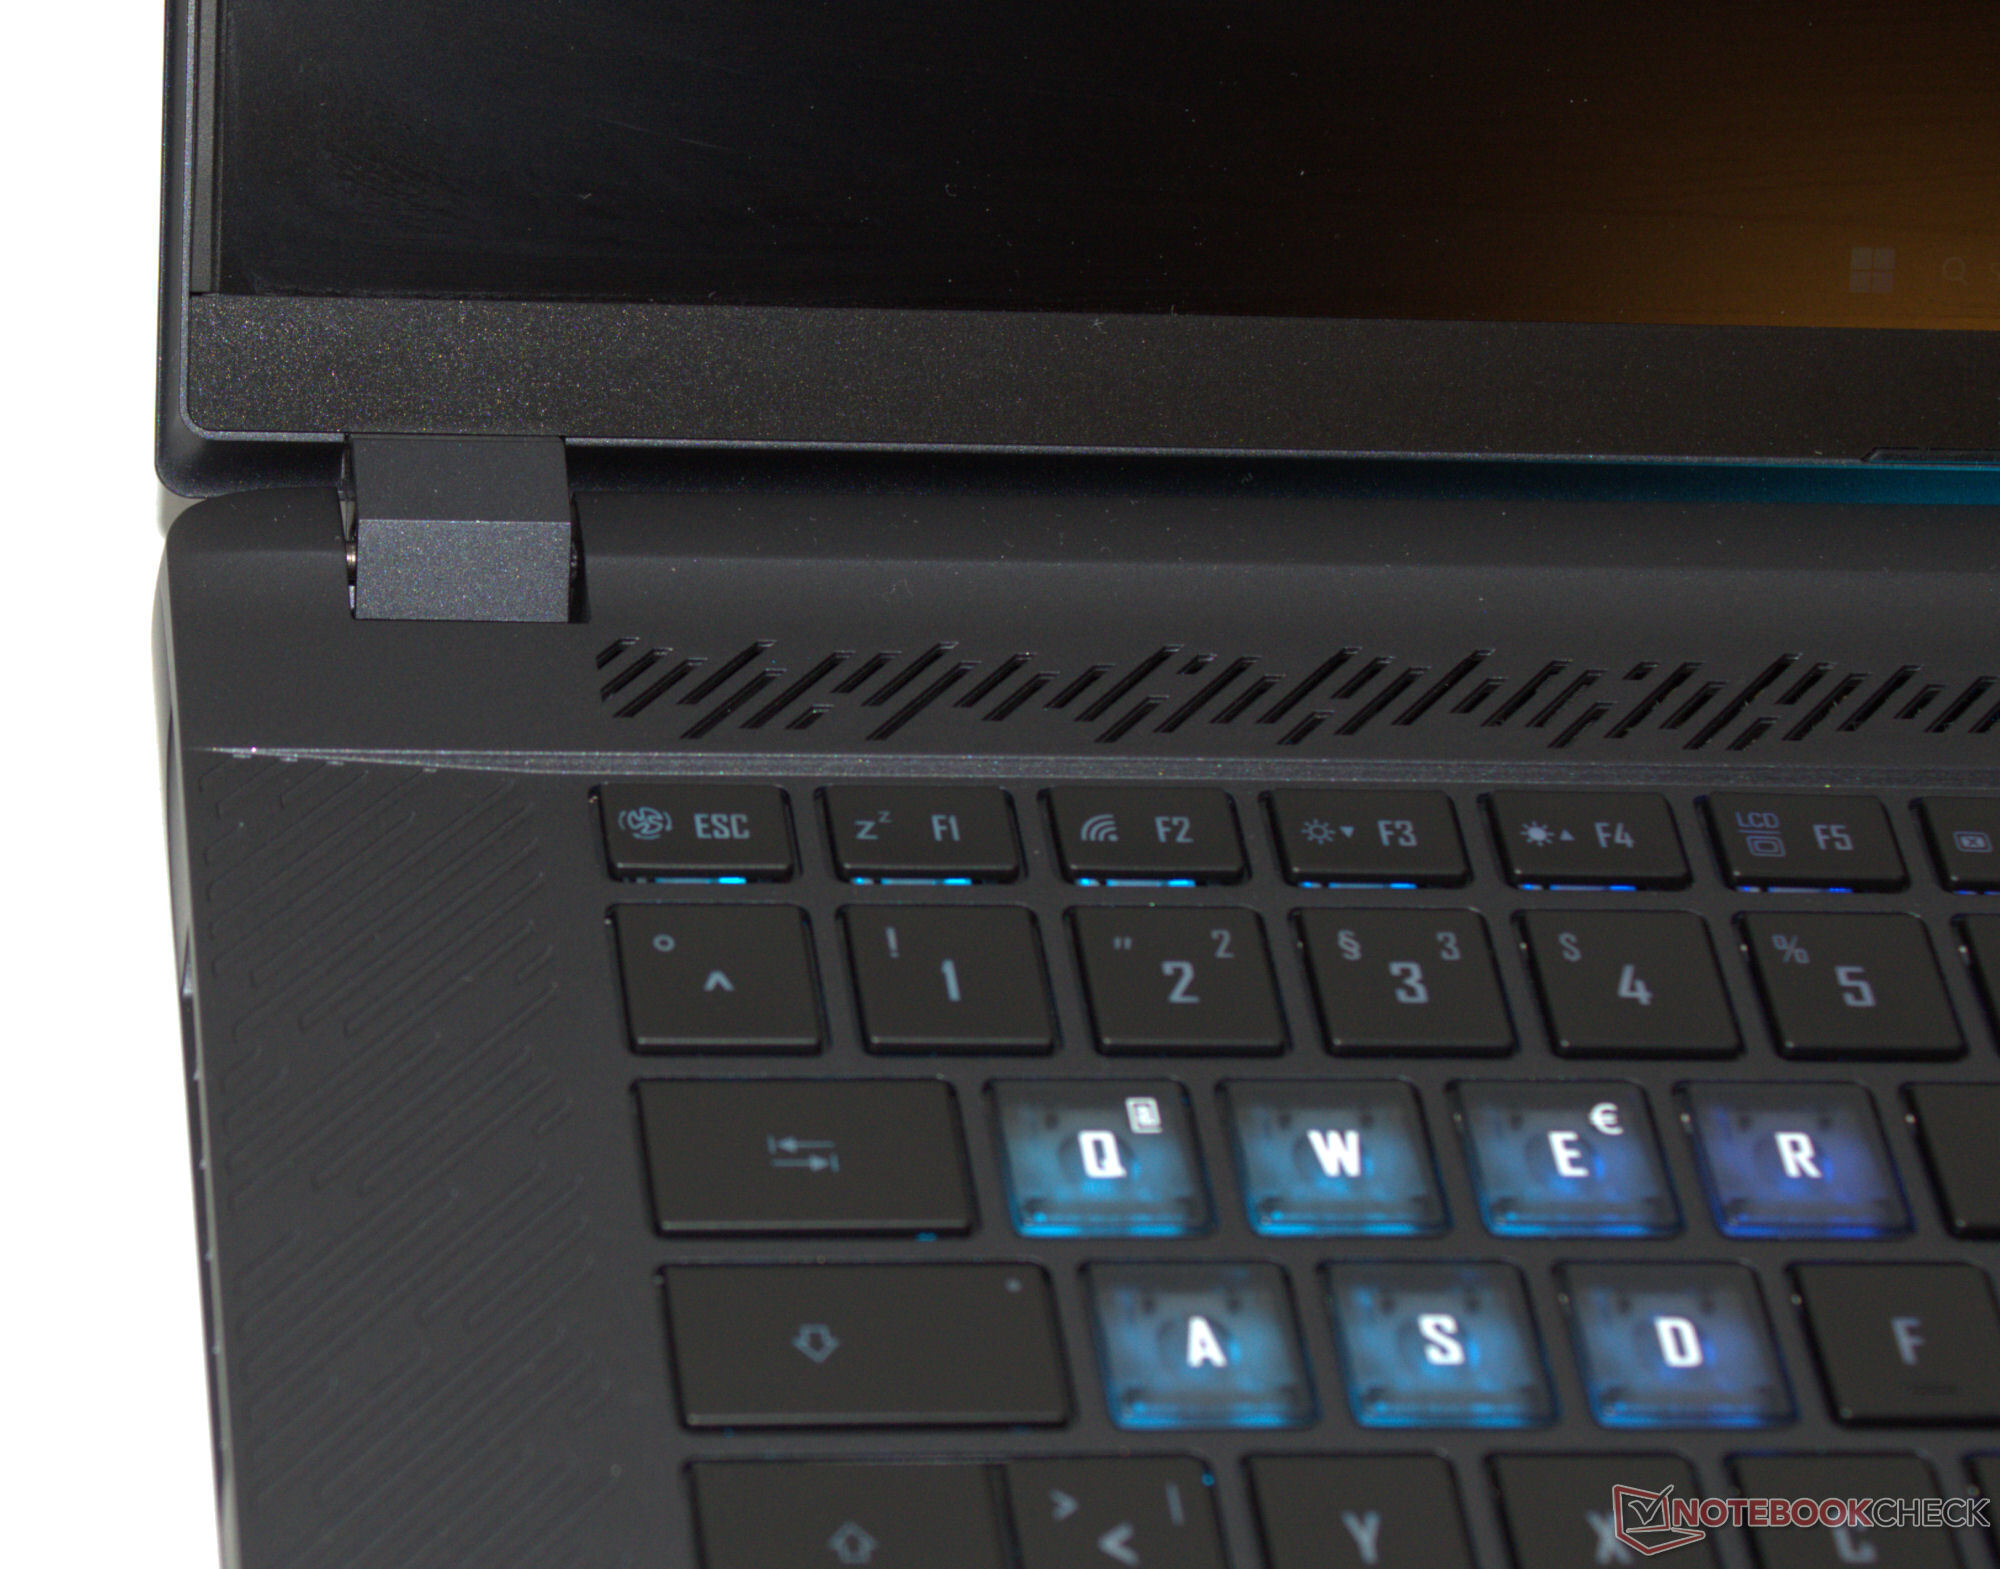
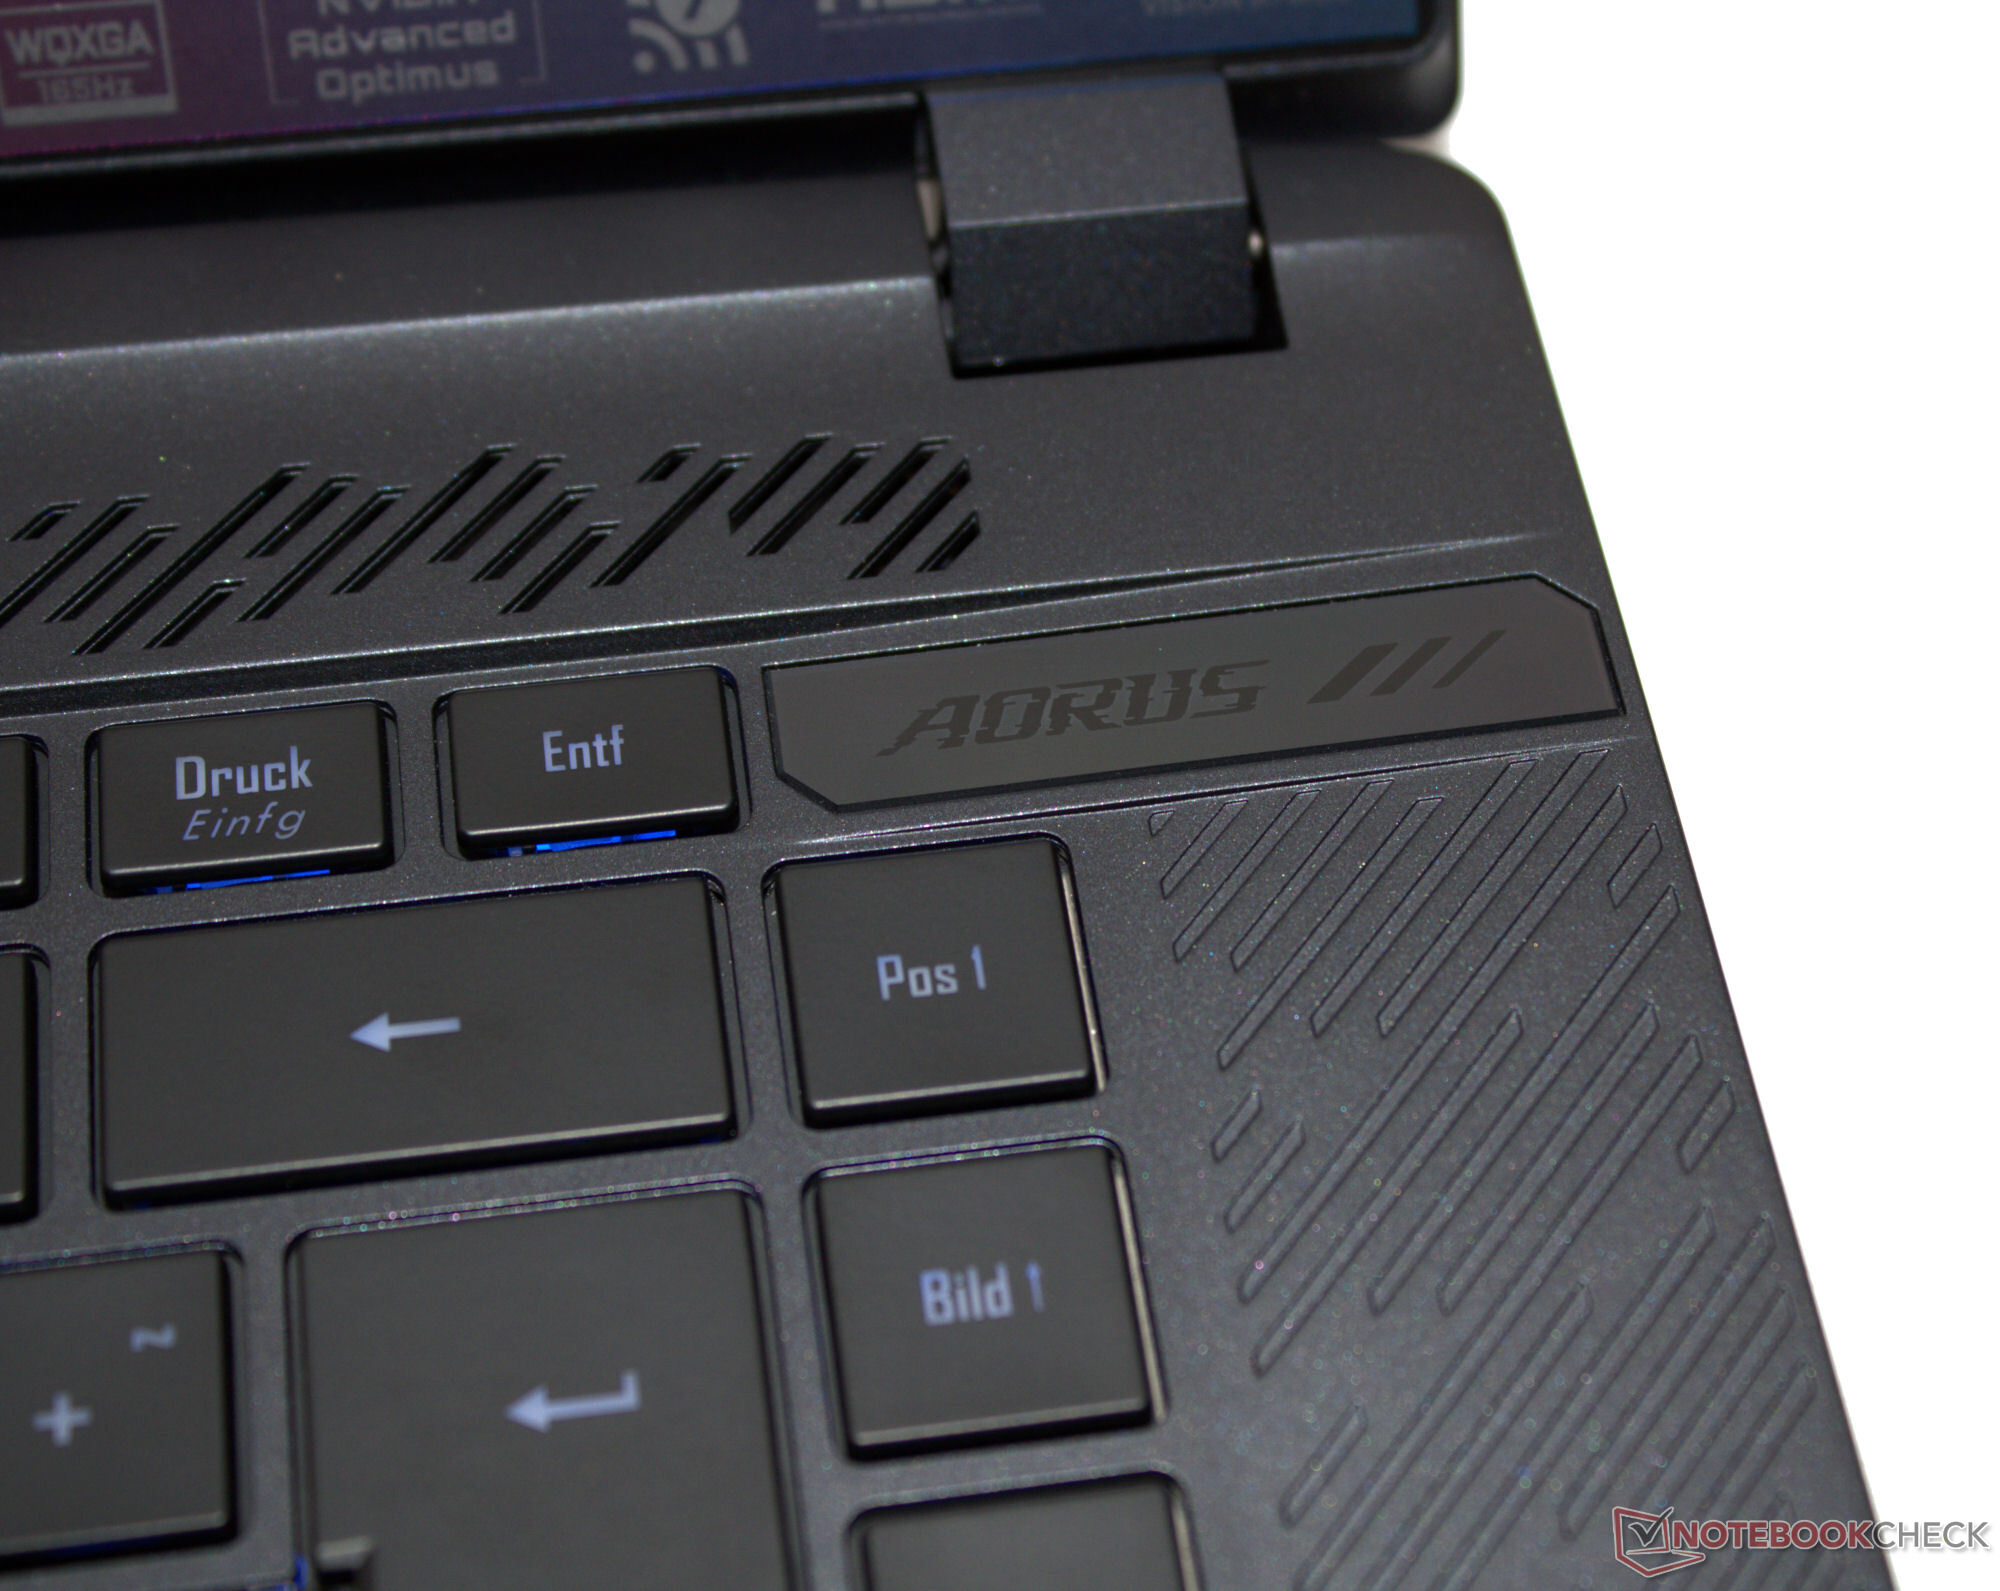
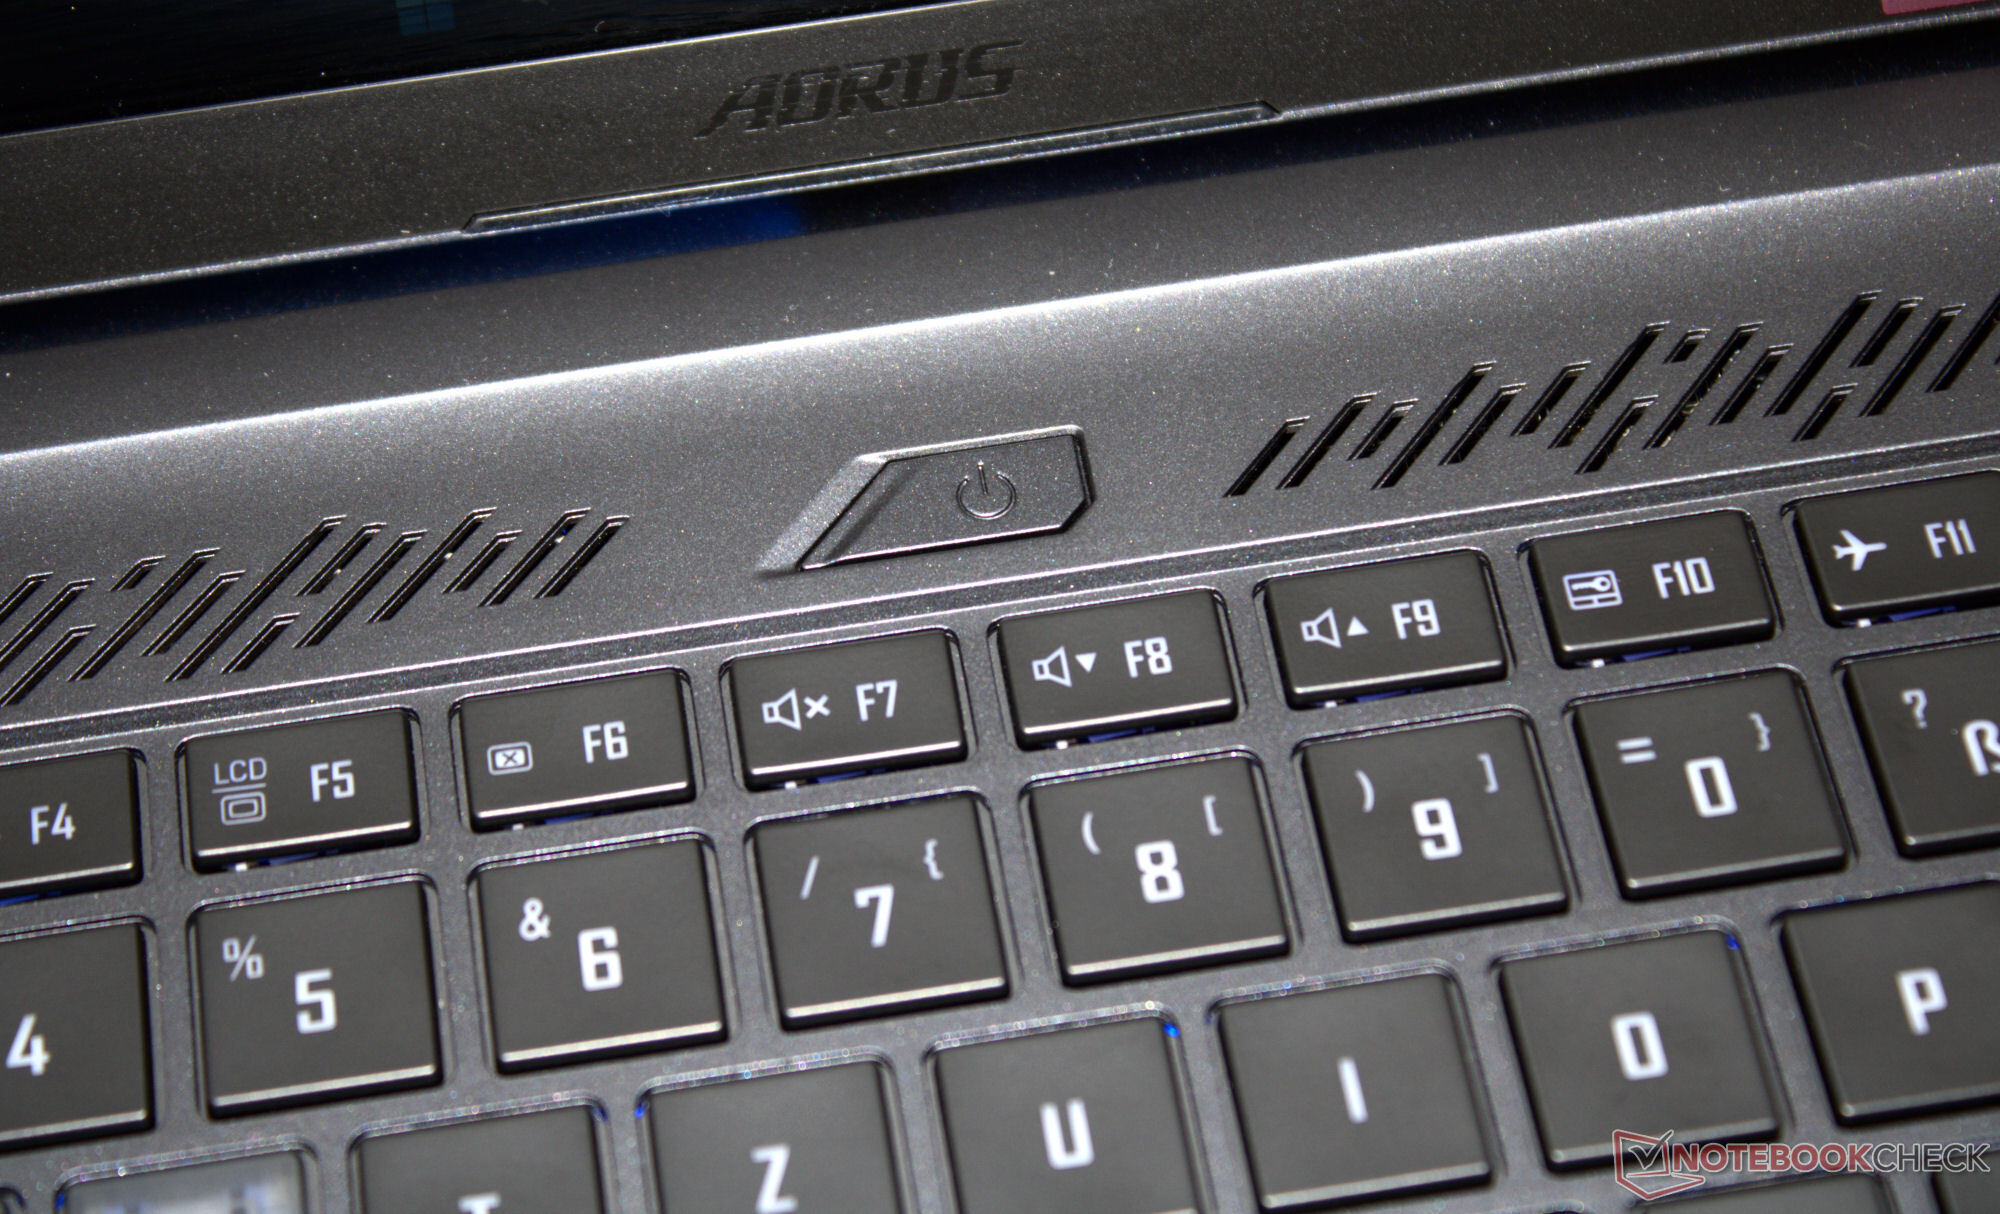
Las teclas del teclado chiclet (iluminación RGB de tres niveles) presentan una elevación media y un punto de presión claro. Su resistencia es aceptable. El teclado cede ligeramente al escribir, pero esto aún no ha resultado molesto. Bien: Las cuatro teclas de flecha son de tamaño normal. Gigabyte ha decidido no instalar un teclado numérico. En definitiva, el fabricante ha suministrado un teclado adecuado para el uso diario.
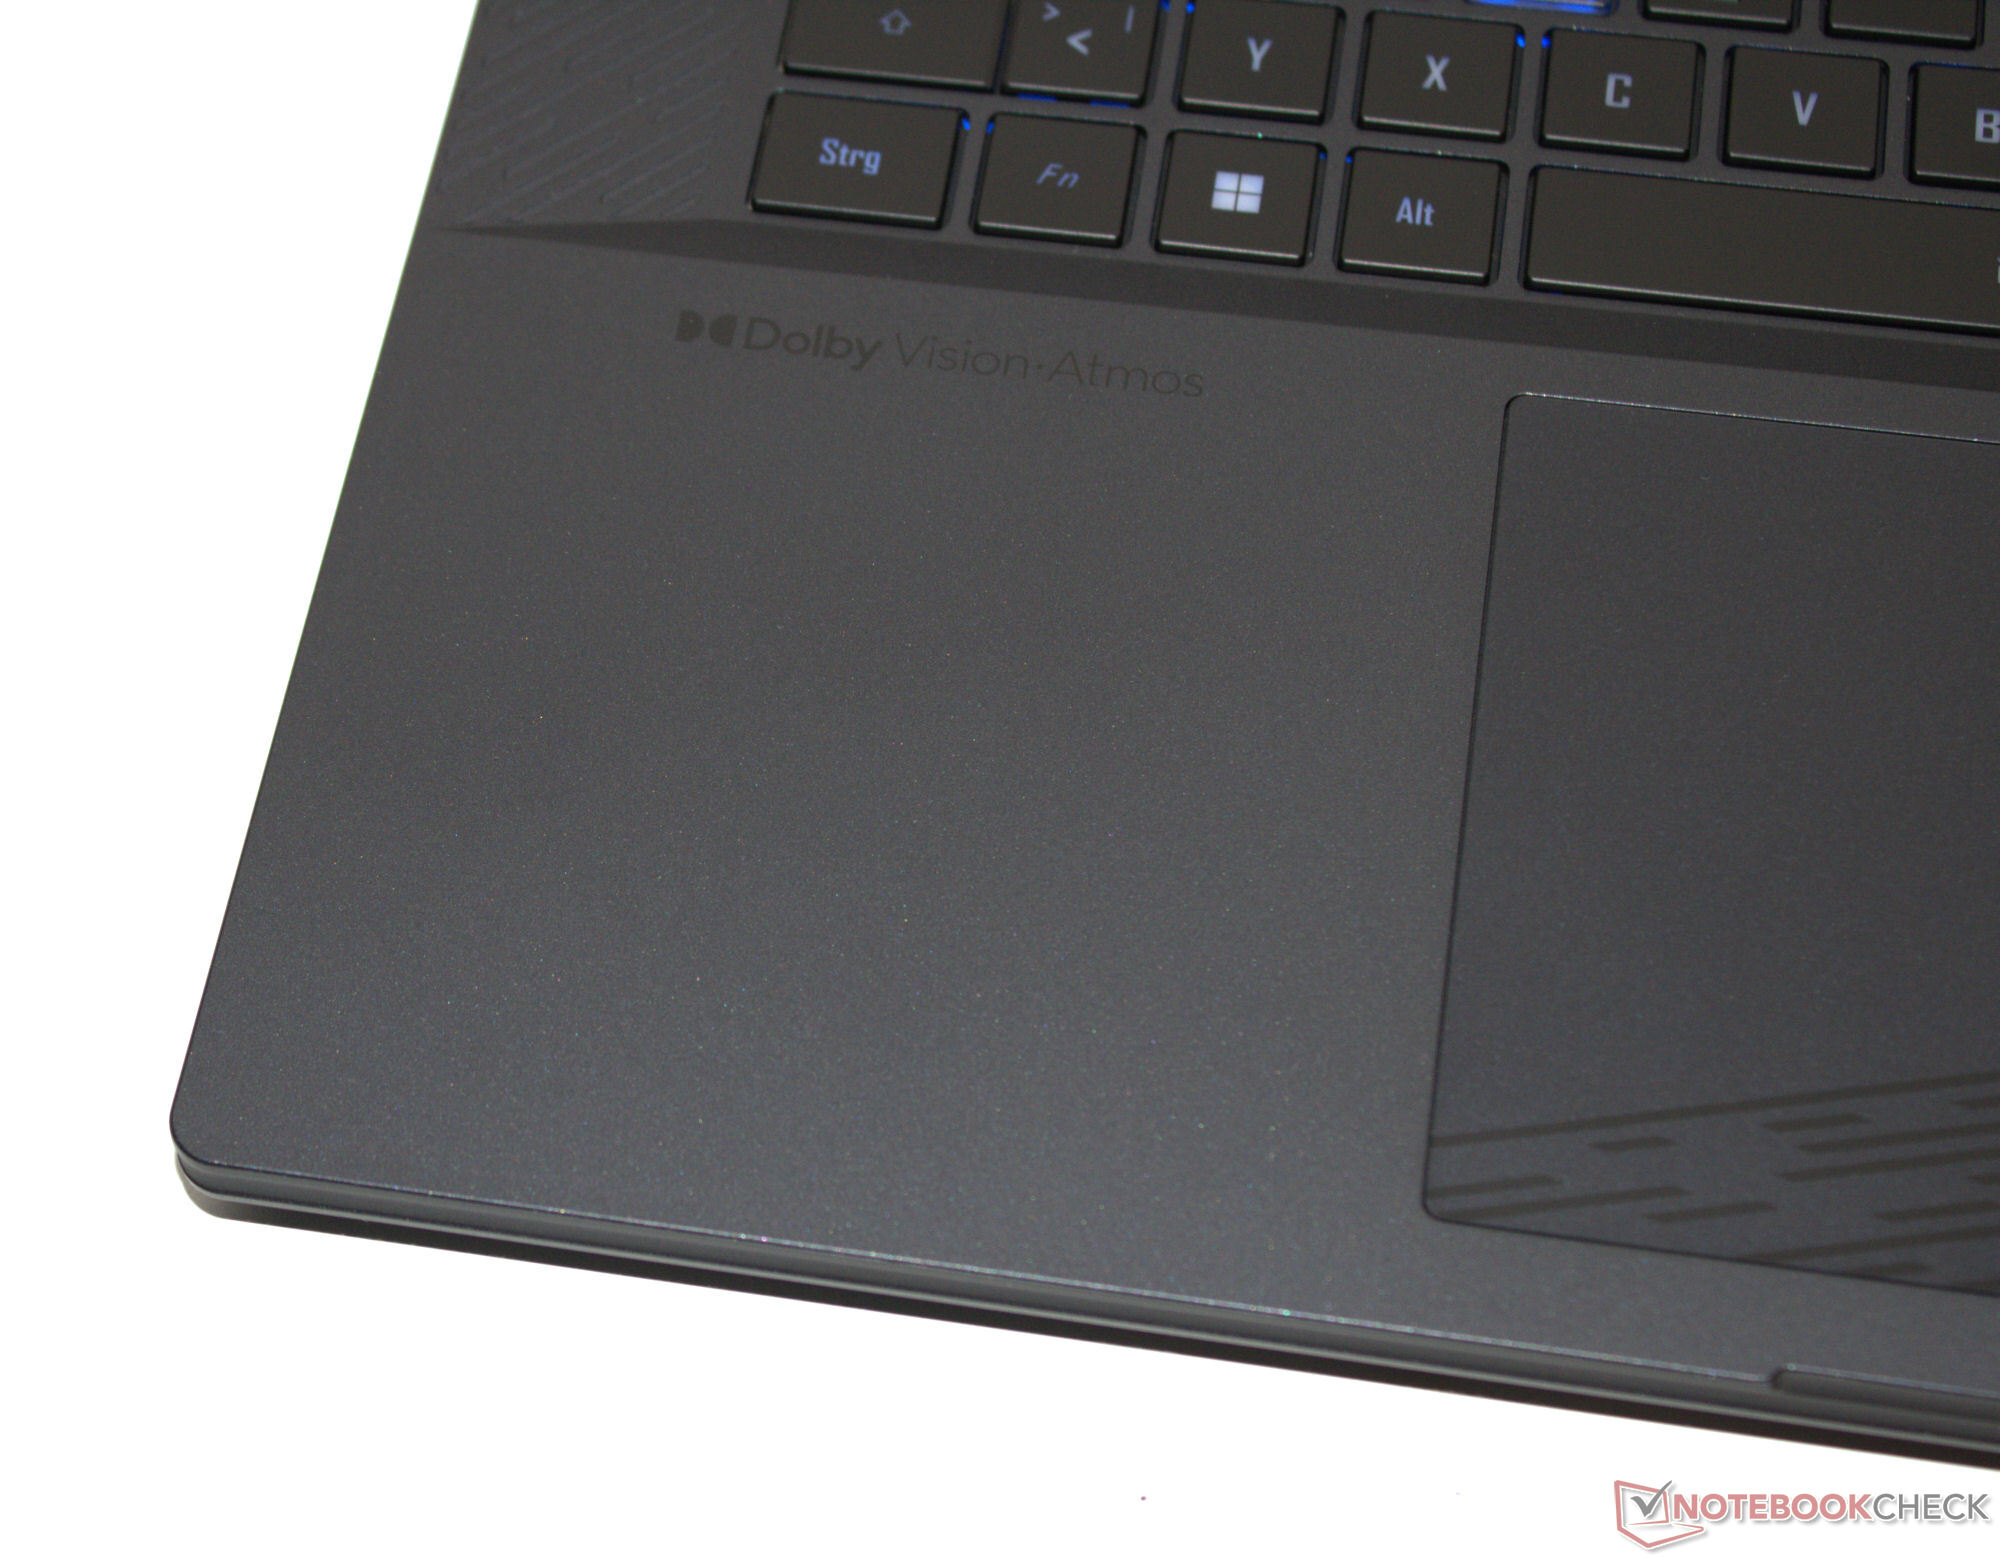
Panel táctil
Un clickpad multitáctil (aprox. 13,3 x 9 cm) sirve como sustituto del ratón, cuya superficie lisa facilita el deslizamiento de los dedos. Presenta una elevación corta y un punto de presión claro.
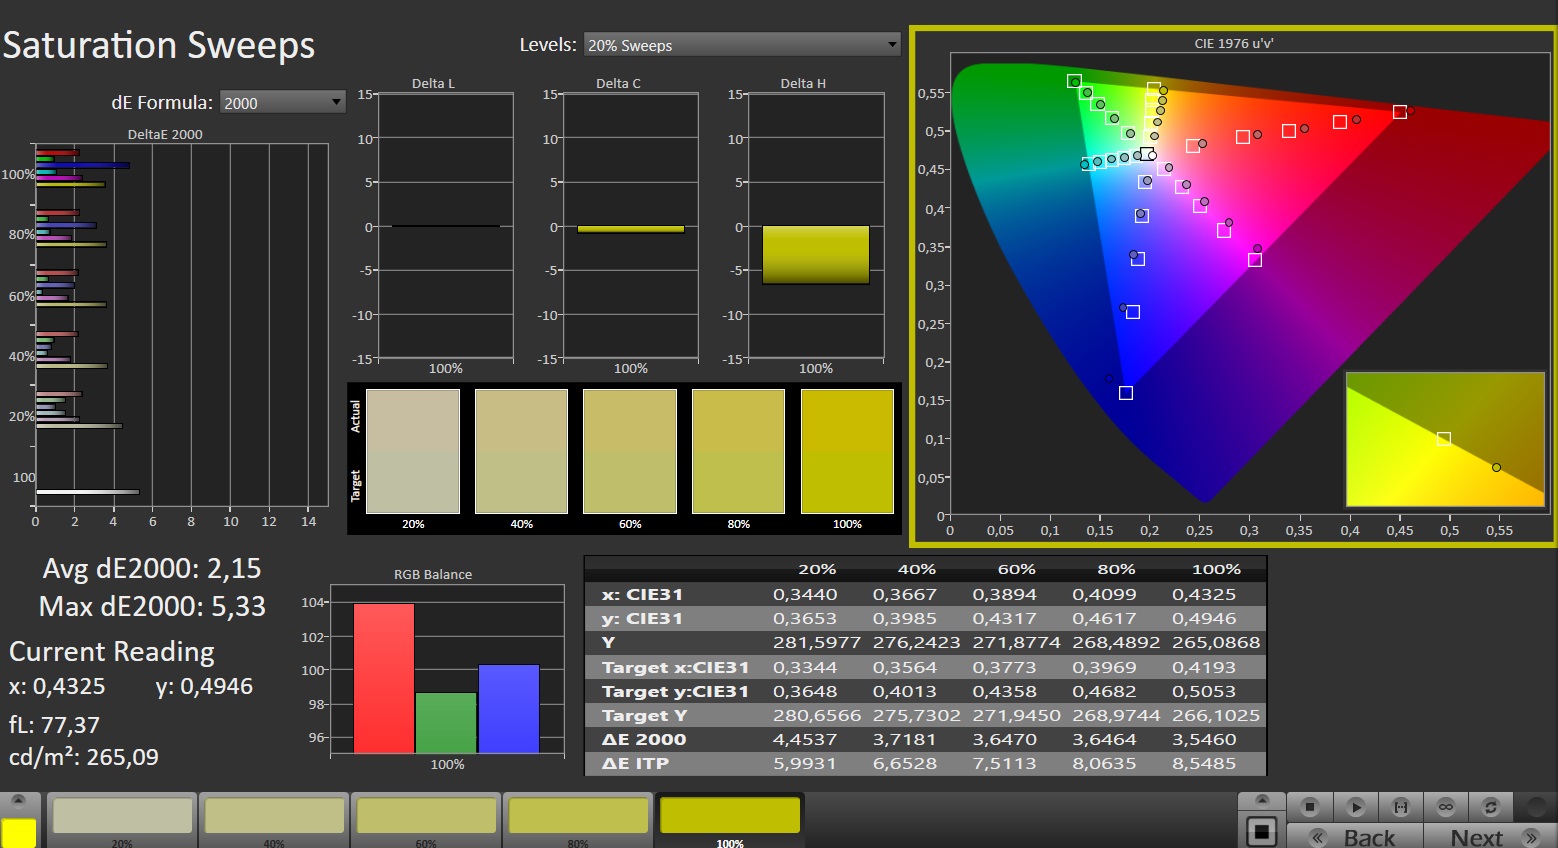
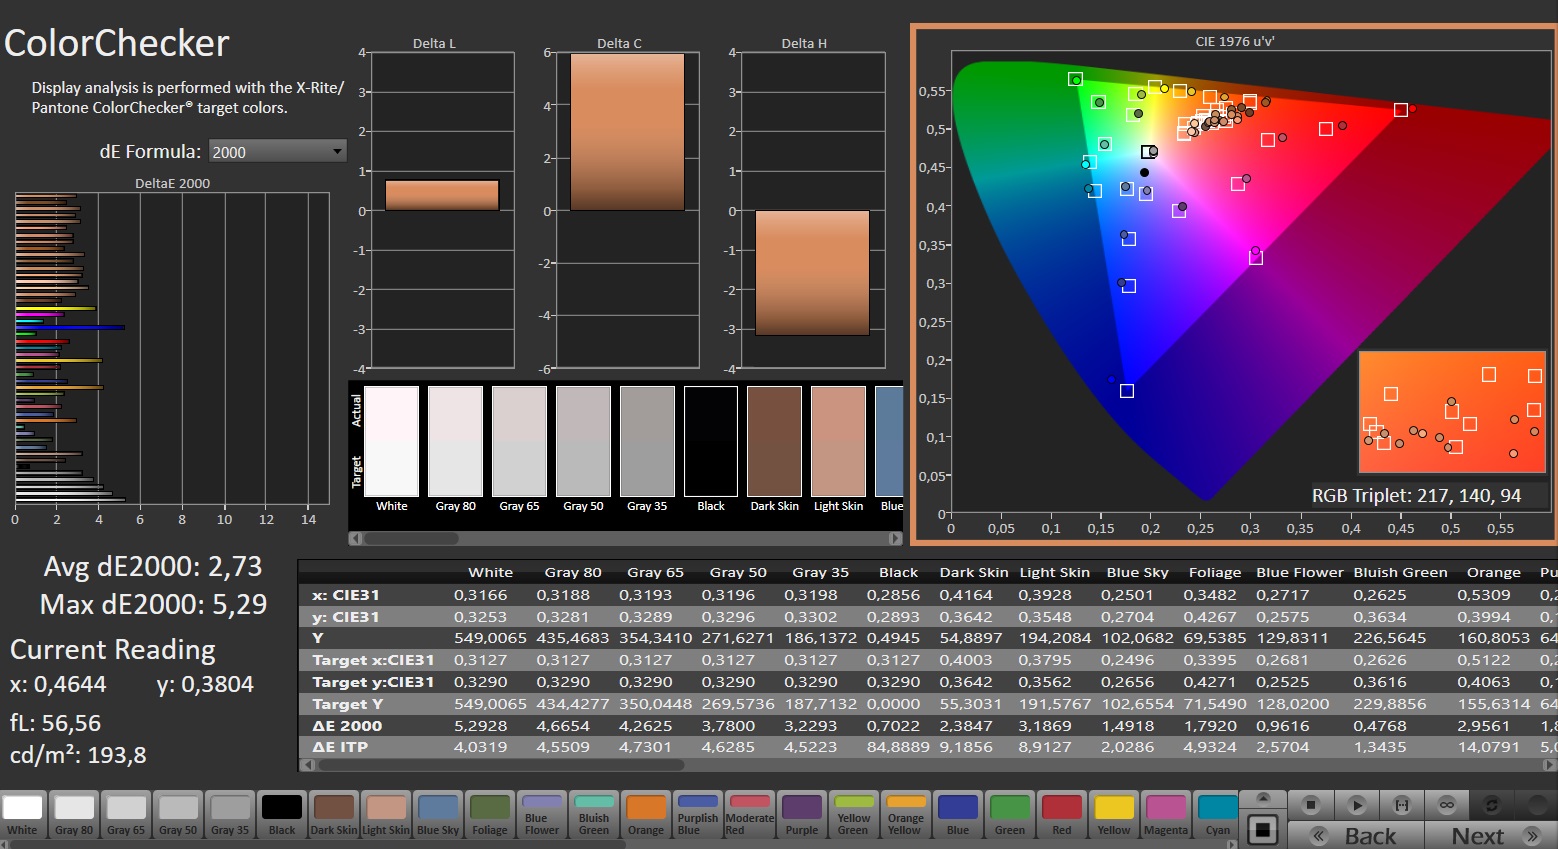
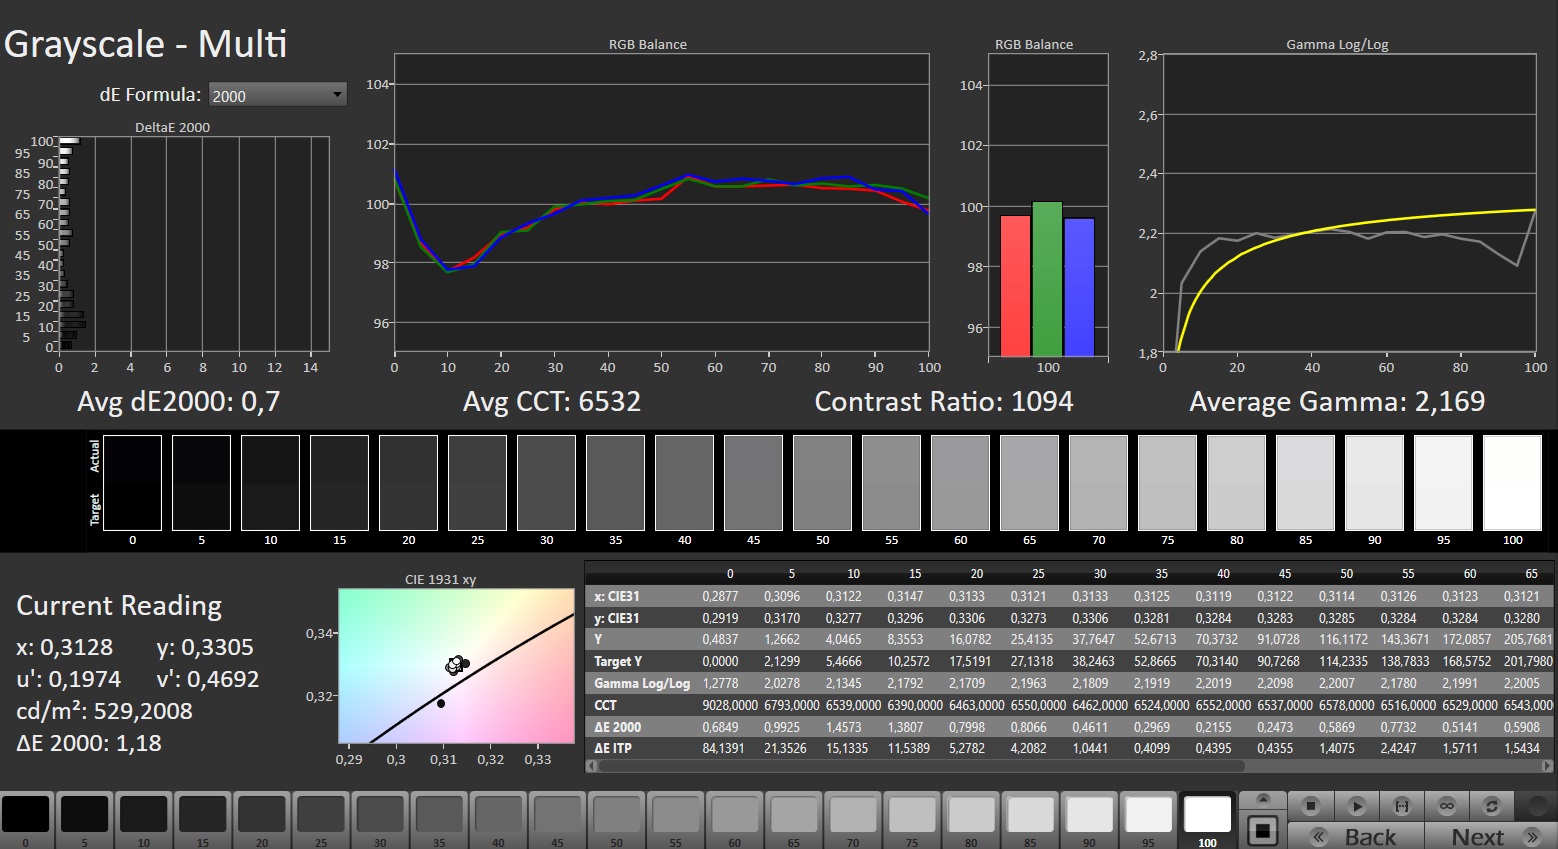
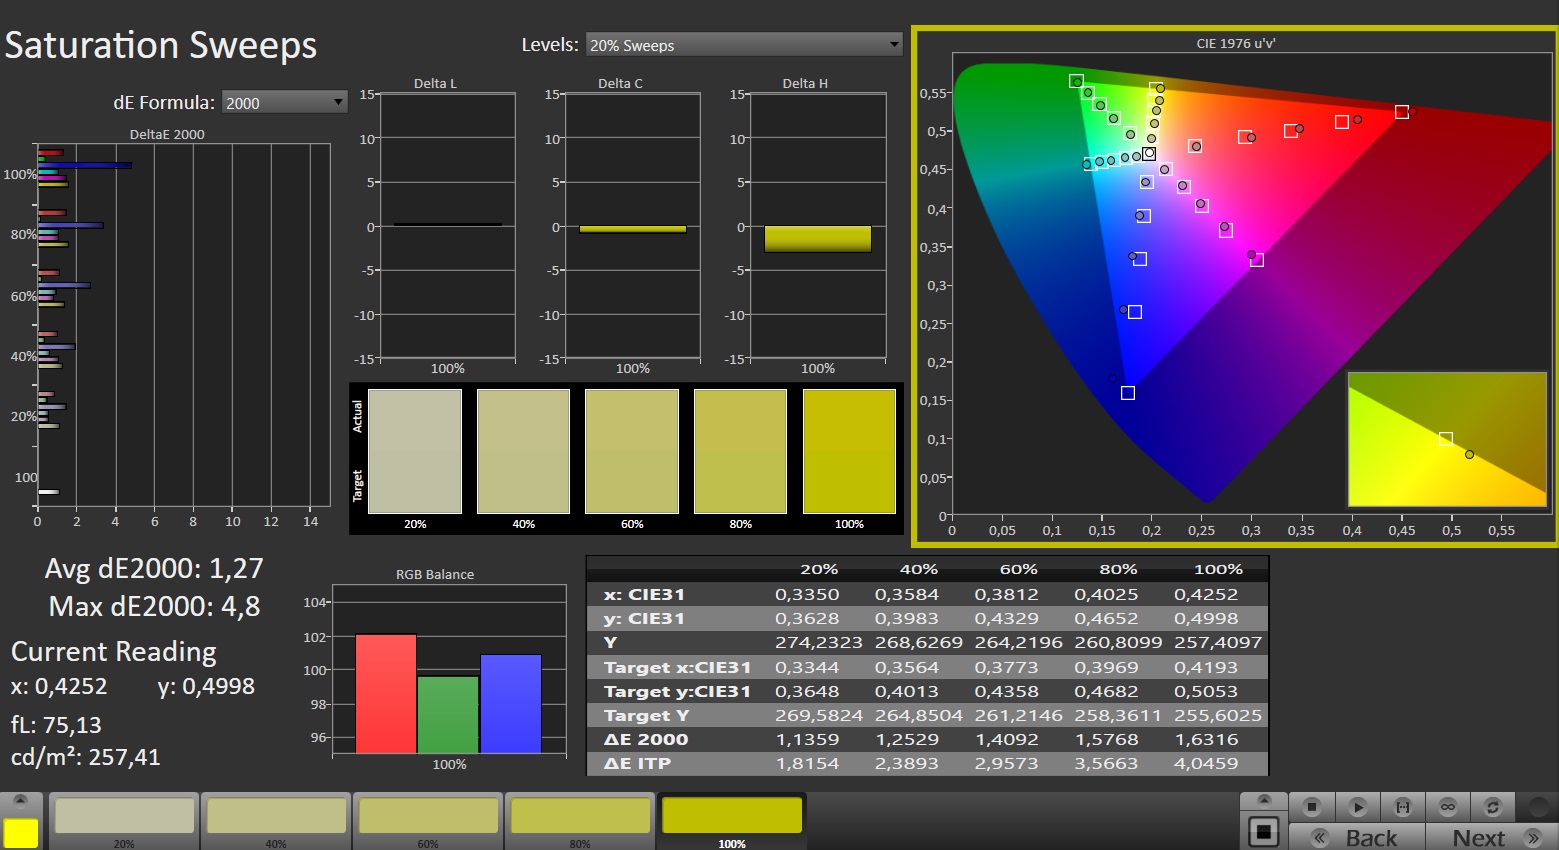
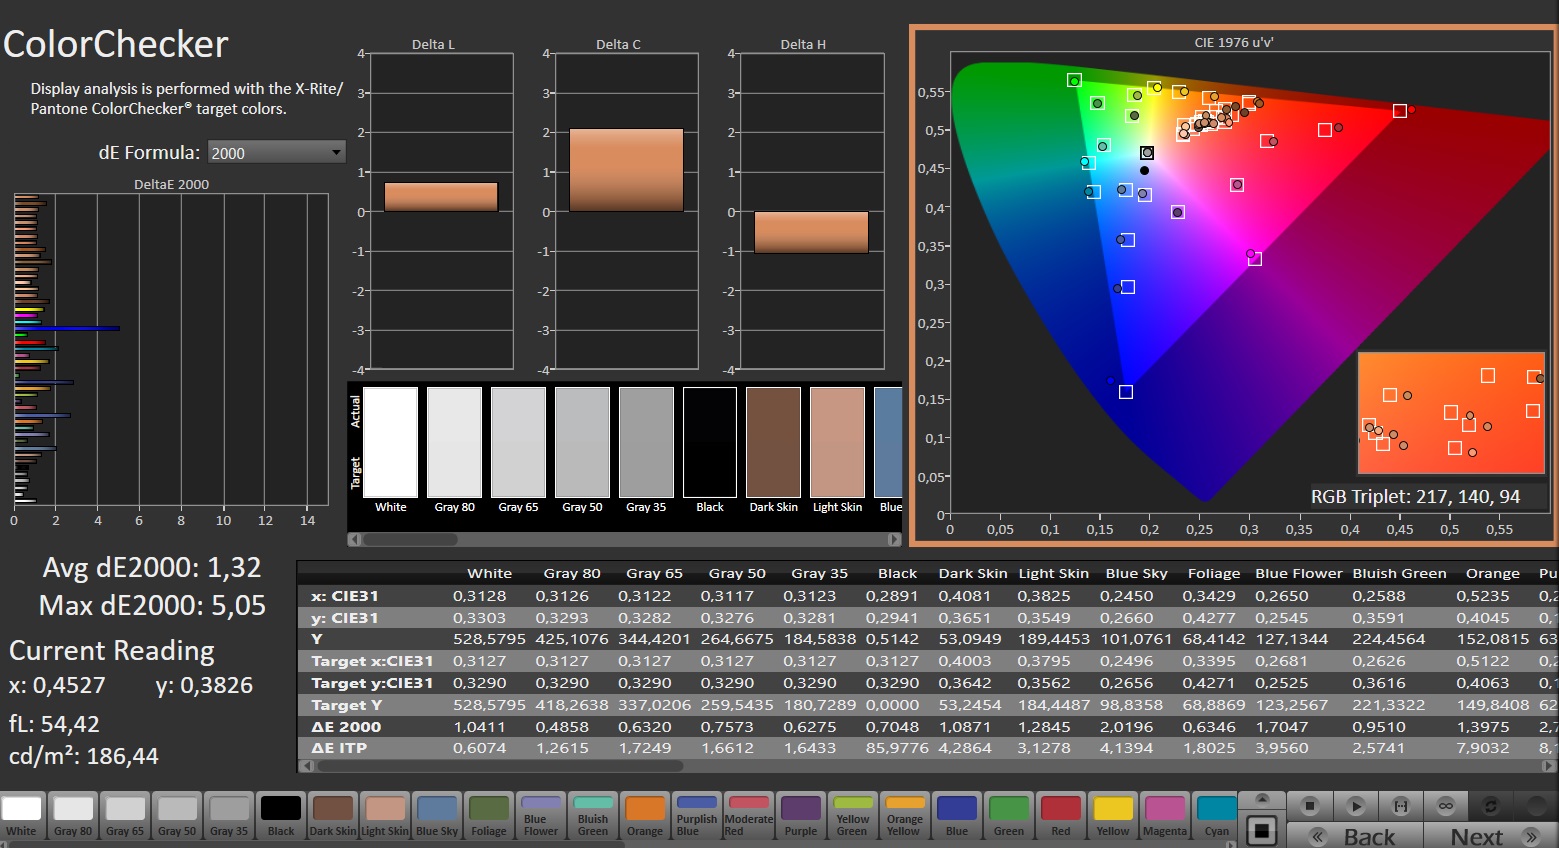
Pantalla - Brillante, 16:10, sRGB
Gigabyte ha instalado un panel de 165 Hz que incluye compatibilidad con G-Sync. Este último ajusta dinámicamente las frecuencias de actualización de la pantalla y la GPU para crear la imagen más fluida posible, especialmente al jugar.
No observamos signos de parpadeo PWM en ningún ajuste de brillo. El brillo y el contraste del panel mate 16:10 de 16 pulgadas (2.560 x 1.600 píxeles) cumplen sus respectivos objetivos (> 300 cd/m² o 1.000:1). Su elevado brillo es especialmente destacable.
| |||||||||||||||||||||||||
iluminación: 86 %
Brillo con batería: 542 cd/m²
Contraste: 1204:1 (Negro: 0.45 cd/m²)
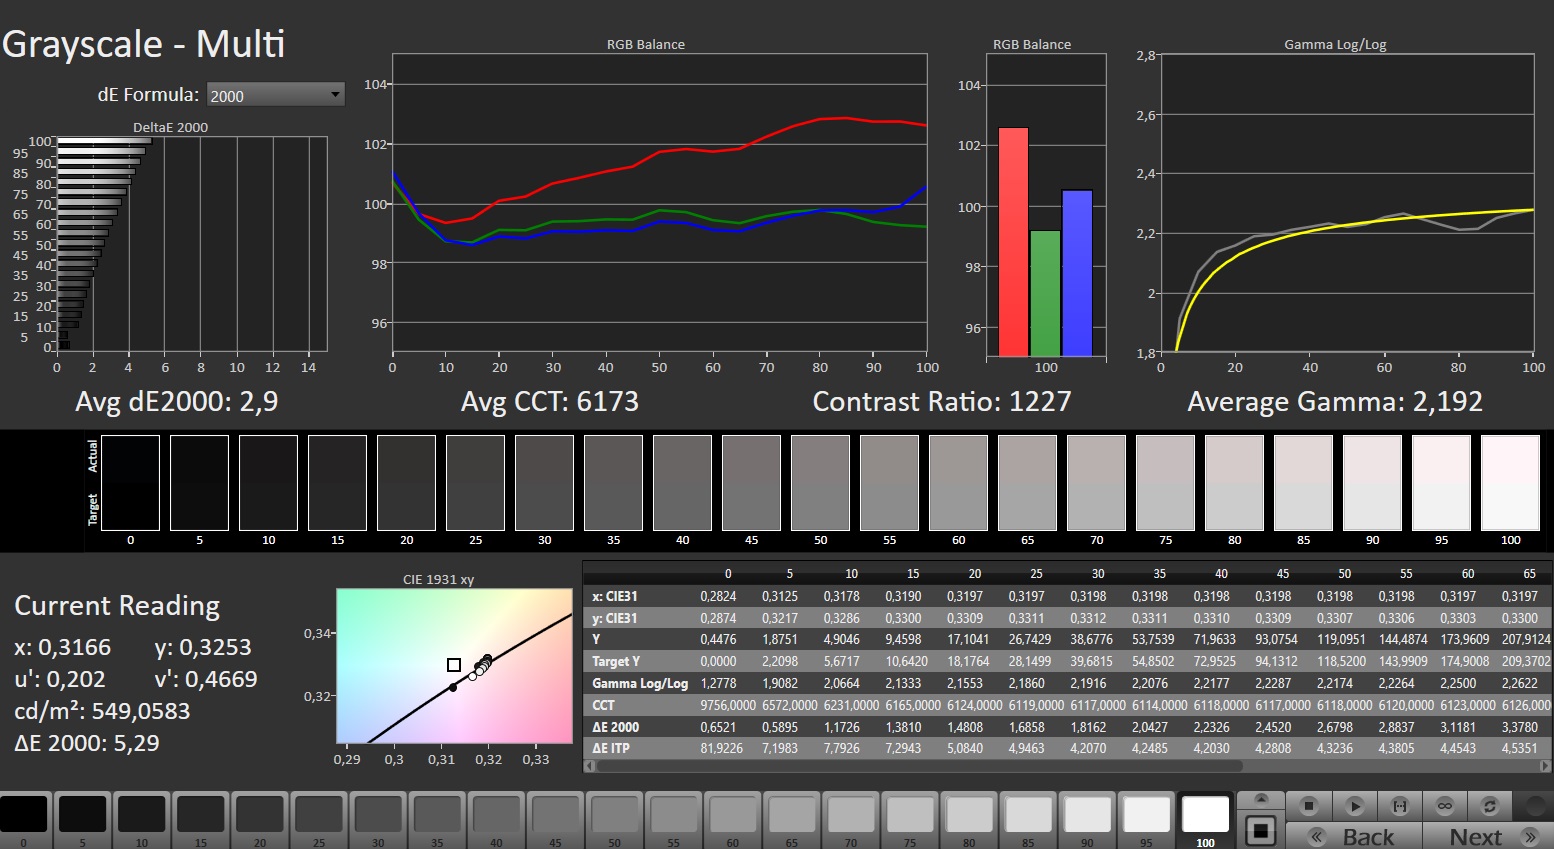
ΔE ColorChecker Calman: 2.73 | ∀{0.5-29.43 Ø4.73}
calibrated: 1.32
ΔE Greyscale Calman: 2.9 | ∀{0.09-98 Ø4.97}
69.3% AdobeRGB 1998 (Argyll 3D)
96.7% sRGB (Argyll 3D)
67.2% Display P3 (Argyll 3D)
Gamma: 2.192
CCT: 6173 K
| Aorus 16X 2024 BOE CQ NE160QDM-NY1, IPS, 2560x1600, 16" | Alienware m16 R2 BOE NE16NYH, IPS, 2560x1600, 16" | HP Omen Transcend 16-u1095ng ATNA60DL02-0 (SDC41A4), OLED, 2560x1600, 16" | Asus TUF Gaming A17 FA707XI-NS94 AU Optronics B173HAN04.9, IPS, 1920x1080, 17.3" | Schenker XMG Pro 16 Studio (Mid 23) BOE CQ NE160QDM-NZ1, IPS, 2560x1600, 16" | Lenovo Legion Pro 5 16IRX9 BOE NE160QDM-NYC, IPS, 2560x1600, 16" | |
|---|---|---|---|---|---|---|
| Display | 4% | 31% | -40% | 2% | 2% | |
| Display P3 Coverage (%) | 67.2 | 71 6% | 99.8 49% | 39.7 -41% | 69.4 3% | 69.3 3% |
| sRGB Coverage (%) | 96.7 | 100 3% | 100 3% | 59.1 -39% | 98.2 2% | 99.4 3% |
| AdobeRGB 1998 Coverage (%) | 69.3 | 71.4 3% | 97 40% | 41 -41% | 70.1 1% | 70.1 1% |
| Response Times | -19% | 97% | -409% | -53% | -62% | |
| Response Time Grey 50% / Grey 80% * (ms) | 7.5 ? | 5.7 ? 24% | 0.2 ? 97% | 39 ? -420% | 12.2 ? -63% | 11.9 ? -59% |
| Response Time Black / White * (ms) | 5.4 ? | 8.7 ? -61% | 0.2 ? 96% | 26.9 ? -398% | 7.7 ? -43% | 8.9 ? -65% |
| PWM Frequency (Hz) | 120 ? | |||||
| Screen | 11% | 162% | -50% | -9% | 17% | |
| Brightness middle (cd/m²) | 542 | 345.8 -36% | 390 -28% | 255.9 -53% | 349 -36% | 384 -29% |
| Brightness (cd/m²) | 504 | 337 -33% | 392 -22% | 248 -51% | 348 -31% | 366 -27% |
| Brightness Distribution (%) | 86 | 87 1% | 98 14% | 91 6% | 93 8% | 91 6% |
| Black Level * (cd/m²) | 0.45 | 0.3 33% | 0.02 96% | 0.21 53% | 0.32 29% | 0.35 22% |
| Contrast (:1) | 1204 | 1153 -4% | 19500 1520% | 1219 1% | 1091 -9% | 1097 -9% |
| Colorchecker dE 2000 * | 2.73 | 1.99 27% | 1.94 29% | 4.51 -65% | 1.98 27% | 0.97 64% |
| Colorchecker dE 2000 max. * | 5.29 | 3.52 33% | 4.26 19% | 20.77 -293% | 7.56 -43% | 3.57 33% |
| Colorchecker dE 2000 calibrated * | 1.32 | 0.62 53% | 4.21 -219% | 1.82 -38% | 1.45 -10% | 0.77 42% |
| Greyscale dE 2000 * | 2.9 | 2.1 28% | 1.5 48% | 3.2 -10% | 3.3 -14% | 1.5 48% |
| Gamma | 2.192 100% | 2.32 95% | 2.221 99% | 2.08 106% | 2.137 103% | 2.24 98% |
| CCT | 6173 105% | 6369 102% | 6395 102% | 6054 107% | 6672 97% | 6709 97% |
| Media total (Programa/Opciones) | -1% /
6% | 97% /
124% | -166% /
-99% | -20% /
-13% | -14% /
2% |
* ... más pequeño es mejor
La pantalla ya mostraba una buena representación del color nada más sacarla de la caja: Con una desviación de alrededor de 2,7, se ha cumplido el objetivo (DeltaE < 3). El calibrado reduce la desviación a 1,3 y garantiza unos tonos de gris más equilibrados. El panel puede reproducir completamente el espacio de color sRGB, pero no los espacios de color AdobeRGB y DCI P3. Esto no difiere de las pantallas de la mayoría de los competidores.
Tiempos de respuesta del display
| ↔ Tiempo de respuesta de Negro a Blanco | ||
|---|---|---|
| 5.4 ms ... subida ↗ y bajada ↘ combinada | ↗ 1.5 ms subida | 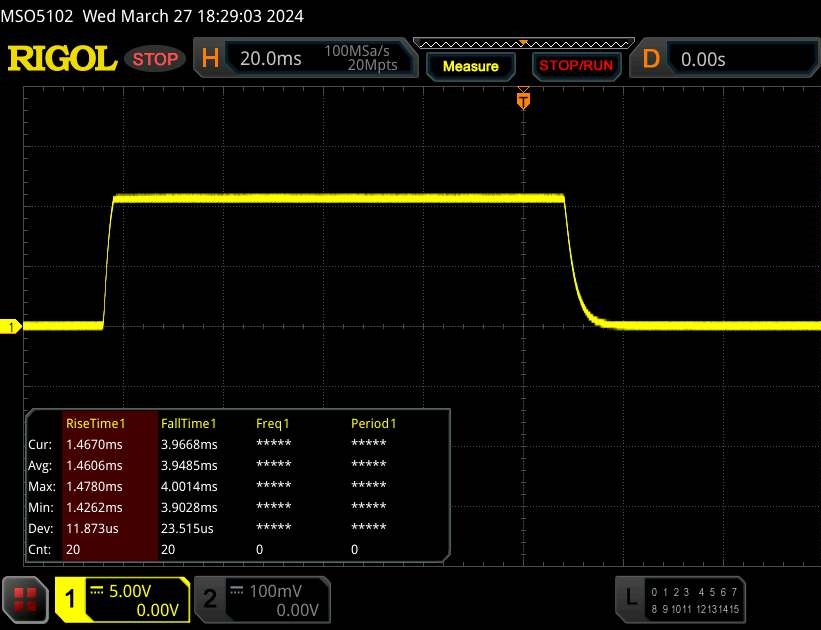 |
| ↘ 3.9 ms bajada | ||
| La pantalla mostró tiempos de respuesta muy rápidos en nuestros tests y debería ser adecuada para juegos frenéticos. En comparación, todos los dispositivos de prueba van de ##min### (mínimo) a 240 (máximo) ms. » 18 % de todos los dispositivos son mejores. Esto quiere decir que el tiempo de respuesta medido es mejor que la media (19.9 ms) de todos los dispositivos testados. | ||
| ↔ Tiempo de respuesta 50% Gris a 80% Gris | ||
| 7.5 ms ... subida ↗ y bajada ↘ combinada | ↗ 3.3 ms subida |  |
| ↘ 4.2 ms bajada | ||
| La pantalla mostró tiempos de respuesta muy rápidos en nuestros tests y debería ser adecuada para juegos frenéticos. En comparación, todos los dispositivos de prueba van de ##min### (mínimo) a 636 (máximo) ms. » 20 % de todos los dispositivos son mejores. Esto quiere decir que el tiempo de respuesta medido es mejor que la media (31.1 ms) de todos los dispositivos testados. | ||
Parpadeo de Pantalla / PWM (Pulse-Width Modulation)
| Parpadeo de Pantalla / PWM no detectado |  | ||
Comparación: 52 % de todos los dispositivos testados no usaron PWM para atenuar el display. Si se usó, medimos una media de 7784 (mínimo: 5 - máxmo: 343500) Hz. | |||
El panel IPS de ángulo de visión estable permanece legible desde cualquier ángulo. En el exterior, podrá leer en el panel siempre que el sol no brille demasiado.

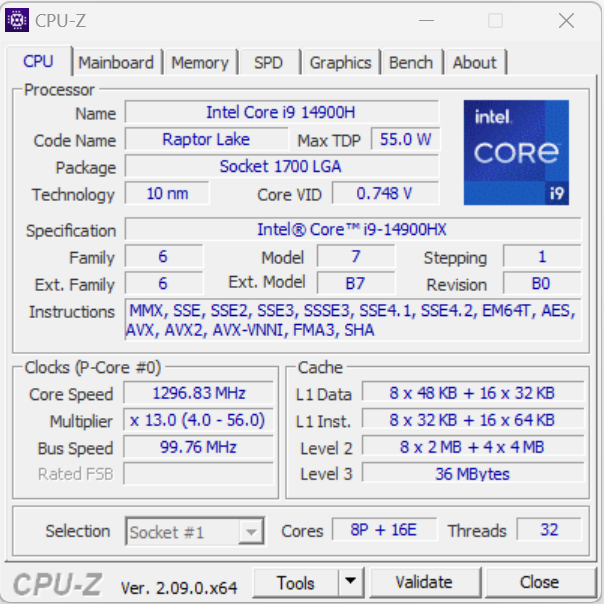
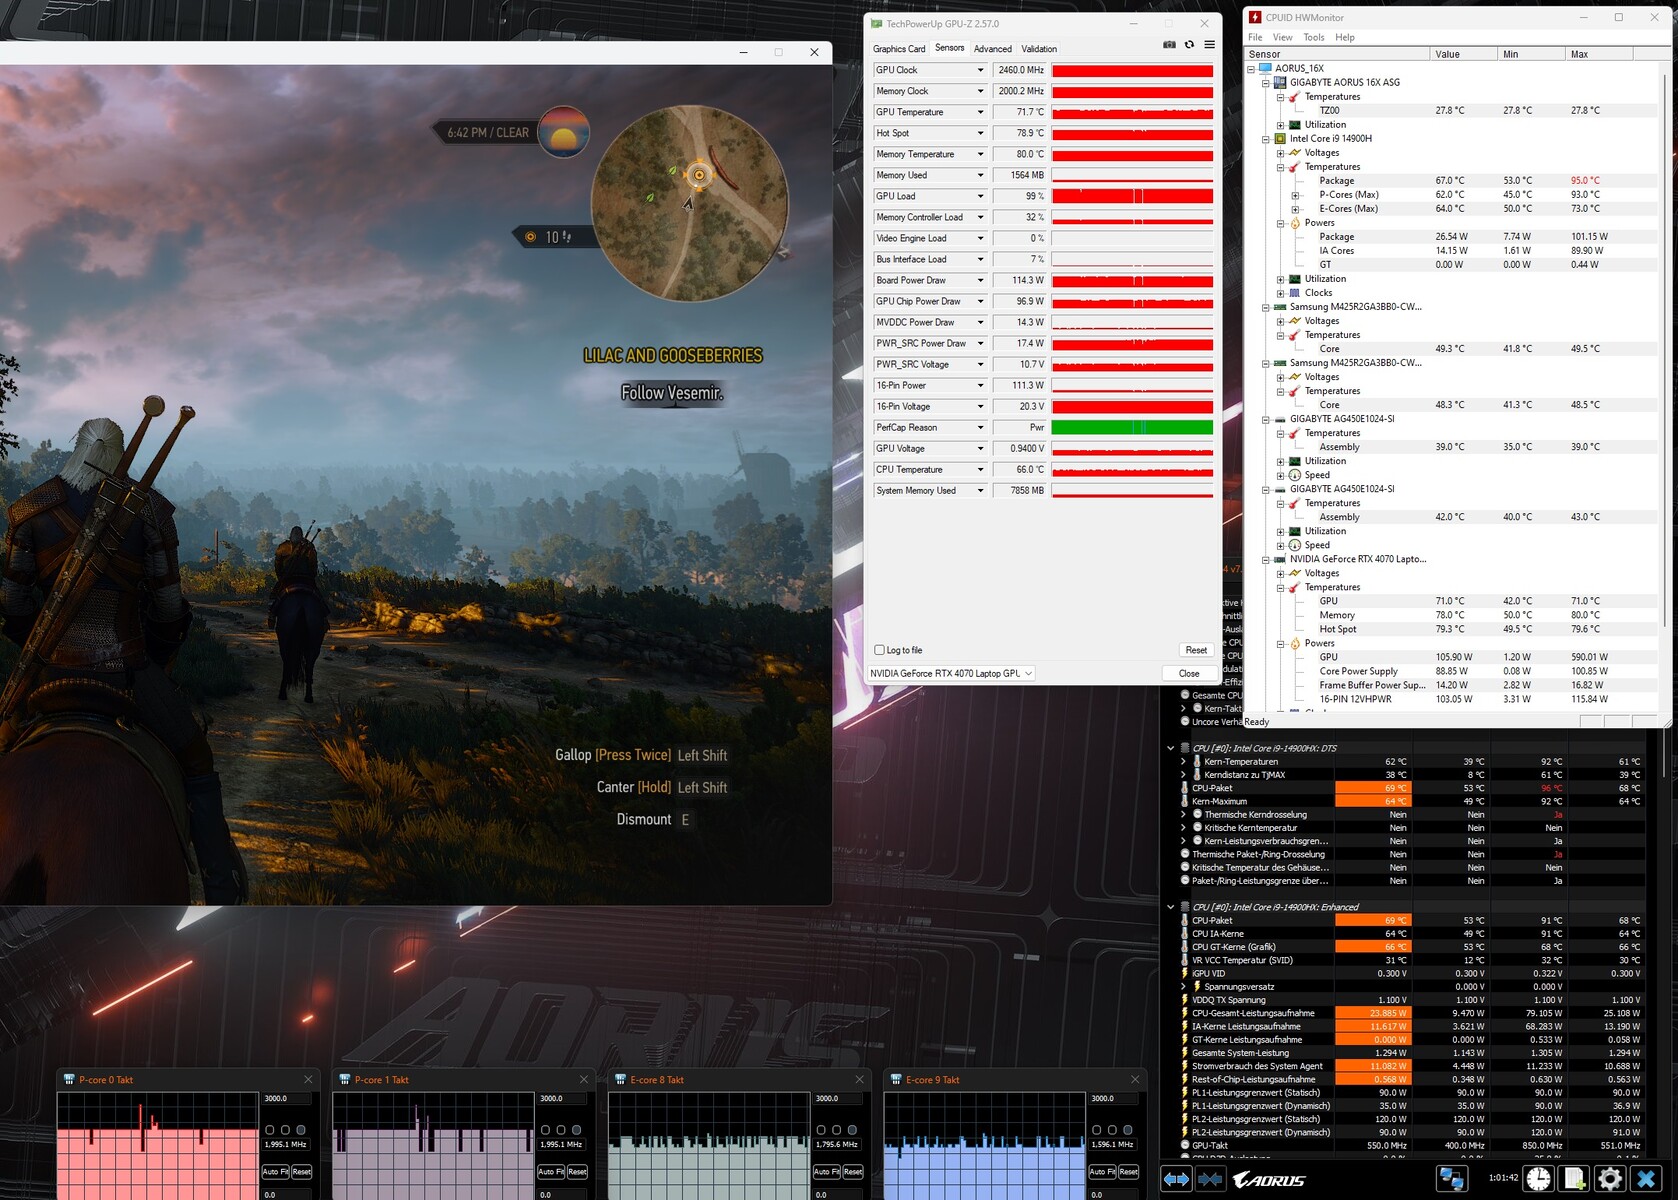
Rendimiento - Raptor Lake y Ada Lovelace alimentan el dispositivo
El Aorus 16X de Gigabyte es un portátil para jugadores y creadores. La potencia de cálculo necesaria la proporcionan Raptor Lake y Ada Lovelace. El modelo actual puede adquirirse por unos 2.000 dólares. También hay disponibles variantes más baratas.
Condiciones de prueba
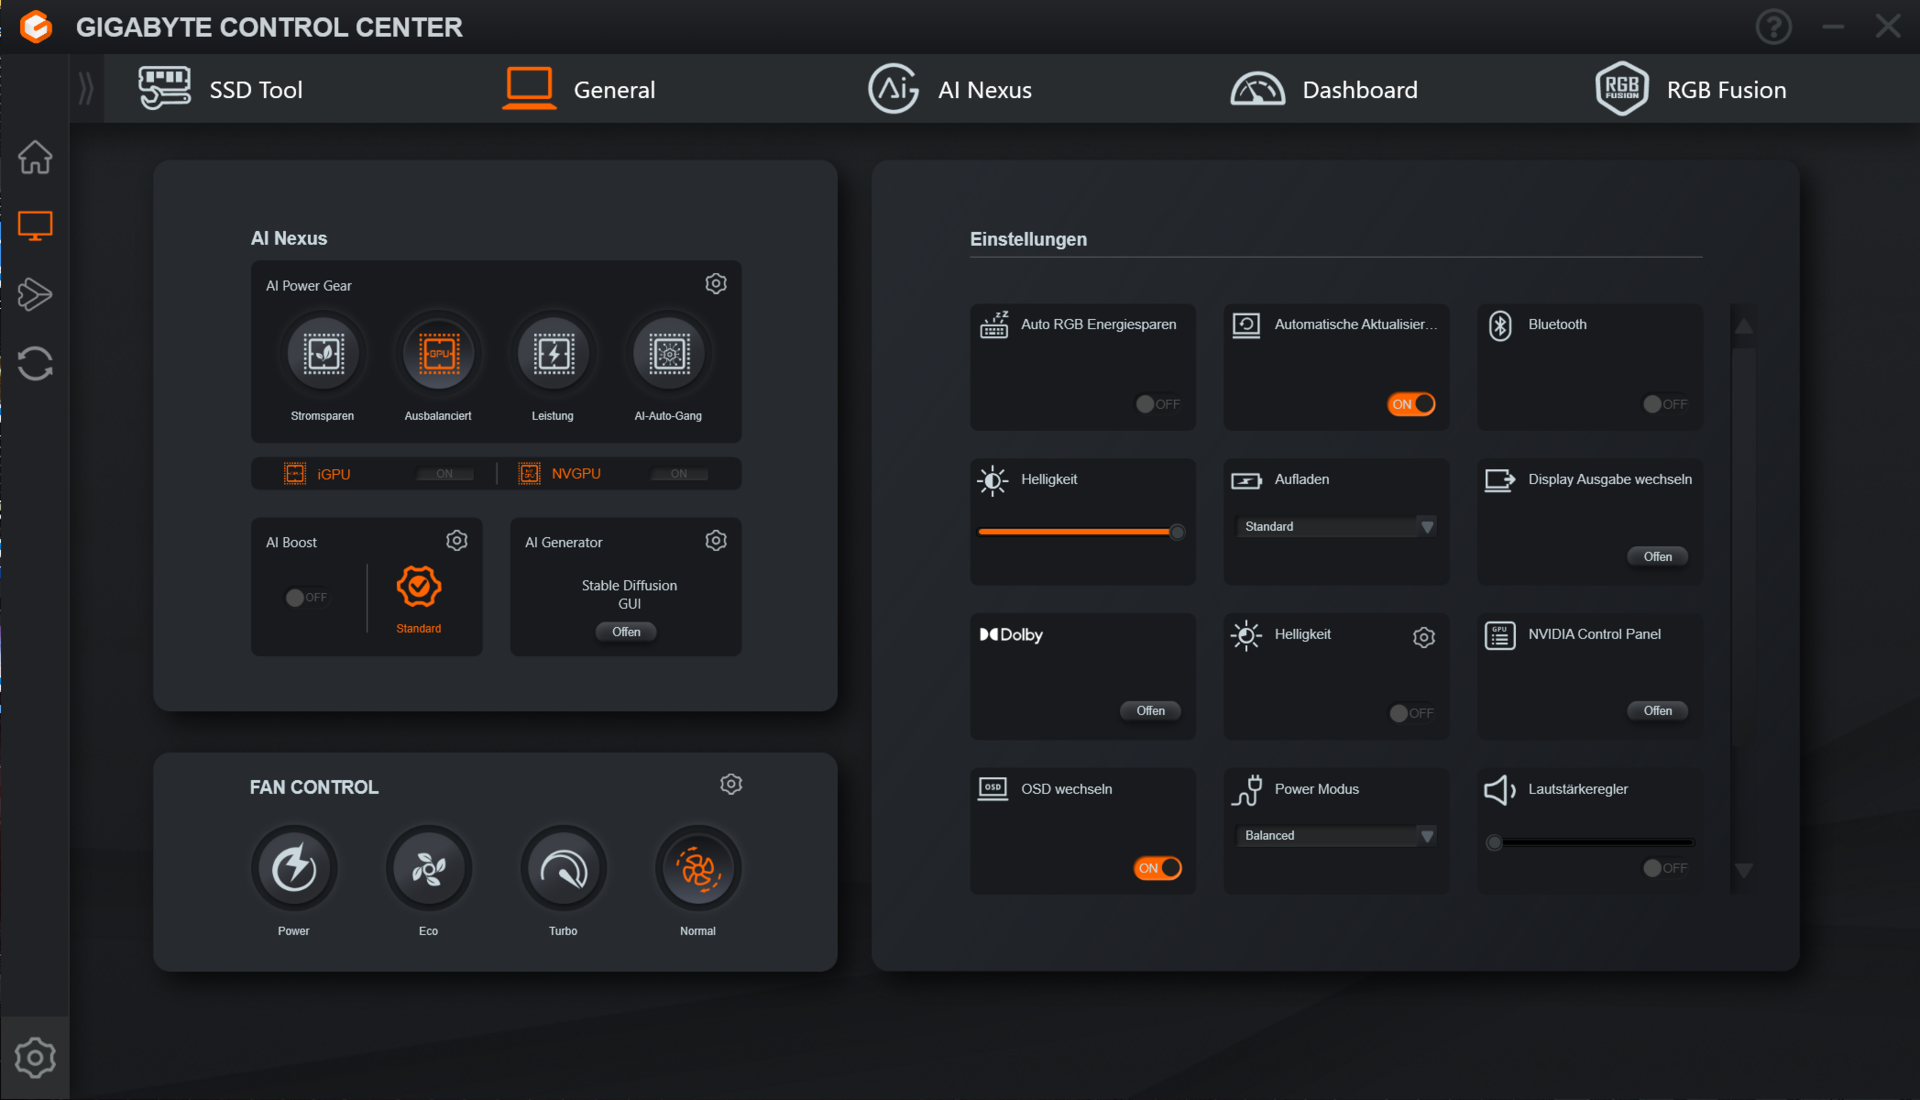
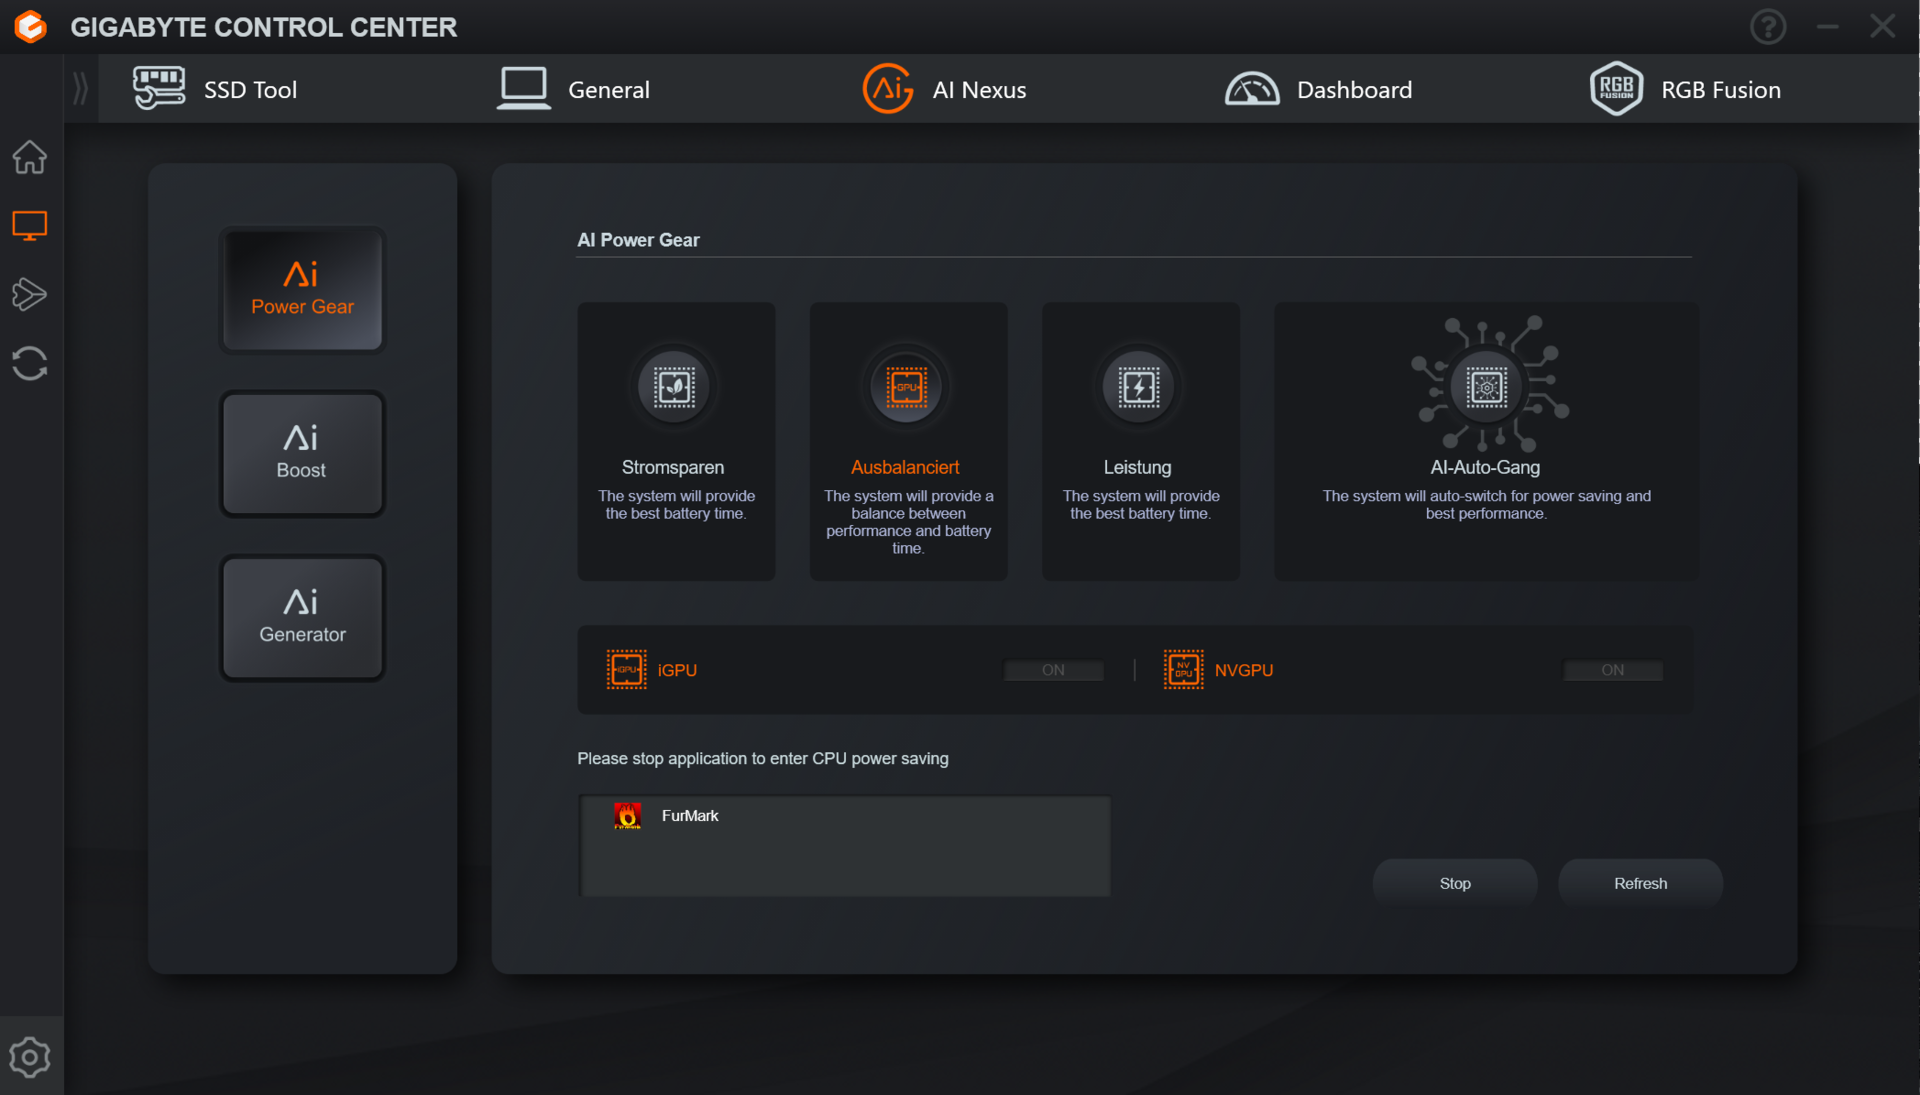
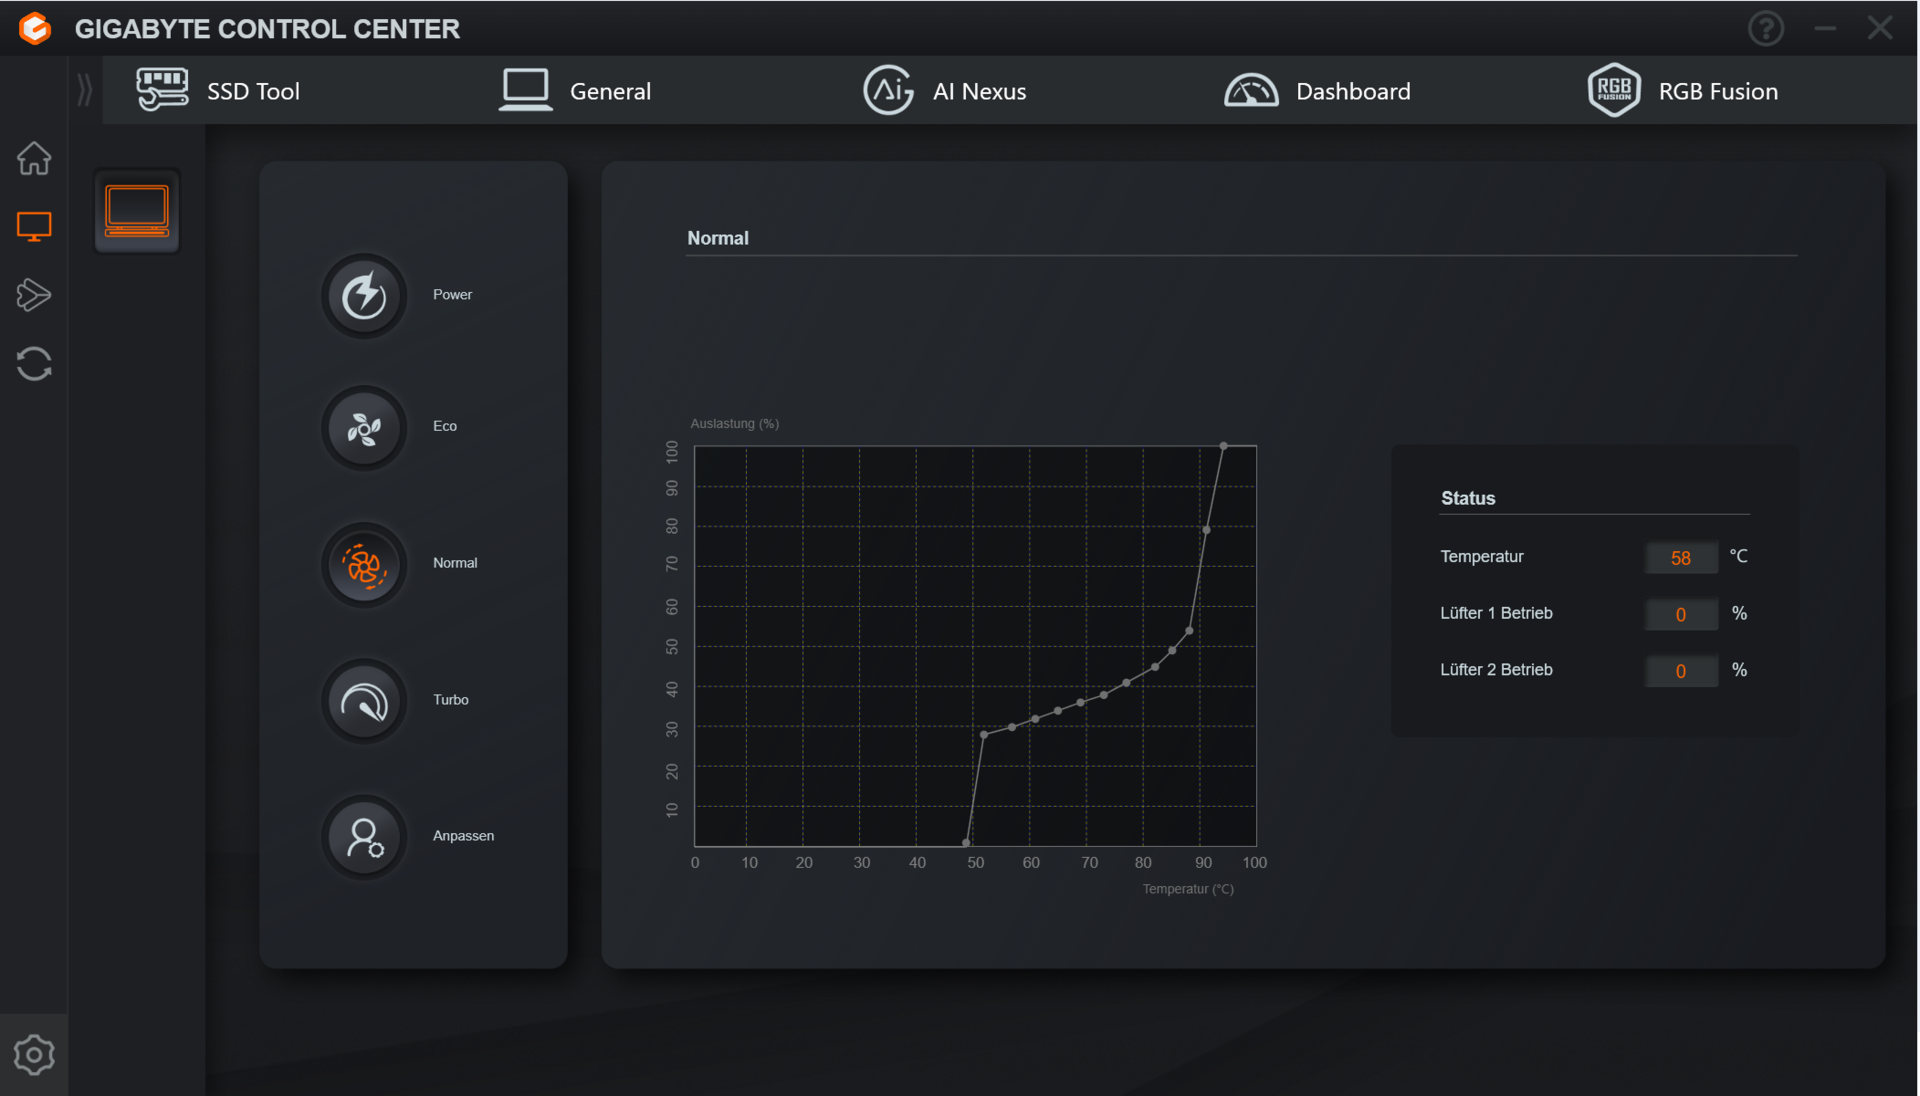
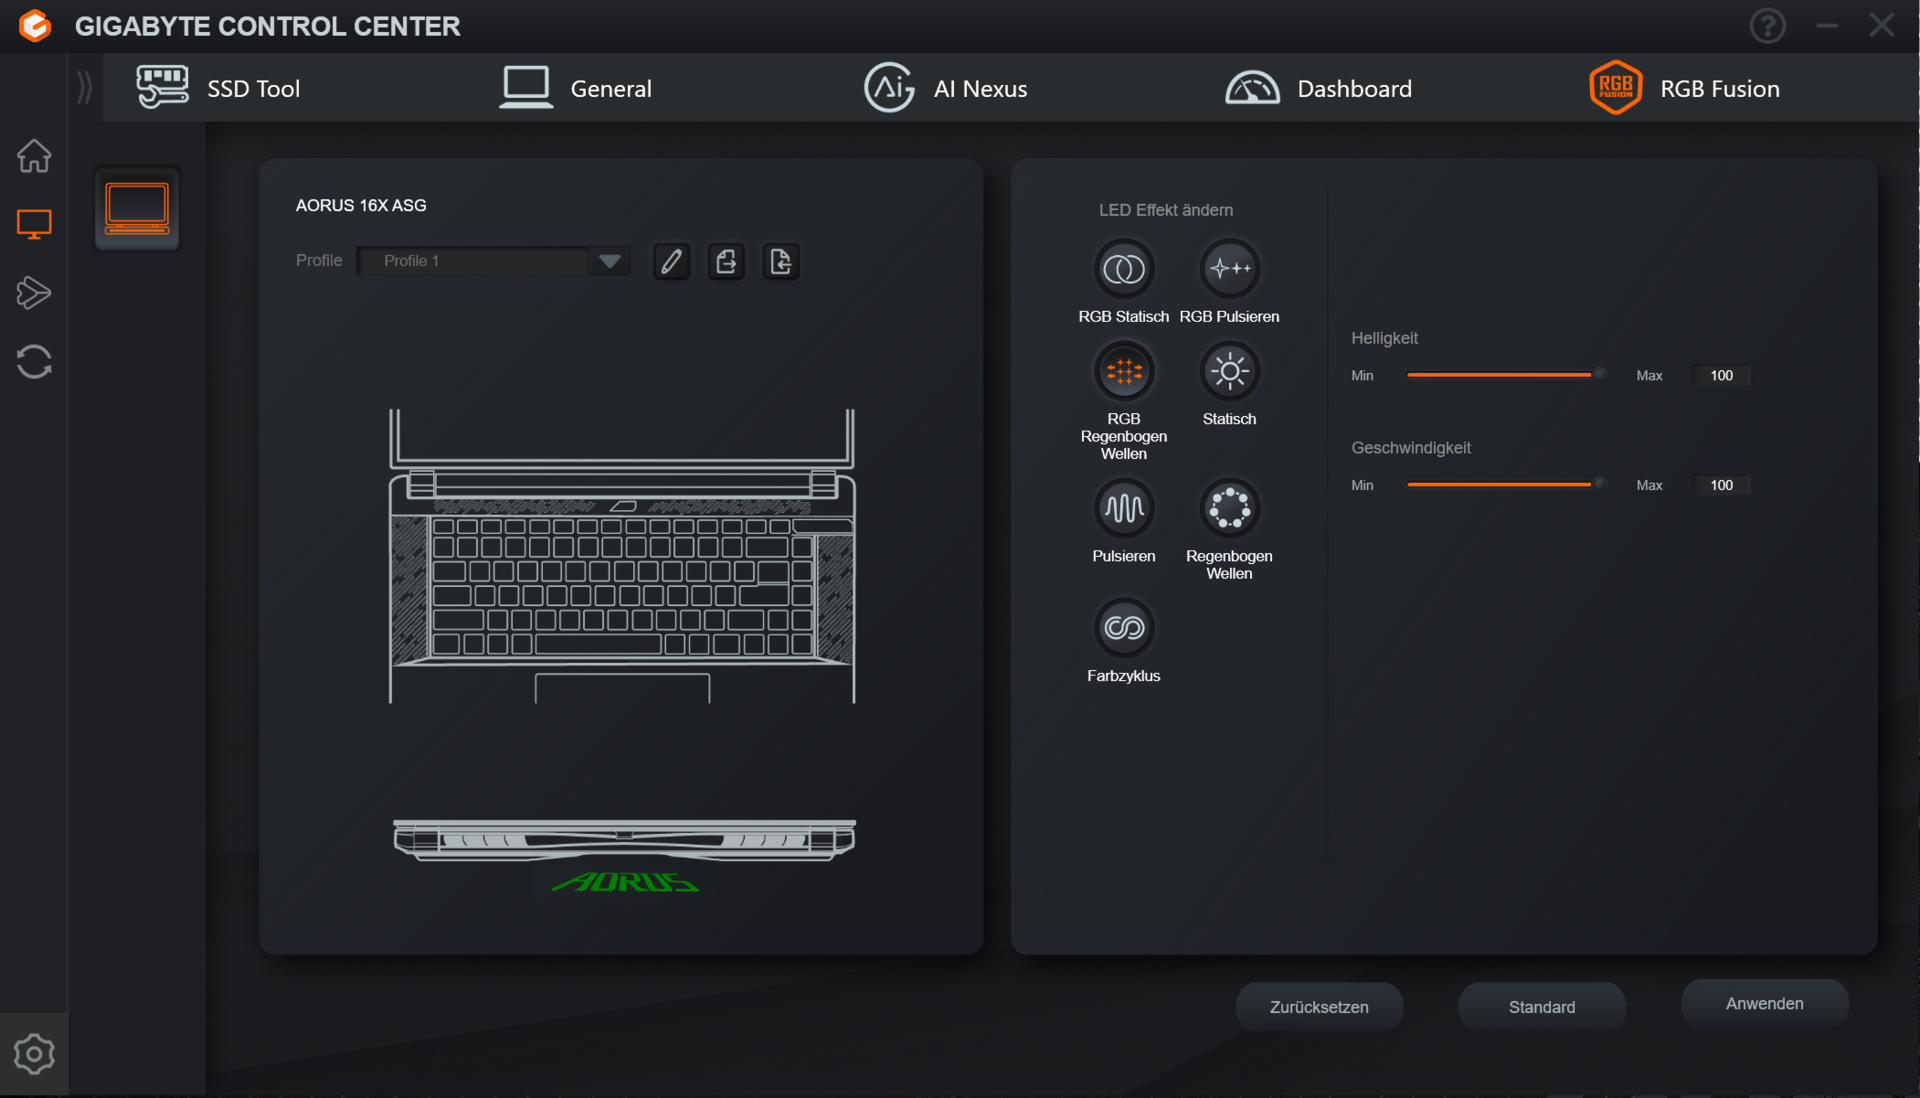
El 16X ofrece seis modos de rendimiento específicos del fabricante (ver tabla), entre los que se puede cambiar a través del Gigabyte Control Center (el centro de control del portátil). Nosotros utilizamos los modos Estándar (pruebas de rendimiento) y Ahorro de energía silencioso (pruebas de batería). Turbo, Gaming y Creator sólo pueden utilizarse con el portátil conectado a la red eléctrica.
Nota: Los ajustes de rendimiento disponibles no se comunican con mucha claridad en el Gigabyte Control Center. Los perfiles de rendimiento de todo el sistema se encuentran en la sección "AI Boost". La sección "AI Power Gear" sólo hace referencia al estado de funcionamiento de la dGPU (sólo dGPU o desactivada, conmutación de gráficos).
| Estándar | Creador | Turbo | Juego | Reunión | Ahorro de energía Silencioso | |
|---|---|---|---|---|---|---|
| Límite de potencia 1 (HWInfo) | 90 vatios | 110 vatios | 125 vatios | 110 vatios | 65 vatios | 65 vatios |
| Límite de potencia 2 (HWInfo) | 120 vatios | 135 vatios | 150 vatios | 135 vatios | 100 vatios | 100 vatios |
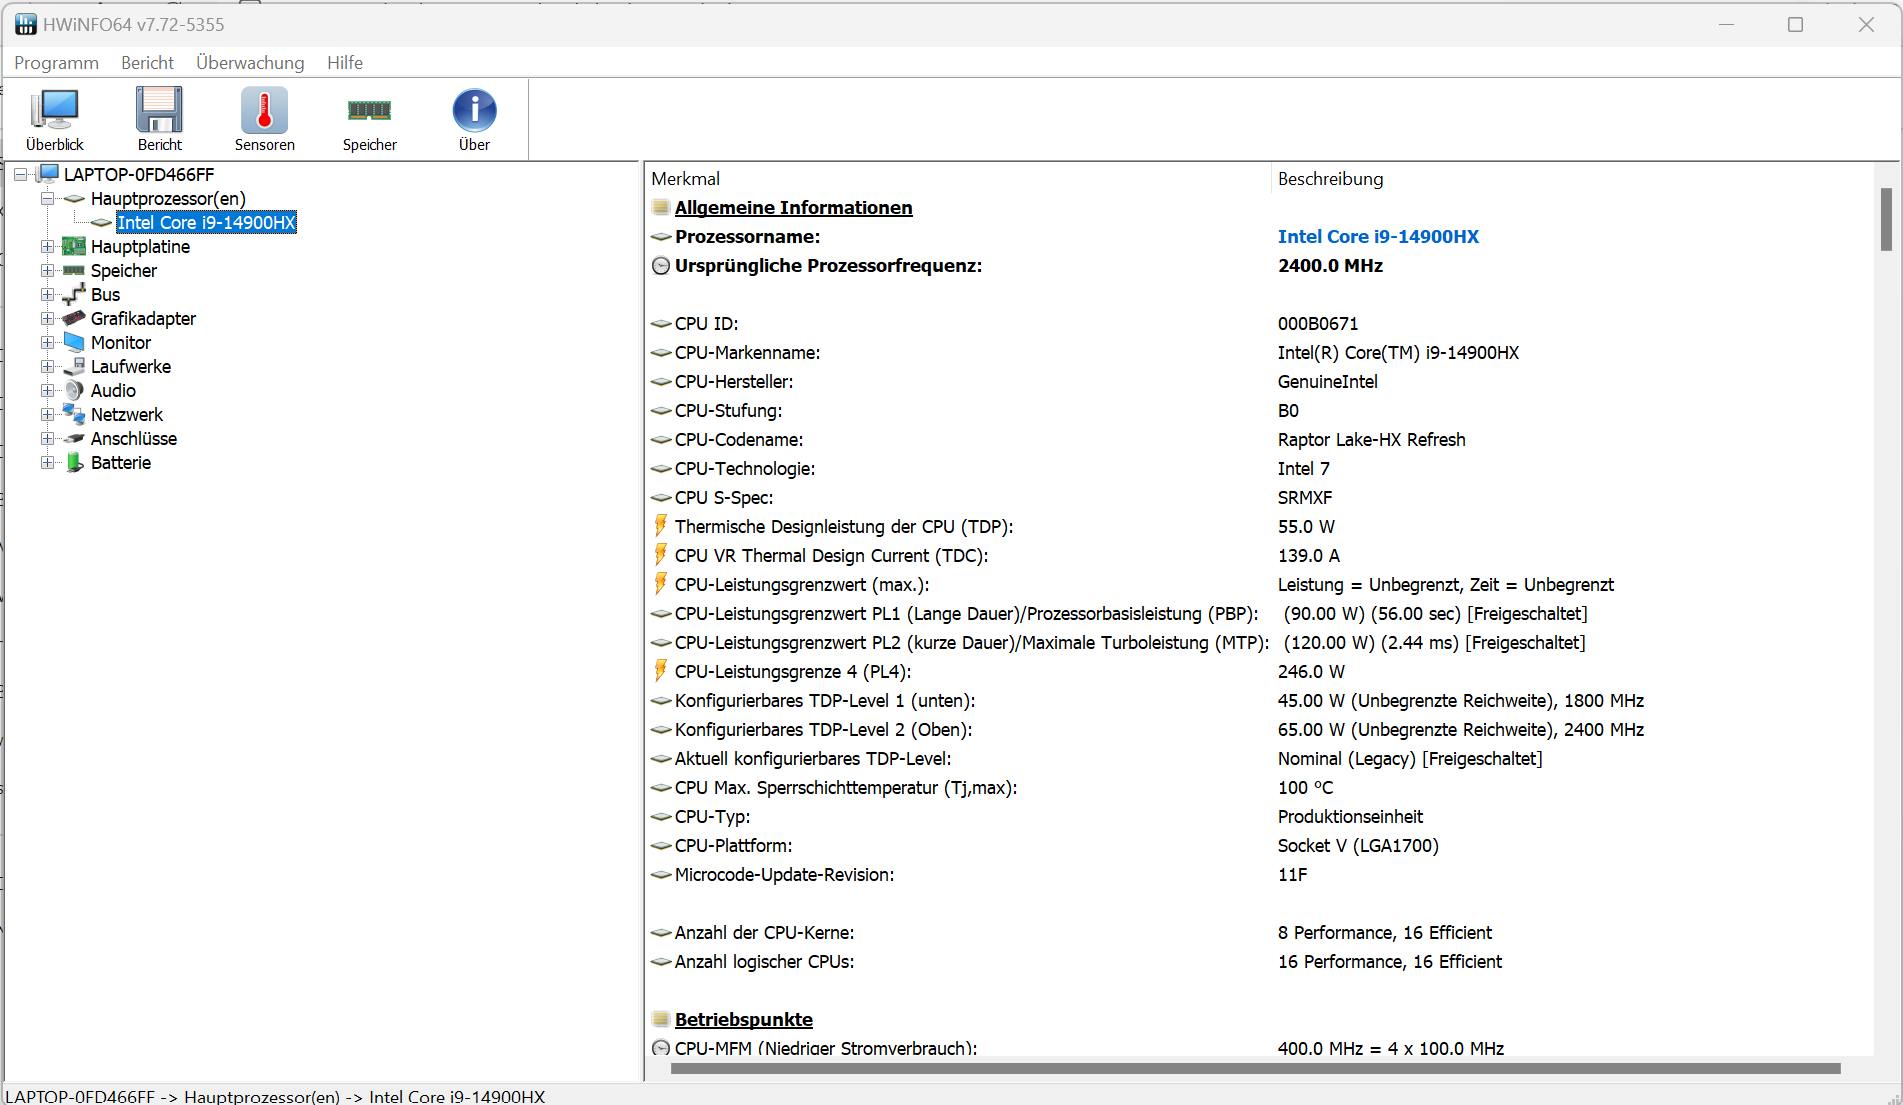
Procesador
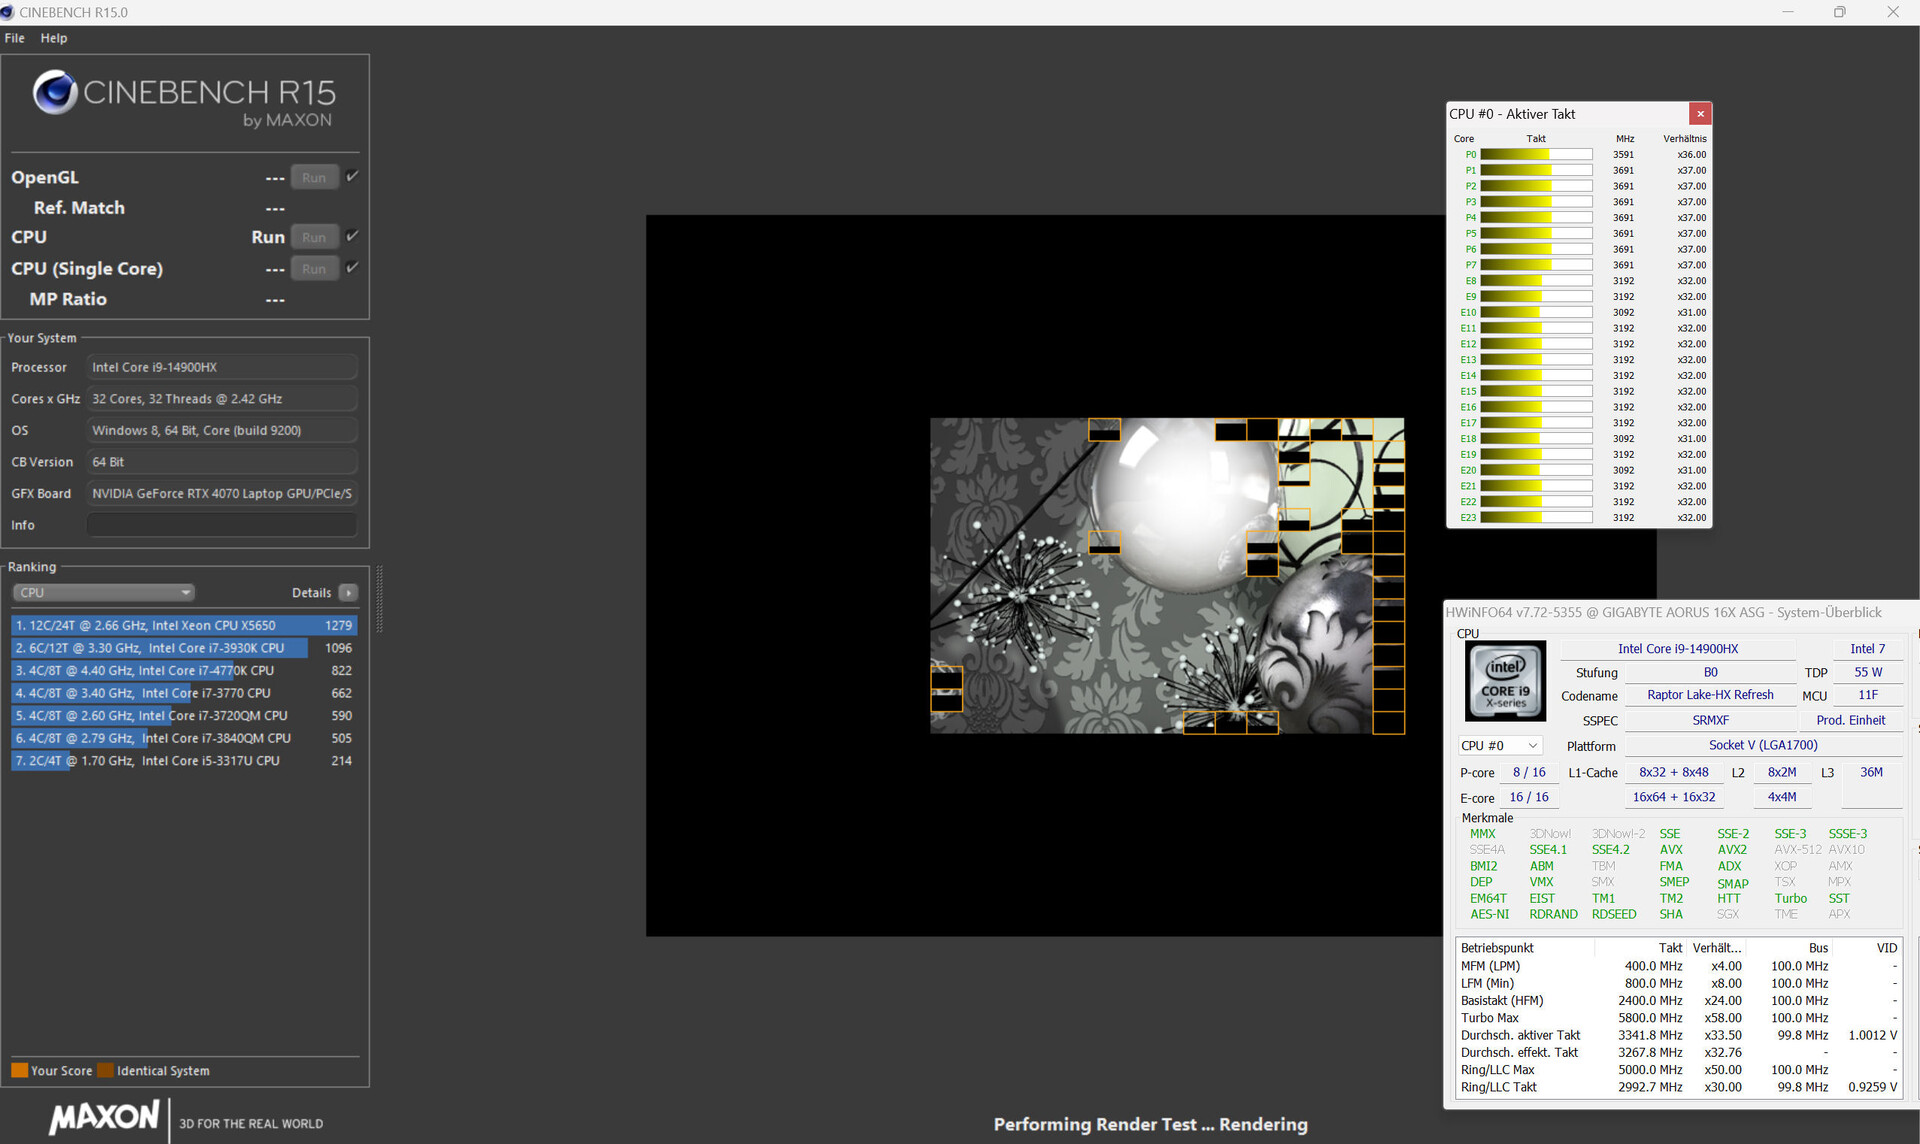
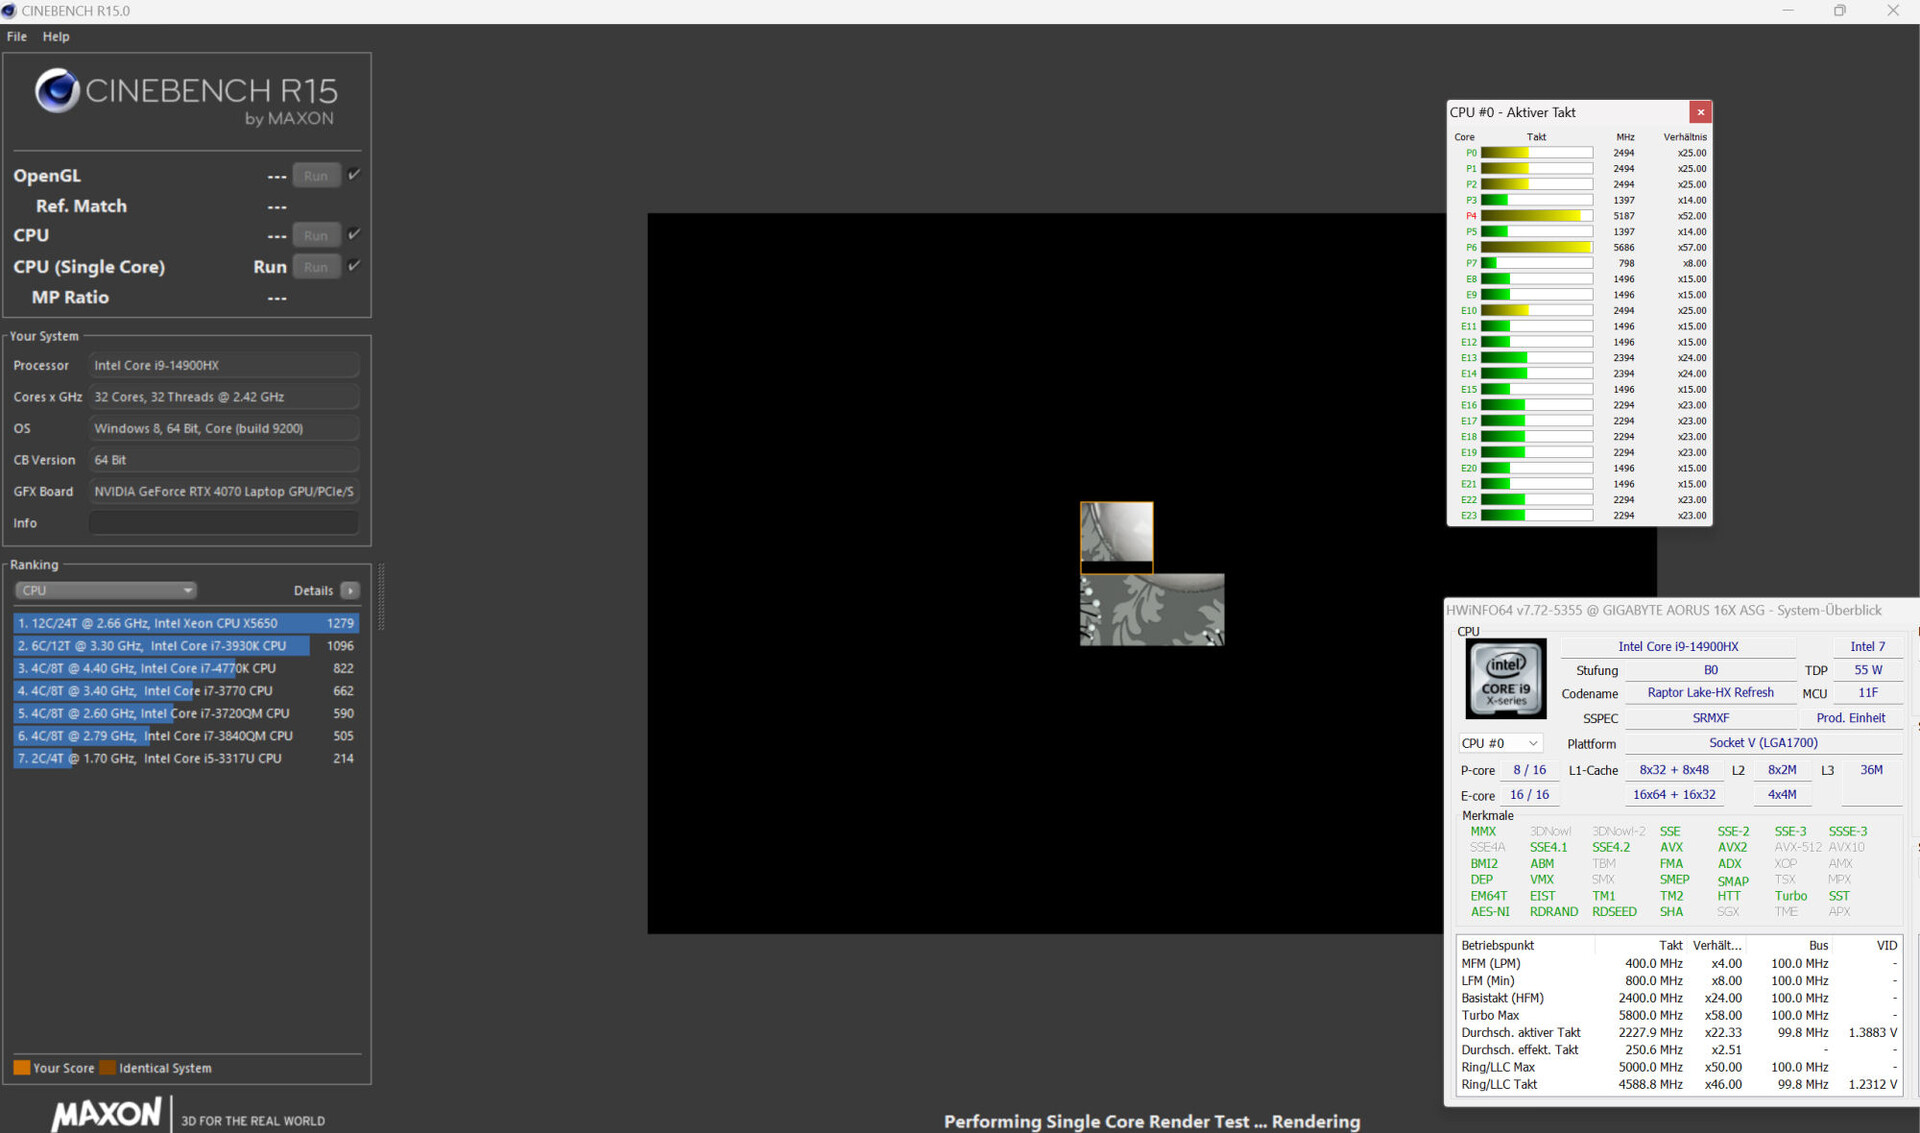
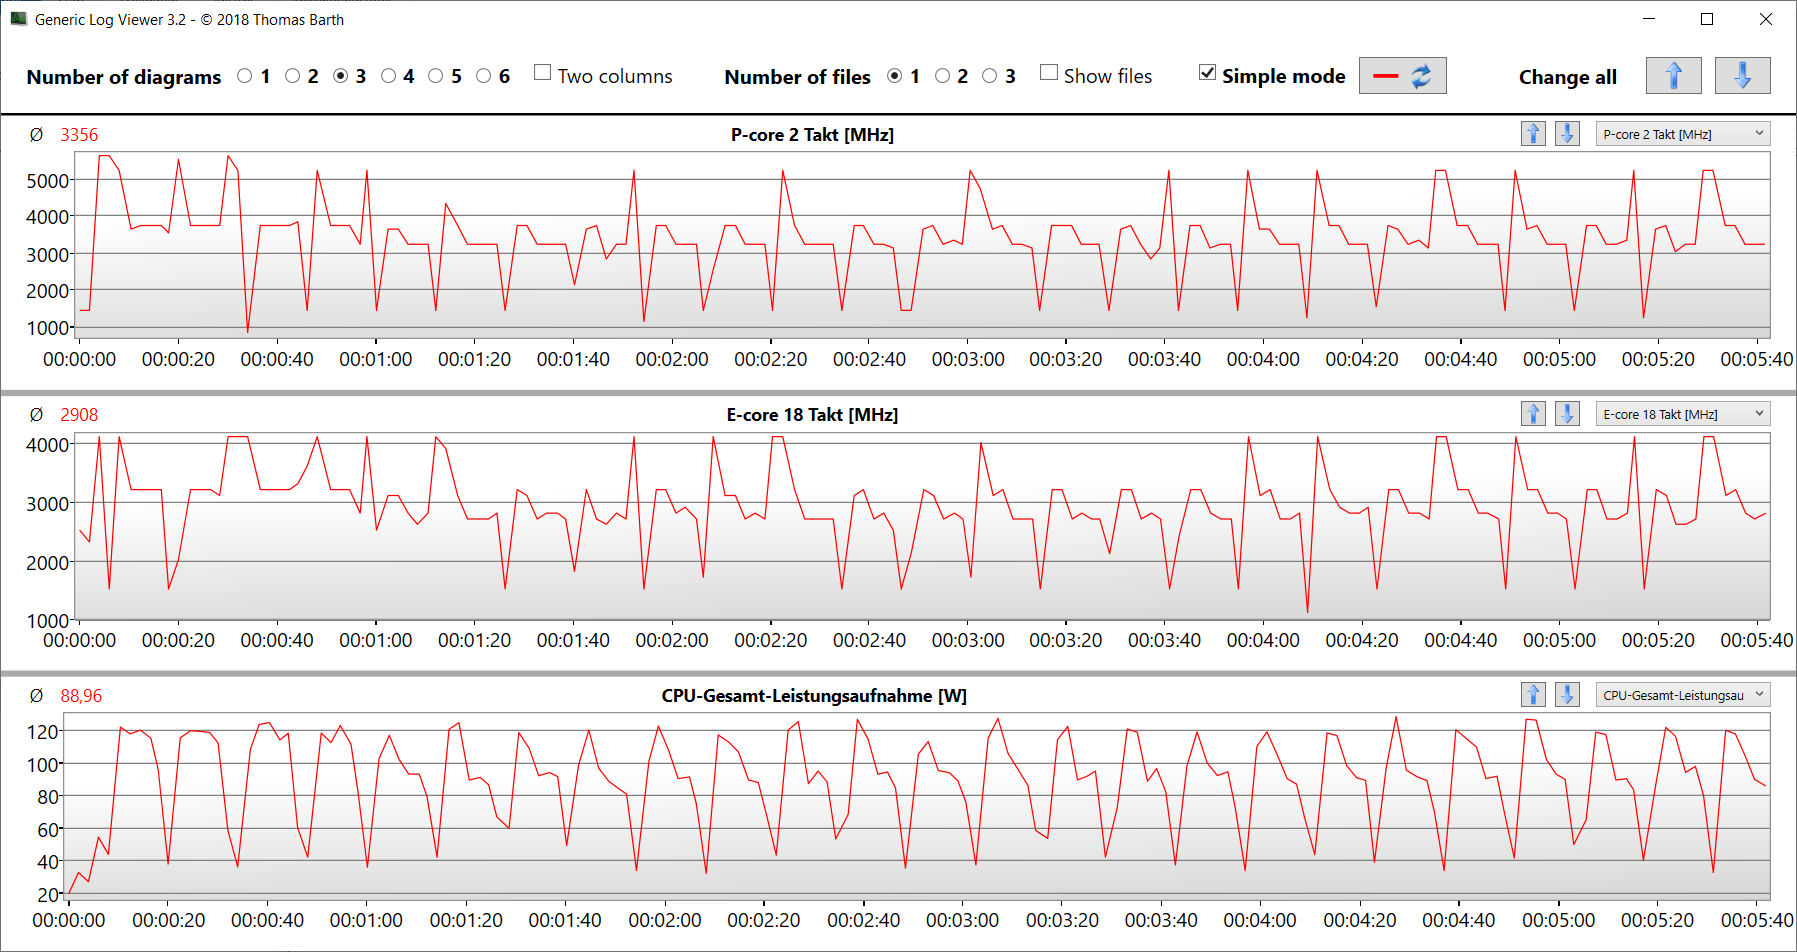
El Core i9-14900HX(Raptor Lake) 24 núcleos de CPU (8P + 16E = 32 hilos) alcanzan velocidades de reloj máximas de 5,8 GHz (P) y 4,1 GHz (E). La carga multihilo continua (CB15 Loop) hizo que su velocidad de reloj cayera de la cuarta a la quinta ejecución. Después, mantuvo un nivel bastante estable. Los perfiles Turbo, Gaming y Creator conducen a un nivel de rendimiento constantemente superior.
Sus puntuaciones en los bancos de pruebas están a la par con la media de la CPU. En modo batería, su rendimiento más relevante en un solo subproceso (187 puntos; CB15) descendió en menor medida que su rendimiento en varios subprocesos (1.533 puntos; CB15).
Encontrará más información sobre el Core i9 en nuestro artículo de análisis.
Cinebench R15 Multi continuous test
| CPU Performance rating - Percent | |
| Aorus 16X 2024 | |
| Lenovo Legion Pro 5 16IRX9 | |
| Aorus 16X 2024 | |
| Medio Intel Core i9-14900HX | |
| Media de la clase Gaming | |
| HP Omen Transcend 16-u1095ng | |
| Asus TUF Gaming A17 FA707XI-NS94 | |
| Schenker XMG Pro 16 Studio (Mid 23) | |
| Alienware m16 R2 -1! | |
| Geekbench 6.7 | |
| Multi-Core | |
| Lenovo Legion Pro 5 16IRX9 (6.2.1) | |
| Aorus 16X 2024 (6.2.1, Turbo) | |
| Aorus 16X 2024 (6.2.1) | |
| Medio Intel Core i9-14900HX (13158 - 19665, n=37) | |
| HP Omen Transcend 16-u1095ng (6.2.1) | |
| Media de la clase Gaming (6625 - 22104, n=109, últimos 2 años) | |
| Schenker XMG Pro 16 Studio (Mid 23) | |
| Alienware m16 R2 (6.2.1) | |
| Asus TUF Gaming A17 FA707XI-NS94 (6.2.1) | |
| Single-Core | |
| Aorus 16X 2024 (6.2.1, Turbo) | |
| Aorus 16X 2024 (6.2.1) | |
| Medio Intel Core i9-14900HX (2419 - 3129, n=37) | |
| Lenovo Legion Pro 5 16IRX9 (6.2.1) | |
| Media de la clase Gaming (1490 - 3259, n=109, últimos 2 años) | |
| HP Omen Transcend 16-u1095ng (6.2.1) | |
| Asus TUF Gaming A17 FA707XI-NS94 (6.2.1) | |
| Schenker XMG Pro 16 Studio (Mid 23) | |
| Alienware m16 R2 (6.2.1) | |
| HWBOT x265 Benchmark v2.2 - 4k Preset | |
| Aorus 16X 2024 (Turbo) | |
| Lenovo Legion Pro 5 16IRX9 | |
| Medio Intel Core i9-14900HX (16.8 - 38.9, n=37) | |
| Media de la clase Gaming (11.5 - 44.3, n=108, últimos 2 años) | |
| Aorus 16X 2024 | |
| HP Omen Transcend 16-u1095ng | |
| Asus TUF Gaming A17 FA707XI-NS94 | |
| Alienware m16 R2 | |
| Schenker XMG Pro 16 Studio (Mid 23) | |
| LibreOffice - 20 Documents To PDF | |
| HP Omen Transcend 16-u1095ng (6.3.4.2) | |
| Alienware m16 R2 (6.3.4.2) | |
| Asus TUF Gaming A17 FA707XI-NS94 (6.3.4.2) | |
| Media de la clase Gaming (19 - 88.8, n=108, últimos 2 años) | |
| Schenker XMG Pro 16 Studio (Mid 23) | |
| Medio Intel Core i9-14900HX (19 - 85.1, n=37) | |
| Lenovo Legion Pro 5 16IRX9 (6.3.4.2) | |
| Aorus 16X 2024 (6.3.4.2) | |
| Aorus 16X 2024 (6.3.4.2, Turbo) | |
* ... más pequeño es mejor
AIDA64: FP32 Ray-Trace | FPU Julia | CPU SHA3 | CPU Queen | FPU SinJulia | FPU Mandel | CPU AES | CPU ZLib | FP64 Ray-Trace | CPU PhotoWorxx
| Performance rating | |
| Aorus 16X 2024 | |
| Lenovo Legion Pro 5 16IRX9 | |
| Media de la clase Gaming | |
| Medio Intel Core i9-14900HX | |
| Aorus 16X 2024 | |
| Asus TUF Gaming A17 FA707XI-NS94 | |
| HP Omen Transcend 16-u1095ng | |
| Schenker XMG Pro 16 Studio (Mid 23) | |
| Alienware m16 R2 | |
| AIDA64 / FP32 Ray-Trace | |
| Media de la clase Gaming (10227 - 85542, n=107, últimos 2 años) | |
| Asus TUF Gaming A17 FA707XI-NS94 (v6.92.6600) | |
| Aorus 16X 2024 (v6.92.6600, Turbo) | |
| Lenovo Legion Pro 5 16IRX9 (v6.92.6600) | |
| Medio Intel Core i9-14900HX (13098 - 33474, n=36) | |
| Aorus 16X 2024 (v6.92.6600) | |
| Alienware m16 R2 (v6.92.6600) | |
| HP Omen Transcend 16-u1095ng (v6.92.6600) | |
| Schenker XMG Pro 16 Studio (Mid 23) (v6.75.6100) | |
| AIDA64 / FPU Julia | |
| Media de la clase Gaming (51376 - 238426, n=107, últimos 2 años) | |
| Aorus 16X 2024 (v6.92.6600, Turbo) | |
| Lenovo Legion Pro 5 16IRX9 (v6.92.6600) | |
| Medio Intel Core i9-14900HX (67573 - 166040, n=36) | |
| Asus TUF Gaming A17 FA707XI-NS94 (v6.92.6600) | |
| Aorus 16X 2024 (v6.92.6600) | |
| Alienware m16 R2 (v6.92.6600) | |
| HP Omen Transcend 16-u1095ng (v6.92.6600) | |
| Schenker XMG Pro 16 Studio (Mid 23) (v6.75.6100) | |
| AIDA64 / CPU SHA3 | |
| Aorus 16X 2024 (v6.92.6600, Turbo) | |
| Lenovo Legion Pro 5 16IRX9 (v6.92.6600) | |
| Media de la clase Gaming (2180 - 9817, n=107, últimos 2 años) | |
| Medio Intel Core i9-14900HX (3589 - 7979, n=36) | |
| Aorus 16X 2024 (v6.92.6600) | |
| Asus TUF Gaming A17 FA707XI-NS94 (v6.92.6600) | |
| HP Omen Transcend 16-u1095ng (v6.92.6600) | |
| Alienware m16 R2 (v6.92.6600) | |
| Schenker XMG Pro 16 Studio (Mid 23) (v6.75.6100) | |
| AIDA64 / CPU Queen | |
| Lenovo Legion Pro 5 16IRX9 (v6.92.6600) | |
| Aorus 16X 2024 (v6.92.6600, Turbo) | |
| Aorus 16X 2024 (v6.92.6600) | |
| Medio Intel Core i9-14900HX (118405 - 148966, n=36) | |
| Asus TUF Gaming A17 FA707XI-NS94 (v6.92.6600) | |
| HP Omen Transcend 16-u1095ng (v6.92.6600) | |
| Media de la clase Gaming (49785 - 173351, n=98, últimos 2 años) | |
| Schenker XMG Pro 16 Studio (Mid 23) (v6.75.6100) | |
| Alienware m16 R2 (v6.92.6600) | |
| AIDA64 / FPU SinJulia | |
| Aorus 16X 2024 (v6.92.6600, Turbo) | |
| Asus TUF Gaming A17 FA707XI-NS94 (v6.92.6600) | |
| Lenovo Legion Pro 5 16IRX9 (v6.92.6600) | |
| Medio Intel Core i9-14900HX (10475 - 18517, n=36) | |
| Aorus 16X 2024 (v6.92.6600) | |
| Media de la clase Gaming (4424 - 33636, n=107, últimos 2 años) | |
| HP Omen Transcend 16-u1095ng (v6.92.6600) | |
| Alienware m16 R2 (v6.92.6600) | |
| Schenker XMG Pro 16 Studio (Mid 23) (v6.75.6100) | |
| AIDA64 / FPU Mandel | |
| Media de la clase Gaming (25115 - 128721, n=107, últimos 2 años) | |
| Aorus 16X 2024 (v6.92.6600, Turbo) | |
| Asus TUF Gaming A17 FA707XI-NS94 (v6.92.6600) | |
| Lenovo Legion Pro 5 16IRX9 (v6.92.6600) | |
| Medio Intel Core i9-14900HX (32543 - 83662, n=36) | |
| Aorus 16X 2024 (v6.92.6600) | |
| Alienware m16 R2 (v6.92.6600) | |
| HP Omen Transcend 16-u1095ng (v6.92.6600) | |
| Schenker XMG Pro 16 Studio (Mid 23) (v6.75.6100) | |
| AIDA64 / CPU AES | |
| Schenker XMG Pro 16 Studio (Mid 23) (v6.75.6100) | |
| Medio Intel Core i9-14900HX (86964 - 241777, n=36) | |
| Aorus 16X 2024 (v6.92.6600, Turbo) | |
| Lenovo Legion Pro 5 16IRX9 (v6.92.6600) | |
| Aorus 16X 2024 (v6.92.6600) | |
| Media de la clase Gaming (39258 - 247074, n=107, últimos 2 años) | |
| Asus TUF Gaming A17 FA707XI-NS94 (v6.92.6600) | |
| HP Omen Transcend 16-u1095ng (v6.92.6600) | |
| Alienware m16 R2 (v6.92.6600) | |
| AIDA64 / CPU ZLib | |
| Aorus 16X 2024 (v6.92.6600, Turbo) | |
| Lenovo Legion Pro 5 16IRX9 (v6.92.6600) | |
| Medio Intel Core i9-14900HX (1054 - 2292, n=36) | |
| Aorus 16X 2024 (v6.92.6600) | |
| Media de la clase Gaming (574 - 2531, n=107, últimos 2 años) | |
| HP Omen Transcend 16-u1095ng (v6.92.6600) | |
| Alienware m16 R2 (v6.92.6600) | |
| Asus TUF Gaming A17 FA707XI-NS94 (v6.92.6600) | |
| Schenker XMG Pro 16 Studio (Mid 23) (v6.75.6100) | |
| AIDA64 / FP64 Ray-Trace | |
| Media de la clase Gaming (5509 - 45446, n=107, últimos 2 años) | |
| Asus TUF Gaming A17 FA707XI-NS94 (v6.92.6600) | |
| Aorus 16X 2024 (v6.92.6600, Turbo) | |
| Lenovo Legion Pro 5 16IRX9 (v6.92.6600) | |
| Medio Intel Core i9-14900HX (6809 - 18349, n=36) | |
| Aorus 16X 2024 (v6.92.6600) | |
| Alienware m16 R2 (v6.92.6600) | |
| HP Omen Transcend 16-u1095ng (v6.92.6600) | |
| Schenker XMG Pro 16 Studio (Mid 23) (v6.75.6100) | |
| AIDA64 / CPU PhotoWorxx | |
| Lenovo Legion Pro 5 16IRX9 (v6.92.6600) | |
| HP Omen Transcend 16-u1095ng (v6.92.6600) | |
| Aorus 16X 2024 (v6.92.6600, Turbo) | |
| Aorus 16X 2024 (v6.92.6600) | |
| Schenker XMG Pro 16 Studio (Mid 23) (v6.75.6100) | |
| Medio Intel Core i9-14900HX (23903 - 54702, n=36) | |
| Media de la clase Gaming (12271 - 89891, n=107, últimos 2 años) | |
| Alienware m16 R2 (v6.92.6600) | |
| Asus TUF Gaming A17 FA707XI-NS94 (v6.92.6600) | |
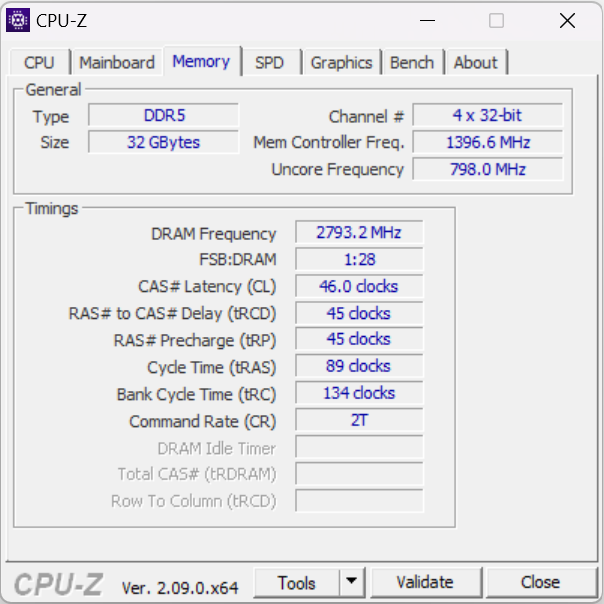
Rendimiento del sistema
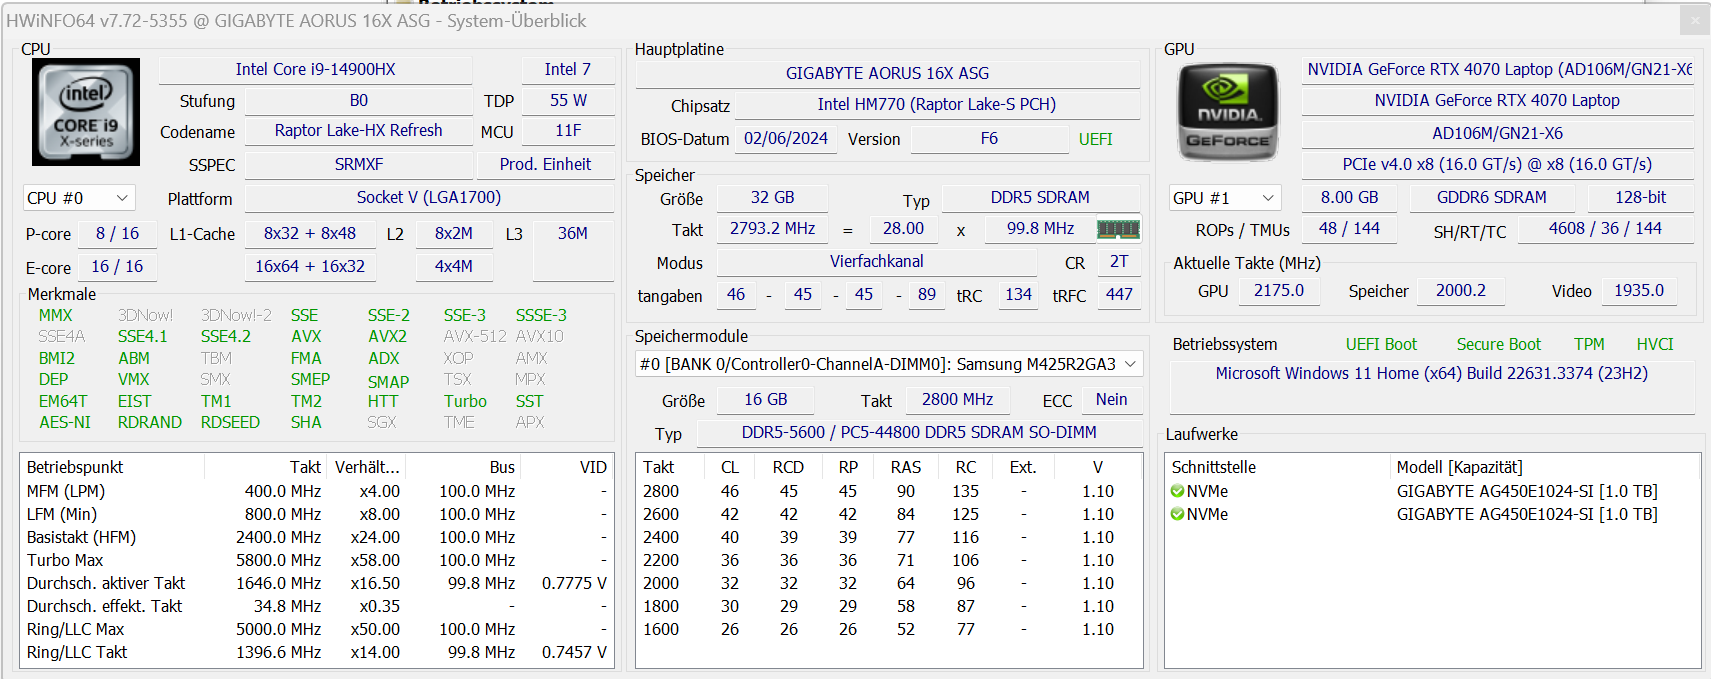
Al sistema, que funciona sin problemas, no le falta potencia de cálculo. Los juegos, el streaming y el renderizado no suponen ningún reto importante para el portátil. Las tasas de transferencia de la RAM están en un nivel normal para una RAM DDR5-5600.
CrossMark: Overall | Productivity | Creativity | Responsiveness
WebXPRT 3: Overall
WebXPRT 4: Overall
Mozilla Kraken 1.1: Total
| PCMark 10 / Score | |
| Lenovo Legion Pro 5 16IRX9 | |
| Aorus 16X 2024 | |
| Media de la clase Gaming (5828 - 11574, n=94, últimos 2 años) | |
| Medio Intel Core i9-14900HX, NVIDIA GeForce RTX 4070 Laptop GPU (7768 - 8550, n=8) | |
| Asus TUF Gaming A17 FA707XI-NS94 | |
| Schenker XMG Pro 16 Studio (Mid 23) | |
| HP Omen Transcend 16-u1095ng | |
| Alienware m16 R2 | |
| PCMark 10 / Essentials | |
| Schenker XMG Pro 16 Studio (Mid 23) | |
| Lenovo Legion Pro 5 16IRX9 | |
| Aorus 16X 2024 | |
| Asus TUF Gaming A17 FA707XI-NS94 | |
| Medio Intel Core i9-14900HX, NVIDIA GeForce RTX 4070 Laptop GPU (10104 - 11815, n=8) | |
| Media de la clase Gaming (8810 - 12600, n=98, últimos 2 años) | |
| HP Omen Transcend 16-u1095ng | |
| Alienware m16 R2 | |
| PCMark 10 / Productivity | |
| Aorus 16X 2024 | |
| Media de la clase Gaming (6845 - 18766, n=96, últimos 2 años) | |
| Medio Intel Core i9-14900HX, NVIDIA GeForce RTX 4070 Laptop GPU (9577 - 11103, n=8) | |
| Schenker XMG Pro 16 Studio (Mid 23) | |
| HP Omen Transcend 16-u1095ng | |
| Lenovo Legion Pro 5 16IRX9 | |
| Asus TUF Gaming A17 FA707XI-NS94 | |
| Alienware m16 R2 | |
| PCMark 10 / Digital Content Creation | |
| Lenovo Legion Pro 5 16IRX9 | |
| Media de la clase Gaming (7602 - 19657, n=96, últimos 2 años) | |
| Asus TUF Gaming A17 FA707XI-NS94 | |
| Medio Intel Core i9-14900HX, NVIDIA GeForce RTX 4070 Laptop GPU (12114 - 14827, n=8) | |
| Aorus 16X 2024 | |
| Alienware m16 R2 | |
| HP Omen Transcend 16-u1095ng | |
| Schenker XMG Pro 16 Studio (Mid 23) | |
| CrossMark / Overall | |
| Aorus 16X 2024 | |
| Medio Intel Core i9-14900HX, NVIDIA GeForce RTX 4070 Laptop GPU (2002 - 2312, n=7) | |
| Lenovo Legion Pro 5 16IRX9 | |
| Media de la clase Gaming (1366 - 2409, n=96, últimos 2 años) | |
| Schenker XMG Pro 16 Studio (Mid 23) | |
| Asus TUF Gaming A17 FA707XI-NS94 | |
| Alienware m16 R2 | |
| CrossMark / Productivity | |
| Aorus 16X 2024 | |
| Medio Intel Core i9-14900HX, NVIDIA GeForce RTX 4070 Laptop GPU (1827 - 2191, n=7) | |
| Schenker XMG Pro 16 Studio (Mid 23) | |
| Media de la clase Gaming (1386 - 2254, n=96, últimos 2 años) | |
| Lenovo Legion Pro 5 16IRX9 | |
| Asus TUF Gaming A17 FA707XI-NS94 | |
| Alienware m16 R2 | |
| CrossMark / Creativity | |
| Aorus 16X 2024 | |
| Medio Intel Core i9-14900HX, NVIDIA GeForce RTX 4070 Laptop GPU (2258 - 2458, n=7) | |
| Lenovo Legion Pro 5 16IRX9 | |
| Media de la clase Gaming (1343 - 2729, n=96, últimos 2 años) | |
| Schenker XMG Pro 16 Studio (Mid 23) | |
| Asus TUF Gaming A17 FA707XI-NS94 | |
| Alienware m16 R2 | |
| CrossMark / Responsiveness | |
| Aorus 16X 2024 | |
| Medio Intel Core i9-14900HX, NVIDIA GeForce RTX 4070 Laptop GPU (1734 - 2330, n=7) | |
| Schenker XMG Pro 16 Studio (Mid 23) | |
| Lenovo Legion Pro 5 16IRX9 | |
| Media de la clase Gaming (1226 - 2334, n=96, últimos 2 años) | |
| Alienware m16 R2 | |
| Asus TUF Gaming A17 FA707XI-NS94 | |
| WebXPRT 3 / Overall | |
| HP Omen Transcend 16-u1095ng | |
| Aorus 16X 2024 | |
| Lenovo Legion Pro 5 16IRX9 | |
| Medio Intel Core i9-14900HX, NVIDIA GeForce RTX 4070 Laptop GPU (269 - 342, n=8) | |
| Schenker XMG Pro 16 Studio (Mid 23) | |
| Asus TUF Gaming A17 FA707XI-NS94 | |
| Media de la clase Gaming (242 - 532, n=99, últimos 2 años) | |
| Alienware m16 R2 | |
| WebXPRT 4 / Overall | |
| Medio Intel Core i9-14900HX, NVIDIA GeForce RTX 4070 Laptop GPU (291 - 304, n=6) | |
| Lenovo Legion Pro 5 16IRX9 | |
| Media de la clase Gaming (176.4 - 354, n=99, últimos 2 años) | |
| Asus TUF Gaming A17 FA707XI-NS94 | |
| Alienware m16 R2 | |
| Mozilla Kraken 1.1 / Total | |
| Alienware m16 R2 | |
| Schenker XMG Pro 16 Studio (Mid 23) | |
| Asus TUF Gaming A17 FA707XI-NS94 | |
| Media de la clase Gaming (391 - 590, n=104, últimos 2 años) | |
| Lenovo Legion Pro 5 16IRX9 | |
| Medio Intel Core i9-14900HX, NVIDIA GeForce RTX 4070 Laptop GPU (431 - 469, n=8) | |
| HP Omen Transcend 16-u1095ng | |
| Aorus 16X 2024 | |
* ... más pequeño es mejor
| PCMark 10 Score | 8389 puntos | |
ayuda | ||
| AIDA64 / Memory Copy | |
| Lenovo Legion Pro 5 16IRX9 | |
| Aorus 16X 2024 | |
| HP Omen Transcend 16-u1095ng | |
| Medio Intel Core i9-14900HX (38028 - 83392, n=36) | |
| Media de la clase Gaming (21750 - 129946, n=107, últimos 2 años) | |
| Schenker XMG Pro 16 Studio (Mid 23) | |
| Alienware m16 R2 | |
| Asus TUF Gaming A17 FA707XI-NS94 | |
| AIDA64 / Memory Read | |
| Aorus 16X 2024 | |
| Lenovo Legion Pro 5 16IRX9 | |
| HP Omen Transcend 16-u1095ng | |
| Medio Intel Core i9-14900HX (43306 - 87568, n=36) | |
| Alienware m16 R2 | |
| Schenker XMG Pro 16 Studio (Mid 23) | |
| Media de la clase Gaming (22956 - 118858, n=107, últimos 2 años) | |
| Asus TUF Gaming A17 FA707XI-NS94 | |
| AIDA64 / Memory Write | |
| HP Omen Transcend 16-u1095ng | |
| Aorus 16X 2024 | |
| Lenovo Legion Pro 5 16IRX9 | |
| Media de la clase Gaming (22297 - 135096, n=107, últimos 2 años) | |
| Asus TUF Gaming A17 FA707XI-NS94 | |
| Medio Intel Core i9-14900HX (37146 - 80589, n=36) | |
| Schenker XMG Pro 16 Studio (Mid 23) | |
| Alienware m16 R2 | |
| AIDA64 / Memory Latency | |
| Alienware m16 R2 | |
| Media de la clase Gaming (75.3 - 259, n=107, últimos 2 años) | |
| Asus TUF Gaming A17 FA707XI-NS94 | |
| Schenker XMG Pro 16 Studio (Mid 23) | |
| HP Omen Transcend 16-u1095ng | |
| Medio Intel Core i9-14900HX (76.1 - 105, n=36) | |
| Lenovo Legion Pro 5 16IRX9 | |
| Aorus 16X 2024 | |
* ... más pequeño es mejor
Latencias del CPD
La prueba estandarizada Latency Monitor (navegación web, reproducción de vídeo 4k, Prime95 de alta carga) reveló algunas anomalías. El sistema no parece adecuado para la edición de vídeo y audio en tiempo real. Futuras actualizaciones del software podrían suponer mejoras o incluso deterioros.
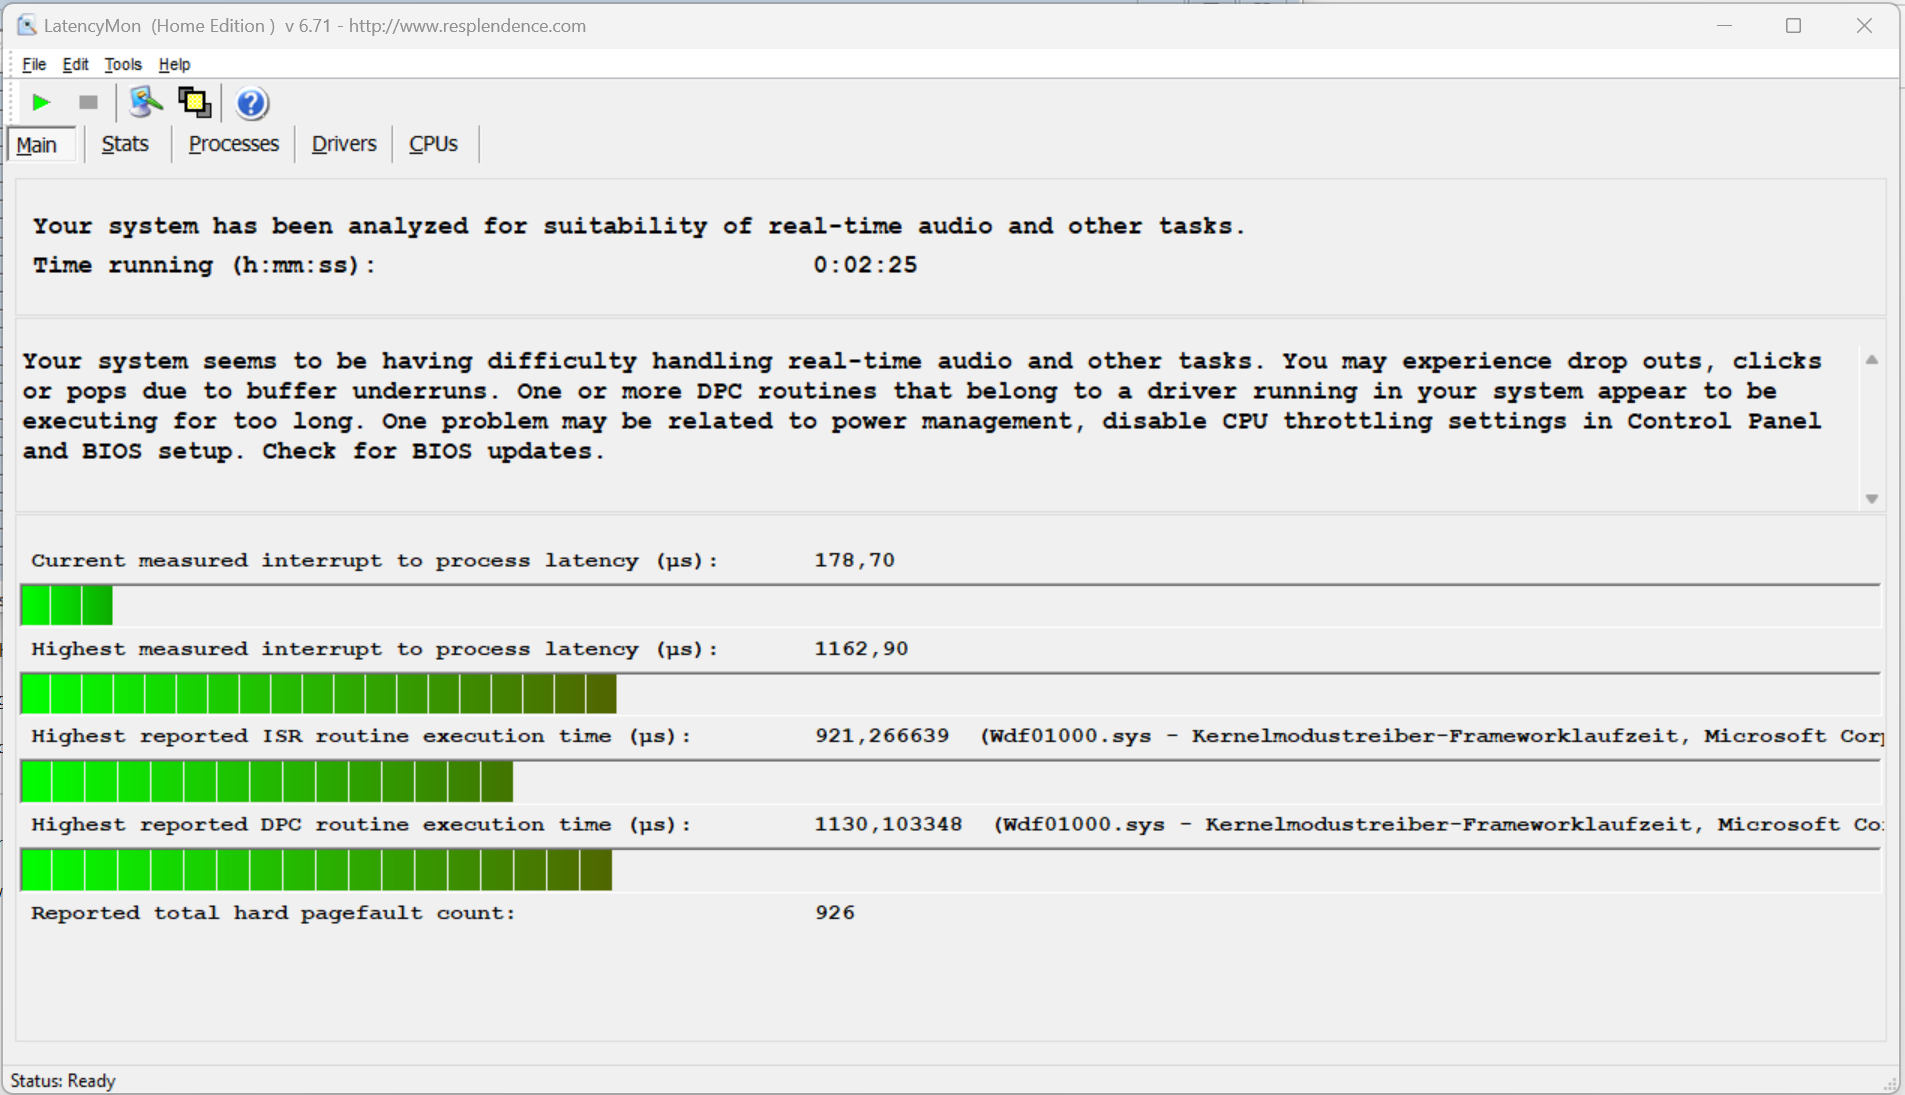
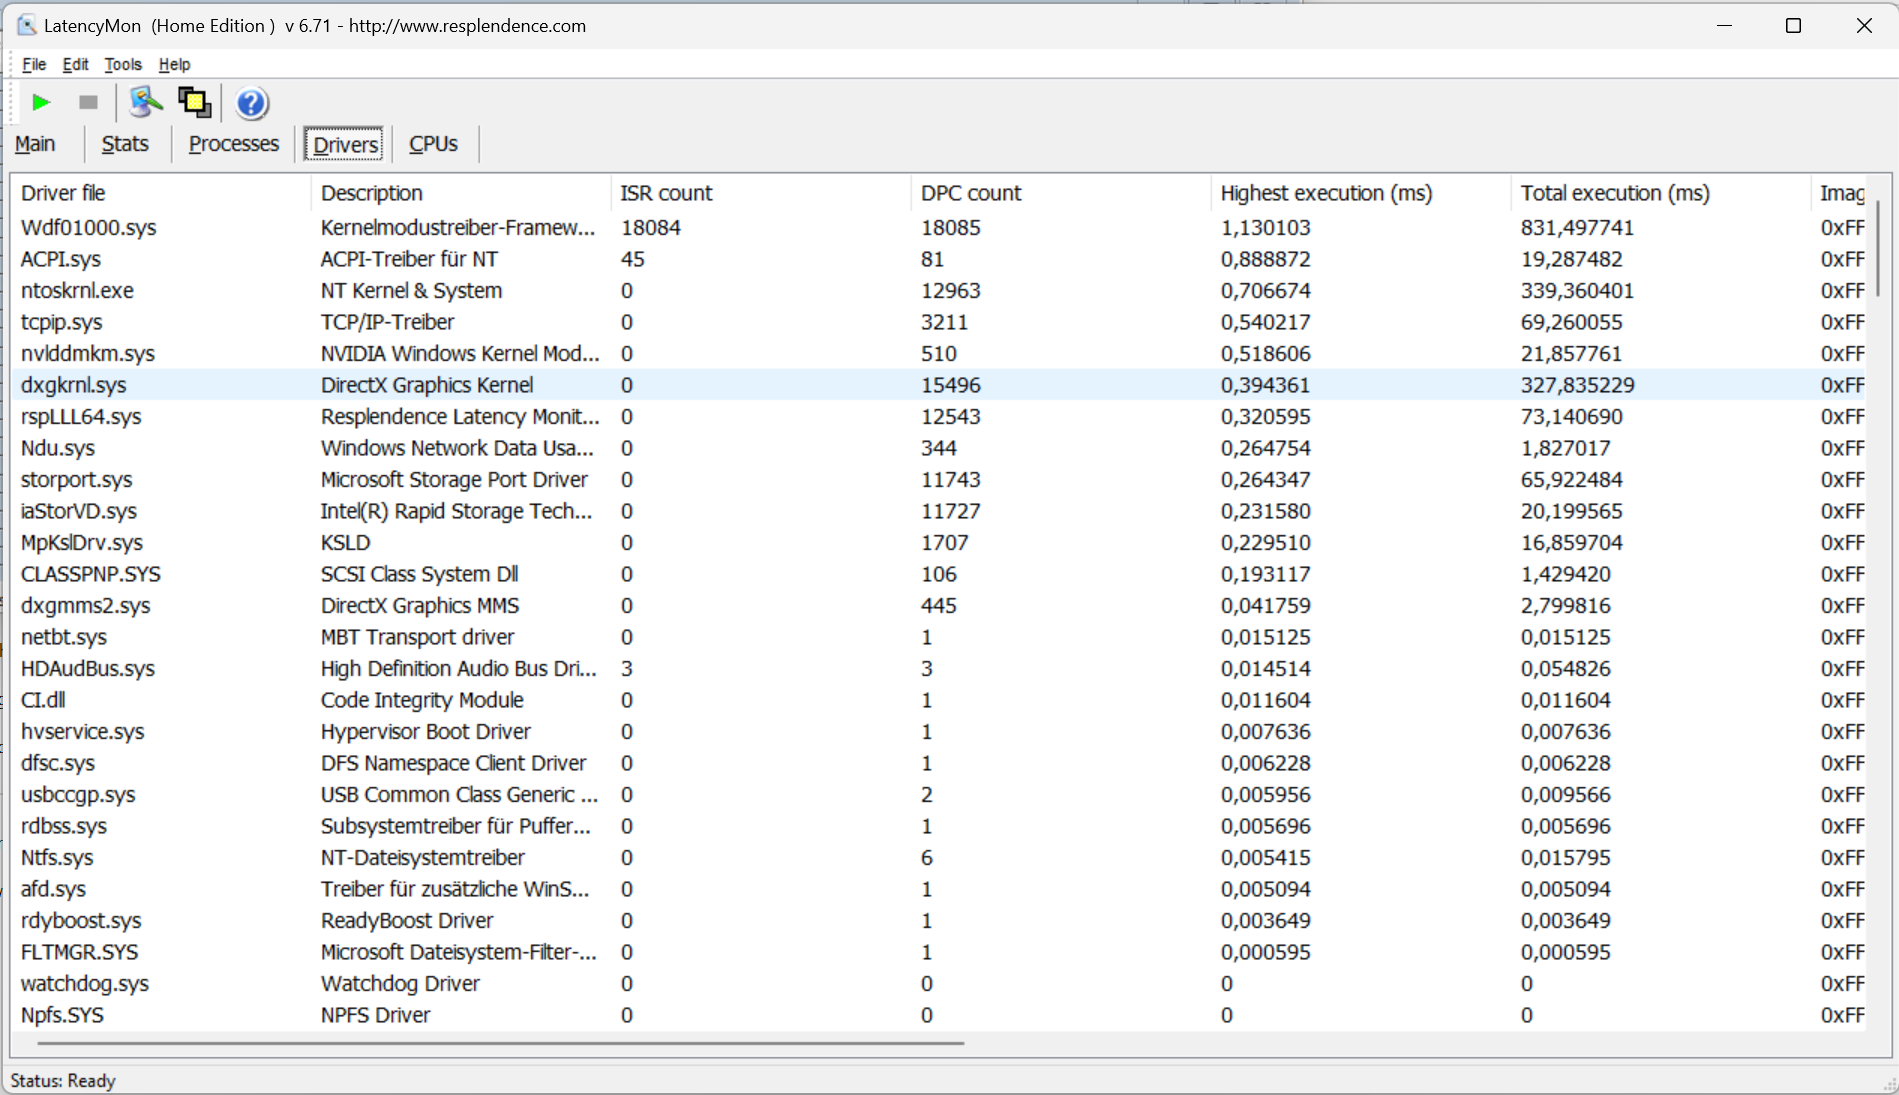
| DPC Latencies / LatencyMon - interrupt to process latency (max), Web, Youtube, Prime95 | |
| Alienware m16 R2 | |
| Schenker XMG Pro 16 Studio (Mid 23) | |
| Asus TUF Gaming A17 FA707XI-NS94 | |
| HP Omen Transcend 16-u1095ng | |
| Aorus 16X 2024 | |
| Lenovo Legion Pro 5 16IRX9 | |
* ... más pequeño es mejor
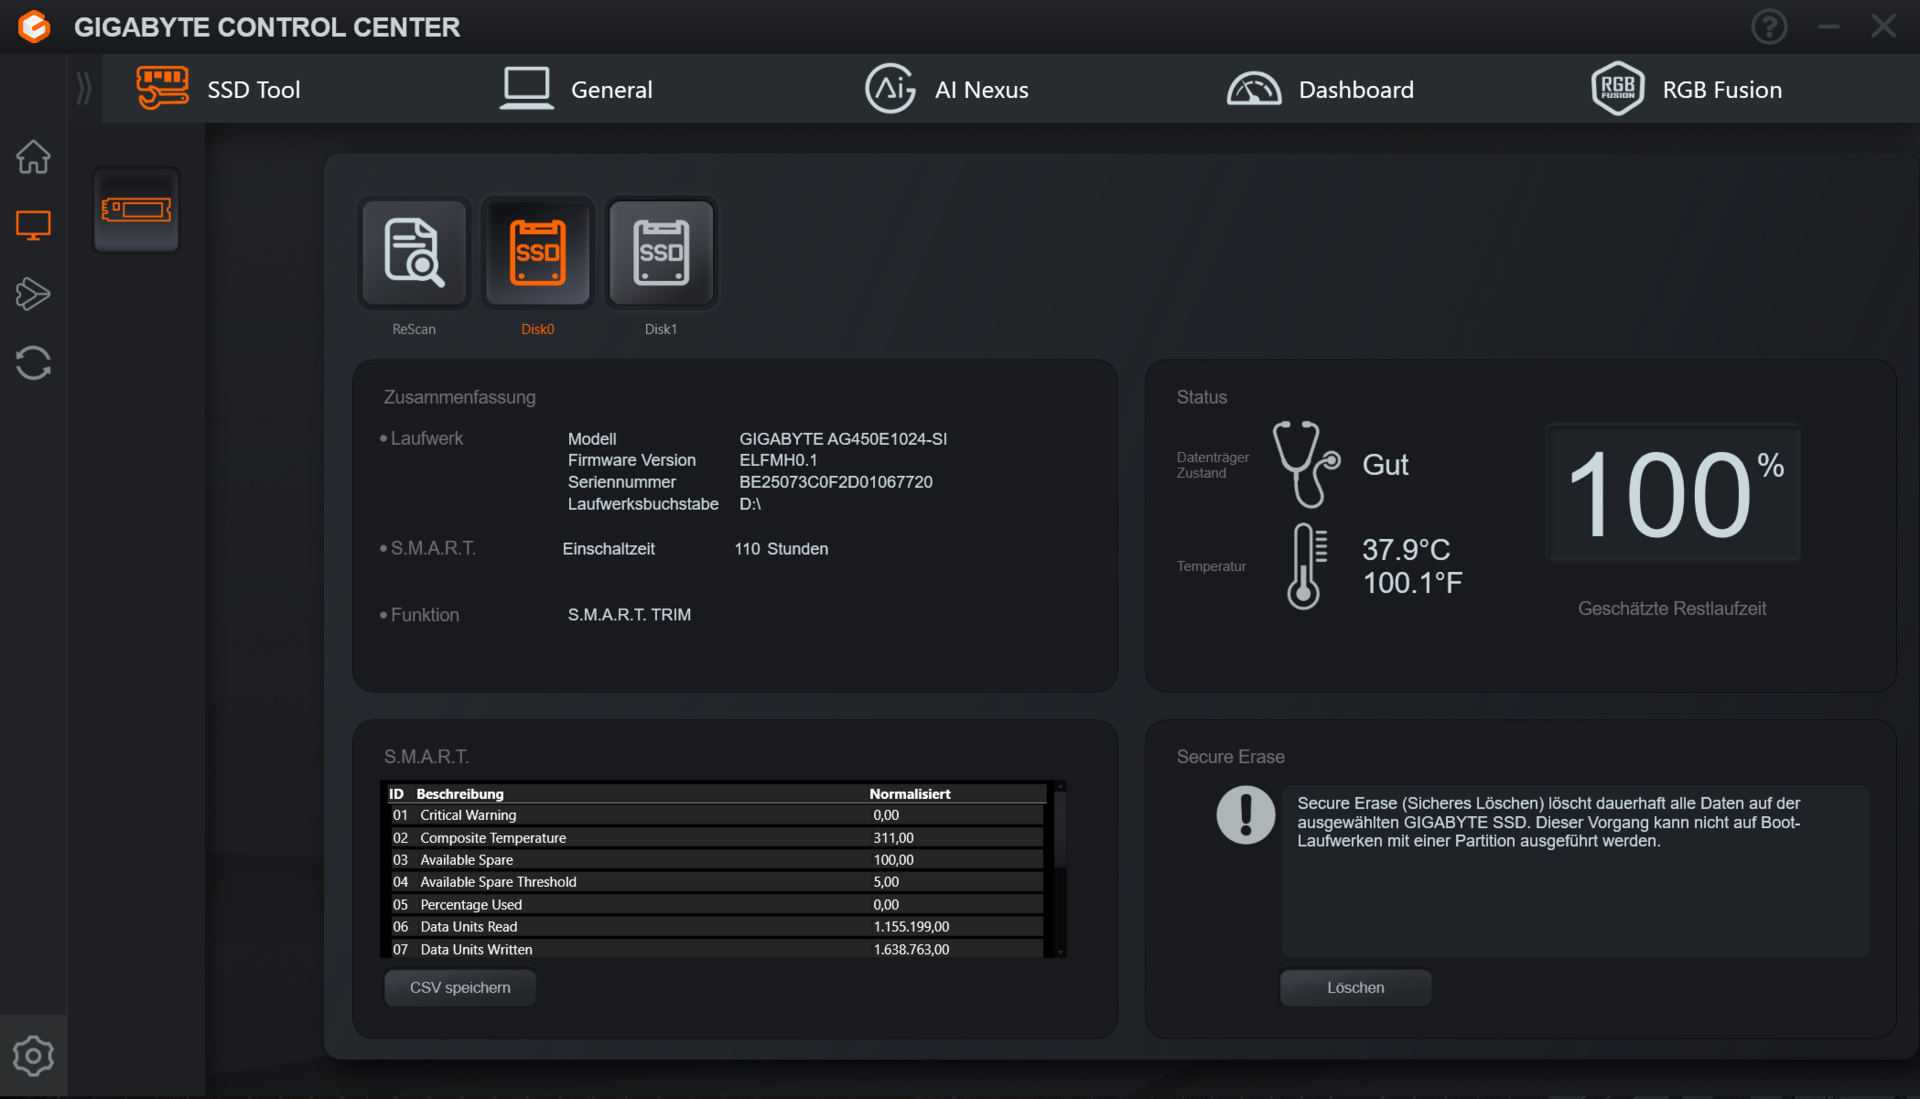
Dispositivos de almacenamiento
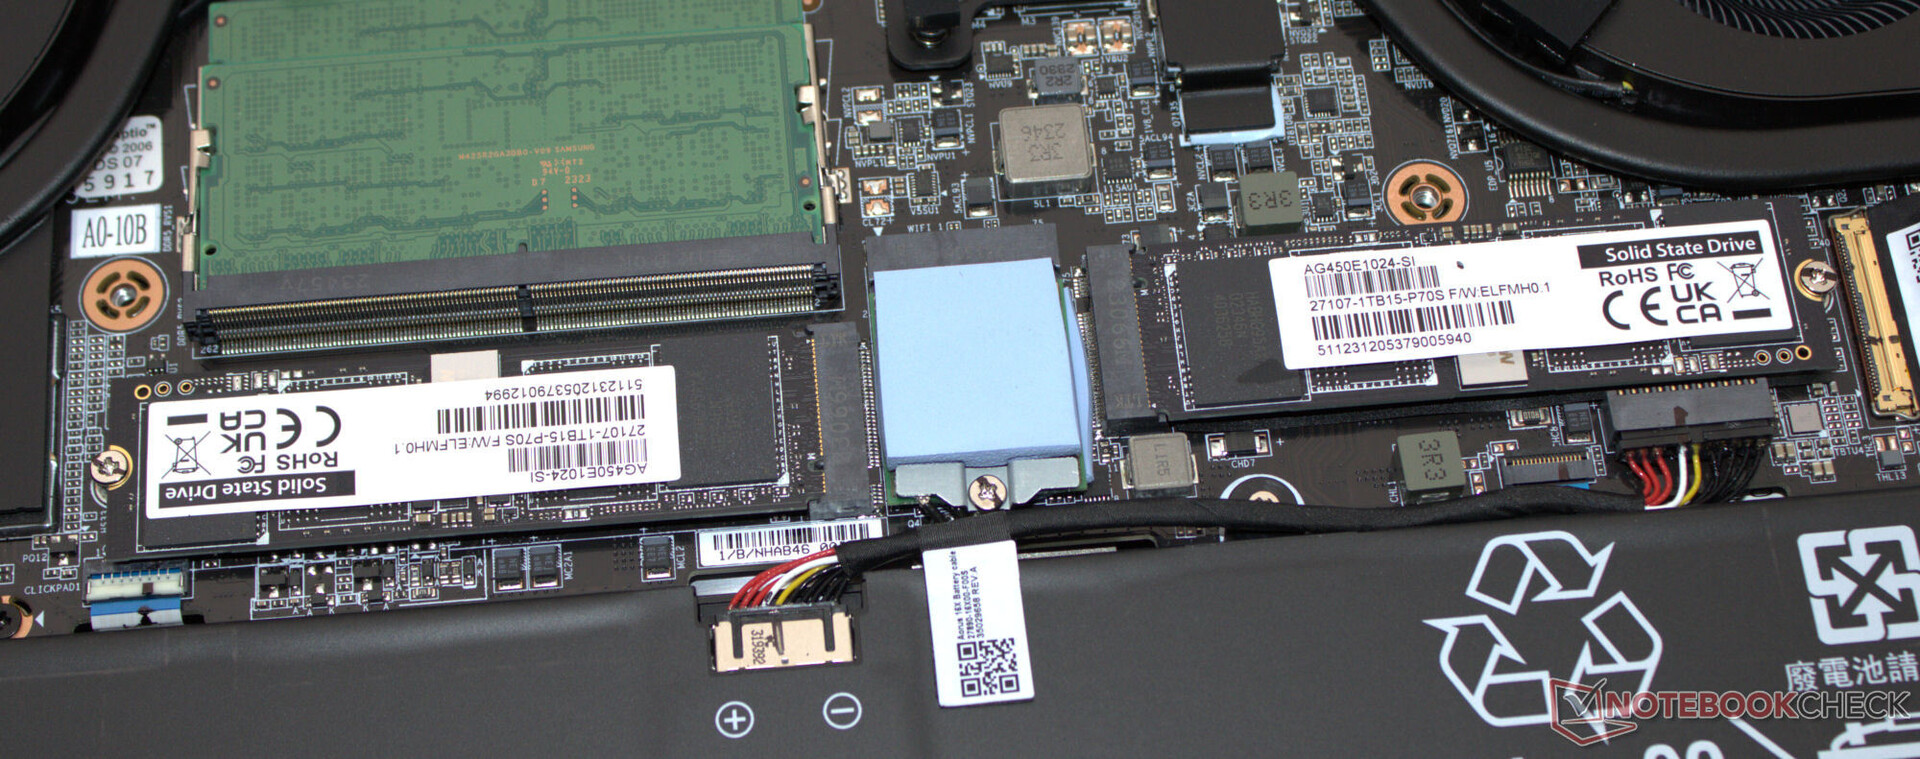
El 16X cuenta con dos unidades SSD PCIe 4 de 1 TB de almacenamiento cada una (M.2-2280)-no forman una matriz RAID. Una SSD sirve como unidad del sistema y la otra como almacenamiento de datos; ambas alcanzan velocidades de datos muy buenas. No observamos caídas debidas al estrangulamiento térmico.
En general, el 16X admite RAID. Sin embargo, primero habría que activar la opción correspondiente en la BIOS, tras lo cual habría que reinstalar Windows. Este procedimiento no es recomendable para los inexpertos.

* ... más pequeño es mejor
Reading continuous performance: DiskSpd Read Loop, Queue Depth 8
Tarjeta gráfica
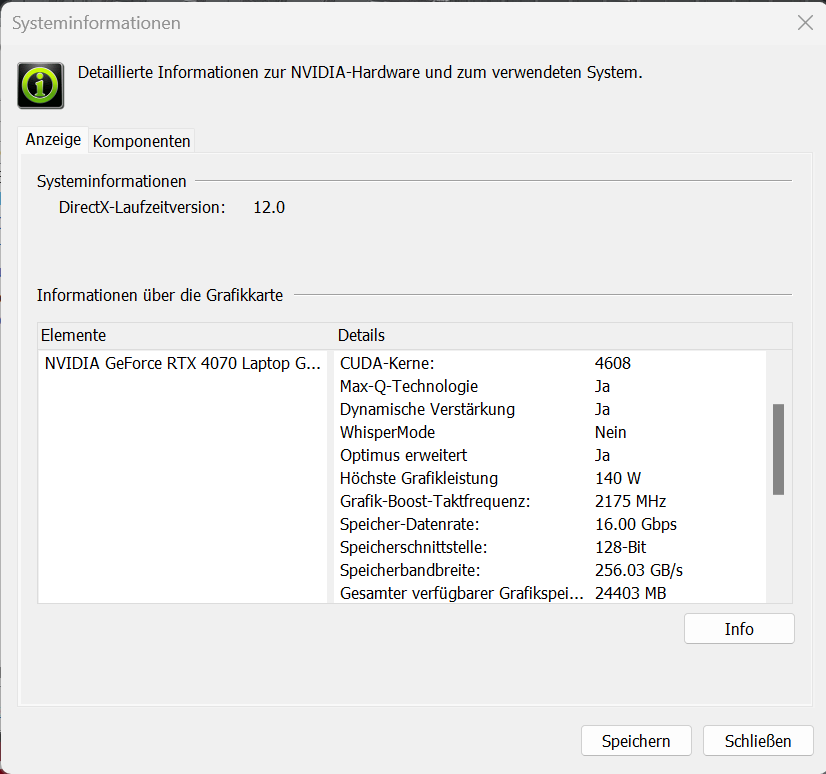
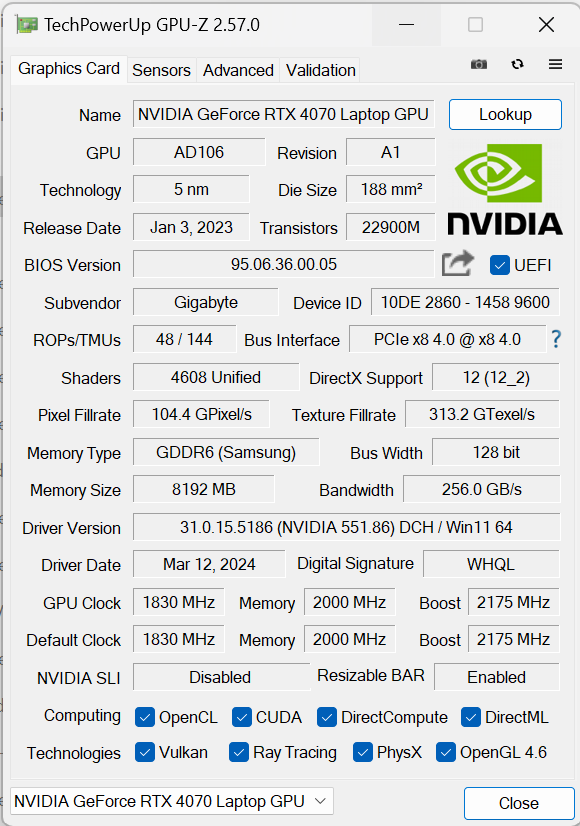
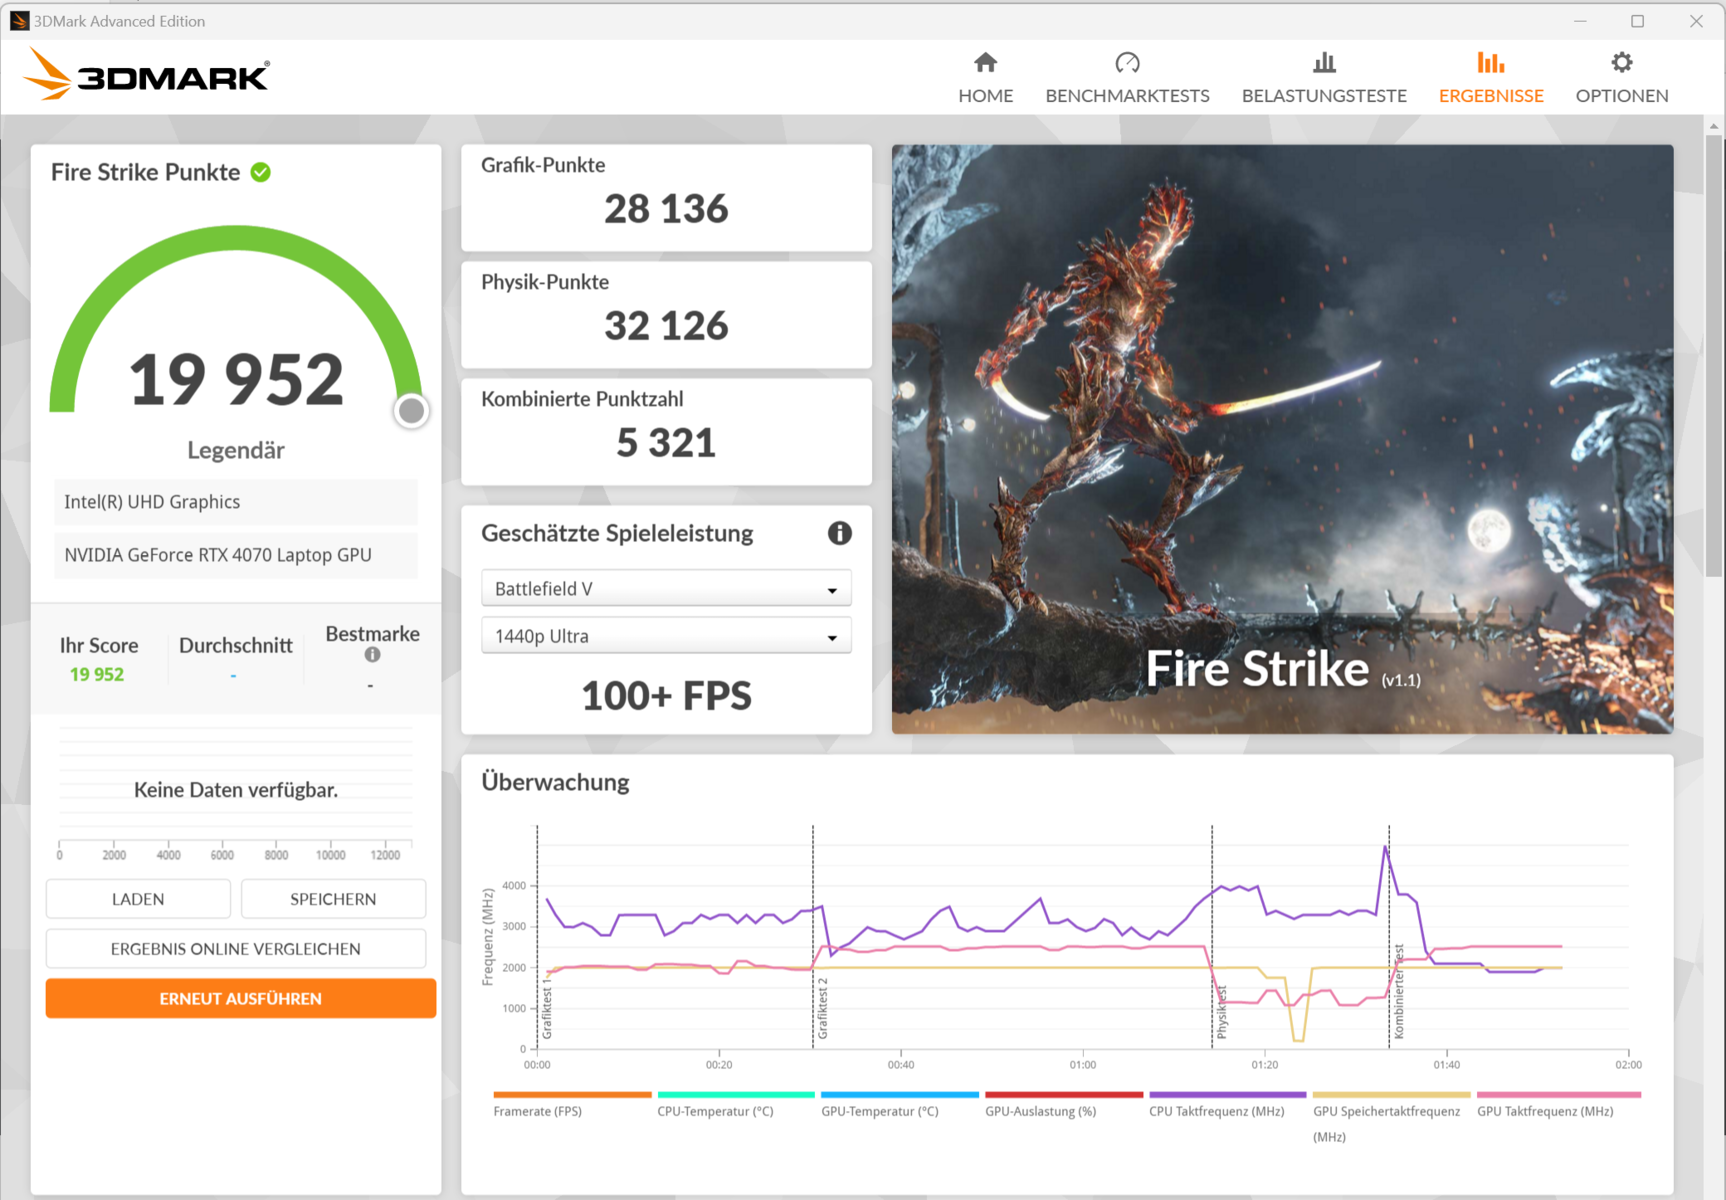
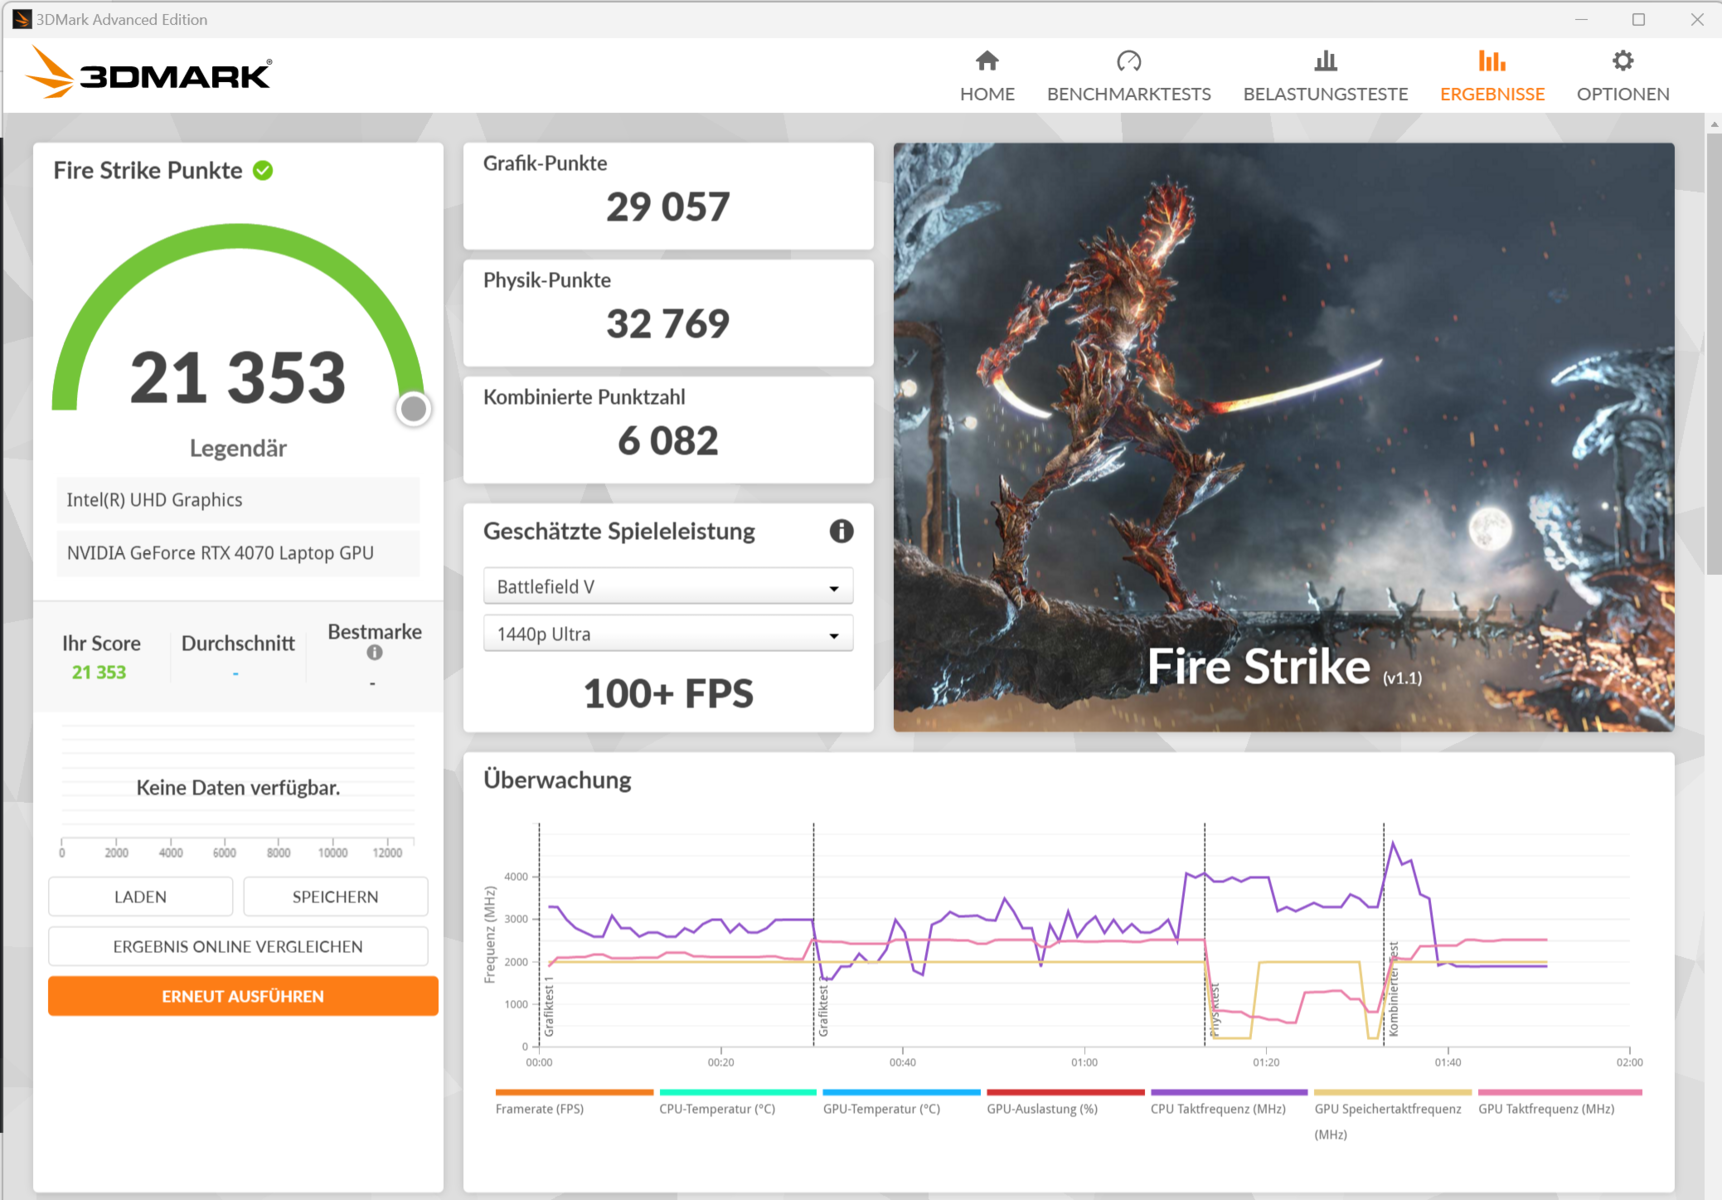
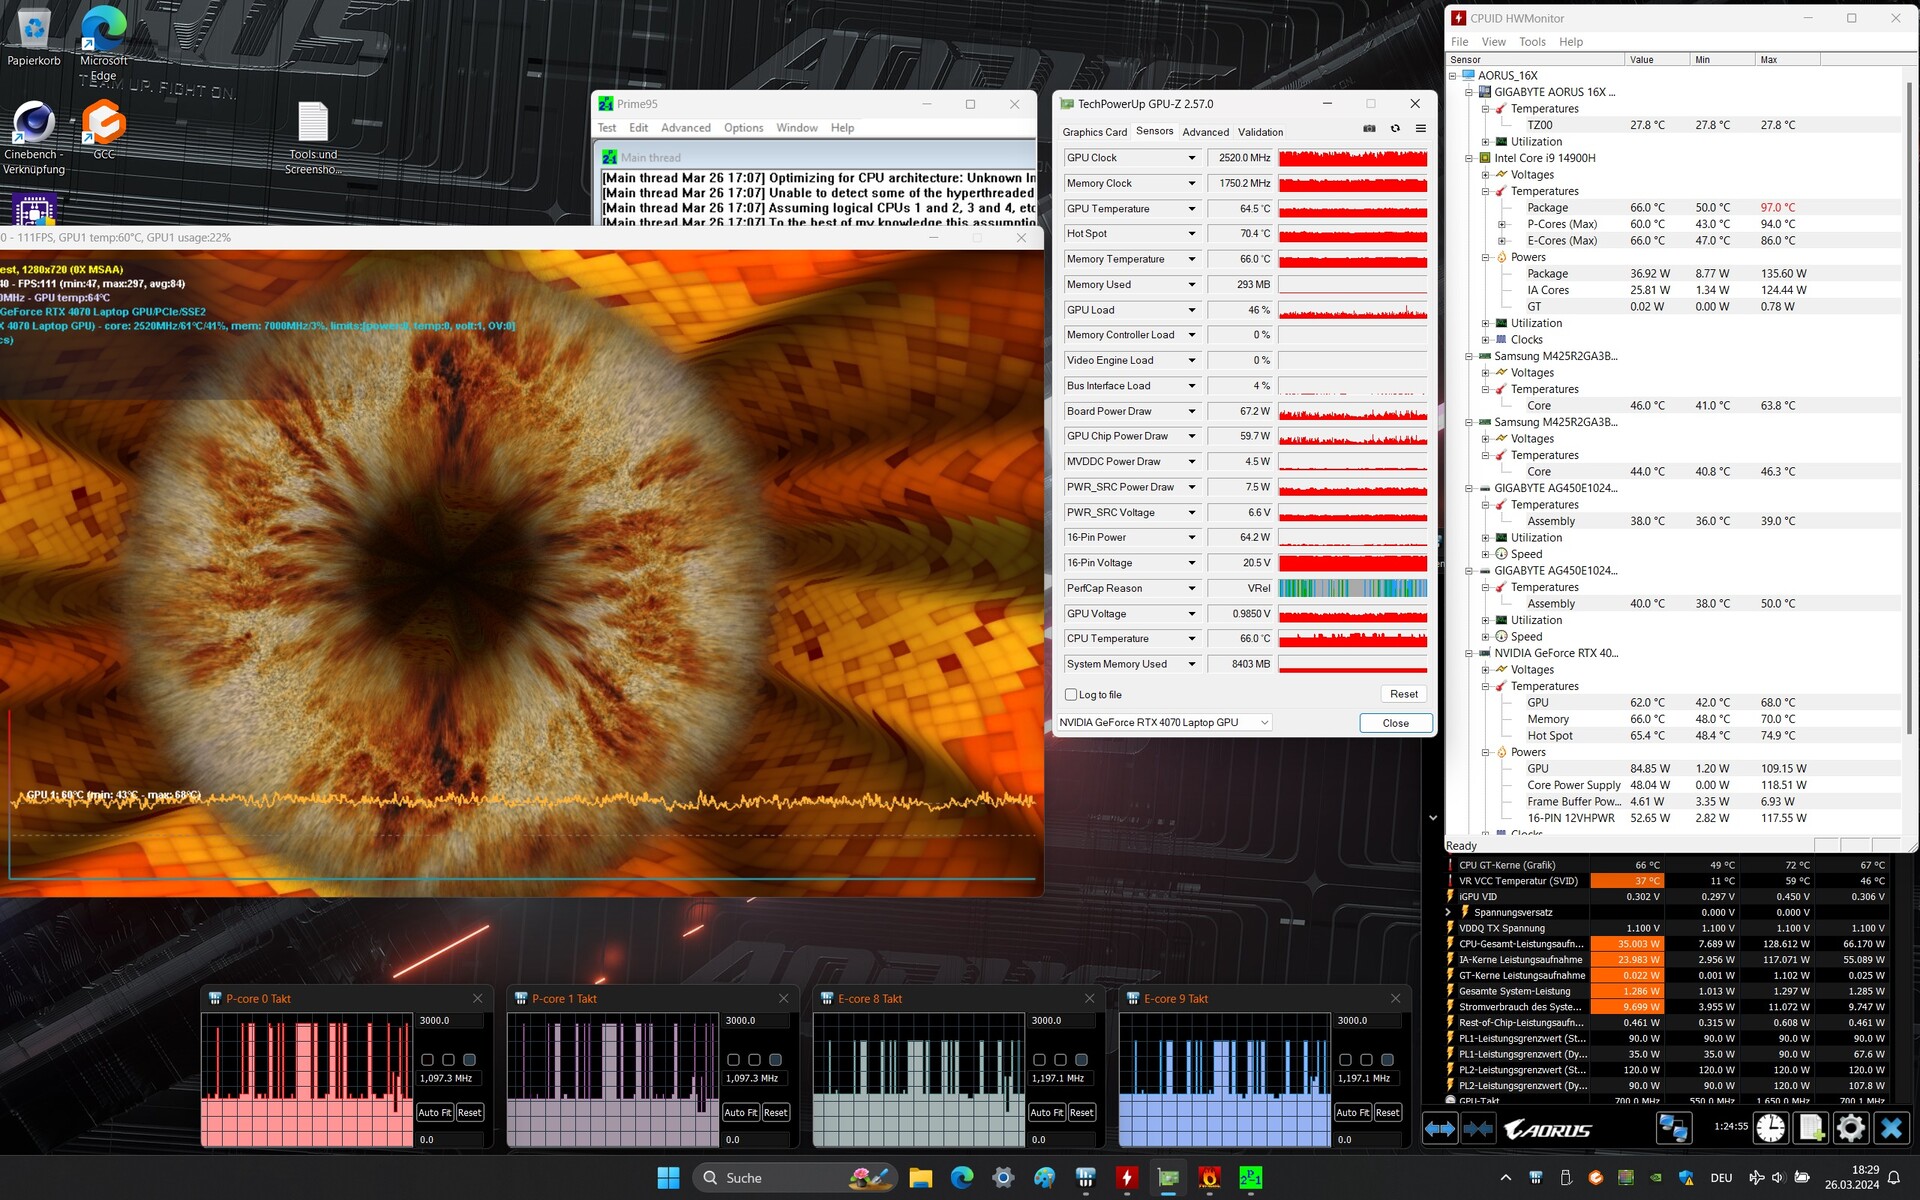
Gigabyte ha fijado la GeForce RTX 4070's máximo TGP a 140 vatios (115 vatios + 25 vatios Dynamic Boost)-más no se especifica por Nvidia. La GPU dispone de 8 GB de VRAM (GDDR6), un poco escasa para las exigencias actuales. Sus resultados en las pruebas de rendimiento estuvieron ligeramente por encima de la media de la RTX-4070(Estándar); los perfiles más potentes ofrecen, como mucho, un pequeño impulso. El cambio entre la dGPU y Optimus no requiere reiniciar el sistema. Optimus avanzado es compatible.


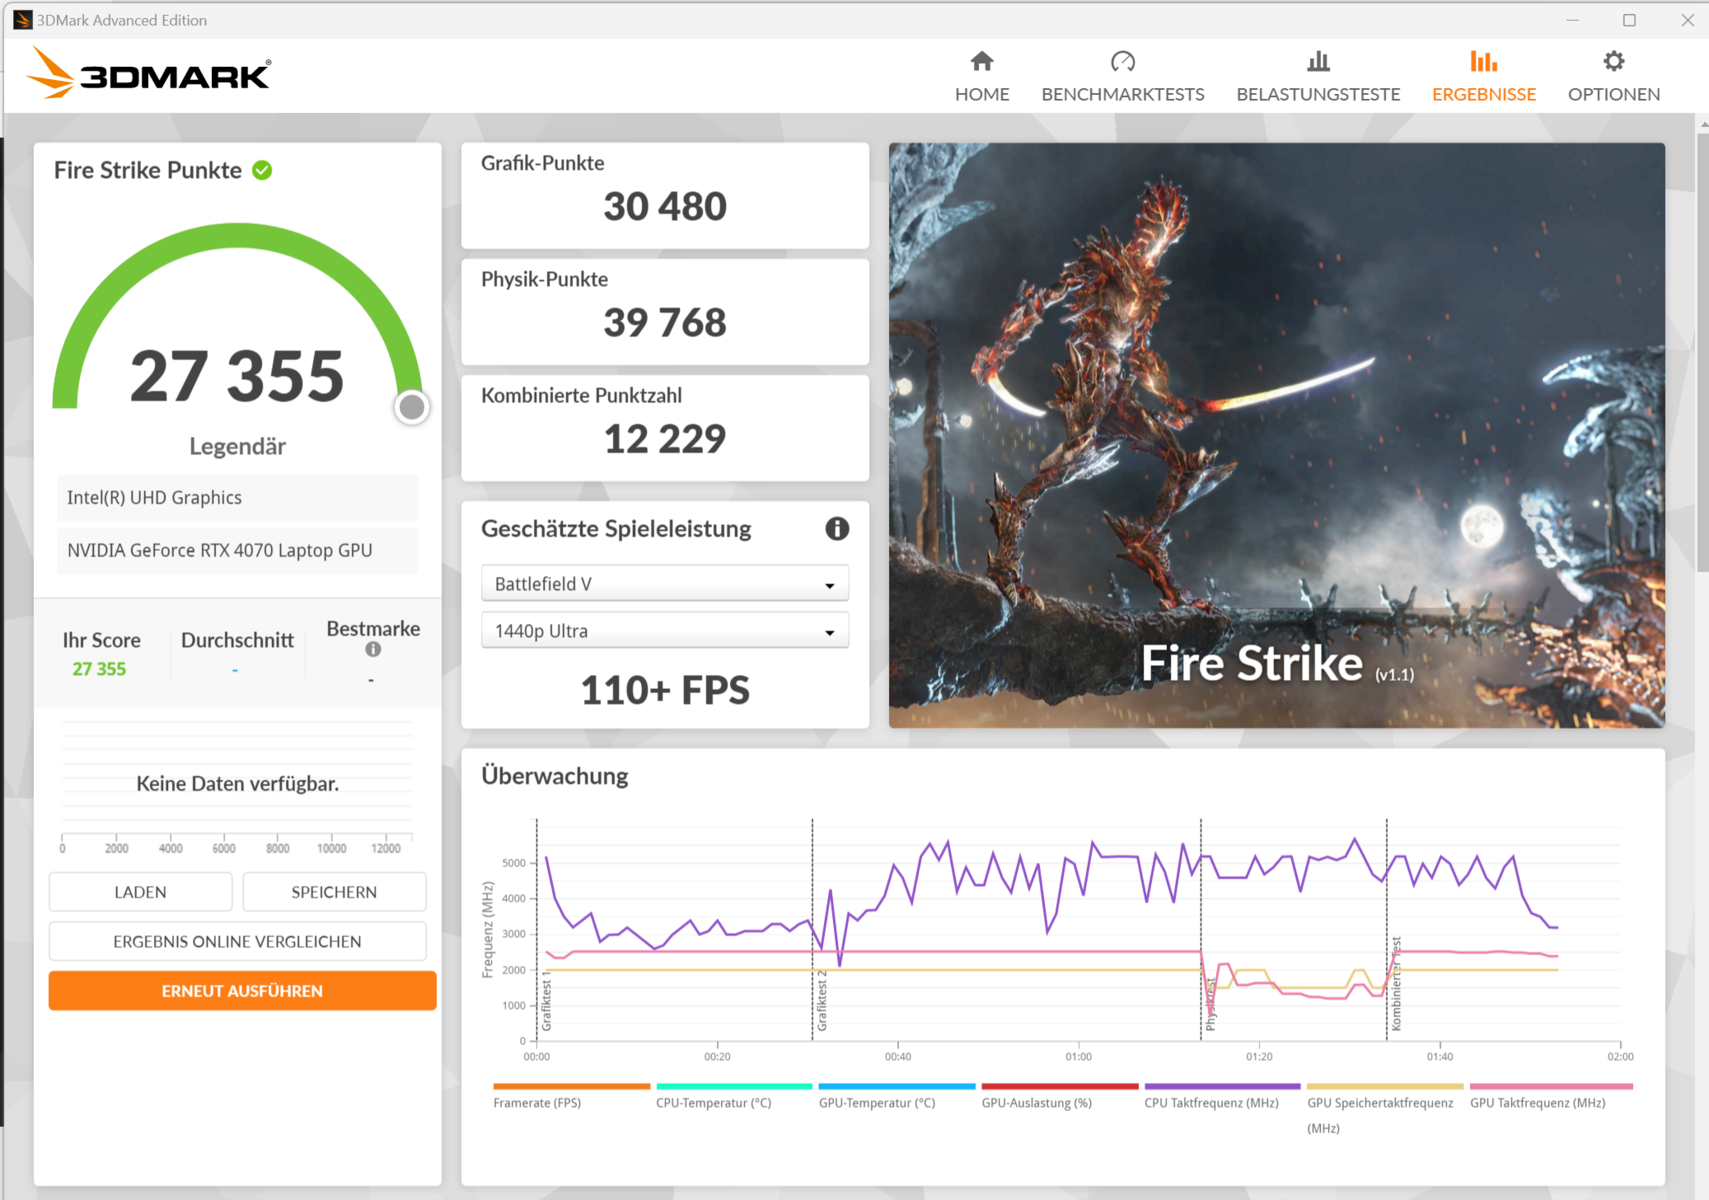
| 3DMark 11 Performance | 35473 puntos | |
| 3DMark Fire Strike Score | 23487 puntos | |
| 3DMark Time Spy Score | 12612 puntos | |
ayuda | ||
* ... más pequeño es mejor
Rendimiento en juegos
El núcleo gráfico permite jugar en QHD con ajustes de altos a máximos. Esto se traduce en velocidades de fotogramas por encima de la media de la RTX 4070 anterior(Estándar); los perfiles más potentes pueden dar lugar a un pequeño aumento en el mejor de los casos. Usando DLSS 3 y la Generación de Fotogramas, también podrían ser posibles los ajustes máximos, incluido el trazado de rayos, a resoluciones más altas, pero sólo para los juegos que los admitan.
| The Witcher 3 - 1920x1080 Ultra Graphics & Postprocessing (HBAO+) | |
| Media de la clase Gaming (95 - 240, n=8, últimos 2 años) | |
| Lenovo Legion Pro 5 16IRX9 | |
| Aorus 16X 2024 | |
| Alienware m16 R2 | |
| Asus TUF Gaming A17 FA707XI-NS94 | |
| Schenker XMG Pro 16 Studio (Mid 23) | |
| HP Omen Transcend 16-u1095ng | |
| Medio NVIDIA GeForce RTX 4070 Laptop GPU (69.8 - 133.7, n=57) | |
| Horizon Forbidden West | |
| 1920x1080 Very High Preset AA:T | |
| Media de la clase Gaming (14.7 - 140.3, n=13, últimos 2 años) | |
| Aorus 16X 2024 | |
| XMG Pro 15 E23 | |
| Medio NVIDIA GeForce RTX 4070 Laptop GPU (53.2 - 76.7, n=10) | |
| 2560x1440 Very High Preset AA:T | |
| Media de la clase Gaming (39.6 - 100.9, n=10, últimos 2 años) | |
| Aorus 16X 2024 | |
| XMG Pro 15 E23 | |
| Medio NVIDIA GeForce RTX 4070 Laptop GPU (40.3 - 59.1, n=9) | |
| Alone in the Dark | |
| 1920x1080 High Preset | |
| XMG Pro 15 E23 | |
| Medio NVIDIA GeForce RTX 4070 Laptop GPU (125.8 - 196.5, n=5) | |
| Aorus 16X 2024 | |
| Media de la clase Gaming (n=1últimos 2 años) | |
| 2560x1440 Cinematic Preset | |
| XMG Pro 15 E23 | |
| Medio NVIDIA GeForce RTX 4070 Laptop GPU (37.4 - 76.6, n=5) | |
| Aorus 16X 2024 | |
| Skull & Bones | |
| 1920x1080 Ultra High Preset AA:T | |
| Aorus 16X 2024 | |
| Medio NVIDIA GeForce RTX 4070 Laptop GPU (75 - 81, n=3) | |
| XMG Pro 15 E23 | |
| 2560x1440 Ultra High Preset AA:T | |
| Aorus 16X 2024 | |
| Medio NVIDIA GeForce RTX 4070 Laptop GPU (56 - 63, n=3) | |
| XMG Pro 15 E23 | |
| Last Epoch | |
| 1920x1080 Ultra Preset AA:T | |
| XMG Pro 15 E23 | |
| Medio NVIDIA GeForce RTX 4070 Laptop GPU (133.8 - 140, n=2) | |
| Aorus 16X 2024 | |
| Media de la clase Gaming (n=1últimos 2 años) | |
| 2560x1440 Ultra Preset AA:T | |
| XMG Pro 15 E23 | |
| Medio NVIDIA GeForce RTX 4070 Laptop GPU (80.4 - 81.1, n=2) | |
| Aorus 16X 2024 | |
| Media de la clase Gaming (n=1últimos 2 años) | |
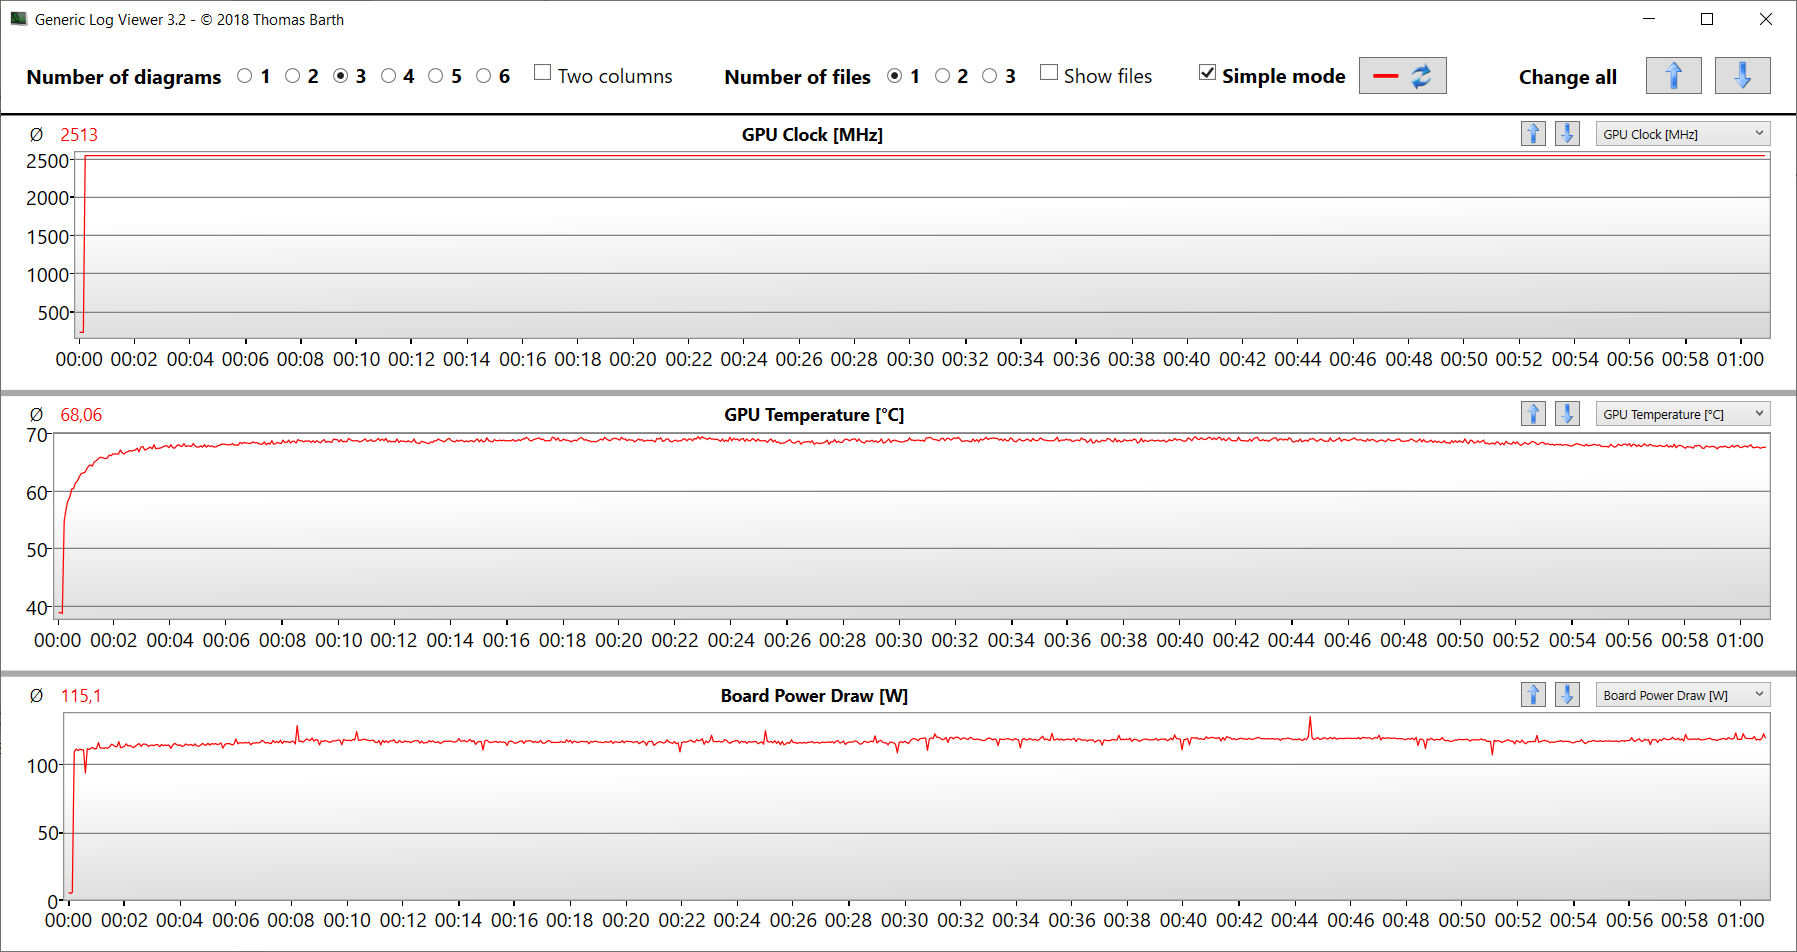
Para comprobar si la velocidad de fotogramas del dispositivo se mantiene prácticamente constante durante un periodo de tiempo más largo, ejecutamos el juego The Witcher 3 durante unos 60 minutos en resolución Full HD y con los ajustes de calidad al máximo. El personaje del juego no se movió. No se produjo ninguna caída notable en la velocidad de fotogramas.
Witcher 3 FPS diagram
| bajo | medio | alto | ultra | QHD | |
|---|---|---|---|---|---|
| GTA V (2015) | 187.5 | 187 | 176.5 | 107.2 | 90.5 |
| The Witcher 3 (2015) | 435 | 338 | 223 | 122 | 88.5 |
| Dota 2 Reborn (2015) | 233 | 208 | 199.1 | 180.9 | |
| Final Fantasy XV Benchmark (2018) | 176.6 | 139.1 | 111.5 | 85.8 | |
| X-Plane 11.11 (2018) | 194.4 | 163 | 126.4 | ||
| Far Cry 5 (2018) | 184 | 124 | 114 | 109 | 98 |
| Strange Brigade (2018) | 455 | 277 | 233 | 204 | 136.2 |
| Cyberpunk 2077 (2023) | 90.2 | 81.6 | 76.9 | 75.8 | 49.4 |
| Skull & Bones (2024) | 107 | 101 | 94 | 81 | 63 |
| Last Epoch (2024) | 169.7 | 156 | 155.9 | 133.8 | 80.4 |
| Alone in the Dark (2024) | 185.9 | 157.3 | 151.1 | 124.7 | 64.7 |
| Horizon Forbidden West (2024) | 92.3 | 77.3 | 73.4 | 71.1 | 54.5 |
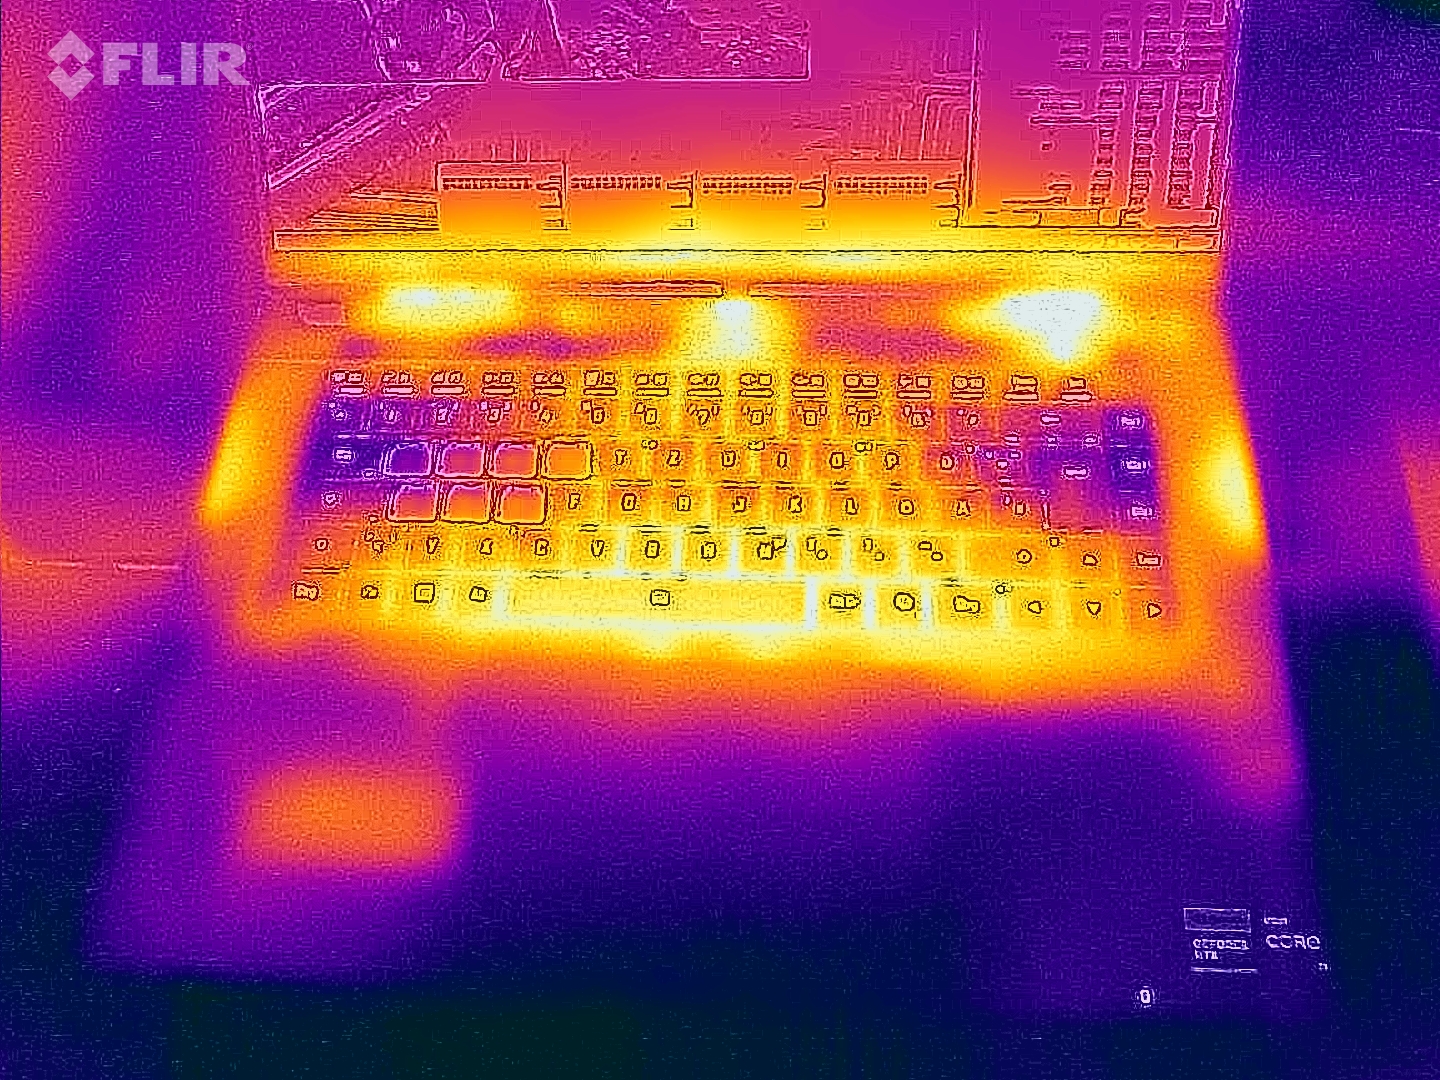
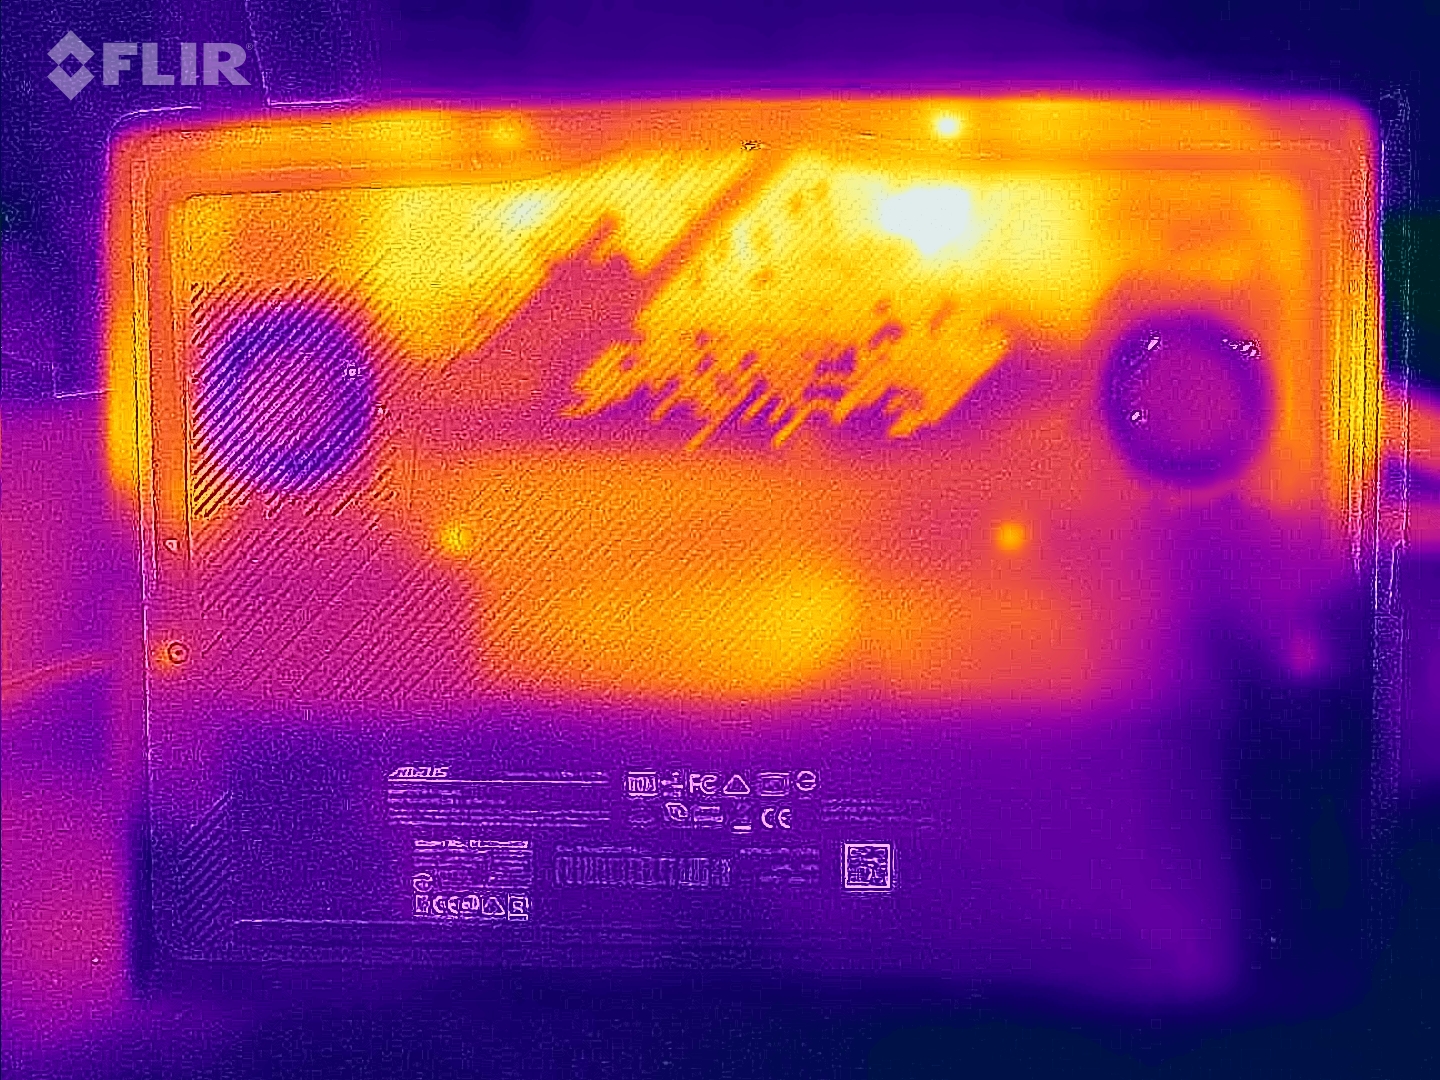
Emisiones - El portátil Aorus no se calienta demasiado
Emisiones sonoras
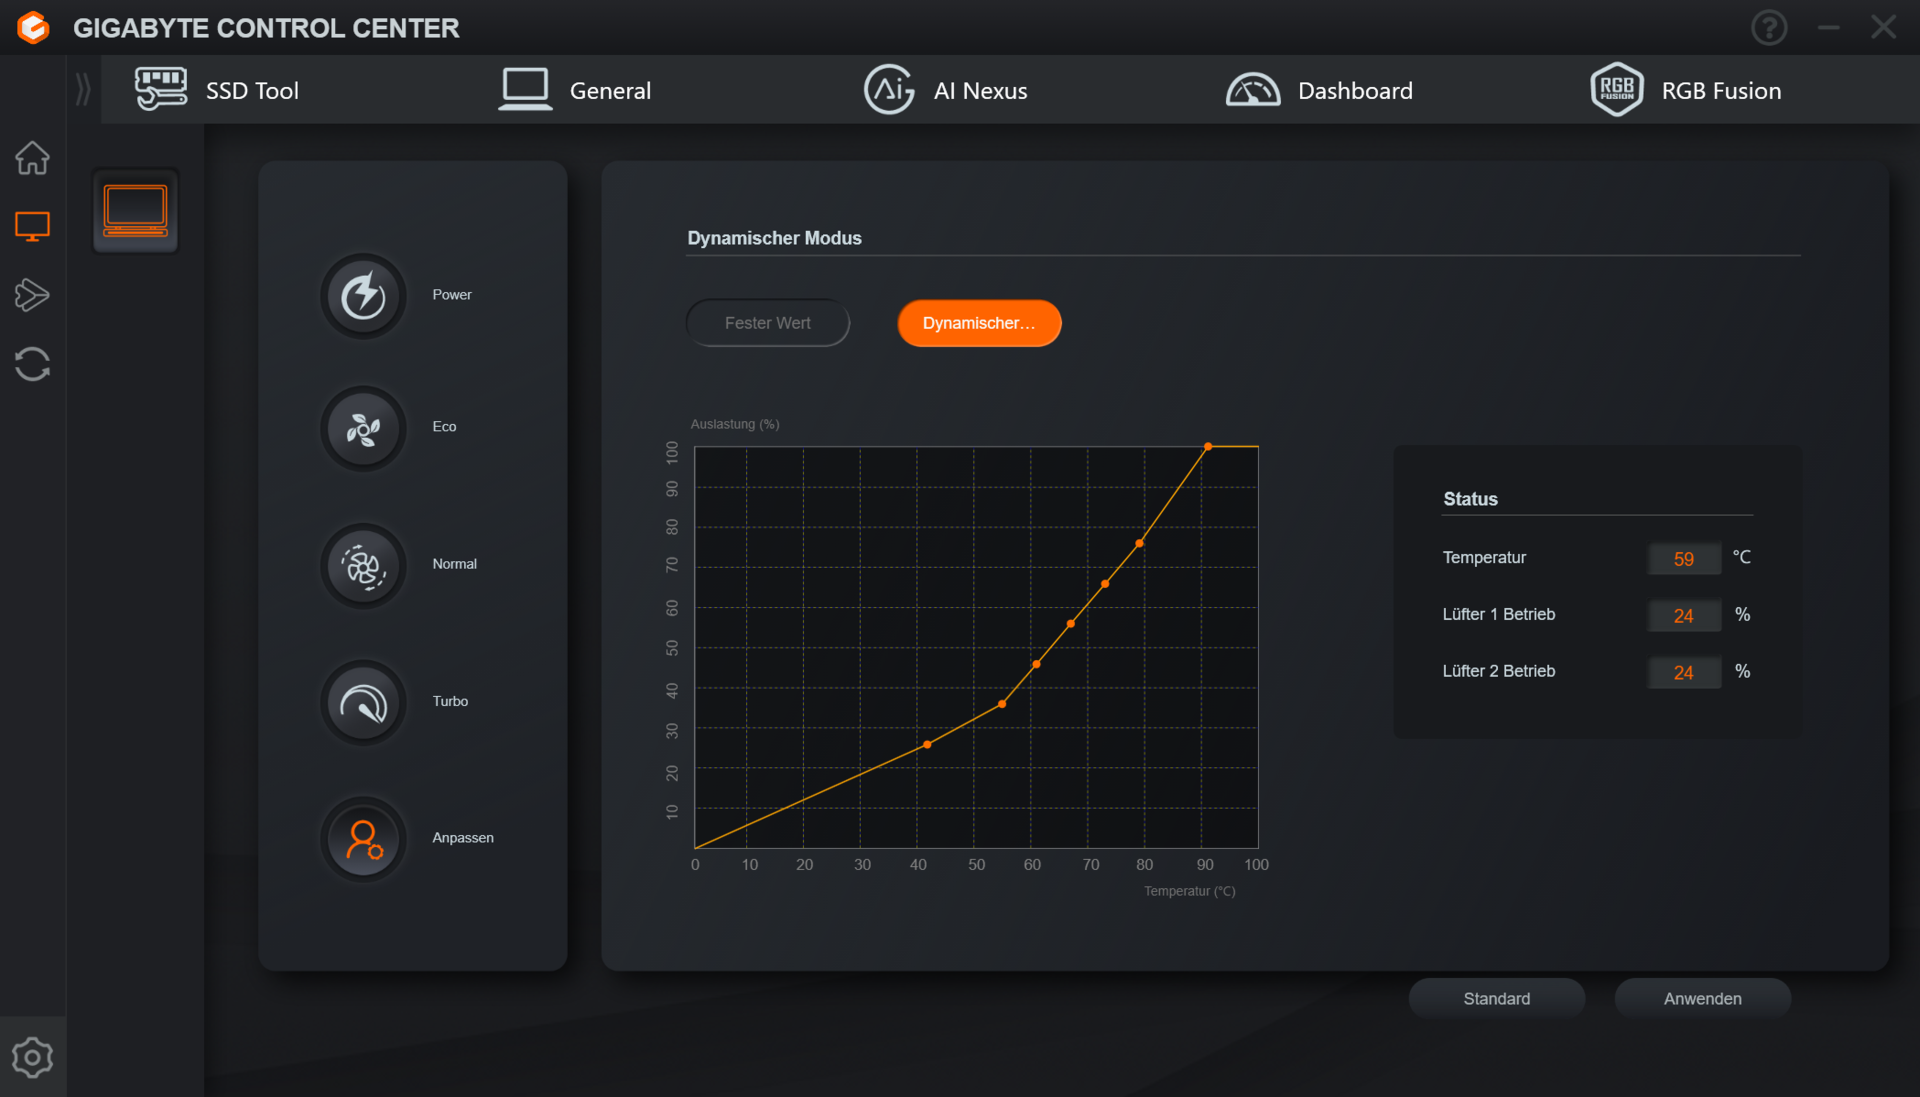
A plena carga, el portátil produce emisiones de ruido de hasta 55 dB(A). Los perfiles de energía Meeting y Energy-Saving Quiet proporcionan una experiencia general más silenciosa, a costa de algo de rendimiento. Alternativamente, la actividad del ventilador puede controlarse mediante cuatro perfiles de ventilador (dentro del Gigabyte Control Center). Si lo desea, también puede crear una curva de ventilador personalizada. En reposo y durante el uso diario (oficina, Internet), el portátil funciona generalmente de forma silenciosa -a veces incluso en silencio. A veces, los ventiladores empiezan a girar bastante rápido.
Ruido
| Ocioso |
| 26 / 32 / 38 dB(A) |
| Carga |
| 54 / 55 dB(A) |
 | ||
30 dB silencioso 40 dB(A) audible 50 dB(A) ruidosamente alto |
||
min: | ||
| Aorus 16X 2024 i9-14900HX, GeForce RTX 4070 Laptop GPU | Alienware m16 R2 Ultra 7 155H, GeForce RTX 4070 Laptop GPU | HP Omen Transcend 16-u1095ng i9-14900HX, GeForce RTX 4070 Laptop GPU | Asus TUF Gaming A17 FA707XI-NS94 R9 7940HS, GeForce RTX 4070 Laptop GPU | Schenker XMG Pro 16 Studio (Mid 23) i9-13900H, GeForce RTX 4070 Laptop GPU | Lenovo Legion Pro 5 16IRX9 i9-14900HX, GeForce RTX 4070 Laptop GPU | |
|---|---|---|---|---|---|---|
| Noise | 12% | 9% | 4% | 9% | 10% | |
| apagado / medio ambiente * (dB) | 26 | 24.7 5% | 24 8% | 27.9 -7% | 25 4% | 23.9 8% |
| Idle Minimum * (dB) | 26 | 25.3 3% | 29 -12% | 28.5 -10% | 26 -0% | 24.3 7% |
| Idle Average * (dB) | 32 | 25.3 21% | 30 6% | 29.8 7% | 29 9% | 24.3 24% |
| Idle Maximum * (dB) | 38 | 25.3 33% | 31 18% | 29.8 22% | 34 11% | 28.9 24% |
| Load Average * (dB) | 54 | 31.7 41% | 45 17% | 34.8 36% | 43 20% | 45.8 15% |
| Witcher 3 ultra * (dB) | 50 | 53.8 -8% | 44 12% | 57.1 -14% | 48 4% | 51 -2% |
| Load Maximum * (dB) | 55 | 62 -13% | 47 15% | 57.3 -4% | 48 13% | 56.6 -3% |
* ... más pequeño es mejor
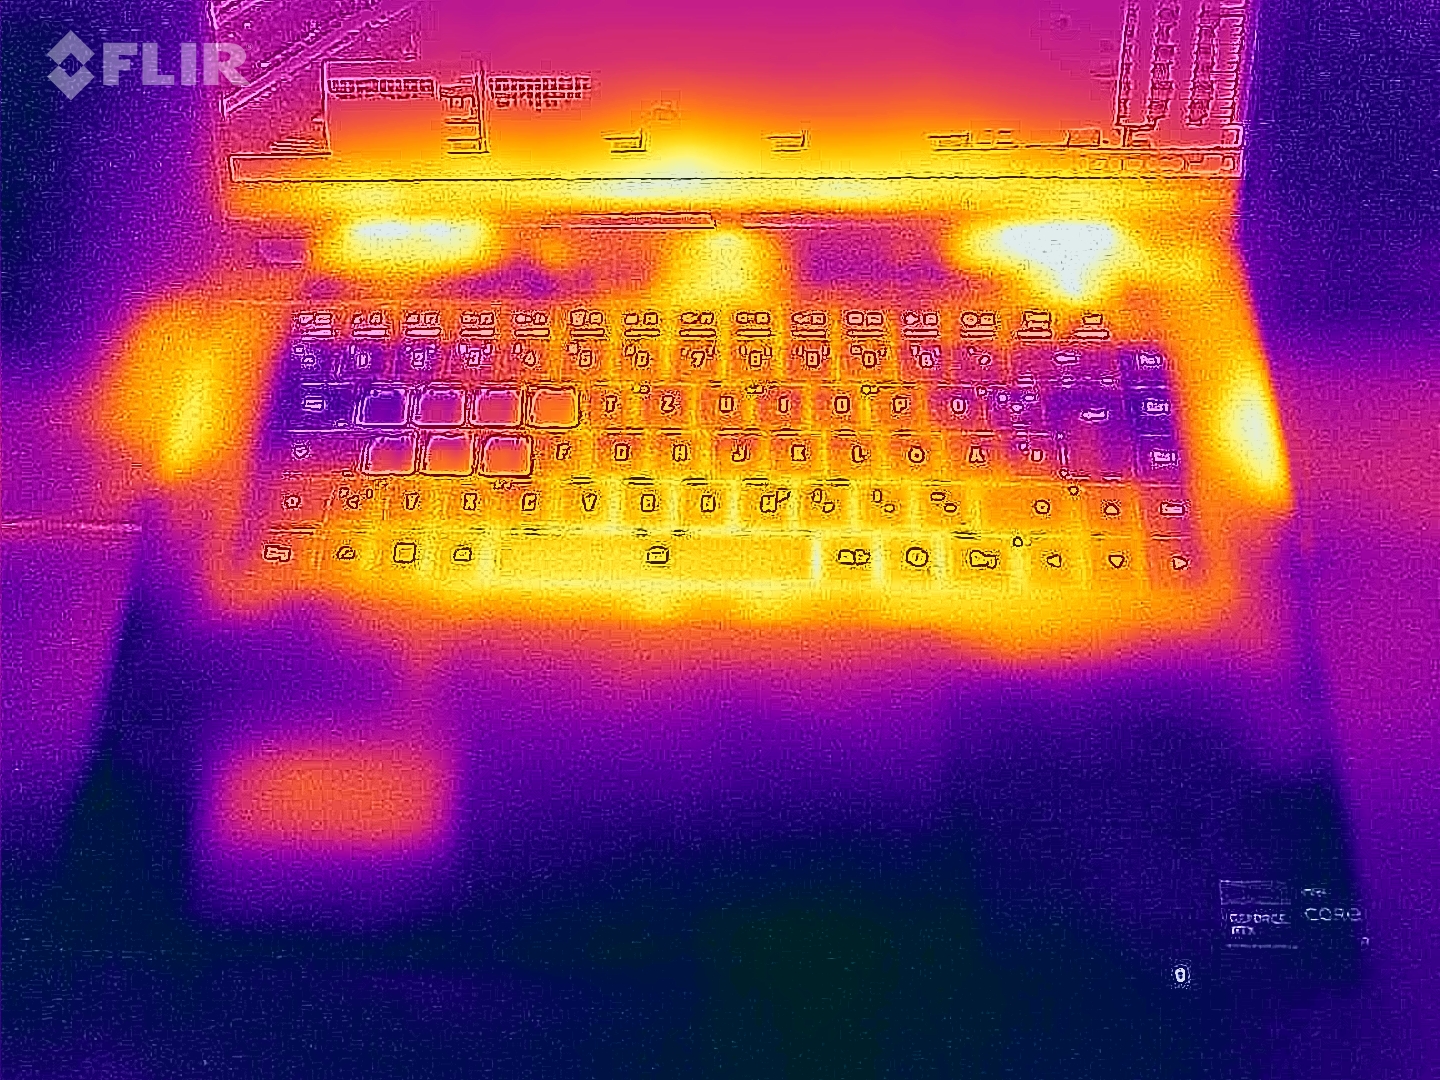
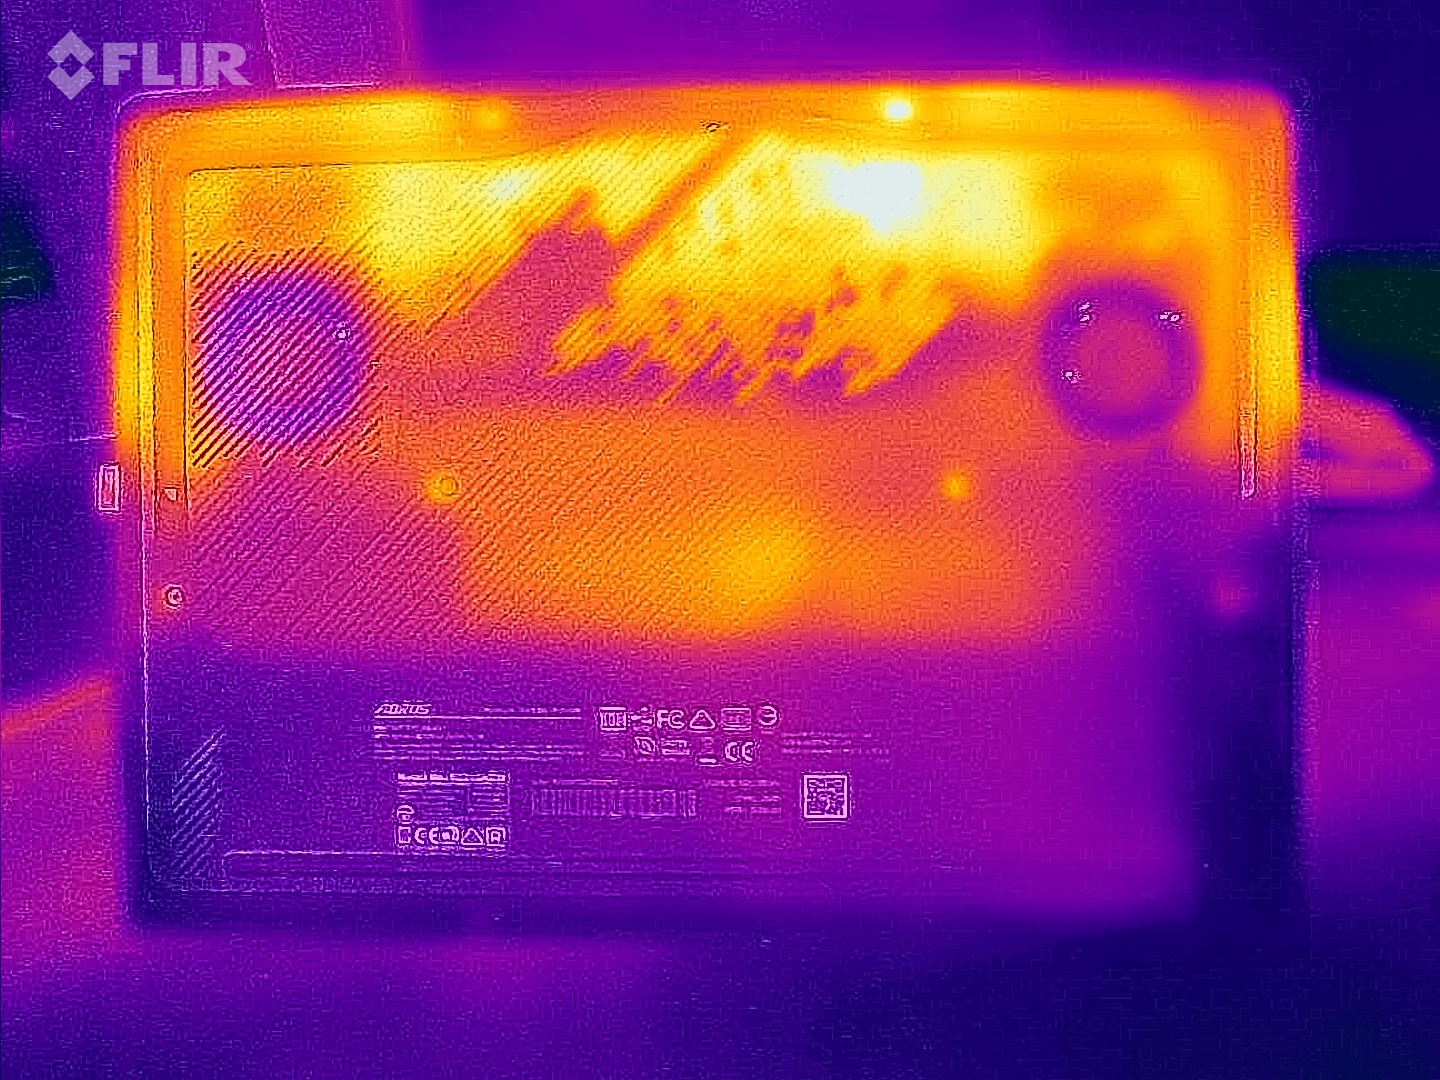
Temperatura
La prueba de estrés y Witcher 3 test sólo hicieron que el portátil se calentara un poco. En algunos casos, medimos valores en el rango inferior a medio de los 40 grados Celsius. En el uso diario (oficina, Internet), los valores se mantendrán en gran medida en la zona verde, sin embargo, están por encima de la media.
(±) La temperatura máxima en la parte superior es de 41 °C / 106 F, frente a la media de 40.4 °C / 105 F, que oscila entre 21.2 y 68.8 °C para la clase Gaming.
(±) El fondo se calienta hasta un máximo de 41 °C / 106 F, frente a la media de 43.2 °C / 110 F
(±) En reposo, la temperatura media de la parte superior es de 33.2 °C / 92# F, frente a la media del dispositivo de 33.9 °C / 93 F.
(±) Jugando a The Witcher 3, la temperatura media de la parte superior es de 35.7 °C / 96 F, frente a la media del dispositivo de 33.9 °C / 93 F.
(+) El reposamanos y el panel táctil están a una temperatura inferior a la de la piel, con un máximo de 30 °C / 86 F y, por tanto, son fríos al tacto.
(±) La temperatura media de la zona del reposamanos de dispositivos similares fue de 28.8 °C / 83.8 F (-1.2 °C / -2.2 F).
| Aorus 16X 2024 i9-14900HX, GeForce RTX 4070 Laptop GPU | Alienware m16 R2 Ultra 7 155H, GeForce RTX 4070 Laptop GPU | HP Omen Transcend 16-u1095ng i9-14900HX, GeForce RTX 4070 Laptop GPU | Asus TUF Gaming A17 FA707XI-NS94 R9 7940HS, GeForce RTX 4070 Laptop GPU | Schenker XMG Pro 16 Studio (Mid 23) i9-13900H, GeForce RTX 4070 Laptop GPU | Lenovo Legion Pro 5 16IRX9 i9-14900HX, GeForce RTX 4070 Laptop GPU | |
|---|---|---|---|---|---|---|
| Heat | -10% | -8% | 21% | -19% | -7% | |
| Maximum Upper Side * (°C) | 41 | 44.8 -9% | 49 -20% | 40 2% | 55 -34% | 43.8 -7% |
| Maximum Bottom * (°C) | 41 | 48 -17% | 63 -54% | 33.6 18% | 66 -61% | 55.4 -35% |
| Idle Upper Side * (°C) | 37 | 37.2 -1% | 30 19% | 26.6 28% | 33 11% | 32.8 11% |
| Idle Bottom * (°C) | 38 | 42 -11% | 29 24% | 24.4 36% | 35 8% | 36 5% |
* ... más pequeño es mejor
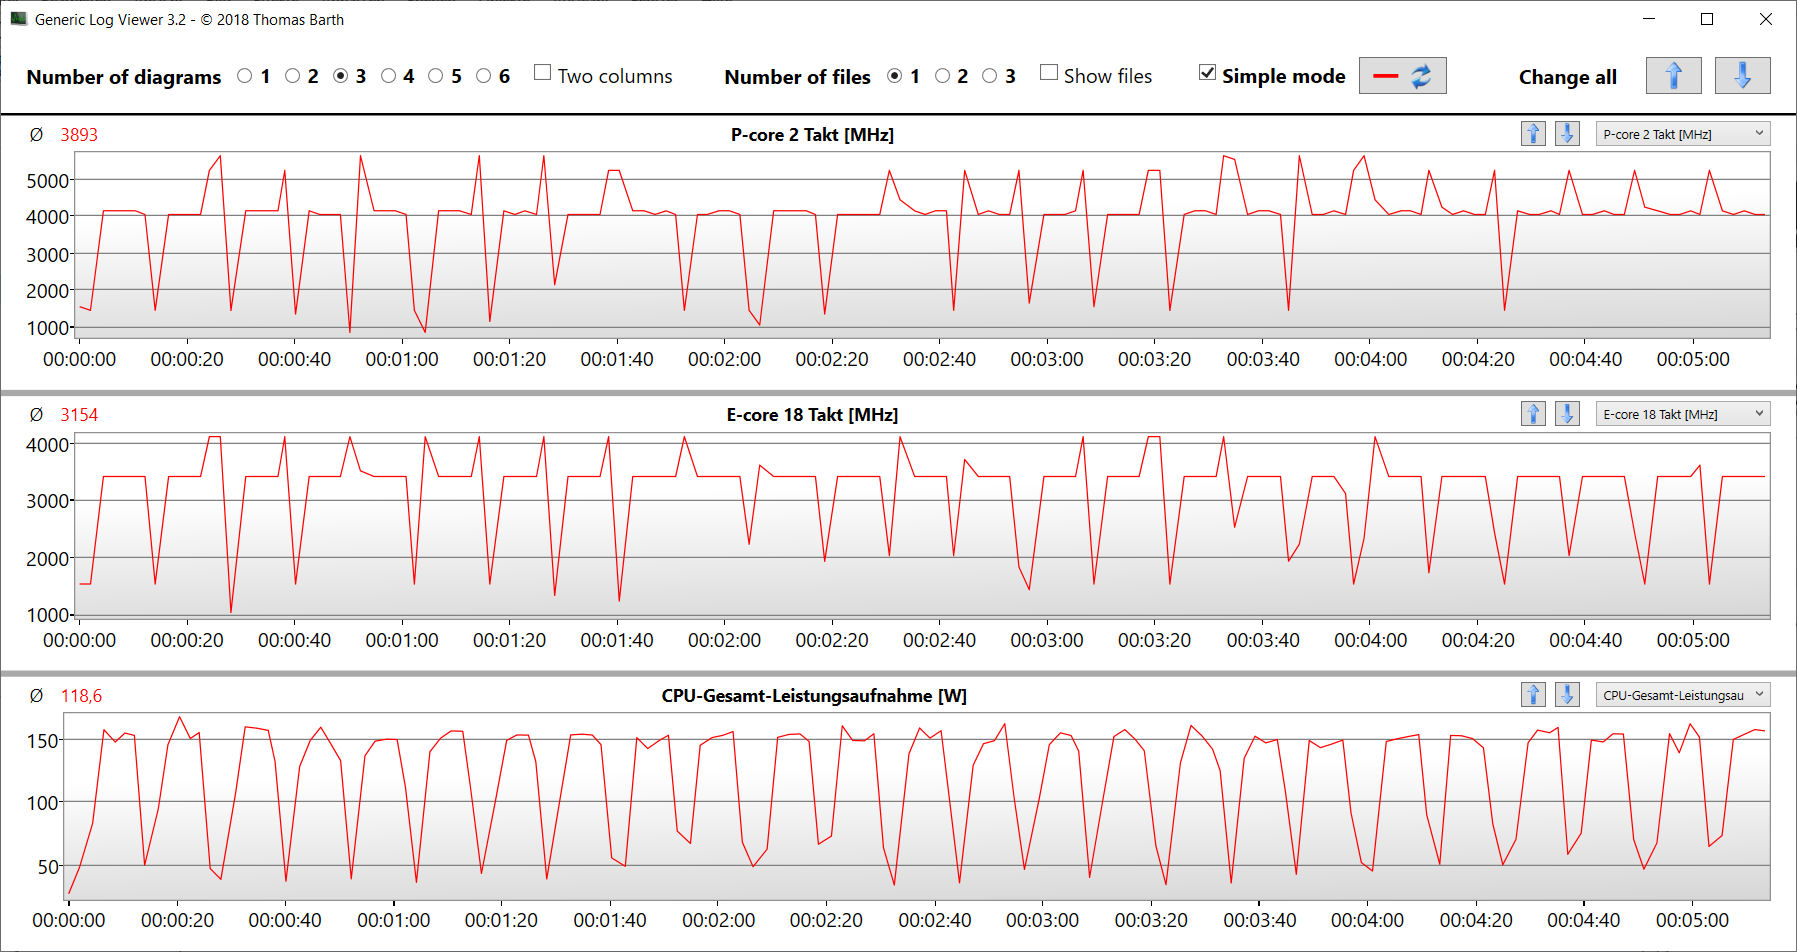
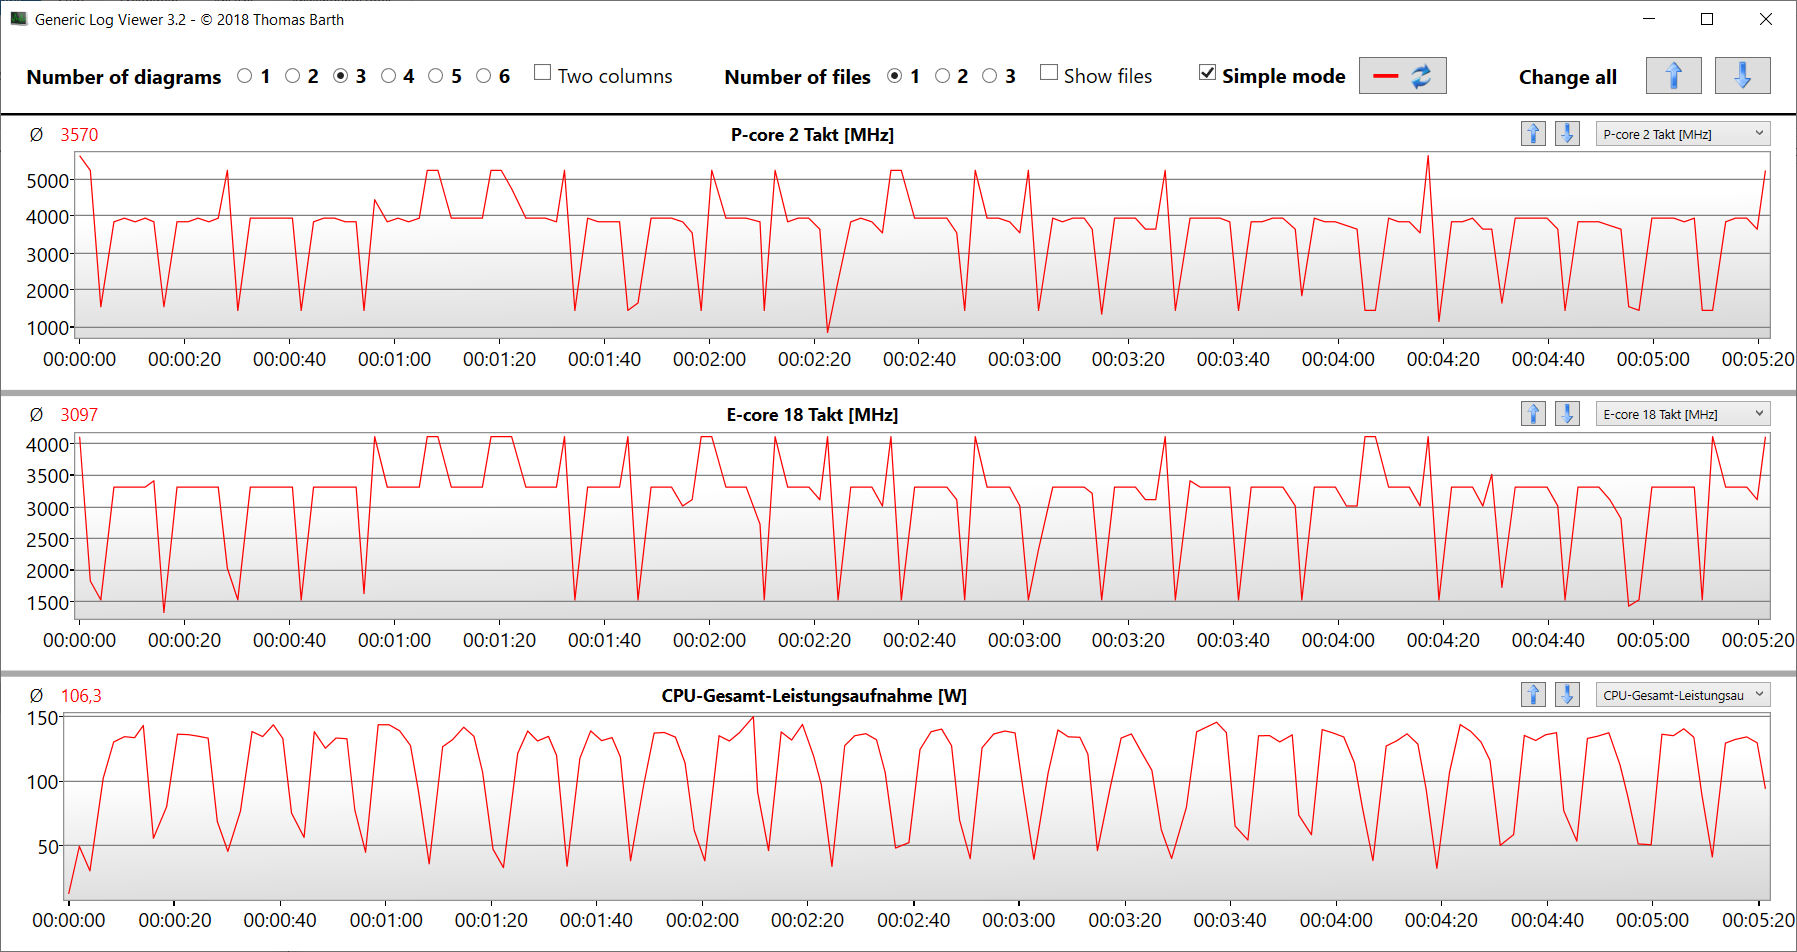
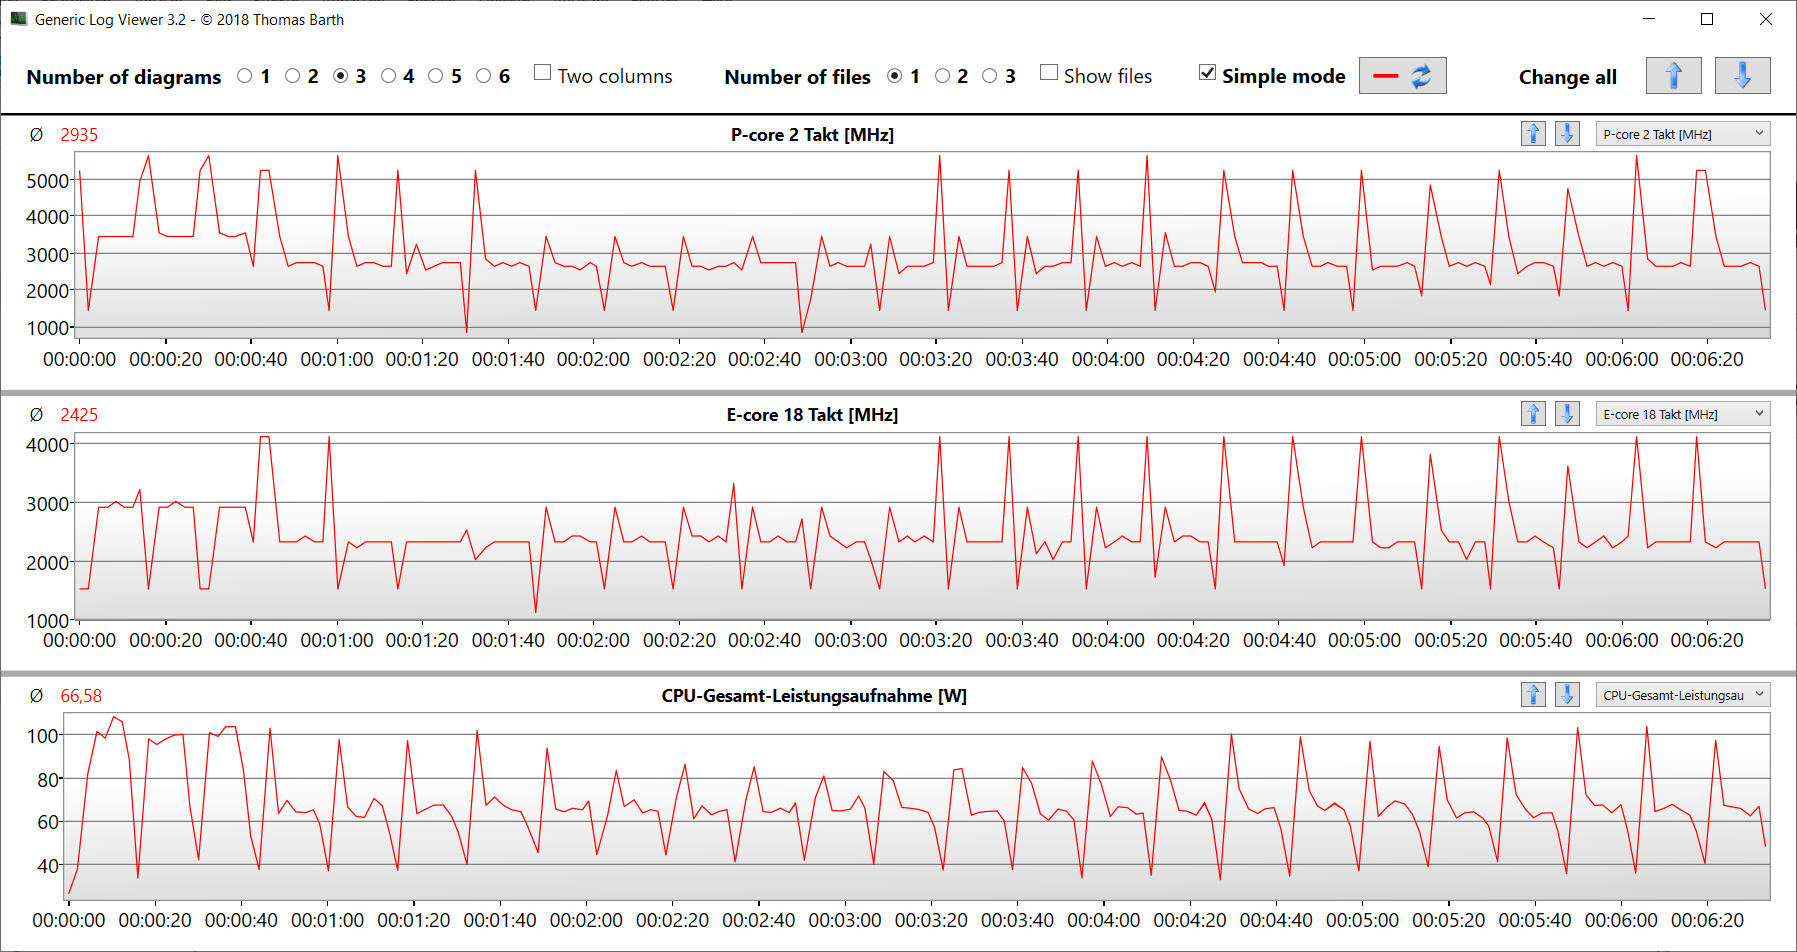
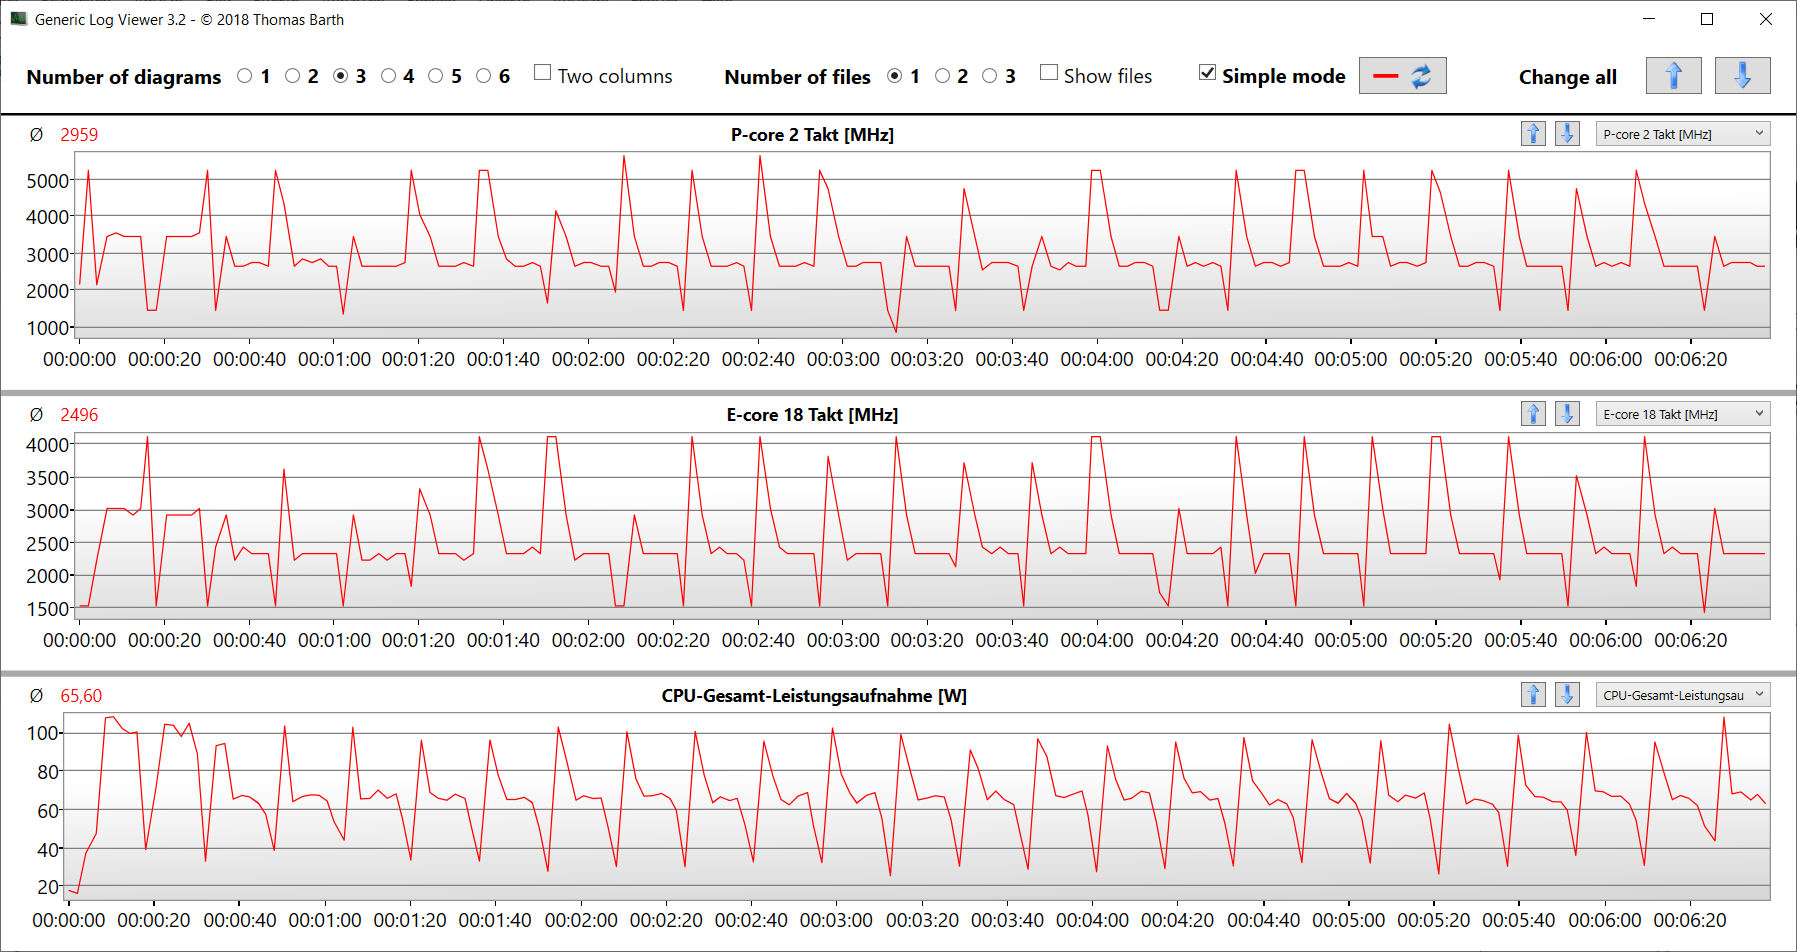
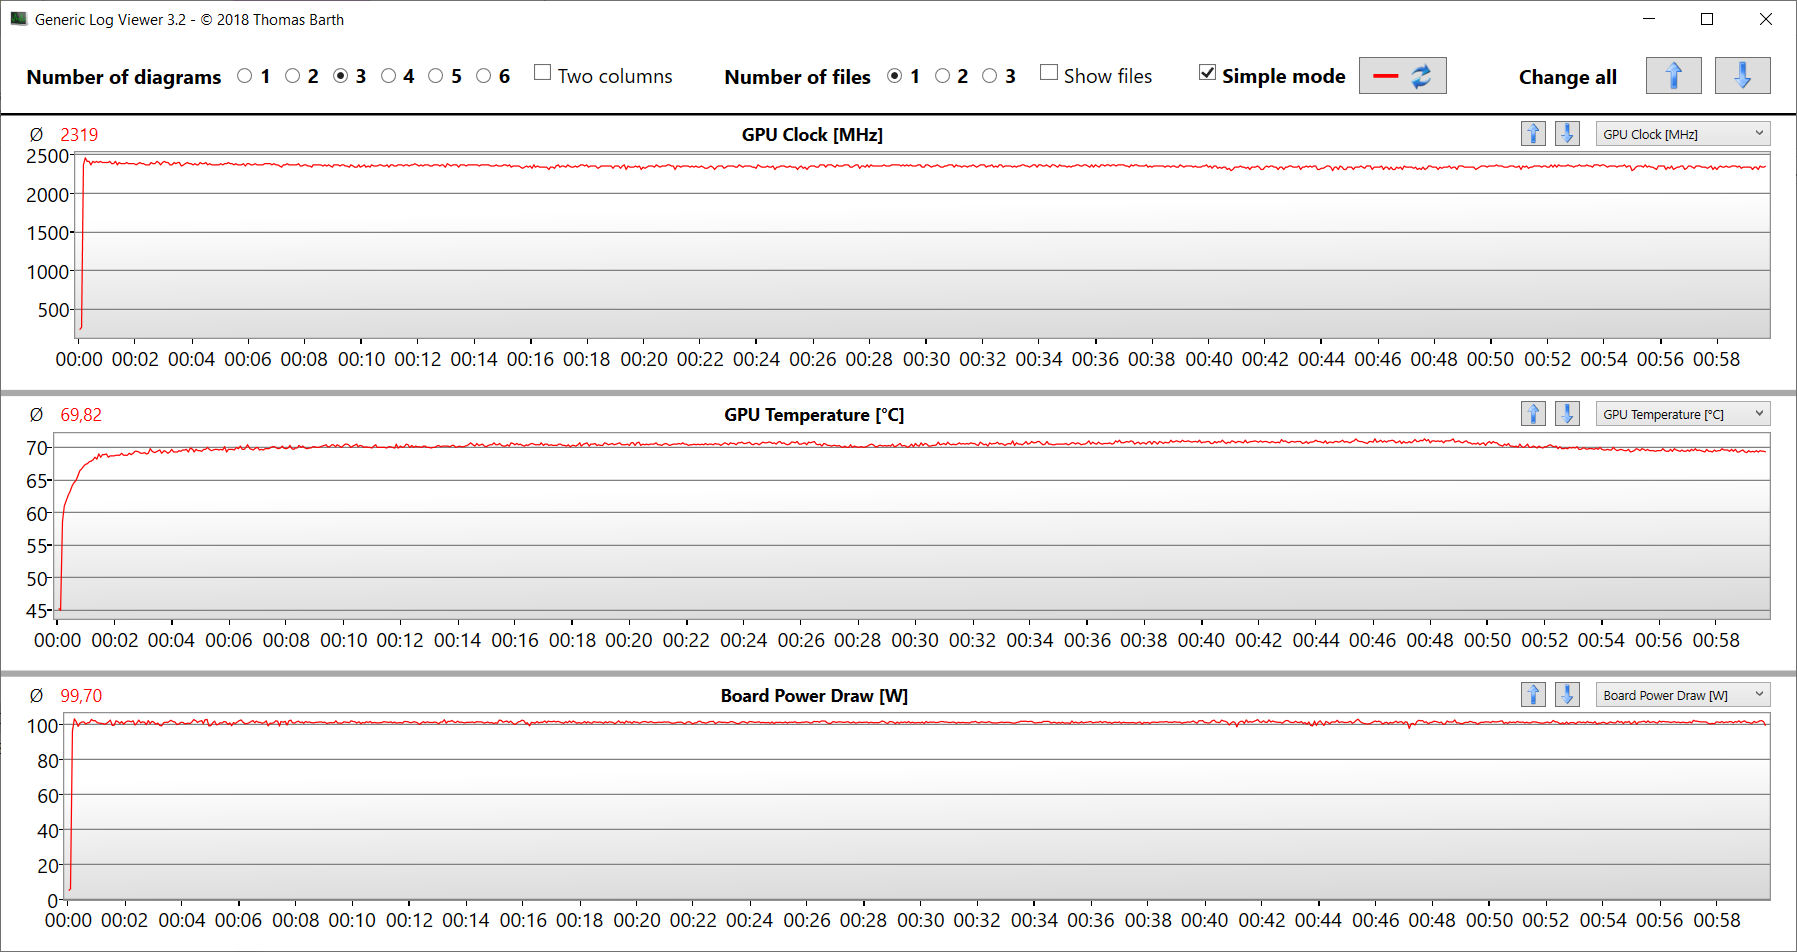
Prueba de esfuerzo
El escenario de la prueba de estrés extremo (Prime95 y Furmark en funcionamiento continuo) comprueba la estabilidad del sistema a plena carga. El reloj de la CPU fluctuó entre 1 y 3 GHz durante bastante tiempo, pero se estabilizó en un nivel bajo al cabo de un rato. El núcleo gráfico funcionó a altas velocidades.
Altavoces
Los altavoces estéreo del portátil producen un buen sonido en general. Se puede conseguir una experiencia de sonido aún mejor utilizando auriculares o altavoces externos.
Aorus 16X 2024 análisis de audio
(+) | los altavoces pueden reproducir a un volumen relativamente alto (#85 dB)
Graves 100 - 315 Hz
(±) | lubina reducida - en promedio 8.5% inferior a la mediana
(±) | la linealidad de los graves es media (8.3% delta a frecuencia anterior)
Medios 400 - 2000 Hz
(+) | medios equilibrados - a sólo 3.1% de la mediana
(+) | los medios son lineales (5.8% delta a la frecuencia anterior)
Altos 2 - 16 kHz
(+) | máximos equilibrados - a sólo 2.5% de la mediana
(±) | la linealidad de los máximos es media (7% delta a frecuencia anterior)
Total 100 - 16.000 Hz
(+) | el sonido global es lineal (8.4% de diferencia con la mediana)
En comparación con la misma clase
» 2% de todos los dispositivos probados de esta clase eran mejores, 1% similares, 97% peores
» El mejor tuvo un delta de 6%, la media fue 18%, el peor fue ###max##%
En comparación con todos los dispositivos probados
» 2% de todos los dispositivos probados eran mejores, 1% similares, 97% peores
» El mejor tuvo un delta de 4%, la media fue 24%, el peor fue ###max##%
Alienware m16 R2 análisis de audio
(+) | los altavoces pueden reproducir a un volumen relativamente alto (#82.4 dB)
Graves 100 - 315 Hz
(-) | casi sin bajos - de media 20.1% inferior a la mediana
(±) | la linealidad de los graves es media (11.1% delta a frecuencia anterior)
Medios 400 - 2000 Hz
(+) | medios equilibrados - a sólo 2.2% de la mediana
(+) | los medios son lineales (3.1% delta a la frecuencia anterior)
Altos 2 - 16 kHz
(+) | máximos equilibrados - a sólo 2.2% de la mediana
(+) | los máximos son lineales (3.5% delta a la frecuencia anterior)
Total 100 - 16.000 Hz
(+) | el sonido global es lineal (12.9% de diferencia con la mediana)
En comparación con la misma clase
» 17% de todos los dispositivos probados de esta clase eran mejores, 4% similares, 79% peores
» El mejor tuvo un delta de 6%, la media fue 18%, el peor fue ###max##%
En comparación con todos los dispositivos probados
» 12% de todos los dispositivos probados eran mejores, 3% similares, 85% peores
» El mejor tuvo un delta de 4%, la media fue 24%, el peor fue ###max##%
Gestión de la energía - El portátil para juegos con una resistencia decente
Consumo de energía
El consumo de energía del dispositivo está en un nivel normal para el hardware instalado. Aunque la Witcher 3 prueba se desarrolló con un consumo de energía constante, la demanda del portátil fluctuó significativamente en los primeros minutos de la prueba de estrés. La fuente de alimentación (240 vatios) tiene un tamaño suficiente.
| Off / Standby | |
| Ocioso | |
| Carga |
|
Clave:
min: | |
| Aorus 16X 2024 i9-14900HX, GeForce RTX 4070 Laptop GPU | Alienware m16 R2 Ultra 7 155H, GeForce RTX 4070 Laptop GPU | HP Omen Transcend 16-u1095ng i9-14900HX, GeForce RTX 4070 Laptop GPU | Asus TUF Gaming A17 FA707XI-NS94 R9 7940HS, GeForce RTX 4070 Laptop GPU | Schenker XMG Pro 16 Studio (Mid 23) i9-13900H, GeForce RTX 4070 Laptop GPU | Media de la clase Gaming | |
|---|---|---|---|---|---|---|
| Power Consumption | 12% | 7% | 17% | 23% | 6% | |
| Idle Minimum * (Watt) | 13 | 8.1 38% | 10 23% | 6.2 52% | 8 38% | 13.2 ? -2% |
| Idle Average * (Watt) | 18 | 13 28% | 18 -0% | 21.8 -21% | 12 33% | 18.9 ? -5% |
| Idle Maximum * (Watt) | 35 | 40.3 -15% | 32 9% | 22 37% | 23 34% | 24.3 ? 31% |
| Load Average * (Watt) | 138 | 79 43% | 128 7% | 59.2 57% | 94 32% | 108.3 ? 22% |
| Witcher 3 ultra * (Watt) | 172.6 | 188.1 -9% | 148.4 14% | 189.7 -10% | 181.5 -5% | |
| Load Maximum * (Watt) | 222 | 254.9 -15% | 242 -9% | 247.8 -12% | 215 3% | 254 ? -14% |
* ... más pequeño es mejor
Power consumption Witcher 3 / stress test
Power consumption with external monitor
Tiempos de ejecución
El dispositivo de 16 pulgadas logró tiempos de ejecución de 8:01 h y 9:01 h durante la prueba WLAN (acceso a sitios web mediante un script) y la prueba de vídeo (cortometraje Big Buck Bunny (codificación H.264, FHD) en bucle). En conjunto, el Aorus 16X ofreció muy buenos resultados. Sin embargo, ninguno de los ordenadores de la comparación se acercó a la resistencia del Asus A17.
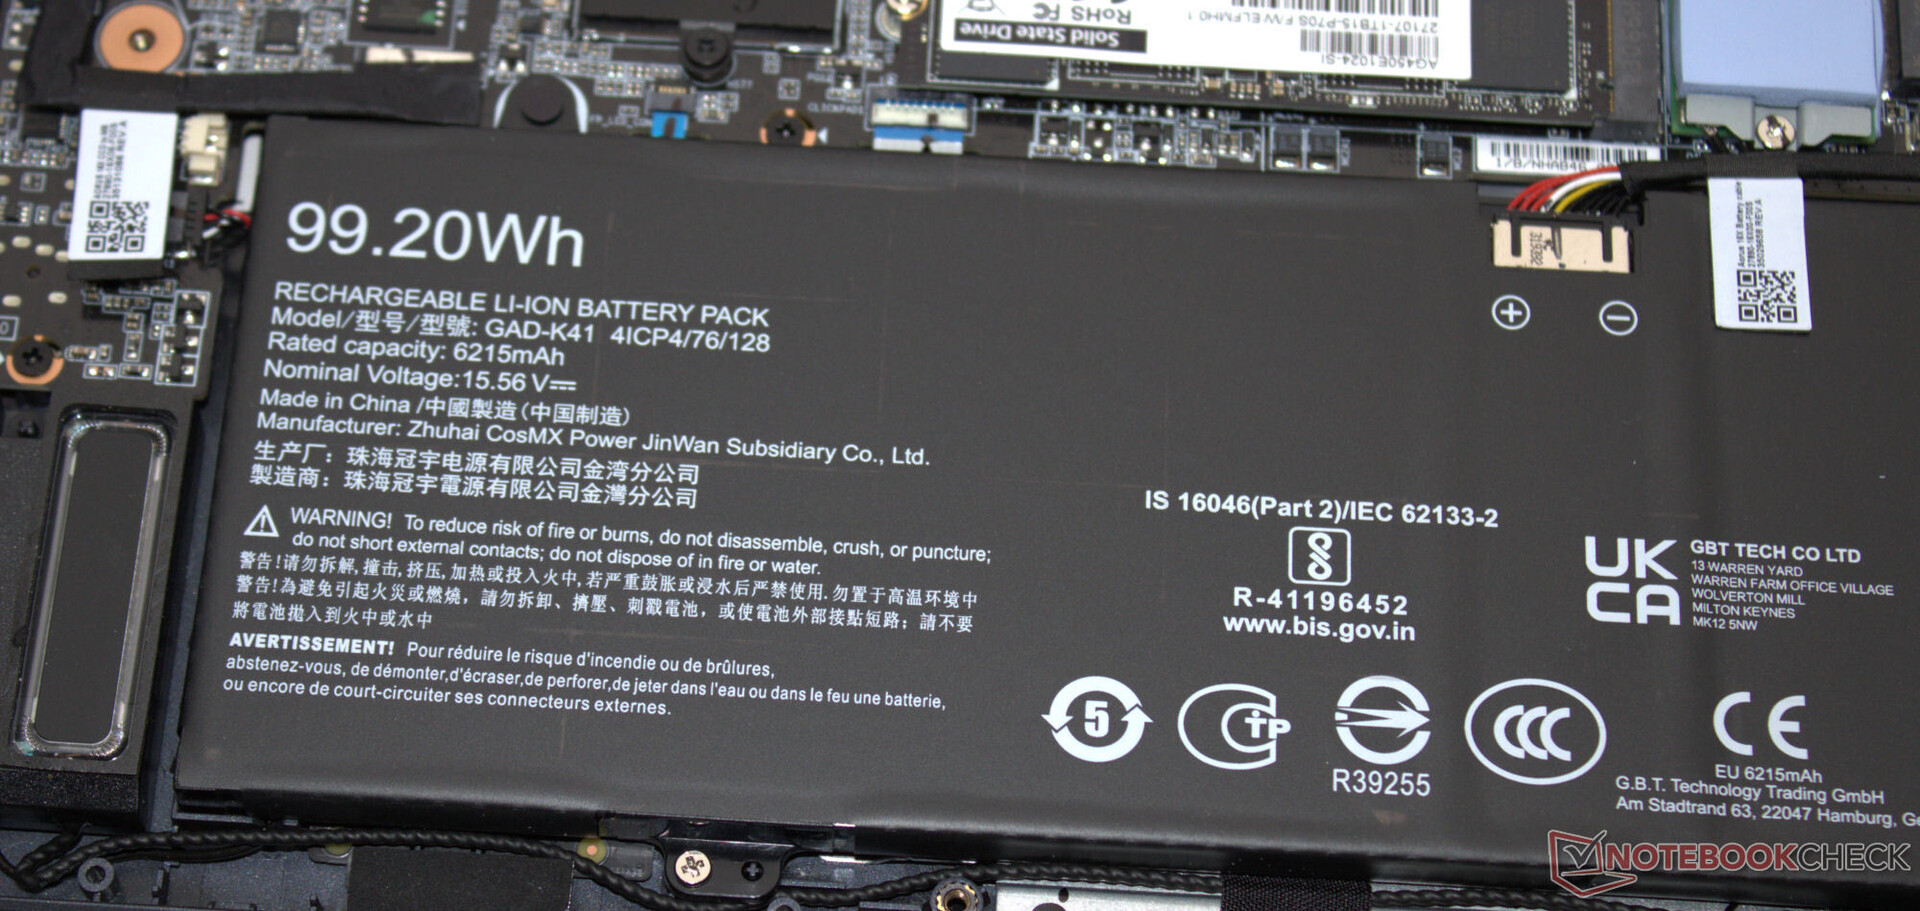
| Aorus 16X 2024 i9-14900HX, GeForce RTX 4070 Laptop GPU, 99 Wh | Alienware m16 R2 Ultra 7 155H, GeForce RTX 4070 Laptop GPU, 90 Wh | HP Omen Transcend 16-u1095ng i9-14900HX, GeForce RTX 4070 Laptop GPU, 97 Wh | Asus TUF Gaming A17 FA707XI-NS94 R9 7940HS, GeForce RTX 4070 Laptop GPU, 90 Wh | Schenker XMG Pro 16 Studio (Mid 23) i9-13900H, GeForce RTX 4070 Laptop GPU, 73 Wh | Lenovo Legion Pro 5 16IRX9 i9-14900HX, GeForce RTX 4070 Laptop GPU, 80 Wh | Media de la clase Gaming | |
|---|---|---|---|---|---|---|---|
| Duración de Batería | -13% | -39% | 23% | -15% | -41% | -16% | |
| Reader / Idle (h) | 12.6 | 12.6 0% | 19.7 56% | 6.7 -47% | 8.71 ? -31% | ||
| H.264 (h) | 9 | 8.26 ? -8% | |||||
| WiFi v1.3 (h) | 8 | 8.1 1% | 4.9 -39% | 9.1 14% | 6.8 -15% | 4.8 -40% | 7.04 ? -12% |
| Load (h) | 1.7 | 1 -41% | 1.7 0% | 1.1 -35% | 1.47 ? -14% |
Pro
Contra
Veredicto - Un portátil para juegos de gama media-alta muy completo
La Aorus 16X está optimizada para juegos, streaming y renderizado QHD+. El Core i9-14900HX y la GeForce RTX 4070 ofrecen el rendimiento necesario. La CPU y el núcleo gráfico funcionan a velocidades de reloj constantemente altas. Dos rápidas unidades SSD PCIe-4 (de 1 TB cada una) garantizan tiempos de carga cortos.
El Aorus 16X (2024) de Gigabyte es un portátil potente y bien equipado para jugadores y creadores que no parece tener grandes defectos.
El portátil no se calienta especialmente bajo carga, pero puede producir bastante ruido. Un funcionamiento más silencioso se produce a expensas de algo de rendimiento informático. La pantalla IPS instalada (16 pulgadas, 2.560 x 1.600 píxeles, 165 Hz) presenta una relación de aspecto 16:10 favorable para el trabajo y nos dejó una buena impresión general. En particular, hace gala de un brillo extremadamente bueno.
Dos puertos USB-C (1x Thunderbolt 4, 1x USB 3.2 Gen 2) facilitan la integración del portátil en las configuraciones existentes en el lugar de trabajo y abren más opciones de ampliación (GPU externa, docking). Ambos puertos pueden emitir una señal DisplayPort y, además, uno de ellos admite Power Delivery. Los tiempos de ejecución del dispositivo son impresionantes.
Una alternativa al Aorus 16X podría ser el Lenovo Legion Pro 5 16IRX9. Ofrece un rendimiento gráfico ligeramente superior utilizando la misma configuración de CPU/GPU, pero sólo cuenta con una unidad SSD y sigue utilizando un módulo WiFi 6E (Aorus: WiFi 7).
Precio y disponibilidad
Actualmente, el Aorus 16X ASG puede adquirirse por 1.949,99 dólares en Amazon.
Aorus 16X 2024
- 04/09/2024 v7 (old)
Sascha Mölck
Transparencia
La selección de los dispositivos que se van a reseñar corre a cargo de nuestro equipo editorial. La muestra de prueba fue proporcionada al autor en calidad de préstamo por el fabricante o el minorista a los efectos de esta reseña. El prestamista no tuvo ninguna influencia en esta reseña, ni el fabricante recibió una copia de la misma antes de su publicación. No había ninguna obligación de publicar esta reseña. Como empresa de medios independiente, Notebookcheck no está sujeta a la autoridad de fabricantes, minoristas o editores.
Así es como prueba Notebookcheck
Cada año, Notebookcheck revisa de forma independiente cientos de portátiles y smartphones utilizando procedimientos estandarizados para asegurar que todos los resultados son comparables. Hemos desarrollado continuamente nuestros métodos de prueba durante unos 20 años y hemos establecido los estándares de la industria en el proceso. En nuestros laboratorios de pruebas, técnicos y editores experimentados utilizan equipos de medición de alta calidad. Estas pruebas implican un proceso de validación en varias fases. Nuestro complejo sistema de clasificación se basa en cientos de mediciones y puntos de referencia bien fundamentados, lo que mantiene la objetividad.Price comparison

