Análisis del XMG Pro 16 Studio (Mid 23): El portátil RTX 4070 para jugadores y creadores
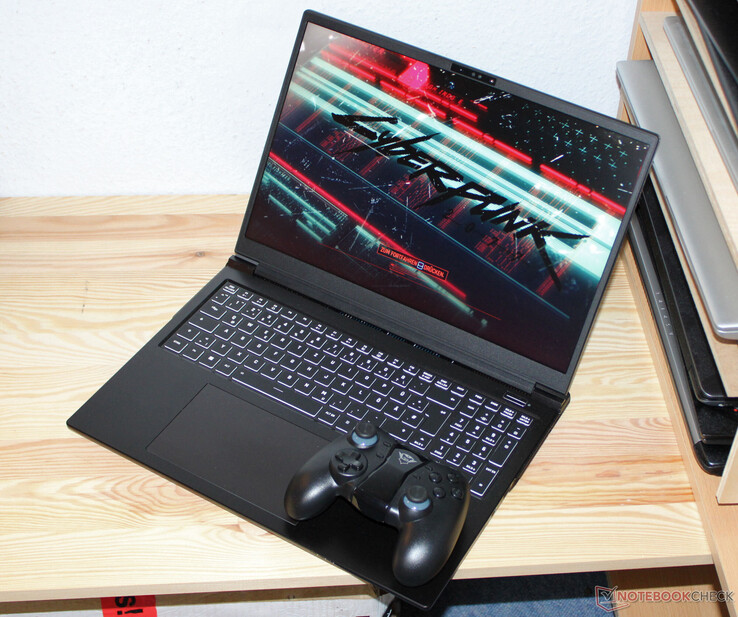
El XMG Pro 16 Studio (Mid 23) -un portátil de 16 pulgadas para jugadores y creadores- se basa en un barebone (PE60RNE-S) fabricado por Clevo y la variante actual puede encontrarse actualmente por unos 2.400 dólares. Entre sus competidores se encuentran elLenovo Legion Slim 7i 16 Gen 8, HP Omen Transcend 16, Asus Vivobook Pro 16X y elMSI Stealth 16 Studio A13VG.
Posibles contendientes en la comparación
Valoración | Fecha | Modelo | Peso | Altura | Tamaño | Resolución | Precio |
|---|---|---|---|---|---|---|---|
| 87.9 % v7 (old) | 10/2023 | Schenker XMG Pro 16 Studio (Mid 23) i9-13900H, GeForce RTX 4070 Laptop GPU | 2.6 kg | 19.9 mm | 16.00" | 2560x1600 | |
| 86.2 % v7 (old) | 07/2023 | Asus Vivobook Pro 16X K6604JV-MX016W i9-13980HX, GeForce RTX 4060 Laptop GPU | 2.1 kg | 22.8 mm | 16.00" | 3200x2000 | |
| 90 % v7 (old) | 07/2023 | Lenovo Legion Slim 7i 16 Gen 8 i9-13900H, GeForce RTX 4070 Laptop GPU | 2.1 kg | 19.9 mm | 16.00" | 2560x1600 | |
| 87.9 % v7 (old) | 08/2023 | HP Omen Transcend 16 i9-13900HX, GeForce RTX 4070 Laptop GPU | 2.3 kg | 19.8 mm | 16.00" | 2560x1600 | |
| 88.8 % v7 (old) | 07/2023 | MSI Stealth 16 Studio A13VG i7-13700H, GeForce RTX 4070 Laptop GPU | 2 kg | 19.95 mm | 16.00" | 2560x1600 |
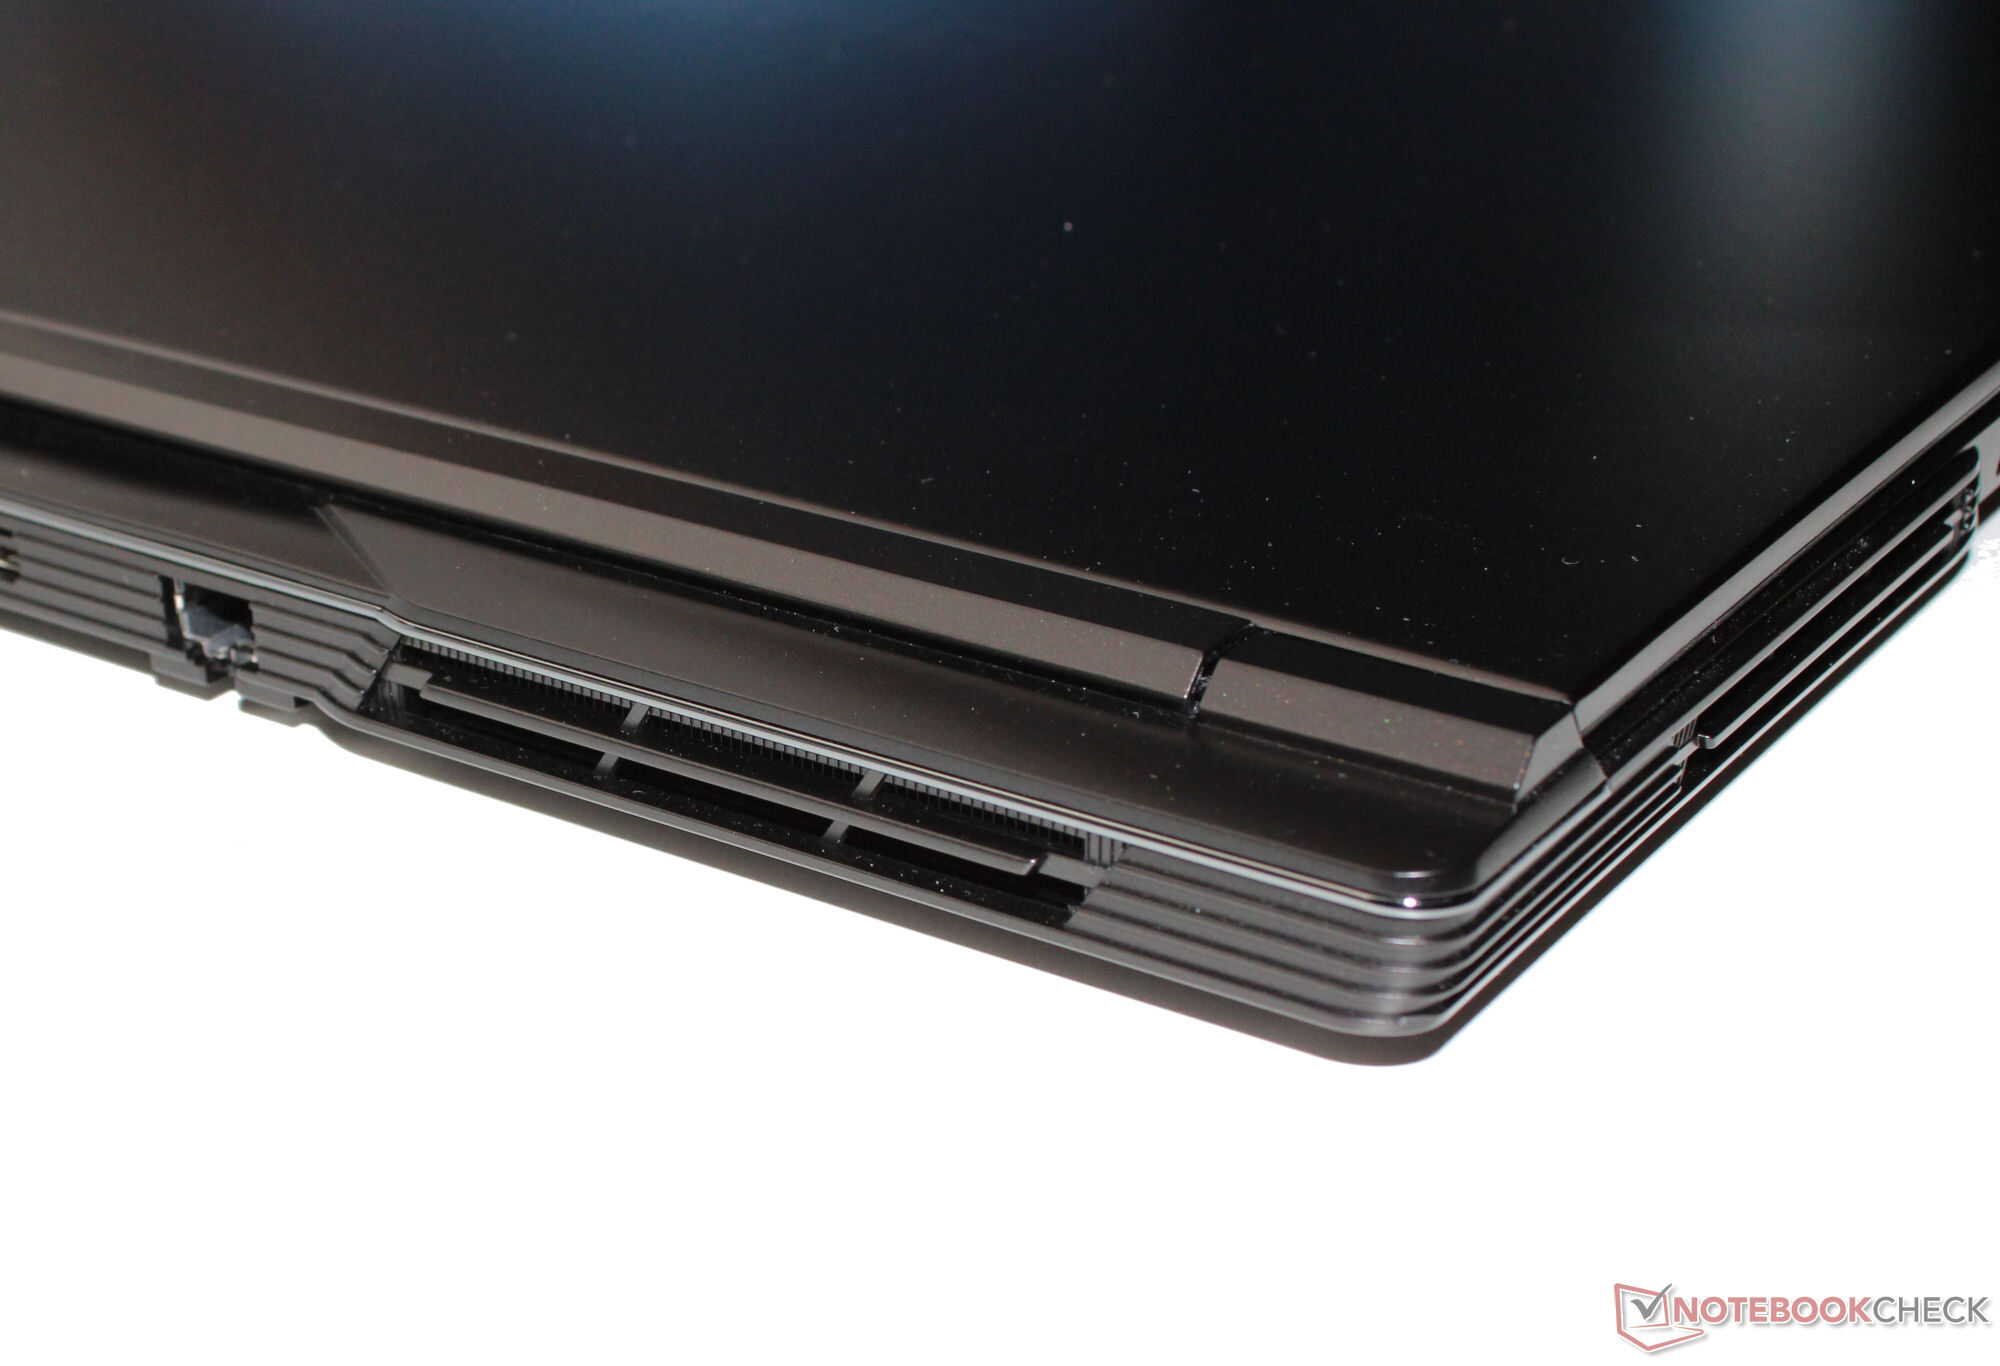
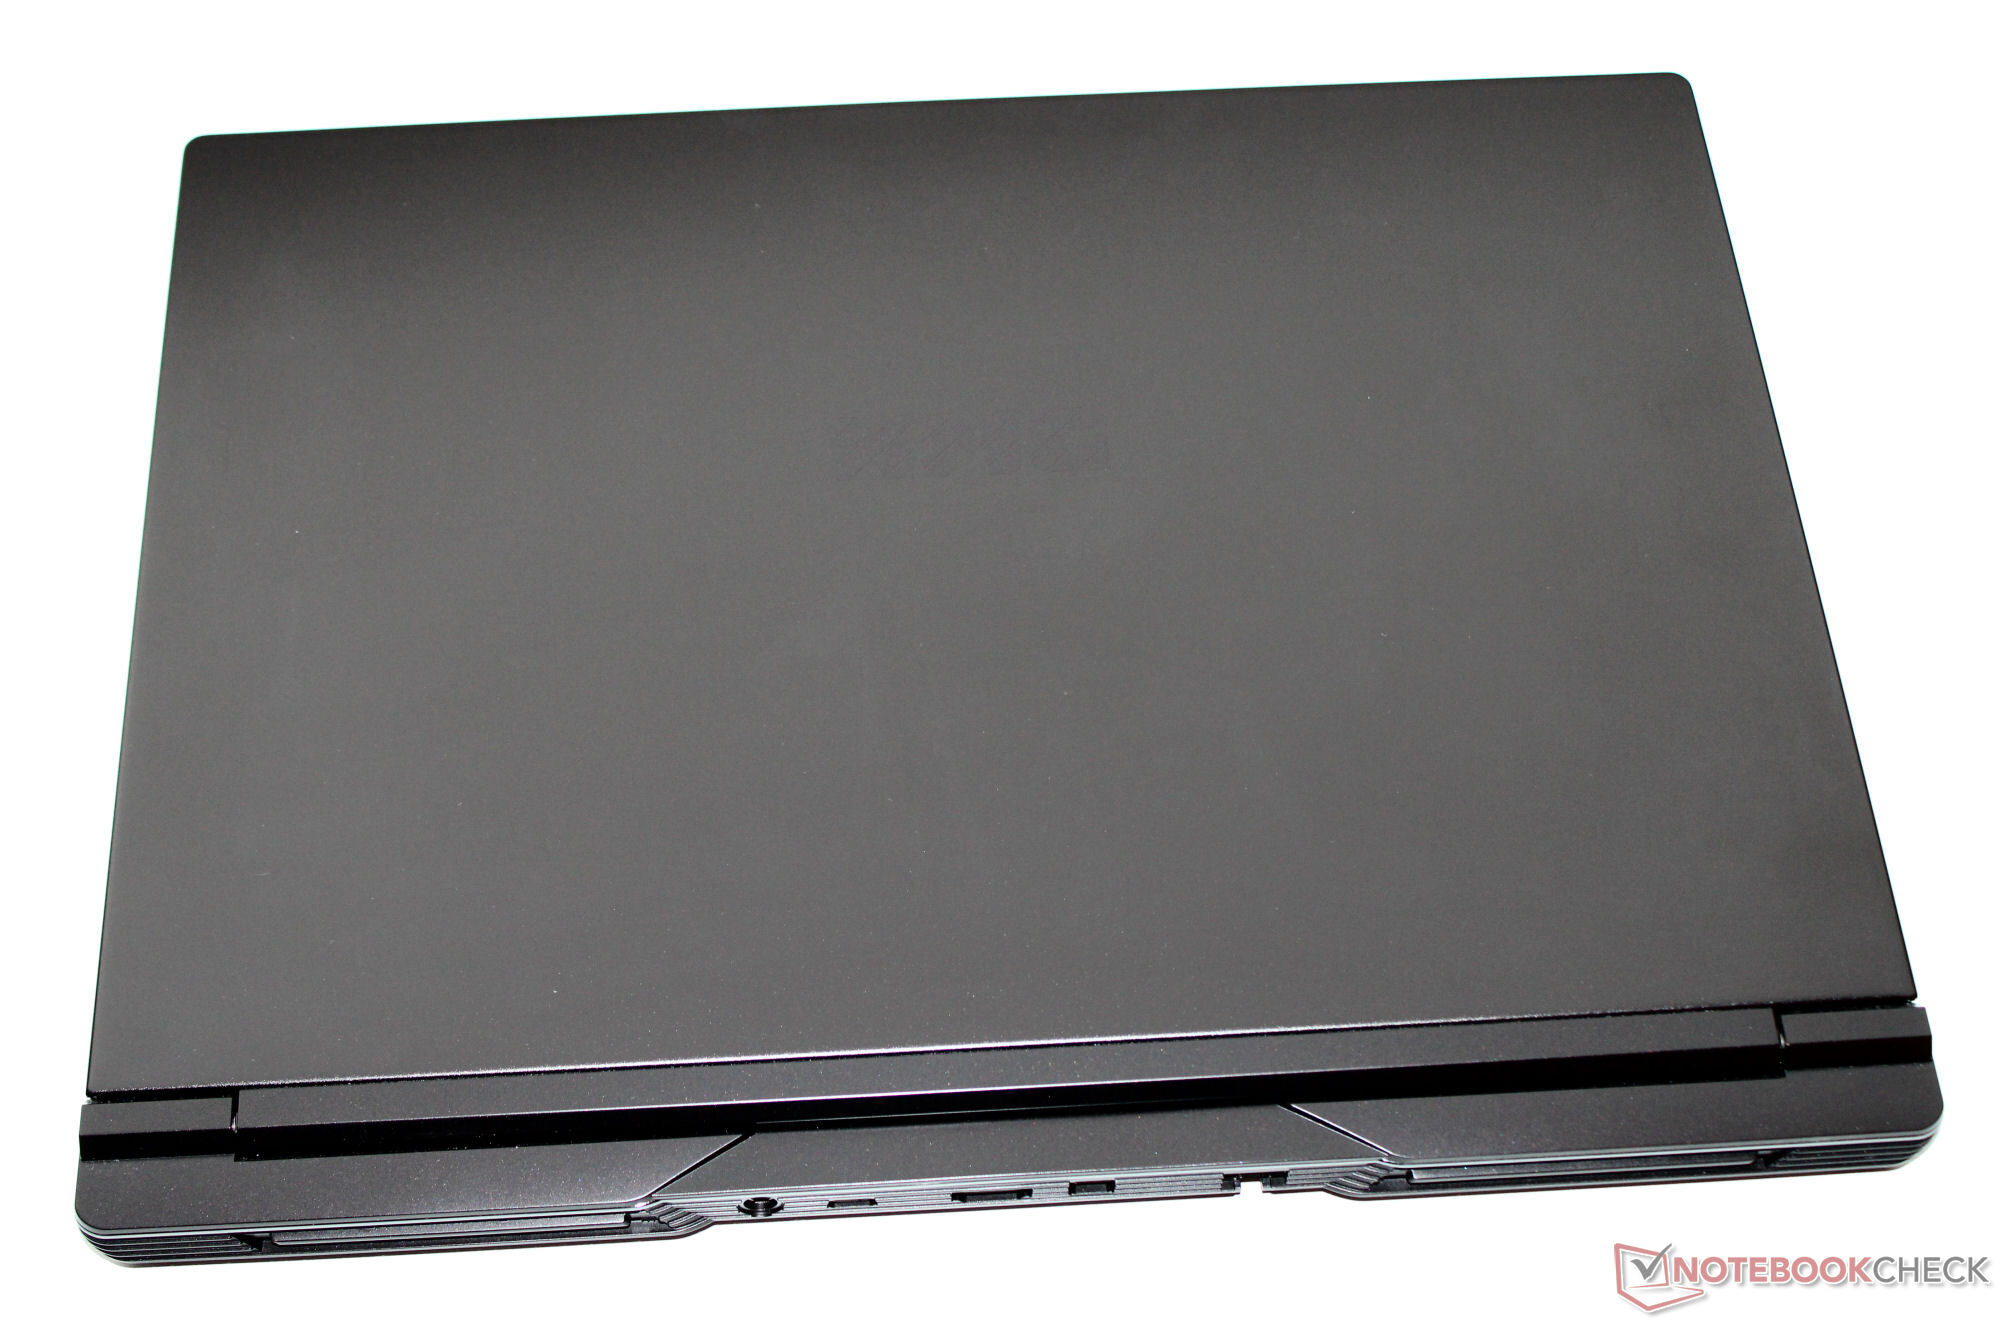
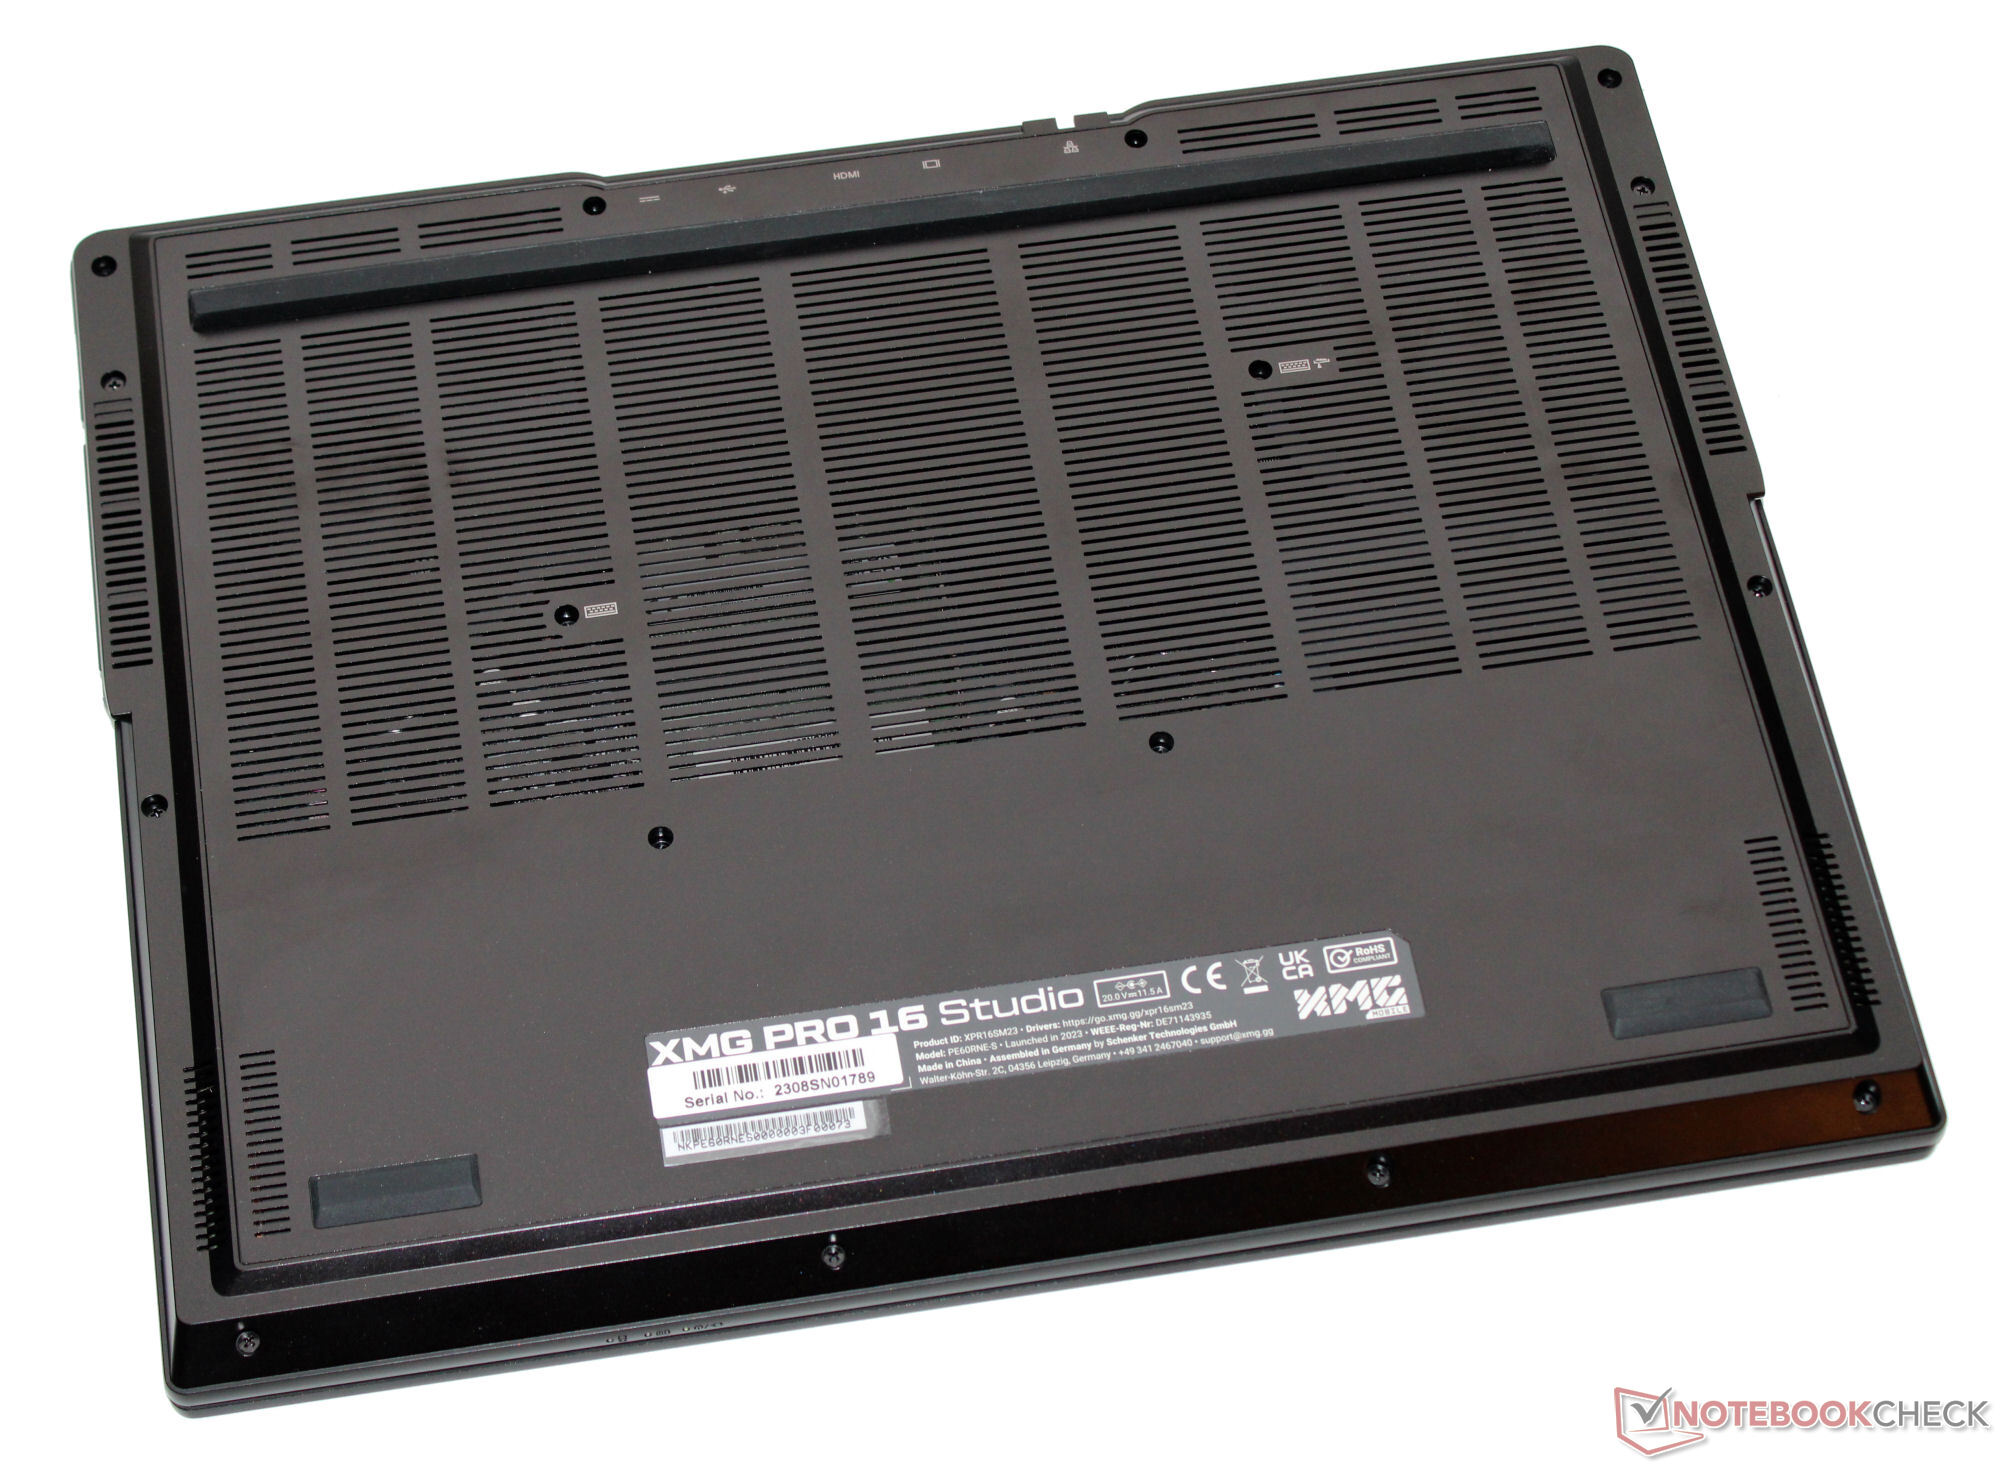
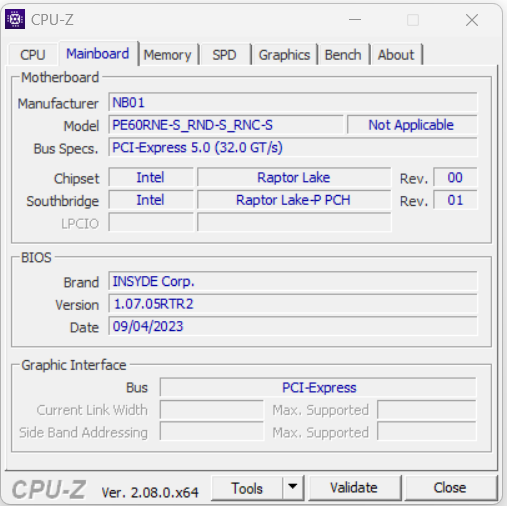
Caja y conectividad - Clevo barebone con Thunderbolt 4
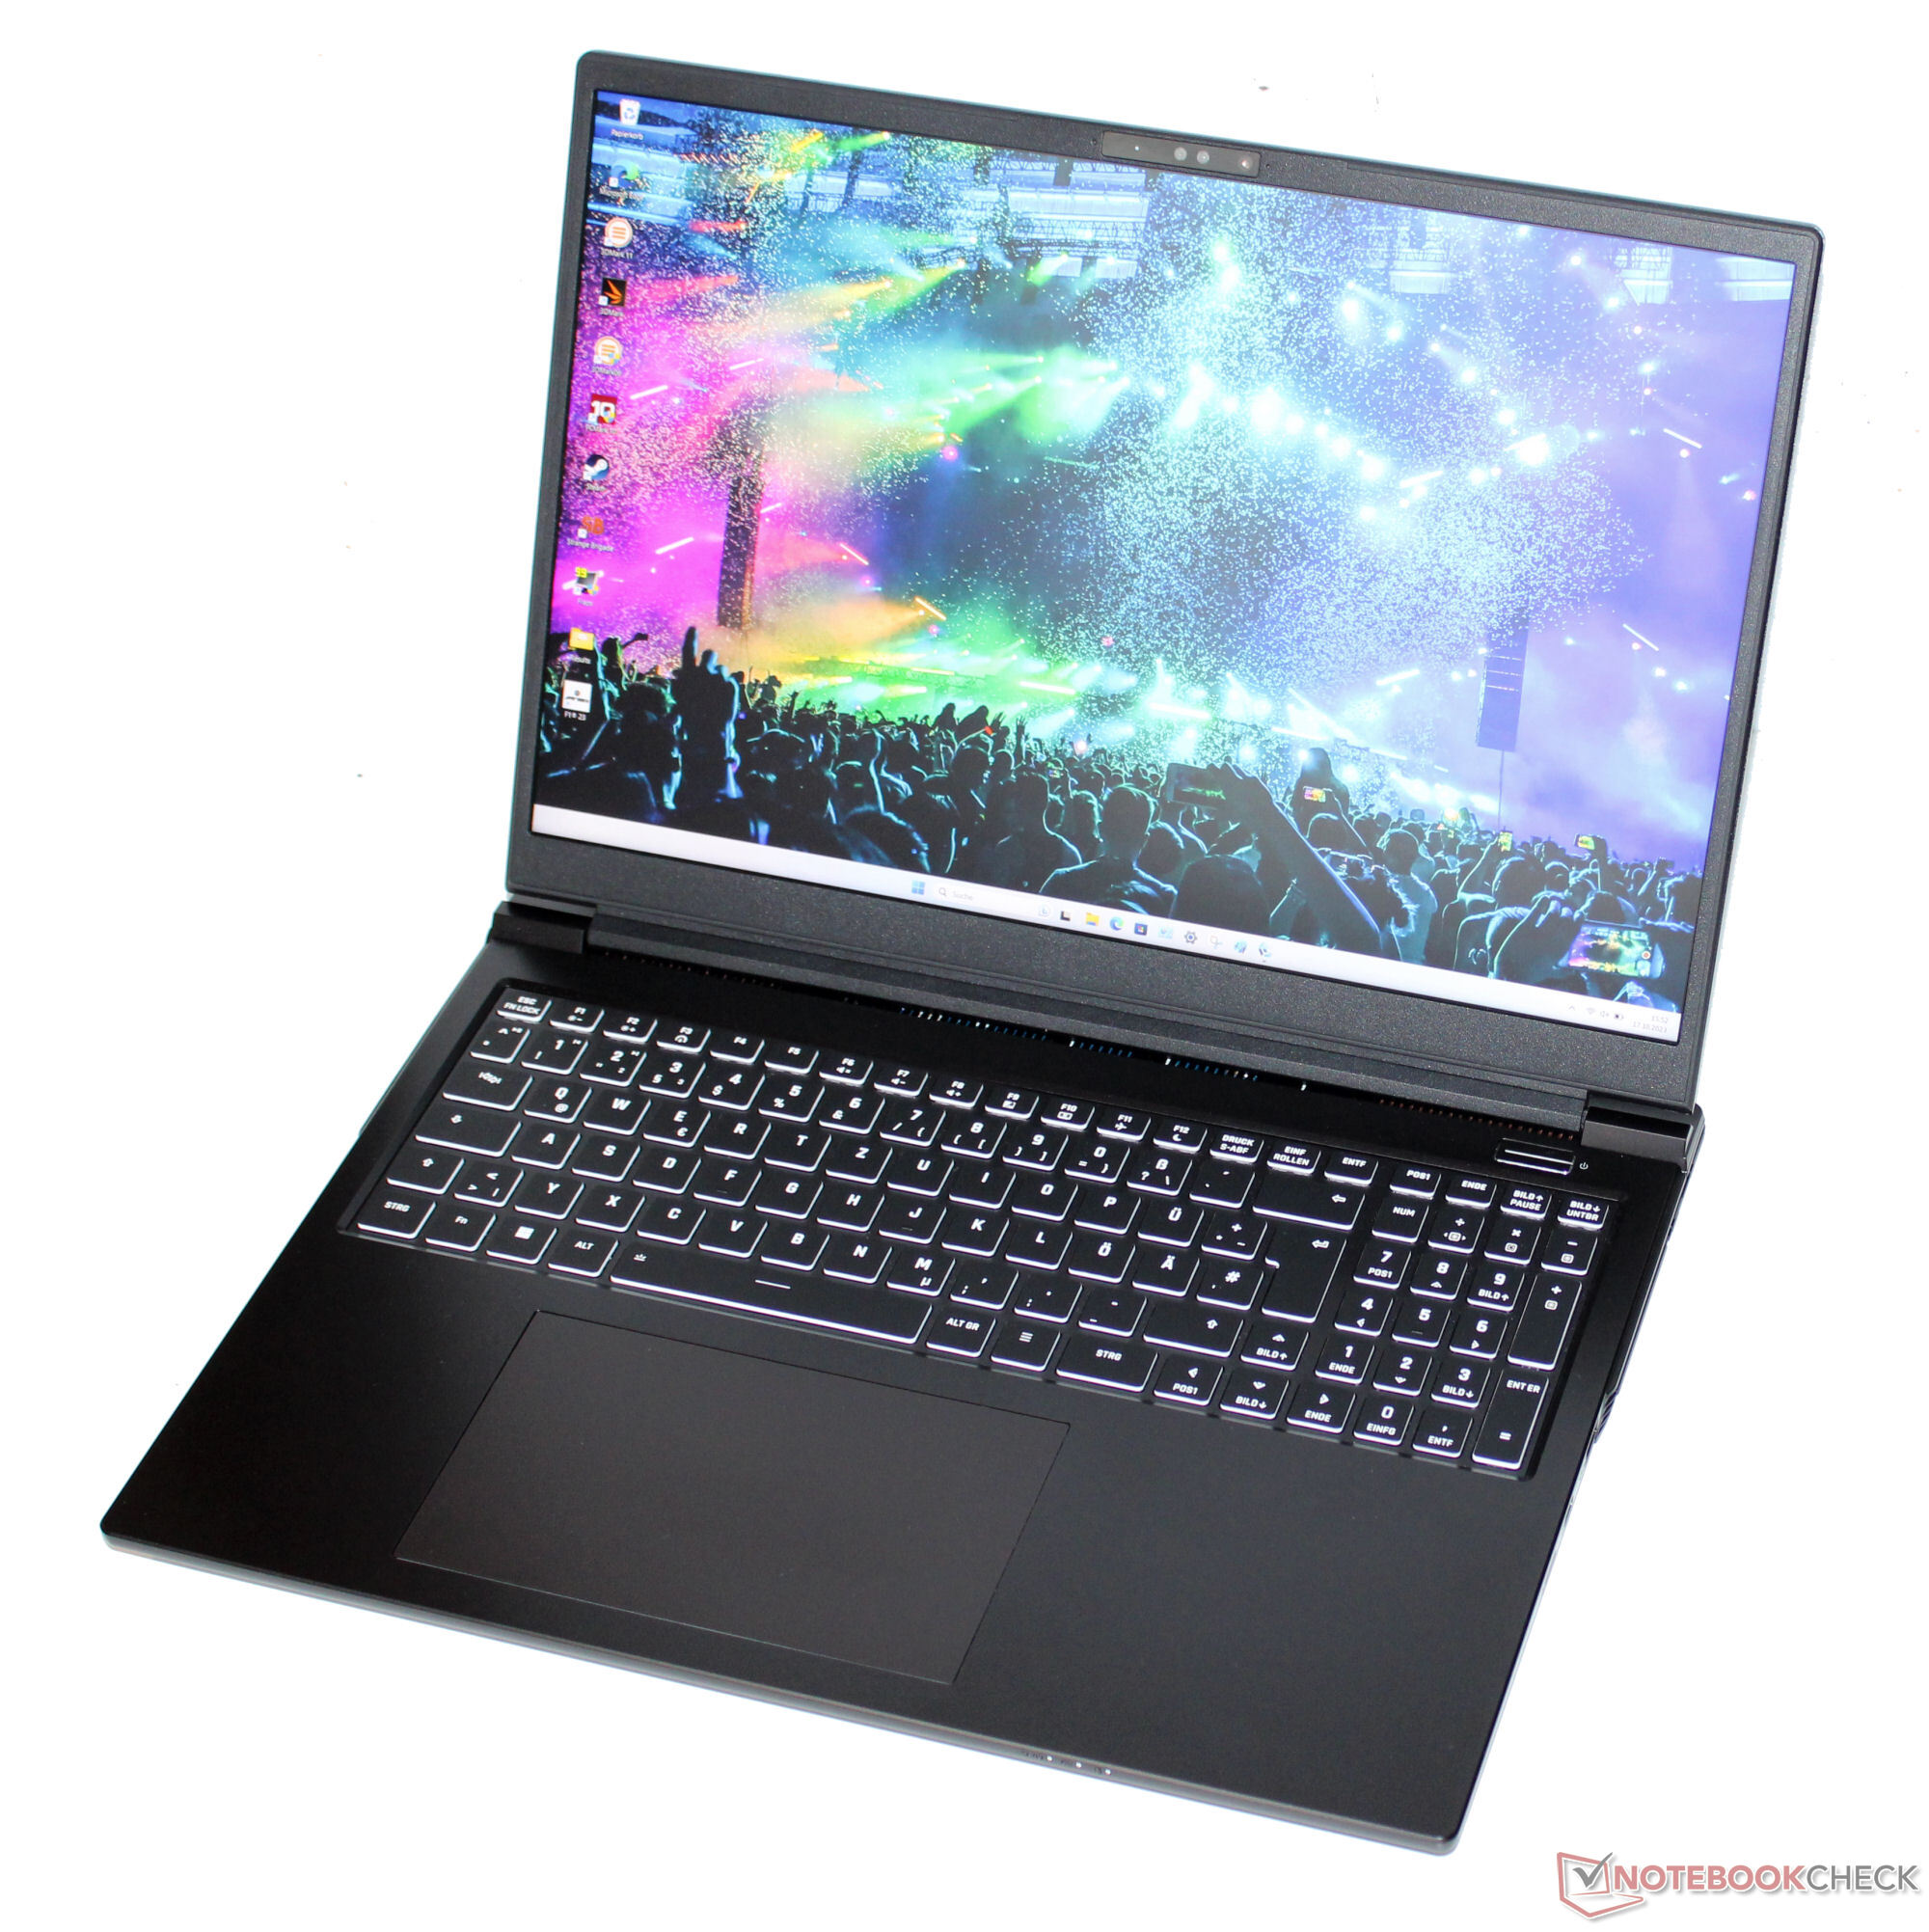
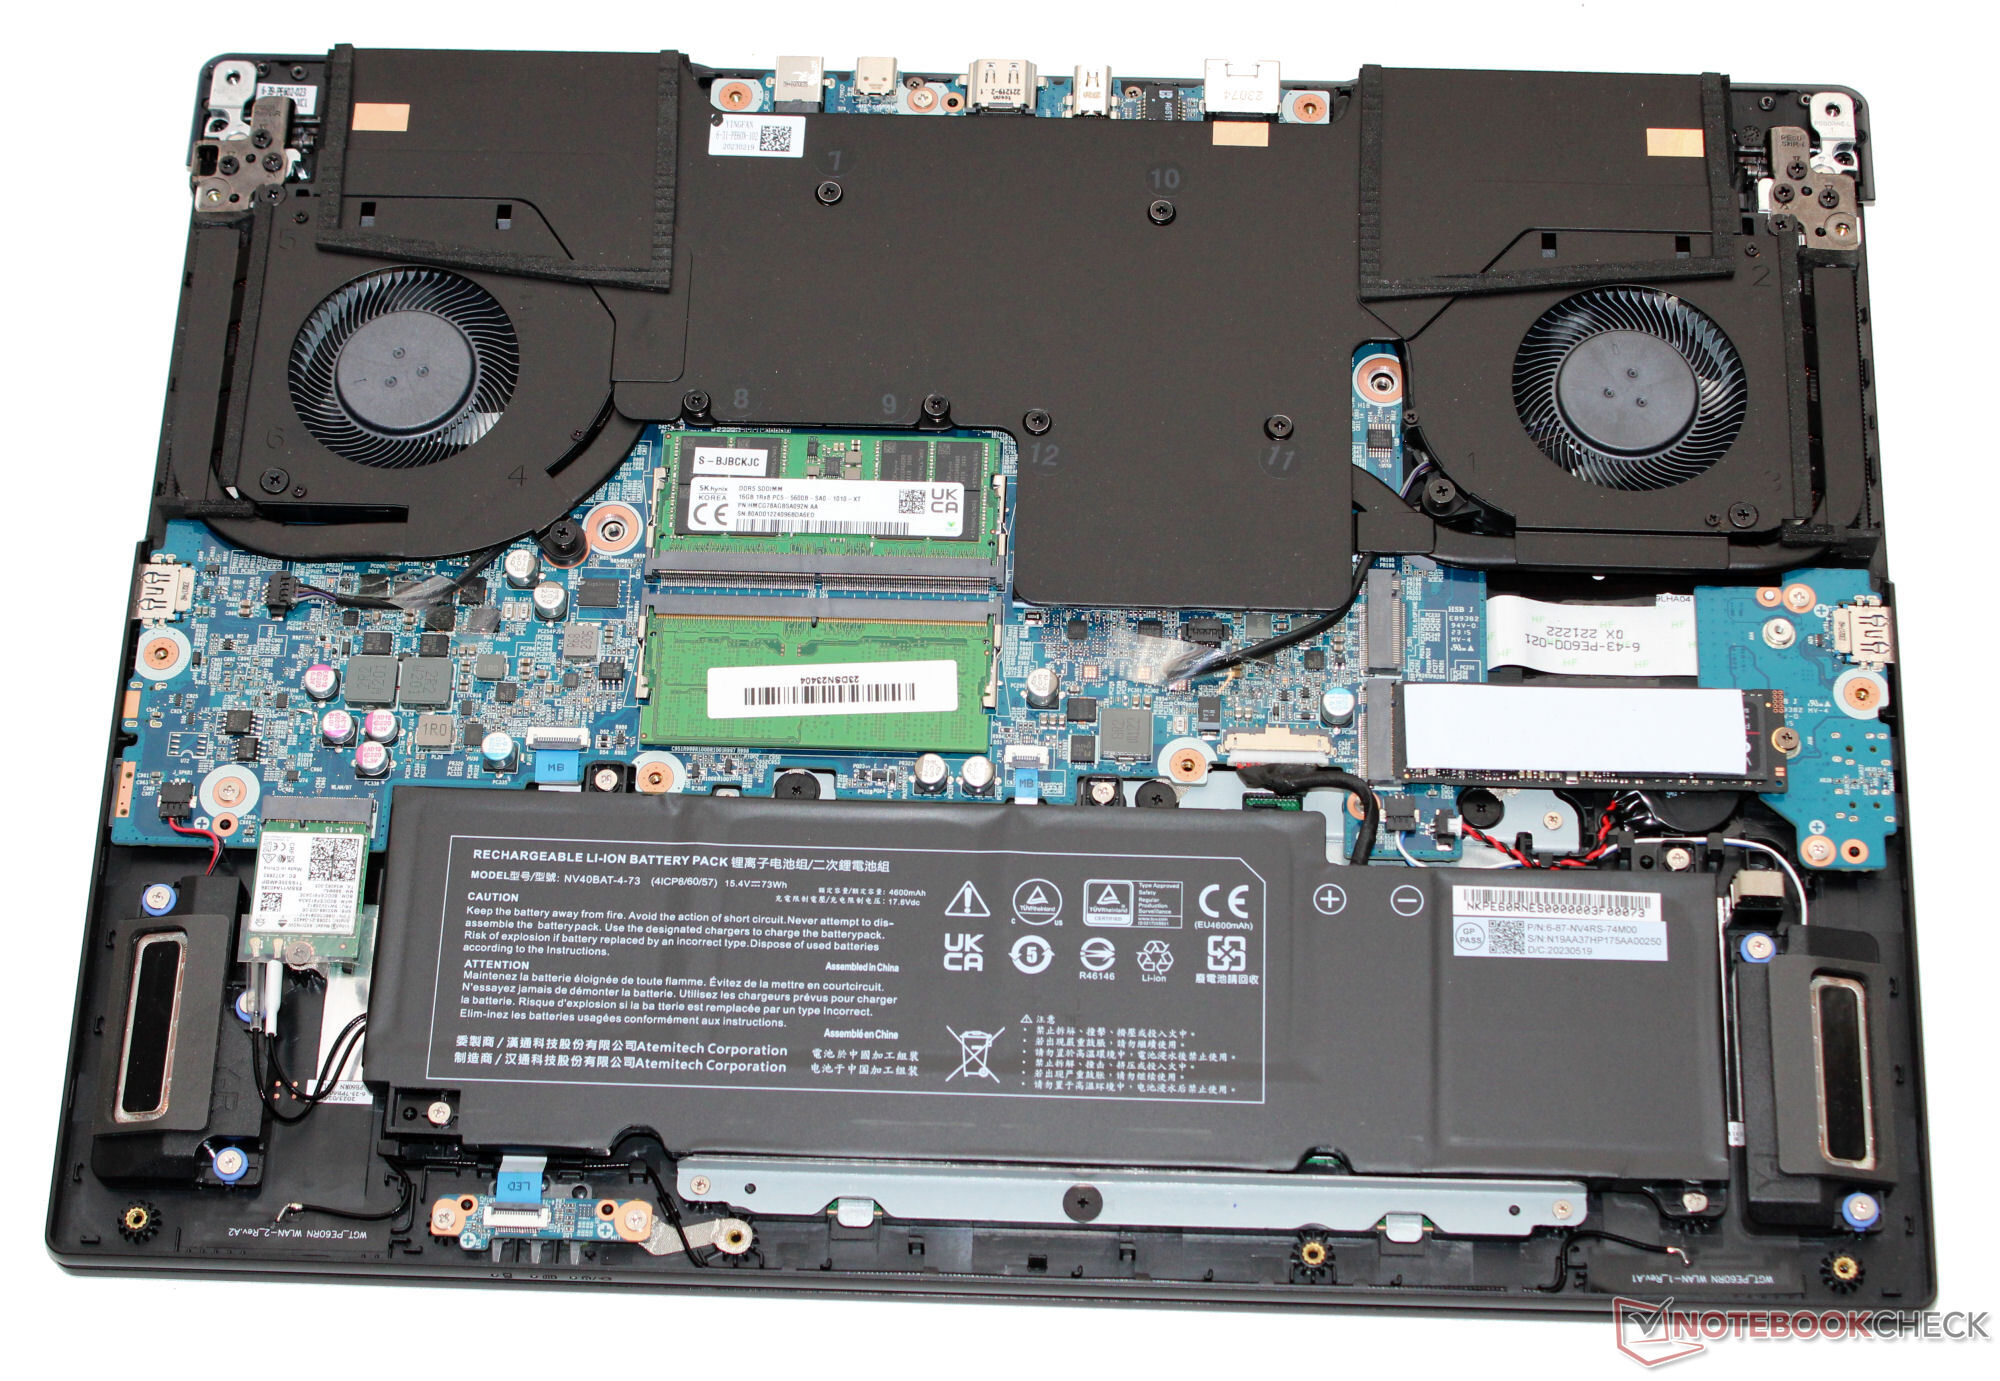
La tapa y el fondo del maletín negro mate son de aluminio y el resto de plástico. La carcasa, de diseño sutil, está bien construida. La unidad base y la tapa pueden torcerse ligeramente, pero no es nada preocupante. Se puede acceder a la batería (atornillada, no pegada), así como al resto de las entrañas del portátil, una vez retirada la placa inferior.
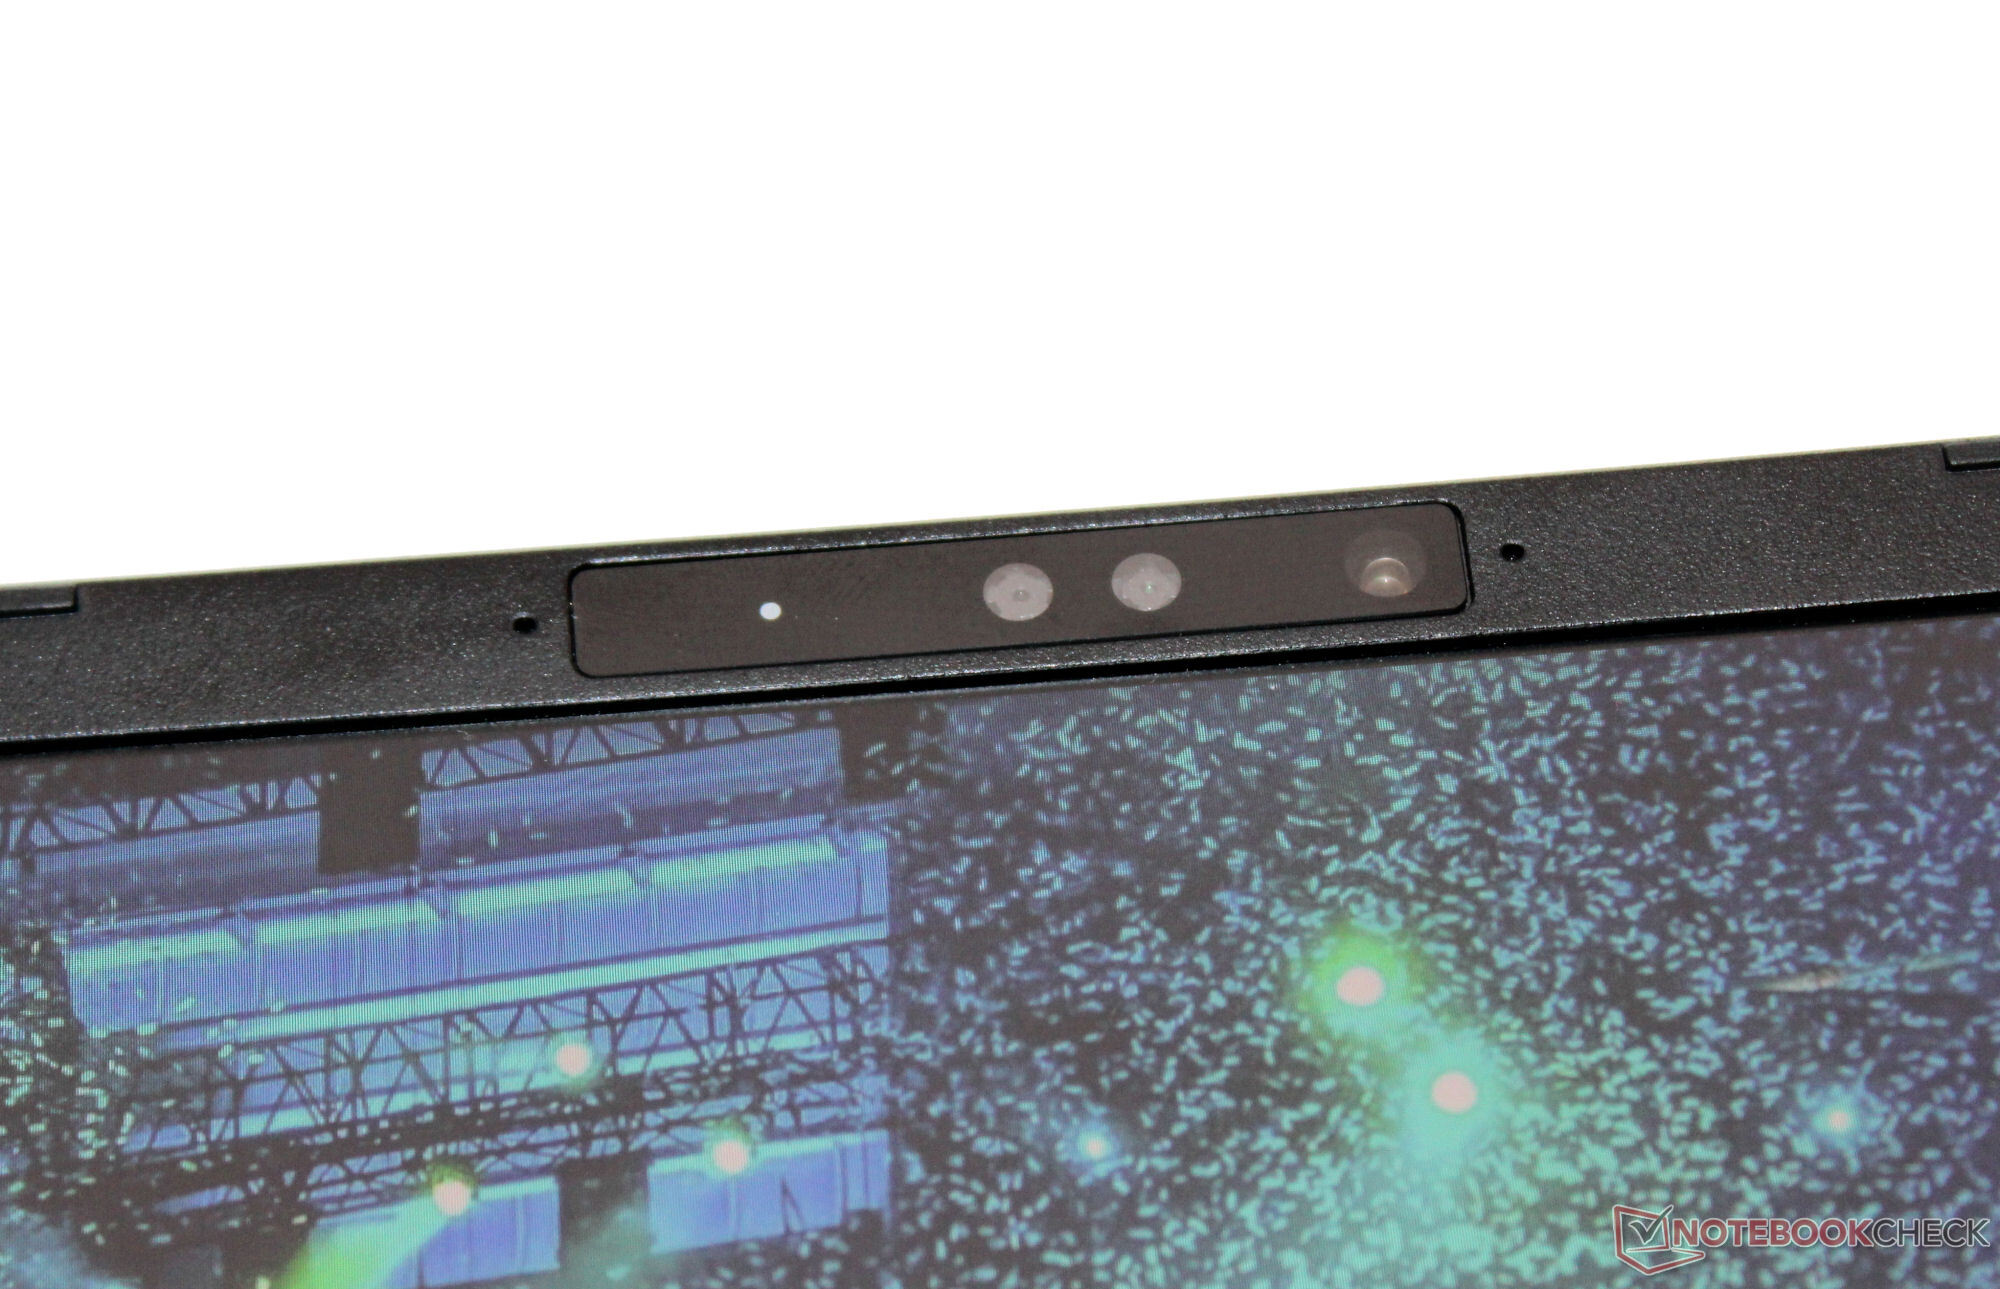
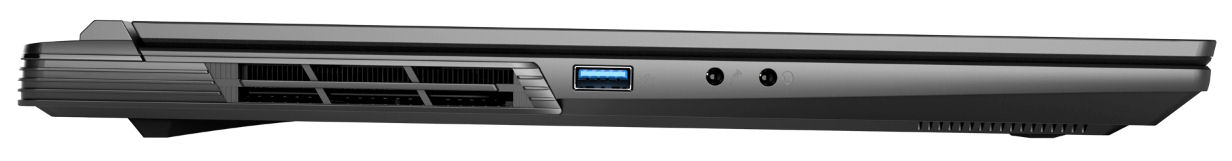
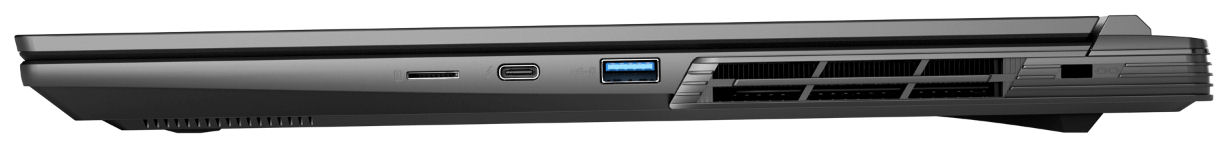
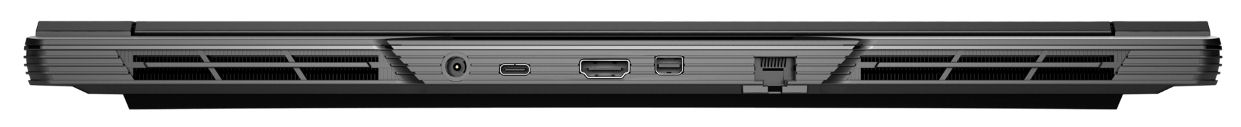
El Pro cuenta con dos puertos USB-A (USB 3.2 Gen 1) y dos puertos USB-C (1x USB 3.2 Gen 2, 1x Thunderbolt 4). El puerto TB-4 admite Power Delivery y puede emitir una señal DisplayPort. En total, el portátil tiene tres salidas de vídeo (1x HDMI, 2x DP). Su lector de tarjetas MicroSD (tarjeta de referencia: AV PRO microSD 128 GB V60) puede clasificarse como uno de velocidad media. Su cámara web (2,1 MP, máx. 1.920 x 1.080 píxeles, sin tapa) es bastante estándar.
En condiciones óptimas (sin dispositivos WiFi cerca, corta distancia entre el portátil y el PC servidor), alcanza excelentes velocidades de transmisión de datos WiFi. El portátil utiliza un chip WiFi 6E (Intel AX211), y de las conexiones por cable se encarga un controlador Realtek RTL8125 (2,5 GBit/s).
| SD Card Reader | |
| average JPG Copy Test (av. of 3 runs) | |
| MSI Stealth 16 Studio A13VG | |
| Media de la clase Gaming (20.9 - 210, n=54, últimos 2 años) | |
| Asus Vivobook Pro 16X K6604JV-MX016W | |
| Schenker XMG Pro 16 Studio (Mid 23) (AV PRO microSD 128 GB V60) | |
| Lenovo Legion Slim 7i 16 Gen 8 (Toshiba Exceria Pro SDXC 64 GB UHS-II) | |
| maximum AS SSD Seq Read Test (1GB) | |
| MSI Stealth 16 Studio A13VG | |
| Media de la clase Gaming (25.5 - 261, n=51, últimos 2 años) | |
| Asus Vivobook Pro 16X K6604JV-MX016W | |
| Schenker XMG Pro 16 Studio (Mid 23) (AV PRO microSD 128 GB V60) | |
| Lenovo Legion Slim 7i 16 Gen 8 (Toshiba Exceria Pro SDXC 64 GB UHS-II) | |

 GeForce RTX 4070 Laptop GPU, i9-13900H, Samsung 990 Pro 1 TB")
 GeForce RTX 4070 Laptop GPU, i9-13900H, Samsung 990 Pro 1 TB")
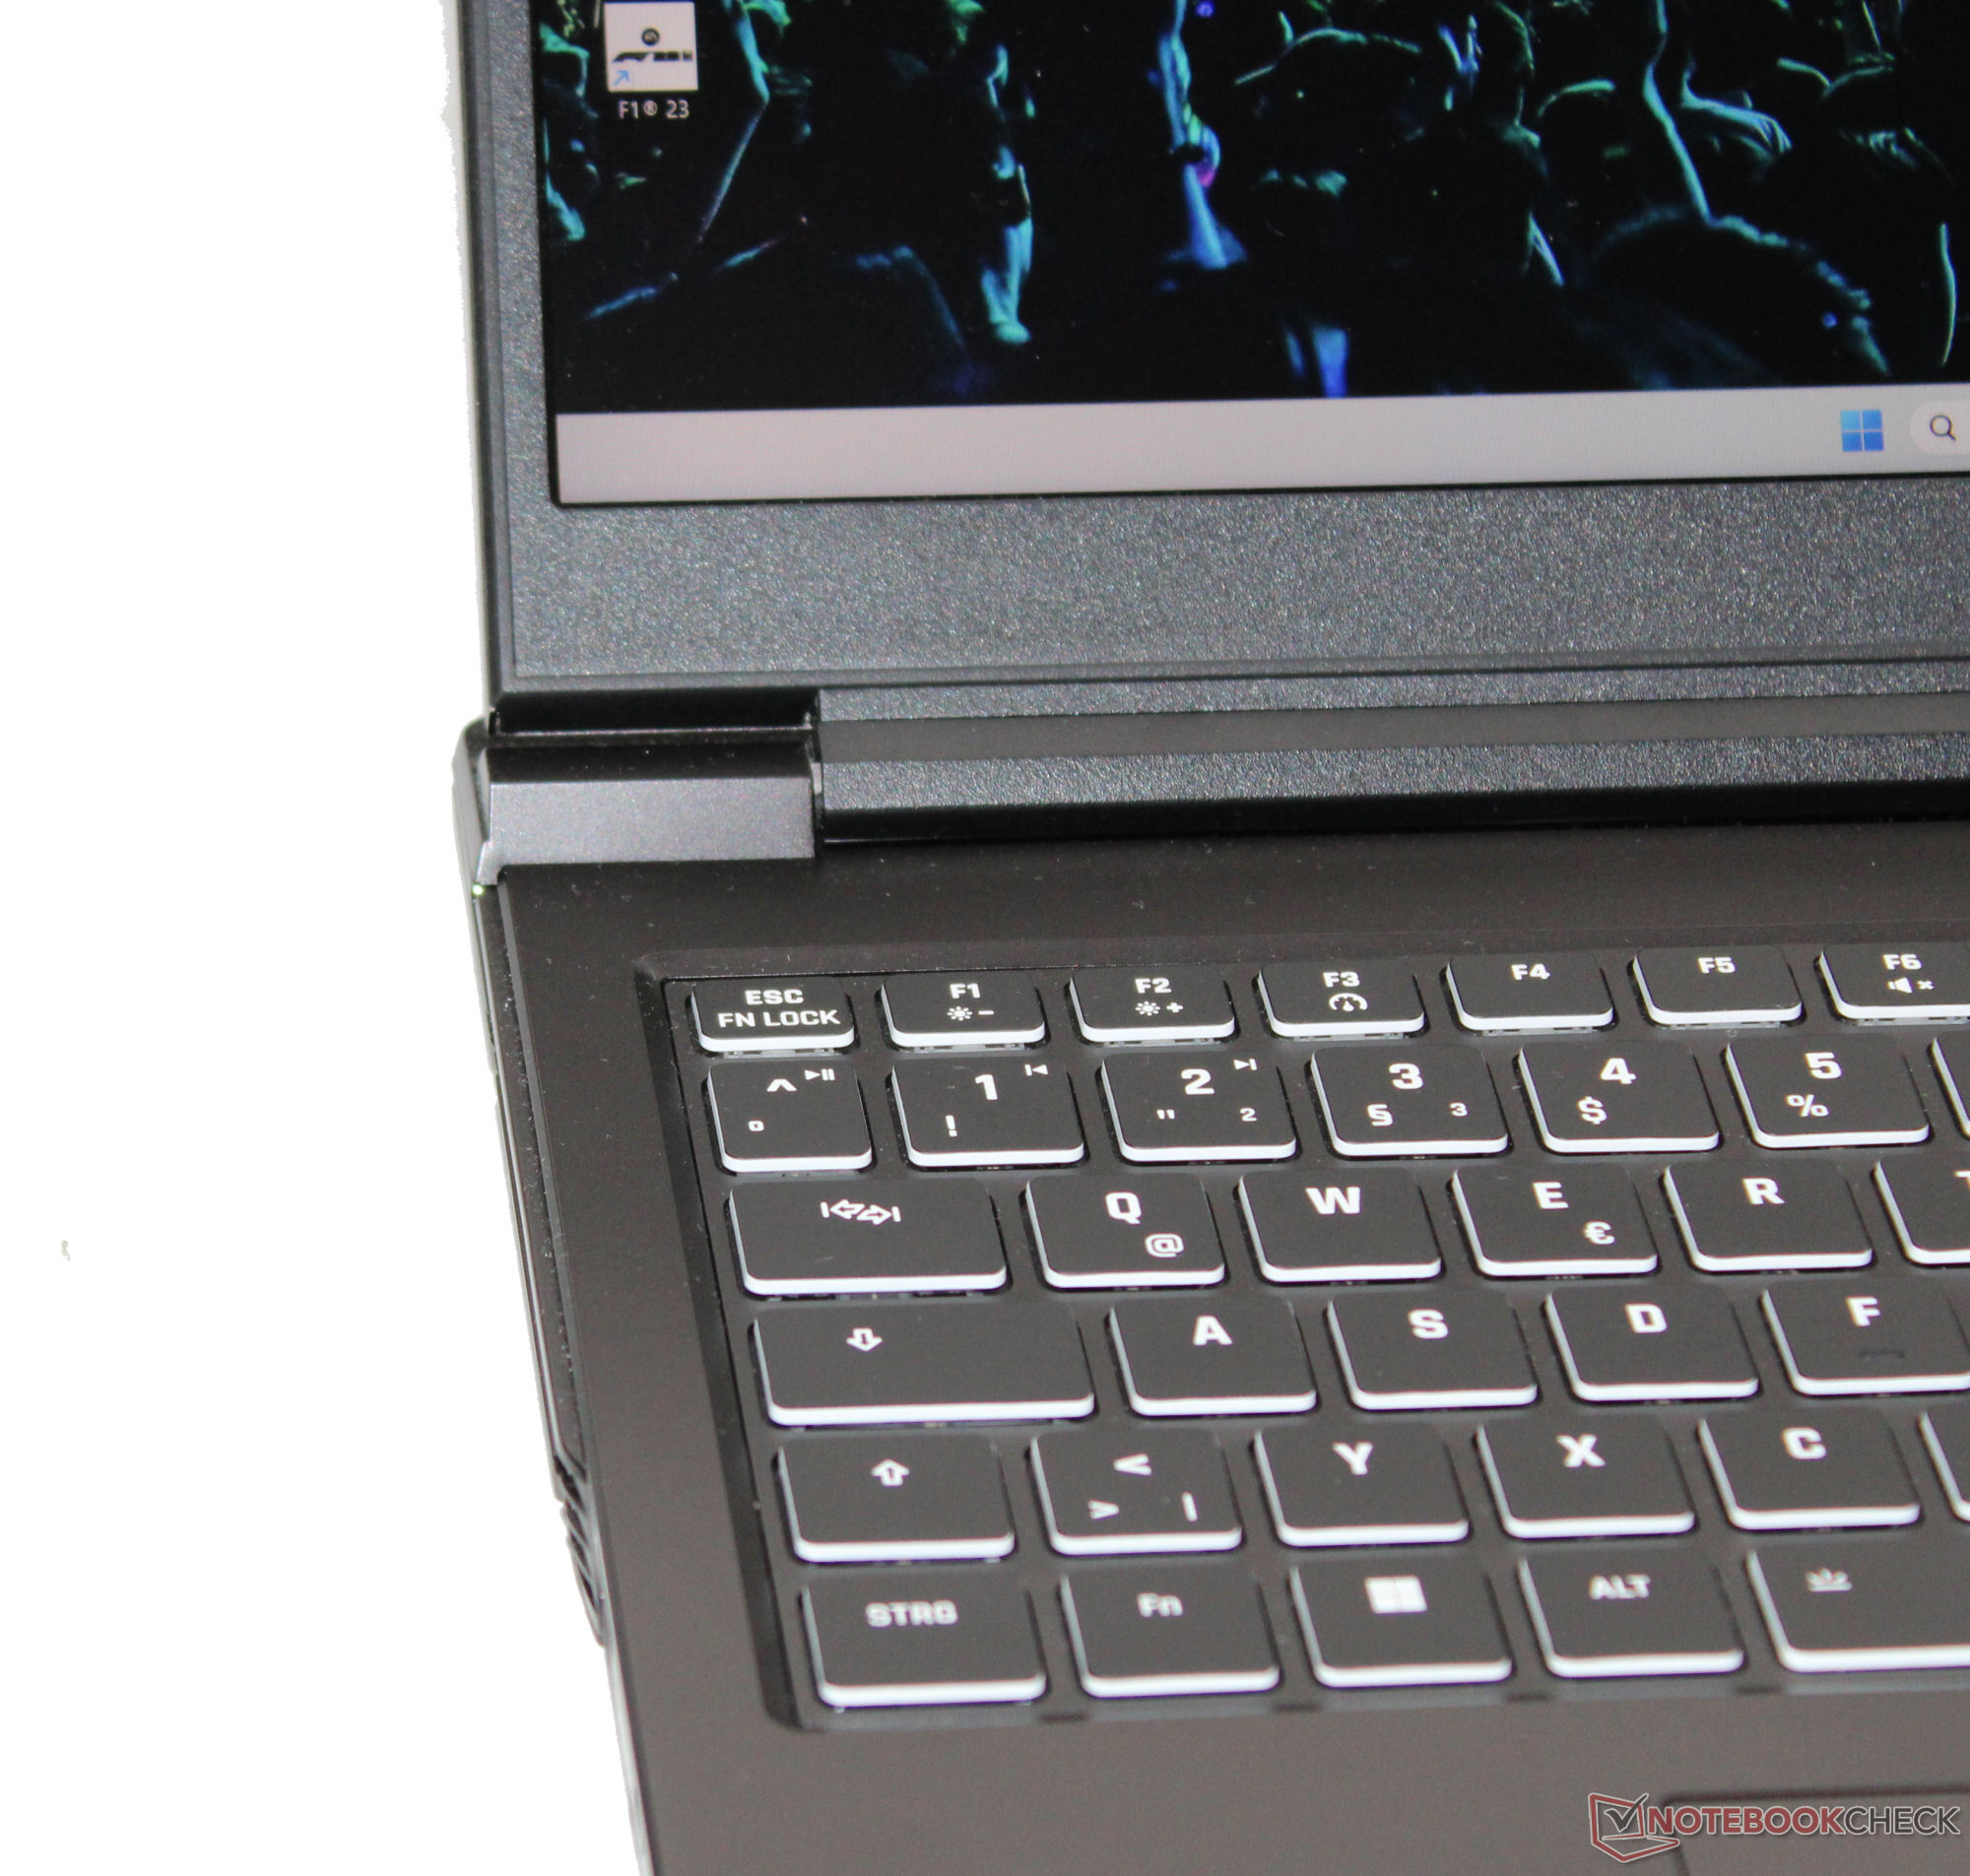
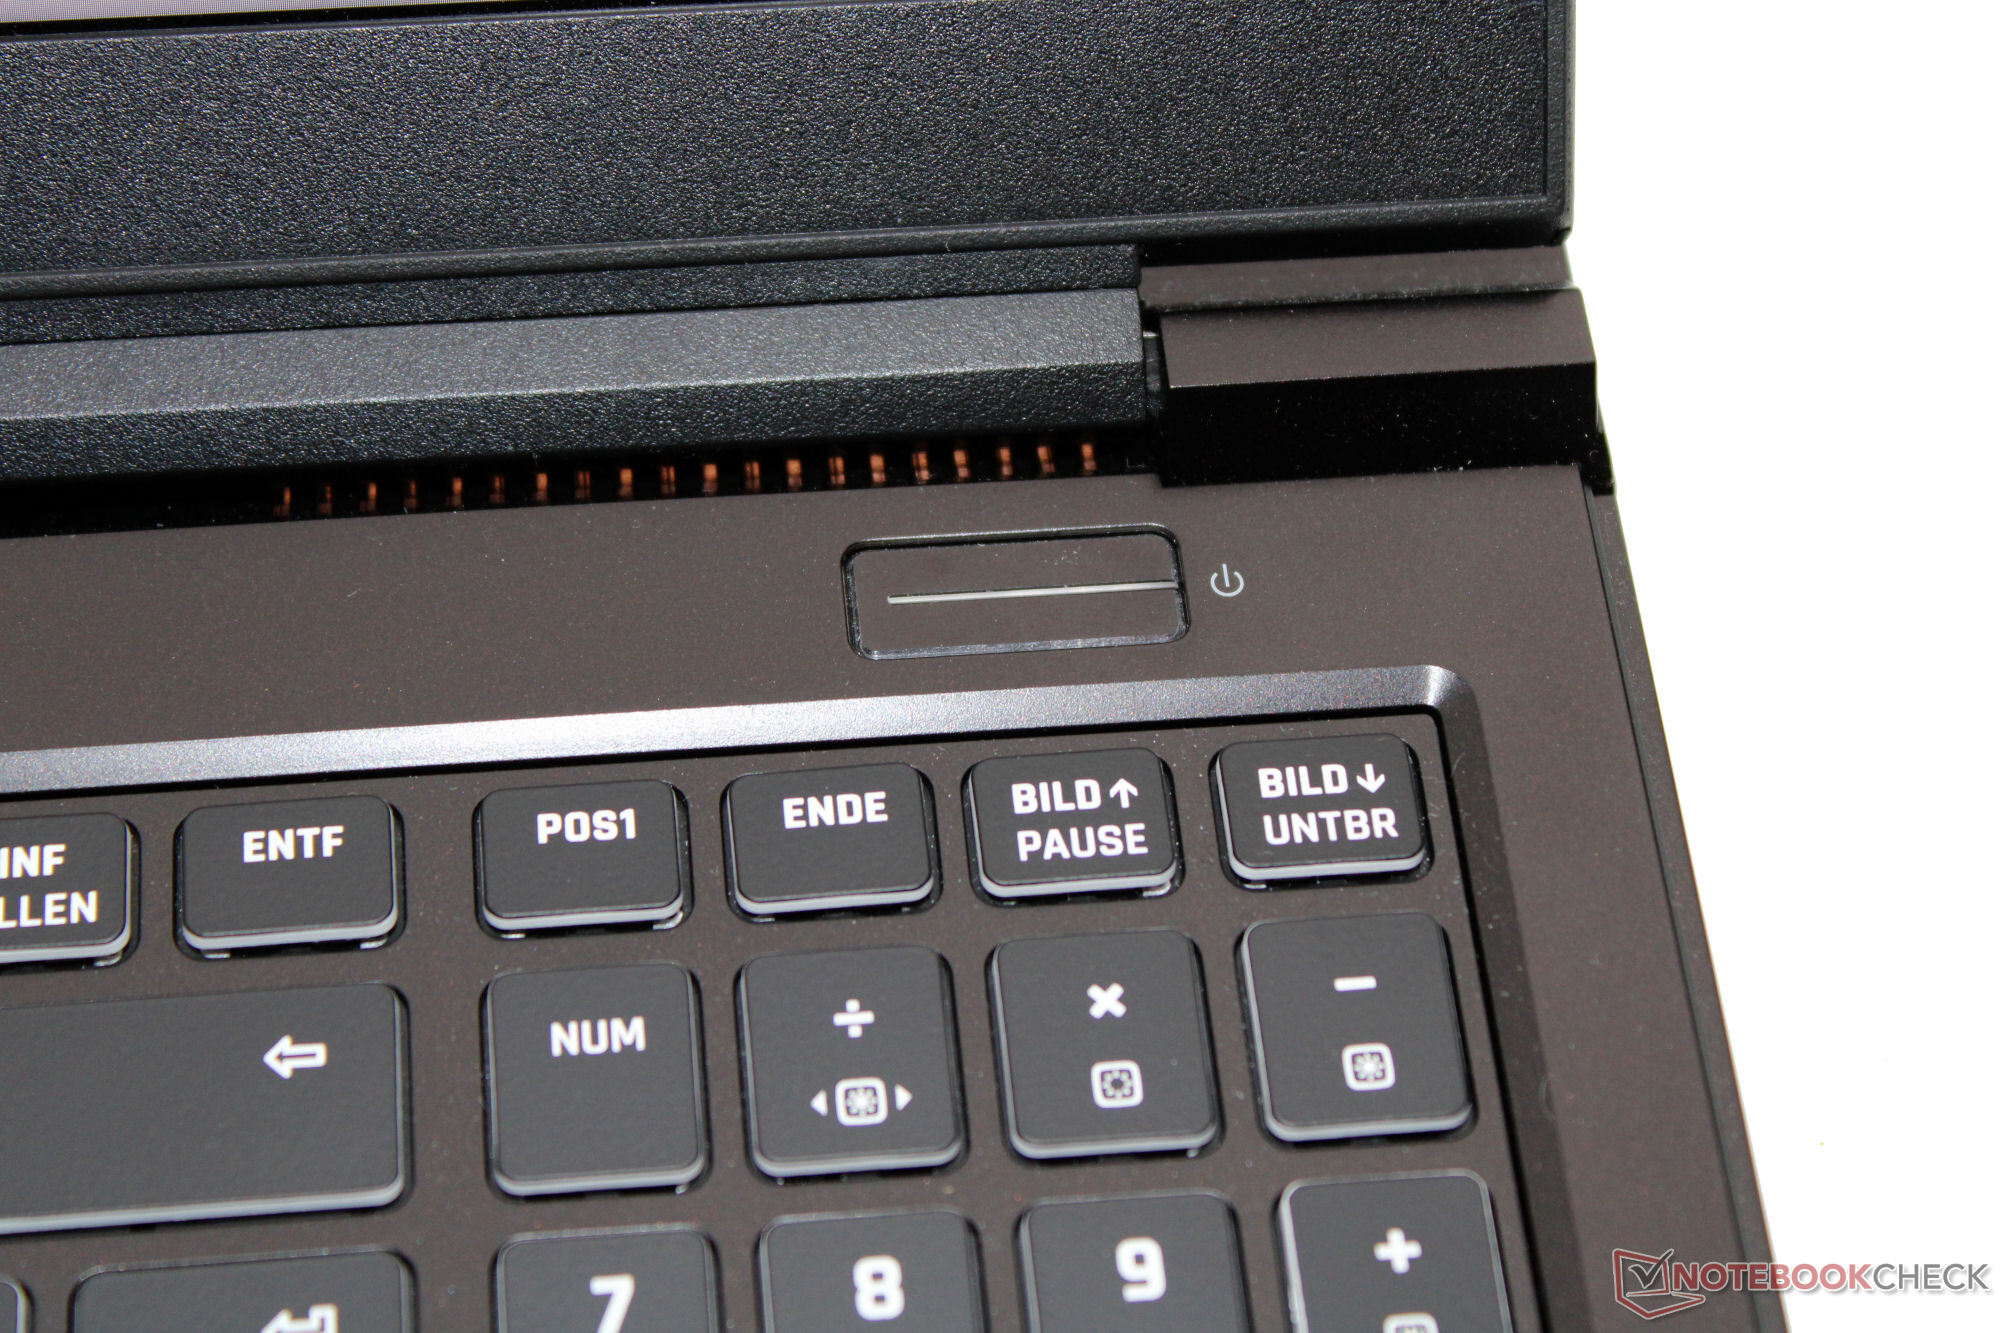
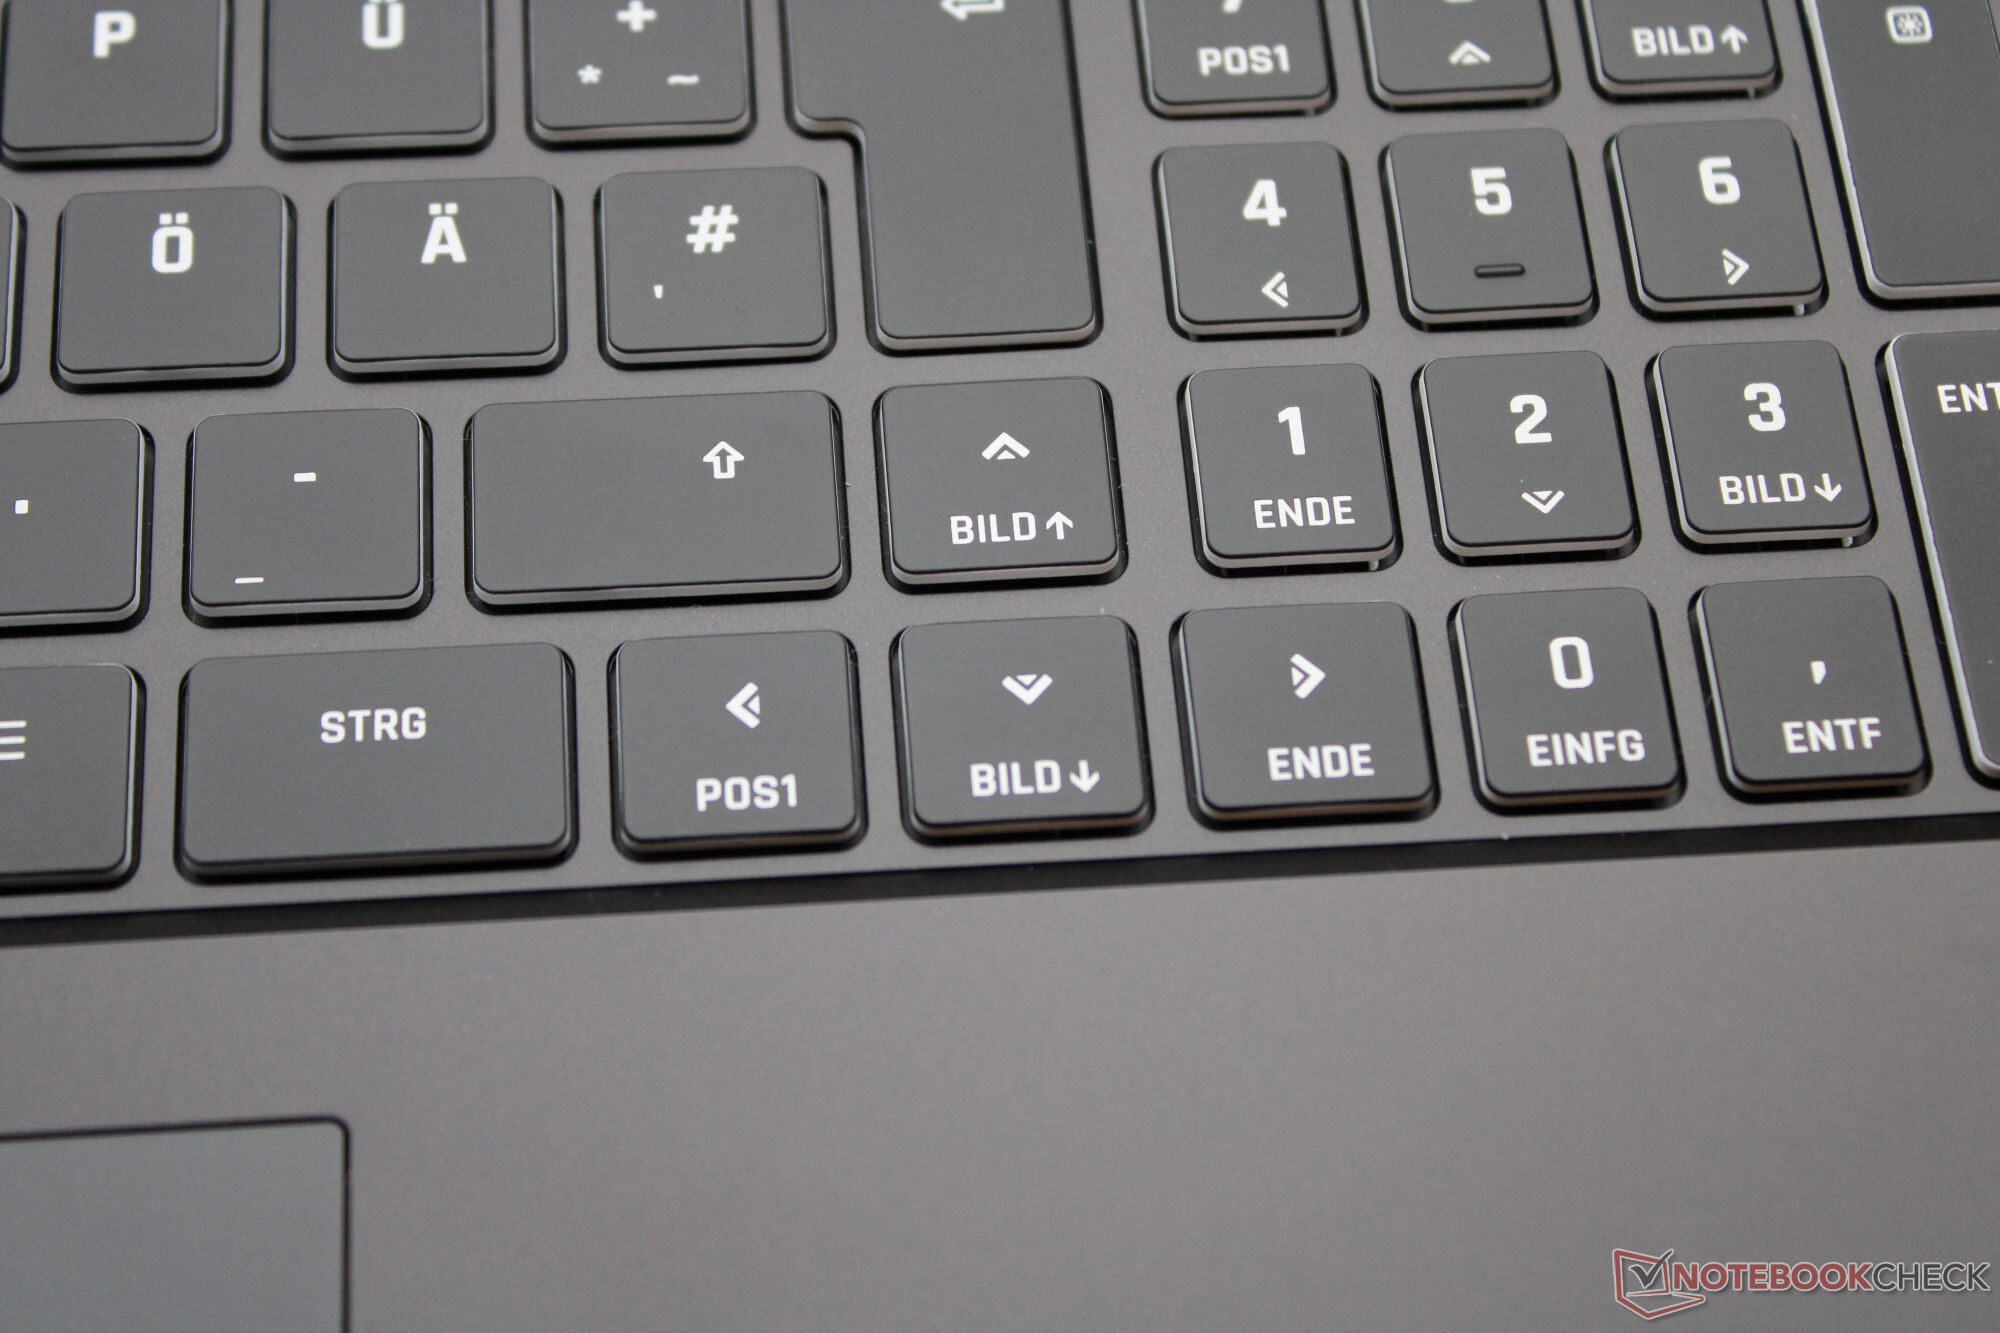
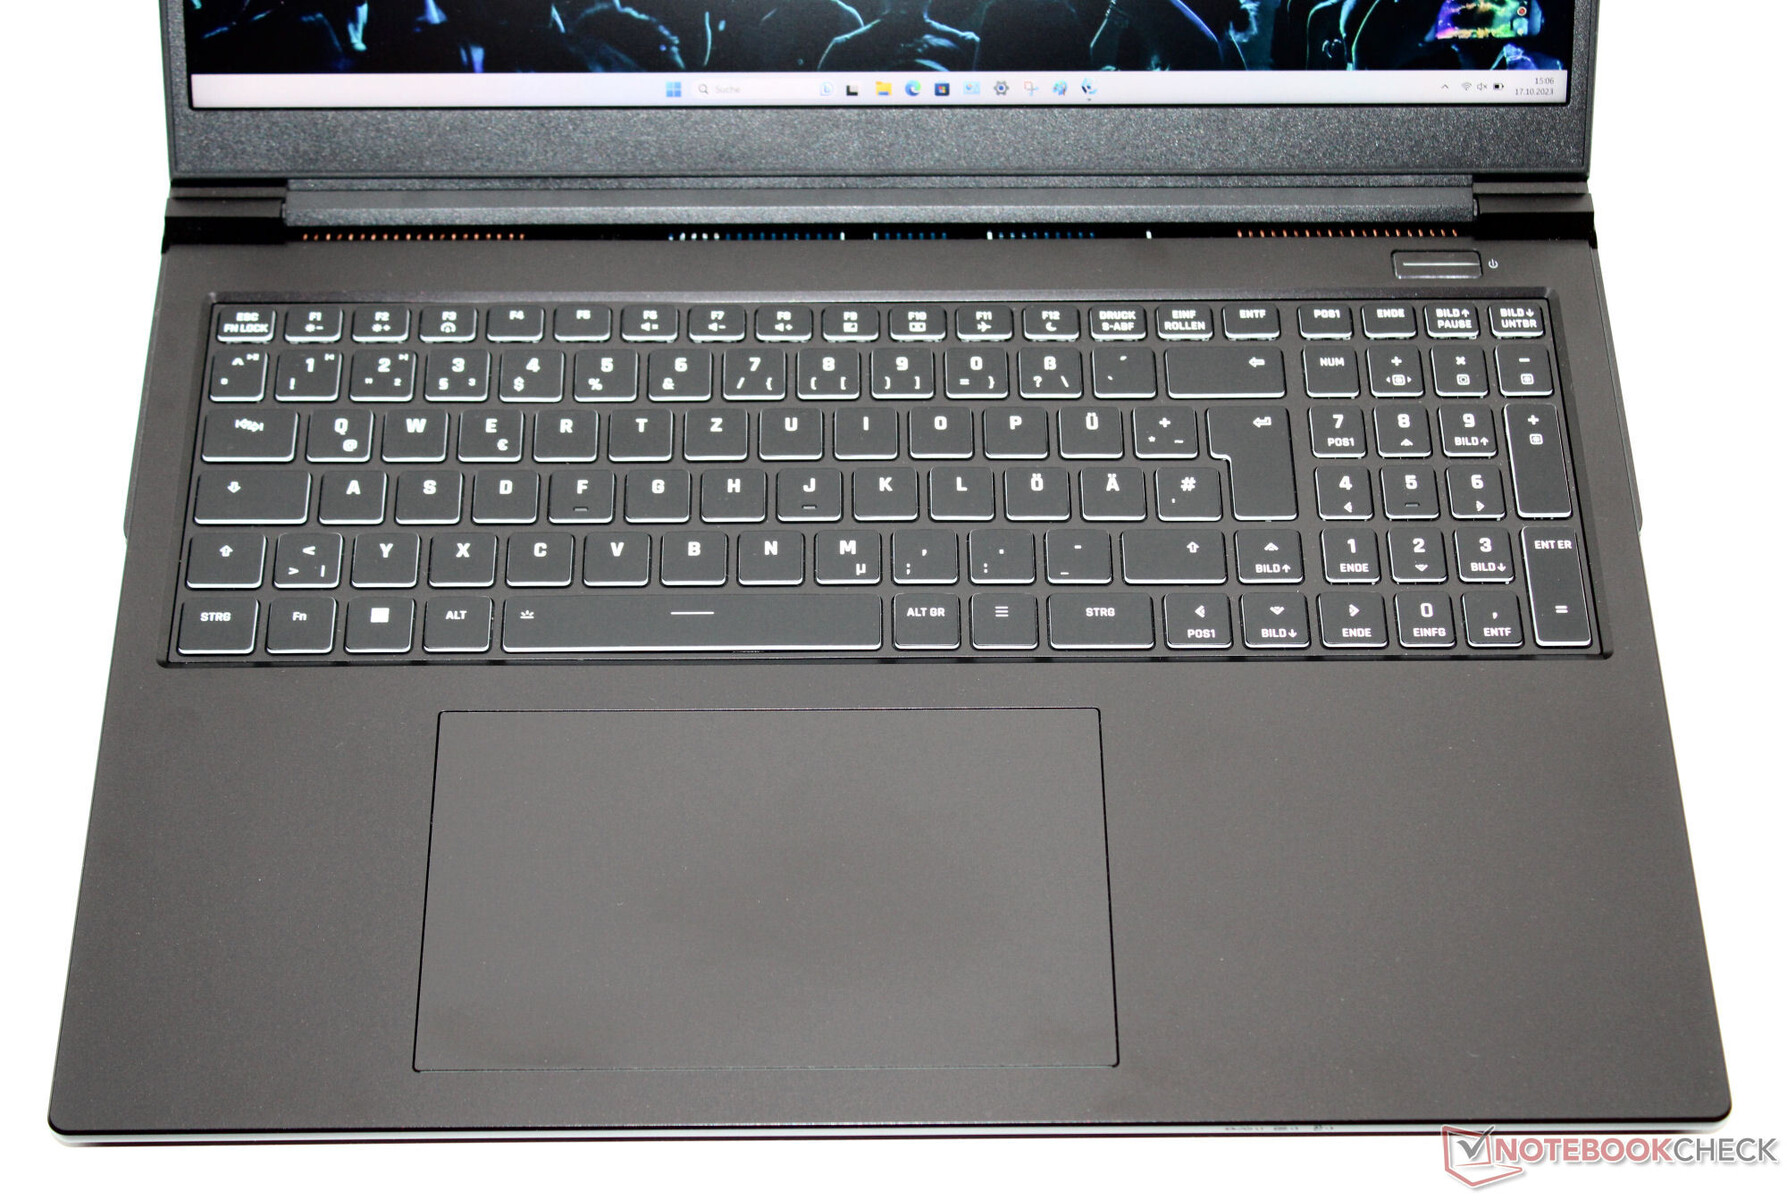
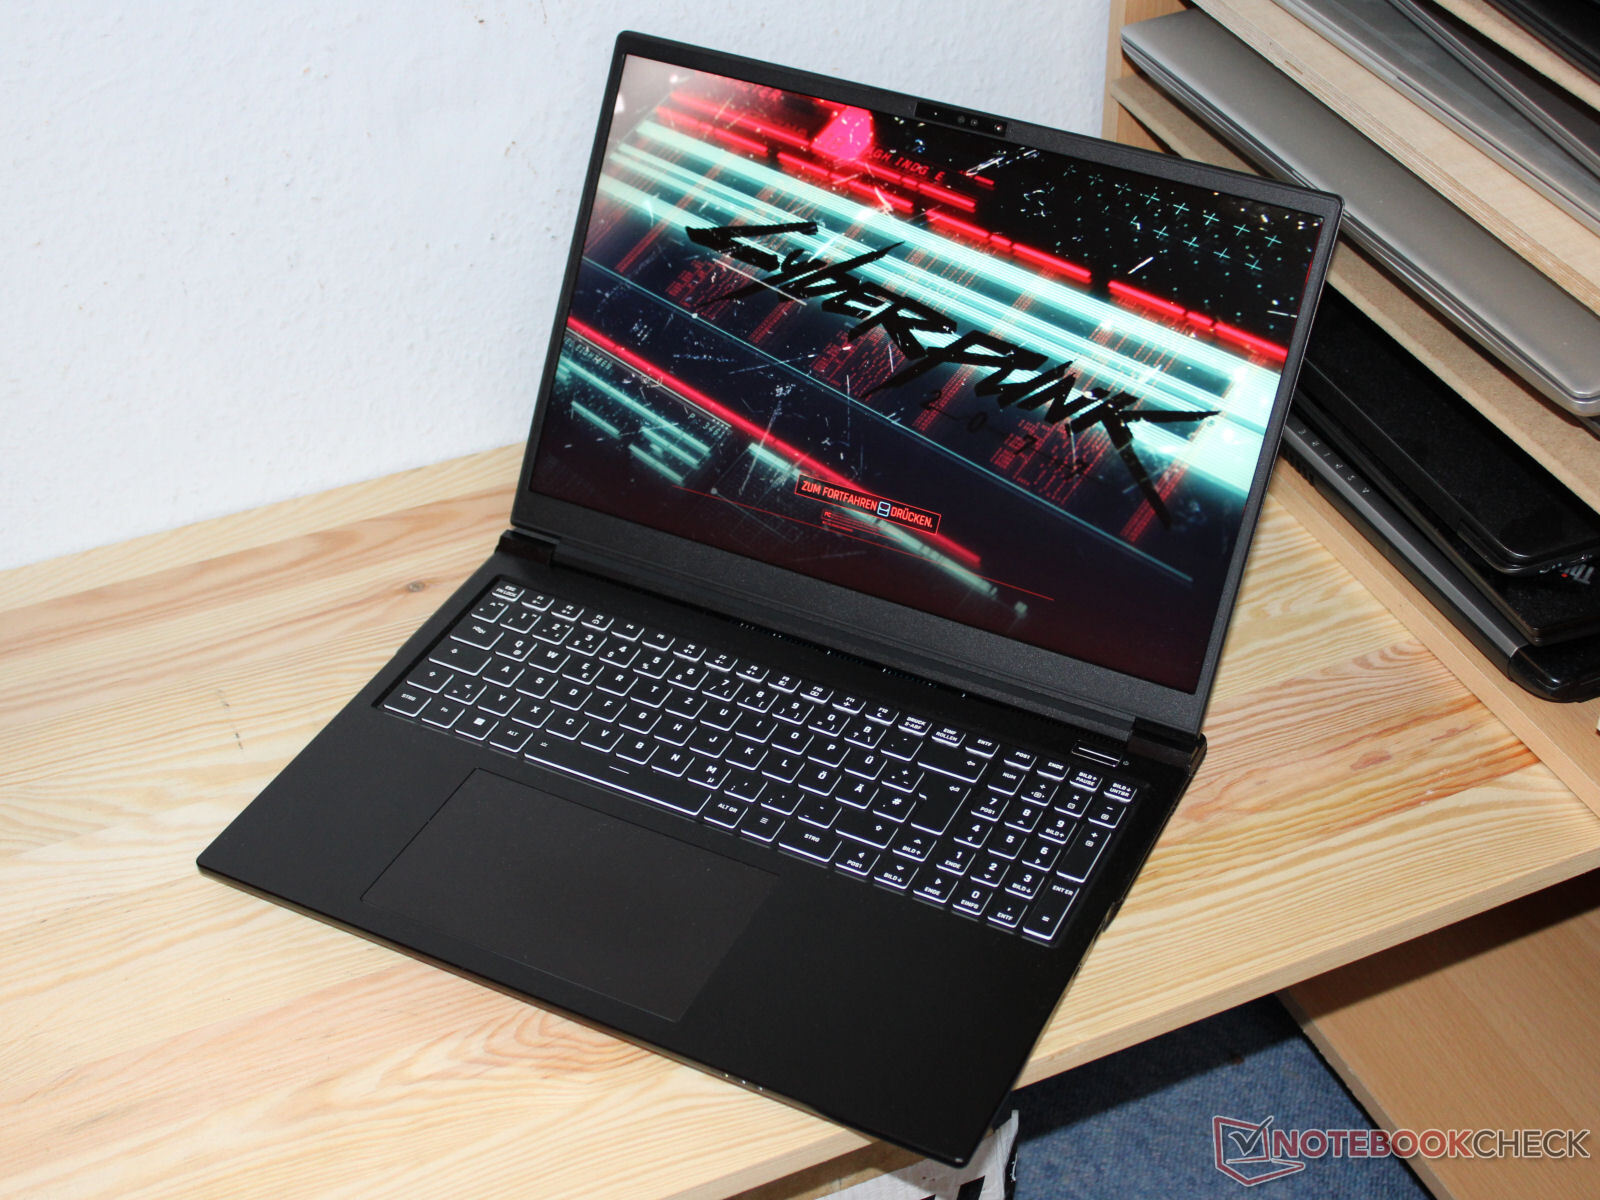
Dispositivos de entrada - El portátil XMG incorpora teclas iluminadas
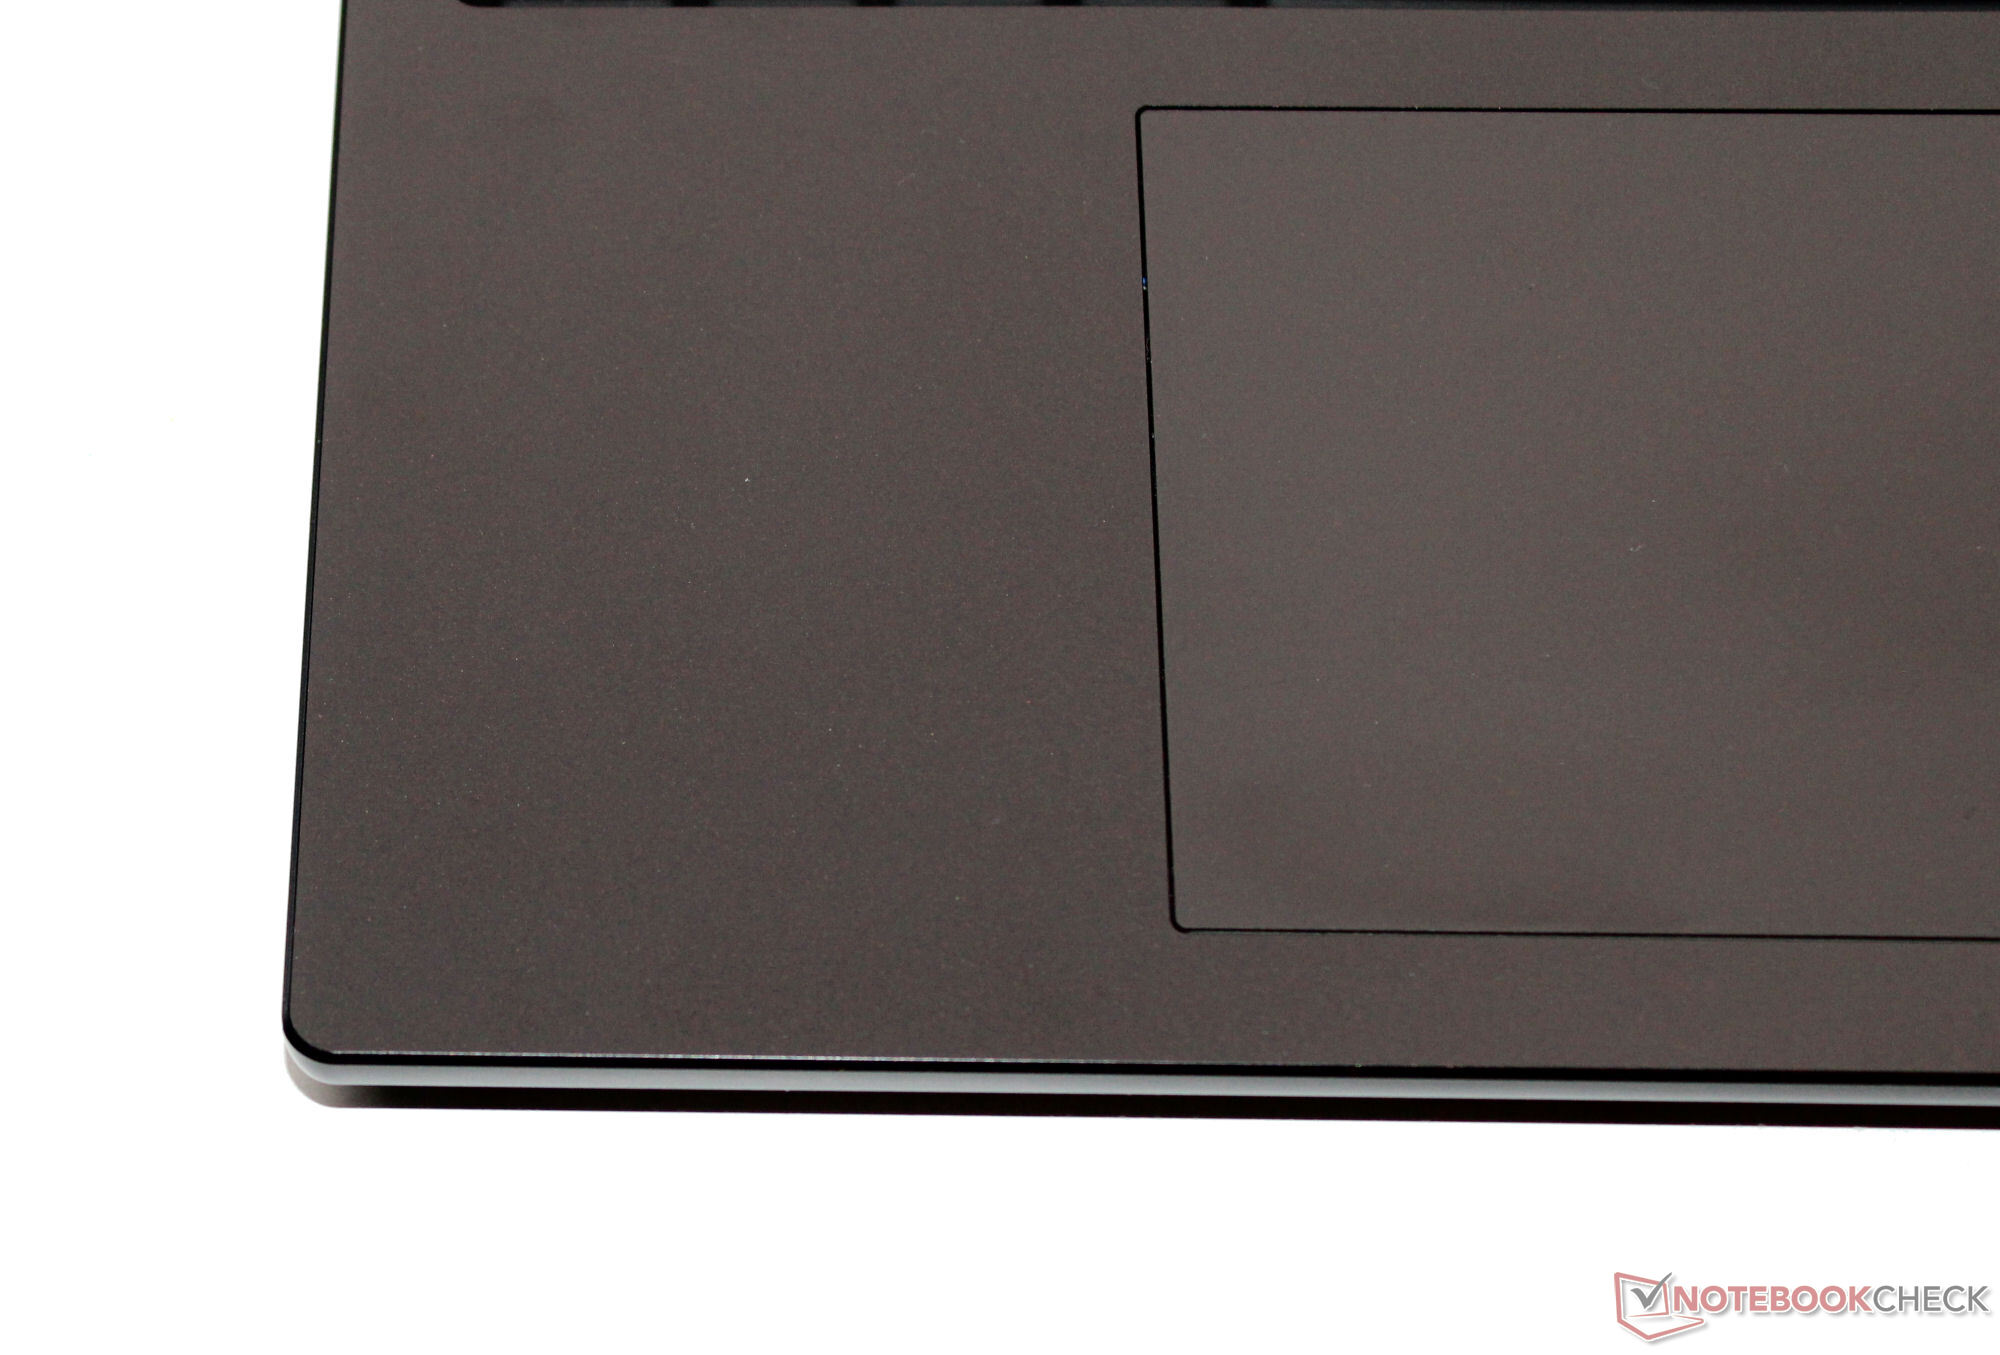
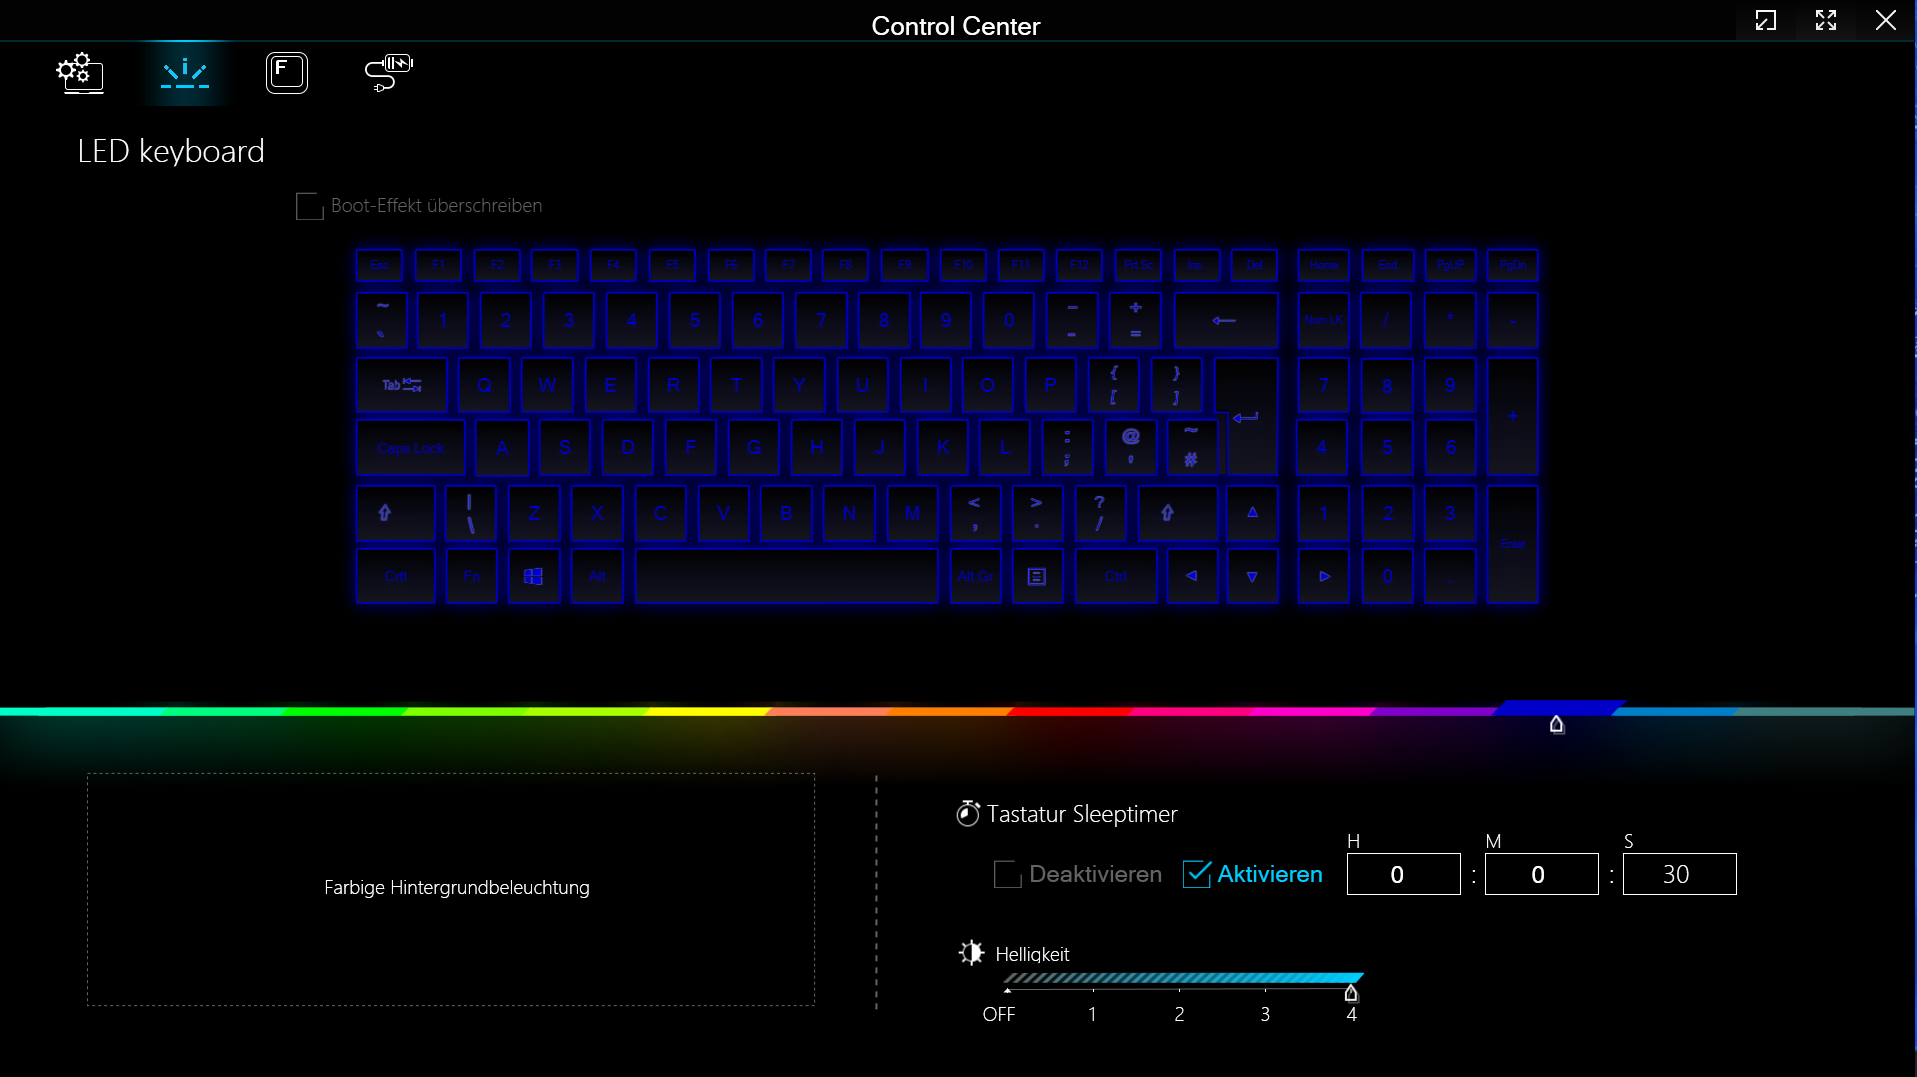
Las teclas lisas y uniformes del teclado chiclet (iluminación RGB) presentan una elevación media y un punto de presión claro. La resistencia de las teclas podría ser un poco más nítida. En total, Schenker ha entregado un teclado apto para el uso diario. Un clickpad actúa como sustituto del ratón (de unos 15,1 x 9,1 cm), que presenta una elevación corta y un punto de presión claro.
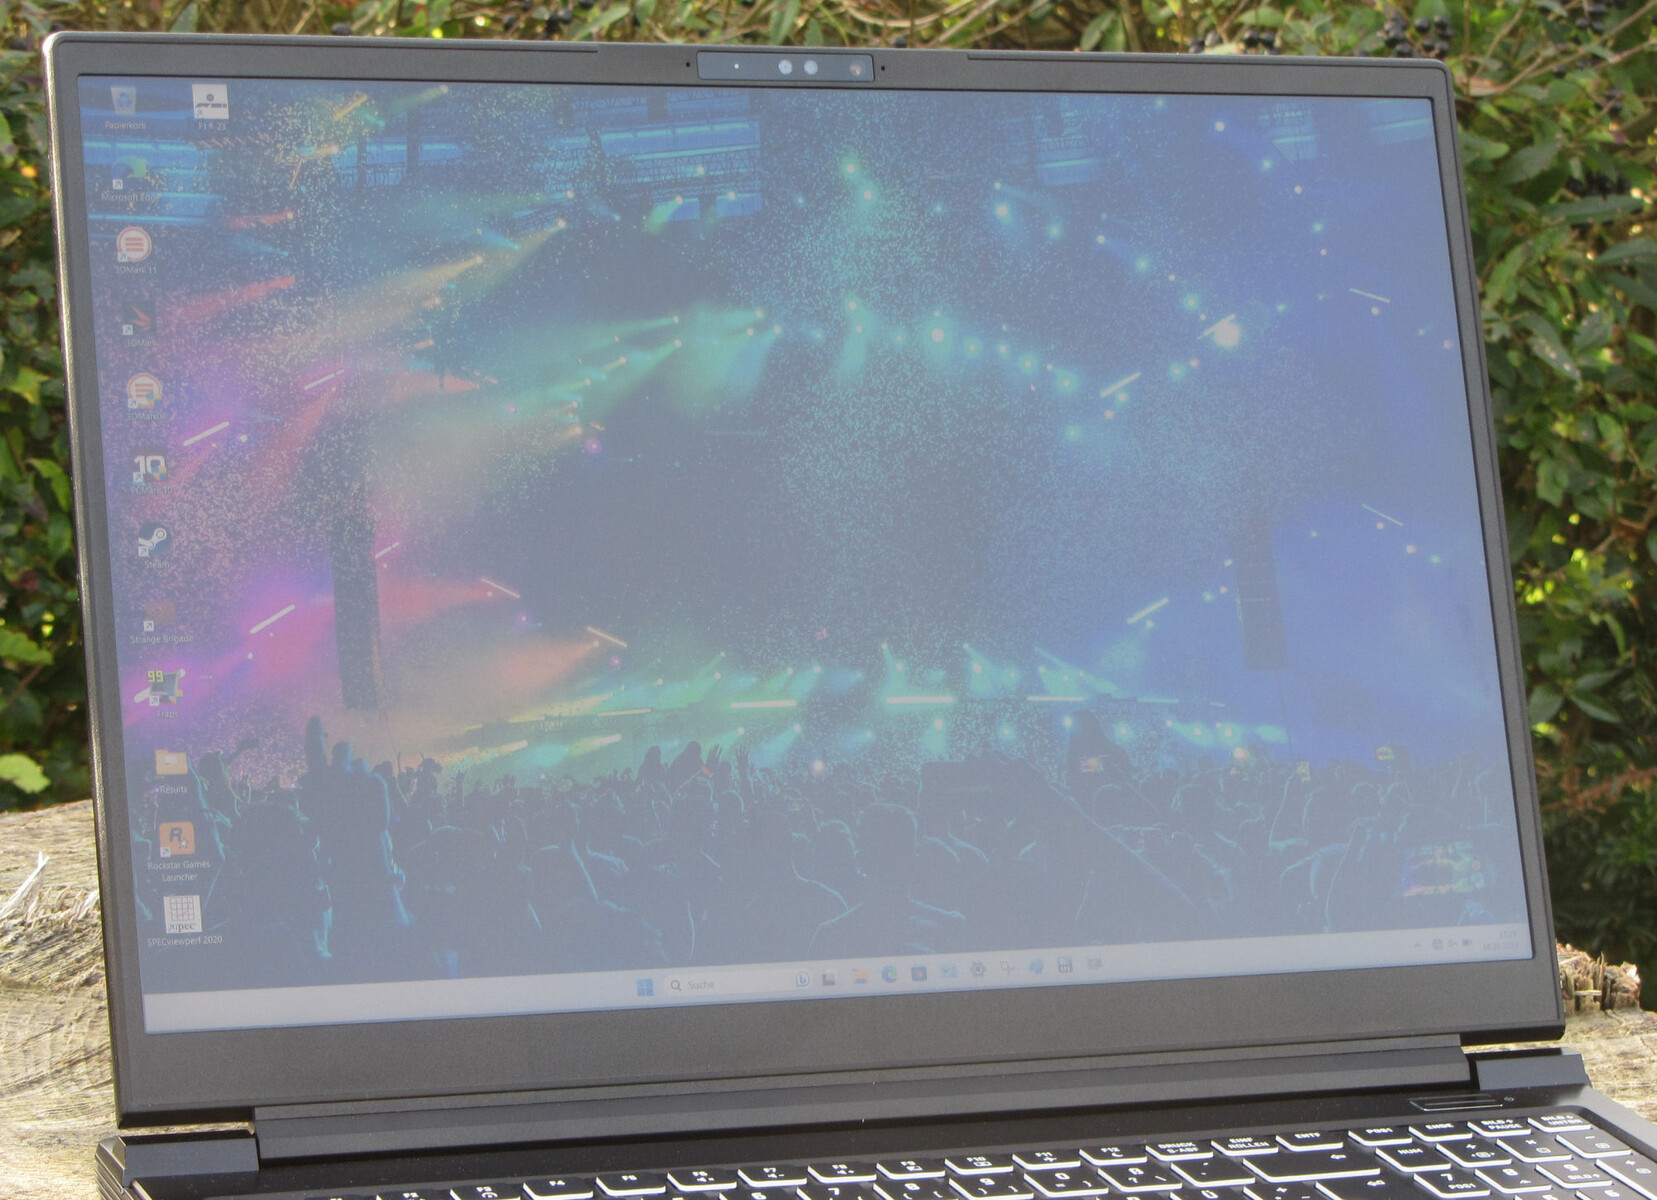
Pantalla - Un panel 16:10 con cobertura sRGB
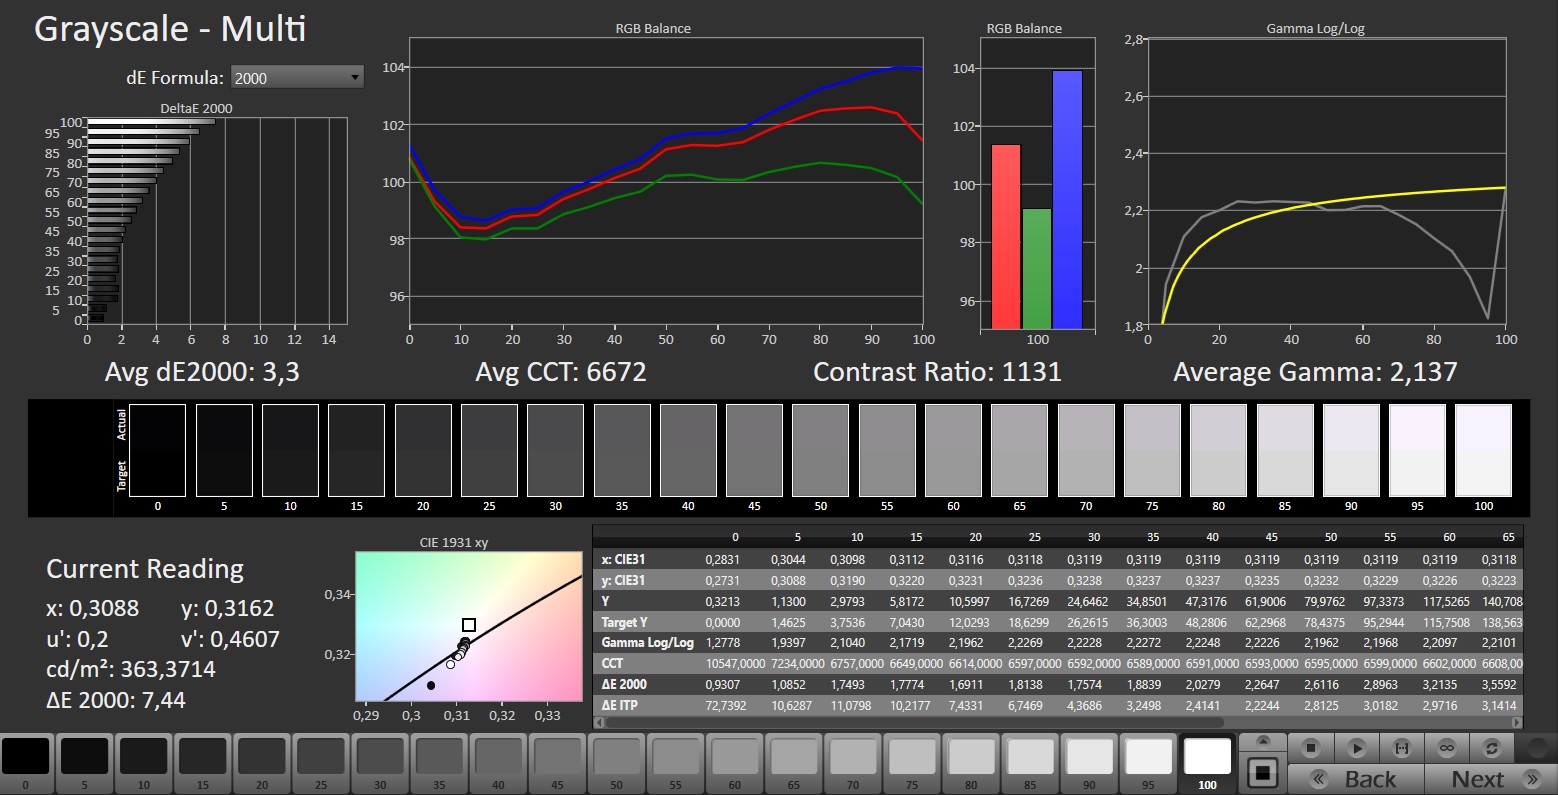
El panel de 240 Hz de rápida reacción del dispositivo con una relación de aspecto de 16:10 no muestra signos de parpadeo PWM en ningún nivel de brillo. Tanto el brillo como el contraste de la pantalla mate de 16 pulgadas (2.560 x 1.600 píxeles) alcanzan sus respectivos objetivos (> 300 cd/m² y 1.000:1). No hay pantallas alternativas disponibles.
| |||||||||||||||||||||||||
iluminación: 93 %
Brillo con batería: 349 cd/m²
Contraste: 1091:1 (Negro: 0.32 cd/m²)
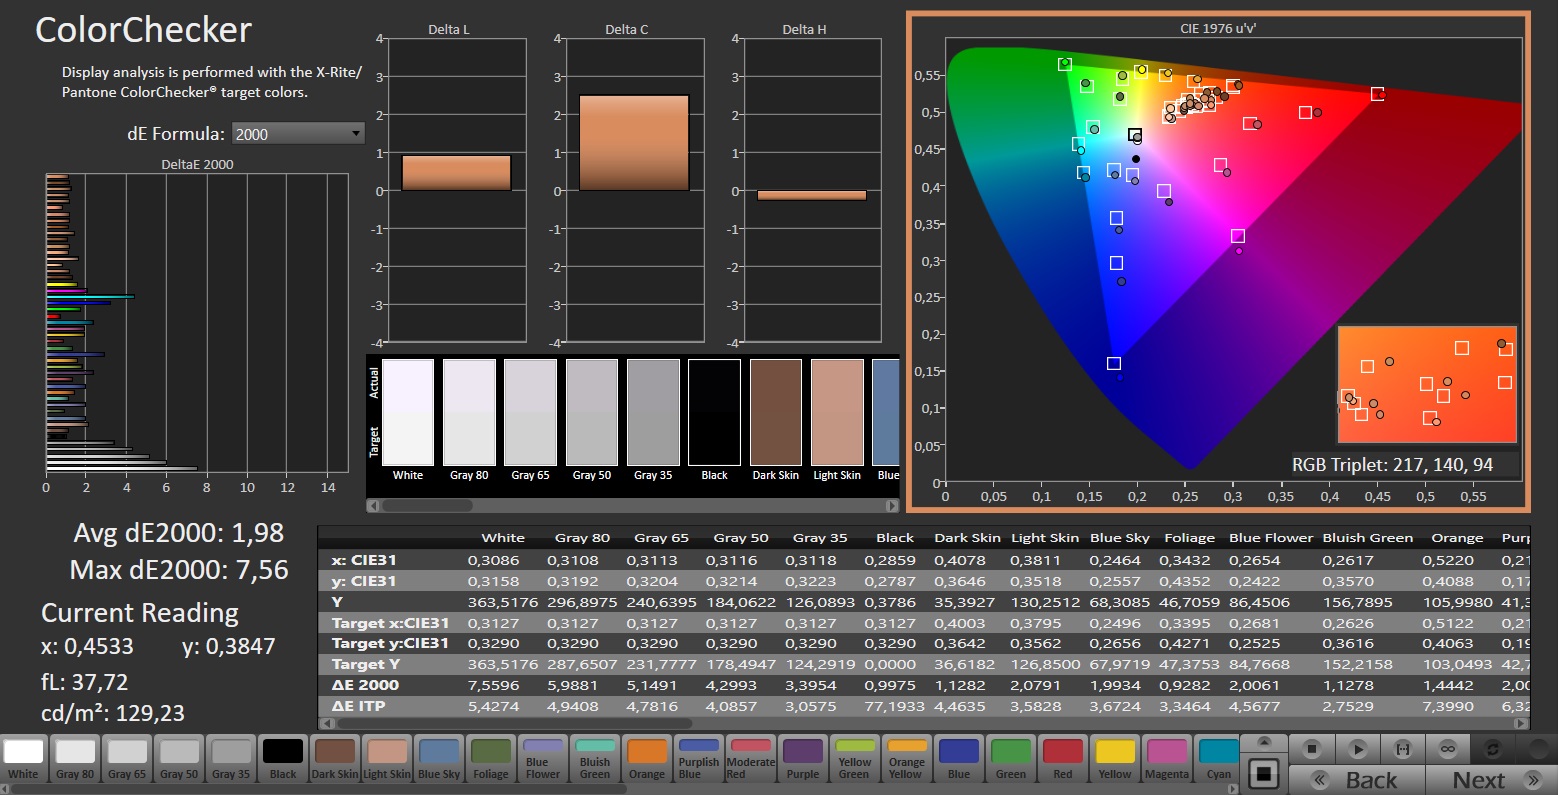
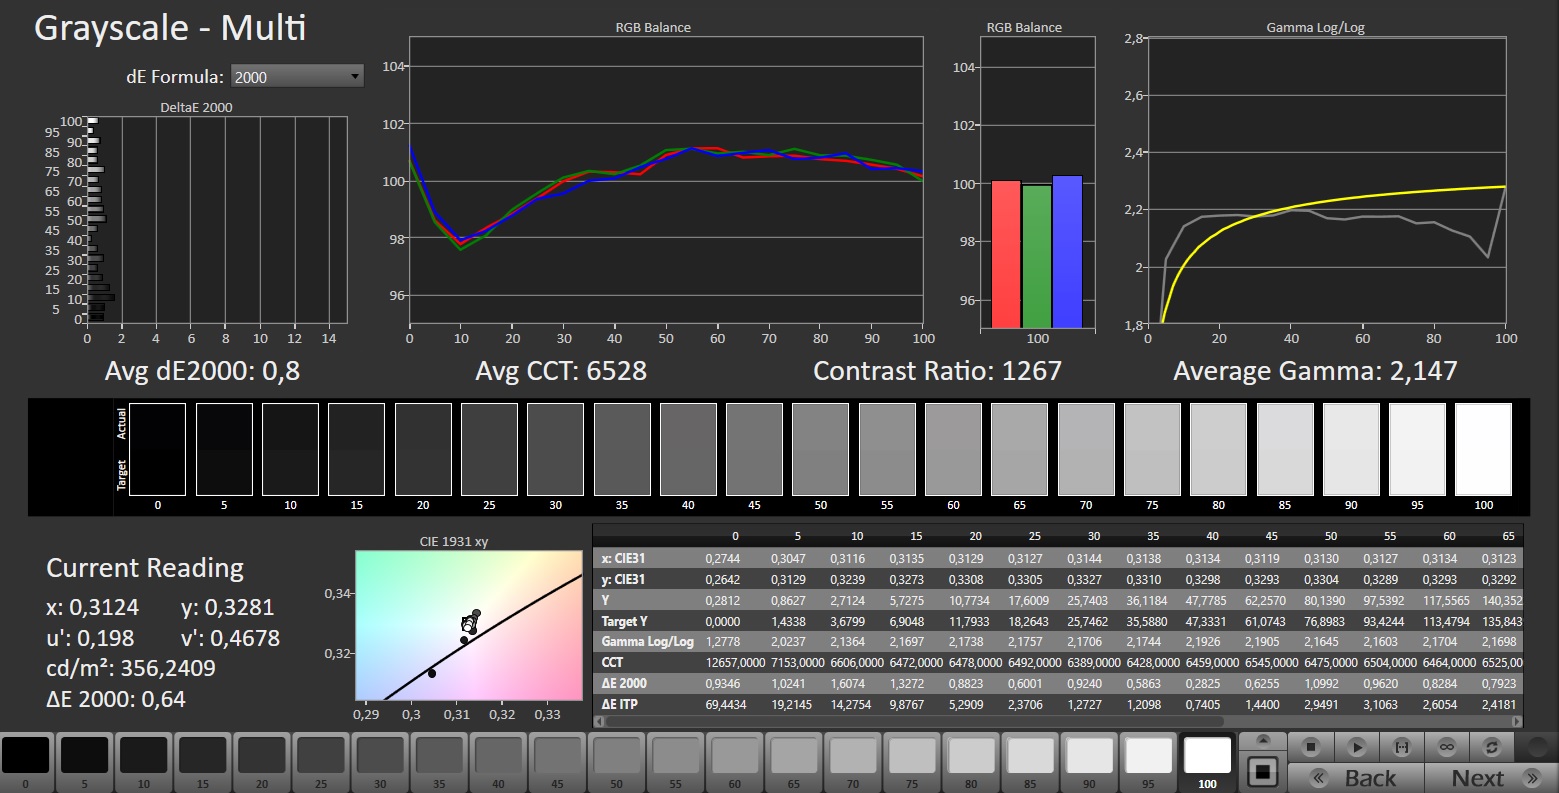
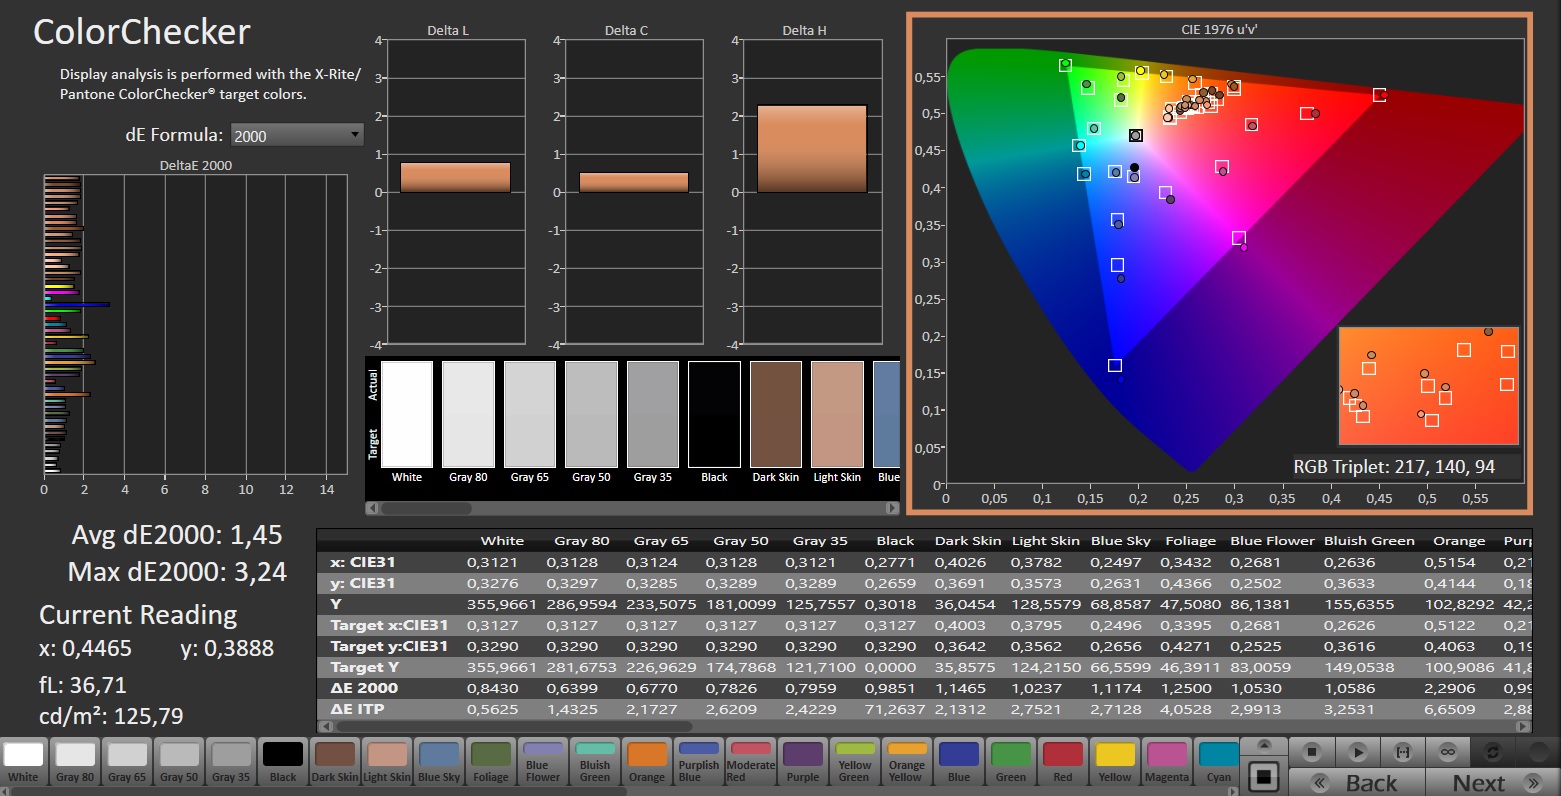
ΔE ColorChecker Calman: 1.98 | ∀{0.5-29.43 Ø4.71}
calibrated: 1.45
ΔE Greyscale Calman: 3.3 | ∀{0.09-98 Ø4.96}
70.1% AdobeRGB 1998 (Argyll 3D)
98.2% sRGB (Argyll 3D)
69.4% Display P3 (Argyll 3D)
Gamma: 2.137
CCT: 6672 K
| Schenker XMG Pro 16 Studio (Mid 23) BOE CQ NE160QDM-NZ1, IPS, 2560x1600, 16" | Asus Vivobook Pro 16X K6604JV-MX016W Samsung SDC4178 ATNA60BX01-1, OLED, 3200x2000, 16" | Lenovo Legion Slim 7i 16 Gen 8 CSOT T3 MNG007DA2-3, IPS, 2560x1600, 16" | HP Omen Transcend 16 AUOA3A6, Mini-LED, 2560x1600, 16" | MSI Stealth 16 Studio A13VG AUO26A9, IPS, 2560x1600, 16" | |
|---|---|---|---|---|---|
| Display | 27% | 2% | 23% | 21% | |
| Display P3 Coverage (%) | 69.4 | 98.4 42% | 70.4 1% | 99.2 43% | 96.4 39% |
| sRGB Coverage (%) | 98.2 | 99.7 2% | 99.4 1% | 100 2% | 99.7 2% |
| AdobeRGB 1998 Coverage (%) | 70.1 | 95.8 37% | 72.5 3% | 87.6 25% | 84.8 21% |
| Response Times | 85% | -7% | -191% | 46% | |
| Response Time Grey 50% / Grey 80% * (ms) | 12.2 ? | 1.6 ? 87% | 12 ? 2% | 26.4 ? -116% | 4.4 ? 64% |
| Response Time Black / White * (ms) | 7.7 ? | 1.4 ? 82% | 8.9 ? -16% | 28.2 ? -266% | 5.6 ? 27% |
| PWM Frequency (Hz) | 120 ? | 3506 ? | |||
| Screen | 66% | 17% | 204% | -19% | |
| Brightness middle (cd/m²) | 349 | 347 -1% | 474.6 36% | 791.1 127% | 424 21% |
| Brightness (cd/m²) | 348 | 346 -1% | 445 28% | 800 130% | 411 18% |
| Brightness Distribution (%) | 93 | 97 4% | 86 -8% | 95 2% | 88 -5% |
| Black Level * (cd/m²) | 0.32 | 0.06 81% | 0.39 -22% | 0.04 87% | 0.37 -16% |
| Contrast (:1) | 1091 | 5783 430% | 1217 12% | 19778 1713% | 1146 5% |
| Colorchecker dE 2000 * | 1.98 | 1.89 5% | 2.12 -7% | 4.37 -121% | 3.04 -54% |
| Colorchecker dE 2000 max. * | 7.56 | 3.26 57% | 4.73 37% | 10.39 -37% | 7.5 1% |
| Colorchecker dE 2000 calibrated * | 1.45 | 1.97 -36% | 0.57 61% | 1.04 28% | 3.04 -110% |
| Greyscale dE 2000 * | 3.3 | 1.55 53% | 2.8 15% | 6.5 -97% | 4.34 -32% |
| Gamma | 2.137 103% | 2.39 92% | 2.22 99% | 2.28 96% | 2.32 95% |
| CCT | 6672 97% | 6458 101% | 6542 99% | 6000 108% | 6952 93% |
| Media total (Programa/Opciones) | 59% /
60% | 4% /
10% | 12% /
109% | 16% /
-1% |
* ... más pequeño es mejor
Nada más sacarla de la caja, la pantalla muestra una representación de colores bastante buena: Con una desviación de aproximadamente 2, se alcanza su objetivo (DeltaE < 3). Calibrando la pantalla se consigue una desviación menor, de 1,45, y unos tonos grises más equilibrados. El panel puede representar casi por completo el espacio de color sRGB, pero no AdobeRGB ni DCI P3. Aquí, la competencia tiene más que ofrecer en ocasiones.

Tiempos de respuesta del display
| ↔ Tiempo de respuesta de Negro a Blanco | ||
|---|---|---|
| 7.7 ms ... subida ↗ y bajada ↘ combinada | ↗ 4 ms subida | 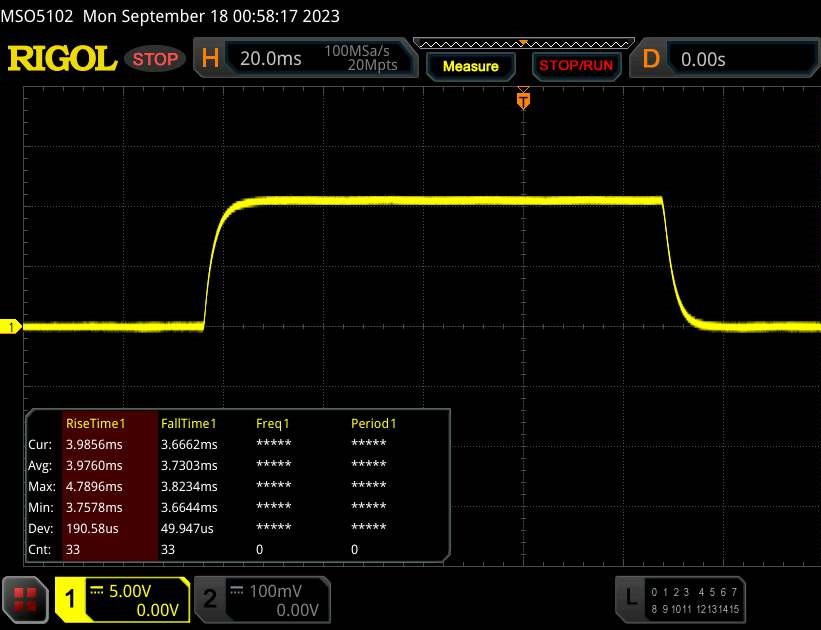 |
| ↘ 3.7 ms bajada | ||
| La pantalla mostró tiempos de respuesta muy rápidos en nuestros tests y debería ser adecuada para juegos frenéticos. En comparación, todos los dispositivos de prueba van de ##min### (mínimo) a 240 (máximo) ms. » 22 % de todos los dispositivos son mejores. Esto quiere decir que el tiempo de respuesta medido es mejor que la media (19.8 ms) de todos los dispositivos testados. | ||
| ↔ Tiempo de respuesta 50% Gris a 80% Gris | ||
| 12.2 ms ... subida ↗ y bajada ↘ combinada | ↗ 5.9 ms subida | 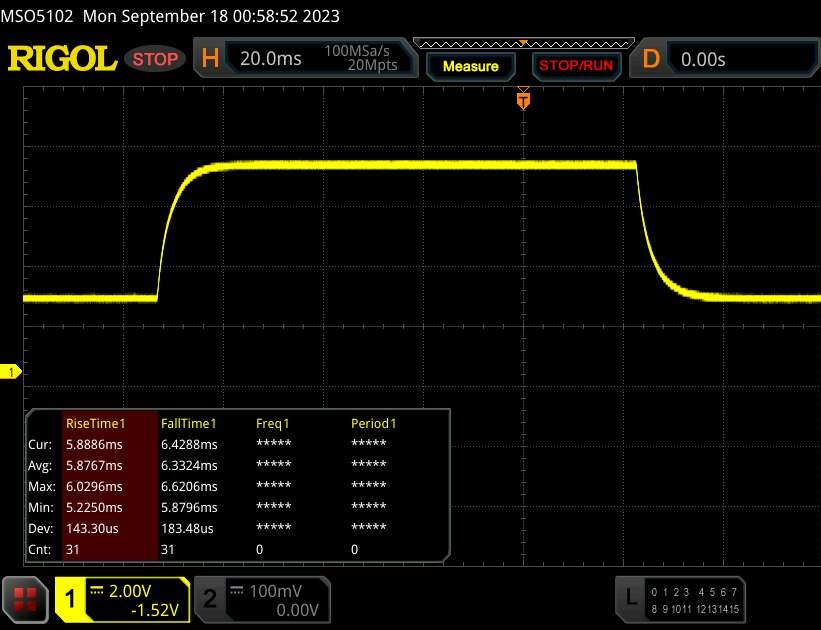 |
| ↘ 6.3 ms bajada | ||
| La pantalla mostró buenos tiempos de respuesta en nuestros tests pero podría ser demasiado lenta para los jugones competitivos. En comparación, todos los dispositivos de prueba van de ##min### (mínimo) a 636 (máximo) ms. » 26 % de todos los dispositivos son mejores. Esto quiere decir que el tiempo de respuesta medido es mejor que la media (31 ms) de todos los dispositivos testados. | ||
Parpadeo de Pantalla / PWM (Pulse-Width Modulation)
| Parpadeo de Pantalla / PWM no detectado | 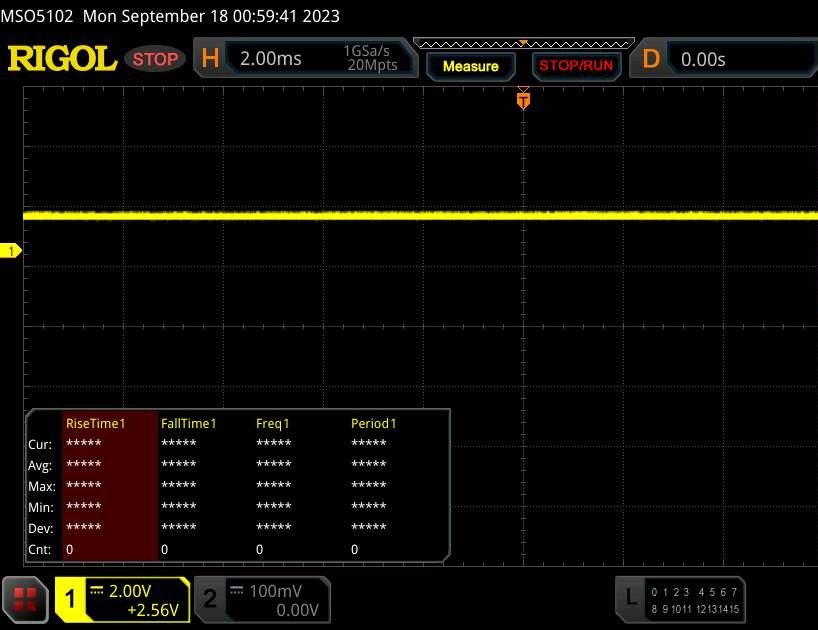 | ||
Comparación: 52 % de todos los dispositivos testados no usaron PWM para atenuar el display. Si se usó, medimos una media de 7754 (mínimo: 5 - máxmo: 343500) Hz. | |||
El panel IPS de ángulo de visión estable del portátil sigue siendo legible desde cualquier ángulo. En el exterior, podrá leer en la pantalla siempre que el sol no brille con demasiada intensidad.
Rendimiento - El portátil Schenker se basa en Raptor Lake y Ada Lovelace
La XMG Pro 16 Studio, orientada a jugadores y creadores, se basa en Raptor Lake y Ada Lovelace. Se supone que la certificación GeForce RTX Studio garantiza un alto rendimiento, controladores personalizados, un buen soporte de software y una cobertura adecuada del espacio de color de la pantalla. El portátil puede configurarse individualmente a través de la tienda en línea de Schenker. La variante actual puede adquirirse por unos 2.400 dólares y los modelos más baratos parten de unos 1.900 dólares.
Condiciones de prueba
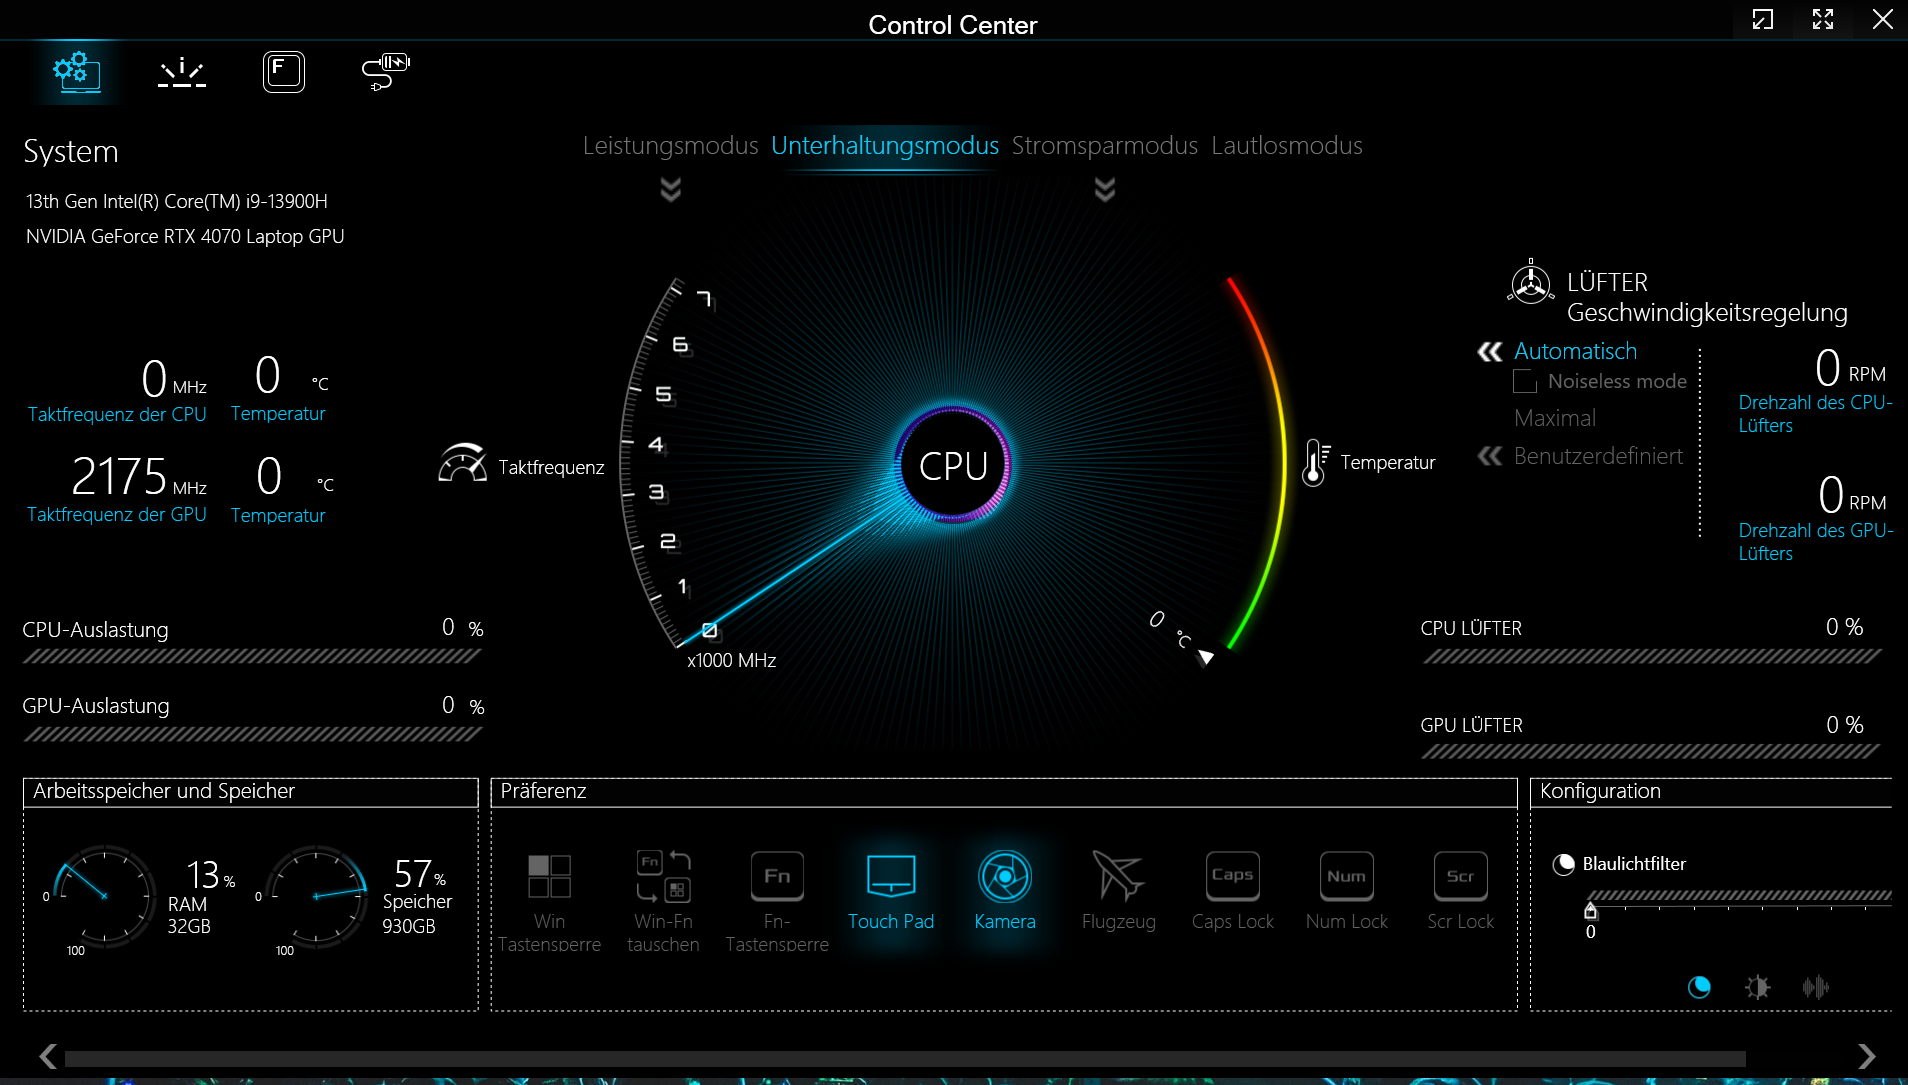
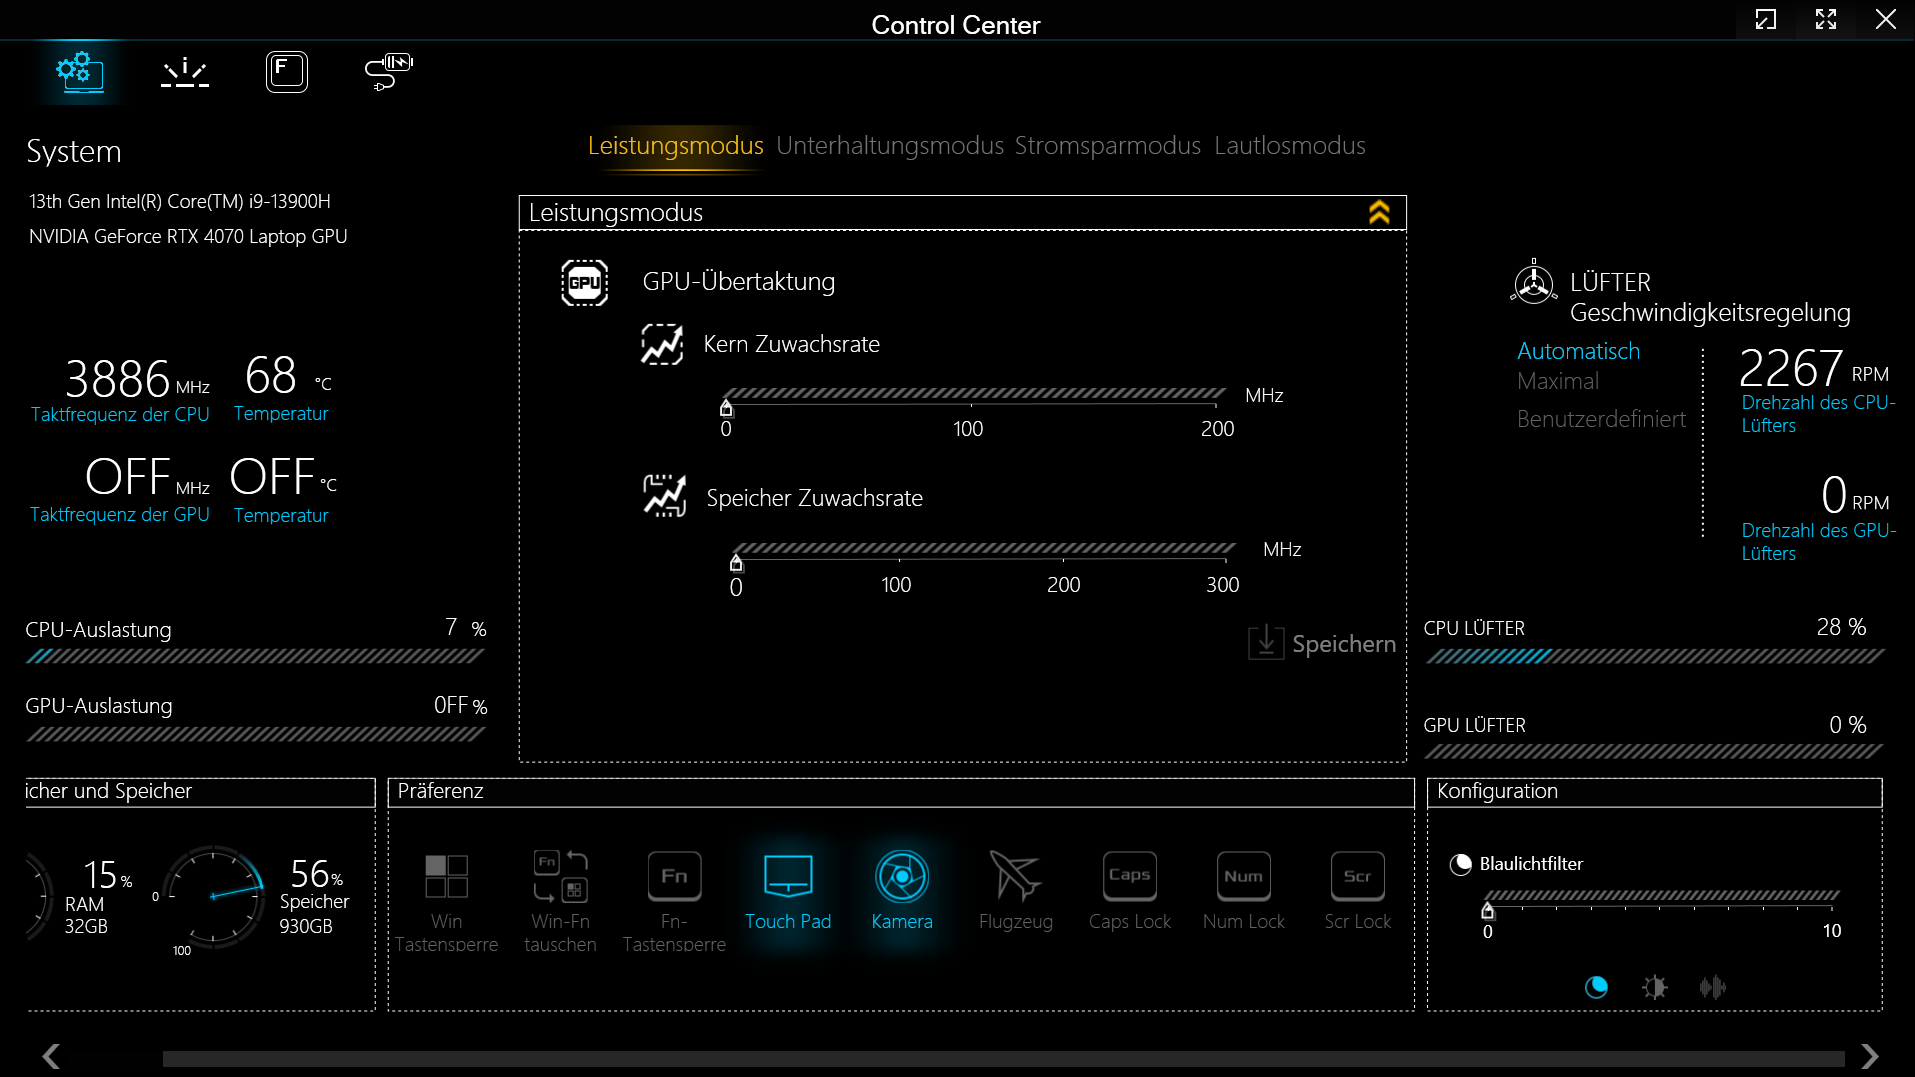
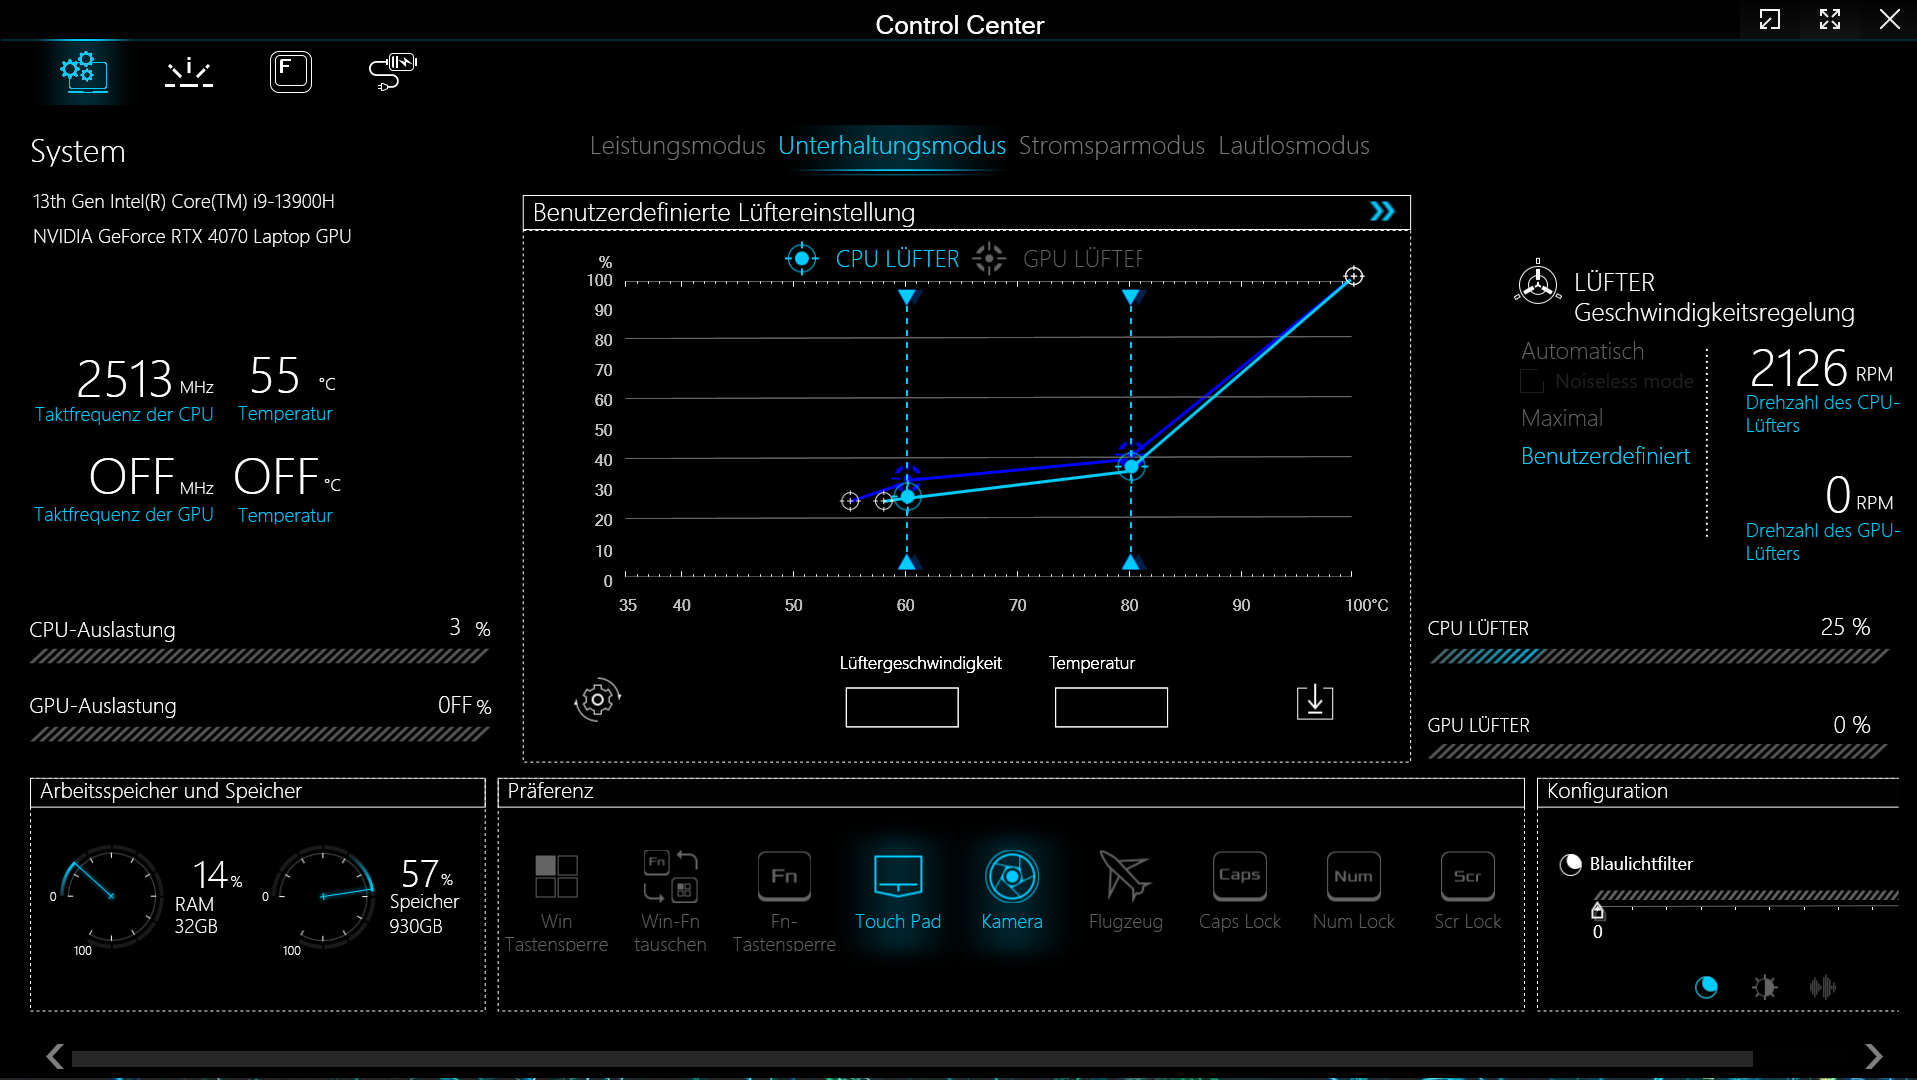
El Pro ofrece cuatro modos de rendimiento específicos del fabricante (véase la tabla) entre los que se puede cambiar a través del software Control Center (el centro de control del portátil). se utilizaron el "Modo de entretenimiento" (pruebas de rendimiento) y el "Modo de ahorro de energía" (pruebas de batería). Optimus estaba activo.
| Modo de entretenimiento | Modo de rendimiento | Modo de ahorro de energía | Modo silencioso | |
|---|---|---|---|---|
| Límite de potencia 1 (HWInfo) | 70 vatios | 100 vatios | 15 vatios | 15 vatios |
| Límite de potencia 2 (HWInfo) | 90 vatios | 120 vatios | 30 vatios | 30 vatios |
| Ruido (Witcher 3) | 48 dB(A) | 55 dB (A) | - | 42 dB (A) |
| Rendimiento (Witcher 3) | ~114 fps | ~118 fps | - | ~100-114 fps |
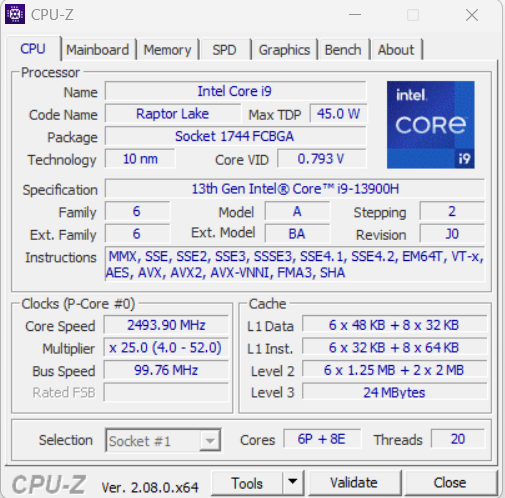
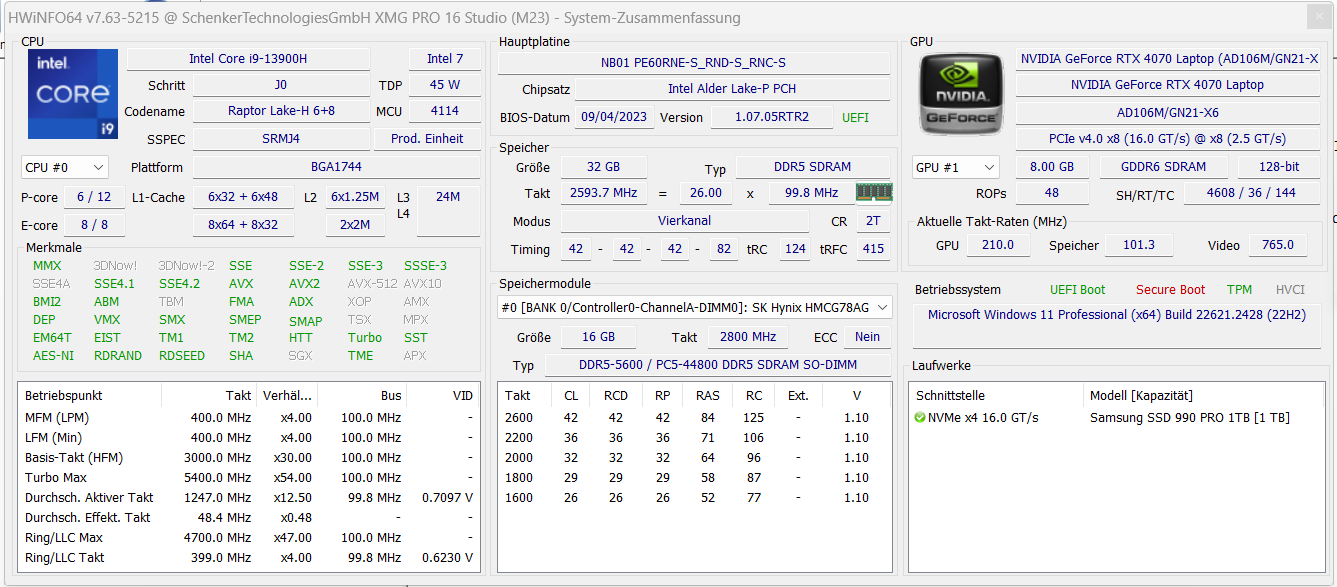
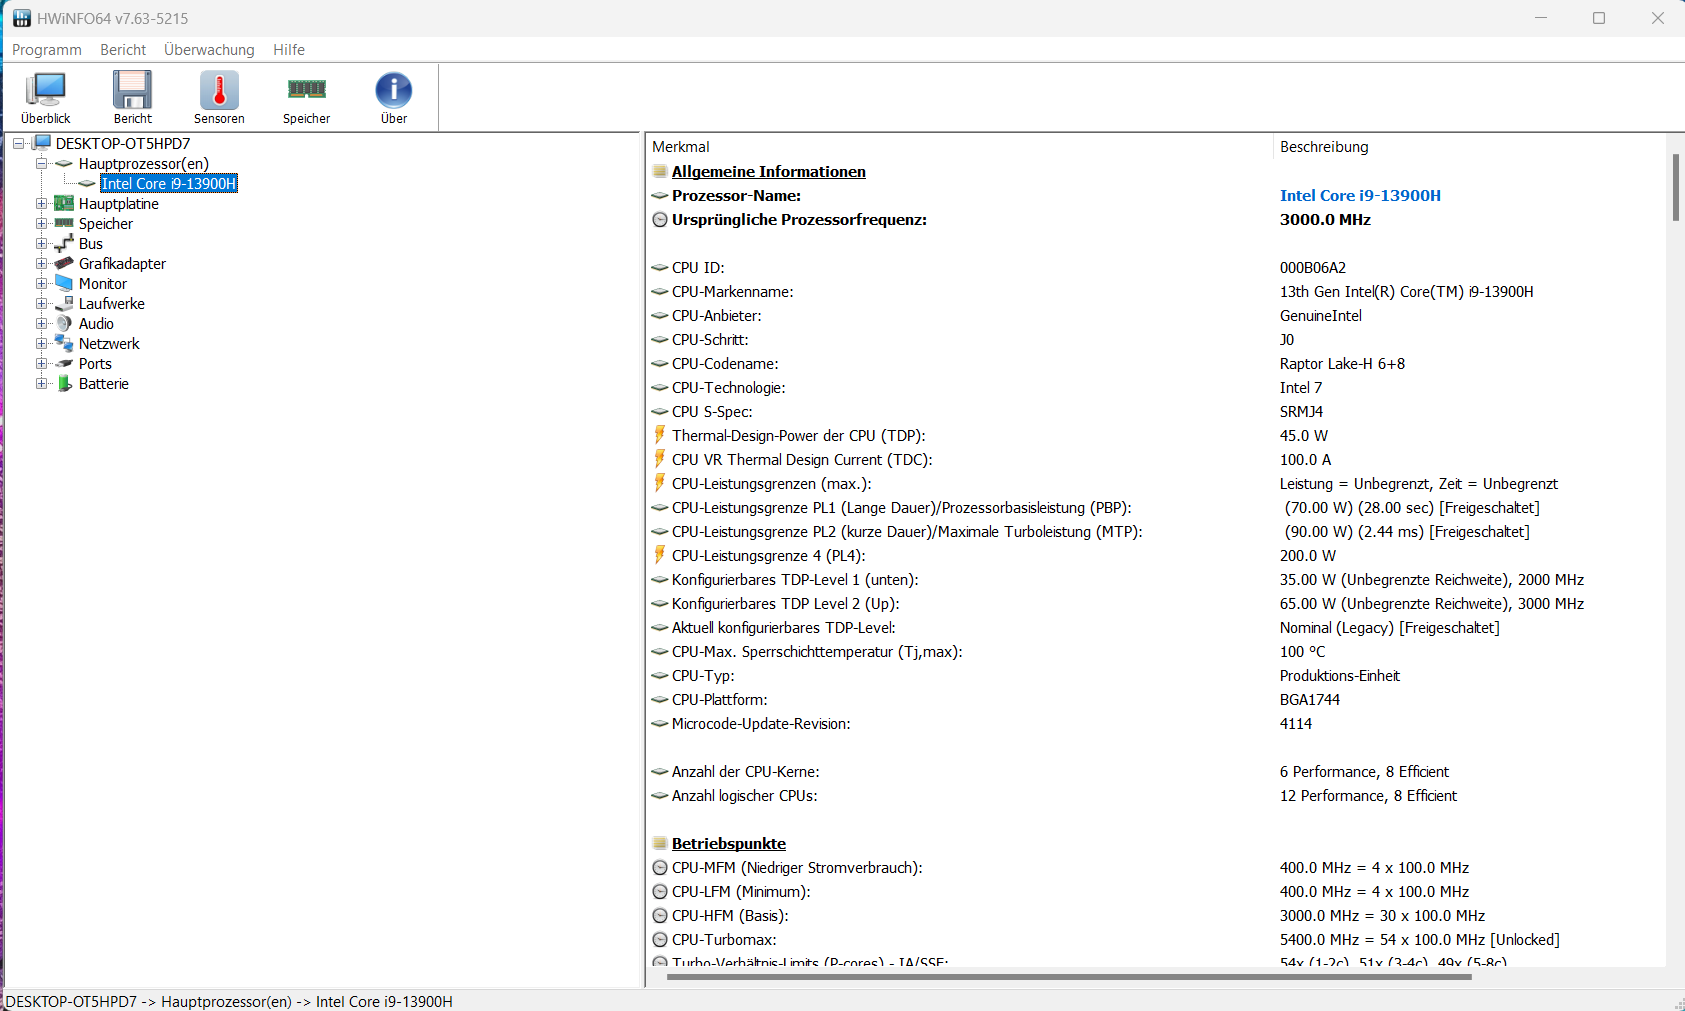
Procesador
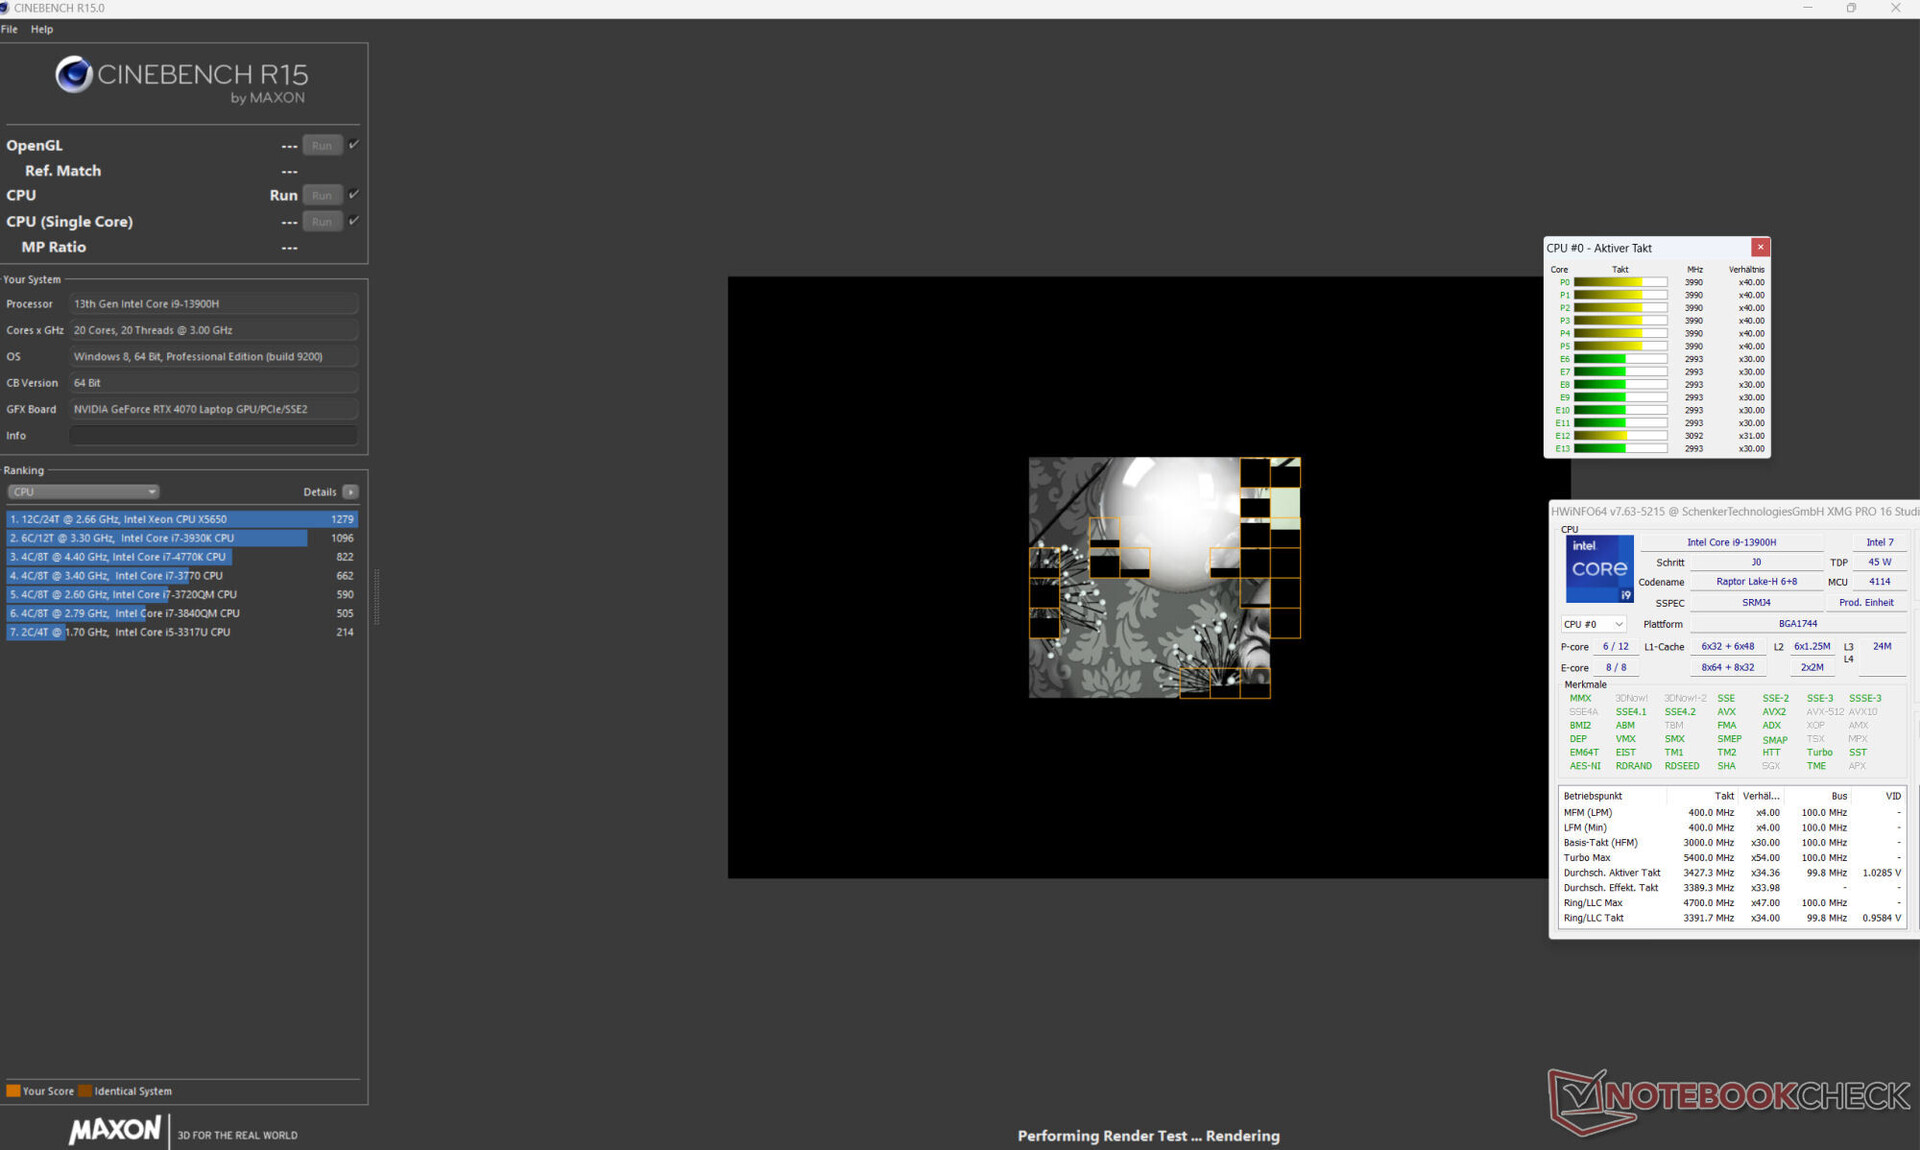
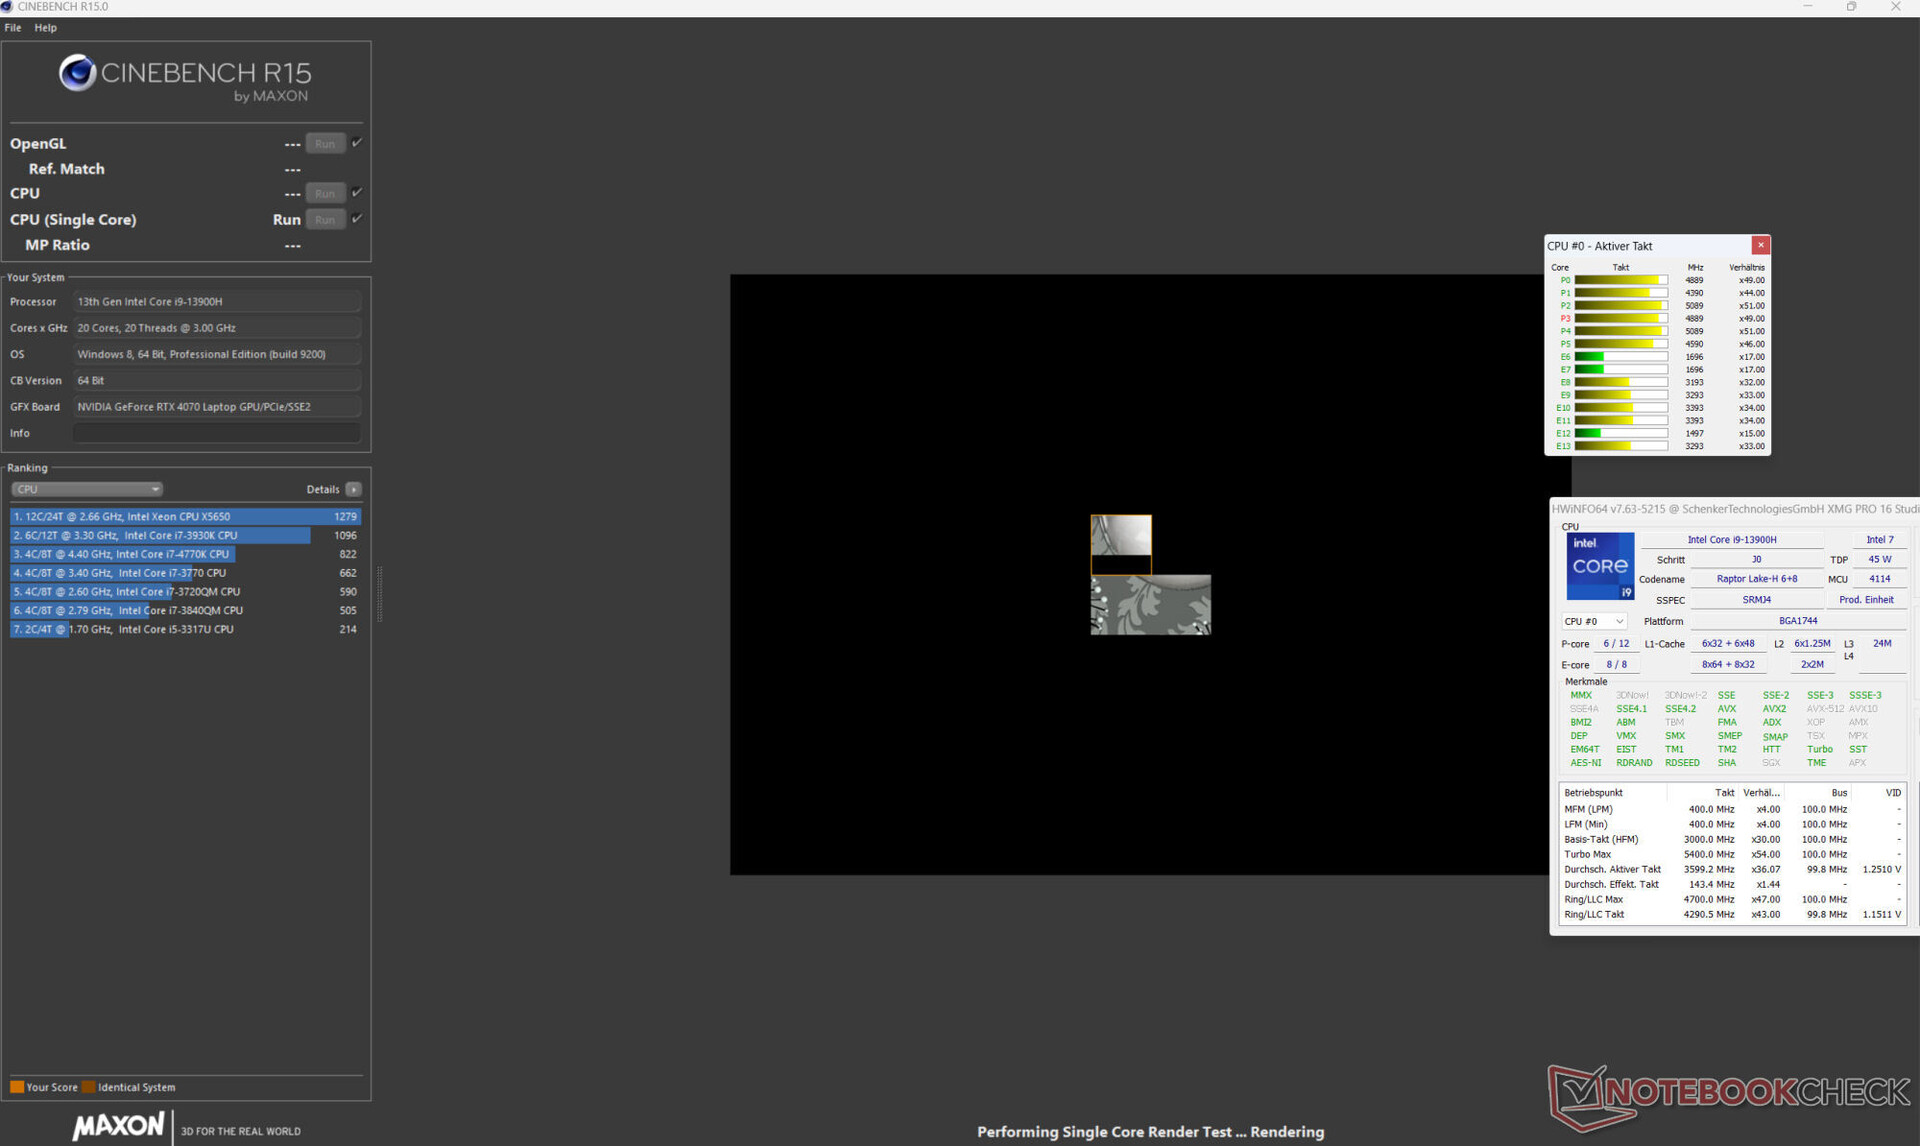
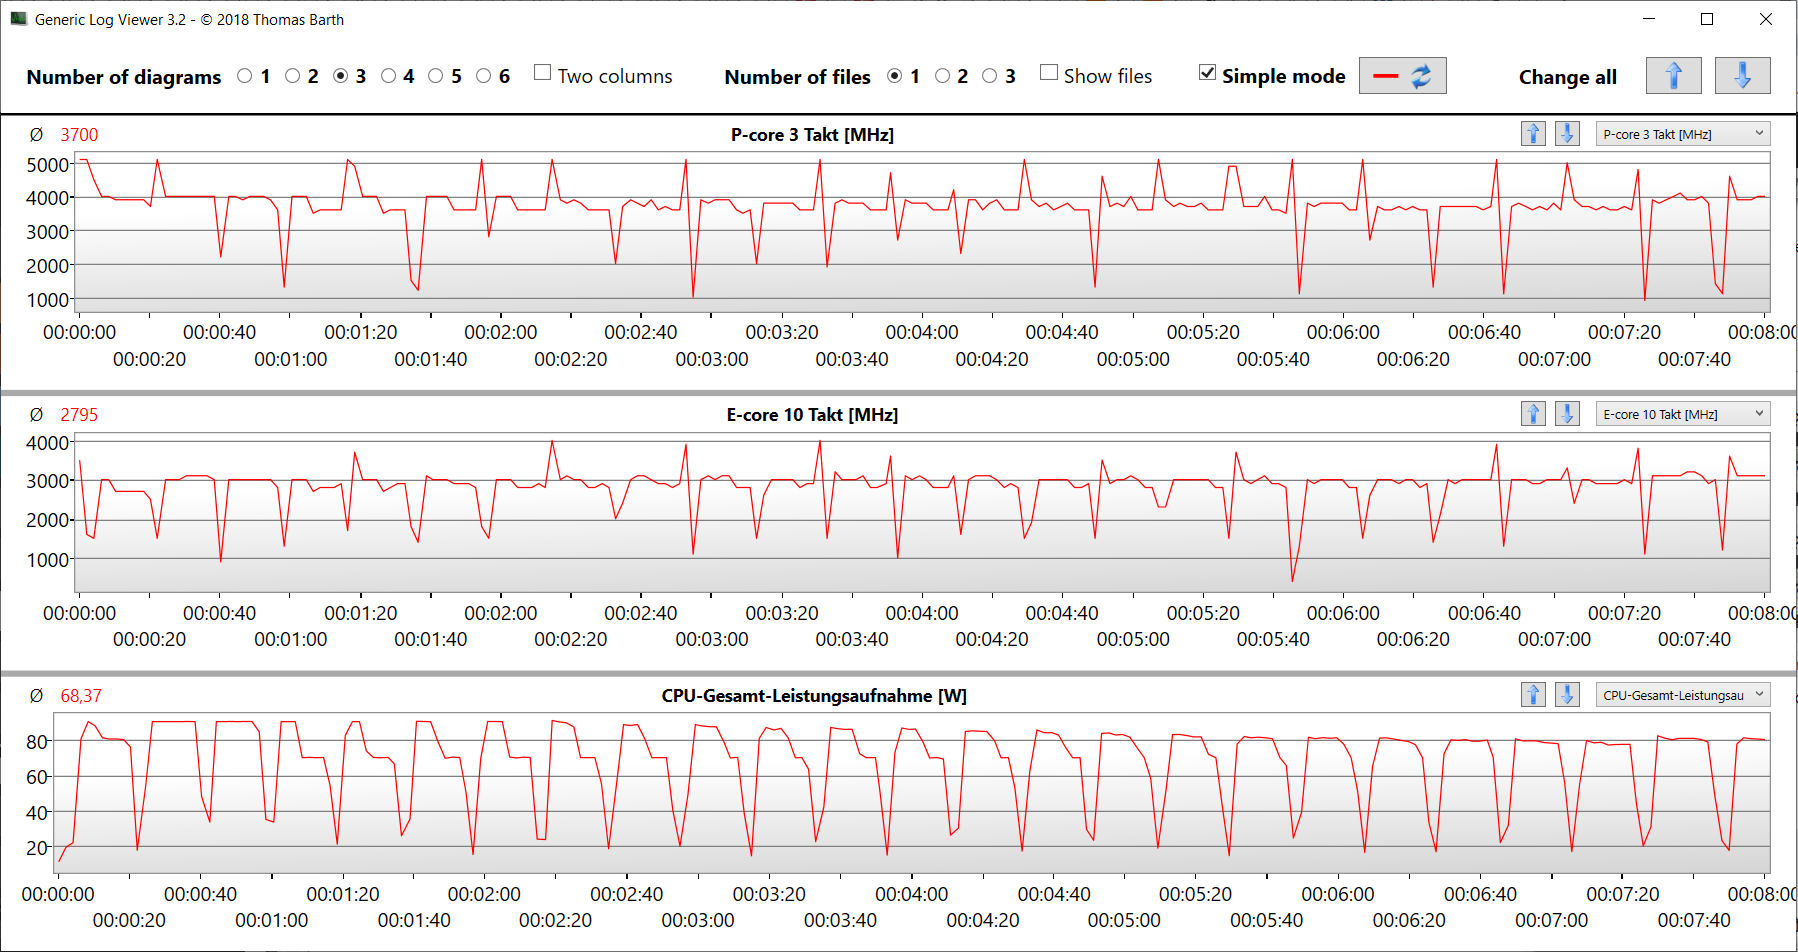
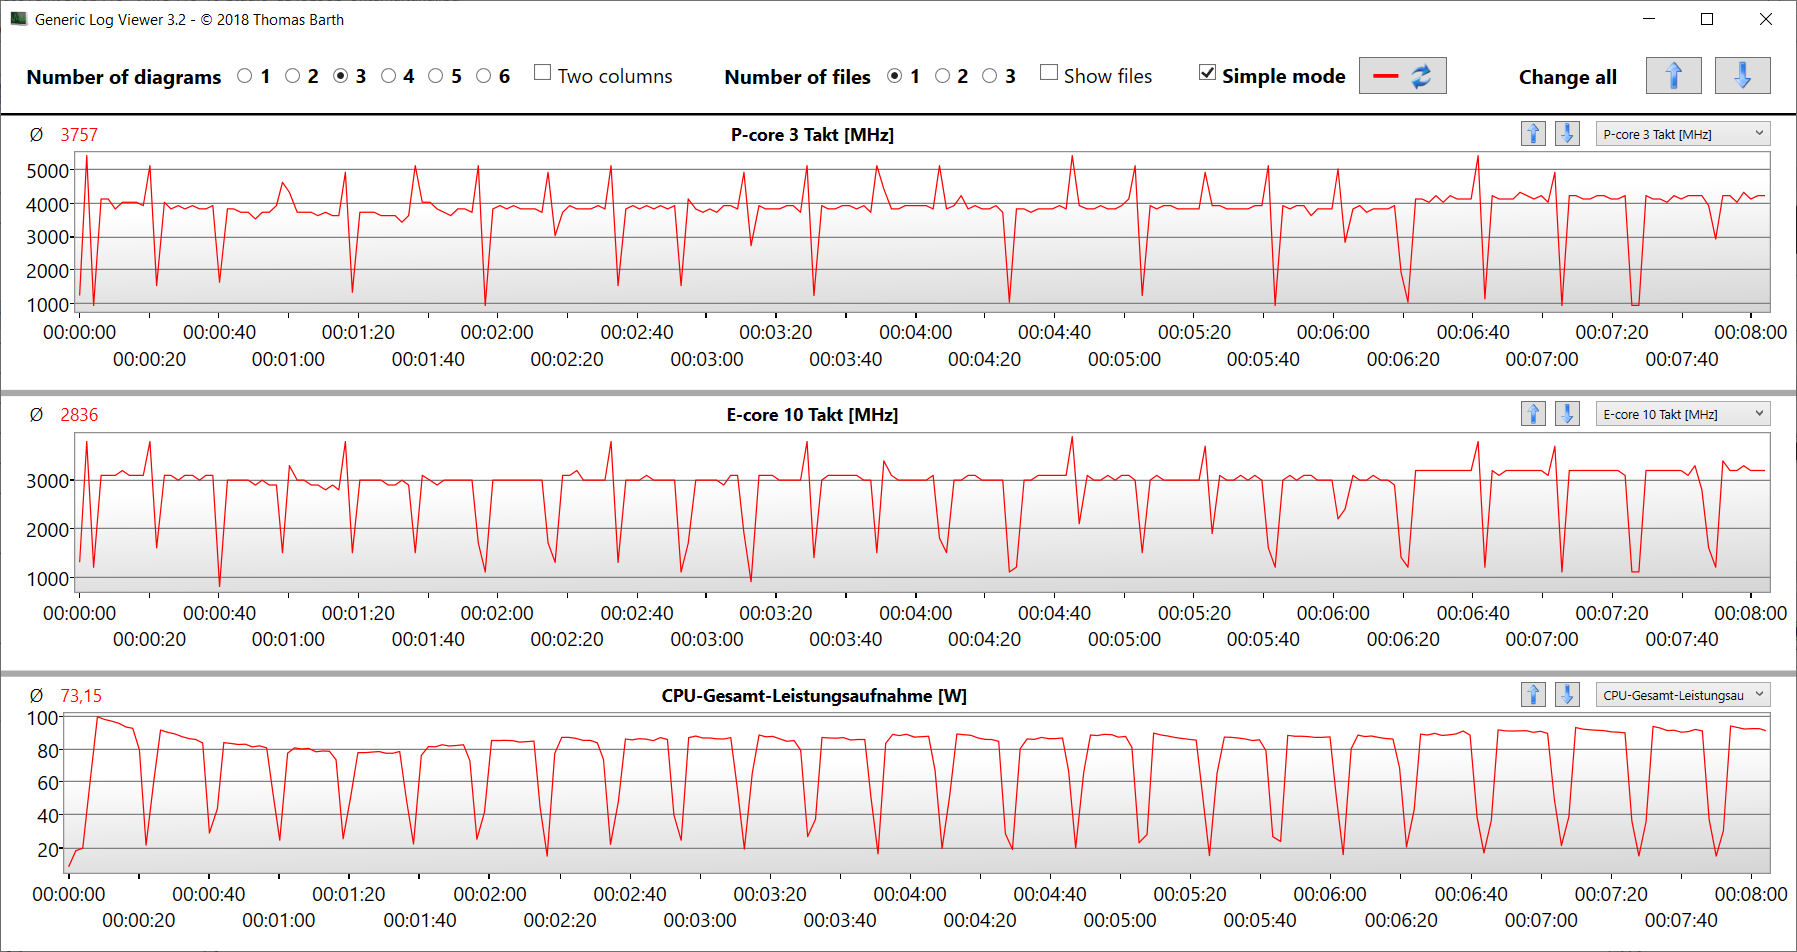
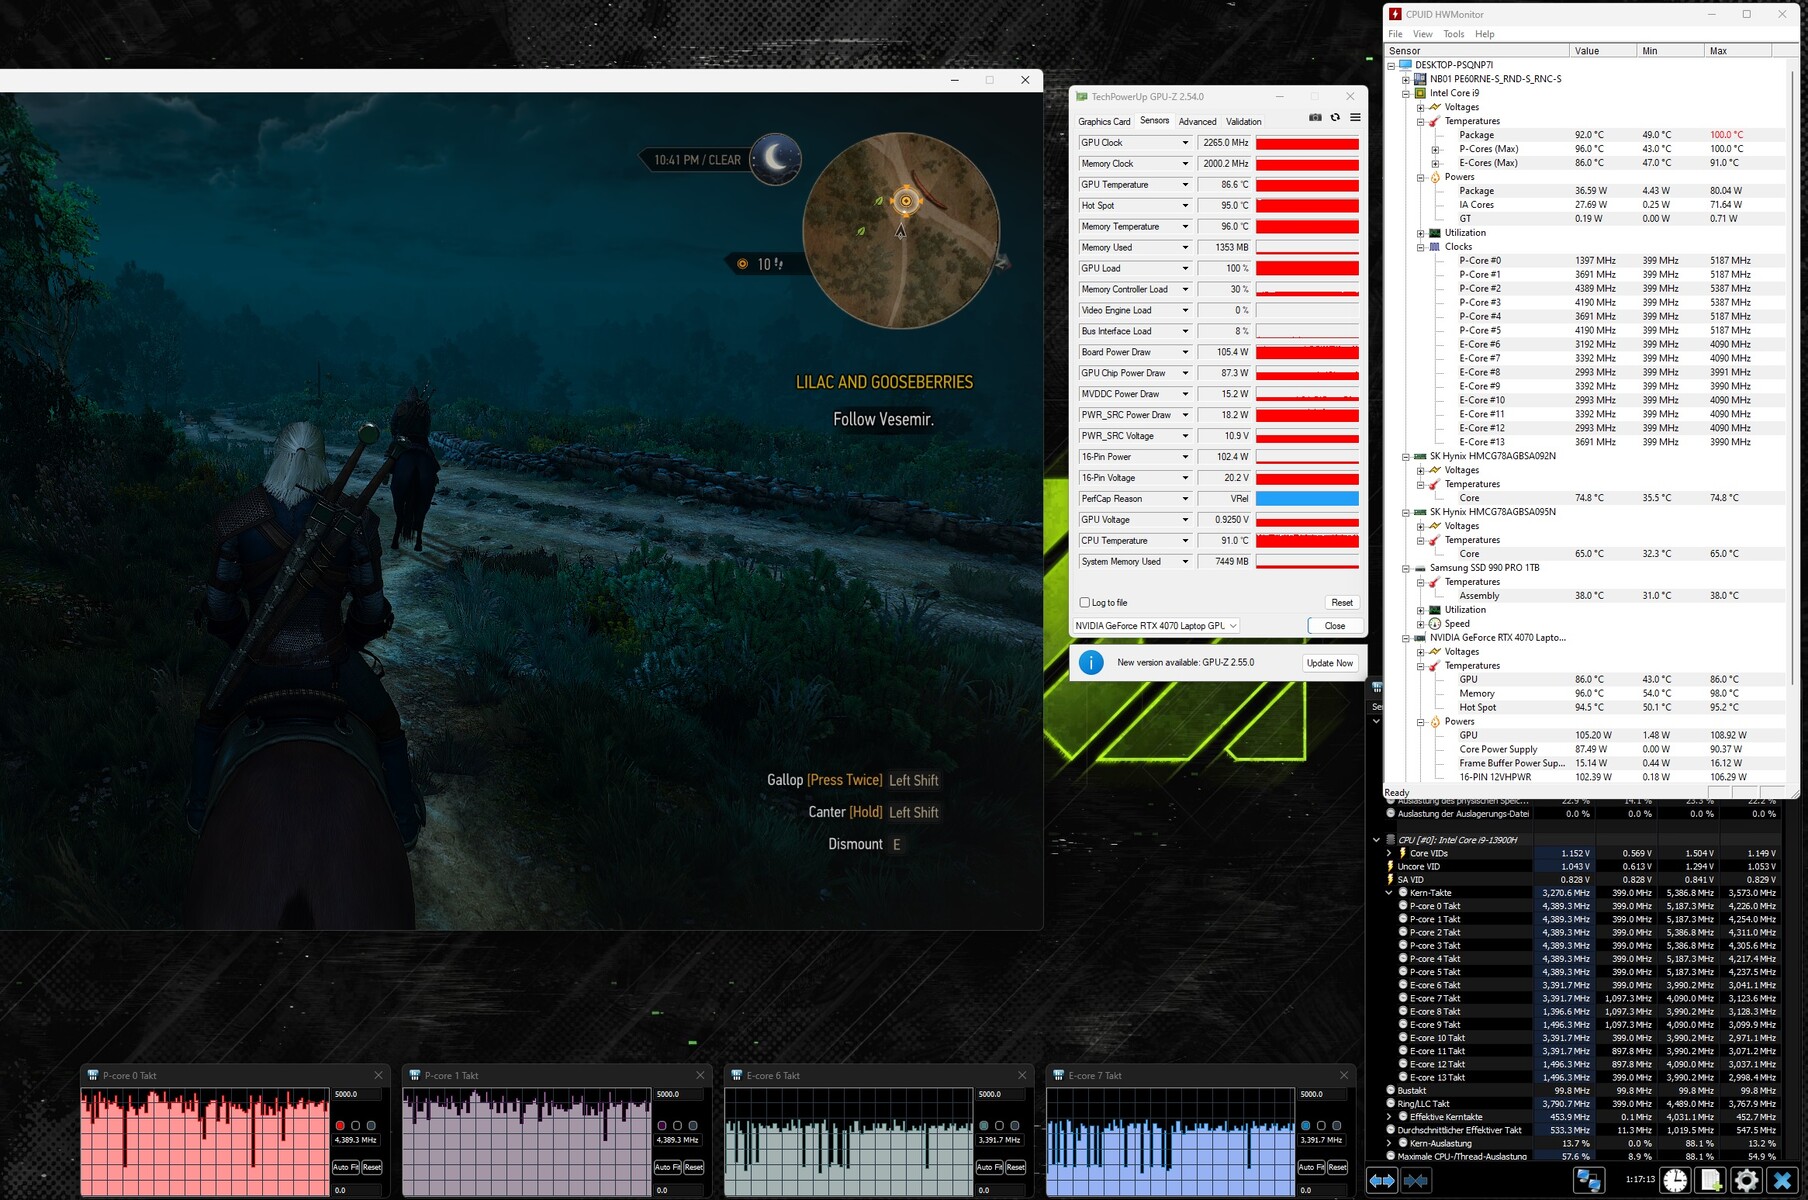
ElCore i9-13900H(6P, 8E) de 14 núcleos de CPU alcanzan velocidades de reloj máximas de 5,4 GHz (P) y 4,1 GHz (E). La carga multihilo permanente (CB15 Loop) hizo que la velocidad de reloj descendiera ligeramente de la primera a la cuarta ejecución. Después de esto, los valores se mantuvieron constantes.
Medimos resultados de referencia ligeramente por encima de la media de la CPU determinada previamente (conectada a la red eléctrica). En modo batería, el rendimiento más relevante de un solo subproceso (158 puntos; CB15) se hundió en mayor medida que el rendimiento de varios subprocesos (1.696 puntos; CB15).
Cinebench R15 Multi continuous test
* ... más pequeño es mejor
AIDA64: FP32 Ray-Trace | FPU Julia | CPU SHA3 | CPU Queen | FPU SinJulia | FPU Mandel | CPU AES | CPU ZLib | FP64 Ray-Trace | CPU PhotoWorxx
| Performance rating | |
| Media de la clase Gaming | |
| HP Omen Transcend 16 | |
| Asus Vivobook Pro 16X K6604JV-MX016W | |
| Schenker XMG Pro 16 Studio (Mid 23) | |
| MSI Stealth 16 Studio A13VG | |
| Lenovo Legion Slim 7i 16 Gen 8 | |
| Medio Intel Core i9-13900H | |
| AIDA64 / FP32 Ray-Trace | |
| Media de la clase Gaming (10227 - 85542, n=105, últimos 2 años) | |
| HP Omen Transcend 16 | |
| Asus Vivobook Pro 16X K6604JV-MX016W | |
| MSI Stealth 16 Studio A13VG | |
| Lenovo Legion Slim 7i 16 Gen 8 | |
| Schenker XMG Pro 16 Studio (Mid 23) | |
| Medio Intel Core i9-13900H (6788 - 19557, n=25) | |
| AIDA64 / FPU Julia | |
| Media de la clase Gaming (51376 - 238426, n=105, últimos 2 años) | |
| HP Omen Transcend 16 | |
| Asus Vivobook Pro 16X K6604JV-MX016W | |
| Lenovo Legion Slim 7i 16 Gen 8 | |
| Schenker XMG Pro 16 Studio (Mid 23) | |
| MSI Stealth 16 Studio A13VG | |
| Medio Intel Core i9-13900H (22551 - 95579, n=25) | |
| AIDA64 / CPU SHA3 | |
| Media de la clase Gaming (2180 - 10115, n=105, últimos 2 años) | |
| HP Omen Transcend 16 | |
| Asus Vivobook Pro 16X K6604JV-MX016W | |
| MSI Stealth 16 Studio A13VG | |
| Lenovo Legion Slim 7i 16 Gen 8 | |
| Schenker XMG Pro 16 Studio (Mid 23) | |
| Medio Intel Core i9-13900H (2491 - 4270, n=25) | |
| AIDA64 / CPU Queen | |
| Asus Vivobook Pro 16X K6604JV-MX016W | |
| HP Omen Transcend 16 | |
| Lenovo Legion Slim 7i 16 Gen 8 | |
| Media de la clase Gaming (49785 - 173351, n=90, últimos 2 años) | |
| MSI Stealth 16 Studio A13VG | |
| Medio Intel Core i9-13900H (65121 - 120936, n=25) | |
| Schenker XMG Pro 16 Studio (Mid 23) | |
| AIDA64 / FPU SinJulia | |
| Media de la clase Gaming (4424 - 33636, n=105, últimos 2 años) | |
| Asus Vivobook Pro 16X K6604JV-MX016W | |
| HP Omen Transcend 16 | |
| Lenovo Legion Slim 7i 16 Gen 8 | |
| MSI Stealth 16 Studio A13VG | |
| Schenker XMG Pro 16 Studio (Mid 23) | |
| Medio Intel Core i9-13900H (6108 - 11631, n=25) | |
| AIDA64 / FPU Mandel | |
| Media de la clase Gaming (25115 - 128721, n=105, últimos 2 años) | |
| HP Omen Transcend 16 | |
| Asus Vivobook Pro 16X K6604JV-MX016W | |
| Lenovo Legion Slim 7i 16 Gen 8 | |
| MSI Stealth 16 Studio A13VG | |
| Schenker XMG Pro 16 Studio (Mid 23) | |
| Medio Intel Core i9-13900H (11283 - 48474, n=25) | |
| AIDA64 / CPU AES | |
| Schenker XMG Pro 16 Studio (Mid 23) | |
| HP Omen Transcend 16 | |
| Media de la clase Gaming (39258 - 247074, n=105, últimos 2 años) | |
| Asus Vivobook Pro 16X K6604JV-MX016W | |
| Medio Intel Core i9-13900H (3691 - 149377, n=25) | |
| MSI Stealth 16 Studio A13VG | |
| Lenovo Legion Slim 7i 16 Gen 8 | |
| AIDA64 / CPU ZLib | |
| HP Omen Transcend 16 | |
| Media de la clase Gaming (574 - 2531, n=105, últimos 2 años) | |
| Asus Vivobook Pro 16X K6604JV-MX016W | |
| Lenovo Legion Slim 7i 16 Gen 8 | |
| Schenker XMG Pro 16 Studio (Mid 23) | |
| Medio Intel Core i9-13900H (789 - 1254, n=25) | |
| MSI Stealth 16 Studio A13VG | |
| AIDA64 / FP64 Ray-Trace | |
| Media de la clase Gaming (5509 - 45446, n=105, últimos 2 años) | |
| HP Omen Transcend 16 | |
| Asus Vivobook Pro 16X K6604JV-MX016W | |
| MSI Stealth 16 Studio A13VG | |
| Lenovo Legion Slim 7i 16 Gen 8 | |
| Schenker XMG Pro 16 Studio (Mid 23) | |
| Medio Intel Core i9-13900H (3655 - 10716, n=25) | |
| AIDA64 / CPU PhotoWorxx | |
| HP Omen Transcend 16 | |
| Schenker XMG Pro 16 Studio (Mid 23) | |
| MSI Stealth 16 Studio A13VG | |
| Media de la clase Gaming (12271 - 89891, n=105, últimos 2 años) | |
| Asus Vivobook Pro 16X K6604JV-MX016W | |
| Medio Intel Core i9-13900H (10871 - 50488, n=25) | |
| Lenovo Legion Slim 7i 16 Gen 8 | |
Rendimiento del sistema
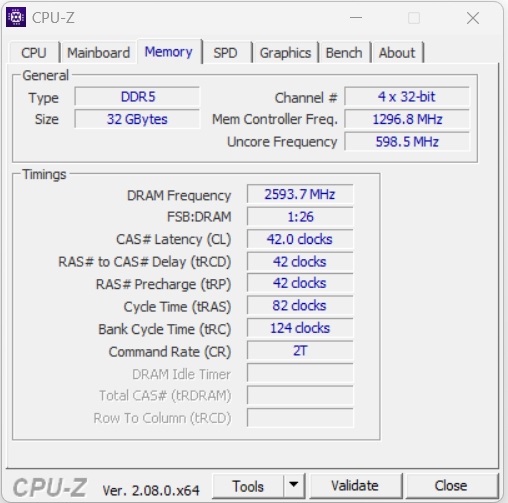
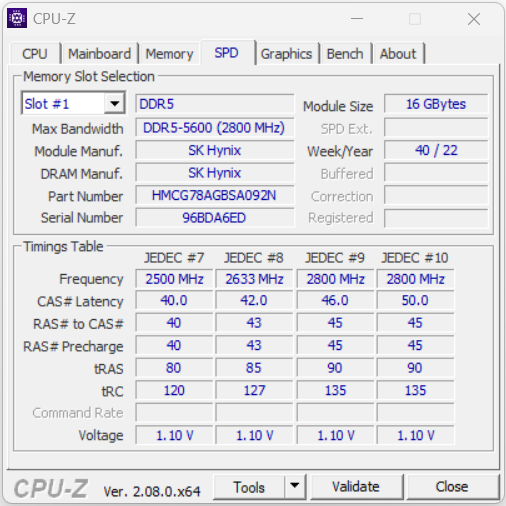
Al sistema, que funciona sin problemas, no le falta potencia de cálculo. Los juegos, el renderizado y la edición de vídeo son algunas de las competencias básicas del ordenador. Las tasas de transferencia de la RAM están en un nivel normal para una RAM DDR5-5600.
CrossMark: Overall | Productivity | Creativity | Responsiveness
| PCMark 10 / Score | |
| Lenovo Legion Slim 7i 16 Gen 8 | |
| Media de la clase Gaming (5828 - 12414, n=93, últimos 2 años) | |
| HP Omen Transcend 16 | |
| Schenker XMG Pro 16 Studio (Mid 23) | |
| Medio Intel Core i9-13900H, NVIDIA GeForce RTX 4070 Laptop GPU (5855 - 8538, n=8) | |
| MSI Stealth 16 Studio A13VG | |
| Asus Vivobook Pro 16X K6604JV-MX016W | |
| PCMark 10 / Essentials | |
| Schenker XMG Pro 16 Studio (Mid 23) | |
| Lenovo Legion Slim 7i 16 Gen 8 | |
| HP Omen Transcend 16 | |
| Medio Intel Core i9-13900H, NVIDIA GeForce RTX 4070 Laptop GPU (8835 - 11940, n=8) | |
| Media de la clase Gaming (8810 - 11935, n=97, últimos 2 años) | |
| Asus Vivobook Pro 16X K6604JV-MX016W | |
| MSI Stealth 16 Studio A13VG | |
| PCMark 10 / Productivity | |
| Media de la clase Gaming (6845 - 25323, n=95, últimos 2 años) | |
| Lenovo Legion Slim 7i 16 Gen 8 | |
| Schenker XMG Pro 16 Studio (Mid 23) | |
| Medio Intel Core i9-13900H, NVIDIA GeForce RTX 4070 Laptop GPU (7967 - 10991, n=8) | |
| HP Omen Transcend 16 | |
| MSI Stealth 16 Studio A13VG | |
| Asus Vivobook Pro 16X K6604JV-MX016W | |
| PCMark 10 / Digital Content Creation | |
| Media de la clase Gaming (7602 - 19954, n=95, últimos 2 años) | |
| Lenovo Legion Slim 7i 16 Gen 8 | |
| HP Omen Transcend 16 | |
| Medio Intel Core i9-13900H, NVIDIA GeForce RTX 4070 Laptop GPU (7738 - 13575, n=8) | |
| Schenker XMG Pro 16 Studio (Mid 23) | |
| MSI Stealth 16 Studio A13VG | |
| Asus Vivobook Pro 16X K6604JV-MX016W | |
| CrossMark / Overall | |
| Asus Vivobook Pro 16X K6604JV-MX016W | |
| Media de la clase Gaming (1366 - 2409, n=94, últimos 2 años) | |
| Lenovo Legion Slim 7i 16 Gen 8 | |
| HP Omen Transcend 16 | |
| Schenker XMG Pro 16 Studio (Mid 23) | |
| Medio Intel Core i9-13900H, NVIDIA GeForce RTX 4070 Laptop GPU (1104 - 1974, n=7) | |
| MSI Stealth 16 Studio A13VG | |
| CrossMark / Productivity | |
| Asus Vivobook Pro 16X K6604JV-MX016W | |
| Lenovo Legion Slim 7i 16 Gen 8 | |
| Schenker XMG Pro 16 Studio (Mid 23) | |
| Media de la clase Gaming (1386 - 2254, n=94, últimos 2 años) | |
| HP Omen Transcend 16 | |
| Medio Intel Core i9-13900H, NVIDIA GeForce RTX 4070 Laptop GPU (1058 - 1914, n=7) | |
| MSI Stealth 16 Studio A13VG | |
| CrossMark / Creativity | |
| Asus Vivobook Pro 16X K6604JV-MX016W | |
| HP Omen Transcend 16 | |
| Media de la clase Gaming (1343 - 2786, n=94, últimos 2 años) | |
| Lenovo Legion Slim 7i 16 Gen 8 | |
| Schenker XMG Pro 16 Studio (Mid 23) | |
| Medio Intel Core i9-13900H, NVIDIA GeForce RTX 4070 Laptop GPU (1178 - 2254, n=7) | |
| MSI Stealth 16 Studio A13VG | |
| CrossMark / Responsiveness | |
| Schenker XMG Pro 16 Studio (Mid 23) | |
| Lenovo Legion Slim 7i 16 Gen 8 | |
| Media de la clase Gaming (1226 - 2334, n=94, últimos 2 años) | |
| Asus Vivobook Pro 16X K6604JV-MX016W | |
| Medio Intel Core i9-13900H, NVIDIA GeForce RTX 4070 Laptop GPU (1037 - 1952, n=7) | |
| MSI Stealth 16 Studio A13VG | |
| HP Omen Transcend 16 | |
| PCMark 10 Score | 8010 puntos | |
ayuda | ||
| AIDA64 / Memory Copy | |
| HP Omen Transcend 16 | |
| Media de la clase Gaming (21750 - 129946, n=105, últimos 2 años) | |
| Schenker XMG Pro 16 Studio (Mid 23) | |
| MSI Stealth 16 Studio A13VG | |
| Asus Vivobook Pro 16X K6604JV-MX016W | |
| Medio Intel Core i9-13900H (37448 - 74486, n=25) | |
| Lenovo Legion Slim 7i 16 Gen 8 | |
| AIDA64 / Memory Read | |
| HP Omen Transcend 16 | |
| Asus Vivobook Pro 16X K6604JV-MX016W | |
| Schenker XMG Pro 16 Studio (Mid 23) | |
| Media de la clase Gaming (22956 - 118858, n=105, últimos 2 años) | |
| MSI Stealth 16 Studio A13VG | |
| Medio Intel Core i9-13900H (41599 - 75433, n=25) | |
| Lenovo Legion Slim 7i 16 Gen 8 | |
| AIDA64 / Memory Write | |
| Media de la clase Gaming (22297 - 135096, n=105, últimos 2 años) | |
| HP Omen Transcend 16 | |
| Schenker XMG Pro 16 Studio (Mid 23) | |
| MSI Stealth 16 Studio A13VG | |
| Asus Vivobook Pro 16X K6604JV-MX016W | |
| Medio Intel Core i9-13900H (36152 - 88505, n=25) | |
| Lenovo Legion Slim 7i 16 Gen 8 | |
| AIDA64 / Memory Latency | |
| Media de la clase Gaming (75.3 - 259, n=105, últimos 2 años) | |
| Asus Vivobook Pro 16X K6604JV-MX016W | |
| Medio Intel Core i9-13900H (75.8 - 102.3, n=25) | |
| HP Omen Transcend 16 | |
| MSI Stealth 16 Studio A13VG | |
| Schenker XMG Pro 16 Studio (Mid 23) | |
| Lenovo Legion Slim 7i 16 Gen 8 | |
* ... más pequeño es mejor
Latencia del CPD
La prueba de monitorización de latencia estandarizada (navegación web, reproducción de vídeo 4k, Prime95 a alta carga) reveló algunas anomalías. El sistema no parece adecuado para la edición de vídeo y audio en tiempo real. Futuras actualizaciones del software podrían suponer mejoras o incluso degradaciones.
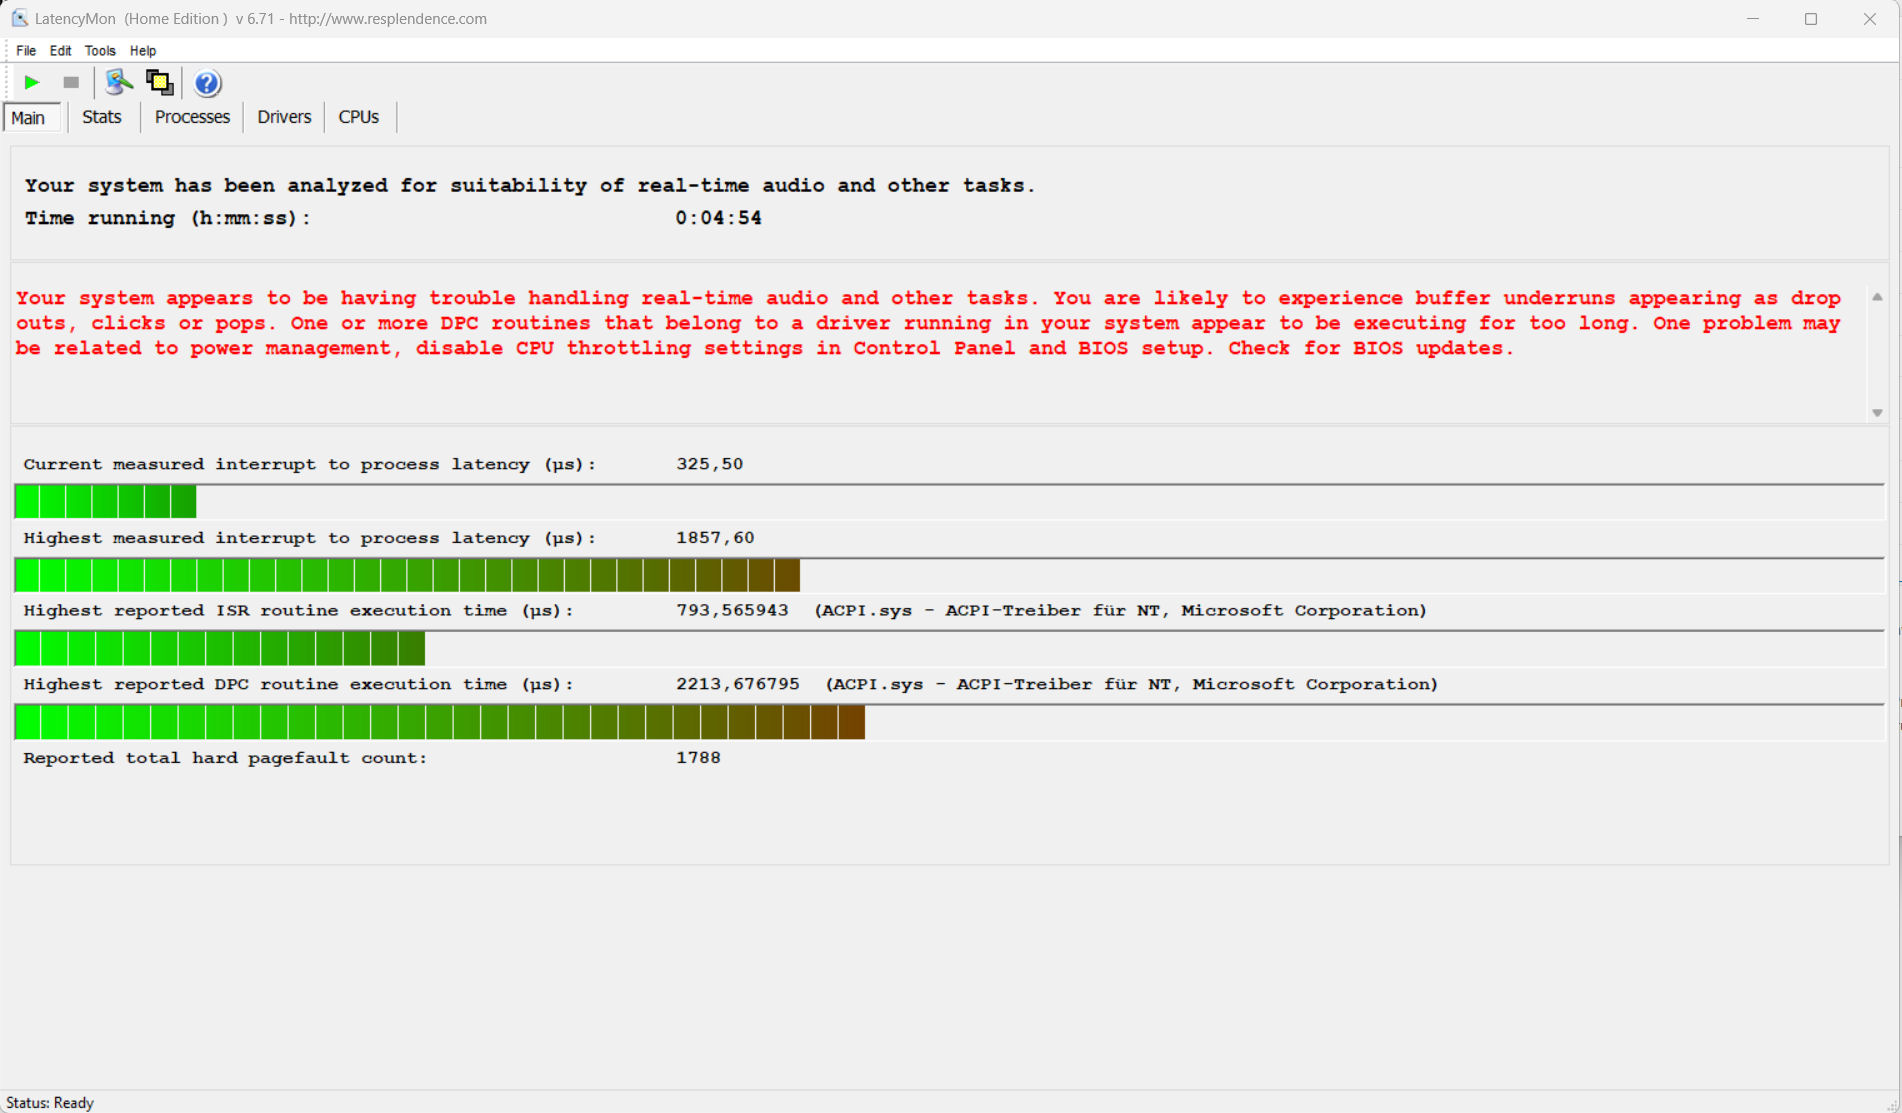
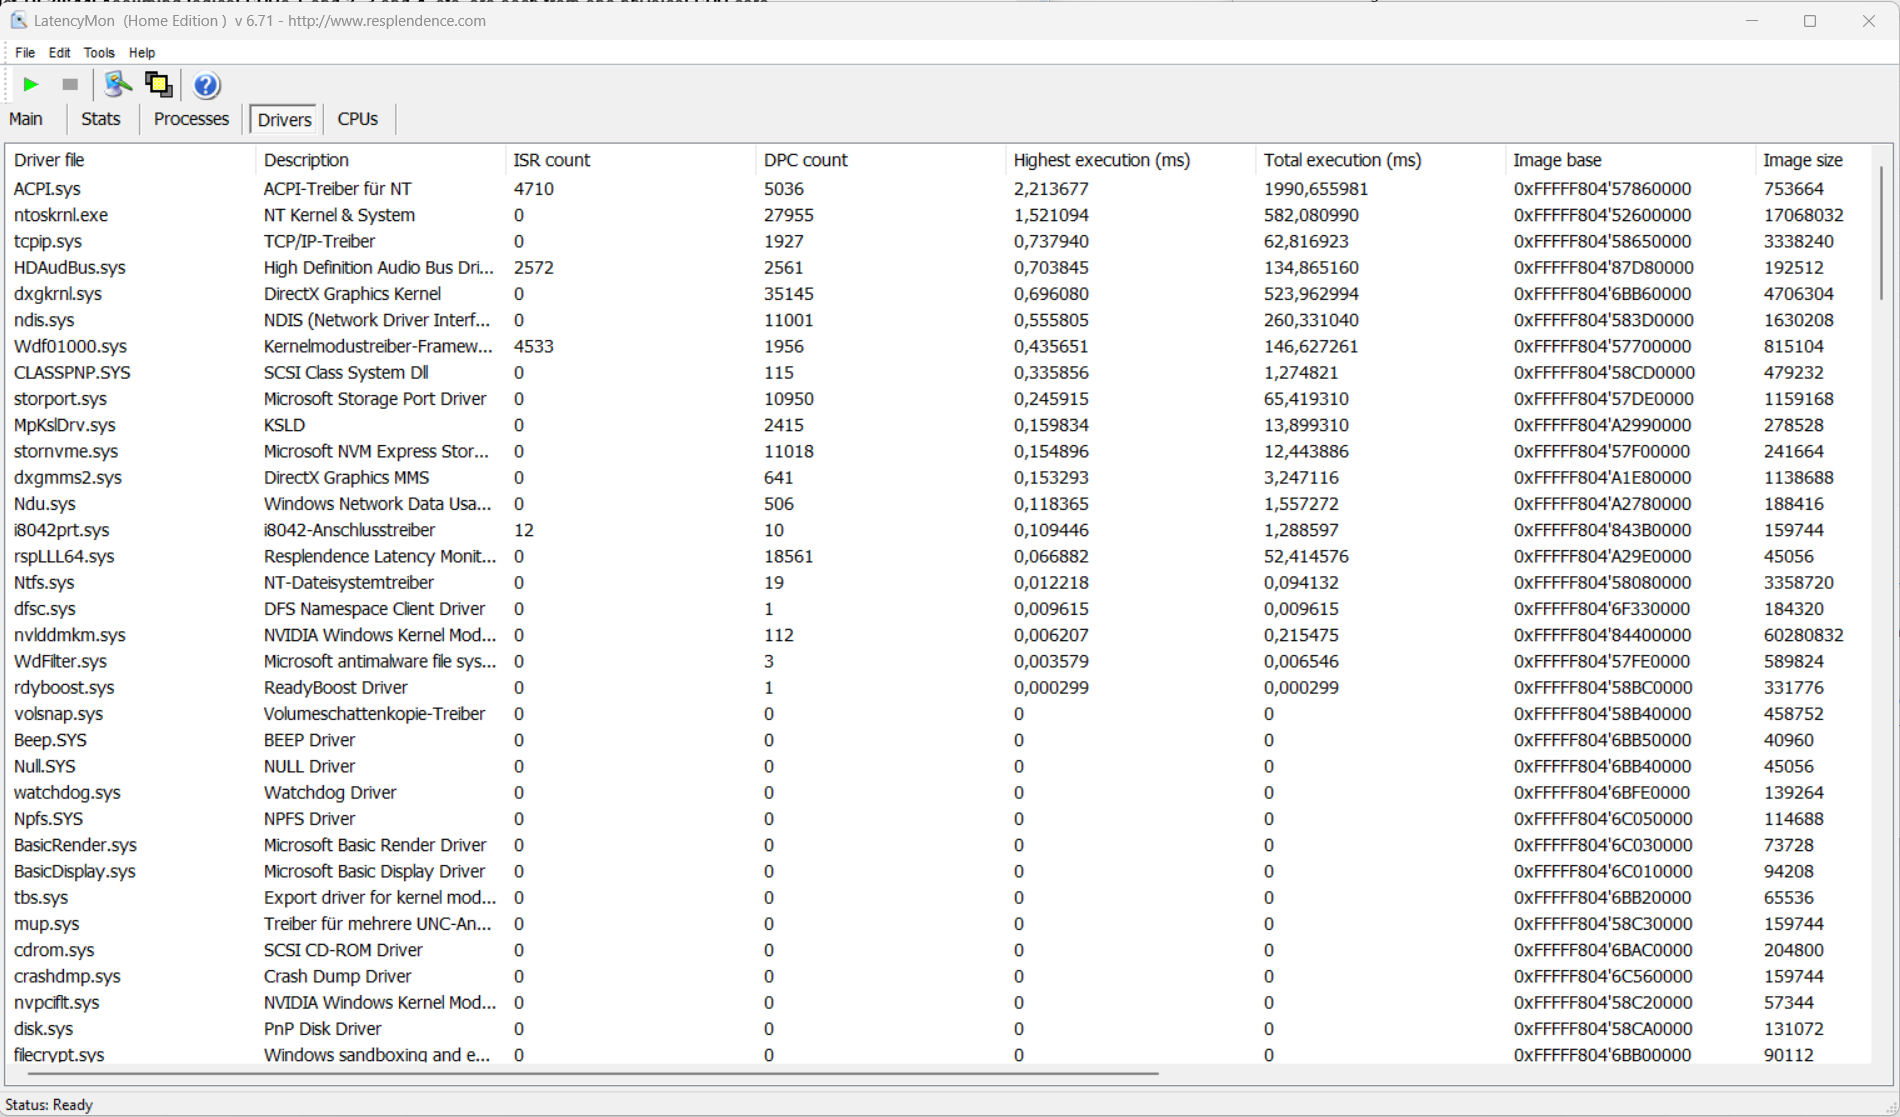
| DPC Latencies / LatencyMon - interrupt to process latency (max), Web, Youtube, Prime95 | |
| MSI Stealth 16 Studio A13VG | |
| Lenovo Legion Slim 7i 16 Gen 8 | |
| Asus Vivobook Pro 16X K6604JV-MX016W | |
| Schenker XMG Pro 16 Studio (Mid 23) | |
| HP Omen Transcend 16 | |
* ... más pequeño es mejor
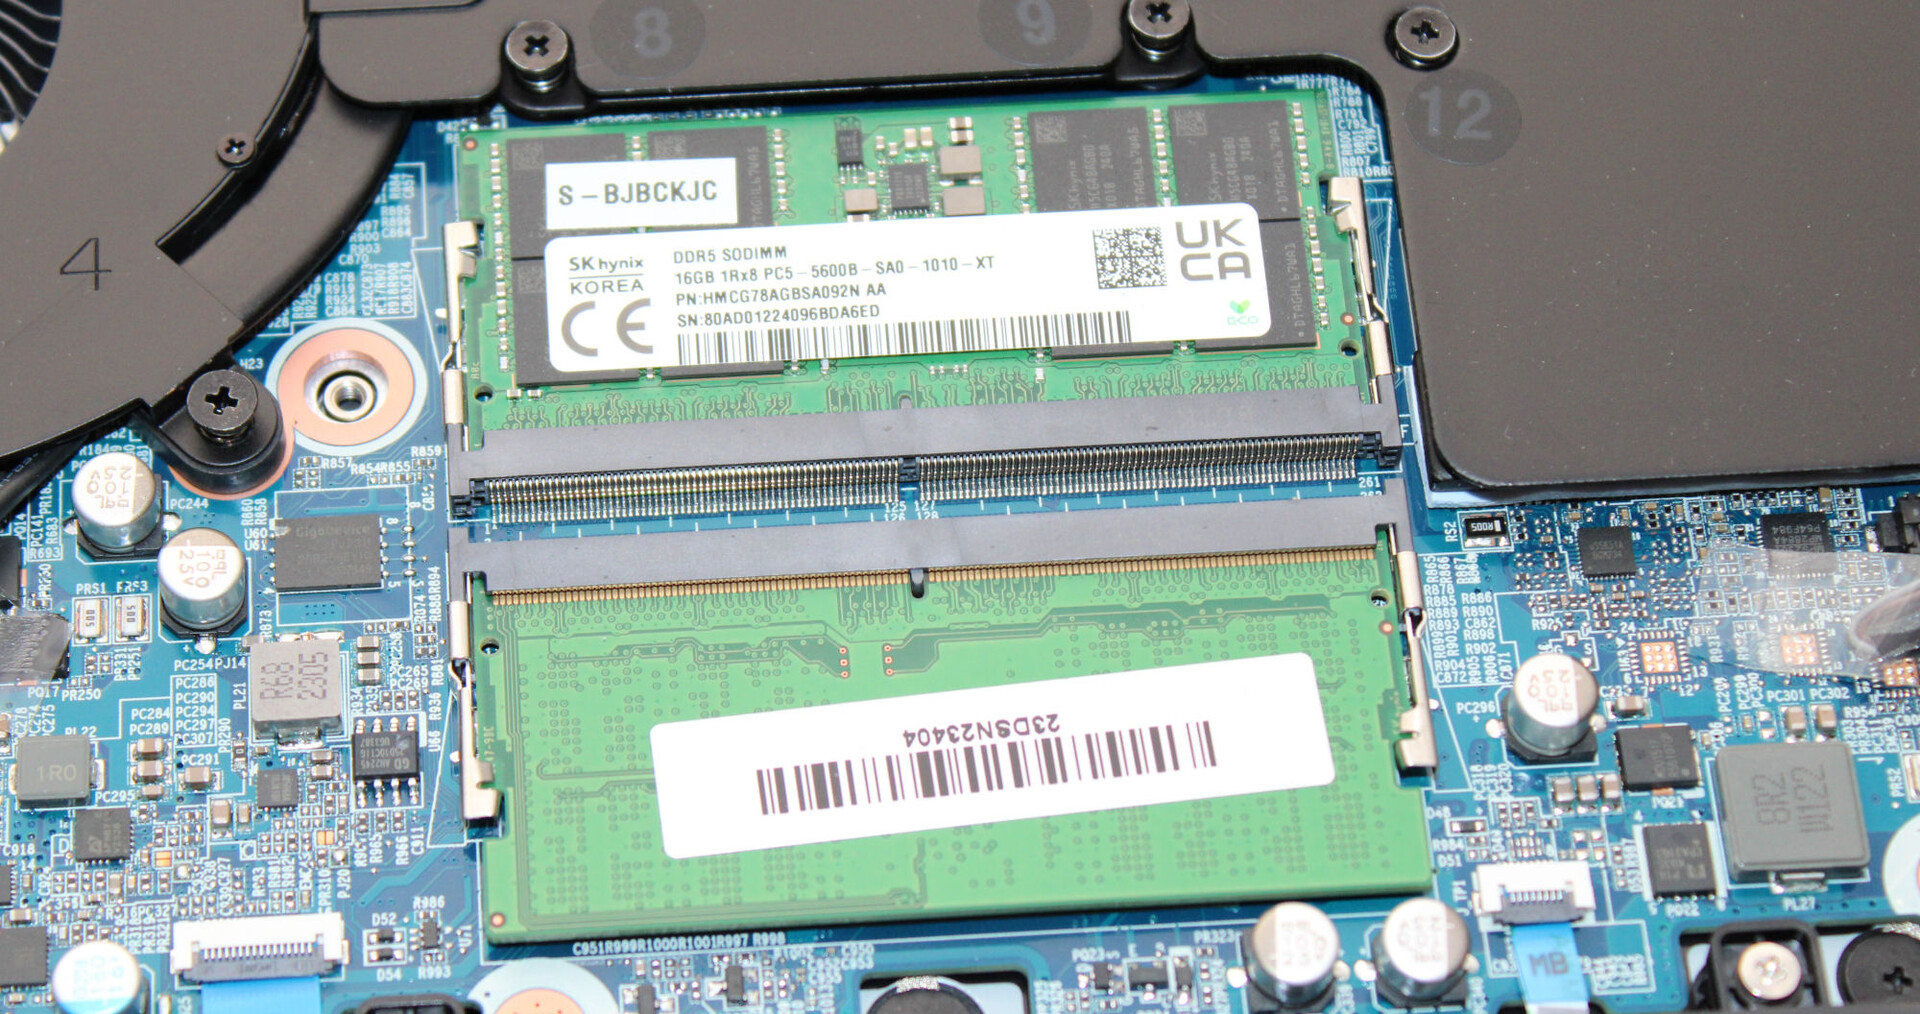
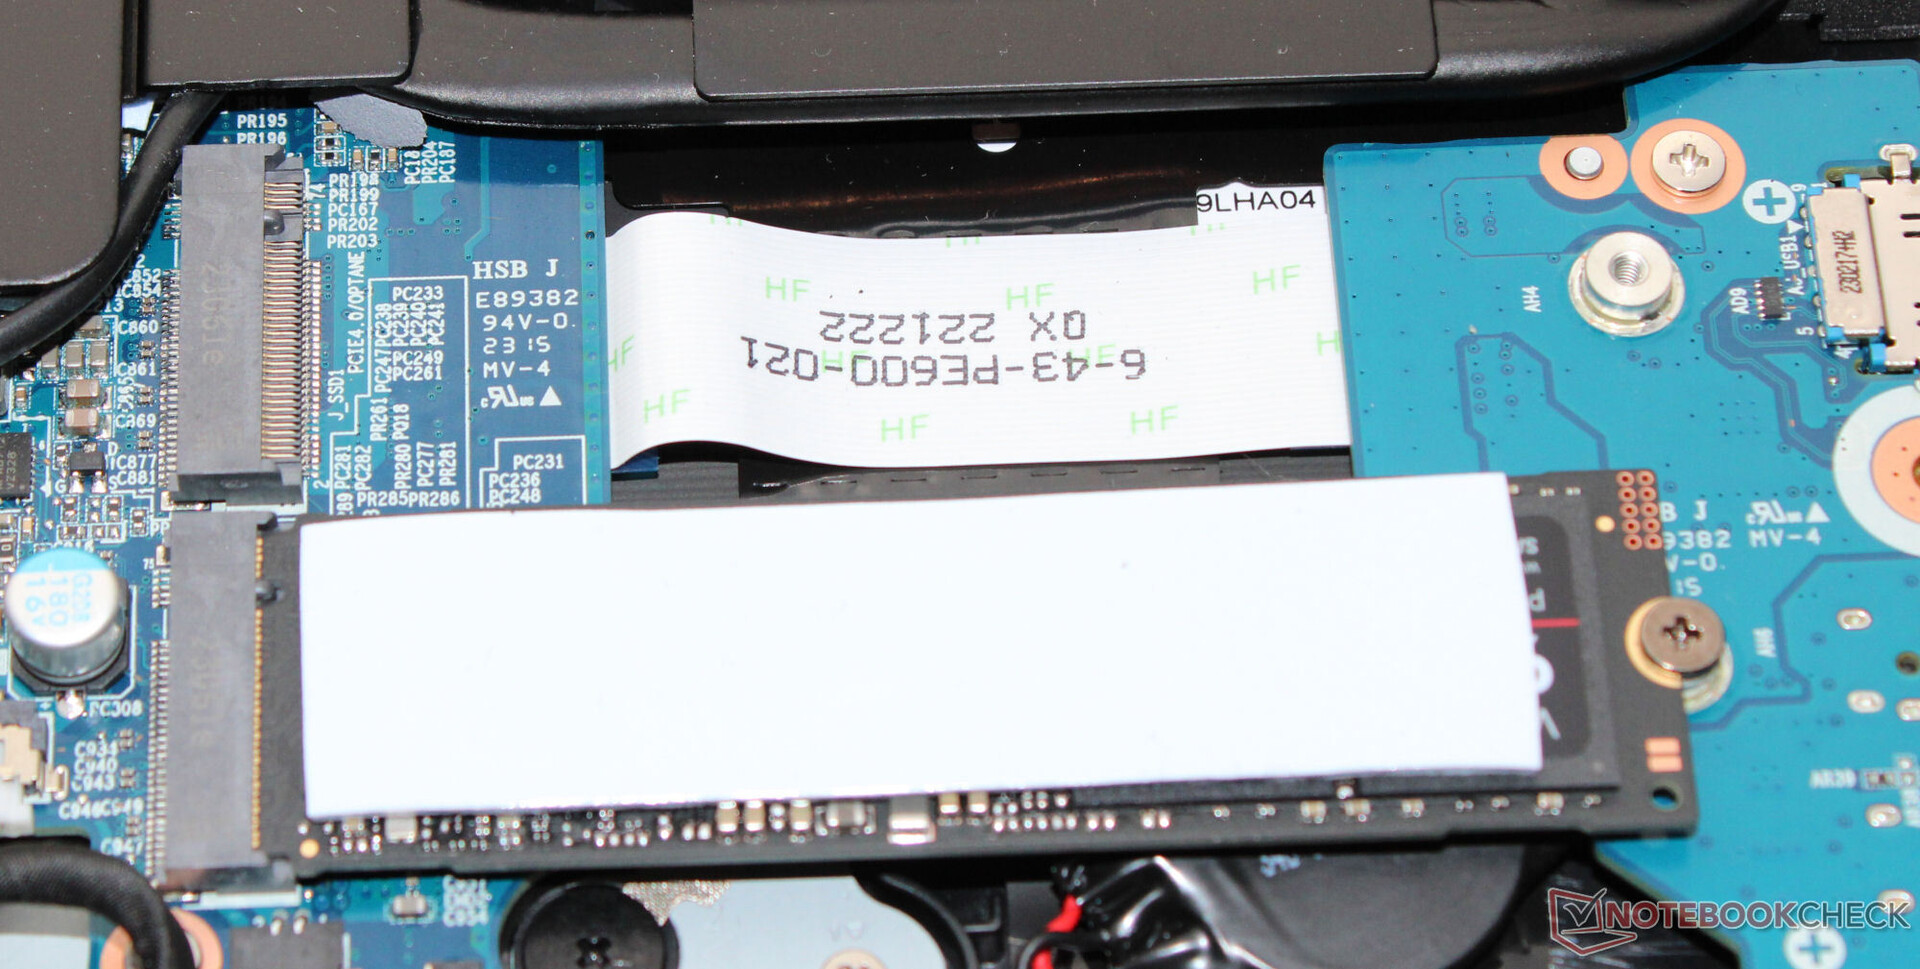
Dispositivos de almacenamiento
La Pro 16 puede alojar un total de dos unidades SSD PCIe 4 con formato M.2-2280. Es compatible con RAID-0/1. La unidad SSD Samsung (1 TB, PCIe 4, M.2-2280) de nuestro dispositivo de prueba ofreció unas excelentes velocidades de transferencia. Positivo: No se produjo estrangulamiento térmico.

* ... más pequeño es mejor
Reading continuous performance: DiskSpd Read Loop, Queue Depth 8
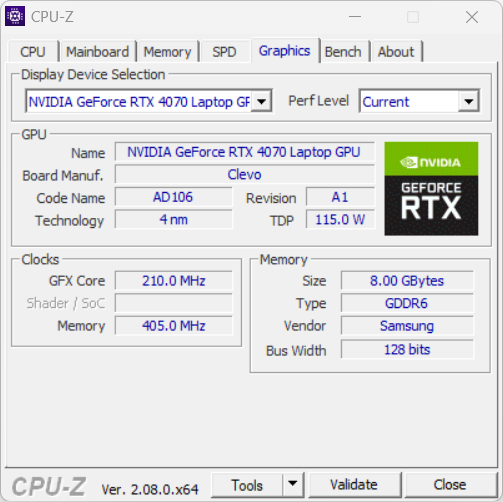
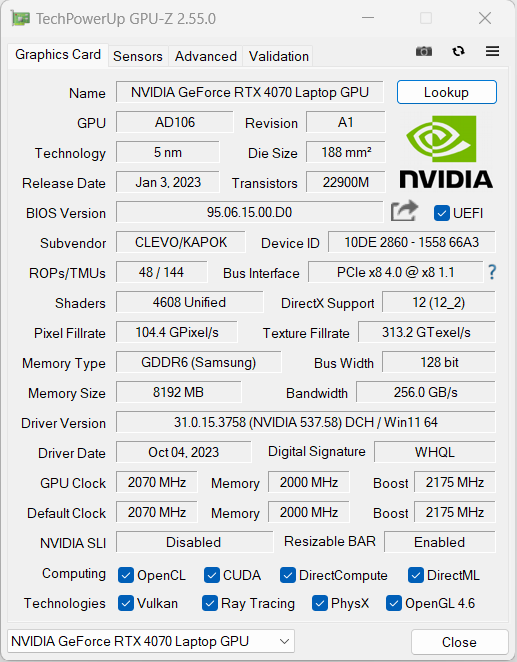
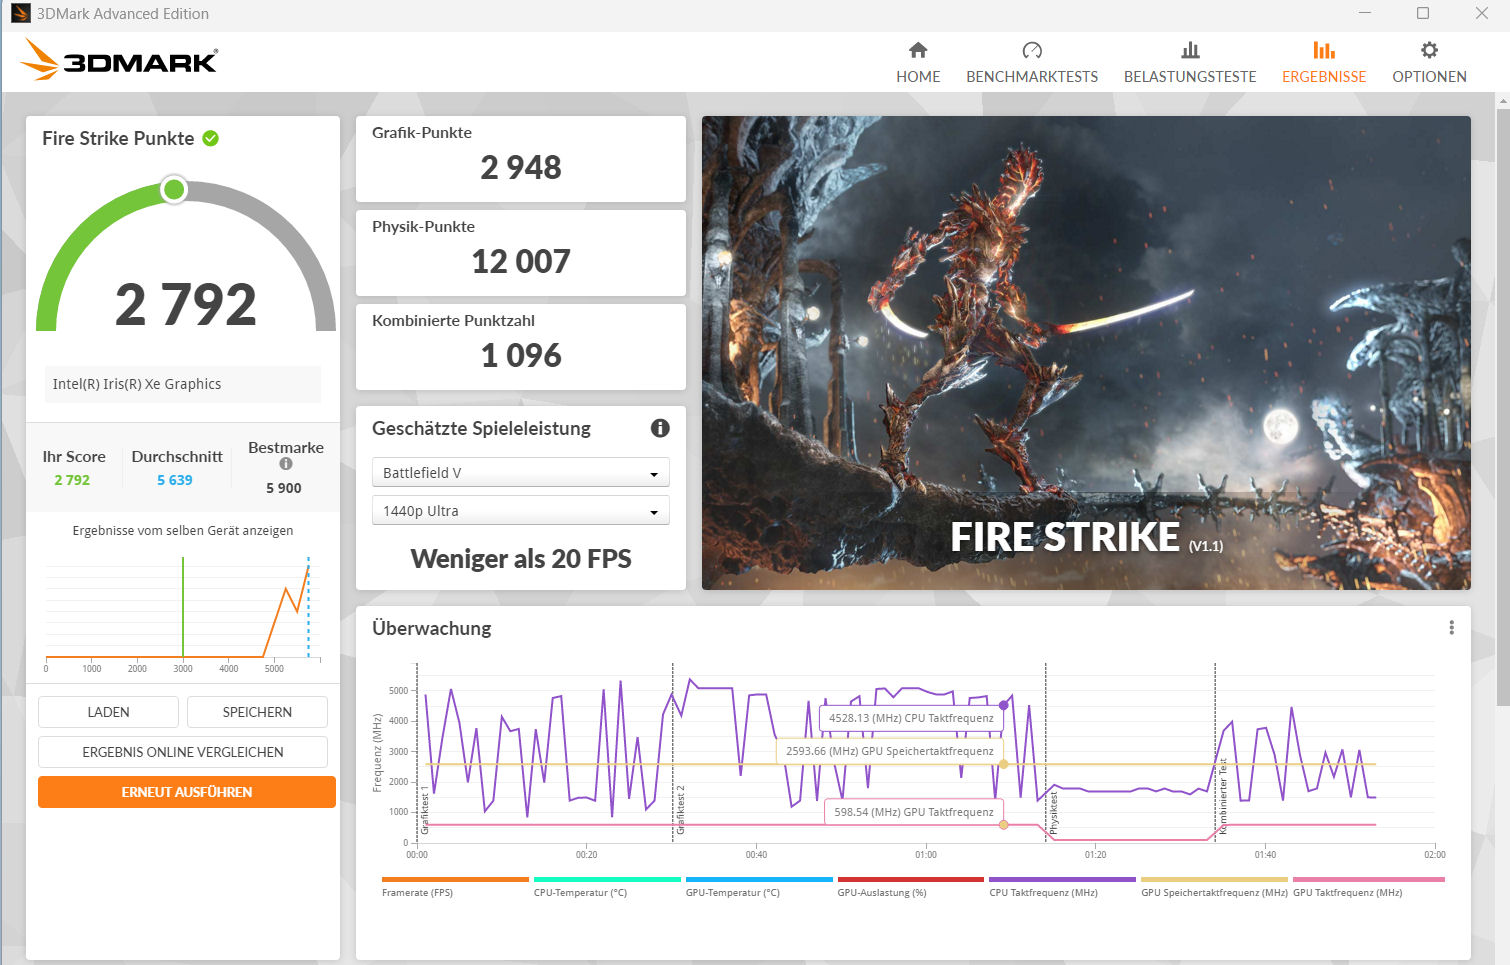
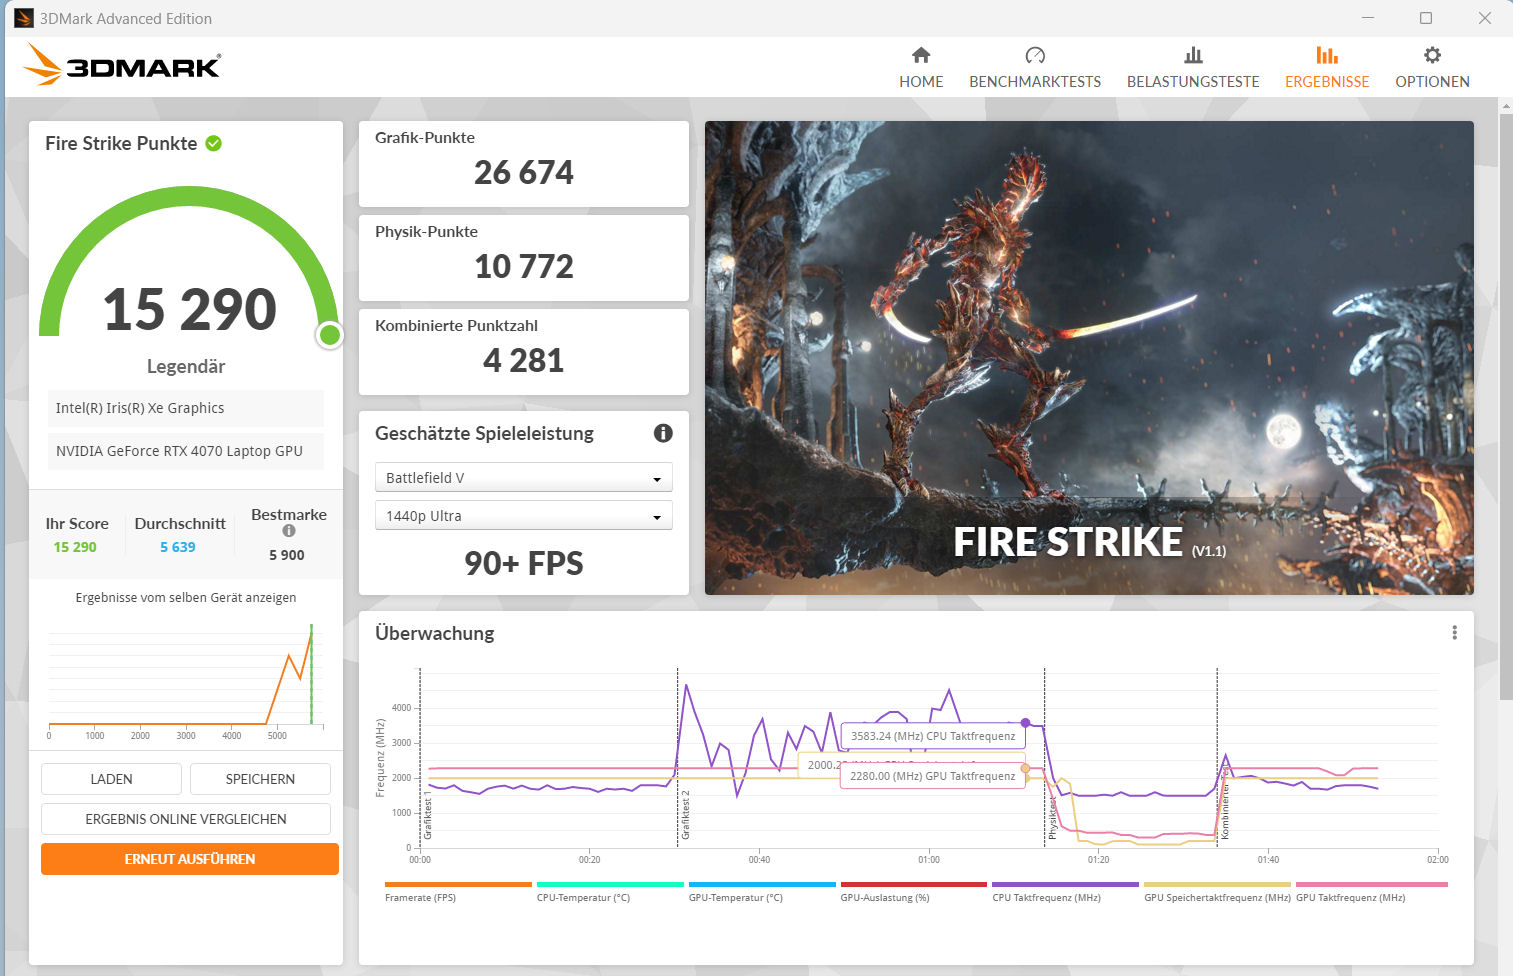
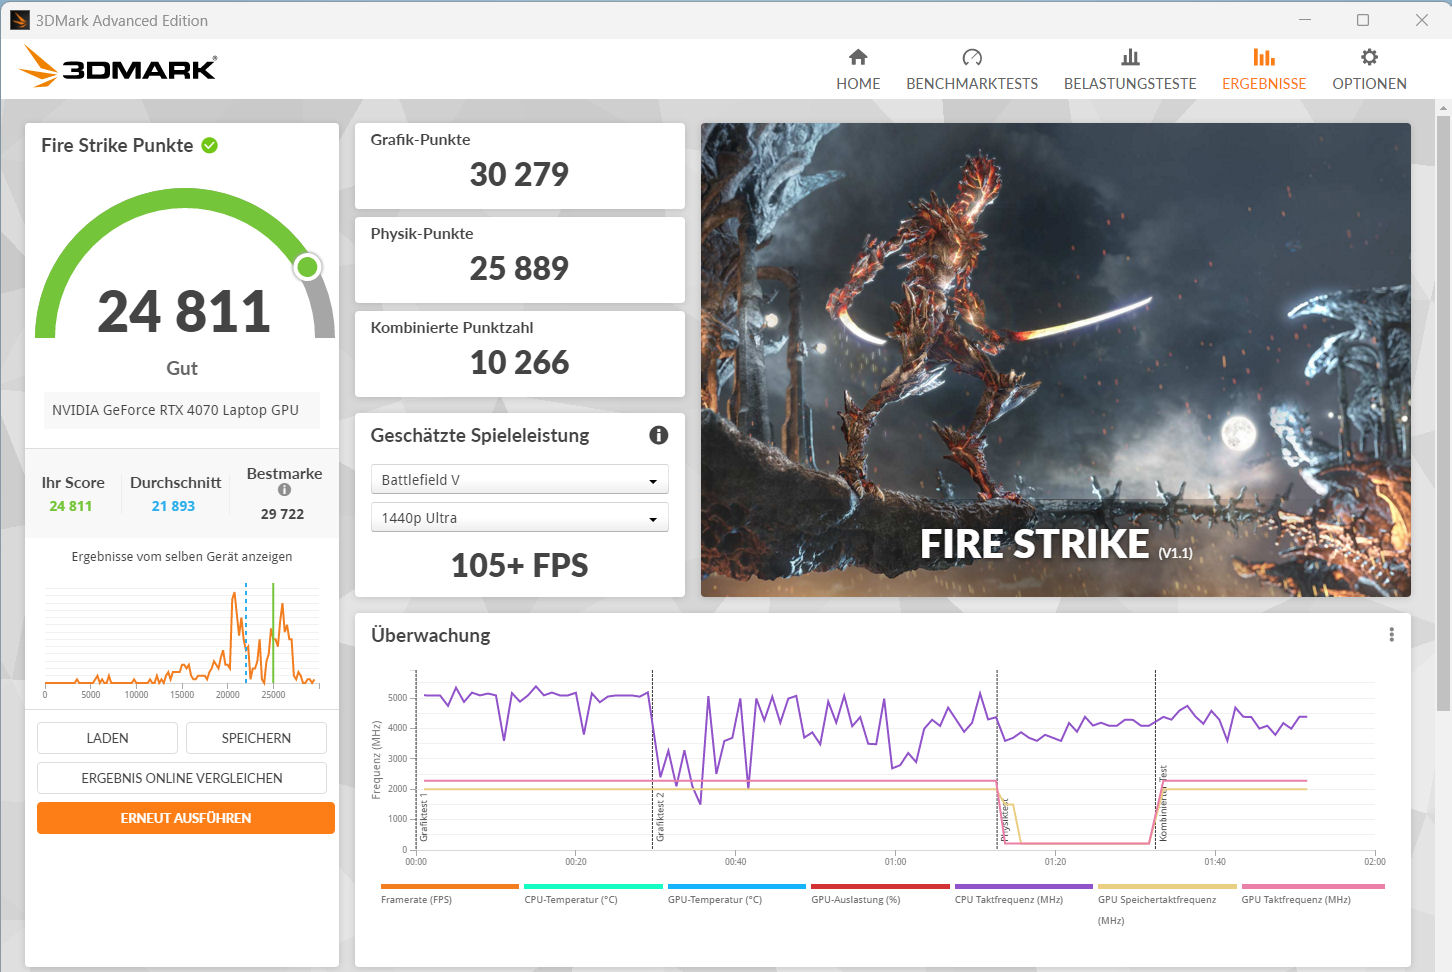
Tarjeta gráfica
LaGeForce RTX 4070 ofrece 4.608 sombreadores, un bus de 128 bits de ancho y una rápida memoria RAM GDDR6 (8.192 MB). Schenker ha fijado su TGP máximo en 140 vatios (115 vatios + 25 vatios Dynamic Boost) - más no es posible.
El núcleo gráfico permite jugar en QHD con ajustes de altos a máximos. Al hacerlo, logra velocidades de fotogramas por encima de la media de la RTX 4070 determinada previamente. El uso del modo dGPU (activado a través de la BIOS) conlleva un ligero aumento del rendimiento. El núcleo gráfico y la memoria pueden overclockearse a través del Centro de Control (Modo Rendimiento -> haga clic en las flechas que apuntan hacia abajo). El Optimus avanzado no es compatible.
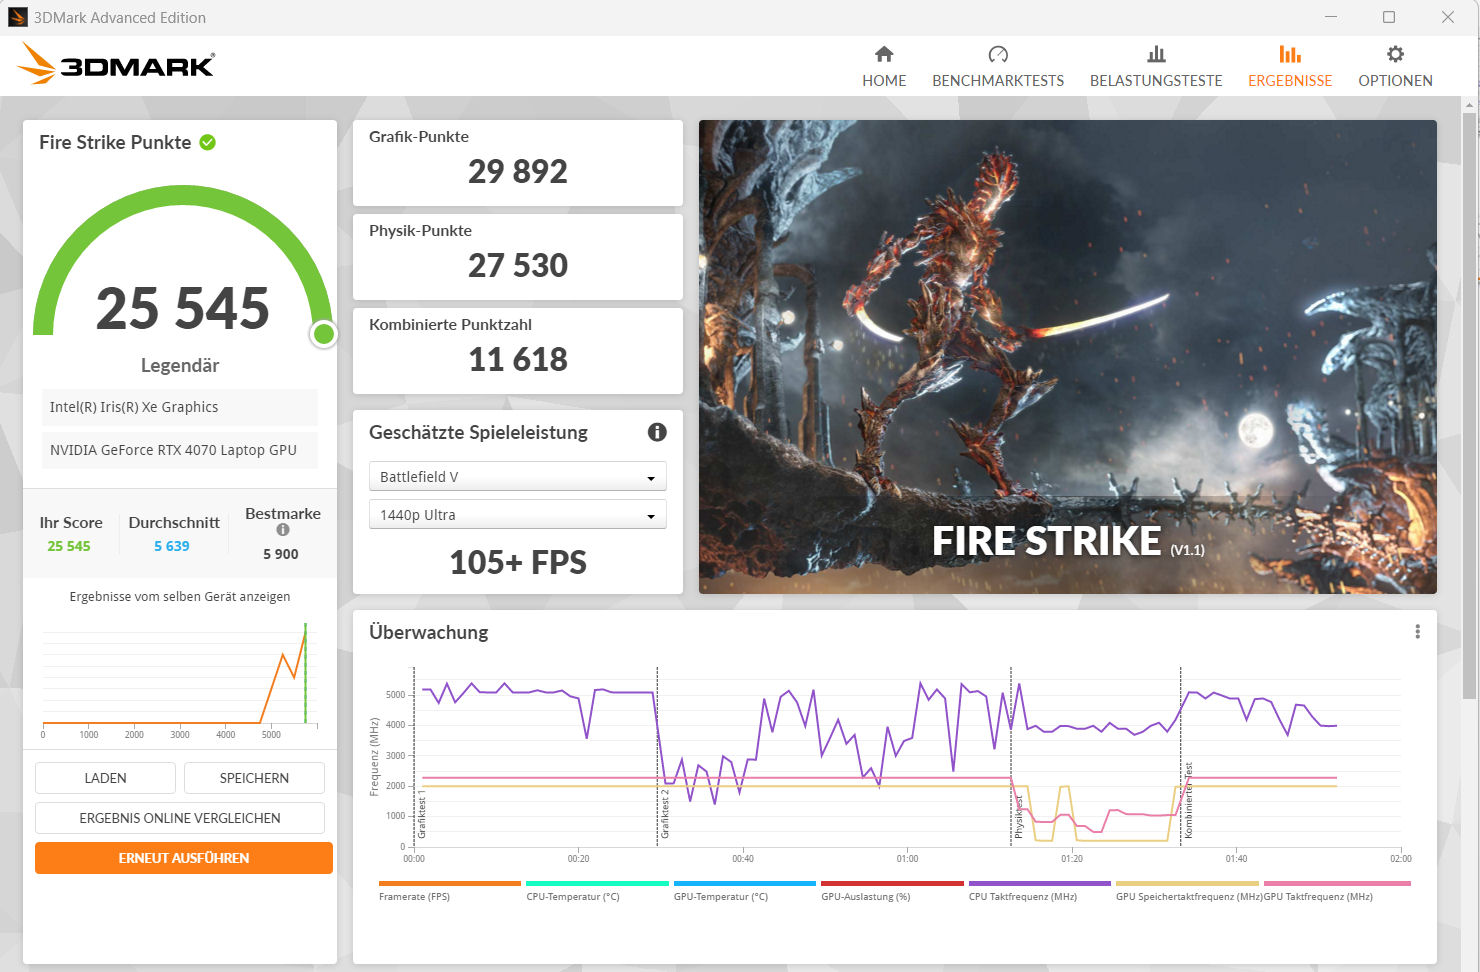
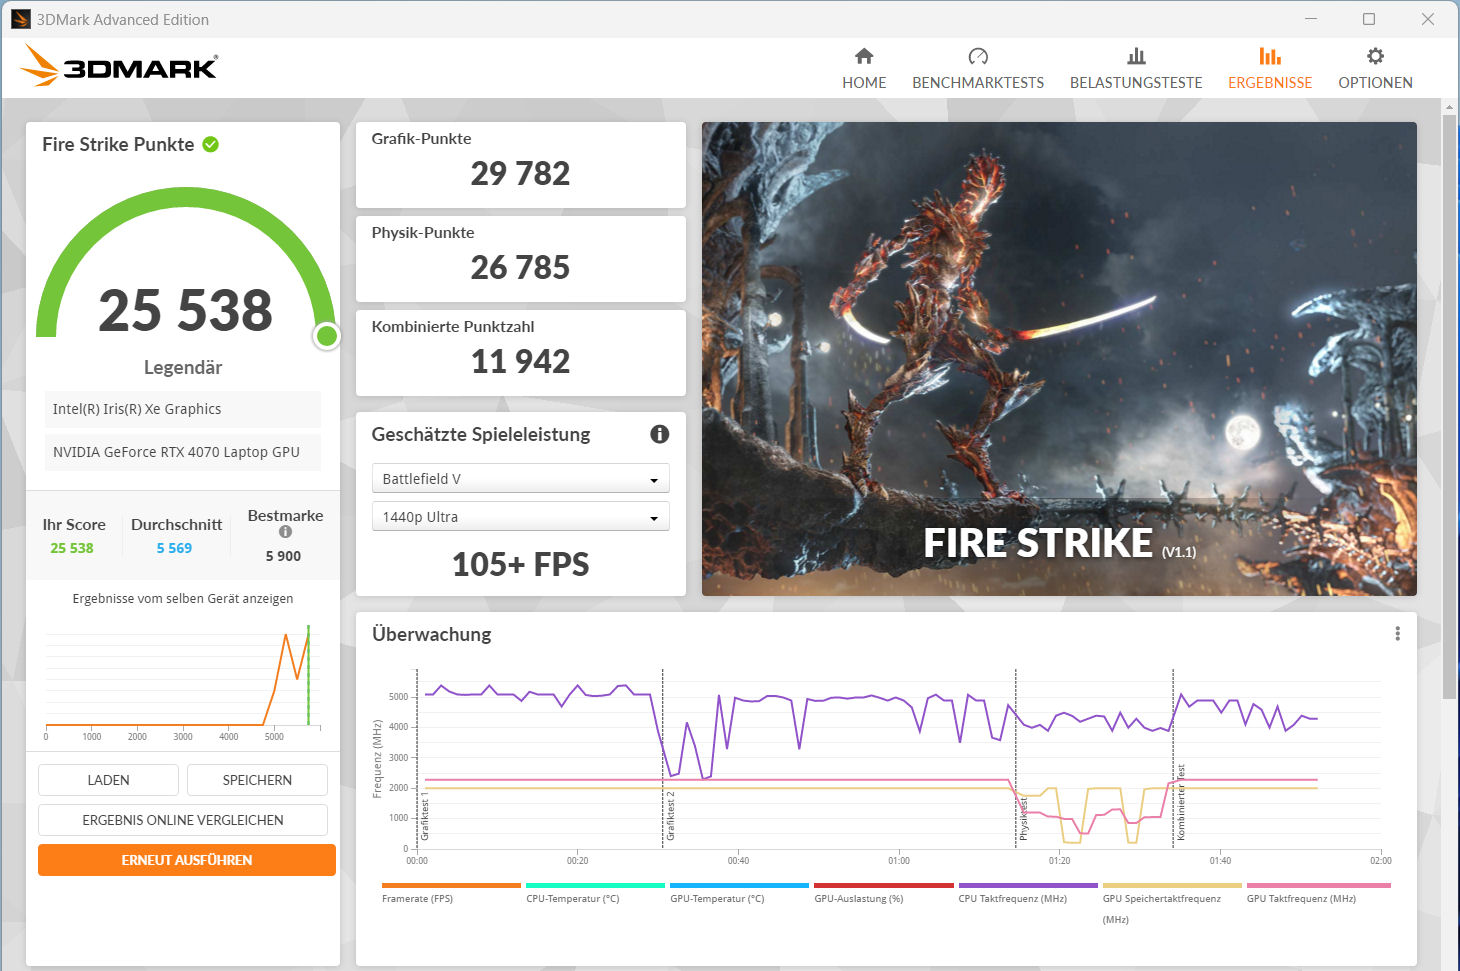
| 3DMark 06 Standard Score | 54913 puntos | |
| 3DMark 11 Performance | 34302 puntos | |
| 3DMark Cloud Gate Standard Score | 62061 puntos | |
| 3DMark Fire Strike Score | 25545 puntos | |
| 3DMark Time Spy Score | 12134 puntos | |
ayuda | ||
* ... más pequeño es mejor
| The Witcher 3 - 1920x1080 Ultra Graphics & Postprocessing (HBAO+) | |
| Media de la clase Gaming (104.7 - 240, n=7, últimos 2 años) | |
| MSI Stealth 16 Studio A13VG | |
| Schenker XMG Pro 16 Studio (Mid 23) | |
| Lenovo Legion Slim 7i 16 Gen 8 | |
| Medio NVIDIA GeForce RTX 4070 Laptop GPU (69.8 - 133.7, n=57) | |
| HP Omen Transcend 16 | |
| Asus Vivobook Pro 16X K6604JV-MX016W | |
| Lies of P | |
| 1920x1080 Best Preset | |
| Medio NVIDIA GeForce RTX 4070 Laptop GPU (137.4 - 148.1, n=4) | |
| Schenker XMG Pro 16 Studio (Mid 23) | |
| 2560x1440 Best Preset | |
| Medio NVIDIA GeForce RTX 4070 Laptop GPU (97.2 - 98.8, n=4) | |
| Schenker XMG Pro 16 Studio (Mid 23) | |
| Assassin's Creed Mirage | |
| 1920x1080 Ultra High Preset (Adaptive Quality Off) | |
| Schenker XMG Pro 16 Studio (Mid 23) | |
| Medio NVIDIA GeForce RTX 4070 Laptop GPU (91 - 99, n=6) | |
| 2560x1440 Ultra High Preset (Adaptive Quality Off) | |
| Medio NVIDIA GeForce RTX 4070 Laptop GPU (73 - 80, n=6) | |
| Schenker XMG Pro 16 Studio (Mid 23) | |
| Lords of the Fallen | |
| 1920x1080 Ultra Preset | |
| Medio NVIDIA GeForce RTX 4070 Laptop GPU (44.3 - 67.7, n=4) | |
| Schenker XMG Pro 16 Studio (Mid 23) | |
| 2560x1440 Ultra Preset | |
| Medio NVIDIA GeForce RTX 4070 Laptop GPU (29.1 - 47.1, n=4) | |
| Schenker XMG Pro 16 Studio (Mid 23) | |
| Total War Pharaoh | |
| 1920x1080 Ultra Preset | |
| Medio NVIDIA GeForce RTX 4070 Laptop GPU (110 - 136.2, n=5) | |
| Schenker XMG Pro 16 Studio (Mid 23) | |
| Media de la clase Gaming (42.9 - 161.4, n=2, últimos 2 años) | |
| 2560x1440 Ultra Preset | |
| Medio NVIDIA GeForce RTX 4070 Laptop GPU (87.2 - 96.6, n=5) | |
| Schenker XMG Pro 16 Studio (Mid 23) | |
| Media de la clase Gaming (24.1 - 127.4, n=2, últimos 2 años) | |
| F1 23 | |
| 1920x1080 Ultra High Preset AA:T AF:16x | |
| MSI Stealth 16 Studio A13VG | |
| Medio NVIDIA GeForce RTX 4070 Laptop GPU (49.5 - 100, n=14) | |
| Schenker XMG Pro 16 Studio (Mid 23) | |
| Asus Vivobook Pro 16X K6604JV-MX016W | |
| 2560x1440 Ultra High Preset AA:T AF:16x | |
| Schenker XMG Pro 16 Studio (Mid 23) | |
| MSI Stealth 16 Studio A13VG | |
| Medio NVIDIA GeForce RTX 4070 Laptop GPU (35.2 - 49, n=13) | |
| Asus Vivobook Pro 16X K6604JV-MX016W | |
Witcher 3 FPS diagram
| bajo | medio | alto | ultra | QHD | |
|---|---|---|---|---|---|
| GTA V (2015) | 186.8 | 185.9 | 181.3 | 125.4 | 93.2 |
| The Witcher 3 (2015) | 474.9 | 365.4 | 231.4 | 118.4 | 86.9 |
| Dota 2 Reborn (2015) | 210 | 187.5 | 176.5 | 162.8 | |
| Final Fantasy XV Benchmark (2018) | 219 | 159.8 | 115.5 | 84.1 | |
| X-Plane 11.11 (2018) | 166.7 | 146.4 | 119.5 | ||
| Strange Brigade (2018) | 544 | 280 | 232 | 202 | 132.8 |
| Cyberpunk 2077 1.6 (2022) | 147 | 115 | 95.3 | 86.7 | 55.4 |
| Returnal (2023) | 115 | 112 | 101 | 85 | 63 |
| F1 23 (2023) | 279 | 261 | 198.2 | 67.6 | 45.6 |
| Lies of P (2023) | 206 | 182 | 159.8 | 140.1 | 97.3 |
| Cyberpunk 2077 (2023) | 131.7 | 113.2 | 98.3 | 87.9 | 57.1 |
| Assassin's Creed Mirage (2023) | 143 | 132 | 125 | 99 | 75 |
| Total War Pharaoh (2023) | 385.9 | 239.5 | 146.2 | 113.3 | 87.2 |
| Lords of the Fallen (2023) | 96.9 | 84.1 | 63.4 | 45.9 | 29.1 |
Emisiones y potencia - La Pro 16 ofrece buenos tiempos de funcionamiento
Emisiones sonoras
Mientras juega, las emisiones de ruido pueden elevarse hasta 55 dB(A) (Modo Rendimiento). el "Modo Entretenimiento", que nosotros utilizamos, ofrece unas emisiones de ruido moderadas de 48 dB(A). Podría ser más silencioso: En el modo silencioso, puede lograr emisiones de 42 dB(A), a expensas de cierto rendimiento en los juegos. En modo inactivo y en el uso diario (oficina, Internet), uno de los dos ventiladores está a menudo en uso y, a veces, ambos permanecen apagados.
Ruido
| Ocioso |
| 26 / 29 / 34 dB(A) |
| Carga |
| 43 / 48 dB(A) |
 | ||
30 dB silencioso 40 dB(A) audible 50 dB(A) ruidosamente alto |
||
min: | ||
| Schenker XMG Pro 16 Studio (Mid 23) i9-13900H, GeForce RTX 4070 Laptop GPU | Asus Vivobook Pro 16X K6604JV-MX016W i9-13980HX, GeForce RTX 4060 Laptop GPU | Lenovo Legion Slim 7i 16 Gen 8 i9-13900H, GeForce RTX 4070 Laptop GPU | HP Omen Transcend 16 i9-13900HX, GeForce RTX 4070 Laptop GPU | MSI Stealth 16 Studio A13VG i7-13700H, GeForce RTX 4070 Laptop GPU | |
|---|---|---|---|---|---|
| Noise | -4% | 10% | -3% | 11% | |
| apagado / medio ambiente * (dB) | 25 | 25.2 -1% | 22.8 9% | 22.9 8% | 24 4% |
| Idle Minimum * (dB) | 26 | 26.6 -2% | 23.6 9% | 29.1 -12% | 24 8% |
| Idle Average * (dB) | 29 | 26.6 8% | 23.6 19% | 29.1 -0% | 24 17% |
| Idle Maximum * (dB) | 34 | 29.2 14% | 25.7 24% | 29.1 14% | 24 29% |
| Load Average * (dB) | 43 | 53.4 -24% | 27.6 36% | 45.7 -6% | 34.81 19% |
| Witcher 3 ultra * (dB) | 48 | 54.4 -13% | 54.3 -13% | 44.05 8% | |
| Load Maximum * (dB) | 48 | 56.9 -19% | 54.4 -13% | 54.3 -13% | 51.57 -7% |
* ... más pequeño es mejor
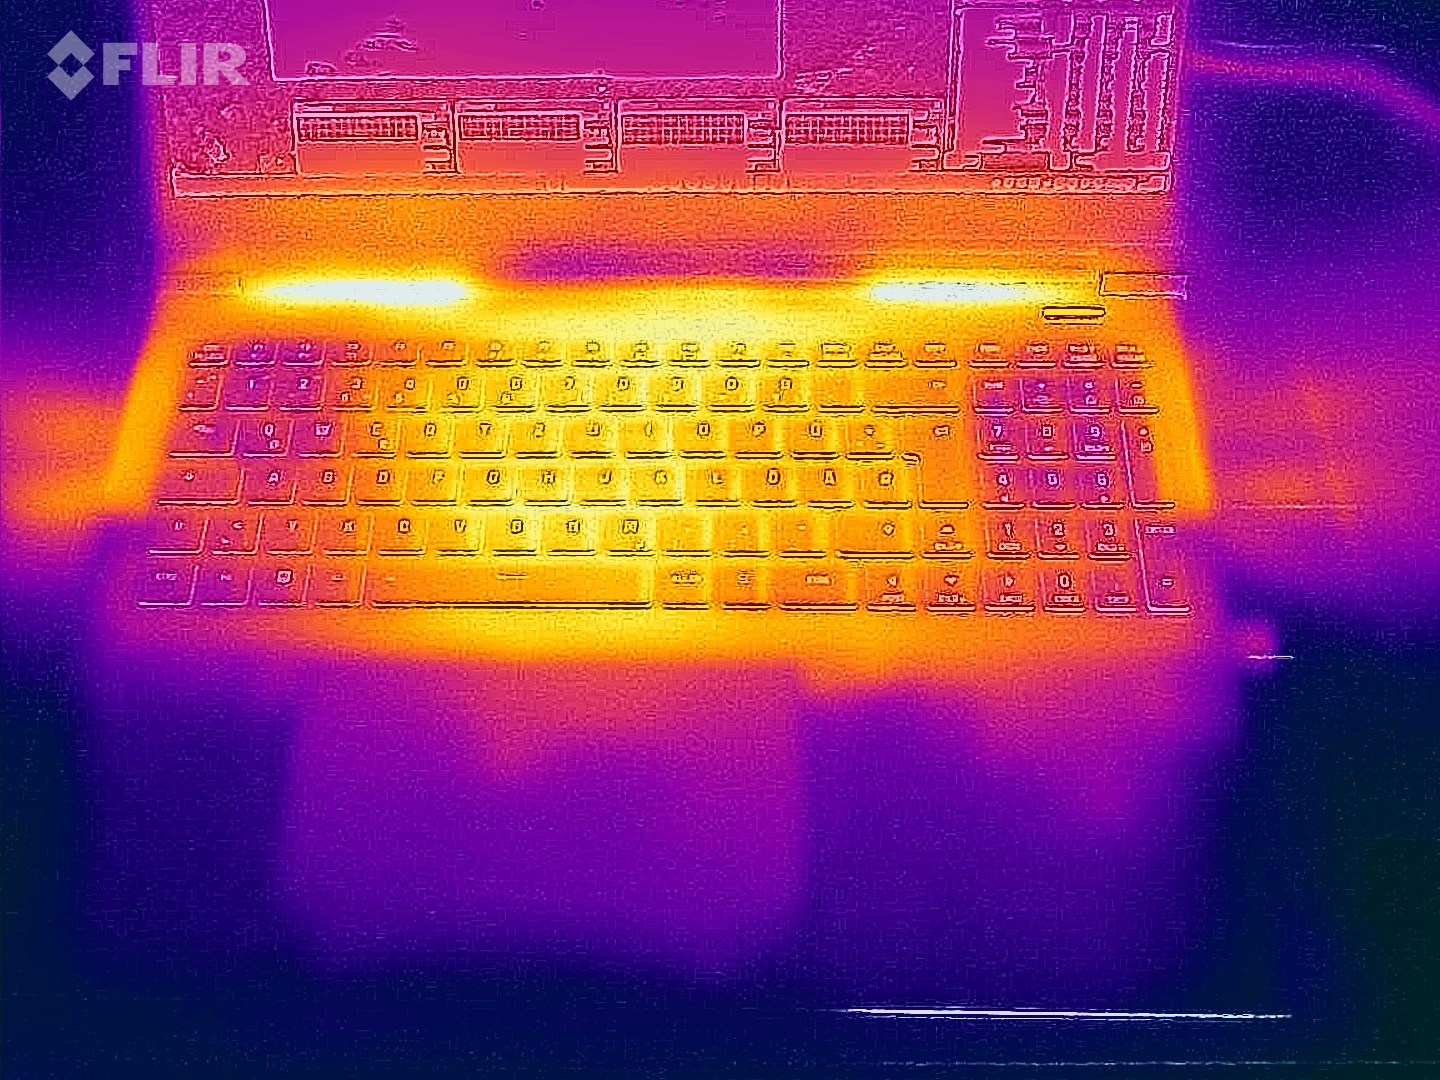
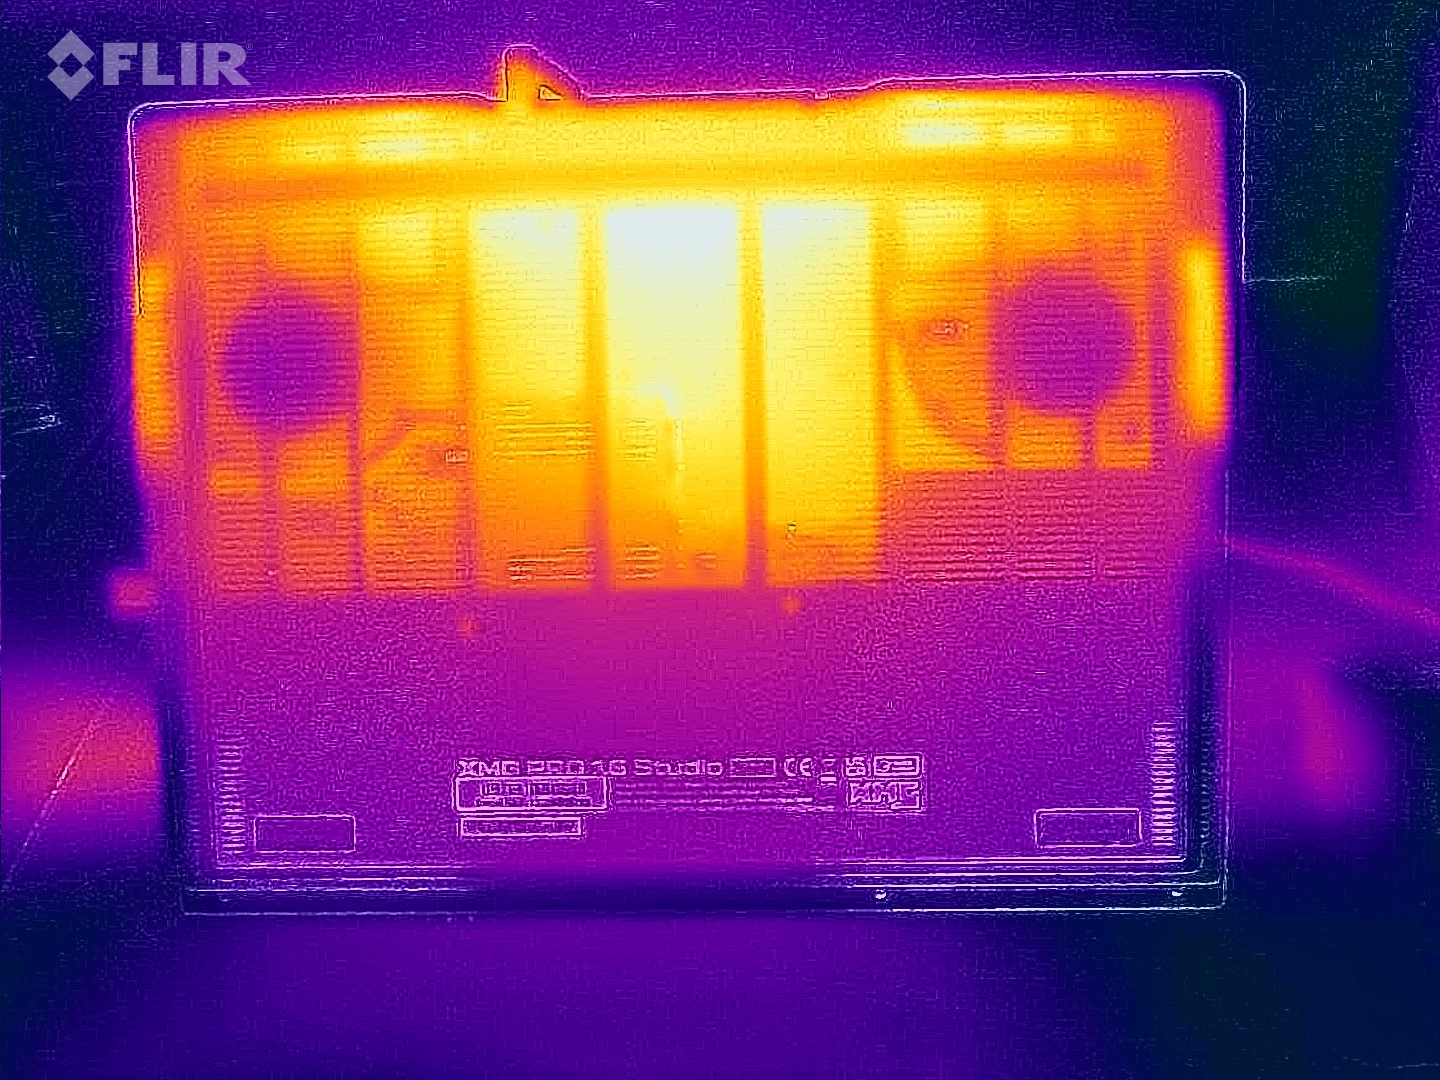
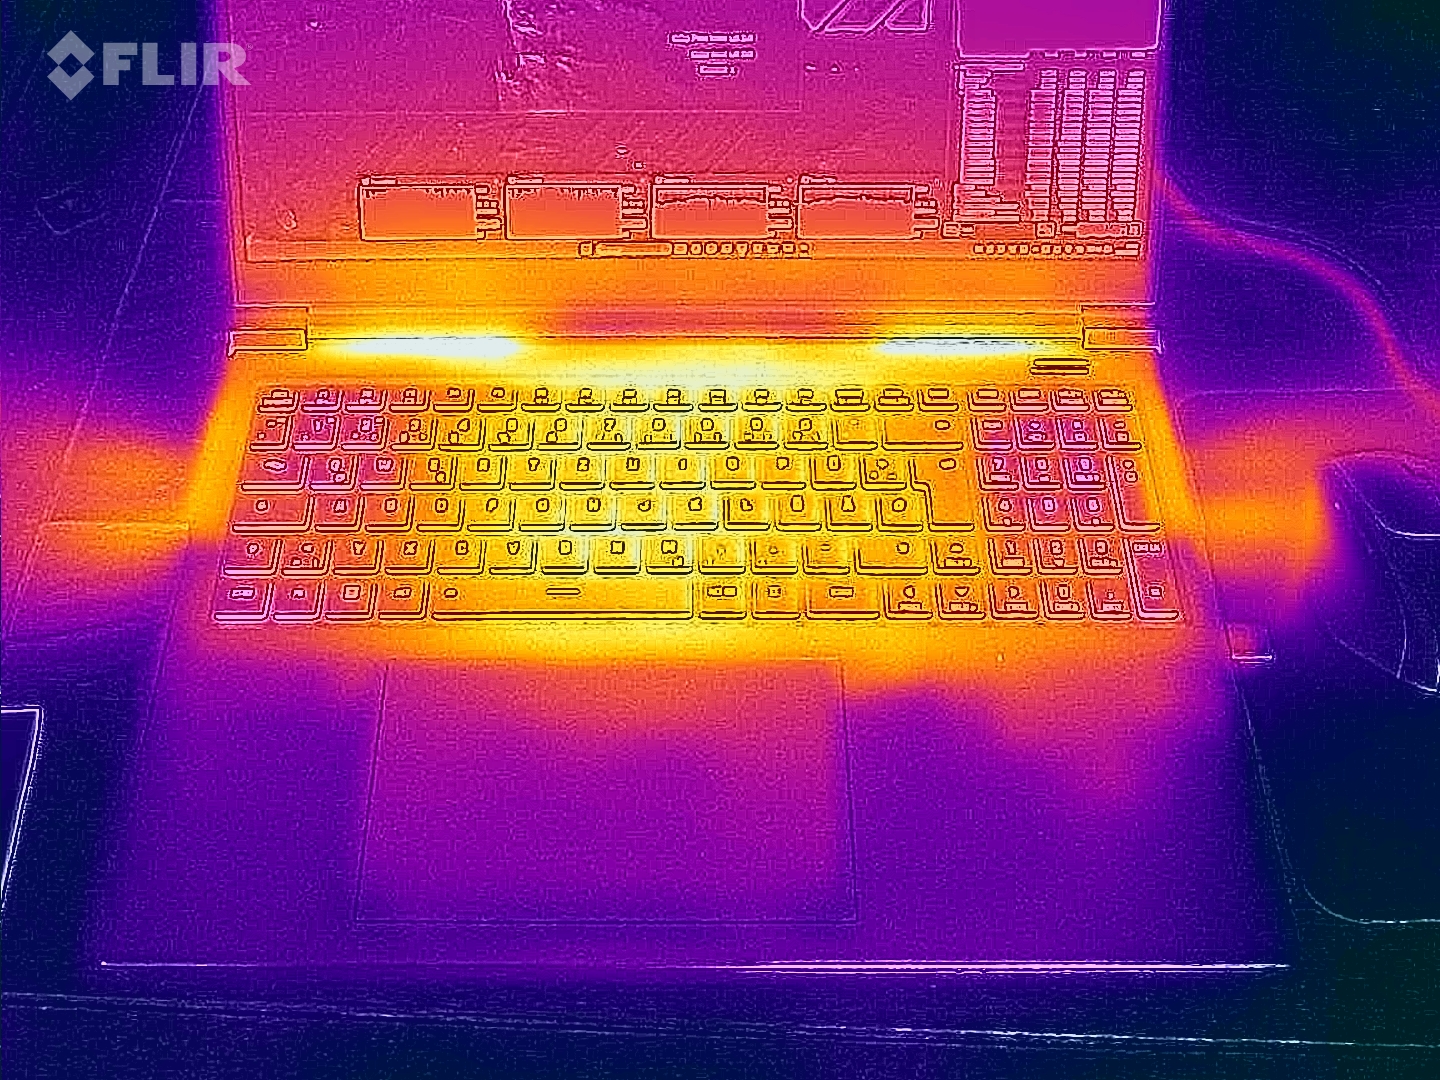
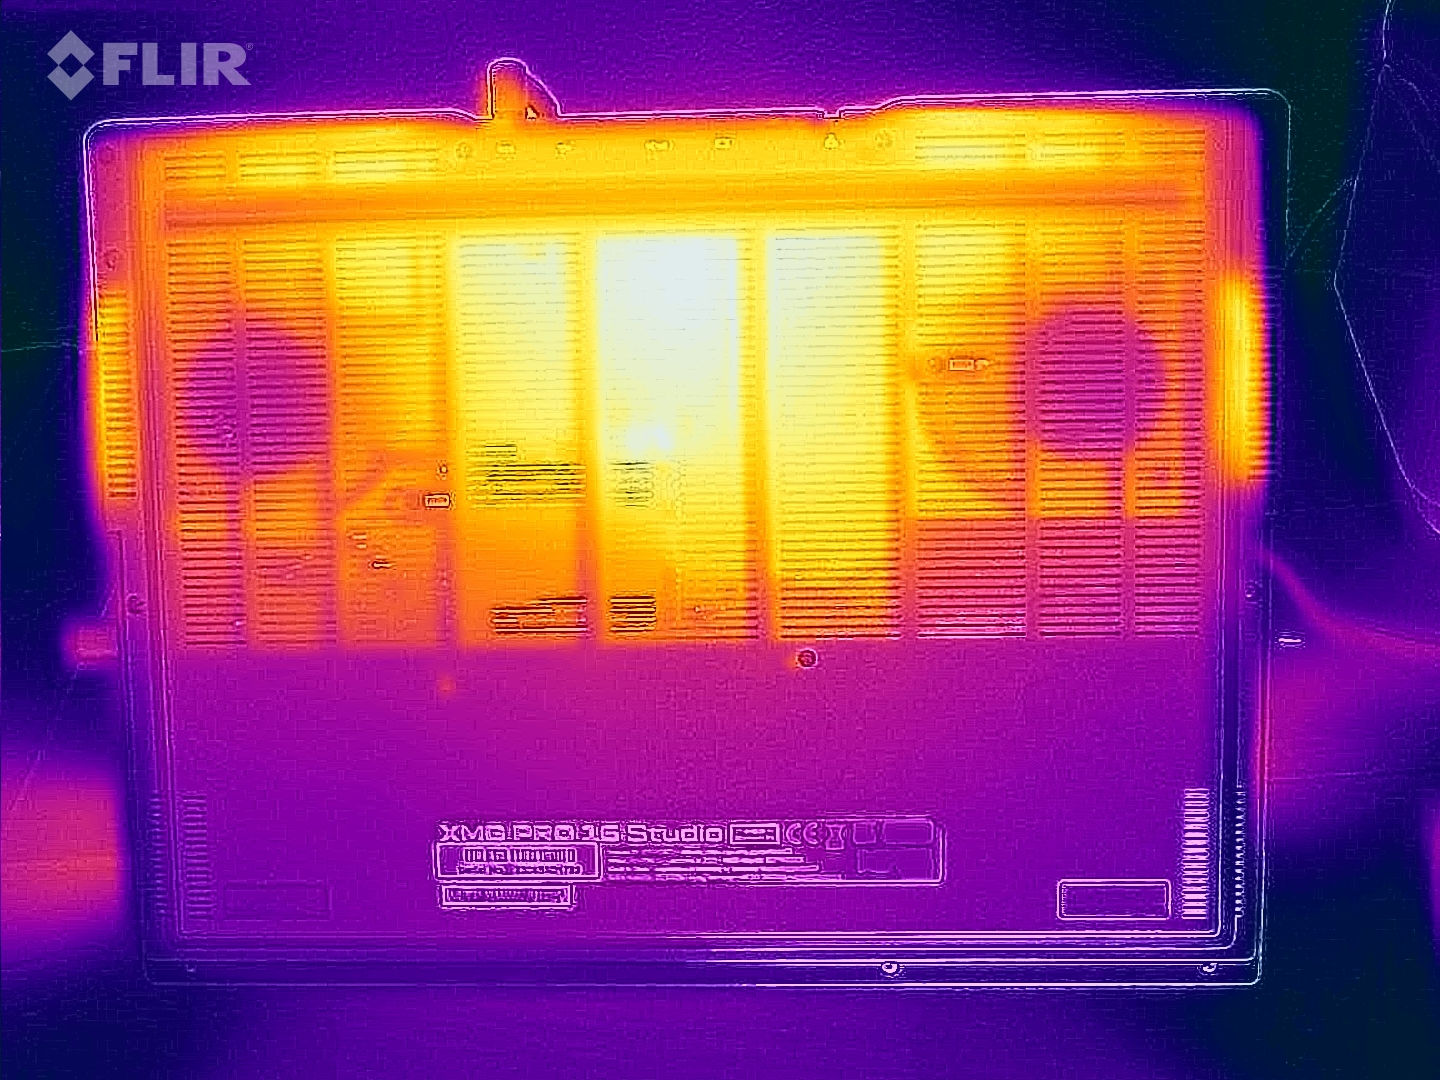
Temperatura
La prueba de estrés y Witcher 3 test provocaron un aumento significativo de las temperaturas del portátil. En ciertas zonas, medimos temperaturas superiores a los 60 grados Celsius. En el uso diario (oficina, Internet), estos valores se mantienen en general dentro de la zona verde, pero en un nivel superior al de competidores como elLenovo Legion Slim 7i 16 Gen 8.
(-) La temperatura máxima en la parte superior es de 55 °C / 131 F, frente a la media de 40.4 °C / 105 F, que oscila entre 21.2 y 68.8 °C para la clase Gaming.
(-) El fondo se calienta hasta un máximo de 66 °C / 151 F, frente a la media de 43.2 °C / 110 F
(+) En reposo, la temperatura media de la parte superior es de 30.1 °C / 86# F, frente a la media del dispositivo de 33.9 °C / 93 F.
(-) Jugando a The Witcher 3, la temperatura media de la parte superior es de 43.9 °C / 111 F, frente a la media del dispositivo de 33.9 °C / 93 F.
(+) Los reposamanos y el panel táctil alcanzan como máximo la temperatura de la piel (33 °C / 91.4 F) y, por tanto, no están calientes.
(-) La temperatura media de la zona del reposamanos de dispositivos similares fue de 28.8 °C / 83.8 F (-4.2 °C / -7.6 F).
| Schenker XMG Pro 16 Studio (Mid 23) Intel Core i9-13900H, NVIDIA GeForce RTX 4070 Laptop GPU | Asus Vivobook Pro 16X K6604JV-MX016W Intel Core i9-13980HX, NVIDIA GeForce RTX 4060 Laptop GPU | Lenovo Legion Slim 7i 16 Gen 8 Intel Core i9-13900H, NVIDIA GeForce RTX 4070 Laptop GPU | HP Omen Transcend 16 Intel Core i9-13900HX, NVIDIA GeForce RTX 4070 Laptop GPU | MSI Stealth 16 Studio A13VG Intel Core i7-13700H, NVIDIA GeForce RTX 4070 Laptop GPU | |
|---|---|---|---|---|---|
| Heat | 11% | 15% | 16% | -6% | |
| Maximum Upper Side * (°C) | 55 | 39.7 28% | 49.8 9% | 47.4 14% | 60 -9% |
| Maximum Bottom * (°C) | 66 | 60 9% | 48.8 26% | 54.4 18% | 61 8% |
| Idle Upper Side * (°C) | 33 | 30.9 6% | 29.4 11% | 28.4 14% | 38.2 -16% |
| Idle Bottom * (°C) | 35 | 34.7 1% | 30 14% | 29.2 17% | 37.7 -8% |
* ... más pequeño es mejor
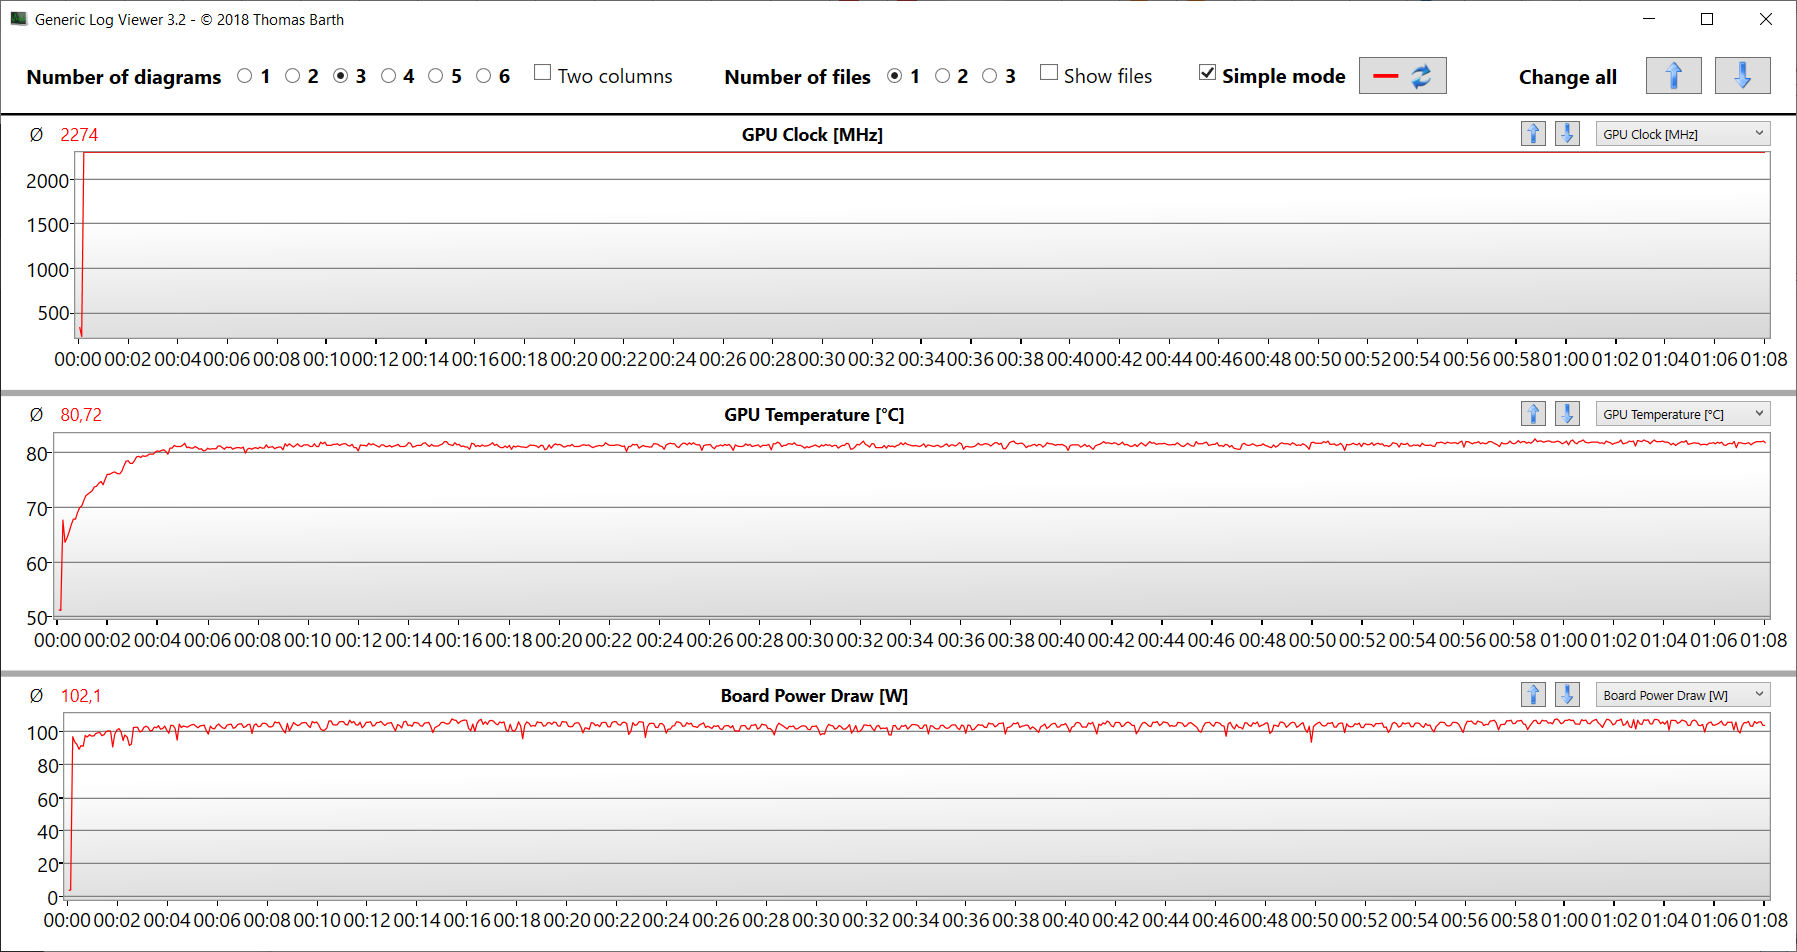
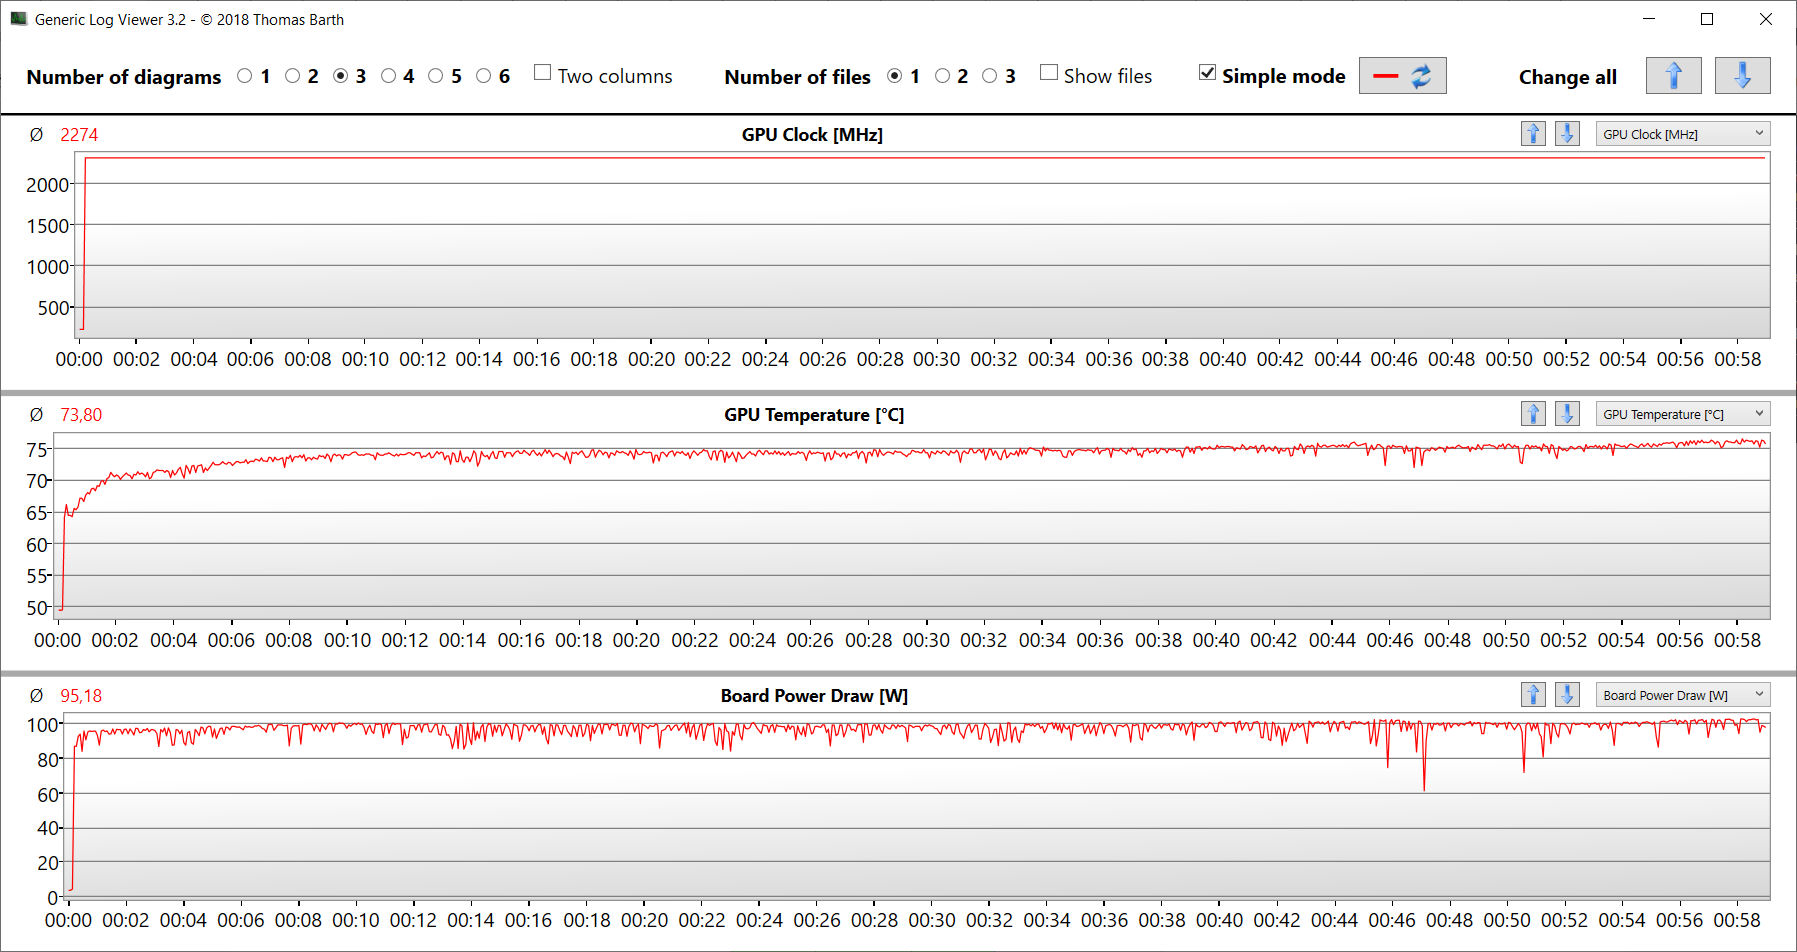
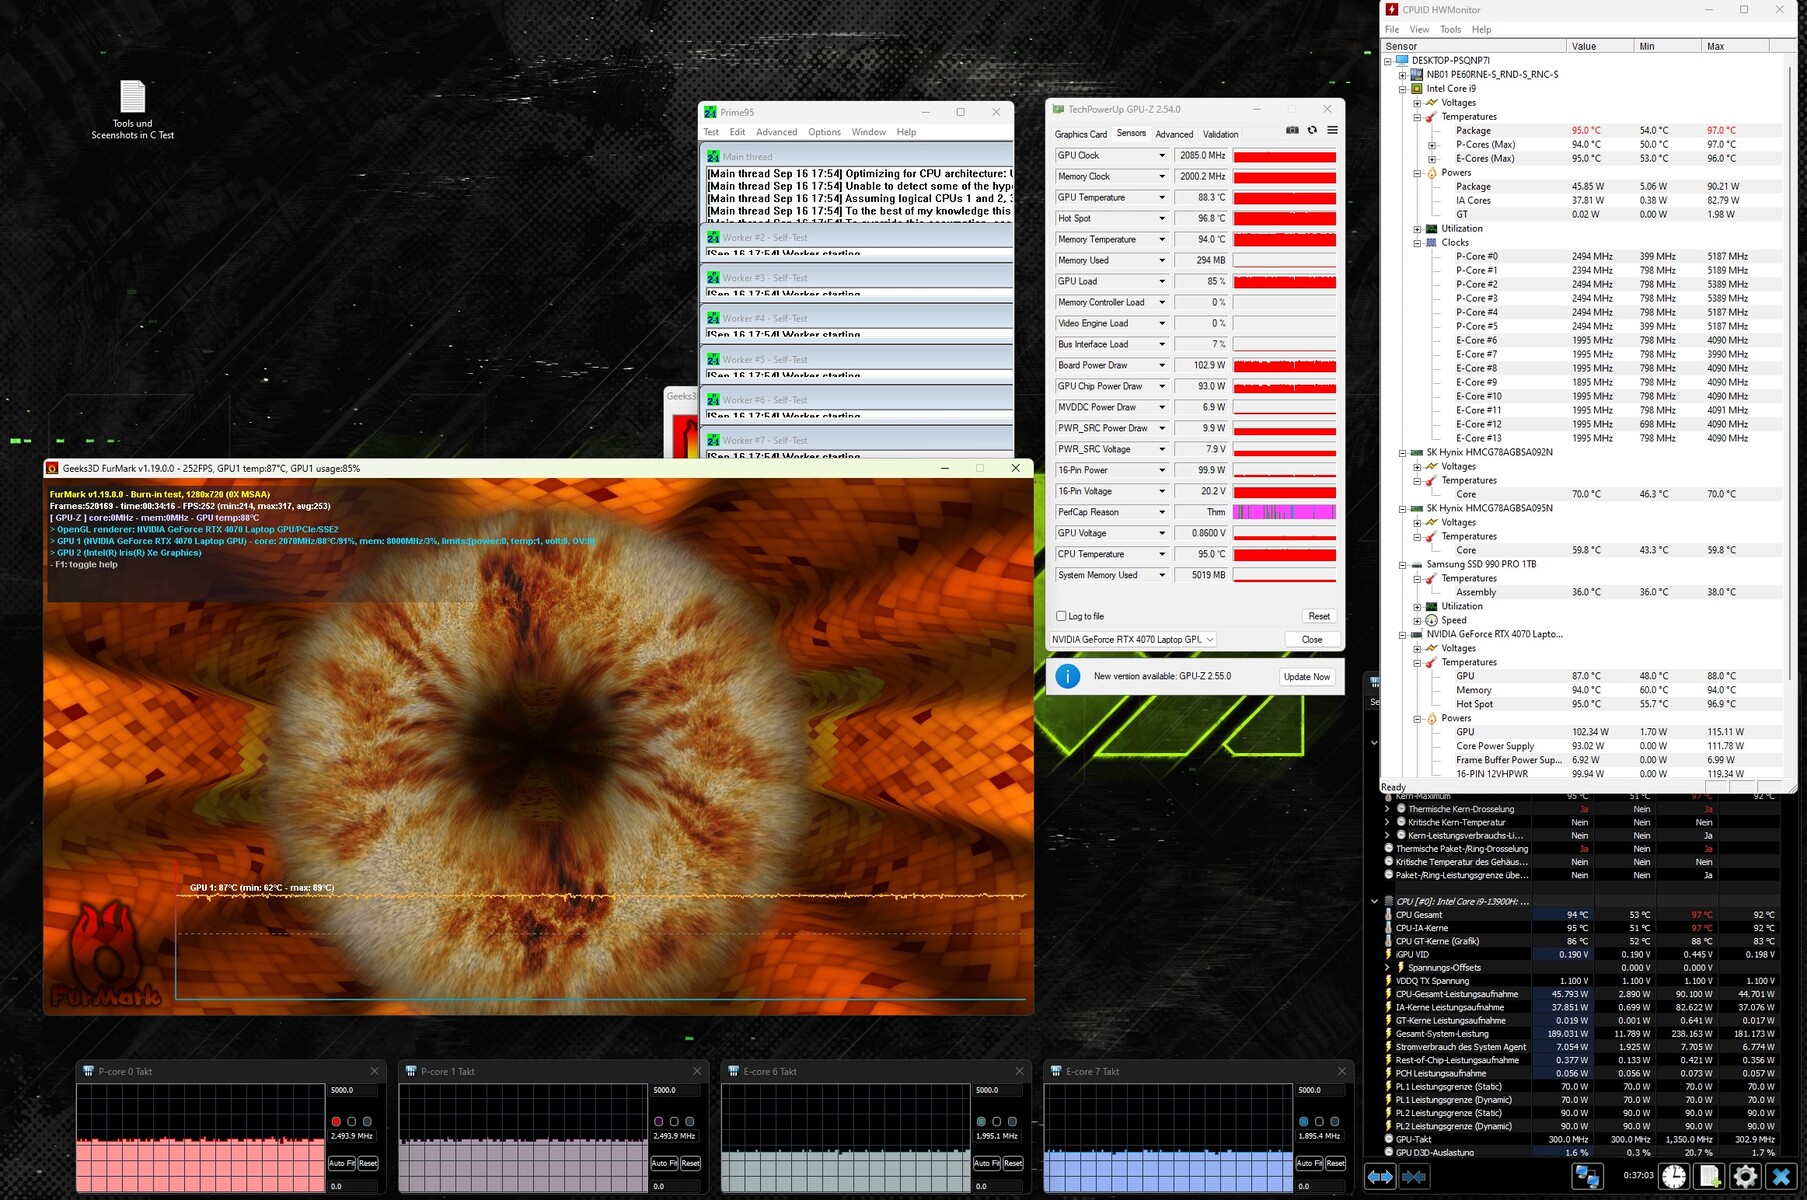
Prueba de esfuerzo
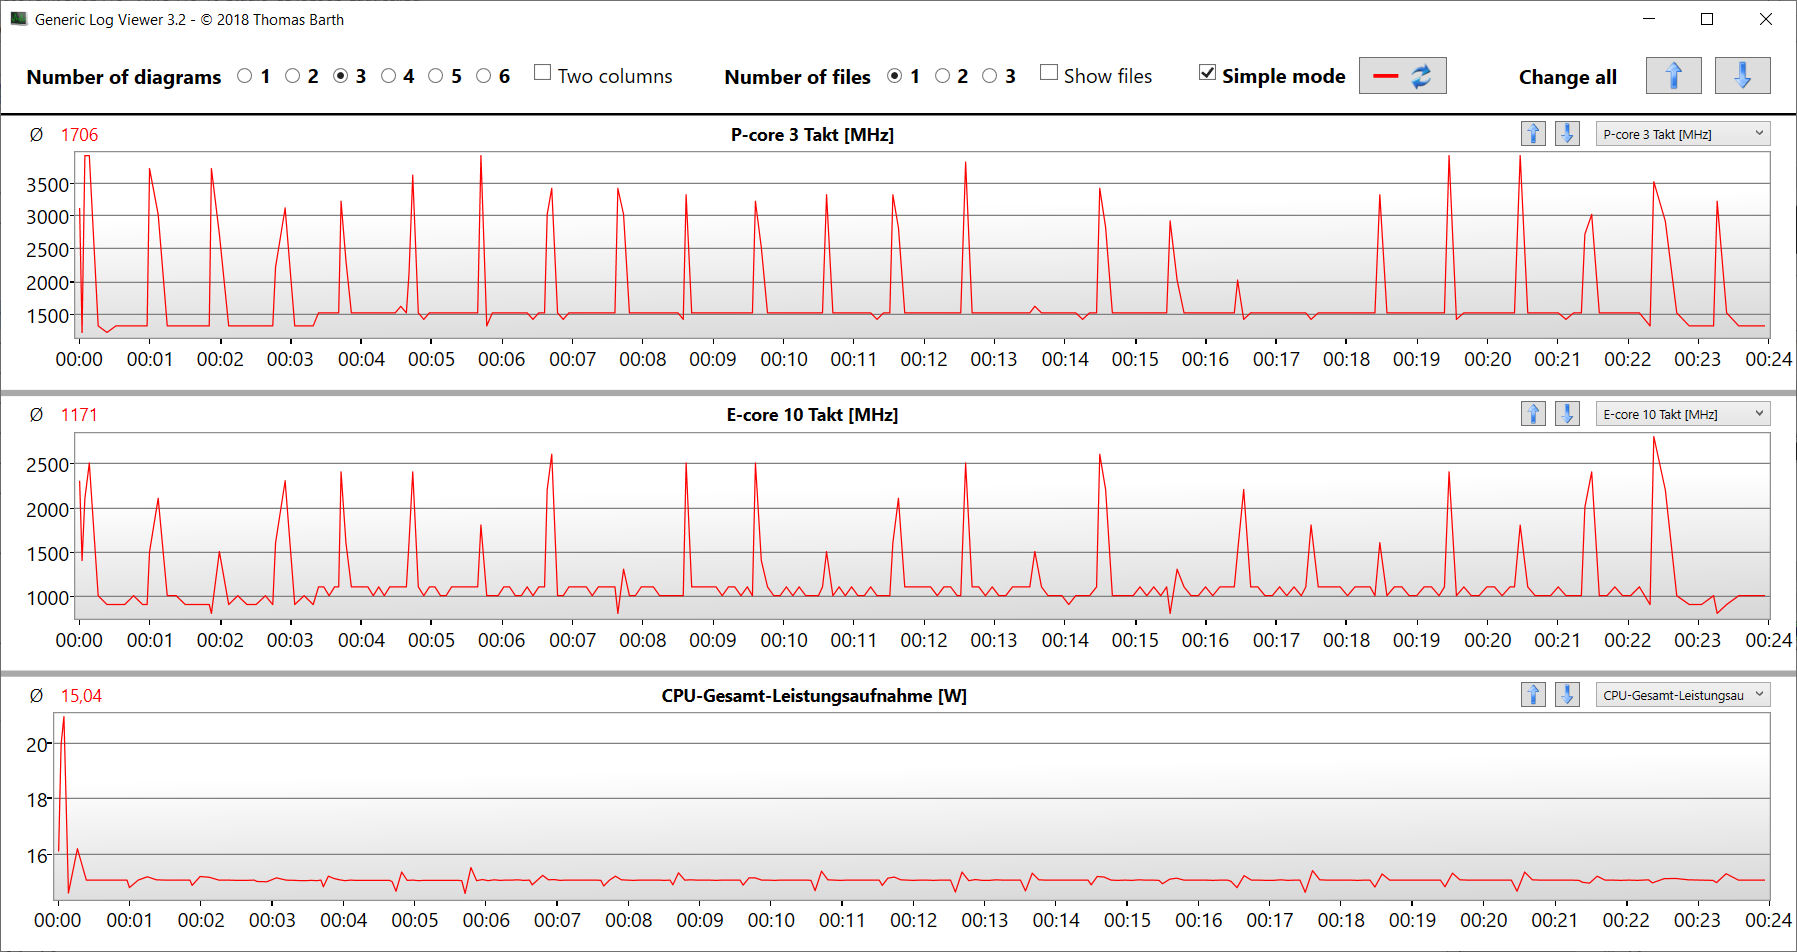
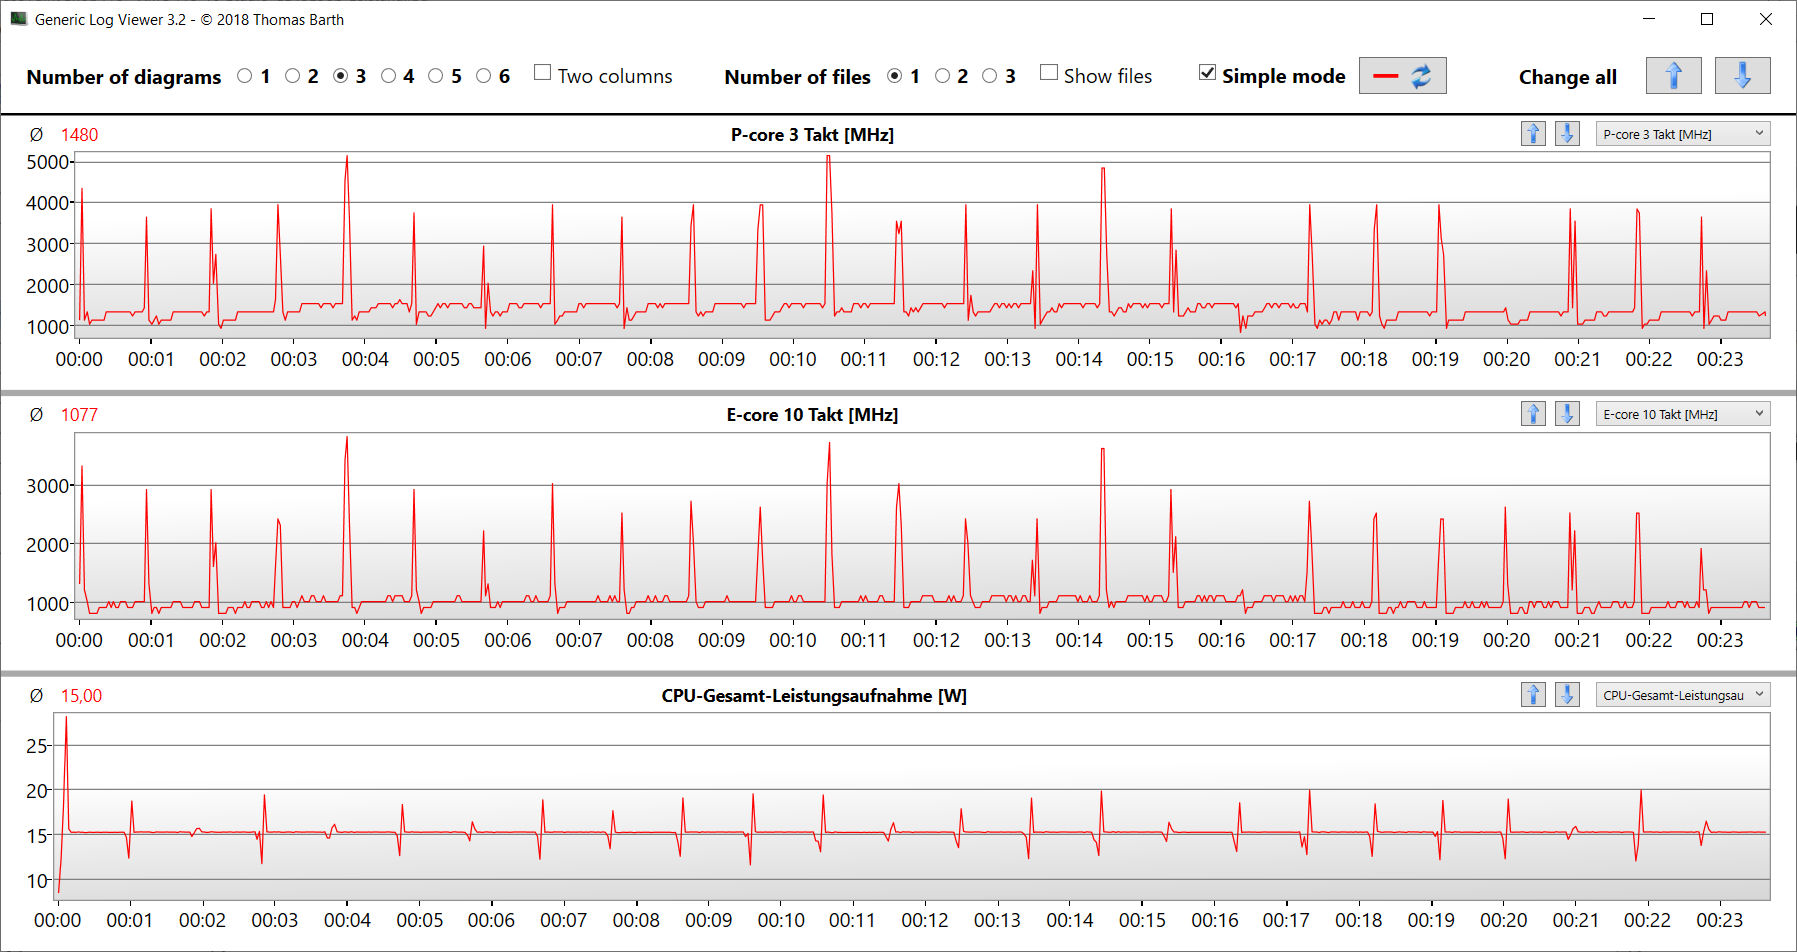
La prueba de estrés (Prime95 y Furmark en uso continuo) simula un escenario extremo para comprobar la estabilidad del sistema a plena carga. La CPU (P: 3,8 a 3,9 GHz, E: 2,7 GHz) comenzó la prueba con velocidades de reloj elevadas. En el transcurso posterior, estos valores se hundieron hasta situarse en torno al nivel de reloj base. La GPU funcionó casi a plena potencia.
Altavoces
Los altavoces estéreo producen un sonido muy decente en general. Los graves podrían ser más potentes.
Schenker XMG Pro 16 Studio (Mid 23) análisis de audio
(±) | la sonoridad del altavoz es media pero buena (80 dB)
Graves 100 - 315 Hz
(±) | lubina reducida - en promedio 12.7% inferior a la mediana
(+) | el bajo es lineal (6.1% delta a la frecuencia anterior)
Medios 400 - 2000 Hz
(+) | medios equilibrados - a sólo 2.3% de la mediana
(+) | los medios son lineales (4.8% delta a la frecuencia anterior)
Altos 2 - 16 kHz
(+) | máximos equilibrados - a sólo 2.6% de la mediana
(+) | los máximos son lineales (6% delta a la frecuencia anterior)
Total 100 - 16.000 Hz
(+) | el sonido global es lineal (10.9% de diferencia con la mediana)
En comparación con la misma clase
» 7% de todos los dispositivos probados de esta clase eran mejores, 3% similares, 90% peores
» El mejor tuvo un delta de 6%, la media fue 18%, el peor fue ###max##%
En comparación con todos los dispositivos probados
» 6% de todos los dispositivos probados eran mejores, 2% similares, 92% peores
» El mejor tuvo un delta de 4%, la media fue 23%, el peor fue ###max##%
Lenovo Legion Slim 7i 16 Gen 8 análisis de audio
(+) | los altavoces pueden reproducir a un volumen relativamente alto (#84.8 dB)
Graves 100 - 315 Hz
(±) | lubina reducida - en promedio 12.1% inferior a la mediana
(±) | la linealidad de los graves es media (9% delta a frecuencia anterior)
Medios 400 - 2000 Hz
(+) | medios equilibrados - a sólo 1.4% de la mediana
(+) | los medios son lineales (3.3% delta a la frecuencia anterior)
Altos 2 - 16 kHz
(+) | máximos equilibrados - a sólo 4.4% de la mediana
(+) | los máximos son lineales (5.6% delta a la frecuencia anterior)
Total 100 - 16.000 Hz
(+) | el sonido global es lineal (10.5% de diferencia con la mediana)
En comparación con la misma clase
» 6% de todos los dispositivos probados de esta clase eran mejores, 2% similares, 92% peores
» El mejor tuvo un delta de 6%, la media fue 18%, el peor fue ###max##%
En comparación con todos los dispositivos probados
» 5% de todos los dispositivos probados eran mejores, 1% similares, 93% peores
» El mejor tuvo un delta de 4%, la media fue 23%, el peor fue ###max##%
Consumo de energía
La Pro 16 no mostró valores de consumo de energía llamativos. Los índices están en un nivel normal para el hardware instalado. La Witcher 3 test y la prueba de estrés se ejecutaron con un consumo de energía ligeramente decreciente. La fuente de alimentación (230 vatios) está suficientemente dimensionada. Loable: Dentro del campo de comparación, el portátil XMG tiene el menor consumo global de energía.
| Off / Standby | |
| Ocioso | |
| Carga |
|
Clave:
min: | |
| Schenker XMG Pro 16 Studio (Mid 23) i9-13900H, GeForce RTX 4070 Laptop GPU | Asus Vivobook Pro 16X K6604JV-MX016W i9-13980HX, GeForce RTX 4060 Laptop GPU | Lenovo Legion Slim 7i 16 Gen 8 i9-13900H, GeForce RTX 4070 Laptop GPU | HP Omen Transcend 16 i9-13900HX, GeForce RTX 4070 Laptop GPU | MSI Stealth 16 Studio A13VG i7-13700H, GeForce RTX 4070 Laptop GPU | Media de la clase Gaming | |
|---|---|---|---|---|---|---|
| Power Consumption | -23% | -65% | -76% | -8% | -33% | |
| Idle Minimum * (Watt) | 8 | 13.8 -73% | 22 -175% | 19.2 -140% | 11 -38% | 13 ? -63% |
| Idle Average * (Watt) | 12 | 16 -33% | 29 -142% | 22.7 -89% | 18 -50% | 19 ? -58% |
| Idle Maximum * (Watt) | 23 | 19 17% | 39.5 -72% | 55.4 -141% | 19 17% | 24.6 ? -7% |
| Load Average * (Watt) | 94 | 147 -56% | 98.7 -5% | 128.4 -37% | 91 3% | 110.7 ? -18% |
| Witcher 3 ultra * (Watt) | 181.5 | 147.8 19% | 171.8 5% | 206 -13% | 130 28% | |
| Load Maximum * (Watt) | 215 | 244 -13% | 213.2 1% | 292 -36% | 228 -6% | 259 ? -20% |
* ... más pequeño es mejor
Power consumption Witcher 3 / stress test
Power consumption with external monitor
Tiempos de ejecución
En nuestra prueba WLAN realista (que representa la carga durante la llamada a sitios web utilizando un script), el portátil de 16 pulgadas logró tiempos de ejecución de 6:45 h, un resultado generalmente bueno. Dentro del campo de comparación, el Pro 16 presenta la menor capacidad de batería (73 Wh) pero ofrece los mejores tiempos de ejecución por Wh.
Pro
Contra
Veredicto - Una potencia armoniosa
La edición de vídeo e imágenes, el streaming, el renderizado y los juegos forman parte de la experiencia del portátil. La potencia necesaria la proporciona unCore i9-13900Hy unaGeForce RTX 4070a un nivel consistentemente alto. Es posible encontrar un buen compromiso entre rendimiento y emisiones de ruido.
El XMG Pro 16 Studio (Mid 23) de Schenker demuestra ser una potente herramienta para jugadores y creadores.
Su pantalla QHD+ (16 pulgadas, 2.560 x 1.600 píxeles, sRGB, IPS, 240 Hz) con una relación de aspecto 16:10 favorable para el trabajo nos causó en general una buena impresión. Aun así: La pantalla de un portátil creador debería ser capaz de representar el espacio de color DCI P3. Dos ranuras SSD (PCIe 4) con soporte RAID-0/1 garantizan mucho almacenamiento y tiempos de carga cortos.
Sus puertos USB-C (1x USB 3.2 Gen 2, 1x Thunderbolt 4) facilitan la integración del portátil en las configuraciones existentes del espacio de trabajo y abren más opciones de ampliación (GPU externa, docking). Su puerto TB-4 puede emitir una señal DisplayPort y es compatible con Power Delivery. A esto se suman unos tiempos de ejecución relativamente buenos.
Una alternativa podría ser elLenovo Legion Slim 7i 16 Gen 8: Cuenta con la misma CPU y GPU pero puede ofrecer una potencia de cálculo ligeramente superior. Los puntos débiles del portátil: Mayor consumo de energía, RAM soldada, ralentización del SSD.
Precio y disponibilidad
El XMG Pro 16 Studio puede configurarse individualmente y encargarse a través de la tienda en línea Schenker. Nuestro aparato de prueba puede adquirirse por unos 2.400 dólares.
Schenker XMG Pro 16 Studio (Mid 23)
- 10/22/2023 v7 (old)
Sascha Mölck
Transparencia
La selección de los dispositivos que se van a reseñar corre a cargo de nuestro equipo editorial. La muestra de prueba fue proporcionada al autor en calidad de préstamo por el fabricante o el minorista a los efectos de esta reseña. El prestamista no tuvo ninguna influencia en esta reseña, ni el fabricante recibió una copia de la misma antes de su publicación. No había ninguna obligación de publicar esta reseña. Como empresa de medios independiente, Notebookcheck no está sujeta a la autoridad de fabricantes, minoristas o editores.
Así es como prueba Notebookcheck
Cada año, Notebookcheck revisa de forma independiente cientos de portátiles y smartphones utilizando procedimientos estandarizados para asegurar que todos los resultados son comparables. Hemos desarrollado continuamente nuestros métodos de prueba durante unos 20 años y hemos establecido los estándares de la industria en el proceso. En nuestros laboratorios de pruebas, técnicos y editores experimentados utilizan equipos de medición de alta calidad. Estas pruebas implican un proceso de validación en varias fases. Nuestro complejo sistema de clasificación se basa en cientos de mediciones y puntos de referencia bien fundamentados, lo que mantiene la objetividad.Price comparison

