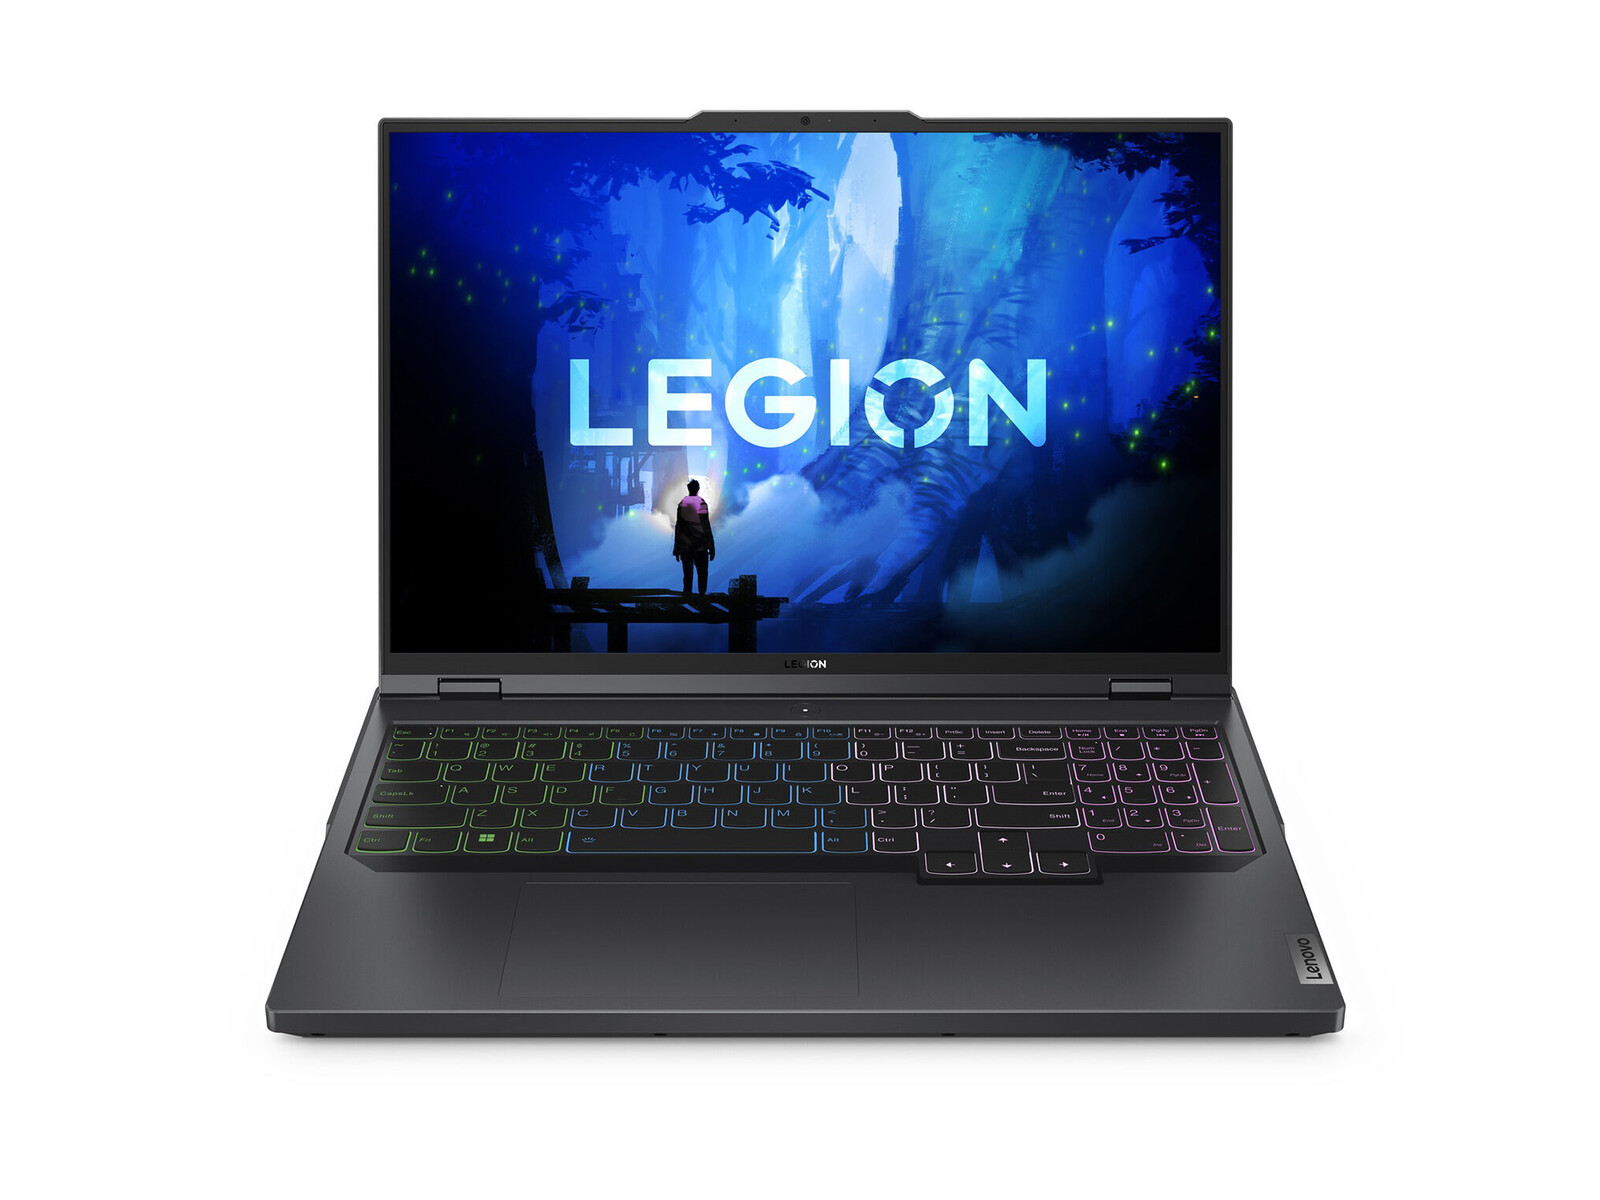
Análisis del portátil Lenovo Legion Pro 5 16IRX9: Gran rendimiento, pero un poco pesado

No confundir con el visualmente diferente Legion 5 16IRX9, la Legion Pro 5 16IRX9 sucede directamente a la del año pasado Legion Pro 5 16 IRX8. Cambia las CPU 2023 Raptor Lake-HX por la línea de actualización 2024 Raptor Lake-HX al tiempo que introduce ligeros cambios visuales y una nueva tercera opción de pantalla.
Nuestra unidad de análisis es una configuración de gama alta con la CPU Core i9-14900HX, GPU GeForce RTX 4070 de 140 W y pantalla IPS sRGB de 165 Hz a 1600p por un precio de venta al público de entre 1900 y 2100 dólares aproximadamente. Otros SKU comienzan con el Core i5-14500HX y RTX 4050 con colores DCI-P3 completos en su lugar, pero la resolución nativa 1600p es la misma en todos los casos.
Las alternativas al Legion Pro 5 16 IRX9 incluyen otros portátiles para juegos de 16 pulgadas de gama media alta como el HP Omen Transcend 16,Asus ROG Zephyrus G16o el MSI Stealth 16.
Más opiniones sobre Lenovo:
Posibles contendientes en la comparación
Valoración | Fecha | Modelo | Peso | Altura | Tamaño | Resolución | Precio |
|---|---|---|---|---|---|---|---|
| 89.3 % v7 (old) | 04/2024 | Lenovo Legion Pro 5 16IRX9 i9-14900HX, GeForce RTX 4070 Laptop GPU | 2.5 kg | 26.95 mm | 16.00" | 2560x1600 | |
| 87.9 % v7 (old) | 05/2023 | Lenovo Legion Pro 5 16IRX8 i7-13700HX, GeForce RTX 4060 Laptop GPU | 2.5 kg | 26.8 mm | 16.00" | 2560x1600 | |
| 90.2 % v7 (old) | 03/2024 | Alienware m16 R2 Ultra 7 155H, GeForce RTX 4070 Laptop GPU | 2.5 kg | 23.5 mm | 16.00" | 2560x1600 | |
| 88.4 % v7 (old) | 02/2024 | HP Omen Transcend 16-u1095ng i9-14900HX, GeForce RTX 4070 Laptop GPU | 2.3 kg | 20 mm | 16.00" | 2560x1600 | |
| 92.3 % v7 (old) | 02/2024 | Asus ROG Zephyrus G16 2024 GU605M Ultra 7 155H, GeForce RTX 4070 Laptop GPU | 1.8 kg | 16.4 mm | 16.00" | 2560x1600 | |
| 89.1 % v7 (old) | 11/2023 | MSI Stealth 16 Mercedes-AMG Motorsport A13VG i9-13900H, GeForce RTX 4070 Laptop GPU | 1.9 kg | 20 mm | 16.00" | 3840x2400 |
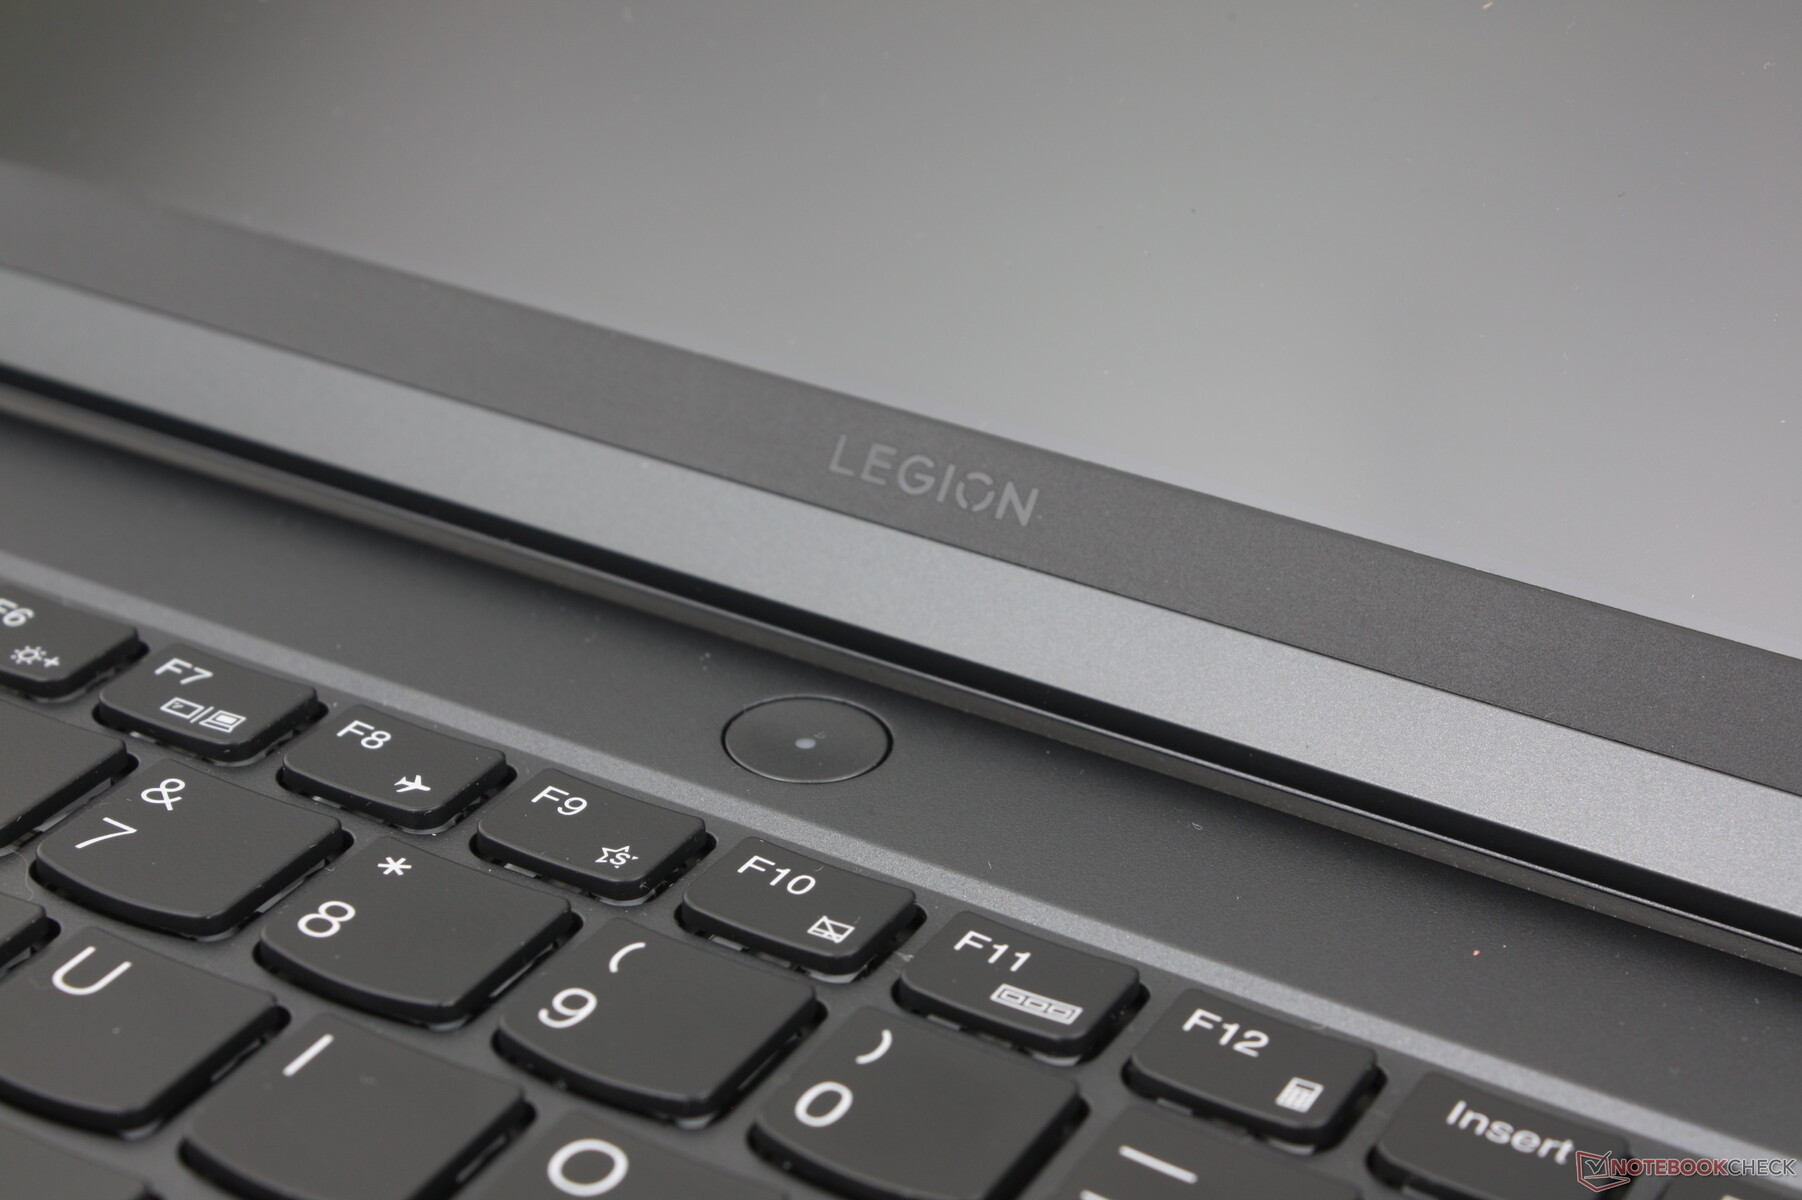
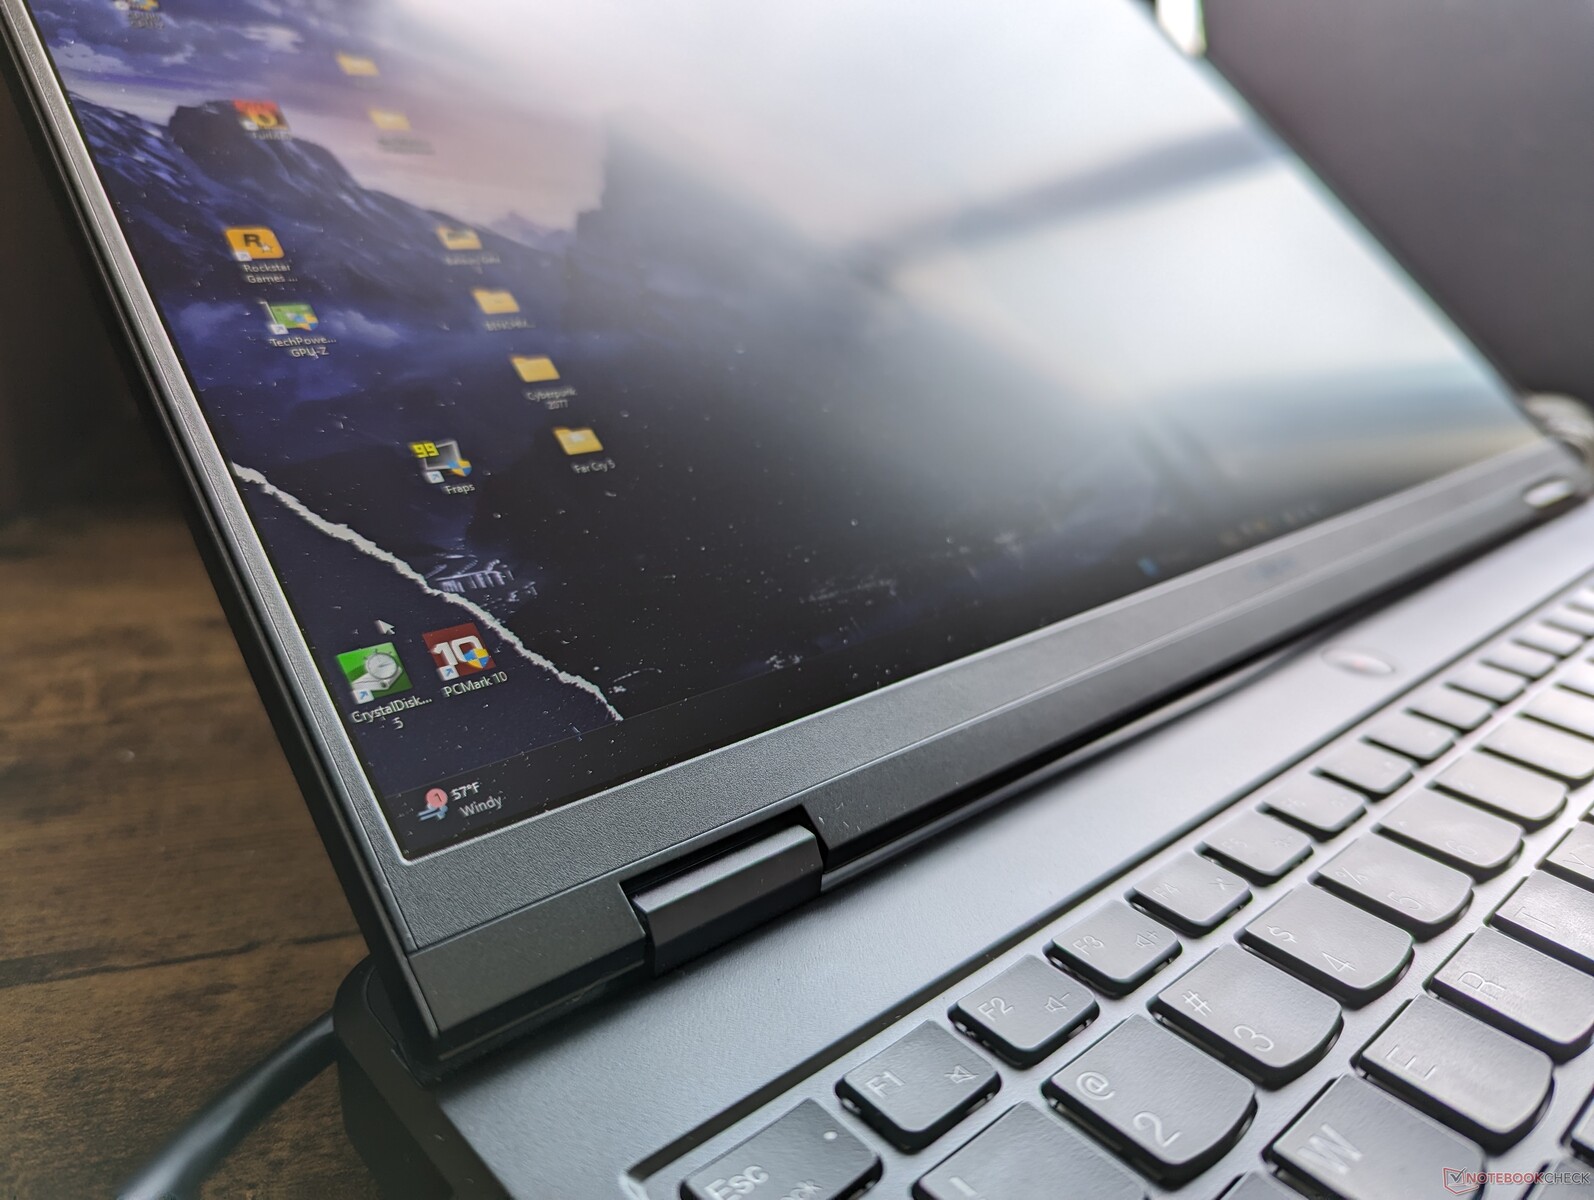
Caso - Pequeños cambios externos
Lenovo utiliza materiales de aluminio gris similares en toda su gama Legion y el Legion Pro 5 16IRX9 no es diferente. La novedad en el modelo de este año son las rejillas de ventilación rediseñadas a lo largo del panel inferior (lado D) que ahora son hexágonos extendidos en lugar de rectángulos. El cambio es predominantemente superficial y el resto del chasis es por lo demás el mismo que el Legion Pro 5 16IRX8.
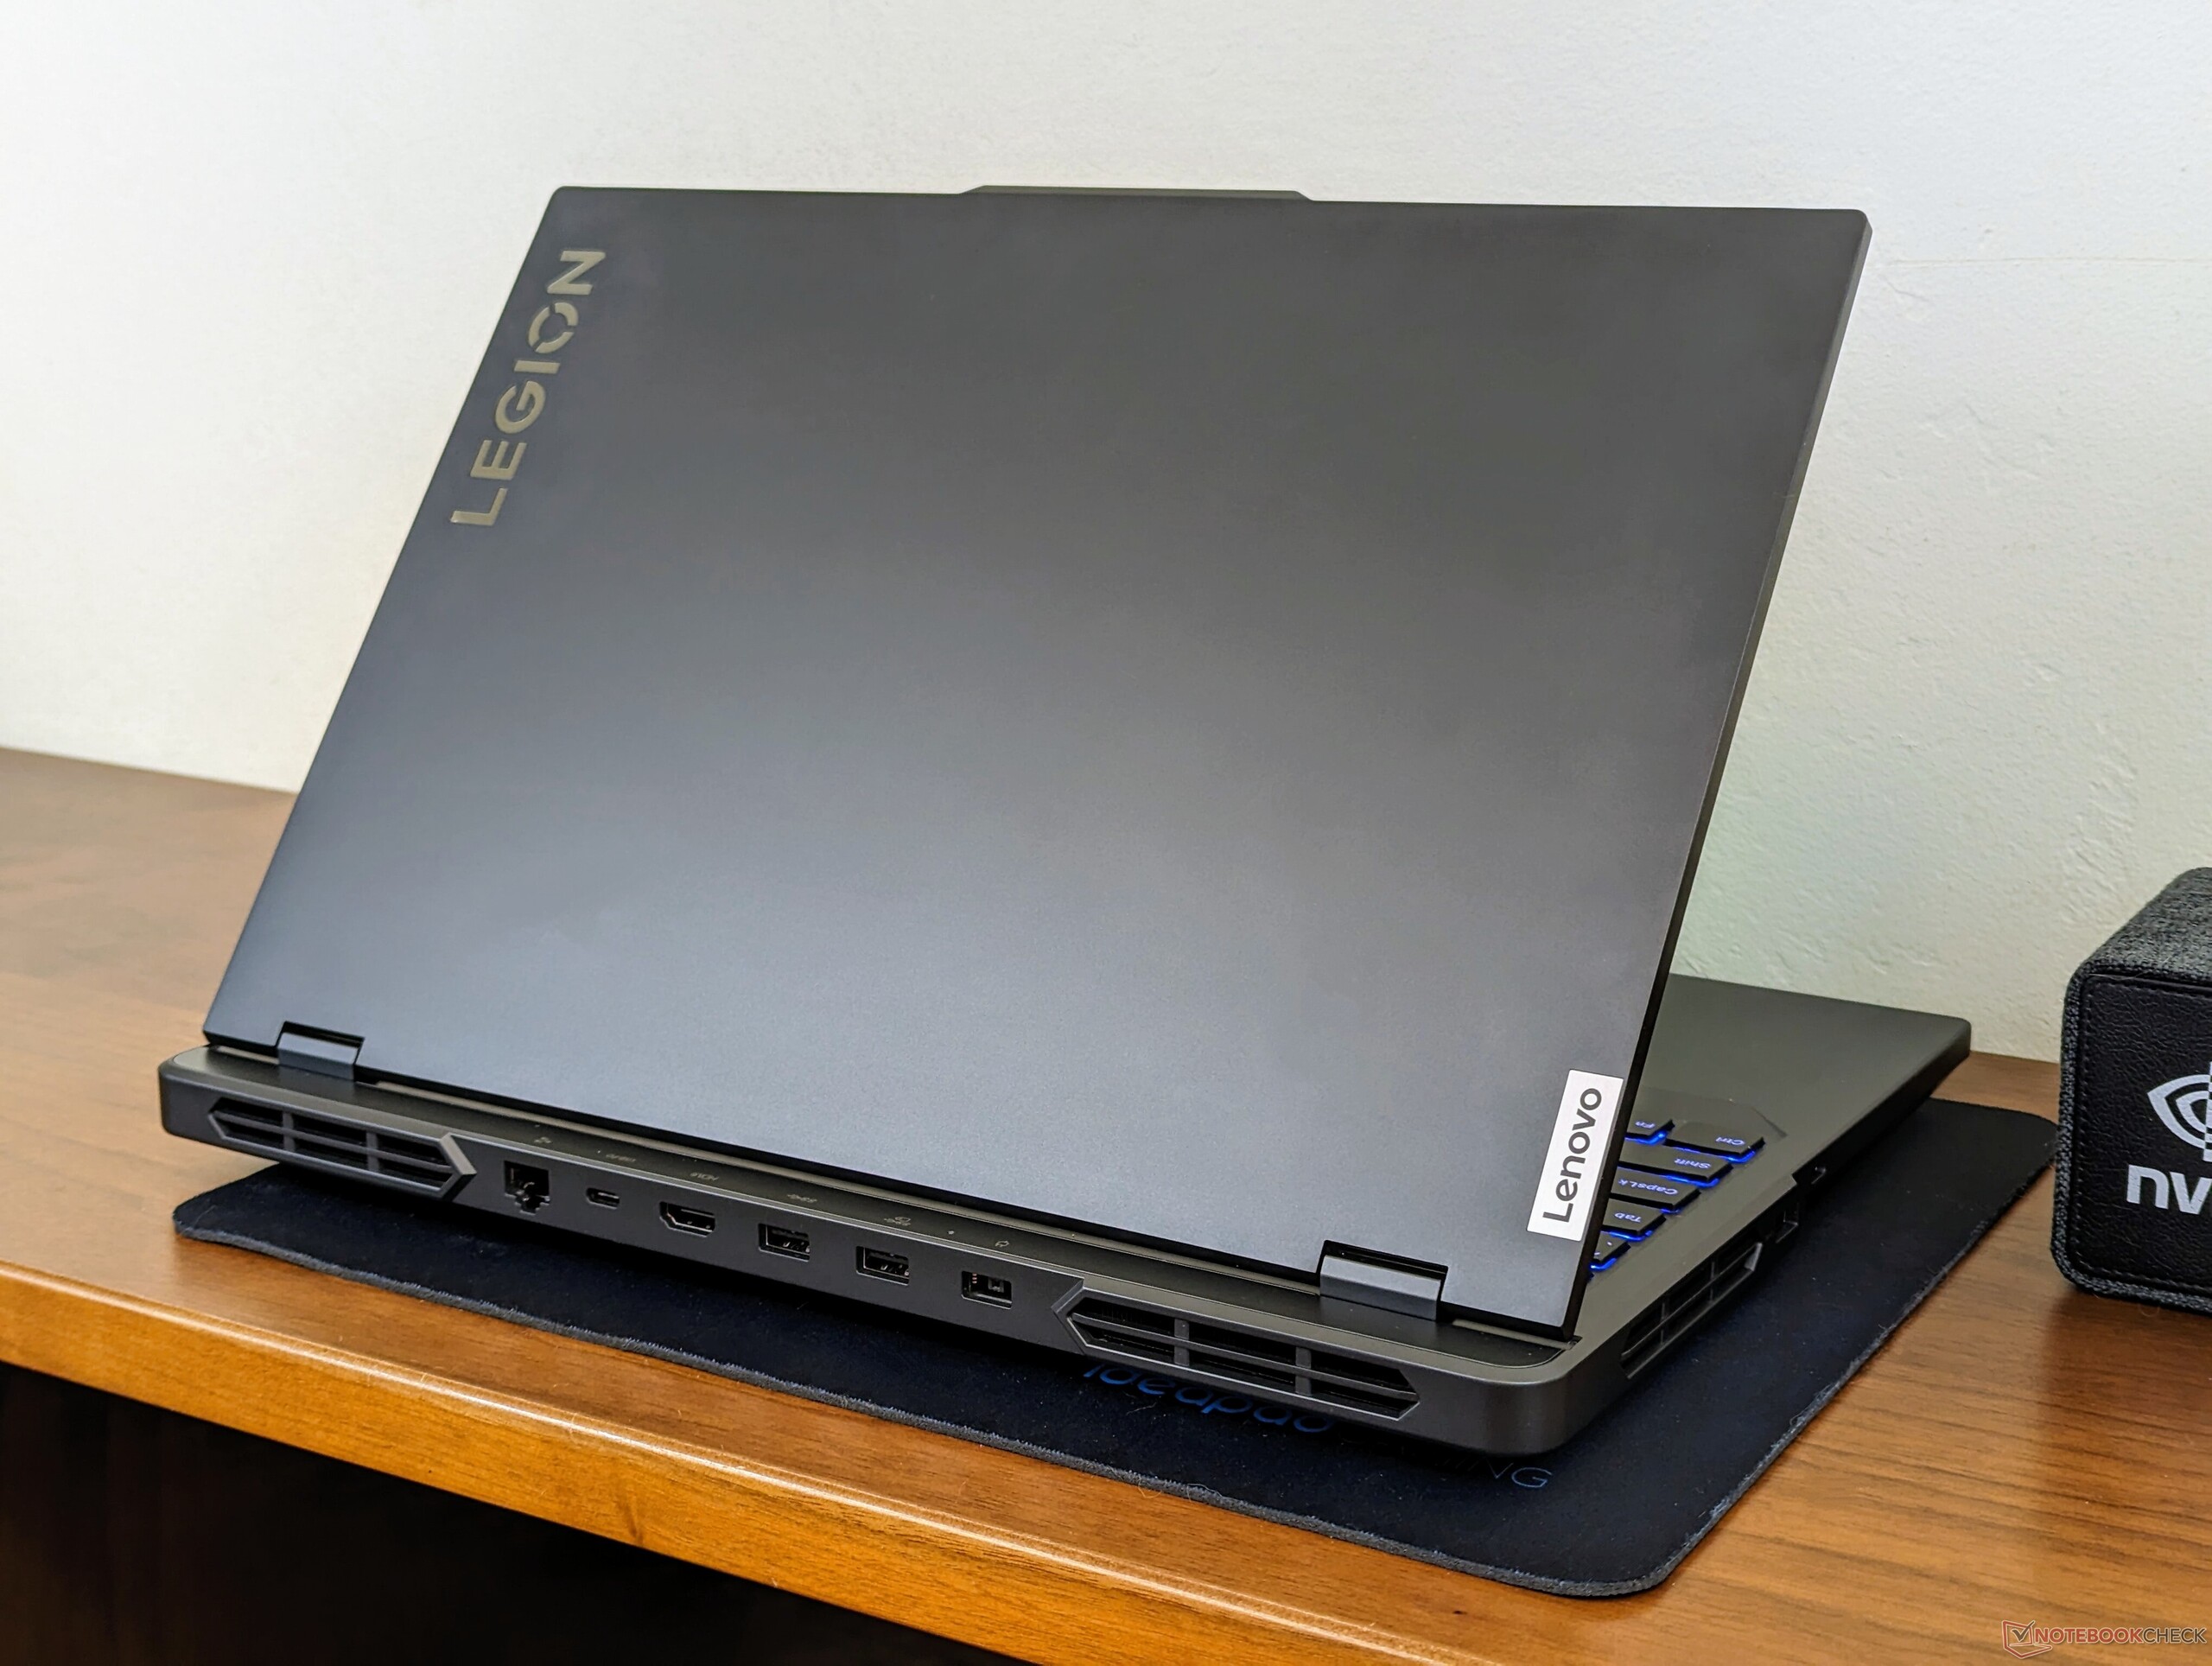
El Legion Pro 5 16 sigue siendo uno de los portátiles para juegos de 16 pulgadas más grandes y pesados, con más de 600 gramos en algunos casos. Sin embargo, el mayor tamaño no es en vano, ya que el Lenovo incorpora las CPU adecuadas de la serie Core-HX, mientras que alternativas más pequeñas y ligeras como el Alienware m16 R2 pueden venir con CPUs Core Ultra más lentas.

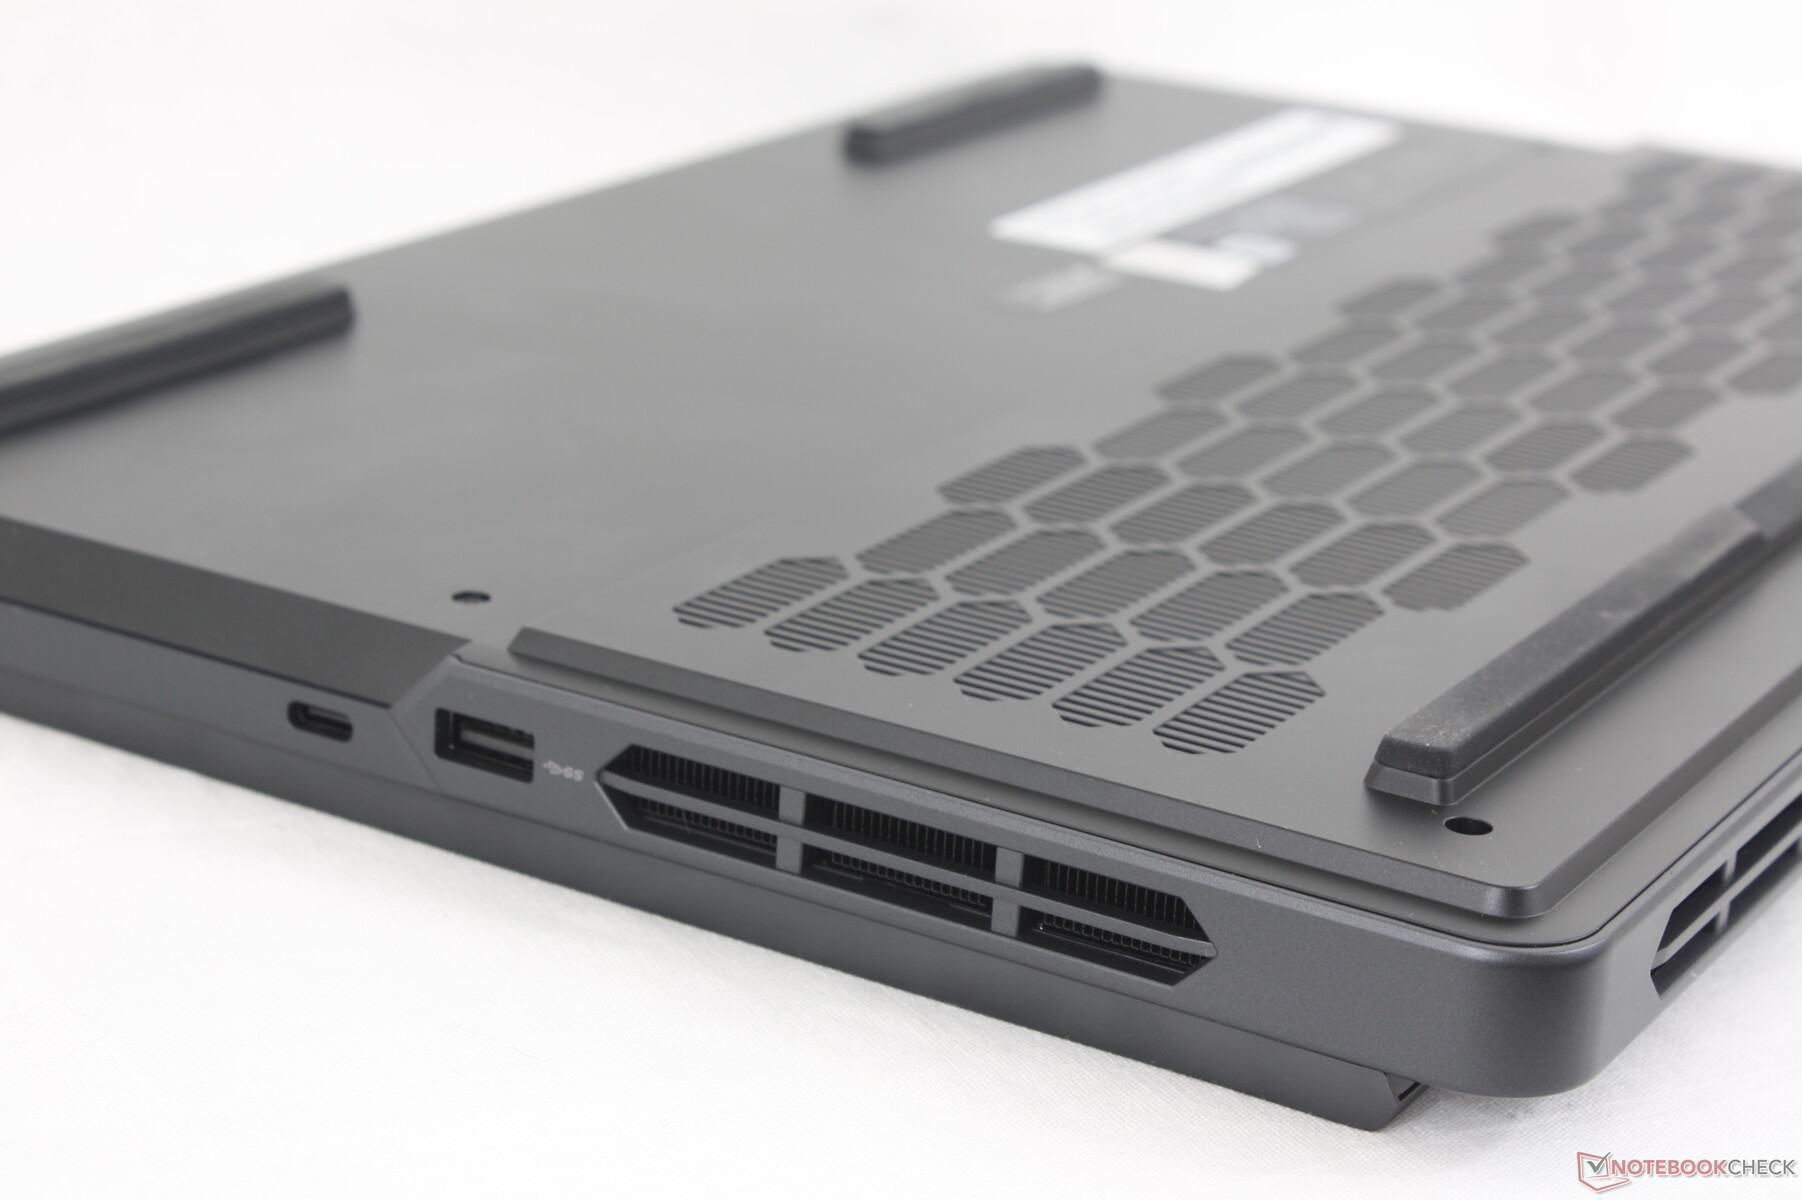
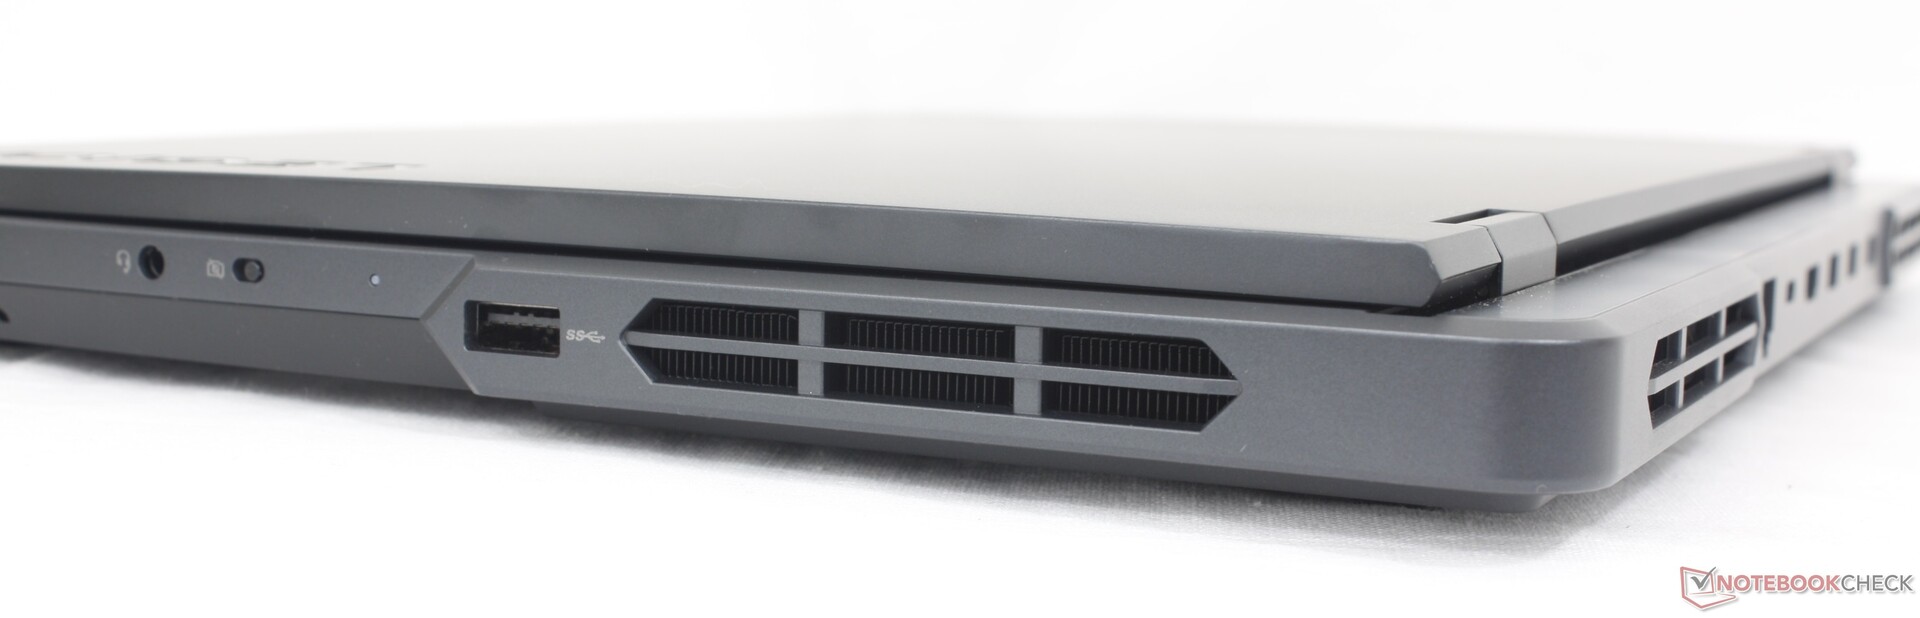
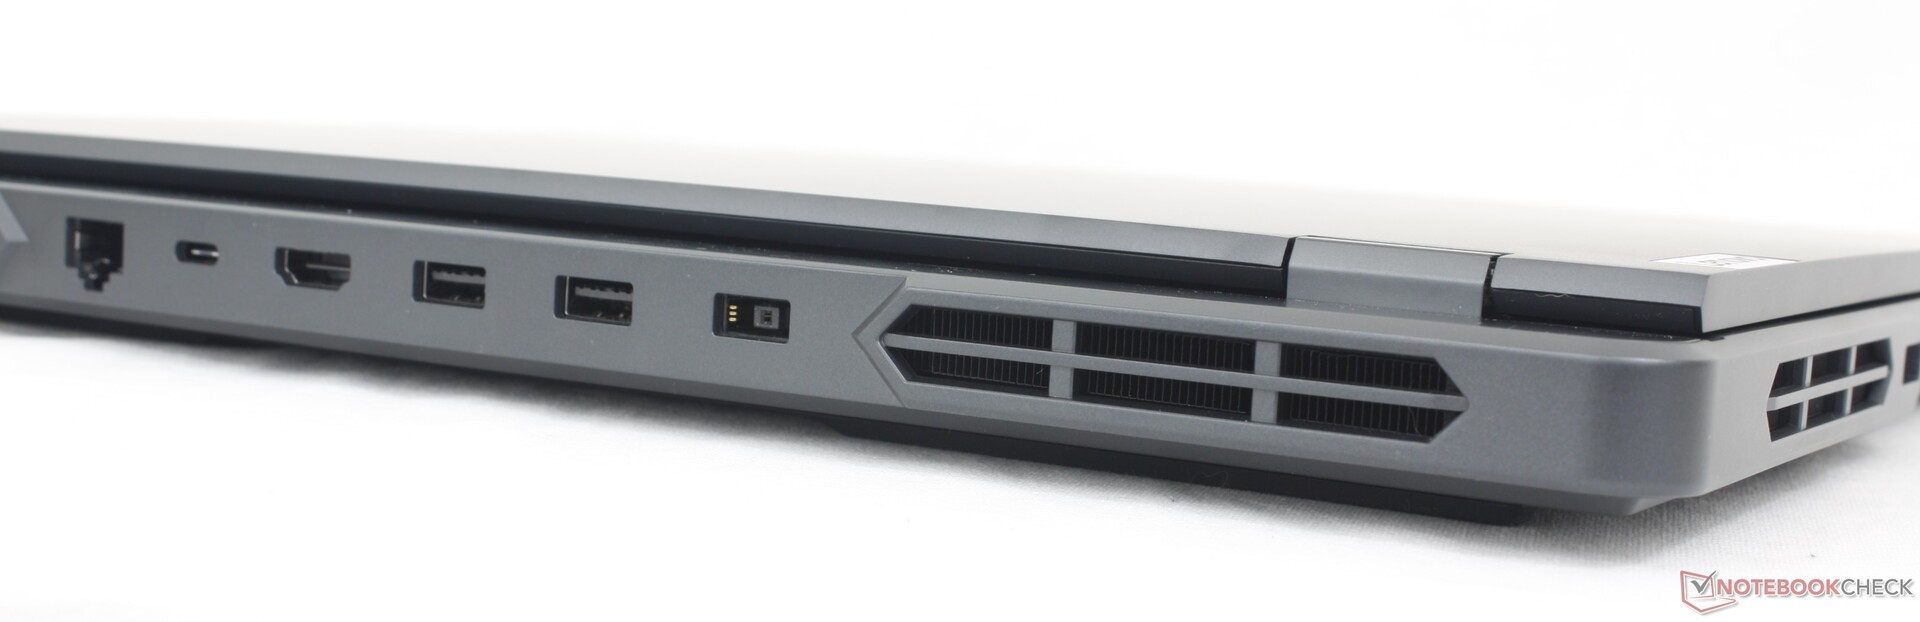
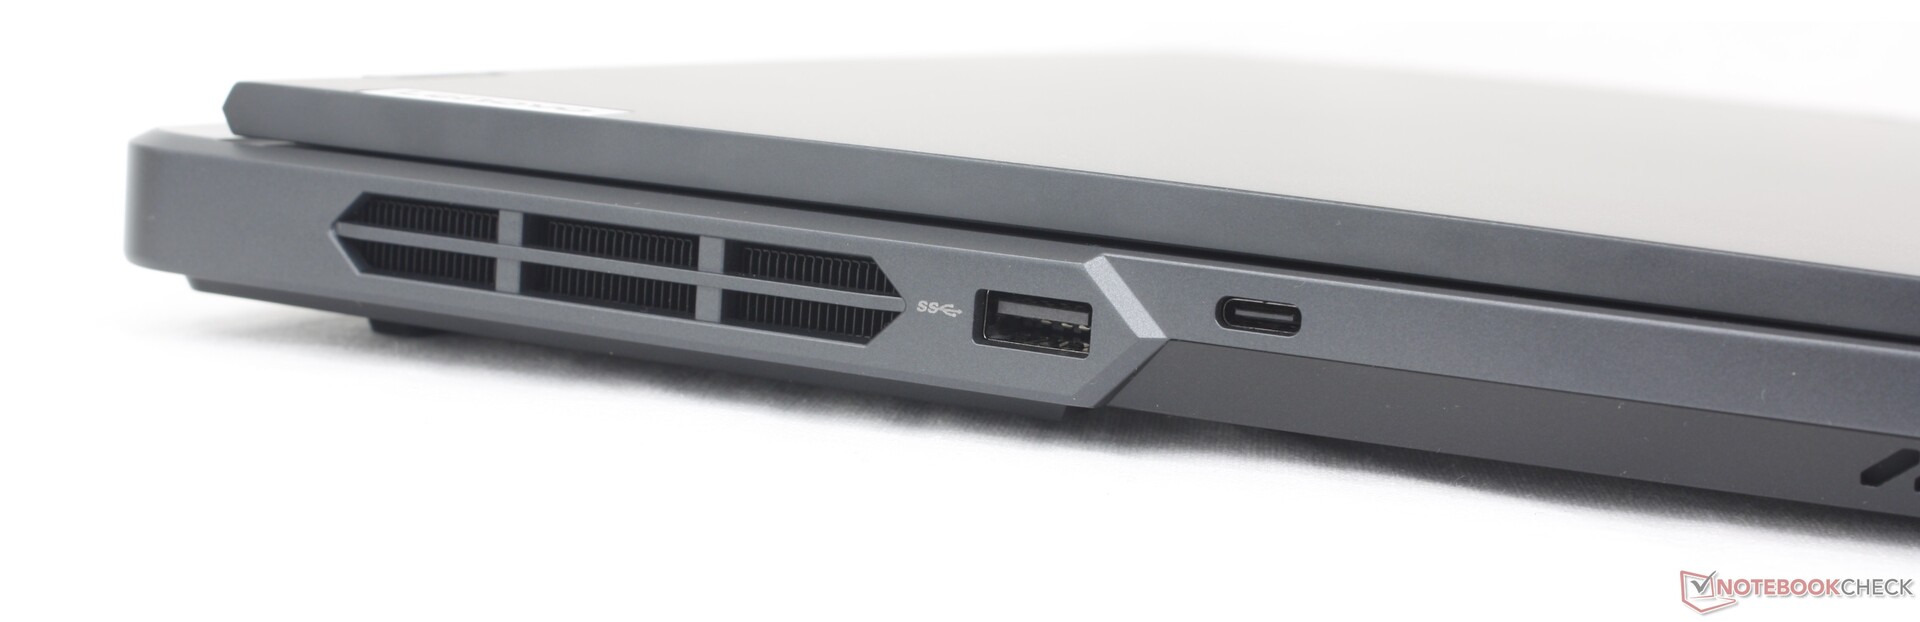
Conectividad
Las opciones de puertos siguen siendo competitivas, aunque la falta de un lector de tarjetas SD integrado podría irritar a algunos creadores de contenidos. Los símbolos impresos de los puertos a lo largo de la cubierta térmica hacen que sea mucho más fácil identificar visualmente los puertos traseros en comparación con portátiles como el Alienware m16 R2 o el HP Omen Transcend 16. Sin embargo, los símbolos no están iluminados como en el Legion Serie Pro 7.
Mientras que los portátiles compatibles con Thunderbolt 5 están empezando a llegar al mercado, el Legion Pro 5 16 sigue funcionando sólo con Thunderbolt 4.
Comunicación
Un Intel AX211 viene de serie para la conectividad Wi-Fi 6E y Bluetooth 5.2. No experimentamos ningún problema al emparejarlo con nuestro router de prueba Asus AXE11000.
Cámara web
Aunque nuestra unidad de prueba viene con una cámara web de 2 MP, es posible que algunas SKU sólo tengan una de 1 MP. Un obturador electrónico viene de serie sin opciones IR.


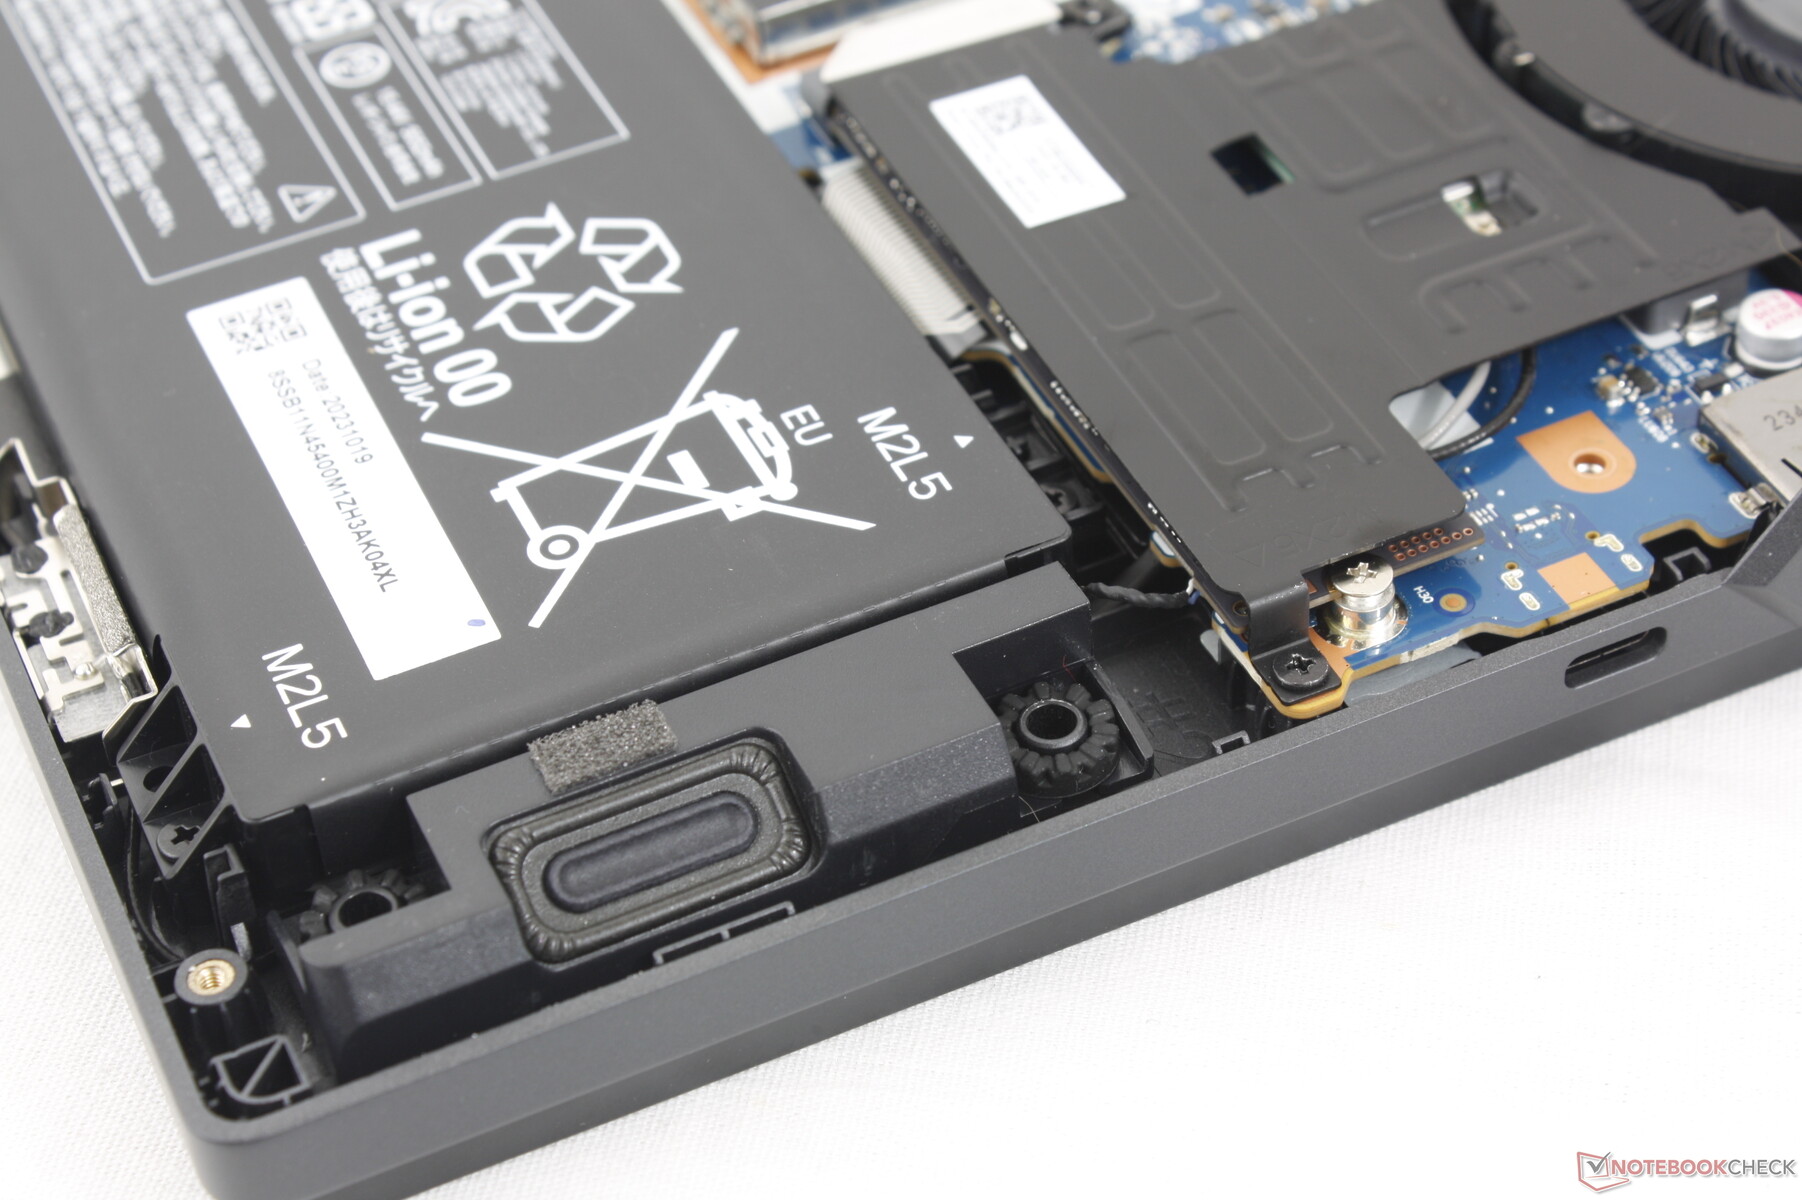
Mantenimiento
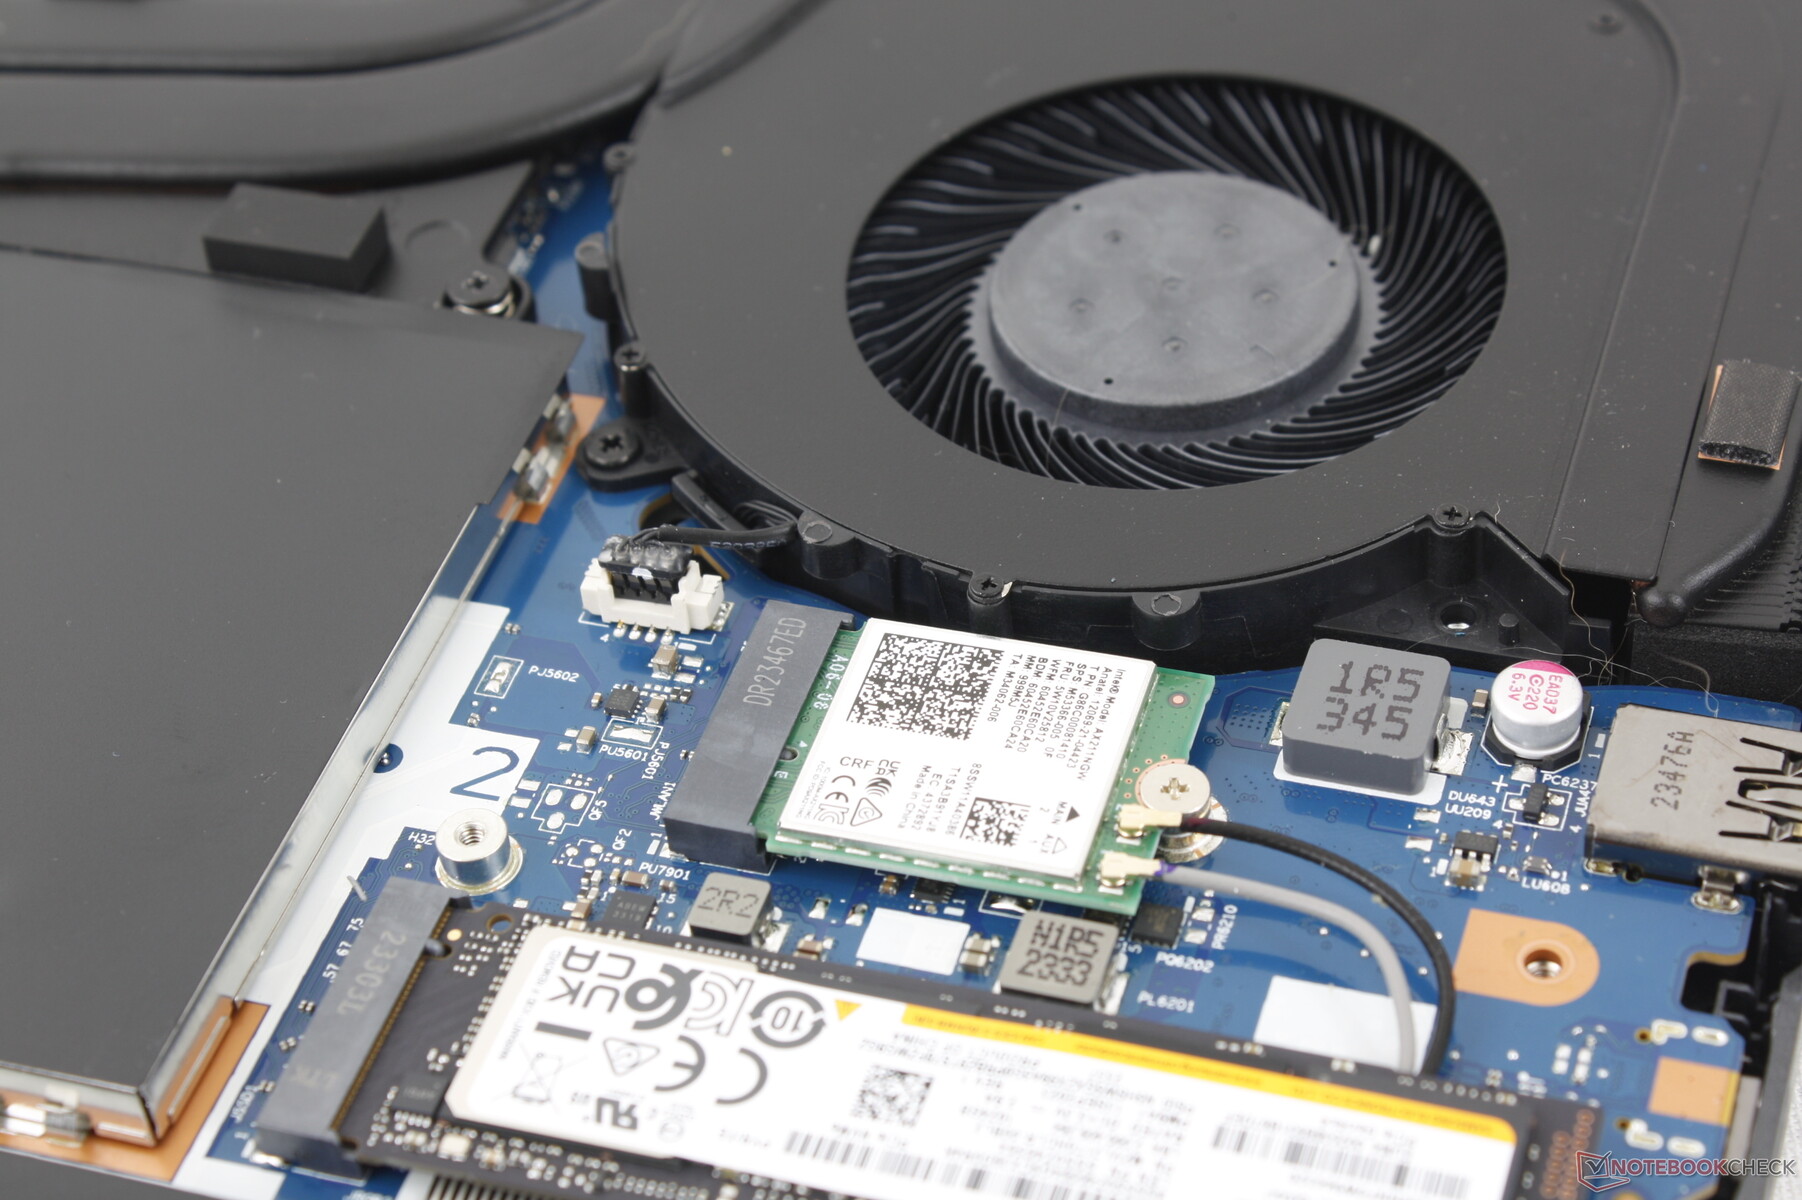
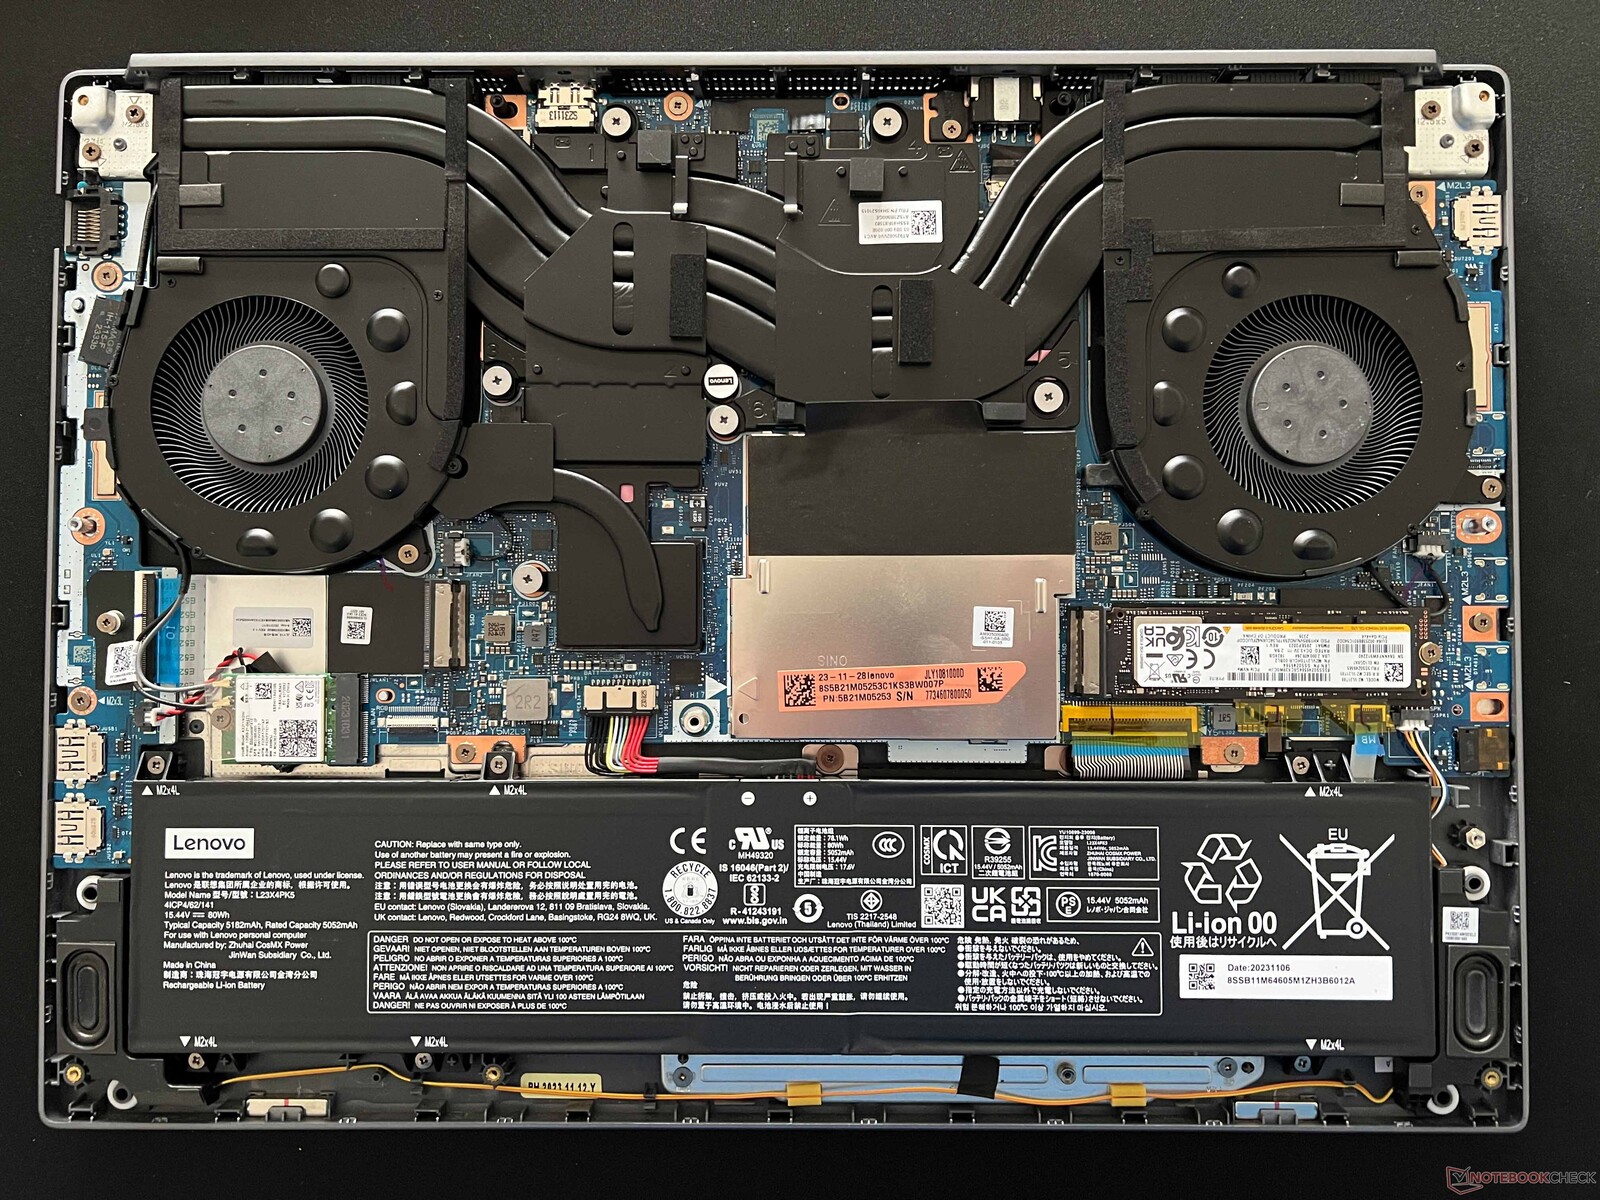
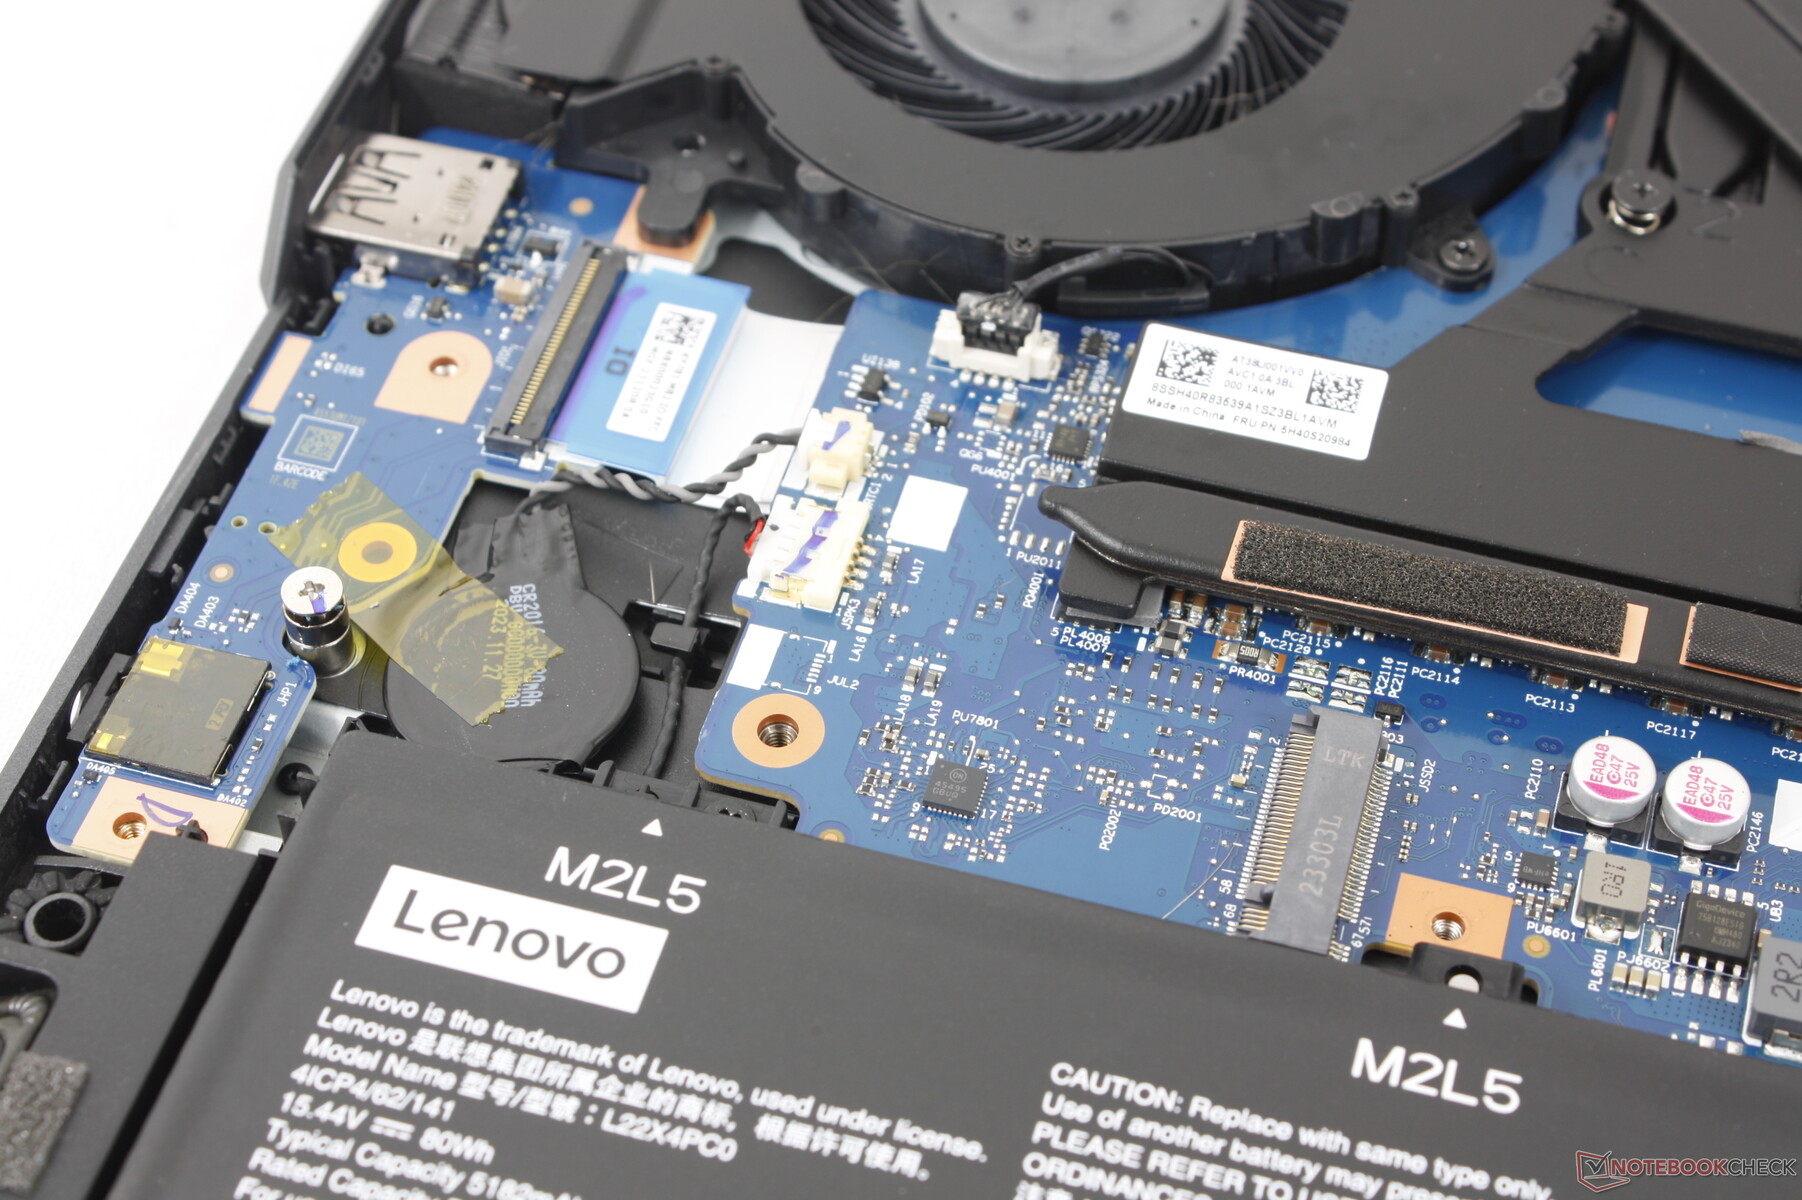
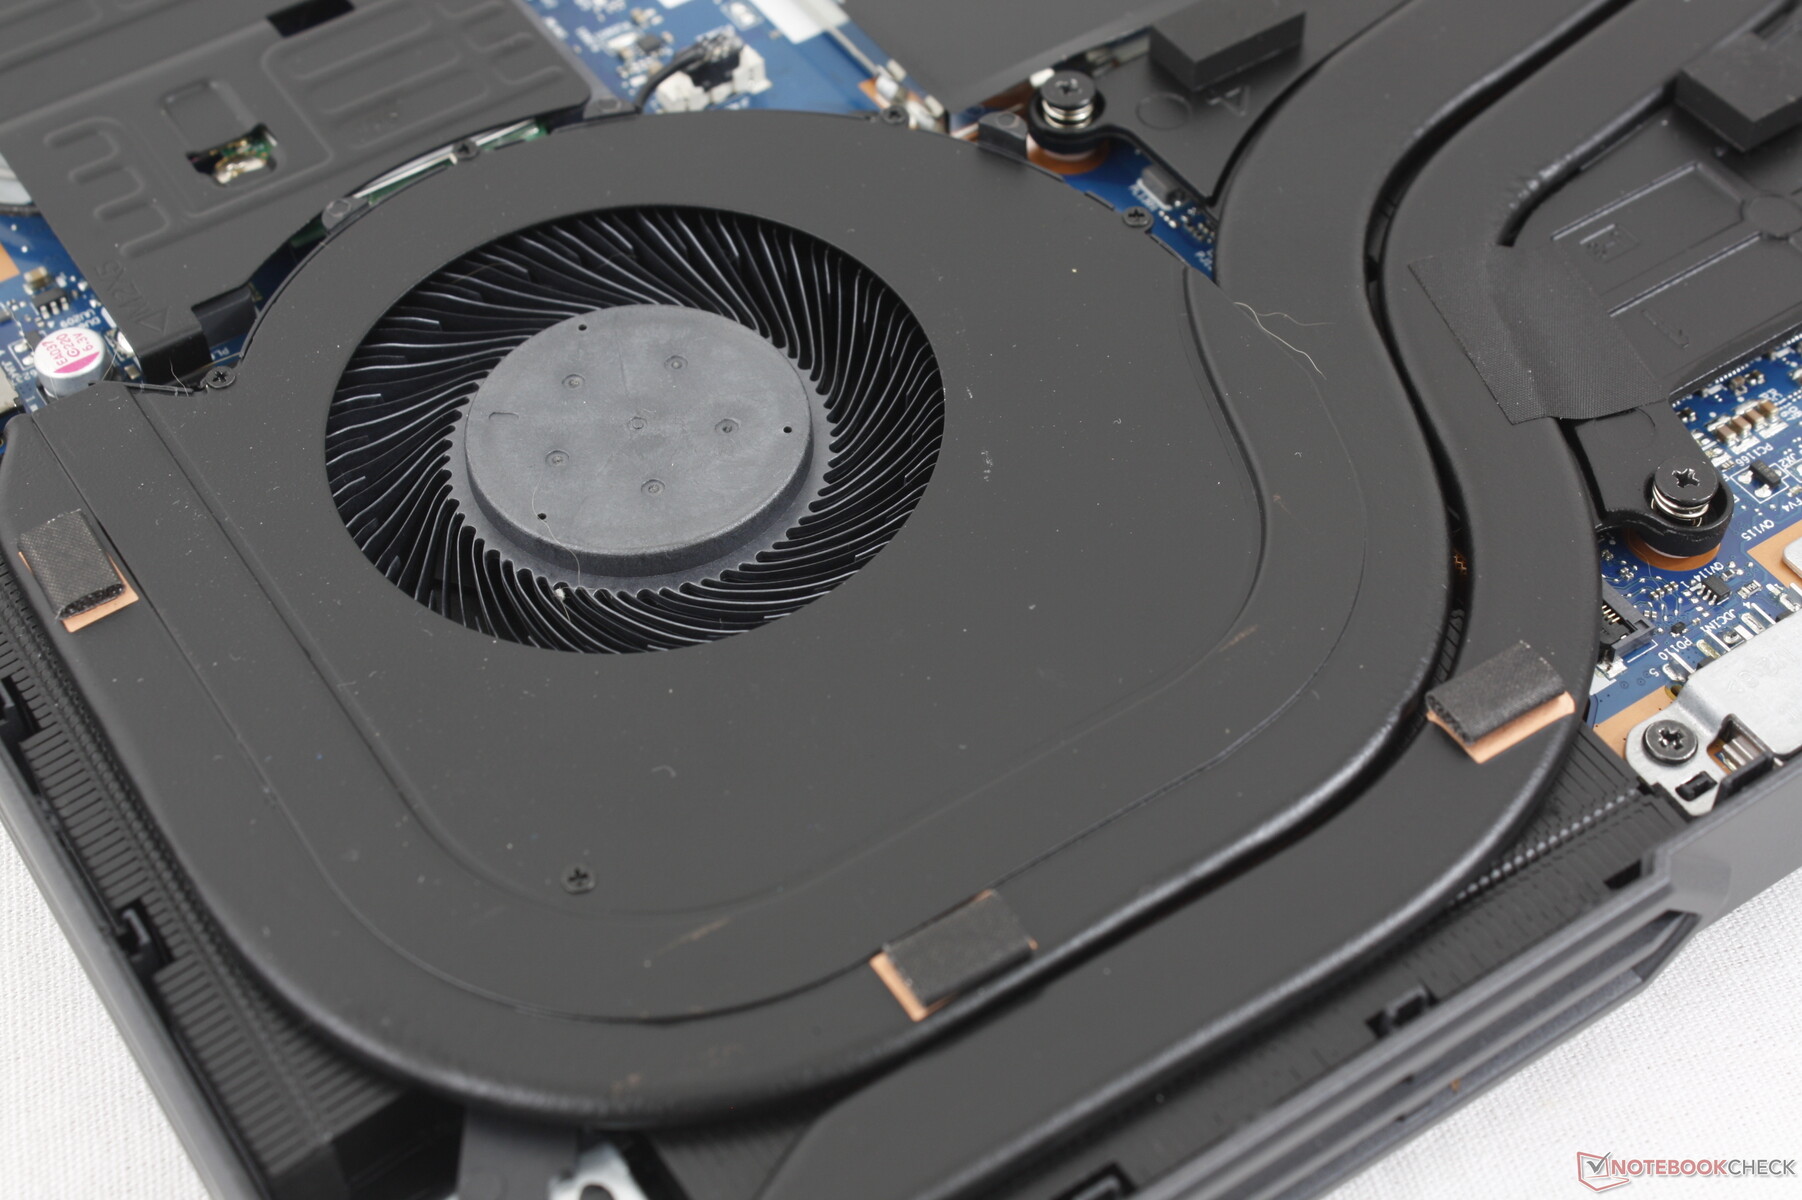
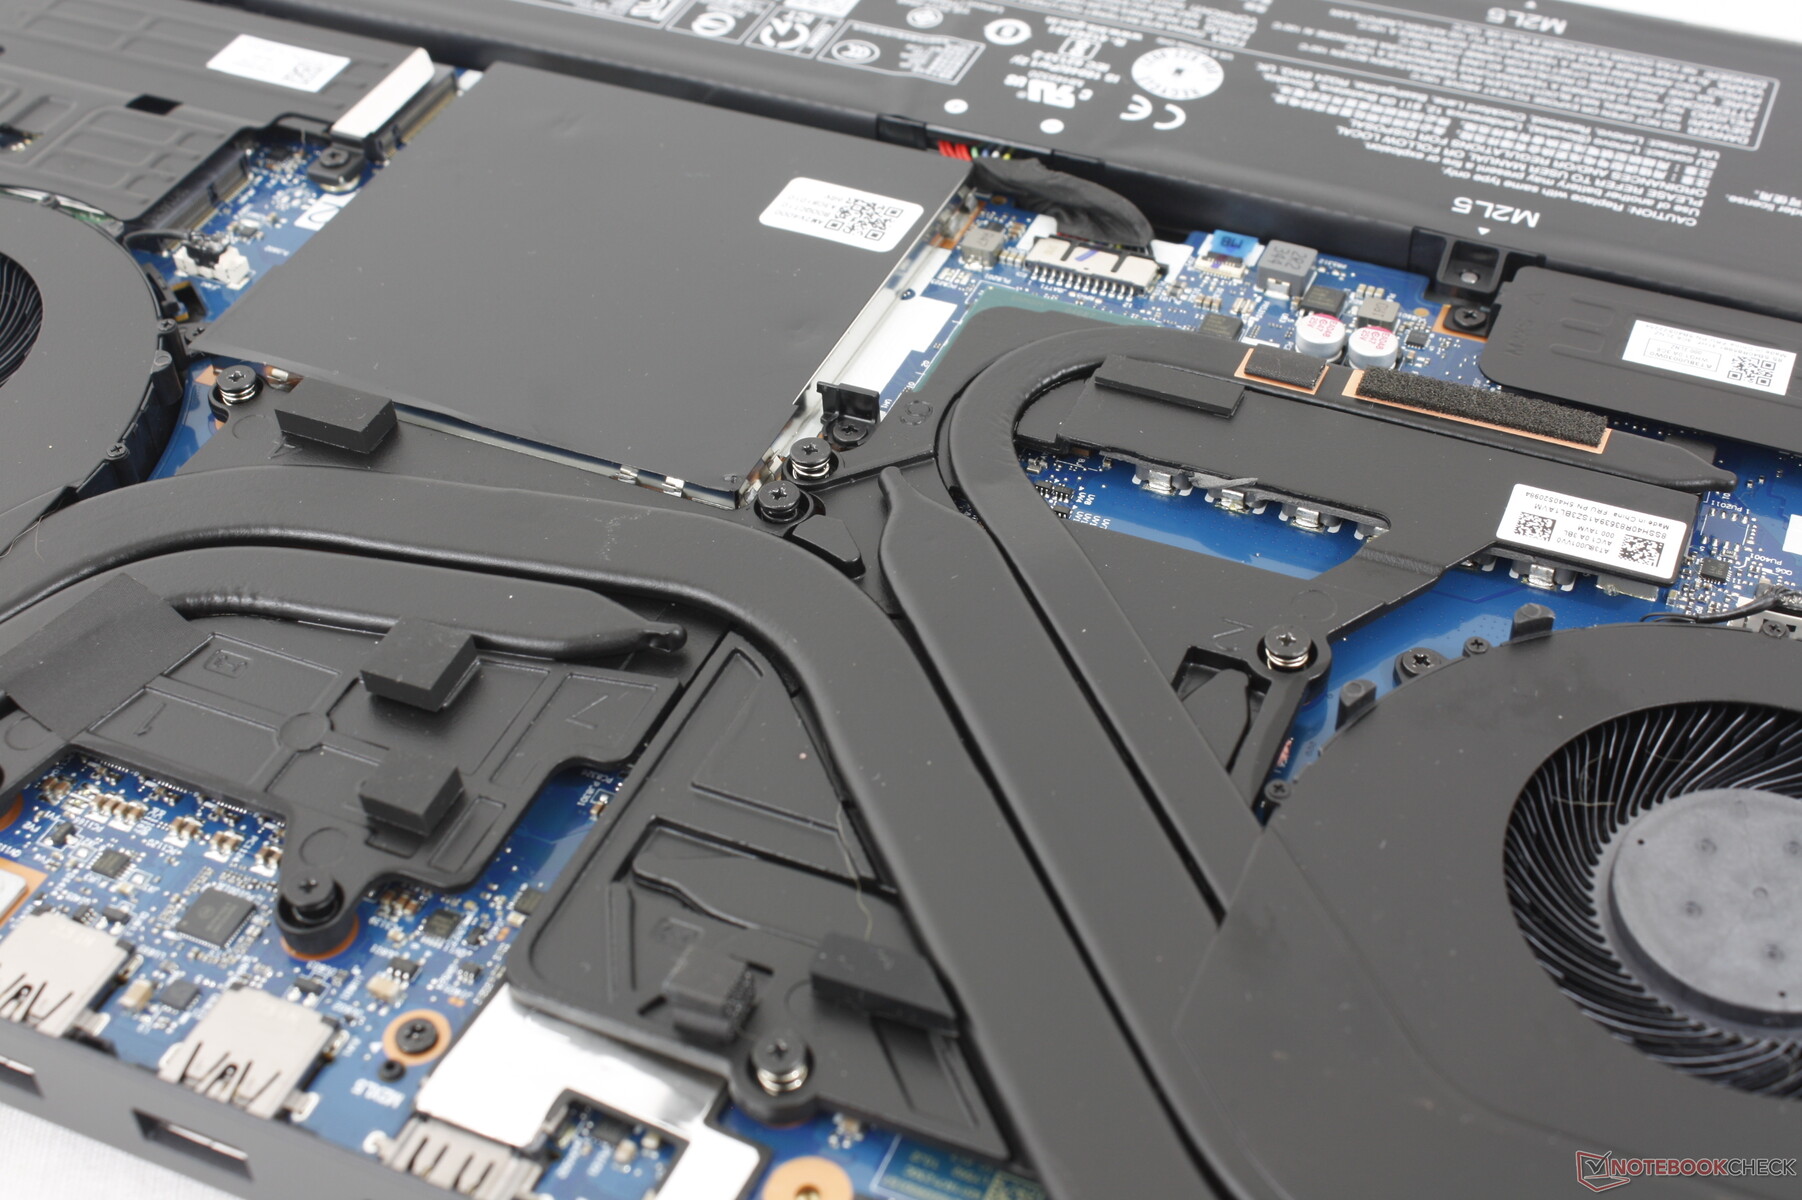
La placa base incorpora sólo pequeños cambios respecto al diseño del año pasado. La WLAN, la RAM y las dos ranuras SSD están protegidas bajo placas de aluminio adicionales. Curiosamente, la Legion Pro 5 16 utiliza menos tubos de calor de cobre, pero más gruesos, que el diseño de la Legion 5 16.
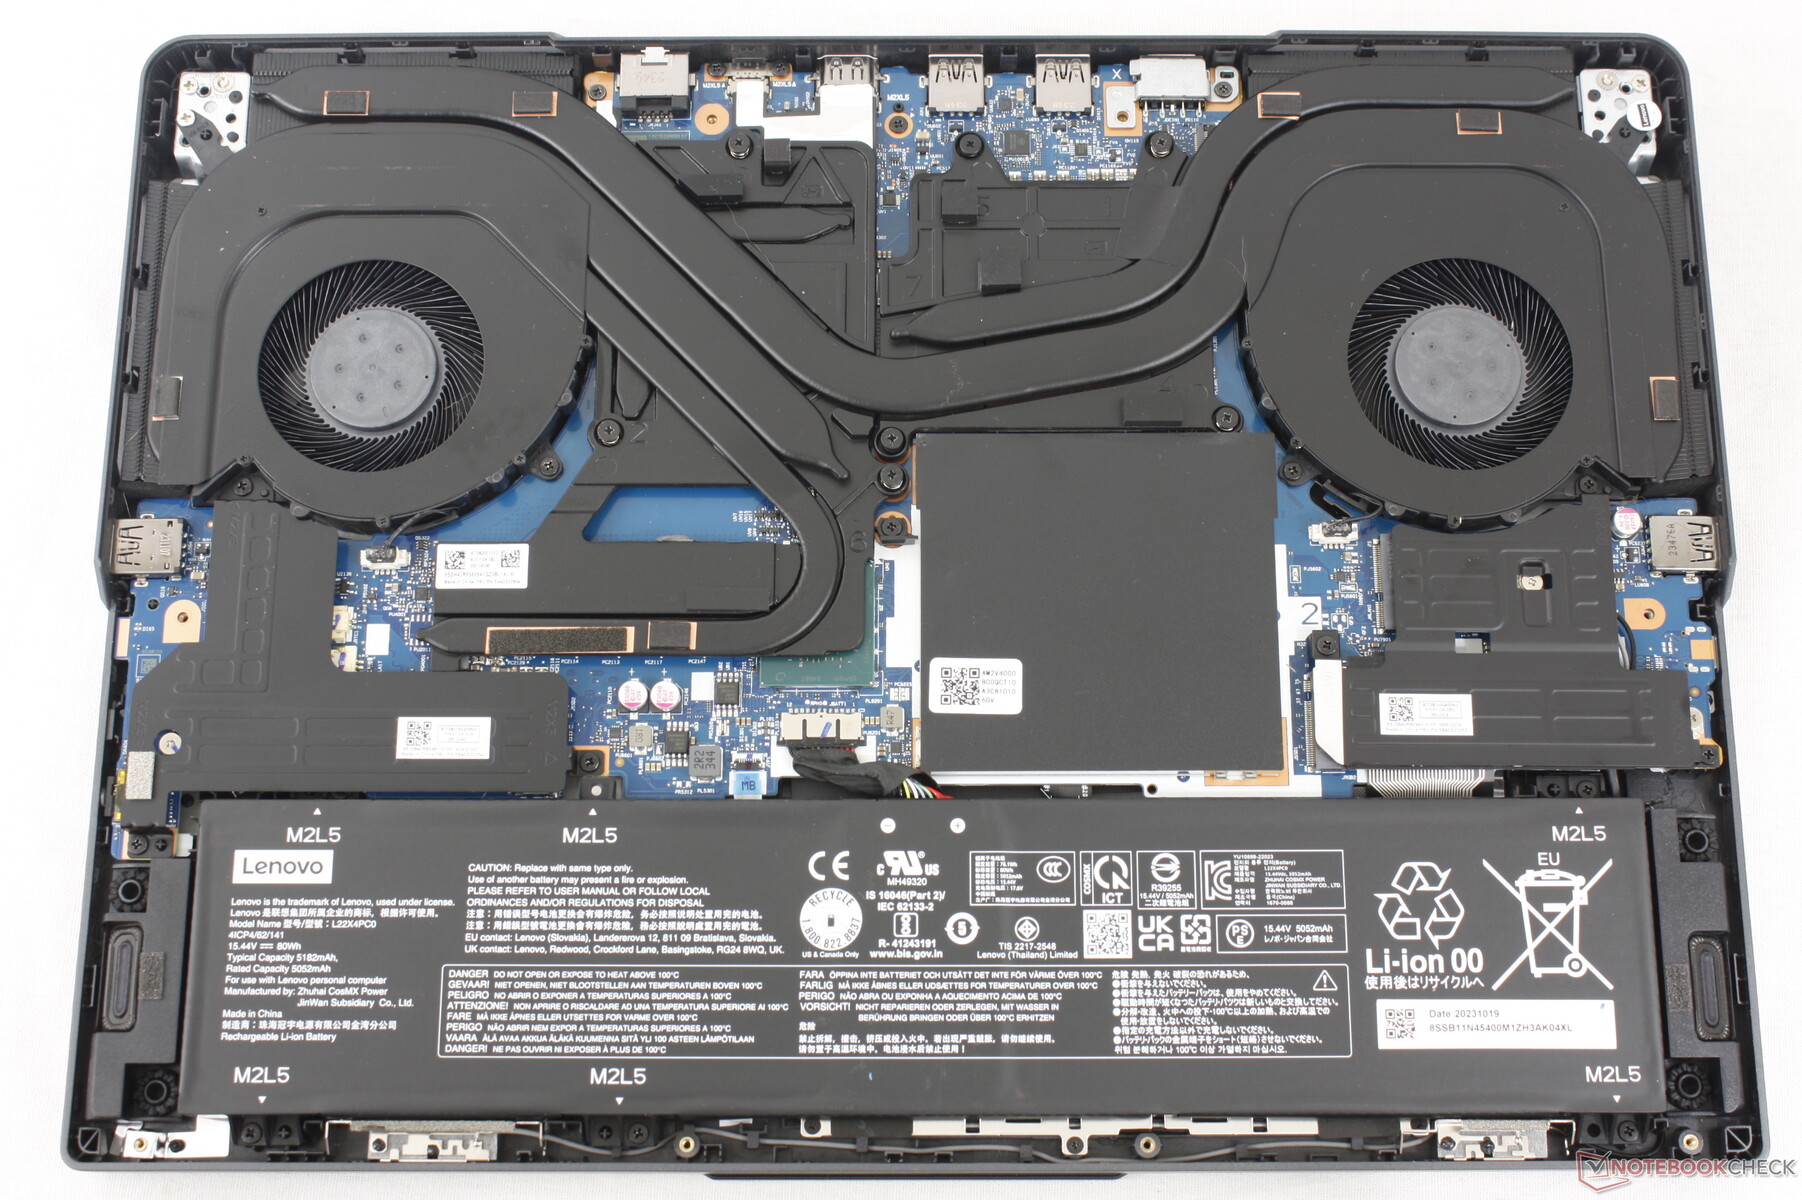
Accesorios y garantía
No hay más extras en la caja que el adaptador de CA y la documentación. Se aplica la habitual garantía limitada de un año del fabricante si se adquiere en EE.UU.
Dispositivos de entrada - Experiencia familiar Legion
Teclado
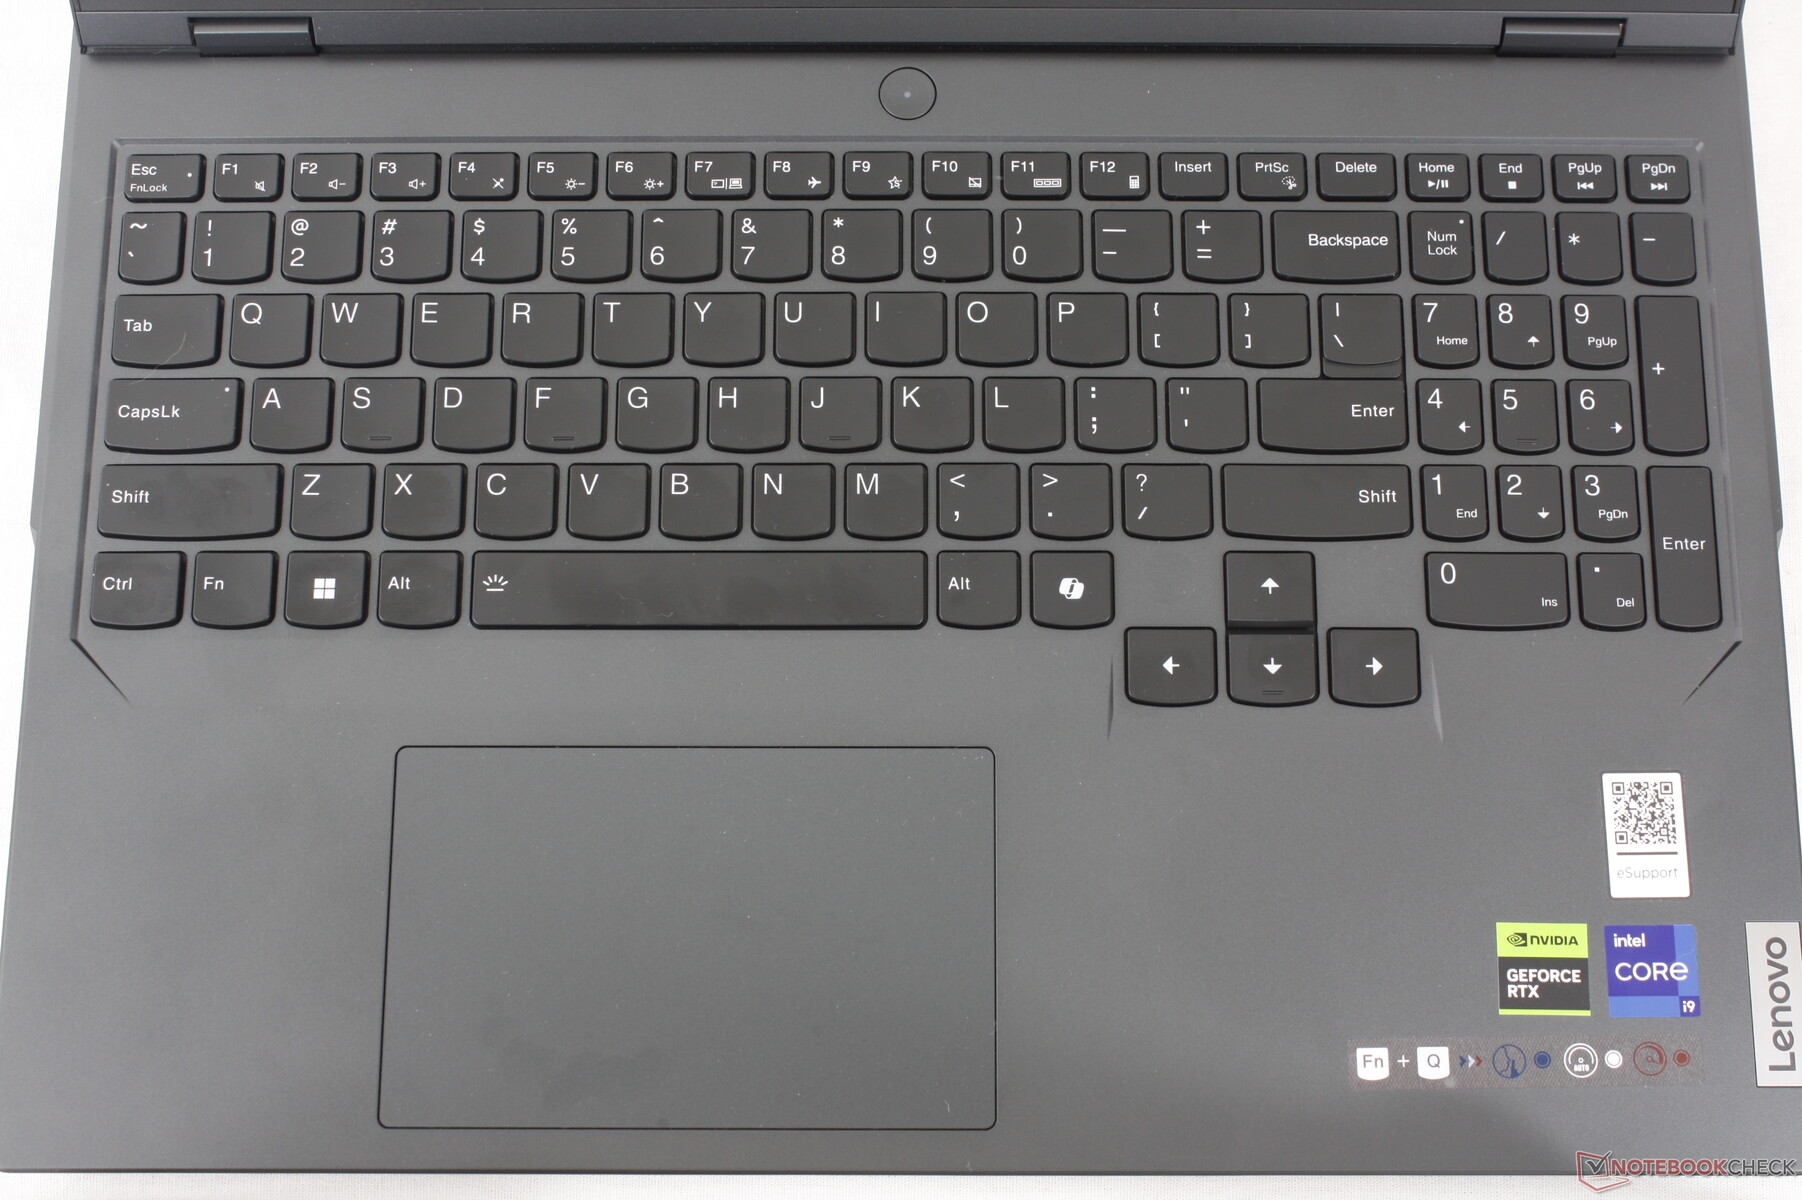
Al igual que en el reciente Yoga Slim 7 14 G9, el Legion Pro 5 16 G9 ha sustituido la segunda tecla Ctrl por una tecla Co-Pilot dedicada. Se espera que Microsoft lance este año una importante actualización para Windows que gire en torno a la IA, por lo que la nueva tecla es la forma que tiene Lenovo de preparar el portátil para el futuro.
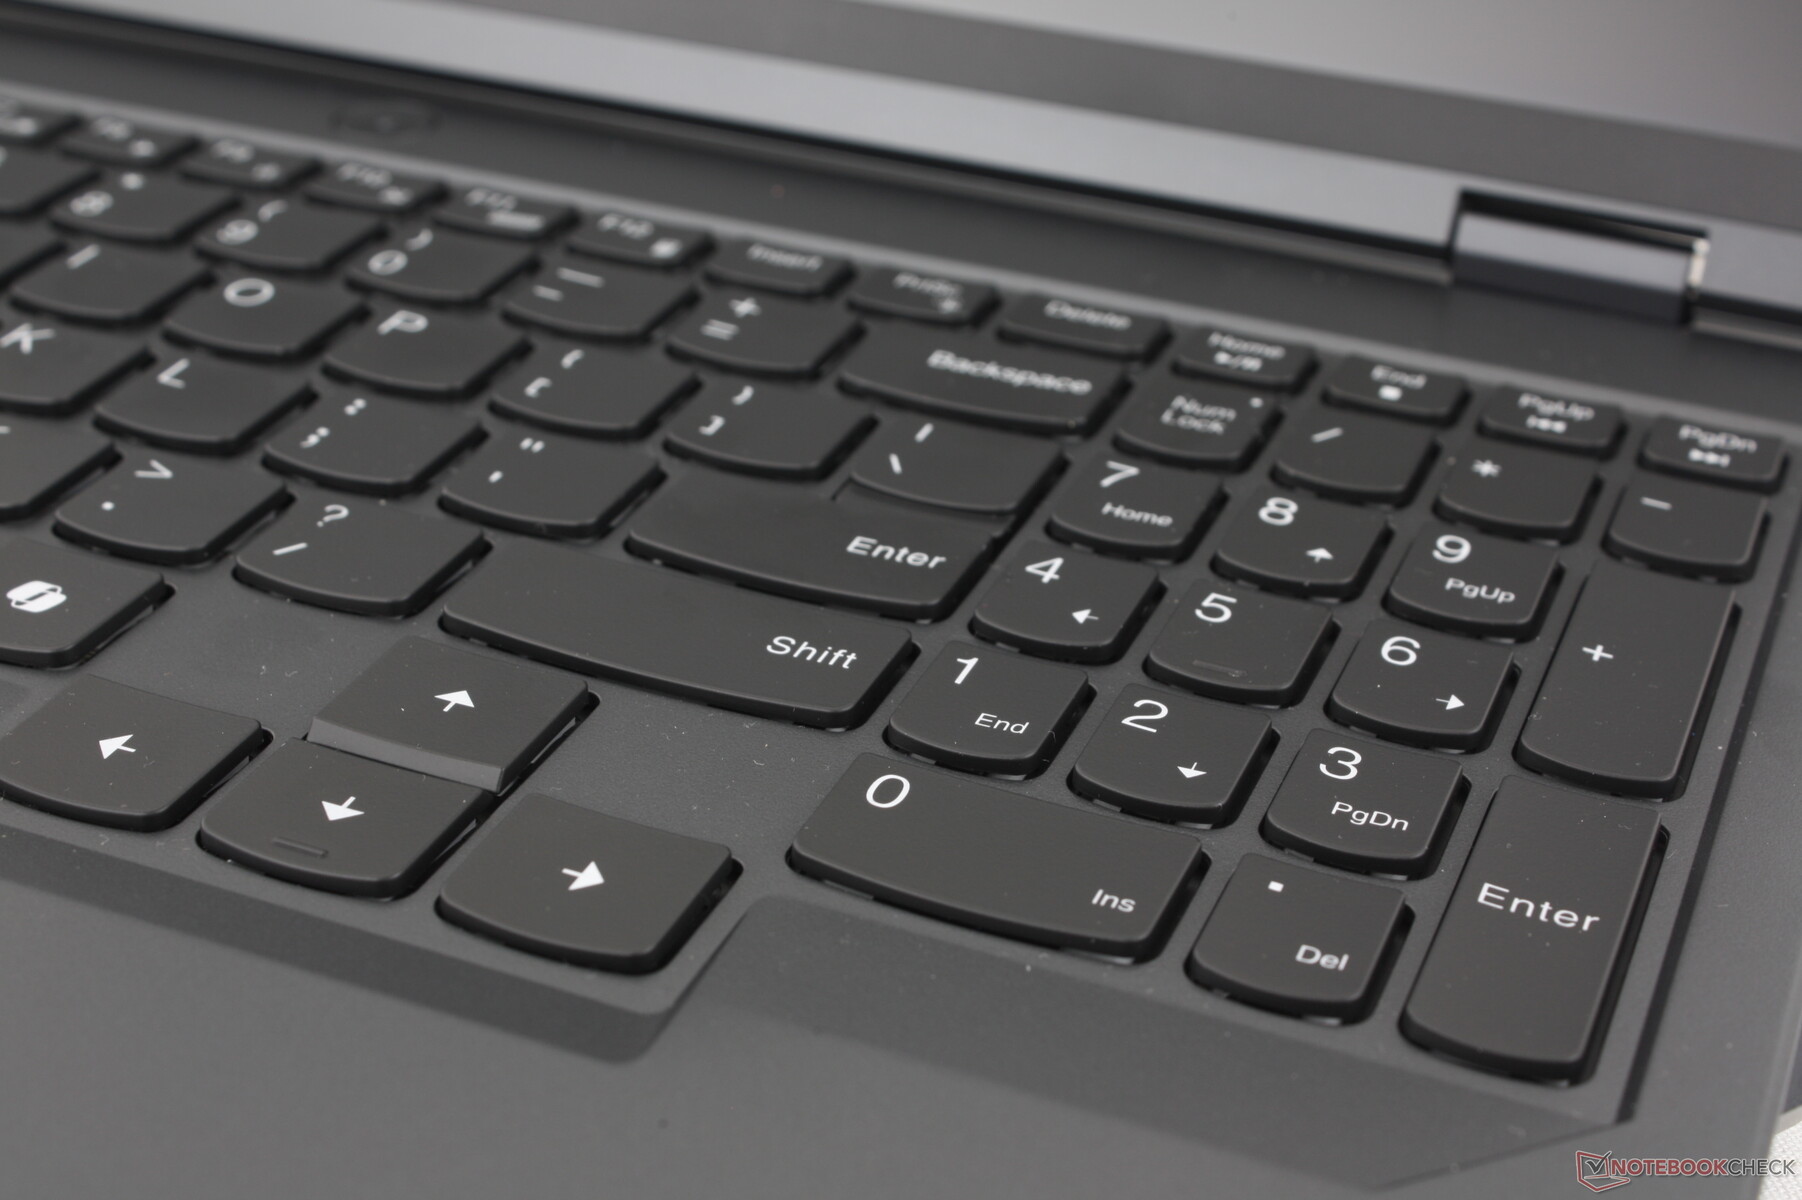
Por lo demás, la experiencia de escritura es la misma que en el Legion Pro 5 16 G8, ya que el tamaño de las teclas y los símbolos no han cambiado. Los modelos Legion siguen siendo uno de los pocos portátiles para juegos con teclado numérico y teclas de flecha de tamaño normal.
La retroiluminación del teclado puede configurarse con RGB de una o cuatro zonas. Para la iluminación RGB por tecla, los usuarios tendrán que considerar en su lugar la serie Legion Pro 7, más cara.
Panel táctil
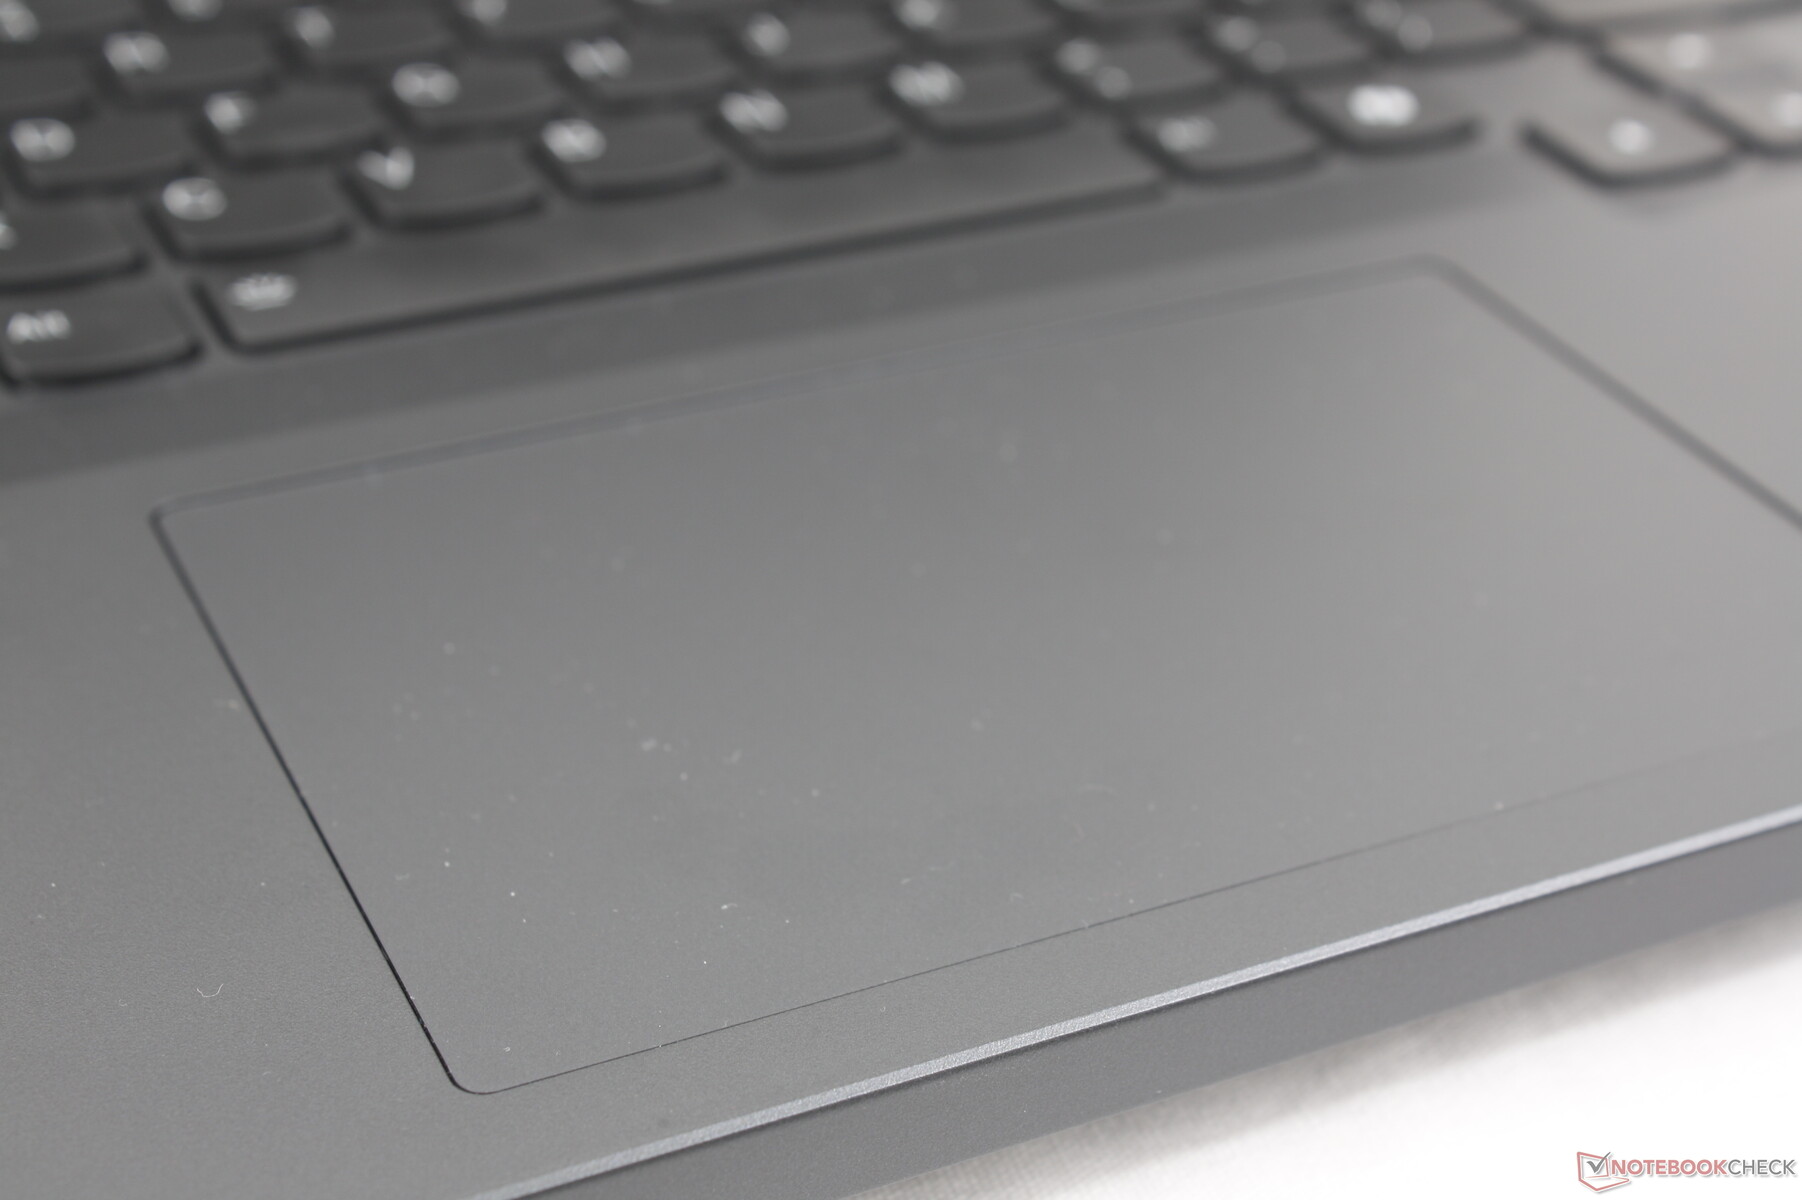
El clickpad Mylar es más pequeño que el del Razer Blade 16 (12 x 7,5 cm frente a 17 x 9,7 cm), pero sigue siendo lo suficientemente espacioso para tareas sencillas como navegar. El clic sigue siendo poco profundo y con una retroalimentación insuficiente para una sensación insatisfactoriamente esponjosa.

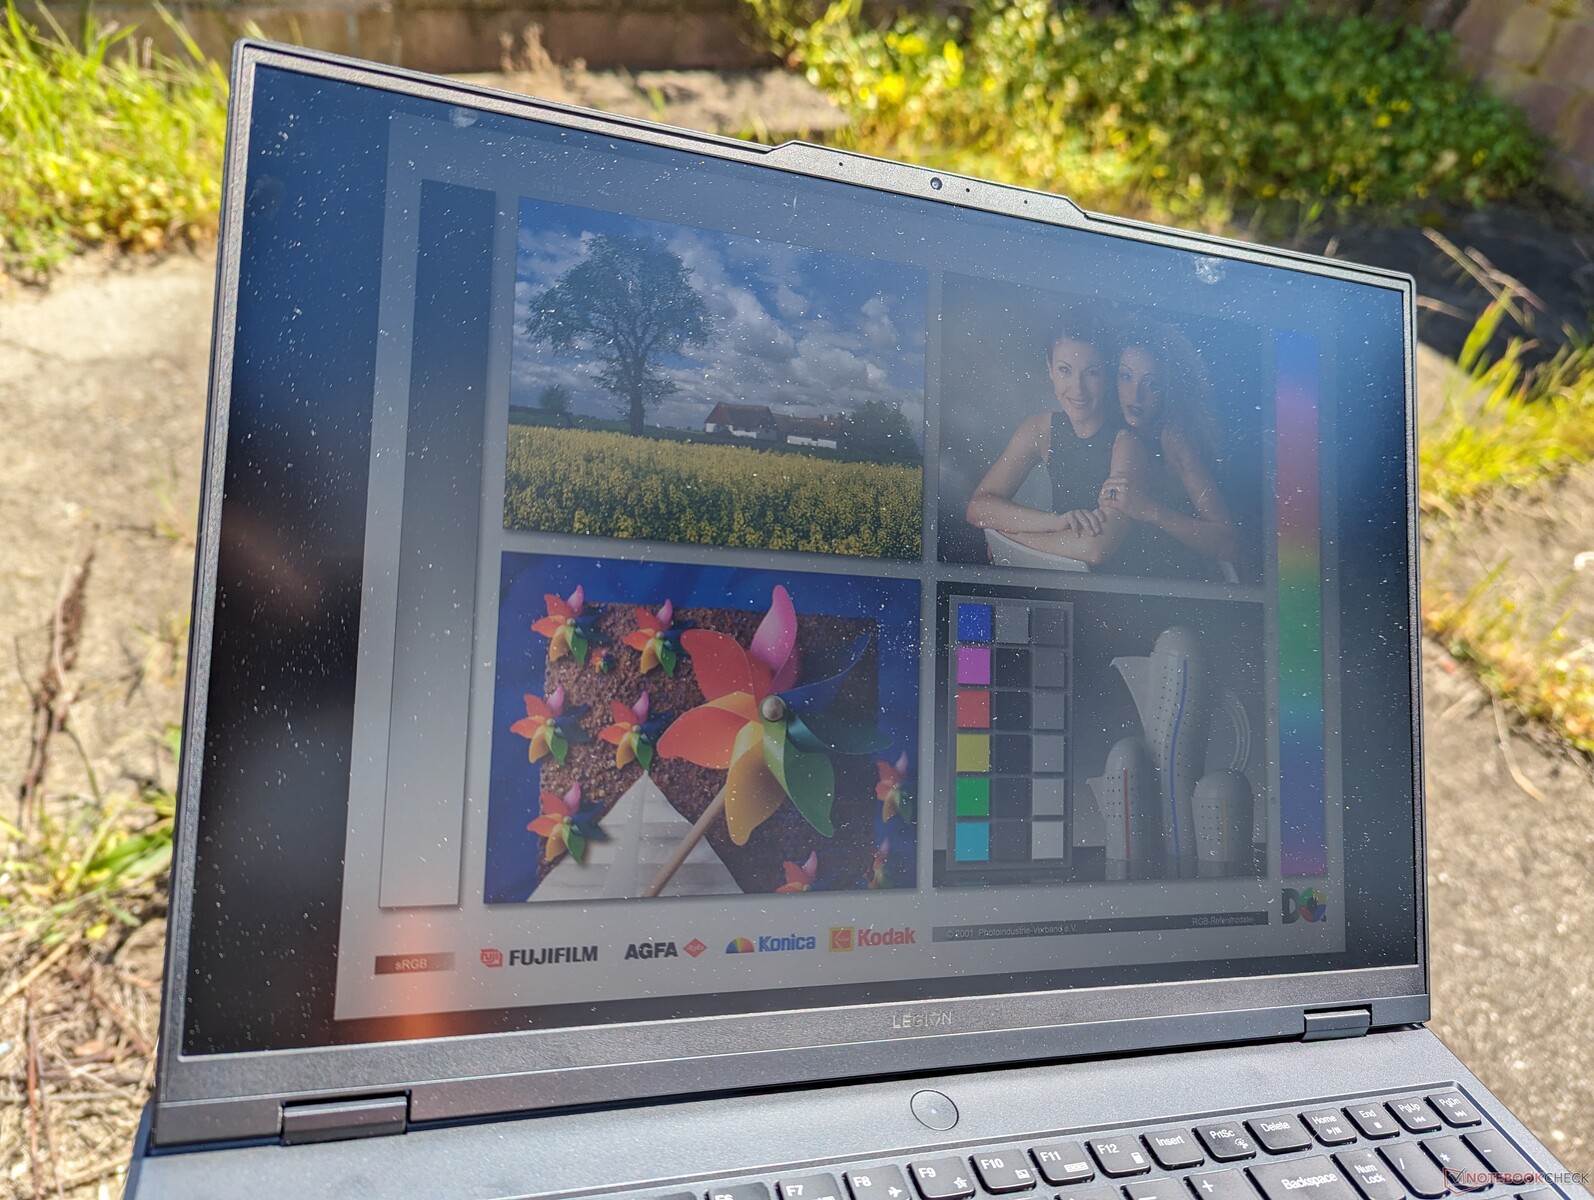
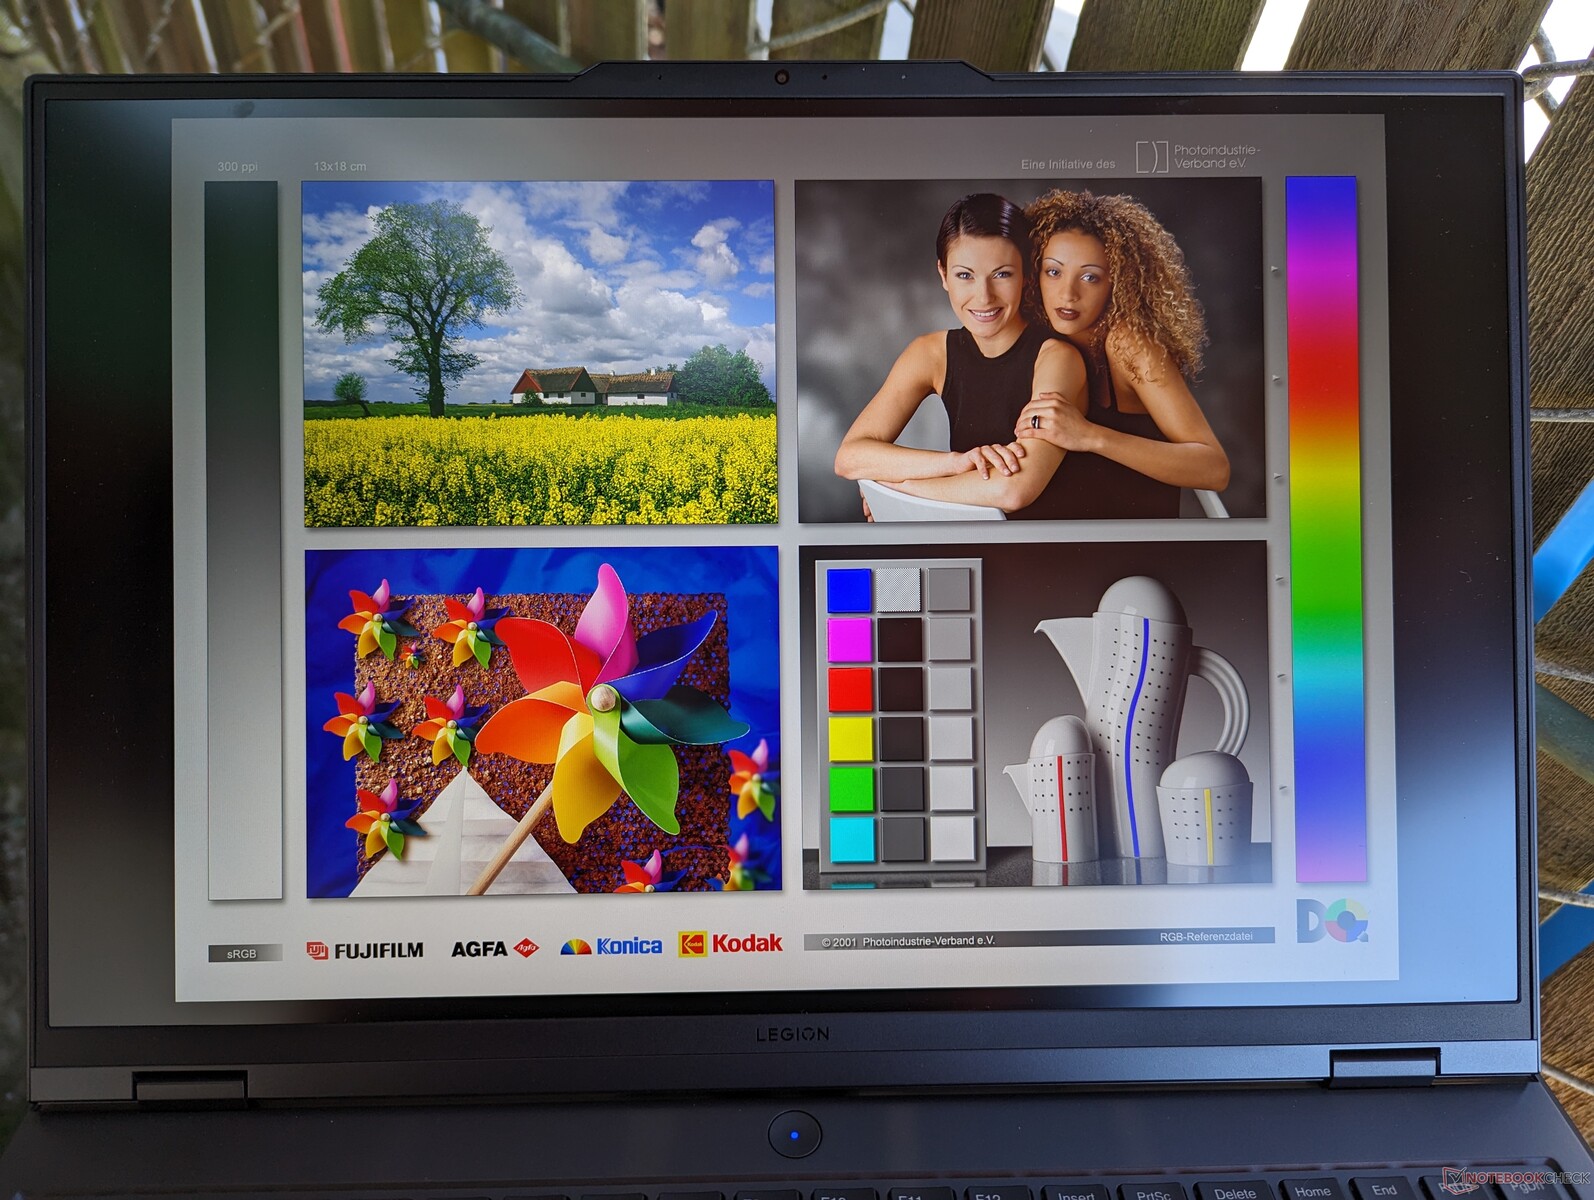
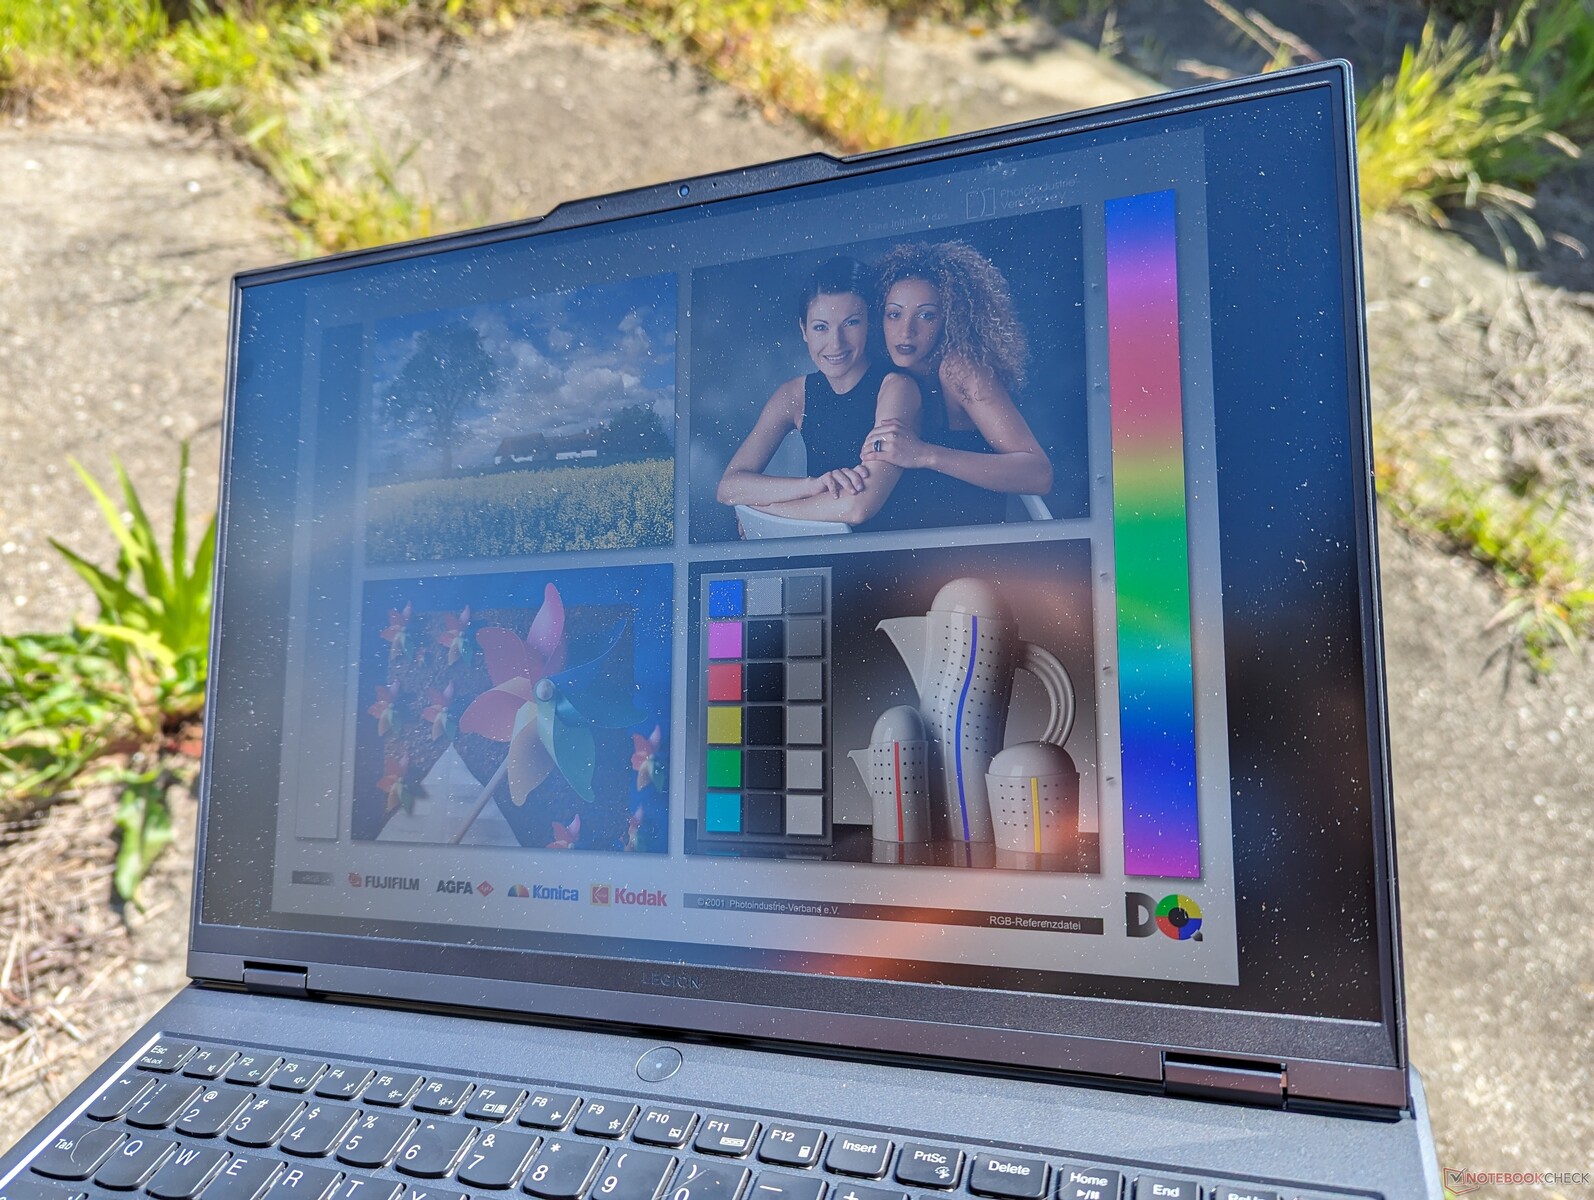
Pantalla - Full sRGB y Fast Refresh vienen de serie
Ahora hay disponibles tres opciones de pantalla, mientras que el modelo del año pasado estaba limitado a sólo dos. Todas son IPS mate compatibles con Advanced Optimus, pero sólo dos admiten HDR. Nuestra unidad de prueba viene con el panel resaltado a continuación.
- 2560 x 1600, 300 nits, 100% sRGB, 165 Hz
- 2560 x 1600, 500 nits, 100% DCI-P3, 240 Hz, HDR400
- 2560 x 1600, 500 nits, 100% sRGB, 240 Hz, HDR400
Curiosamente, nuestra unidad de pruebas utiliza el BOE NE160QDM-NYC mientras que el modelo del año pasado venía con el AU Optronics B160QAN03.1. Por lo demás, ambos ofrecen la misma frecuencia de actualización de 165 Hz, rápidos tiempos de respuesta en blanco y negro y colores sRGB completos para una experiencia visual similar. Aunque sigue siendo un panel excelente para los juegos y la edición ocasional, carece de compatibilidad con la frecuencia de actualización variable de Windows, que es una característica nueva en algunos otros portátiles como el Framework Laptop 16. Además, el HDR en paneles IPS no es tan impresionante como el HDR en OLED o mini-LED debido a sus niveles de negro más profundos y blancos más brillantes. En su lugar, los usuarios tendrán que actualizarse a la serie Legion Pro 9 más cara para obtener estas características de pantalla de gama más alta.


| |||||||||||||||||||||||||
iluminación: 91 %
Brillo con batería: 384 cd/m²
Contraste: 1097:1 (Negro: 0.35 cd/m²)
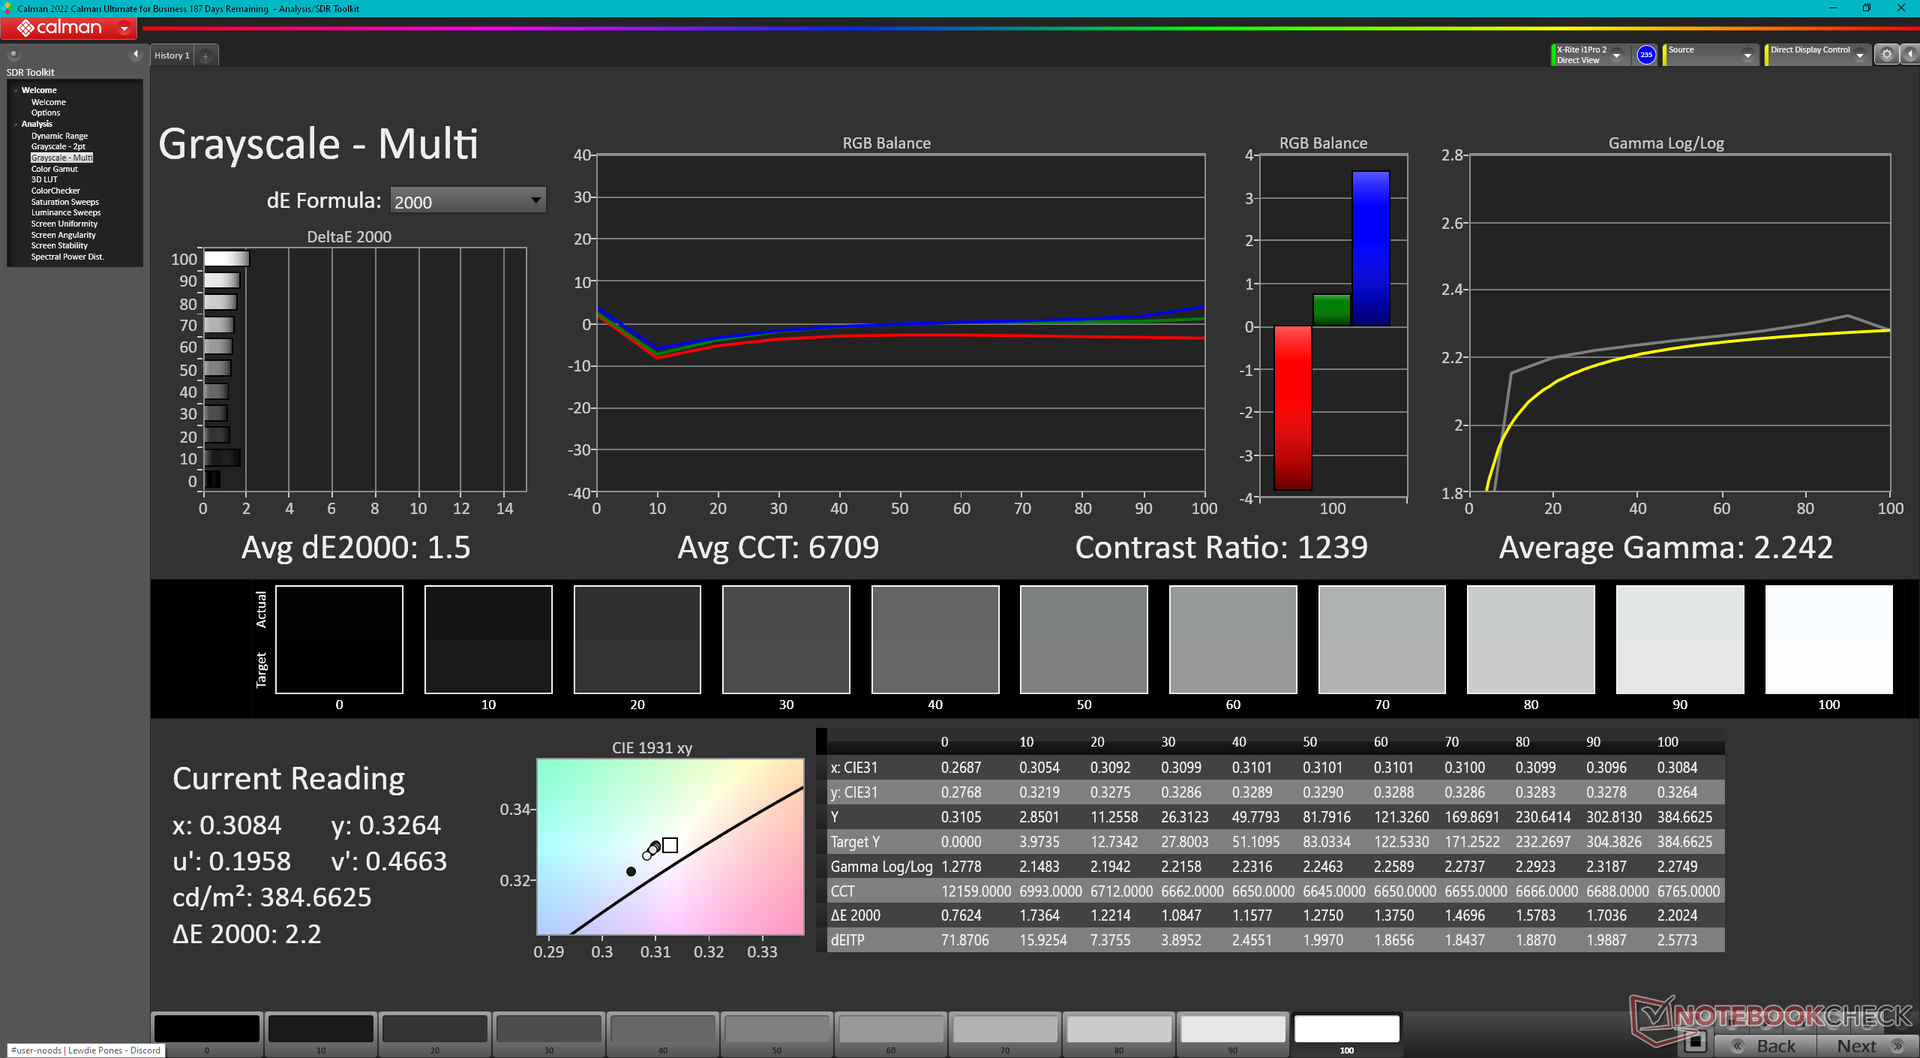
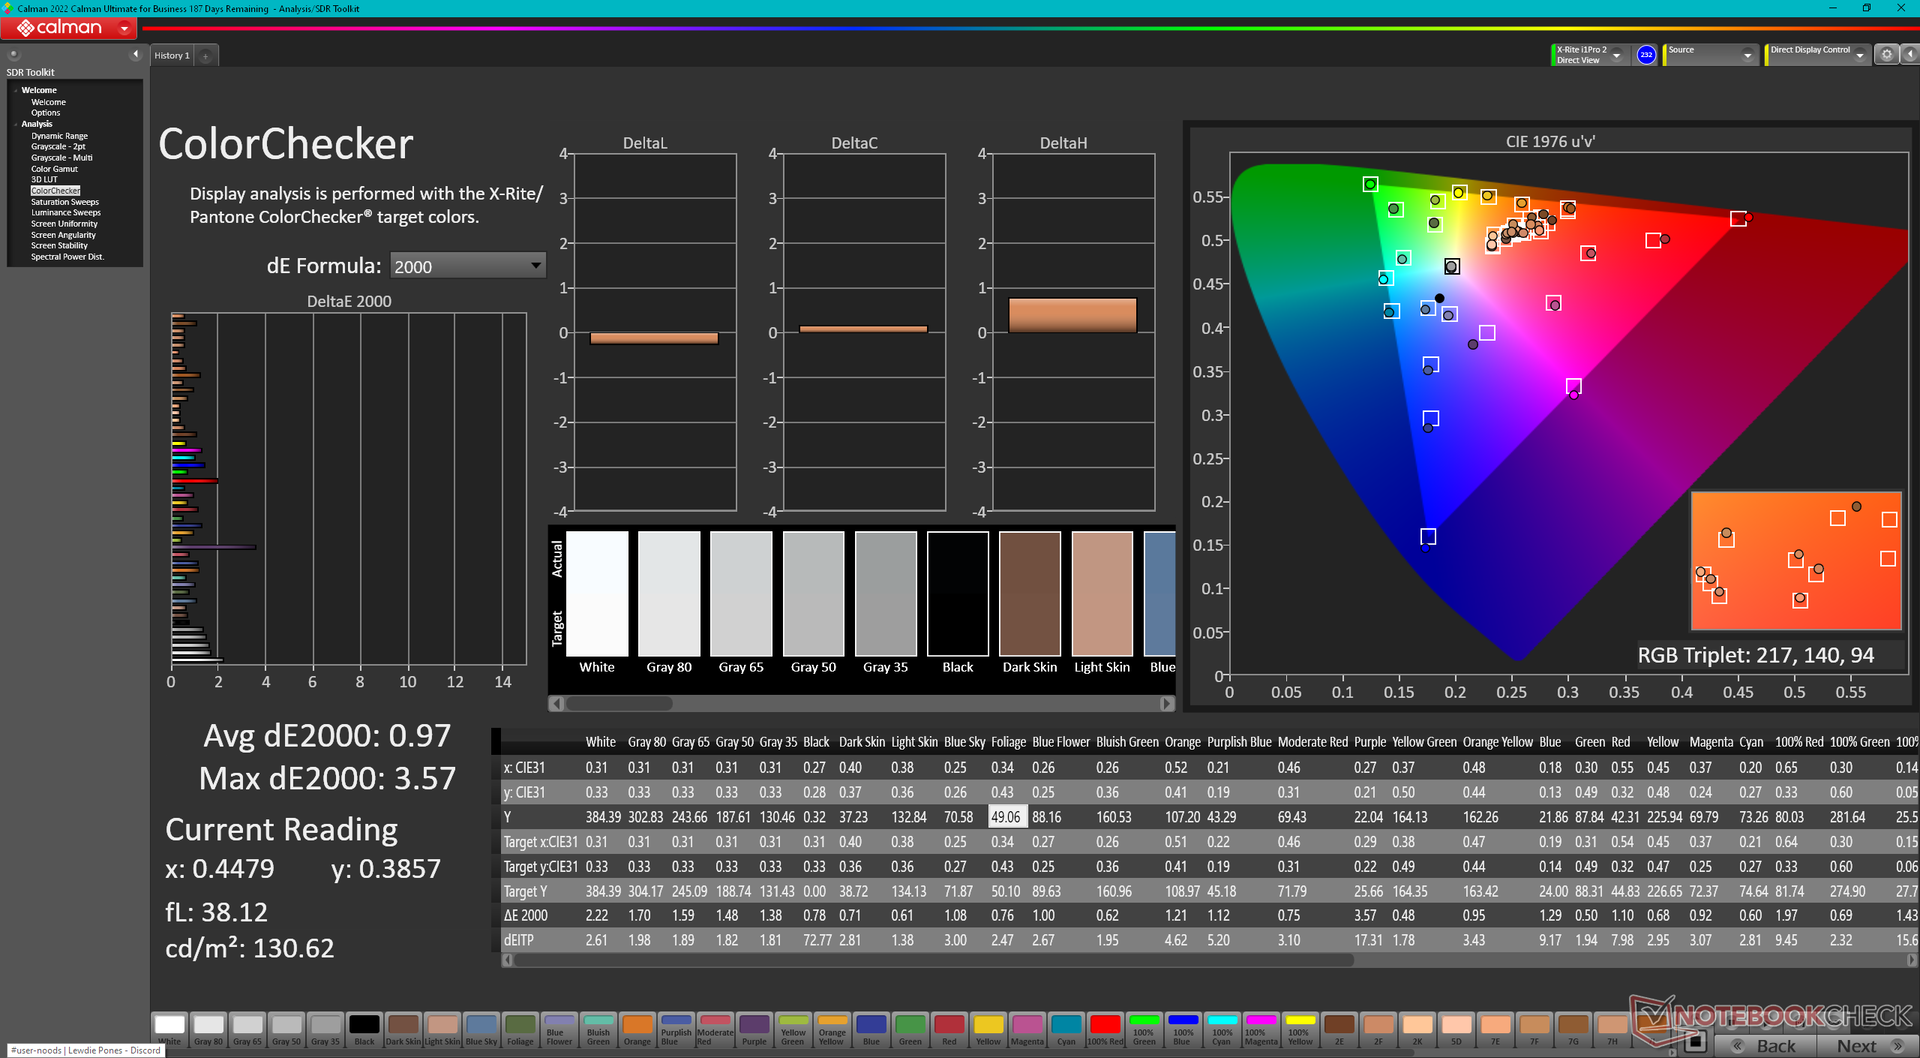
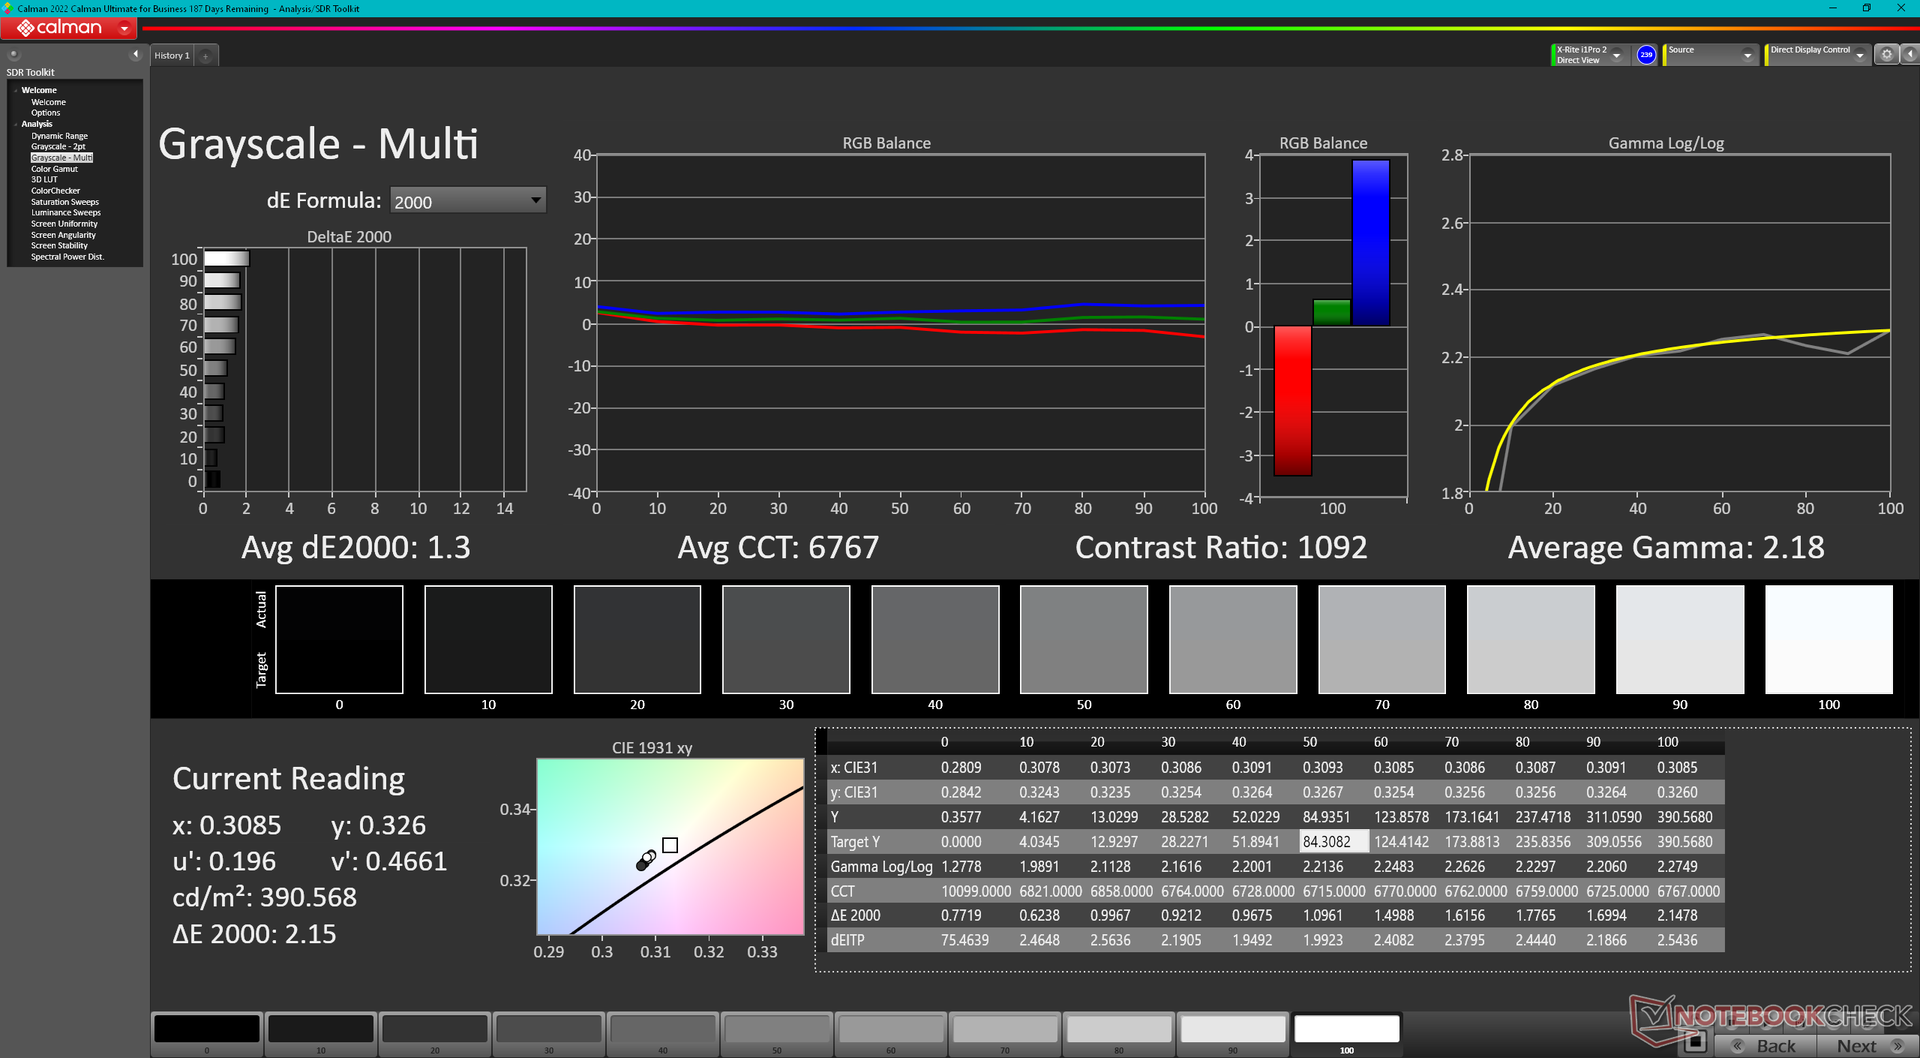
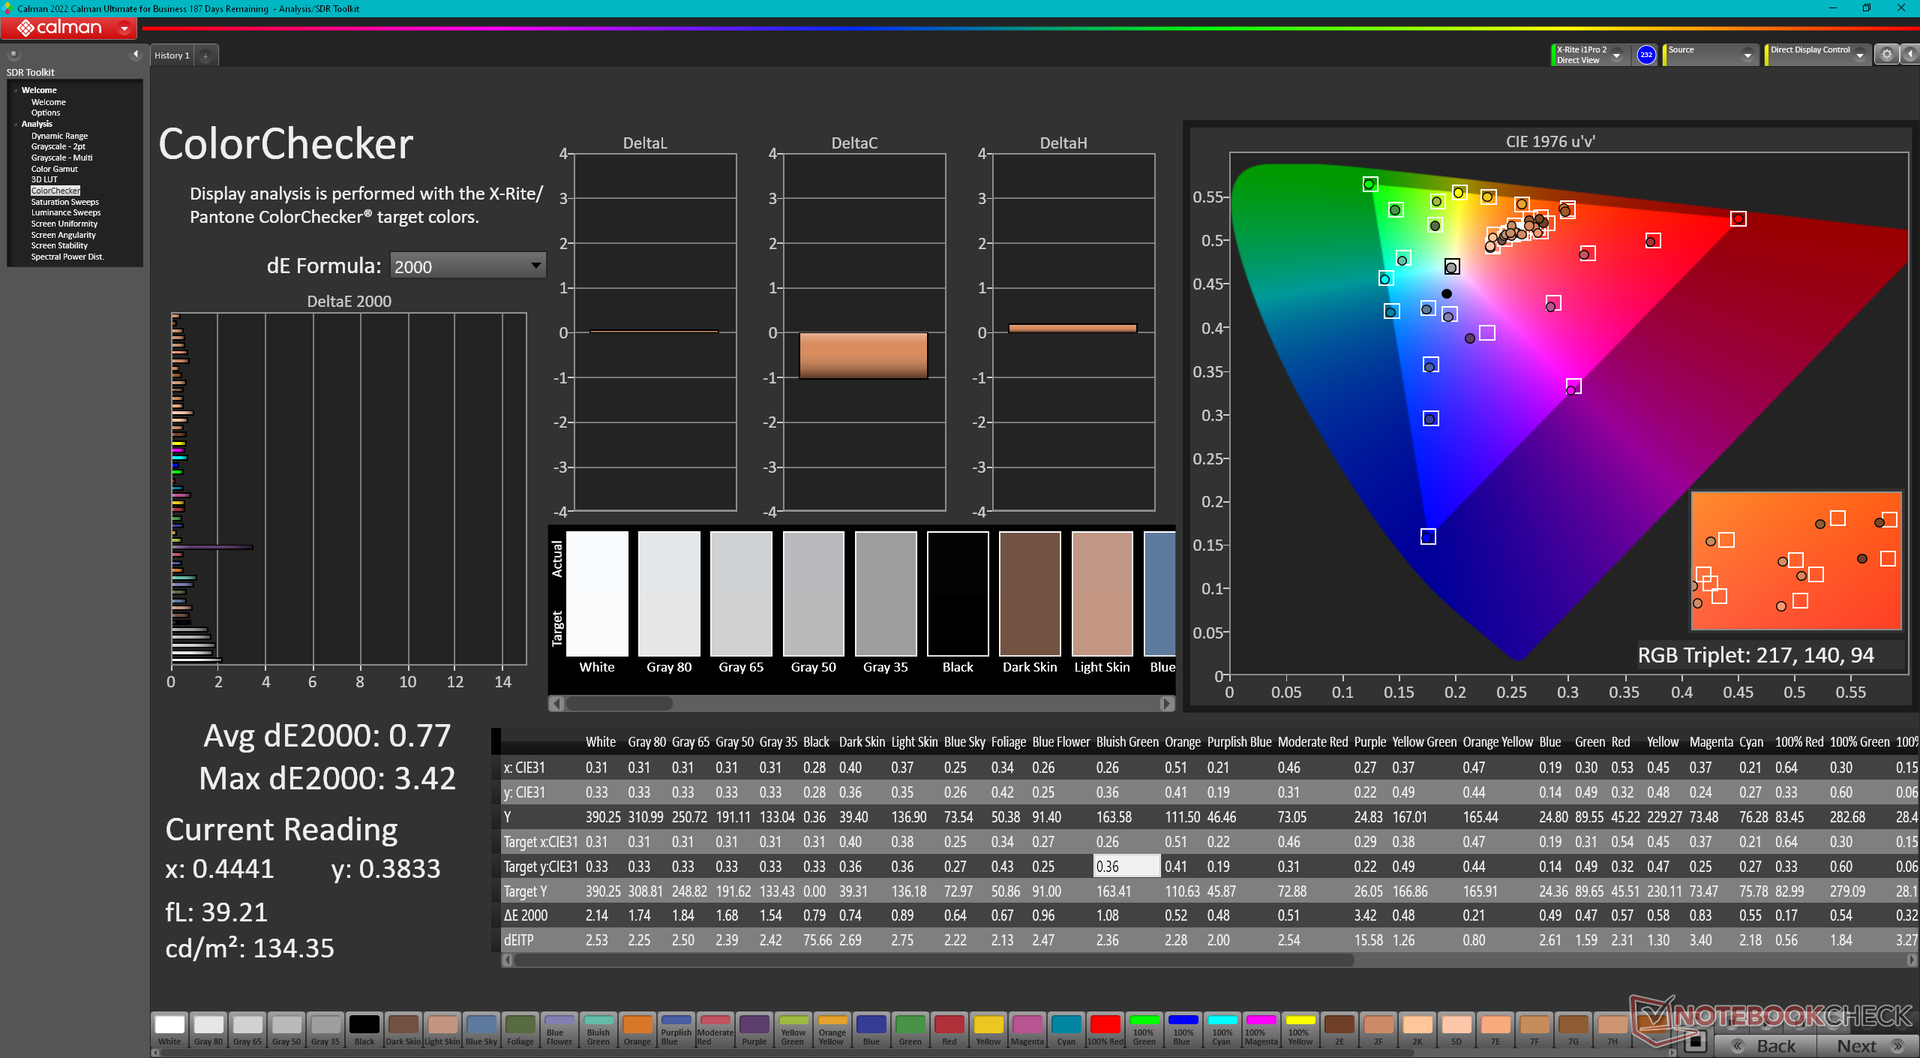
ΔE ColorChecker Calman: 0.97 | ∀{0.5-29.43 Ø4.71}
calibrated: 0.77
ΔE Greyscale Calman: 1.5 | ∀{0.09-98 Ø4.96}
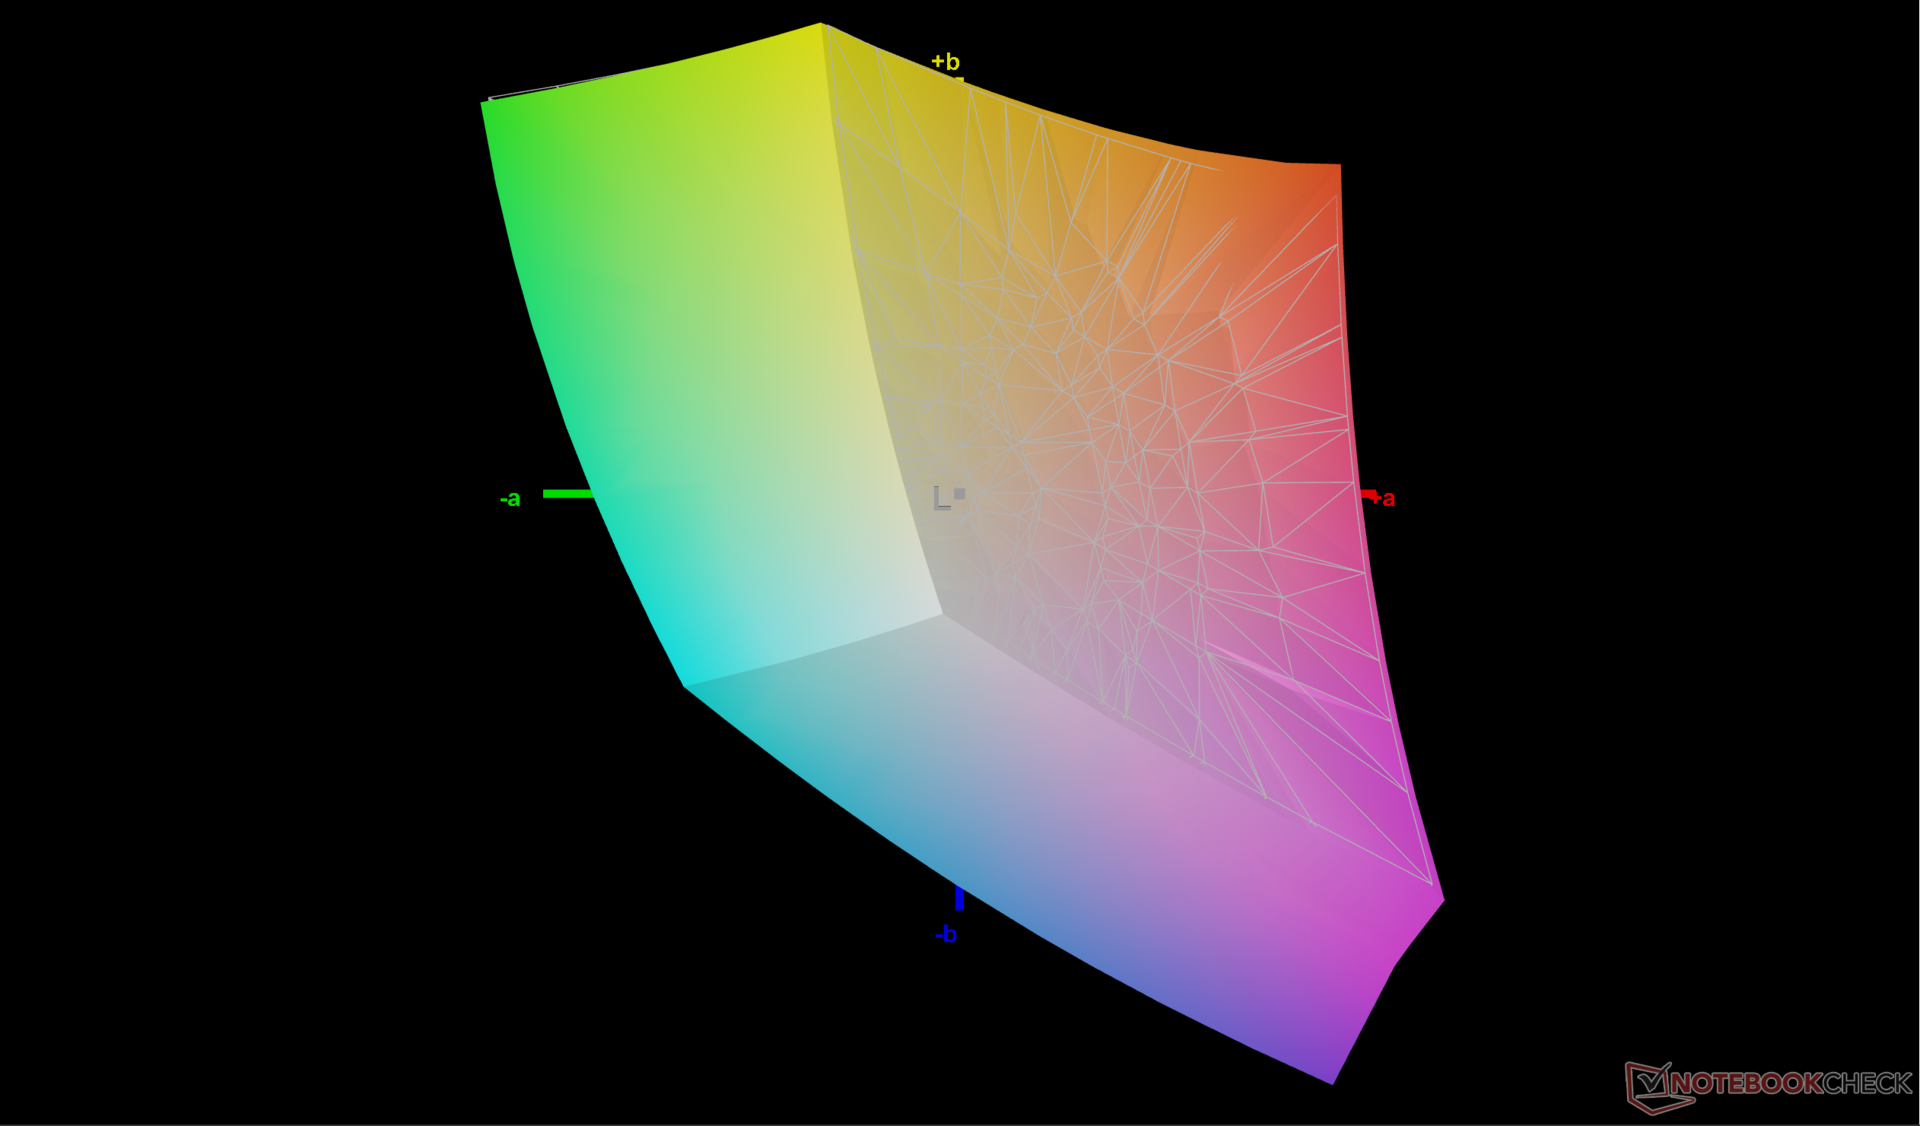
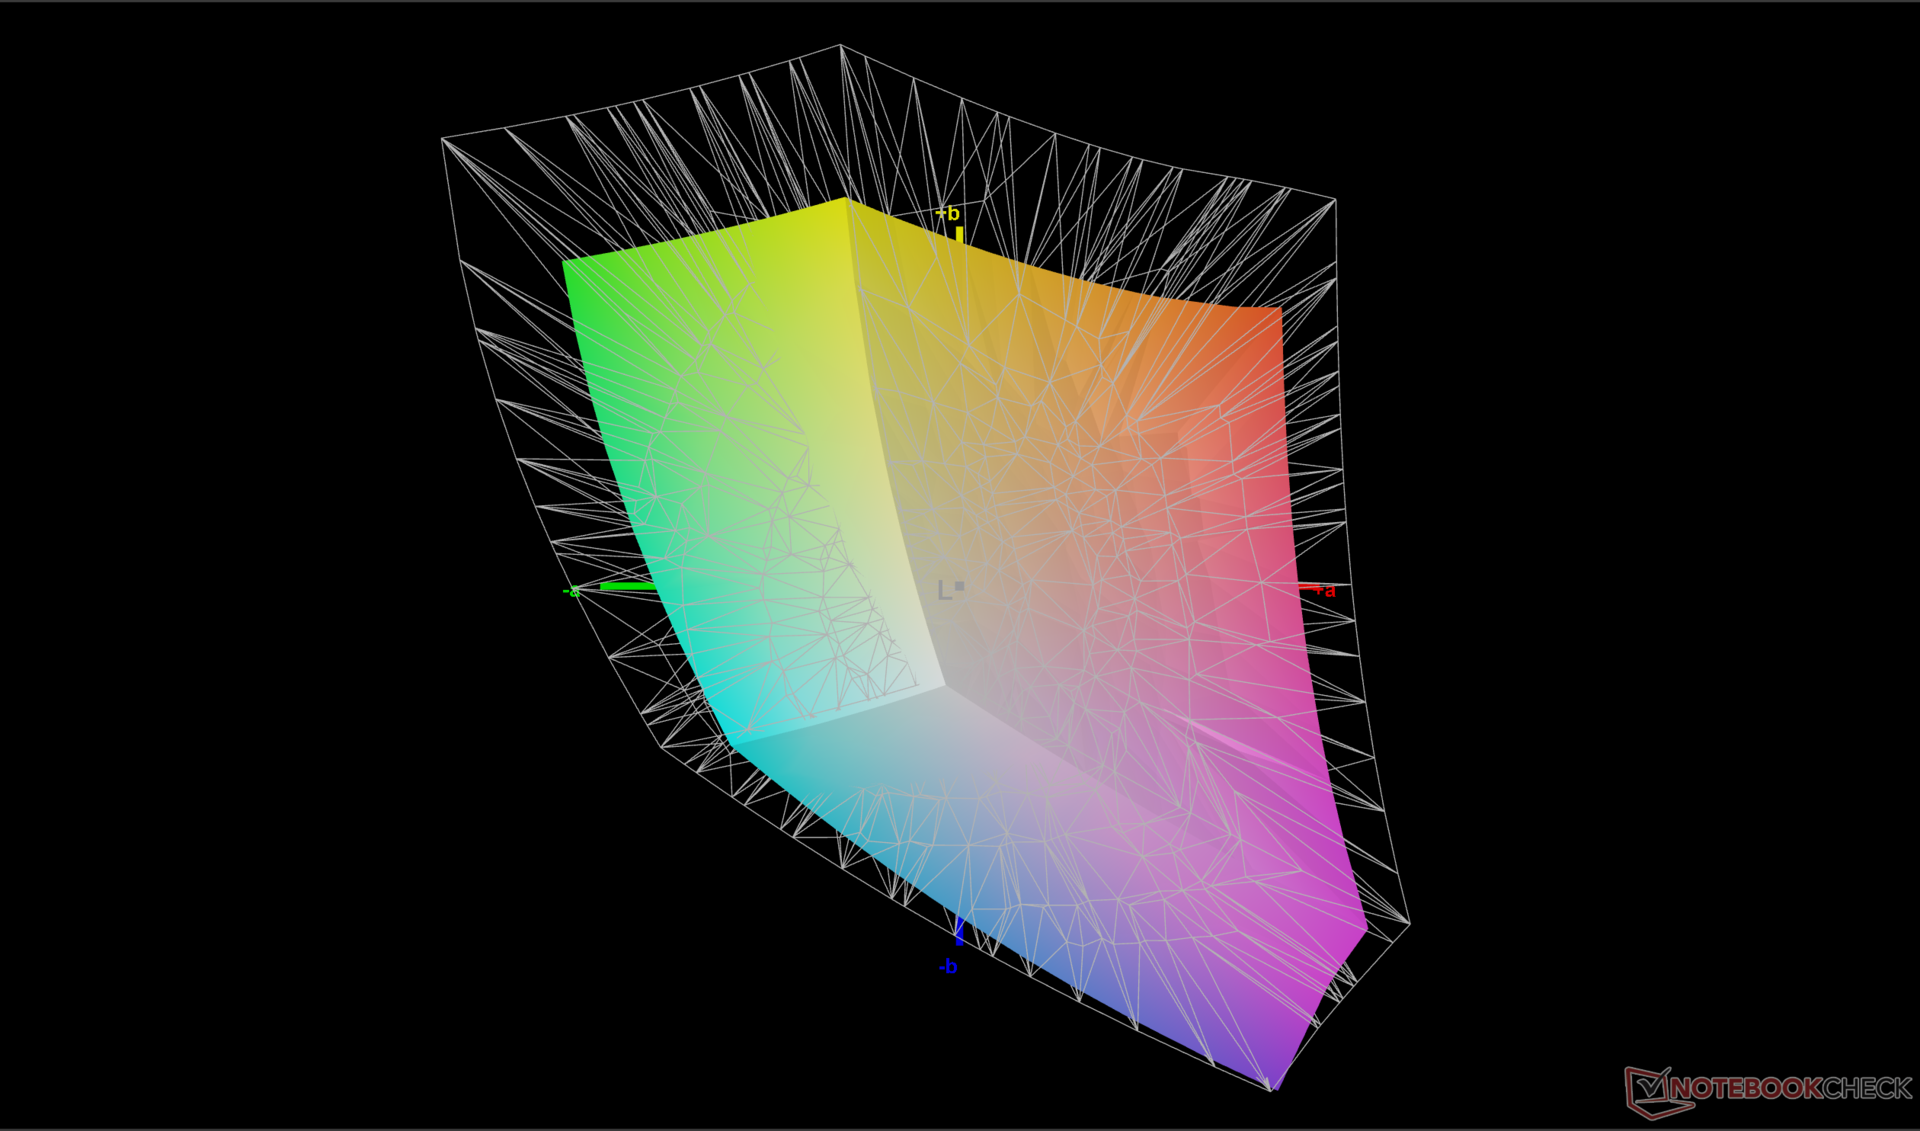
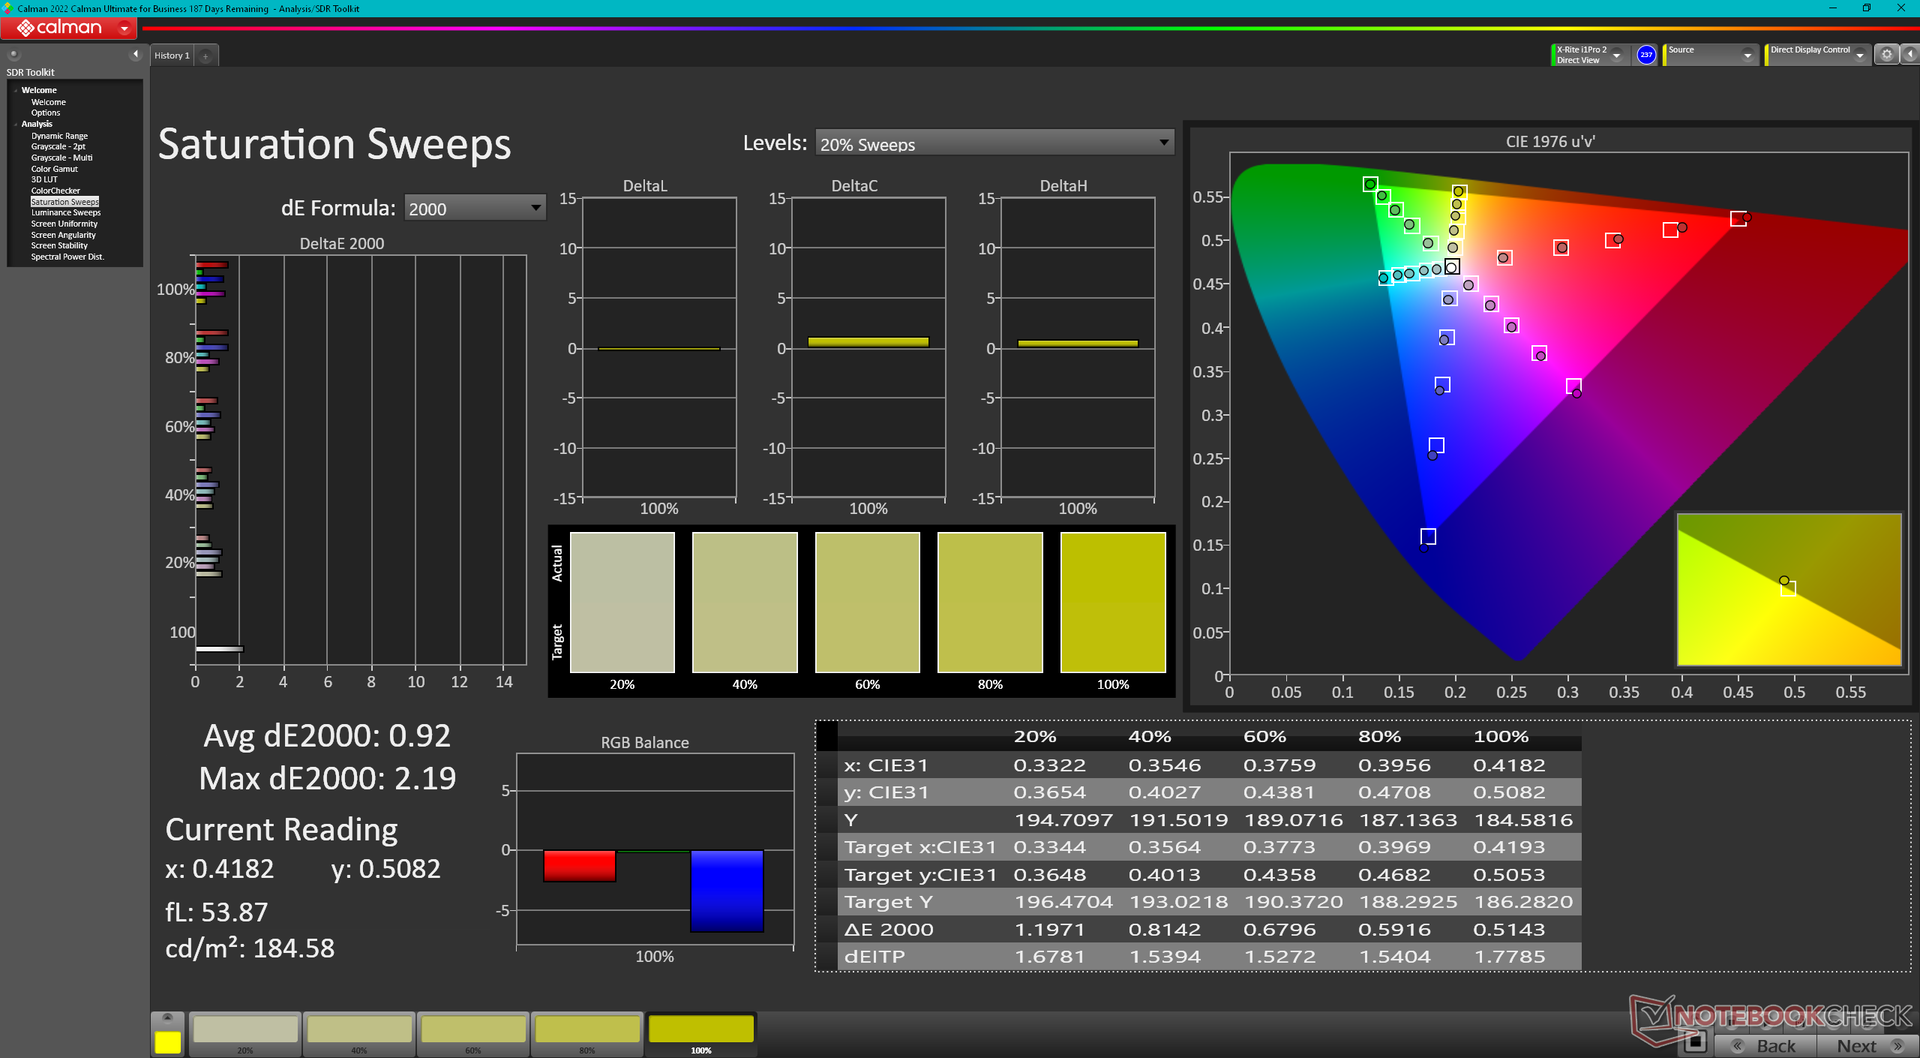
70.1% AdobeRGB 1998 (Argyll 3D)
99.4% sRGB (Argyll 3D)
69.3% Display P3 (Argyll 3D)
Gamma: 2.24
CCT: 6709 K
| Lenovo Legion Pro 5 16IRX9 BOE NE160QDM-NYC, IPS, 2560x1600, 16" | Lenovo Legion Pro 5 16IRX8 AU Optronics B160QAN03.1, IPS, 2560x1600, 16" | Alienware m16 R2 BOE NE16NYH, IPS, 2560x1600, 16" | HP Omen Transcend 16-u1095ng ATNA60DL02-0 (SDC41A4), OLED, 2560x1600, 16" | Asus ROG Zephyrus G16 2024 GU605M ATNA60DL01-0, OLED, 2560x1600, 16" | MSI Stealth 16 Mercedes-AMG Motorsport A13VG ATNA60YV09-0 (SDC4191), OLED, 3840x2400, 16" | |
|---|---|---|---|---|---|---|
| Display | 2% | 2% | 28% | 28% | 23% | |
| Display P3 Coverage (%) | 69.3 | 71.2 3% | 71 2% | 99.8 44% | 99.9 44% | 99.2 43% |
| sRGB Coverage (%) | 99.4 | 98.8 -1% | 100 1% | 100 1% | 100 1% | 99.9 1% |
| AdobeRGB 1998 Coverage (%) | 70.1 | 73.3 5% | 71.4 2% | 97 38% | 96.9 38% | 88.4 26% |
| Response Times | -20% | 27% | 98% | 98% | 87% | |
| Response Time Grey 50% / Grey 80% * (ms) | 11.9 ? | 14.5 ? -22% | 5.7 ? 52% | 0.2 ? 98% | 0.22 ? 98% | 1.5 ? 87% |
| Response Time Black / White * (ms) | 8.9 ? | 10.4 ? -17% | 8.7 ? 2% | 0.2 ? 98% | 0.25 ? 97% | 1.2 ? 87% |
| PWM Frequency (Hz) | 120 ? | 960 ? | 60 ? | |||
| Screen | -5% | -14% | 136% | -13% | 5% | |
| Brightness middle (cd/m²) | 384 | 405.7 6% | 345.8 -10% | 390 2% | 416 8% | 382 -1% |
| Brightness (cd/m²) | 366 | 368 1% | 337 -8% | 392 7% | 418 14% | 383 5% |
| Brightness Distribution (%) | 91 | 87 -4% | 87 -4% | 98 8% | 96 5% | 96 5% |
| Black Level * (cd/m²) | 0.35 | 0.38 -9% | 0.3 14% | 0.02 94% | ||
| Contrast (:1) | 1097 | 1068 -3% | 1153 5% | 19500 1678% | ||
| Colorchecker dE 2000 * | 0.97 | 1.65 -70% | 1.99 -105% | 1.94 -100% | 1.6 -65% | 0.84 13% |
| Colorchecker dE 2000 max. * | 3.57 | 4.2 -18% | 3.52 1% | 4.26 -19% | 2.1 41% | 3.39 5% |
| Colorchecker dE 2000 calibrated * | 0.77 | 0.53 31% | 0.62 19% | 4.21 -447% | 0.8 -4% | |
| Greyscale dE 2000 * | 1.5 | 1.2 20% | 2.1 -40% | 1.5 -0% | 2.7 -80% | 1.3 13% |
| Gamma | 2.24 98% | 2.3 96% | 2.32 95% | 2.221 99% | 2.16 102% | 2.166 102% |
| CCT | 6709 97% | 6453 101% | 6369 102% | 6395 102% | 6331 103% | 6550 99% |
| Media total (Programa/Opciones) | -8% /
-6% | 5% /
-5% | 87% /
107% | 38% /
18% | 38% /
23% |
* ... más pequeño es mejor
La pantalla viene precalibrada de fábrica con unos valores medios de escala de grises y deltaE de color de sólo 1,5 y 0,97, respectivamente, lo que resulta sorprendente de ver en un portátil para juegos de gama media. Por tanto, para la mayoría de los usuarios no es necesaria una calibración final.

Tiempos de respuesta del display
| ↔ Tiempo de respuesta de Negro a Blanco | ||
|---|---|---|
| 8.9 ms ... subida ↗ y bajada ↘ combinada | ↗ 4.8 ms subida | 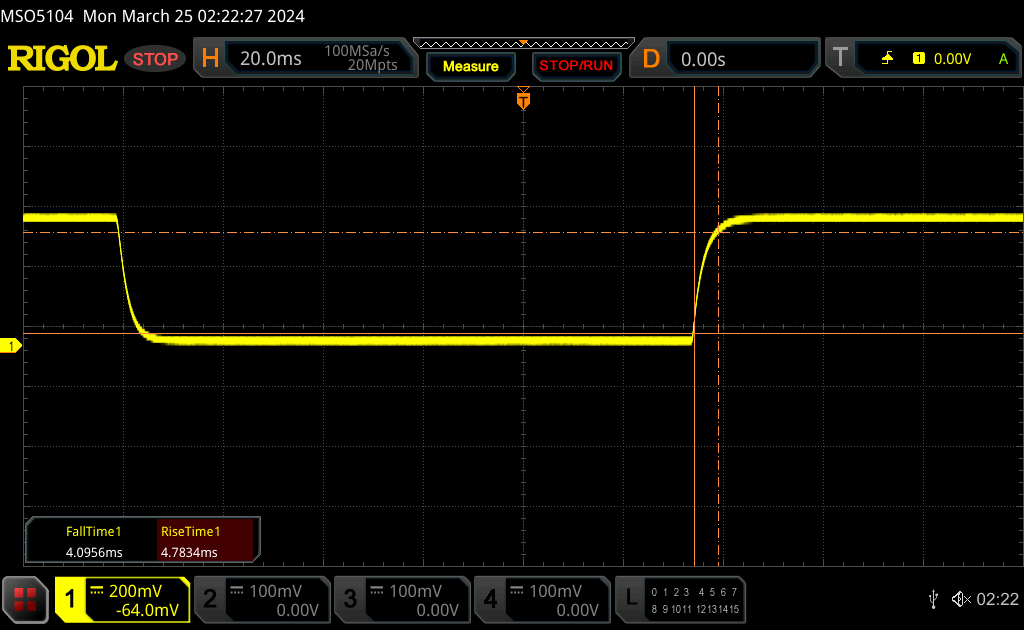 |
| ↘ 4.1 ms bajada | ||
| La pantalla mostró tiempos de respuesta rápidos en nuestros tests y debería ser adecuada para juegos. En comparación, todos los dispositivos de prueba van de ##min### (mínimo) a 240 (máximo) ms. » 25 % de todos los dispositivos son mejores. Esto quiere decir que el tiempo de respuesta medido es mejor que la media (19.8 ms) de todos los dispositivos testados. | ||
| ↔ Tiempo de respuesta 50% Gris a 80% Gris | ||
| 11.9 ms ... subida ↗ y bajada ↘ combinada | ↗ 5.5 ms subida | 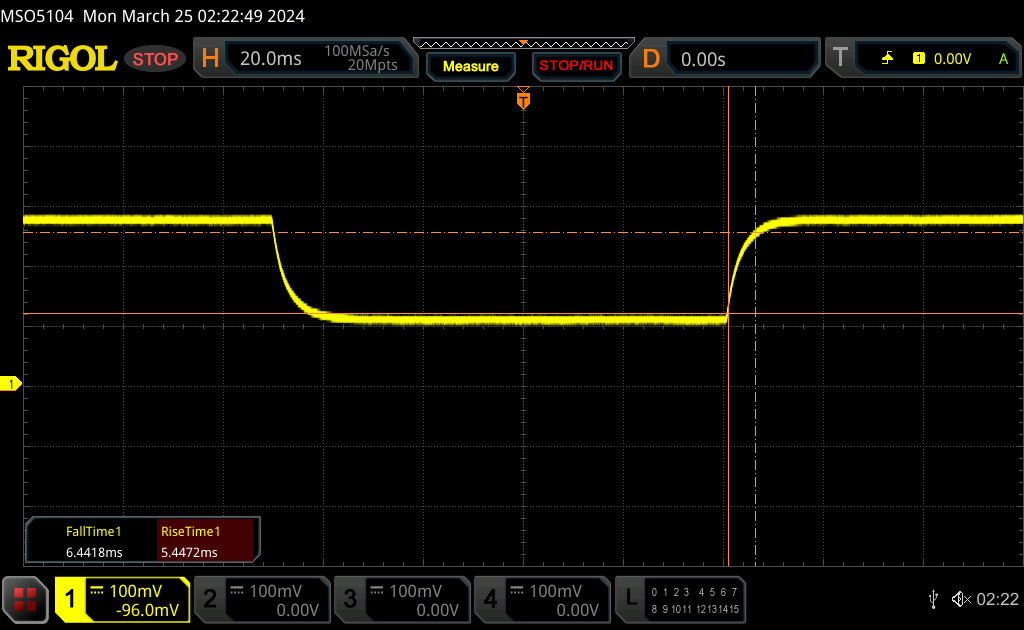 |
| ↘ 6.4 ms bajada | ||
| La pantalla mostró buenos tiempos de respuesta en nuestros tests pero podría ser demasiado lenta para los jugones competitivos. En comparación, todos los dispositivos de prueba van de ##min### (mínimo) a 636 (máximo) ms. » 25 % de todos los dispositivos son mejores. Esto quiere decir que el tiempo de respuesta medido es mejor que la media (30.9 ms) de todos los dispositivos testados. | ||
Parpadeo de Pantalla / PWM (Pulse-Width Modulation)
| Parpadeo de Pantalla / PWM no detectado | 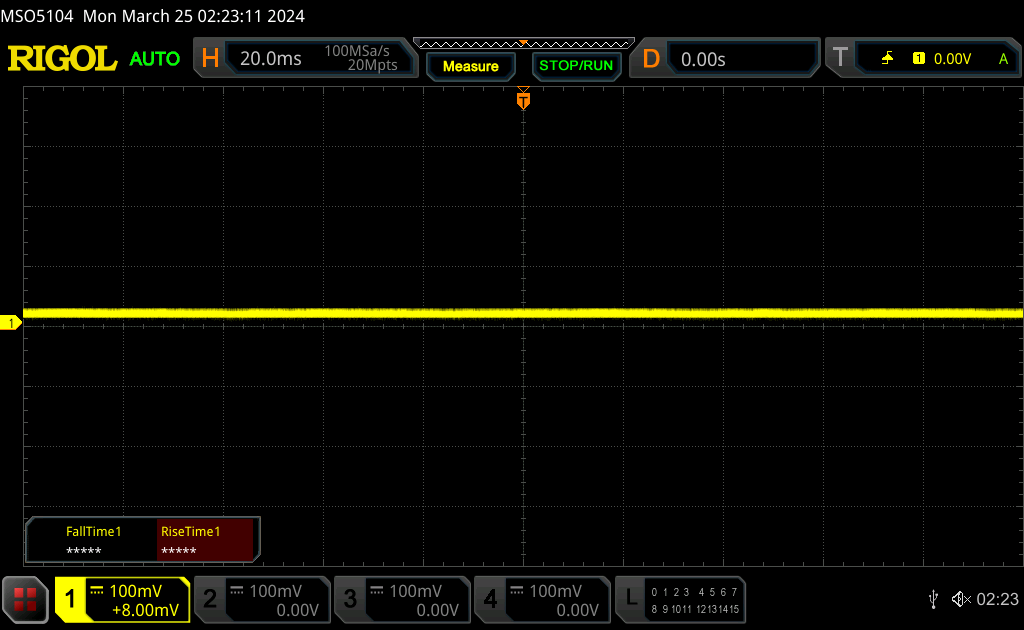 | ||
Comparación: 52 % de todos los dispositivos testados no usaron PWM para atenuar el display. Si se usó, medimos una media de 7744 (mínimo: 5 - máxmo: 343500) Hz. | |||
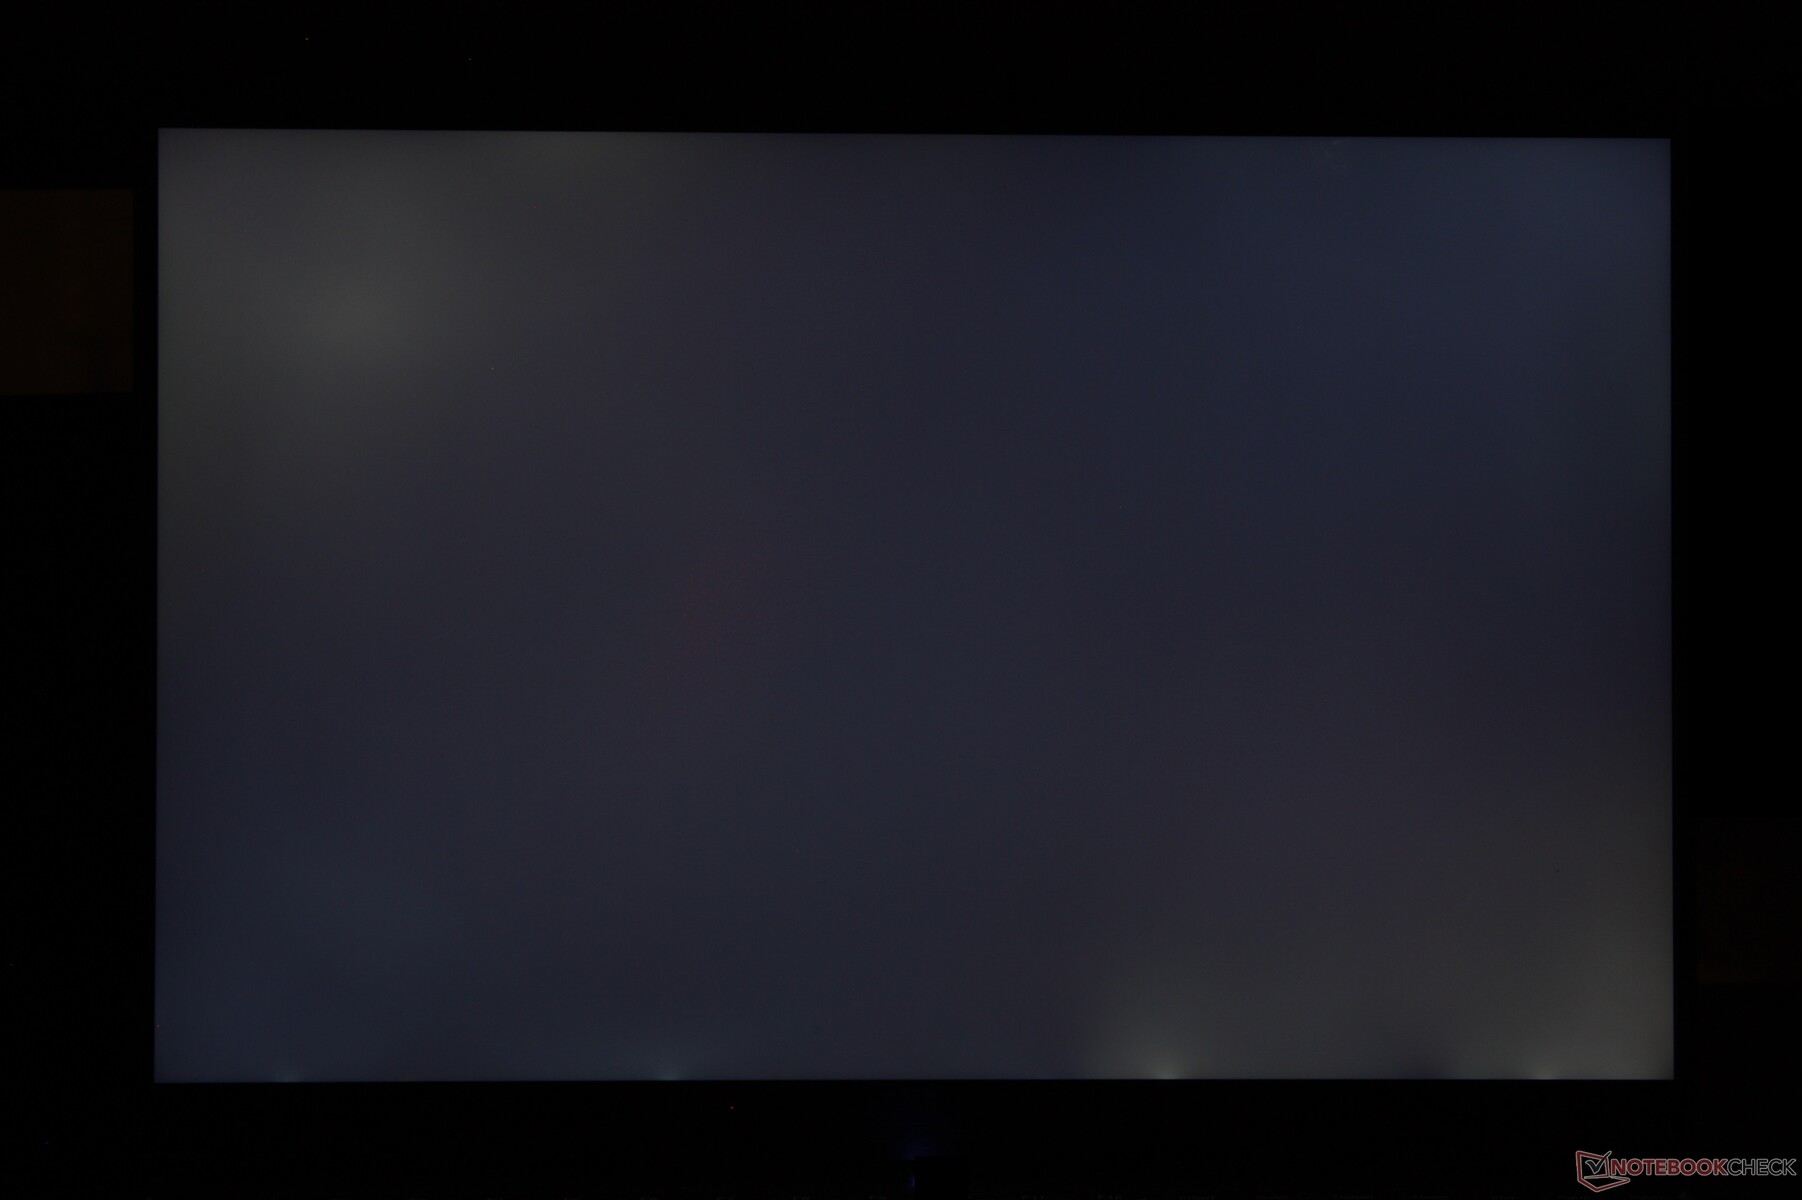
La visibilidad en exteriores no ha cambiado mucho respecto al modelo del año pasado, ya que la luminosidad máxima es prácticamente la misma. Aunque el modelo ofrece paneles más brillantes, el aumento no es lo suficientemente significativo como para marcar una diferencia notable en exteriores.

Rendimiento - Distinto nombre, mismo rendimiento
Condiciones de prueba
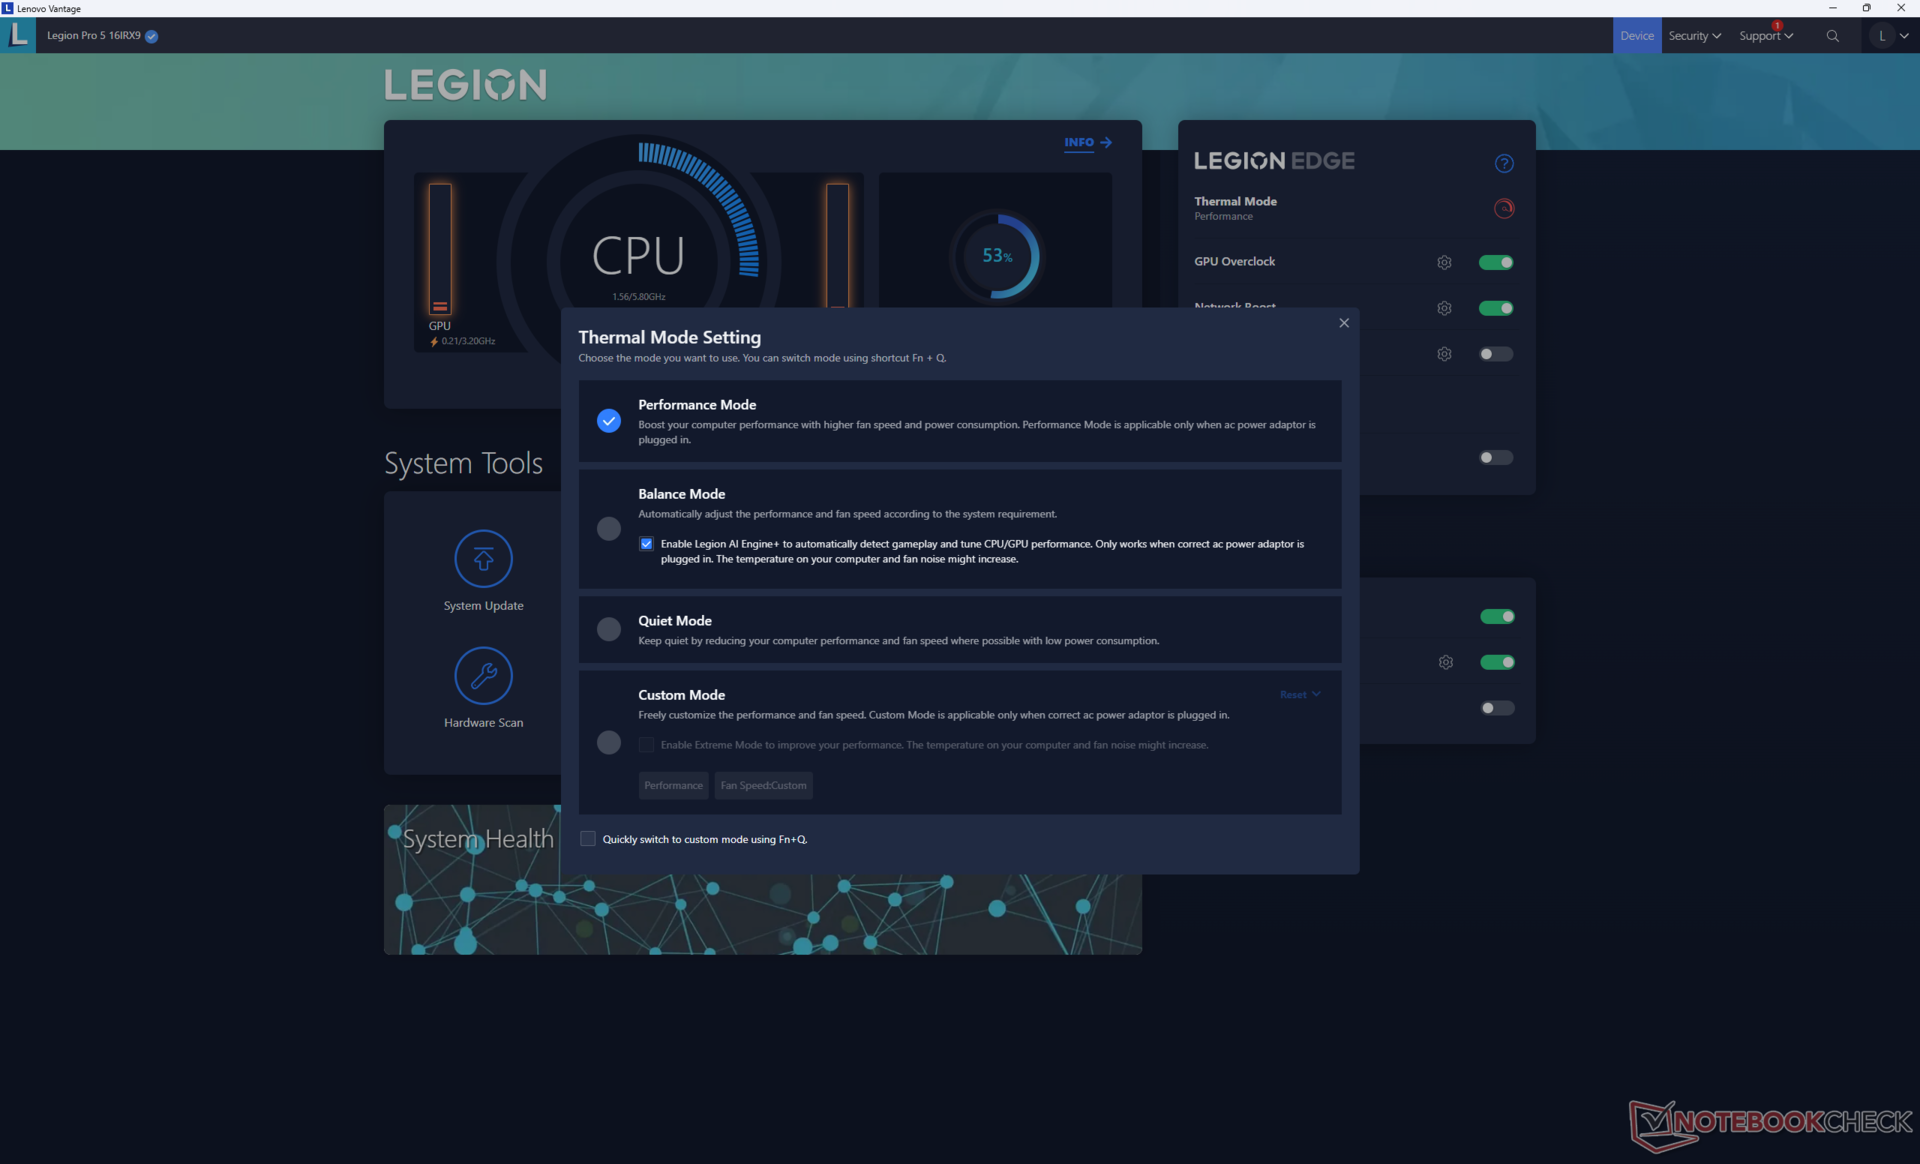
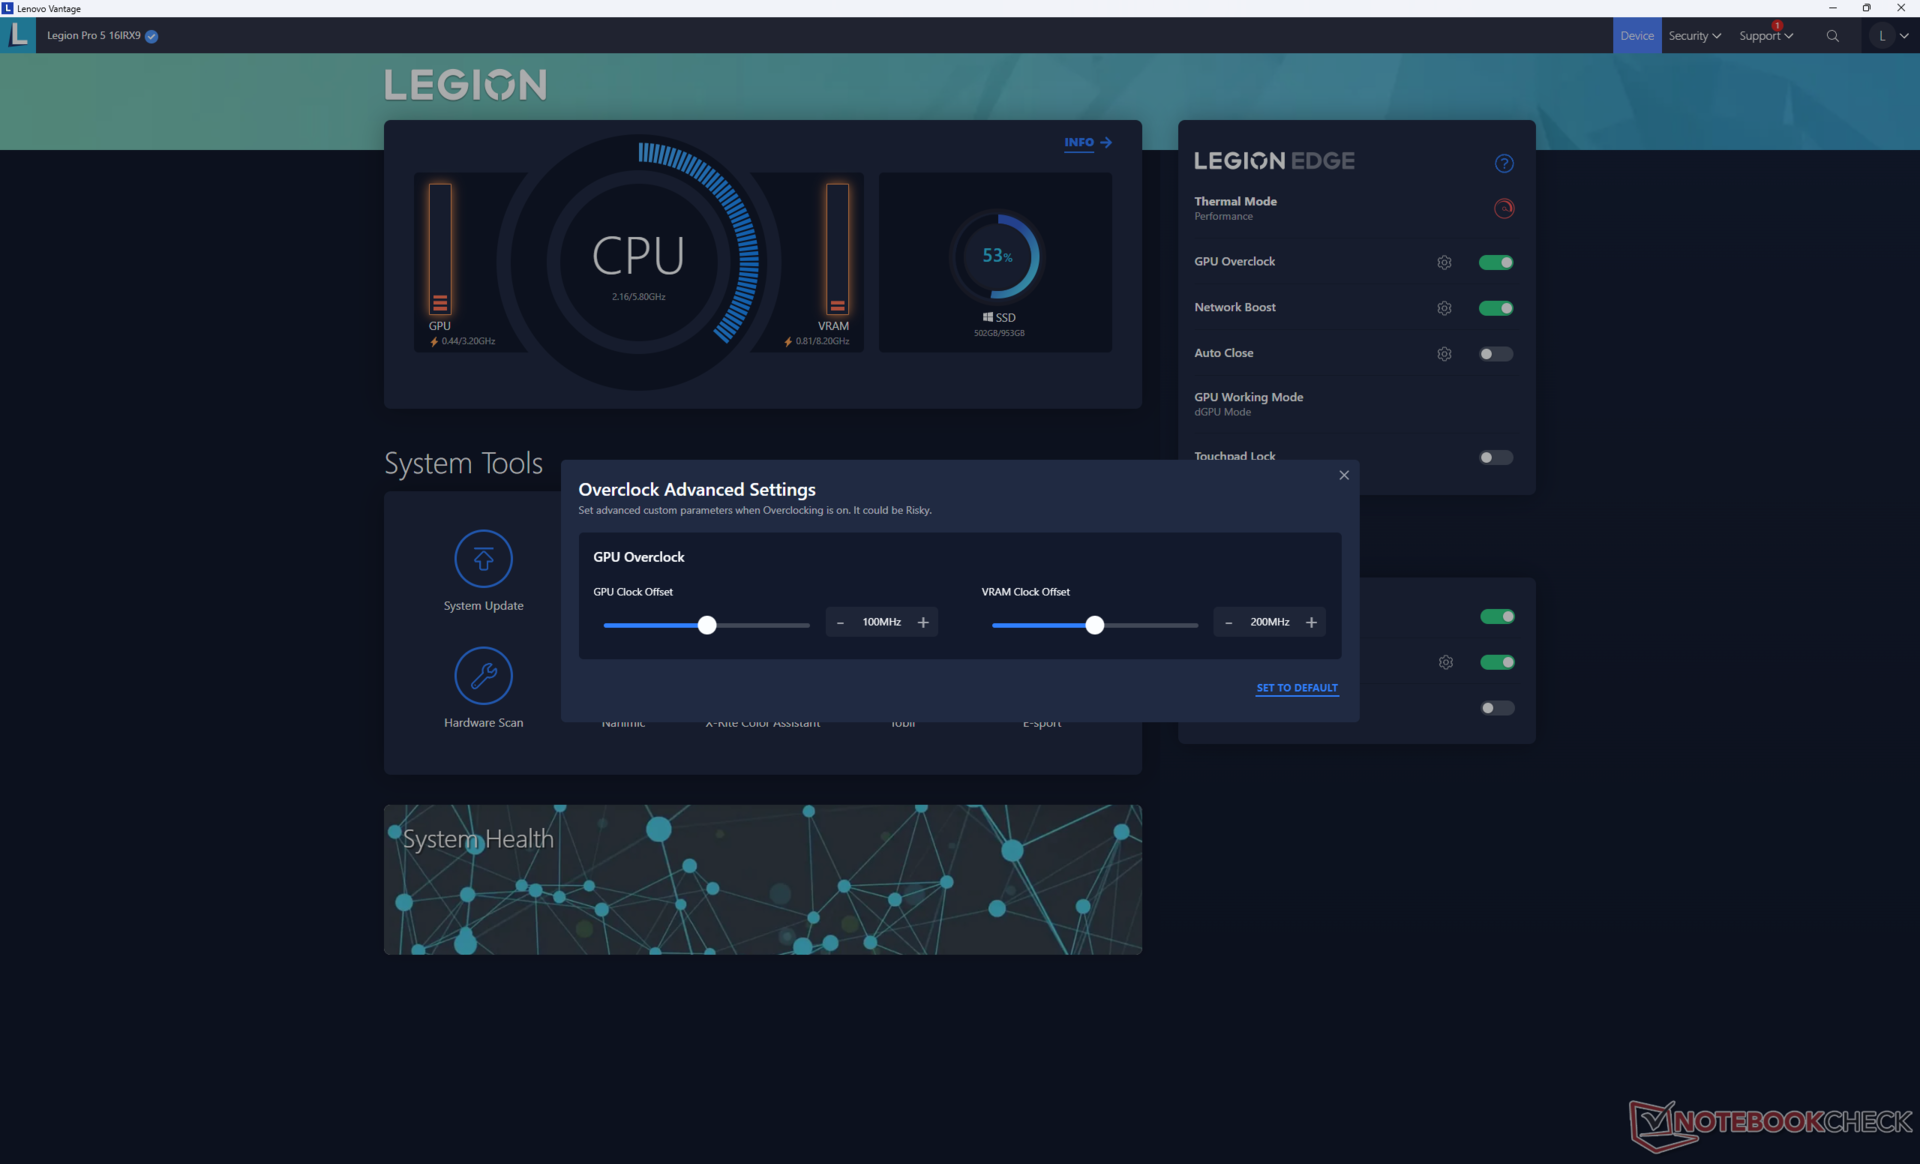
Pusimos Lenovo Vantage en modo Rendimiento, modo dGPU y Windows en modo Rendimiento antes de ejecutar los benchmarks que se muestran a continuación. El Overclock de la GPU también está habilitado por defecto a +100/+200 MHz reloj/VRAM.
Se admite Advanced Optimus. Como es habitual, G-Sync sólo está activo para la pantalla principal cuando se configura en modo dGPU.
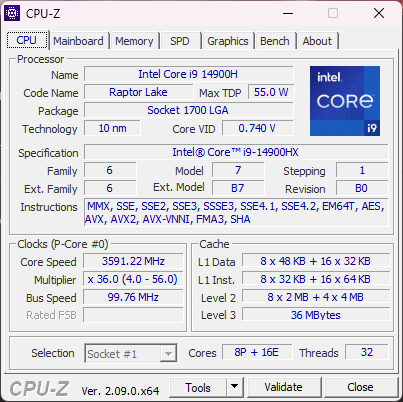
Procesador
El rendimiento de la CPU es excelente, especialmente si se compara con el HP Omen Transcend 16 que viene con el mismo Core i9-14900HX pero está más ralentizado. También ofrece un aumento de rendimiento muy respetable de casi el 50 por ciento sobre el Core i7-13700HX en nuestra unidad de pruebas Legion 5 Pro 16IRX8 más antigua. Aun así, el rendimiento general es comparable al del menos caro Core i9-13900HX ya que el i9-14900HX no es más que un cambio de marca.
La sostenibilidad del rendimiento es buena pero no perfecta. Por ejemplo, el rendimiento caería alrededor de un 6 por ciento con el tiempo al ejecutar CineBench R15 xT en bucle. Afortunadamente, la caída no es tan grave como la que observamos en el portátil HP antes mencionado, como muestra el gráfico siguiente.
Cambiando al i7-14700HX o i5-14500HX se espera que reduzca el rendimiento entre un 35 y un 45 por ciento, ya que también son marcas posteriores de los antiguos i7-13700HX e i5-13500HX, respectivamente.
Cinebench R15 Multi Loop
Cinebench R23: Multi Core | Single Core
Cinebench R20: CPU (Multi Core) | CPU (Single Core)
Cinebench R15: CPU Multi 64Bit | CPU Single 64Bit
Blender: v2.79 BMW27 CPU
7-Zip 18.03: 7z b 4 | 7z b 4 -mmt1
Geekbench 6.7: Multi-Core | Single-Core
Geekbench 5.5: Multi-Core | Single-Core
HWBOT x265 Benchmark v2.2: 4k Preset
LibreOffice : 20 Documents To PDF
R Benchmark 2.5: Overall mean
* ... más pequeño es mejor
AIDA64: FP32 Ray-Trace | FPU Julia | CPU SHA3 | CPU Queen | FPU SinJulia | FPU Mandel | CPU AES | CPU ZLib | FP64 Ray-Trace | CPU PhotoWorxx
| Performance rating | |
| Lenovo Legion Pro 5 16IRX9 | |
| Medio Intel Core i9-14900HX | |
| Lenovo Legion Pro 5 16IRX8 | |
| HP Omen Transcend 16-u1095ng | |
| MSI Stealth 16 Mercedes-AMG Motorsport A13VG | |
| Alienware m16 R2 | |
| Asus ROG Zephyrus G16 2024 GU605M | |
| AIDA64 / FP32 Ray-Trace | |
| Lenovo Legion Pro 5 16IRX9 | |
| Medio Intel Core i9-14900HX (13098 - 33474, n=36) | |
| Lenovo Legion Pro 5 16IRX8 | |
| MSI Stealth 16 Mercedes-AMG Motorsport A13VG | |
| Alienware m16 R2 | |
| HP Omen Transcend 16-u1095ng | |
| Asus ROG Zephyrus G16 2024 GU605M | |
| AIDA64 / FPU Julia | |
| Lenovo Legion Pro 5 16IRX9 | |
| Medio Intel Core i9-14900HX (67573 - 166040, n=36) | |
| Lenovo Legion Pro 5 16IRX8 | |
| Alienware m16 R2 | |
| MSI Stealth 16 Mercedes-AMG Motorsport A13VG | |
| HP Omen Transcend 16-u1095ng | |
| Asus ROG Zephyrus G16 2024 GU605M | |
| AIDA64 / CPU SHA3 | |
| Lenovo Legion Pro 5 16IRX9 | |
| Medio Intel Core i9-14900HX (3589 - 7979, n=36) | |
| Lenovo Legion Pro 5 16IRX8 | |
| HP Omen Transcend 16-u1095ng | |
| Alienware m16 R2 | |
| MSI Stealth 16 Mercedes-AMG Motorsport A13VG | |
| Asus ROG Zephyrus G16 2024 GU605M | |
| AIDA64 / CPU Queen | |
| Lenovo Legion Pro 5 16IRX9 | |
| Medio Intel Core i9-14900HX (118405 - 148966, n=36) | |
| HP Omen Transcend 16-u1095ng | |
| MSI Stealth 16 Mercedes-AMG Motorsport A13VG | |
| Lenovo Legion Pro 5 16IRX8 | |
| Asus ROG Zephyrus G16 2024 GU605M | |
| Alienware m16 R2 | |
| AIDA64 / FPU SinJulia | |
| Lenovo Legion Pro 5 16IRX9 | |
| Medio Intel Core i9-14900HX (10475 - 18517, n=36) | |
| Lenovo Legion Pro 5 16IRX8 | |
| HP Omen Transcend 16-u1095ng | |
| MSI Stealth 16 Mercedes-AMG Motorsport A13VG | |
| Asus ROG Zephyrus G16 2024 GU605M | |
| Alienware m16 R2 | |
| AIDA64 / FPU Mandel | |
| Lenovo Legion Pro 5 16IRX9 | |
| Medio Intel Core i9-14900HX (32543 - 83662, n=36) | |
| Lenovo Legion Pro 5 16IRX8 | |
| Alienware m16 R2 | |
| MSI Stealth 16 Mercedes-AMG Motorsport A13VG | |
| HP Omen Transcend 16-u1095ng | |
| Asus ROG Zephyrus G16 2024 GU605M | |
| AIDA64 / CPU ZLib | |
| Lenovo Legion Pro 5 16IRX9 | |
| Medio Intel Core i9-14900HX (1054 - 2292, n=36) | |
| Lenovo Legion Pro 5 16IRX8 | |
| HP Omen Transcend 16-u1095ng | |
| Alienware m16 R2 | |
| MSI Stealth 16 Mercedes-AMG Motorsport A13VG | |
| Asus ROG Zephyrus G16 2024 GU605M | |
| AIDA64 / FP64 Ray-Trace | |
| Lenovo Legion Pro 5 16IRX9 | |
| Medio Intel Core i9-14900HX (6809 - 18349, n=36) | |
| Lenovo Legion Pro 5 16IRX8 | |
| MSI Stealth 16 Mercedes-AMG Motorsport A13VG | |
| Alienware m16 R2 | |
| HP Omen Transcend 16-u1095ng | |
| Asus ROG Zephyrus G16 2024 GU605M | |
| AIDA64 / CPU PhotoWorxx | |
| Lenovo Legion Pro 5 16IRX9 | |
| HP Omen Transcend 16-u1095ng | |
| Asus ROG Zephyrus G16 2024 GU605M | |
| MSI Stealth 16 Mercedes-AMG Motorsport A13VG | |
| Medio Intel Core i9-14900HX (23903 - 54702, n=36) | |
| Alienware m16 R2 | |
| Lenovo Legion Pro 5 16IRX8 | |
Prueba de estrés
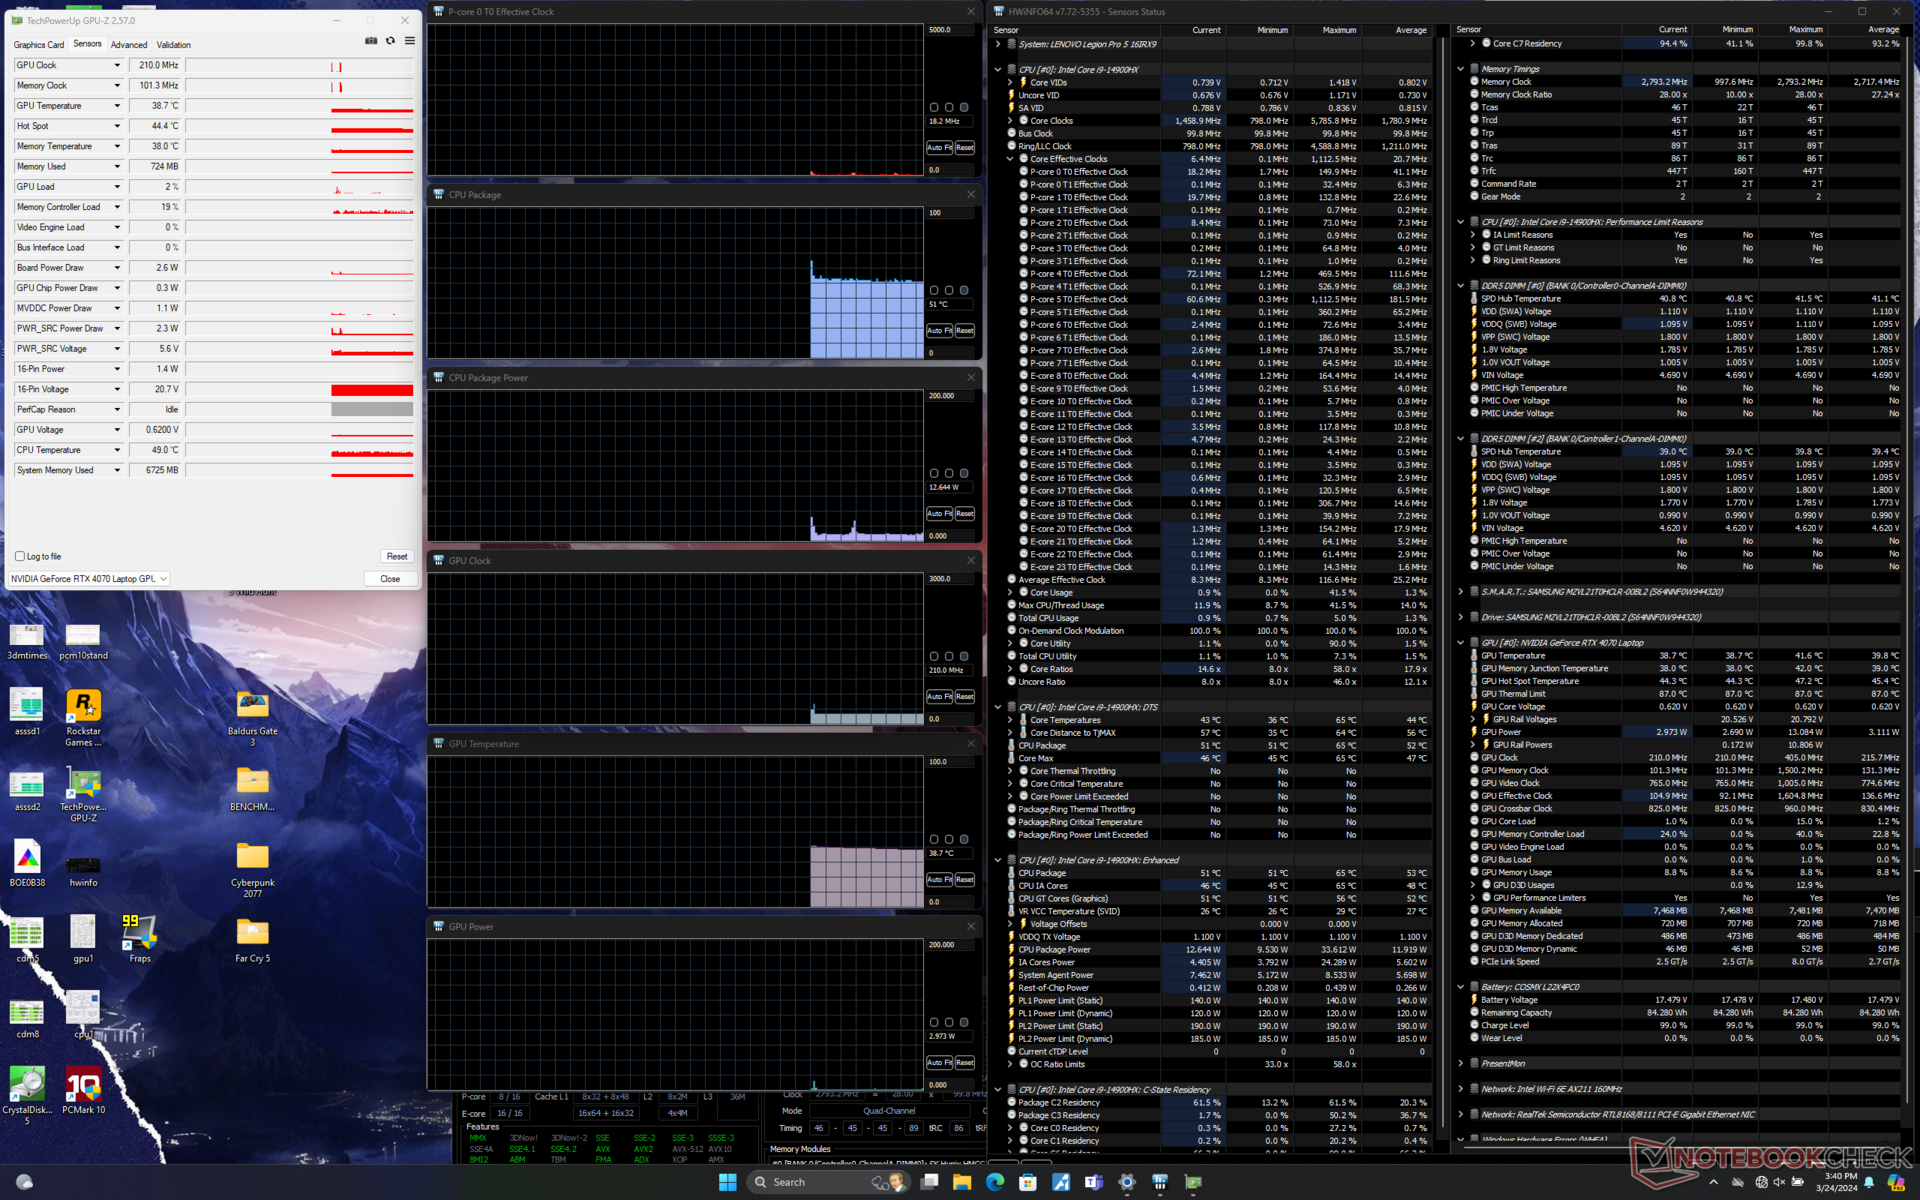
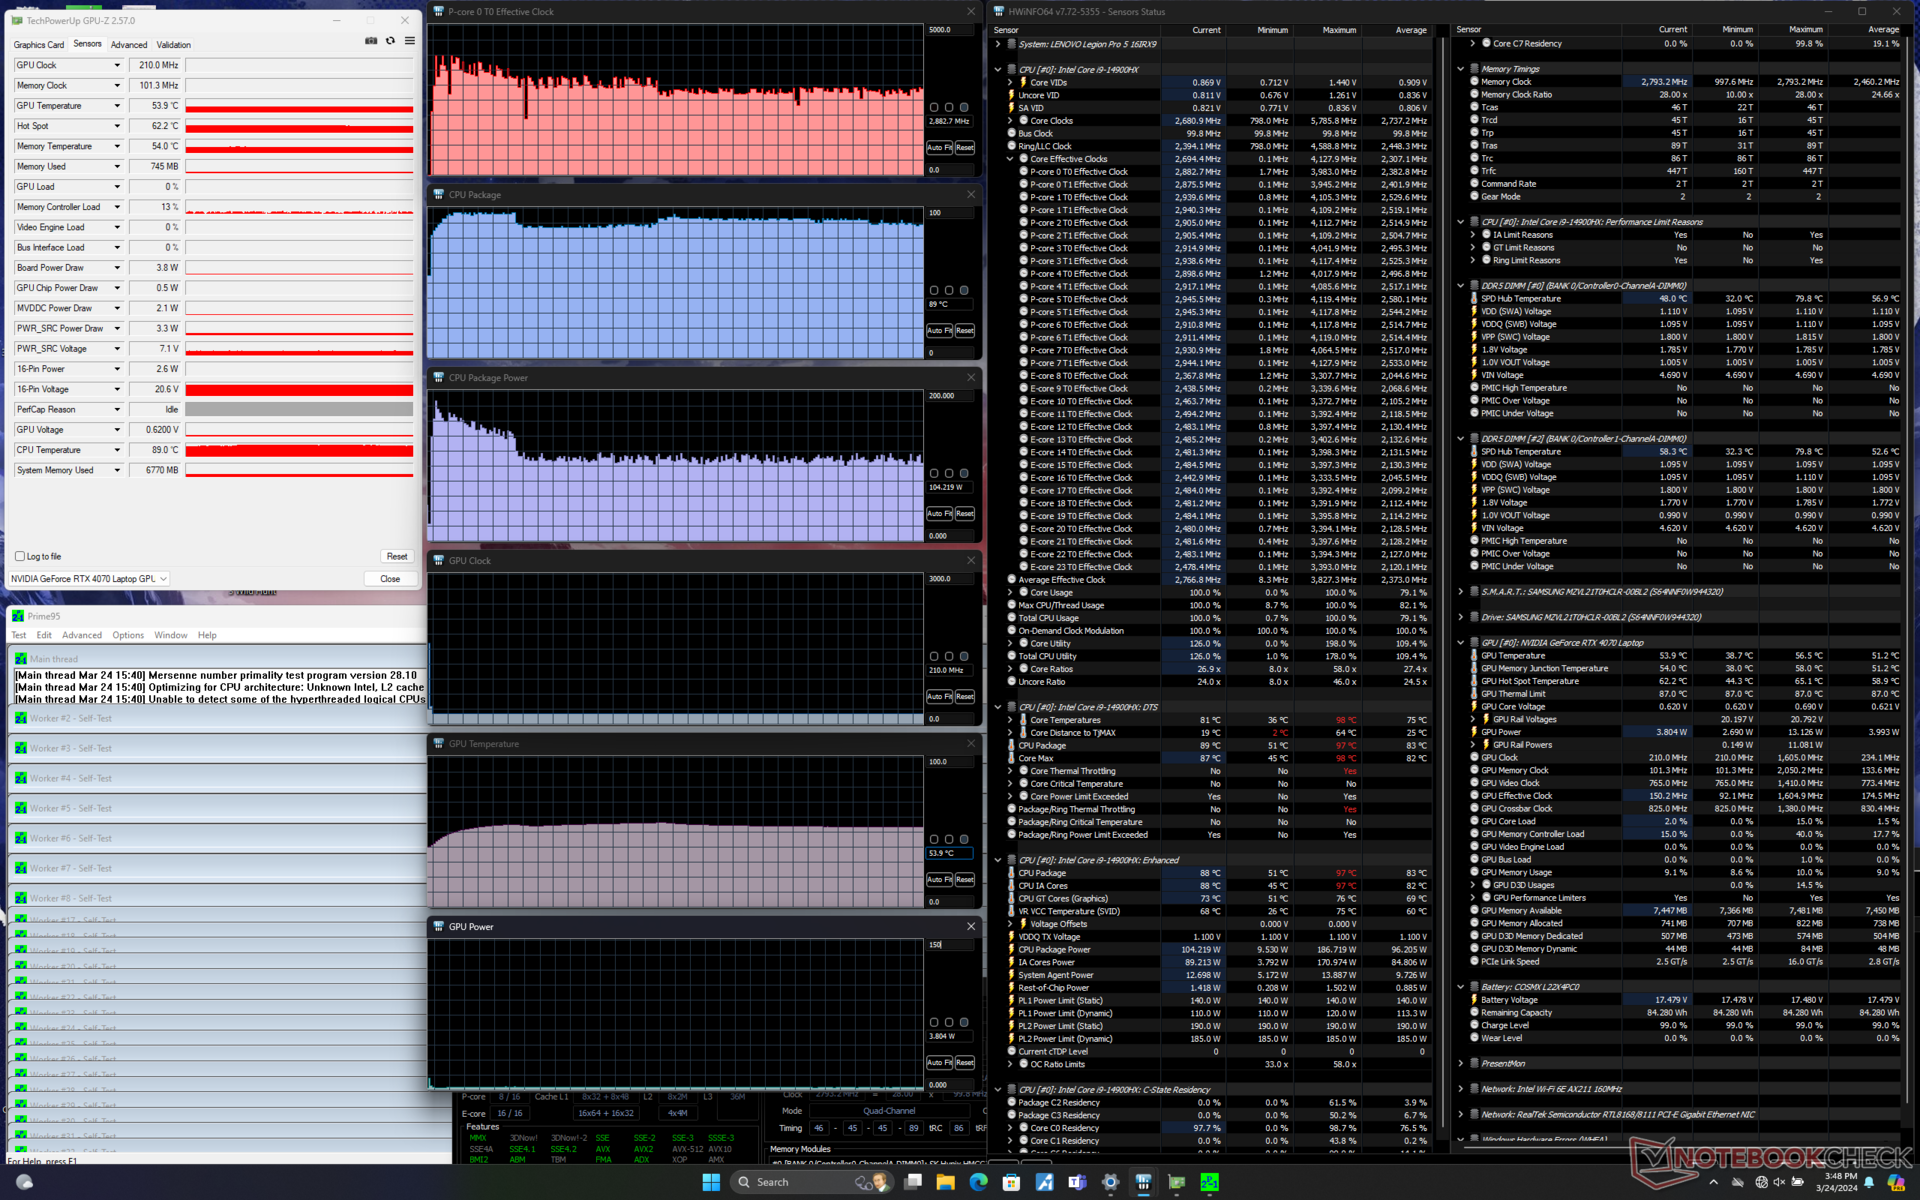
La CPU aumentaría a 4 GHz y 187 W al ejecutar el estrés Prime95. Sin embargo, una vez que la temperatura del núcleo alcanza los 97 C unos segundos después, la CPU se estabilizaría rápidamente a 2,8 GHz y 104 W para mantener una temperatura del núcleo más manejable de 89 C. Aunque es ligeramente más cálida que en el modelo del año pasado, al menos es más fría que en el Alienware m16 R2 con la CPU Core Ultra 7 más lenta en condiciones similares.
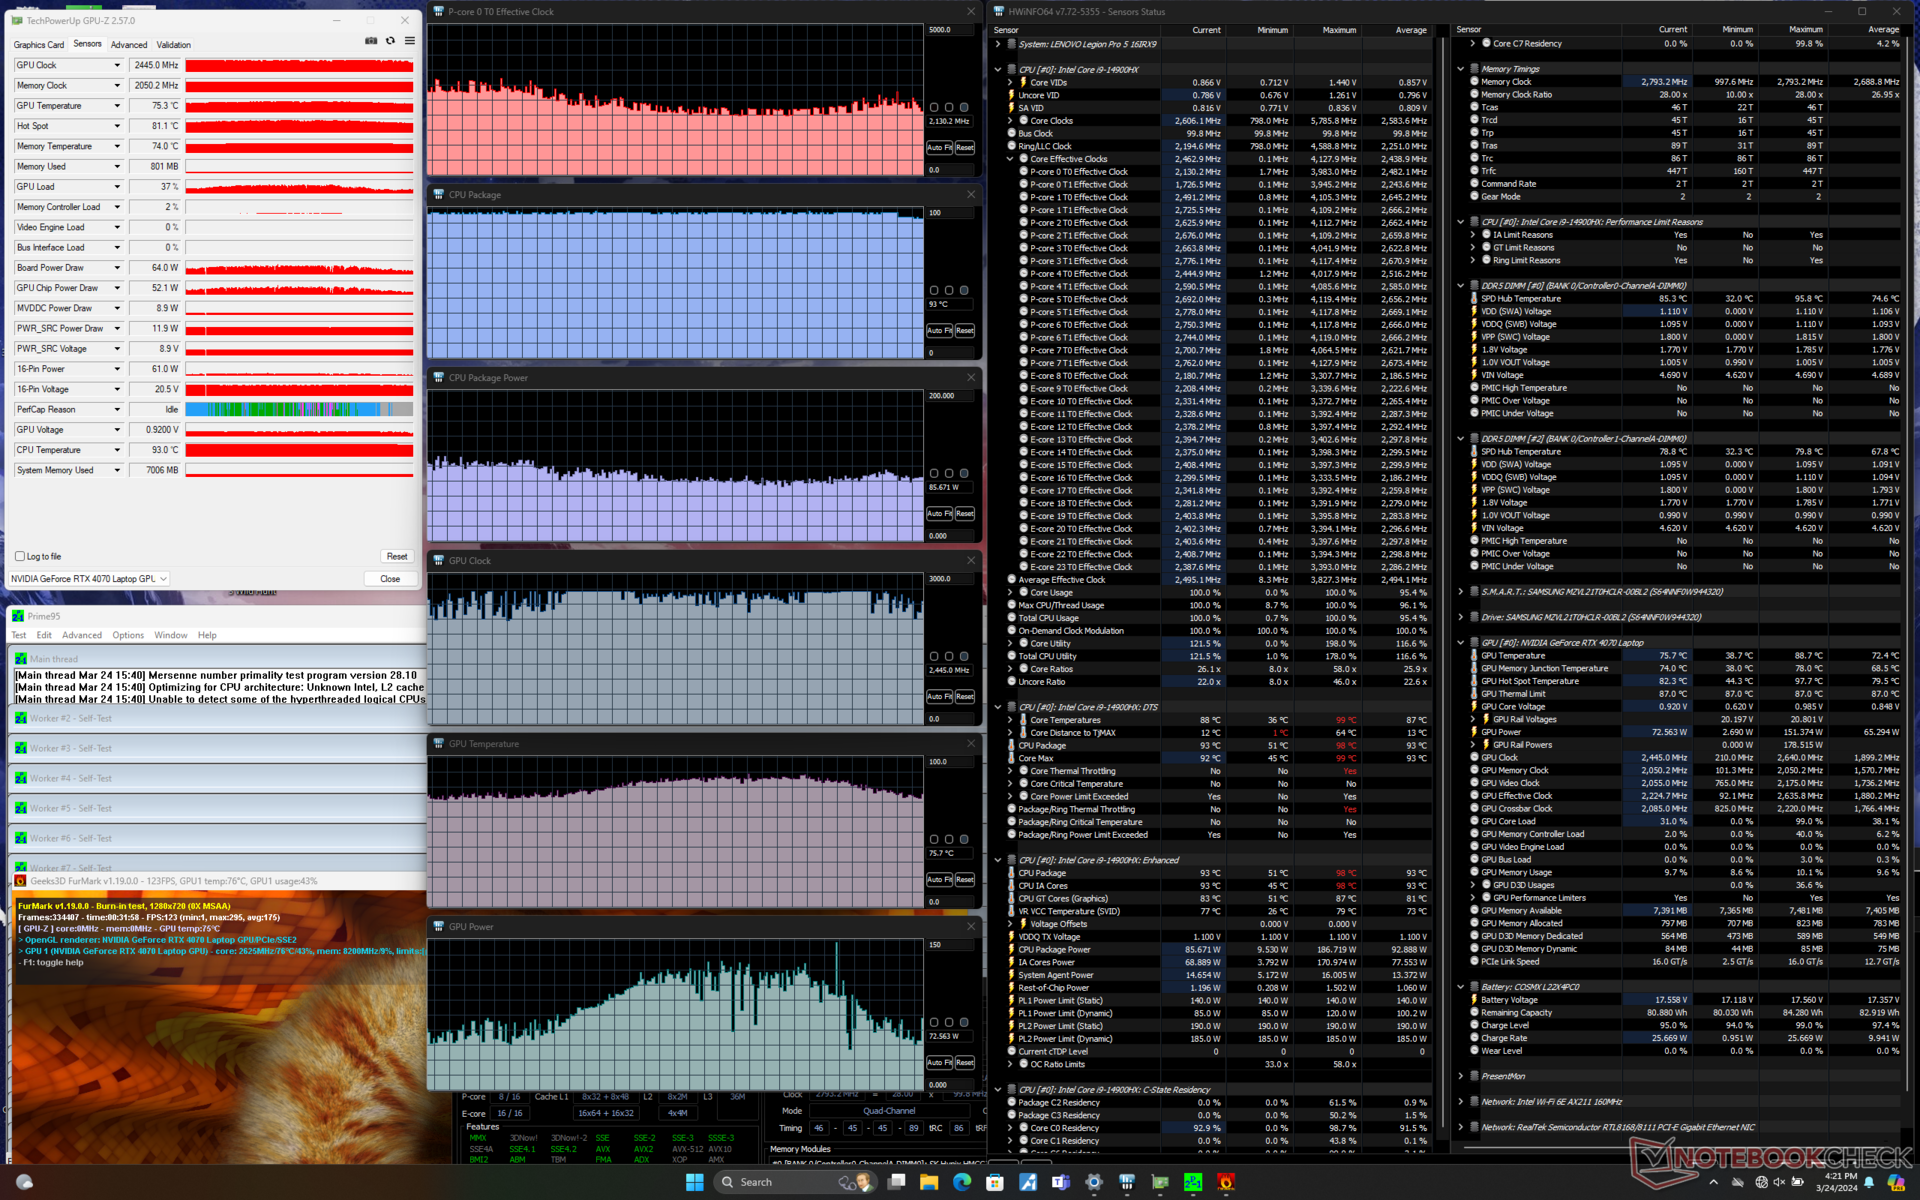
El rendimiento gráfico se reduce al cambiar del modo Rendimiento al modo Equilibrado, como se indica en la sección Rendimiento de la GPU a continuación. El consumo de energía de la placa GPU y la velocidad de reloj en el modo Rendimiento caerían de 114 W y 2640 MHz, respectivamente, a 2280 MHz y 77 W en el modo Equilibrado. Por otro lado, las temperaturas del núcleo son notablemente más frías en unos 10 C cuando se ejecuta en modo Equilibrado, ya que el rendimiento general es más lento.
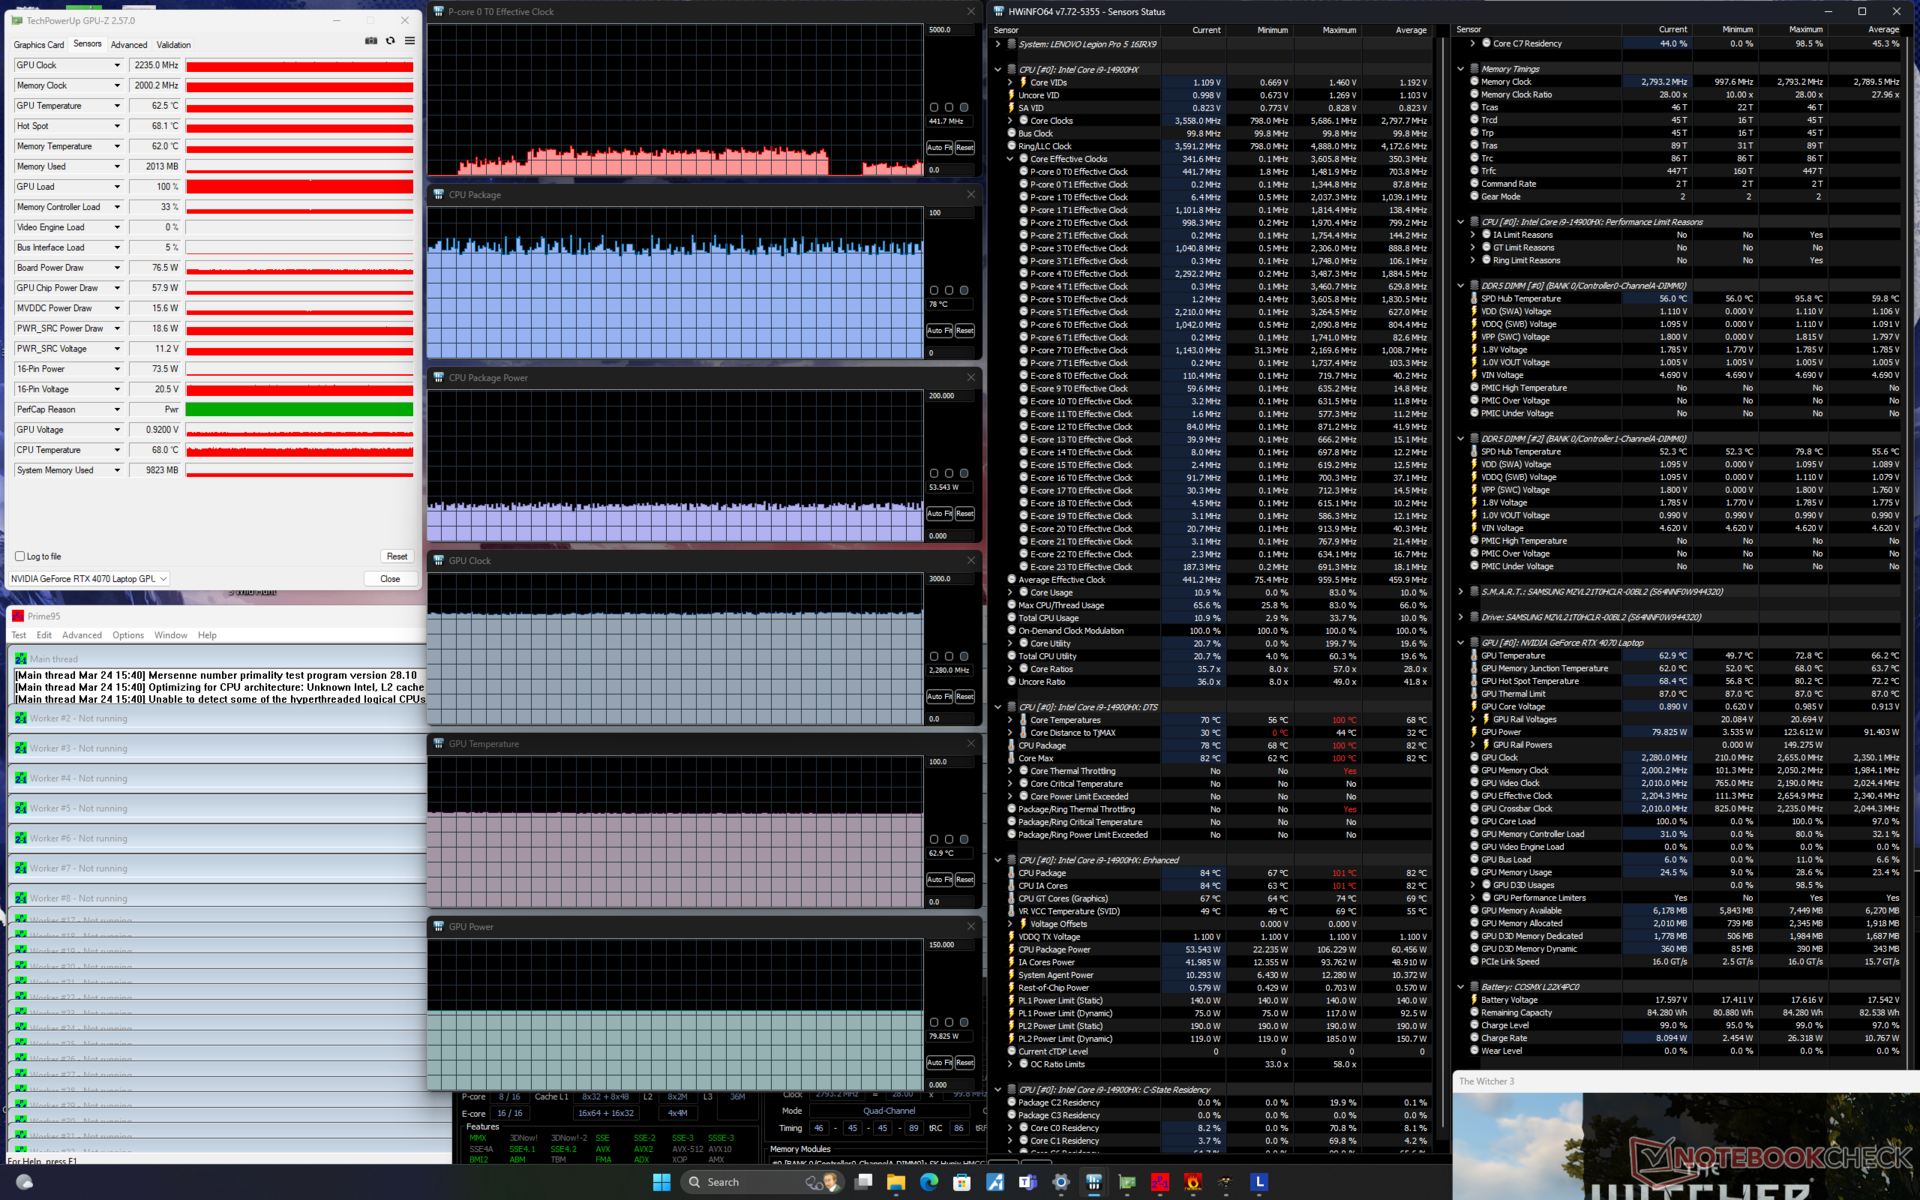
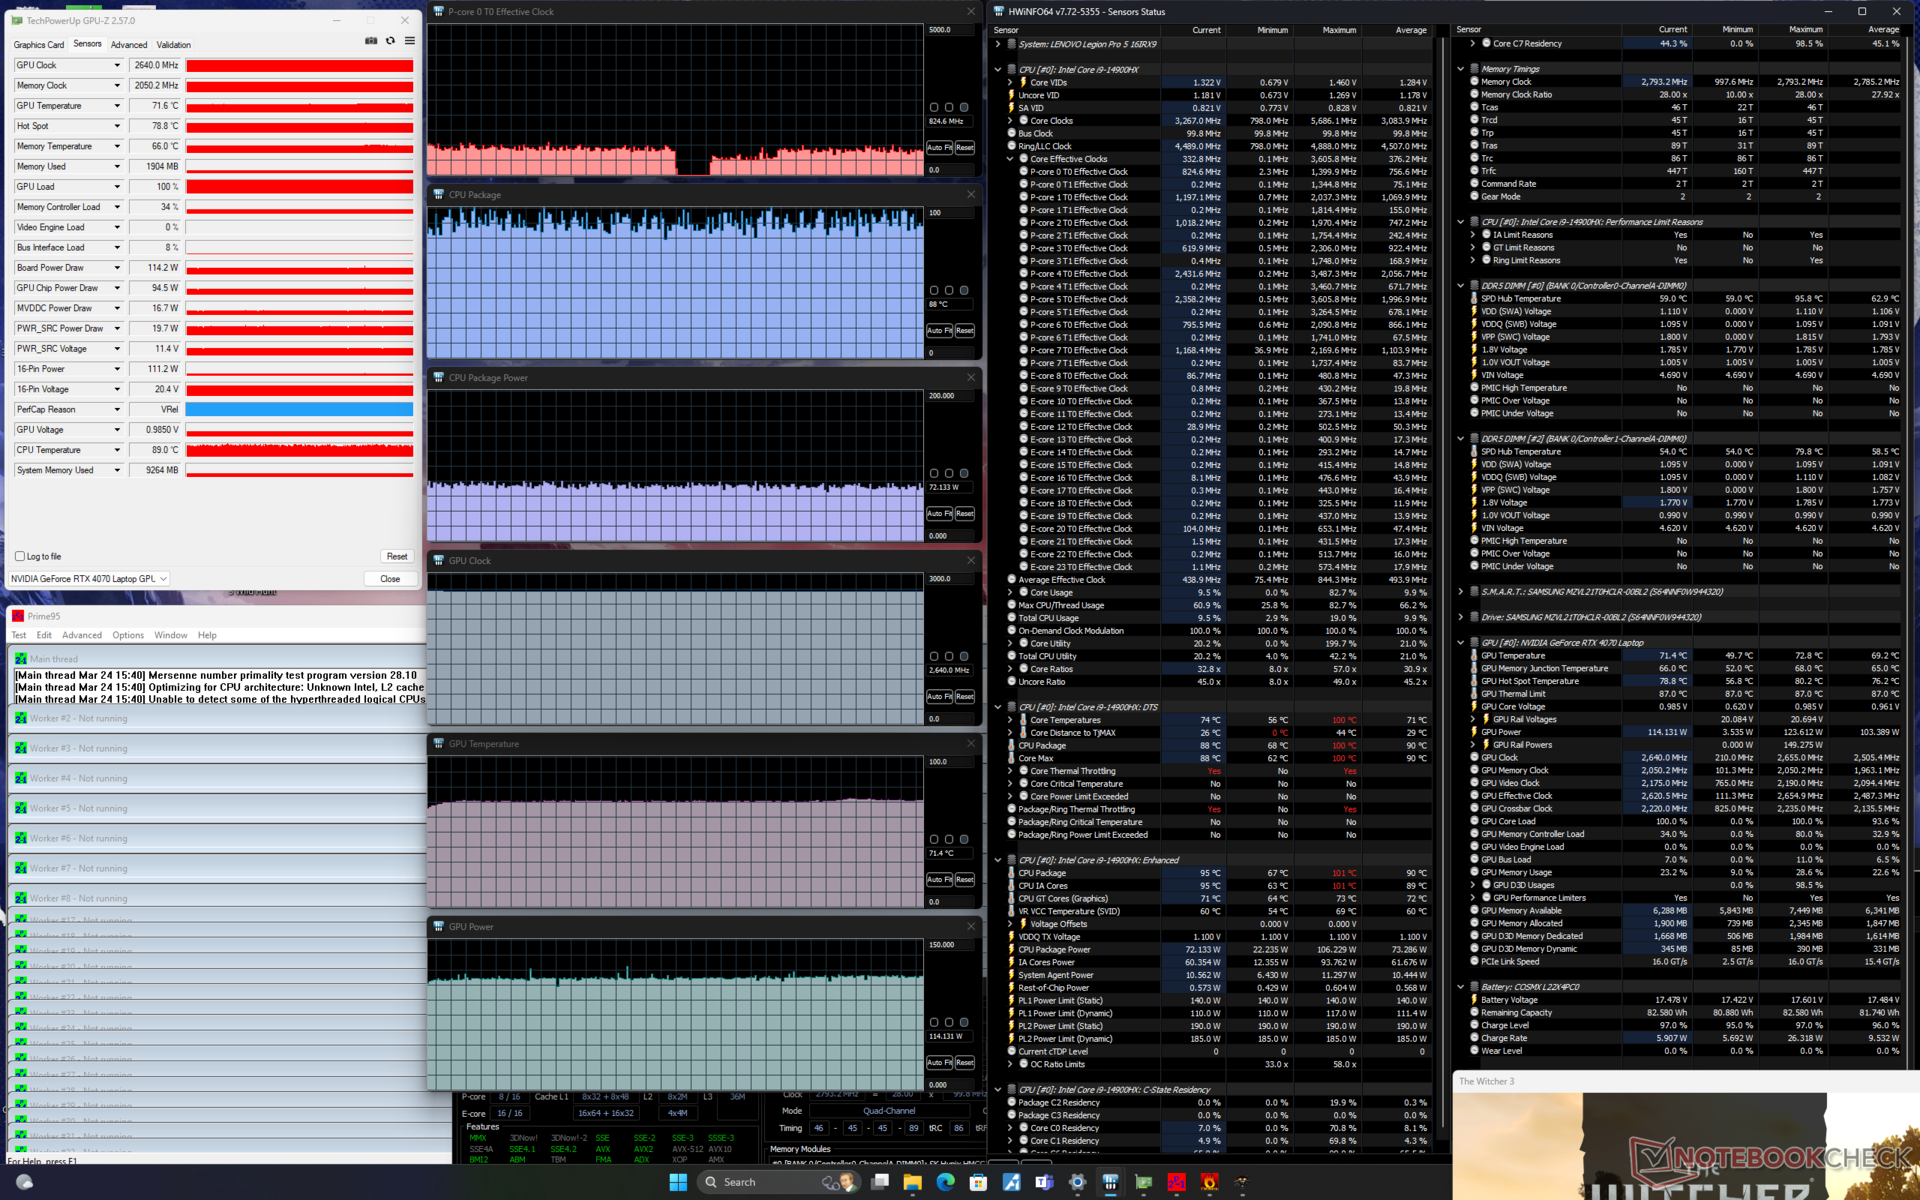
| Reloj dela CPU (GHz) | Reloj de la GPU (MHz) | Temperatura media dela CPU (°C) | Temperatura media de la GPU (°C) | |
| Sistema en reposo | -- | -- | 51 | 39 |
| Prime95 Stress | 2.8 | -- | 89 | 54 |
| Estrés Prime95+ FurMark | ~2,1 | 2100 - 2700 | 95 | 70 - 88 |
| Witcher 3 Estrés (modoequilibrado) | ~0,5 | 2280 | ~78 | 63 |
| Witcher 3 Estrés (modoRendimiento) | ~0,9 | 2640 | ~88 | 72 |
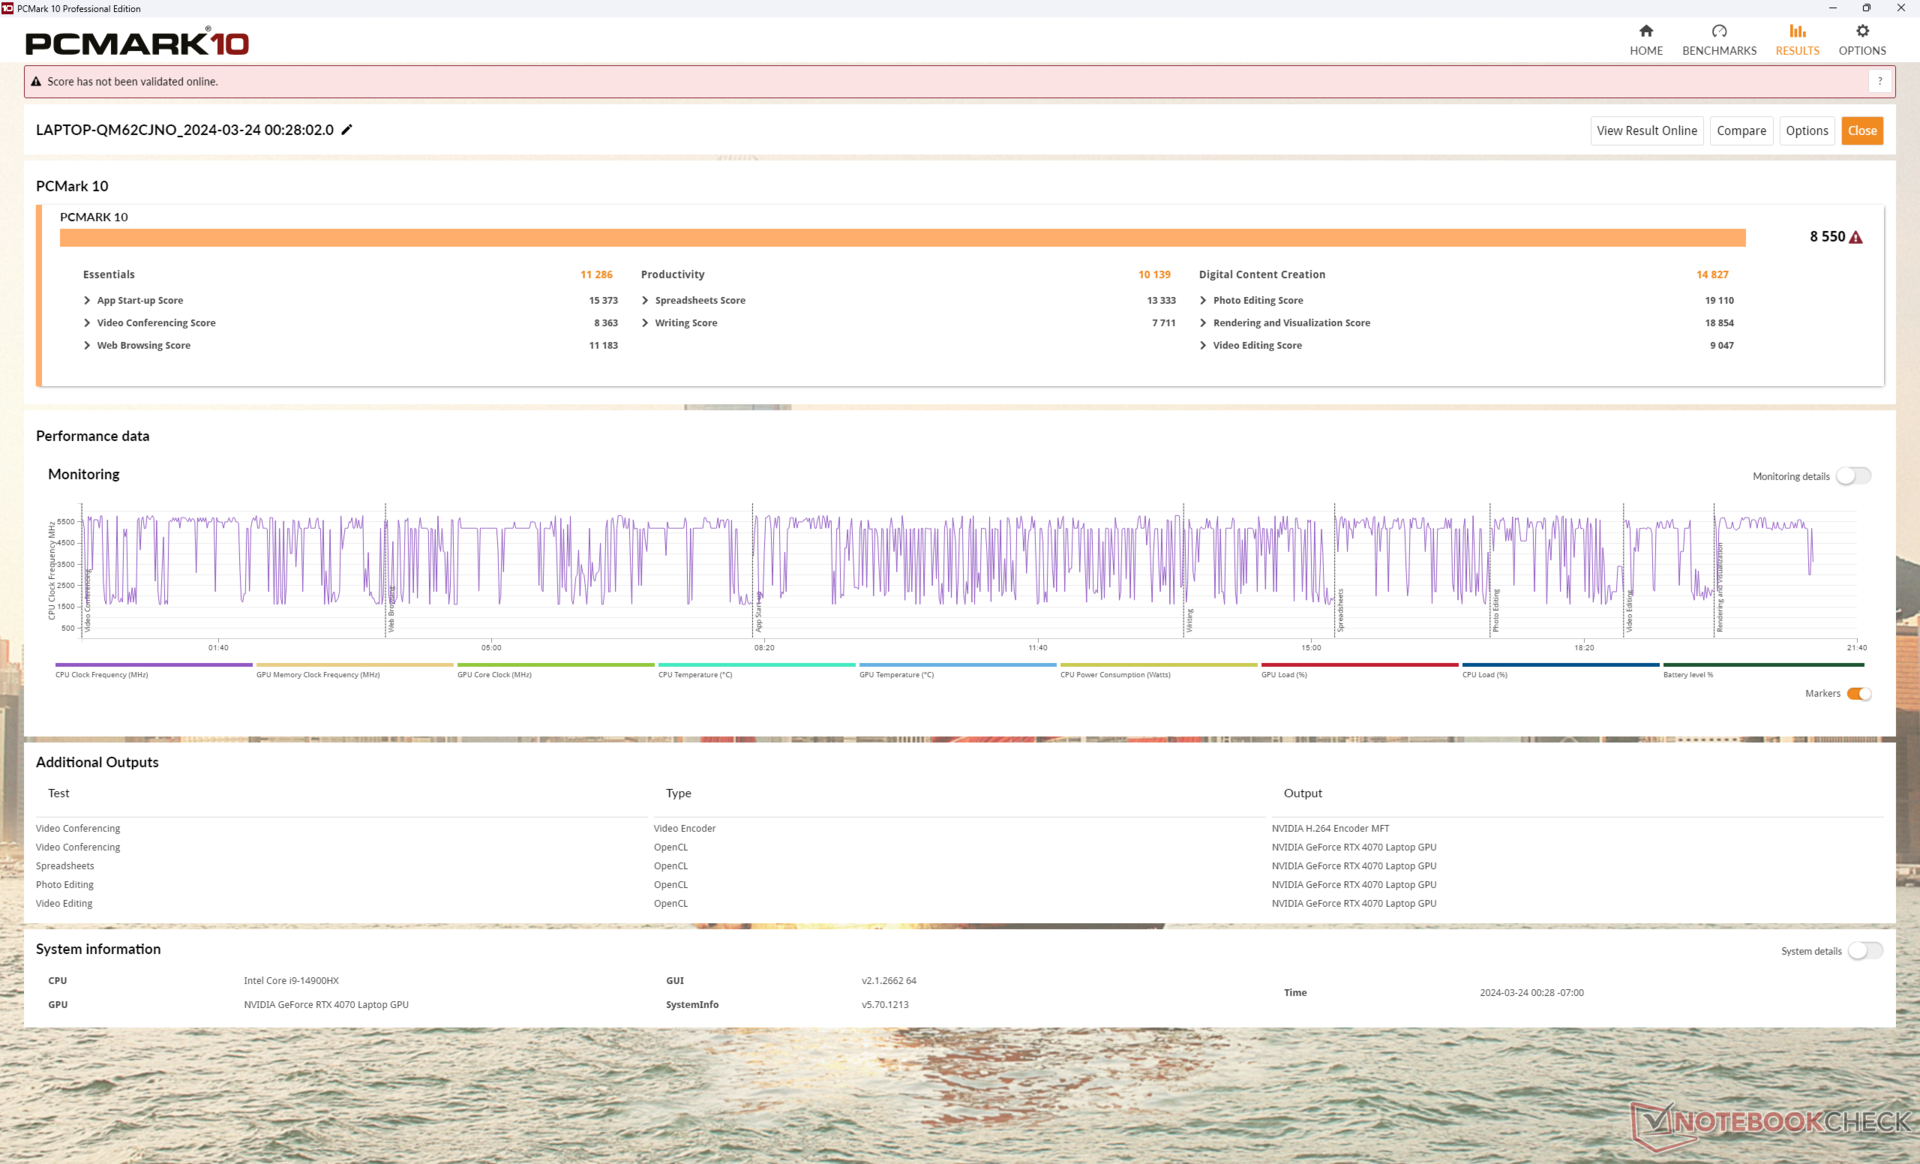
Rendimiento del sistema
Las puntuaciones de PCMark están sistemáticamente por delante de la antigua Legion Pro 5 16IRX8 ya que nuestra unidad viene configurada con piezas Core i9 de gama superior y GeForce RTX. Tampoco experimentamos ningún problema de despertar del sueño que vimos en el reciente Alienware m16 R2.
CrossMark: Overall | Productivity | Creativity | Responsiveness
WebXPRT 3: Overall
WebXPRT 4: Overall
Mozilla Kraken 1.1: Total
| PCMark 10 / Score | |
| Lenovo Legion Pro 5 16IRX9 | |
| Medio Intel Core i9-14900HX, NVIDIA GeForce RTX 4070 Laptop GPU (7768 - 8550, n=8) | |
| HP Omen Transcend 16-u1095ng | |
| Alienware m16 R2 | |
| Lenovo Legion Pro 5 16IRX8 | |
| MSI Stealth 16 Mercedes-AMG Motorsport A13VG | |
| Asus ROG Zephyrus G16 2024 GU605M | |
| PCMark 10 / Essentials | |
| Lenovo Legion Pro 5 16IRX9 | |
| Medio Intel Core i9-14900HX, NVIDIA GeForce RTX 4070 Laptop GPU (10104 - 11815, n=8) | |
| Lenovo Legion Pro 5 16IRX8 | |
| MSI Stealth 16 Mercedes-AMG Motorsport A13VG | |
| HP Omen Transcend 16-u1095ng | |
| Alienware m16 R2 | |
| Asus ROG Zephyrus G16 2024 GU605M | |
| PCMark 10 / Productivity | |
| Medio Intel Core i9-14900HX, NVIDIA GeForce RTX 4070 Laptop GPU (9577 - 11103, n=8) | |
| HP Omen Transcend 16-u1095ng | |
| Lenovo Legion Pro 5 16IRX9 | |
| MSI Stealth 16 Mercedes-AMG Motorsport A13VG | |
| Alienware m16 R2 | |
| Asus ROG Zephyrus G16 2024 GU605M | |
| Lenovo Legion Pro 5 16IRX8 | |
| PCMark 10 / Digital Content Creation | |
| Lenovo Legion Pro 5 16IRX9 | |
| Medio Intel Core i9-14900HX, NVIDIA GeForce RTX 4070 Laptop GPU (12114 - 14827, n=8) | |
| Alienware m16 R2 | |
| Lenovo Legion Pro 5 16IRX8 | |
| HP Omen Transcend 16-u1095ng | |
| Asus ROG Zephyrus G16 2024 GU605M | |
| MSI Stealth 16 Mercedes-AMG Motorsport A13VG | |
| CrossMark / Overall | |
| Medio Intel Core i9-14900HX, NVIDIA GeForce RTX 4070 Laptop GPU (2002 - 2312, n=7) | |
| Lenovo Legion Pro 5 16IRX9 | |
| Alienware m16 R2 | |
| Asus ROG Zephyrus G16 2024 GU605M | |
| Lenovo Legion Pro 5 16IRX8 | |
| CrossMark / Productivity | |
| Medio Intel Core i9-14900HX, NVIDIA GeForce RTX 4070 Laptop GPU (1827 - 2191, n=7) | |
| Lenovo Legion Pro 5 16IRX9 | |
| Alienware m16 R2 | |
| Asus ROG Zephyrus G16 2024 GU605M | |
| Lenovo Legion Pro 5 16IRX8 | |
| CrossMark / Creativity | |
| Medio Intel Core i9-14900HX, NVIDIA GeForce RTX 4070 Laptop GPU (2258 - 2458, n=7) | |
| Lenovo Legion Pro 5 16IRX9 | |
| Asus ROG Zephyrus G16 2024 GU605M | |
| Alienware m16 R2 | |
| Lenovo Legion Pro 5 16IRX8 | |
| CrossMark / Responsiveness | |
| Medio Intel Core i9-14900HX, NVIDIA GeForce RTX 4070 Laptop GPU (1734 - 2330, n=7) | |
| Lenovo Legion Pro 5 16IRX9 | |
| Lenovo Legion Pro 5 16IRX8 | |
| Alienware m16 R2 | |
| Asus ROG Zephyrus G16 2024 GU605M | |
| WebXPRT 3 / Overall | |
| HP Omen Transcend 16-u1095ng | |
| Lenovo Legion Pro 5 16IRX9 | |
| Medio Intel Core i9-14900HX, NVIDIA GeForce RTX 4070 Laptop GPU (269 - 342, n=8) | |
| Alienware m16 R2 | |
| Asus ROG Zephyrus G16 2024 GU605M | |
| Lenovo Legion Pro 5 16IRX8 | |
| WebXPRT 4 / Overall | |
| Medio Intel Core i9-14900HX, NVIDIA GeForce RTX 4070 Laptop GPU (291 - 304, n=6) | |
| Lenovo Legion Pro 5 16IRX9 | |
| Alienware m16 R2 | |
| Asus ROG Zephyrus G16 2024 GU605M | |
| Lenovo Legion Pro 5 16IRX8 | |
| Mozilla Kraken 1.1 / Total | |
| Asus ROG Zephyrus G16 2024 GU605M | |
| Alienware m16 R2 | |
| Lenovo Legion Pro 5 16IRX8 | |
| Lenovo Legion Pro 5 16IRX9 | |
| Medio Intel Core i9-14900HX, NVIDIA GeForce RTX 4070 Laptop GPU (431 - 469, n=8) | |
| HP Omen Transcend 16-u1095ng | |
* ... más pequeño es mejor
| PCMark 10 Score | 8550 puntos | |
ayuda | ||
| AIDA64 / Memory Copy | |
| Asus ROG Zephyrus G16 2024 GU605M | |
| Lenovo Legion Pro 5 16IRX9 | |
| HP Omen Transcend 16-u1095ng | |
| Medio Intel Core i9-14900HX (38028 - 83392, n=36) | |
| MSI Stealth 16 Mercedes-AMG Motorsport A13VG | |
| Alienware m16 R2 | |
| Lenovo Legion Pro 5 16IRX8 | |
| AIDA64 / Memory Read | |
| Asus ROG Zephyrus G16 2024 GU605M | |
| Lenovo Legion Pro 5 16IRX9 | |
| HP Omen Transcend 16-u1095ng | |
| Medio Intel Core i9-14900HX (43306 - 87568, n=36) | |
| Alienware m16 R2 | |
| MSI Stealth 16 Mercedes-AMG Motorsport A13VG | |
| Lenovo Legion Pro 5 16IRX8 | |
| AIDA64 / Memory Write | |
| HP Omen Transcend 16-u1095ng | |
| Lenovo Legion Pro 5 16IRX9 | |
| Asus ROG Zephyrus G16 2024 GU605M | |
| MSI Stealth 16 Mercedes-AMG Motorsport A13VG | |
| Medio Intel Core i9-14900HX (37146 - 80589, n=36) | |
| Alienware m16 R2 | |
| Lenovo Legion Pro 5 16IRX8 | |
| AIDA64 / Memory Latency | |
| Asus ROG Zephyrus G16 2024 GU605M | |
| Alienware m16 R2 | |
| MSI Stealth 16 Mercedes-AMG Motorsport A13VG | |
| HP Omen Transcend 16-u1095ng | |
| Medio Intel Core i9-14900HX (76.1 - 105, n=36) | |
| Lenovo Legion Pro 5 16IRX9 | |
| Lenovo Legion Pro 5 16IRX8 | |
* ... más pequeño es mejor
Latencia del CPD
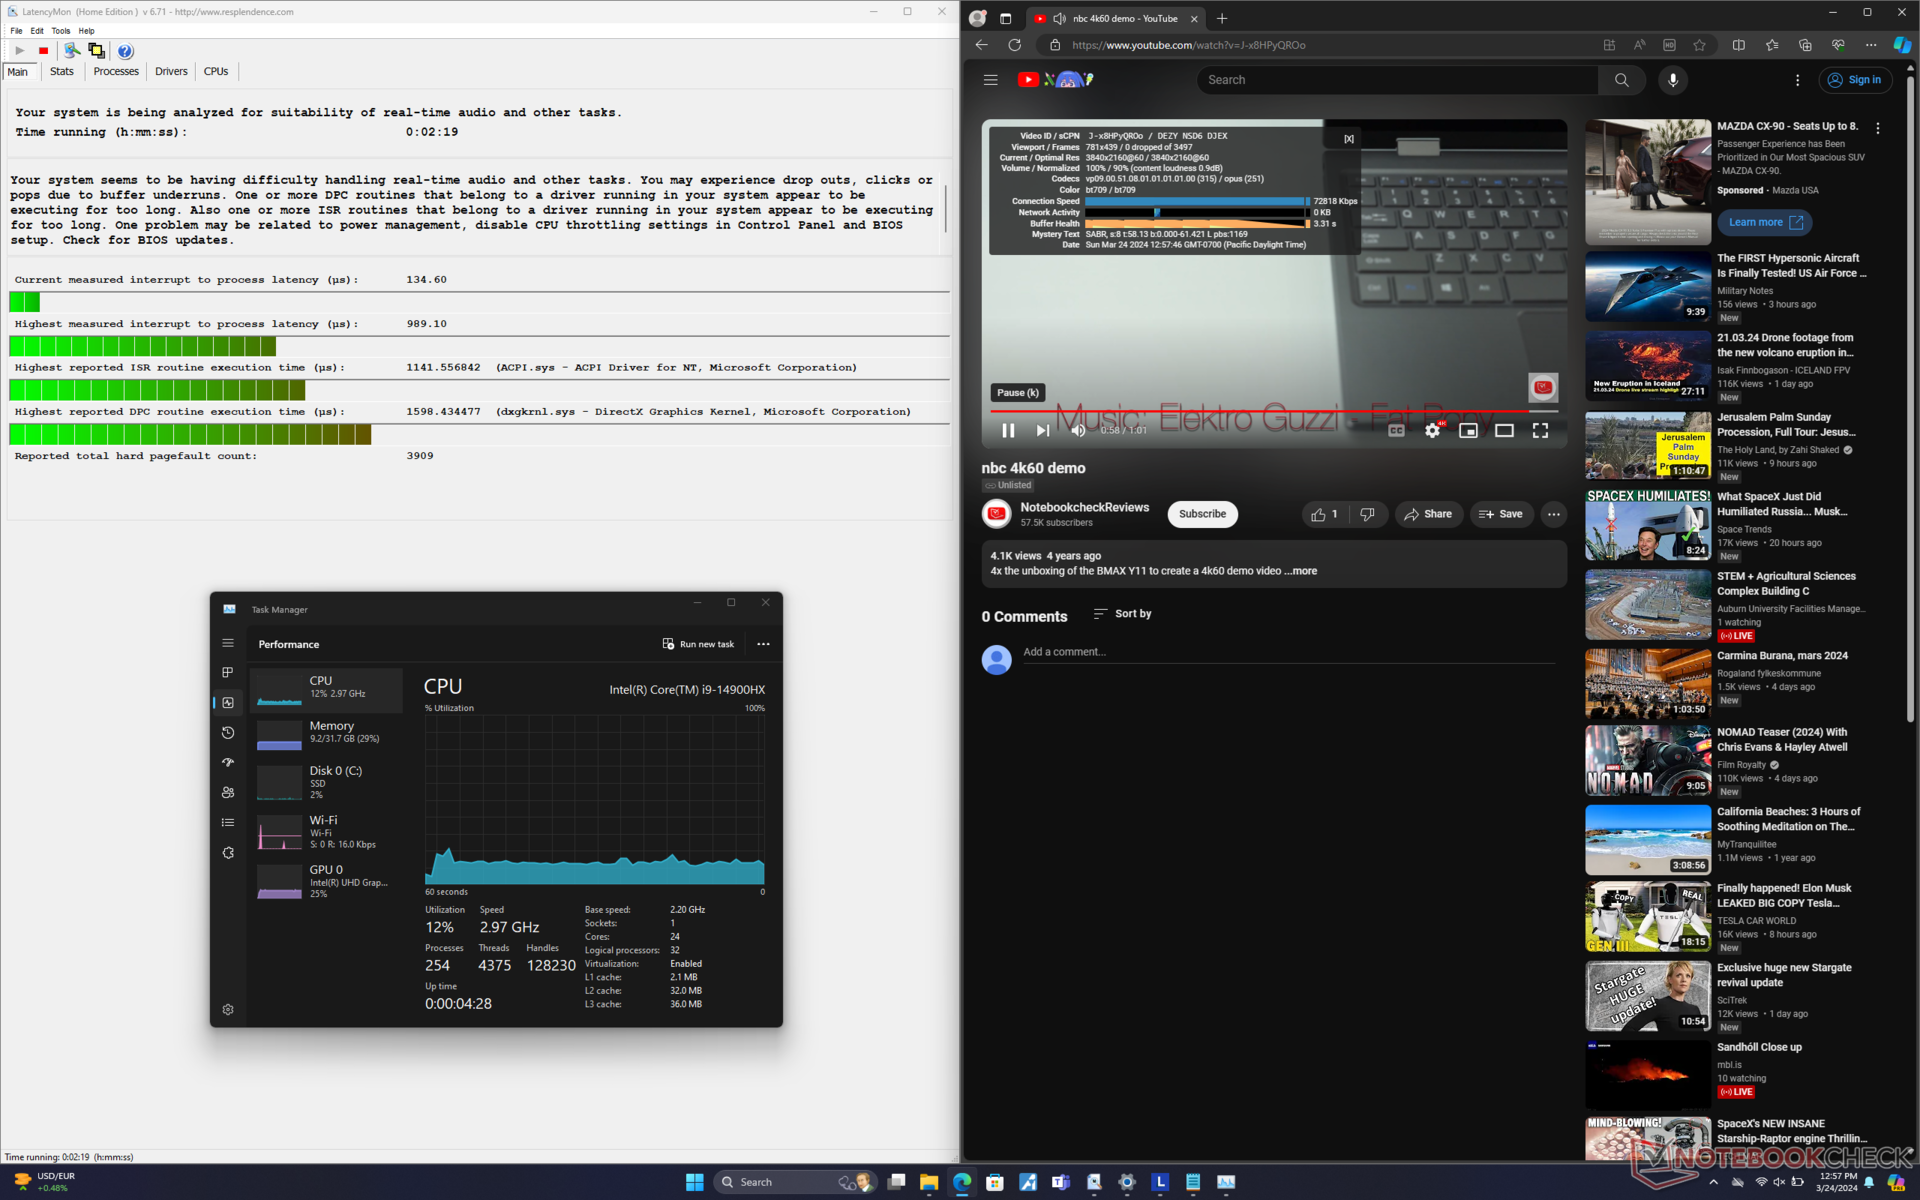
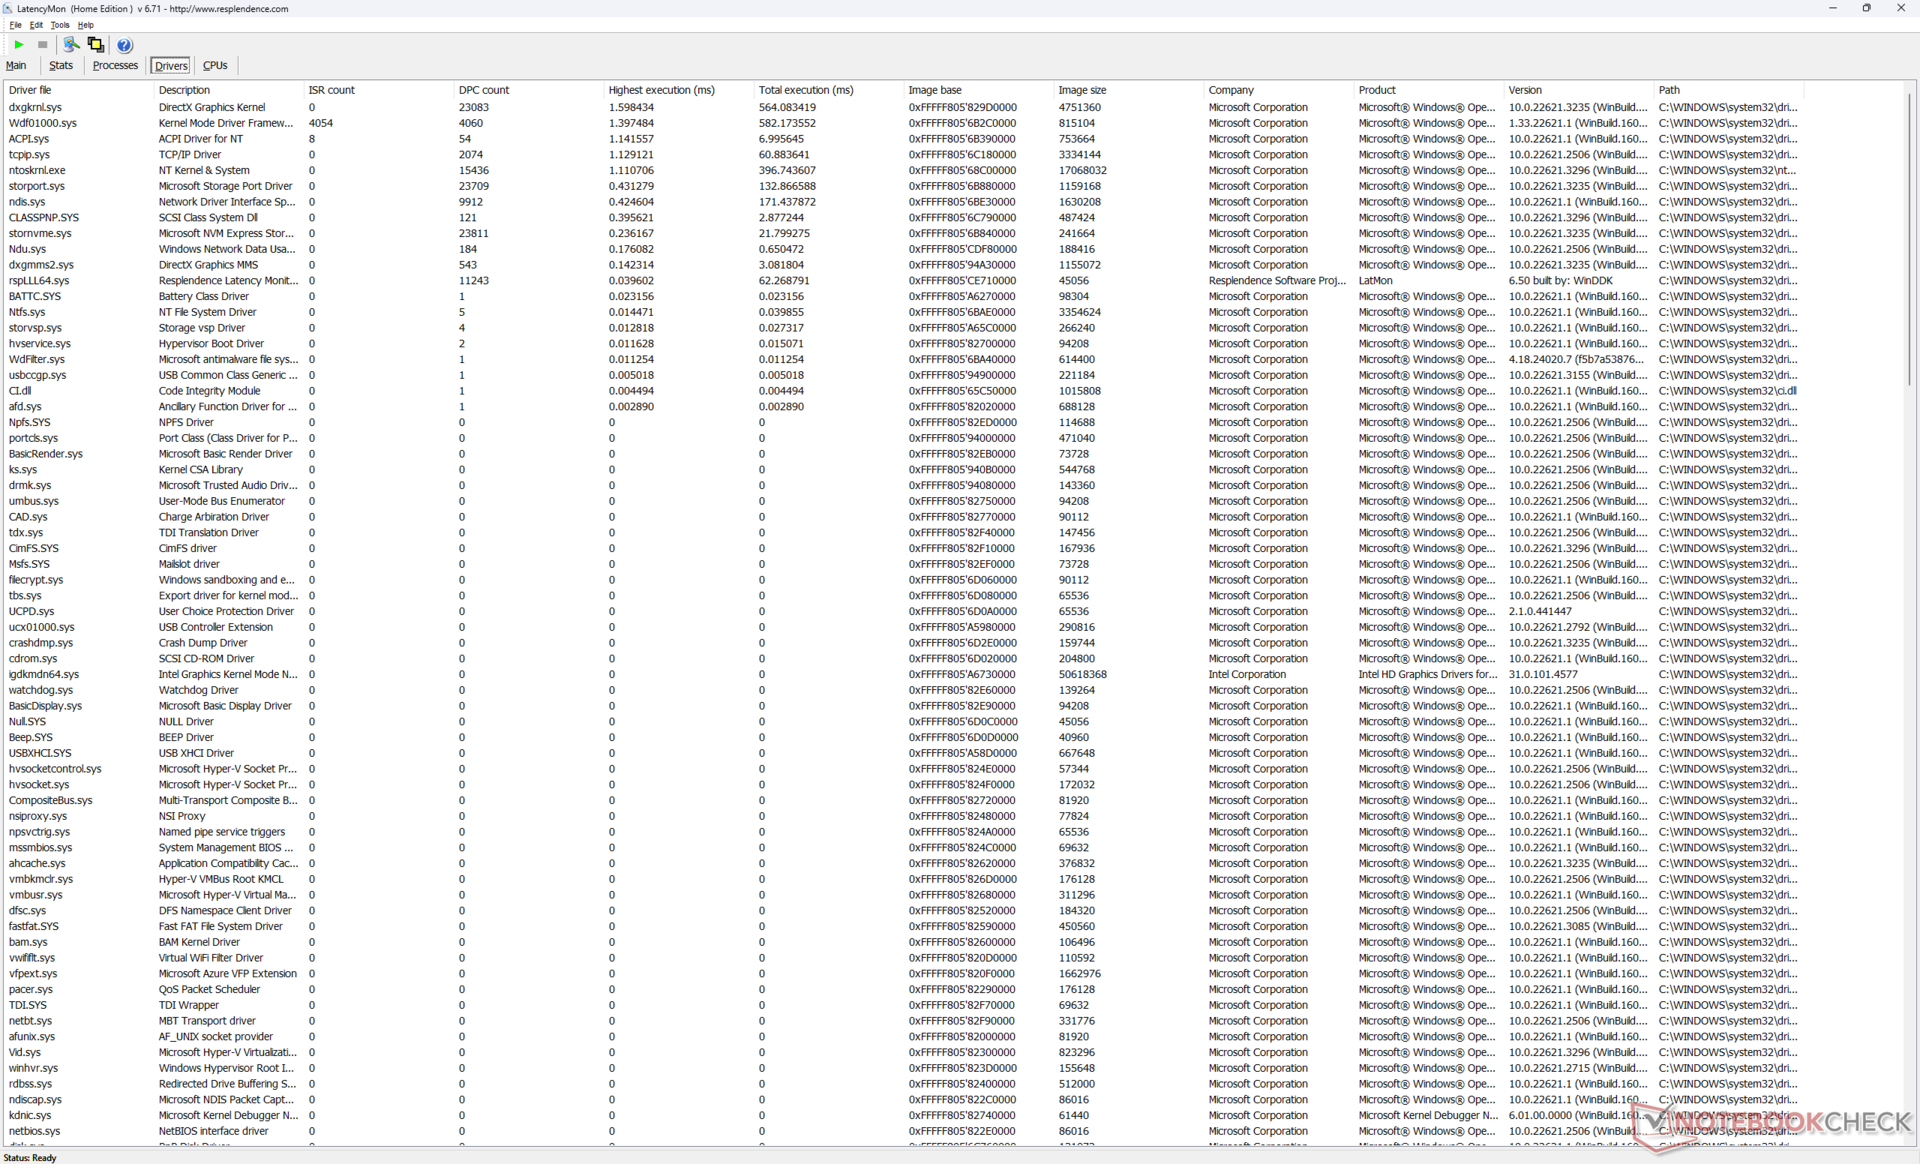
LatencyMon muestra problemas de CPD al abrir varias pestañas del navegador de nuestra página principal. por lo demás, la reproducción de vídeo 4K a 60 FPS es perfecta en el modo iGPU sin que se registren caídas de fotogramas.
| DPC Latencies / LatencyMon - interrupt to process latency (max), Web, Youtube, Prime95 | |
| MSI Stealth 16 Mercedes-AMG Motorsport A13VG | |
| Asus ROG Zephyrus G16 2024 GU605M | |
| Alienware m16 R2 | |
| HP Omen Transcend 16-u1095ng | |
| Lenovo Legion Pro 5 16IRX9 | |
| Lenovo Legion Pro 5 16IRX8 | |
* ... más pequeño es mejor
Dispositivos de almacenamiento
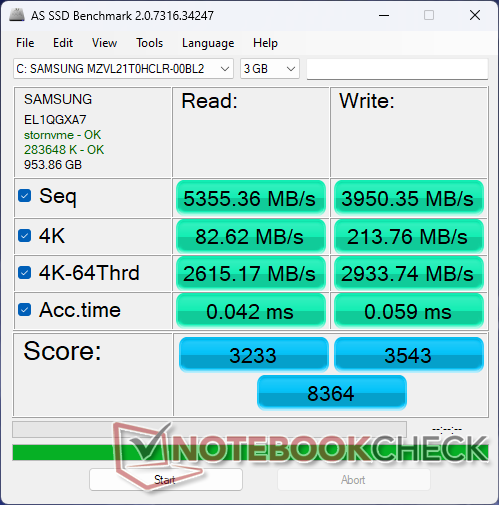
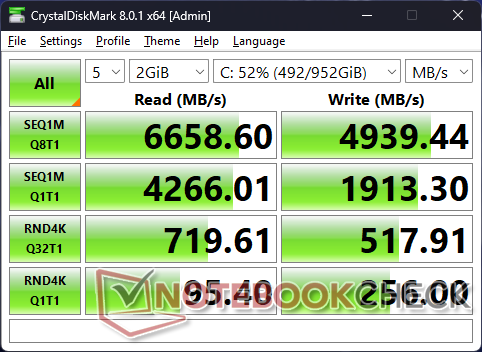
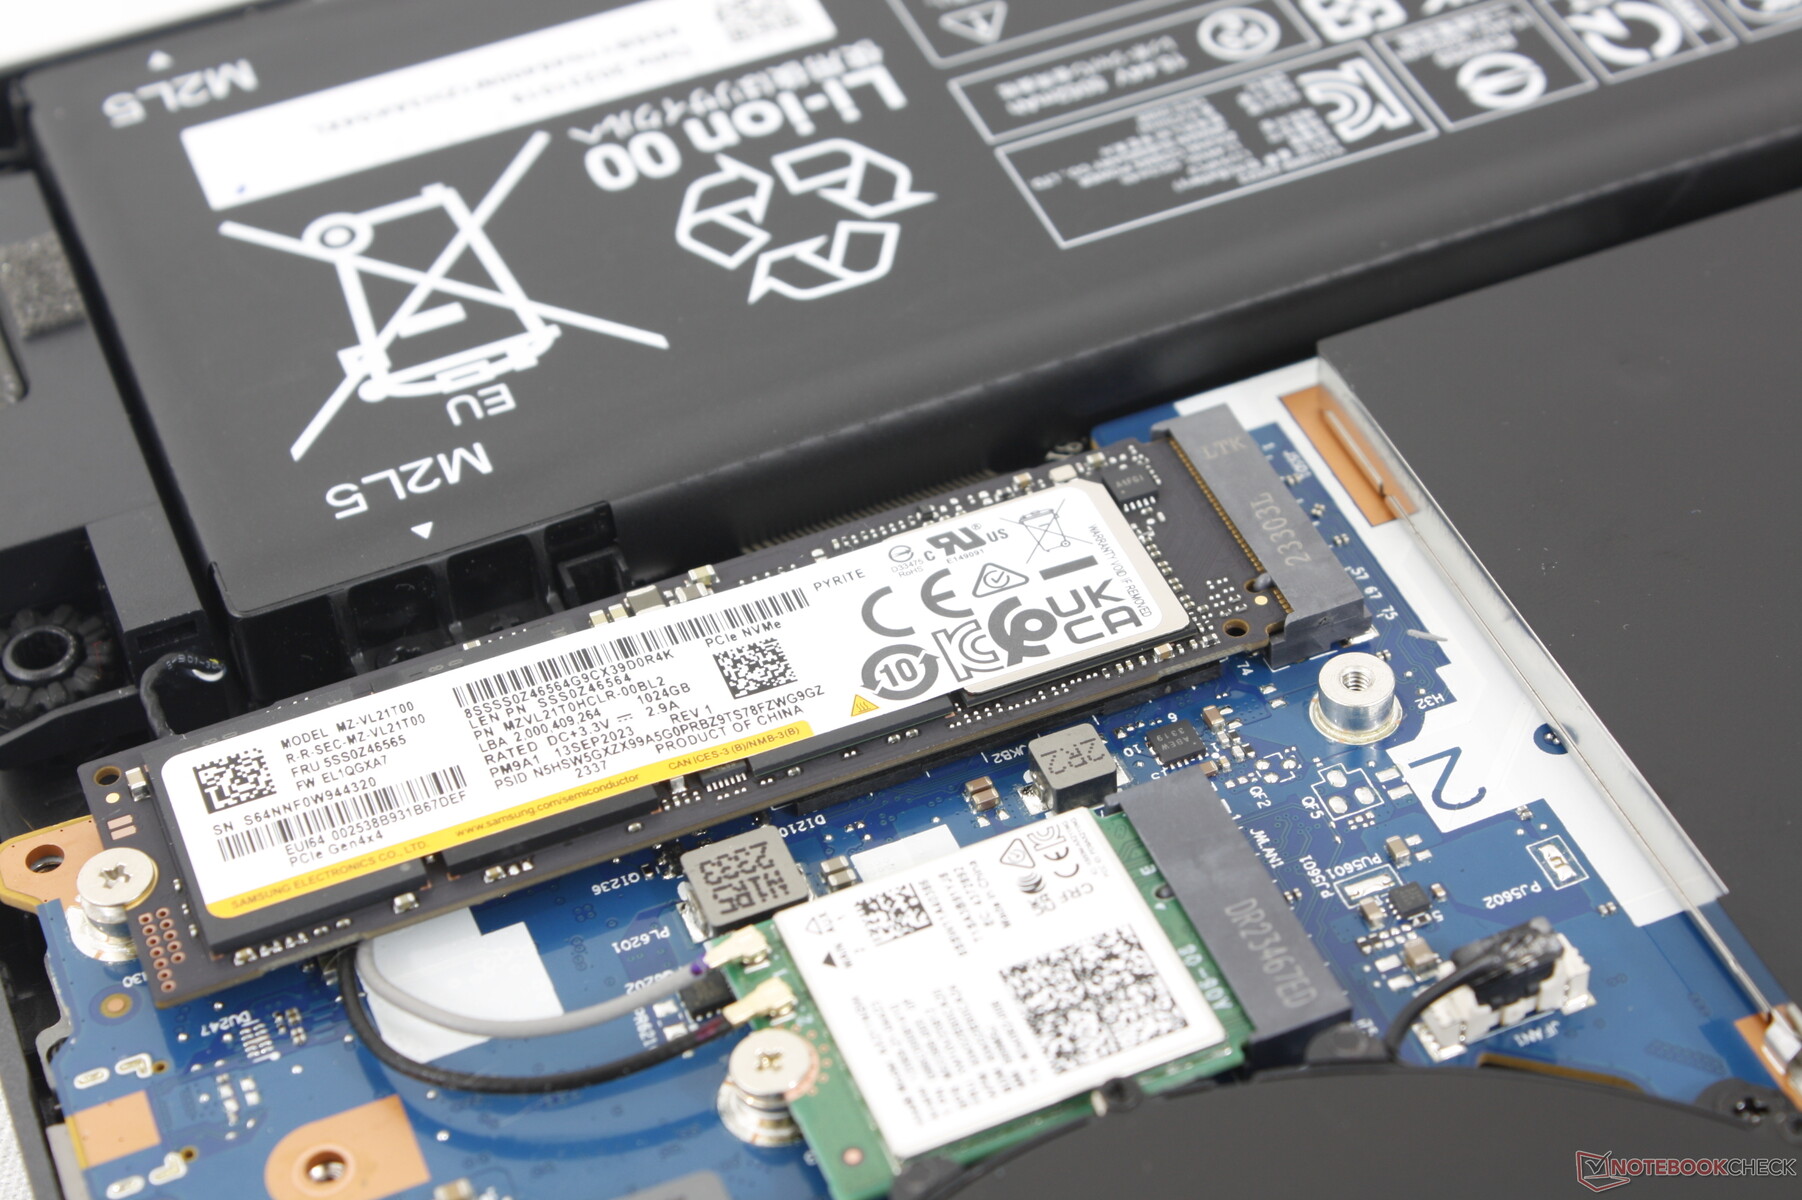
Nuestra unidad se envía con el Samsung PM9A1 en lugar del SK Hynix PC801 que se encuentra en el Legion Pro 5 16IRX8 del año pasado. Curiosamente, nuestra unidad Samsung mostraba estrangulamiento con tasas de transferencia que caían de 6600 MB/s a sólo 3300 MB/s a mitad de nuestra prueba de bucle DiskSpd. Mientras tanto, la unidad SK Hynix del modelo del año pasado no tendría problemas para mantener tasas de transferencia mucho más altas en condiciones similares, tal y como muestra nuestro gráfico comparativo a continuación. Desgraciadamente, no hay una forma fácil de saber con qué unidad SSD saldrá el modelo antes de comprarlo.

* ... más pequeño es mejor
Disk Throttling: DiskSpd Read Loop, Queue Depth 8
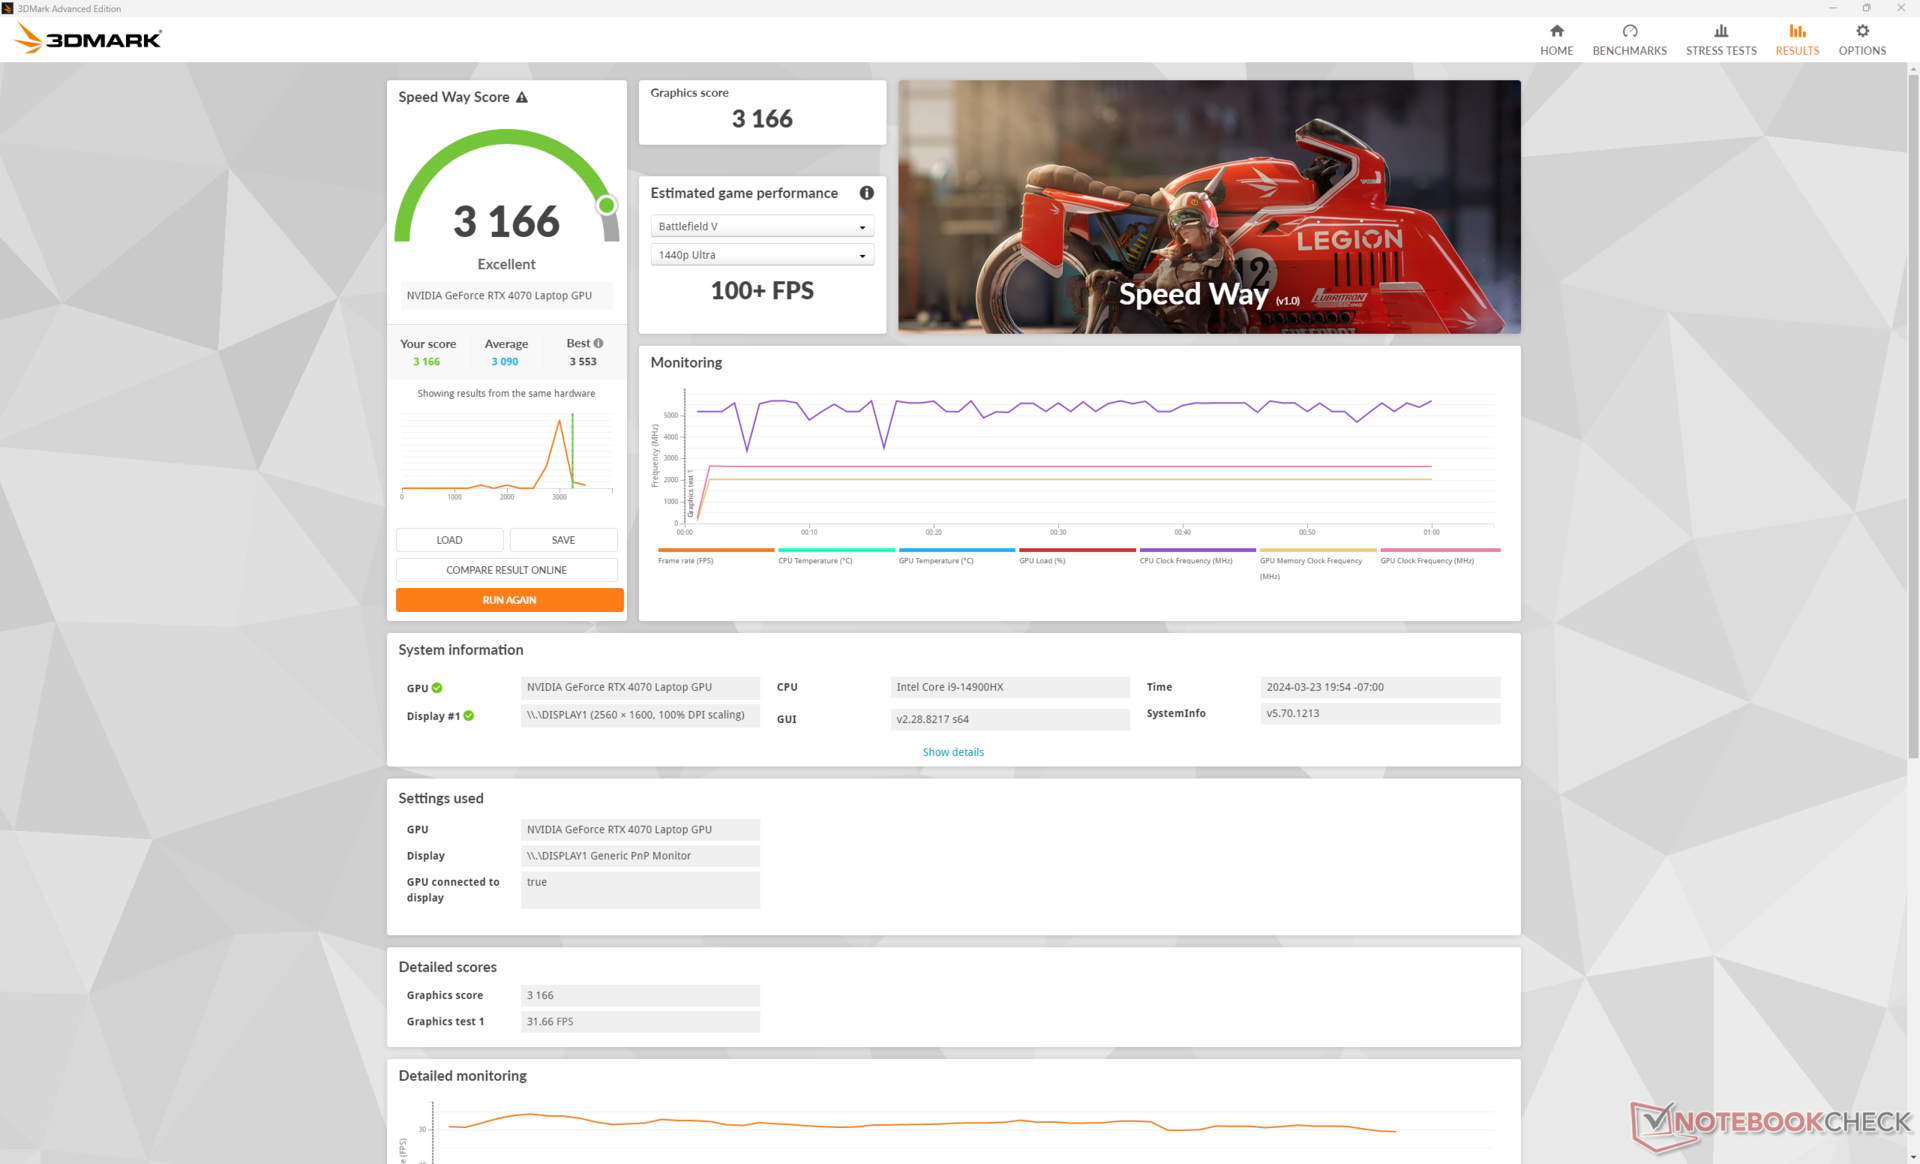
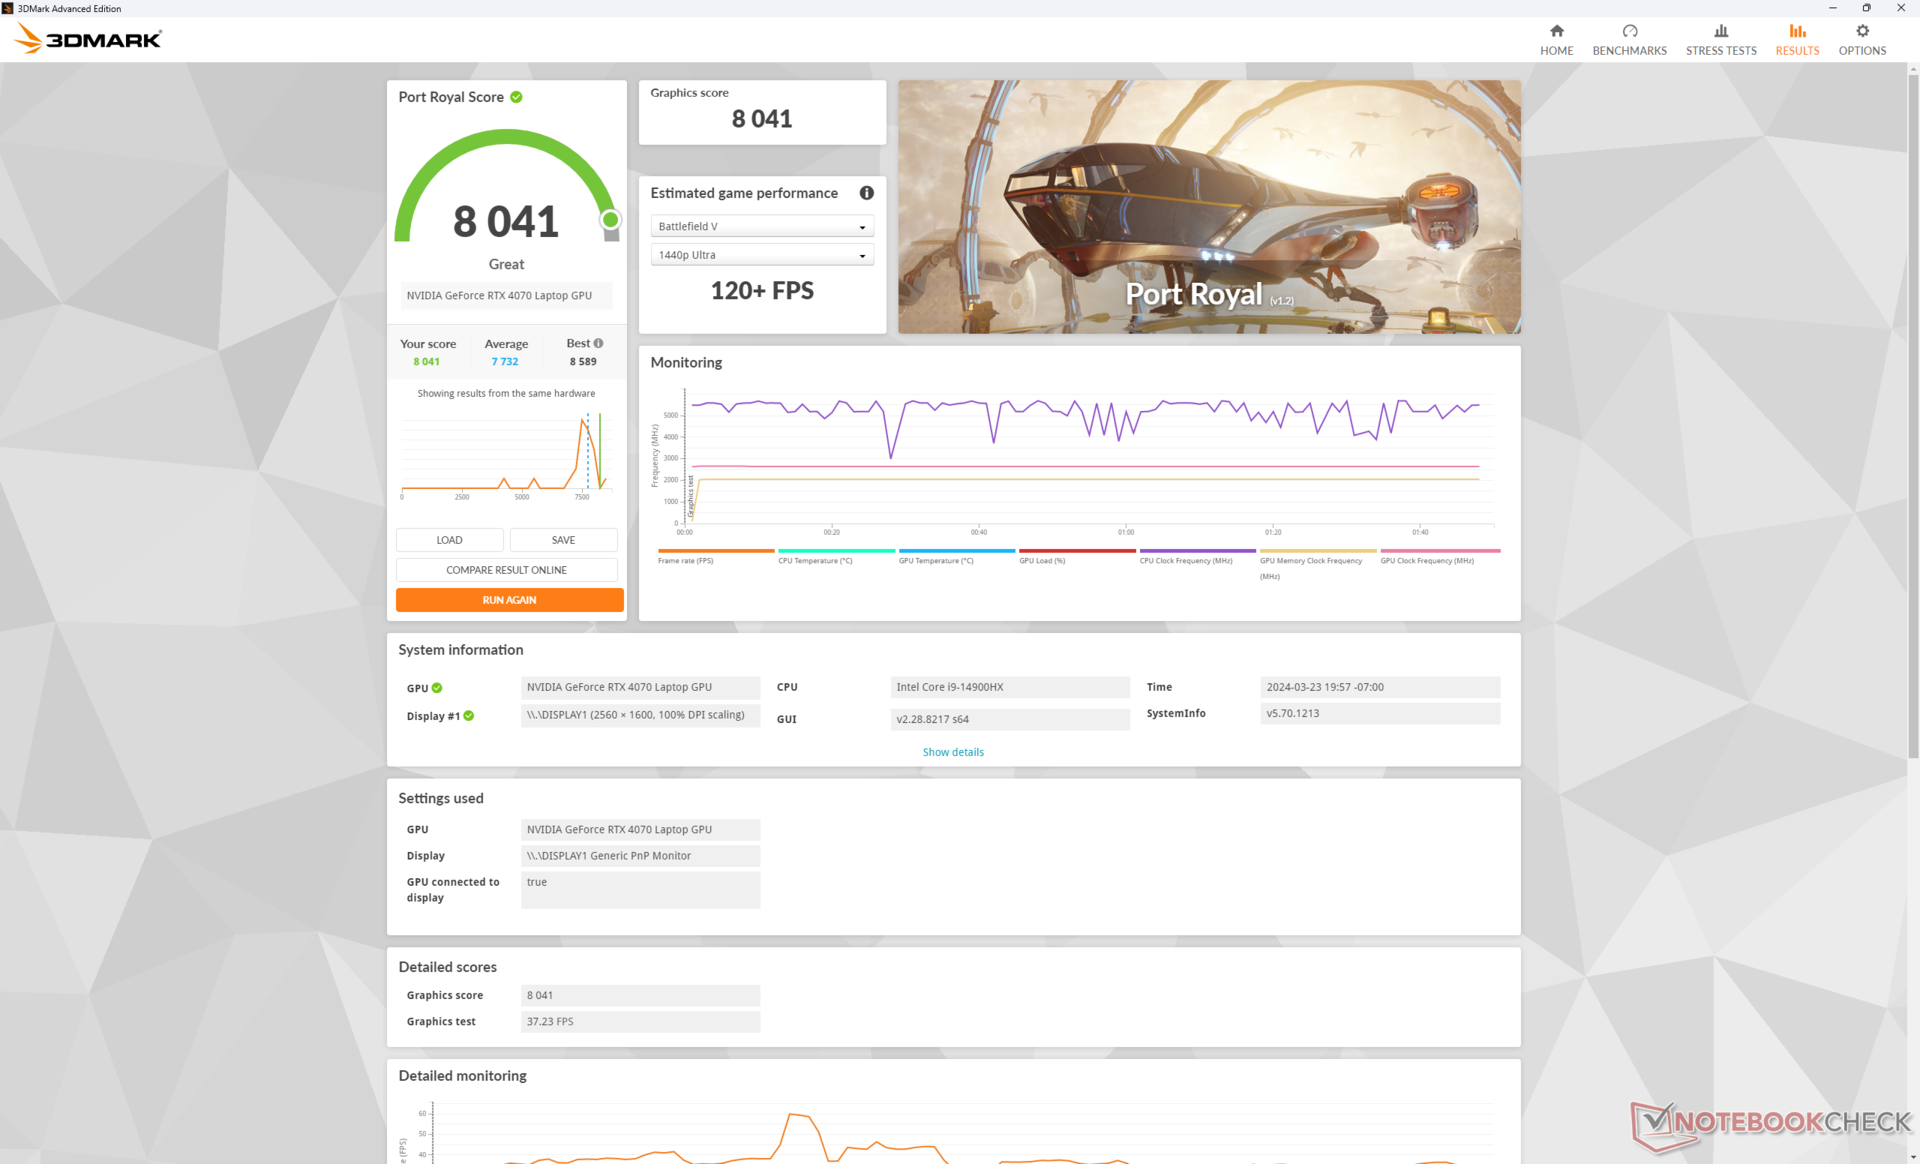
Rendimiento de la GPU
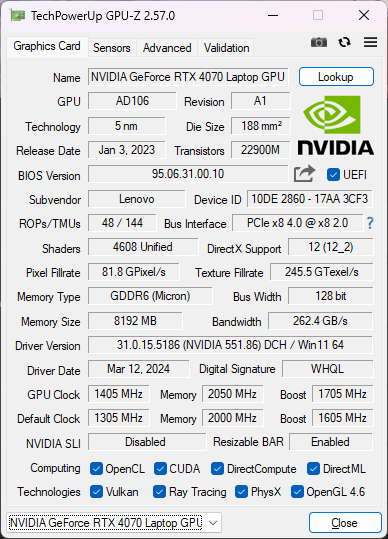
Las opciones gráficas incluyen las GeForce RTX 4050, 4060 y 4070 con el mismo objetivo TGP de 140 W. Estamos dispuestos a apostar que el modelo puede soportar las más rápidas RTX 4080 y 4090 más rápidas dado su tamaño y peso, pero Lenovo quiere reservar esas opciones de gama alta para la serie Legion Pro 7, más costosa. No obstante, el RTX 4070 en nuestro Legion Pro 5 16 se ejecuta muy bien con resultados de referencia que son hasta un 15 por ciento más rápidos que la media de portátiles de nuestra base de datos con la misma opción de GPU.
El cambio a la RTX 4060 o 4050 se espera que afecte al rendimiento gráfico en un 10 a 20 por ciento y un 25 a 35 por ciento, respectivamente. Los usuarios que actualicen desde una RTX 3070 Ti no verán beneficios significativos a menos que el título sea compatible con DLSS 3, ya que la función sigue siendo exclusiva de las GPU RTX 40 Ada Lovelace.
| Perfil de potencia | Puntuación gráfica | Puntuación de física | Puntuación combinada |
| Modo Rendimiento | 31105 | 35822 | 11823 |
| Modo equilibrado | 29127 (-6%) | 37119 (+4%) | 11040 (-7%) |
| Batería | 21813 (-29%) | 21747 (-39%) | 6324 (-47%) |
Si configuramos el sistema en modo Equilibrado en lugar de en modo Rendimiento, el rendimiento de la GPU se reducirá sólo ligeramente, en torno a un 6%, mientras que el rendimiento de la CPU no se verá afectado.
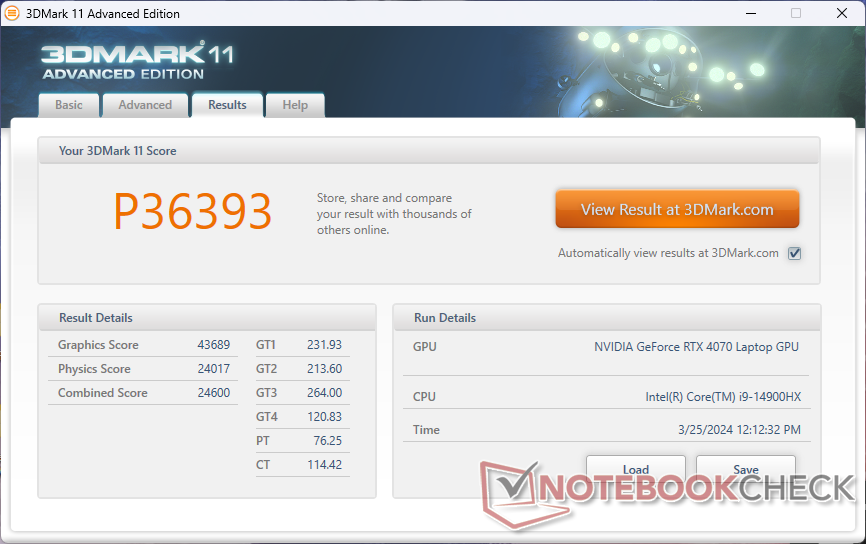
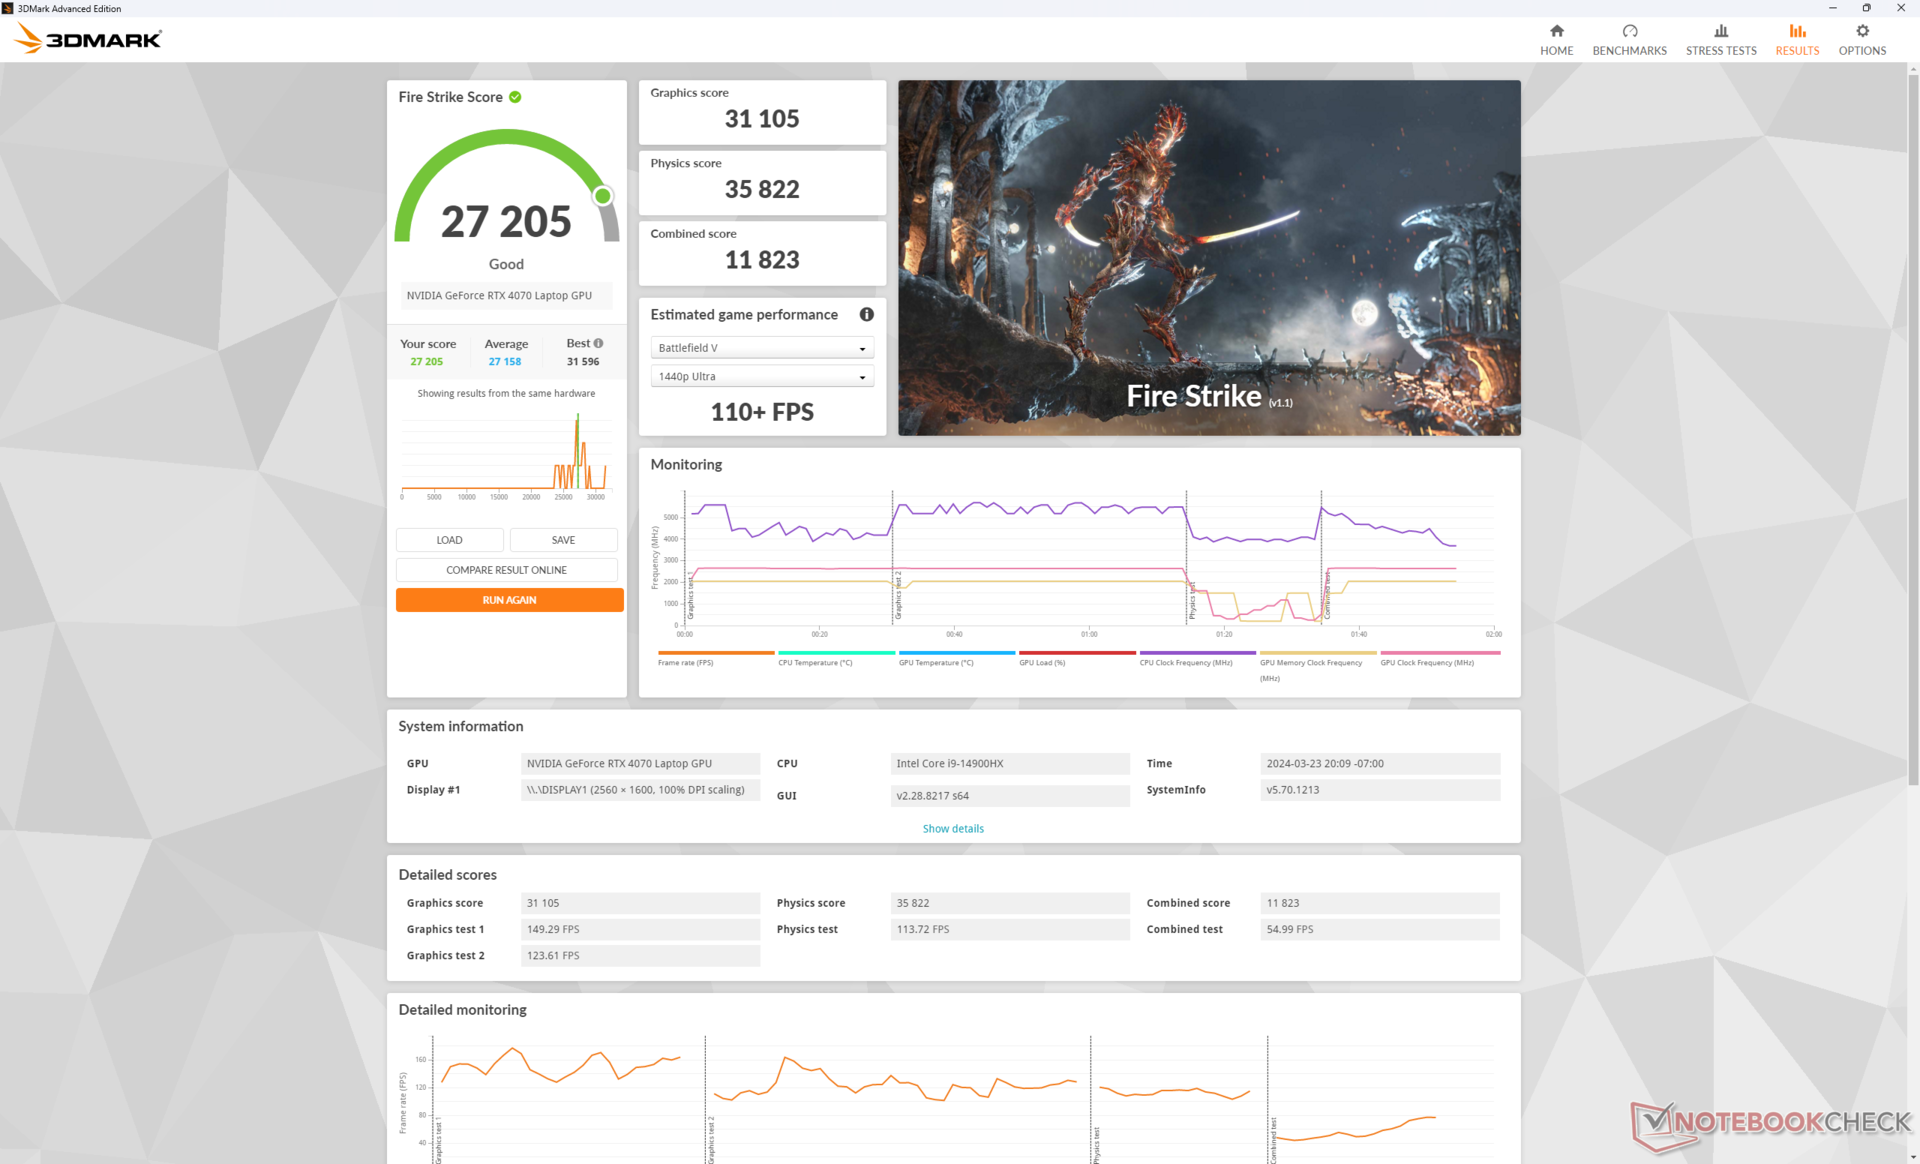
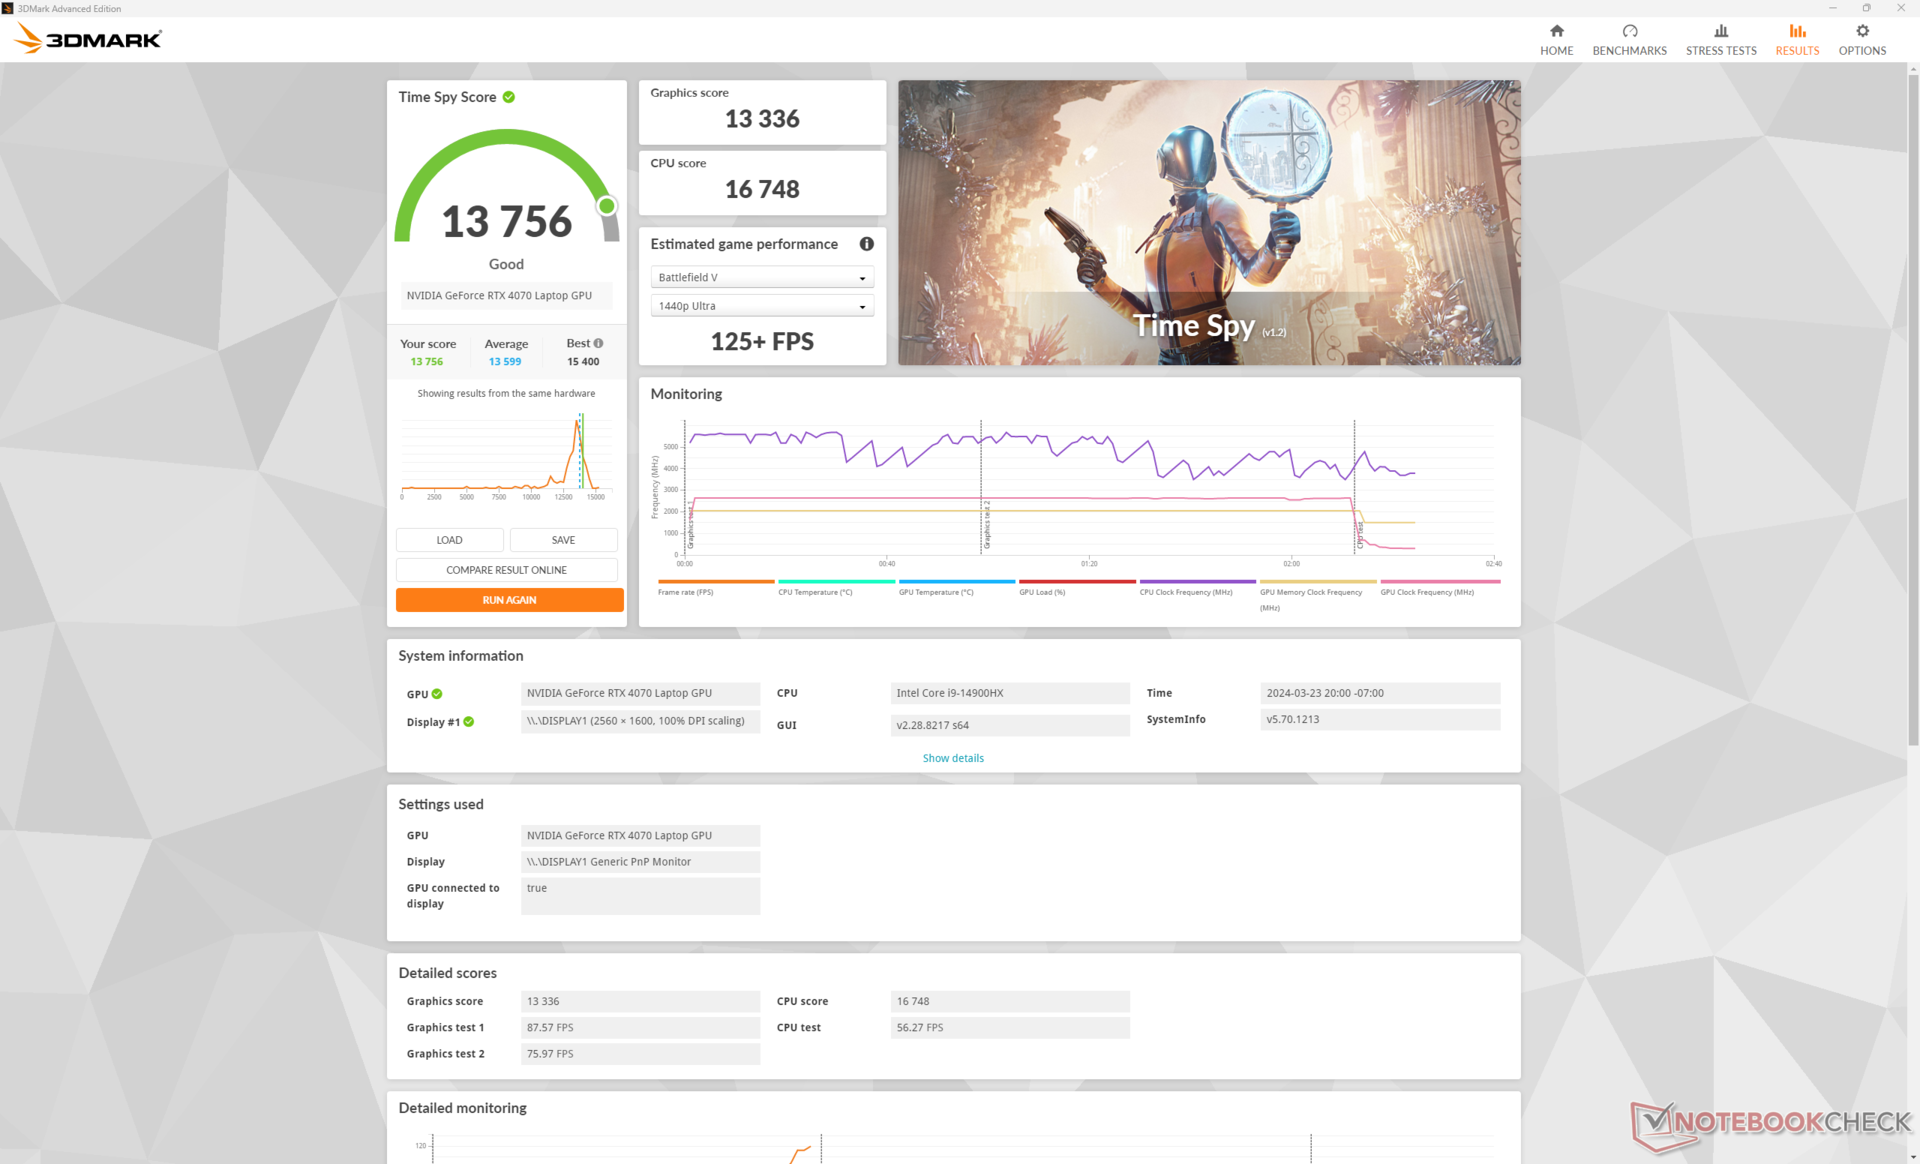
| 3DMark 11 Performance | 36393 puntos | |
| 3DMark Fire Strike Score | 27205 puntos | |
| 3DMark Time Spy Score | 13756 puntos | |
ayuda | ||
* ... más pequeño es mejor
Rendimiento en juegos
Nuestro Lenovo supera casi sistemáticamente al Alienware m16 R2 entre un 5 y un 10 por ciento a pesar de que ambos vienen con la misma GPU GeForce RTX 4070 de 140 W. Es probable que la diferencia se deba a nuestra CPU Core i9-14900HX, más rápida, mientras que el Alienware viene con la Core Ultra 7 155H en su lugar.
La RTX 4070 móvil rinde mal en resoluciones 4K, ya que es mucho más débil que una RTX 4070 de sobremesa "adecuada". Para estos escenarios, usted querrá habilitar DLSS 2 y / o generación de fotogramas siempre que sea aplicable para obtener velocidades de fotogramas más suaves. Por ejemplo, ejecutar Cyberpunk 2077 a 4K nativos con ajustes Ultra y sin RT daría como resultado una tasa de fotogramas media de sólo 21. Sin embargo, si se activa DLSS 3 en equilibrado, la tasa media de fotogramas saltaría a 64.
Witcher 3 FPS Chart
| bajo | medio | alto | ultra | QHD | 4K | |
|---|---|---|---|---|---|---|
| GTA V (2015) | 186.7 | 184.9 | 181.7 | 127.2 | 100.1 | 99.8 |
| The Witcher 3 (2015) | 607.3 | 448.7 | 268.3 | 133.7 | 83.5 | |
| Dota 2 Reborn (2015) | 231 | 205 | 196.7 | 185.3 | 153.3 | |
| Final Fantasy XV Benchmark (2018) | 205 | 185.9 | 131 | 95.1 | 52.8 | |
| X-Plane 11.11 (2018) | 188.3 | 173.3 | 137.6 | 120.3 | ||
| Far Cry 5 (2018) | 191 | 183 | 170 | 158 | 128 | 65 |
| Strange Brigade (2018) | 496 | 340 | 268 | 234 | 150.9 | 77.9 |
| Tiny Tina's Wonderlands (2022) | 283.4 | 230.6 | 151.4 | 115.9 | 79.5 | 36.9 |
| F1 22 (2022) | 320 | 312 | 245 | 88.7 | 58.8 | 27.6 |
| Baldur's Gate 3 (2023) | 176 | 150.8 | 128.5 | 125.6 | 89.6 | 45.2 |
| Cyberpunk 2077 (2023) | 143.4 | 124 | 102.2 | 87.1 | 52.8 | 23.5 |
Emisiones
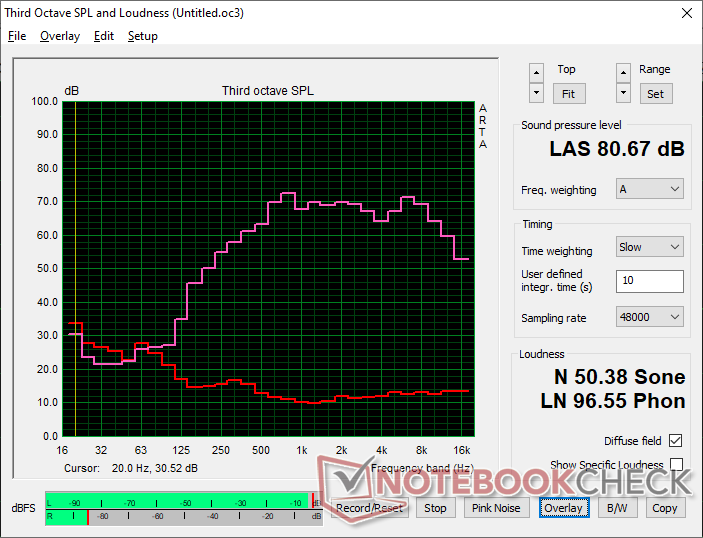
Ruido del sistema
El ruido del ventilador es en general más fuerte que el que registramos en el modelo Core i7 y RTX 4060 del año pasado, potencialmente debido a nuestra configuración más rápida de Core i9 y RTX 4070. Cuando se ejecutan cargas poco exigentes, como navegadores o vídeo, el ruido del ventilador suele rondar justo por debajo de los 30 dB(A), lo que resulta prácticamente inaudible en la mayoría de los escenarios. Cuando se ejecuta 3DMark 06, sin embargo, los ventiladores ganan velocidad con bastante rapidez, incluso cuando se configura en modo equilibrado.
Curiosamente, el ruido de los ventiladores al jugar en modo Equilibrado es idéntico al del modo Rendimiento, con 51 dB(A). Esto es apoyado por nuestras mediciones de la Prueba de Estrés arriba, donde las temperaturas del núcleo serían notablemente más frías en el modo Equilibrado. Como resultado, recomendamos jugar en modo Rendimiento ya que el modo Equilibrado no ofrece una experiencia notablemente más silenciosa. Con más de 50 dB(A), el Lenovo va a ser más ruidoso que la mayoría de los otros portátiles para juegos independientemente de ello.
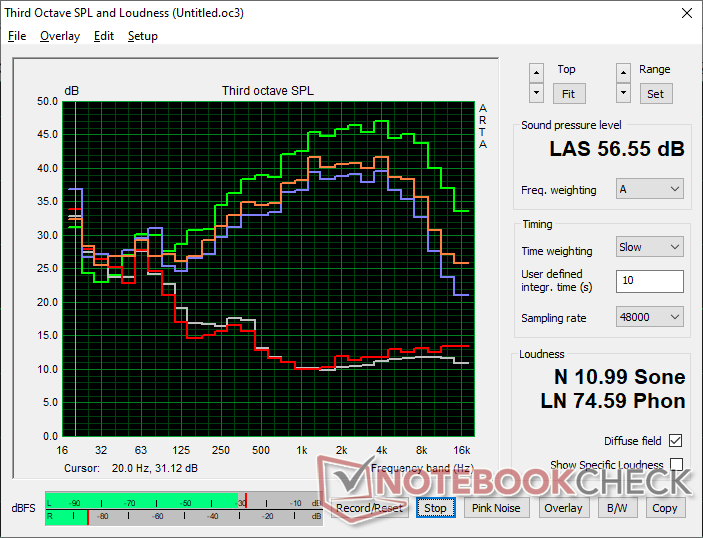
Ruido
| Ocioso |
| 24.3 / 24.3 / 28.9 dB(A) |
| Carga |
| 45.8 / 56.6 dB(A) |
 | ||
30 dB silencioso 40 dB(A) audible 50 dB(A) ruidosamente alto |
||
min: | ||
| Lenovo Legion Pro 5 16IRX9 GeForce RTX 4070 Laptop GPU, i9-14900HX, Samsung PM9A1 MZVL21T0HCLR | Lenovo Legion Pro 5 16IRX8 GeForce RTX 4060 Laptop GPU, i7-13700HX, SK hynix PC801 HFS512GEJ9X115N | Alienware m16 R2 GeForce RTX 4070 Laptop GPU, Ultra 7 155H, Samsung PM9A1 MZVL21T0HCLR | HP Omen Transcend 16-u1095ng GeForce RTX 4070 Laptop GPU, i9-14900HX, Kioxia XG8 KXG80ZNV1T02 | Asus ROG Zephyrus G16 2024 GU605M GeForce RTX 4070 Laptop GPU, Ultra 7 155H, WD PC SN560 SDDPNQE-1T00 | MSI Stealth 16 Mercedes-AMG Motorsport A13VG GeForce RTX 4070 Laptop GPU, i9-13900H, Samsung PM9A1 MZVL22T0HBLB | |
|---|---|---|---|---|---|---|
| Noise | 8% | 2% | -2% | 5% | 4% | |
| apagado / medio ambiente * (dB) | 23.9 | 23 4% | 24.7 -3% | 24 -0% | 23.9 -0% | 25 -5% |
| Idle Minimum * (dB) | 24.3 | 23.1 5% | 25.3 -4% | 29 -19% | 23.9 2% | 25 -3% |
| Idle Average * (dB) | 24.3 | 23.1 5% | 25.3 -4% | 30 -23% | 27.8 -14% | 26 -7% |
| Idle Maximum * (dB) | 28.9 | 26.6 8% | 25.3 12% | 31 -7% | 30.1 -4% | 27 7% |
| Load Average * (dB) | 45.8 | 34.7 24% | 31.7 31% | 45 2% | 34.2 25% | 39 15% |
| Witcher 3 ultra * (dB) | 51 | 47.6 7% | 53.8 -5% | 44 14% | 46.4 9% | 45 12% |
| Load Maximum * (dB) | 56.6 | 54.8 3% | 62 -10% | 47 17% | 46.4 18% | 51 10% |
* ... más pequeño es mejor
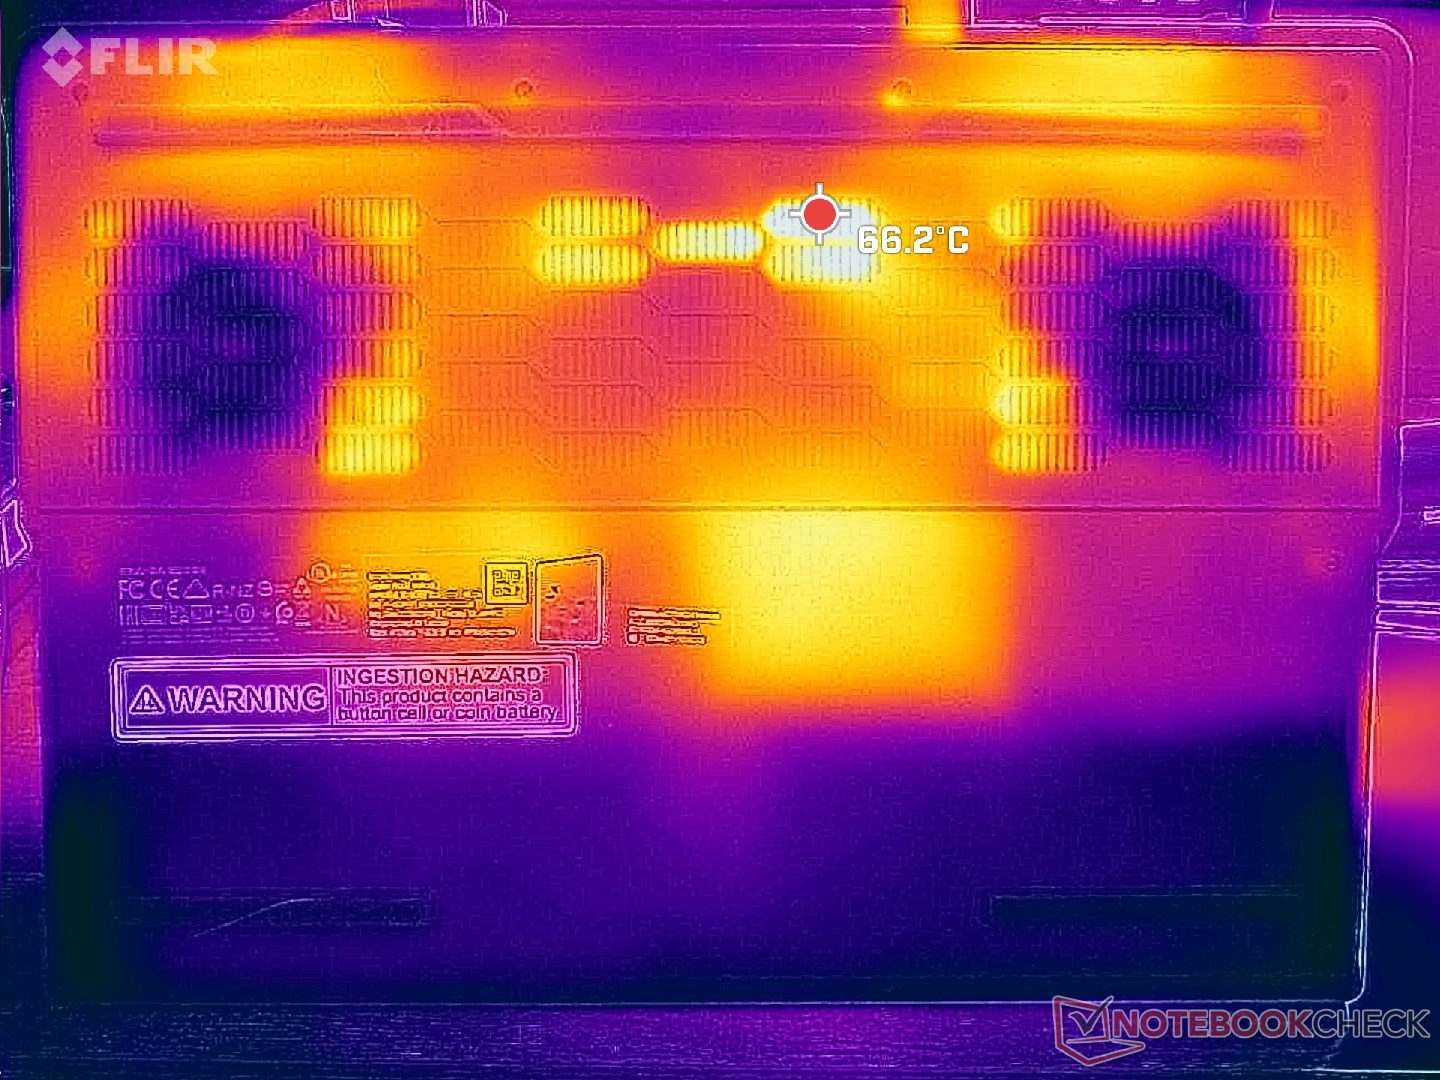
Temperatura
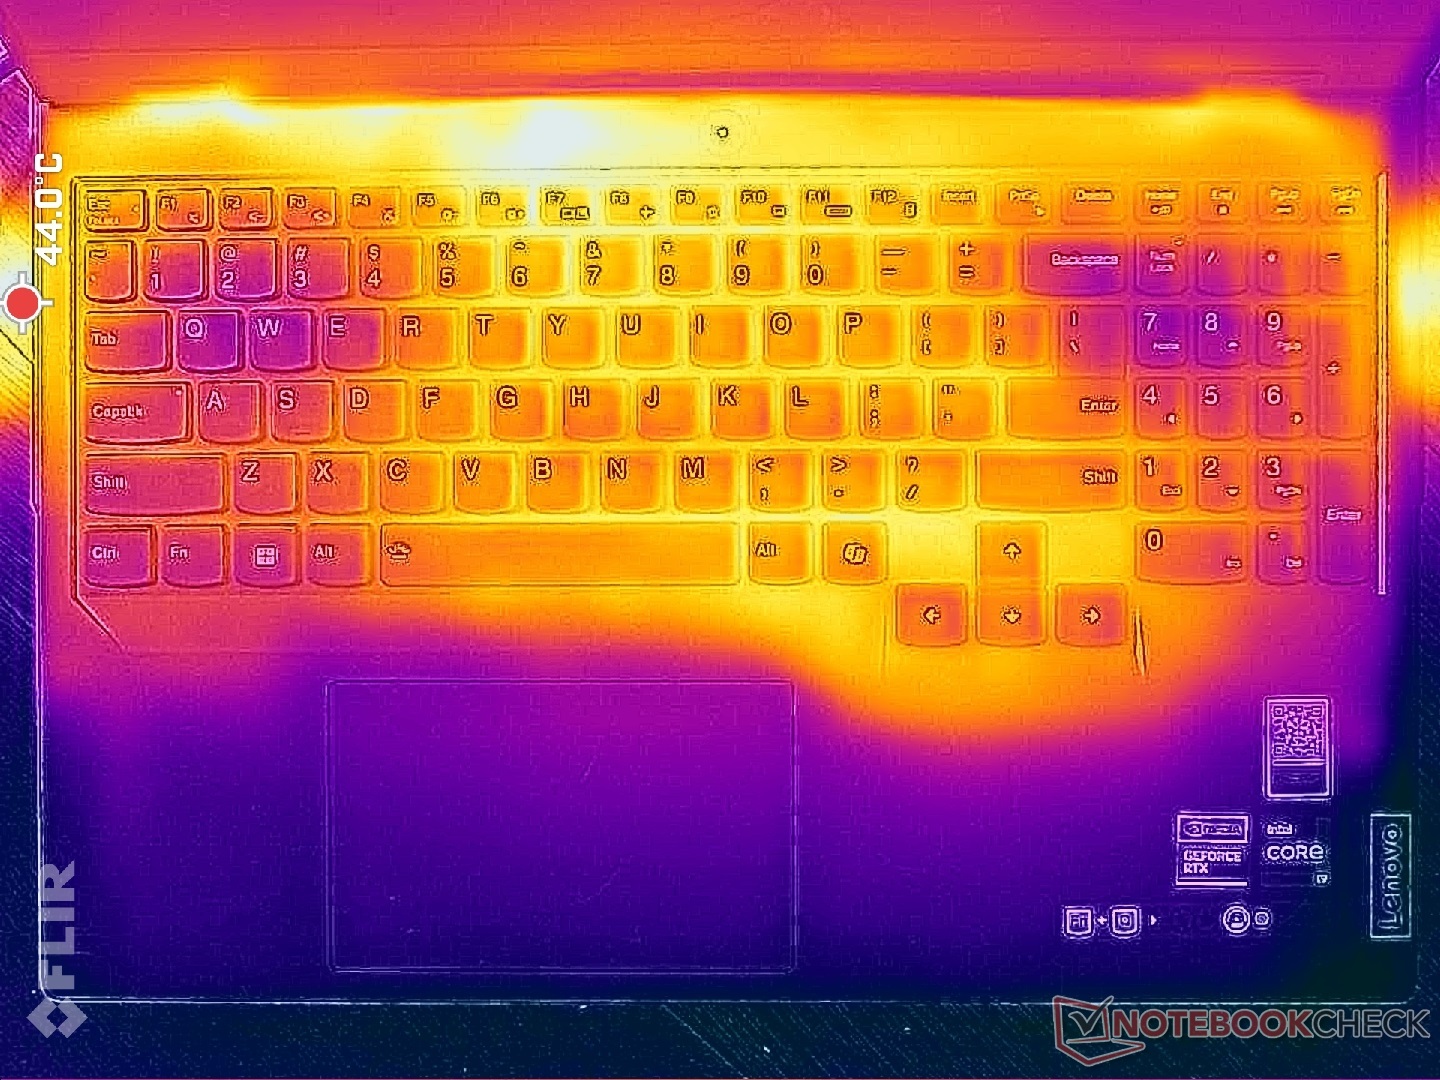
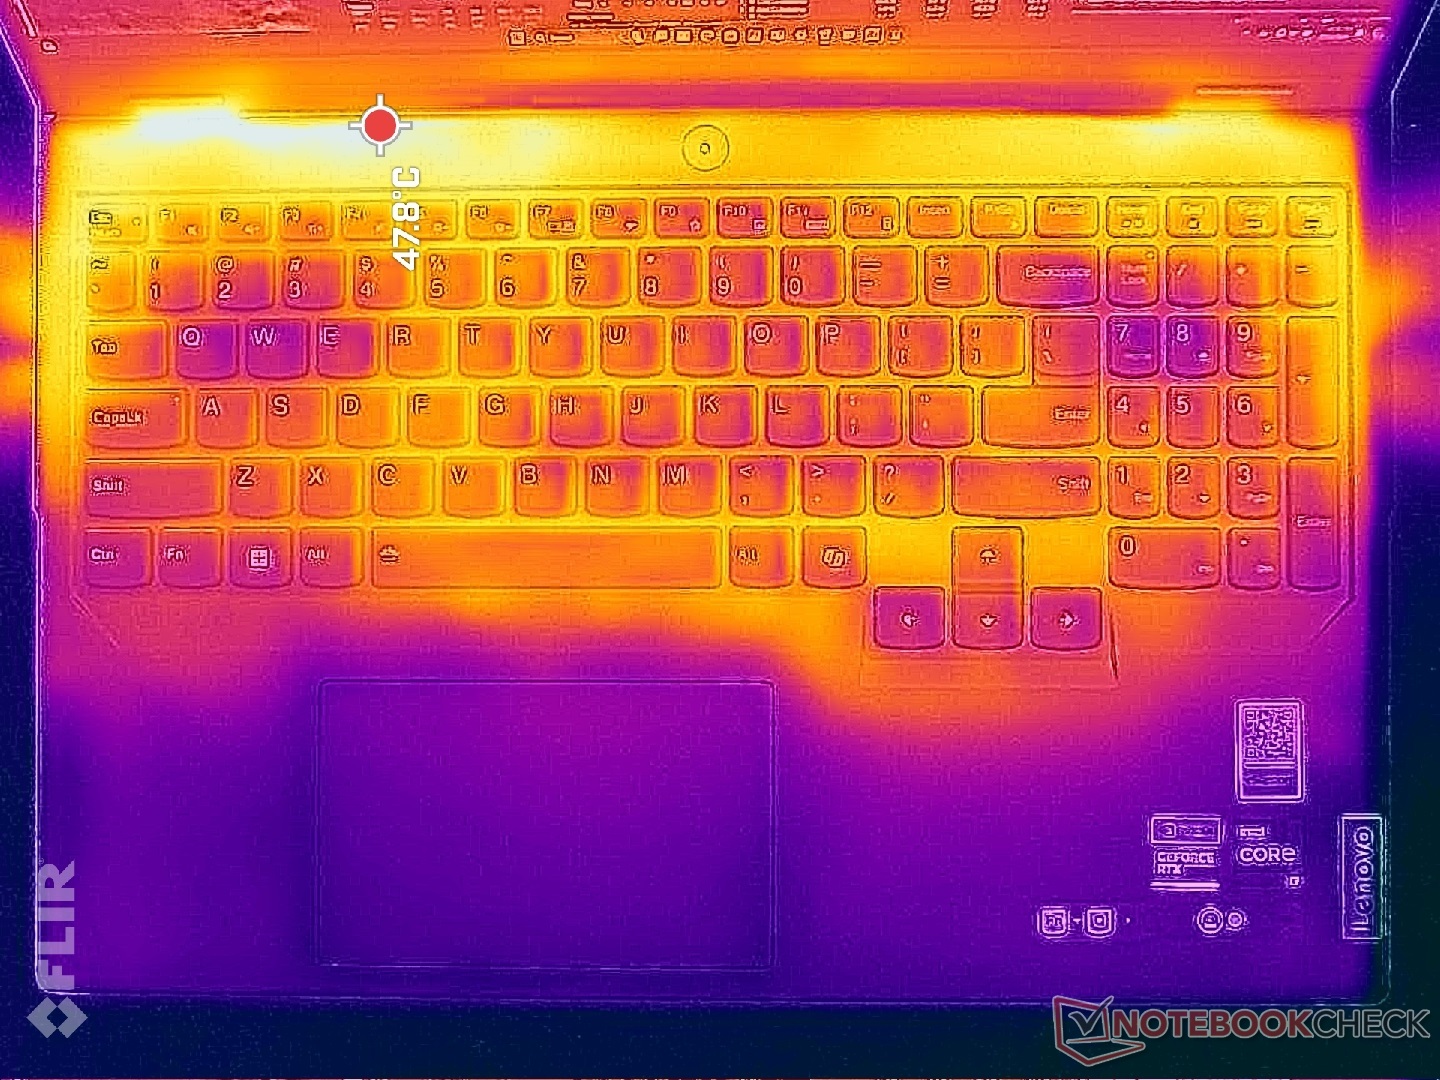
Las temperaturas de la superficie pueden ser más cálidas que las que registramos en el modelo del año pasado. Cuando se juega, por ejemplo, gran parte del teclado estaría a 40 C en comparación con los sólo 36 C del Legion Pro 5 16IRX8 o los 34 C del Alienware m16 R2. Los reposamanos y las teclas WASD permanecerían más fríos para mantener las manos cómodas cuando se juega, pero el resto del portátil estará bastante tostado.
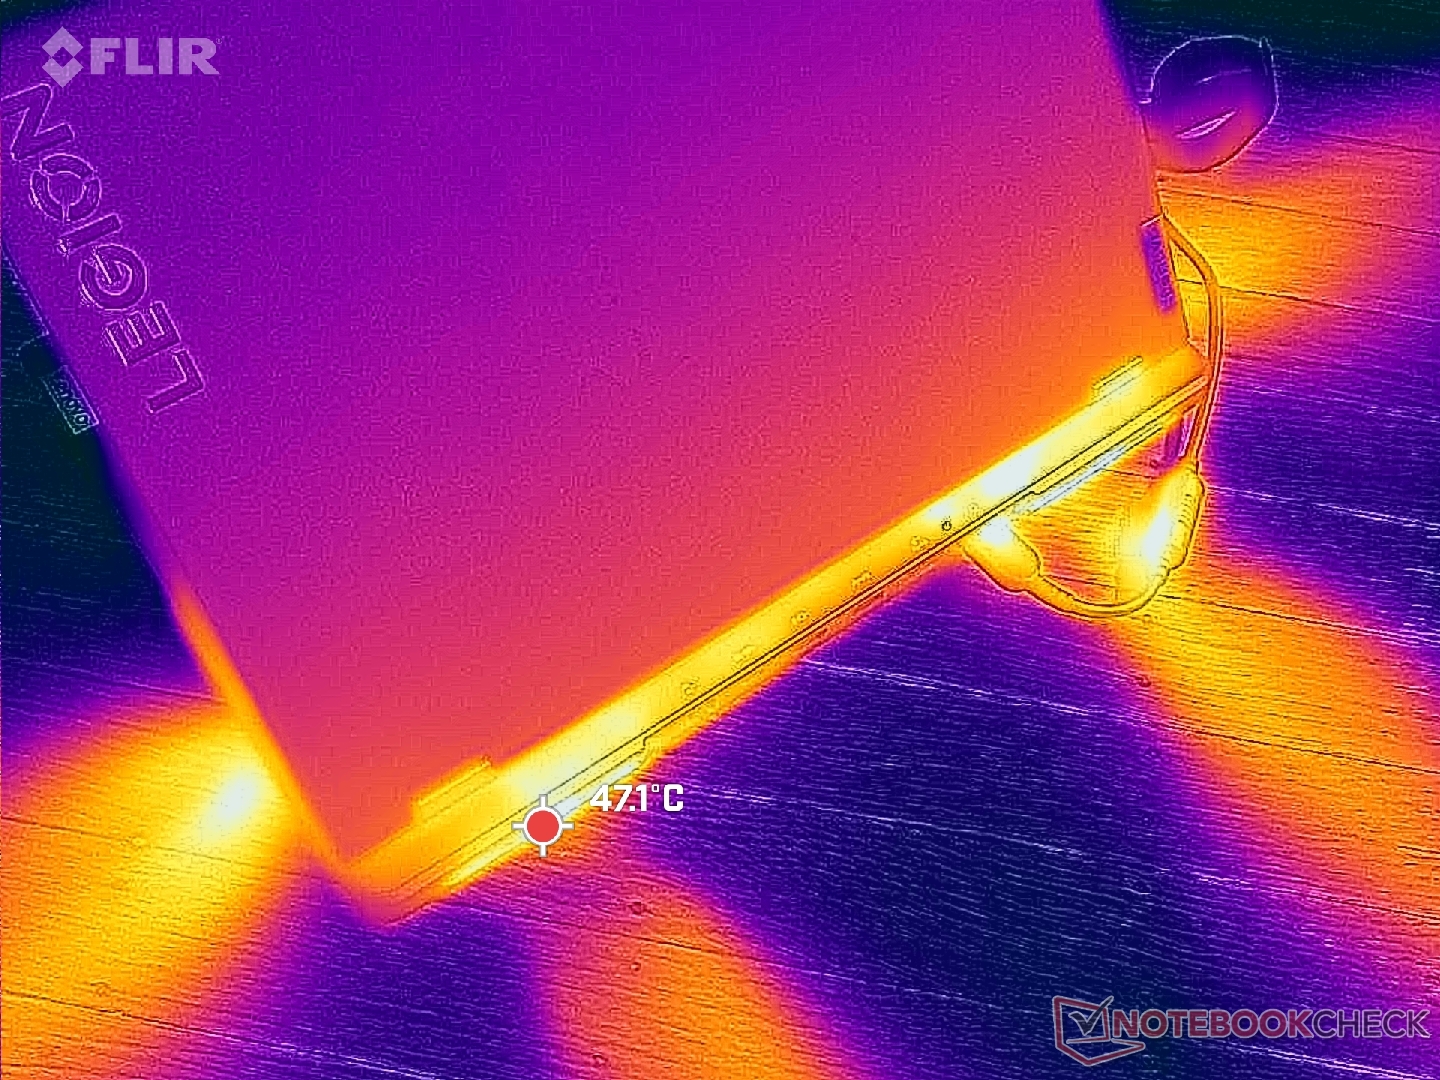
(±) La temperatura máxima en la parte superior es de 43.8 °C / 111 F, frente a la media de 40.4 °C / 105 F, que oscila entre 21.2 y 68.8 °C para la clase Gaming.
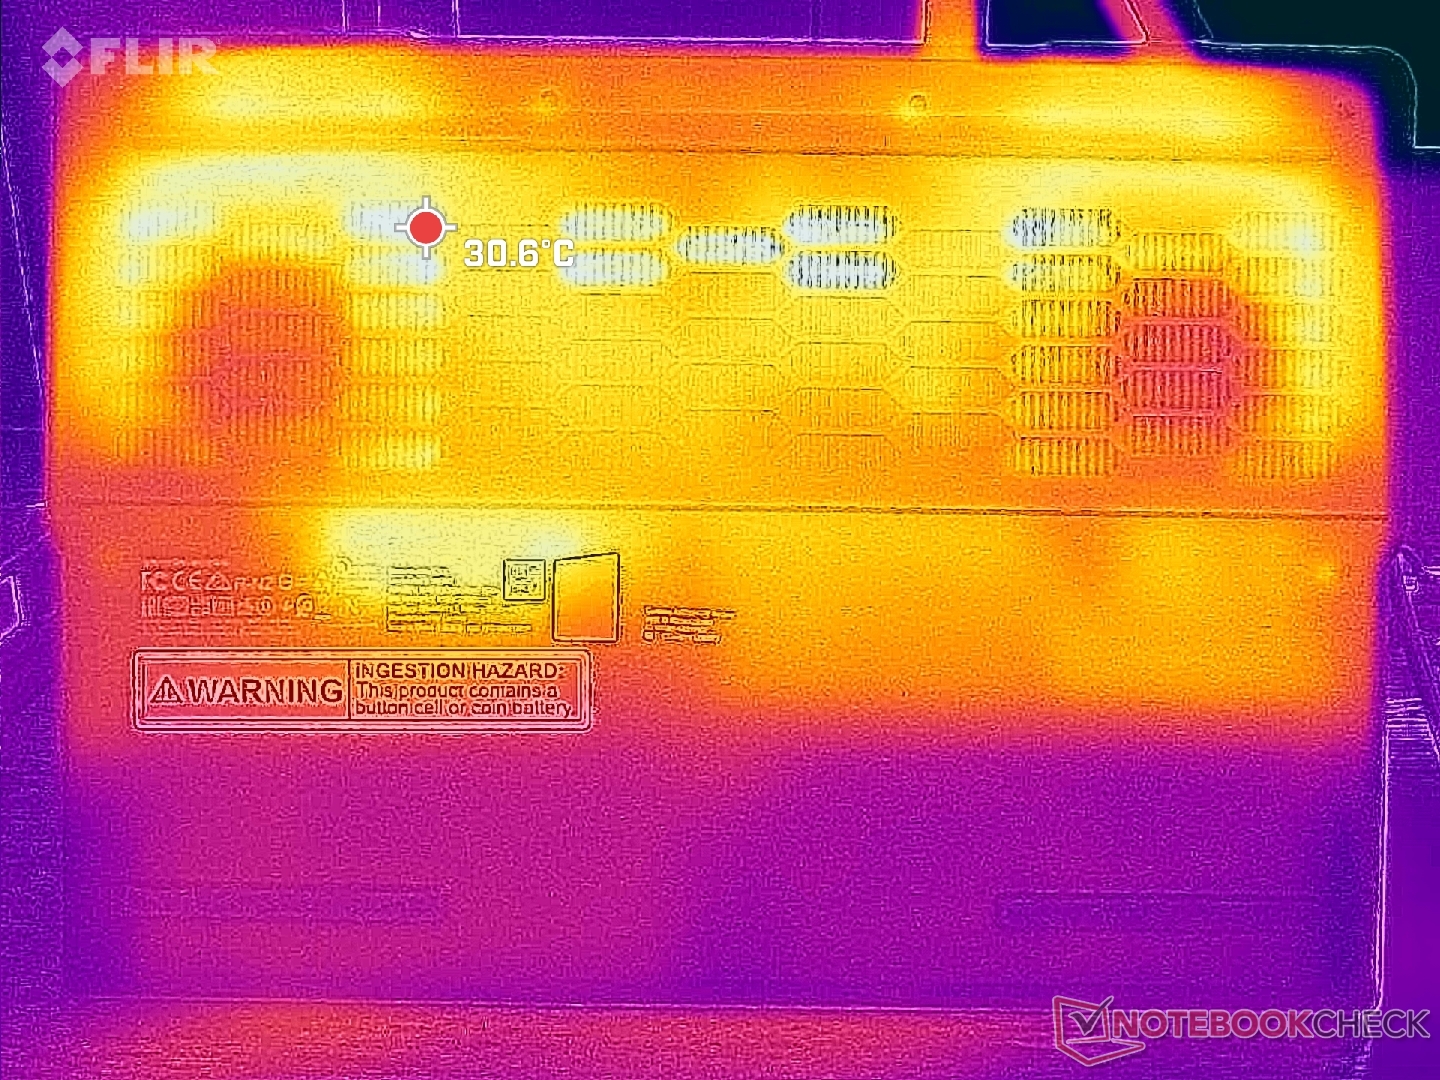
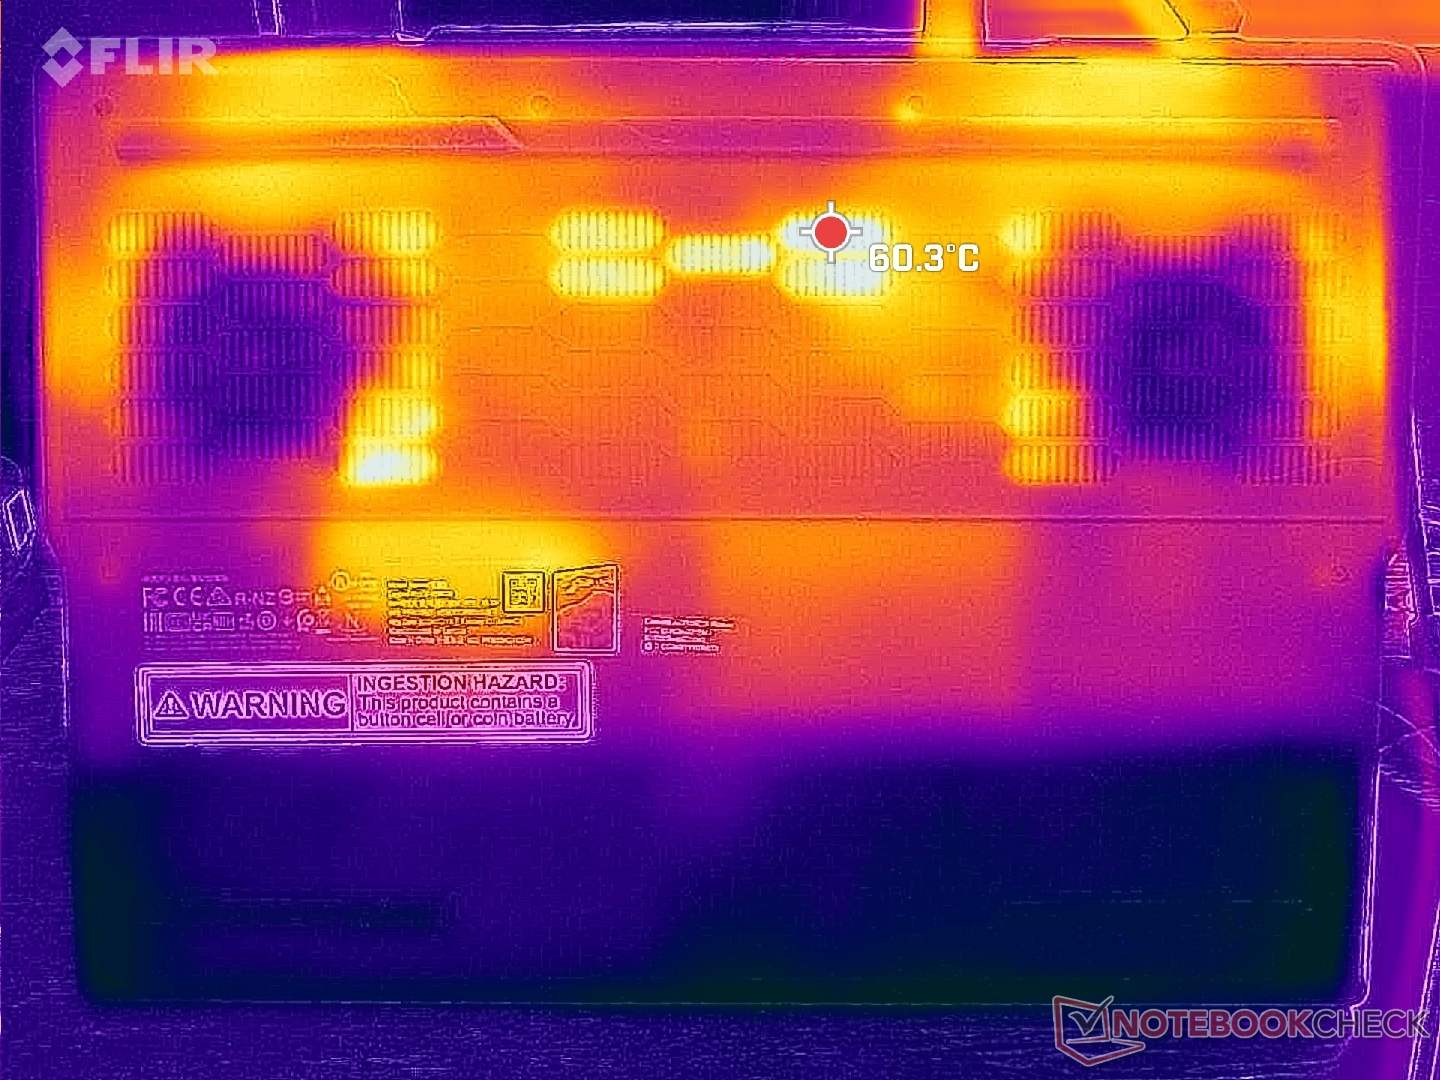
(-) El fondo se calienta hasta un máximo de 55.4 °C / 132 F, frente a la media de 43.2 °C / 110 F
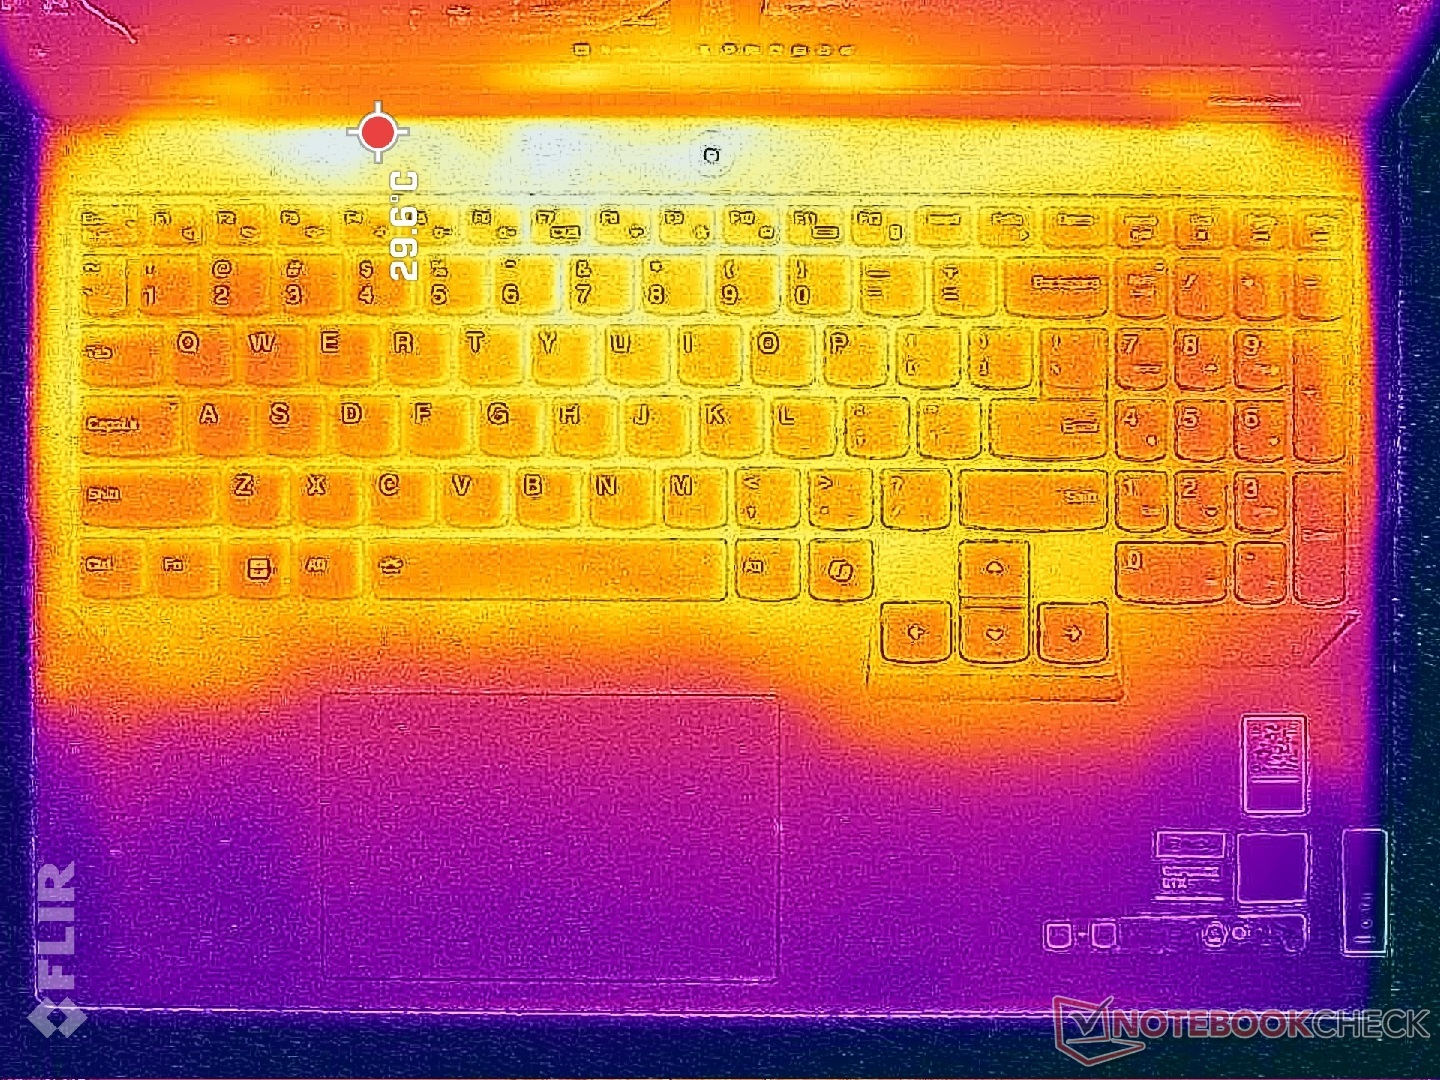
(+) En reposo, la temperatura media de la parte superior es de 29.6 °C / 85# F, frente a la media del dispositivo de 33.9 °C / 93 F.
(±) Jugando a The Witcher 3, la temperatura media de la parte superior es de 36.1 °C / 97 F, frente a la media del dispositivo de 33.9 °C / 93 F.
(+) El reposamanos y el panel táctil están a una temperatura inferior a la de la piel, con un máximo de 28 °C / 82.4 F y, por tanto, son fríos al tacto.
(±) La temperatura media de la zona del reposamanos de dispositivos similares fue de 28.8 °C / 83.8 F (+0.8 °C / 1.4 F).
| Lenovo Legion Pro 5 16IRX9 Intel Core i9-14900HX, NVIDIA GeForce RTX 4070 Laptop GPU | Lenovo Legion Pro 5 16IRX8 Intel Core i7-13700HX, NVIDIA GeForce RTX 4060 Laptop GPU | Alienware m16 R2 Intel Core Ultra 7 155H, NVIDIA GeForce RTX 4070 Laptop GPU | HP Omen Transcend 16-u1095ng Intel Core i9-14900HX, NVIDIA GeForce RTX 4070 Laptop GPU | Asus ROG Zephyrus G16 2024 GU605M Intel Core Ultra 7 155H, NVIDIA GeForce RTX 4070 Laptop GPU | MSI Stealth 16 Mercedes-AMG Motorsport A13VG Intel Core i9-13900H, NVIDIA GeForce RTX 4070 Laptop GPU | |
|---|---|---|---|---|---|---|
| Heat | 7% | -5% | 1% | 7% | 1% | |
| Maximum Upper Side * (°C) | 43.8 | 42.8 2% | 44.8 -2% | 49 -12% | 50.3 -15% | 49 -12% |
| Maximum Bottom * (°C) | 55.4 | 50 10% | 48 13% | 63 -14% | 48 13% | 52 6% |
| Idle Upper Side * (°C) | 32.8 | 29.6 10% | 37.2 -13% | 30 9% | 28.8 12% | 32 2% |
| Idle Bottom * (°C) | 36 | 34 6% | 42 -17% | 29 19% | 29.8 17% | 34 6% |
* ... más pequeño es mejor
Altavoces
Lenovo Legion Pro 5 16IRX9 análisis de audio
(±) | la sonoridad del altavoz es media pero buena (80.7 dB)
Graves 100 - 315 Hz
(-) | casi sin bajos - de media 19% inferior a la mediana
(±) | la linealidad de los graves es media (10.1% delta a frecuencia anterior)
Medios 400 - 2000 Hz
(+) | medios equilibrados - a sólo 4.7% de la mediana
(+) | los medios son lineales (5.7% delta a la frecuencia anterior)
Altos 2 - 16 kHz
(+) | máximos equilibrados - a sólo 3.3% de la mediana
(+) | los máximos son lineales (5.6% delta a la frecuencia anterior)
Total 100 - 16.000 Hz
(±) | la linealidad del sonido global es media (17.2% de diferencia con la mediana)
En comparación con la misma clase
» 47% de todos los dispositivos probados de esta clase eran mejores, 11% similares, 42% peores
» El mejor tuvo un delta de 6%, la media fue 18%, el peor fue ###max##%
En comparación con todos los dispositivos probados
» 32% de todos los dispositivos probados eran mejores, 8% similares, 60% peores
» El mejor tuvo un delta de 4%, la media fue 23%, el peor fue ###max##%
Apple MacBook Pro 16 2021 M1 Pro análisis de audio
(+) | los altavoces pueden reproducir a un volumen relativamente alto (#84.7 dB)
Graves 100 - 315 Hz
(+) | buen bajo - sólo 3.8% lejos de la mediana
(+) | el bajo es lineal (5.2% delta a la frecuencia anterior)
Medios 400 - 2000 Hz
(+) | medios equilibrados - a sólo 1.3% de la mediana
(+) | los medios son lineales (2.1% delta a la frecuencia anterior)
Altos 2 - 16 kHz
(+) | máximos equilibrados - a sólo 1.9% de la mediana
(+) | los máximos son lineales (2.7% delta a la frecuencia anterior)
Total 100 - 16.000 Hz
(+) | el sonido global es lineal (4.6% de diferencia con la mediana)
En comparación con la misma clase
» 0% de todos los dispositivos probados de esta clase eran mejores, 0% similares, 100% peores
» El mejor tuvo un delta de 5%, la media fue 17%, el peor fue ###max##%
En comparación con todos los dispositivos probados
» 0% de todos los dispositivos probados eran mejores, 0% similares, 100% peores
» El mejor tuvo un delta de 4%, la media fue 23%, el peor fue ###max##%
Gestión de la energía
Consumo de energía
Ejecutando Witcher 3 rondaría los 220 W para ser más exigente que lo que registramos en el modelo del año pasado. También es notablemente superior al HP Omen Transcend 16 que viene con la misma CPU y GPU que nuestro Lenovo. Gran parte de la diferencia puede atribuirse a la CPU Core i9 del Lenovo, que mantiene un estado de mayor potencia cuando el sistema está configurado en modo Rendimiento.
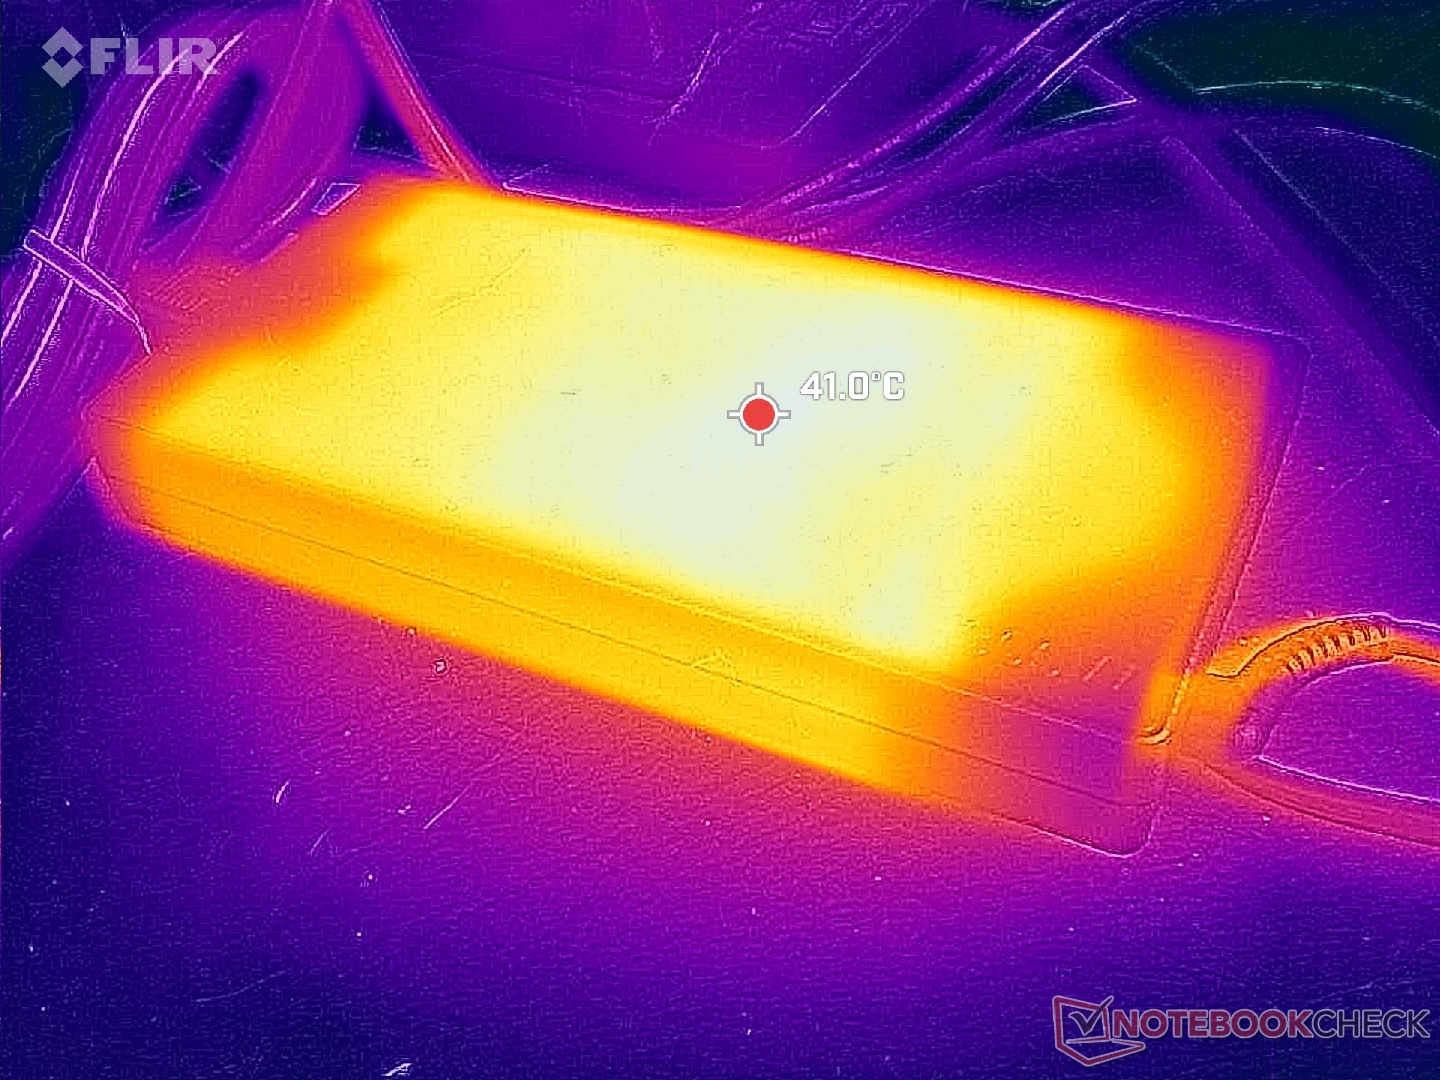
Somos capaces de registrar un consumo máximo temporal de unos 274 W cuando la CPU y la GPU están cada una al 100% de utilización. El gran adaptador de CA de 300 W (~19,9 x 9,9 x 2,6 cm) de https://www.lenovo.com/us/en/p/accessories-and-software/chargers-and-batteries/chargers/gx21f23045 es el mismo que se suministra con los modelos Legion 5 15, Legion 5 17 y Legion 7 16.
(Nota del editor: Esta sección se actualizará cuando finalicen las reparaciones de nuestro multímetro Metrahit Energy. Rogamos disculpen las molestias)
| Off / Standby | |
| Ocioso | |
| Carga |
|
Clave:
min: | |
| Lenovo Legion Pro 5 16IRX9 i9-14900HX, GeForce RTX 4070 Laptop GPU, Samsung PM9A1 MZVL21T0HCLR, IPS, 2560x1600, 16" | Lenovo Legion Pro 5 16IRX8 i7-13700HX, GeForce RTX 4060 Laptop GPU, SK hynix PC801 HFS512GEJ9X115N, IPS, 2560x1600, 16" | Alienware m16 R2 Ultra 7 155H, GeForce RTX 4070 Laptop GPU, Samsung PM9A1 MZVL21T0HCLR, IPS, 2560x1600, 16" | HP Omen Transcend 16-u1095ng i9-14900HX, GeForce RTX 4070 Laptop GPU, Kioxia XG8 KXG80ZNV1T02, OLED, 2560x1600, 16" | Asus ROG Zephyrus G16 2024 GU605M Ultra 7 155H, GeForce RTX 4070 Laptop GPU, WD PC SN560 SDDPNQE-1T00, OLED, 2560x1600, 16" | MSI Stealth 16 Mercedes-AMG Motorsport A13VG i9-13900H, GeForce RTX 4070 Laptop GPU, Samsung PM9A1 MZVL22T0HBLB, OLED, 3840x2400, 16" | |
|---|---|---|---|---|---|---|
| Power Consumption | -19% | 12% | 8% | 42% | 22% | |
| Idle Minimum * (Watt) | 12.5 | 24.5 -96% | 8.1 35% | 10 20% | 8.3 34% | 11 12% |
| Idle Average * (Watt) | 24.6 | 29.2 -19% | 13 47% | 18 27% | 12.5 49% | 14 43% |
| Idle Maximum * (Watt) | 24.8 | 34.3 -38% | 40.3 -62% | 32 -29% | 12.8 48% | 28 -13% |
| Load Average * (Watt) | 109.6 | 98.7 10% | 79 28% | 128 -17% | 71.3 35% | 83 24% |
| Witcher 3 ultra * (Watt) | 218 | 178.6 18% | 188.1 14% | 148.4 32% | 127.5 42% | 140 36% |
| Load Maximum * (Watt) | 284.9 | 249.6 12% | 254.9 11% | 242 15% | 169.1 41% | 204 28% |
* ... más pequeño es mejor
Power Consumption Witcher 3 / Stresstest
Power Consumption external Monitor
Duración de las pilas
Con 80 Wh, la capacidad de la batería es inferior a la de la mayoría de portátiles de 16 pulgadas, en los que 90 Wh o más es lo habitual. Aun así, la duración de la batería es superior a la del Legion Pro 5 16IRX8 del año pasado en casi 90 minutos. El Zephyrus G16 y el Alienware m16 R2 pueden durar horas más cada uno, pero también se suministran con CPU Core Ultra 7 más lentas.
La carga desde vacío a plena capacidad es muy rápida, con algo menos de una hora, en comparación con las 1,5 a 2 horas de la mayoría de los demás portátiles. La carga rápida de Lenovo está activada por defecto. El sistema también se puede cargar con adaptadores USB-C de terceros a través del puerto USB-C trasero.
| Lenovo Legion Pro 5 16IRX9 i9-14900HX, GeForce RTX 4070 Laptop GPU, 80 Wh | Lenovo Legion Pro 5 16IRX8 i7-13700HX, GeForce RTX 4060 Laptop GPU, 80 Wh | Alienware m16 R2 Ultra 7 155H, GeForce RTX 4070 Laptop GPU, 90 Wh | HP Omen Transcend 16-u1095ng i9-14900HX, GeForce RTX 4070 Laptop GPU, 97 Wh | Asus ROG Zephyrus G16 2024 GU605M Ultra 7 155H, GeForce RTX 4070 Laptop GPU, 90 Wh | MSI Stealth 16 Mercedes-AMG Motorsport A13VG i9-13900H, GeForce RTX 4070 Laptop GPU, 99.99 Wh | |
|---|---|---|---|---|---|---|
| Duración de Batería | -22% | 49% | 2% | 31% | 35% | |
| Reader / Idle (h) | 6.7 | 6.7 0% | 12.6 88% | |||
| WiFi v1.3 (h) | 4.8 | 3.4 -29% | 8.1 69% | 4.9 2% | 7.3 52% | 6.5 35% |
| Load (h) | 1.1 | 0.7 -36% | 1 -9% | 1.2 9% | ||
| H.264 (h) | 11.2 |
Pro
Contra
Veredicto - Cambios sencillos para una experiencia similar a la de antes
Similar al reciente Alienware m18 R2, el Lenovo Legion Pro 5 16 G9 no ofrece lo suficiente sobre su predecesor inmediato como para merecer una actualización. Es igual de bueno que antes, pero no mueve mucho la aguja ya que está bloqueado a las mismas opciones de GPU junto con las CPU Raptor Lake-HX de nueva marca. En otras palabras, el 2024 Legion Pro 5 16 rinde de forma casi idéntica a la versión 2023 más económica en lo que a juegos se refiere. Sería prudente comprobar si hay alguna oferta en los SKU 2023 antes de considerar las opciones más nuevas 2024.
Hay algunas adiciones menores, siendo la más notable una nueva opción de panel DCI-P3, mientras que el modelo del año pasado se limitaba únicamente a los colores sRGB. Sin embargo, los inconvenientes innatos como el gran tamaño, el gran adaptador de CA y los ruidosos ventiladores permanecen.
A menos que si realmente desea colores DCI-P3, el Lenovo Legion Pro 5 16IRX9 2024 es casi idéntico al modelo 2023, ahora menos caro, en rendimiento, opciones y características físicas.
El Legion Pro 5 16 puede resultar atractivo para quienes prefieran las CPU de la serie Core HX a las opciones Core Ultra, más lentas. De lo contrario, alternativas más pequeñas o portátiles como el Asus ROG Zephyrus G16 o Alienware m16 R2 tienen un rendimiento de procesador más lento pero con casi el mismo rendimiento en juegos.
Precio y disponibilidad
Lenovo ya está distribuyendo la Legion 5 Pro 16 a partir de 1770 $ para la configuración Core i7-14650HX y RTX 4060 hasta 2000 $ para nuestra configuración Core i9-14900HX y RTX 4070.
Lenovo Legion Pro 5 16IRX9
- 03/28/2024 v7 (old)
Allen Ngo
Transparencia
La selección de los dispositivos que se van a reseñar corre a cargo de nuestro equipo editorial. La muestra de prueba fue proporcionada al autor en calidad de préstamo por el fabricante o el minorista a los efectos de esta reseña. El prestamista no tuvo ninguna influencia en esta reseña, ni el fabricante recibió una copia de la misma antes de su publicación. No había ninguna obligación de publicar esta reseña. Como empresa de medios independiente, Notebookcheck no está sujeta a la autoridad de fabricantes, minoristas o editores.
Así es como prueba Notebookcheck
Cada año, Notebookcheck revisa de forma independiente cientos de portátiles y smartphones utilizando procedimientos estandarizados para asegurar que todos los resultados son comparables. Hemos desarrollado continuamente nuestros métodos de prueba durante unos 20 años y hemos establecido los estándares de la industria en el proceso. En nuestros laboratorios de pruebas, técnicos y editores experimentados utilizan equipos de medición de alta calidad. Estas pruebas implican un proceso de validación en varias fases. Nuestro complejo sistema de clasificación se basa en cientos de mediciones y puntos de referencia bien fundamentados, lo que mantiene la objetividad.Price comparison

