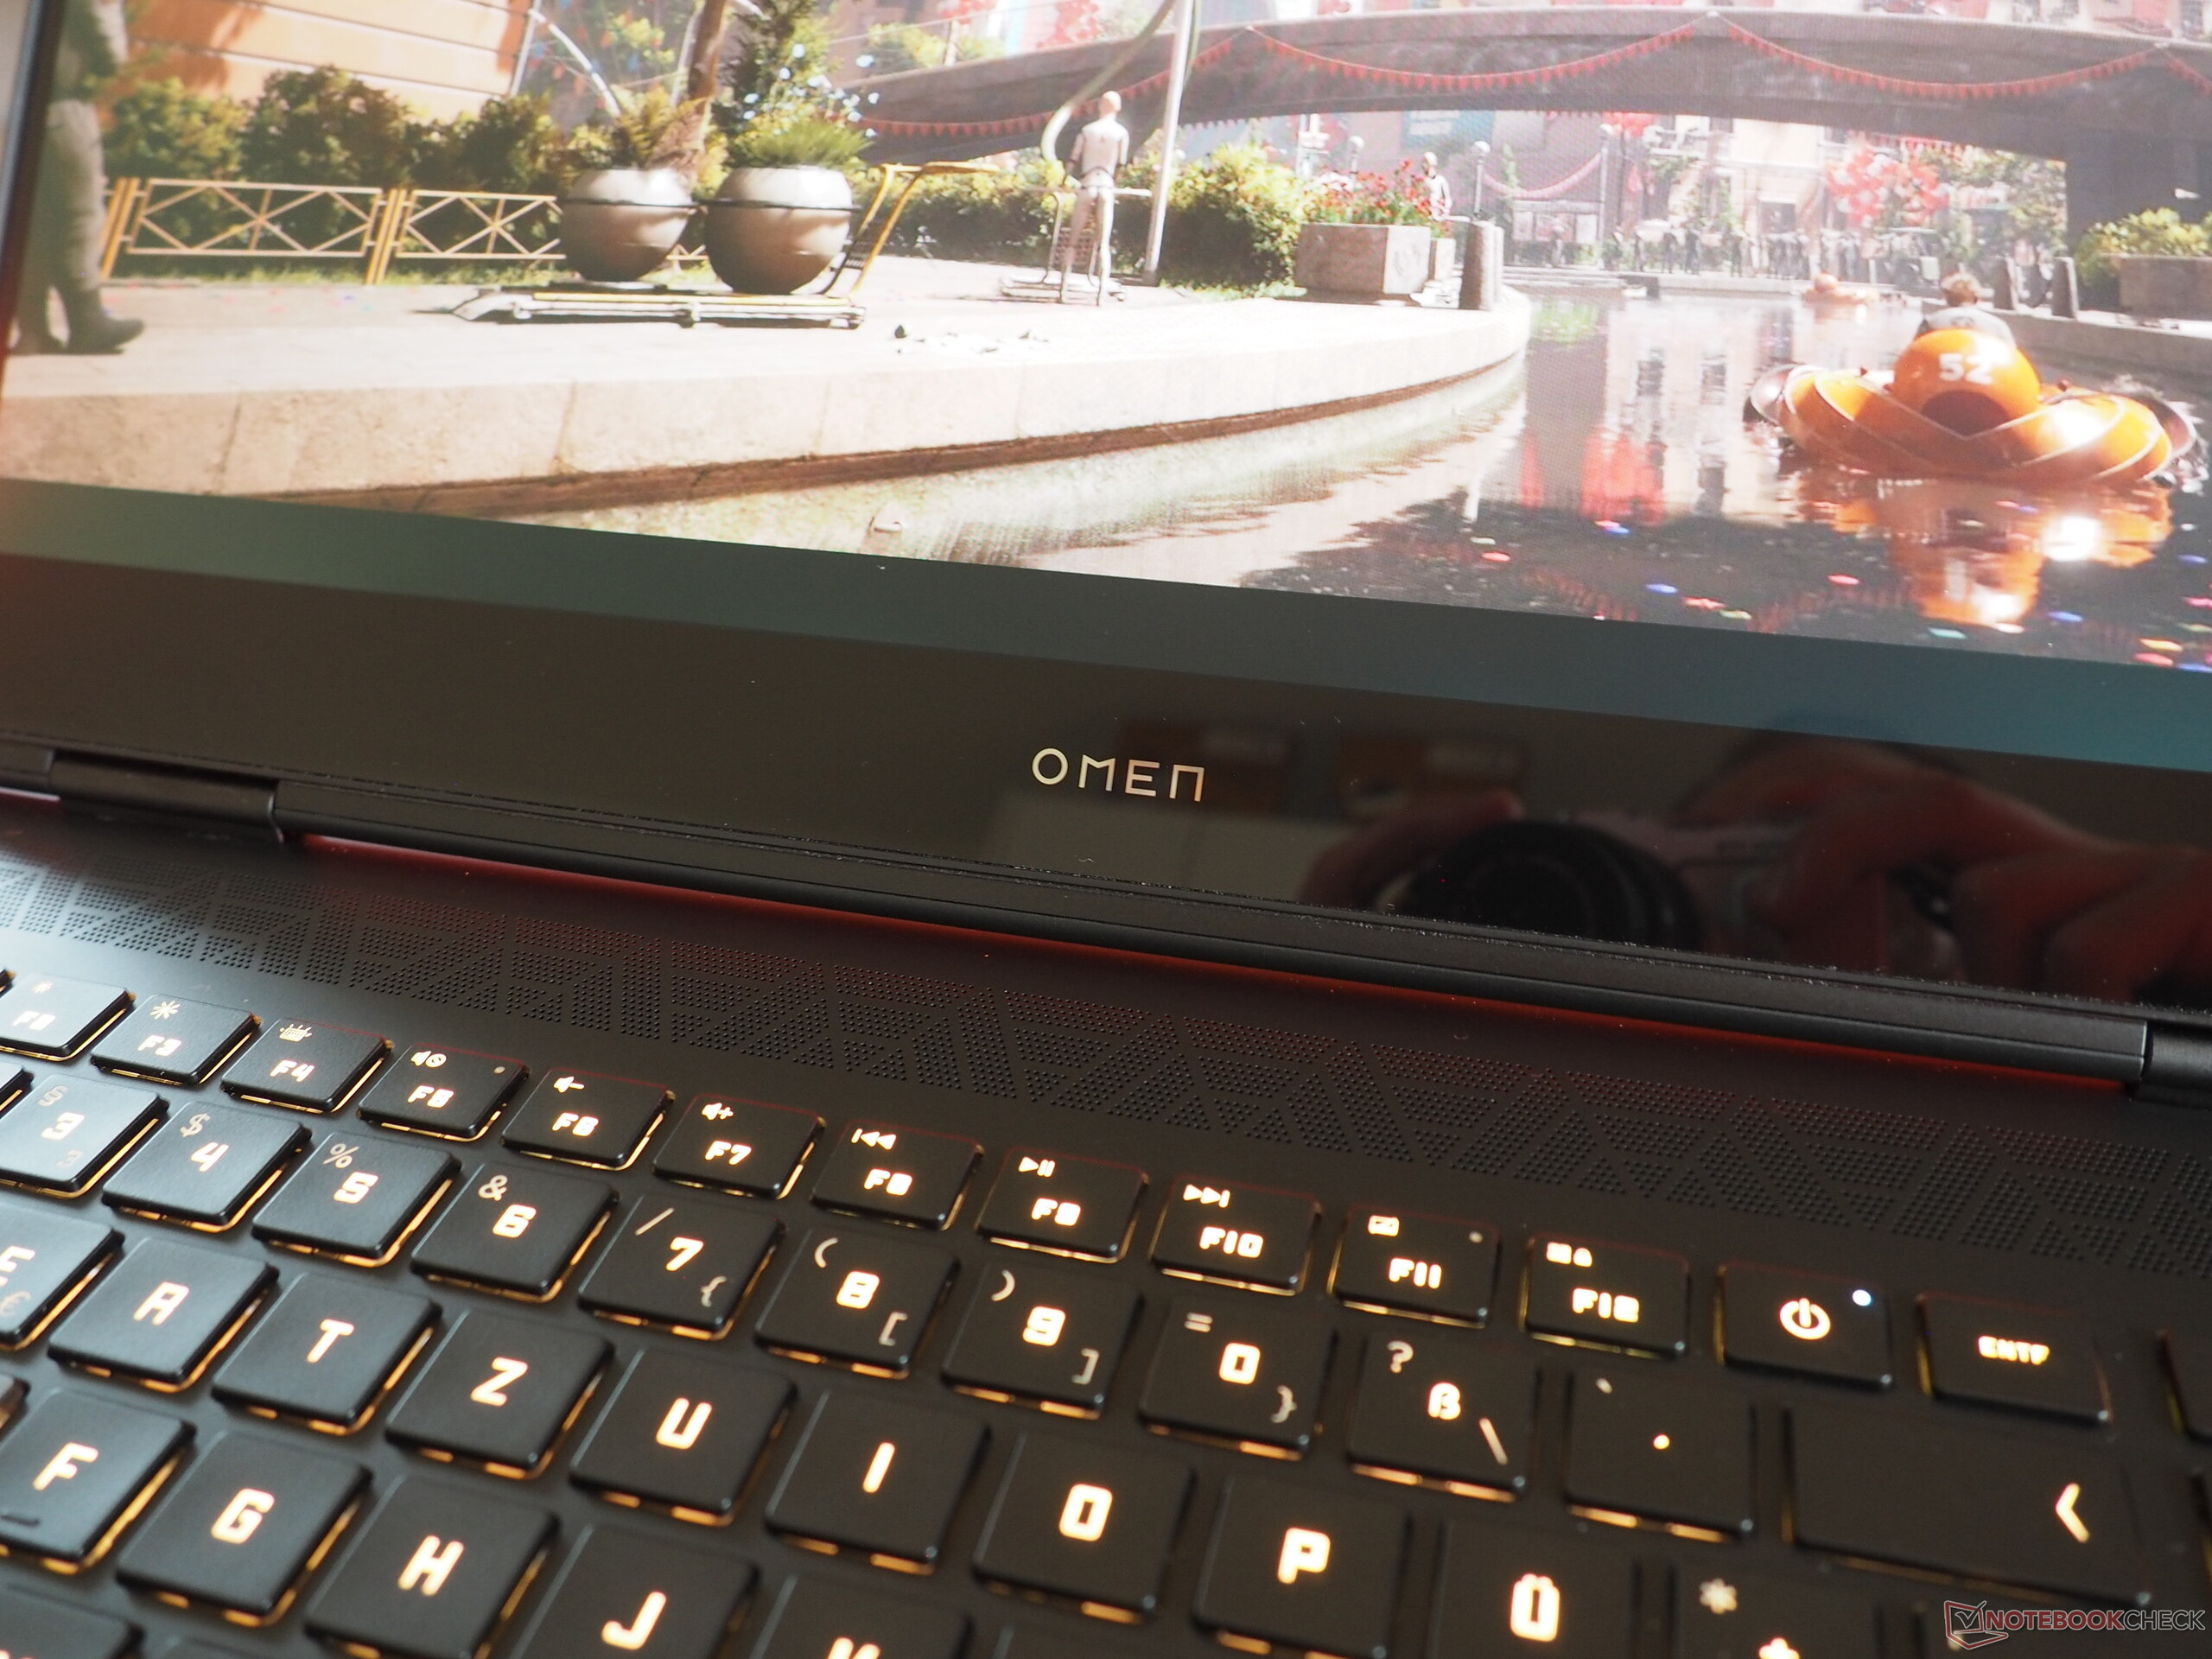
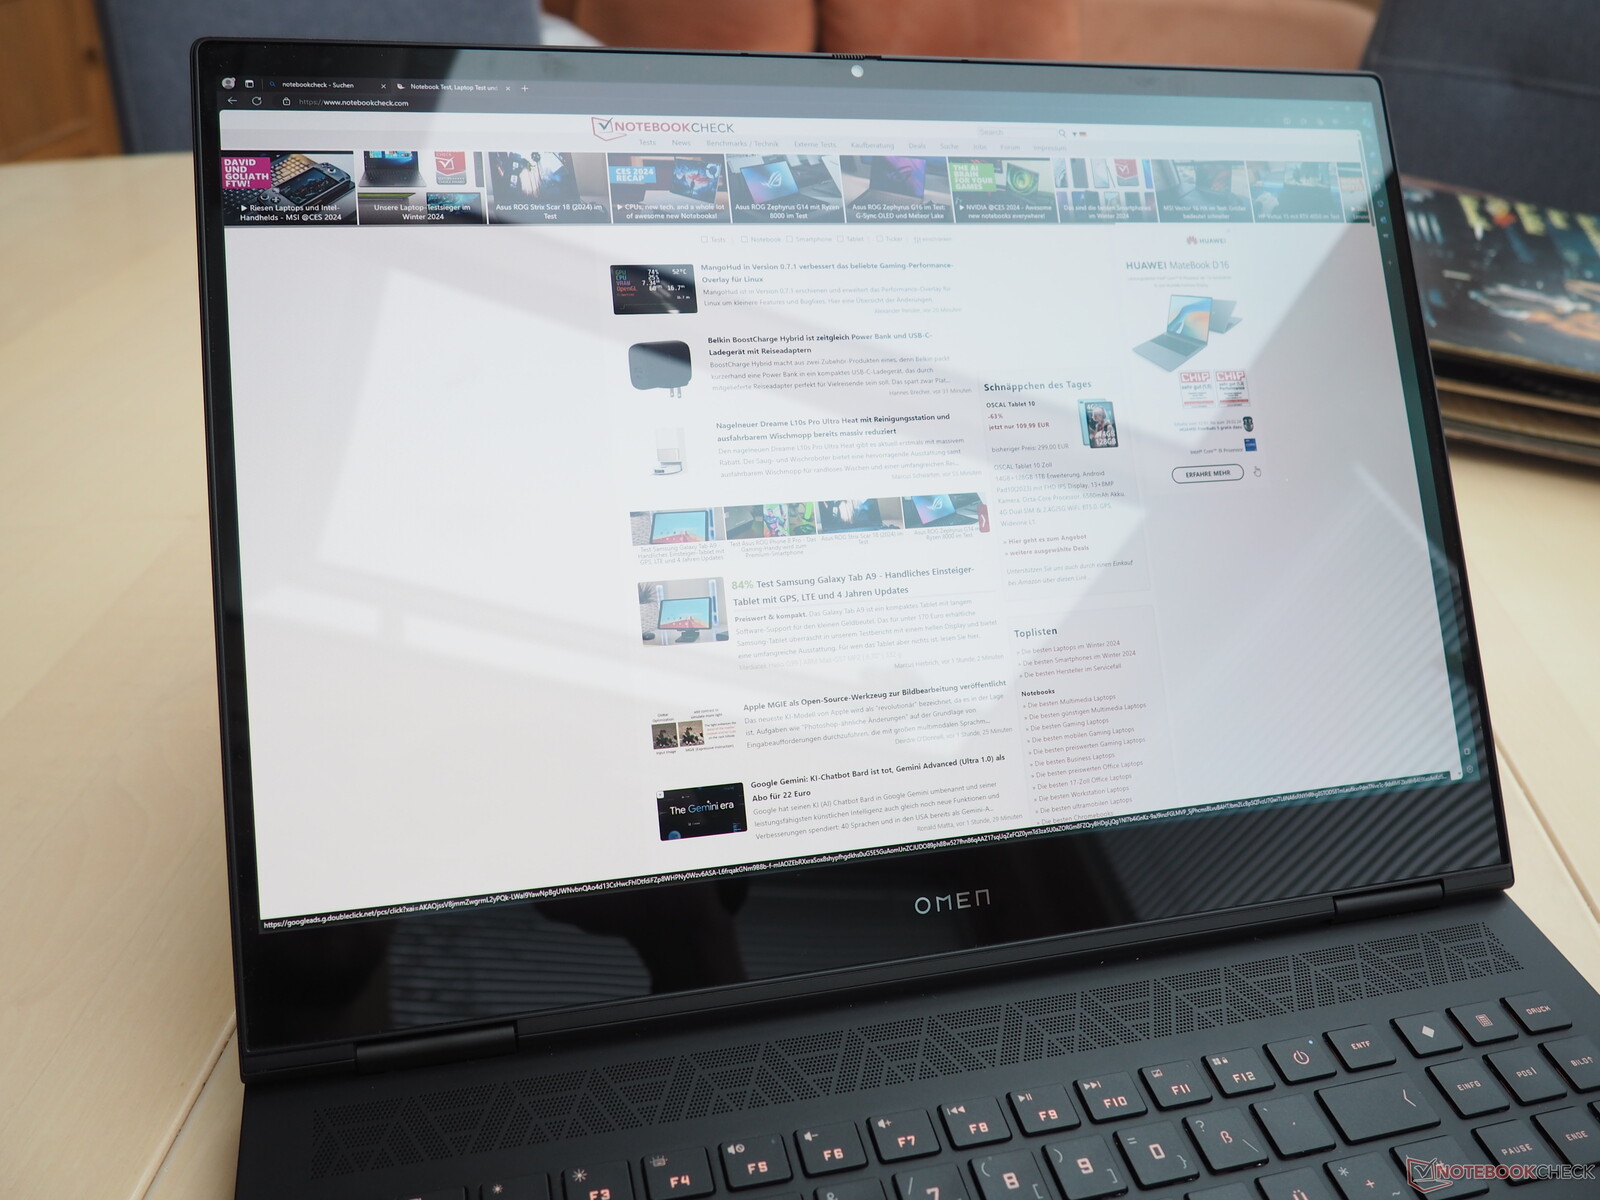
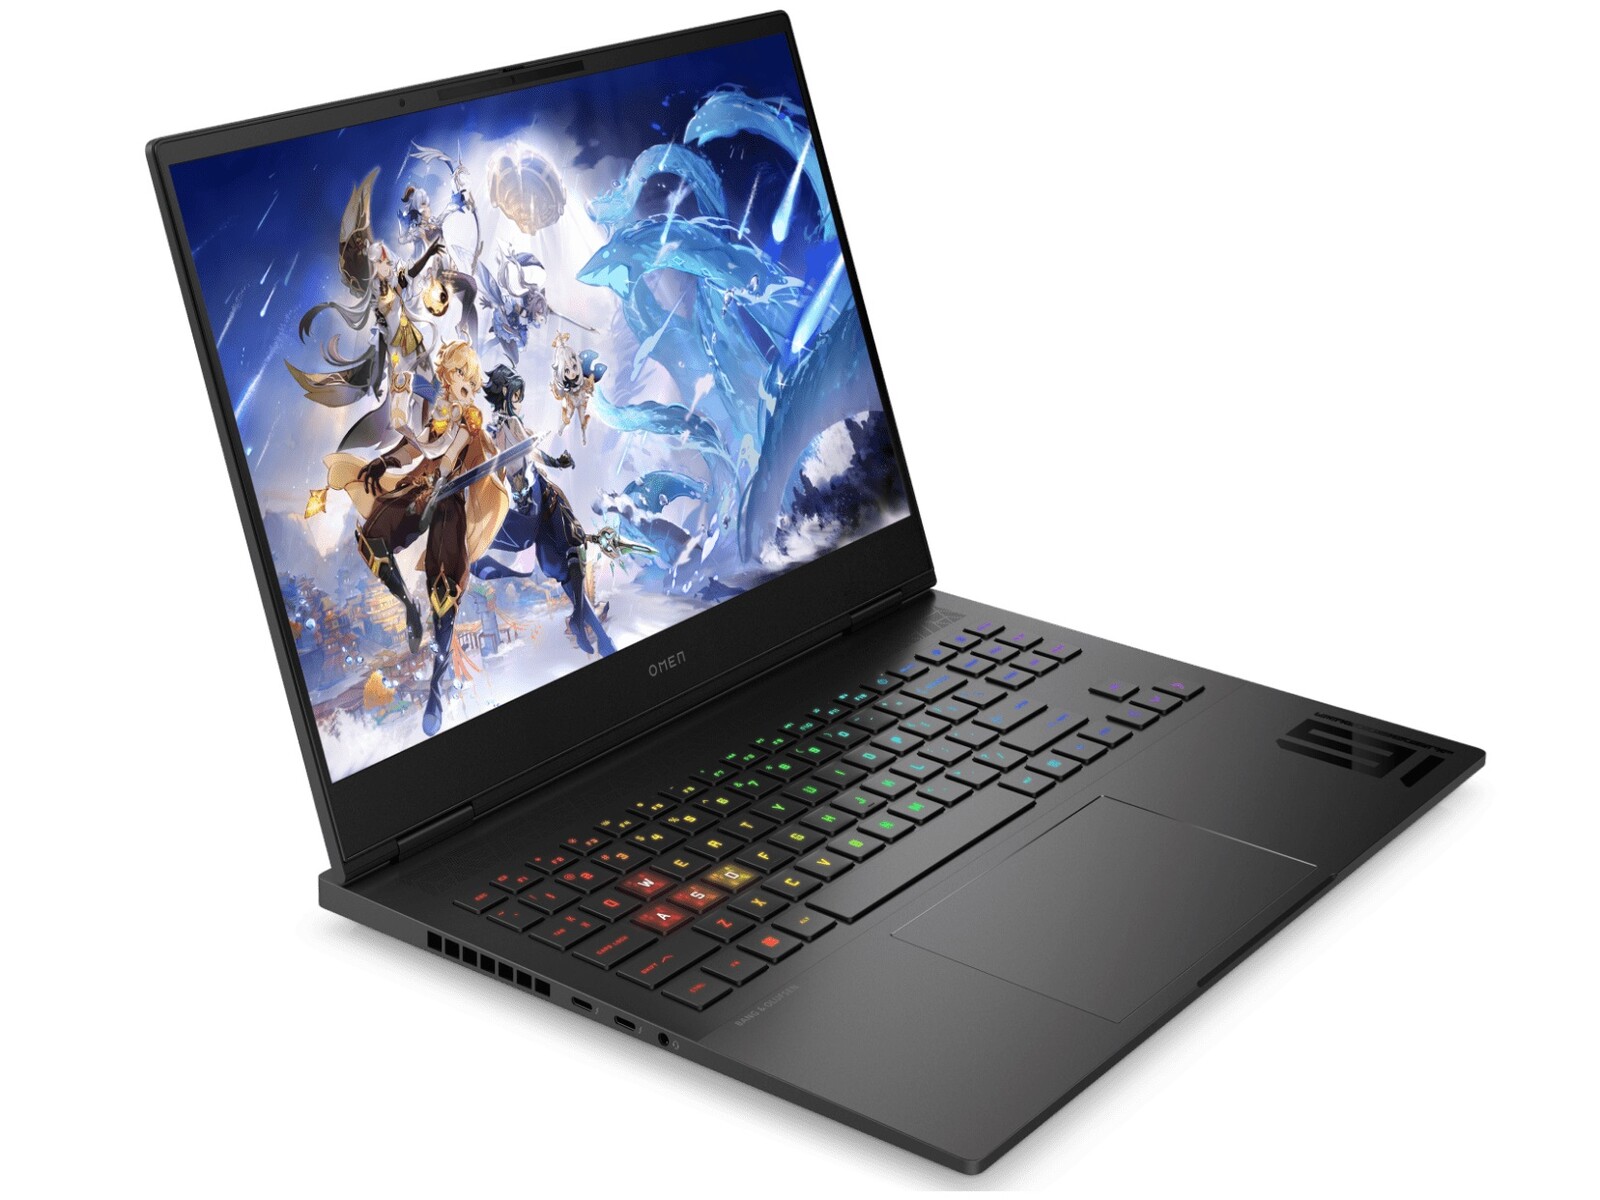
Análisis del portátil HP Omen Transcend 16 (2024): Una máquina de juegos RTX 4070 con pantalla OLED

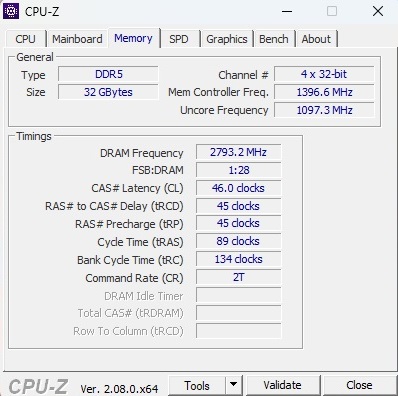
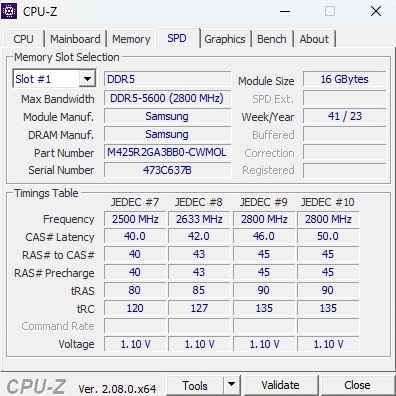
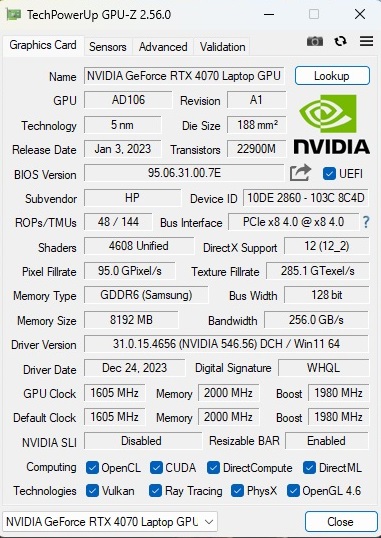
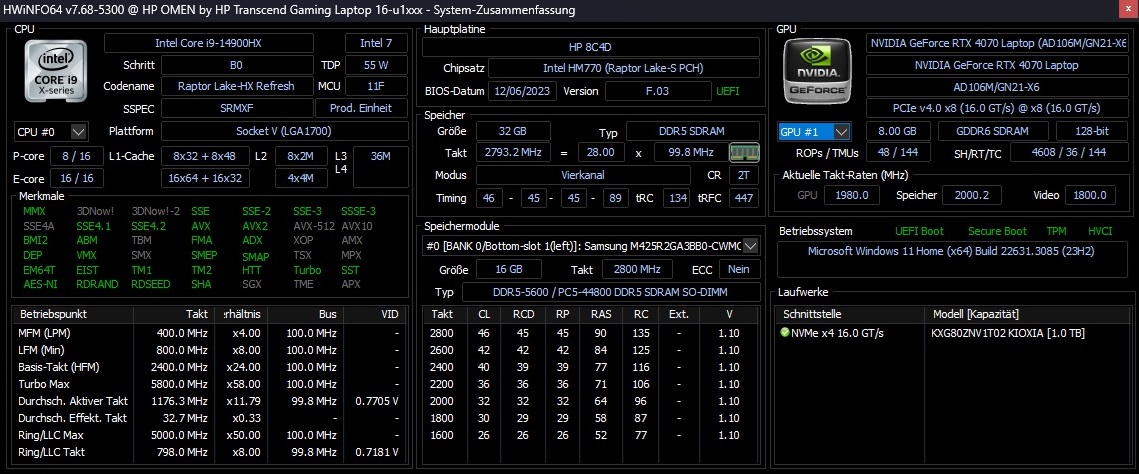
El modelo de revisión Omen Transcend 16 - que termina en u1095ng - se puede conseguir actualmente por algo menos de 3.000 dólares. Por este precio, el comprador obtiene un Core i9-14900HX combinado con una GeForce RTX 4070 que tiende a pertenecer más a la categoría de gama media y no a la de gama alta debido a sus más bien escasos 8 GB de VRAM. A esto se unen 32 GB de RAM DDR5-5600 (2x 16 GB SO-DIMM) y una SSD M.2 NVMe de 1 TB. Lo más destacado es el vibrante panel OLED del que se dice que tiene 2.560 x 1.600 píxeles, 240 Hz, 400 cd/m² y 100 % DCI P3. El paquete se completa con Windows 11 Home.
El competidor del Omen Transcend 16 puede encontrarse en forma de otros gamers de 16 pulgadas equipados con la GeForce RTX 4070 así como el Asus ROG Zephyrus G16 2024 (Ultra 7 155H), el Schenker XMG Core 16 L23 (Ryzen 7 7840HS) y el Lenovo Legion Pro 5 16ARX8 (Ryzen 7 7745HX), todos los cuales aparecen en nuestra tabla comparativa de dispositivos.
Dado que el chasis es en su mayor parte idéntico al predecesor que tenía un Core i9-13900HX (véase nuestro reseña), sólo entraremos brevemente en las categorías de carcasa, características y dispositivo de entrada.
Posibles contendientes en la comparación
Valoración | Fecha | Modelo | Peso | Altura | Tamaño | Resolución | Precio |
|---|---|---|---|---|---|---|---|
| 88.4 % v7 (old) | 02/2024 | HP Omen Transcend 16-u1095ng i9-14900HX, GeForce RTX 4070 Laptop GPU | 2.3 kg | 20 mm | 16.00" | 2560x1600 | |
| 87.9 % v7 (old) | 08/2023 | HP Omen Transcend 16 i9-13900HX, GeForce RTX 4070 Laptop GPU | 2.3 kg | 19.8 mm | 16.00" | 2560x1600 | |
| 92.3 % v7 (old) | 02/2024 | Asus ROG Zephyrus G16 2024 GU605M Ultra 7 155H, GeForce RTX 4070 Laptop GPU | 1.8 kg | 16.4 mm | 16.00" | 2560x1600 | |
| 89.2 % v7 (old) | 10/2023 | Schenker XMG CORE 16 (L23) R7 7840HS, GeForce RTX 4070 Laptop GPU | 2.4 kg | 26.1 mm | 16.00" | 2560x1600 | |
| 88.4 % v7 (old) | 05/2023 | Lenovo Legion Pro 5 16ARX8 R7 7745HX, GeForce RTX 4070 Laptop GPU | 2.5 kg | 26.8 mm | 16.00" | 2560x1600 |
Caso
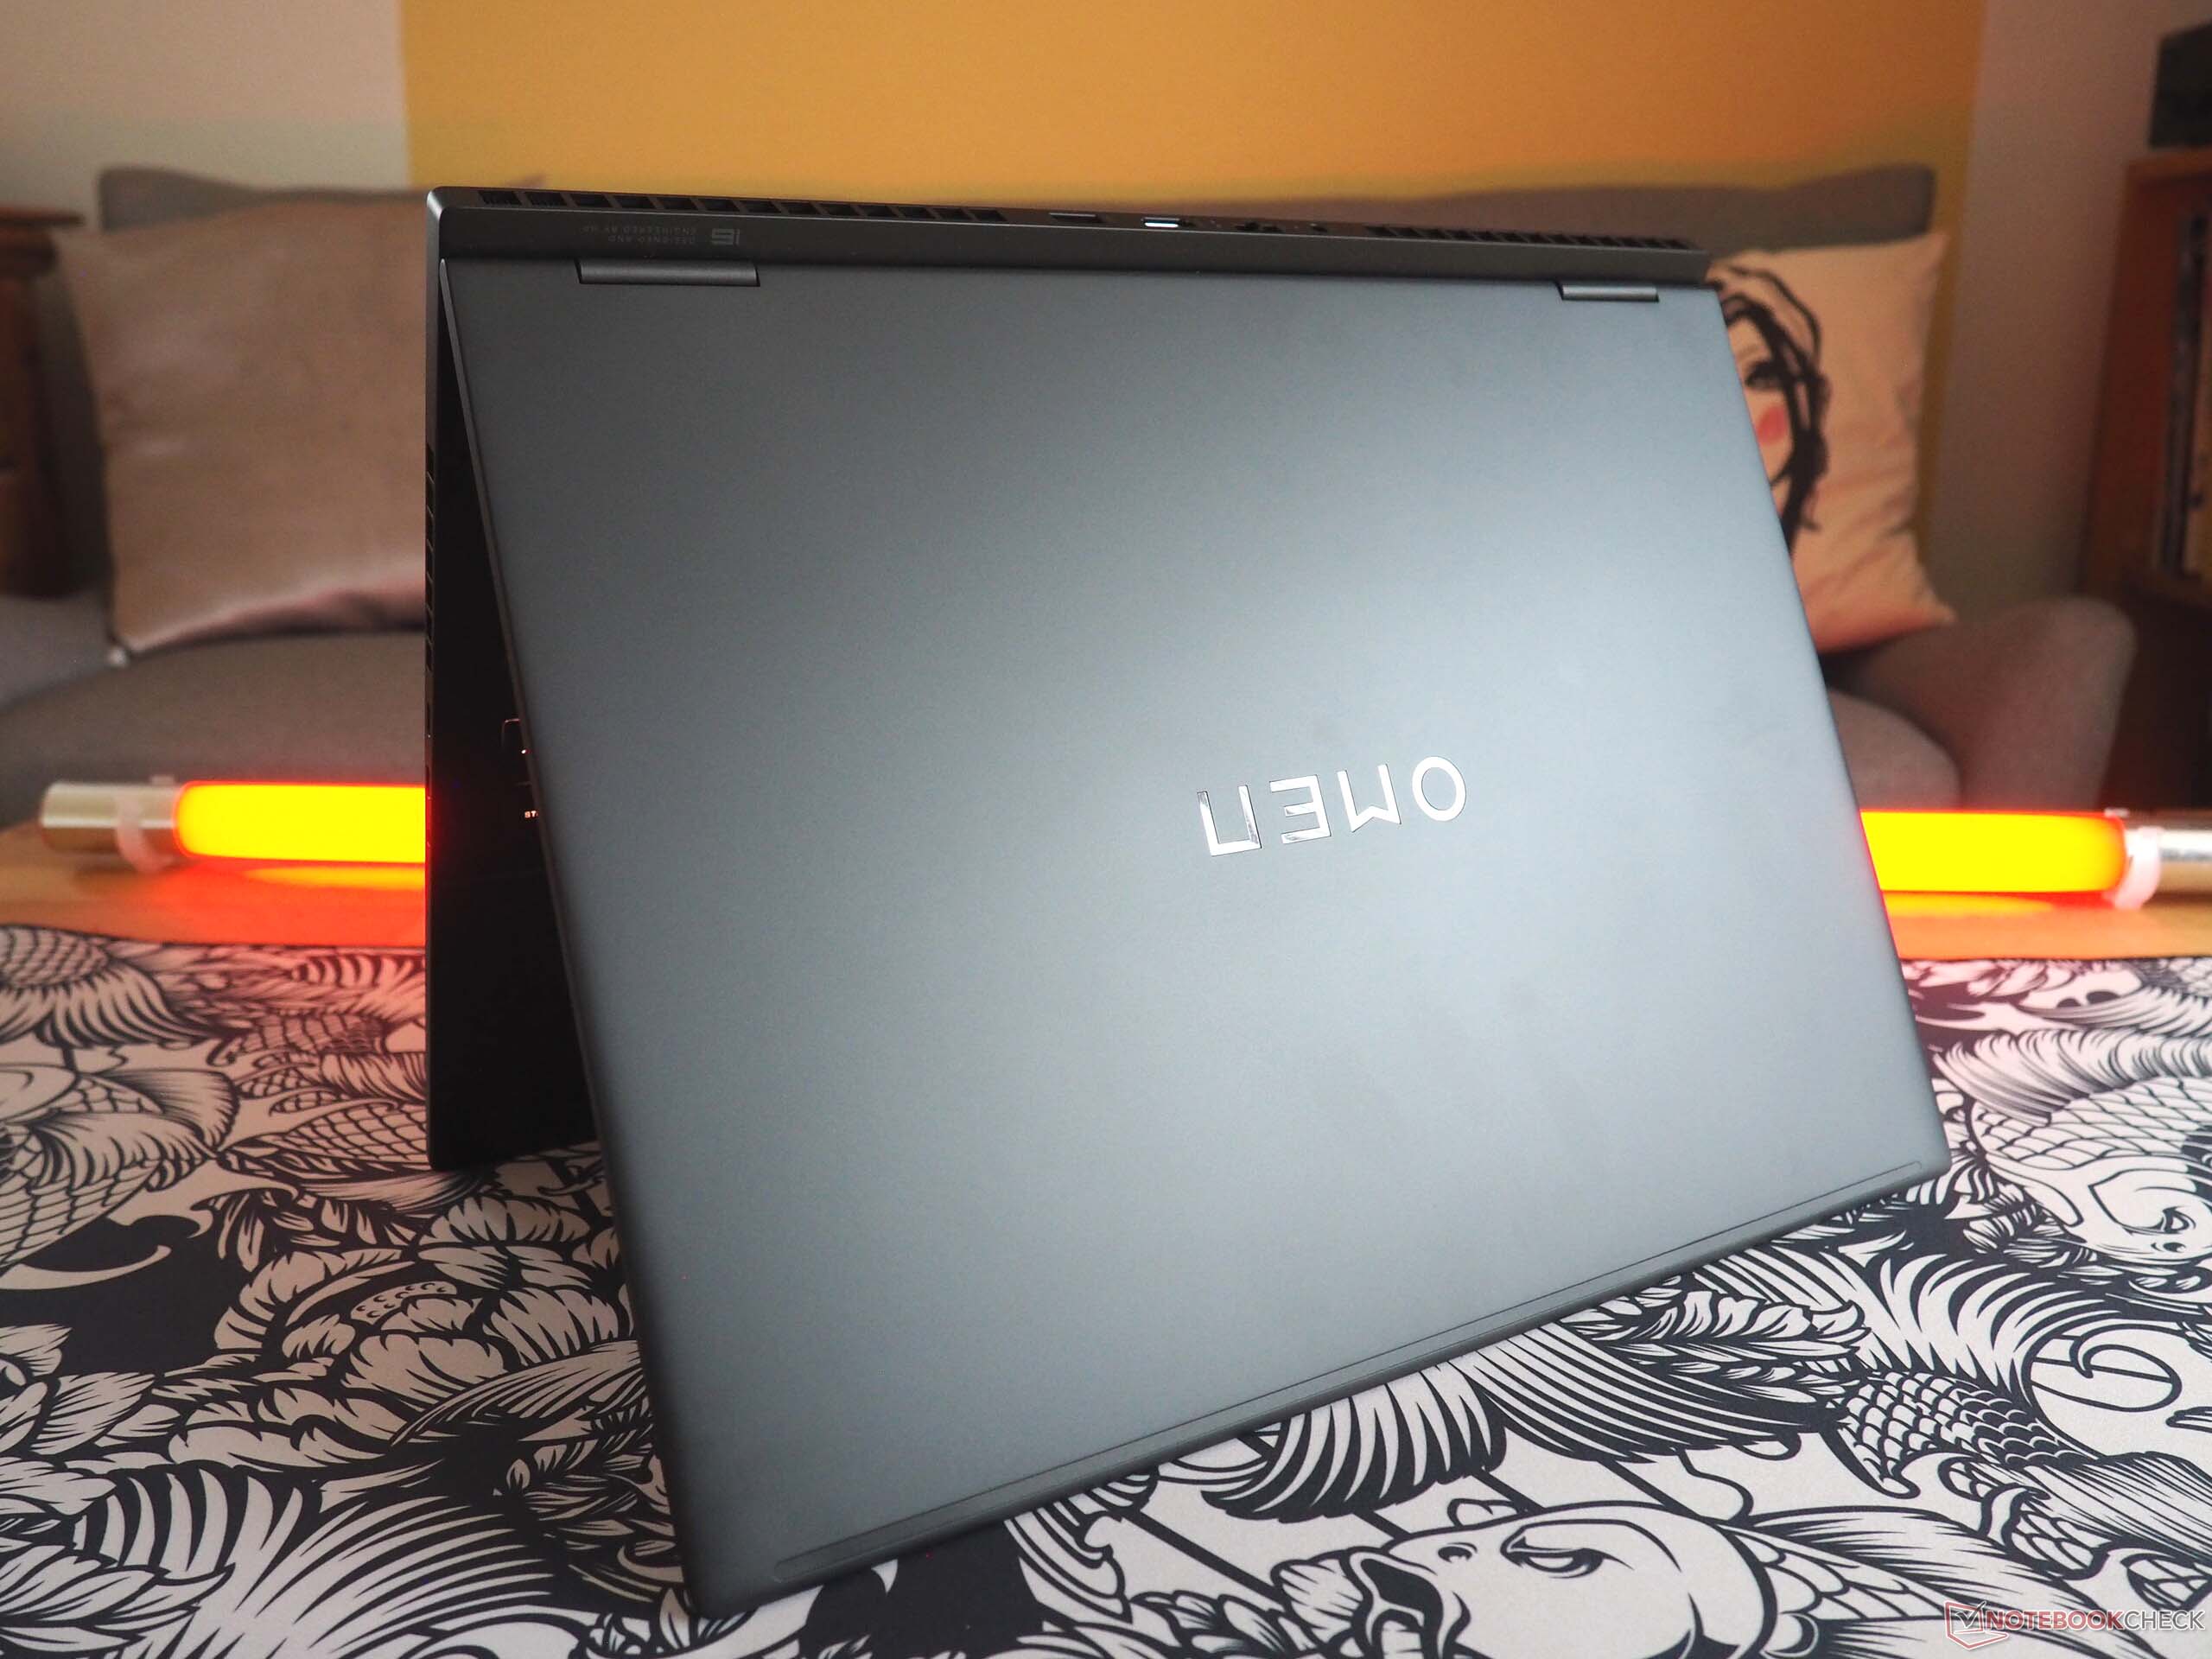
El Transcend 16 ofrece un diseño llamativo y, desde un punto de vista visual, corta una figura impresionantemente delgada (todos los dispositivos de la competencia son más gruesos excepto el Zephyrus G16). En cuanto a la estabilidad, la unidad base consigue al menos ofrecer un rendimiento sólido. En cambio, a la tapa -como a tantos otros dispositivos- le habría venido bien una mayor rigidez a la torsión. A primera vista, la superficie mate tiene un aspecto premium, sin embargo, HP sólo ha utilizado plástico en su mayor parte. No se pueden hacer quejas en cuanto a la calidad de construcción. El fabricante merece elogios por el generoso ángulo de apertura de 180°, aunque las bisagras podrían ser más resistentes. En cuanto al peso, con 2,3 kg, el dispositivo se sitúa en el medio del pelotón y esto hace que el 16 pulgadas no sea ni especialmente ligero ni pesado.

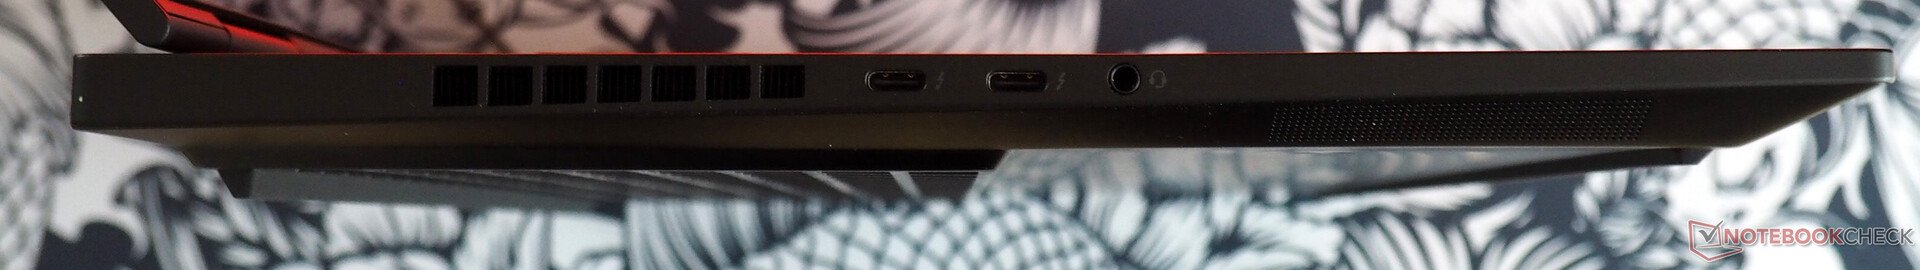
Características
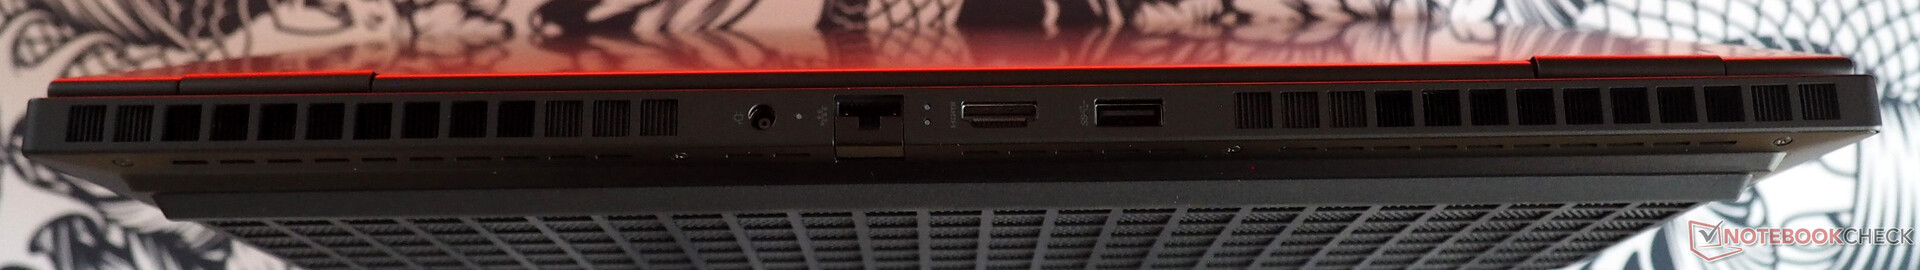
La selección de puertos puede describirse como muy moderna. Mientras que la parte trasera alberga un puerto RJ45 (desafortunadamente no LAN de 2,5 Gbit), una salida HDMI 2.1 y un puerto USB 3.0 (tipo A), el lado izquierdo es el hogar de dos puertos Thunderbolt 4 (incluyendo Power Delivery) y una toma de audio. En el lado derecho, sólo hay un puerto USB 3.0 solitario (tipo A). Los compradores tienen que conformarse con prescindir de un bloqueo Kensington y un lector de tarjetas.

Comunicación
El rendimiento Wi-Fi está a un alto nivel y con una velocidad de envío de casi 1.400 Mbit/s y alrededor de 1.700 Mbit/s cuando se trata de recibir datos (a 1 m de distancia del router de referencia) el rendimiento está entre bueno y muy bueno. Con el Wi-Fi 6E AX211, HP ha instalado un módulo inalámbrico Intel actualizado.
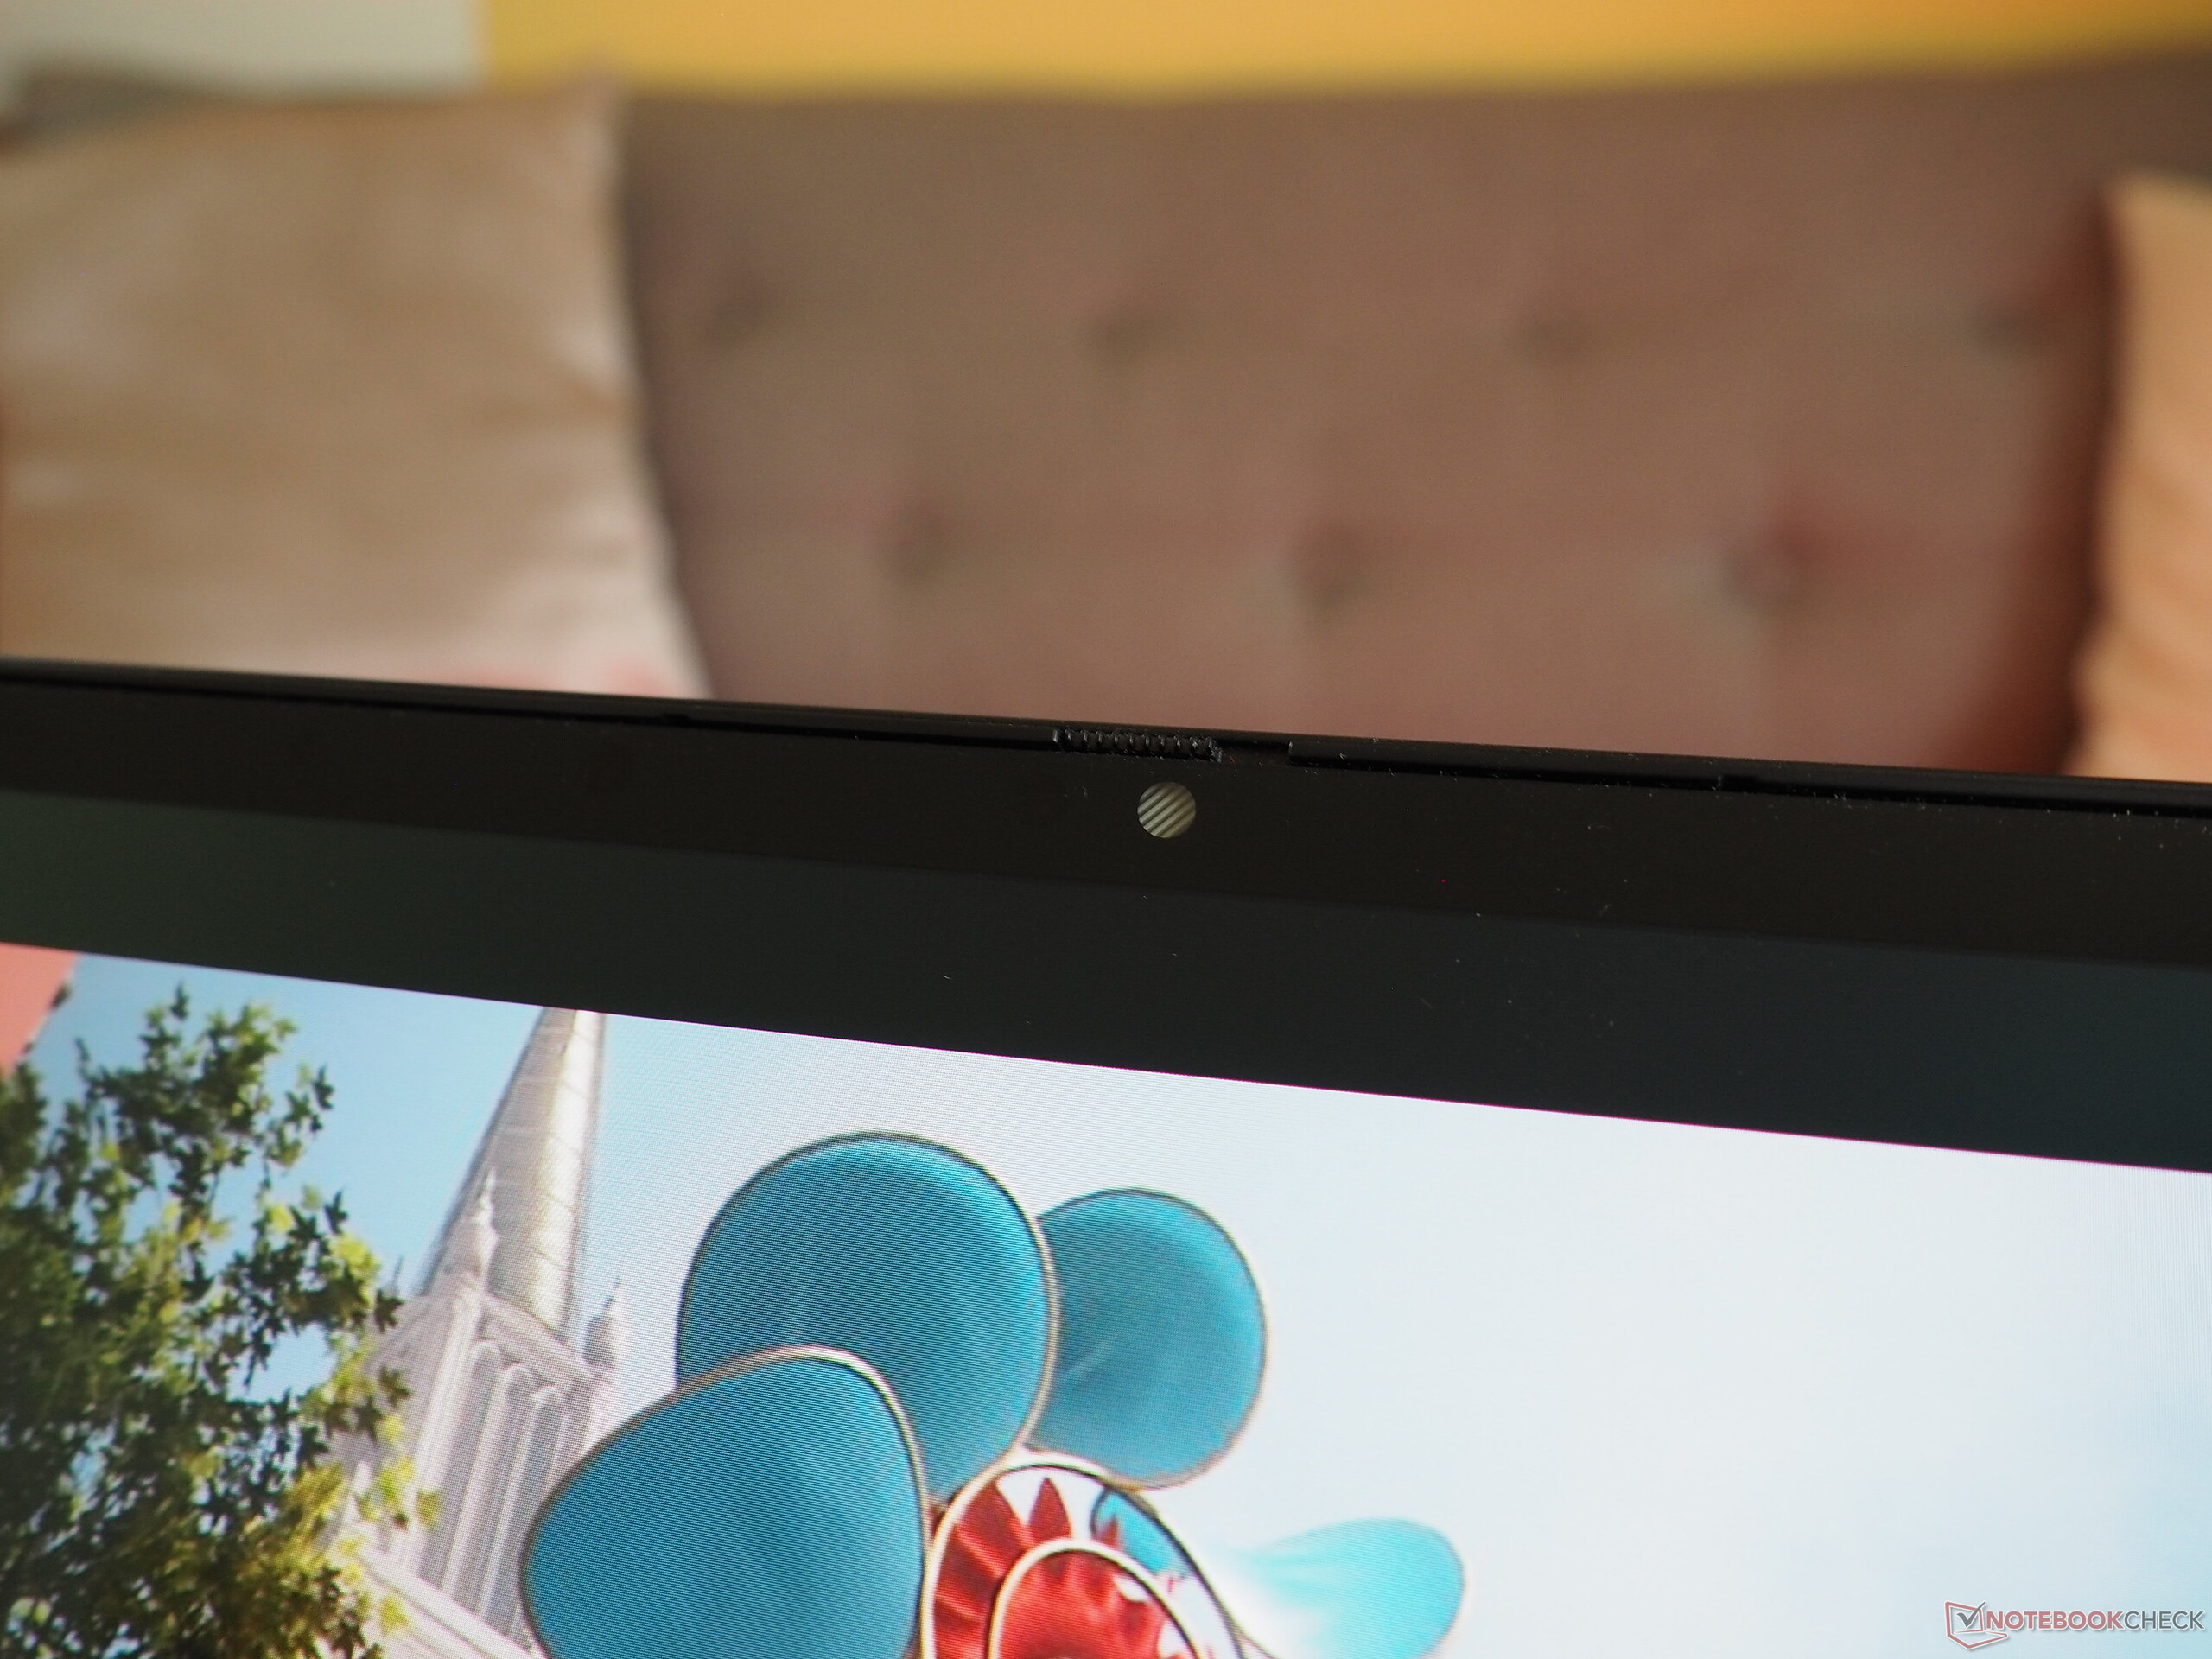
Cámara web
Tenemos sentimientos encontrados respecto a la webcam de 2 MP. Aunque la nitidez de la imagen está por encima de la media, la precisión del color deja mucho que desear. Lo que sí es bueno es el obturador manual para la privacidad.


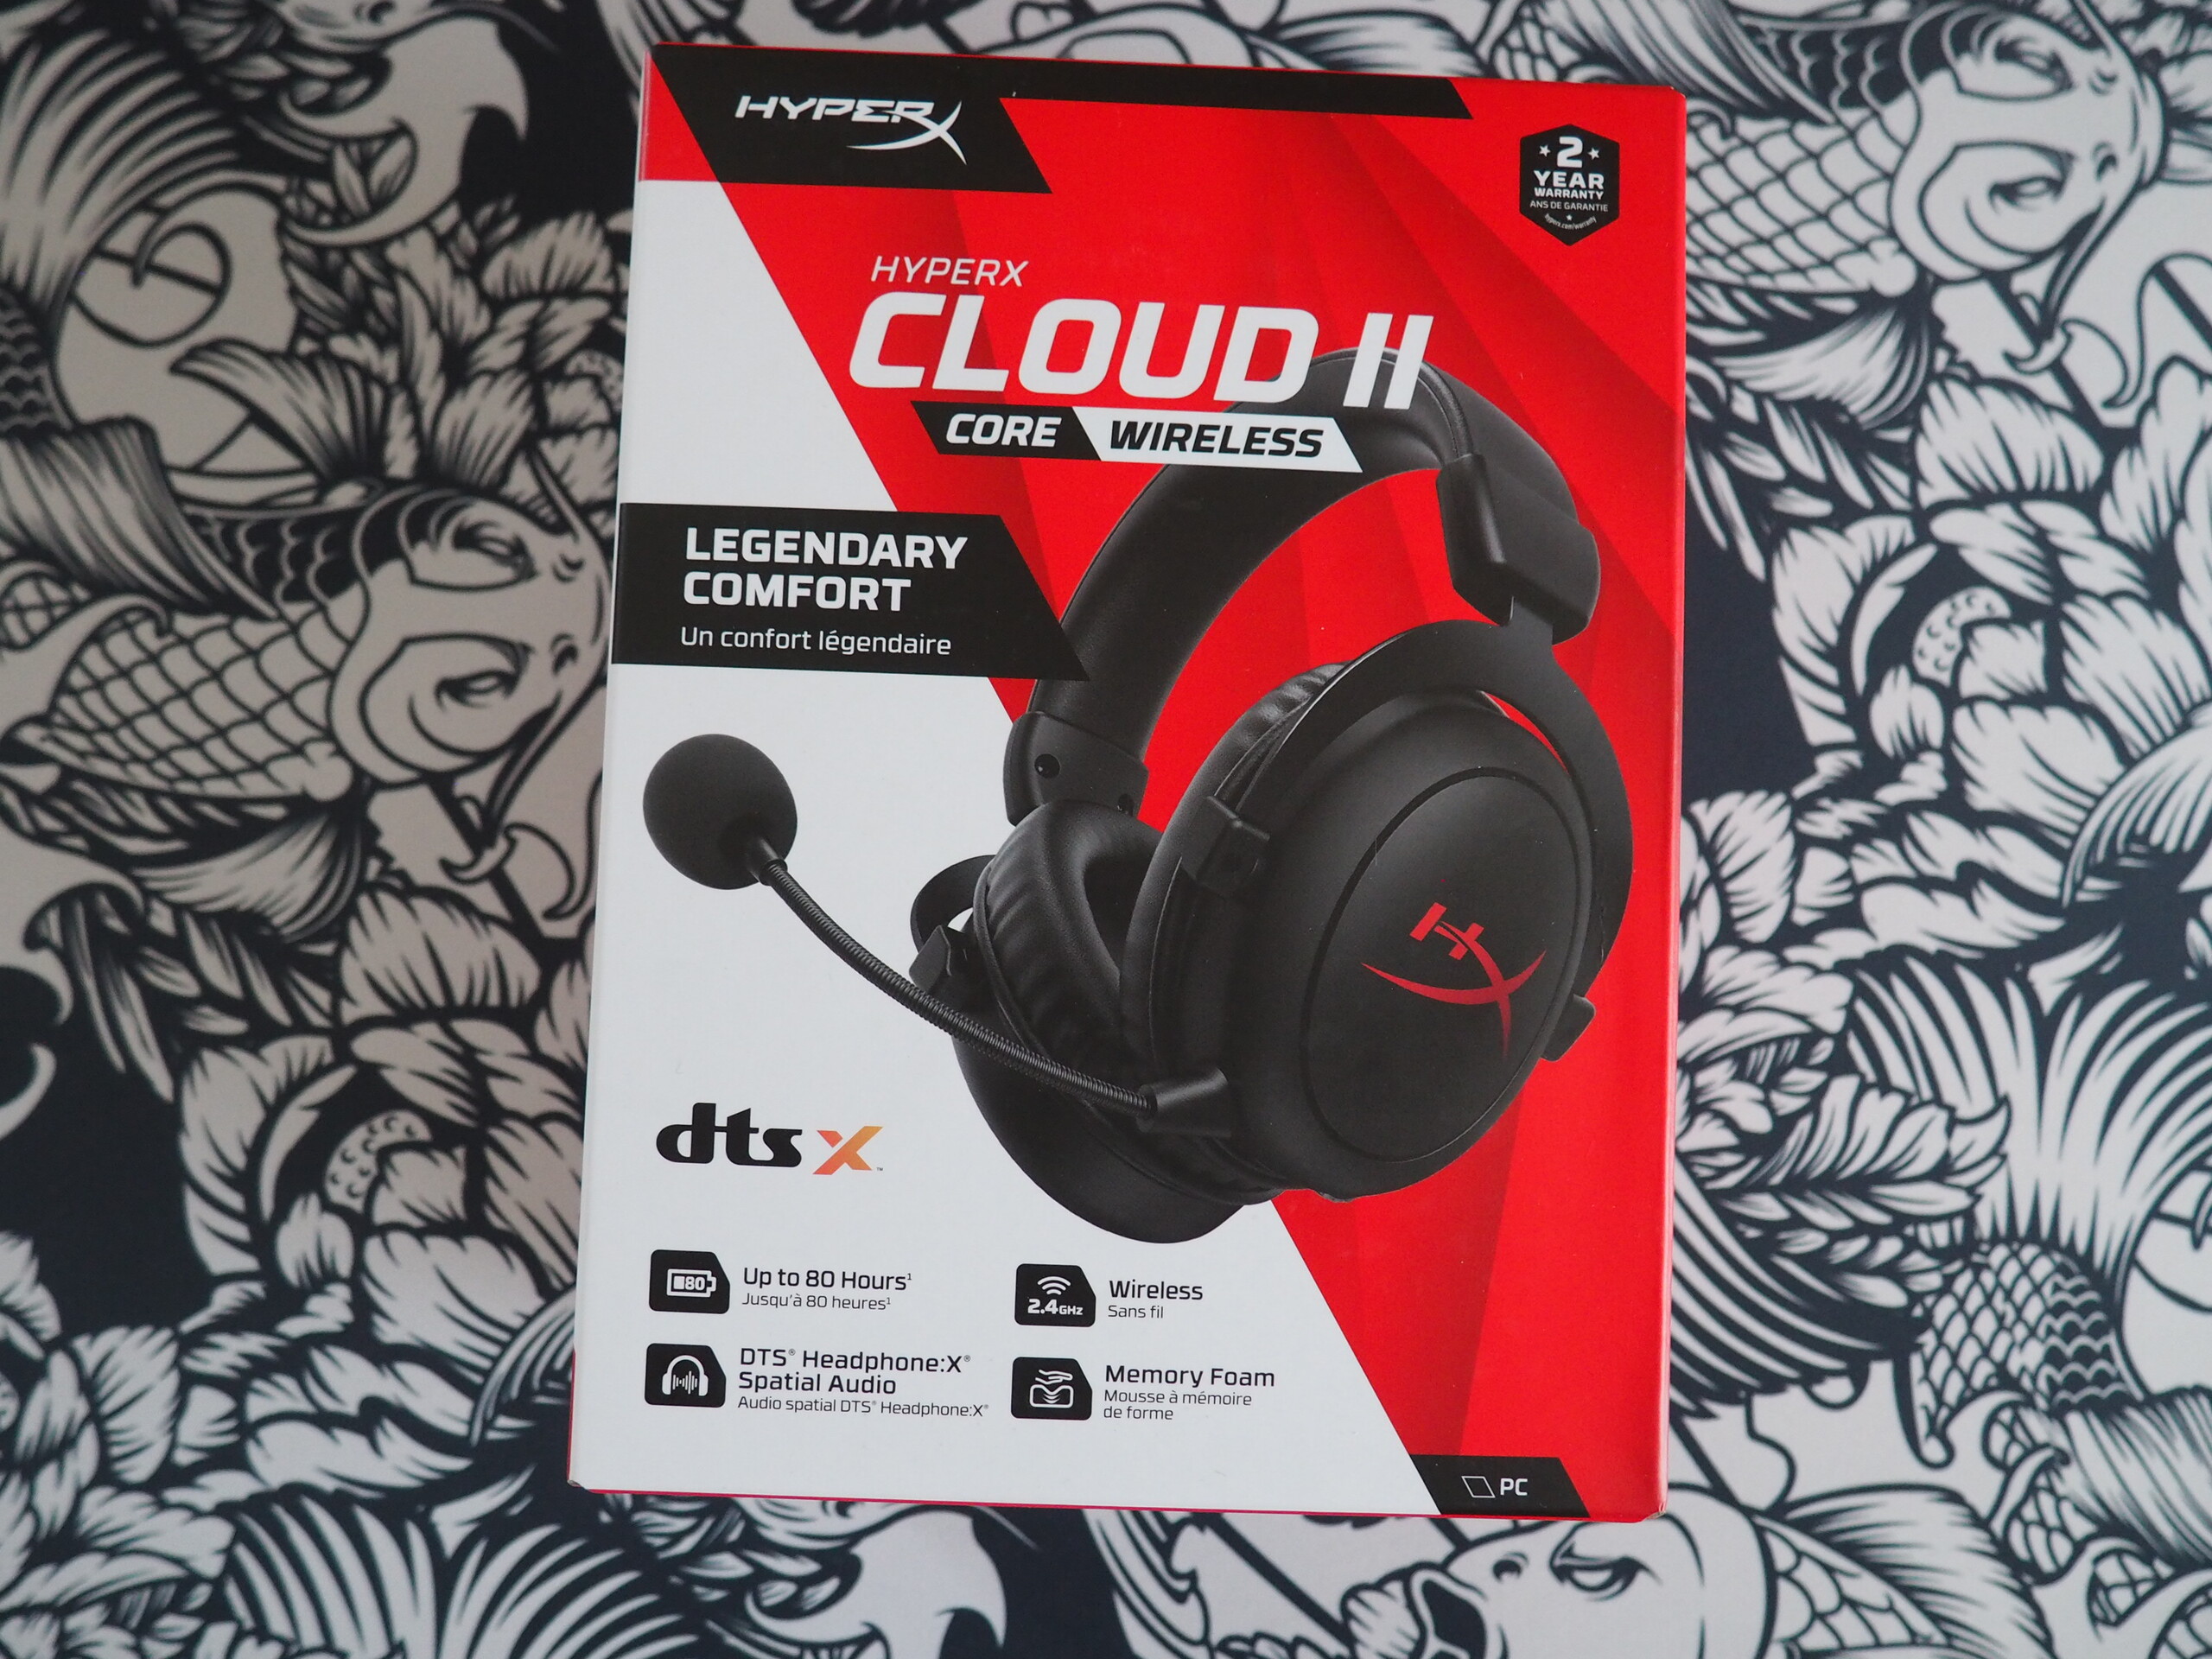
Accesorios
Nuestro dispositivo de revisión también venía con una fuente de alimentación muy delgada de 230 vatios, así como con unos auriculares HyperX (Cloud II Core inalámbricos).
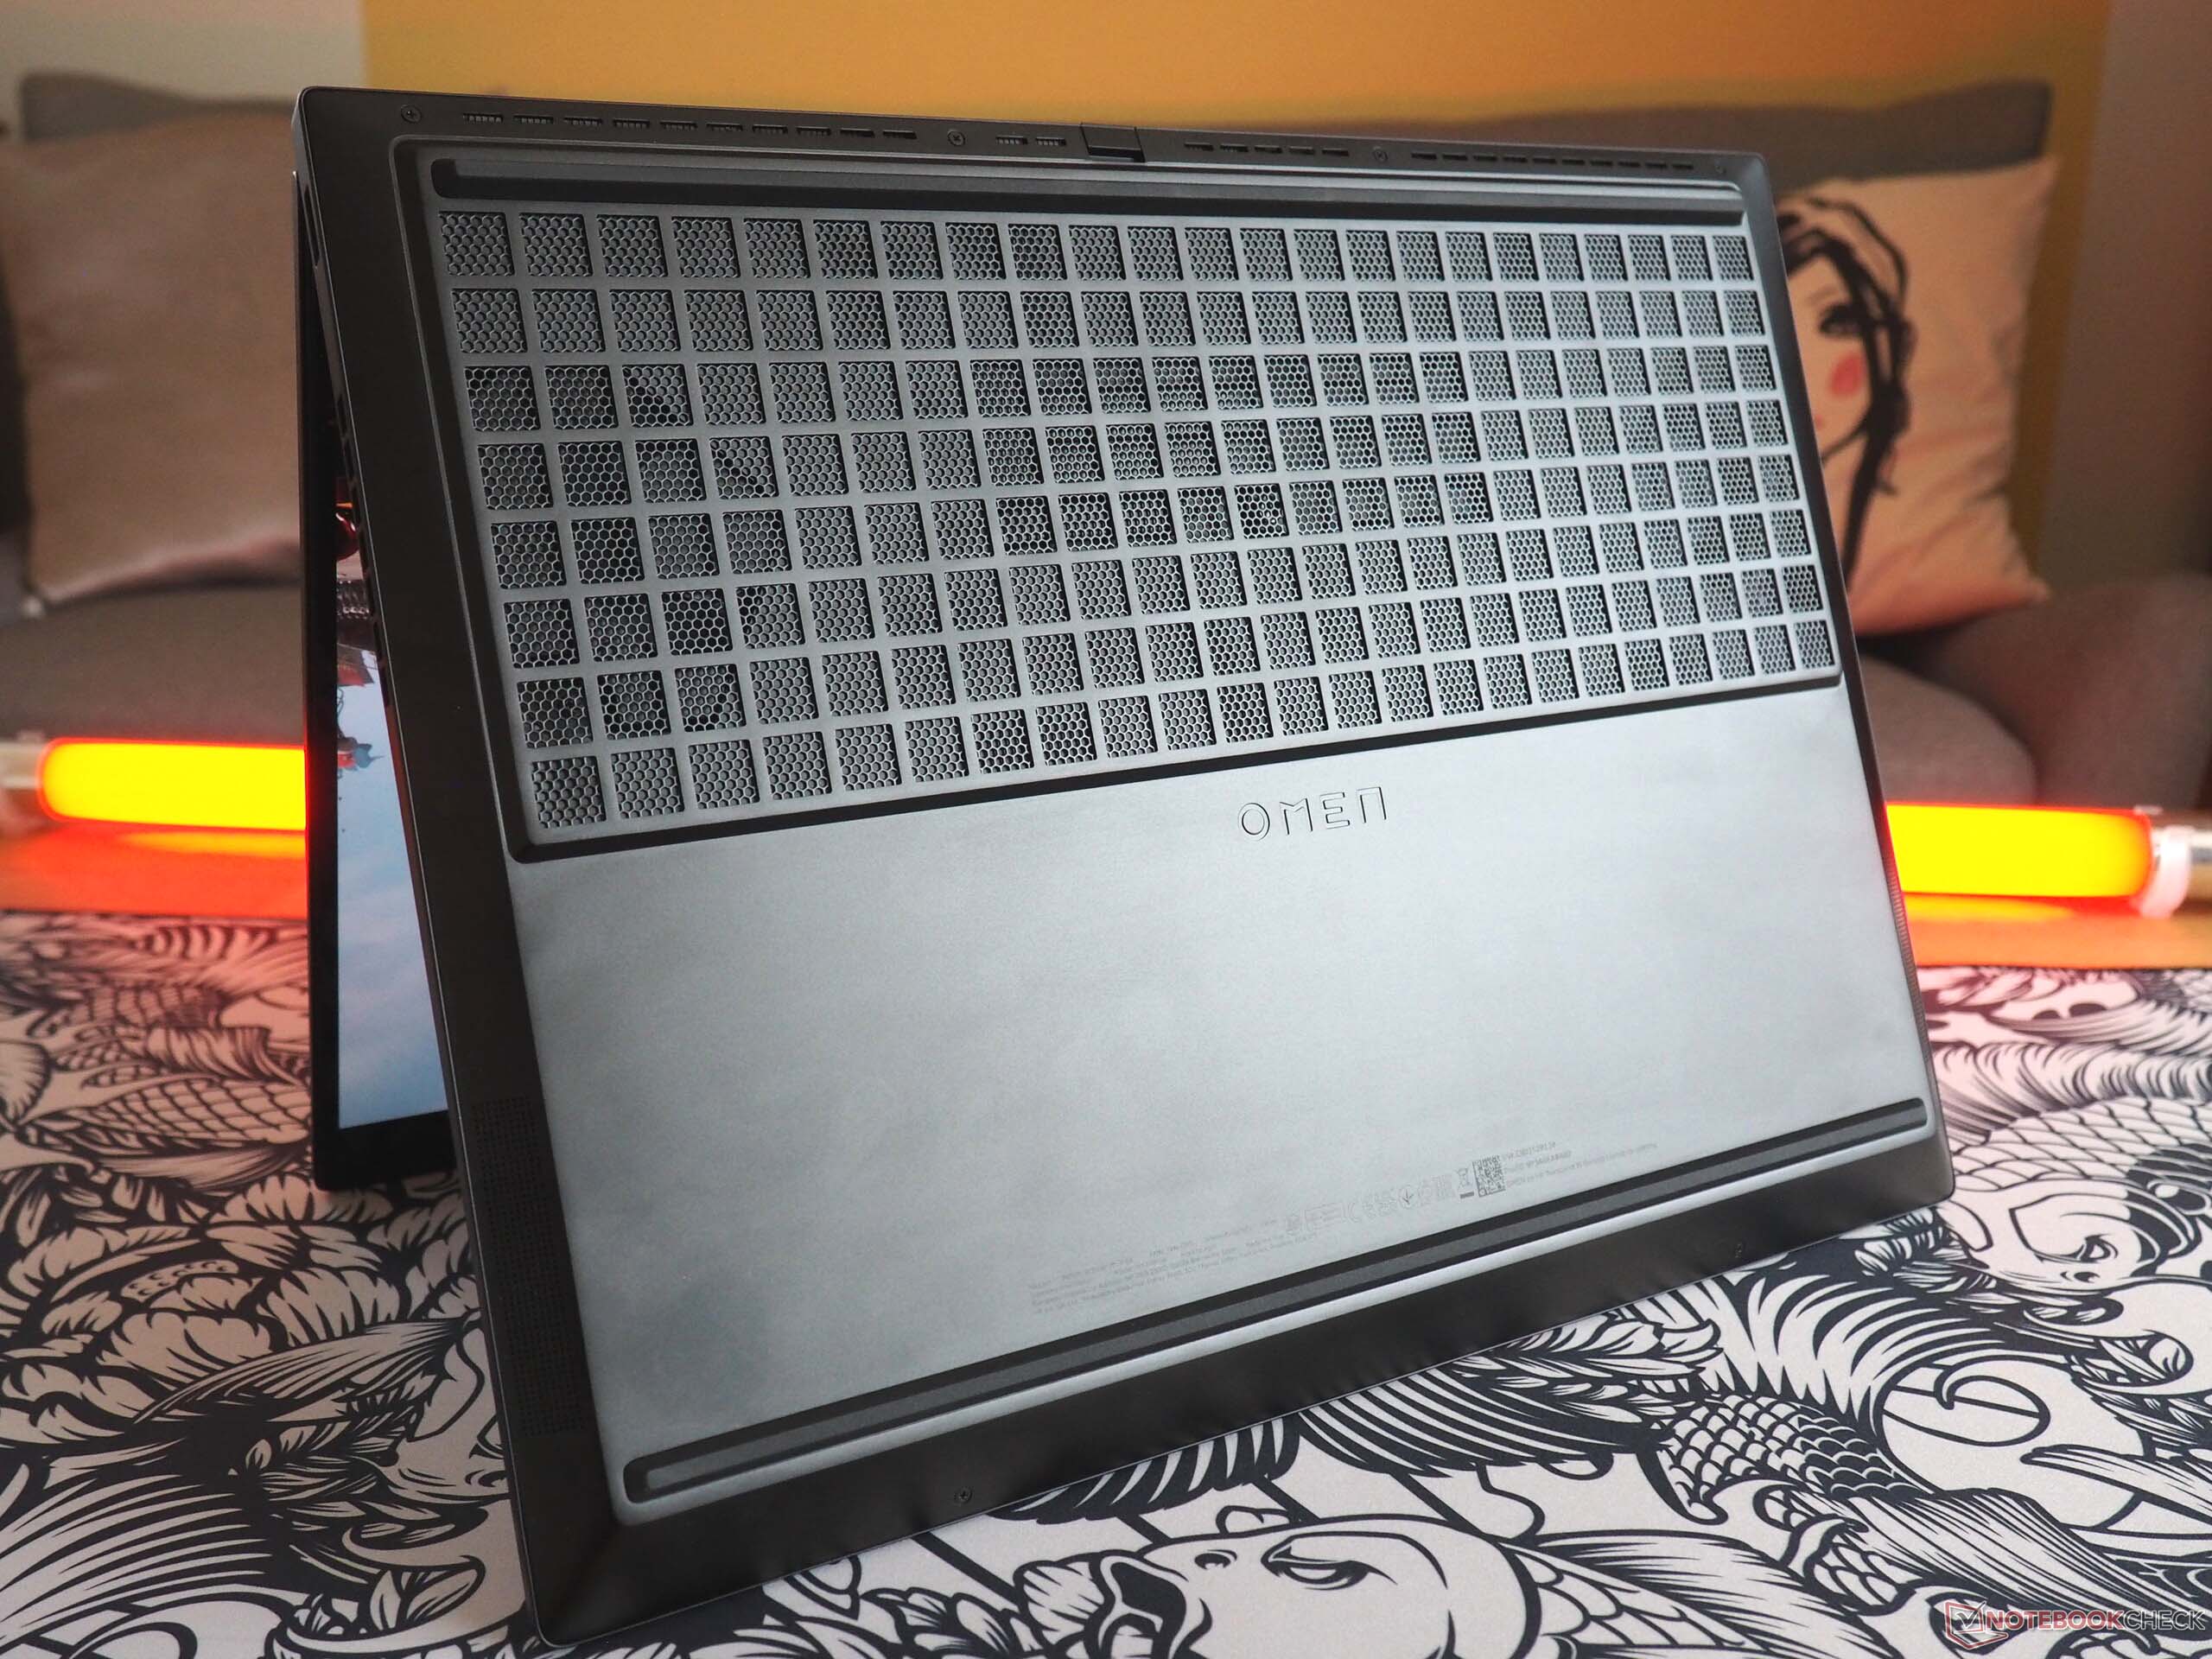
Mantenimiento
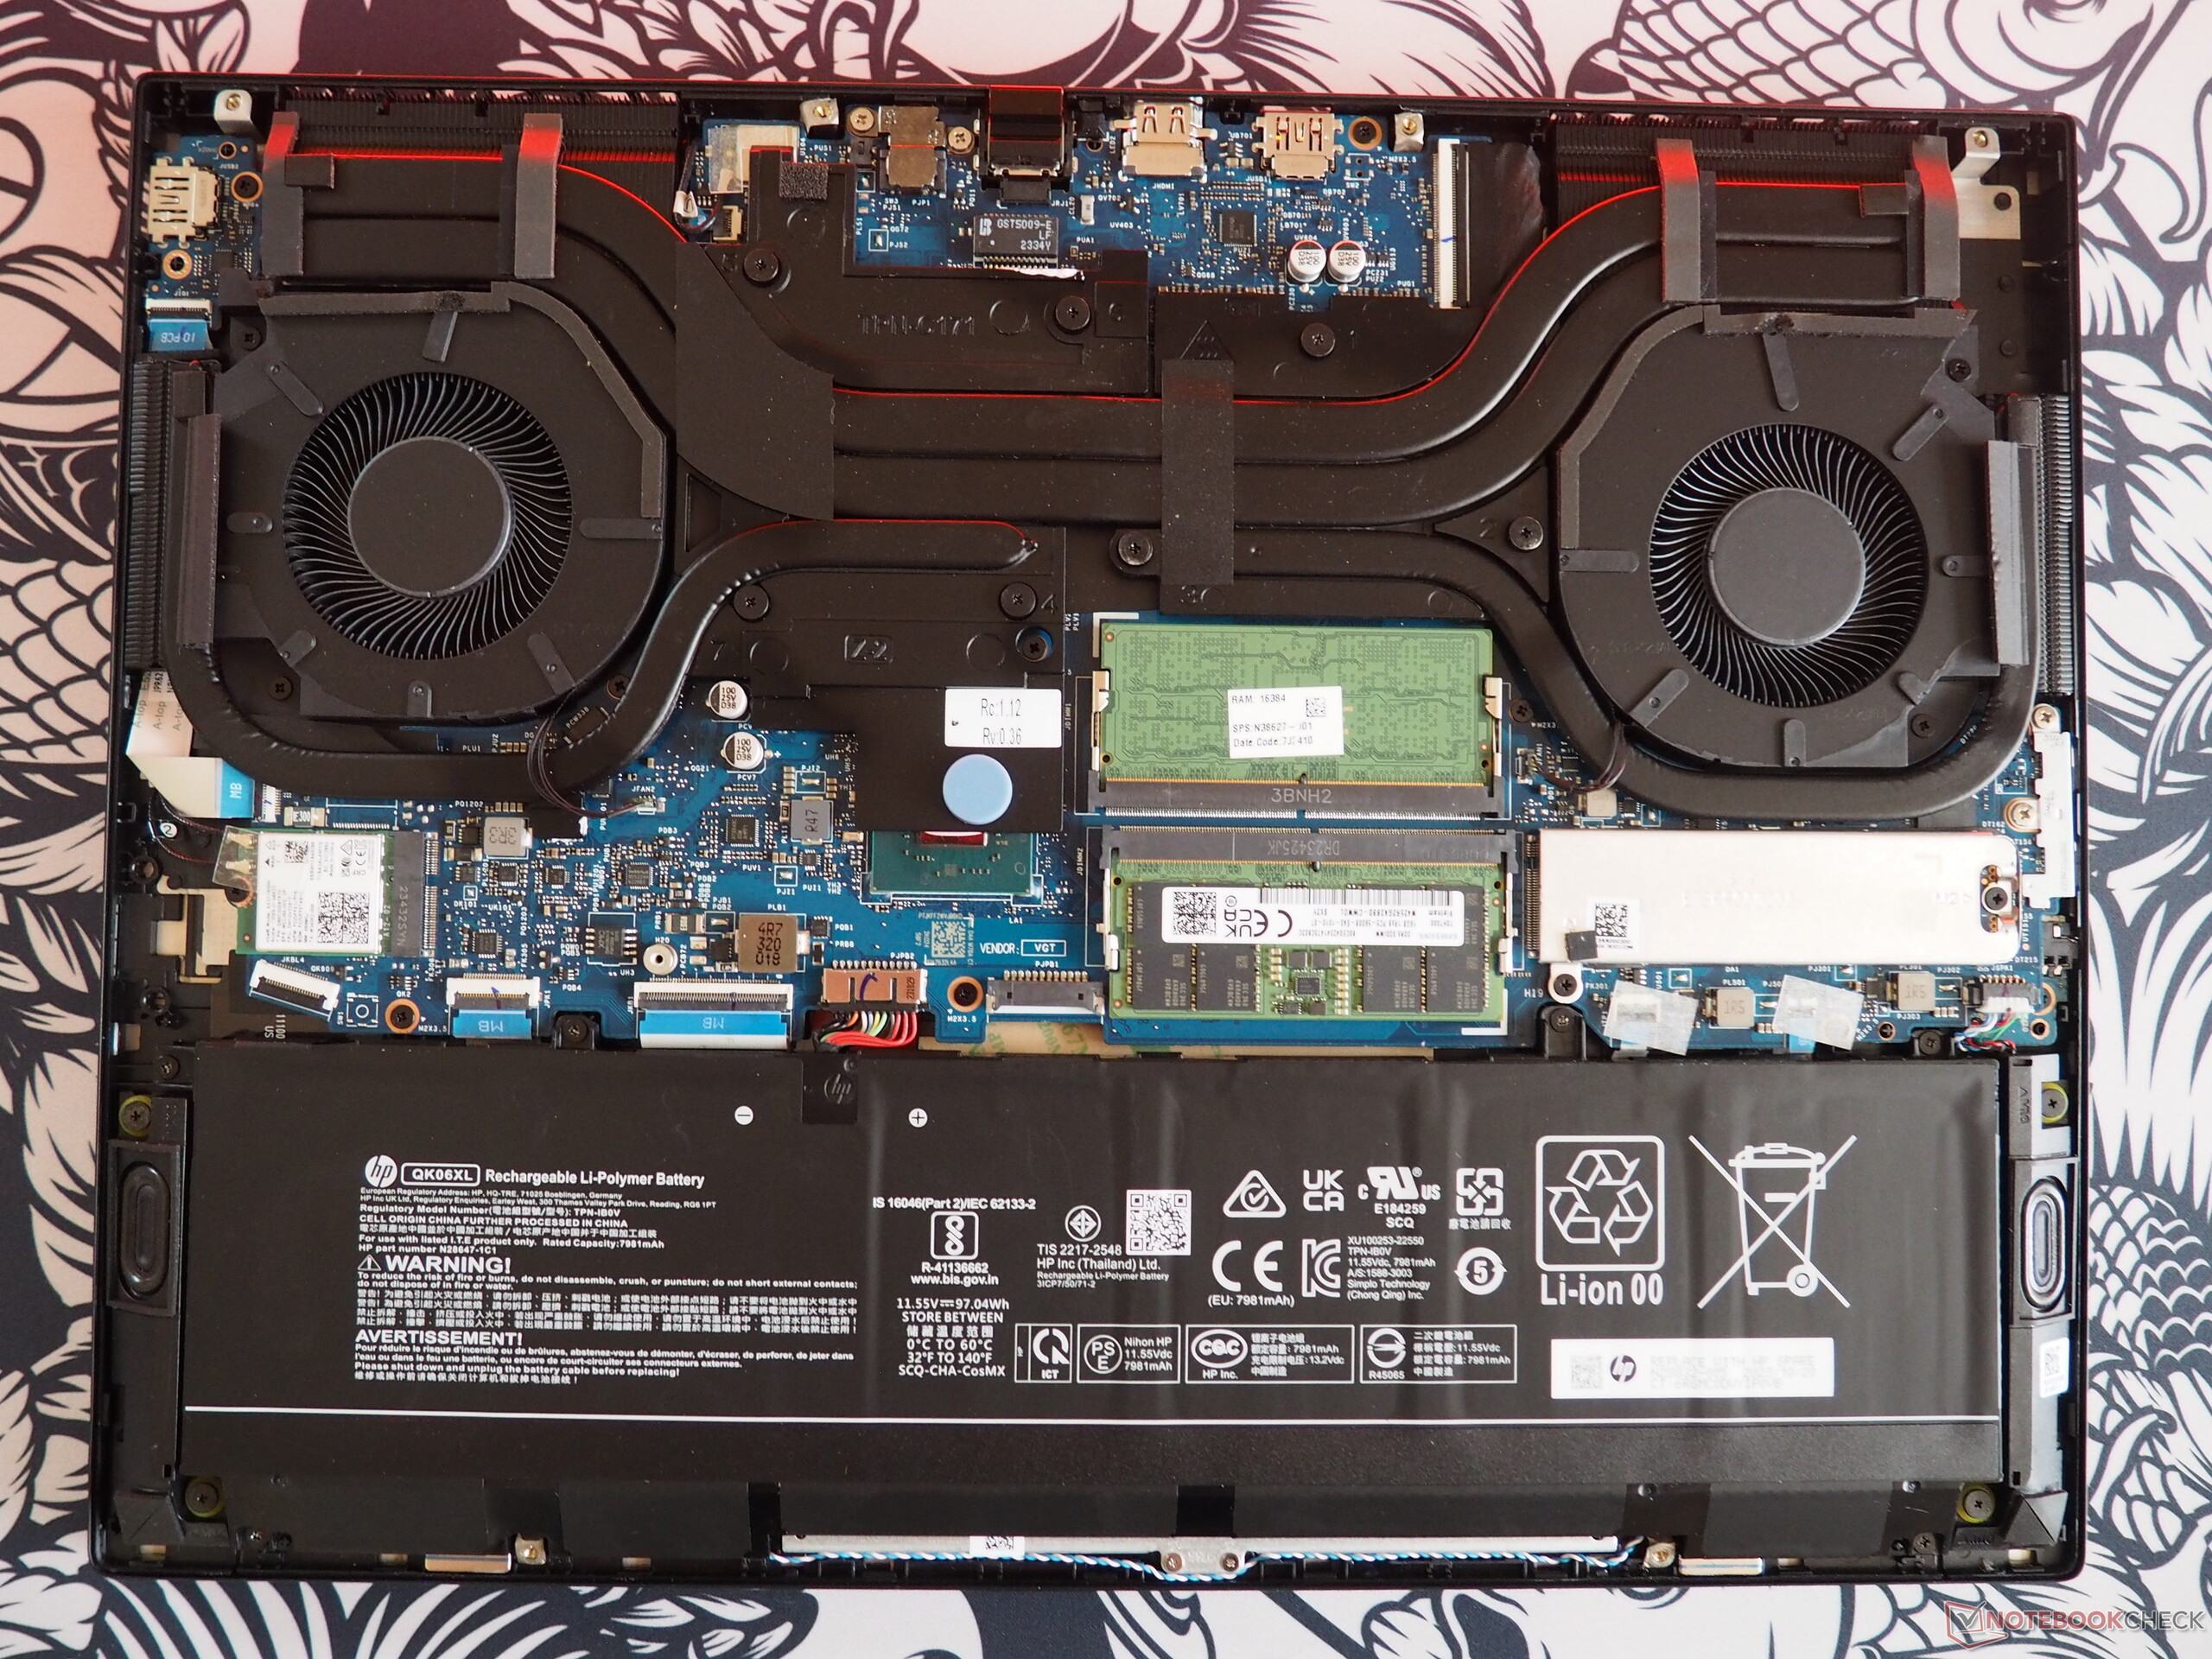
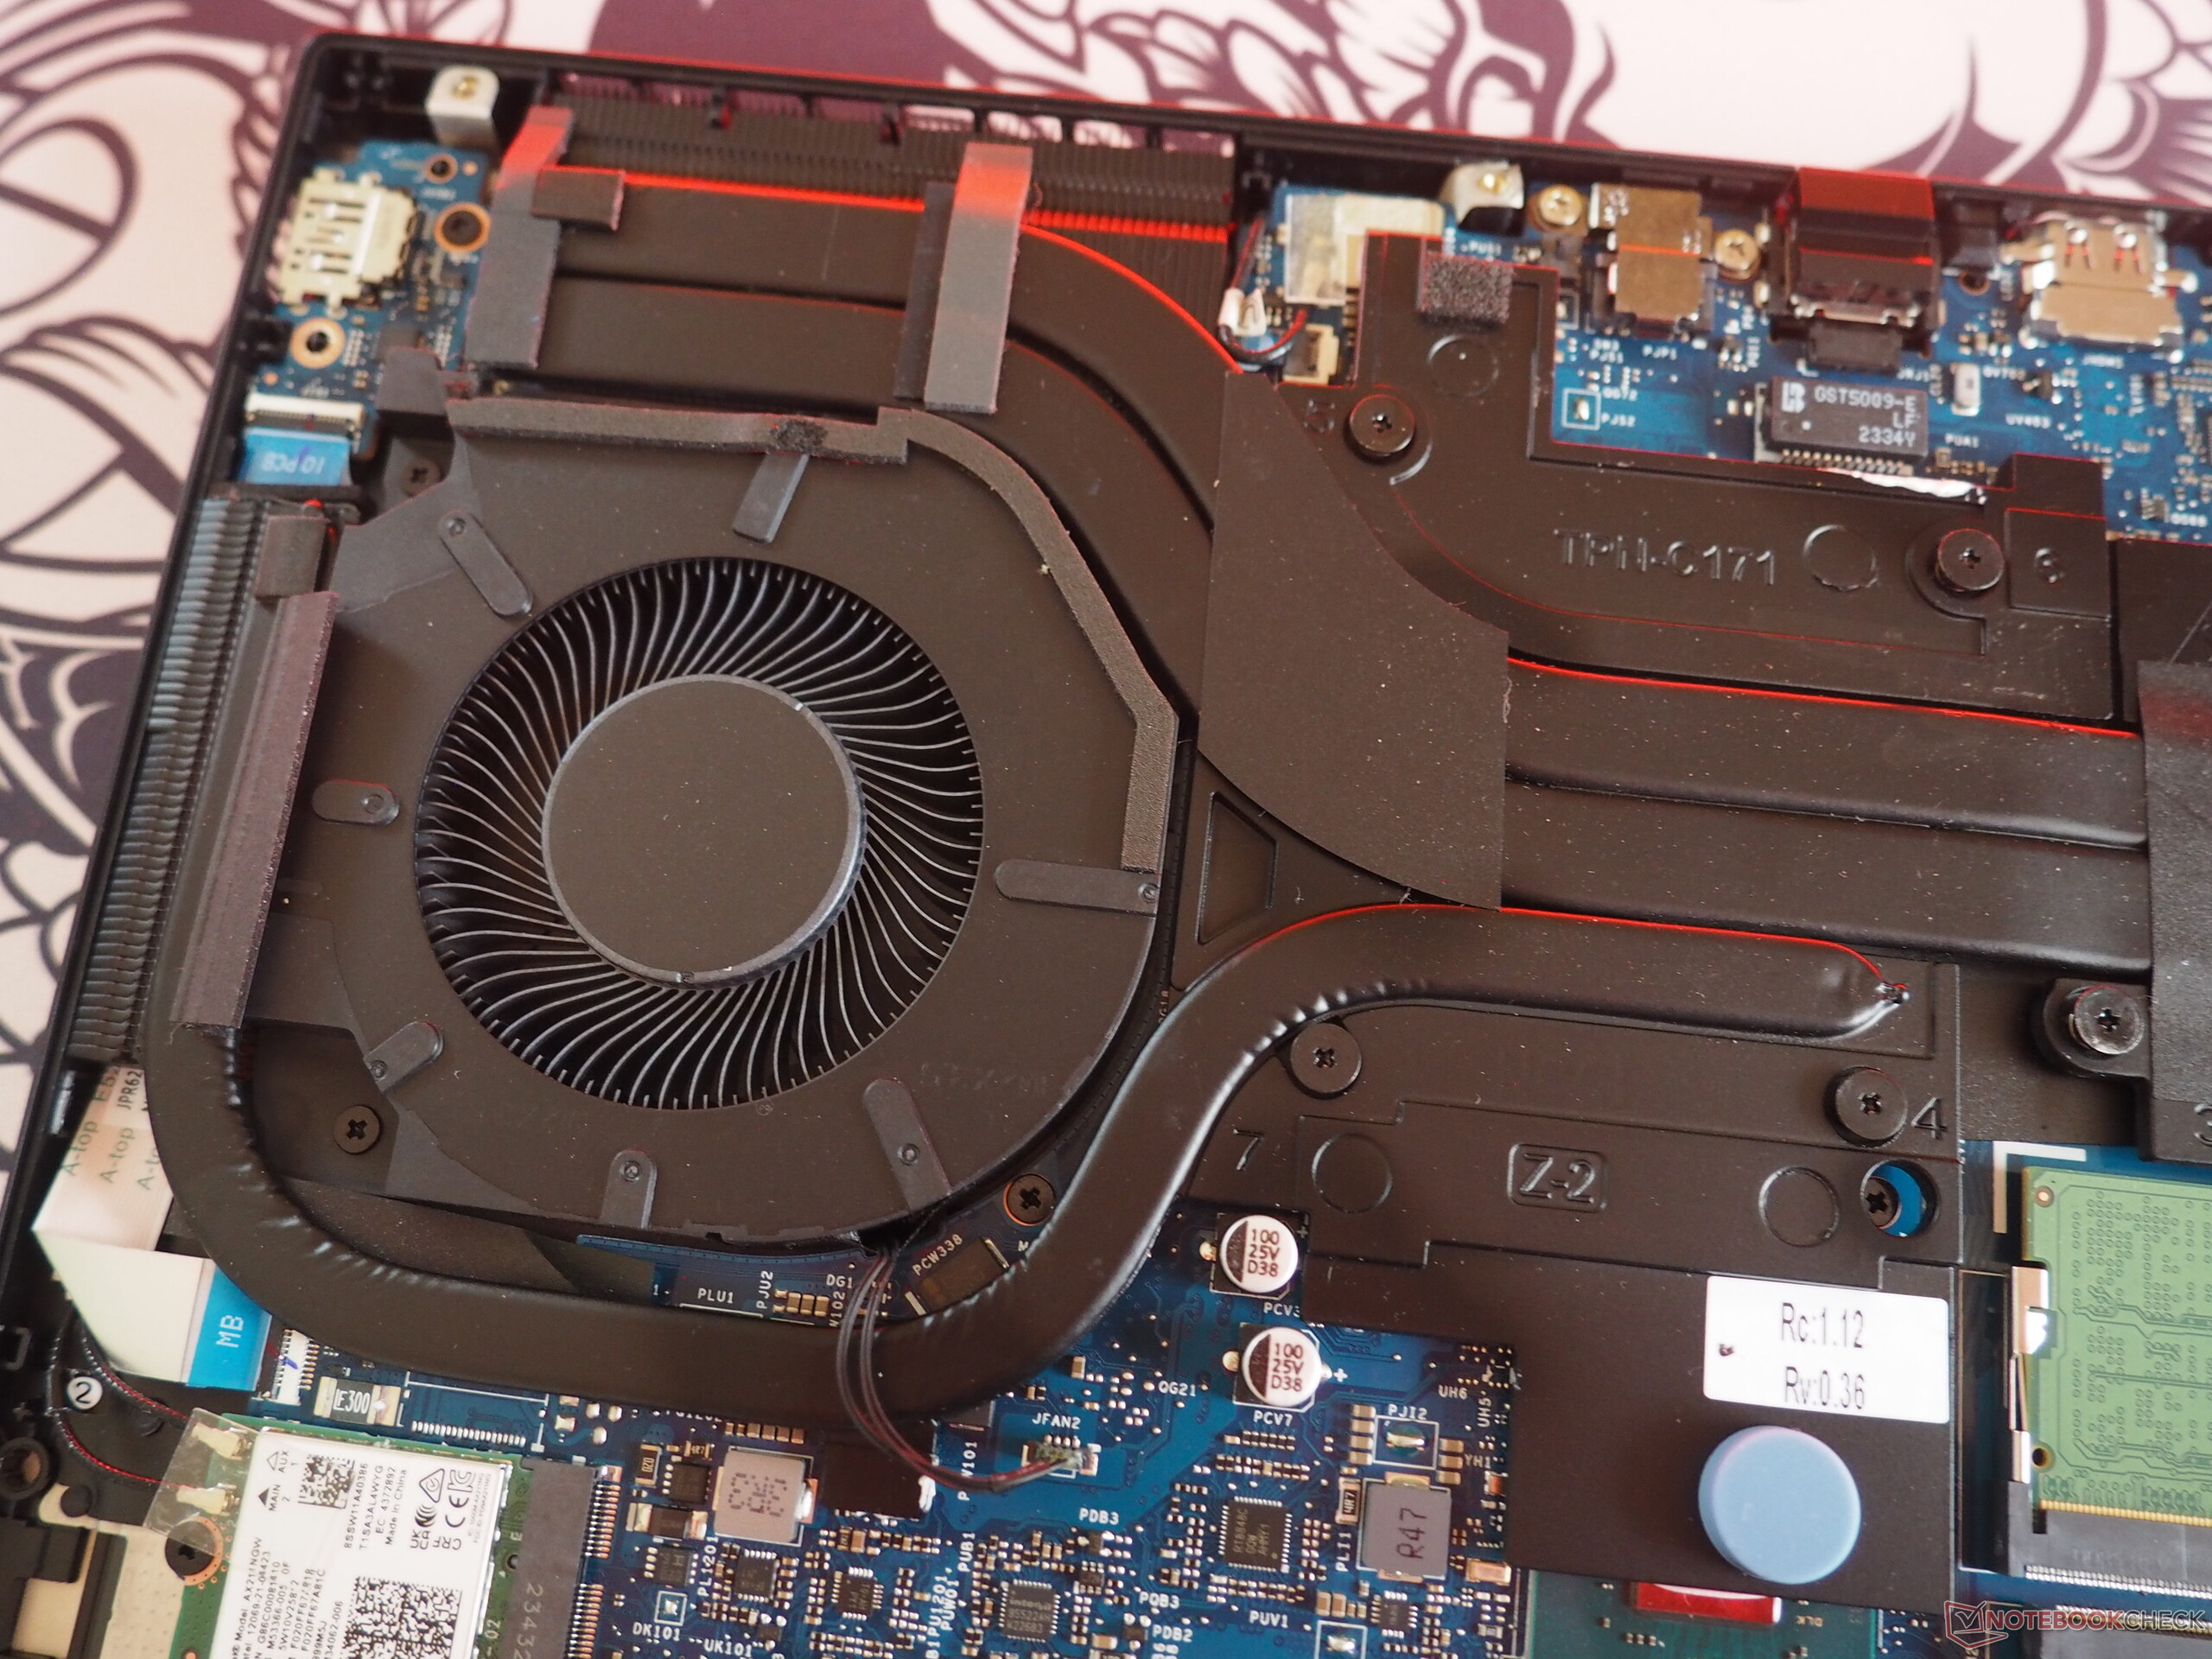
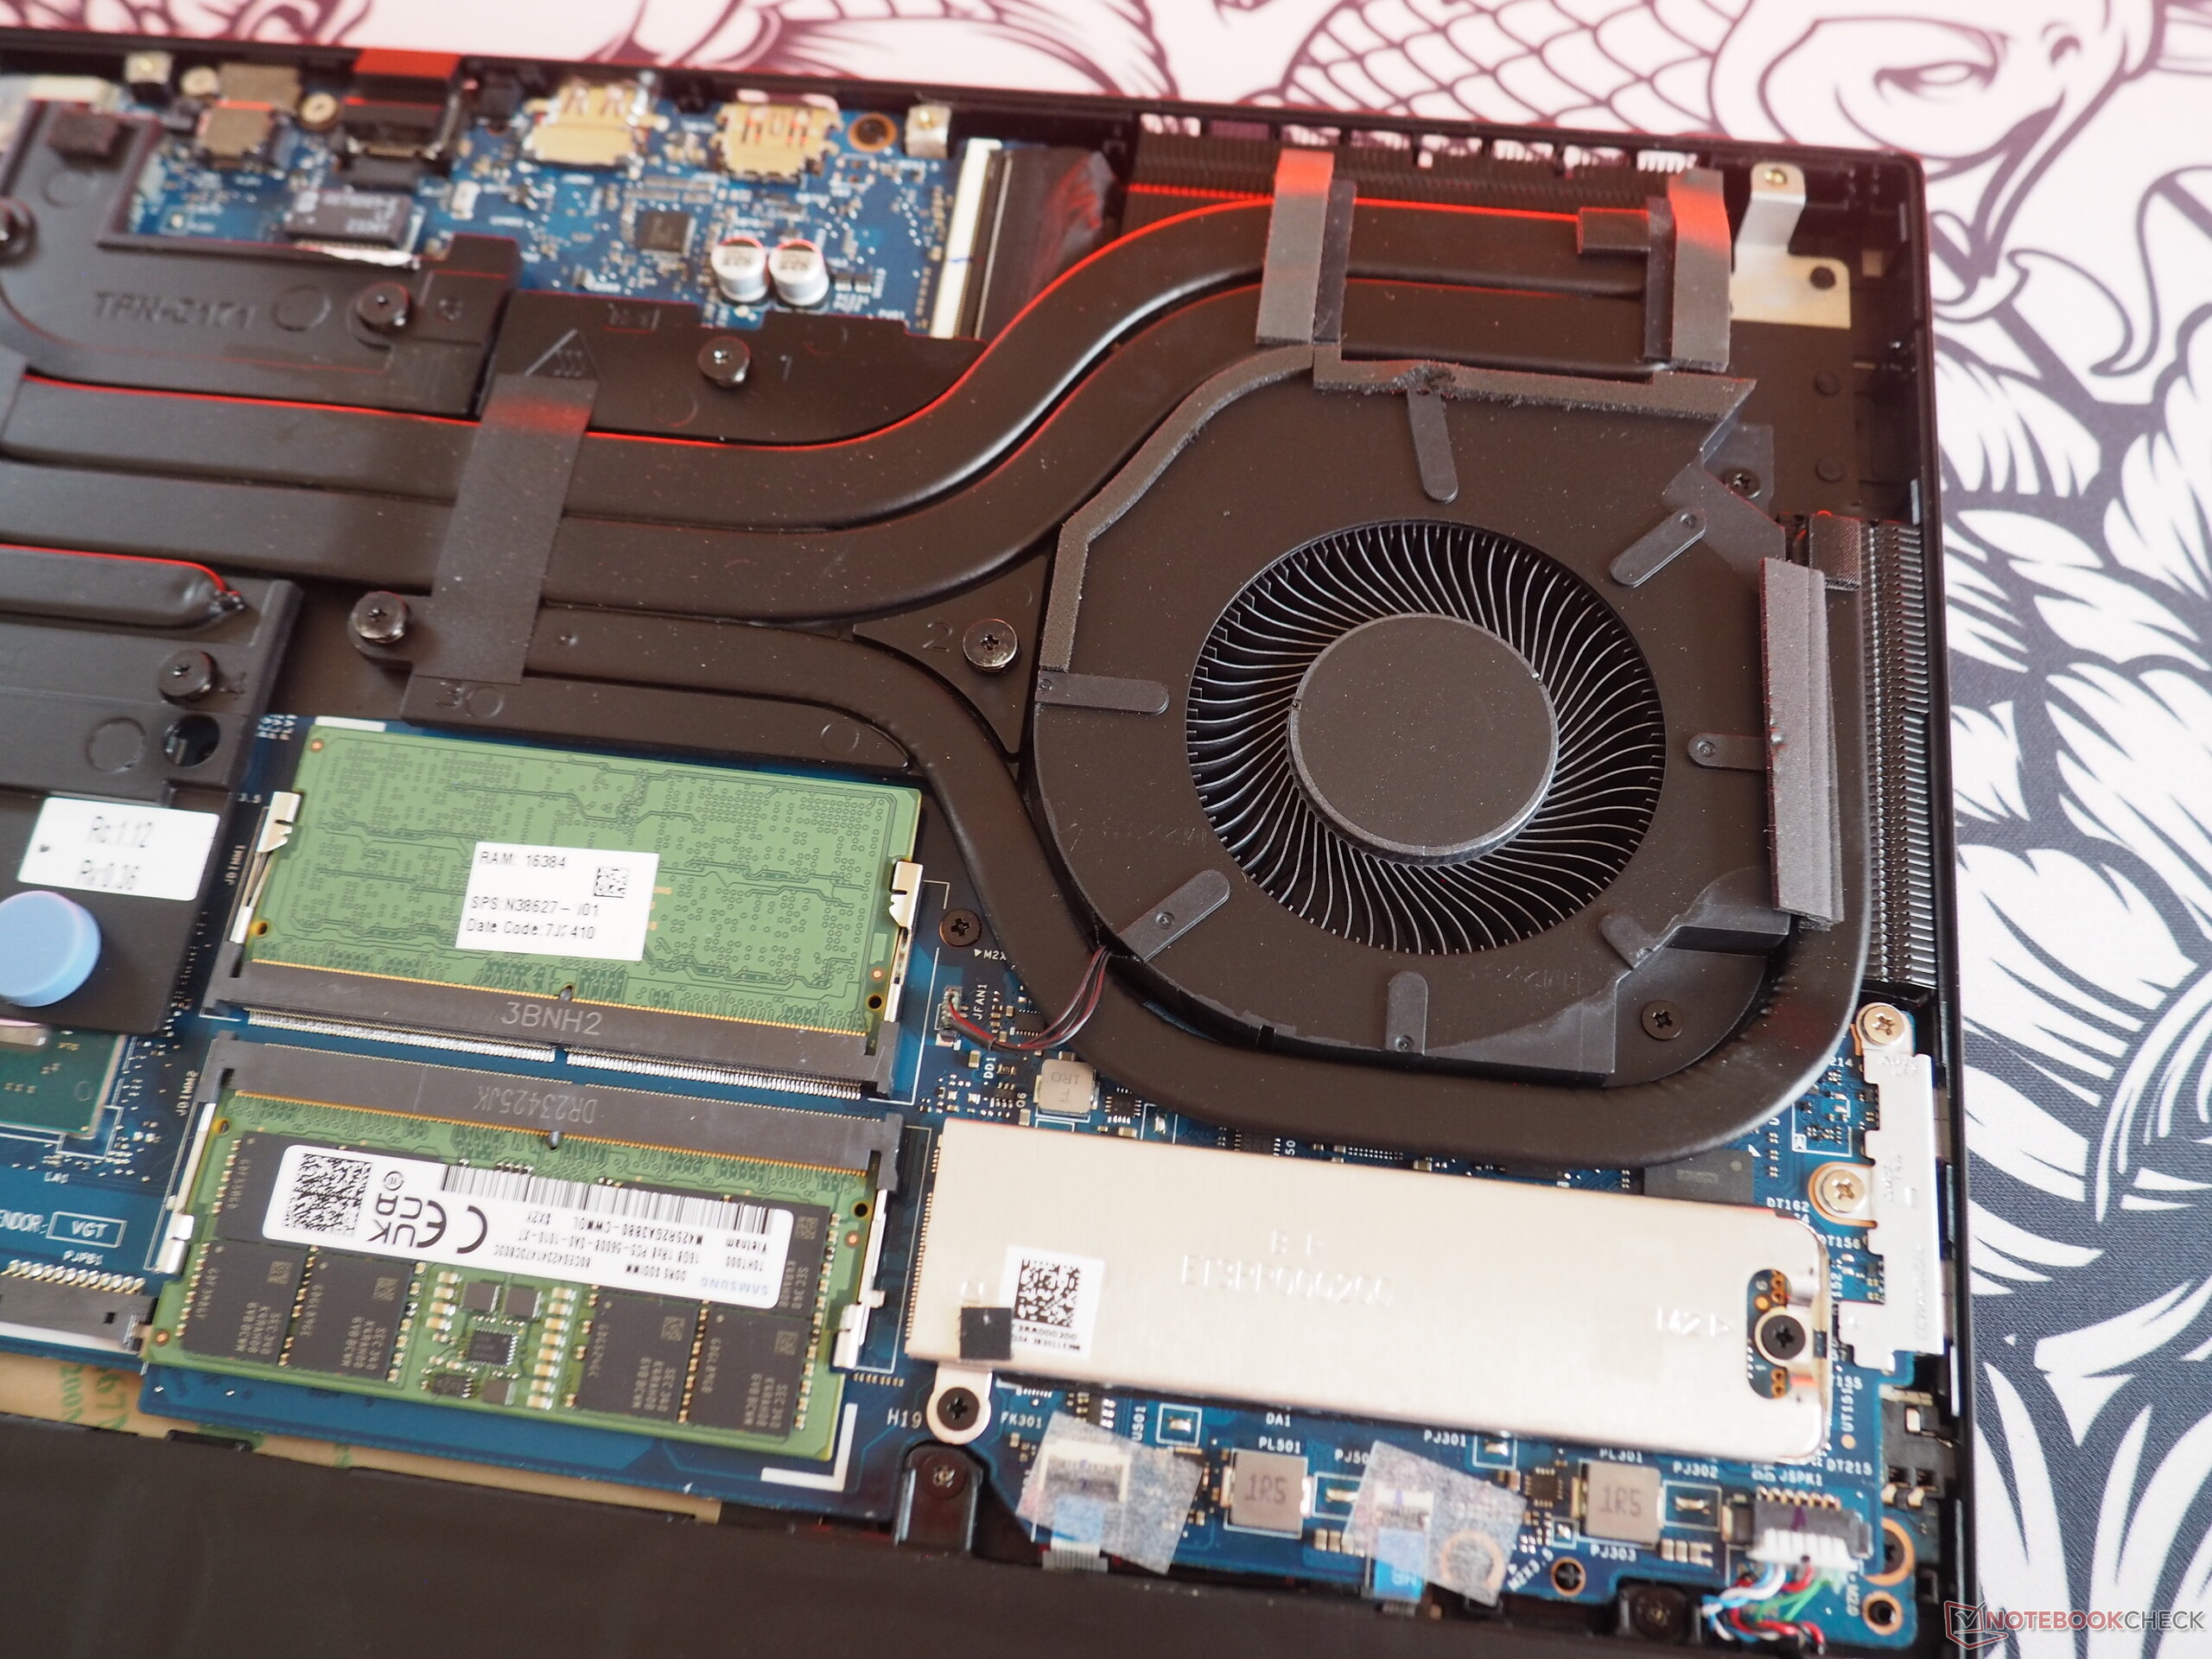
En cuanto al mantenimiento, la Omen 16 no es especialmente complicada. Tras ocuparse de seis pequeños tornillos de cabeza en cruz, la placa base puede levantarse de su posición anclada con la ayuda de una herramienta plana. En el interior del dispositivo, todos los componentes importantes son accesibles, ya sean los bancos de RAM, la batería, la ranura M.2, los ventiladores o el módulo inalámbrico.
Garantía
La garantía es de 24 meses.
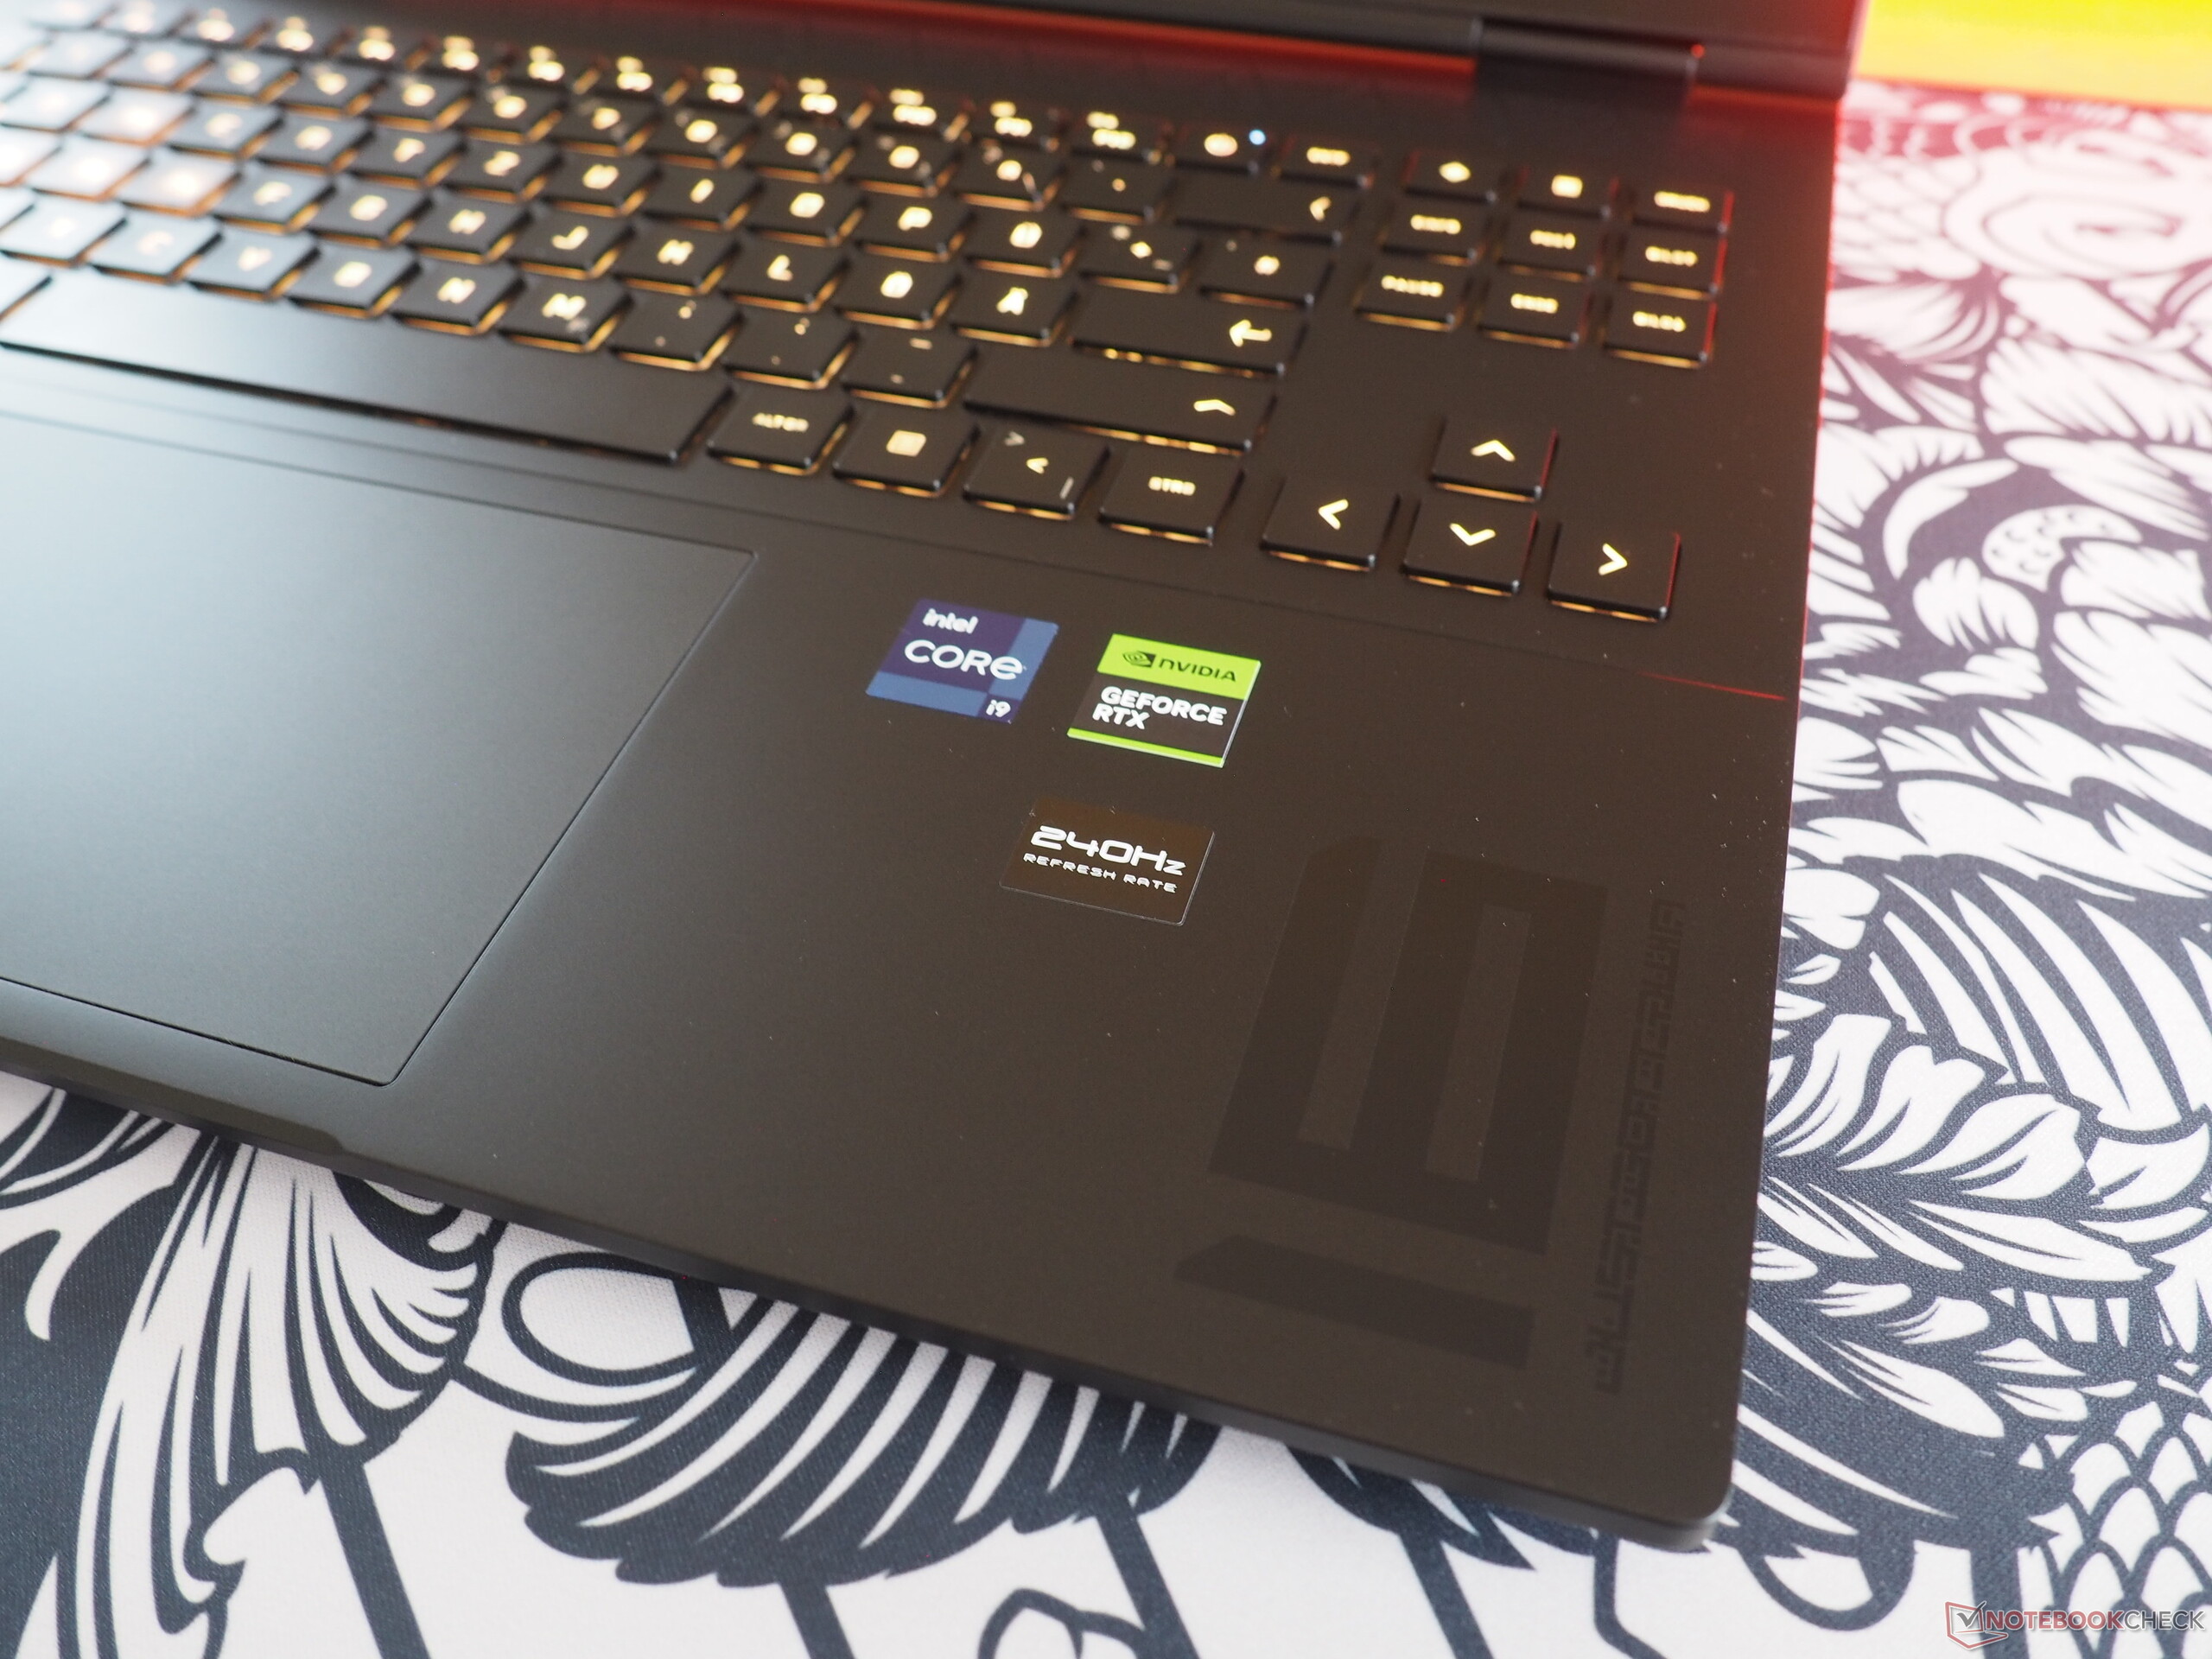
Dispositivos de entrada
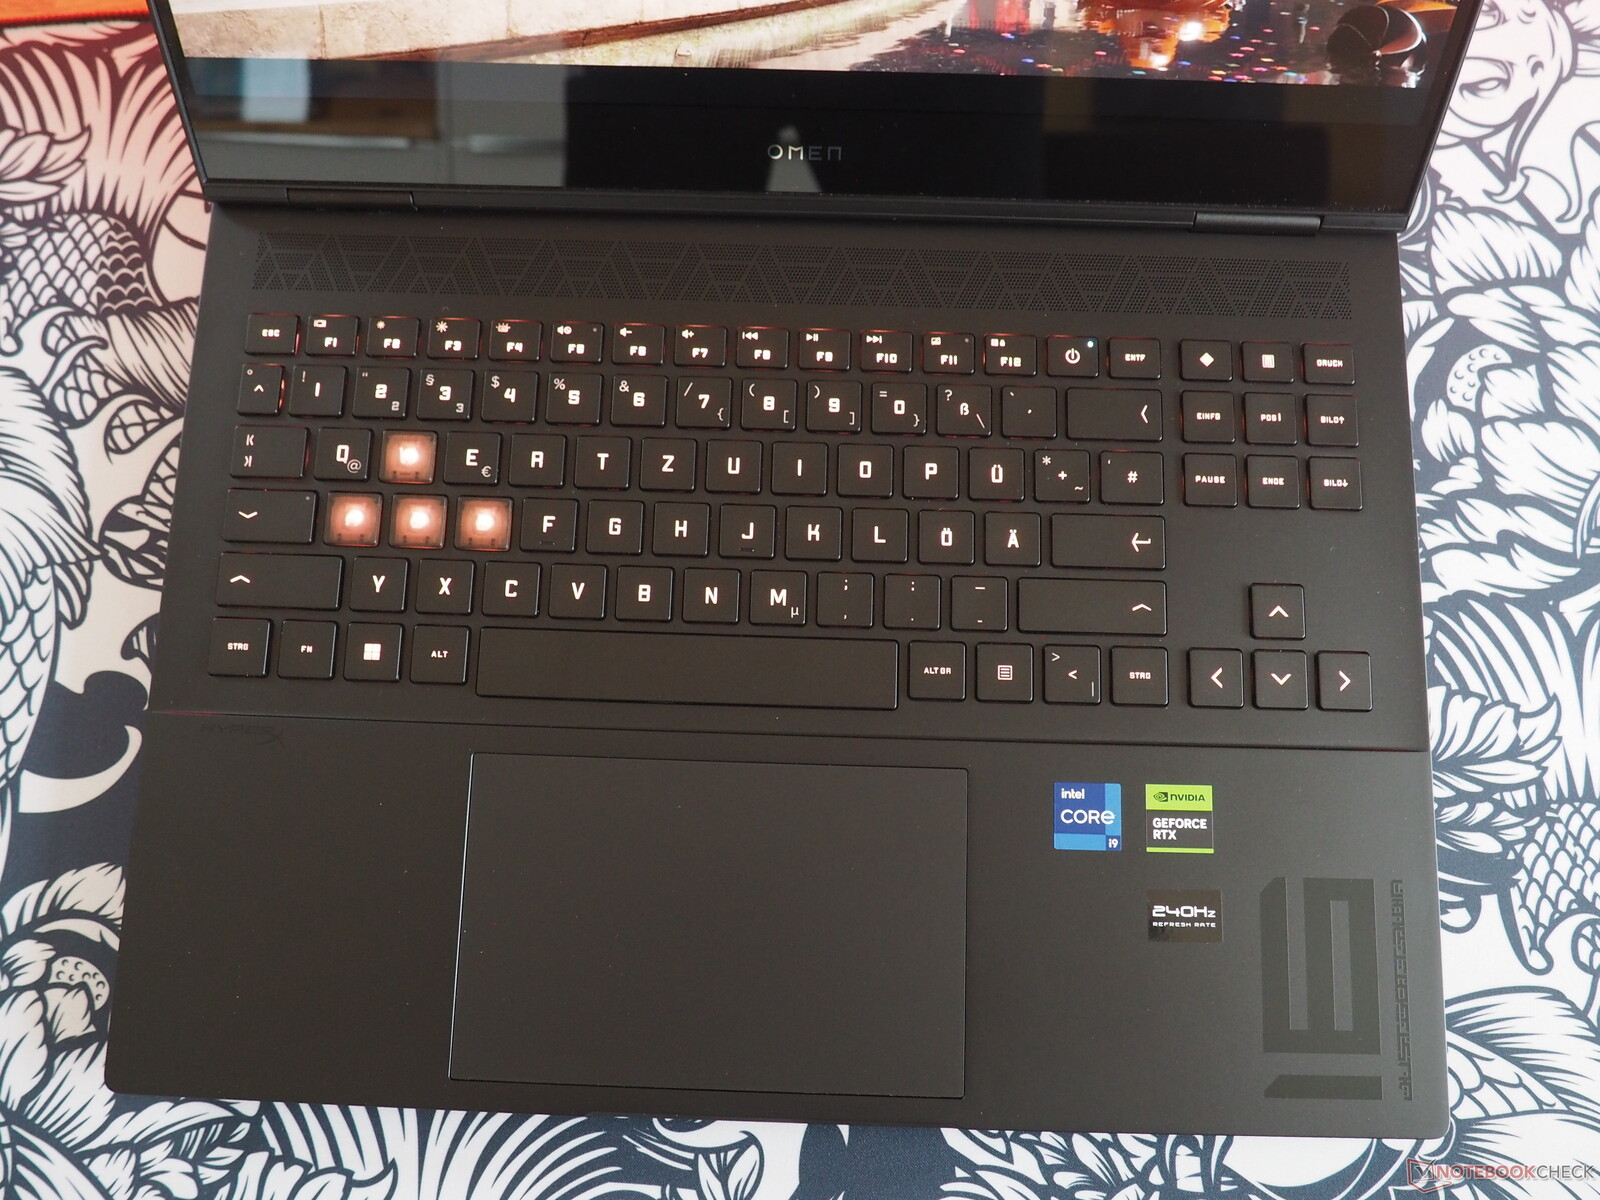
Teclado
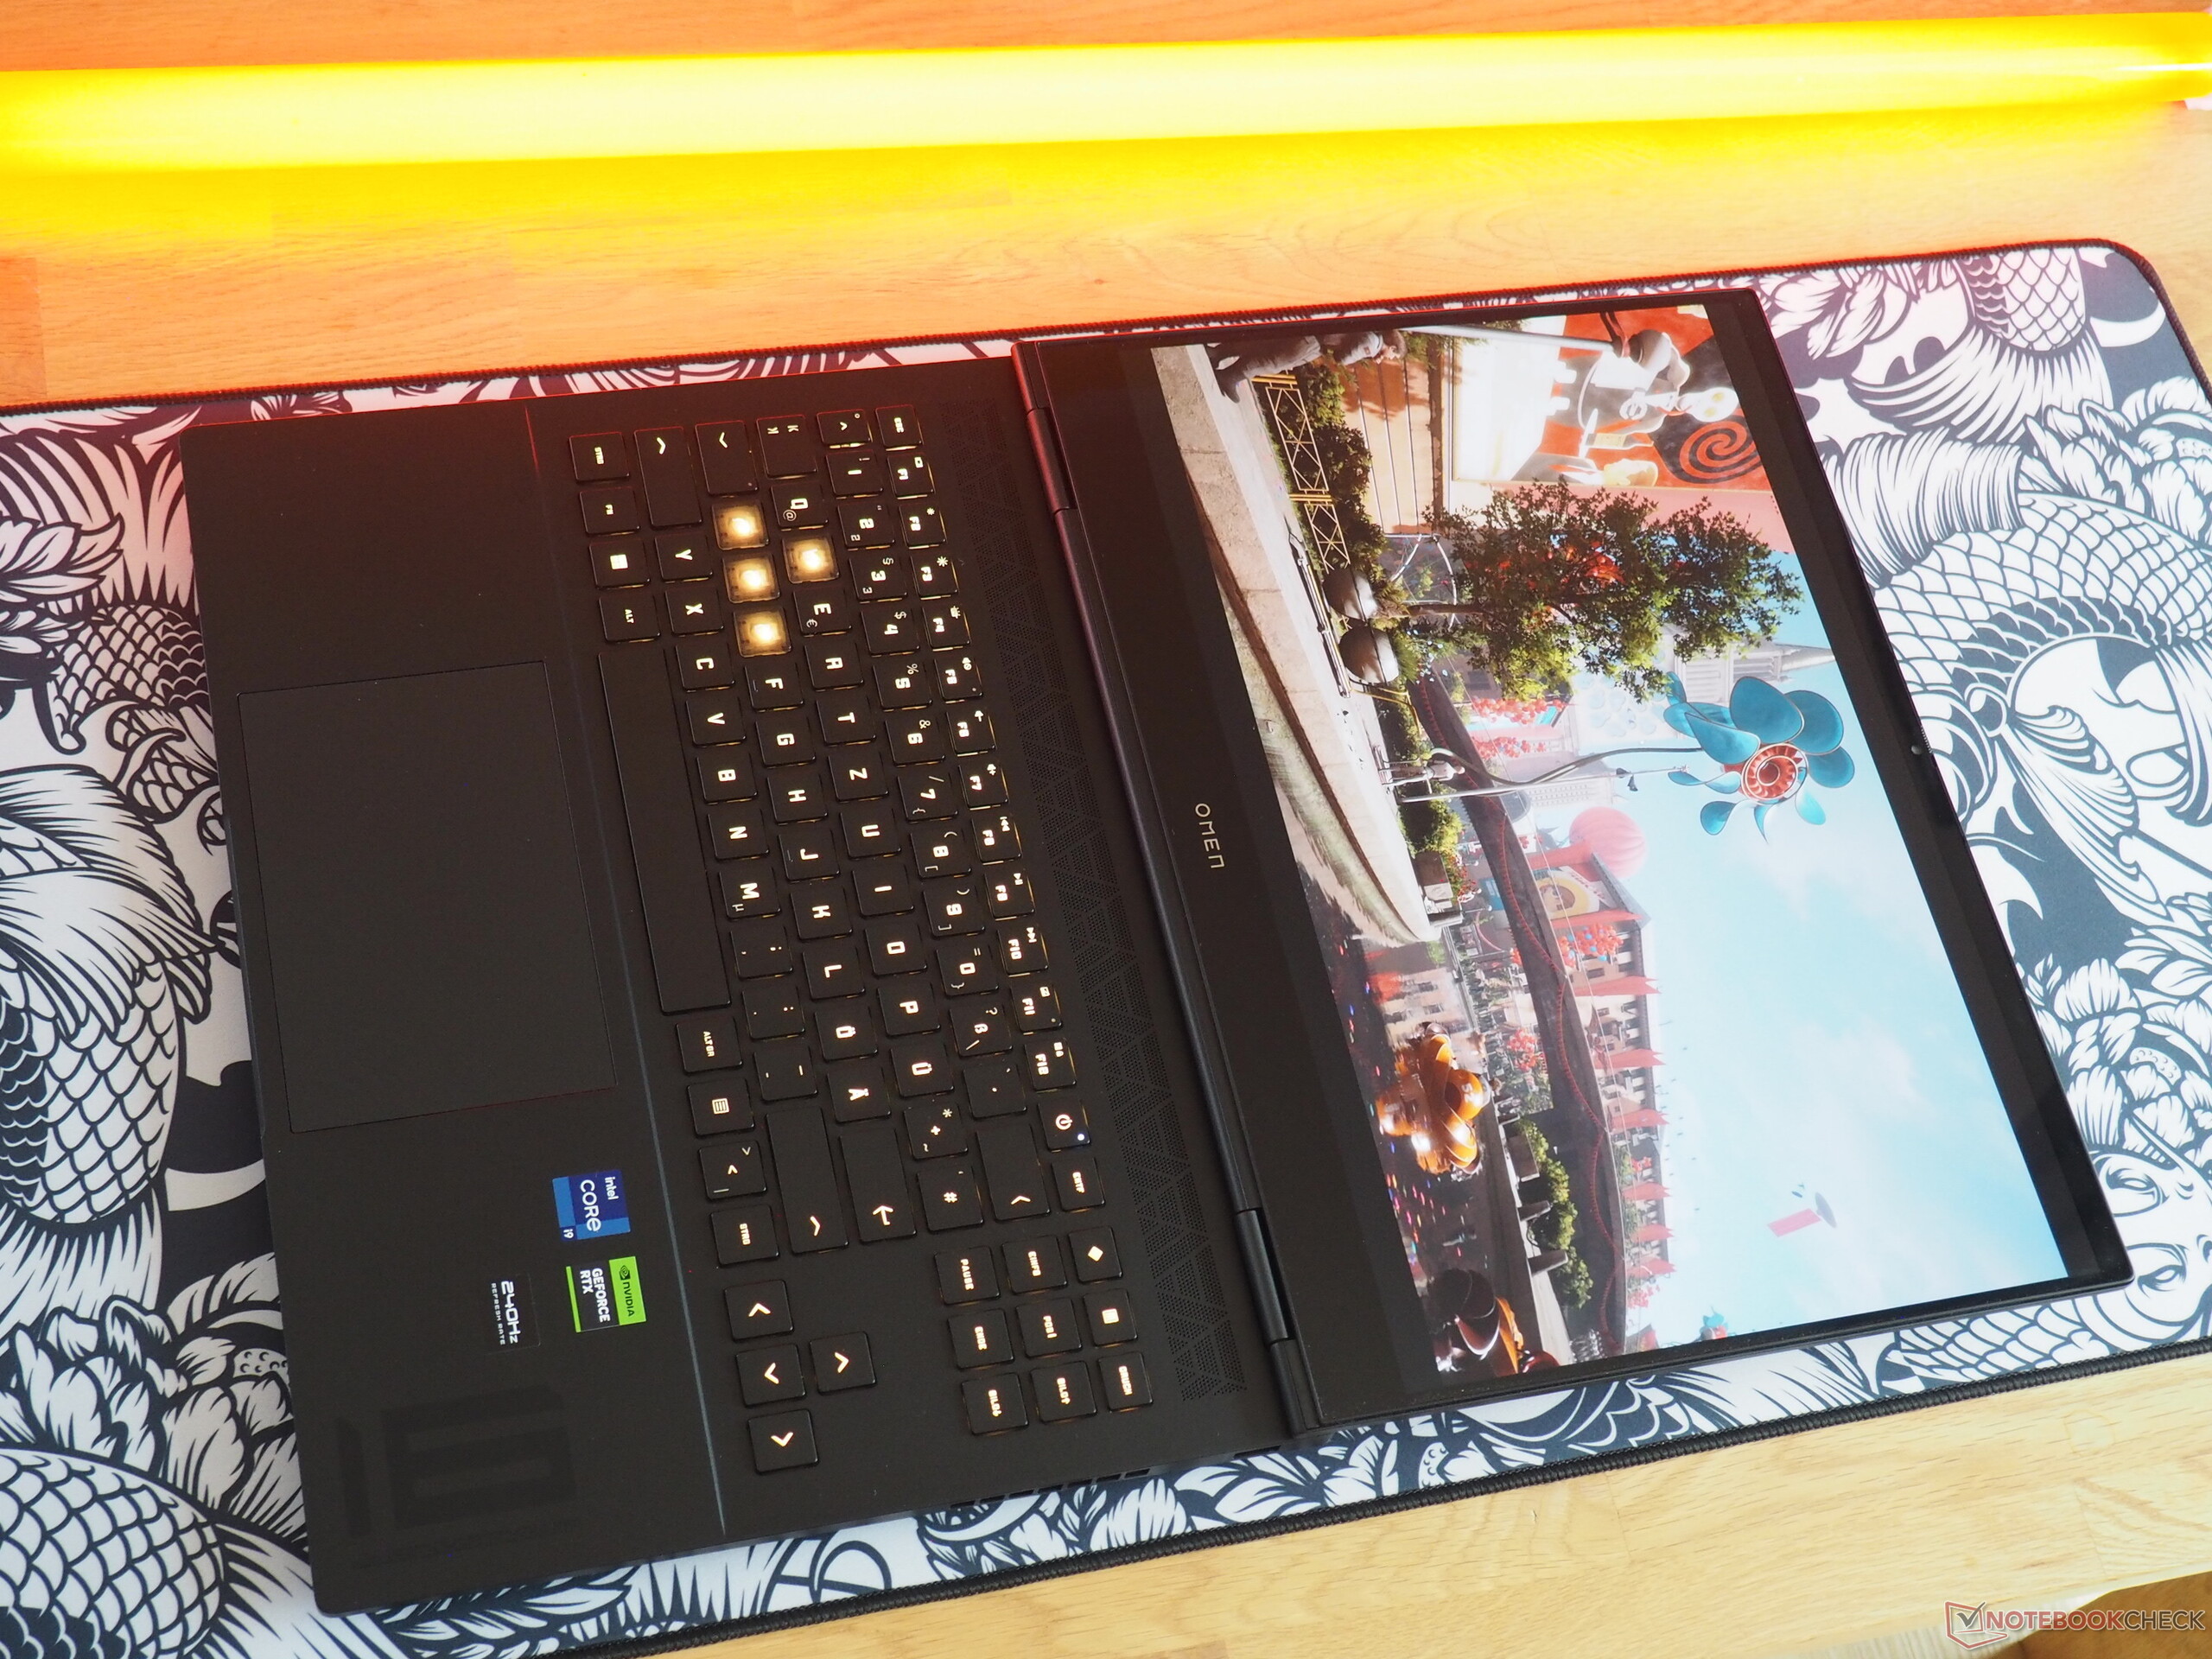
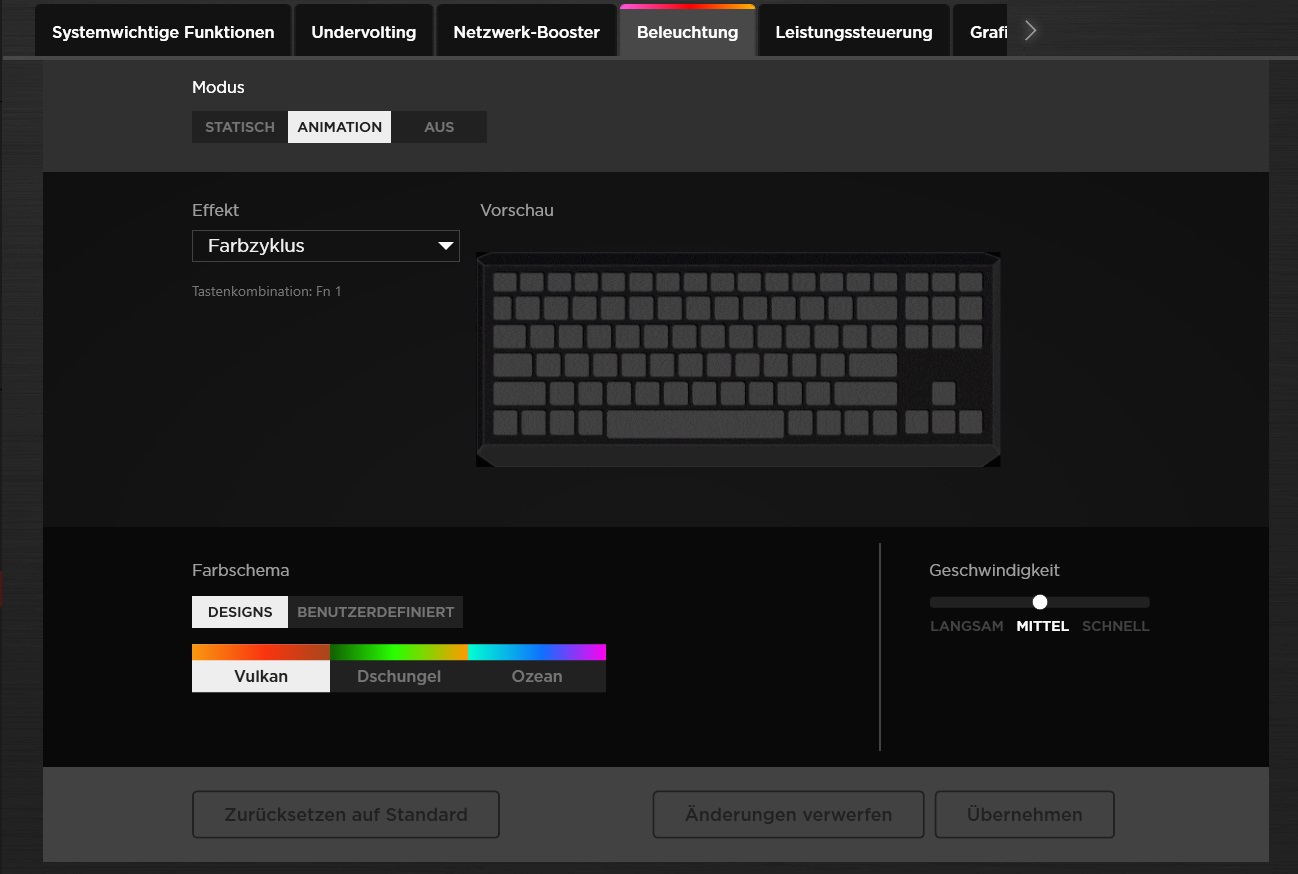
Con sus teclas WASD transparentes, HP ha apostado por un cierto aire gamer. La disposición es muy singular, e incluso cuesta un poco acostumbrarse a ella. El fabricante ha optado por no instalar un teclado numérico y, en su lugar, ha dotado al dispositivo de 16 pulgadas de teclas de flecha independientes y de buen tamaño. Otras decisiones (por ejemplo, la ubicación del botón de encendido) son realmente difíciles de asimilar. La experiencia de tecleo es mediocre y HP ha tenido que utilizar un modelo mecánico para obtener una mejor respuesta. Los fans de las teclas retroiluminadas pueden esperar múltiples colores.
Panel táctil
Con unas dimensiones de 13,5 x 8,5 cm, el touchpad, agradablemente grande, puede calificarse de discreto en lo que se refiere a precisión, suavidad y áreas de clic. Asimismo, el soporte de gestos es intuitivo.
Mostrar
Las opiniones difieren cuando se trata de paneles OLED. En el lado negativo, algunos problemas son las superficies muy reflectantes (que pueden hacer tortuoso el uso en exteriores), el parpadeo de la pantalla en todos los niveles de brillo y el problema del posible quemado.
| |||||||||||||||||||||||||
iluminación: 98 %
Brillo con batería: 390 cd/m²
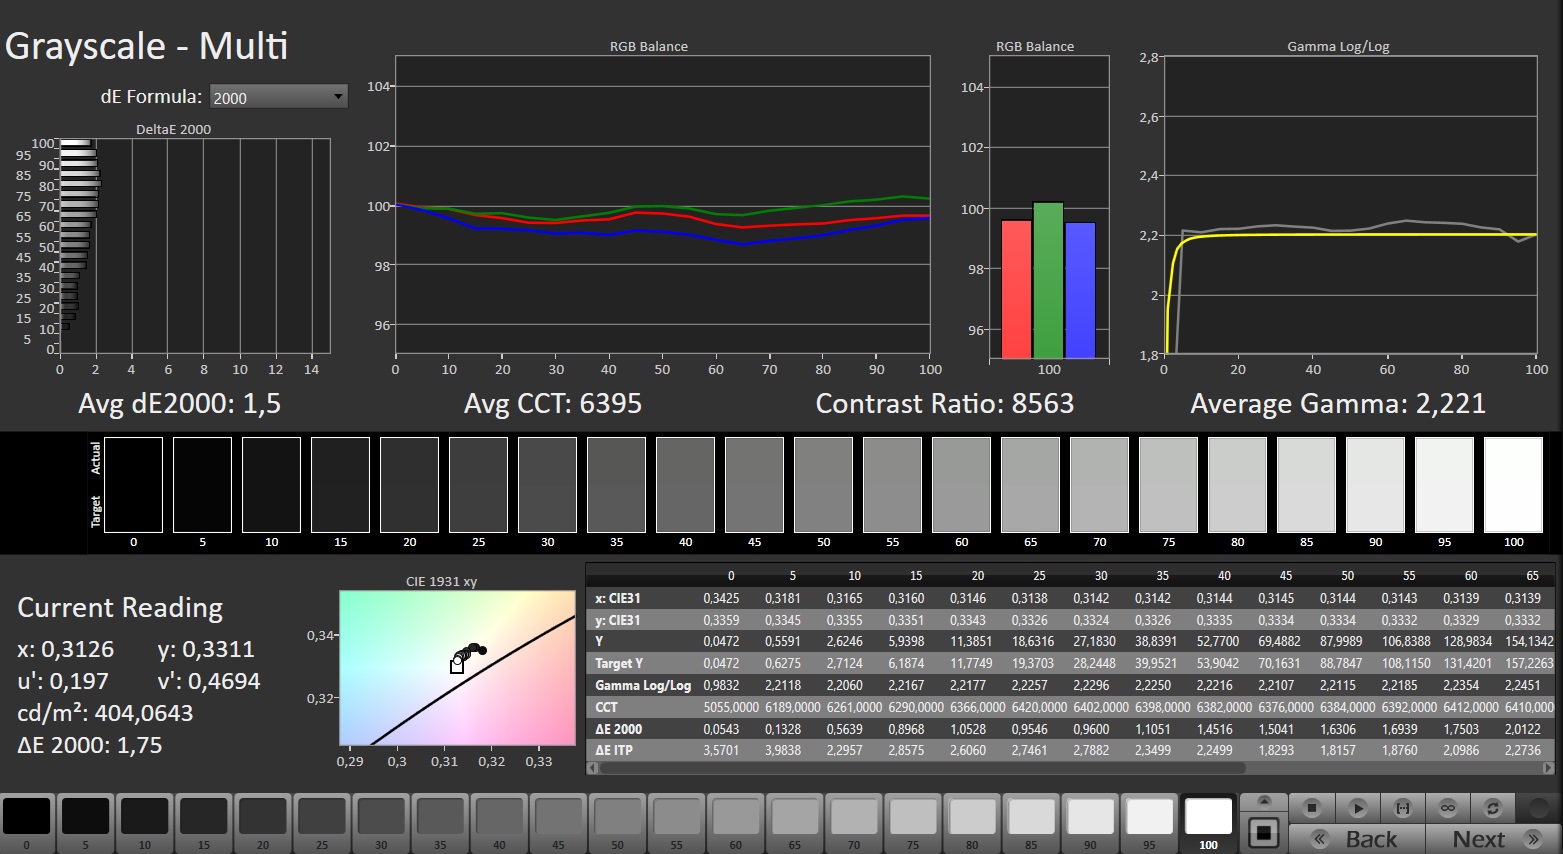
Contraste: 19500:1 (Negro: 0.02 cd/m²)
ΔE ColorChecker Calman: 1.94 | ∀{0.5-29.43 Ø4.73}
calibrated: 4.21
ΔE Greyscale Calman: 1.5 | ∀{0.09-98 Ø4.97}
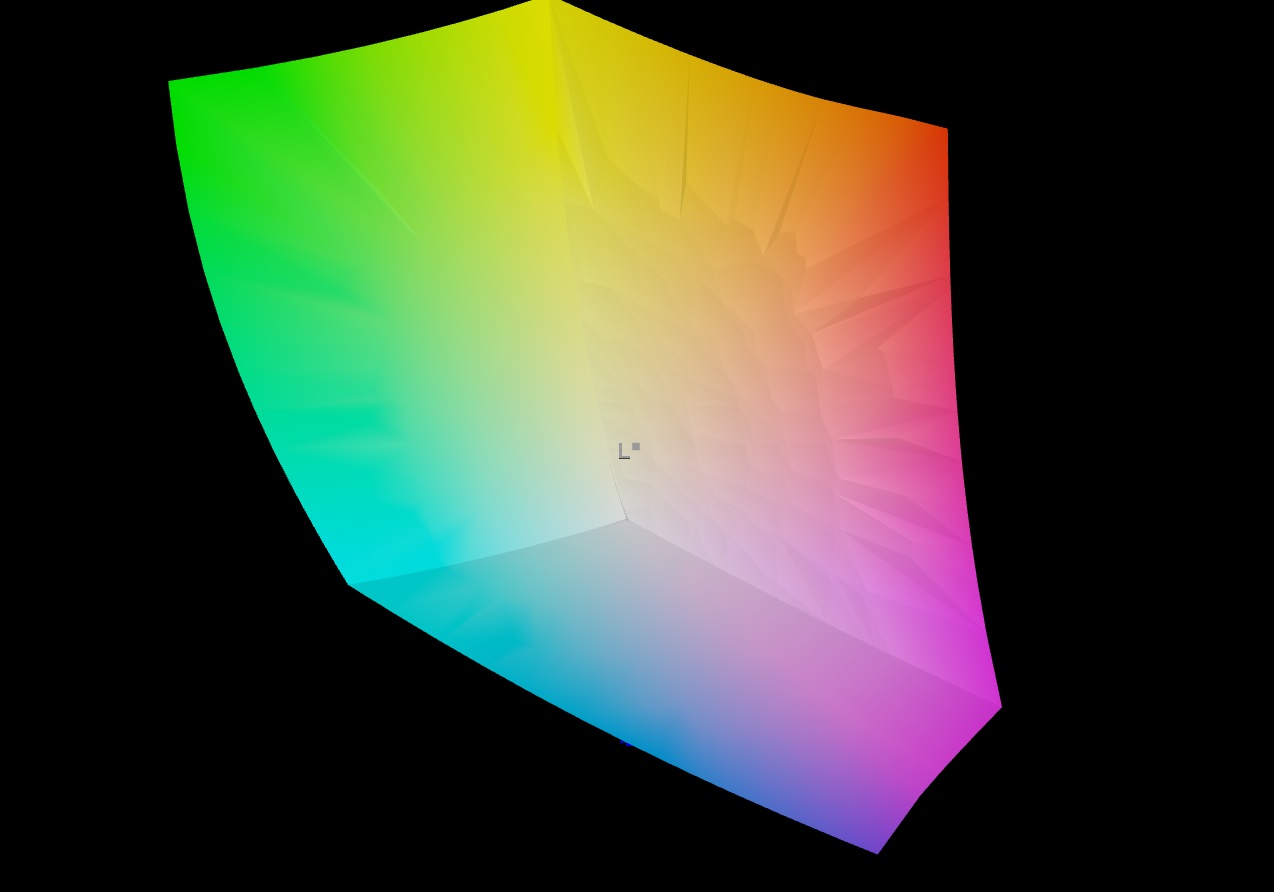
97% AdobeRGB 1998 (Argyll 3D)
100% sRGB (Argyll 3D)
99.8% Display P3 (Argyll 3D)
Gamma: 2.221
CCT: 6395 K
| HP Omen Transcend 16-u1095ng ATNA60DL02-0 (SDC41A4), OLED, 2560x1600, 16" | HP Omen Transcend 16 AUOA3A6, Mini-LED, 2560x1600, 16" | Asus ROG Zephyrus G16 2024 GU605M ATNA60DL01-0, OLED, 2560x1600, 16" | Schenker XMG CORE 16 (L23) BOE0AF0 (), IPS, 2560x1600, 16" | Lenovo Legion Pro 5 16ARX8 CSOT T3 MNG007DA1-Q, IPS, 2560x1600, 16" | |
|---|---|---|---|---|---|
| Display | -4% | 0% | -20% | -18% | |
| Display P3 Coverage (%) | 99.8 | 99.2 -1% | 99.9 0% | 68.3 -32% | 70.4 -29% |
| sRGB Coverage (%) | 100 | 100 0% | 100 0% | 98.6 -1% | 99.6 0% |
| AdobeRGB 1998 Coverage (%) | 97 | 87.6 -10% | 96.9 0% | 69.6 -28% | 72.6 -25% |
| Response Times | -13550% | -18% | -4850% | -3925% | |
| Response Time Grey 50% / Grey 80% * (ms) | 0.2 ? | 26.4 ? -13100% | 0.22 ? -10% | 13.2 ? -6500% | 7 ? -3400% |
| Response Time Black / White * (ms) | 0.2 ? | 28.2 ? -14000% | 0.25 ? -25% | 6.6 ? -3200% | 9.1 ? -4450% |
| PWM Frequency (Hz) | 120 ? | 3506 ? | 960 ? | ||
| Screen | -47% | 0% | -203% | -161% | |
| Brightness middle (cd/m²) | 390 | 791.1 103% | 416 7% | 376 -4% | 355.3 -9% |
| Brightness (cd/m²) | 392 | 800 104% | 418 7% | 358 -9% | 340 -13% |
| Brightness Distribution (%) | 98 | 95 -3% | 96 -2% | 88 -10% | 91 -7% |
| Black Level * (cd/m²) | 0.02 | 0.04 -100% | 0.33 -1550% | 0.32 -1500% | |
| Contrast (:1) | 19500 | 19778 1% | 1139 -94% | 1110 -94% | |
| Colorchecker dE 2000 * | 1.94 | 4.37 -125% | 1.6 18% | 2.74 -41% | 1.13 42% |
| Colorchecker dE 2000 max. * | 4.26 | 10.39 -144% | 2.1 51% | 6.78 -59% | 2.78 35% |
| Colorchecker dE 2000 calibrated * | 4.21 | 1.04 75% | 0.88 79% | 0.32 92% | |
| Greyscale dE 2000 * | 1.5 | 6.5 -333% | 2.7 -80% | 3.57 -138% | 1.4 7% |
| Gamma | 2.221 99% | 2.28 96% | 2.16 102% | 2.4 92% | 2.24 98% |
| CCT | 6395 102% | 6000 108% | 6331 103% | 7246 90% | 6372 102% |
| Media total (Programa/Opciones) | -4534% /
-1967% | -6% /
-3% | -1691% /
-828% | -1368% /
-668% |
* ... más pequeño es mejor
A cambio, la tecnología OLED obtiene unos magníficos niveles de negro (casi 0,0 cd/m²) que se traducen en una excelente relación de contraste a la que no se acercan los paneles IPS. Lo mismo ocurre con la estabilidad del ángulo de visión.
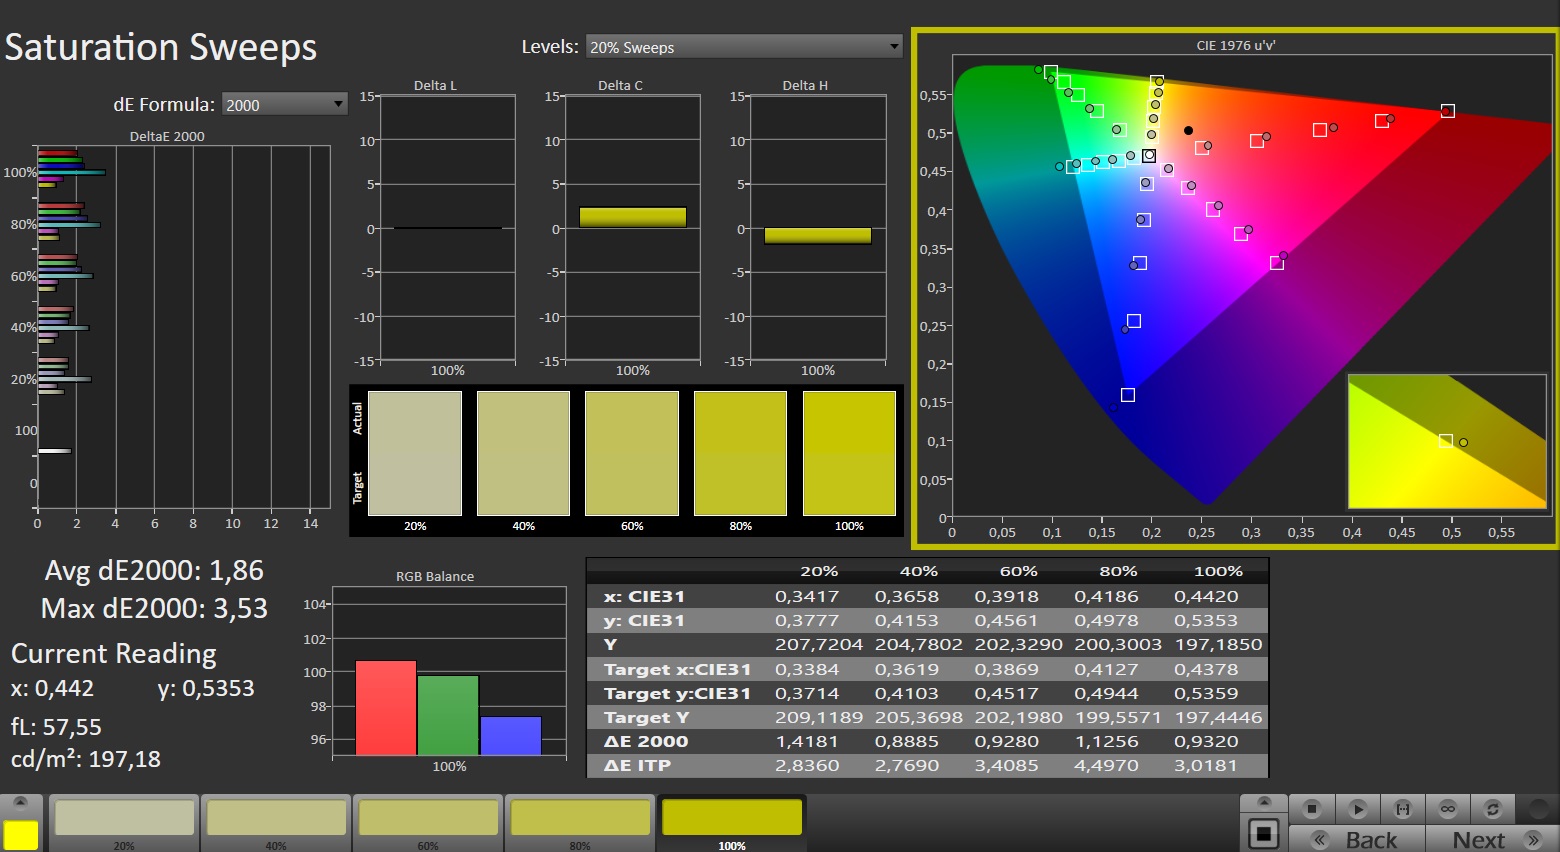
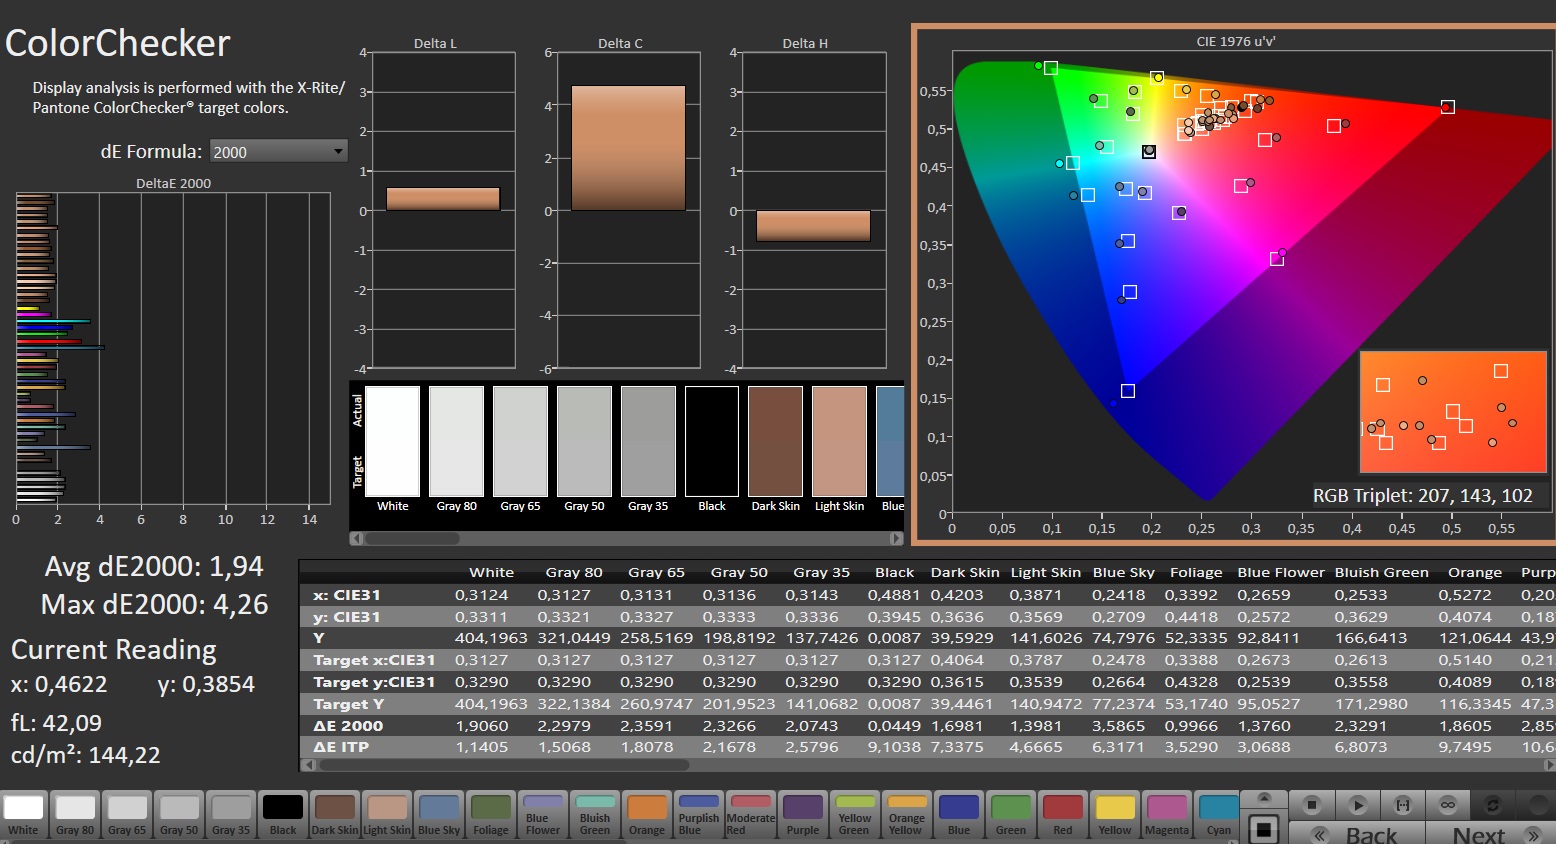
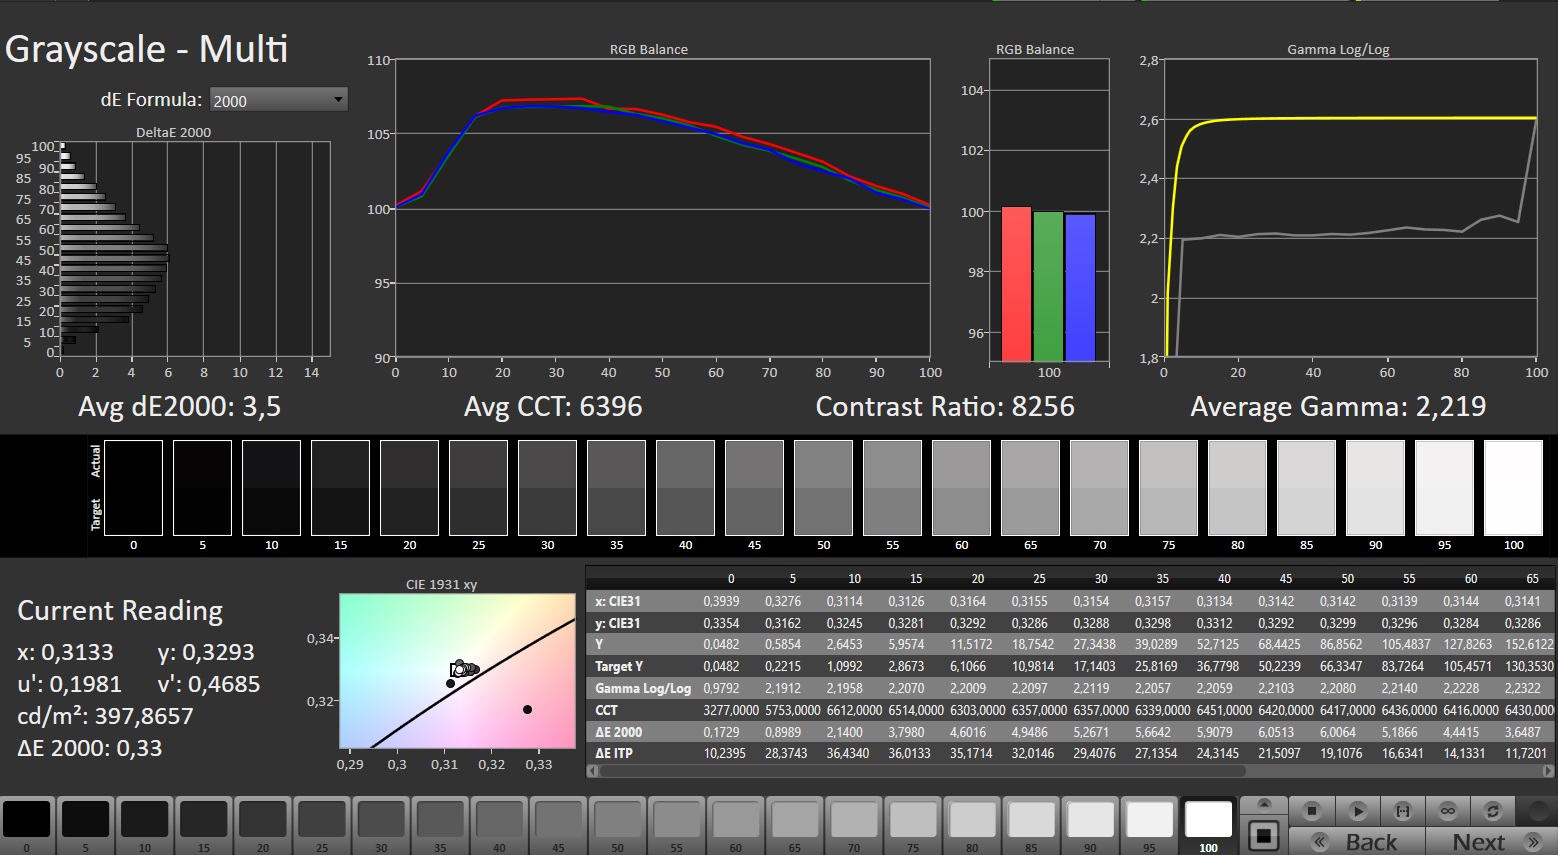
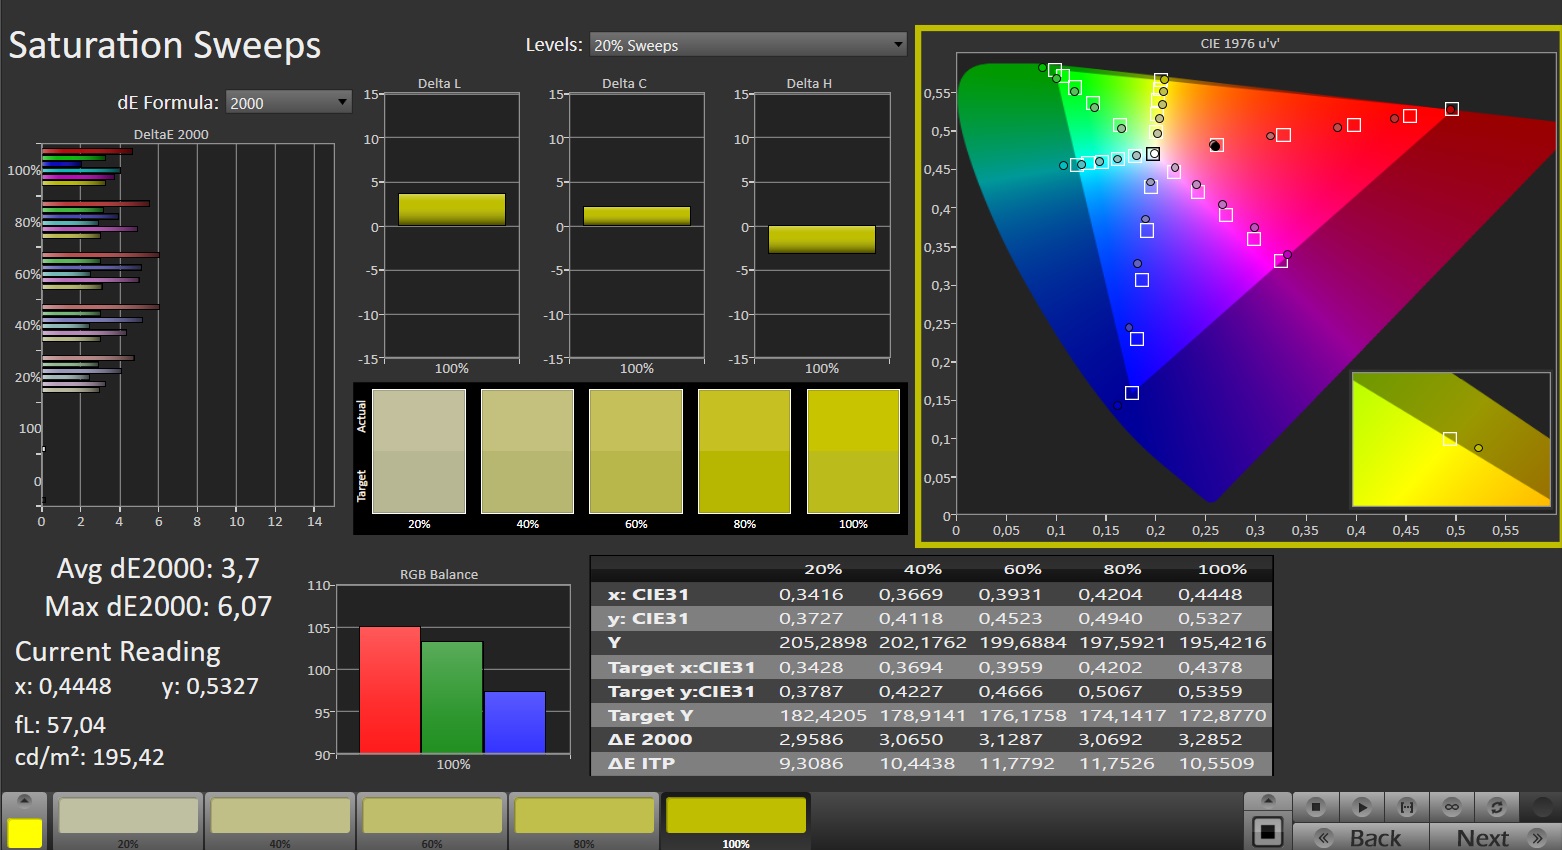
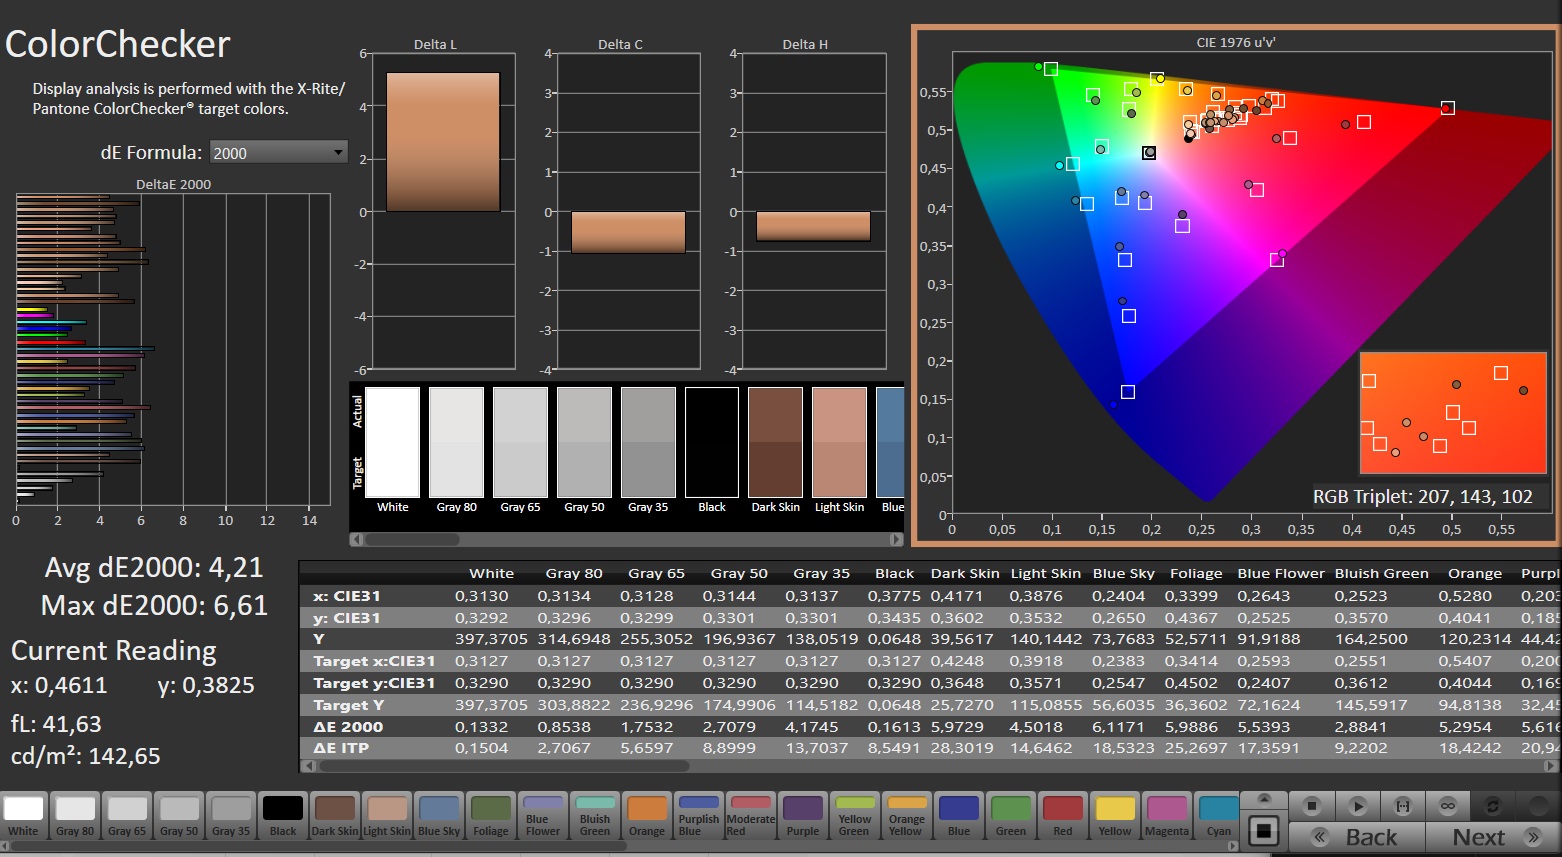
Otro aspecto destacado es la riqueza del espacio de color: 100 % DCI P3 y 97 % AdobeRGB no son algo que deba darse por sentado en el mundo de los juegos. Las cosas son similares en el ámbito de la precisión del color, que ya era impresionante antes de la calibración.


Los elogios también se reservan para los cortos tiempos de respuesta: Los paneles IPS clásicos sólo pueden soñar con 0,2 ms. La mini pantalla LED del predecesor era considerablemente más brillante (800 frente a 392 cd/m²) pero también bastante más lenta.

Tiempos de respuesta del display
| ↔ Tiempo de respuesta de Negro a Blanco | ||
|---|---|---|
| 0.2 ms ... subida ↗ y bajada ↘ combinada | ↗ 0.1 ms subida | 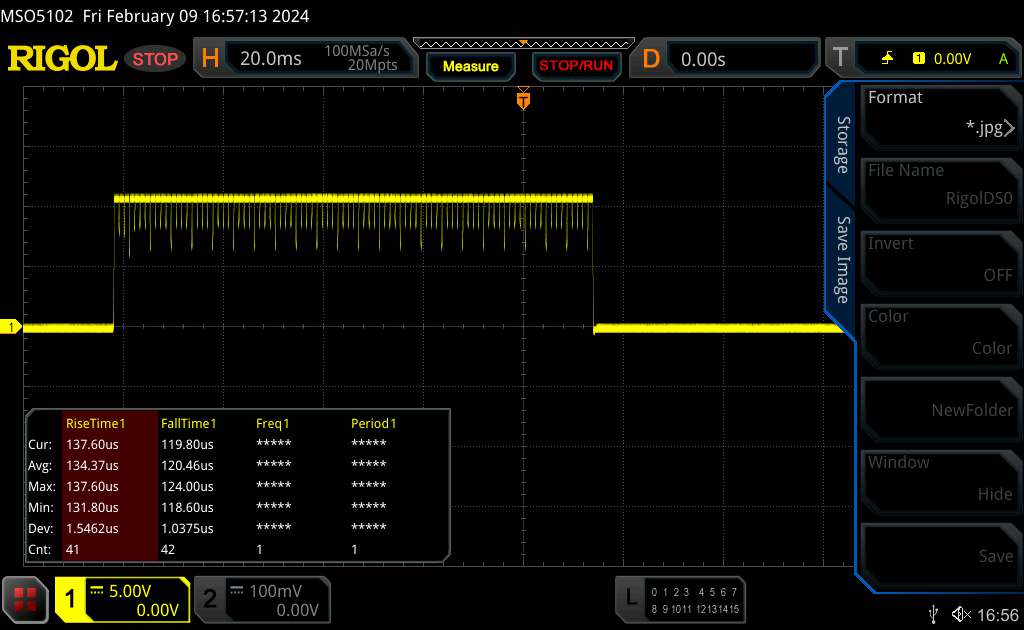 |
| ↘ 0.1 ms bajada | ||
| La pantalla mostró tiempos de respuesta muy rápidos en nuestros tests y debería ser adecuada para juegos frenéticos. En comparación, todos los dispositivos de prueba van de ##min### (mínimo) a 240 (máximo) ms. » 0 % de todos los dispositivos son mejores. Esto quiere decir que el tiempo de respuesta medido es mejor que la media (19.9 ms) de todos los dispositivos testados. | ||
| ↔ Tiempo de respuesta 50% Gris a 80% Gris | ||
| 0.2 ms ... subida ↗ y bajada ↘ combinada | ↗ 0.1 ms subida | 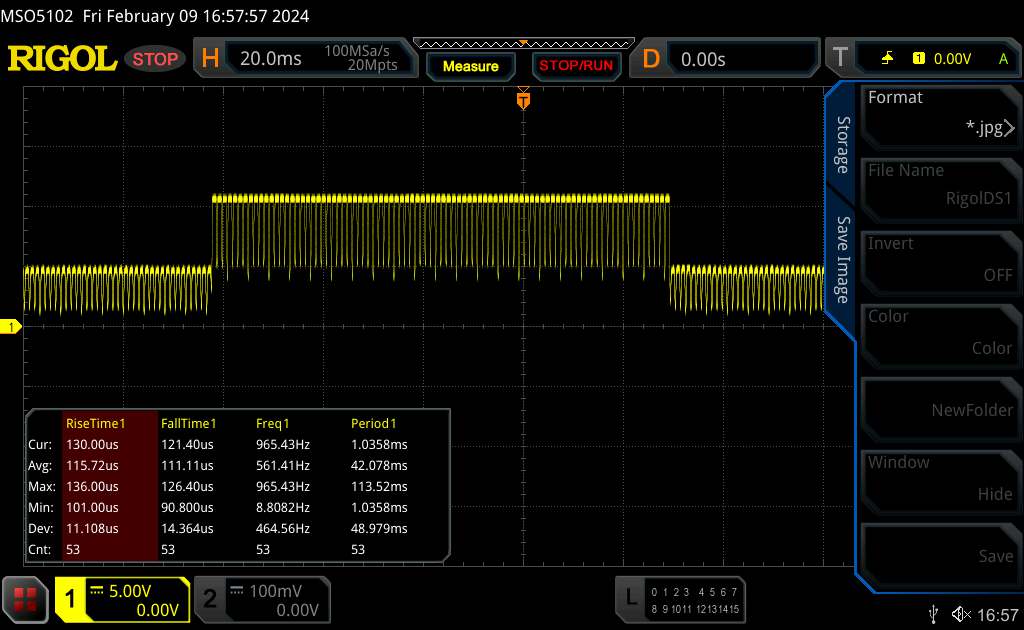 |
| ↘ 0.1 ms bajada | ||
| La pantalla mostró tiempos de respuesta muy rápidos en nuestros tests y debería ser adecuada para juegos frenéticos. En comparación, todos los dispositivos de prueba van de ##min### (mínimo) a 636 (máximo) ms. » 0 % de todos los dispositivos son mejores. Esto quiere decir que el tiempo de respuesta medido es mejor que la media (31.1 ms) de todos los dispositivos testados. | ||
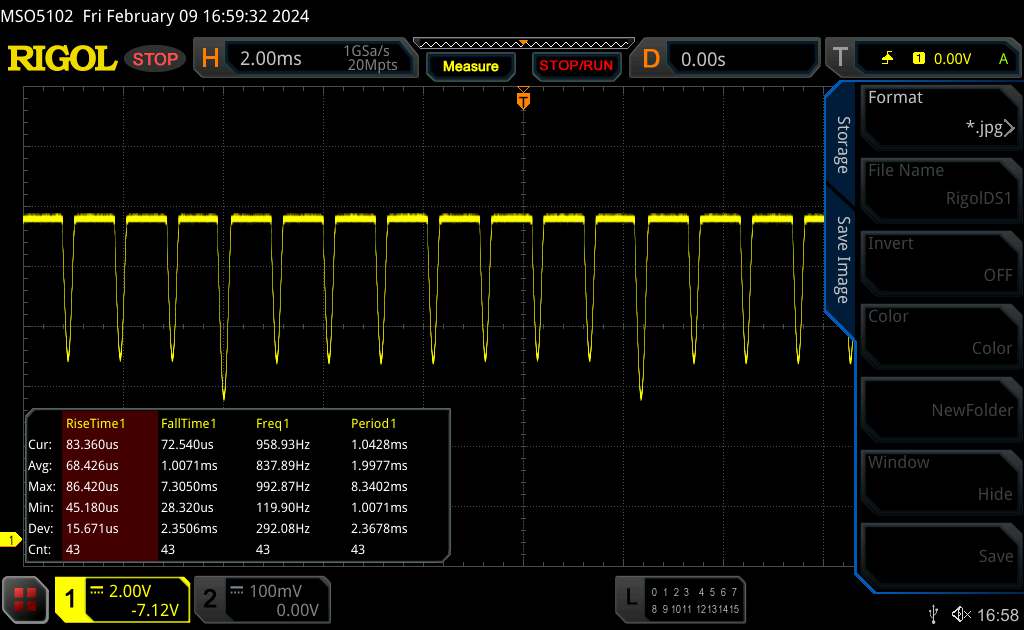
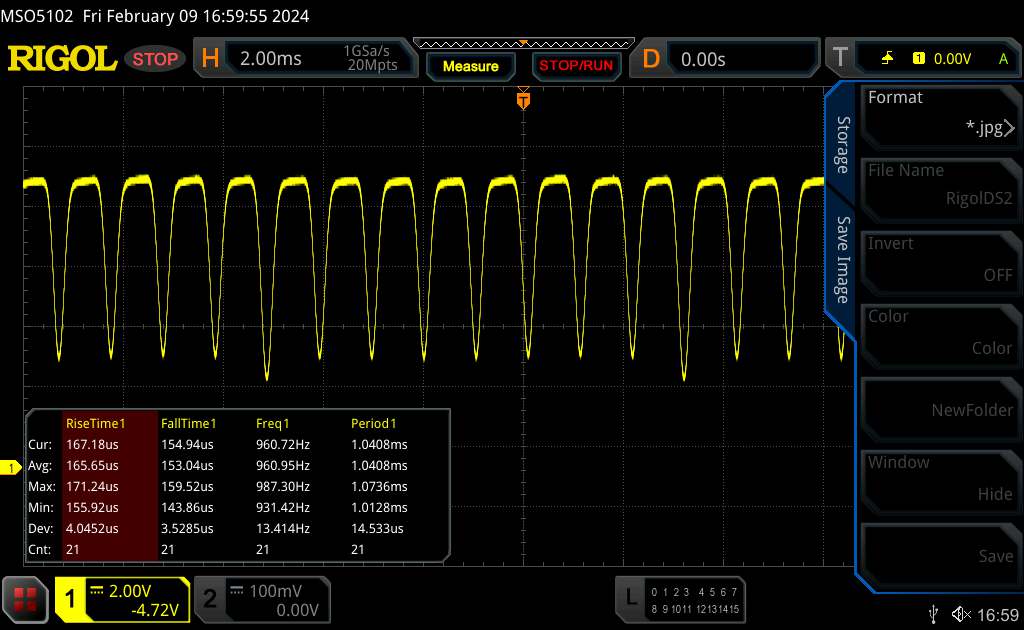
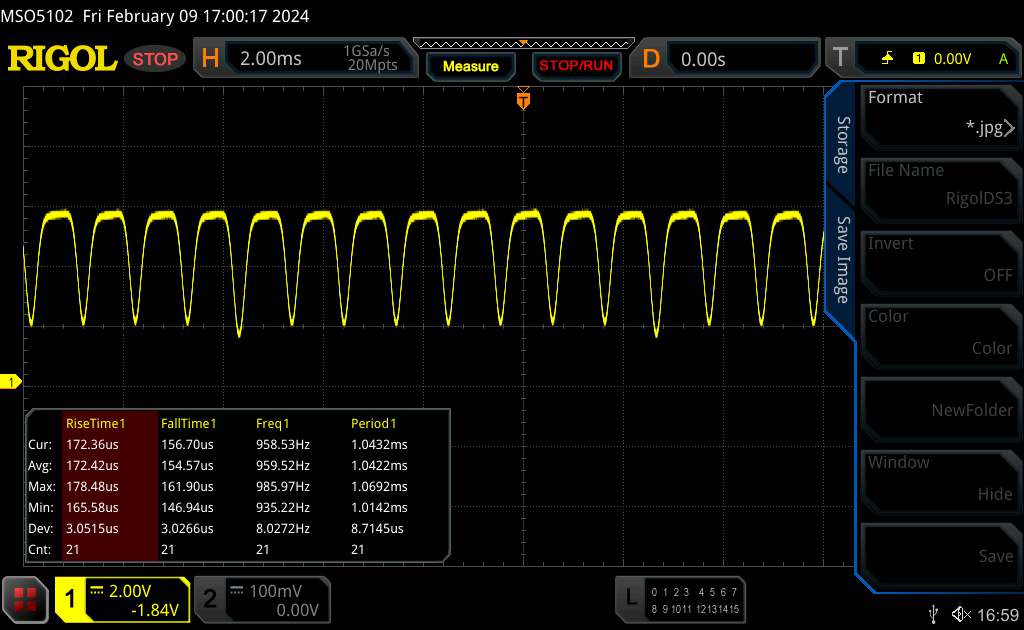
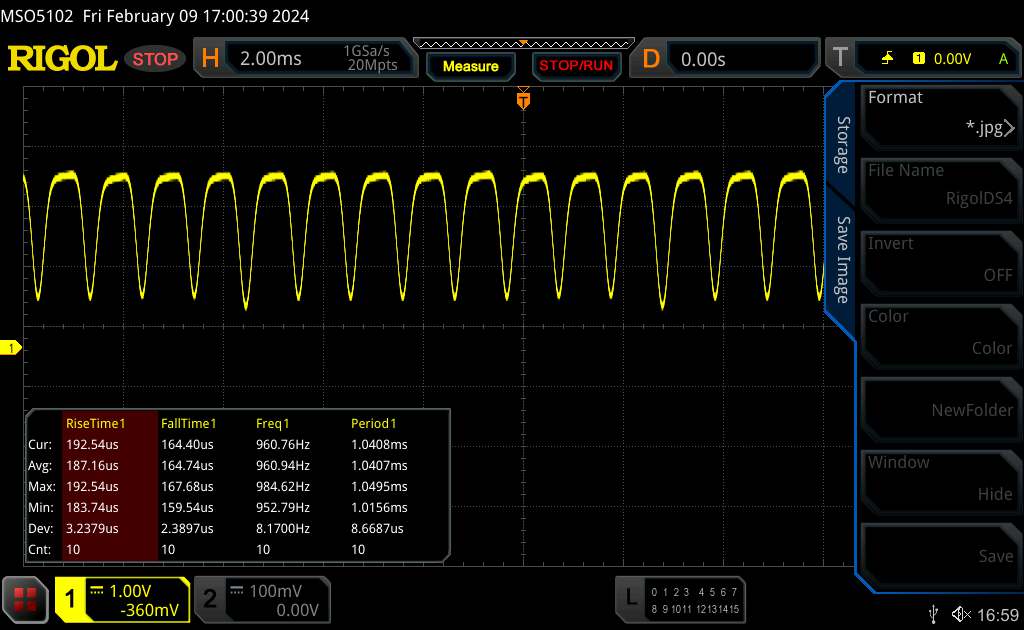
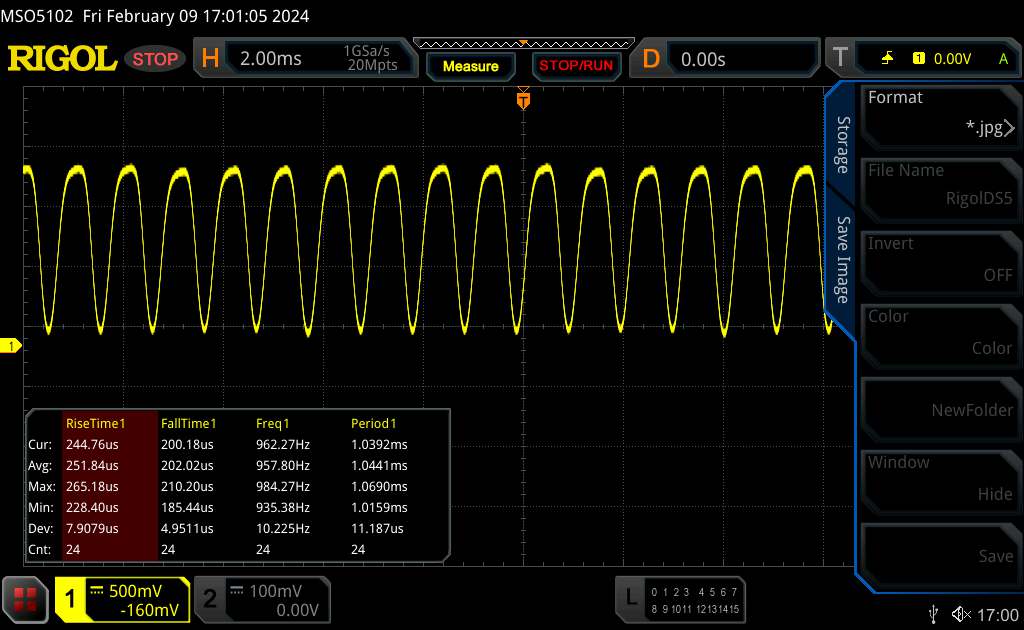
Parpadeo de Pantalla / PWM (Pulse-Width Modulation)
| Parpadeo de Pantalla / PWM detectado | 120 Hz | ≤ 100 % de brillo | 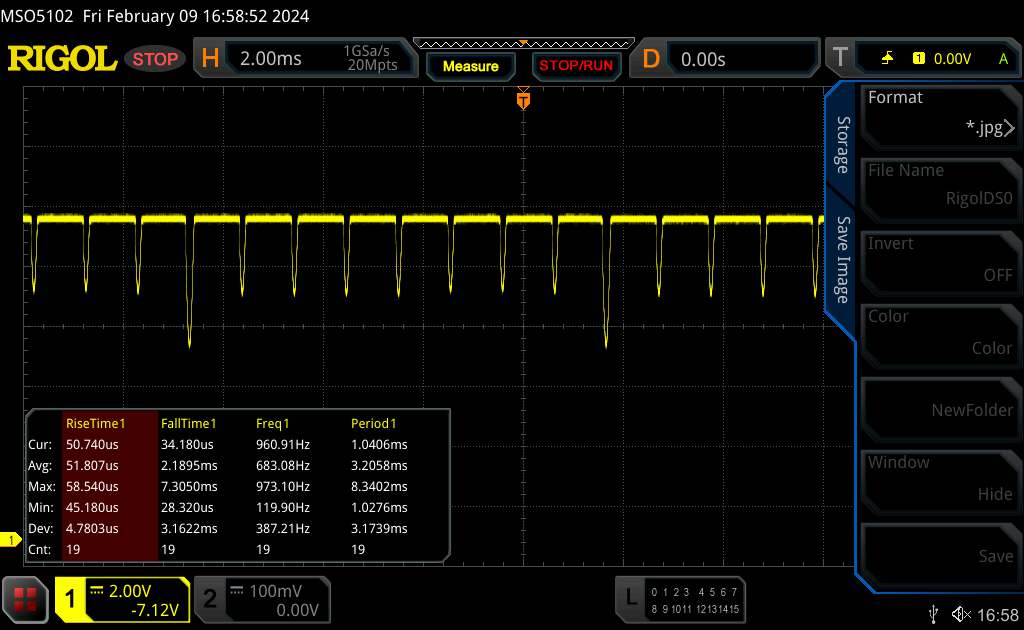 |
La retroiluminación del display parpadea a 120 Hz (seguramente usa PWM - Pulse-Width Modulation) a un brillo del 100 % e inferior. Sobre este nivel de brillo no debería darse parpadeo / PWM. La frecuencia de 120 Hz es bajísima, por lo que el parpadeo puede causar fatiga visual y cefaleas cuando se usa mucho tiempo. Comparación: 52 % de todos los dispositivos testados no usaron PWM para atenuar el display. Si se usó, medimos una media de 7784 (mínimo: 5 - máxmo: 343500) Hz. | |||
Rendimiento
En cuanto al precio, el Omen Transcend 16 parte de unos 1.600 dólares. La variante básica está equipada con un Core i7-13700HX, a GeForce RTX 4060, 16 GB de RAM y una pantalla IPS de escasa resolución. Nuestro modelo de revisión se encuentra más en el extremo superior de la escala de precios y especificaciones.
Condiciones de la prueba
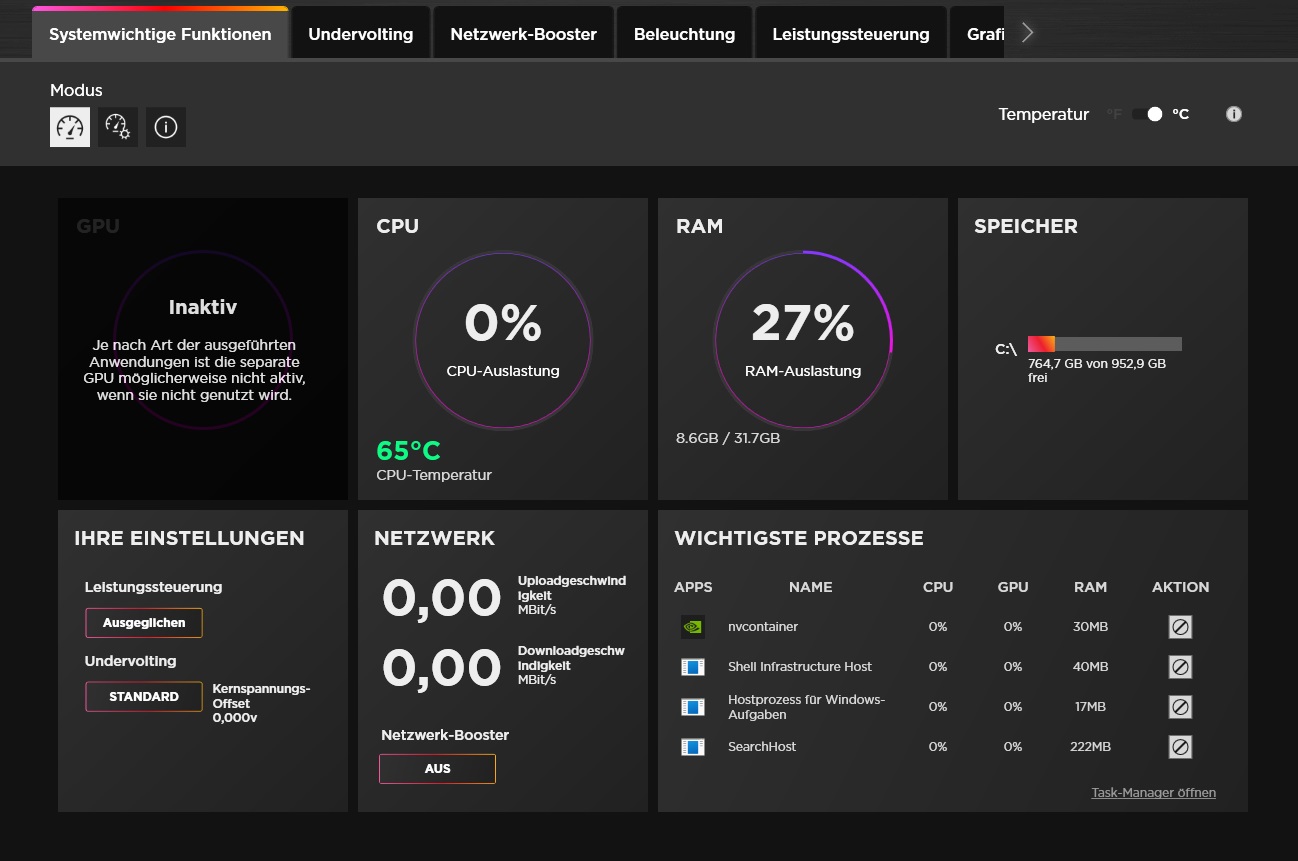
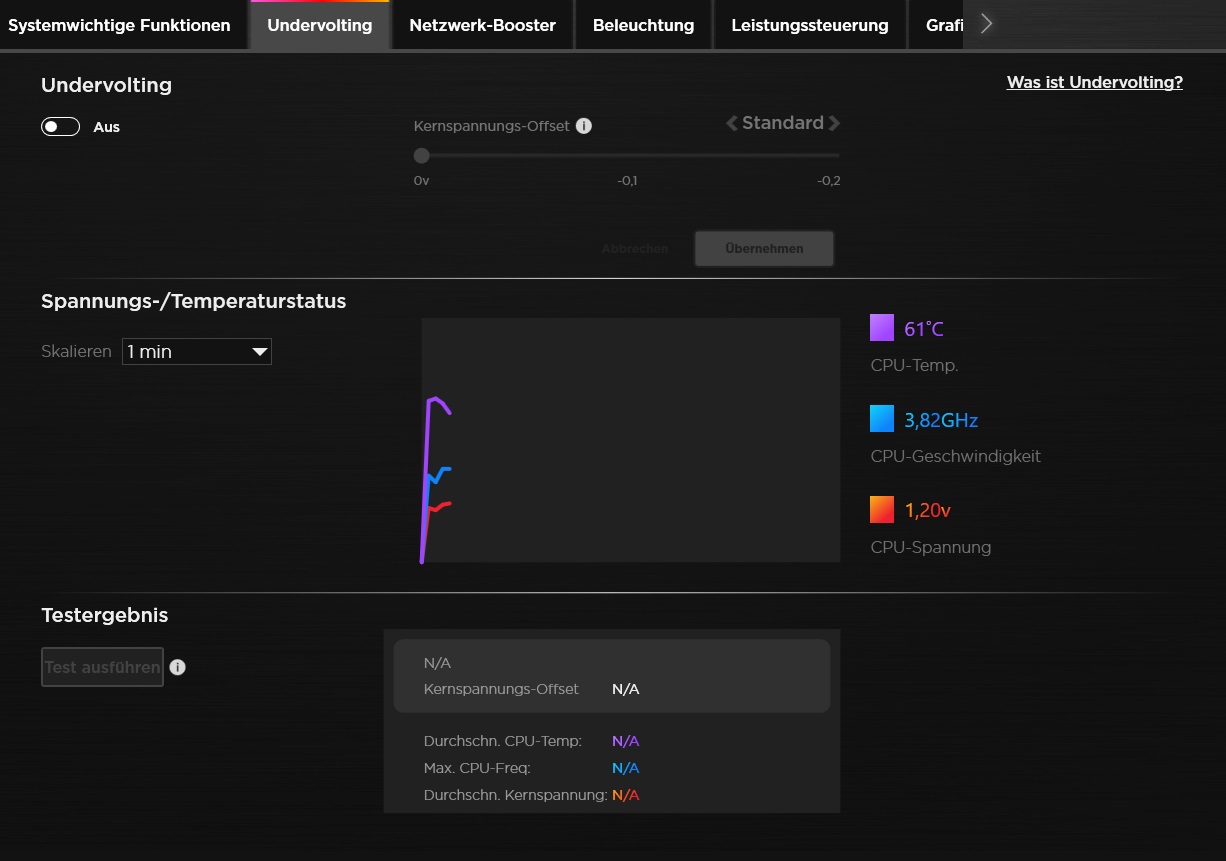
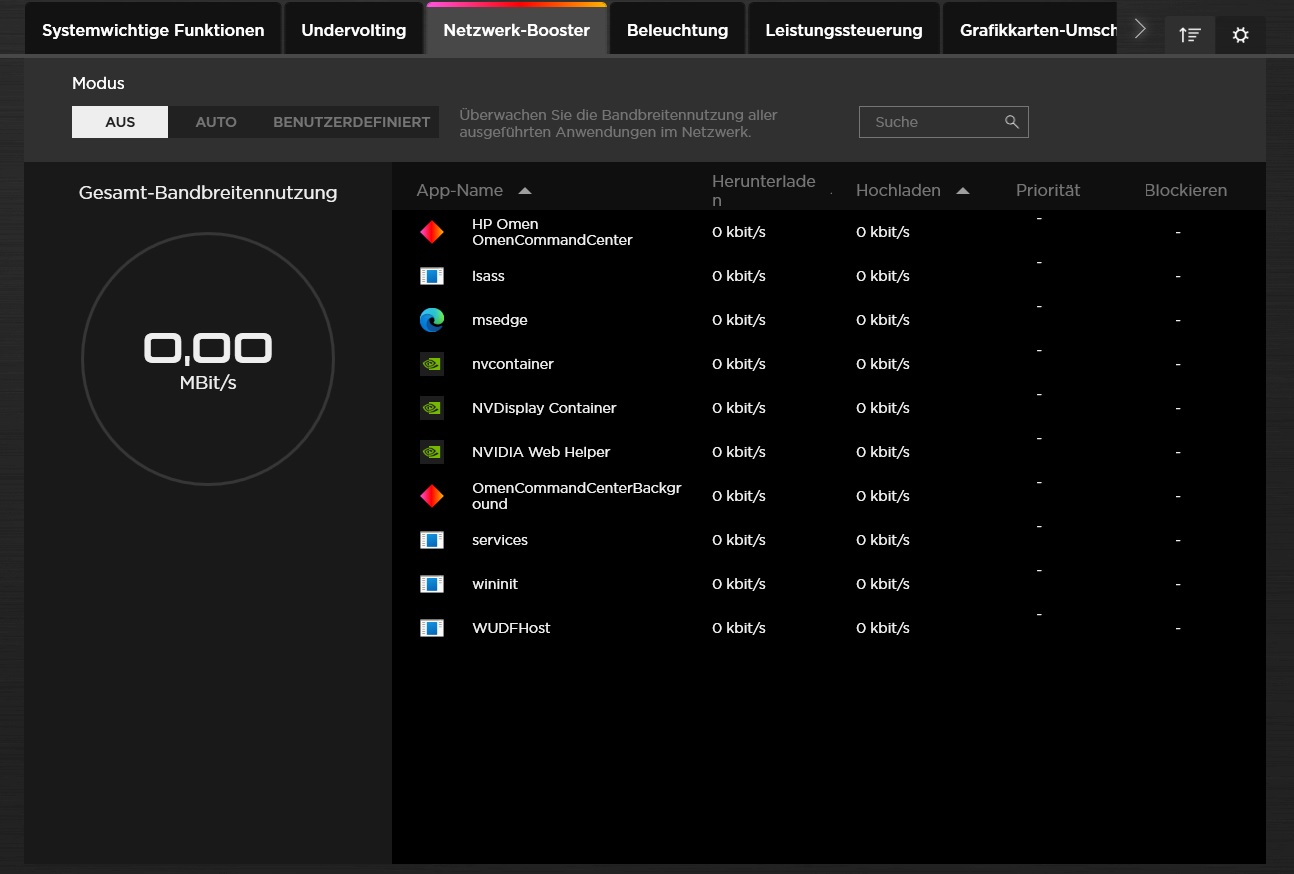
La gestión del rendimiento del concentrador de juegos preinstalado es algo difícil de acceder. En el menú correspondiente, aguardan tres modos de energía y un gestor del calor. Dado que el modo de rendimiento -análogo al de la mayoría de portátiles para juegos- garantiza tanto un mejor rendimiento como una producción de ruido desproporcionada, todas las mediciones se realizaron utilizando el modo equilibrado. Por tanto, los valores determinados sólo pueden compararse con el predecesor de forma limitada. Además, tanto el control automático del ventilador como el cambio automático de gráficos estaban activos.
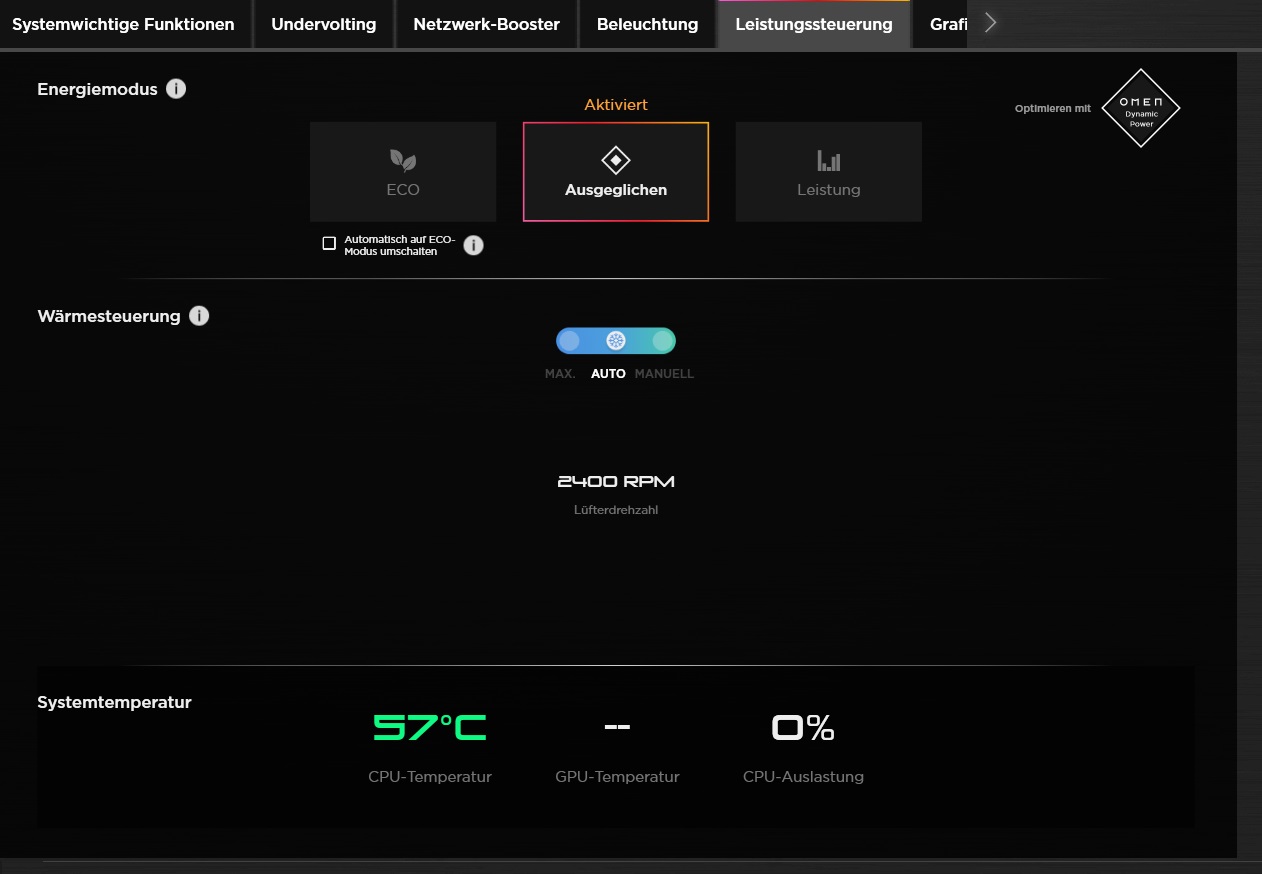

| Witcher 3 (FHD/Ultra) | Eco | Ausgegleichen | Leistung |
| Ruido | 39 dB(A) | 44 dB(A) | 53 dB(A) |
| Rendimiento | 60 fps bloqueo | 114 fps | 126 fps |
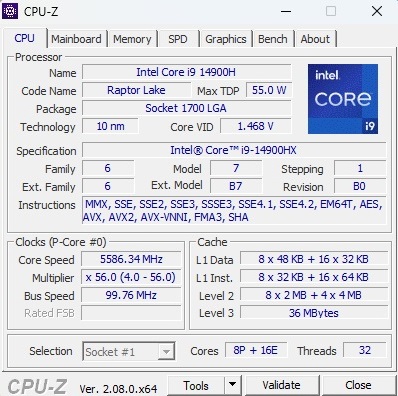
Procesador
El Core i9-14900HX es casi descomunal en comparación con la potencia de la GPU y el grosor de la carcasa. El modelo de 10 nm de la serie Raptor Lake ofrece 8 núcleos de rendimiento con hyper threading y 16 núcleos de eficiencia sin HT, lo que resulta en un total de 32 hilos. En el modo equilibrado, la CPU sólo alcanza su potencial de forma limitada. El mejor ejemplo es nuestro bucle Cinebench: Aunque el rendimiento fue relativamente alto en las primeras ejecuciones, al cabo de poco tiempo, la puntuación cayó bastante bruscamente (pero luego se mantuvo en un nivel constante). En definitiva, sólo es suficiente para alcanzar el nivel del Ultra 7 155H (ROG Zephyrus G16) o del Ryzen 7 7840HS (Schenker XMG Core 16).
Cinebench R15 Multi Continuous Test
* ... más pequeño es mejor
AIDA64: FP32 Ray-Trace | FPU Julia | CPU SHA3 | CPU Queen | FPU SinJulia | FPU Mandel | CPU AES | CPU ZLib | FP64 Ray-Trace | CPU PhotoWorxx
| Performance rating | |
| Media de la clase Gaming | |
| Medio Intel Core i9-14900HX | |
| HP Omen Transcend 16 | |
| Lenovo Legion Pro 5 16ARX8 | |
| Schenker XMG CORE 16 (L23) | |
| HP Omen Transcend 16-u1095ng | |
| Asus ROG Zephyrus G16 2024 GU605M | |
| AIDA64 / FP32 Ray-Trace | |
| Media de la clase Gaming (10227 - 85542, n=107, últimos 2 años) | |
| Lenovo Legion Pro 5 16ARX8 | |
| Schenker XMG CORE 16 (L23) | |
| Medio Intel Core i9-14900HX (13098 - 33474, n=36) | |
| HP Omen Transcend 16 | |
| HP Omen Transcend 16-u1095ng | |
| Asus ROG Zephyrus G16 2024 GU605M | |
| AIDA64 / FPU Julia | |
| Media de la clase Gaming (51376 - 238426, n=107, últimos 2 años) | |
| Medio Intel Core i9-14900HX (67573 - 166040, n=36) | |
| Lenovo Legion Pro 5 16ARX8 | |
| Schenker XMG CORE 16 (L23) | |
| HP Omen Transcend 16 | |
| HP Omen Transcend 16-u1095ng | |
| Asus ROG Zephyrus G16 2024 GU605M | |
| AIDA64 / CPU SHA3 | |
| Media de la clase Gaming (2180 - 9817, n=107, últimos 2 años) | |
| Medio Intel Core i9-14900HX (3589 - 7979, n=36) | |
| HP Omen Transcend 16 | |
| Lenovo Legion Pro 5 16ARX8 | |
| Schenker XMG CORE 16 (L23) | |
| HP Omen Transcend 16-u1095ng | |
| Asus ROG Zephyrus G16 2024 GU605M | |
| AIDA64 / CPU Queen | |
| Medio Intel Core i9-14900HX (118405 - 148966, n=36) | |
| Lenovo Legion Pro 5 16ARX8 | |
| HP Omen Transcend 16 | |
| HP Omen Transcend 16-u1095ng | |
| Media de la clase Gaming (49785 - 173351, n=98, últimos 2 años) | |
| Schenker XMG CORE 16 (L23) | |
| Asus ROG Zephyrus G16 2024 GU605M | |
| AIDA64 / FPU SinJulia | |
| Lenovo Legion Pro 5 16ARX8 | |
| Medio Intel Core i9-14900HX (10475 - 18517, n=36) | |
| Schenker XMG CORE 16 (L23) | |
| Media de la clase Gaming (4424 - 33636, n=107, últimos 2 años) | |
| HP Omen Transcend 16 | |
| HP Omen Transcend 16-u1095ng | |
| Asus ROG Zephyrus G16 2024 GU605M | |
| AIDA64 / FPU Mandel | |
| Media de la clase Gaming (25115 - 128721, n=107, últimos 2 años) | |
| Lenovo Legion Pro 5 16ARX8 | |
| Schenker XMG CORE 16 (L23) | |
| Medio Intel Core i9-14900HX (32543 - 83662, n=36) | |
| HP Omen Transcend 16 | |
| HP Omen Transcend 16-u1095ng | |
| Asus ROG Zephyrus G16 2024 GU605M | |
| AIDA64 / CPU AES | |
| Medio Intel Core i9-14900HX (86964 - 241777, n=36) | |
| HP Omen Transcend 16 | |
| Media de la clase Gaming (39258 - 247074, n=107, últimos 2 años) | |
| Schenker XMG CORE 16 (L23) | |
| HP Omen Transcend 16-u1095ng | |
| Asus ROG Zephyrus G16 2024 GU605M | |
| Lenovo Legion Pro 5 16ARX8 | |
| AIDA64 / CPU ZLib | |
| Medio Intel Core i9-14900HX (1054 - 2292, n=36) | |
| HP Omen Transcend 16 | |
| Media de la clase Gaming (574 - 2531, n=107, últimos 2 años) | |
| HP Omen Transcend 16-u1095ng | |
| Lenovo Legion Pro 5 16ARX8 | |
| Asus ROG Zephyrus G16 2024 GU605M | |
| Schenker XMG CORE 16 (L23) | |
| AIDA64 / FP64 Ray-Trace | |
| Media de la clase Gaming (5509 - 45446, n=107, últimos 2 años) | |
| Lenovo Legion Pro 5 16ARX8 | |
| Schenker XMG CORE 16 (L23) | |
| Medio Intel Core i9-14900HX (6809 - 18349, n=36) | |
| HP Omen Transcend 16 | |
| HP Omen Transcend 16-u1095ng | |
| Asus ROG Zephyrus G16 2024 GU605M | |
| AIDA64 / CPU PhotoWorxx | |
| HP Omen Transcend 16 | |
| HP Omen Transcend 16-u1095ng | |
| Asus ROG Zephyrus G16 2024 GU605M | |
| Medio Intel Core i9-14900HX (23903 - 54702, n=36) | |
| Media de la clase Gaming (12271 - 89891, n=107, últimos 2 años) | |
| Schenker XMG CORE 16 (L23) | |
| Lenovo Legion Pro 5 16ARX8 | |
Rendimiento del sistema
El rendimiento del sistema corta una buena cifra sin estar entre los primeros. En cuanto a la velocidad de la RAM, el Transcend se asegura el segundo puesto en la comparativa.
CrossMark: Overall | Productivity | Creativity | Responsiveness
WebXPRT 3: Overall
WebXPRT 4: Overall
Mozilla Kraken 1.1: Total
| PCMark 10 / Score | |
| Media de la clase Gaming (5828 - 11574, n=94, últimos 2 años) | |
| Lenovo Legion Pro 5 16ARX8 | |
| Medio Intel Core i9-14900HX, NVIDIA GeForce RTX 4070 Laptop GPU (7768 - 8550, n=8) | |
| Schenker XMG CORE 16 (L23) | |
| HP Omen Transcend 16 | |
| HP Omen Transcend 16-u1095ng | |
| Asus ROG Zephyrus G16 2024 GU605M | |
| PCMark 10 / Essentials | |
| HP Omen Transcend 16 | |
| Lenovo Legion Pro 5 16ARX8 | |
| Schenker XMG CORE 16 (L23) | |
| Medio Intel Core i9-14900HX, NVIDIA GeForce RTX 4070 Laptop GPU (10104 - 11815, n=8) | |
| Media de la clase Gaming (8810 - 12600, n=98, últimos 2 años) | |
| HP Omen Transcend 16-u1095ng | |
| Asus ROG Zephyrus G16 2024 GU605M | |
| PCMark 10 / Productivity | |
| Media de la clase Gaming (6845 - 18766, n=96, últimos 2 años) | |
| Schenker XMG CORE 16 (L23) | |
| Medio Intel Core i9-14900HX, NVIDIA GeForce RTX 4070 Laptop GPU (9577 - 11103, n=8) | |
| HP Omen Transcend 16-u1095ng | |
| Lenovo Legion Pro 5 16ARX8 | |
| HP Omen Transcend 16 | |
| Asus ROG Zephyrus G16 2024 GU605M | |
| PCMark 10 / Digital Content Creation | |
| Media de la clase Gaming (7602 - 19657, n=96, últimos 2 años) | |
| HP Omen Transcend 16 | |
| Lenovo Legion Pro 5 16ARX8 | |
| Medio Intel Core i9-14900HX, NVIDIA GeForce RTX 4070 Laptop GPU (12114 - 14827, n=8) | |
| Schenker XMG CORE 16 (L23) | |
| HP Omen Transcend 16-u1095ng | |
| Asus ROG Zephyrus G16 2024 GU605M | |
| CrossMark / Overall | |
| Medio Intel Core i9-14900HX, NVIDIA GeForce RTX 4070 Laptop GPU (2002 - 2312, n=7) | |
| Lenovo Legion Pro 5 16ARX8 | |
| Media de la clase Gaming (1366 - 2409, n=96, últimos 2 años) | |
| HP Omen Transcend 16 | |
| Asus ROG Zephyrus G16 2024 GU605M | |
| Schenker XMG CORE 16 (L23) | |
| CrossMark / Productivity | |
| Medio Intel Core i9-14900HX, NVIDIA GeForce RTX 4070 Laptop GPU (1827 - 2191, n=7) | |
| Lenovo Legion Pro 5 16ARX8 | |
| Media de la clase Gaming (1386 - 2254, n=96, últimos 2 años) | |
| HP Omen Transcend 16 | |
| Schenker XMG CORE 16 (L23) | |
| Asus ROG Zephyrus G16 2024 GU605M | |
| CrossMark / Creativity | |
| Medio Intel Core i9-14900HX, NVIDIA GeForce RTX 4070 Laptop GPU (2258 - 2458, n=7) | |
| HP Omen Transcend 16 | |
| Media de la clase Gaming (1343 - 2729, n=96, últimos 2 años) | |
| Lenovo Legion Pro 5 16ARX8 | |
| Asus ROG Zephyrus G16 2024 GU605M | |
| Schenker XMG CORE 16 (L23) | |
| CrossMark / Responsiveness | |
| Medio Intel Core i9-14900HX, NVIDIA GeForce RTX 4070 Laptop GPU (1734 - 2330, n=7) | |
| Lenovo Legion Pro 5 16ARX8 | |
| Media de la clase Gaming (1226 - 2334, n=96, últimos 2 años) | |
| HP Omen Transcend 16 | |
| Schenker XMG CORE 16 (L23) | |
| Asus ROG Zephyrus G16 2024 GU605M | |
| WebXPRT 3 / Overall | |
| Lenovo Legion Pro 5 16ARX8 | |
| HP Omen Transcend 16-u1095ng | |
| HP Omen Transcend 16 | |
| Medio Intel Core i9-14900HX, NVIDIA GeForce RTX 4070 Laptop GPU (269 - 342, n=8) | |
| Media de la clase Gaming (242 - 532, n=99, últimos 2 años) | |
| Schenker XMG CORE 16 (L23) | |
| Asus ROG Zephyrus G16 2024 GU605M | |
| WebXPRT 4 / Overall | |
| HP Omen Transcend 16 | |
| Medio Intel Core i9-14900HX, NVIDIA GeForce RTX 4070 Laptop GPU (291 - 304, n=6) | |
| Media de la clase Gaming (176.4 - 354, n=99, últimos 2 años) | |
| Lenovo Legion Pro 5 16ARX8 | |
| Asus ROG Zephyrus G16 2024 GU605M | |
| Mozilla Kraken 1.1 / Total | |
| Asus ROG Zephyrus G16 2024 GU605M | |
| Schenker XMG CORE 16 (L23) | |
| Lenovo Legion Pro 5 16ARX8 | |
| Media de la clase Gaming (391 - 590, n=104, últimos 2 años) | |
| HP Omen Transcend 16 | |
| Medio Intel Core i9-14900HX, NVIDIA GeForce RTX 4070 Laptop GPU (431 - 469, n=8) | |
| HP Omen Transcend 16-u1095ng | |
* ... más pequeño es mejor
| PCMark 10 Score | 7866 puntos | |
ayuda | ||
| AIDA64 / Memory Copy | |
| Asus ROG Zephyrus G16 2024 GU605M | |
| HP Omen Transcend 16-u1095ng | |
| HP Omen Transcend 16 | |
| Medio Intel Core i9-14900HX (38028 - 83392, n=36) | |
| Media de la clase Gaming (21750 - 129946, n=107, últimos 2 años) | |
| Schenker XMG CORE 16 (L23) | |
| Lenovo Legion Pro 5 16ARX8 | |
| AIDA64 / Memory Read | |
| Asus ROG Zephyrus G16 2024 GU605M | |
| HP Omen Transcend 16-u1095ng | |
| HP Omen Transcend 16 | |
| Medio Intel Core i9-14900HX (43306 - 87568, n=36) | |
| Media de la clase Gaming (22956 - 118858, n=107, últimos 2 años) | |
| Schenker XMG CORE 16 (L23) | |
| Lenovo Legion Pro 5 16ARX8 | |
| AIDA64 / Memory Write | |
| Schenker XMG CORE 16 (L23) | |
| HP Omen Transcend 16-u1095ng | |
| Media de la clase Gaming (22297 - 135096, n=107, últimos 2 años) | |
| HP Omen Transcend 16 | |
| Asus ROG Zephyrus G16 2024 GU605M | |
| Medio Intel Core i9-14900HX (37146 - 80589, n=36) | |
| Lenovo Legion Pro 5 16ARX8 | |
| AIDA64 / Memory Latency | |
| Asus ROG Zephyrus G16 2024 GU605M | |
| Media de la clase Gaming (75.3 - 259, n=107, últimos 2 años) | |
| Schenker XMG CORE 16 (L23) | |
| HP Omen Transcend 16 | |
| Lenovo Legion Pro 5 16ARX8 | |
| HP Omen Transcend 16-u1095ng | |
| Medio Intel Core i9-14900HX (76.1 - 105, n=36) | |
* ... más pequeño es mejor
Latencias del CPD
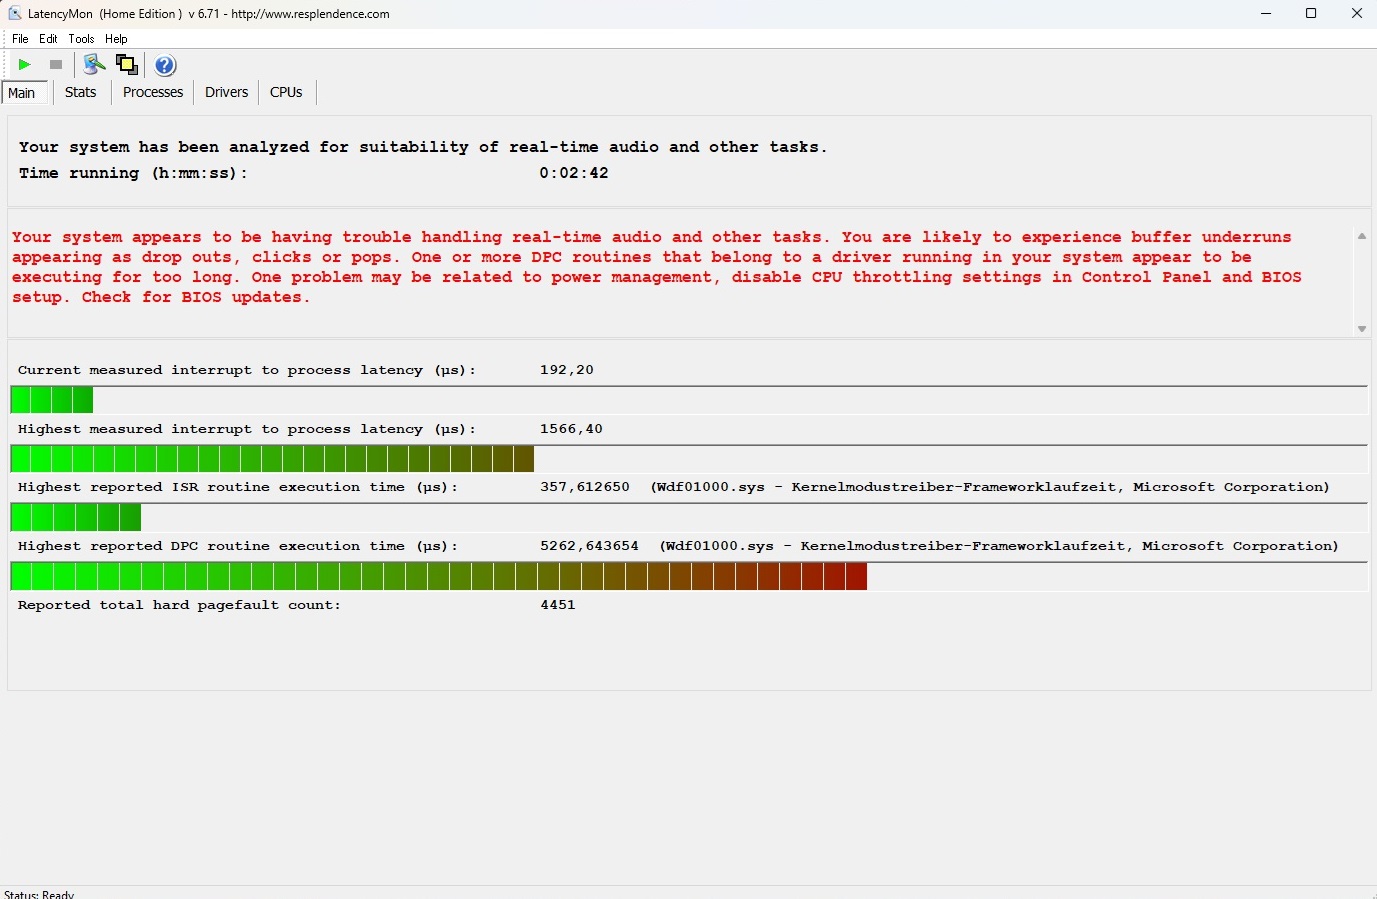
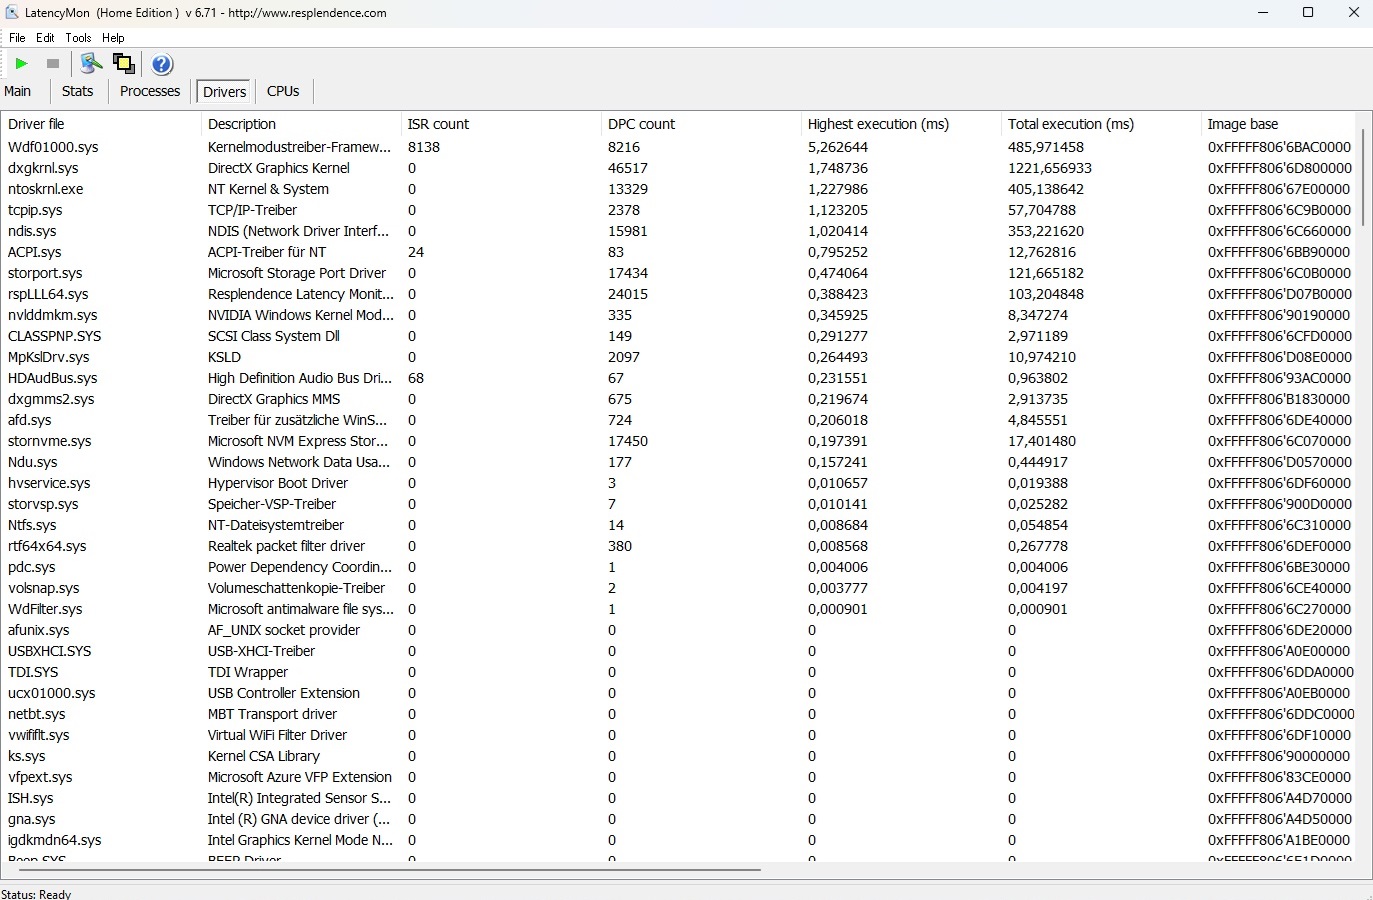
Al igual que su predecesor, el nuevo Omen 16 también tiene que luchar con latencias relativamente altas y esto podría acarrear problemas en algunos escenarios de aplicación (por ejemplo, el procesamiento de audio y vídeo en tiempo real).
| DPC Latencies / LatencyMon - interrupt to process latency (max), Web, Youtube, Prime95 | |
| Asus ROG Zephyrus G16 2024 GU605M | |
| HP Omen Transcend 16-u1095ng | |
| HP Omen Transcend 16 | |
| Schenker XMG CORE 16 (L23) | |
| Lenovo Legion Pro 5 16ARX8 | |
* ... más pequeño es mejor
Almacenamiento masivo
En comparación con el rendimiento de la CPU, no observamos ningún bajón en el rendimiento de la unidad SSD. La unidad Kioxia instalada es un poco más lenta que la unidad SK hynix que se encuentra en el antiguo Transcend pero, a pesar de ello, ofrece velocidades suficientemente altas. Lo que es una lástima es que la unidad de 16 pulgadas sólo tiene una ranura M.2 y esto significa que habrá que sustituir la unidad SSD incorporada para ampliar el almacenamiento.

* ... más pequeño es mejor
Continuous Performance Read: DiskSpd Read Loop, Queue Depth 8
Tarjeta gráfica
La GeForce RTX 4070 está basada en la arquitectura Ada Lovelace y, en cuanto a rendimiento, se posiciona más cerca de la RTX 4060 que de la RTX 4080. A pesar de la generosa TGP de 130 vatios, la Omen 16 navegó por nuestro campo de pruebas de forma ligeramente inferior a la media, aunque la diferencia con la competencia es a veces muy pequeña. La preparación para el futuro de la RTX 4070 es bastante pobre debido a la escasa cantidad de VRAM. En algunos juegos, 8 GB podrían convertirse ya en un factor limitante. A nuestros ojos, Nvidia debería haber dotado a la GPU de al menos 12 GB, sobre todo teniendo en cuenta que los portátiles de este tipo no son precisamente baratos.
| 3DMark Performance rating - Percent | |
| Media de la clase Gaming | |
| Schenker XMG CORE 16 (L23) | |
| Lenovo Legion Pro 5 16ARX8 -1! | |
| Medio NVIDIA GeForce RTX 4070 Laptop GPU | |
| HP Omen Transcend 16 -1! | |
| HP Omen Transcend 16-u1095ng | |
| Asus ROG Zephyrus G16 2024 GU605M -1! | |
| 3DMark 11 Performance | 32528 puntos | |
| 3DMark Cloud Gate Standard Score | 53528 puntos | |
| 3DMark Fire Strike Score | 23683 puntos | |
| 3DMark Time Spy Score | 11682 puntos | |
ayuda | ||
* ... más pequeño es mejor
Rendimiento en juegos
El Transcend 16 es lo suficientemente rápido como para poder jugar a casi todos los juegos a su resolución nativa de 2.560 x 1.600 y con ajustes de altos a máximos. Las cosas sólo se ponen problemáticas en juegos muy exigentes o mal optimizados como Enshrouded. Para monitores 4K, recomendamos al menos una RTX 4080.
| The Witcher 3 - 1920x1080 Ultra Graphics & Postprocessing (HBAO+) | |
| Media de la clase Gaming (95 - 240, n=8, últimos 2 años) | |
| Schenker XMG CORE 16 (L23) | |
| Lenovo Legion Pro 5 16ARX8 | |
| HP Omen Transcend 16-u1095ng | |
| Medio NVIDIA GeForce RTX 4070 Laptop GPU (69.8 - 133.7, n=57) | |
| HP Omen Transcend 16 | |
| Asus ROG Zephyrus G16 2024 GU605M | |
| Final Fantasy XV Benchmark - 1920x1080 High Quality | |
| Media de la clase Gaming (41 - 215, n=101, últimos 2 años) | |
| Schenker XMG CORE 16 (L23) | |
| Lenovo Legion Pro 5 16ARX8 | |
| Medio NVIDIA GeForce RTX 4070 Laptop GPU (41 - 131.9, n=65) | |
| HP Omen Transcend 16-u1095ng | |
| Asus ROG Zephyrus G16 2024 GU605M | |
| Enshrouded - 2560x1440 Max. Quality AA:FX | |
| HP Omen Transcend 16-u1095ng | |
| Medio NVIDIA GeForce RTX 4070 Laptop GPU (38.9 - 42.3, n=2) | |
| XMG Pro 15 E23 | |
| Palworld - 2560x1440 Epic Preset AA:TSR | |
| XMG Pro 15 E23 | |
| Medio NVIDIA GeForce RTX 4070 Laptop GPU (69.1 - 81.3, n=2) | |
| HP Omen Transcend 16-u1095ng | |
| Prince of Persia The Lost Crown - 2560x1440 Ultra Preset AA:SM | |
| Media de la clase Gaming (352 - 357, n=4, últimos 2 años) | |
| XMG Pro 15 E23 | |
| Medio NVIDIA GeForce RTX 4070 Laptop GPU (325 - 354, n=2) | |
| HP Omen Transcend 16-u1095ng | |
| Ready or Not - 2560x1440 Epic Preset | |
| XMG Pro 15 E23 | |
| Medio NVIDIA GeForce RTX 4070 Laptop GPU (84.8 - 95.6, n=2) | |
| HP Omen Transcend 16-u1095ng | |
| The Finals - 2560x1440 Epic Preset | |
| XMG Pro 15 E23 | |
| Medio NVIDIA GeForce RTX 4070 Laptop GPU (82.8 - 94.6, n=3) | |
| HP Omen Transcend 16-u1095ng | |
| Media de la clase Gaming (n=1últimos 2 años) | |
Utilizamos el juego de rol, El Witcher 3 (FHD/Ultra) para ver cómo se comportaba el rendimiento 3D durante un periodo de tiempo más largo e incluso después de aproximadamente una hora, la tasa de imágenes por segundo se mantuvo muy estable.
Witcher 3 FPS diagram
| bajo | medio | alto | ultra | QHD | |
|---|---|---|---|---|---|
| GTA V (2015) | 181.2 | 175.3 | 115.8 | ||
| The Witcher 3 (2015) | 114 | ||||
| Dota 2 Reborn (2015) | 202 | 178.9 | 167 | 154.1 | |
| Final Fantasy XV Benchmark (2018) | 147.5 | 108.3 | |||
| X-Plane 11.11 (2018) | 166.6 | 141.7 | 114.9 | ||
| Strange Brigade (2018) | 272 | 220 | 194.2 | ||
| The Finals (2023) | 168 | 130.2 | 82.8 | ||
| Ready or Not (2023) | 194.2 | 134 | 84.8 | ||
| Prince of Persia The Lost Crown (2024) | 358 | 358 | 325 | ||
| Palworld (2024) | 102.2 | 96.6 | 69.1 | ||
| Enshrouded (2024) | 66.6 | 56.5 | 42.3 | ||
| Helldivers 2 (2024) | 91.5 | 91.1 | 69.2 |
Emisiones
Emisiones sonoras
Si se limita a utilizar el modo equilibrado, el dispositivo de 16 pulgadas no resulta demasiado ruidoso. El nivel de ruido 3D de 44 a 47 dB(A) es audible pero no molesto (esto último se aplicaría al modo de rendimiento con un registro de más de 50 dB). En modo inactivo, los ventiladores están continuamente activos y funcionan a unos audibles 29 a 31 dB(A), lo que no es del todo óptimo.
Ruido
| Ocioso |
| 29 / 30 / 31 dB(A) |
| Carga |
| 45 / 47 dB(A) |
 | ||
30 dB silencioso 40 dB(A) audible 50 dB(A) ruidosamente alto |
||
min: | ||
| HP Omen Transcend 16-u1095ng i9-14900HX, GeForce RTX 4070 Laptop GPU | HP Omen Transcend 16 i9-13900HX, GeForce RTX 4070 Laptop GPU | Asus ROG Zephyrus G16 2024 GU605M Ultra 7 155H, GeForce RTX 4070 Laptop GPU | Schenker XMG CORE 16 (L23) R7 7840HS, GeForce RTX 4070 Laptop GPU | Lenovo Legion Pro 5 16ARX8 R7 7745HX, GeForce RTX 4070 Laptop GPU | |
|---|---|---|---|---|---|
| Noise | -4% | 7% | 5% | 10% | |
| apagado / medio ambiente * (dB) | 24 | 22.9 5% | 23.9 -0% | 23 4% | 23.2 3% |
| Idle Minimum * (dB) | 29 | 29.1 -0% | 23.9 18% | 23 21% | 23.2 20% |
| Idle Average * (dB) | 30 | 29.1 3% | 27.8 7% | 28.48 5% | 23.2 23% |
| Idle Maximum * (dB) | 31 | 29.1 6% | 30.1 3% | 28.48 8% | 26.2 15% |
| Load Average * (dB) | 45 | 45.7 -2% | 34.2 24% | 30 33% | 31.4 30% |
| Witcher 3 ultra * (dB) | 44 | 54.3 -23% | 46.4 -5% | 54.12 -23% | 48.4 -10% |
| Load Maximum * (dB) | 47 | 54.3 -16% | 46.4 1% | 54.12 -15% | 53.8 -14% |
* ... más pequeño es mejor
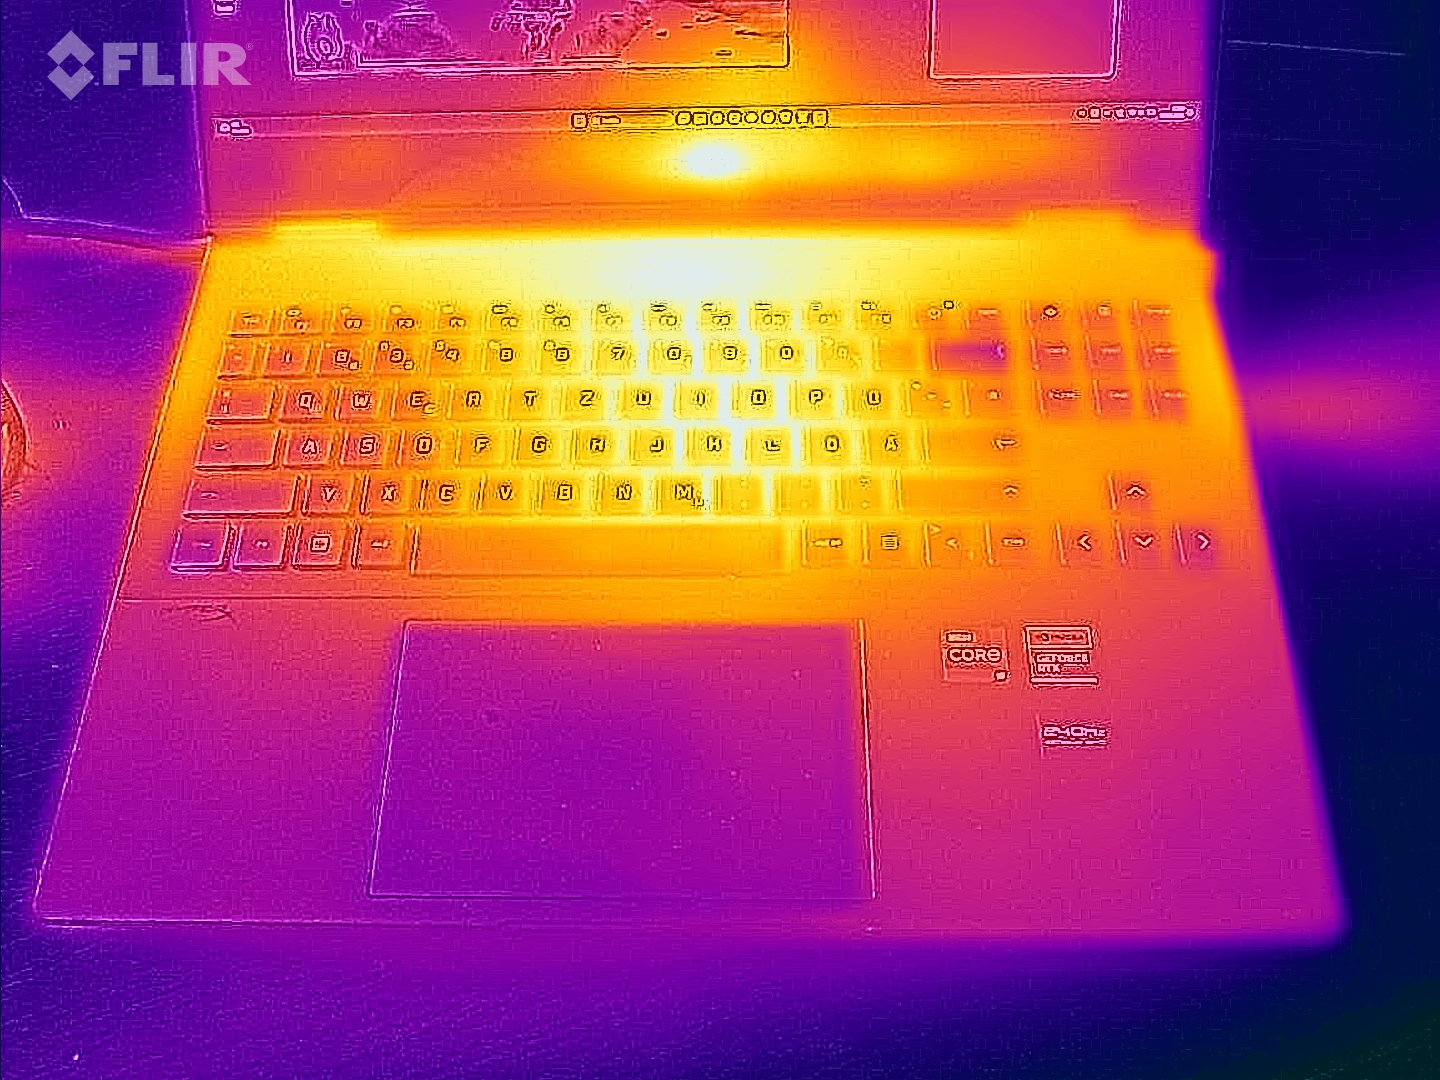
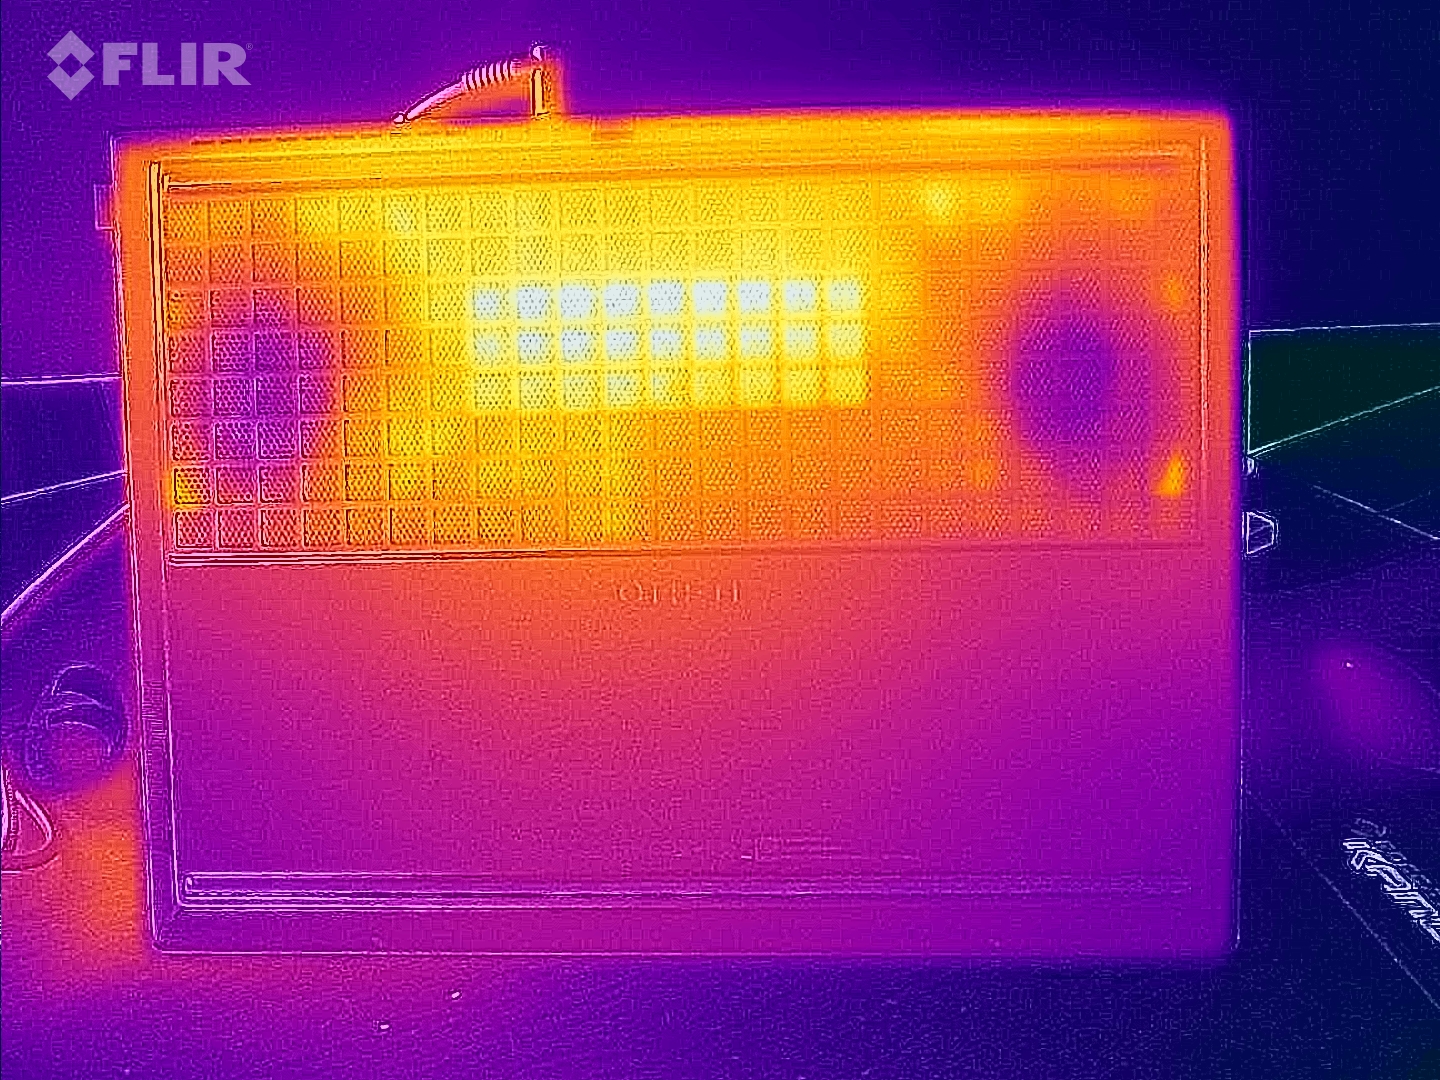
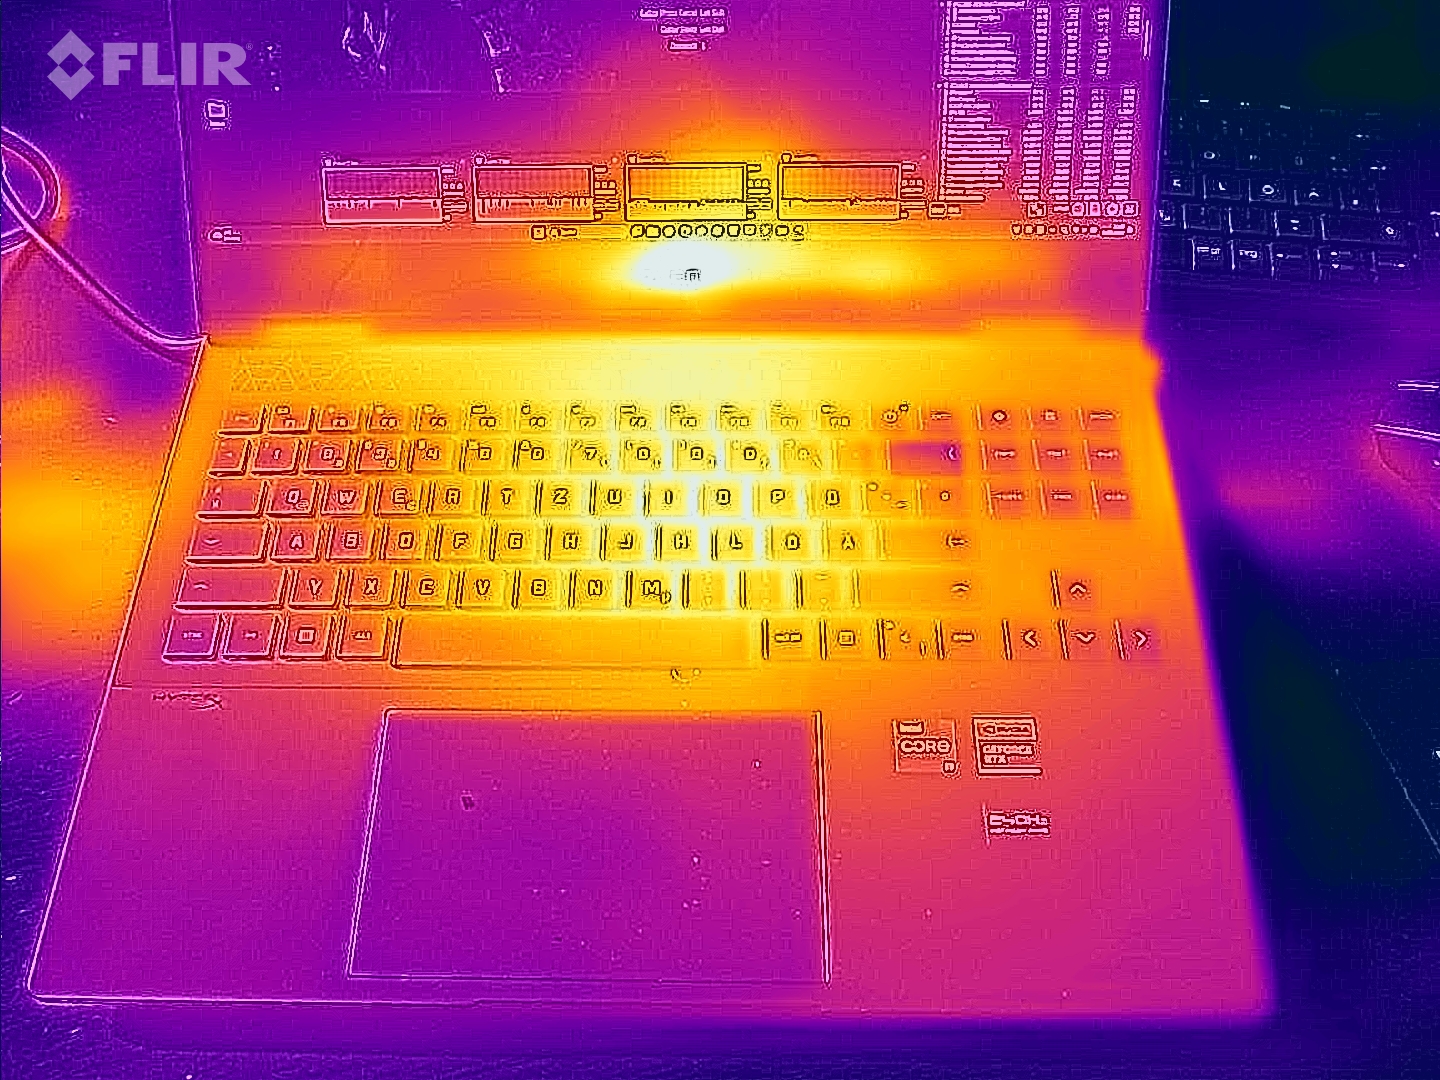
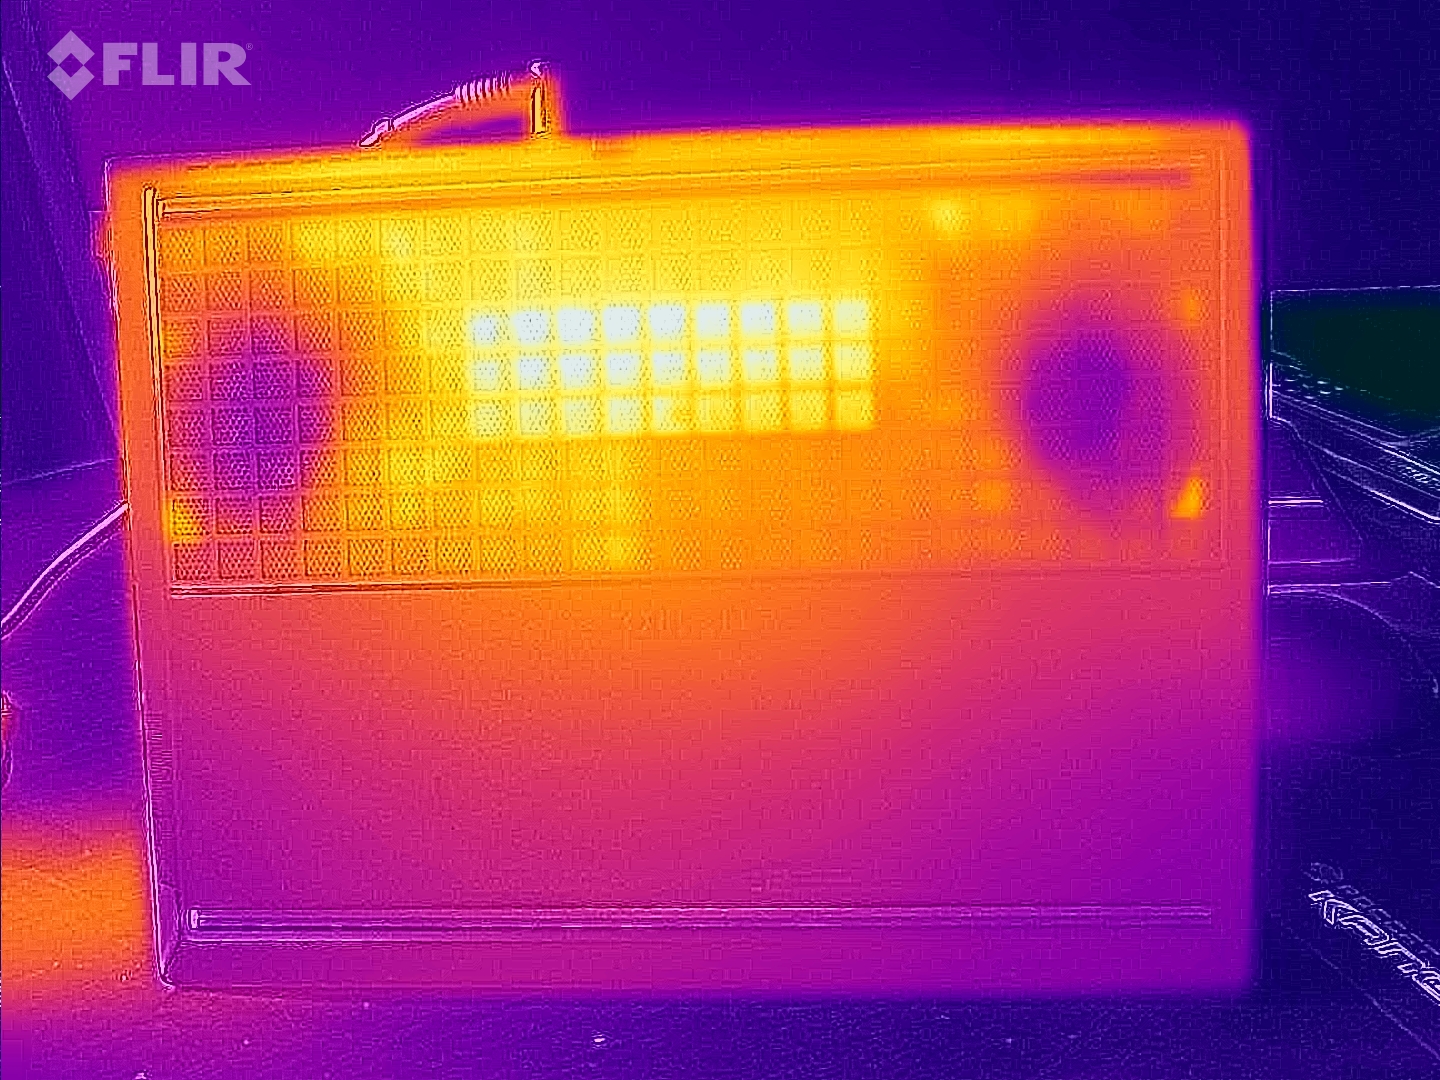
Temperatura
Mientras que las temperaturas en la parte superior del portátil se sitúan en el medio del pelotón, la base de la carcasa se calienta más que la competencia bajo carga. Un máximo de 63 °C (cuando se juega) impedirá a los usuarios utilizar el dispositivo colocado sobre sus rodillas. En funcionamiento en reposo, la situación es bastante más cómoda, con el chasis manteniéndose agradablemente fresco a un máximo de 30 °C.
(-) La temperatura máxima en la parte superior es de 49 °C / 120 F, frente a la media de 40.4 °C / 105 F, que oscila entre 21.2 y 68.8 °C para la clase Gaming.
(-) El fondo se calienta hasta un máximo de 63 °C / 145 F, frente a la media de 43.2 °C / 110 F
(+) En reposo, la temperatura media de la parte superior es de 26.6 °C / 80# F, frente a la media del dispositivo de 33.9 °C / 93 F.
(-) Jugando a The Witcher 3, la temperatura media de la parte superior es de 40.3 °C / 105 F, frente a la media del dispositivo de 33.9 °C / 93 F.
(+) Los reposamanos y el panel táctil alcanzan como máximo la temperatura de la piel (35 °C / 95 F) y, por tanto, no están calientes.
(-) La temperatura media de la zona del reposamanos de dispositivos similares fue de 28.8 °C / 83.8 F (-6.2 °C / -11.2 F).
| HP Omen Transcend 16-u1095ng i9-14900HX, GeForce RTX 4070 Laptop GPU | HP Omen Transcend 16 i9-13900HX, GeForce RTX 4070 Laptop GPU | Asus ROG Zephyrus G16 2024 GU605M Ultra 7 155H, GeForce RTX 4070 Laptop GPU | Schenker XMG CORE 16 (L23) R7 7840HS, GeForce RTX 4070 Laptop GPU | Lenovo Legion Pro 5 16ARX8 R7 7745HX, GeForce RTX 4070 Laptop GPU | |
|---|---|---|---|---|---|
| Heat | 5% | 6% | 4% | 12% | |
| Maximum Upper Side * (°C) | 49 | 47.4 3% | 50.3 -3% | 46 6% | 41.8 15% |
| Maximum Bottom * (°C) | 63 | 54.4 14% | 48 24% | 44 30% | 41.4 34% |
| Idle Upper Side * (°C) | 30 | 28.4 5% | 28.8 4% | 32 -7% | 29 3% |
| Idle Bottom * (°C) | 29 | 29.2 -1% | 29.8 -3% | 33 -14% | 30.4 -5% |
* ... más pequeño es mejor
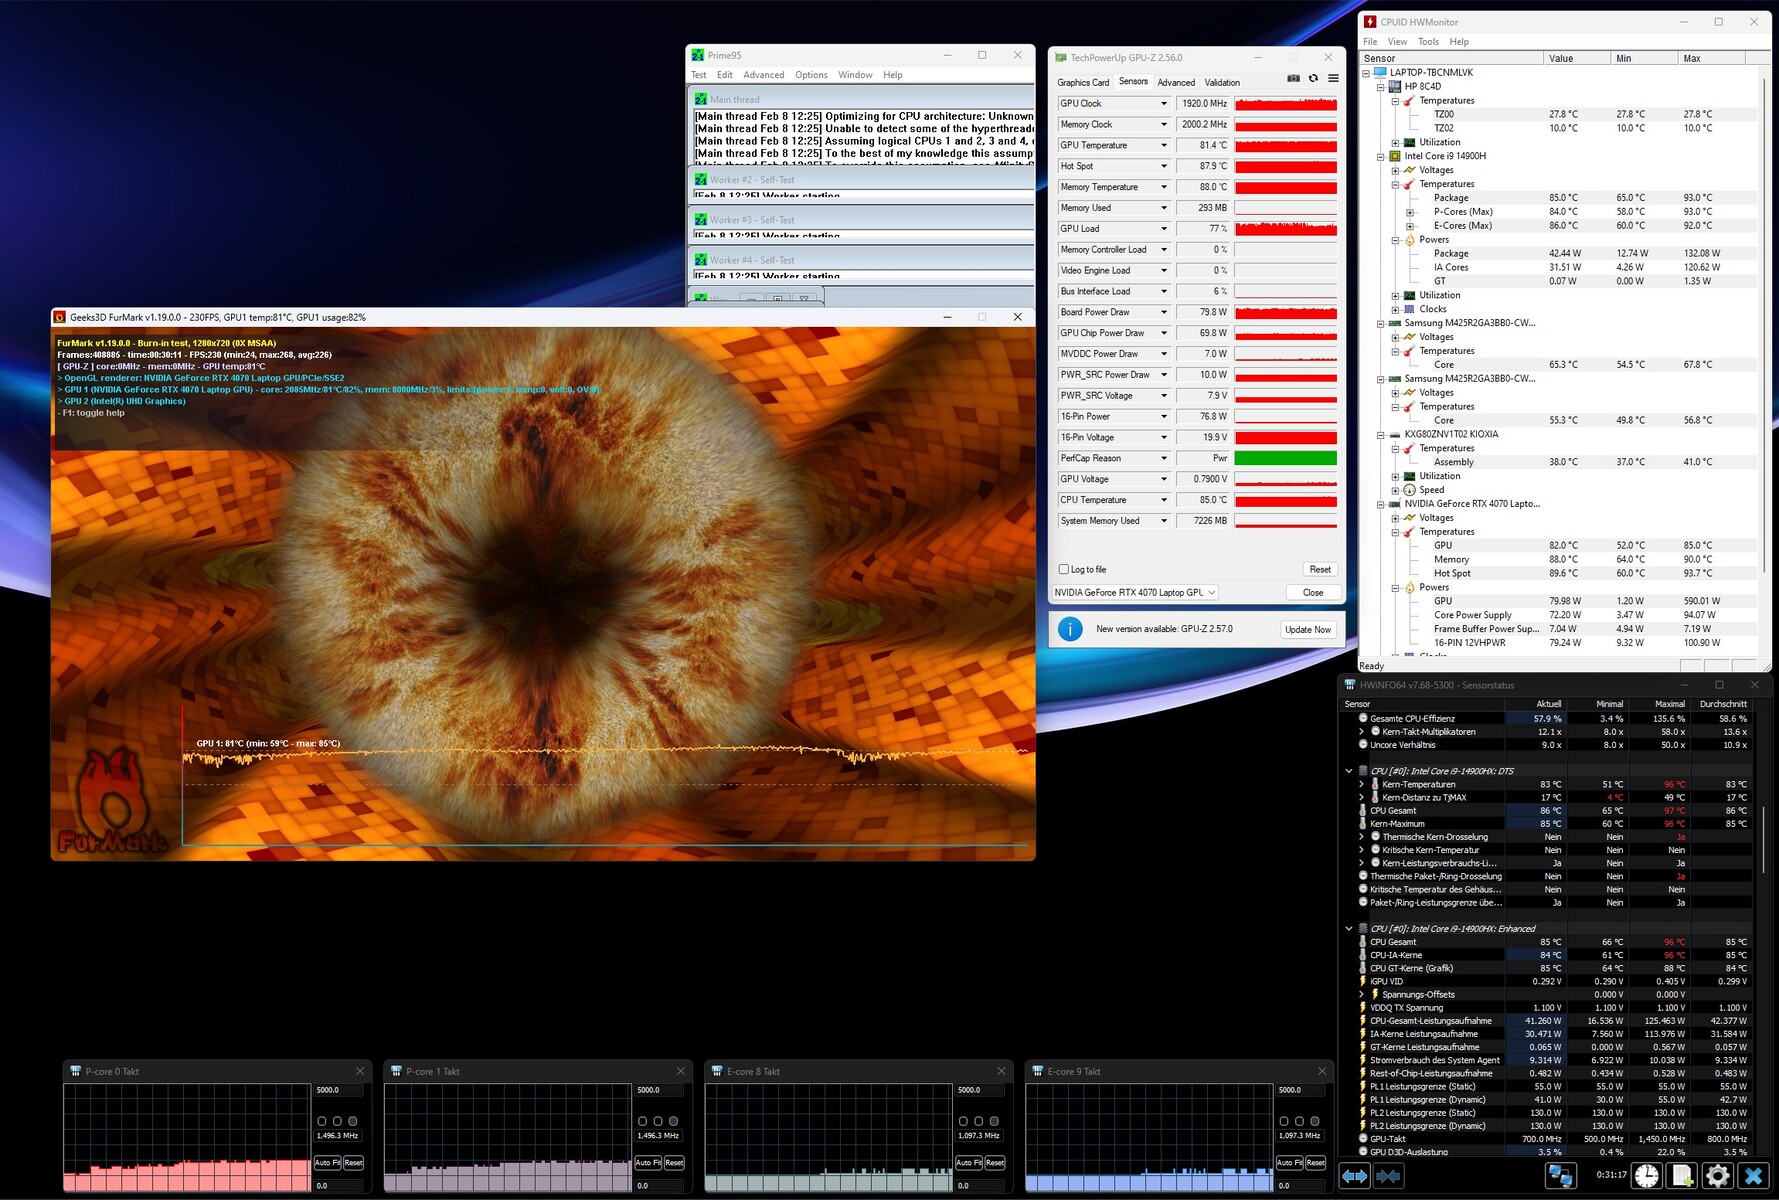
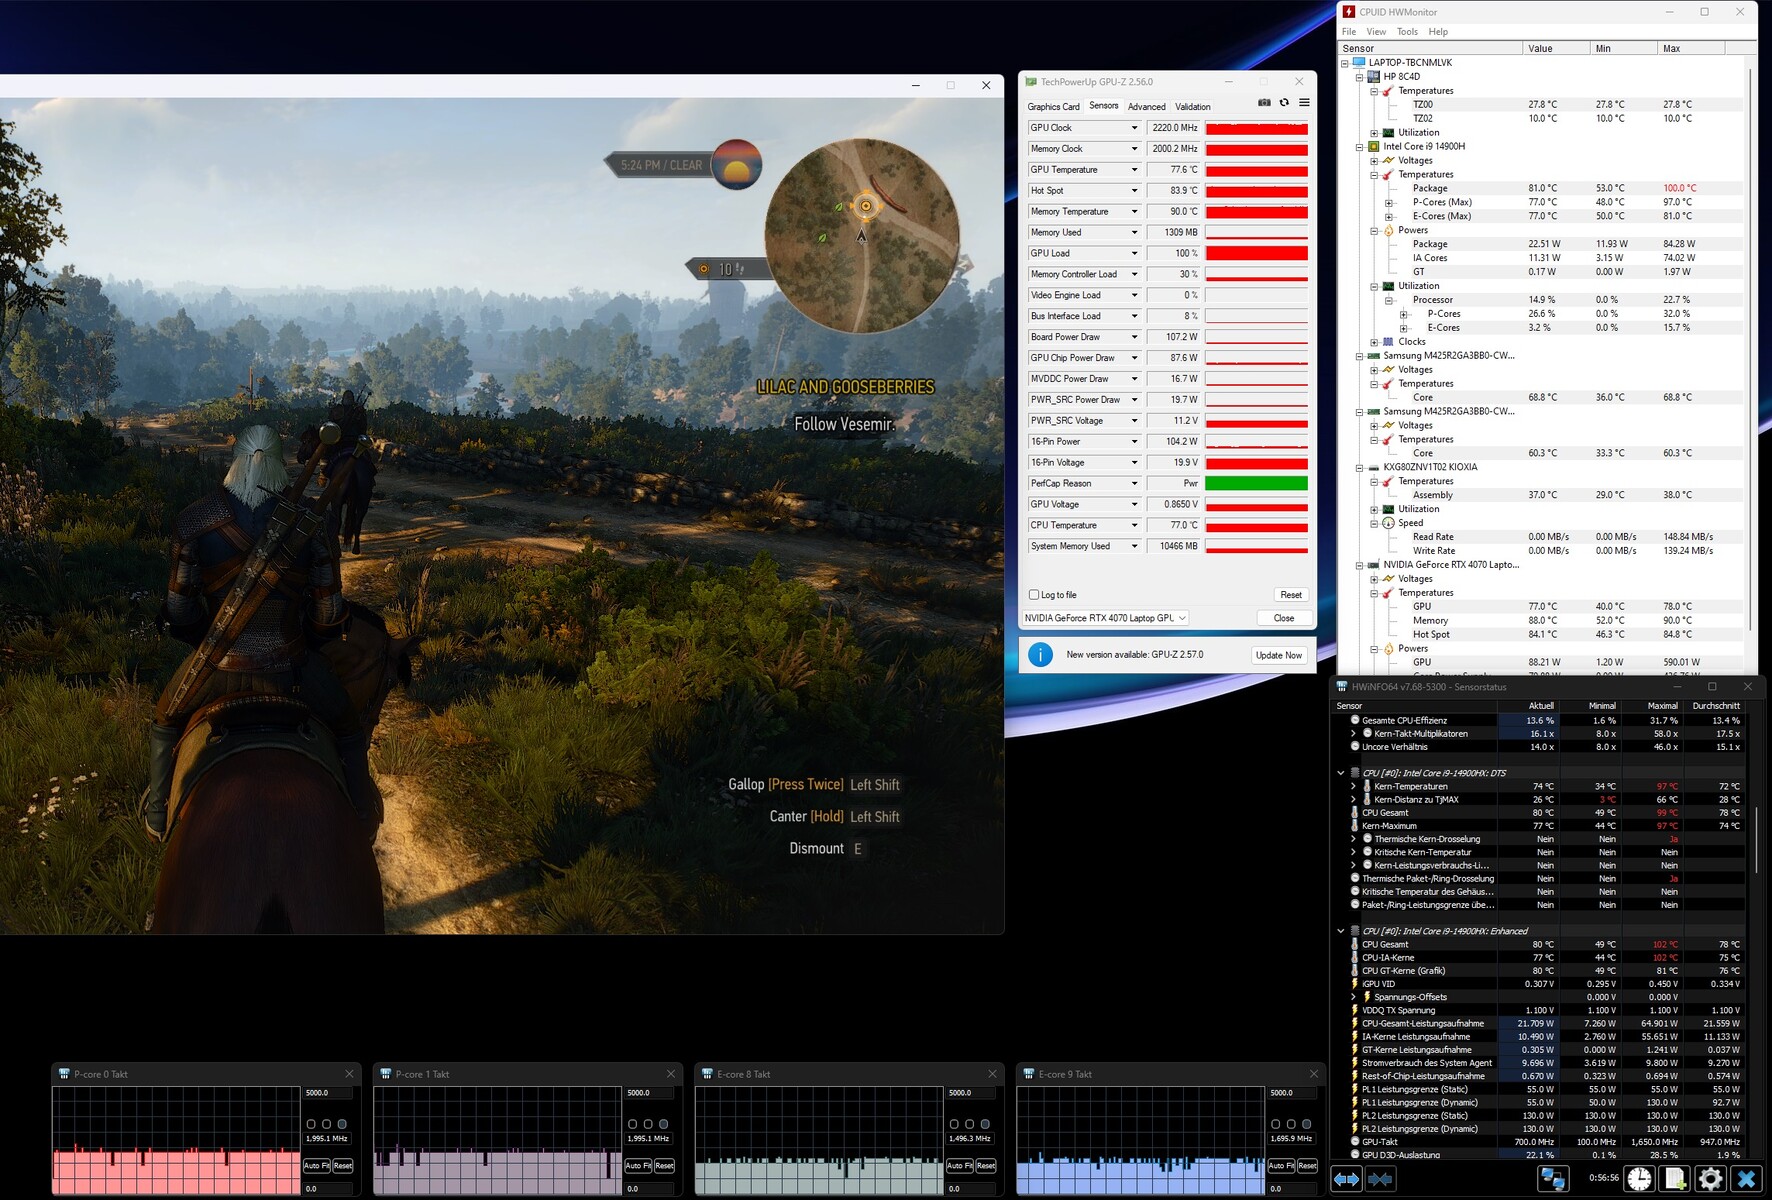
Prueba de esfuerzo
En la prueba de estrés con las herramientas Furmark y Prime95, tras 60 minutos, la CPU se estabilizó en torno a los 85 °C, mientras que la GPU alcanzó los 81 °C (un punto caliente de 88 °C), ambos valores relativamente altos pero inofensivos.
Altavoces
La calidad del sonido es algo mejor que la media general de los portátiles para juegos, aunque, como suele ocurrir, los graves luchan y podrían ser más potentes y precisos. El volumen máximo de 82 dB(A) es más que decente.
HP Omen Transcend 16-u1095ng análisis de audio
(+) | los altavoces pueden reproducir a un volumen relativamente alto (#82 dB)
Graves 100 - 315 Hz
(-) | casi sin bajos - de media 21.9% inferior a la mediana
(±) | la linealidad de los graves es media (11% delta a frecuencia anterior)
Medios 400 - 2000 Hz
(+) | medios equilibrados - a sólo 3.2% de la mediana
(+) | los medios son lineales (5.3% delta a la frecuencia anterior)
Altos 2 - 16 kHz
(+) | máximos equilibrados - a sólo 1.4% de la mediana
(+) | los máximos son lineales (5.2% delta a la frecuencia anterior)
Total 100 - 16.000 Hz
(+) | el sonido global es lineal (14.5% de diferencia con la mediana)
En comparación con la misma clase
» 27% de todos los dispositivos probados de esta clase eran mejores, 7% similares, 66% peores
» El mejor tuvo un delta de 6%, la media fue 18%, el peor fue ###max##%
En comparación con todos los dispositivos probados
» 18% de todos los dispositivos probados eran mejores, 4% similares, 78% peores
» El mejor tuvo un delta de 4%, la media fue 24%, el peor fue ###max##%
Asus ROG Zephyrus G16 2024 GU605M análisis de audio
(+) | los altavoces pueden reproducir a un volumen relativamente alto (#83.3 dB)
Graves 100 - 315 Hz
(+) | buen bajo - sólo 3.8% lejos de la mediana
(±) | la linealidad de los graves es media (8.1% delta a frecuencia anterior)
Medios 400 - 2000 Hz
(+) | medios equilibrados - a sólo 3.5% de la mediana
(+) | los medios son lineales (2.4% delta a la frecuencia anterior)
Altos 2 - 16 kHz
(+) | máximos equilibrados - a sólo 2.2% de la mediana
(+) | los máximos son lineales (3.7% delta a la frecuencia anterior)
Total 100 - 16.000 Hz
(+) | el sonido global es lineal (7.3% de diferencia con la mediana)
En comparación con la misma clase
» 1% de todos los dispositivos probados de esta clase eran mejores, 0% similares, 99% peores
» El mejor tuvo un delta de 6%, la media fue 18%, el peor fue ###max##%
En comparación con todos los dispositivos probados
» 1% de todos los dispositivos probados eran mejores, 0% similares, 99% peores
» El mejor tuvo un delta de 4%, la media fue 24%, el peor fue ###max##%
Gestión de la energía
Consumo de energía
Los requisitos energéticos son similares a los valores estándar encontrados en esta categoría de rendimiento. un consumo de 10 a 32 vatios en ralentí y de 128 a 242 vatios bajo carga no es ni especialmente alto ni bajo.
| Off / Standby | |
| Ocioso | |
| Carga |
|
Clave:
min: | |
| HP Omen Transcend 16-u1095ng i9-14900HX, GeForce RTX 4070 Laptop GPU | HP Omen Transcend 16 i9-13900HX, GeForce RTX 4070 Laptop GPU | Asus ROG Zephyrus G16 2024 GU605M Ultra 7 155H, GeForce RTX 4070 Laptop GPU | Schenker XMG CORE 16 (L23) R7 7840HS, GeForce RTX 4070 Laptop GPU | Lenovo Legion Pro 5 16ARX8 R7 7745HX, GeForce RTX 4070 Laptop GPU | Media de la clase Gaming | |
|---|---|---|---|---|---|---|
| Power Consumption | -42% | 33% | 12% | 1% | -1% | |
| Idle Minimum * (Watt) | 10 | 19.2 -92% | 8.3 17% | 11 -10% | 8.1 19% | 13.2 ? -32% |
| Idle Average * (Watt) | 18 | 22.7 -26% | 12.5 31% | 15.2 16% | 15.9 12% | 18.9 ? -5% |
| Idle Maximum * (Watt) | 32 | 55.4 -73% | 12.8 60% | 16 50% | 37.2 -16% | 24.3 ? 24% |
| Load Average * (Watt) | 128 | 128.4 -0% | 71.3 44% | 64 50% | 90.9 29% | 108.3 ? 15% |
| Witcher 3 ultra * (Watt) | 148.4 | 206 -39% | 127.5 14% | 179 -21% | 189.6 -28% | |
| Load Maximum * (Watt) | 242 | 292 -21% | 169.1 30% | 280 -16% | 263.5 -9% | 254 ? -5% |
* ... más pequeño es mejor
Power consumption Witcher 3 / stress test
Power consumption with an external monitor
Duración de las pilas
En lo que respecta a los requisitos energéticos en modo batería, HP aún tiene trabajo por hacer. A pesar de la potente batería de 97 Wh, el equipo de 16 pulgadas sólo consiguió durar algo menos de 5 horas en nuestra prueba Wi-Fi con un brillo reducido de 150 cd/m². A modo de comparación: El ROG Zyphrus G16 consiguió más de 7 horas y el XMG Core 16 llegó a durar más de 8 horas.
| HP Omen Transcend 16-u1095ng i9-14900HX, GeForce RTX 4070 Laptop GPU, 97 Wh | HP Omen Transcend 16 i9-13900HX, GeForce RTX 4070 Laptop GPU, 97 Wh | Asus ROG Zephyrus G16 2024 GU605M Ultra 7 155H, GeForce RTX 4070 Laptop GPU, 90 Wh | Schenker XMG CORE 16 (L23) R7 7840HS, GeForce RTX 4070 Laptop GPU, 99 Wh | Lenovo Legion Pro 5 16ARX8 R7 7745HX, GeForce RTX 4070 Laptop GPU, 80 Wh | Media de la clase Gaming | |
|---|---|---|---|---|---|---|
| Duración de Batería | -14% | 49% | 71% | -18% | 44% | |
| WiFi v1.3 (h) | 4.9 | 4.2 -14% | 7.3 49% | 8.4 71% | 4 -18% | 7.04 ? 44% |
| Reader / Idle (h) | 6.3 | 6.5 | 8.71 ? | |||
| Load (h) | 1.2 | 1.2 | 2.4 | 1 | 1.47 ? | |
| H.264 (h) | 11.2 | 10.2 | 8.26 ? |
Pro
Contra
Veredicto
En primer lugar, el Omen Transcend 16-u1095ng intenta atraer a los clientes potenciales con una brillante pantalla OLED que habla tanto a los jugadores como a los creadores.
Si usted puede lidiar con una pantalla muy reflectante y no tiene problemas con el parpadeo, obtendrá una pantalla colorida con una excelente relación de contraste y grandes tiempos de respuesta, además de unos niveles de negro y ángulos de visión magníficos.
Hay algunos puntos negativos en cuanto a emisiones y velocidad. Mientras que la máquina de 16 pulgadas se vuelve desagradablemente ruidosa en el modo de rendimiento, el rendimiento del modo equilibrado parece algo por debajo de la media. Aparte de eso, el Omen Transcend 16 es similar a otros portátiles para juegos en lo que respecta a la calidad de la carcasa, los dispositivos de entrada y la selección de puertos.
En conjunto, la puntuación total es comparable a la del XMG Core 16 L23 o el Legion Pro 5 16ARX8. Quien busque un dispositivo especialmente ligero y compacto en la categoría de 16 pulgadas debería fijarse en el nuevo ROG Zeyphrus G16.
Precio y disponibilidad
En el momento de realizar nuestro análisis, el HP Omen Transcend 16-u1095ng con el Core i9-14900HX y la GeForce RTX 4070 no está disponible actualmente en la tienda online de HP, Amazon o Best Buy.
HP Omen Transcend 16-u1095ng
- 02/12/2024 v7 (old)
Florian Glaser
Transparencia
La selección de los dispositivos que se van a reseñar corre a cargo de nuestro equipo editorial. La muestra de prueba fue proporcionada al autor en calidad de préstamo por el fabricante o el minorista a los efectos de esta reseña. El prestamista no tuvo ninguna influencia en esta reseña, ni el fabricante recibió una copia de la misma antes de su publicación. No había ninguna obligación de publicar esta reseña. Como empresa de medios independiente, Notebookcheck no está sujeta a la autoridad de fabricantes, minoristas o editores.
Así es como prueba Notebookcheck
Cada año, Notebookcheck revisa de forma independiente cientos de portátiles y smartphones utilizando procedimientos estandarizados para asegurar que todos los resultados son comparables. Hemos desarrollado continuamente nuestros métodos de prueba durante unos 20 años y hemos establecido los estándares de la industria en el proceso. En nuestros laboratorios de pruebas, técnicos y editores experimentados utilizan equipos de medición de alta calidad. Estas pruebas implican un proceso de validación en varias fases. Nuestro complejo sistema de clasificación se basa en cientos de mediciones y puntos de referencia bien fundamentados, lo que mantiene la objetividad.Price comparison

