Análisis del portátil Alienware m16 R2: Cambios grandes y arriesgados

El Alienware m16 R2 sucede al m16 R1pero no de la forma que cabría esperar. El nuevo modelo es un completo rediseño y replanteamiento de la serie m16 en un intento de atraer tanto a los jugadores como a los usuarios en general, mientras que otros productos de Alienware están orientados a los jugadores hardcore. Sólo por esto, el m16 R2 es uno de los portátiles Alienware más interesantes de los últimos años, ya que sacrifica algunas opciones de CPU y GPU de gama más alta que estaban disponibles en el m16 R1 en favor de un diseño más pequeño.
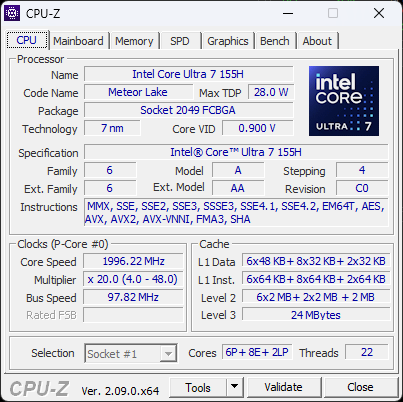
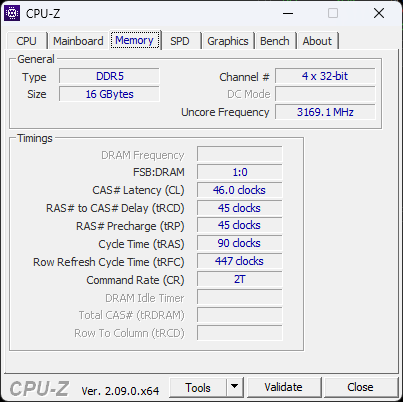
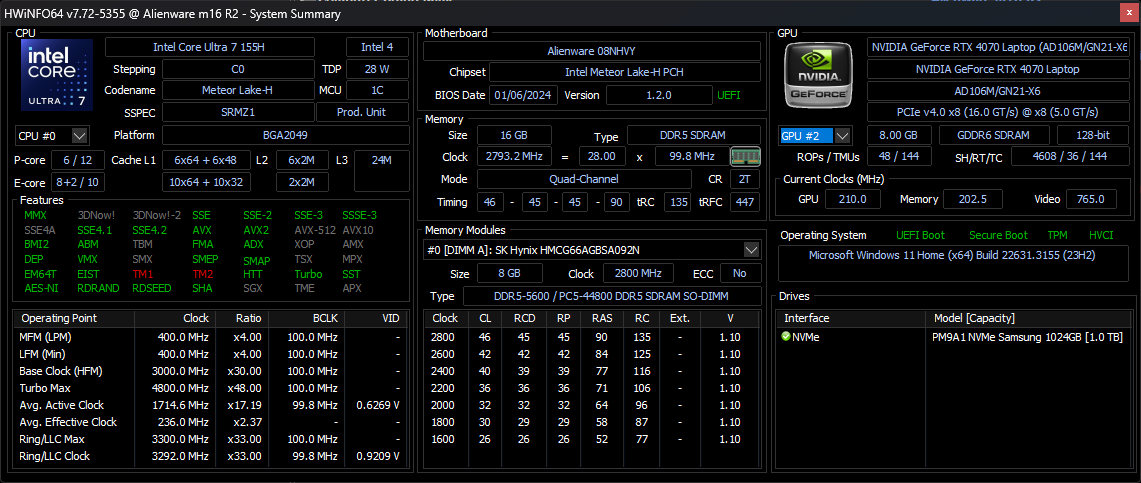
Nuestra unidad de revisión es una configuración de gama alta con la CPU Meteor Lake-H Core Ultra 7 155H, la GPU GeForce RTX 4070 y la pantalla IPS 1600p 240 Hz por aproximadamente 1850 USD. Las SKU de gama más baja pueden configurarse con la RTX 4050 o 4060 en su lugar y las SKU de gama más alta incluyen la Core Ultra 9, pero por lo demás todas las configuraciones se limitan a la misma pantalla IPS de 1600p240 y hasta la RTX 4070 únicamente.
Las alternativas al Alienware m16 R2 incluyen otros portátiles de 16 pulgadas de alto rendimiento como el Razer Blade 16, HP Omen Transcend 16, Asus ROG Zephyrus G16o Lenovo Legion Slim 7 16.
Más opiniones sobre Alienware:
Posibles contendientes en la comparación
Valoración | Fecha | Modelo | Peso | Altura | Tamaño | Resolución | Precio |
|---|---|---|---|---|---|---|---|
| 90.2 % v7 (old) | 03/2024 | Alienware m16 R2 Ultra 7 155H, GeForce RTX 4070 Laptop GPU | 2.5 kg | 23.5 mm | 16.00" | 2560x1600 | |
| 88.3 % v7 (old) | 09/2023 | Alienware m16 R1 Intel i7-13700HX, GeForce RTX 4060 Laptop GPU | 3 kg | 25.4 mm | 16.00" | 2560x1600 | |
| 88.4 % v7 (old) | 06/2023 | Alienware x16 R1 i9-13900HK, GeForce RTX 4080 Laptop GPU | 2.6 kg | 18.57 mm | 16.00" | 2560x1600 | |
| 88.4 % v7 (old) | 02/2024 | HP Omen Transcend 16-u1095ng i9-14900HX, GeForce RTX 4070 Laptop GPU | 2.3 kg | 20 mm | 16.00" | 2560x1600 | |
| 92.3 % v7 (old) | 02/2024 | Asus ROG Zephyrus G16 2024 GU605M Ultra 7 155H, GeForce RTX 4070 Laptop GPU | 1.8 kg | 16.4 mm | 16.00" | 2560x1600 | |
| 90.4 % v7 (old) | 11/2023 | Lenovo Legion Slim 7 16APH8 R7 7840HS, GeForce RTX 4060 Laptop GPU | 2.1 kg | 20 mm | 16.00" | 2560x1600 |
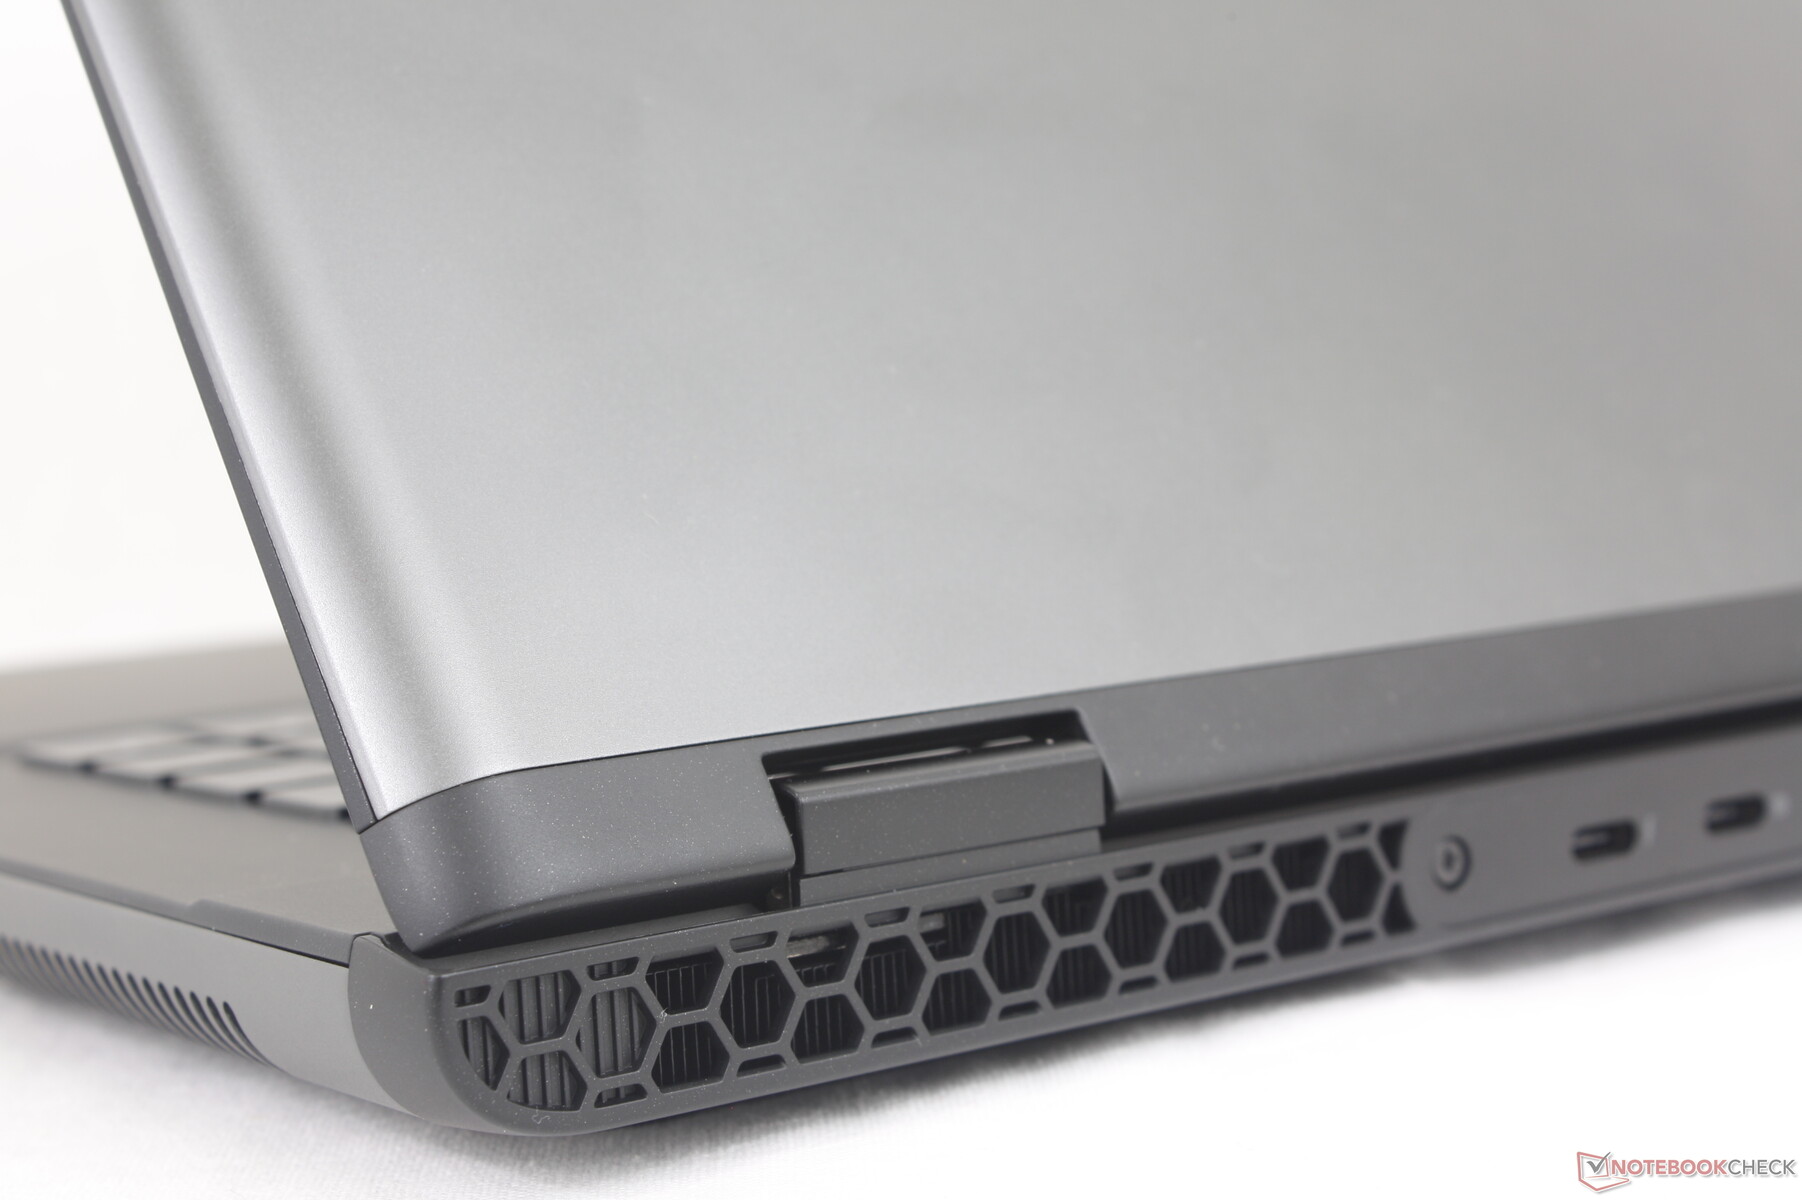
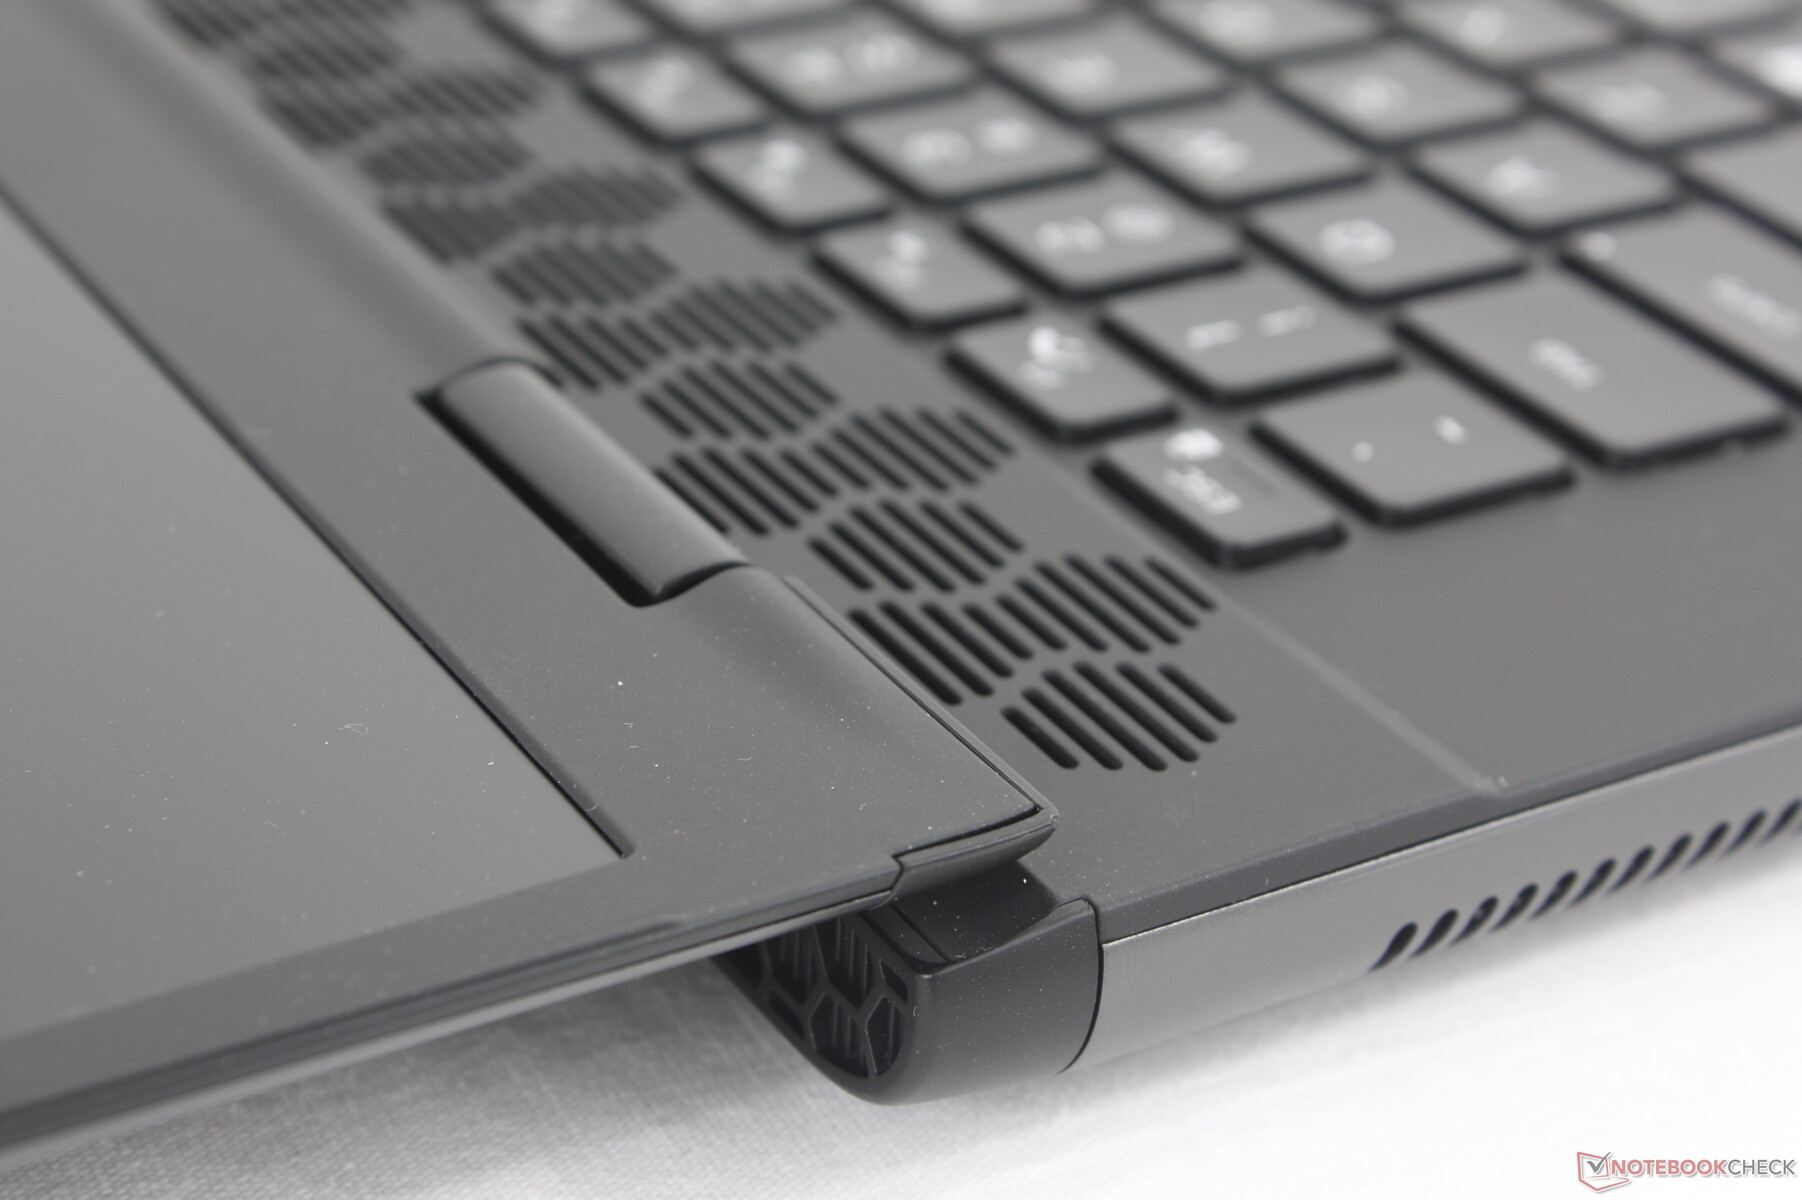
Caso - Leyenda 3.0 redefinida
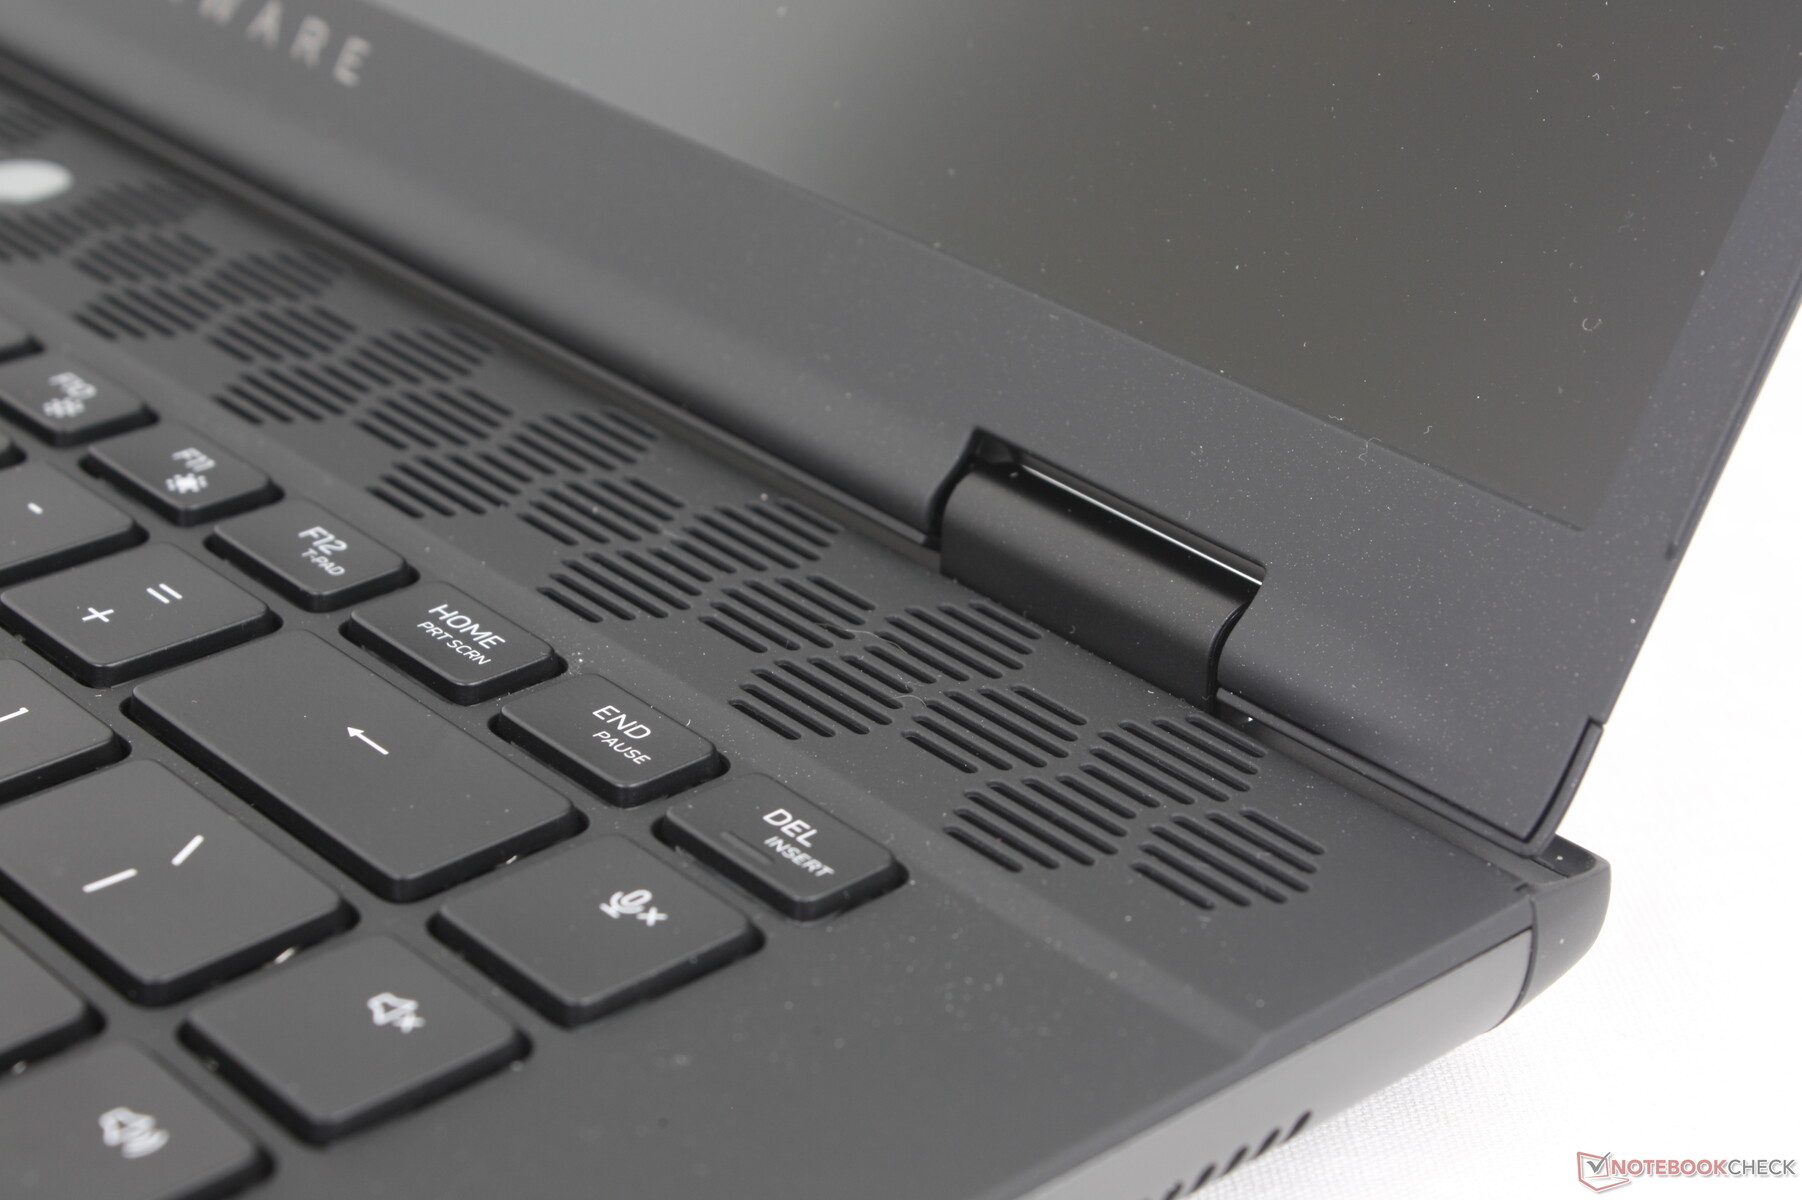
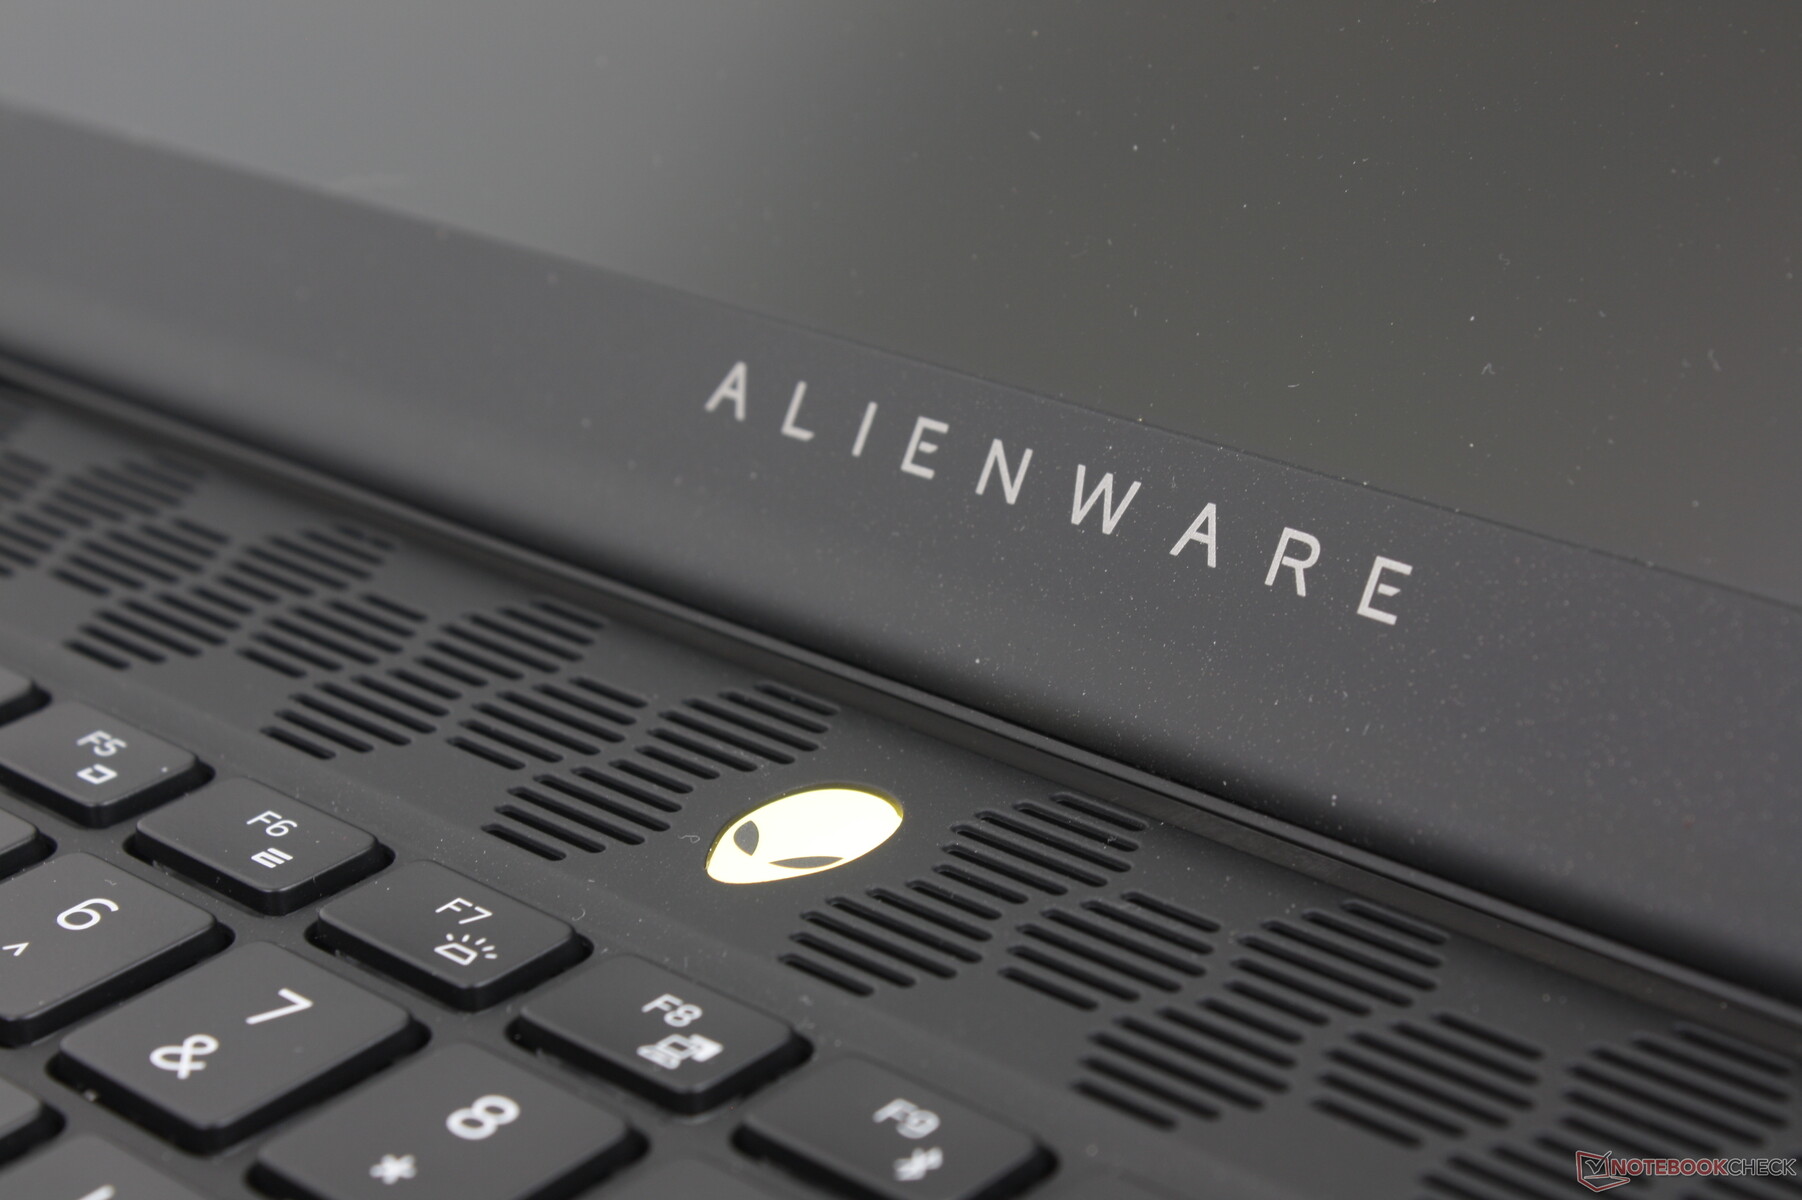
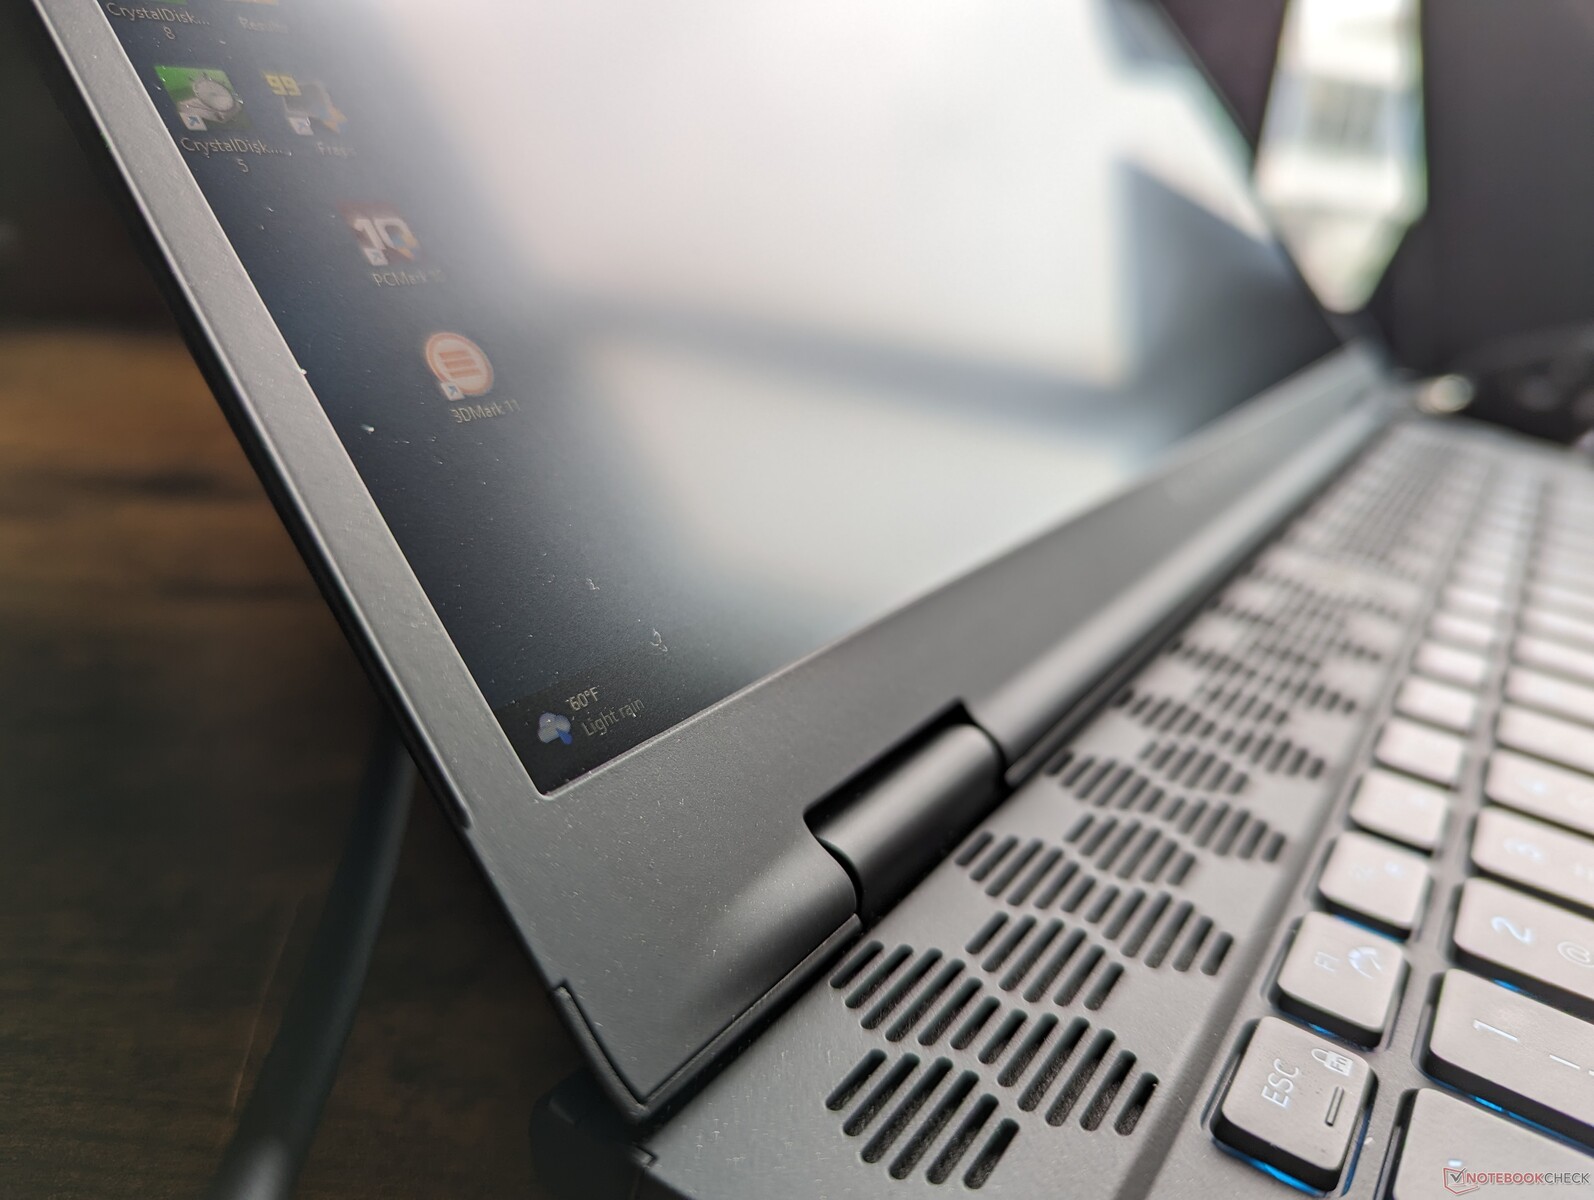
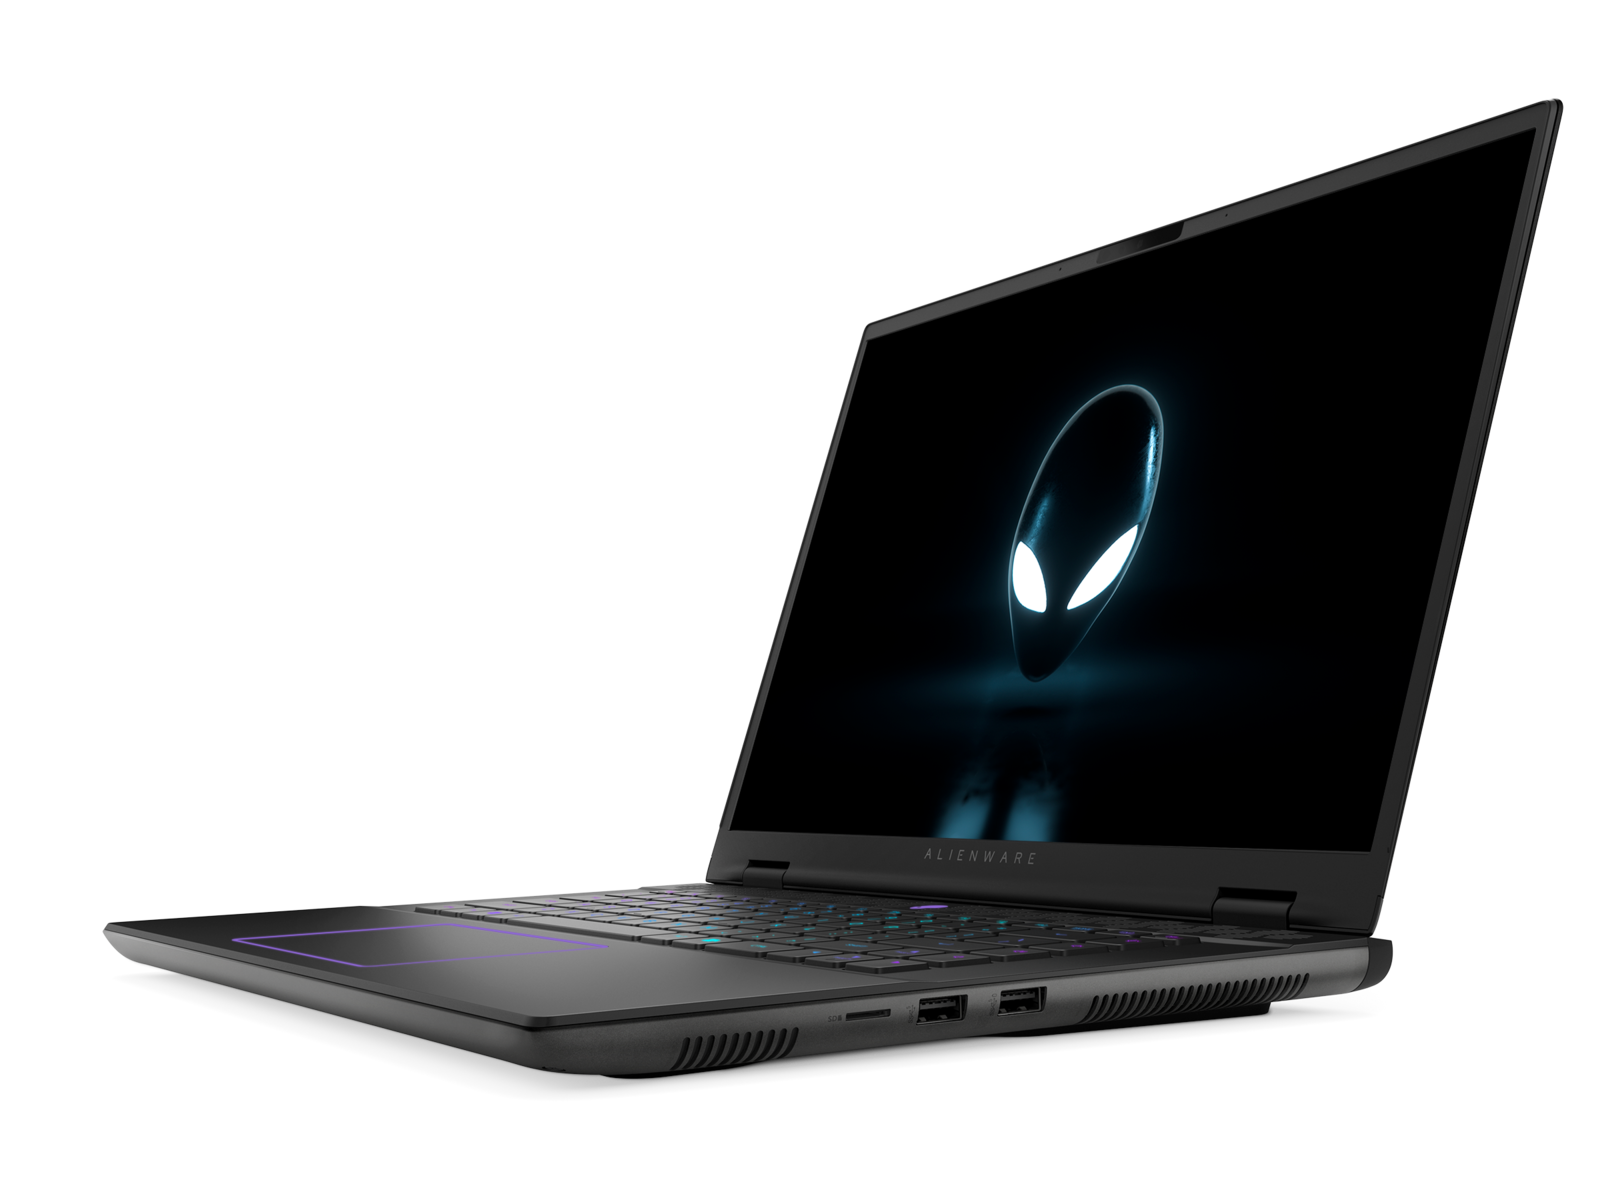
El Alienware m16 R1 no tiene ni un año y Dell ya está introduciendo un diseño de chasis revisado con la m16 R2. El cambio más notable consiste en la eliminación de la cubierta térmica que sobresale a lo largo de la parte trasera para conseguir un tamaño mucho menor que antes. El anillo de LED RGB de la parte trasera ha desaparecido y el teclado se ha desplazado hacia arriba para dejar espacio a un reposamanos y un clickpad más grandes.
Por lo demás, los materiales del chasis son los mismos que antes para ofrecer texturas e impresiones similares. La rigidez no ha cambiado en ningún grado notable, por lo que la unidad se sigue sintiendo bastante fuerte de arriba a abajo, sin crujidos importantes ni puntos débiles evidentes.
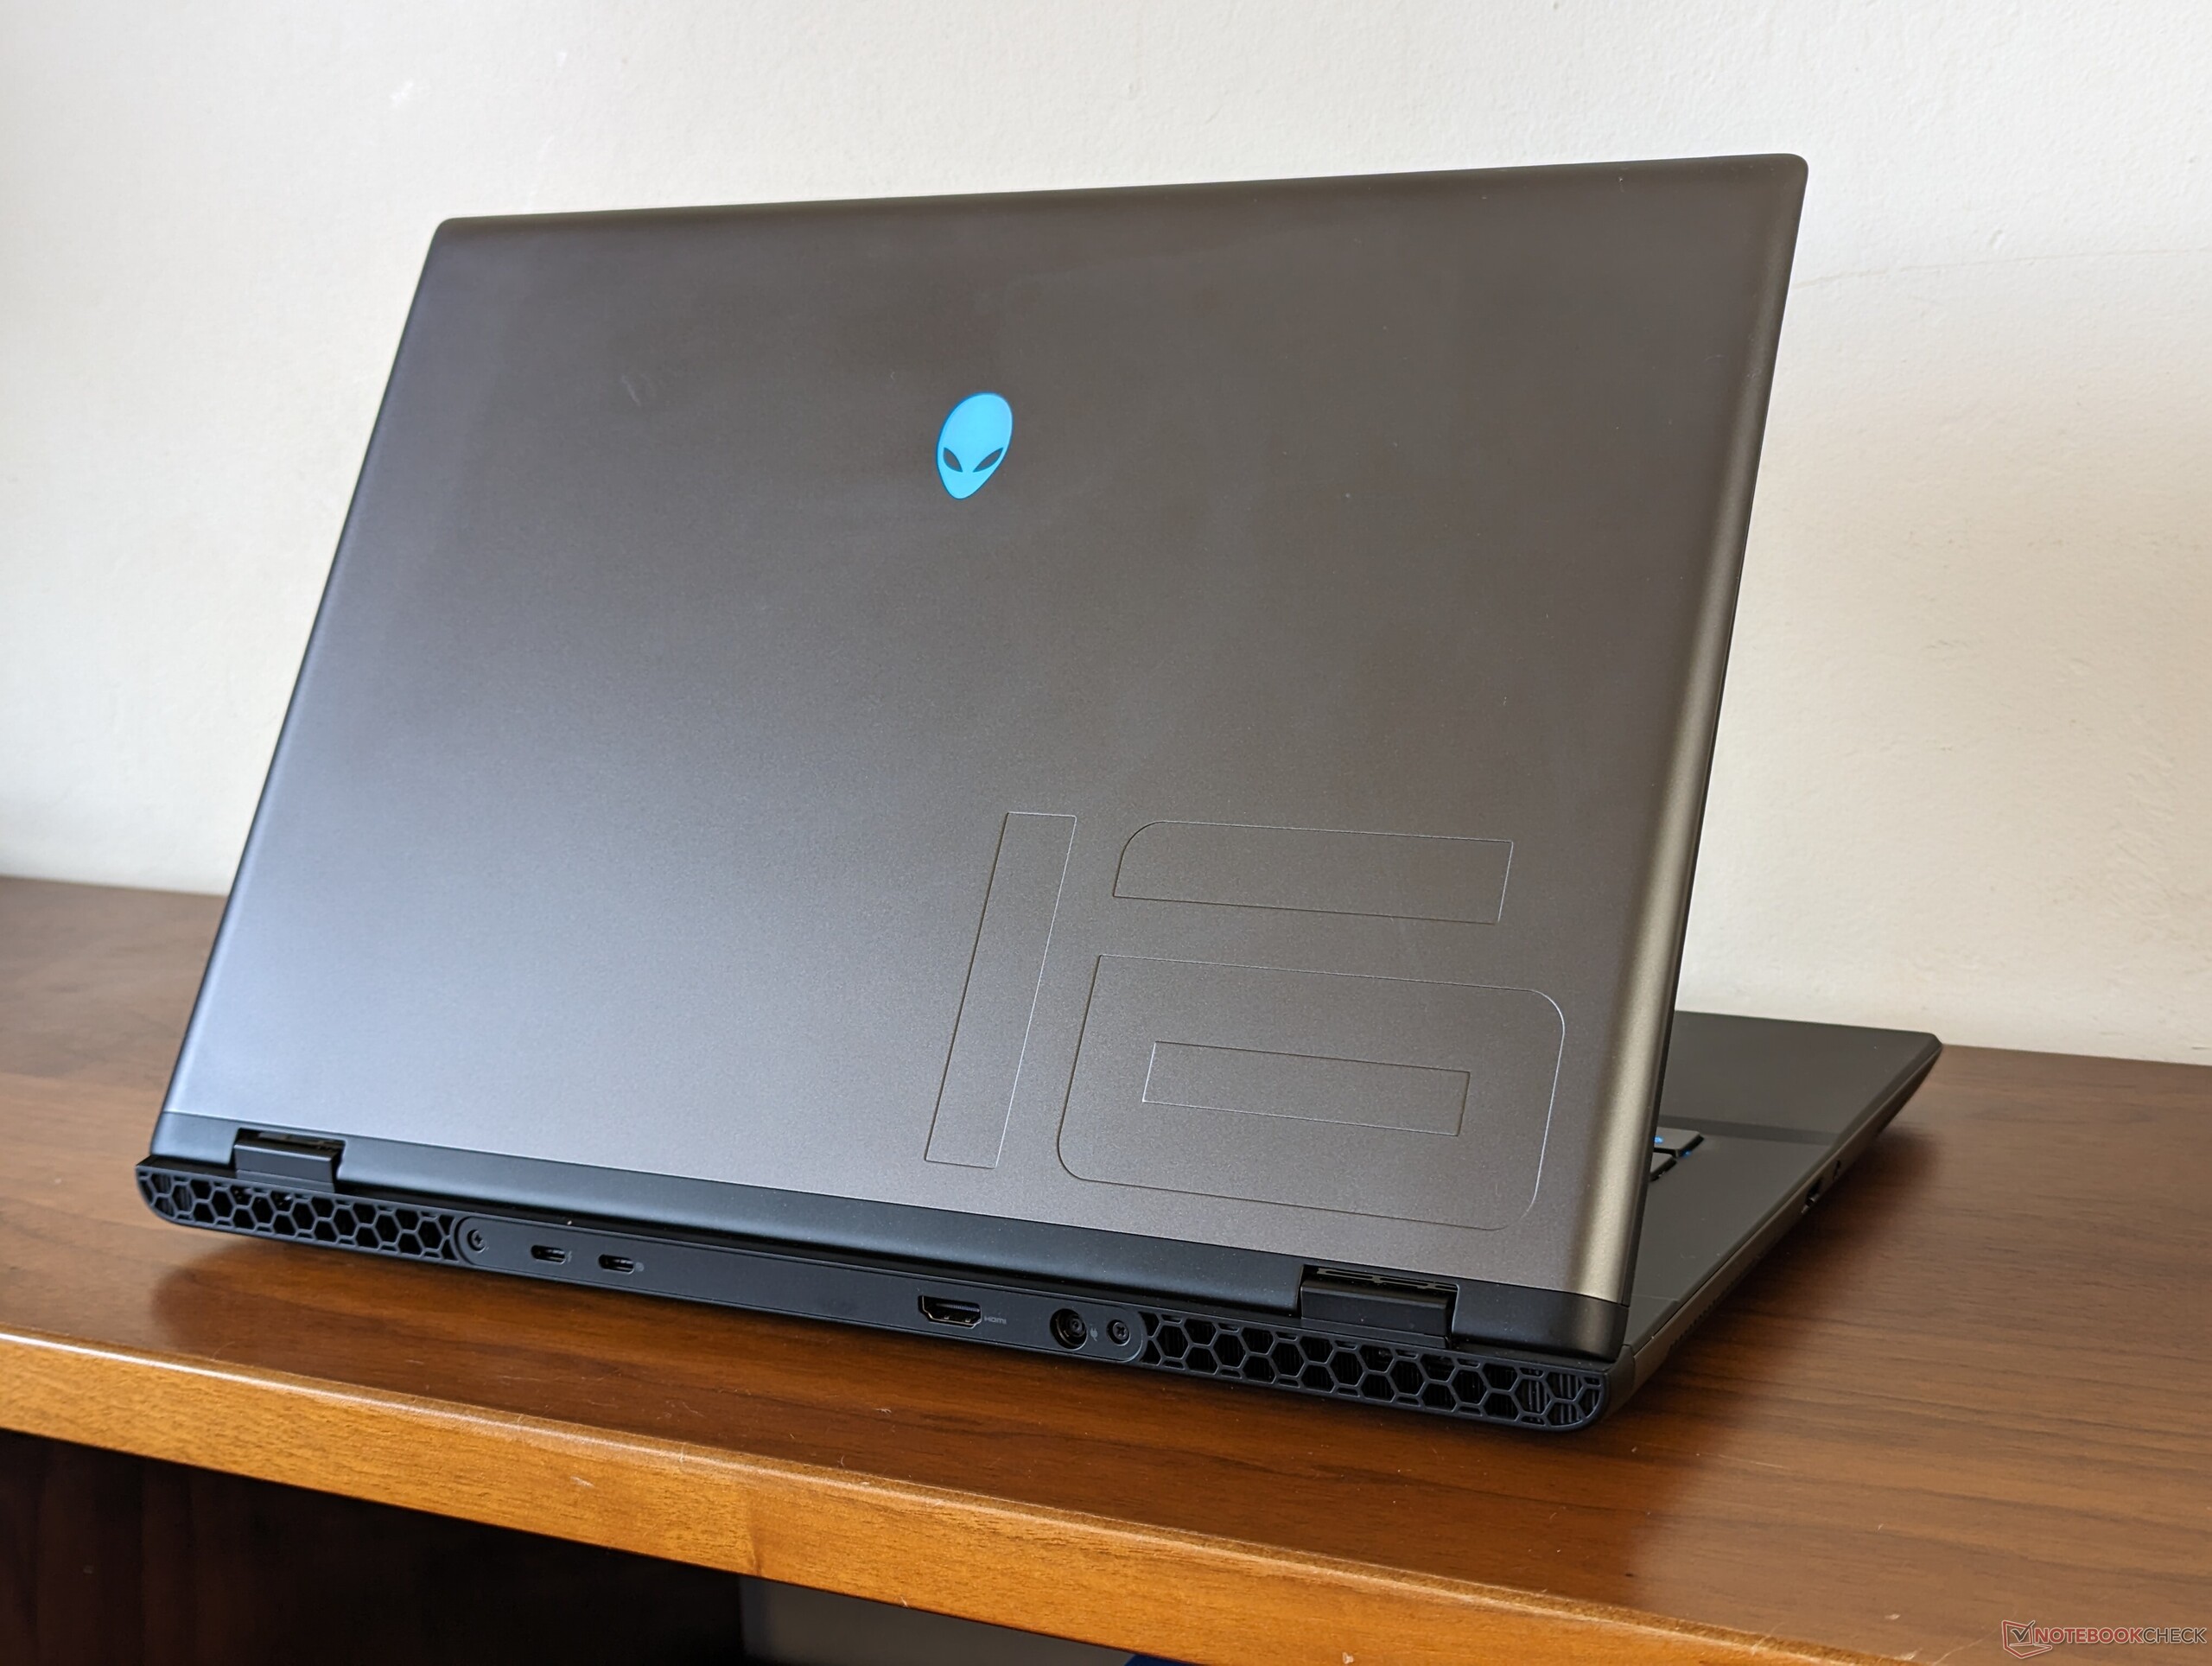
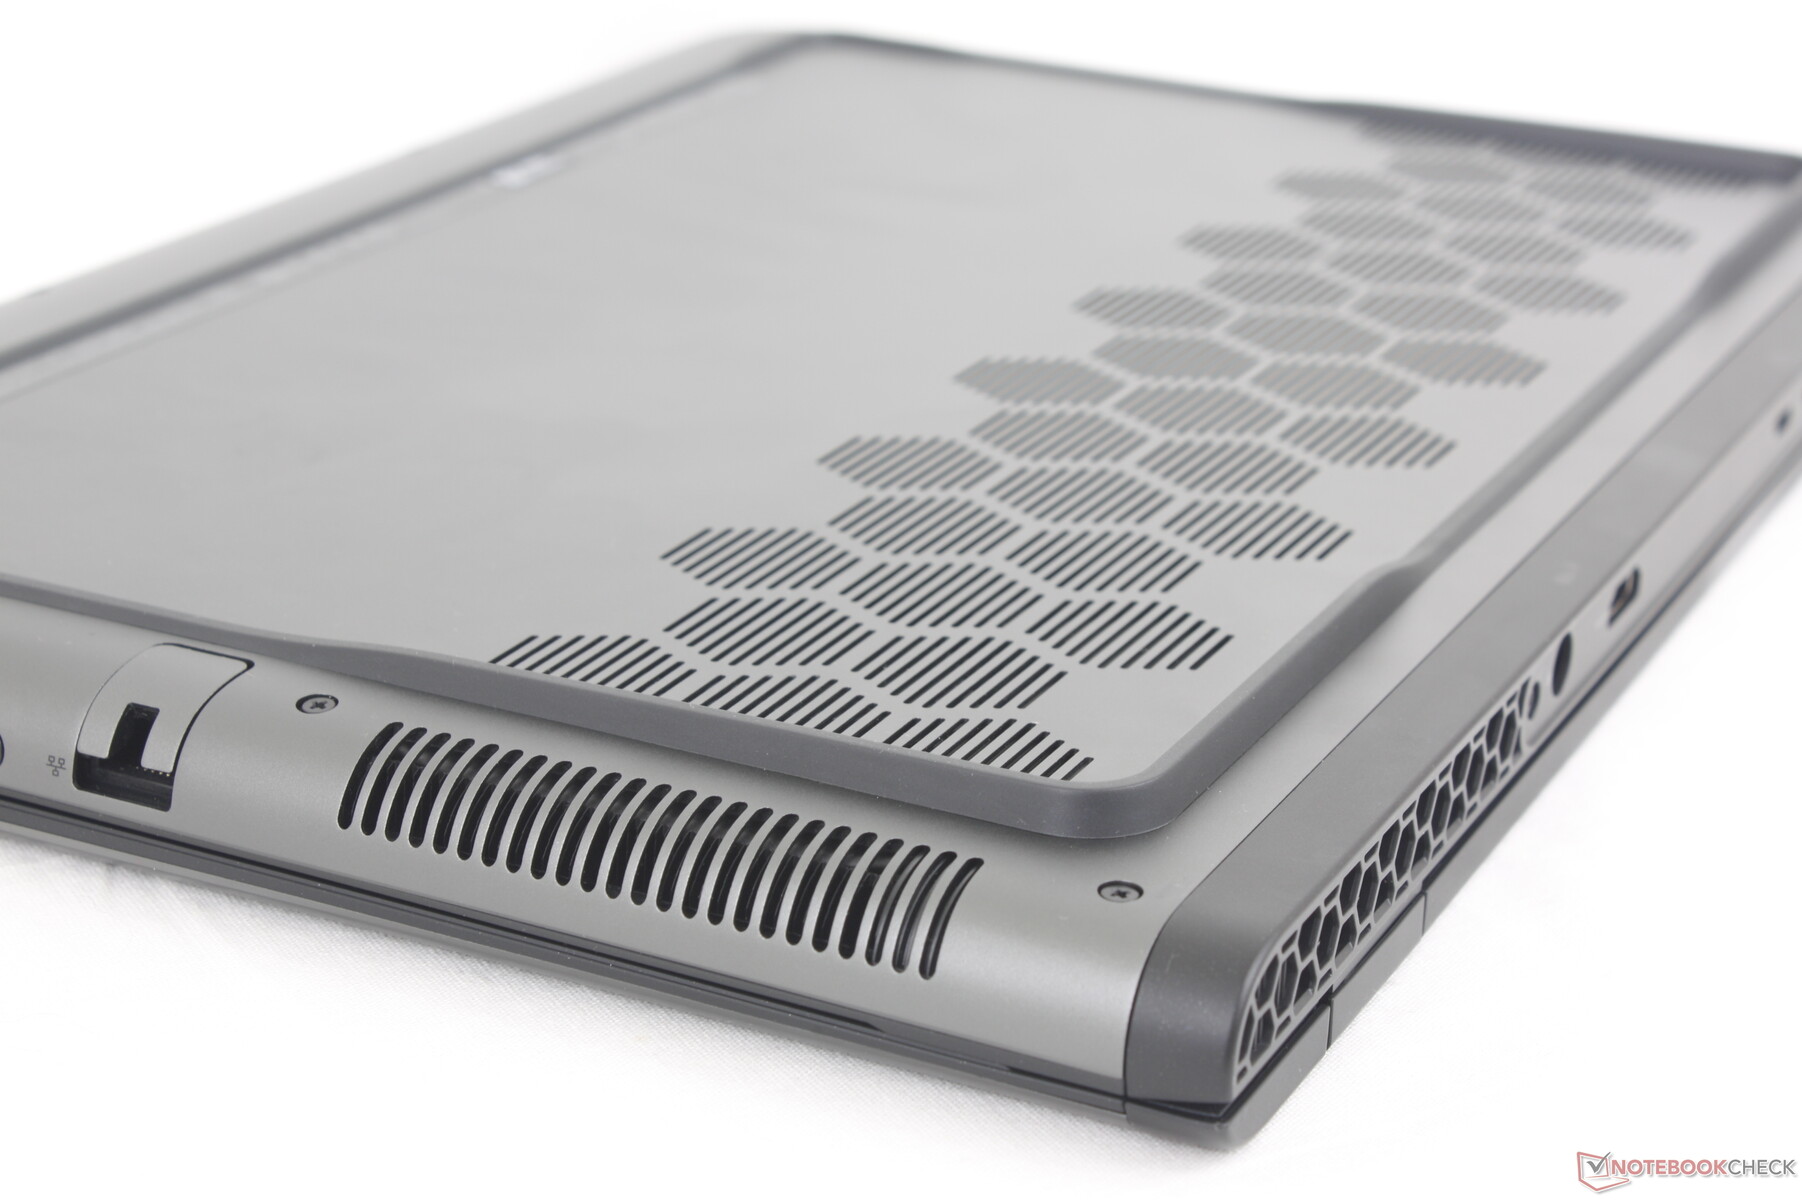
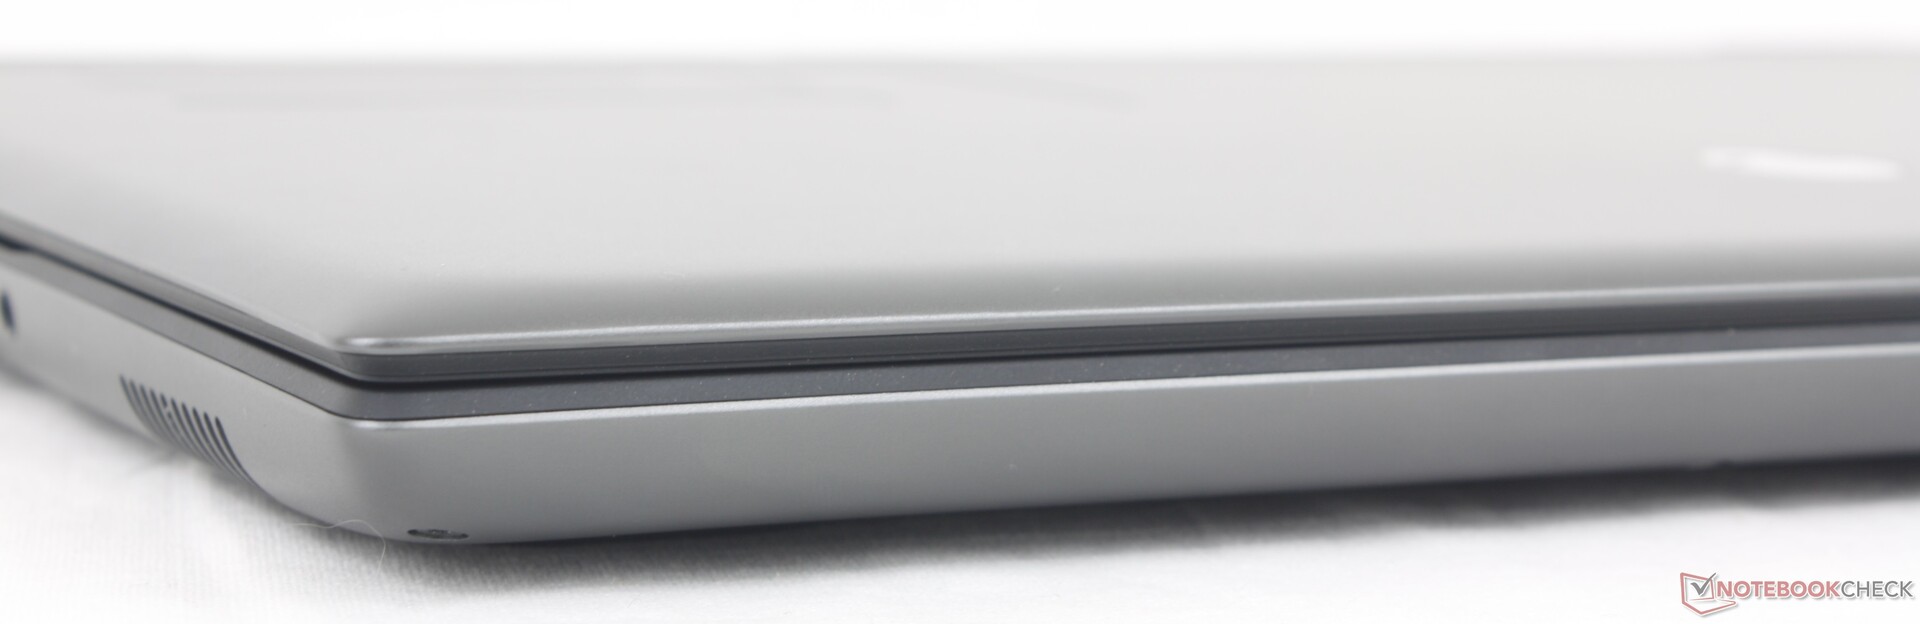
Los importantes cambios en el chasis han dado lugar a recortes significativos tanto en el peso como en las dimensiones. La m16 R2 es aproximadamente un 17% más ligera y un 22% más pequeña que la m16 R1 para mejorar su portabilidad. El menor tamaño también ayuda a que el sistema quepa en mochilas más pequeñas, ya que las dimensiones más anchas de la m16 R1 original requerirían bolsas más grandes.
La reducción de tamaño no es suficiente para que el m16 R2 sea el más pequeño de su categoría, ya que tanto el Razer Blade 16 y el Asus Zephyrus G16 siguen siendo más ligeros y pequeños.
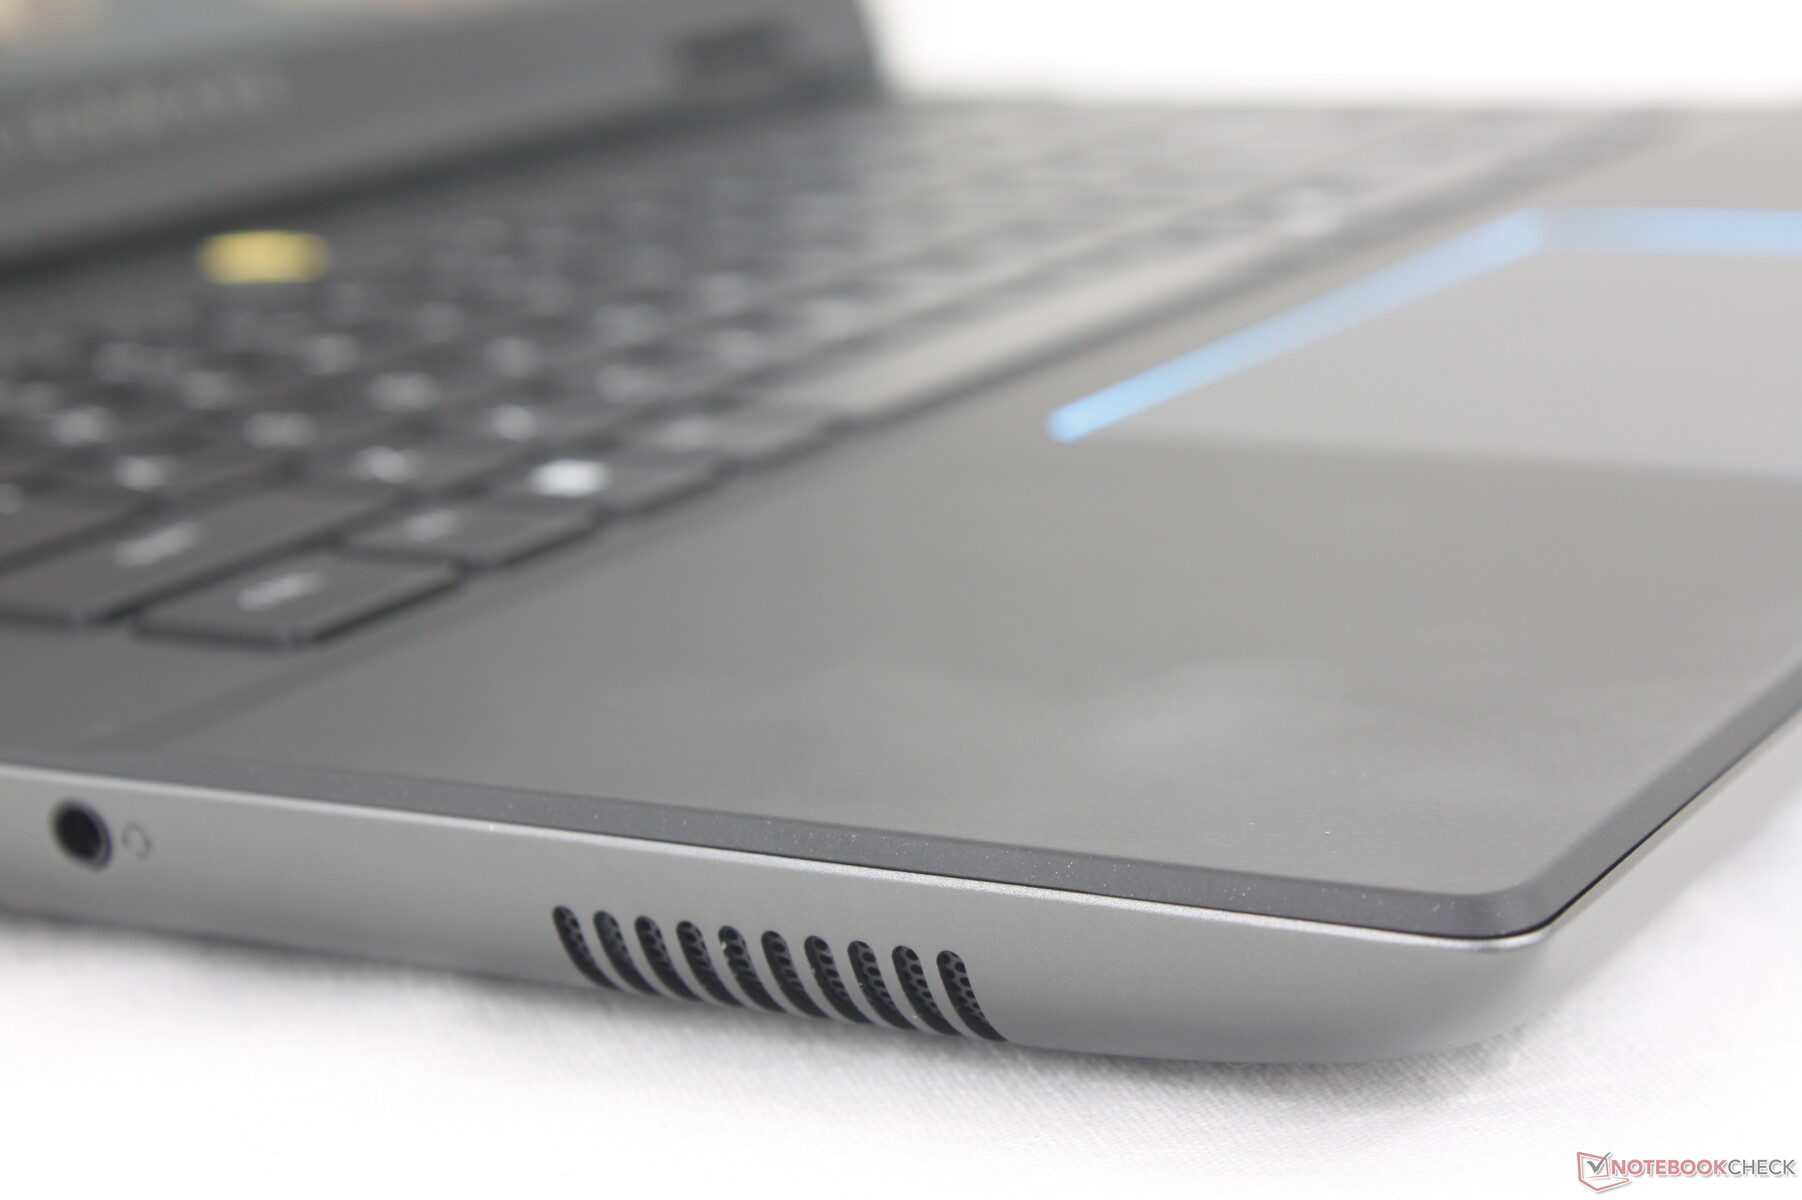
Conectividad: lo básico está aquí
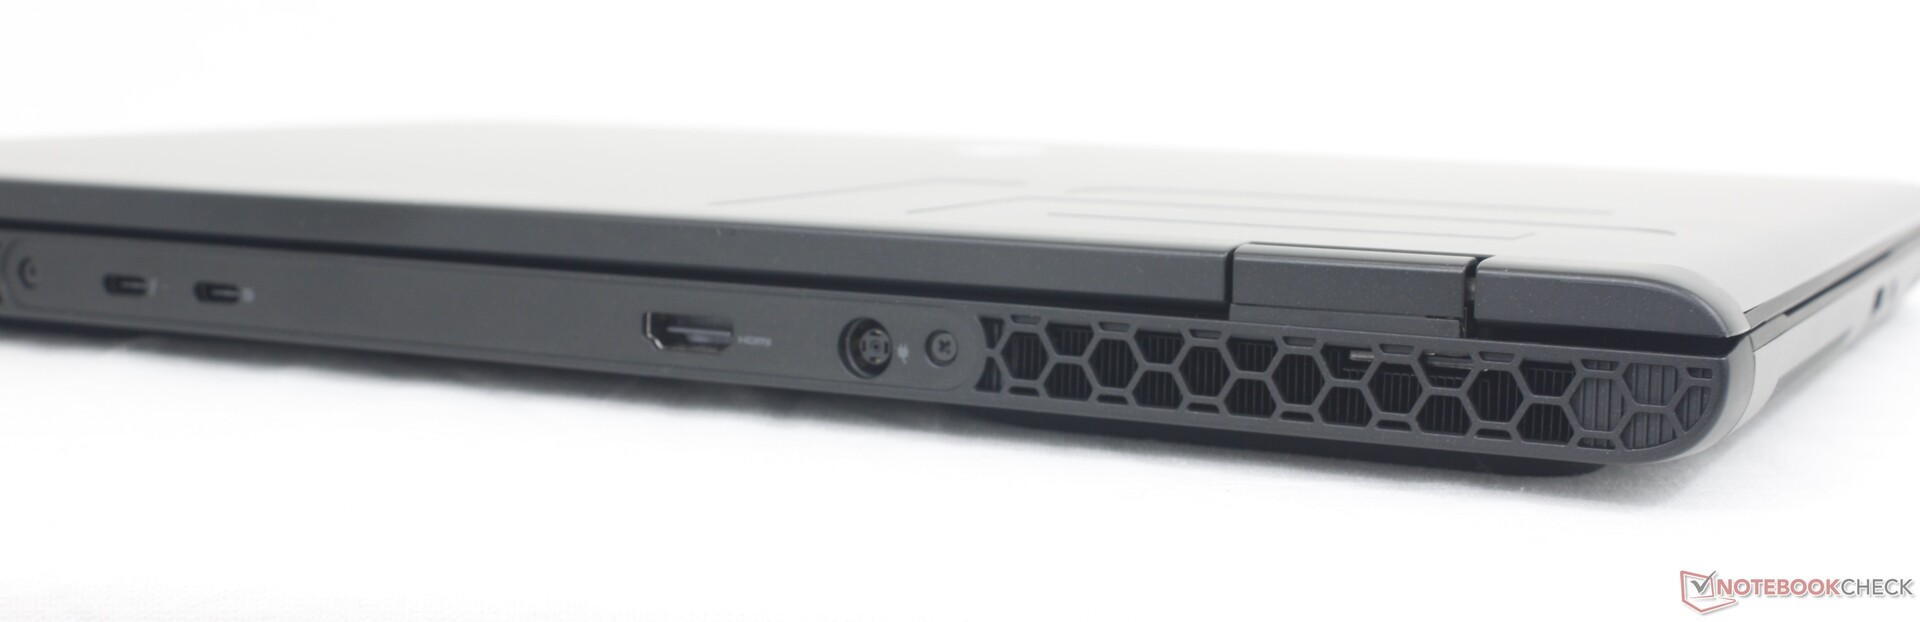
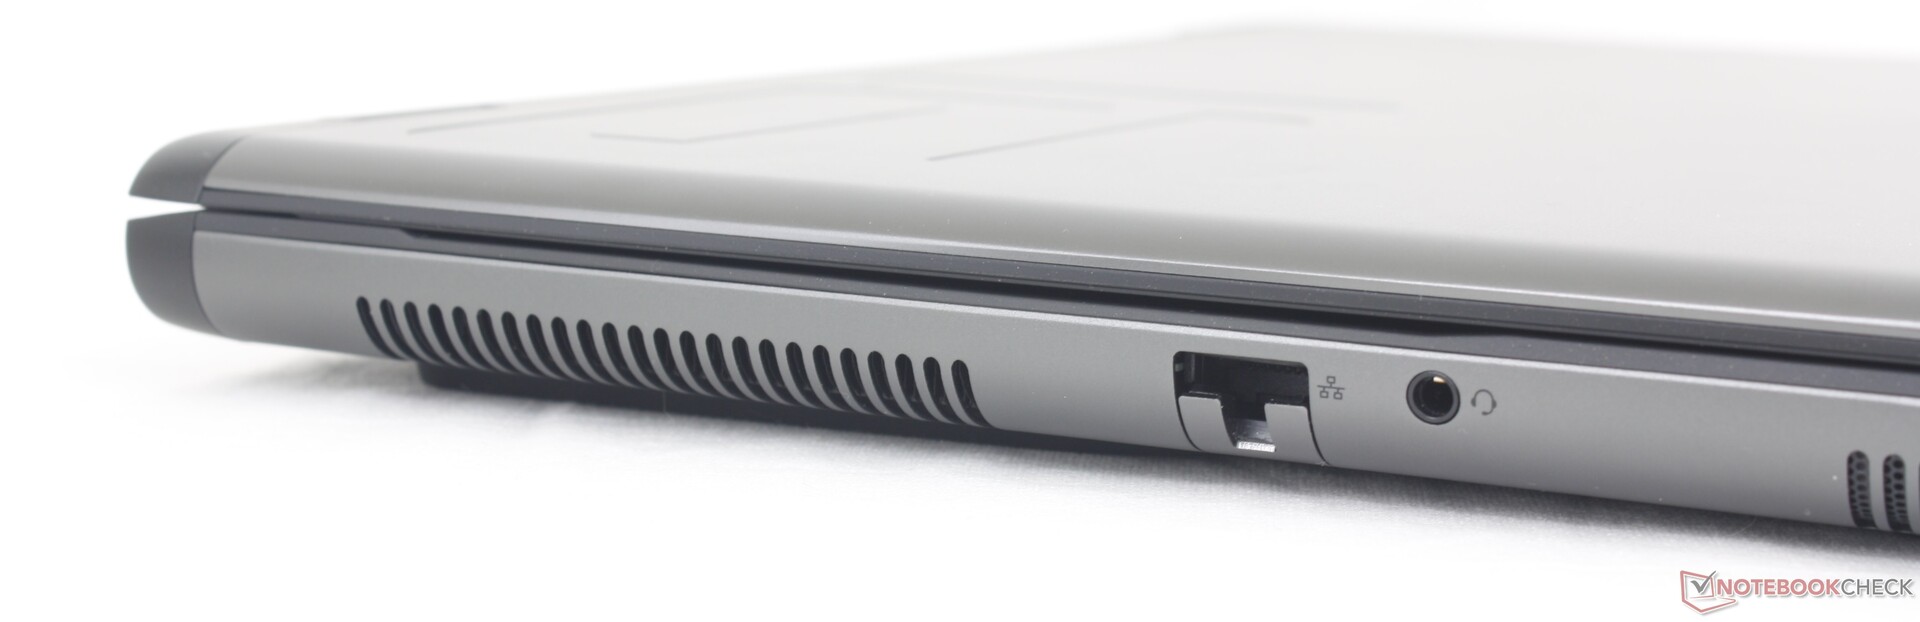
Todos los puertos del m16 R1 del año pasado han regresado a excepción del mini-DisplayPort. La posición de los puertos ha cambiado con RJ-45 y el conector de audio desplazados al borde izquierdo, mientras que la mayoría de los puertos de la m16 R1 se encontraban incómodamente a lo largo de la parte trasera.
Tenga en cuenta que sólo uno de los dos puertos USB-C es compatible con Power Delivery. Por lo demás, ambos son compatibles con monitores externos.
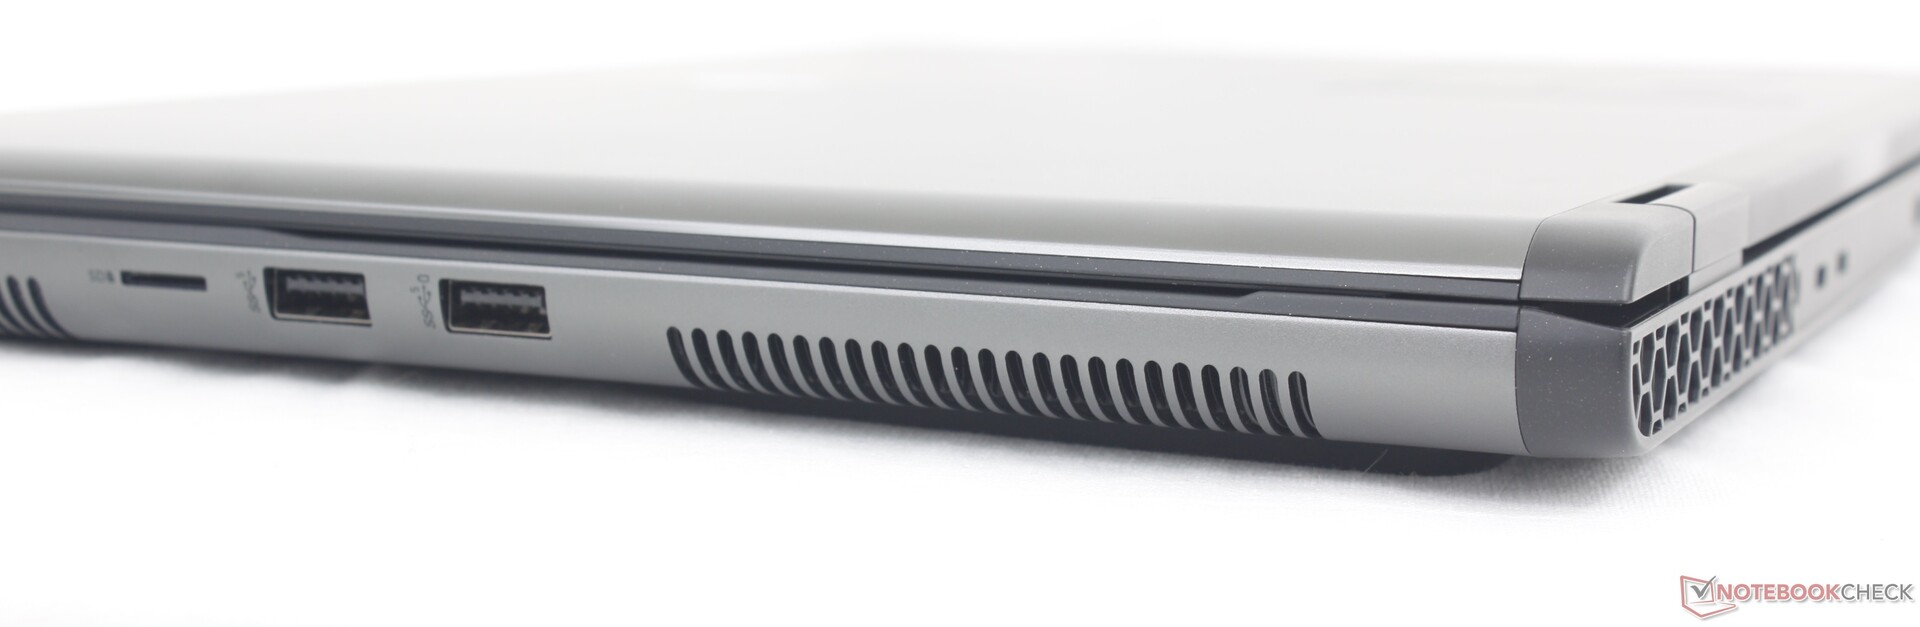
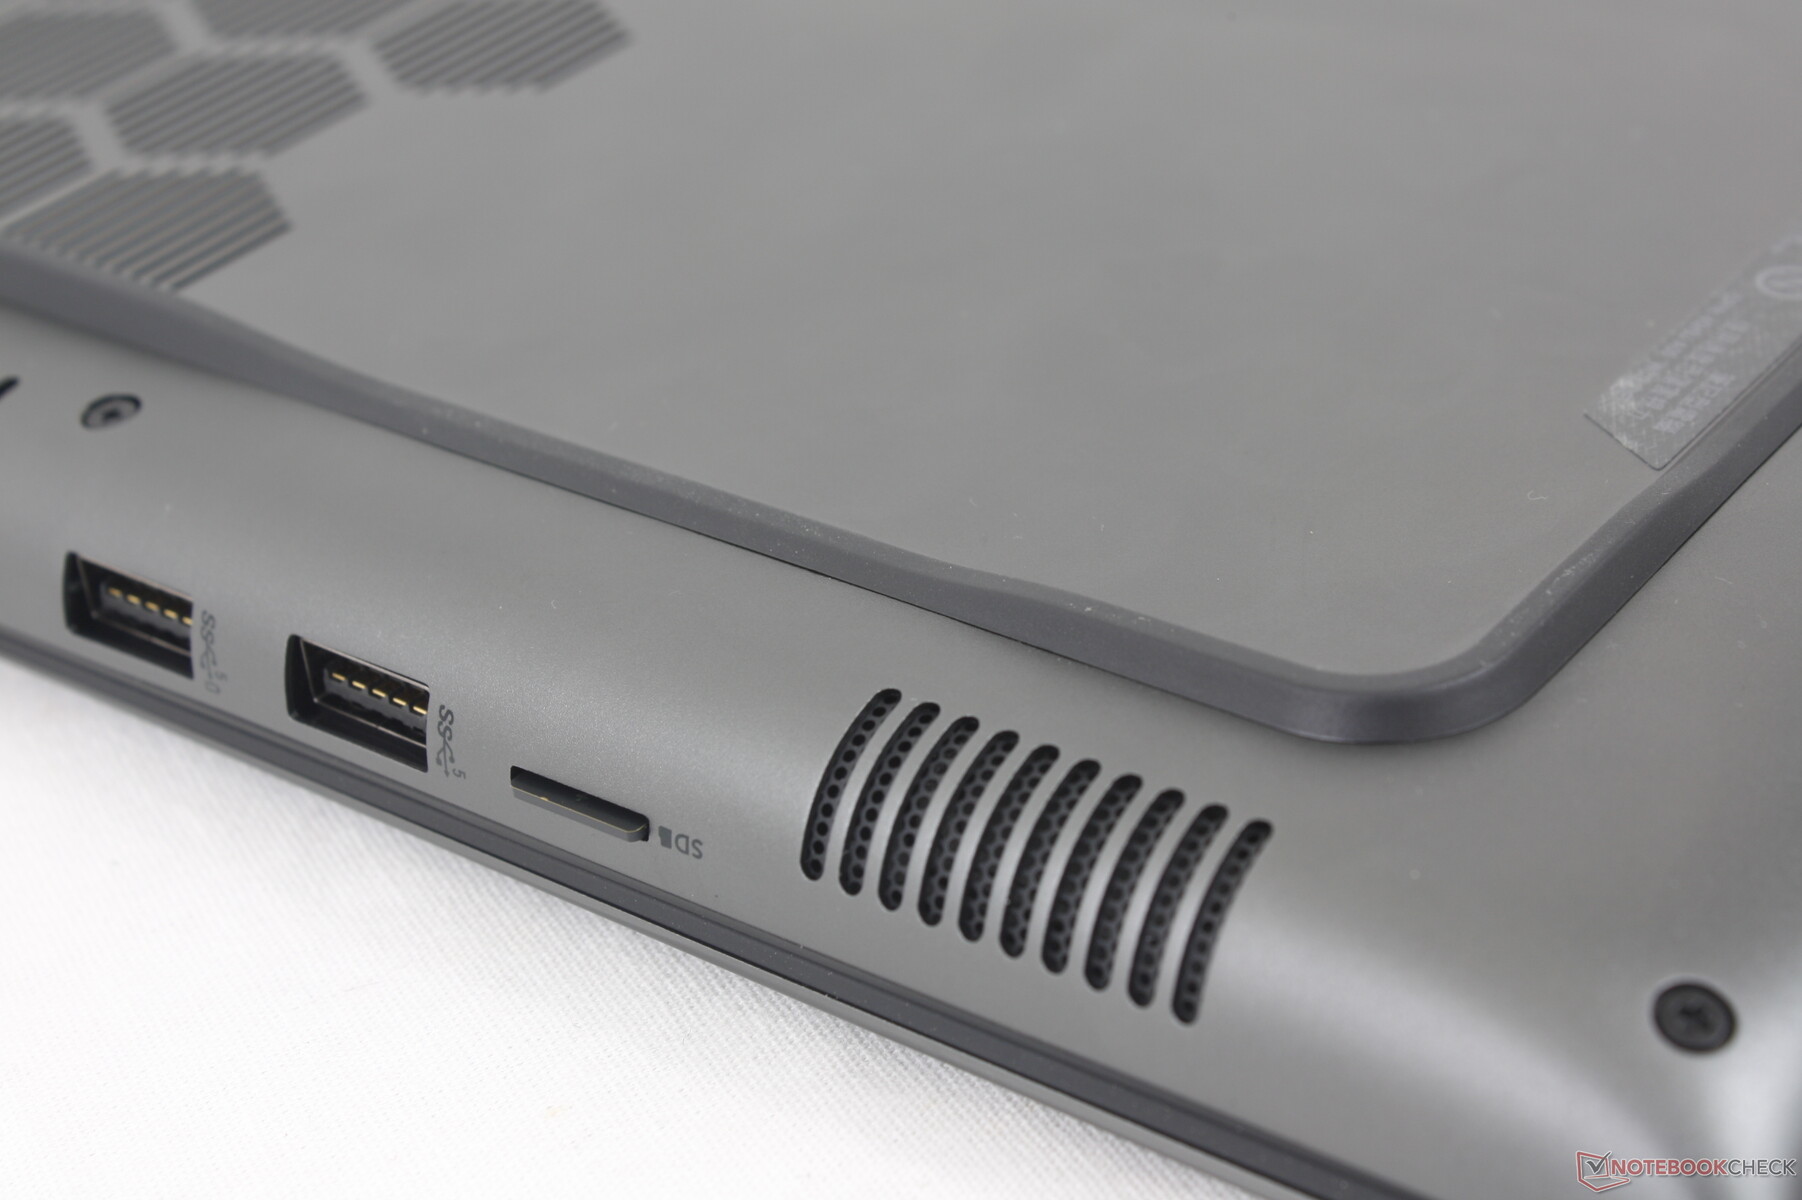
Lector de tarjetas SD
Mientras que la m16 R1 tenía un lector SD de tamaño completo, la m16 R2 se ha retirado tristemente a un lector MicroSD en su lugar, lo que puede molestar a algunos creadores de contenidos. No obstante, las velocidades de transferencia son prácticamente las mismas que las que registramos en la m16 R1 a pesar del cambio a MicroSD.
| SD Card Reader | |
| average JPG Copy Test (av. of 3 runs) | |
| Alienware m16 R1 Intel (AV PRO microSD 128 GB V60) | |
| Lenovo Legion Slim 7 16APH8 (AV PRO microSD 128 GB V60) | |
| Asus ROG Zephyrus G16 2024 GU605M | |
| Alienware m16 R2 (AV PRO microSD 128 GB V60) | |
| Alienware x16 R1 (AV PRO microSD 128 GB V60) | |
| maximum AS SSD Seq Read Test (1GB) | |
| Alienware x16 R1 (AV PRO microSD 128 GB V60) | |
| Alienware m16 R2 (AV PRO microSD 128 GB V60) | |
| Alienware m16 R1 Intel (AV PRO microSD 128 GB V60) | |
| Asus ROG Zephyrus G16 2024 GU605M | |
| Lenovo Legion Slim 7 16APH8 (AV PRO microSD 128 GB V60) | |
Comunicación
El Intel Killer AX1675 viene de serie para conectividad Wi-Fi 6E con opción de actualización al BE202 para compatibilidad Wi-Fi 7. No experimentamos ningún problema al emparejarlo con nuestro router de prueba Asus AXE11000.
| Networking | |
| iperf3 transmit AXE11000 | |
| Asus ROG Zephyrus G16 2024 GU605M | |
| HP Omen Transcend 16-u1095ng | |
| Alienware m16 R1 Intel | |
| Alienware m16 R2 | |
| Alienware x16 R1 | |
| Lenovo Legion Slim 7 16APH8 | |
| iperf3 receive AXE11000 | |
| Lenovo Legion Slim 7 16APH8 | |
| HP Omen Transcend 16-u1095ng | |
| Alienware m16 R1 Intel | |
| Asus ROG Zephyrus G16 2024 GU605M | |
| Alienware x16 R1 | |
| Alienware m16 R2 | |
| iperf3 transmit AXE11000 6GHz | |
| Alienware m16 R2 | |
| Alienware x16 R1 | |
| iperf3 receive AXE11000 6GHz | |
| Alienware m16 R2 | |
| Alienware x16 R1 | |
Cámara web
Una webcam de 2 MP viene de serie con IR para compatibilidad con Windows Hello. No hay obturador de privacidad integrado.


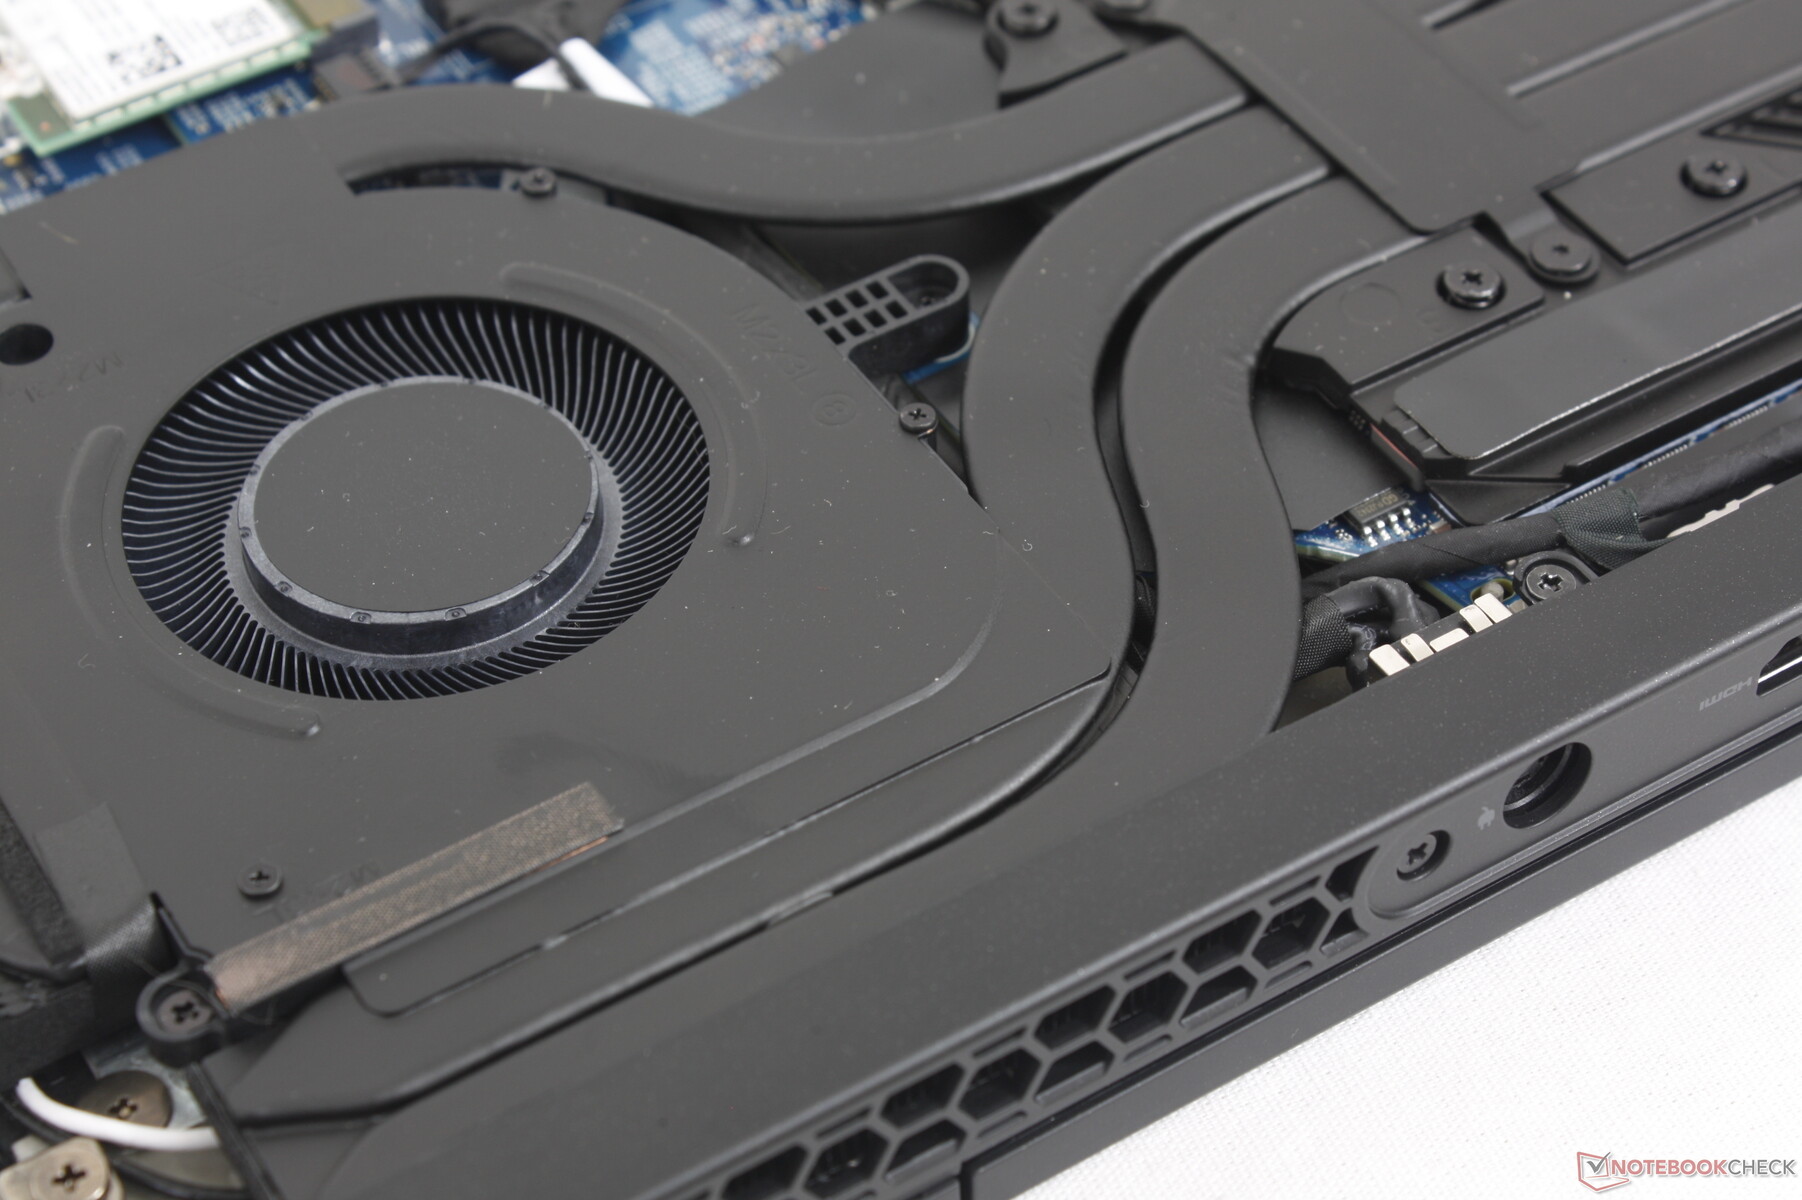
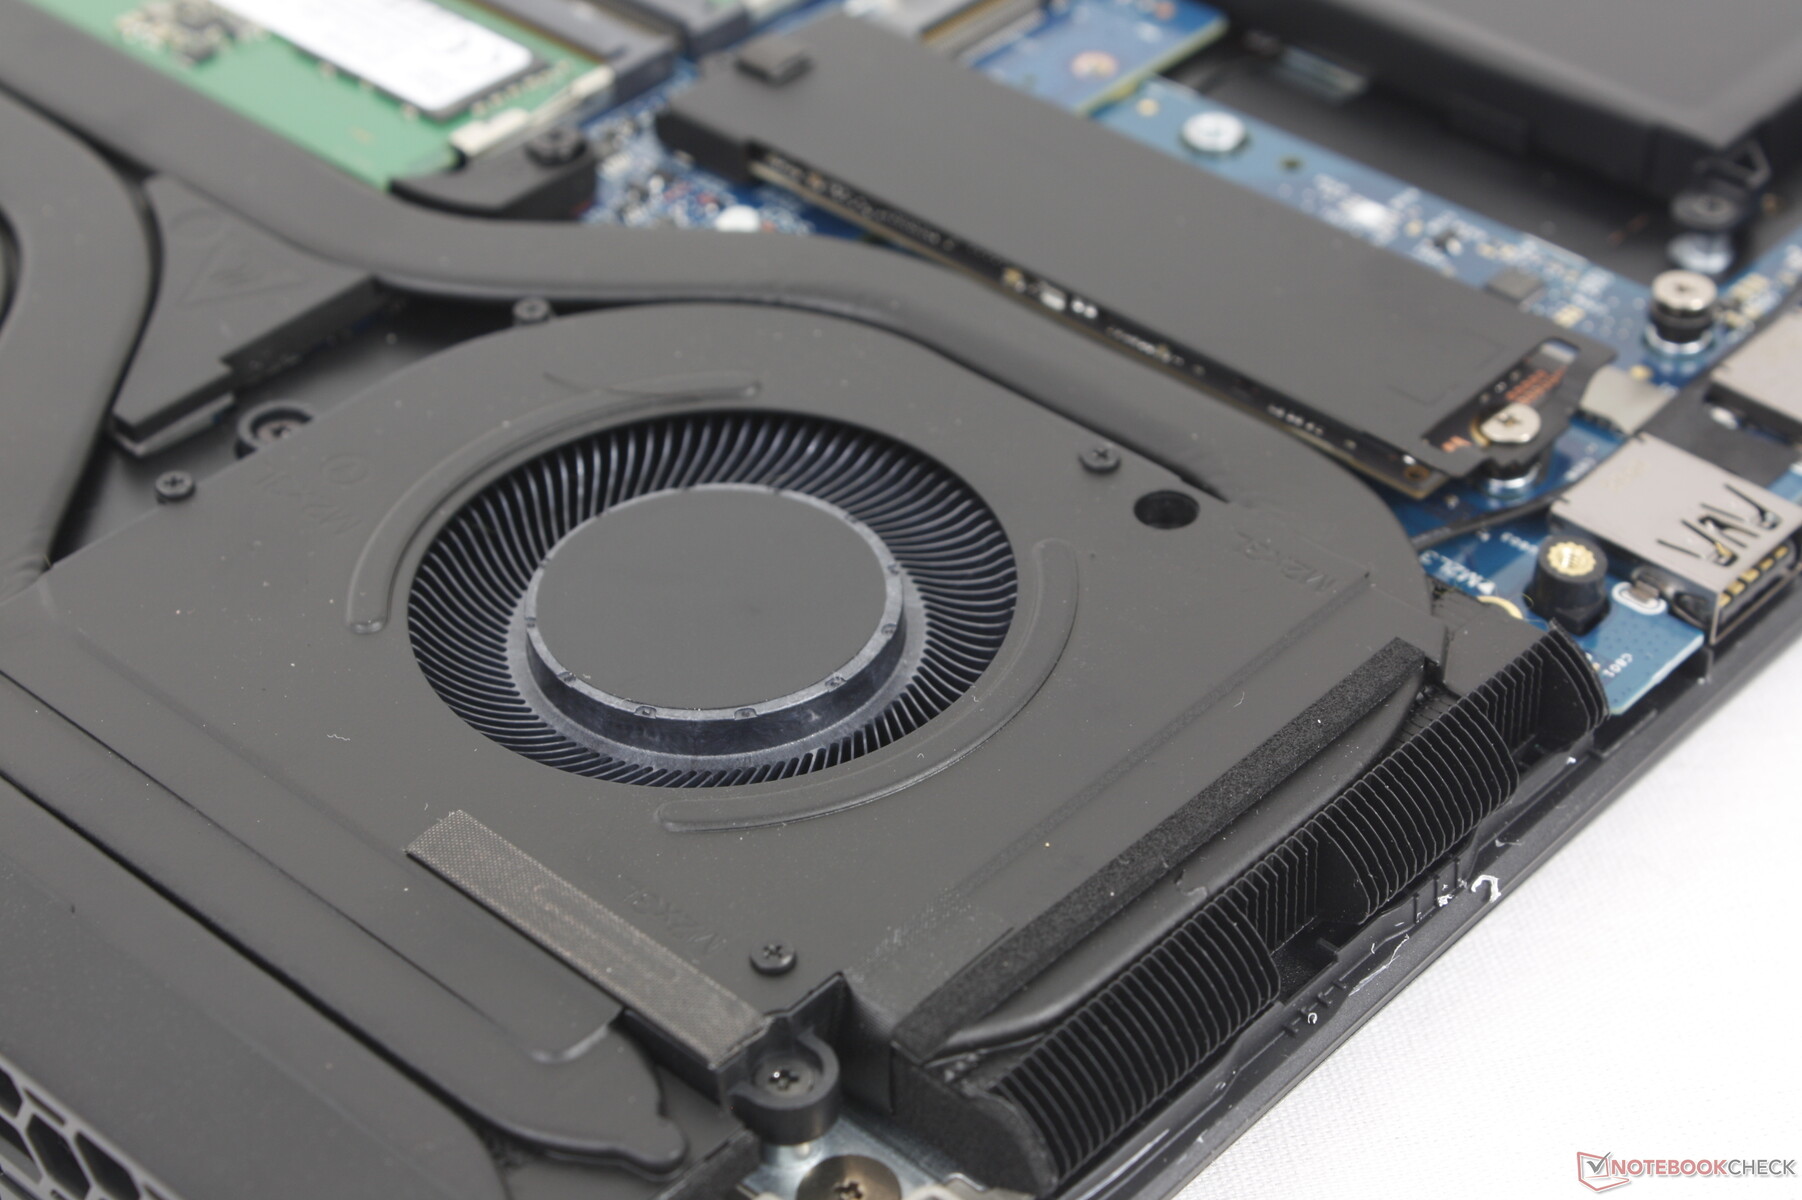
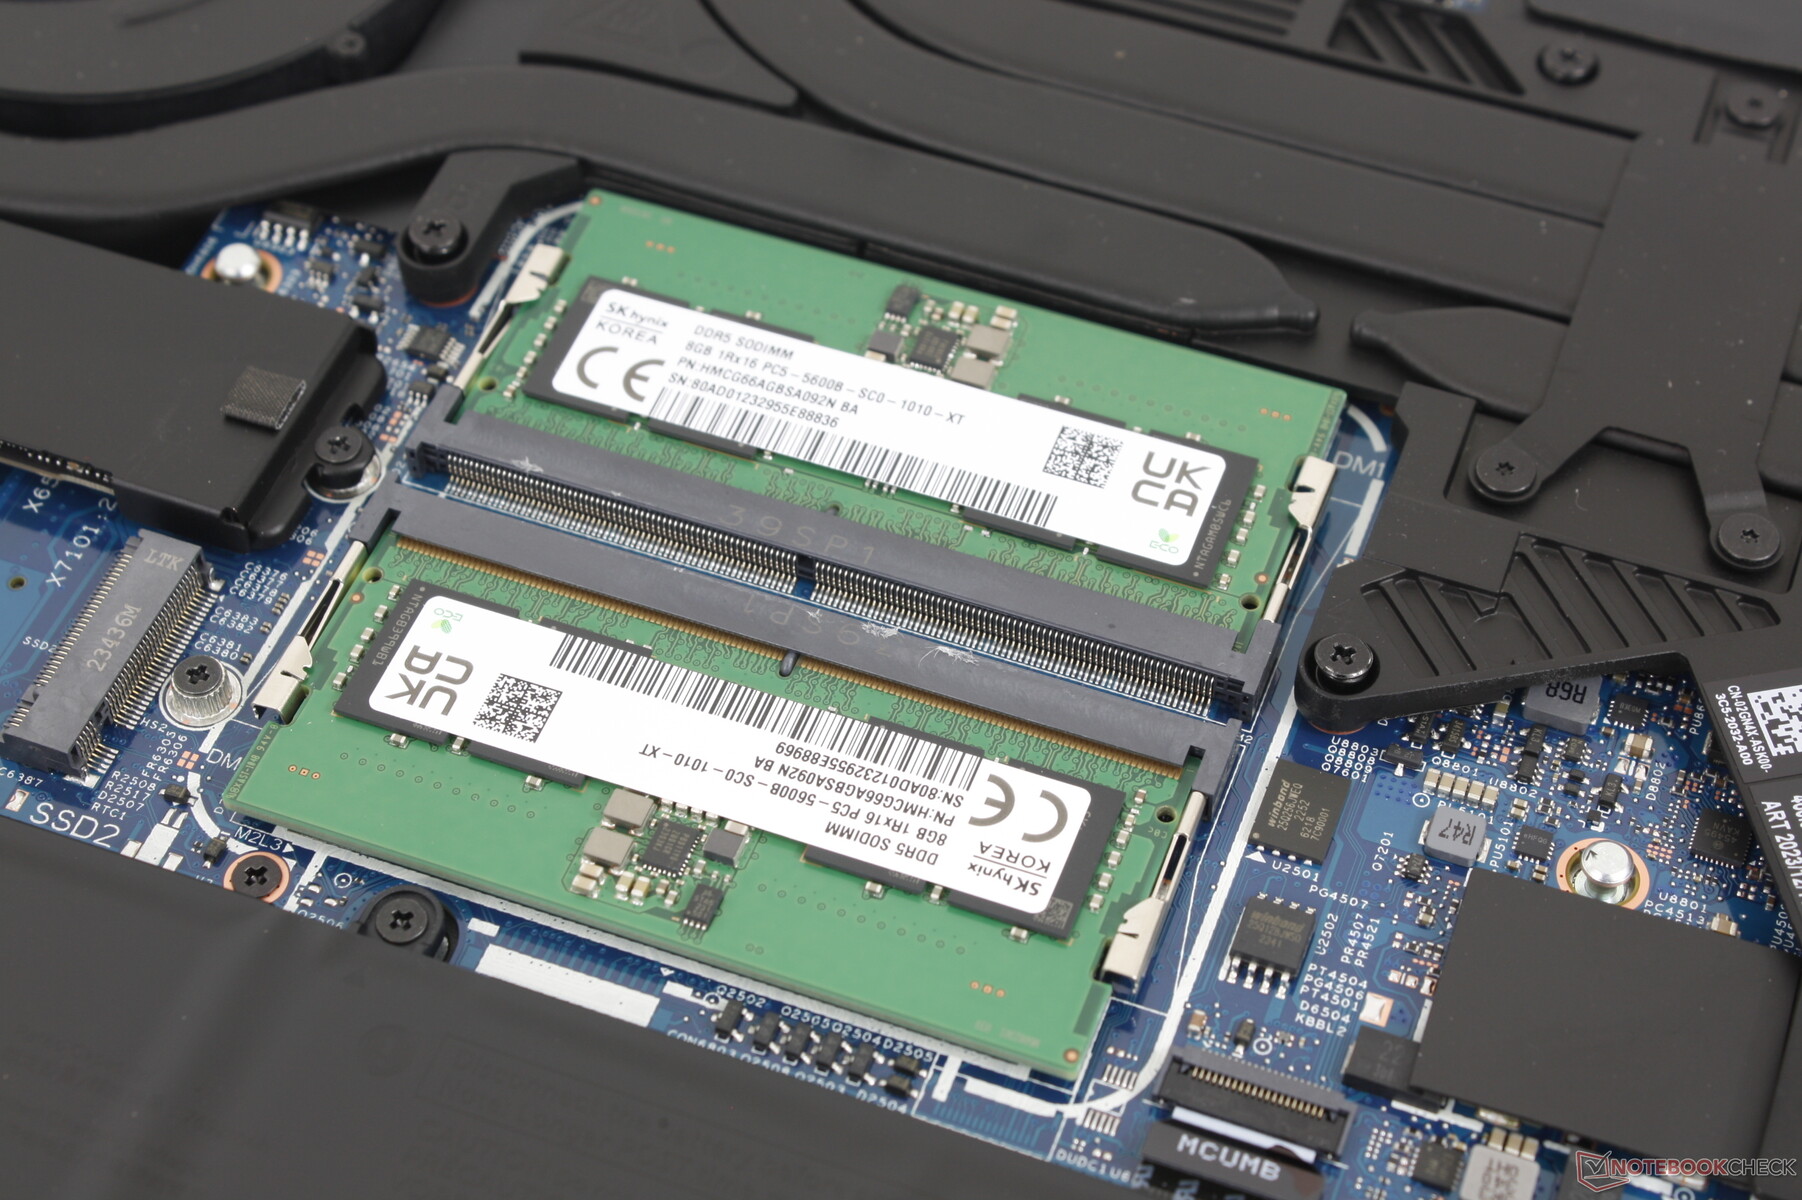
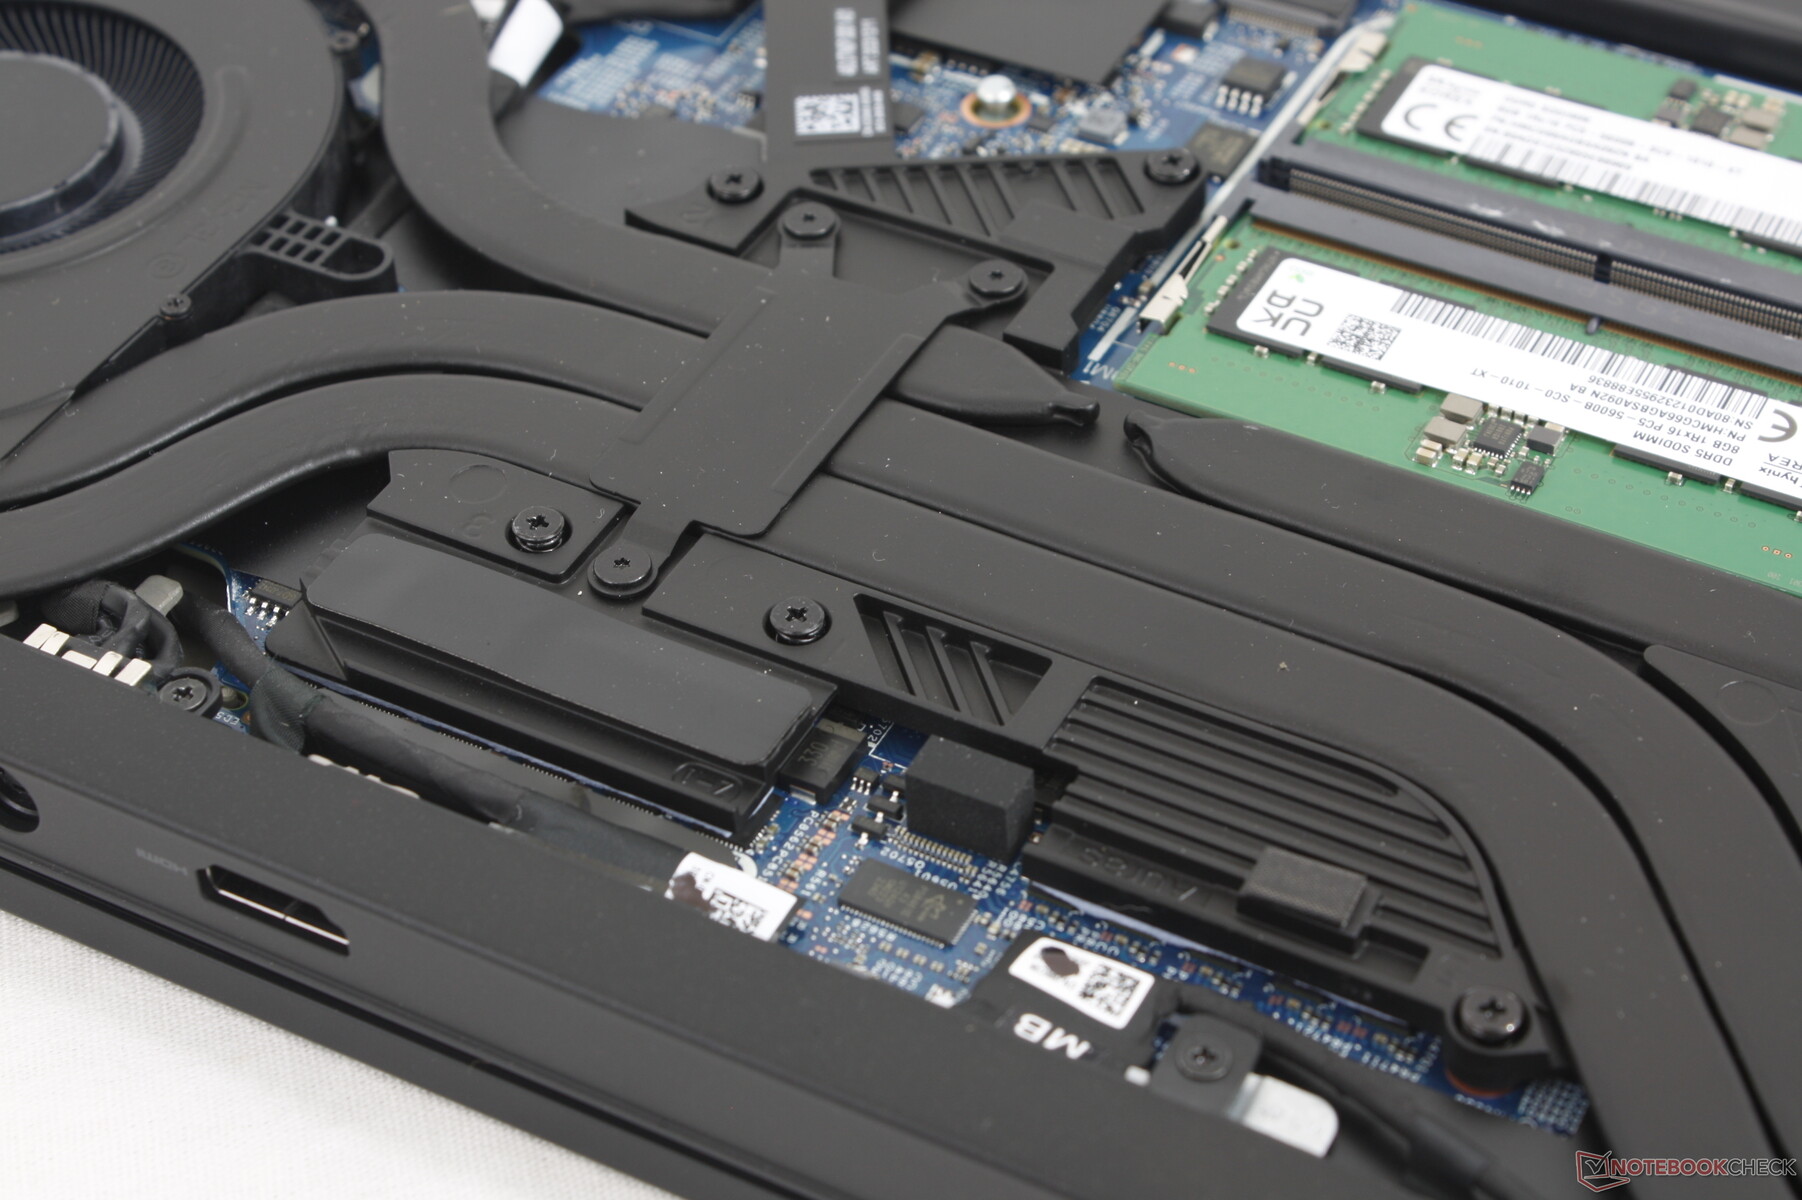
Mantenimiento
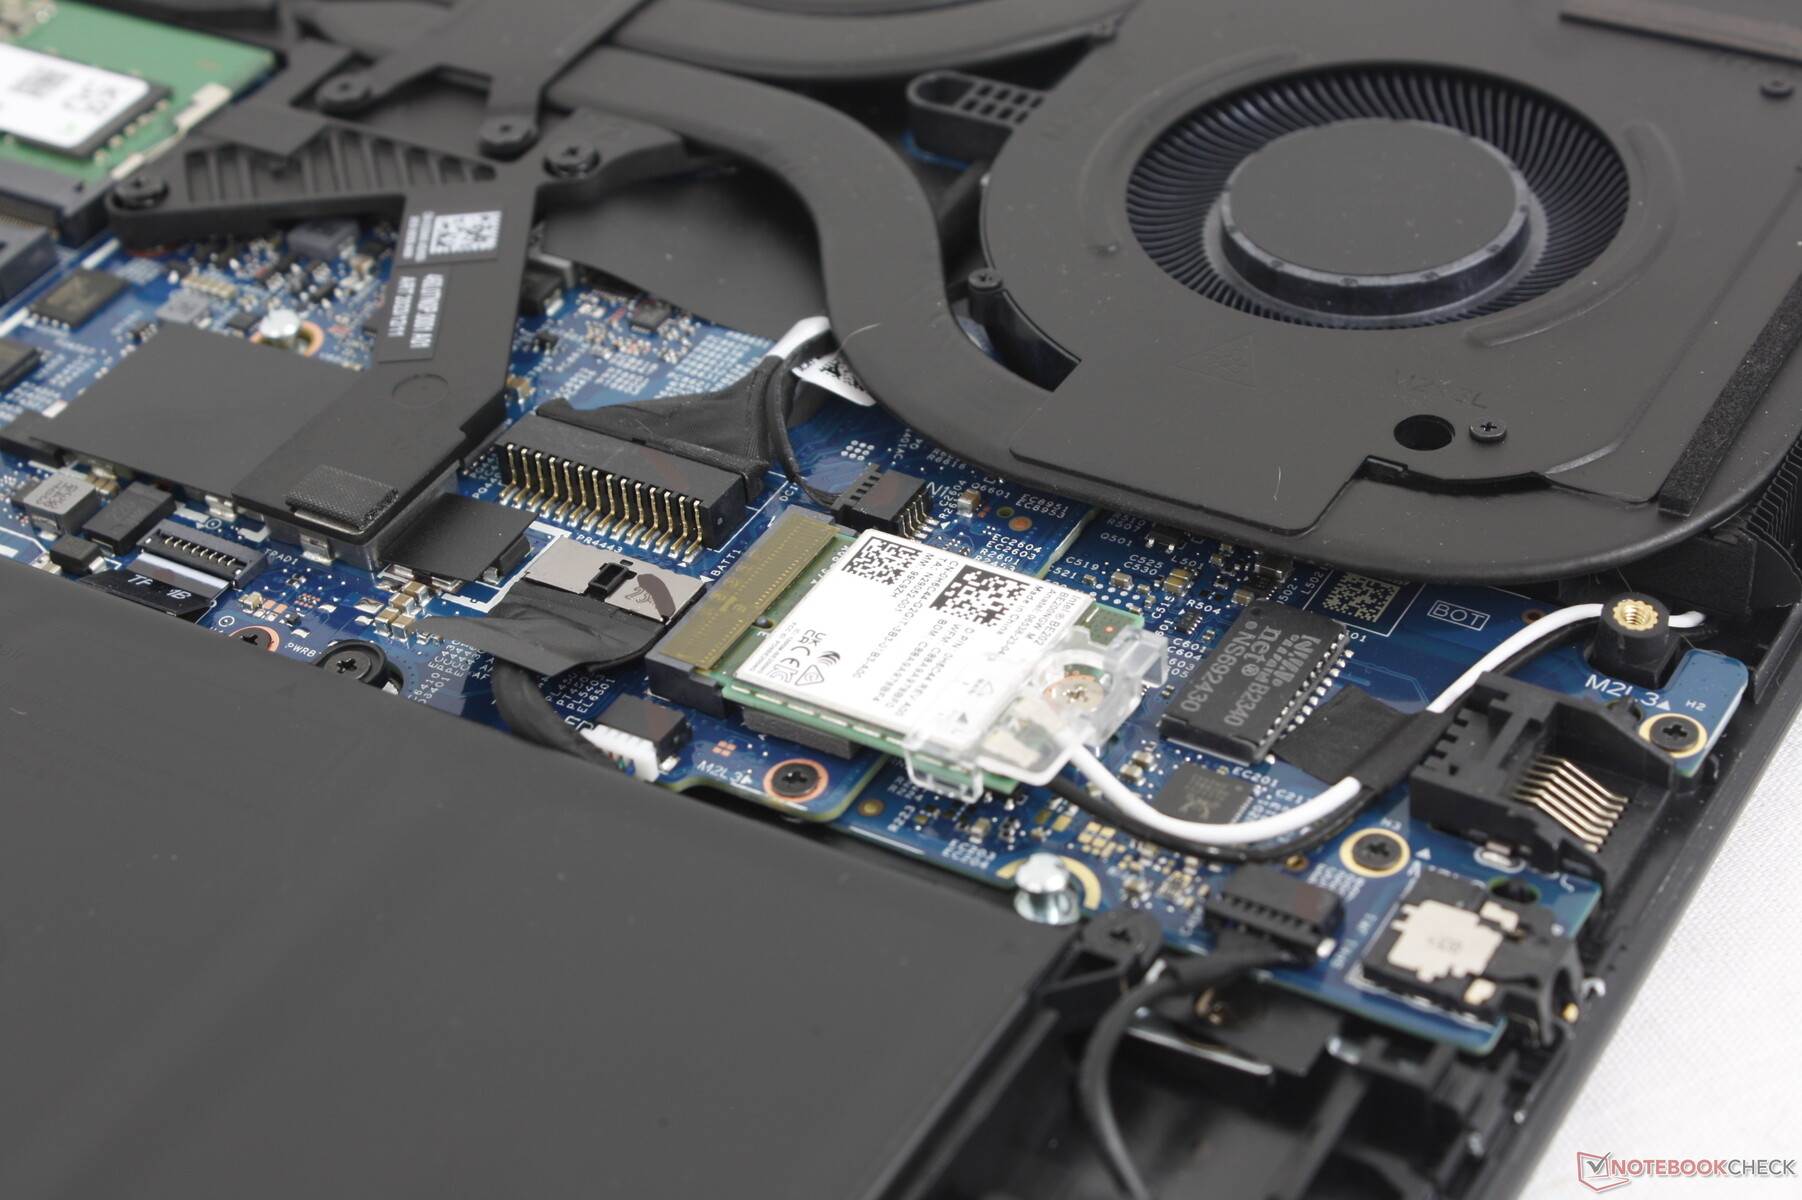
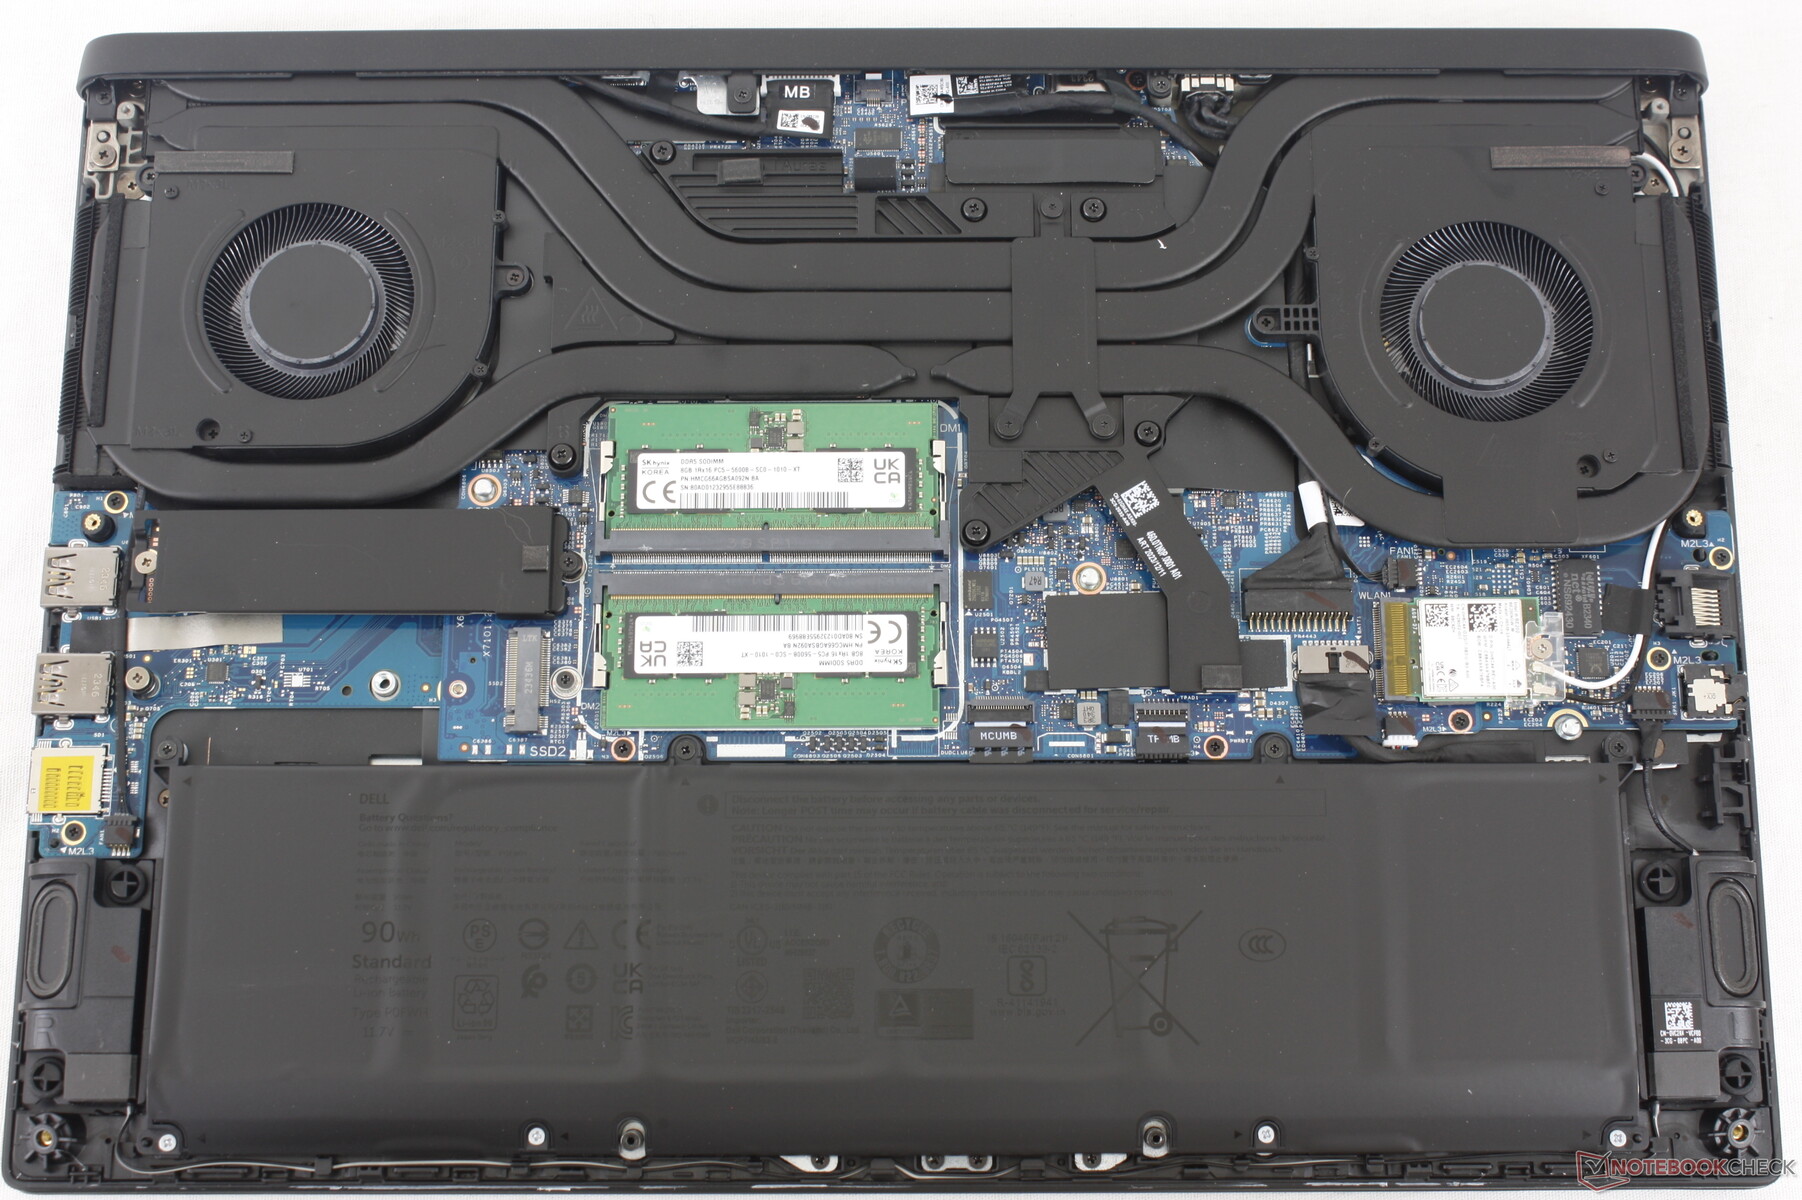
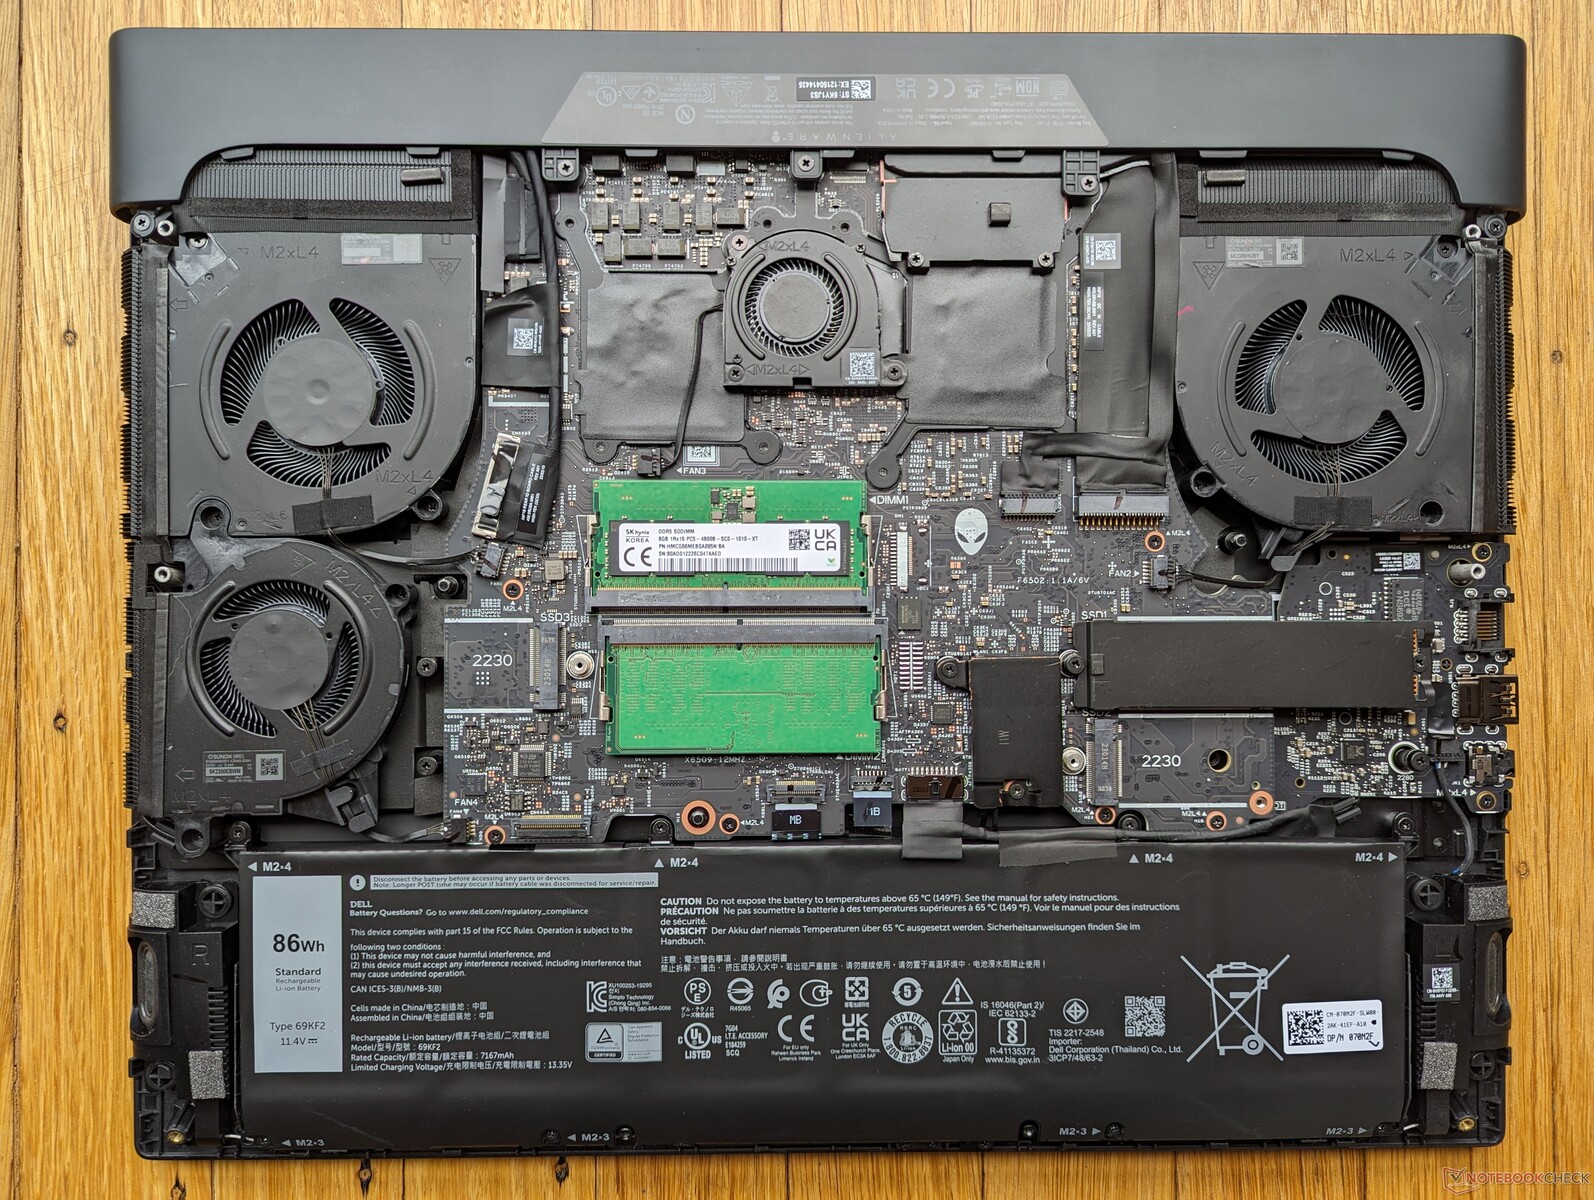
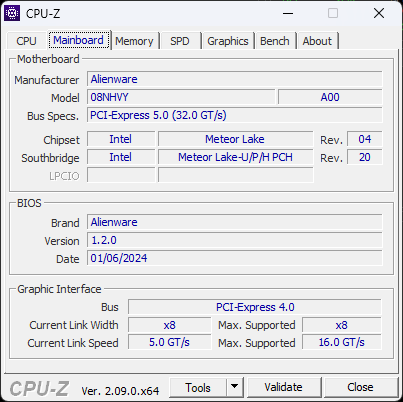
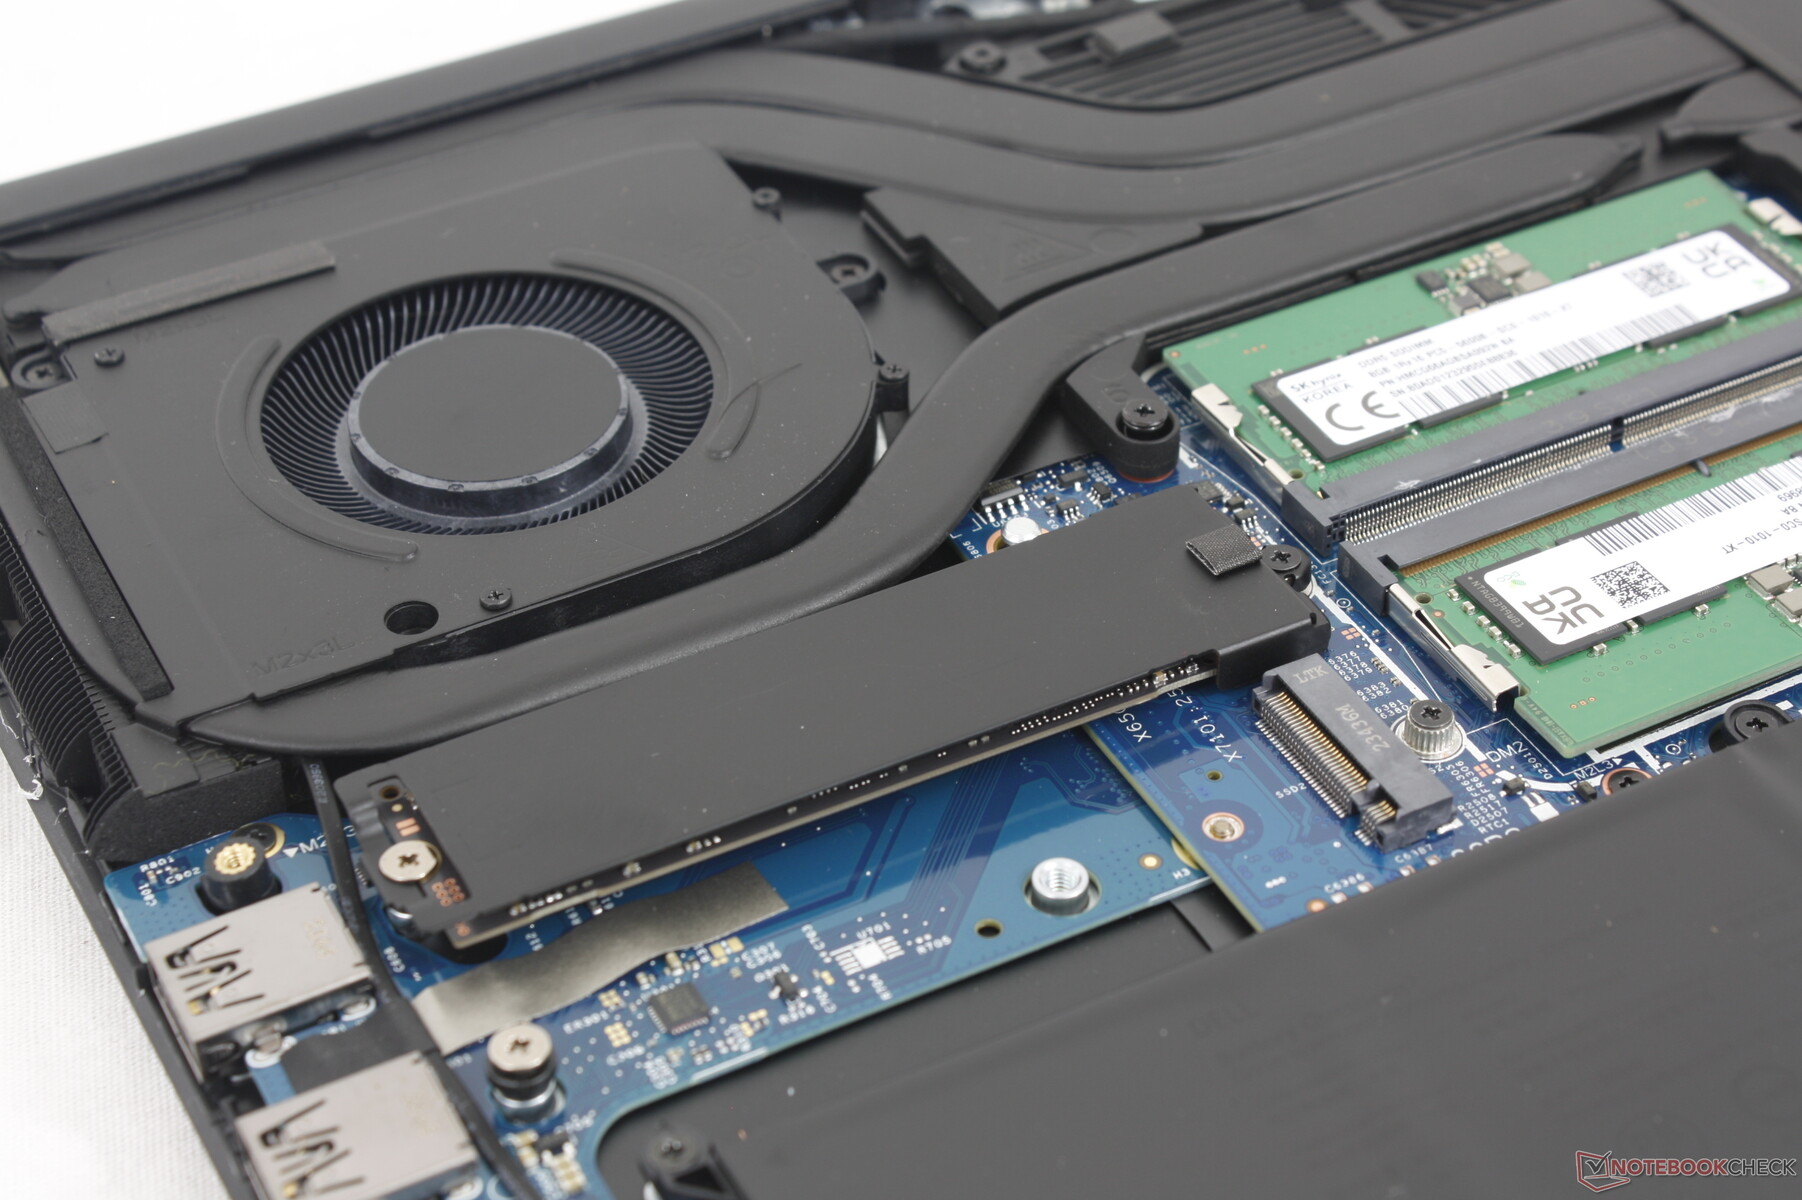
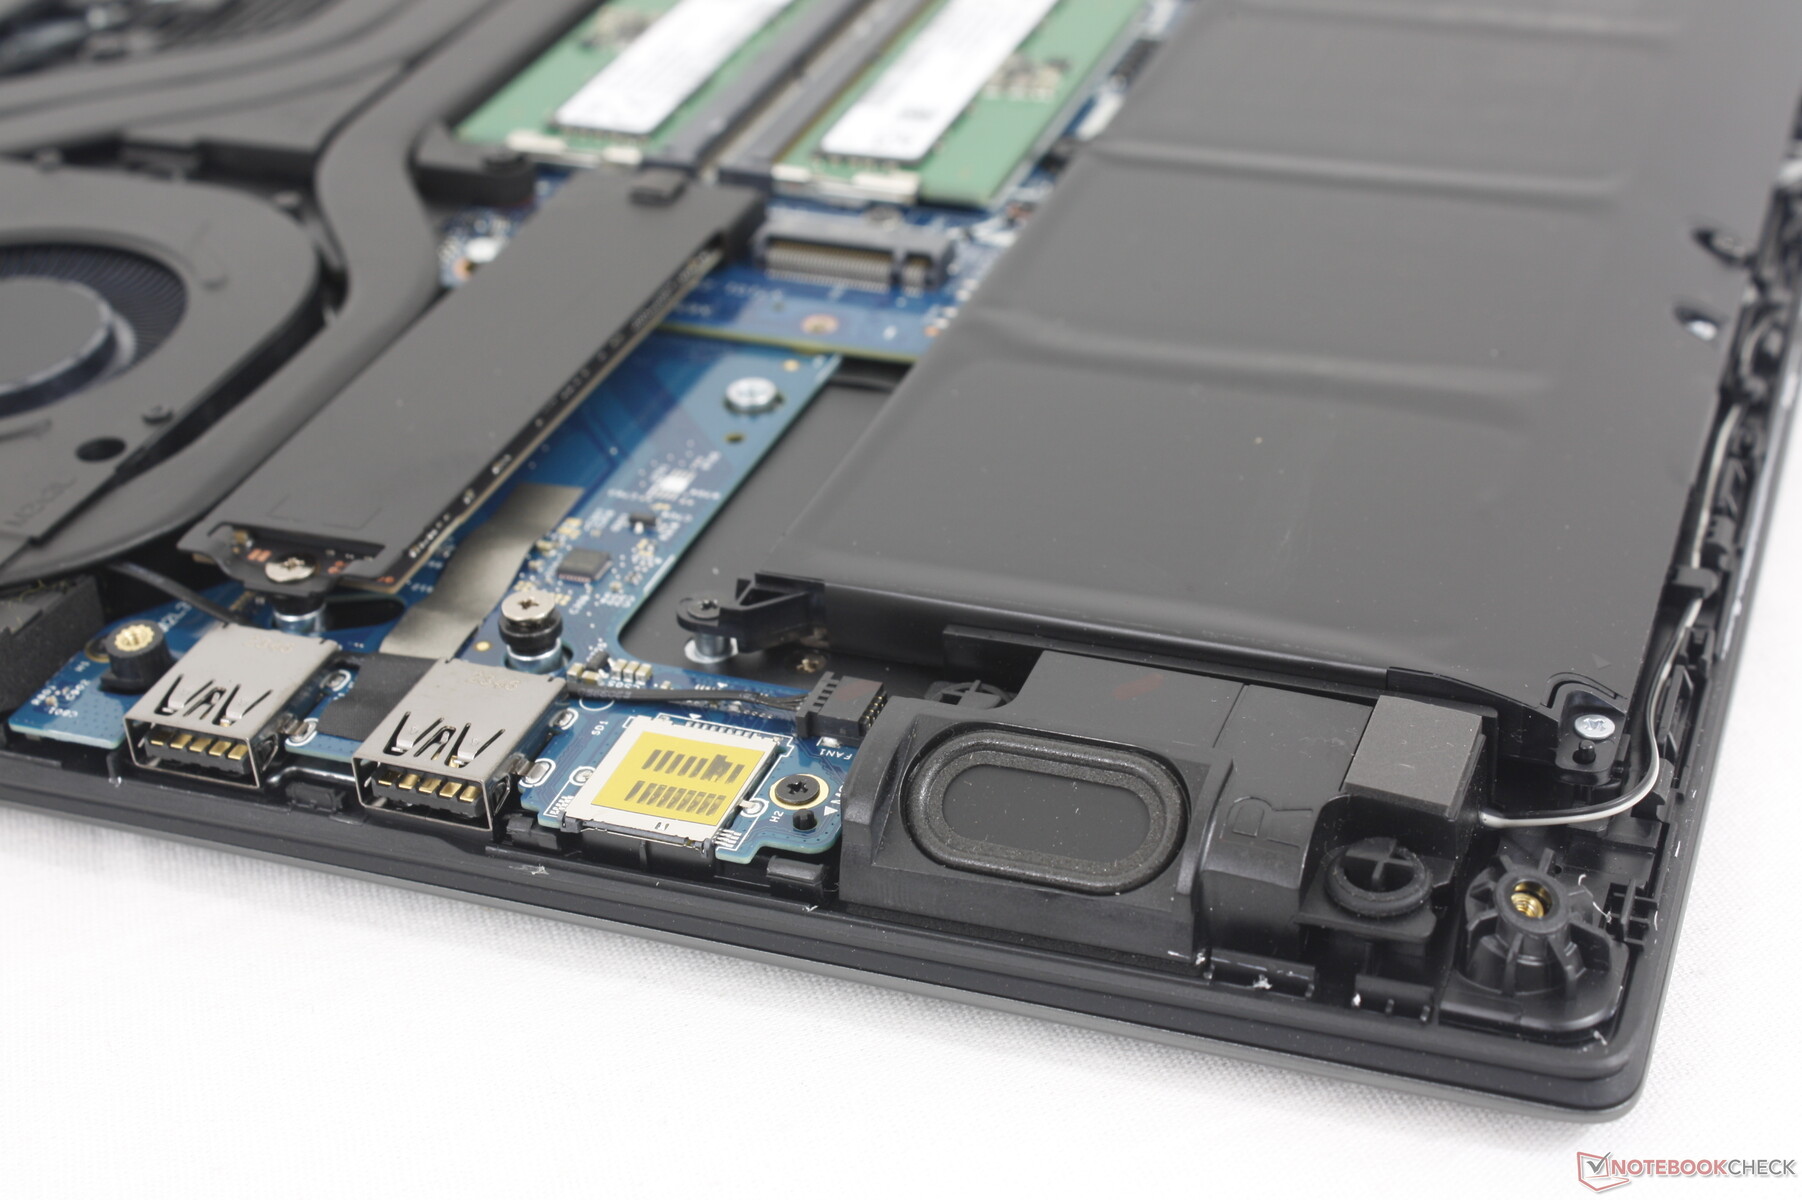
El panel inferior está asegurado por 8 tornillos Phillips para facilitar el mantenimiento. La RAM y la WLAN siguen siendo extraíbles, pero la configuración del almacenamiento ha cambiado; el sistema admite ahora dos unidades SSD M.2 2280 en lugar de una M.2 2280 y dos M.2 2230 del diseño del año pasado.
Accesorios y garantía
La caja de venta al público incluye algunas pegatinas con el logotipo de Alienware junto con el habitual adaptador de CA y el papeleo. La garantía estándar limitada de un año del fabricante viene de serie si se adquiere en EE.UU.
Dispositivos de entrada: no es necesario que sean mecánicos
Teclado
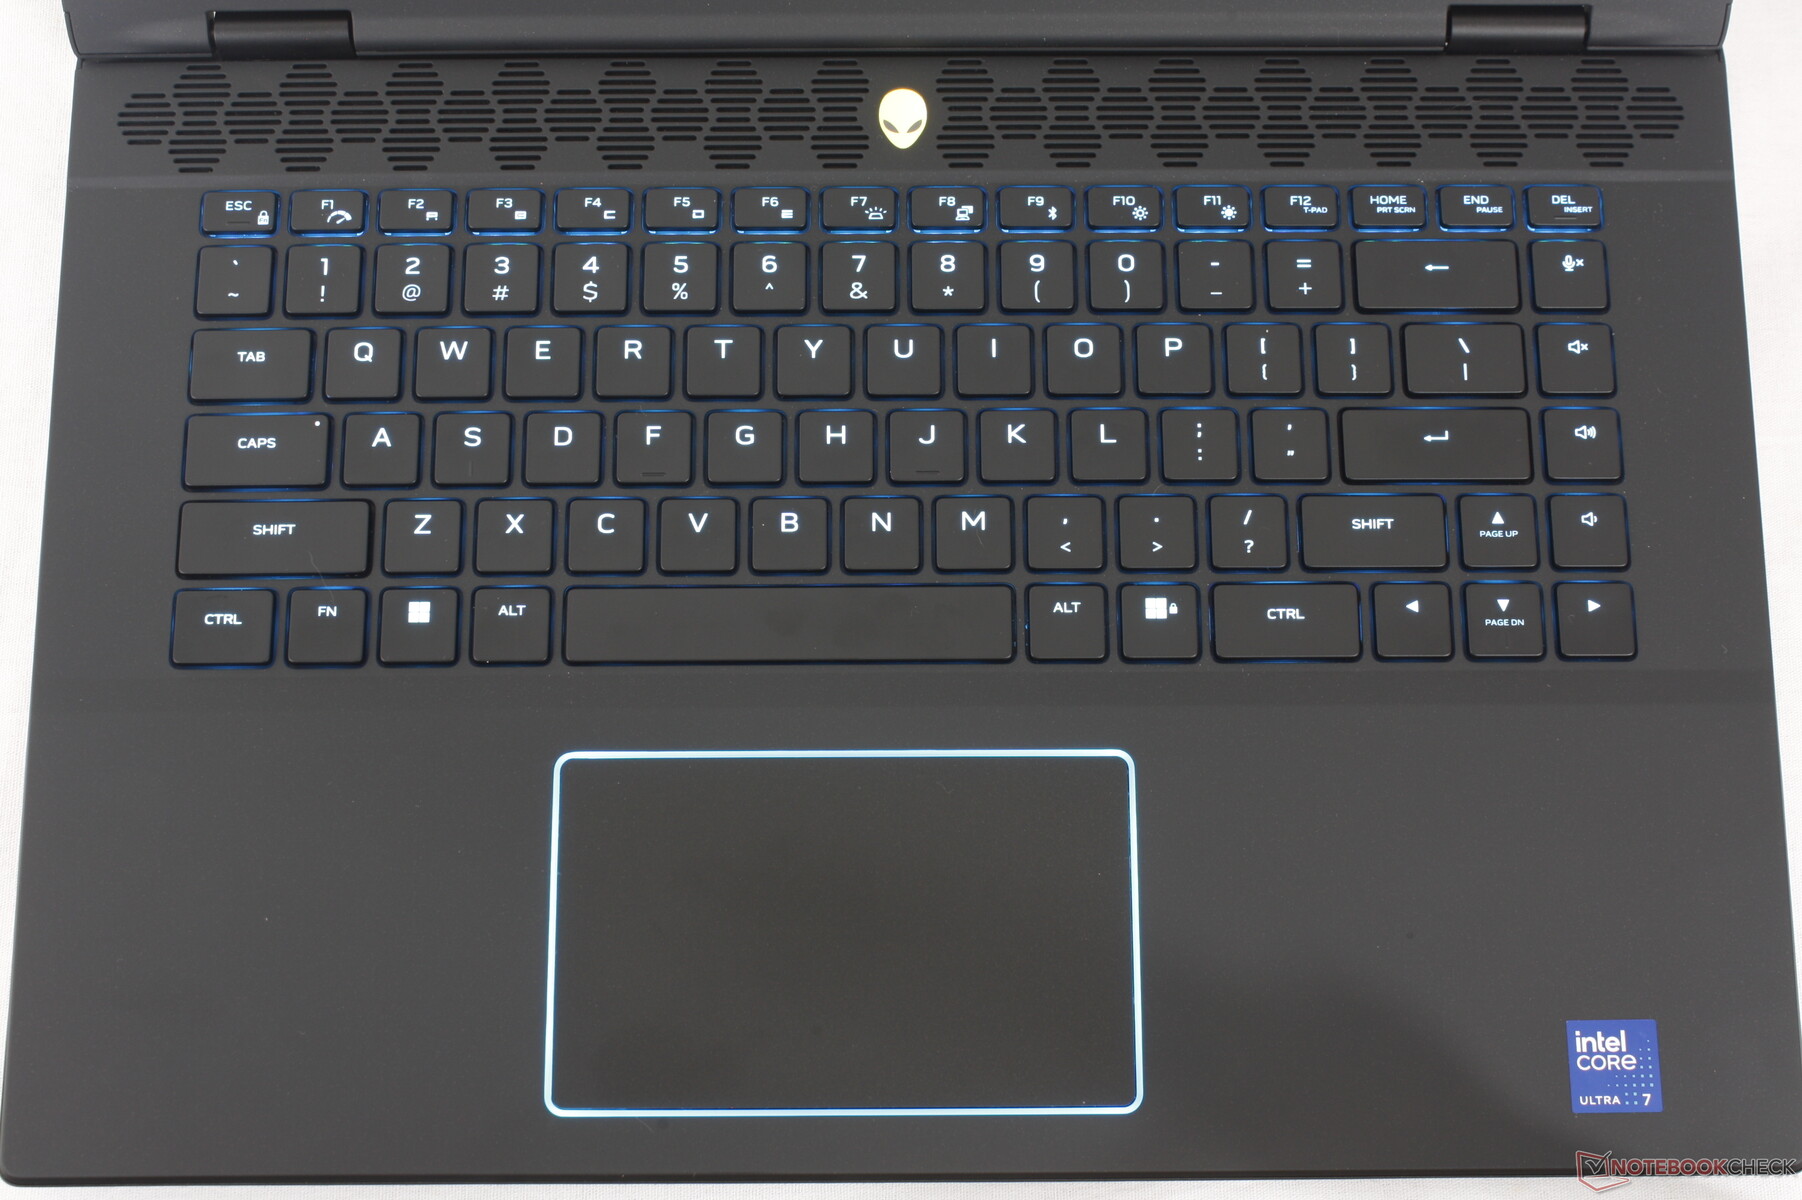
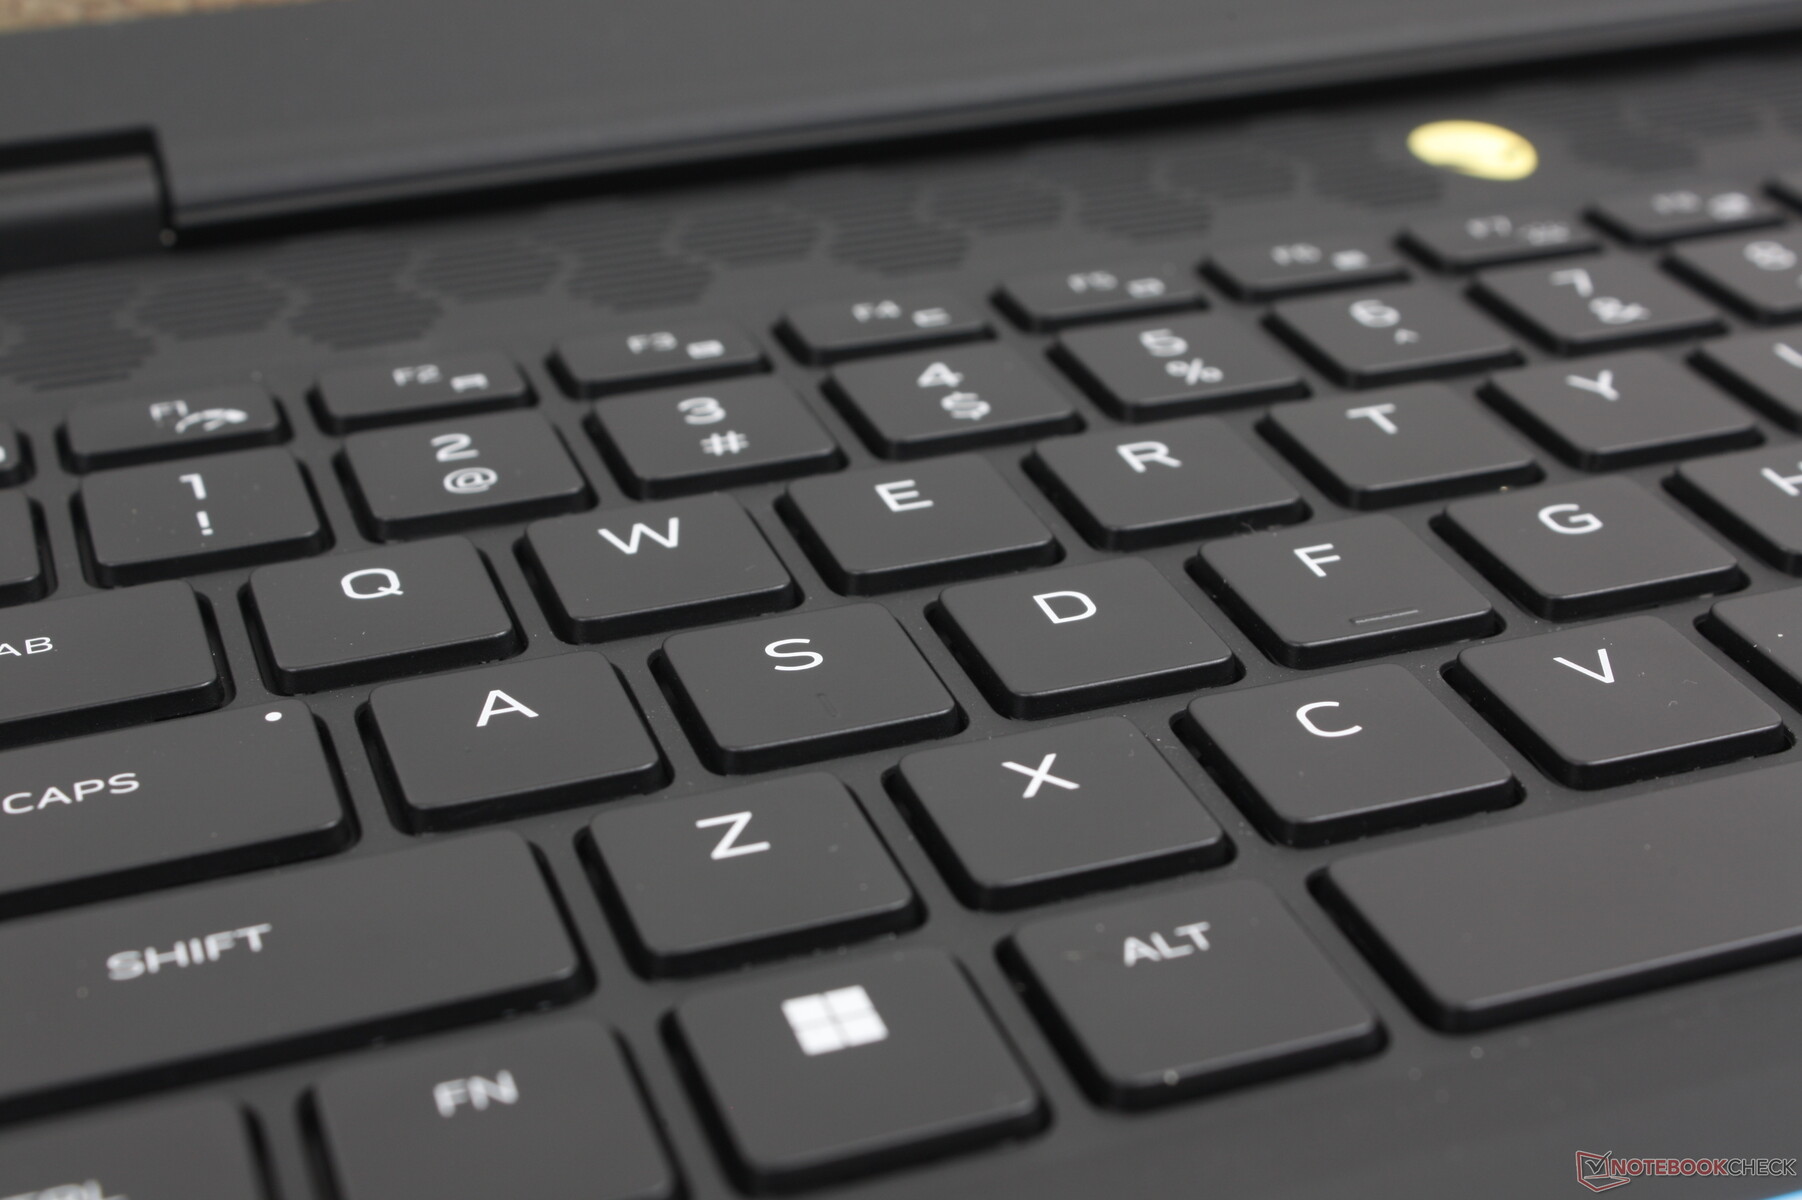
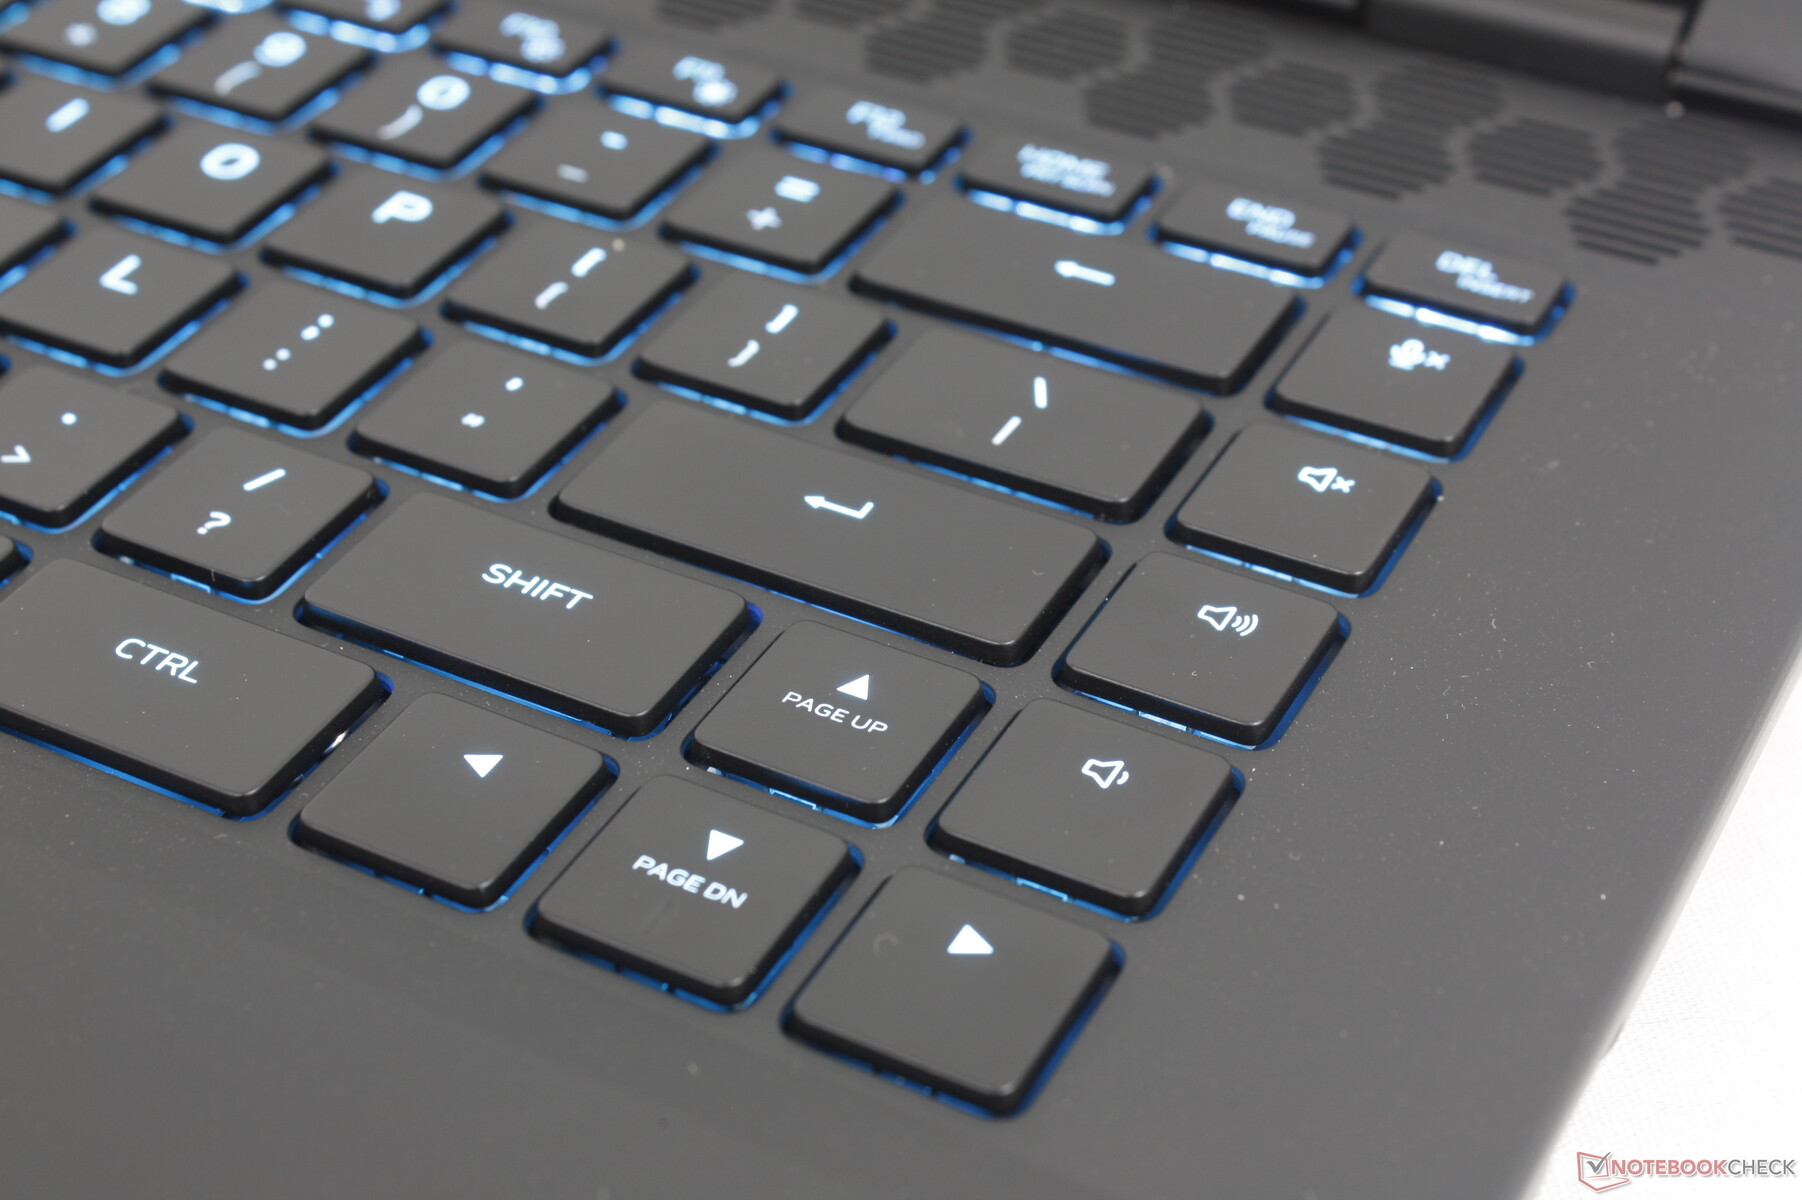
El sistema utiliza teclas de membrana con un recorrido de 1,8 mm y ninguna opción mecánica más para mantener el peso bajo y atraer a un público más amplio que el de los jugadores. No obstante, resultan cómodos y hacen más clic de lo esperado si se comparan con los teclados de la mayoría de portátiles para juegos, incluido el MSI Raider GE68 o el HP Omen Transcend 16. Las teclas Space y Enter en particular son mucho más ruidosas y nítidas que las teclas QWERTY principales cuando se pulsan.
La novedad del teclado de este año es una práctica función de "modo sigiloso" vinculada a la tecla F2 que cambia el sistema al modo silencioso sin necesidad de iniciar primero el Centro de comandos de Alienware. Por lo demás, la distribución del teclado sigue siendo la misma que en el m16 R1 original.
Panel táctil
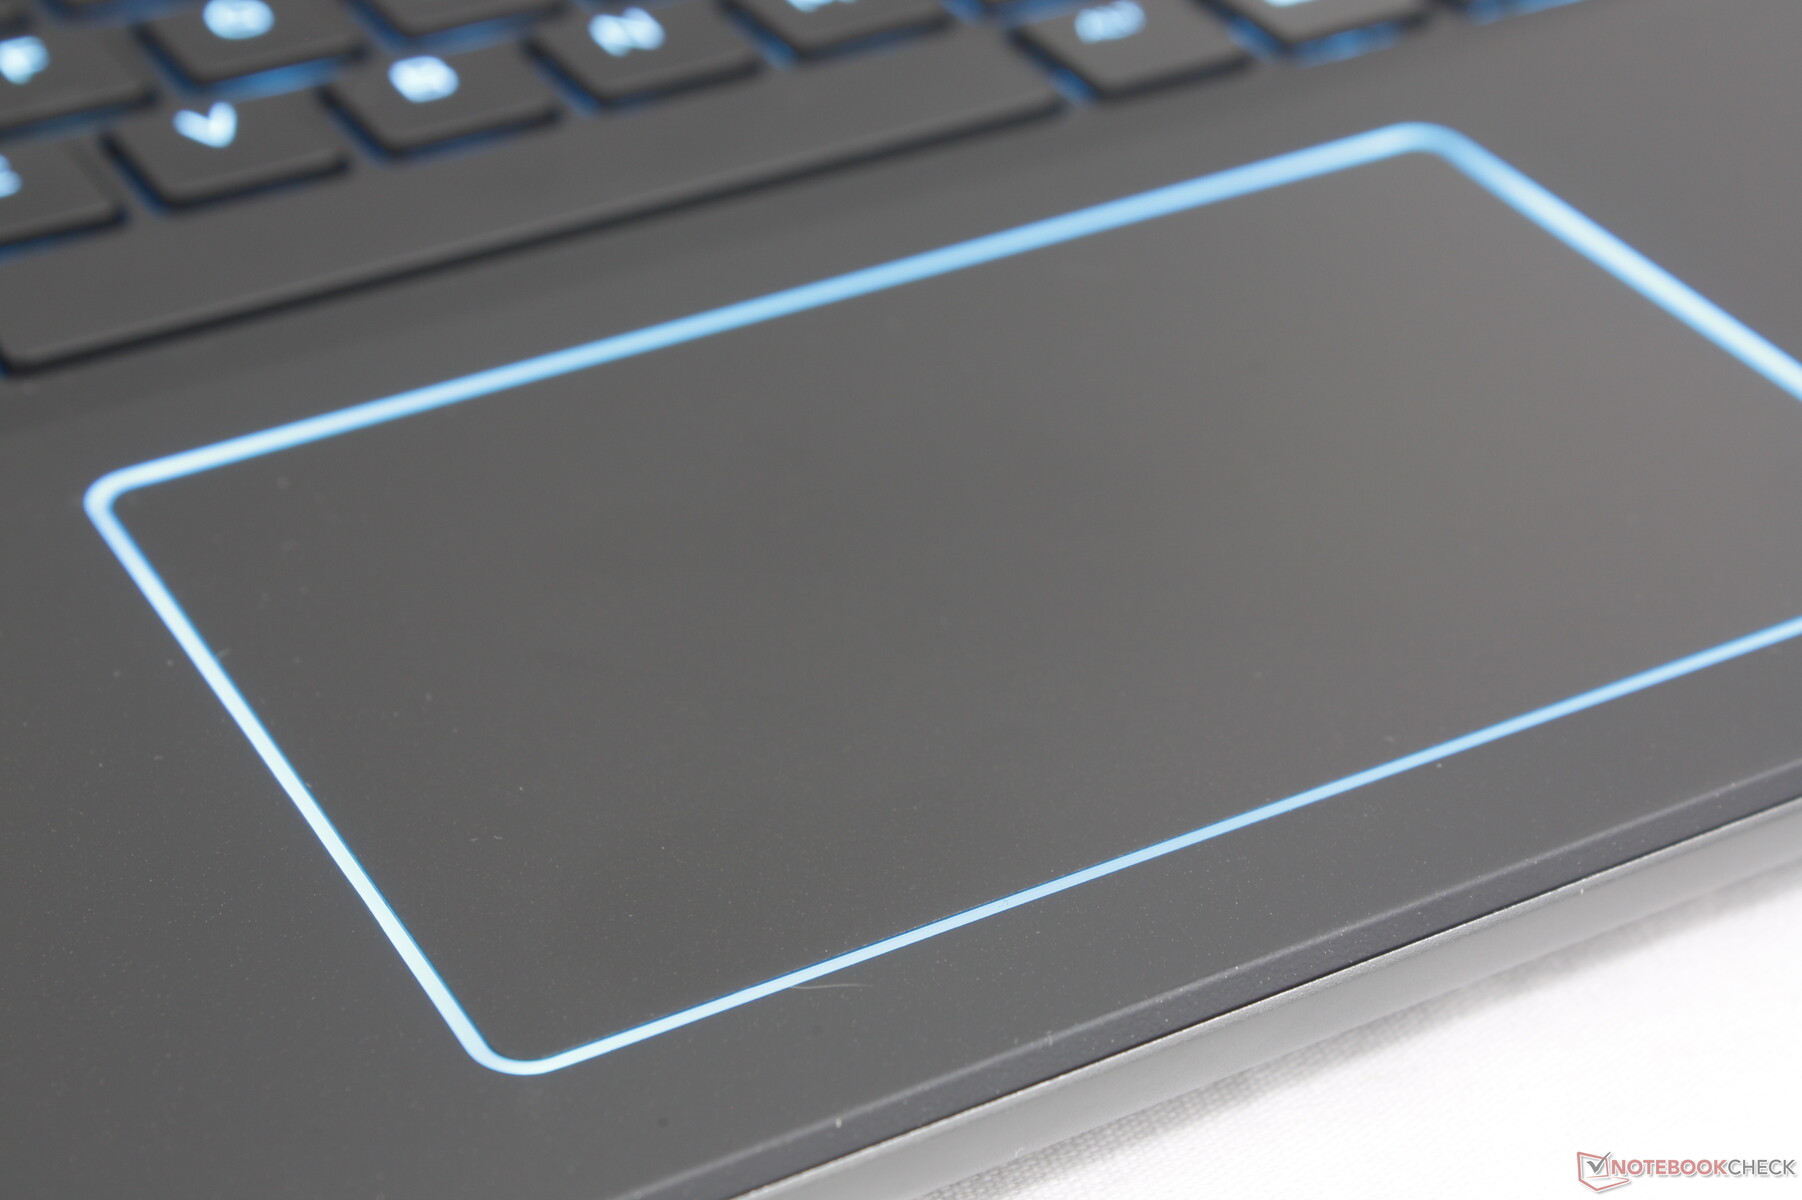
El clickpad es ligeramente más grande que en el modelo del año pasado (11,5 x 7 cm frente a 11,3 x 6,6 cm) e incluye una nueva iluminación RGB en todo el perímetro. Sin embargo, la retroalimentación al hacer clic sigue siendo esponjosa y muy superficial para una sensación insatisfactoria. Funciona con suficiente fiabilidad para apuntar y hacer clic de forma básica, pero se sigue recomendando un ratón para acciones más precisas como arrastrar y soltar.
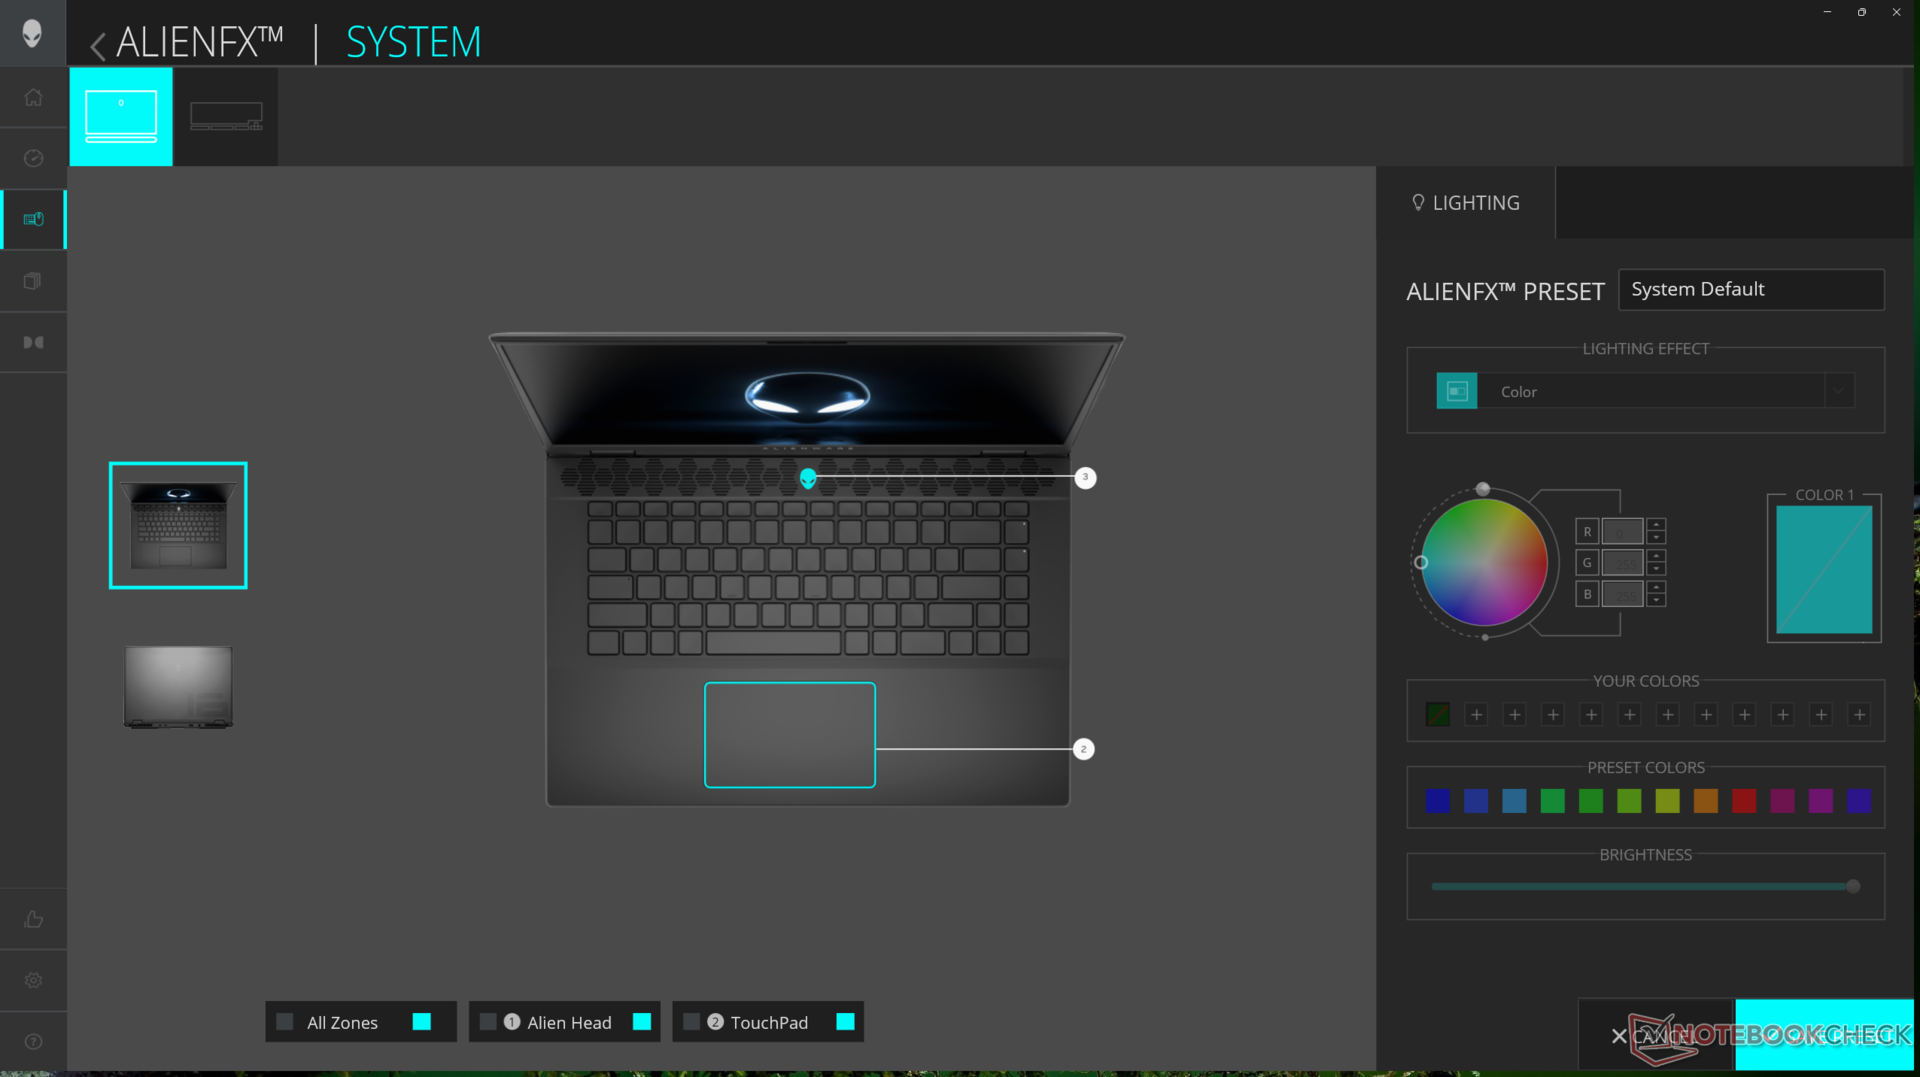
Resulta molesto que la iluminación RGB sólo se pueda activar o desactivar a través del Centro de Comandos de Alienware, ya que no existe una tecla de acceso directo para alternarla. Ajustar el brillo de las teclas RGB no afecta a la iluminación alrededor del clickpad.
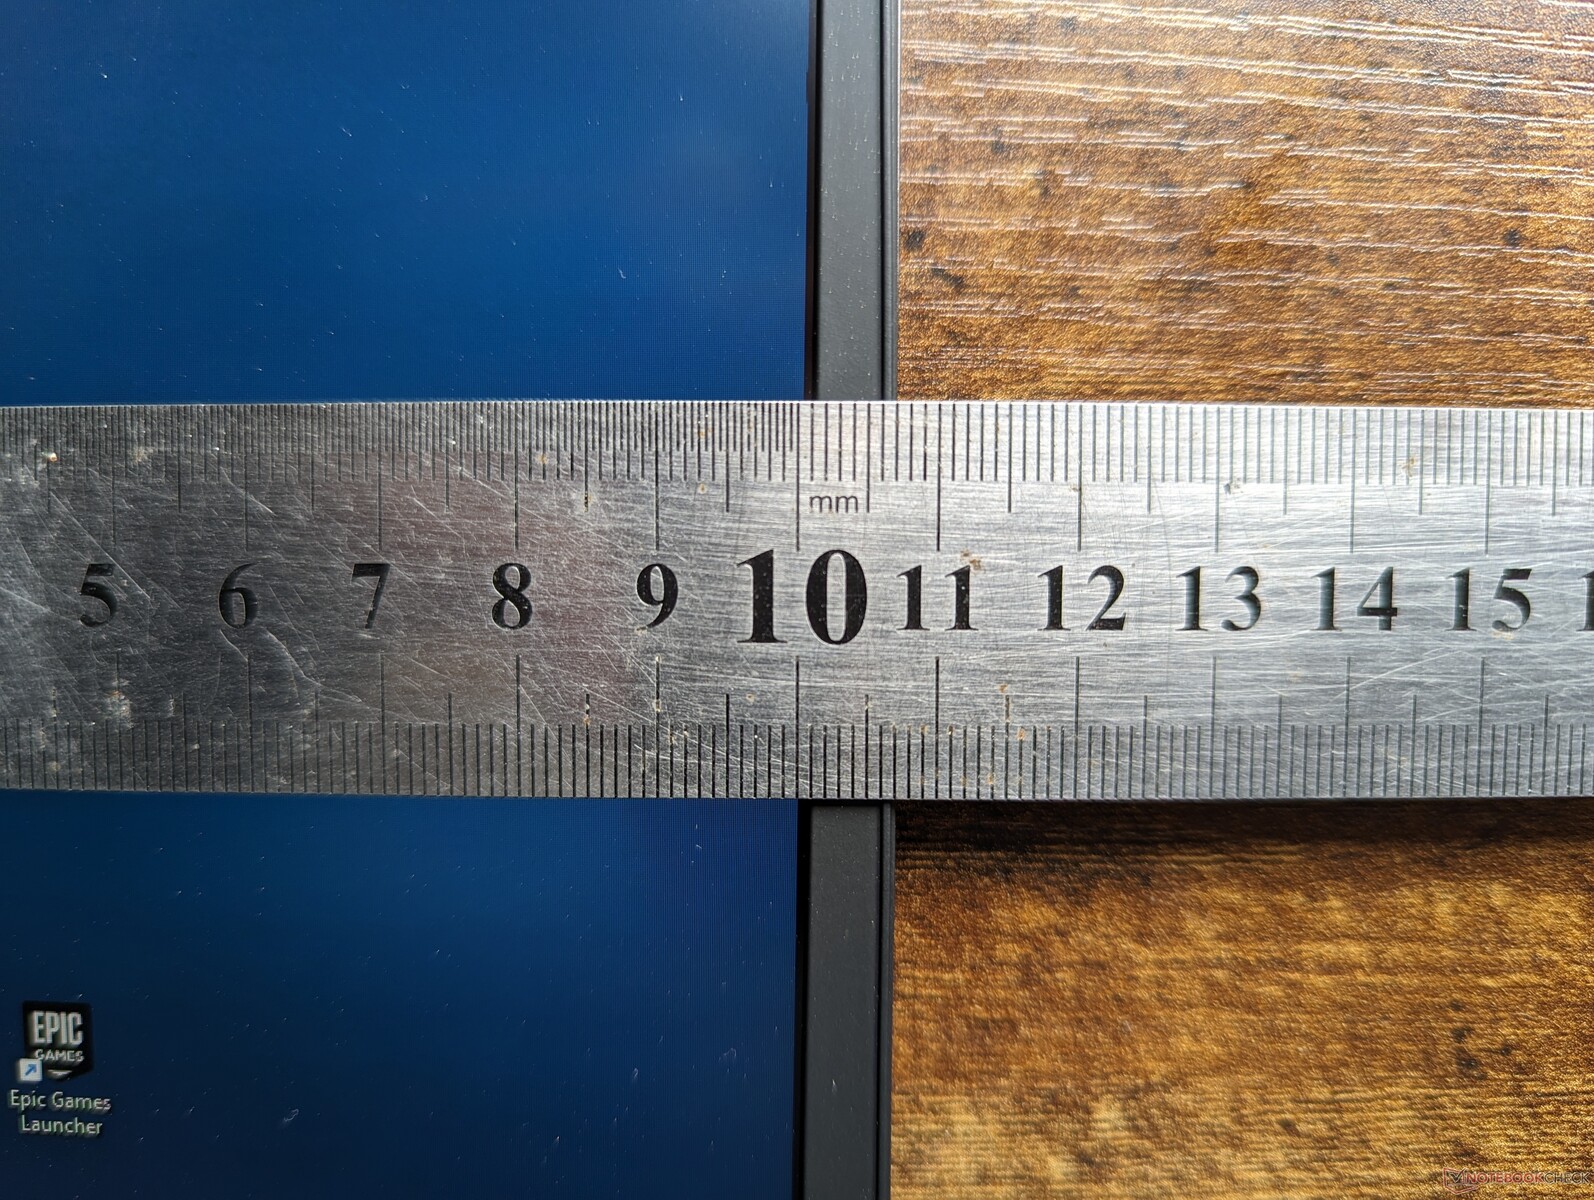
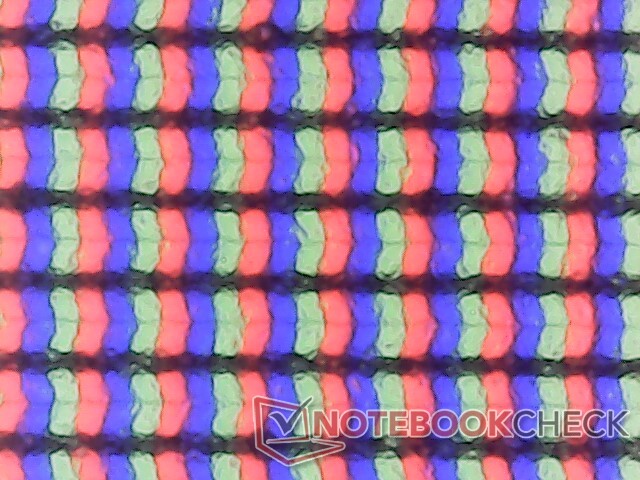
Pantalla - 240 Hz y sRGB completo ahora de serie
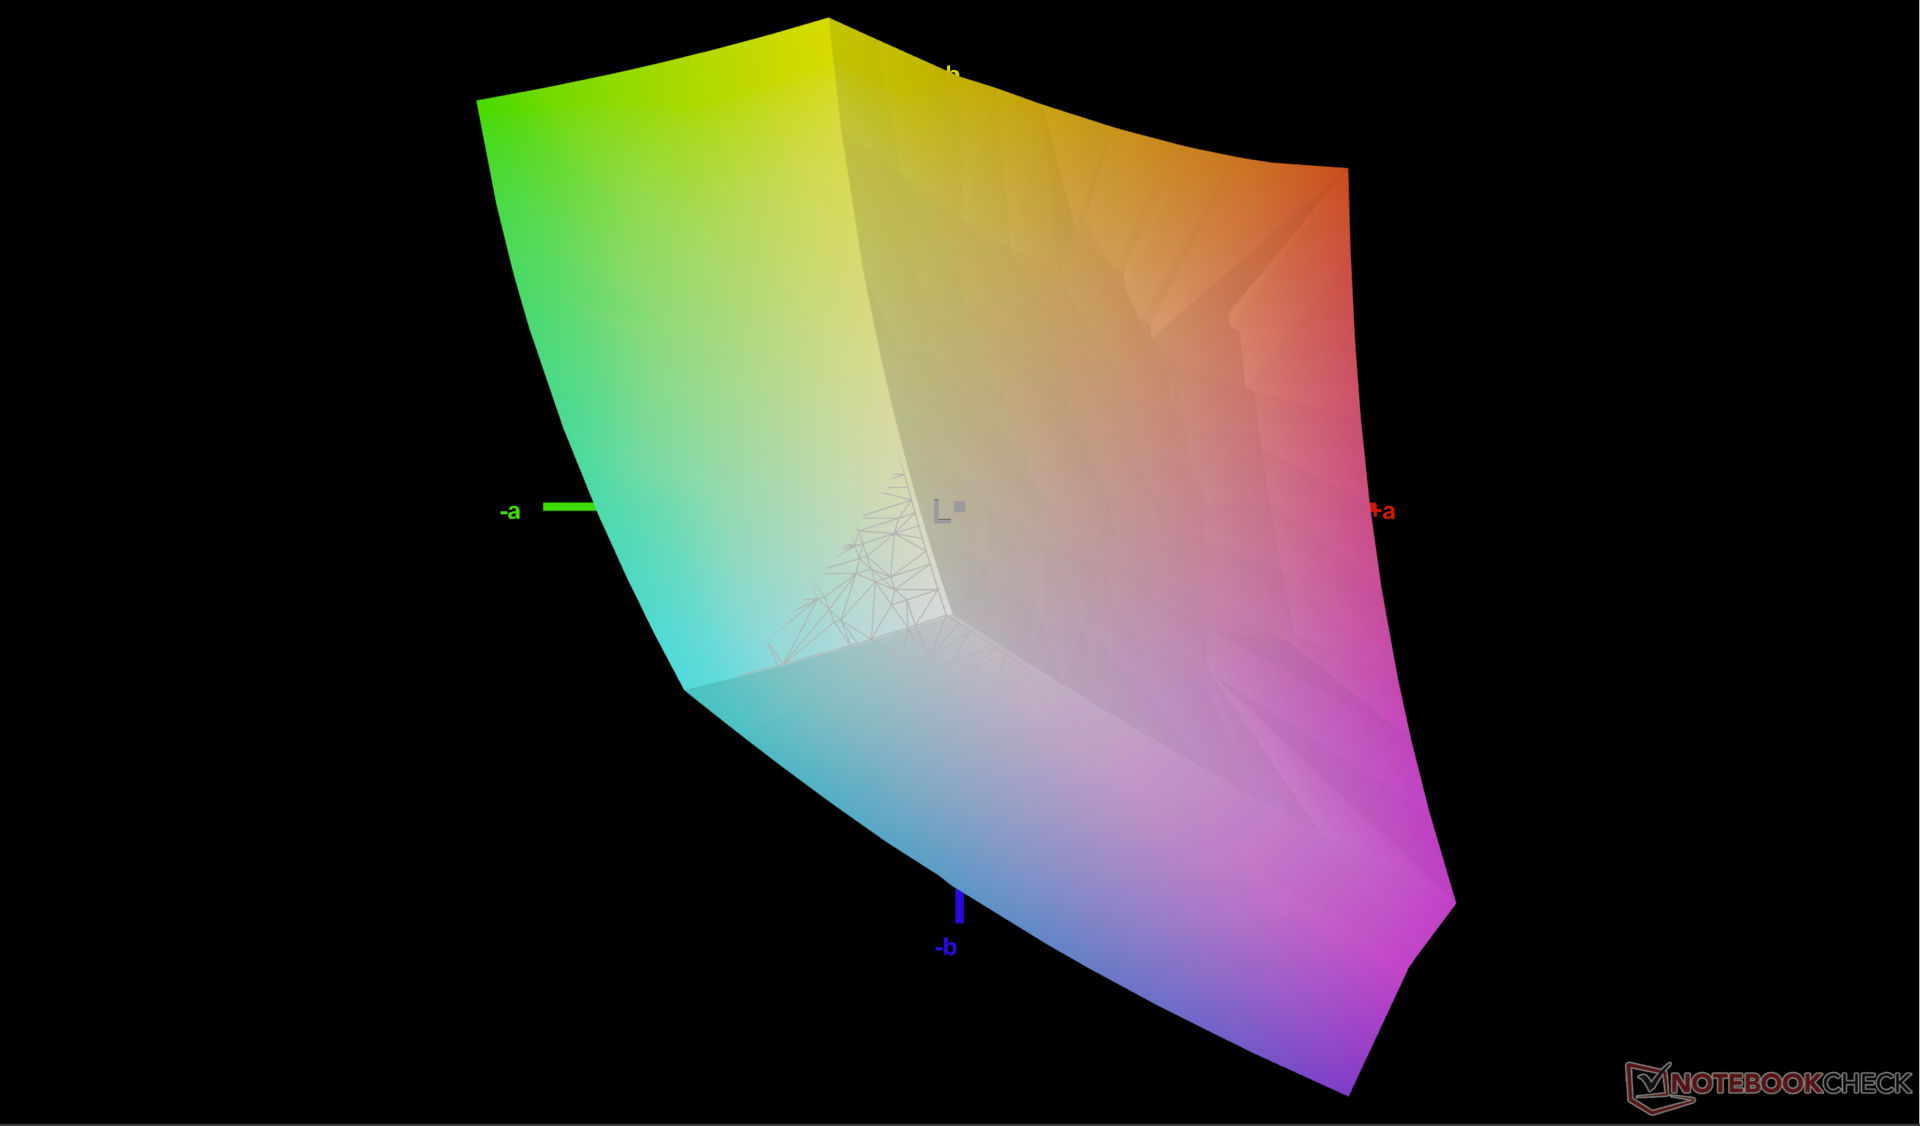
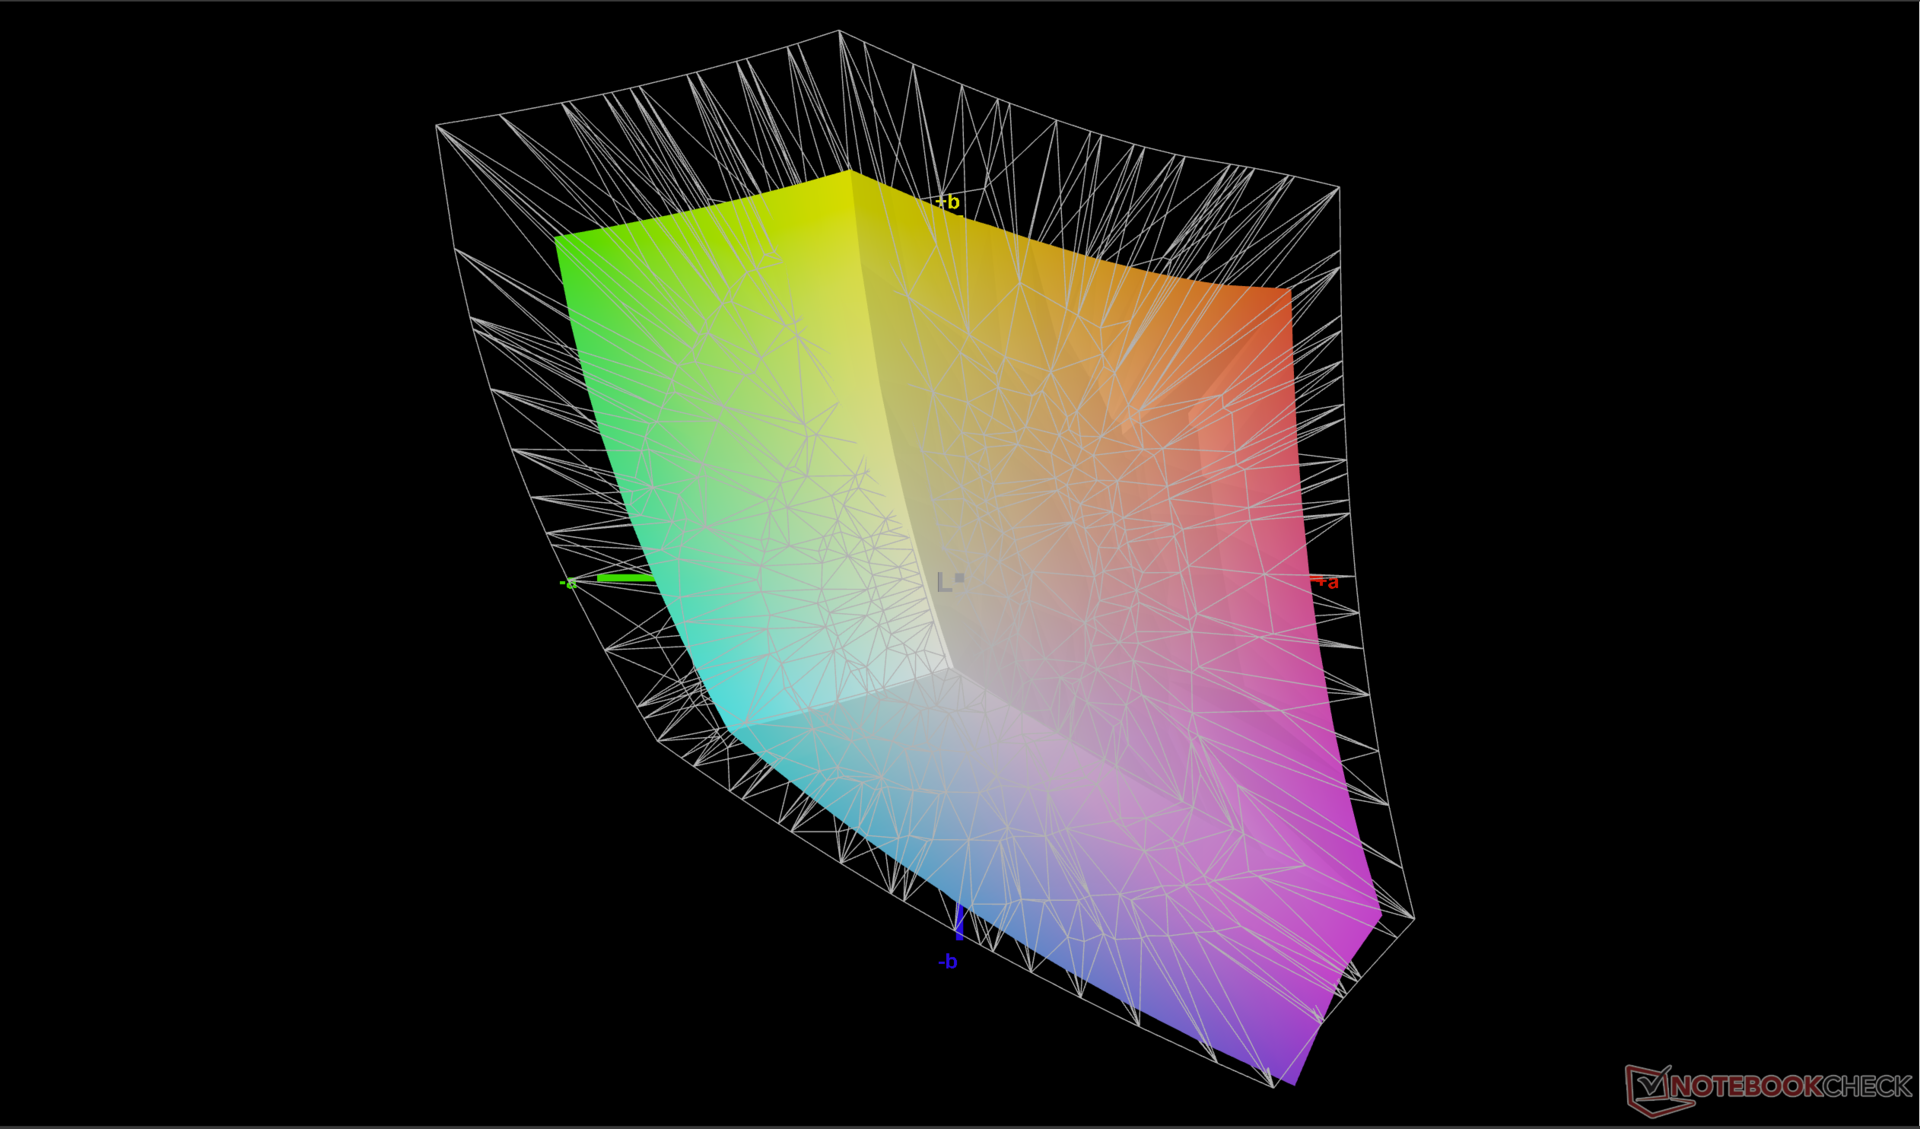
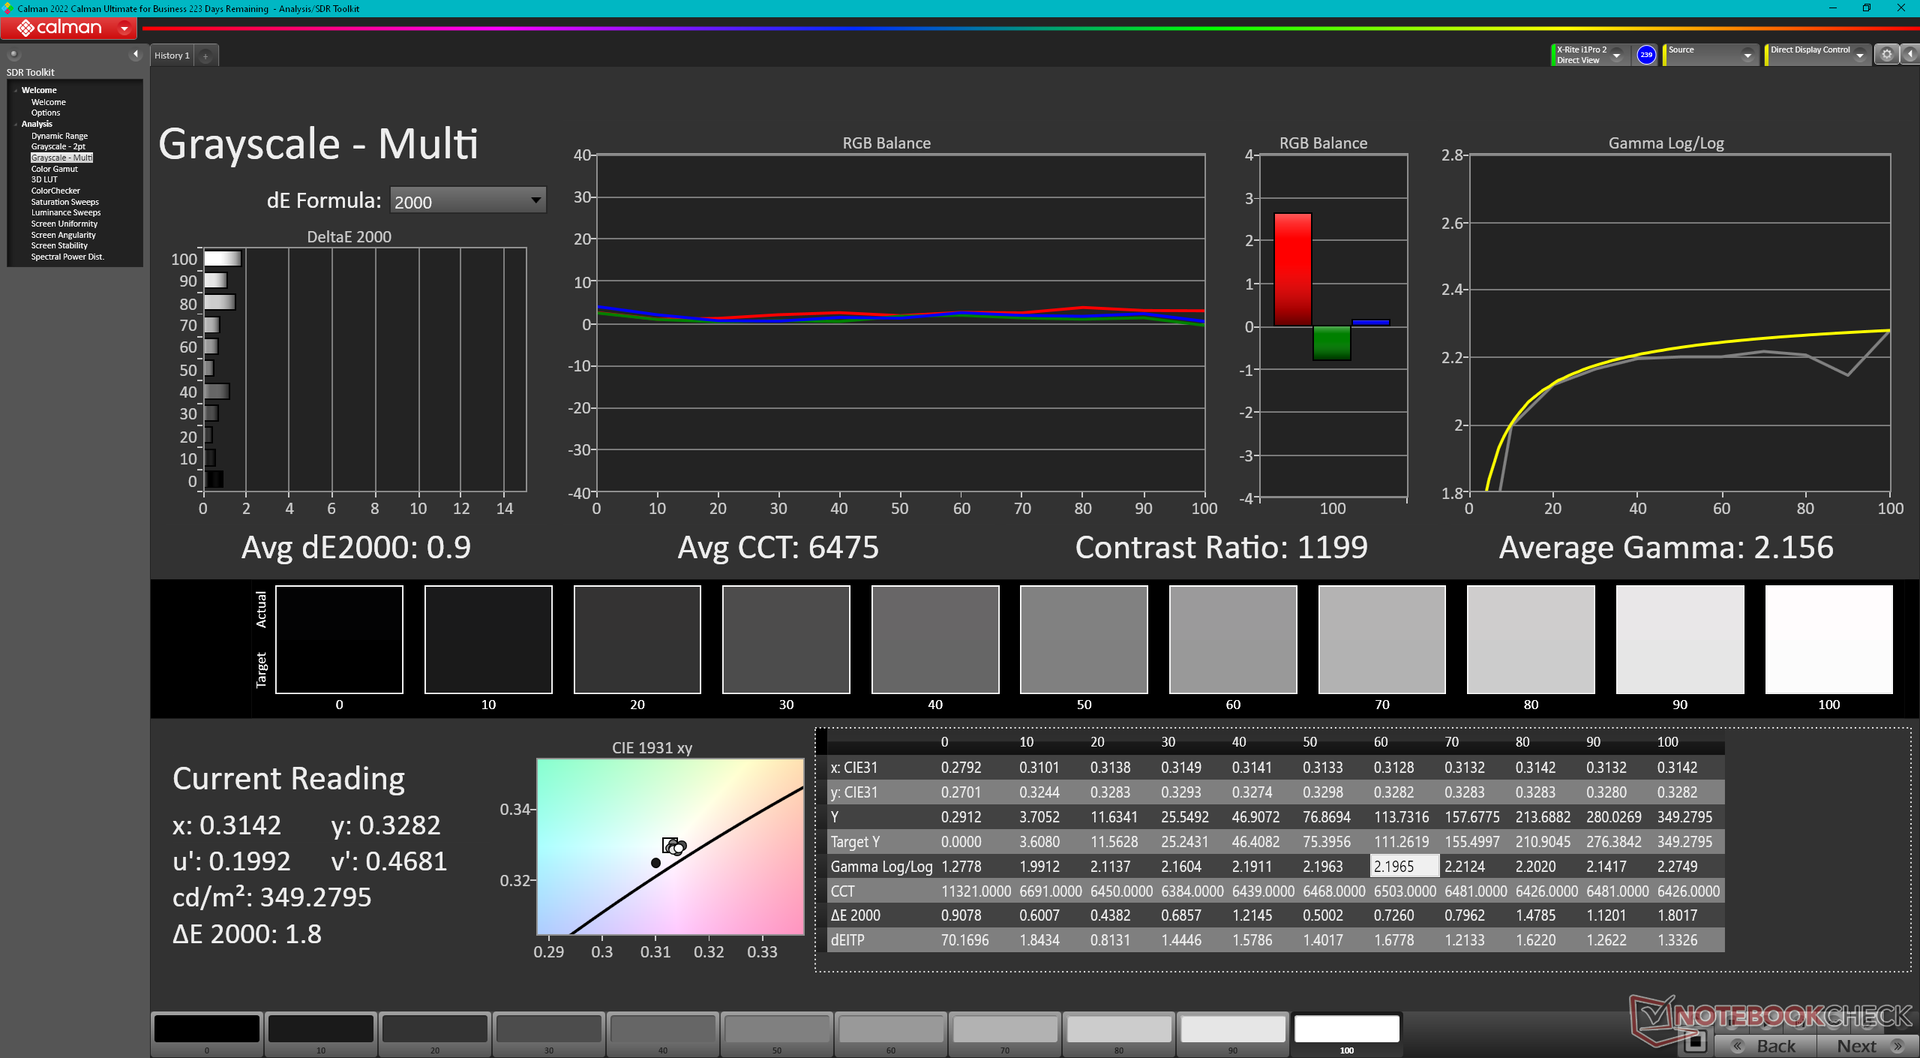
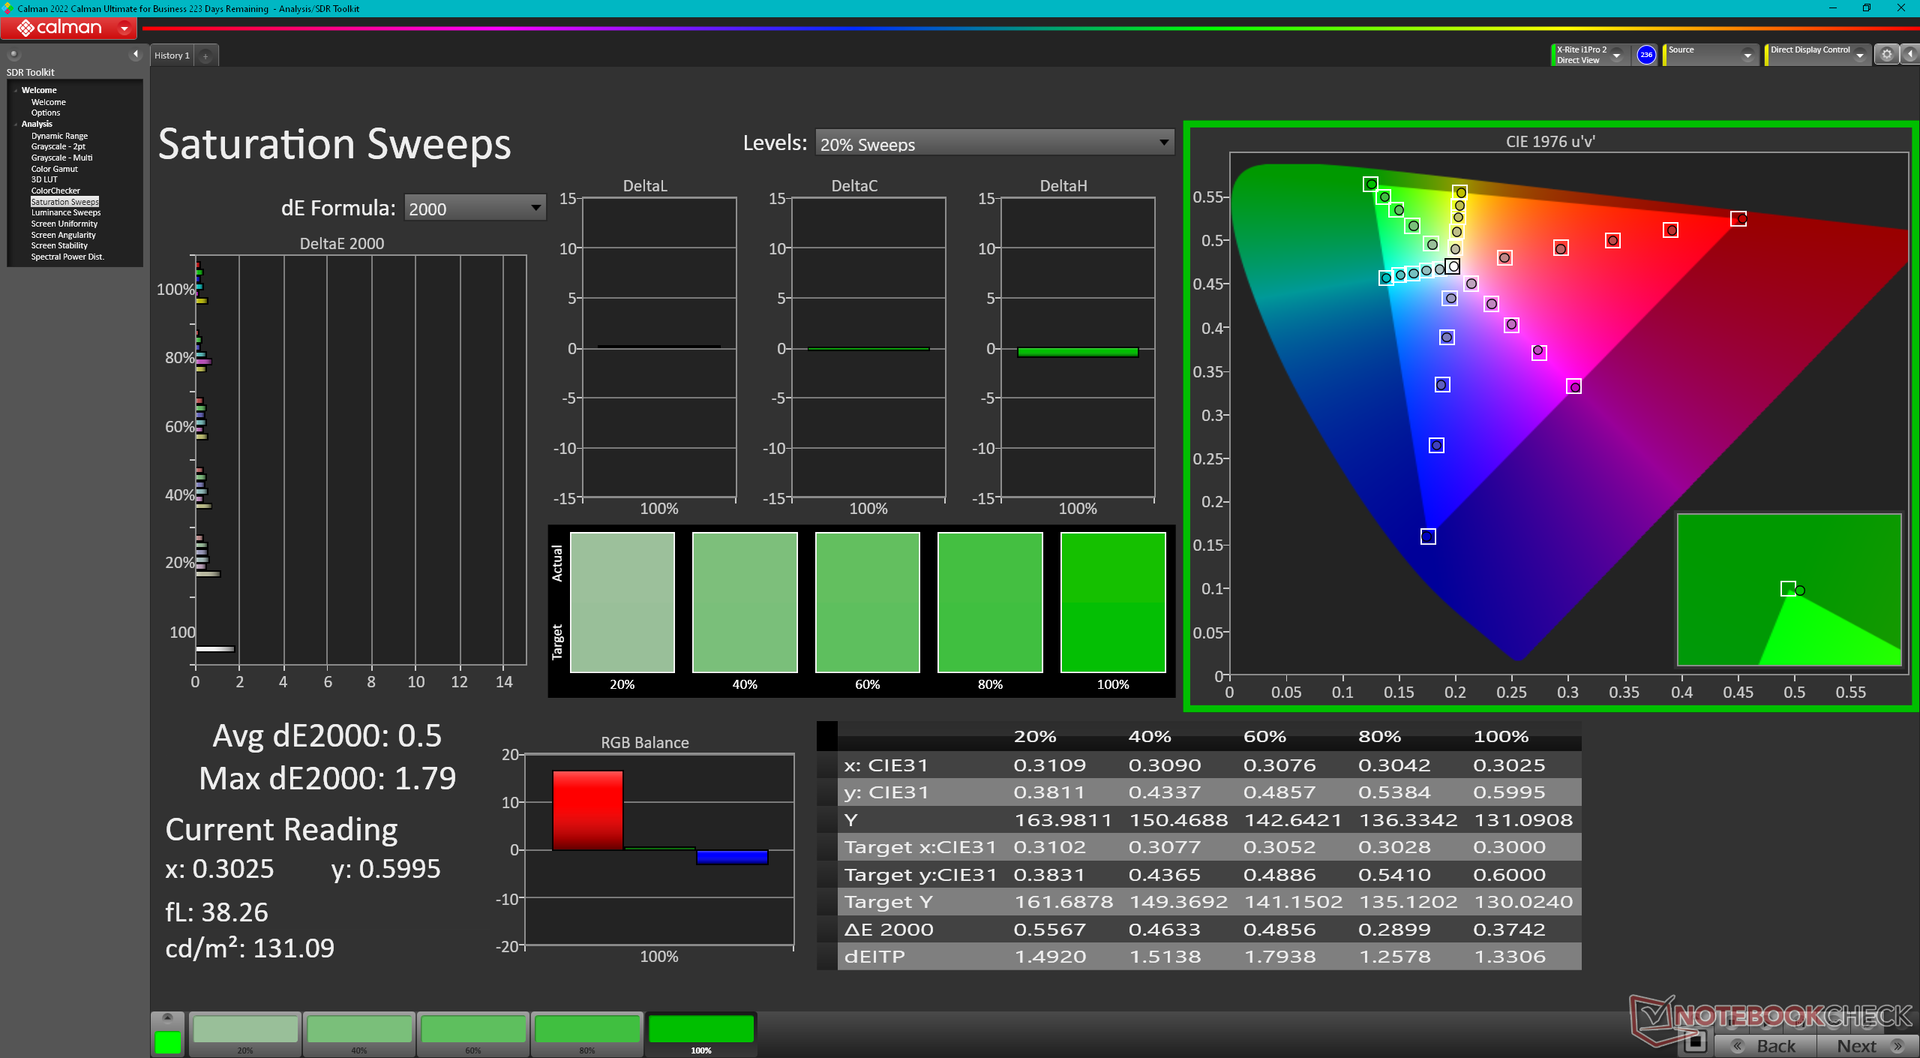
El modelo utiliza un panel BOE NE16NYH en contraste con el BOE NE16NYB del m16 R1 del año pasado. El panel más nuevo tiene una frecuencia de actualización nativa más rápida (240 Hz frente a 165 Hz), mientras que el resto de atributos siguen siendo esencialmente los mismos, incluidos los rápidos tiempos de respuesta blanco-negro, la relación de contraste de ~1000:1, la cobertura sRGB completa y el brillo máximo de 300 a 350 nit. La pantalla es apta tanto para juegos como para la edición de aficionados.
Por muy suave que sea el nuevo panel, sigue careciendo de colores DCI-P3 y de frecuencia de actualización variable de Windows. Lo primero habría atraído a los editores gráficos más profesionales, mientras que lo segundo habría mejorado la duración de la batería. Los colores DCI-P3 completos están disponibles en el x16 R1, el HP Omen Transcend 16 y el Asus ROG Zephyrus G16. Tampoco es compatible con HDR, ya que la pantalla no es lo suficientemente brillante como para cumplir los requisitos previos de HDR400+.
| |||||||||||||||||||||||||
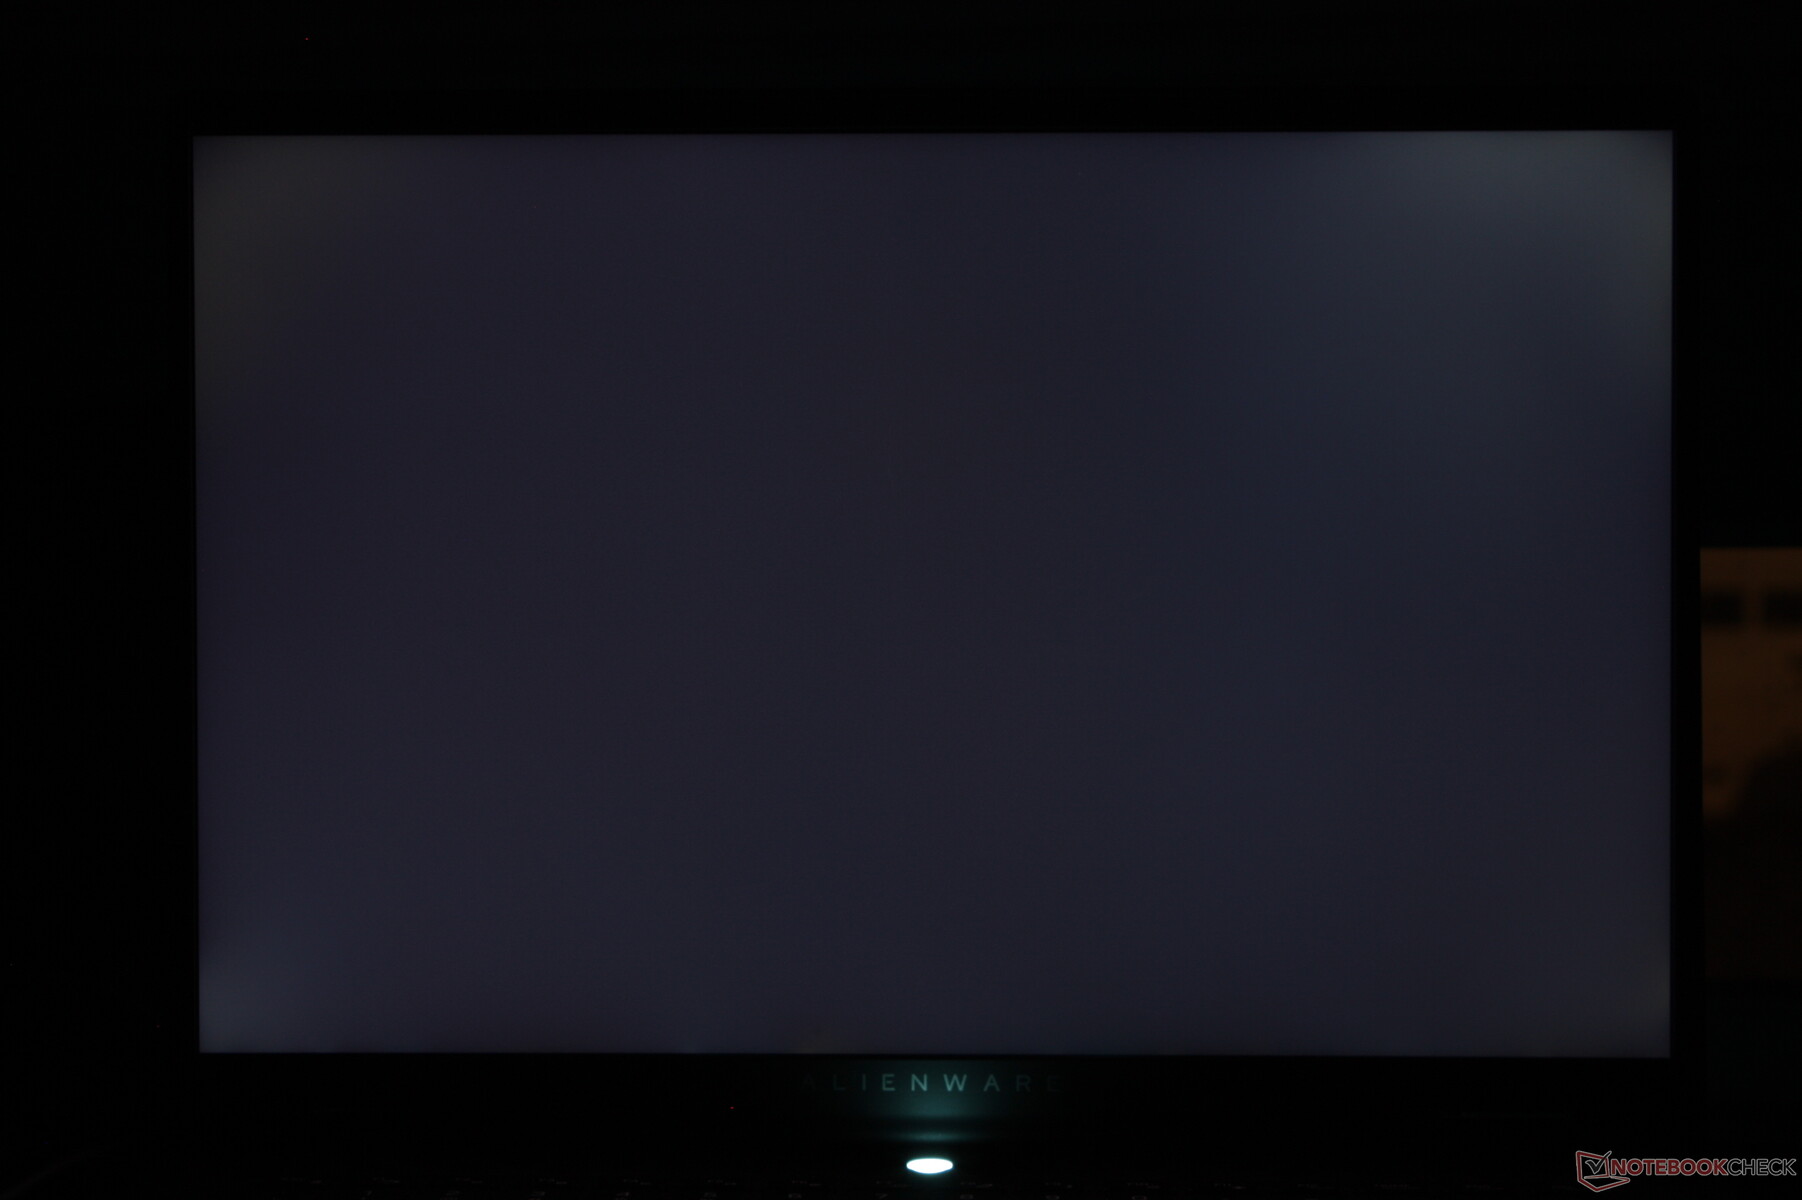
iluminación: 87 %
Brillo con batería: 345.8 cd/m²
Contraste: 1153:1 (Negro: 0.3 cd/m²)
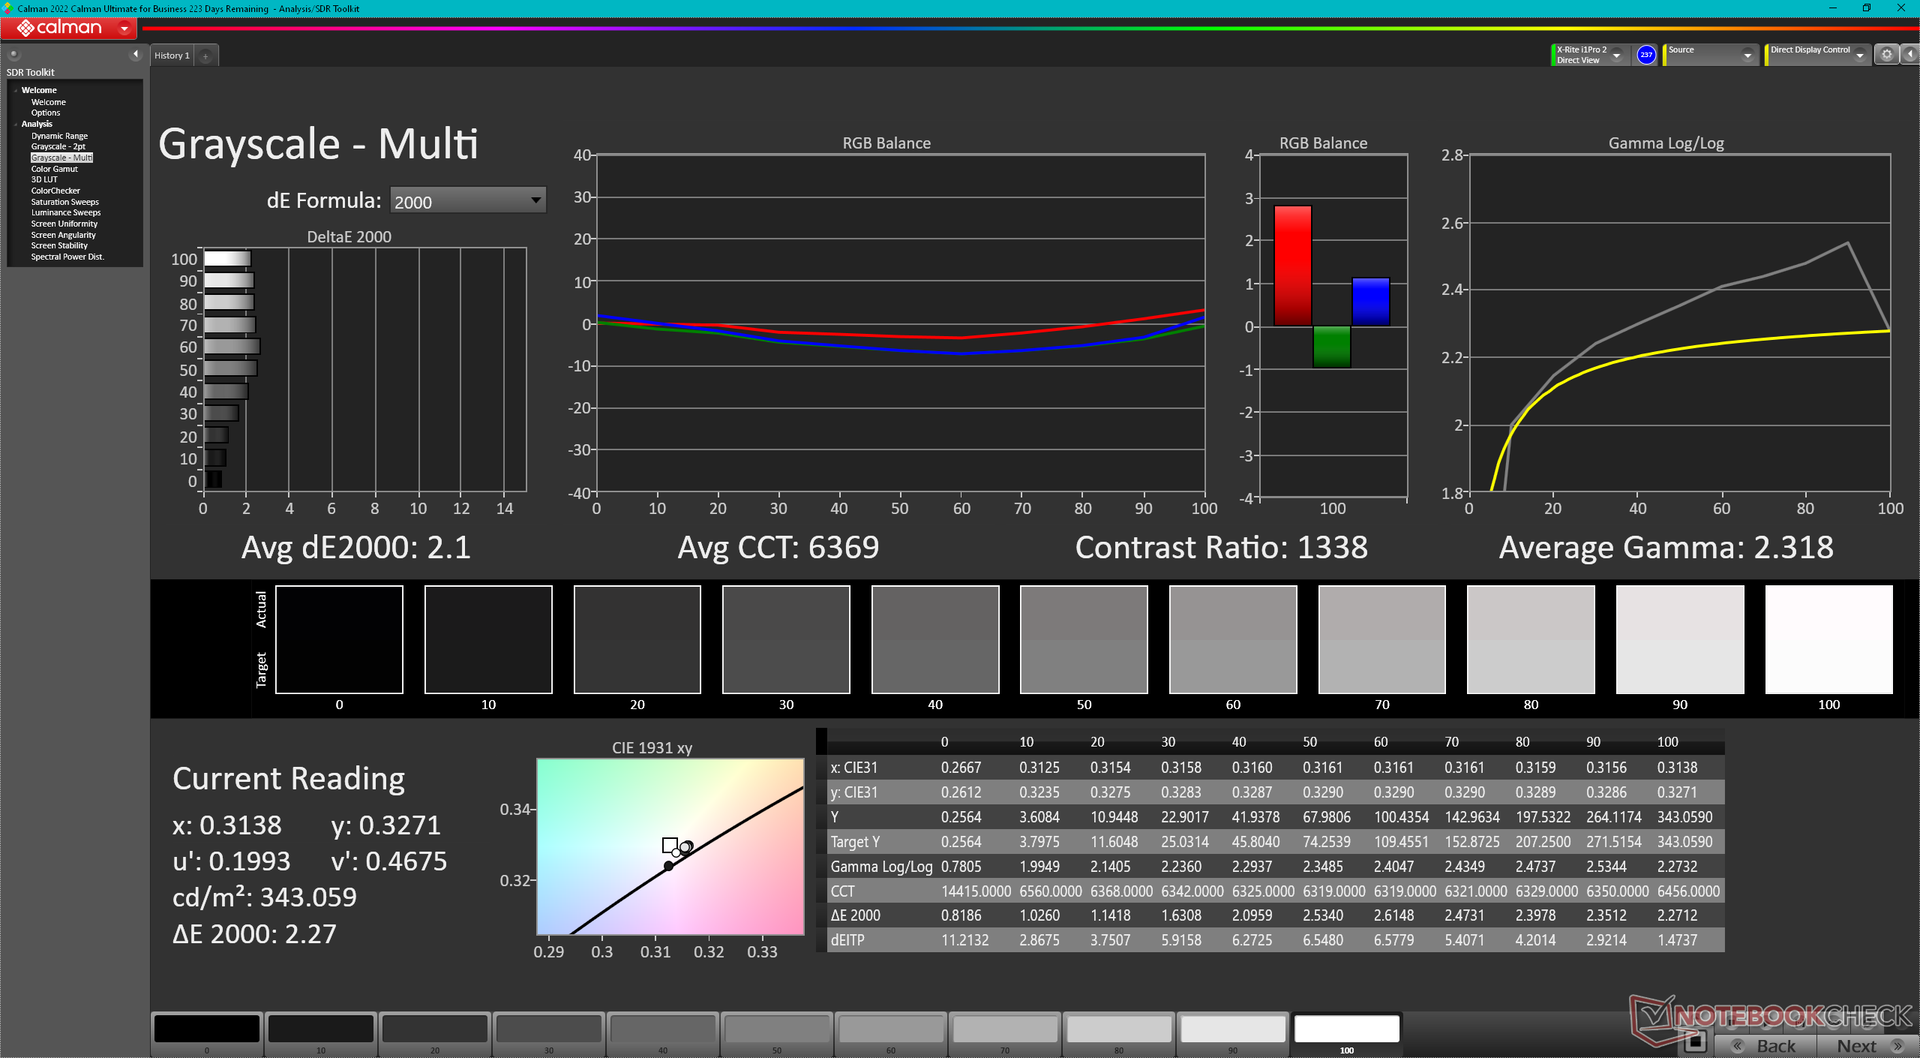
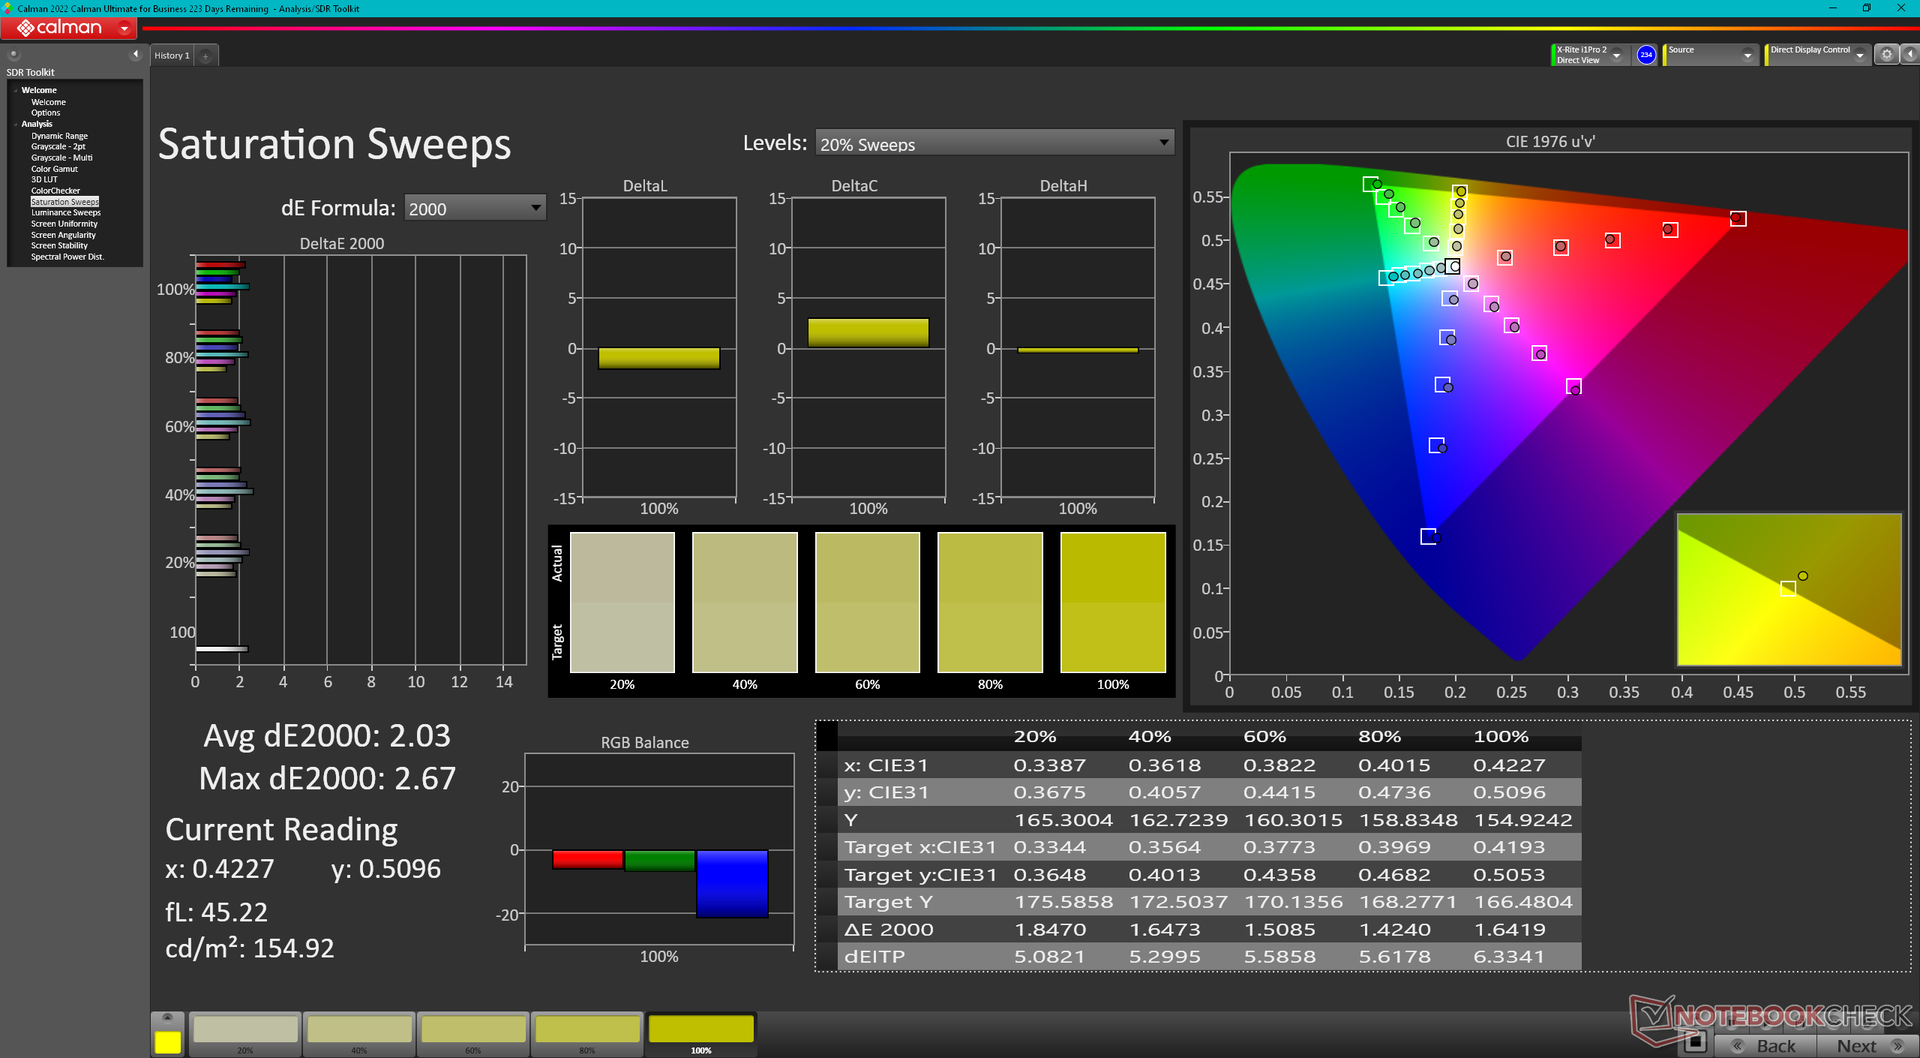
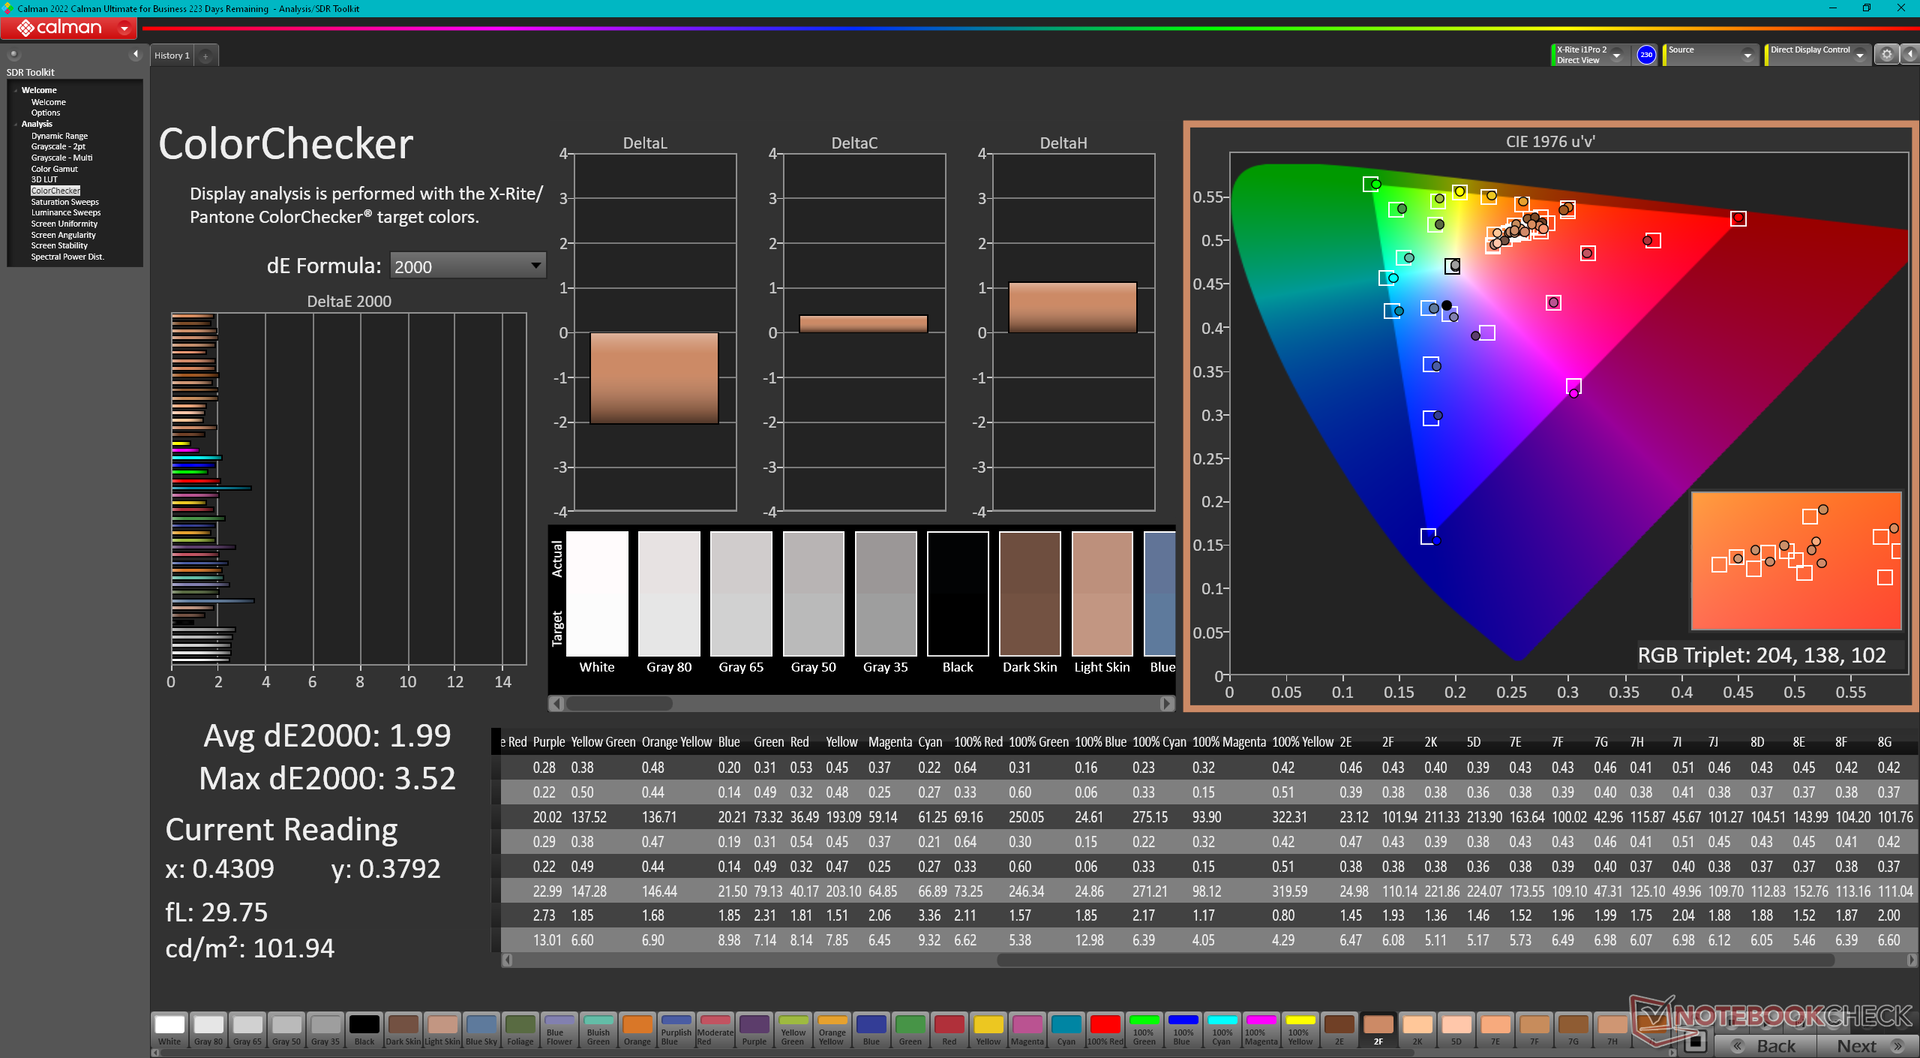
ΔE ColorChecker Calman: 1.99 | ∀{0.5-29.43 Ø4.71}
calibrated: 0.62
ΔE Greyscale Calman: 2.1 | ∀{0.09-98 Ø4.96}
71.4% AdobeRGB 1998 (Argyll 3D)
100% sRGB (Argyll 3D)
71% Display P3 (Argyll 3D)
Gamma: 2.32
CCT: 6369 K
| Alienware m16 R2 BOE NE16NYH, IPS, 2560x1600, 16" | Alienware m16 R1 Intel BOE NE16NYB, IPS, 2560x1600, 16" | Alienware x16 R1 BOE NE16NZ4, IPS, 2560x1600, 16" | HP Omen Transcend 16-u1095ng ATNA60DL02-0 (SDC41A4), OLED, 2560x1600, 16" | Asus ROG Zephyrus G16 2024 GU605M ATNA60DL01-0, OLED, 2560x1600, 16" | Lenovo Legion Slim 7 16APH8 BOE NE160QDM-NZ3, IPS, 2560x1600, 16" | |
|---|---|---|---|---|---|---|
| Display | -3% | 21% | 26% | 26% | 0% | |
| Display P3 Coverage (%) | 71 | 67.7 -5% | 99.2 40% | 99.8 41% | 99.9 41% | 70.3 -1% |
| sRGB Coverage (%) | 100 | 97.2 -3% | 100 0% | 100 0% | 100 0% | 99.6 0% |
| AdobeRGB 1998 Coverage (%) | 71.4 | 70 -2% | 88.6 24% | 97 36% | 96.9 36% | 72.4 1% |
| Response Times | 23% | -4% | 97% | 97% | -45% | |
| Response Time Grey 50% / Grey 80% * (ms) | 5.7 ? | 4 ? 30% | 5.1 ? 11% | 0.2 ? 96% | 0.22 ? 96% | 12.6 ? -121% |
| Response Time Black / White * (ms) | 8.7 ? | 7.3 ? 16% | 10.3 ? -18% | 0.2 ? 98% | 0.25 ? 97% | 5.9 ? 32% |
| PWM Frequency (Hz) | 120 ? | 960 ? | ||||
| Screen | -20% | -13% | 129% | 14% | 5% | |
| Brightness middle (cd/m²) | 345.8 | 306 -12% | 302.2 -13% | 390 13% | 416 20% | 545 58% |
| Brightness (cd/m²) | 337 | 302 -10% | 285 -15% | 392 16% | 418 24% | 502 49% |
| Brightness Distribution (%) | 87 | 89 2% | 89 2% | 98 13% | 96 10% | 82 -6% |
| Black Level * (cd/m²) | 0.3 | 0.3 -0% | 0.26 13% | 0.02 93% | 0.48 -60% | |
| Contrast (:1) | 1153 | 1020 -12% | 1162 1% | 19500 1591% | 1135 -2% | |
| Colorchecker dE 2000 * | 1.99 | 2.57 -29% | 1.63 18% | 1.94 3% | 1.6 20% | 1.36 32% |
| Colorchecker dE 2000 max. * | 3.52 | 4.26 -21% | 4.13 -17% | 4.26 -21% | 2.1 40% | 3.11 12% |
| Colorchecker dE 2000 calibrated * | 0.62 | 0.85 -37% | 1.17 -89% | 4.21 -579% | 1.04 -68% | |
| Greyscale dE 2000 * | 2.1 | 3.3 -57% | 2.5 -19% | 1.5 29% | 2.7 -29% | 1.4 33% |
| Gamma | 2.32 95% | 1.997 110% | 2.23 99% | 2.221 99% | 2.16 102% | 2.253 98% |
| CCT | 6369 102% | 6895 94% | 6590 99% | 6395 102% | 6331 103% | 6631 98% |
| Media total (Programa/Opciones) | 0% /
-10% | 1% /
-4% | 84% /
102% | 46% /
32% | -13% /
-3% |
* ... más pequeño es mejor
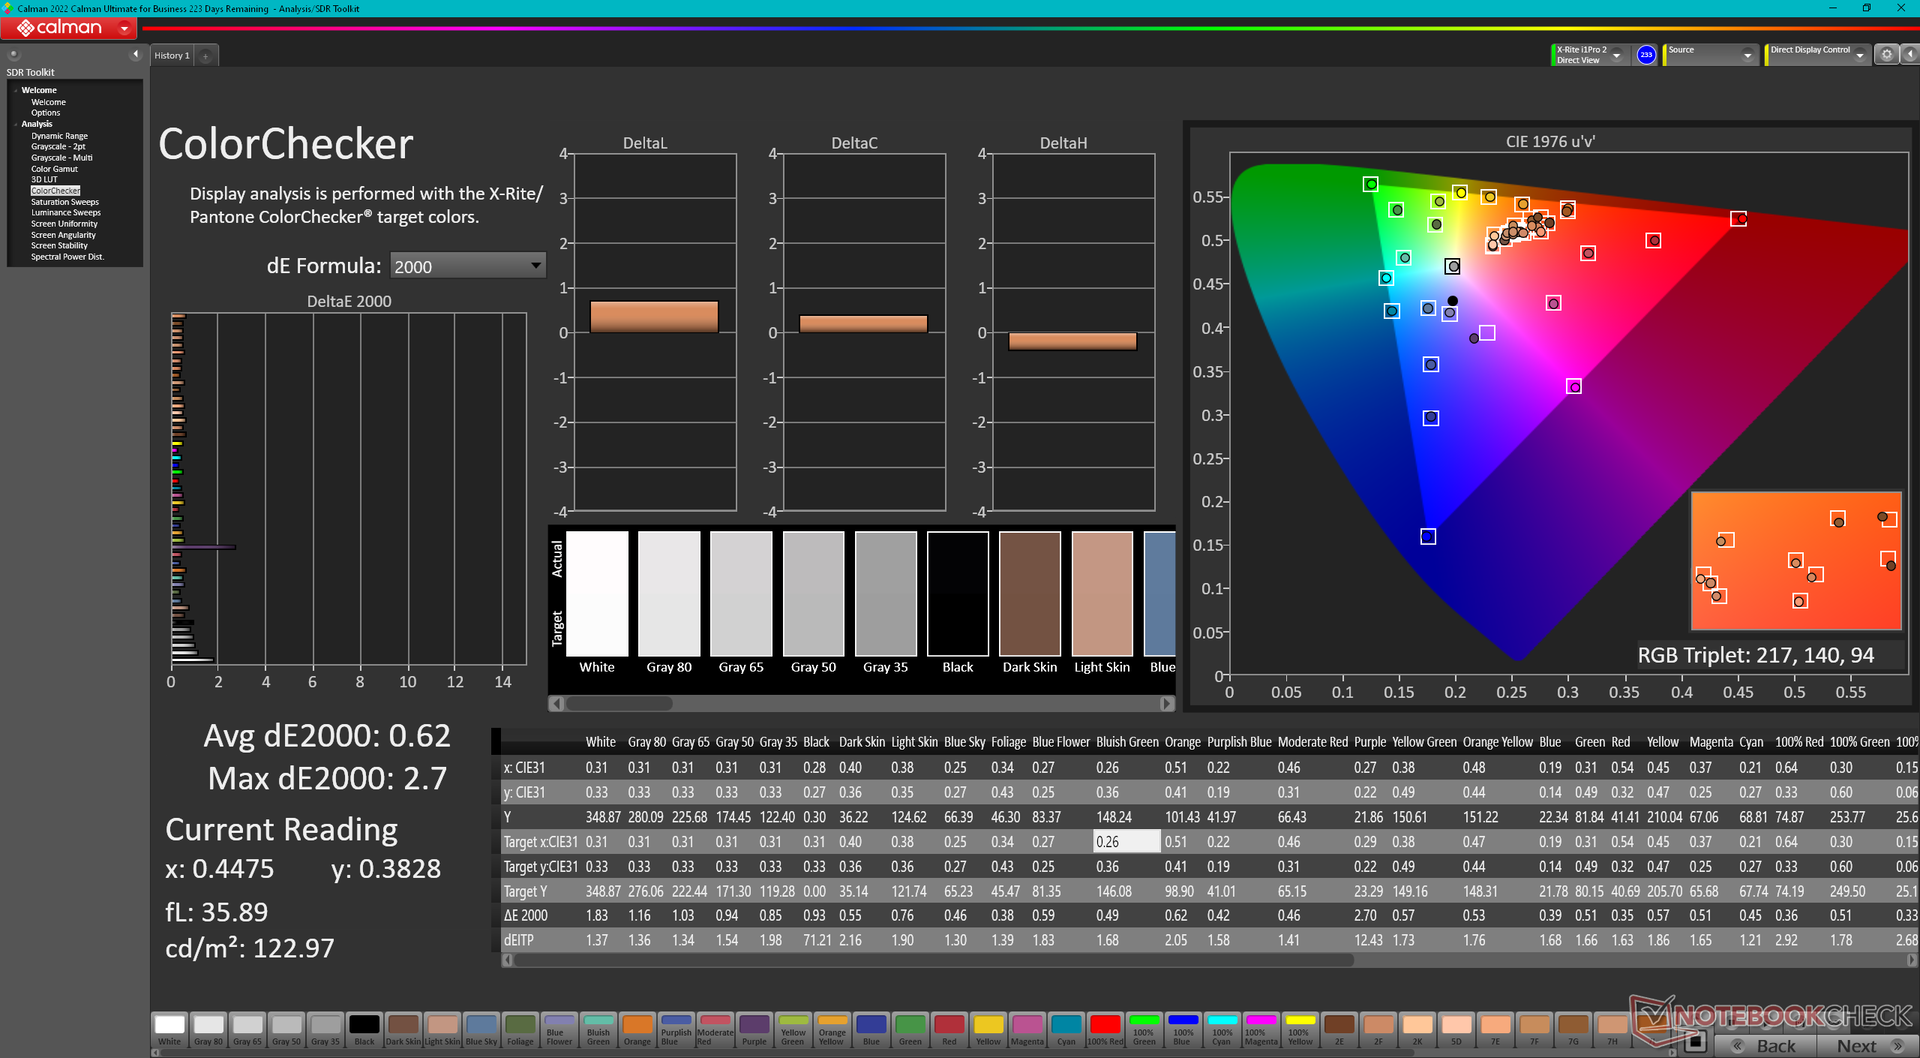
La pantalla viene bien calibrada nada más sacarla de la caja, con unos valores medios deltaE en escala de grises y color de sólo 2,1 y 1,99, respectivamente. Los resultados mejorarían aún más a <1 cada uno al calibrarlos más con nuestro colorímetro X-Rite, pero esto no debería ser necesario para la mayoría de los usuarios. Nuestro perfil ICM calibrado está disponible para su descarga gratuita más arriba.
Tiempos de respuesta del display
| ↔ Tiempo de respuesta de Negro a Blanco | ||
|---|---|---|
| 8.7 ms ... subida ↗ y bajada ↘ combinada | ↗ 4.6 ms subida | 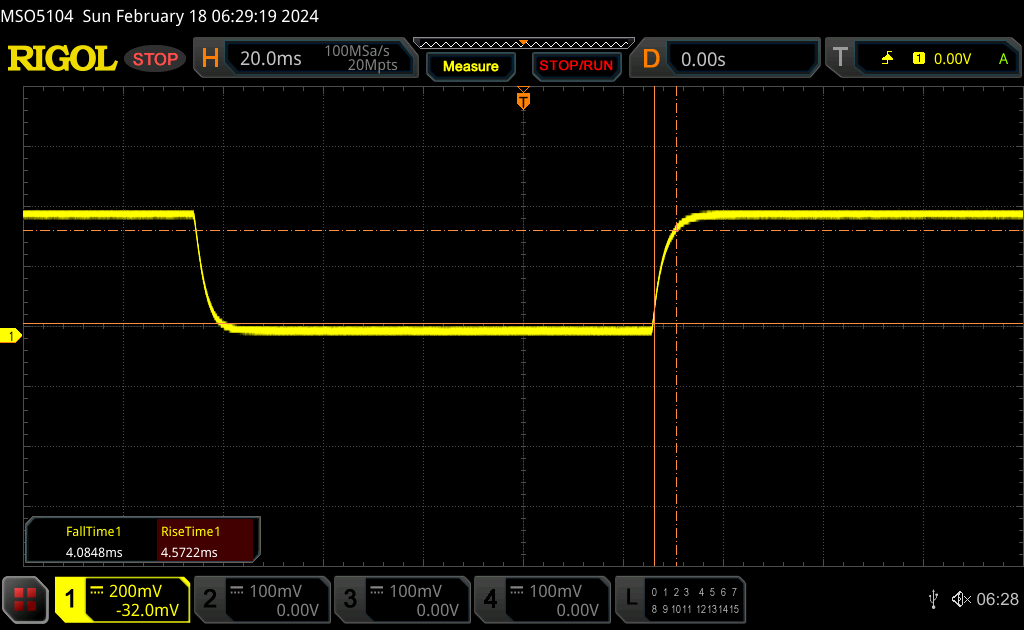 |
| ↘ 4.1 ms bajada | ||
| La pantalla mostró tiempos de respuesta rápidos en nuestros tests y debería ser adecuada para juegos. En comparación, todos los dispositivos de prueba van de ##min### (mínimo) a 240 (máximo) ms. » 24 % de todos los dispositivos son mejores. Esto quiere decir que el tiempo de respuesta medido es mejor que la media (19.8 ms) de todos los dispositivos testados. | ||
| ↔ Tiempo de respuesta 50% Gris a 80% Gris | ||
| 5.7 ms ... subida ↗ y bajada ↘ combinada | ↗ 2.6 ms subida | 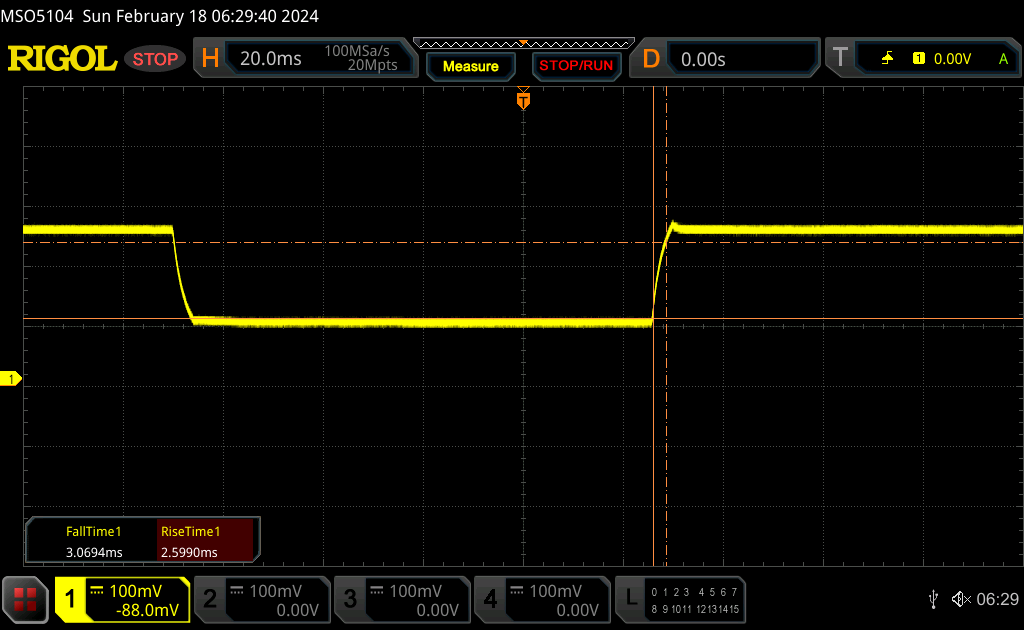 |
| ↘ 3.1 ms bajada | ||
| La pantalla mostró tiempos de respuesta muy rápidos en nuestros tests y debería ser adecuada para juegos frenéticos. En comparación, todos los dispositivos de prueba van de ##min### (mínimo) a 636 (máximo) ms. » 18 % de todos los dispositivos son mejores. Esto quiere decir que el tiempo de respuesta medido es mejor que la media (30.9 ms) de todos los dispositivos testados. | ||
Parpadeo de Pantalla / PWM (Pulse-Width Modulation)
| Parpadeo de Pantalla / PWM no detectado | 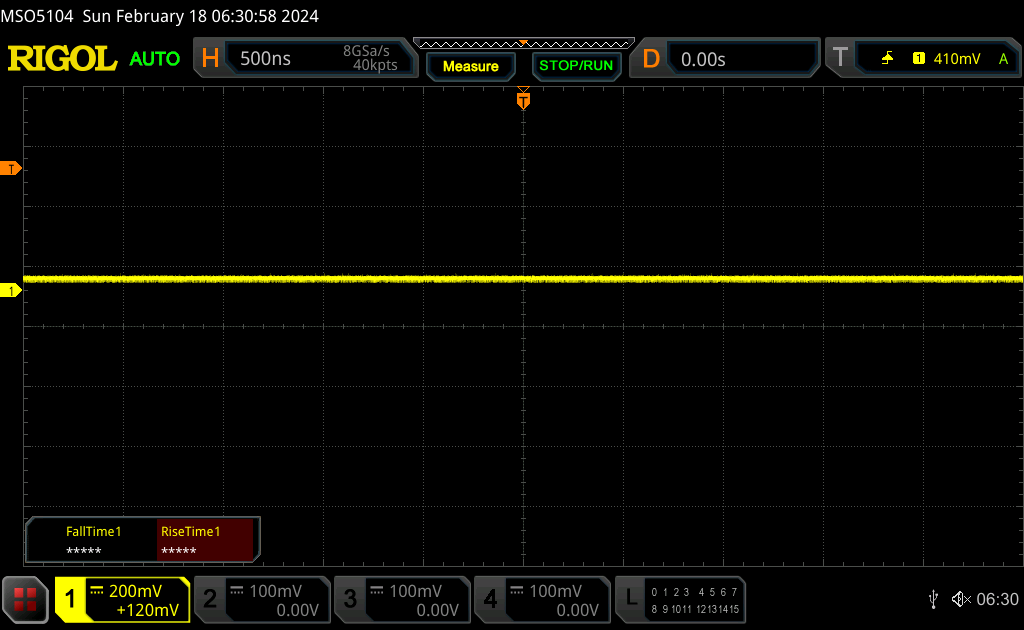 | ||
Comparación: 52 % de todos los dispositivos testados no usaron PWM para atenuar el display. Si se usó, medimos una media de 7744 (mínimo: 5 - máxmo: 343500) Hz. | |||
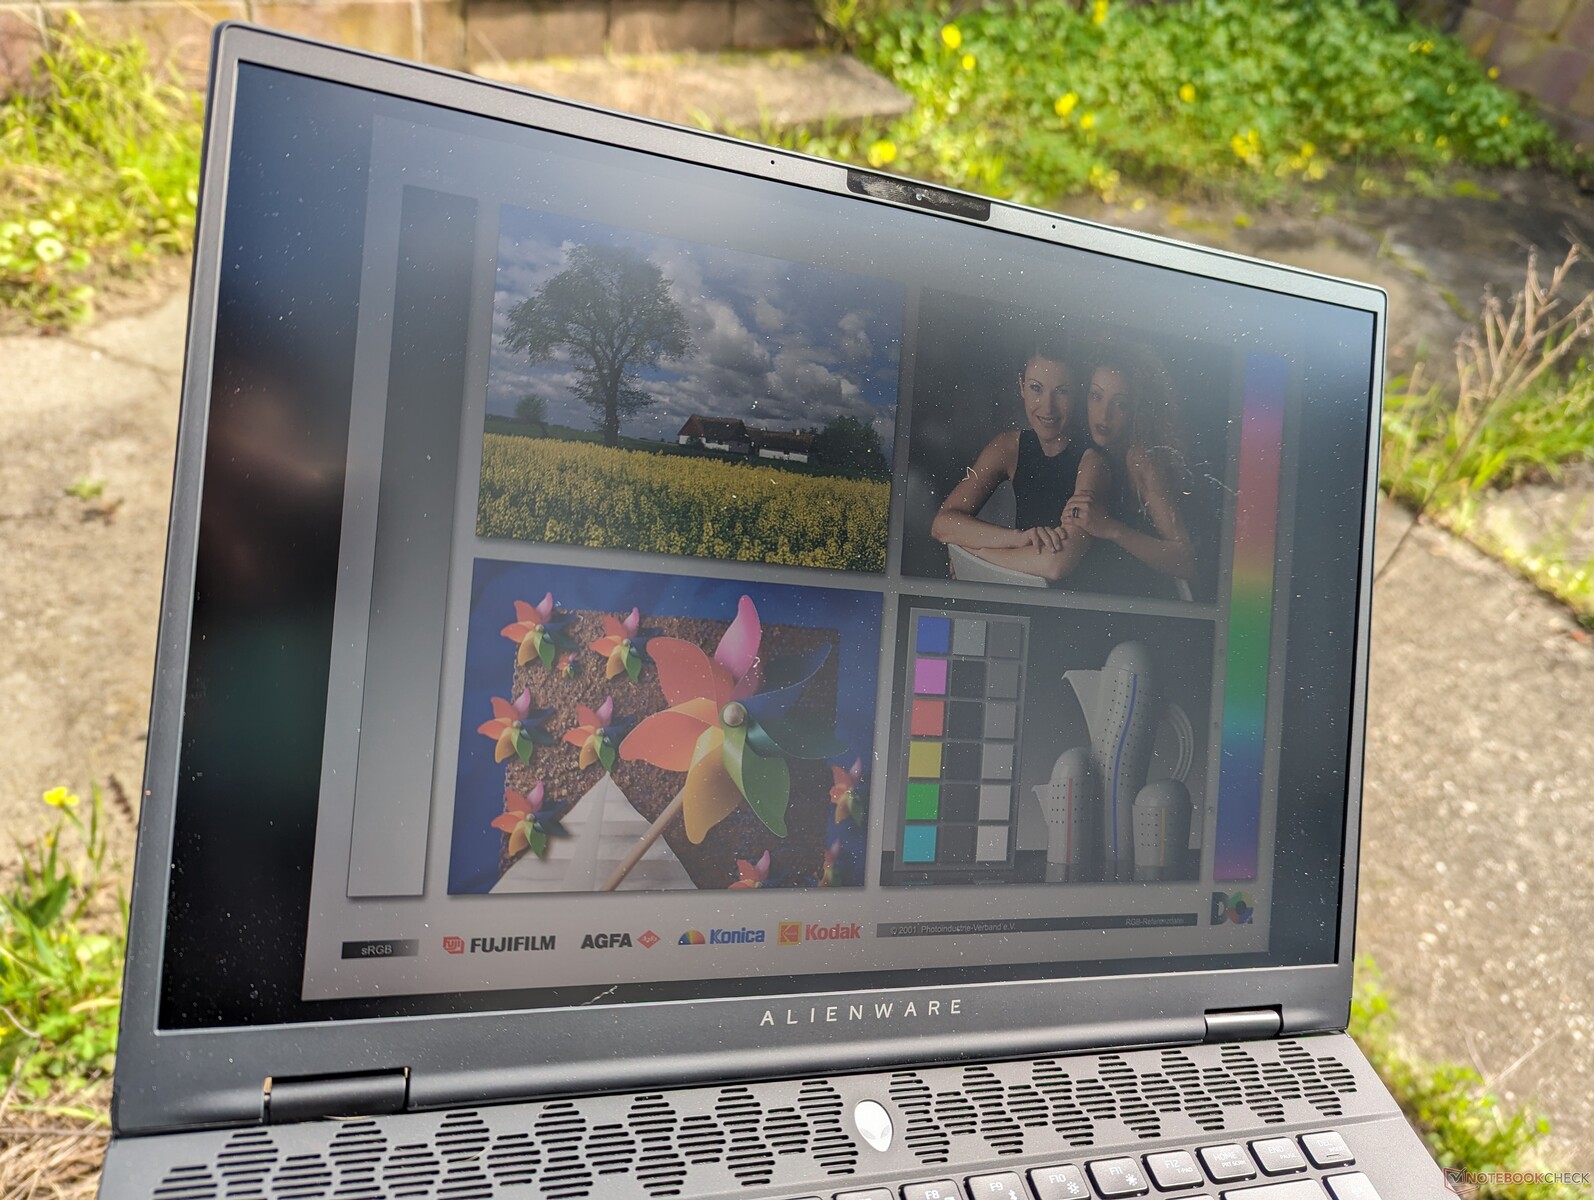
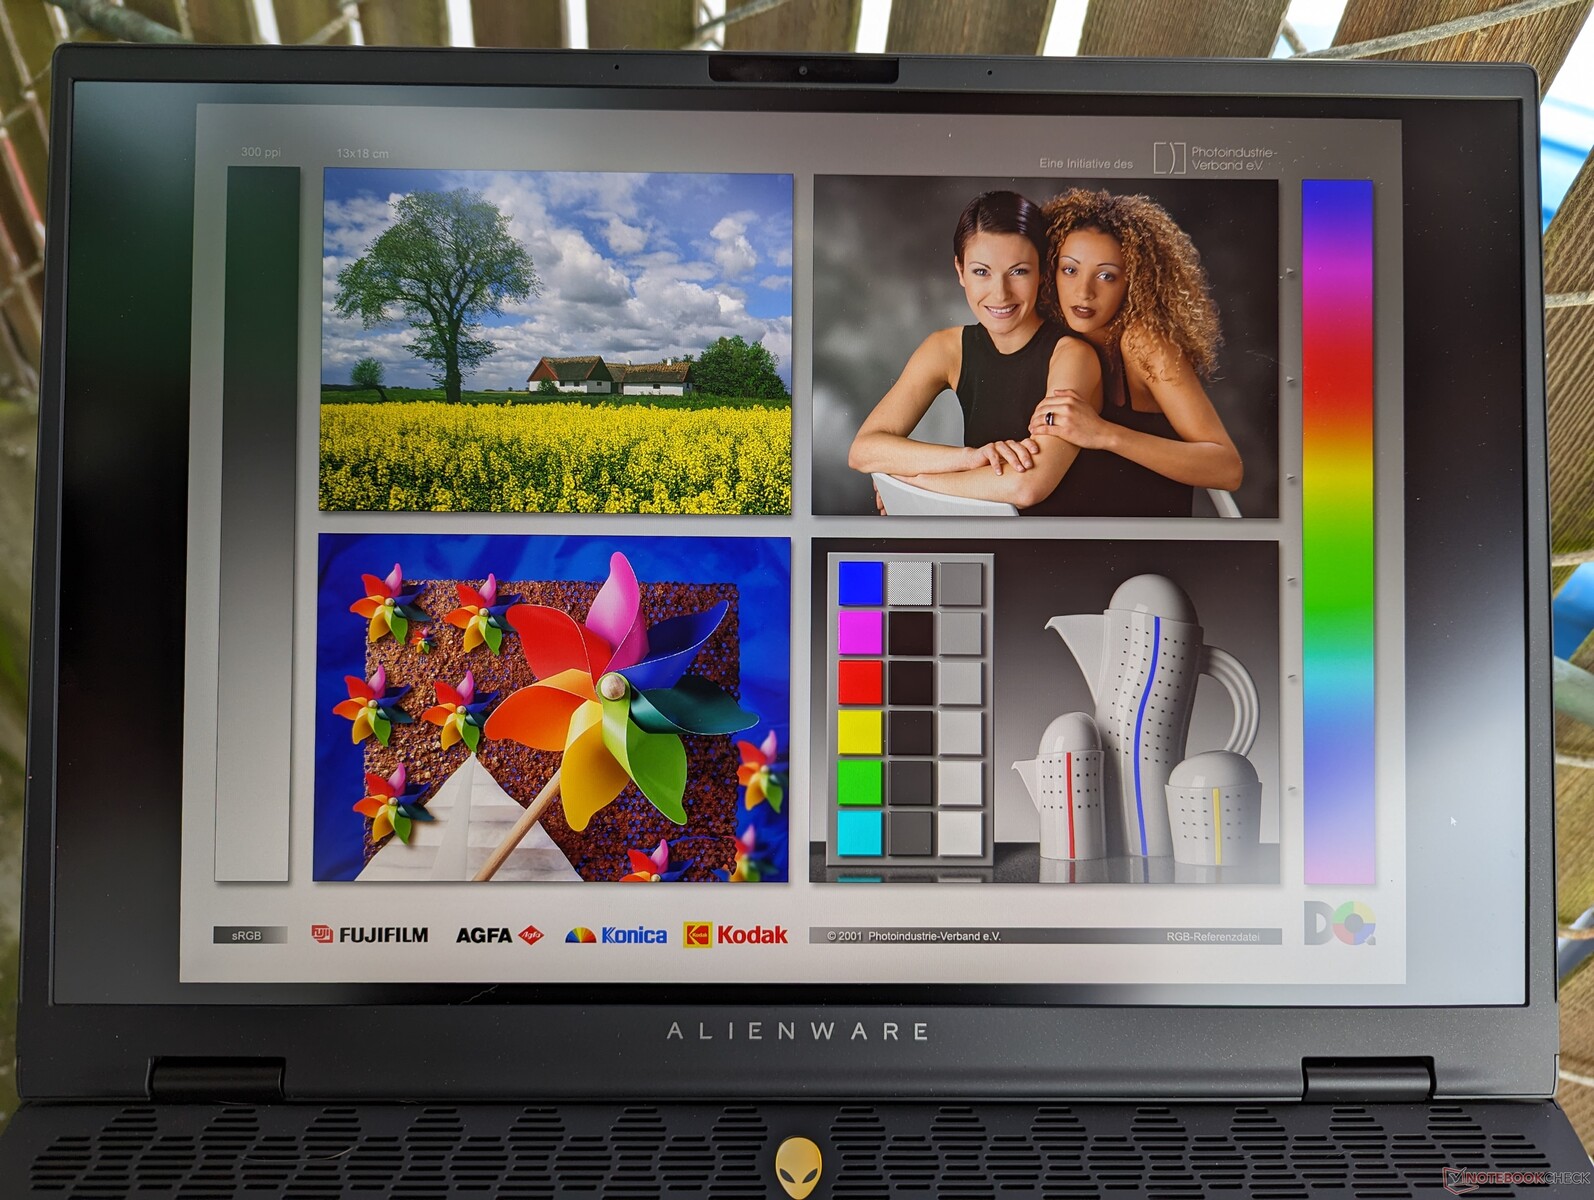
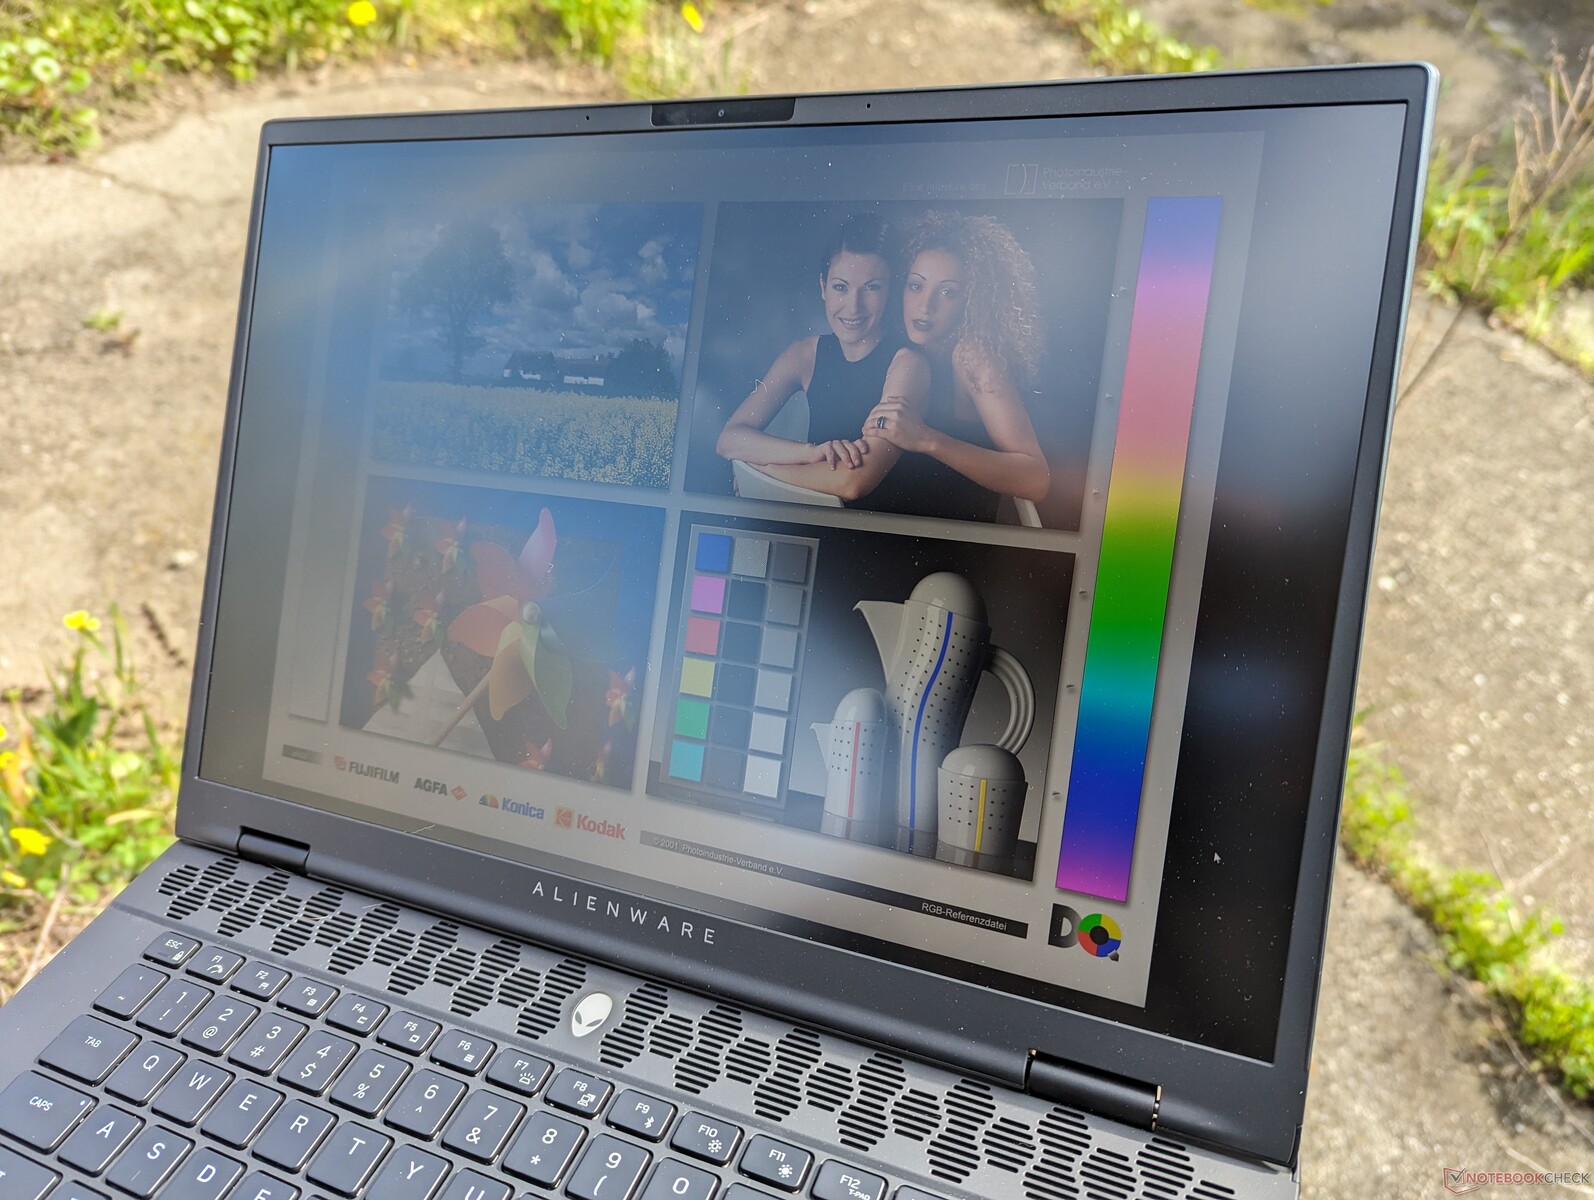
La visibilidad en exteriores sigue siendo prácticamente la misma que antes, por lo que se recomienda permanecer a la sombra siempre que sea posible para reducir el deslumbramiento y conservar los colores. Sin embargo, su menor peso y tamaño hacen que el sistema sea más fácil de manejar.
Rendimiento - De Raptor Lake-HX a Meteor Lake-H
Condiciones de prueba
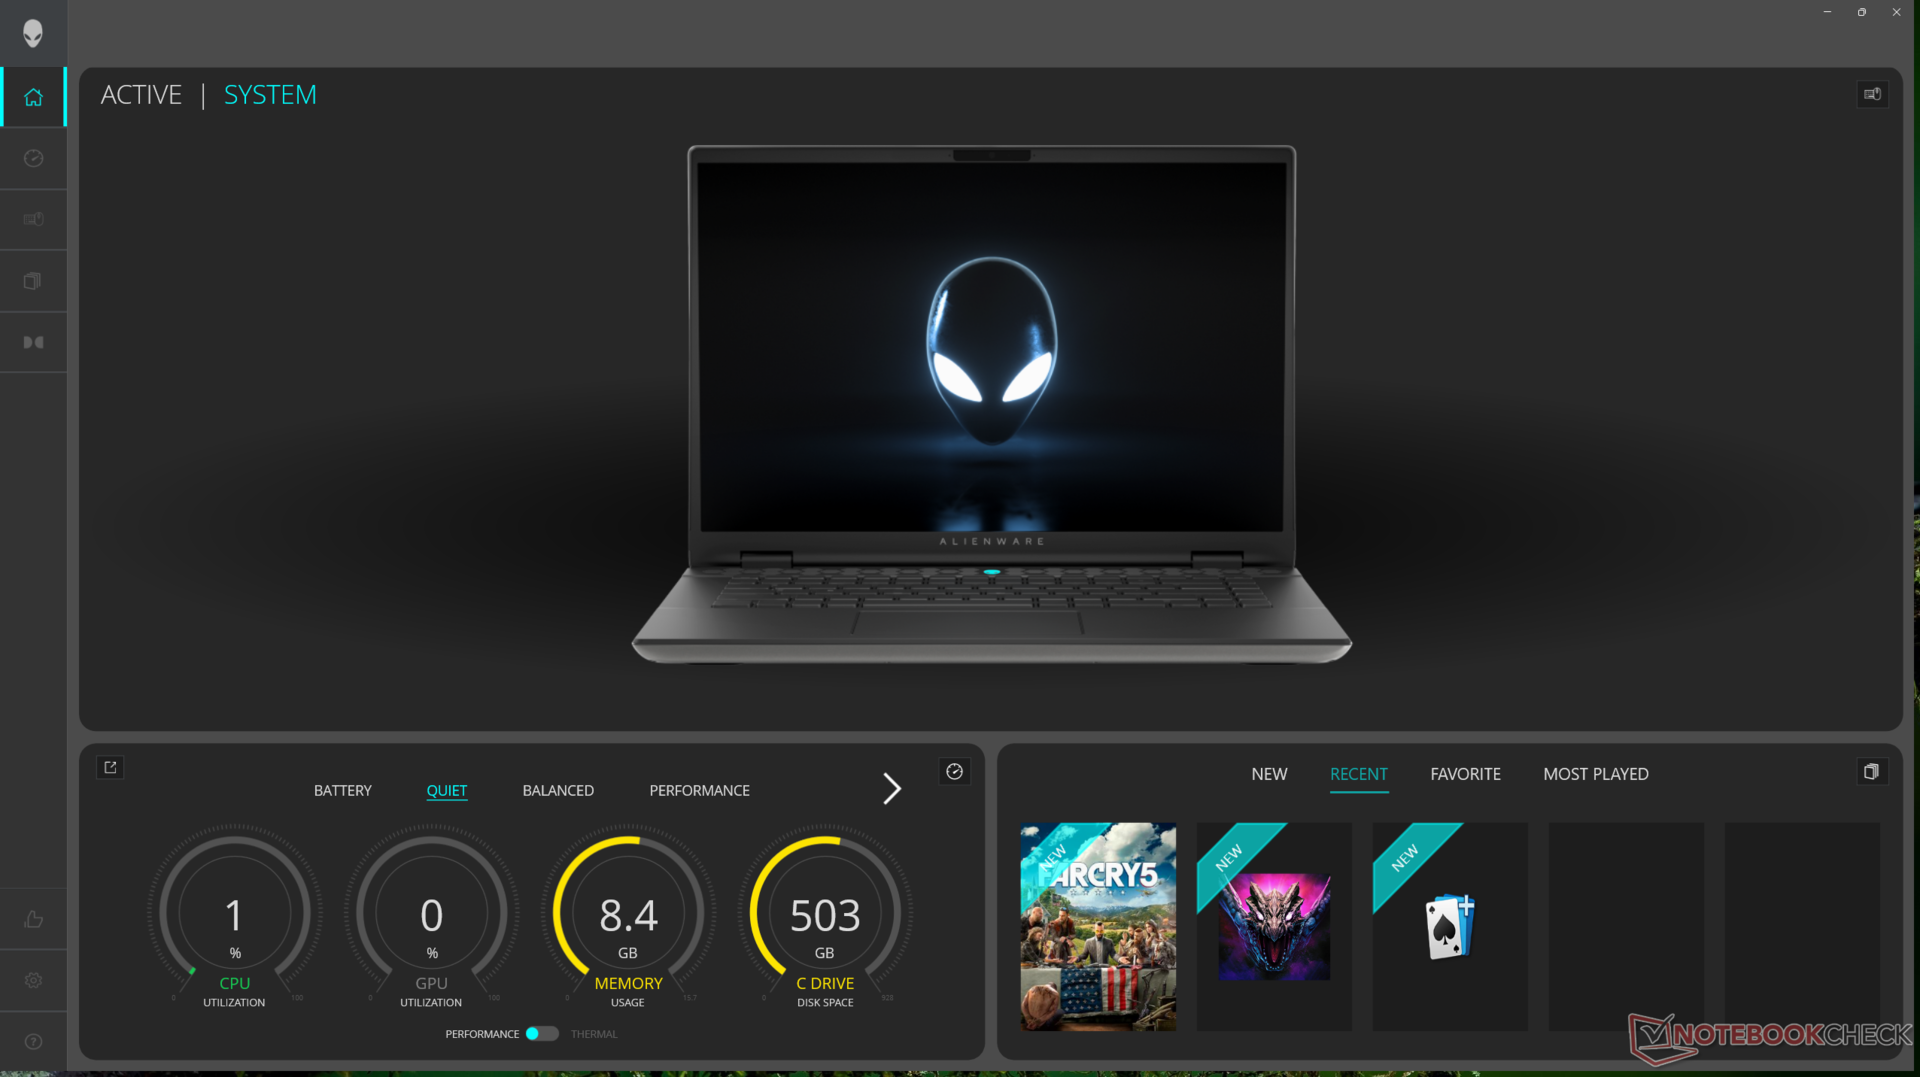
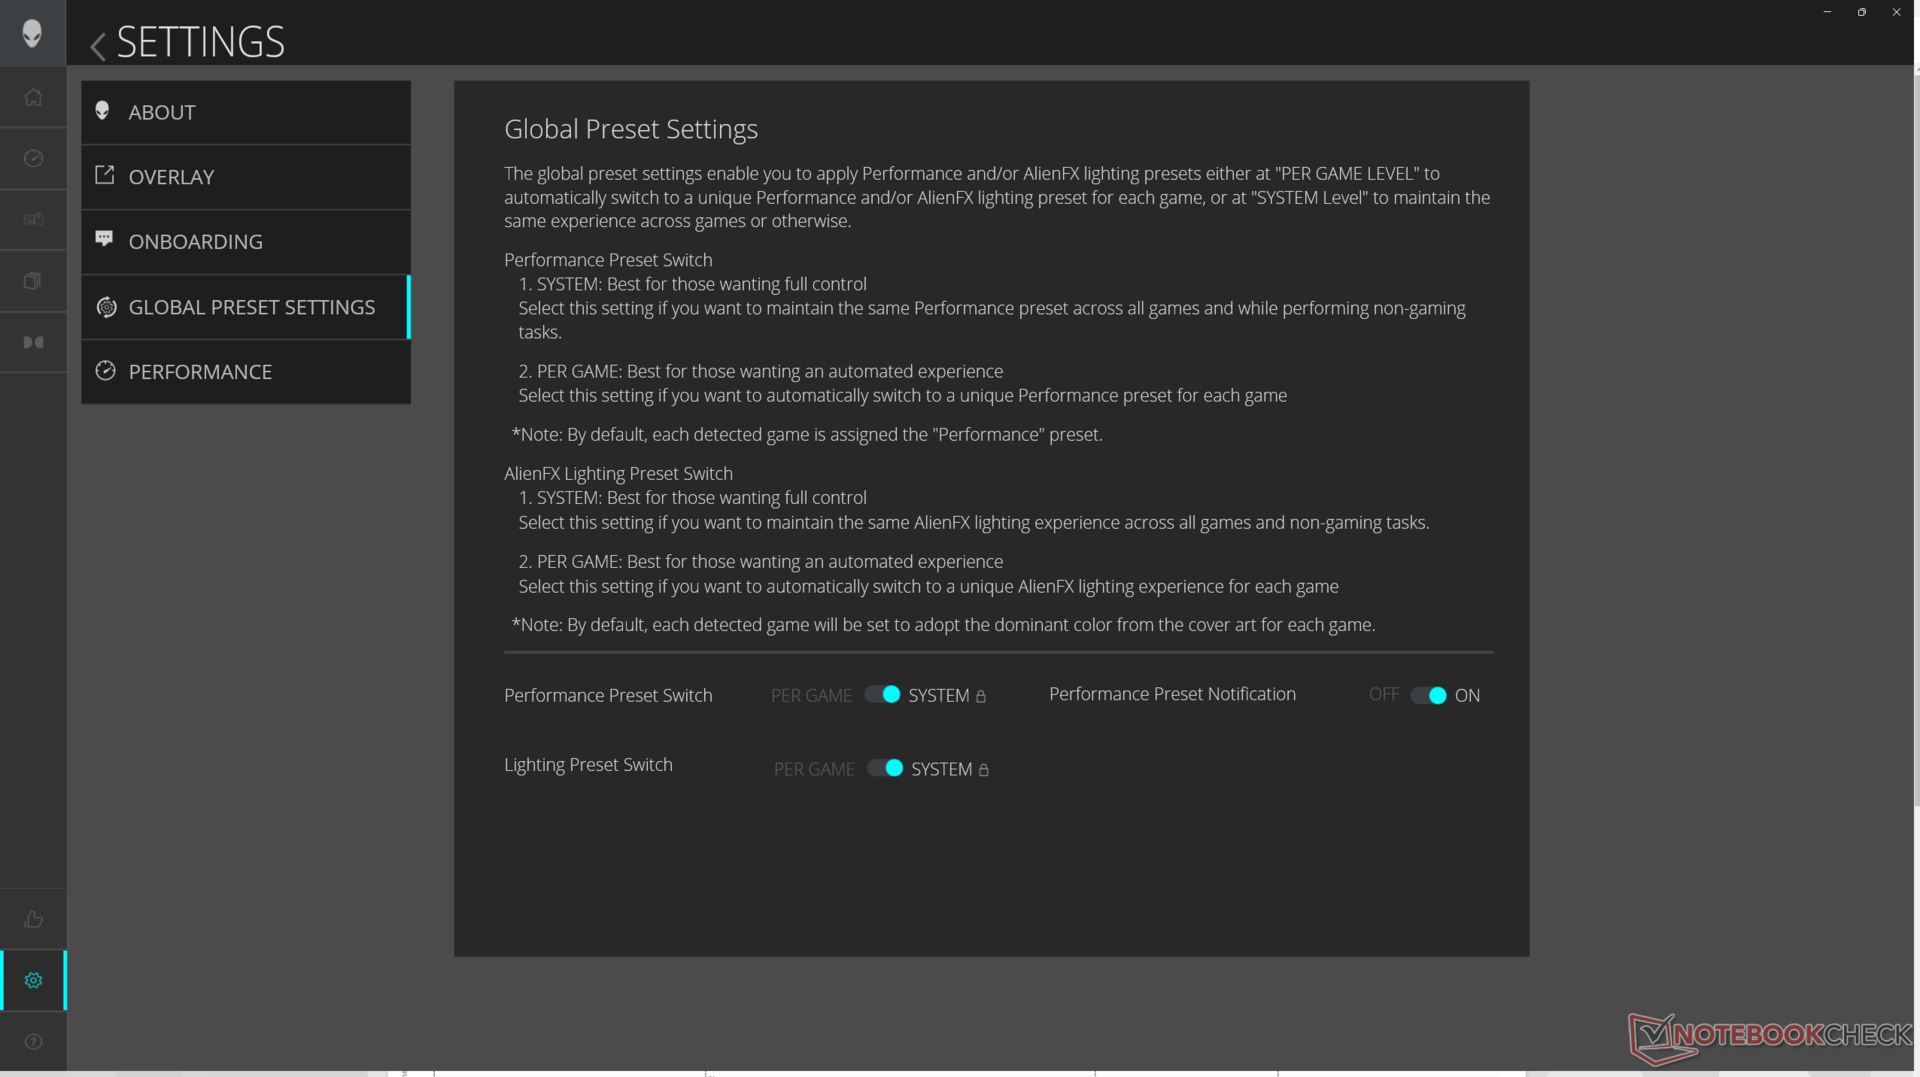
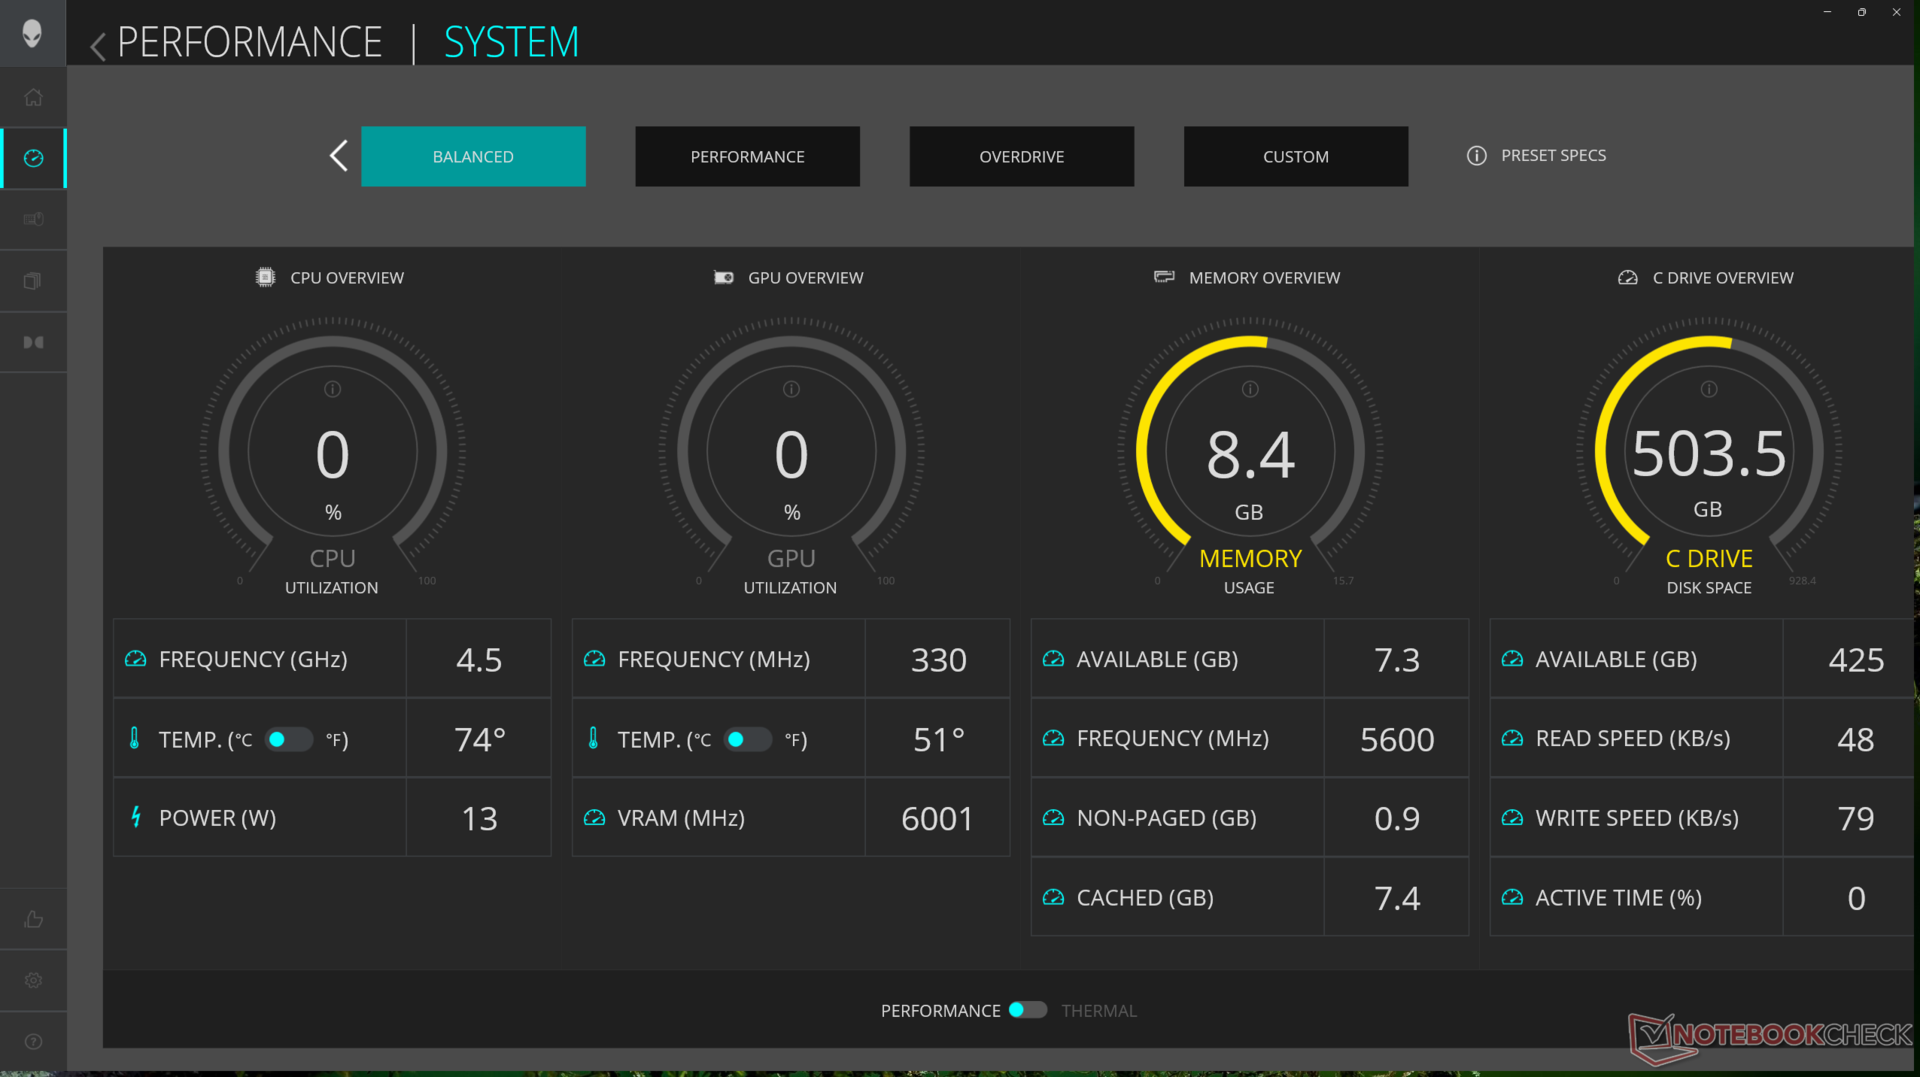
Pusimos Alienware Command Center (ACC) en modo Overdrive y Nvidia Control Panel en modo dGPU antes de ejecutar los puntos de referencia que se muestran a continuación. ACC ha sido actualizado para funcionar mucho más suavemente y sin muchos de los problemas que experimentamos en la m16 R1. Por ejemplo, ahora se inicia casi inmediatamente tras el arranque, mientras que los modos de perfil de ventilador y la iluminación RGB AlienFX ya no cambian automáticamente sin avisar primero al usuario.
No obstante, seguimos experimentando un error por el que el sistema a veces no entraba correctamente en el modo de reposo cuando se cerraba la tapa, incluso después de comprobar dos veces la configuración de energía de Windows. Esto provocaba un portátil muy caliente y una batería completamente agotada pocas horas después.
Tanto Advanced Optimus como G-Sync son compatibles, lo que significa que los usuarios pueden cambiar entre los modos iGPU y dGPU sin un reinicio suave. Tenga en cuenta que el sistema debe estar configurado en modo dGPU para que funcione G-Sync.
Procesador
Nuestra Core Ultra 7 155H es entre un 10 y un 15 por ciento más lento que el Core i7-13700HX en el m16 R1 del año pasado tanto en operaciones monohilo como multihilo. Está esencialmente a la par con el reciente Ryzen 9 8945HS. Al igual que en otras CPU Meteor Lake, la Core Ultra 7 155H integra una NPU para acelerar tareas de IA como Microsoft Co-Pilot. Sin embargo, la mayoría de las aplicaciones de IA en este momento están basadas en la nube y sin opciones para ejecutarse localmente, por lo que las capacidades de IA integradas de la nueva CPU son muy limitadas por el momento.
A pesar del déficit de rendimiento frente al Core i7-13700HX, el m16 R2 es capaz de ejecutar el Core Ultra 7 155H notablemente más rápido que otros portátiles equipados con el mismo procesador. Por ejemplo, el Core Ultra 7 155H del reciente MSI Prestige 16 funciona casi un 20 por ciento más lento.
Dell afirma que tiene previsto ofrecer una SKU Ultra 9 185H en un futuro próximo, lo que debería ayudar a reducir la diferencia de rendimiento frente al Core i7-13700HX. Los Core i7-14700HX o Core i9-14900HX más exigentes no se ofrecen debido a limitaciones térmicas; Dell dio prioridad a maximizar el TGP de la GPU en lugar del TDP de la CPU.
Cinebench R15 Multi Loop
Cinebench R23: Multi Core | Single Core
Cinebench R20: CPU (Multi Core) | CPU (Single Core)
Cinebench R15: CPU Multi 64Bit | CPU Single 64Bit
Blender: v2.79 BMW27 CPU
7-Zip 18.03: 7z b 4 | 7z b 4 -mmt1
Geekbench 6.7: Multi-Core | Single-Core
Geekbench 5.5: Multi-Core | Single-Core
HWBOT x265 Benchmark v2.2: 4k Preset
LibreOffice : 20 Documents To PDF
R Benchmark 2.5: Overall mean
| Geekbench 6.7 / Multi-Core | |
| Lenovo Legion 9 16IRX8 | |
| HP Omen Transcend 16-u1095ng | |
| Alienware m16 R1 Intel | |
| Razer Blade 14 RZ09-0508 | |
| Asus ROG Zephyrus G16 2024 GU605M | |
| Framework Laptop 16 | |
| Lenovo Legion Slim 7 16APH8 | |
| Alienware m16 R2 | |
| Alienware m16 R1 AMD | |
| Medio Intel Core Ultra 7 155H (7732 - 13656, n=55) | |
| Geekbench 6.7 / Single-Core | |
| Lenovo Legion 9 16IRX8 | |
| HP Omen Transcend 16-u1095ng | |
| Alienware m16 R1 AMD | |
| Razer Blade 14 RZ09-0508 | |
| Alienware m16 R1 Intel | |
| Framework Laptop 16 | |
| Lenovo Legion Slim 7 16APH8 | |
| Asus ROG Zephyrus G16 2024 GU605M | |
| Alienware m16 R2 | |
| Medio Intel Core Ultra 7 155H (1901 - 2473, n=52) | |
Cinebench R23: Multi Core | Single Core
Cinebench R20: CPU (Multi Core) | CPU (Single Core)
Cinebench R15: CPU Multi 64Bit | CPU Single 64Bit
Blender: v2.79 BMW27 CPU
7-Zip 18.03: 7z b 4 | 7z b 4 -mmt1
Geekbench 6.7: Multi-Core | Single-Core
Geekbench 5.5: Multi-Core | Single-Core
HWBOT x265 Benchmark v2.2: 4k Preset
LibreOffice : 20 Documents To PDF
R Benchmark 2.5: Overall mean
* ... más pequeño es mejor
AIDA64: FP32 Ray-Trace | FPU Julia | CPU SHA3 | CPU Queen | FPU SinJulia | FPU Mandel | CPU AES | CPU ZLib | FP64 Ray-Trace | CPU PhotoWorxx
| Performance rating | |
| Lenovo Legion Slim 7 16APH8 | |
| Alienware m16 R1 Intel | |
| Alienware x16 R1 | |
| HP Omen Transcend 16-u1095ng | |
| Alienware m16 R2 | |
| Asus ROG Zephyrus G16 2024 GU605M | |
| Medio Intel Core Ultra 7 155H | |
| AIDA64 / FP32 Ray-Trace | |
| Lenovo Legion Slim 7 16APH8 | |
| Alienware m16 R1 Intel | |
| Alienware m16 R2 | |
| Alienware x16 R1 | |
| HP Omen Transcend 16-u1095ng | |
| Asus ROG Zephyrus G16 2024 GU605M | |
| Medio Intel Core Ultra 7 155H (6670 - 18470, n=50) | |
| AIDA64 / FPU Julia | |
| Lenovo Legion Slim 7 16APH8 | |
| Alienware m16 R1 Intel | |
| Alienware m16 R2 | |
| Alienware x16 R1 | |
| HP Omen Transcend 16-u1095ng | |
| Asus ROG Zephyrus G16 2024 GU605M | |
| Medio Intel Core Ultra 7 155H (40905 - 93181, n=50) | |
| AIDA64 / CPU SHA3 | |
| Alienware m16 R1 Intel | |
| Lenovo Legion Slim 7 16APH8 | |
| HP Omen Transcend 16-u1095ng | |
| Alienware m16 R2 | |
| Alienware x16 R1 | |
| Asus ROG Zephyrus G16 2024 GU605M | |
| Medio Intel Core Ultra 7 155H (1940 - 4436, n=50) | |
| AIDA64 / CPU Queen | |
| HP Omen Transcend 16-u1095ng | |
| Alienware x16 R1 | |
| Lenovo Legion Slim 7 16APH8 | |
| Alienware m16 R1 Intel | |
| Asus ROG Zephyrus G16 2024 GU605M | |
| Alienware m16 R2 | |
| Medio Intel Core Ultra 7 155H (64698 - 94181, n=50) | |
| AIDA64 / FPU SinJulia | |
| Lenovo Legion Slim 7 16APH8 | |
| Alienware m16 R1 Intel | |
| HP Omen Transcend 16-u1095ng | |
| Alienware x16 R1 | |
| Asus ROG Zephyrus G16 2024 GU605M | |
| Alienware m16 R2 | |
| Medio Intel Core Ultra 7 155H (5639 - 10647, n=50) | |
| AIDA64 / FPU Mandel | |
| Lenovo Legion Slim 7 16APH8 | |
| Alienware m16 R1 Intel | |
| Alienware m16 R2 | |
| Alienware x16 R1 | |
| HP Omen Transcend 16-u1095ng | |
| Asus ROG Zephyrus G16 2024 GU605M | |
| Medio Intel Core Ultra 7 155H (18236 - 47685, n=50) | |
| AIDA64 / CPU AES | |
| Alienware m16 R1 Intel | |
| HP Omen Transcend 16-u1095ng | |
| Alienware m16 R2 | |
| Alienware x16 R1 | |
| Asus ROG Zephyrus G16 2024 GU605M | |
| Medio Intel Core Ultra 7 155H (45713 - 152179, n=50) | |
| Lenovo Legion Slim 7 16APH8 | |
| AIDA64 / CPU ZLib | |
| Alienware m16 R1 Intel | |
| HP Omen Transcend 16-u1095ng | |
| Alienware x16 R1 | |
| Alienware m16 R2 | |
| Asus ROG Zephyrus G16 2024 GU605M | |
| Lenovo Legion Slim 7 16APH8 | |
| Medio Intel Core Ultra 7 155H (557 - 1250, n=50) | |
| AIDA64 / FP64 Ray-Trace | |
| Lenovo Legion Slim 7 16APH8 | |
| Alienware m16 R1 Intel | |
| Alienware x16 R1 | |
| Alienware m16 R2 | |
| HP Omen Transcend 16-u1095ng | |
| Asus ROG Zephyrus G16 2024 GU605M | |
| Medio Intel Core Ultra 7 155H (3569 - 9802, n=50) | |
| AIDA64 / CPU PhotoWorxx | |
| Alienware x16 R1 | |
| HP Omen Transcend 16-u1095ng | |
| Asus ROG Zephyrus G16 2024 GU605M | |
| Medio Intel Core Ultra 7 155H (32719 - 54223, n=50) | |
| Lenovo Legion Slim 7 16APH8 | |
| Alienware m16 R2 | |
| Alienware m16 R1 Intel | |
Prueba de estrés
Al ejecutar el estrés de Prime95 en el modo Overdrive, la CPU aumentaría a 4,6 GHz y 115 W durante varios segundos antes de descender de forma constante y finalmente estabilizarse en 3,4 GHz y 102 W. La temperatura del núcleo, sin embargo, sería extremadamente cálida a 100 C, lo que sugiere que la CPU ya está empujando la solución de refrigeración hasta sus límites.
Curiosamente, casi no hay cambios en las velocidades de reloj de la GPU o en el consumo de energía de la placa cuando se ejecuta Witcher 3 en los modos Equilibrado, Rendimiento u Overdrive, lo que se correlaciona con nuestros hallazgos más adelante en la sección Rendimiento de la GPU. En cambio, la temperatura de la GPU tiende a disminuir cuando está en los modos Rendimiento u Overdrive debido a los techos más ruidosos del ventilador en estos modos. En otras palabras, las velocidades de reloj y la TGP en tiempo real permanecerían constantes mientras que el ruido del ventilador cambiaría. Puede haber algunos pequeños cambios en el rendimiento de la CPU entre los modos, pero la mayoría de los juegos no están ligados a la CPU de todos modos.
Vale la pena señalar que mientras que la GPU está clasificada en 140 W TGP según el Panel de Control de Nvidia, tiende a estabilizarse en 106 W cuando se juega. Somos capaces de alcanzar un máximo temporal de 121 W.
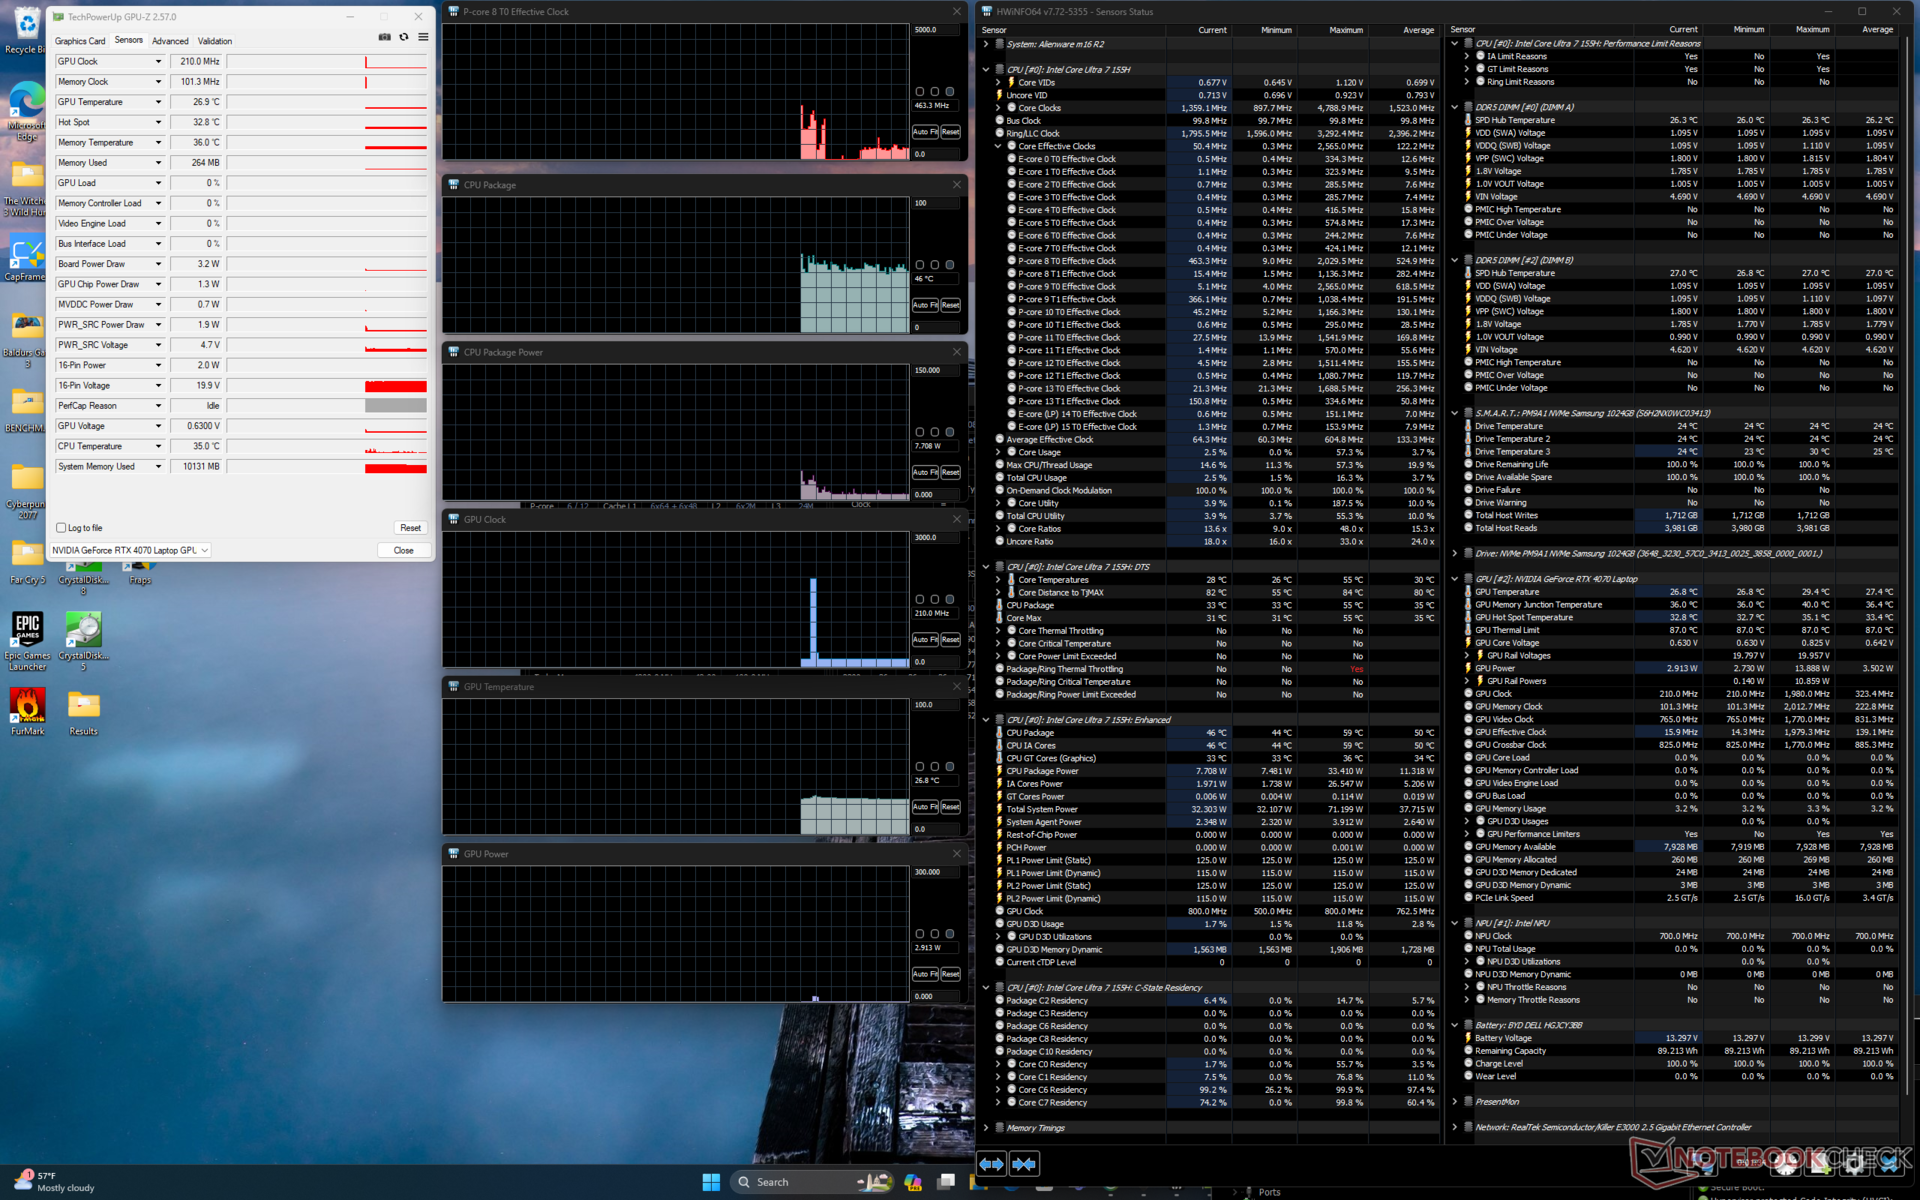
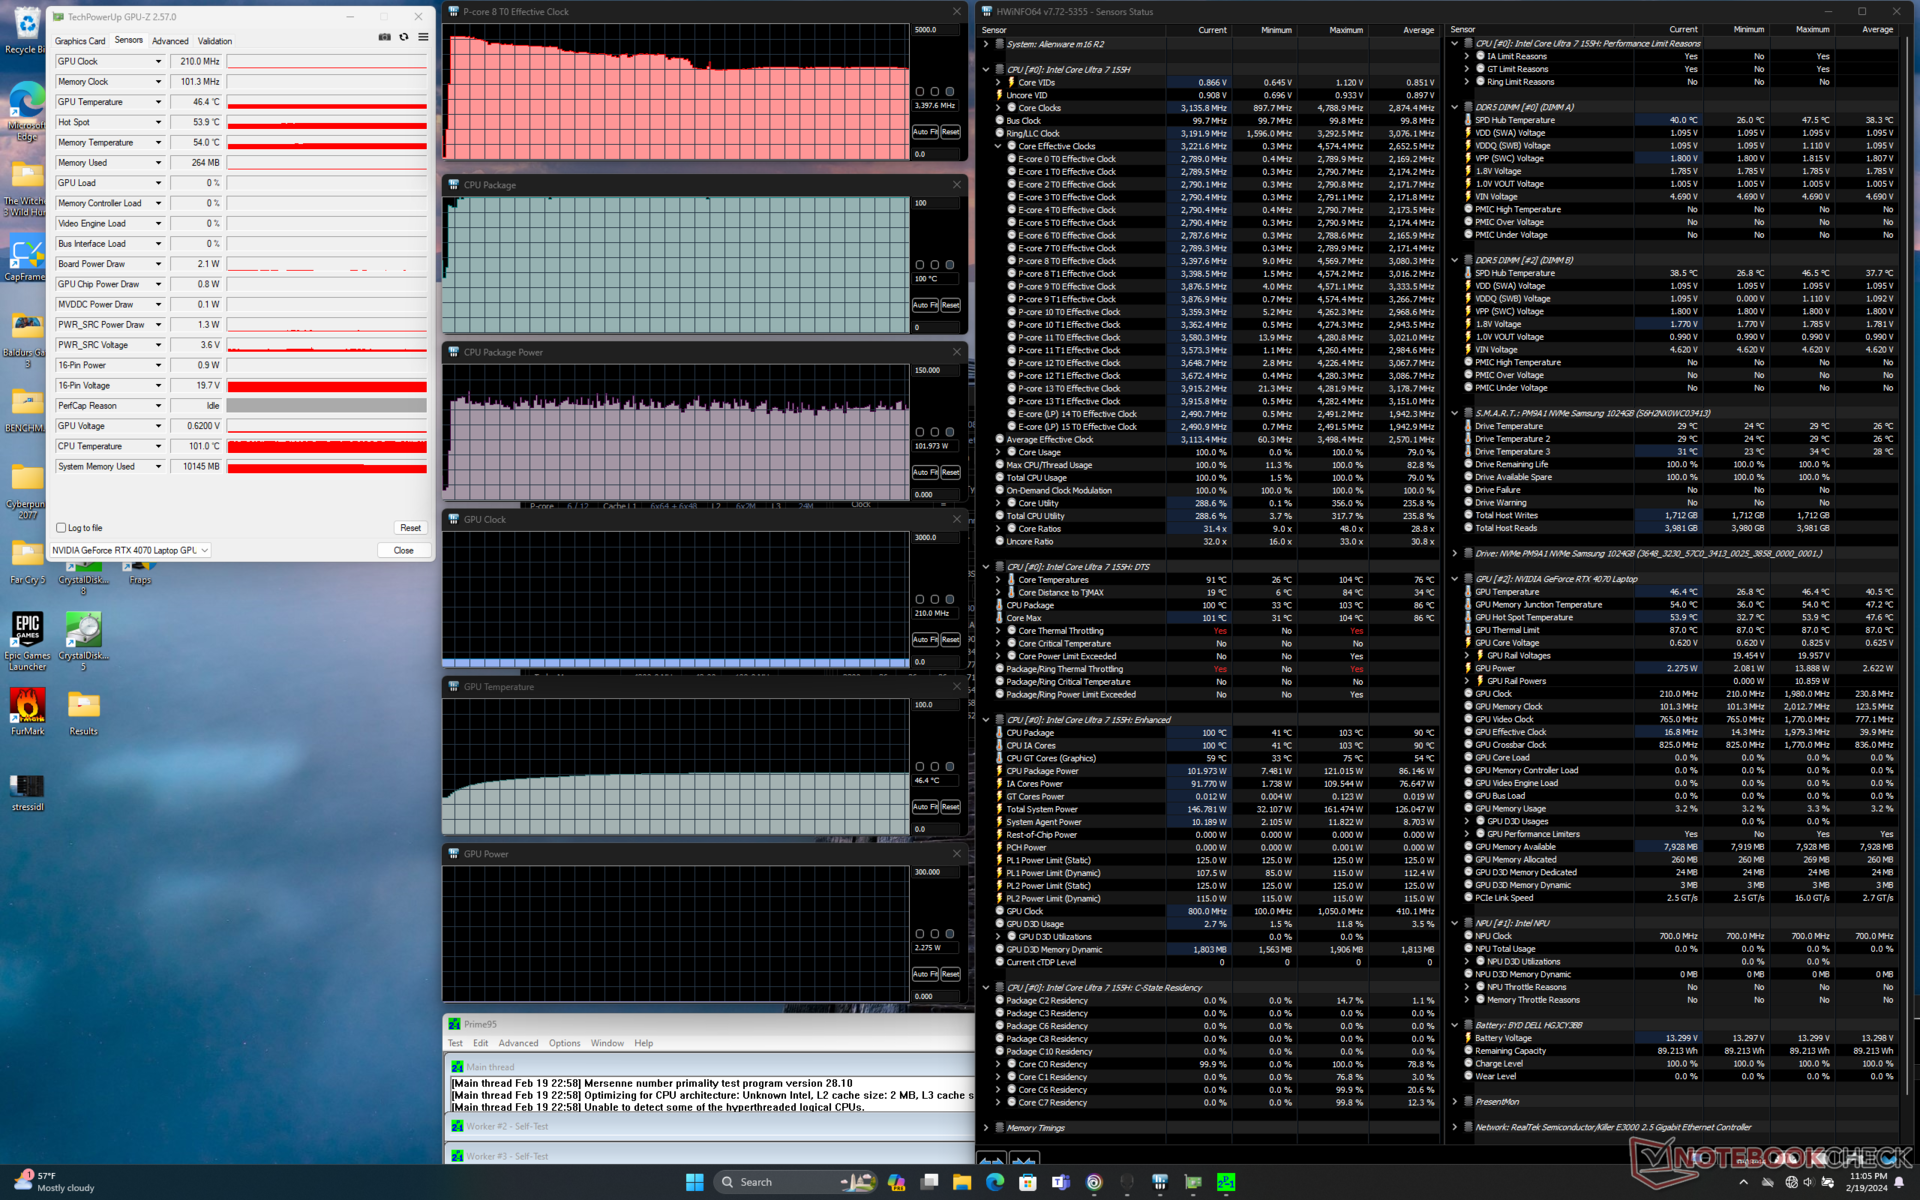
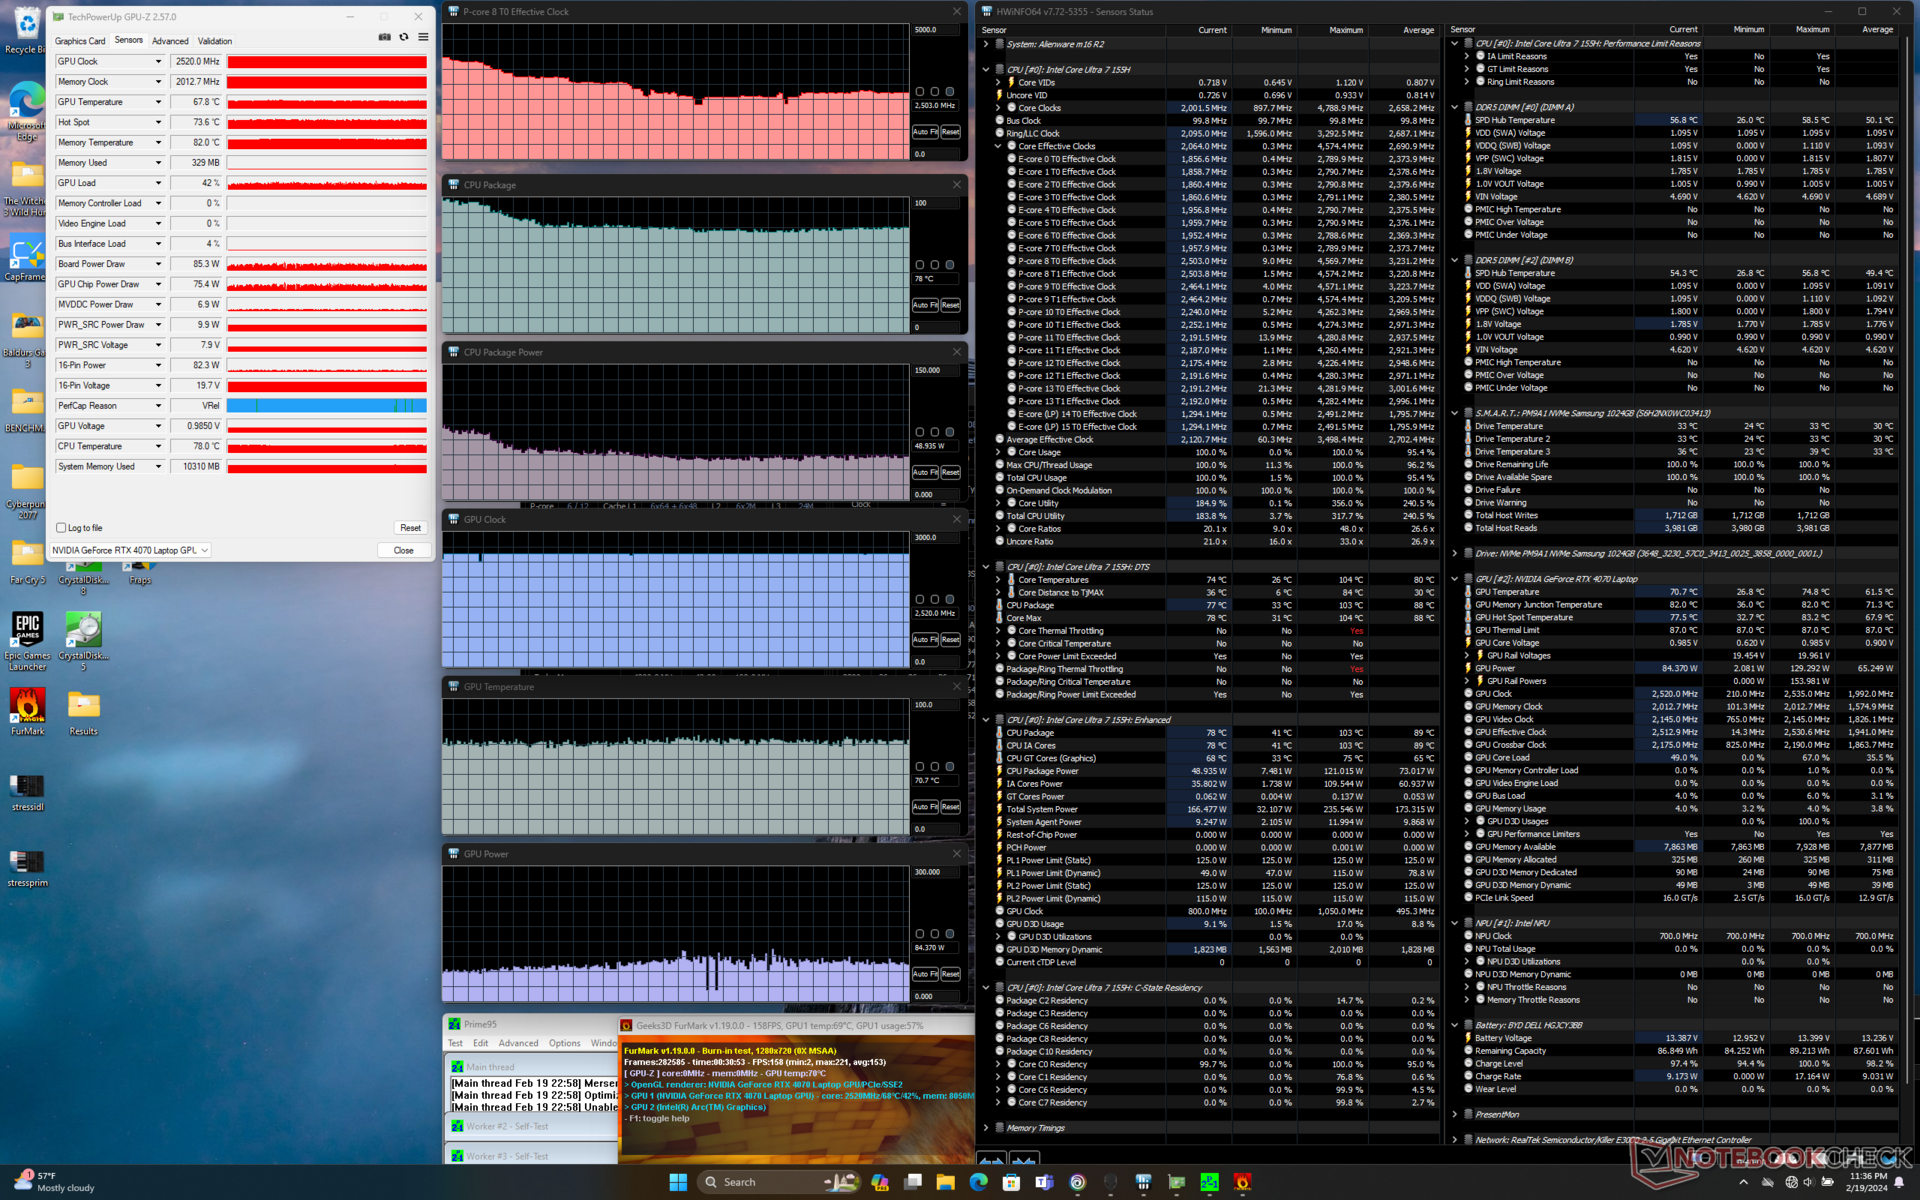

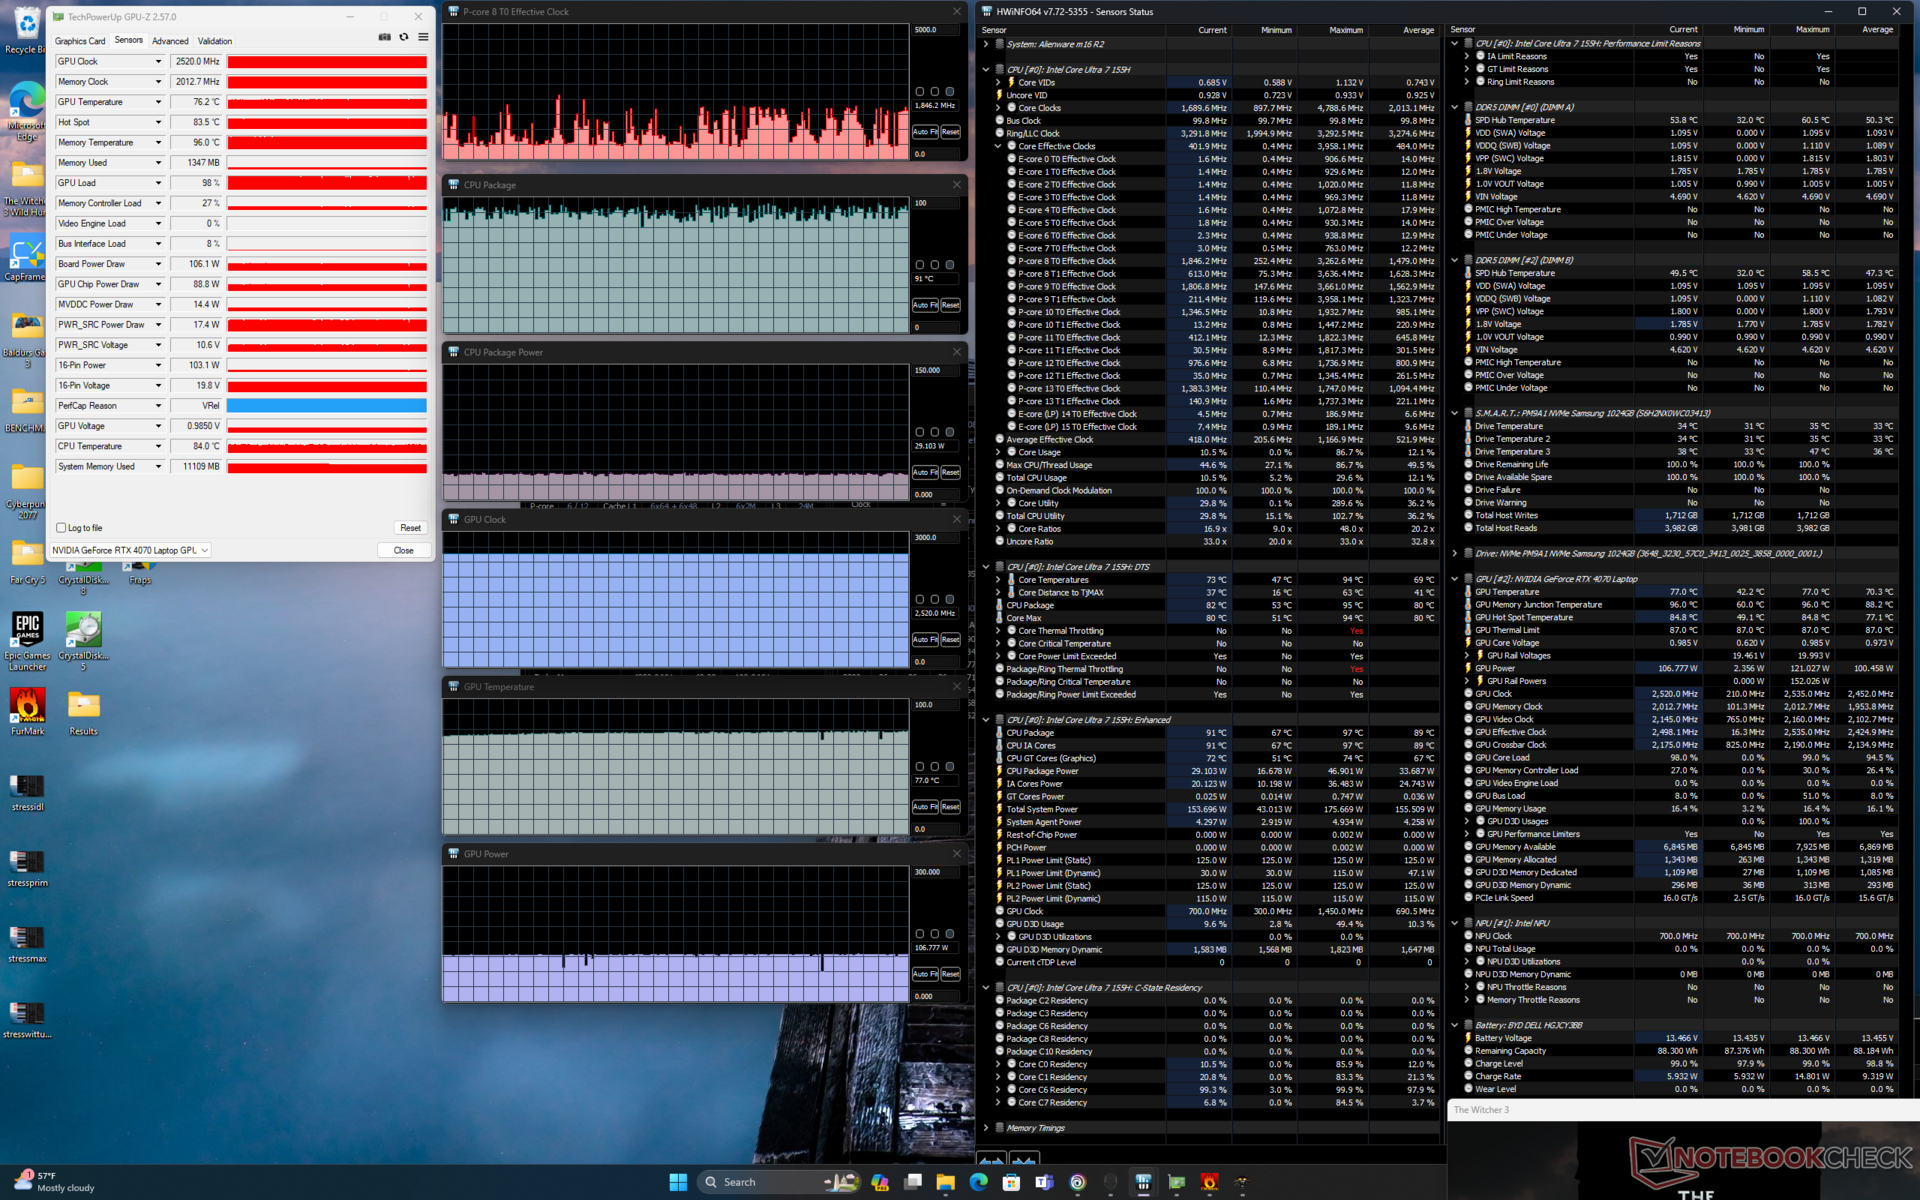
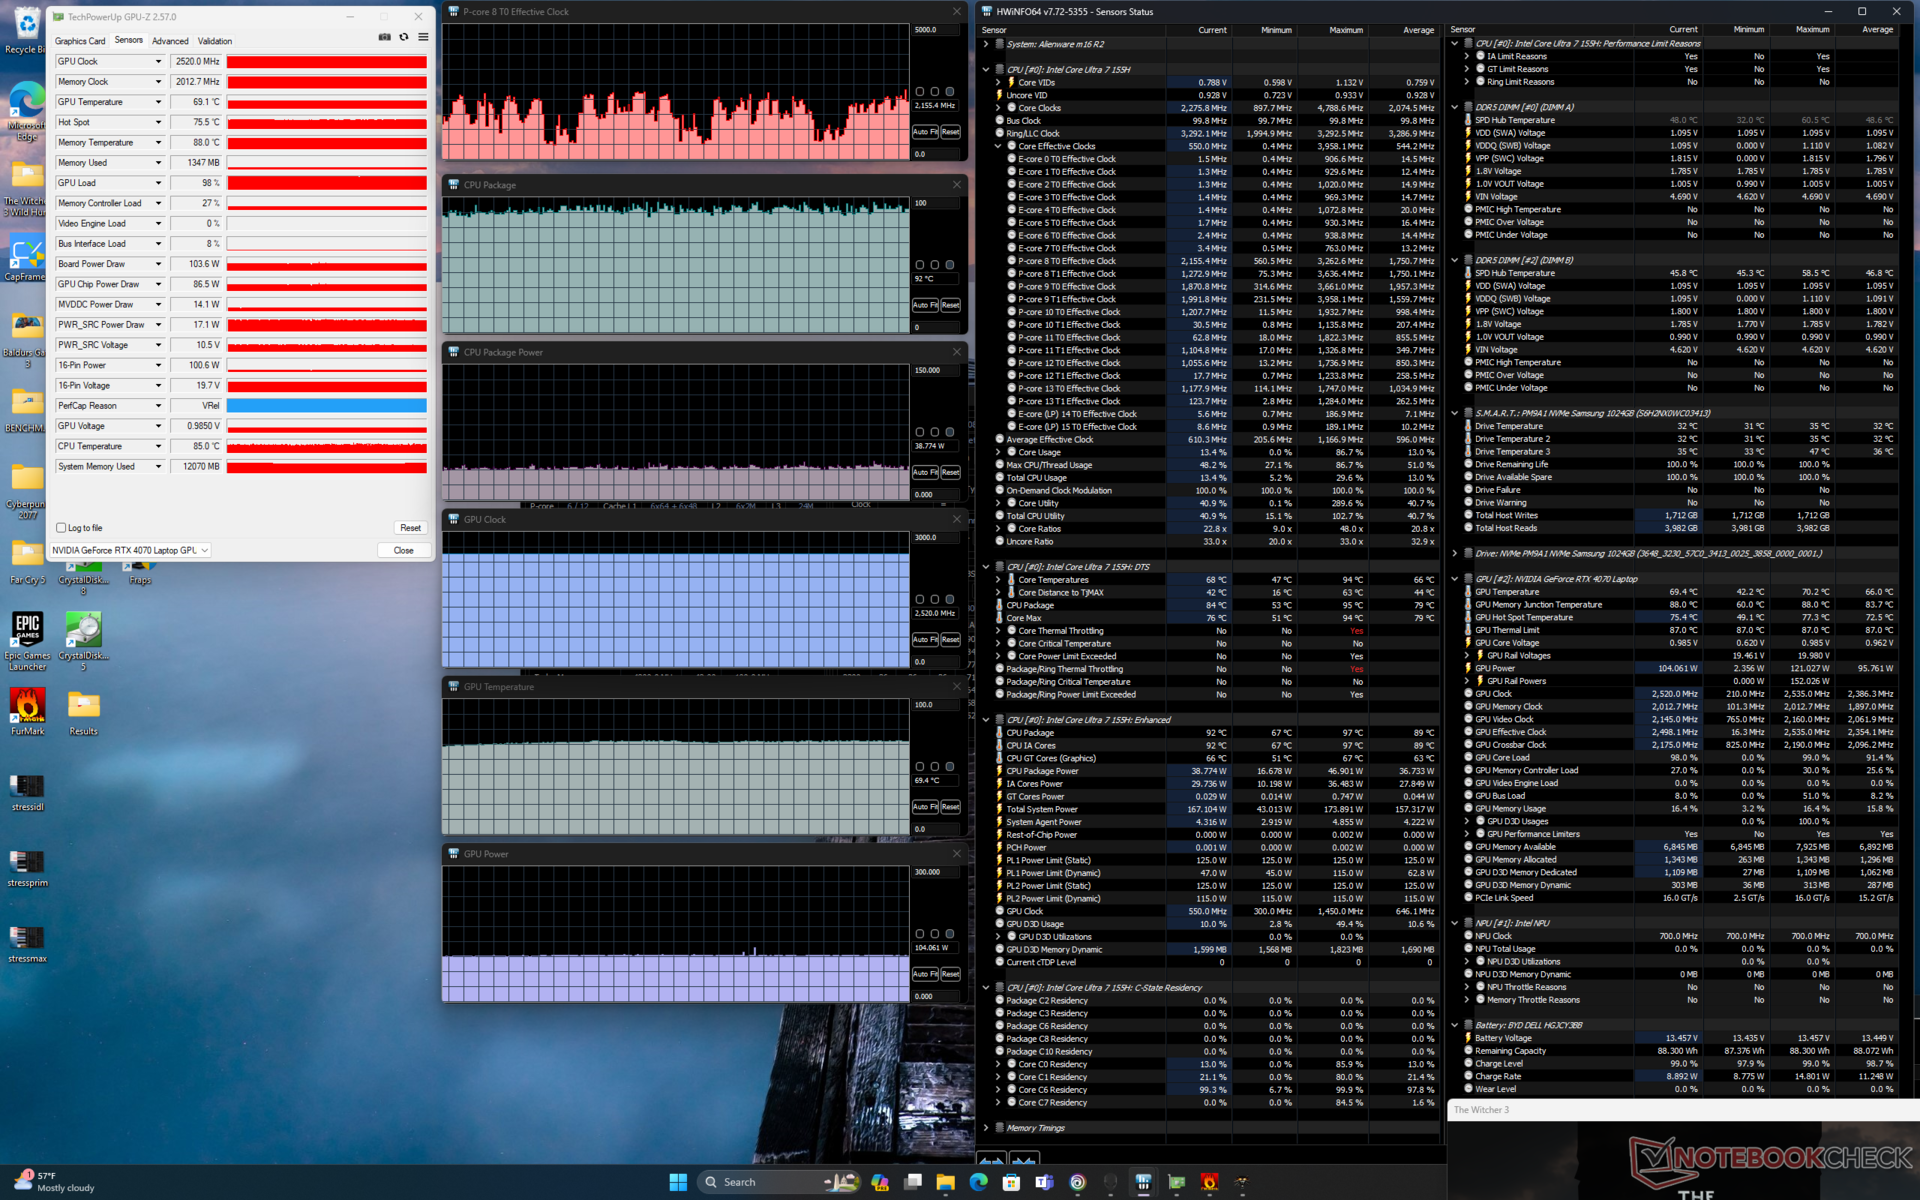
| Reloj dela CPU (GHz) | Reloj de la GPU (MHz) | Temperatura media dela CPU (°C) | Temperatura media de la GPU (°C) | |
| Sistema en reposo | -- | -- | 46 | 27 |
| Prime95 Stress | 3.4 | -- | 100 | 47 |
| Estrés Prime95+ FurMark | 2,5 | 2520 | 78 | 71 |
| Witcher 3 Estrés (modoequilibrado) | ~1,8 | 2502 | 93 | 80 |
| Witcher 3 Estrés (modoRendimiento) | ~1,8 | 2520 | 91 | 77 |
| Witcher 3 Tensión (modoOverdrive) | ~2.0 | 2520 | 92 | 69 |
Rendimiento del sistema
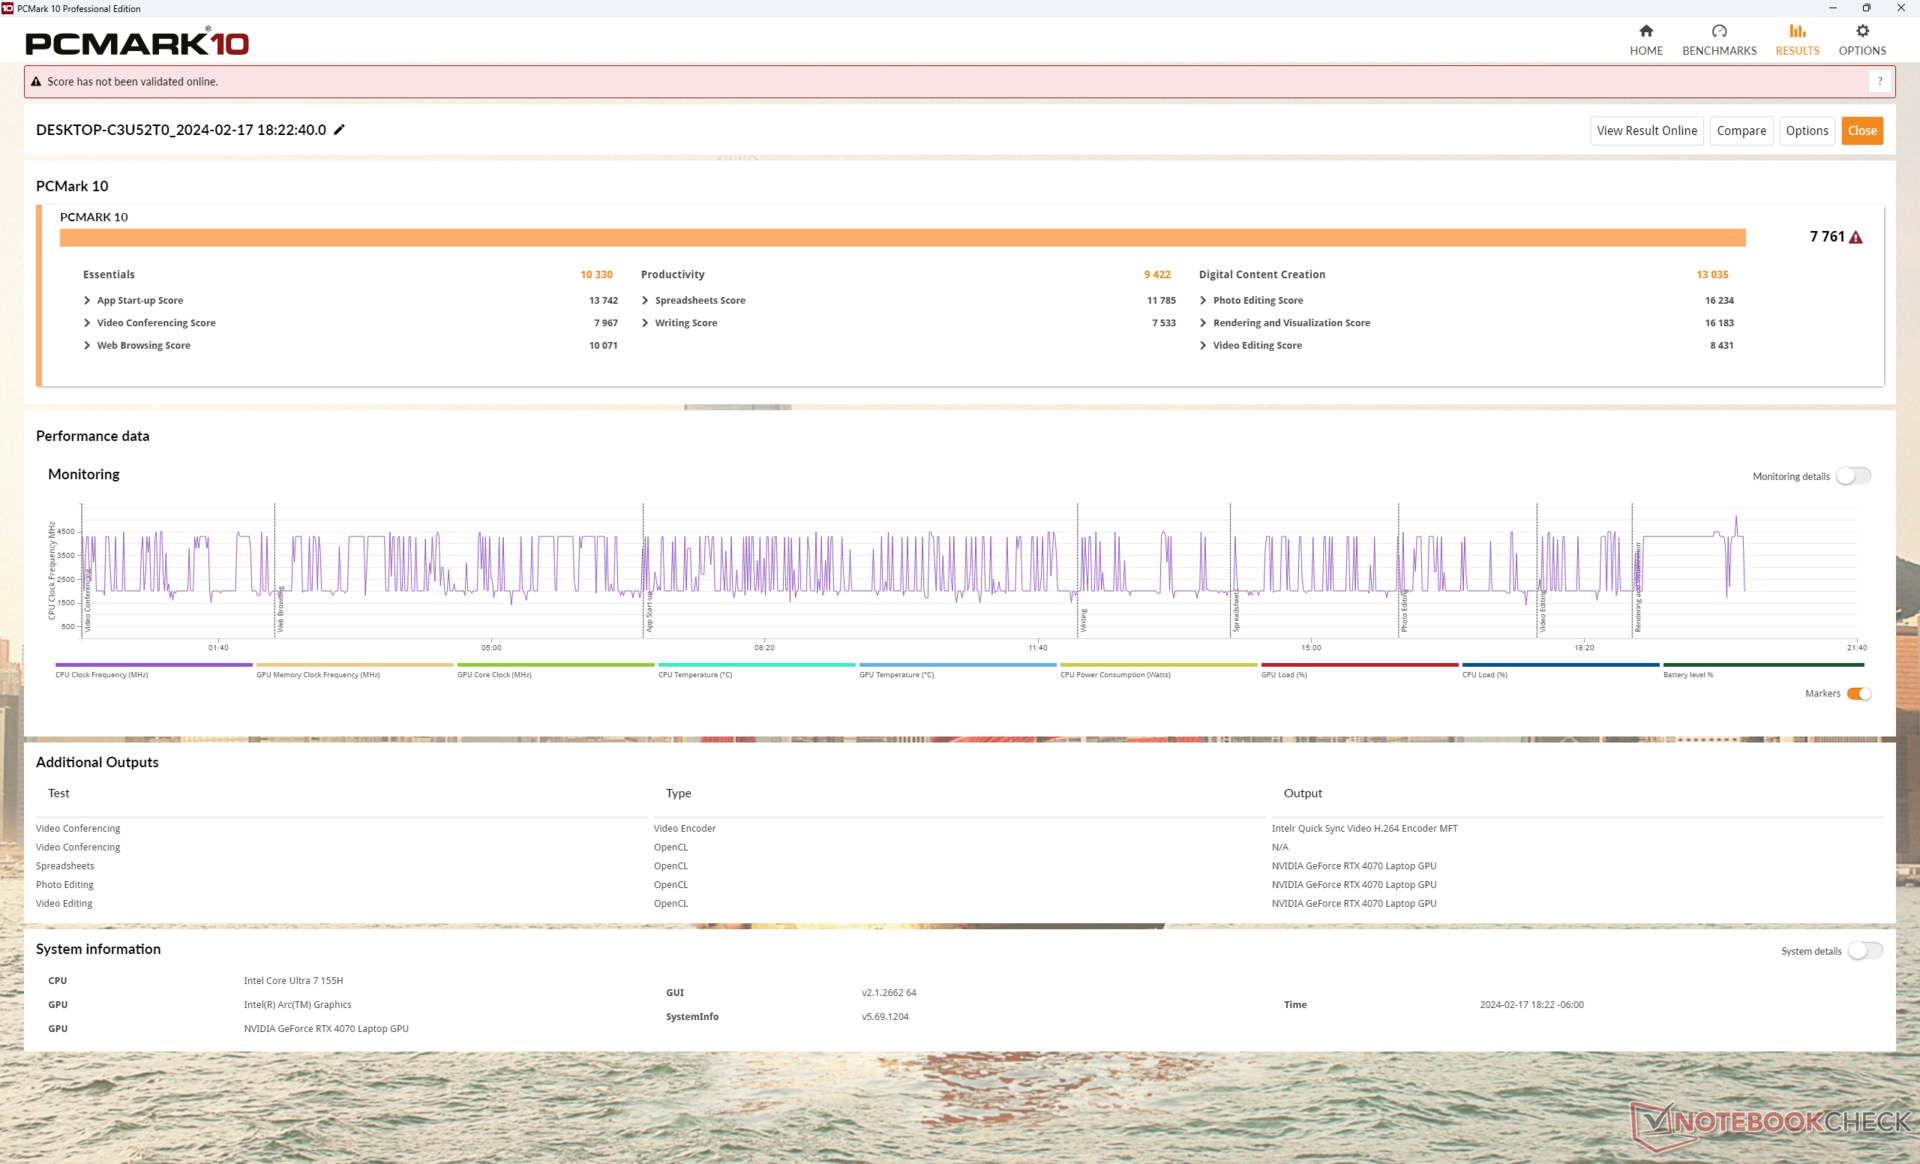
Los resultados de PCMark 10 son comparables a los de la m16 R1 excepto por nuestra puntuación más baja en la subprueba de Creación de Contenidos Digitales ya que la m16 R2 está equipada con la RTX 4070 más lenta. El rendimiento del sistema es por lo demás muy similar al no mostrar ganancias significativas en la mayoría de las cargas cotidianas a pesar de la CPU de nueva generación.
CrossMark: Overall | Productivity | Creativity | Responsiveness
WebXPRT 3: Overall
WebXPRT 4: Overall
Mozilla Kraken 1.1: Total
| PCMark 10 / Score | |
| Alienware x16 R1 | |
| HP Omen Transcend 16-u1095ng | |
| Alienware m16 R2 | |
| Lenovo Legion Slim 7 16APH8 | |
| Medio Intel Core Ultra 7 155H, NVIDIA GeForce RTX 4070 Laptop GPU (7084 - 7761, n=4) | |
| Alienware m16 R1 Intel | |
| Asus ROG Zephyrus G16 2024 GU605M | |
| PCMark 10 / Essentials | |
| Alienware x16 R1 | |
| Alienware m16 R1 Intel | |
| HP Omen Transcend 16-u1095ng | |
| Lenovo Legion Slim 7 16APH8 | |
| Alienware m16 R2 | |
| Medio Intel Core Ultra 7 155H, NVIDIA GeForce RTX 4070 Laptop GPU (10038 - 10393, n=4) | |
| Asus ROG Zephyrus G16 2024 GU605M | |
| PCMark 10 / Productivity | |
| HP Omen Transcend 16-u1095ng | |
| Alienware x16 R1 | |
| Lenovo Legion Slim 7 16APH8 | |
| Alienware m16 R1 Intel | |
| Alienware m16 R2 | |
| Medio Intel Core Ultra 7 155H, NVIDIA GeForce RTX 4070 Laptop GPU (9192 - 9518, n=4) | |
| Asus ROG Zephyrus G16 2024 GU605M | |
| PCMark 10 / Digital Content Creation | |
| Alienware x16 R1 | |
| Alienware m16 R2 | |
| HP Omen Transcend 16-u1095ng | |
| Medio Intel Core Ultra 7 155H, NVIDIA GeForce RTX 4070 Laptop GPU (10100 - 13035, n=4) | |
| Lenovo Legion Slim 7 16APH8 | |
| Asus ROG Zephyrus G16 2024 GU605M | |
| Alienware m16 R1 Intel | |
| CrossMark / Overall | |
| Alienware m16 R1 Intel | |
| Alienware x16 R1 | |
| Alienware m16 R2 | |
| Medio Intel Core Ultra 7 155H, NVIDIA GeForce RTX 4070 Laptop GPU (1687 - 1848, n=4) | |
| Asus ROG Zephyrus G16 2024 GU605M | |
| CrossMark / Productivity | |
| Alienware m16 R1 Intel | |
| Alienware x16 R1 | |
| Alienware m16 R2 | |
| Medio Intel Core Ultra 7 155H, NVIDIA GeForce RTX 4070 Laptop GPU (1589 - 1750, n=4) | |
| Asus ROG Zephyrus G16 2024 GU605M | |
| CrossMark / Creativity | |
| Alienware m16 R1 Intel | |
| Alienware x16 R1 | |
| Asus ROG Zephyrus G16 2024 GU605M | |
| Medio Intel Core Ultra 7 155H, NVIDIA GeForce RTX 4070 Laptop GPU (1860 - 2014, n=4) | |
| Alienware m16 R2 | |
| CrossMark / Responsiveness | |
| Alienware x16 R1 | |
| Alienware m16 R1 Intel | |
| Alienware m16 R2 | |
| Medio Intel Core Ultra 7 155H, NVIDIA GeForce RTX 4070 Laptop GPU (1424 - 1683, n=4) | |
| Asus ROG Zephyrus G16 2024 GU605M | |
| WebXPRT 3 / Overall | |
| HP Omen Transcend 16-u1095ng | |
| Alienware m16 R1 Intel | |
| Alienware x16 R1 | |
| Alienware m16 R2 | |
| Asus ROG Zephyrus G16 2024 GU605M | |
| Medio Intel Core Ultra 7 155H, NVIDIA GeForce RTX 4070 Laptop GPU (264 - 294, n=4) | |
| WebXPRT 4 / Overall | |
| Alienware m16 R1 Intel | |
| Alienware x16 R1 | |
| Alienware m16 R2 | |
| Asus ROG Zephyrus G16 2024 GU605M | |
| Medio Intel Core Ultra 7 155H, NVIDIA GeForce RTX 4070 Laptop GPU (247 - 257, n=4) | |
| Mozilla Kraken 1.1 / Total | |
| Medio Intel Core Ultra 7 155H, NVIDIA GeForce RTX 4070 Laptop GPU (546 - 568, n=3) | |
| Asus ROG Zephyrus G16 2024 GU605M | |
| Alienware m16 R2 | |
| Alienware m16 R1 Intel | |
| Alienware x16 R1 | |
| HP Omen Transcend 16-u1095ng | |
* ... más pequeño es mejor
| PCMark 10 Score | 7761 puntos | |
ayuda | ||
| AIDA64 / Memory Copy | |
| Asus ROG Zephyrus G16 2024 GU605M | |
| Medio Intel Core Ultra 7 155H (62397 - 96791, n=50) | |
| HP Omen Transcend 16-u1095ng | |
| Alienware x16 R1 | |
| Lenovo Legion Slim 7 16APH8 | |
| Alienware m16 R2 | |
| Alienware m16 R1 Intel | |
| AIDA64 / Memory Read | |
| Asus ROG Zephyrus G16 2024 GU605M | |
| HP Omen Transcend 16-u1095ng | |
| Medio Intel Core Ultra 7 155H (60544 - 90647, n=50) | |
| Alienware m16 R2 | |
| Alienware x16 R1 | |
| Alienware m16 R1 Intel | |
| Lenovo Legion Slim 7 16APH8 | |
| AIDA64 / Memory Write | |
| Lenovo Legion Slim 7 16APH8 | |
| Alienware x16 R1 | |
| HP Omen Transcend 16-u1095ng | |
| Asus ROG Zephyrus G16 2024 GU605M | |
| Medio Intel Core Ultra 7 155H (58692 - 93451, n=50) | |
| Alienware m16 R2 | |
| Alienware m16 R1 Intel | |
| AIDA64 / Memory Latency | |
| Medio Intel Core Ultra 7 155H (116.2 - 233, n=50) | |
| Asus ROG Zephyrus G16 2024 GU605M | |
| Alienware m16 R2 | |
| Alienware x16 R1 | |
| Lenovo Legion Slim 7 16APH8 | |
| Alienware m16 R1 Intel | |
| HP Omen Transcend 16-u1095ng | |
* ... más pequeño es mejor
Latencia del CPD
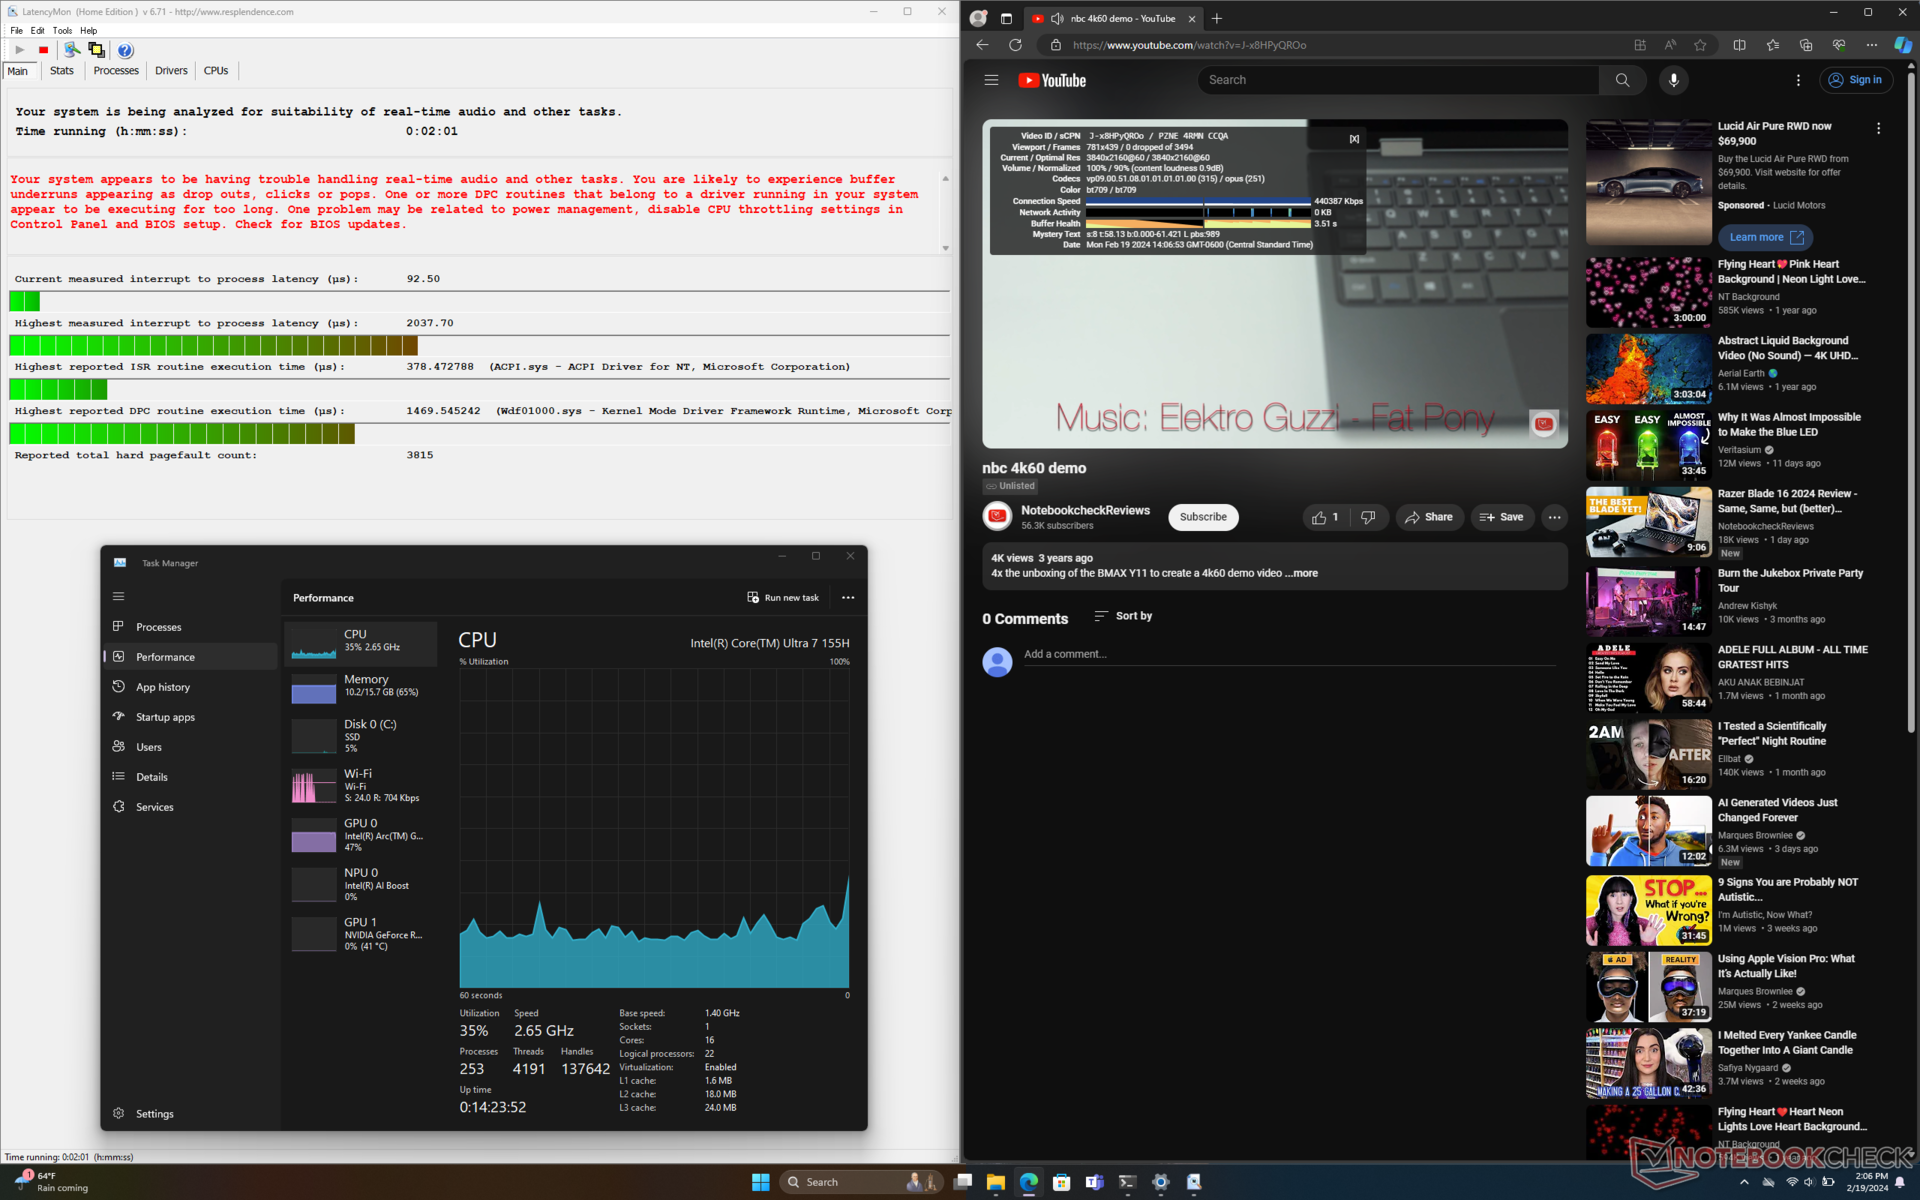
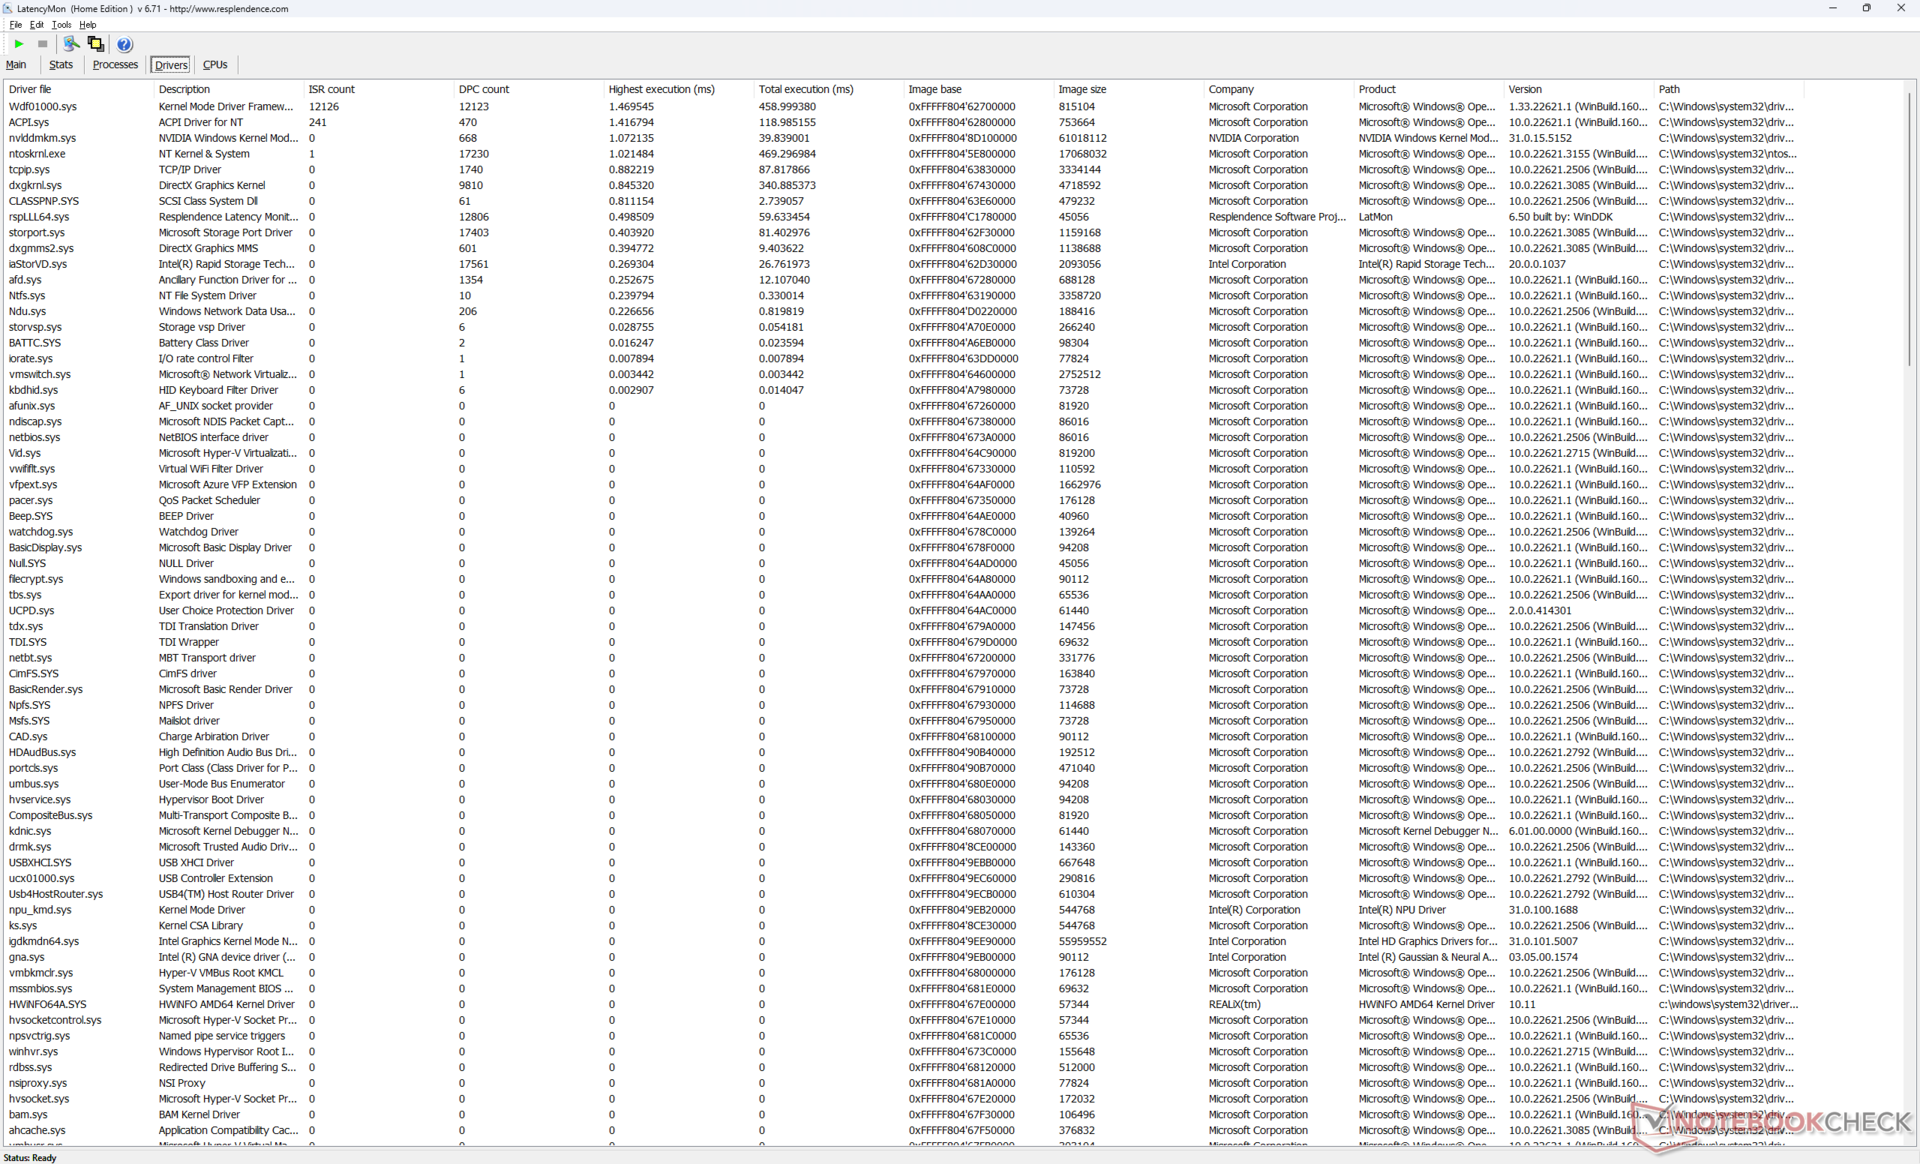
LatencyMon revela problemas de CPD al abrir varias pestañas de nuestra página de inicio. por lo demás, la reproducción de vídeo 4K a 60 FPS es perfecta, sin que se registren caídas de fotogramas.
| DPC Latencies / LatencyMon - interrupt to process latency (max), Web, Youtube, Prime95 | |
| Alienware m16 R1 Intel | |
| Asus ROG Zephyrus G16 2024 GU605M | |
| Alienware m16 R2 | |
| HP Omen Transcend 16-u1095ng | |
| Alienware x16 R1 | |
| Lenovo Legion Slim 7 16APH8 | |
* ... más pequeño es mejor
Dispositivos de almacenamiento
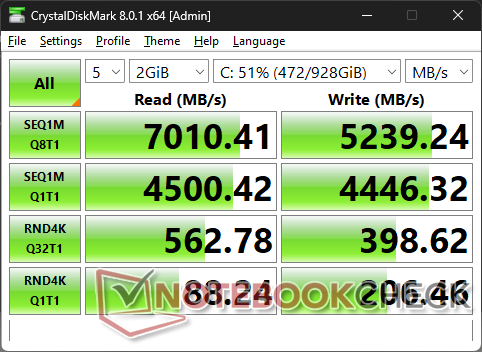
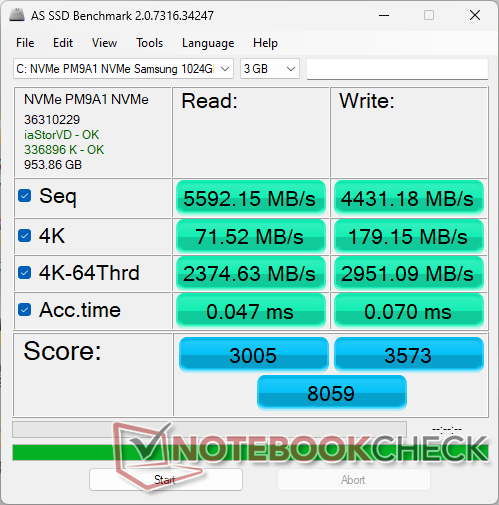
Nuestra unidad se envía con el Samsung PM9A1 SSD NVMe PCIe4 x4 en lugar de la Kioxia de la m16 R1 del año pasado. La unidad no mostraría problemas para mantener su tasa de transferencia máxima de 7000 MB/s durante periodos prolongados. Se incluye un disipador de calor para cada una de las dos ranuras M.2 2280.

| Drive Performance rating - Percent | |
| Alienware x16 R1 | |
| Alienware m16 R2 | |
| Alienware m16 R1 Intel | |
| Lenovo Legion Slim 7 16APH8 | |
| HP Omen Transcend 16-u1095ng | |
| Asus ROG Zephyrus G16 2024 GU605M | |
* ... más pequeño es mejor
Disk Throttling: DiskSpd Read Loop, Queue Depth 8
Rendimiento de la GPU
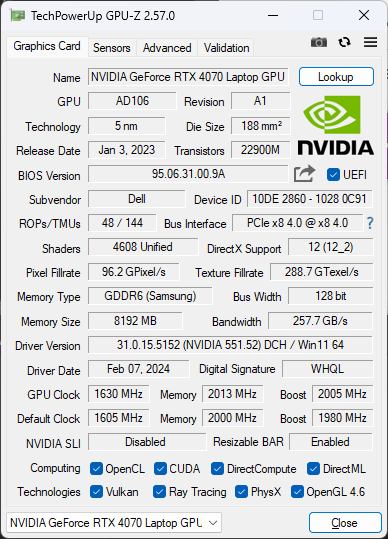
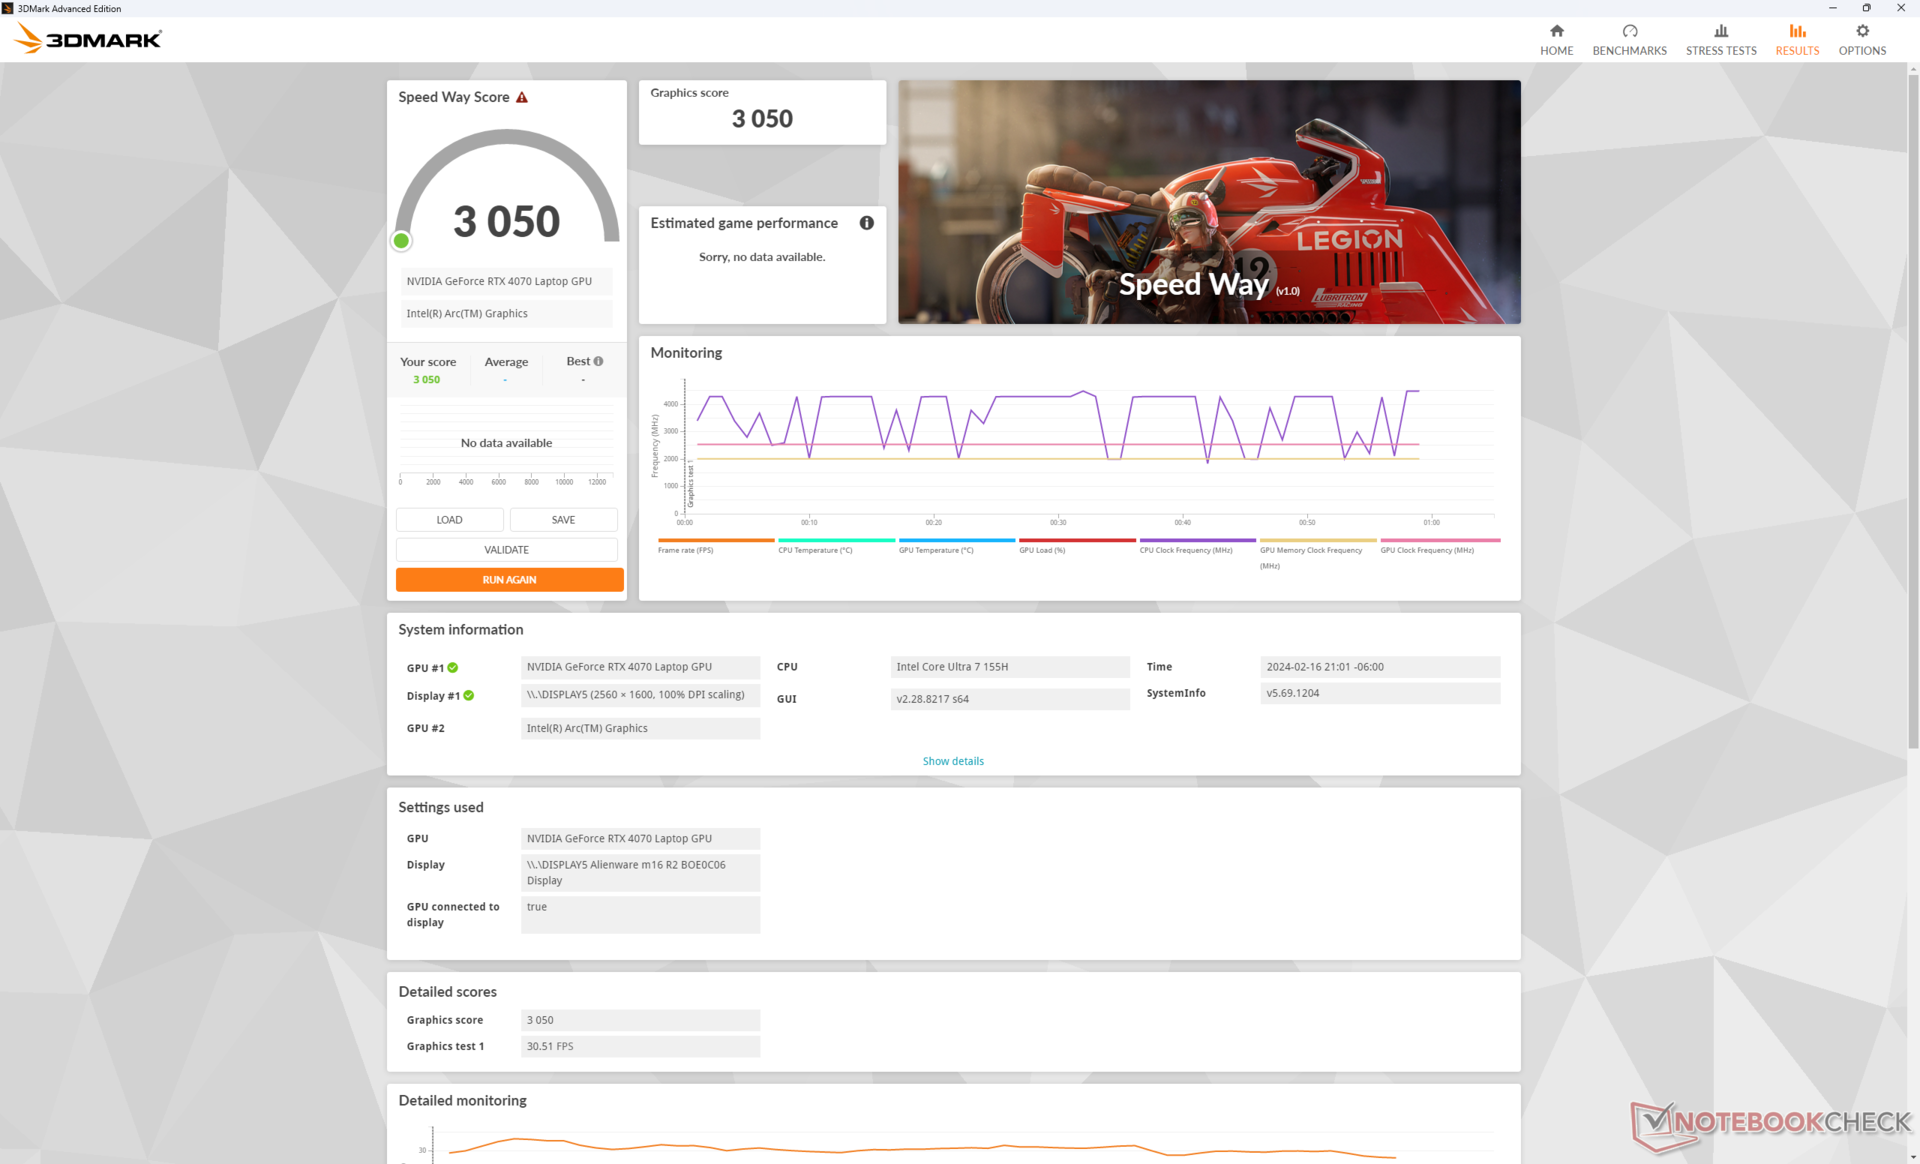
El rendimiento gráfico de nuestro GeForce RTX 4070 de 140 W es aproximadamente un 10 por ciento más rápido que el del portátil medio de nuestra base de datos equipado con la misma GPU. Aunque es una rebaja con respecto al m16 R1 de entre un 30 y un 45 por ciento debido a la falta de opciones RTX 4080 o 4090 , al menos es bueno ver que la RTX 4070 rinde aquí mejor de lo esperado. Los usuarios que quieran la RTX 4080 o 4090 tendrán que considerar la más antigua m16 R1 o la más cara Alienware x16 series en su lugar.
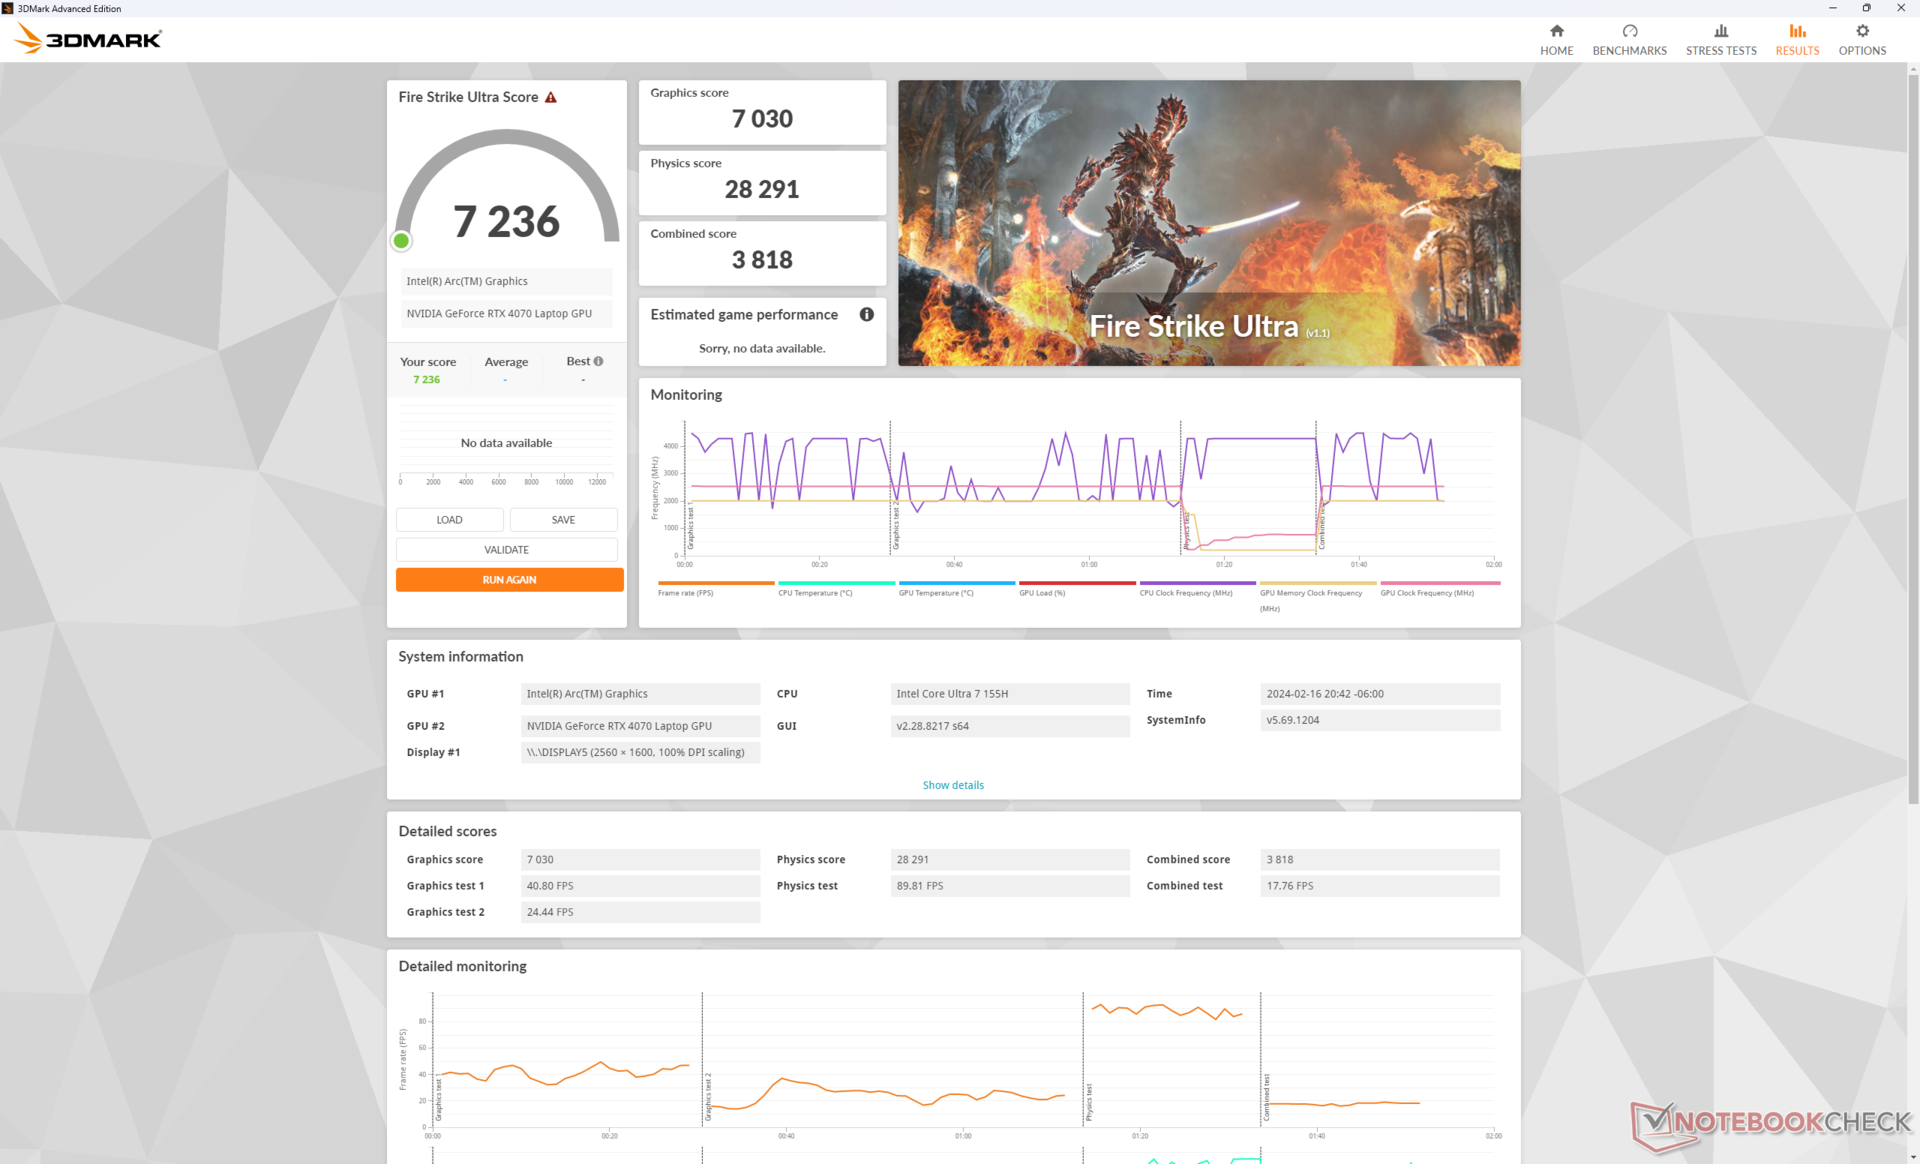
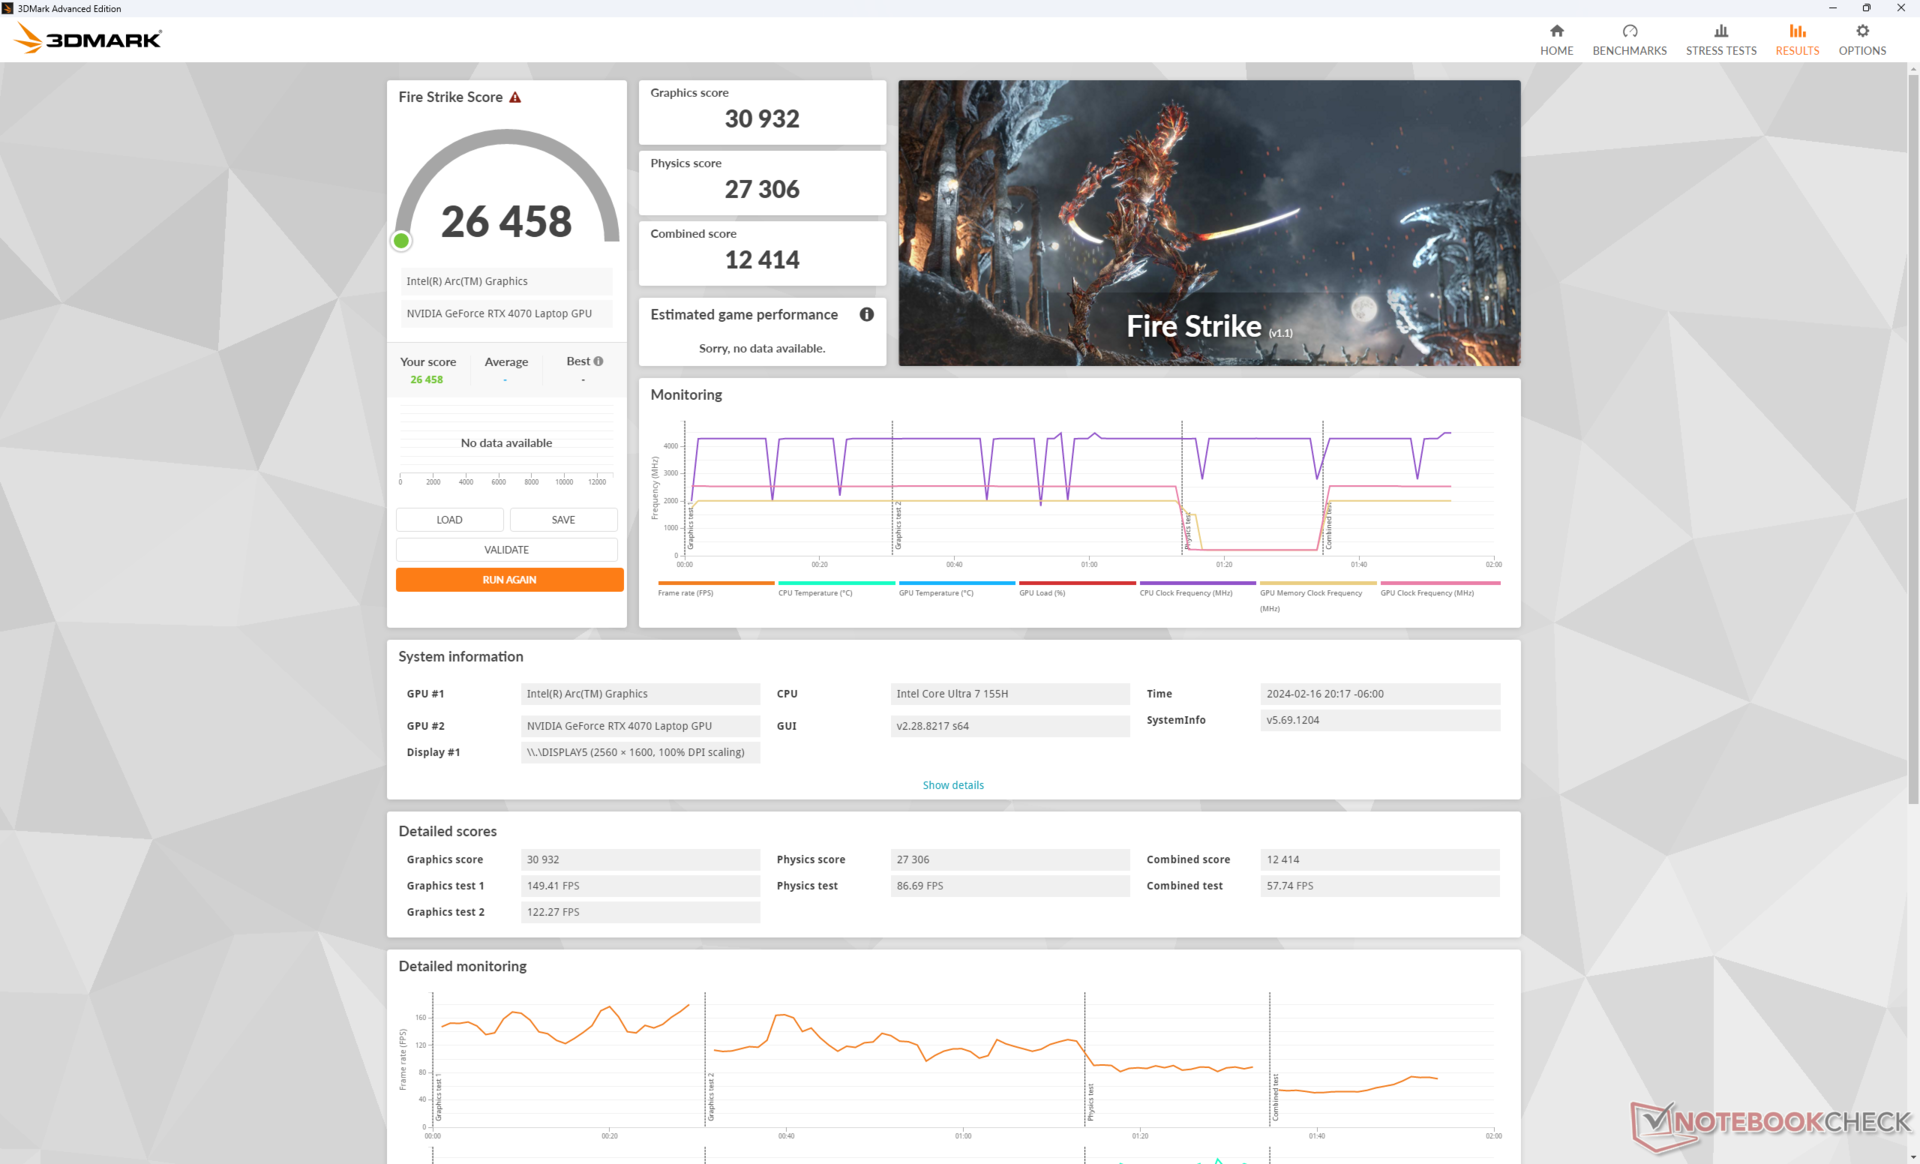
Curiosamente, las diferencias de rendimiento entre los modos Overdrive, Rendimiento y Equilibrado son, como mucho, menores. Esto es sorprendente porque pasar al modo Equilibrado normalmente implicaría una pérdida de rendimiento del 10 al 30 por ciento en la mayoría de los otros portátiles para juegos, pero las puntuaciones de Fire Strike se mantendrían casi constantes en nuestro Alienware m16 R2. Definitivamente, Dell ha alterado los perfiles de ruido de los ventiladores y los consiguientes comportamientos de rendimiento durante el desarrollo de este modelo.
| Perfil de potencia | Puntuación Gráfica | Puntuación Física | Puntuación combinada |
| Modo Overdrive | 30932 | 27306 | 12414 |
| Modo Rendimiento | 31012 (-0%) | 28306 (-0%) | 12236 (-0%) |
| Modo equilibrado | 30603 (-0%) | 28281 (-0%) | 12448 (-0%) |
| Batería | 24398 (-21%) | 24684 (-10%) | 10088 (-19%) |
Cambiando a la RTX 4060 se espera que afecte al rendimiento entre un 10 y un 15 por ciento.
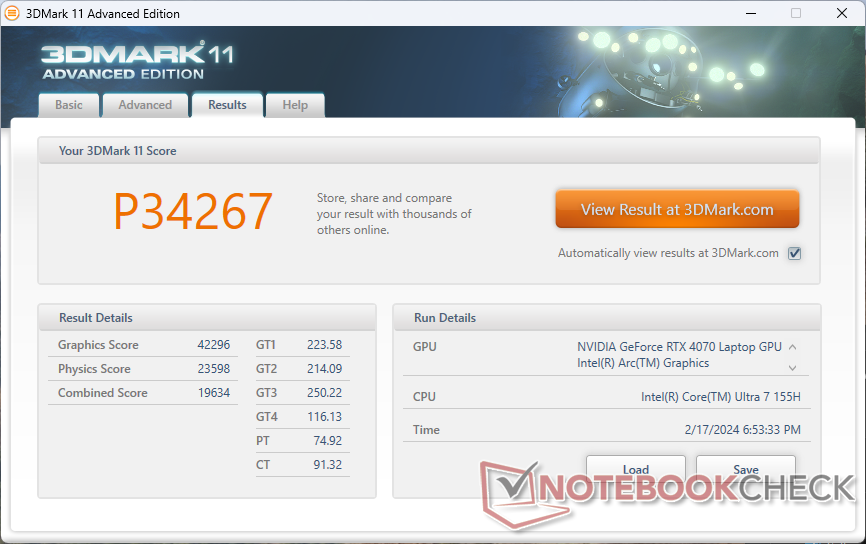
| 3DMark 11 Performance | 34267 puntos | |
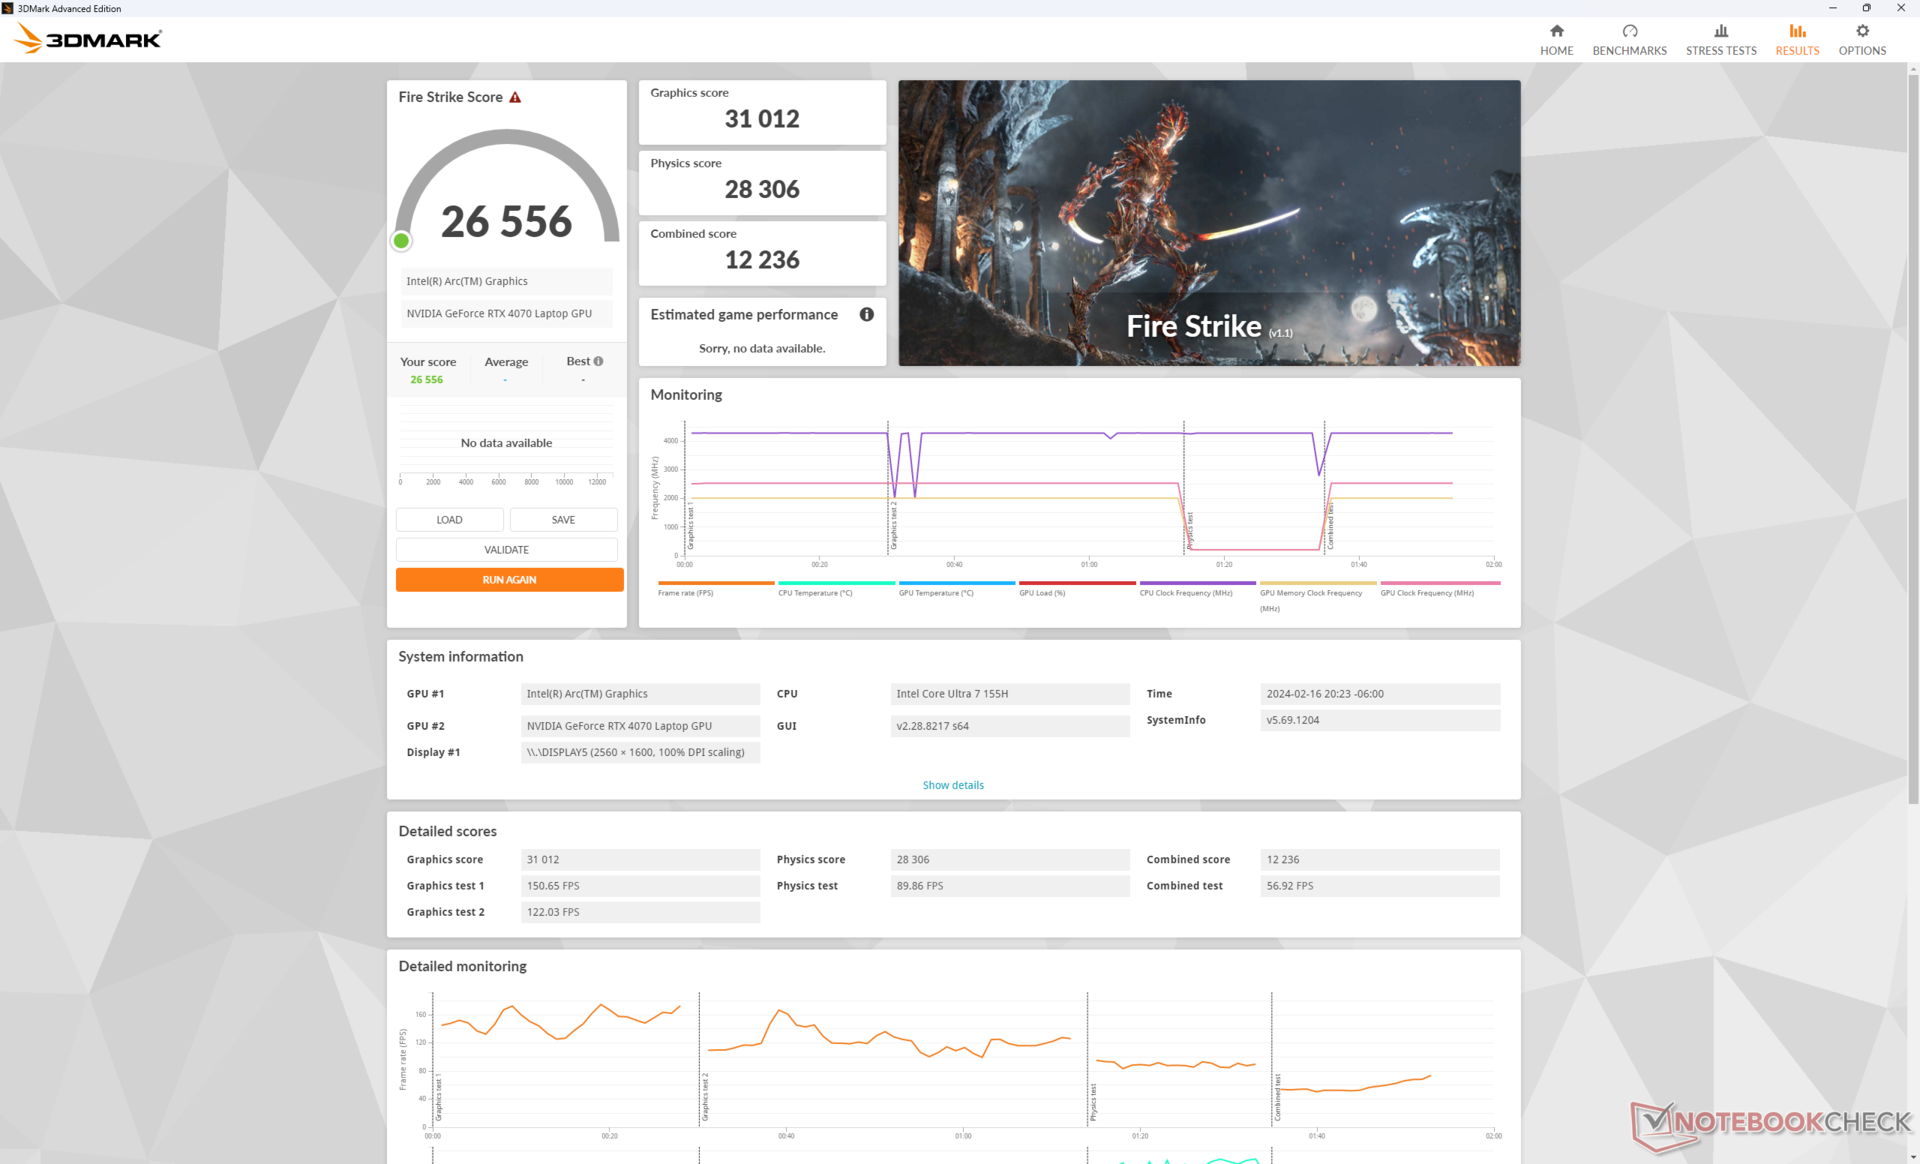
| 3DMark Fire Strike Score | 26458 puntos | |
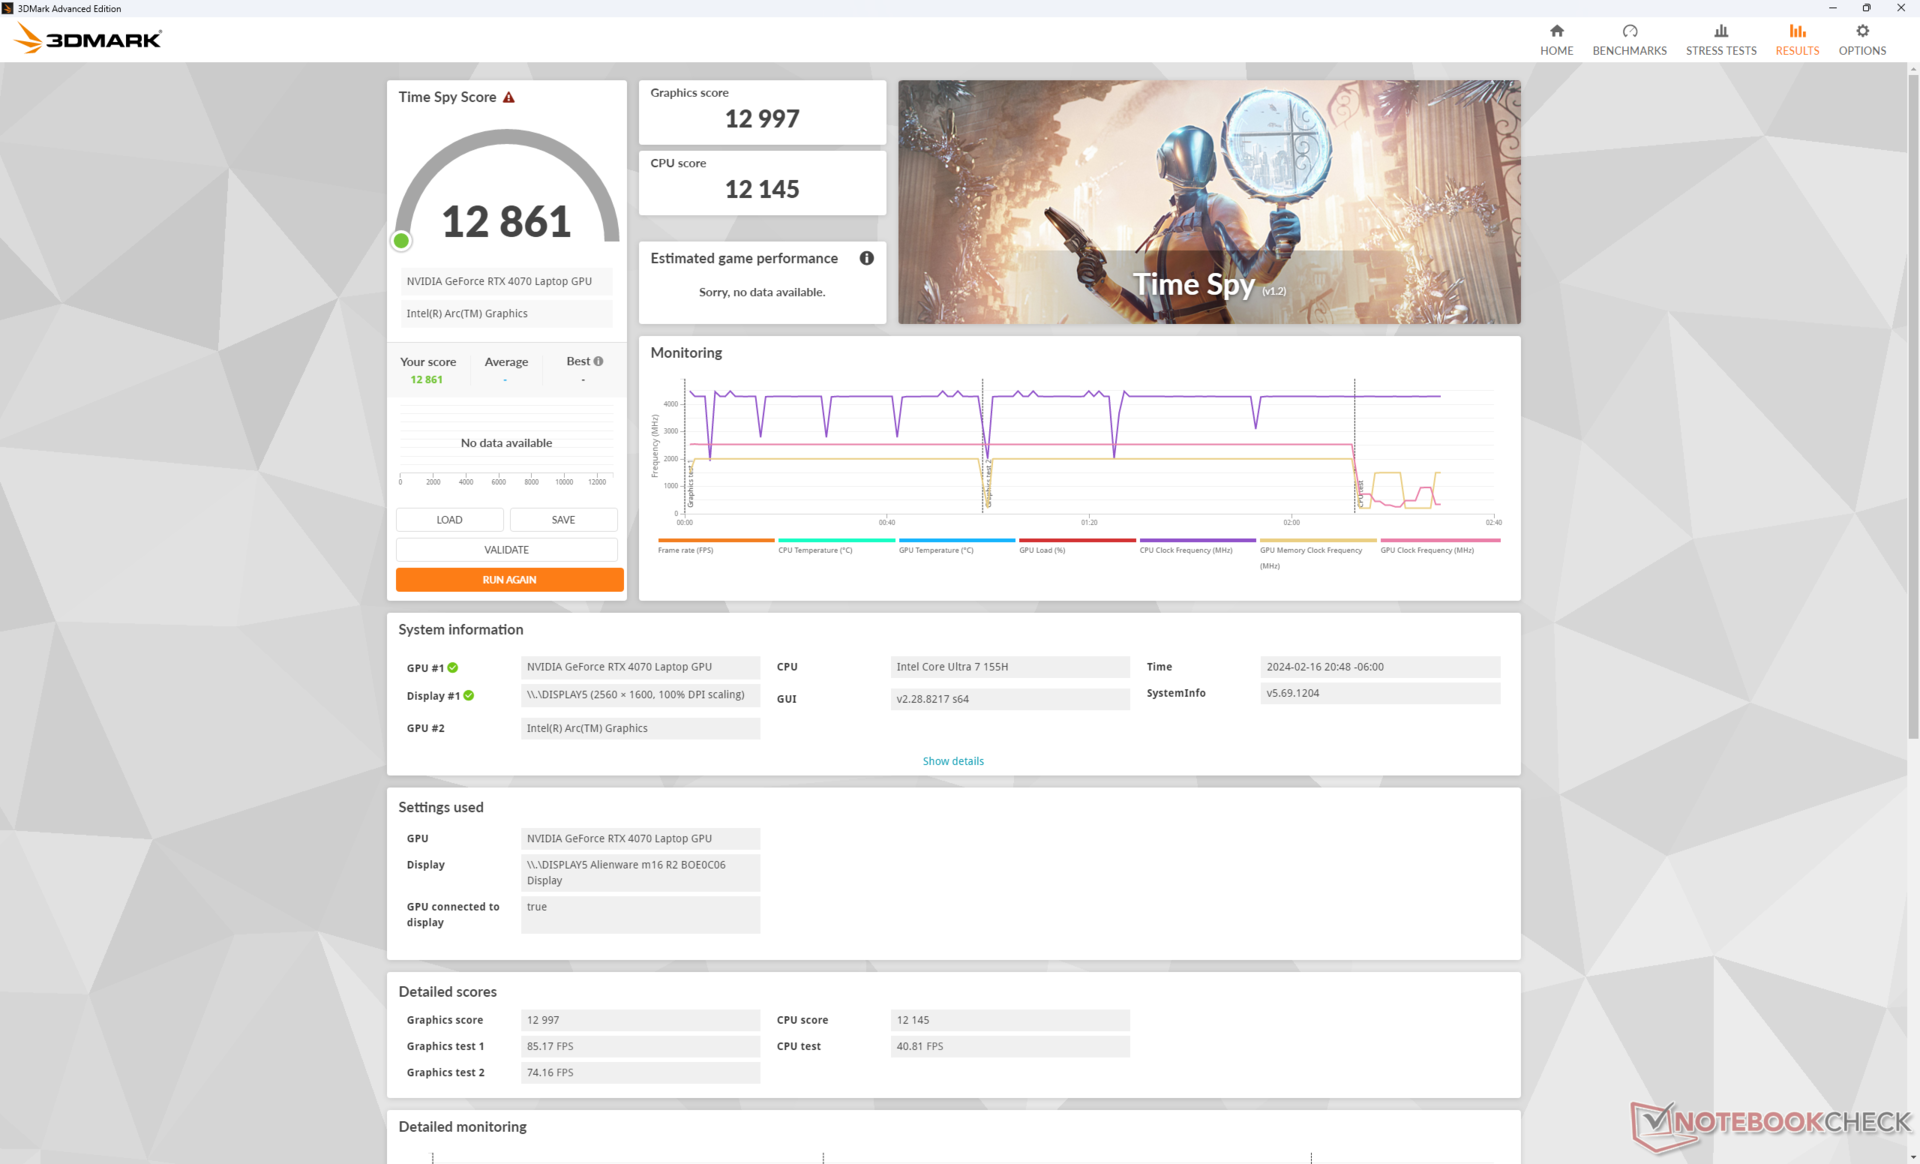
| 3DMark Time Spy Score | 12861 puntos | |
ayuda | ||
* ... más pequeño es mejor
| F1 22 | |
| 1920x1080 Ultra High Preset AA:T AF:16x | |
| Lenovo Legion 9 16IRX8 | |
| Alienware m16 R1 AMD | |
| Alienware m16 R2 | |
| Medio NVIDIA GeForce RTX 4070 Laptop GPU (39.2 - 88.7, n=32) | |
| Lenovo Legion 5 16IRX G9 | |
| HP Victus 16-r0076TX | |
| Framework Laptop 16 | |
| 2560x1440 Ultra High Preset AA:T AF:16x | |
| Lenovo Legion 9 16IRX8 | |
| Alienware m16 R1 AMD | |
| Alienware m16 R2 | |
| Medio NVIDIA GeForce RTX 4070 Laptop GPU (10.6 - 58.8, n=30) | |
| Lenovo Legion 5 16IRX G9 | |
| Framework Laptop 16 | |
| 3840x2160 Ultra High Preset AA:T AF:16x | |
| Alienware m16 R1 AMD | |
| Alienware m16 R2 | |
| Medio NVIDIA GeForce RTX 4070 Laptop GPU (4.7 - 27.6, n=15) | |
| Framework Laptop 16 | |
| The Witcher 3 | |
| 1920x1080 Ultra Graphics & Postprocessing (HBAO+) | |
| Lenovo Legion 9 16IRX8 | |
| Alienware m16 R1 AMD | |
| Alienware m16 R2 | |
| Lenovo Legion 7 16IAX7-82TD004SGE | |
| HP Omen Transcend 16-u1095ng | |
| Medio NVIDIA GeForce RTX 4070 Laptop GPU (69.8 - 133.7, n=57) | |
| Asus ROG Zephyrus M16 GU603Z | |
| Lenovo Legion 5 16IRX G9 | |
| HP Victus 16-r0076TX | |
| Lenovo Legion S7 16ARHA7 | |
| Asus ROG Zephyrus M16 GU603H | |
| Dell G16 7620 | |
| Framework Laptop 16 | |
| 3840x2160 High Graphics & Postprocessing (Nvidia HairWorks Off) | |
| Alienware m16 R1 AMD | |
| Alienware m16 R2 | |
| Medio NVIDIA GeForce RTX 4070 Laptop GPU (26.5 - 83.5, n=16) | |
| Framework Laptop 16 | |
| Tiny Tina's Wonderlands | |
| 1920x1080 Badass Preset (DX12) | |
| Lenovo Legion 9 16IRX8 | |
| Alienware m16 R1 AMD | |
| Alienware m16 R2 | |
| Medio NVIDIA GeForce RTX 4070 Laptop GPU (58.6 - 115.9, n=18) | |
| Framework Laptop 16 | |
| 2560x1440 Badass Preset (DX12) | |
| Lenovo Legion 9 16IRX8 | |
| Alienware m16 R1 AMD | |
| Alienware m16 R2 | |
| Medio NVIDIA GeForce RTX 4070 Laptop GPU (49.8 - 79.5, n=17) | |
| Framework Laptop 16 | |
| 3840x2160 Badass Preset (DX12) | |
| Alienware m16 R1 AMD | |
| Medio NVIDIA GeForce RTX 4070 Laptop GPU (28.3 - 39.7, n=13) | |
| Alienware m16 R2 | |
| Framework Laptop 16 | |
| Baldur's Gate 3 | |
| 1920x1080 Ultra Preset AA:T | |
| Alienware m16 R2 | |
| Medio NVIDIA GeForce RTX 4070 Laptop GPU (66.7 - 128.5, n=30) | |
| Framework Laptop 16 | |
| 2560x1440 Ultra Preset AA:T | |
| Alienware m16 R2 | |
| Medio NVIDIA GeForce RTX 4070 Laptop GPU (54.4 - 89.6, n=25) | |
| Framework Laptop 16 | |
| 3840x2160 Ultra Preset AA:T | |
| Alienware m16 R2 | |
| Medio NVIDIA GeForce RTX 4070 Laptop GPU (33.4 - 45.2, n=12) | |
| Framework Laptop 16 | |
| Cyberpunk 2077 | |
| 1920x1080 Ultra Preset (FSR off) | |
| Lenovo Legion 9 16IRX8 | |
| Alienware m16 R2 | |
| Lenovo Legion 5 16IRX G9 | |
| Medio NVIDIA GeForce RTX 4070 Laptop GPU (30.7 - 90.7, n=40) | |
| Framework Laptop 16 | |
| 2560x1440 Ultra Preset (FSR off) | |
| Lenovo Legion 9 16IRX8 | |
| Alienware m16 R2 | |
| Lenovo Legion 5 16IRX G9 | |
| Medio NVIDIA GeForce RTX 4070 Laptop GPU (24.8 - 57.1, n=37) | |
| Framework Laptop 16 | |
| 3840x2160 Ultra Preset (FSR off) | |
| Medio NVIDIA GeForce RTX 4070 Laptop GPU (20.2 - 24, n=13) | |
| Alienware m16 R2 | |
| Framework Laptop 16 | |
Witcher 3 FPS Chart
| bajo | medio | alto | ultra | QHD | 4K | |
|---|---|---|---|---|---|---|
| The Witcher 3 (2015) | 399.6 | 344.6 | 240.5 | 121.3 | 72 | |
| Dota 2 Reborn (2015) | 166.8 | 149 | 149.5 | 139.7 | 130.6 | |
| Final Fantasy XV Benchmark (2018) | 184.6 | 165.1 | 119.3 | 85.2 | 48.5 | |
| X-Plane 11.11 (2018) | 132.3 | 116 | 90.8 | 78.2 | ||
| Far Cry 5 (2018) | 146 | 134 | 123 | 115 | 61 | |
| Strange Brigade (2018) | 427 | 308 | 255 | 219 | 141.7 | 73.8 |
| Tiny Tina's Wonderlands (2022) | 244 | 202.8 | 138.3 | 107.6 | 74.6 | 34.8 |
| F1 22 (2022) | 235 | 225 | 217 | 83.6 | 52.9 | 26.6 |
| Baldur's Gate 3 (2023) | 168.7 | 148.9 | 129.3 | 128.5 | 88.3 | 44.3 |
| Cyberpunk 2077 (2023) | 125.7 | 114.1 | 95.6 | 83.1 | 52.7 | 21 |
Emisiones
Ruido del sistema
El comportamiento del ruido del ventilador ha mejorado significativamente con respecto al m16 R1. Al ejecutar 3DMark 06 en modo equilibrado, por ejemplo, el m16 R2 permanecería más silencioso durante más tiempo con 32 dB(A) mientras que el m16 R1 sería innecesariamente ruidoso con 52 dB(A) durante toda la primera escena del benchmark. Esto hace que el m16 R2 sea más comparable a competidores como el Lenovo Legion Slim 7 en condiciones similares.
El ruido del ventilador al jugar está estrechamente ligado al perfil de potencia seleccionado. Por ejemplo, el ruido del ventilador se establecería en 52 dB(A), 54 dB(A) y 62 dB(A) cuando se ejecuta Witcher 3 en modo Equilibrado, modo Rendimiento y modo Overdrive, respectivamente. Dado que los deltas de rendimiento entre estos tres modos son muy pequeños, como se ha mencionado anteriormente, recomendamos jugar en modo Rendimiento y evitar el modo Overdrive para la mayoría de los escenarios. El máximo de 62 dB(A) es mucho más ruidoso de lo que registramos incluso en la Alienware x16 R1 más potente, pero este modo es principalmente para fines de overclocking del usuario final; el modo Rendimiento es suficiente para los ajustes de stock.
Ruido
| Ocioso |
| 25.3 / 25.3 / 25.3 dB(A) |
| Carga |
| 31.7 / 62 dB(A) |
 | ||
30 dB silencioso 40 dB(A) audible 50 dB(A) ruidosamente alto |
||
min: | ||
| Alienware m16 R2 GeForce RTX 4070 Laptop GPU, Ultra 7 155H, Samsung PM9A1 MZVL21T0HCLR | Alienware m16 R1 Intel GeForce RTX 4060 Laptop GPU, i7-13700HX, Kioxia KXG70ZNV512G | Alienware x16 R1 GeForce RTX 4080 Laptop GPU, i9-13900HK, SK hynix PC801 HFS001TEJ9X101N | HP Omen Transcend 16-u1095ng GeForce RTX 4070 Laptop GPU, i9-14900HX, Kioxia XG8 KXG80ZNV1T02 | Asus ROG Zephyrus G16 2024 GU605M GeForce RTX 4070 Laptop GPU, Ultra 7 155H, WD PC SN560 SDDPNQE-1T00 | Lenovo Legion Slim 7 16APH8 GeForce RTX 4060 Laptop GPU, R7 7840HS, WDC PC SN810 1TB | |
|---|---|---|---|---|---|---|
| Noise | -8% | 1% | -8% | 2% | 0% | |
| apagado / medio ambiente * (dB) | 24.7 | 25 -1% | 22.7 8% | 24 3% | 23.9 3% | 24 3% |
| Idle Minimum * (dB) | 25.3 | 25 1% | 23.1 9% | 29 -15% | 23.9 6% | 25 1% |
| Idle Average * (dB) | 25.3 | 26 -3% | 25.8 -2% | 30 -19% | 27.8 -10% | 28 -11% |
| Idle Maximum * (dB) | 25.3 | 27 -7% | 25.8 -2% | 31 -23% | 30.1 -19% | 31 -23% |
| Load Average * (dB) | 31.7 | 52 -64% | 39.3 -24% | 45 -42% | 34.2 -8% | 33 -4% |
| Witcher 3 ultra * (dB) | 53.8 | 51 5% | 49.9 7% | 44 18% | 46.4 14% | 47 13% |
| Load Maximum * (dB) | 62 | 53 15% | 54.8 12% | 47 24% | 46.4 25% | 49 21% |
* ... más pequeño es mejor
Temperatura
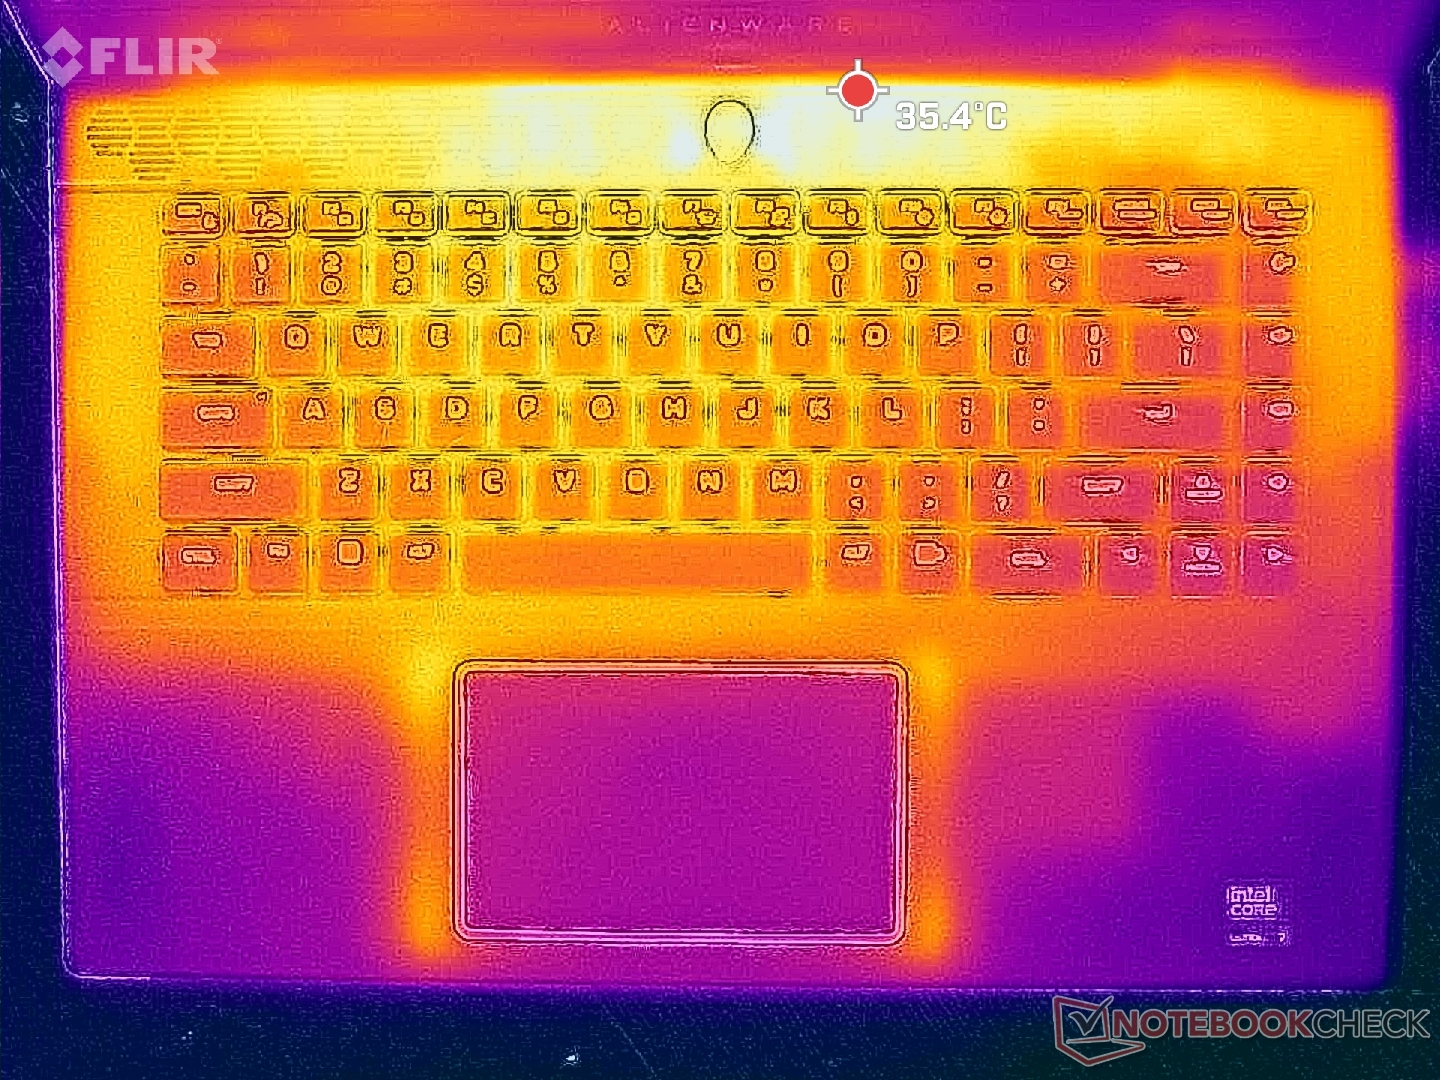
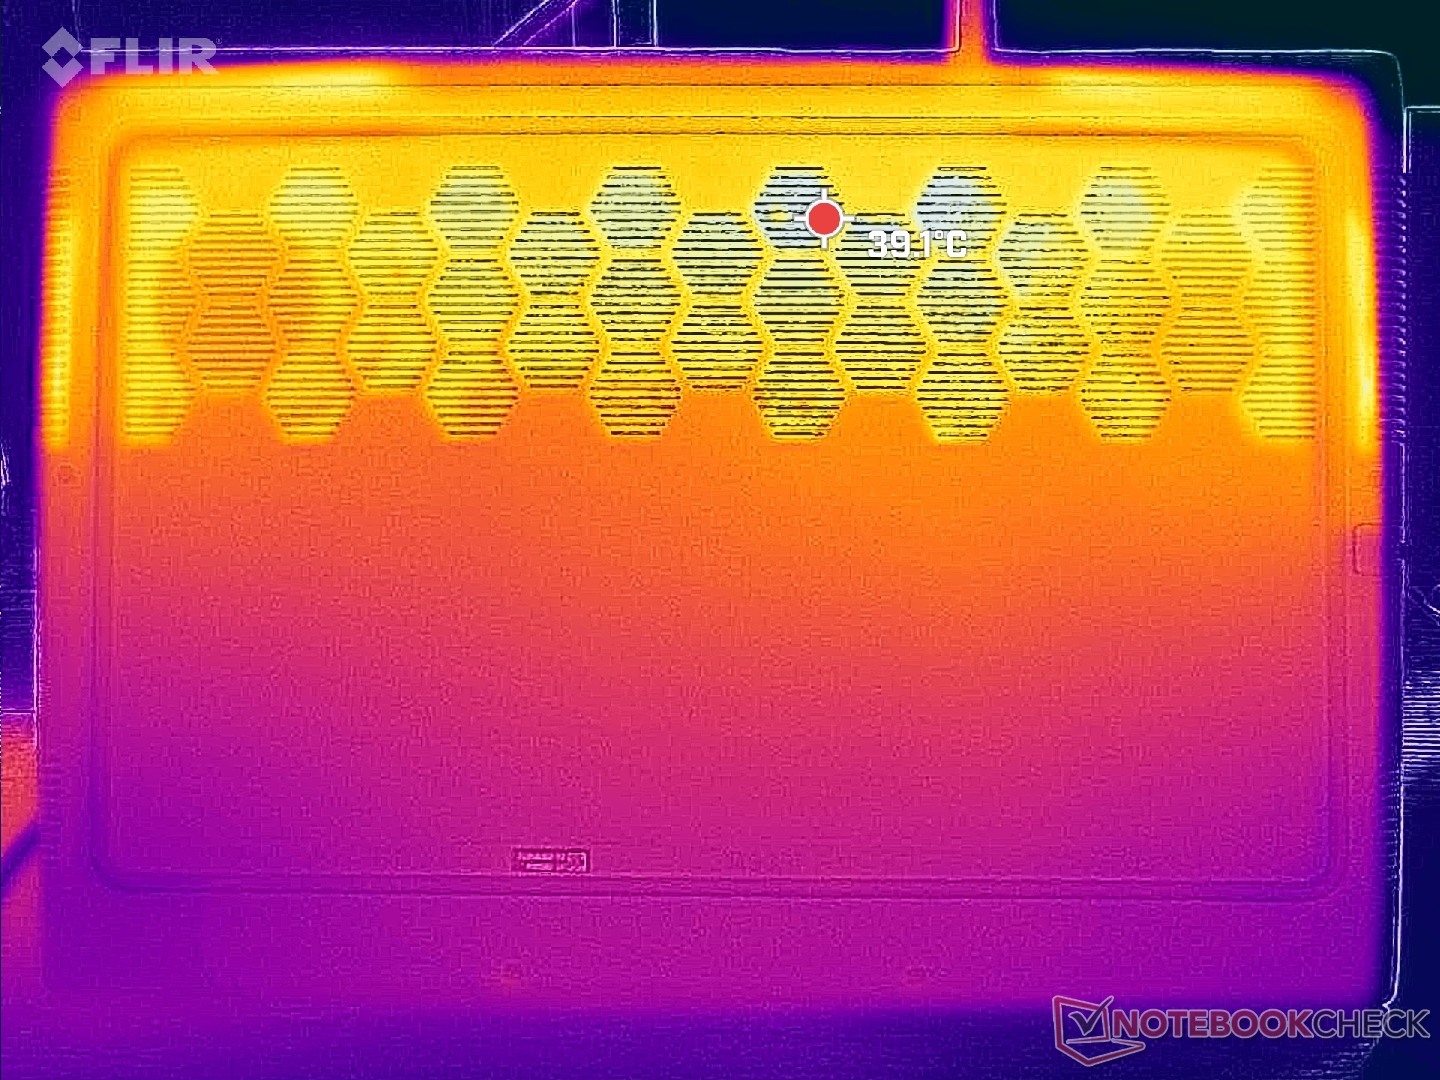
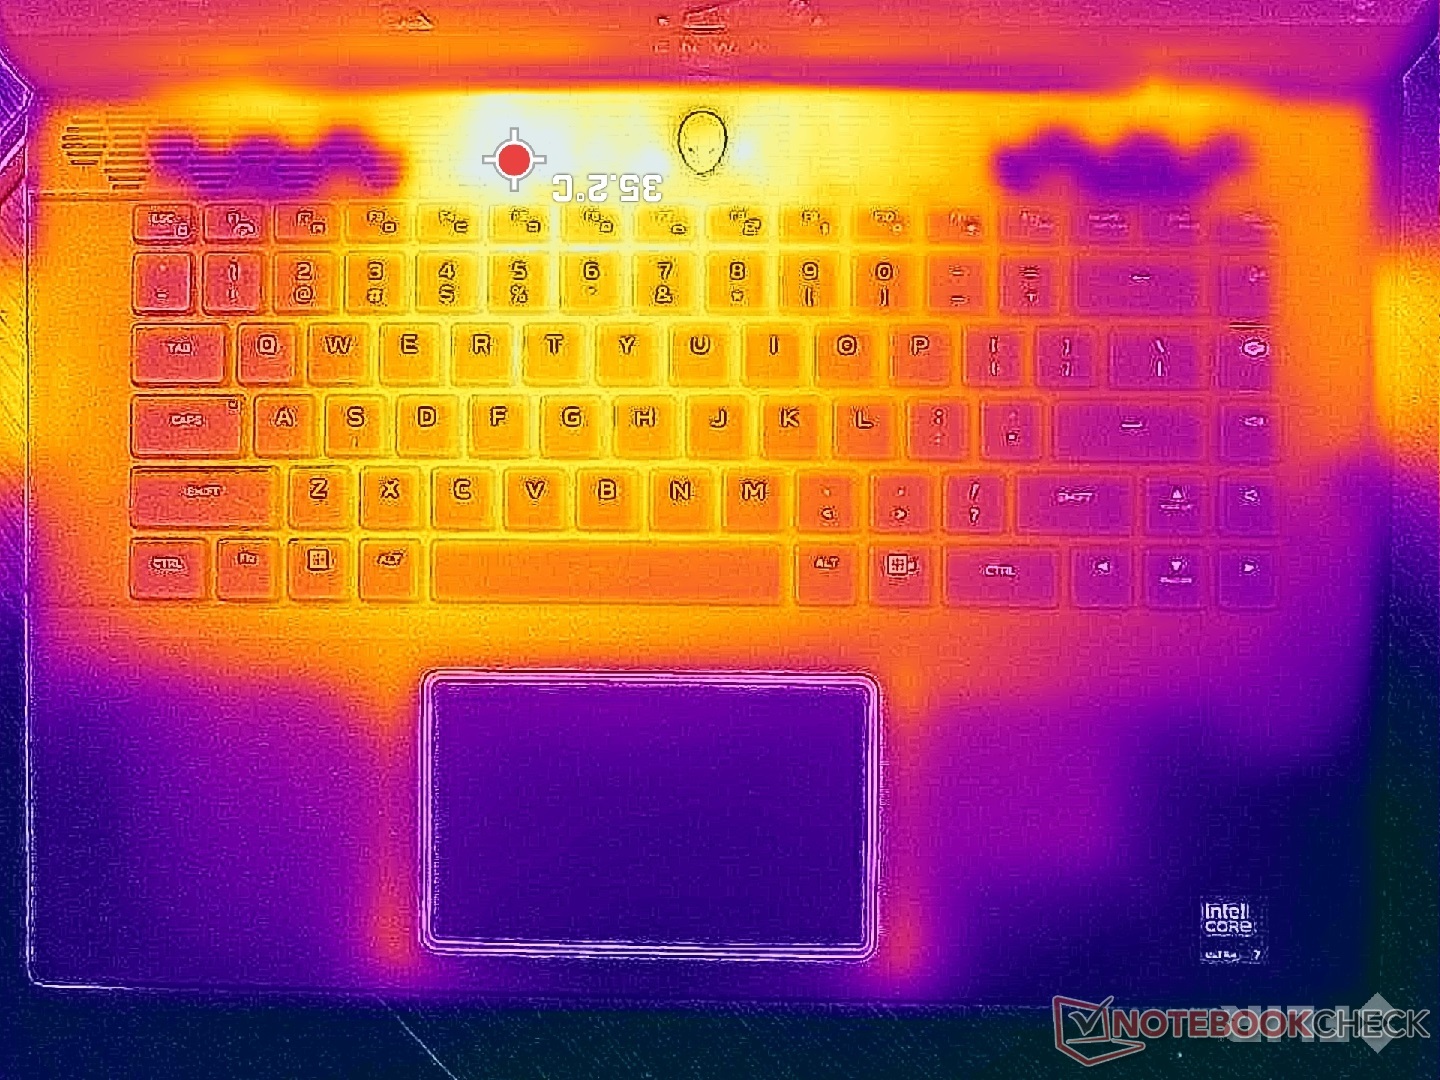
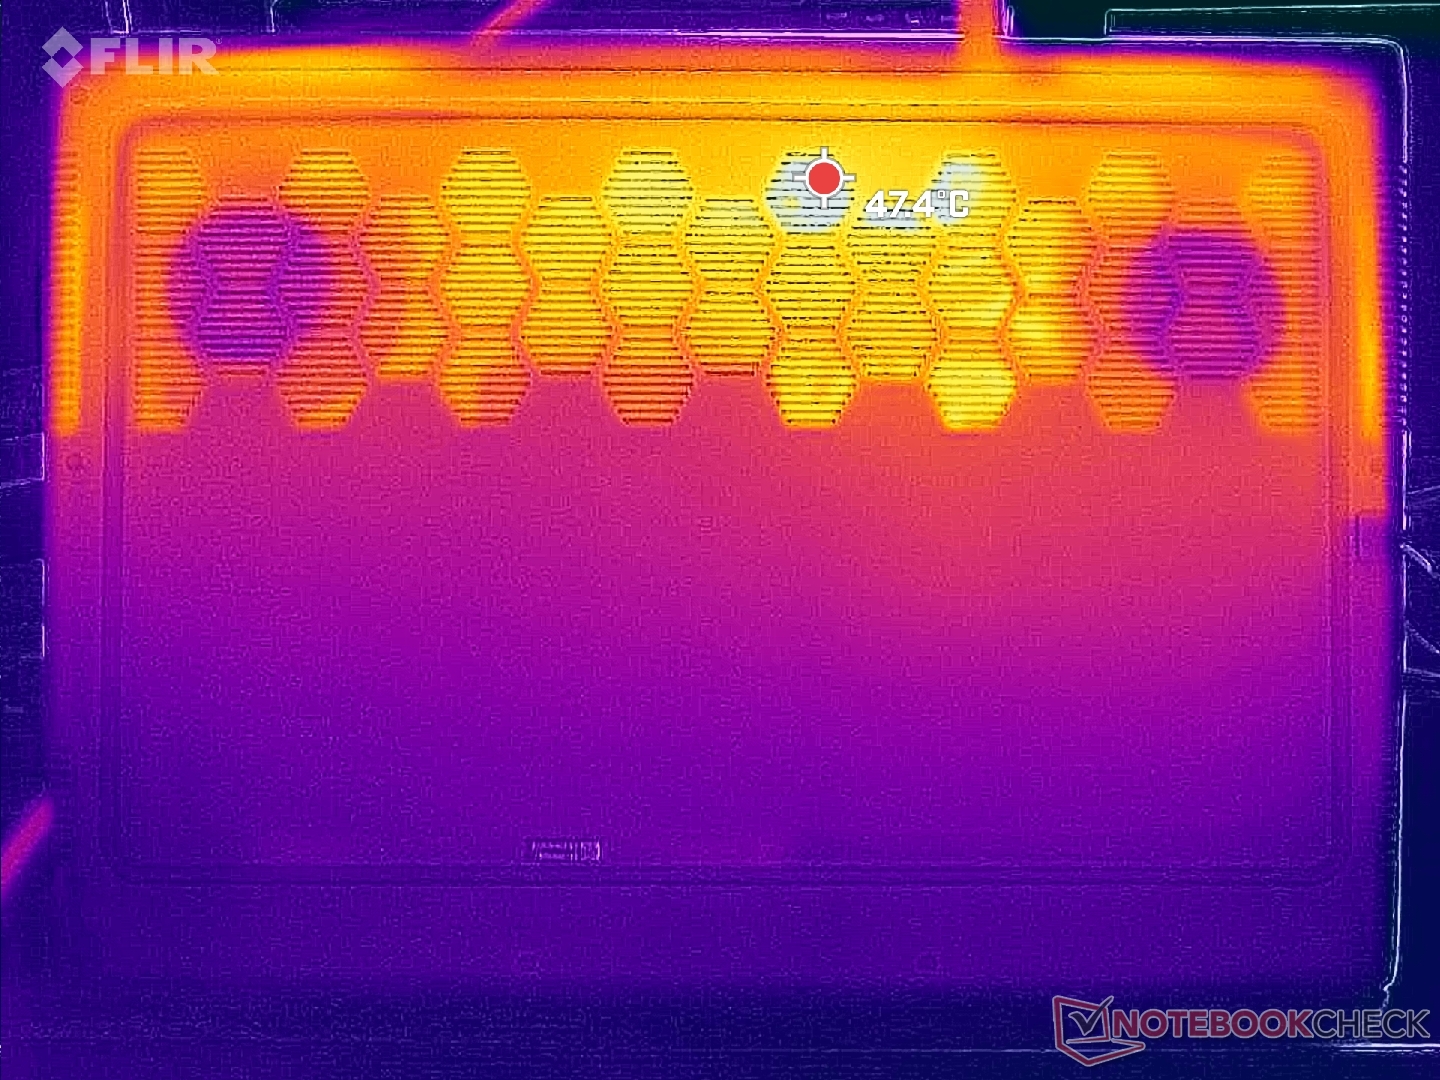
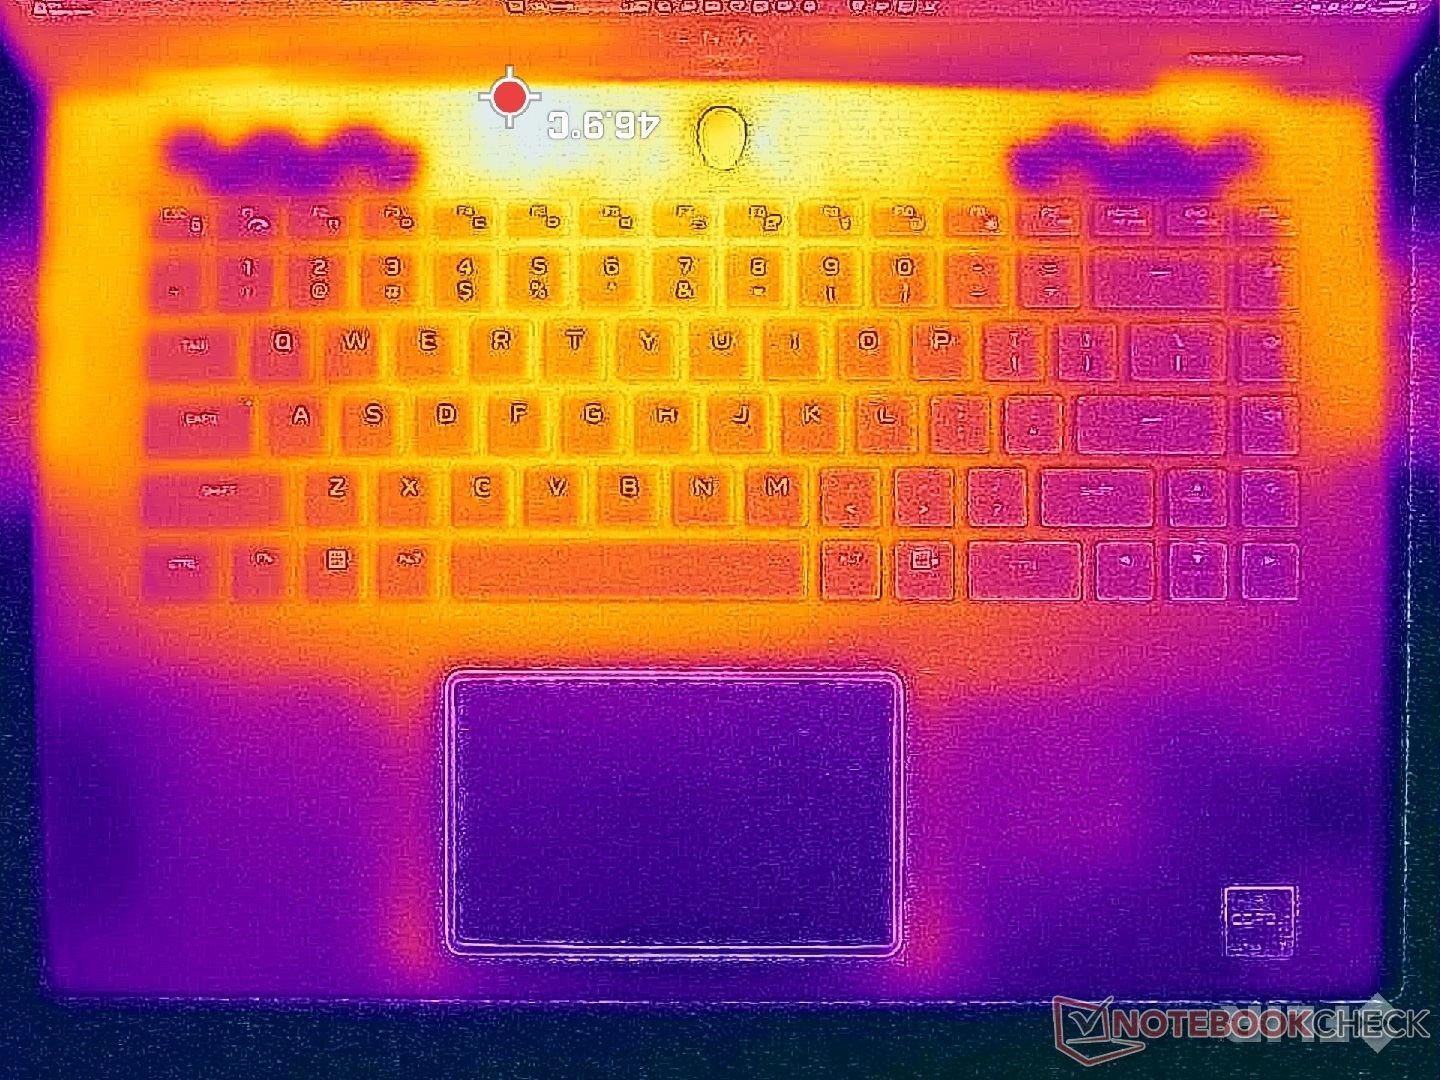
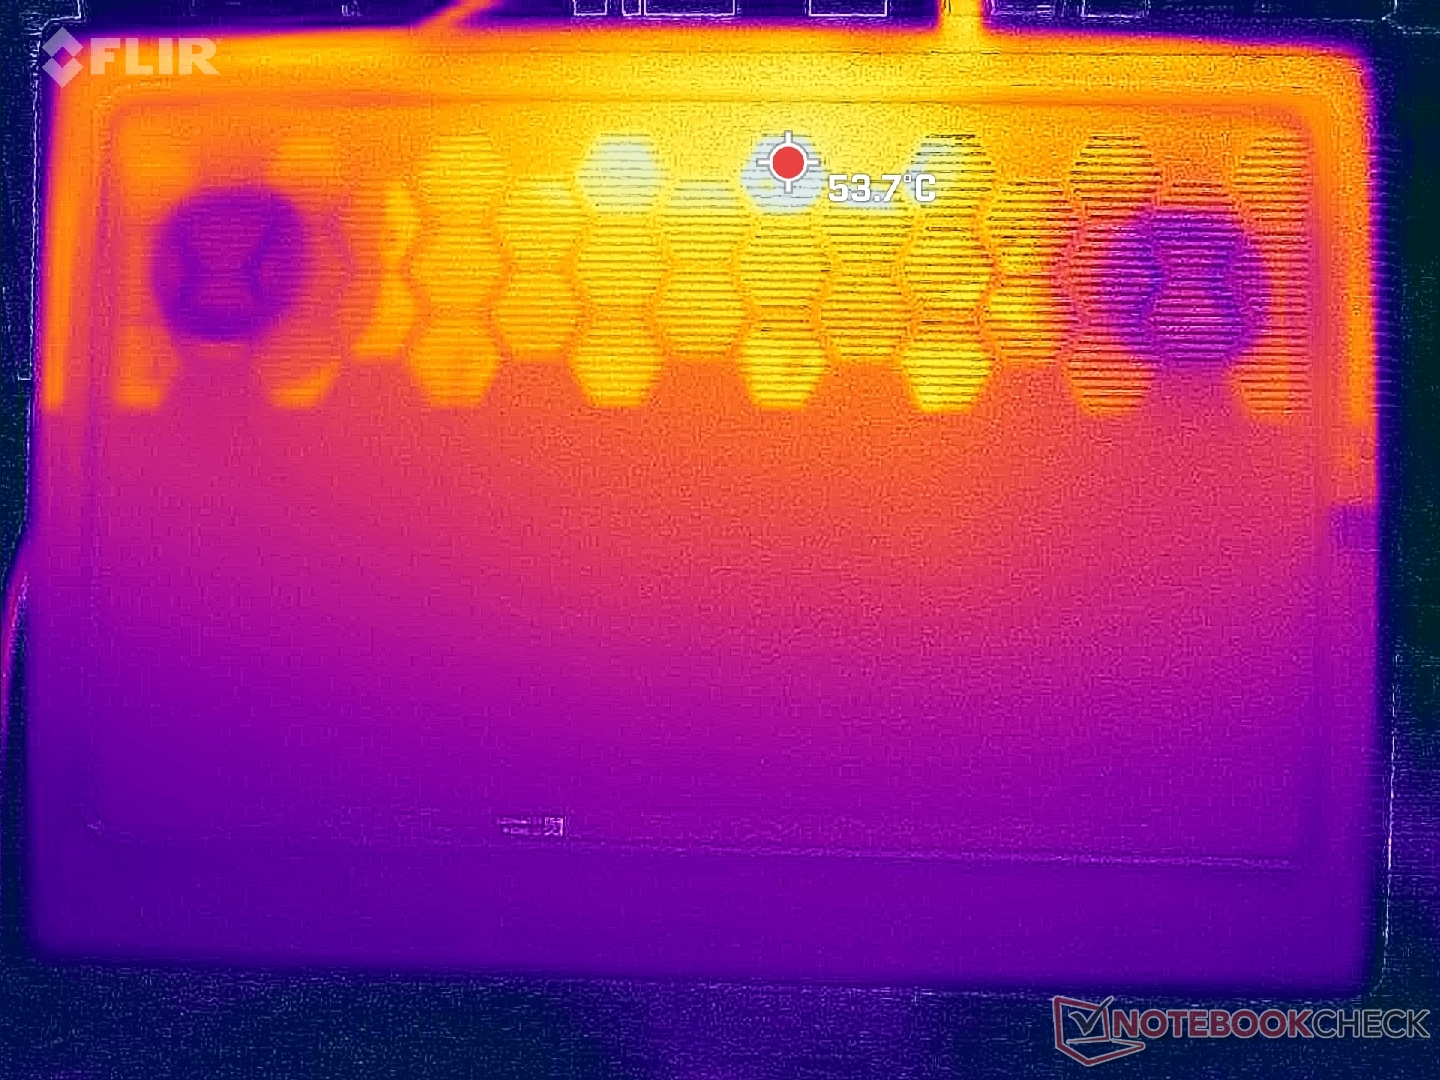
Los puntos calientes cuando se ejecutan cargas exigentes como juegos se concentran hacia la parte trasera del chasis, donde es poco probable que las manos toquen. Los reposamanos y el teclado se mantendrían razonablemente fríos en el rango medio de 20 C y 30 C, respectivamente, mientras que la parte trasera puede acercarse a los 50 C. Las temperaturas medias de la superficie son más cálidas que las que registramos en el Blade 16 pero aún más frías que en el HP Omen Transcend 16 donde ciertas zonas pueden alcanzar más de 60 C.
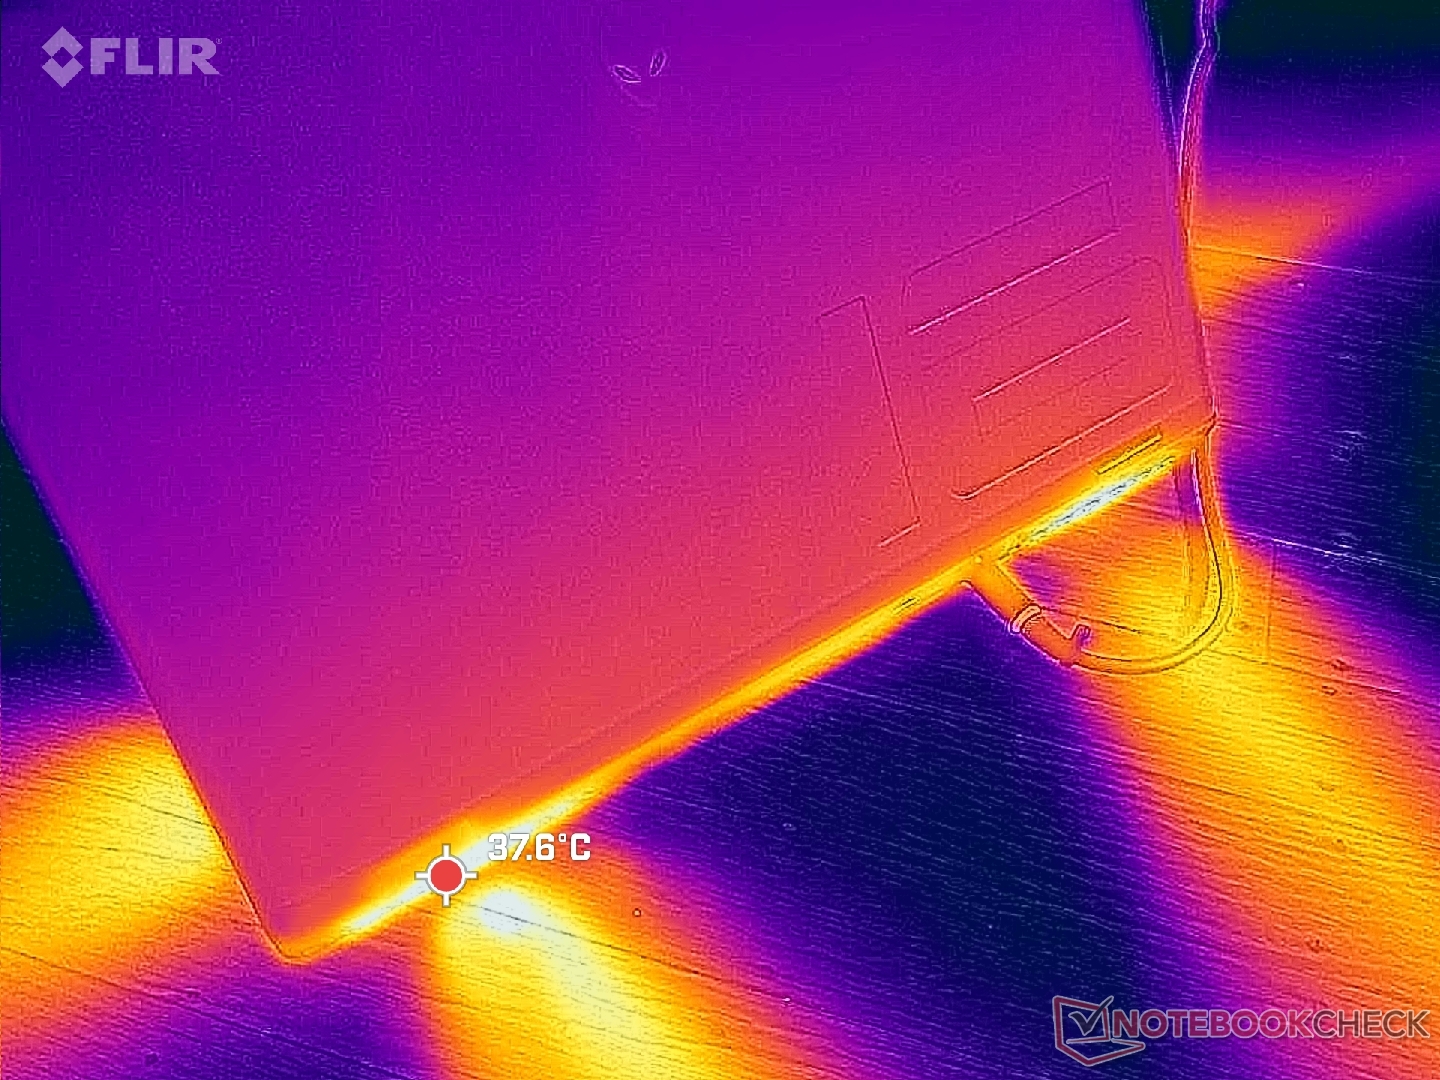
(±) La temperatura máxima en la parte superior es de 44.8 °C / 113 F, frente a la media de 40.4 °C / 105 F, que oscila entre 21.2 y 68.8 °C para la clase Gaming.
(-) El fondo se calienta hasta un máximo de 48 °C / 118 F, frente a la media de 43.2 °C / 110 F
(+) En reposo, la temperatura media de la parte superior es de 30.9 °C / 88# F, frente a la media del dispositivo de 33.9 °C / 93 F.
(+) Jugando a The Witcher 3, la temperatura media de la parte superior es de 28.7 °C / 84 F, frente a la media del dispositivo de 33.9 °C / 93 F.
(+) El reposamanos y el panel táctil están a una temperatura inferior a la de la piel, con un máximo de 27.2 °C / 81 F y, por tanto, son fríos al tacto.
(±) La temperatura media de la zona del reposamanos de dispositivos similares fue de 28.8 °C / 83.8 F (+1.6 °C / 2.8 F).
| Alienware m16 R2 Intel Core Ultra 7 155H, NVIDIA GeForce RTX 4070 Laptop GPU | Alienware m16 R1 Intel Intel Core i7-13700HX, NVIDIA GeForce RTX 4060 Laptop GPU | Alienware x16 R1 Intel Core i9-13900HK, NVIDIA GeForce RTX 4080 Laptop GPU | HP Omen Transcend 16-u1095ng Intel Core i9-14900HX, NVIDIA GeForce RTX 4070 Laptop GPU | Asus ROG Zephyrus G16 2024 GU605M Intel Core Ultra 7 155H, NVIDIA GeForce RTX 4070 Laptop GPU | Lenovo Legion Slim 7 16APH8 AMD Ryzen 7 7840HS, NVIDIA GeForce RTX 4060 Laptop GPU | |
|---|---|---|---|---|---|---|
| Heat | -3% | 3% | 3% | 10% | 8% | |
| Maximum Upper Side * (°C) | 44.8 | 49 -9% | 47.2 -5% | 49 -9% | 50.3 -12% | 46 -3% |
| Maximum Bottom * (°C) | 48 | 48 -0% | 47.8 -0% | 63 -31% | 48 -0% | 46 4% |
| Idle Upper Side * (°C) | 37.2 | 40 -8% | 36.8 1% | 30 19% | 28.8 23% | 33 11% |
| Idle Bottom * (°C) | 42 | 39 7% | 35.8 15% | 29 31% | 29.8 29% | 34 19% |
* ... más pequeño es mejor
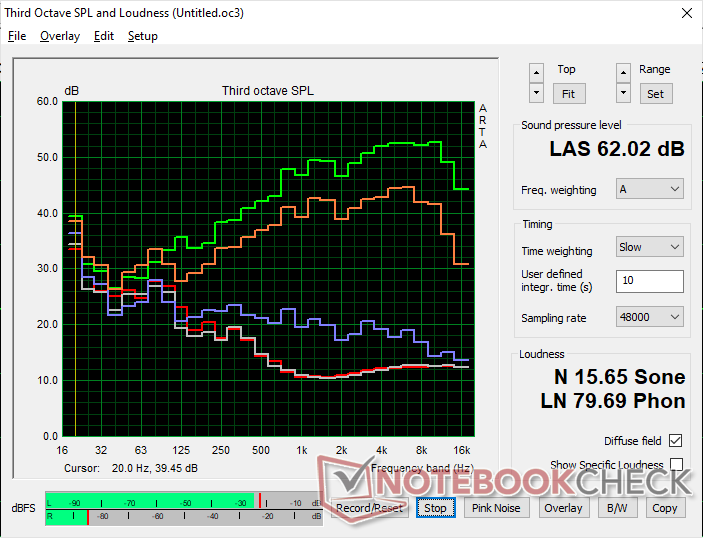
Altavoces
Alienware m16 R2 análisis de audio
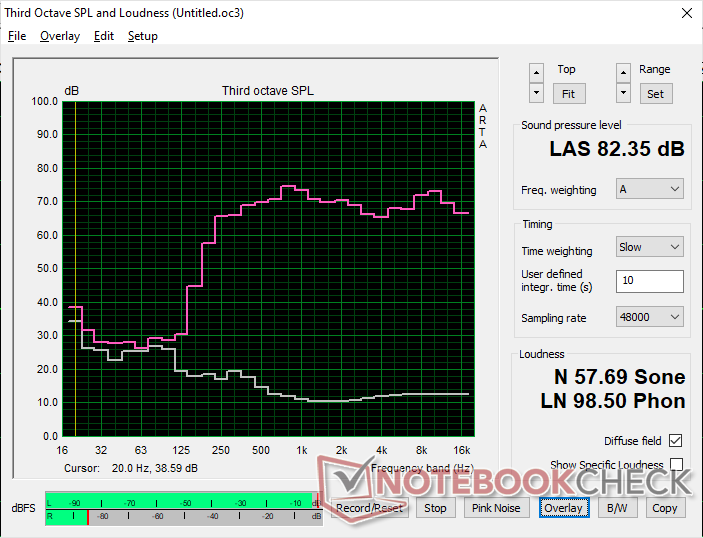
(+) | los altavoces pueden reproducir a un volumen relativamente alto (#82.4 dB)
Graves 100 - 315 Hz
(-) | casi sin bajos - de media 20.1% inferior a la mediana
(±) | la linealidad de los graves es media (11.1% delta a frecuencia anterior)
Medios 400 - 2000 Hz
(+) | medios equilibrados - a sólo 2.2% de la mediana
(+) | los medios son lineales (3.1% delta a la frecuencia anterior)
Altos 2 - 16 kHz
(+) | máximos equilibrados - a sólo 2.2% de la mediana
(+) | los máximos son lineales (3.5% delta a la frecuencia anterior)
Total 100 - 16.000 Hz
(+) | el sonido global es lineal (12.9% de diferencia con la mediana)
En comparación con la misma clase
» 17% de todos los dispositivos probados de esta clase eran mejores, 4% similares, 79% peores
» El mejor tuvo un delta de 6%, la media fue 18%, el peor fue ###max##%
En comparación con todos los dispositivos probados
» 12% de todos los dispositivos probados eran mejores, 3% similares, 85% peores
» El mejor tuvo un delta de 4%, la media fue 23%, el peor fue ###max##%
Apple MacBook Pro 16 2021 M1 Pro análisis de audio
(+) | los altavoces pueden reproducir a un volumen relativamente alto (#84.7 dB)
Graves 100 - 315 Hz
(+) | buen bajo - sólo 3.8% lejos de la mediana
(+) | el bajo es lineal (5.2% delta a la frecuencia anterior)
Medios 400 - 2000 Hz
(+) | medios equilibrados - a sólo 1.3% de la mediana
(+) | los medios son lineales (2.1% delta a la frecuencia anterior)
Altos 2 - 16 kHz
(+) | máximos equilibrados - a sólo 1.9% de la mediana
(+) | los máximos son lineales (2.7% delta a la frecuencia anterior)
Total 100 - 16.000 Hz
(+) | el sonido global es lineal (4.6% de diferencia con la mediana)
En comparación con la misma clase
» 0% de todos los dispositivos probados de esta clase eran mejores, 0% similares, 100% peores
» El mejor tuvo un delta de 5%, la media fue 17%, el peor fue ###max##%
En comparación con todos los dispositivos probados
» 0% de todos los dispositivos probados eran mejores, 0% similares, 100% peores
» El mejor tuvo un delta de 4%, la media fue 23%, el peor fue ###max##%
Gestión de la energía: más esbelta y menos hambrienta de energía
Consumo de energía
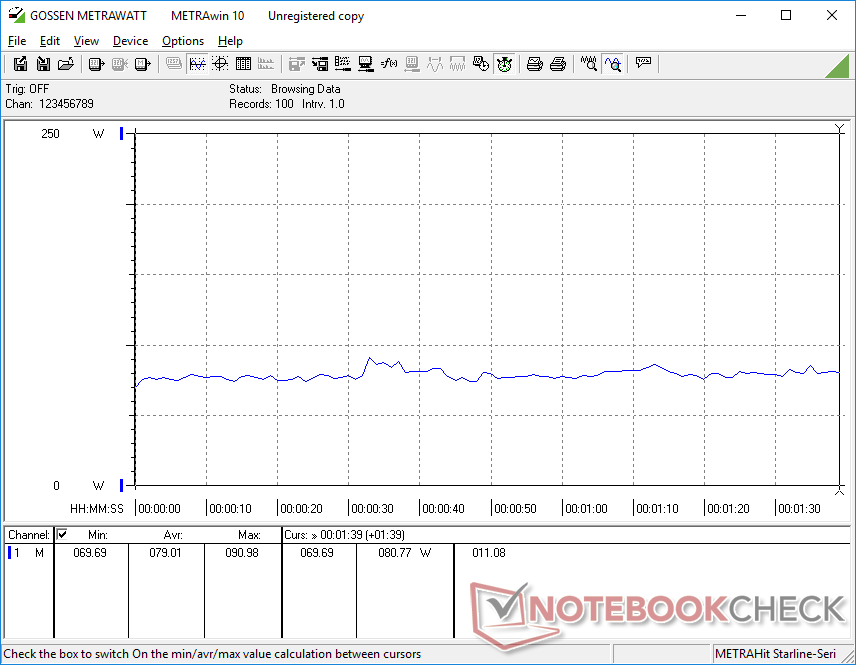
El ralentí en el escritorio puede ser tan bajo como 8 W cuando se ajusta al brillo mínimo en el modo Silencioso y el modo iGPU o hasta 40 W cuando se ajusta al brillo máximo en el modo Overdrive y el modo dGPU. Le convendrá estar en modo Equilibrado y modo iGPU cuando no necesite la potencia extra para prolongar la duración de la batería, como se muestra en la siguiente sección.
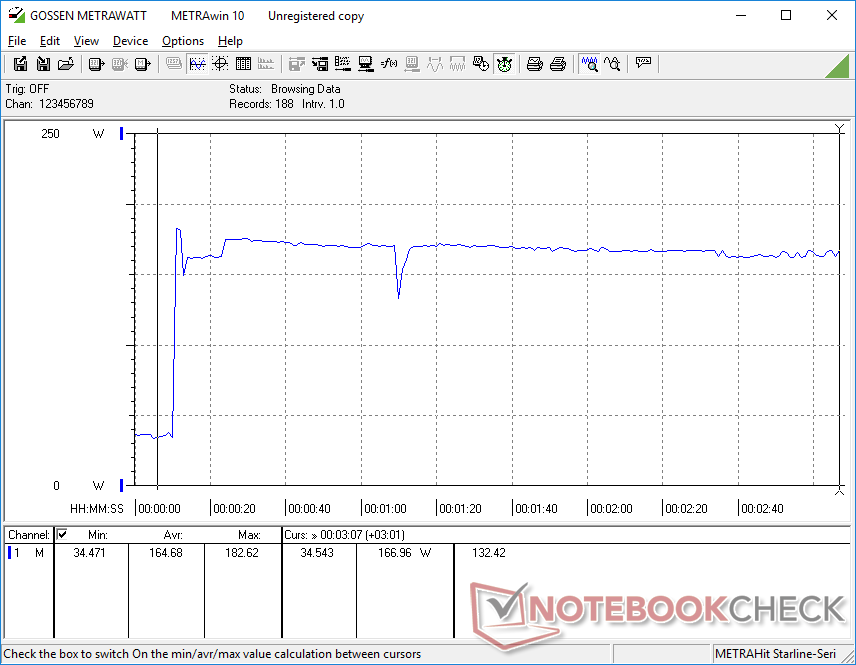
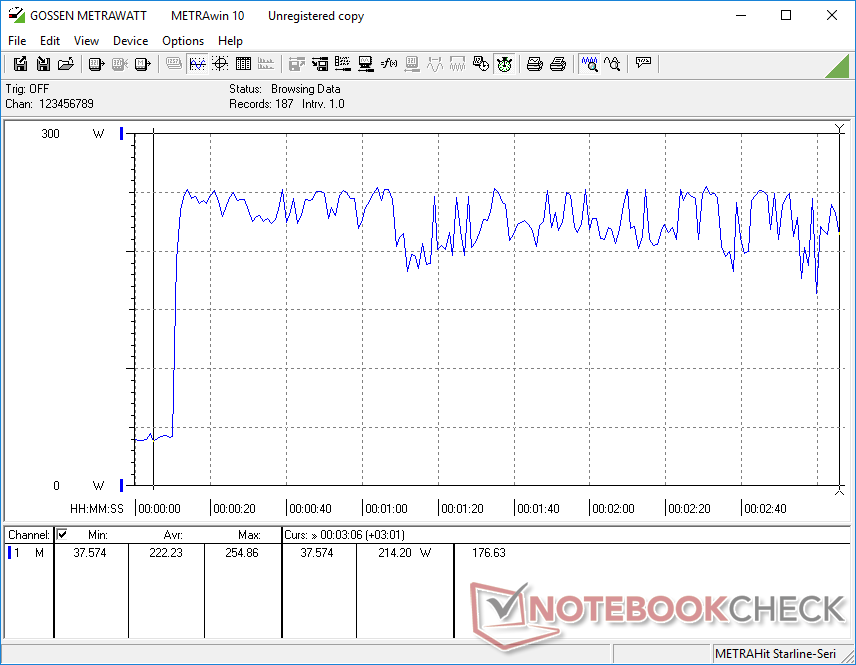
Cuando se juega o se ejecutan cargas pesadas para la CPU, el consumo general es aproximadamente el mismo que el que registramos en la m16 R1 potenciada con RTX 4060 para un rendimiento por vatio ligeramente superior.
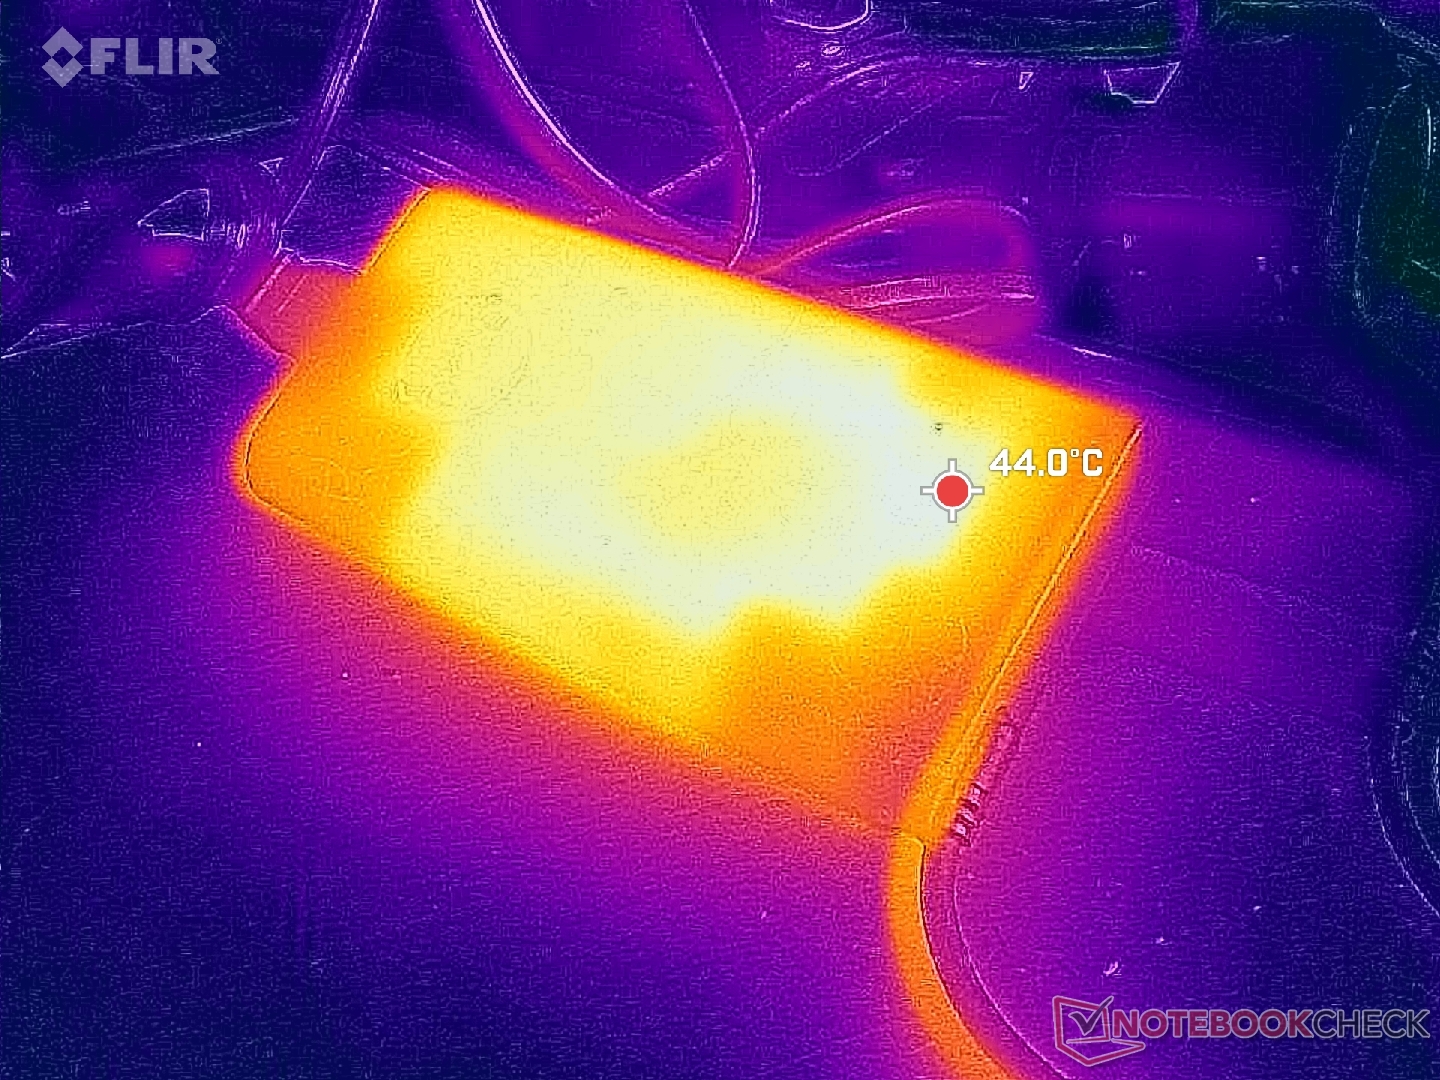
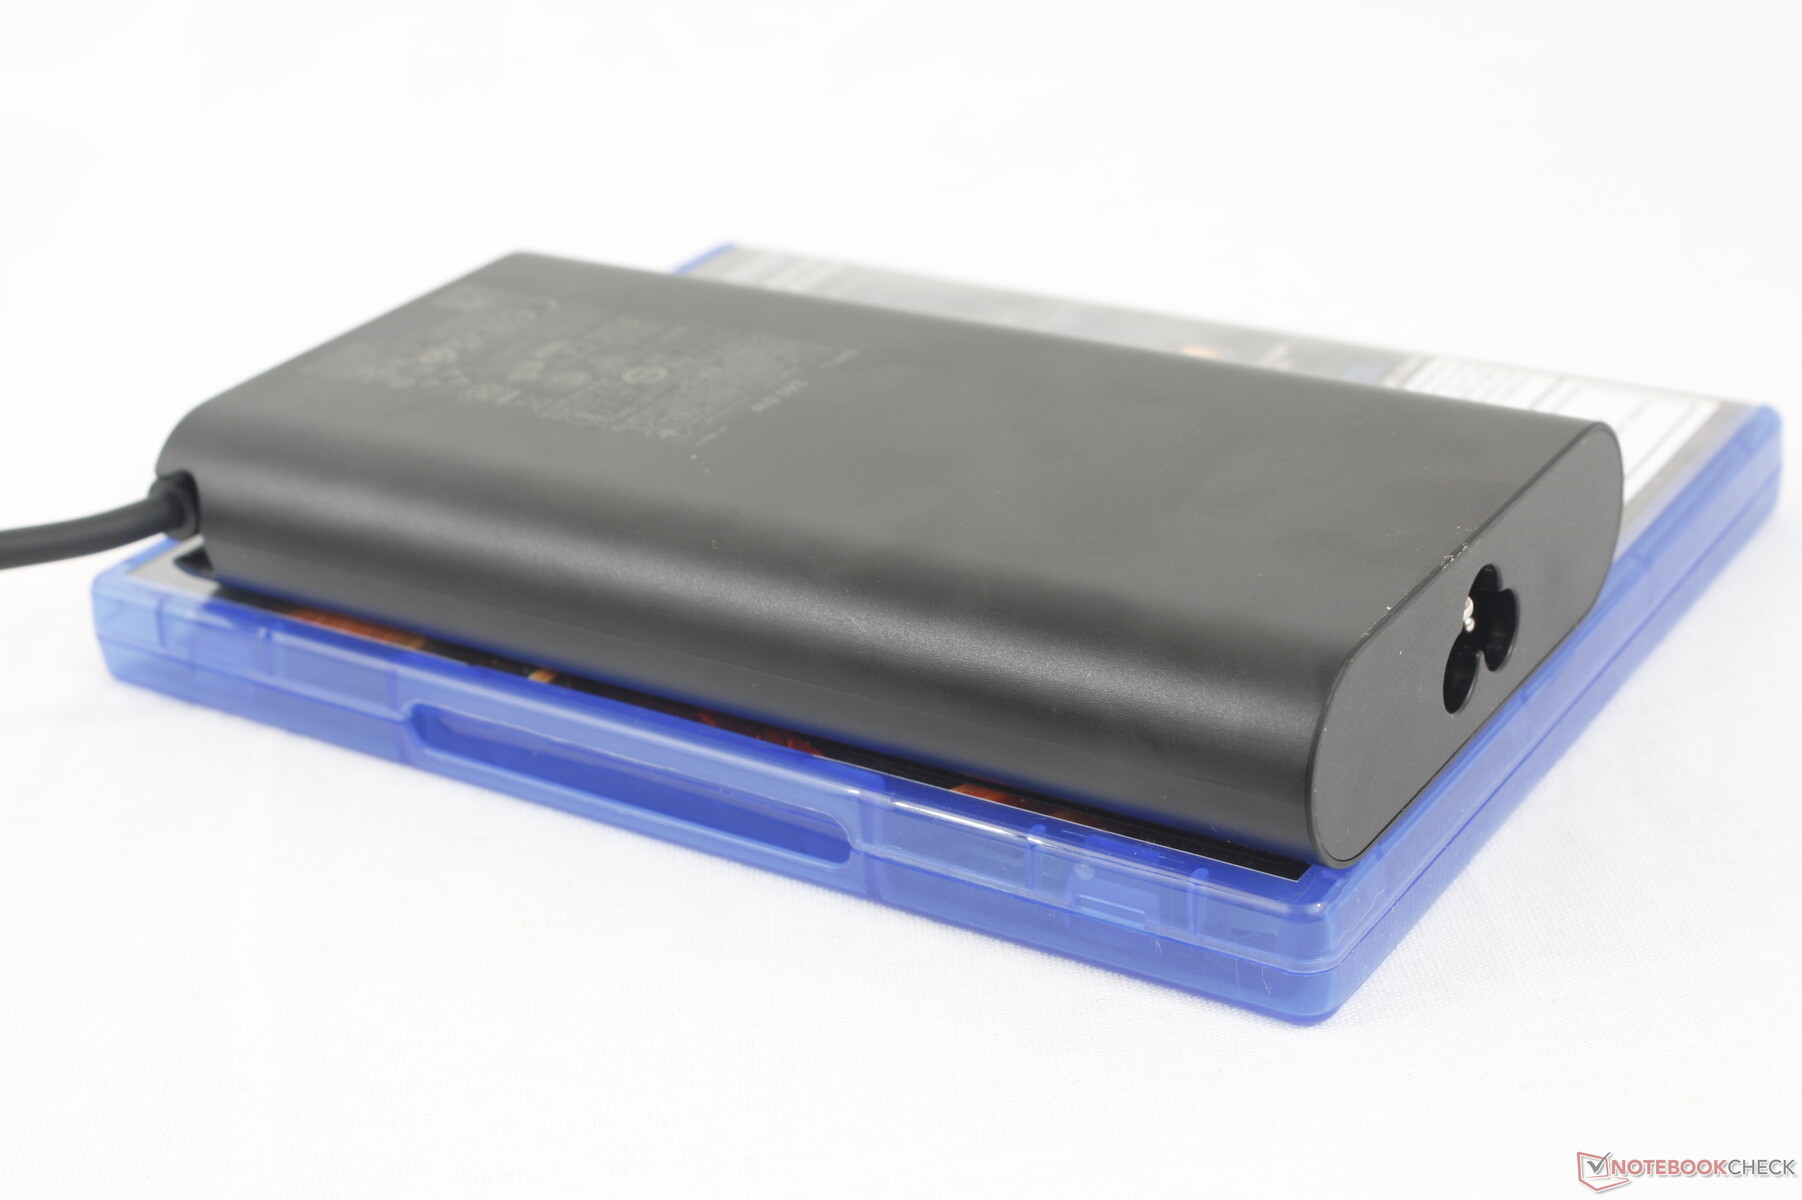
La m16 R2 puede configurarse para que se suministre con un adaptador de CA GaN pequeño (~15,2 x 7,7 x 2,3 cm) de 240 W, mientras que la m16 R1 se entrega con uno más grande (~20 x 10 x 4,5 cm) de 330 W para adaptarse a las configuraciones RTX 4080 y 4090. Es posible que algunas SKU como la nuestra se envíen con un adaptador de CA de 280 W en su lugar.

| Off / Standby | |
| Ocioso | |
| Carga |
|
Clave:
min: | |
| Alienware m16 R2 Ultra 7 155H, GeForce RTX 4070 Laptop GPU, Samsung PM9A1 MZVL21T0HCLR, IPS, 2560x1600, 16" | Alienware m16 R1 Intel i7-13700HX, GeForce RTX 4060 Laptop GPU, Kioxia KXG70ZNV512G, IPS, 2560x1600, 16" | Alienware x16 R1 i9-13900HK, GeForce RTX 4080 Laptop GPU, SK hynix PC801 HFS001TEJ9X101N, IPS, 2560x1600, 16" | HP Omen Transcend 16-u1095ng i9-14900HX, GeForce RTX 4070 Laptop GPU, Kioxia XG8 KXG80ZNV1T02, OLED, 2560x1600, 16" | Asus ROG Zephyrus G16 2024 GU605M Ultra 7 155H, GeForce RTX 4070 Laptop GPU, WD PC SN560 SDDPNQE-1T00, OLED, 2560x1600, 16" | Lenovo Legion Slim 7 16APH8 R7 7840HS, GeForce RTX 4060 Laptop GPU, WDC PC SN810 1TB, IPS, 2560x1600, 16" | |
|---|---|---|---|---|---|---|
| Power Consumption | -10% | -77% | -13% | 24% | -67% | |
| Idle Minimum * (Watt) | 8.1 | 10 -23% | 25.2 -211% | 10 -23% | 8.3 -2% | 33 -307% |
| Idle Average * (Watt) | 13 | 14 -8% | 29.9 -130% | 18 -38% | 12.5 4% | 35 -169% |
| Idle Maximum * (Watt) | 40.3 | 21 48% | 49.8 -24% | 32 21% | 12.8 68% | 45 -12% |
| Load Average * (Watt) | 79 | 119 -51% | 105.4 -33% | 128 -62% | 71.3 10% | 59 25% |
| Witcher 3 ultra * (Watt) | 188.1 | 186.7 1% | 263 -40% | 148.4 21% | 127.5 32% | 131 30% |
| Load Maximum * (Watt) | 254.9 | 323 -27% | 313.8 -23% | 242 5% | 169.1 34% | 177 31% |
* ... más pequeño es mejor
Power Consumption Witcher 3 / Stresstest
Power Consumption external Monitor
Duración de las pilas
La capacidad de la batería es en realidad ligeramente mayor este año, con 90 Wh, a pesar del diseño más pequeño del chasis. También parece que Dell ha solucionado los problemas de duración de la batería que experimentábamos en muchos portátiles Alienware más antiguos; la navegación web en modo Equilibrado y Optimus duraba la friolera de 8 horas en comparación con casi la mitad en el Alienware m16 R1. El sistema puede incluso durar más que el último Asus ROG Zephyrus G16 GU605M en casi una hora.
La carga desde vacío a plena capacidad tarda unos 90 minutos. Por otra parte, la carga hasta el 85% tardaría algo menos de 40 minutos. El modelo también puede recargarse mediante adaptadores USB-C genéricos, aunque mucho más lentamente.
| Alienware m16 R2 Ultra 7 155H, GeForce RTX 4070 Laptop GPU, 90 Wh | Alienware m16 R1 Intel i7-13700HX, GeForce RTX 4060 Laptop GPU, 86 Wh | Alienware x16 R1 i9-13900HK, GeForce RTX 4080 Laptop GPU, 90 Wh | HP Omen Transcend 16-u1095ng i9-14900HX, GeForce RTX 4070 Laptop GPU, 97 Wh | Asus ROG Zephyrus G16 2024 GU605M Ultra 7 155H, GeForce RTX 4070 Laptop GPU, 90 Wh | Lenovo Legion Slim 7 16APH8 R7 7840HS, GeForce RTX 4060 Laptop GPU, 99.9 Wh | |
|---|---|---|---|---|---|---|
| Duración de Batería | -30% | -47% | -40% | 5% | -12% | |
| Reader / Idle (h) | 12.6 | 6.4 -49% | 7.3 -42% | |||
| WiFi v1.3 (h) | 8.1 | 4.8 -41% | 2.5 -69% | 4.9 -40% | 7.3 -10% | 7.1 -12% |
| Load (h) | 1 | 1 0% | 0.7 -30% | 1.2 20% | ||
| H.264 (h) | 5.6 | 11.2 |
Pro
Contra
Veredicto - Lograr un nuevo equilibrio entre el juego y el trabajo híbrido
La Alienware m16 R2 se creó con un claro objetivo en mente: ser más pequeña que la Alienware m16 R1 aunque eso signifique comprometer el rendimiento. El modelo es definitivamente mucho más portátil que antes, pero los usuarios pierden en el proceso los gráficos GeForce RTX 4080/4090, las CPU Core HX y las teclas mecánicas. Dell espera que al eliminar estas características de nivel entusiasta en favor de un diseño más pequeño, el m16 R2 más delgado pueda atraer a un público más amplio de trabajadores híbridos, estudiantes y jugadores convencionales que pueden haber pasado por alto el m16 R1 más "hardcore" y menos fácil de transportar o el x16 R1.
El resultado final es un sistema que equilibra muy bien todos los frentes, desde el rendimiento hasta la duración de la batería y la portabilidad, mientras que el m16 R1 se centraba casi por completo en el rendimiento a costa del peso y la autonomía. Incluso los niveles de ruido del ventilador y su comportamiento han mejorado para ser más apropiados en entornos de aula u oficina donde no se necesitan los caballos de potencia extra. Este es definitivamente el portátil Alienware más completo que hemos probado debido a todos los cambios de hardware y software.
Si se conforma con los gráficos GeForce RTX 4060 o 4070, entonces el Alienware m16 R2 es fácilmente la mejor opción "jack-of-all-trades" que puede elegir en la serie. Si necesita más potencia y quiere conservar la portabilidad, entonces el Blade 16, más caro, sigue siendo el camino a seguir.
Aunque impresionante y a menudo sorprendente, el m16 R2 todavía se enfrenta a una dura competencia en la categoría de 16 pulgadas. El Razer Blade 16por ejemplo, sigue siendo más ligero, más pequeño y más rápido que el m16 R2 y con colores DCI-P3 más profundos. El Asus ROG Zephyrus G16 es igualmente más ligero y con más opciones de pantalla, pero el rendimiento de la GPU está ligeramente por detrás. En este escenario, Dell ha fijado el precio del Alienware m16 R2 para que sea menos caro que los sistemas Razer y Asus.
Precio y disponibilidad
Dell ya está distribuyendo la Alienware m16 R2 a partir de 1650 dólares para la RTX 4060 o hasta más de 1850 dólares para la configuración RTX 4070. La configuración RTX 4050 de nivel básico también está disponible por $1500.
Alienware m16 R2
- 02/24/2024 v7 (old)
Allen Ngo
Transparencia
La selección de los dispositivos que se van a reseñar corre a cargo de nuestro equipo editorial. La muestra de prueba fue proporcionada al autor en calidad de préstamo por el fabricante o el minorista a los efectos de esta reseña. El prestamista no tuvo ninguna influencia en esta reseña, ni el fabricante recibió una copia de la misma antes de su publicación. No había ninguna obligación de publicar esta reseña. Como empresa de medios independiente, Notebookcheck no está sujeta a la autoridad de fabricantes, minoristas o editores.
Así es como prueba Notebookcheck
Cada año, Notebookcheck revisa de forma independiente cientos de portátiles y smartphones utilizando procedimientos estandarizados para asegurar que todos los resultados son comparables. Hemos desarrollado continuamente nuestros métodos de prueba durante unos 20 años y hemos establecido los estándares de la industria en el proceso. En nuestros laboratorios de pruebas, técnicos y editores experimentados utilizan equipos de medición de alta calidad. Estas pruebas implican un proceso de validación en varias fases. Nuestro complejo sistema de clasificación se basa en cientos de mediciones y puntos de referencia bien fundamentados, lo que mantiene la objetividad.Price comparison

