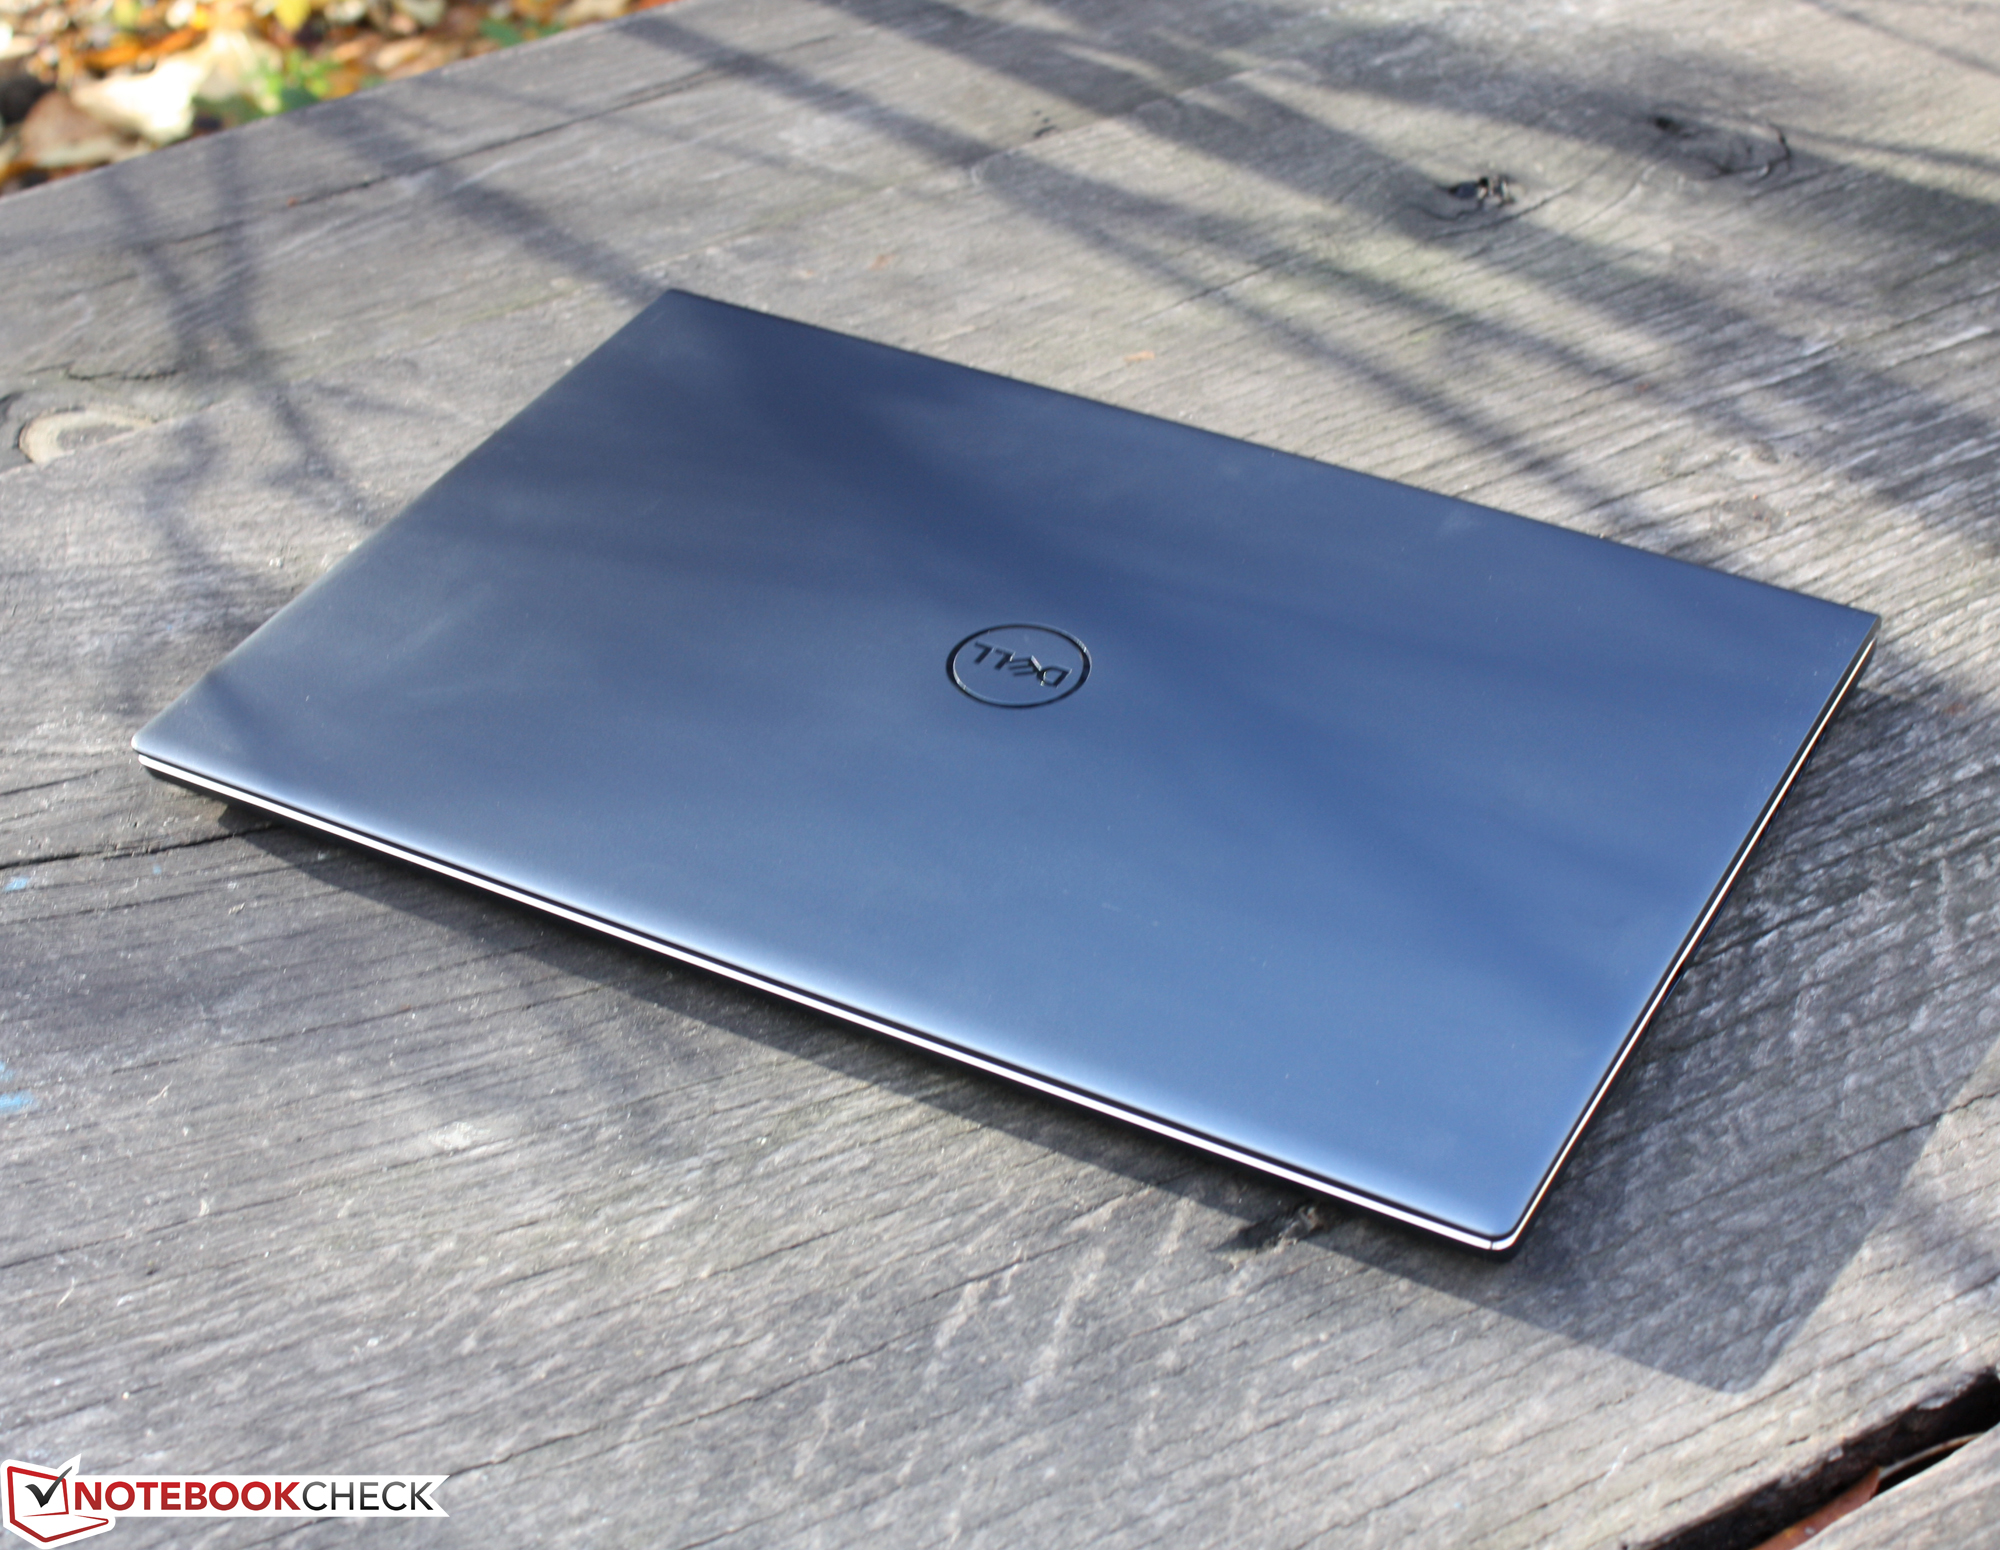
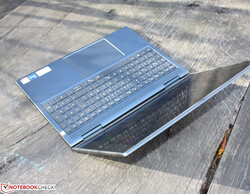
Análisis del Dell Inspiron 16 Plus 7610: ¿Más rendimiento sin Nvidia?

¿Un Inspiron 16 Plus 7610 sin la tarjeta gráfica Nvidia sería quizás mejor para mí como no jugador que la versión dGPU? Hemos adquirido un Inspiron 16 Plus 7610 MHJ8F con uni7-11800H16 GB de RAM y un SSD de 512 GB para responder exactamente a esta pregunta. En la prueba delInspiron 16 Plus 7610 con RTXnuestros colegas se quejaron del desarrollo del rendimiento del procesador por debajo de la media. Entonces, ¿el Core i7 tiene ahora más espacio en términos de refrigeración? ¿Es el desarrollo de calor tal vez más bajo o la duración de la batería más larga? Descubrimos las respuestas en esta prueba
Possible Competitors in Comparison
Valoración | Fecha | Modelo | Peso | Altura | Tamaño | Resolución | Precio |
|---|---|---|---|---|---|---|---|
| 82.6 % v7 (old) | 11/2021 | Dell Inspiron 16 Plus 7610-MHJ8F i7-11800H, UHD Graphics Xe 32EUs (Tiger Lake-H) | 2 kg | 19 mm | 16.00" | 3072x1920 | |
| 86.7 % v7 (old) | 08/2021 | Dell Inspiron 16 Plus 7610 i7-11800H, GeForce RTX 3050 4GB Laptop GPU | 2 kg | 18.99 mm | 16.00" | 3072x1920 | |
| 86.3 % v7 (old) | 06/2021 | LG Gram 16 (2021) i7-1165G7, Iris Xe G7 96EUs | 1.2 kg | 16.8 mm | 16.00" | 2560x1600 | |
| 87.4 % v7 (old) | 08/2021 | Lenovo Legion 5 Pro 16ACH6H (82JQ001PGE) R7 5800H, GeForce RTX 3070 Laptop GPU | 2.6 kg | 26.85 mm | 16.00" | 2560x1600 | |
| 82.4 % v7 (old) | 01/2021 | Dell Inspiron 15 7000 7506 2-in-1 Black Edition i7-1165G7, Xe MAX | 1.9 kg | 17.94 mm | 15.60" | 3840x2160 | |
| 82.7 % v7 (old) | 03/2021 | Acer Aspire 5 A517-52G-79Z5 i7-1165G7, GeForce MX350 | 2.2 kg | 19.9 mm | 17.30" | 1920x1080 |
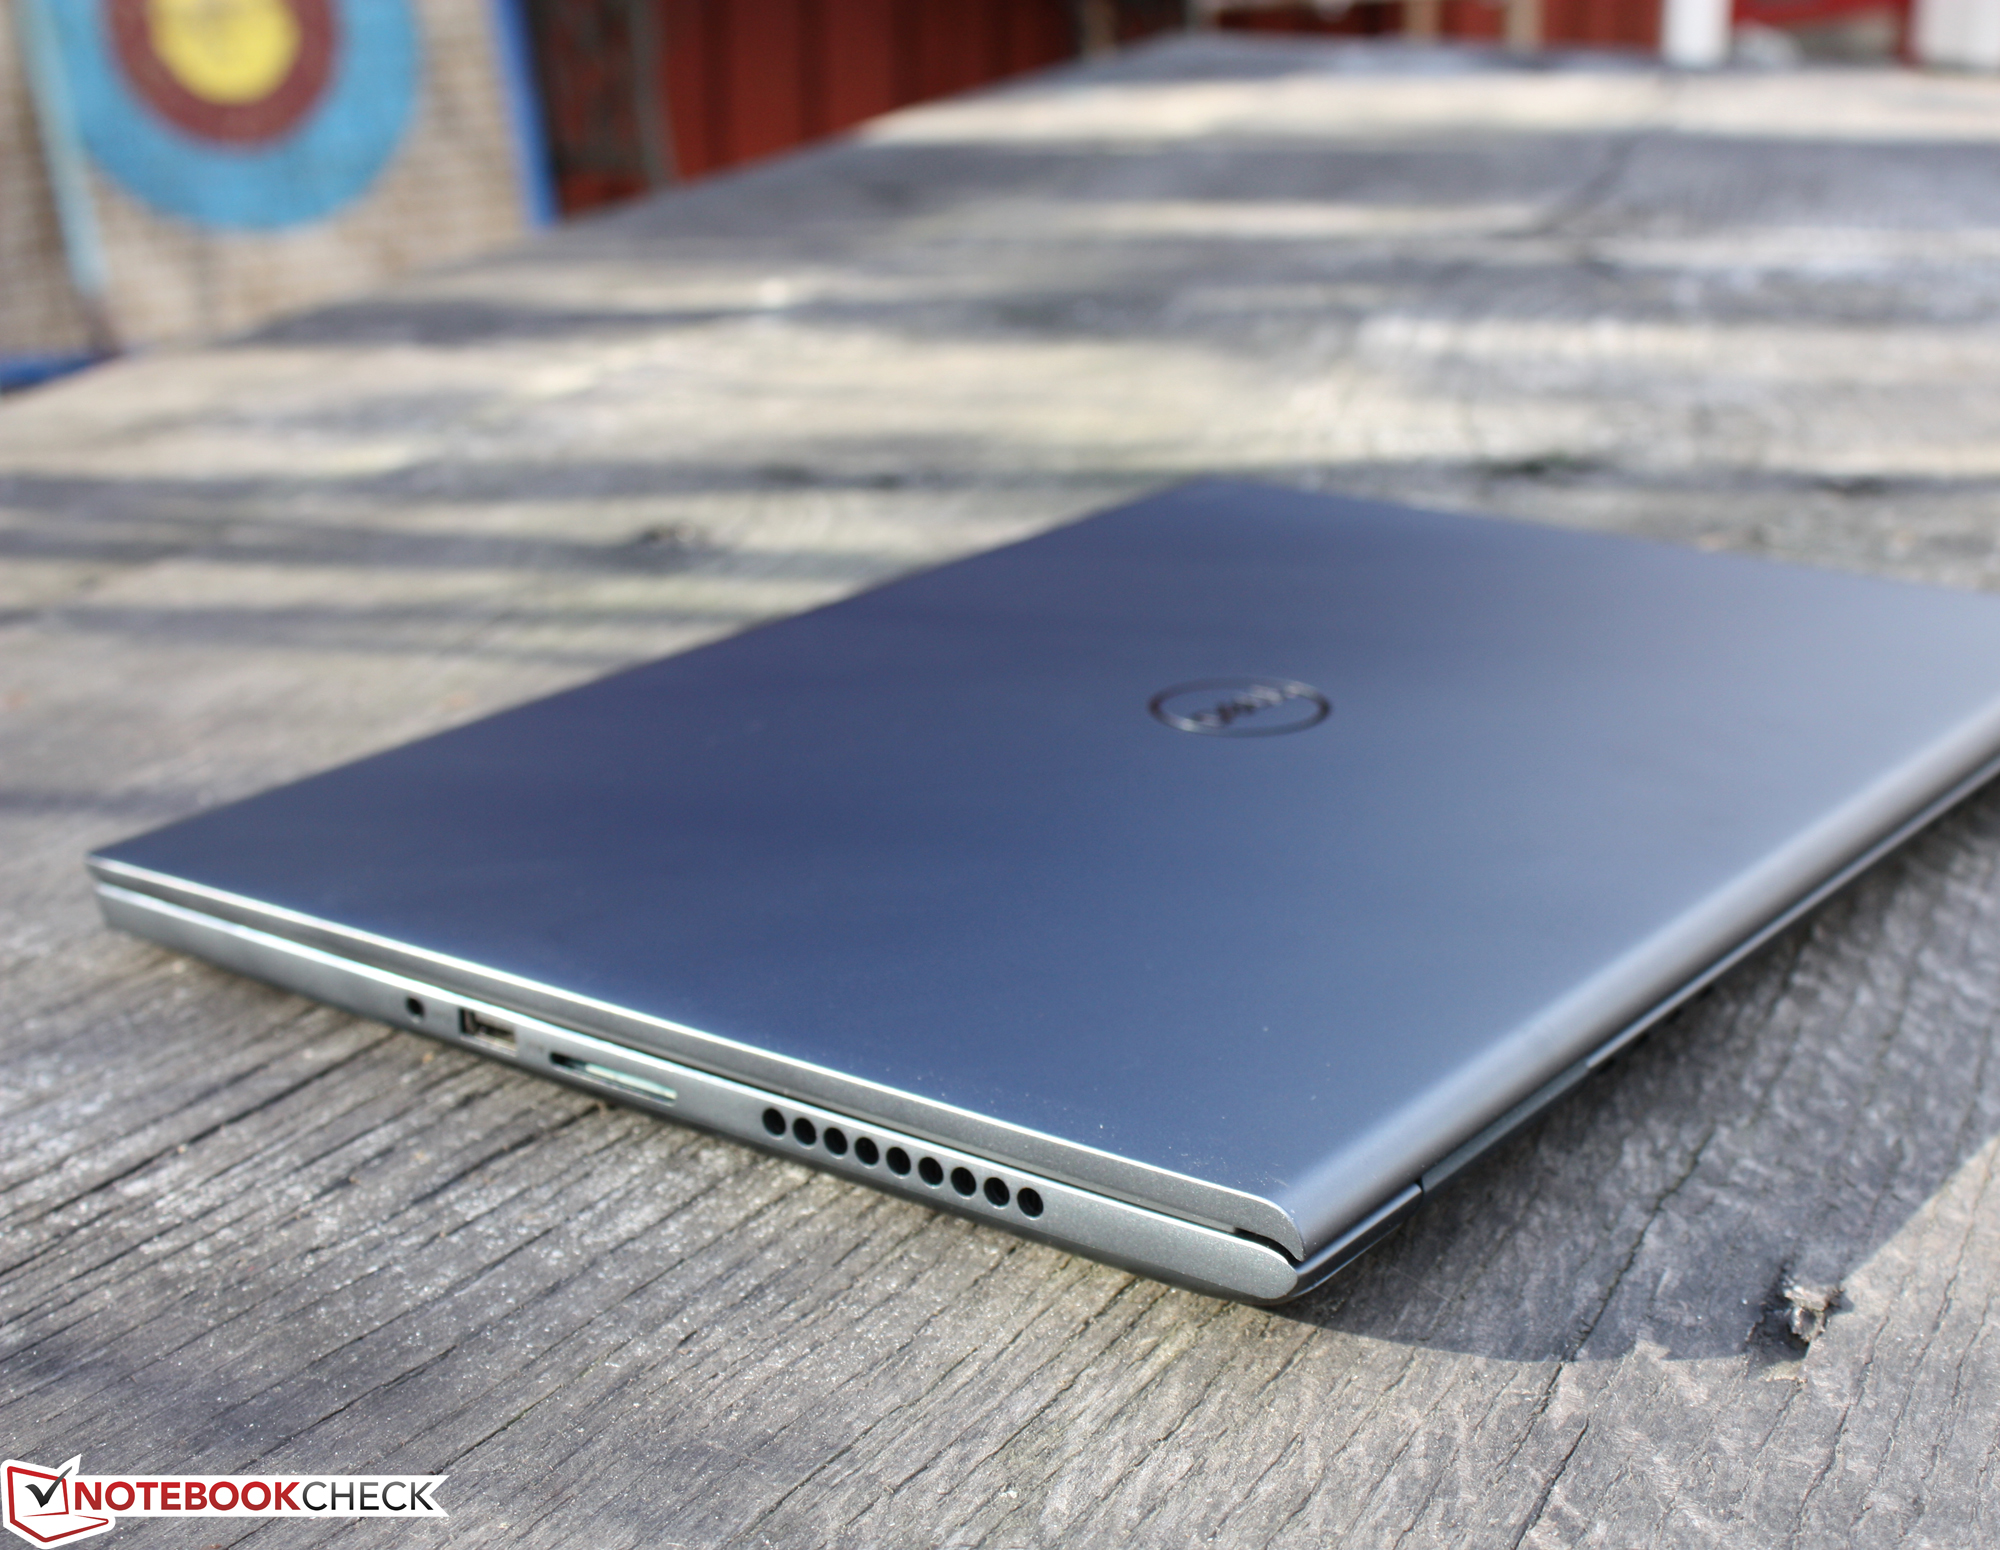
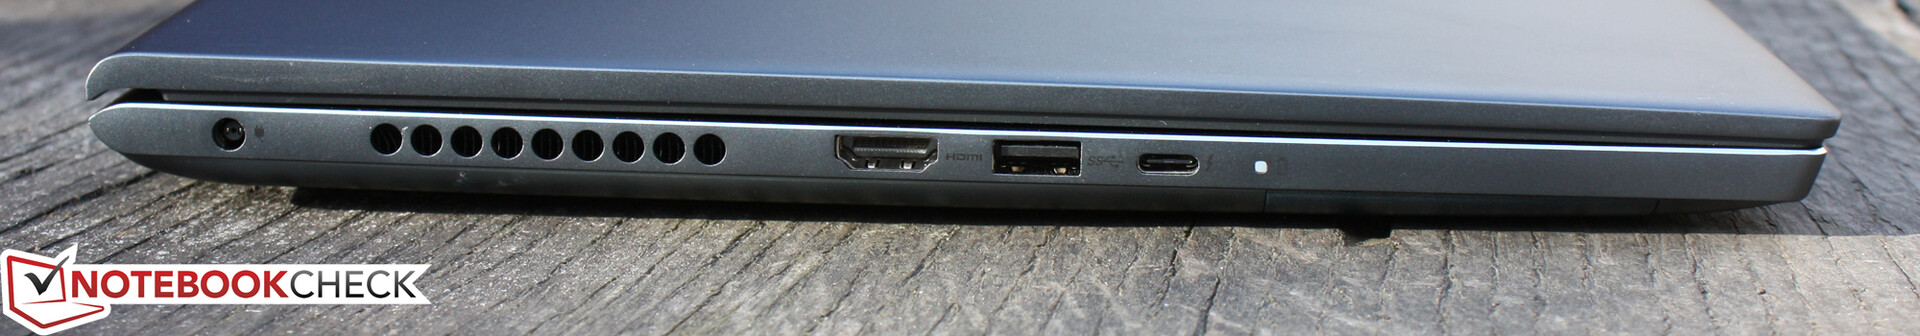
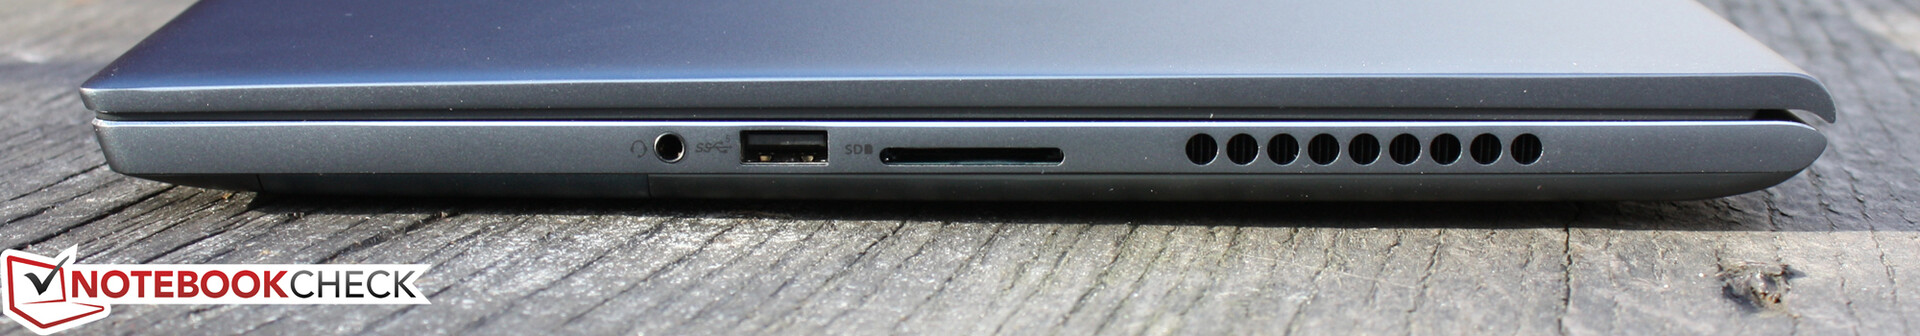
Maletín y equipo
Puedes conocer todos los detalles al respecto en nuestra prueba completa del Dell Inspiron 16 Plus 7610Versión de la GPU.

| SD Card Reader | |
| average JPG Copy Test (av. of 3 runs) | |
| Media de la clase Multimedia (23 - 531, n=44, últimos 2 años) | |
| LG Gram 16 (2021) (Toshiba Exceria Pro M501 microSDXC 64GB) | |
| Dell Inspiron 15 7000 7506 2-in-1 Black Edition (Toshiba Exceria Pro M501 microSDXC 32GB) | |
| Dell Inspiron 16 Plus 7610-MHJ8F (AV Pro SD microSD 128 GB V60) | |
| Dell Inspiron 16 Plus 7610 (AV PRO microSD 128 GB V60) | |
| maximum AS SSD Seq Read Test (1GB) | |
| Media de la clase Multimedia (27.9 - 1455, n=43, últimos 2 años) | |
| LG Gram 16 (2021) (Toshiba Exceria Pro M501 microSDXC 64GB) | |
| Dell Inspiron 15 7000 7506 2-in-1 Black Edition (Toshiba Exceria Pro M501 microSDXC 32GB) | |
| Dell Inspiron 16 Plus 7610-MHJ8F (AV Pro SD microSD 128 GB V60) | |
| Dell Inspiron 16 Plus 7610 (AV PRO microSD 128 GB V60) | |

, i7-11800H, OM3PDP3-AD NVMe KDI 512GB")
, i7-11800H, OM3PDP3-AD NVMe KDI 512GB")
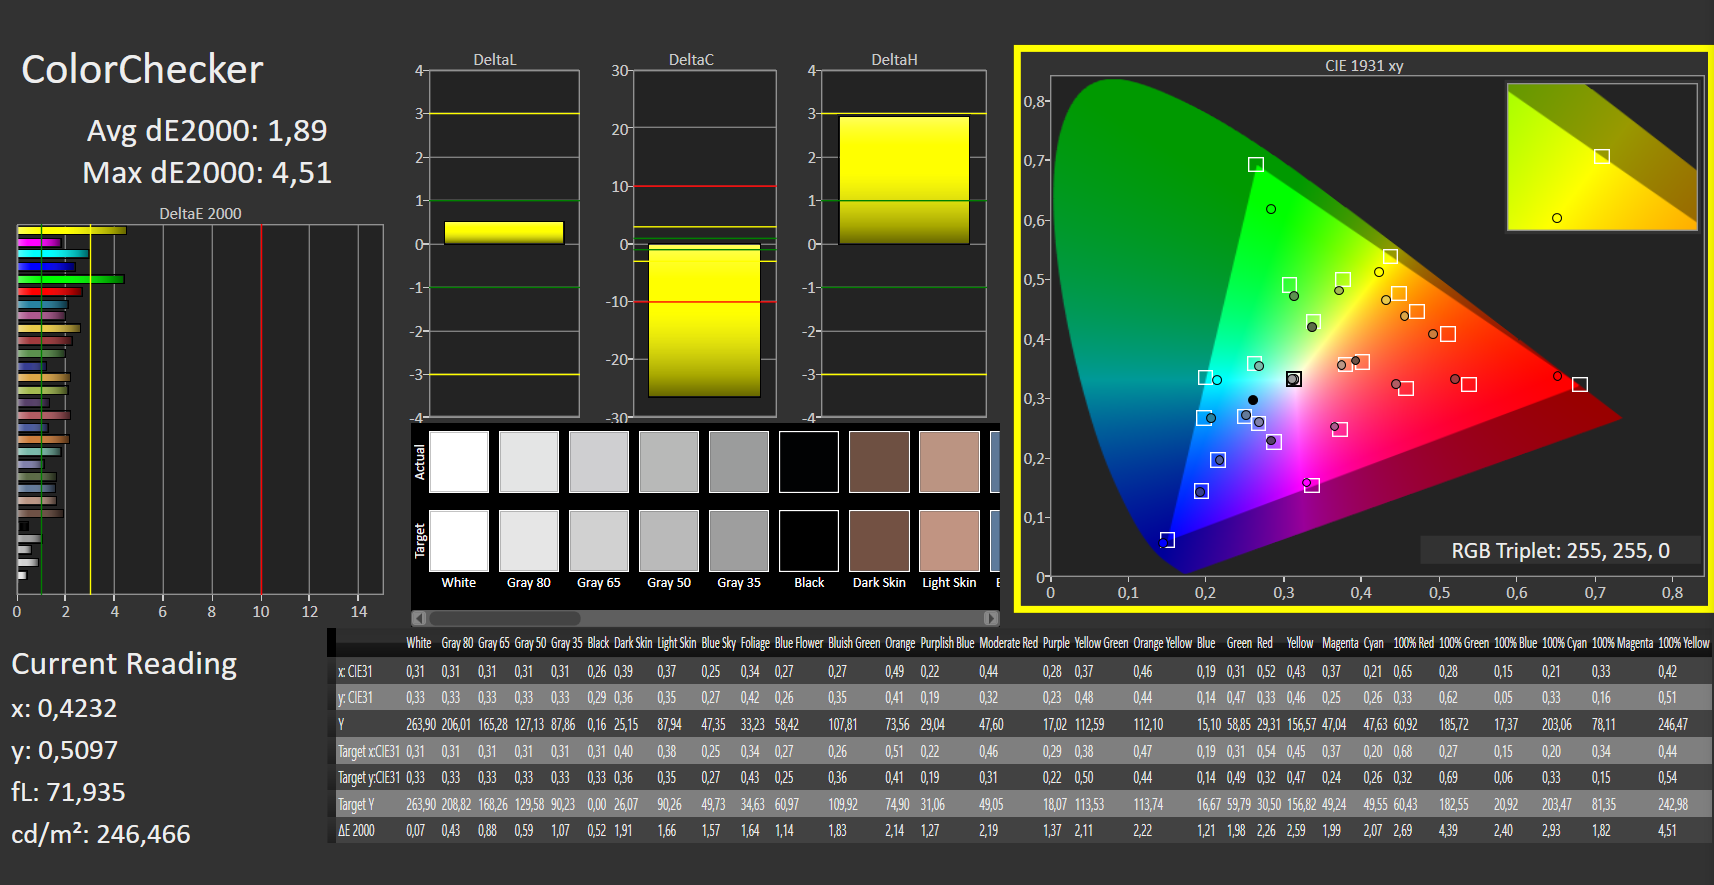
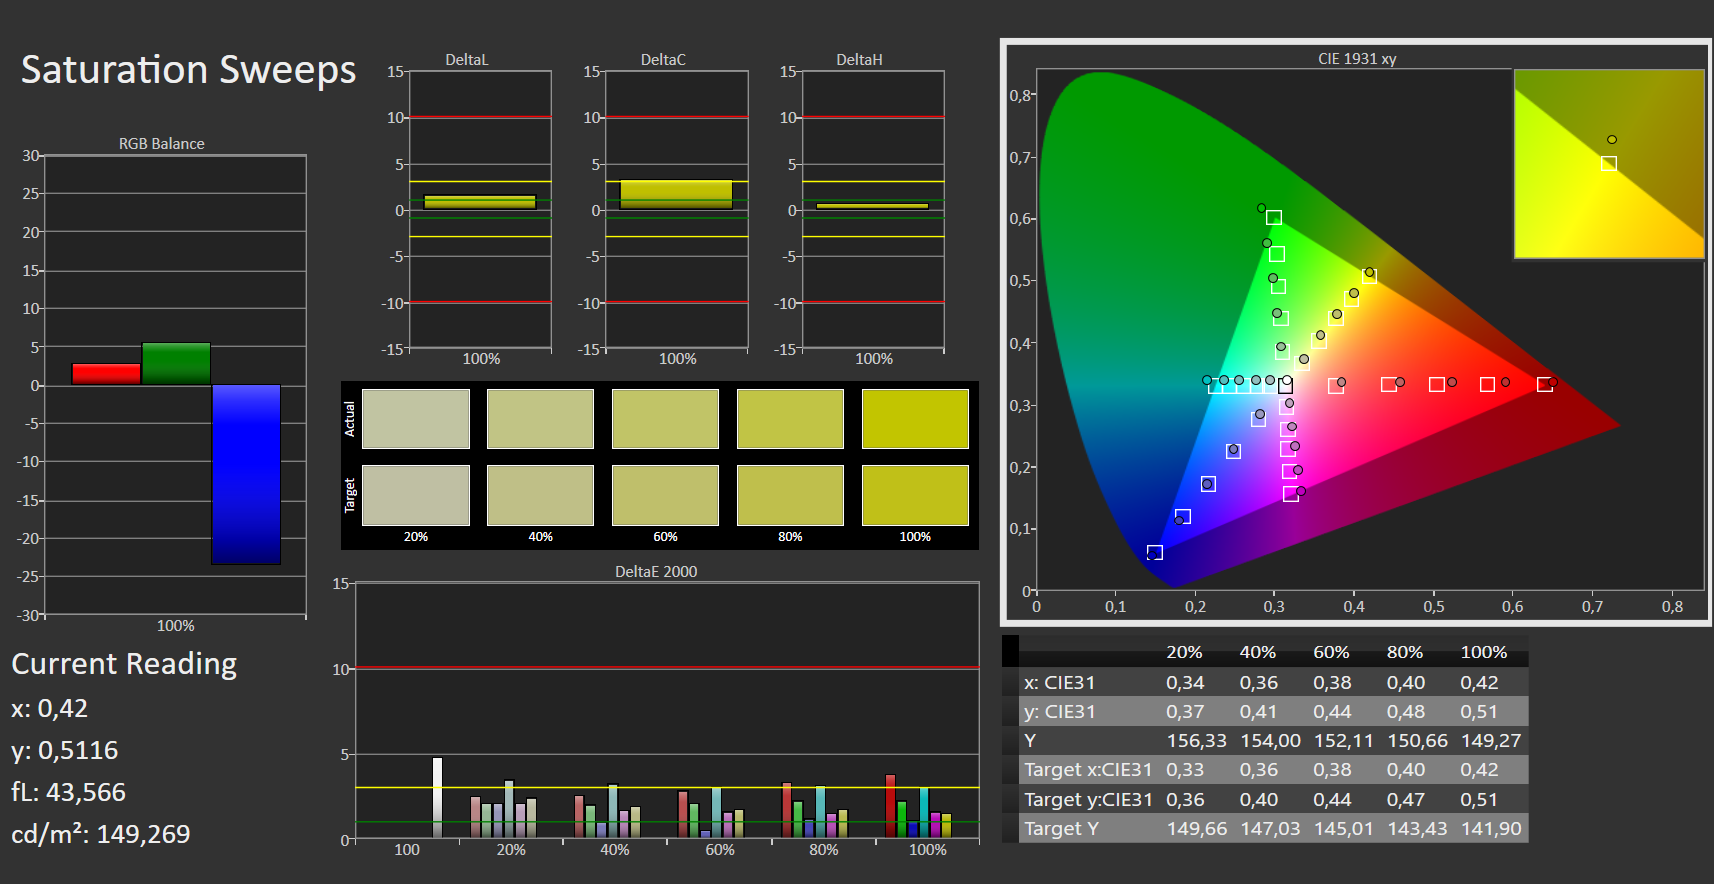
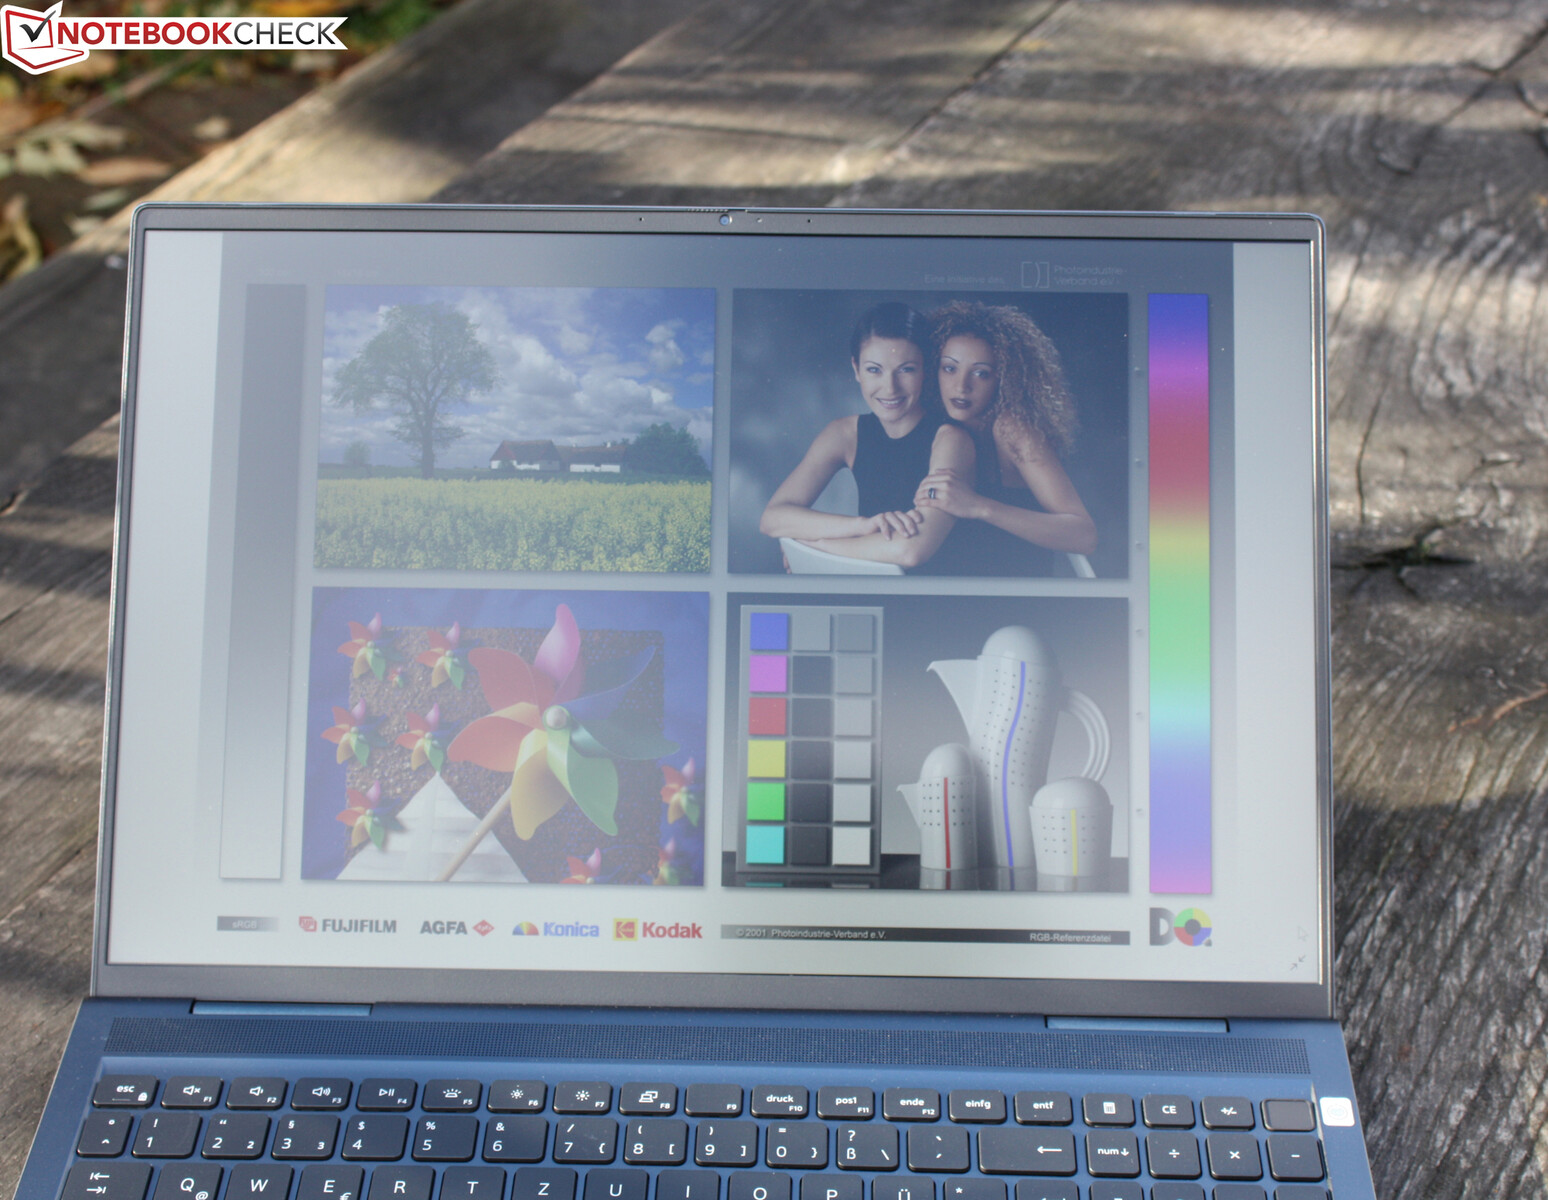
Pantalla - Buenos colores, brillo aceptable y tiempos de respuesta lentos
Nuestra unidad de prueba también utiliza el panel IPS 3K AU Optronics B160QAN, que aparentemente es el estándar para todos los modelos 7610. La resolución es idéntica a la del MacBook Pro 16. Dado que los DPI resultan casi tan altos como en una pantalla 4K, es posible que haya que ajustar el escalado del texto para mejorar la legibilidad.
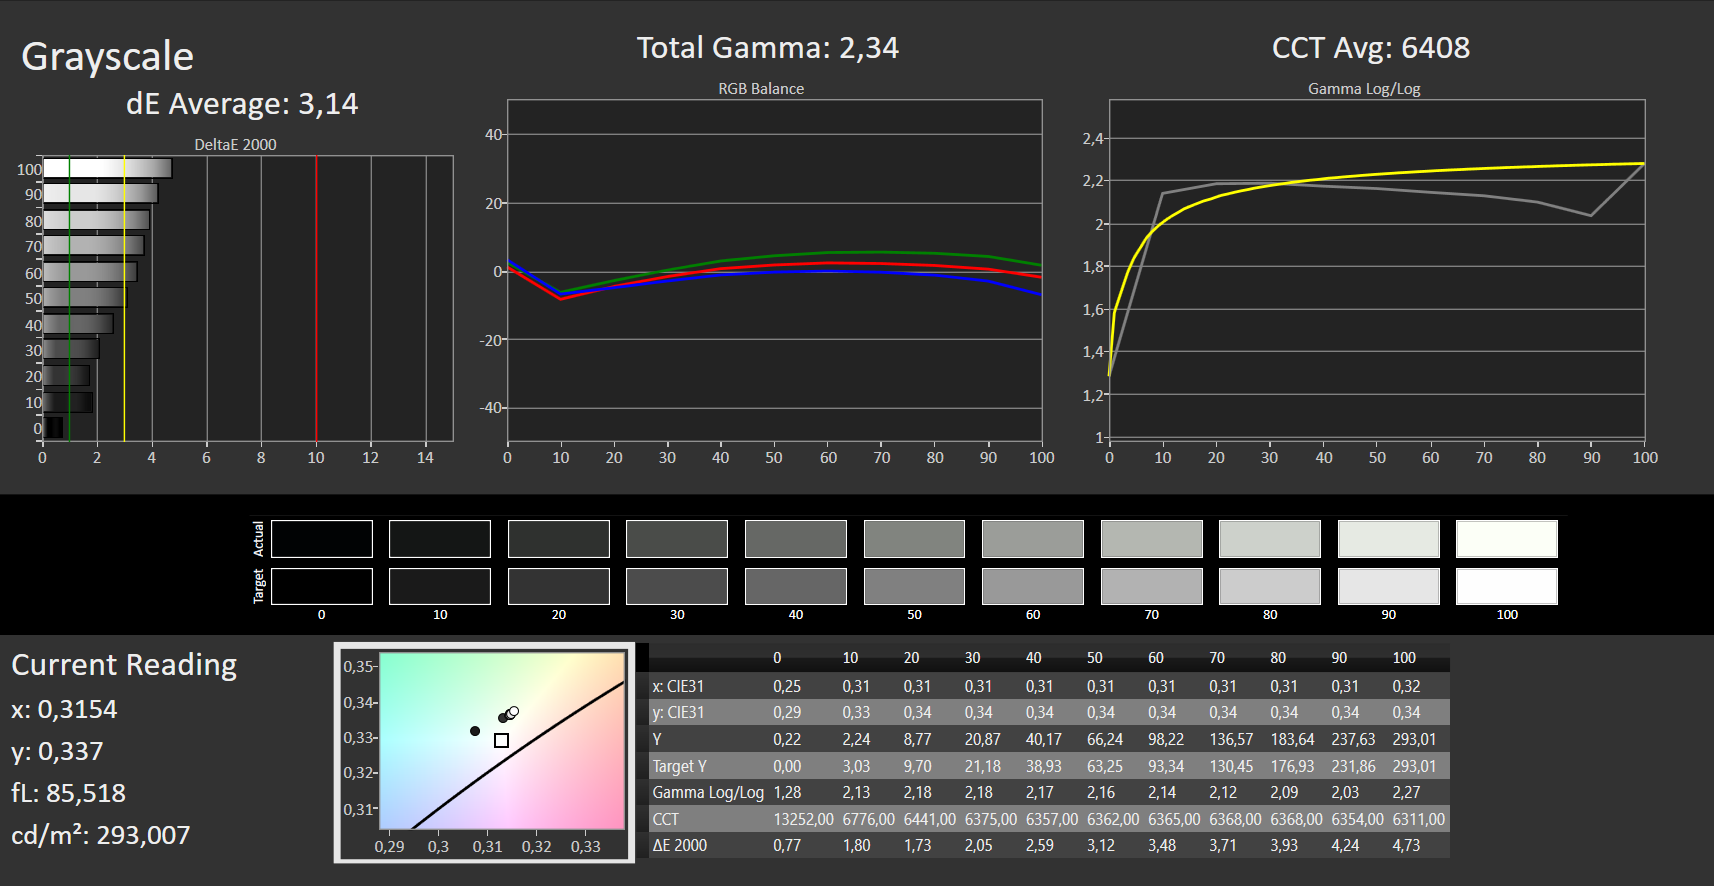
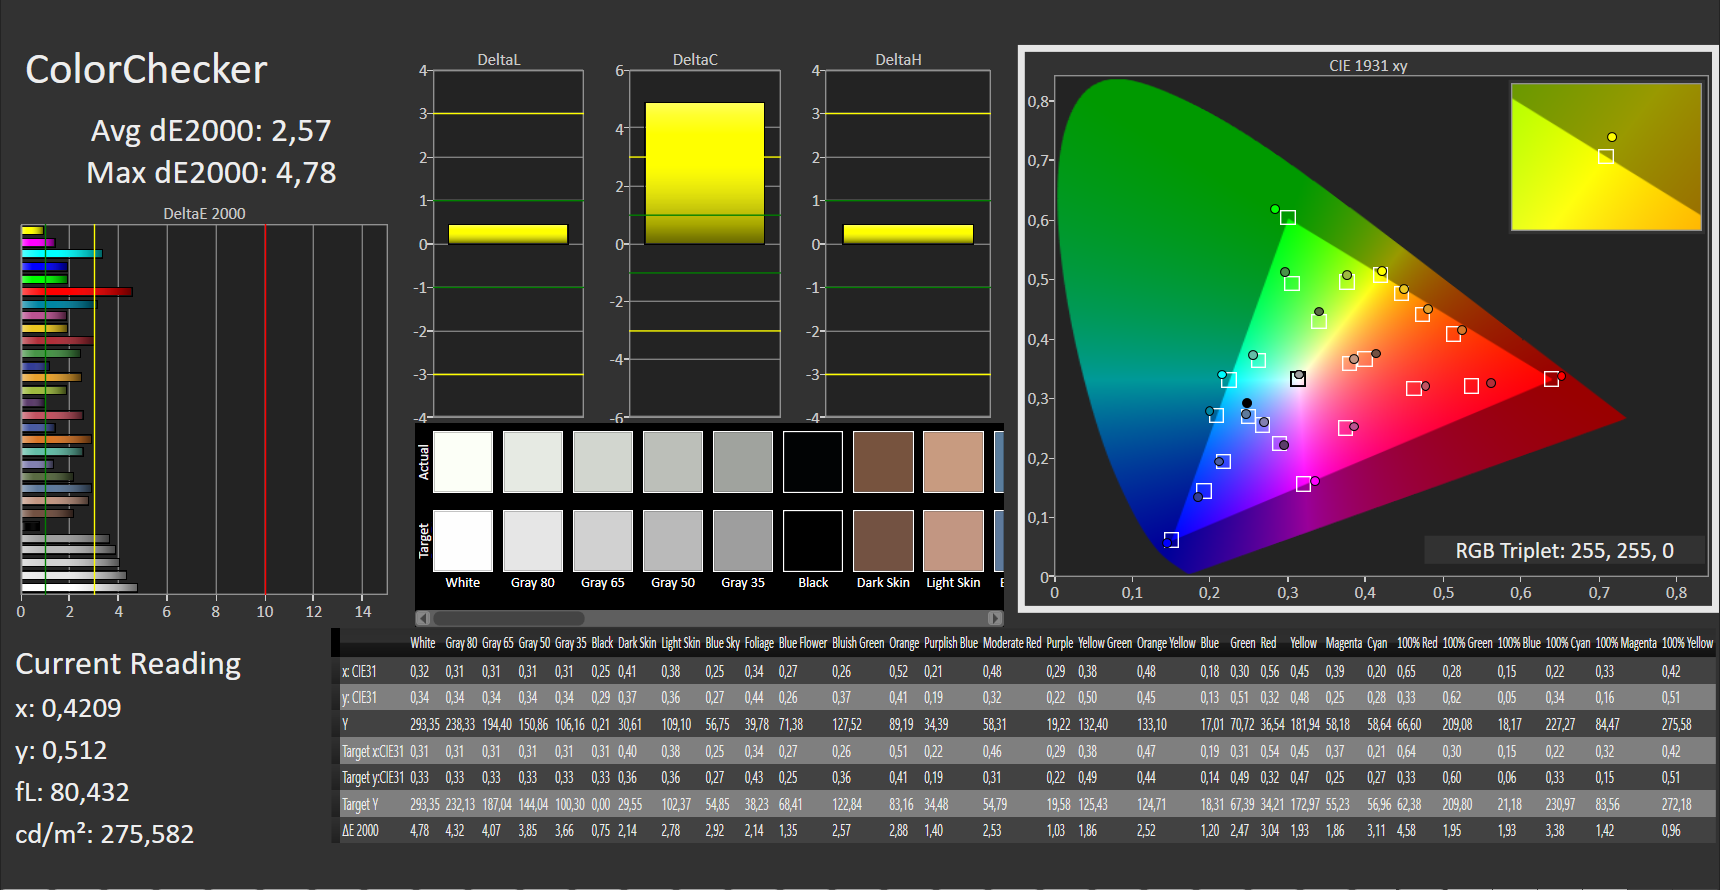
Debido a la idéntica construcción del panel que en el modelo Geforce, los mismos puntos también son válidos aquí: la calidad de la pantalla es buena pero no excelente, la relación de contraste está en casi 1400:1, las desviaciones DeltaE son bajas, y el sRGB está cubierto - pero no el espacio de color Adobe. El Inspiron 16 se distingue por sus lentos tiempos de respuesta de los portátiles de 16 pulgadas para juegos como el Legion 5 Pro, que ofrece tiempos de respuesta significativamente más rápidos. Comparado con los competidores, el brillo es moderado, pero distribuido uniformemente. No hay PWM.
| |||||||||||||||||||||||||
iluminación: 88 %
Brillo con batería: 275 cd/m²
Contraste: 1381:1 (Negro: 0.21 cd/m²)
ΔE ColorChecker Calman: 2.57 | ∀{0.5-29.43 Ø4.72}
calibrated: 1.89
ΔE Greyscale Calman: 3.14 | ∀{0.09-98 Ø4.97}
76% AdobeRGB 1998 (Argyll 3D)
100% sRGB (Argyll 3D)
75% Display P3 (Argyll 3D)
Gamma: 2.34
CCT: 6408 K
| Dell Inspiron 16 Plus 7610-MHJ8F AU Optronics B160QAN, AUO9F91, IPS, 3072x1920, 16" | Dell Inspiron 16 Plus 7610 AU Optronics B160QAN, IPS, 3072x1920, 16" | LG Gram 16 (2021) LG Philips LP160WQ1-SPA1, IPS, 2560x1600, 16" | Lenovo Legion 5 Pro 16ACH6H (82JQ001PGE) CSOT T3 MNG007DA1-1, IPS, 2560x1600, 16" | Dell Inspiron 15 7000 7506 2-in-1 Black Edition AU Optronics B156ZAN, IPS, 3840x2160, 15.6" | Acer Aspire 5 A517-52G-79Z5 BOE084E, IPS, 1920x1080, 17.3" | |
|---|---|---|---|---|---|---|
| Display | -1% | 13% | -3% | -1% | -45% | |
| Display P3 Coverage (%) | 75 | 74.1 -1% | 95.8 28% | 74.3 -1% | 39.98 -47% | |
| sRGB Coverage (%) | 100 | 99.4 -1% | 99.8 0% | 99 -1% | 99 -1% | 59.3 -41% |
| AdobeRGB 1998 Coverage (%) | 76 | 75.8 0% | 83.8 10% | 73 -4% | 74.6 -2% | 41.3 -46% |
| Response Times | -3% | 28% | 84% | -4% | 75% | |
| Response Time Grey 50% / Grey 80% * (ms) | 54 ? | 49.2 ? 9% | 44 ? 19% | 9.2 ? 83% | 55.2 ? -2% | 14 ? 74% |
| Response Time Black / White * (ms) | 32 ? | 36.8 ? -15% | 20 ? 37% | 4.8 85% | 34 ? -6% | 8 ? 75% |
| PWM Frequency (Hz) | ||||||
| Screen | 3% | -39% | 13% | -33% | -24% | |
| Brightness middle (cd/m²) | 290 | 296.8 2% | 331 14% | 551 90% | 303.8 5% | 321 11% |
| Brightness (cd/m²) | 285 | 292 2% | 309 8% | 523 84% | 296 4% | 282 -1% |
| Brightness Distribution (%) | 88 | 87 -1% | 88 0% | 88 0% | 93 6% | 81 -8% |
| Black Level * (cd/m²) | 0.21 | 0.21 -0% | 0.22 -5% | 0.54 -157% | 0.24 -14% | 0.36 -71% |
| Contrast (:1) | 1381 | 1413 2% | 1505 9% | 1020 -26% | 1266 -8% | 892 -35% |
| Colorchecker dE 2000 * | 2.57 | 2.56 -0% | 4.64 -81% | 1.8 30% | 4.58 -78% | 4.3 -67% |
| Colorchecker dE 2000 max. * | 4.78 | 4.76 -0% | 9.82 -105% | 2.53 47% | 9.4 -97% | 7.1 -49% |
| Colorchecker dE 2000 calibrated * | 1.89 | 1.86 2% | 3.16 -67% | 1.66 12% | 2.17 -15% | |
| Greyscale dE 2000 * | 3.14 | 2.6 17% | 6.9 -120% | 1.85 41% | 6.4 -104% | 2.26 28% |
| Gamma | 2.34 94% | 2.07 106% | 2.34 94% | 2.3 96% | 2.3 96% | 2.36 93% |
| CCT | 6408 101% | 6628 98% | 7904 82% | 6338 103% | 7414 88% | 6650 98% |
| Color Space (Percent of AdobeRGB 1998) (%) | 75.1 | 72.81 | 66.7 | 38 | ||
| Color Space (Percent of sRGB) (%) | 100 | 99.41 | 99 | 59 | ||
| Media total (Programa/Opciones) | -0% /
1% | 1% /
-18% | 31% /
22% | -13% /
-22% | 2% /
-14% |
* ... más pequeño es mejor
Tiempos de respuesta del display
| ↔ Tiempo de respuesta de Negro a Blanco | ||
|---|---|---|
| 32 ms ... subida ↗ y bajada ↘ combinada | ↗ 15 ms subida |  |
| ↘ 17 ms bajada | ||
| La pantalla mostró tiempos de respuesta lentos en nuestros tests y podría ser demasiado lenta para los jugones. En comparación, todos los dispositivos de prueba van de ##min### (mínimo) a 240 (máximo) ms. » 86 % de todos los dispositivos son mejores. Eso quiere decir que el tiempo de respuesta es peor que la media (19.8 ms) de todos los dispositivos testados. | ||
| ↔ Tiempo de respuesta 50% Gris a 80% Gris | ||
| 54 ms ... subida ↗ y bajada ↘ combinada | ↗ 24 ms subida |  |
| ↘ 30 ms bajada | ||
| La pantalla mostró tiempos de respuesta lentos en nuestros tests y podría ser demasiado lenta para los jugones. En comparación, todos los dispositivos de prueba van de ##min### (mínimo) a 636 (máximo) ms. » 91 % de todos los dispositivos son mejores. Eso quiere decir que el tiempo de respuesta es peor que la media (31 ms) de todos los dispositivos testados. | ||
Parpadeo de Pantalla / PWM (Pulse-Width Modulation)
| Parpadeo de Pantalla / PWM no detectado |  | ||
Comparación: 52 % de todos los dispositivos testados no usaron PWM para atenuar el display. Si se usó, medimos una media de 7781 (mínimo: 5 - máxmo: 343500) Hz. | |||
Rendimiento
Como estándar, las CPUs Tiger Lake H de Intel (11400H, 11800H) y, opcionalmente, una GeForce RTX 3050 o RTX 3060se utilizan. Aunque nuestra unidad de prueba no tiene una dGPU, no es del todo de gama baja con sus 16 GB de RAM. En el momento de la prueba, no hay modelos AMD.
Condiciones de la prueba
Las pruebas de rendimiento se realizaron en funcionamiento de red utilizando el perfil de mayor rendimiento.
Procesador
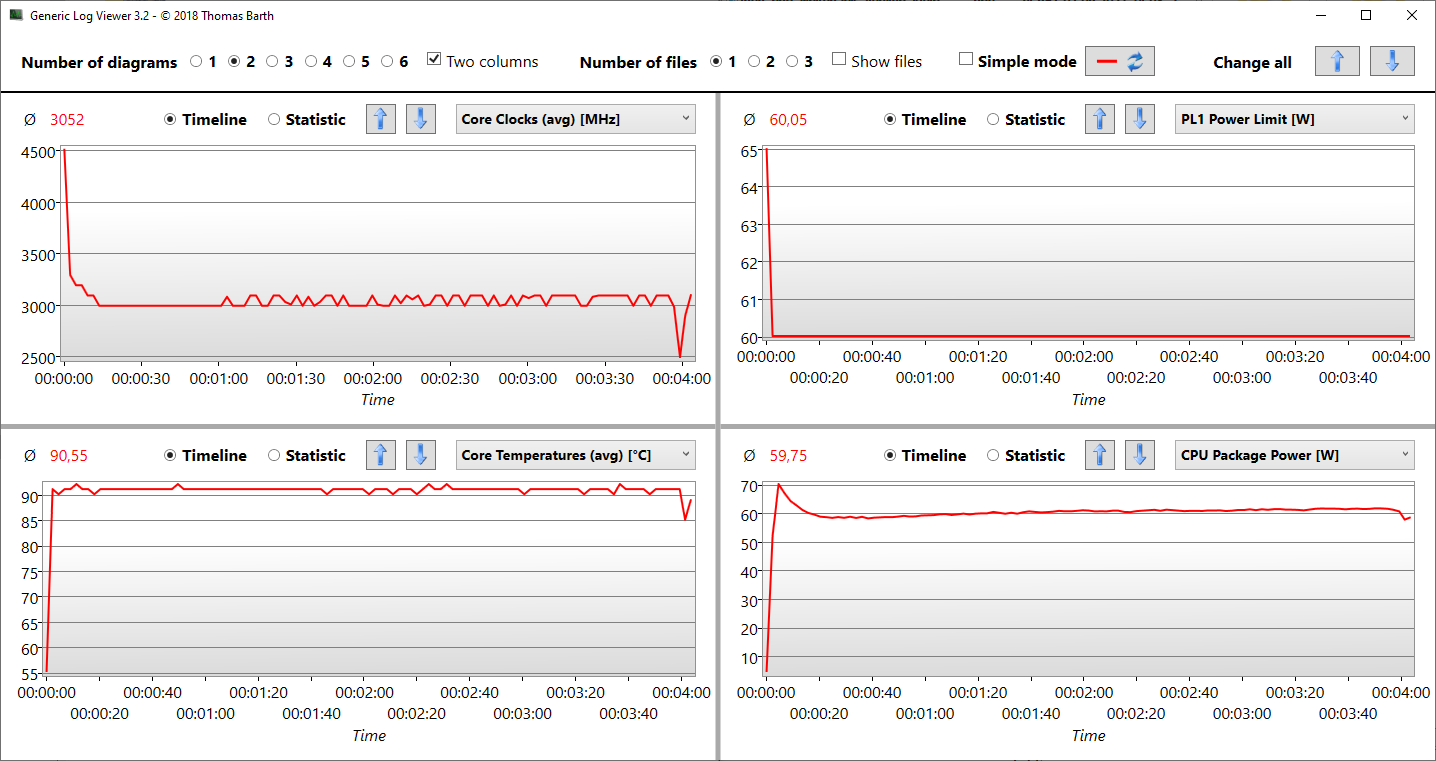
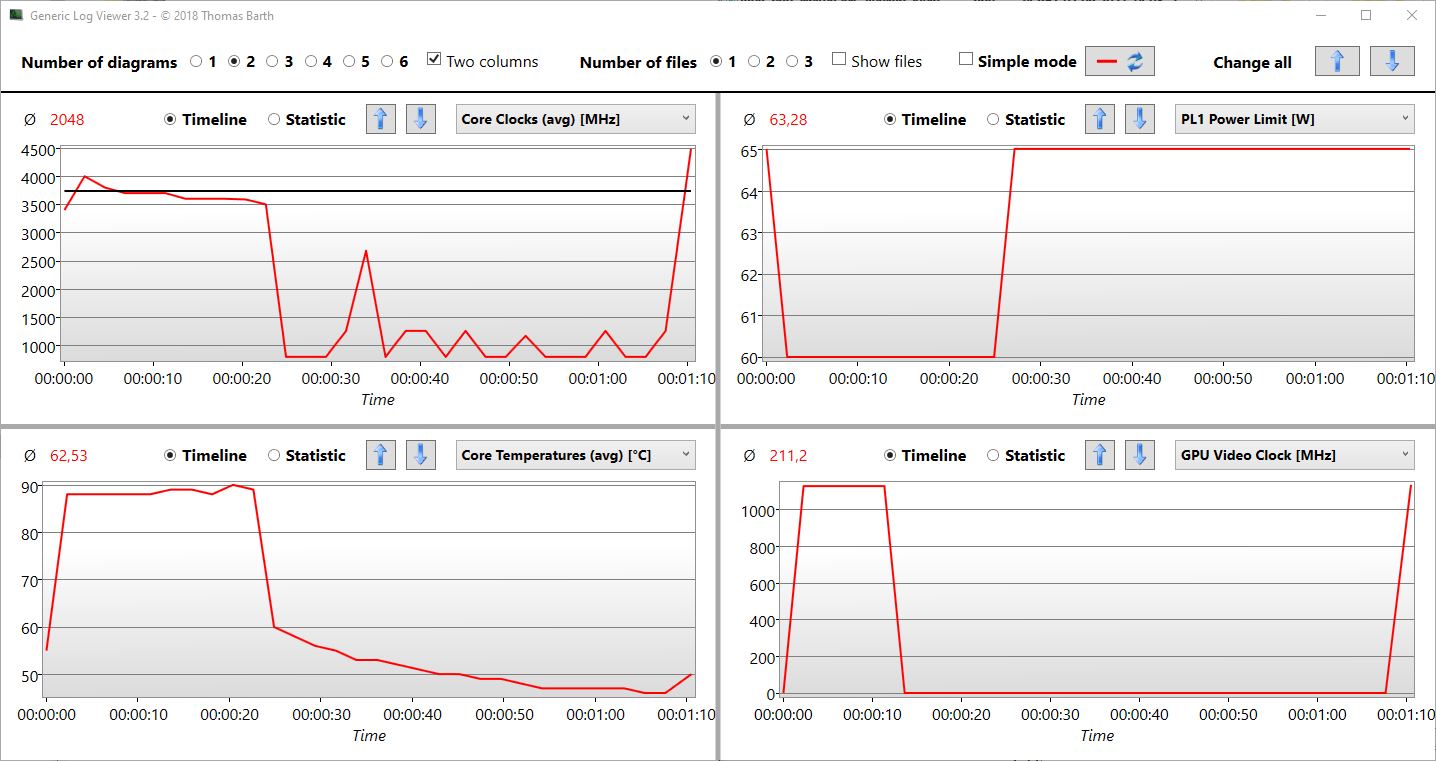
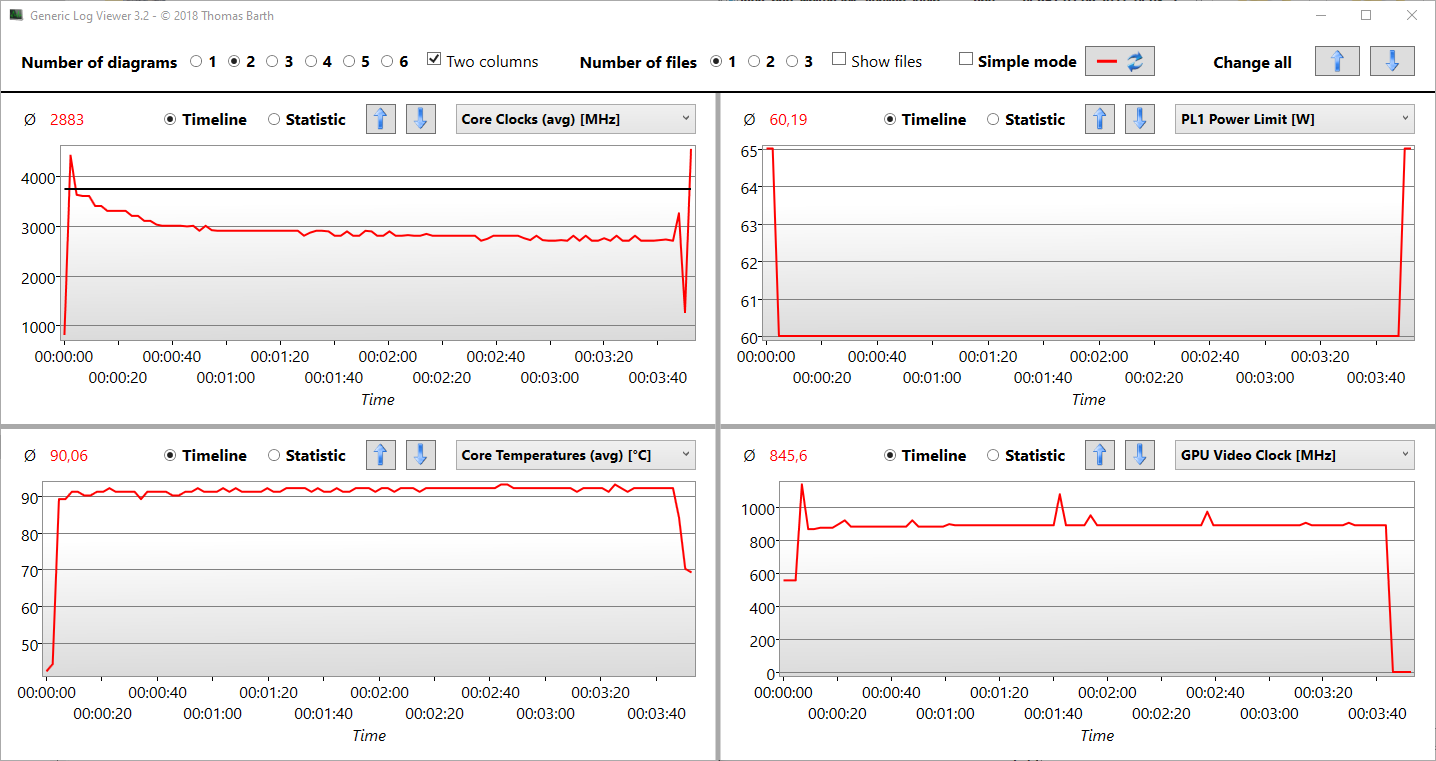
El rendimiento de la CPU podría ser mejor, y los resultados multihilo de Cinebench quedan entre un 5 y un 20% por detrás de los de un portátil medio equipado con el Core i7-11800H. El Inspiron 16 Plus 7610 sin dGPU sólo consigue un 13% más de puntos en un único benchmark, el R15, que el idéntico SoC en el modelo con una Geforce. Así que parece que el modelo sin dGPU no tiene ninguna ventaja térmica. El rendimiento de un solo hilo es excelente y corresponde a nuestras expectativas en un11800H. Desde la primera hasta la tercera ejecución, el bucle R15 muestra una ventaja de la unidad de prueba, por lo que podría ser posible algo más de margen térmico aquí, permitiendo que la velocidad de reloj se mantenga en un nivel alto durante varios segundos más. El registro gráfico 15 muestra en detalle lo que ocurre: Roza brevemente la marca de los 4 GHz antes de caer a 3,6 GHz y que el PL1 se reduzca en 5 vatios. Pero como ya se ha dicho, el i7-11800H sin acompañamiento de la dGPU sólo consigue mejores puntuaciones en los benchmarks R15 y Blender
Cinebench R15 Multi Constant Load Test
Cinebench R23: Multi Core | Single Core
Cinebench R20: CPU (Multi Core) | CPU (Single Core)
Cinebench R15: CPU Multi 64Bit | CPU Single 64Bit
Blender: v2.79 BMW27 CPU
7-Zip 18.03: 7z b 4 | 7z b 4 -mmt1
Geekbench 5.5: Multi-Core | Single-Core
HWBOT x265 Benchmark v2.2: 4k Preset
LibreOffice : 20 Documents To PDF
R Benchmark 2.5: Overall mean
| CPU Performance rating | |
| Media de la clase Multimedia | |
| Medio Intel Core i7-11800H | |
| Lenovo Legion 5 Pro 16ACH6H (82JQ001PGE) | |
| Dell Inspiron 16 Plus 7610 -2! | |
| Dell Inspiron 16 Plus 7610-MHJ8F | |
| Acer Aspire 5 A517-52G-79Z5 | |
| Dell Inspiron 15 7000 7506 2-in-1 Black Edition -1! | |
| LG Gram 16 (2021) | |
| Cinebench R23 / Multi Core | |
| Media de la clase Multimedia (4861 - 33362, n=81, últimos 2 años) | |
| Lenovo Legion 5 Pro 16ACH6H (82JQ001PGE) | |
| Lenovo Legion 5 Pro 16ACH6H (82JQ001PGE) | |
| Medio Intel Core i7-11800H (6508 - 14088, n=48) | |
| Dell Inspiron 16 Plus 7610-MHJ8F | |
| Dell Inspiron 16 Plus 7610 | |
| Acer Aspire 5 A517-52G-79Z5 | |
| Dell Inspiron 15 7000 7506 2-in-1 Black Edition | |
| LG Gram 16 (2021) | |
| Cinebench R23 / Single Core | |
| Media de la clase Multimedia (1128 - 2459, n=73, últimos 2 años) | |
| Dell Inspiron 16 Plus 7610 | |
| Acer Aspire 5 A517-52G-79Z5 | |
| Dell Inspiron 16 Plus 7610-MHJ8F | |
| Medio Intel Core i7-11800H (1386 - 1522, n=45) | |
| Lenovo Legion 5 Pro 16ACH6H (82JQ001PGE) | |
| Lenovo Legion 5 Pro 16ACH6H (82JQ001PGE) | |
| LG Gram 16 (2021) | |
| Cinebench R20 / CPU (Multi Core) | |
| Media de la clase Multimedia (1887 - 12912, n=64, últimos 2 años) | |
| Lenovo Legion 5 Pro 16ACH6H (82JQ001PGE) | |
| Lenovo Legion 5 Pro 16ACH6H (82JQ001PGE) | |
| Medio Intel Core i7-11800H (2498 - 5408, n=50) | |
| Dell Inspiron 16 Plus 7610 | |
| Dell Inspiron 16 Plus 7610-MHJ8F | |
| Acer Aspire 5 A517-52G-79Z5 | |
| Dell Inspiron 15 7000 7506 2-in-1 Black Edition | |
| LG Gram 16 (2021) | |
| Cinebench R20 / CPU (Single Core) | |
| Media de la clase Multimedia (425 - 853, n=64, últimos 2 años) | |
| Dell Inspiron 16 Plus 7610 | |
| Dell Inspiron 16 Plus 7610-MHJ8F | |
| Medio Intel Core i7-11800H (520 - 586, n=47) | |
| Acer Aspire 5 A517-52G-79Z5 | |
| Lenovo Legion 5 Pro 16ACH6H (82JQ001PGE) | |
| Lenovo Legion 5 Pro 16ACH6H (82JQ001PGE) | |
| LG Gram 16 (2021) | |
| Dell Inspiron 15 7000 7506 2-in-1 Black Edition | |
| Cinebench R15 / CPU Multi 64Bit | |
| Media de la clase Multimedia (856 - 5224, n=68, últimos 2 años) | |
| Lenovo Legion 5 Pro 16ACH6H (82JQ001PGE) | |
| Medio Intel Core i7-11800H (1342 - 2173, n=50) | |
| Dell Inspiron 16 Plus 7610-MHJ8F | |
| Dell Inspiron 16 Plus 7610 | |
| Acer Aspire 5 A517-52G-79Z5 | |
| LG Gram 16 (2021) | |
| Dell Inspiron 15 7000 7506 2-in-1 Black Edition | |
| Cinebench R15 / CPU Single 64Bit | |
| Media de la clase Multimedia (184.8 - 326, n=66, últimos 2 años) | |
| Lenovo Legion 5 Pro 16ACH6H (82JQ001PGE) | |
| Lenovo Legion 5 Pro 16ACH6H (82JQ001PGE) | |
| Dell Inspiron 16 Plus 7610 | |
| Dell Inspiron 16 Plus 7610-MHJ8F | |
| Medio Intel Core i7-11800H (201 - 231, n=46) | |
| Acer Aspire 5 A517-52G-79Z5 | |
| LG Gram 16 (2021) | |
| Dell Inspiron 15 7000 7506 2-in-1 Black Edition | |
| Blender / v2.79 BMW27 CPU | |
| LG Gram 16 (2021) | |
| Dell Inspiron 15 7000 7506 2-in-1 Black Edition | |
| Acer Aspire 5 A517-52G-79Z5 | |
| Dell Inspiron 16 Plus 7610-MHJ8F | |
| Medio Intel Core i7-11800H (217 - 454, n=46) | |
| Dell Inspiron 16 Plus 7610 | |
| Lenovo Legion 5 Pro 16ACH6H (82JQ001PGE) | |
| Lenovo Legion 5 Pro 16ACH6H (82JQ001PGE) | |
| Media de la clase Multimedia (100 - 557, n=65, últimos 2 años) | |
| 7-Zip 18.03 / 7z b 4 | |
| Media de la clase Multimedia (26062 - 130368, n=62, últimos 2 años) | |
| Lenovo Legion 5 Pro 16ACH6H (82JQ001PGE) | |
| Lenovo Legion 5 Pro 16ACH6H (82JQ001PGE) | |
| Medio Intel Core i7-11800H (33718 - 56758, n=46) | |
| Dell Inspiron 16 Plus 7610 | |
| Dell Inspiron 16 Plus 7610-MHJ8F | |
| Acer Aspire 5 A517-52G-79Z5 | |
| Dell Inspiron 15 7000 7506 2-in-1 Black Edition | |
| LG Gram 16 (2021) | |
| 7-Zip 18.03 / 7z b 4 -mmt1 | |
| Media de la clase Multimedia (3666 - 7545, n=63, últimos 2 años) | |
| Dell Inspiron 16 Plus 7610 | |
| Lenovo Legion 5 Pro 16ACH6H (82JQ001PGE) | |
| Lenovo Legion 5 Pro 16ACH6H (82JQ001PGE) | |
| Medio Intel Core i7-11800H (5138 - 5732, n=46) | |
| Acer Aspire 5 A517-52G-79Z5 | |
| Dell Inspiron 16 Plus 7610-MHJ8F | |
| Dell Inspiron 15 7000 7506 2-in-1 Black Edition | |
| LG Gram 16 (2021) | |
| Geekbench 5.5 / Multi-Core | |
| Media de la clase Multimedia (4652 - 20422, n=62, últimos 2 años) | |
| Medio Intel Core i7-11800H (4655 - 9851, n=40) | |
| Lenovo Legion 5 Pro 16ACH6H (82JQ001PGE) | |
| Lenovo Legion 5 Pro 16ACH6H (82JQ001PGE) | |
| Dell Inspiron 16 Plus 7610-MHJ8F | |
| Dell Inspiron 16 Plus 7610-MHJ8F | |
| Dell Inspiron 16 Plus 7610-MHJ8F | |
| Dell Inspiron 15 7000 7506 2-in-1 Black Edition | |
| LG Gram 16 (2021) | |
| Acer Aspire 5 A517-52G-79Z5 | |
| Geekbench 5.5 / Single-Core | |
| Media de la clase Multimedia (805 - 2974, n=62, últimos 2 años) | |
| Dell Inspiron 16 Plus 7610-MHJ8F | |
| Dell Inspiron 16 Plus 7610-MHJ8F | |
| Dell Inspiron 16 Plus 7610-MHJ8F | |
| Acer Aspire 5 A517-52G-79Z5 | |
| Medio Intel Core i7-11800H (1429 - 1625, n=40) | |
| LG Gram 16 (2021) | |
| Dell Inspiron 15 7000 7506 2-in-1 Black Edition | |
| Lenovo Legion 5 Pro 16ACH6H (82JQ001PGE) | |
| Lenovo Legion 5 Pro 16ACH6H (82JQ001PGE) | |
| HWBOT x265 Benchmark v2.2 / 4k Preset | |
| Media de la clase Multimedia (5.26 - 36.1, n=63, últimos 2 años) | |
| Lenovo Legion 5 Pro 16ACH6H (82JQ001PGE) | |
| Lenovo Legion 5 Pro 16ACH6H (82JQ001PGE) | |
| Medio Intel Core i7-11800H (7.38 - 17.4, n=46) | |
| Dell Inspiron 16 Plus 7610 | |
| Dell Inspiron 16 Plus 7610-MHJ8F | |
| Dell Inspiron 15 7000 7506 2-in-1 Black Edition | |
| Acer Aspire 5 A517-52G-79Z5 | |
| LG Gram 16 (2021) | |
| LibreOffice / 20 Documents To PDF | |
| Lenovo Legion 5 Pro 16ACH6H (82JQ001PGE) | |
| Lenovo Legion 5 Pro 16ACH6H (82JQ001PGE) | |
| Acer Aspire 5 A517-52G-79Z5 | |
| Media de la clase Multimedia (23.9 - 146.7, n=64, últimos 2 años) | |
| Dell Inspiron 15 7000 7506 2-in-1 Black Edition | |
| Medio Intel Core i7-11800H (38.6 - 59.9, n=45) | |
| Dell Inspiron 16 Plus 7610 | |
| LG Gram 16 (2021) | |
| Dell Inspiron 16 Plus 7610-MHJ8F | |
| R Benchmark 2.5 / Overall mean | |
| LG Gram 16 (2021) | |
| Dell Inspiron 15 7000 7506 2-in-1 Black Edition | |
| Dell Inspiron 16 Plus 7610-MHJ8F | |
| Acer Aspire 5 A517-52G-79Z5 | |
| Medio Intel Core i7-11800H (0.548 - 0.615, n=46) | |
| Dell Inspiron 16 Plus 7610 | |
| Lenovo Legion 5 Pro 16ACH6H (82JQ001PGE) | |
| Lenovo Legion 5 Pro 16ACH6H (82JQ001PGE) | |
| Media de la clase Multimedia (0.3604 - 0.947, n=63, últimos 2 años) | |
* ... más pequeño es mejor
AIDA64: FP32 Ray-Trace | FPU Julia | CPU SHA3 | CPU Queen | FPU SinJulia | FPU Mandel | CPU AES | CPU ZLib | FP64 Ray-Trace | CPU PhotoWorxx
| Performance rating | |
| Media de la clase Multimedia | |
| Lenovo Legion 5 Pro 16ACH6H (82JQ001PGE) | |
| Medio Intel Core i7-11800H | |
| Dell Inspiron 16 Plus 7610-MHJ8F | |
| LG Gram 16 (2021) | |
| Dell Inspiron 16 Plus 7610 -9! | |
| AIDA64 / FP32 Ray-Trace | |
| Media de la clase Multimedia (2214 - 50388, n=60, últimos 2 años) | |
| Lenovo Legion 5 Pro 16ACH6H (82JQ001PGE) | |
| Lenovo Legion 5 Pro 16ACH6H (82JQ001PGE) | |
| Medio Intel Core i7-11800H (8772 - 15961, n=20) | |
| Dell Inspiron 16 Plus 7610-MHJ8F | |
| LG Gram 16 (2021) | |
| AIDA64 / FPU Julia | |
| Lenovo Legion 5 Pro 16ACH6H (82JQ001PGE) | |
| Lenovo Legion 5 Pro 16ACH6H (82JQ001PGE) | |
| Media de la clase Multimedia (12867 - 201874, n=61, últimos 2 años) | |
| Medio Intel Core i7-11800H (39404 - 65636, n=20) | |
| Dell Inspiron 16 Plus 7610-MHJ8F | |
| LG Gram 16 (2021) | |
| AIDA64 / CPU SHA3 | |
| Media de la clase Multimedia (626 - 8623, n=61, últimos 2 años) | |
| Medio Intel Core i7-11800H (2599 - 4439, n=20) | |
| Dell Inspiron 16 Plus 7610-MHJ8F | |
| Lenovo Legion 5 Pro 16ACH6H (82JQ001PGE) | |
| Lenovo Legion 5 Pro 16ACH6H (82JQ001PGE) | |
| LG Gram 16 (2021) | |
| AIDA64 / CPU Queen | |
| Lenovo Legion 5 Pro 16ACH6H (82JQ001PGE) | |
| Lenovo Legion 5 Pro 16ACH6H (82JQ001PGE) | |
| Dell Inspiron 16 Plus 7610-MHJ8F | |
| Medio Intel Core i7-11800H (85233 - 91941, n=20) | |
| Media de la clase Multimedia (13483 - 181505, n=48, últimos 2 años) | |
| LG Gram 16 (2021) | |
| AIDA64 / FPU SinJulia | |
| Lenovo Legion 5 Pro 16ACH6H (82JQ001PGE) | |
| Lenovo Legion 5 Pro 16ACH6H (82JQ001PGE) | |
| Medio Intel Core i7-11800H (6420 - 9792, n=20) | |
| Media de la clase Multimedia (886 - 28794, n=61, últimos 2 años) | |
| Dell Inspiron 16 Plus 7610-MHJ8F | |
| LG Gram 16 (2021) | |
| AIDA64 / FPU Mandel | |
| Lenovo Legion 5 Pro 16ACH6H (82JQ001PGE) | |
| Lenovo Legion 5 Pro 16ACH6H (82JQ001PGE) | |
| Media de la clase Multimedia (6395 - 105740, n=60, últimos 2 años) | |
| Medio Intel Core i7-11800H (23365 - 39464, n=20) | |
| Dell Inspiron 16 Plus 7610-MHJ8F | |
| LG Gram 16 (2021) | |
| AIDA64 / CPU AES | |
| Lenovo Legion 5 Pro 16ACH6H (82JQ001PGE) | |
| Lenovo Legion 5 Pro 16ACH6H (82JQ001PGE) | |
| Medio Intel Core i7-11800H (74617 - 149388, n=20) | |
| Dell Inspiron 16 Plus 7610-MHJ8F | |
| Media de la clase Multimedia (8171 - 126790, n=61, últimos 2 años) | |
| LG Gram 16 (2021) | |
| AIDA64 / CPU ZLib | |
| Media de la clase Multimedia (143.8 - 2022, n=61, últimos 2 años) | |
| Lenovo Legion 5 Pro 16ACH6H (82JQ001PGE) | |
| Lenovo Legion 5 Pro 16ACH6H (82JQ001PGE) | |
| Dell Inspiron 16 Plus 7610-MHJ8F | |
| Medio Intel Core i7-11800H (461 - 830, n=43) | |
| LG Gram 16 (2021) | |
| Dell Inspiron 16 Plus 7610 | |
| AIDA64 / FP64 Ray-Trace | |
| Media de la clase Multimedia (1014 - 26875, n=61, últimos 2 años) | |
| Lenovo Legion 5 Pro 16ACH6H (82JQ001PGE) | |
| Lenovo Legion 5 Pro 16ACH6H (82JQ001PGE) | |
| Medio Intel Core i7-11800H (4545 - 8717, n=21) | |
| Dell Inspiron 16 Plus 7610-MHJ8F | |
| LG Gram 16 (2021) | |
| AIDA64 / CPU PhotoWorxx | |
| Media de la clase Multimedia (8187 - 88154, n=61, últimos 2 años) | |
| LG Gram 16 (2021) | |
| Medio Intel Core i7-11800H (11898 - 26757, n=21) | |
| Lenovo Legion 5 Pro 16ACH6H (82JQ001PGE) | |
| Lenovo Legion 5 Pro 16ACH6H (82JQ001PGE) | |
| Dell Inspiron 16 Plus 7610-MHJ8F | |
Rendimiento del sistema
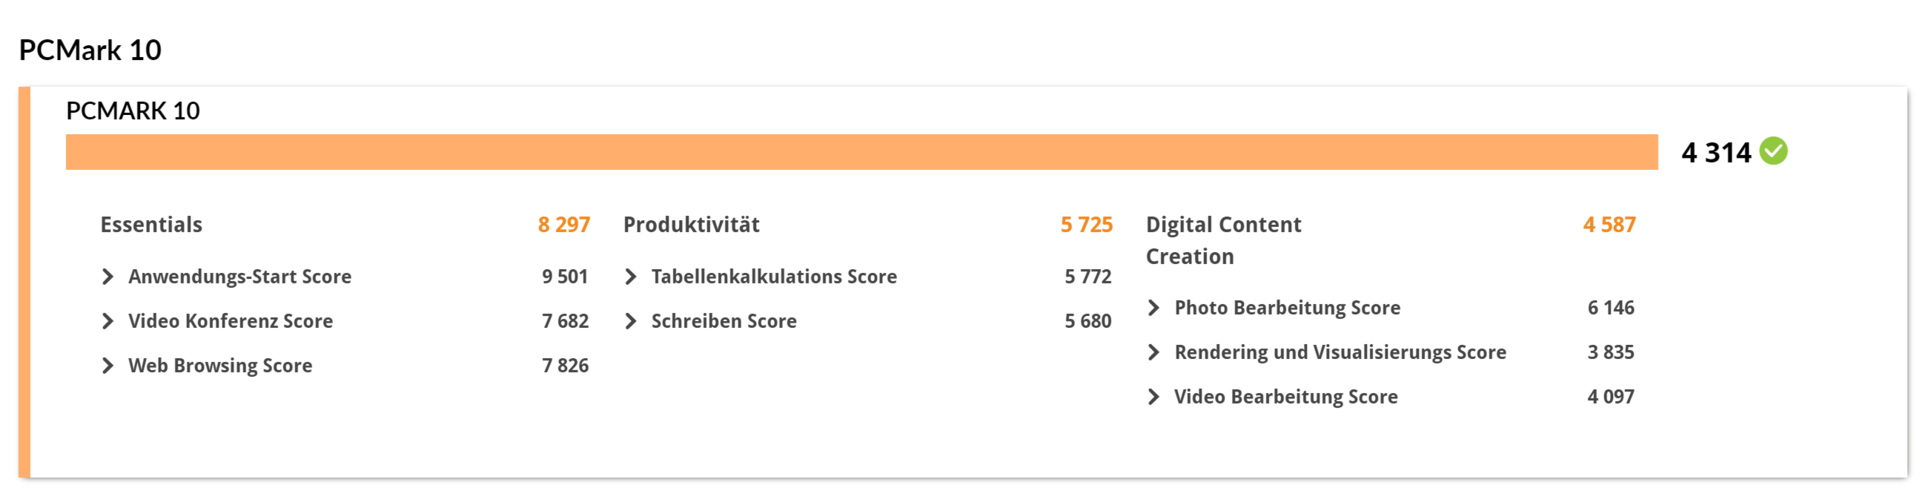
La puntuación de PCMark se resiente de la falta de la Geforce, y vemos una diferencia del 25 al 50% en las puntuaciones secundarias. Sin embargo, este no es el caso de los Essentials, que resultan incluso más altos que con la dGPU. En funcionamiento en batería, el rendimiento cae ligeramente pero no mucho.
| PCMark 10 / Score | |
| Media de la clase Multimedia (4325 - 10386, n=58, últimos 2 años) | |
| Lenovo Legion 5 Pro 16ACH6H (82JQ001PGE) | |
| Dell Inspiron 16 Plus 7610 | |
| Acer Aspire 5 A517-52G-79Z5 | |
| Dell Inspiron 16 Plus 7610-MHJ8F | |
| Medio Intel Core i7-11800H, Intel UHD Graphics Xe 32EUs (Tiger Lake-H) (5036 - 5067, n=2) | |
| Dell Inspiron 15 7000 7506 2-in-1 Black Edition | |
| LG Gram 16 (2021) | |
| PCMark 10 / Essentials | |
| Media de la clase Multimedia (8025 - 11664, n=57, últimos 2 años) | |
| LG Gram 16 (2021) | |
| Dell Inspiron 16 Plus 7610-MHJ8F | |
| Dell Inspiron 16 Plus 7610 | |
| Medio Intel Core i7-11800H, Intel UHD Graphics Xe 32EUs (Tiger Lake-H) (9694 - 9847, n=2) | |
| Dell Inspiron 15 7000 7506 2-in-1 Black Edition | |
| Lenovo Legion 5 Pro 16ACH6H (82JQ001PGE) | |
| Acer Aspire 5 A517-52G-79Z5 | |
| PCMark 10 / Productivity | |
| Media de la clase Multimedia (7323 - 18233, n=57, últimos 2 años) | |
| Acer Aspire 5 A517-52G-79Z5 | |
| Lenovo Legion 5 Pro 16ACH6H (82JQ001PGE) | |
| Dell Inspiron 16 Plus 7610 | |
| LG Gram 16 (2021) | |
| Medio Intel Core i7-11800H, Intel UHD Graphics Xe 32EUs (Tiger Lake-H) (6562 - 6723, n=2) | |
| Dell Inspiron 15 7000 7506 2-in-1 Black Edition | |
| Dell Inspiron 16 Plus 7610-MHJ8F | |
| PCMark 10 / Digital Content Creation | |
| Media de la clase Multimedia (3651 - 16240, n=57, últimos 2 años) | |
| Lenovo Legion 5 Pro 16ACH6H (82JQ001PGE) | |
| Dell Inspiron 16 Plus 7610 | |
| Dell Inspiron 16 Plus 7610-MHJ8F | |
| Dell Inspiron 15 7000 7506 2-in-1 Black Edition | |
| Medio Intel Core i7-11800H, Intel UHD Graphics Xe 32EUs (Tiger Lake-H) (5318 - 5464, n=2) | |
| Acer Aspire 5 A517-52G-79Z5 | |
| LG Gram 16 (2021) | |
| PCMark 10 Score | 5067 puntos | |
ayuda | ||
| AIDA64 / Memory Copy | |
| Media de la clase Multimedia (11299 - 132135, n=61, últimos 2 años) | |
| LG Gram 16 (2021) | |
| Medio Intel Core i7-11800H (24508 - 48144, n=21) | |
| Dell Inspiron 16 Plus 7610-MHJ8F | |
| Lenovo Legion 5 Pro 16ACH6H (82JQ001PGE) | |
| Lenovo Legion 5 Pro 16ACH6H (82JQ001PGE) | |
| AIDA64 / Memory Read | |
| Media de la clase Multimedia (11624 - 174586, n=61, últimos 2 años) | |
| LG Gram 16 (2021) | |
| Lenovo Legion 5 Pro 16ACH6H (82JQ001PGE) | |
| Lenovo Legion 5 Pro 16ACH6H (82JQ001PGE) | |
| Dell Inspiron 16 Plus 7610-MHJ8F | |
| Medio Intel Core i7-11800H (25882 - 50365, n=20) | |
| AIDA64 / Memory Write | |
| Media de la clase Multimedia (11755 - 134998, n=61, últimos 2 años) | |
| LG Gram 16 (2021) | |
| Dell Inspiron 16 Plus 7610-MHJ8F | |
| Medio Intel Core i7-11800H (22240 - 46214, n=20) | |
| Lenovo Legion 5 Pro 16ACH6H (82JQ001PGE) | |
| Lenovo Legion 5 Pro 16ACH6H (82JQ001PGE) | |
| AIDA64 / Memory Latency | |
| Media de la clase Multimedia (7 - 535, n=60, últimos 2 años) | |
| Dell Inspiron 16 Plus 7610-MHJ8F | |
| LG Gram 16 (2021) | |
| Lenovo Legion 5 Pro 16ACH6H (82JQ001PGE) | |
| Lenovo Legion 5 Pro 16ACH6H (82JQ001PGE) | |
| Medio Intel Core i7-11800H (71.9 - 104.1, n=44) | |
| Dell Inspiron 16 Plus 7610 | |
* ... más pequeño es mejor
Latencias del CPD
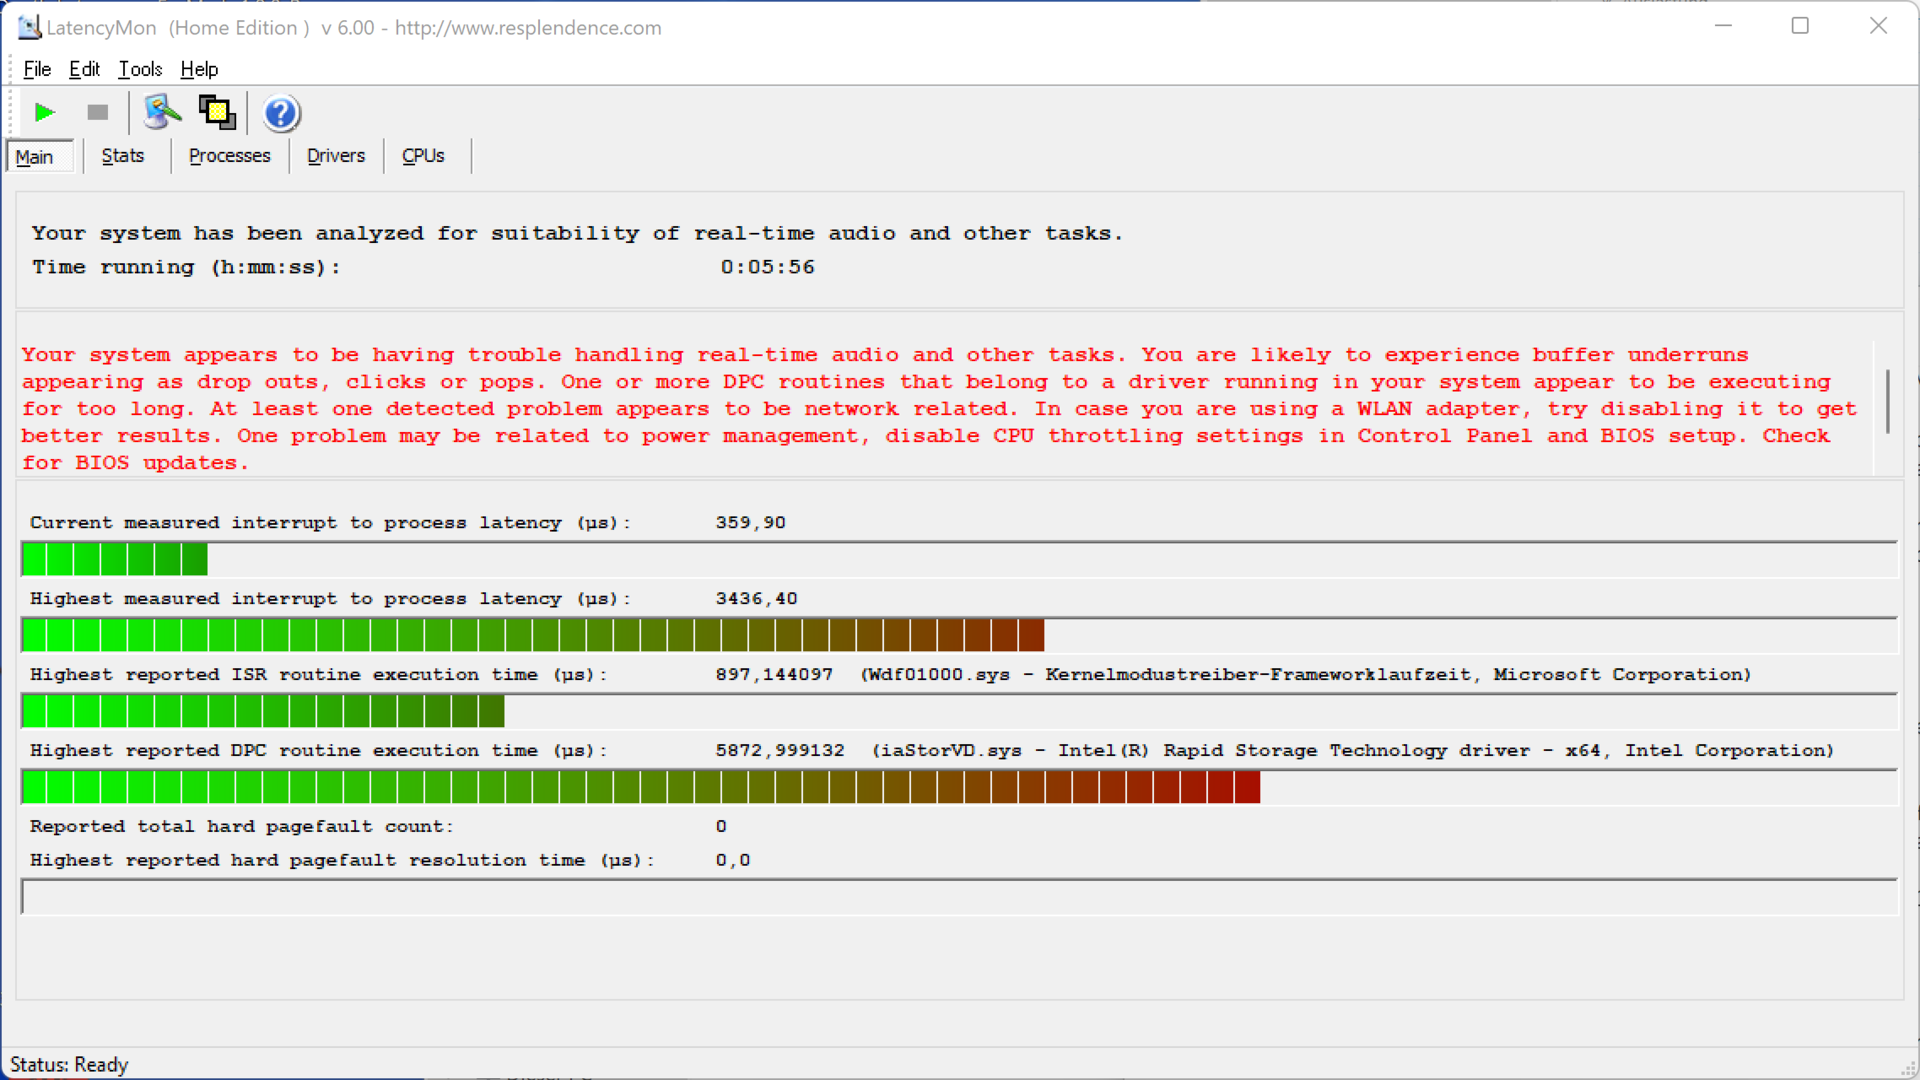
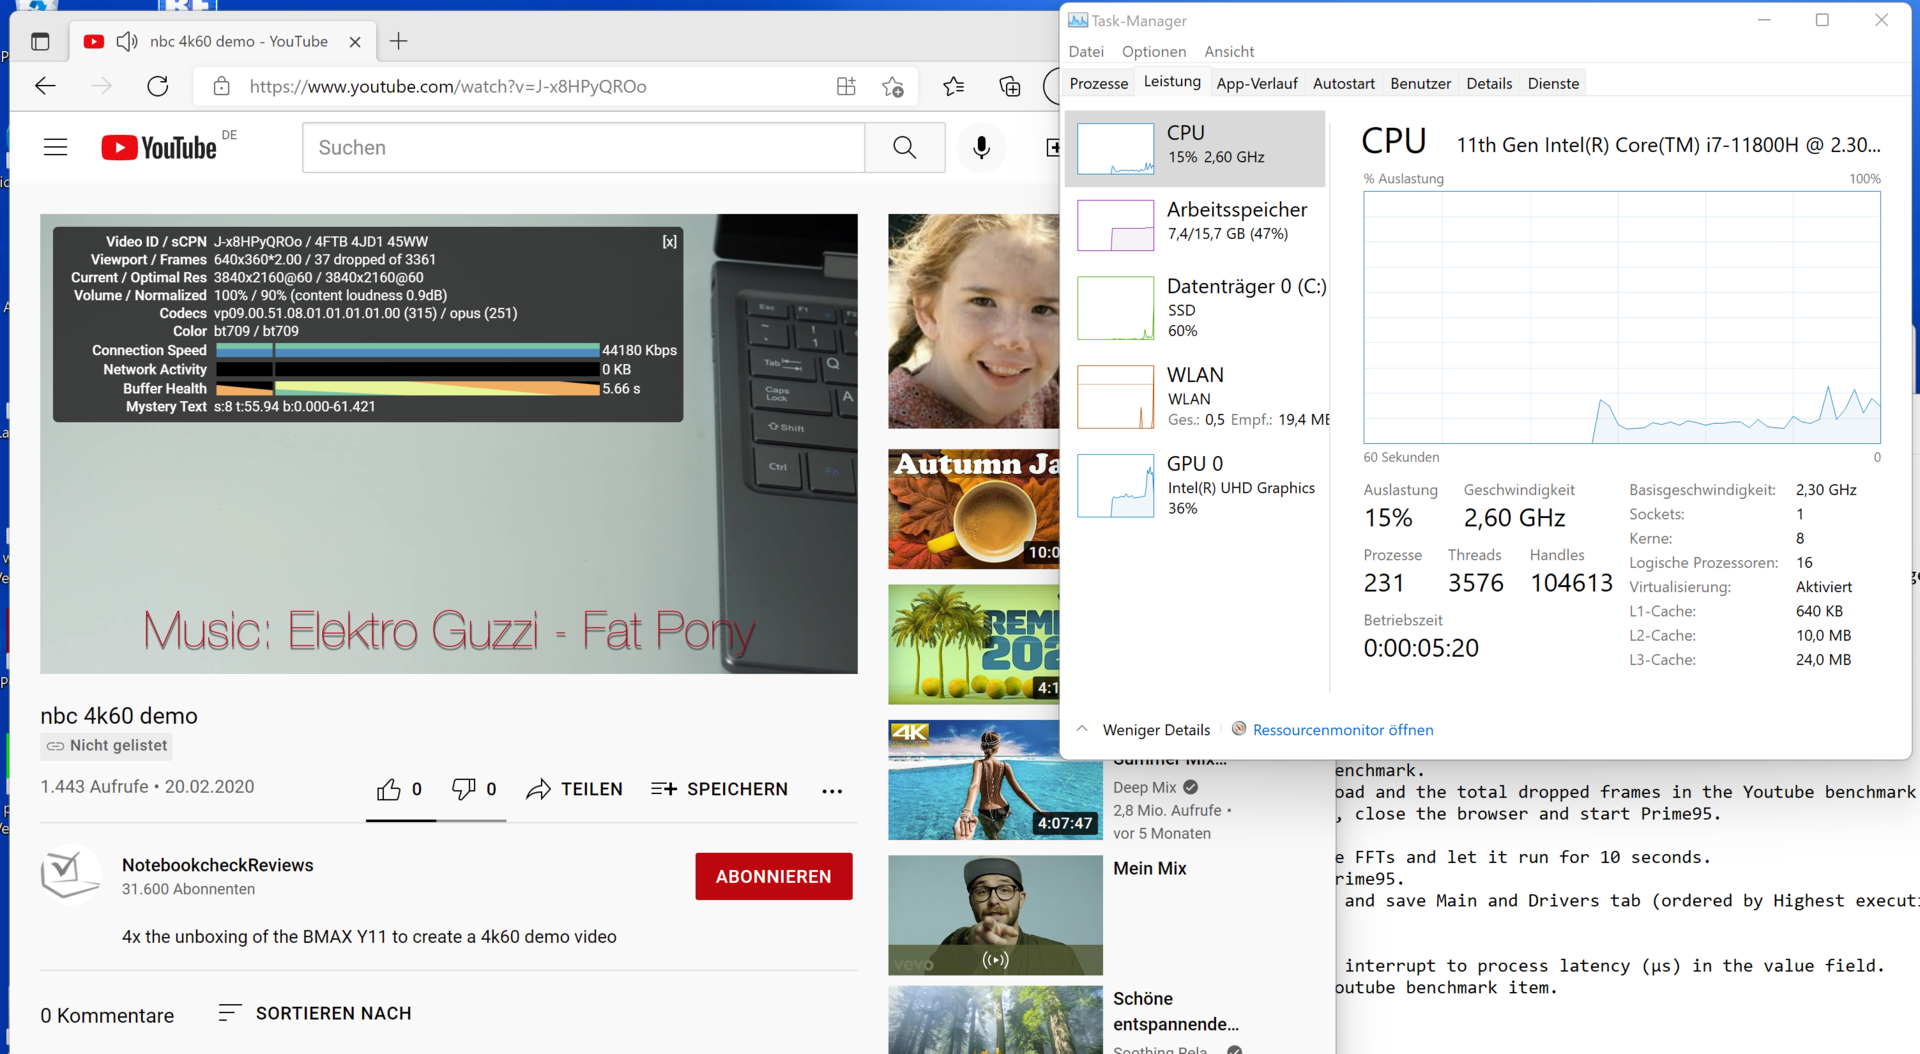
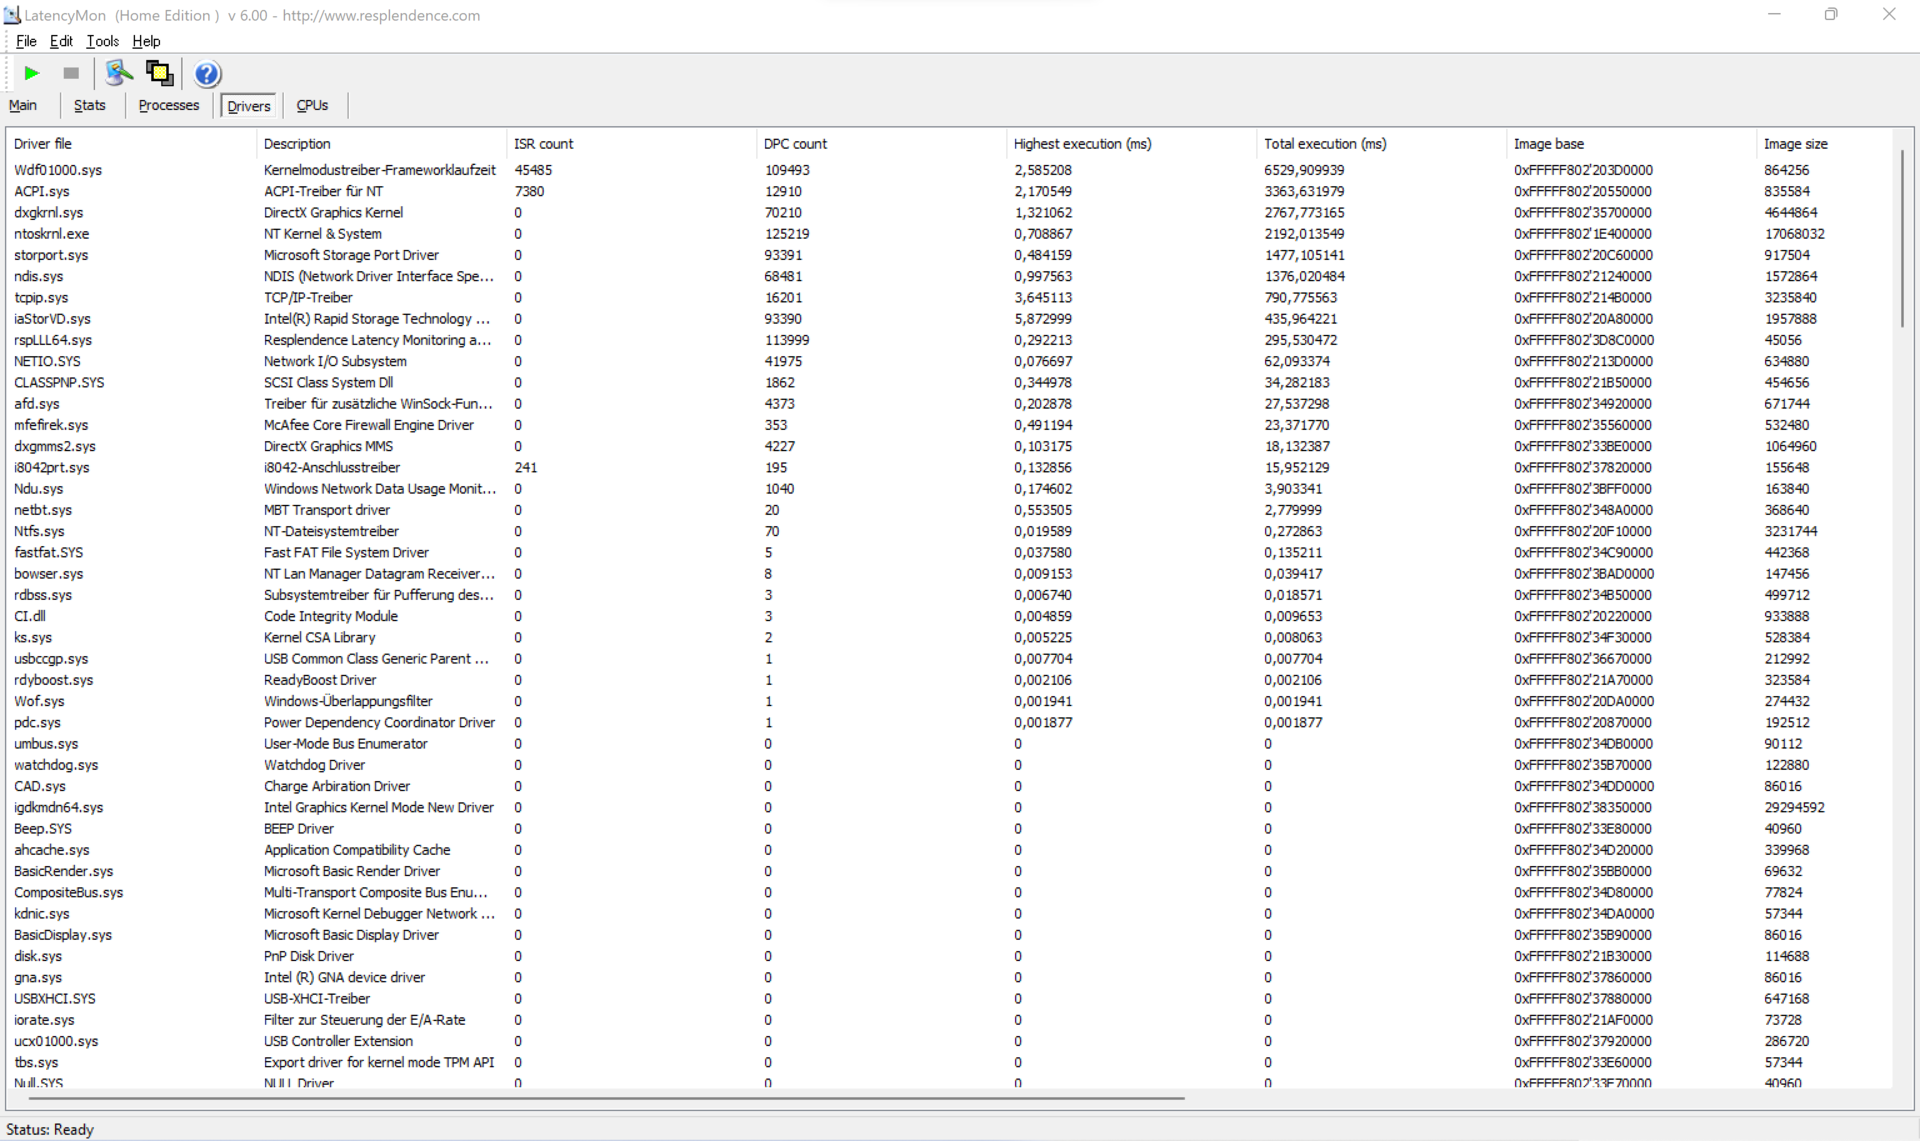
Al abrir nuestra página de inicio en varias pestañas o mientras se ejecuta Prime95, LatencyMon informa de algunas latencias DPC problemáticas. La reproducción de un vídeo 4K tampoco funciona sin problemas, ya que se pierden 37 fotogramas mientras se ejecuta el vídeo de 60 segundos. La razón está en el Kernel y el controlador ACPI.
| DPC Latencies / LatencyMon - interrupt to process latency (max), Web, Youtube, Prime95 | |
| Dell Inspiron 16 Plus 7610 | |
| Acer Aspire 5 A517-52G-79Z5 | |
| Lenovo Legion 5 Pro 16ACH6H (82JQ001PGE) | |
| LG Gram 16 (2021) | |
| Dell Inspiron 15 7000 7506 2-in-1 Black Edition | |
* ... más pequeño es mejor
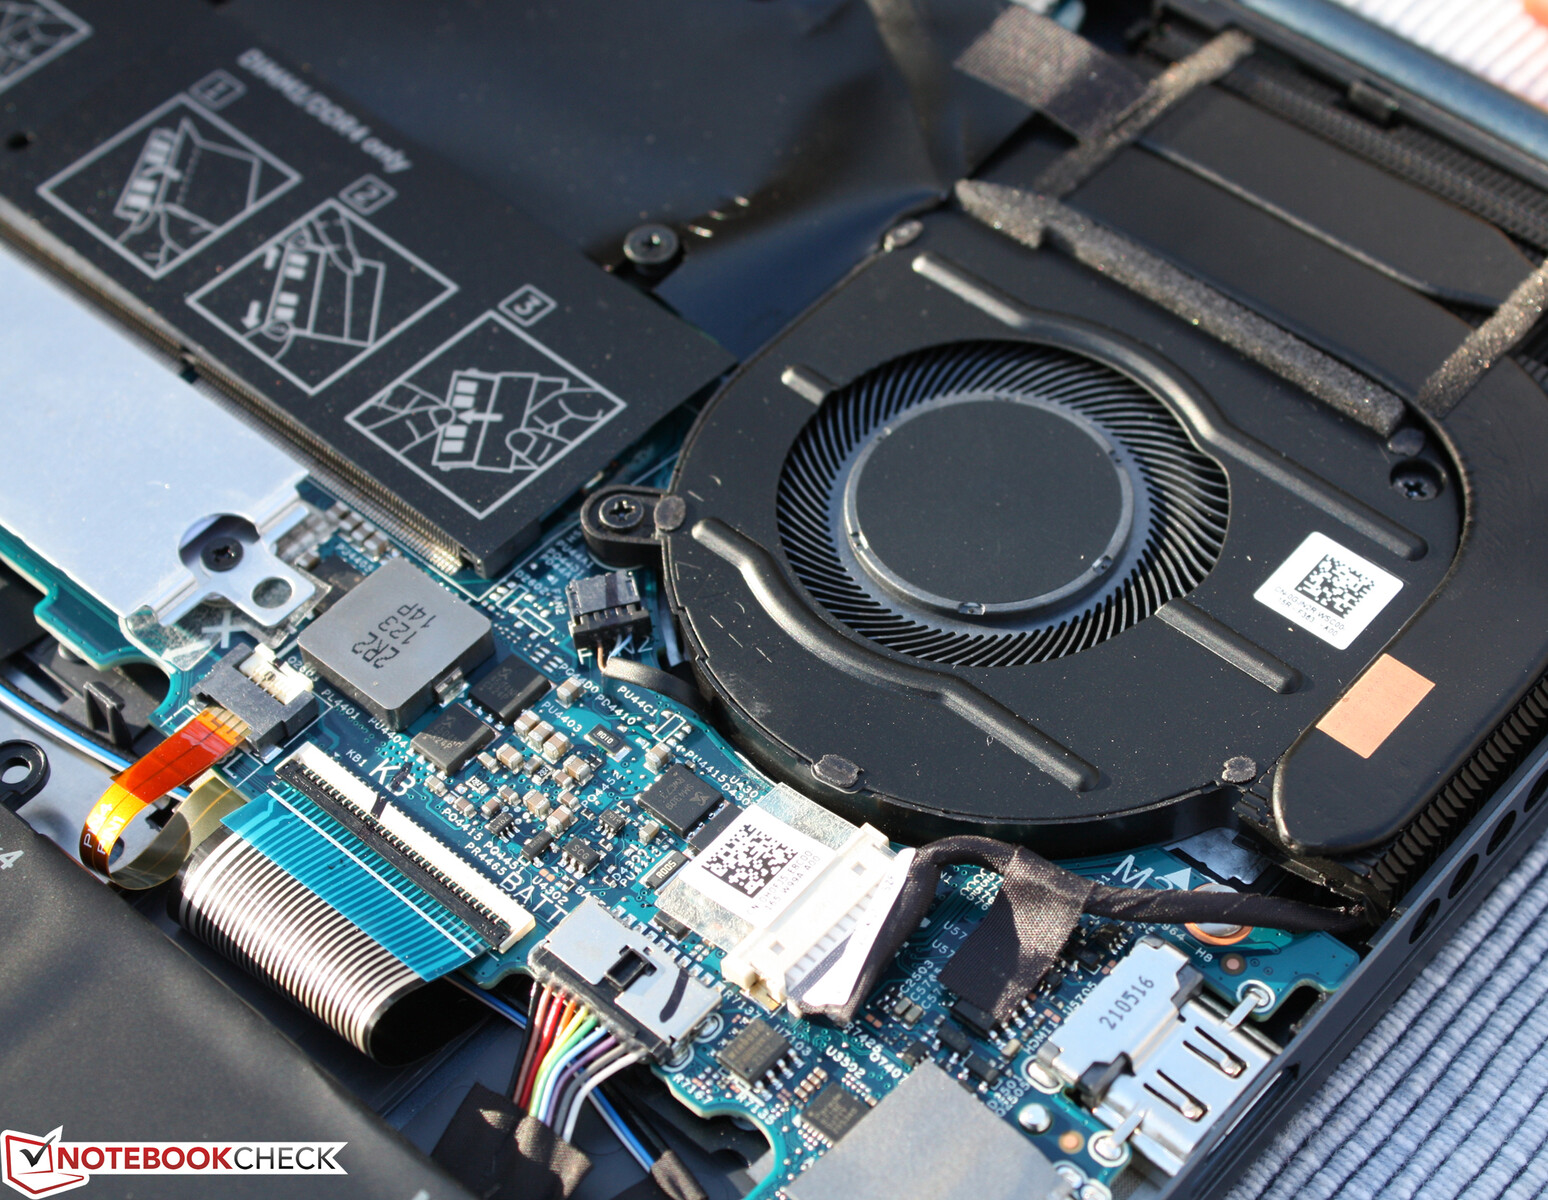
Solución de almacenamiento: una unidad interna
Nuestro modelo 7610 está equipado con el inusual SSD NVMe Kingston OM3PDP3-AD. Con hasta la mitad de rendimiento que el Micron 2300 del XPS 15 9510, su velocidad es media en el mejor de los casos. Dado que Dell obtiene sus unidades de varios fabricantes de SSD que incluyen a Samsung, Micron, Western Digital, Toshiba y, aparentemente, también Kingston, es difícil predecir con qué unidad estará equipado un portátil Inspiron disponible en los proveedores.
Nota: Aunque se pueden insertar hasta dos unidades internas, al menos una de ellas tiene que tener el formato 2230, más pequeño.

* ... más pequeño es mejor
Constant Performance Reading: DiskSpd Read Loop, Queue Depth 8
Tarjeta gráfica
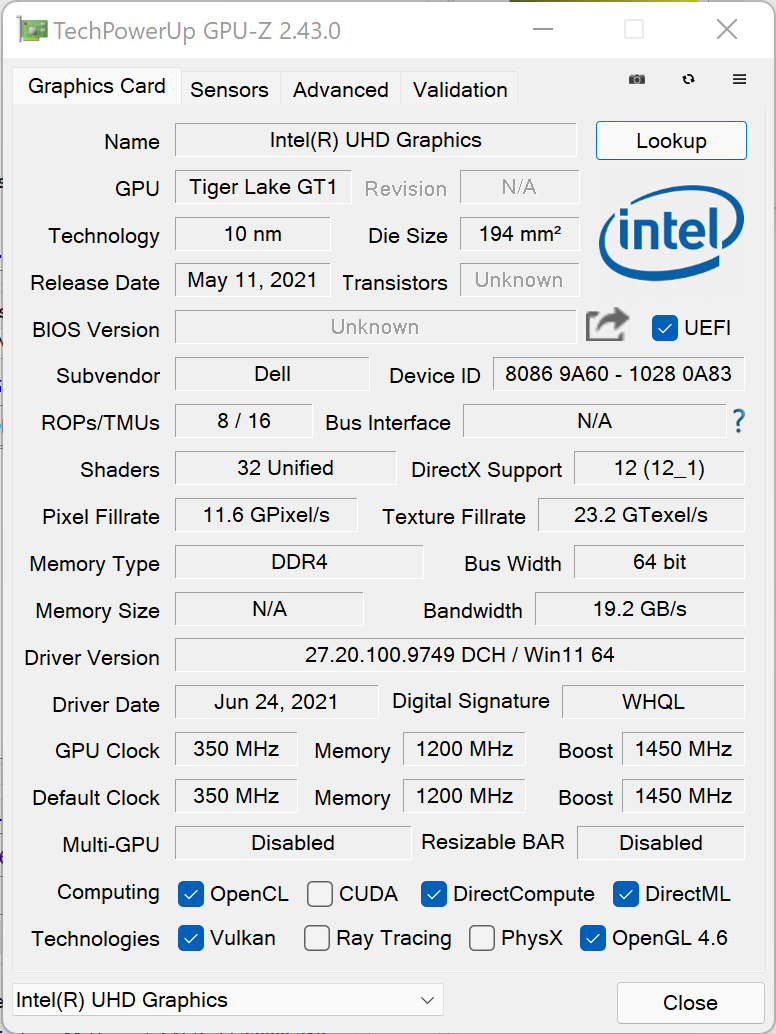
No hay duda, pero el Intel UHD Xe (32 UE) no aporta mucho rendimiento, lo que se confirma en todos los benchmarks. El Inspiron 16 Plus 7610 equipado con RTX está un 500% por delante, y en juegos, entre un 250 y casi un 500%.
Aquellos que se decidan por la versión iGPU tienen que vivir con el hecho de que entonces también faltará el soporte de hardware a través de los núcleos CUDA de Nvidia. Esto disminuirá, por ejemplo, la velocidad de renderizado durante el procesamiento de vídeo o de imágenes de forma significativa. Sólo es posible jugar de forma fluida en algunos juegos antiguos seleccionados o en aquellos que son menos exigentes.
| 3DMark 11 Performance | 3691 puntos | |
| 3DMark Fire Strike Score | 2345 puntos | |
| 3DMark Time Spy Score | 805 puntos | |
ayuda | ||
| bajo | medio | alto | ultra | 4K | |
|---|---|---|---|---|---|
| The Witcher 3 (2015) | 50.1 | 31.1 | 15.8 | 7.5 | |
| Dota 2 Reborn (2015) | 126.2 | 76.6 | 36.3 | 33.3 | 12.1 |
| X-Plane 11.11 (2018) | 21.3 | 17.6 | 11.1 | 9.43 | |
| Strange Brigade (2018) | 56.7 | 21.7 | 16.9 | 16.2 |
Emisiones y gestión de la energía - Un portátil Dell genial
Emisiones acústicas
Los ventiladores del Inspiron 16 consiguen permanecer silenciosos o al menos muy silenciosos durante mucho tiempo. Con el mejor modo de ahorro de energía, los ventiladores casi nunca se encienden. En el modo equilibrado, los dos ventiladores funcionan esporádicamente durante unos segundos. Ambas afirmaciones se refieren al funcionamiento en vacío. Llama la atención que la carga no provoque una aceleración inmediata de los ventiladores, sino una respuesta muy retardada, incluso en el modo Rendimiento. En 3DMark, por ejemplo, sólo se notan tras unos 40 segundos. En cuanto aumentan su velocidad, con 49 dB(A), el portátil se vuelve rápidamente igual de ruidoso que los portátiles para juegos. El valor máximo es idéntico al de la versión Nvidia del portátil, las características del ventilador son idénticas
Ruido
| Ocioso |
| 26.3 / 26.3 / dB(A) |
| Carga |
| 33 / 49.2 dB(A) |
 | ||
30 dB silencioso 40 dB(A) audible 50 dB(A) ruidosamente alto |
||
min: | ||
| Dell Inspiron 16 Plus 7610-MHJ8F UHD Graphics Xe 32EUs (Tiger Lake-H), i7-11800H, OM3PDP3-AD NVMe KDI 512GB | Dell Inspiron 16 Plus 7610 GeForce RTX 3050 4GB Laptop GPU, i7-11800H, Kingston OM3PDP3512B | LG Gram 16 (2021) Iris Xe G7 96EUs, i7-1165G7, SK Hynix PC601 1TB HFS001TD9TNG | Lenovo Legion 5 Pro 16ACH6H (82JQ001PGE) GeForce RTX 3070 Laptop GPU, R7 5800H, WDC PC SN730 SDBPNTY-1T00 | Dell Inspiron 15 7000 7506 2-in-1 Black Edition Xe MAX, i7-1165G7, Micron 2300 1TB MTFDHBA1T0TDV | Acer Aspire 5 A517-52G-79Z5 GeForce MX350, i7-1165G7, WDC PC SN530 SDBPNPZ-1T00 | |
|---|---|---|---|---|---|---|
| Noise | -6% | 9% | 1% | -10% | -2% | |
| apagado / medio ambiente * (dB) | 26.3 | 24.4 7% | 26 1% | 23 13% | 27.3 -4% | 24.9 5% |
| Idle Minimum * (dB) | 26.3 | 24.4 7% | 26 1% | 25 5% | 27.3 -4% | 24.9 5% |
| Idle Average * (dB) | 26.3 | 24.4 7% | 26 1% | 25 5% | 27.3 -4% | 24.9 5% |
| Load Average * (dB) | 33 | 48.3 -46% | 30.8 7% | 35.5 -8% | 47.4 -44% | 44.1 -34% |
| Witcher 3 ultra * (dB) | 44 | 48.9 -11% | 46.67 -6% | 47.4 -8% | ||
| Load Maximum * (dB) | 49.2 | 48.9 1% | 31.1 37% | 50.35 -2% | 47.5 3% | 44.8 9% |
| Idle Maximum * (dB) | 24.4 | 26 | 25 | 27.3 | 27 |
* ... más pequeño es mejor
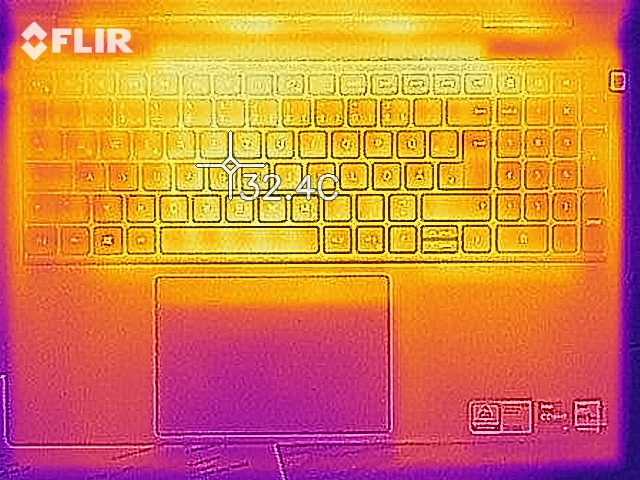
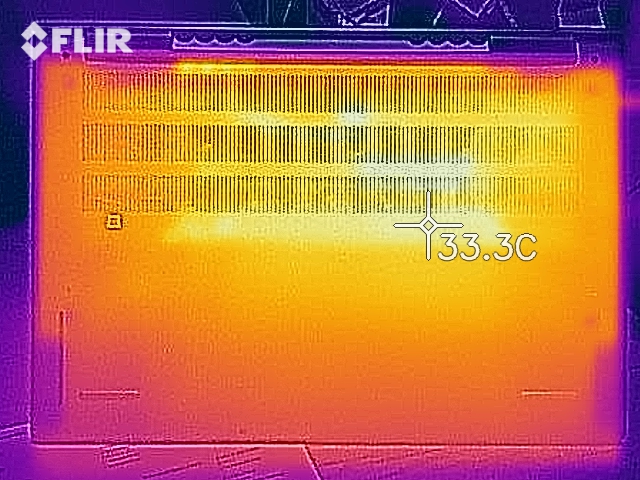
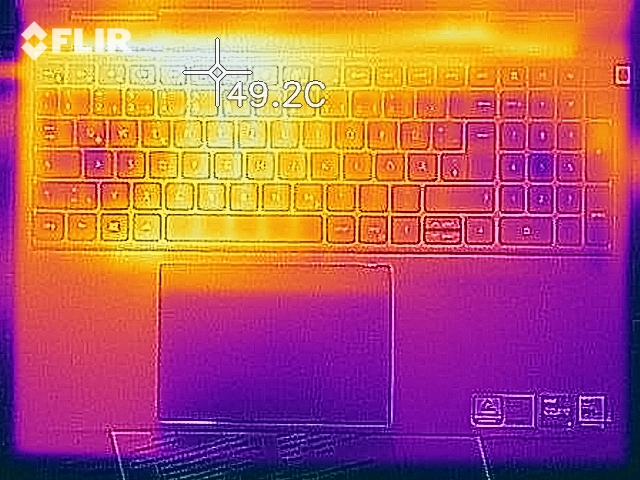
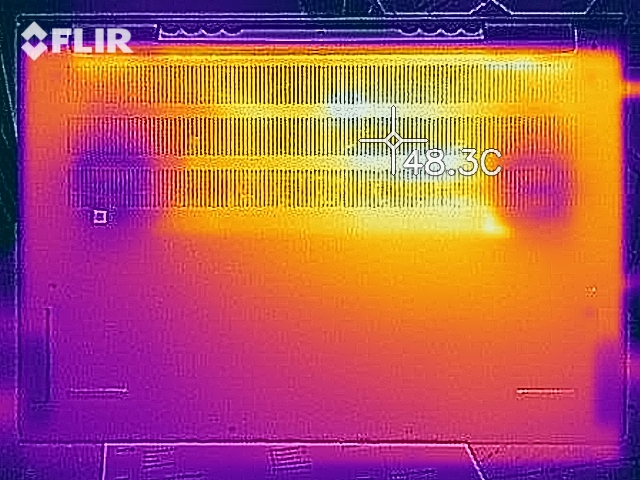
Temperatura
A pesar de la lentitud de los ventiladores, las temperaturas de la superficie no son elevadas, oscilando en torno a los 29 ºC (~84 ºF) de media. El modelo dGPU tiene una media de 3 ºC más alta, pero sólo en la parte inferior. Como era de esperar, hay una diferencia significativa bajo carga: En el punto caliente de la parte inferior, el modelo Geforce está unos 10 ºC más caliente que la versión iGPU
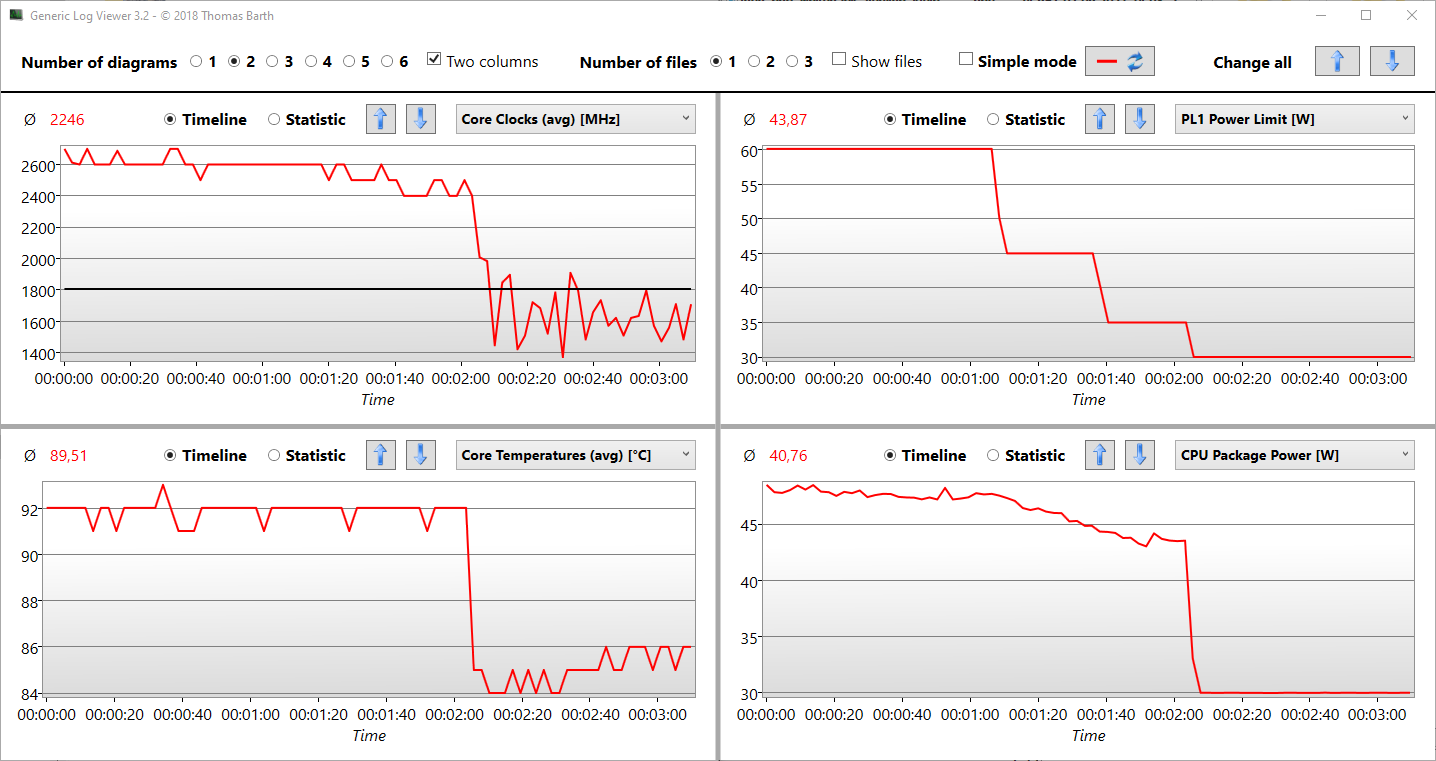
Bajo carga de Prime95, la velocidad de reloj aumenta a 4,3 GHz durante uno o dos segundos, tras lo cual se alcanza una temperatura del núcleo de 90 °C (194 °F). A continuación, la velocidad de reloj desciende al rango de 2,8 a 3,0 GHz, para mantener una temperatura de unos 90 °C (194 °F). La diferencia es que el modelo dGPU trata de mantener 83 °C (181 °F), nivelándose en el rango de 2,4 a 3,2-GHz.
(±) La temperatura máxima en la parte superior es de 43.4 °C / 110 F, frente a la media de 36.8 °C / 98 F, que oscila entre 21 y 71 °C para la clase Multimedia.
(-) El fondo se calienta hasta un máximo de 45.1 °C / 113 F, frente a la media de 39.1 °C / 102 F
(+) En reposo, la temperatura media de la parte superior es de 28.4 °C / 83# F, frente a la media del dispositivo de 31.3 °C / 88 F.
(+) Los reposamanos y el panel táctil alcanzan como máximo la temperatura de la piel (34.8 °C / 94.6 F) y, por tanto, no están calientes.
(-) La temperatura media de la zona del reposamanos de dispositivos similares fue de 28.7 °C / 83.7 F (-6.1 °C / -10.9 F).
| Dell Inspiron 16 Plus 7610-MHJ8F Intel Core i7-11800H, Intel UHD Graphics Xe 32EUs (Tiger Lake-H) | Dell Inspiron 16 Plus 7610 Intel Core i7-11800H, NVIDIA GeForce RTX 3050 4GB Laptop GPU | LG Gram 16 (2021) Intel Core i7-1165G7, Intel Iris Xe Graphics G7 96EUs | Lenovo Legion 5 Pro 16ACH6H (82JQ001PGE) AMD Ryzen 7 5800H, NVIDIA GeForce RTX 3070 Laptop GPU | Dell Inspiron 15 7000 7506 2-in-1 Black Edition Intel Core i7-1165G7, Intel Iris Xe MAX Graphics | Acer Aspire 5 A517-52G-79Z5 Intel Core i7-1165G7, NVIDIA GeForce MX350 | |
|---|---|---|---|---|---|---|
| Heat | -13% | 7% | -17% | -9% | 16% | |
| Maximum Upper Side * (°C) | 43.4 | 46.4 -7% | 46.9 -8% | 50 -15% | 43 1% | 35 19% |
| Maximum Bottom * (°C) | 45.1 | 54.8 -22% | 45.1 -0% | 55 -22% | 48.8 -8% | 40 11% |
| Idle Upper Side * (°C) | 30.6 | 31.4 -3% | 26.4 14% | 34 -11% | 31.6 -3% | 25.6 16% |
| Idle Bottom * (°C) | 31.1 | 36.6 -18% | 24.1 23% | 37 -19% | 38.6 -24% | 25.3 19% |
* ... más pequeño es mejor
Dell Inspiron 16 Plus 7610-MHJ8F análisis de audio
(±) | la sonoridad del altavoz es media pero buena (73.2 dB)
Graves 100 - 315 Hz
(-) | casi sin bajos - de media 19.5% inferior a la mediana
(±) | la linealidad de los graves es media (11.1% delta a frecuencia anterior)
Medios 400 - 2000 Hz
(+) | medios equilibrados - a sólo 4.6% de la mediana
(+) | los medios son lineales (6.4% delta a la frecuencia anterior)
Altos 2 - 16 kHz
(±) | máximos más altos - de media 6.1% más altos que la mediana
(±) | la linealidad de los máximos es media (7.7% delta a frecuencia anterior)
Total 100 - 16.000 Hz
(±) | la linealidad del sonido global es media (22.5% de diferencia con la mediana)
En comparación con la misma clase
» 80% de todos los dispositivos probados de esta clase eran mejores, 4% similares, 16% peores
» El mejor tuvo un delta de 5%, la media fue 17%, el peor fue ###max##%
En comparación con todos los dispositivos probados
» 66% de todos los dispositivos probados eran mejores, 6% similares, 28% peores
» El mejor tuvo un delta de 4%, la media fue 24%, el peor fue ###max##%
LG Gram 16 (2021) análisis de audio
(±) | la sonoridad del altavoz es media pero buena (76.1 dB)
Graves 100 - 315 Hz
(-) | casi sin bajos - de media 18.8% inferior a la mediana
(±) | la linealidad de los graves es media (12.2% delta a frecuencia anterior)
Medios 400 - 2000 Hz
(+) | medios equilibrados - a sólo 2.2% de la mediana
(+) | los medios son lineales (5.4% delta a la frecuencia anterior)
Altos 2 - 16 kHz
(+) | máximos equilibrados - a sólo 2.5% de la mediana
(+) | los máximos son lineales (3.7% delta a la frecuencia anterior)
Total 100 - 16.000 Hz
(+) | el sonido global es lineal (14.7% de diferencia con la mediana)
En comparación con la misma clase
» 12% de todos los dispositivos probados de esta clase eran mejores, 4% similares, 84% peores
» El mejor tuvo un delta de 7%, la media fue 21%, el peor fue ###max##%
En comparación con todos los dispositivos probados
» 19% de todos los dispositivos probados eran mejores, 4% similares, 77% peores
» El mejor tuvo un delta de 4%, la media fue 24%, el peor fue ###max##%
Gestión de la energía
Consumo de energía
Durante el funcionamiento en reposo, el portátil utiliza algo más de 5 vatios en el nivel de brillo más bajo y en el perfil de rendimiento de mayor ahorro de energía. El máximo durante el reposo está en 14 vatios, que es un valor moderado. En escenarios similares, el LG Gram 16 sólo consume entre 4 y 11 vatios. El correspondiente Inspiron 16 Plus 7610 con Geforce consume entre 8 y 17 vatios a pesar de que su dGPU está apagada por la conmutación Optimus.
Bajo carga, las diferencias son naturalmente enormes. Bajo carga extremadamente alta, medimos un consumo máximo de sólo 76 vatios en la fuente de alimentación de 130 vatios. Como muestra el gráfico siguiente, el modelo iGPU es capaz de consumir más energía (test de estrés con Prime95 y Furmark), llegando a los 100 vatios. Durante la prueba de estrés, se estabiliza en 90 vatios. Al ejecutar The Witcher 3 Ultra, oscila en torno a una media de 44 vatios.
| Off / Standby | |
| Ocioso | |
| Carga |
|
Clave:
min: | |
Power Consumption The Witcher 3 / Stress Test
| Dell Inspiron 16 Plus 7610-MHJ8F i7-11800H, UHD Graphics Xe 32EUs (Tiger Lake-H), OM3PDP3-AD NVMe KDI 512GB, IPS, 3072x1920, 16" | Dell Inspiron 16 Plus 7610 i7-11800H, GeForce RTX 3050 4GB Laptop GPU, Kingston OM3PDP3512B, IPS, 3072x1920, 16" | LG Gram 16 (2021) i7-1165G7, Iris Xe G7 96EUs, SK Hynix PC601 1TB HFS001TD9TNG, IPS, 2560x1600, 16" | Lenovo Legion 5 Pro 16ACH6H (82JQ001PGE) R7 5800H, GeForce RTX 3070 Laptop GPU, WDC PC SN730 SDBPNTY-1T00, IPS, 2560x1600, 16" | Dell Inspiron 15 7000 7506 2-in-1 Black Edition i7-1165G7, Xe MAX, Micron 2300 1TB MTFDHBA1T0TDV, IPS, 3840x2160, 15.6" | Acer Aspire 5 A517-52G-79Z5 i7-1165G7, GeForce MX350, WDC PC SN530 SDBPNPZ-1T00, IPS, 1920x1080, 17.3" | |
|---|---|---|---|---|---|---|
| Power Consumption | -69% | 24% | -129% | -17% | 16% | |
| Idle Minimum * (Watt) | 5.4 | 7.7 -43% | 3.8 30% | 10.45 -94% | 4 26% | 4.1 24% |
| Idle Average * (Watt) | 9.8 | 10.7 -9% | 9 8% | 14.92 -52% | 15.5 -58% | 7.8 20% |
| Idle Maximum * (Watt) | 14 | 16.8 -20% | 11.3 19% | 16.02 -14% | 16.2 -16% | 10 29% |
| Load Average * (Watt) | 44 | 100.39 -128% | 35.2 20% | 119.65 -172% | 49.7 -13% | 47 -7% |
| Witcher 3 ultra * (Watt) | 44 | 108 -145% | 174.9 -298% | 52.2 -19% | ||
| Load Maximum * (Watt) | 76.8 | 129 -68% | 43.5 43% | 187.26 -144% | 92.7 -21% | 64.7 16% |
* ... más pequeño es mejor
Duración de la batería
La diferencia en la duración de la batería de las versiones iGPU y dGPU es sólo marginal en la prueba WiFi, y el modelo Geforce dura incluso unos minutos más aquí. Por otro lado, bajo carga el modelo iGPU es capaz de durar 50 minutos más (Battery Eater Classic). El modelo iGPU también gana en cuanto a la duración de la batería en reposo, y un plus de 120 minutos permite que la unidad de prueba dure 22:30 horas. Sin embargo, este valor no es realmente realista, ya que se mide con el brillo mínimo y en el modo avión. Los 86 Wh son idénticos en ambos modelos.
| Dell Inspiron 16 Plus 7610-MHJ8F i7-11800H, UHD Graphics Xe 32EUs (Tiger Lake-H), 86 Wh | Dell Inspiron 16 Plus 7610 i7-11800H, GeForce RTX 3050 4GB Laptop GPU, 86 Wh | LG Gram 16 (2021) i7-1165G7, Iris Xe G7 96EUs, 80 Wh | Lenovo Legion 5 Pro 16ACH6H (82JQ001PGE) R7 5800H, GeForce RTX 3070 Laptop GPU, 80 Wh | Dell Inspiron 15 7000 7506 2-in-1 Black Edition i7-1165G7, Xe MAX, 68 Wh | Acer Aspire 5 A517-52G-79Z5 i7-1165G7, GeForce MX350, 50.2 Wh | Media de la clase Multimedia | |
|---|---|---|---|---|---|---|---|
| Duración de Batería | -8% | 32% | -56% | -16% | -36% | -7% | |
| Reader / Idle (h) | 22.5 | 20.5 -9% | 28.6 27% | 9.1 -60% | 25 11% | 13.8 -39% | 25.2 ? 12% |
| WiFi (h) | 9.5 | ||||||
| WiFi v1.3 (h) | 9.5 | 9.9 4% | 15.7 65% | 7 -26% | 9.7 2% | 7.4 -22% | 12 ? 26% |
| Load (h) | 4.1 | 3.3 -20% | 4.3 5% | 0.7 -83% | 1.6 -61% | 2.2 -46% | 1.675 ? -59% |
| H.264 (h) | 20.1 | 4.9 | 16.4 ? | ||||
| Witcher 3 ultra (h) | 1.3 |
Pro
Contra
Veredicto - Más frío y más resistencia
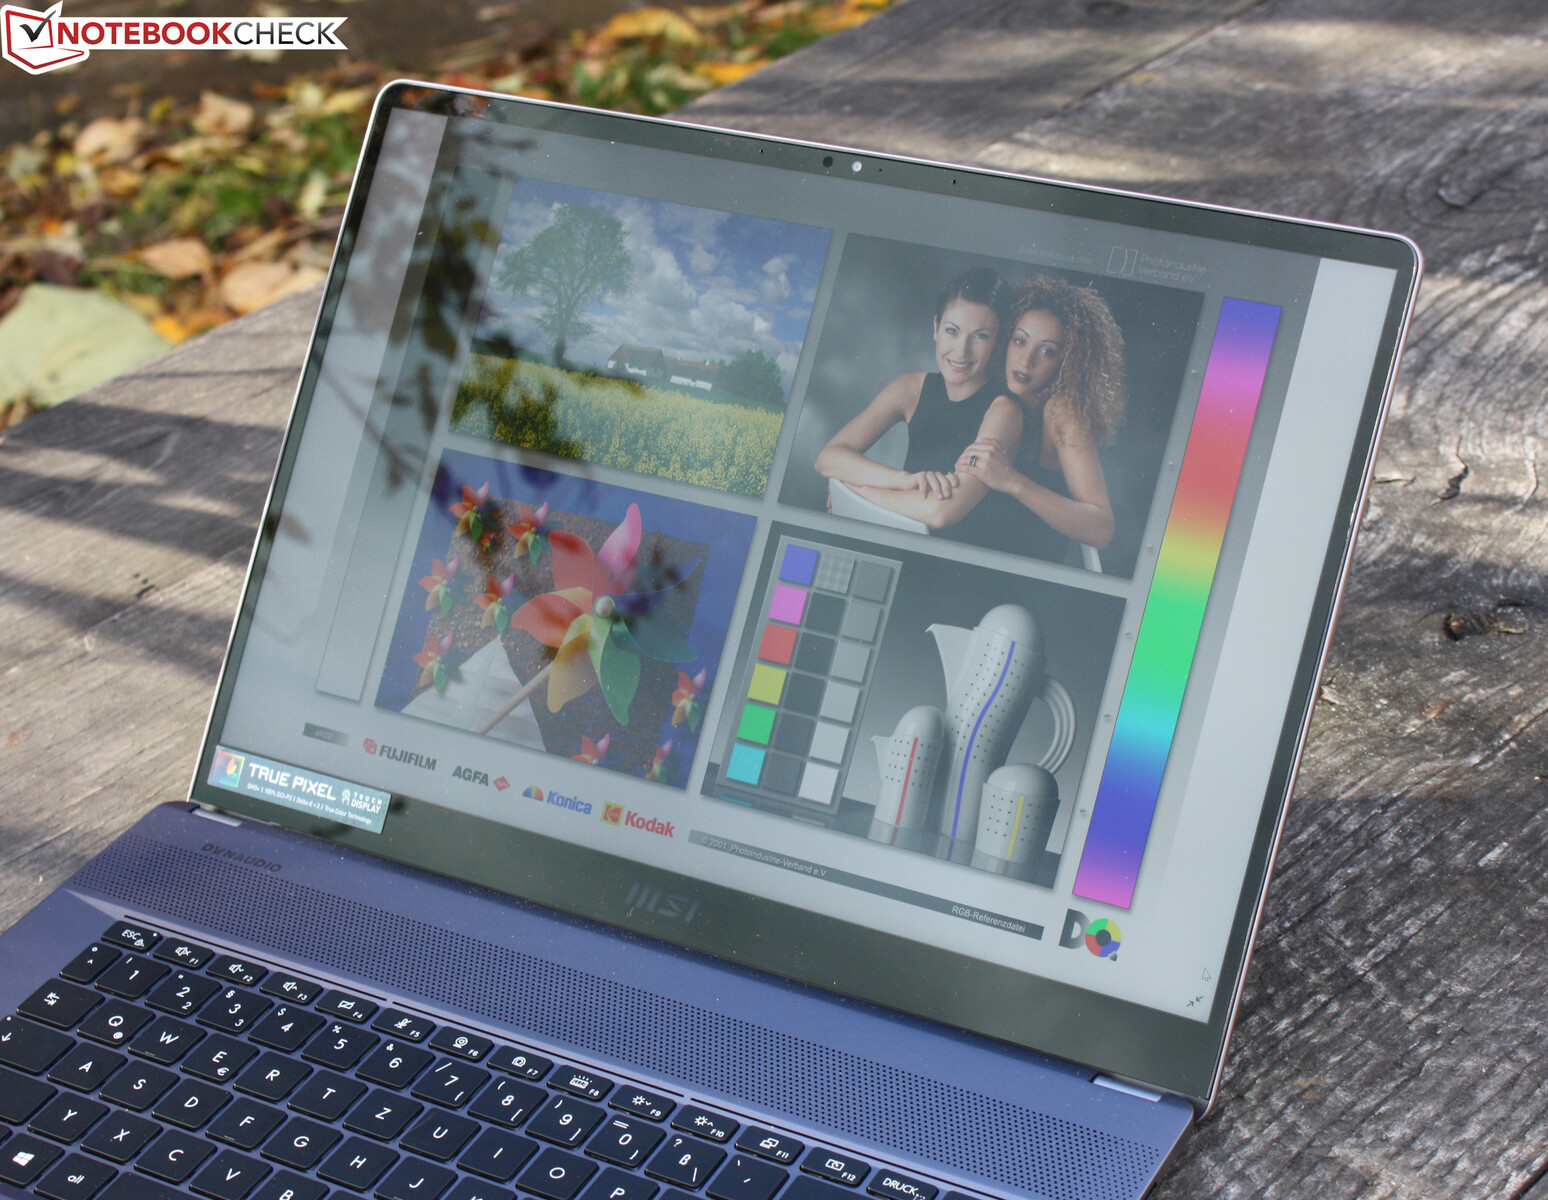
El Inspiron 16 es un portátil para presumir: La pesada carcasa de metal transmite una calidad háptica que se acerca a la del XPS 15, más caro. Los biseles son delgados, y el equipo de conexión es amplio. El mantenimiento resulta fácil, y la pantalla 3K mate remata perfectamente el conjunto.
En el rendimiento, las cosas no parecen tan buenas. En comparación con los competidores de equipamiento similar o casi similar, la CPU es más lenta de lo esperado, lo que también ocurre con el modelo iGPU. Sin embargo, nuestra unidad de prueba fue capaz de ponerse al día ligeramente en términos de puntos, lo que significa que inicialmente calculó más rápido que la versión con el chip gráfico Nvidia.
Aunque el Dell Inspiron 16 Plus 7610 comparte las ventajas de su modelo hermano, renuncia al rendimiento de la gráfica Geforce. Esto aporta una mayor duración de la batería, un menor consumo de energía y una carcasa más fresca.
Aquellos que se sientan entusiasmados con el Inspiron 16 Plus 7610 en general, pero que estén considerando si la versión iGPU más asequible es suficiente, deberían entender esto: No hay diferencia en la duración de la batería WiFi, que es la medida más realista en la práctica. Sin embargo, la unidad de prueba dura más durante el funcionamiento en vacío o bajo carga constante. Su funcionamiento es más eficiente y no se calienta tanto bajo carga. Así que aquellos que busquen un compañero de oficina de 16 pulgadas con una buena pantalla 3K no quedarán decepcionados con el Inspiron 16 Plus 7610
Actualmente, la diferencia de precio entre nuestra unidad de prueba iGPU (1200 Euros = ~$1348, i7, 512 GB, 16 GB, versión de tienda) y la versión Geforce más asequible con una RTX 3050 pero por lo demás un equipo similar es de 200 Euros (~$225). Si eliges el i5, la diferencia es de sólo 50 Euros (~$56).
Una alternativa más potente y asequible al Dell es elLegion 5 Prode Lenovo, que puntúa con un Ryzen 5000H más potente y ya incluye una RTX 3050 Ti junto con un display de 165-Hz por 1300 Euros (~$1461). ElLG Gramm 16pone el foco en el bajo peso y una duración de batería considerablemente mayor con un rendimiento inferior. Aquellos para los que todo esto sea demasiado caro pueden echar un vistazo al Acer Aspire 5 A517. Por apenas 800 euros, obtienes menos pantalla y un menor rendimiento que con la iGPU de Dell, pero una dGPU de nivel básico.
Precio y disponibilidad
La unidad de prueba configurada con un i7-11800H16 GB de RAM y 512 GB de SSD está disponible en por 999 dólares.

Dell Inspiron 16 Plus 7610-MHJ8F
- 11/22/2021 v7 (old)
Sebastian Jentsch
Price comparison

