Análisis del Dell Inspiron 16 Plus 7620: El portátil multimedia que lo hace todo
El Dell Inspiron 16 Plus 7620 de 2022 sucede directamente al 2021 Inspiron 16 Plus 7610 introduciendo CPUs de 12ª generación y GPUs GeForce RTX más rápidas para reemplazar las CPUs de 11ª generación del modelo del año pasado. El fabricante incluso ha revisado el chasis para darle un aspecto diferente tras sólo un año en el mercado de la serie.
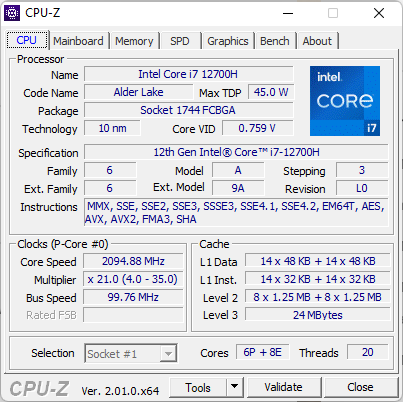
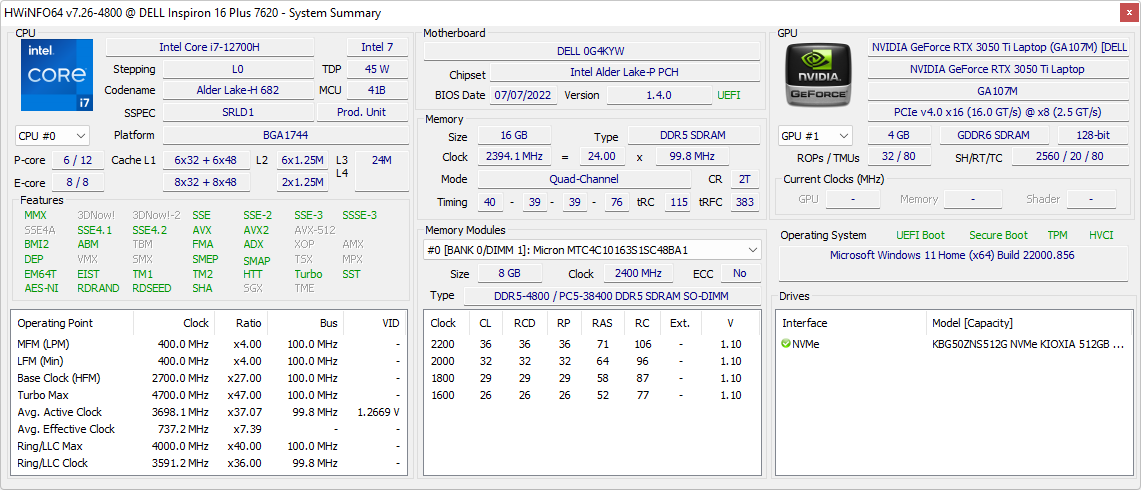
Nuestra unidad de prueba viene configurada con la CPU Alder Lake-H Core i7-12700H, 65 W GeForce RTX 3050 Ti, y pantalla IPS 16:10 3072 x 1280 por unos 1400 dólares. También están disponibles otros modelos con el Core i5-12500H, 60 W RTX 3060 y pantalla táctil de 1920 x 1200. Existe una versión 2-en-1 del modelo llamada Inspiron 16 Plus 7620 2-en-1.
Los competidores en este espacio incluyen otros portátiles multimedia o de creación de 16 pulgadas de gama media a alta como el Lenovo Yoga 7 16IAP7, Huawei MateBook D 16, Acer Swift X, Asus Vivobook Pro 16X, o incluso el MSI Creator Z16.
Más opiniones de Dell:
Posibles contendientes en la comparación
Valoración | Fecha | Modelo | Peso | Altura | Tamaño | Resolución | Precio |
|---|---|---|---|---|---|---|---|
| 87.4 % v7 (old) | 08/2022 | Dell Inspiron 16 Plus 7620 i7-12700H, GeForce RTX 3050 Ti Laptop GPU | 2.1 kg | 18.99 mm | 16.00" | 3072x1920 | |
| 86.7 % v7 (old) | 08/2021 | Dell Inspiron 16 Plus 7610 i7-11800H, GeForce RTX 3050 4GB Laptop GPU | 2 kg | 18.99 mm | 16.00" | 3072x1920 | |
| 88.7 % v7 (old) | 08/2022 | Lenovo Yoga 7 16IAP7 i7-1260P, Iris Xe G7 96EUs | 2 kg | 19.2 mm | 16.00" | 2560x1600 | |
| 83.6 % v7 (old) | 07/2022 | Huawei MateBook D 16 2022 i7-12700H, Iris Xe G7 96EUs | 1.7 kg | 18.4 mm | 16.00" | 1920x1200 | |
| 86.2 % v7 (old) | 07/2022 | Acer Swift X SFX16-51G-5388 i5-11320H, GeForce RTX 3050 4GB Laptop GPU | 1.8 kg | 18.9 mm | 16.10" | 1920x1080 | |
v (old) | 12/2021 | Asus Vivobook Pro 16X-M7600QE R9 5900HX, GeForce RTX 3050 Ti Laptop GPU | 1.9 kg | 19 mm | 16.10" | 3840x2400 |
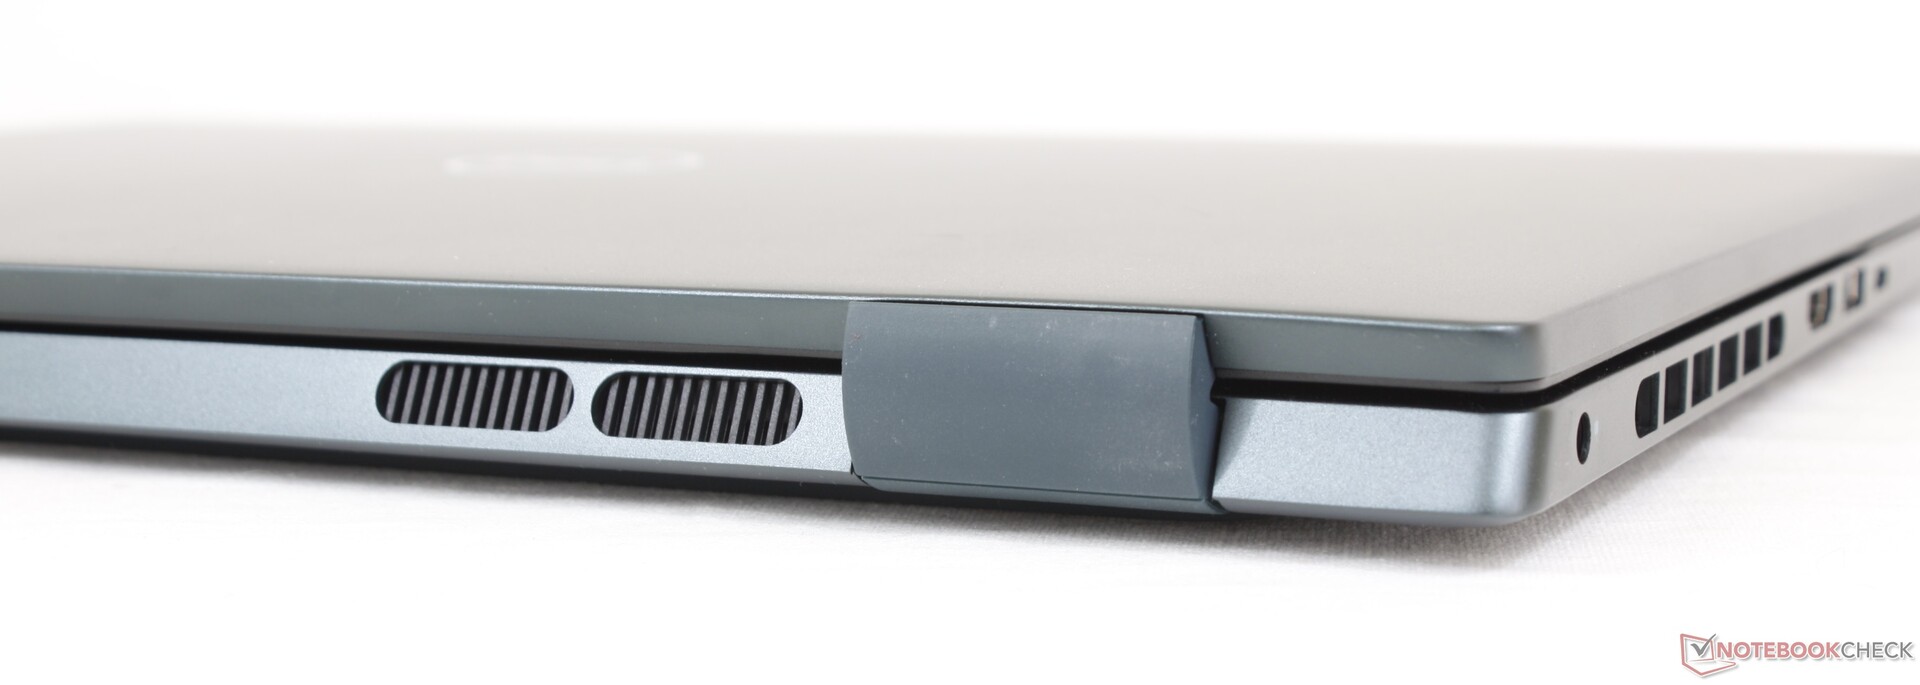
Caso - Tonos más oscuros
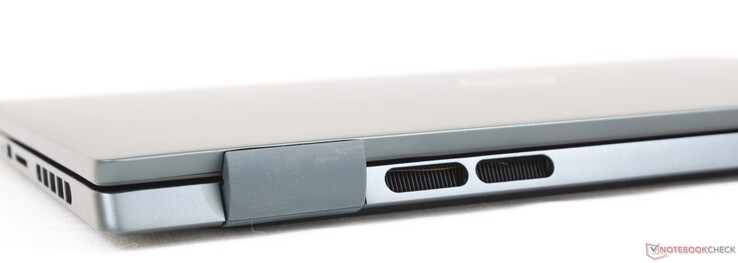
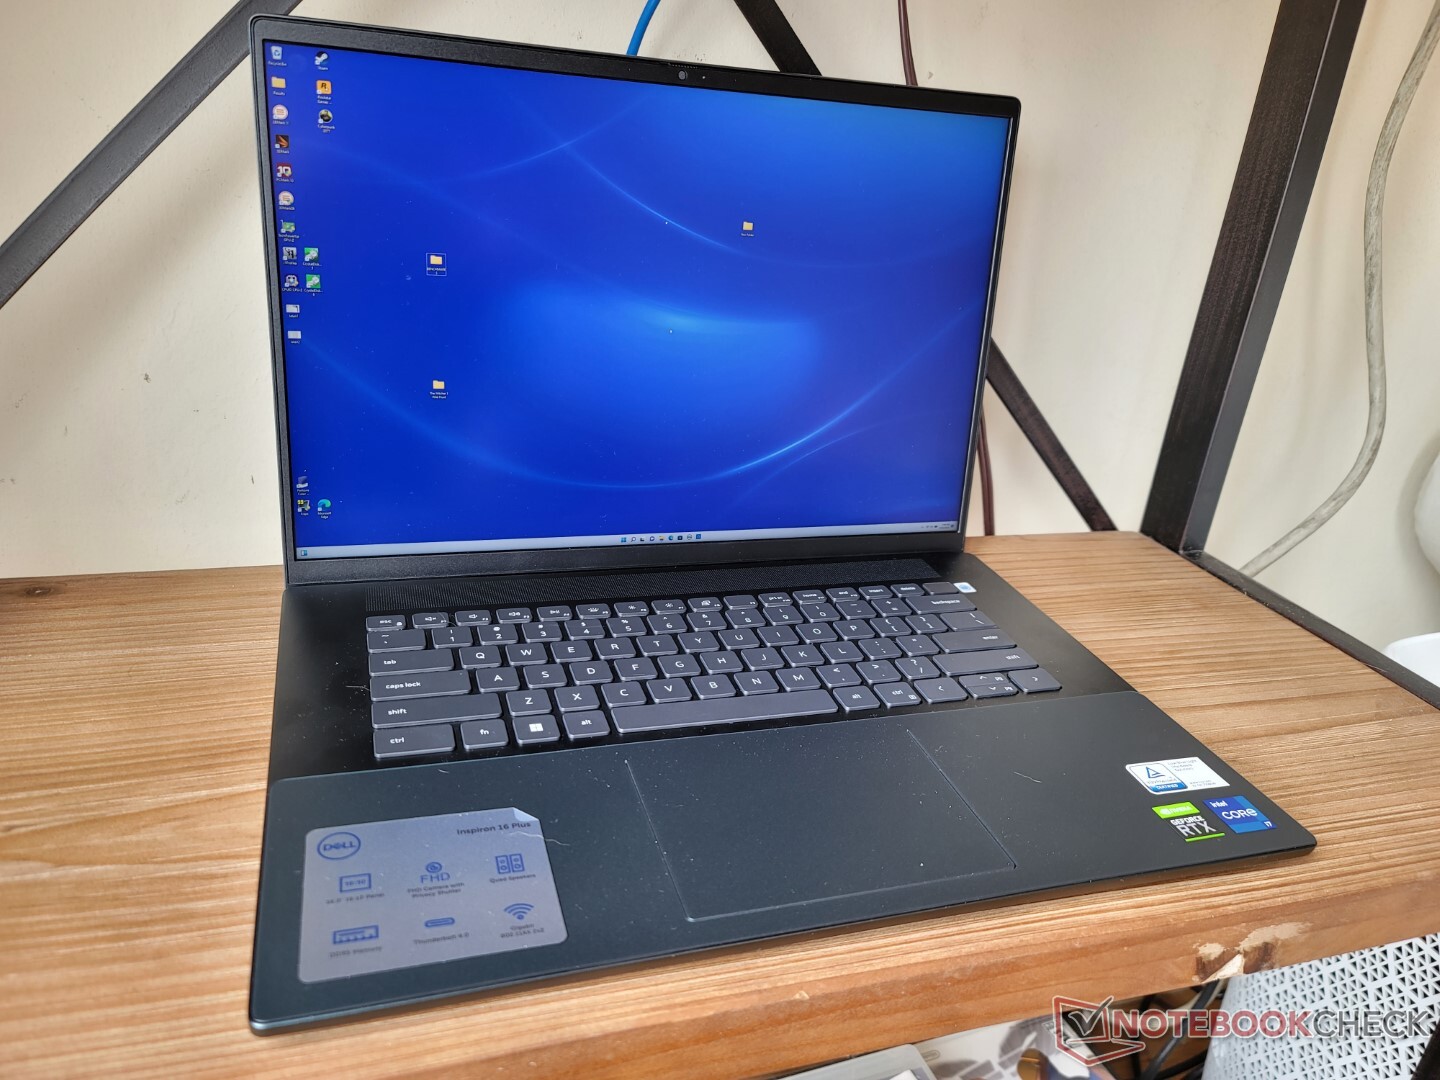
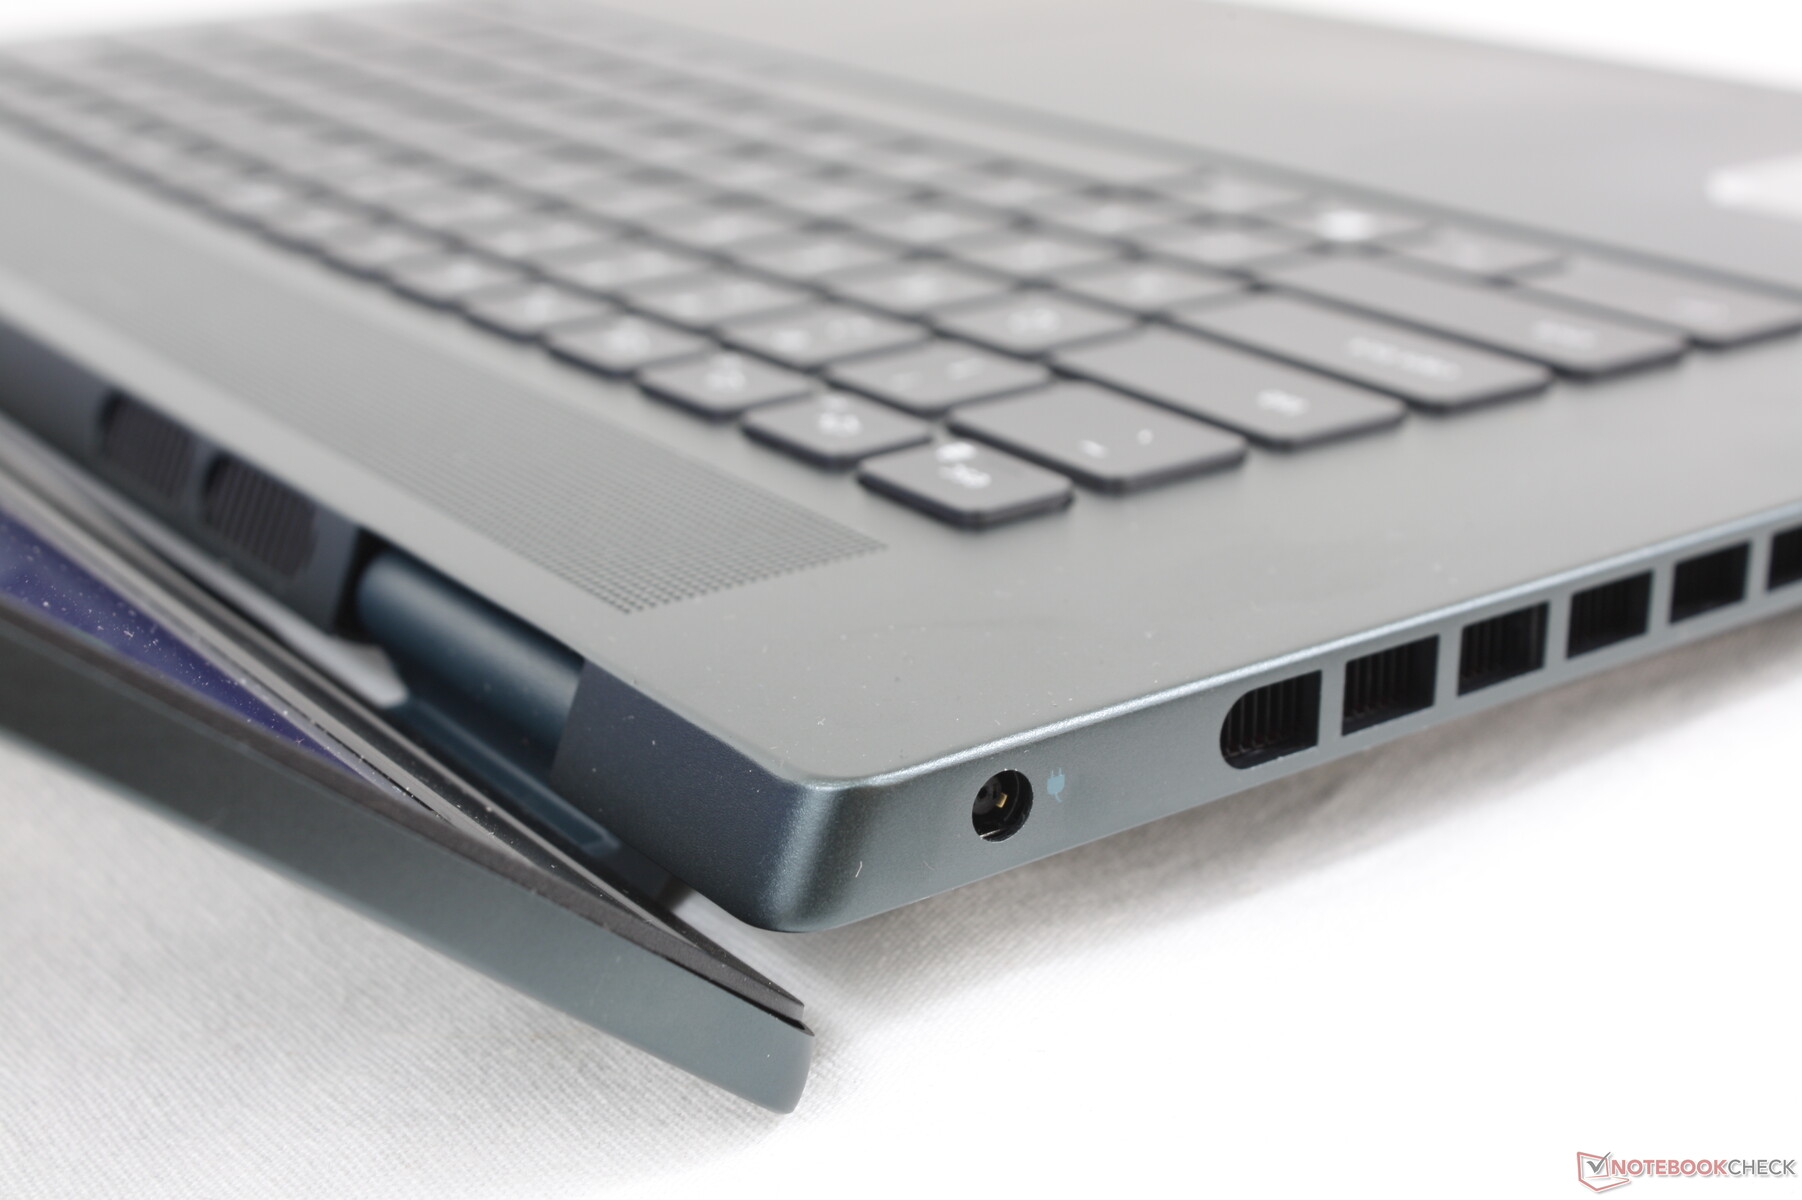
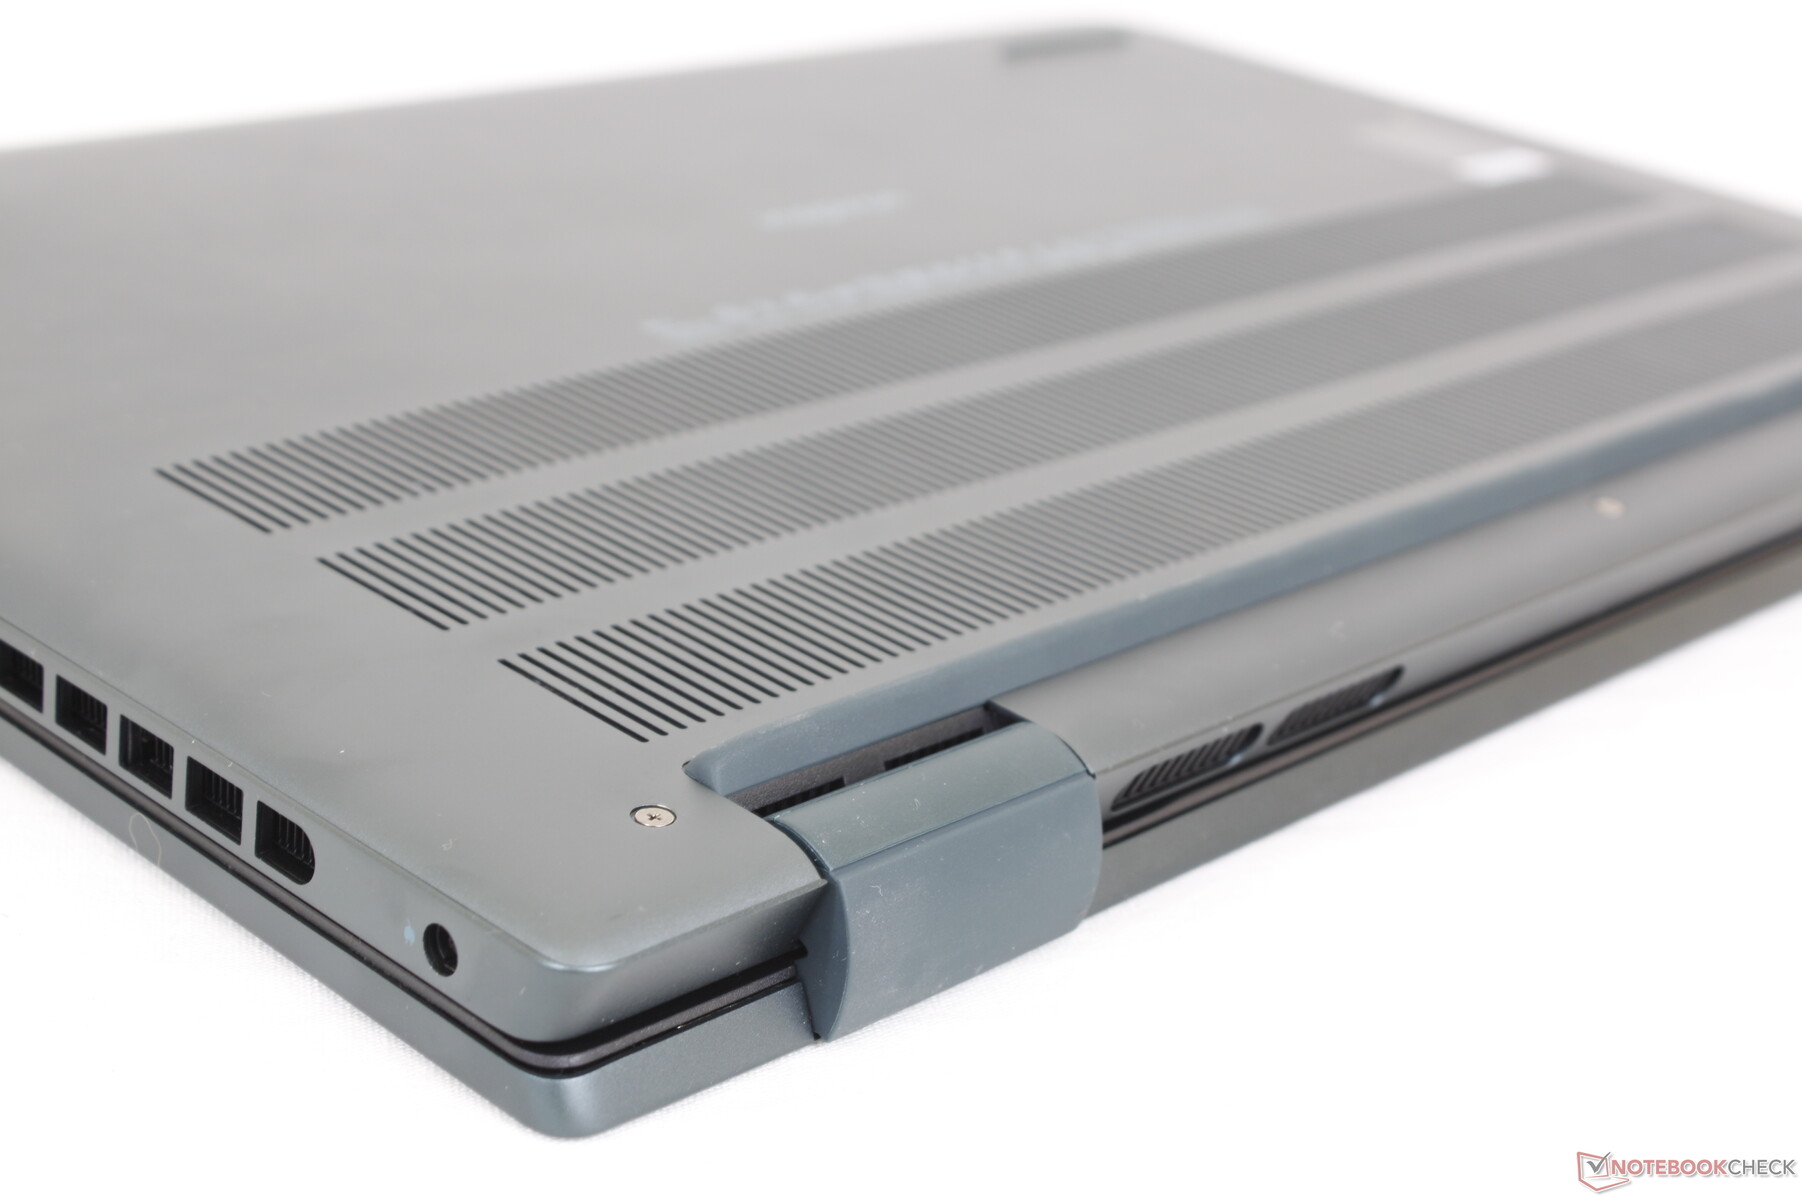
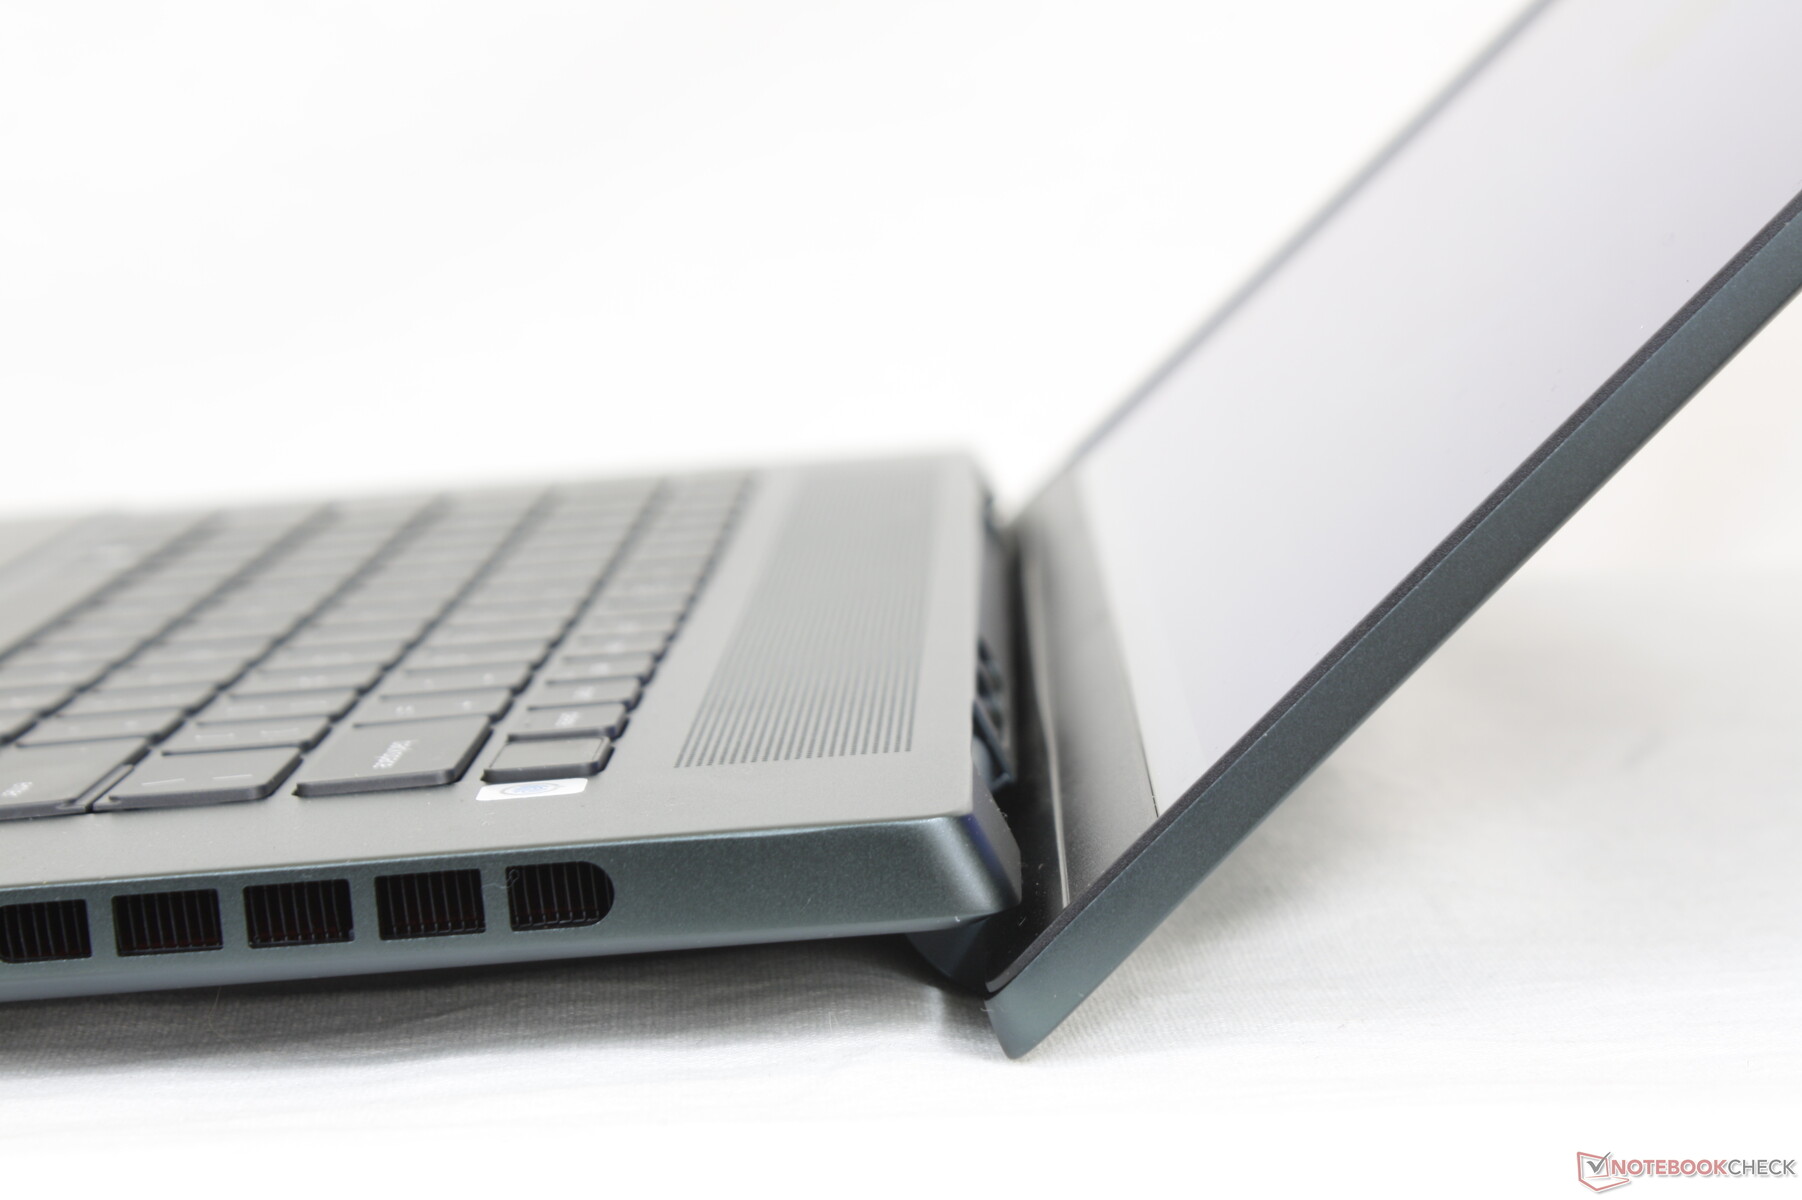
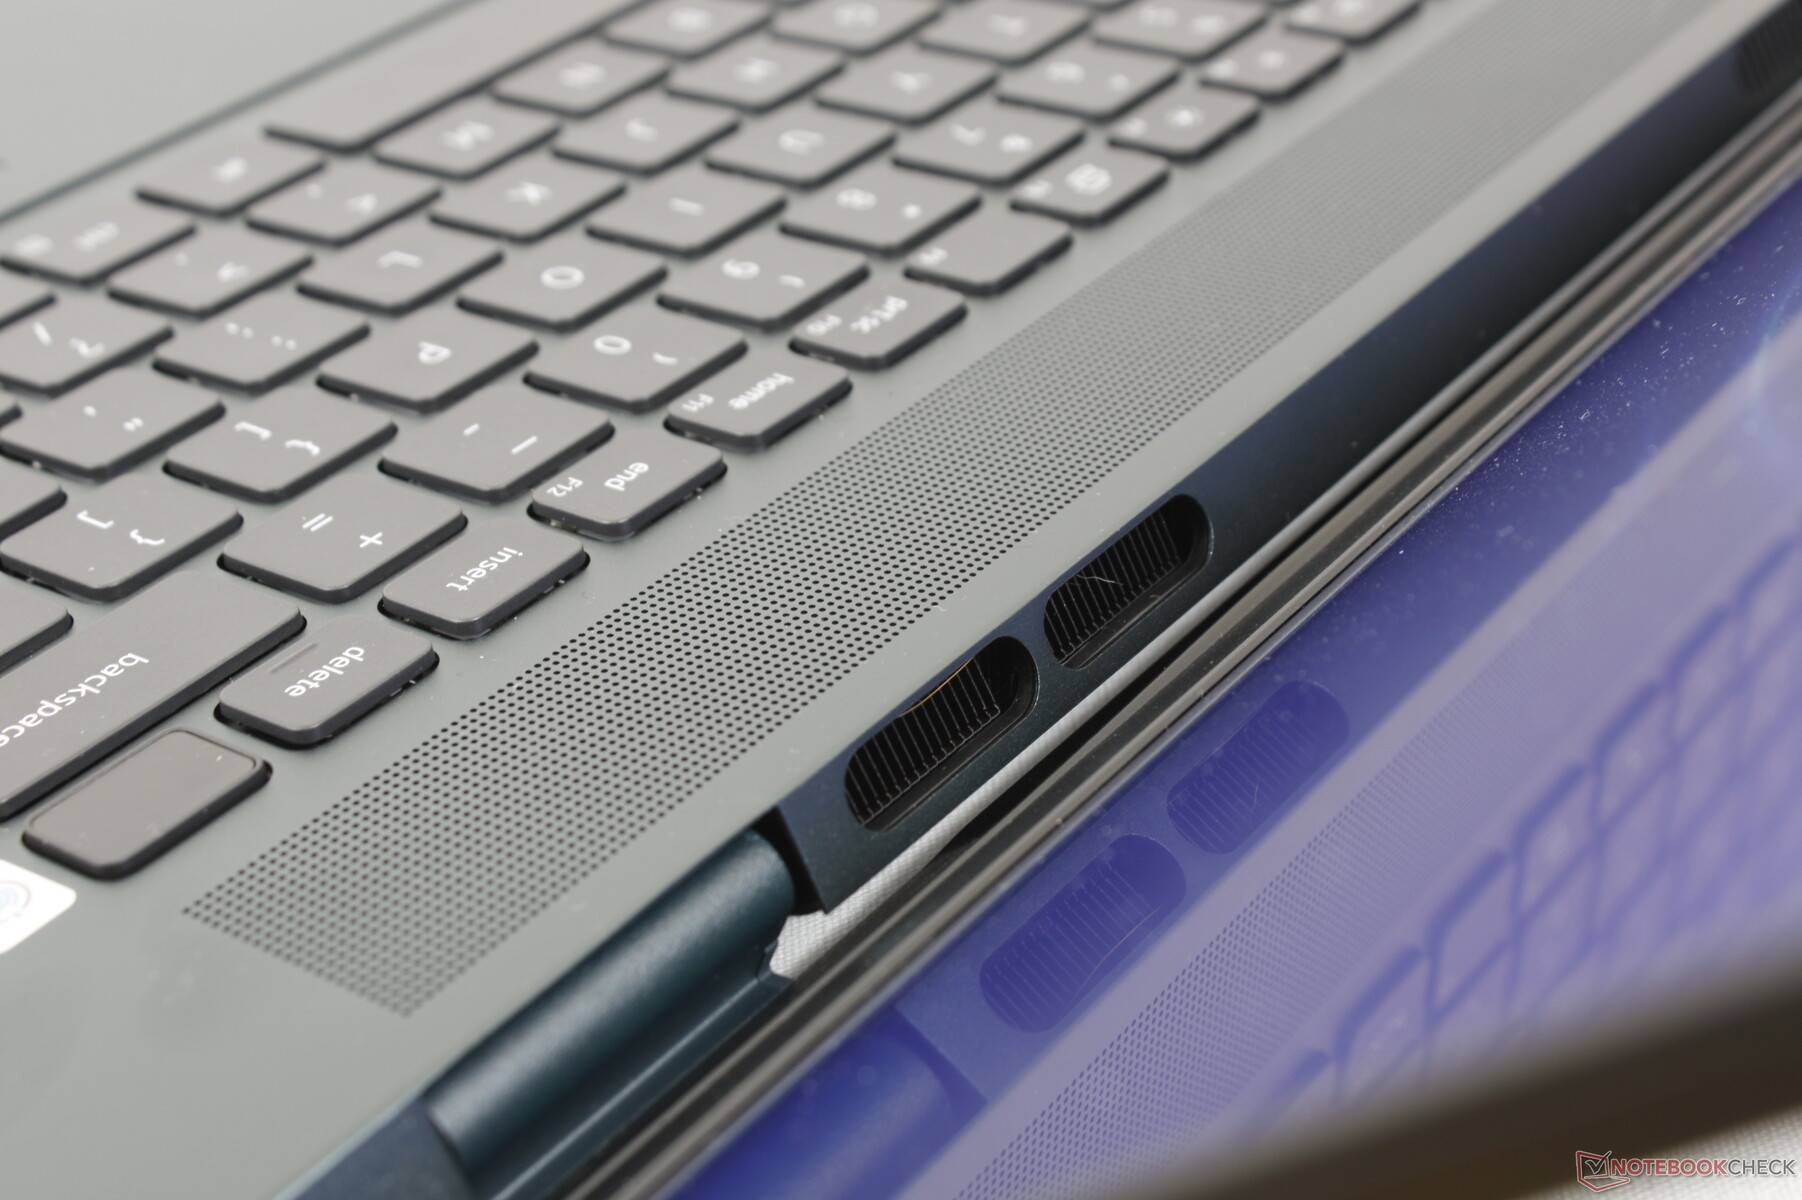
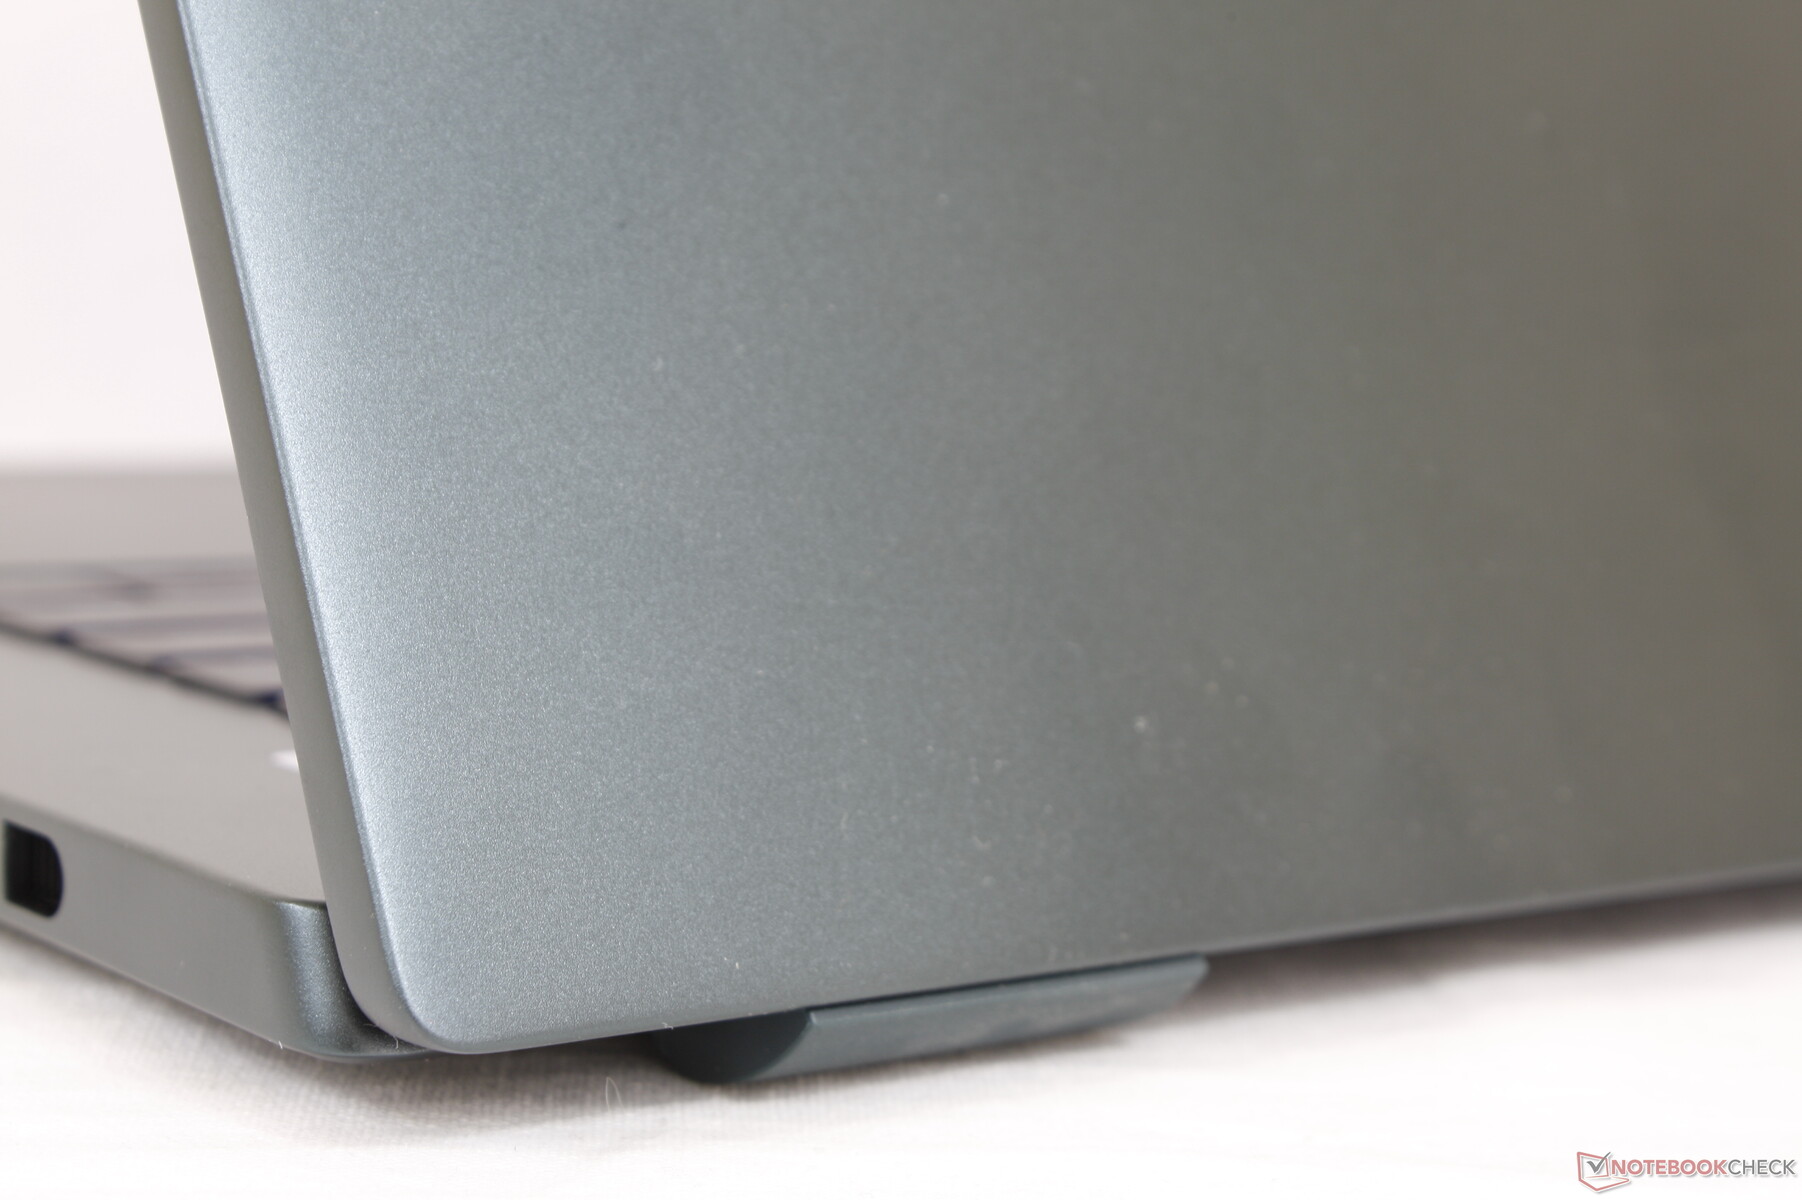
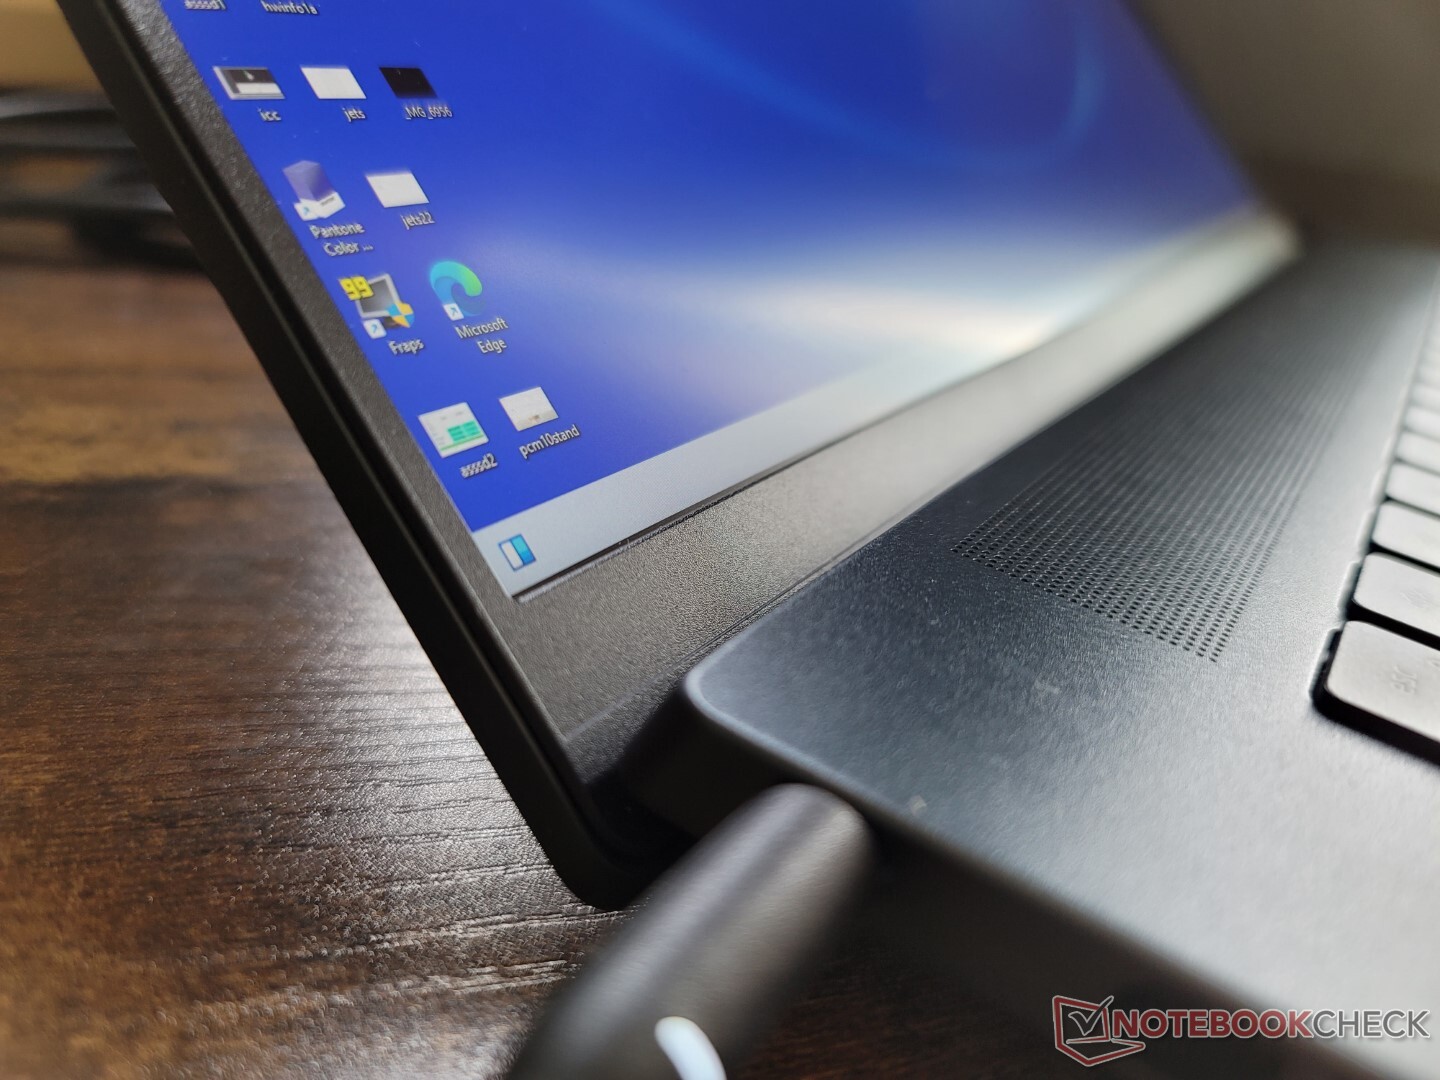
Visualmente, las diferencias entre los modelos de 2021 y 2022 son inmediatamente perceptibles. Las rejillas de ventilación de los laterales y la parte trasera, por ejemplo, son ahora rectangulares y ovaladas, respectivamente, en lugar de circulares. Los bordes y esquinas cromados han desaparecido para dar un aspecto más monocromático y menos ornamentado
La calidad de construcción sigue siendo la misma. La base metálica se retuerce y cruje un poco más que en los XPS o Spectre más caros y esto es especialmente cierto en la tapa. Esperábamos que todos los cambios visuales llevaran a un chasis más fuerte, pero no parece ser el caso. Si sigues con el modelo 2021, entonces no te pierdes mucho desde el punto de vista del diseño con el modelo 2022.
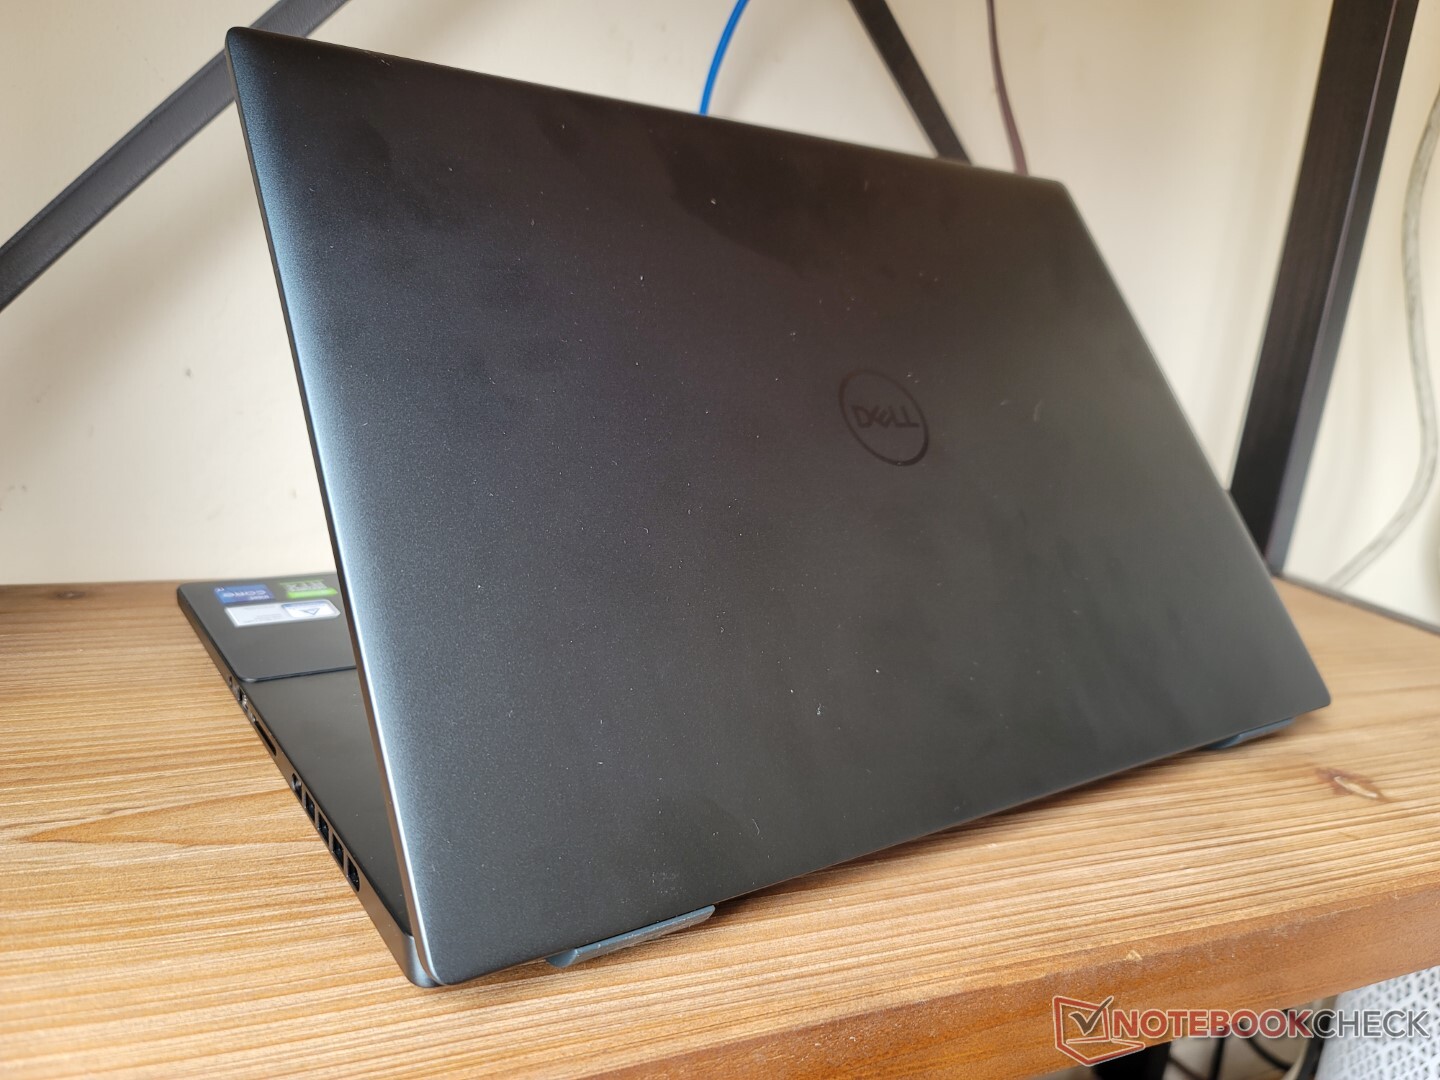
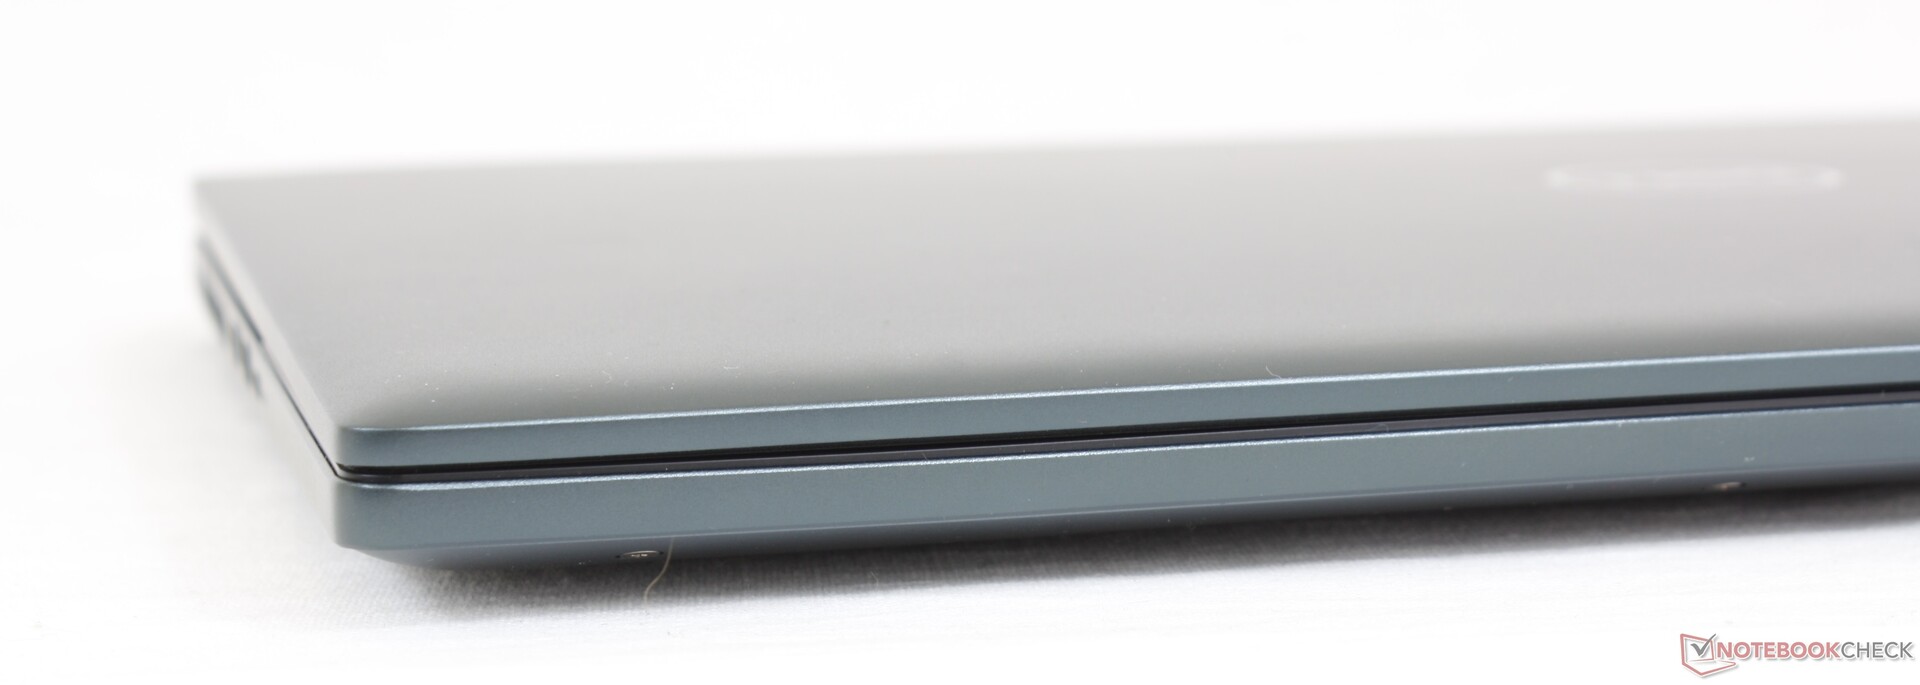
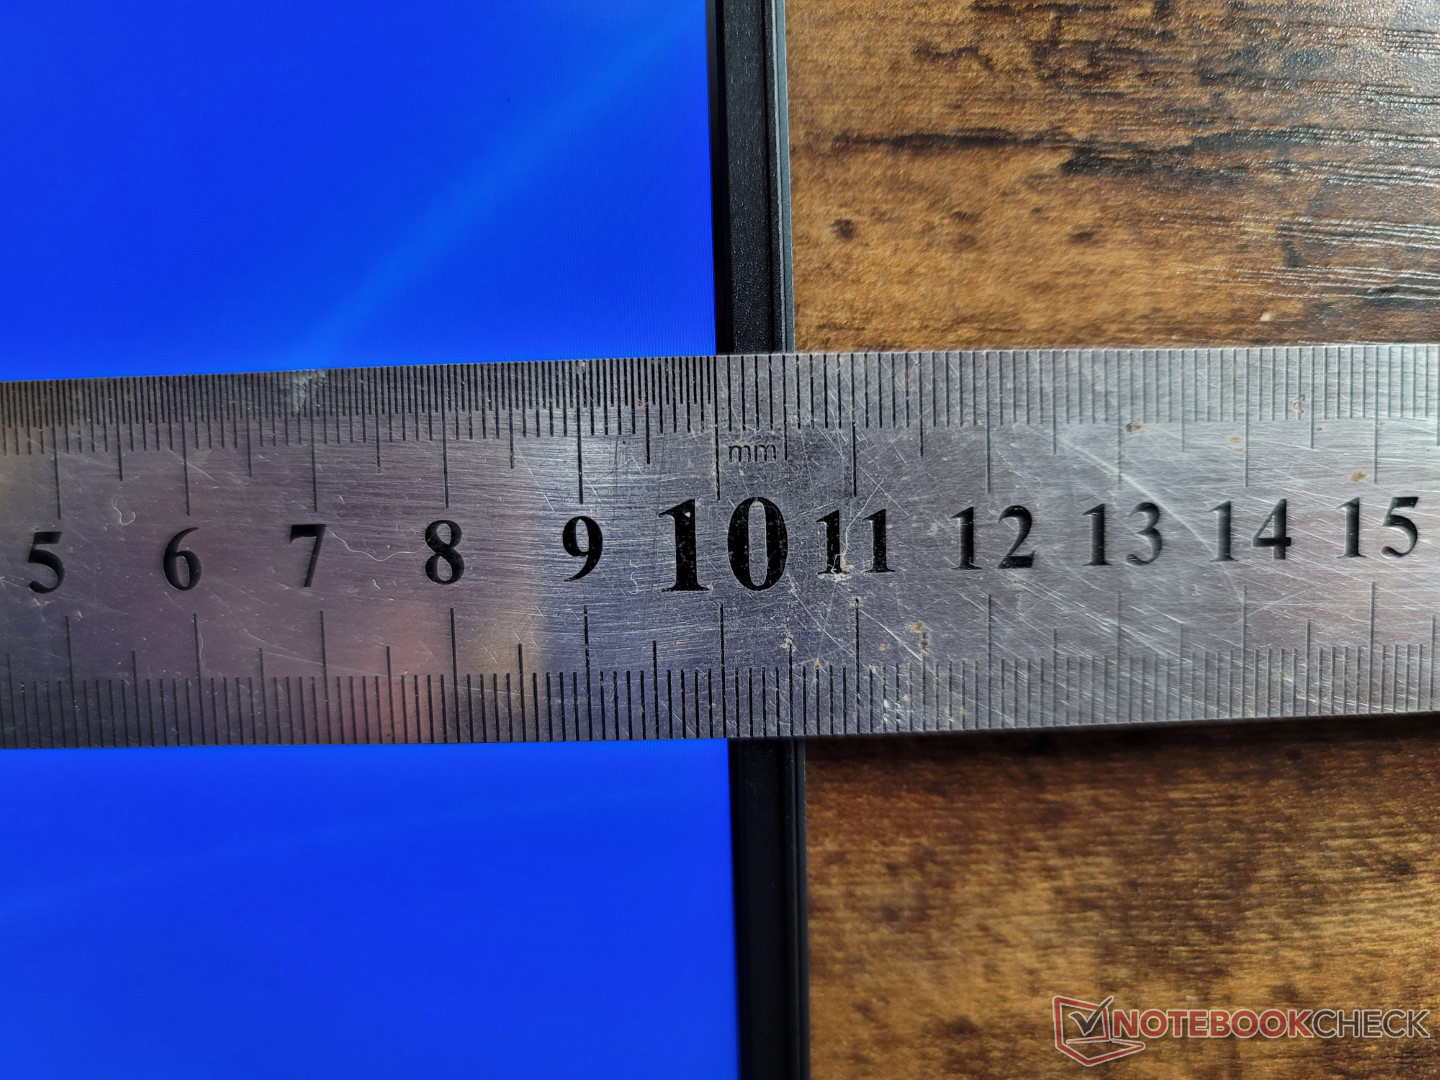
Una de nuestras quejas sobre el Inspiron 16 Plus 7610 era su peso y esto sigue siendo cierto para el 7620 a pesar del rediseño del chasis. Con un peso de entre 2 y 2,1 kg, el sistema es unos cientos de gramos más pesado que el 16 pulgadas Acer Swift X o el Huawei MateBook D 16. El nuevo diseño tampoco es más pequeño, ya que las dimensiones son ligeramente superiores a las del 7610.
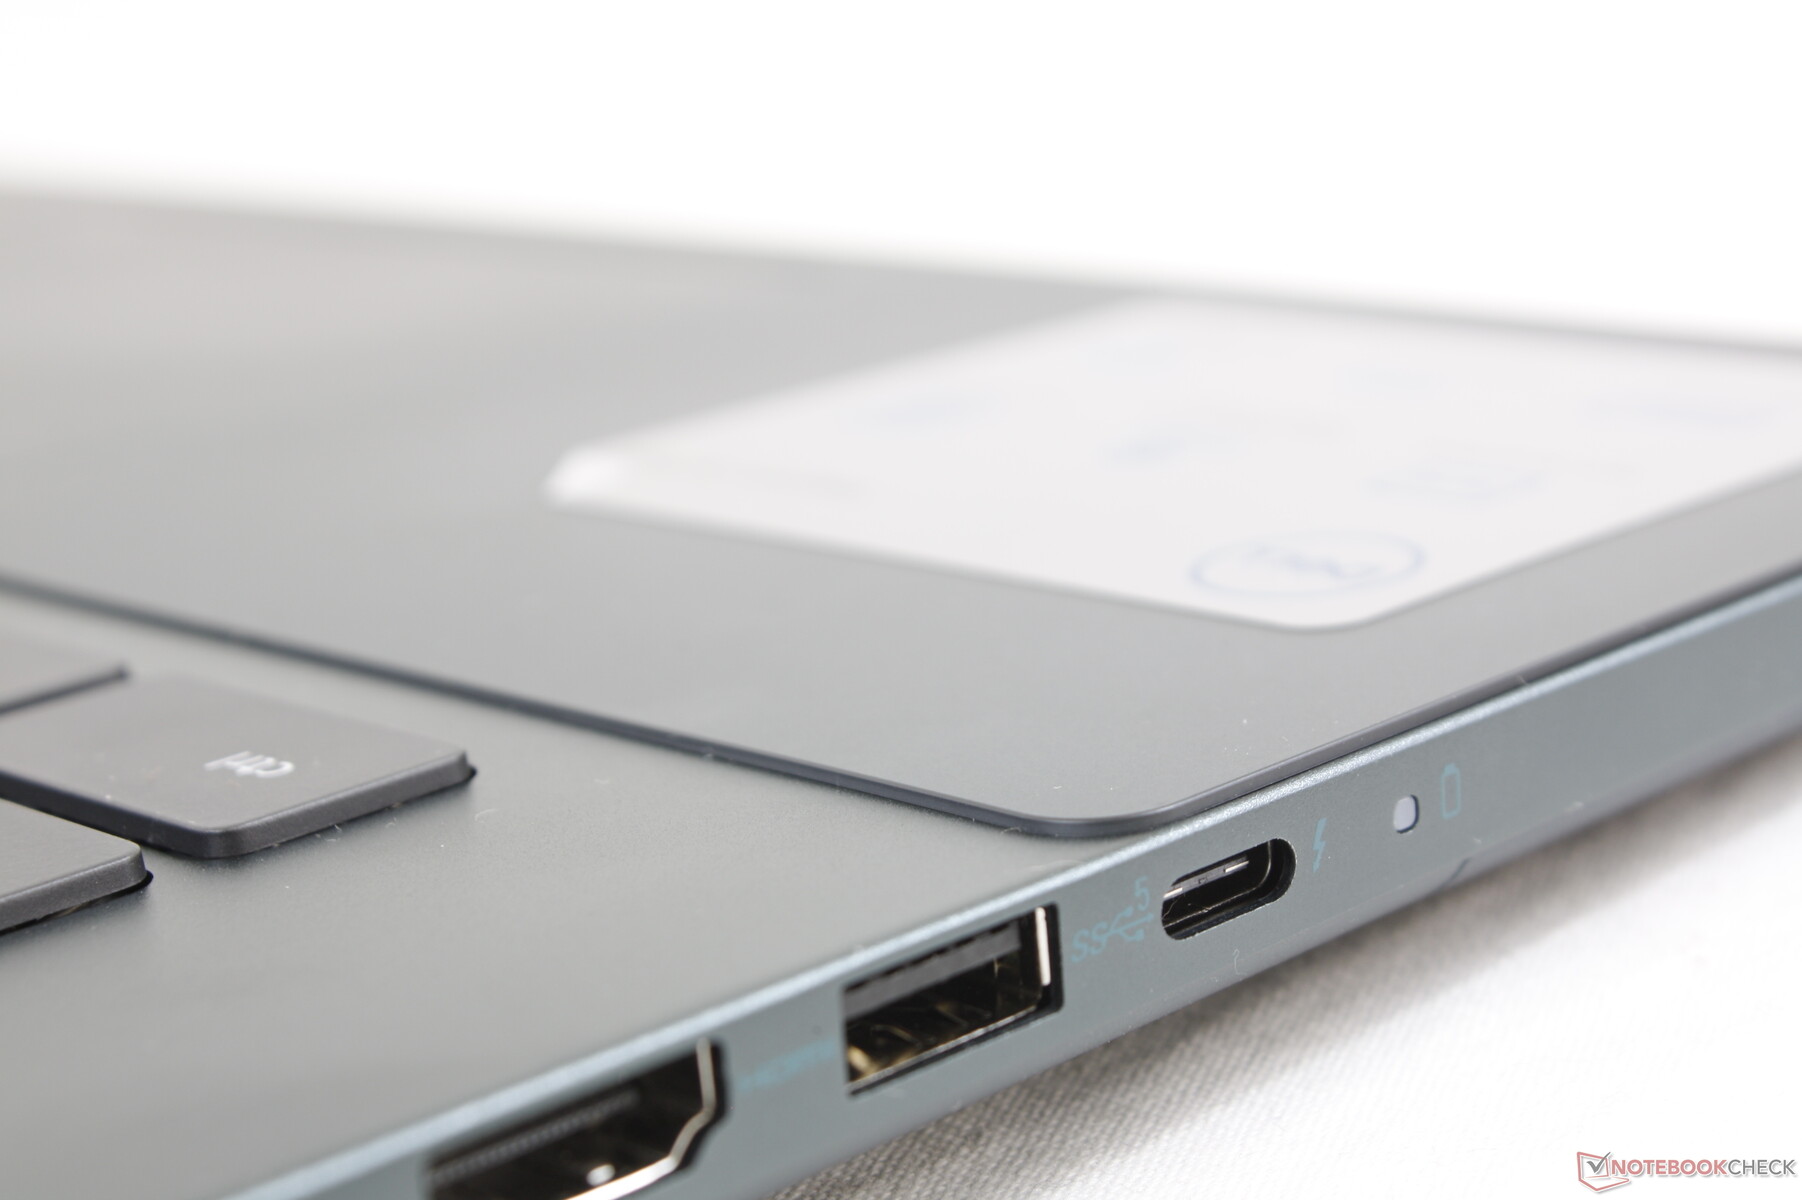
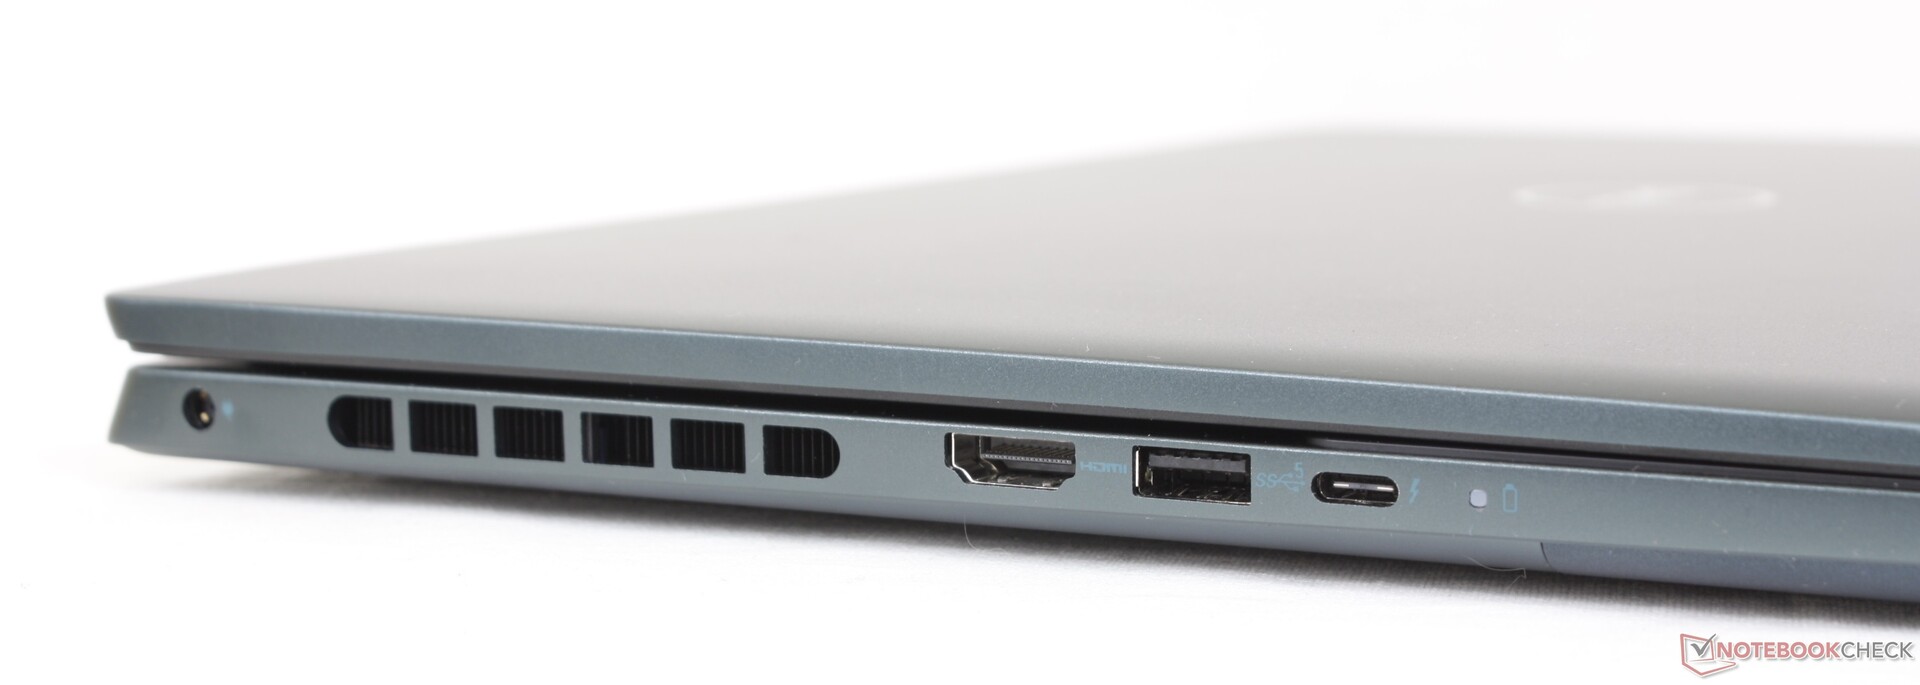
Conectividad - Soporte de Thunderbolt 4
El 7620 lleva todos los mismos puertos que se encuentran en el 7610 a pesar de los cambios exteriores. Un segundo puerto USB-C como en el Lenovo Yoga 7 16 Gen 7 habría estado bien teniendo en cuenta lo grande y pesada que es la unidad.
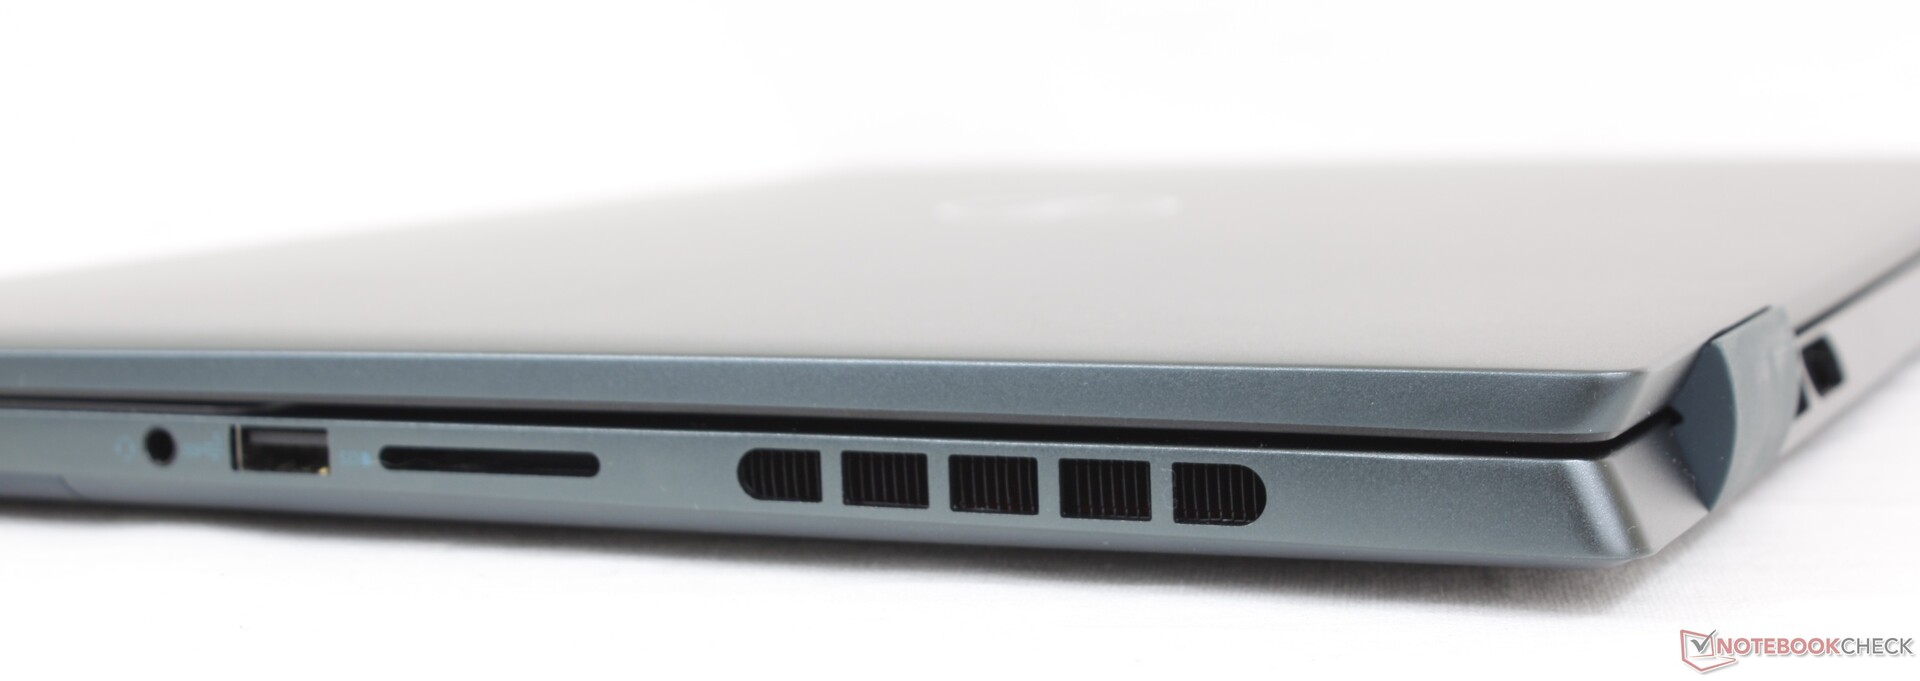
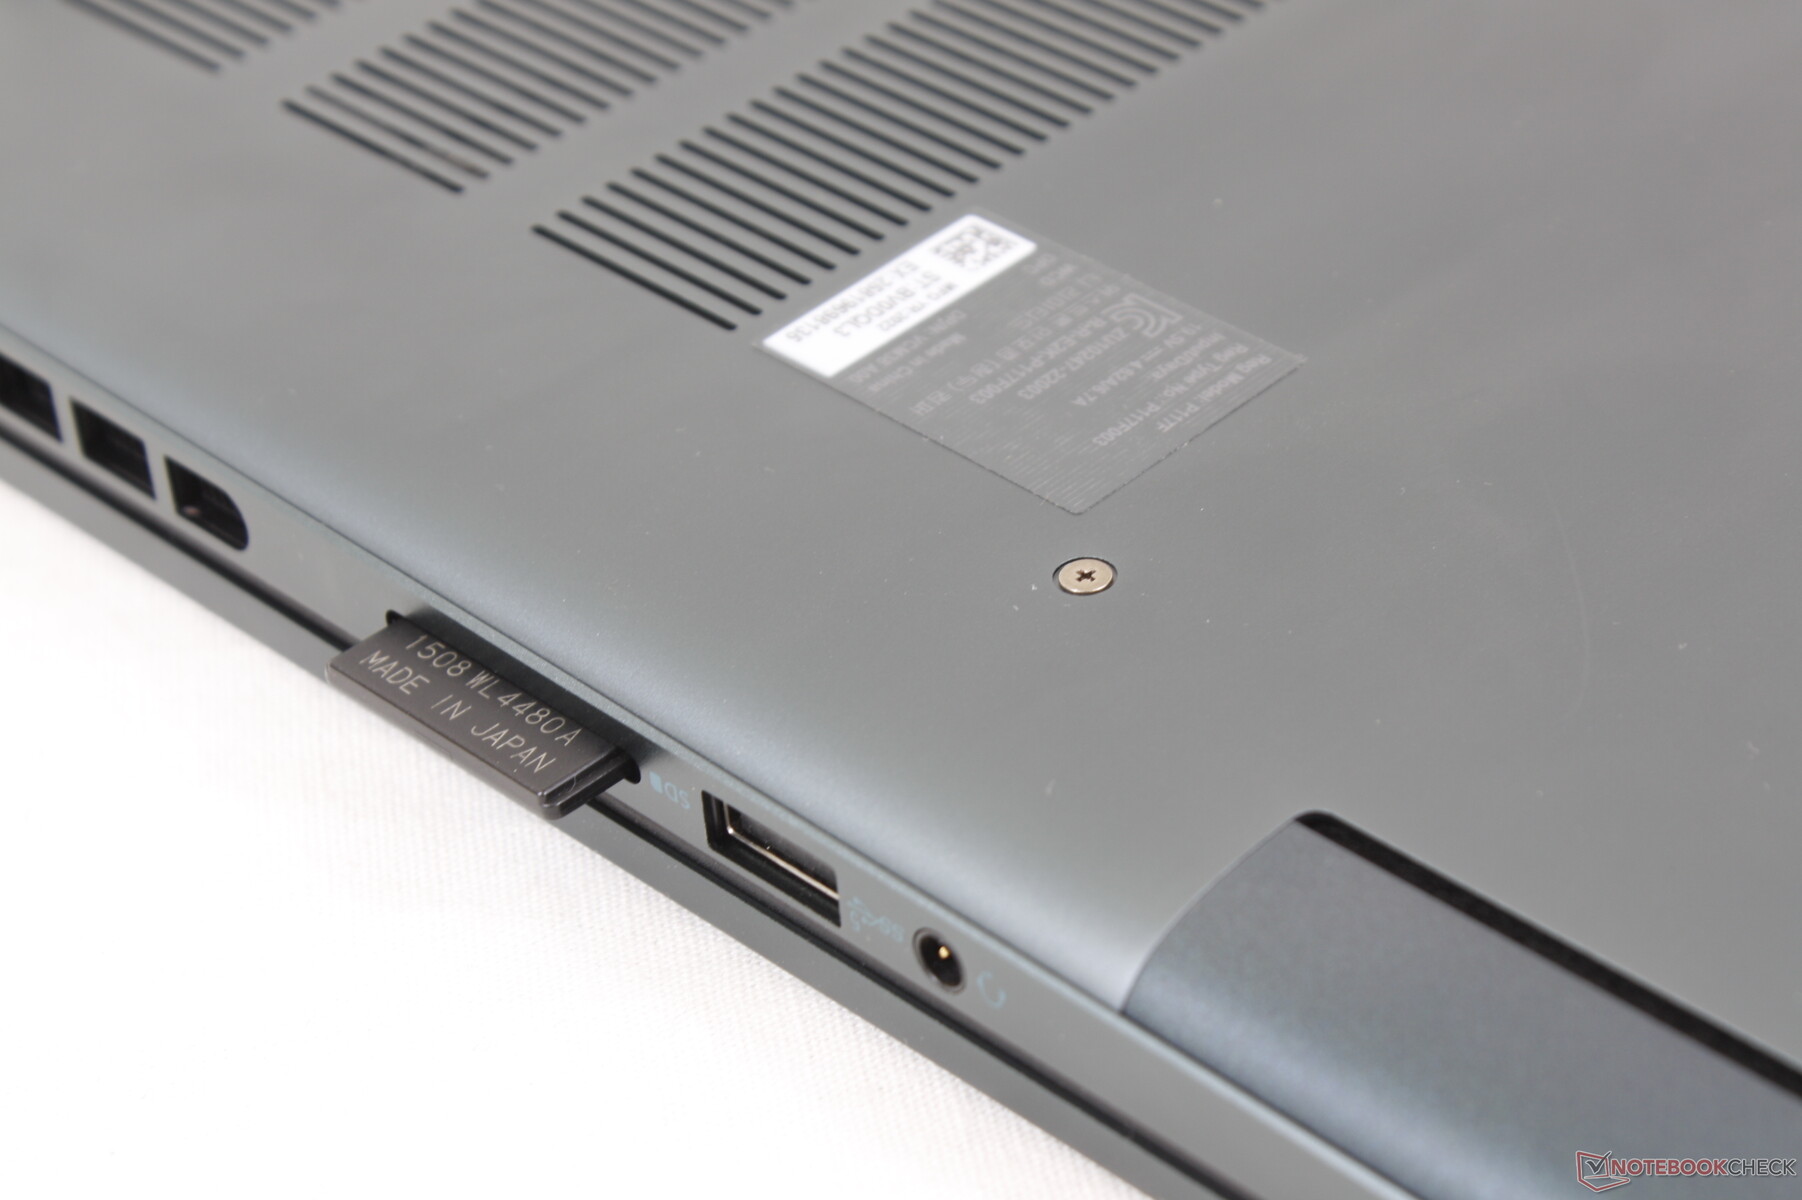
Lector de tarjetas SD
Las tasas de transferencia con la tarjeta SD siguen siendo muy lentas. Está claro que Dell quiere que los usuarios se pasen a la serie XPS más cara si quieren un rendimiento más rápido de la tarjeta SD.
Hay que tener en cuenta que la SKU RTX 3060 viene con un lector MicroSD en lugar de uno de tamaño completo.
| SD Card Reader | |
| average JPG Copy Test (av. of 3 runs) | |
| Dell XPS 15 9520 RTX 3050 Ti (Toshiba Exceria Pro SDXC 64 GB UHS-II) | |
| Lenovo Yoga 7 16IAP7 (Toshiba Exceria Pro SDXC 64 GB UHS-II) | |
| Asus Vivobook Pro 16X-M7600QE (AV Pro SD microSD 128 GB V60) | |
| Dell Inspiron 16 Plus 7620 (Toshiba Exceria Pro SDXC 64 GB UHS-II) | |
| Dell Inspiron 16 Plus 7610 (AV PRO microSD 128 GB V60) | |
| maximum AS SSD Seq Read Test (1GB) | |
| Dell XPS 15 9520 RTX 3050 Ti (Toshiba Exceria Pro SDXC 64 GB UHS-II) | |
| Lenovo Yoga 7 16IAP7 (Toshiba Exceria Pro SDXC 64 GB UHS-II) | |
| Asus Vivobook Pro 16X-M7600QE (AV Pro SD microSD 128 GB V60) | |
| Dell Inspiron 16 Plus 7620 (Toshiba Exceria Pro SDXC 64 GB UHS-II) | |
| Dell Inspiron 16 Plus 7610 (AV PRO microSD 128 GB V60) | |
Comunicación
Las unidades se pueden configurar con el Intel AX201 o AX211 para la conectividad Wi-Fi 6 y Wi-Fi 6E, respectivamente. El AX211 en nuestra unidad mostró excelentes tasas de recepción cuando se emparejó con nuestro router de 6 GHz, pero las tasas de transmisión no son tan estables como se esperaba incluso después de múltiples reintentos.
| Networking | |
| iperf3 transmit AX12 | |
| Acer Swift X SFX16-51G-5388 | |
| Dell Inspiron 16 Plus 7610 | |
| Asus Vivobook Pro 16X-M7600QE | |
| iperf3 receive AX12 | |
| Acer Swift X SFX16-51G-5388 | |
| Dell Inspiron 16 Plus 7610 | |
| Asus Vivobook Pro 16X-M7600QE | |
| iperf3 receive AXE11000 6GHz | |
| Lenovo Yoga 7 16IAP7 | |
| Dell Inspiron 16 Plus 7620 | |
| iperf3 transmit AXE11000 6GHz | |
| Lenovo Yoga 7 16IAP7 | |
| Dell Inspiron 16 Plus 7620 | |
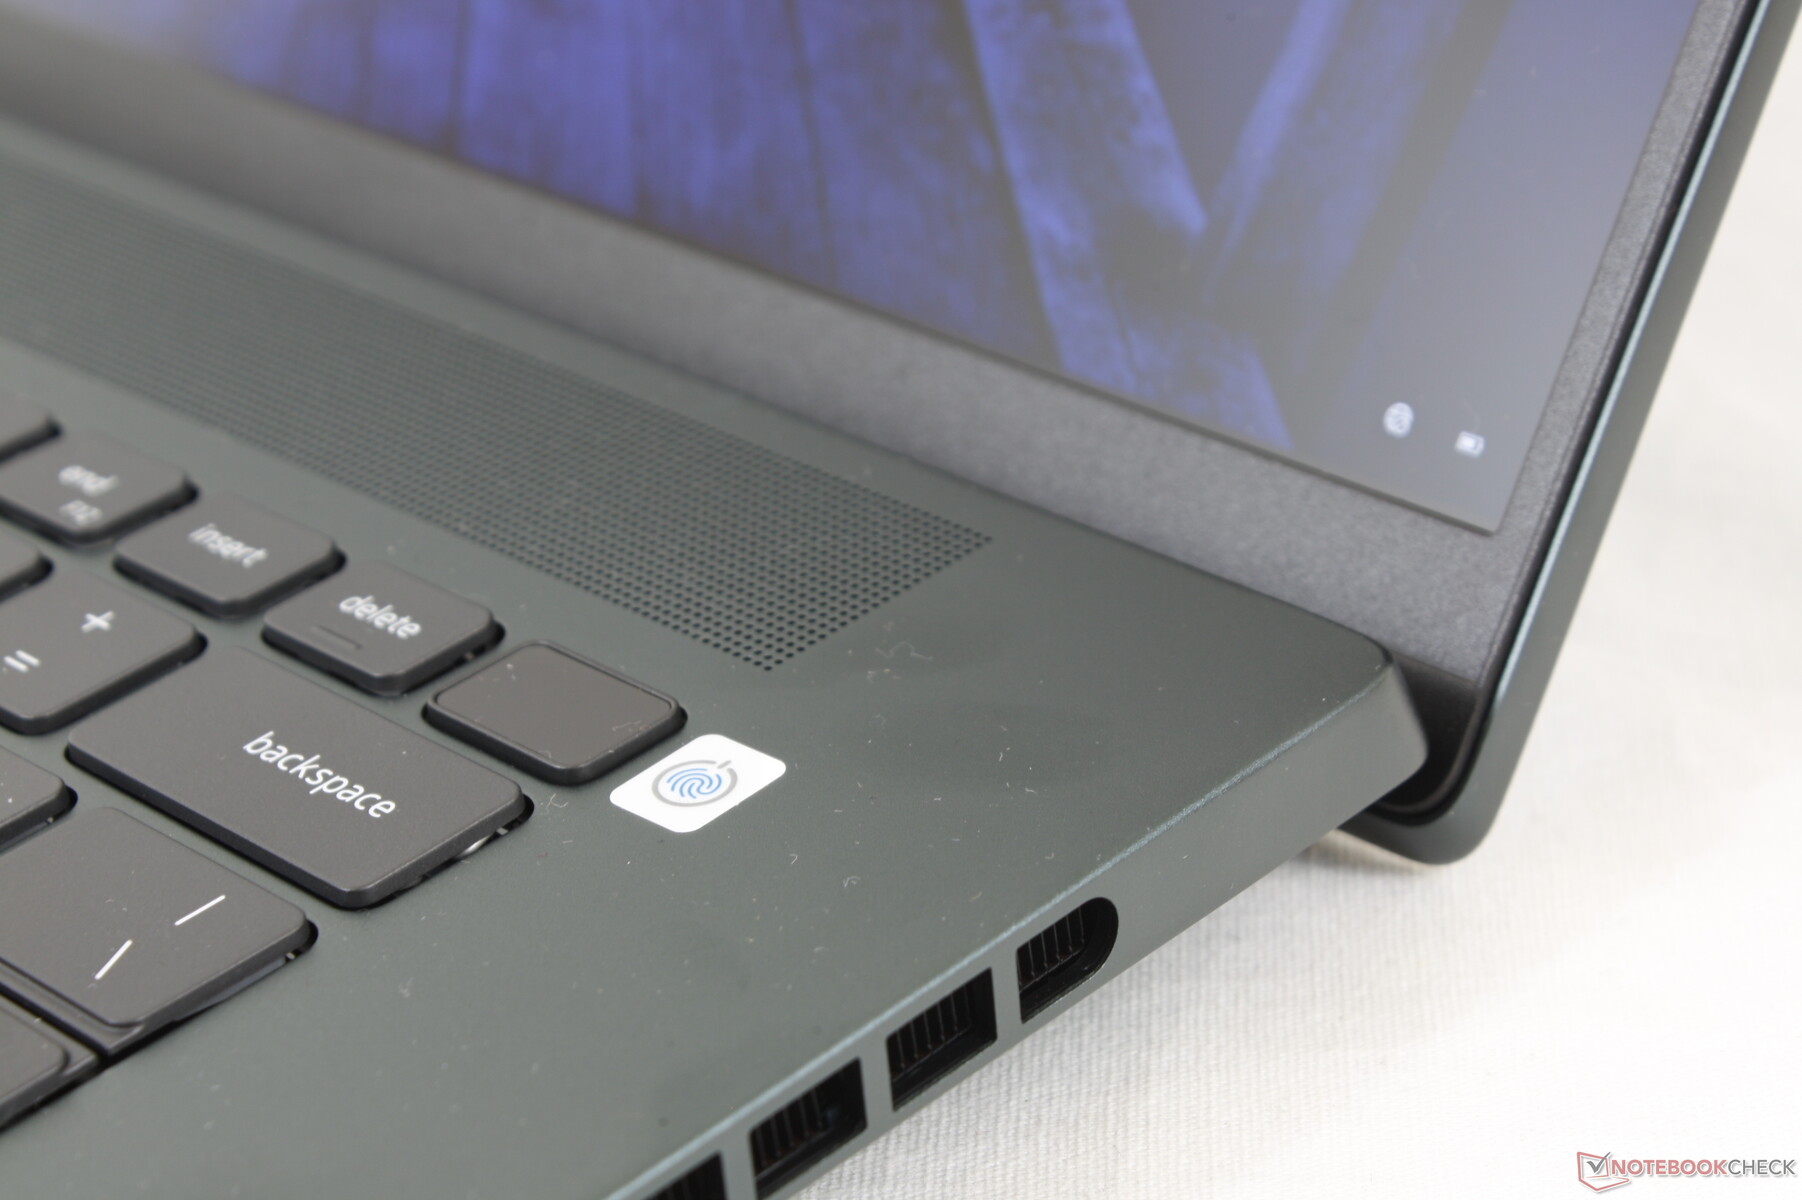
Webcam - Ahora 2 MP en lugar de 1 MP
Dell ha actualizado la webcam de 720p o 1 MP en el Inspiron 16 Plus 7610 a 1080p o 2 MP en el modelo 7620 para obtener imágenes más limpias. Hay soporte para Windows Hello y un obturador físico de la webcam para la privacidad.


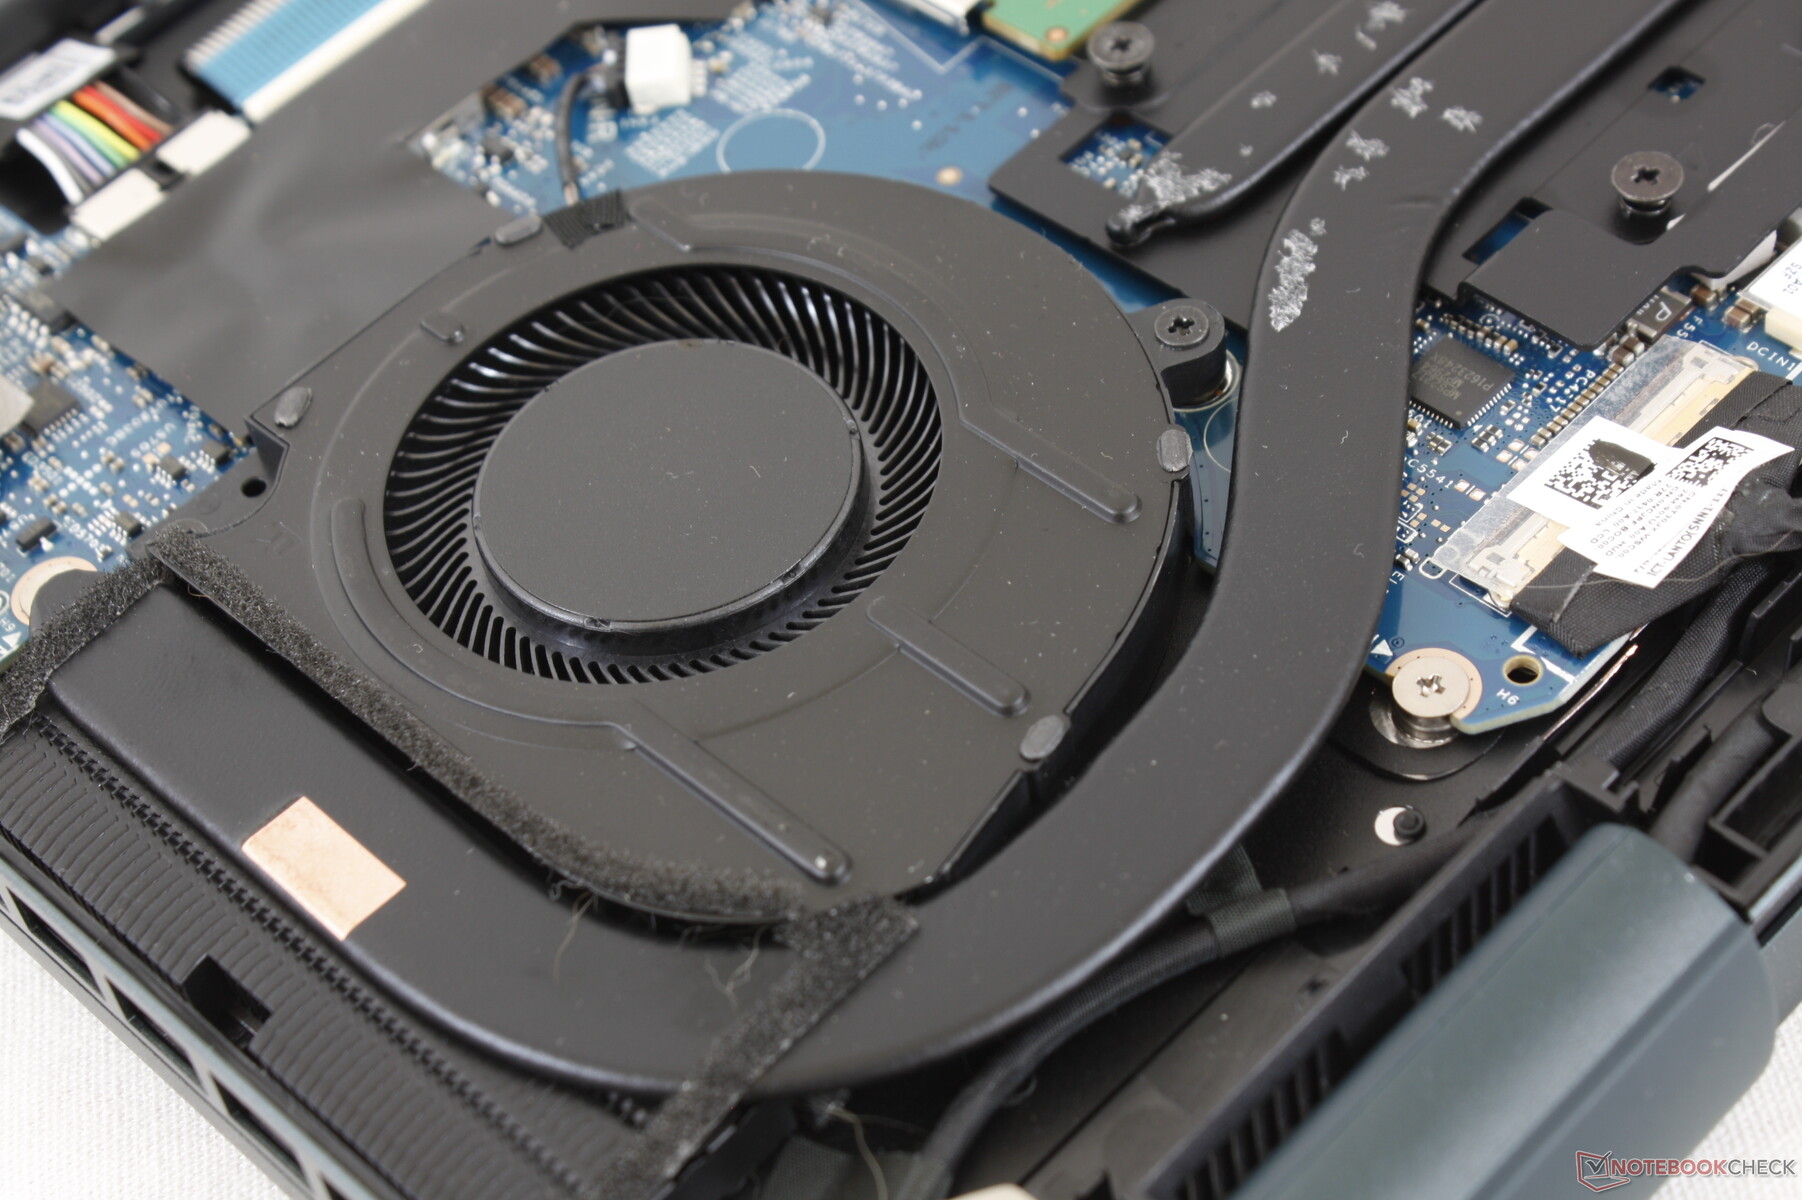
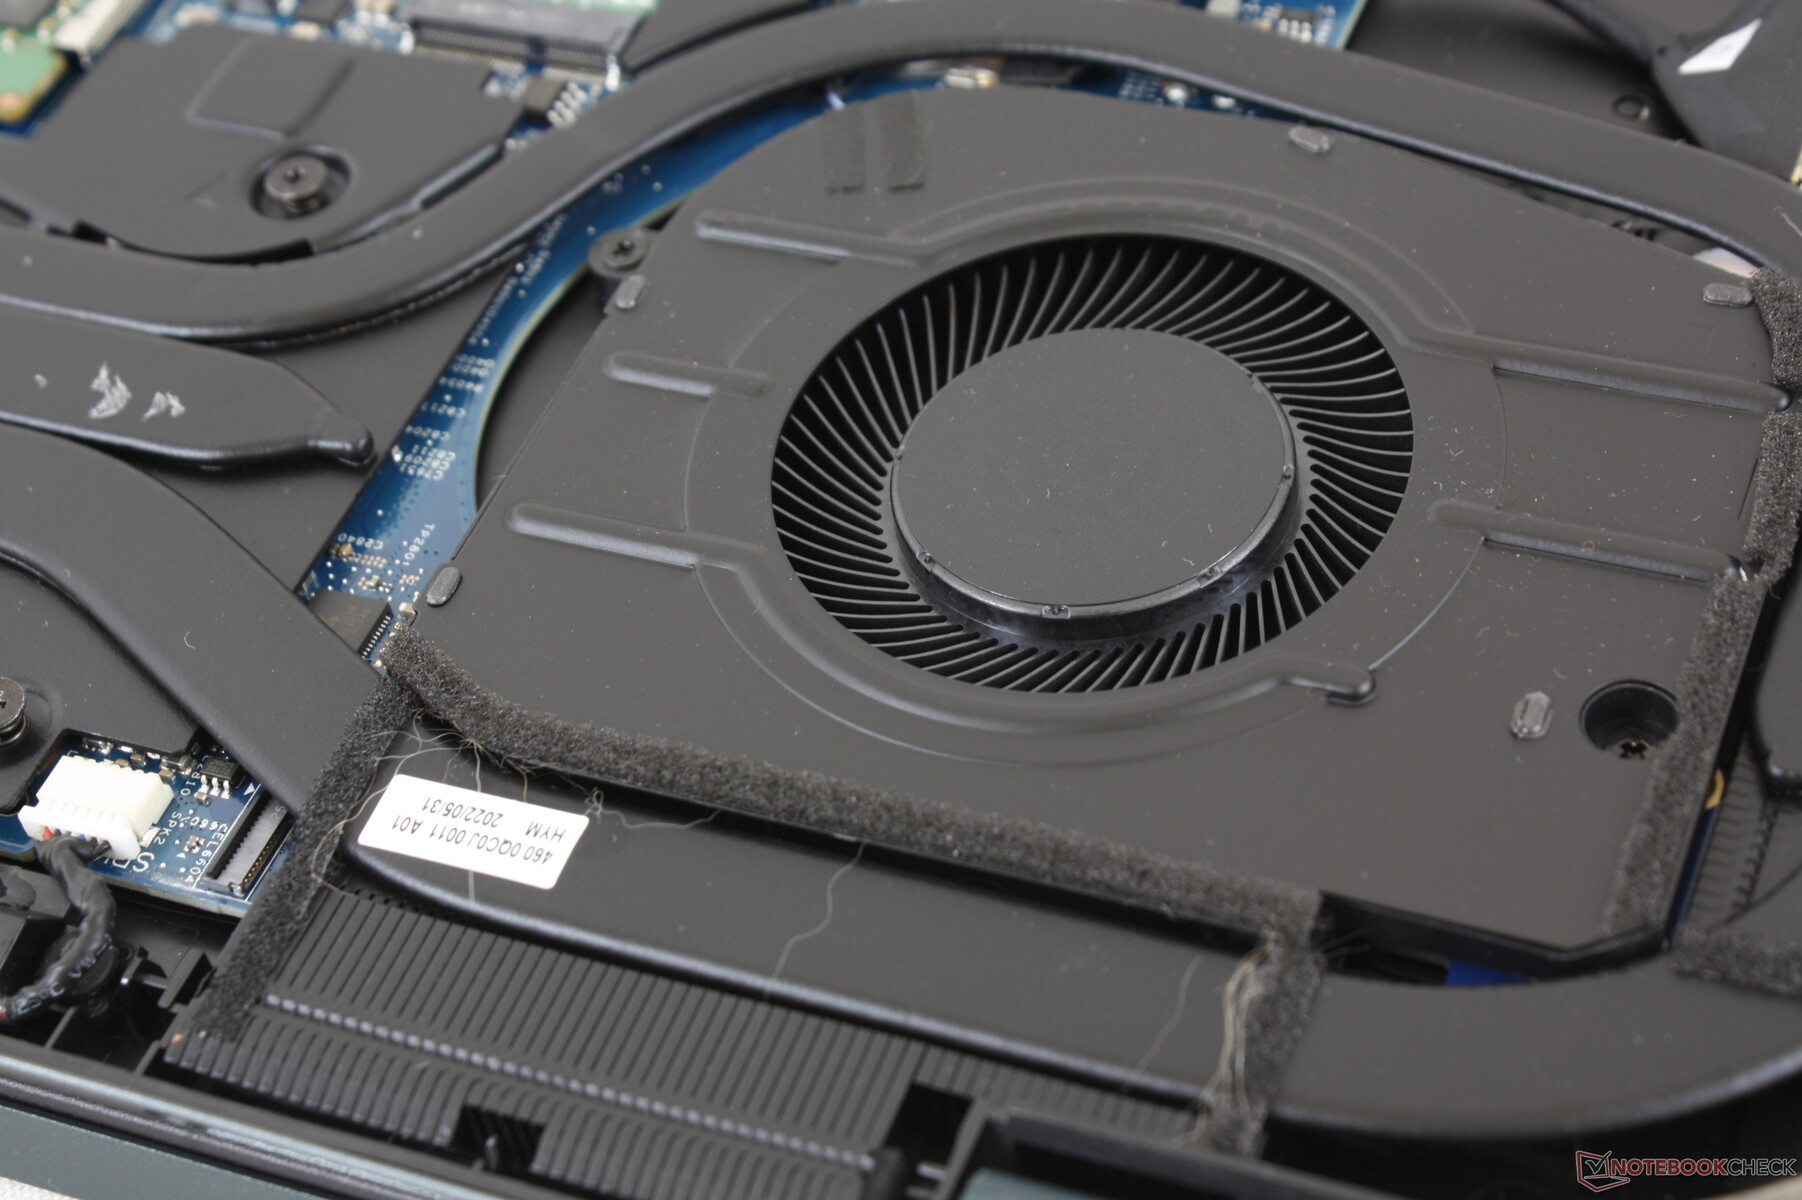
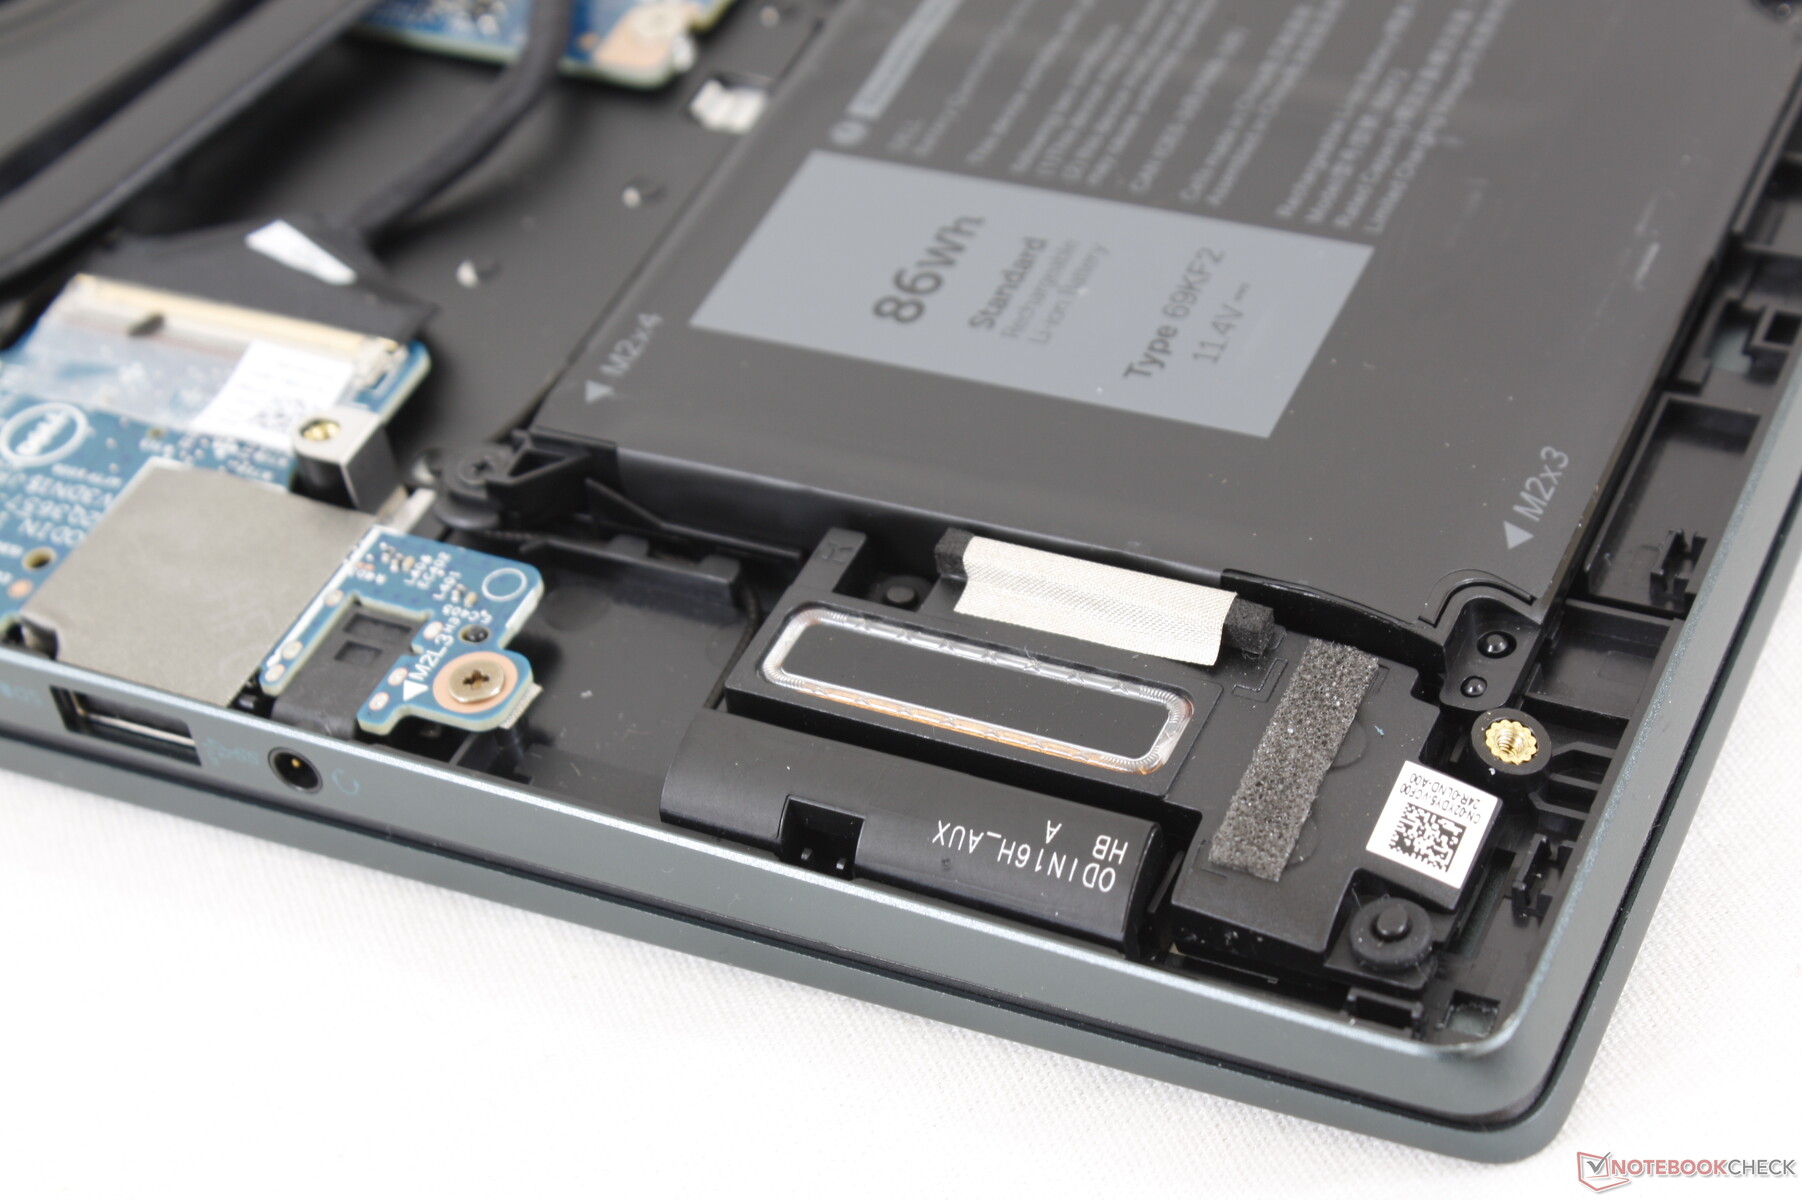
Mantenimiento
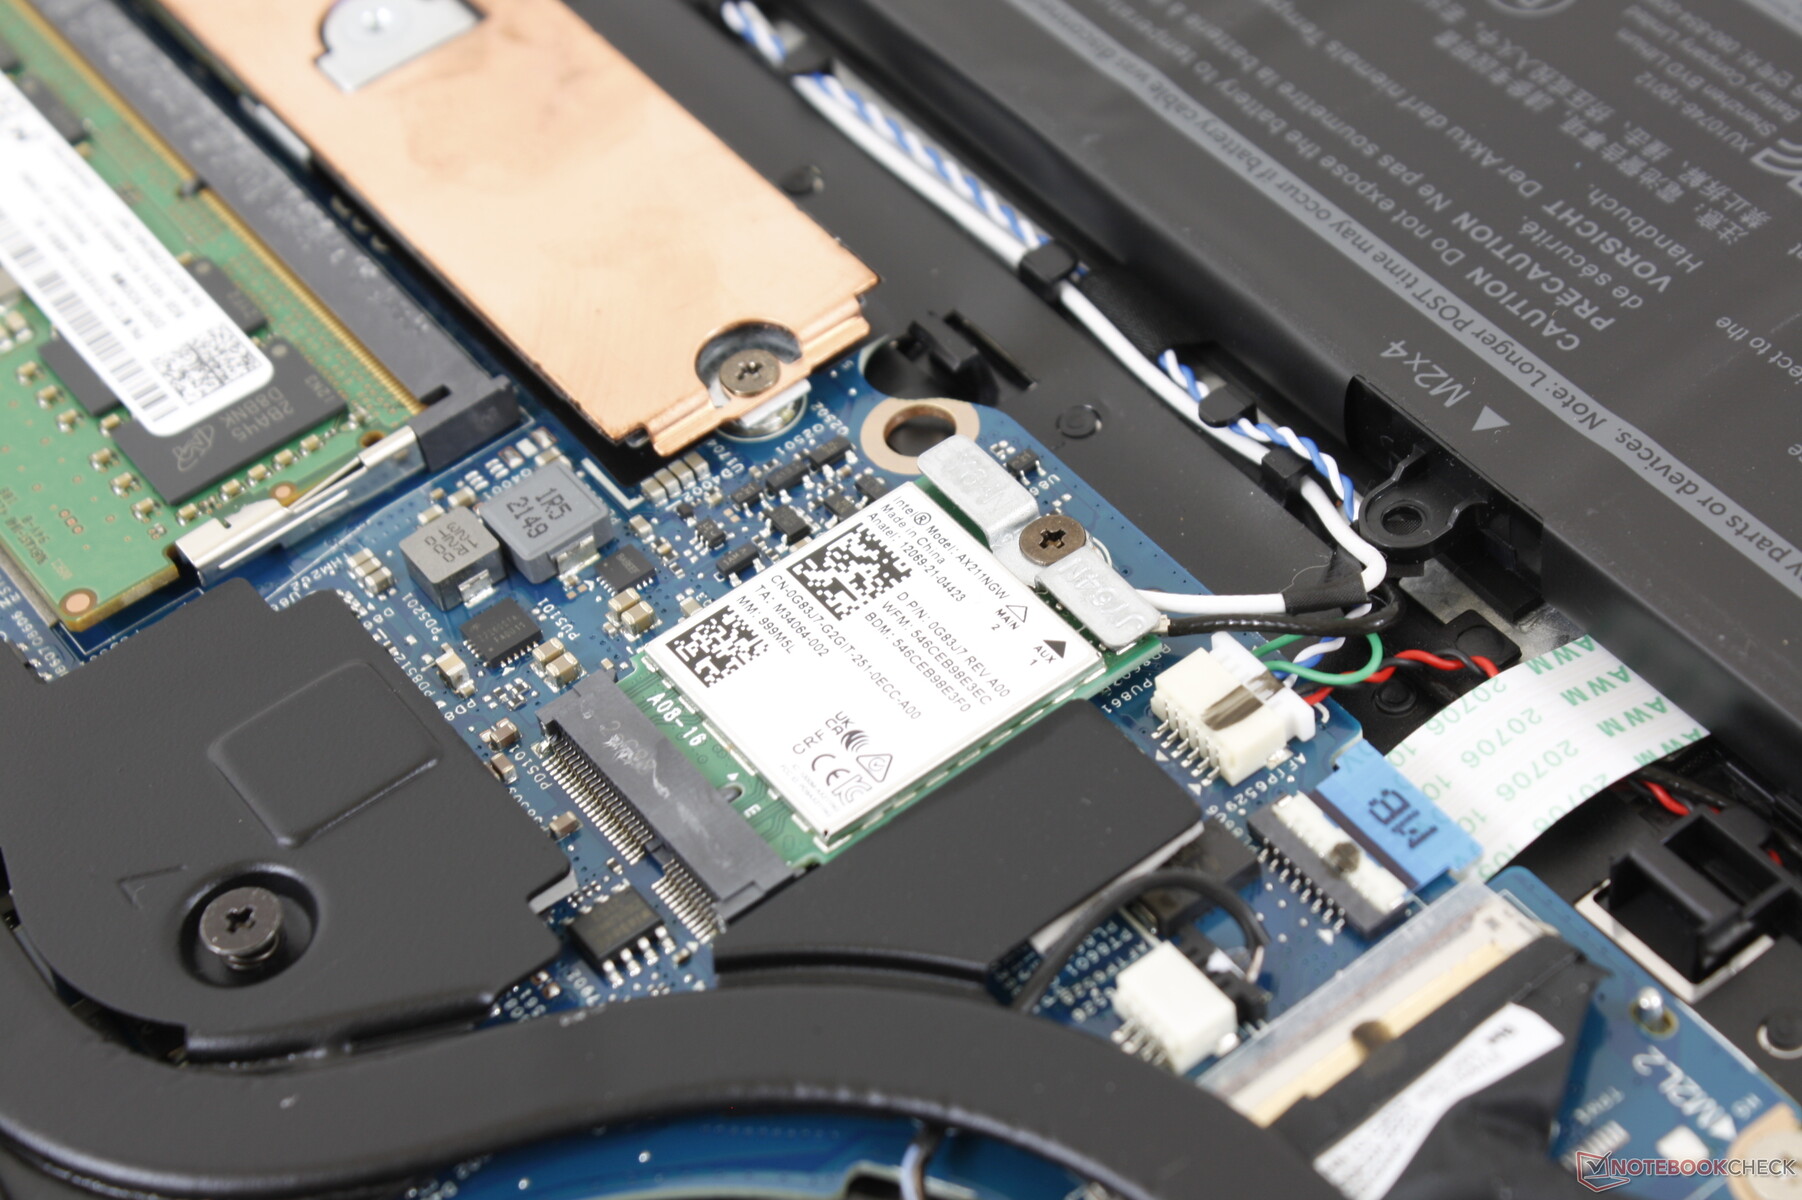
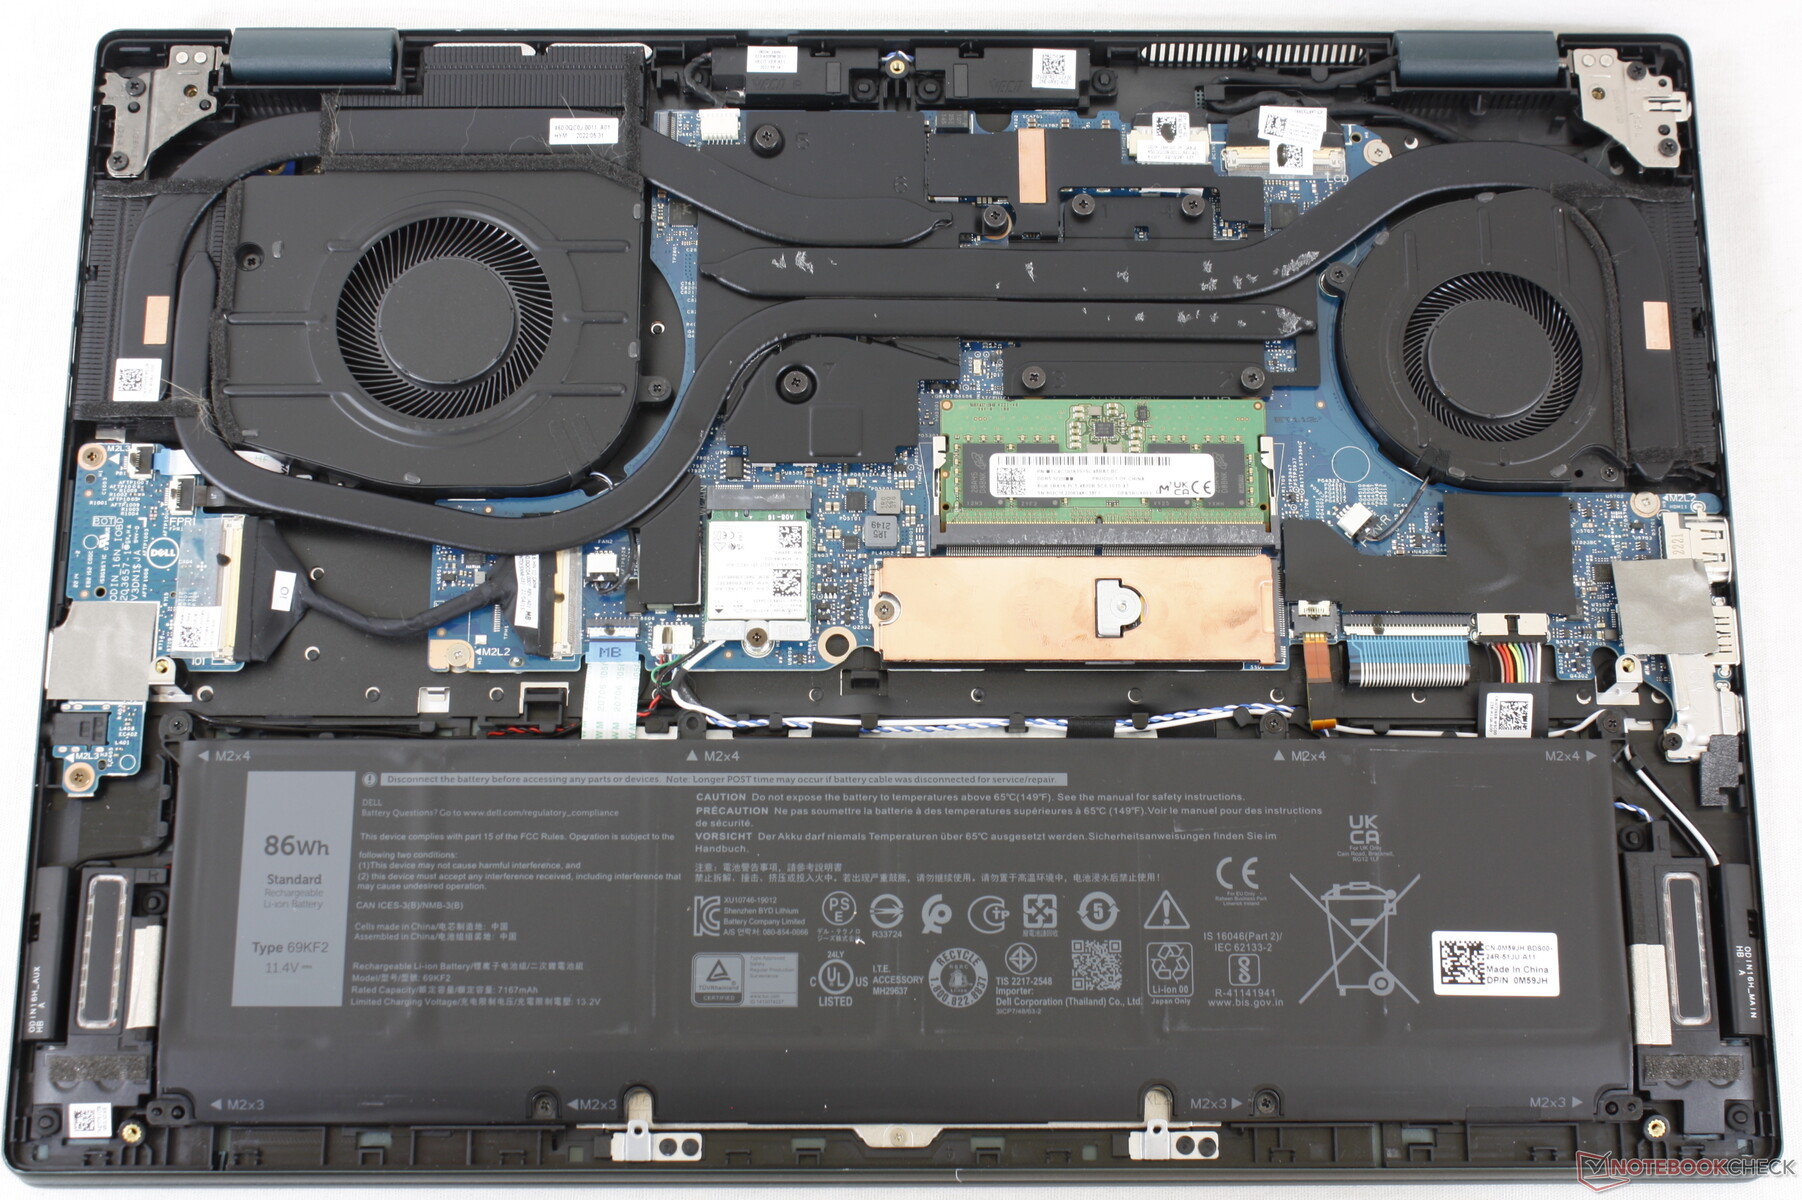
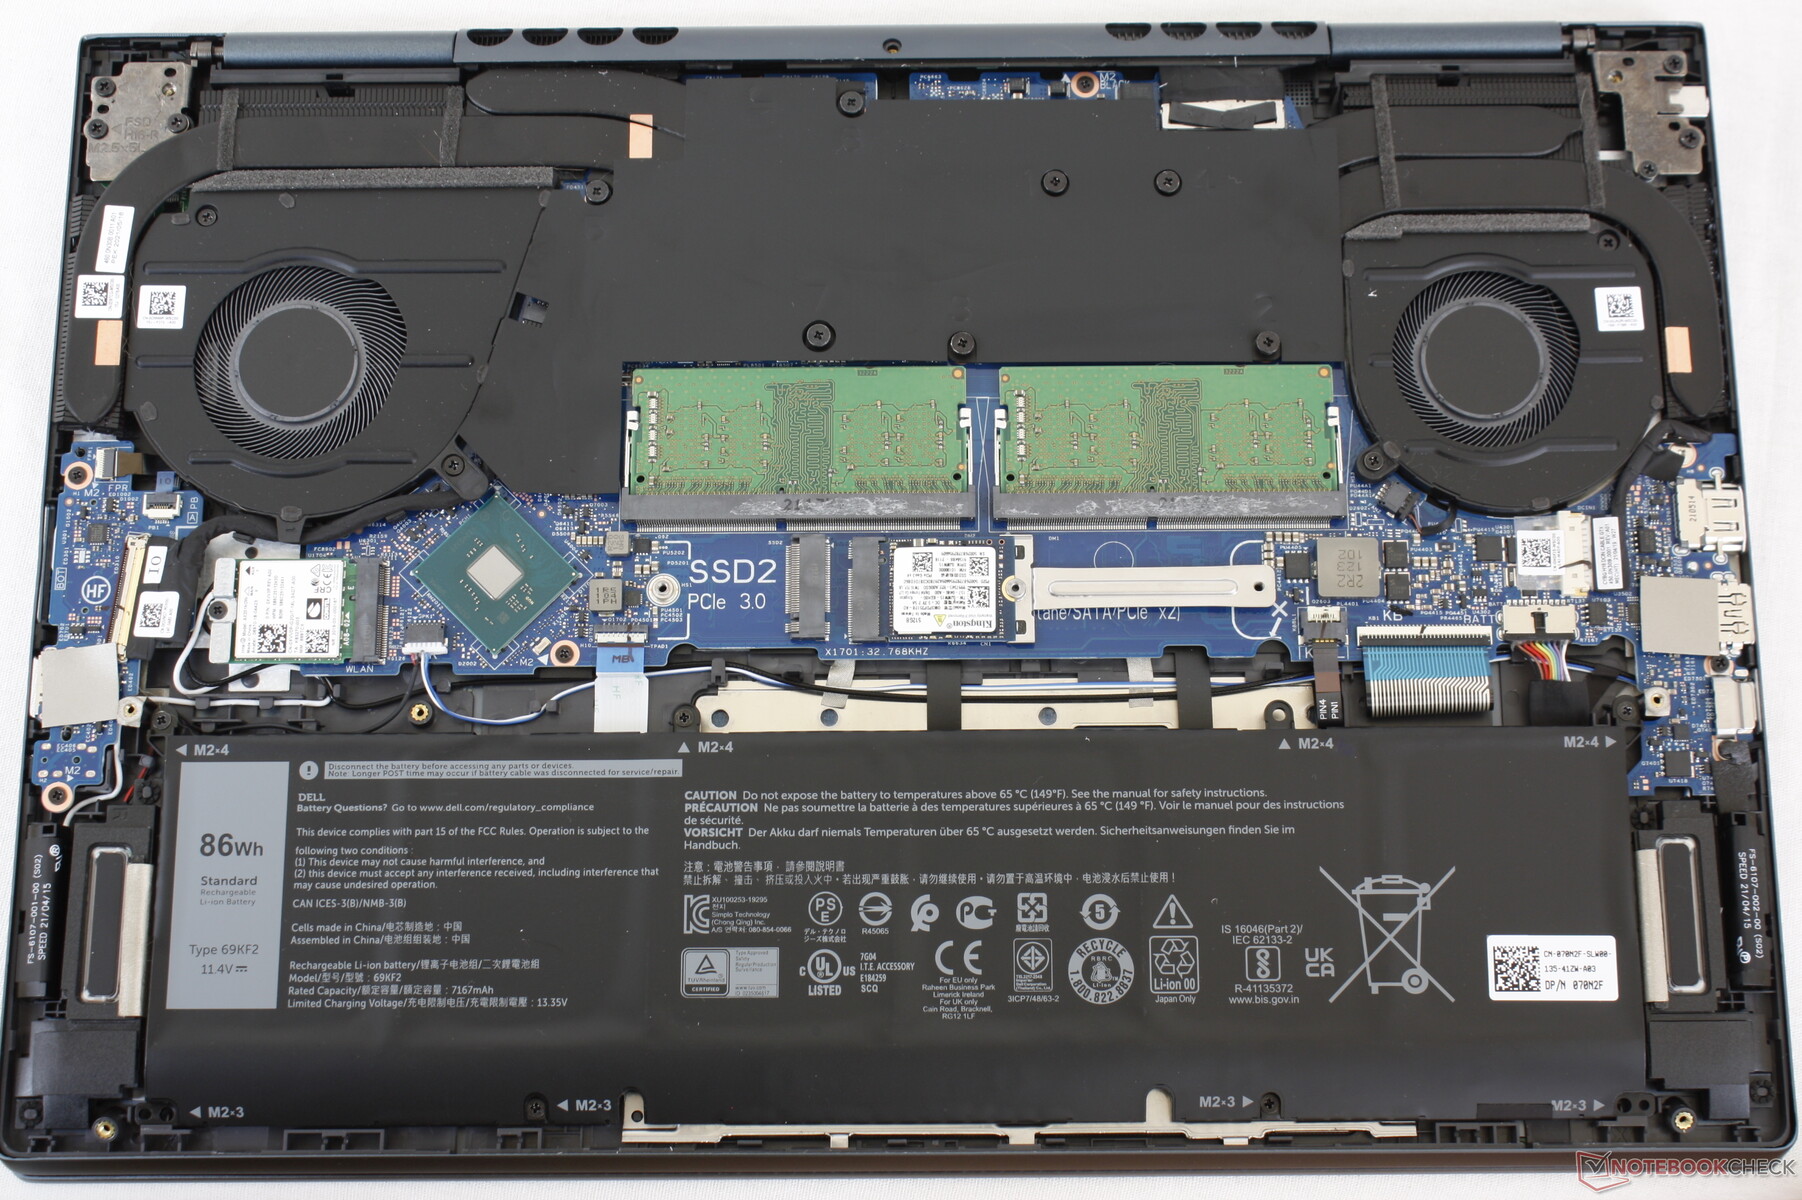
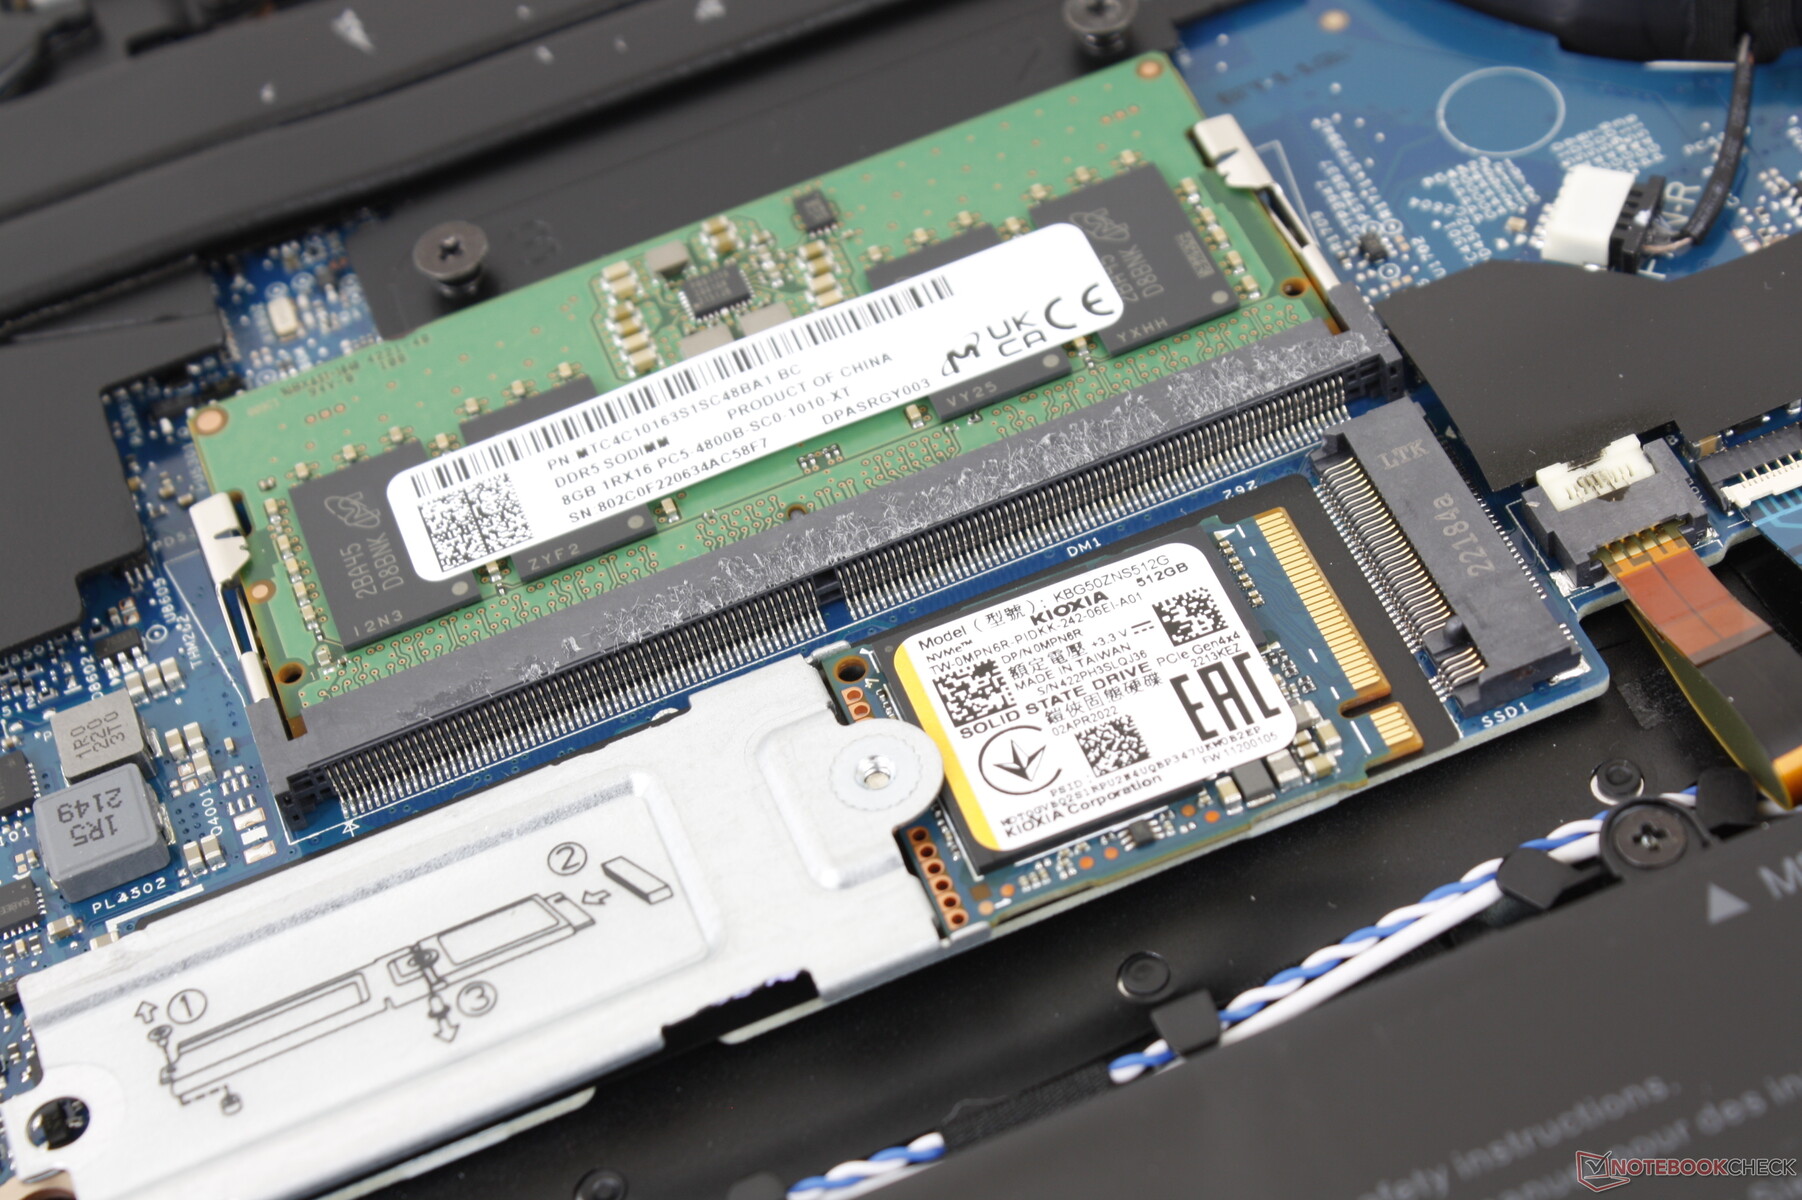
El panel inferior se quita fácilmente con un destornillador Philips. Una vez dentro, los usuarios notarán la solución de refrigeración revisada en comparación con el antiguo 7610. Los cambios han eliminado una ranura SODIMM y una ranura SSD M.2 del 7620, dejando sólo una ranura SSD y una ranura SODIMM con las que trabajar, como muestran nuestras imágenes de abajo. Lo más confuso es que los usuarios que opten por la SKU RTX 3060 tendrán dos ranuras SODIMM.
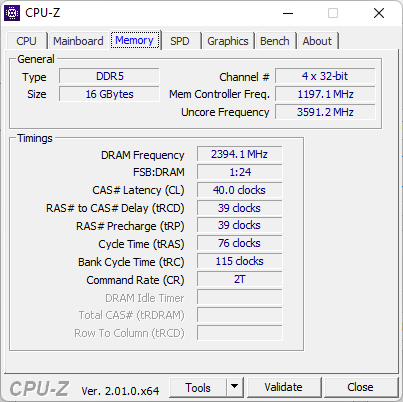
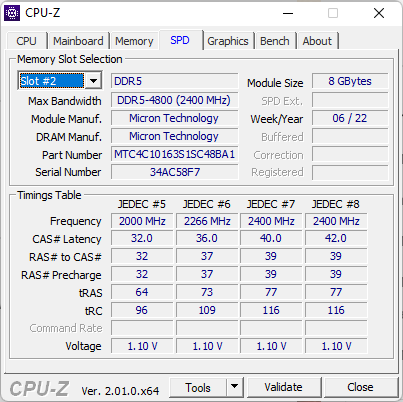
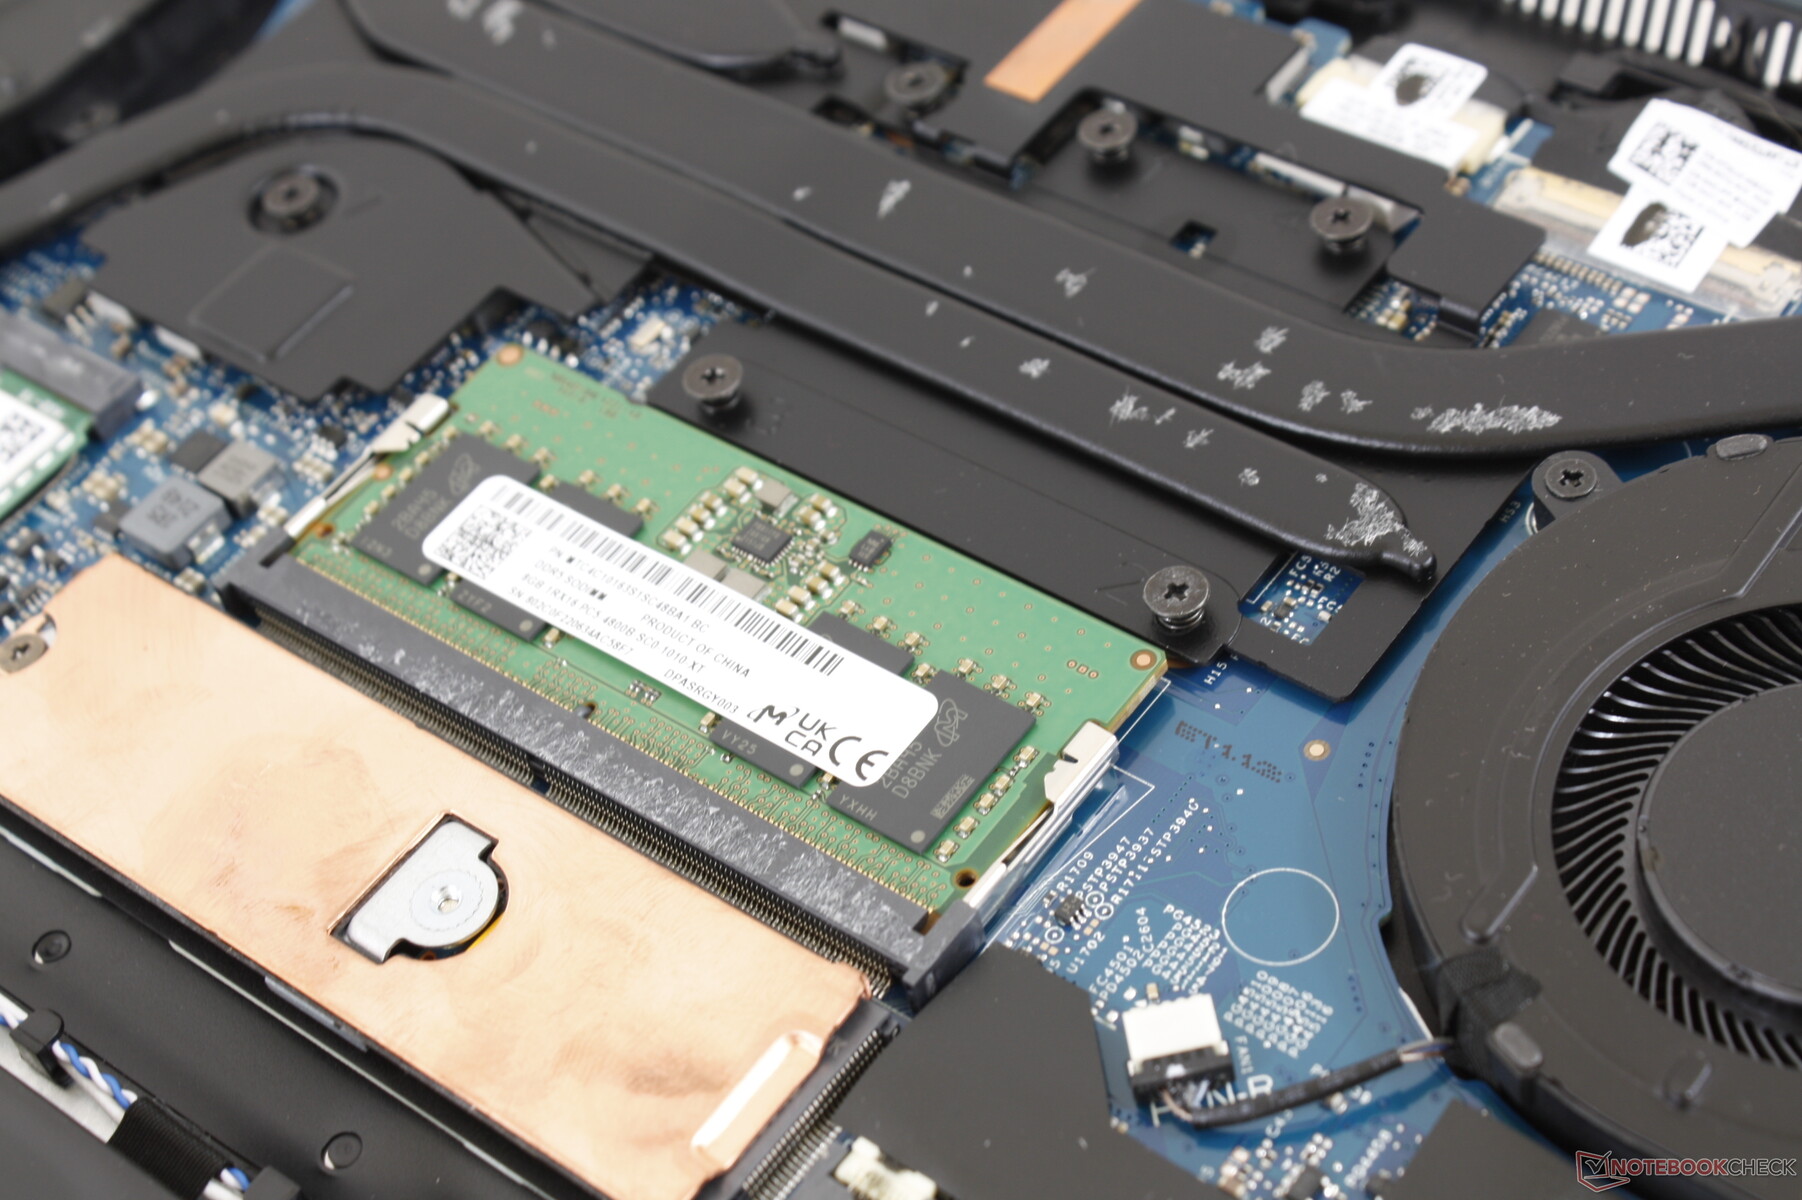
8 GB de RAM vienen soldados en nuestra placa para un máximo de 40 GB si se configura con un módulo de RAM DDR5 extraíble de 32 GB. Las SKU RTX 3060 pueden configurarse con hasta 64 GB, ya que tienen 2 ranuras SODIMM y no tienen RAM soldada.
Accesorios y garantía
No hay más extras en la caja que el adaptador de CA y la documentación. Se aplica la garantía limitada estándar de un año si se compra en los Estados Unidos.
Dispositivos de entrada - Igual que el Inspiron 16 Plus 7620 2-en-1
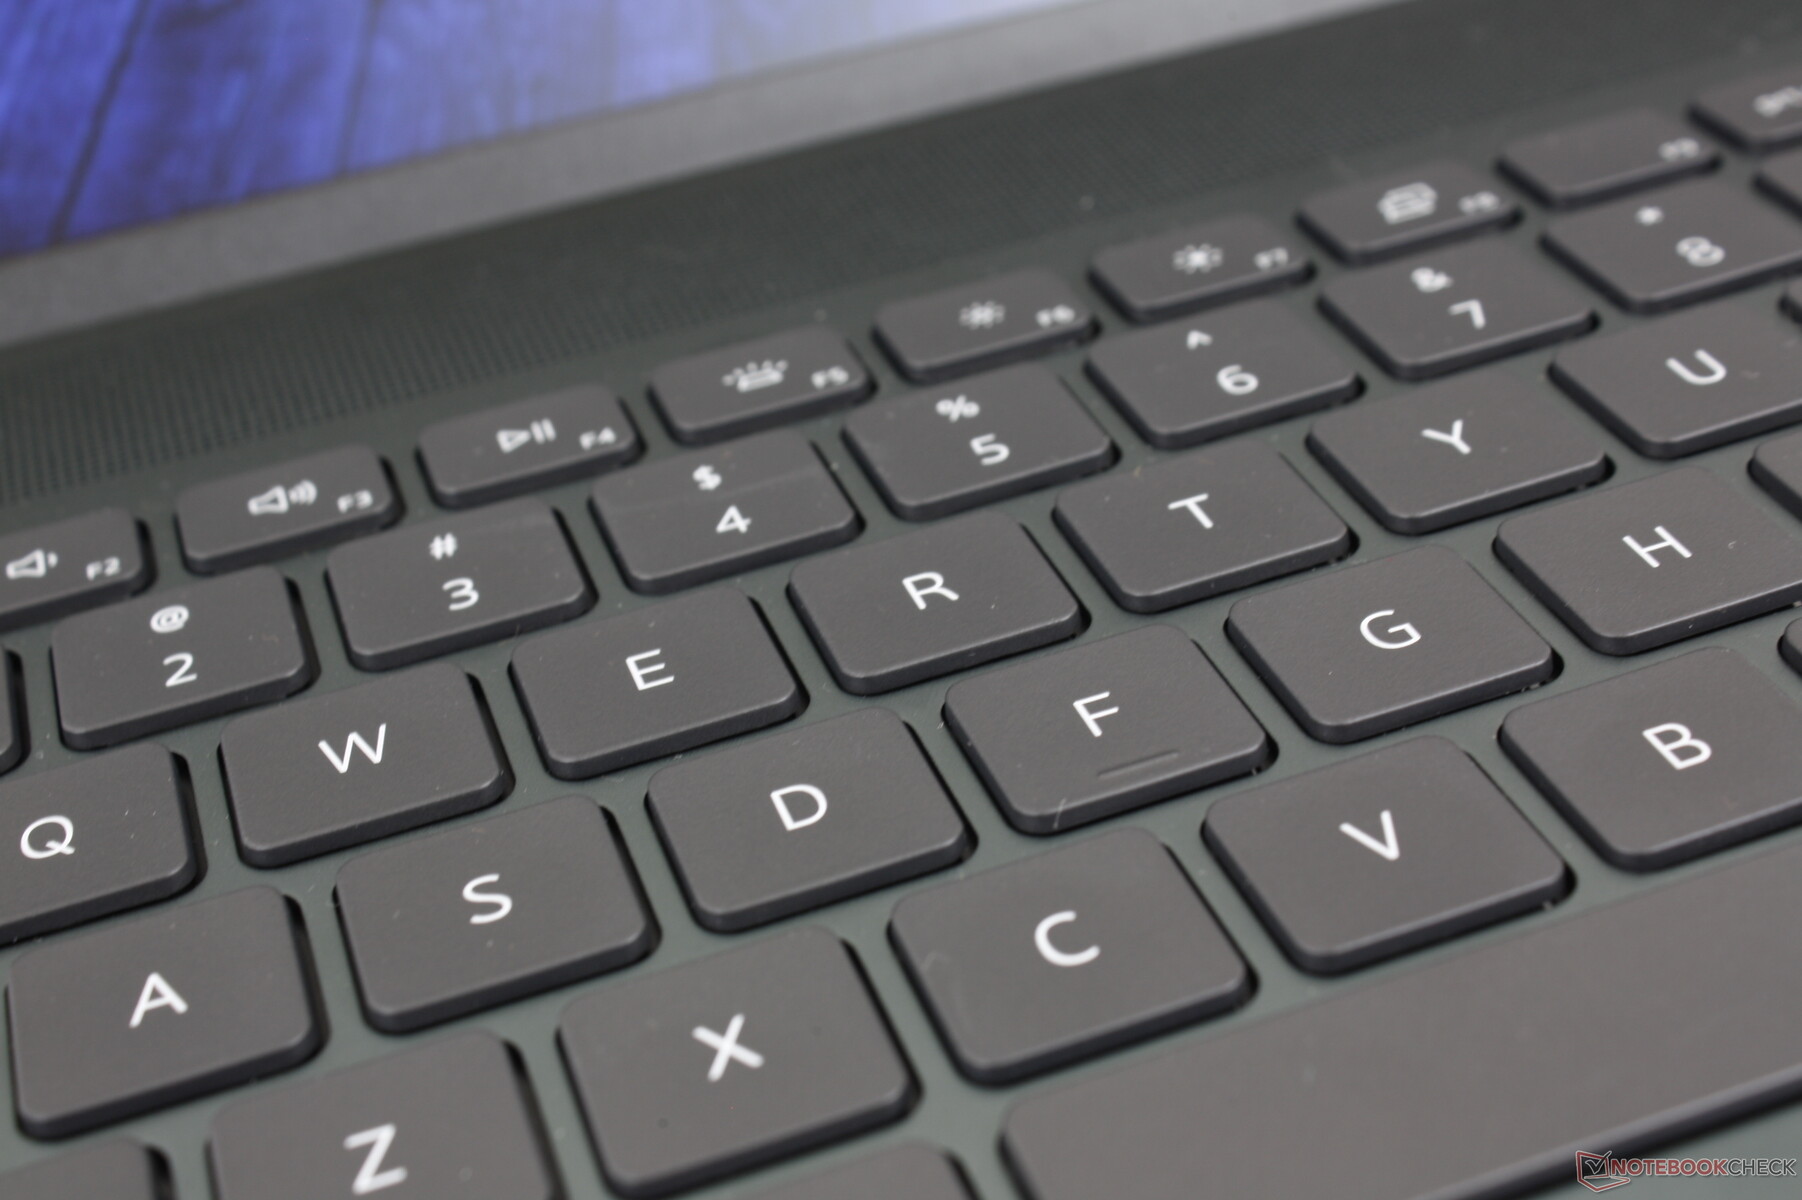
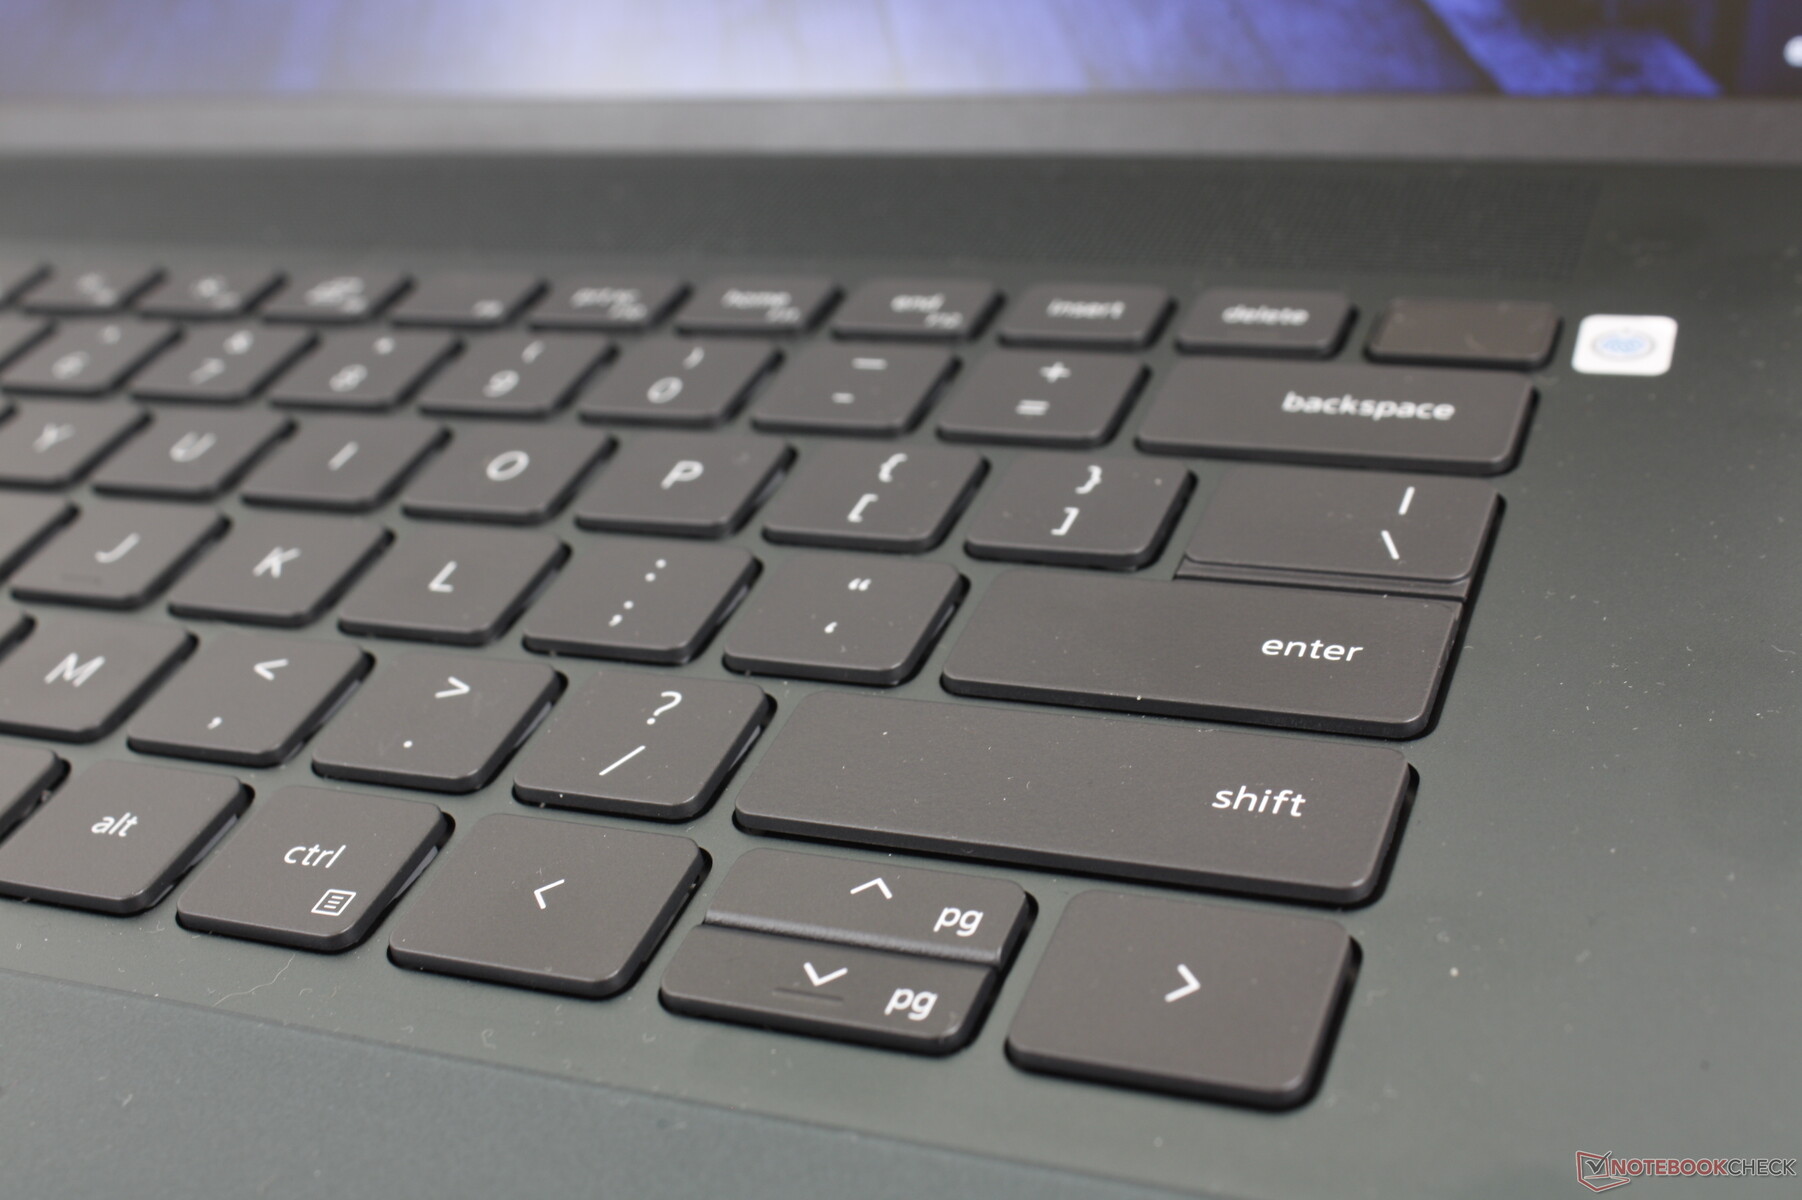
Teclado
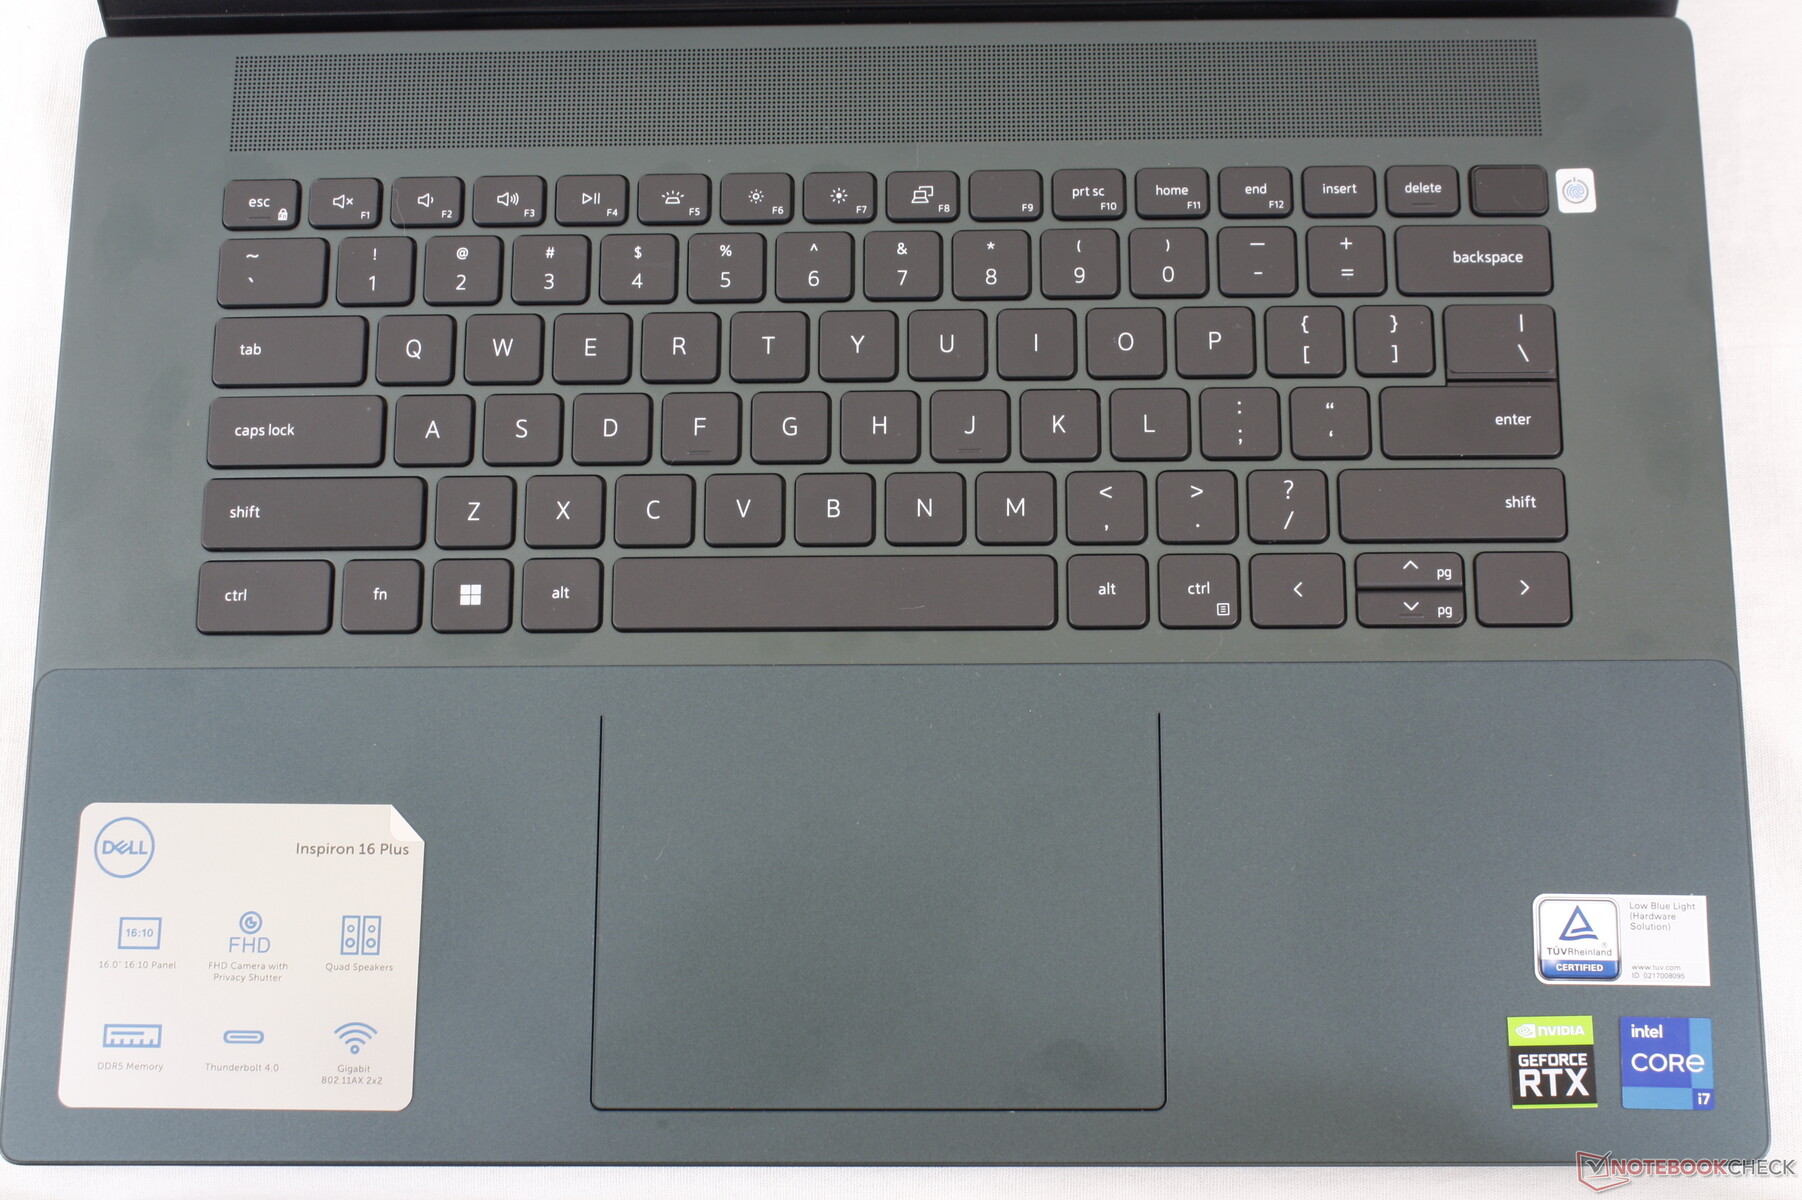
Dell ha renovado el teclado este año para excluir el teclado numérico. Por lo demás, la experiencia de tecleo es similar a la delInspiron 16 Plus 7620 2 en 1 ya que las teclas siguen siendo ligeramente más suaves que las del LG Gram 16 o la serie HP Spectre.
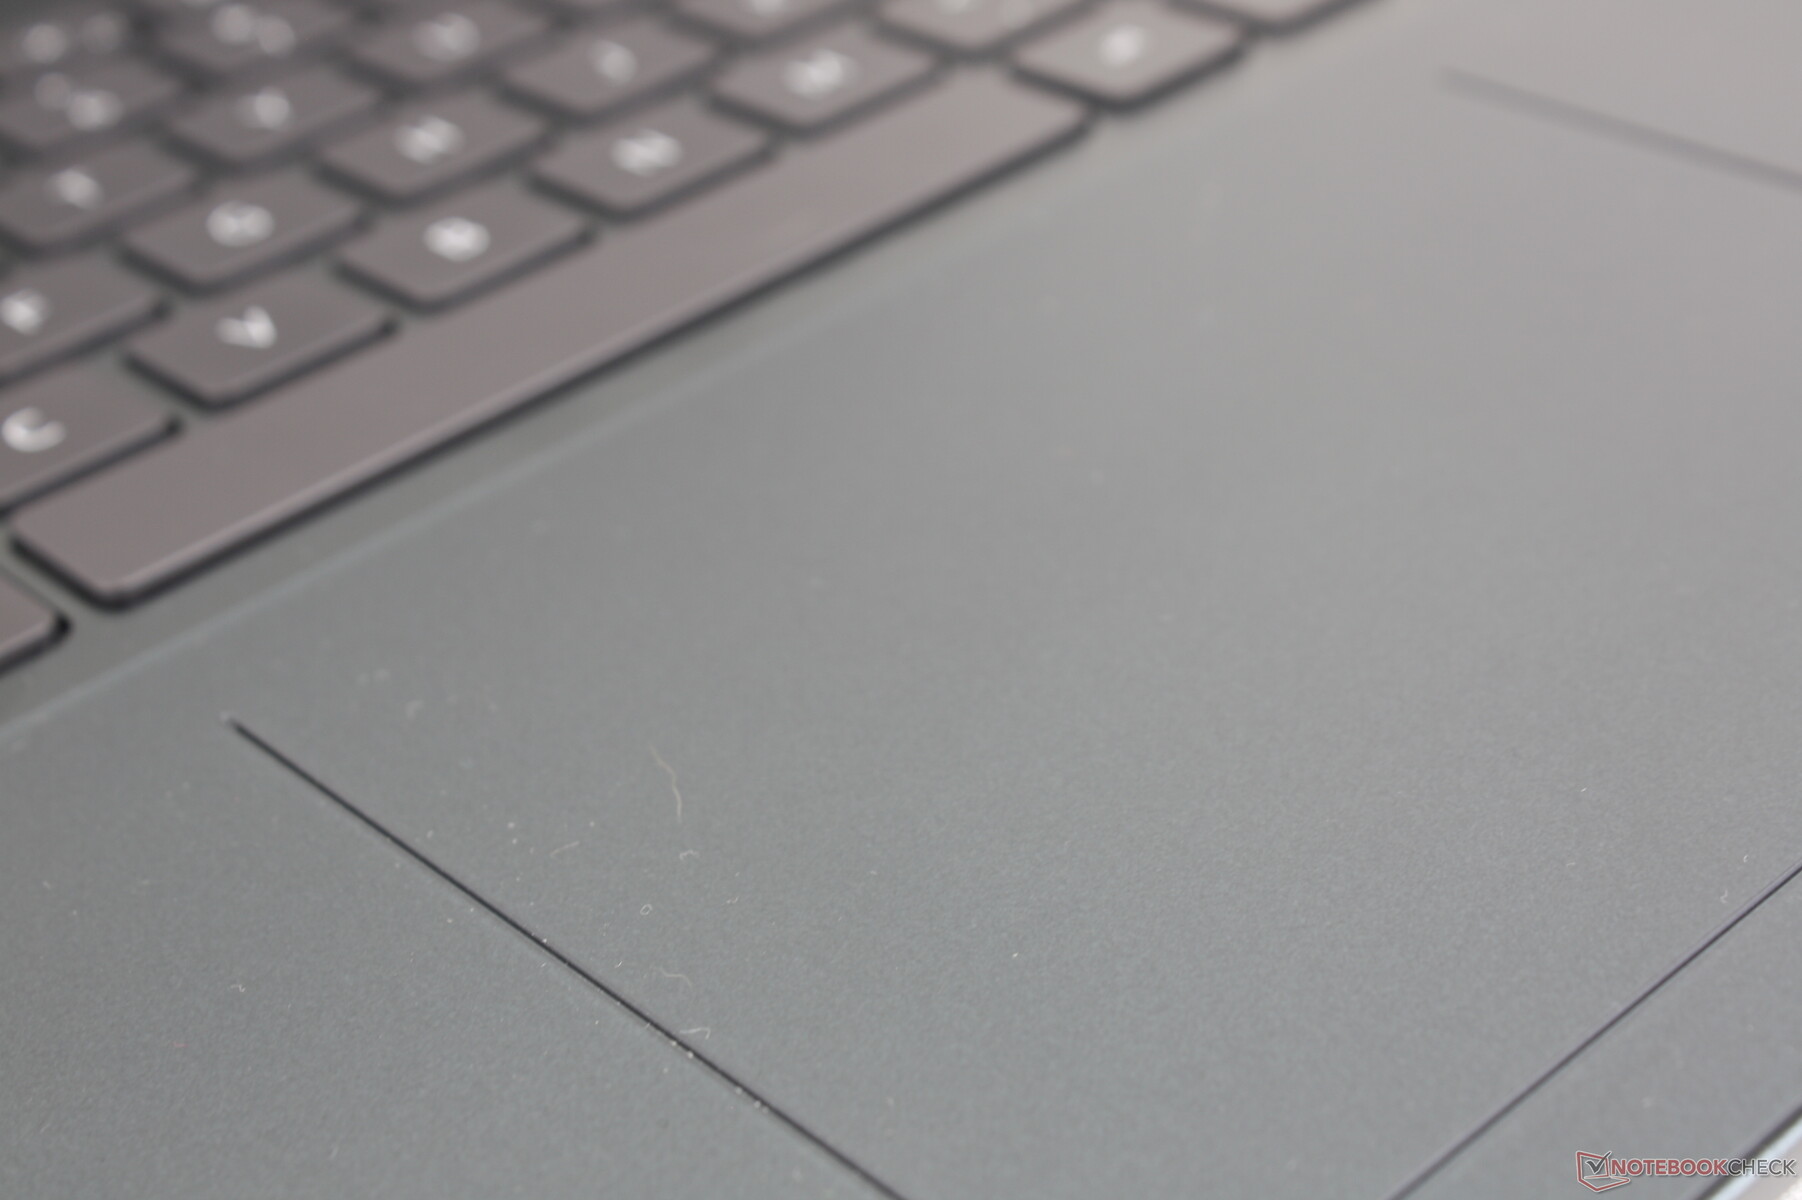
Teclado táctil
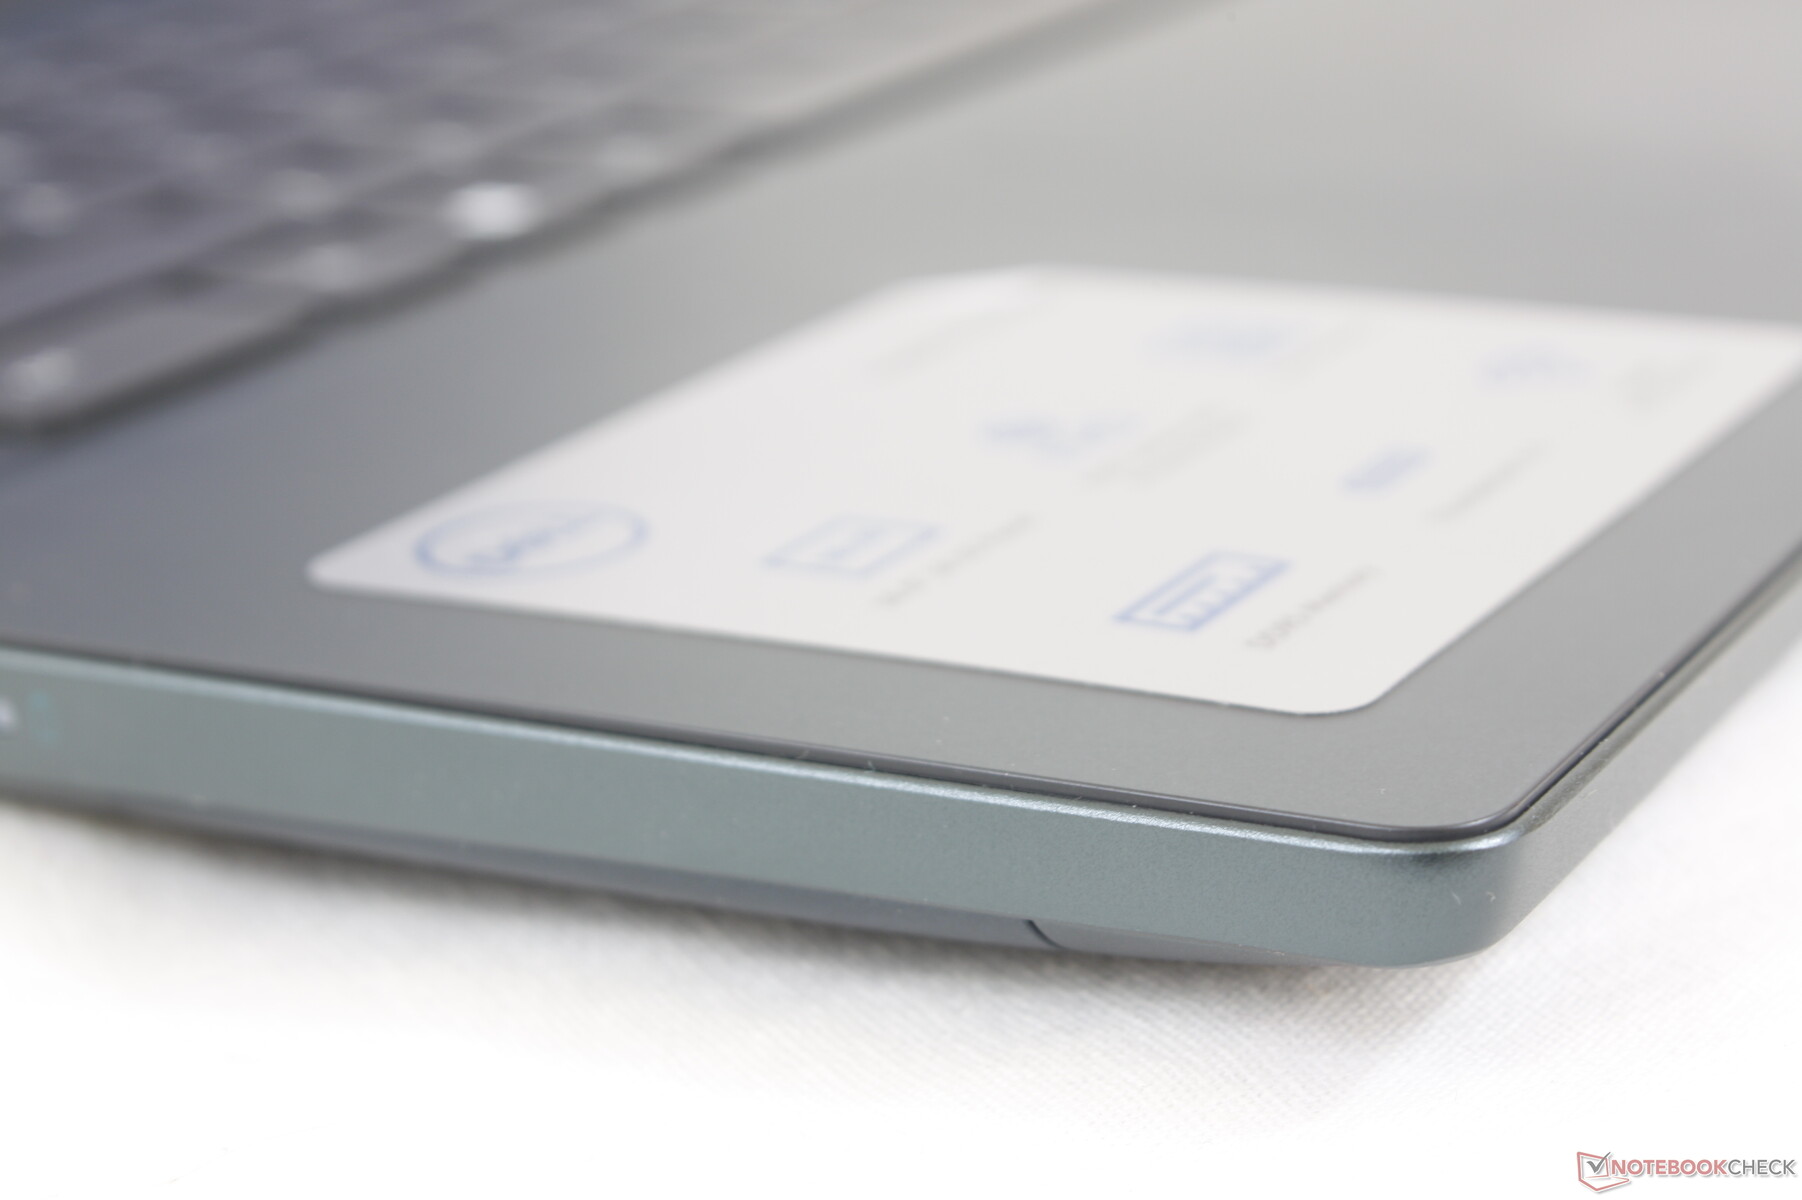
El clickpad de nuestro modelo 2022 es más pequeño que el del modelo 2021 (11,5 x 8 cm frente a 13,5 x 9 cm) para estar en igualdad de condiciones con el clickpad del Inspiron 16 7620 2 en 1. La nueva superficie de Mylar funciona muy bien para el control del cursor, ya que es suave cuando se desliza rápidamente, pero un poco pegajosa cuando se desliza lentamente para obtener clics más precisos. Sin embargo, hacer clic en el clickpad sigue siendo más suave y esponjoso de lo que nos gustaría.
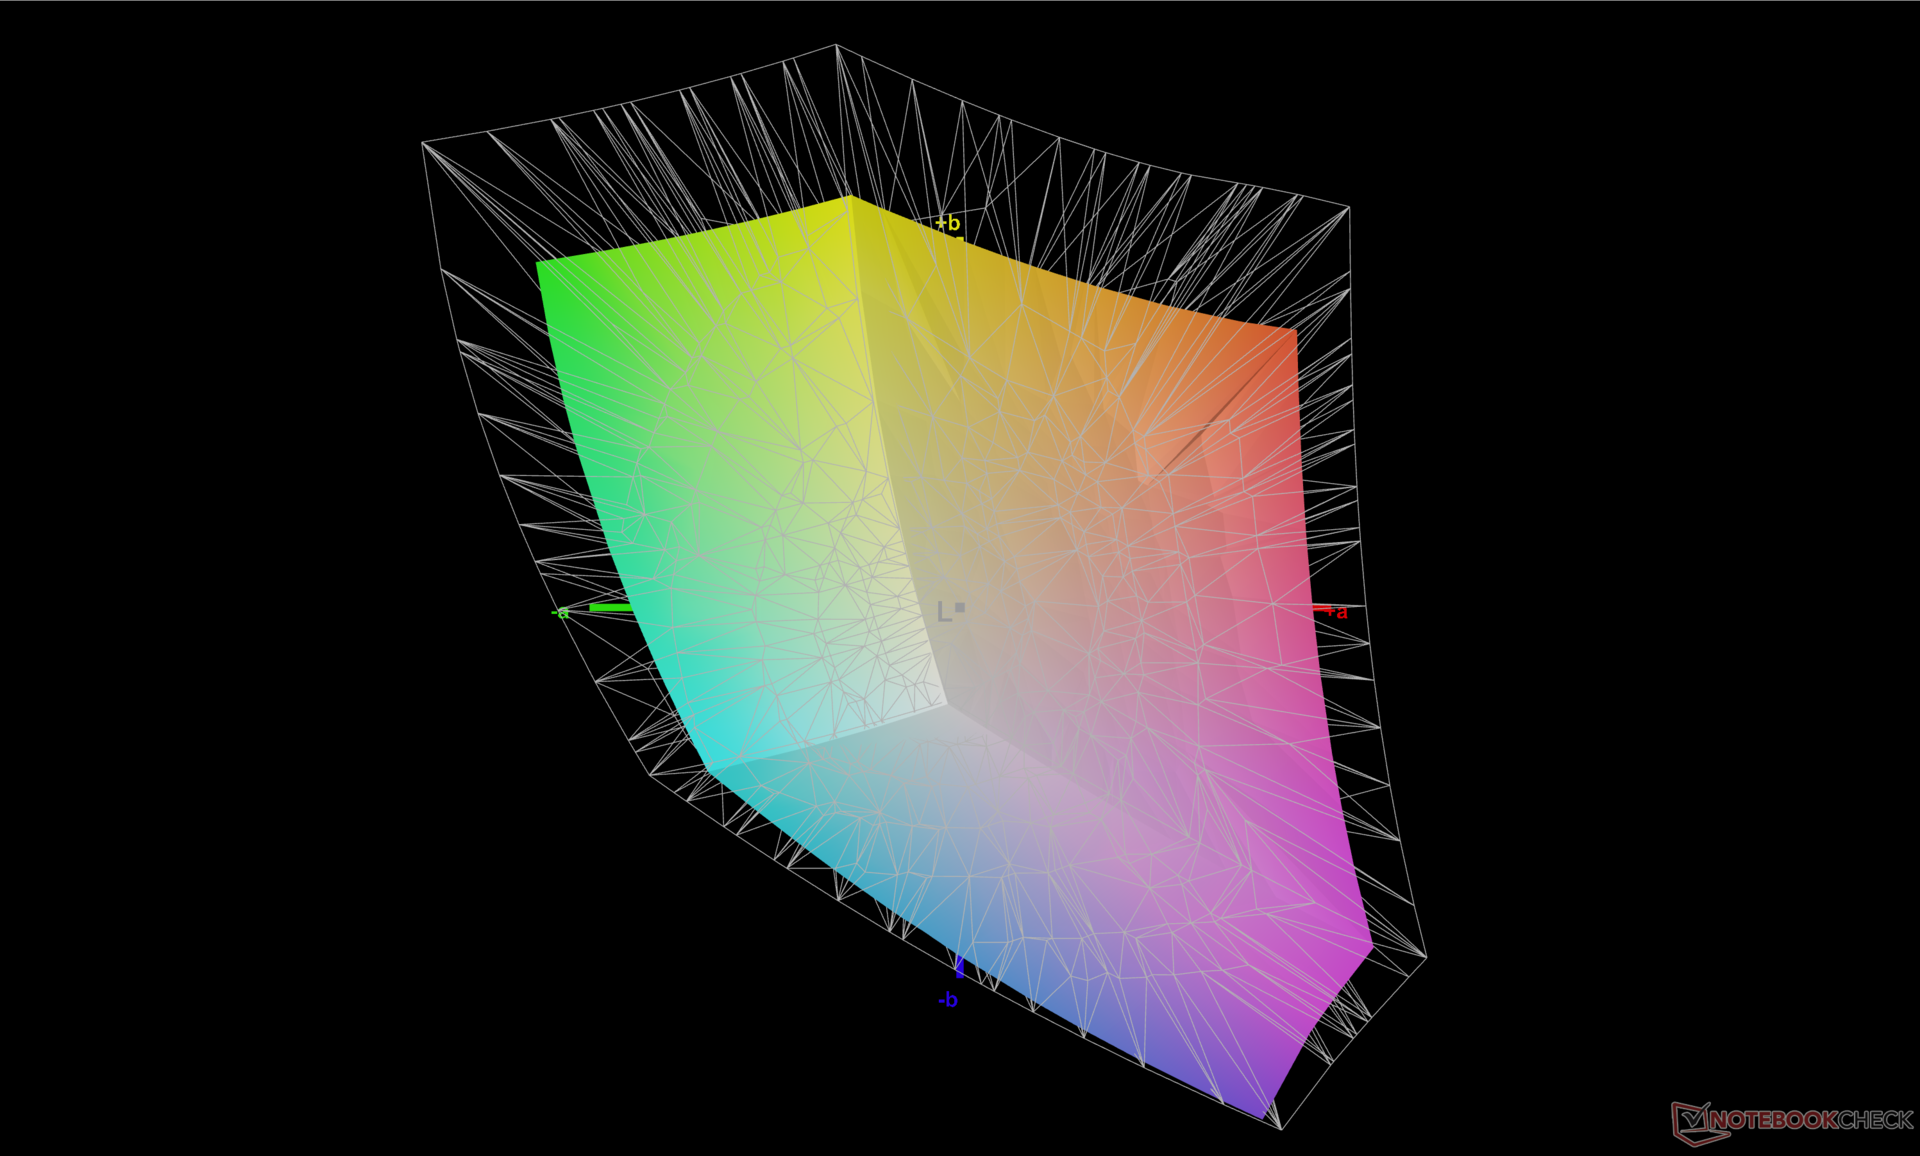
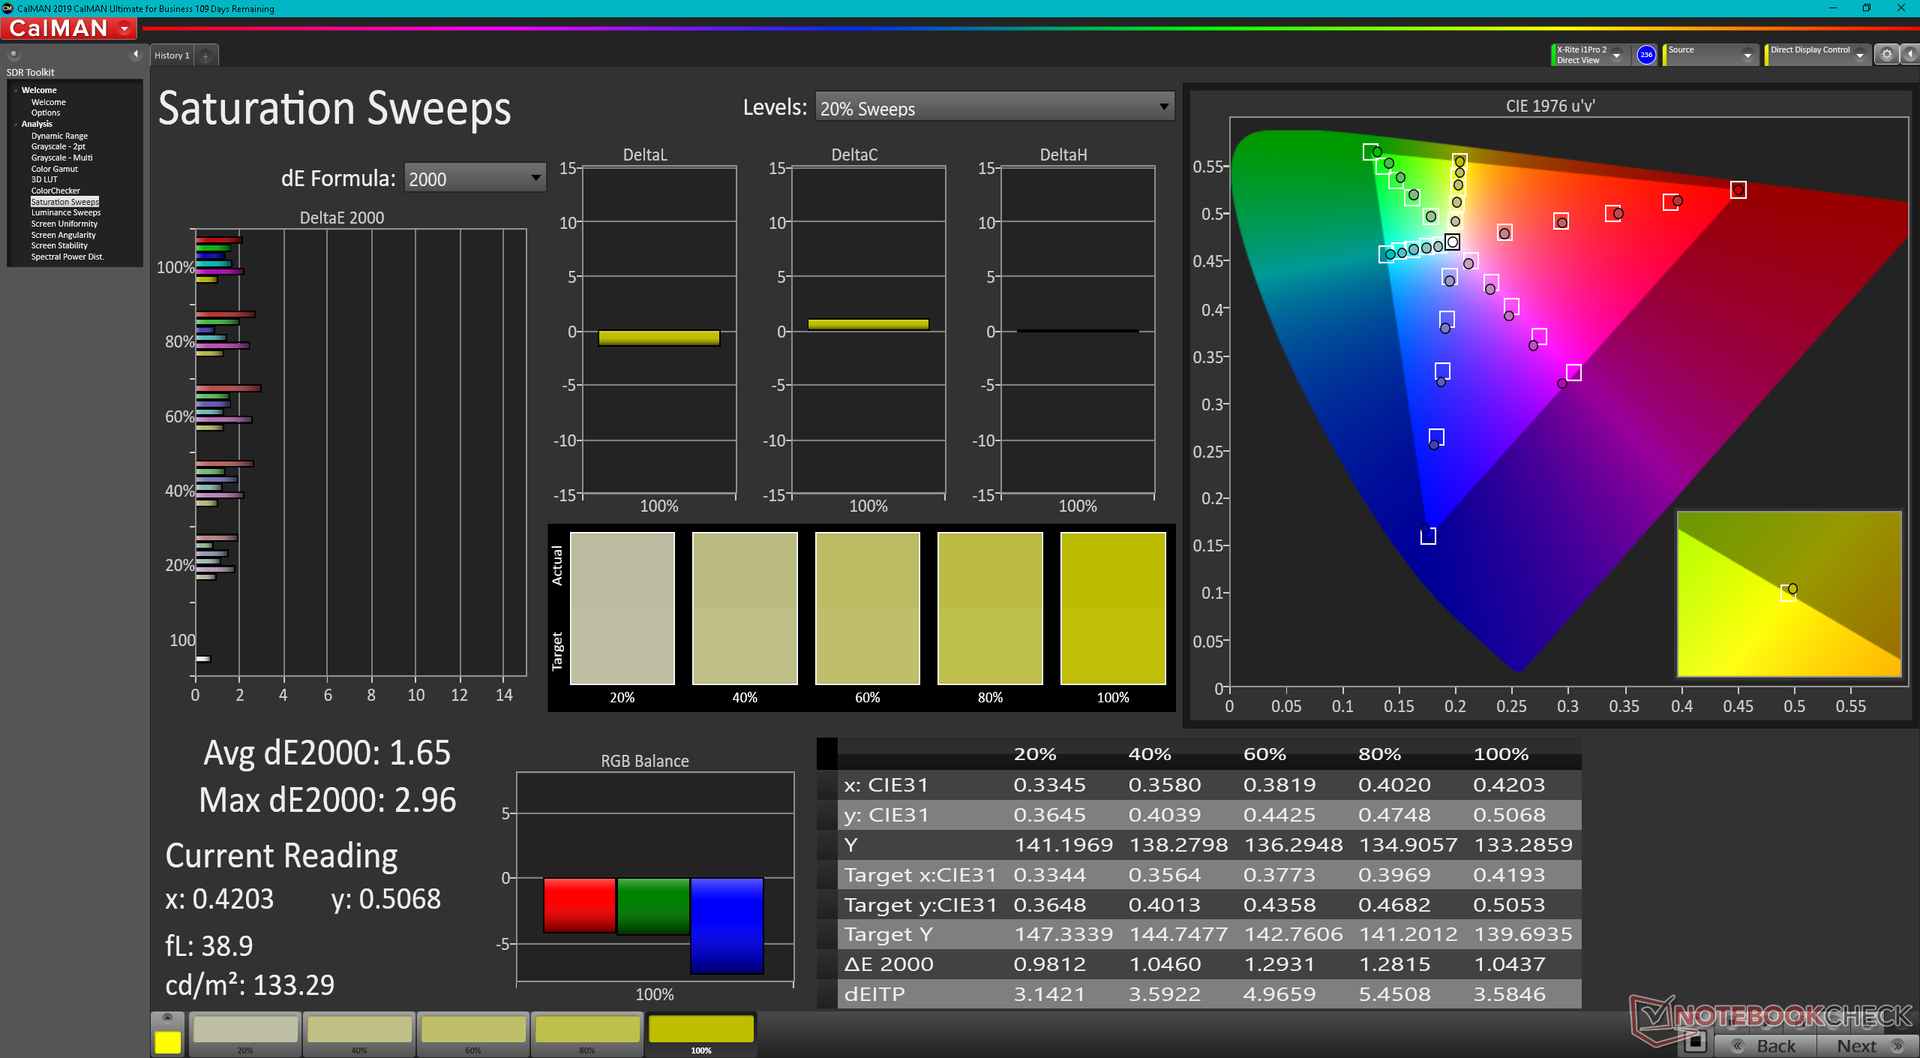
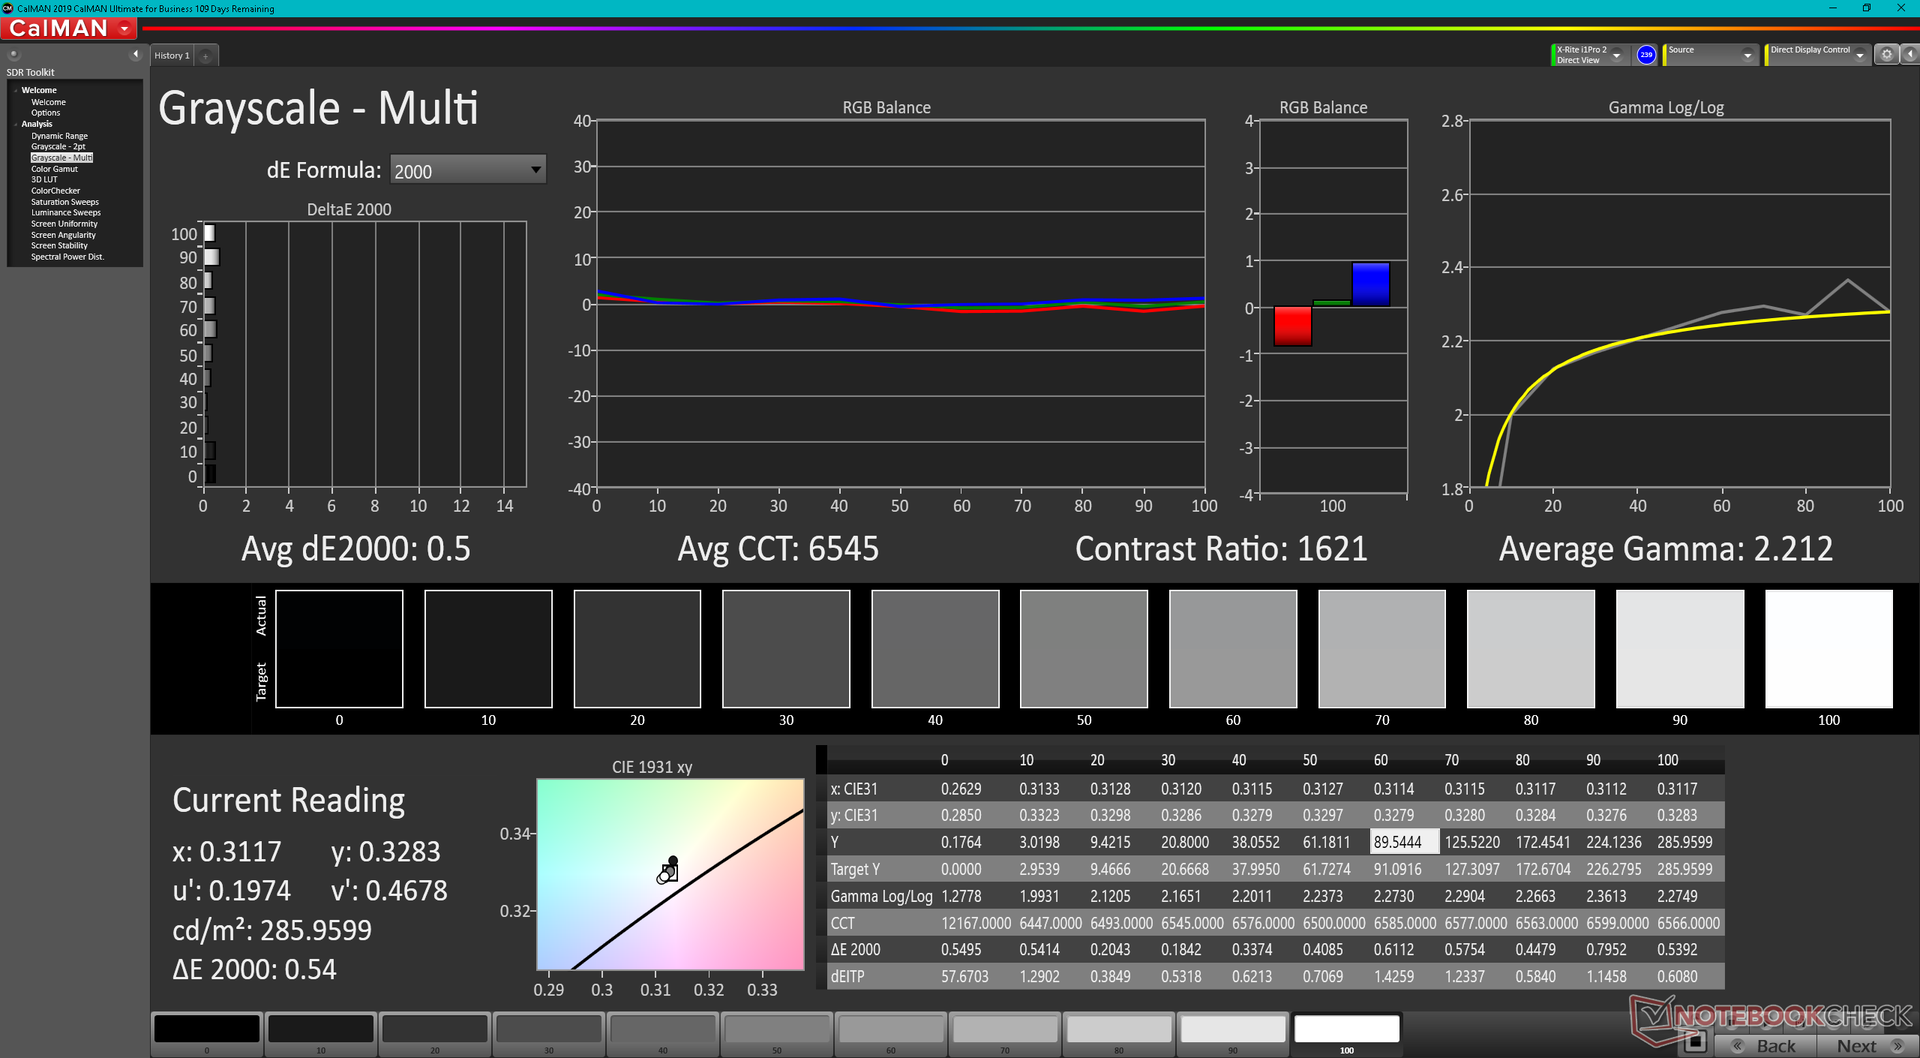
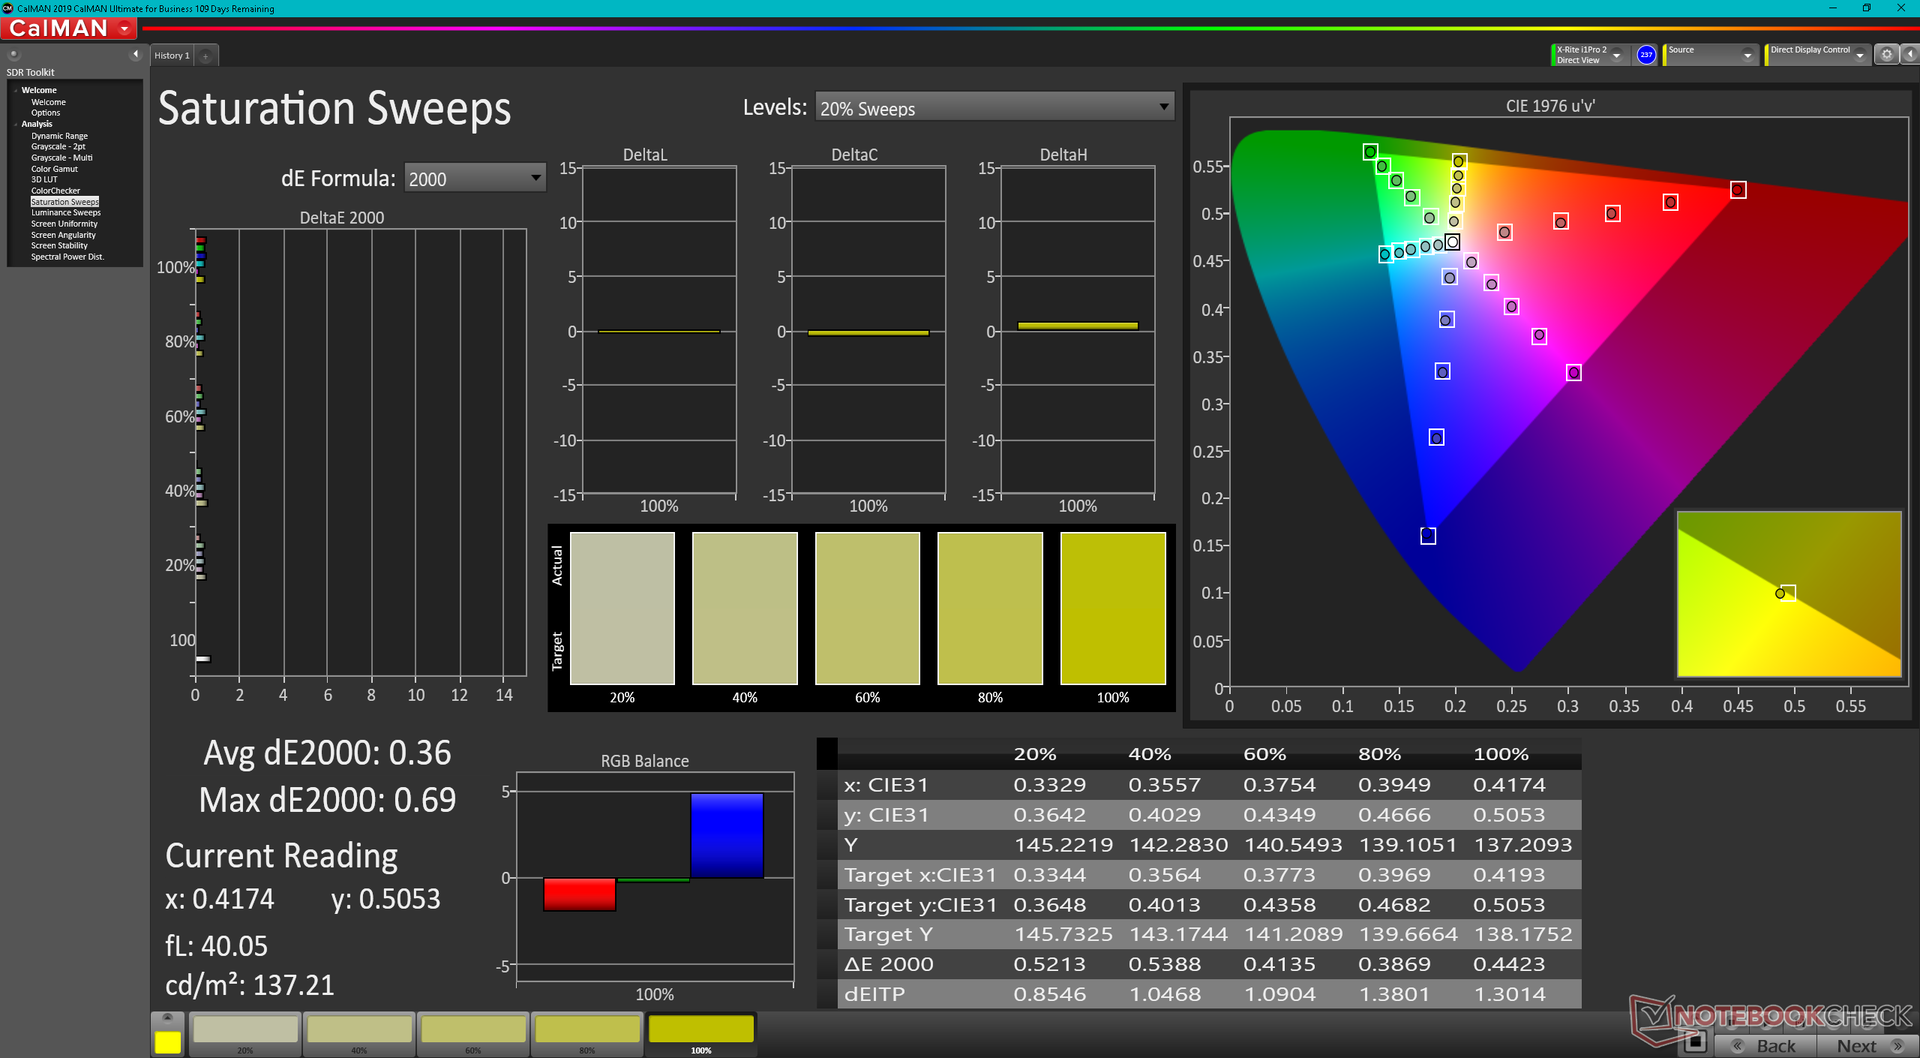
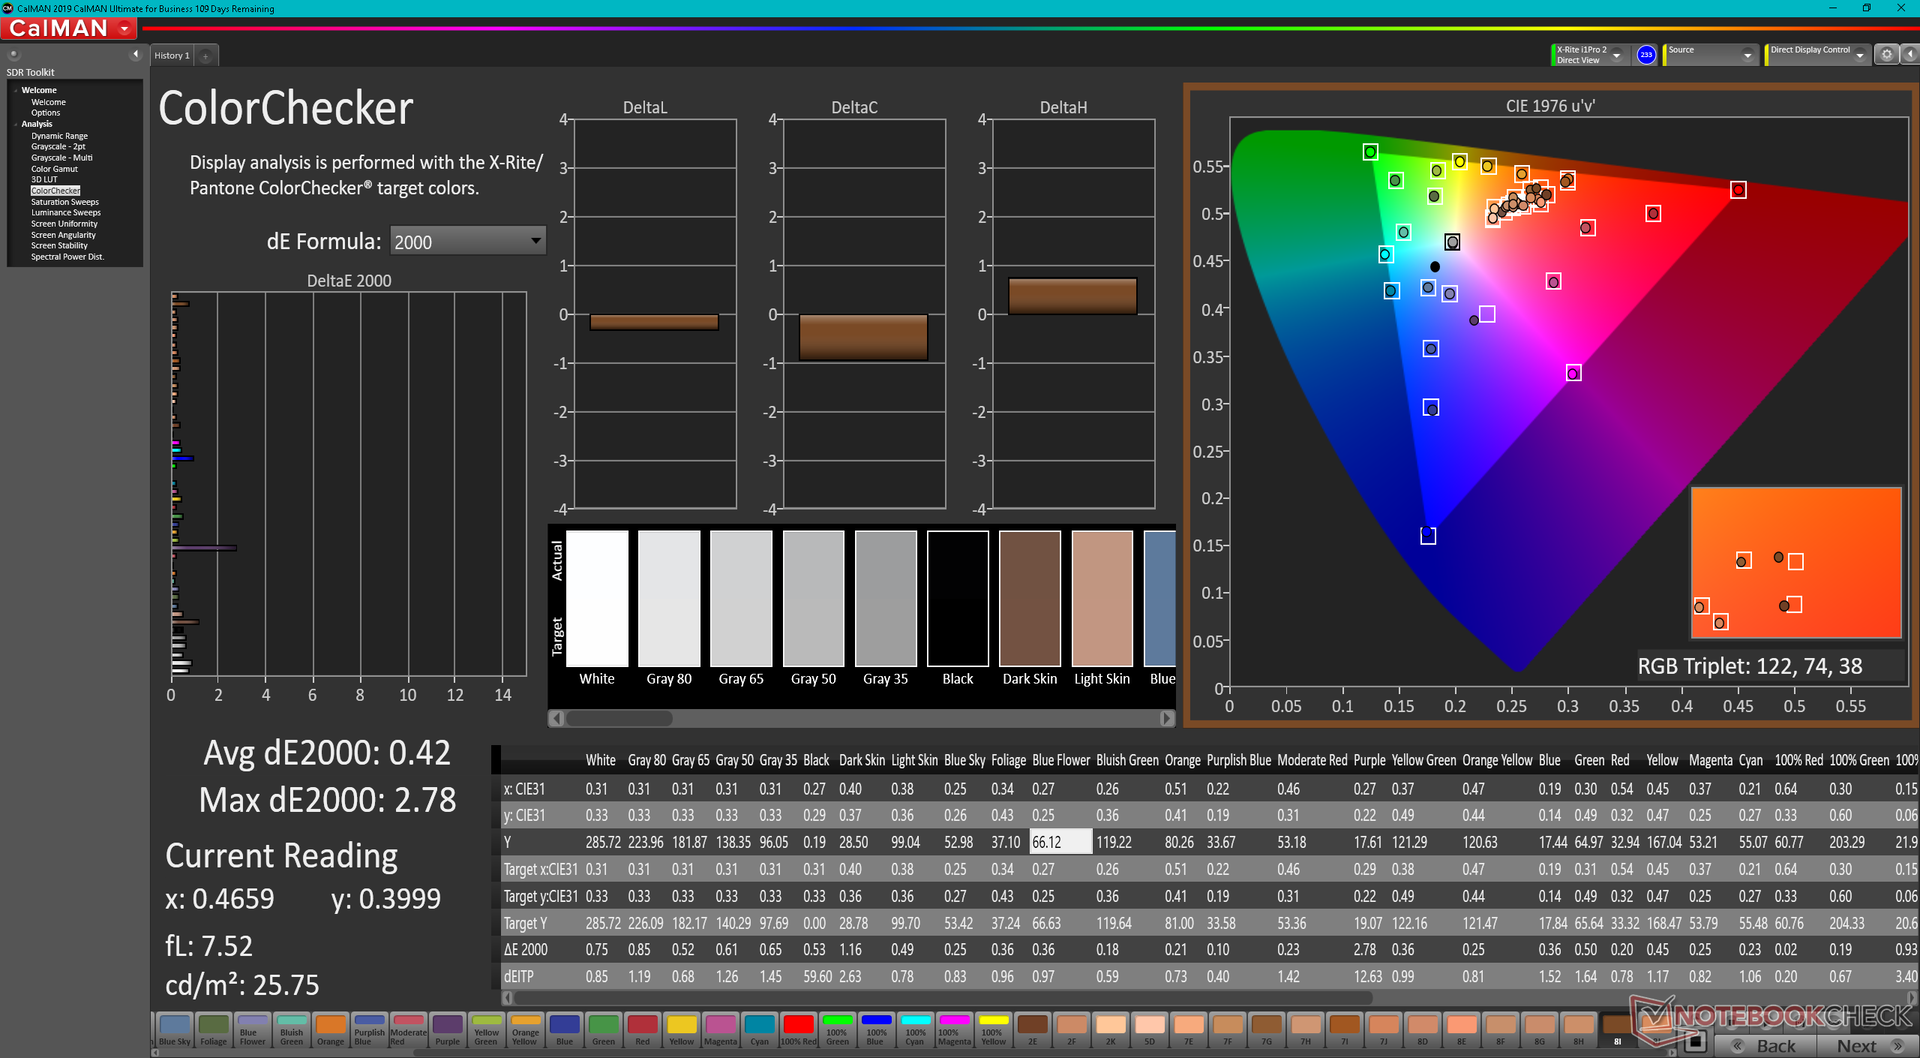
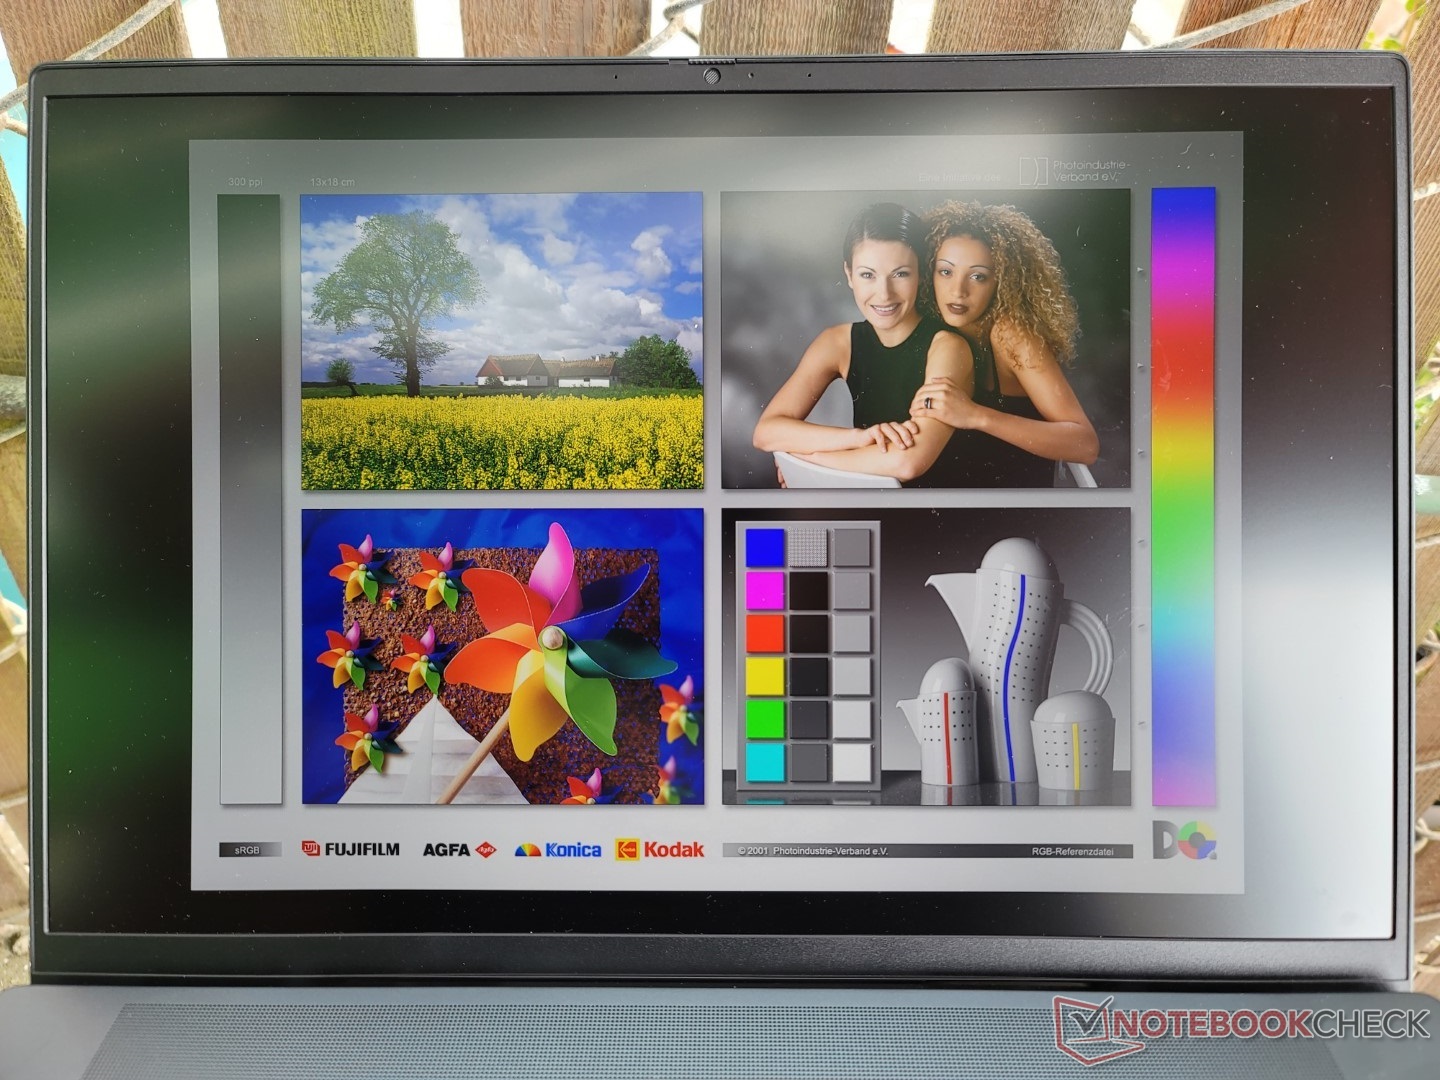
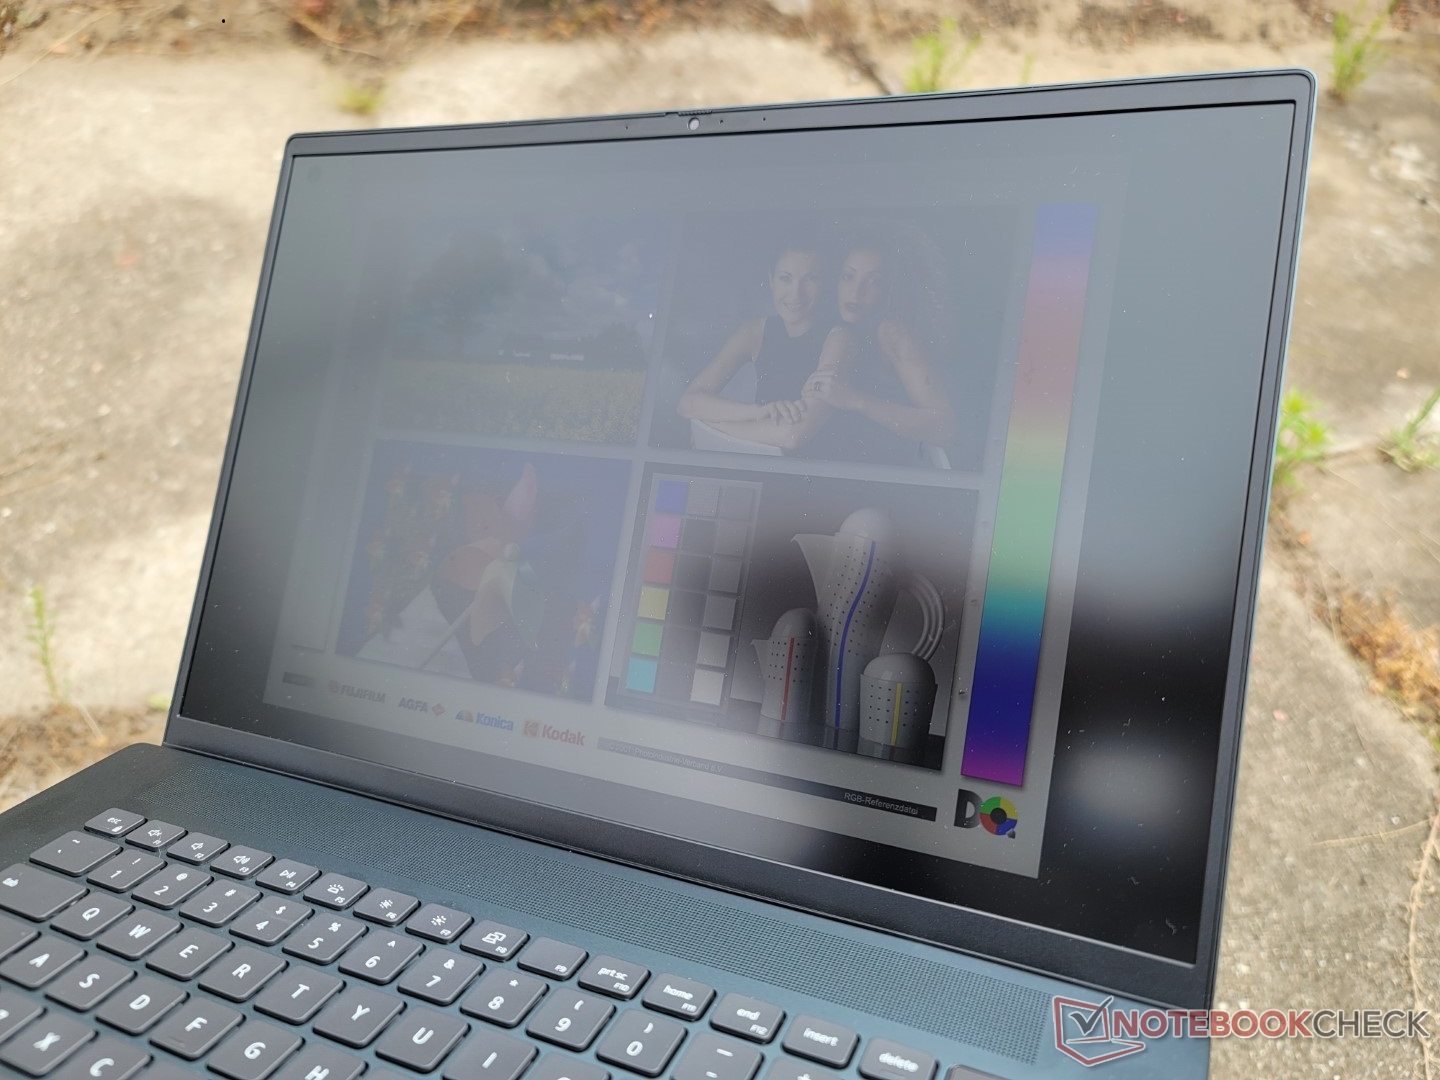
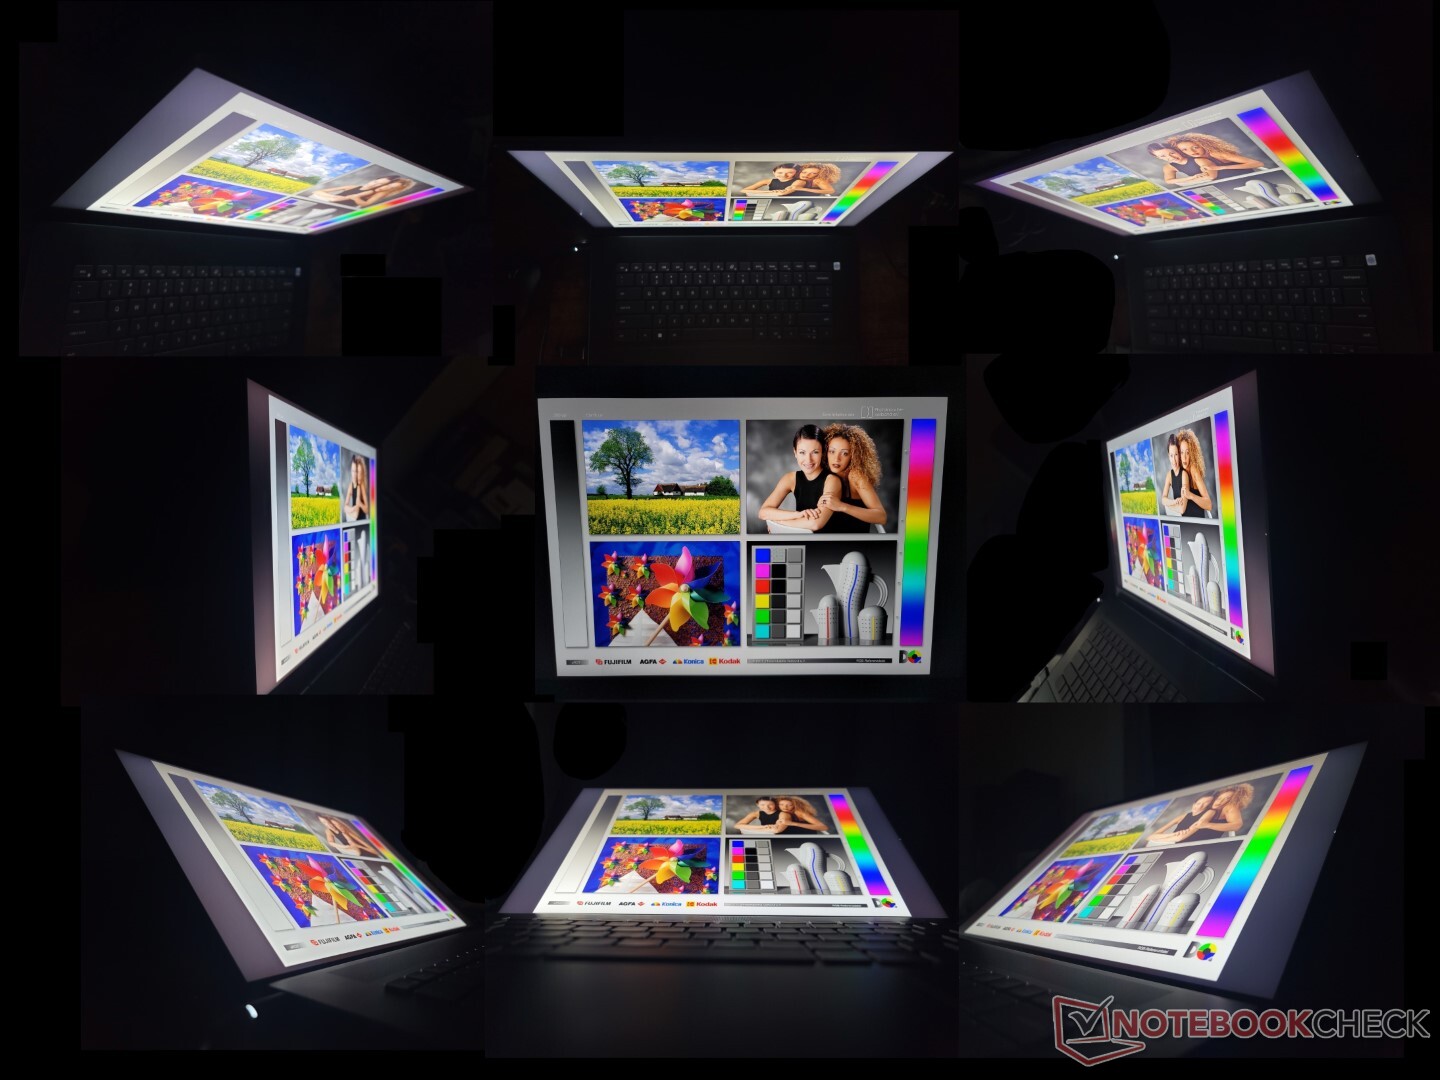
Pantalla - Sin cambios importantes
Curiosamente, Dell ha cambiado los proveedores de paneles de AU Optronics en el Inspiron 16 Plus 7610 del año pasado a BOE para este último modelo. Los tiempos de respuesta son ligeramente más rápidos para un ghosting menos severo, pero todo lo demás sigue siendo mayormente igual, incluyendo la cobertura sRGB completa, el ratio de contraste de ~1000:1, y el brillo máximo de ~290 nit
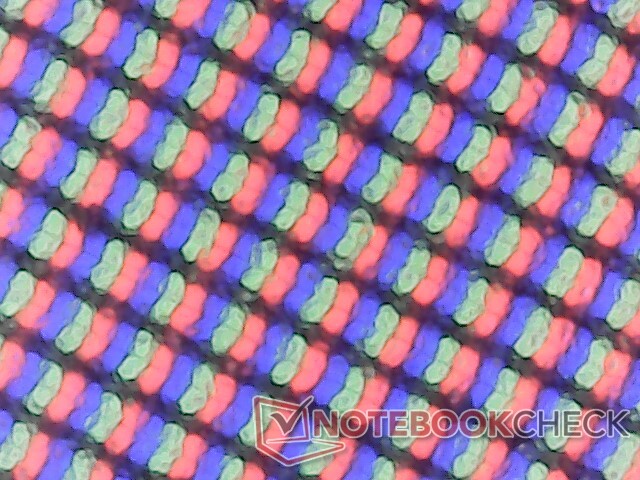
La experiencia de visionado es buena, pero sigue estando un poco por debajo de la serie XPS o el panel OLED del Asus VivoBook Pro 16X. La calidad de la imagen es notablemente más granulada debido a la agresiva superposición mate, mientras que los colores no son tan vibrantes como en OLED. Entendemos que la serie Inspiron no se supone que sea de alta gama, pero es decepcionante que Dell no haya hecho ningún cambio significativo en la pantalla este año
Hay tres opciones de panel de 300 nits para elegir: 3072 x 1920 mate no táctil, 1920 x 1200 mate no táctil y 1920 x 1200 táctil brillante. Nuestras mediciones a continuación reflejan sólo el panel de mayor resolución.
| |||||||||||||||||||||||||
iluminación: 92 %
Brillo con batería: 288.9 cd/m²
Contraste: 1111:1 (Negro: 0.26 cd/m²)
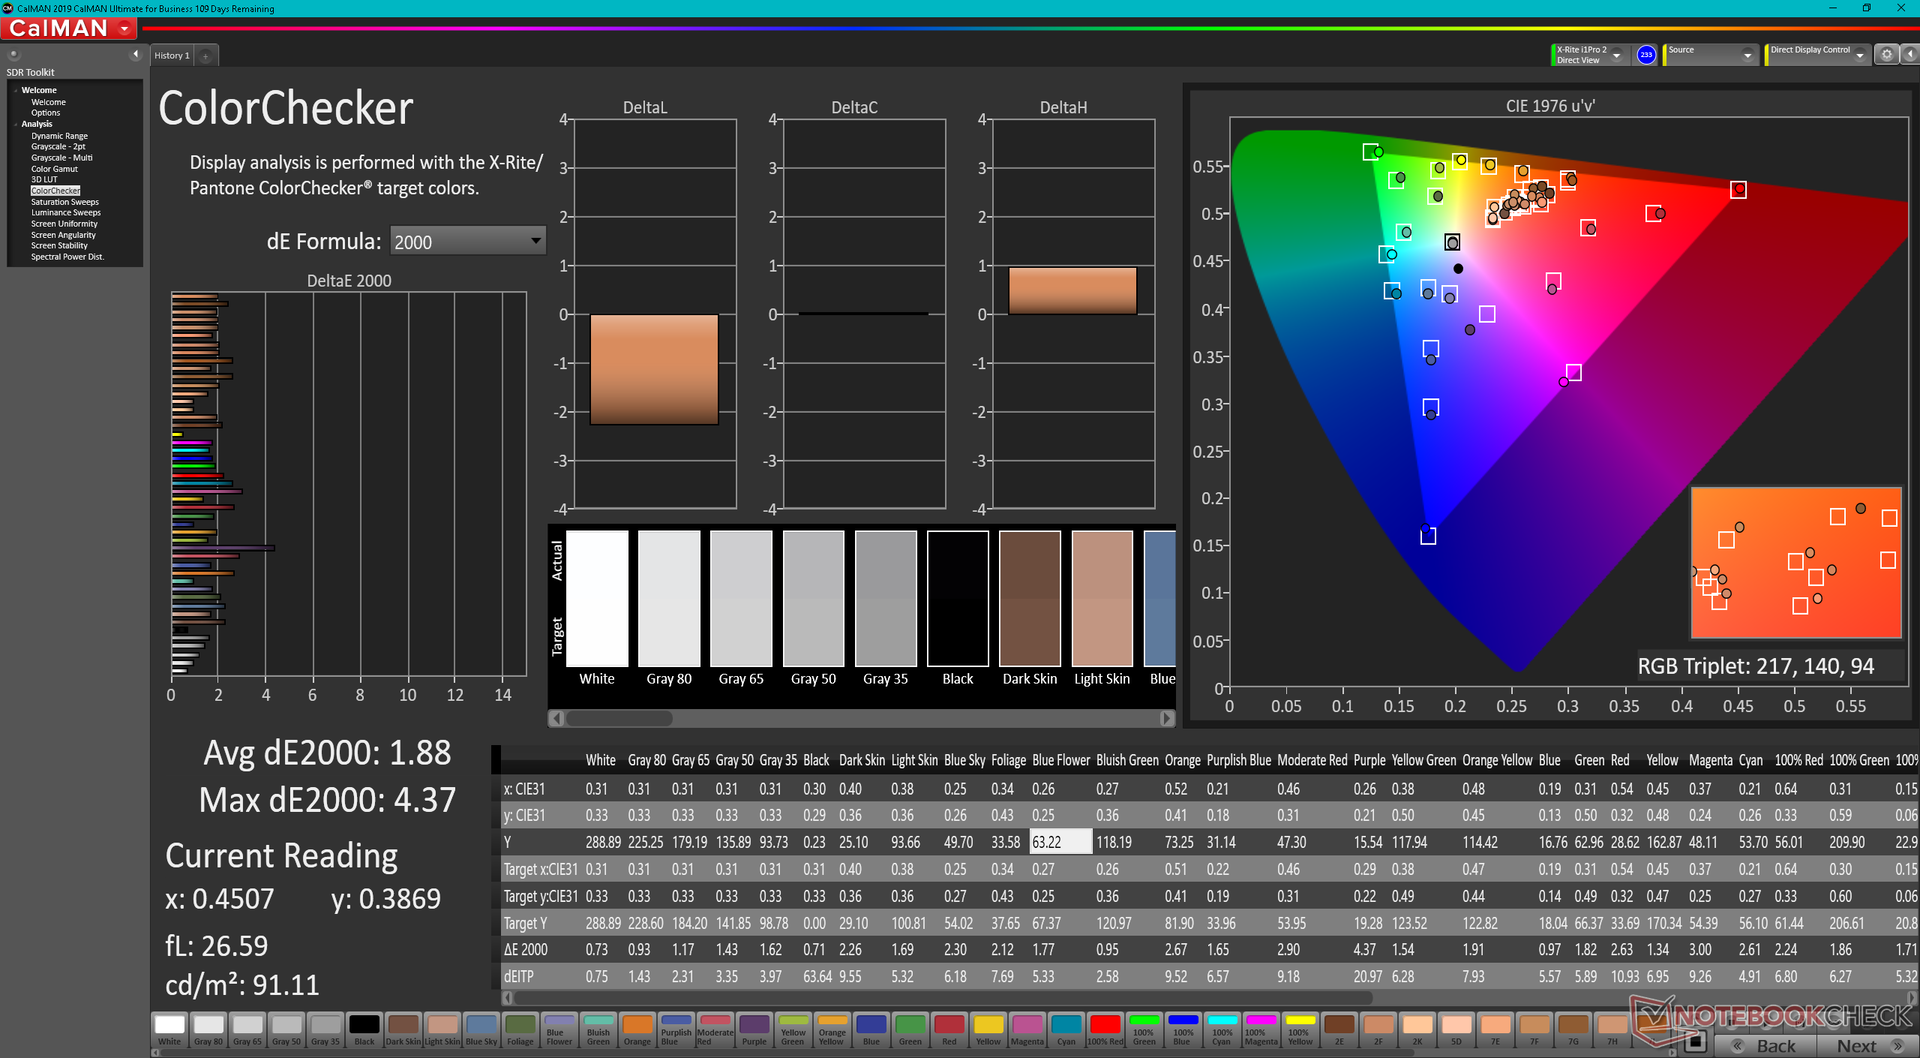
ΔE ColorChecker Calman: 1.88 | ∀{0.5-29.43 Ø4.71}
calibrated: 0.42
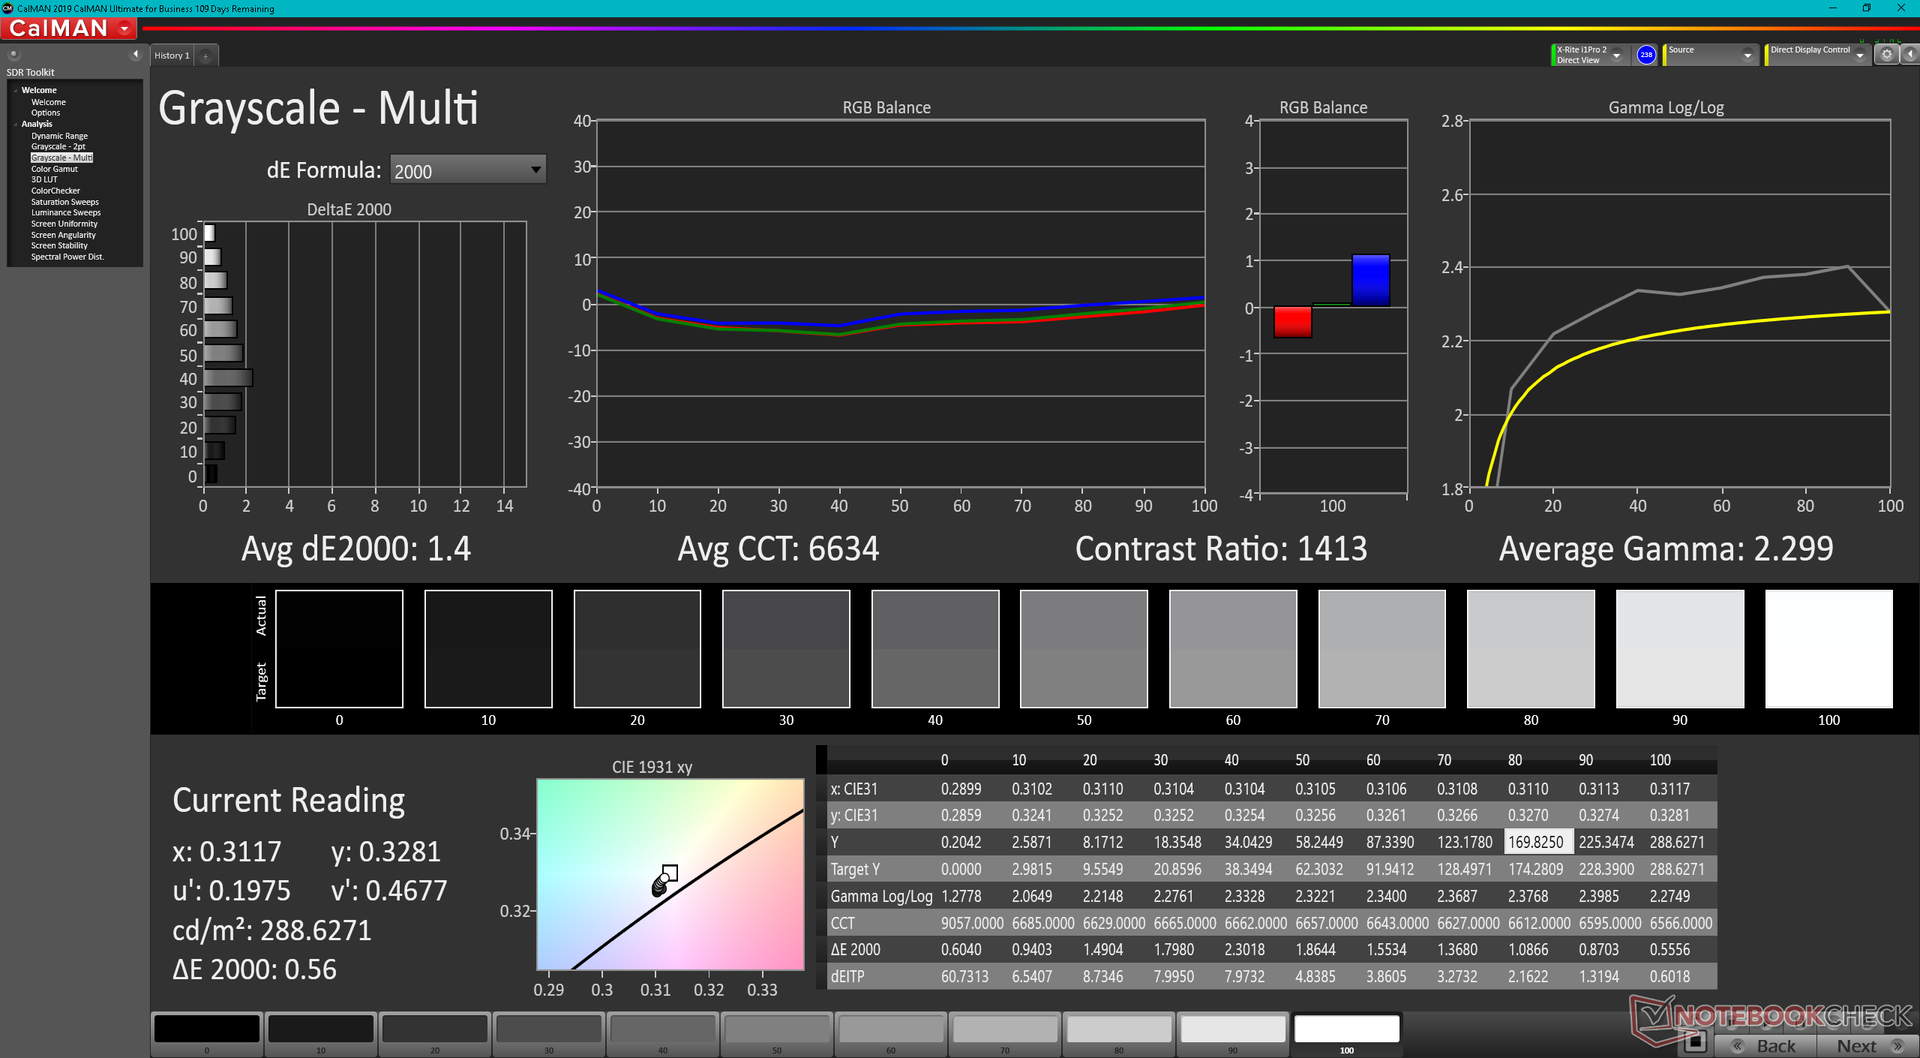
ΔE Greyscale Calman: 1.4 | ∀{0.09-98 Ø4.96}
73.2% AdobeRGB 1998 (Argyll 3D)
99.5% sRGB (Argyll 3D)
70.8% Display P3 (Argyll 3D)
Gamma: 2.3
CCT: 6634 K
| Dell Inspiron 16 Plus 7620 BOE NE16N41, IPS, 3072x1920, 16" | Dell Inspiron 16 Plus 7610 AU Optronics B160QAN, IPS, 3072x1920, 16" | Lenovo Yoga 7 16IAP7 Lenovo LEN160WQXGA, IPS, 2560x1600, 16" | Huawei MateBook D 16 2022 BOE NV160WUM-NH0, IPS, 1920x1200, 16" | Acer Swift X SFX16-51G-5388 Chi Mei N161HCA-EA3, , 1920x1080, 16.1" | Asus Vivobook Pro 16X-M7600QE Samsung ATNA60YV02-0, OLED, 3840x2400, 16.1" | |
|---|---|---|---|---|---|---|
| Display | 3% | -5% | -5% | -7% | 25% | |
| Display P3 Coverage (%) | 70.8 | 74.1 5% | 67 -5% | 66.2 -6% | 65.1 -8% | 99.8 41% |
| sRGB Coverage (%) | 99.5 | 99.4 0% | 95.7 -4% | 96.4 -3% | 95.65 -4% | 100 1% |
| AdobeRGB 1998 Coverage (%) | 73.2 | 75.8 4% | 69.3 -5% | 68.3 -7% | 66.75 -9% | 96.9 32% |
| Response Times | -30% | 8% | 27% | 25% | 94% | |
| Response Time Grey 50% / Grey 80% * (ms) | 38 ? | 49.2 ? -29% | 36 ? 5% | 30.5 ? 20% | 30 ? 21% | 2 ? 95% |
| Response Time Black / White * (ms) | 28 ? | 36.8 ? -31% | 24.8 ? 11% | 18.7 ? 33% | 20 ? 29% | 2 ? 93% |
| PWM Frequency (Hz) | 60 ? | |||||
| Screen | -47% | -13% | -56% | -6% | -35% | |
| Brightness middle (cd/m²) | 288.9 | 296.8 3% | 393.7 36% | 319 10% | 276 -4% | 392 36% |
| Brightness (cd/m²) | 276 | 292 6% | 367 33% | 317 15% | 264 -4% | 396 43% |
| Brightness Distribution (%) | 92 | 87 -5% | 84 -9% | 90 -2% | 85 -8% | 98 7% |
| Black Level * (cd/m²) | 0.26 | 0.21 19% | 0.38 -46% | 0.23 12% | 0.16 38% | |
| Contrast (:1) | 1111 | 1413 27% | 1036 -7% | 1387 25% | 1725 55% | |
| Colorchecker dE 2000 * | 1.88 | 2.56 -36% | 1.97 -5% | 3.4 -81% | 1.8 4% | 1.74 7% |
| Colorchecker dE 2000 max. * | 4.37 | 4.76 -9% | 5.46 -25% | 8.1 -85% | 3.77 14% | 3.18 27% |
| Colorchecker dE 2000 calibrated * | 0.42 | 1.86 -343% | 0.62 -48% | 0.8 -90% | 0.63 -50% | 1.85 -340% |
| Greyscale dE 2000 * | 1.4 | 2.6 -86% | 2.1 -50% | 5.7 -307% | 2.76 -97% | 1.77 -26% |
| Gamma | 2.3 96% | 2.07 106% | 2.1 105% | 2.1 105% | 2.37 93% | 2.22 99% |
| CCT | 6634 98% | 6628 98% | 6461 101% | 7433 87% | 6564 99% | 6483 100% |
| Media total (Programa/Opciones) | -25% /
-34% | -3% /
-9% | -11% /
-33% | 4% /
-2% | 28% /
1% |
* ... más pequeño es mejor
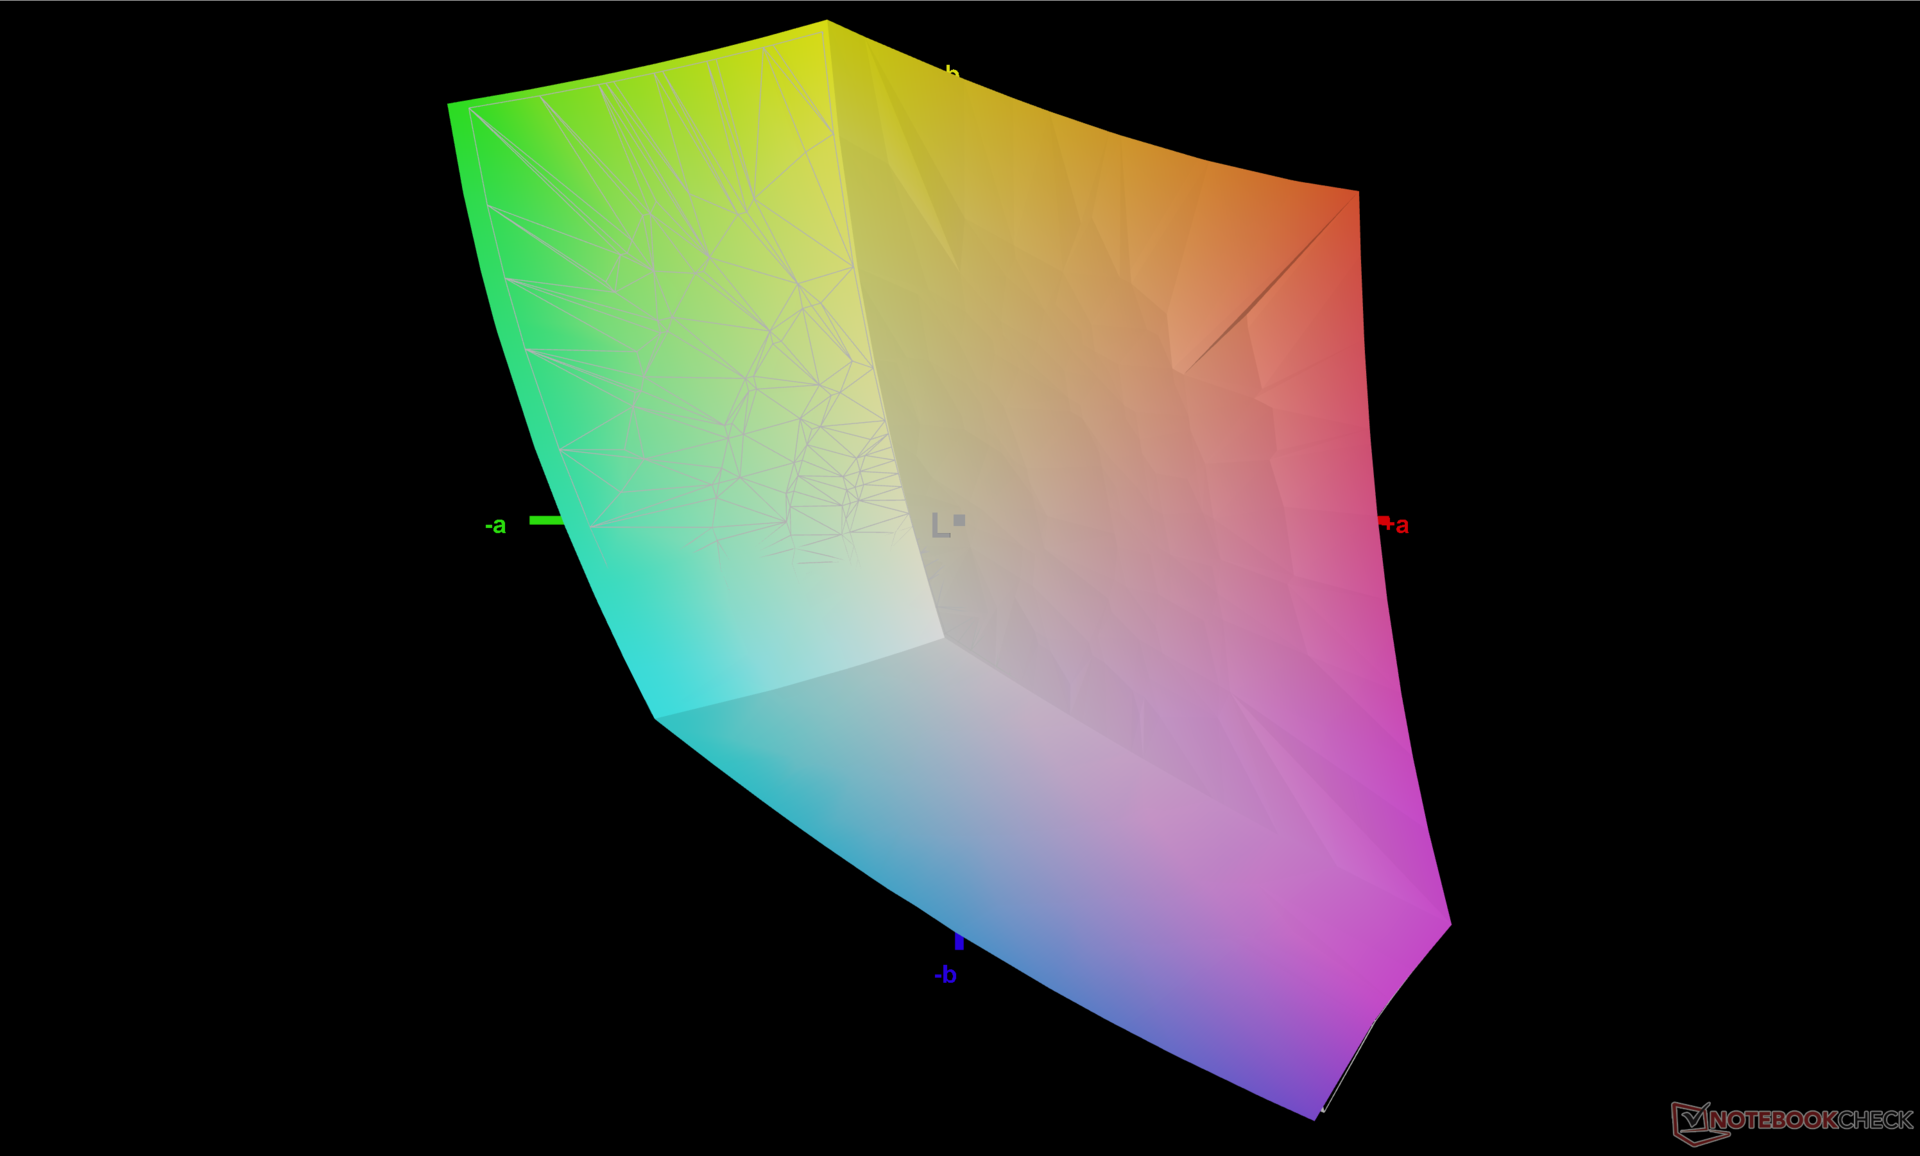
La pantalla está bien calibrada al salir de la caja, al igual que lo que descubrimos en el 7610. Los valores medios de escala de grises y color DeltaE se sitúan en 1,4 y 1,88, respectivamente, mientras que nuestros propios intentos de calibración mejoran los promedios aún más a sólo 0,5 y 0,42. Si valoras las pantallas con precisión sRGB, entonces te gustará lo que verás aquí.
Tiempos de respuesta del display
| ↔ Tiempo de respuesta de Negro a Blanco | ||
|---|---|---|
| 28 ms ... subida ↗ y bajada ↘ combinada | ↗ 13.2 ms subida | 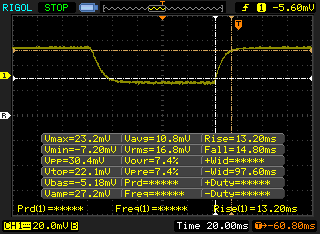 |
| ↘ 14.8 ms bajada | ||
| La pantalla mostró tiempos de respuesta relativamente lentos en nuestros tests pero podría ser demasiado lenta para los jugones. En comparación, todos los dispositivos de prueba van de ##min### (mínimo) a 240 (máximo) ms. » 71 % de todos los dispositivos son mejores. Eso quiere decir que el tiempo de respuesta es peor que la media (19.8 ms) de todos los dispositivos testados. | ||
| ↔ Tiempo de respuesta 50% Gris a 80% Gris | ||
| 38 ms ... subida ↗ y bajada ↘ combinada | ↗ 21.2 ms subida | 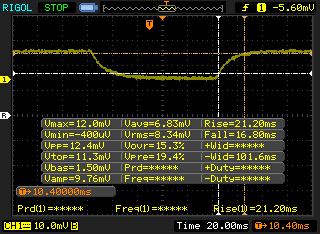 |
| ↘ 16.8 ms bajada | ||
| La pantalla mostró tiempos de respuesta lentos en nuestros tests y podría ser demasiado lenta para los jugones. En comparación, todos los dispositivos de prueba van de ##min### (mínimo) a 636 (máximo) ms. » 55 % de todos los dispositivos son mejores. Eso quiere decir que el tiempo de respuesta es peor que la media (30.9 ms) de todos los dispositivos testados. | ||
Parpadeo de Pantalla / PWM (Pulse-Width Modulation)
| Parpadeo de Pantalla / PWM no detectado | 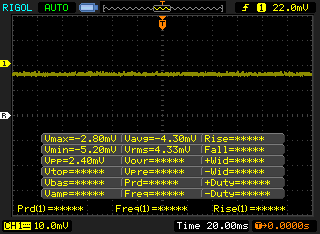 | ||
Comparación: 52 % de todos los dispositivos testados no usaron PWM para atenuar el display. Si se usó, medimos una media de 7741 (mínimo: 5 - máxmo: 343500) Hz. | |||
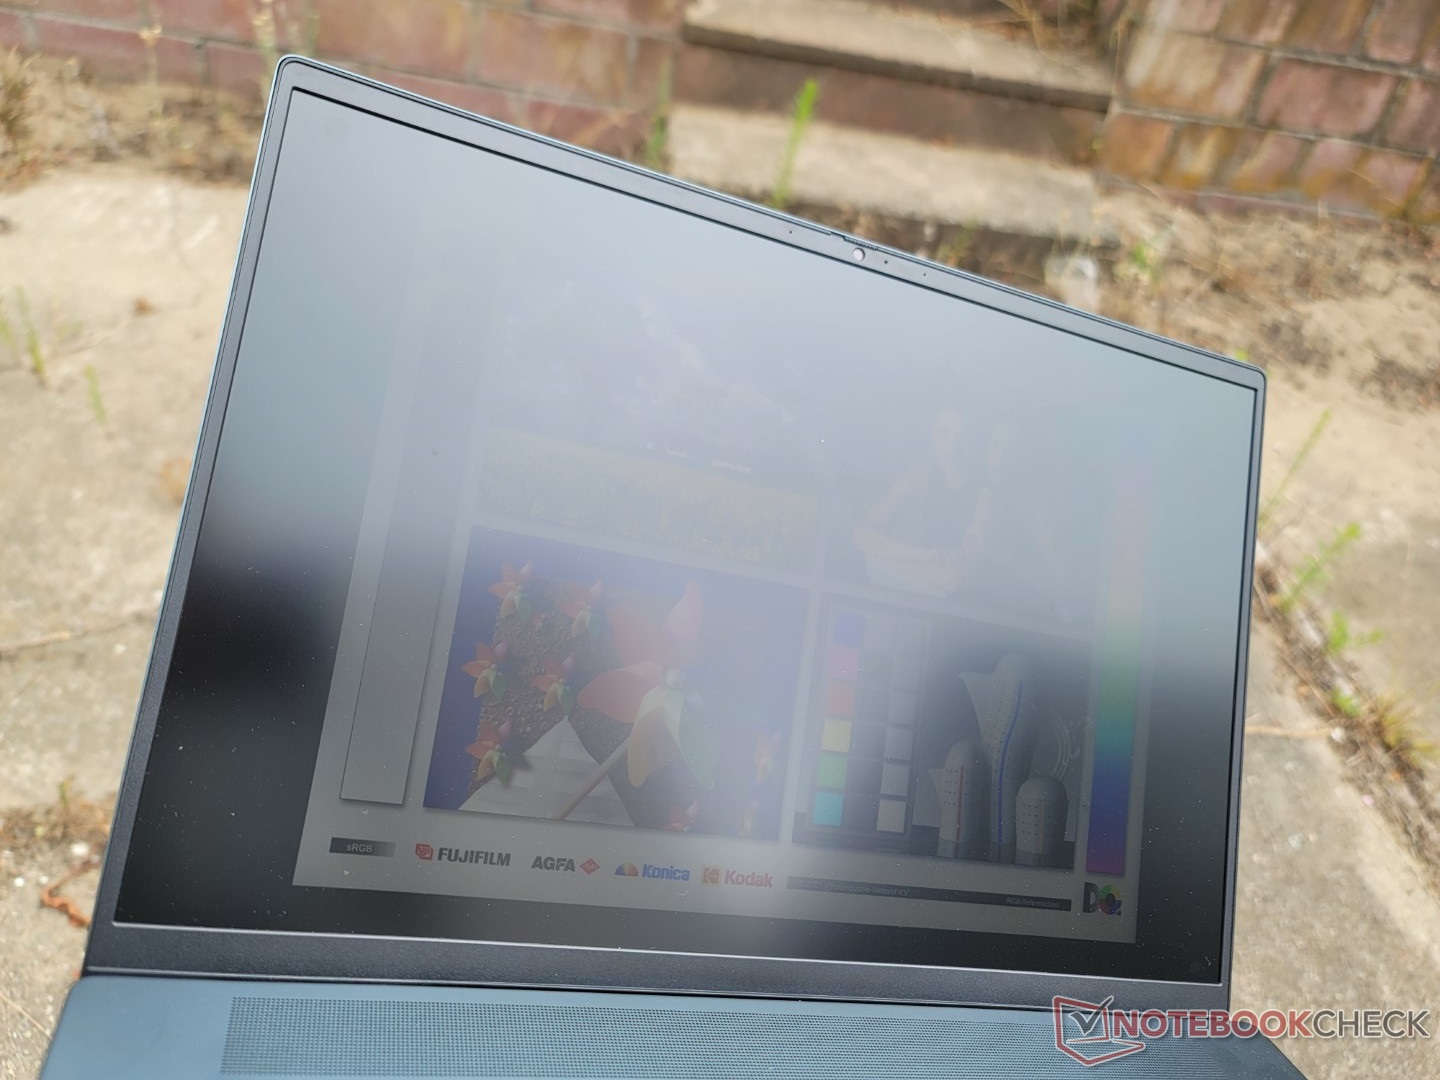
La visibilidad en exteriores es comparable a la del modelo del año pasado ya que el brillo máximo no ha cambiado. El Lenovo Yoga 7 o el Asus VivoBook Pro 16X tienen pantallas más brillantes, pero los reflejos de sus superposiciones brillantes son más difíciles de evitar.
Rendimiento - La 12ª generación ofrece un mayor rendimiento y consumo de energía
Condiciones de la prueba
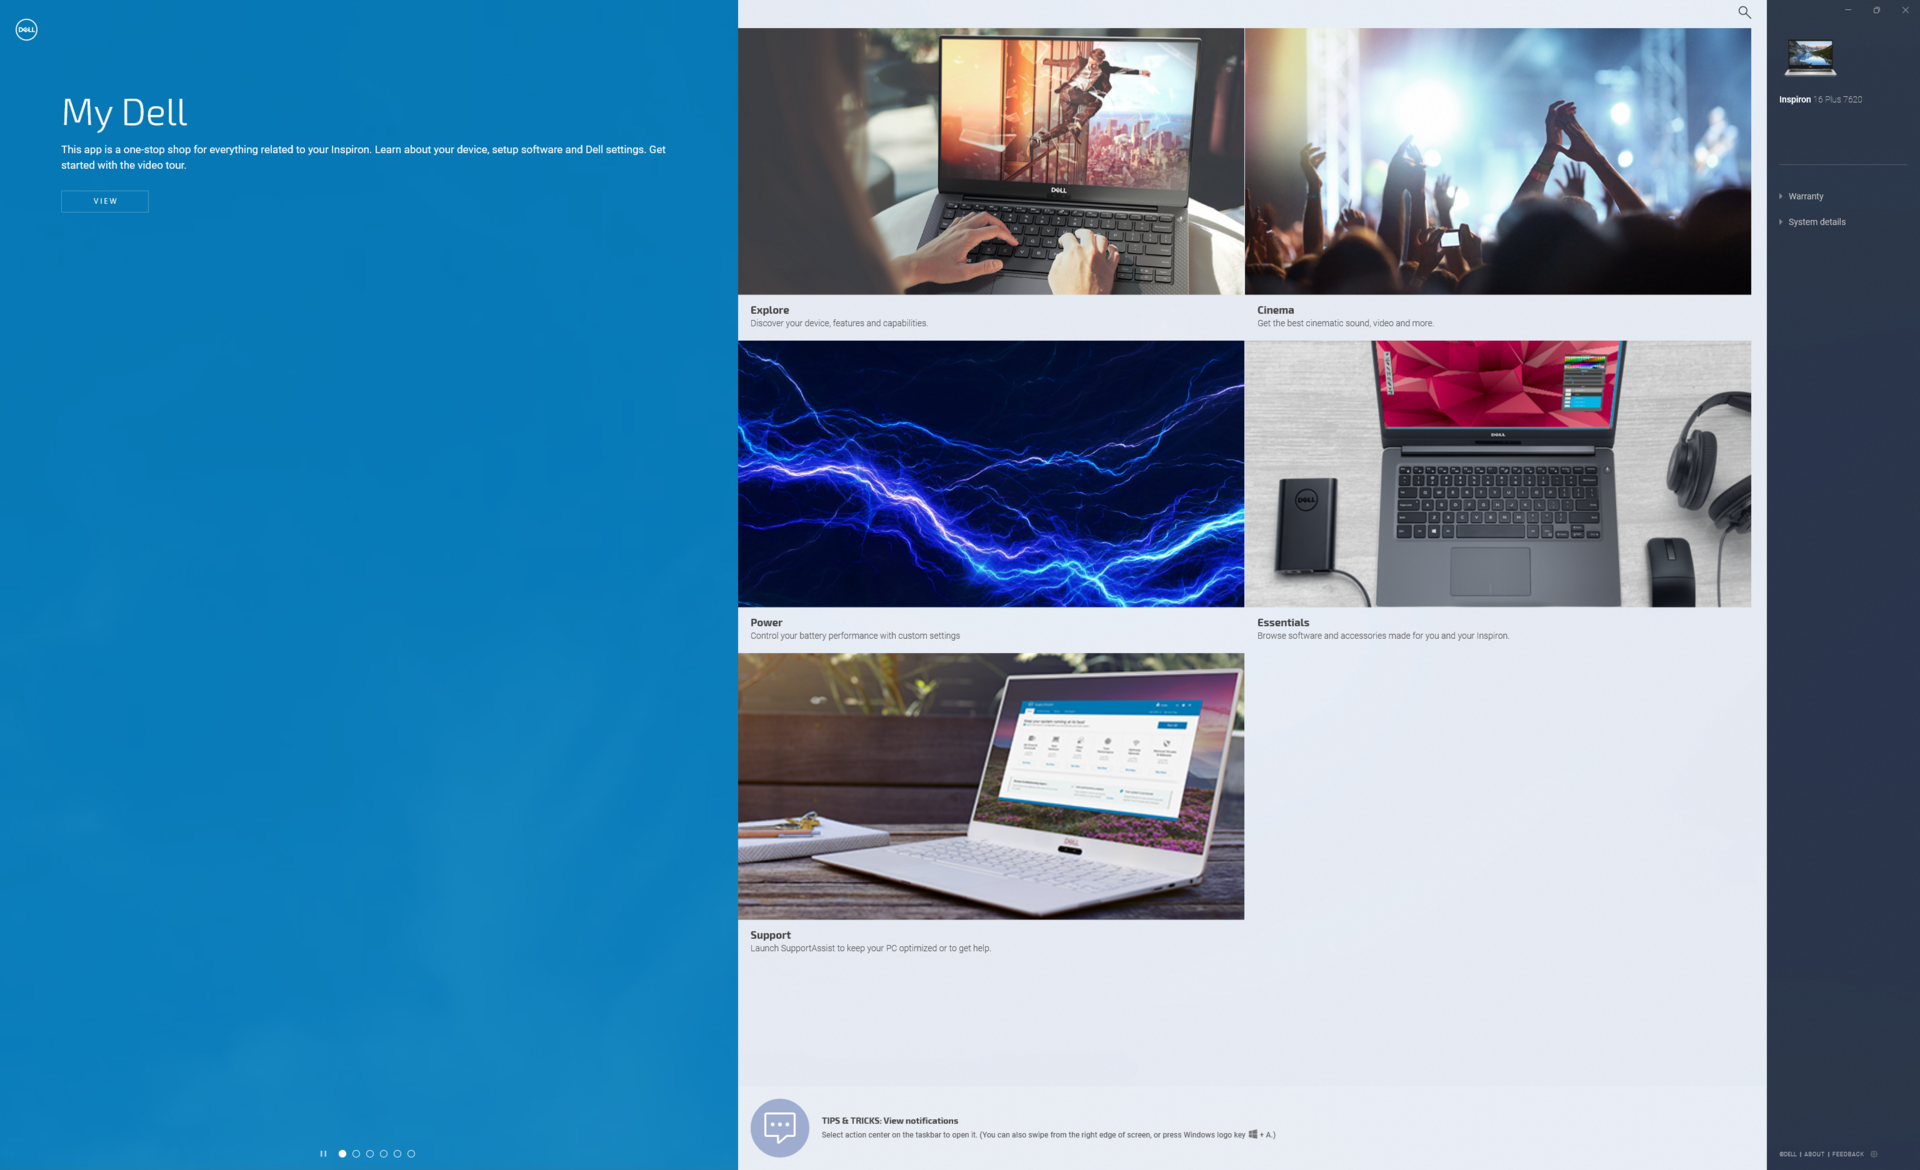
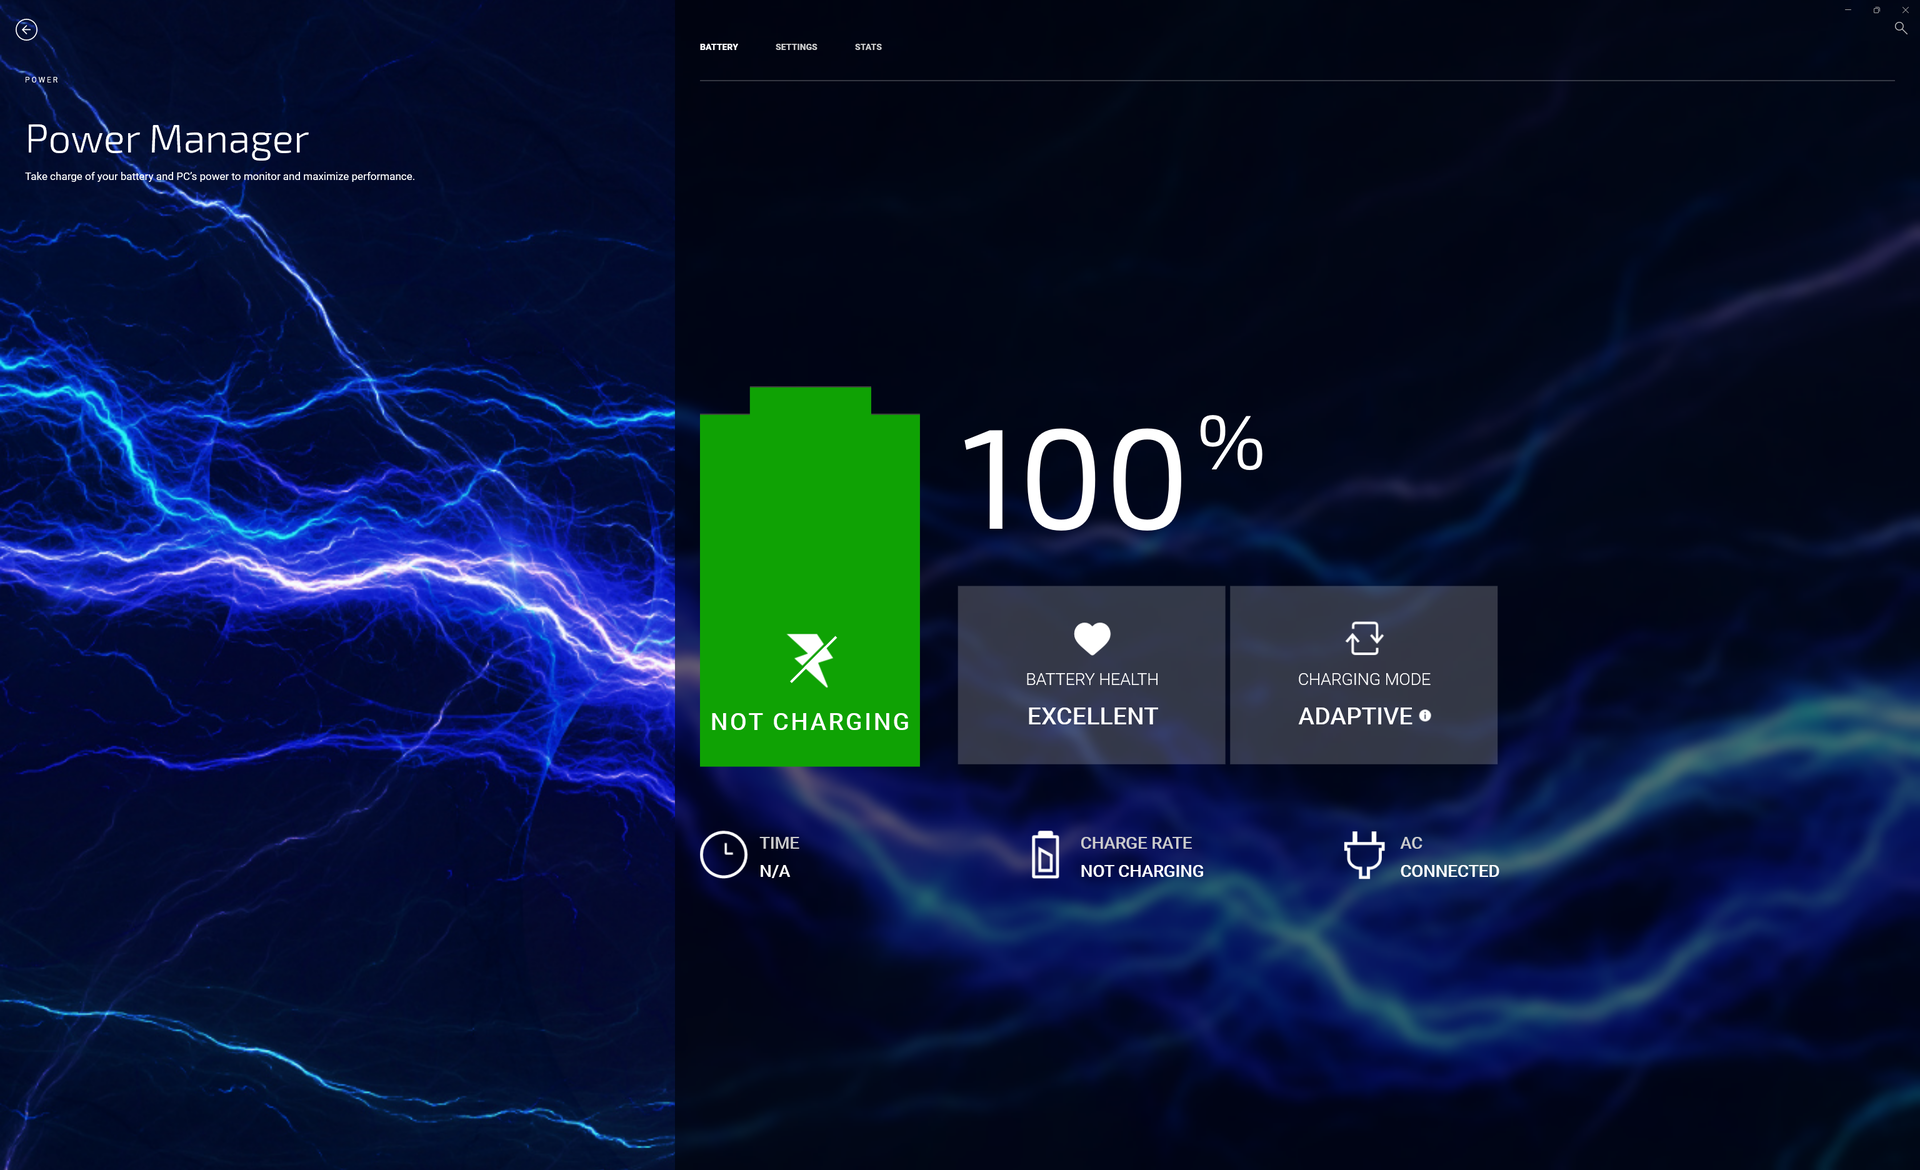
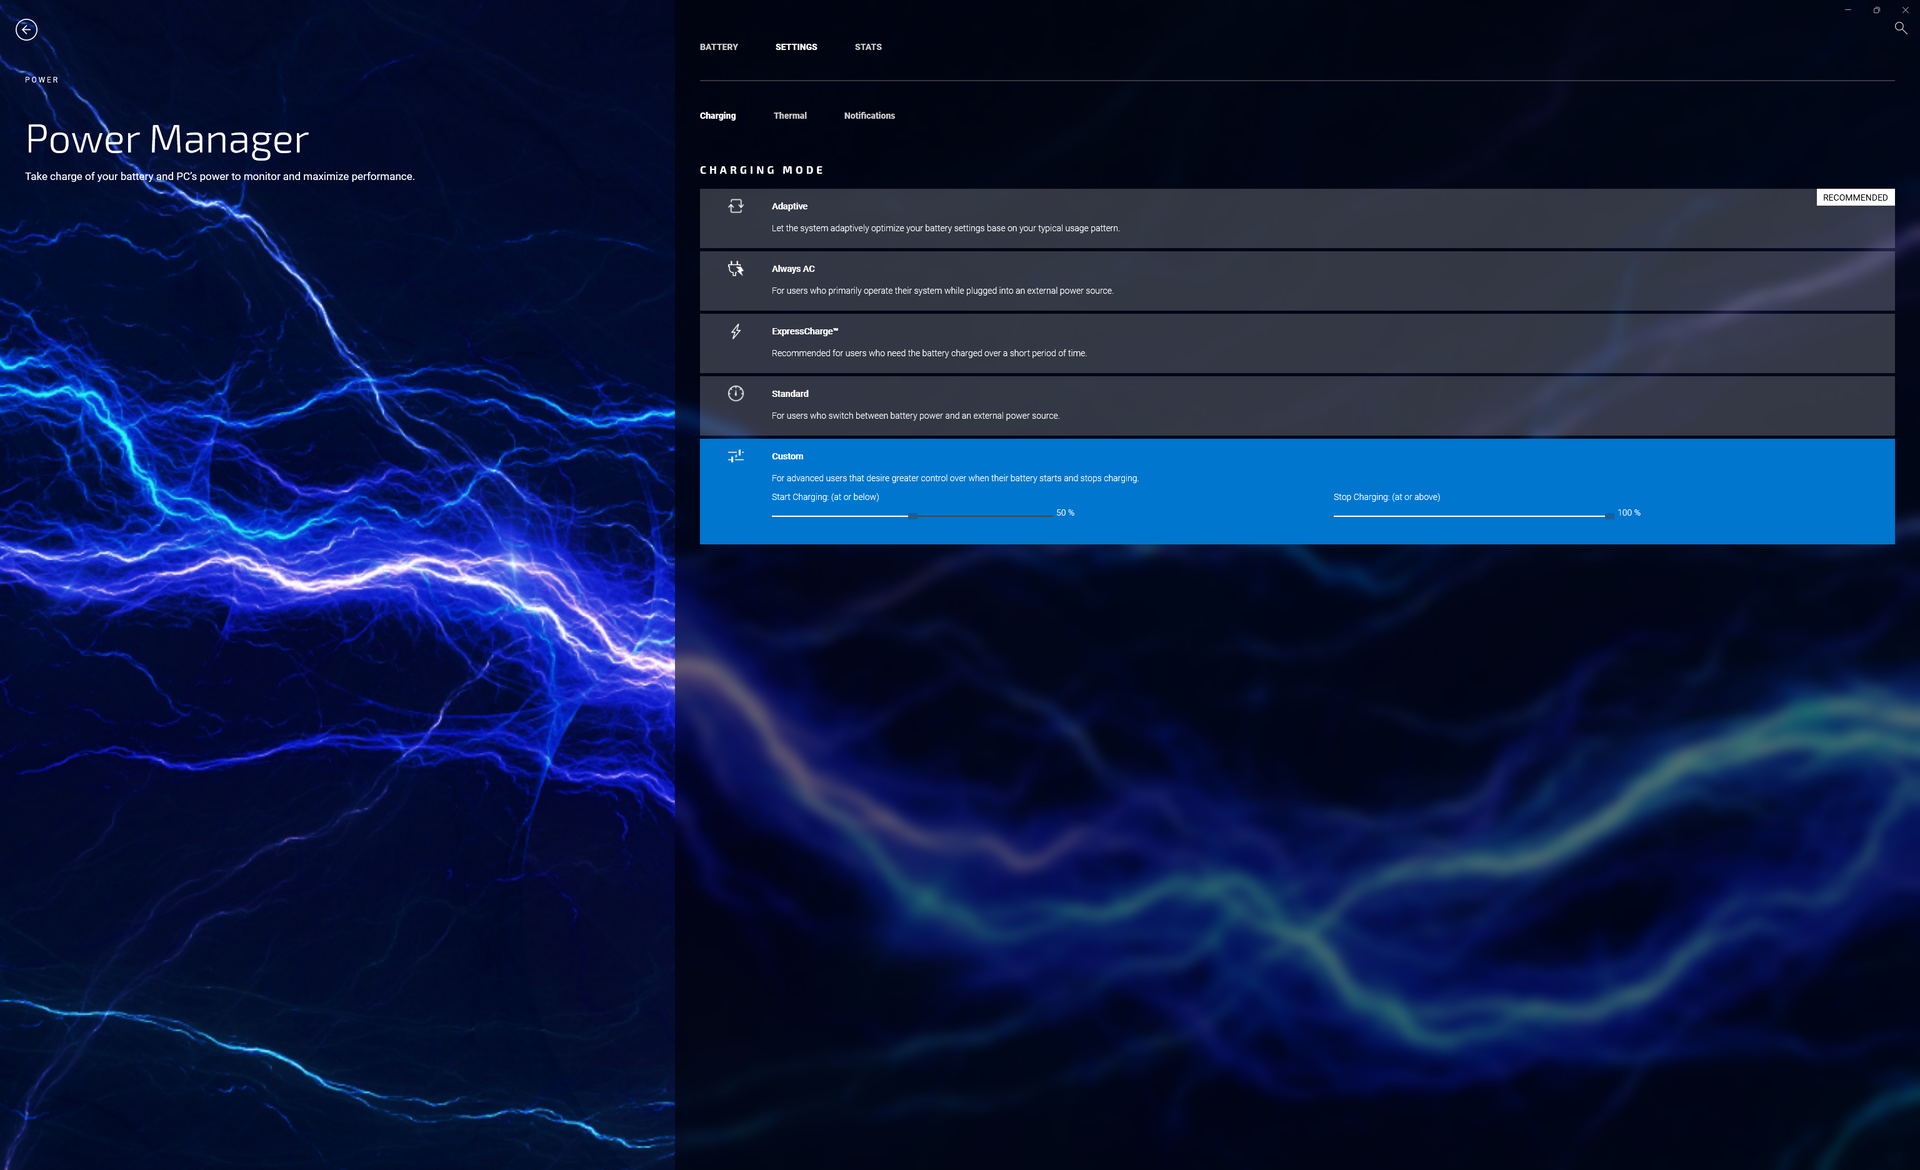
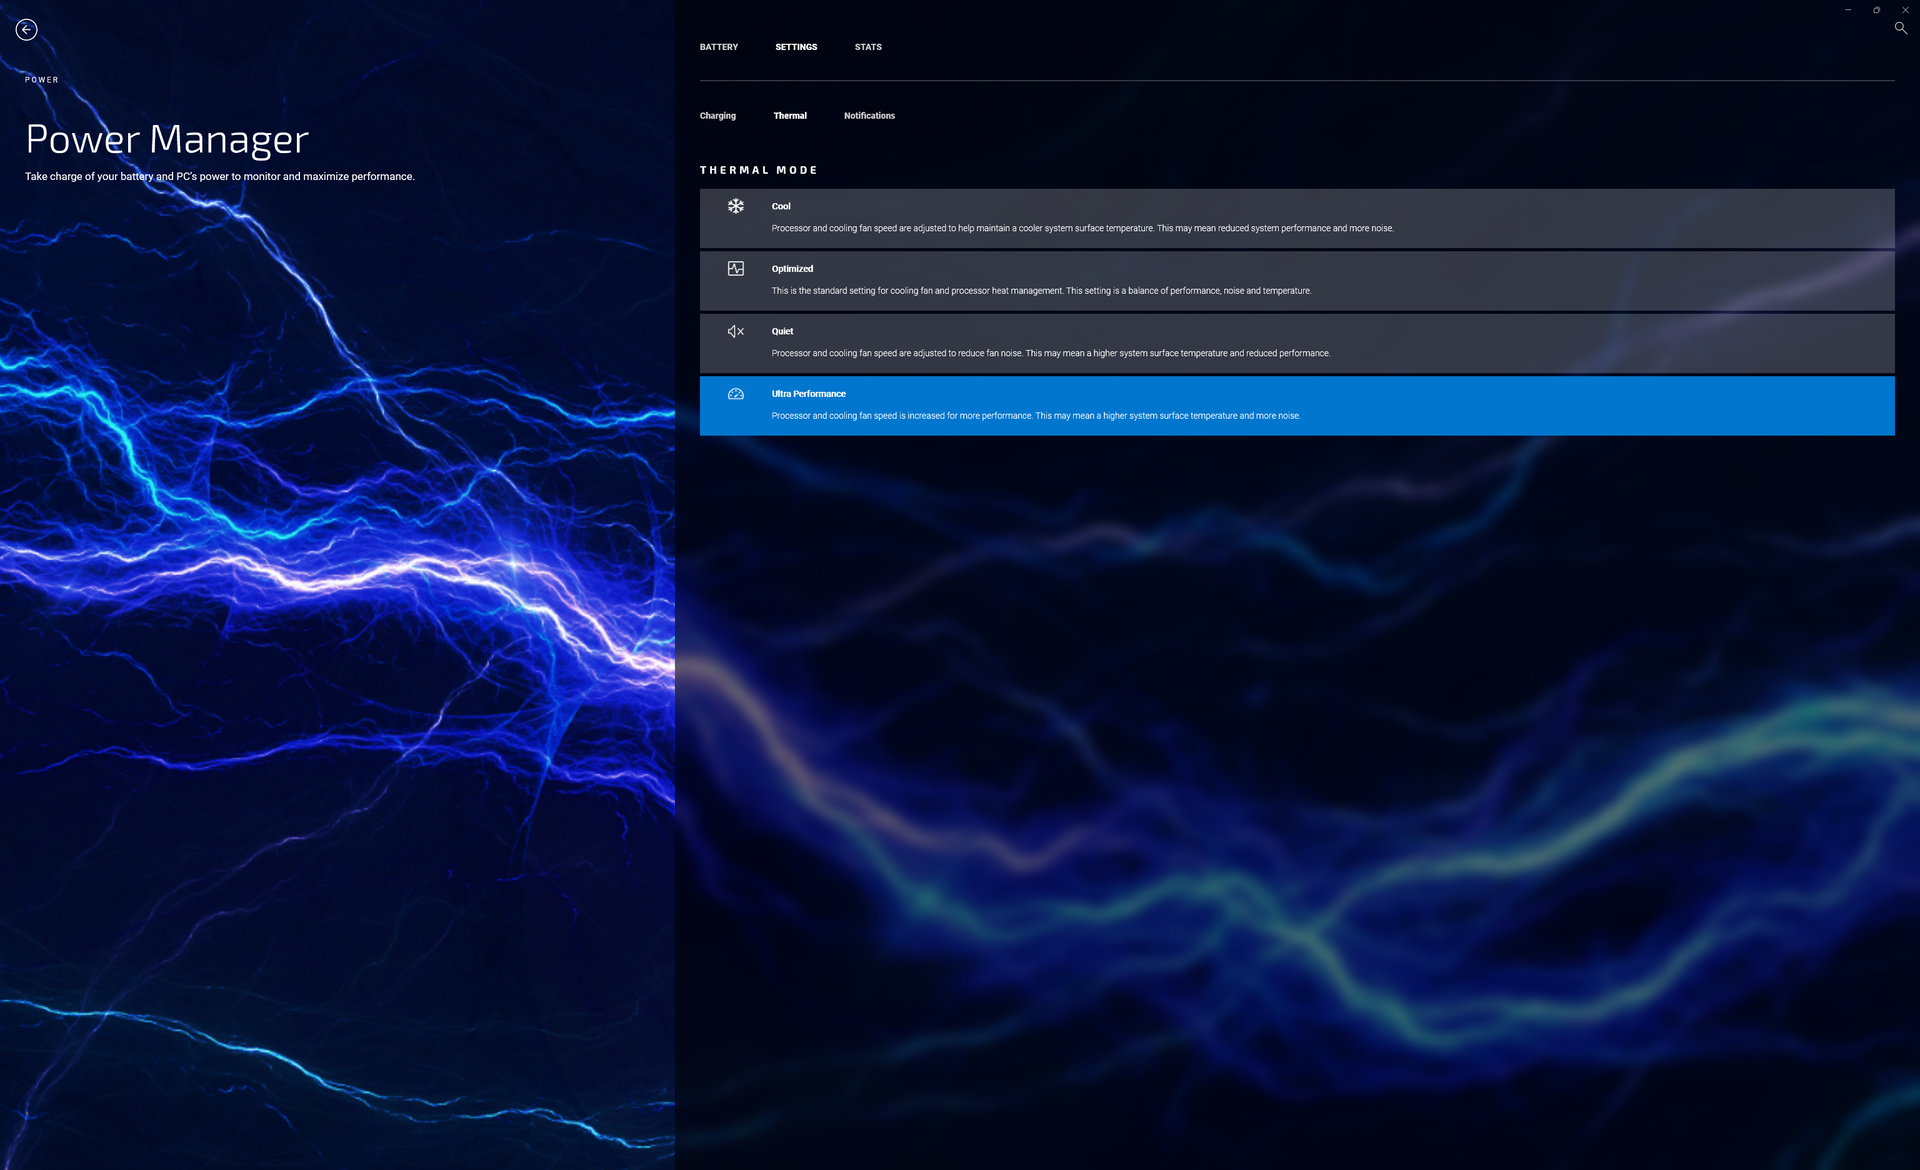
Configuramos nuestra unidad en el modo Rendimiento a través de Windows y en el modo Ultra Rendimiento a través del software preinstalado de MyDell antes de ejecutar cualquier prueba de rendimiento a continuación. Los usuarios deberían familiarizarse con MyDell, ya que es el centro de operaciones de la garantía, el registro del producto, la configuración de la carga de la batería y los modos de rendimiento
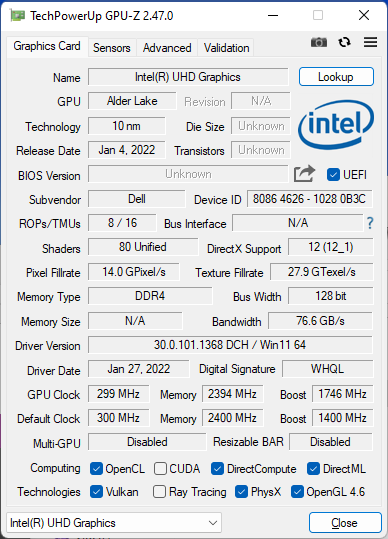
Nvidia Optimus viene de serie sin la opción MUX.
Procesador
El rendimiento multihilo en bruto es entre un 30 y un 50 por ciento más rápido que la última generación Core i7-11800H para representar un aumento bastante significativo de un año a otro. La sostenibilidad del rendimiento podría ser un poco mejor, sin embargo, ya que las puntuaciones de CineBench R15 xT caerían alrededor de un 18 por ciento cuando se ejecuta el benchmark en un bucle. No estamos seguros de la magnitud de la caída de rendimiento que los usuarios deberían esperar si se cambian al Core i5-12500H ya que aún no hemos probado ningún portátil con dicha CPU en el momento de escribir este artículo.
Cinebench R15 Multi Loop
Cinebench R23: Multi Core | Single Core
Cinebench R15: CPU Multi 64Bit | CPU Single 64Bit
Blender: v2.79 BMW27 CPU
7-Zip 18.03: 7z b 4 | 7z b 4 -mmt1
Geekbench 5.5: Multi-Core | Single-Core
HWBOT x265 Benchmark v2.2: 4k Preset
LibreOffice : 20 Documents To PDF
R Benchmark 2.5: Overall mean
| HWBOT x265 Benchmark v2.2 / 4k Preset | |
| MSI Creator Z16P B12UHST | |
| Gigabyte Aero 16 YE5 | |
| Razer Blade 15 2022 | |
| Medio Intel Core i7-12700H (4.67 - 21.8, n=64) | |
| Dell Inspiron 16 Plus 7620 | |
| HP Victus 16-e0145ng | |
| Lenovo Yoga 7 16IAP7 | |
| Dell Inspiron 16 Plus 7610-MHJ8F | |
| Dell Inspiron 14 7420 2-in-1 | |
| Acer Swift X SFX16-51G-5388 | |
| HP Pavilion Gaming 16-a0242ng | |
* ... más pequeño es mejor
AIDA64: FP32 Ray-Trace | FPU Julia | CPU SHA3 | CPU Queen | FPU SinJulia | FPU Mandel | CPU AES | CPU ZLib | FP64 Ray-Trace | CPU PhotoWorxx
| Performance rating | |
| Asus Vivobook Pro 16X-M7600QE | |
| Dell Inspiron 16 Plus 7620 | |
| Medio Intel Core i7-12700H | |
| Huawei MateBook D 16 2022 | |
| Lenovo Yoga 7 16IAP7 | |
| Acer Swift X SFX16-51G-5388 | |
| Dell Inspiron 16 Plus 7610 -9! | |
| AIDA64 / FP32 Ray-Trace | |
| Asus Vivobook Pro 16X-M7600QE | |
| Asus Vivobook Pro 16X-M7600QE | |
| Dell Inspiron 16 Plus 7620 | |
| Huawei MateBook D 16 2022 | |
| Medio Intel Core i7-12700H (2585 - 17957, n=64) | |
| Lenovo Yoga 7 16IAP7 | |
| Acer Swift X SFX16-51G-5388 | |
| AIDA64 / FPU Julia | |
| Asus Vivobook Pro 16X-M7600QE | |
| Asus Vivobook Pro 16X-M7600QE | |
| Dell Inspiron 16 Plus 7620 | |
| Huawei MateBook D 16 2022 | |
| Medio Intel Core i7-12700H (12439 - 90760, n=64) | |
| Lenovo Yoga 7 16IAP7 | |
| Acer Swift X SFX16-51G-5388 | |
| AIDA64 / CPU SHA3 | |
| Asus Vivobook Pro 16X-M7600QE | |
| Asus Vivobook Pro 16X-M7600QE | |
| Medio Intel Core i7-12700H (833 - 4242, n=64) | |
| Dell Inspiron 16 Plus 7620 | |
| Huawei MateBook D 16 2022 | |
| Lenovo Yoga 7 16IAP7 | |
| Acer Swift X SFX16-51G-5388 | |
| AIDA64 / CPU Queen | |
| Asus Vivobook Pro 16X-M7600QE | |
| Asus Vivobook Pro 16X-M7600QE | |
| Medio Intel Core i7-12700H (57923 - 103202, n=63) | |
| Huawei MateBook D 16 2022 | |
| Dell Inspiron 16 Plus 7620 | |
| Lenovo Yoga 7 16IAP7 | |
| Acer Swift X SFX16-51G-5388 | |
| AIDA64 / FPU SinJulia | |
| Asus Vivobook Pro 16X-M7600QE | |
| Asus Vivobook Pro 16X-M7600QE | |
| Medio Intel Core i7-12700H (3249 - 9939, n=64) | |
| Dell Inspiron 16 Plus 7620 | |
| Huawei MateBook D 16 2022 | |
| Lenovo Yoga 7 16IAP7 | |
| Acer Swift X SFX16-51G-5388 | |
| AIDA64 / FPU Mandel | |
| Asus Vivobook Pro 16X-M7600QE | |
| Asus Vivobook Pro 16X-M7600QE | |
| Dell Inspiron 16 Plus 7620 | |
| Medio Intel Core i7-12700H (7135 - 44760, n=64) | |
| Huawei MateBook D 16 2022 | |
| Lenovo Yoga 7 16IAP7 | |
| Acer Swift X SFX16-51G-5388 | |
| AIDA64 / CPU AES | |
| Asus Vivobook Pro 16X-M7600QE | |
| Asus Vivobook Pro 16X-M7600QE | |
| Huawei MateBook D 16 2022 | |
| Medio Intel Core i7-12700H (31839 - 144360, n=64) | |
| Dell Inspiron 16 Plus 7620 | |
| Acer Swift X SFX16-51G-5388 | |
| Lenovo Yoga 7 16IAP7 | |
| AIDA64 / FP64 Ray-Trace | |
| Asus Vivobook Pro 16X-M7600QE | |
| Asus Vivobook Pro 16X-M7600QE | |
| Dell Inspiron 16 Plus 7620 | |
| Medio Intel Core i7-12700H (1437 - 9692, n=64) | |
| Huawei MateBook D 16 2022 | |
| Lenovo Yoga 7 16IAP7 | |
| Acer Swift X SFX16-51G-5388 | |
| AIDA64 / CPU PhotoWorxx | |
| Lenovo Yoga 7 16IAP7 | |
| Huawei MateBook D 16 2022 | |
| Acer Swift X SFX16-51G-5388 | |
| Dell Inspiron 16 Plus 7620 | |
| Medio Intel Core i7-12700H (12863 - 52207, n=64) | |
| Asus Vivobook Pro 16X-M7600QE | |
| Asus Vivobook Pro 16X-M7600QE | |
Rendimiento del sistema
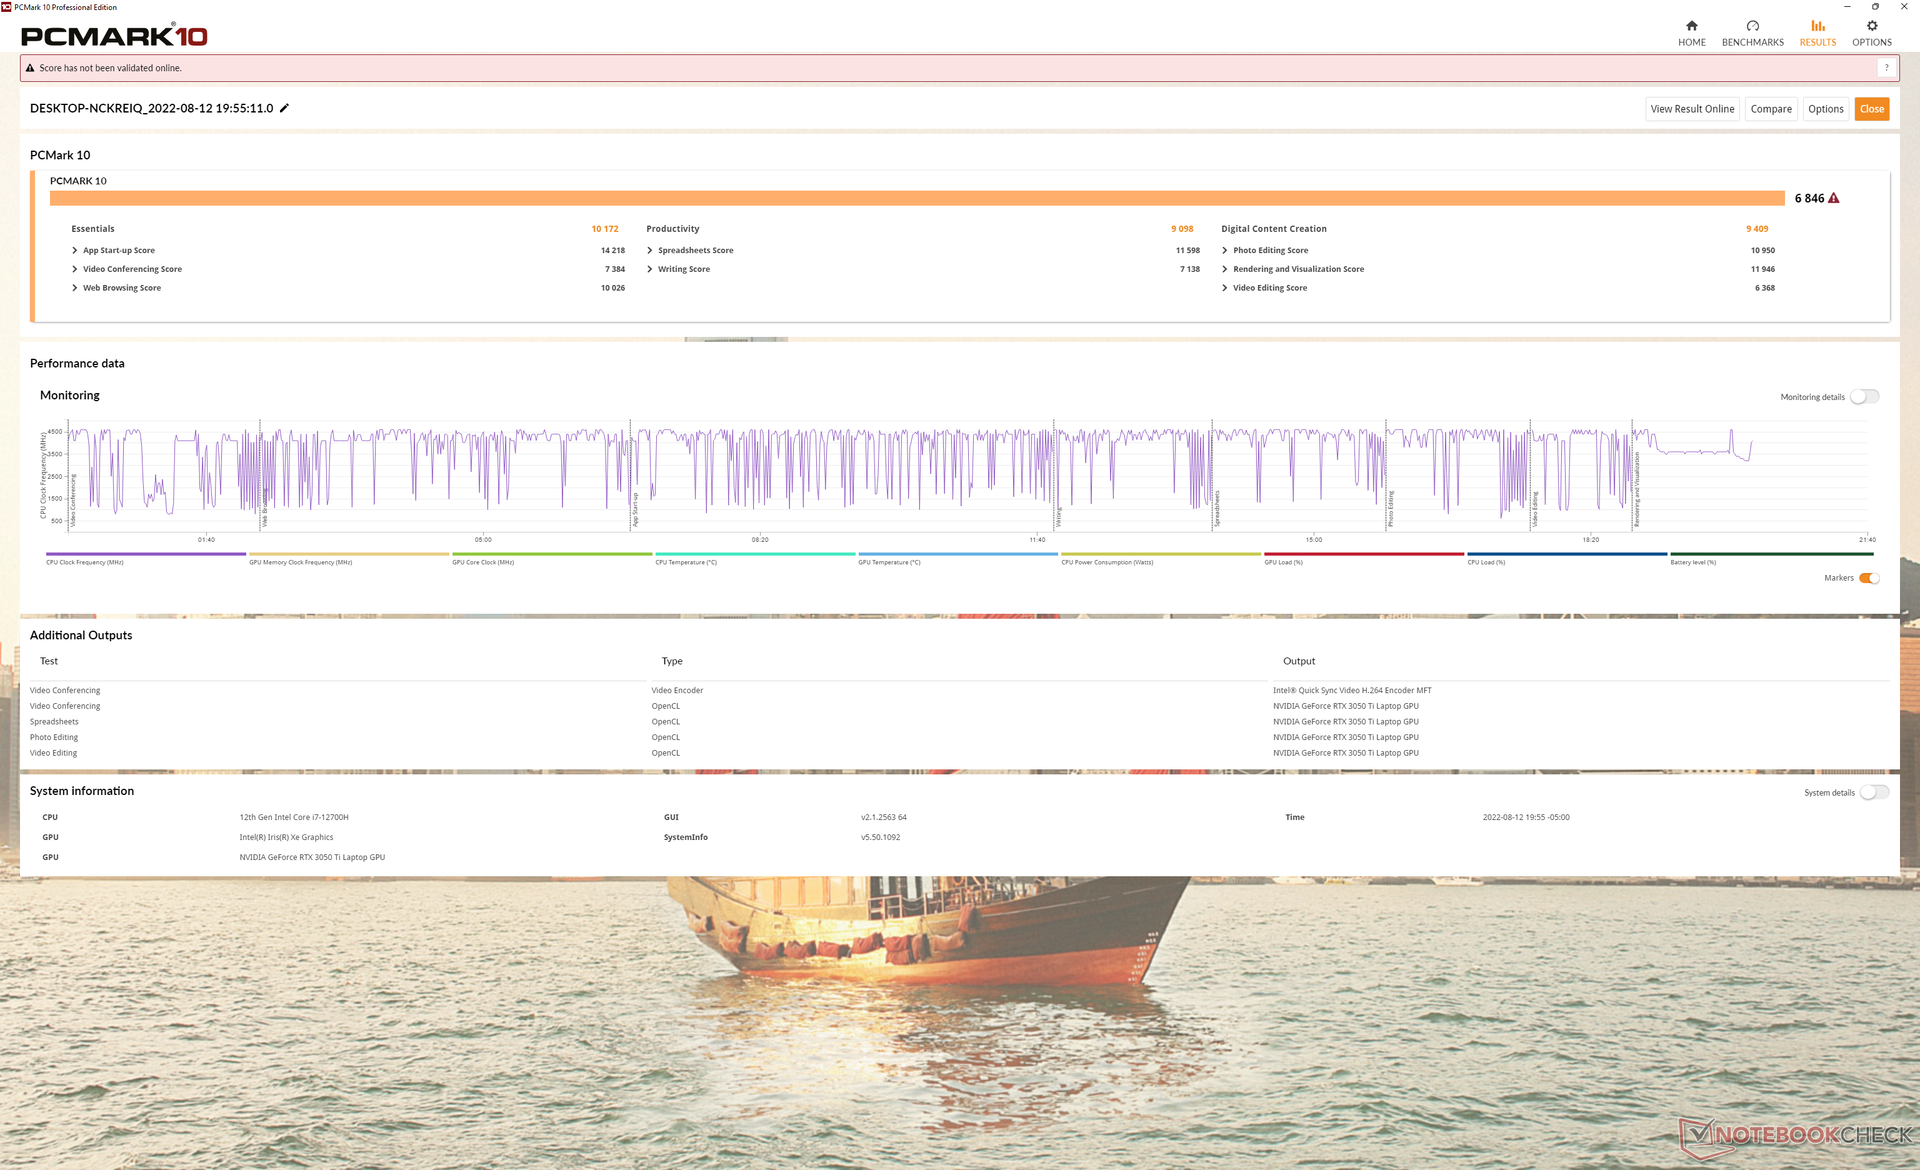
Los resultados de PCMark 10 son sistemáticamente superiores a los de la generación anterior del Inspiron 16 Plus 7610, así como a los de la mayoría de los portátiles multimedia de 16 pulgadas.
CrossMark: Overall | Productivity | Creativity | Responsiveness
| PCMark 10 / Score | |
| Dell Inspiron 16 Plus 7620 | |
| Medio Intel Core i7-12700H, NVIDIA GeForce RTX 3050 Ti Laptop GPU (6623 - 7075, n=5) | |
| Asus Vivobook Pro 16X-M7600QE | |
| Dell Inspiron 16 Plus 7610 | |
| Huawei MateBook D 16 2022 | |
| Lenovo Yoga 7 16IAP7 | |
| Acer Swift X SFX16-51G-5388 | |
| PCMark 10 / Essentials | |
| Huawei MateBook D 16 2022 | |
| Lenovo Yoga 7 16IAP7 | |
| Asus Vivobook Pro 16X-M7600QE | |
| Medio Intel Core i7-12700H, NVIDIA GeForce RTX 3050 Ti Laptop GPU (9540 - 10970, n=5) | |
| Dell Inspiron 16 Plus 7620 | |
| Dell Inspiron 16 Plus 7610 | |
| Acer Swift X SFX16-51G-5388 | |
| PCMark 10 / Productivity | |
| Asus Vivobook Pro 16X-M7600QE | |
| Dell Inspiron 16 Plus 7620 | |
| Medio Intel Core i7-12700H, NVIDIA GeForce RTX 3050 Ti Laptop GPU (8530 - 9555, n=5) | |
| Acer Swift X SFX16-51G-5388 | |
| Dell Inspiron 16 Plus 7610 | |
| Huawei MateBook D 16 2022 | |
| Lenovo Yoga 7 16IAP7 | |
| PCMark 10 / Digital Content Creation | |
| Dell Inspiron 16 Plus 7620 | |
| Medio Intel Core i7-12700H, NVIDIA GeForce RTX 3050 Ti Laptop GPU (8855 - 9542, n=5) | |
| Dell Inspiron 16 Plus 7610 | |
| Asus Vivobook Pro 16X-M7600QE | |
| Lenovo Yoga 7 16IAP7 | |
| Huawei MateBook D 16 2022 | |
| Acer Swift X SFX16-51G-5388 | |
| CrossMark / Overall | |
| Huawei MateBook D 16 2022 | |
| Dell Inspiron 16 Plus 7620 | |
| Medio Intel Core i7-12700H, NVIDIA GeForce RTX 3050 Ti Laptop GPU (1654 - 1872, n=5) | |
| Lenovo Yoga 7 16IAP7 | |
| Acer Swift X SFX16-51G-5388 | |
| CrossMark / Productivity | |
| Huawei MateBook D 16 2022 | |
| Medio Intel Core i7-12700H, NVIDIA GeForce RTX 3050 Ti Laptop GPU (1595 - 1792, n=5) | |
| Dell Inspiron 16 Plus 7620 | |
| Lenovo Yoga 7 16IAP7 | |
| Acer Swift X SFX16-51G-5388 | |
| CrossMark / Creativity | |
| Huawei MateBook D 16 2022 | |
| Dell Inspiron 16 Plus 7620 | |
| Lenovo Yoga 7 16IAP7 | |
| Medio Intel Core i7-12700H, NVIDIA GeForce RTX 3050 Ti Laptop GPU (1699 - 1993, n=5) | |
| Acer Swift X SFX16-51G-5388 | |
| CrossMark / Responsiveness | |
| Huawei MateBook D 16 2022 | |
| Medio Intel Core i7-12700H, NVIDIA GeForce RTX 3050 Ti Laptop GPU (1383 - 1768, n=5) | |
| Dell Inspiron 16 Plus 7620 | |
| Lenovo Yoga 7 16IAP7 | |
| Acer Swift X SFX16-51G-5388 | |
| PCMark 10 Score | 6846 puntos | |
ayuda | ||
| AIDA64 / Memory Copy | |
| Lenovo Yoga 7 16IAP7 | |
| Huawei MateBook D 16 2022 | |
| Acer Swift X SFX16-51G-5388 | |
| Dell Inspiron 16 Plus 7620 | |
| Medio Intel Core i7-12700H (25615 - 80511, n=64) | |
| Asus Vivobook Pro 16X-M7600QE | |
| Asus Vivobook Pro 16X-M7600QE | |
| AIDA64 / Memory Read | |
| Lenovo Yoga 7 16IAP7 | |
| Dell Inspiron 16 Plus 7620 | |
| Medio Intel Core i7-12700H (25586 - 79442, n=64) | |
| Huawei MateBook D 16 2022 | |
| Acer Swift X SFX16-51G-5388 | |
| Asus Vivobook Pro 16X-M7600QE | |
| Asus Vivobook Pro 16X-M7600QE | |
| AIDA64 / Memory Write | |
| Acer Swift X SFX16-51G-5388 | |
| Lenovo Yoga 7 16IAP7 | |
| Huawei MateBook D 16 2022 | |
| Dell Inspiron 16 Plus 7620 | |
| Medio Intel Core i7-12700H (23679 - 88660, n=64) | |
| Asus Vivobook Pro 16X-M7600QE | |
| Asus Vivobook Pro 16X-M7600QE | |
| AIDA64 / Memory Latency | |
| Acer Swift X SFX16-51G-5388 | |
| Huawei MateBook D 16 2022 | |
| Lenovo Yoga 7 16IAP7 | |
| Dell Inspiron 16 Plus 7620 | |
| Medio Intel Core i7-12700H (76.2 - 133.9, n=62) | |
| Asus Vivobook Pro 16X-M7600QE | |
| Asus Vivobook Pro 16X-M7600QE | |
| Dell Inspiron 16 Plus 7610 | |
* ... más pequeño es mejor
Latencia del CPD
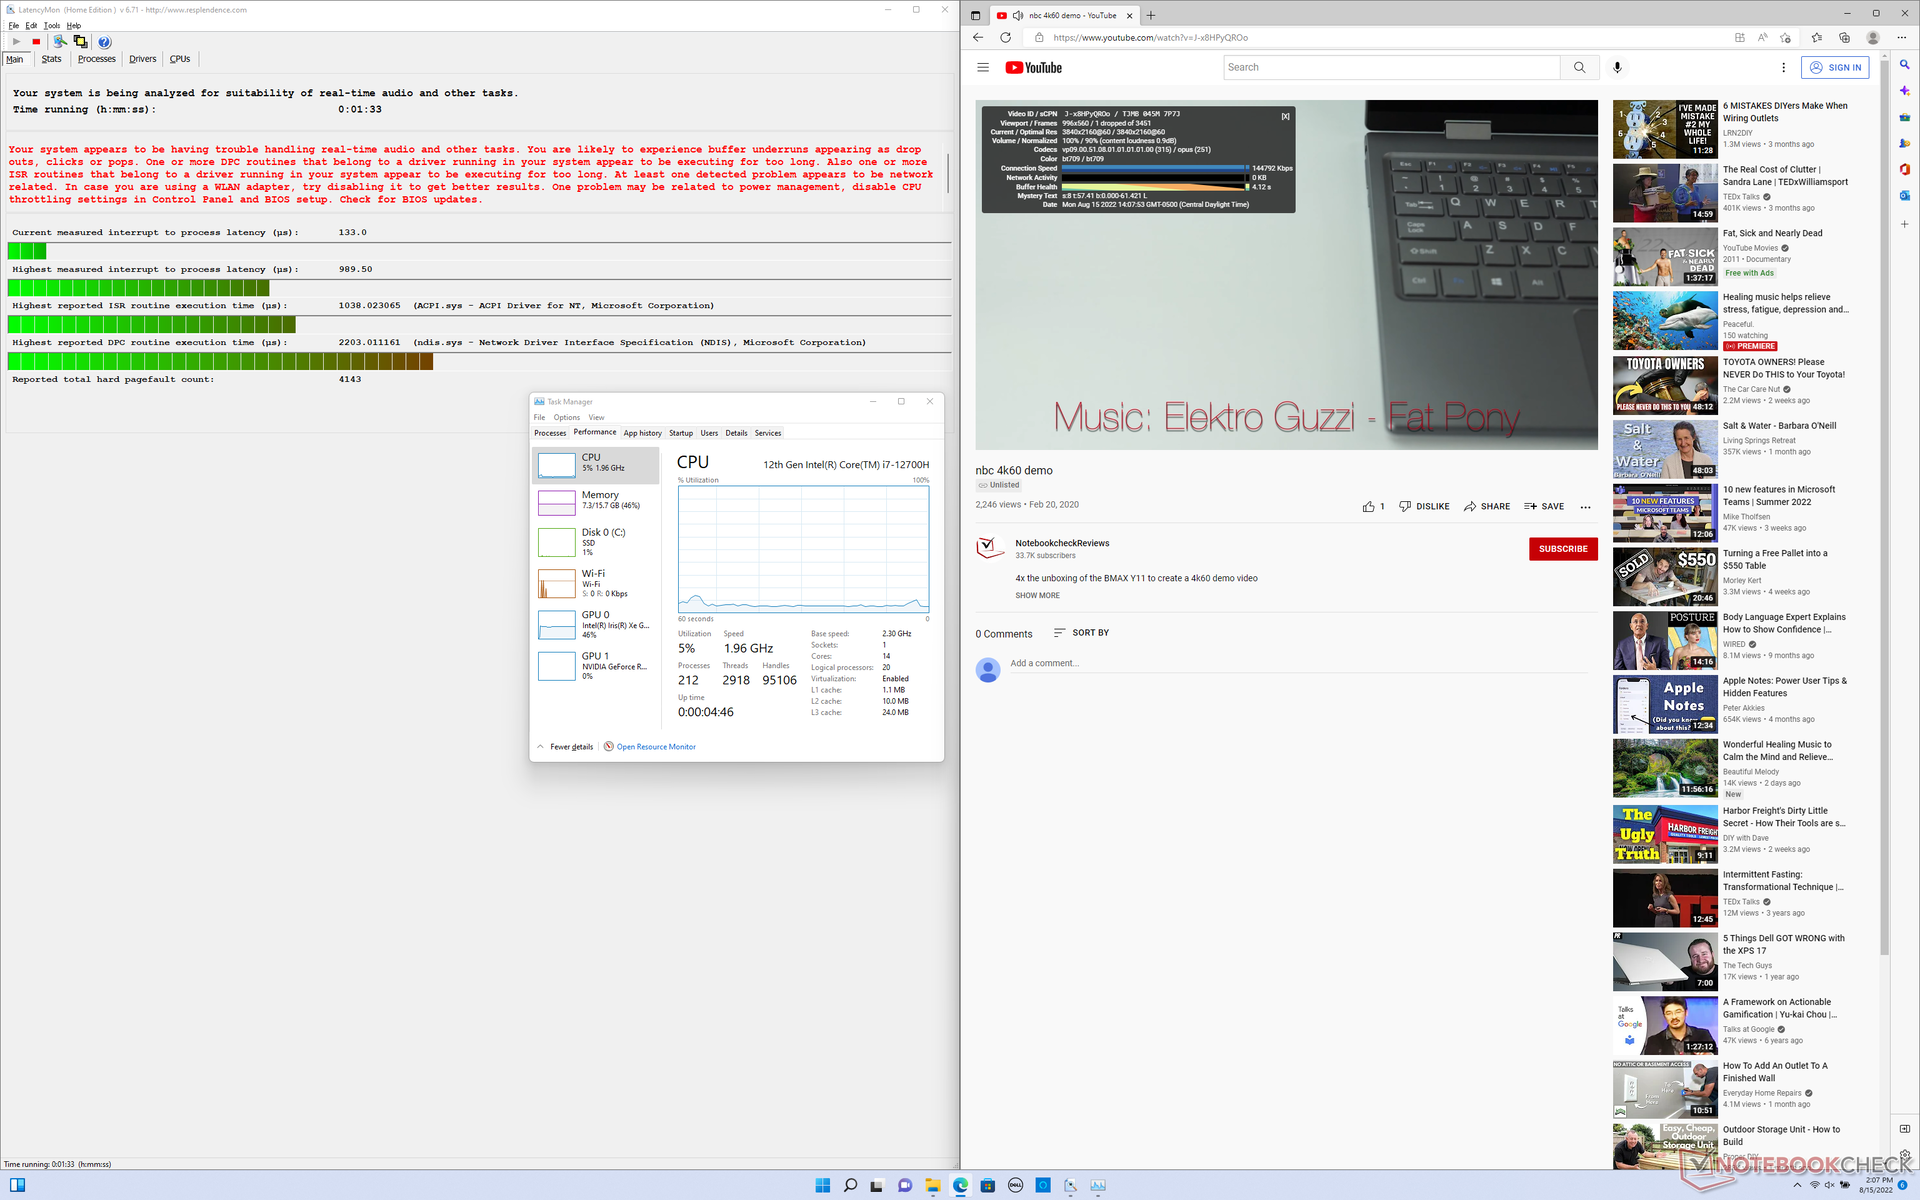
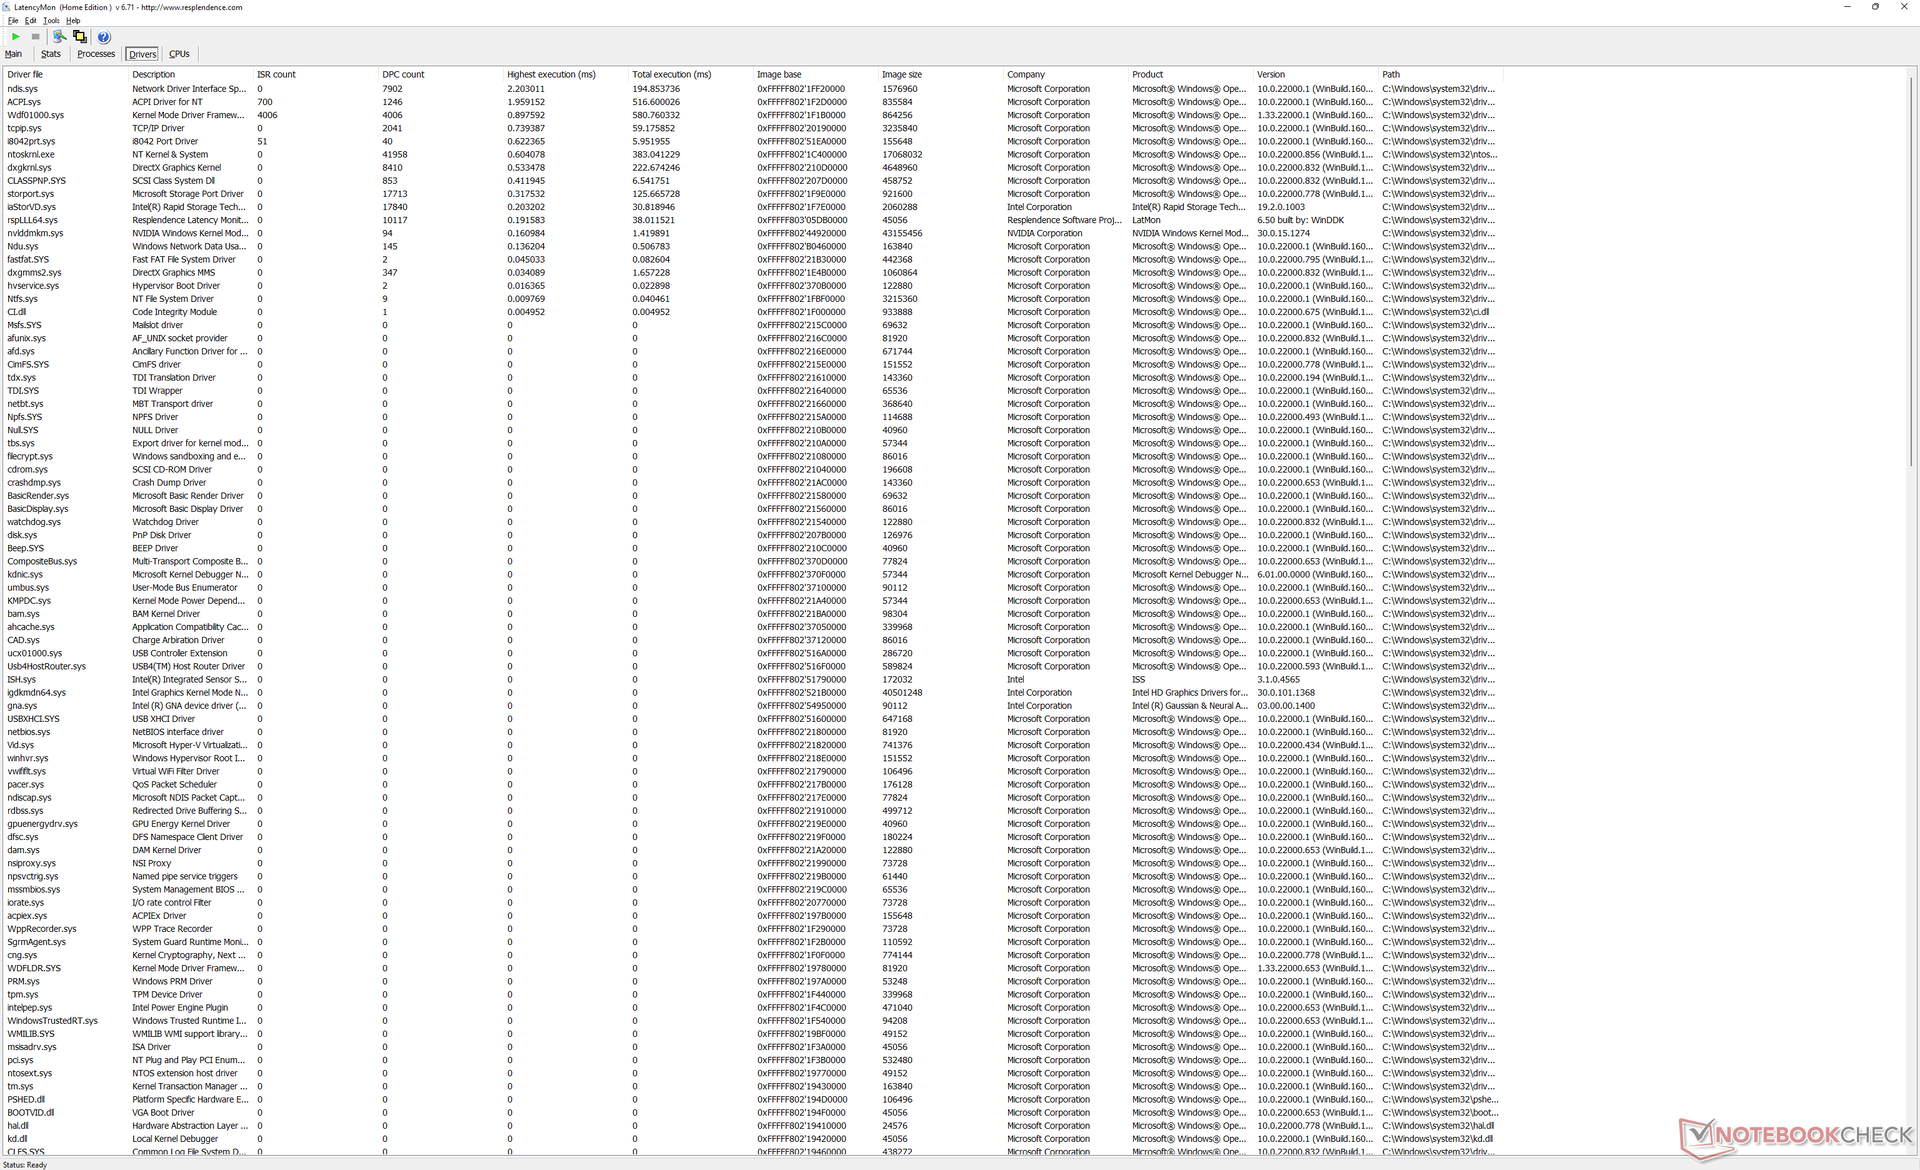
LatencyMon revela problemas menores de CPD al abrir varias pestañas del navegador en nuestra página de inicio. la reproducción de vídeo 4K a 60 FPS es, por lo demás, fluida, con un solo fotograma perdido durante nuestro vídeo de prueba de un minuto.
| DPC Latencies / LatencyMon - interrupt to process latency (max), Web, Youtube, Prime95 | |
| Acer Swift X SFX16-51G-5388 | |
| Asus Vivobook Pro 16X-M7600QE | |
| Dell Inspiron 16 Plus 7610 | |
| Dell Inspiron 16 Plus 7620 | |
| Huawei MateBook D 16 2022 | |
| Lenovo Yoga 7 16IAP7 | |
* ... más pequeño es mejor
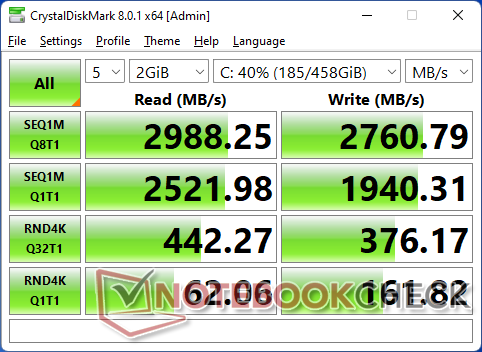
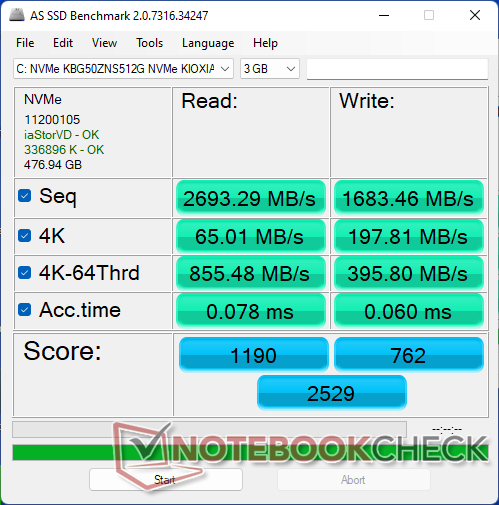
Dispositivos de almacenamiento
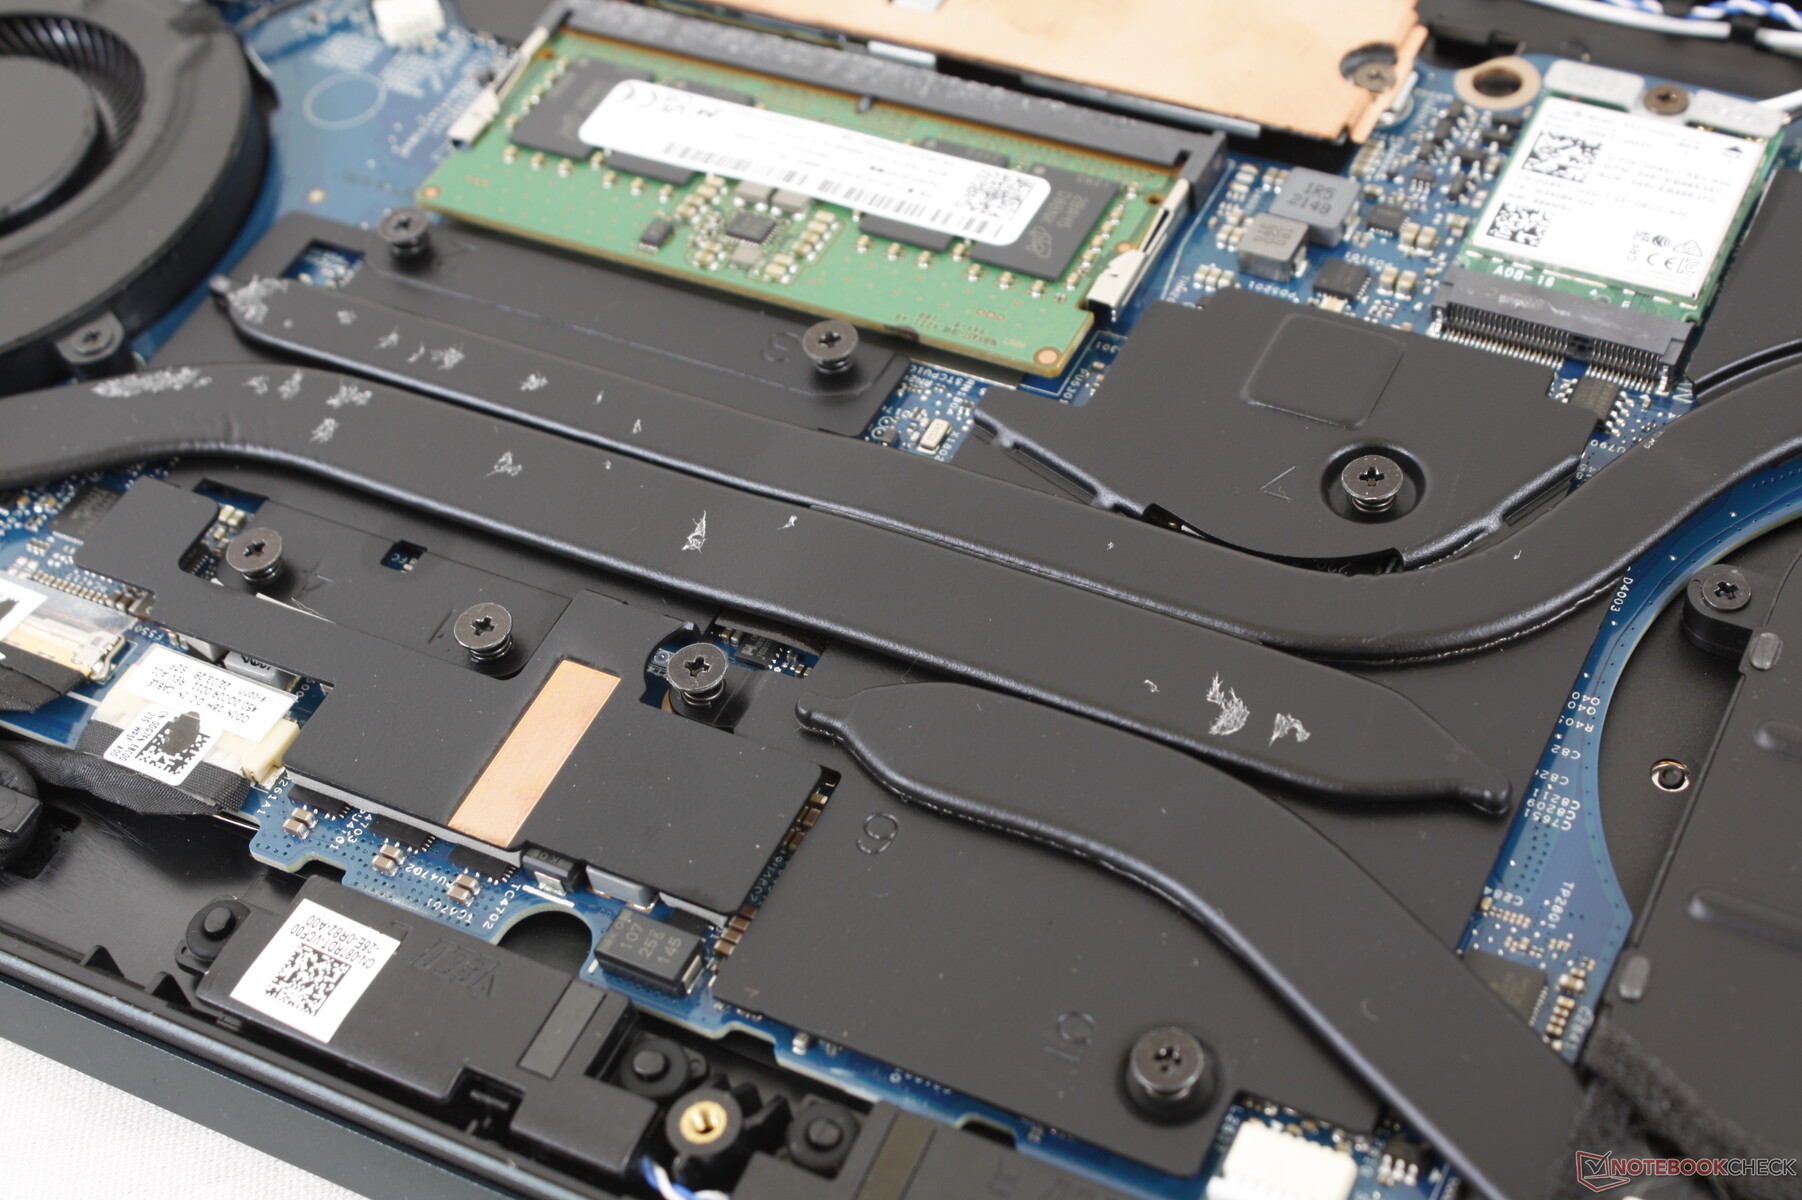
Nuestra unidad de prueba viene con una económica unidad M.2 PCIe4 x4 de 512 GBKioxia SSD para velocidades de lectura y escritura secuenciales de hasta ~2700 MB/s cada una. Un disipador de calor de cobre se encuentra en la parte superior para ayudar a la refrigeración. La unidad de nuestra unidad no mostró problemas de rendimiento al ejecutar DiskSpd en un bucle.

| Drive Performance rating - Percent | |
| Huawei MateBook D 16 2022 | |
| Asus Vivobook Pro 16X-M7600QE | |
| Lenovo Yoga 7 16IAP7 | |
| Dell Inspiron 16 Plus 7620 | |
| Acer Swift X SFX16-51G-5388 | |
| Dell Inspiron 16 Plus 7610 | |
* ... más pequeño es mejor
Disk Throttling: DiskSpd Read Loop, Queue Depth 8
Rendimiento de la GPU: ligeramente más rápido que antes
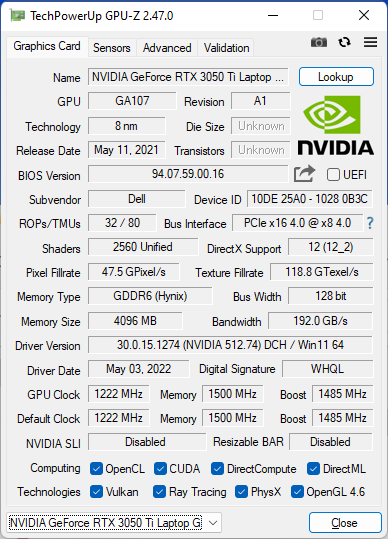
El rendimiento gráfico de nuestra GeForce RTX 3050 Ti es sólo un 10% más rápido que la RTX 3050 del modelo del año pasado. Aunque la serie RTX 3050 es en general decepcionante ya que la más antigua y barata GTX 1660 Ti es superior, al menos la implementación de Dell aquí es más rápida que la mayoría de portátiles que llevan la misma GPU
Se espera que la actualización a la configuración RTX 3060 aumente el rendimiento gráfico hasta un 20 por ciento. Sin embargo, la GPU estaría limitada a un TGP de 60 W, que está en el extremo inferior del espectro de las opciones RTX 3060 para portátiles.
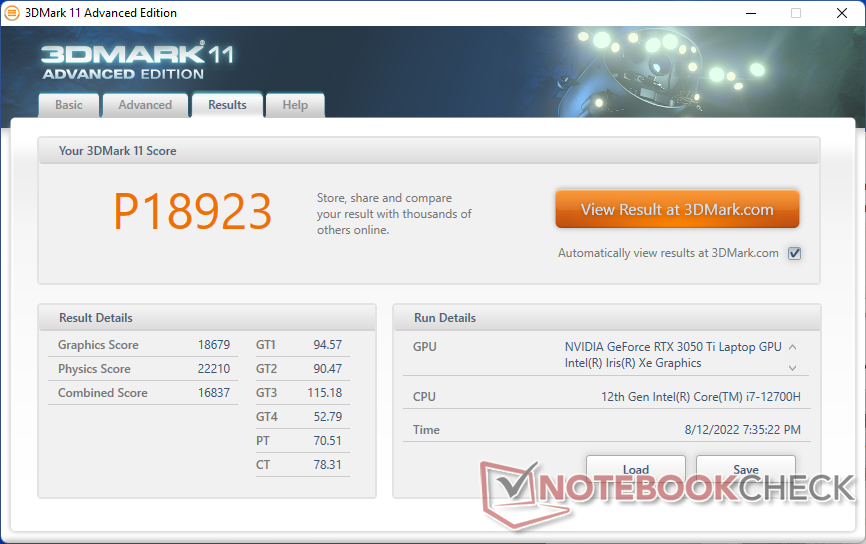
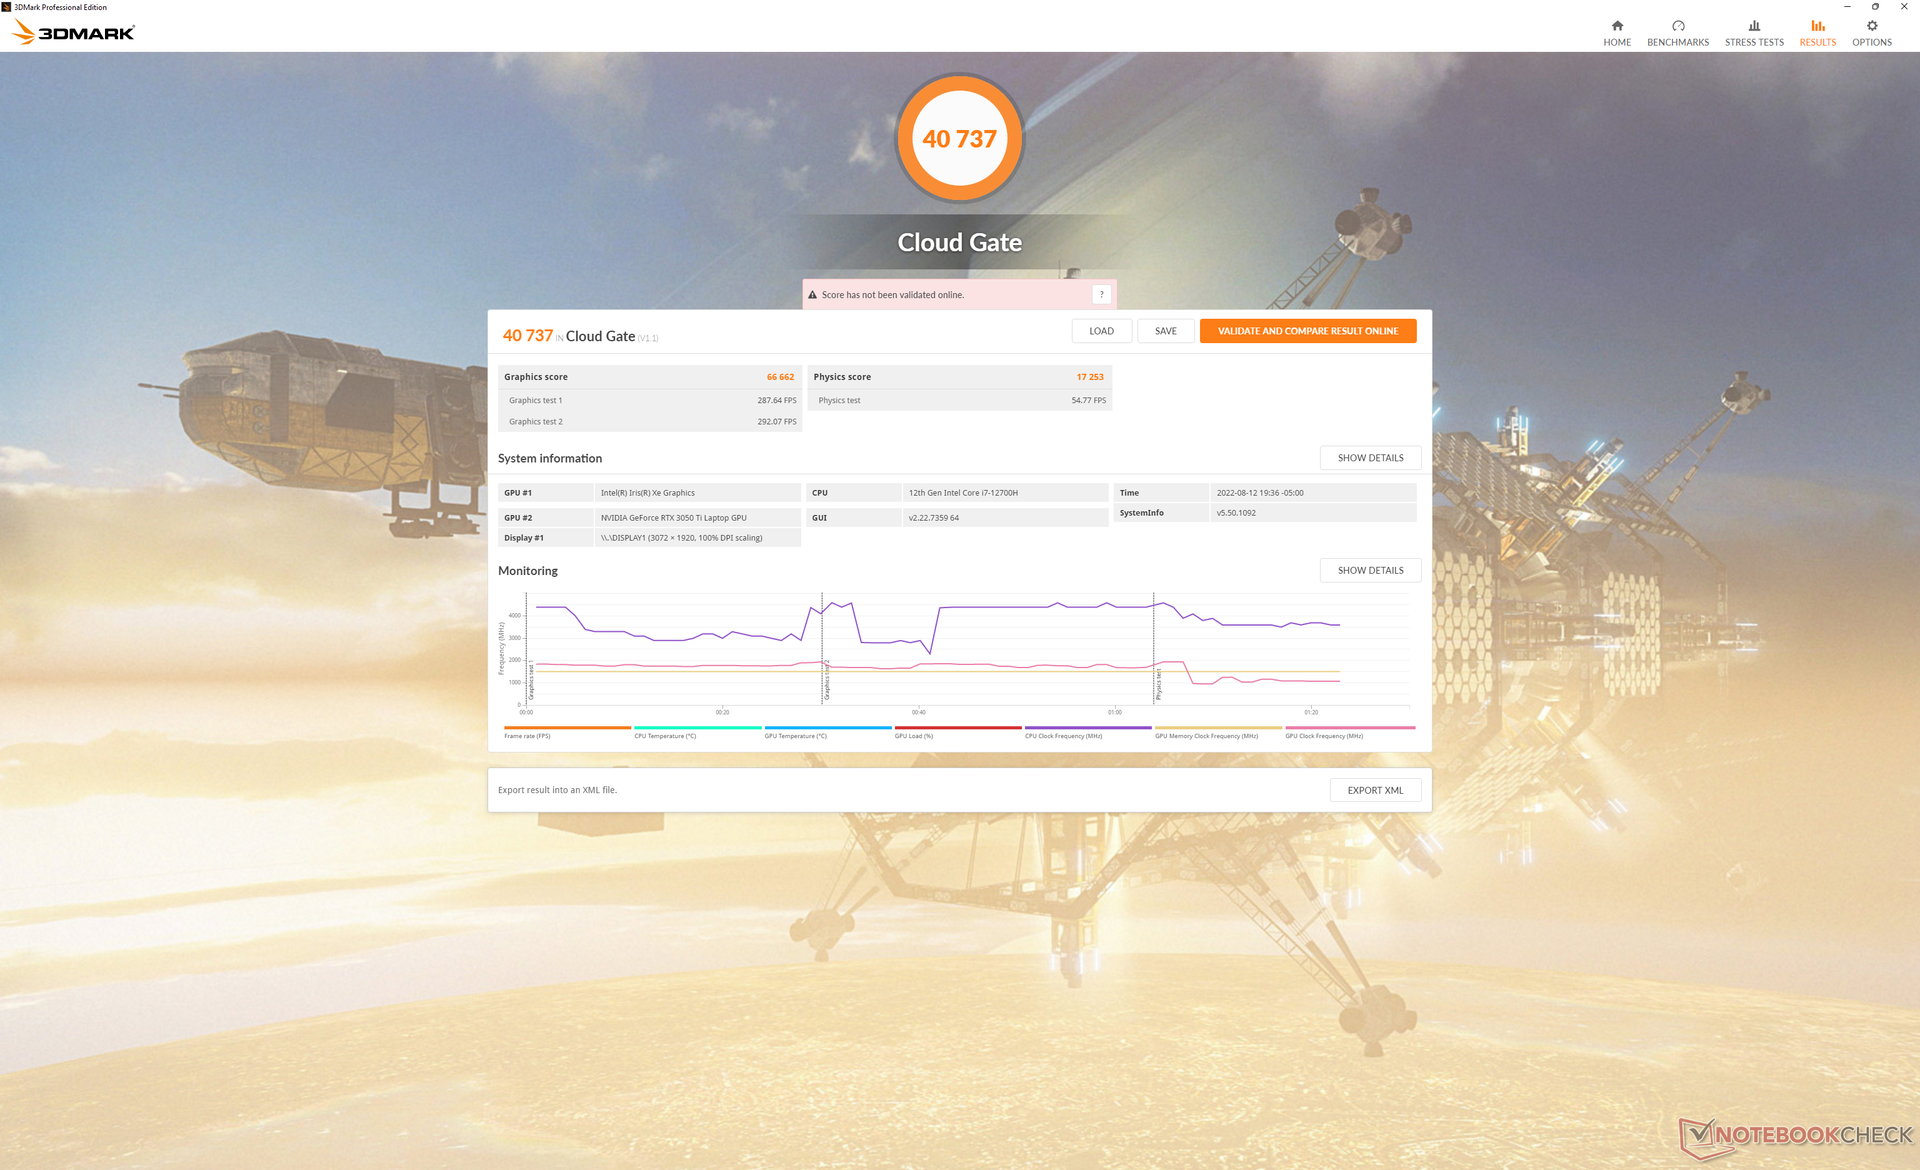
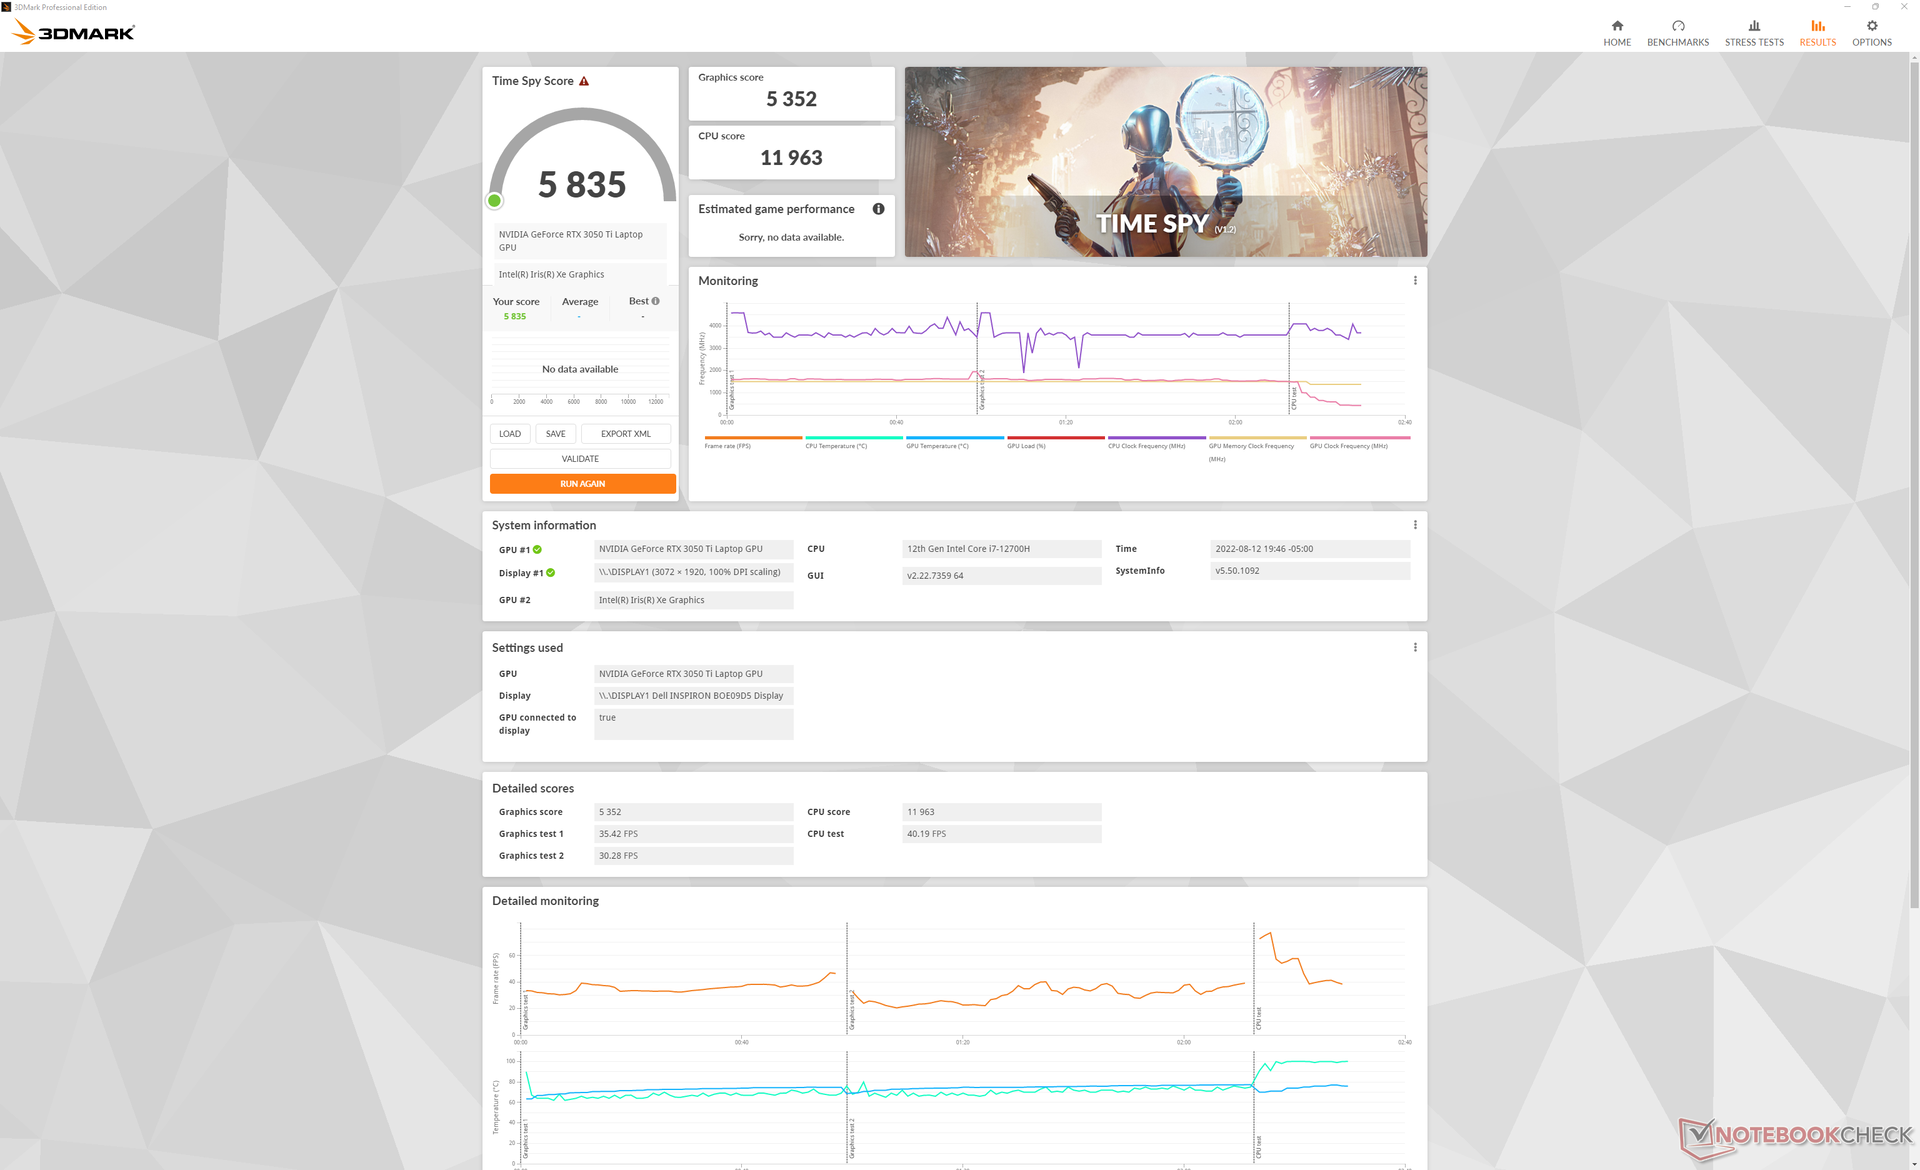
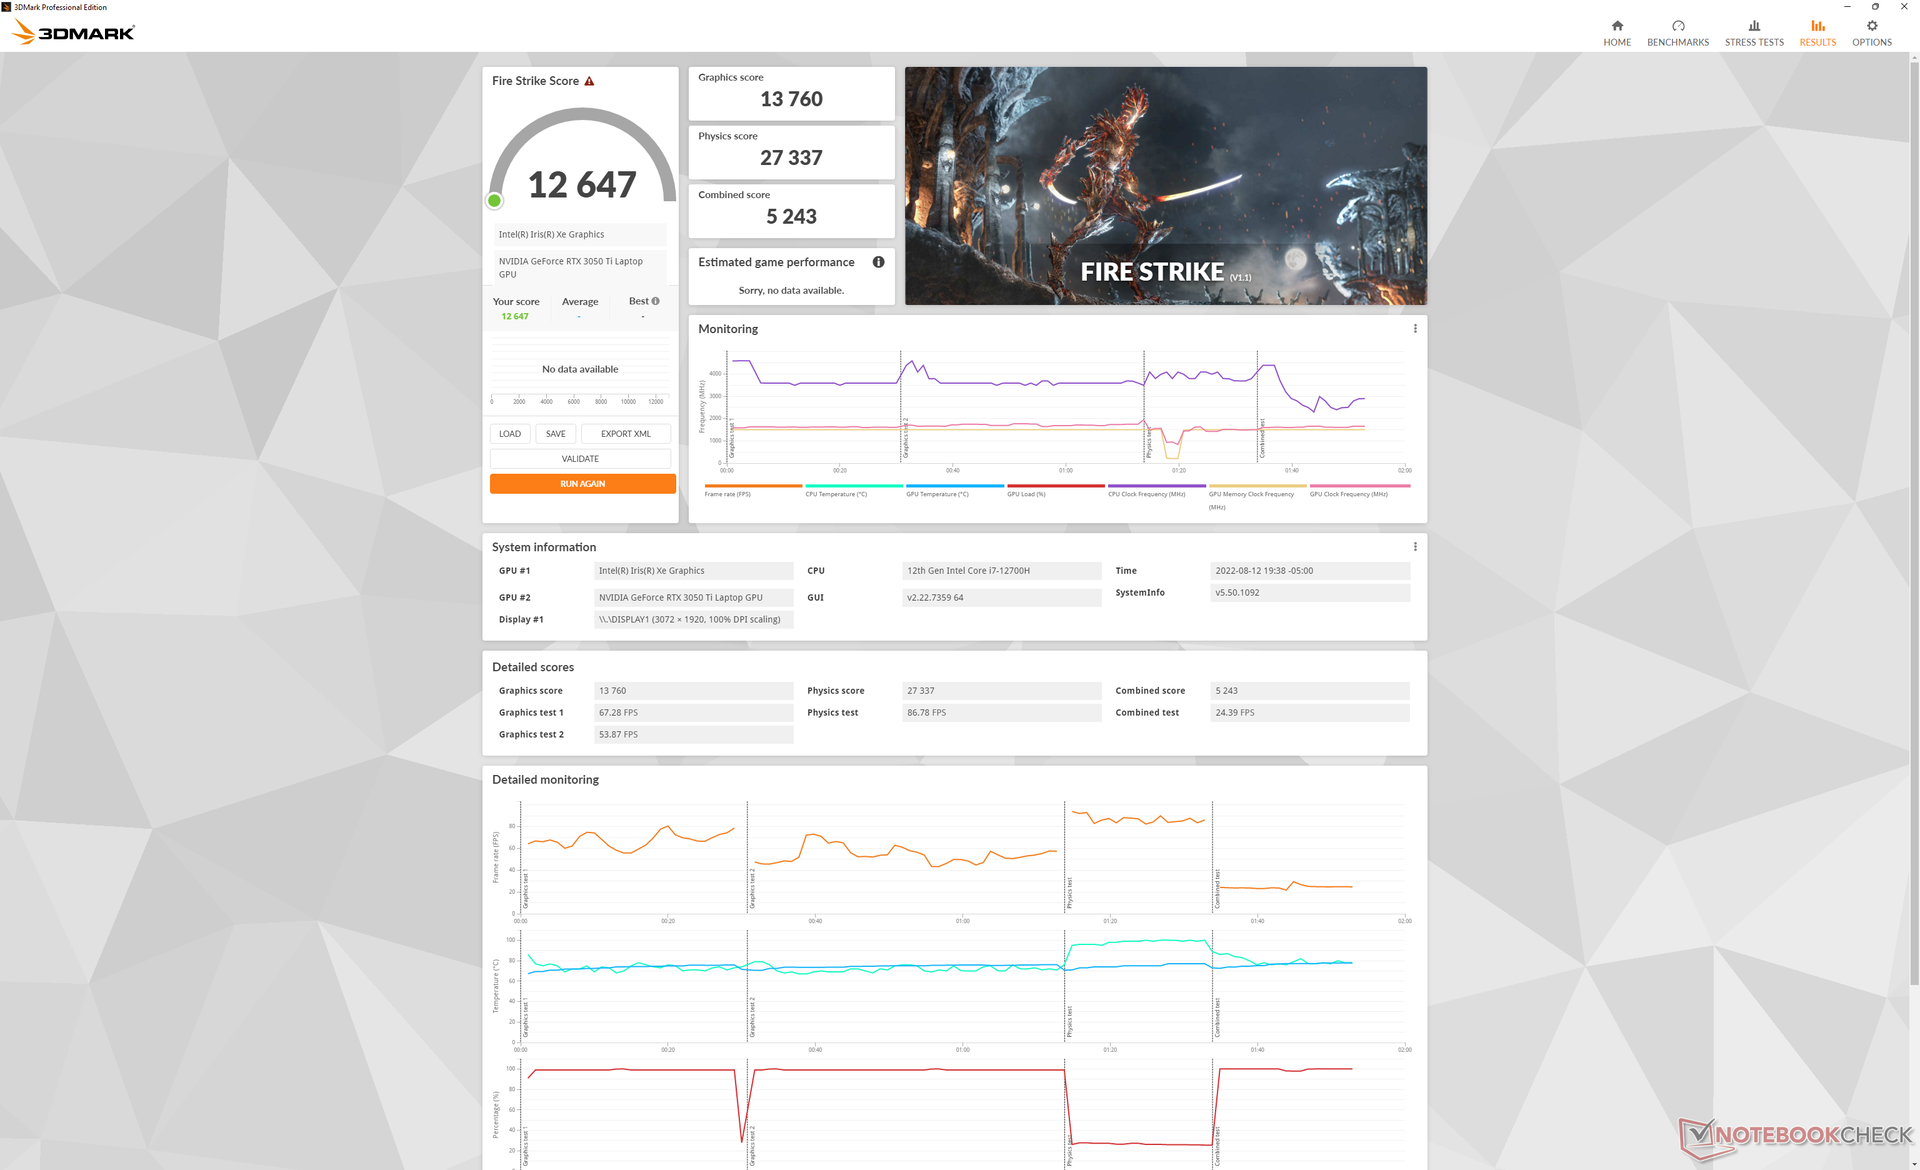
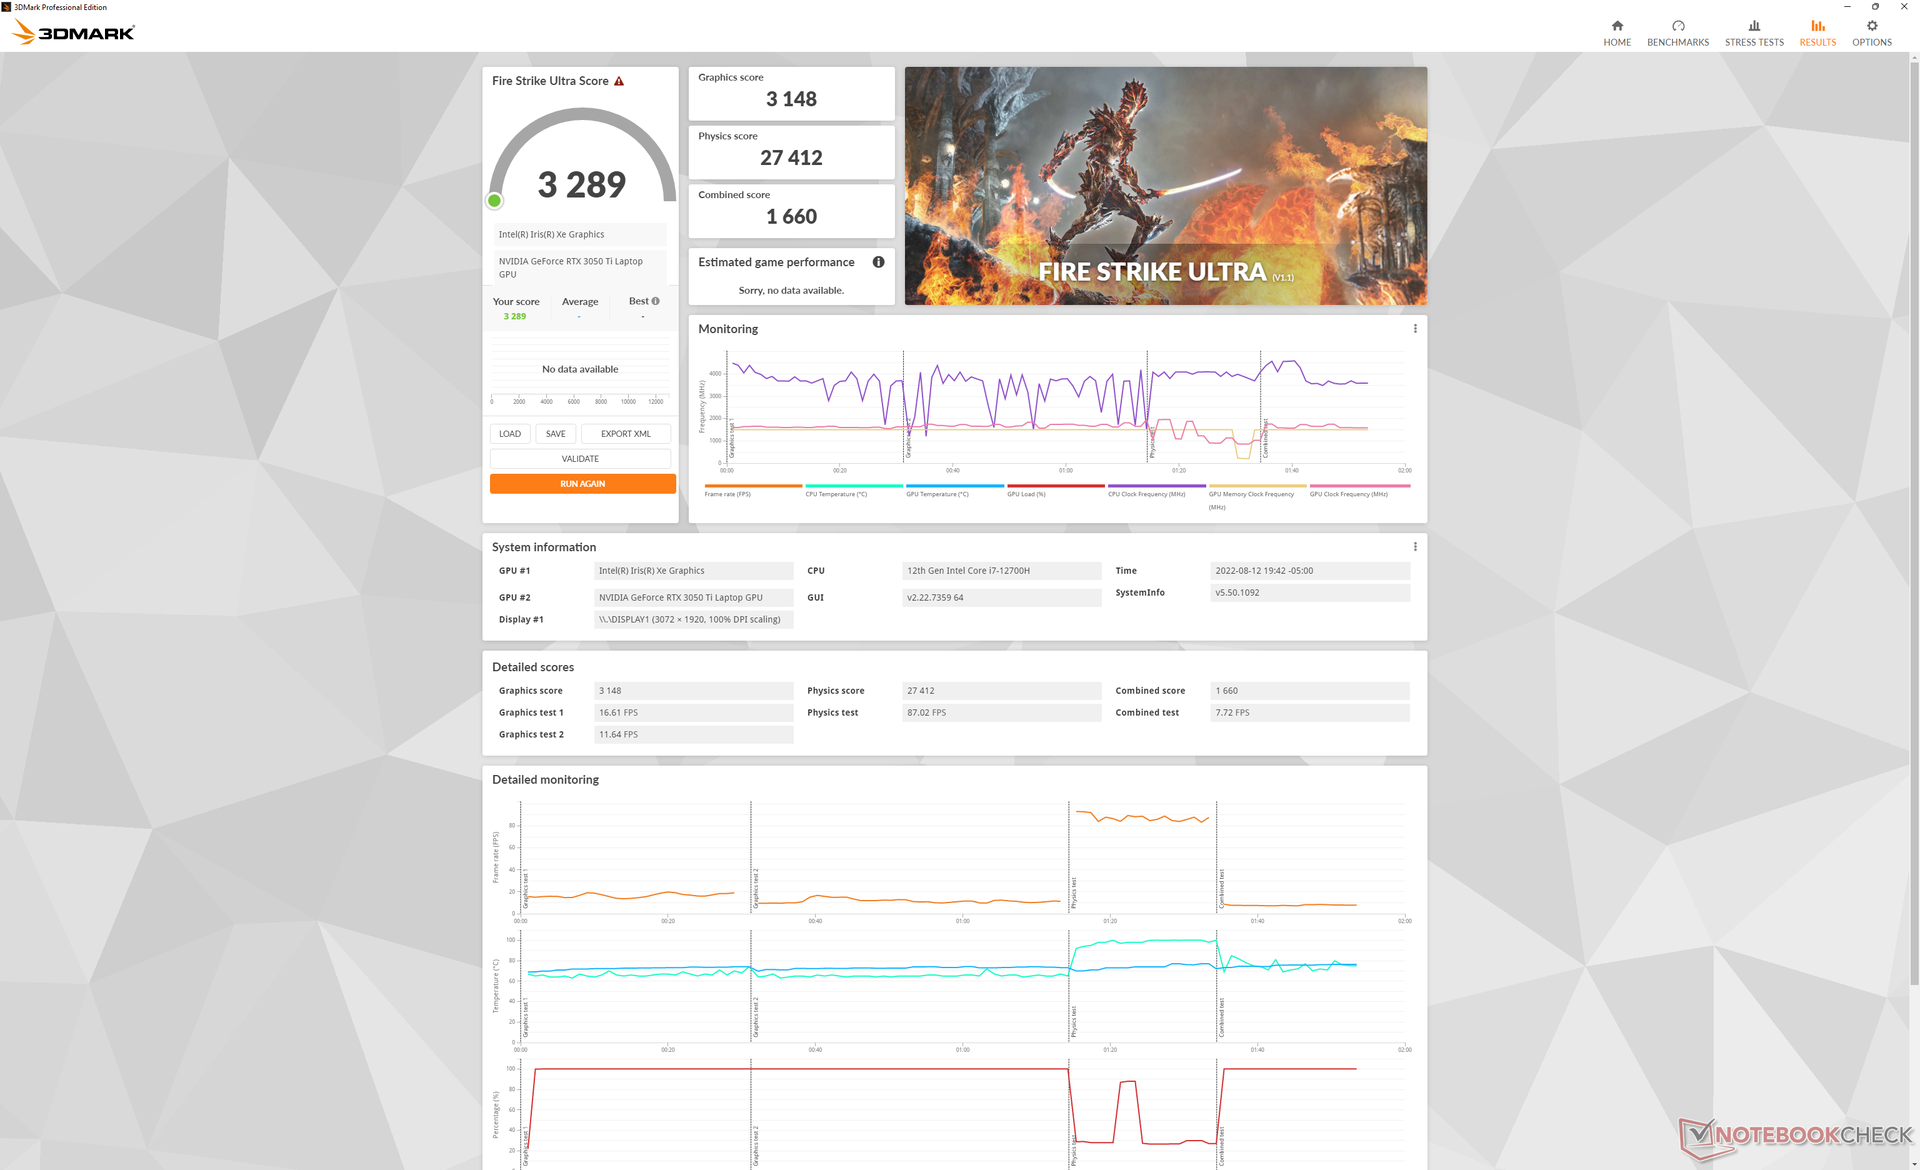
| 3DMark 11 Performance | 18923 puntos | |
| 3DMark Cloud Gate Standard Score | 40737 puntos | |
| 3DMark Fire Strike Score | 12647 puntos | |
| 3DMark Time Spy Score | 5835 puntos | |
ayuda | ||
| Cyberpunk 2077 1.6 | |
| 1920x1080 Low Preset | |
| Dell Inspiron 16 Plus 7620 | |
| Medio NVIDIA GeForce RTX 3050 Ti Laptop GPU (48.2 - 81.9, n=9) | |
| Lenovo Yoga 7 16IAP7 | |
| 1920x1080 Medium Preset | |
| Dell Inspiron 16 Plus 7620 | |
| Medio NVIDIA GeForce RTX 3050 Ti Laptop GPU (47.4 - 67.4, n=9) | |
| Lenovo Yoga 7 16IAP7 | |
| 1920x1080 High Preset | |
| Dell Inspiron 16 Plus 7620 | |
| Medio NVIDIA GeForce RTX 3050 Ti Laptop GPU (39 - 51.5, n=9) | |
| Lenovo Yoga 7 16IAP7 | |
| 1920x1080 Ultra Preset | |
| Medio NVIDIA GeForce RTX 3050 Ti Laptop GPU (31 - 50.5, n=9) | |
| Dell Inspiron 16 Plus 7620 | |
| Lenovo Yoga 7 16IAP7 | |
| 2560x1440 Ultra Preset | |
| Dell Inspiron 16 Plus 7620 | |
| Medio NVIDIA GeForce RTX 3050 Ti Laptop GPU (20 - 25, n=4) | |
Witcher 3 FPS Chart
| bajo | medio | alto | ultra | QHD | |
|---|---|---|---|---|---|
| GTA V (2015) | 181.7 | 176.1 | 148.7 | 75.4 | 53.4 |
| The Witcher 3 (2015) | 297.3 | 183 | 108.4 | 57 | |
| Dota 2 Reborn (2015) | 171.8 | 157.5 | 148 | 140.7 | |
| Final Fantasy XV Benchmark (2018) | 138.9 | 77.7 | 54.1 | 38.1 | |
| X-Plane 11.11 (2018) | 132.5 | 115.6 | 92.8 | ||
| Strange Brigade (2018) | 307 | 138.3 | 110.2 | 95.2 | 69.1 |
| Cyberpunk 2077 1.6 (2022) | 79.5 | 66.2 | 47.9 | 39.5 | 23.4 |
Emisiones - Podría ser más silencioso
Ruido del sistema
El ruido del ventilador está siempre presente, ya que ambos ventiladores nunca están realmente inactivos, incluso cuando está sentado en el escritorio sin aplicaciones en ejecución. En su punto más silencioso, podemos registrar un ruido de 25,7 dB(A) contra un fondo silencioso de 23,3 dB(A) incluso cuando se ajusta al perfil de energía "silencioso". Además, el ruido del ventilador tarda un poco en calmarse después de ejecutar cargas altas como juegos. Después de cerrar Witcher 3por ejemplo, los ventiladores seguirían siendo ruidosos durante varios minutos.
El ruido del ventilador se estabiliza en 49,2 dB(A) cuando funciona Witcher 3 en modo Ultra Performance o 46,1 dB(A) si está en modo Balanceado para ser más ruidoso que el Vivobook Pro 16X equipado con la misma GPU RTX 3050 Ti. El elevado rango de 40 dB(A) tiene más en común con los portátiles de juego de alta potencia que con otros portátiles multimedia.
Ruido
| Ocioso |
| 25.7 / 26.1 / 30.6 dB(A) |
| Carga |
| 46.2 / 49.4 dB(A) |
 | ||
30 dB silencioso 40 dB(A) audible 50 dB(A) ruidosamente alto |
||
min: | ||
| Dell Inspiron 16 Plus 7620 GeForce RTX 3050 Ti Laptop GPU, i7-12700H, Kioxia BG5 KBG50ZNS512G | Dell Inspiron 16 Plus 7610 GeForce RTX 3050 4GB Laptop GPU, i7-11800H, Kingston OM3PDP3512B | Lenovo Yoga 7 16IAP7 Iris Xe G7 96EUs, i7-1260P, Micron 2450 512GB MTFDKCD512TFK | Huawei MateBook D 16 2022 Iris Xe G7 96EUs, i7-12700H, Silicon Motion PCIe-8 SSD | Acer Swift X SFX16-51G-5388 GeForce RTX 3050 4GB Laptop GPU, i5-11320H, Samsung PM991 MZVLQ512HBLU | Asus Vivobook Pro 16X-M7600QE GeForce RTX 3050 Ti Laptop GPU, R9 5900HX, SK Hynix HFM001TD3JX013N | |
|---|---|---|---|---|---|---|
| Noise | 3% | 14% | 8% | 3% | 1% | |
| apagado / medio ambiente * (dB) | 23.3 | 24.4 -5% | 23.6 -1% | 24.2 -4% | 25.4 -9% | 26 -12% |
| Idle Minimum * (dB) | 25.7 | 24.4 5% | 23.6 8% | 24.2 6% | 25.4 1% | 27 -5% |
| Idle Average * (dB) | 26.1 | 24.4 7% | 23.6 10% | 25.8 1% | 25.4 3% | 27 -3% |
| Idle Maximum * (dB) | 30.6 | 24.4 20% | 23.6 23% | 30.5 -0% | 27.8 9% | 27.5 10% |
| Load Average * (dB) | 46.2 | 48.3 -5% | 37.7 18% | 39.8 14% | 41 11% | 41.7 10% |
| Witcher 3 ultra * (dB) | 49.2 | 48.9 1% | 40 19% | 39.8 19% | ||
| Load Maximum * (dB) | 49.4 | 48.9 1% | 40.2 19% | 39.8 19% | 47 5% | 45.3 8% |
* ... más pequeño es mejor
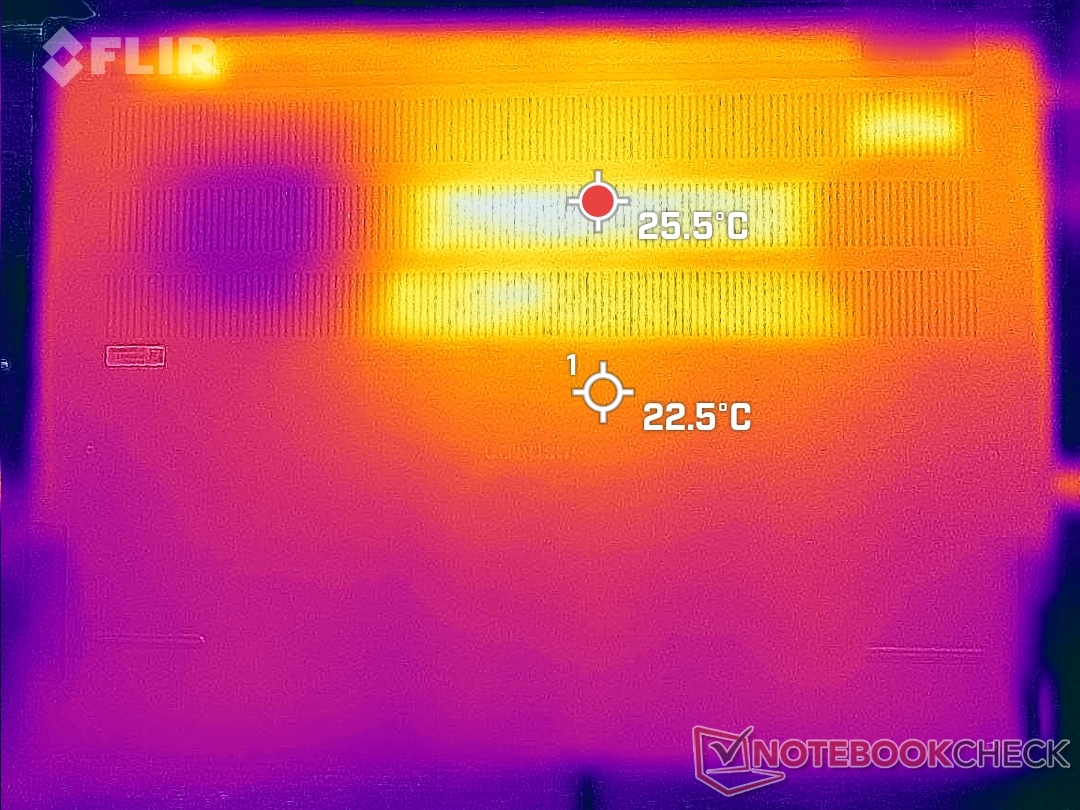
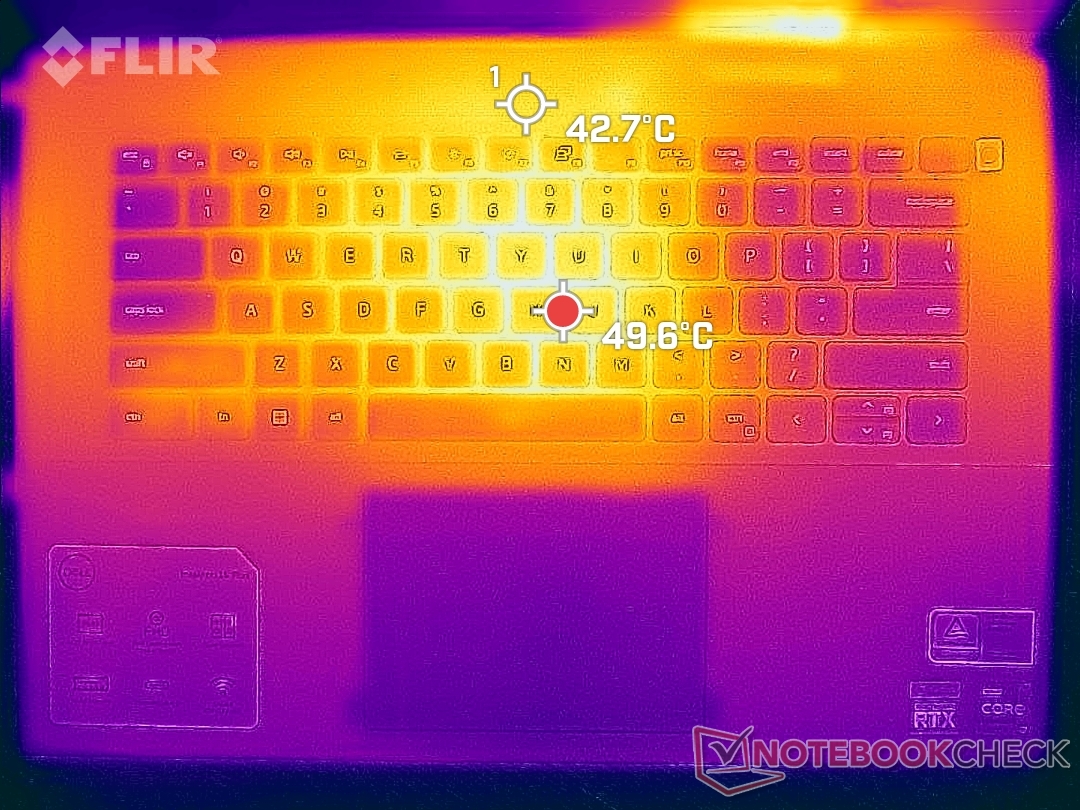
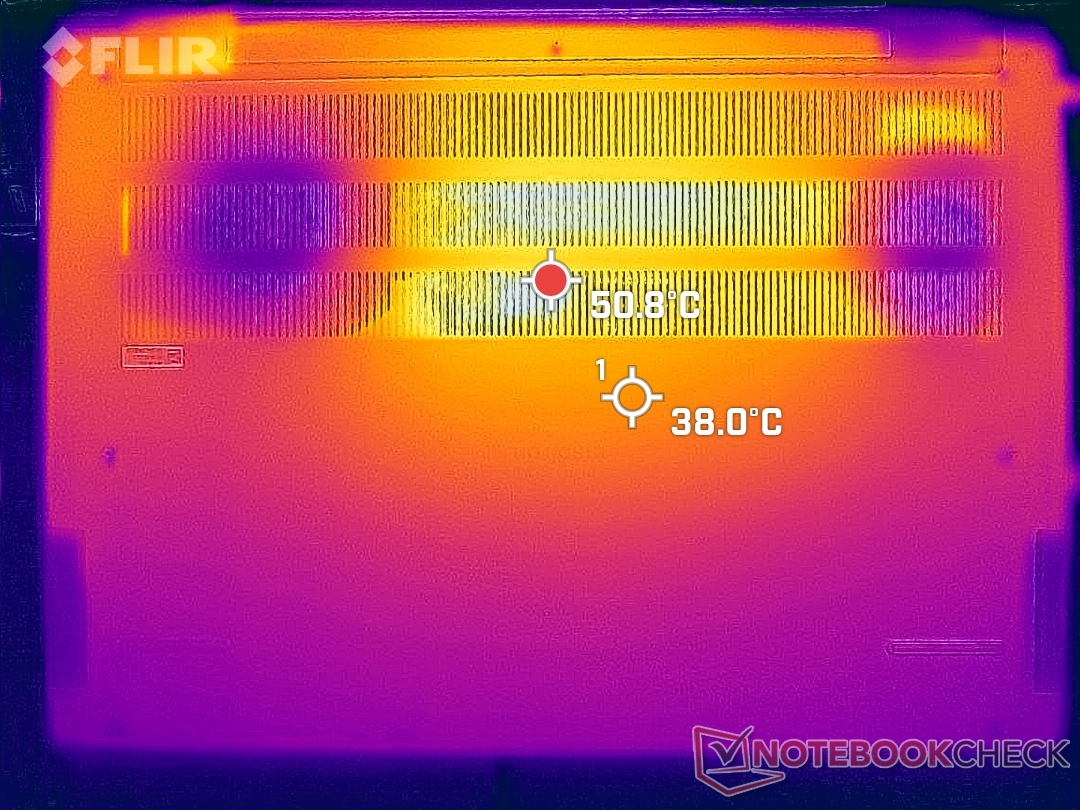
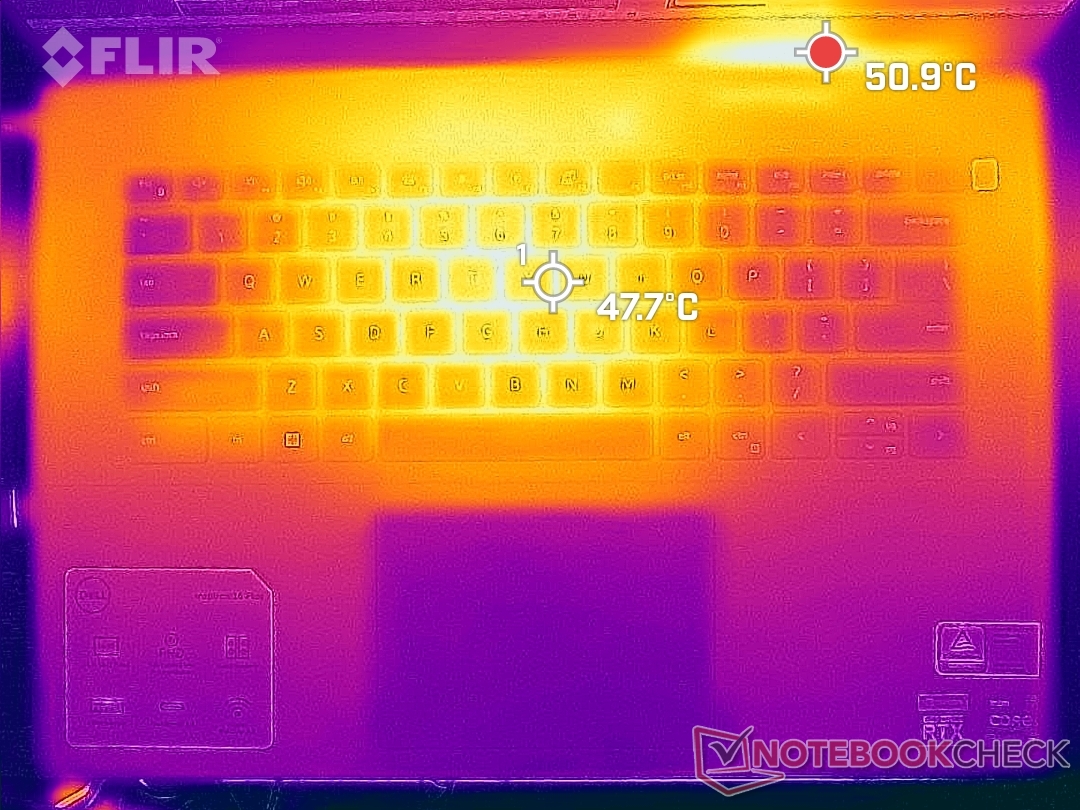
Temperatura
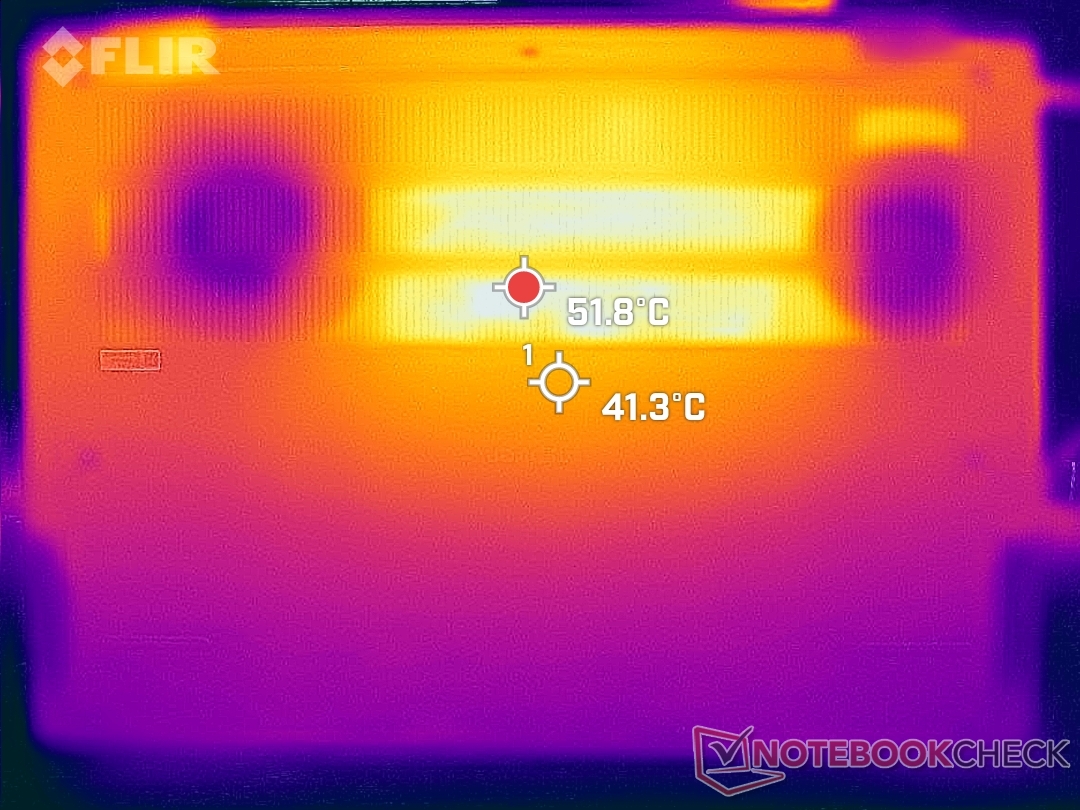
Los puntos calientes están en el mismo centro del teclado, donde las temperaturas pueden alcanzar los 50 C cuando se ejecutan cargas altas como los juegos. Otros portátiles de 16 pulgadas como el Asus Vivobook Pro 16X, el Lenovo Yoga 7, e incluso el antiguo Inspiron 16 7610 son más fríos por más de unos pocos grados cuando están bajo cargas similares. El reposamanos puede estar más caliente de lo esperado también a 30 C comparado con el rango más común de 20 C. El Inspiron 16 Plus 7620 es ciertamente más un portátil de sobremesa que un portátil para las piernas.
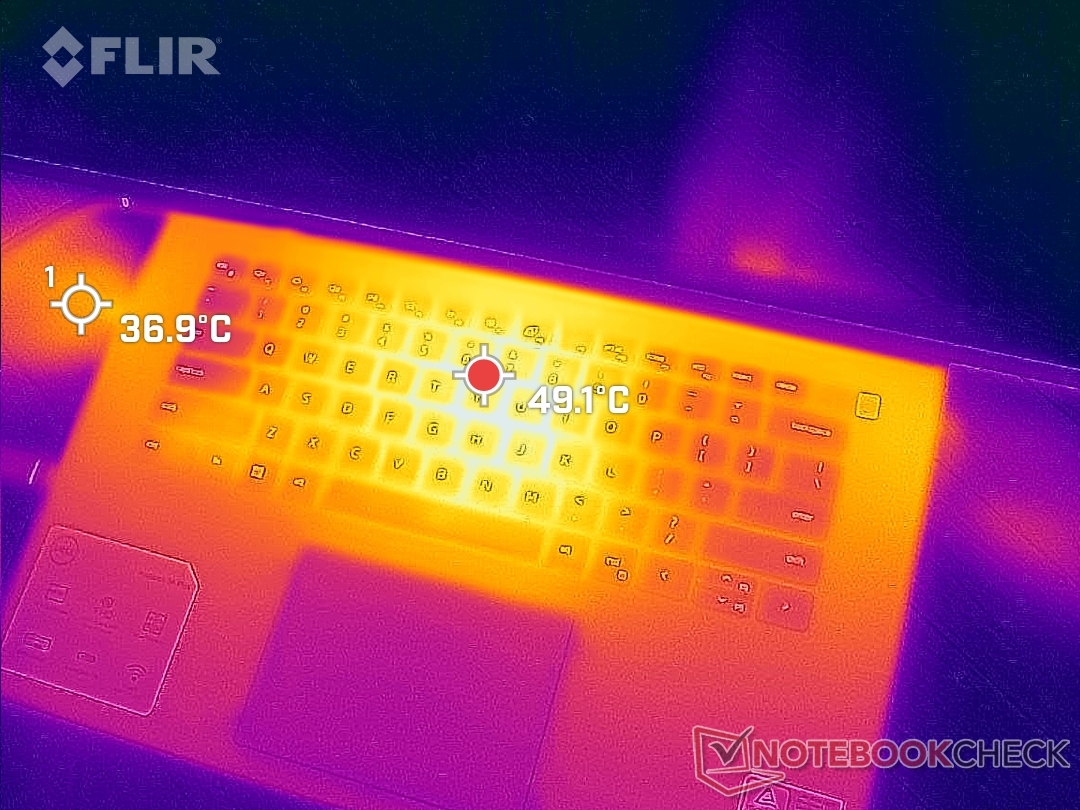
(-) La temperatura máxima en la parte superior es de 46 °C / 115 F, frente a la media de 36.8 °C / 98 F, que oscila entre 21 y 71 °C para la clase Multimedia.
(-) El fondo se calienta hasta un máximo de 45.8 °C / 114 F, frente a la media de 39.1 °C / 102 F
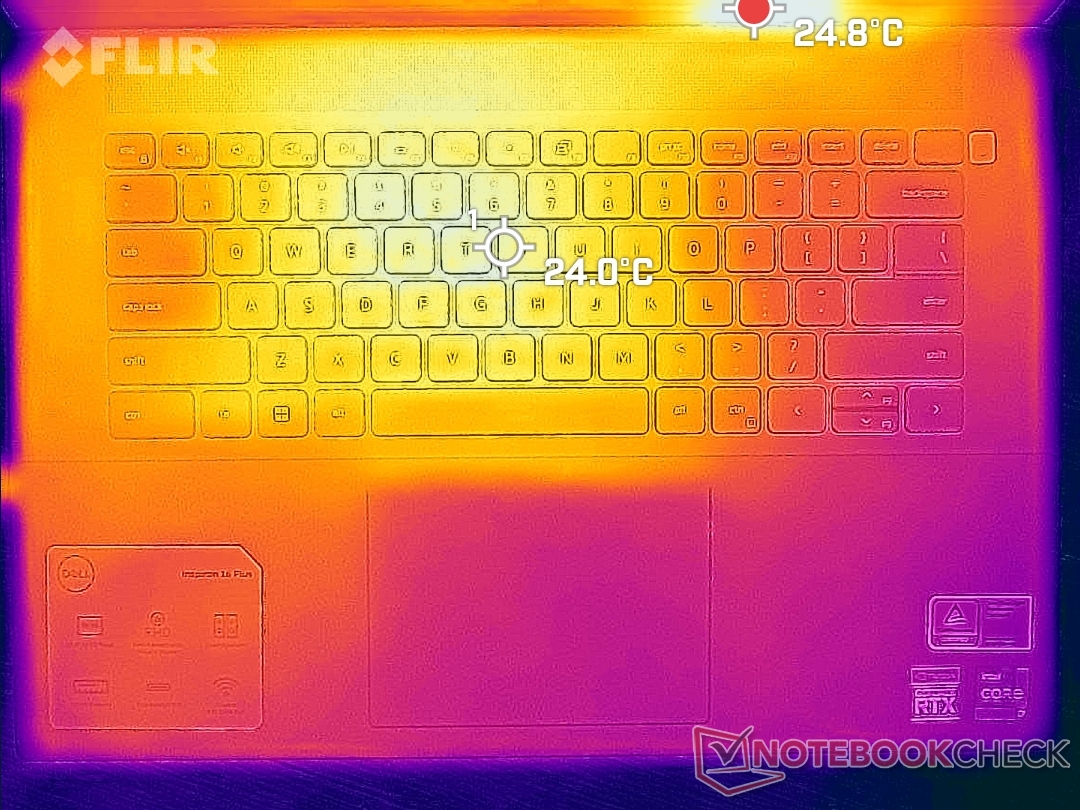
(+) En reposo, la temperatura media de la parte superior es de 26.8 °C / 80# F, frente a la media del dispositivo de 31.3 °C / 88 F.
(±) Jugando a The Witcher 3, la temperatura media de la parte superior es de 36.8 °C / 98 F, frente a la media del dispositivo de 31.3 °C / 88 F.
(+) El reposamanos y el panel táctil están a una temperatura inferior a la de la piel, con un máximo de 30.6 °C / 87.1 F y, por tanto, son fríos al tacto.
(±) La temperatura media de la zona del reposamanos de dispositivos similares fue de 28.7 °C / 83.7 F (-1.9 °C / -3.4 F).
| Dell Inspiron 16 Plus 7620 Intel Core i7-12700H, NVIDIA GeForce RTX 3050 Ti Laptop GPU | Dell Inspiron 16 Plus 7610 Intel Core i7-11800H, NVIDIA GeForce RTX 3050 4GB Laptop GPU | Lenovo Yoga 7 16IAP7 Intel Core i7-1260P, Intel Iris Xe Graphics G7 96EUs | Huawei MateBook D 16 2022 Intel Core i7-12700H, Intel Iris Xe Graphics G7 96EUs | Acer Swift X SFX16-51G-5388 Intel Core i5-11320H, NVIDIA GeForce RTX 3050 4GB Laptop GPU | Asus Vivobook Pro 16X-M7600QE AMD Ryzen 9 5900HX, NVIDIA GeForce RTX 3050 Ti Laptop GPU | |
|---|---|---|---|---|---|---|
| Heat | -12% | 24% | 3% | -6% | 9% | |
| Maximum Upper Side * (°C) | 46 | 46.4 -1% | 39 15% | 41.8 9% | 52.4 -14% | 39.4 14% |
| Maximum Bottom * (°C) | 45.8 | 54.8 -20% | 34.2 25% | 47.3 -3% | 50 -9% | 43.6 5% |
| Idle Upper Side * (°C) | 29.2 | 31.4 -8% | 21.2 27% | 28.3 3% | 30.3 -4% | 27.6 5% |
| Idle Bottom * (°C) | 31 | 36.6 -18% | 21.6 30% | 30.2 3% | 30.4 2% | 27.5 11% |
* ... más pequeño es mejor
Prueba de esfuerzo
Cuando se ejecuta Prime95, la CPU alcanza los 3,5 GHz y los 80 W durante los primeros 15 segundos hasta que la temperatura del núcleo alcanza los 90 C. A partir de ahí, la velocidad de reloj y el consumo de energía de la placa caen gradualmente antes de estabilizarse en 2,3 GHz y 50 W, respectivamente, para mantener una temperatura del núcleo de 86 C. Si se ejecuta esta misma prueba en el modelo 2021, las temperaturas del núcleo son ligeramente inferiores y el consumo de energía de la placa es de 83 C y 45 W, respectivamente.
La velocidad de reloj de la GPU, la temperatura y el consumo de energía de la placa se estabilizarían en 1627 MHz, 85 C y 64 W, respectivamente, al funcionar Witcher 3 en comparación con los 1837 MHz, 69 C y 63 W del Inspiron 16 Plus 7610. No hay duda de que los procesadores del modelo 2022 se calientan más para ofrecer mayores niveles de rendimiento.
El uso de la batería limita el rendimiento, incluso si se ajusta al modo de Ultra Rendimiento. Un test 3DMark 11 en batería arrojaría unas puntuaciones de Física y Gráficos de 10252 y 8609 puntos, respectivamente, frente a los 22210 y 18923 puntos de la red eléctrica.
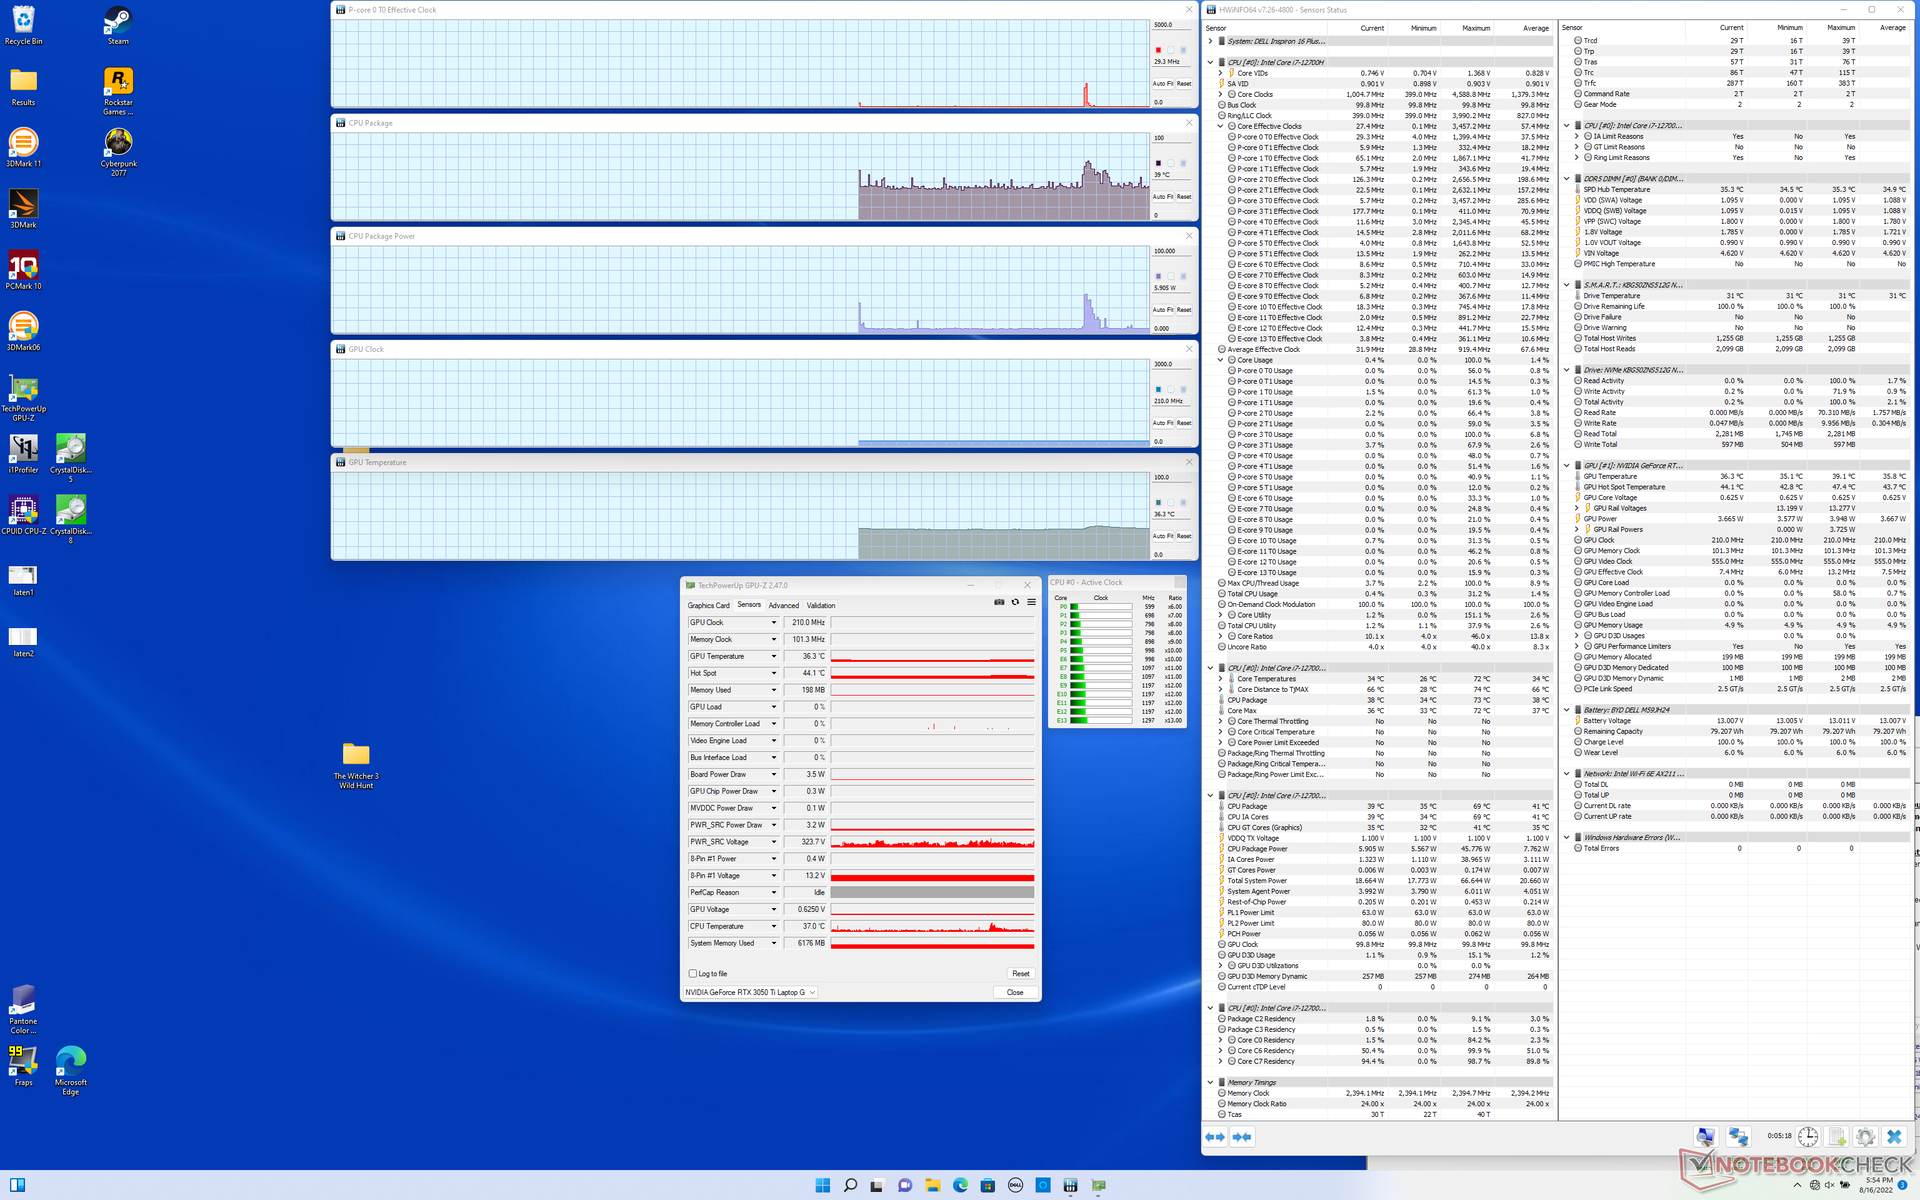
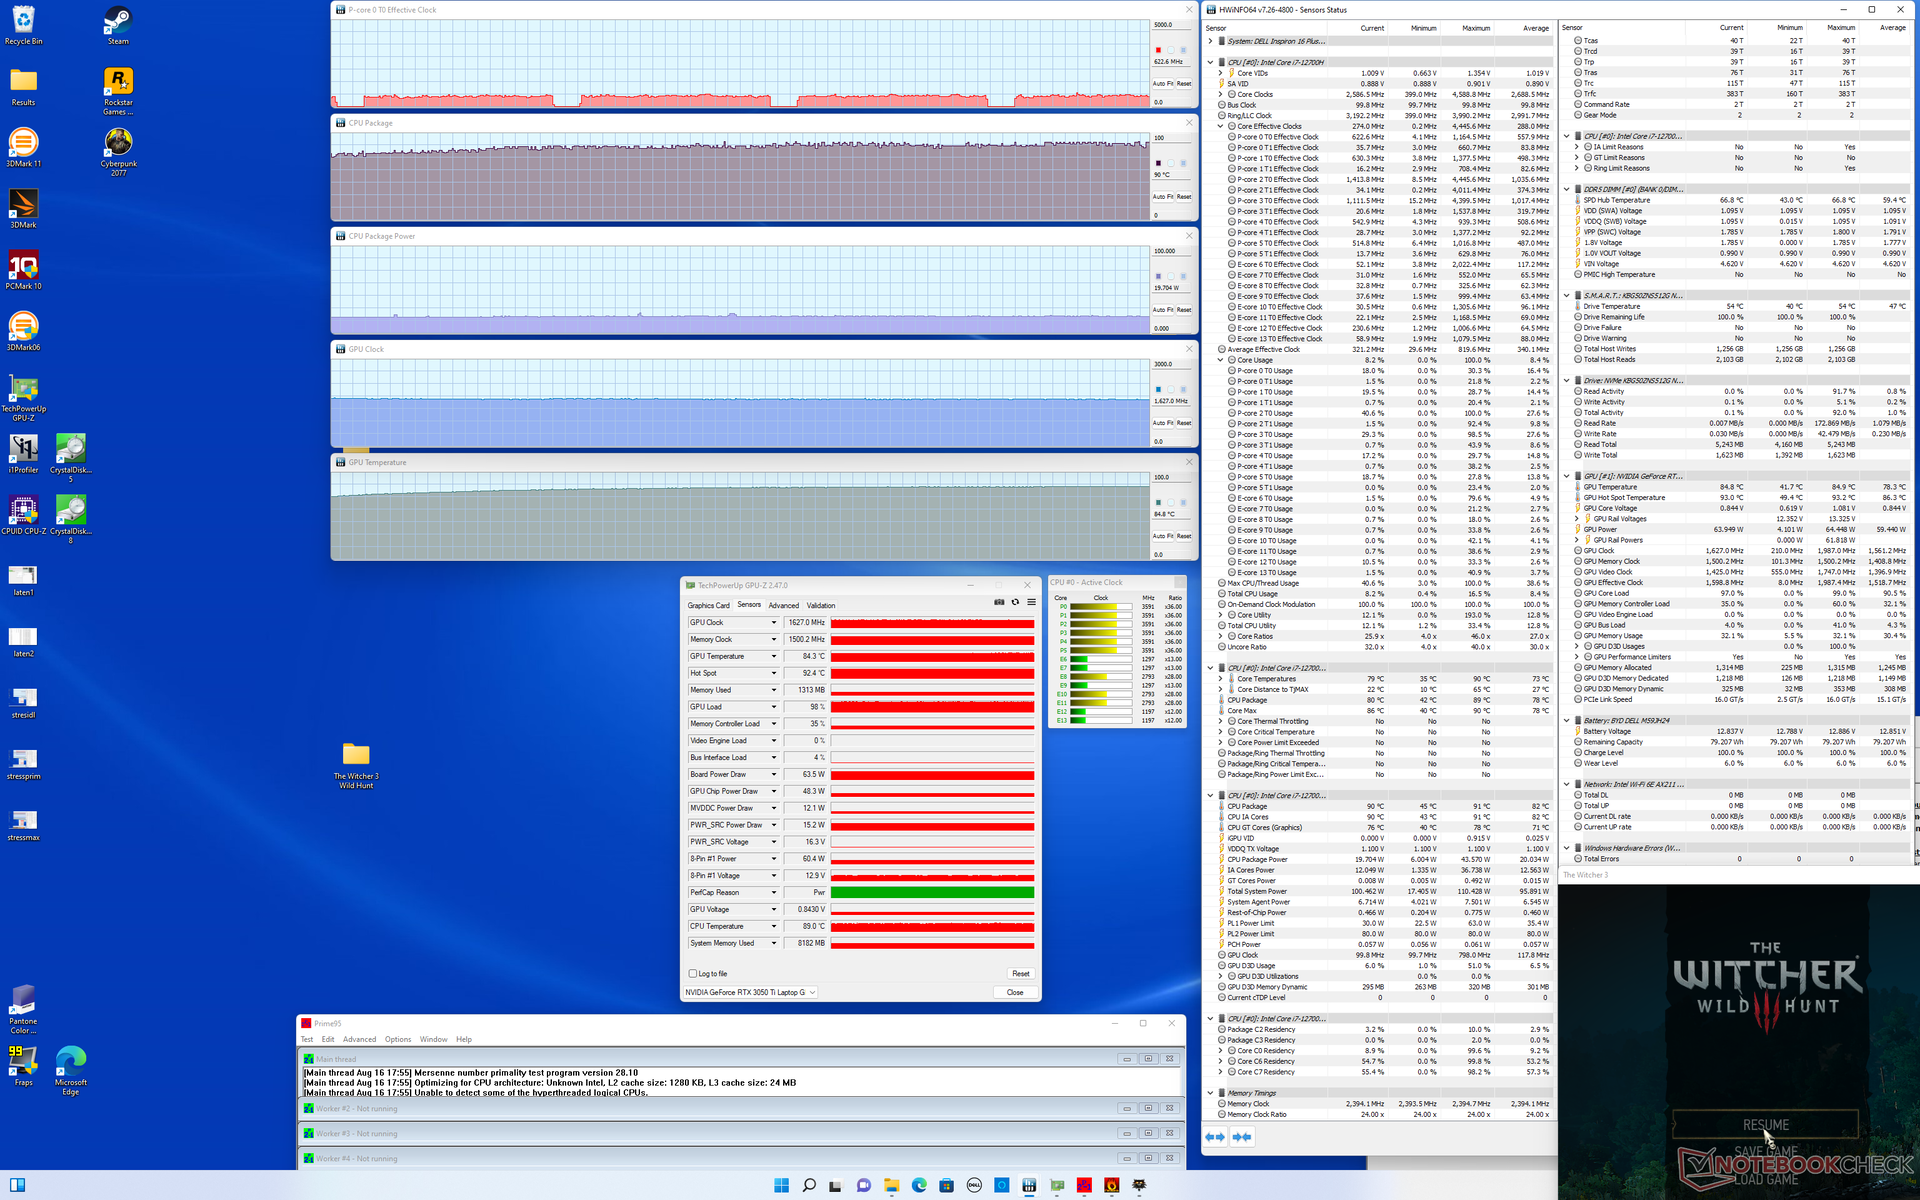
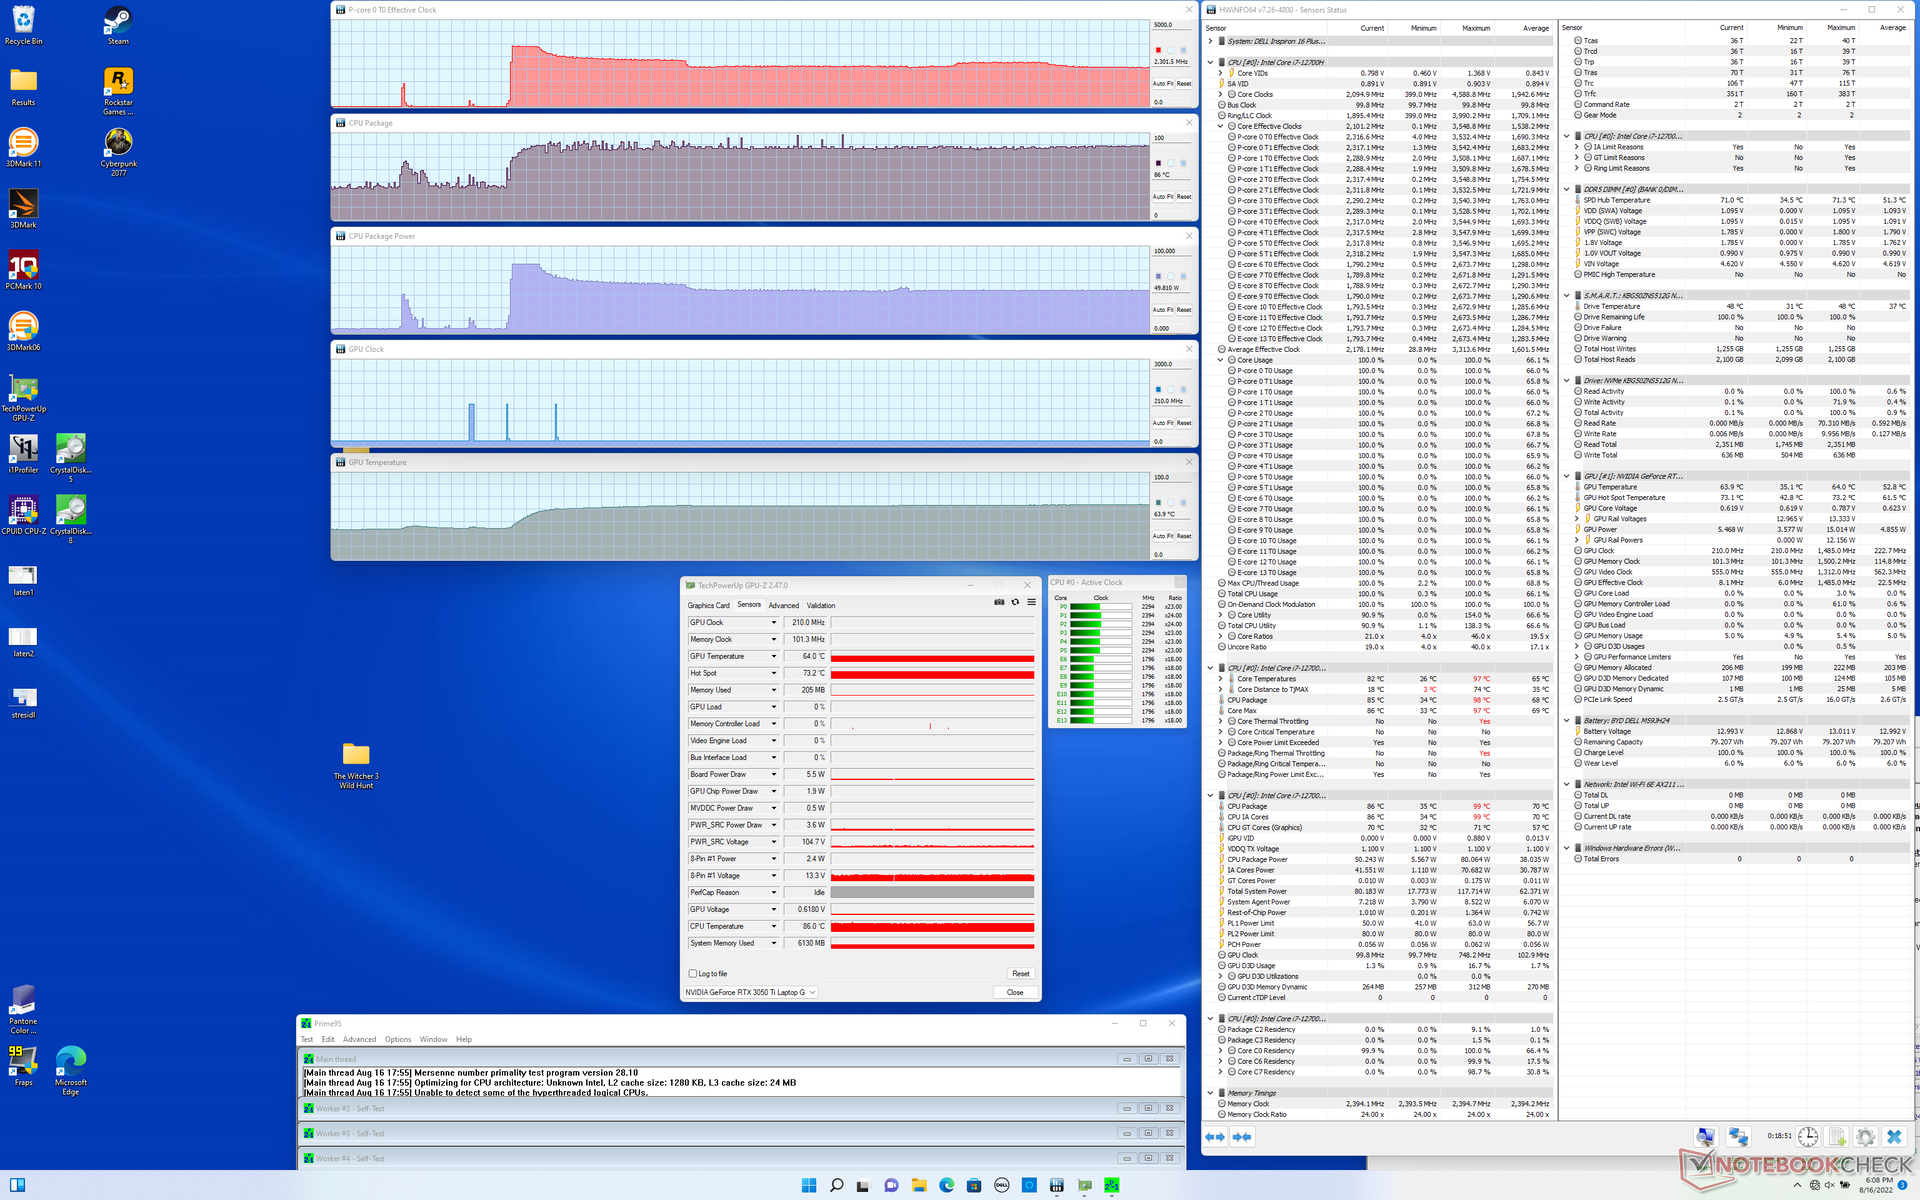
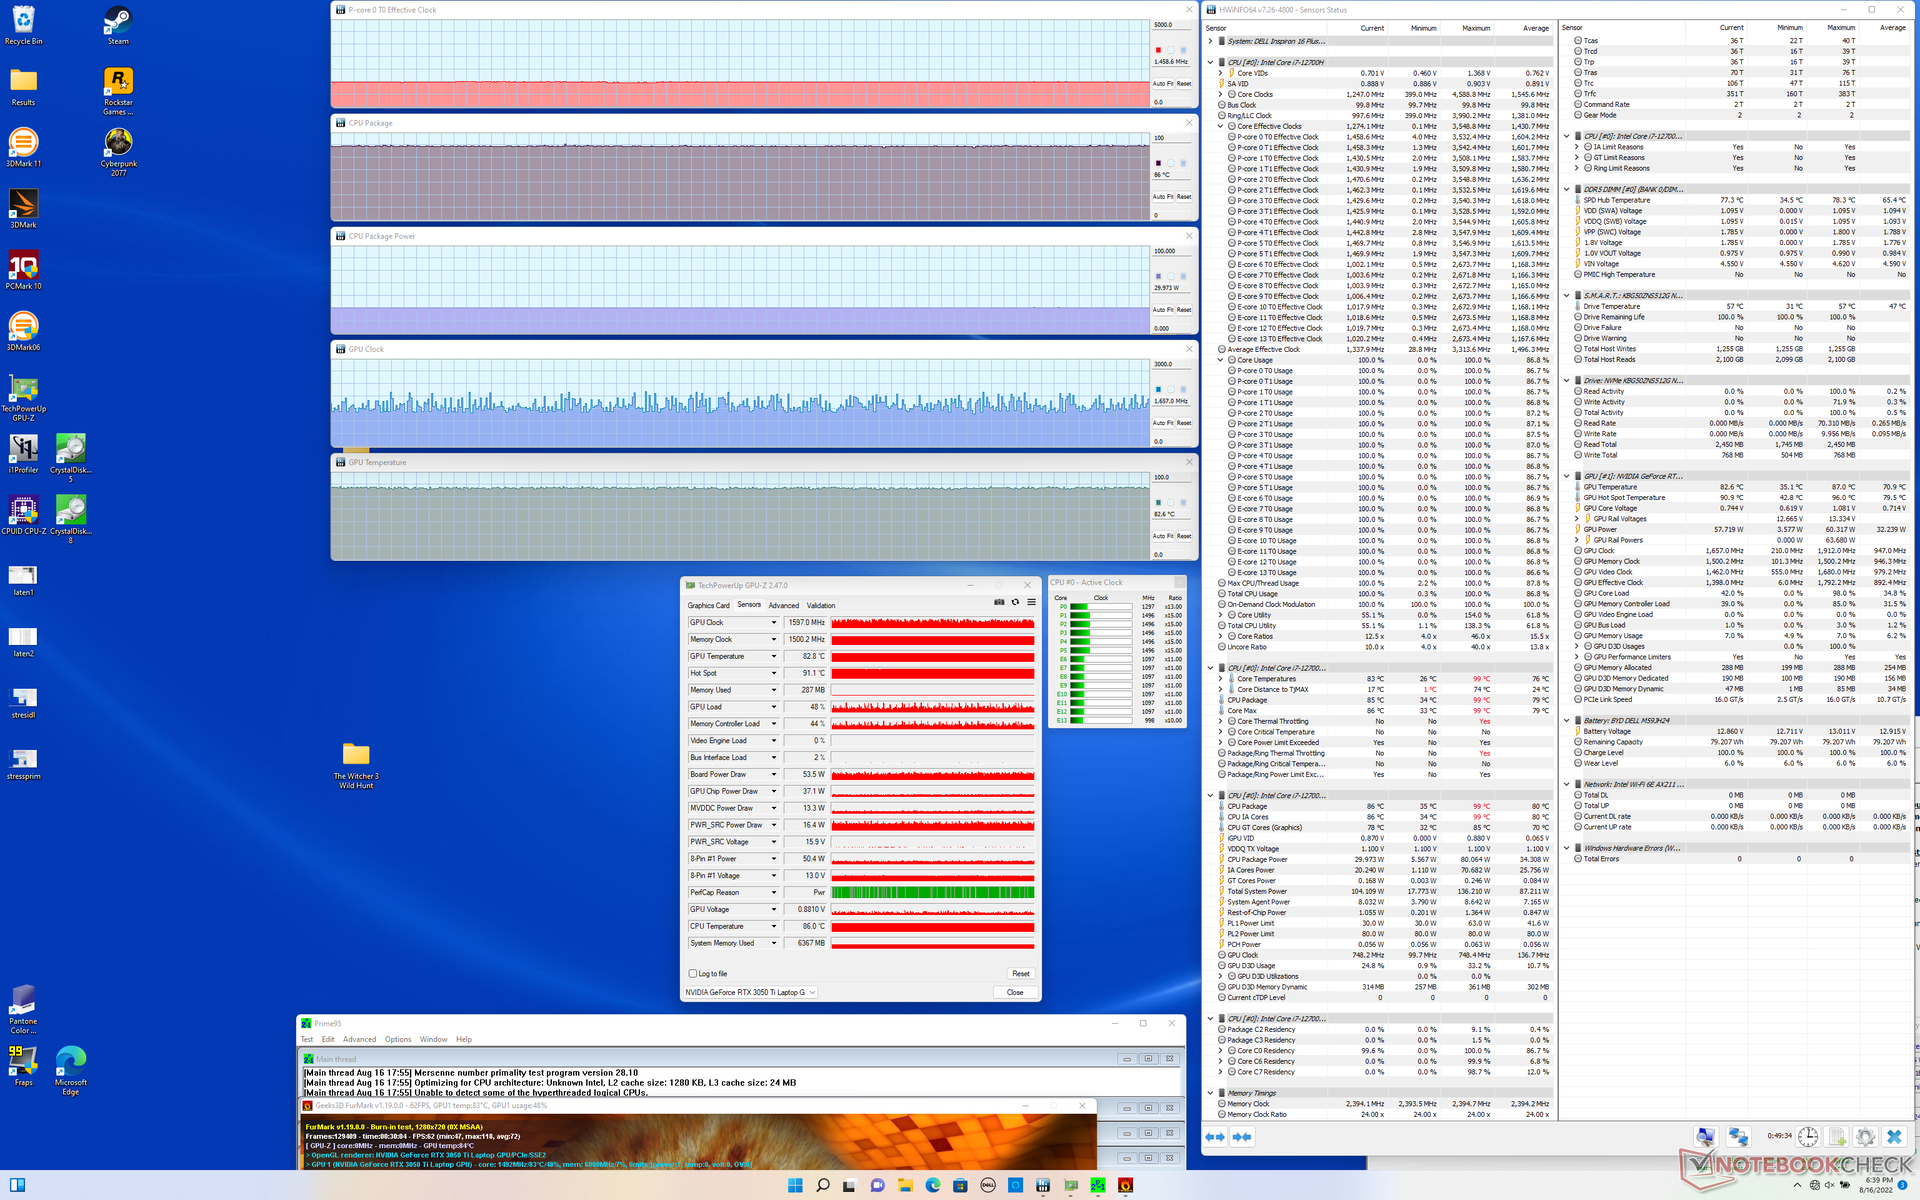
| Reloj dela CPU (GHz) | Reloj de la GPU (MHz) | Temperatura media dela CPU (°C) | Temperatura media de la GPU (°C) | |
| Sistema en reposo | -- | -- | 39 | 36 |
| Prime95Stress | 2.3 | -- | 86 | 64 |
| Prime95+ FurMark Stress | 1,5 | ~1597 | 86 | 83 |
| Witcher 3 Stress | ~0,6 | 1627 | 90 | 85 |
Altavoces
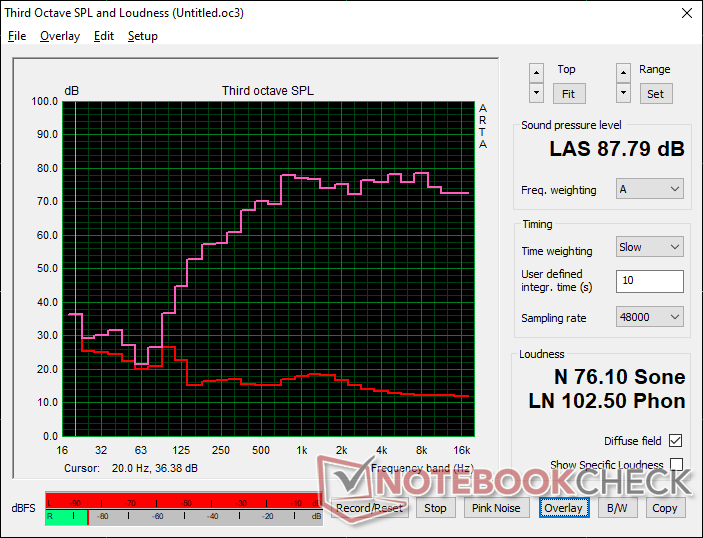
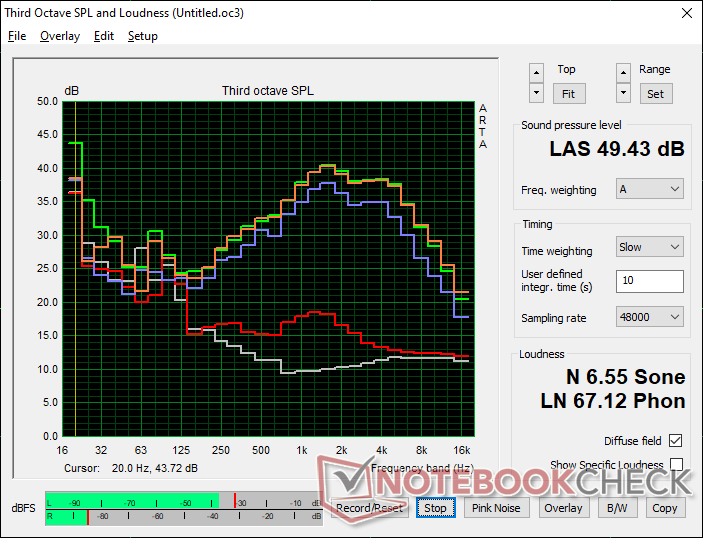
Dell Inspiron 16 Plus 7620 análisis de audio
(+) | los altavoces pueden reproducir a un volumen relativamente alto (#87.8 dB)
Graves 100 - 315 Hz
(-) | casi sin bajos - de media 22.2% inferior a la mediana
(±) | la linealidad de los graves es media (9.7% delta a frecuencia anterior)
Medios 400 - 2000 Hz
(+) | medios equilibrados - a sólo 3.3% de la mediana
(+) | los medios son lineales (5.3% delta a la frecuencia anterior)
Altos 2 - 16 kHz
(+) | máximos equilibrados - a sólo 2.5% de la mediana
(+) | los máximos son lineales (4.7% delta a la frecuencia anterior)
Total 100 - 16.000 Hz
(+) | el sonido global es lineal (13.4% de diferencia con la mediana)
En comparación con la misma clase
» 28% de todos los dispositivos probados de esta clase eran mejores, 5% similares, 68% peores
» El mejor tuvo un delta de 5%, la media fue 17%, el peor fue ###max##%
En comparación con todos los dispositivos probados
» 14% de todos los dispositivos probados eran mejores, 4% similares, 82% peores
» El mejor tuvo un delta de 4%, la media fue 23%, el peor fue ###max##%
Apple MacBook Pro 16 2021 M1 Pro análisis de audio
(+) | los altavoces pueden reproducir a un volumen relativamente alto (#84.7 dB)
Graves 100 - 315 Hz
(+) | buen bajo - sólo 3.8% lejos de la mediana
(+) | el bajo es lineal (5.2% delta a la frecuencia anterior)
Medios 400 - 2000 Hz
(+) | medios equilibrados - a sólo 1.3% de la mediana
(+) | los medios son lineales (2.1% delta a la frecuencia anterior)
Altos 2 - 16 kHz
(+) | máximos equilibrados - a sólo 1.9% de la mediana
(+) | los máximos son lineales (2.7% delta a la frecuencia anterior)
Total 100 - 16.000 Hz
(+) | el sonido global es lineal (4.6% de diferencia con la mediana)
En comparación con la misma clase
» 0% de todos los dispositivos probados de esta clase eran mejores, 0% similares, 100% peores
» El mejor tuvo un delta de 5%, la media fue 17%, el peor fue ###max##%
En comparación con todos los dispositivos probados
» 0% de todos los dispositivos probados eran mejores, 0% similares, 100% peores
» El mejor tuvo un delta de 4%, la media fue 23%, el peor fue ###max##%
Gestión de la energía - CPU de alto consumo
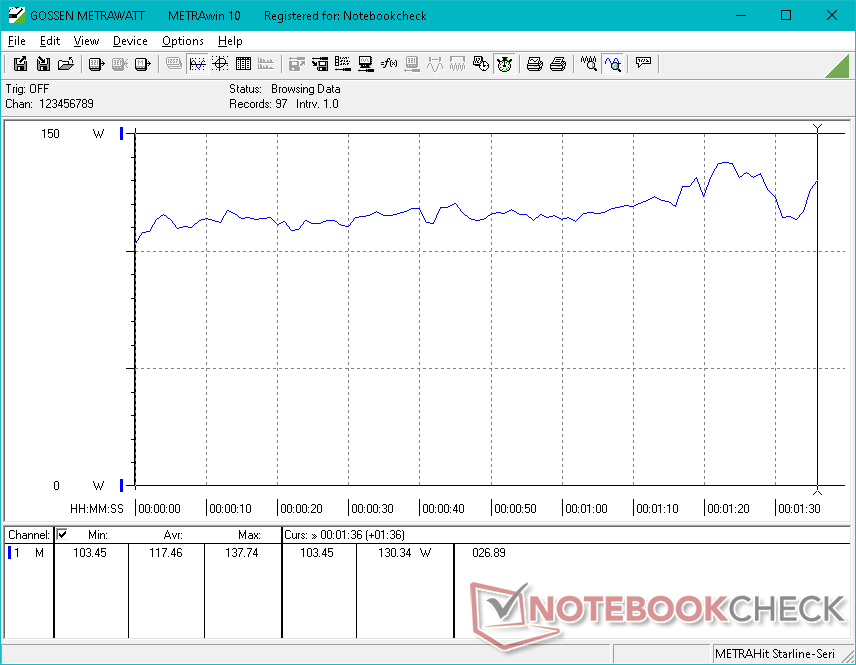
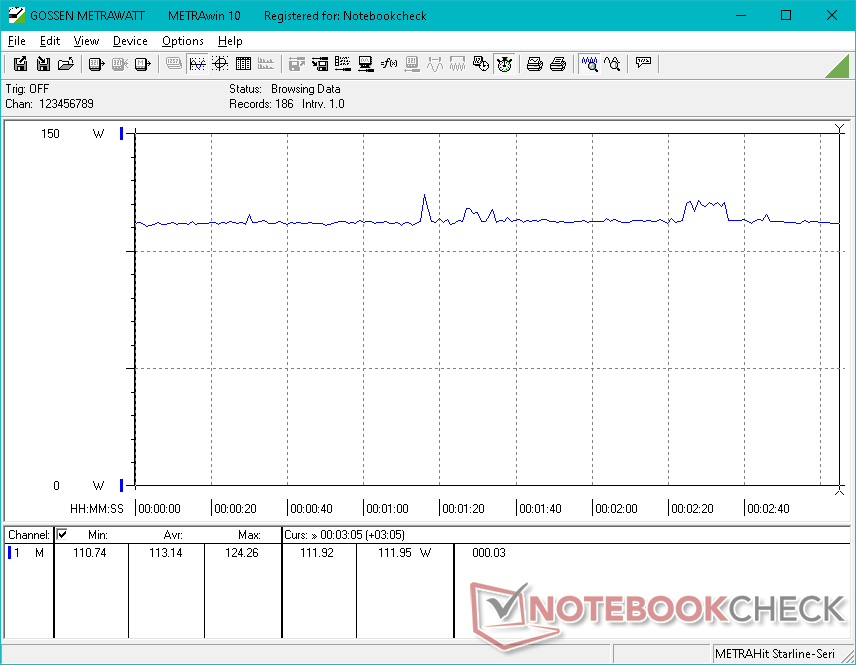
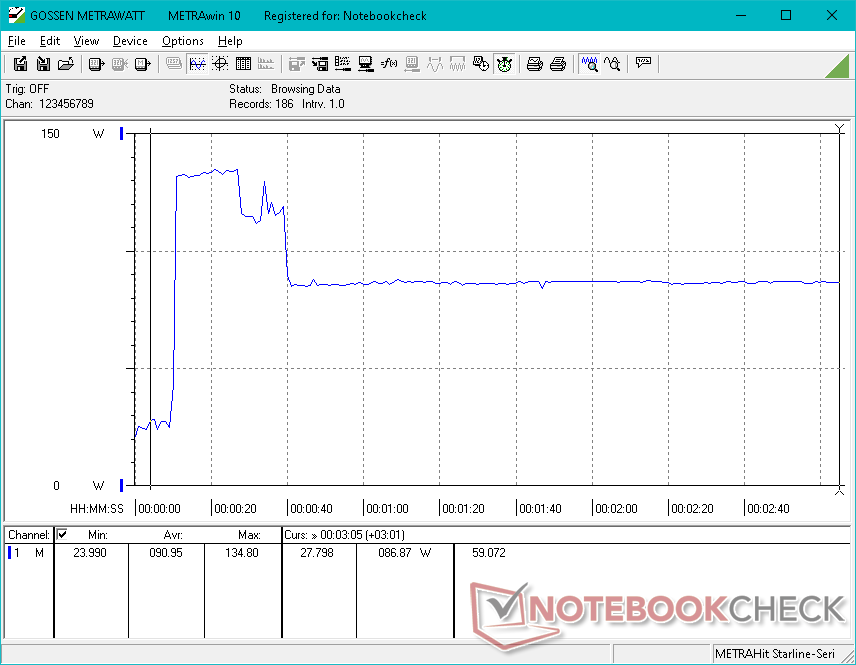
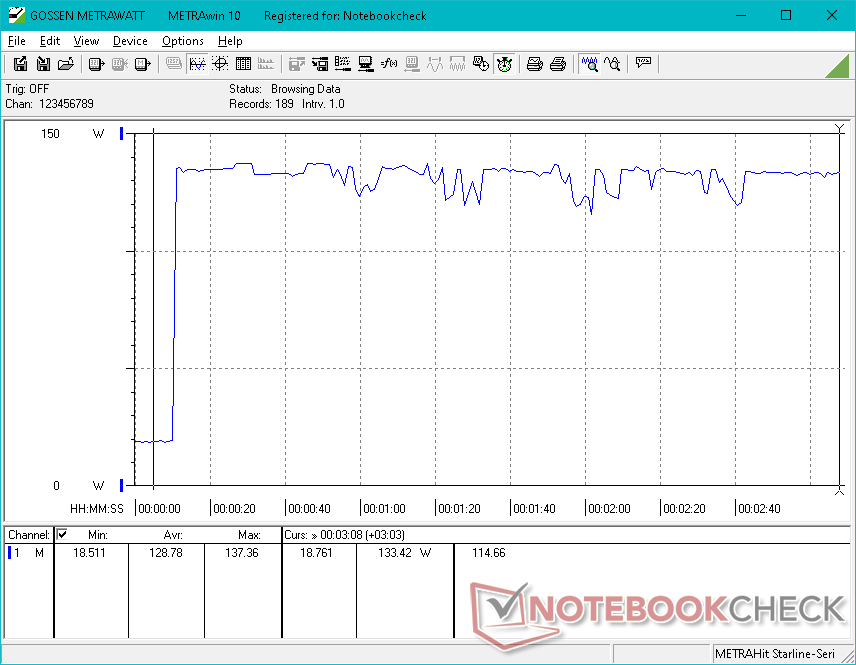
Consumo de energía
El consumo de energía es similar al del modelo 2021 cuando está en reposo en el escritorio o cuando ejecuta cargas muy bajas. Sin embargo, cuando se ejecutan cargas más altas, el modelo 2022 se vuelve más exigente, especialmente si dichas cargas son intensivas para la CPU. Si se ejecuta Witcher 3por ejemplo, sólo consume un 5 por ciento más de energía, mientras que Prime95 consume la friolera de un 72 por ciento más. El consumo significativamente mayor está en línea con la mayoría de portátiles que hemos probado hasta ahora con CPUs Alder Lake de 12ª generación
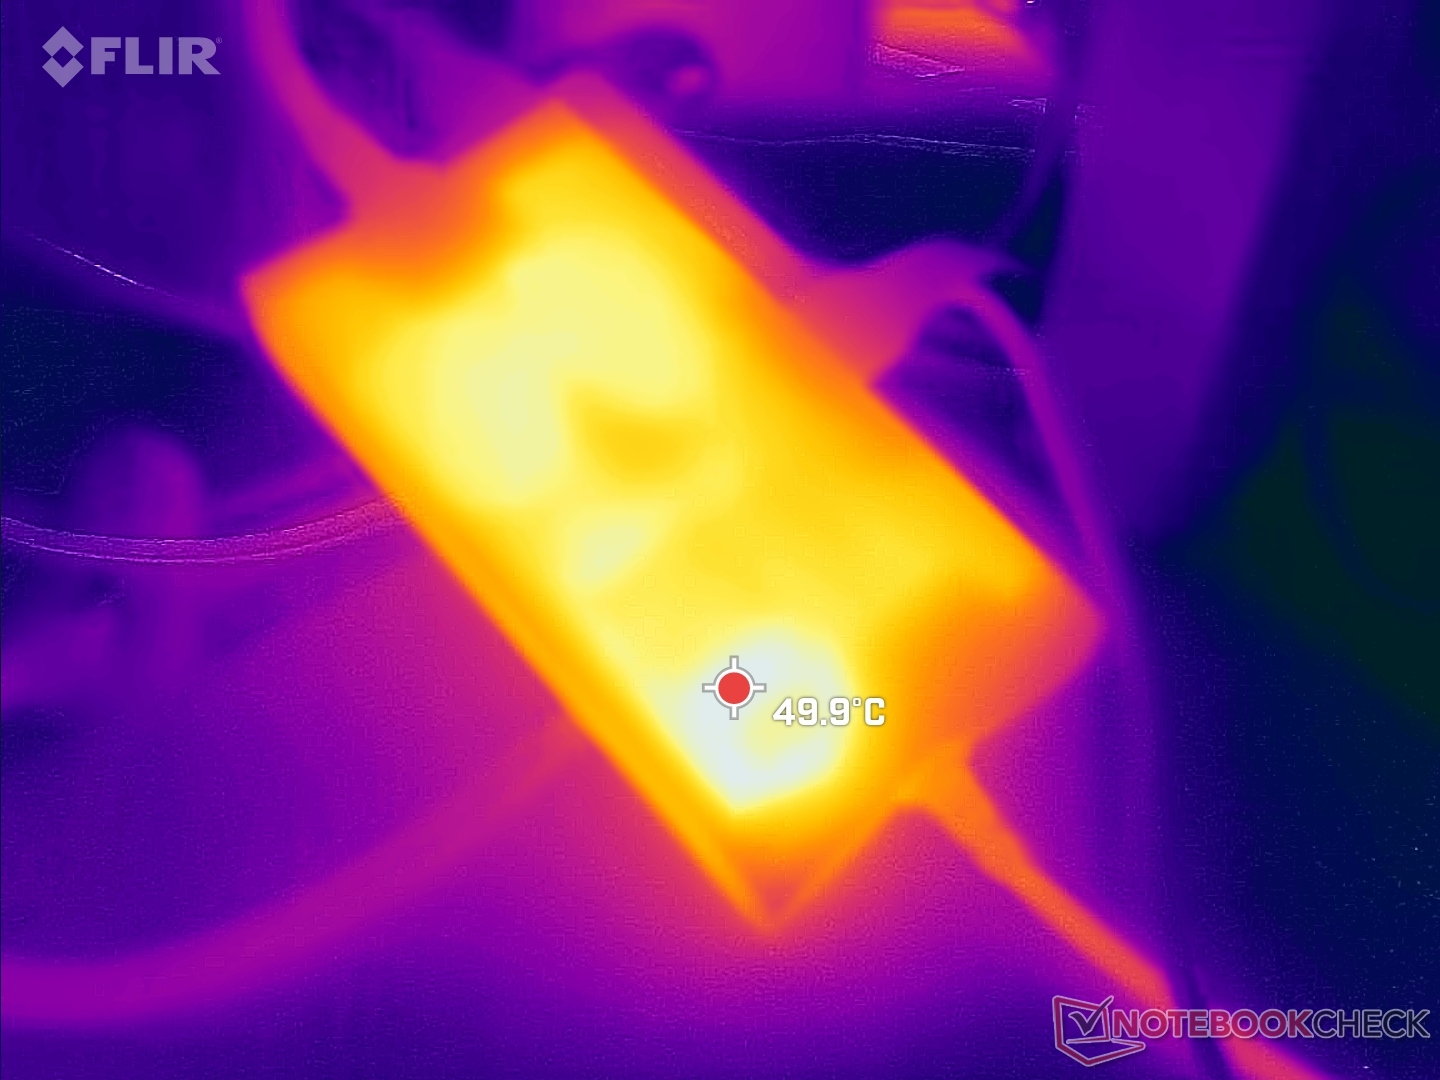
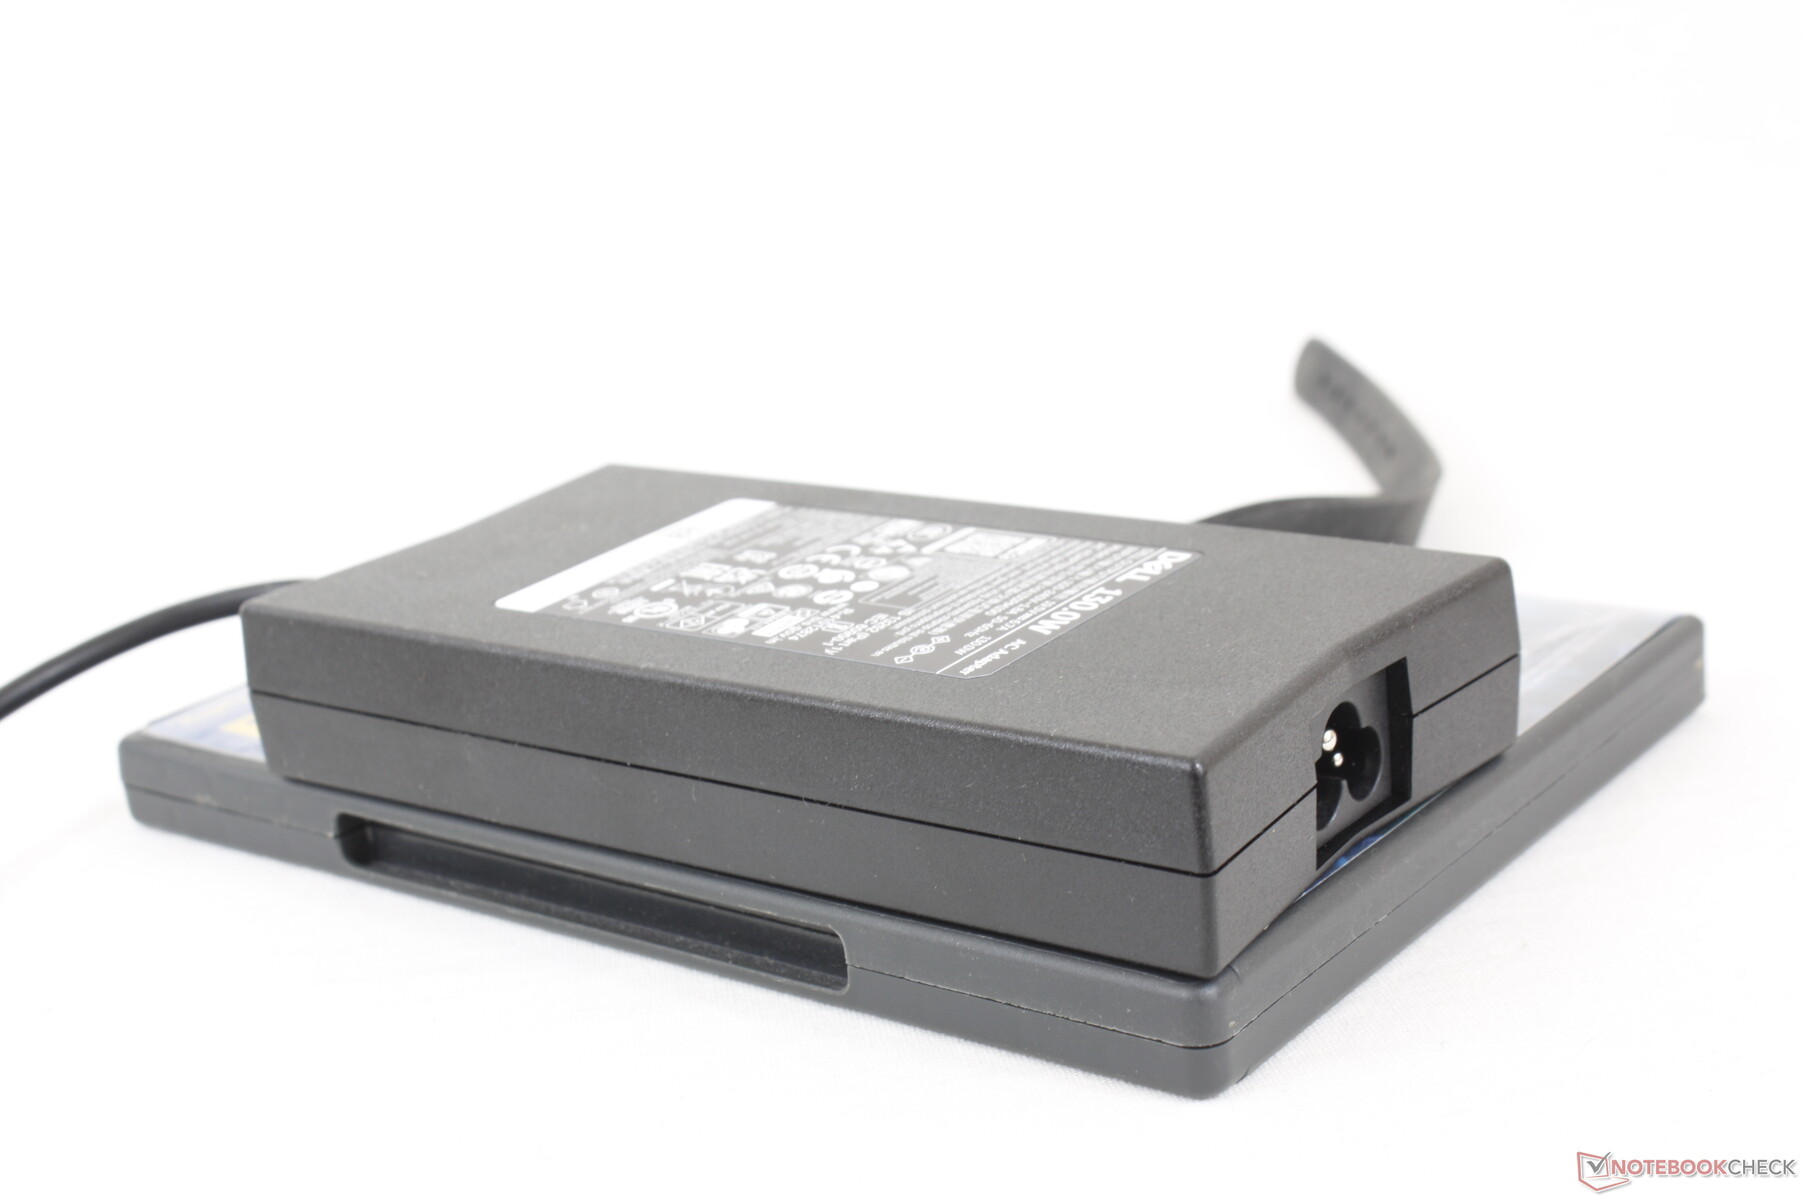
Pudimos registrar un consumo máximo de 137 W con el adaptador de CA de tamaño medio (~15.3 x 7.5 x 2.6 cm) de 130 W. Dell no ha hecho cambios en el adaptador ni en su capacidad nominal a pesar de que la CPU consume más energía.
| Off / Standby | |
| Ocioso | |
| Carga |
|
Clave:
min: | |
| Dell Inspiron 16 Plus 7620 i7-12700H, GeForce RTX 3050 Ti Laptop GPU, Kioxia BG5 KBG50ZNS512G, IPS, 3072x1920, 16" | Dell Inspiron 16 Plus 7610 i7-11800H, GeForce RTX 3050 4GB Laptop GPU, Kingston OM3PDP3512B, IPS, 3072x1920, 16" | Lenovo Yoga 7 16IAP7 i7-1260P, Iris Xe G7 96EUs, Micron 2450 512GB MTFDKCD512TFK, IPS, 2560x1600, 16" | Huawei MateBook D 16 2022 i7-12700H, Iris Xe G7 96EUs, Silicon Motion PCIe-8 SSD, IPS, 1920x1200, 16" | Acer Swift X SFX16-51G-5388 i5-11320H, GeForce RTX 3050 4GB Laptop GPU, Samsung PM991 MZVLQ512HBLU, , 1920x1080, 16.1" | Asus Vivobook Pro 16X-M7600QE R9 5900HX, GeForce RTX 3050 Ti Laptop GPU, SK Hynix HFM001TD3JX013N, OLED, 3840x2400, 16.1" | |
|---|---|---|---|---|---|---|
| Power Consumption | 1% | 35% | 29% | 21% | 1% | |
| Idle Minimum * (Watt) | 6.8 | 7.7 -13% | 6.6 3% | 6.1 10% | 7 -3% | 8.2 -21% |
| Idle Average * (Watt) | 9.6 | 10.7 -11% | 8.3 14% | 10.6 -10% | 10.1 -5% | 16.2 -69% |
| Idle Maximum * (Watt) | 17 | 16.8 1% | 9.8 42% | 11.5 32% | 15 12% | 19.7 -16% |
| Load Average * (Watt) | 117.5 | 100.39 15% | 66 44% | 65.5 44% | 63.3 46% | 65.8 44% |
| Witcher 3 ultra * (Watt) | 113.1 | 108 5% | 52 54% | 61.2 46% | 63.3 44% | 65.6 42% |
| Load Maximum * (Watt) | 137.4 | 129 6% | 67.1 51% | 68.4 50% | 94 32% | 104 24% |
* ... más pequeño es mejor
Power Consumption Witcher 3 / Stresstest
Power Consumption external Monitor
Duración de la batería
La capacidad de la batería no ha cambiado con respecto al modelo del año pasado, por lo que las duraciones son similares. Los usuarios pueden esperar 9,5 horas de uso real de la WLAN con el perfil de energía equilibrado. Hay una opción de batería menor de 56 Wh en algunos modelos para un peso total más ligero.
La carga de vacío a lleno tarda unas 2 horas con el adaptador de CA de barril incluido. El sistema también puede recargarse con cargadores USB-C de terceros.
| Dell Inspiron 16 Plus 7620 i7-12700H, GeForce RTX 3050 Ti Laptop GPU, 86 Wh | Dell Inspiron 16 Plus 7610 i7-11800H, GeForce RTX 3050 4GB Laptop GPU, 86 Wh | Lenovo Yoga 7 16IAP7 i7-1260P, Iris Xe G7 96EUs, 71 Wh | Huawei MateBook D 16 2022 i7-12700H, Iris Xe G7 96EUs, 60 Wh | Acer Swift X SFX16-51G-5388 i5-11320H, GeForce RTX 3050 4GB Laptop GPU, 58.7 Wh | Asus Vivobook Pro 16X-M7600QE R9 5900HX, GeForce RTX 3050 Ti Laptop GPU, 96 Wh | |
|---|---|---|---|---|---|---|
| Duración de Batería | 63% | 2% | -26% | 5% | 6% | |
| Reader / Idle (h) | 18.6 | 20.5 10% | 12.2 -34% | 20.3 9% | ||
| WiFi v1.3 (h) | 9.6 | 9.9 3% | 7.9 -18% | 7.1 -26% | 8.1 -16% | 11.3 18% |
| Load (h) | 1.2 | 3.3 175% | 1.9 58% | 1.5 25% | 1.1 -8% | |
| H.264 (h) | 8.4 | |||||
| Gaming (h) | 1.1 |
Pro
Contra
Veredicto - En parte multimedia, en parte creador, en parte jugador
La ventaja más notable del Inspiron 16 Plus 7620 en comparación con el 7610 es su CPU Intel Core-H de 12ª generación, ya que ofrece un rendimiento multihilo hasta un 50% más rápido. Si sus cargas de trabajo pueden explotar el procesador más rápido, entonces el 7620 puede ser una inversión que vale la pena sobre su predecesor.
La mayoría de los demás cambios son un paso al costado de la serie o, en el mejor de los casos, actualizaciones relativamente menores. Por ejemplo, la cámara web de 2 MP de mayor resolución está bien, pero no se acerca a las cámaras web de 5 MP del HP Spectre o el Envy 16. El diseño revisado del chasis también está bien, pero realmente no hace que el sistema sea más ligero, más pequeño o más fuerte que el antiguo diseño del 7610. Alternativas como el más ligero Asus VivoBook Pro 16X vienen con la RTX 3050 Ti y un panel OLED, el último de los cuales nuestro Dell aún no ofrece. Un panel de refresco más rápido, como el de 120 Hz del HP Envy 16, sería una gran opción a tener en cuenta.
El Inspiron 16 Plus 7620 es mucho más rápido que el 7610 en lo que respecta al rendimiento de la CPU. Por lo demás, casi todo lo demás es en gran medida igual o incluso peor, como las temperaturas más cálidas y el menor número de ranuras de expansión.
Mientras tanto, varios otros cambios pueden ser vistos como mejoras, tales como la omisión del teclado numérico, un clickpad más pequeño, mayor consumo de energía bajo carga, temperaturas más cálidas, y menor número de ranuras SODIMM y M.2 SSD. Sigue siendo un sistema potente con los colores y el rendimiento adecuados para el juego casual y la creación de contenidos, pero no es exactamente un homerun cuando faltan algunas características.
Precio y disponibilidad
Amazon tiene actualmente una configuración disponible con el Core i7-12700H, 16 GB de RAM, 512 GB de SSD, pantalla 3K y gráficos RTX 3050 por 1450 dólares. Recomendamos pedir directamente a Dell para obtener más opciones.
Dell Inspiron 16 Plus 7620
- 08/18/2022 v7 (old)
Allen Ngo
Price comparison

