Análisis para el Intel Core i7-11800H procesador
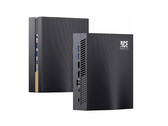
Análisis del mini PC Acemagic AD15: Potente alternativa al NUC con Intel Core i7-11800H
¿Demostrará el Acemagic AD15 con Intel Core i7-11800H ser un buen compañero diario en nuestra prueba? Echamos un vistazo detallado a lo que se puede esperar de un SoC que ya tiene más de tres años. Usando numerosas mediciones y pruebas, evaluamos el rendimiento del Acemagic AD15 frente a sus competidores y expondremos aquí sus ventajas y desventajas.
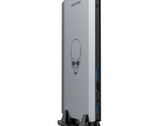
Intel Core i7-11800H, UHD Graphics Xe 32EUs (Tiger Lake-H), 765 gAnálisis del PC de sobremesa NUCXi7 de Minisforum: PC de juegos ultra delgado con GeForce RTX 3070 y Core i7-11800H
Con la serie NUCX, el fabricante de sistemas Minisforum ofrece un PC para juegos con todas las funciones, utilizando casi exclusivamente componentes de portátil. Pudimos tener en nuestras manos un NUCXi7 y echamos un vistazo más detallado al modelo, haciéndolo pasar por nuestro curso de pruebas. Puedes encontrar toda la información importante sobre este interesante dispositivo en nuestro extenso análisis aquí.
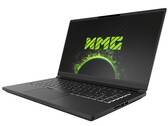
Intel Core i7-11800H, NVIDIA GeForce RTX 3070 Laptop GPU, 2.4 kgAnálisis del Schenker XMG Fusion 15 (Mid 22): Portátil ligero RTX 3070 con buena duración de batería
La CPU Core i7-11800H y la GPU GeForce RTX 3070 para portátiles llevan todos los juegos más recientes con fluidez a la pantalla mate QHD (165 Hz). Esto se complementa con un teclado mecánico, una buena duración de la batería y un puerto Thunderbolt 4.
Intel Core i7-11800H, NVIDIA GeForce RTX 3070 Laptop GPU, 15.6", 1.9 kgAnálisis del portátil HP ZBook Power 15 G8: Mucha gama alta en una estación de trabajo asequible
En nuestra prueba de portátiles, el asequible ZBook Power 15 G8 de HP con el Core i7-11800H de Intel muestra un rendimiento de estación de trabajo bueno pero inconsistente. Nuestra unidad de pruebas viene con una Nvidia T600 y puntúa con una muy buena duración de batería, excelentes dispositivos de entrada y un brillante panel FDH.
Intel Core i7-11800H, NVIDIA T600 Laptop GPU, 15.6", 2 kgAnálisis del portátil Lenovo ThinkPad P15v G2: Estación de trabajo empresarial asequible
El ThinkPad P15v G2 de Lenovo es una estación de trabajo barata de 15 pulgadas con opción de pantalla 4K en un formato bastante delgado. No sólo es rápido, silencioso y robusto, sino que también ofrece duraciones de batería aceptables, muy buenos dispositivos de entrada, rápido Wi-Fi 6 y opciones de expansión
Intel Core i7-11800H, NVIDIA T1200 Laptop GPU, 15.6", 2.3 kgZotac ZBOX Magnus EN173070C: NVIDIA GeForce RTX 3070 Laptop GPU, 1.8 kg
análise » Análisis de la Zotac ZBOX Magnus: GeForce RTX 3070 Mobile y Tiger Lake SoC en una caja de 2,65 litros
Lenovo ThinkBook 15p G2 ITH 21B1000YGE: NVIDIA GeForce RTX 3050 Ti Laptop GPU, 15.60", 1.9 kg
análise » Lenovo ThinkBook 15p G2: Probando el portátil creador con RTX y 4K
Eurocom RX315 NH57AF1: NVIDIA GeForce RTX 3070 Laptop GPU, 15.60", 2 kg
análise » Análisis del portátil Eurocom RX315: La alternativa al MSI GS66 Stealth
Schenker XMG Pro 15 (Late 2021): NVIDIA GeForce RTX 3080 Laptop GPU, 15.60", 2 kg
análise » Análisis del Schenker XMG Pro 15 (Clevo PC50HS-D): Portátil de juegos 4K fino y ligero
Schenker XMG Pro 17 (Late 2021, RTX 3080): NVIDIA GeForce RTX 3080 Laptop GPU, 17.30", 2.4 kg
análise » Análisis del Schenker XMG Pro 17 con RTX 3080 (Clevo PC70HS): Un portátil de juegos ultradelgado y estación de trabajo en uno
MSI GP66 Leopard 11UH-028: NVIDIA GeForce RTX 3080 Laptop GPU, 15.60", 2.3 kg
análise » El económico MSI GP66 Leopard 11UH en revisión: Gamer con RTX 3080 por menos de 2.000 euros
MSI Creator Z16 A11UET-209: NVIDIA GeForce RTX 3060 Laptop GPU, 16.00", 2.2 kg
análise » MSI Creator Z16: análisis del portátil creativo con AdobeRGB
Alienware m15 R6, i7-11800H RTX 3080: NVIDIA GeForce RTX 3080 Laptop GPU, 15.60", 2.5 kg
análise » Análisis del portátil Alienware m15 R6: Más eficiente, pero la RTX 3080 es más lenta que en su predecesor
Dell Inspiron 16 Plus 7610-MHJ8F: Intel UHD Graphics Xe 32EUs (Tiger Lake-H), 16.00", 2 kg
análise » Análisis del Dell Inspiron 16 Plus 7610: ¿Más rendimiento sin Nvidia?
Lenovo ThinkPad X1 Extreme G4-20Y5CTO1WW (3050 Ti): NVIDIA GeForce RTX 3050 Ti Laptop GPU, 16.00", 2 kg
análise » Análisis del portátil Lenovo ThinkPad X1 Extreme Gen 4: El buque insignia del rendimiento con pantalla táctil 16:10
ADATA XPG Xenia 15: NVIDIA GeForce RTX 3070 Laptop GPU, 15.60", 1.9 kg
análise » Análisis del portátil ADATA XPG Xenia 15: Casi tan afilado como un Razer Blade
Lenovo ThinkPad P1 G4-20Y30017GE: NVIDIA T1200 Laptop GPU, 16.00", 1.8 kg
análise » Lenovo ThinkPad P1 G4 - Versión de estación de trabajo del X1 Extreme G4 en revisión
HP Omen 16-b0085ng: NVIDIA GeForce RTX 3070 Laptop GPU, 16.10", 2.4 kg
análise » Análisis del portátil HP Omen 16: Potente portátil para juegos con RTX 3070 pero con inconvenientes innecesarios
Schenker XMG Focus 17: NVIDIA GeForce RTX 3050 Ti Laptop GPU, 17.30", 2.5 kg
análise » Análisis del portátil XMG Focus 17 (Clevo NP70HK): Portátil para juegos de gama media equipado con la RTX 3050 Ti
Lenovo ThinkPad P17 G2-20YU0025G: NVIDIA RTX A2000 Laptop GPU, 17.30", 3.6 kg
análise » Análisis del portátil Lenovo ThinkPad P17 G2: Estación de trabajo masiva con actualizaciones internas
Lenovo ThinkPad P15 G2-20YQ001JGE: NVIDIA RTX A3000 Laptop GPU, 15.60", 2.9 kg
análise » Análisis del portátil Lenovo ThinkPad P15 Gen 2: Estación de trabajo tradicional con nuevas GPU
Alienware x15 RTX 3070 P111F: NVIDIA GeForce RTX 3070 Laptop GPU, 15.60", 2.4 kg
análise » Análisis del portátil Alienware x15 R1: El OVNI más delgado de Dell ha aterrizado
Schenker XMG Focus 15: NVIDIA GeForce RTX 3050 Ti Laptop GPU, 15.60", 1.9 kg
análise » Análisis del portátil para juegos XMG Focus 15 (Clevo NP50HK): RTX 3050 Ti al límite
Schenker XMG NEO 17 GM7TG8S: NVIDIA GeForce RTX 3080 Laptop GPU, 17.30", 2.6 kg
análise » Schenker XMG NEO 17 con RTX 3080 en la revisión del portátil: Los usuarios pueden dar rienda suelta a la RTX 3080 por sí mismos
Alienware x17 RTX 3080 P48E: NVIDIA GeForce RTX 3080 Laptop GPU, 17.30", 3.2 kg
análise » Análisis del portátil Alienware x17 R1 RTX 3080: Un nuevo comienzo
Razer Blade 17 RTX 3070: NVIDIA GeForce RTX 3070 Laptop GPU, 17.30", 2.8 kg
análise » Análisis del portátil Razer Blade 17: Ahora con gráficos TGP GeForce RTX de 130 W
MSI Katana GF66 11UG-220: NVIDIA GeForce RTX 3070 Laptop GPU, 15.60", 2.3 kg
análise » Análisis del MSI Katana GF66 11UG: Un portátil para juegos con un potencial desperdiciado
Maingear Vector Pro MG-VCP17: NVIDIA GeForce RTX 3080 Laptop GPU, 17.30", 2.3 kg
análise » Análisis del portátil Maingear Vector Pro MG-VCP17: 165 W GeForce RTX 3080 para un tamaño ultradelgado
Dell Inspiron 16 Plus 7610: NVIDIA GeForce RTX 3050 4GB Laptop GPU, 16.00", 2 kg
análise » Casi un XPS 16: análisis del portátil Dell Inspiron 16 Plus 7610
Dell XPS 15 9510 11800H RTX 3050 Ti OLED: NVIDIA GeForce RTX 3050 Ti Laptop GPU, 15.60", 1.9 kg
análise » Análisis del Dell XPS 15 9510: El portátil multimedia convence con su nuevo panel OLED
Gigabyte Aero 15 OLED XD: NVIDIA GeForce RTX 3070 Laptop GPU, 15.60", 2.2 kg
análise » Análisis del portátil Gigabyte Aero 15 OLED XD: OLED 4K de nueva generación
Dell XPS 17 9710 Core i7 RTX 3060: NVIDIA GeForce RTX 3060 Laptop GPU, 17.00", 2.5 kg
análise » Análisis del portátil Dell XPS 17 9710 de 11ª generación de Intel: Pequeños cambios que importan
Razer Blade 15 Advanced (Mid 2021): NVIDIA GeForce RTX 3080 Laptop GPU, 15.60", 2 kg
análise » Análisis del Razer Blade 15 Advanced Model 11th Gen Intel (2021): Pequeños cambios, grandes ganancias en la CPU
MSI Katana GF76 11UE: NVIDIA GeForce RTX 3060 Laptop GPU, 17.30", 2.7 kg
análise » Análisis del MSI Katana GF76: Portátil para juegos con margen de mejora
Asus TUF Gaming F15 FX506HM: NVIDIA GeForce RTX 3060 Laptop GPU, 15.60", 2.3 kg
análise » Análisis del portátil Asus TUF Gaming F15 FX506HM: Sin extras, sólo rendimiento
Aorus 17G YD: NVIDIA GeForce RTX 3080 Laptop GPU, 17.30", 2.8 kg
análise » Análisis del Aorus 17G YD: Un portátil para juegos ruidoso con un buen teclado mecánico
Schenker XMG Neo 15 Tiger Lake: NVIDIA GeForce RTX 3080 Laptop GPU, 15.60", 2.2 kg
análise » Análisis del portátil para juegos Schenker XMG Neo 15 - La RTX 3080 con TGP de 165W garantiza altas puntuaciones
Aorus 15P YD: NVIDIA GeForce RTX 3080 Laptop GPU, 15.60", 2.2 kg
análise » Análisis del Aorus 15P YD: Portátil para juegos de gama alta con pantalla rápida de 360 Hz
Alienware m15 R6, i7-11800H RTX 3080: NVIDIA GeForce RTX 3080 Laptop GPU, 15.60", 2.5 kg
análise externo » Alienware m15 R6, i7-11800H RTX 3080
Acer Predator Helios 300 PH315-54-73HX: NVIDIA GeForce RTX 3070 Laptop GPU, 15.60", 2.3 kg
análise externo » Acer Predator Helios 300 PH315-54-73HX
MSI GF63 Thin 11UC: NVIDIA GeForce RTX 3050 4GB Laptop GPU, 15.60", 1.9 kg
análise externo » MSI GF63 Thin 11UC
Acer Nitro 5 AN515-57-77G3: NVIDIA GeForce RTX 3070 Laptop GPU, 15.60", 2.2 kg
análise externo » Acer Nitro 5 AN515-57-77G3
Acer Nitro 5 AN515-57-79TD: NVIDIA GeForce RTX 3050 4GB Laptop GPU, 15.60", 2.3 kg
análise externo » Acer Nitro 5 AN515-57-79TD
Asus TUF Gaming F17 FX706HM-HX004: NVIDIA GeForce RTX 3060 Laptop GPU, 17.30", 2.6 kg
análise externo » Asus TUF Gaming F17 FX706HM-HX004
HP Victus 16-d0077ns: NVIDIA GeForce RTX 3060 Laptop GPU, 16.10", 2.5 kg
análise externo » HP Victus 16-d0077ns
HP Omen 17-ck0010ca: NVIDIA GeForce RTX 3060 Laptop GPU, 17.30", 2.8 kg
análise externo » HP Omen 17-ck0010ca
MSI Katana GF66 11UC-809NL: NVIDIA GeForce RTX 3050 4GB Laptop GPU, 15.60", 2.3 kg
análise externo » MSI Katana GF66 11UC-809NL
MSI Thin GF63 11UD: NVIDIA GeForce RTX 3050 Ti Laptop GPU, 15.60", 1.9 kg
análise externo » MSI Thin GF63 11UD
Lenovo Legion 5 15ITH6H-82JH0070SP: NVIDIA GeForce RTX 3070 Laptop GPU, 15.60", 2.4 kg
análise externo » Lenovo Legion 5 15ITH6H-82JH0070SP
Acer ConceptD 7 Ezel Pro CC715-72G-71H9: NVIDIA GeForce RTX 3080 Laptop GPU, 16.00", 2.5 kg
análise externo » Acer ConceptD 7 Ezel Pro CC715-72G-71H9
Acer ConceptD 3 Ezel Pro CC315-73P-73QS: NVIDIA T1200 Laptop GPU, 15.60", 2.2 kg
análise externo » Acer ConceptD 3 Ezel Pro CC315-73P-73QS
HP Omen 17-ck0420nd: NVIDIA GeForce RTX 3060 Laptop GPU, 17.30", 2.8 kg
análise externo » HP Omen 17-ck0420nd
Gigabyte Aero 15 OLED YD, i7-11800H: NVIDIA GeForce RTX 3080 Laptop GPU, 15.60", 2 kg
análise externo » Gigabyte Aero 15 OLED YD, i7-11800H
HP Omen 17-ck0006np: NVIDIA GeForce RTX 3070 Laptop GPU, 17.30", 2.8 kg
análise externo » HP Omen 17-ck0006np
Acer Predator Triton 300 PT315-53-76B9: NVIDIA GeForce RTX 3080 Laptop GPU, 15.60", 2.1 kg
análise externo » Acer Predator Triton 300 PT315-53-76B9
MSI Katana GF76 11UG-090: NVIDIA GeForce RTX 3070 Laptop GPU, 17.30", 2.3 kg
análise externo » MSI Katana GF76 11UG-090
Asus TUF Gaming F17 FX706HM-HX059: NVIDIA GeForce RTX 3060 Laptop GPU, 17.30", 2.6 kg
análise externo » Asus TUF Gaming F17 FX706HM-HX059
Asus TUF Gaming F15 FX506HM-HN014: NVIDIA GeForce RTX 3060 Laptop GPU, 15.60", 2.3 kg
análise externo » Asus TUF Gaming F15 FX506HM-HN014
MSI Pulse GL66 11UGKV-231CA: NVIDIA GeForce RTX 3070 Laptop GPU, 15.60", 2.3 kg
análise externo » MSI Pulse GL66 11UGKV-231CA
HP Victus 16-d0018ns: NVIDIA GeForce RTX 3050 4GB Laptop GPU, 15.60", 2.5 kg
análise externo » HP Victus 16-d0018ns
HP Victus 16-d0057ns: NVIDIA GeForce RTX 3060 Laptop GPU, 16.10", 2.5 kg
análise externo » HP Victus 16-d0057ns
MSI Creator 15 A11UE-491: NVIDIA GeForce RTX 3060 Laptop GPU, 15.60", 2.1 kg
análise externo » MSI Creator 15 A11UE-491
Lenovo Legion 5 15ITH6, i7-11800H RTX 3050: NVIDIA GeForce RTX 3050 4GB Laptop GPU, 15.60", 2.4 kg
análise externo » Lenovo Legion 5 15ITH6, i7-11800H RTX 3050
HP Omen 16-b0028ns: NVIDIA GeForce RTX 3060 Laptop GPU, 16.10", 2.3 kg
análise externo » HP Omen 16-b0028ns
Hyperbook Pulsar V17, 11800H RTX 3070: NVIDIA GeForce RTX 3070 Laptop GPU, 17.30", 2 kg
análise externo » Hyperbook Pulsar V17, 11800H RTX 3070
Asus ProArt StudioBook 16 H7600HM-L2030X: NVIDIA GeForce RTX 3060 Laptop GPU, 16.00", 2.4 kg
análise externo » Asus ProArt StudioBook 16 H7600HM-L2030X
HP Omen 16-b0352TX: NVIDIA GeForce RTX 3050 Ti Laptop GPU, 16.00", 2.3 kg
análise externo » HP Omen 16-b0352TX
Lenovo ThinkPad X1 Extreme G4-20Y5001NGE: NVIDIA GeForce RTX 3050 Ti Laptop GPU, 16.00", 1.9 kg
análise externo » Lenovo ThinkPad X1 Extreme G4-20Y5001NGE
HP Envy 15-ep1074ng: NVIDIA GeForce RTX 3050 Ti Laptop GPU, 15.60", 2.2 kg
análise externo » HP Envy 15-ep1074ng
Acer Predator Helios 500 PH517-52-78TY: NVIDIA GeForce RTX 3080 Laptop GPU, 17.30", 4 kg
análise externo » Acer Predator Helios 500 PH517-52-78TY
Lenovo ThinkBook 15p G2 ITH 21B1000YGE: NVIDIA GeForce RTX 3050 Ti Laptop GPU, 15.60", 1.9 kg
análise externo » Lenovo ThinkBook 15p G2 ITH 21B1000YGE
Lenovo ThinkBook 15p G2 ITH-21B1001LUS: NVIDIA GeForce GTX 1650 Mobile, 15.60", 1.9 kg
análise externo » Lenovo ThinkBook 15p G2 ITH-21B1001LUS
Asus TUF Gaming F17 FX706HM-HX116R: NVIDIA GeForce RTX 3060 Laptop GPU, 17.30", 2.6 kg
análise externo » Asus TUF Gaming F17 FX706HM-HX116R
HP Victus 16-d0021ns: NVIDIA GeForce RTX 3050 4GB Laptop GPU, 16.10", 2.5 kg
análise externo » HP Victus 16-d0021ns
Asus ProArt StudioBook 16 W7600H3A-L2034X: NVIDIA RTX A3000 Laptop GPU, 16.00", 2.4 kg
análise externo » Asus ProArt StudioBook 16 W7600H3A-L2034X
Gigabyte Aero 15 OLED KD-72DE624SP: NVIDIA GeForce RTX 3060 Laptop GPU, 15.60", 2 kg
análise externo » Gigabyte Aero 15 OLED KD-72DE624SP
ADATA XPG Xenia 15: NVIDIA GeForce RTX 3070 Laptop GPU, 15.60", 1.9 kg
análise externo » ADATA XPG Xenia 15
Lenovo Legion 7 16ITHg6-82K600AFGE: NVIDIA GeForce RTX 3070 Laptop GPU, 16.00", 2.5 kg
análise externo » Lenovo Legion 7 16ITHg6-82K600AFGE
HP Omen 17-ck0039nf: NVIDIA GeForce RTX 3070 Laptop GPU, 17.30", 1.8 kg
análise externo » HP Omen 17-ck0039nf
MSI Katana GF66 11UC-231ES: NVIDIA GeForce RTX 3050 4GB Laptop GPU, 15.60", 2.1 kg
análise externo » MSI Katana GF66 11UC-231ES
MSI Katana GF66 11UE-088NEU: NVIDIA GeForce RTX 3060 Laptop GPU, 15.60", 2.1 kg
análise externo » MSI Katana GF66 11UE-088NEU
HP Omen 16-b0426no: NVIDIA GeForce RTX 3070 Laptop GPU, 16.10", 2.3 kg
análise externo » HP Omen 16-b0426no
Acer Nitro 5 AN515-57-742V: NVIDIA GeForce RTX 3060 Laptop GPU, 15.60", 2.2 kg
análise externo » Acer Nitro 5 AN515-57-742V
HP ZBook Fury 15 G8-314J6EA : NVIDIA RTX A2000 Laptop GPU, 15.60", 2.4 kg
análise externo » HP ZBook Fury 15 G8-314J6EA
HP Victus 16-d0065ng: NVIDIA GeForce RTX 3050 Ti Laptop GPU, 16.10", 2.5 kg
análise externo » HP Victus 16-d0065ng
HP Victus 16-d0097nr: NVIDIA GeForce RTX 3060 Laptop GPU, 16.10", 2.5 kg
análise externo » HP Victus 16-d0097nr
Alienware m15 R6, i7-11800H RTX 3060: NVIDIA GeForce RTX 3060 Laptop GPU, 15.60", 2.4 kg
análise externo » Alienware m15 R6, i7-11800H RTX 3060
Acer Nitro 5 AN515-57-77QK: NVIDIA GeForce RTX 3050 4GB Laptop GPU, 15.60", 2.3 kg
análise externo » Acer Nitro 5 AN515-57-77QK
MSI Pulse GL76 11UEK-055XES: NVIDIA GeForce RTX 3060 Laptop GPU, 17.30", 2.3 kg
análise externo » MSI Pulse GL76 11UEK-055XES
MSI Katana GF76 11UC-080ES: NVIDIA GeForce RTX 3050 4GB Laptop GPU, 17.30", 2.3 kg
análise externo » MSI Katana GF76 11UC-080ES
MSI GP66 Leopard 11UG-016XES: Intel UHD Graphics Xe 32EUs (Tiger Lake-H), 15.60", 2.4 kg
análise externo » MSI GP66 Leopard 11UG-016XES
MSI Pulse GL66 11UEK-061XES: NVIDIA GeForce RTX 3060 Laptop GPU, 17.30", 2.3 kg
análise externo » MSI Pulse GL66 11UEK-061XES
MSI Sword 15 A11UD: NVIDIA GeForce RTX 3050 Ti Laptop GPU, 15.60", 2.3 kg
análise externo » MSI Sword 15 A11UD
Acer Predator Triton 500 PT516-51s-72LN: NVIDIA GeForce RTX 3080 Laptop GPU, 16.10", 2.5 kg
análise externo » Acer Predator Triton 500 PT516-51s-72LN
Razer Blade 15 Advanced RZ09-0409CGC3-R3G1: NVIDIA GeForce RTX 3080 Laptop GPU, 15.60", 2 kg
análise externo » Razer Blade 15 Advanced RZ09-0409CGC3-R3G1
Acer Nitro 5 AN517-54-79L1: NVIDIA GeForce RTX 3050 Ti Laptop GPU, 17.30", 2.7 kg
análise externo » Acer Nitro 5 AN517-54-79L1
MSI Katana GF66 11UC-072XES: NVIDIA GeForce RTX 3050 4GB Laptop GPU, 15.60", 2.1 kg
análise externo » MSI Katana GF66 11UC-072XES
HP Omen 17-ck0065ng: NVIDIA GeForce RTX 3060 Laptop GPU, 17.30", 1.8 kg
análise externo » HP Omen 17-ck0065ng
Lenovo Legion 5 17ITH6H-82JM0010GE: NVIDIA GeForce RTX 3060 Laptop GPU, 17.30", 3 kg
análise externo » Lenovo Legion 5 17ITH6H-82JM0010GE
MSI Sword 15 A11UE-214PL: NVIDIA GeForce RTX 3060 Laptop GPU, 15.60", 2.3 kg
análise externo » MSI Sword 15 A11UE-214PL
Dell G15 5511-RNGVW: NVIDIA GeForce RTX 3050 Ti Laptop GPU, 15.60", 2.8 kg
análise externo » Dell G15 5511-RNGVW
Lenovo Legion 5 Pro 16ITH6H, i7-11800H RTX 3050: NVIDIA GeForce RTX 3050 4GB Laptop GPU, 16.00", 2.3 kg
análise externo » Lenovo Legion 5 Pro 16ITH6H, i7-11800H RTX 3050
HP Victus 16-d0108TX: NVIDIA GeForce RTX 3050 4GB Laptop GPU, 16.10", 2.5 kg
análise externo » HP Victus 16-d0108TX
MSI GE66 Raider 11UG-267: NVIDIA GeForce RTX 3070 Laptop GPU, 15.60", 2.4 kg
análise externo » MSI GE66 Raider 11UG-267
Acer Predator Triton 300 PT315-53-717C: NVIDIA GeForce RTX 3060 Laptop GPU, 15.60", 2.1 kg
análise externo » Acer Predator Triton 300 PT315-53-717C
MSI Katana GF66 11UG-220: NVIDIA GeForce RTX 3070 Laptop GPU, 15.60", 2.3 kg
análise externo » MSI Katana GF66 11UG-220
MSI GP66 Leopard 11UG-017PL: NVIDIA GeForce RTX 3070 Laptop GPU, 15.60", 2.4 kg
análise externo » MSI GP66 Leopard 11UG-017PL
Acer Nitro 5 AN517-54-706P: NVIDIA GeForce RTX 3050 4GB Laptop GPU, 17.30", 2.7 kg
análise externo » Acer Nitro 5 AN517-54-706P
Lenovo ThinkPad X1 Extreme G4-20Y5001SPB: NVIDIA GeForce RTX 3060 Laptop GPU, 16.00", 1.8 kg
análise externo » Lenovo ThinkPad X1 Extreme G4-20Y5001SPB
MSI GS76 Stealth 11UG-270: NVIDIA GeForce RTX 3070 Laptop GPU, 17.30", 2.5 kg
análise externo » MSI GS76 Stealth 11UG-270
Razer Blade 15 Advanced Model RZ09-0409BGA3-R3G1: NVIDIA GeForce RTX 3070 Laptop GPU, 15.60", 2 kg
análise externo » Razer Blade 15 Advanced Model RZ09-0409BGA3-R3G1
Alienware x15 R1-JYMD9: NVIDIA GeForce RTX 3080 Laptop GPU, 15.60", 2.4 kg
análise externo » Alienware x15 R1-JYMD9
HP ZBook Power G8, 11800H T600: NVIDIA T600 Laptop GPU, 15.60", 1.9 kg
análise externo » HP ZBook Power G8, 11800H T600
Lenovo ThinkPad P15v G2-21A9000AGE: NVIDIA T600 Laptop GPU, 15.60", 2.1 kg
análise externo » Lenovo ThinkPad P15v G2-21A9000AGE
MSI Creator Z16 A11UET-011NEU: NVIDIA GeForce RTX 3060 Laptop GPU, 16.00", 2.2 kg
análise externo » MSI Creator Z16 A11UET-011NEU
Acer ConceptD 3 Ezel CC315-73G-74TT: NVIDIA GeForce RTX 3050 Ti Laptop GPU, 15.60", 2.2 kg
análise externo » Acer ConceptD 3 Ezel CC315-73G-74TT
HP Omen 16-b0064TX: NVIDIA GeForce RTX 3060 Laptop GPU, 16.10", 2.3 kg
análise externo » HP Omen 16-b0064TX
Lenovo Legion 5 15ITH6, i7-11800H 3050 Ti: NVIDIA GeForce RTX 3050 Ti Laptop GPU, 15.60", 2.4 kg
análise externo » Lenovo Legion 5 15ITH6, i7-11800H 3050 Ti
Alienware x15 R1-JH85R: NVIDIA GeForce RTX 3070 Laptop GPU, 15.60", 2.4 kg
análise externo » Alienware x15 R1-JH85R
Alienware m15 R6-C0DK5: NVIDIA GeForce RTX 3080 Laptop GPU, 15.60", 2.7 kg
análise externo » Alienware m15 R6-C0DK5
Acer Nitro 5 AN517-54-77KG: NVIDIA GeForce RTX 3050 Ti Laptop GPU, 17.30", 2.7 kg
análise externo » Acer Nitro 5 AN517-54-77KG
Acer Predator Helios 300 PH317-55-70YF: NVIDIA GeForce RTX 3070 Laptop GPU, 17.30", 3 kg
análise externo » Acer Predator Helios 300 PH317-55-70YF
MSI Creator 17 B11UH-241: NVIDIA GeForce RTX 3080 Laptop GPU, 17.30", 2.5 kg
análise externo » MSI Creator 17 B11UH-241
MSI GP66 Leopard 11UG-296: NVIDIA GeForce RTX 3070 Laptop GPU, 15.60", 2.4 kg
análise externo » MSI GP66 Leopard 11UG-296
Razer Blade 17, i7-11800H RTX 3080: NVIDIA GeForce RTX 3080 Laptop GPU, 17.30", 2.8 kg
análise externo » Razer Blade 17, i7-11800H RTX 3080
Alienware x17 R1, i7-11800H RTX 3070 FHD: NVIDIA GeForce RTX 3070 Laptop GPU, 17.30", 3 kg
análise externo » Alienware x17 R1, i7-11800H RTX 3070 FHD
Acer Predator Triton 500 SE PT516-51s-70TP: NVIDIA GeForce RTX 3060 Laptop GPU, 16.00", 2.5 kg
análise externo » Acer Predator Triton 500 SE PT516-51s-70TP
Lenovo Legion 5 Pro 16ITH6H-82JD000TGE: NVIDIA GeForce RTX 3060 Laptop GPU, 16.00", 2.3 kg
análise externo » Lenovo Legion 5 Pro 16ITH6H-82JD000TGE
Acer Predator Triton 500 PT516-51s-72JQ: NVIDIA GeForce RTX 3080 Laptop GPU, 16.10", 2.5 kg
análise externo » Acer Predator Triton 500 PT516-51s-72JQ
Asus TUF Gaming F17 FX706HC-HX008T: NVIDIA GeForce RTX 3050 4GB Laptop GPU, 17.30", 2.6 kg
análise externo » Asus TUF Gaming F17 FX706HC-HX008T
MSI Katana GF66 11UE-063: NVIDIA GeForce RTX 3060 Laptop GPU, 15.60", 2.1 kg
análise externo » MSI Katana GF66 11UE-063
Aorus 15P KD: NVIDIA GeForce RTX 3060 Laptop GPU, 15.60", 2.2 kg
análise externo » Aorus 15P KD
HP Victus 16-d0166ng: NVIDIA GeForce RTX 3060 Laptop GPU, 16.10", 2.5 kg
análise externo » HP Victus 16-d0166ng
Lenovo Legion 5i Pro 16ITH6H-82JD0011HH: NVIDIA GeForce RTX 3070 Laptop GPU, 16.00", 2.3 kg
análise externo » Lenovo Legion 5i Pro 16ITH6H-82JD0011HH
Asus TUF Gaming F15 FX506HM: NVIDIA GeForce RTX 3060 Laptop GPU, 15.60", 2.3 kg
análise externo » Asus TUF Gaming F15 FX506HM
Razer Blade 15 Advanced (Mid 2021): NVIDIA GeForce RTX 3080 Laptop GPU, 15.60", 2 kg
análise externo » Razer Blade 15 Advanced Model Core i7-11800H
Acer Predator Helios 300 PH315-54-760S: NVIDIA GeForce RTX 3060 Laptop GPU, 15.60", 2.2 kg
análise externo » Acer Predator Helios 300 PH315-54-760S
MSI GS66 Stealth 11UH-471: NVIDIA GeForce RTX 3080 Laptop GPU, 15.60", 2.1 kg
análise externo » MSI GS66 Stealth 11UH-471
Asus ROG Zephyrus M16 GU603HR-K8030T: NVIDIA GeForce RTX 3070 Laptop GPU, 16.00", 1.9 kg
análise externo » Asus ROG Zephyrus M16 GU603HR-K8030T
Asus ROG Zephyrus M16 GU603HM-K8062T: NVIDIA GeForce RTX 3060 Laptop GPU, 16.00", 1.9 kg
análise externo » Asus ROG Zephyrus M16 GU603HM-K8062T
Acer Nitro 5 AN515-57-796N: NVIDIA GeForce RTX 3050 Ti Laptop GPU, 15.60", 2.3 kg
análise externo » Acer Nitro 5 AN515-57-796N
Razer Blade 17, 11800H 3060 QHD: NVIDIA GeForce RTX 3060 Laptop GPU, 17.30", 2.8 kg
análise externo » Razer Blade 17, 11800H 3060 QHD
Dell Inspiron 16 Plus 7610: NVIDIA GeForce RTX 3050 4GB Laptop GPU, 16.00", 2 kg
análise externo » Dell Inspiron 16 Plus 7610
MSI Katana GF66 11UD-092: NVIDIA GeForce RTX 3050 Ti Laptop GPU, 15.60", 2.1 kg
análise externo » MSI Katana GF66 11UD-092
Asus ROG Zephyrus S17 GX703HM-K4002T: NVIDIA GeForce RTX 3060 Laptop GPU, 17.30", 2.6 kg
análise externo » Asus ROG Zephyrus S17 GX703HM-K4002T
MSI GE76 Raider 11UH-083: NVIDIA GeForce RTX 3080 Laptop GPU, 17.30", 2.9 kg
análise externo » MSI GE76 Raider 11UH-083
Acer Nitro 5 AN515-57-729U: NVIDIA GeForce RTX 3070 Laptop GPU, 15.60", 2.3 kg
análise externo » Acer Nitro 5 AN515-57-729U
MSI Pulse GL66 11UGK-001: NVIDIA GeForce RTX 3070 Laptop GPU, 15.60", 2.3 kg
análise externo » MSI Pulse GL66 11UGK-001
Aorus 15P XD: NVIDIA GeForce RTX 3070 Laptop GPU, 15.40", 2.2 kg
análise externo » Aorus 15P XD
MSI GP66 Leopard 11UH-229RU: NVIDIA GeForce RTX 3080 Laptop GPU, 15.60", 2.4 kg
análise externo » MSI GP66 Leopard 11UH-229RU
Dell XPS 17 9710 Core i7 RTX 3060: NVIDIA GeForce RTX 3060 Laptop GPU, 17.00", 2.5 kg
análise externo » Dell XPS 17 9710 Core i7 RTX 3060
MSI Pulse GL66 11UDK: NVIDIA GeForce RTX 3050 Ti Laptop GPU, 15.60", 2.3 kg
análise externo » MSI Pulse GL66 11UDK
MSI Pulse GL76 11UDK: NVIDIA GeForce RTX 3050 Ti Laptop GPU, 17.30", 2.3 kg
análise externo » MSI Pulse GL76 11UDK
Acer Predator Triton 500 PT516-51s-75VF: NVIDIA GeForce RTX 3060 Laptop GPU, 16.10", 2.5 kg
análise externo » Acer Predator Triton 500 PT516-51s-75VF
MSI Creator Z16 A11UE-074: NVIDIA GeForce RTX 3060 Laptop GPU, 15.60", 2.2 kg
análise externo » MSI Creator Z16 A11UE-074
Alienware m15 R6 8F42P: NVIDIA GeForce RTX 3070 Laptop GPU, 15.60", 2.7 kg
análise externo » Alienware m15 R6 8F42P
Alienware x15 RTX 3060 P26M7: NVIDIA GeForce RTX 3060 Laptop GPU, 15.60", 2.4 kg
análise externo » Alienware x15 RTX 3060 P26M7
Dell XPS 15 9510, 11800H RTX 3050 Ti FHD: NVIDIA GeForce RTX 3050 Ti Laptop GPU, 15.60", 2 kg
análise externo » Dell XPS 15 9510, 11800H RTX 3050 Ti FHD
Dell XPS 15 9510 11800H RTX 3050 Ti OLED: NVIDIA GeForce RTX 3050 Ti Laptop GPU, 15.60", 1.9 kg
análise externo » Dell XPS 15 9510 11800H RTX 3050 Ti OLED
Alienware x17 RTX 3080 P48E: NVIDIA GeForce RTX 3080 Laptop GPU, 17.30", 3.2 kg
análise externo » Alienware x17 RTX 3080 P48E
Razer Blade 15 Advanced Model RZ09-0409CGC3-R3G1: NVIDIA GeForce RTX 3080 Laptop GPU, 15.60", 2 kg
análise externo » Razer Blade 15 Advanced Model RZ09-0409CGC3-R3G1
Razer Blade 15 Advanced Model RZ09-0409AGD3-R3G1: NVIDIA GeForce RTX 3060 Laptop GPU, 15.60", 2 kg
análise externo » Razer Blade Advanced Model 15 RZ09-0409AGD3-R3G1
MSI Katana GF66 11UC-011NL: NVIDIA GeForce RTX 3050 4GB Laptop GPU, 15.60", 2.1 kg
análise externo » MSI Katana GF66 11UC-011NL
Lenovo ThinkPad P15 G2, i7-11800H RTX A3000: NVIDIA RTX A3000 Laptop GPU, 15.60", 2.9 kg
análise externo » Lenovo ThinkPad P15 G2, i7-11800H RTX A3000
MSI Katana GF76 11UE: NVIDIA GeForce RTX 3060 Laptop GPU, 17.30", 2.7 kg
análise externo » MSI Katana GF76 11UE
MSI Katana GF76 11UE-036: NVIDIA GeForce RTX 3060 Laptop GPU, 17.30", 2.3 kg
análise externo » MSI Katana GF76 11UE-036
Acer Predator Helios 300 PH315-54-NH.QC1EK.002: NVIDIA GeForce RTX 3070 Laptop GPU, 15.60", 2.3 kg
análise externo » Acer Predator Helios 300 PH315-54-NH.QC1EK.002
Gigabyte Aero 17 HDR XD: NVIDIA GeForce RTX 3070 Laptop GPU, 17.30", 2.5 kg
análise externo » Gigabyte Aero 17 HDR XD
MSI GP76 Leopard 11UG-081IT: NVIDIA GeForce RTX 3070 Laptop GPU, 17.30", 2.9 kg
análise externo » MSI GP76 Leopard 11UG-081IT
MSI Katana GF76 11UD-050: NVIDIA GeForce RTX 3050 Ti Laptop GPU, 17.30", 2.3 kg
análise externo » MSI Katana GF76 11UD-050
MSI Katana GF66 11UC-228: NVIDIA GeForce RTX 3050 4GB Laptop GPU, 15.60", 2.1 kg
análise externo » MSI Katana GF66 11UC-228
Asus TUF Gaming F15 TUF506HE-DS74: NVIDIA GeForce RTX 3050 Ti Laptop GPU, 15.60", 2.3 kg
análise externo » Asus TUF Gaming F15 TUF506HE-DS74
Asus TUF Gaming F15 FX506HM-HN004T: NVIDIA GeForce RTX 3060 Laptop GPU, 15.60", 2.3 kg
análise externo » Asus TUF F15 FX506HM-HN004T
MSI Katana GF76 11UE-005NL: NVIDIA GeForce RTX 3060 Laptop GPU, 17.30", 2.3 kg
análise externo » MSI Katana GF76 11UE-005NL
MSI GS76 Stealth 11UE-221: NVIDIA GeForce RTX 3060 Laptop GPU, 17.30", 2.5 kg
análise externo » MSI GS76 Stealth 11UE-221
MSI Pulse GL76 11UEK-033: NVIDIA GeForce RTX 3060 Laptop GPU, 17.30", 2.3 kg
análise externo » MSI Pulse GL76 11UEK-033
MSI Pulse GL66 11UEK-034: NVIDIA GeForce RTX 3060 Laptop GPU, 15.60", 2.1 kg
análise externo » MSI Pulse GL66 11UEK-034
Aorus 15P YD: NVIDIA GeForce RTX 3080 Laptop GPU, 15.60", 2.2 kg
análise externo » Aorus 15P YD
Acer ConceptD 5 CN516-72G-756Y: NVIDIA GeForce RTX 3060 Laptop GPU, 16.00", 2.5 kg
análise externo » Acer ConceptD 5 CN516-72G-756Y
Acer Predator Triton 500 SE PT516-51s-75WM: NVIDIA GeForce RTX 3070 Laptop GPU, 16.00", 2.5 kg
análise externo » Acer Predator Triton 500 SE PT516-51s-75WM
Gigabyte Aero 15 OLED XD: NVIDIA GeForce RTX 3070 Laptop GPU, 15.60", 2.2 kg
análise externo » Gigabyte Aero 15 OLED XD
Aorus 17G YD: NVIDIA GeForce RTX 3080 Laptop GPU, 17.30", 2.8 kg
análise externo » Aorus 17G YD
Schenker XMG Pro 17 (Late 2021, RTX 3080): NVIDIA GeForce RTX 3080 Laptop GPU, 17.30", 2.4 kg
» Los fabricantes intentan atraer cada vez más a los jugadores y a los profesionales al mismo tiempo - Análisis del Schenker XMG Pro 17 (Clevo PC70HS)
ADATA XPG Xenia 15: NVIDIA GeForce RTX 3070 Laptop GPU, 15.60", 1.9 kg
» El TGP máximo de la GPU que aparece en el panel de control de Nvidia no siempre dice la verdad
Lenovo ThinkPad P1 G4-20Y30017GE: NVIDIA T1200 Laptop GPU, 16.00", 1.8 kg
» Los clientes se quedan en la oscuridad: Sólo los modelos con cámara de vapor del Lenovo ThinkPad P1 G4/X1 Extreme G4 ofrecen todo el rendimiento de la CPU
Alienware x17 RTX 3080 P48E: NVIDIA GeForce RTX 3080 Laptop GPU, 17.30", 3.2 kg
» La actualización Essential BIOS 1.3.0 para los propietarios de Alienware x15 y x17 ya está disponible para aumentar el rendimiento y permitir el cambio de gráficos híbridos
Razer Blade 17 RTX 3070: NVIDIA GeForce RTX 3070 Laptop GPU, 17.30", 2.8 kg
» 100 W GeForce RTX 3080 vs. 130 W GeForce RTX 3070: ¿Cuál es la mejor opción?
Maingear Vector Pro MG-VCP17: NVIDIA GeForce RTX 3080 Laptop GPU, 17.30", 2.3 kg
» El Maingear Vector Pro es un kilo y medio más ligero que el Razer Blade Pro y con un rendimiento casi idéntico
Dell XPS 15 9510 11800H RTX 3050 Ti OLED: NVIDIA GeForce RTX 3050 Ti Laptop GPU, 15.60", 1.9 kg
» ¿Cuándo tendremos por fin el Dell XPS 15 con CPUs AMD Ryzen?
Dell Inspiron 16 Plus 7610: NVIDIA GeForce RTX 3050 4GB Laptop GPU, 16.00", 2 kg
» Vaya, la flamante GeForce RTX 3050 es más lenta que la GTX 1660 Ti y la RTX 2060
Dell XPS 15 9510 11800H RTX 3050 Ti OLED: NVIDIA GeForce RTX 3050 Ti Laptop GPU, 15.60", 1.9 kg
» El nuevo Dell XPS 15 9510 OLED tiene problemas con el rendimiento de la GPU