Análisis del portátil Dell Inspiron 16 Plus 7630: 60 W GeForce RTX 4060 no está tan mal

El Dell Inspiron 16 Plus 7630 2023 sucede al 2022 Inspiron 16 Plus 7620 del año pasado con interiores y exteriores actualizados a pesar de que el modelo 2022 ya era un rediseño completo del 2021 Inspiron 16 Plus 7610. Es raro ver que una serie sufra tres rediseños importantes tres años seguidos, ya que los fabricantes suelen revisar el exterior solo una vez cada pocos años. Al igual que otros portátiles multimedia de 2023, el Inspiron 16 Plus 7630 incorpora CPU Intel Raptor Lake-H de 13ª generación y GPU Nvidia Ada Lovelace.
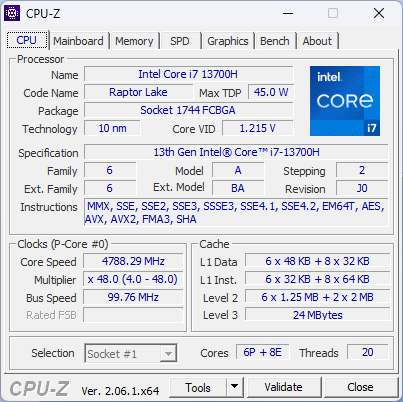
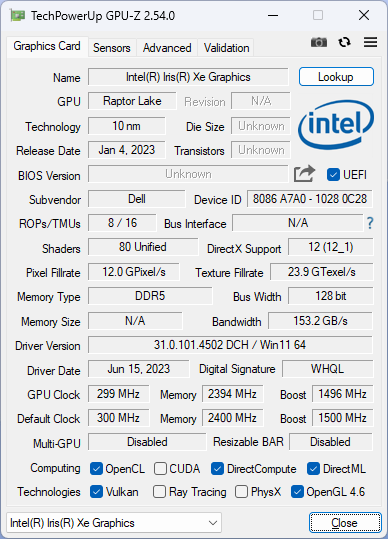
Nuestra unidad de análisis es una configuración de gama alta con la CPU Core i7-13700H, la GPU GeForce RTX 4060 y una pantalla IPS de 2560 x 1600 120 Hz por aproximadamente 1250 USD. Se están preparando versiones inferiores con Core i5-13500H, iris Xe integrado, RTX 3050, RTX 4050 o pantalla 1200p 60 Hz. También están previstas variantes AMD con Ryzen 5 7640HS y Ryzen 7 7840HS bajo el nombre de modelo Inspiron 16 Plus 7635.
Las alternativas al Inspiron 16 Plus 7630 incluyen otros portátiles multimedia de 16 pulgadas como el Lenovo Slim Pro 9i 16, Asus VivoBook Pro 16X, HP Envy 16, o MSI Summit E16 Flip. El Inspiron 16 Plus 7630 no debe confundirse con el Inspiron 16 estándar más lento o el Inspiron 16 Plus 7630 2 en 1 que tienen especificaciones y características muy diferentes.
Más opiniones sobre Dell:
Posibles contendientes en la comparación
Valoración | Fecha | Modelo | Peso | Altura | Tamaño | Resolución | Precio |
|---|---|---|---|---|---|---|---|
| 87.1 % v7 (old) | 08/2023 | Dell Inspiron 16 Plus 7630 i7-13700H, GeForce RTX 4060 Laptop GPU | 2.2 kg | 19.95 mm | 16.00" | 2560x1600 | |
| 87.4 % v7 (old) | 08/2022 | Dell Inspiron 16 Plus 7620 i7-12700H, GeForce RTX 3050 Ti Laptop GPU | 2.1 kg | 18.99 mm | 16.00" | 3072x1920 | |
| 88 % v7 (old) | 08/2023 | Lenovo Slim Pro 9i 16IRP8 i9-13905H, GeForce RTX 4050 Laptop GPU | 2.2 kg | 18.2 mm | 16.00" | 3200x2000 | |
| 86.2 % v7 (old) | 07/2023 | Asus Vivobook Pro 16X K6604JV-MX016W i9-13980HX, GeForce RTX 4060 Laptop GPU | 2.1 kg | 22.8 mm | 16.00" | 3200x2000 | |
| 86.9 % v7 (old) | 09/2022 | HP Envy 16 h0112nr i7-12700H, GeForce RTX 3060 Laptop GPU | 2.3 kg | 19.8 mm | 16.00" | 3840x2400 | |
| 84.2 % v7 (old) | 10/2022 | MSI Summit E16 Flip A12UDT-031 i7-1280P, GeForce RTX 3050 Ti Laptop GPU | 1.9 kg | 16.85 mm | 16.00" | 2560x1600 |
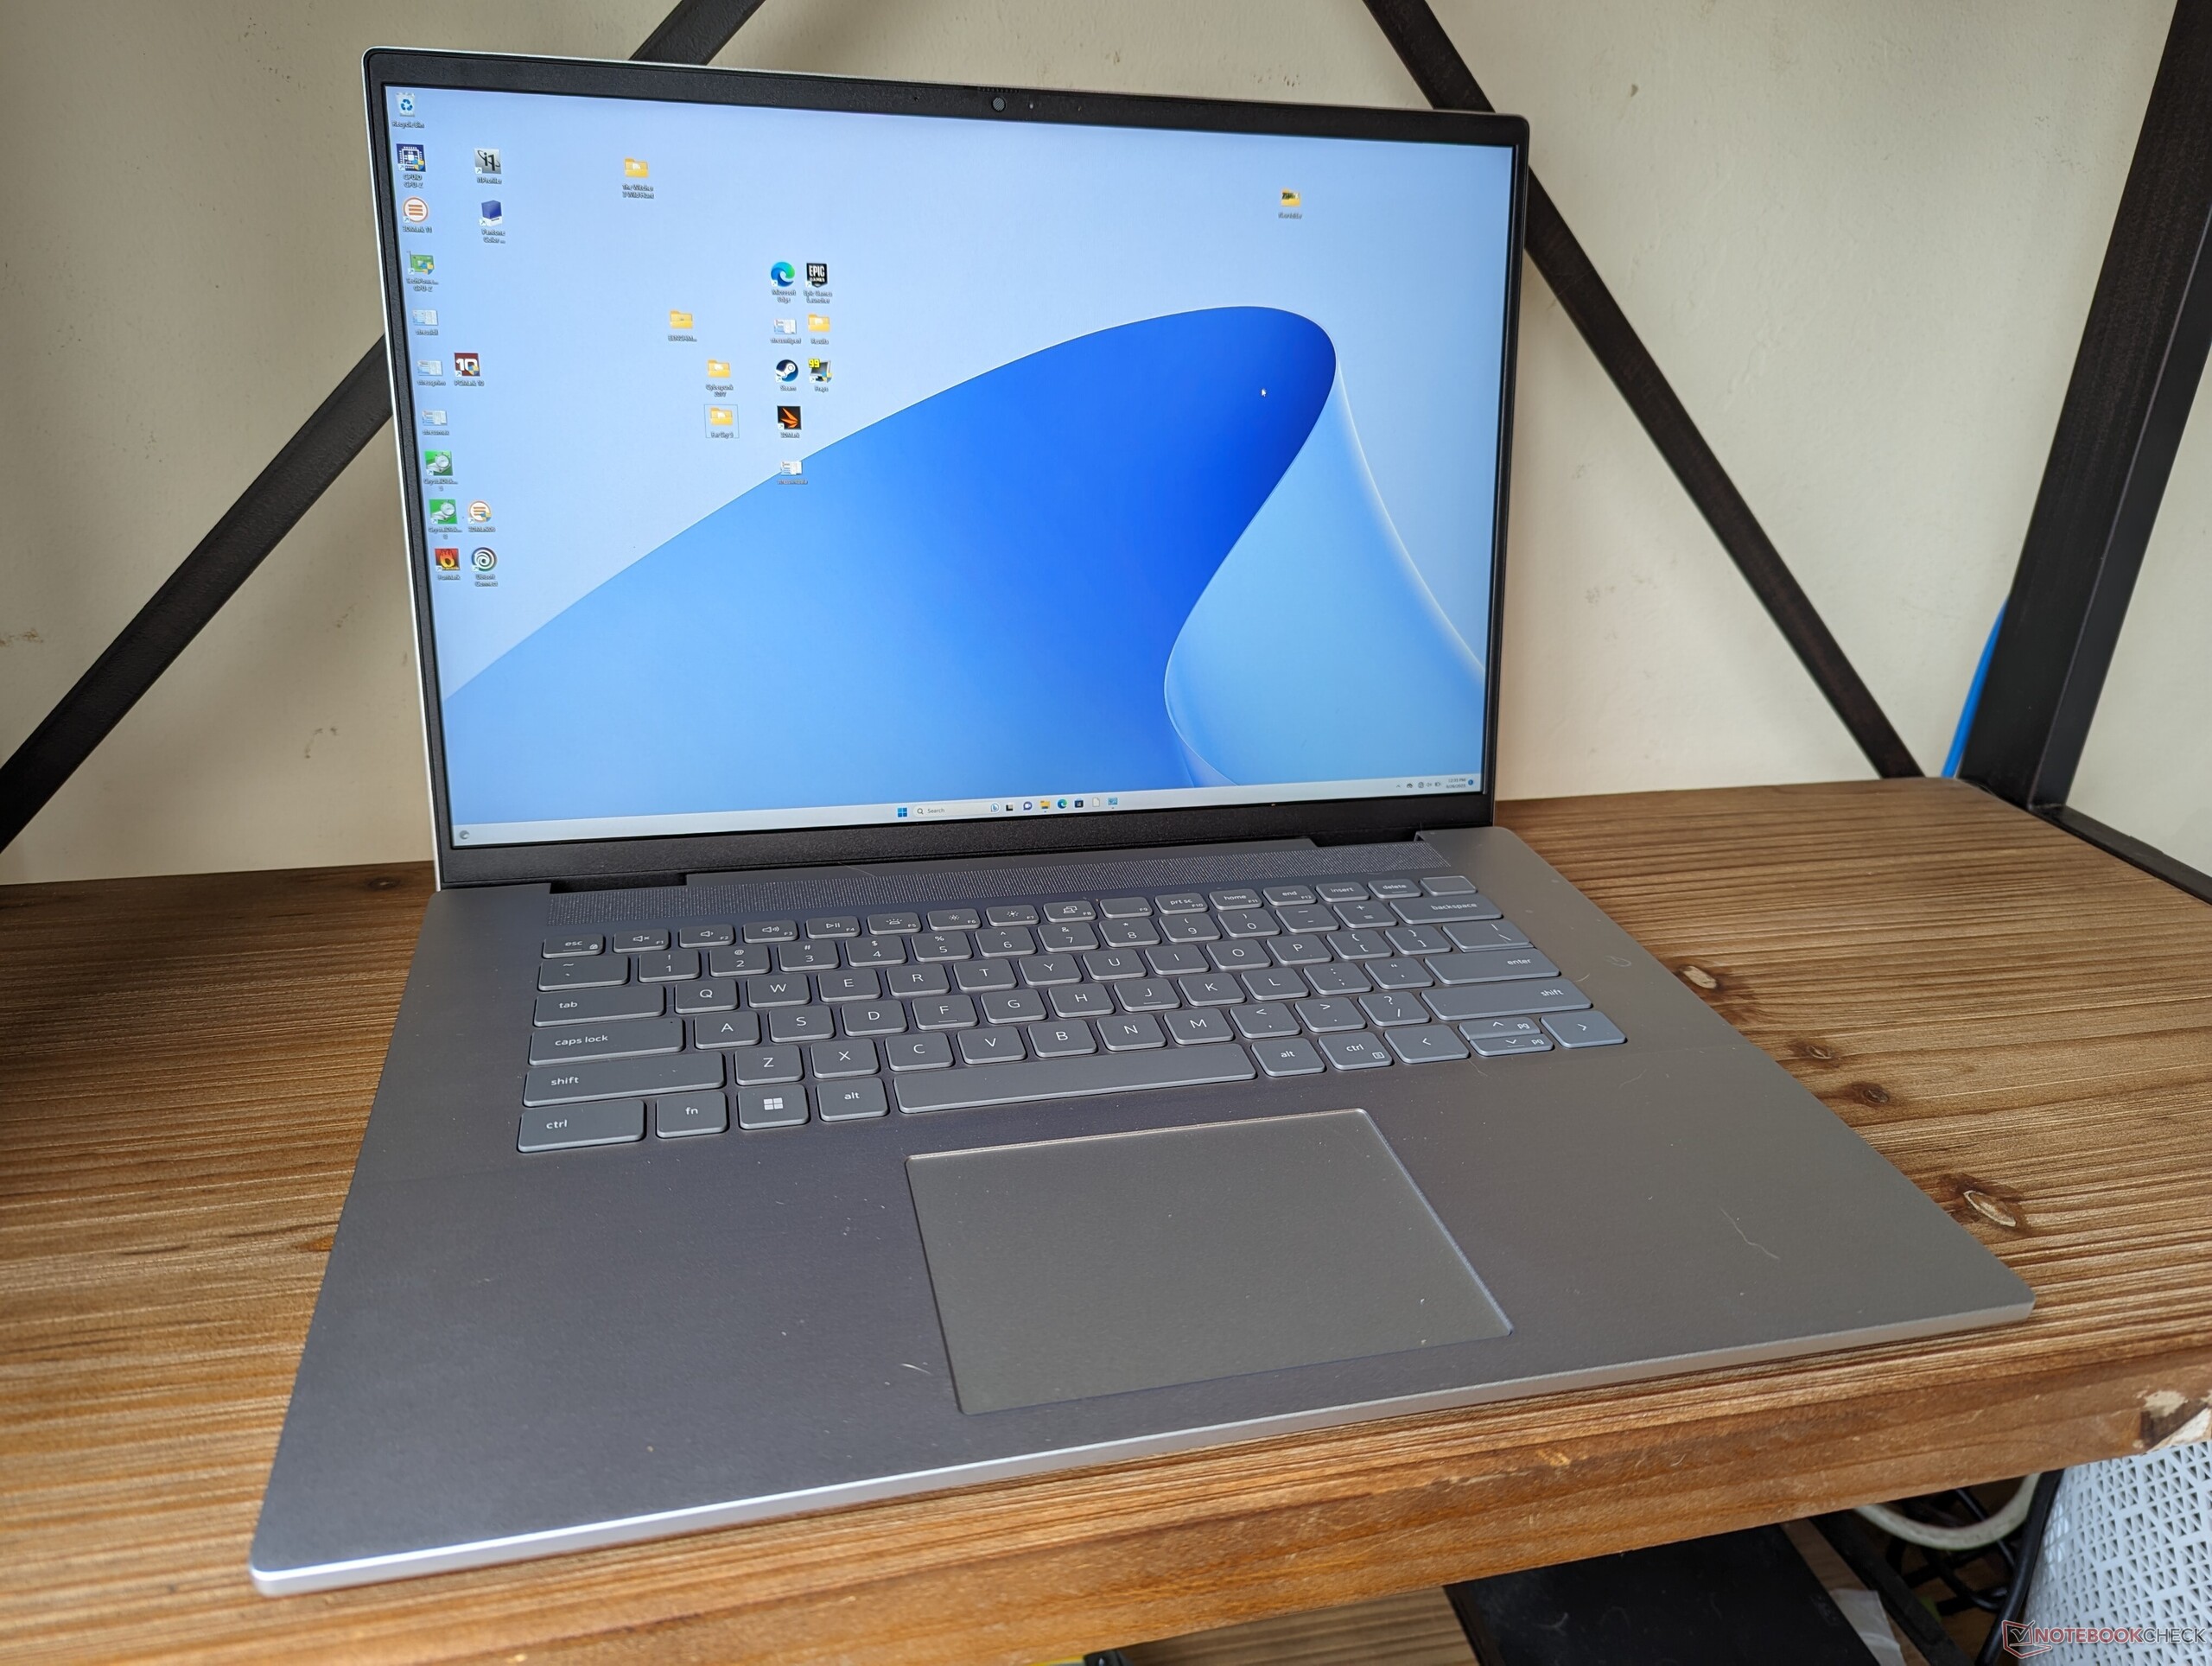
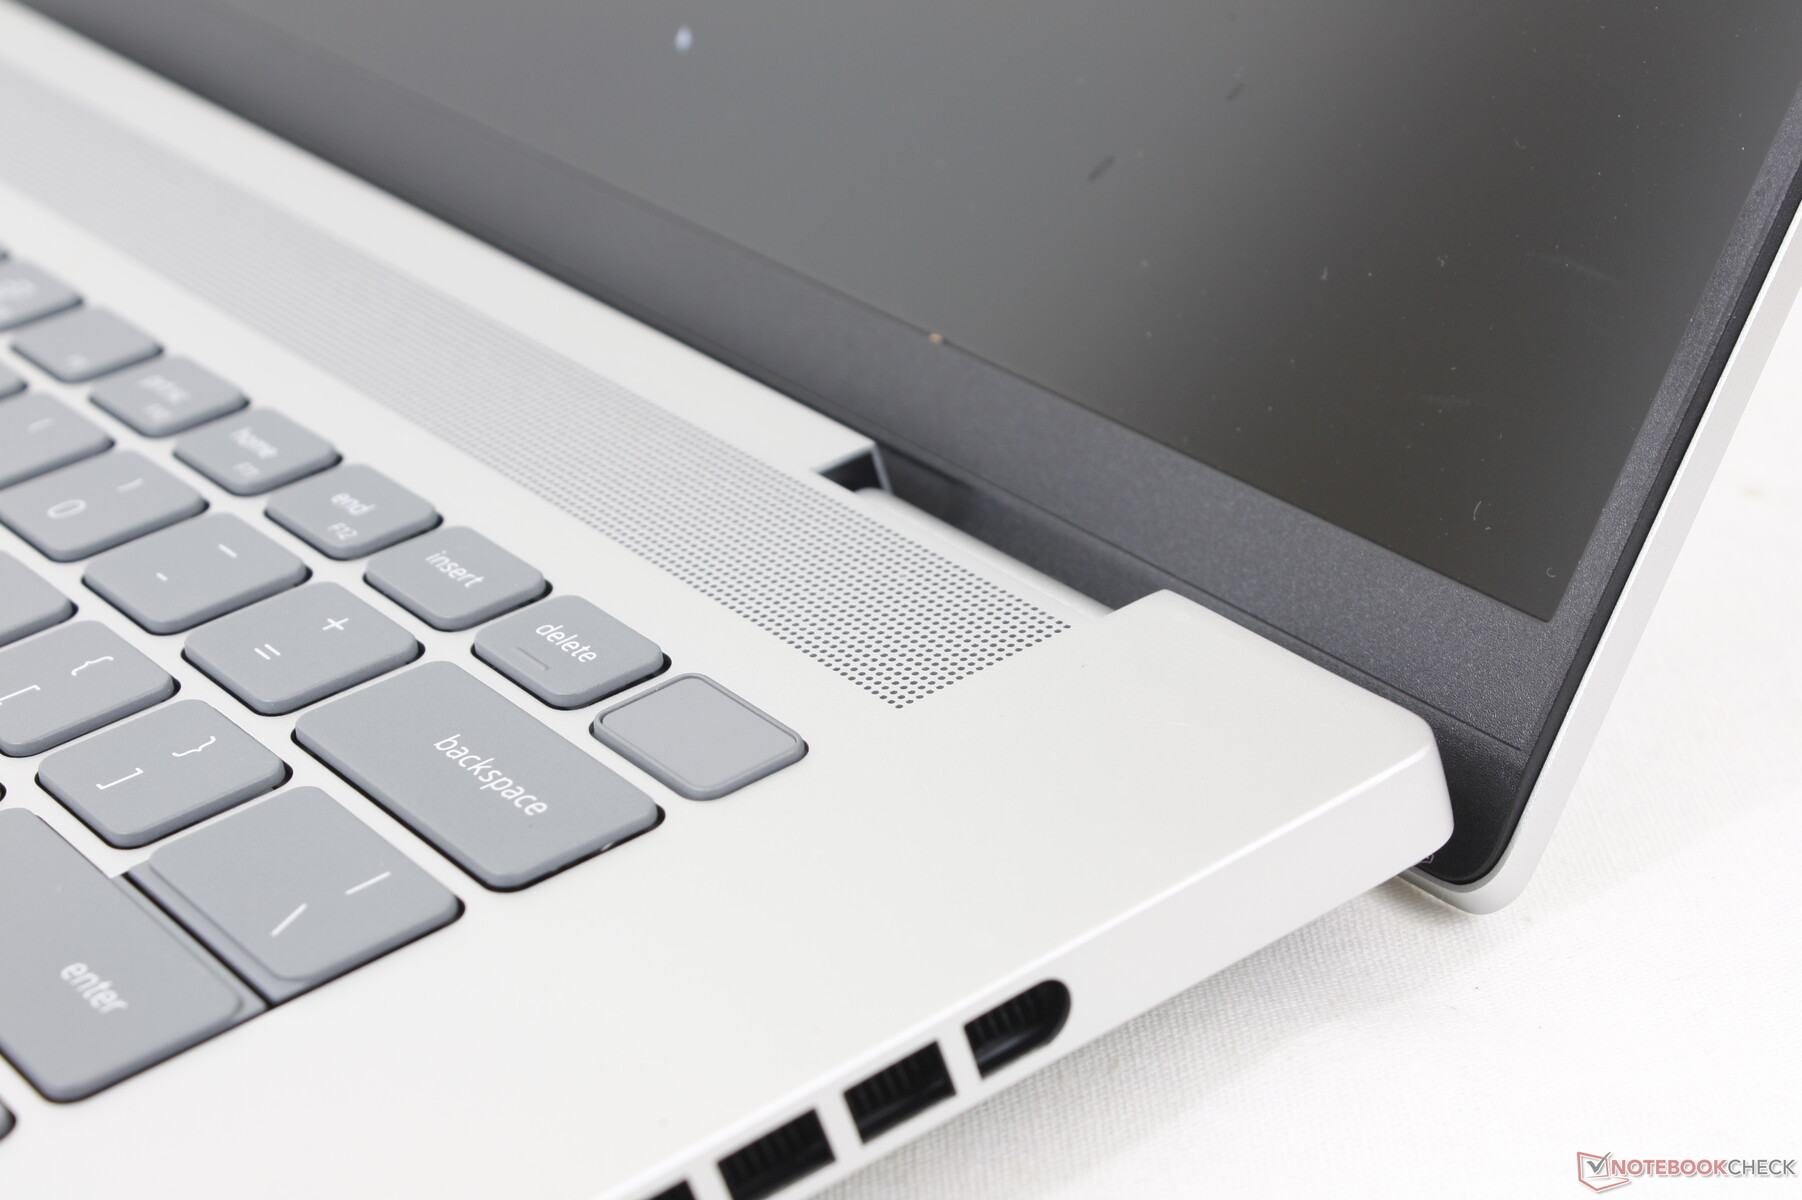
Caso: simplificar las cosas
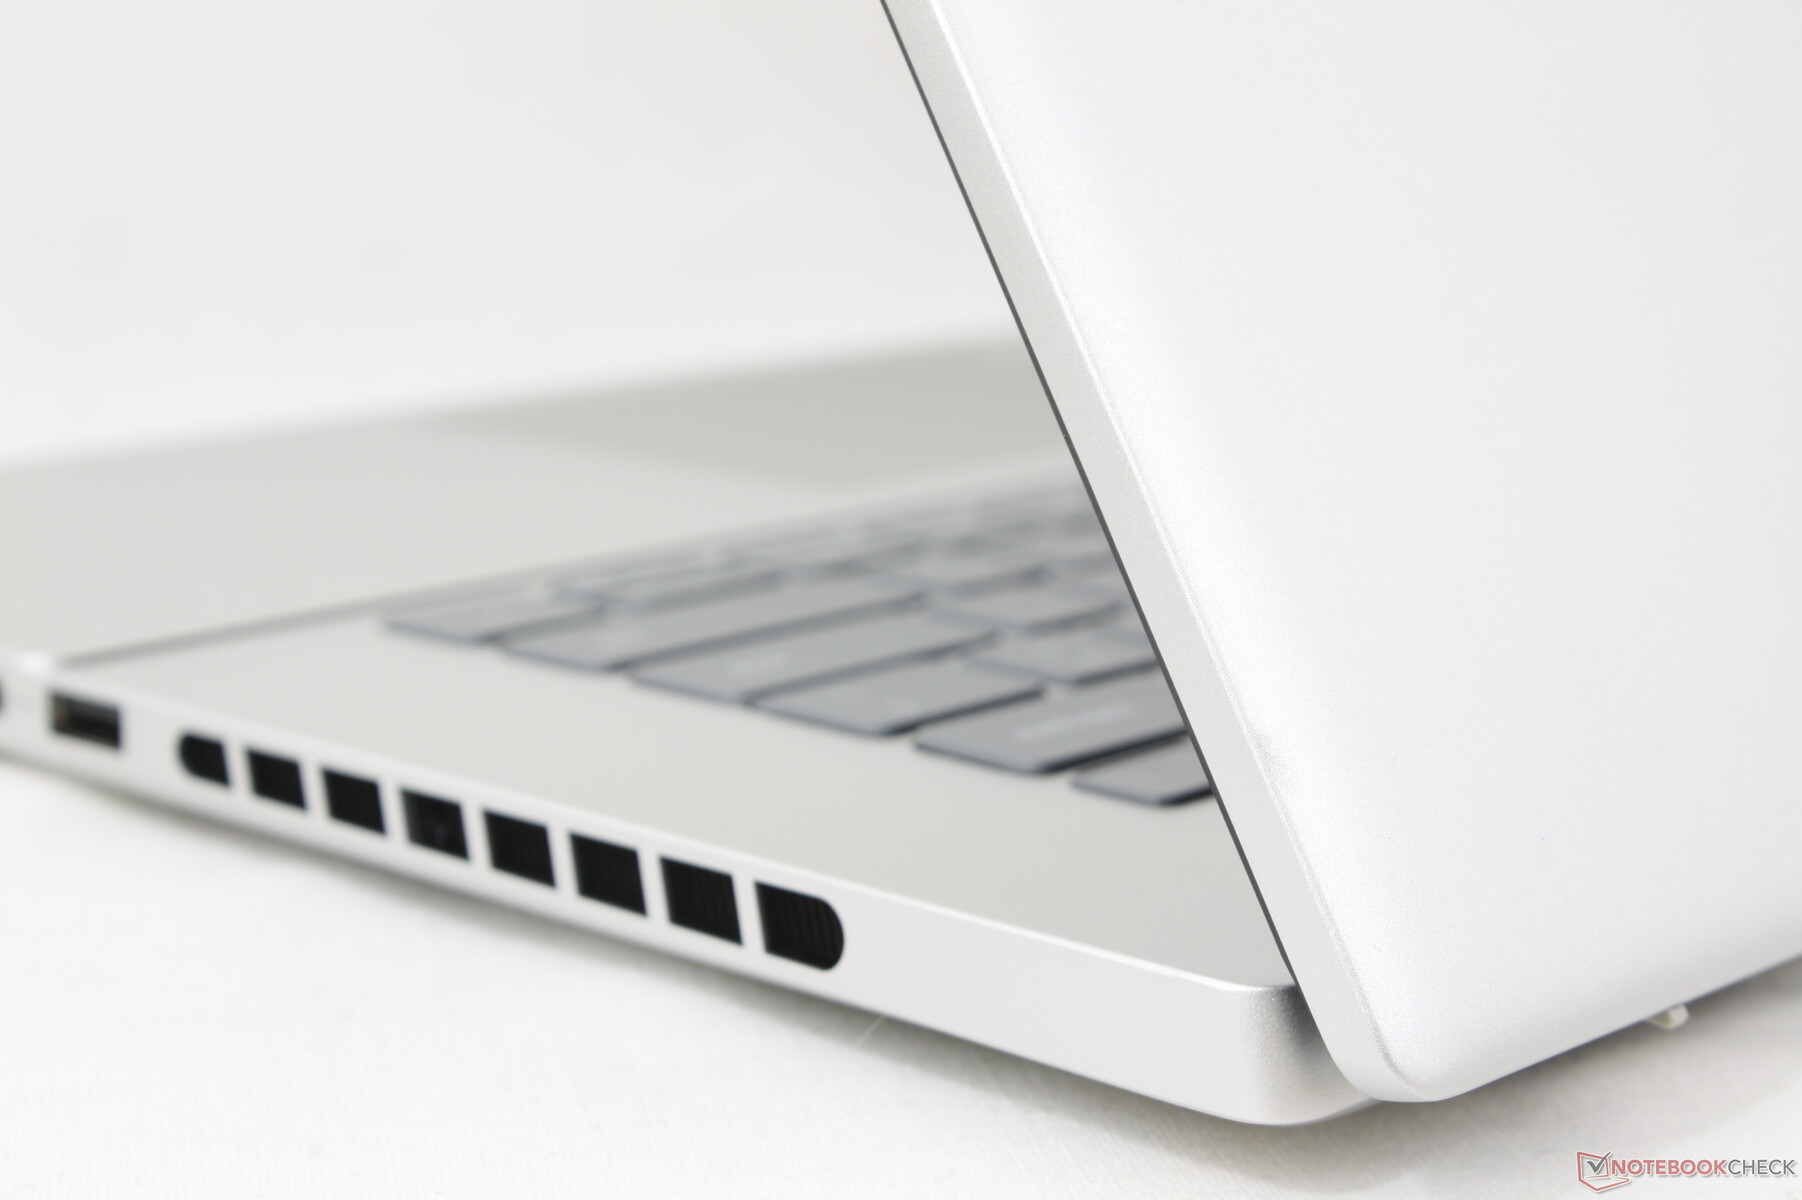
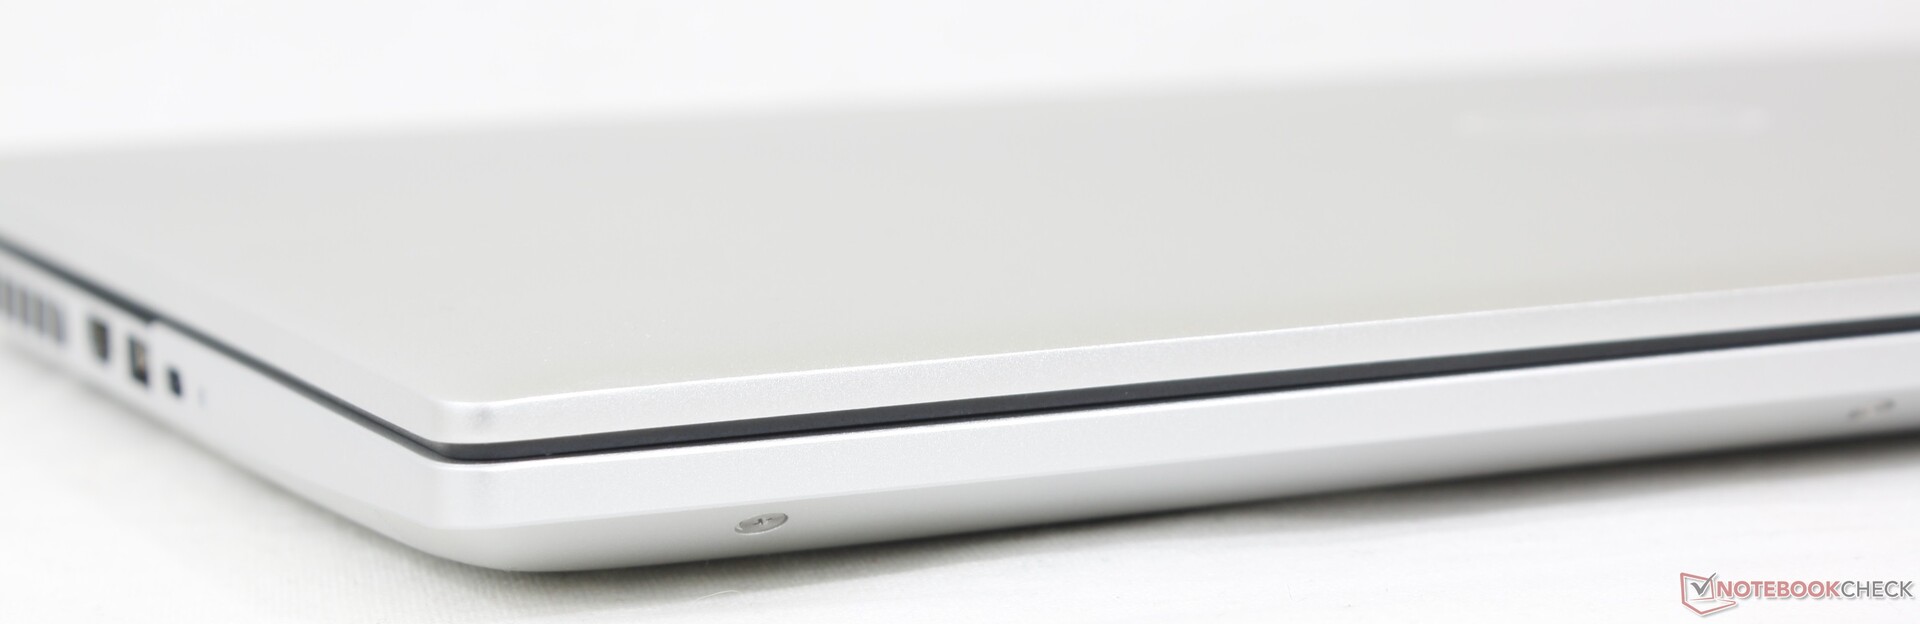
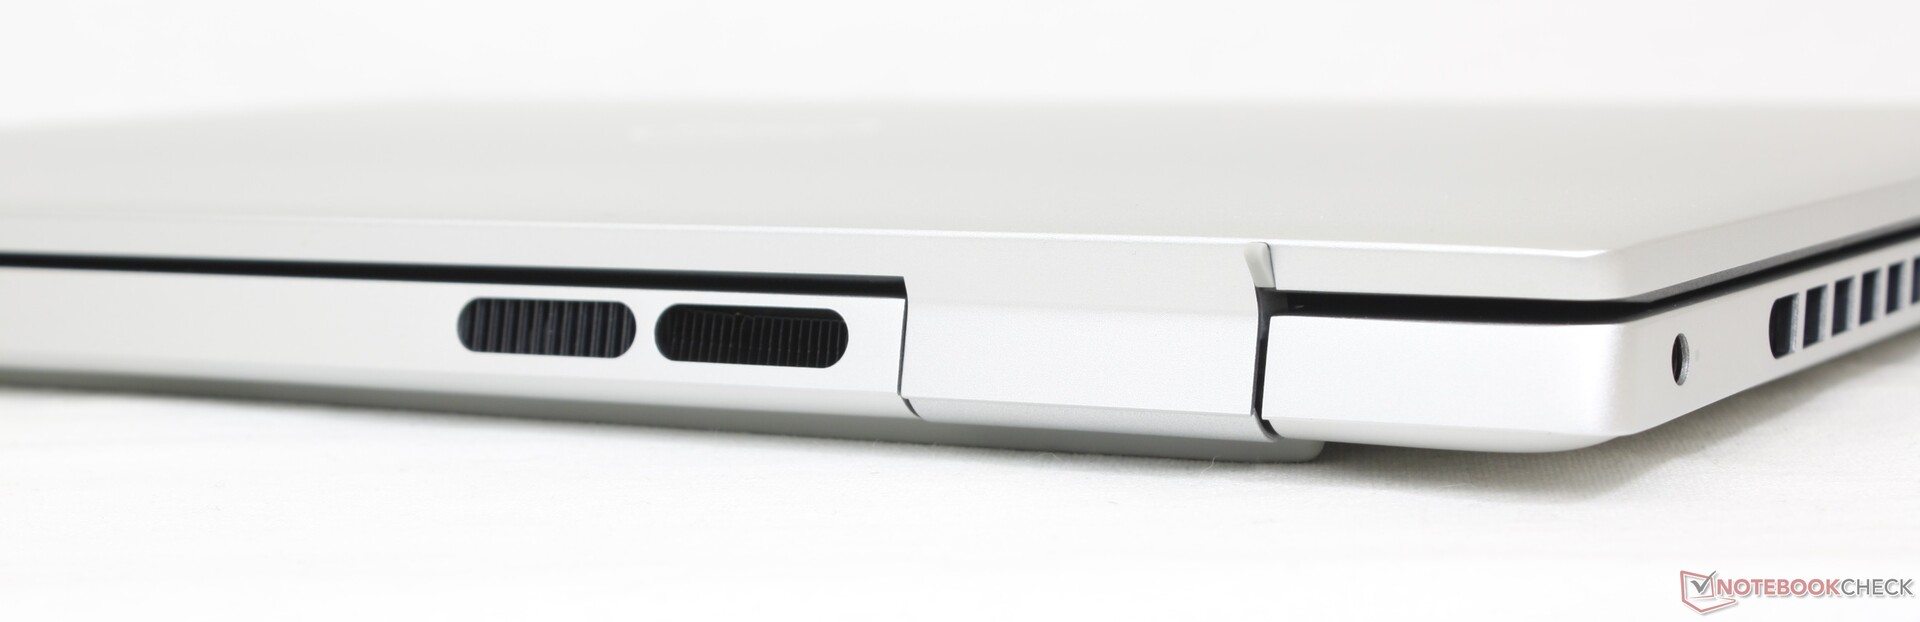
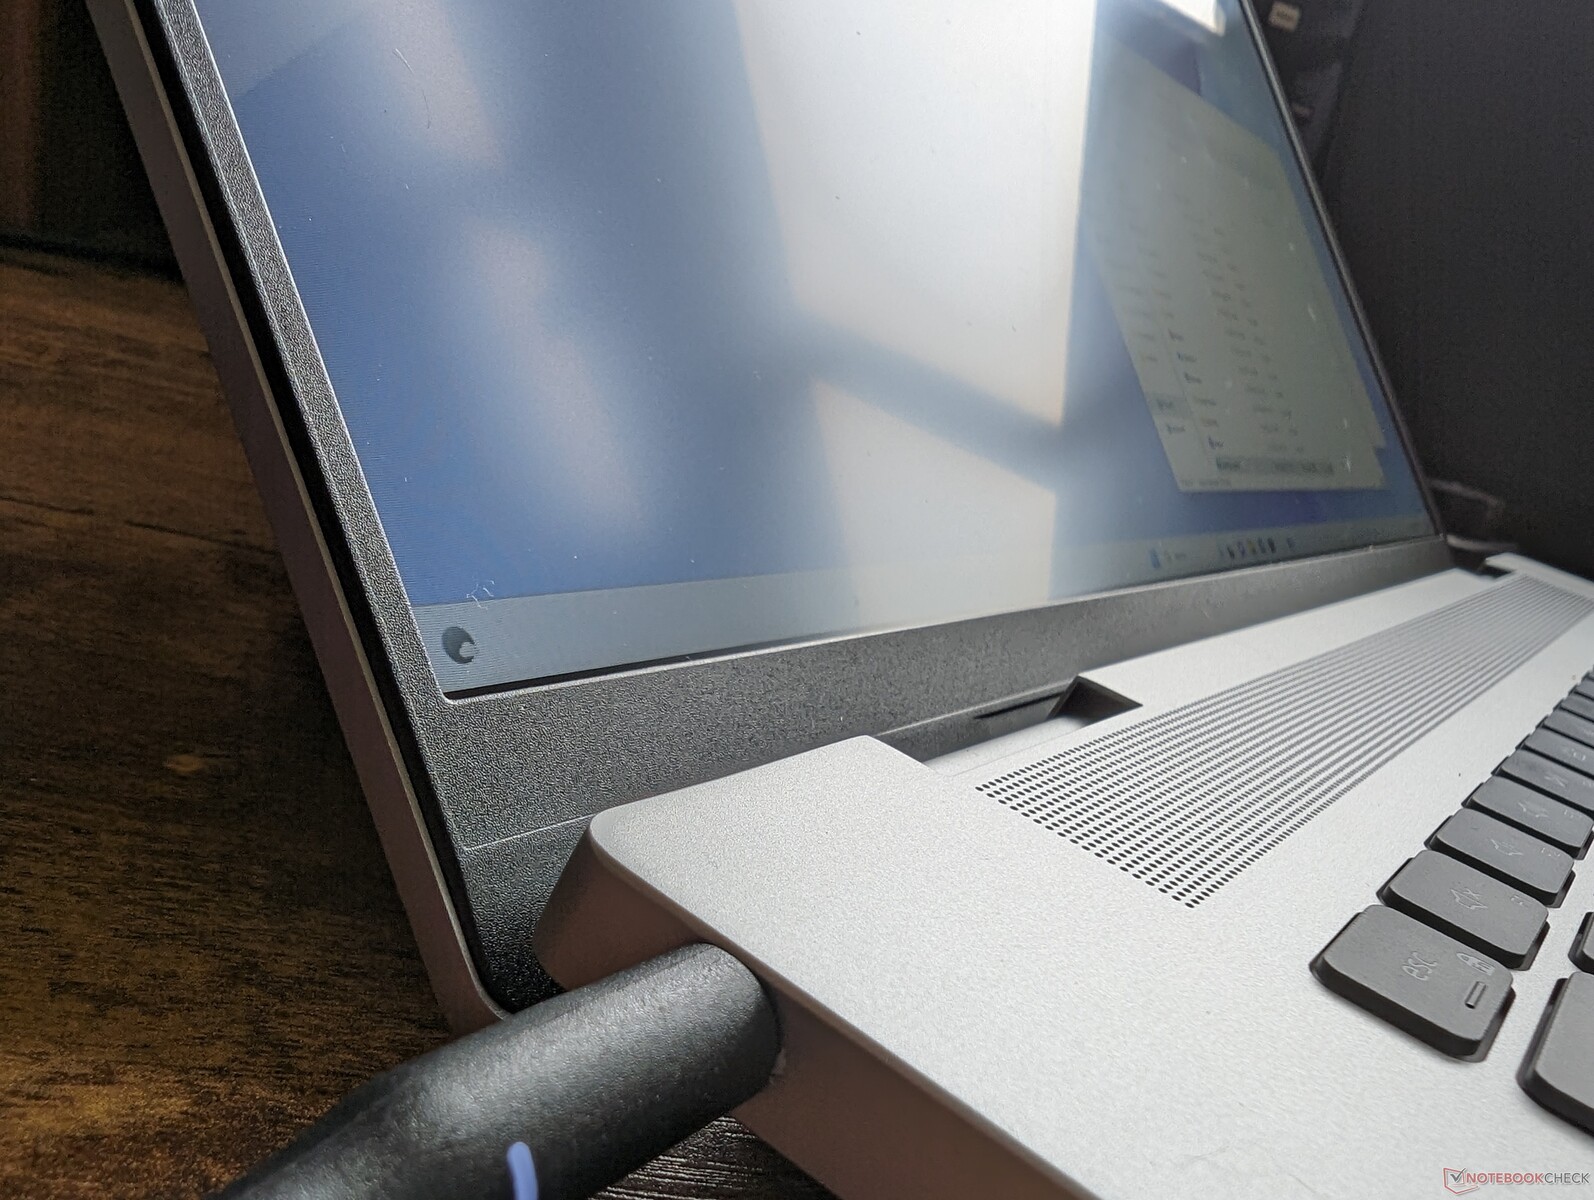
El Inspiron 16 Plus 7630 presenta tres cambios exteriores notables con respecto al modelo del año pasado. En primer lugar, y quizás el más importante, las bisagras se han rediseñado para que sean más gruesas y resistentes que antes. En segundo lugar, ahora hay rejillas de ventilación adicionales a lo largo de los bordes para ayudar a la refrigeración. Y, por último, se han eliminado los reposamuñecas de Mylar y el clickpad, al igual que en el Inspiron 16 Plus 7635 2 en 1. Los dos primeros en particular deberían aumentar la vida útil del sistema, mientras que el último es probablemente una medida de ahorro de costes.
Por lo demás, la rigidez general del chasis es prácticamente la misma que la del Inspiron 16 Plus 7620, ya que sus esqueletos están fabricados con los mismos materiales. La unidad se siente fuerte en la mano, similar al Envy 16pero con una tapa ligeramente más débil ya que el Dell carece de refuerzo Gorilla Glass.
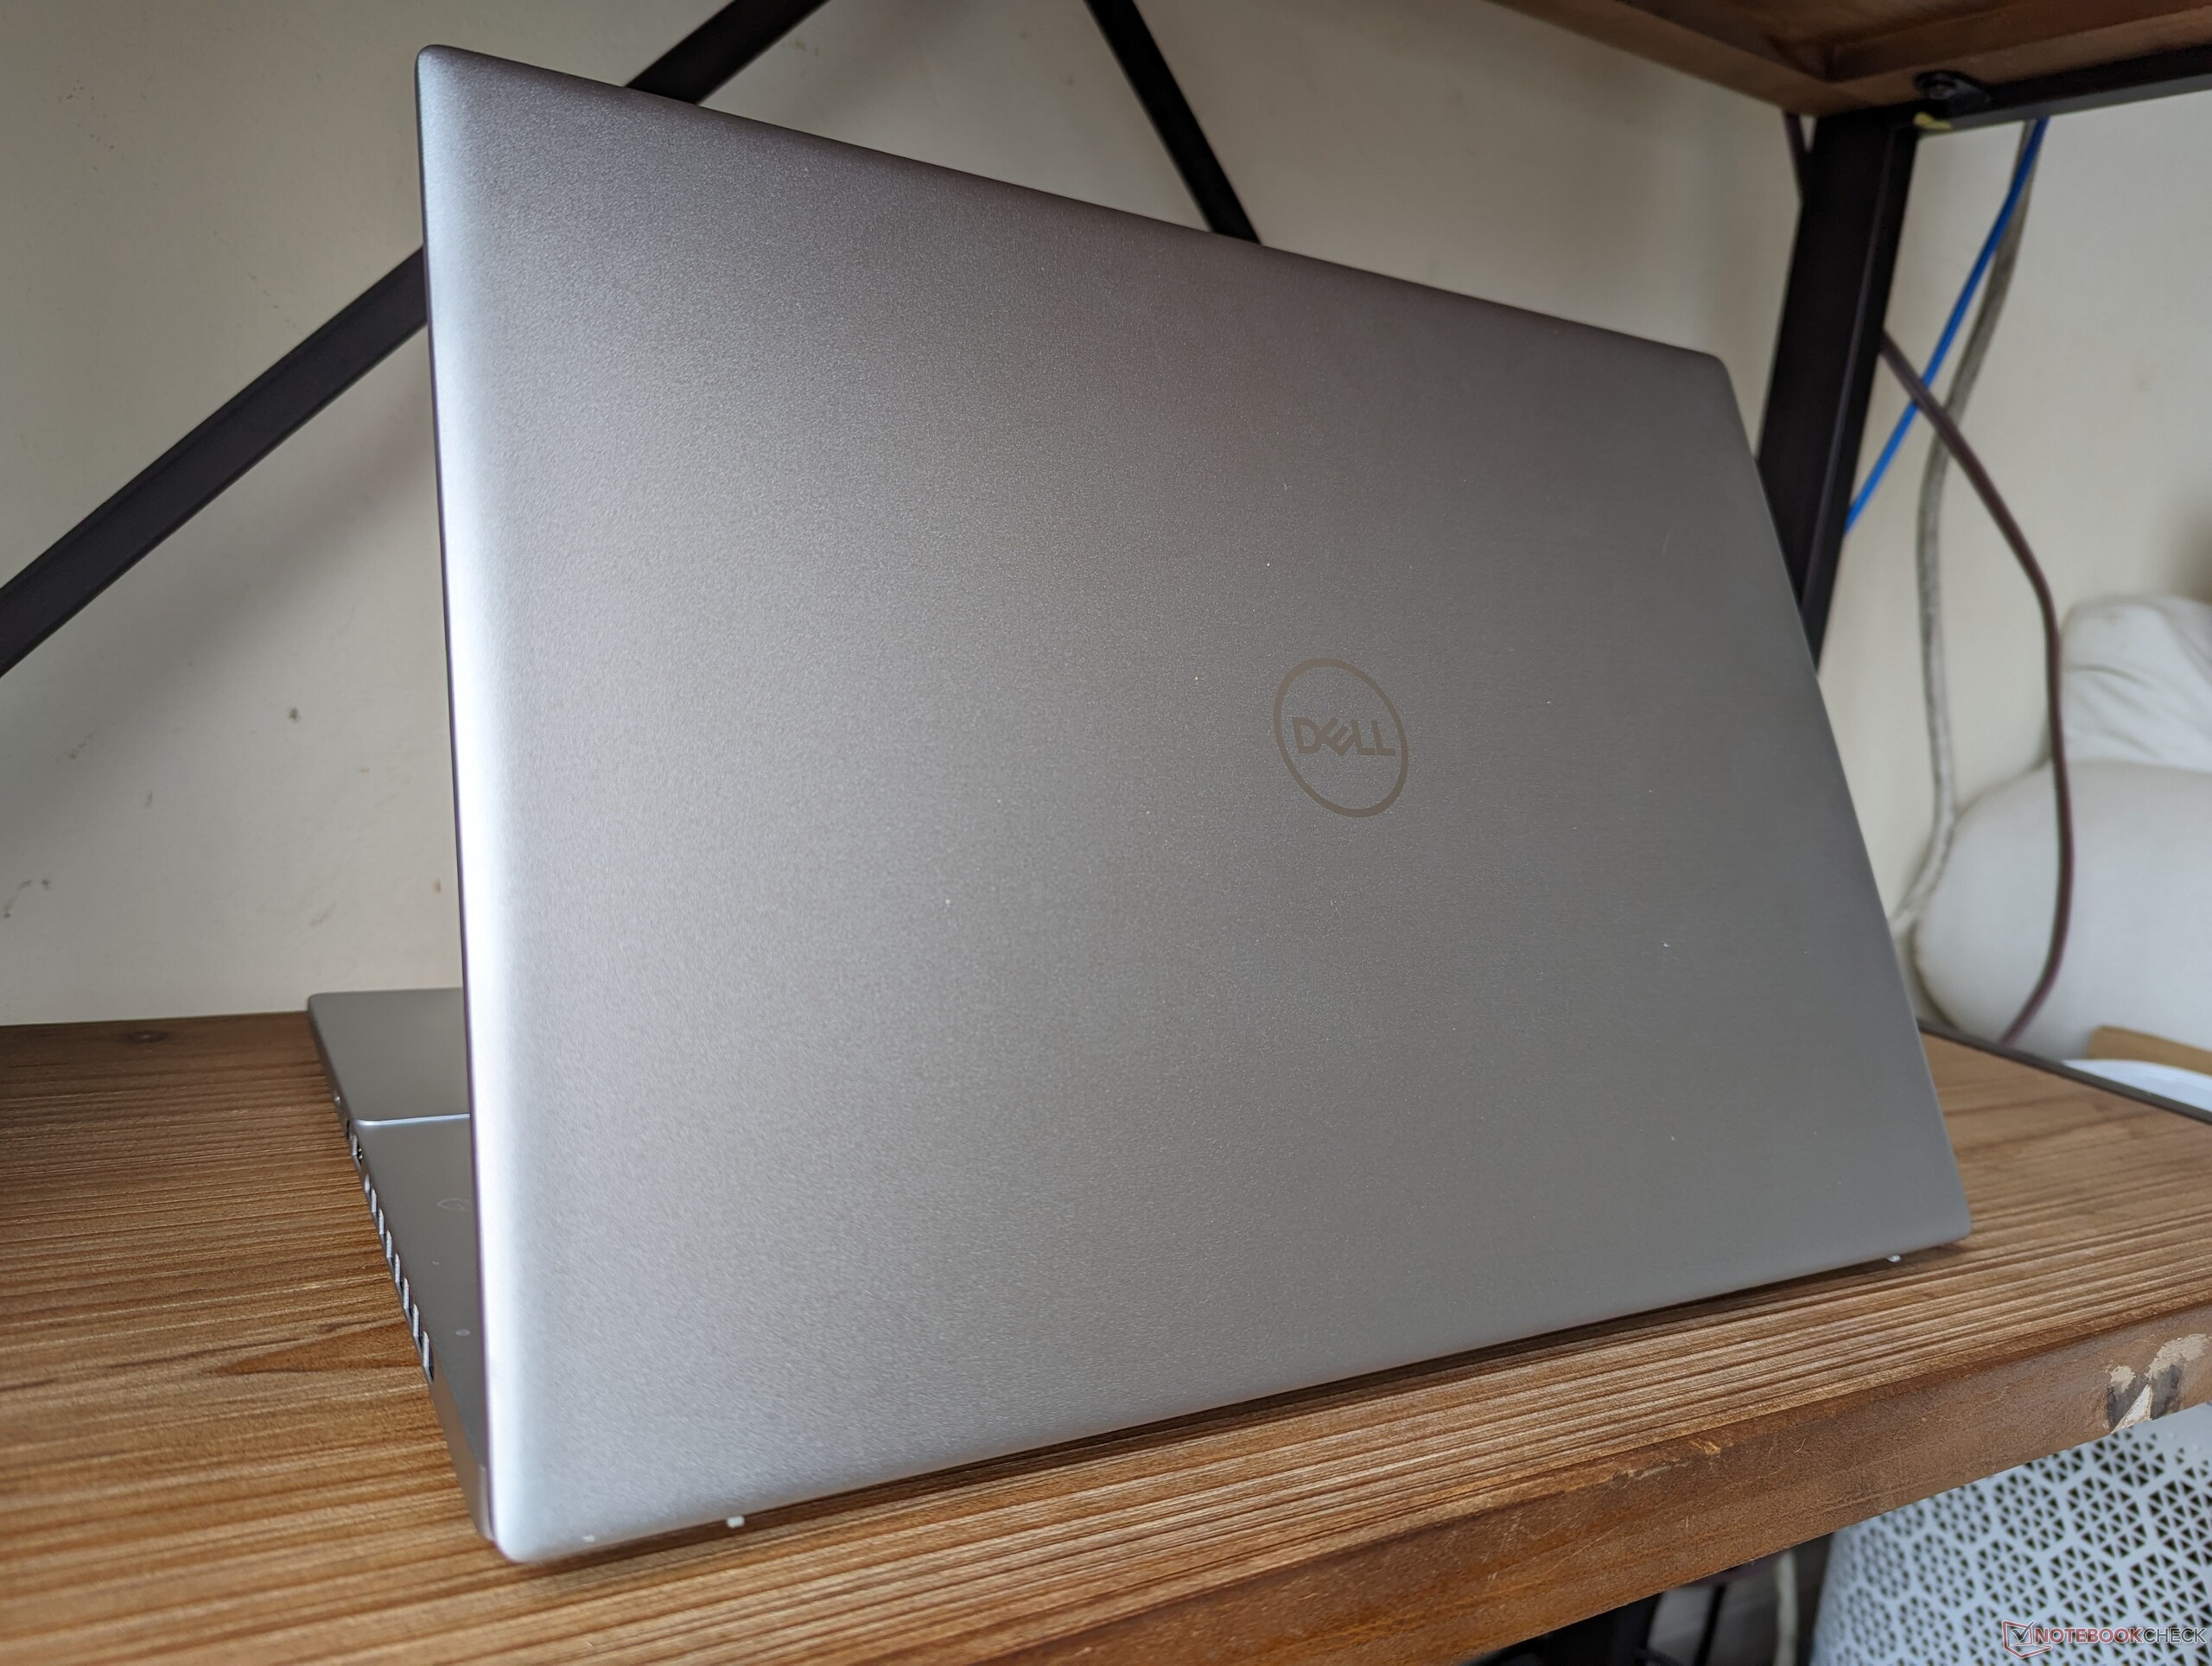
Las dimensiones y el peso siguen siendo prácticamente los mismos que en el diseño del año pasado, si no ligeramente más pesado en unos 100 g. Aunque no es exactamente ligero, el Dell sigue siendo comparable a alternativas como el Slim Pro 9i 16 o el Envy 16 en este aspecto.
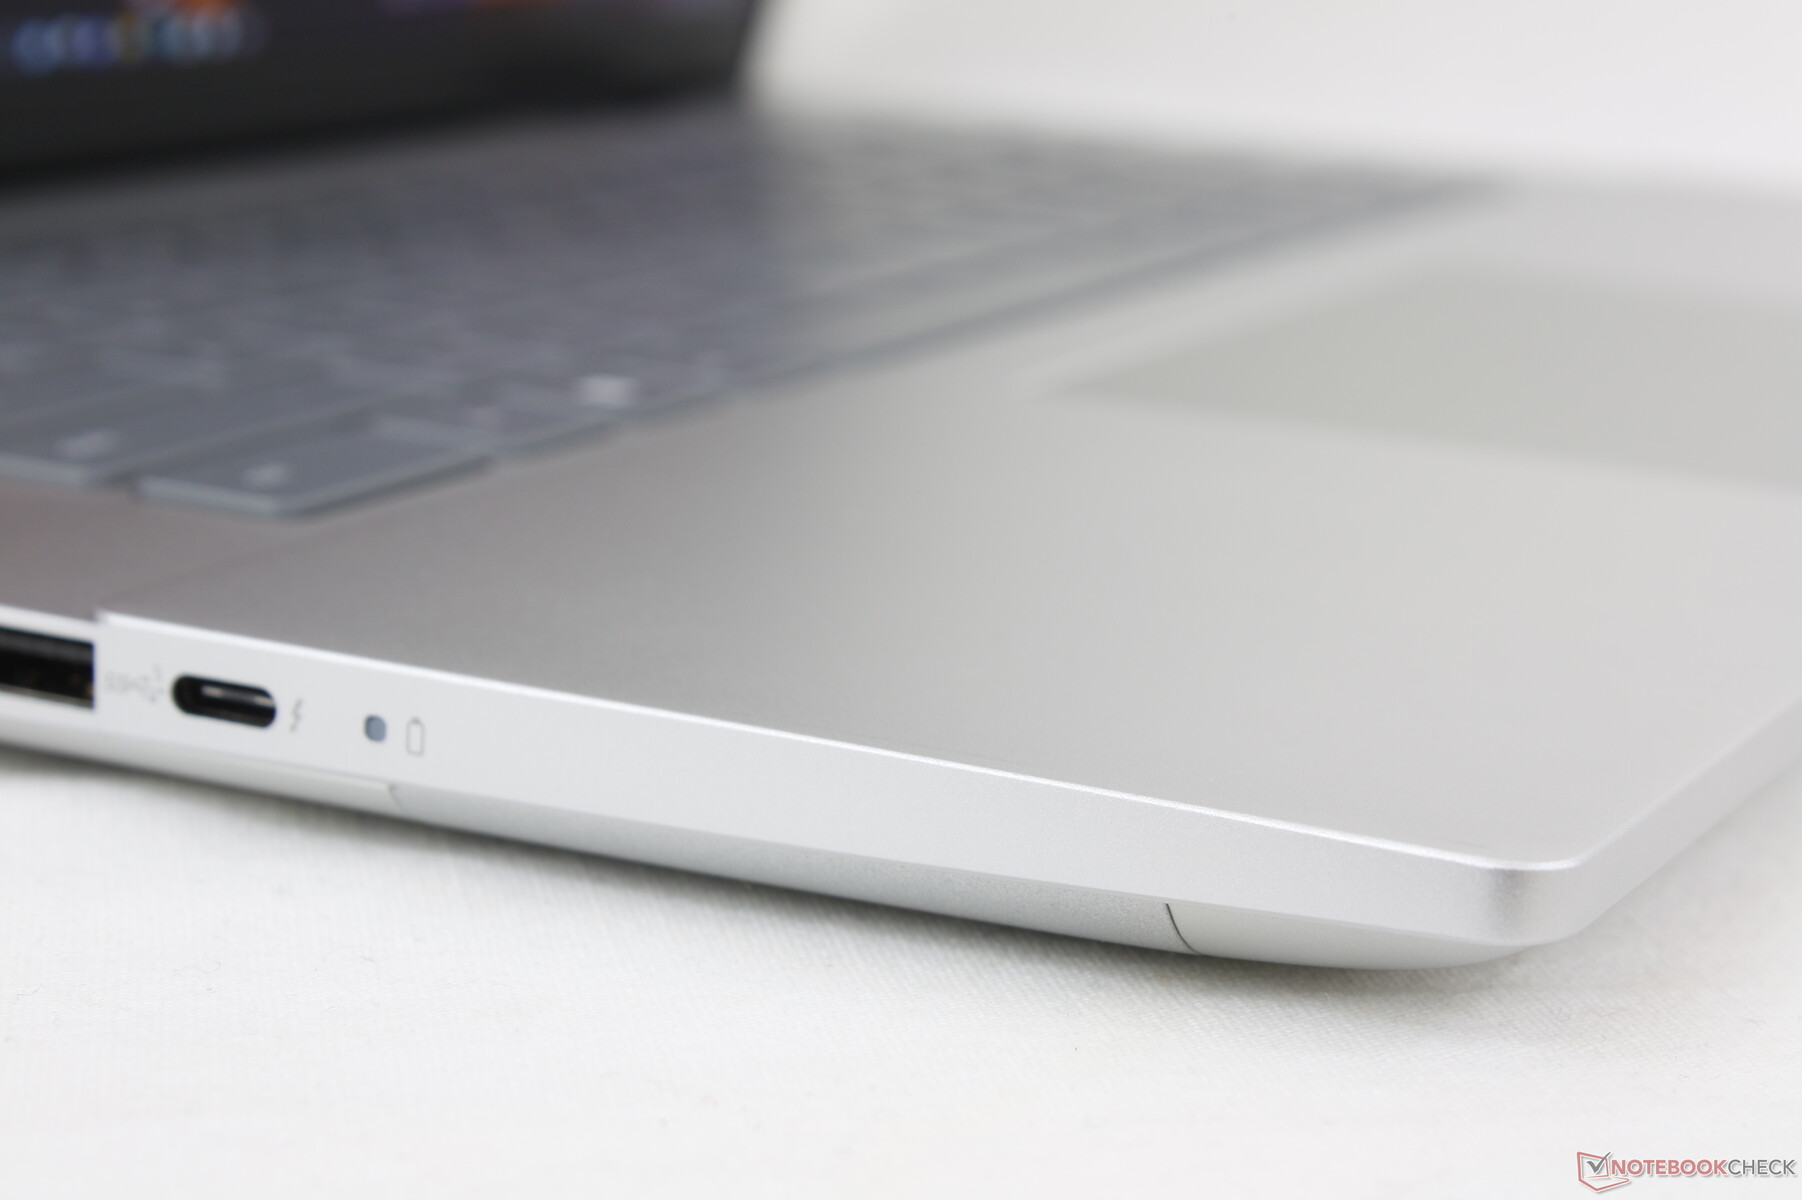
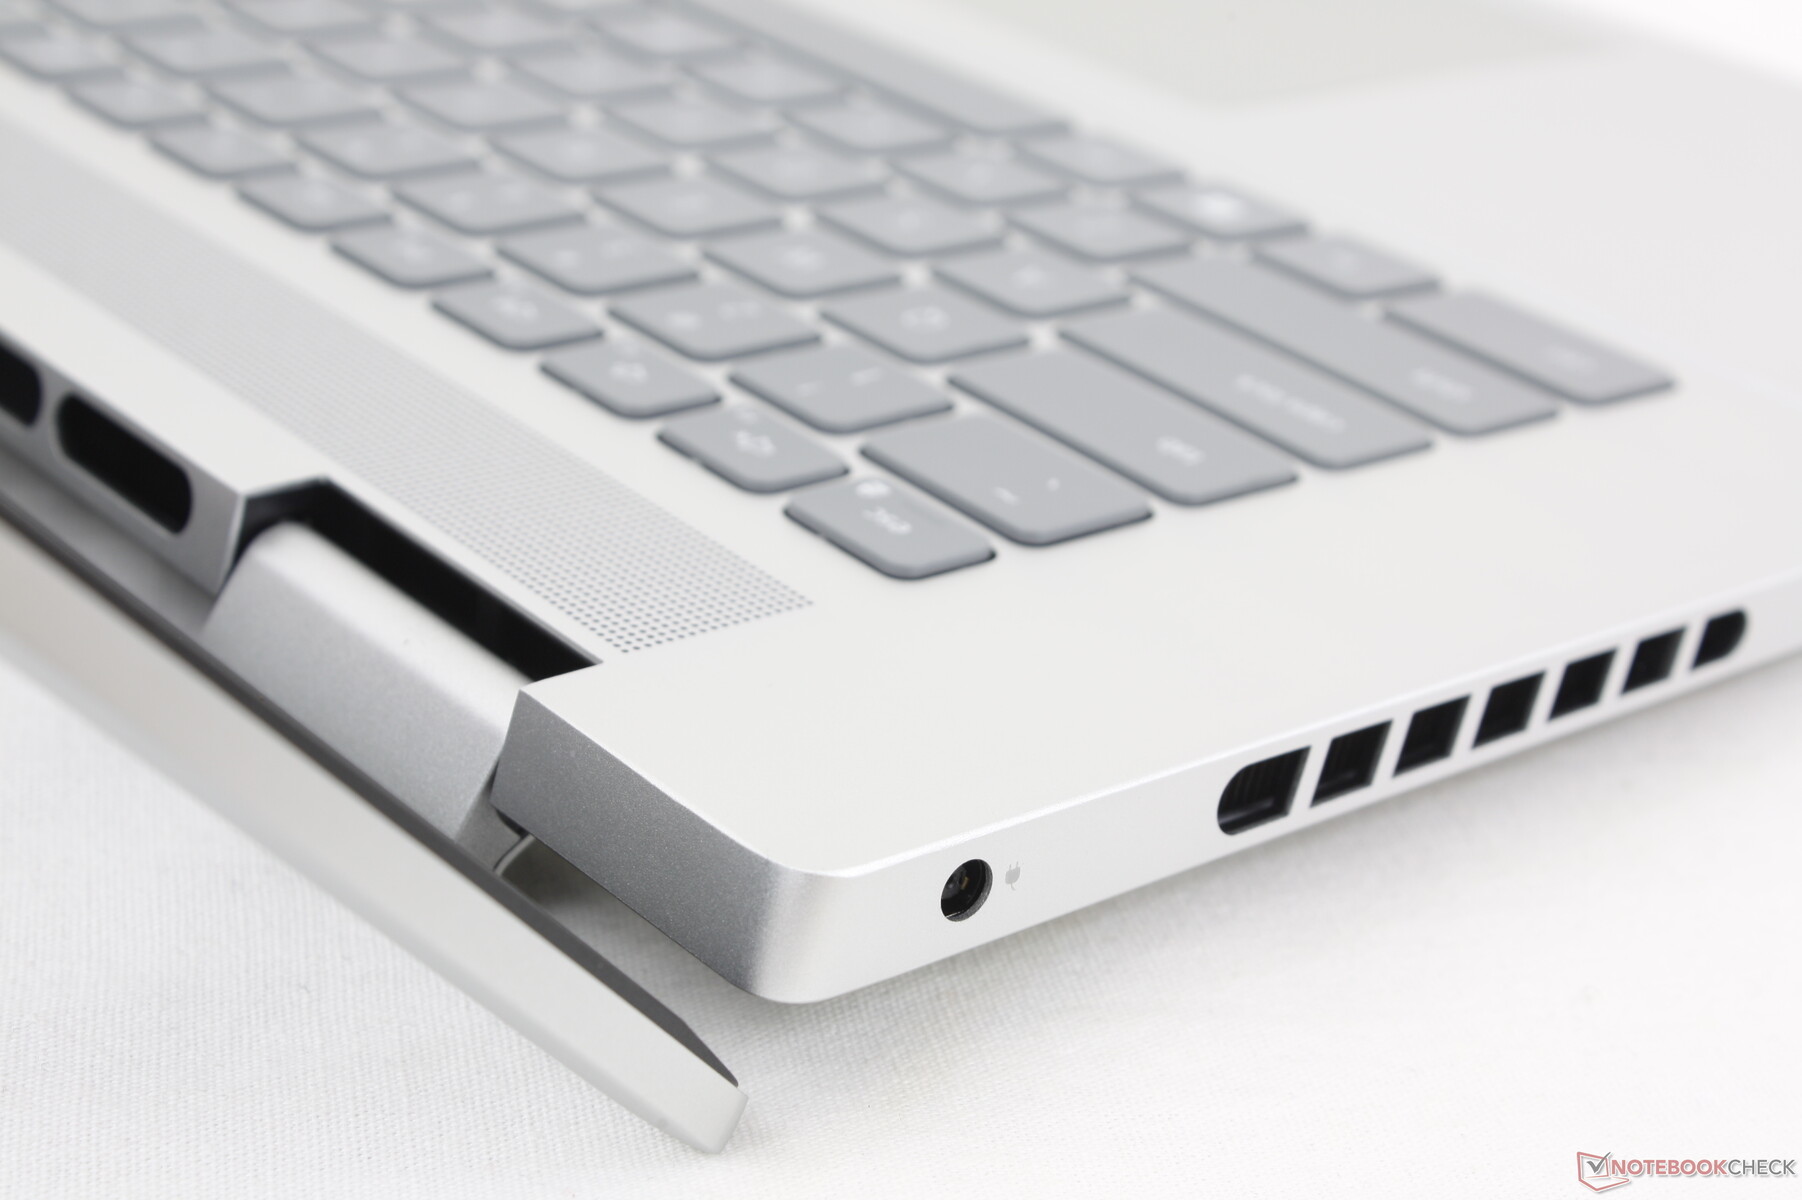
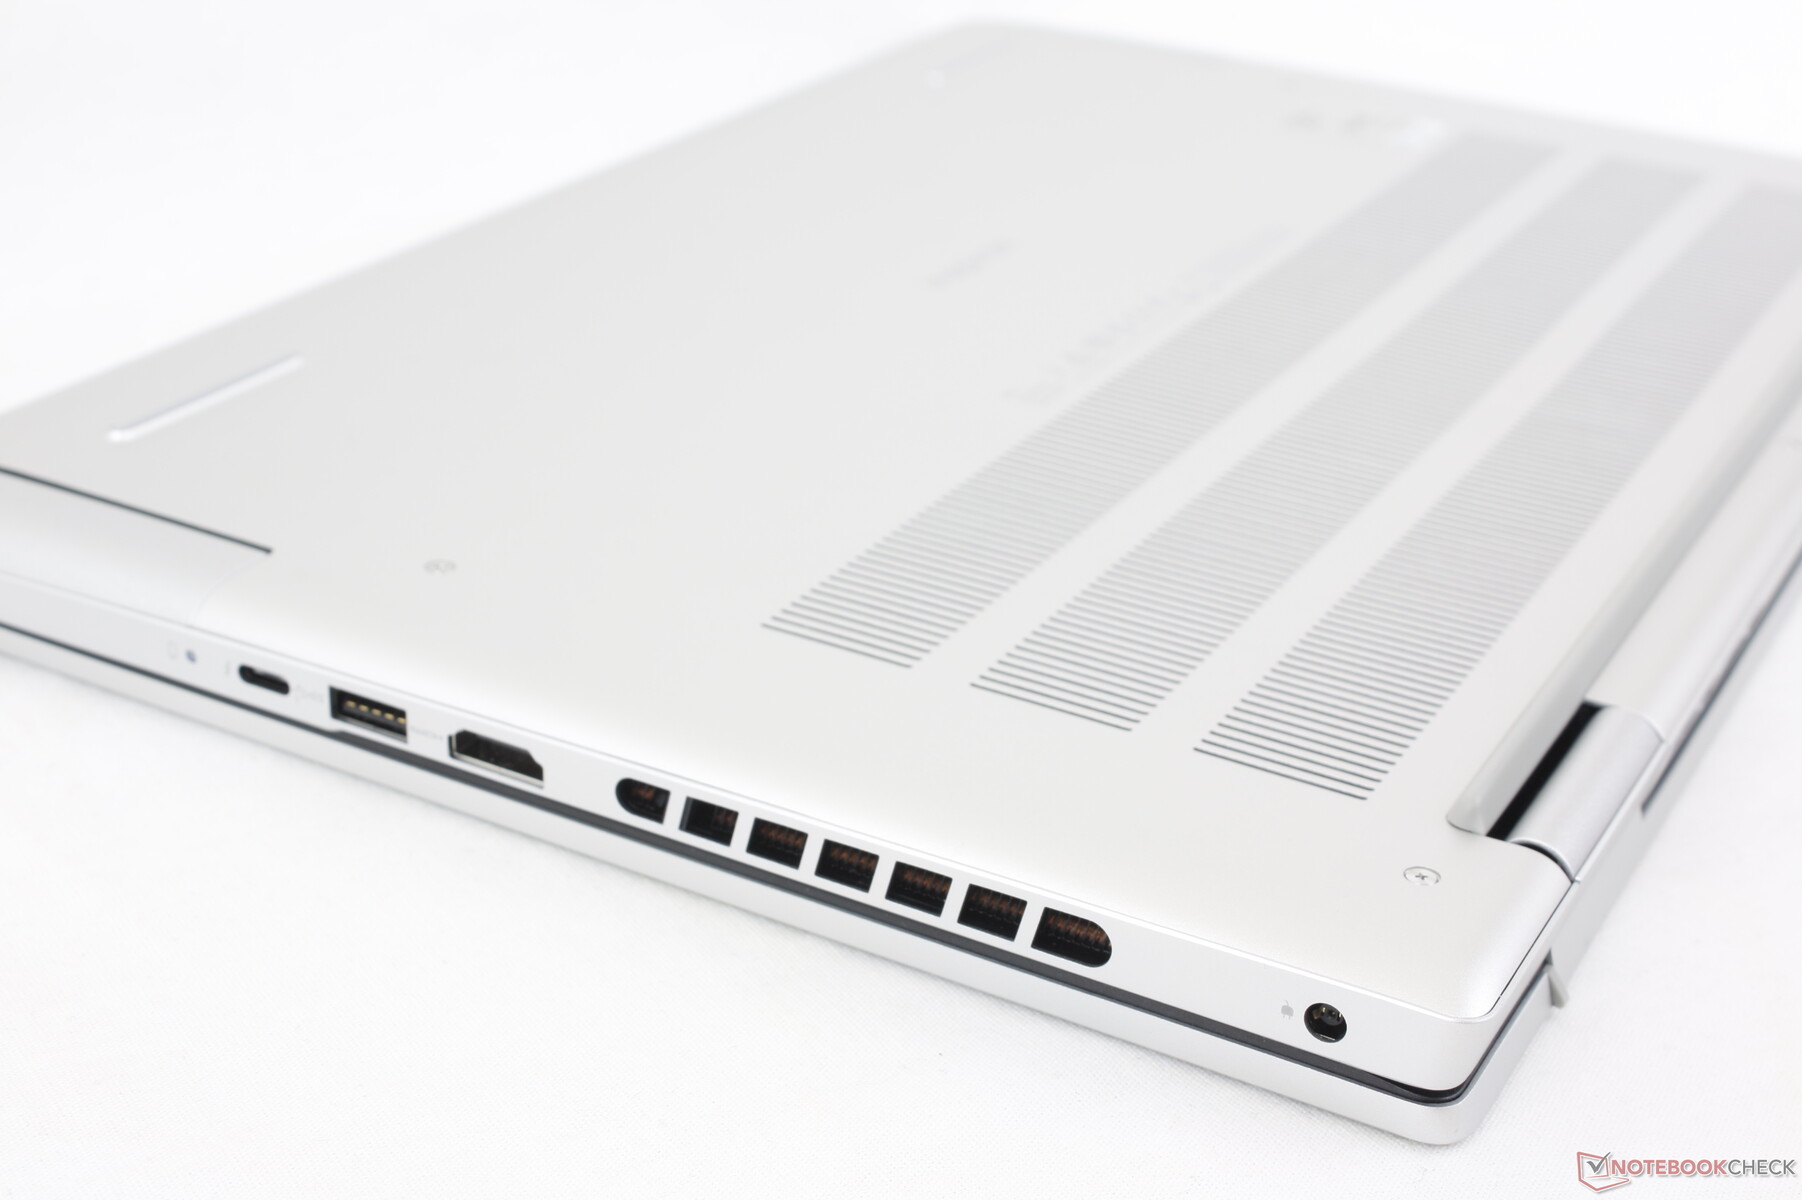
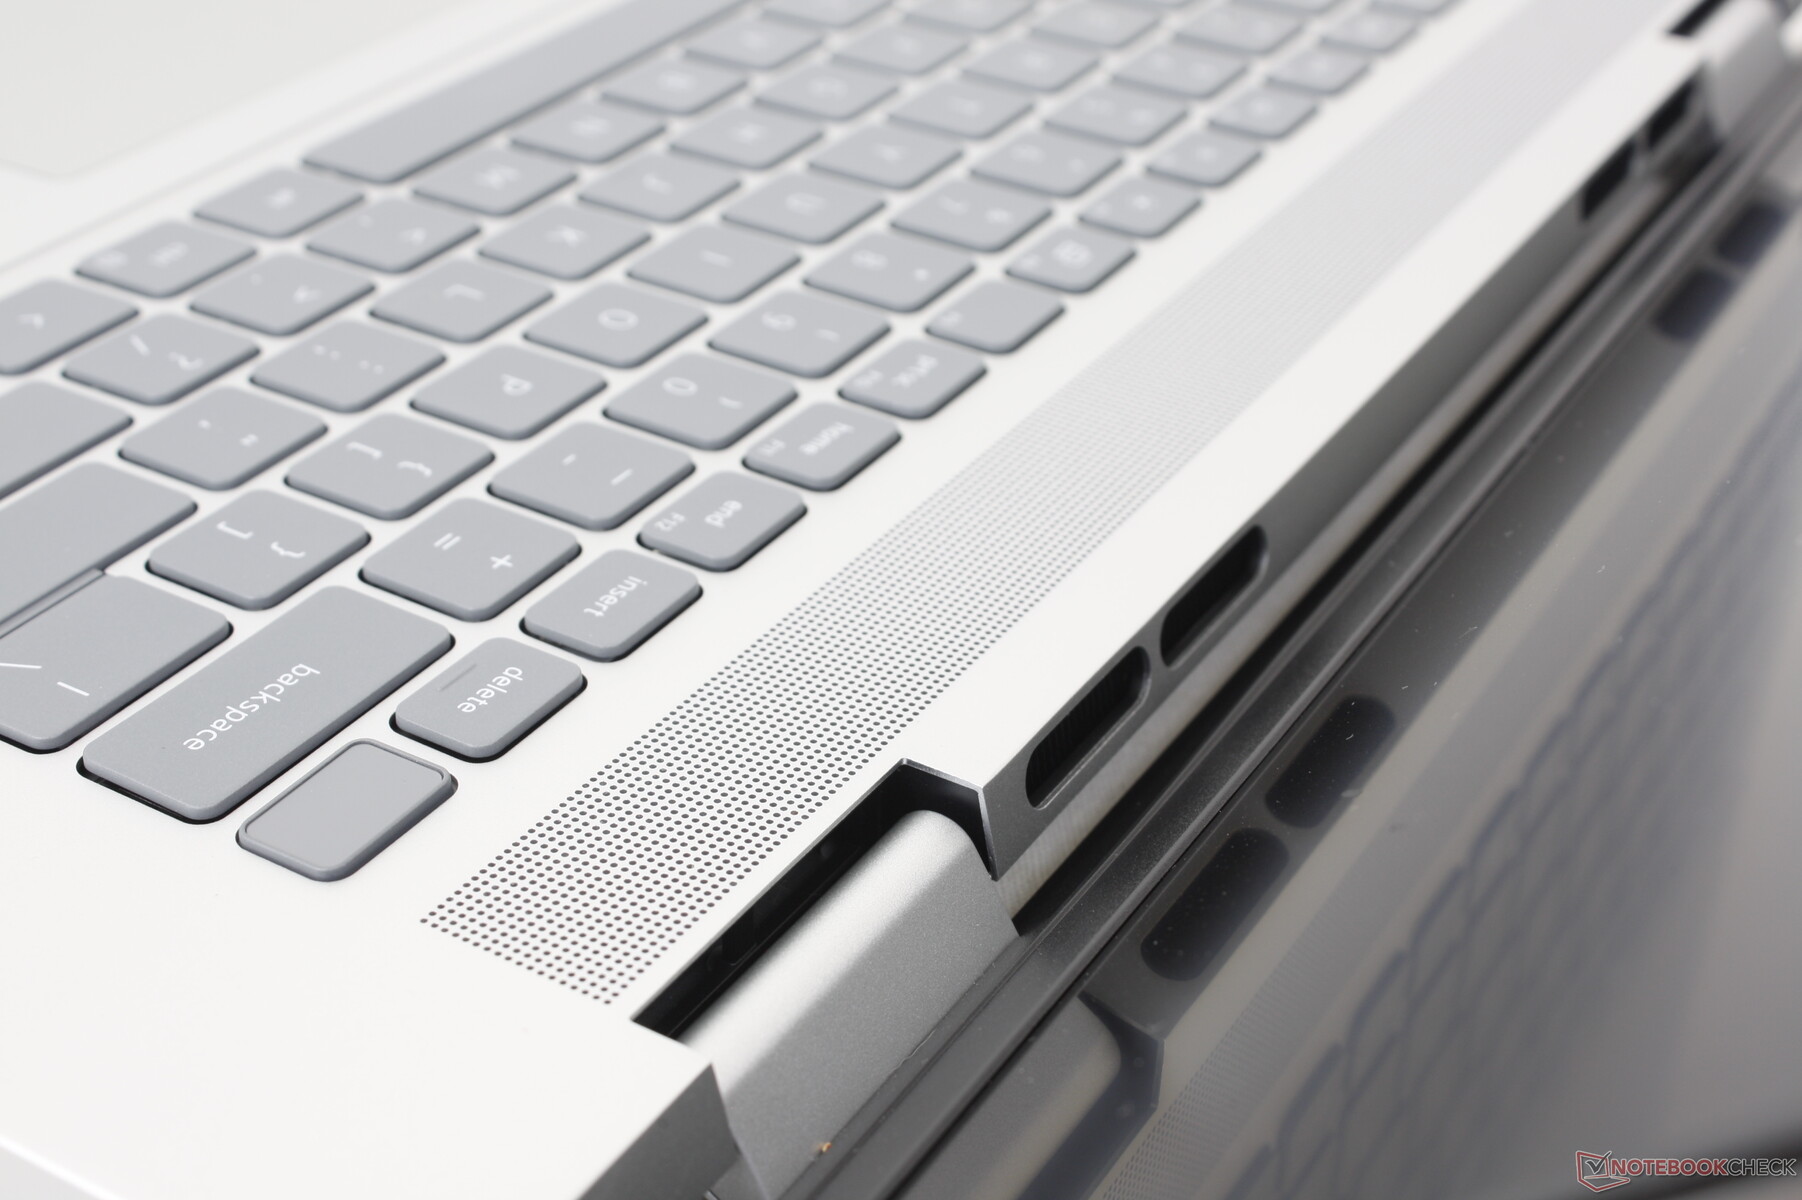
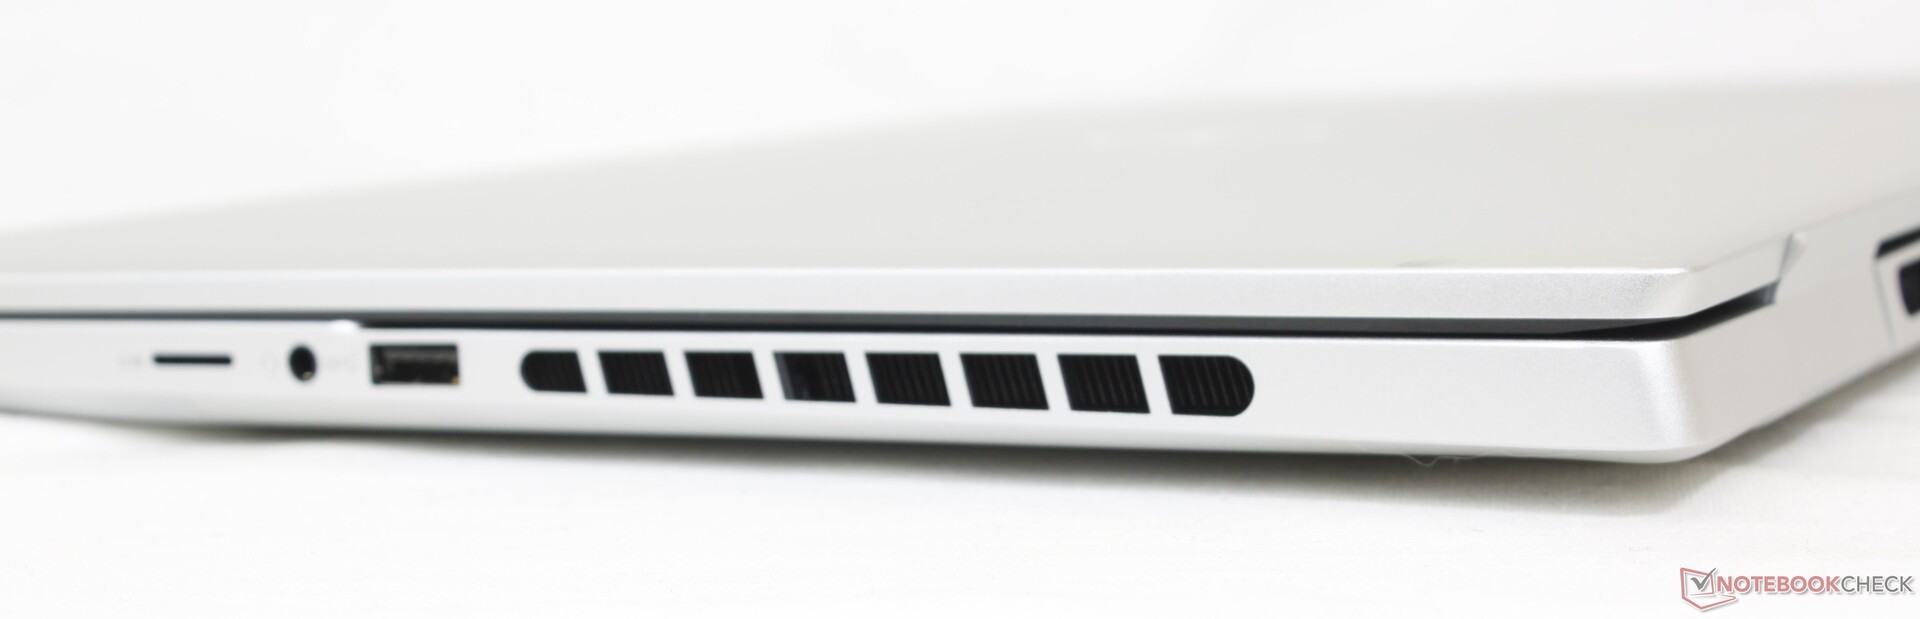
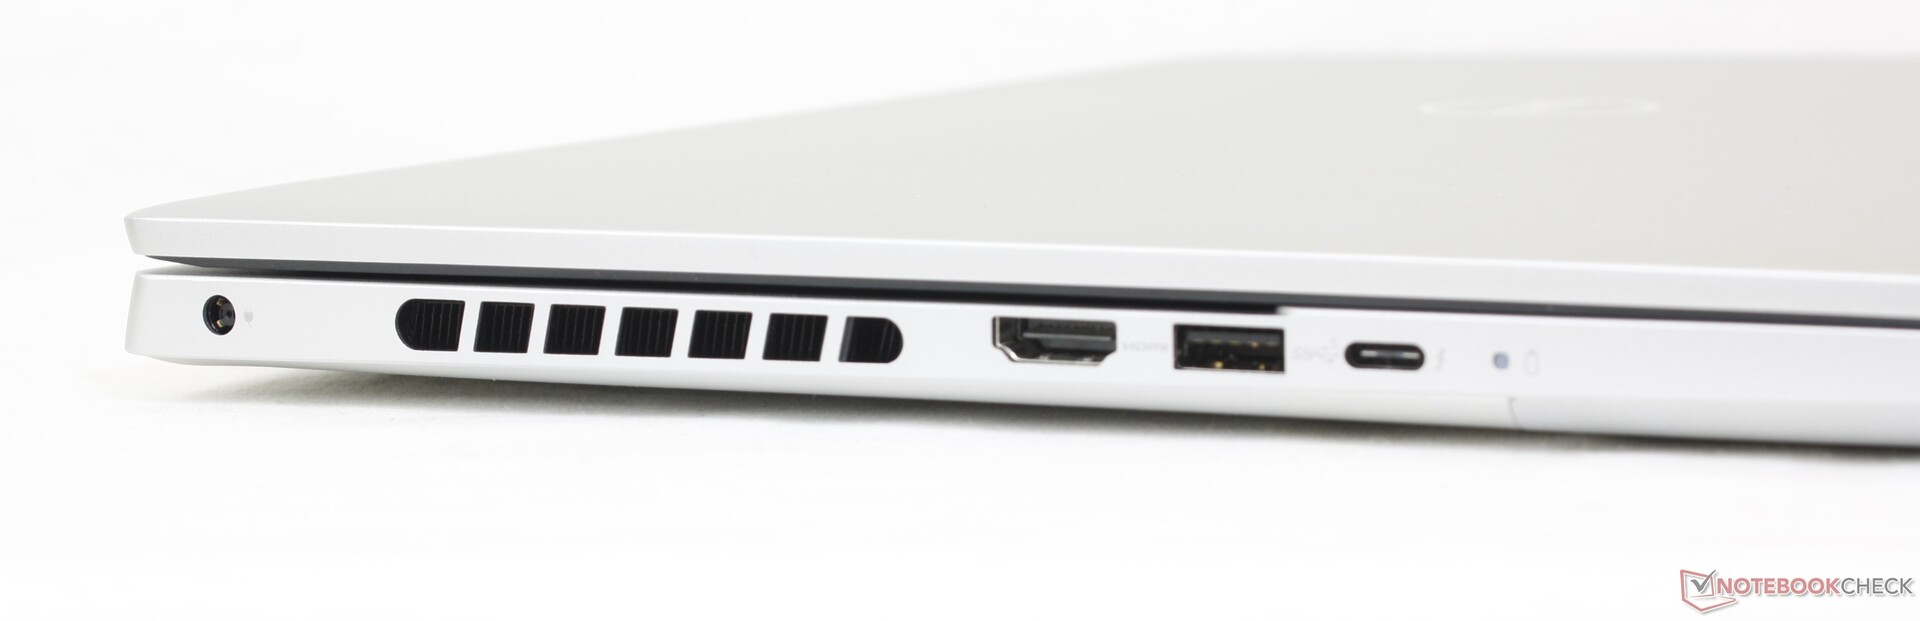
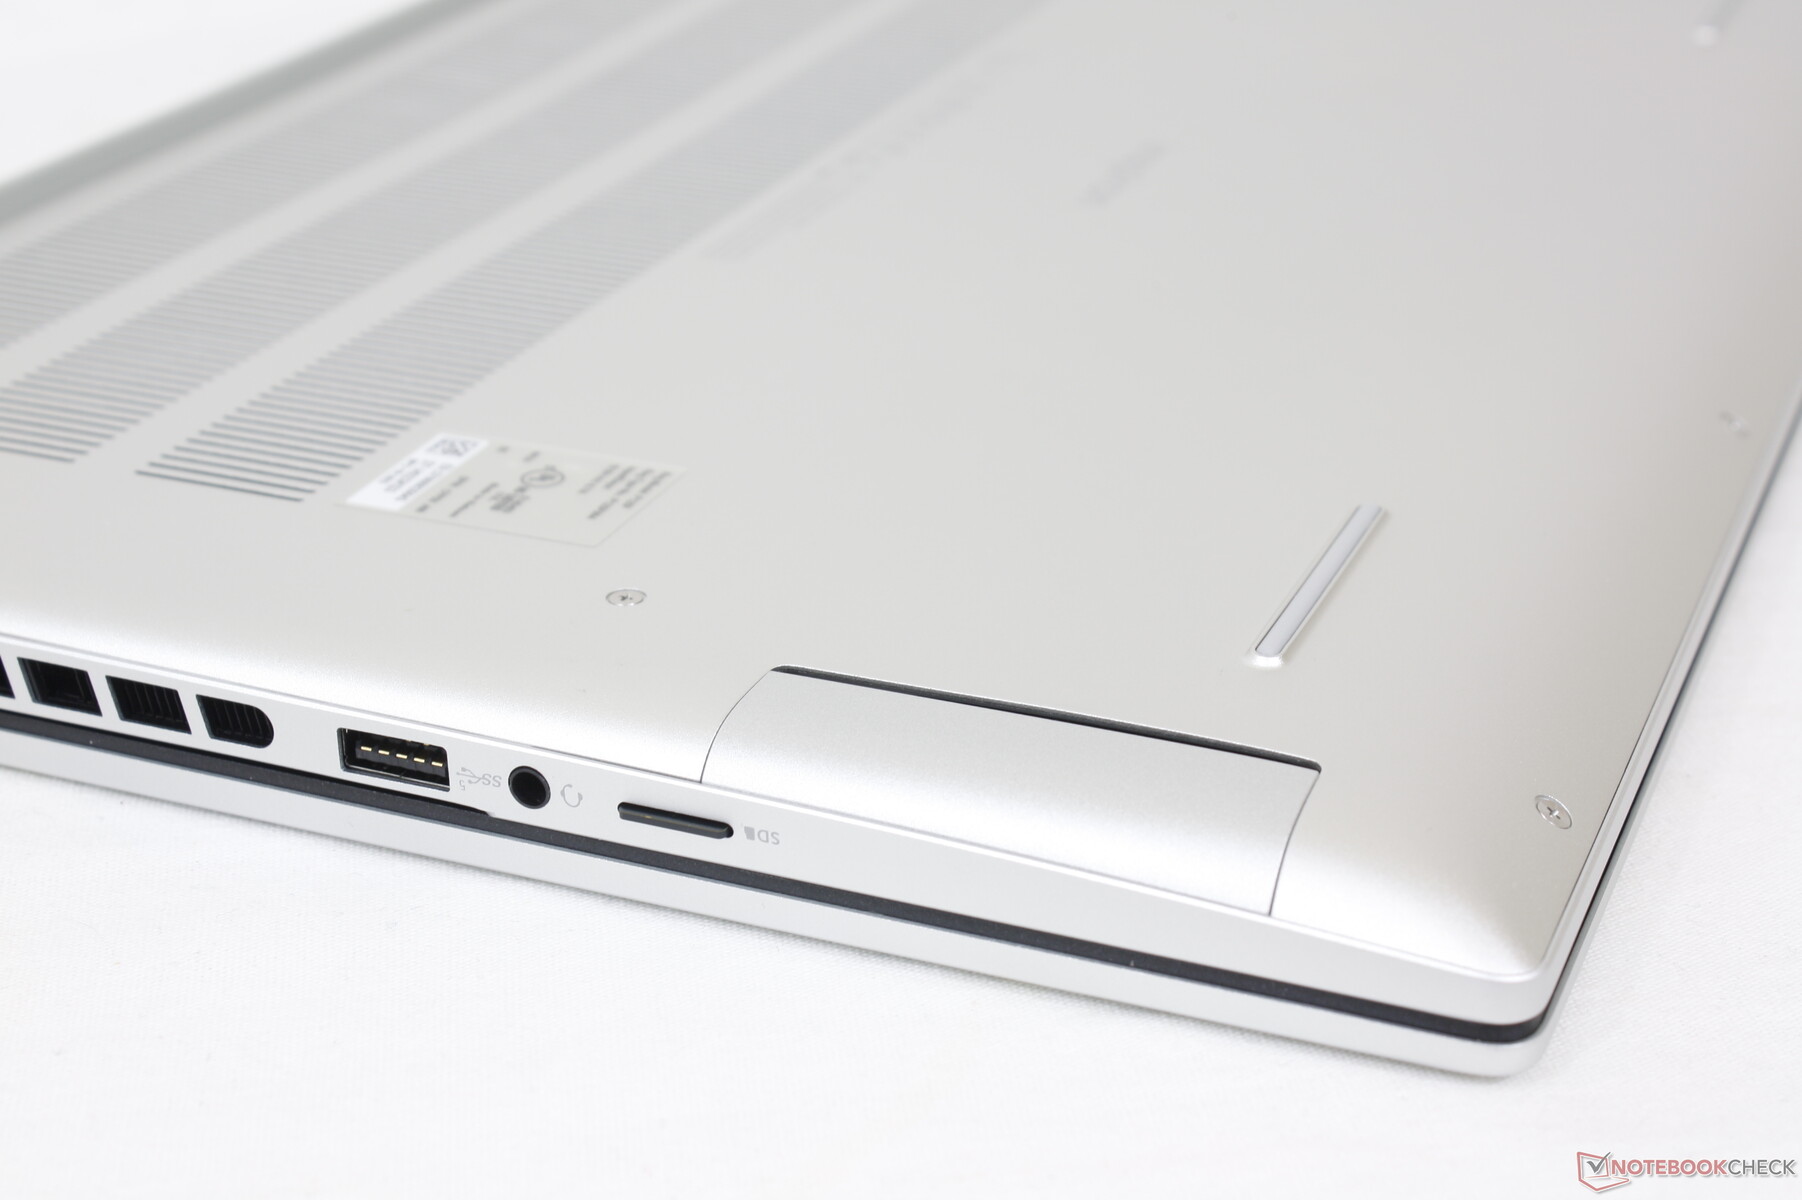
Conectividad - Podría utilizar más USB-C
El posicionamiento de los puertos y las opciones incluyen todo lo del modelo del año pasado, pero con una notable rebaja: el lector de tarjetas SD de tamaño completo se ha eliminado en favor de un lector microSD más pequeño en todas las configuraciones RTX 4060. Alternativas como el Envy 16 o el VivoBook Pro 16X integran más puertos USB-C que nuestro Dell o tienen lectores de tarjetas SD de tamaño completo.
También nos encantaría ver futuros modelos Inspiron abandonar el puerto de barril del adaptador de CA propietario a favor de la carga USB-C como en las series XPS 15 y XPS 17.
Lector de tarjetas SD
Mientras que la serie XPS cuenta con algunos de los lectores de tarjetas SD más rápidos de cualquier portátil, la serie Inspiron incluye algunos de los más lentos. Mover 1 GB de imágenes de nuestra tarjeta de prueba UHS-II al escritorio tardaría más de 50 segundos, en comparación con sólo 5 a 6 segundos en un XPS 15 o XPS 17.
| SD Card Reader | |
| average JPG Copy Test (av. of 3 runs) | |
| MSI Summit E16 Flip A12UDT-031 (AV Pro SD microSD 128 GB V60) | |
| Asus Vivobook Pro 16X K6604JV-MX016W | |
| Lenovo Slim Pro 9i 16IRP8 (PNY EliteX-Pro60 V60 256 GB) | |
| HP Envy 16 h0112nr (AV Pro SD microSD 128 GB V60) | |
| Dell Inspiron 16 Plus 7620 (Toshiba Exceria Pro SDXC 64 GB UHS-II) | |
| Dell Inspiron 16 Plus 7630 (AV Pro SD microSD 128 GB V60) | |
| maximum AS SSD Seq Read Test (1GB) | |
| MSI Summit E16 Flip A12UDT-031 (AV Pro SD microSD 128 GB V60) | |
| Asus Vivobook Pro 16X K6604JV-MX016W | |
| Lenovo Slim Pro 9i 16IRP8 (PNY EliteX-Pro60 V60 256 GB) | |
| HP Envy 16 h0112nr (AV Pro SD microSD 128 GB V60) | |
| Dell Inspiron 16 Plus 7620 (Toshiba Exceria Pro SDXC 64 GB UHS-II) | |
| Dell Inspiron 16 Plus 7630 (AV Pro SD microSD 128 GB V60) | |
Comunicación
Un Intel AX211 viene de serie para la conectividad Wi-Fi 6E y Bluetooth 5.3. Experimentamos un rendimiento estable y fiable cuando lo emparejamos con nuestra red de pruebas Asus AXE11000 6GHz.
Se incluye un módulo MediaTek si se configura con una CPU AMD.
Cámara web
La webcam de 2 MP se ha convertido en un estándar en la mayoría de portátiles multimedia. Los modelos más caros de HP incluyen webcams de 5 MP o incluso 8 MP si la calidad de la webcam es prioritaria.
Incluye un deslizador físico para mayor privacidad, pero no admite infrarrojos.


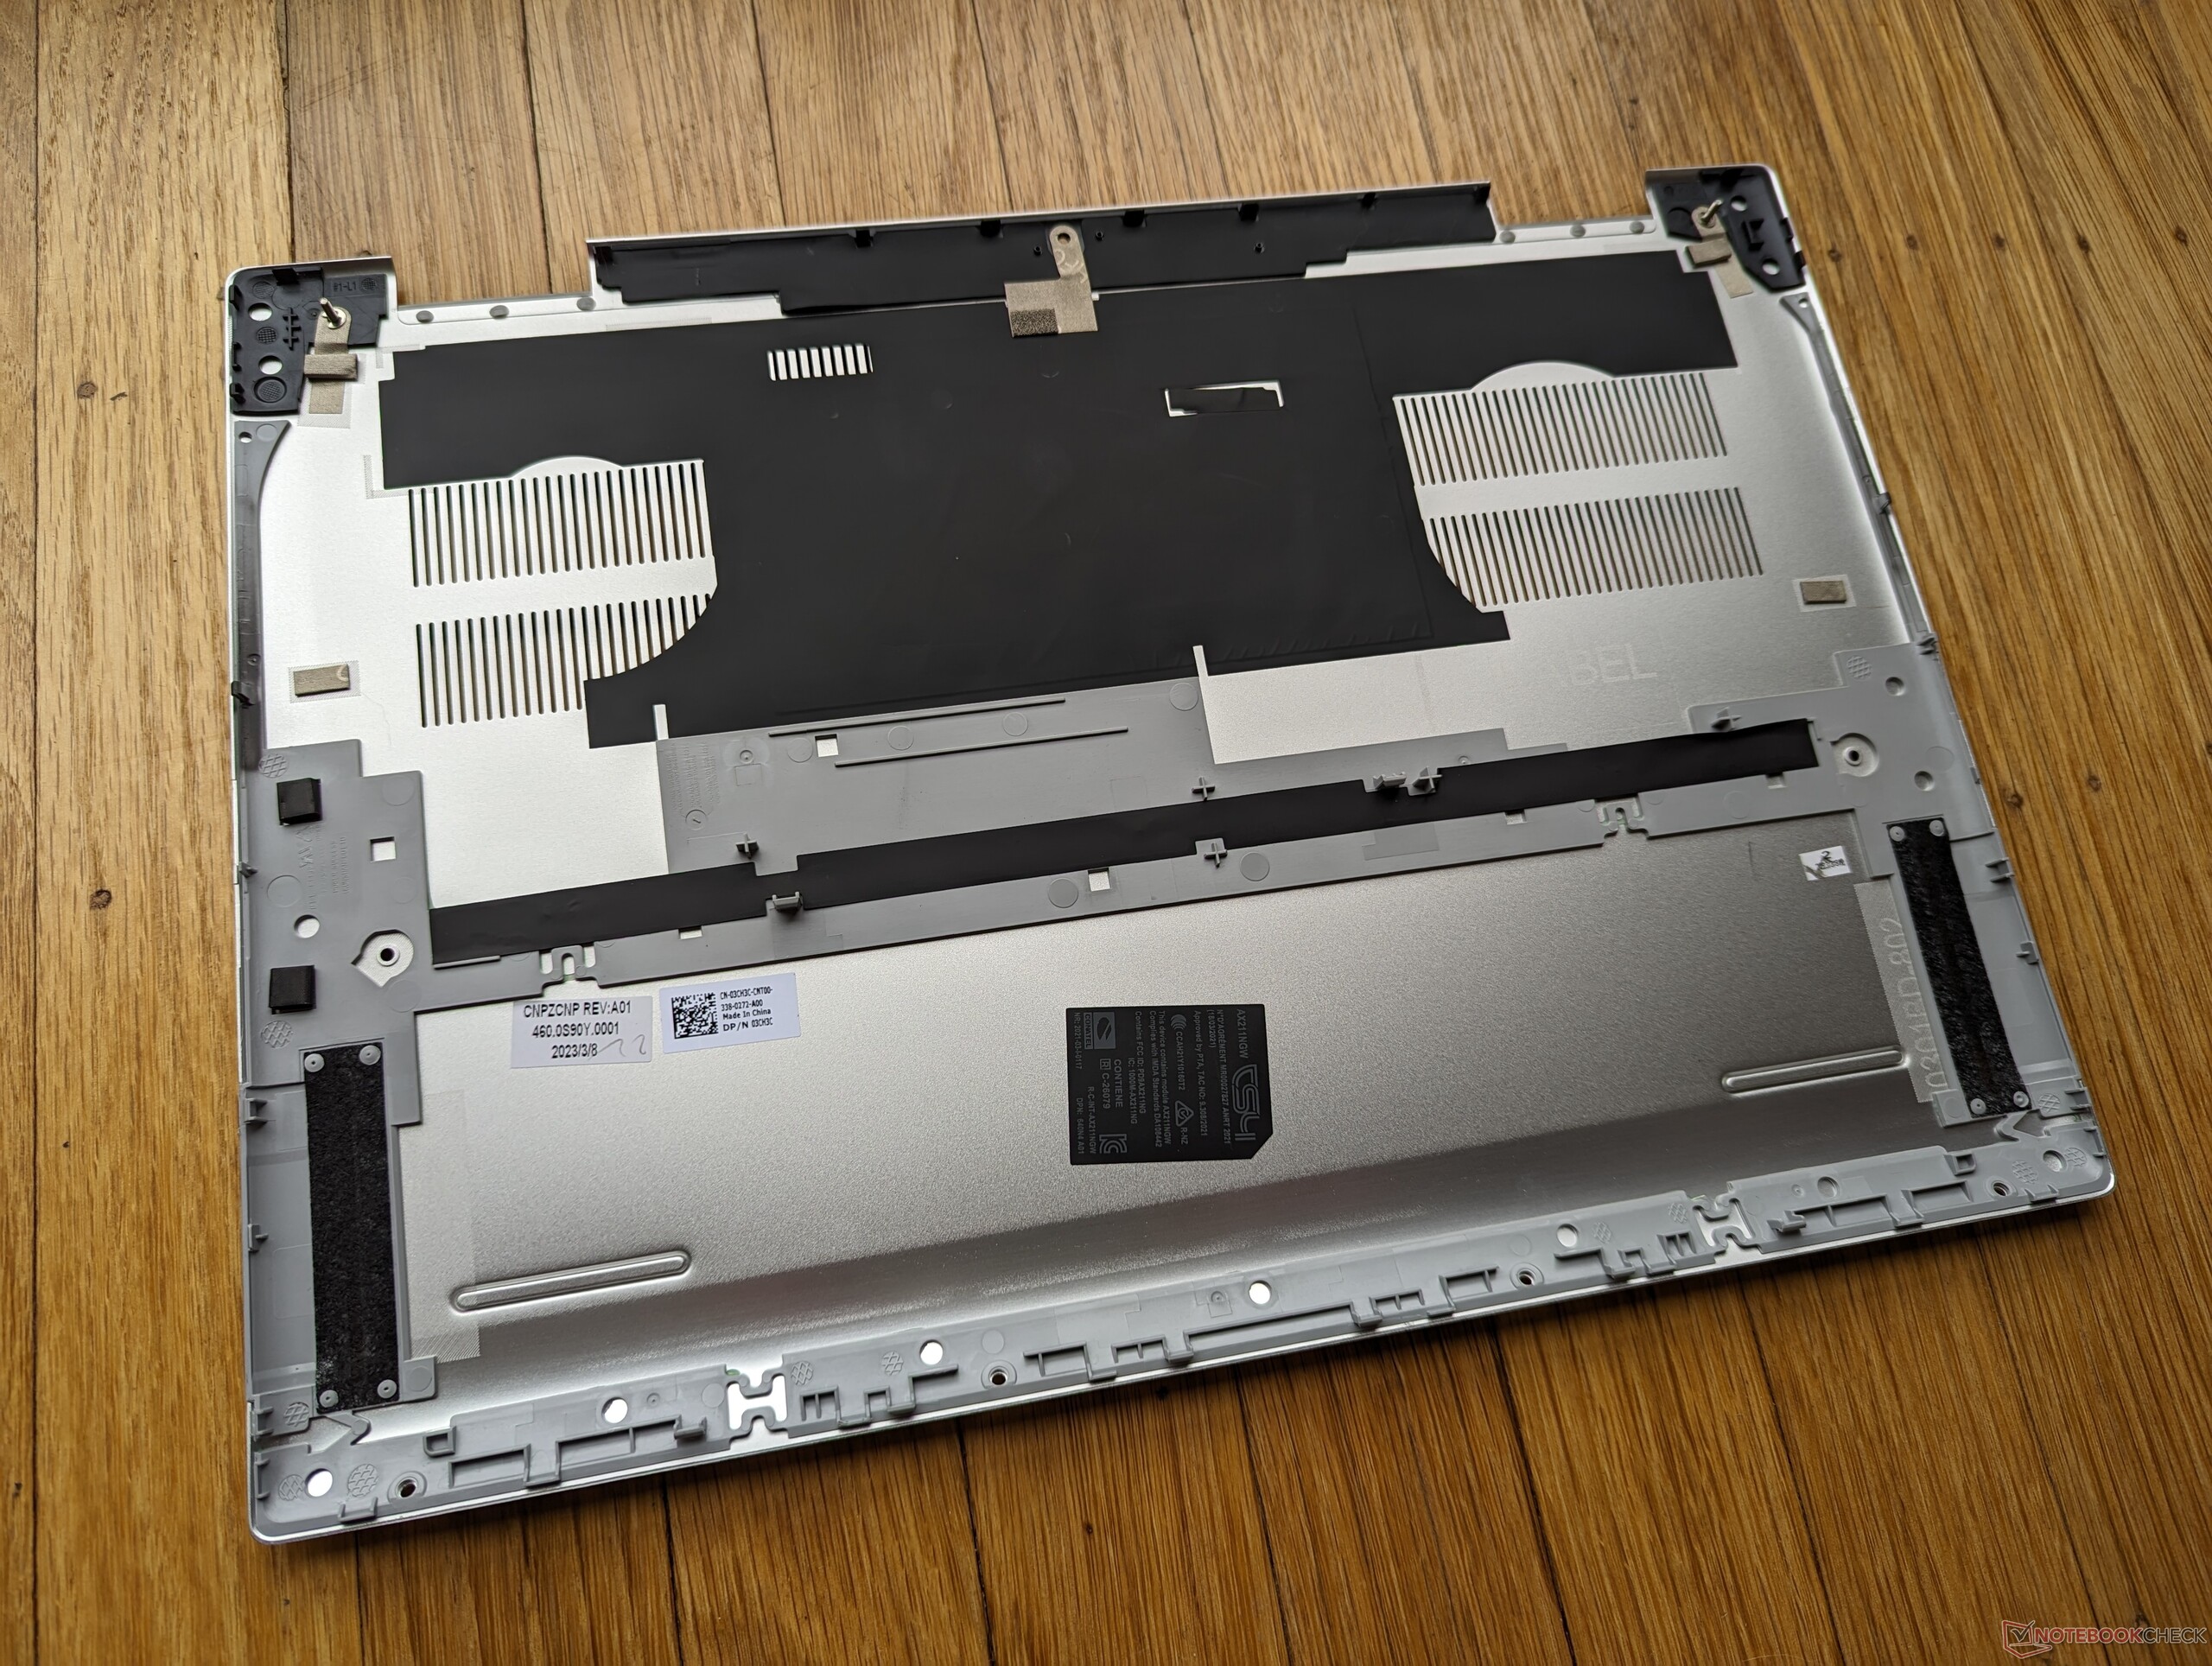
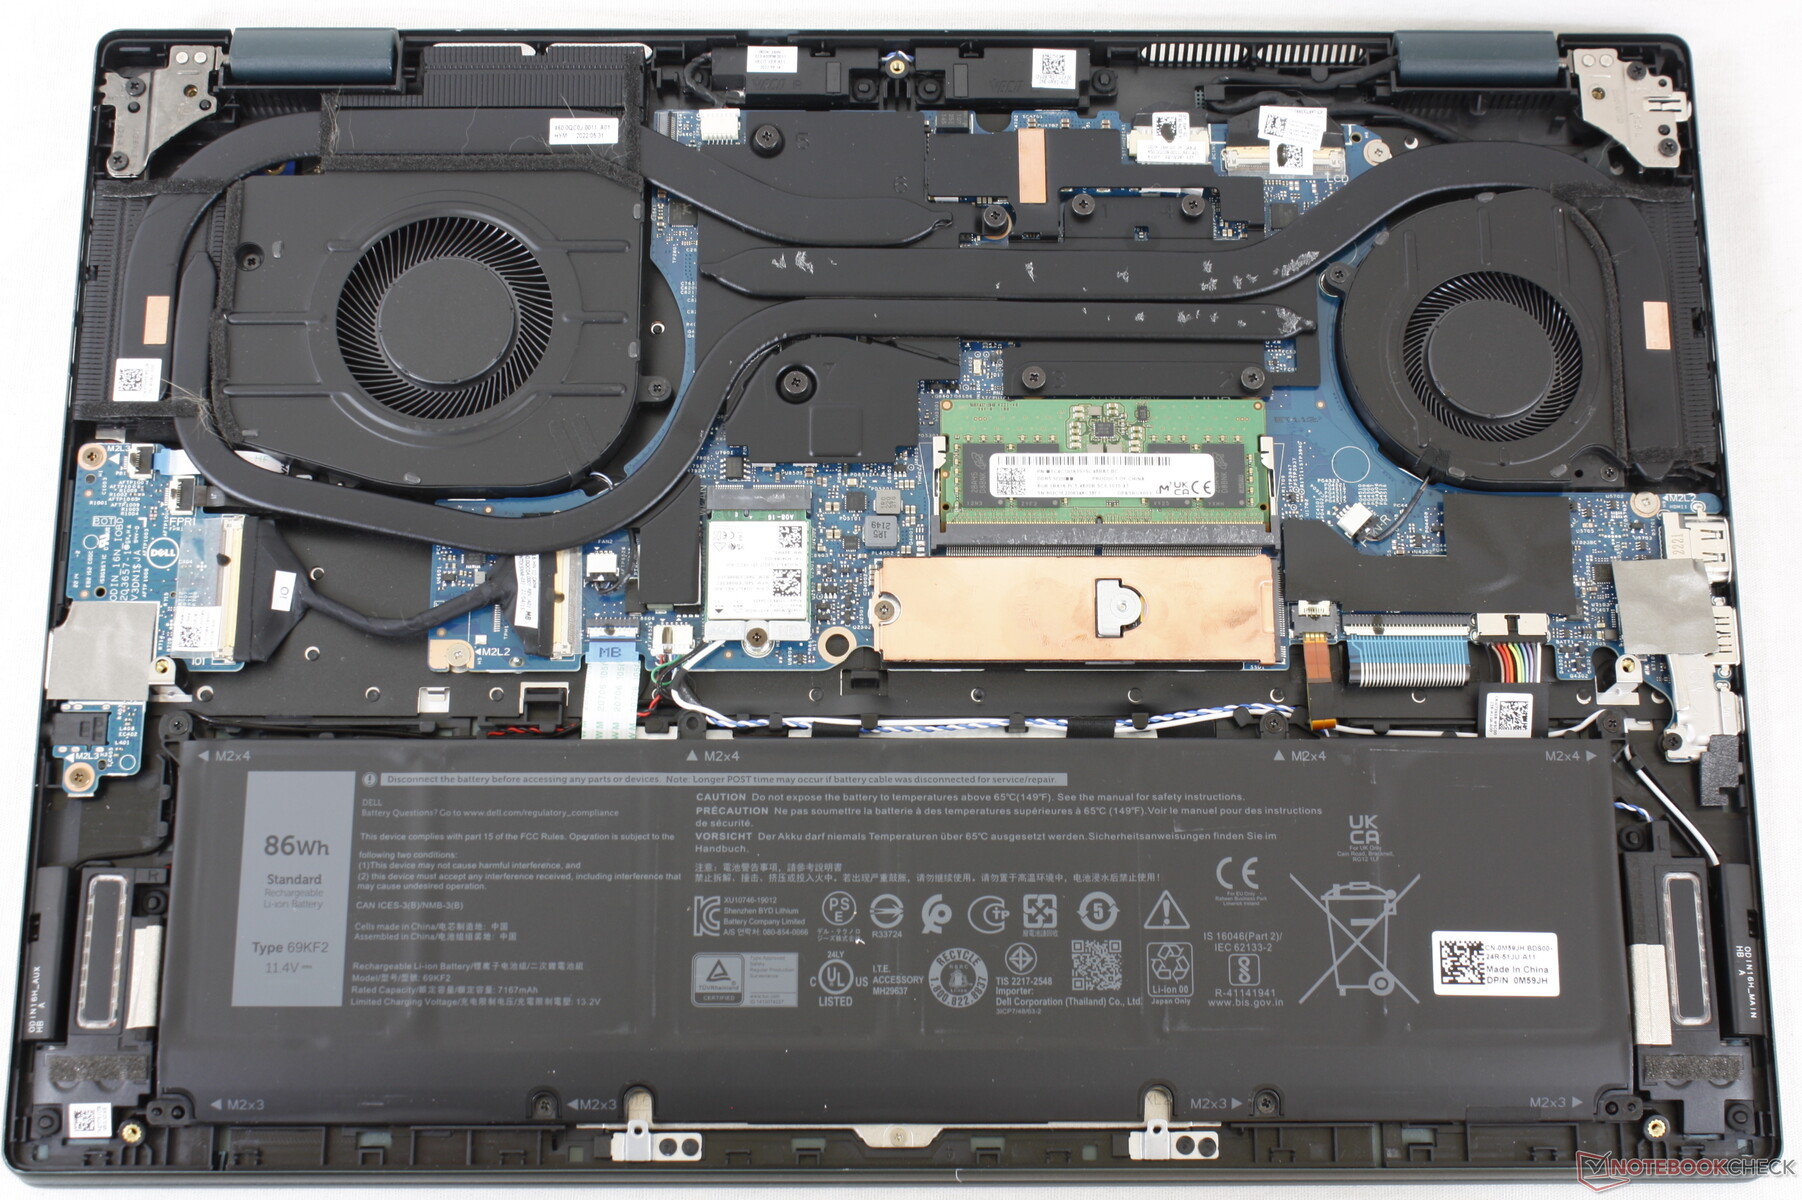
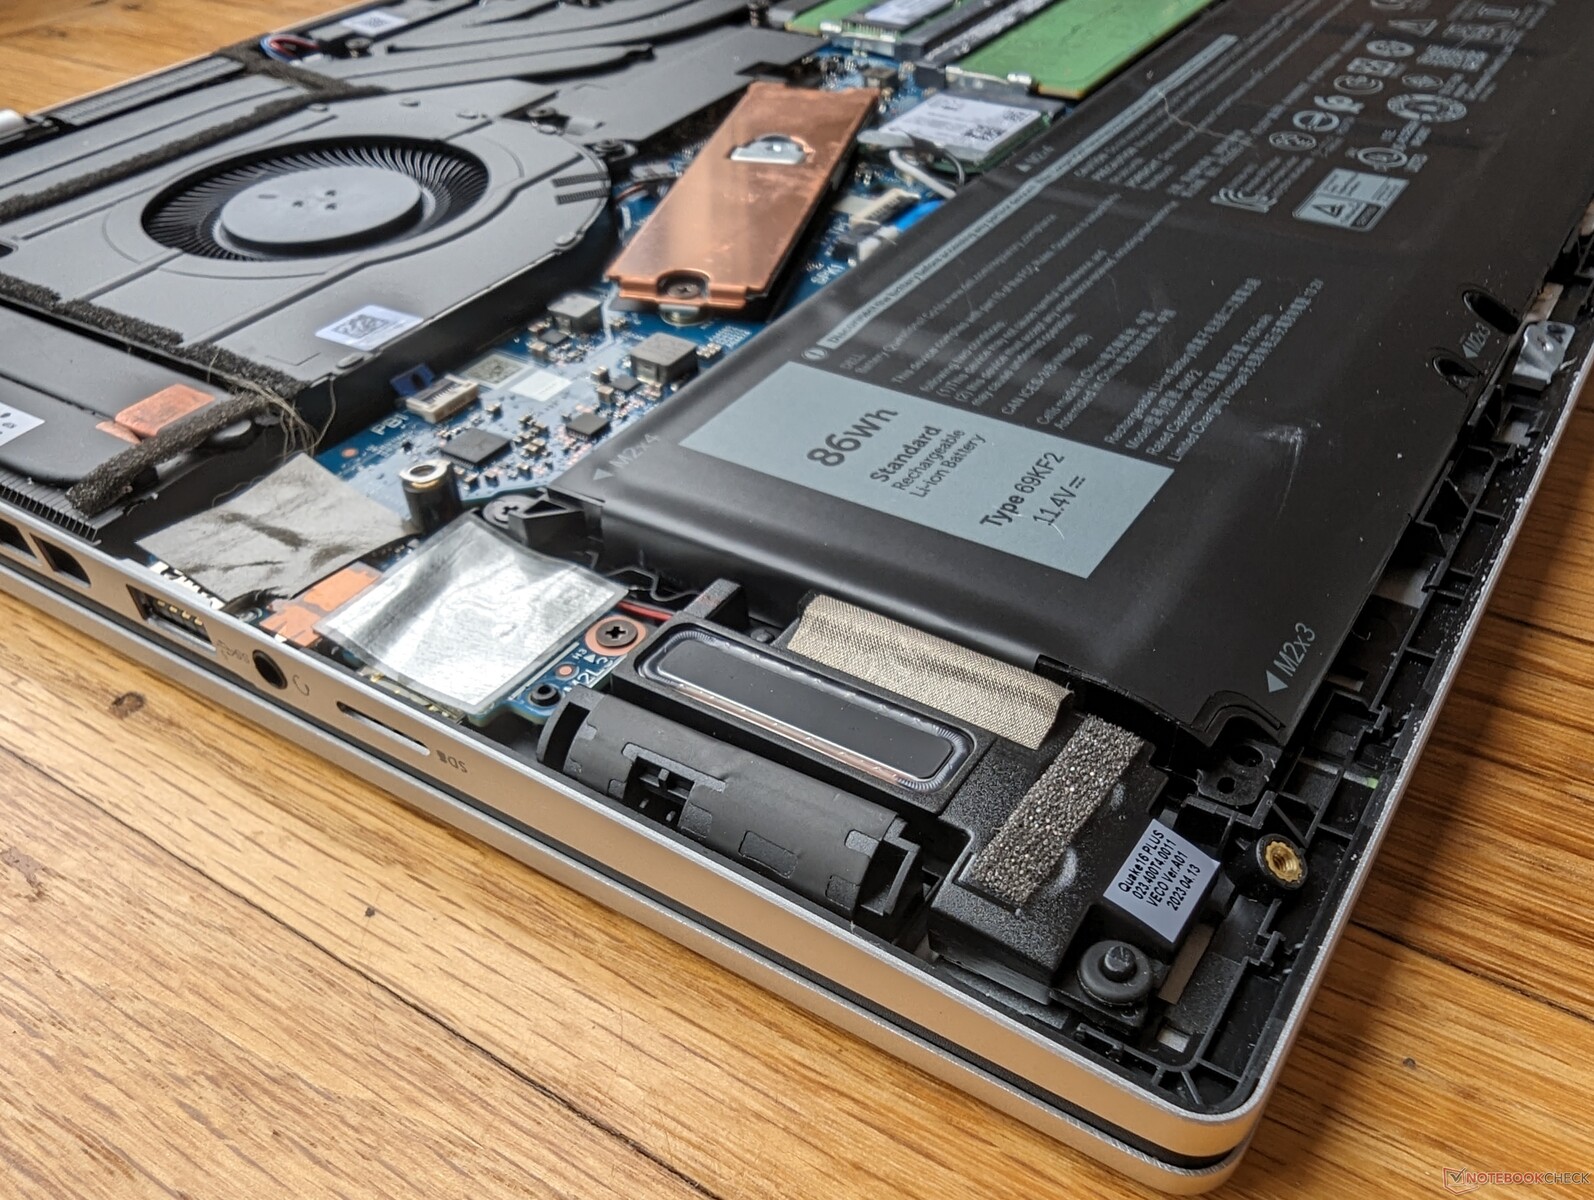
Mantenimiento
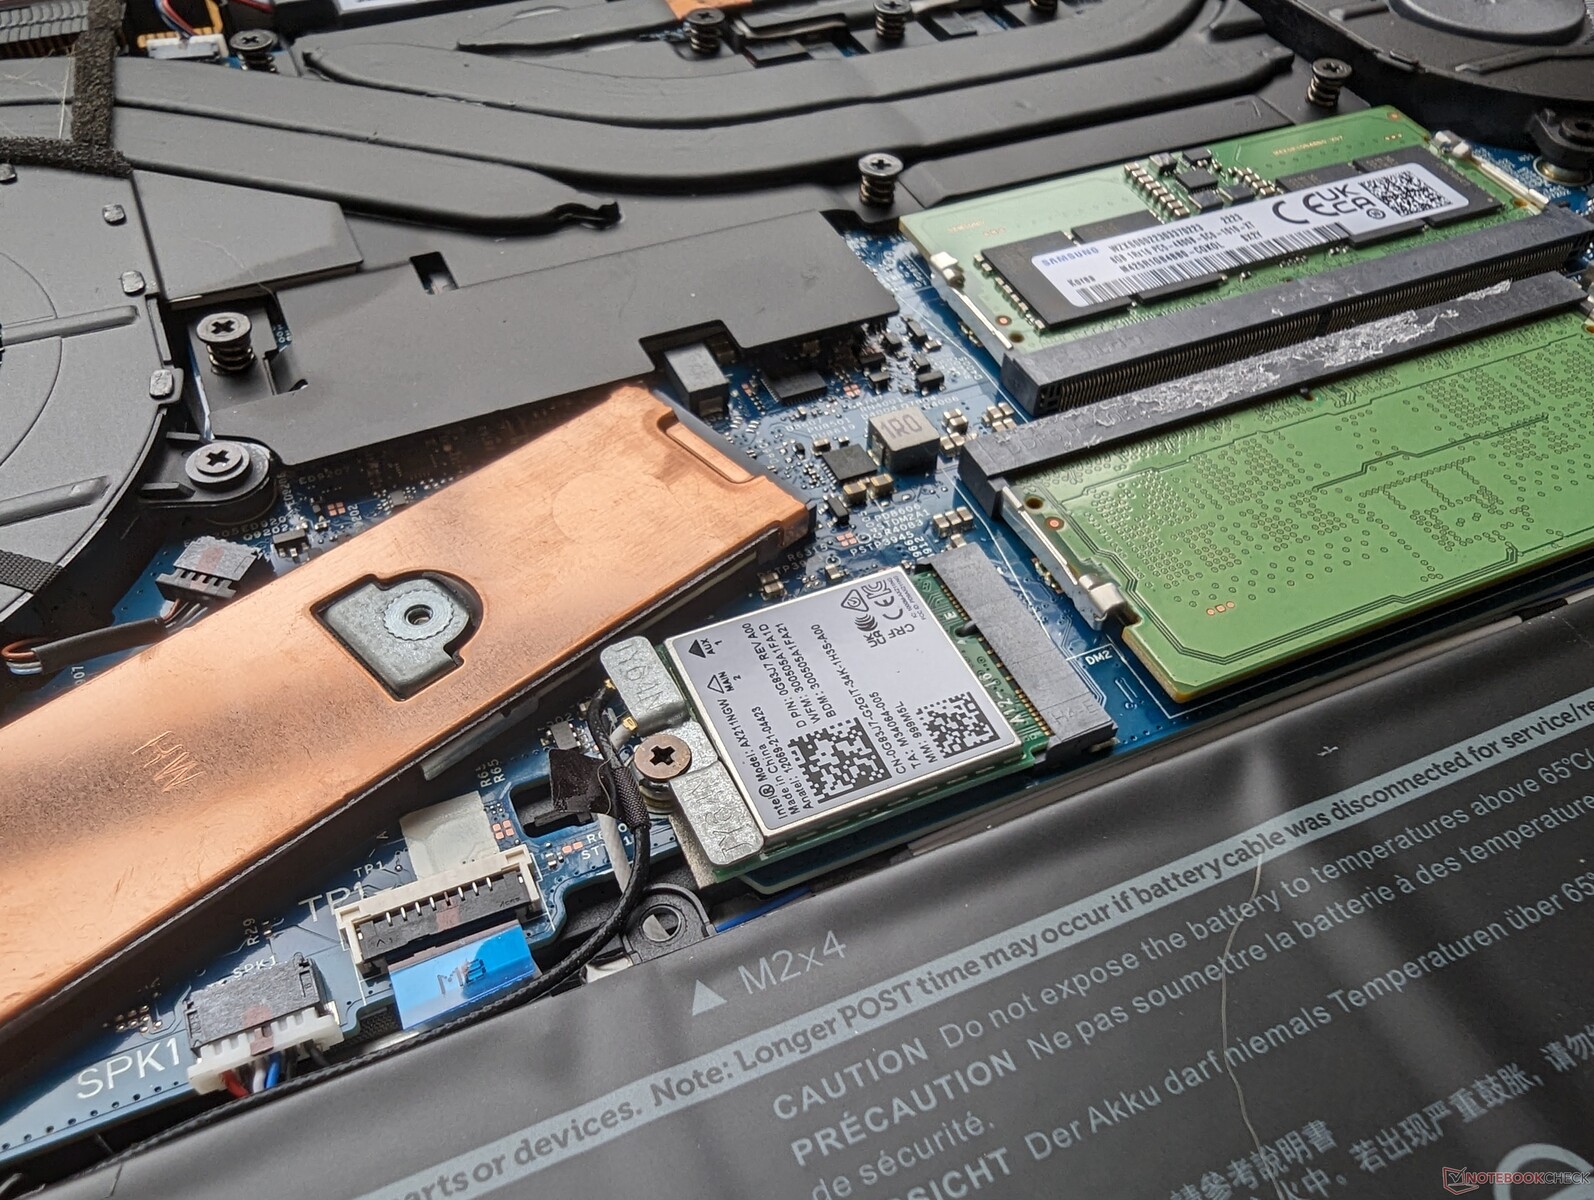
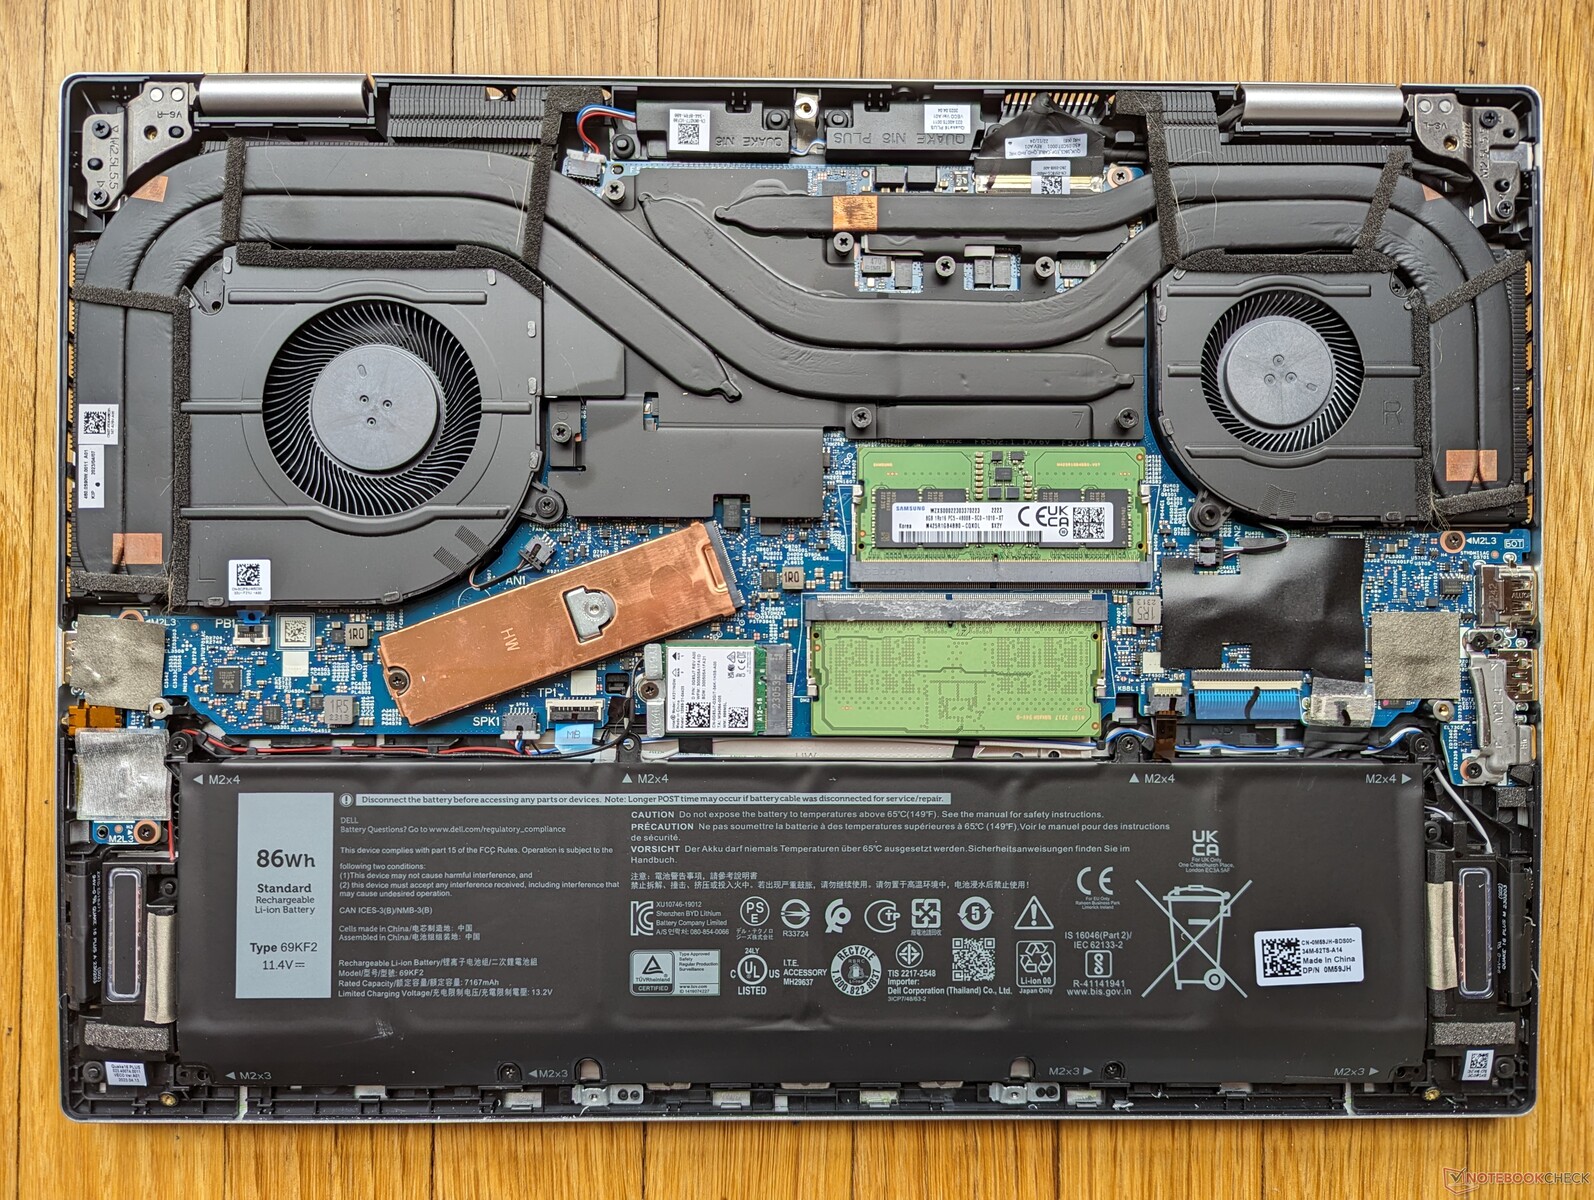
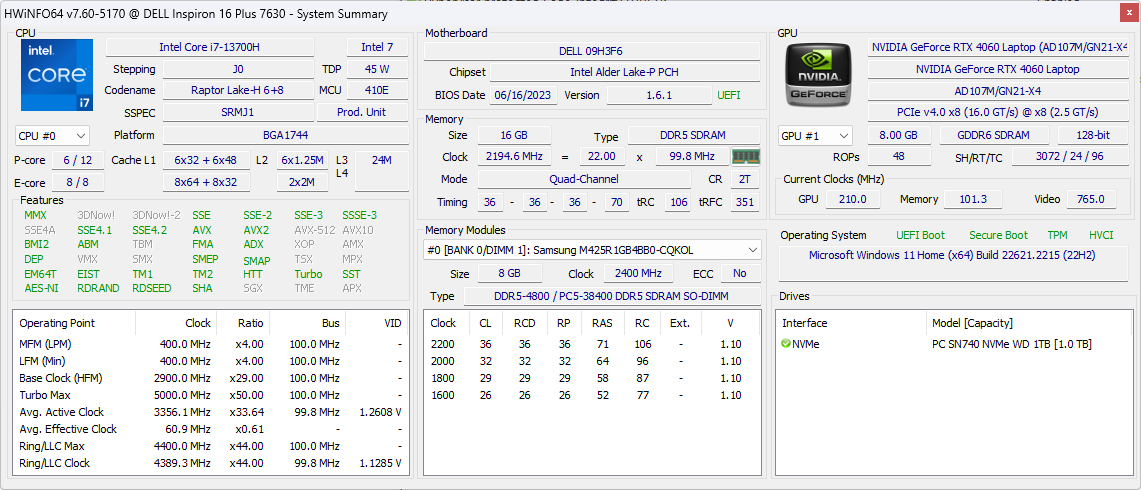
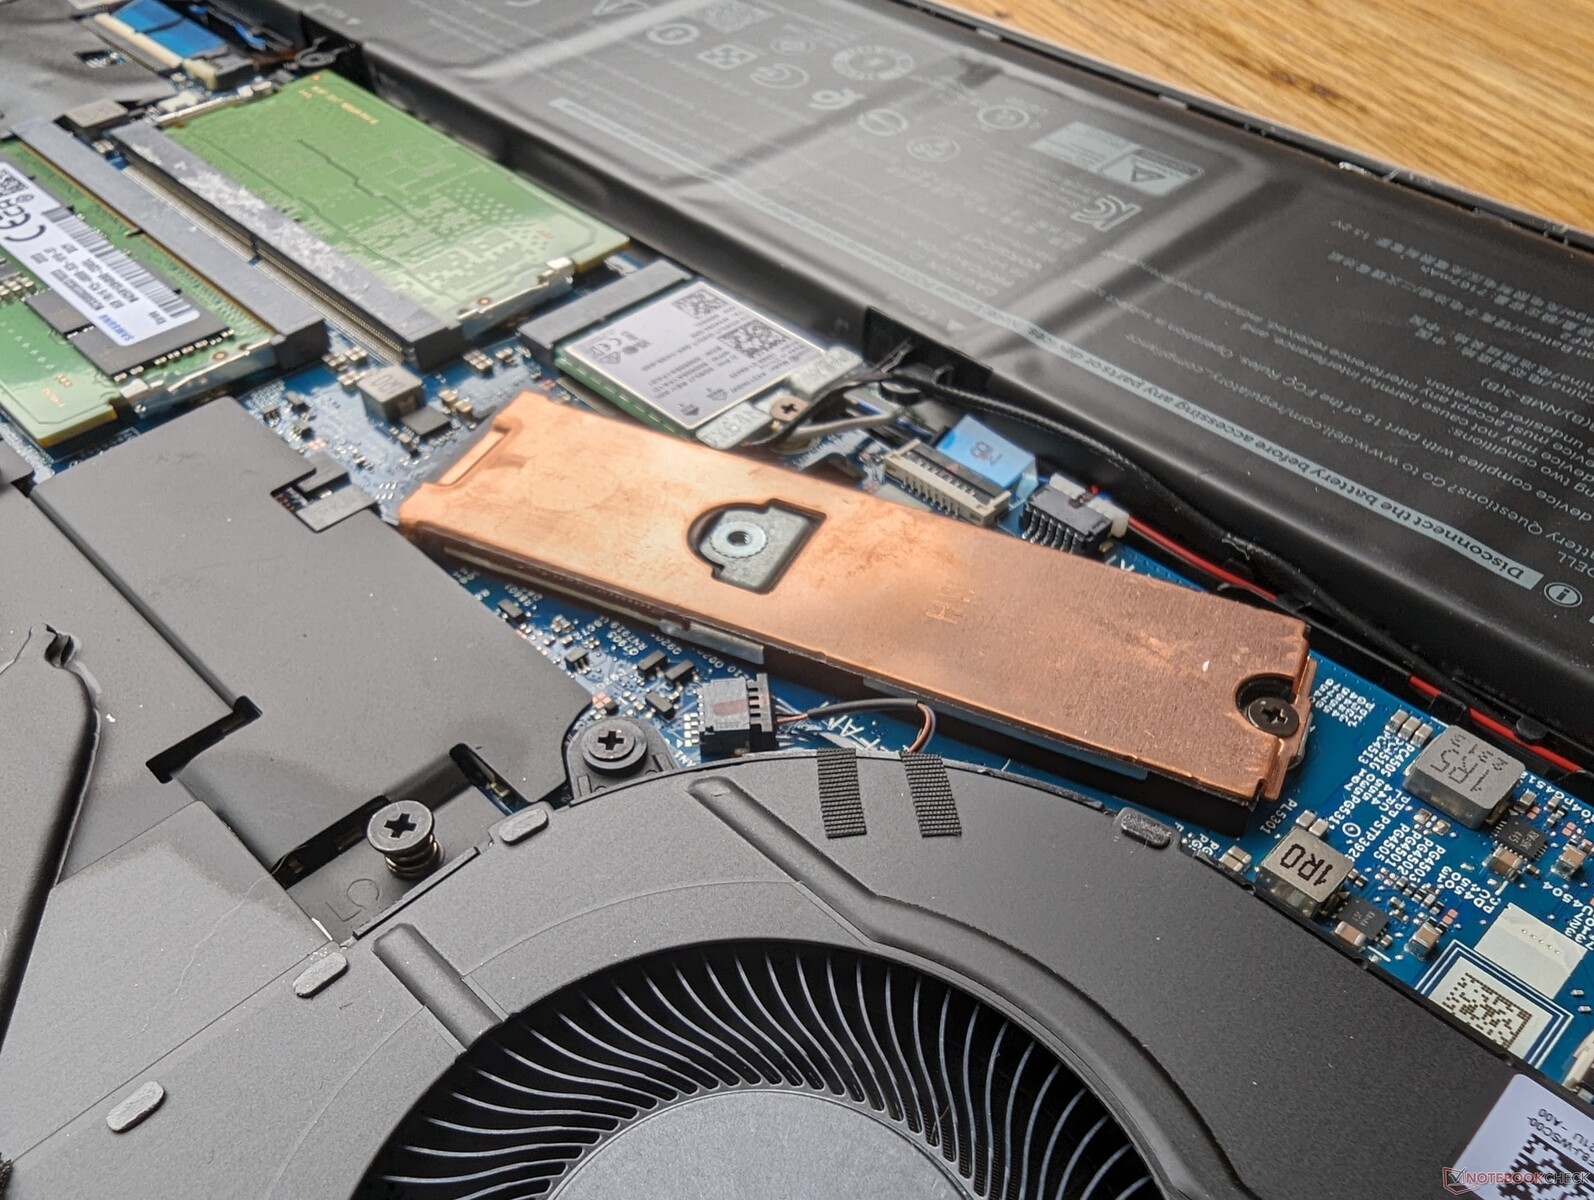
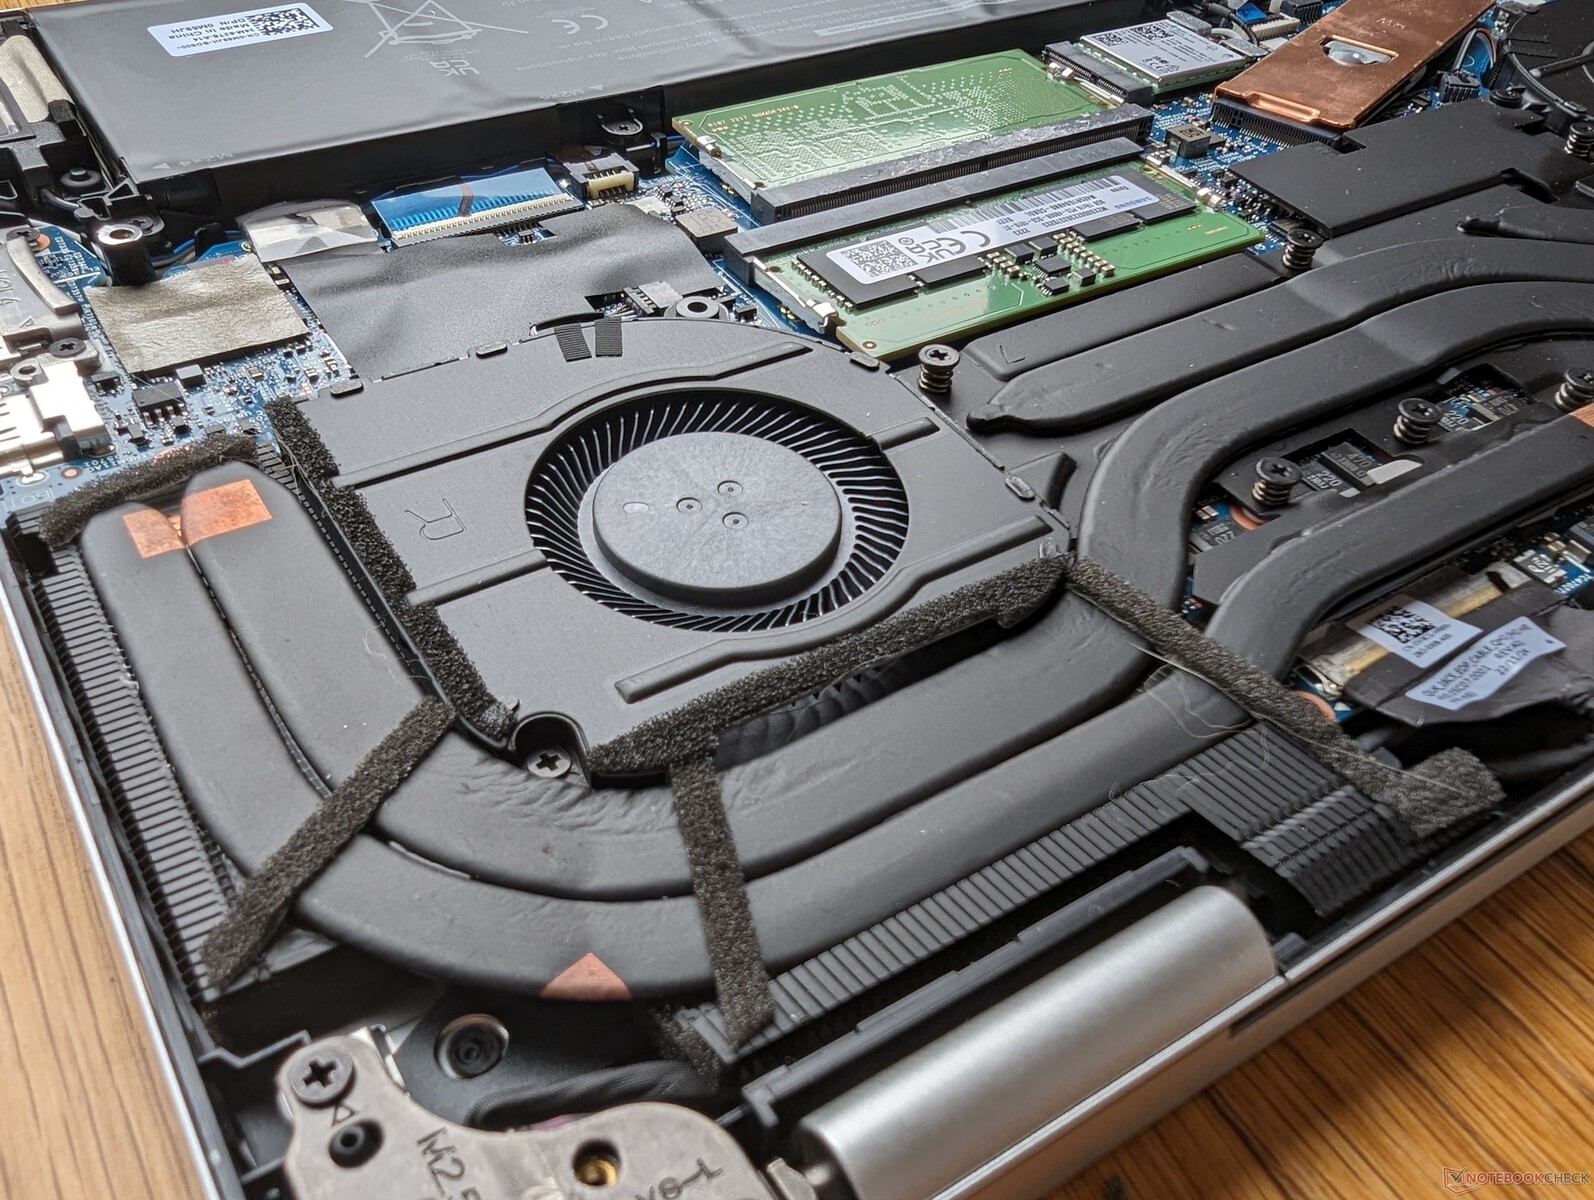
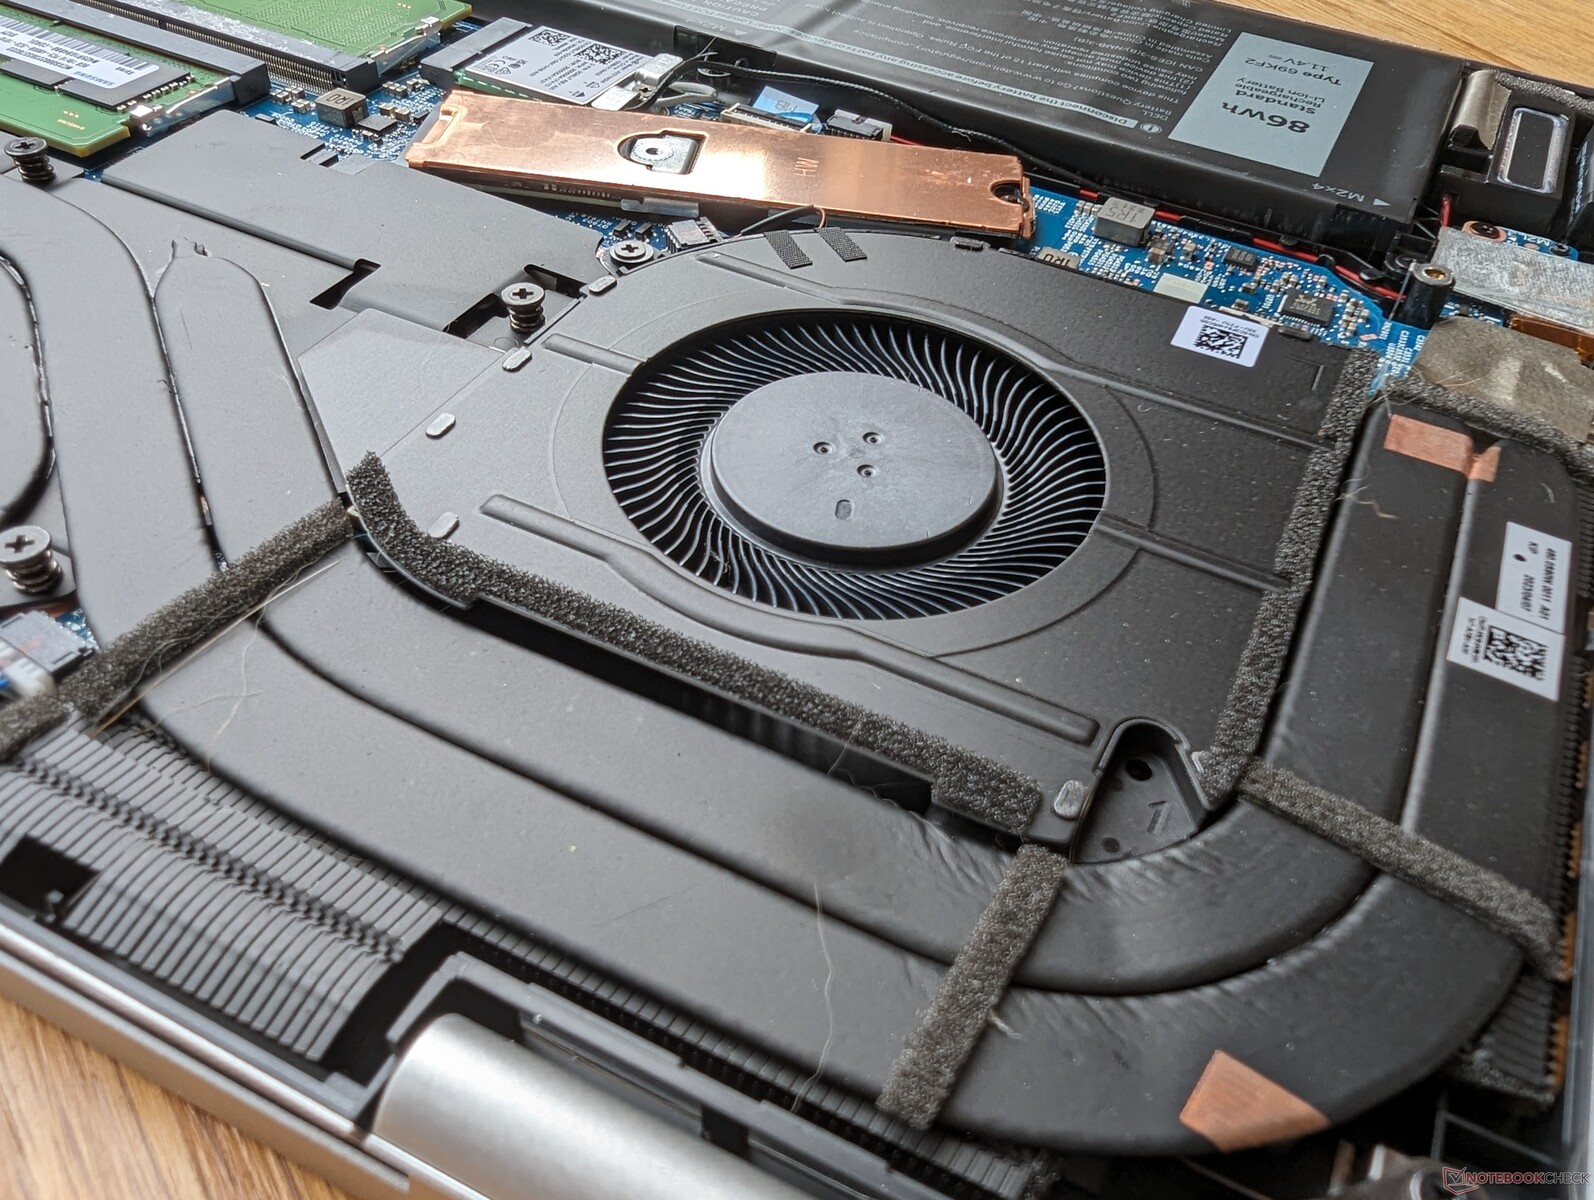
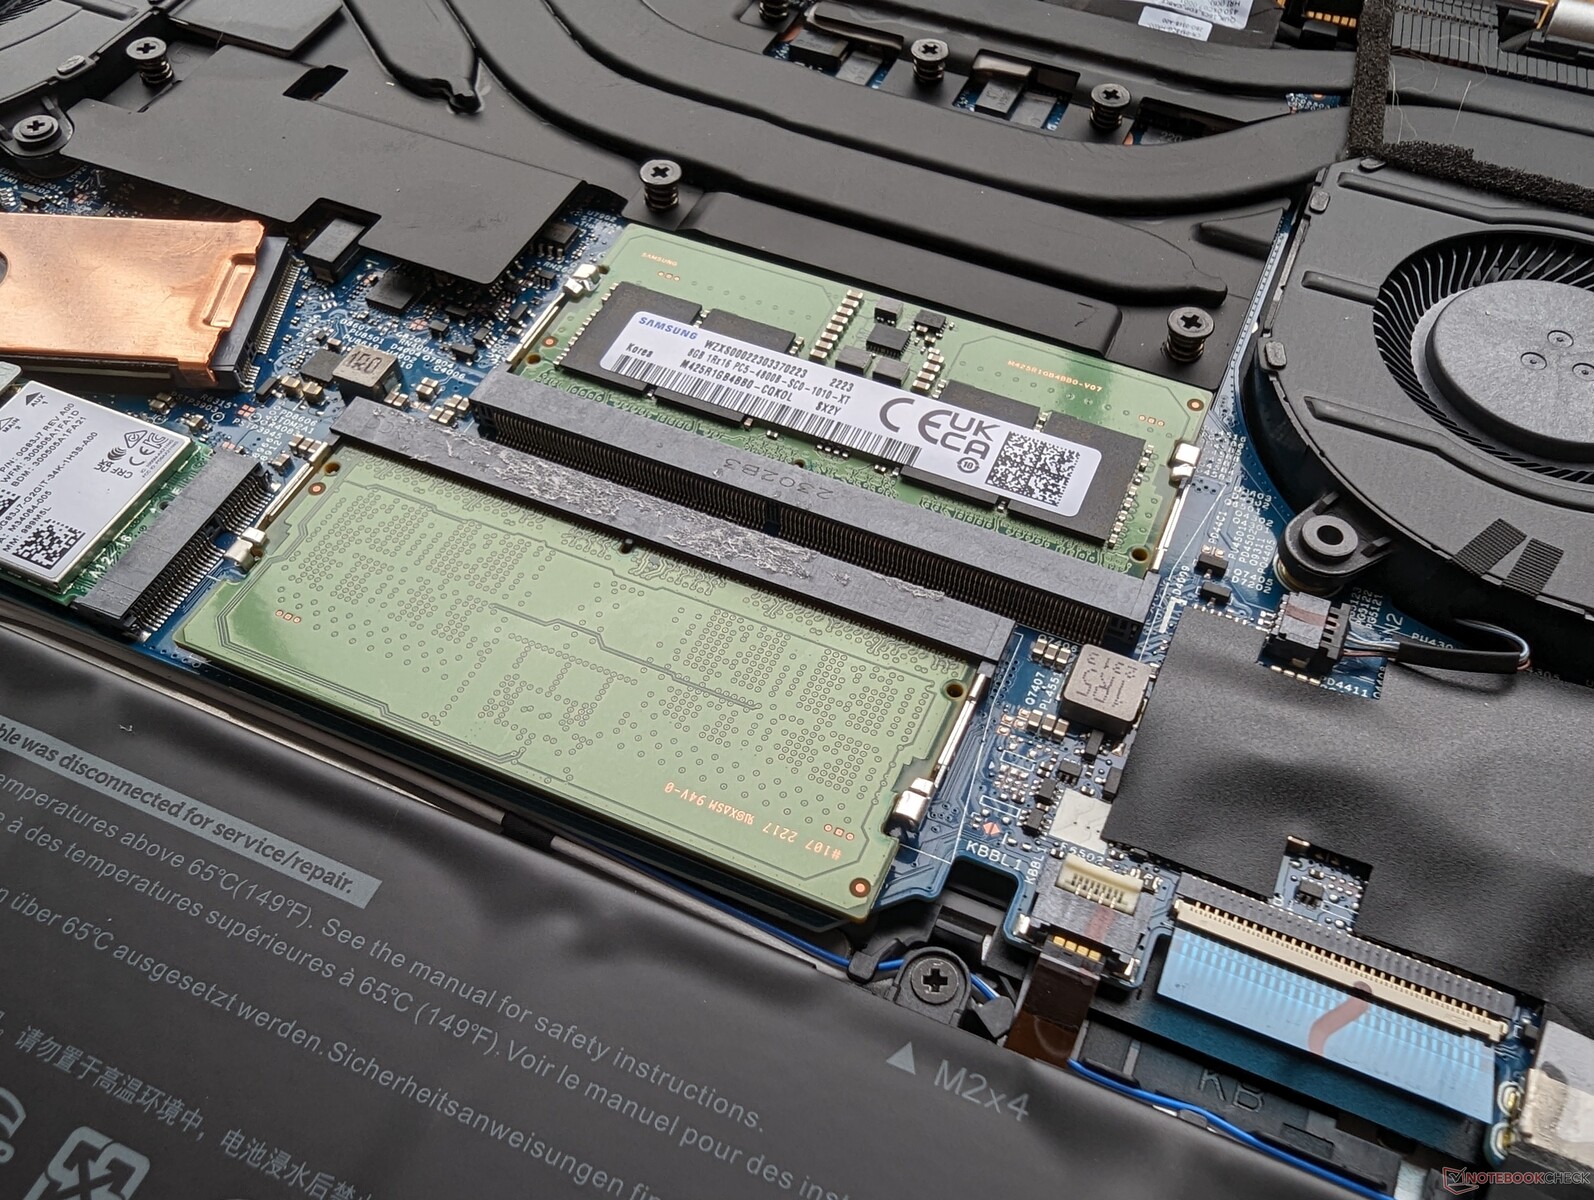
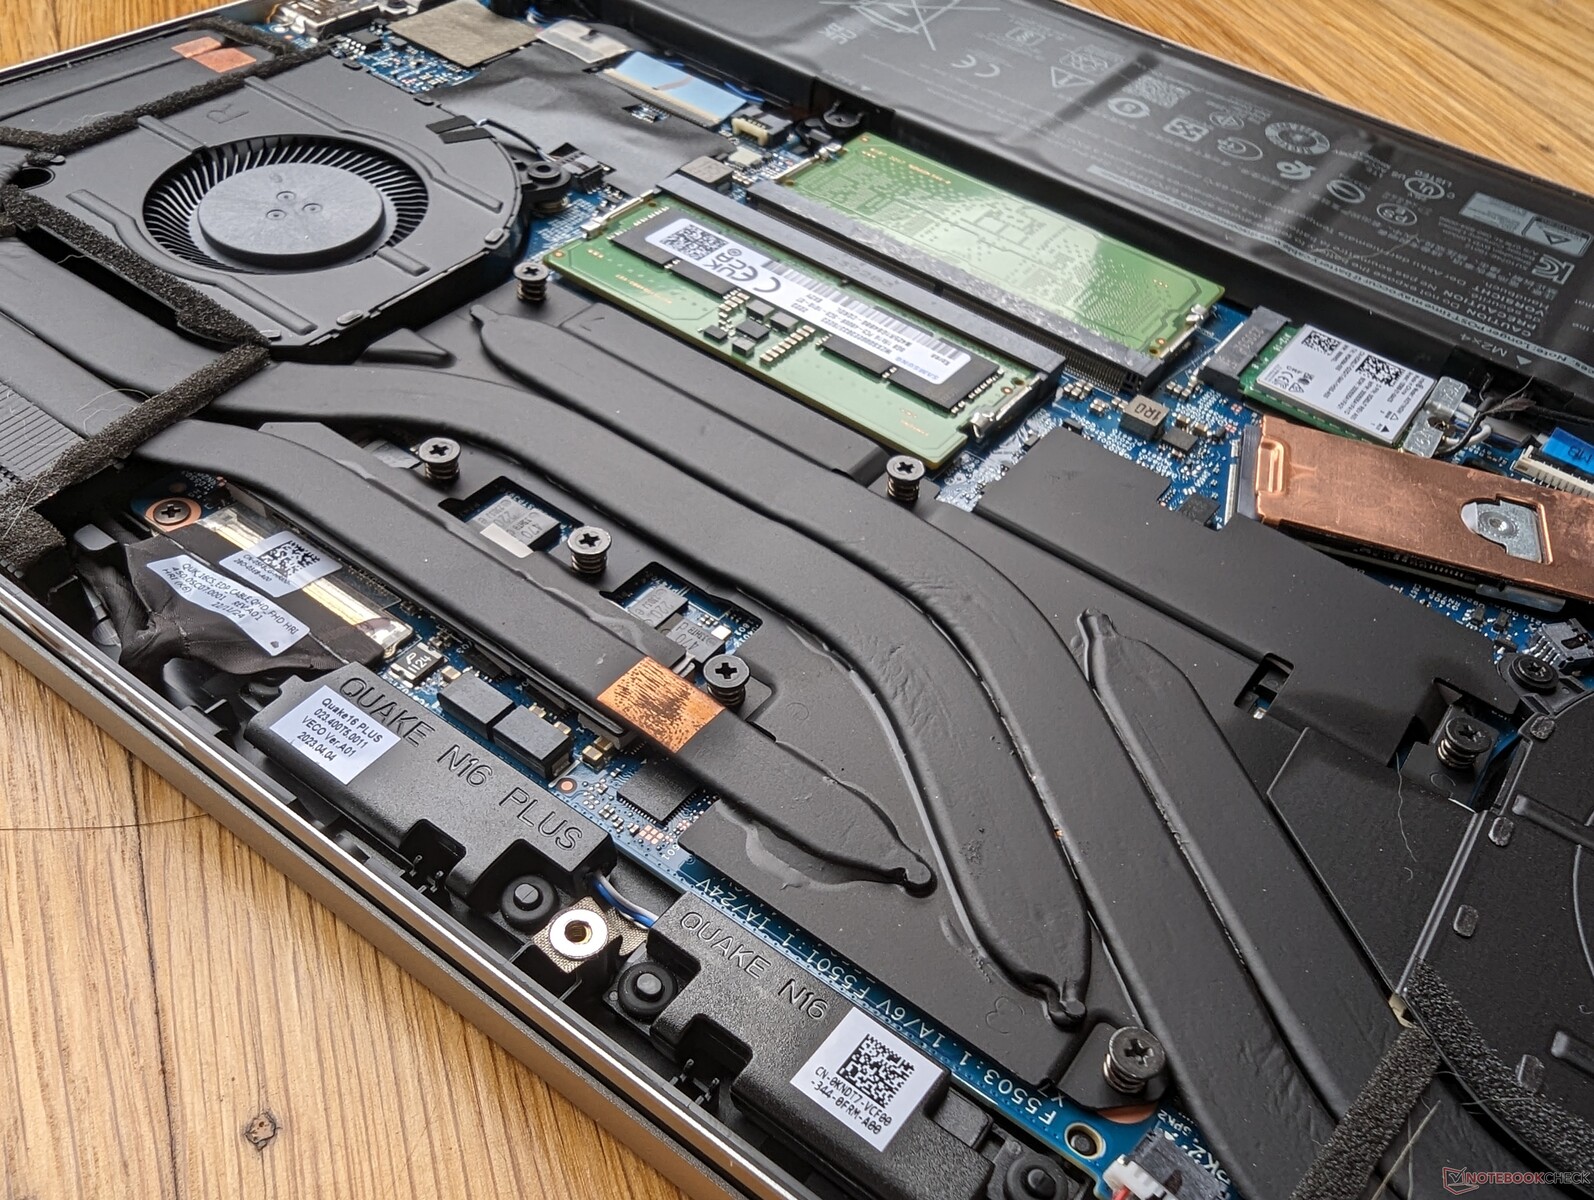
El panel inferior sólo requiere un destornillador Phillips y un borde afilado para un mantenimiento relativamente sencillo. Los propietarios tienen acceso directo al SSD, WLAN, y 2x ranuras SODIMM mientras que el modelo del año pasado estaba limitado a sólo 1x ranura SODIMM como se muestra en las fotos comparativas de abajo. Los ventiladores también son más grandes esta vez y con tubos de calor de cobre más gruesos para mejorar el potencial de refrigeración.
Ten en cuenta que la versión AMD de este modelo utiliza RAM LPDDR5 soldada en contraste con el enfoque 2x SODIMM totalmente ampliable de nuestra versión Intel.
Accesorios y garantía
No hay más extras en la caja que el adaptador de CA y la documentación. Se aplica la habitual garantía limitada de un año del fabricante si se compra en EE.UU.
Dispositivos de entrada: sensación familiar de Inspiron
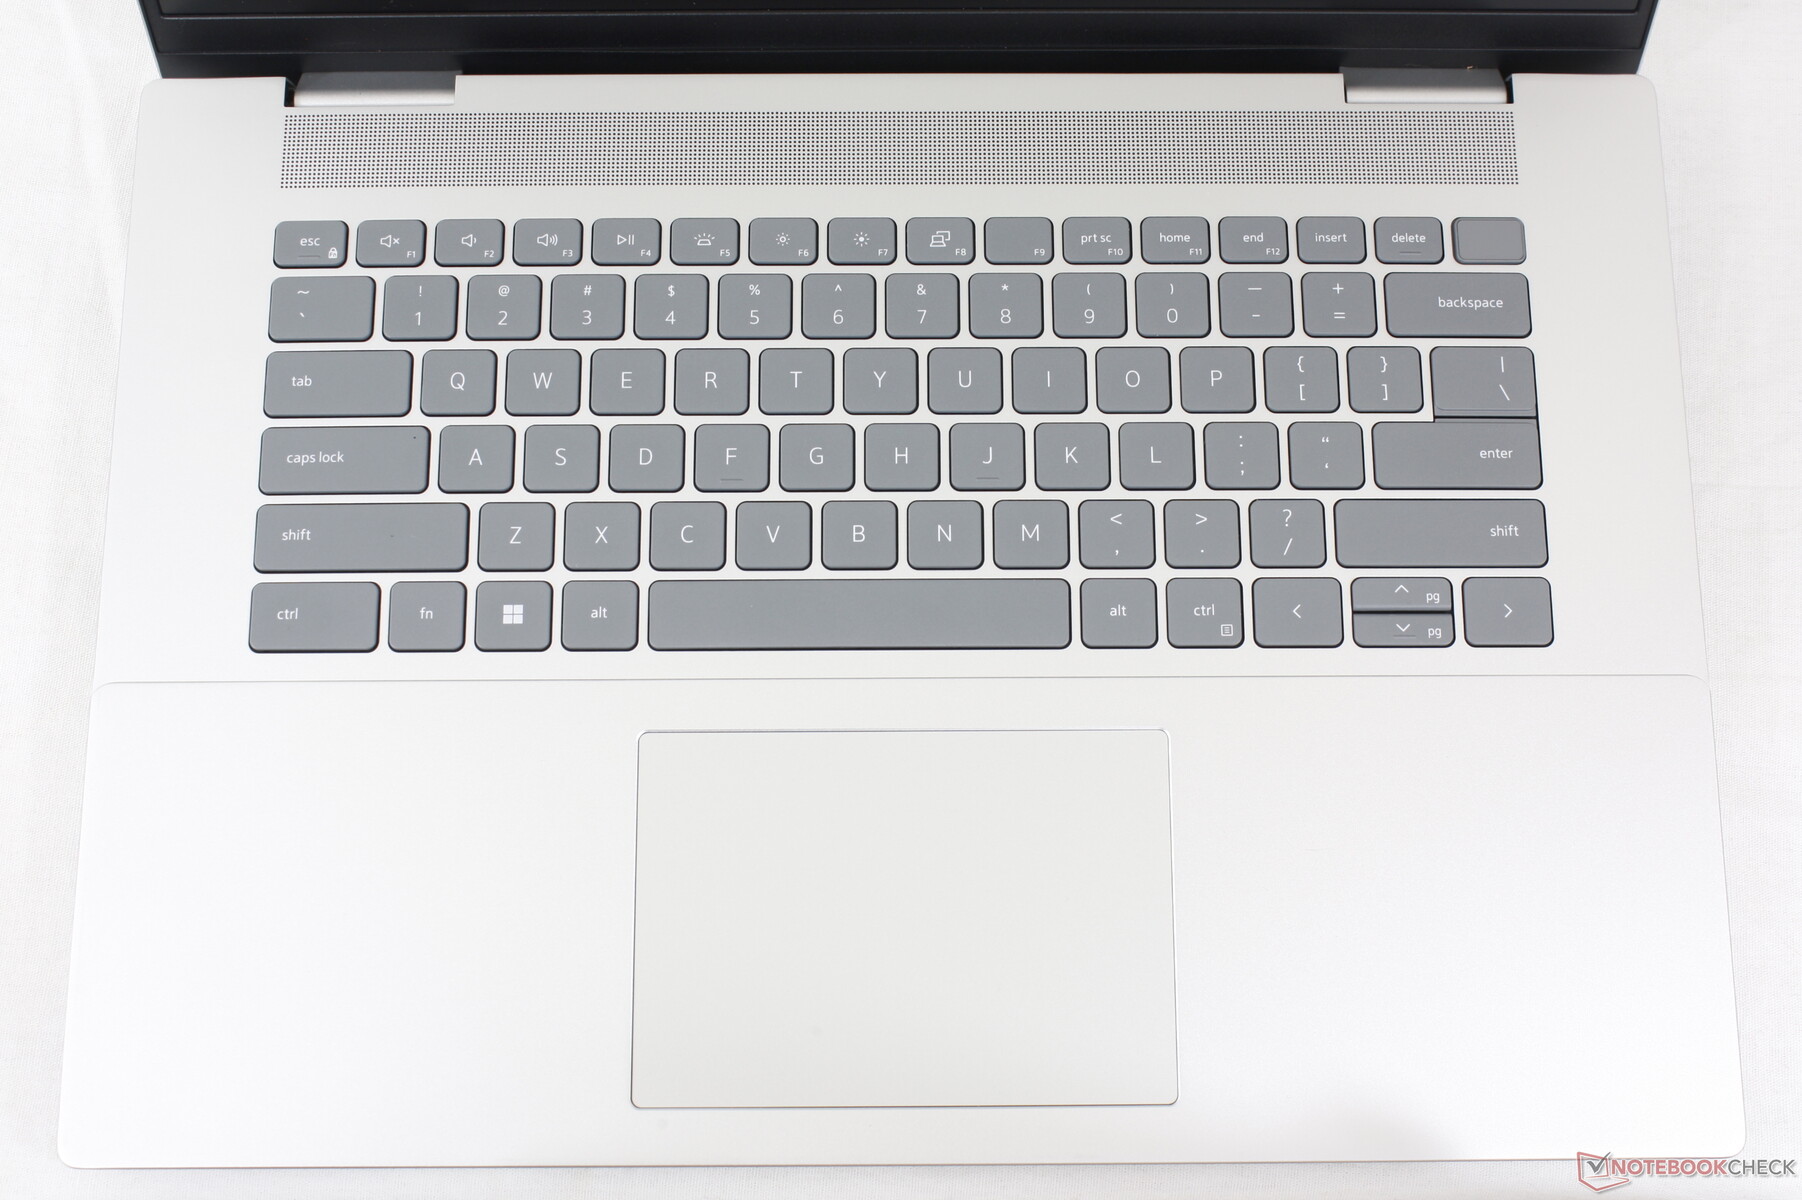
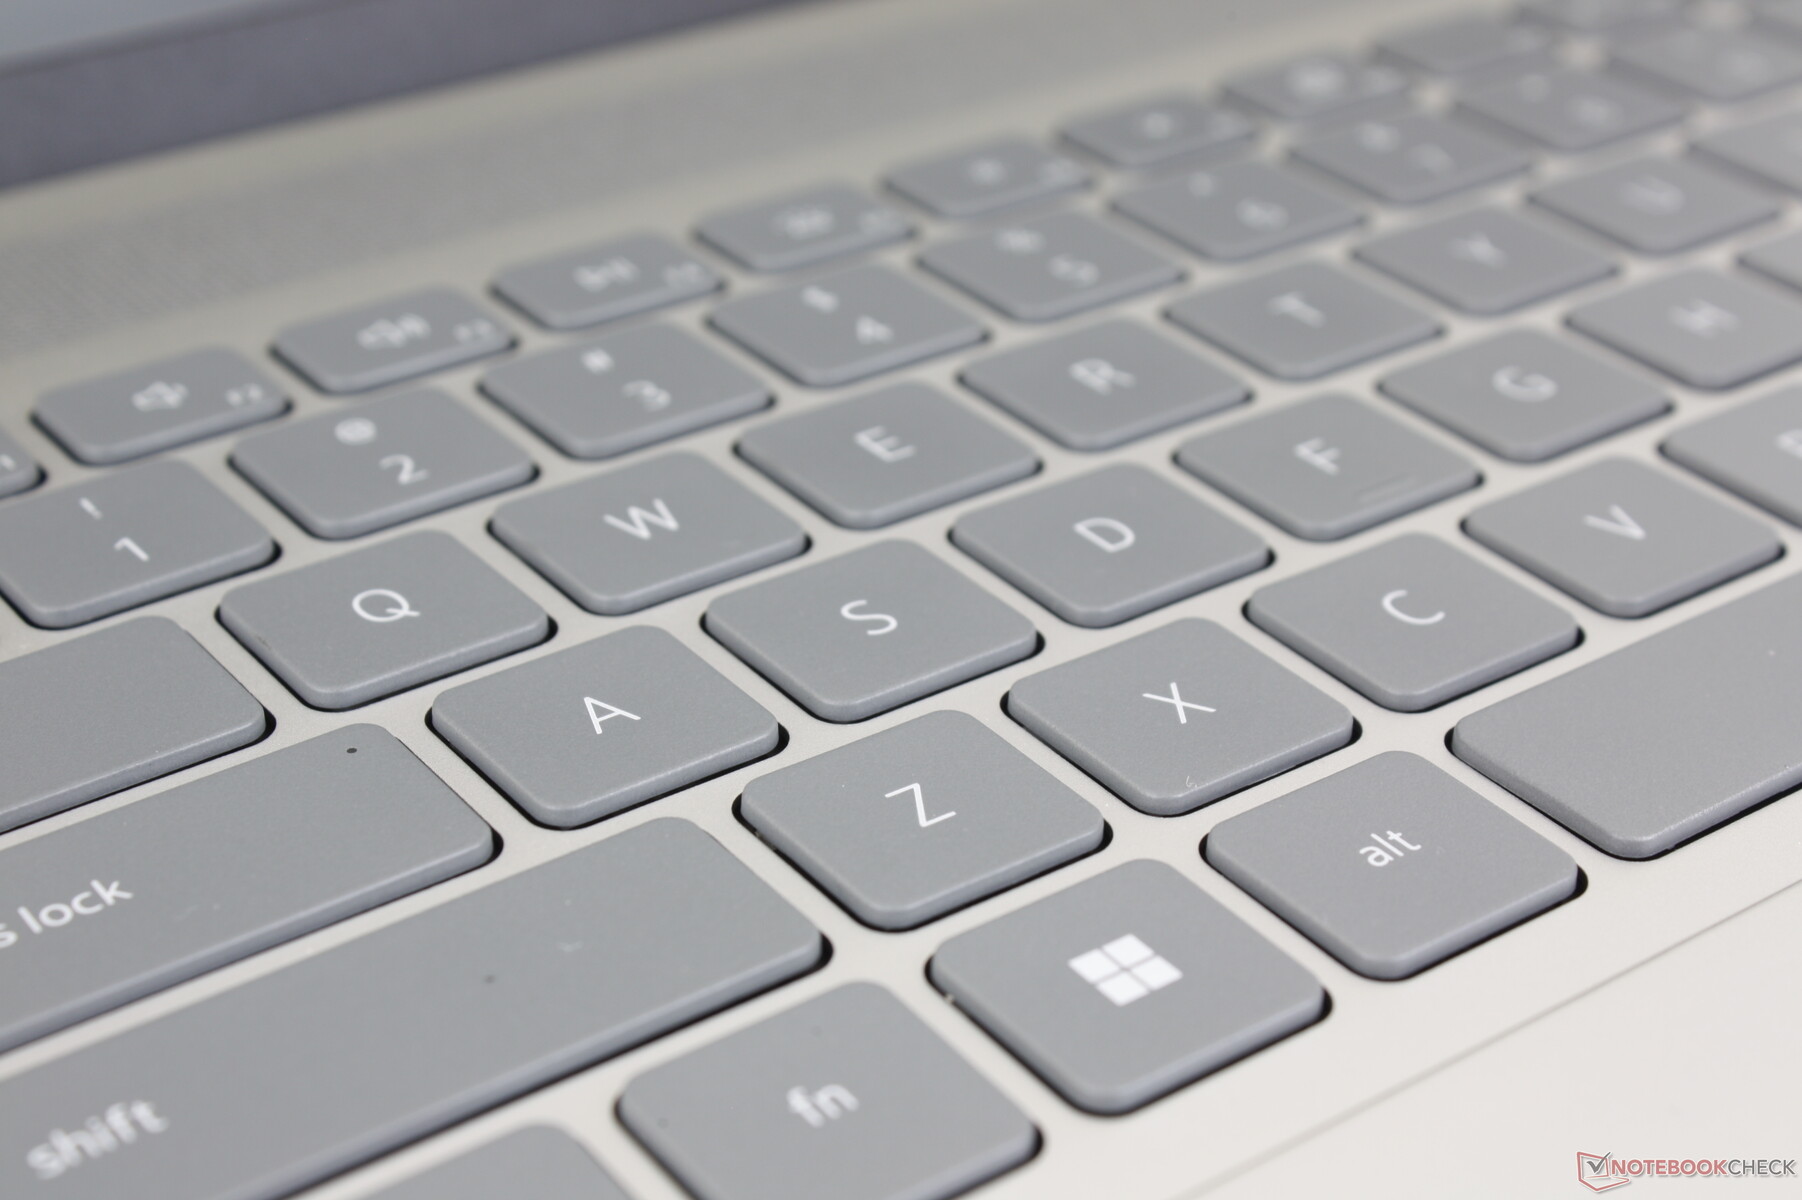
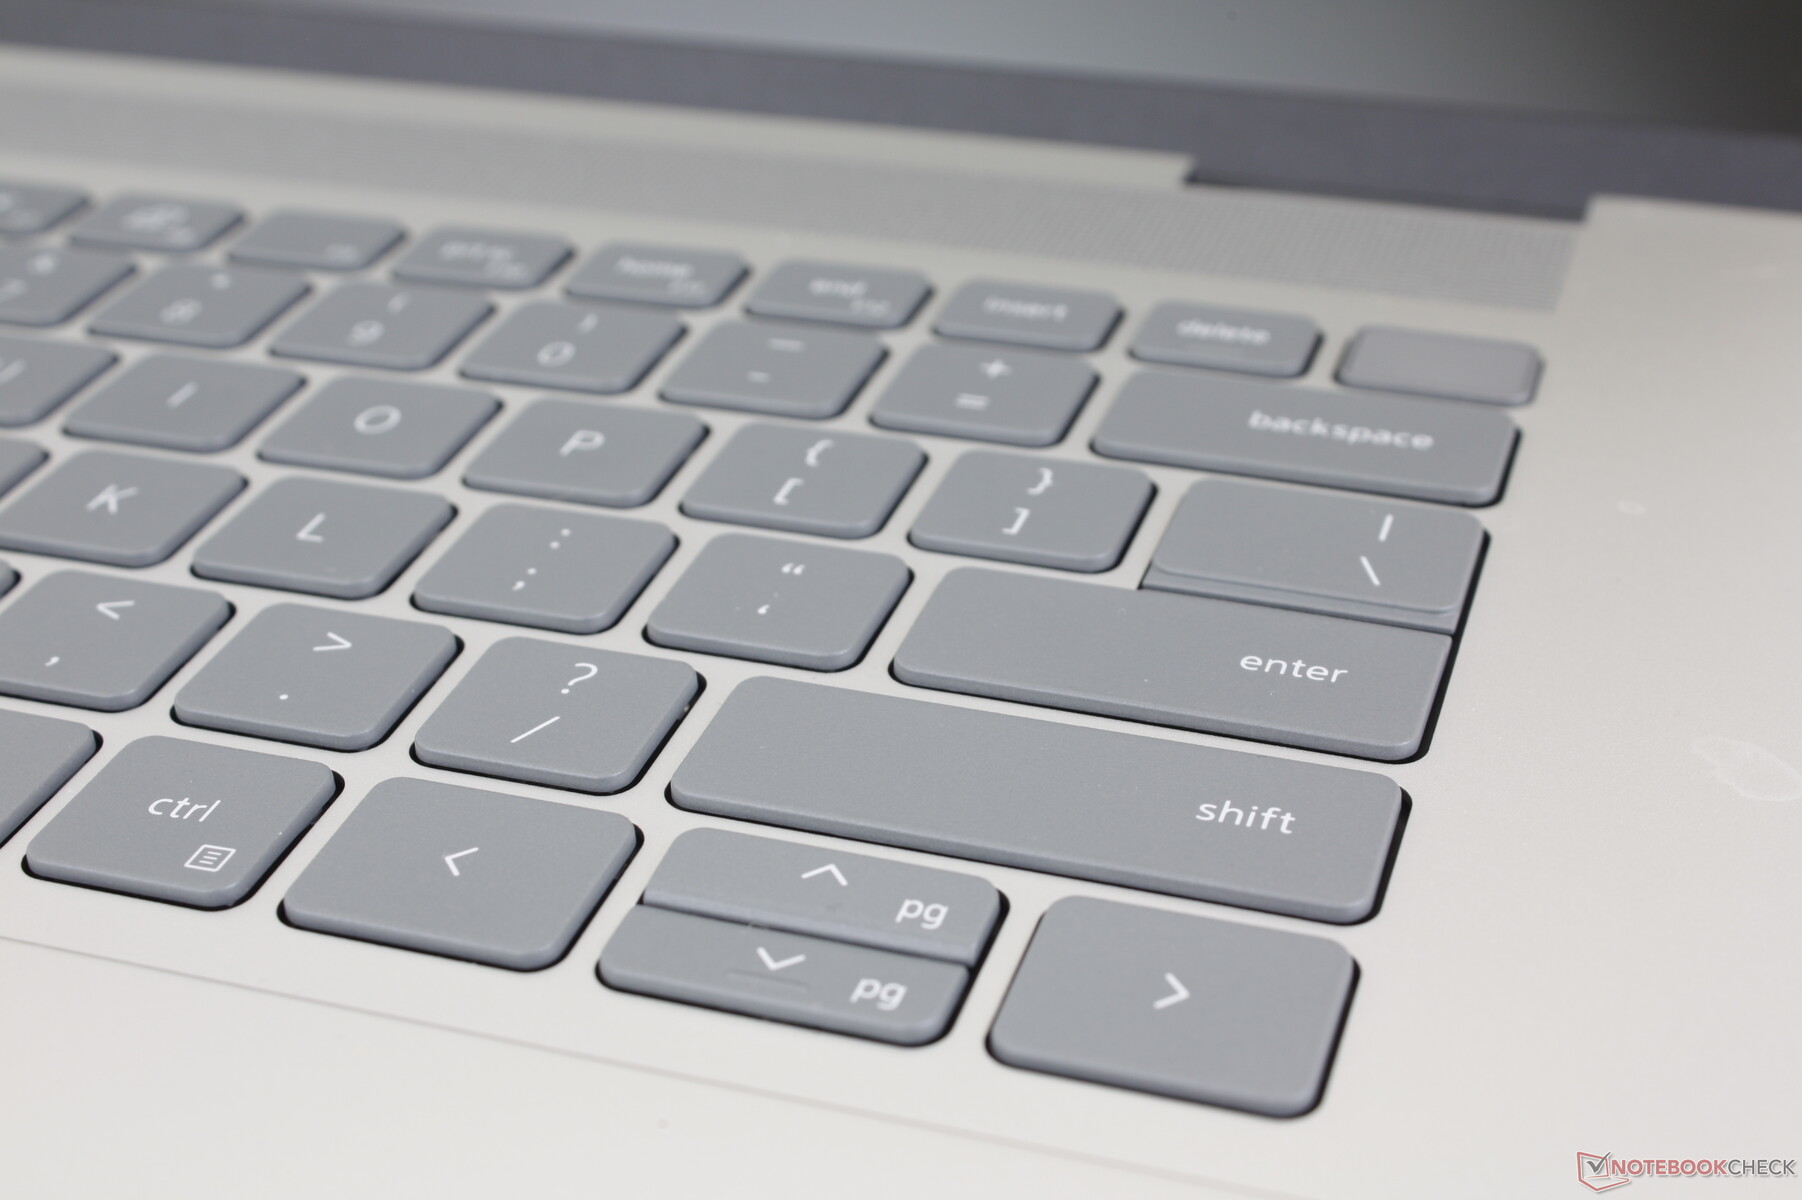
Teclado
La experiencia de escritura sigue siendo idéntica a la del Inspiron 16 Plus 7620 hasta cada tecla de función y acción secundaria. Esto no es necesariamente algo malo ya que se agradece la consistencia entre los diferentes modelos Inspiron. Sin embargo, otros portátiles multimedia como el LG Gram 16 o el HP Spectre x360 16 tienen teclas notablemente más firmes y cómodas.
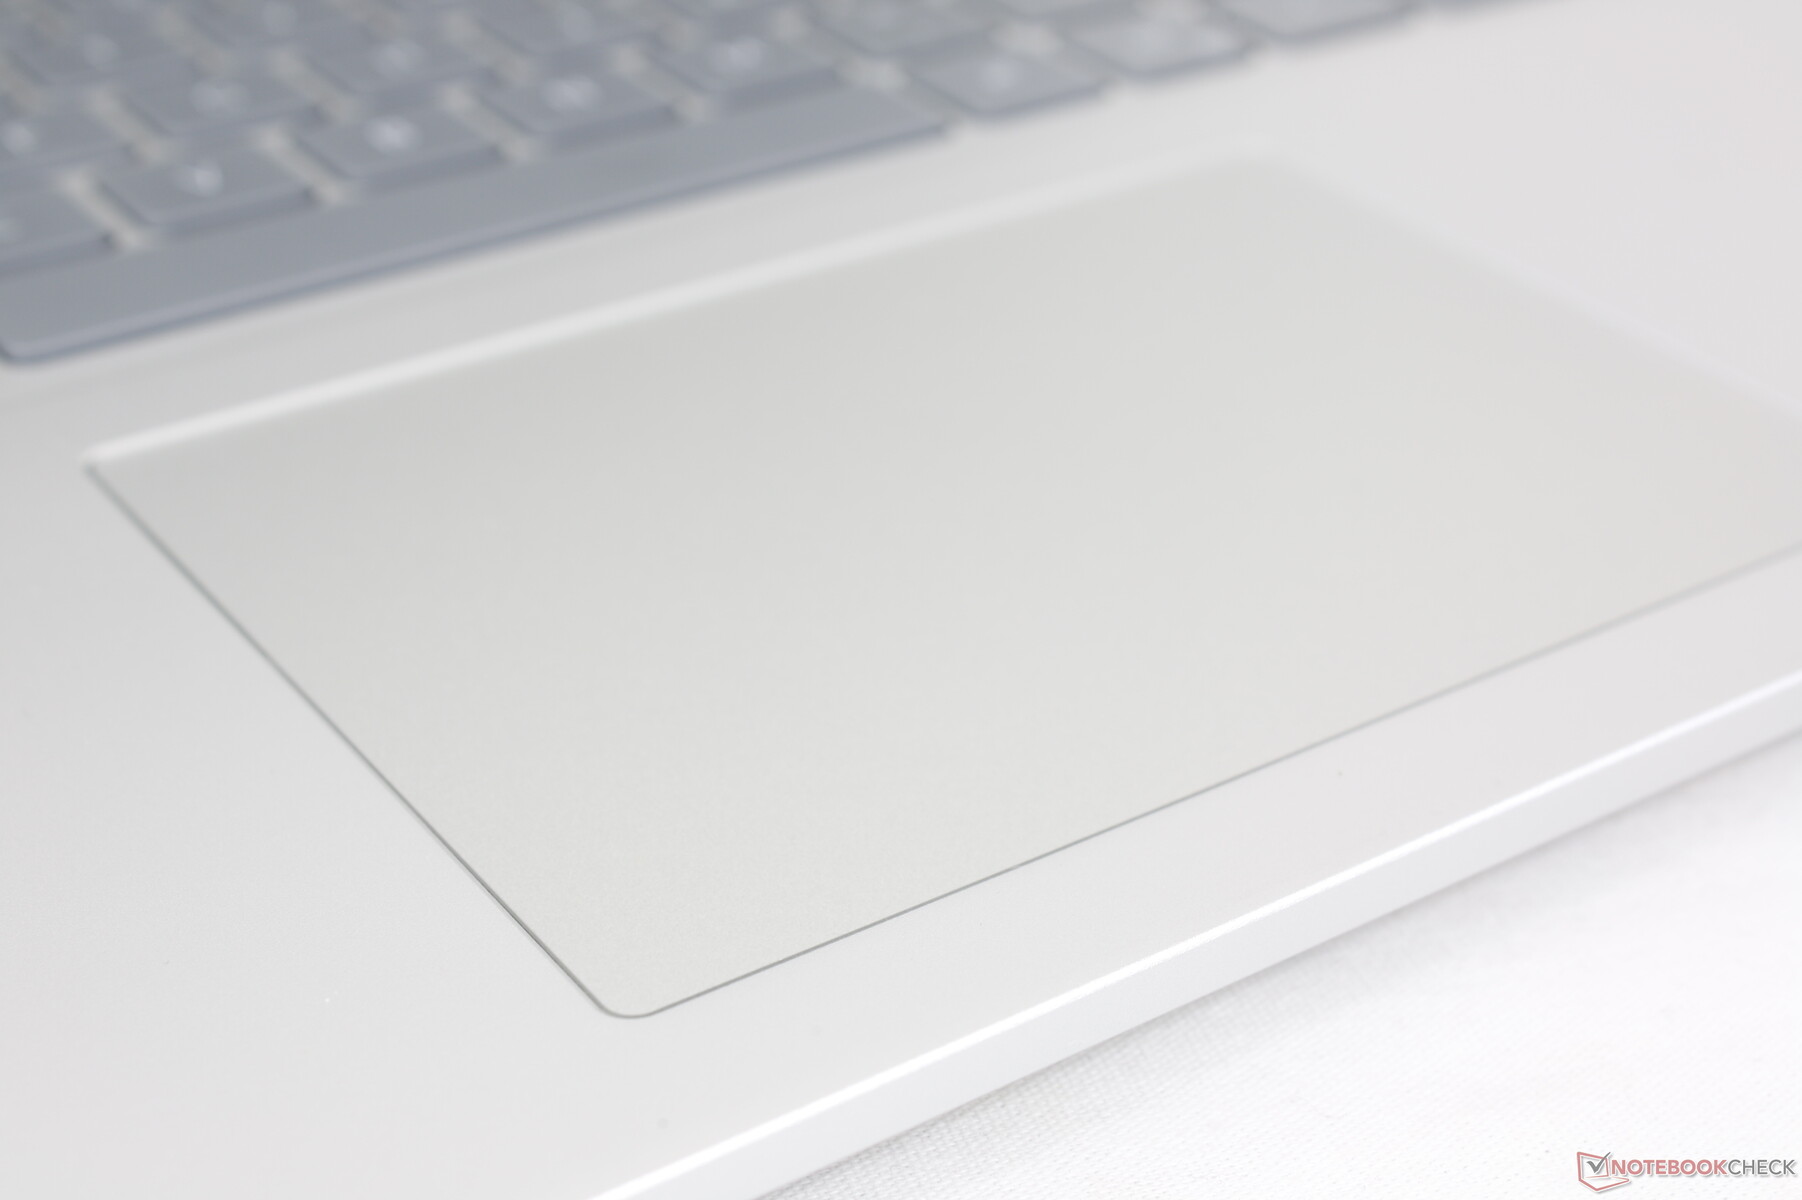
Panel táctil
El clickpad es del mismo tamaño que el del modelo del año pasado (11,5 x 8 cm). El deslizamiento es suave con un poco de adherencia a bajas velocidades para entradas más precisas. La respuesta al pulsar el clickpad es, por desgracia, un poco blanda a pesar del fuerte clic.
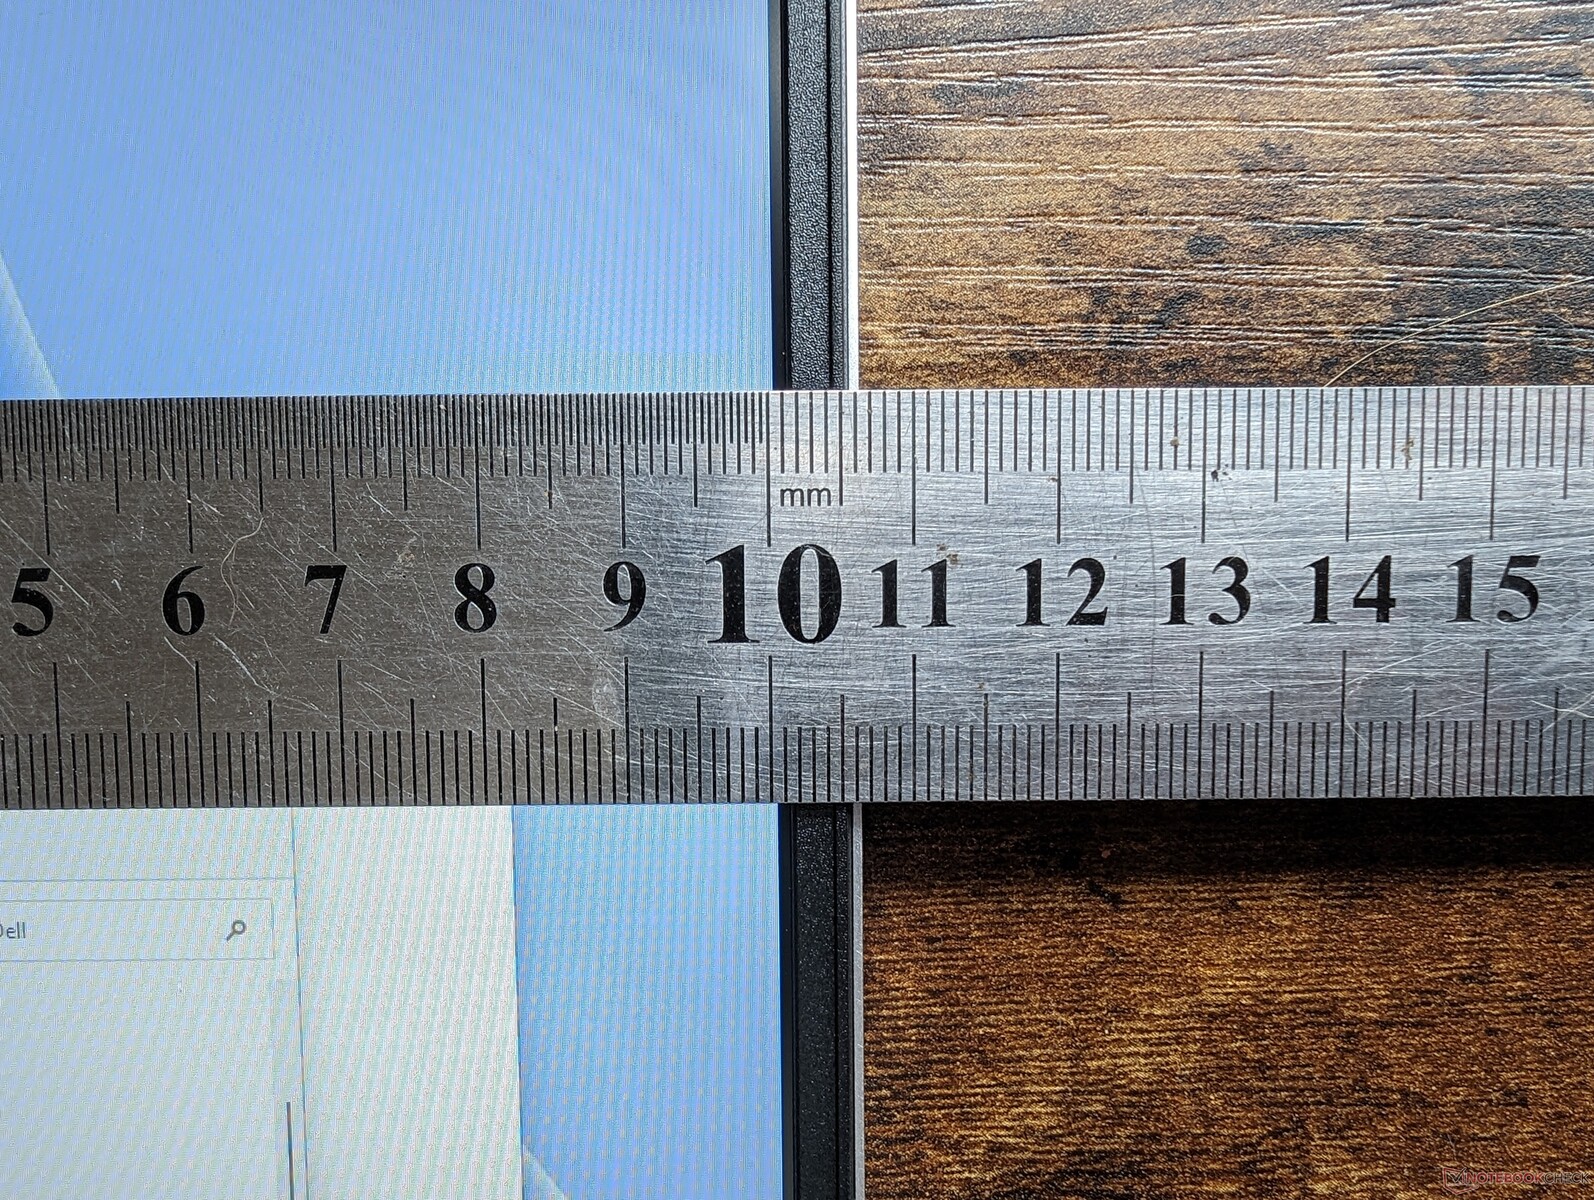
Pantalla - Decente pero con opciones limitadas
Las opciones de pantalla han cambiado con respecto al anterior Inspiron 16 Plus 7620. Desaparece el panel 3K 3072 x 1920 en favor de estas dos nuevas opciones:
- 2560 x 1600 (2.5K), 120 Hz
- 1920 x 1200, 60 Hz
Ambas opciones son IPS y no táctiles y ninguna soporta G-Sync. Nuestras mediciones a continuación reflejan sólo la opción 1600p en negrita.
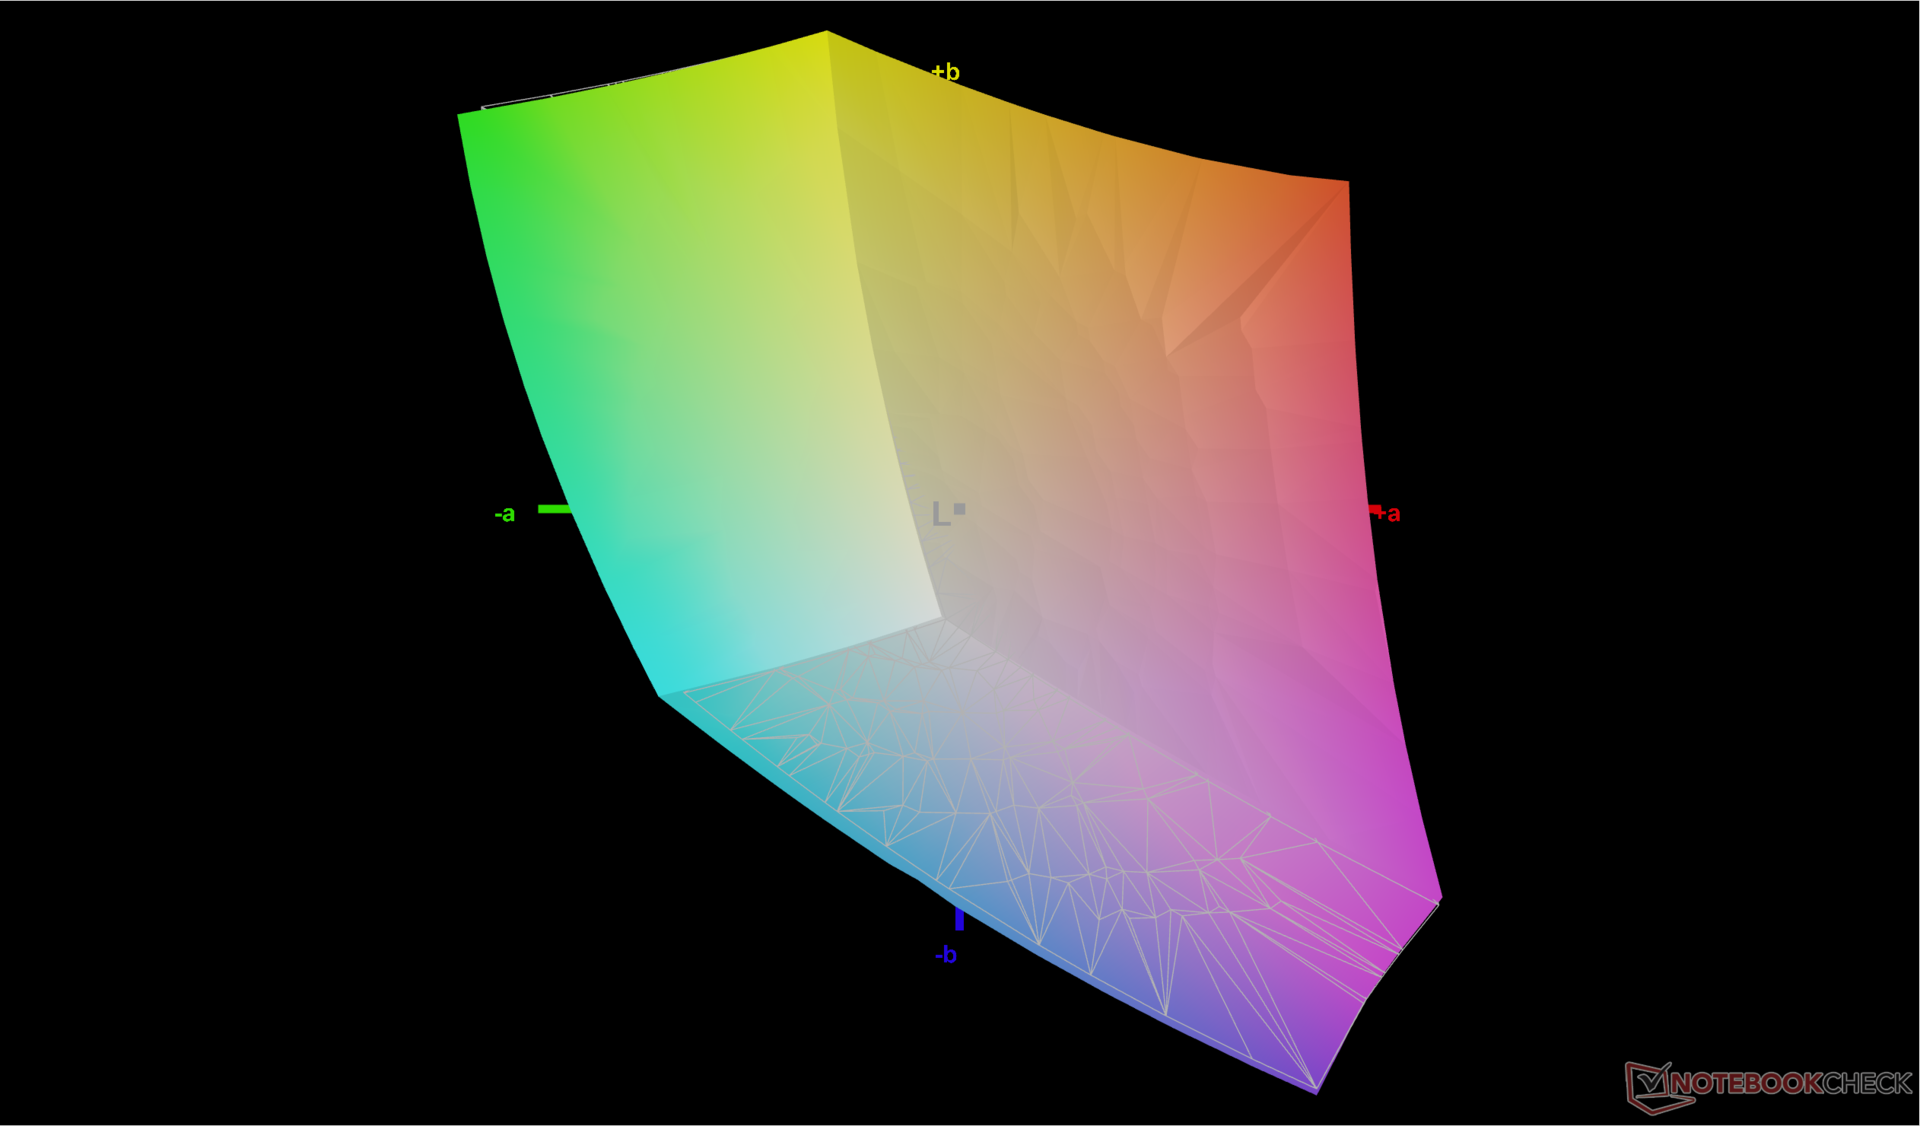
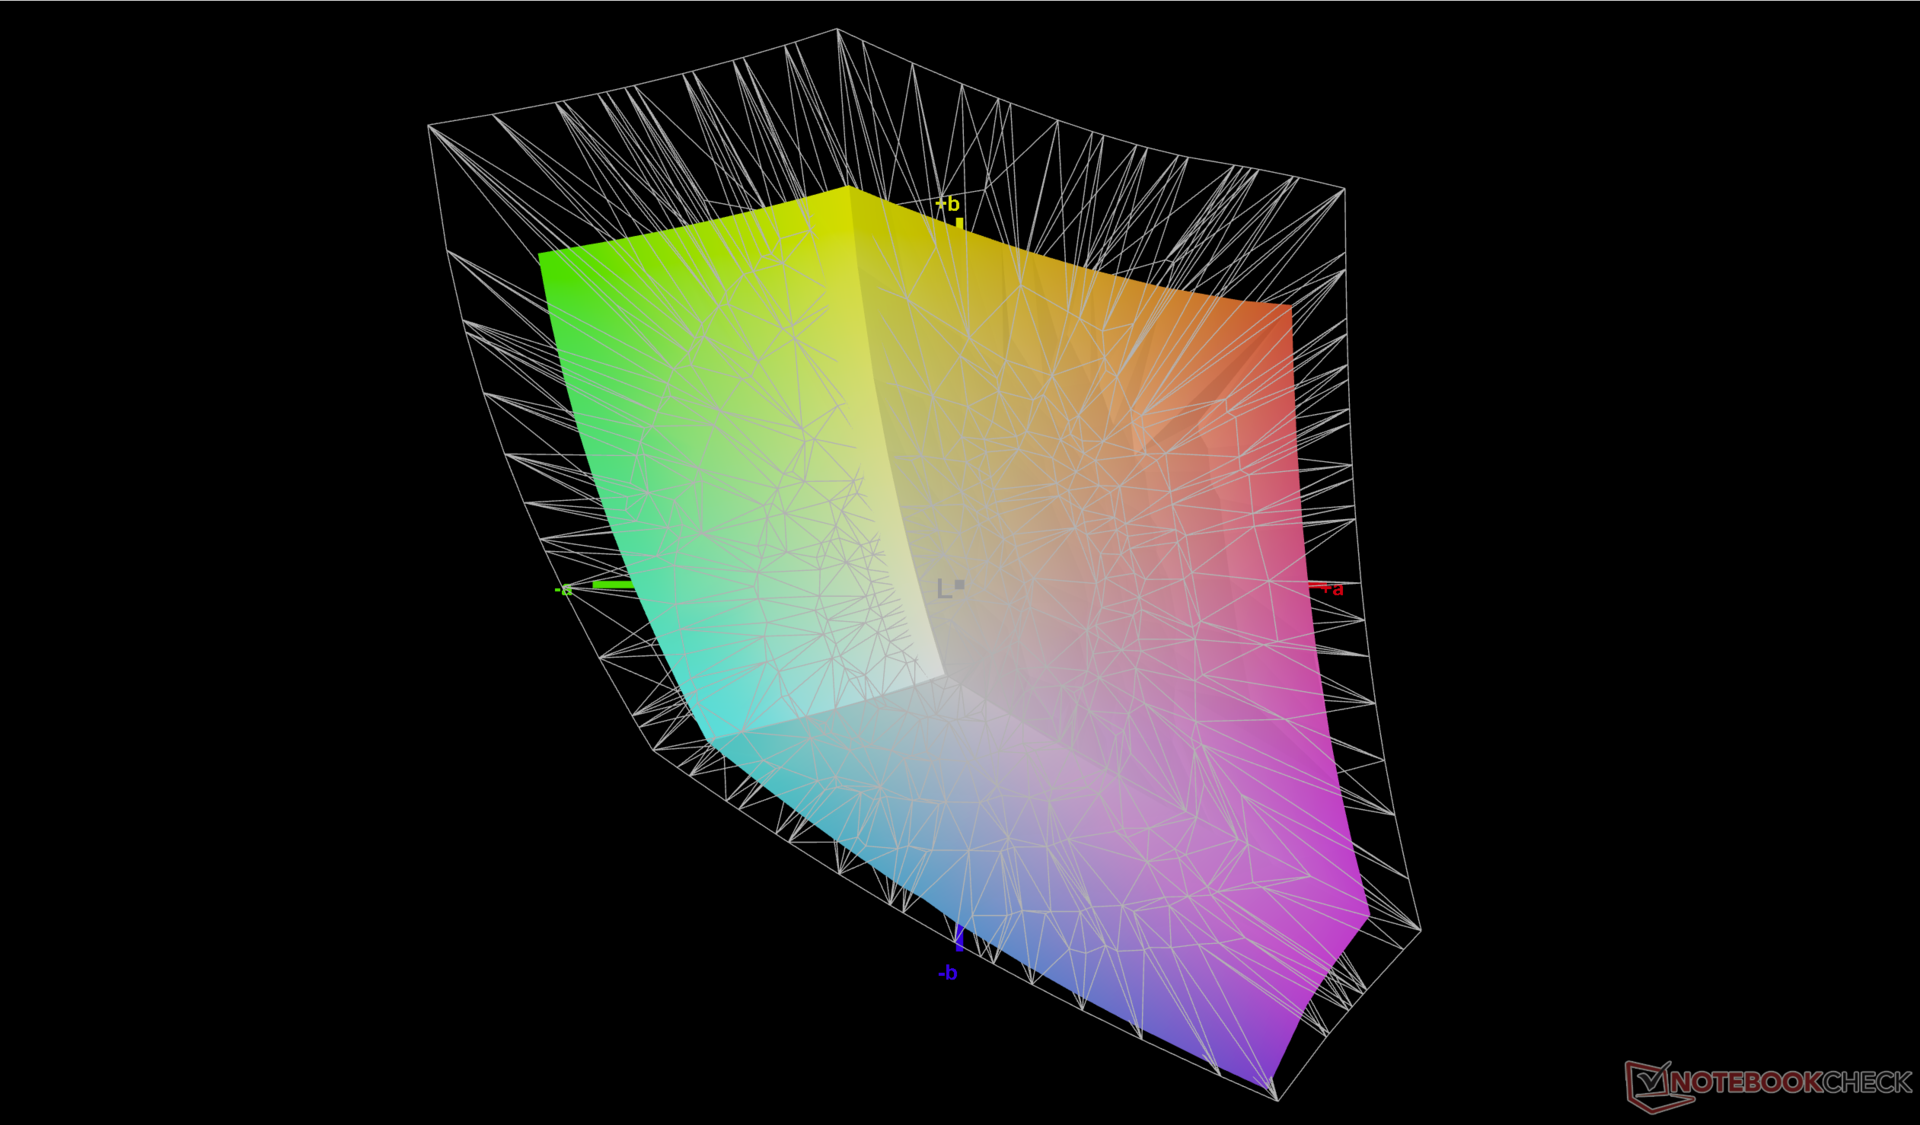
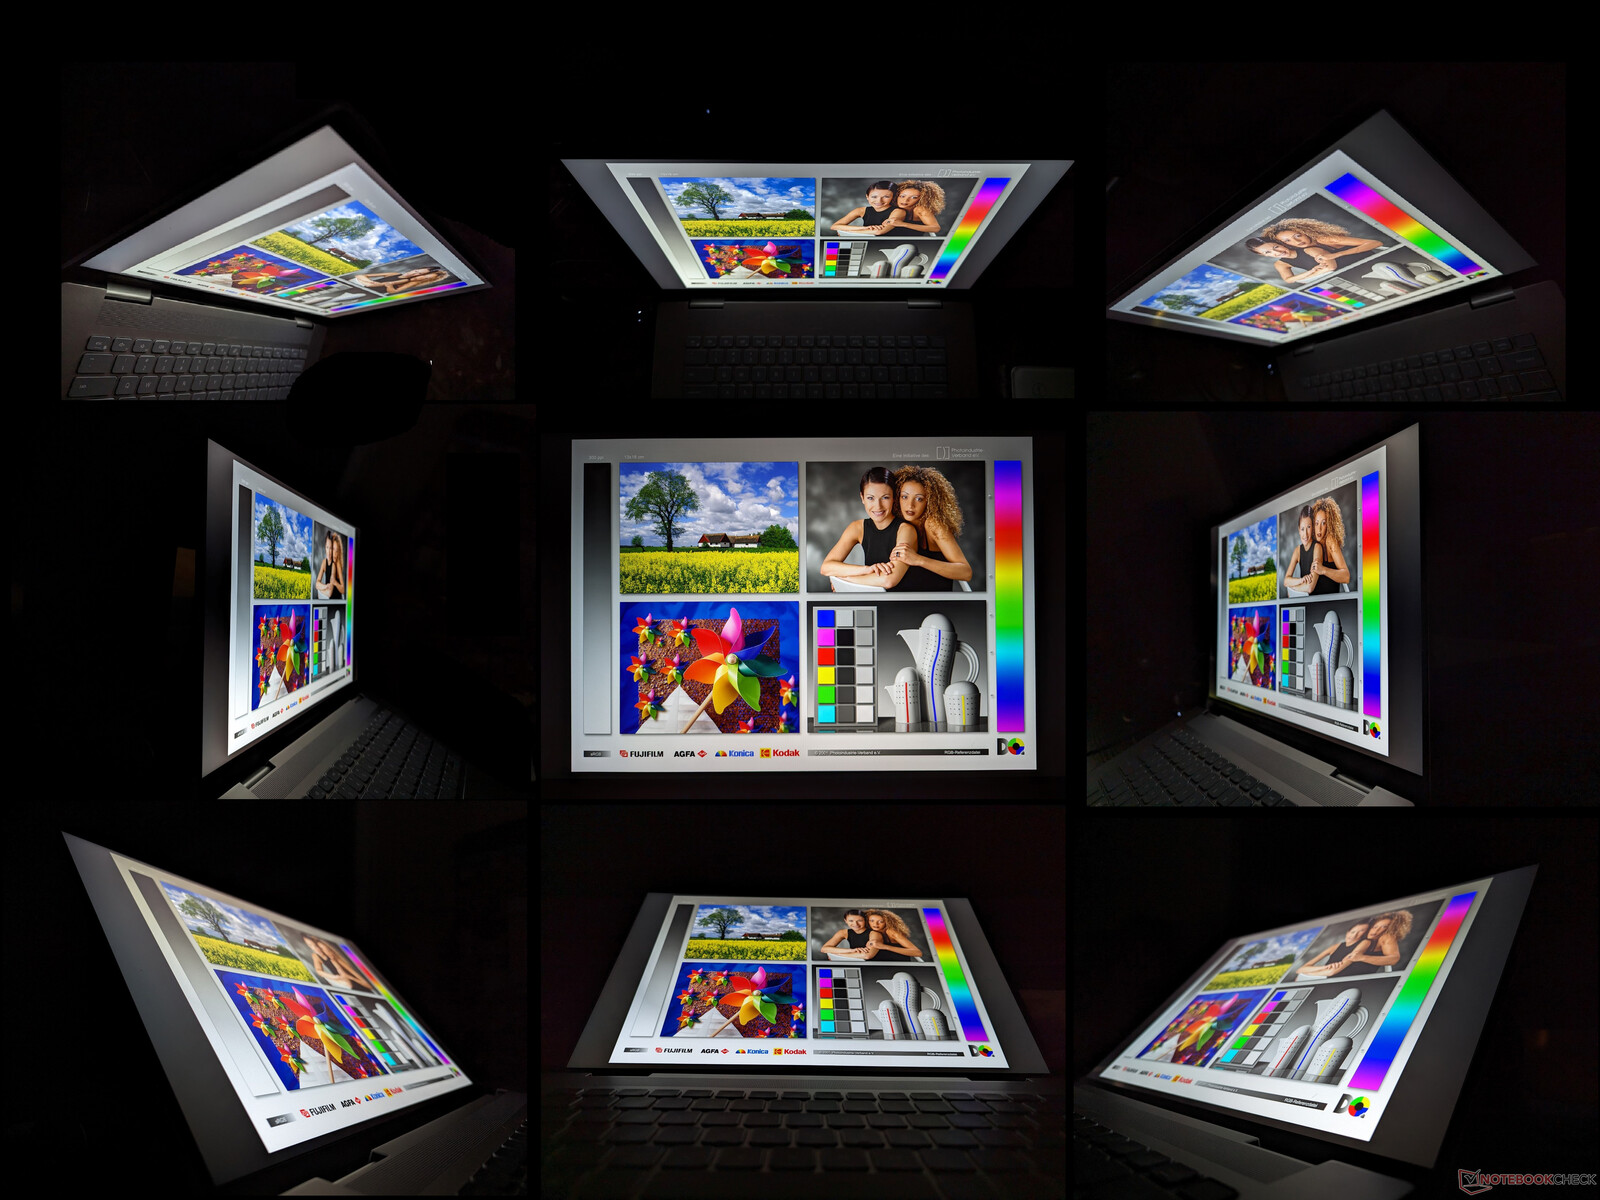
En comparación con el panel BOE 3K del año pasado, el nuevo panel LG Philips 2.5K tiene el doble de frecuencia de actualización nativa a costa de una resolución nativa inferior. Por lo demás, la cobertura sRGB completa, el brillo de 300 nits, la relación de contraste >1000:1 y los tiempos de respuesta medios son bastante similares entre ellos. No obstante, modelos de la competencia como el Vivobook Pro 16X o Envy 16 ofrecen opciones de mayor resolución con colores aún más profundos que los creadores de contenidos podrían apreciar. En consecuencia, nuestro panel LG Philips es más económico.
| |||||||||||||||||||||||||
iluminación: 92 %
Brillo con batería: 299.4 cd/m²
Contraste: 1426:1 (Negro: 0.21 cd/m²)
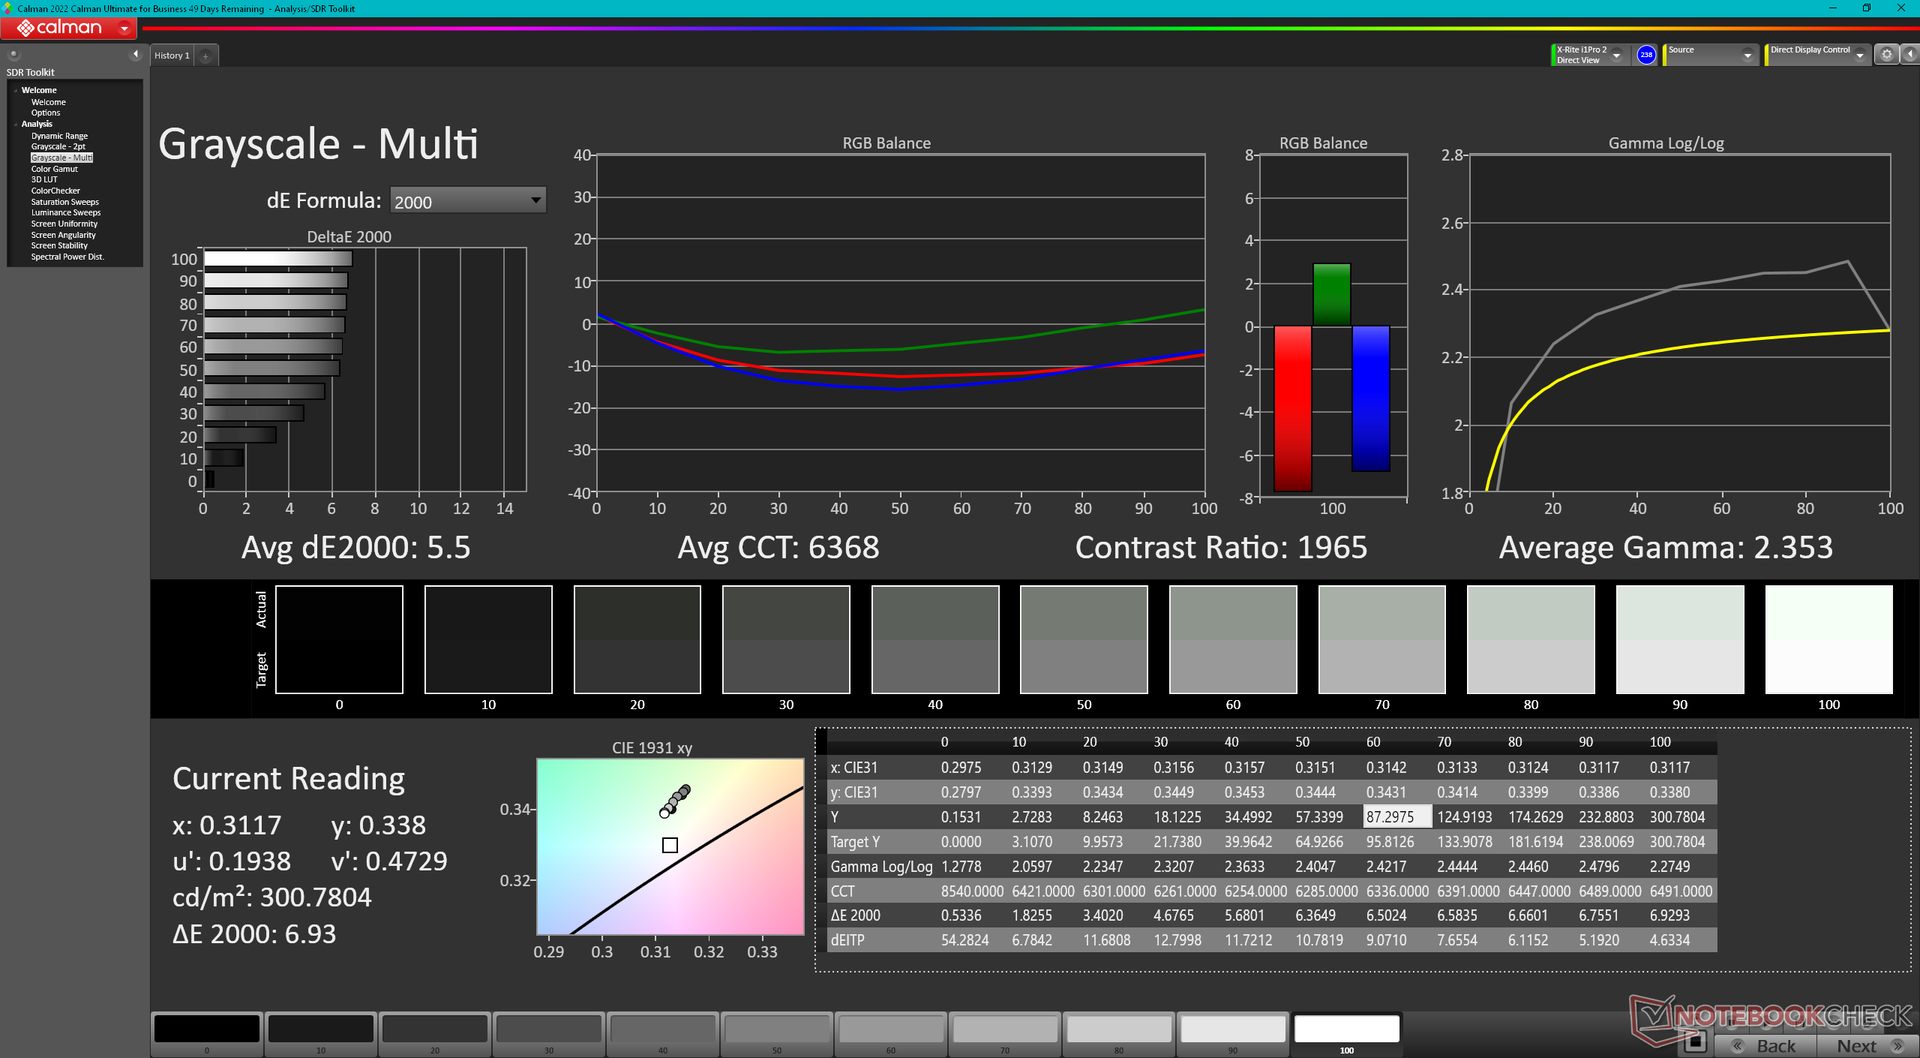
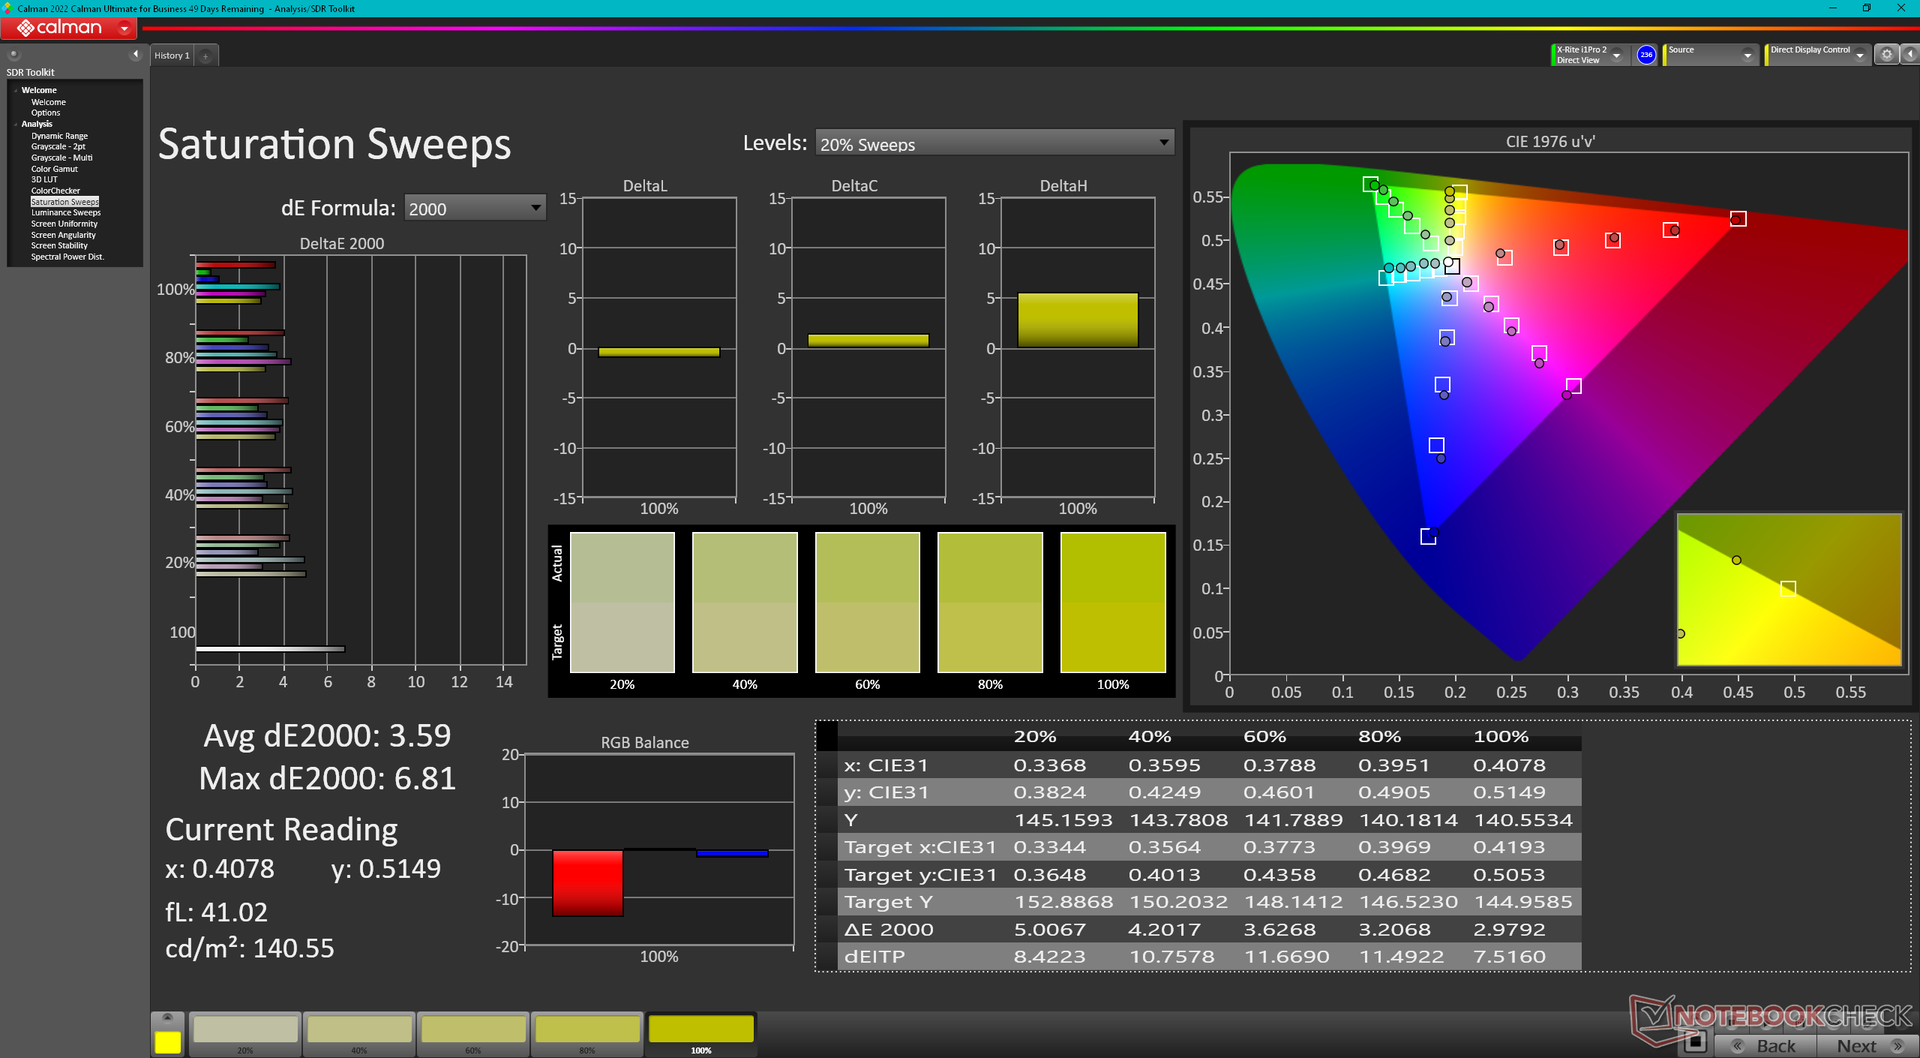
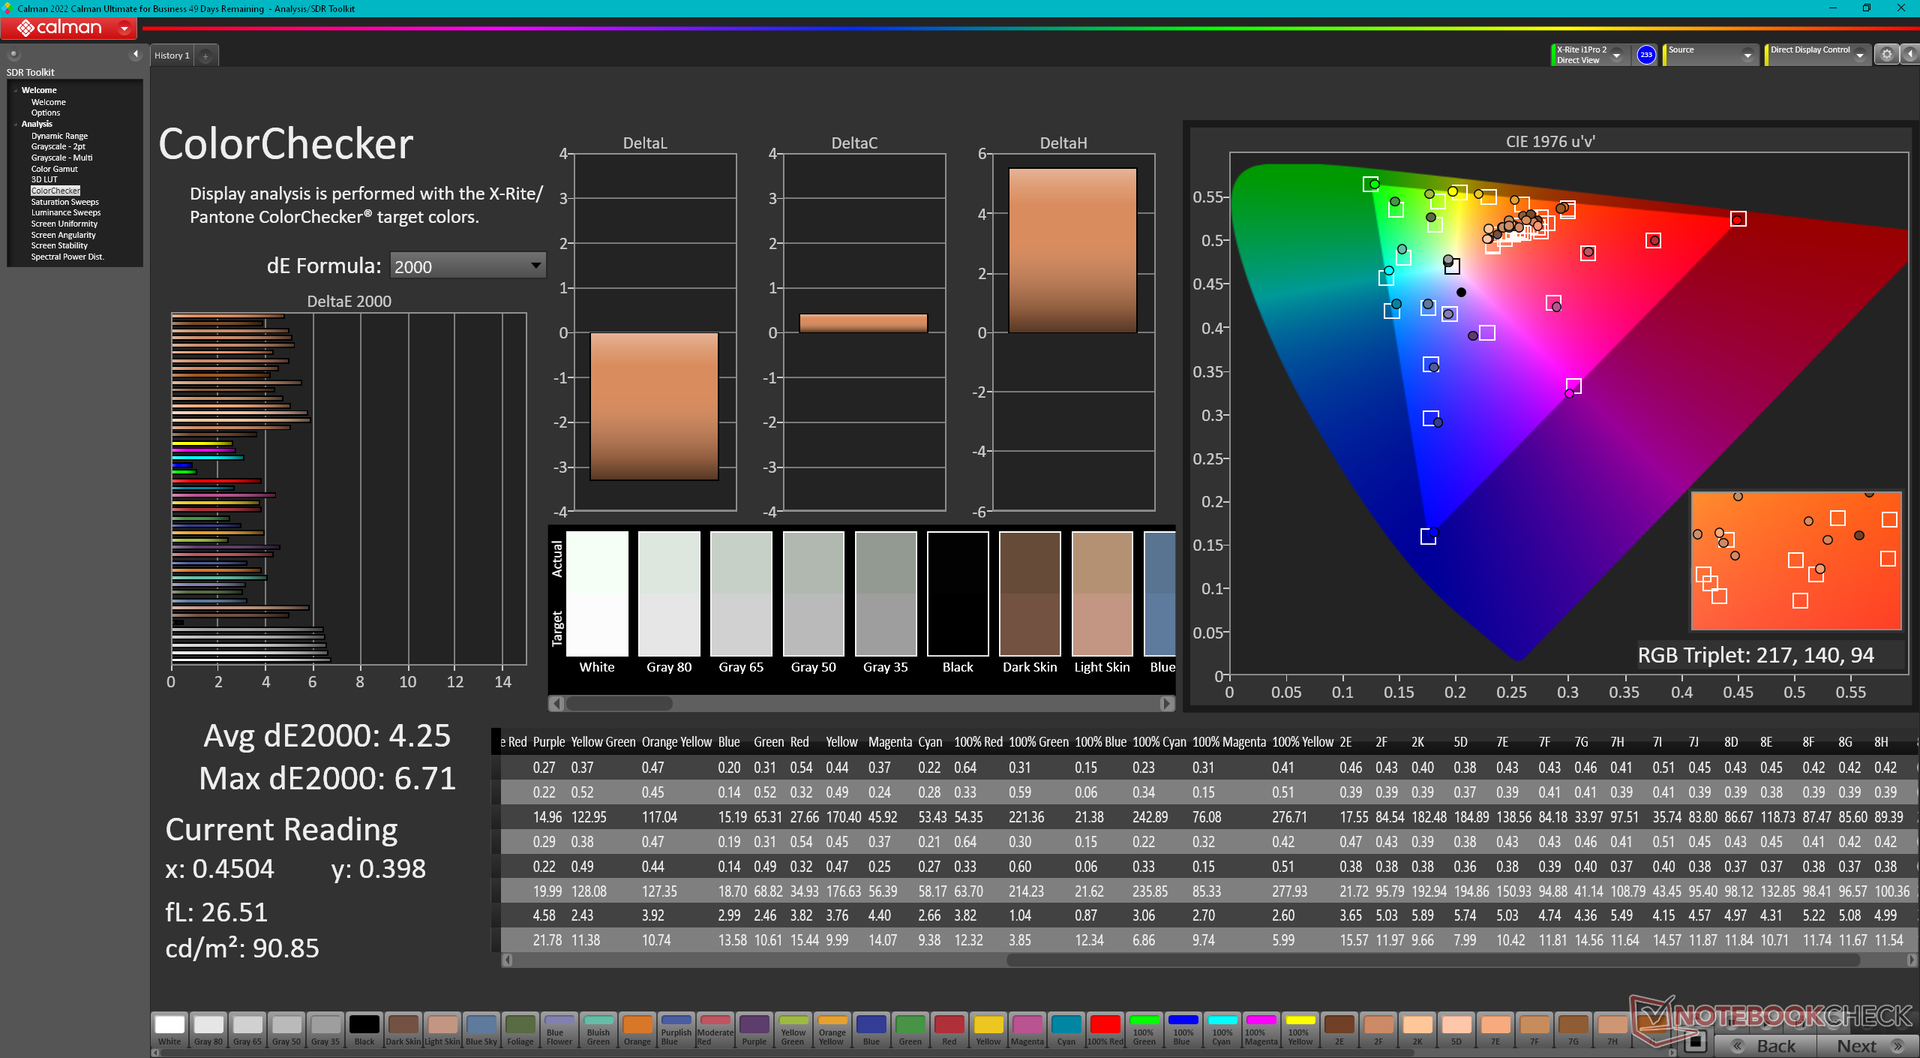
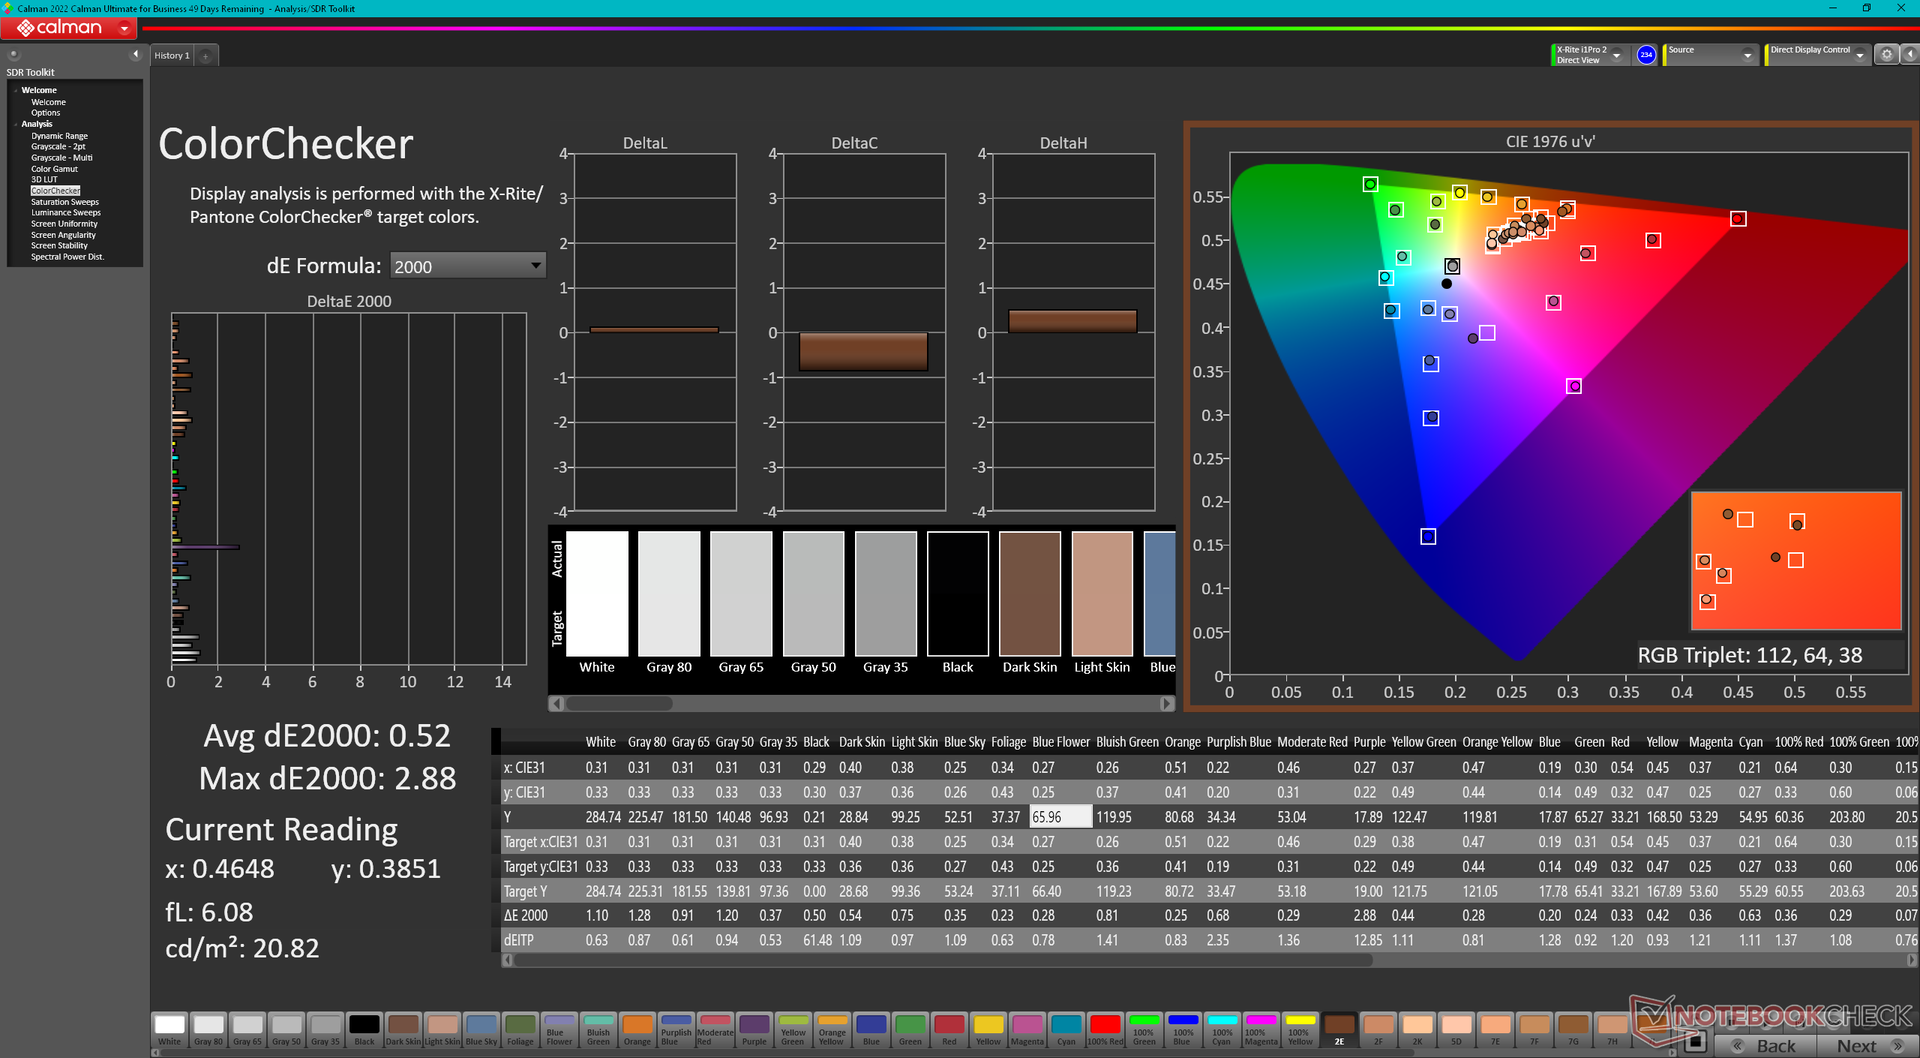
ΔE ColorChecker Calman: 4.25 | ∀{0.5-29.43 Ø4.72}
calibrated: 0.52
ΔE Greyscale Calman: 5.5 | ∀{0.09-98 Ø4.97}
72.3% AdobeRGB 1998 (Argyll 3D)
99.6% sRGB (Argyll 3D)
70.1% Display P3 (Argyll 3D)
Gamma: 2.35
CCT: 6368 K
| Dell Inspiron 16 Plus 7630 LG Philips 160WQ2, IPS, 2560x1600, 16" | Dell Inspiron 16 Plus 7620 BOE NE16N41, IPS, 3072x1920, 16" | Lenovo Slim Pro 9i 16IRP8 LEN160-3.2K, Mini-LED, 3200x2000, 16" | Asus Vivobook Pro 16X K6604JV-MX016W Samsung SDC4178 ATNA60BX01-1, OLED, 3200x2000, 16" | HP Envy 16 h0112nr Samsung SDC4174, OLED, 3840x2400, 16" | MSI Summit E16 Flip A12UDT-031 AU Optronics B16QAN02.N, IPS, 2560x1600, 16" | |
|---|---|---|---|---|---|---|
| Display | 1% | 18% | 24% | 21% | 20% | |
| Display P3 Coverage (%) | 70.1 | 70.8 1% | 95.1 36% | 98.4 40% | 99.3 42% | 98.9 41% |
| sRGB Coverage (%) | 99.6 | 99.5 0% | 99.9 0% | 99.7 0% | 100 0% | 100 0% |
| AdobeRGB 1998 Coverage (%) | 72.3 | 73.2 1% | 84.6 17% | 95.8 33% | 88 22% | 86.5 20% |
| Response Times | -13% | 61% | 95% | 93% | 63% | |
| Response Time Grey 50% / Grey 80% * (ms) | 35 ? | 38 ? -9% | 14 ? 60% | 1.6 ? 95% | 2 ? 94% | 13 ? 63% |
| Response Time Black / White * (ms) | 24.2 ? | 28 ? -16% | 9.2 ? 62% | 1.4 ? 94% | 1.9 ? 92% | 9 ? 63% |
| PWM Frequency (Hz) | 5784 ? | 120 ? | 240.4 ? | |||
| Screen | 14% | -55% | 35% | 30% | -5% | |
| Brightness middle (cd/m²) | 299.4 | 288.9 -4% | 627.4 110% | 347 16% | 328.8 10% | 314 5% |
| Brightness (cd/m²) | 290 | 276 -5% | 618 113% | 346 19% | 332 14% | 294 1% |
| Brightness Distribution (%) | 92 | 92 0% | 95 3% | 97 5% | 97 5% | 89 -3% |
| Black Level * (cd/m²) | 0.21 | 0.26 -24% | 0.19 10% | 0.06 71% | 0.28 -33% | |
| Contrast (:1) | 1426 | 1111 -22% | 3302 132% | 5783 306% | 1121 -21% | |
| Colorchecker dE 2000 * | 4.25 | 1.88 56% | 5.84 -37% | 1.89 56% | 1.53 64% | 3.08 28% |
| Colorchecker dE 2000 max. * | 6.71 | 4.37 35% | 10.22 -52% | 3.26 51% | 6.04 10% | 5.49 18% |
| Colorchecker dE 2000 calibrated * | 0.52 | 0.42 19% | 4.45 -756% | 1.97 -279% | 0.88 -69% | |
| Greyscale dE 2000 * | 5.5 | 1.4 75% | 6.7 -22% | 1.55 72% | 1.3 76% | 3.99 27% |
| Gamma | 2.35 94% | 2.3 96% | 2.77 79% | 2.39 92% | 2.18 101% | 2.3 96% |
| CCT | 6368 102% | 6634 98% | 5795 112% | 6458 101% | 6362 102% | 6219 105% |
| Media total (Programa/Opciones) | 1% /
8% | 8% /
-23% | 51% /
41% | 48% /
39% | 26% /
10% |
* ... más pequeño es mejor
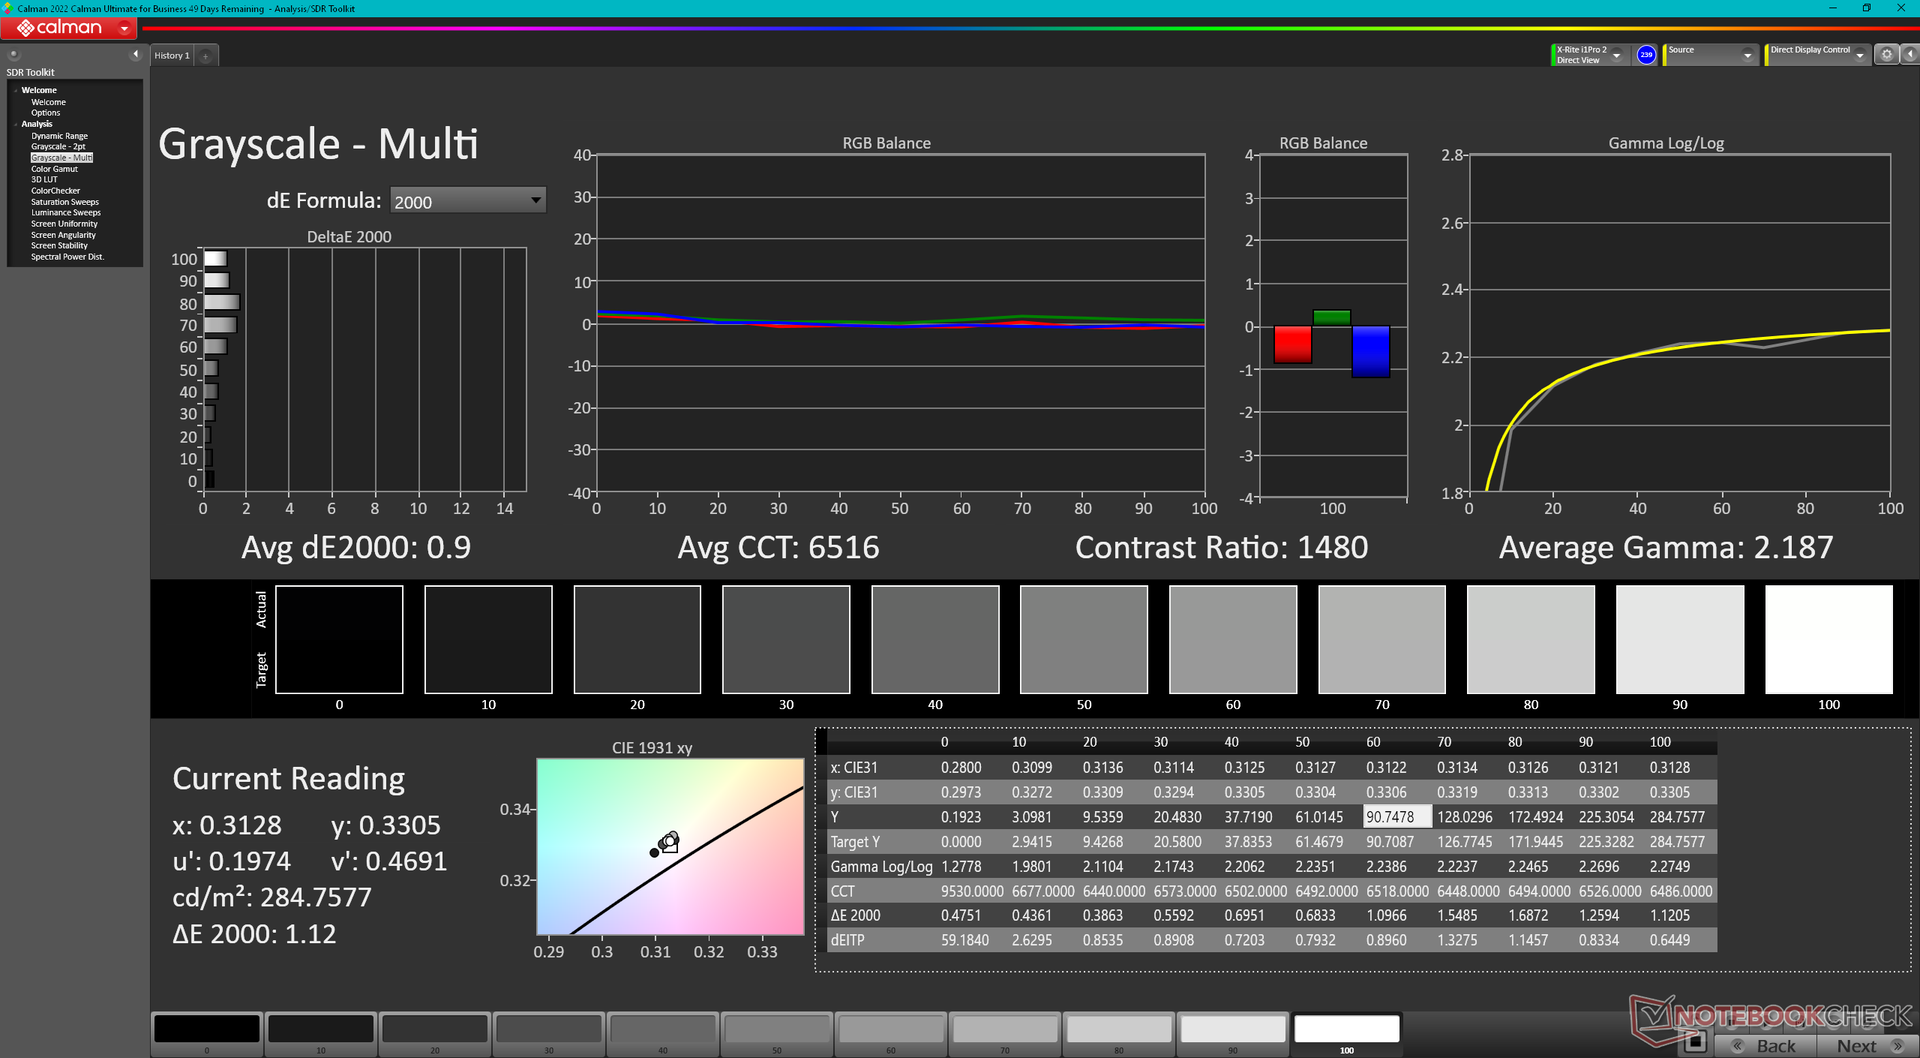
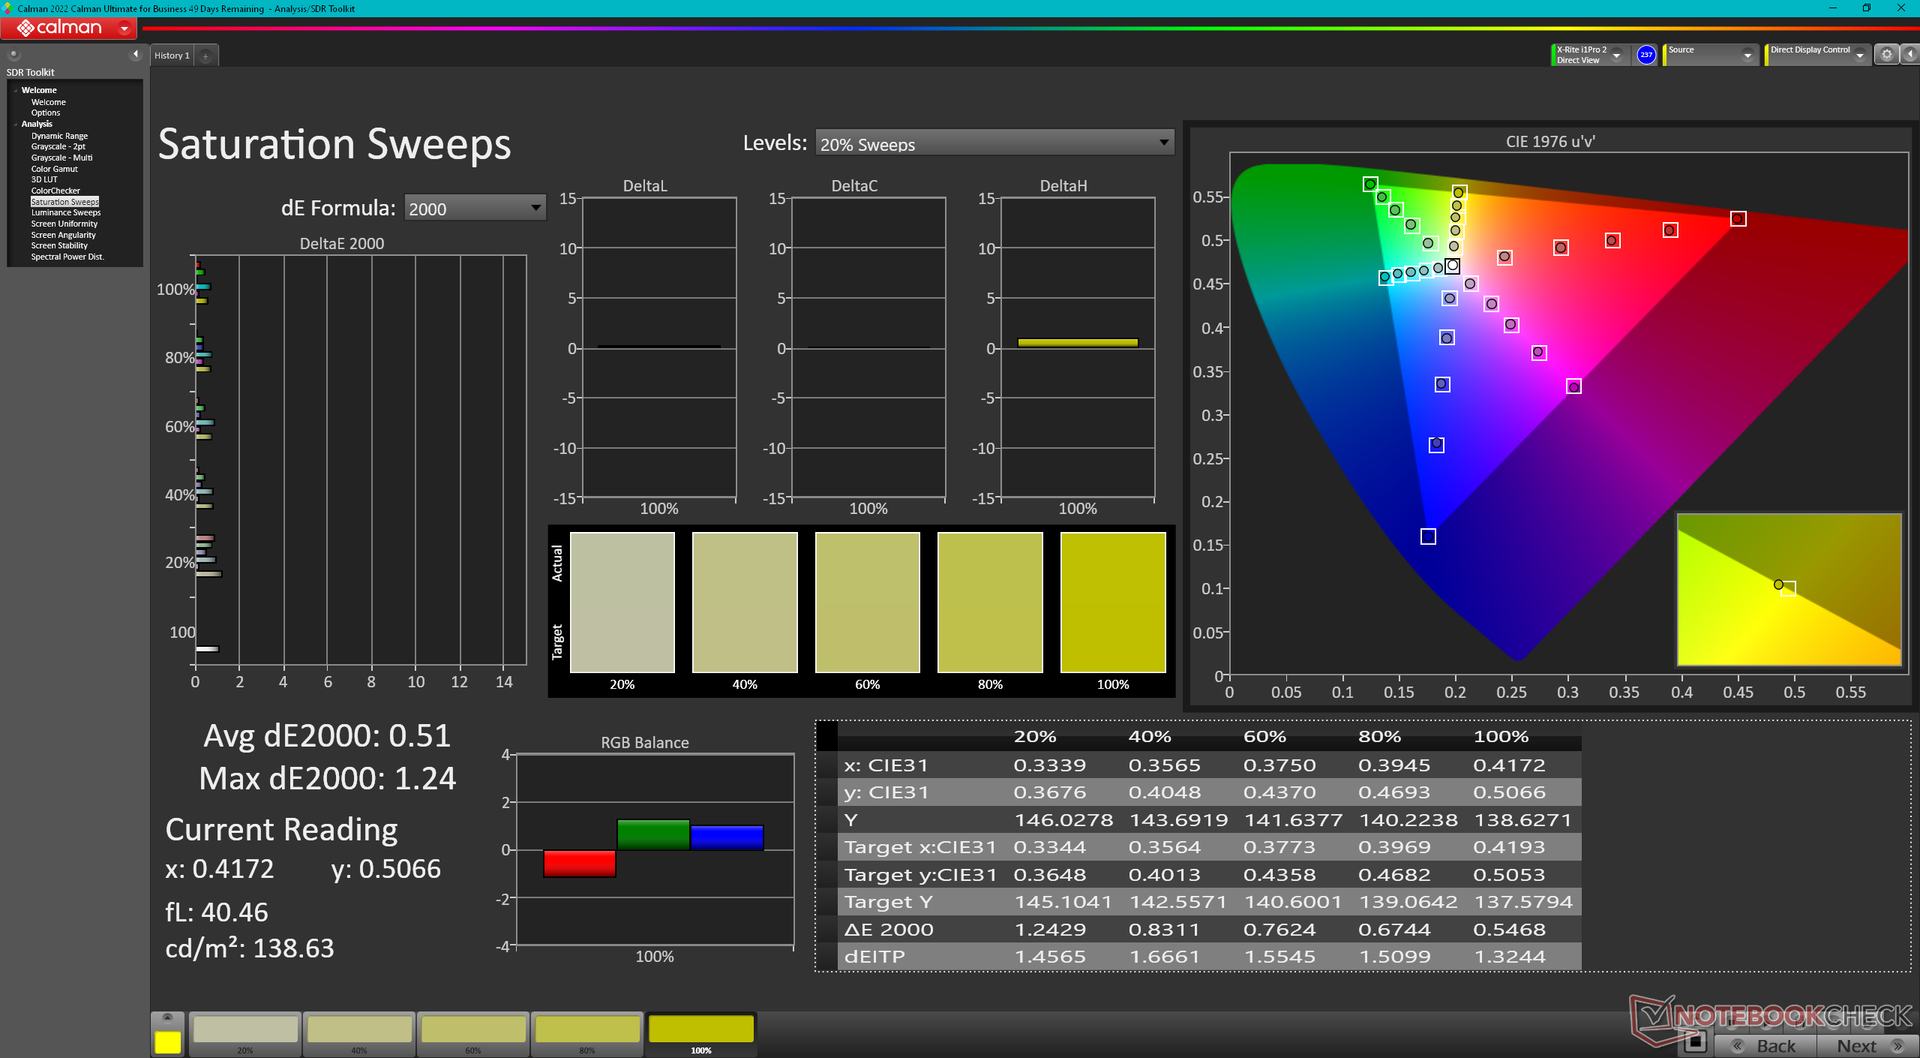
La pantalla no viene precalibrada con unos valores medios de escala de grises y deltaE de color de 5,5 y 4,25, respectivamente. La temperatura de color también es más cálida de lo habitual, 6368. Una calibración adecuada con nuestro colorímetro X-Rite solucionaría todos estos problemas para obtener una pantalla notablemente más precisa, como muestran nuestros resultados CalMAN a continuación. Nuestro perfil ICM calibrado está disponible para su descarga gratuita si los propietarios no tienen sus propias herramientas de calibración.
Tiempos de respuesta del display
| ↔ Tiempo de respuesta de Negro a Blanco | ||
|---|---|---|
| 24.2 ms ... subida ↗ y bajada ↘ combinada | ↗ 10.8 ms subida | 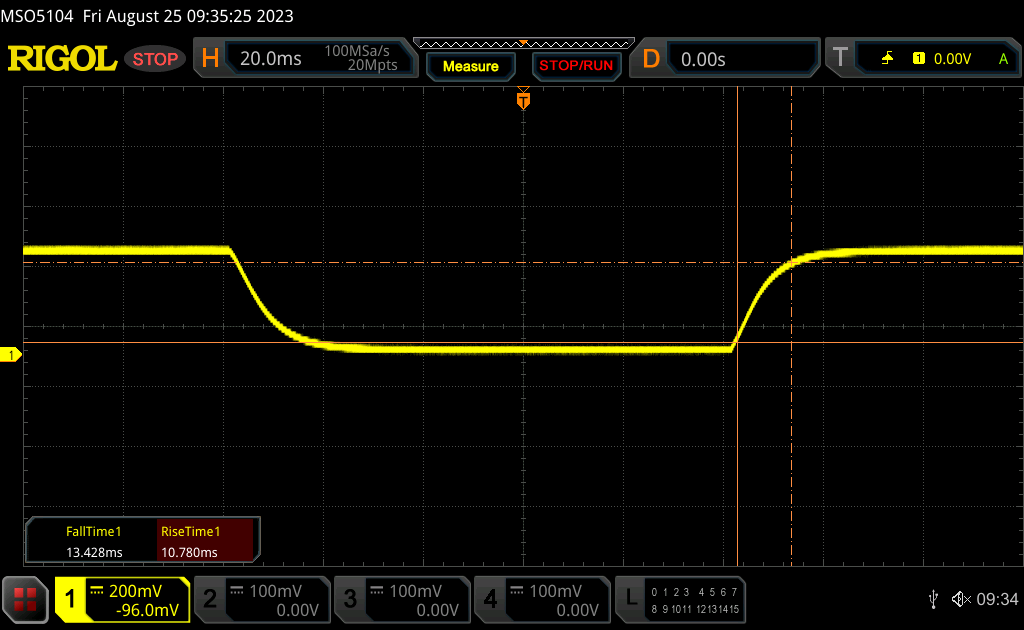 |
| ↘ 13.4 ms bajada | ||
| La pantalla mostró buenos tiempos de respuesta en nuestros tests pero podría ser demasiado lenta para los jugones competitivos. En comparación, todos los dispositivos de prueba van de ##min### (mínimo) a 240 (máximo) ms. » 57 % de todos los dispositivos son mejores. Eso quiere decir que el tiempo de respuesta es peor que la media (19.8 ms) de todos los dispositivos testados. | ||
| ↔ Tiempo de respuesta 50% Gris a 80% Gris | ||
| 35 ms ... subida ↗ y bajada ↘ combinada | ↗ 15.7 ms subida | 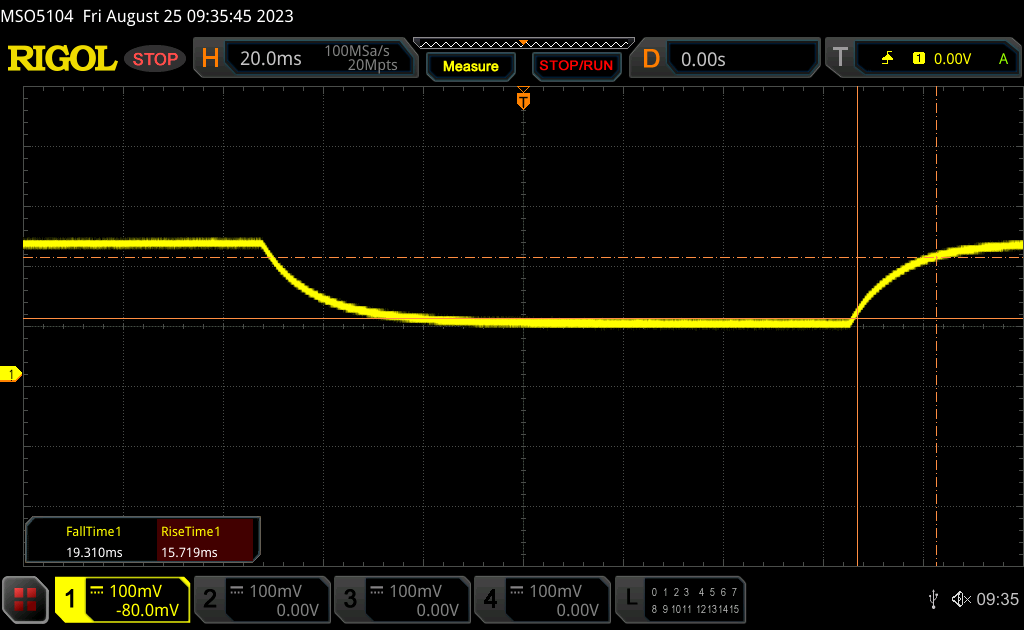 |
| ↘ 19.3 ms bajada | ||
| La pantalla mostró tiempos de respuesta lentos en nuestros tests y podría ser demasiado lenta para los jugones. En comparación, todos los dispositivos de prueba van de ##min### (mínimo) a 636 (máximo) ms. » 49 % de todos los dispositivos son mejores. Eso quiere decir que el tiempo de respuesta es peor que la media (31 ms) de todos los dispositivos testados. | ||
Parpadeo de Pantalla / PWM (Pulse-Width Modulation)
| Parpadeo de Pantalla / PWM no detectado | 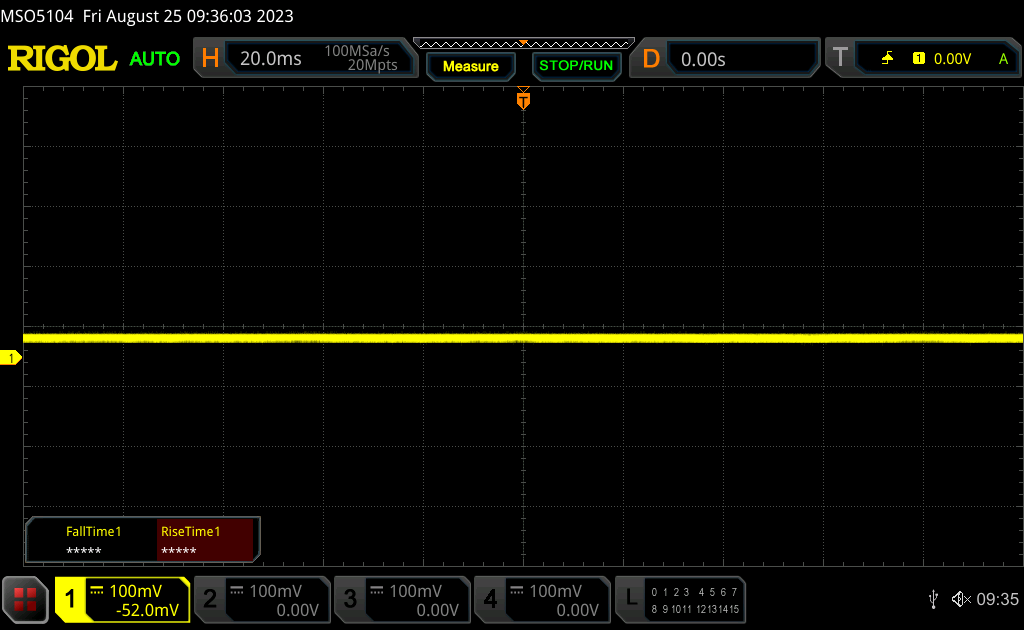 | ||
Comparación: 52 % de todos los dispositivos testados no usaron PWM para atenuar el display. Si se usó, medimos una media de 7778 (mínimo: 5 - máxmo: 343500) Hz. | |||
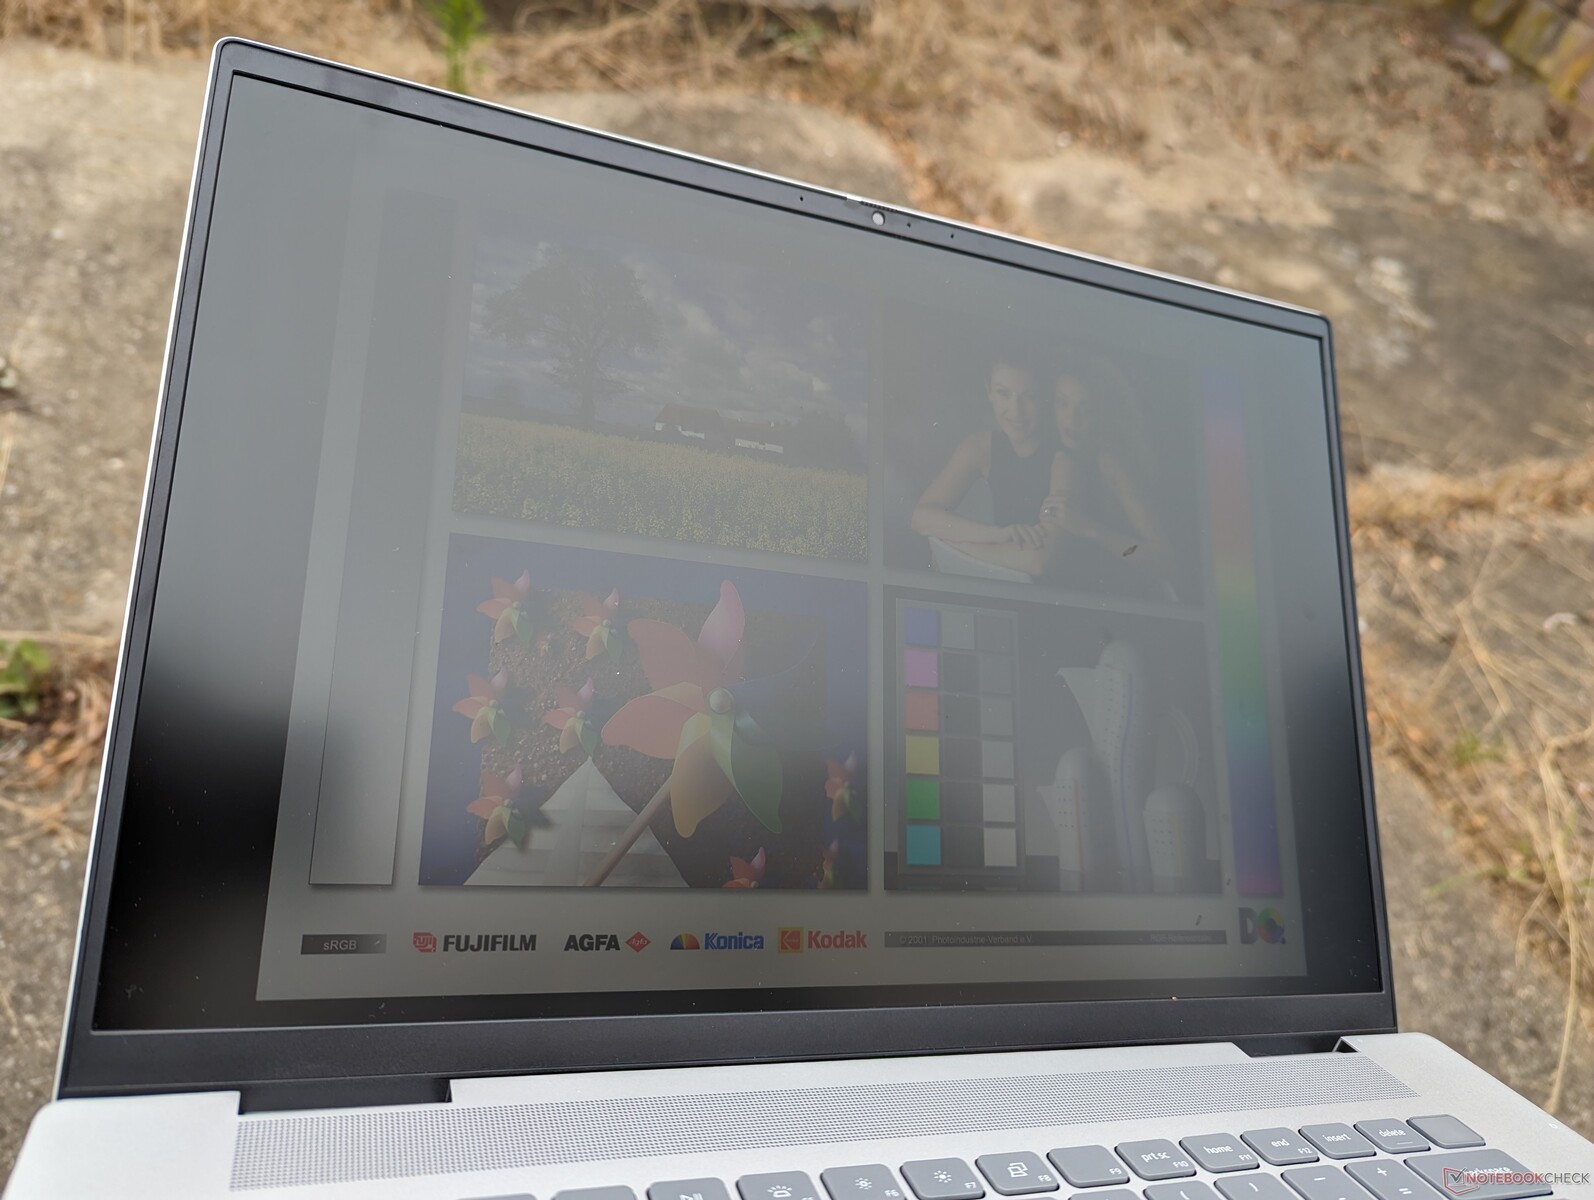
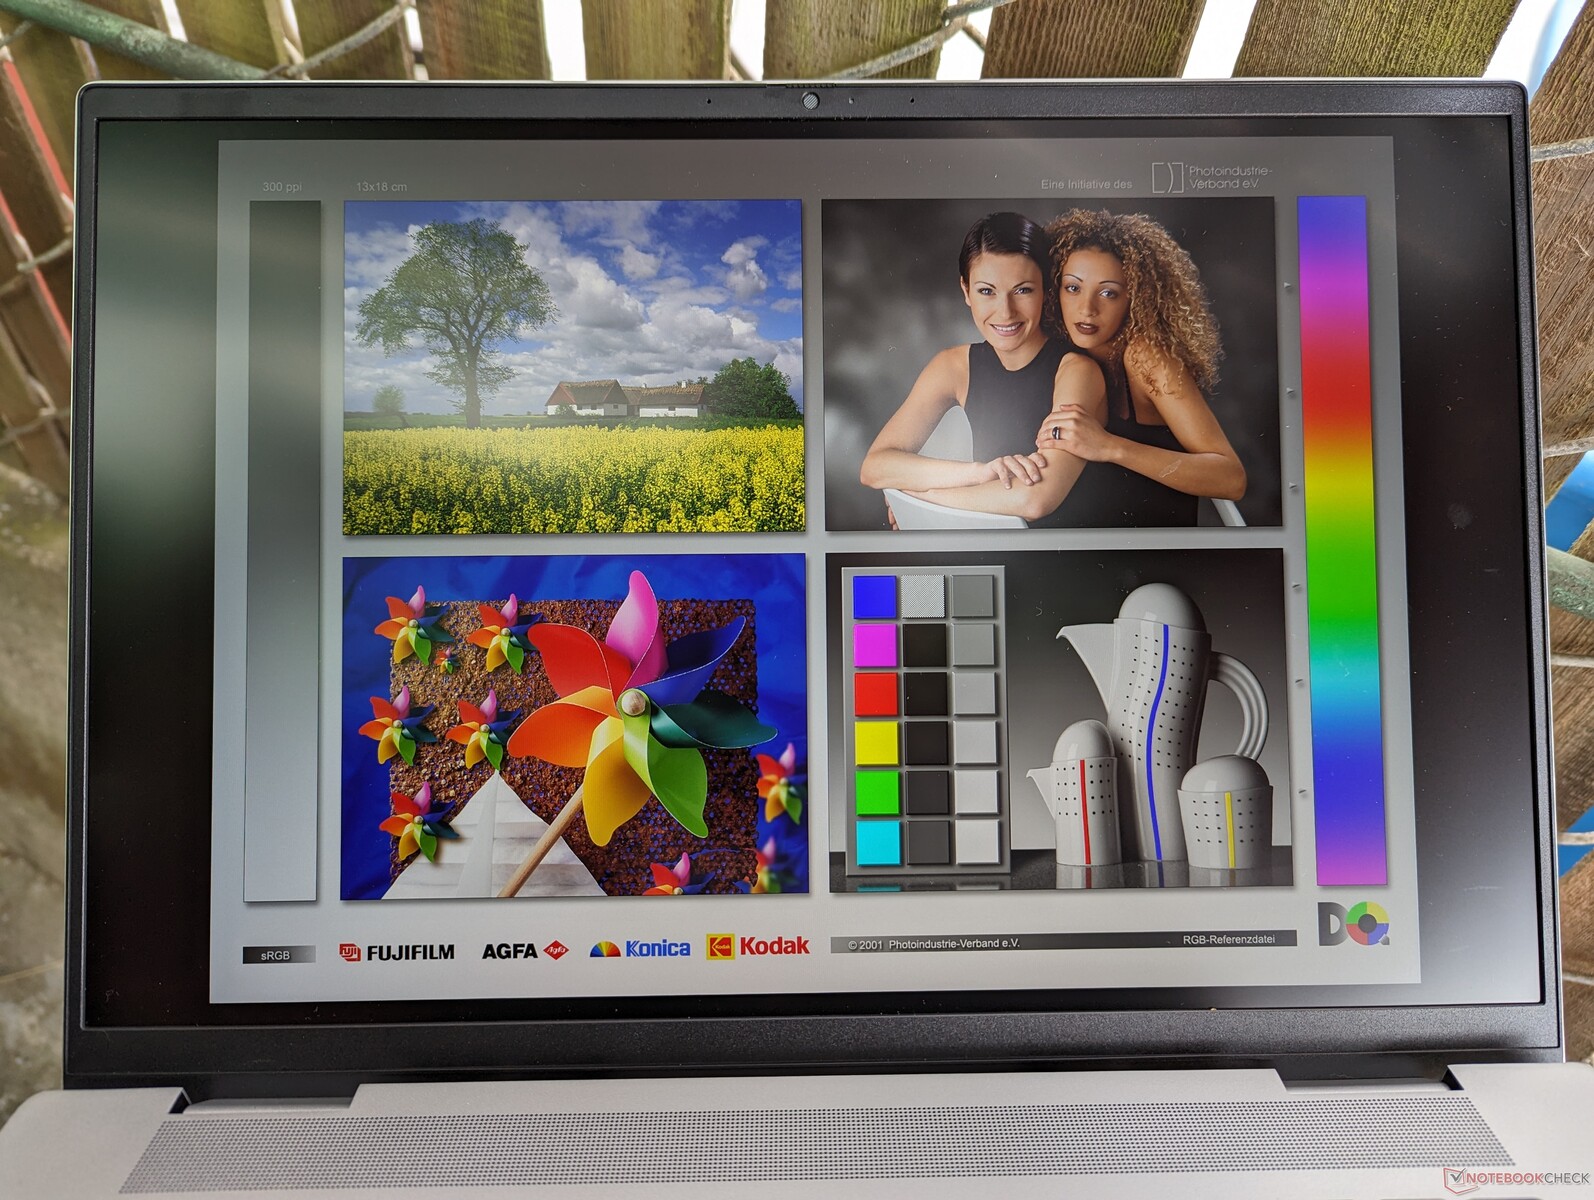
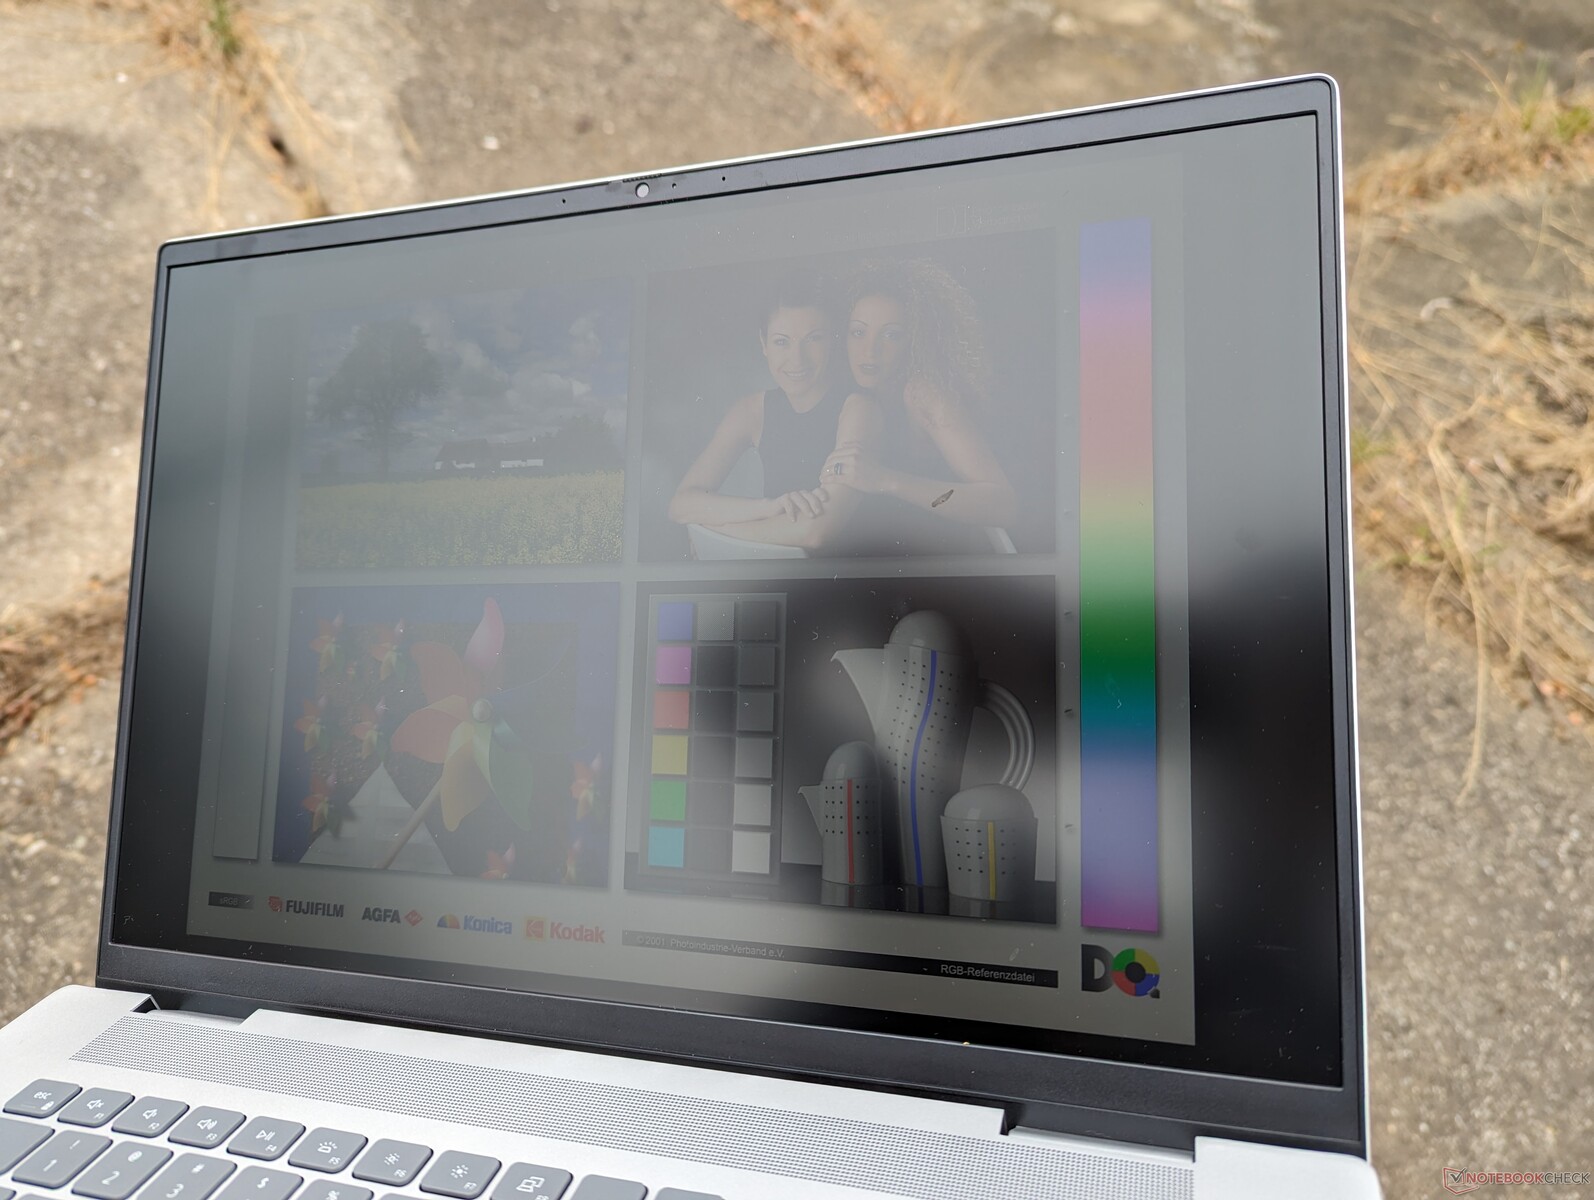
La visibilidad en exteriores es comparable a la del modelo del año pasado y decente sólo cuando está a la sombra para minimizar los reflejos. Otros portátiles de 16 pulgadas con mini-LED u OLED como el Yoga 9i 16 o el Razer Blade 16 tienden a ser más brillantes para mejorar la visibilidad en exteriores, pero también son mucho más caros que nuestro Dell.
Rendimiento - Intel Raptor Lake-H de 13ª generación
Condiciones de ensayo
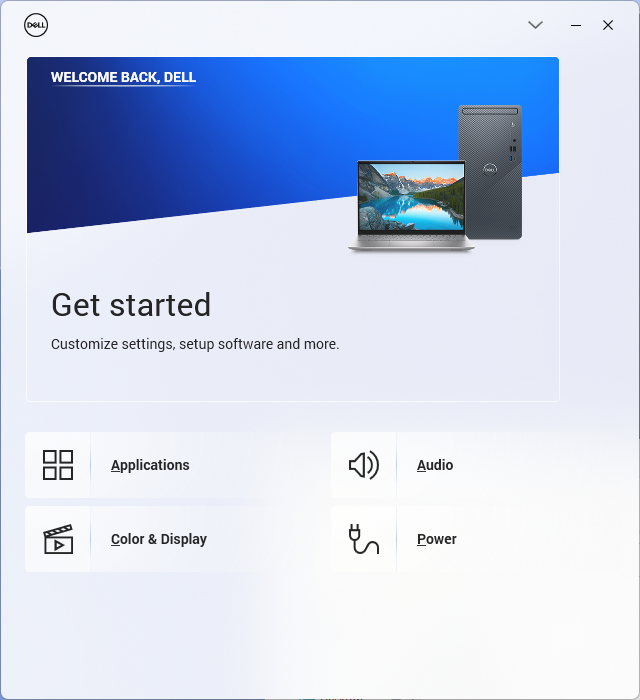
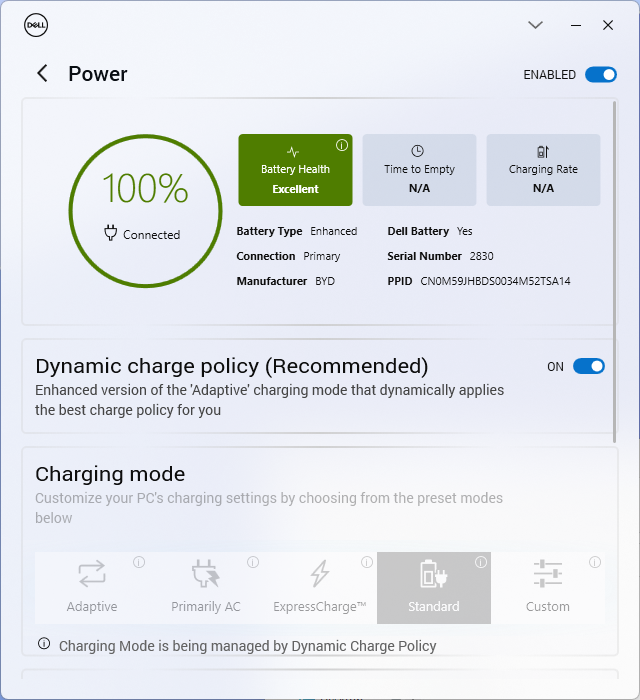
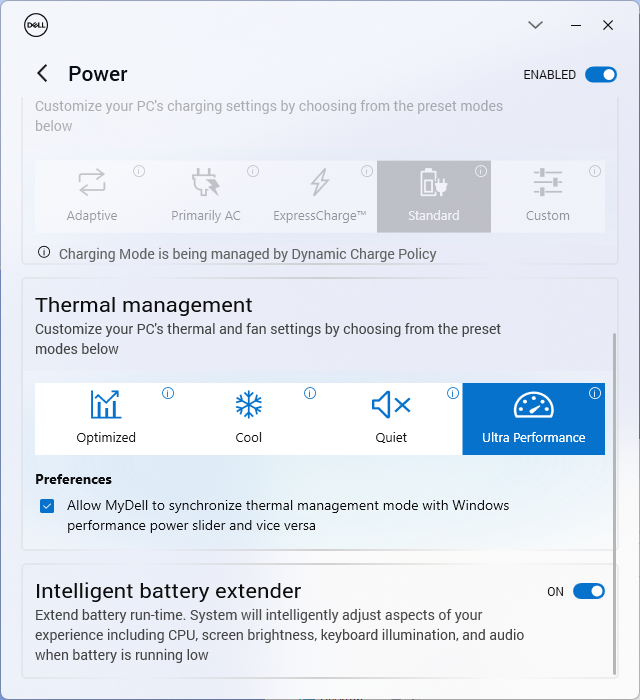
Configuramos nuestra unidad en modo Rendimiento a través del software MyDell preinstalado antes de ejecutar los benchmarks que se muestran a continuación. Los perfiles de energía de MyDell pueden sincronizarse con los perfiles de energía de Windows para reducir la confusión y evitar configuraciones conflictivas.
El Inspiron no soporta Advanced Optimus o MUX que son características comunes en los modelos dedicados a juegos de la serie G de Dell o la serie Alienware.
Procesador
Rendimiento de la CPU de nuestro Core i7-13700H es sólo un 10% más rápido que el 12º gen Core i7-12700H del Inspiron 16 Plus 7620 del año pasado. Una vez que sus respectivos beneficios Turbo Boost disminuyen, sin embargo, sus diferencias de rendimiento se vuelven aún más estrechas, como lo demuestran nuestros resultados del bucle CineBench R15 xT a continuación. En otras palabras, el Inspiron 16 Plus 7630 es sólo ligeramente más rápido que el modelo del año pasado en el mejor de los casos cuando se trata de rendimiento del procesador.
Cambiando al Core i5-13500H se espera que afecte al rendimiento del procesador sólo en un 10 por ciento, basándonos en nuestra experiencia con el Asus VivoBook 14X. Mientras tanto, el AMD basado en Ryzen 7 7840HS basada en AMD rendirá a la par de nuestro Core i7-13700H.
Cinebench R15 Multi Loop
Cinebench R23: Multi Core | Single Core
Cinebench R20: CPU (Multi Core) | CPU (Single Core)
Cinebench R15: CPU Multi 64Bit | CPU Single 64Bit
Blender: v2.79 BMW27 CPU
7-Zip 18.03: 7z b 4 | 7z b 4 -mmt1
Geekbench 5.5: Multi-Core | Single-Core
HWBOT x265 Benchmark v2.2: 4k Preset
LibreOffice : 20 Documents To PDF
R Benchmark 2.5: Overall mean
* ... más pequeño es mejor
AIDA64: FP32 Ray-Trace | FPU Julia | CPU SHA3 | CPU Queen | FPU SinJulia | FPU Mandel | CPU AES | CPU ZLib | FP64 Ray-Trace | CPU PhotoWorxx
| Performance rating | |
| Asus Vivobook Pro 16X K6604JV-MX016W | |
| Lenovo Slim Pro 9i 16IRP8 | |
| Medio Intel Core i7-13700H | |
| Dell Inspiron 16 Plus 7630 | |
| MSI Summit E16 Flip A12UDT-031 | |
| HP Envy 16 h0112nr | |
| Dell Inspiron 16 Plus 7620 | |
| AIDA64 / FP32 Ray-Trace | |
| Asus Vivobook Pro 16X K6604JV-MX016W | |
| Lenovo Slim Pro 9i 16IRP8 | |
| Medio Intel Core i7-13700H (4986 - 18908, n=29) | |
| Dell Inspiron 16 Plus 7630 | |
| MSI Summit E16 Flip A12UDT-031 | |
| Dell Inspiron 16 Plus 7620 | |
| HP Envy 16 h0112nr | |
| AIDA64 / FPU Julia | |
| Asus Vivobook Pro 16X K6604JV-MX016W | |
| Lenovo Slim Pro 9i 16IRP8 | |
| Medio Intel Core i7-13700H (25360 - 92359, n=29) | |
| Dell Inspiron 16 Plus 7630 | |
| MSI Summit E16 Flip A12UDT-031 | |
| Dell Inspiron 16 Plus 7620 | |
| HP Envy 16 h0112nr | |
| AIDA64 / CPU SHA3 | |
| Asus Vivobook Pro 16X K6604JV-MX016W | |
| Lenovo Slim Pro 9i 16IRP8 | |
| Medio Intel Core i7-13700H (1339 - 4224, n=29) | |
| Dell Inspiron 16 Plus 7630 | |
| MSI Summit E16 Flip A12UDT-031 | |
| Dell Inspiron 16 Plus 7620 | |
| HP Envy 16 h0112nr | |
| AIDA64 / CPU Queen | |
| Asus Vivobook Pro 16X K6604JV-MX016W | |
| Lenovo Slim Pro 9i 16IRP8 | |
| Dell Inspiron 16 Plus 7630 | |
| HP Envy 16 h0112nr | |
| MSI Summit E16 Flip A12UDT-031 | |
| Medio Intel Core i7-13700H (59324 - 107159, n=29) | |
| Dell Inspiron 16 Plus 7620 | |
| AIDA64 / FPU SinJulia | |
| Asus Vivobook Pro 16X K6604JV-MX016W | |
| Lenovo Slim Pro 9i 16IRP8 | |
| Dell Inspiron 16 Plus 7630 | |
| Medio Intel Core i7-13700H (4800 - 11050, n=29) | |
| MSI Summit E16 Flip A12UDT-031 | |
| Dell Inspiron 16 Plus 7620 | |
| HP Envy 16 h0112nr | |
| AIDA64 / FPU Mandel | |
| Asus Vivobook Pro 16X K6604JV-MX016W | |
| Lenovo Slim Pro 9i 16IRP8 | |
| Medio Intel Core i7-13700H (12321 - 45118, n=29) | |
| Dell Inspiron 16 Plus 7630 | |
| MSI Summit E16 Flip A12UDT-031 | |
| Dell Inspiron 16 Plus 7620 | |
| HP Envy 16 h0112nr | |
| AIDA64 / CPU AES | |
| HP Envy 16 h0112nr | |
| Asus Vivobook Pro 16X K6604JV-MX016W | |
| Lenovo Slim Pro 9i 16IRP8 | |
| Medio Intel Core i7-13700H (28769 - 151254, n=29) | |
| Dell Inspiron 16 Plus 7620 | |
| MSI Summit E16 Flip A12UDT-031 | |
| Dell Inspiron 16 Plus 7630 | |
| AIDA64 / CPU ZLib | |
| Asus Vivobook Pro 16X K6604JV-MX016W | |
| Lenovo Slim Pro 9i 16IRP8 | |
| Dell Inspiron 16 Plus 7620 | |
| Medio Intel Core i7-13700H (389 - 1215, n=29) | |
| MSI Summit E16 Flip A12UDT-031 | |
| Dell Inspiron 16 Plus 7630 | |
| HP Envy 16 h0112nr | |
| AIDA64 / FP64 Ray-Trace | |
| Asus Vivobook Pro 16X K6604JV-MX016W | |
| Lenovo Slim Pro 9i 16IRP8 | |
| Medio Intel Core i7-13700H (2540 - 10135, n=29) | |
| Dell Inspiron 16 Plus 7630 | |
| MSI Summit E16 Flip A12UDT-031 | |
| Dell Inspiron 16 Plus 7620 | |
| HP Envy 16 h0112nr | |
| AIDA64 / CPU PhotoWorxx | |
| Lenovo Slim Pro 9i 16IRP8 | |
| Asus Vivobook Pro 16X K6604JV-MX016W | |
| MSI Summit E16 Flip A12UDT-031 | |
| Medio Intel Core i7-13700H (12872 - 52727, n=29) | |
| Dell Inspiron 16 Plus 7630 | |
| HP Envy 16 h0112nr | |
| Dell Inspiron 16 Plus 7620 | |
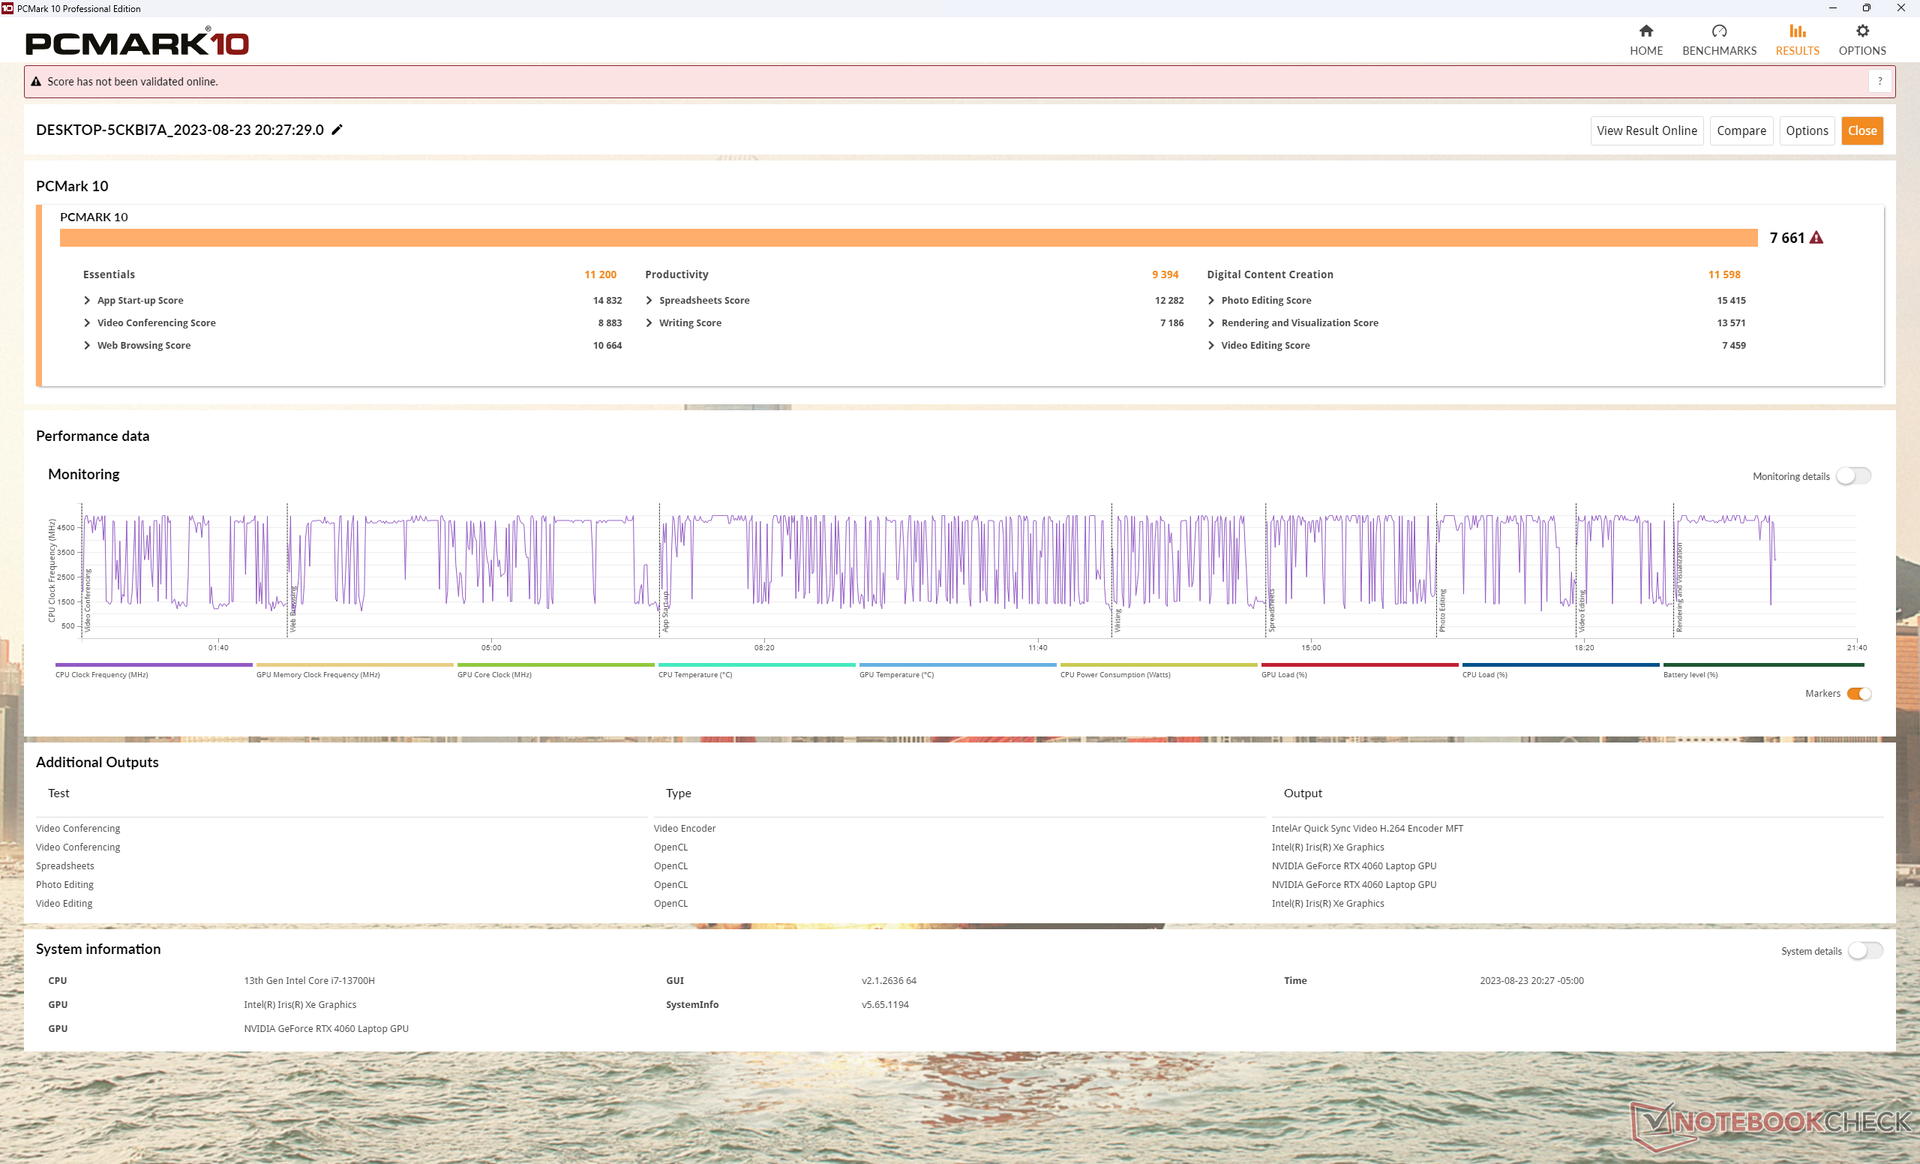
Rendimiento del sistema
Las puntuaciones en PCMark son sistemáticamente superiores a las del Inspiron 16 Plus 7620 del año pasado, especialmente en la subprueba de creación de contenidos digitales, donde el rendimiento de la GPU es más importante.
No experimentamos problemas de despertar del reposo o BSODs a diferencia del reciente Alienware m16 R1.
CrossMark: Overall | Productivity | Creativity | Responsiveness
| PCMark 10 / Score | |
| Lenovo Slim Pro 9i 16IRP8 | |
| Dell Inspiron 16 Plus 7630 | |
| HP Envy 16 h0112nr | |
| Medio Intel Core i7-13700H, NVIDIA GeForce RTX 4060 Laptop GPU (7157 - 7661, n=5) | |
| Asus Vivobook Pro 16X K6604JV-MX016W | |
| Dell Inspiron 16 Plus 7620 | |
| MSI Summit E16 Flip A12UDT-031 | |
| PCMark 10 / Essentials | |
| HP Envy 16 h0112nr | |
| Lenovo Slim Pro 9i 16IRP8 | |
| Dell Inspiron 16 Plus 7630 | |
| Medio Intel Core i7-13700H, NVIDIA GeForce RTX 4060 Laptop GPU (10179 - 11200, n=5) | |
| Asus Vivobook Pro 16X K6604JV-MX016W | |
| Dell Inspiron 16 Plus 7620 | |
| MSI Summit E16 Flip A12UDT-031 | |
| PCMark 10 / Productivity | |
| Lenovo Slim Pro 9i 16IRP8 | |
| Medio Intel Core i7-13700H, NVIDIA GeForce RTX 4060 Laptop GPU (8238 - 10249, n=5) | |
| Dell Inspiron 16 Plus 7630 | |
| HP Envy 16 h0112nr | |
| Dell Inspiron 16 Plus 7620 | |
| Asus Vivobook Pro 16X K6604JV-MX016W | |
| MSI Summit E16 Flip A12UDT-031 | |
| PCMark 10 / Digital Content Creation | |
| Dell Inspiron 16 Plus 7630 | |
| Lenovo Slim Pro 9i 16IRP8 | |
| Medio Intel Core i7-13700H, NVIDIA GeForce RTX 4060 Laptop GPU (10308 - 11862, n=5) | |
| HP Envy 16 h0112nr | |
| Dell Inspiron 16 Plus 7620 | |
| Asus Vivobook Pro 16X K6604JV-MX016W | |
| MSI Summit E16 Flip A12UDT-031 | |
| CrossMark / Overall | |
| Asus Vivobook Pro 16X K6604JV-MX016W | |
| Dell Inspiron 16 Plus 7630 | |
| HP Envy 16 h0112nr | |
| Lenovo Slim Pro 9i 16IRP8 | |
| Dell Inspiron 16 Plus 7620 | |
| Medio Intel Core i7-13700H, NVIDIA GeForce RTX 4060 Laptop GPU (1629 - 1849, n=5) | |
| MSI Summit E16 Flip A12UDT-031 | |
| CrossMark / Productivity | |
| Asus Vivobook Pro 16X K6604JV-MX016W | |
| Dell Inspiron 16 Plus 7630 | |
| HP Envy 16 h0112nr | |
| Dell Inspiron 16 Plus 7620 | |
| Lenovo Slim Pro 9i 16IRP8 | |
| Medio Intel Core i7-13700H, NVIDIA GeForce RTX 4060 Laptop GPU (1561 - 1743, n=5) | |
| MSI Summit E16 Flip A12UDT-031 | |
| CrossMark / Creativity | |
| Asus Vivobook Pro 16X K6604JV-MX016W | |
| Lenovo Slim Pro 9i 16IRP8 | |
| Dell Inspiron 16 Plus 7630 | |
| HP Envy 16 h0112nr | |
| Dell Inspiron 16 Plus 7620 | |
| Medio Intel Core i7-13700H, NVIDIA GeForce RTX 4060 Laptop GPU (1691 - 2064, n=5) | |
| MSI Summit E16 Flip A12UDT-031 | |
| CrossMark / Responsiveness | |
| Asus Vivobook Pro 16X K6604JV-MX016W | |
| HP Envy 16 h0112nr | |
| Dell Inspiron 16 Plus 7630 | |
| MSI Summit E16 Flip A12UDT-031 | |
| Dell Inspiron 16 Plus 7620 | |
| Medio Intel Core i7-13700H, NVIDIA GeForce RTX 4060 Laptop GPU (1381 - 1656, n=5) | |
| Lenovo Slim Pro 9i 16IRP8 | |
| PCMark 10 Score | 7661 puntos | |
ayuda | ||
| AIDA64 / Memory Copy | |
| Lenovo Slim Pro 9i 16IRP8 | |
| Asus Vivobook Pro 16X K6604JV-MX016W | |
| MSI Summit E16 Flip A12UDT-031 | |
| Medio Intel Core i7-13700H (24334 - 78081, n=29) | |
| Dell Inspiron 16 Plus 7630 | |
| HP Envy 16 h0112nr | |
| Dell Inspiron 16 Plus 7620 | |
| AIDA64 / Memory Read | |
| Asus Vivobook Pro 16X K6604JV-MX016W | |
| Lenovo Slim Pro 9i 16IRP8 | |
| Dell Inspiron 16 Plus 7630 | |
| HP Envy 16 h0112nr | |
| MSI Summit E16 Flip A12UDT-031 | |
| Medio Intel Core i7-13700H (23681 - 79656, n=29) | |
| Dell Inspiron 16 Plus 7620 | |
| AIDA64 / Memory Write | |
| Lenovo Slim Pro 9i 16IRP8 | |
| Asus Vivobook Pro 16X K6604JV-MX016W | |
| Medio Intel Core i7-13700H (22986 - 99898, n=29) | |
| Dell Inspiron 16 Plus 7630 | |
| HP Envy 16 h0112nr | |
| MSI Summit E16 Flip A12UDT-031 | |
| Dell Inspiron 16 Plus 7620 | |
| AIDA64 / Memory Latency | |
| MSI Summit E16 Flip A12UDT-031 | |
| Lenovo Slim Pro 9i 16IRP8 | |
| Dell Inspiron 16 Plus 7620 | |
| Medio Intel Core i7-13700H (82.4 - 136.8, n=29) | |
| Dell Inspiron 16 Plus 7630 | |
| HP Envy 16 h0112nr | |
| Asus Vivobook Pro 16X K6604JV-MX016W | |
* ... más pequeño es mejor
Latencia del CPD
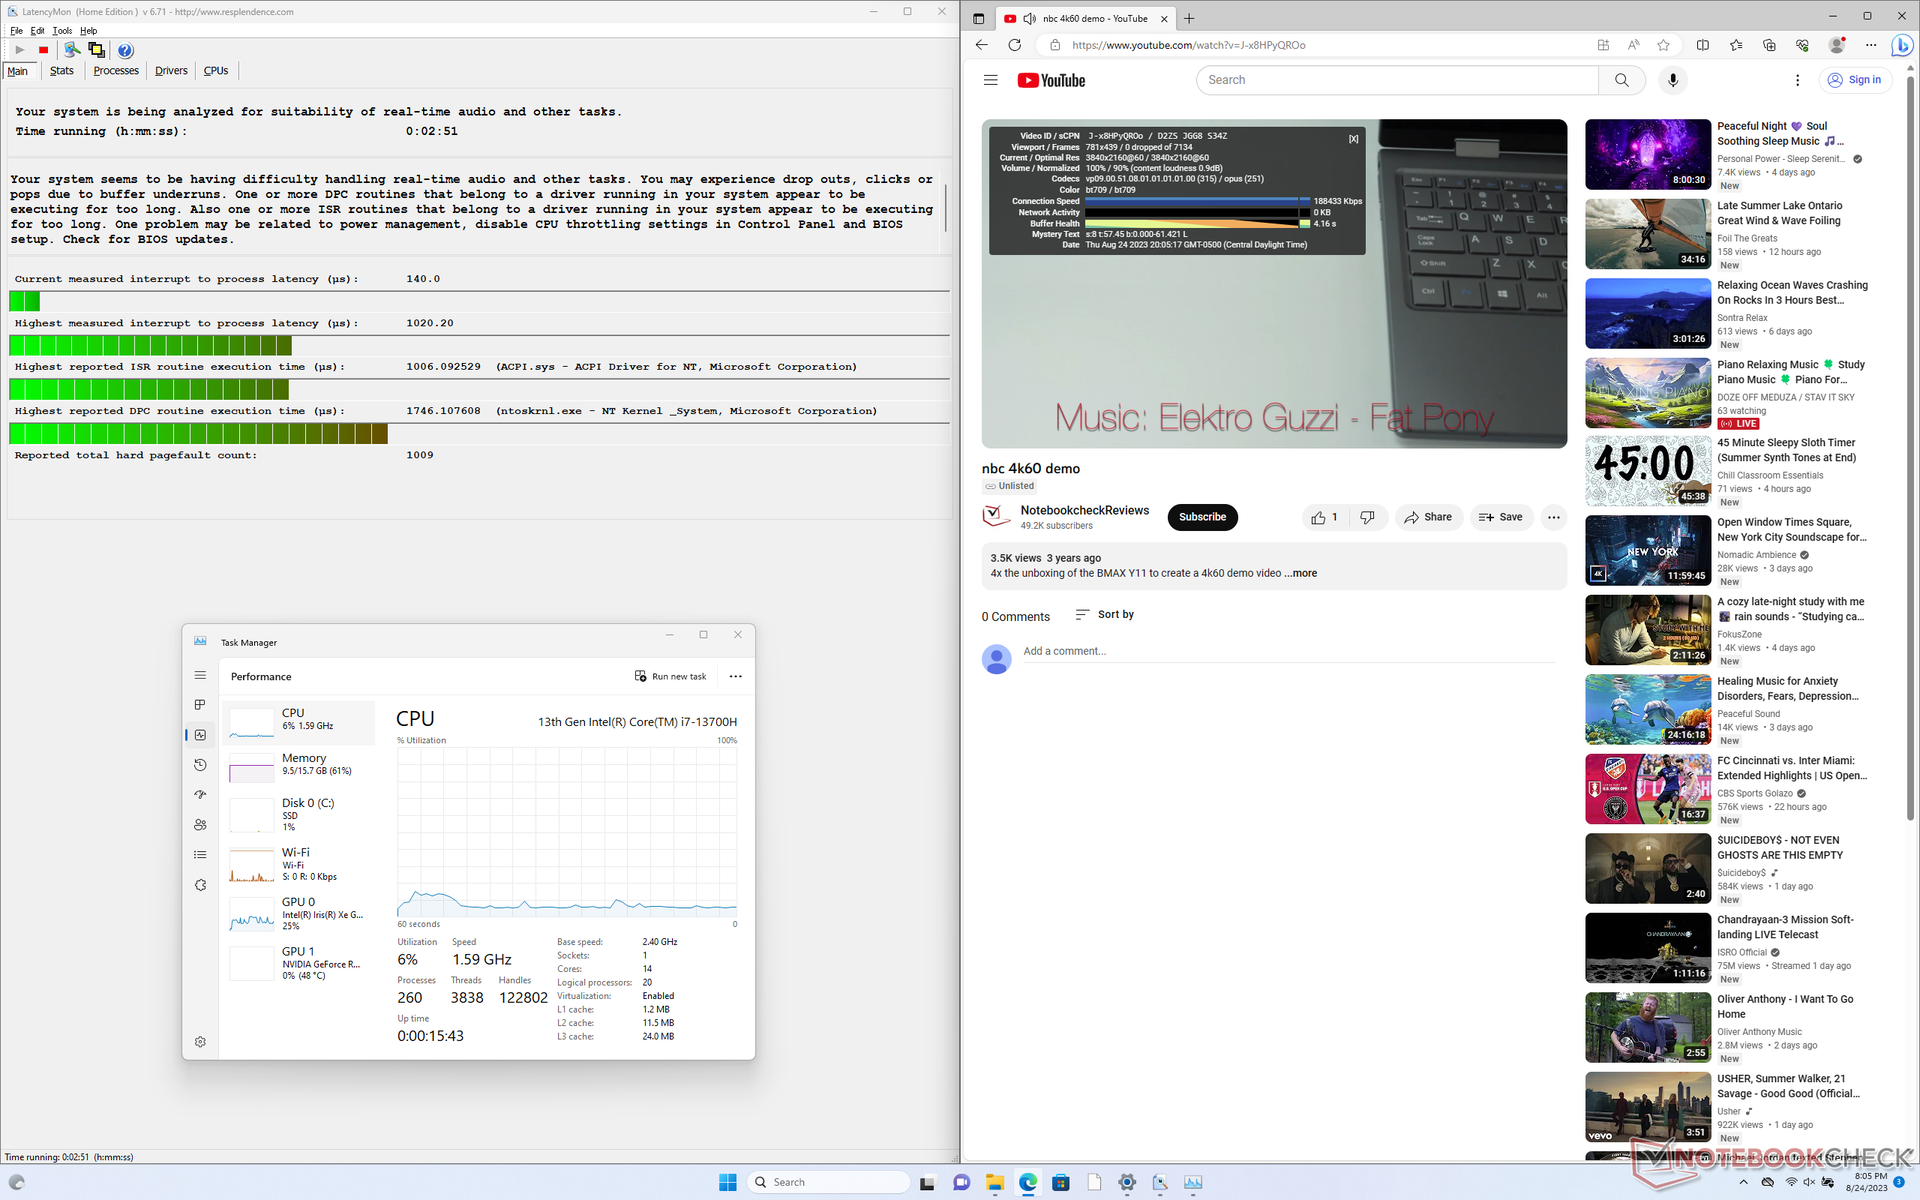
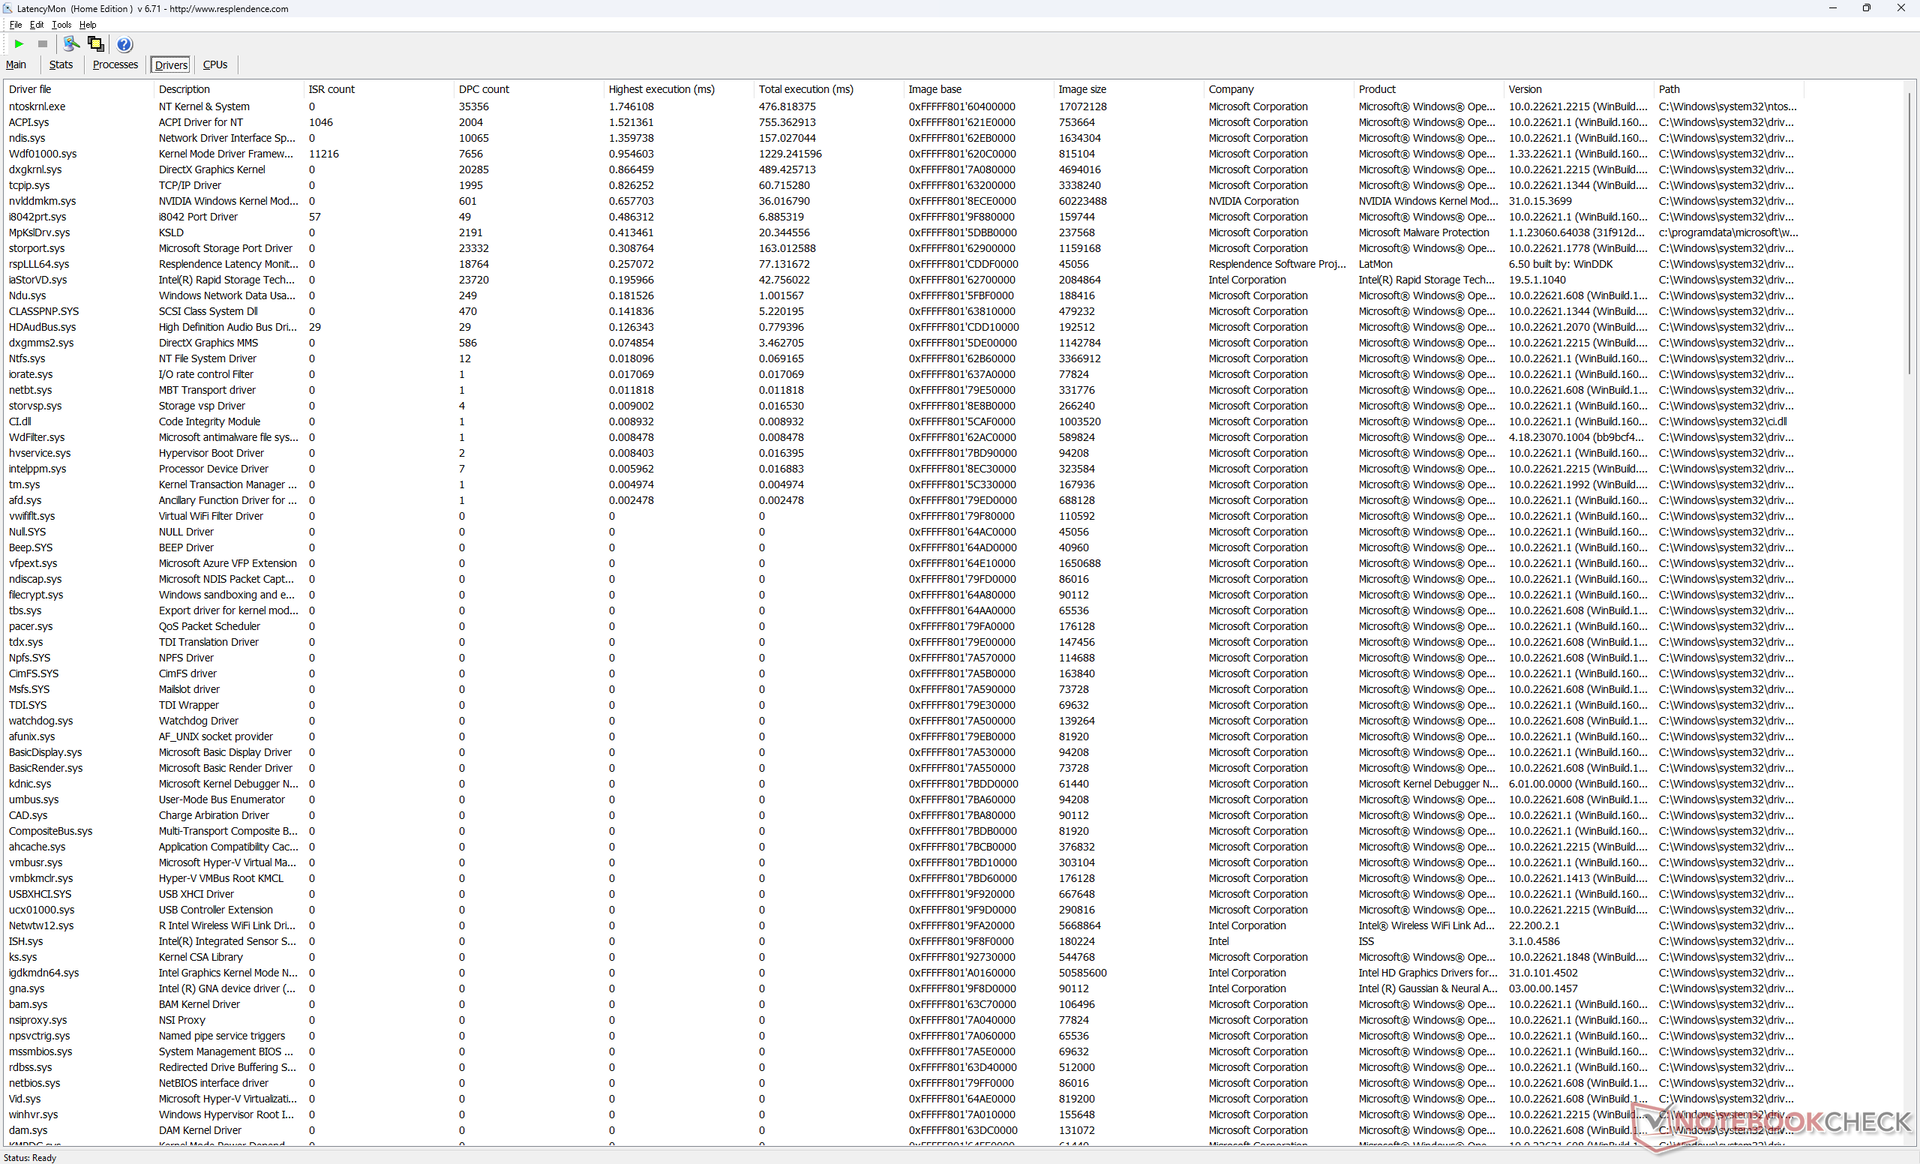
LatencyMon sólo muestra problemas menores de CPD al abrir múltiples pestañas de navegador de nuestra página principal. por lo demás, la reproducción de vídeo 4K a 60 FPS es perfecta, sin caídas de frames, a diferencia del reciente Alienware m16 R1, en el que los saltos de frames eran persistentes.
| DPC Latencies / LatencyMon - interrupt to process latency (max), Web, Youtube, Prime95 | |
| Asus Vivobook Pro 16X K6604JV-MX016W | |
| Lenovo Slim Pro 9i 16IRP8 | |
| Dell Inspiron 16 Plus 7630 | |
| Dell Inspiron 16 Plus 7620 | |
| MSI Summit E16 Flip A12UDT-031 | |
| HP Envy 16 h0112nr | |
* ... más pequeño es mejor
Dispositivos de almacenamiento: sólo admite un SSD
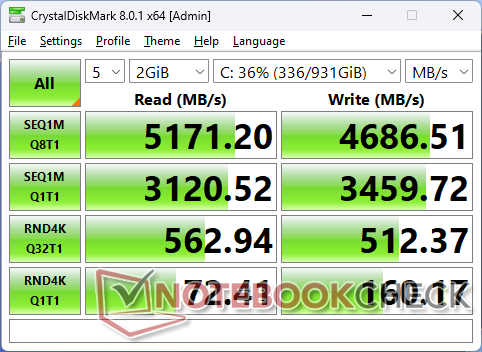
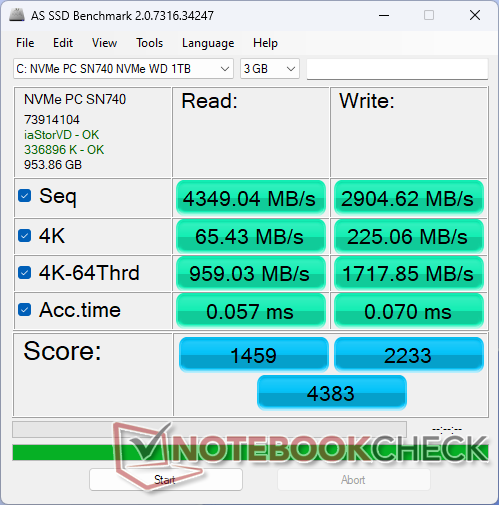
Nuestra unidad viene con un Western Digital SN740 PCIe4 x4 NVMe SSD que ofrece tasas de transferencia de hasta 5200 MB/s. Este máximo sólo es sostenible durante un minuto, empero, antes de ralentizarse hasta los 2400 MB/s como muestran nuestros resultados DiskSpd. Esta limitación no es un problema para el rendimiento de los juegos y la gran mayoría de los escenarios de uso.
El modelo sólo admite hasta un SSD interno, mientras que otros portátiles de 16 pulgadas como el Envy 16 pueden soportar hasta dos unidades.

| Drive Performance rating - Percent | |
| MSI Summit E16 Flip A12UDT-031 | |
| Lenovo Slim Pro 9i 16IRP8 | |
| HP Envy 16 h0112nr | |
| Dell Inspiron 16 Plus 7630 | |
| Asus Vivobook Pro 16X K6604JV-MX016W | |
| Dell Inspiron 16 Plus 7620 | |
* ... más pequeño es mejor
Disk Throttling: DiskSpd Read Loop, Queue Depth 8
Rendimiento de la GPU
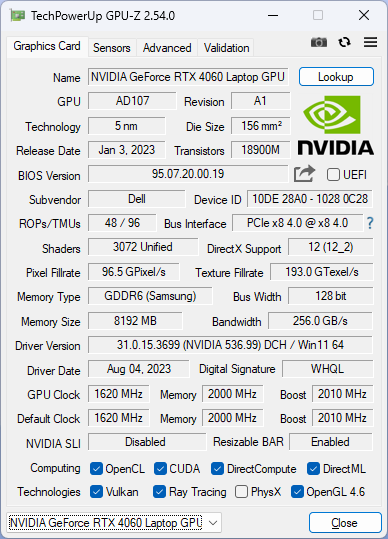
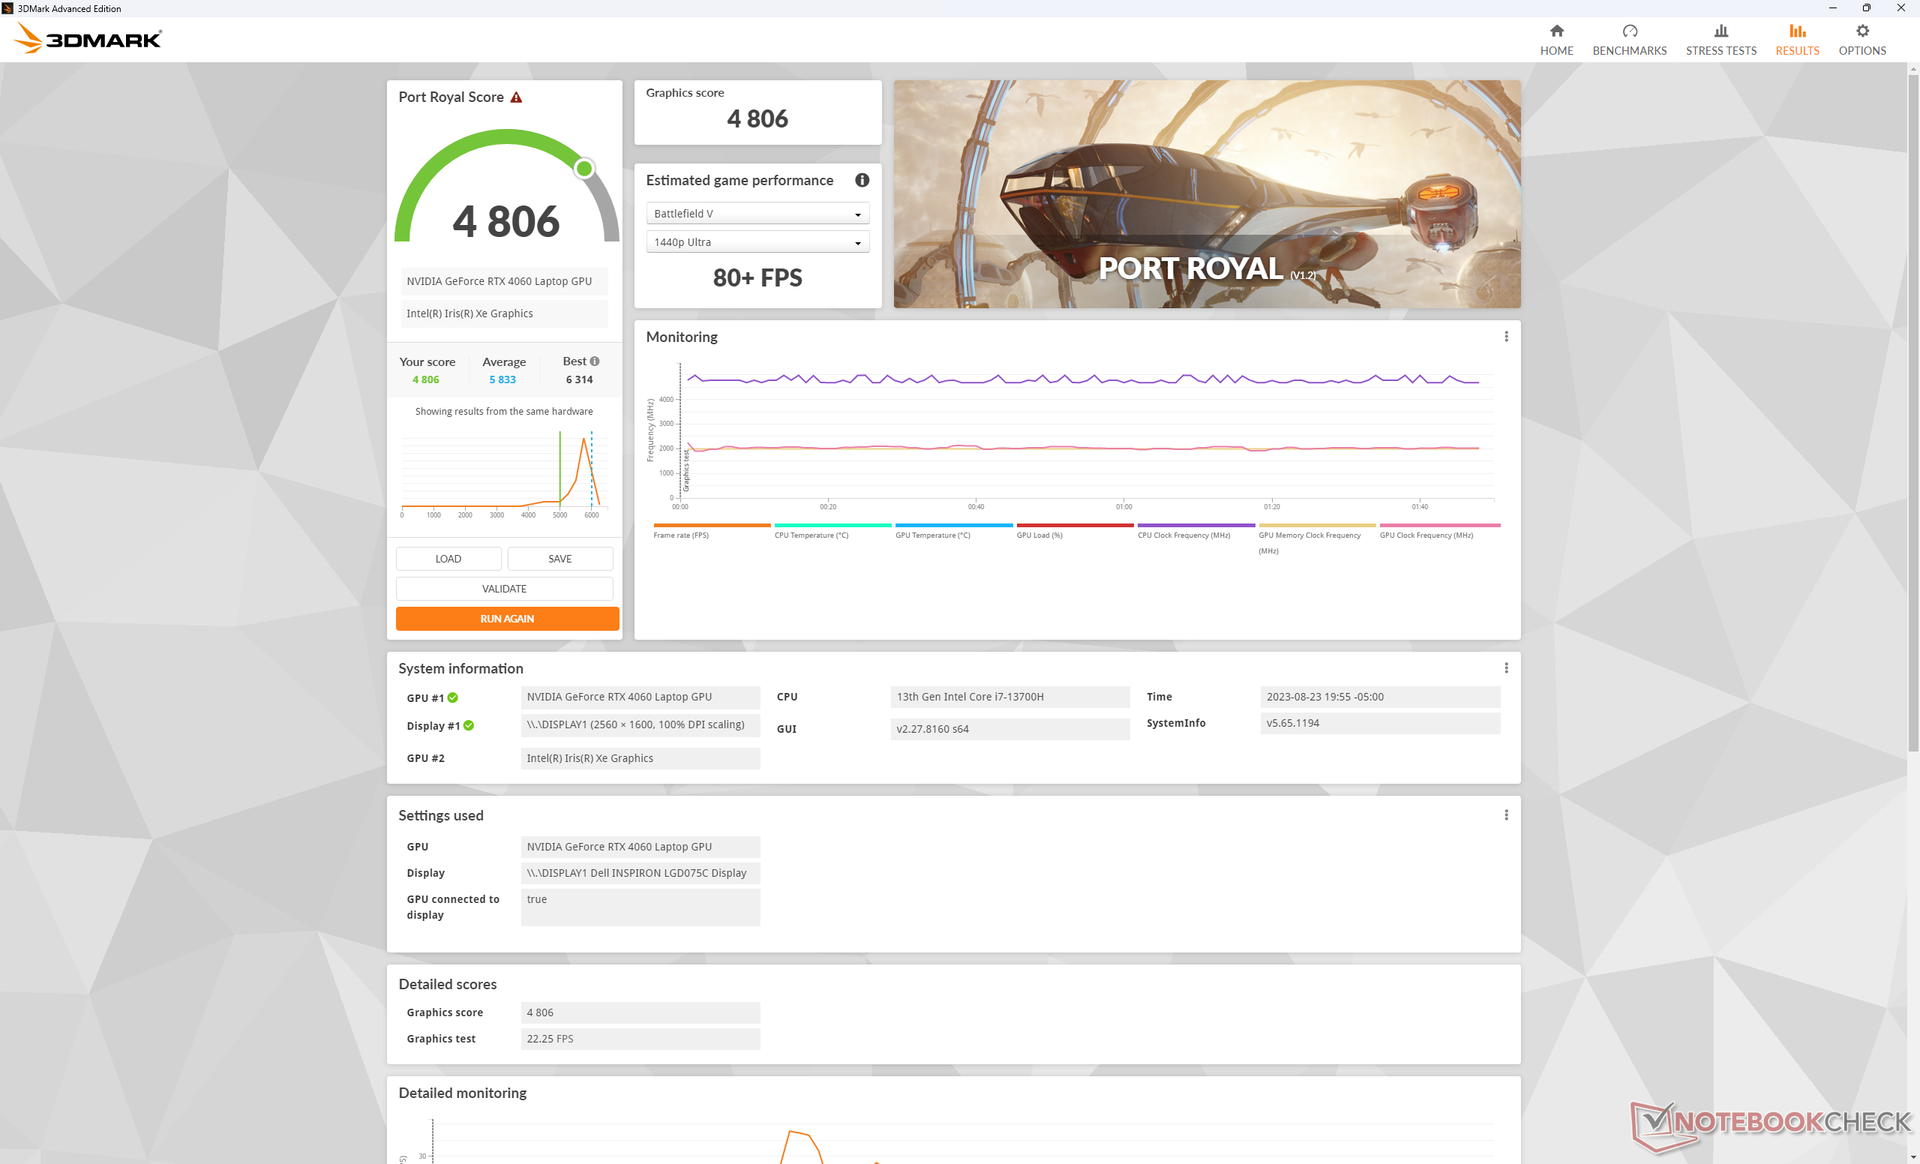
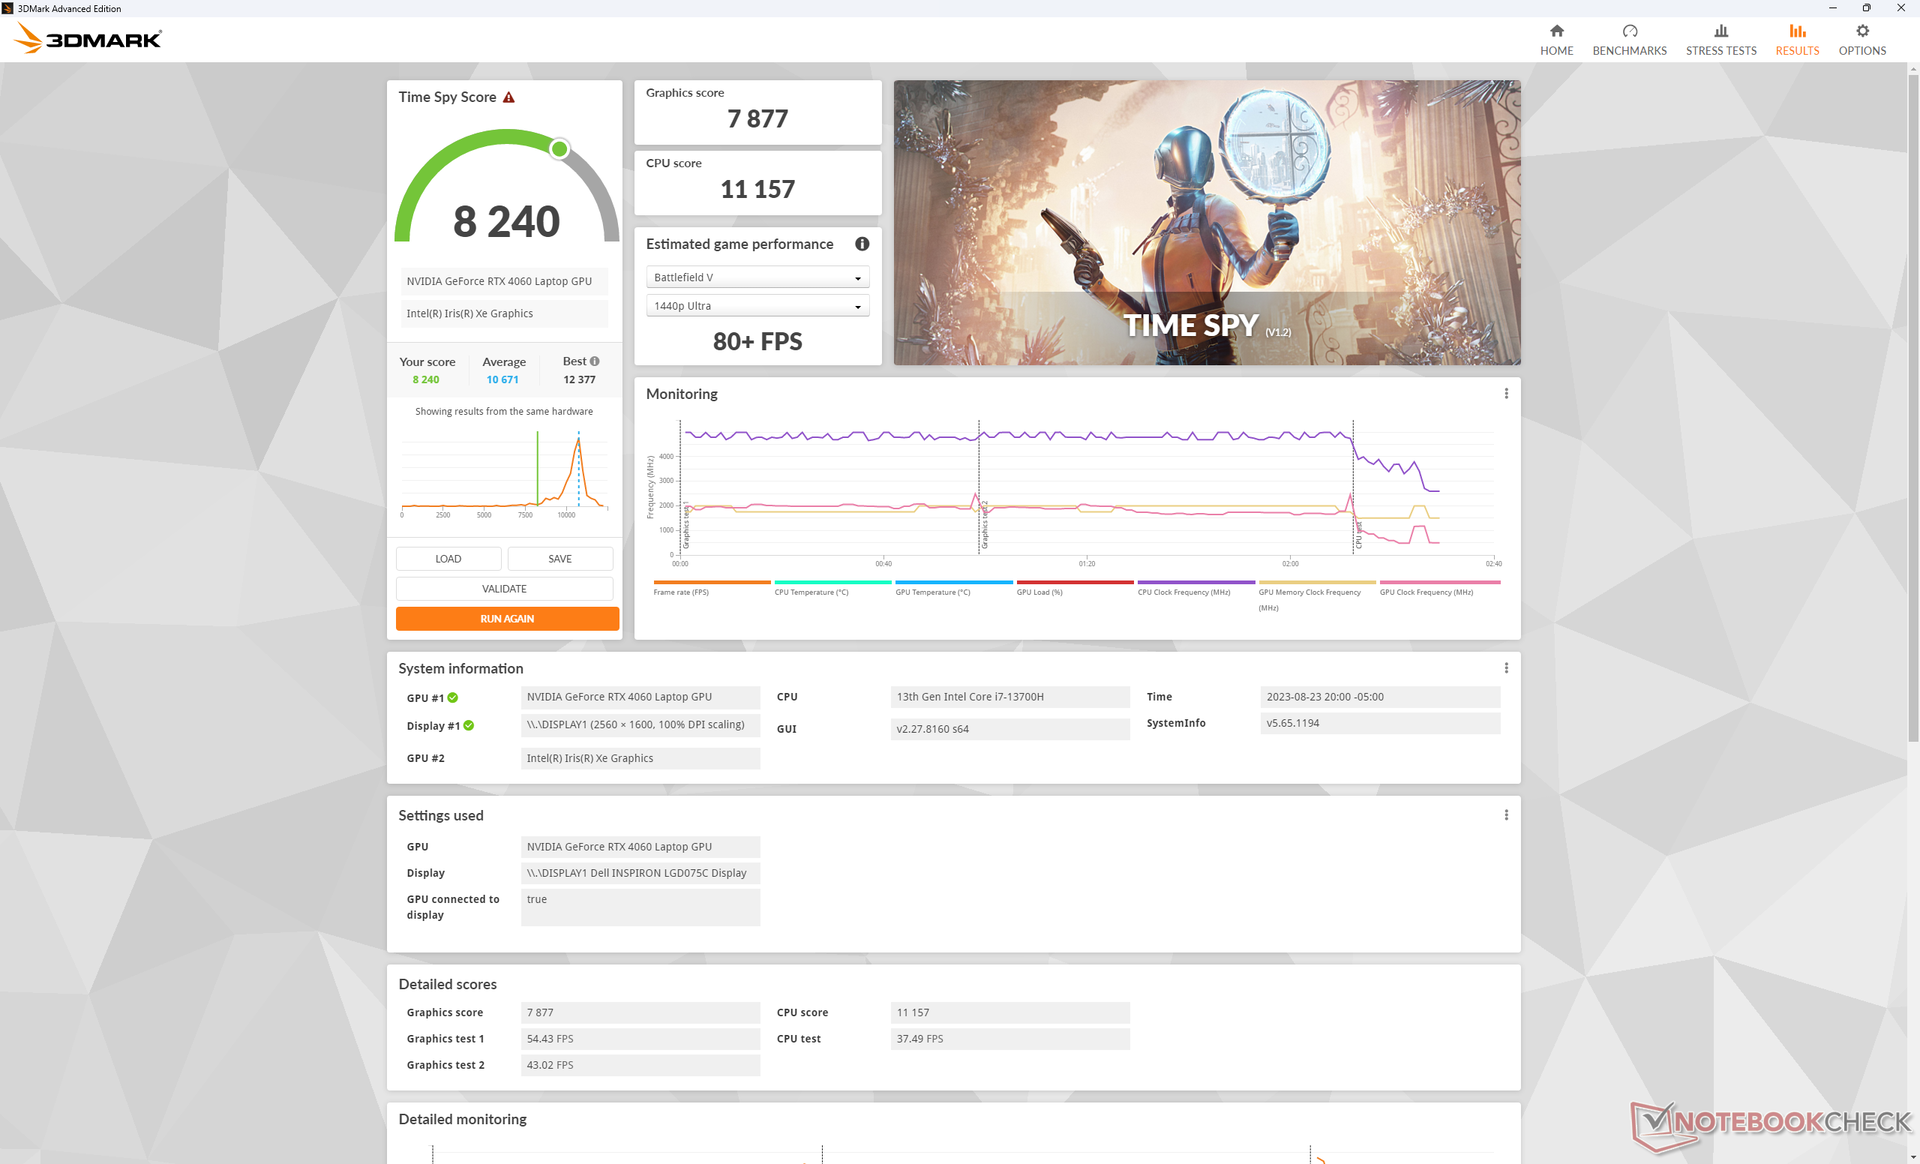
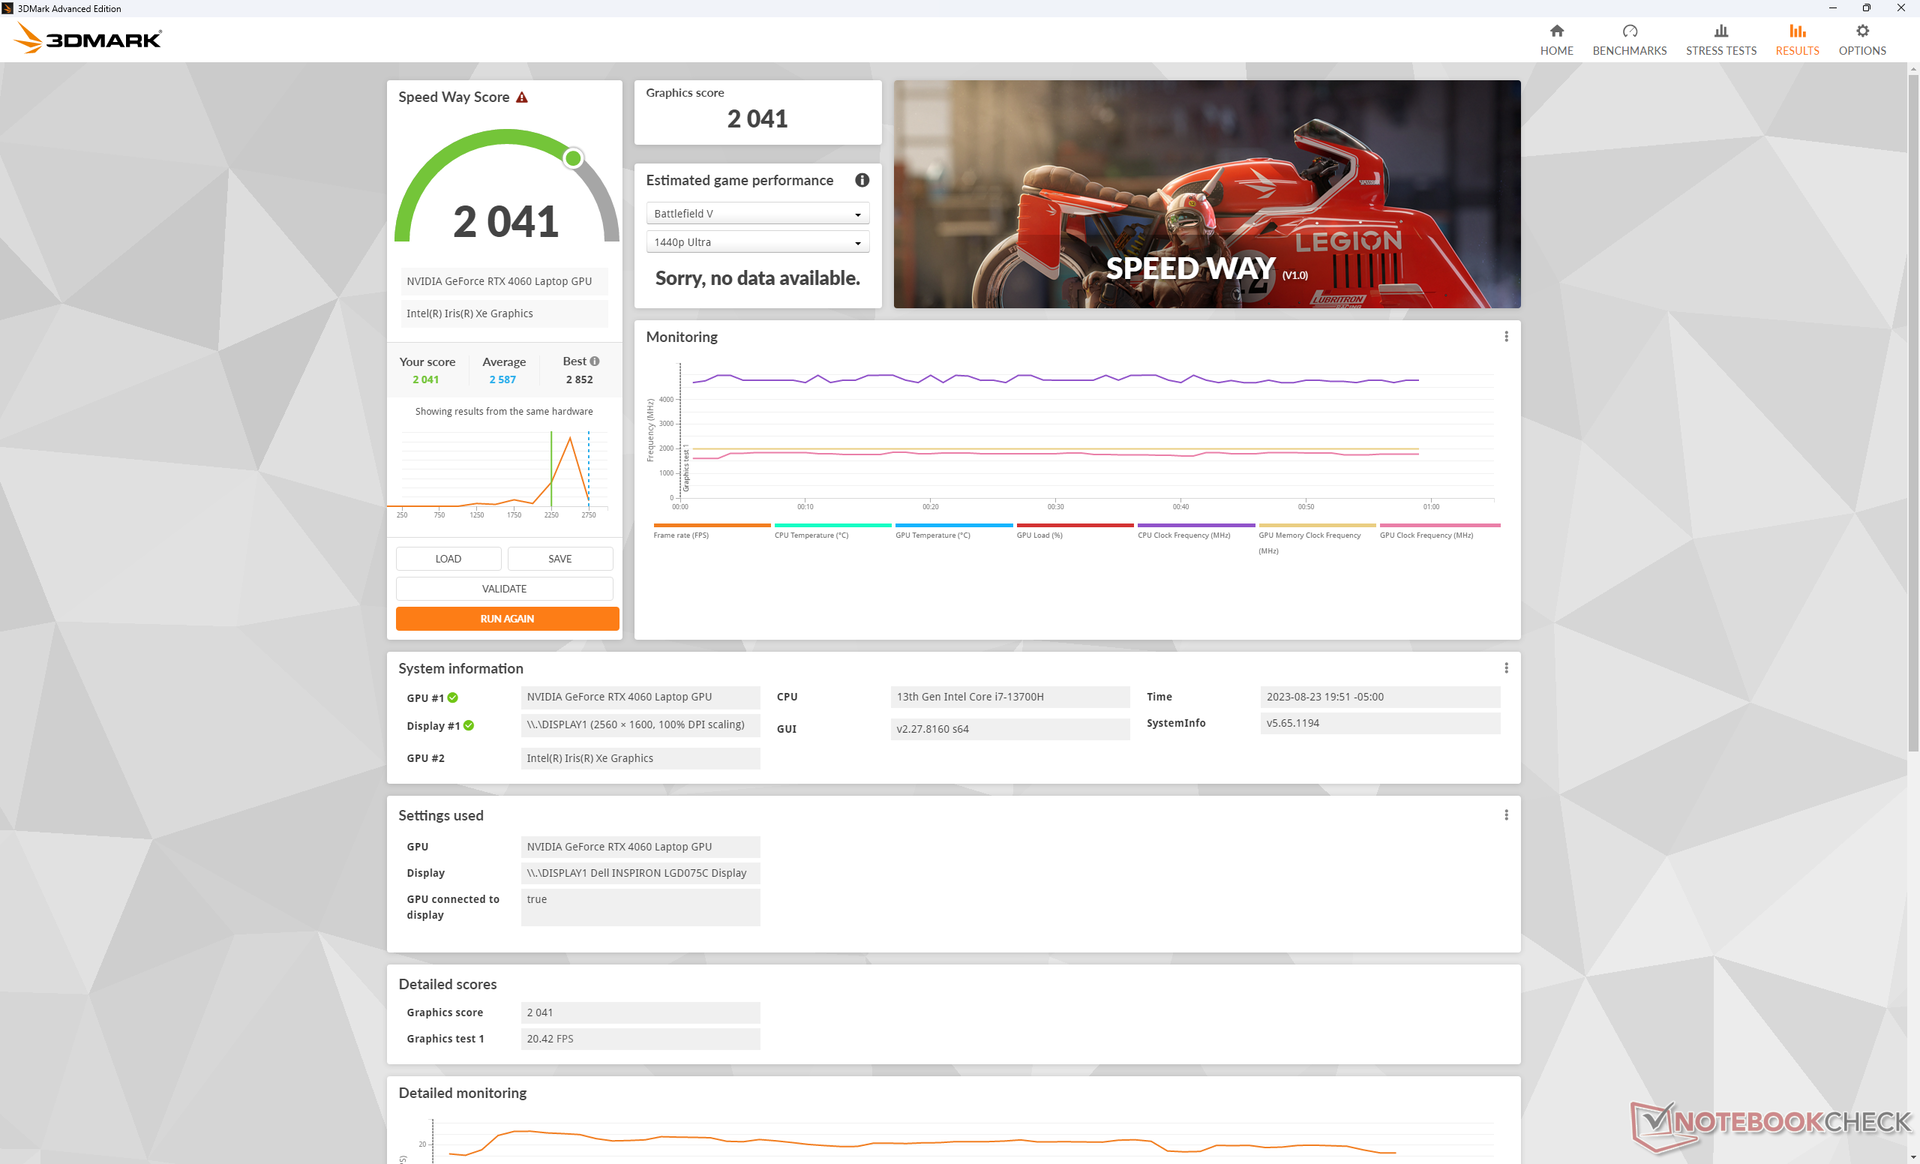
La GeForce RTX 4060 de nuestro Dell es entre un 10 y un 15 por ciento más lenta que la media de portátiles de nuestra base de datos equipados con la misma GPU. El delta se debe probablemente al objetivo TGP relativamente bajo de 60 W del Inspiron 16 Plus 7630, ya que la mayoría de portátiles con la RTX 4060 tienden a ser portátiles dedicados a juegos optimizados para rangos de potencia de GPU más altos, de 90 W o más. Por tanto, el rendimiento general es más comparable al de la GeForce RTX 4050 del Lenovo Slim Pro 9i 16, lo que resulta un poco decepcionante. No obstante, la mejora de rendimiento de una generación a otra con respecto a la RTX 3050 Ti de la Inspiron 16 Plus 7620 del año pasado sigue siendo significativa, entre un 40 y un 60 por ciento.
Los usuarios pueden considerar configurar la Inspiron 16 Plus 7630 con la RTX 4050, más barata, ya que la opción RTX 4060 tiene un rendimiento inferior. Todas las opciones de GPU apuntan al mismo TGP de 60 W.
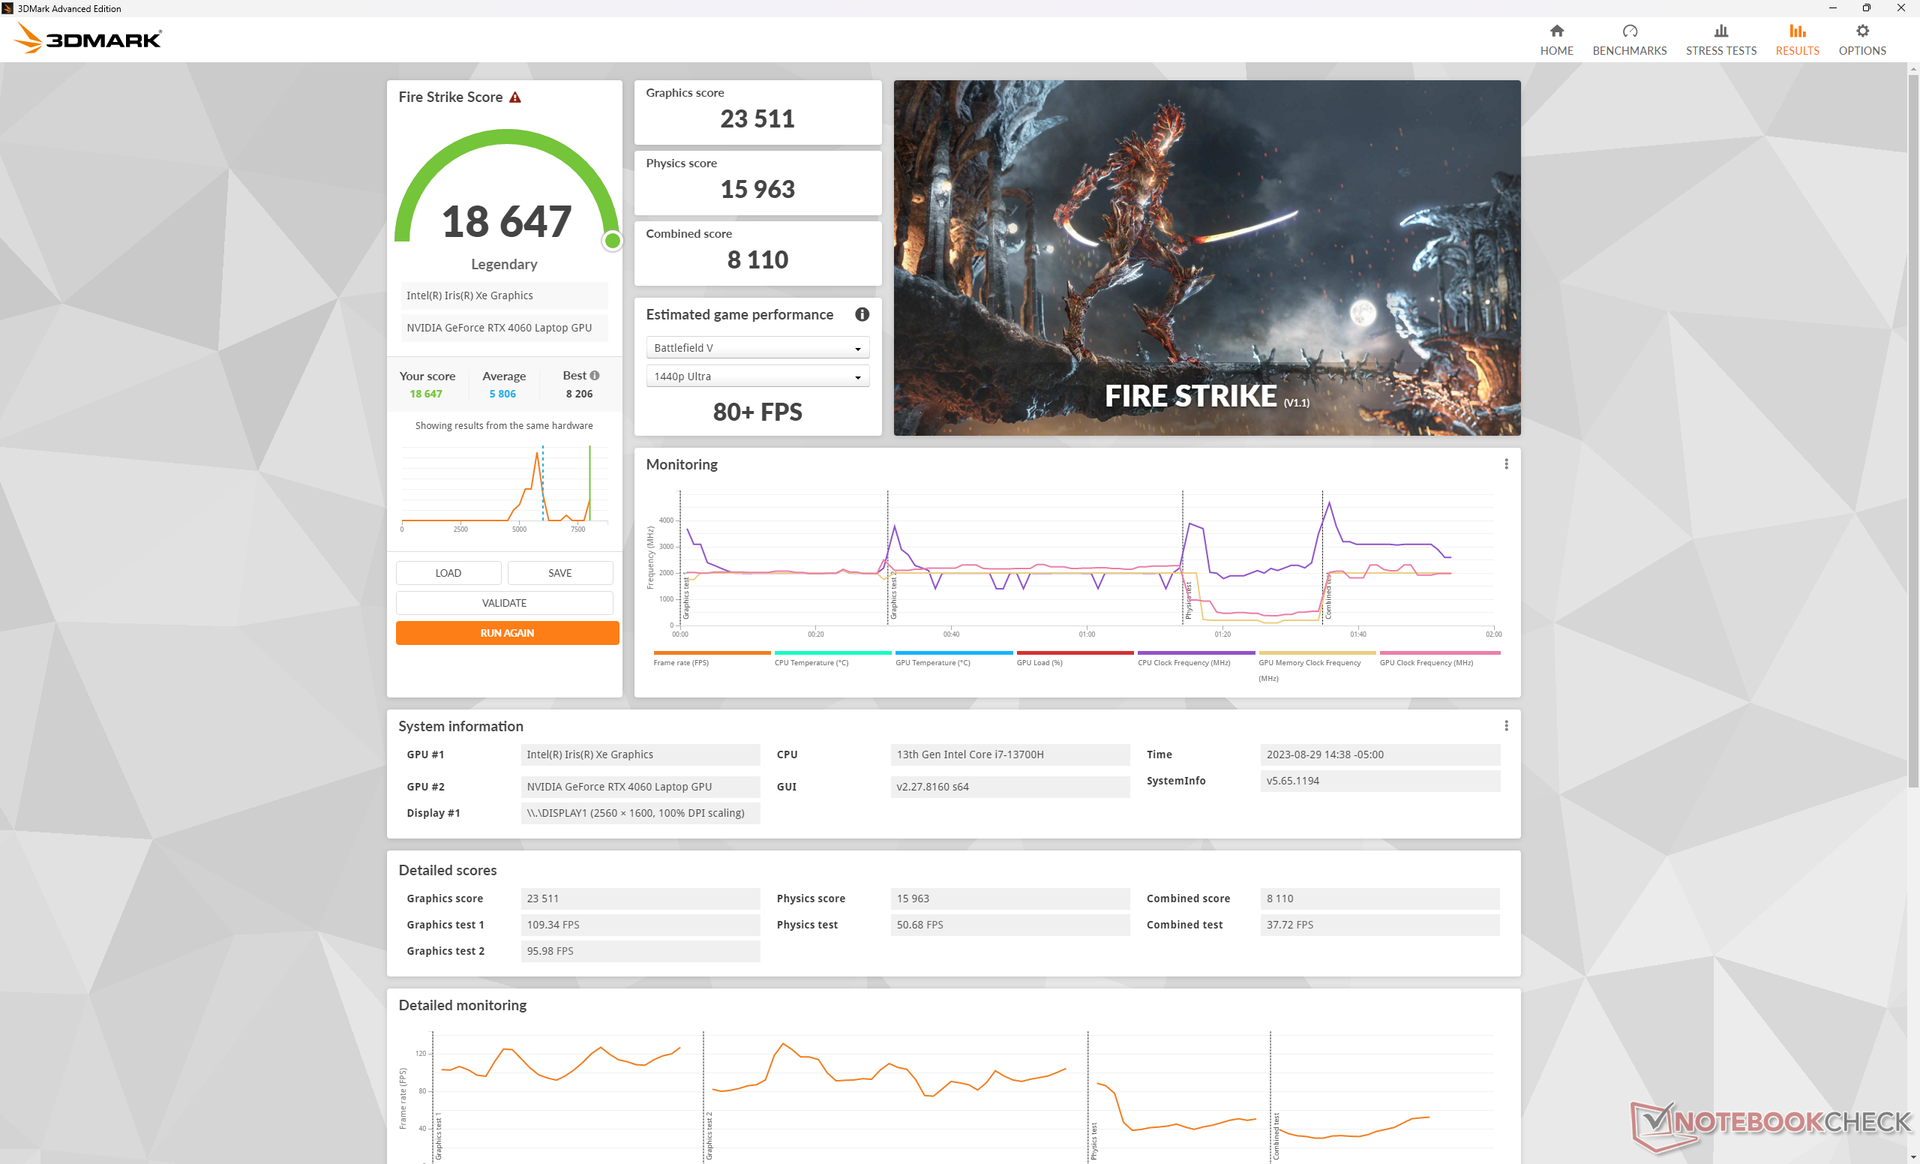
Cambiar del modo Rendimiento al modo Equilibrado afecta bastante al rendimiento de la CPU, mientras que el rendimiento de la GPU se mantendría casi igual, como muestran nuestros resultados de Fire Strike a continuación. Asegúrate de estar en modo Rendimiento si ejecutas tareas intensivas de CPU.
| Perfil de potencia | Puntuación gráfica | Puntuación física | Puntuación combinada |
| Batería | 19574 (-9%) | 10010 (-61%) | 4793 (-46%) |
| Modo equilibrado | 23511 (-2%) | 15963 (-41%) | 8110 (-21%) |
| Modo Rendimiento | 24008 | 26852 | 10239 |

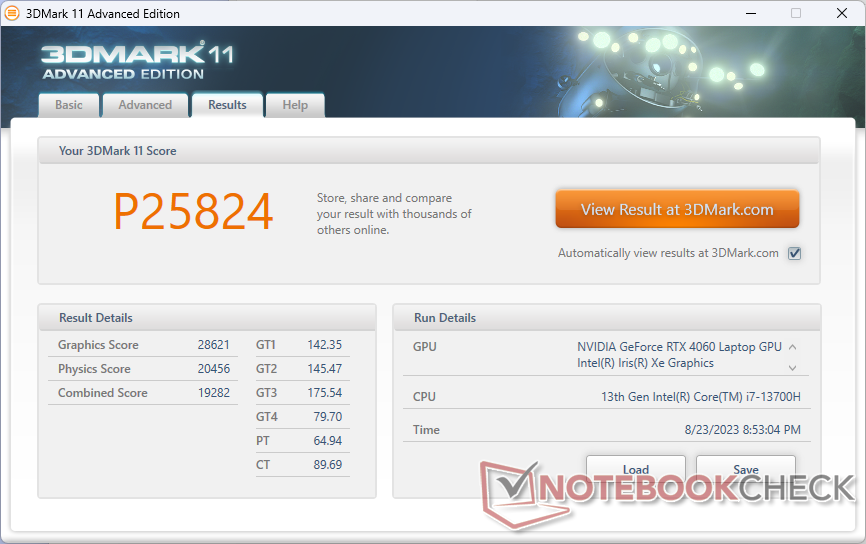
| 3DMark 11 Performance | 25824 puntos | |
| 3DMark Fire Strike Score | 19289 puntos | |
| 3DMark Time Spy Score | 8240 puntos | |
ayuda | ||
* ... más pequeño es mejor
Rendimiento en juegos
Como predecían los resultados 3DMark anteriores, el rendimiento general en juegos está ligeramente por debajo de la media para un portátil con gráficos RTX 4060. Tiny Tina's Wonderlands, por ejemplo, funciona a 48 FPS con la configuración máxima de 1440p en comparación con los 57 FPS de la mayoría de portátiles RTX 4060. Desafortunadamente, la serie Inspiron 7630 no es compatible con G-Sync, lo que habría suavizado el desgarro de fotogramas.
Witcher 3 FPS Chart
| bajo | medio | alto | ultra | QHD | |
|---|---|---|---|---|---|
| The Witcher 3 (2015) | 409.3 | 275.3 | 169.5 | 90.9 | 68 |
| Dota 2 Reborn (2015) | 184.7 | 166.6 | 157.9 | 146.1 | |
| Final Fantasy XV Benchmark (2018) | 172.2 | 122.2 | 88.9 | 64.4 | |
| X-Plane 11.11 (2018) | 153.5 | 135.7 | 109.7 | ||
| Far Cry 5 (2018) | 133 | 120 | 115 | 103 | 83 |
| Strange Brigade (2018) | 378 | 234 | 185.9 | 161 | 110.9 |
| Cyberpunk 2077 1.6 (2022) | 108.1 | 84.2 | 72.9 | 65.7 | 40.8 |
| Tiny Tina's Wonderlands (2022) | 169.5 | 141.5 | 92.1 | 71.4 | 48 |
| F1 22 (2022) | 205 | 201 | 148.4 | 53.8 | 34.1 |
| Returnal (2023) | 71 | 68 | 63 | 57 | 39 |
Emisiones
Ruido del sistema: más silencioso y alto que antes
Los ventiladores internos pueden ser silenciosos cuando están en ralentí en el escritorio, pero la mayoría de las veces rondan los 26 a 28 dB(A) cuando se ejecutan cargas comunes como navegadores web o secuencias de vídeo. Y lo que es más impresionante, pueden permanecer relativamente silenciosos durante un buen rato incluso cuando se introducen cargas más altas, mientras que los ventiladores del Inspiron 16 Plus 7620 pulsarían más rápida y fácilmente. Cuando se ejecuta 3DMark 06, por ejemplo, el ruido del ventilador sólo aumenta hasta 35 dB(A) hacia el final de la primera escena de 90 segundos del benchmark.
El ruido del ventilador aumenta significativamente cuando se ejecutan juegos. Mientras que el Inspiron 16 Plus 7630 es generalmente más silencioso que el modelo del año pasado cuando se ejecutan cargas poco exigentes, lo contrario es cierto cuando se juega. El ruido del ventilador alcanza un máximo de casi 53 dB(A) cuando se ejecuta Witcher 3 en comparación con los 49 dB(A) del Inspiron 16 Plus 7620. No obstante, el bajo rango de 50 dB(A) es comparable al de competidores como elSlim Pro 9i 16 o el Envy 16.
Curiosamente, cambiar el perfil de potencia entre los modos Equilibrado y Rendimiento no afecta al techo de ruido del ventilador al jugar, ya que sigue alcanzando un máximo de 52,5 dB(A) en cualquiera de los dos ajustes.
Ruido
| Ocioso |
| 23.2 / 23.2 / 23.2 dB(A) |
| Carga |
| 35.1 / 52.5 dB(A) |
 | ||
30 dB silencioso 40 dB(A) audible 50 dB(A) ruidosamente alto |
||
min: | ||
| Dell Inspiron 16 Plus 7630 GeForce RTX 4060 Laptop GPU, i7-13700H, WD PC SN740 SDDPTQD-1T00 | Dell Inspiron 16 Plus 7620 GeForce RTX 3050 Ti Laptop GPU, i7-12700H, Kioxia BG5 KBG50ZNS512G | Lenovo Slim Pro 9i 16IRP8 GeForce RTX 4050 Laptop GPU, i9-13905H, Samsung PM9A1 MZVL21T0HCLR | Asus Vivobook Pro 16X K6604JV-MX016W GeForce RTX 4060 Laptop GPU, i9-13980HX, Solidigm P41 Plus SSDPFKNU010TZ | HP Envy 16 h0112nr GeForce RTX 3060 Laptop GPU, i7-12700H, Micron 3400 1TB MTFDKBA1T0TFH | MSI Summit E16 Flip A12UDT-031 GeForce RTX 3050 Ti Laptop GPU, i7-1280P, Samsung PM9A1 MZVL22T0HBLB | |
|---|---|---|---|---|---|---|
| Noise | -11% | 1% | -21% | -6% | -14% | |
| apagado / medio ambiente * (dB) | 23.2 | 23.3 -0% | 22.7 2% | 25.2 -9% | 22.8 2% | 25 -8% |
| Idle Minimum * (dB) | 23.2 | 25.7 -11% | 22.7 2% | 26.6 -15% | 22.9 1% | 25 -8% |
| Idle Average * (dB) | 23.2 | 26.1 -13% | 22.7 2% | 26.6 -15% | 22.9 1% | 25 -8% |
| Idle Maximum * (dB) | 23.2 | 30.6 -32% | 27.5 -19% | 29.2 -26% | 30.5 -31% | 28.9 -25% |
| Load Average * (dB) | 35.1 | 46.2 -32% | 28.9 18% | 53.4 -52% | 41.4 -18% | 49.3 -40% |
| Witcher 3 ultra * (dB) | 52.5 | 49.2 6% | 52.6 -0% | 51.1 3% | ||
| Load Maximum * (dB) | 52.5 | 49.4 6% | 52.5 -0% | 56.9 -8% | 51.4 2% | 48.2 8% |
* ... más pequeño es mejor
Temperatura
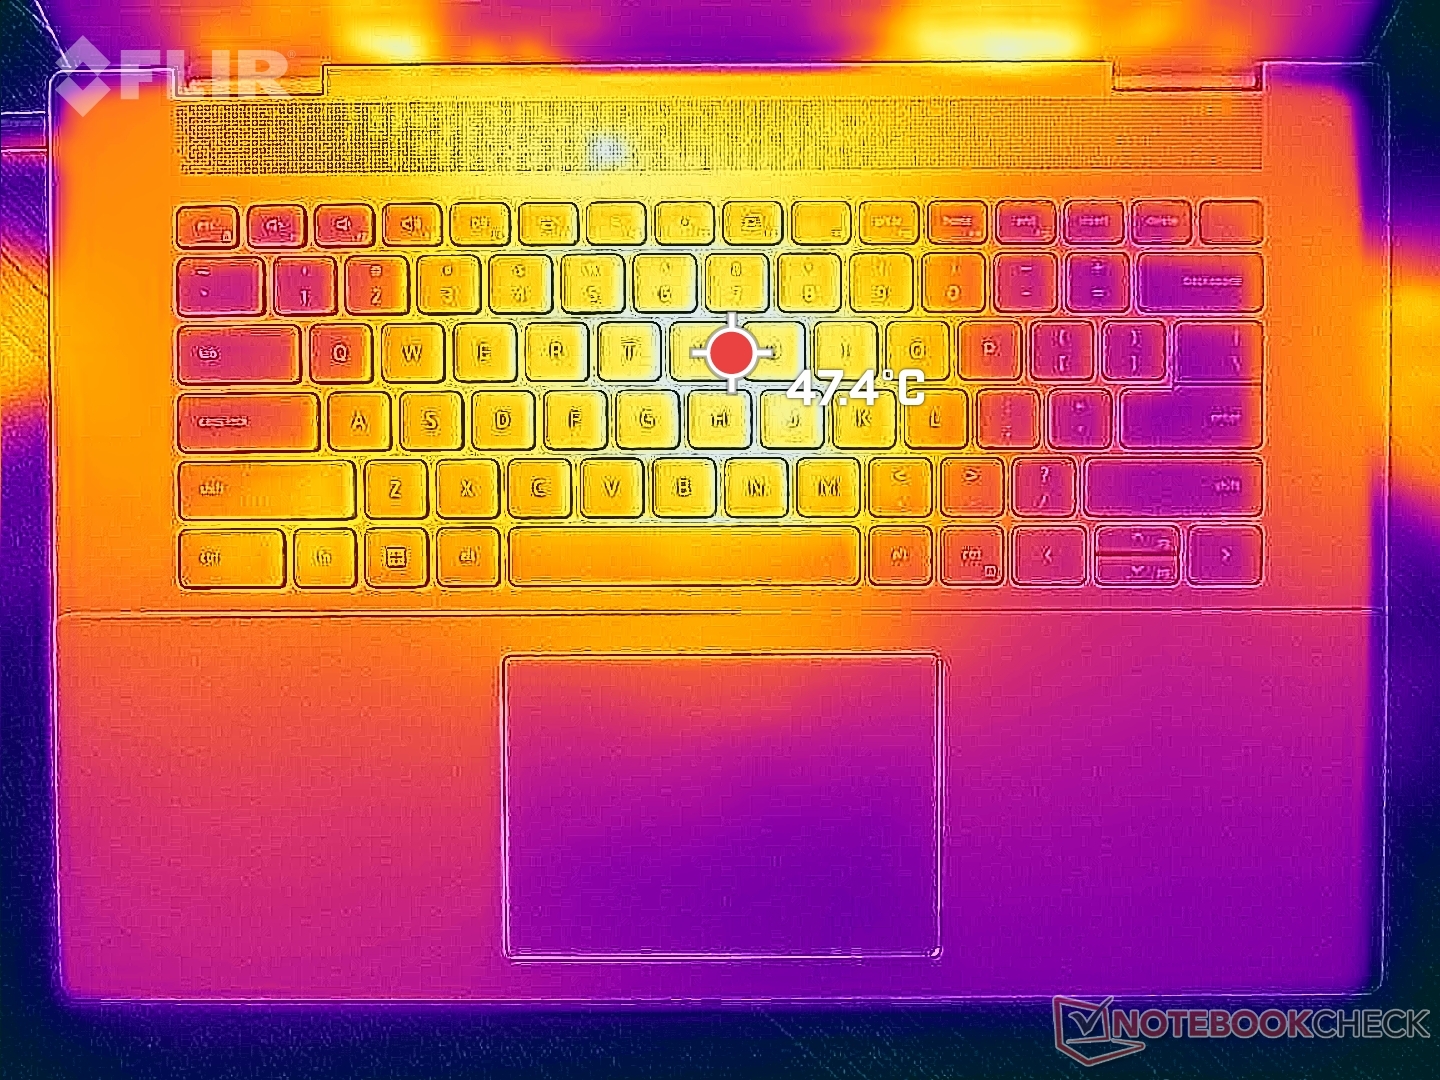
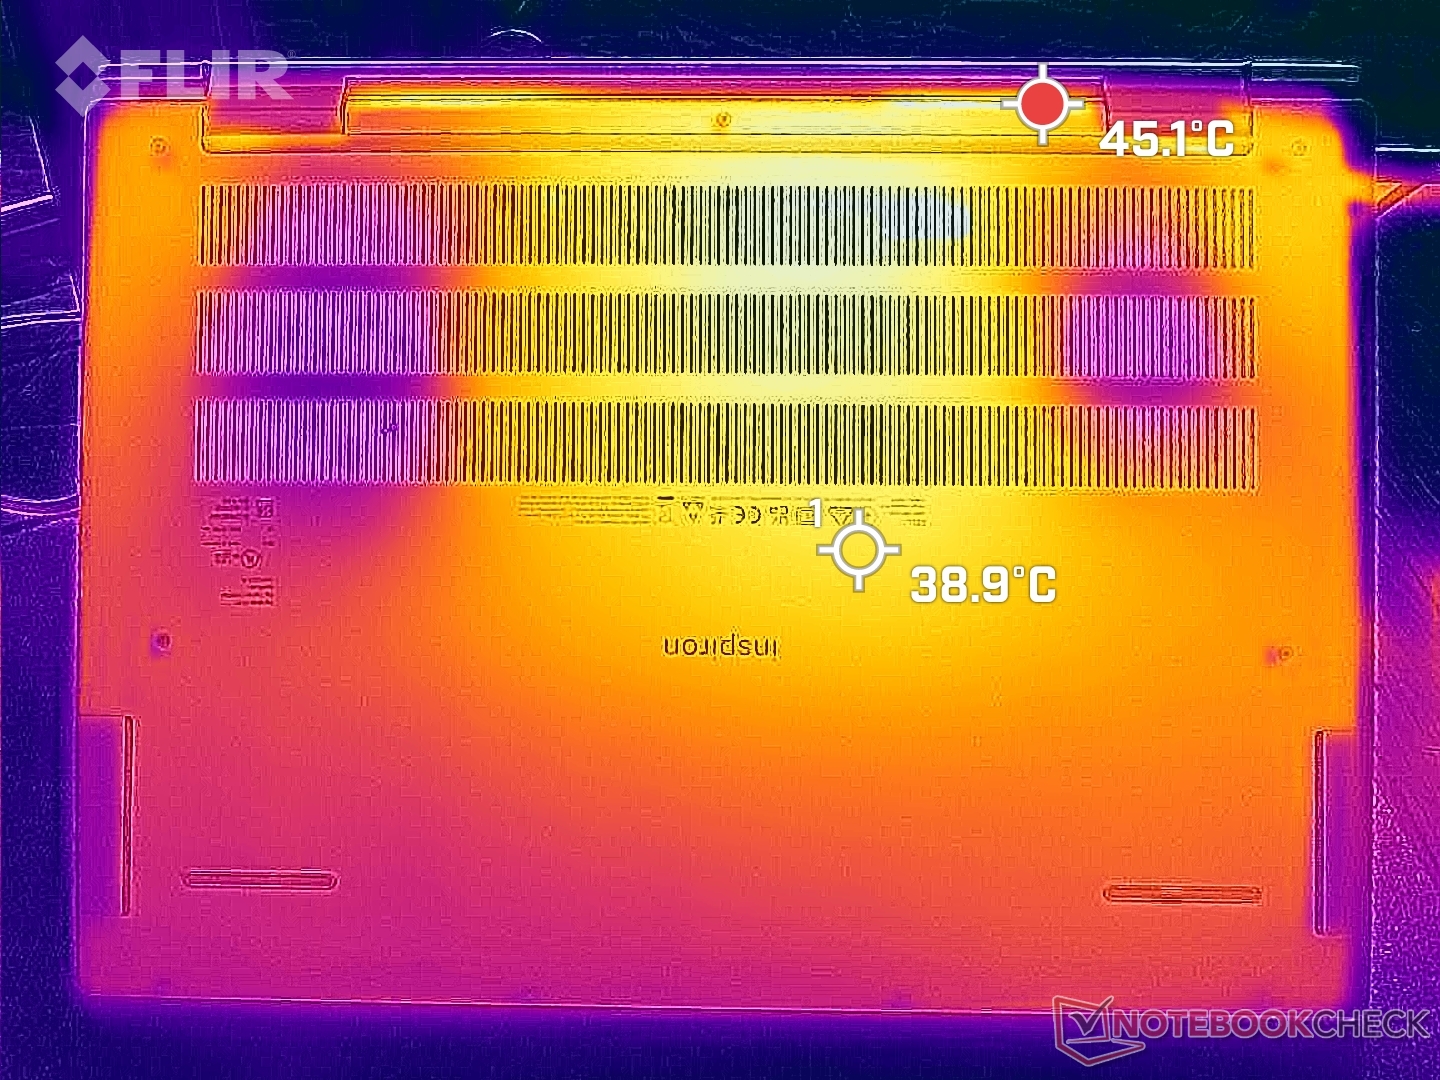
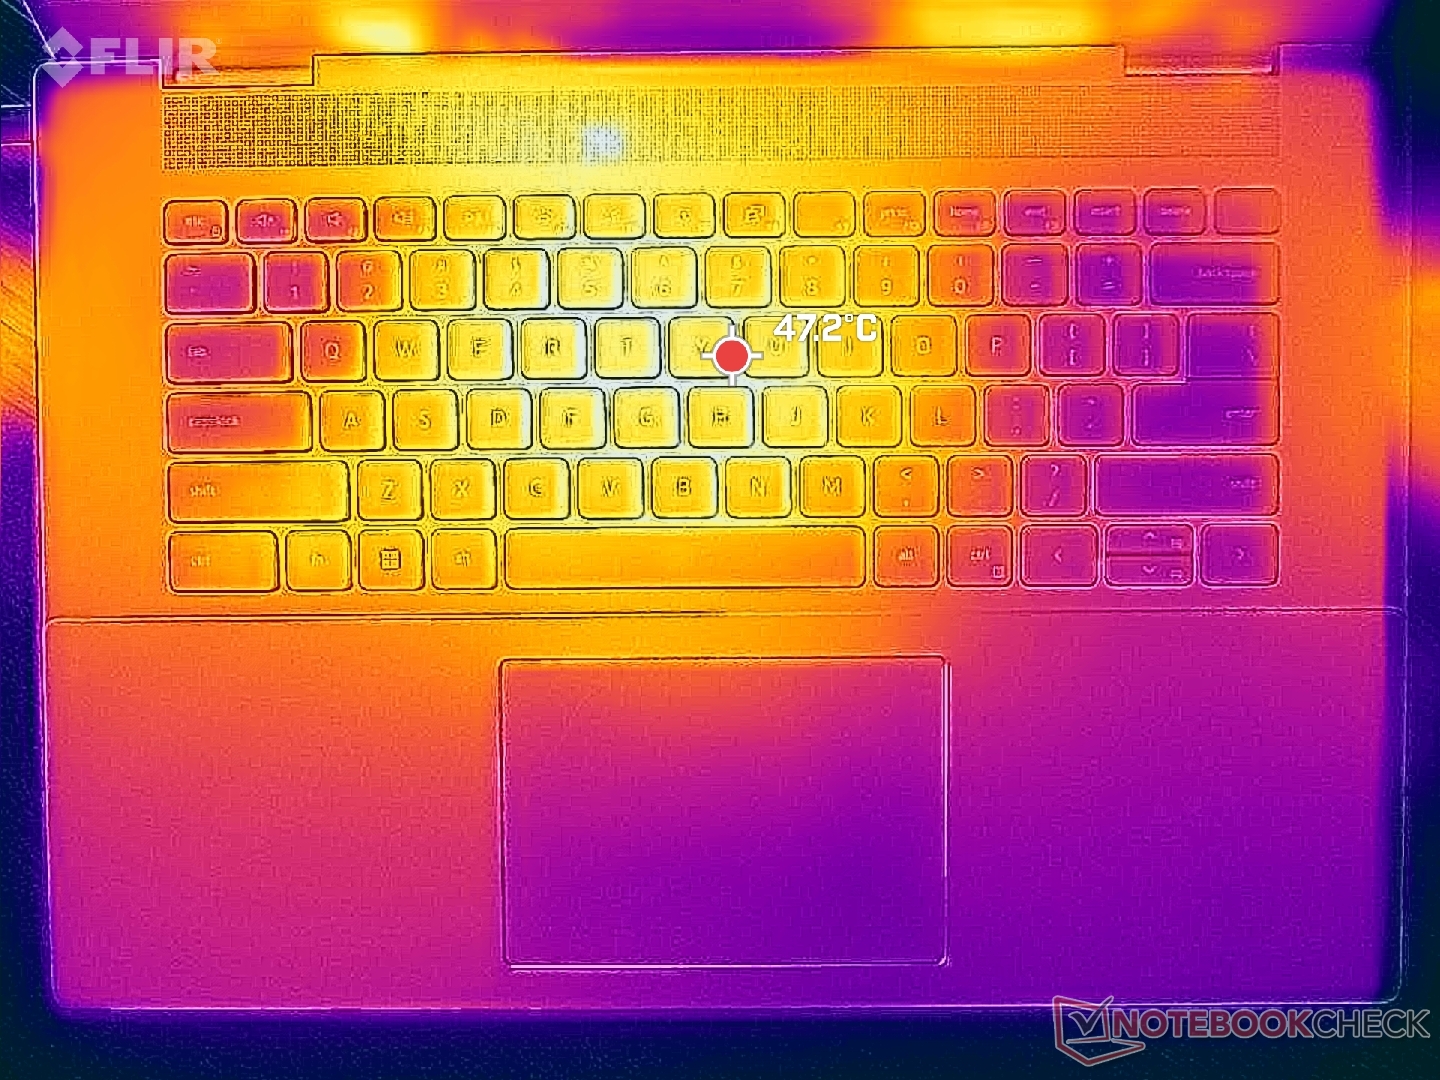
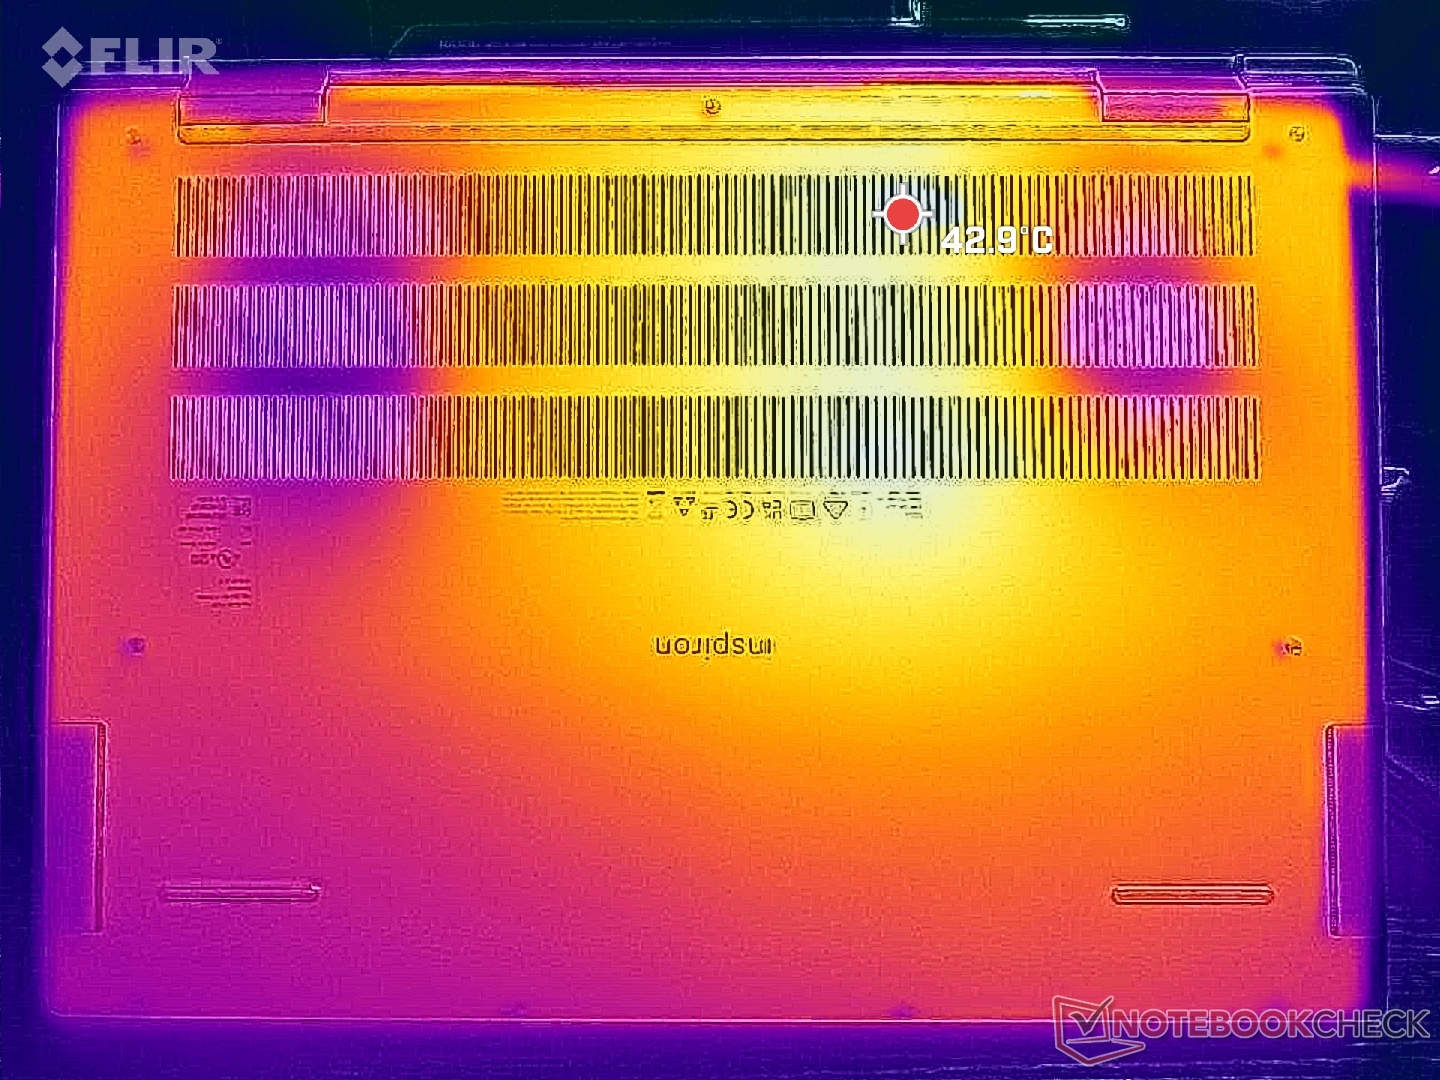
Las temperaturas de la superficie cuando se ejecutan cargas exigentes como juegos son más cálidas de lo esperado. Los puntos calientes de la parte superior e inferior pueden alcanzar los 48 C y 43 C, respectivamente, cerca del centro del teclado. Los reposamuñecas también pueden calentarse mucho, hasta 37ºC comparados con los 31ºC del Asus Vivobook Pro 16X.Asus Vivobook Pro 16X o el HP Envy 16. Esto es ciertamente más de un calentador de manos en comparación con otros portátiles.
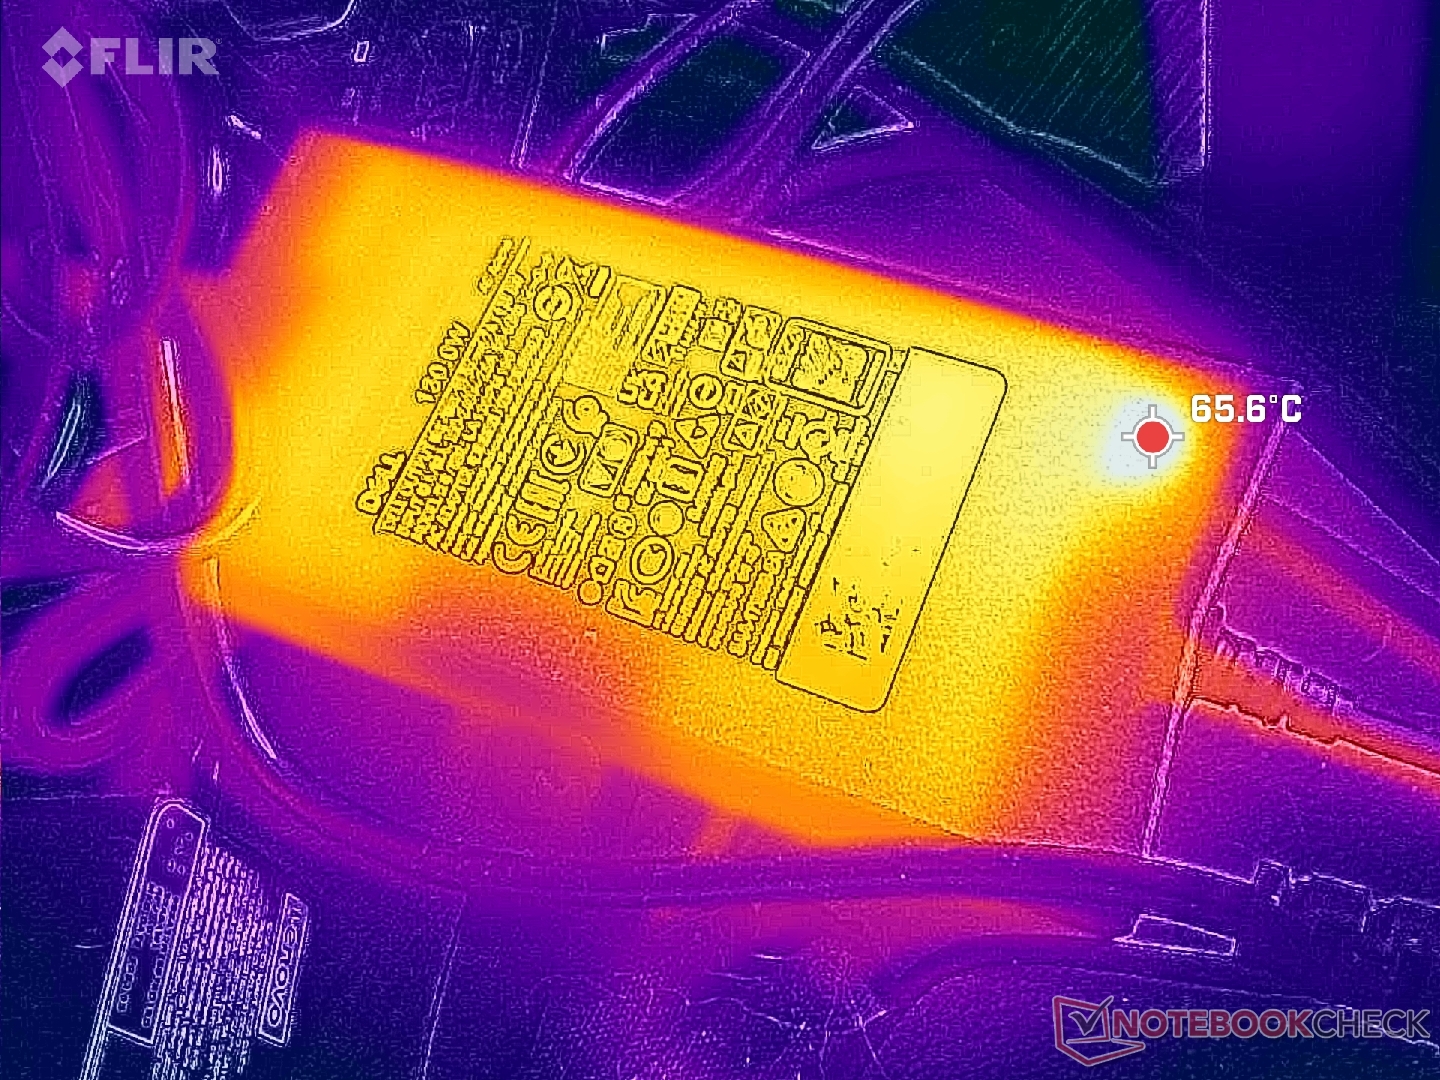
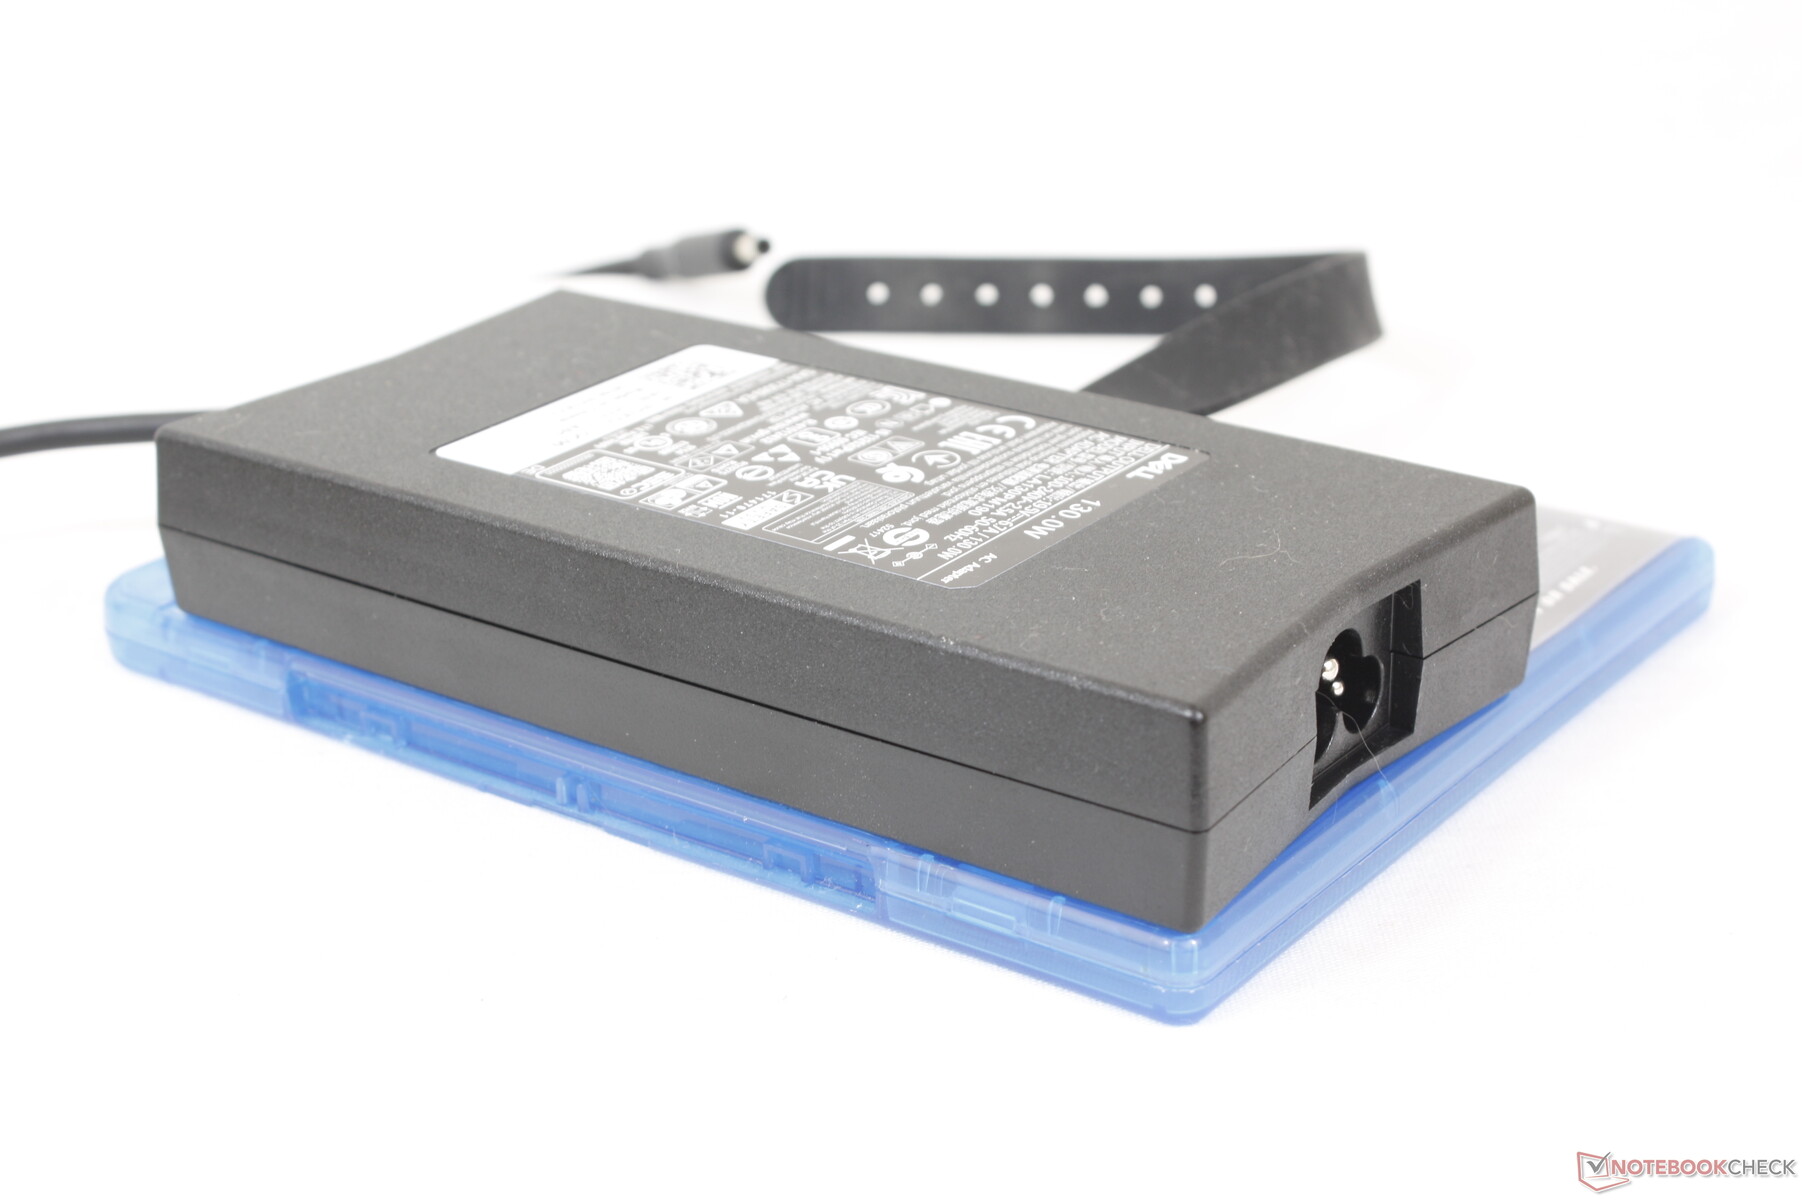
Adicionalmente, el adaptador AC es notablemente más caliente que el promedio a más de 65 C. Usted querrá dar amplio espacio para el adaptador AC por si acaso.
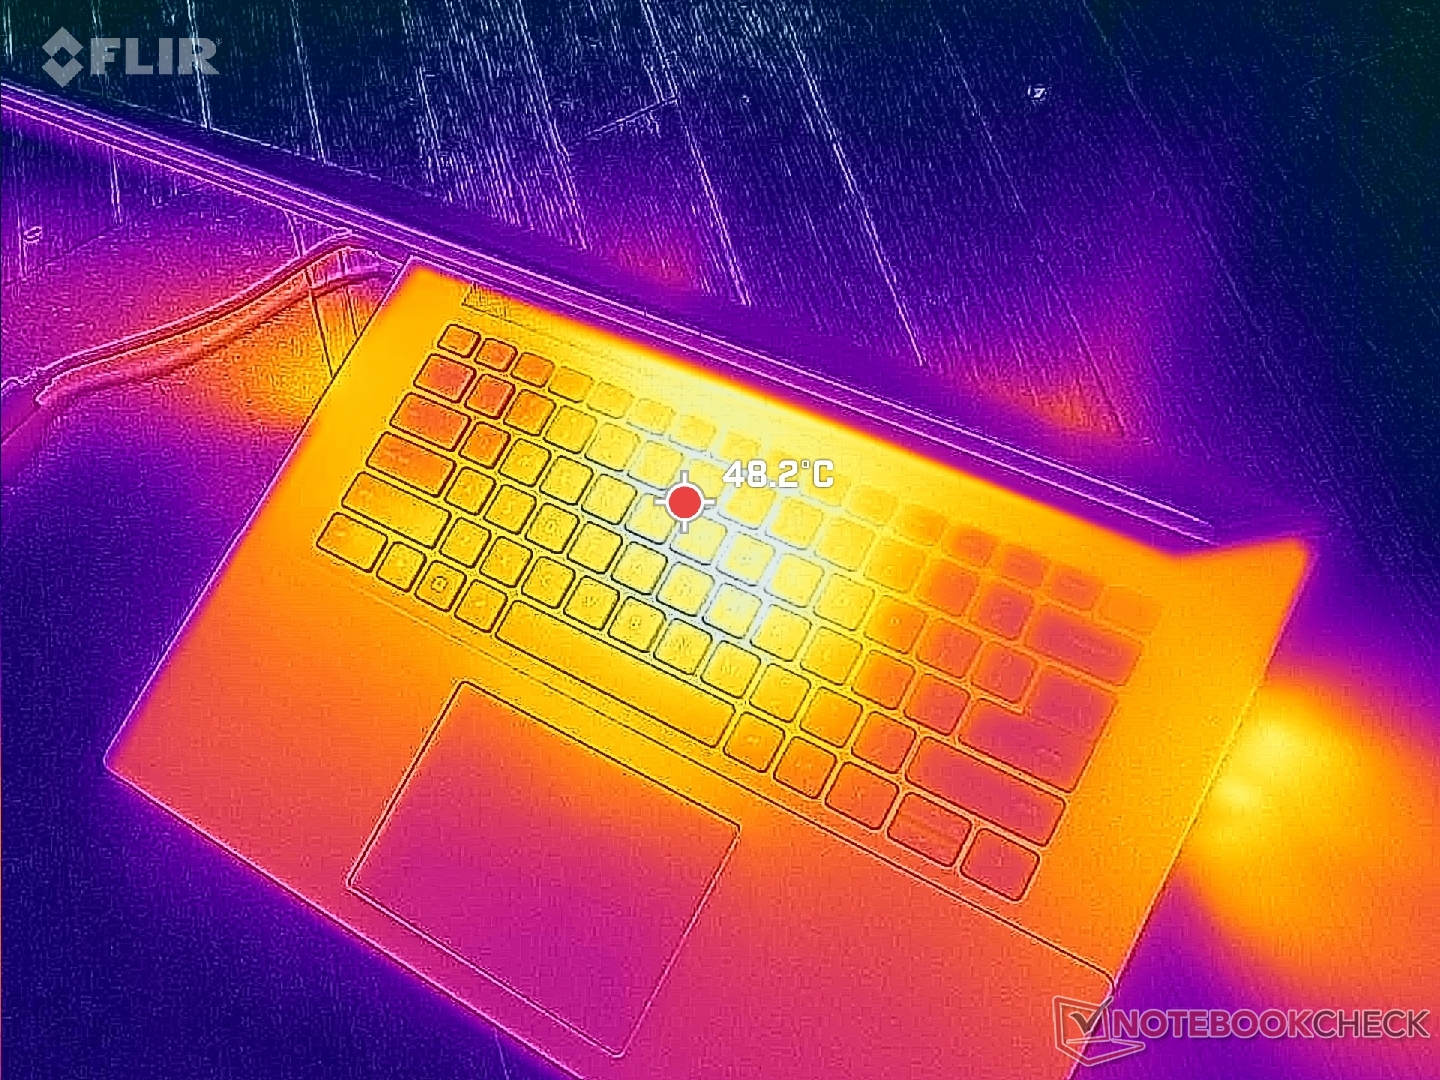
(-) La temperatura máxima en la parte superior es de 47.8 °C / 118 F, frente a la media de 36.8 °C / 98 F, que oscila entre 21 y 71 °C para la clase Multimedia.
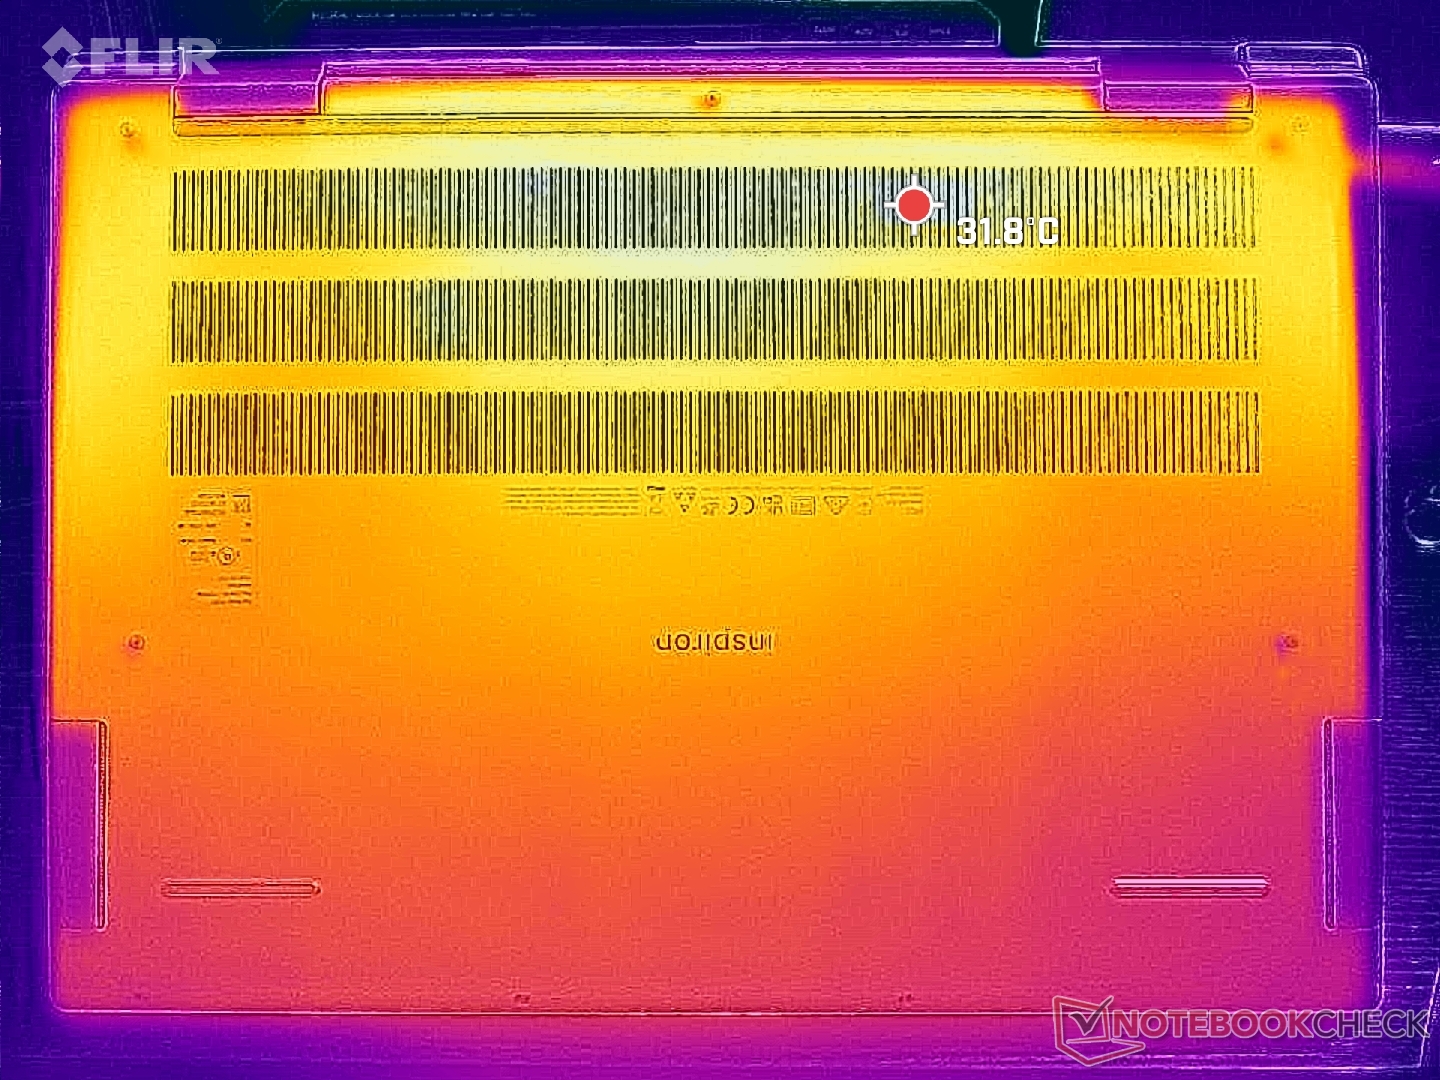
(±) El fondo se calienta hasta un máximo de 42.2 °C / 108 F, frente a la media de 39.1 °C / 102 F
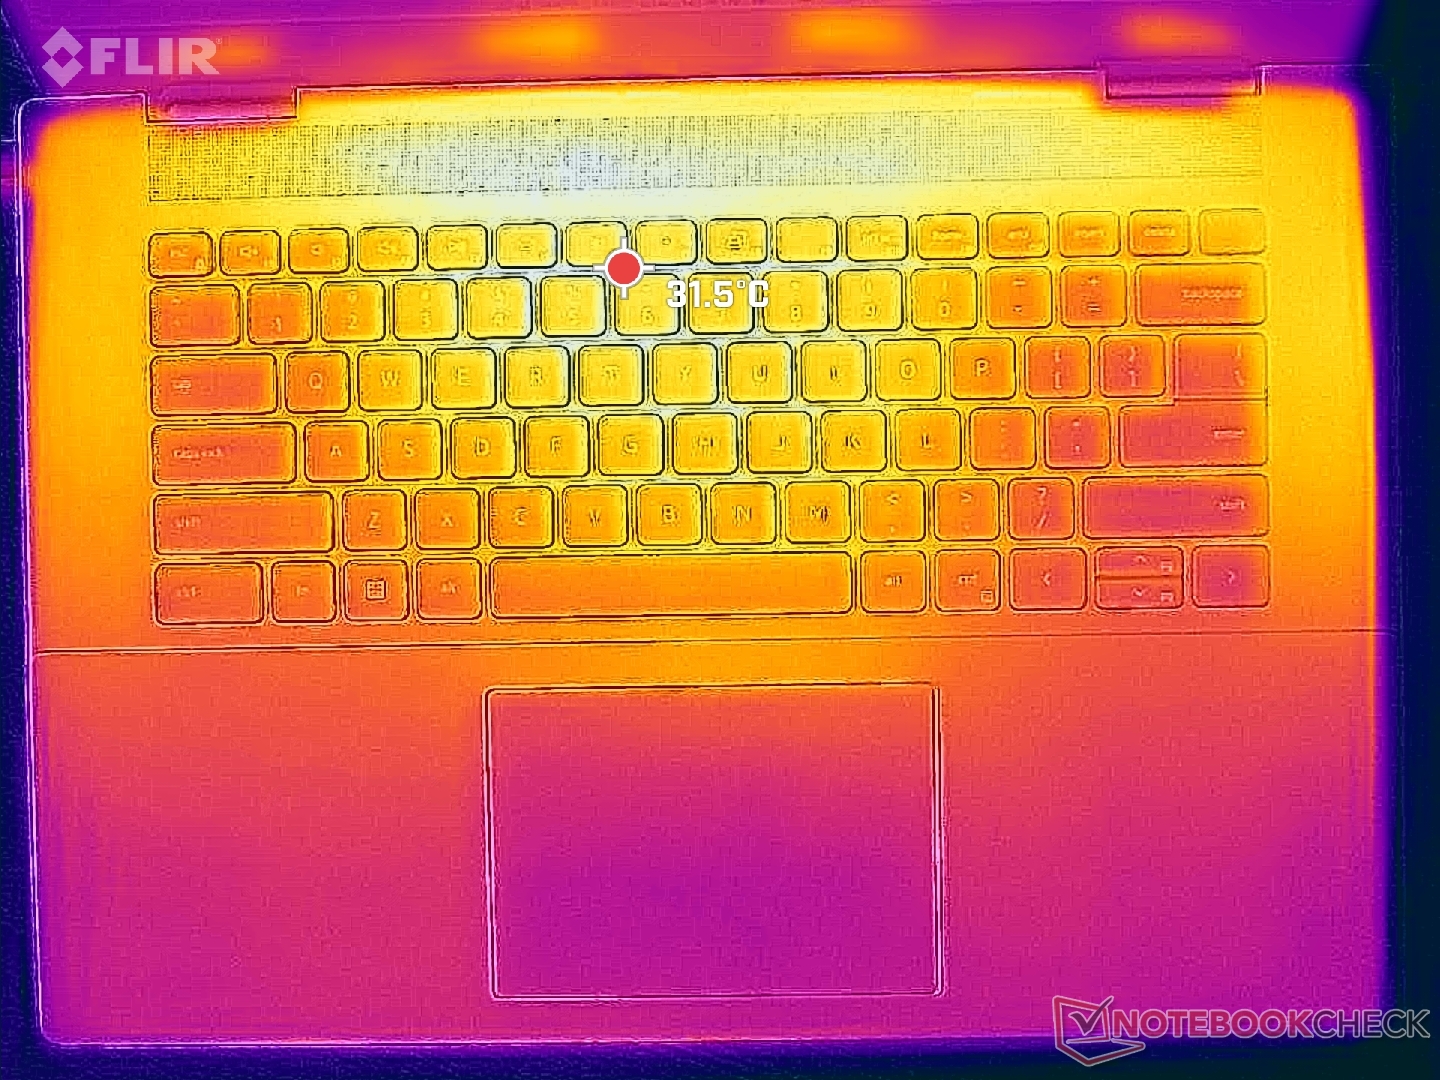
(±) En reposo, la temperatura media de la parte superior es de 32 °C / 90# F, frente a la media del dispositivo de 31.3 °C / 88 F.
(-) Jugando a The Witcher 3, la temperatura media de la parte superior es de 40.6 °C / 105 F, frente a la media del dispositivo de 31.3 °C / 88 F.
(±) El reposamanos y el touchpad pueden calentarse mucho al tacto con un máximo de 36.6 °C / 97.9 F.
(-) La temperatura media de la zona del reposamanos de dispositivos similares fue de 28.7 °C / 83.7 F (-7.9 °C / -14.2 F).
| Dell Inspiron 16 Plus 7630 Intel Core i7-13700H, NVIDIA GeForce RTX 4060 Laptop GPU | Dell Inspiron 16 Plus 7620 Intel Core i7-12700H, NVIDIA GeForce RTX 3050 Ti Laptop GPU | Lenovo Slim Pro 9i 16IRP8 Intel Core i9-13905H, NVIDIA GeForce RTX 4050 Laptop GPU | Asus Vivobook Pro 16X K6604JV-MX016W Intel Core i9-13980HX, NVIDIA GeForce RTX 4060 Laptop GPU | HP Envy 16 h0112nr Intel Core i7-12700H, NVIDIA GeForce RTX 3060 Laptop GPU | MSI Summit E16 Flip A12UDT-031 Intel Core i7-1280P, NVIDIA GeForce RTX 3050 Ti Laptop GPU | |
|---|---|---|---|---|---|---|
| Heat | 6% | 10% | -3% | 3% | 2% | |
| Maximum Upper Side * (°C) | 47.8 | 46 4% | 37.8 21% | 39.7 17% | 45.2 5% | 49.2 -3% |
| Maximum Bottom * (°C) | 42.2 | 45.8 -9% | 44.8 -6% | 60 -42% | 44 -4% | 50.2 -19% |
| Idle Upper Side * (°C) | 35.2 | 29.2 17% | 30.6 13% | 30.9 12% | 33.6 5% | 29.4 16% |
| Idle Bottom * (°C) | 35 | 31 11% | 31 11% | 34.7 1% | 32.6 7% | 30 14% |
* ... más pequeño es mejor
Prueba de resistencia
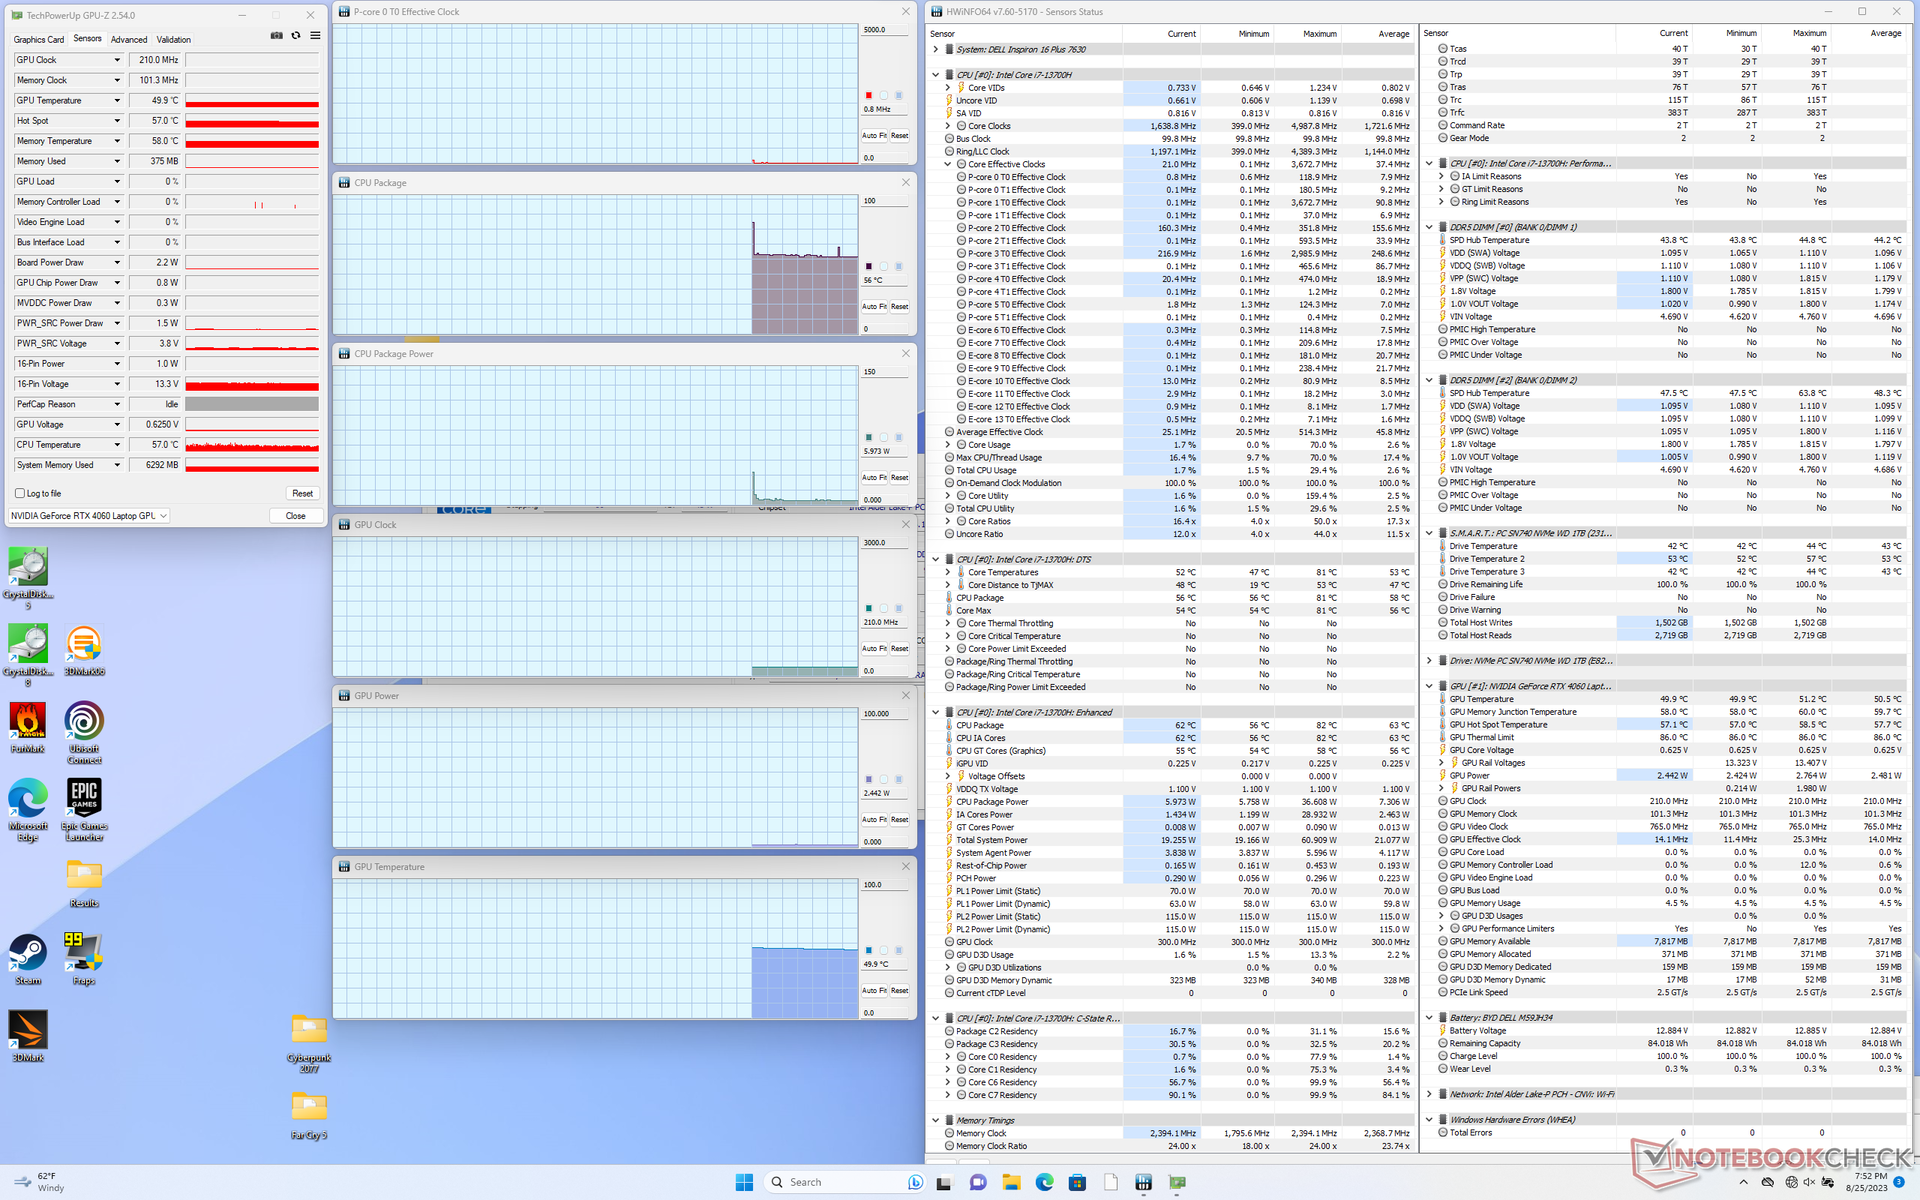
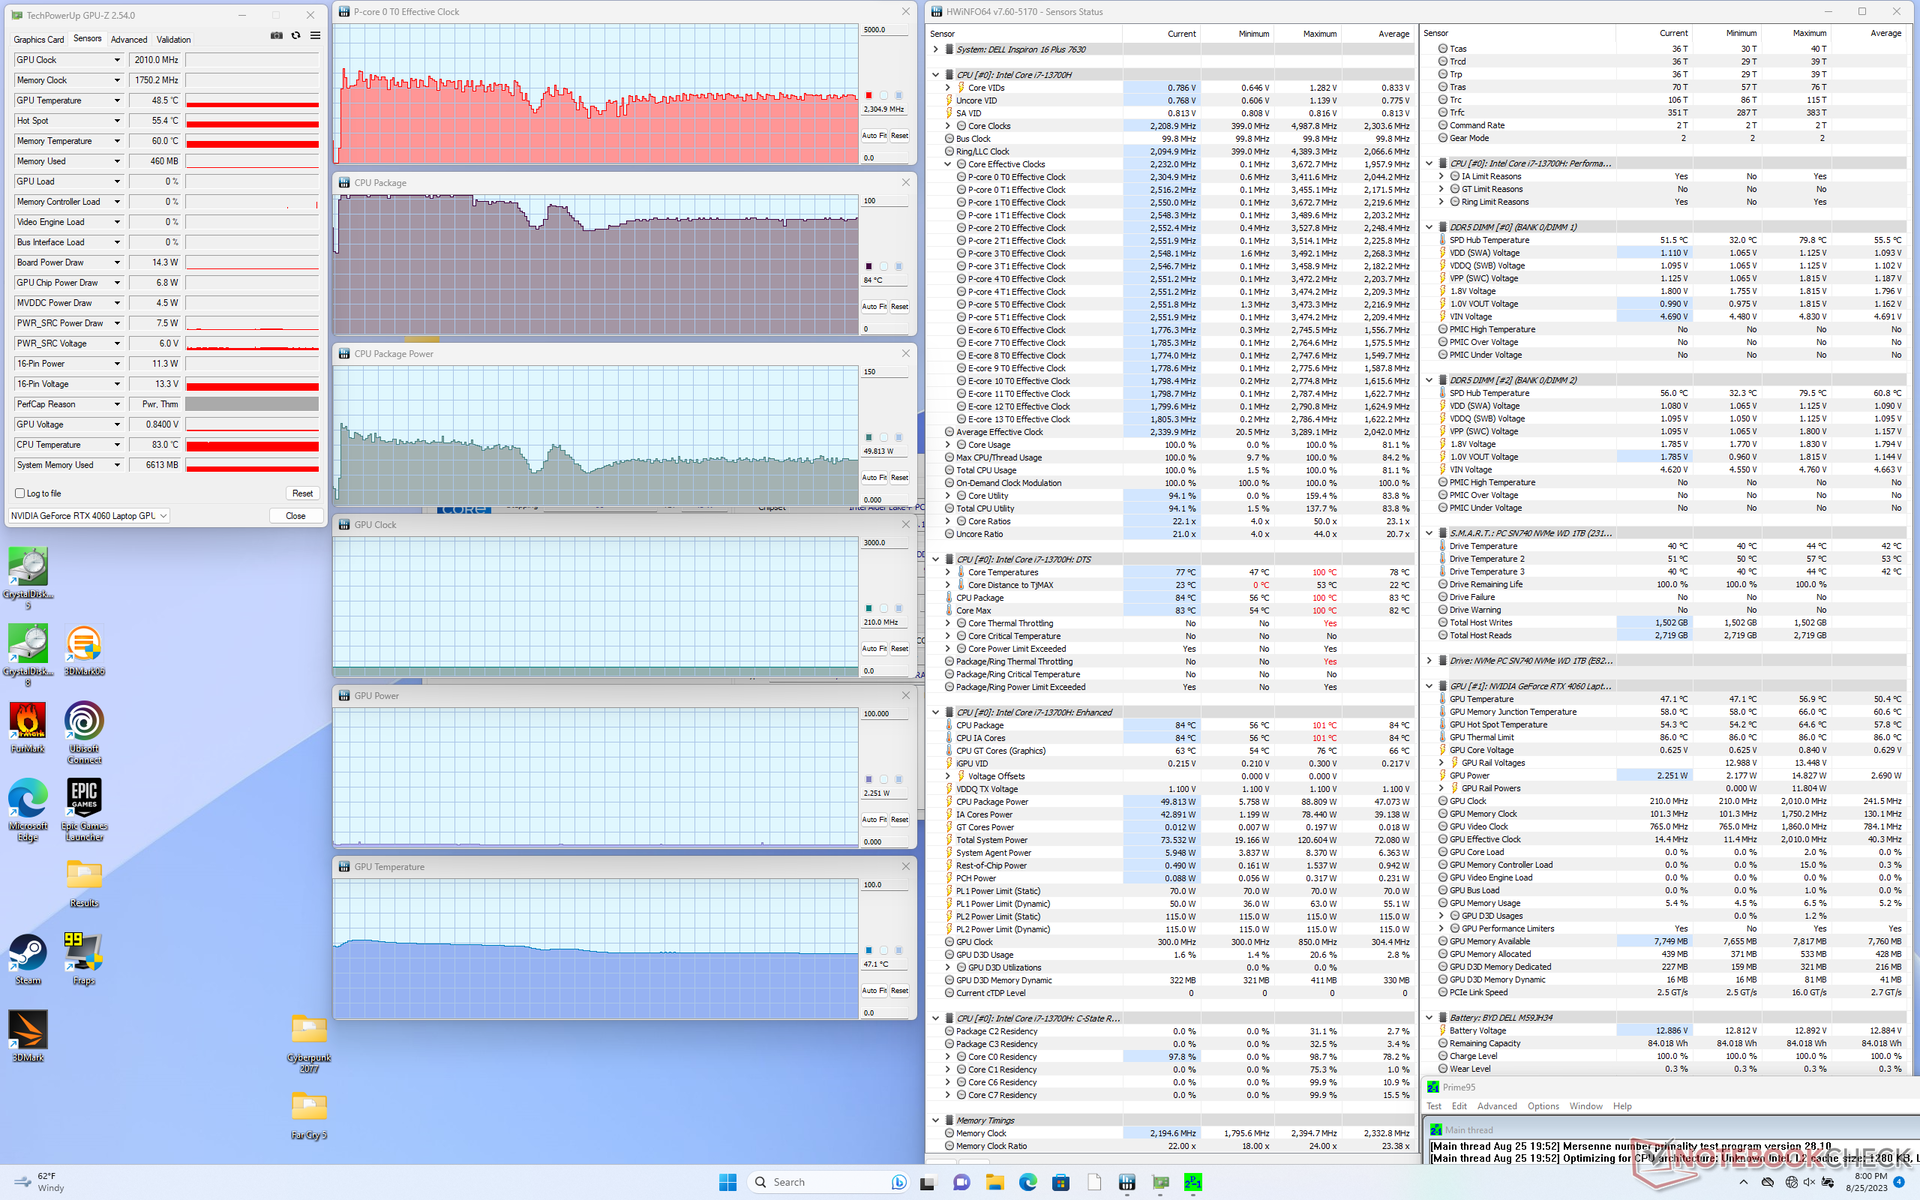
Cuando se ejecuta Prime95, la CPU alcanza los 3,4 GHz, 89 W y una temperatura de 100 C durante sólo unos segundos antes de estabilizarse en torno a los 2,3 GHz y 50 W para mantener una temperatura del núcleo más razonable de 84 C. El modelo del año pasado también se estabilizaba en torno a los mismos valores cuando se ejecutaba la misma prueba.
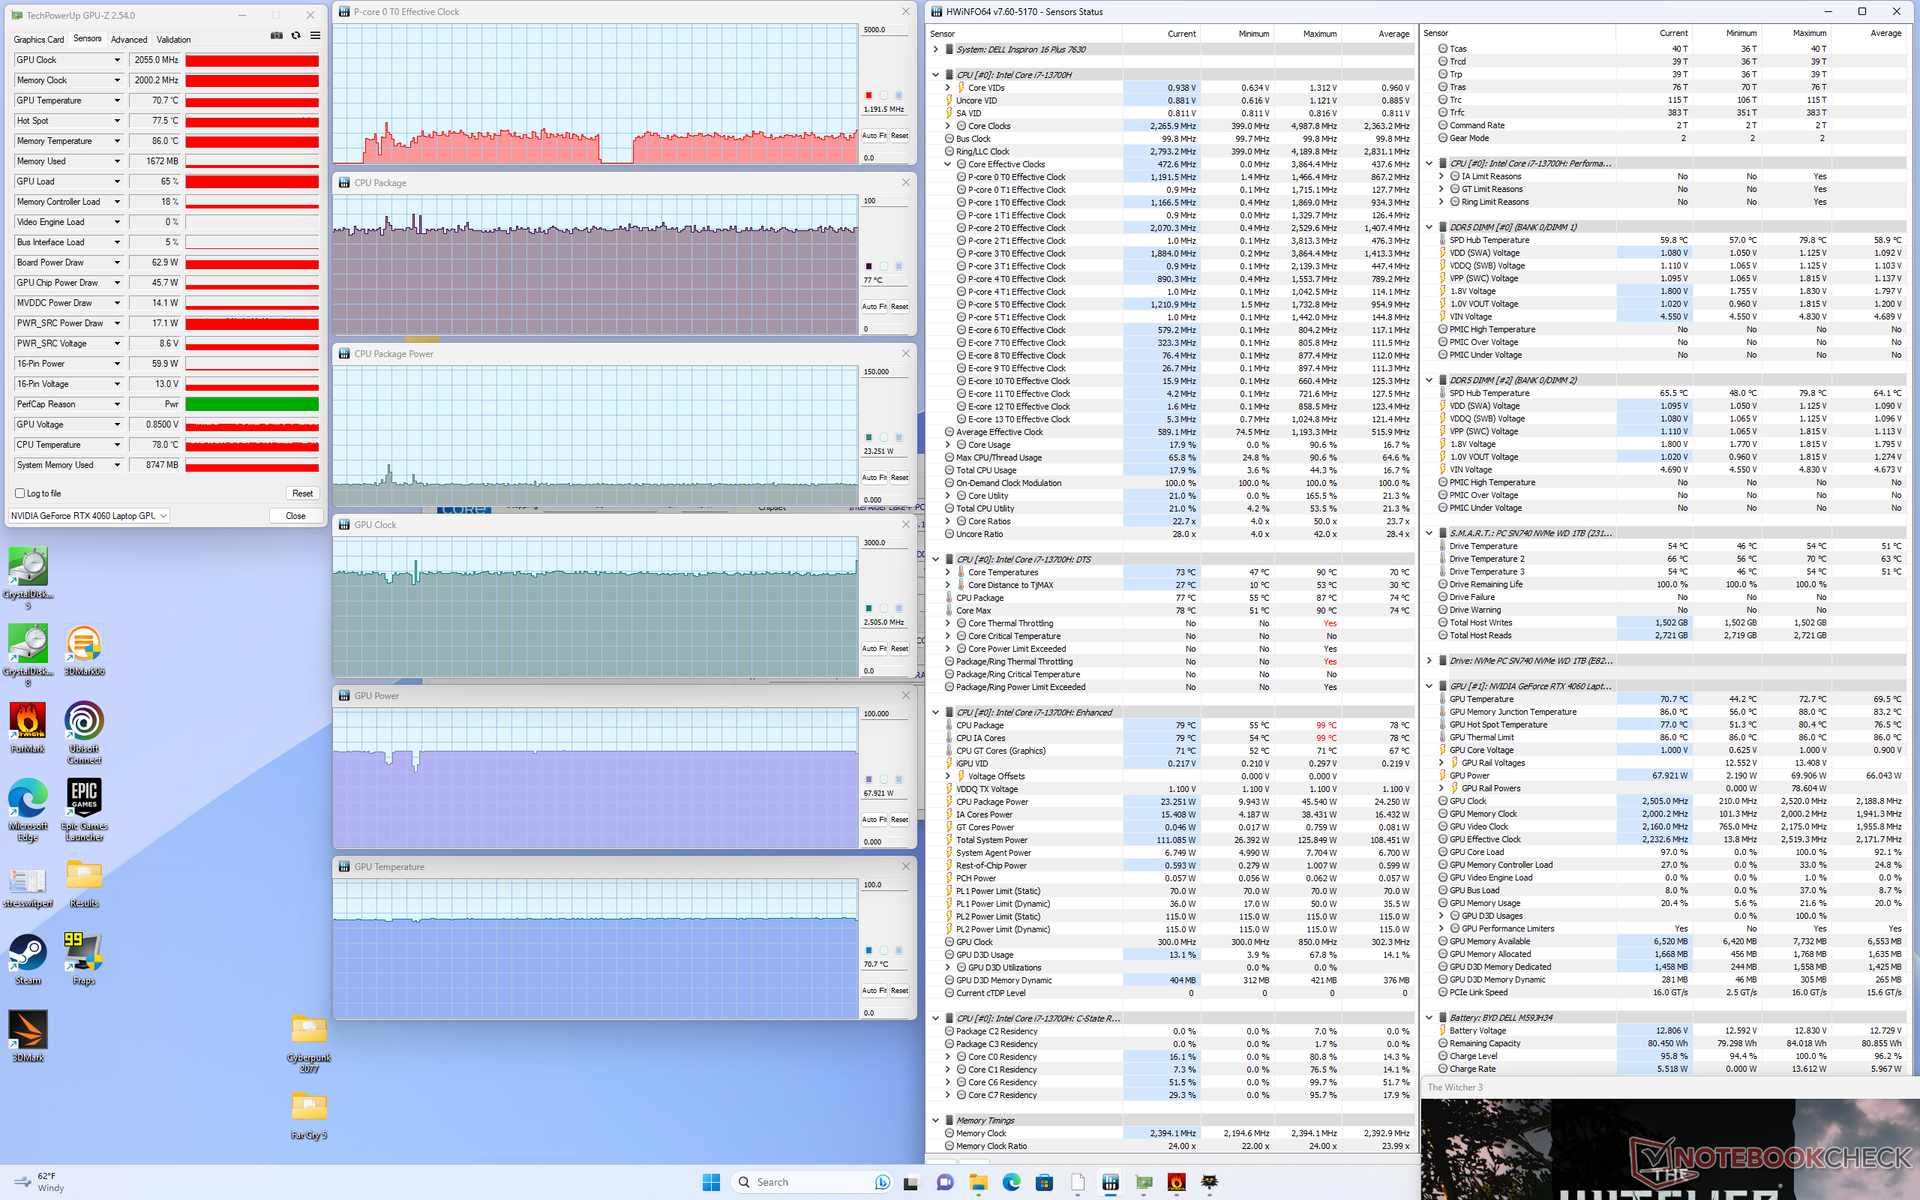
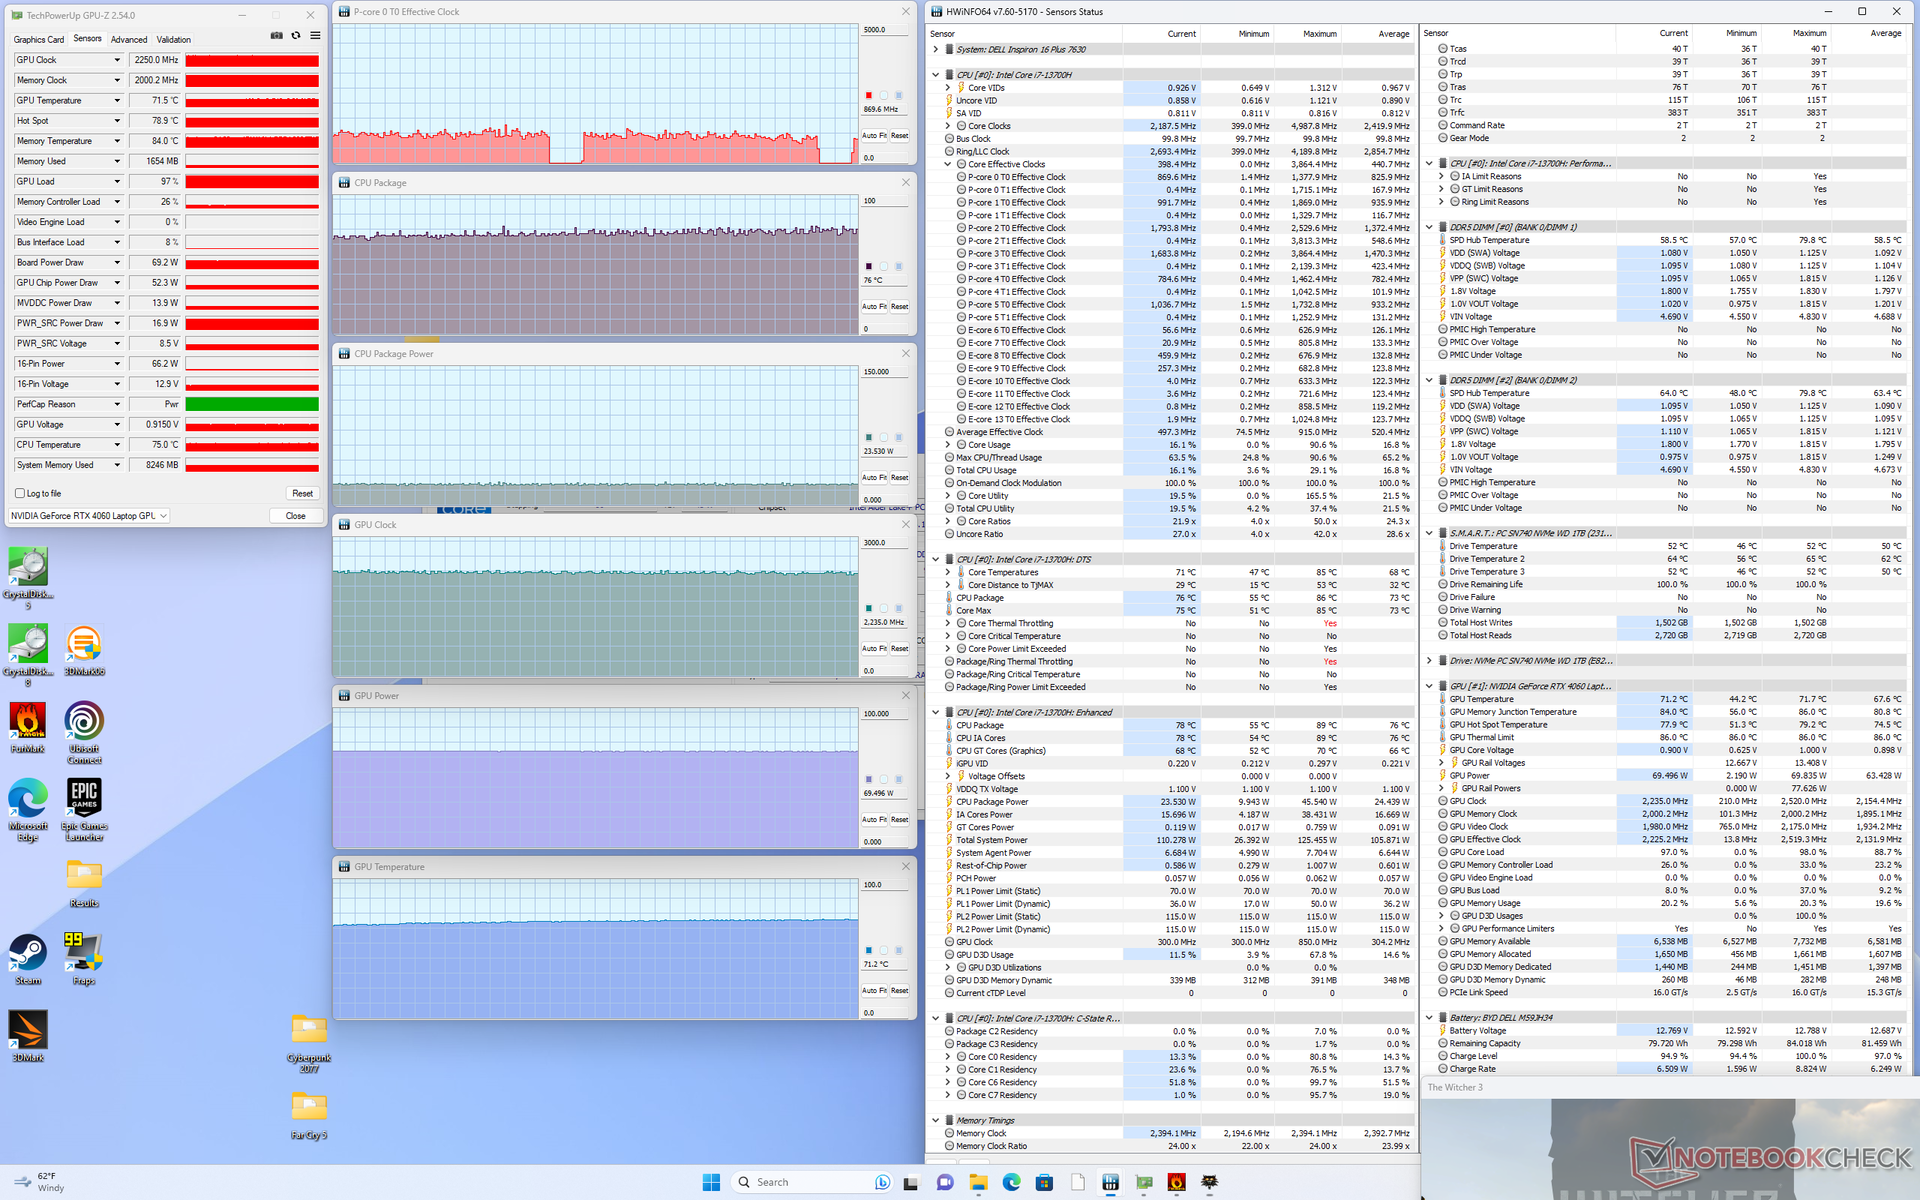
Cuando se ejecuta Witcher 3 en modo Rendimiento para representar cargas típicas de juego, la GPU Nvidia se estabilizaría en 2235 MHz, 71 C y 69 W según HWiNFO. Pasar al modo Equilibrado no afecta significativamente a estos valores, lo que concuerda con nuestras observaciones anteriores de Fire Strike. Curiosamente, las temperaturas del núcleo serían mucho más bajas que las registradas en el Inspiron 16 Plus 7620 al ejecutar el mismo juego, probablemente debido a nuestro ventilador más ruidoso y a las mejoras generales de la solución de refrigeración.
Obsérvese que mientras HWiNFO indica un consumo de la GPU de 69 W al jugar, Dell anuncia una potencia de la GPU de sólo 60 W. El panel de control de Nvidia indica una potencia objetivo de la GPU de 70 W.
| RelojCPU (GHz) | Reloj GPU (MHz) | Temperatura mediaCPU (°C) | Temperatura media GPU (°C) | |
| Sistema en reposo | -- | -- | 56 | 50 |
| Prime95 Stress | 2.3 - 2.4 | -- | 84 | 47 |
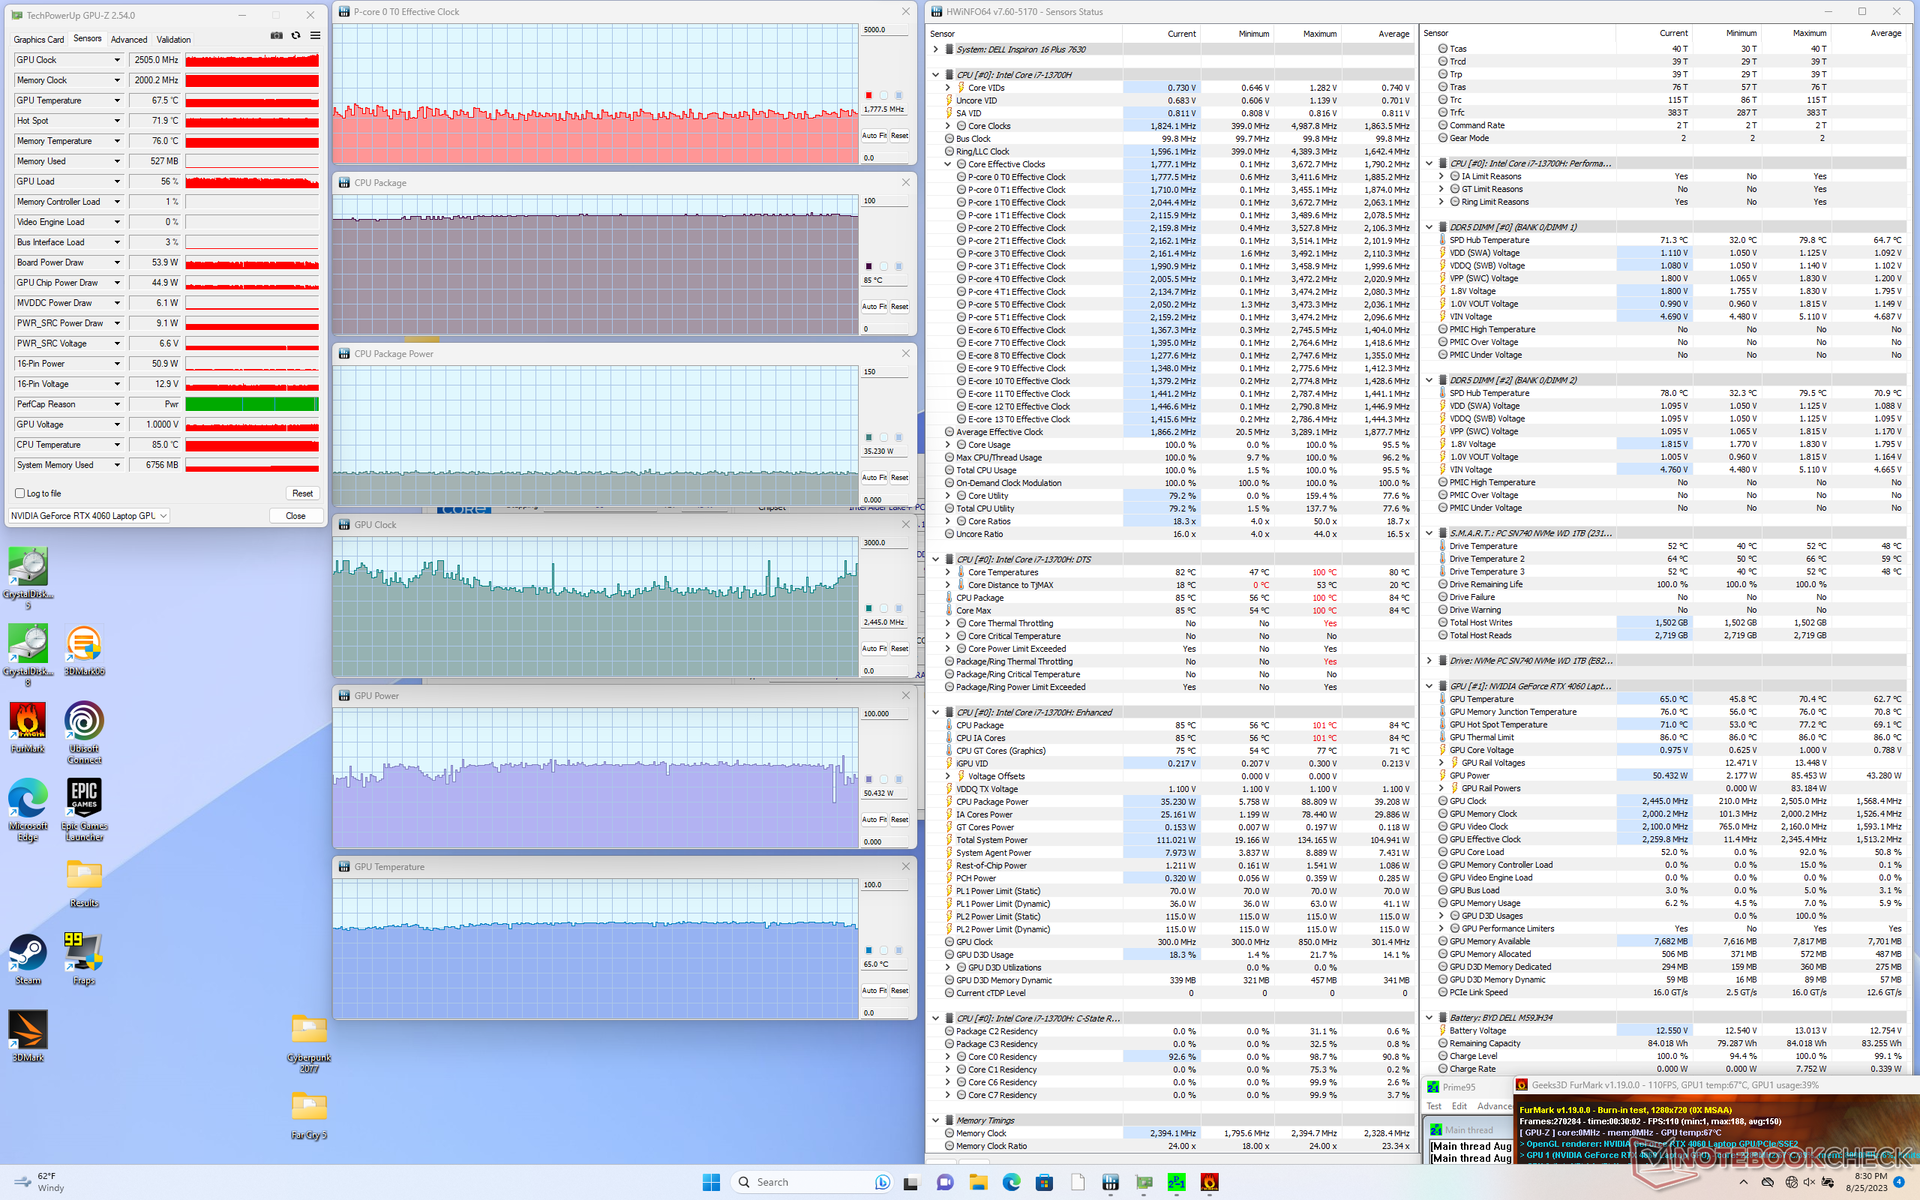
| Estrés Prime95+ FurMark | ~1,8 | ~2445 | 85 | 65 |
| Witcher 3 Estrés (modoequilibrado) | ~1,1 | 2055 | 77 | 71 |
| Witcher 3 Estrés (modoRendimiento) | ~1,1 | 2250 | 76 | 71 |
Altavoces
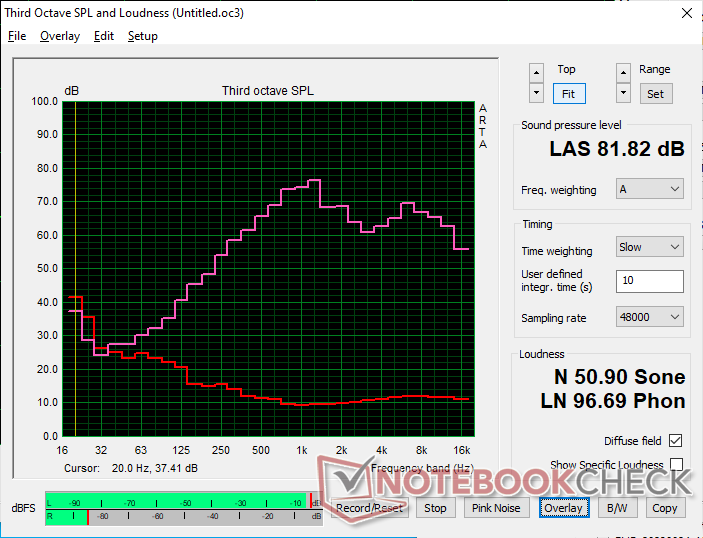
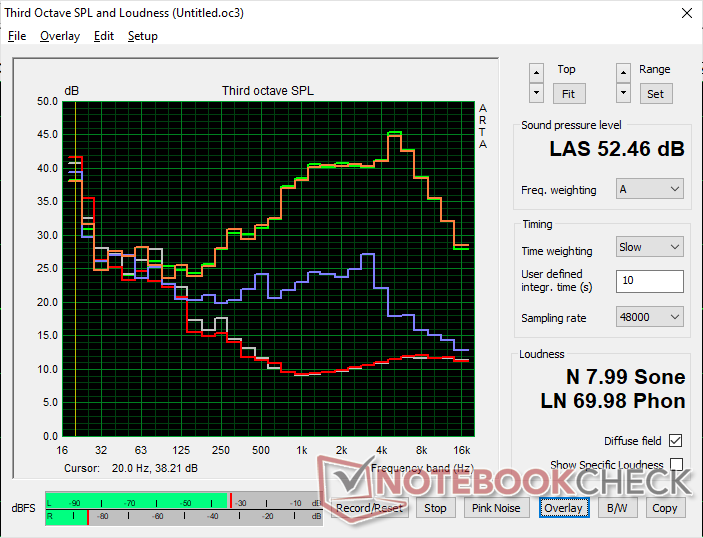
Dell Inspiron 16 Plus 7630 análisis de audio
(±) | la sonoridad del altavoz es media pero buena (81.8 dB)
Graves 100 - 315 Hz
(-) | casi sin bajos - de media 17% inferior a la mediana
(±) | la linealidad de los graves es media (8.4% delta a frecuencia anterior)
Medios 400 - 2000 Hz
(±) | medias más altas - de media 6.3% más altas que la mediana
(+) | los medios son lineales (6.2% delta a la frecuencia anterior)
Altos 2 - 16 kHz
(+) | máximos equilibrados - a sólo 2.2% de la mediana
(+) | los máximos son lineales (5.6% delta a la frecuencia anterior)
Total 100 - 16.000 Hz
(±) | la linealidad del sonido global es media (15.9% de diferencia con la mediana)
En comparación con la misma clase
» 40% de todos los dispositivos probados de esta clase eran mejores, 6% similares, 54% peores
» El mejor tuvo un delta de 5%, la media fue 17%, el peor fue ###max##%
En comparación con todos los dispositivos probados
» 25% de todos los dispositivos probados eran mejores, 5% similares, 70% peores
» El mejor tuvo un delta de 4%, la media fue 24%, el peor fue ###max##%
Apple MacBook Pro 16 2021 M1 Pro análisis de audio
(+) | los altavoces pueden reproducir a un volumen relativamente alto (#84.7 dB)
Graves 100 - 315 Hz
(+) | buen bajo - sólo 3.8% lejos de la mediana
(+) | el bajo es lineal (5.2% delta a la frecuencia anterior)
Medios 400 - 2000 Hz
(+) | medios equilibrados - a sólo 1.3% de la mediana
(+) | los medios son lineales (2.1% delta a la frecuencia anterior)
Altos 2 - 16 kHz
(+) | máximos equilibrados - a sólo 1.9% de la mediana
(+) | los máximos son lineales (2.7% delta a la frecuencia anterior)
Total 100 - 16.000 Hz
(+) | el sonido global es lineal (4.6% de diferencia con la mediana)
En comparación con la misma clase
» 0% de todos los dispositivos probados de esta clase eran mejores, 0% similares, 100% peores
» El mejor tuvo un delta de 5%, la media fue 17%, el peor fue ###max##%
En comparación con todos los dispositivos probados
» 0% de todos los dispositivos probados eran mejores, 0% similares, 100% peores
» El mejor tuvo un delta de 4%, la media fue 24%, el peor fue ###max##%
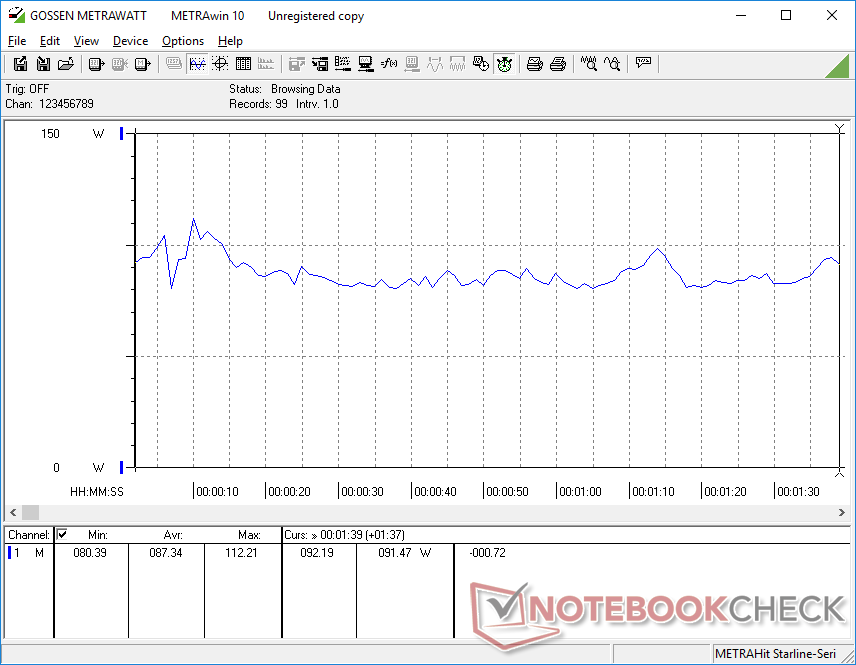
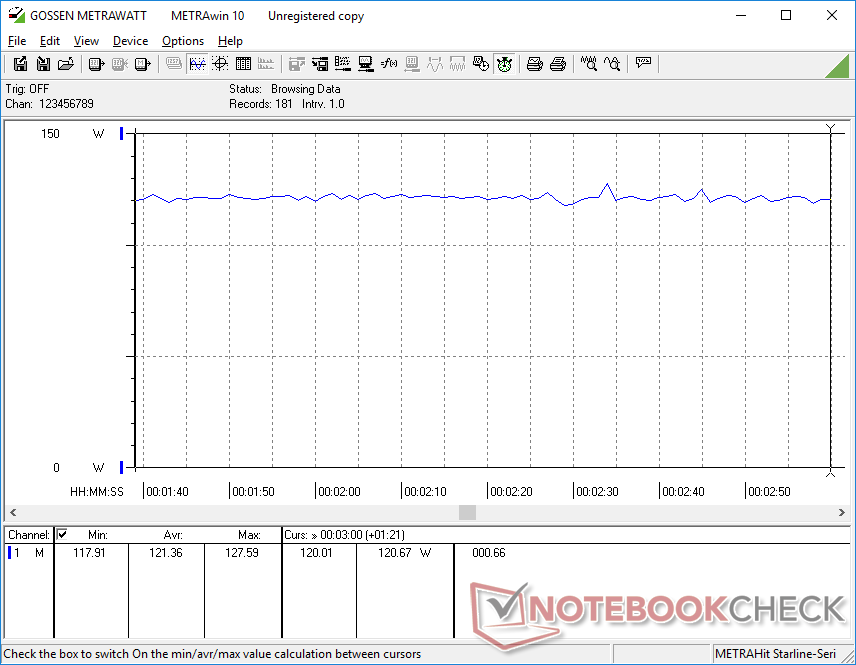
Gestión de la energía
Consumo energético - Alto rendimiento de la GPU por vatio
El consumo es ligeramente superior al del modelo del año pasado cuando está en reposo en el escritorio o cuando se ejecutan juegos. El aumento del 8% al ejecutar juegos, sin embargo, palidece en comparación con el aumento del 40% al 60% en rendimiento gráfico respecto a la RTX 3050 Ti. Así pues, el rendimiento por vatio sigue favoreciendo a nuestro modelo más reciente, aunque el consumo de energía pueda ser un poco mayor.
Portátiles para juegos con la misma CPU y GPU que nuestro Dell Inspiron, como elAcer Nitro 17tienden a consumir más energía, ya que se centran en niveles de potencia más altos para exprimir más rendimiento de los procesadores. Al jugar, por ejemplo, el Acer demandaría unos 30 W más.
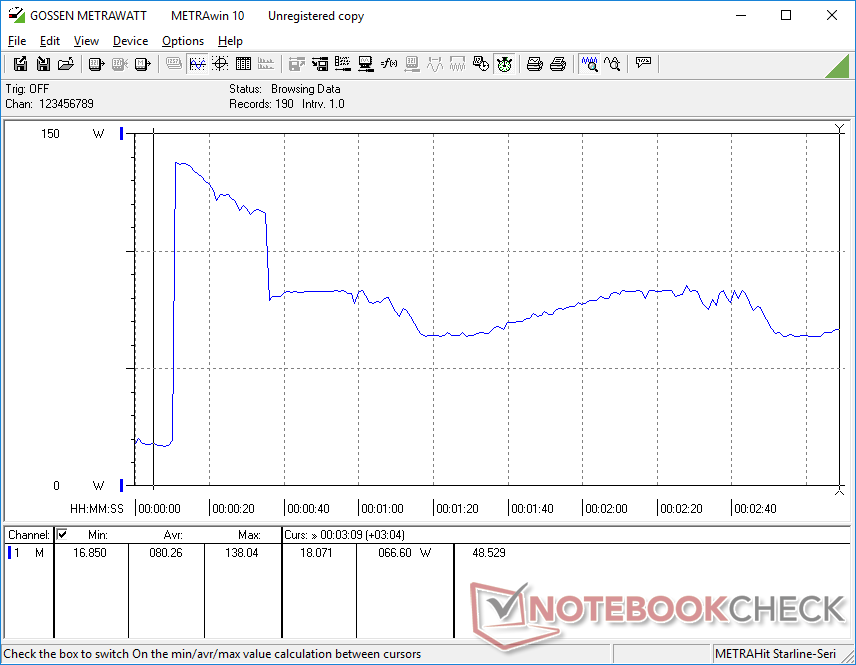
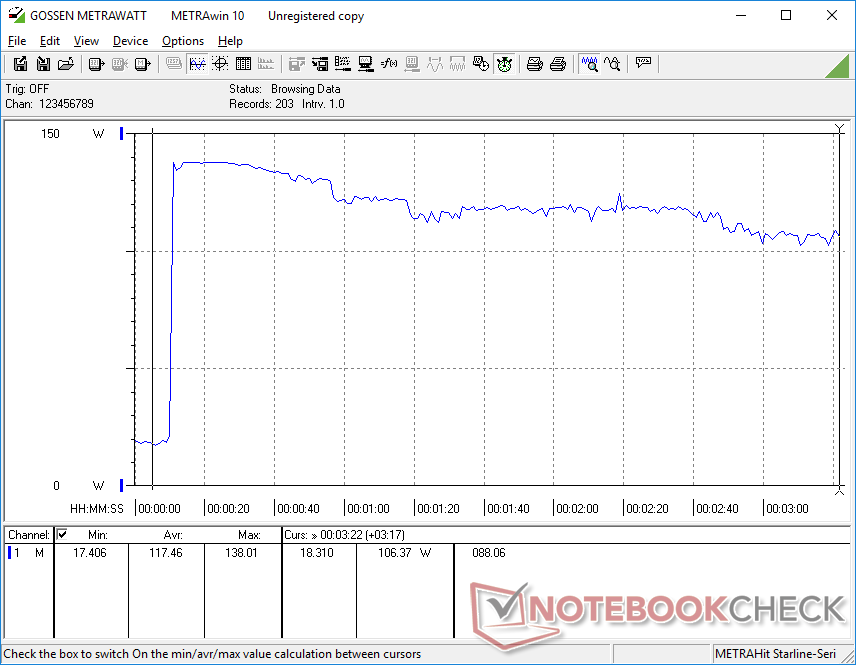
Hemos podido medir un consumo máximo temporal de 138 W del adaptador de CA de 130 W de tamaño medio (~15 x 7,4 x 2,5 cm) cuando la CPU y la GPU están al 100% de utilización. Ten en cuenta que las configuraciones sin gráficos discretos vienen con un adaptador de CA más pequeño de 90 W.
| Off / Standby | |
| Ocioso | |
| Carga |
|
Clave:
min: | |
| Dell Inspiron 16 Plus 7630 i7-13700H, GeForce RTX 4060 Laptop GPU, WD PC SN740 SDDPTQD-1T00, IPS, 2560x1600, 16" | Dell Inspiron 16 Plus 7620 i7-12700H, GeForce RTX 3050 Ti Laptop GPU, Kioxia BG5 KBG50ZNS512G, IPS, 3072x1920, 16" | Lenovo Slim Pro 9i 16IRP8 i9-13905H, GeForce RTX 4050 Laptop GPU, Samsung PM9A1 MZVL21T0HCLR, Mini-LED, 3200x2000, 16" | Asus Vivobook Pro 16X K6604JV-MX016W i9-13980HX, GeForce RTX 4060 Laptop GPU, Solidigm P41 Plus SSDPFKNU010TZ, OLED, 3200x2000, 16" | HP Envy 16 h0112nr i7-12700H, GeForce RTX 3060 Laptop GPU, Micron 3400 1TB MTFDKBA1T0TFH, OLED, 3840x2400, 16" | MSI Summit E16 Flip A12UDT-031 i7-1280P, GeForce RTX 3050 Ti Laptop GPU, Samsung PM9A1 MZVL22T0HBLB, IPS, 2560x1600, 16" | |
|---|---|---|---|---|---|---|
| Power Consumption | 15% | -28% | -23% | -9% | 22% | |
| Idle Minimum * (Watt) | 15.6 | 6.8 56% | 16 -3% | 13.8 12% | 10 36% | 9.8 37% |
| Idle Average * (Watt) | 17.7 | 9.6 46% | 30 -69% | 16 10% | 10.9 38% | 15.3 14% |
| Idle Maximum * (Watt) | 20.6 | 17 17% | 30.4 -48% | 19 8% | 27.8 -35% | 16.3 21% |
| Load Average * (Watt) | 87.4 | 117.5 -34% | 78.9 10% | 147 -68% | 116.4 -33% | 87 -0% |
| Witcher 3 ultra * (Watt) | 121.7 | 113.1 7% | 155.3 -28% | 147.8 -21% | 133.7 -10% | 86.1 29% |
| Load Maximum * (Watt) | 138 | 137.4 -0% | 180.4 -31% | 244 -77% | 209.8 -52% | 100 28% |
* ... más pequeño es mejor
Power Consumption Witcher 3 / Stresstest
Power Consumption external Monitor
Duración de la batería
Tanto la capacidad como la duración de la batería siguen siendo las mismas que antes. Hemos podido registrar 9,5 horas de navegación WLAN real en modo equilibrado, lo que es más que en modelos de la competencia como elLenovo Slim Pro 9i 16IRP8 o HP Envy 16 por al menos un par de horas cada uno.
La carga desde vacío a plena capacidad tarda unos 90 minutos con el adaptador de CA incluido. El sistema también se puede recargar con adaptadores USB-C como los que vienen con la serie XPS.
| Dell Inspiron 16 Plus 7630 i7-13700H, GeForce RTX 4060 Laptop GPU, 86 Wh | Dell Inspiron 16 Plus 7620 i7-12700H, GeForce RTX 3050 Ti Laptop GPU, 86 Wh | Lenovo Slim Pro 9i 16IRP8 i9-13905H, GeForce RTX 4050 Laptop GPU, 75 Wh | Asus Vivobook Pro 16X K6604JV-MX016W i9-13980HX, GeForce RTX 4060 Laptop GPU, 90 Wh | HP Envy 16 h0112nr i7-12700H, GeForce RTX 3060 Laptop GPU, 83 Wh | MSI Summit E16 Flip A12UDT-031 i7-1280P, GeForce RTX 3050 Ti Laptop GPU, 82 Wh | |
|---|---|---|---|---|---|---|
| Duración de Batería | -2% | -30% | -12% | -0% | -24% | |
| Reader / Idle (h) | 17.6 | 18.6 6% | 17.8 1% | |||
| WiFi v1.3 (h) | 9.4 | 9.6 2% | 6.6 -30% | 6.5 -31% | 7.9 -16% | 7.1 -24% |
| Load (h) | 1.4 | 1.2 -14% | 1.5 7% | 1.6 14% | ||
| H.264 (h) | 5.3 |
Pro
Contra
Veredicto: mejora por una GPU más rápida
Las mejoras con respecto al Inspiron 16 Plus 7620 son más significativas de lo esperado en muchos aspectos. Aparte de la enorme mejora en el rendimiento gráfico al pasar de la RTX 3050 Ti a la RTX 4060, el ruido del ventilador más silencioso y más fuerte entre los dos modelos es notable, así como las temperaturas del núcleo más frías en el modelo más reciente. Las opciones de pantalla son diferentes, ya que ahora incluyen una frecuencia de actualización opcional de 120 Hz, mientras que las actualizaciones SODIMM ahora ofrecen dos ranuras en lugar de una. Las bisagras más rígidas también son un cambio bienvenido para reducir las posibilidades de que se rompan demasiado pronto. La experiencia de usuario ha mejorado lo suficiente aunque el rendimiento de la CPU sea rancio y el teclado siga siendo el mismo que antes.
El Inspiron 16 Plus 7630 es todo equilibrio. Sus características y rendimiento son suficientes para satisfacer la mayoría de los propósitos multimedia y de juego sin necesidad de gastar un ojo de la cara.
Sin embargo, como portátil multimedia y de juegos de todo tipo, el Inspiron 16 Plus 7630 carece de algunas características que los portátiles multimedia y los portátiles de juegos suelen tener. En el apartado multimedia, los propietarios del Inspiron 16 Plus 7630 echarán en falta colores DCi-P3 más intensos, resoluciones nativas más altas y un rápido lector de tarjetas SD integrado. En el lado de los juegos, el sistema omite G-Sync y MUX y su RTX 4060 es en general más lenta que la media. El Inspiron 16 Plus 7630 es estupendo para la creación de contenidos y los juegos, pero los usuarios que se inclinen más por la creación de contenidos deberían considerar un HP Envy 16 o Asus ZenBook Pro Duo mientras que los jugadores intensivos querrán buscar máquinas de juego dedicadas como un Modelo Dell G o un Asus ROG.
Precio y disponibilidad
Dell ya comercializa el Inspiron 16 Plus 7630 con Core i7 y RTX 4060 por 1250 dólares.
Dell Inspiron 16 Plus 7630
- 08/30/2023 v7 (old)
Allen Ngo
Transparencia
La selección de los dispositivos que se van a reseñar corre a cargo de nuestro equipo editorial. La muestra de prueba fue proporcionada al autor en calidad de préstamo por el fabricante o el minorista a los efectos de esta reseña. El prestamista no tuvo ninguna influencia en esta reseña, ni el fabricante recibió una copia de la misma antes de su publicación. No había ninguna obligación de publicar esta reseña. Como empresa de medios independiente, Notebookcheck no está sujeta a la autoridad de fabricantes, minoristas o editores.
Así es como prueba Notebookcheck
Cada año, Notebookcheck revisa de forma independiente cientos de portátiles y smartphones utilizando procedimientos estandarizados para asegurar que todos los resultados son comparables. Hemos desarrollado continuamente nuestros métodos de prueba durante unos 20 años y hemos establecido los estándares de la industria en el proceso. En nuestros laboratorios de pruebas, técnicos y editores experimentados utilizan equipos de medición de alta calidad. Estas pruebas implican un proceso de validación en varias fases. Nuestro complejo sistema de clasificación se basa en cientos de mediciones y puntos de referencia bien fundamentados, lo que mantiene la objetividad.Price comparison

