Casi un XPS 16: análisis del portátil Dell Inspiron 16 Plus 7610
La familia Inspiron es probablemente la mayor y más amplia familia de PC de consumo de Dell. Está formada por la serie 3000, de bajo coste, hasta la serie 7000, de gama alta, con todos los tamaños de pantalla, desde 13 hasta 17 pulgadas. El último Inspiron 16 destaca por ser el primer modelo de 16 pulgadas de la familia equipado con ciertas características que no se encuentran en otros modelos como anunciado originalmente en abril.
Nuestra unidad de prueba es una configuración de gama alta del Inspiron 16 7610 con la CPU Intel Core i7-11800H de 11ª generación y gráficos GeForce RTX 3050 por aproximadamente 1150 dólares. Hay otros modelos disponibles con el Core i5-11400H de menor tamaño o con UHD Graphics integrado, pero todas las opciones vienen con la misma pantalla 3K de 16,0 pulgadas y 16:10 y el color del chasis Mist Blue. El sistema se comercializa como una máquina Nvidia Studio para contrastar con la serie G, centrada en los juegos, o la serie XPS, de uso prosumidor.
Entre los competidores directos se encuentran otros portátiles multimedia de 16 pulgadas como el LG Gram 16, Honor MagicBook Pro, o el MacBook Pro 16.
Más opiniones de Dell:
potential competitors in comparison
Valoración | Fecha | Modelo | Peso | Altura | Tamaño | Resolución | Precio |
|---|---|---|---|---|---|---|---|
| 86.7 % v7 (old) | 08/2021 | Dell Inspiron 16 Plus 7610 i7-11800H, GeForce RTX 3050 4GB Laptop GPU | 2 kg | 18.99 mm | 16.00" | 3072x1920 | |
| 87.4 % v7 (old) | 08/2021 | Lenovo Legion 5 Pro 16ACH6H (82JQ001PGE) R7 5800H, GeForce RTX 3070 Laptop GPU | 2.6 kg | 26.85 mm | 16.00" | 2560x1600 | |
| 85.6 % v7 (old) | 07/2021 | Asus ROG Zephyrus M16 GU603H i9-11900H, GeForce RTX 3070 Laptop GPU | 2 kg | 20 mm | 16.00" | 2560x1600 | |
| 86.3 % v7 (old) | 06/2021 | LG Gram 16 (2021) i7-1165G7, Iris Xe G7 96EUs | 1.2 kg | 16.8 mm | 16.00" | 2560x1600 | |
| 79.9 % v7 (old) | 08/2020 | HP Pavilion Gaming 16-a0242ng i5-10300H, GeForce GTX 1650 Ti Mobile | 2.2 kg | 23.5 mm | 16.10" | 1920x1080 | |
| 82.4 % v7 (old) | 01/2021 | Dell Inspiron 15 7000 7506 2-in-1 Black Edition i7-1165G7, Xe MAX | 1.9 kg | 17.94 mm | 15.60" | 3840x2160 |
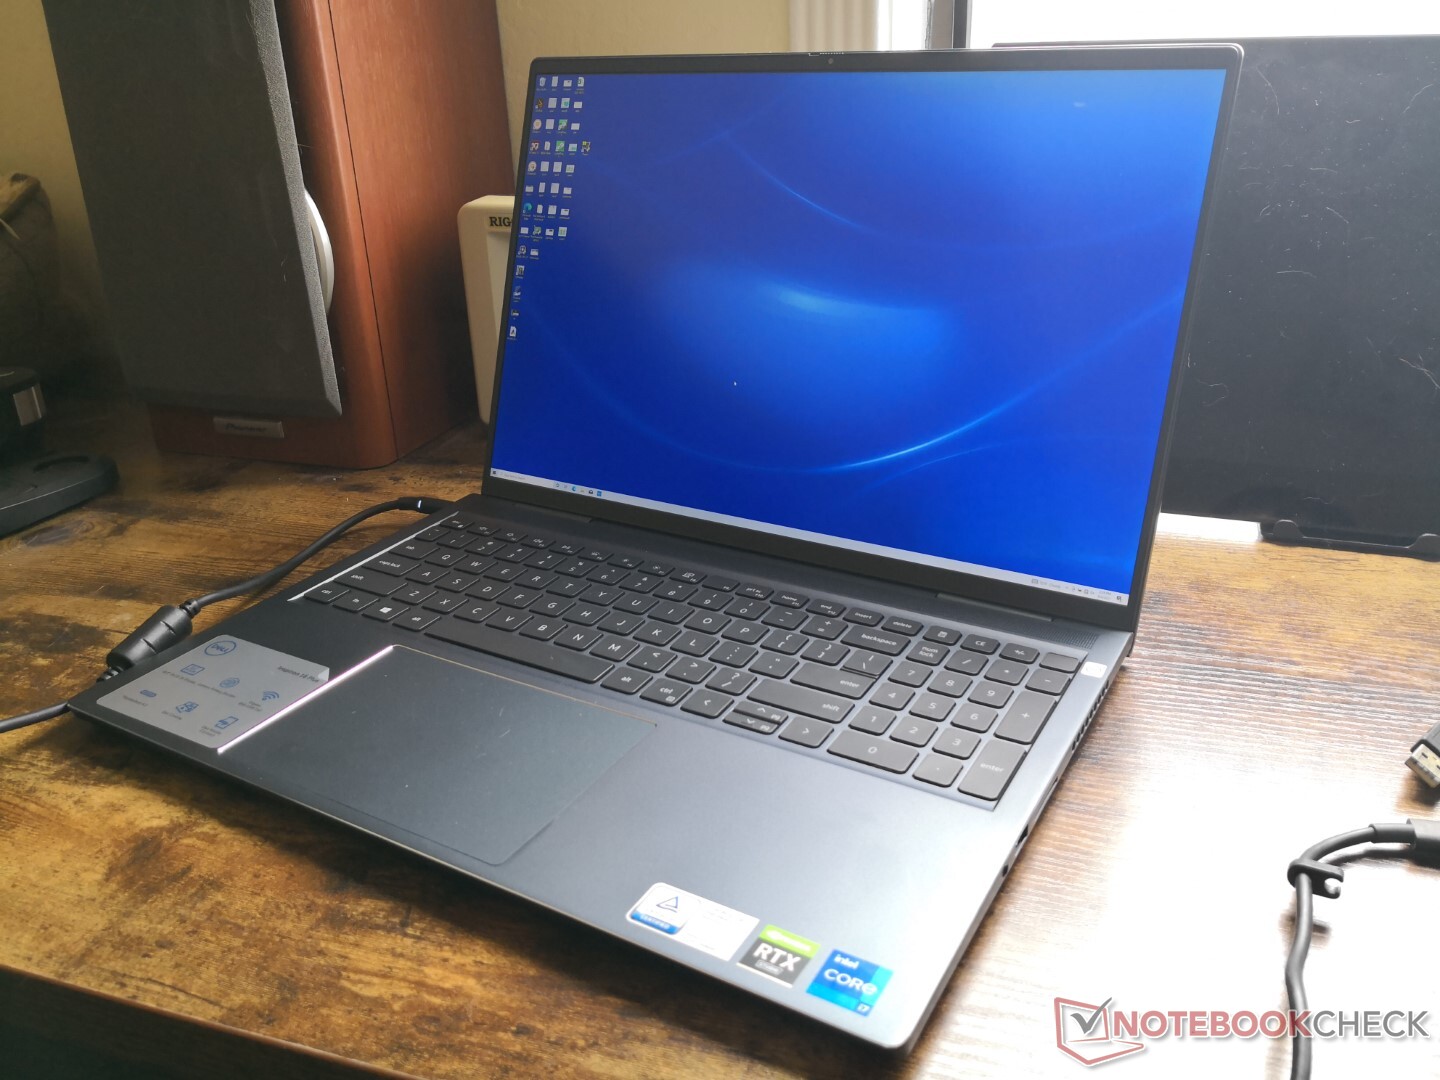
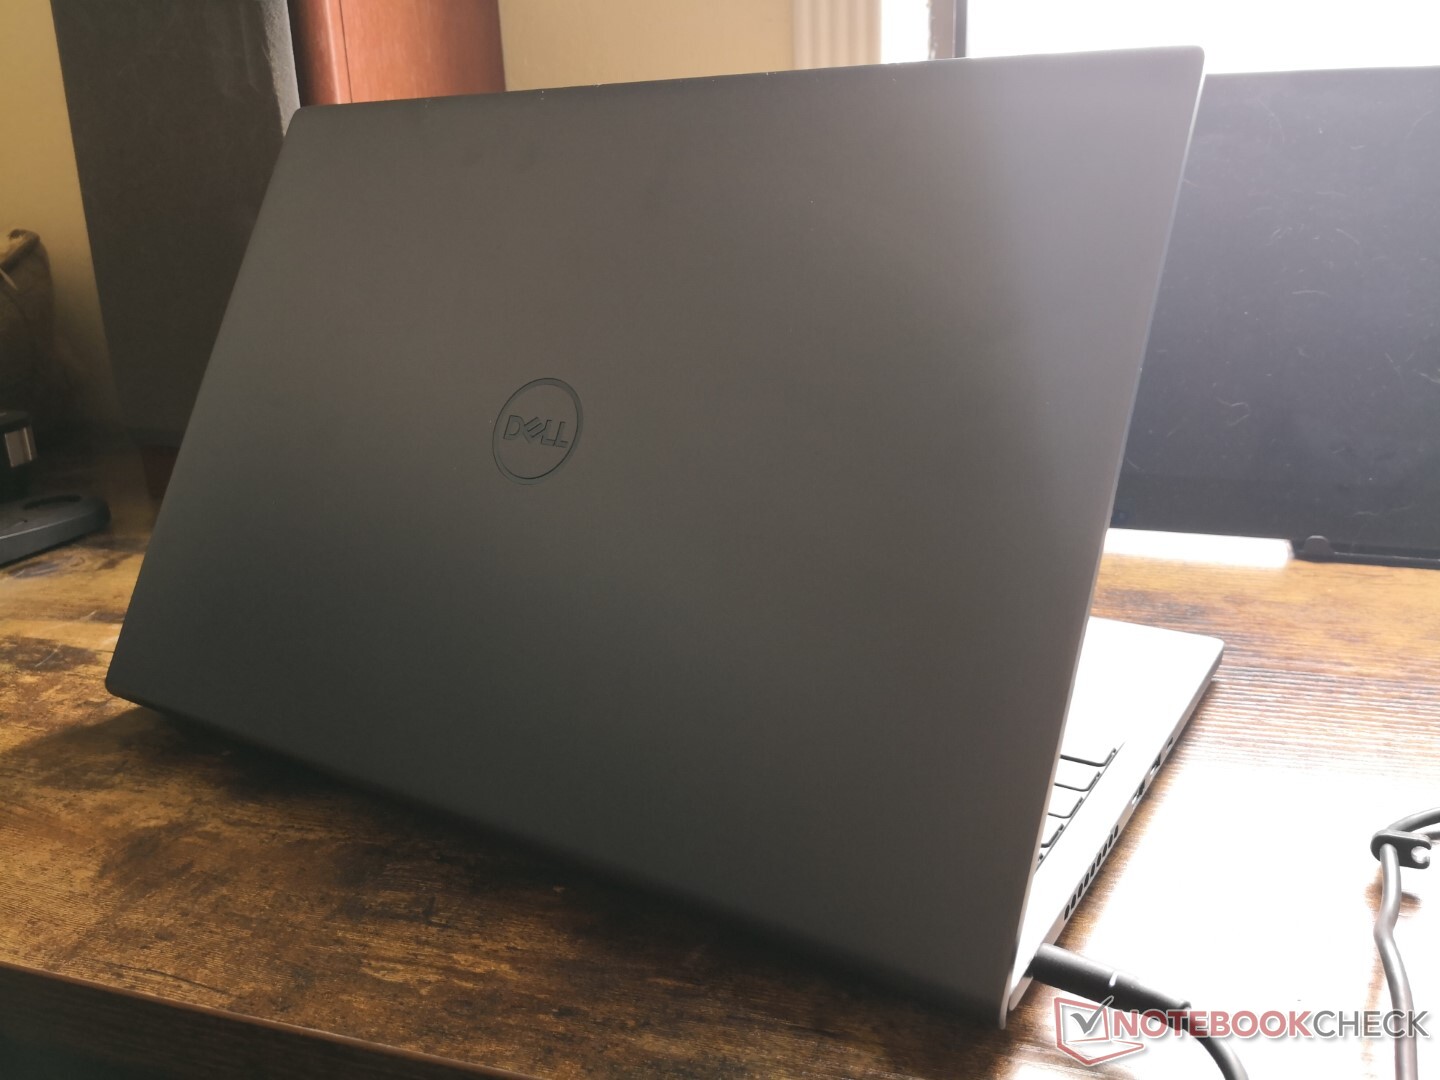
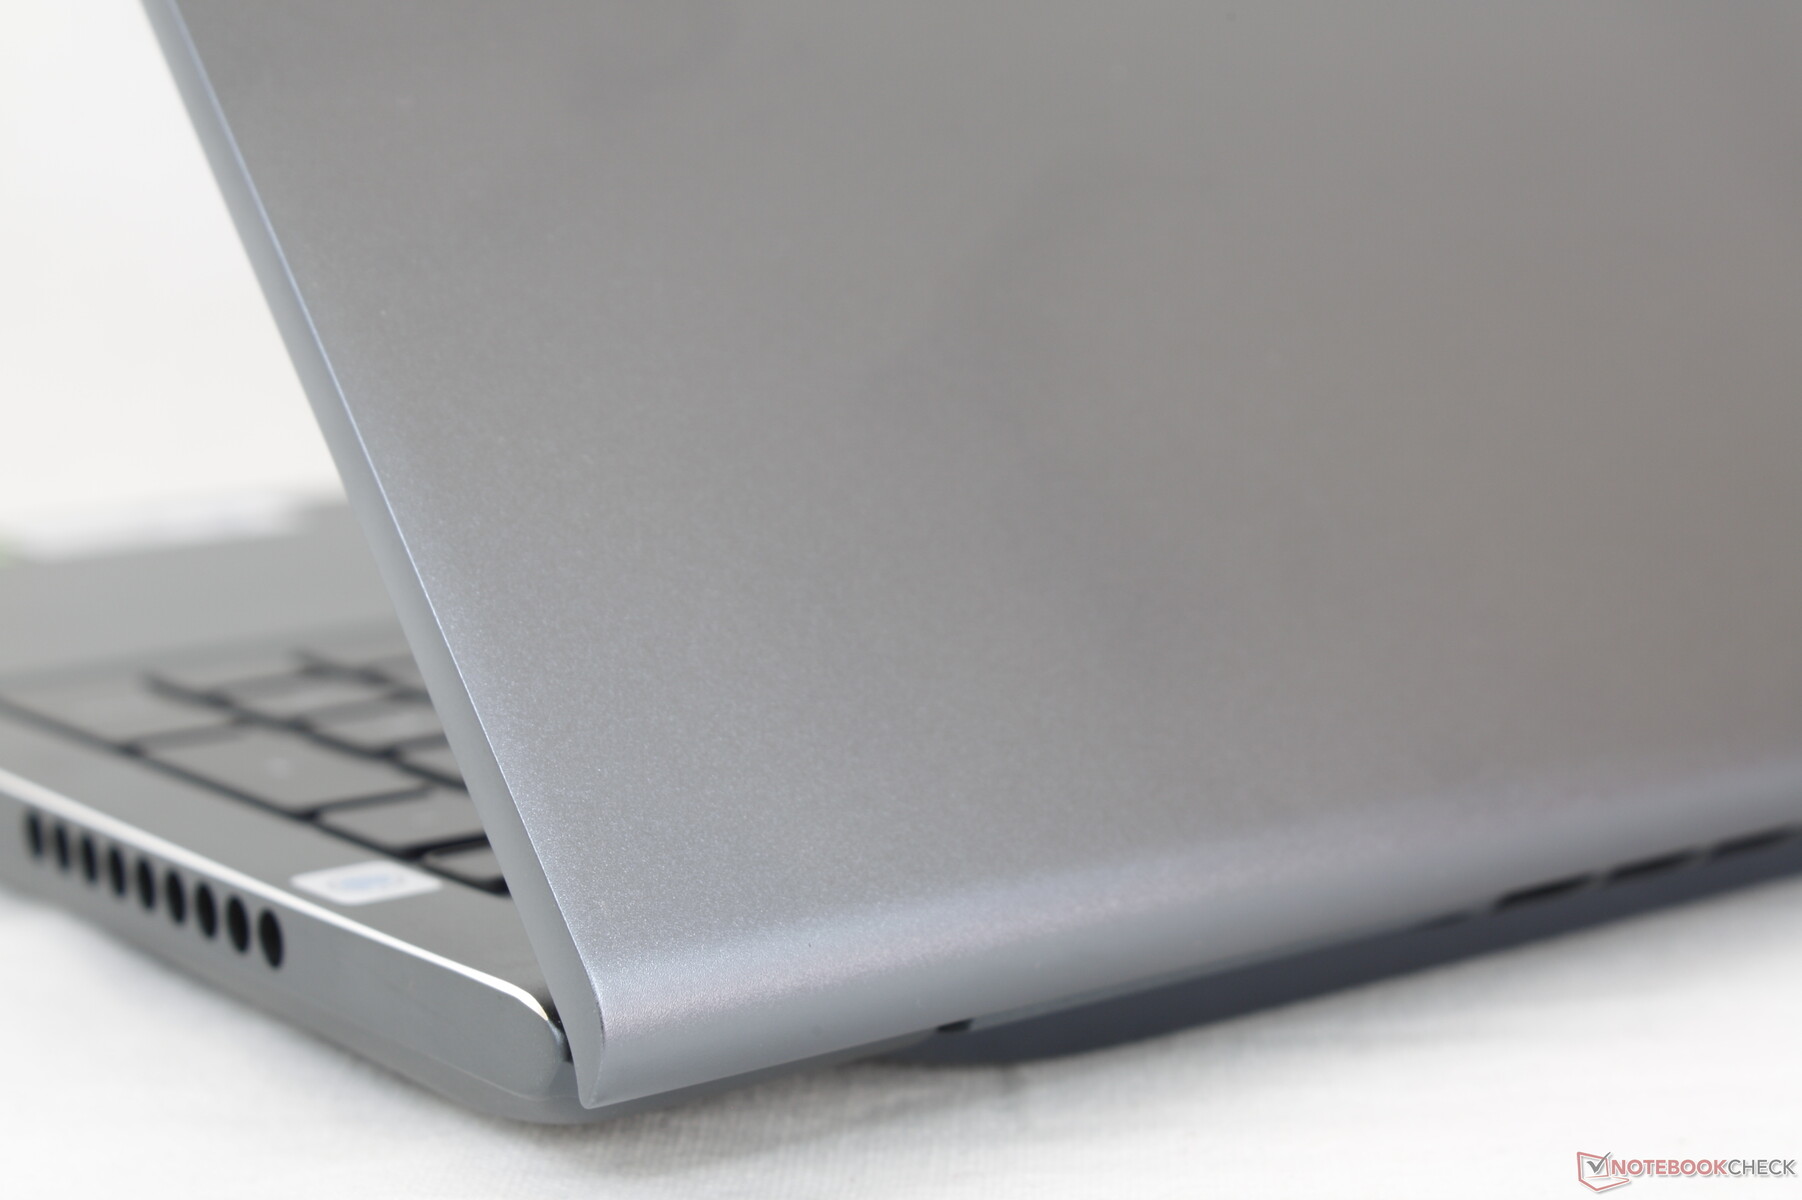
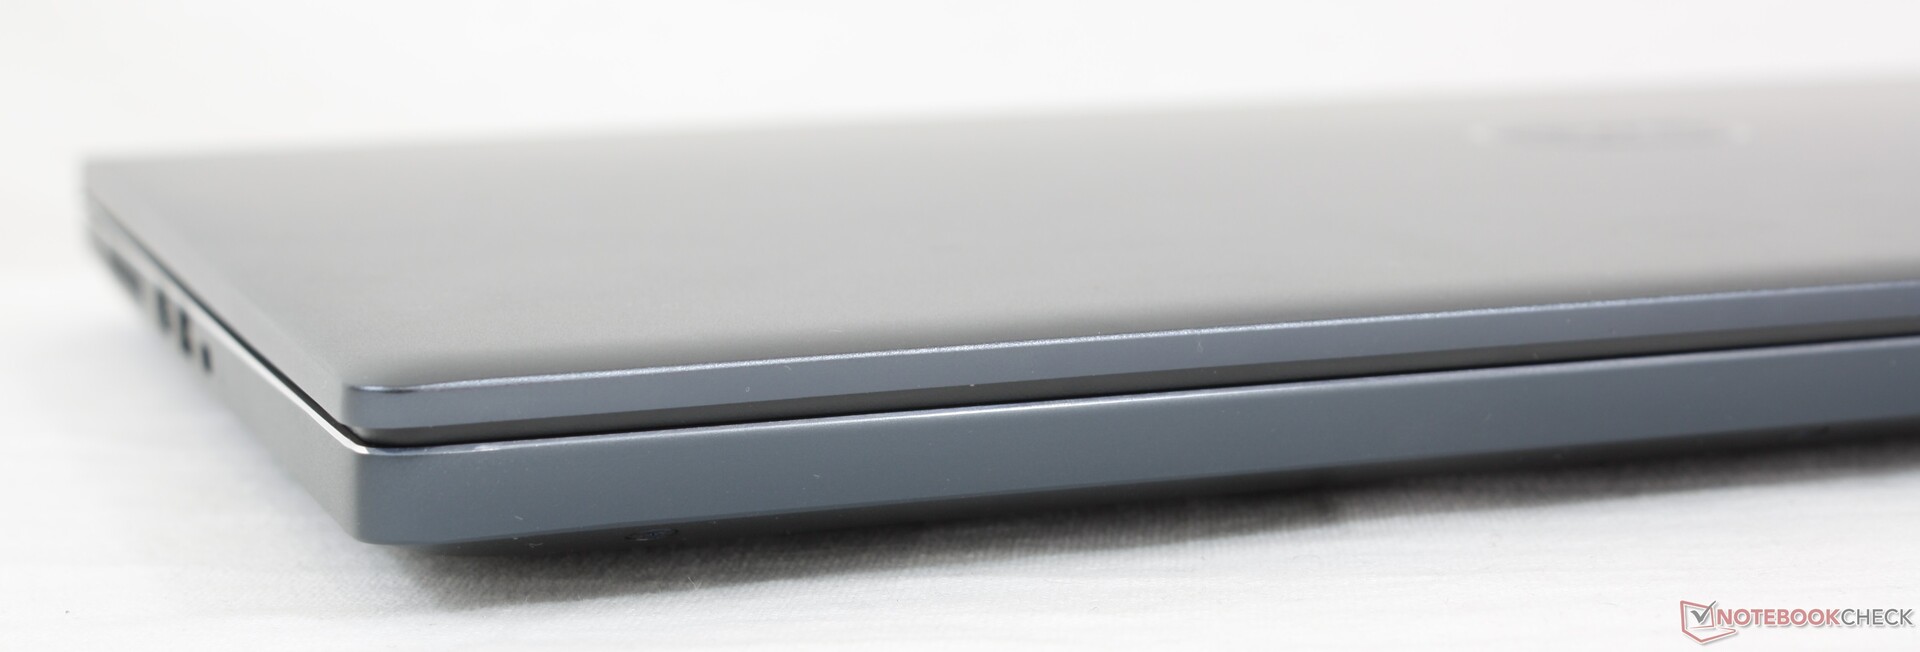
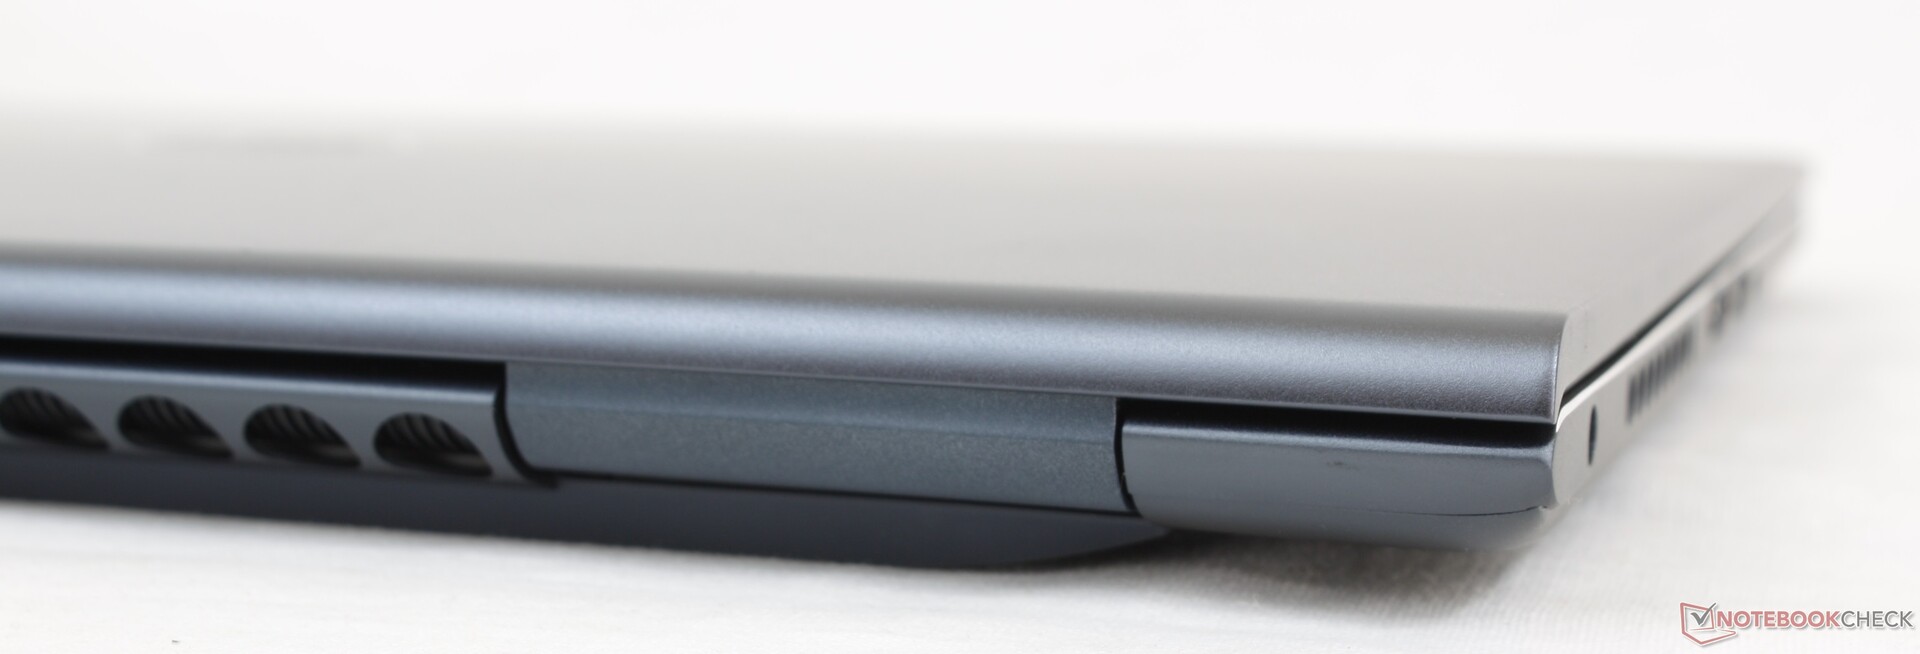
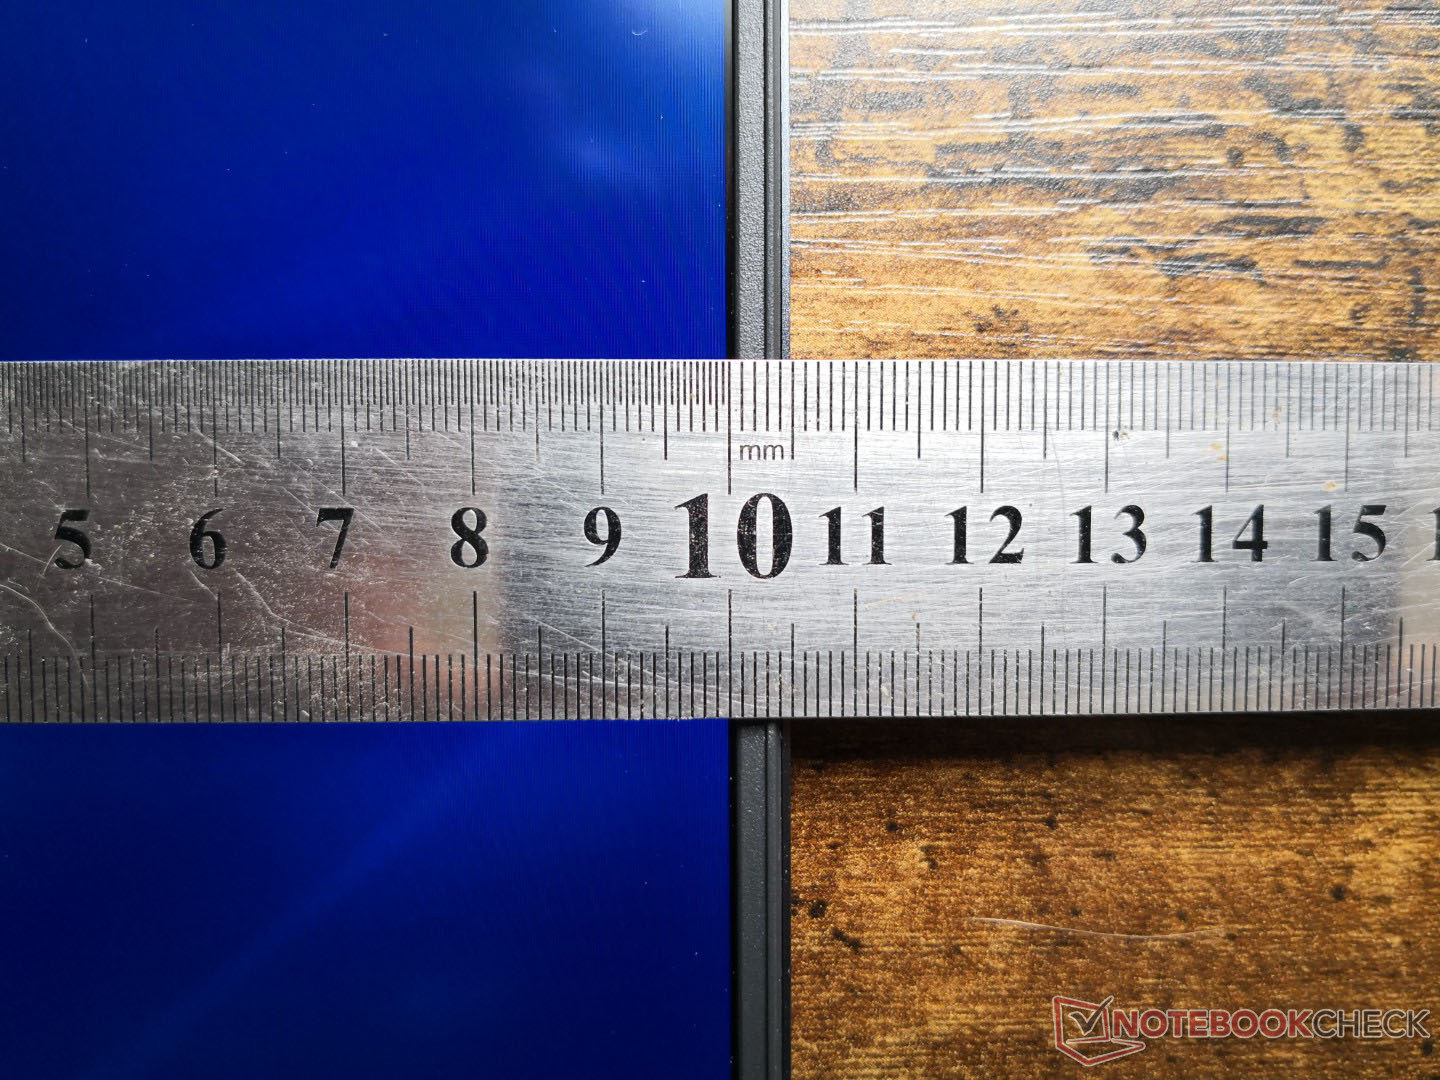
Caja - Fuerte y pesada
El sistema parece ser un nuevo diseño que no deriva de ningún modelo Inspiron 15 o 17 existente. El actual Inspiron 15por ejemplo, utiliza bisagras que levantan la base en ángulo sin rejillas de ventilación visibles a lo largo de los laterales o la parte trasera. Por el contrario, el Inspiron 16, totalmente metálico, tiene bisagras más tradicionales con rejillas de ventilación visibles alrededor. El chasis y la tapa son más rígidos y de mejor calidad que cualquier Inspiron 15 que hayamos probado hasta ahora. Es más débil en la tapa exterior, donde no recomendamos apilar libros pesados
La solidez de su construcción tiene como contrapartida el peso, ya que el Inspiron 16 es más pesado que el ya de por sí abultadoXPS 15. Si se compara con otros modelos de 16 pulgadas, el sistema está muycerca del más potente Asus Zephyrus M16 mientras que es más pequeño y ligero que el Pavilion Gaming 16.
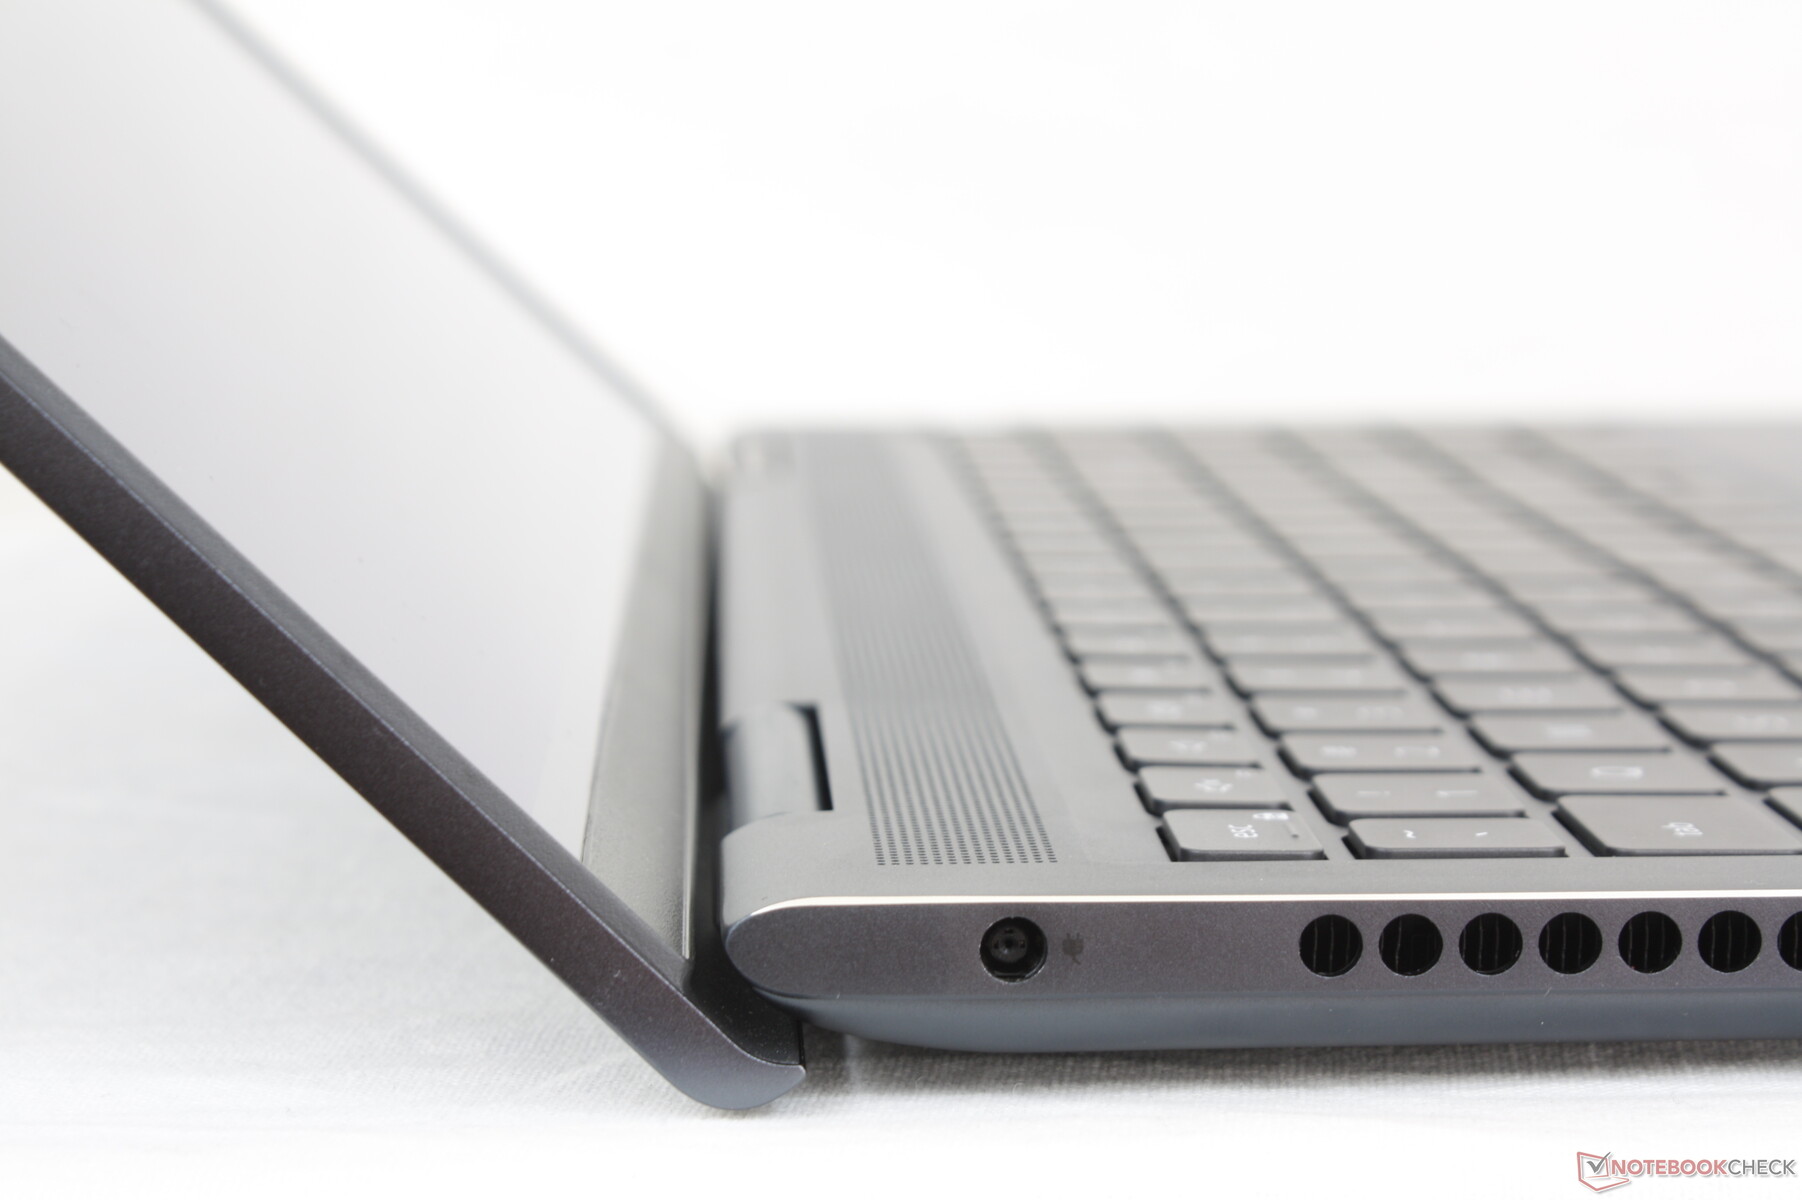
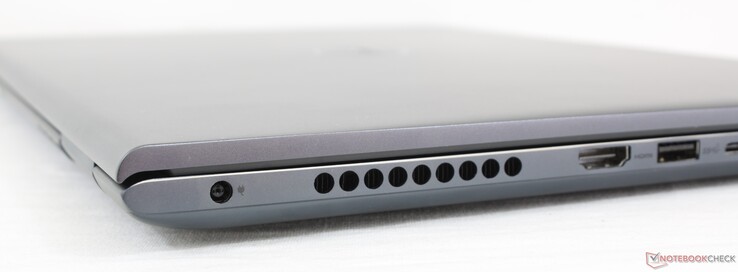
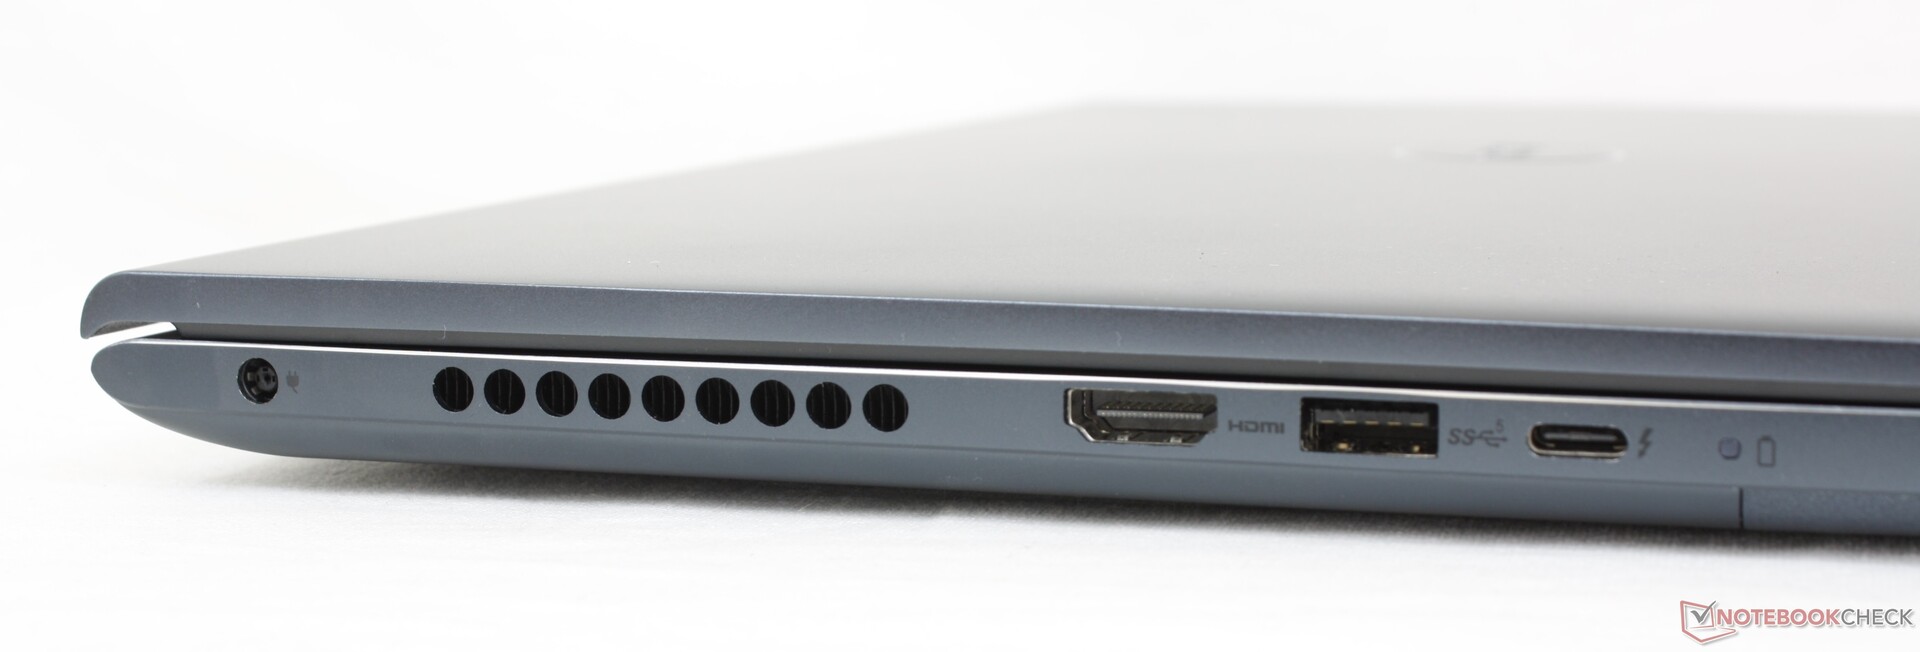
Conectividad - Un poco de todo
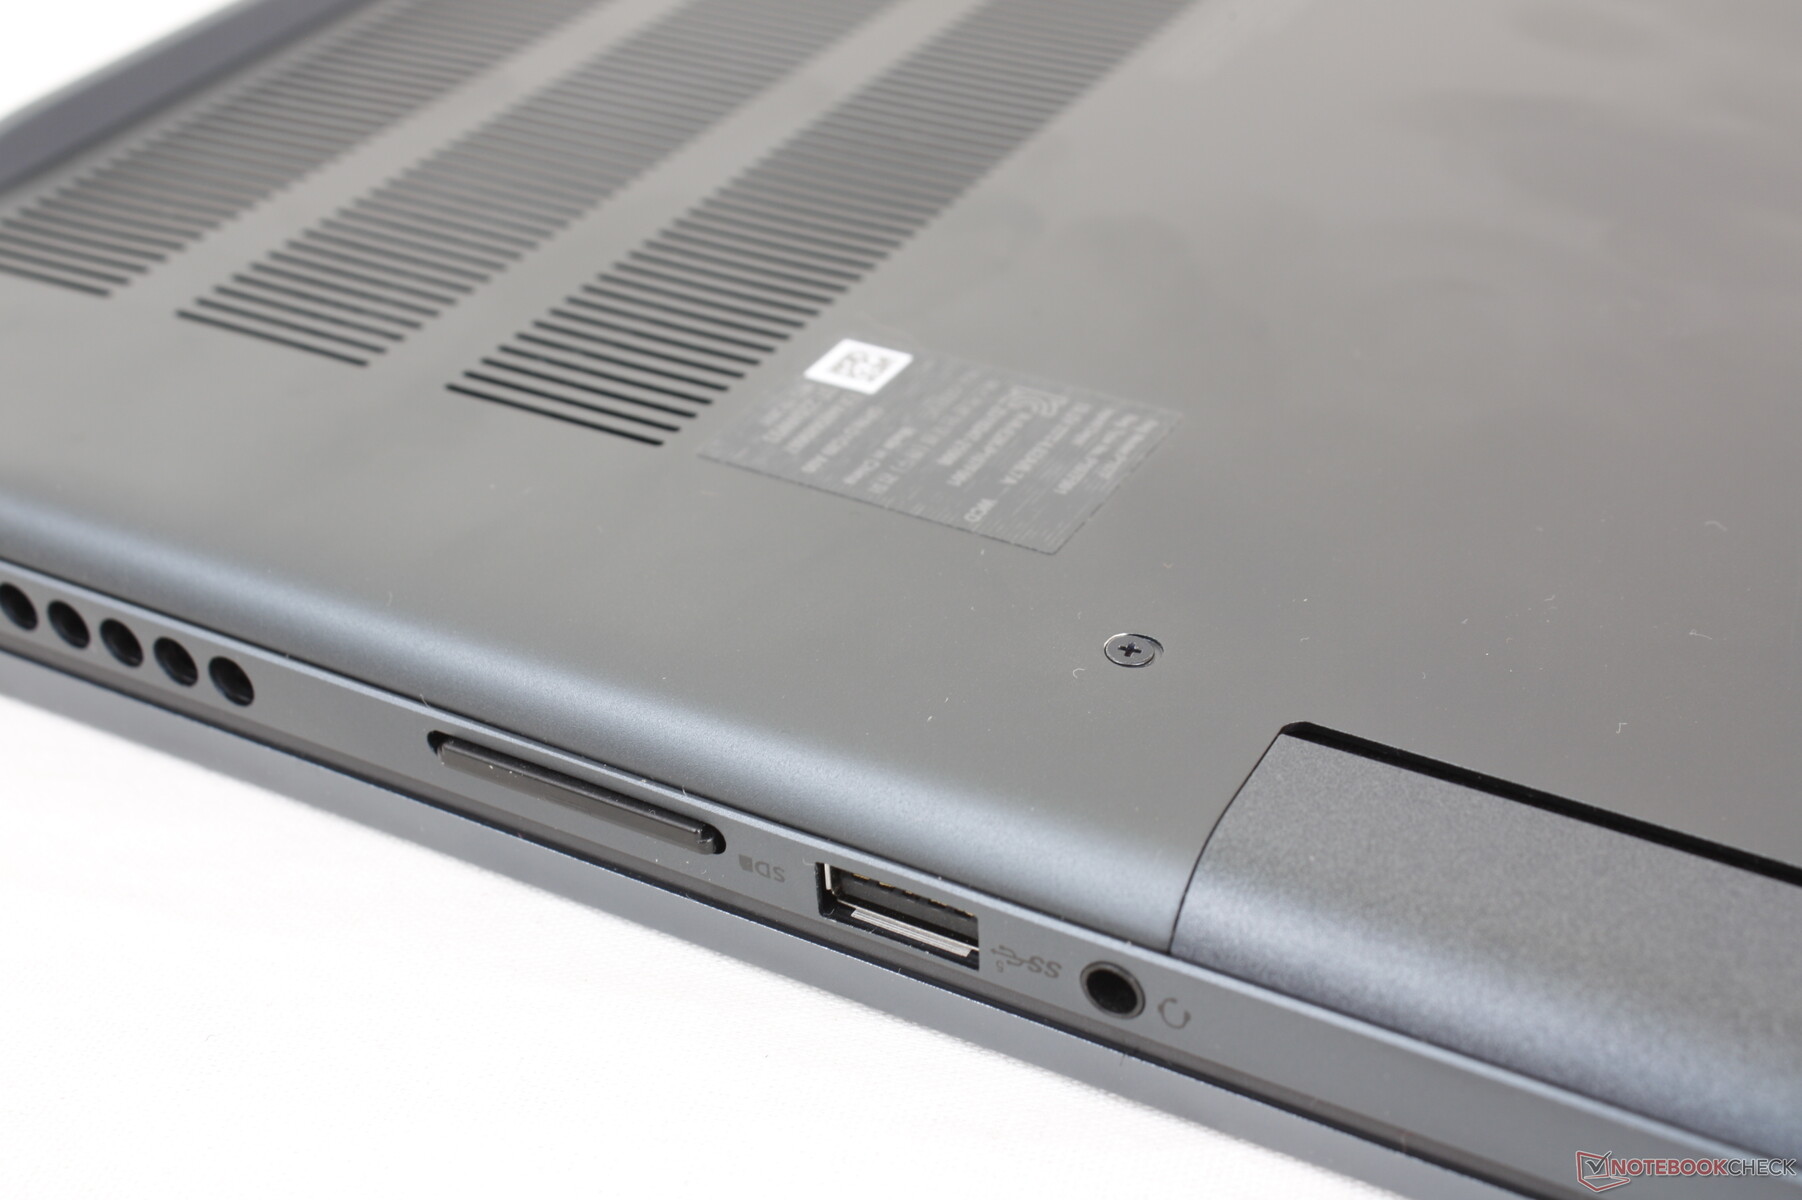
Las opciones de puerto son similares a las delInspiron 15 7506 2-en-1 pero con dos pequeñas diferencias: el lector MicroSD se ha actualizado a tamaño completo mientras que la posición de los puertos es ligeramente diferente debido a las nuevas rejillas de ventilación. Los puertos son más variados aquí a diferencia de la línea XPS donde los puertos USB-C tienen prioridad sobre todo lo demás.
Vale la pena señalar que experimentamos un problema en el que ninguno de los dos puertos USB-A podía reconocer nuestro SSD externo. Sin embargo, al conectar nuestra unidad al puerto USB-C, no hubo ningún problema. Recomendamos comprobar los puertos USB-A inmediatamente después de la compra para detectar cualquier problema potencial.
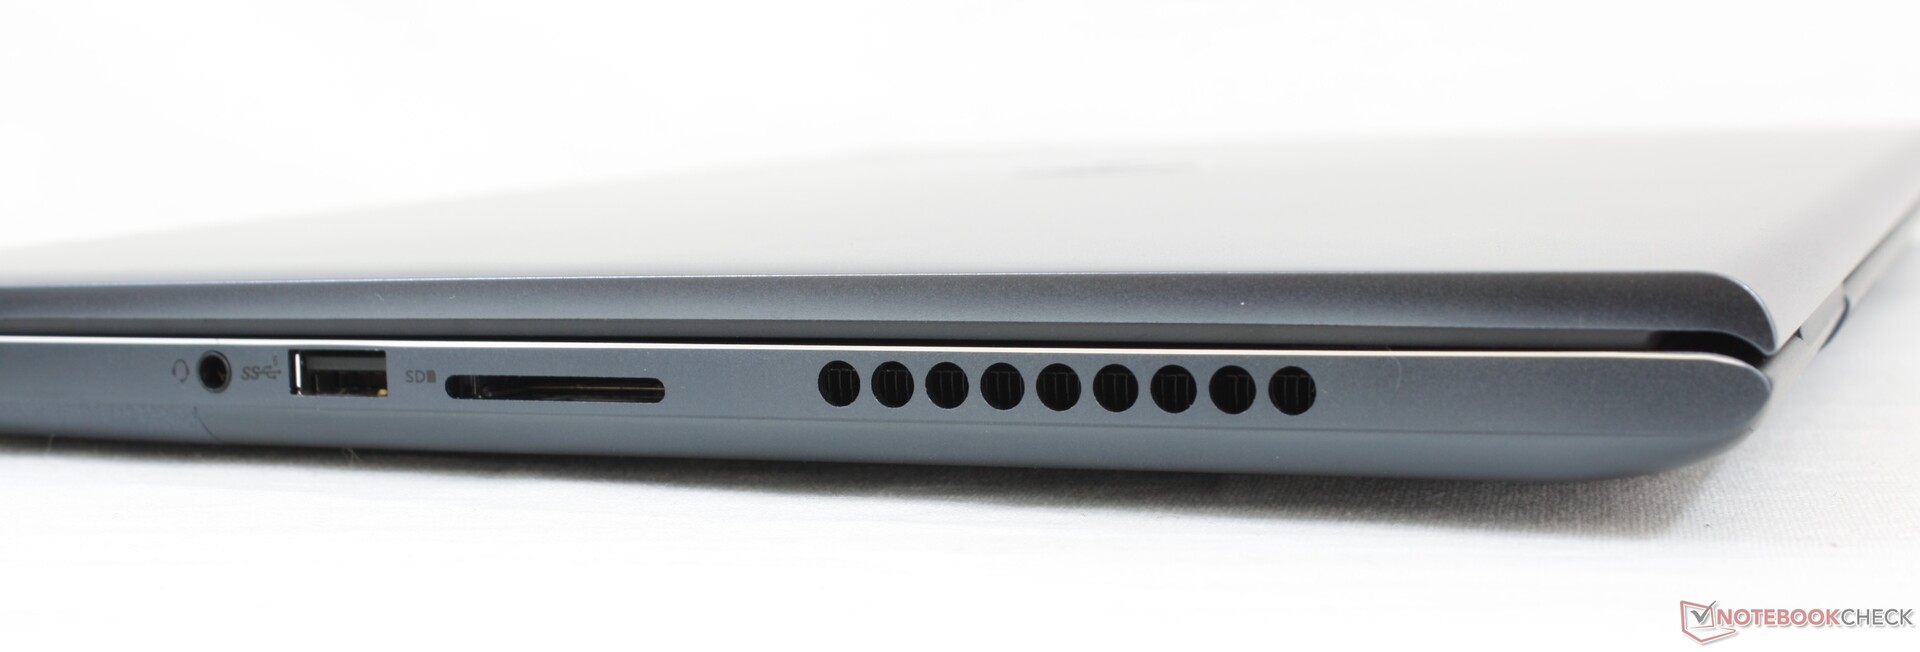
Lector de tarjetas SD
Las velocidades de transferencia desde el lector SD con resorte son muy lentas. Mover 1 GB de fotos desde nuestra tarjeta de prueba UHS-II al escritorio lleva más de 50 segundos, comparado con sólo 6 segundos en el XPS 15.
| SD Card Reader | |
| average JPG Copy Test (av. of 3 runs) | |
| Asus ROG Zephyrus M16 GU603H (AV PRO microSD 128 GB V60) | |
| LG Gram 16 (2021) (Toshiba Exceria Pro M501 microSDXC 64GB) | |
| HP Pavilion Gaming 16-a0242ng (Toshiba Exceria Pro SDXC 64 GB UHS-II) | |
| Dell Inspiron 15 7000 7506 2-in-1 Black Edition (Toshiba Exceria Pro M501 microSDXC 32GB) | |
| Dell Inspiron 16 Plus 7610 (AV PRO microSD 128 GB V60) | |
| maximum AS SSD Seq Read Test (1GB) | |
| Asus ROG Zephyrus M16 GU603H (AV PRO microSD 128 GB V60) | |
| LG Gram 16 (2021) (Toshiba Exceria Pro M501 microSDXC 64GB) | |
| HP Pavilion Gaming 16-a0242ng (Toshiba Exceria Pro SDXC 64 GB UHS-II) | |
| Dell Inspiron 15 7000 7506 2-in-1 Black Edition (Toshiba Exceria Pro M501 microSDXC 32GB) | |
| Dell Inspiron 16 Plus 7610 (AV PRO microSD 128 GB V60) | |
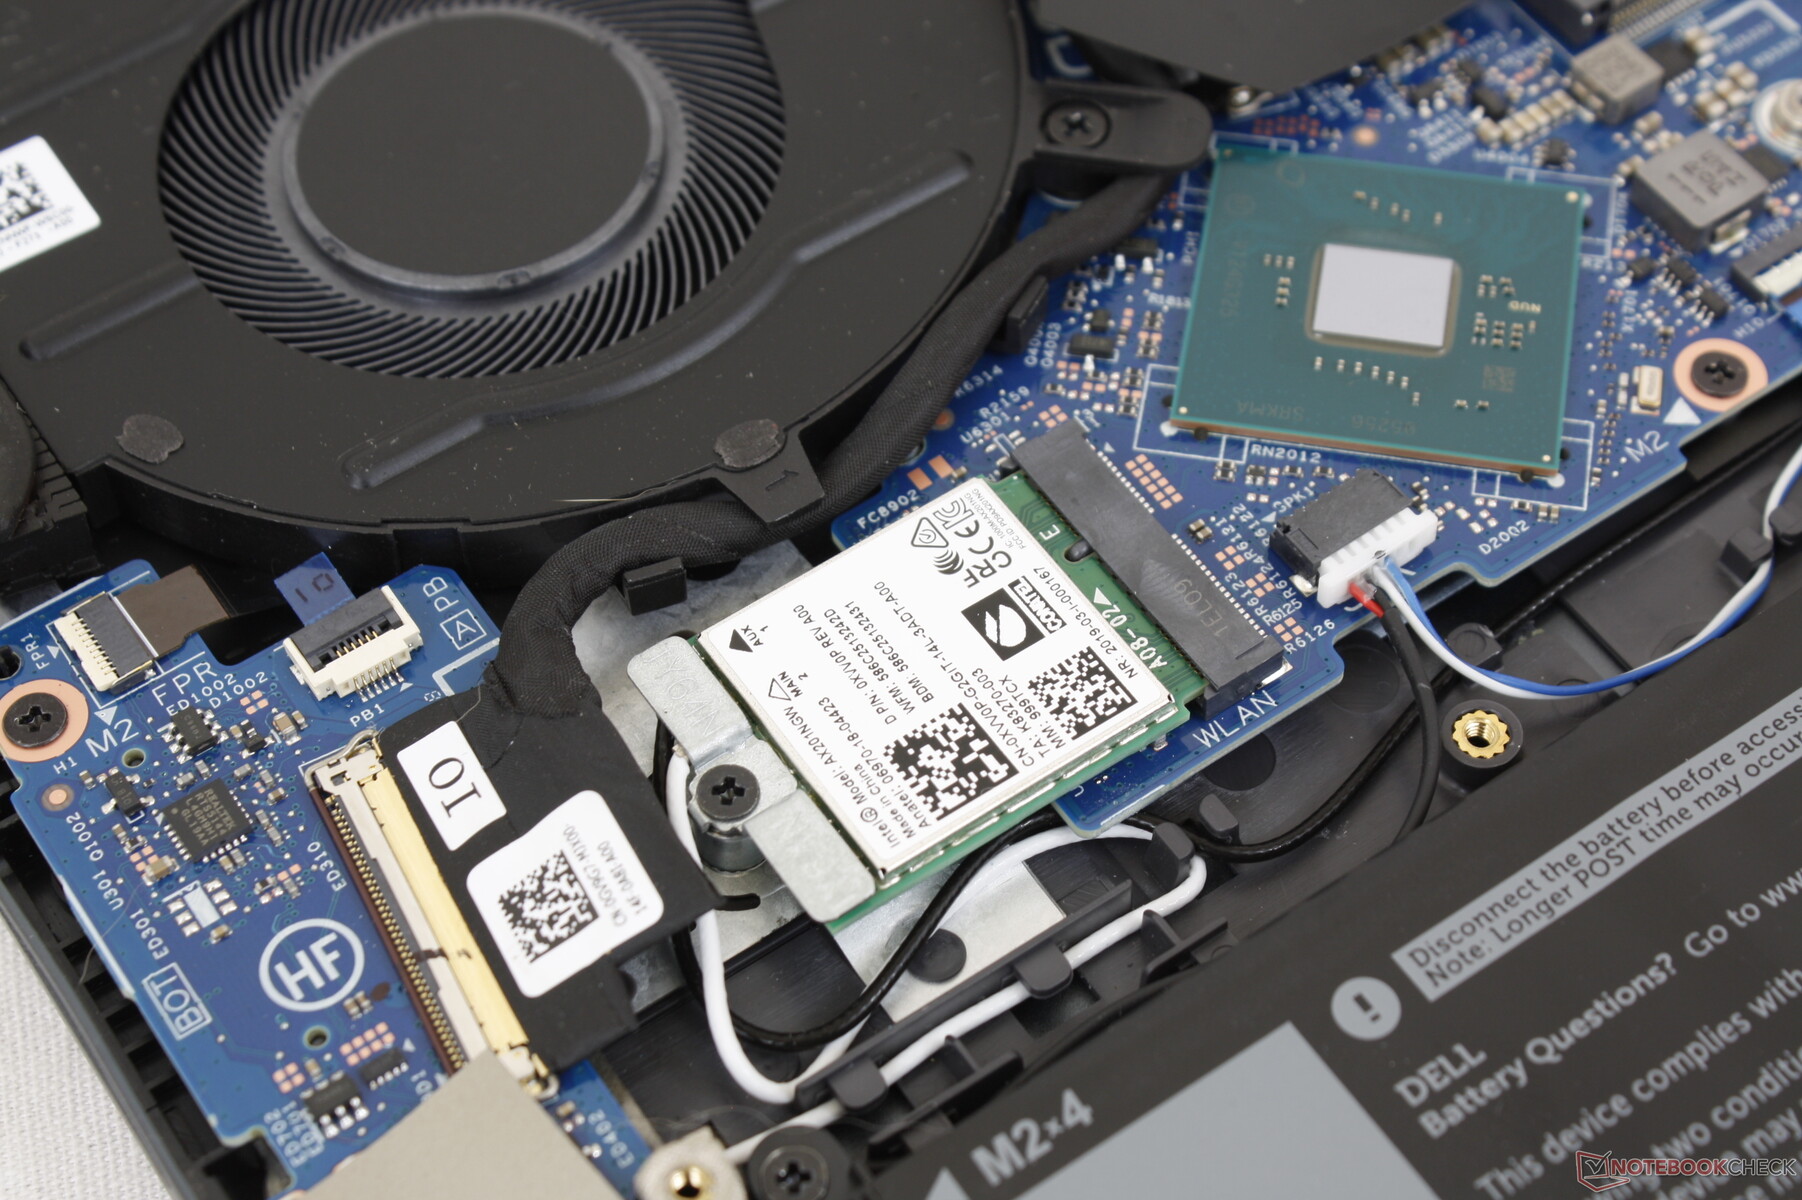
Comunicación
El Intel AX201 viene de serie con conectividad Wi-Fi 6 y Bluetooth 5.1. No experimentamos ningún problema al emparejarlo con nuestro router de prueba Netgear RAX200.
Cámara web
La cámara es la estándar de 1 MP o calidad 720p que todos conocemos en la mayoría de los portátiles. Aunque integra un obturador manual, no incluye capacidades IR o Windows Hello.


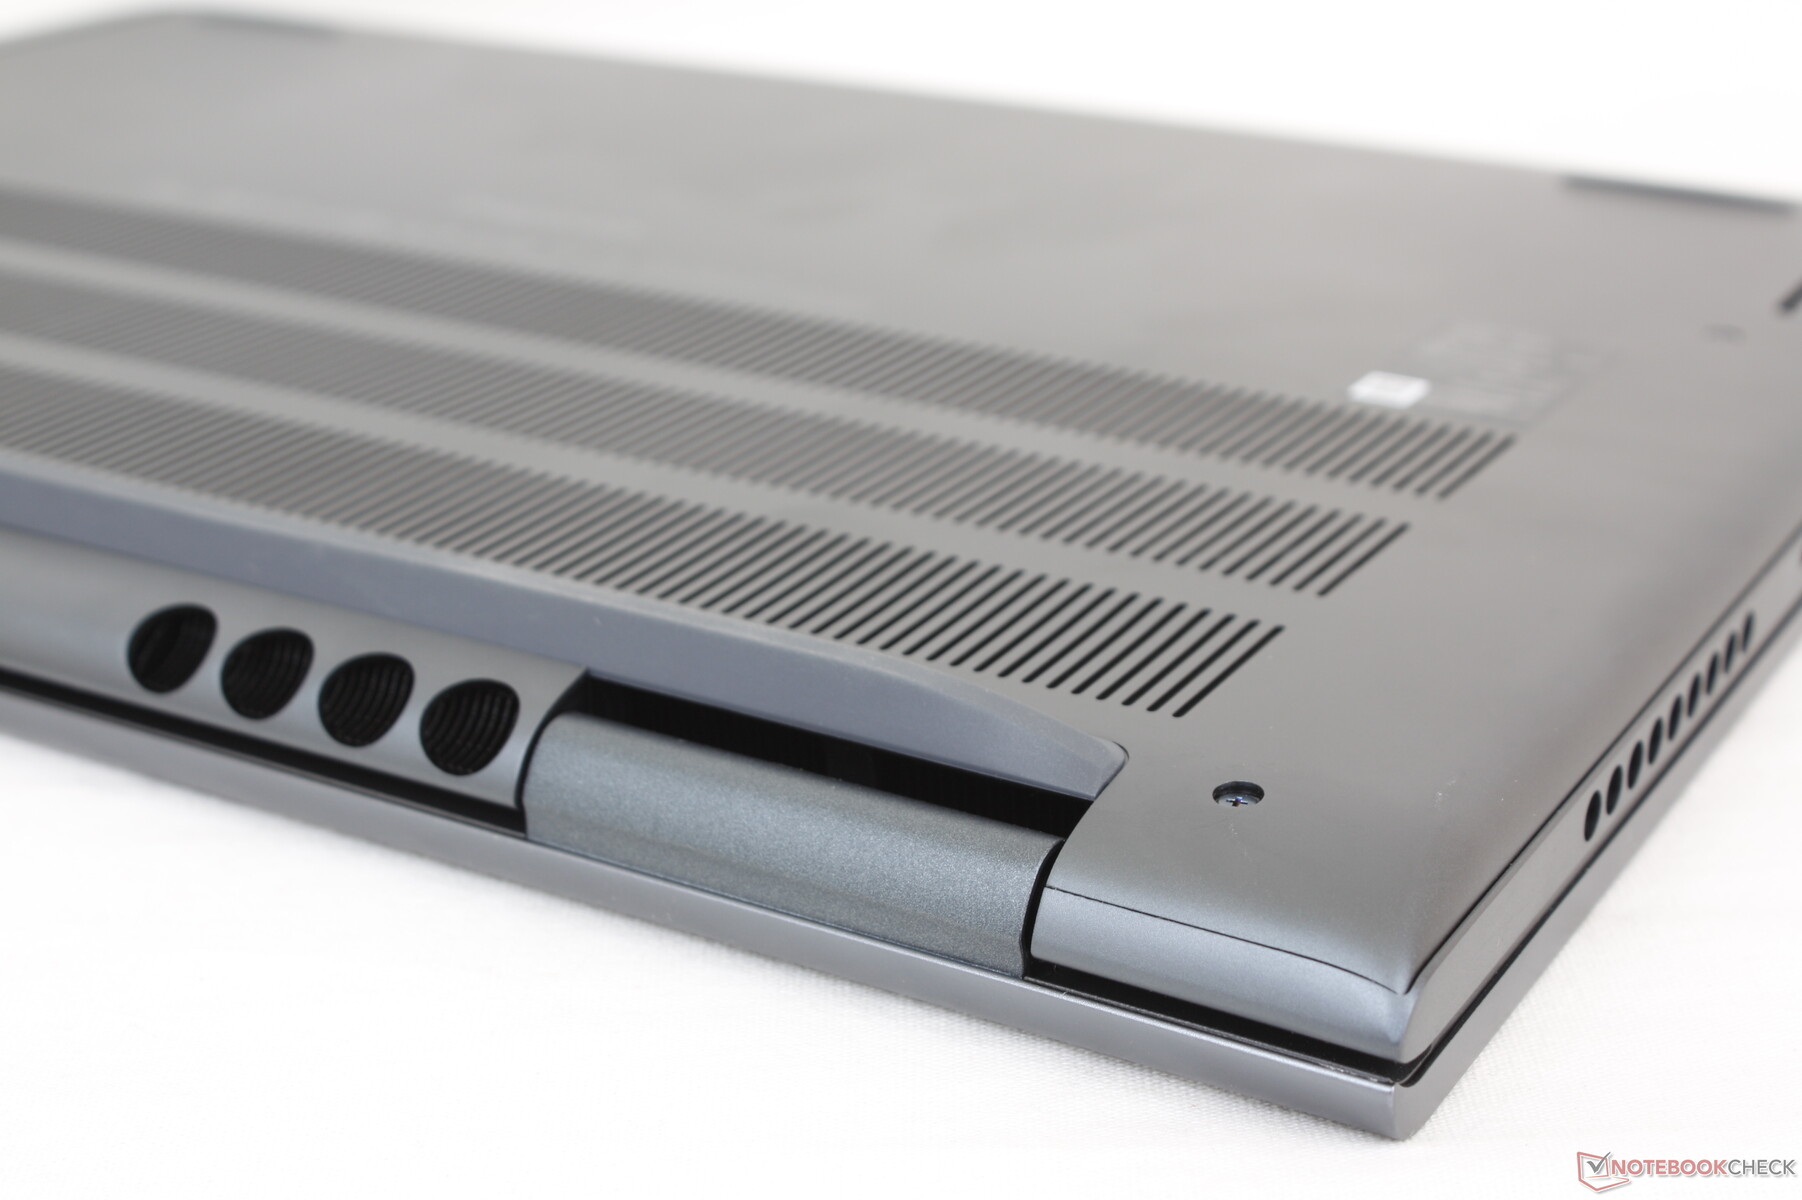
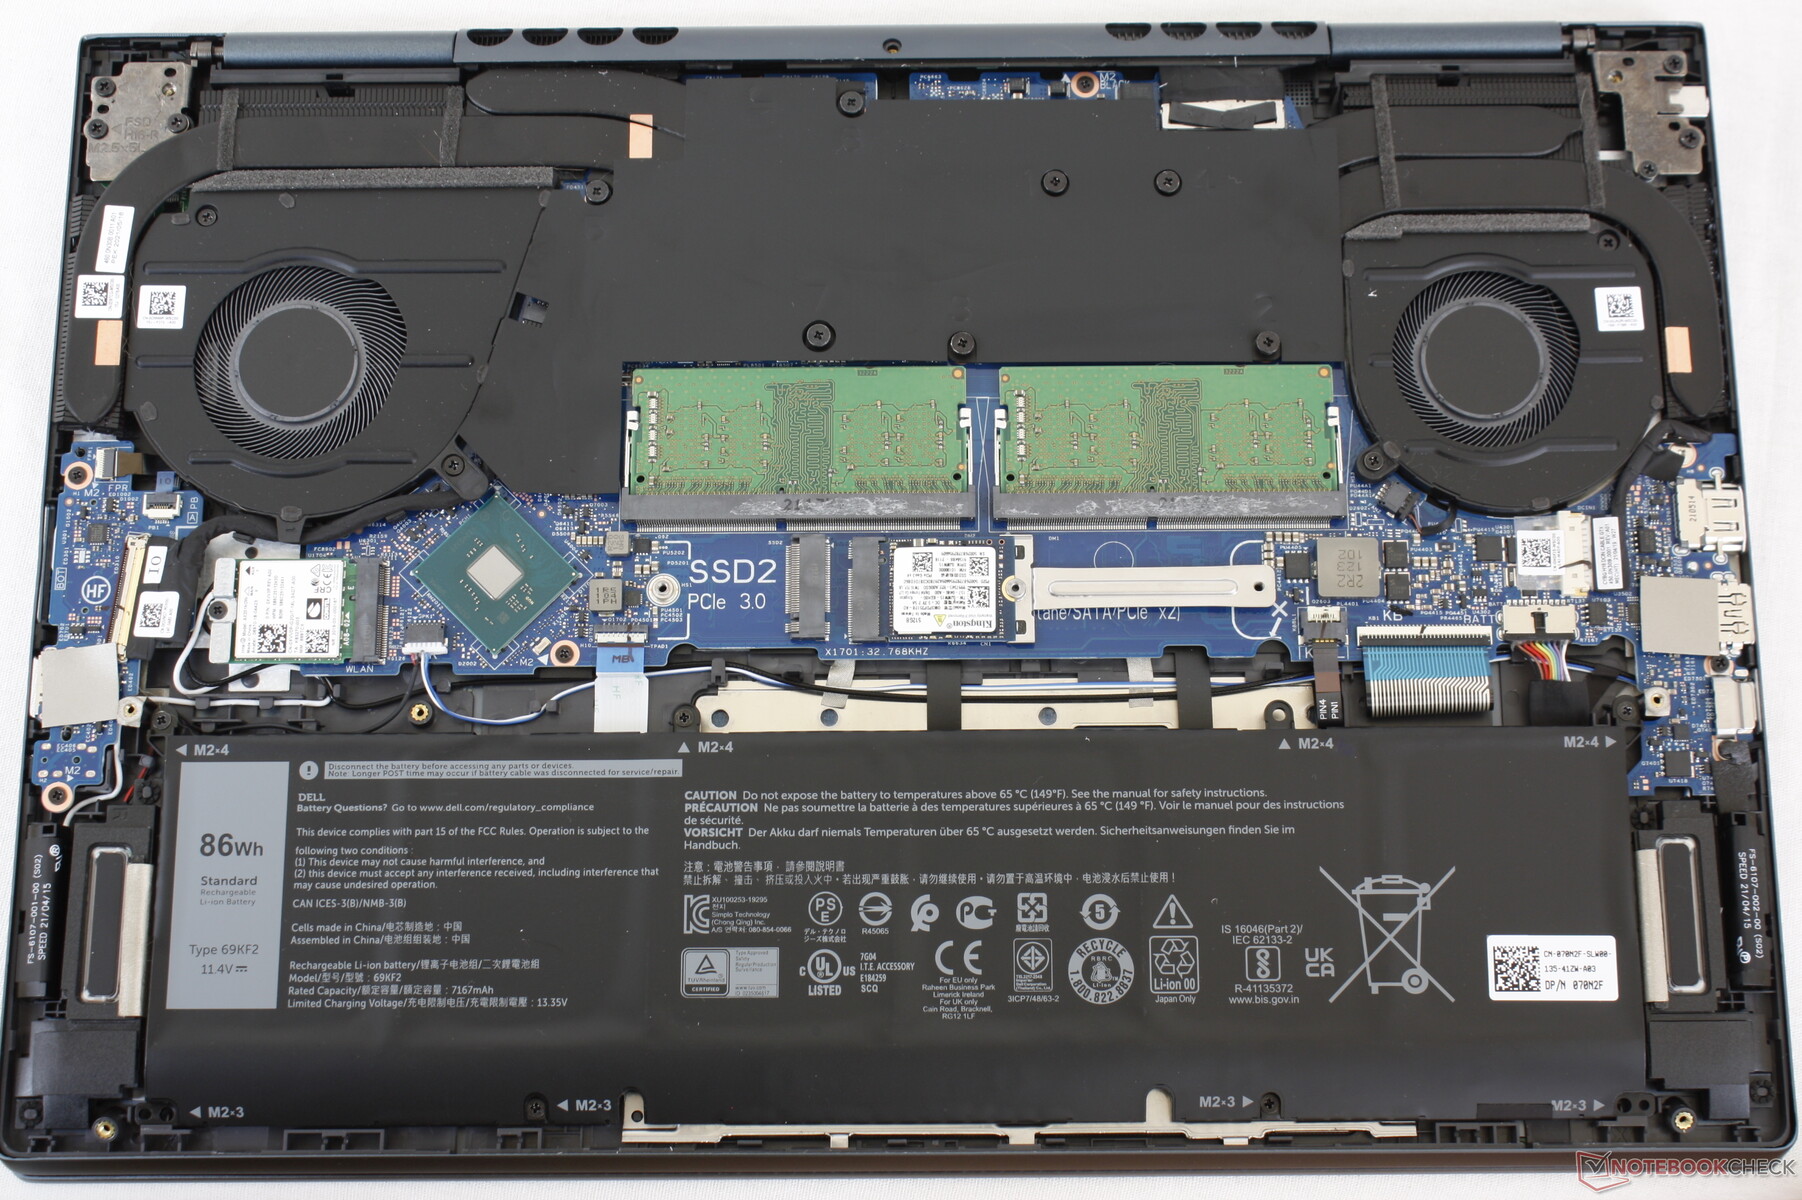
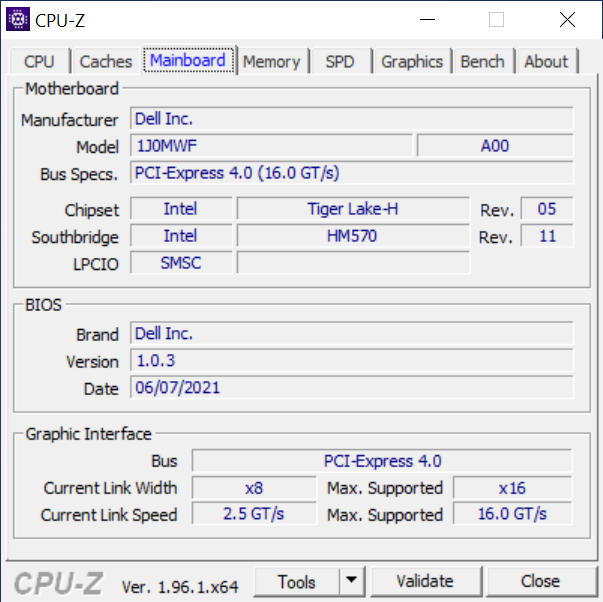
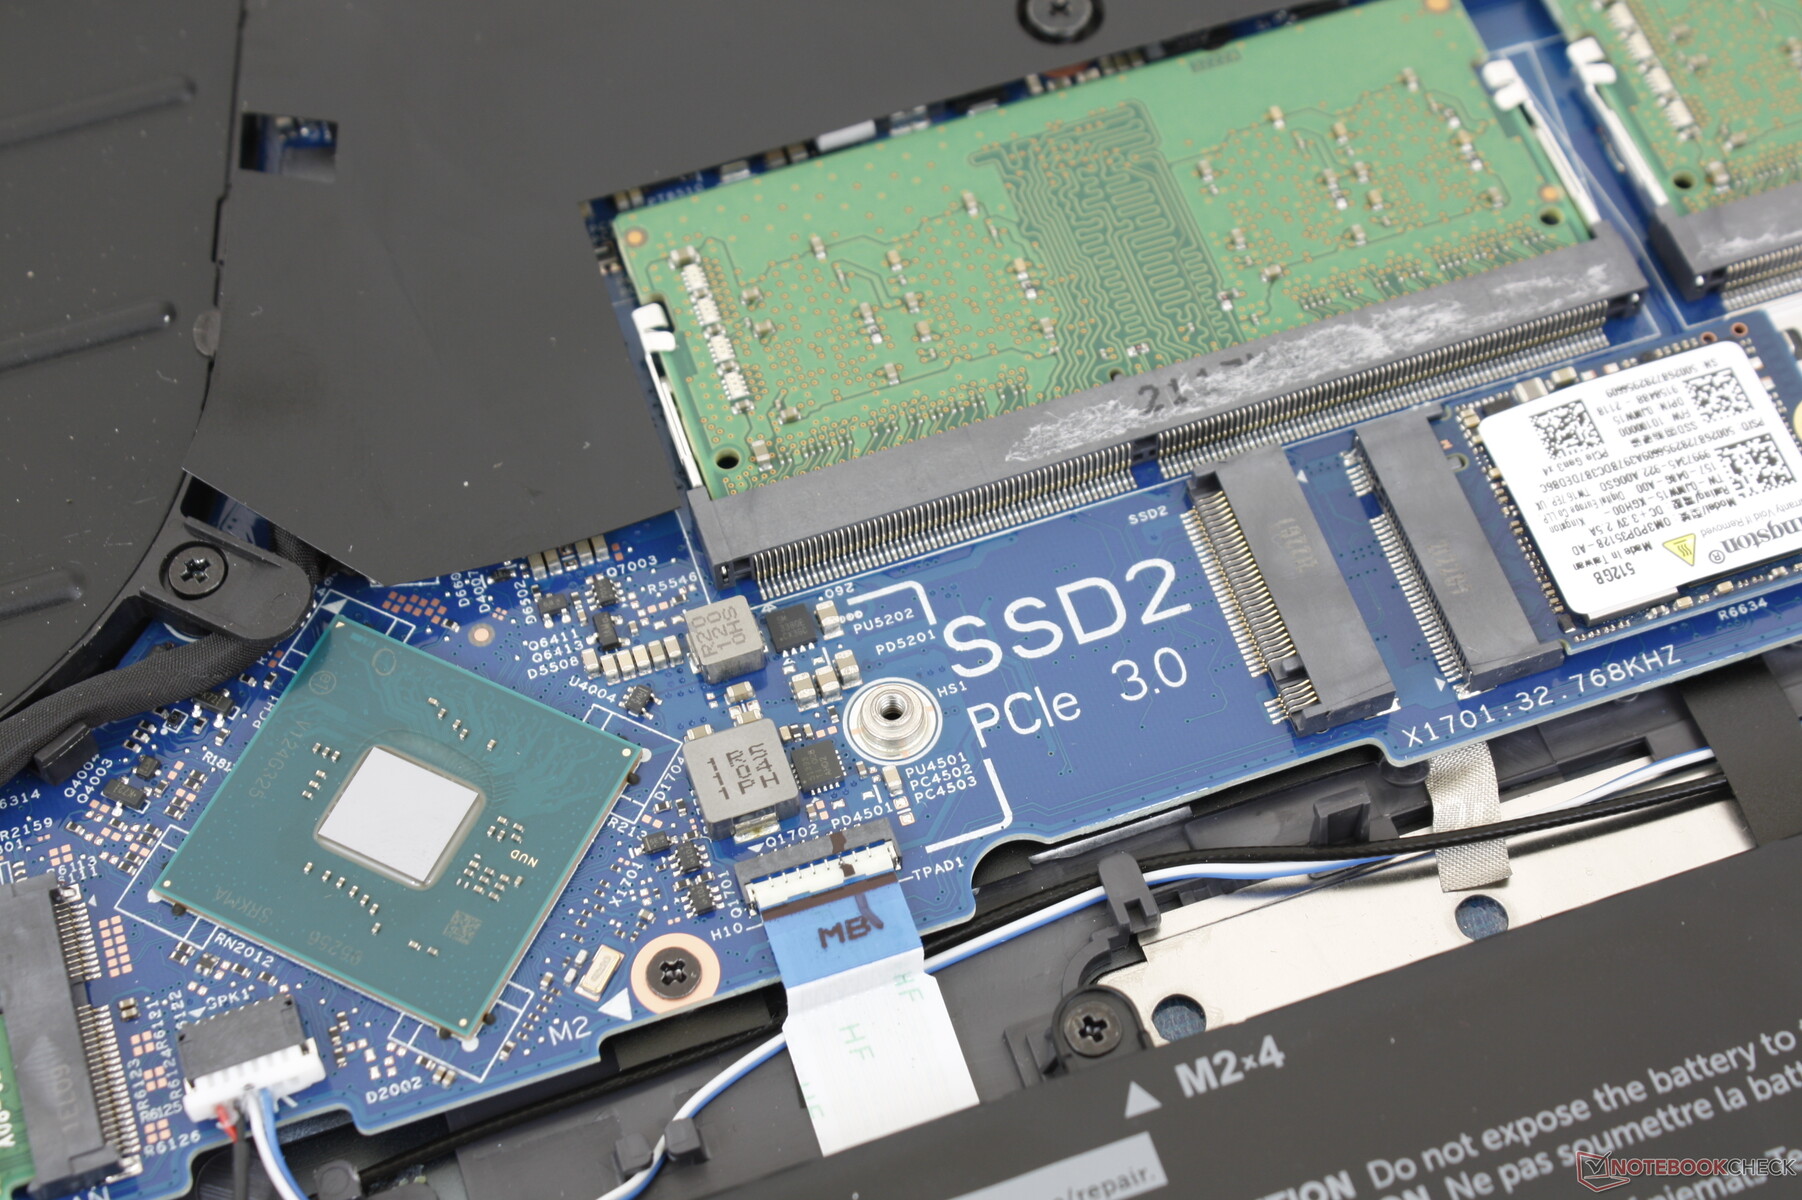
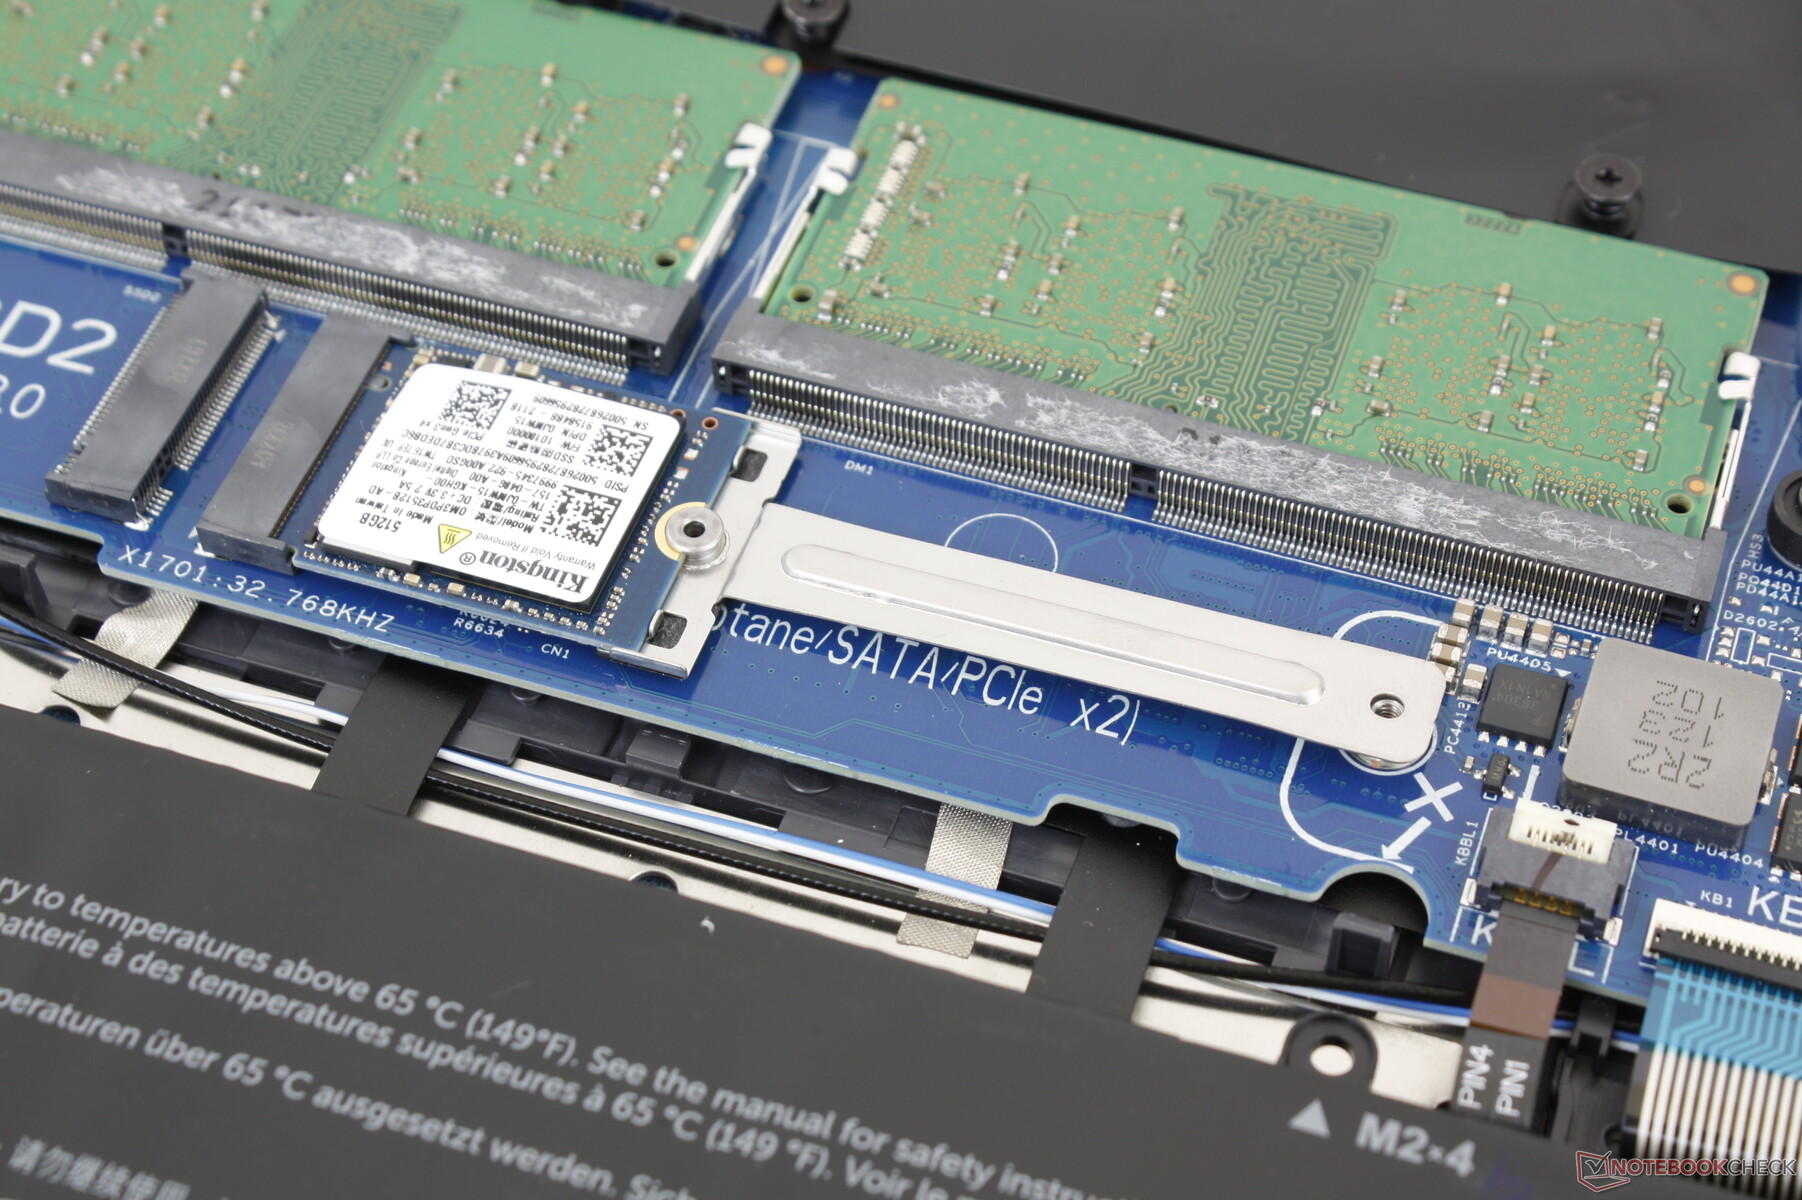
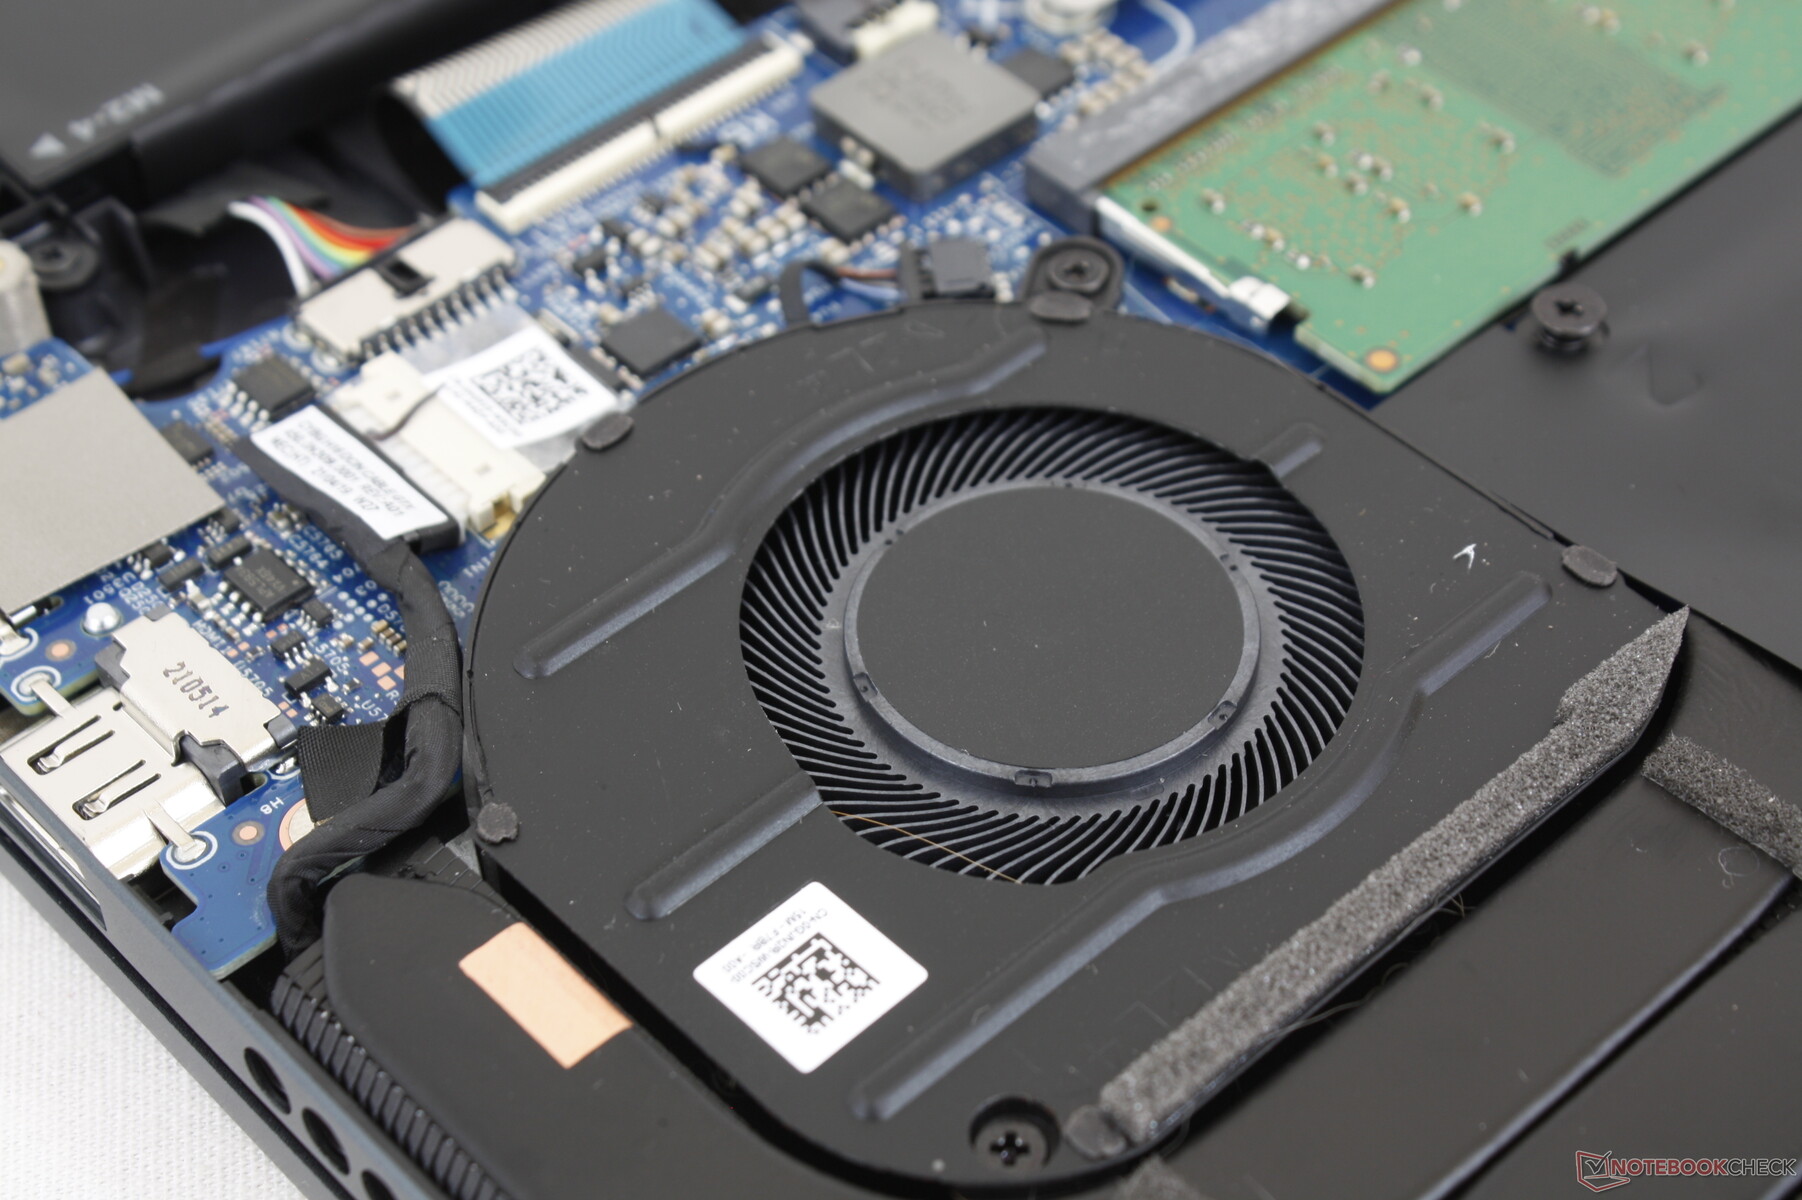
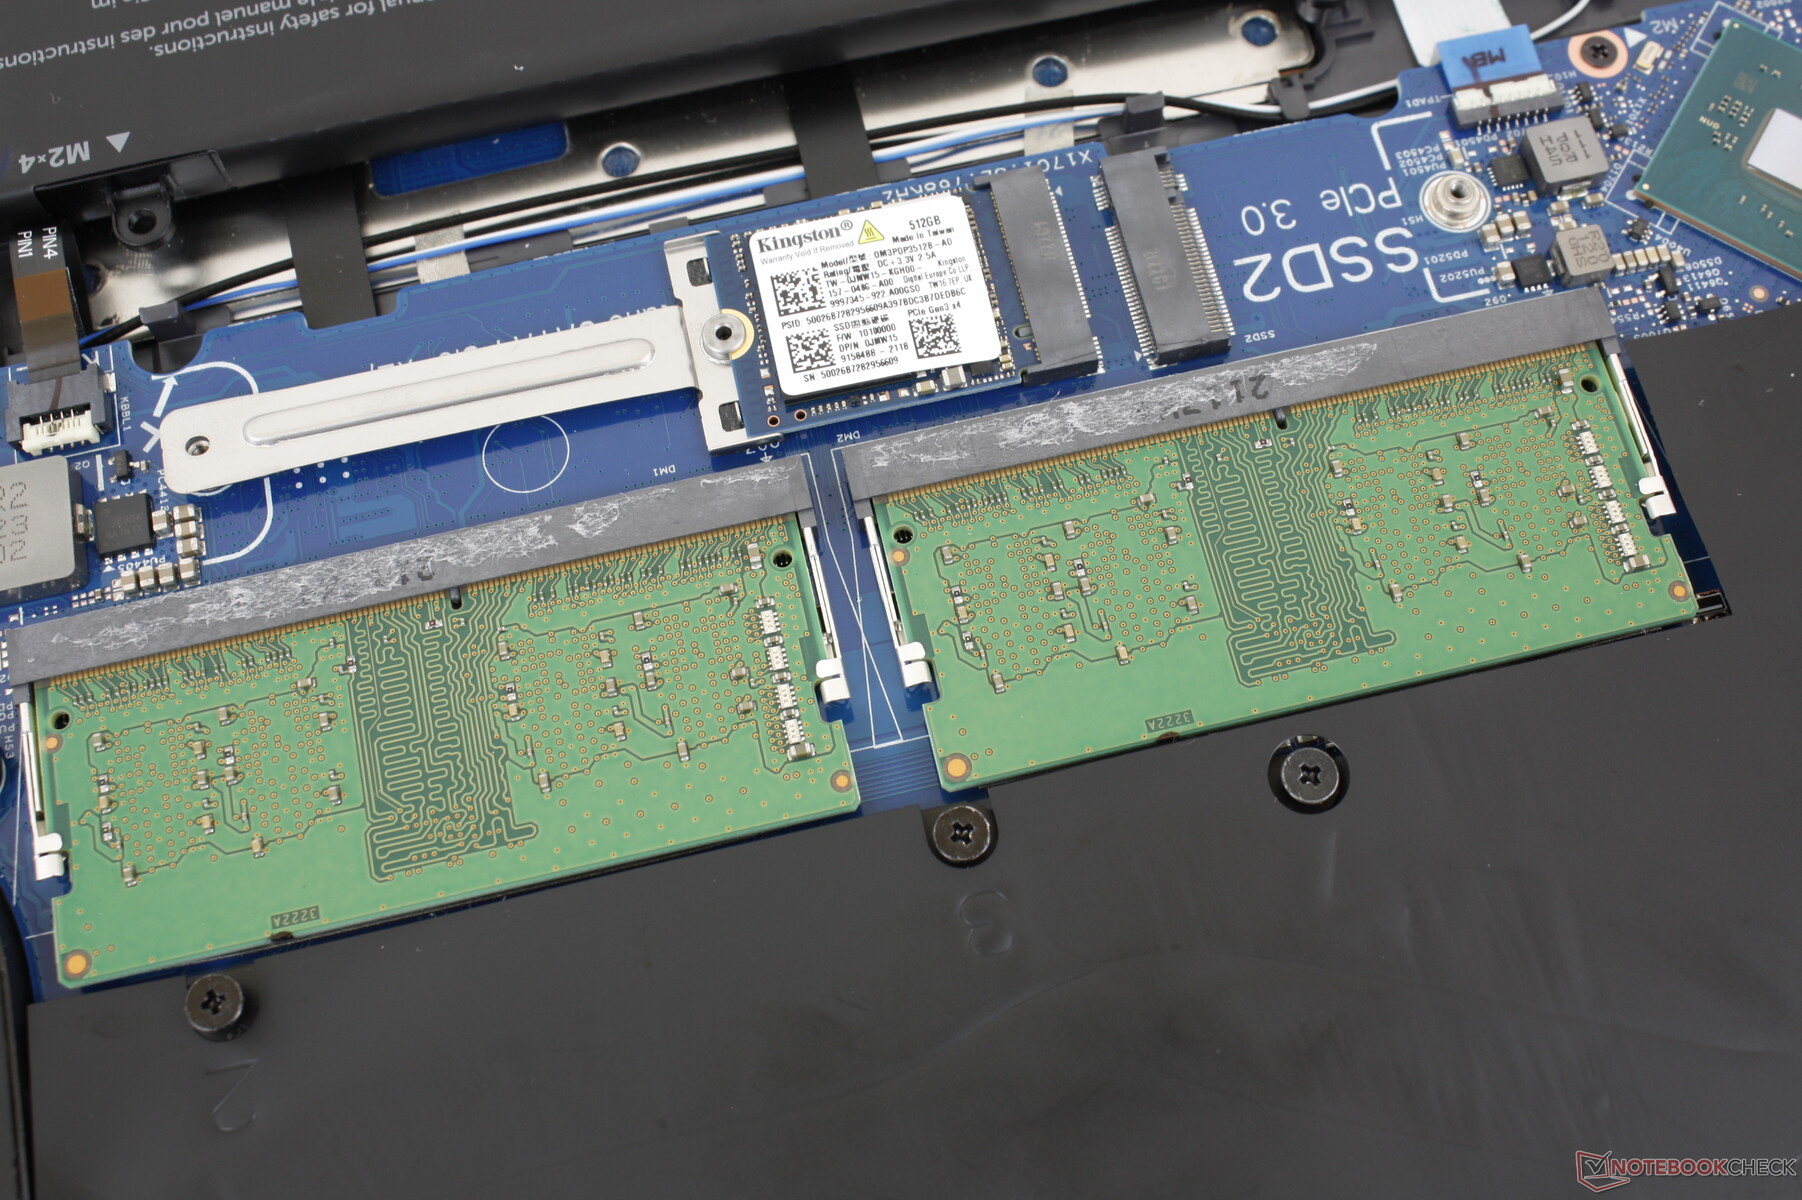
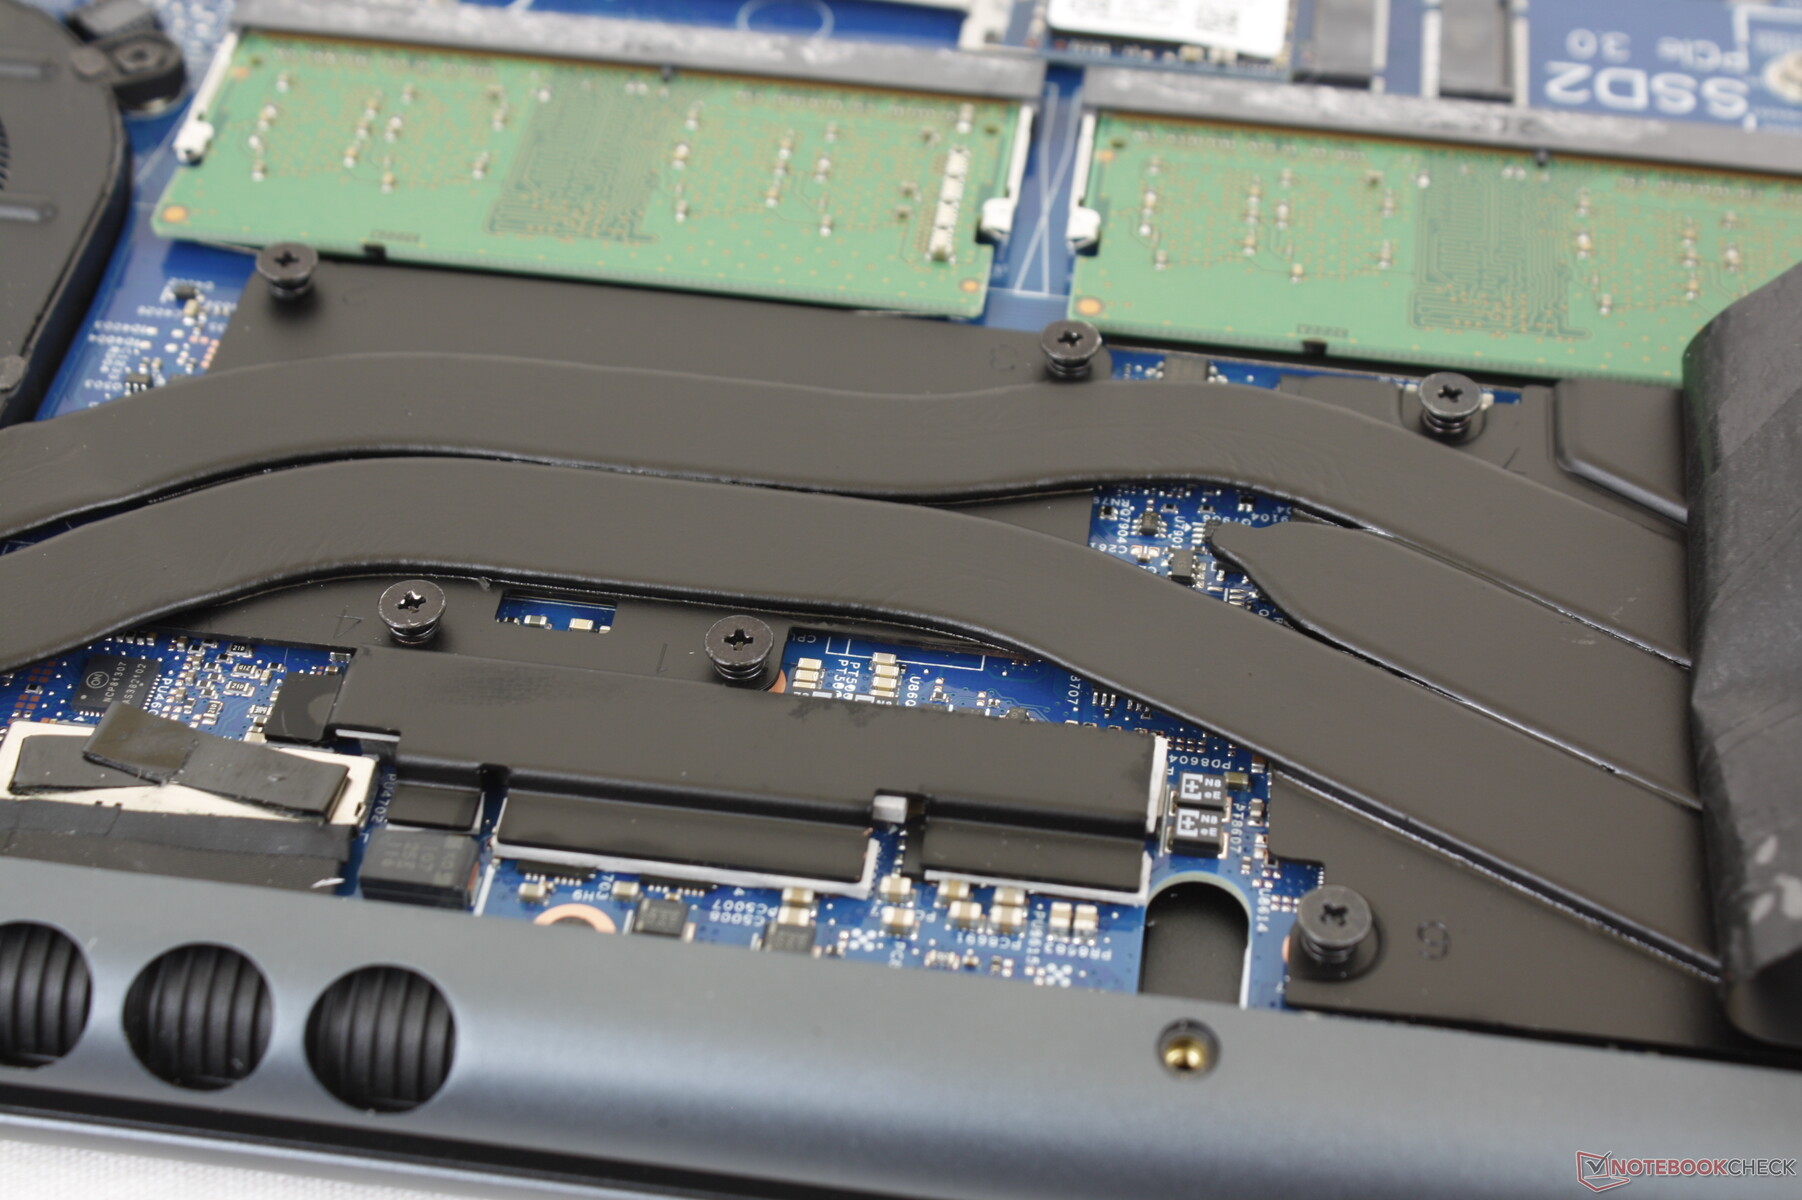
Mantenimiento - Actualizaciones sencillas
El panel inferior requiere un destornillador Philips, un borde afilado y algo de paciencia para abrirlo, ya que la parte trasera puede ser difícil de separar.Una vez dentro, los usuarios tendrán acceso directo a dos ranuras SODIMM, dos bahías de almacenamiento M.2 y el módulo WLAN extraíble.
Accesorios y garantía
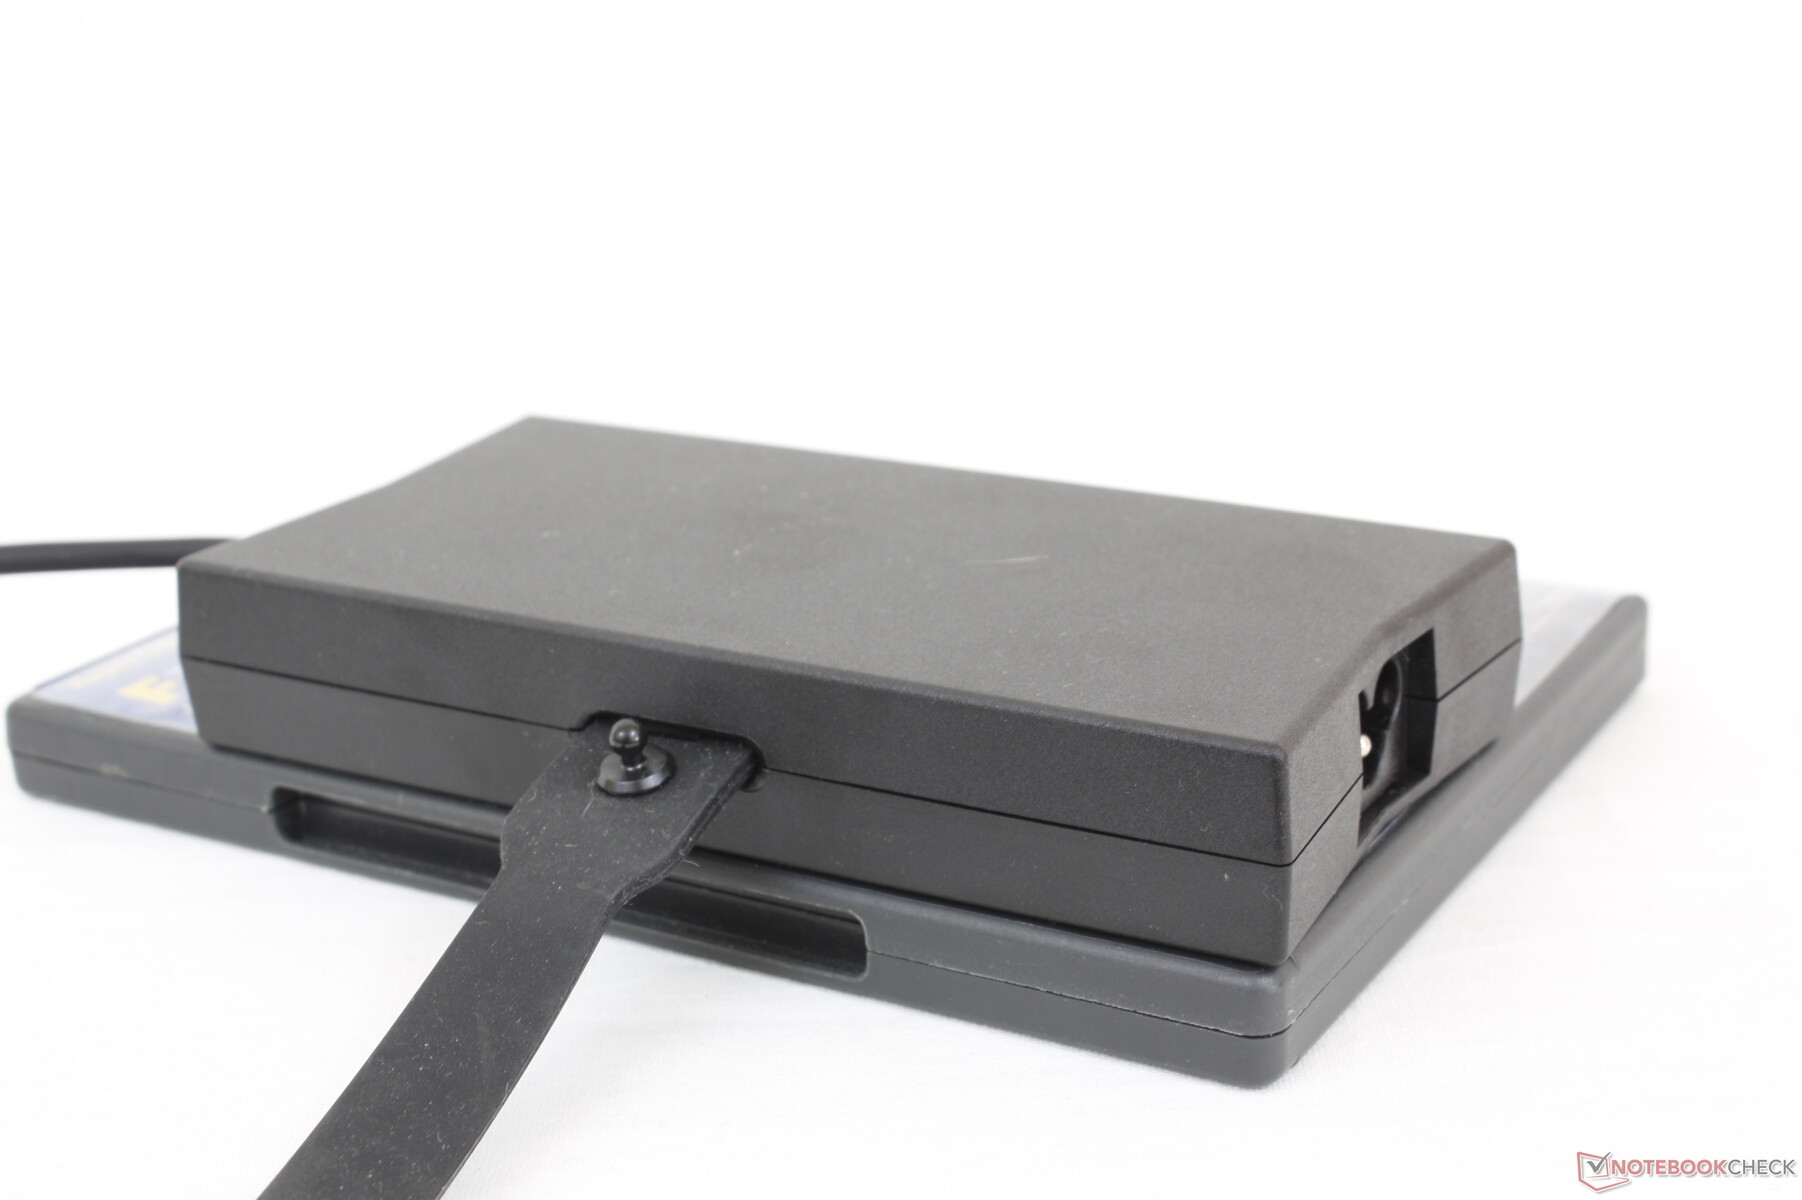
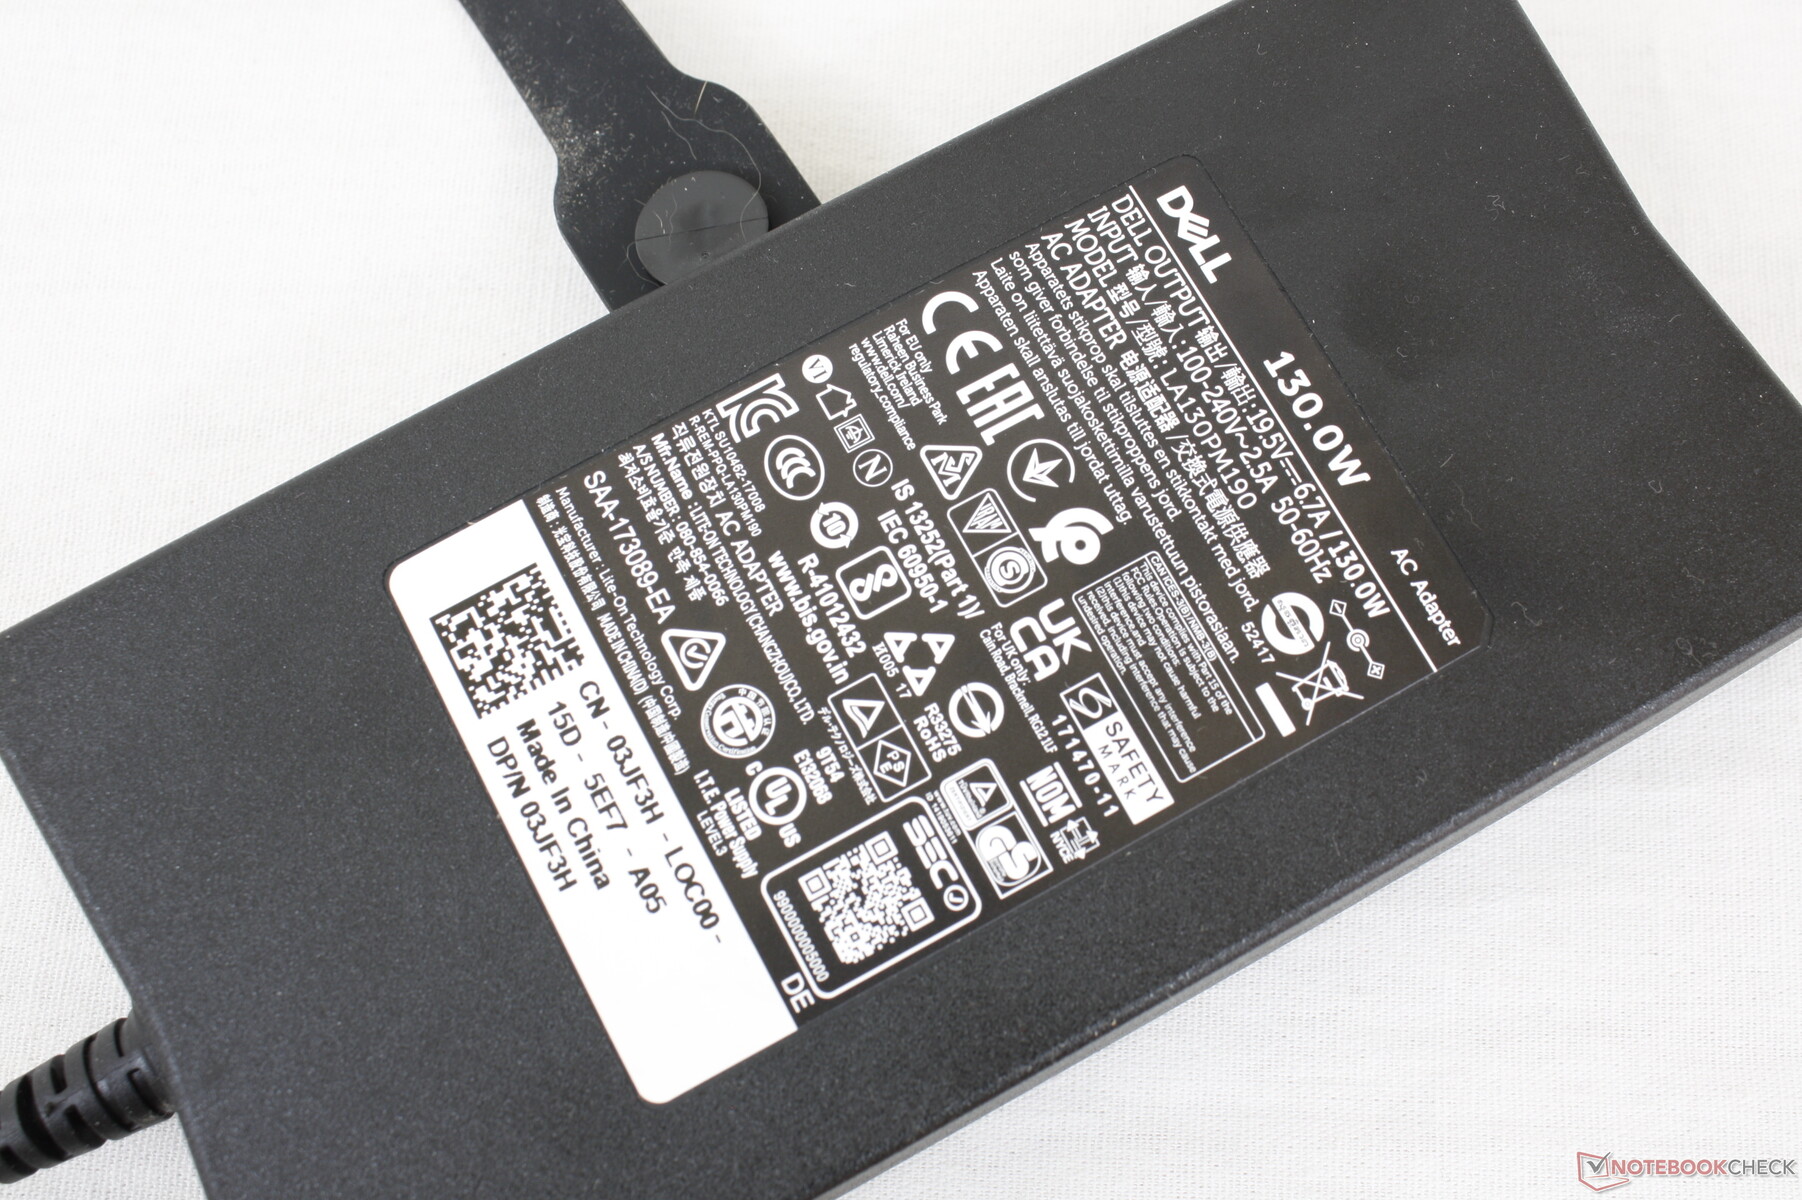
No hay extras en la caja más allá del adaptador de CA de barril y la documentación. Se aplica la garantía limitada estándar de un año con opciones de ampliación si se compra directamente a Dell.
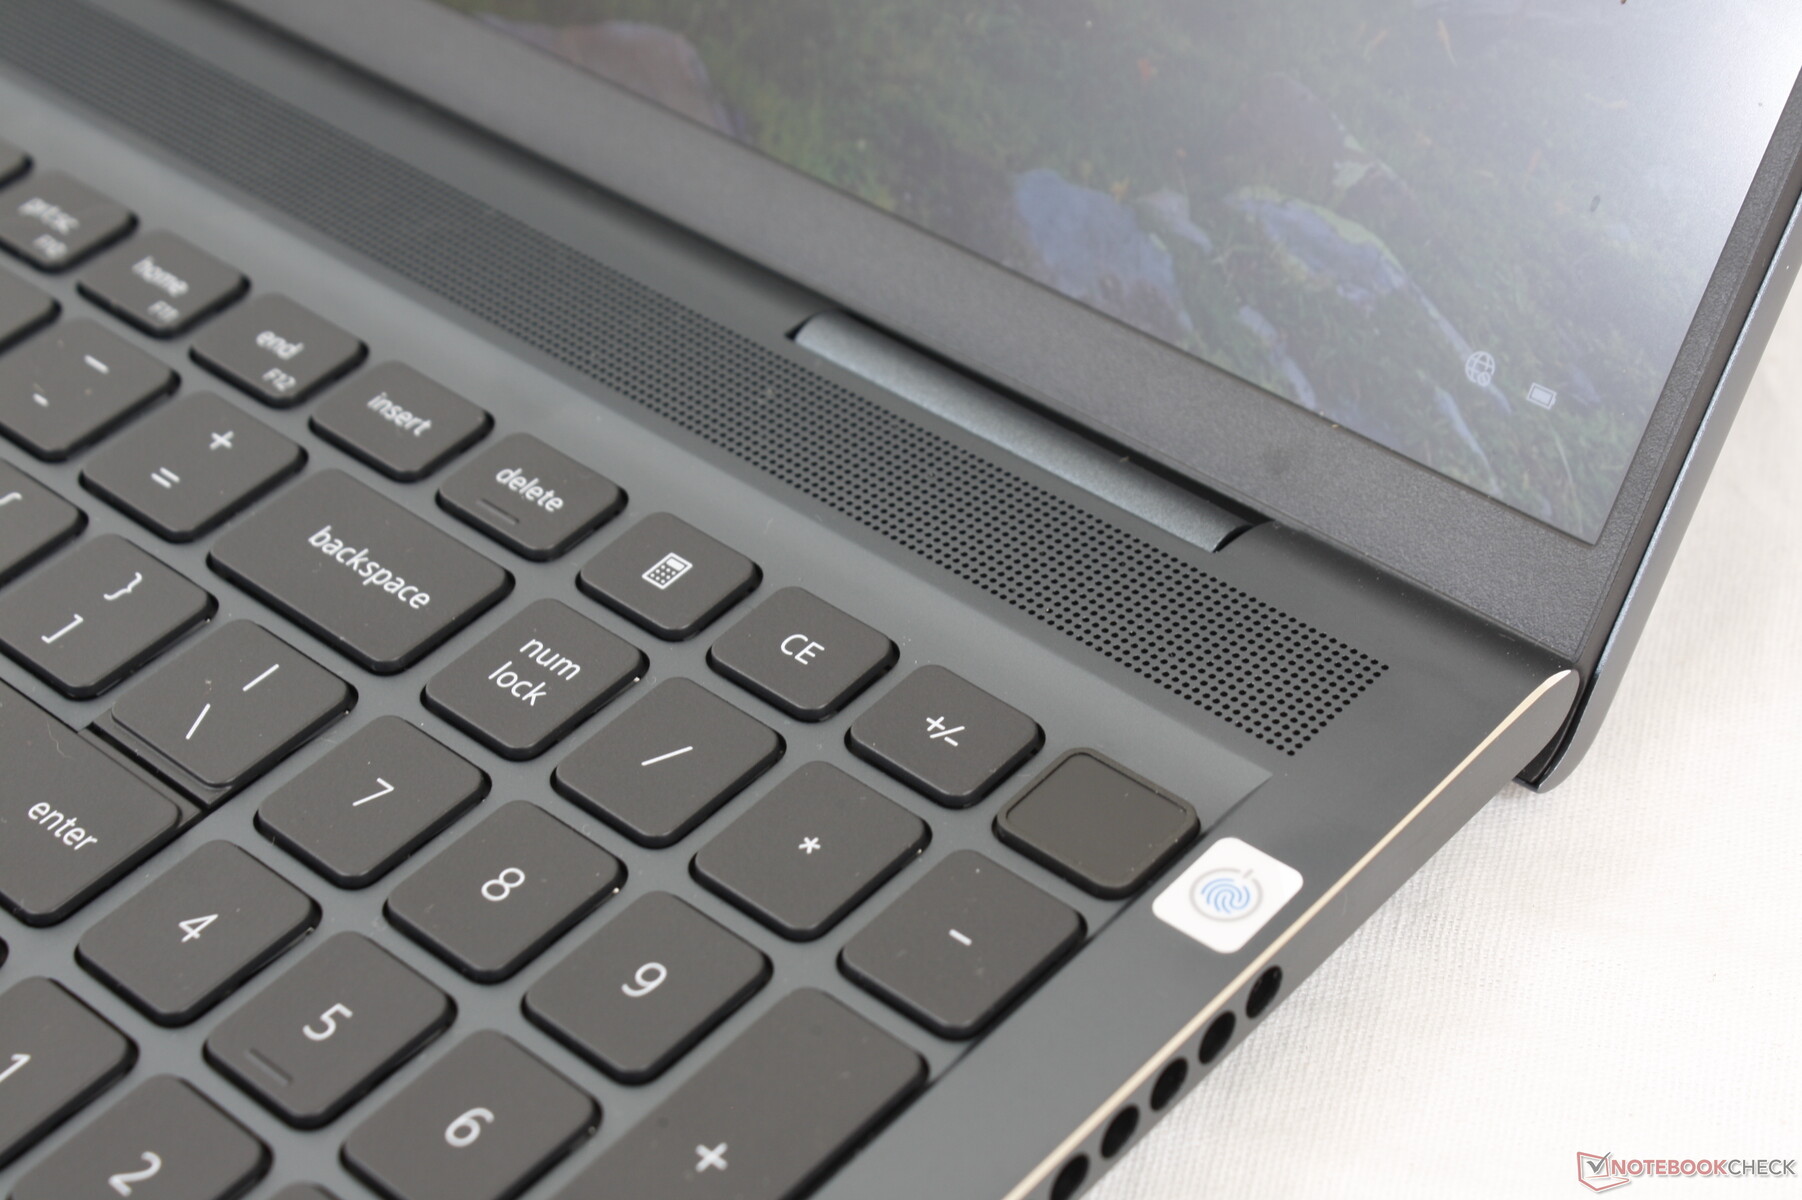
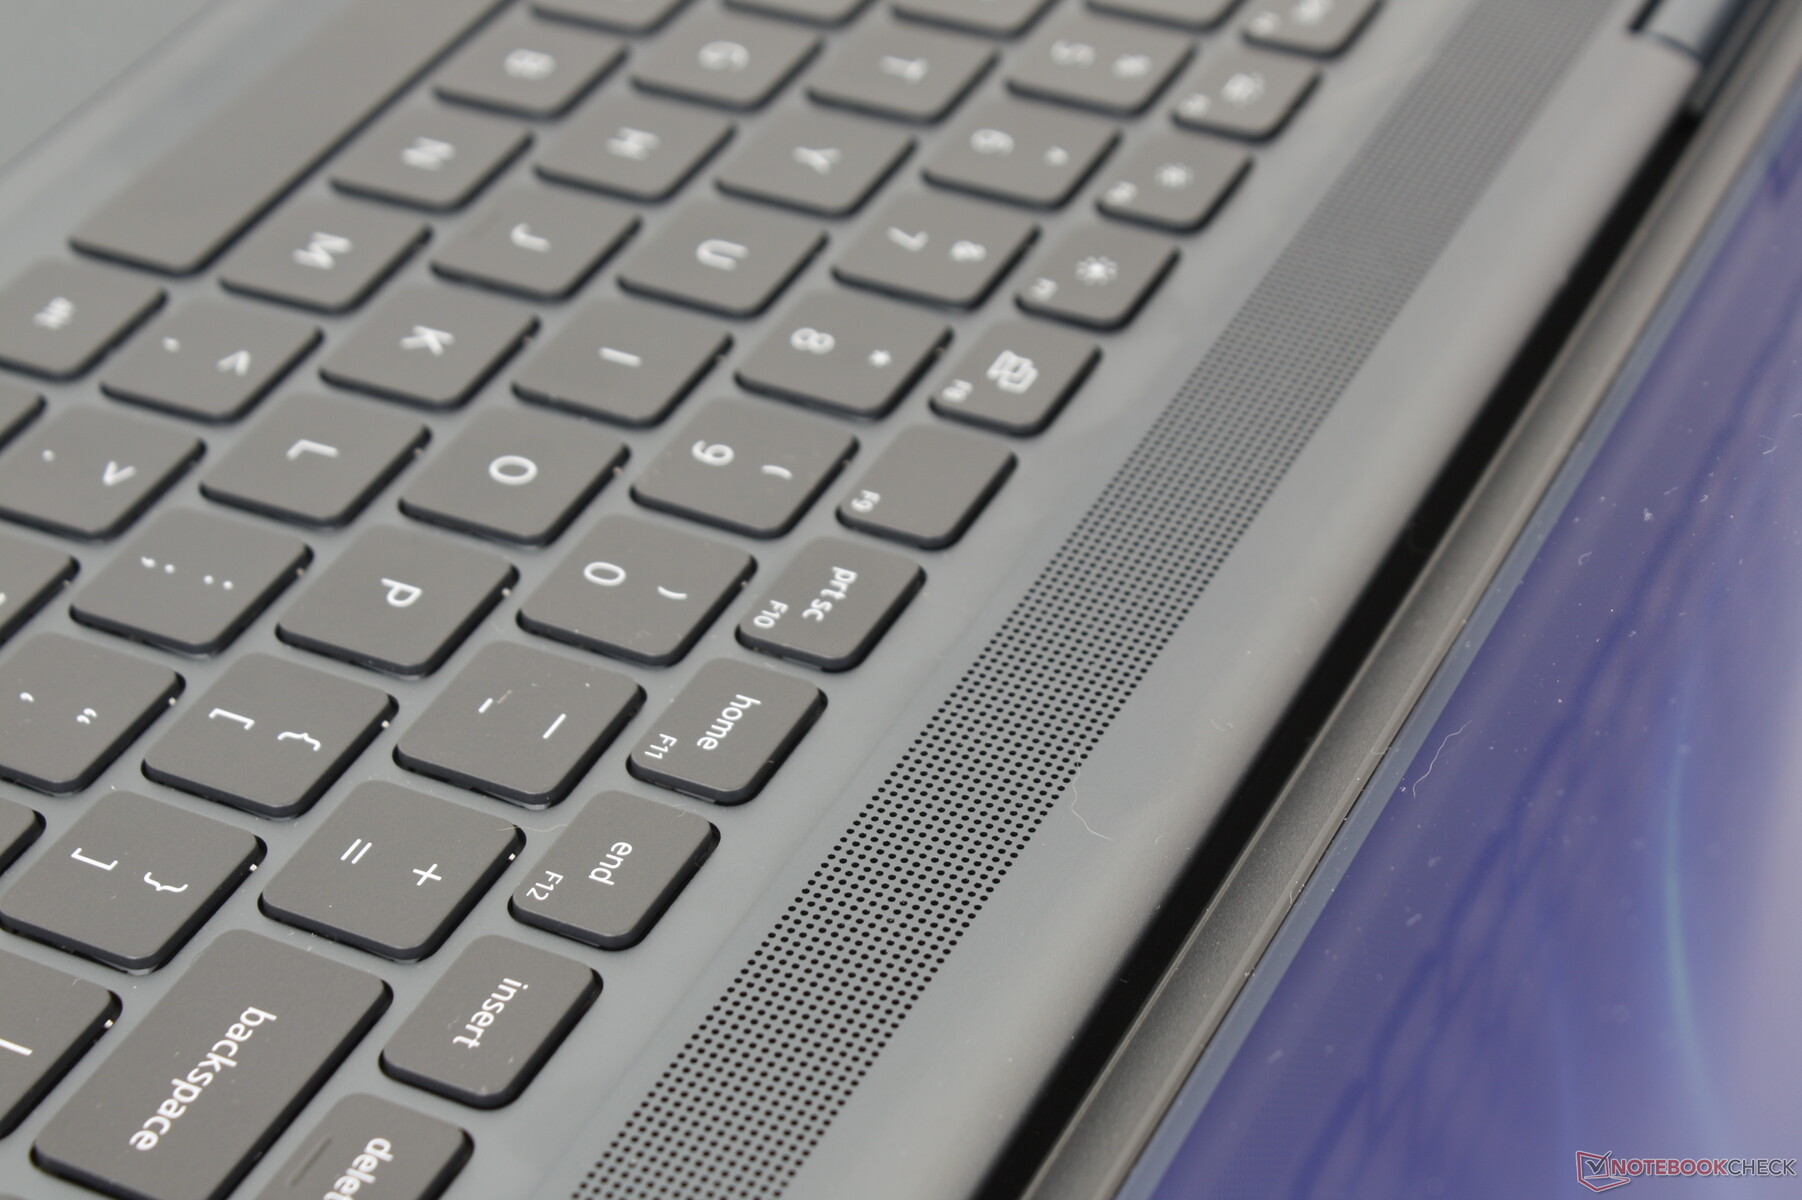
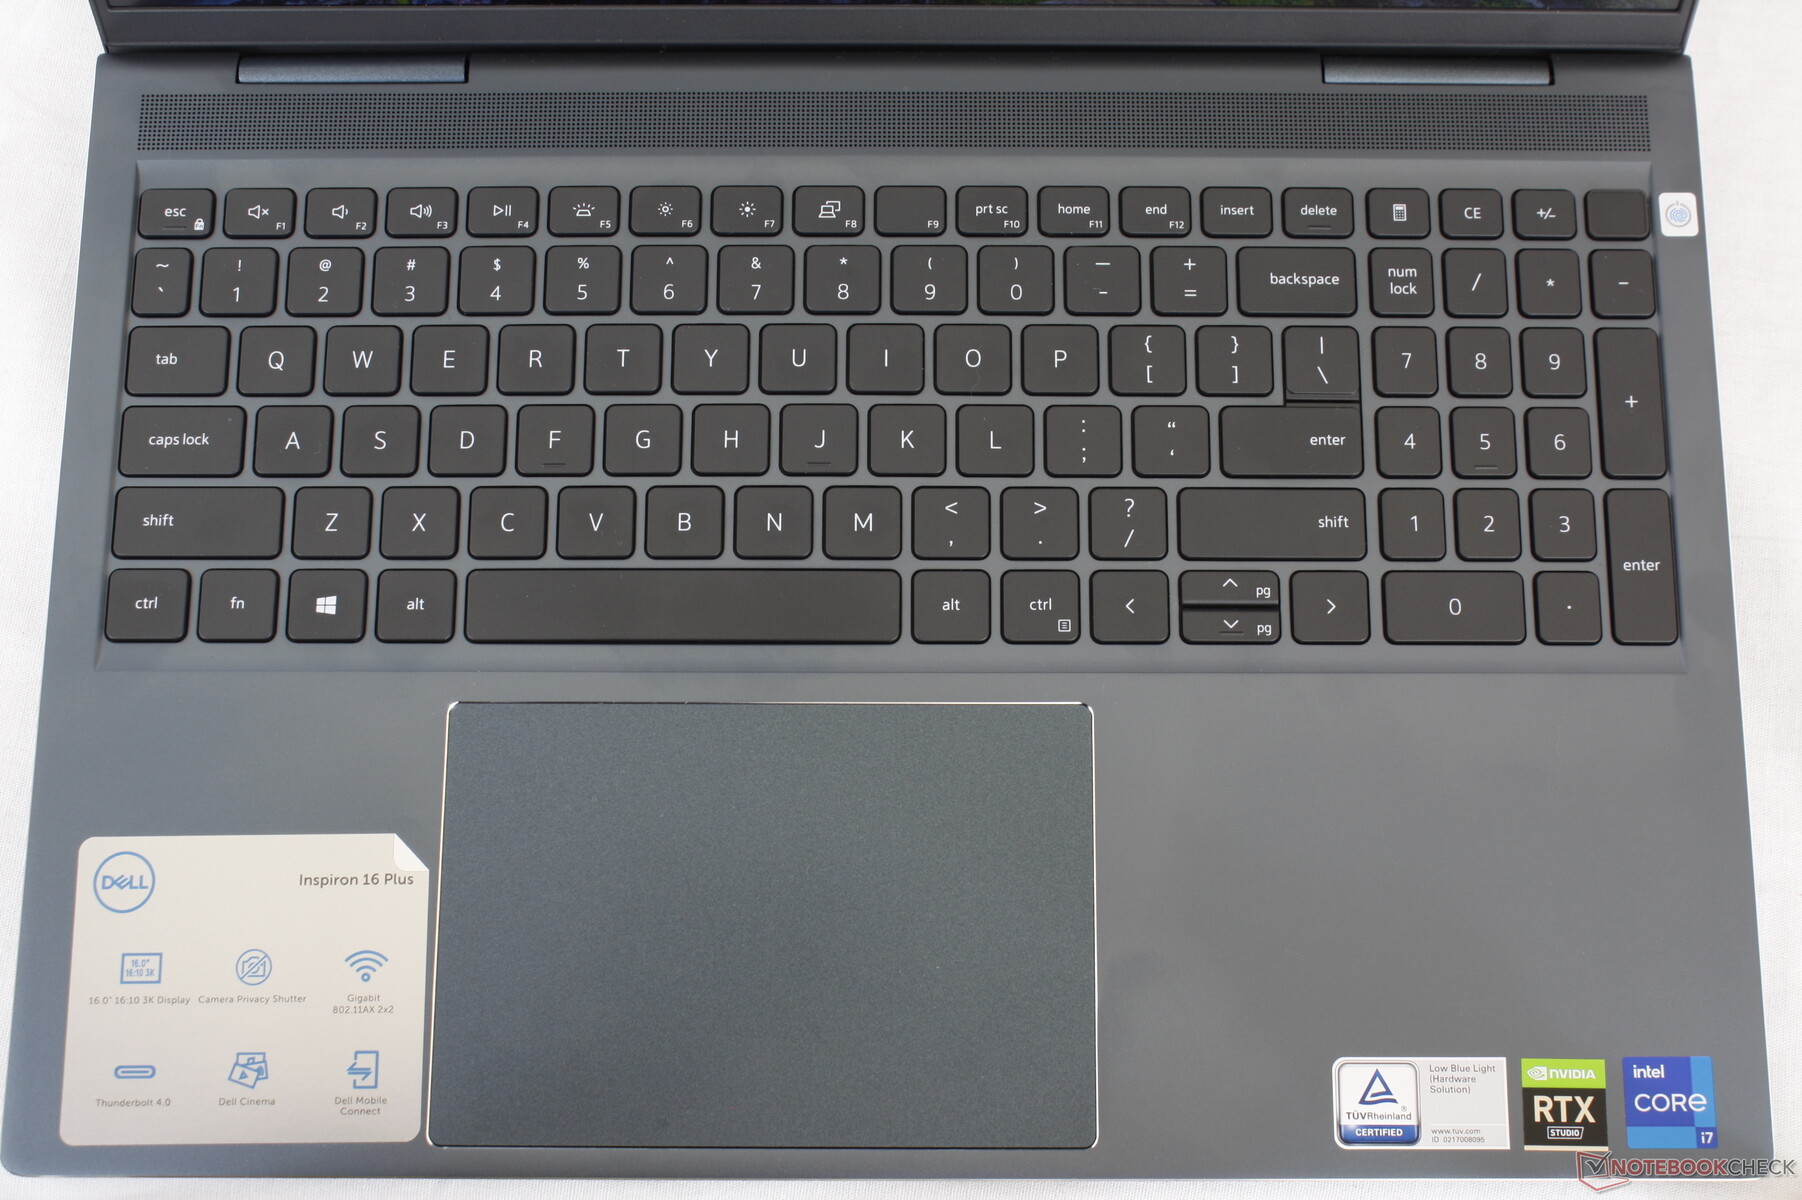
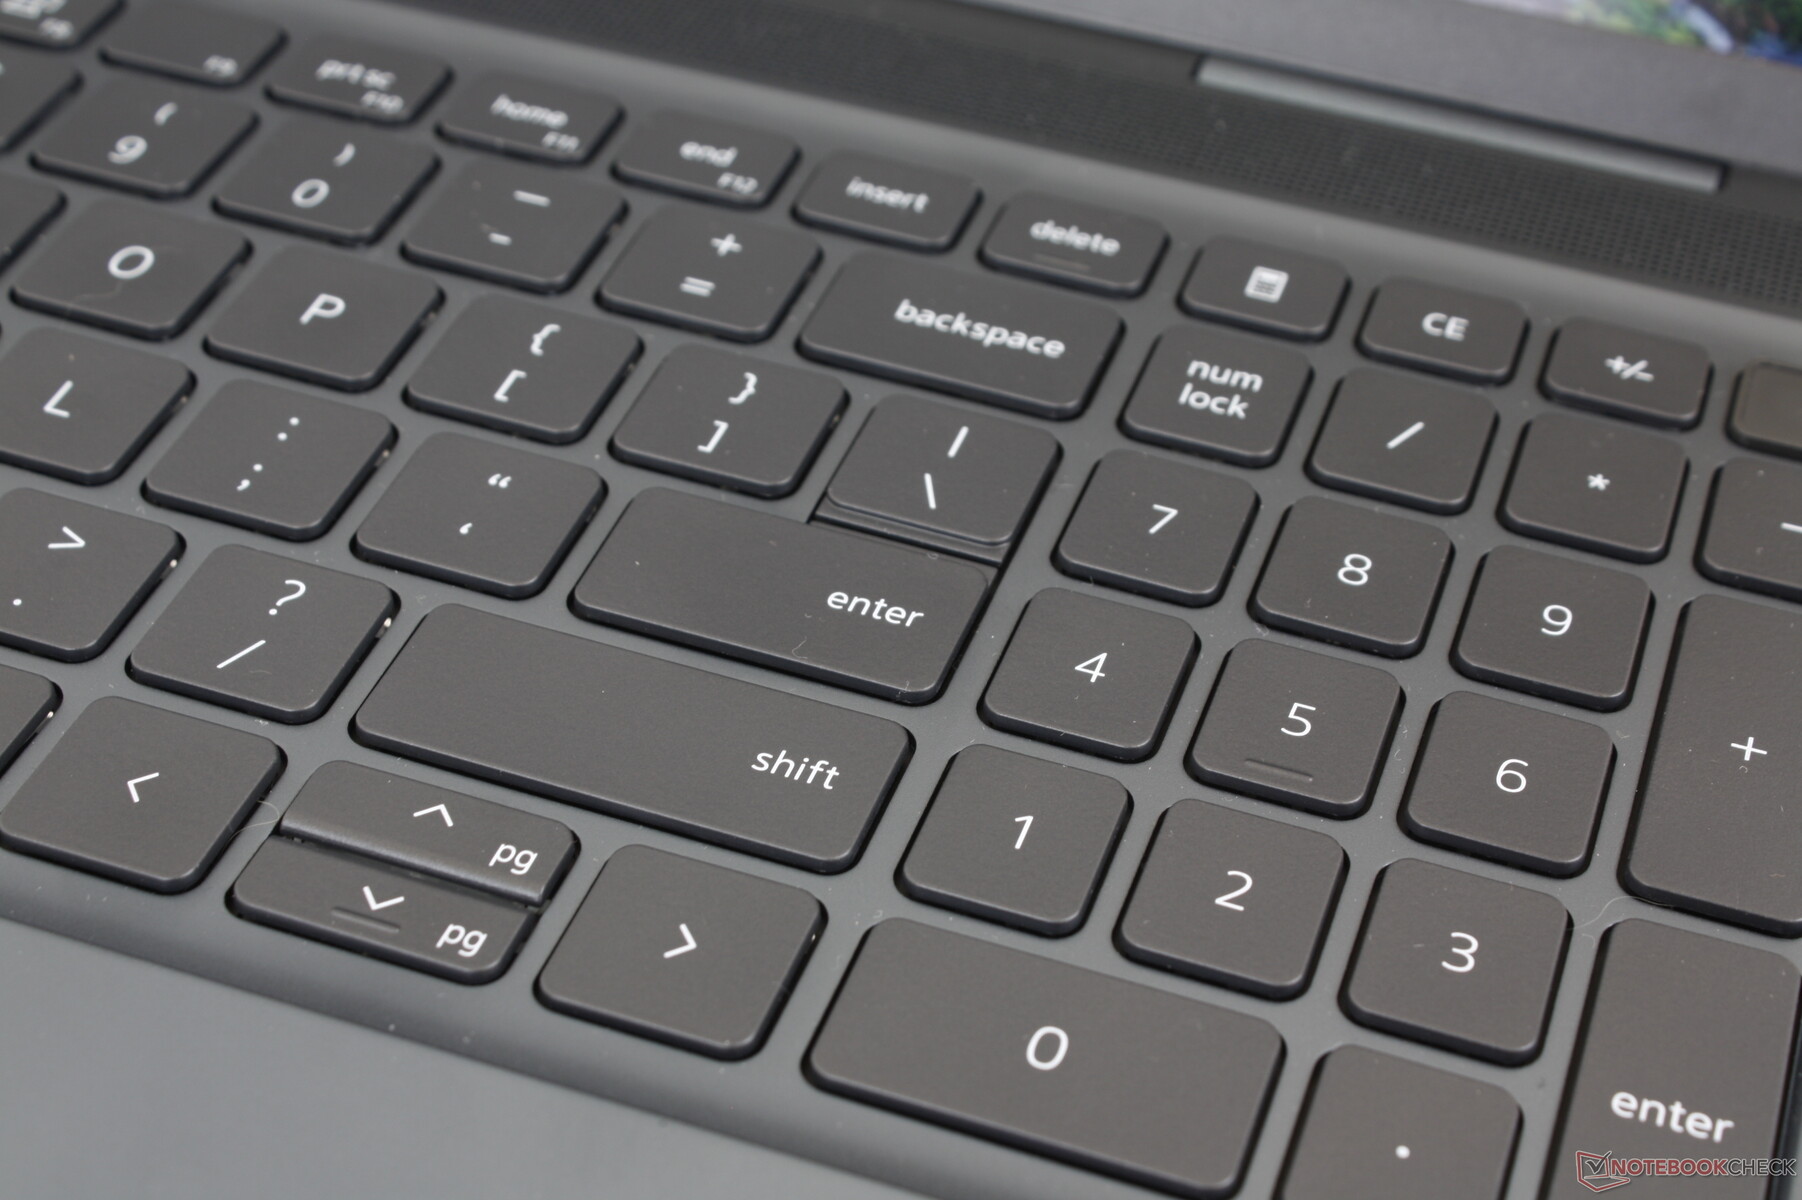
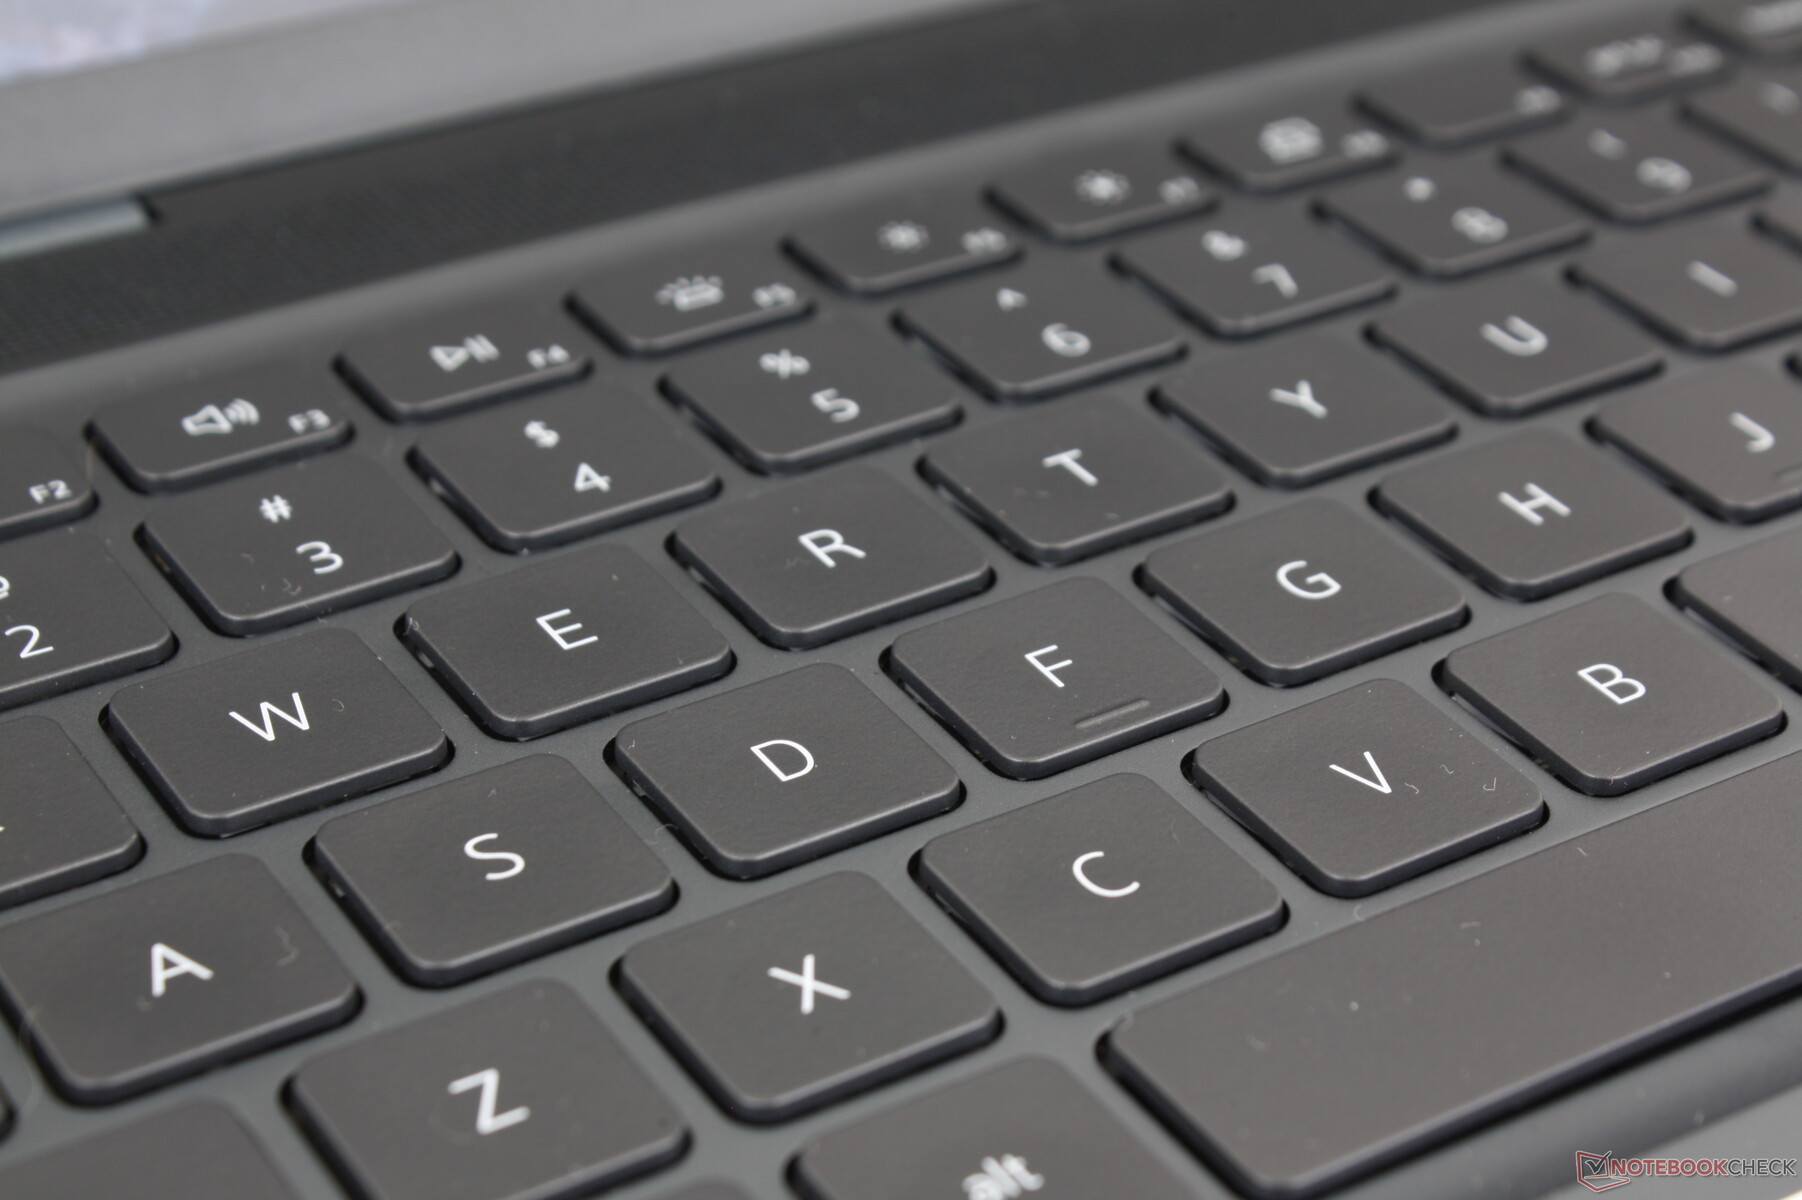
Dispositivos de entrada: silenciosos pero poco profundos
Teclado
Encontramos que la experiencia de tecleo es una bolsa mixta. Si bien las teclas tienen una respuesta más nítida y satisfactoria en comparación con la serie XPS, el desplazamiento es demasiado superficial y ligero. Un desplazamiento más profundo, como en los portátiles HP Envy o Spectre, habría hecho que las teclas del Inspiron fueran aún mejores y menos parecidas a las de un típico Ultrabook.
Una retroiluminación blanca de dos niveles viene de serie para iluminar todas las teclas y símbolos, salvo el botón de encendido opcional con huella dactilar. No es tan brillante como la mayoría de los teclados retroiluminados, pero es lo suficientemente bueno en entornos oscuros.
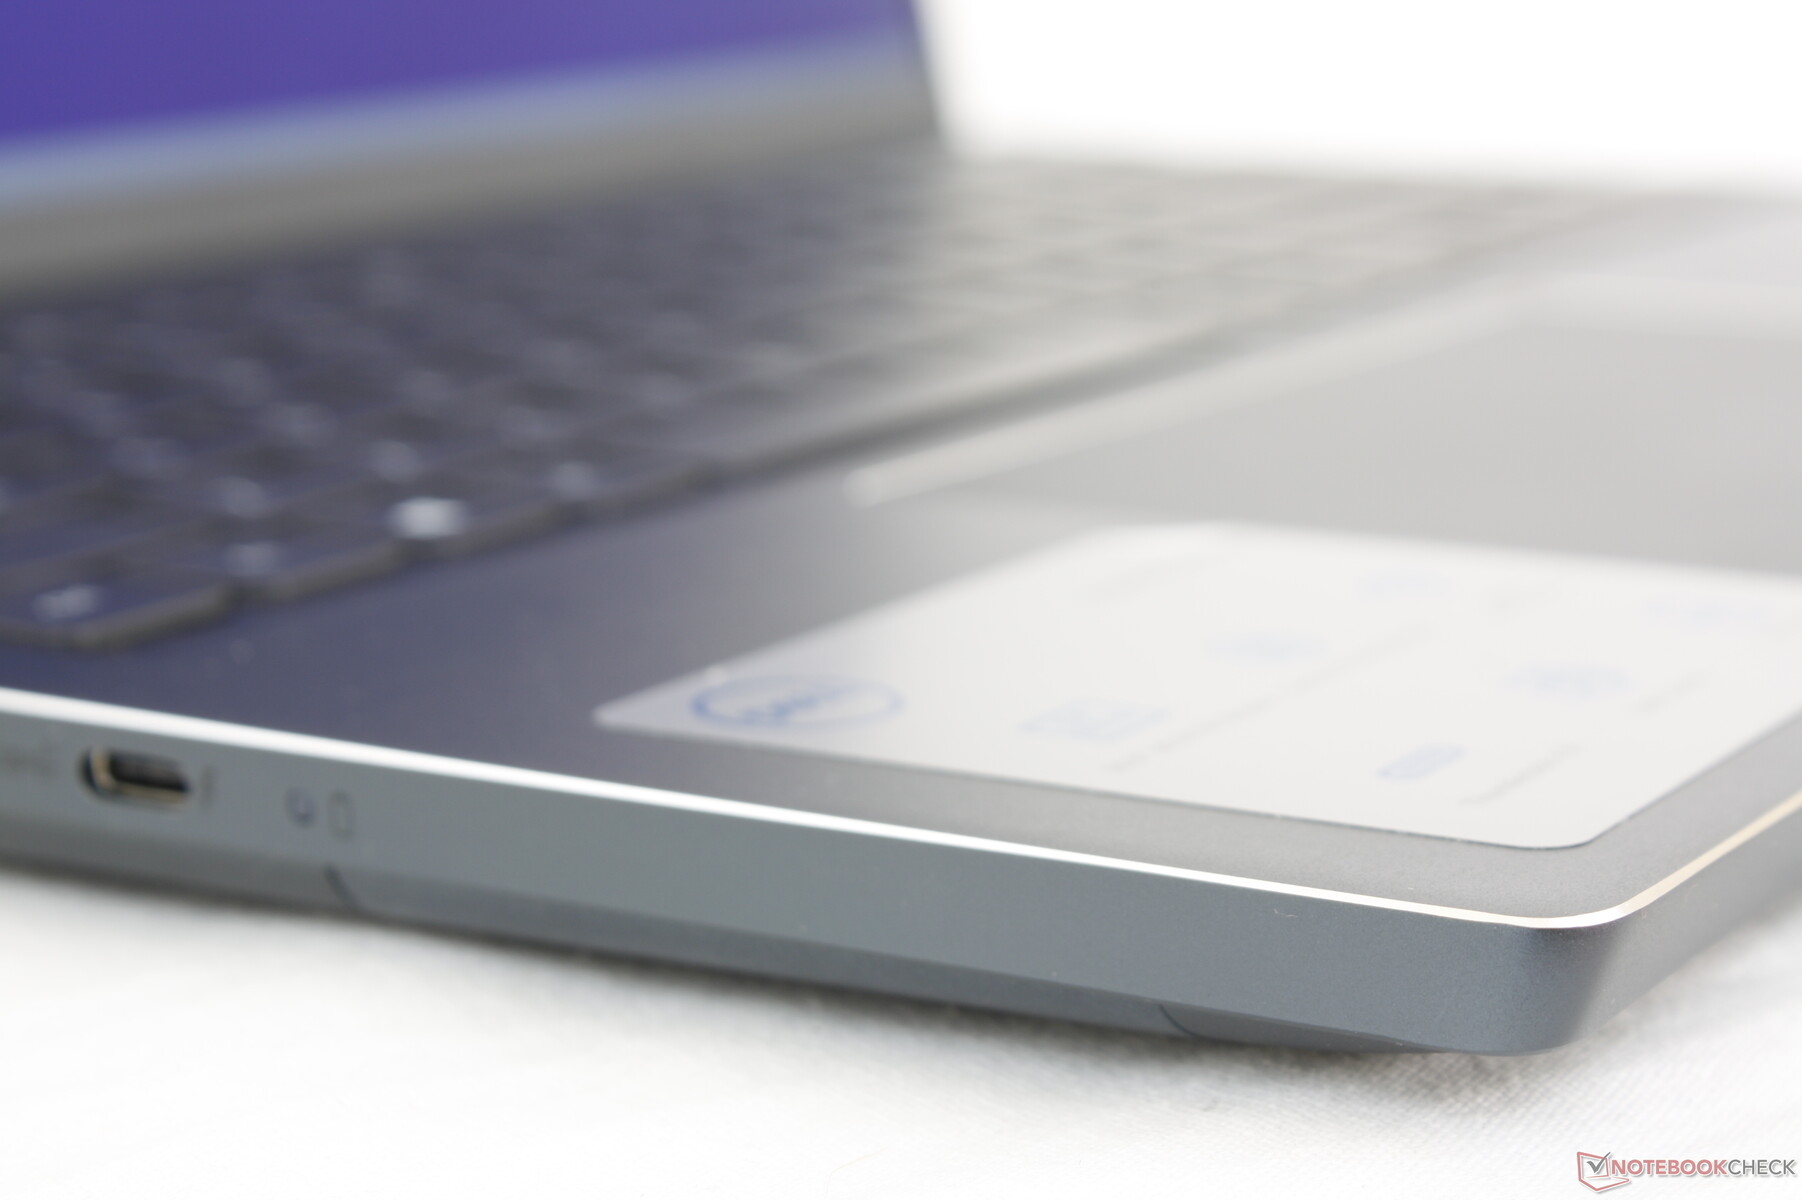
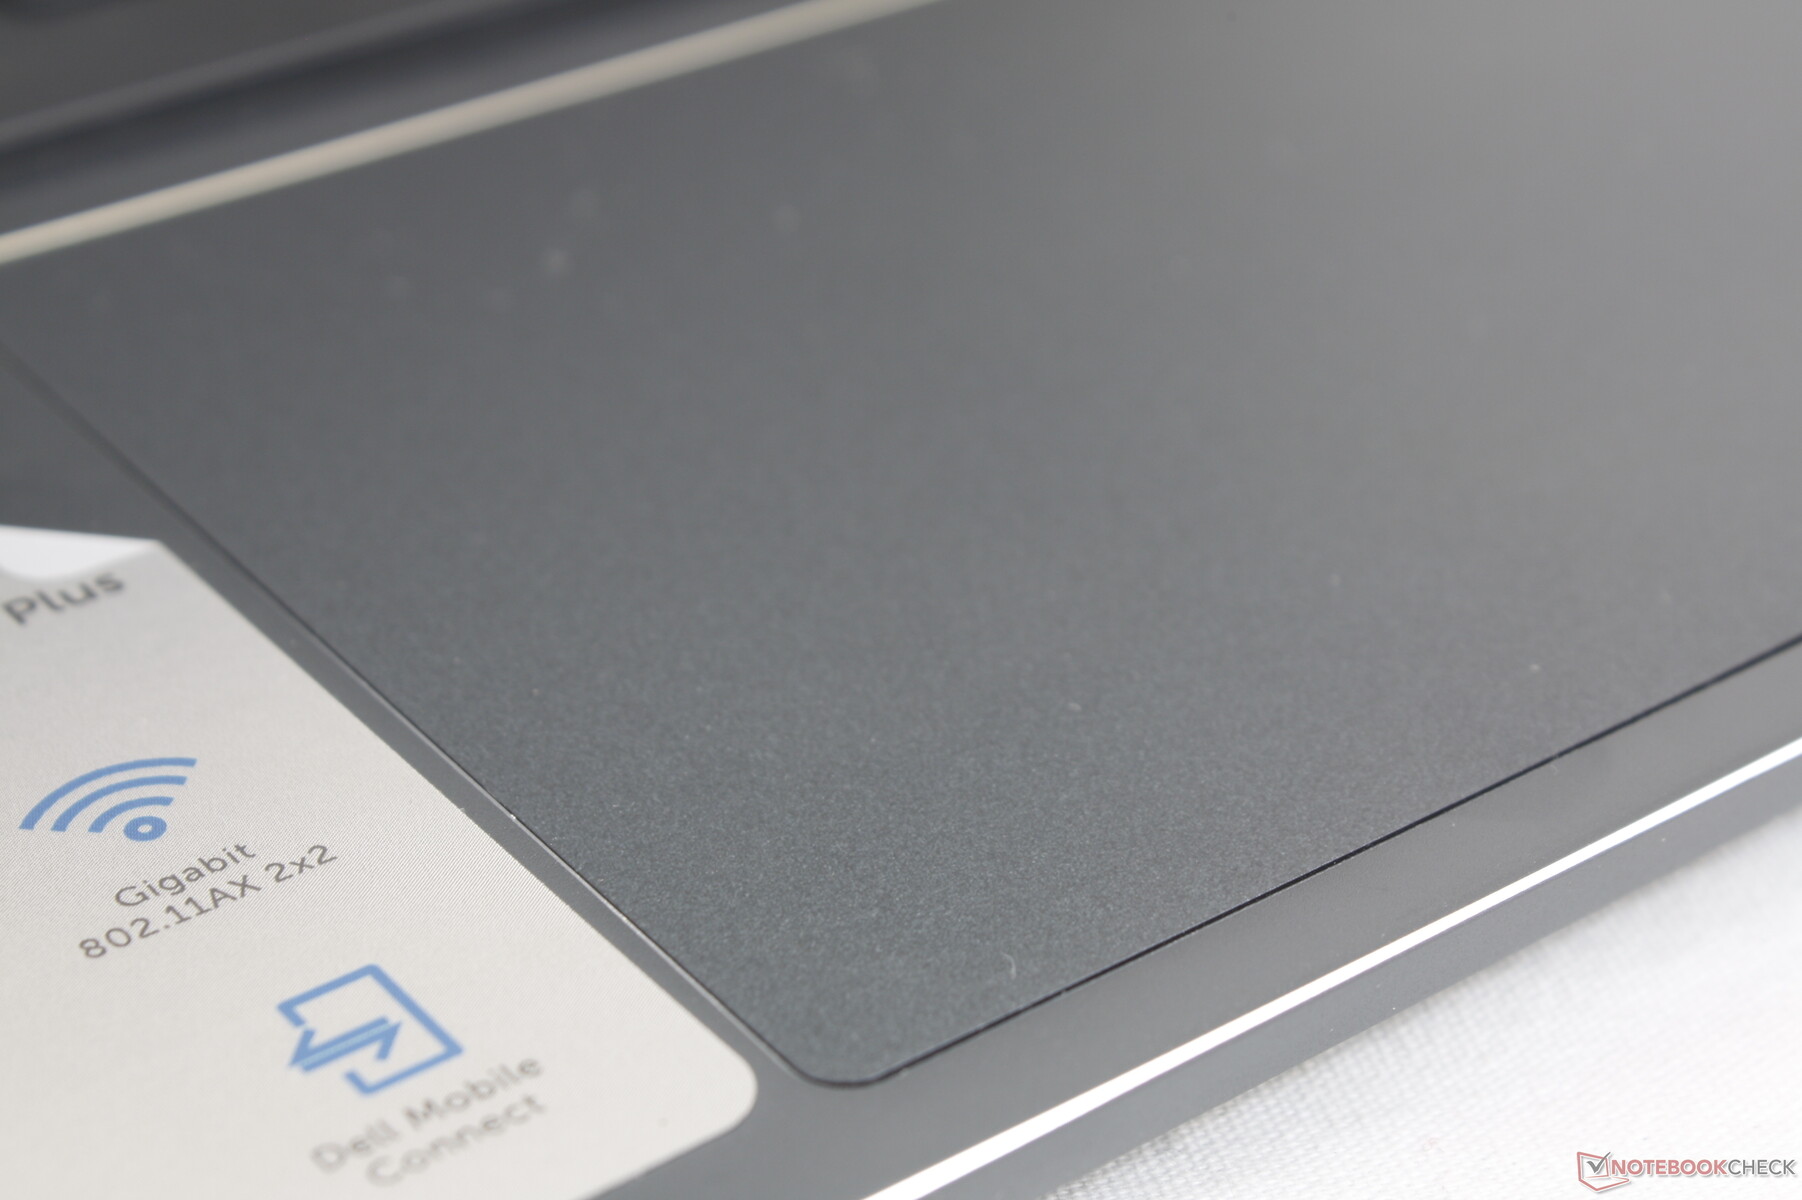
Panel táctil
El clickpad es más grande que el del antiguo Inspiron 15 7506 (13,5 x 9 cm frente a 11,5 x 8 cm) para facilitar las entradas multitáctiles. El deslizamiento sobre la superficie lisa es fiable, con sólo un poco de adherencia a velocidades más lentas para un control más preciso del cursor. Por desgracia, el clic en el clickpad es esponjoso y con una respuesta poco satisfactoria.
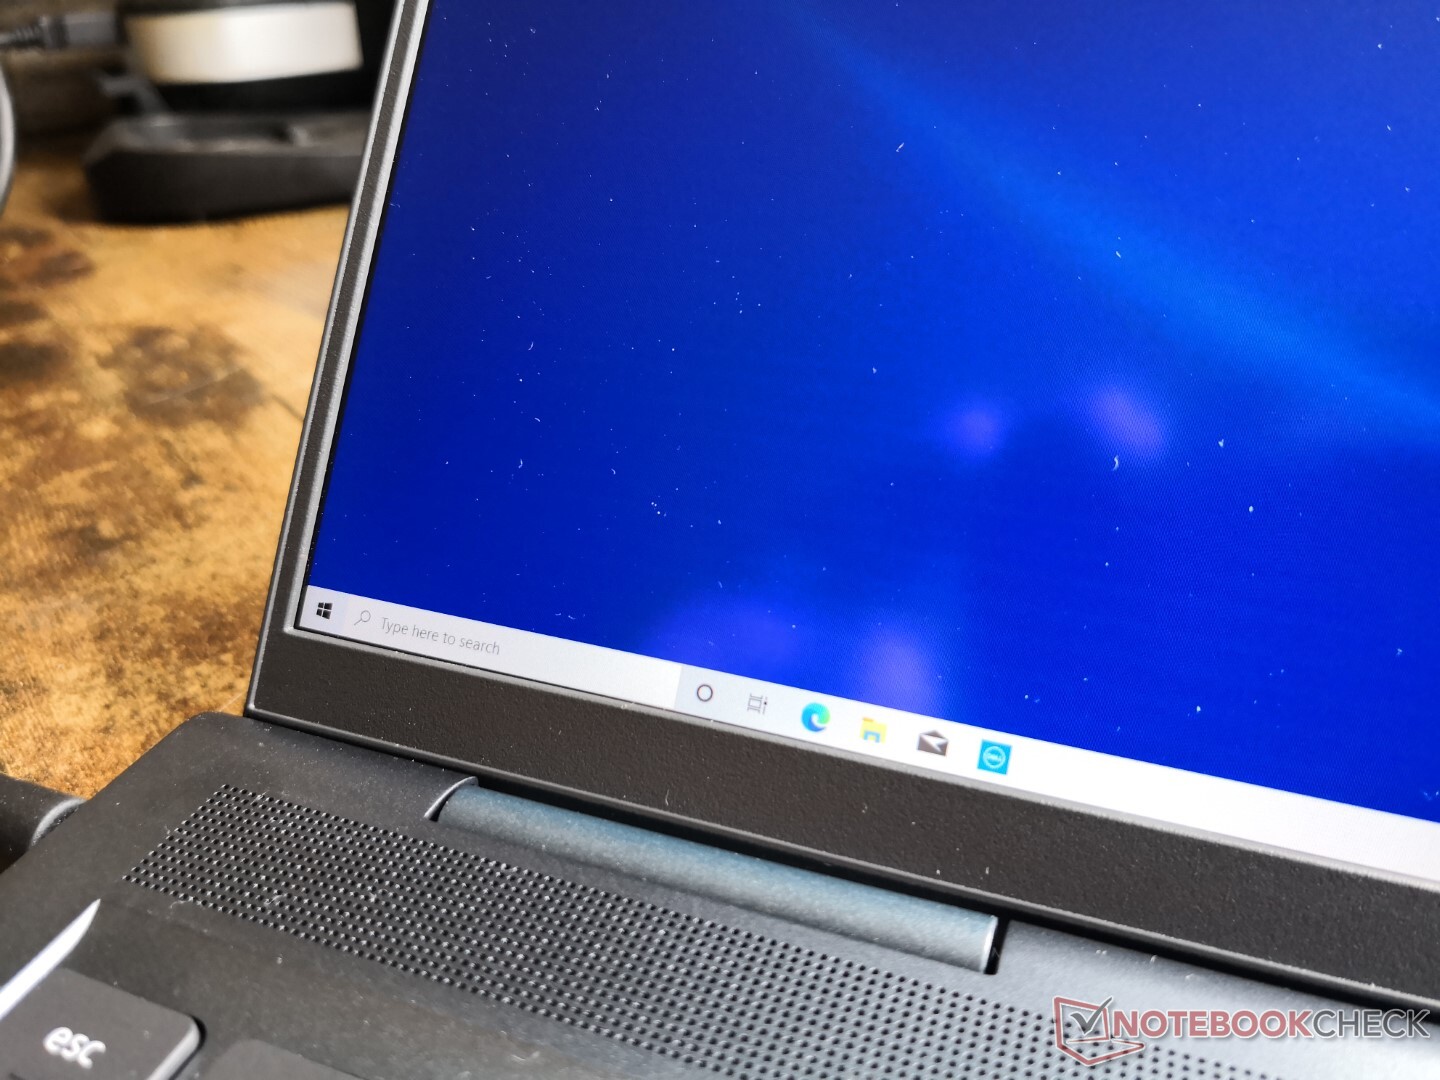
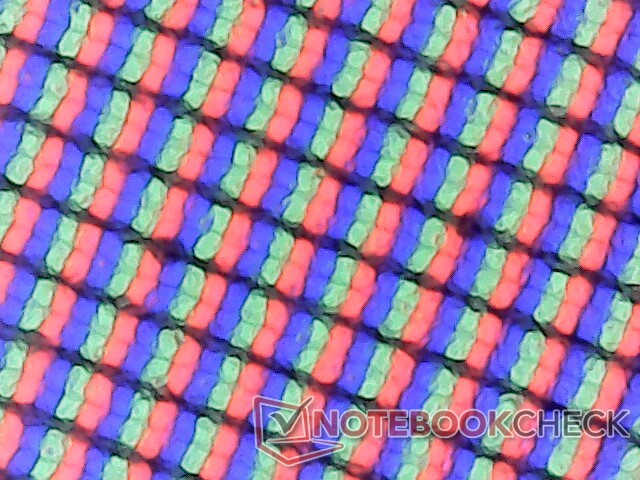
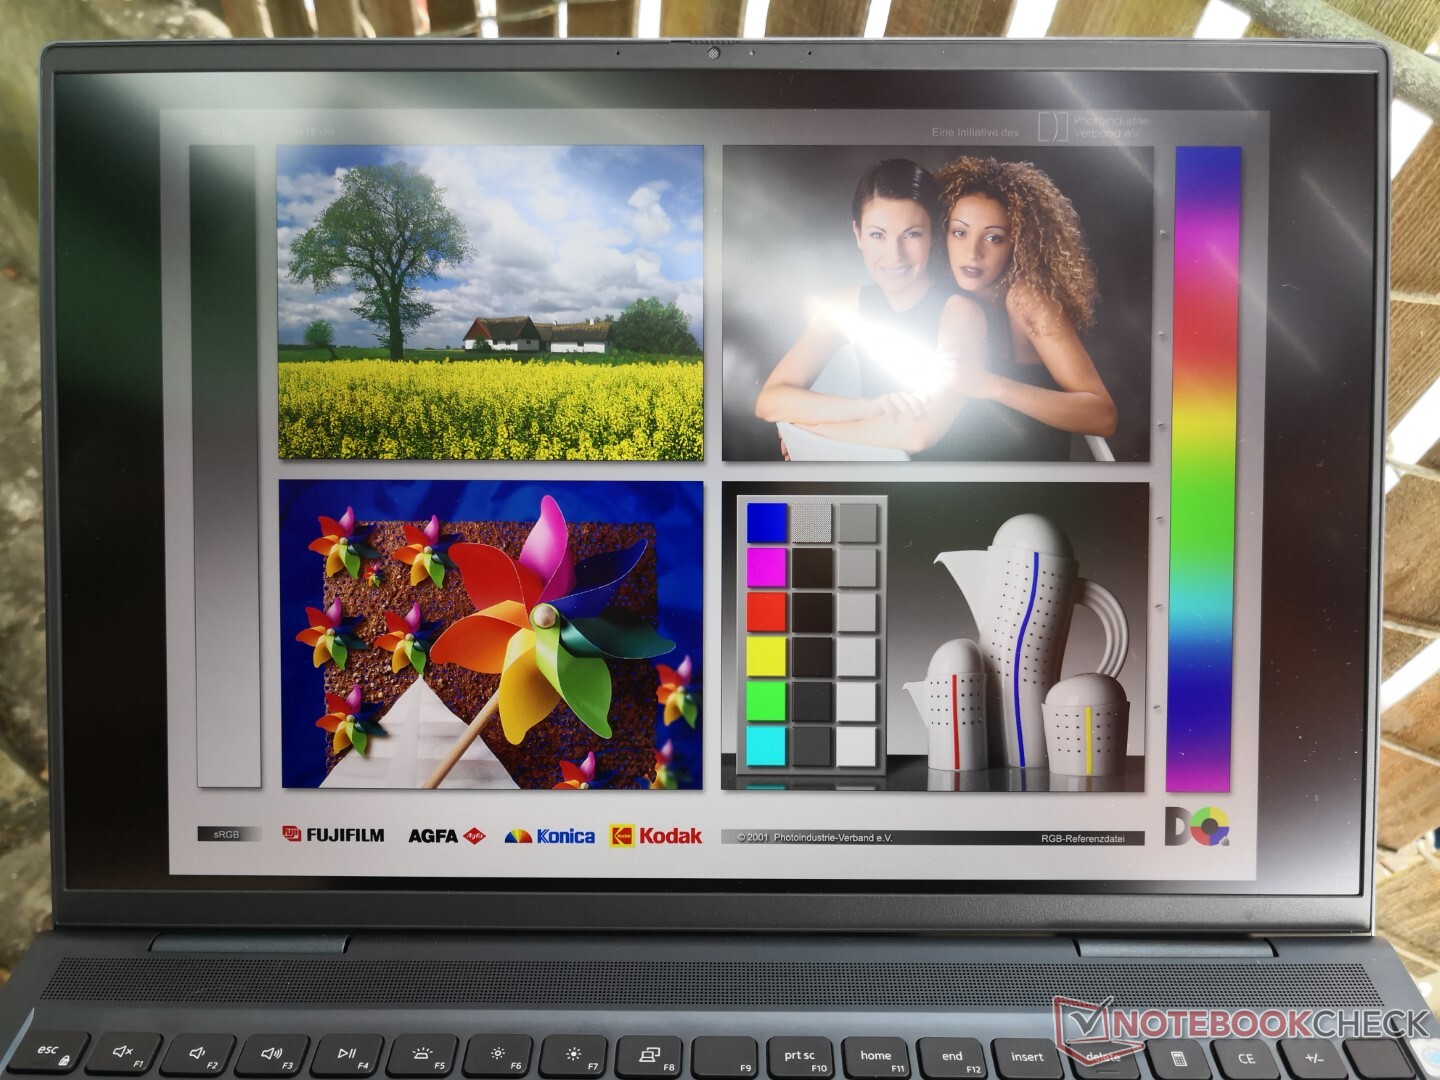
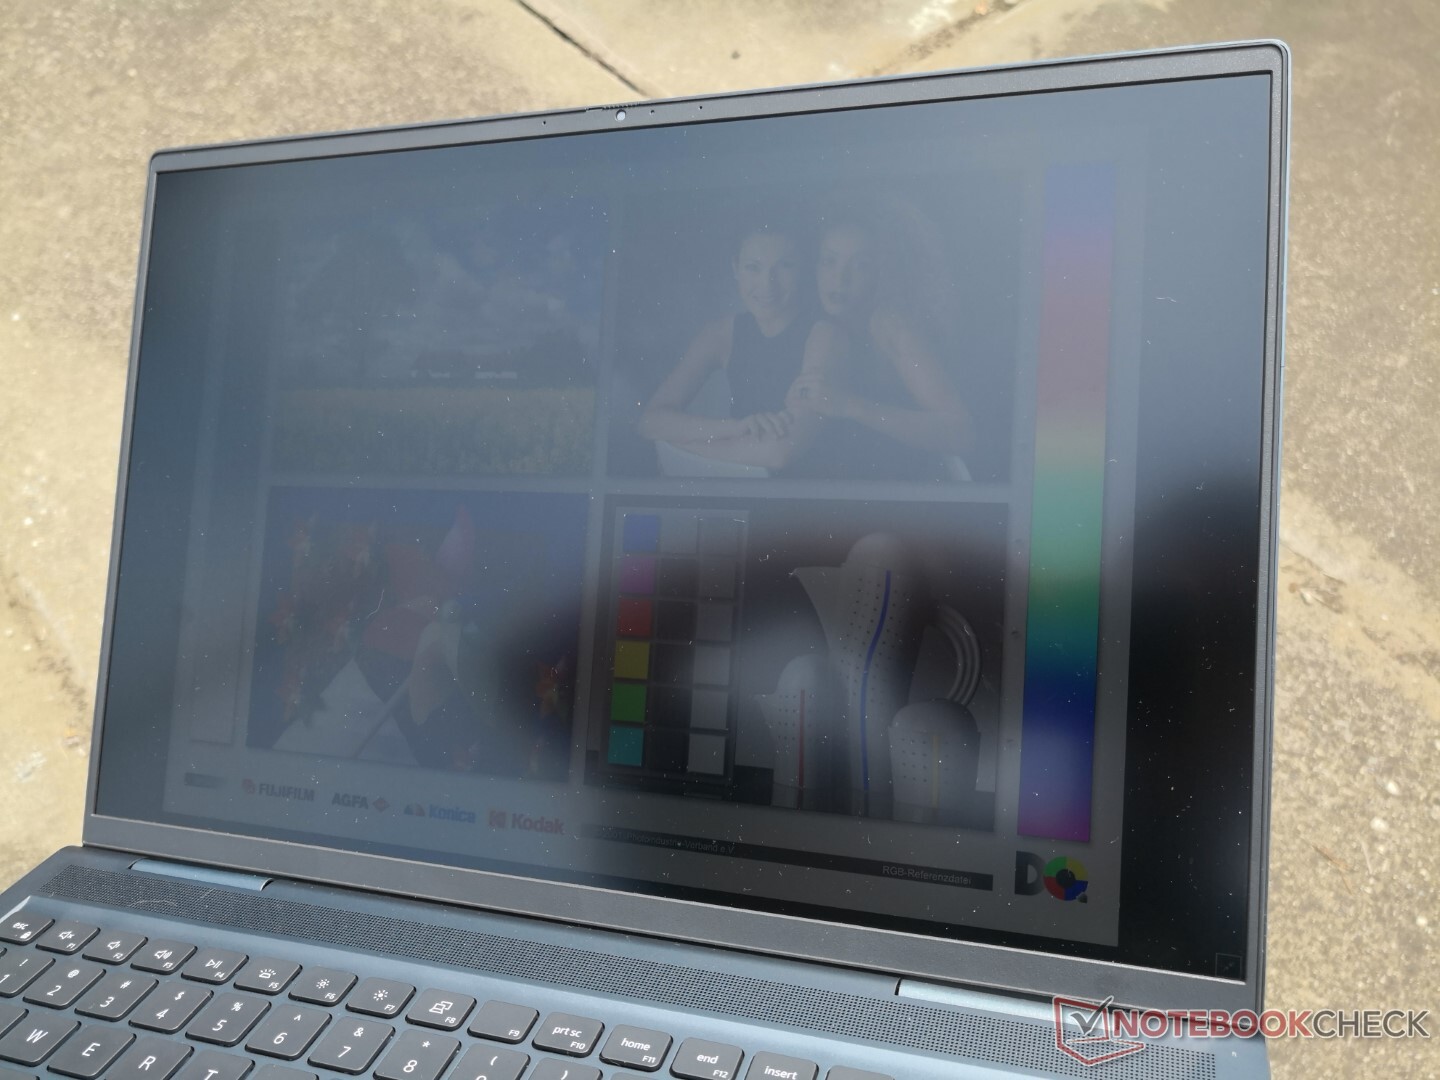
Pantalla - Buenos colores, brillo aceptable, tiempos de respuesta lentos
El modelo utiliza un panel AU Optronics B160QAN 3K IPS que no se puede encontrar en ningún otro portátil en el momento de escribir este artículo. Sin embargo, comparte la misma resolución nativa que la pantalla del MacBook Pro 16. El PPI es casi tan denso como el de un panel 4K, lo que significa que la mayoría de los usuarios seguirán queriendo ajustar la escala de la fuente para facilitar la lectura.
La calidad de la pantalla es excelente, con una relación de contraste que se acerca a los 1500:1. Sin embargo, sus lentos tiempos de respuesta son el factor distintivo clave que separa al Inspiron 16 de los portátiles de juego "puros" de 16 pulgadas como el Asus ROG Zephyrus M16 donde los tiempos de respuesta son significativamente más rápidos.
| |||||||||||||||||||||||||
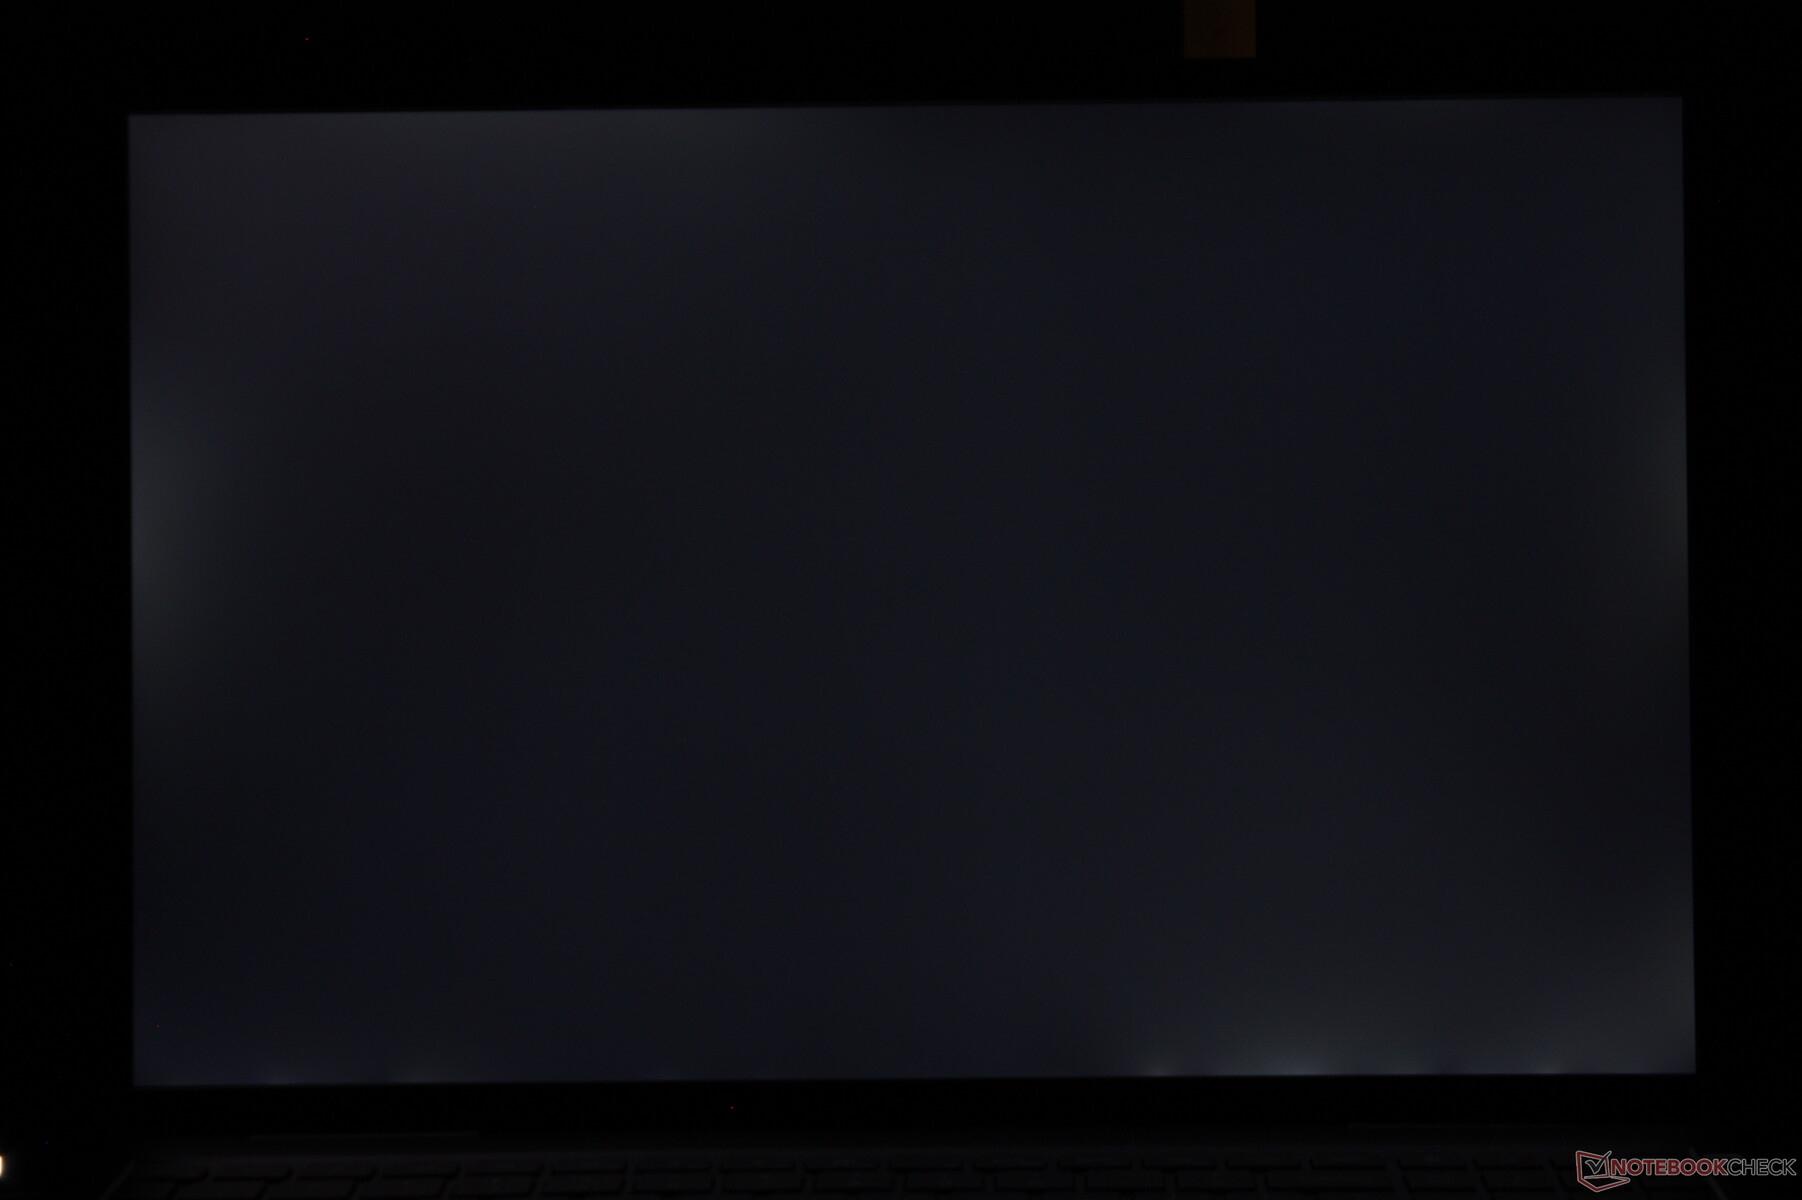
iluminación: 87 %
Brillo con batería: 296.8 cd/m²
Contraste: 1413:1 (Negro: 0.21 cd/m²)
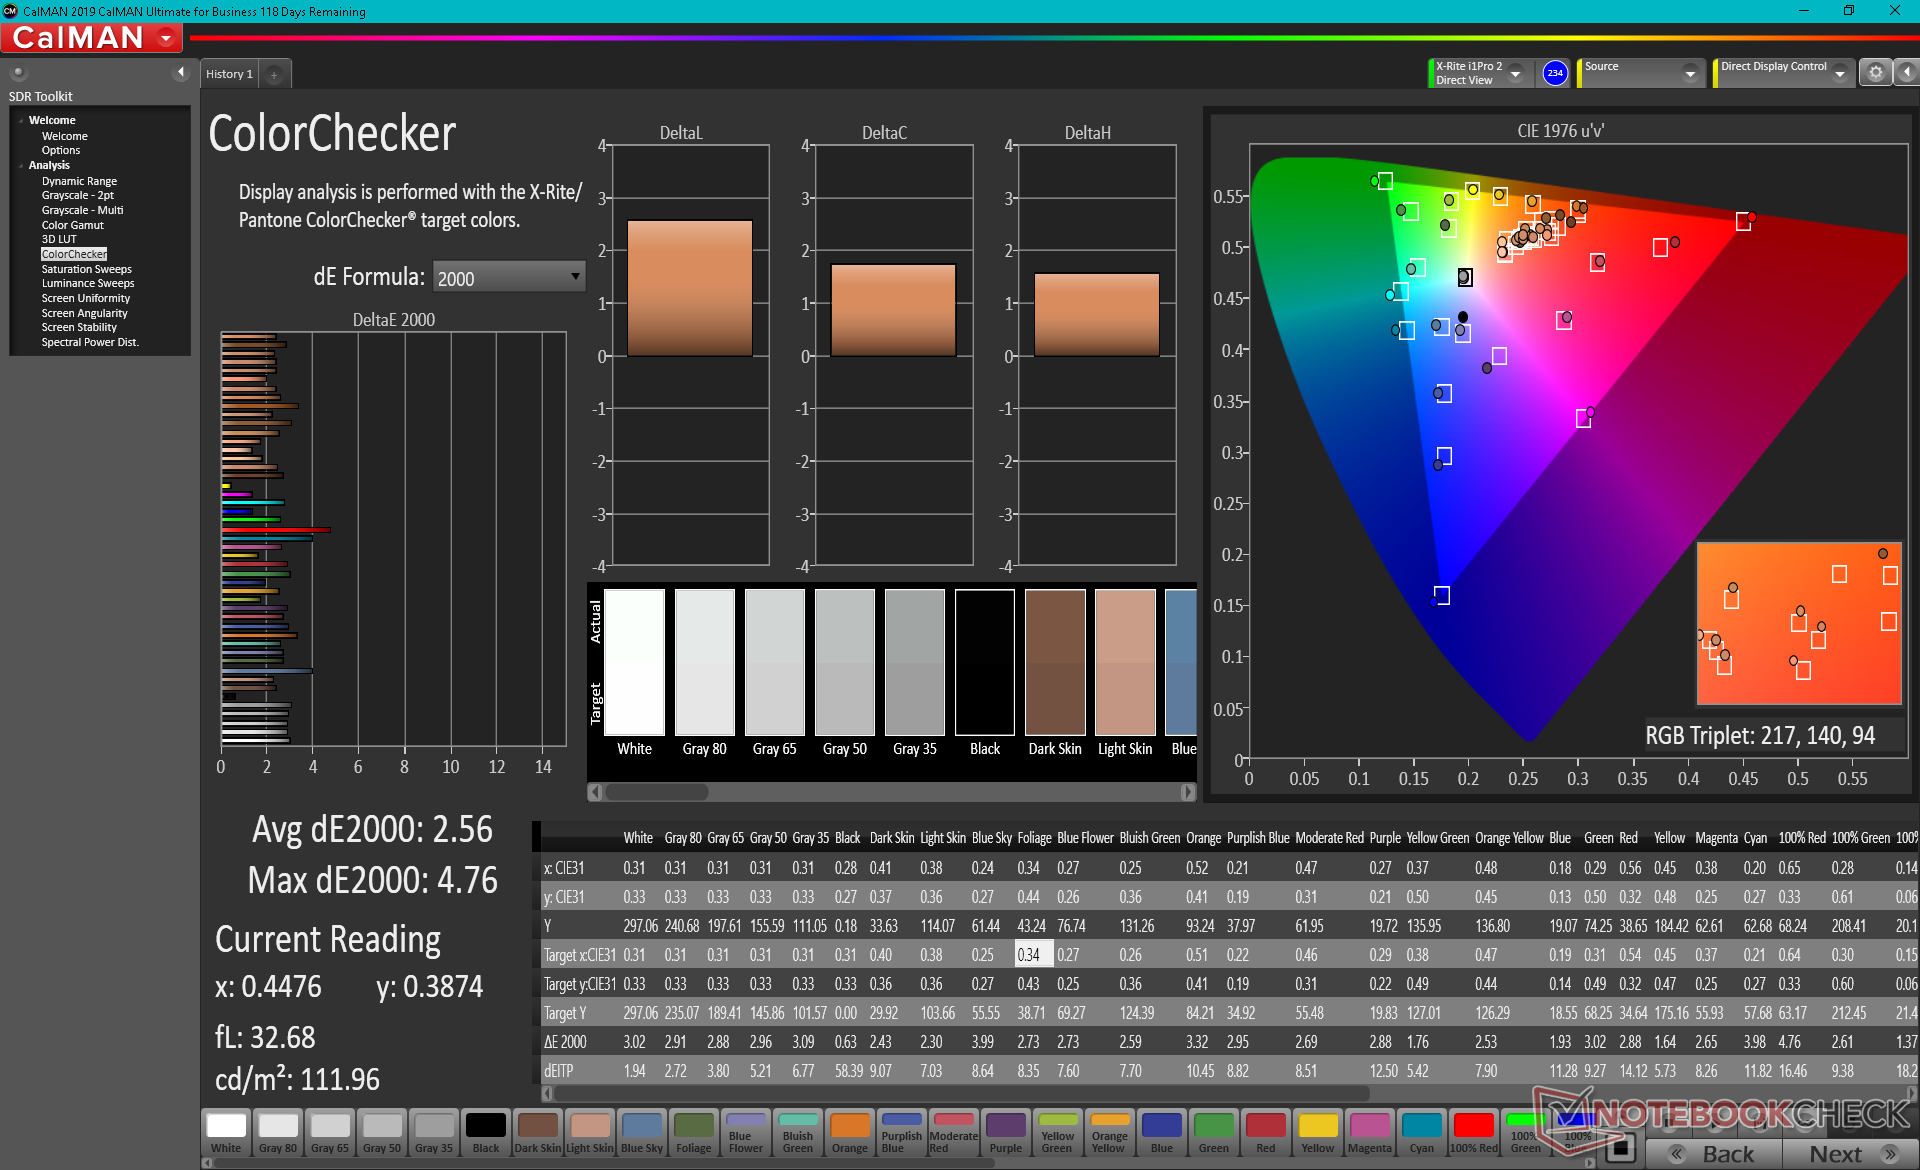
ΔE ColorChecker Calman: 2.56 | ∀{0.5-29.43 Ø4.71}
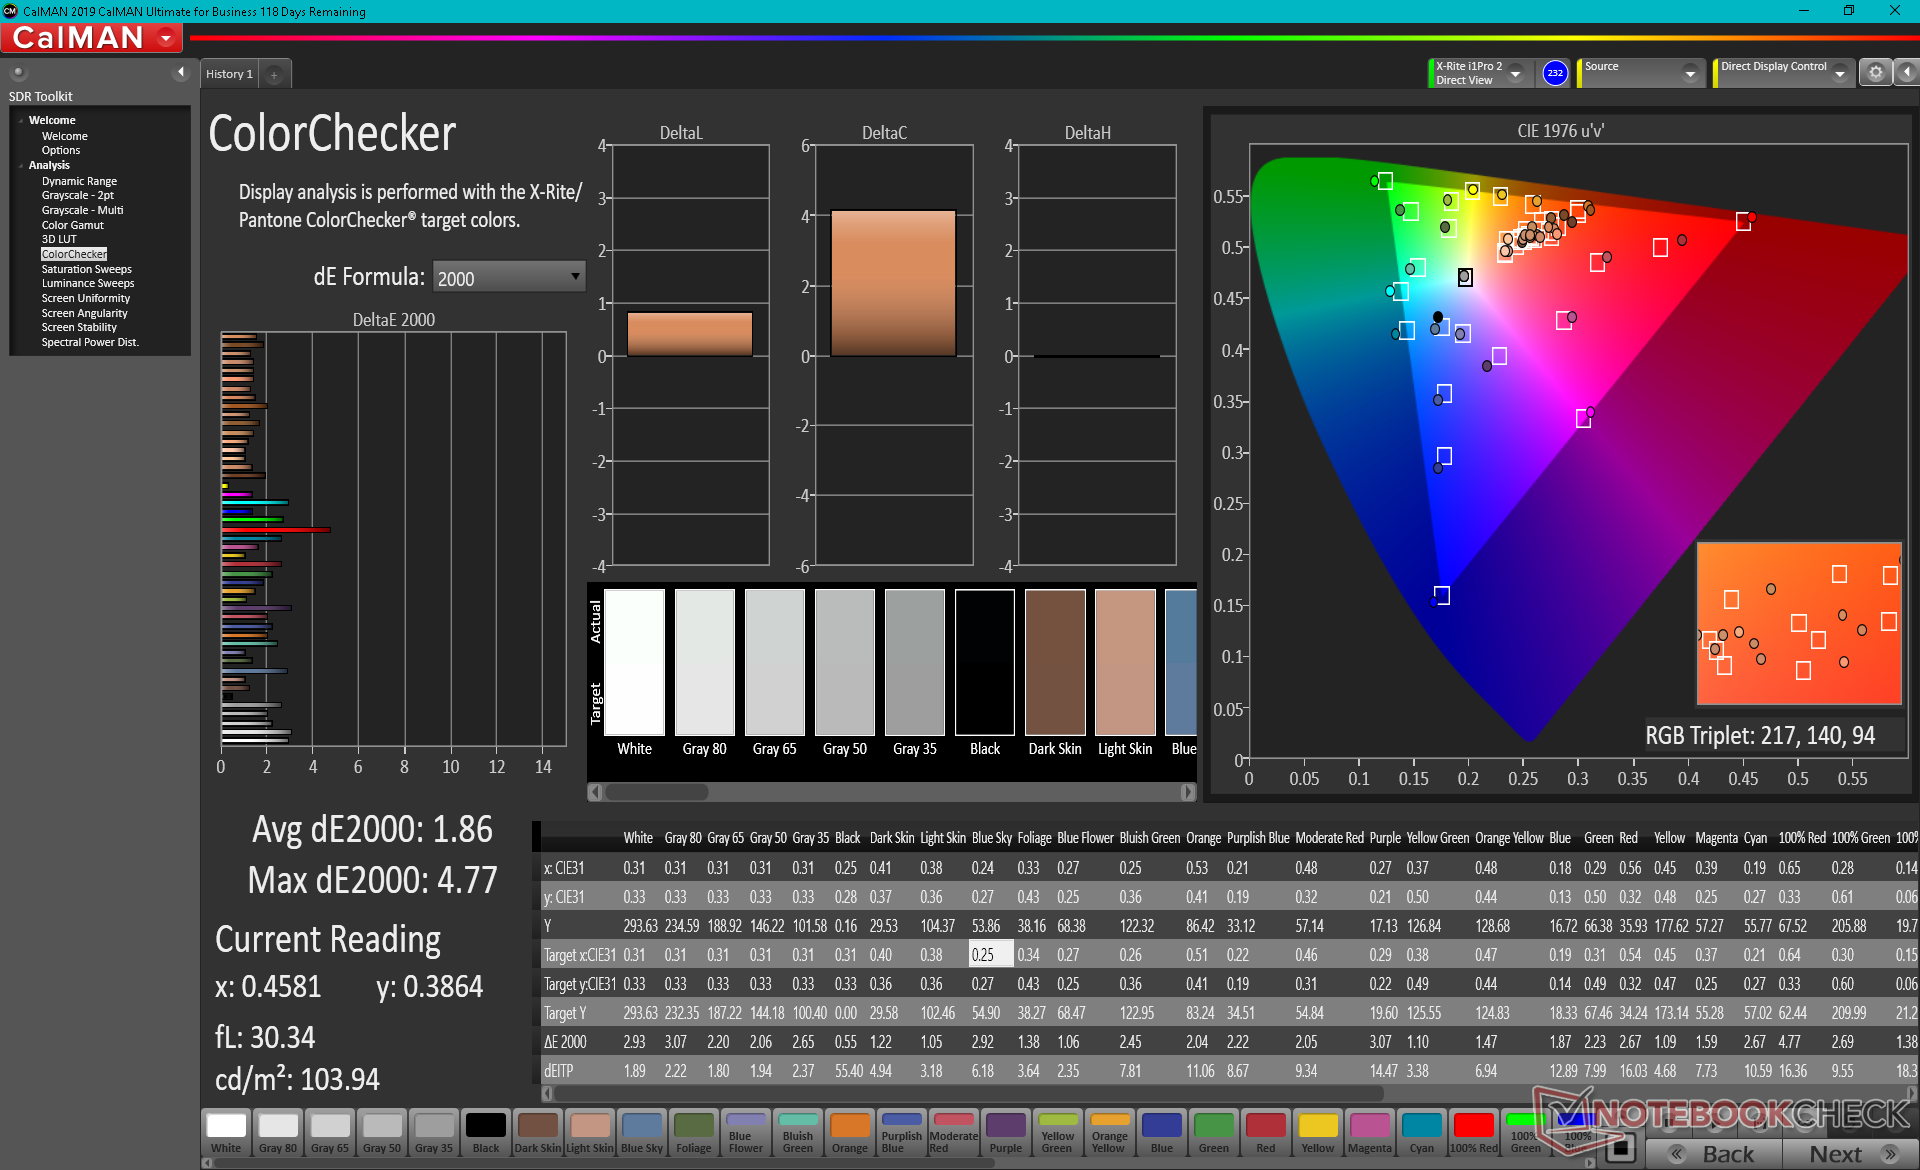
calibrated: 1.86
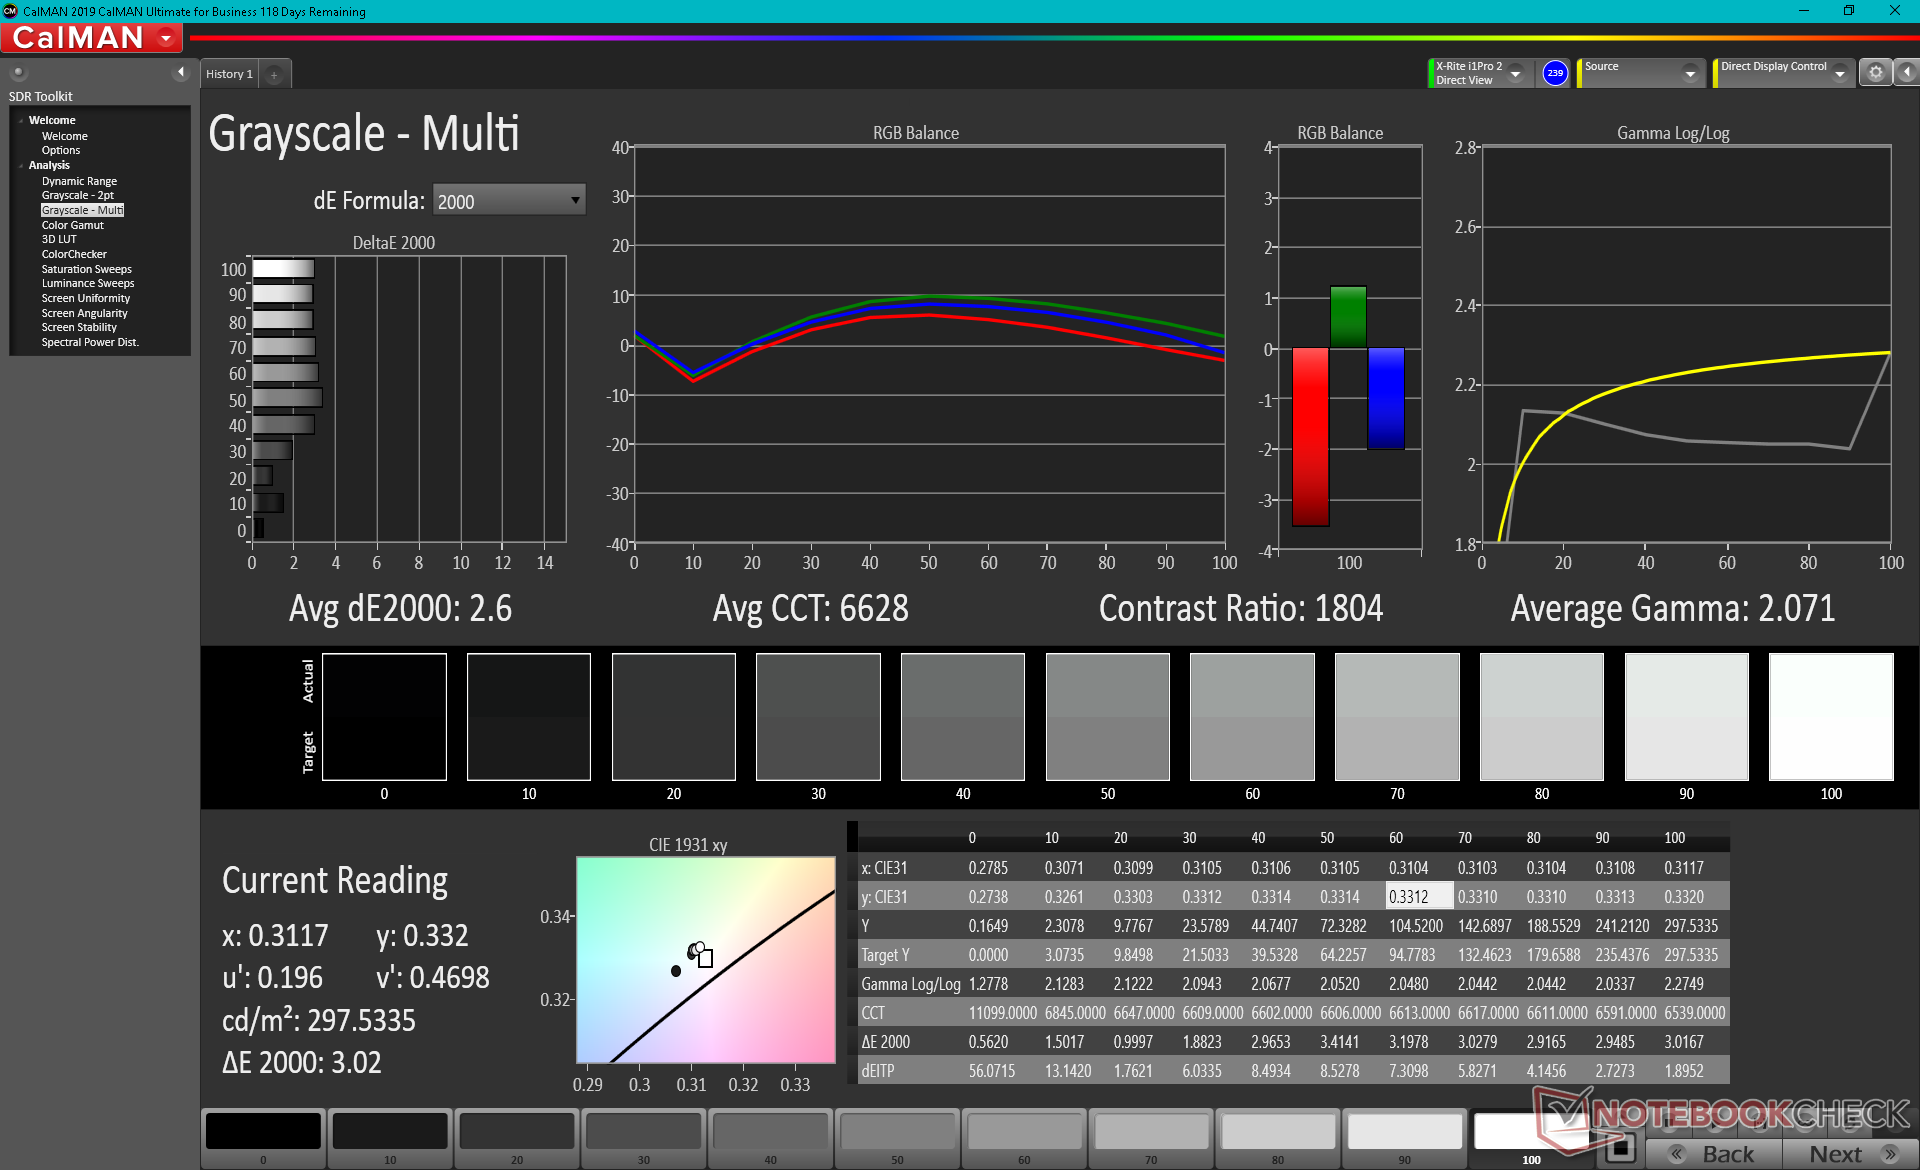
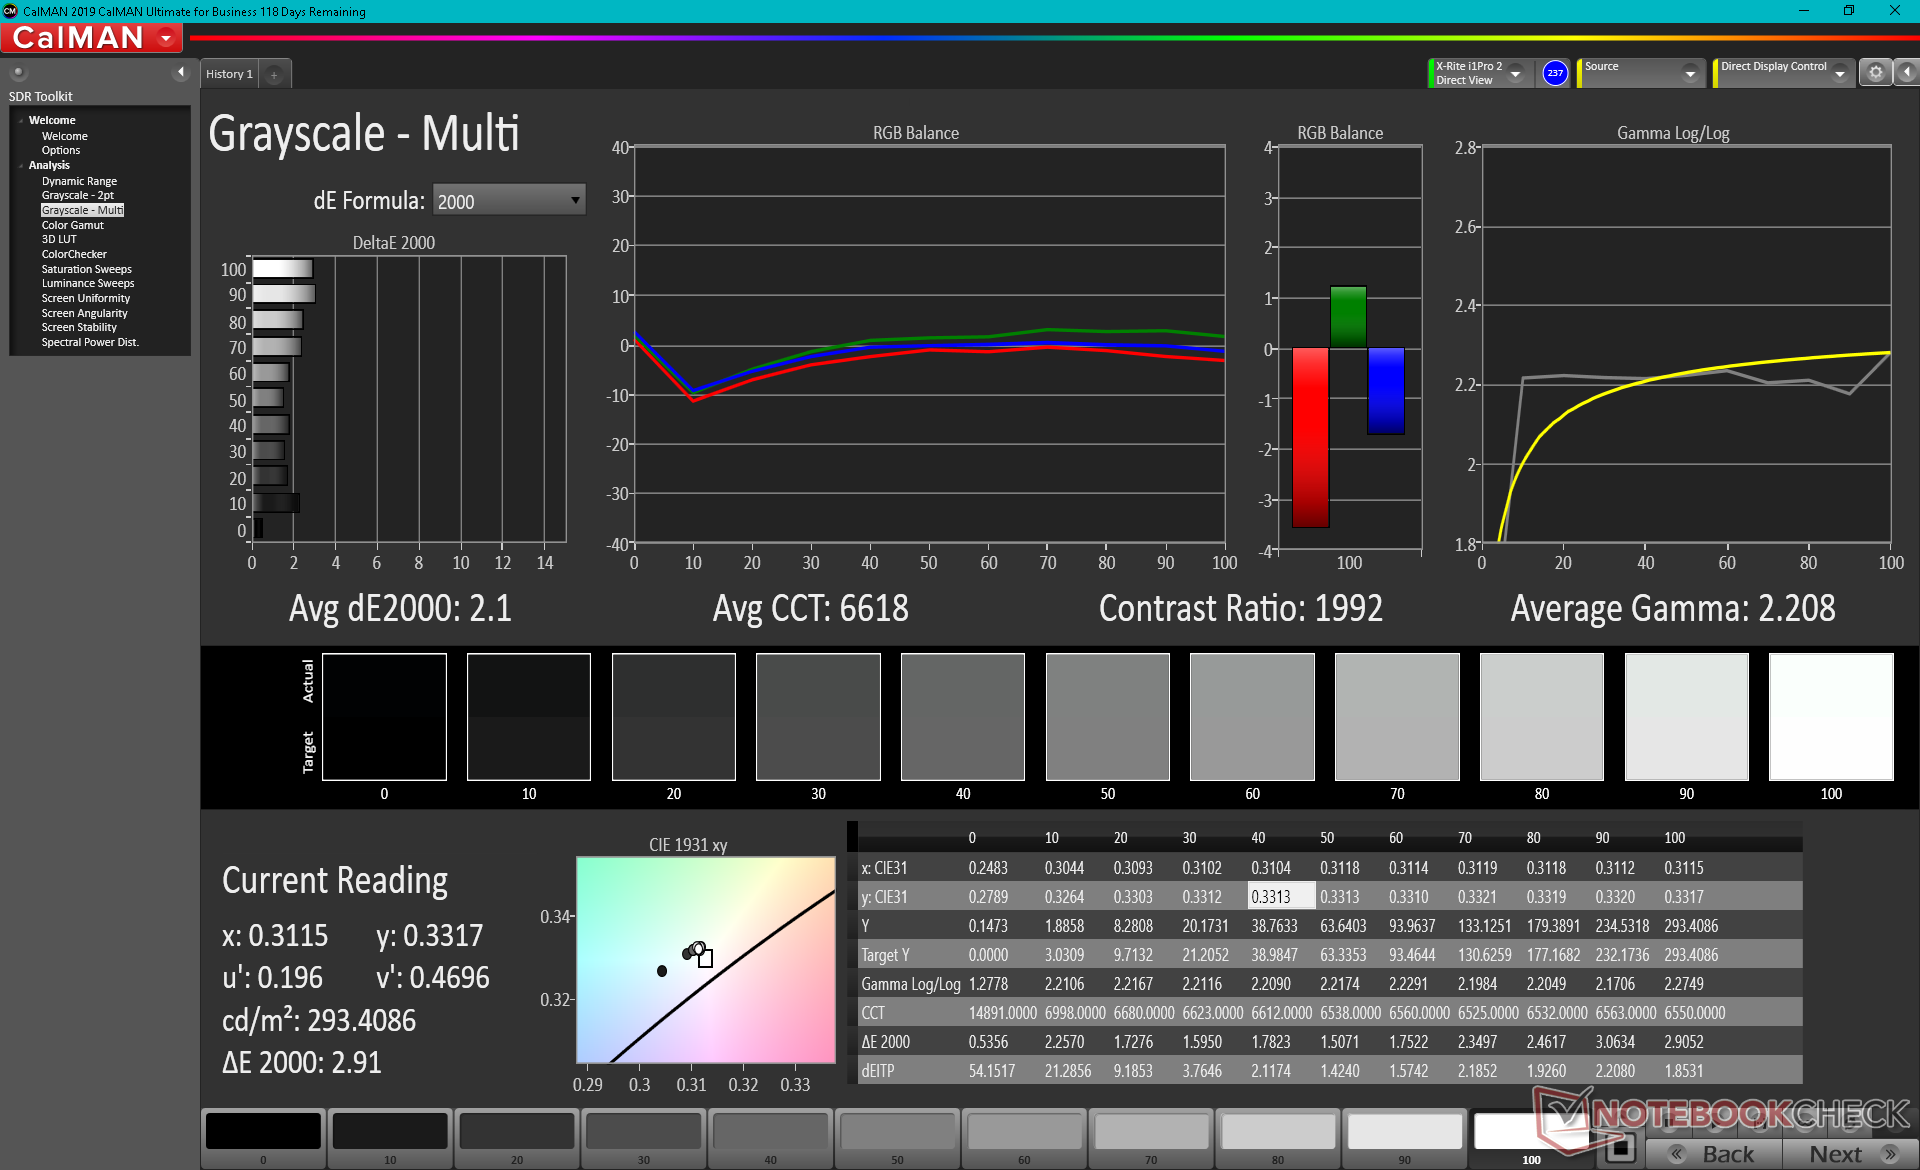
ΔE Greyscale Calman: 2.6 | ∀{0.09-98 Ø4.96}
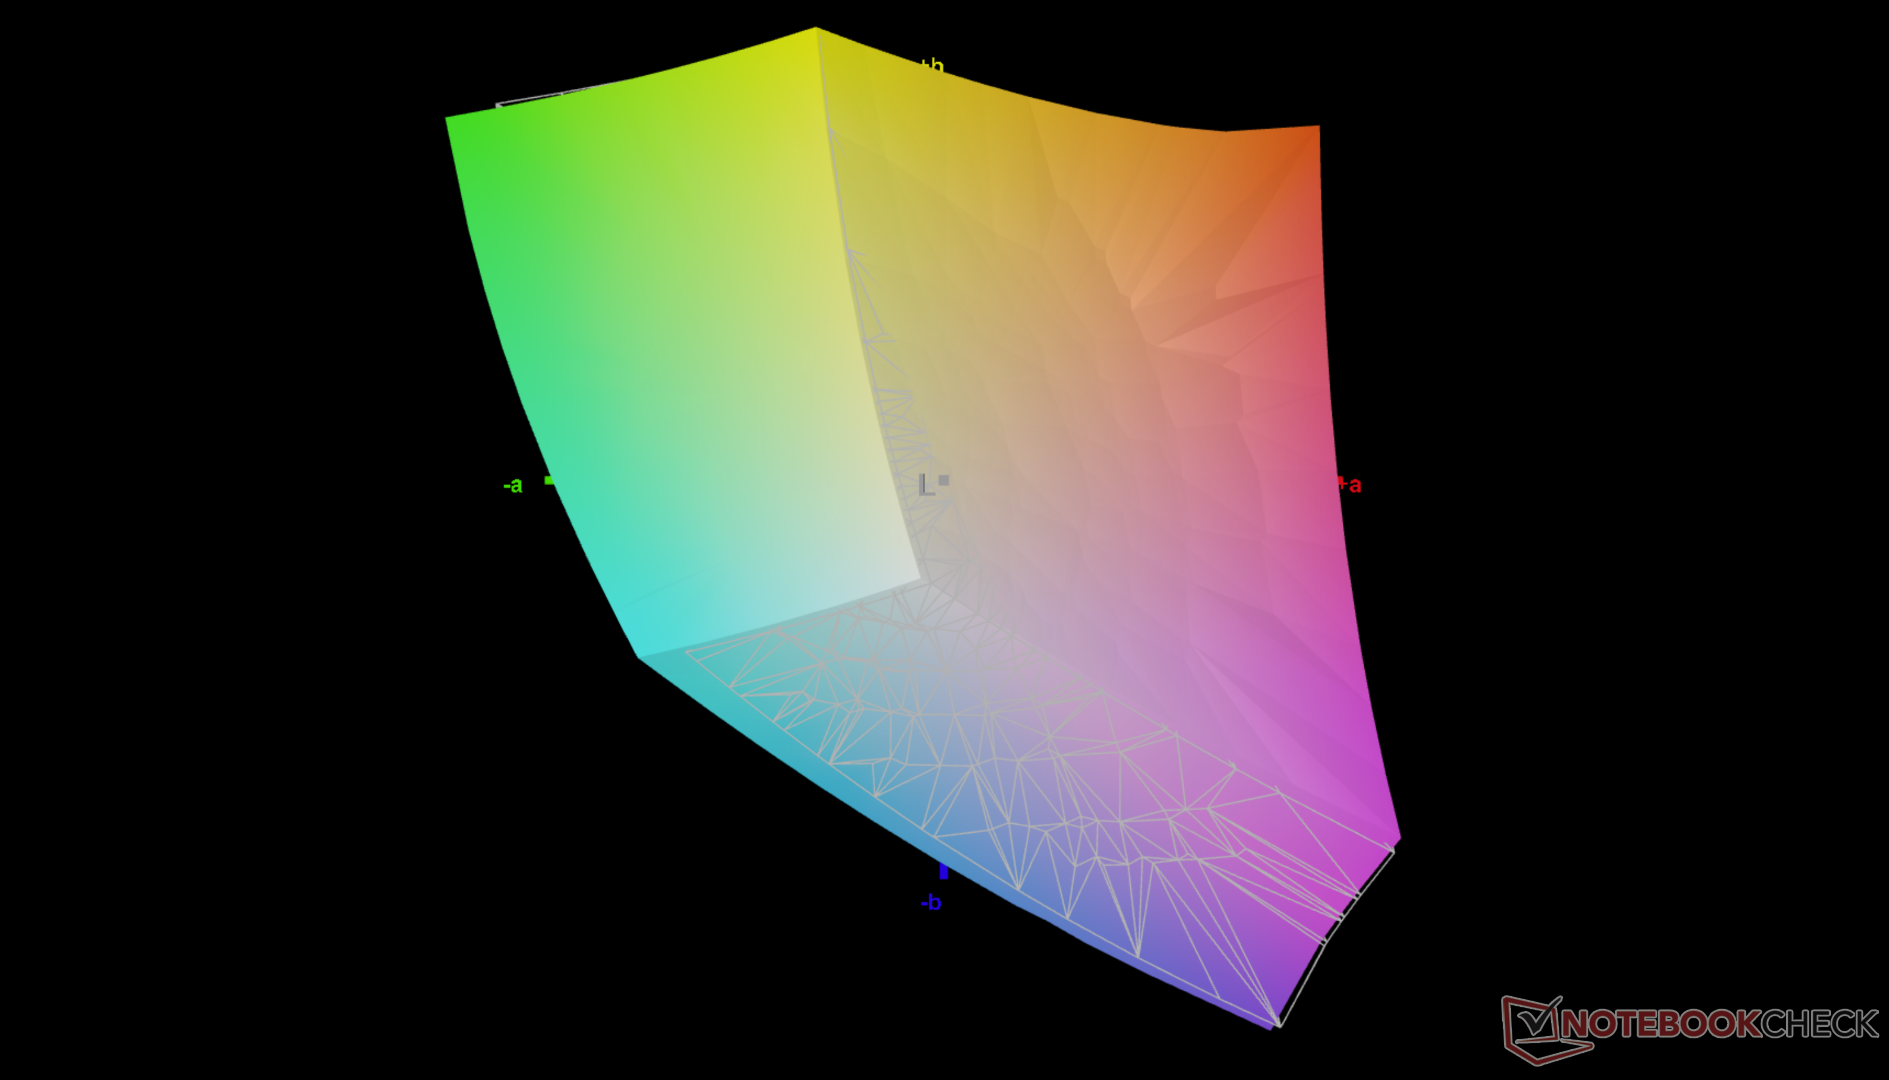
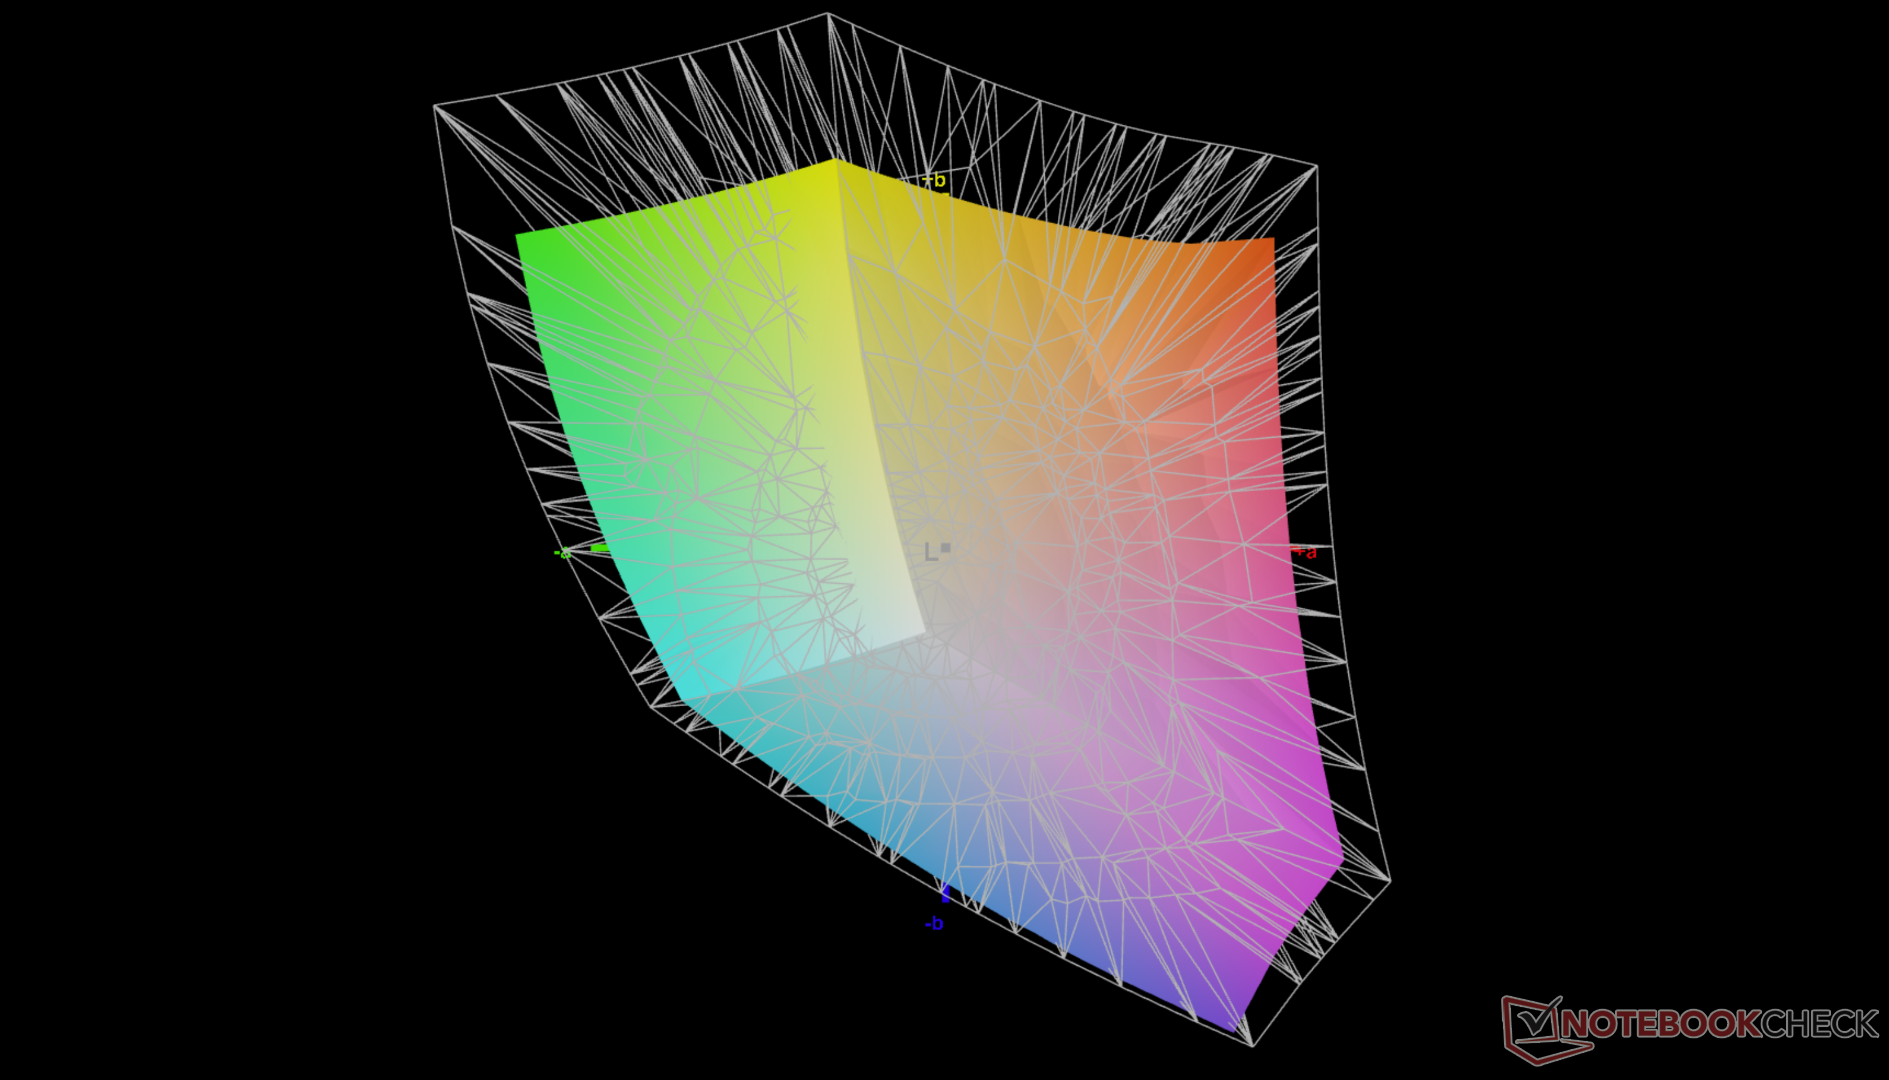
75.8% AdobeRGB 1998 (Argyll 3D)
99.4% sRGB (Argyll 3D)
74.1% Display P3 (Argyll 3D)
Gamma: 2.07
CCT: 6628 K
| Dell Inspiron 16 Plus 7610 AU Optronics B160QAN, IPS, 16", 3072x1920 | Lenovo Legion 5 Pro 16ACH6H (82JQ001PGE) CSOT T3 MNG007DA1-1, IPS, 16", 2560x1600 | Asus ROG Zephyrus M16 GU603H AU Optronics AUOC199, IPS, 16", 2560x1600 | LG Gram 16 (2021) LG Philips LP160WQ1-SPA1, IPS, 16", 2560x1600 | HP Pavilion Gaming 16-a0242ng BOE08F6, IPS, 16.1", 1920x1080 | Dell Inspiron 15 7000 7506 2-in-1 Black Edition AU Optronics B156ZAN, IPS, 15.6", 3840x2160 | |
|---|---|---|---|---|---|---|
| Display | -2% | 13% | -43% | -1% | ||
| Display P3 Coverage (%) | 74.1 | 95.8 29% | 40.42 -45% | 74.3 0% | ||
| sRGB Coverage (%) | 99.4 | 99 0% | 99.8 0% | 60.7 -39% | 99 0% | |
| AdobeRGB 1998 Coverage (%) | 75.8 | 73 -4% | 83.8 11% | 41.77 -45% | 74.6 -2% | |
| Response Times | 84% | 87% | 29% | 15% | -2% | |
| Response Time Grey 50% / Grey 80% * (ms) | 49.2 ? | 9.2 ? 81% | 4.8 ? 90% | 44 ? 11% | 43.2 ? 12% | 55.2 ? -12% |
| Response Time Black / White * (ms) | 36.8 ? | 4.8 87% | 6 ? 84% | 20 ? 46% | 30.4 ? 17% | 34 ? 8% |
| PWM Frequency (Hz) | ||||||
| Screen | 11% | -21% | -45% | -20% | -39% | |
| Brightness middle (cd/m²) | 296.8 | 551 86% | 448 51% | 331 12% | 319 7% | 303.8 2% |
| Brightness (cd/m²) | 292 | 523 79% | 446 53% | 309 6% | 306 5% | 296 1% |
| Brightness Distribution (%) | 87 | 88 1% | 86 -1% | 88 1% | 91 5% | 93 7% |
| Black Level * (cd/m²) | 0.21 | 0.54 -157% | 0.48 -129% | 0.22 -5% | 0.18 14% | 0.24 -14% |
| Contrast (:1) | 1413 | 1020 -28% | 933 -34% | 1505 7% | 1772 25% | 1266 -10% |
| Colorchecker dE 2000 * | 2.56 | 1.8 30% | 2.76 -8% | 4.64 -81% | 4 -56% | 4.58 -79% |
| Colorchecker dE 2000 max. * | 4.76 | 2.53 47% | 7.09 -49% | 9.82 -106% | 11.18 -135% | 9.4 -97% |
| Colorchecker dE 2000 calibrated * | 1.86 | 1.66 11% | 2.86 -54% | 3.16 -70% | 3.52 -89% | 2.17 -17% |
| Greyscale dE 2000 * | 2.6 | 1.85 29% | 3.1 -19% | 6.9 -165% | 1.53 41% | 6.4 -146% |
| Gamma | 2.07 106% | 2.3 96% | 2.153 102% | 2.34 94% | 2.39 92% | 2.3 96% |
| CCT | 6628 98% | 6338 103% | 6826 95% | 7904 82% | 6533 99% | 7414 88% |
| Color Space (Percent of AdobeRGB 1998) (%) | 72.81 | 87 | 75.1 | 38 | 66.7 | |
| Color Space (Percent of sRGB) (%) | 99.41 | 100 | 100 | 60 | 99 | |
| Media total (Programa/Opciones) | 31% /
20% | 33% /
-1% | -1% /
-22% | -16% /
-20% | -14% /
-26% |
* ... más pequeño es mejor
El espacio de color abarca sRGB por completo para satisfacer a la mayoría de los artistas gráficos aficionados. Otros portátiles multimedia como la Serie ZenBook Pro ofrecen colores AdobeRGB o DCI-P3 más amplios que el Inspiron 16 aún no puede ofrecer.
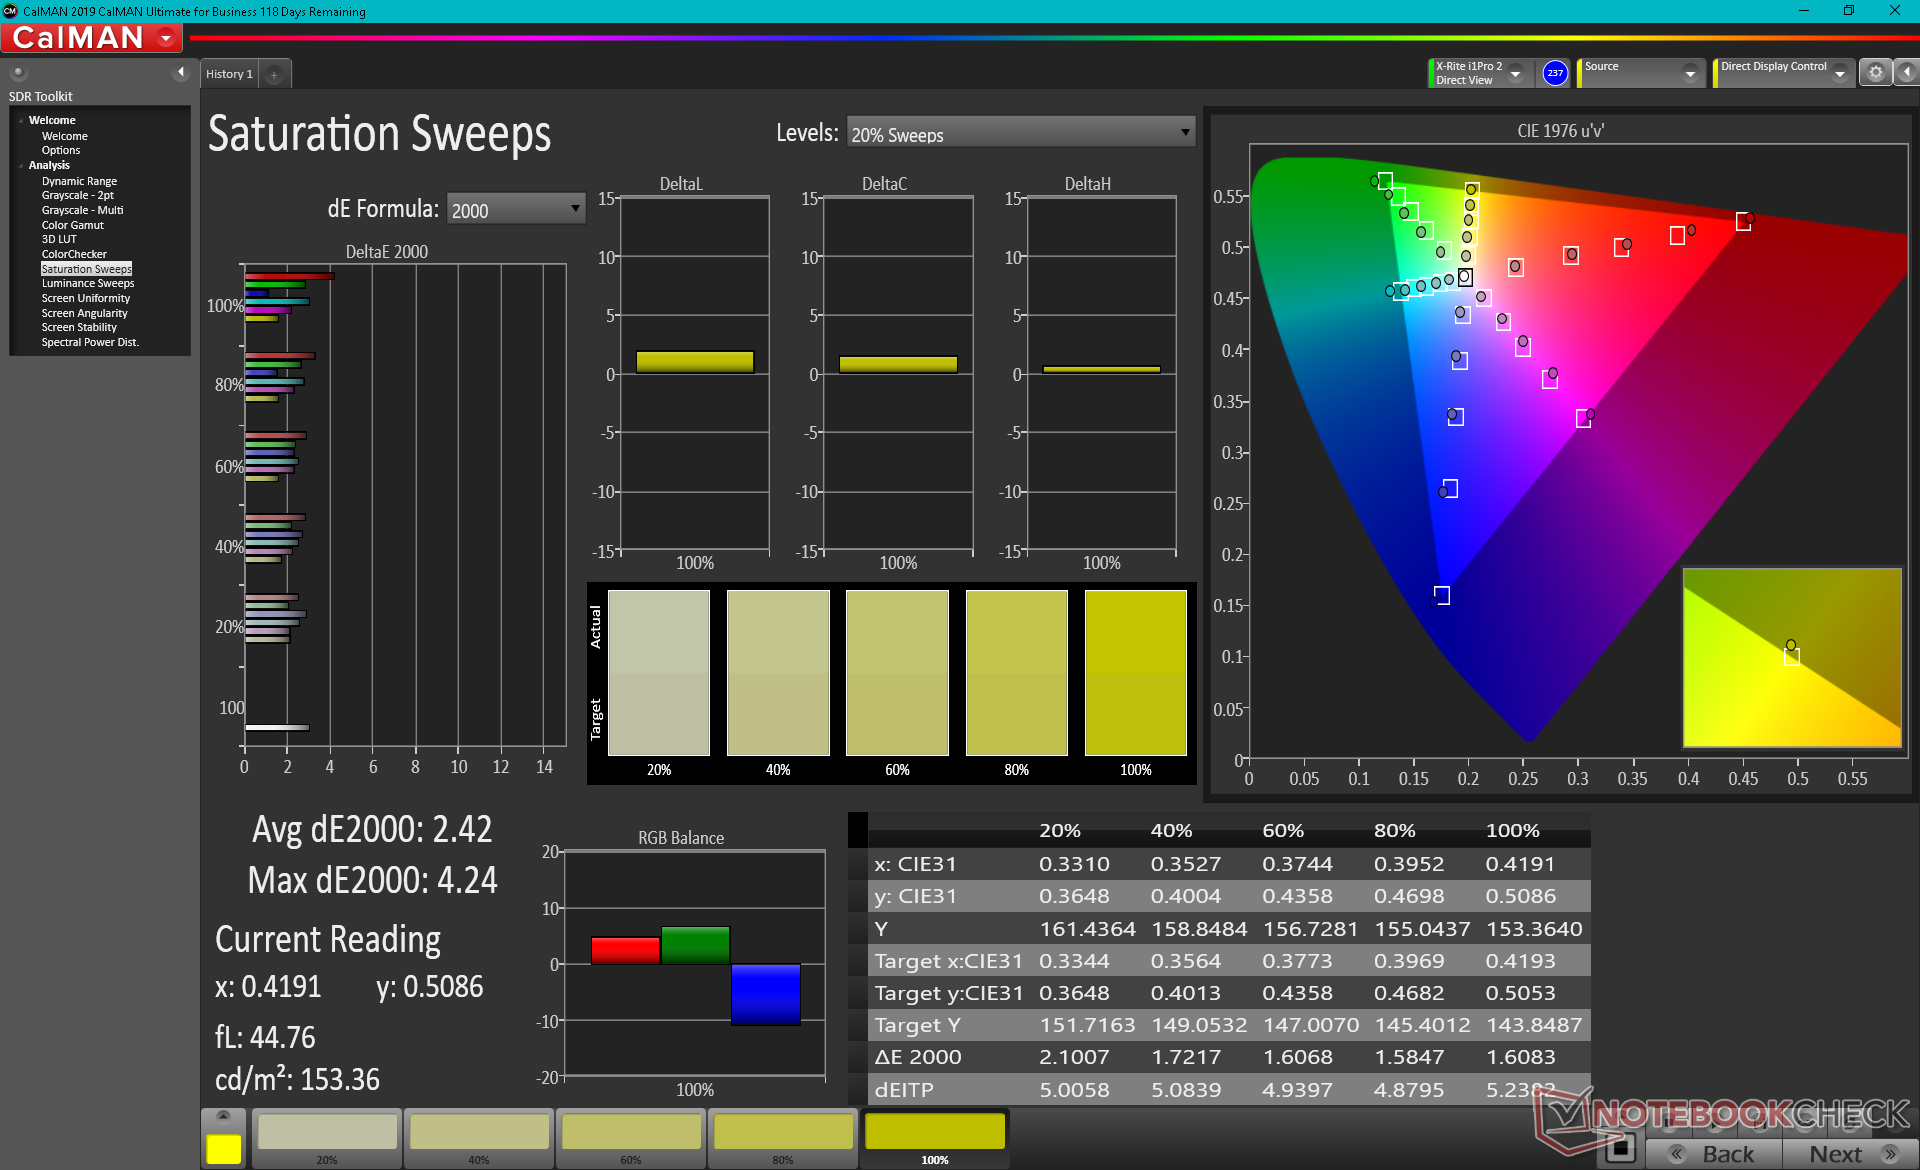
Nuestro colorímetro X-Rite revela una pantalla bien calibrada al sacarla de la caja, con unos valores medios de deltaE en escala de grises y color de sólo 2,6 y 2,56, respectivamente. Sin embargo, hay margen de mejora, ya que nuestro propio intento de calibración mejoraría ligeramente ambos valores deltaE a 2,1 y 1,86.

Tiempos de respuesta del display
| ↔ Tiempo de respuesta de Negro a Blanco | ||
|---|---|---|
| 36.8 ms ... subida ↗ y bajada ↘ combinada | ↗ 20.8 ms subida | 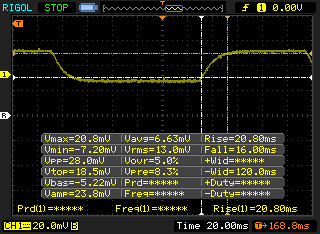 |
| ↘ 16 ms bajada | ||
| La pantalla mostró tiempos de respuesta lentos en nuestros tests y podría ser demasiado lenta para los jugones. En comparación, todos los dispositivos de prueba van de ##min### (mínimo) a 240 (máximo) ms. » 95 % de todos los dispositivos son mejores. Eso quiere decir que el tiempo de respuesta es peor que la media (19.8 ms) de todos los dispositivos testados. | ||
| ↔ Tiempo de respuesta 50% Gris a 80% Gris | ||
| 49.2 ms ... subida ↗ y bajada ↘ combinada | ↗ 24.8 ms subida | 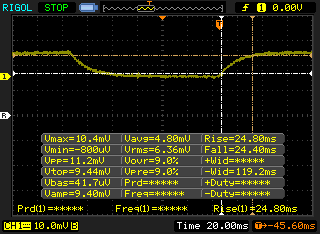 |
| ↘ 24.4 ms bajada | ||
| La pantalla mostró tiempos de respuesta lentos en nuestros tests y podría ser demasiado lenta para los jugones. En comparación, todos los dispositivos de prueba van de ##min### (mínimo) a 636 (máximo) ms. » 85 % de todos los dispositivos son mejores. Eso quiere decir que el tiempo de respuesta es peor que la media (31 ms) de todos los dispositivos testados. | ||
Parpadeo de Pantalla / PWM (Pulse-Width Modulation)
| Parpadeo de Pantalla / PWM no detectado | 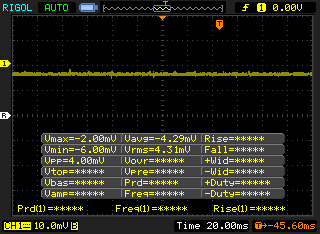 | ||
Comparación: 52 % de todos los dispositivos testados no usaron PWM para atenuar el display. Si se usó, medimos una media de 7757 (mínimo: 5 - máxmo: 343500) Hz. | |||
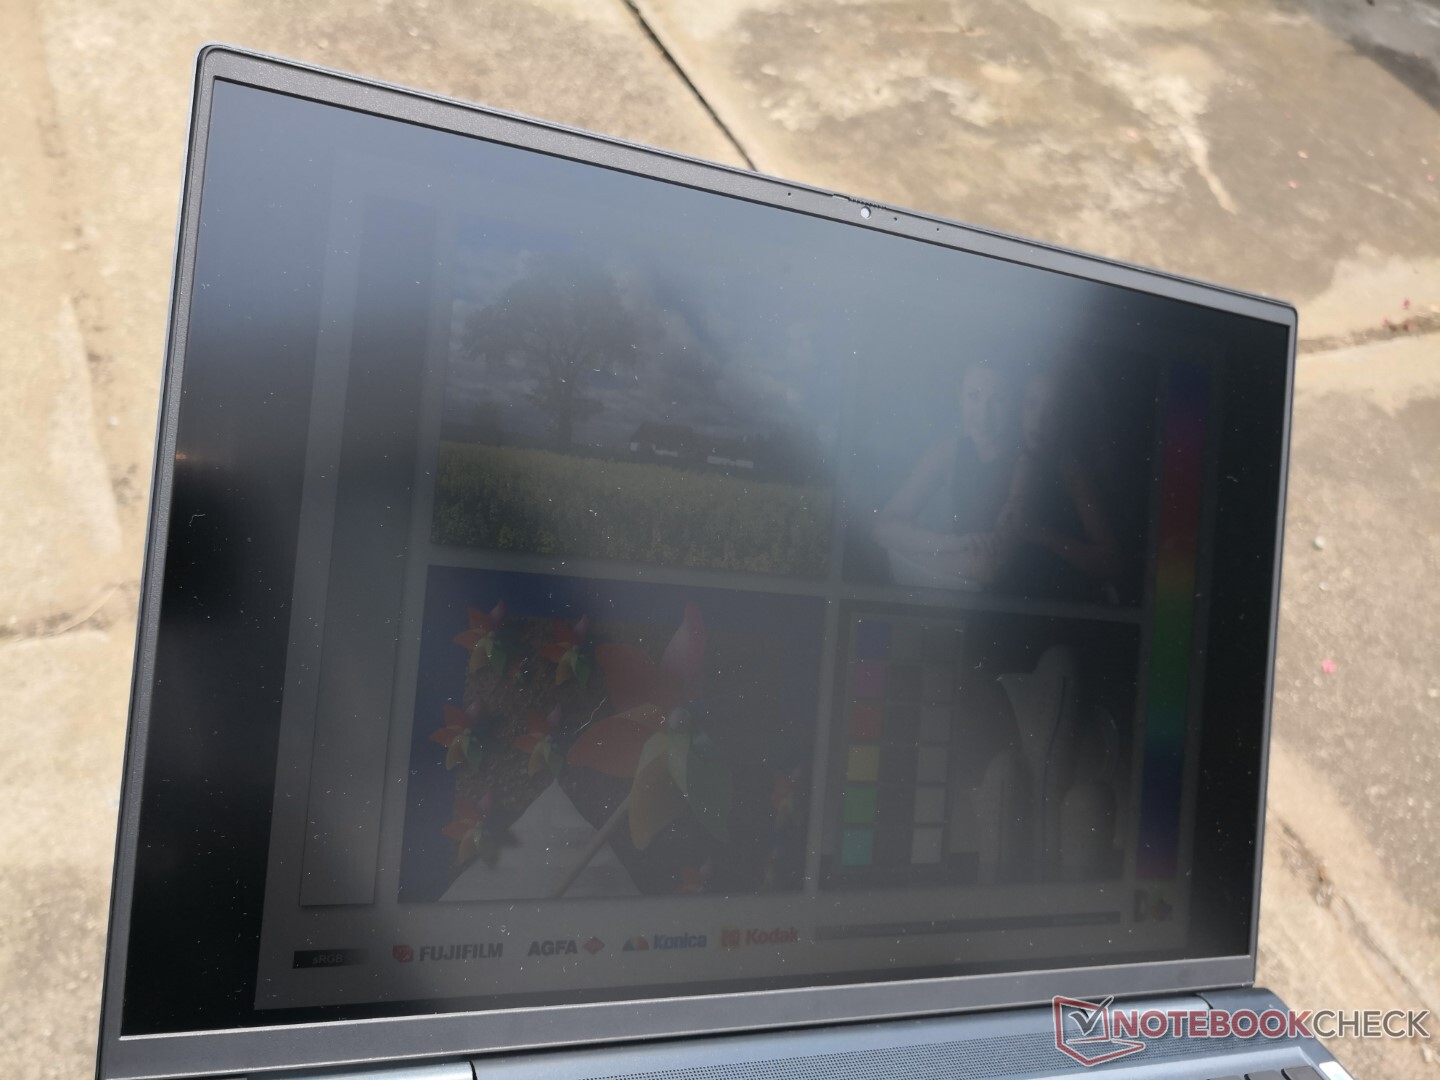
La visibilidad en exteriores está por debajo de la media y es similar a la de muchos portátiles de juego de 15,6 pulgadas, ya que la mayoría de los modelos de la categoría apuntan al mismo brillo de panel de 300 nits. El Asus ROG Zephyrus M16, el MacBook Pro 16, o el Lenovo Legion 5 Pro son notablemente más brillantes si la visión en exteriores es importante.

Desempeño - Desarrollado por Intel Core H
Las CPUs Intel Tiger Lake-H vienen de serie mientras que las GeForce RTX 3050 o RTX 3060 son opcionales. El Inspiron 16 es un portátil casi XPS, ya que lleva opciones similares de CPU y GPU, sin el Core i9 de gama alta. No hay SKUs de AMD en el momento de escribir este artículo.
La barra redimensionable y Optimus 1.0 se incluyen si se configura con una GPU Nvidia.
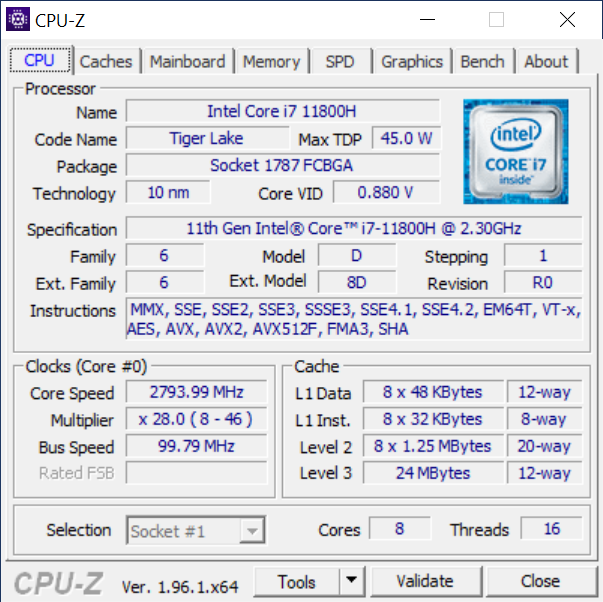

Procesador
El rendimiento de la CPU podría haber sido mejor, ya que los resultados multihilo de CineBench son entre un 11 y un 16 por ciento más lentos que los de un portátil medio equipado con el mismo Core i7-11800H que el mismo Core i7-11800H. Este déficit significa que la mayoría de los portátiles con el antiguo AMD Ryzen 7 4800Hpueden superar a nuestro Dell. Aun así, sigue siendo un paso adelante respecto a la generación anterior Core i7-10870H entre un 10 y un 15 por ciento. El rendimiento de un solo hilo es, por lo demás, excelente y está donde esperamos que esté.
Si se opta por el Core i5-11400H en lugar de nuestro i7-11800H supondrá un déficit de rendimiento de entre el 10 y el 20 por ciento.
Cinebench R15 Multi Loop
Cinebench R23: Multi Core | Single Core
Cinebench R15: CPU Multi 64Bit | CPU Single 64Bit
Blender: v2.79 BMW27 CPU
7-Zip 18.03: 7z b 4 -mmt1 | 7z b 4
Geekbench 5.5: Single-Core | Multi-Core
HWBOT x265 Benchmark v2.2: 4k Preset
LibreOffice : 20 Documents To PDF
R Benchmark 2.5: Overall mean
| Cinebench R23 / Multi Core | |
| Medio Intel Core i7-11800H (6508 - 14088, n=48) | |
| Schenker XMG Core 15 Ampere | |
| Dell Inspiron 16 Plus 7610 | |
| Gigabyte Aero 15 OLED XC | |
| Razer Blade 15 Advanced Model Early 2021 | |
| Acer Aspire Nitro 5 AN515-55-57GF | |
| Cinebench R23 / Single Core | |
| Dell Inspiron 16 Plus 7610 | |
| Medio Intel Core i7-11800H (1386 - 1522, n=45) | |
| Schenker XMG Core 15 Ampere | |
| Gigabyte Aero 15 OLED XC | |
| Razer Blade 15 Advanced Model Early 2021 | |
| Acer Aspire Nitro 5 AN515-55-57GF | |
| HWBOT x265 Benchmark v2.2 / 4k Preset | |
| Asus ROG Zephyrus M16 GU603H | |
| Medio Intel Core i7-11800H (7.38 - 17.4, n=46) | |
| Schenker XMG Core 15 Ampere | |
| Asus TUF Gaming A15 FA506QR-AZ061T | |
| Dell Inspiron 16 Plus 7610 | |
| Gigabyte Aero 15 OLED XC | |
| Razer Blade 15 Advanced Model Early 2021 | |
| Asus ProArt StudioBook Pro 15 W500G5T | |
| Acer Aspire Nitro 5 AN515-55-57GF | |
* ... más pequeño es mejor
Rendimiento del sistema
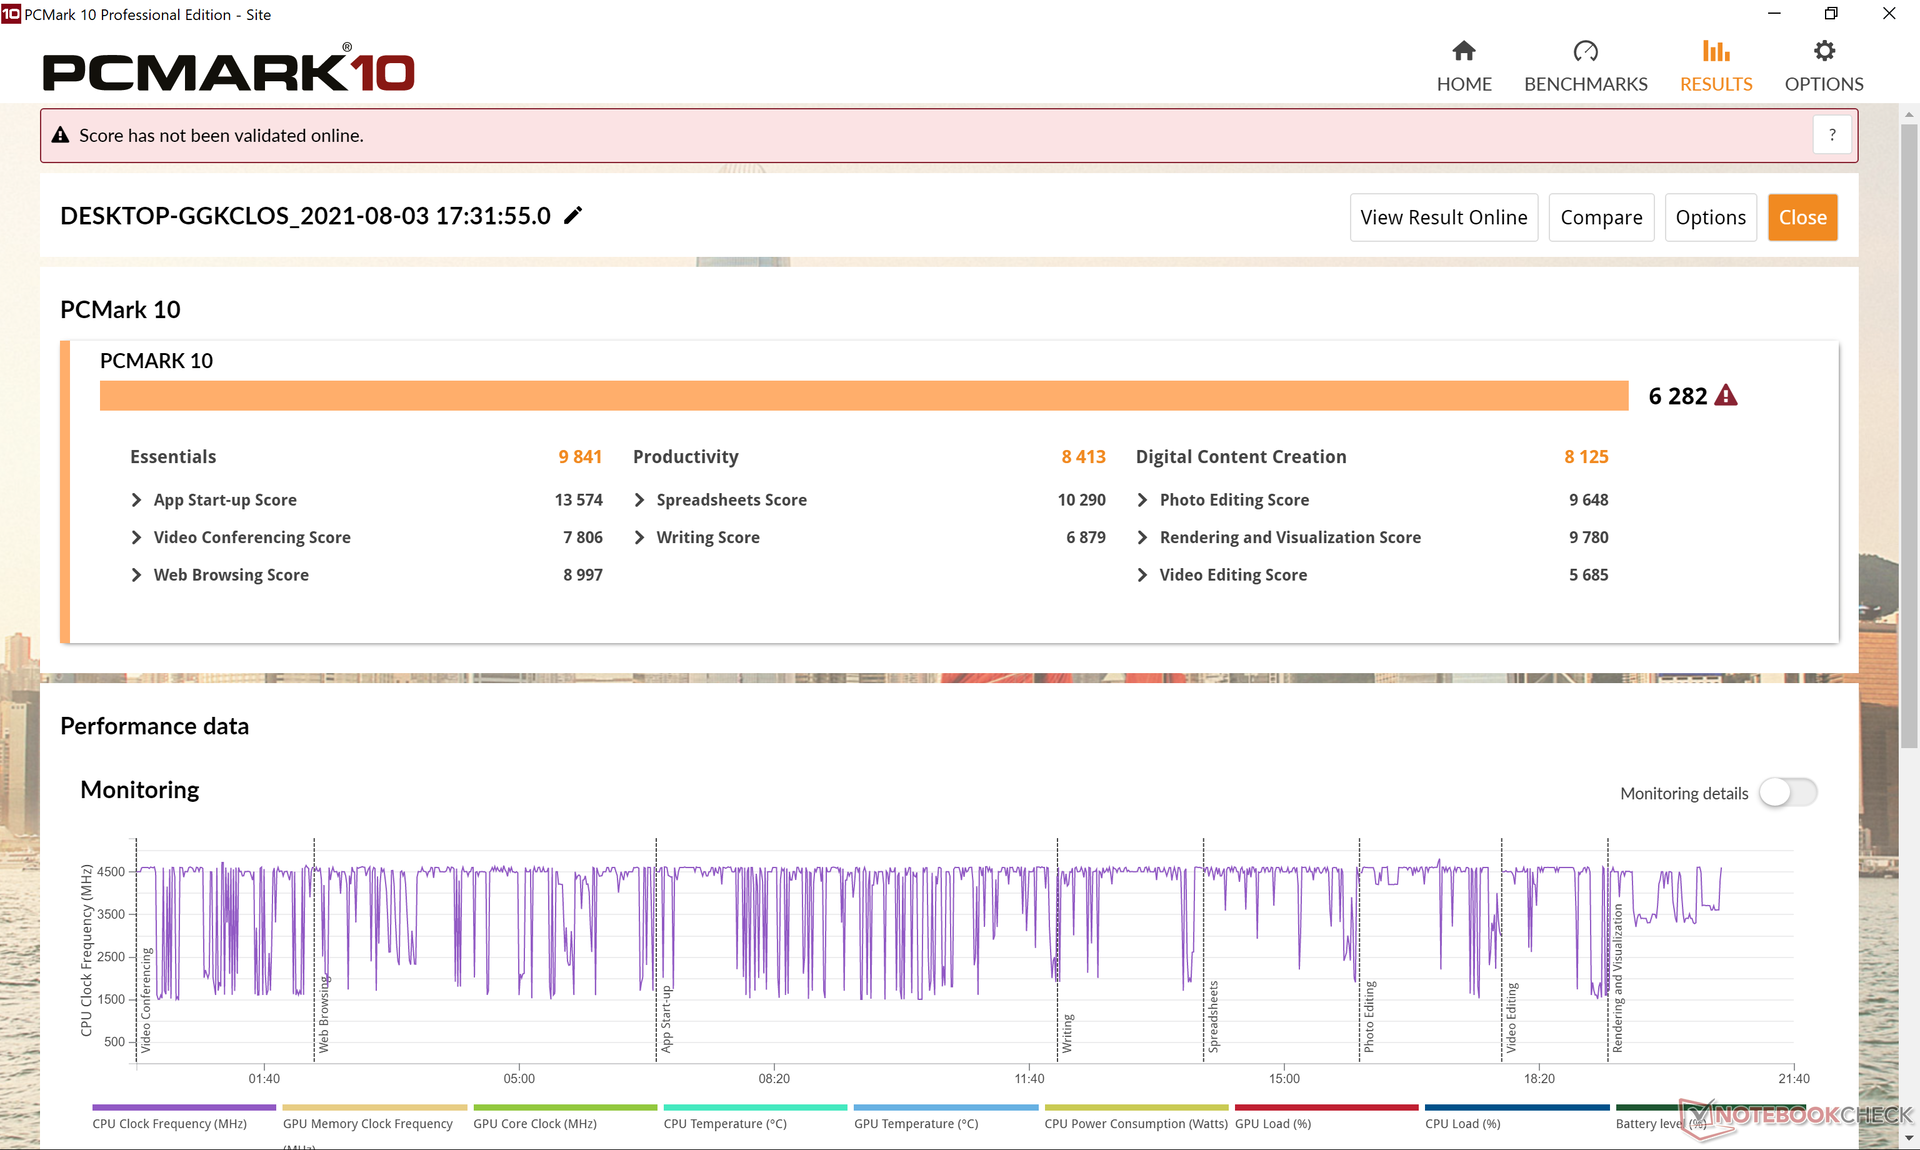
Los resultados de PCMark 10 son generalmente superiores a los de los portátiles con CPUs Core-H de 10ª generación más antiguos, como elAsus ROG Zephyrus M15. Las diferencias son especialmente pronunciadas cuando se comparan con los portátiles con CPUs de la serie Core U.
| PCMark 10 / Score | |
| Asus ROG Zephyrus M16 GU603H | |
| Lenovo Legion 5 Pro 16ACH6H (82JQ001PGE) | |
| Dell Inspiron 16 Plus 7610 | |
| Medio Intel Core i7-11800H, NVIDIA GeForce RTX 3050 4GB Laptop GPU (n=1) | |
| Dell Inspiron 15 7000 7506 2-in-1 Black Edition | |
| LG Gram 16 (2021) | |
| HP Pavilion Gaming 16-a0242ng | |
| PCMark 10 / Essentials | |
| Asus ROG Zephyrus M16 GU603H | |
| LG Gram 16 (2021) | |
| Dell Inspiron 16 Plus 7610 | |
| Medio Intel Core i7-11800H, NVIDIA GeForce RTX 3050 4GB Laptop GPU (n=1) | |
| Dell Inspiron 15 7000 7506 2-in-1 Black Edition | |
| Lenovo Legion 5 Pro 16ACH6H (82JQ001PGE) | |
| HP Pavilion Gaming 16-a0242ng | |
| PCMark 10 / Productivity | |
| Asus ROG Zephyrus M16 GU603H | |
| Lenovo Legion 5 Pro 16ACH6H (82JQ001PGE) | |
| Dell Inspiron 16 Plus 7610 | |
| Medio Intel Core i7-11800H, NVIDIA GeForce RTX 3050 4GB Laptop GPU (n=1) | |
| HP Pavilion Gaming 16-a0242ng | |
| LG Gram 16 (2021) | |
| Dell Inspiron 15 7000 7506 2-in-1 Black Edition | |
| PCMark 10 / Digital Content Creation | |
| Asus ROG Zephyrus M16 GU603H | |
| Lenovo Legion 5 Pro 16ACH6H (82JQ001PGE) | |
| Dell Inspiron 16 Plus 7610 | |
| Medio Intel Core i7-11800H, NVIDIA GeForce RTX 3050 4GB Laptop GPU (n=1) | |
| Dell Inspiron 15 7000 7506 2-in-1 Black Edition | |
| HP Pavilion Gaming 16-a0242ng | |
| LG Gram 16 (2021) | |
| PCMark 10 Score | 6282 puntos | |
ayuda | ||
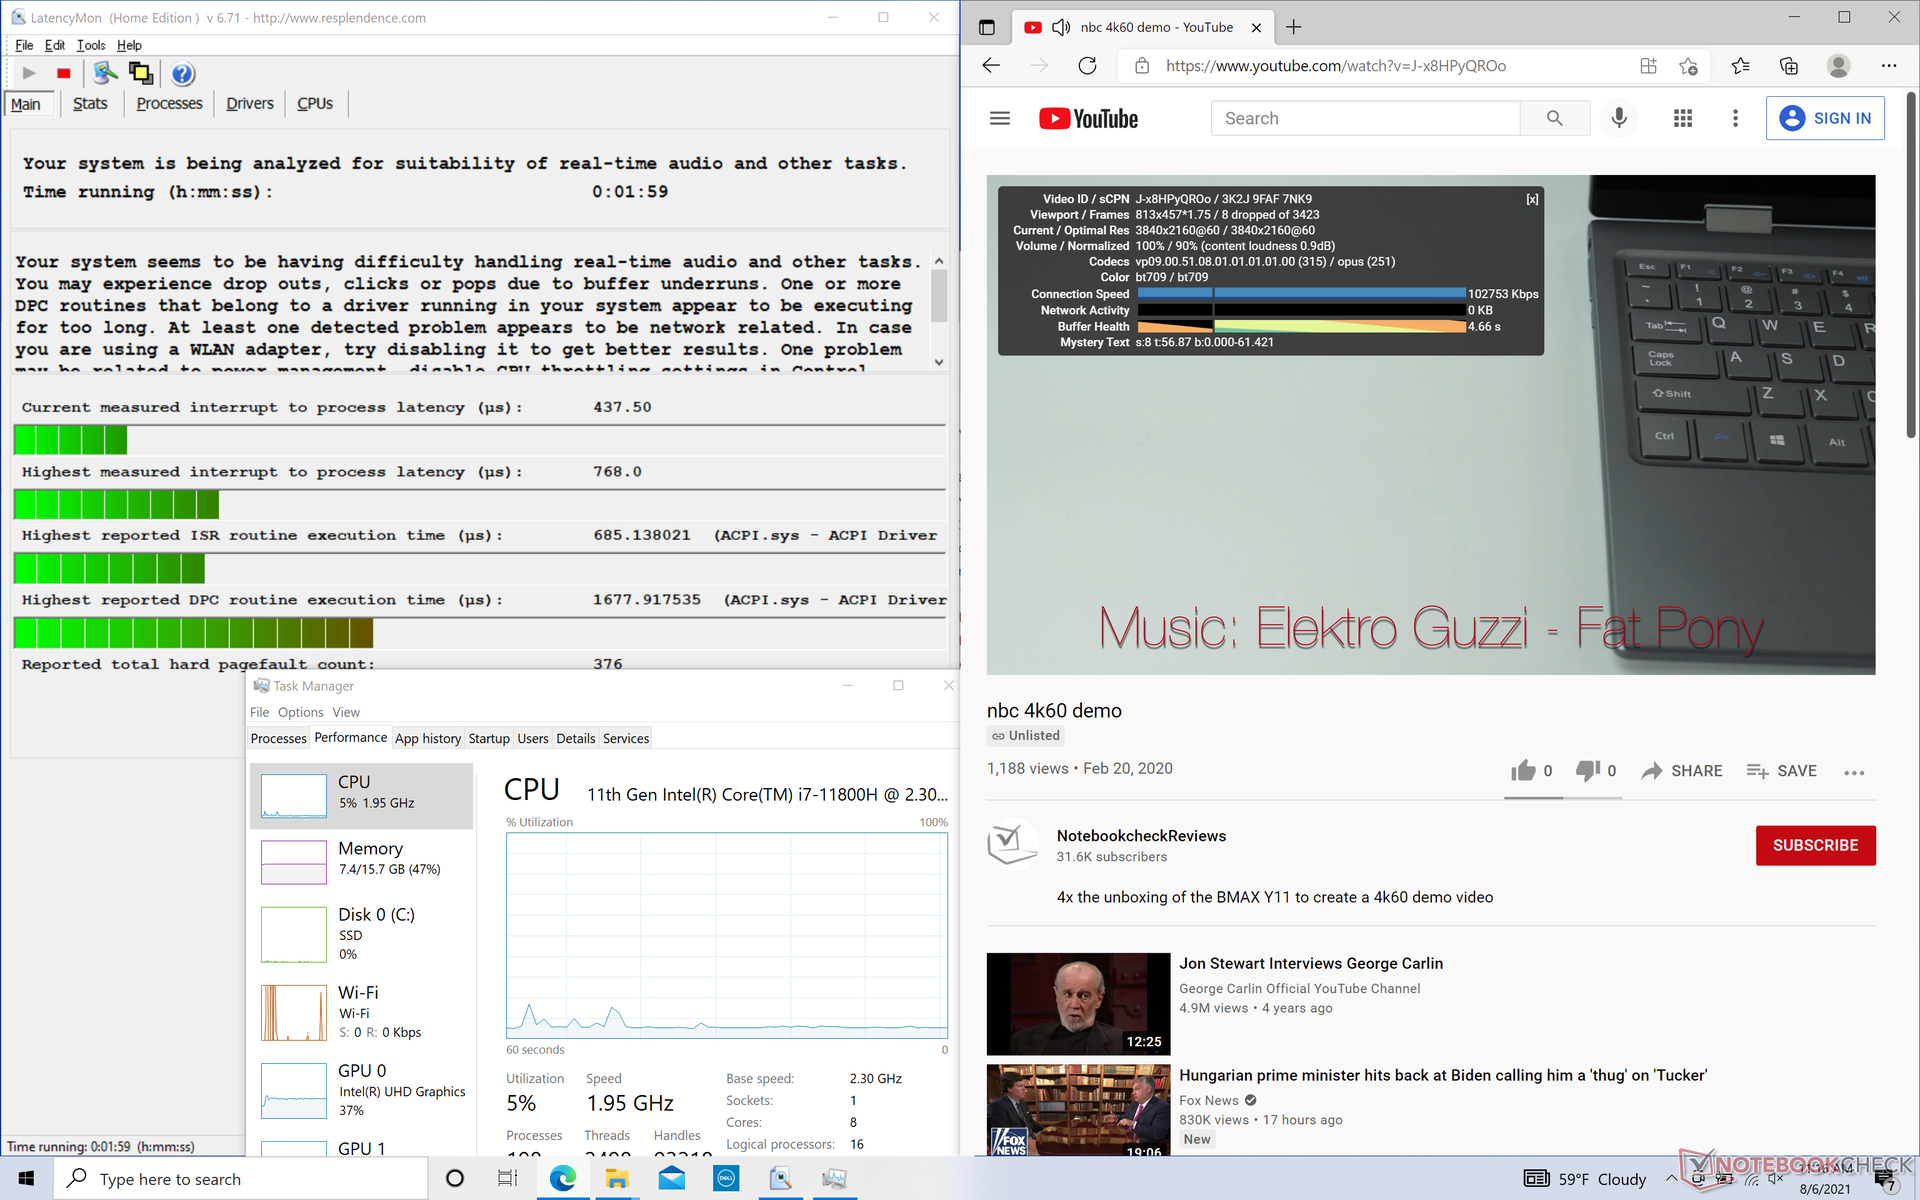
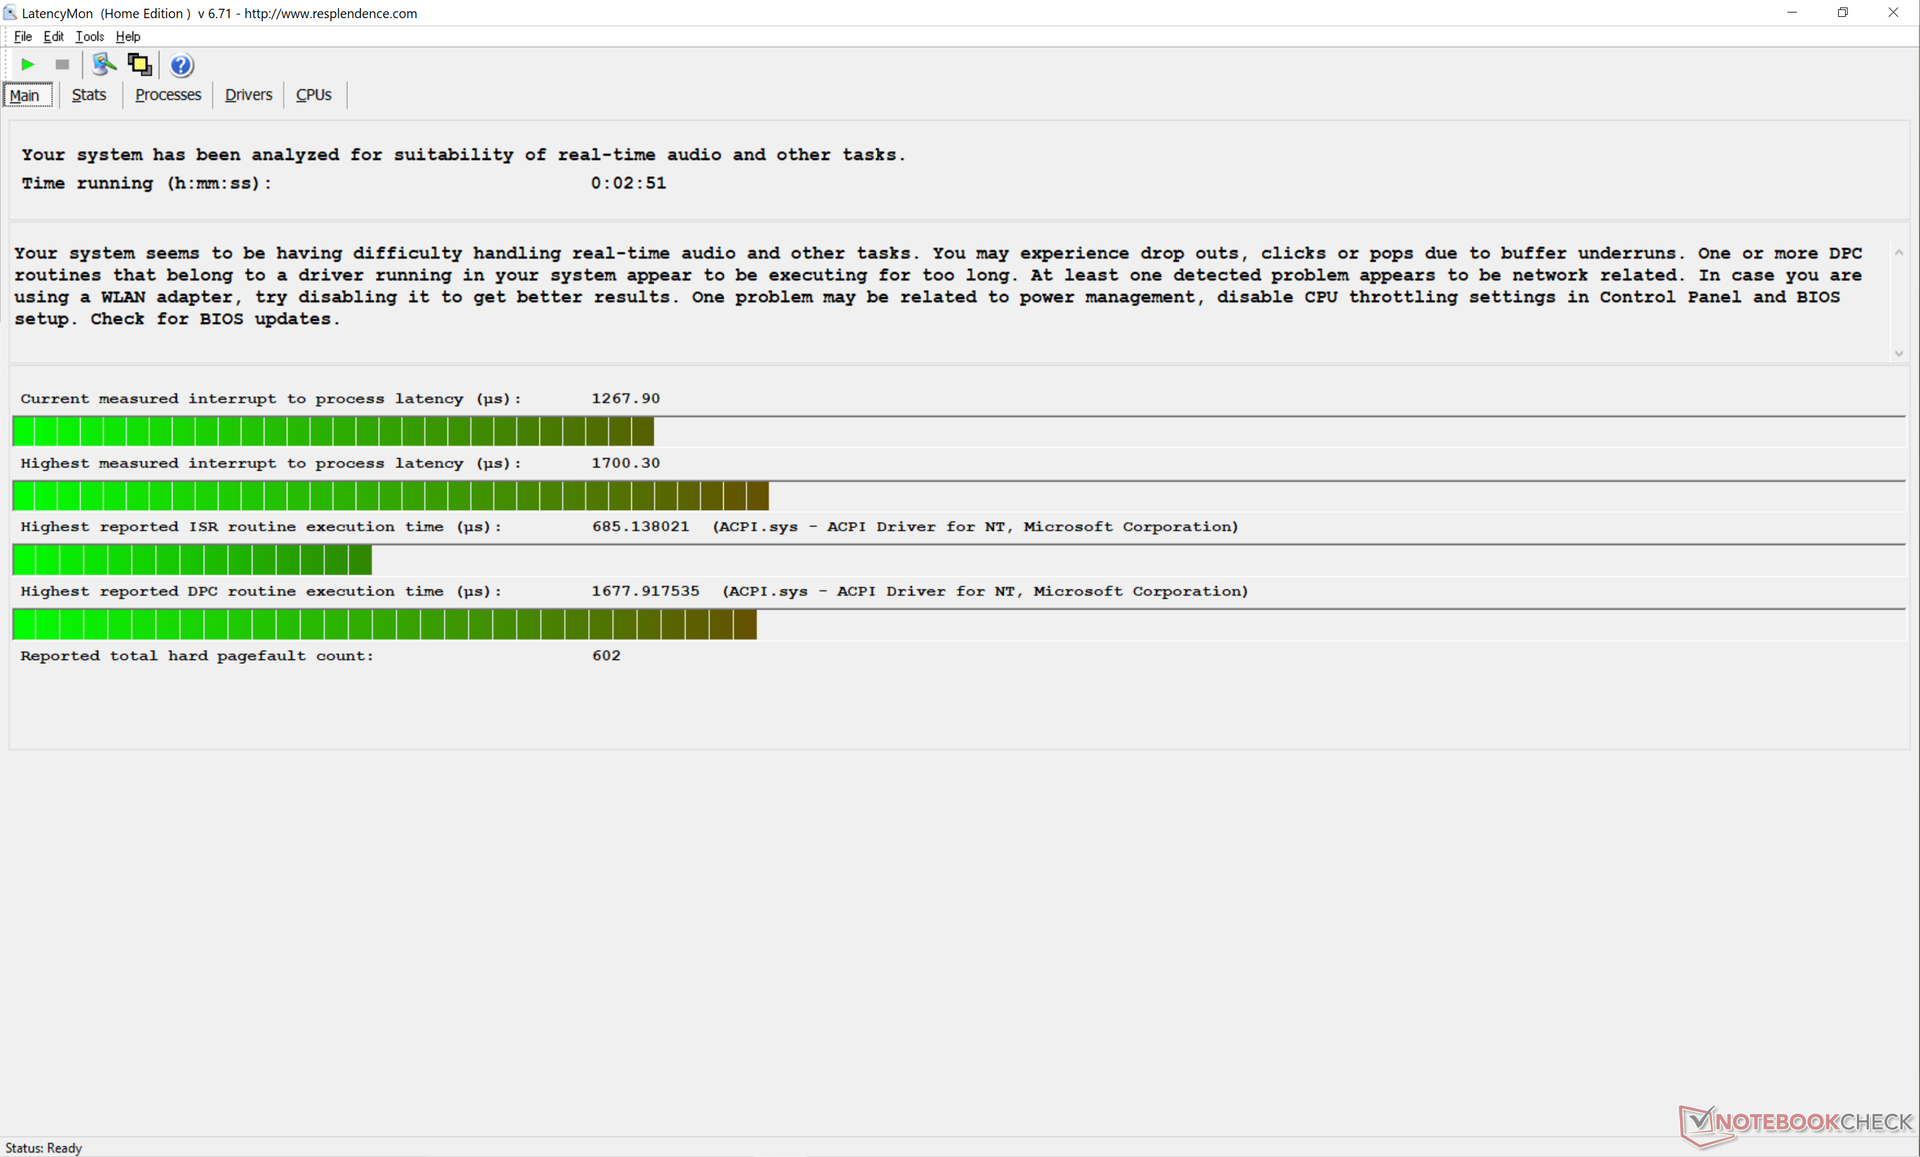
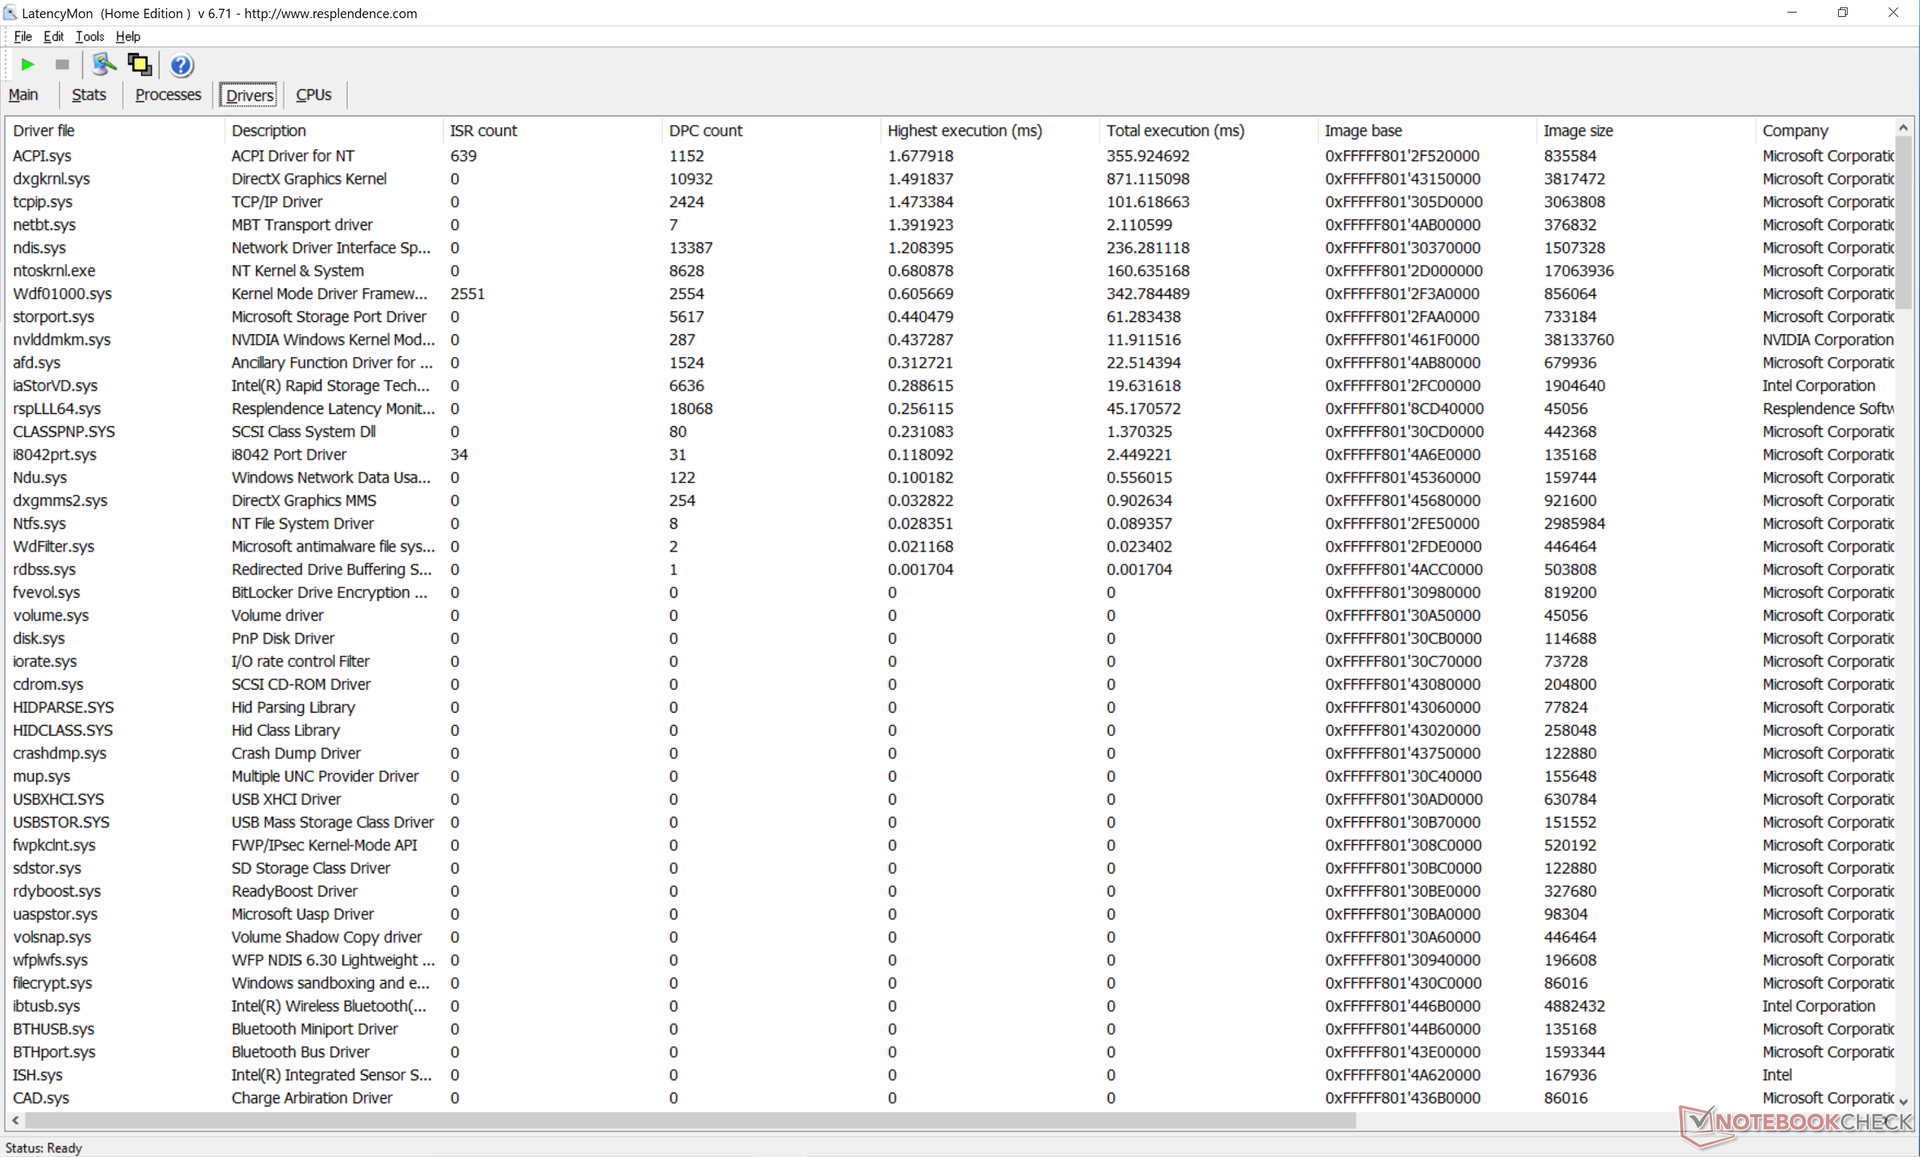
Latencia del CPD
LatencyMon revela problemas de latencia del CPD al abrir varias pestañas en nuestra página de inicio o al ejecutar el estrés de Prime95. La reproducción de vídeo 4K a 60 FPS tampoco es impecable, ya que registramos 8 fotogramas perdidos durante nuestro vídeo de 60 segundos.
| DPC Latencies / LatencyMon - interrupt to process latency (max), Web, Youtube, Prime95 | |
| HP Pavilion Gaming 16-a0242ng | |
| Dell Inspiron 16 Plus 7610 | |
| Lenovo Legion 5 Pro 16ACH6H (82JQ001PGE) | |
| Asus ROG Zephyrus M16 GU603H | |
| LG Gram 16 (2021) | |
| Dell Inspiron 15 7000 7506 2-in-1 Black Edition | |
* ... más pequeño es mejor
Dispositivos de almacenamiento - Dos unidades internas
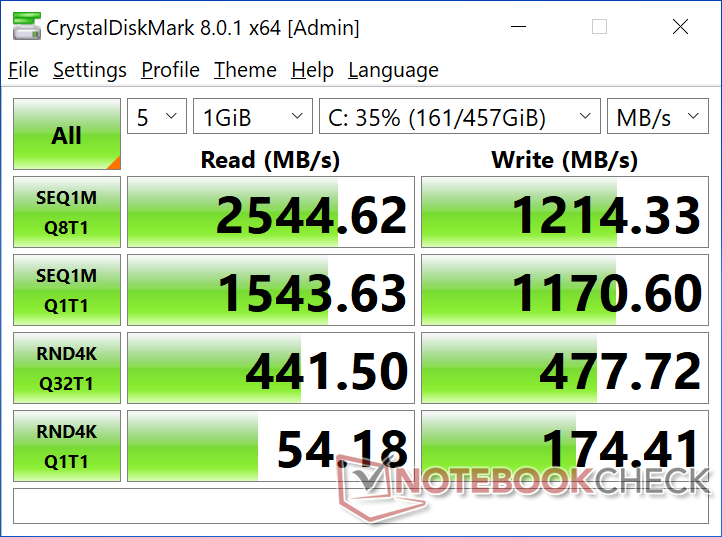
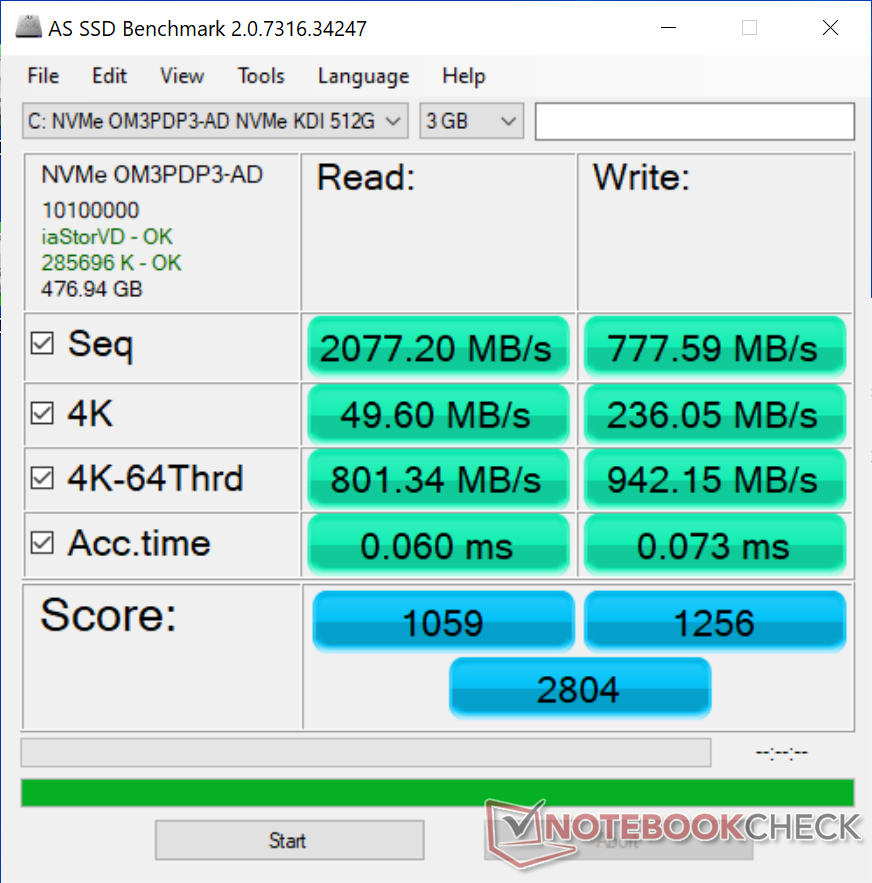
Nuestra unidad de prueba viene con un SSD NVMe Kingston OM3PDP3-AD poco común. El rendimiento es bastante mediocre, hasta la mitad del Micron 2300 en el XPS 15 9510. Es difícil predecir con qué unidades se enviarán las unidades de venta, ya que Dell se abastece de múltiples proveedores de SSD, incluyendo Samsung, Micron, Western Digital, Toshiba y, aparentemente, Kingston.
Los usuarios pueden instalar hasta dos unidades internas, pero al menos una debe estar en el factor de forma 2230 más pequeño.
| Dell Inspiron 16 Plus 7610 Kingston OM3PDP3512B | Lenovo Legion 5 Pro 16ACH6H (82JQ001PGE) WDC PC SN730 SDBPNTY-1T00 | LG Gram 16 (2021) SK Hynix PC601 1TB HFS001TD9TNG | HP Pavilion Gaming 16-a0242ng Intel SSD 660p SSDPEKNW512G8 | Dell Inspiron 15 7000 7506 2-in-1 Black Edition Micron 2300 1TB MTFDHBA1T0TDV | |
|---|---|---|---|---|---|
| AS SSD | -28% | 57% | -23% | 31% | |
| Seq Read (MB/s) | 2077 | 2695 30% | 2808 35% | 1438 -31% | 1910 -8% |
| Seq Write (MB/s) | 778 | 2384 206% | 2345 201% | 905 16% | 2795 259% |
| 4K Read (MB/s) | 49.6 | 29.75 -40% | 50.2 1% | 50.3 1% | 50.5 2% |
| 4K Write (MB/s) | 236.1 | 52 -78% | 138.6 -41% | 111.7 -53% | 103.8 -56% |
| 4K-64 Read (MB/s) | 801 | 1193 49% | 1584 98% | 324 -60% | 1485 85% |
| 4K-64 Write (MB/s) | 942 | 1107 18% | 1687 79% | 729 -23% | 1820 93% |
| Access Time Read * (ms) | 0.06 | 0.136 -127% | 0.035 42% | 0.105 -75% | 0.056 7% |
| Access Time Write * (ms) | 0.073 | 0.36 -393% | 0.028 62% | 0.047 36% | 0.282 -286% |
| Score Read (Points) | 1059 | 1493 41% | 1915 81% | 518 -51% | 1727 63% |
| Score Write (Points) | 1256 | 1397 11% | 2060 64% | 931 -26% | 2203 75% |
| Score Total (Points) | 2804 | 3636 30% | 4934 76% | 1707 -39% | 4863 73% |
| Copy ISO MB/s (MB/s) | 1028 | 1007 -2% | 1852 80% | 1145 11% | 1892 84% |
| Copy Program MB/s (MB/s) | 794 | 43.11 -95% | 704 -11% | 602 -24% | 649 -18% |
| Copy Game MB/s (MB/s) | 987 | 621 -37% | 1329 35% | 929 -6% | 1558 58% |
| CrystalDiskMark 5.2 / 6 | 13% | 49% | 51% | ||
| Write 4K (MB/s) | 176.8 | 89.9 -49% | 204.2 15% | 111.4 -37% | |
| Read 4K (MB/s) | 52.3 | 30.98 -41% | 47.14 -10% | 53.4 2% | |
| Write Seq (MB/s) | 1170 | 2521 115% | 2598 122% | ||
| Read Seq (MB/s) | 1557 | 1748 12% | 2308 48% | ||
| Write 4K Q32T1 (MB/s) | 471.5 | 371.6 -21% | 669 42% | 644 37% | |
| Read 4K Q32T1 (MB/s) | 437.9 | 470.6 7% | 760 74% | 665 52% | |
| Write Seq Q32T1 (MB/s) | 1214 | 3065 152% | 2513 107% | 3147 159% | |
| Read Seq Q32T1 (MB/s) | 2549 | 3370 32% | 3452 35% | 3242 27% | |
| Write 4K Q8T8 (MB/s) | 1619 | ||||
| Read 4K Q8T8 (MB/s) | 1670 | ||||
| Media total (Programa/Opciones) | -8% /
-15% | 53% /
54% | -23% /
-23% | 41% /
38% |
* ... más pequeño es mejor

Disk Throttling: DiskSpd Read Loop, Queue Depth 8
Rendimiento de la GPU: hasta 65 W TGP
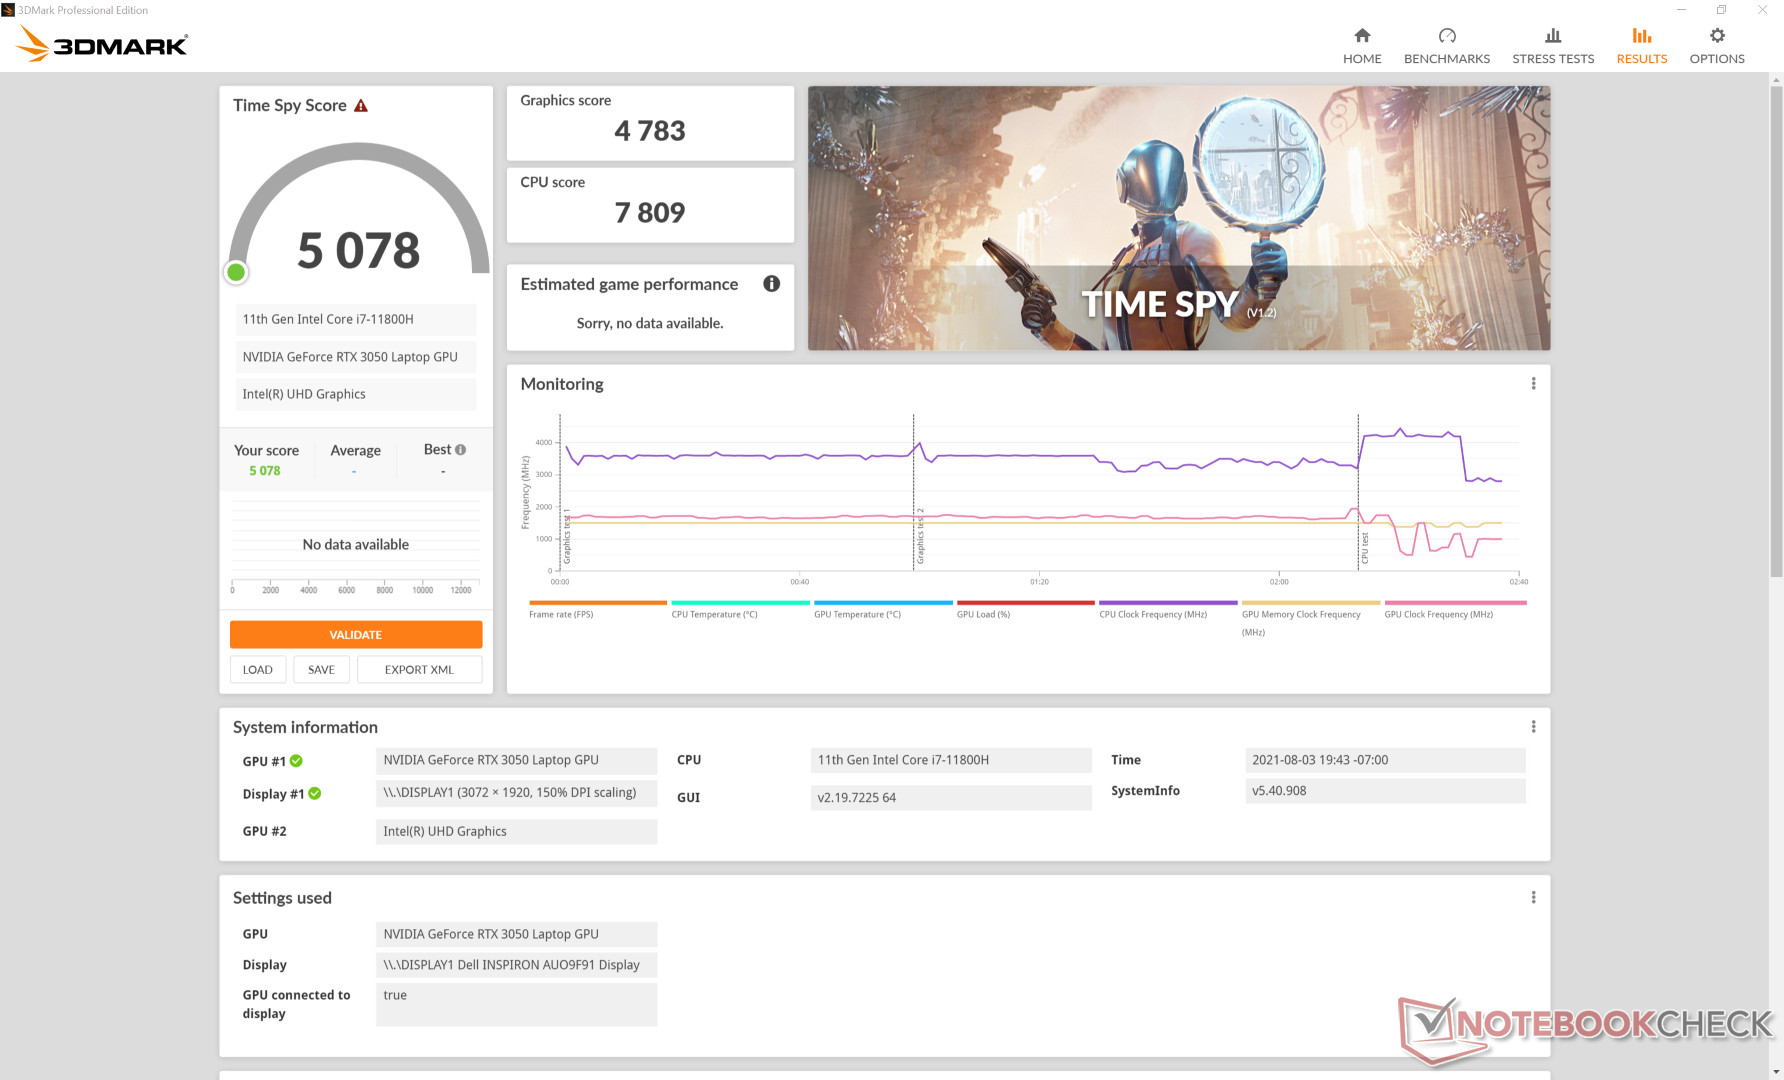
El rendimiento gráfico es algo decepcionante. Aunque no esperábamos nada parecido a la más cara RTX 3060nuestra RTX 3050 ni siquiera puede superar a la GTX 1660 Ti en la mayoría de los casos. La caída del 40 por ciento en el rendimiento en comparación con la RTX 3060 es suficiente para situarla por debajo de los portátiles más antiguos y baratos que funcionan con la GTX 1660 Ti o la RTX 2060.
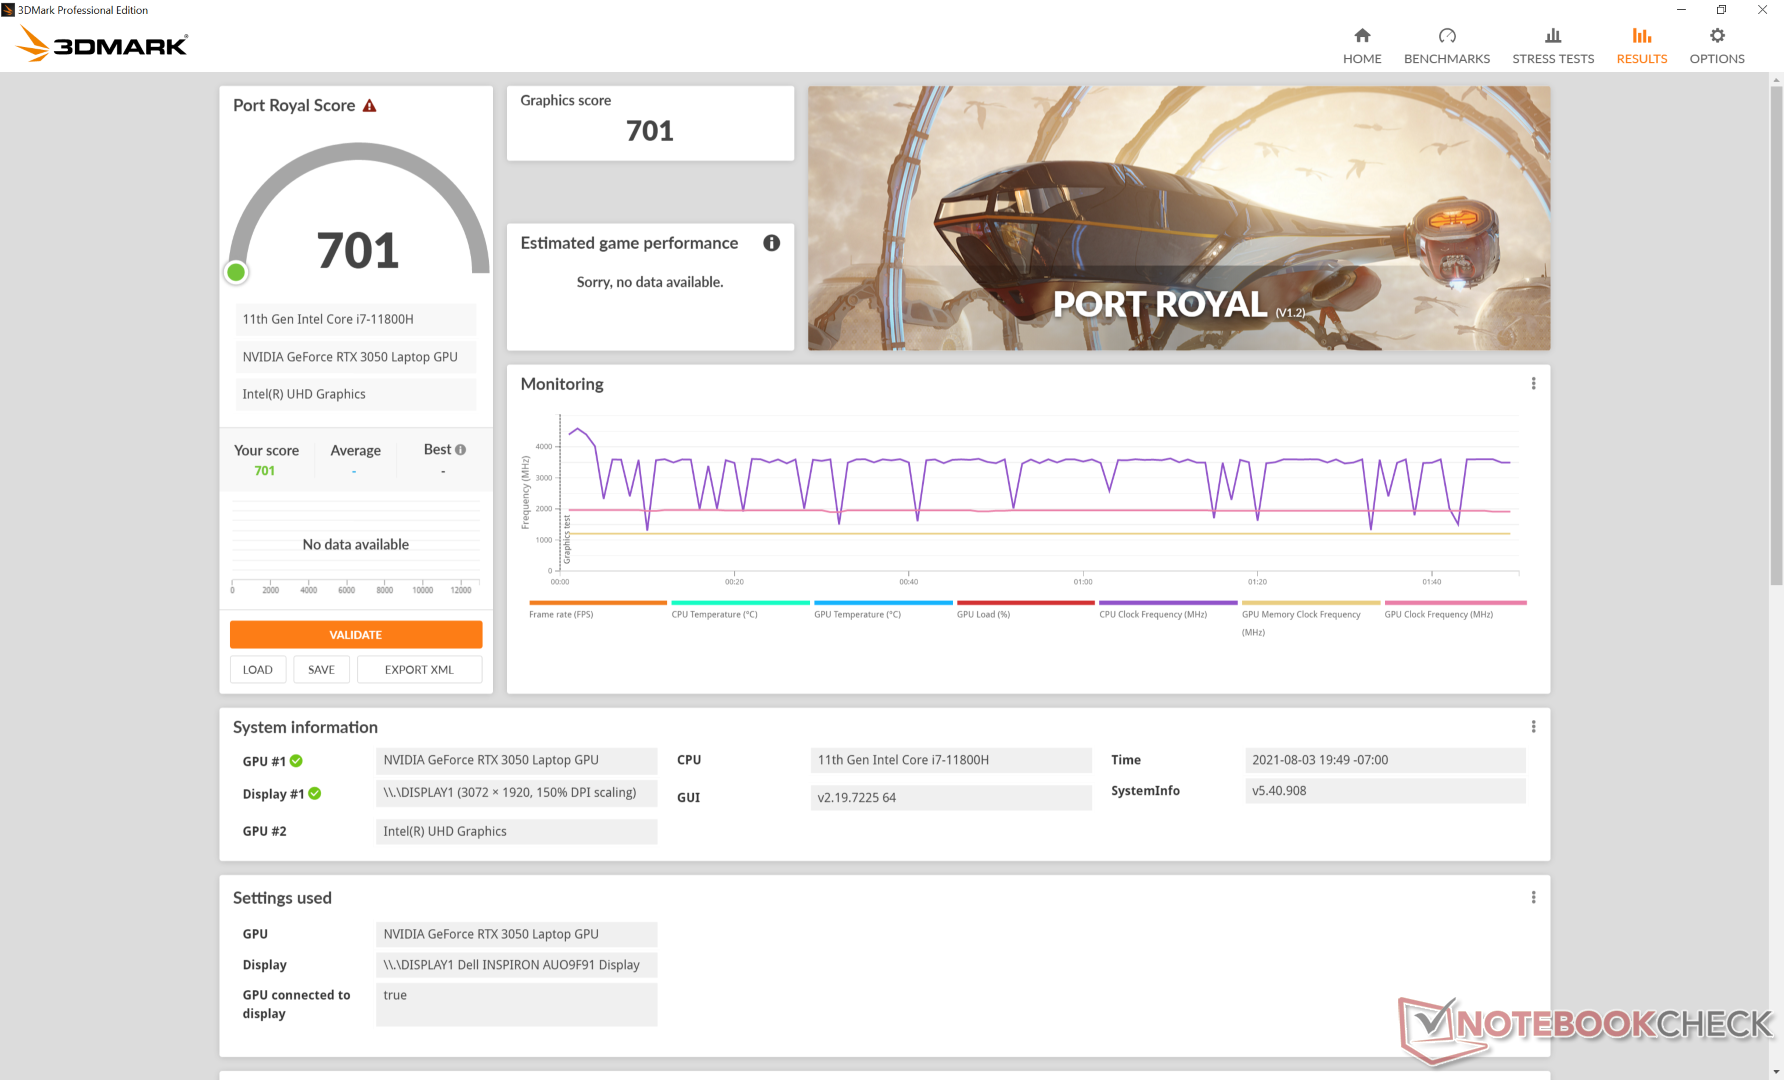
Además, nuestra puntuación en 3DMark Port Royal es inusualmente baja, con sólo 701 puntos, incluso después de actualizar los drivers y el benchmark a sus respectivas últimas versiones. Nos hemos puesto en contacto con Dell para ver si esto puede ser un error.
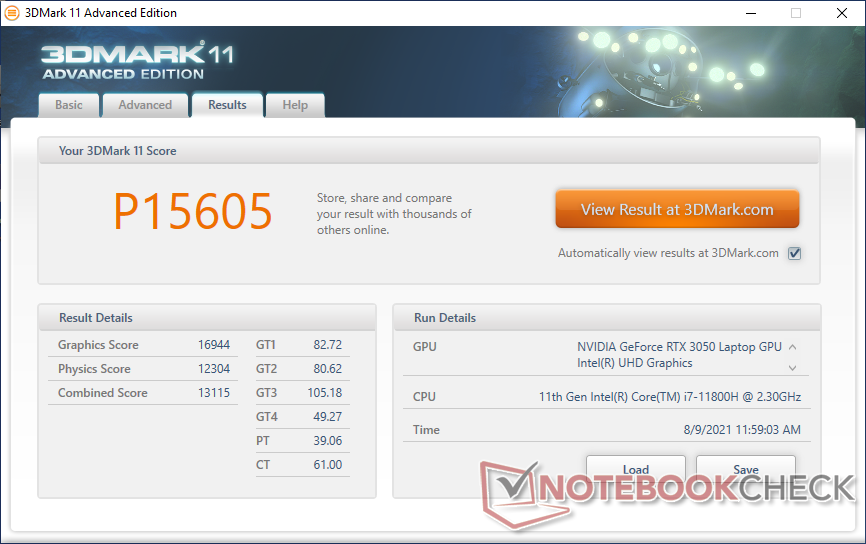
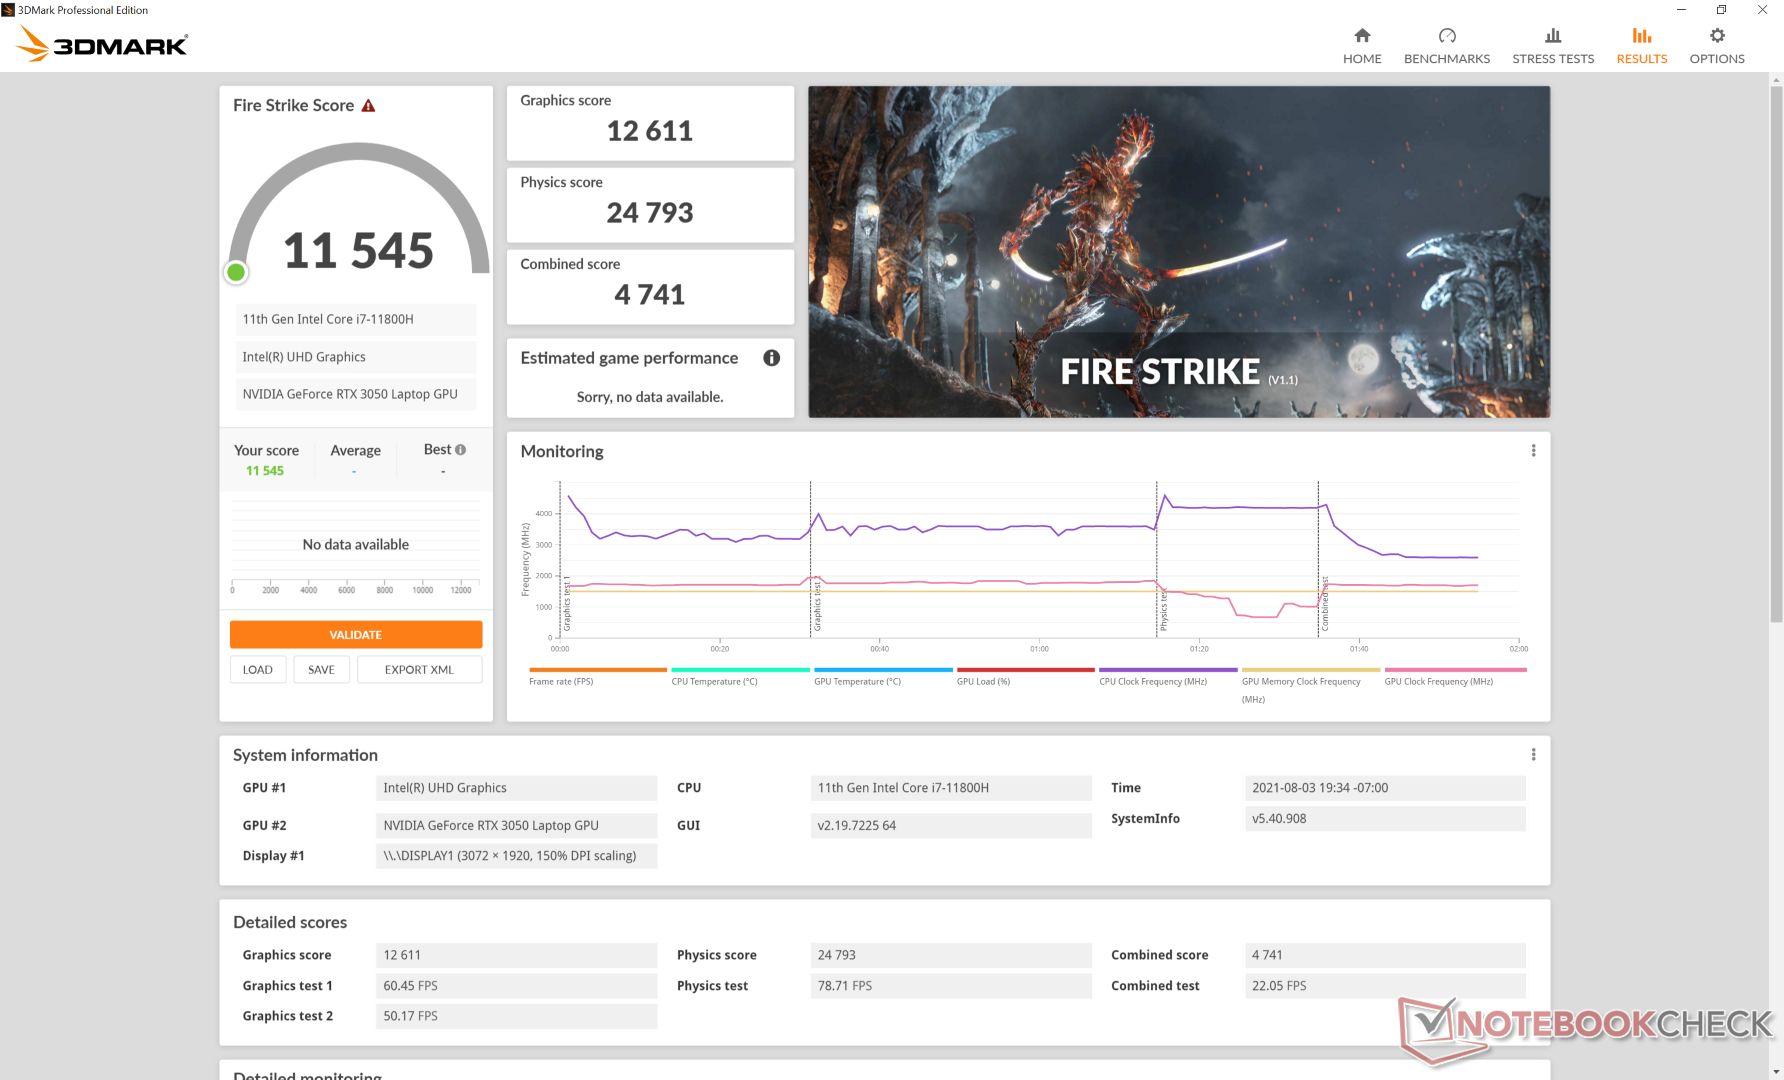
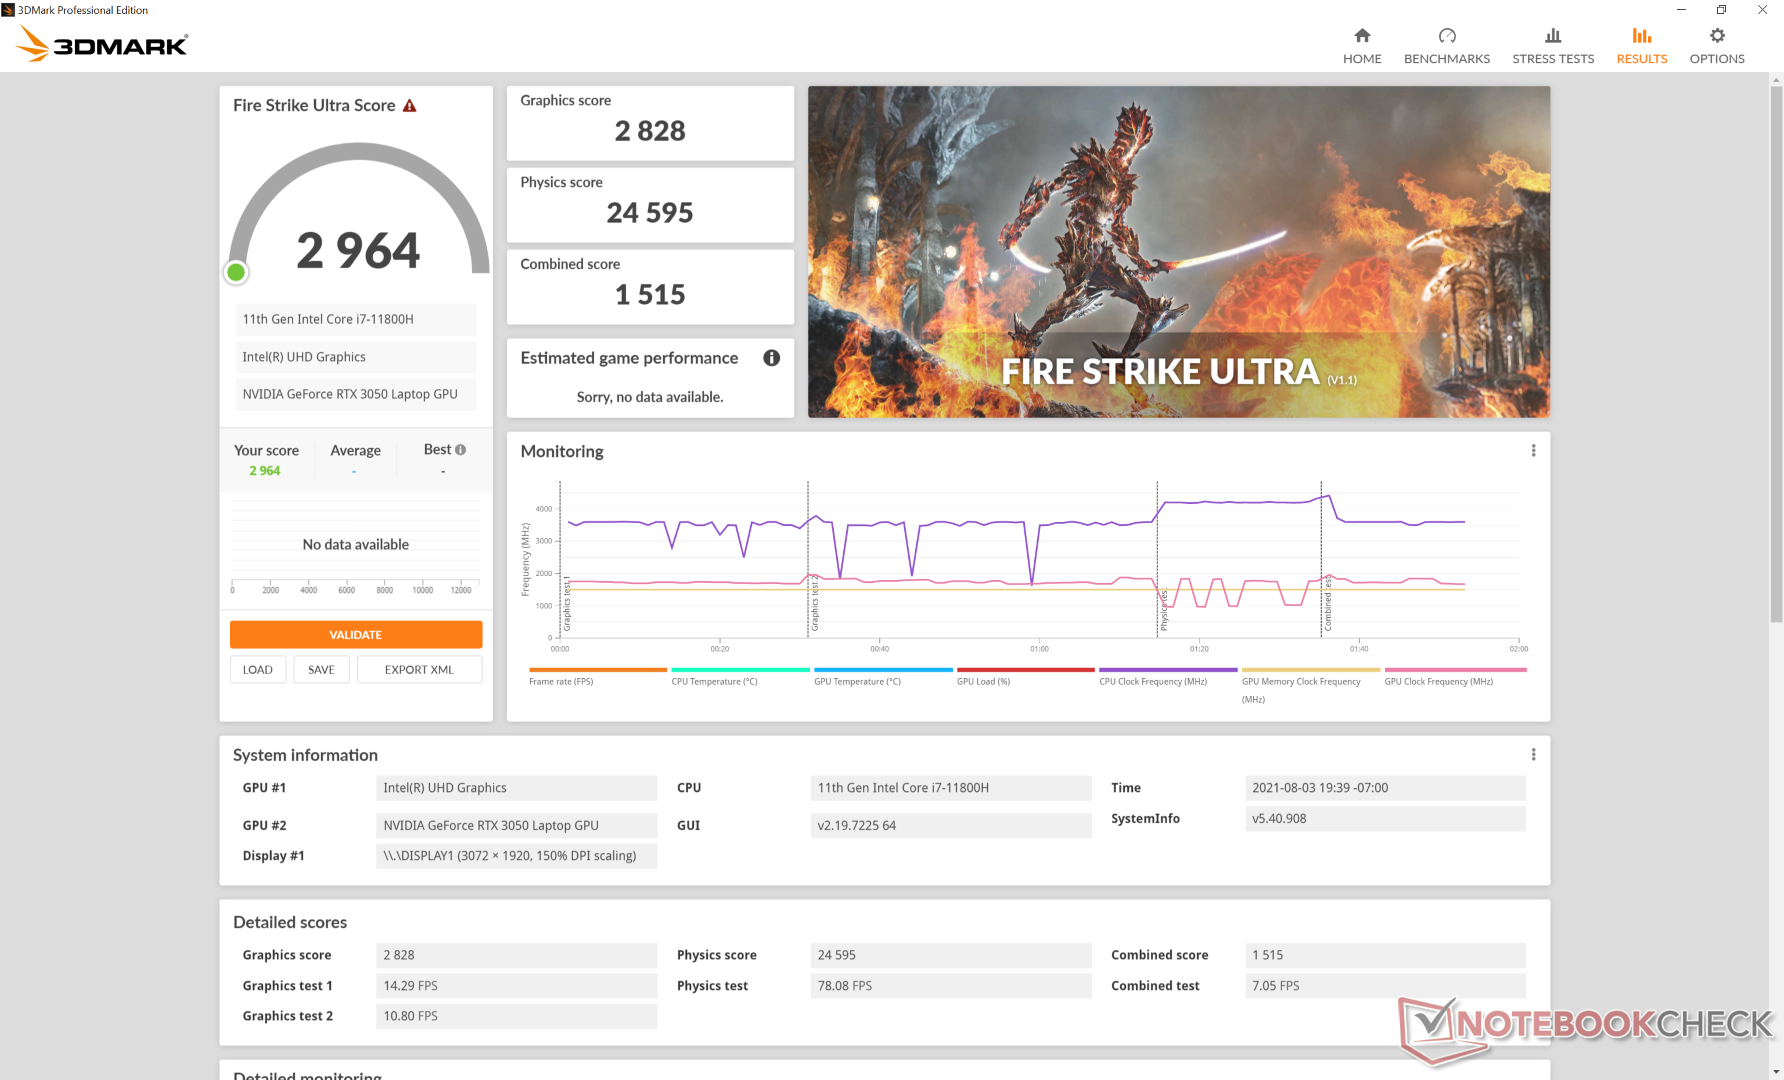
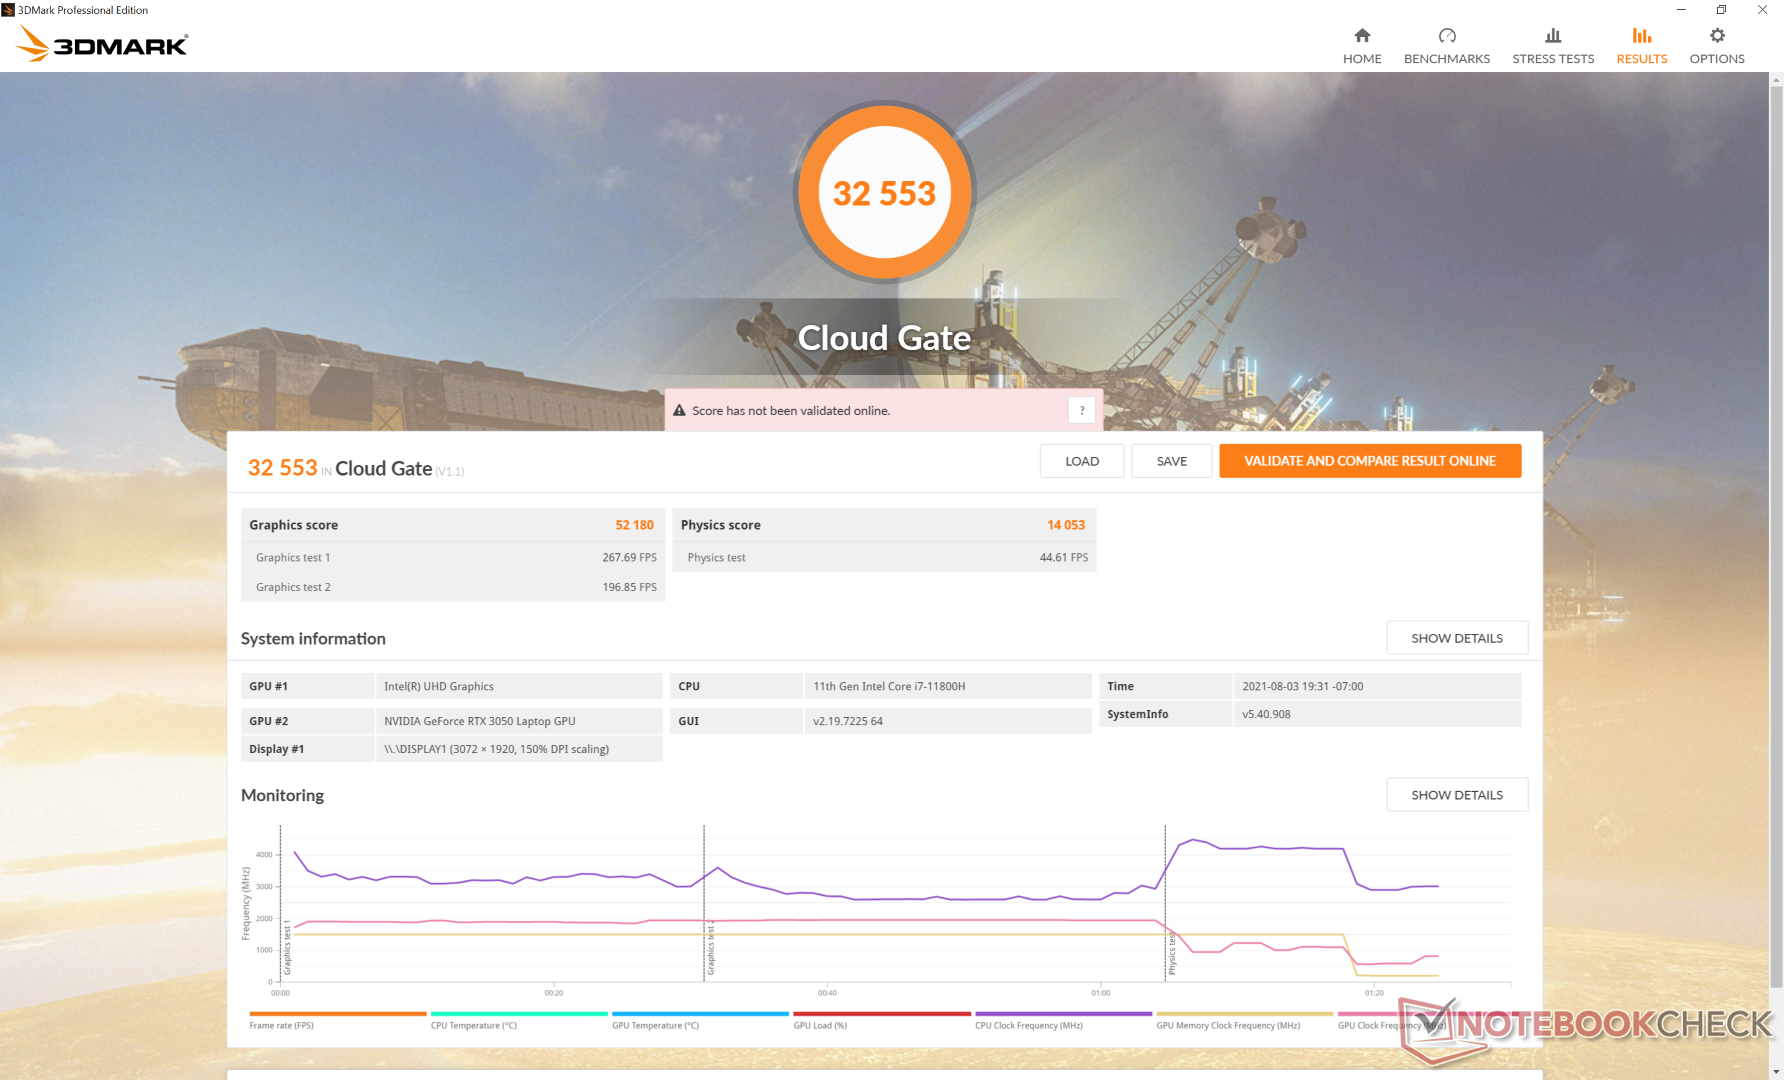
| 3DMark 11 Performance | 15605 puntos | |
| 3DMark Cloud Gate Standard Score | 32553 puntos | |
| 3DMark Fire Strike Score | 11545 puntos | |
| 3DMark Time Spy Score | 5078 puntos | |
ayuda | ||
Rendimiento de los juegos
El Inspiron 16 Plus no fue construido para los juegos, pero sigue siendo una máquina capaz de jugar en la configuración de 1080p. Vas a querer conectar un monitor externo para evitar los tiempos de respuesta lentos y el ghosting notable de la pantalla interna.
Witcher 3 FPS Chart
| bajo | medio | alto | ultra | QHD | |
|---|---|---|---|---|---|
| GTA V (2015) | 179 | 174 | 131 | 68.3 | 48.9 |
| The Witcher 3 (2015) | 248.5 | 153.9 | 92.1 | 51.6 | |
| Dota 2 Reborn (2015) | 162 | 142 | 135 | 125 | |
| Final Fantasy XV Benchmark (2018) | 117 | 69.6 | 50.1 | 36.5 | |
| X-Plane 11.11 (2018) | 119 | 101 | 76.2 | ||
| Far Cry 5 (2018) | 138 | 88 | 80 | 74 | 51 |
| Strange Brigade (2018) | 274 | 125 | 101 | 87 | 63.4 |
| Shadow of the Tomb Raider (2018) | 118 | 81 | 71 | 61 | 39 |
| Far Cry New Dawn (2019) | 118 | 83 | 77 | 66 | 52 |
| Metro Exodus (2019) | 123 | 62.2 | 45.8 | 36.5 | 28.6 |
| The Division 2 (2019) | 132 | 77 | 66 | 50 | 32 |
| Borderlands 3 (2019) | 111.7 | 69.2 | 49.4 | 34.9 | 22.5 |
| GRID 2019 (2019) | 181 | 108 | 104 | 43 | 27 |
| Gears Tactics (2020) | 253 | 122 | 81 | 58 | 38 |
| F1 2020 (2020) | 218 | 134 | 113 | 81 | 59 |
| Horizon Zero Dawn (2020) | 99 | 75 | 62 | 56 | 46 |
| Watch Dogs Legion (2020) | 80 | 71 | 60 | 26 | 19 |
| Dirt 5 (2020) | 141 | 66 | 51 | 40 | 34 |
| Assassin´s Creed Valhalla (2020) | 99 | 56 | 36 | 27 | 24 |
| Immortals Fenyx Rising (2020) | 106 | 71 | 57 | 53 | 39 |
| Hitman 3 (2021) | 159.4 | 100.7 | 86.9 | 79.9 | 49.1 |
| F1 2021 (2021) | 186 | 130 | 110 | 52 | 36 |
Emissions
Ruido del sistema
Los ventiladores del Inspiron 16 son bastante adeptos a permanecer en silencio o en silencio durante largos períodos. Por ejemplo, el ruido de los ventiladores no se hace notar cuando se ejecuta 3DMark 06 hasta después de 40 segundos en el benchmark. Sin embargo, una vez que los ventiladores se ponen en marcha, el sistema se vuelve ruidoso muy rápidamente a casi 50 dB(A) para ser similar a muchos portátiles de juego.
El ruido del ventilador suele alcanzar un máximo de 33 dB(A) temporalmente durante actividades menos exigentes como la navegación o el streaming de vídeo. Las pulsaciones ocurren aunque con poca frecuencia.
| Dell Inspiron 16 Plus 7610 GeForce RTX 3050 4GB Laptop GPU, i7-11800H, Kingston OM3PDP3512B | Asus ROG Zephyrus M16 GU603H GeForce RTX 3070 Laptop GPU, i9-11900H, Samsung PM9A1 MZVL22T0HBLB | LG Gram 16 (2021) Iris Xe G7 96EUs, i7-1165G7, SK Hynix PC601 1TB HFS001TD9TNG | HP Pavilion Gaming 16-a0242ng GeForce GTX 1650 Ti Mobile, i5-10300H, Intel SSD 660p SSDPEKNW512G8 | Dell Inspiron 15 7000 7506 2-in-1 Black Edition Xe MAX, i7-1165G7, Micron 2300 1TB MTFDHBA1T0TDV | |
|---|---|---|---|---|---|
| Noise | -18% | 7% | -16% | -6% | |
| apagado / medio ambiente * (dB) | 24.4 | 25 -2% | 26 -7% | 25 -2% | 27.3 -12% |
| Idle Minimum * (dB) | 24.4 | 25 -2% | 26 -7% | 25 -2% | 27.3 -12% |
| Idle Average * (dB) | 24.4 | 31 -27% | 26 -7% | 33 -35% | 27.3 -12% |
| Idle Maximum * (dB) | 24.4 | 42 -72% | 26 -7% | 42 -72% | 27.3 -12% |
| Load Average * (dB) | 48.3 | 48 1% | 30.8 36% | 48 1% | 47.4 2% |
| Witcher 3 ultra * (dB) | 48.9 | 52 -6% | 46 6% | 47.4 3% | |
| Load Maximum * (dB) | 48.9 | 56 -15% | 31.1 36% | 54 -10% | 47.5 3% |
* ... más pequeño es mejor
Ruido
| Ocioso |
| 24.4 / 24.4 / 24.4 dB(A) |
| Carga |
| 48.3 / 48.9 dB(A) |
 | ||
30 dB silencioso 40 dB(A) audible 50 dB(A) ruidosamente alto |
||
min: | ||
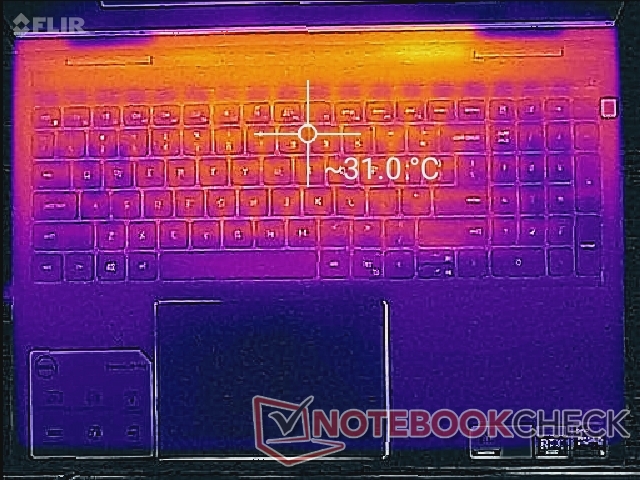
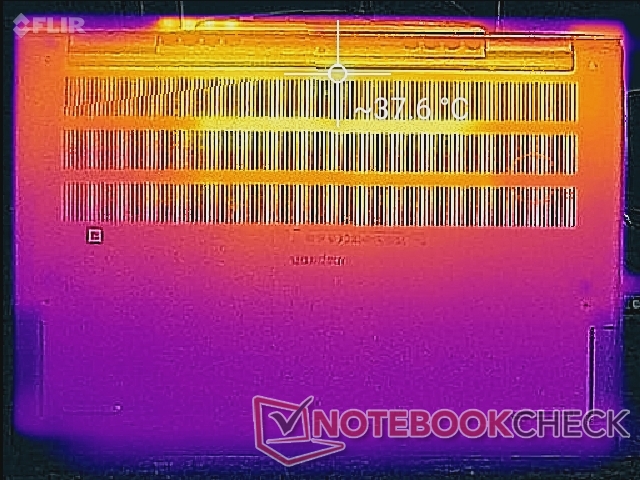
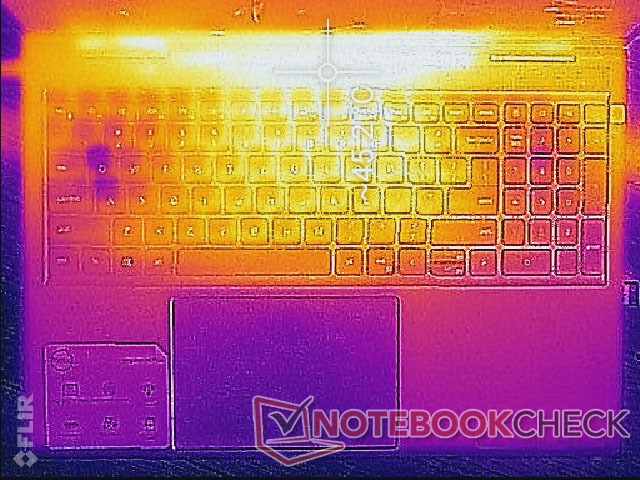
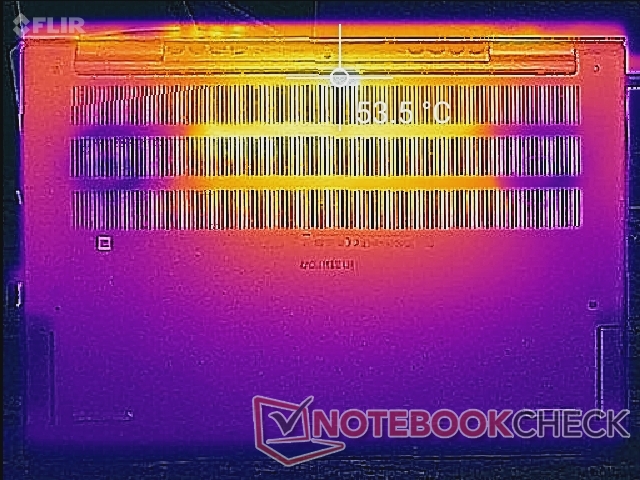
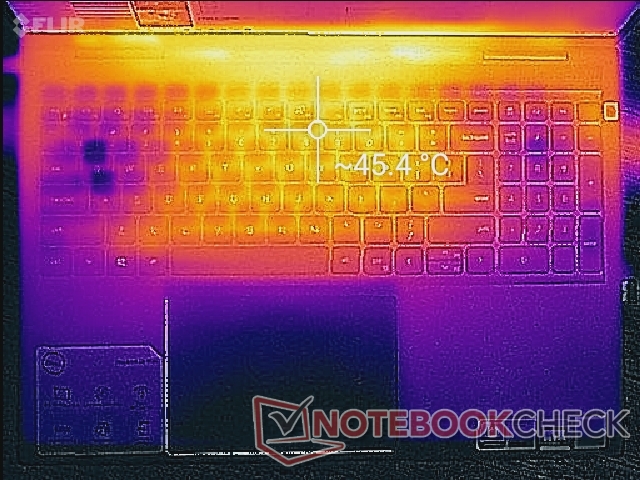
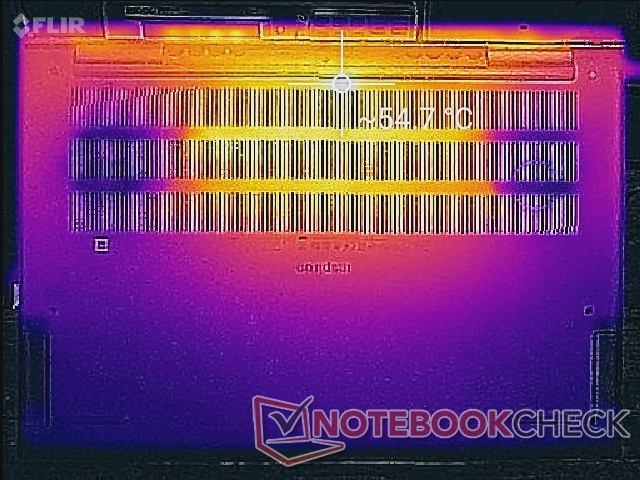
Temperatura - Casi siempre cálida
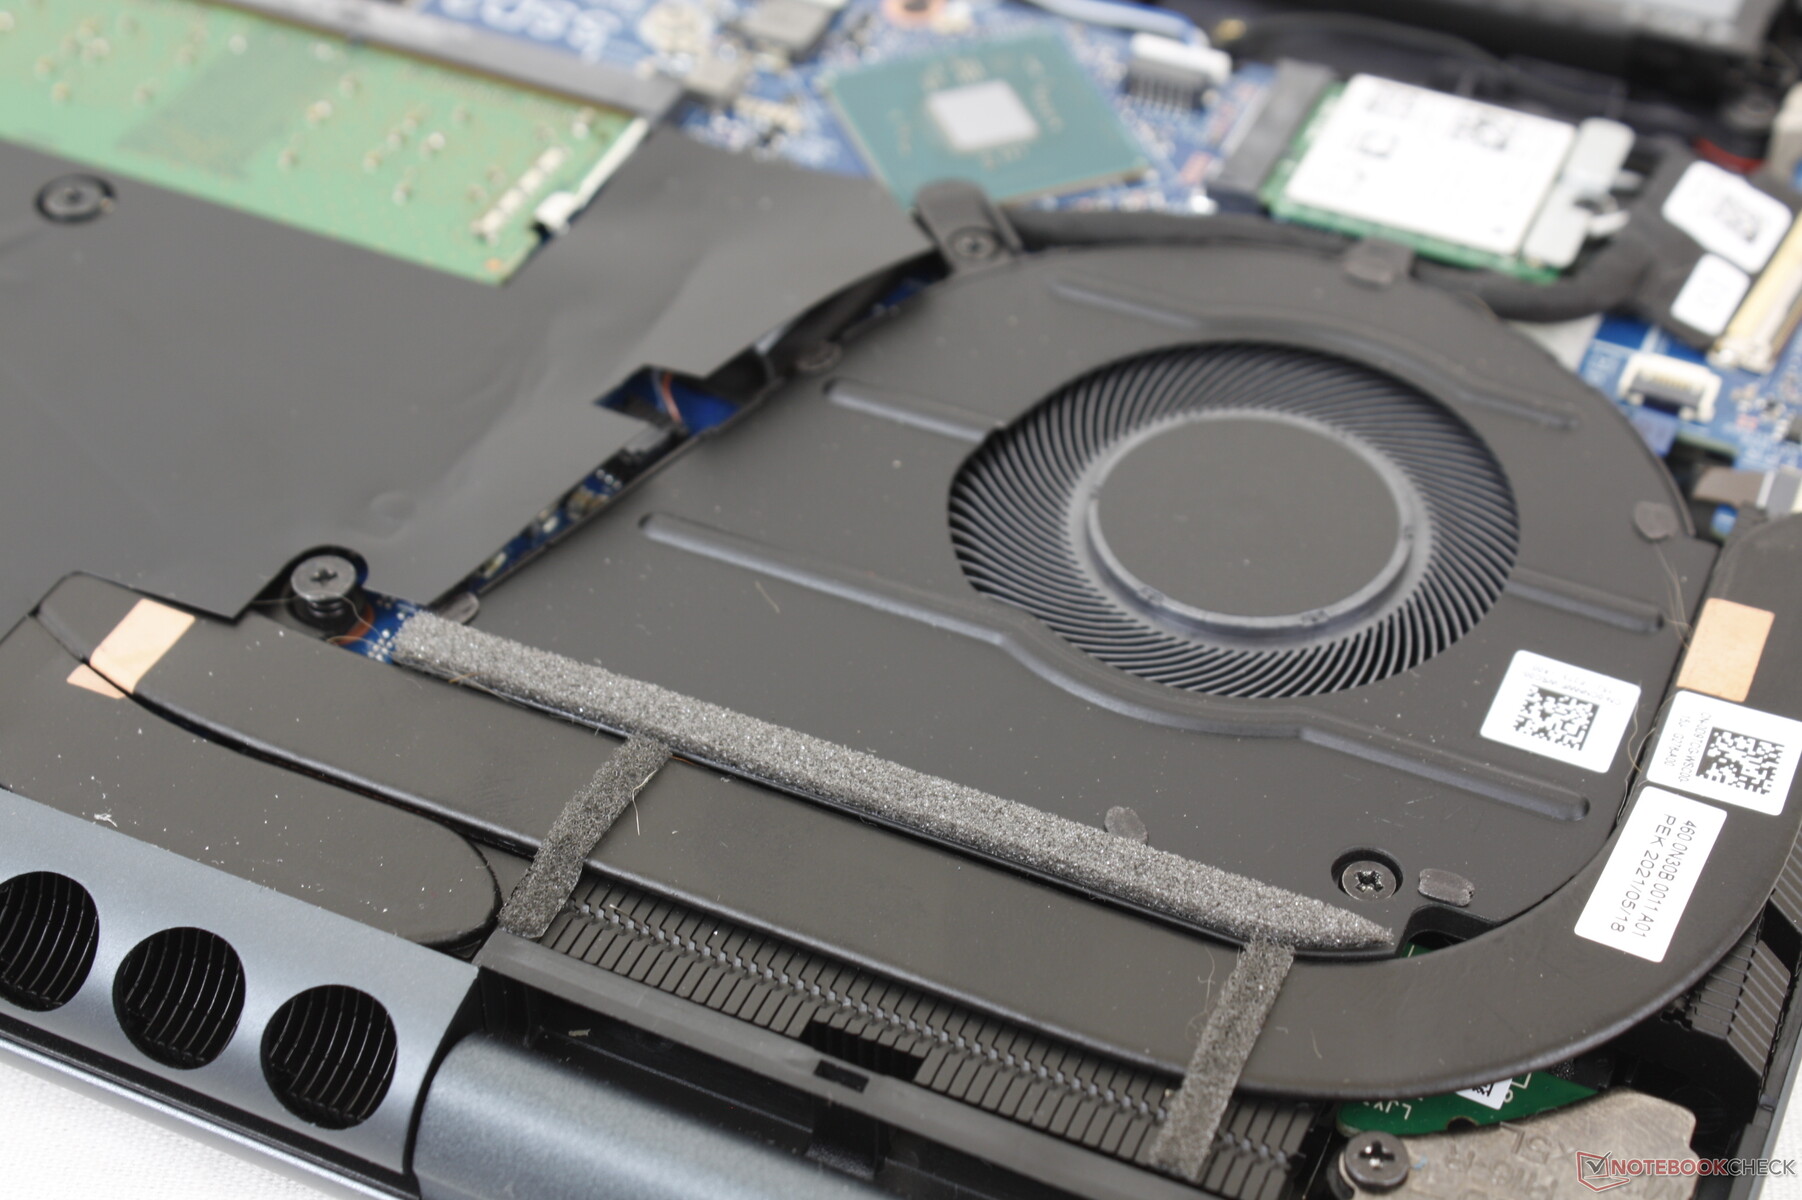
Las temperaturas de la superficie están en el lado caliente probablemente debido a los ventiladores letárgicos mencionados anteriormente. Por ejemplo, los puntos calientes de la parte superior e inferior pueden alcanzar los 31 C y 38 C, respectivamente, cuando simplemente está en reposo en el escritorio sin ejecutar aplicaciones. Si se juega, el centro del teclado puede llegar a los 45 C, que es similar a lo que observamos en el Pavilion Gaming 16. Las rejillas de ventilación del Inspiron 16 son más grandes y numerosas en comparación con los portátiles más lentos con Core U, como el LG Gram 16.
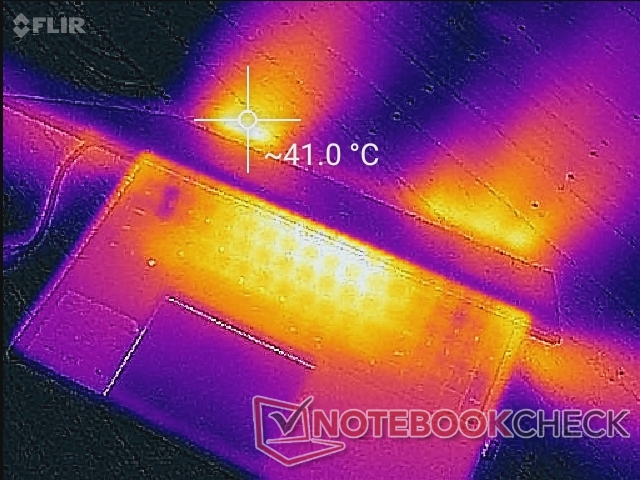
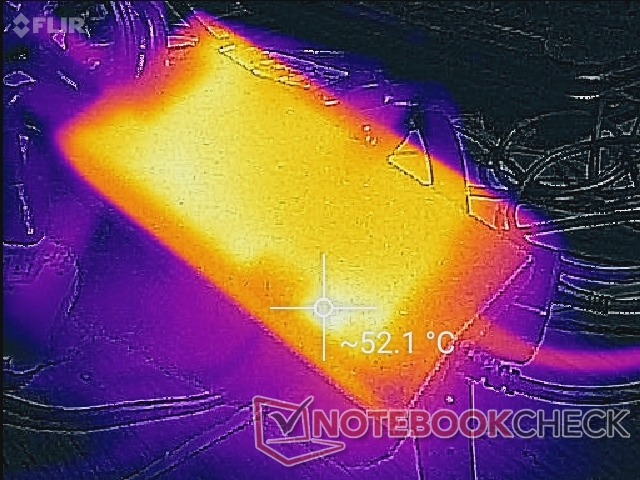
(-) La temperatura máxima en la parte superior es de 46.4 °C / 116 F, frente a la media de 36.8 °C / 98 F, que oscila entre 21 y 71 °C para la clase Multimedia.
(-) El fondo se calienta hasta un máximo de 54.8 °C / 131 F, frente a la media de 39.1 °C / 102 F
(+) En reposo, la temperatura media de la parte superior es de 28.3 °C / 83# F, frente a la media del dispositivo de 31.3 °C / 88 F.
(±) Jugando a The Witcher 3, la temperatura media de la parte superior es de 35.4 °C / 96 F, frente a la media del dispositivo de 31.3 °C / 88 F.
(+) El reposamanos y el panel táctil están a una temperatura inferior a la de la piel, con un máximo de 29 °C / 84.2 F y, por tanto, son fríos al tacto.
(±) La temperatura media de la zona del reposamanos de dispositivos similares fue de 28.7 °C / 83.7 F (-0.3 °C / -0.5 F).
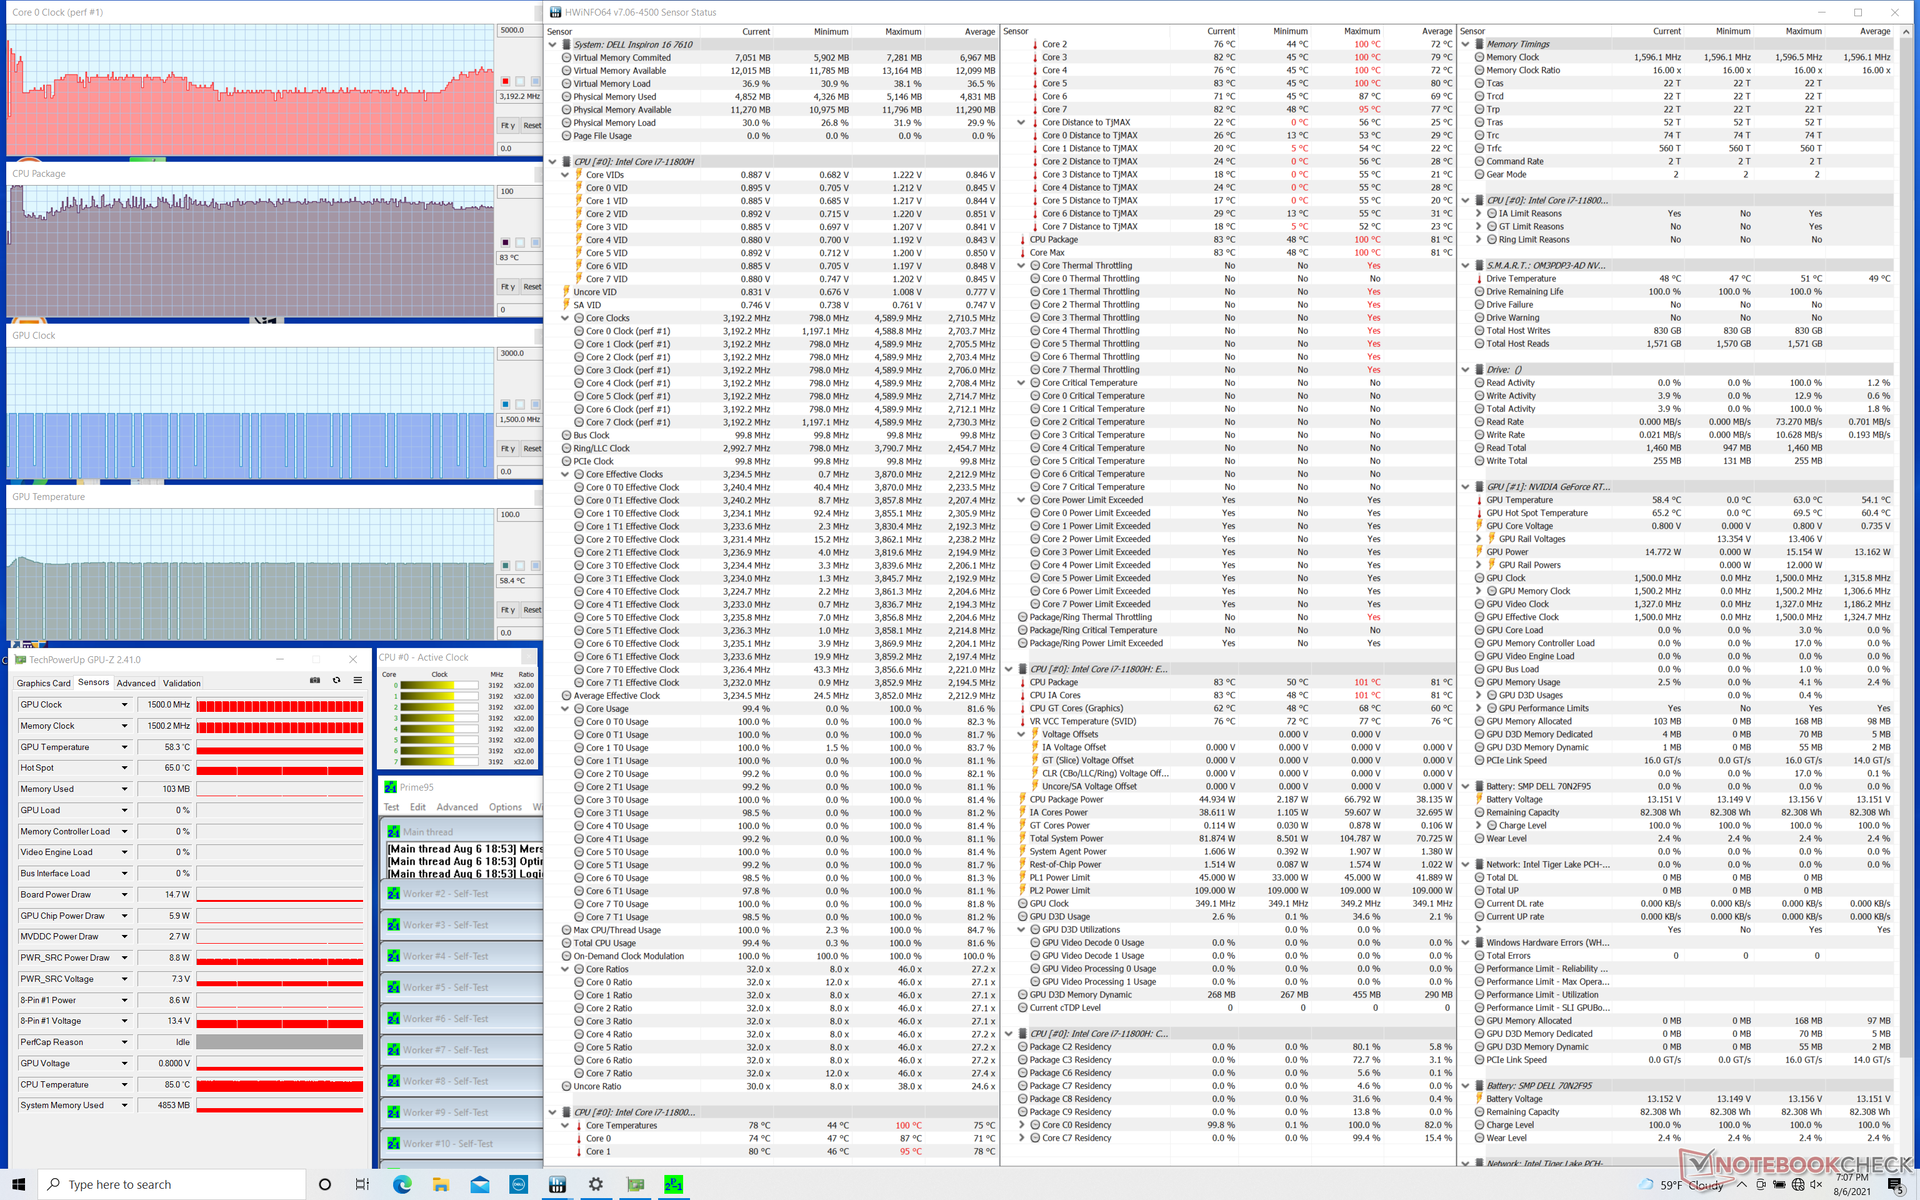
Prueba de esfuerzo
Cuando se estresa con Prime95, las frecuencias de reloj aumentan hasta los 4,1 GHz durante uno o dos segundos antes de alcanzar inmediatamente una temperatura del núcleo de 100 C. A continuación, las frecuencias de reloj caen hasta el rango de 2,4 a 3,2 GHz para mantener una temperatura más razonable de 83 C
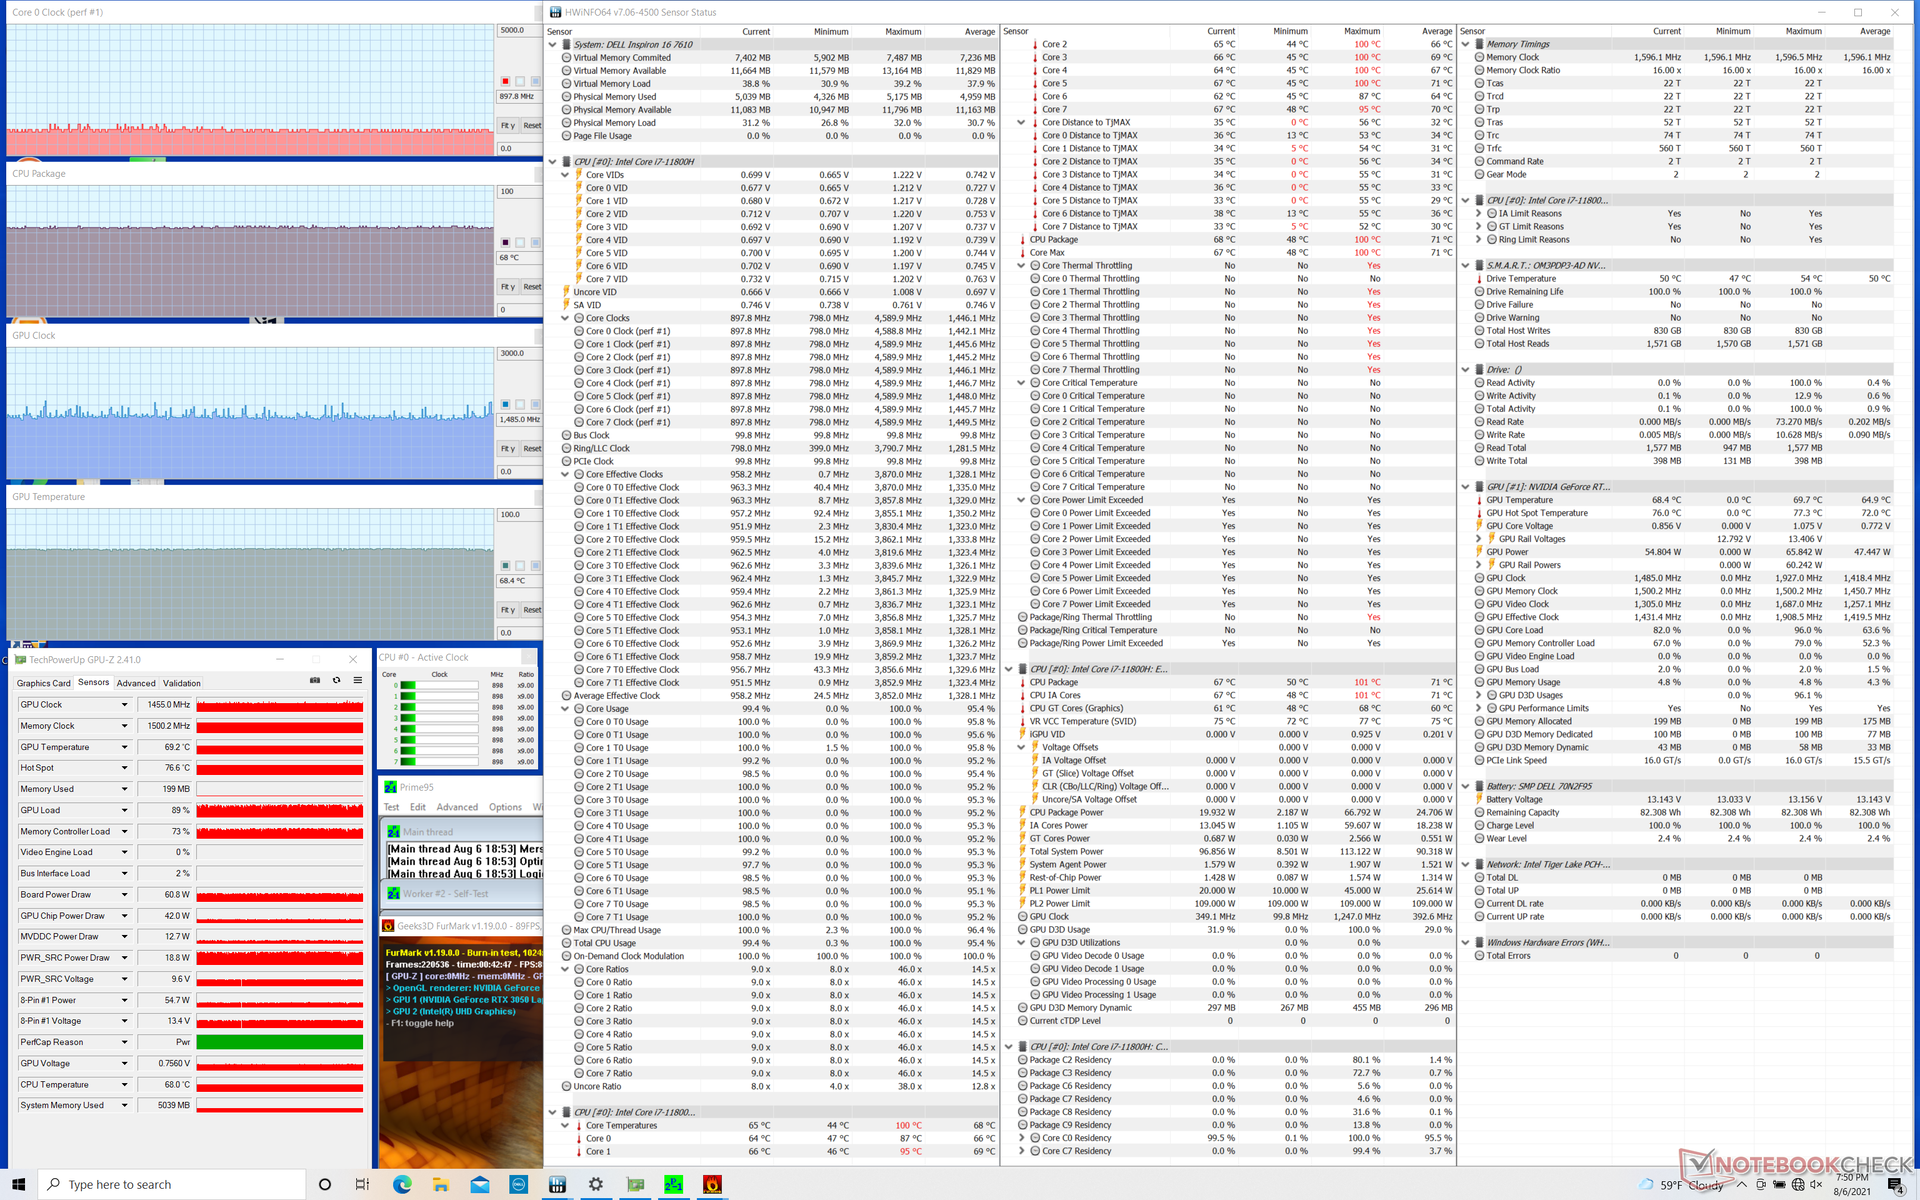
Cuando se ejecuta Witcher 3 para representar el estrés de los juegos en el mundo real, la CPU y la GPU se estabilizarían a 63 C y 69 C, respectivamente, en comparación con los 61 C y 72 C de la más gruesa y ruidosa MSI GF65 con la antigua GTX 1660 Ti. El consumo de energía de la tarjeta GPU también se estabilizó en 49 W en lugar de los 65 W máximos de TGP que la tarjeta es capaz de producir. Sólo cuando se ejecuta FurMark, el consumo de la tarjeta GPU supera los 60 W.
El uso de la batería limita el rendimiento gráfico. Una prueba 3DMark 11 con baterías arrojaría unas puntuaciones de Física y Gráficos de 12832 y 10938 puntos, respectivamente, frente a los 12304 y 16944 puntos de la red eléctrica.
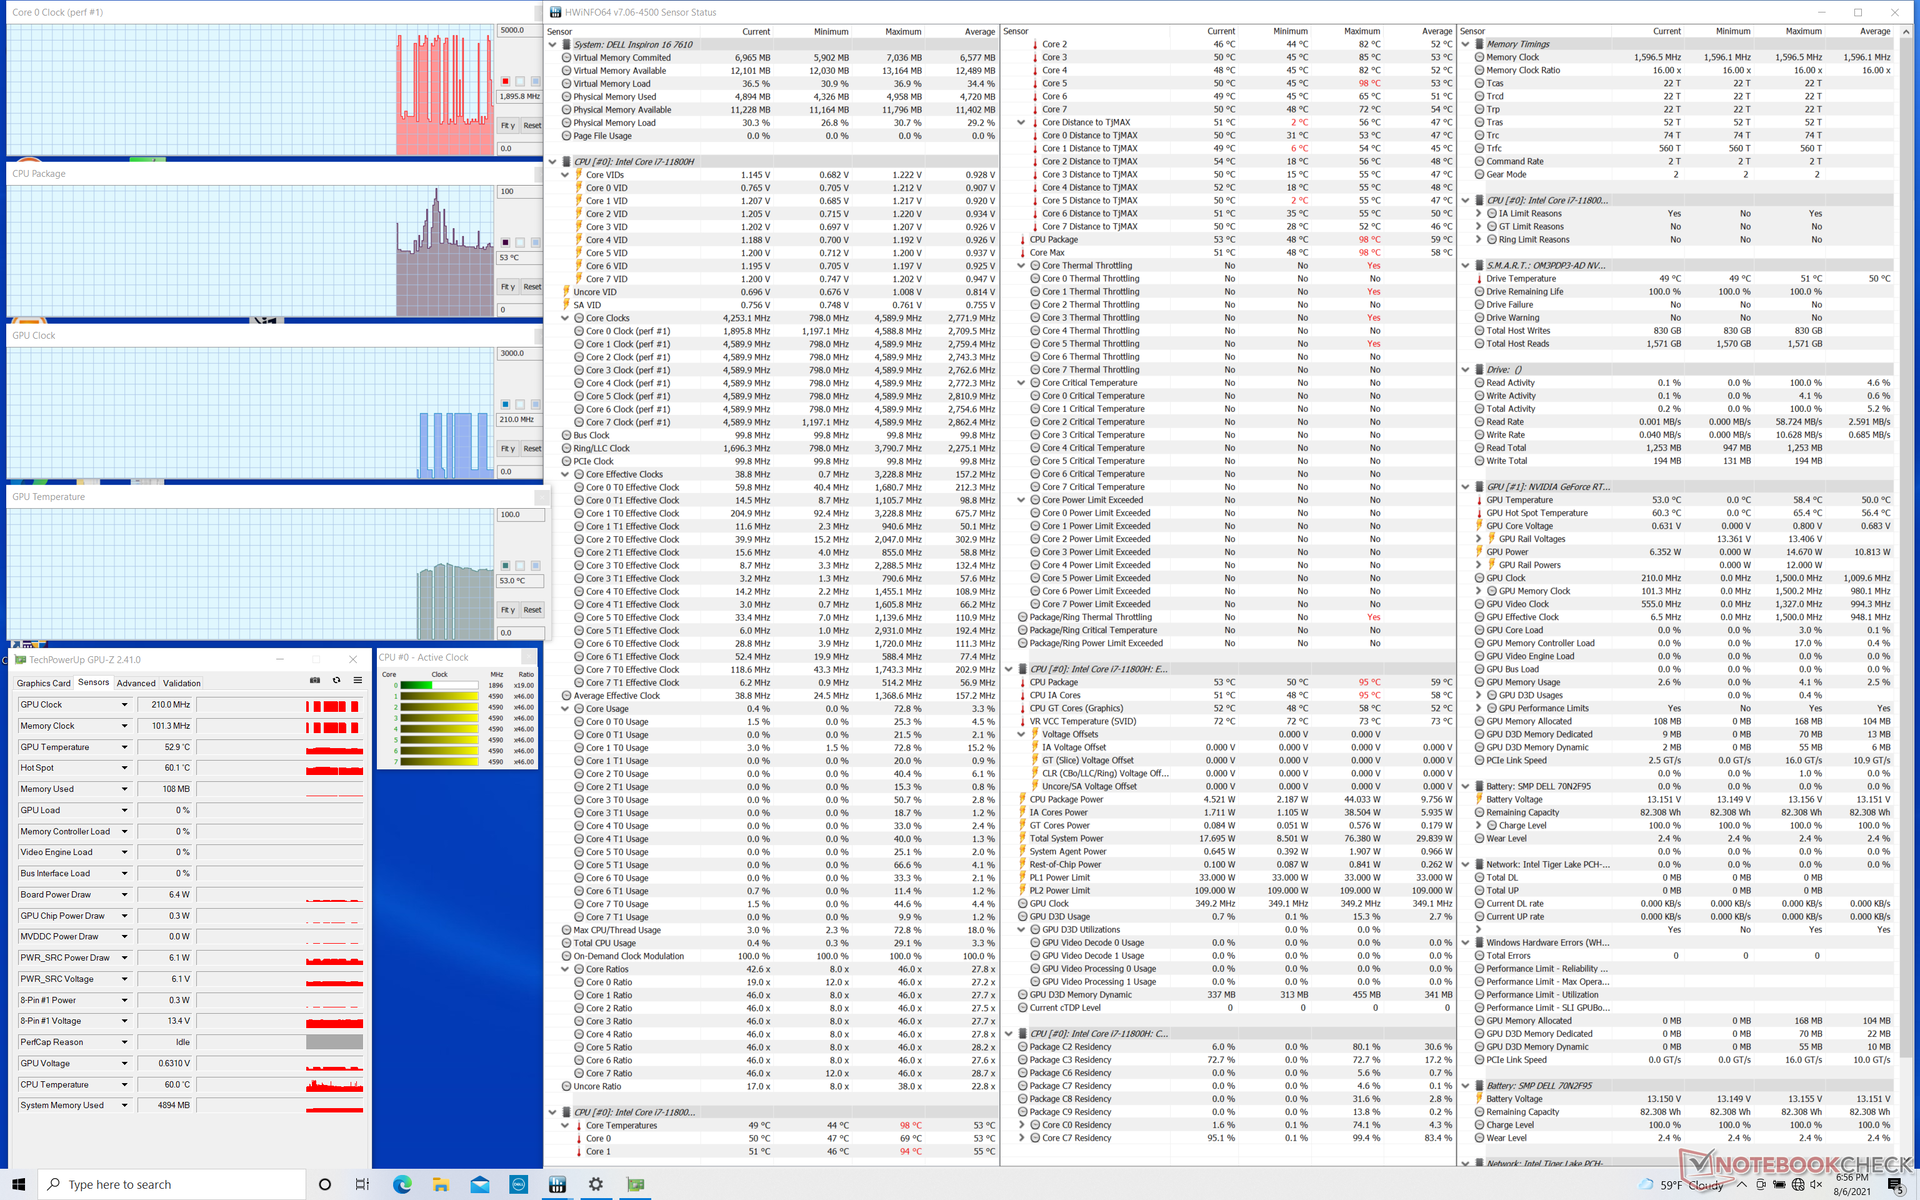
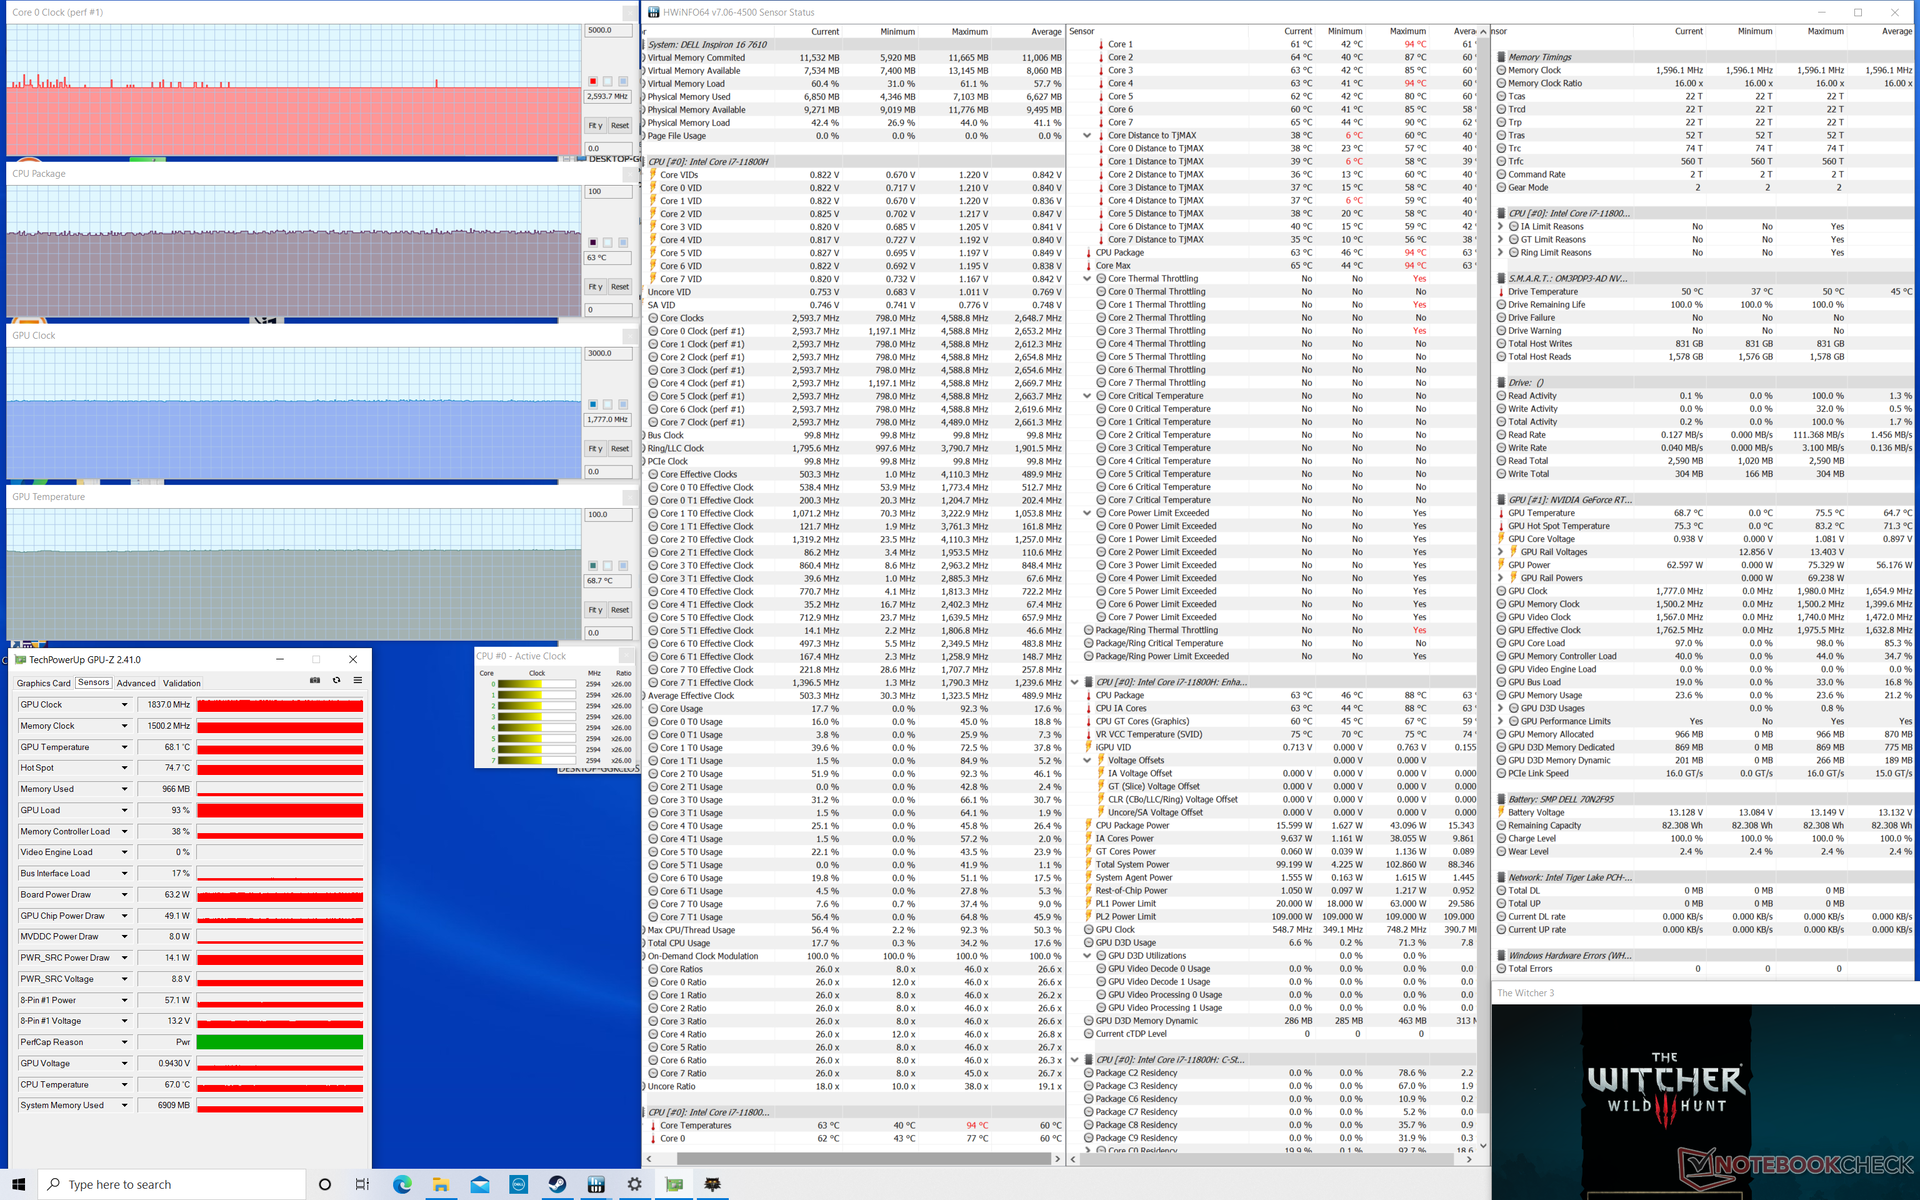
| Relojde la CPU(GHz) | Reloj dela GPU(MHz) | Temperatura media de la CPU (°C) | Temperaturamediade la GPU (°C) |
| Sistema en reposo | 53 | ||
| EstrésPrime95 | 2,4 - 3,2 | -- | 83 |
| Estrés de Prime95+ FurMark | 0,9 - 1,0 | 1455 | 68 |
| Witcher 3 Stress | 2.6 | 1837 | 63 |
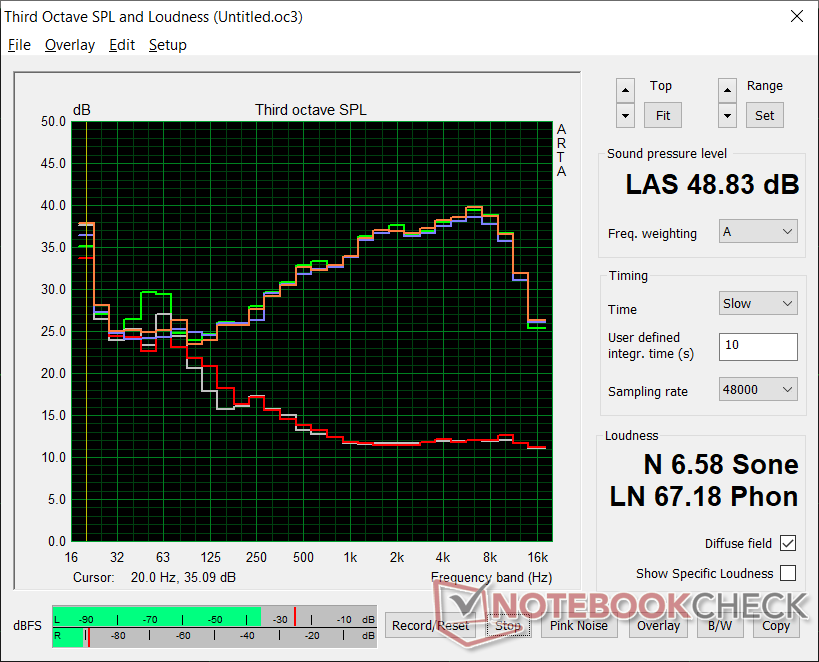
Altavoces - En el lado débil
La calidad de audio de los altavoces integrados no es tan buena. El volumen máximo es decente, pero los graves son pobres. Nuestro gráfico de ruido rosa muestra un roll-off en torno a los 500 Hz y un nivel de presión sonora de sólo 75 dB. Otros portátiles suelen tener altavoces más potentes o una mejor reproducción de los graves, como el XPG Xenia Xe o Envy x360 15respectivamente.


Dell Inspiron 16 Plus 7610 análisis de audio
(±) | la sonoridad del altavoz es media pero buena (75.3 dB)
Graves 100 - 315 Hz
(±) | lubina reducida - en promedio 14.4% inferior a la mediana
(±) | la linealidad de los graves es media (8.4% delta a frecuencia anterior)
Medios 400 - 2000 Hz
(±) | medias más altas - de media 5.6% más altas que la mediana
(±) | la linealidad de los medios es media (7.9% delta respecto a la frecuencia anterior)
Altos 2 - 16 kHz
(+) | máximos equilibrados - a sólo 3.9% de la mediana
(±) | la linealidad de los máximos es media (7.2% delta a frecuencia anterior)
Total 100 - 16.000 Hz
(±) | la linealidad del sonido global es media (19.3% de diferencia con la mediana)
En comparación con la misma clase
» 62% de todos los dispositivos probados de esta clase eran mejores, 8% similares, 30% peores
» El mejor tuvo un delta de 5%, la media fue 17%, el peor fue ###max##%
En comparación con todos los dispositivos probados
» 47% de todos los dispositivos probados eran mejores, 8% similares, 46% peores
» El mejor tuvo un delta de 4%, la media fue 23%, el peor fue ###max##%
Apple MacBook 12 (Early 2016) 1.1 GHz análisis de audio
(+) | los altavoces pueden reproducir a un volumen relativamente alto (#83.6 dB)
Graves 100 - 315 Hz
(±) | lubina reducida - en promedio 11.3% inferior a la mediana
(±) | la linealidad de los graves es media (14.2% delta a frecuencia anterior)
Medios 400 - 2000 Hz
(+) | medios equilibrados - a sólo 2.4% de la mediana
(+) | los medios son lineales (5.5% delta a la frecuencia anterior)
Altos 2 - 16 kHz
(+) | máximos equilibrados - a sólo 2% de la mediana
(+) | los máximos son lineales (4.5% delta a la frecuencia anterior)
Total 100 - 16.000 Hz
(+) | el sonido global es lineal (10.2% de diferencia con la mediana)
En comparación con la misma clase
» 7% de todos los dispositivos probados de esta clase eran mejores, 2% similares, 90% peores
» El mejor tuvo un delta de 5%, la media fue 18%, el peor fue ###max##%
En comparación con todos los dispositivos probados
» 5% de todos los dispositivos probados eran mejores, 1% similares, 94% peores
» El mejor tuvo un delta de 4%, la media fue 23%, el peor fue ###max##%
Energy Management
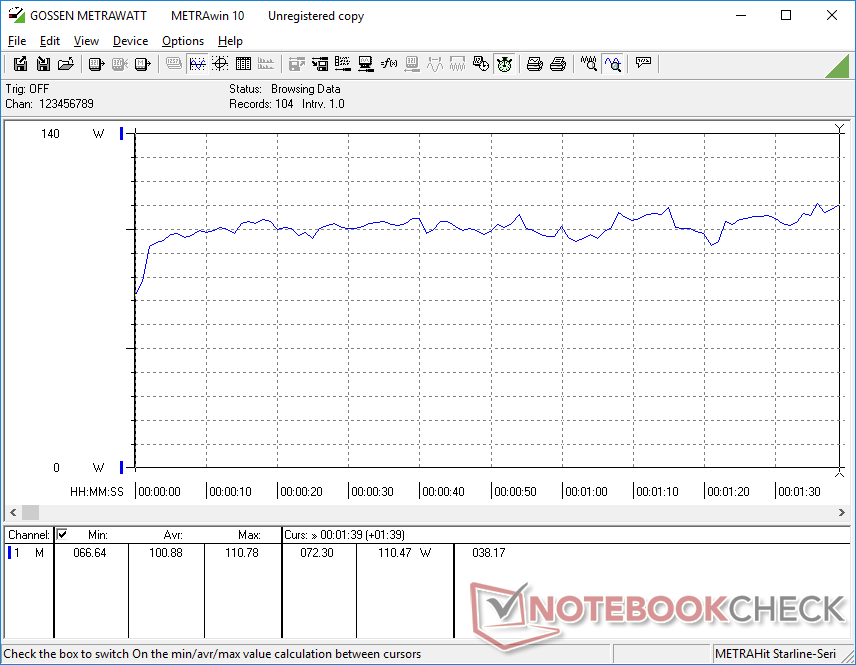
Consumo de energía
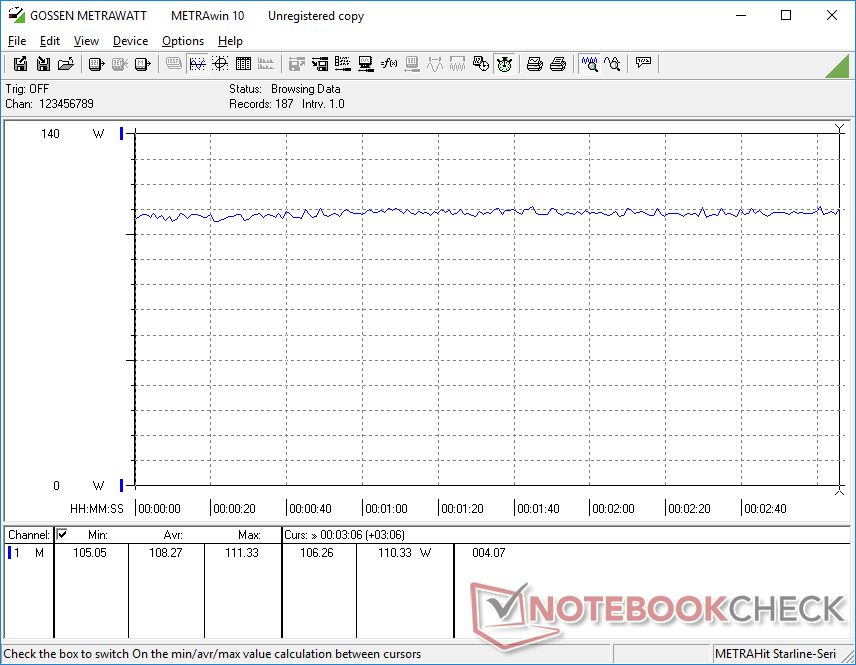
El funcionamiento en vacío en el escritorio con el ajuste de brillo y el perfil de energía más bajos consumiría algo más de 7 W, lo que es un poco más de lo esperado. El LG Gram 16 y el Pavilion Gaming 16, por ejemplo, tendrían un consumo de entre 3 y 4 W cada uno en condiciones similares.
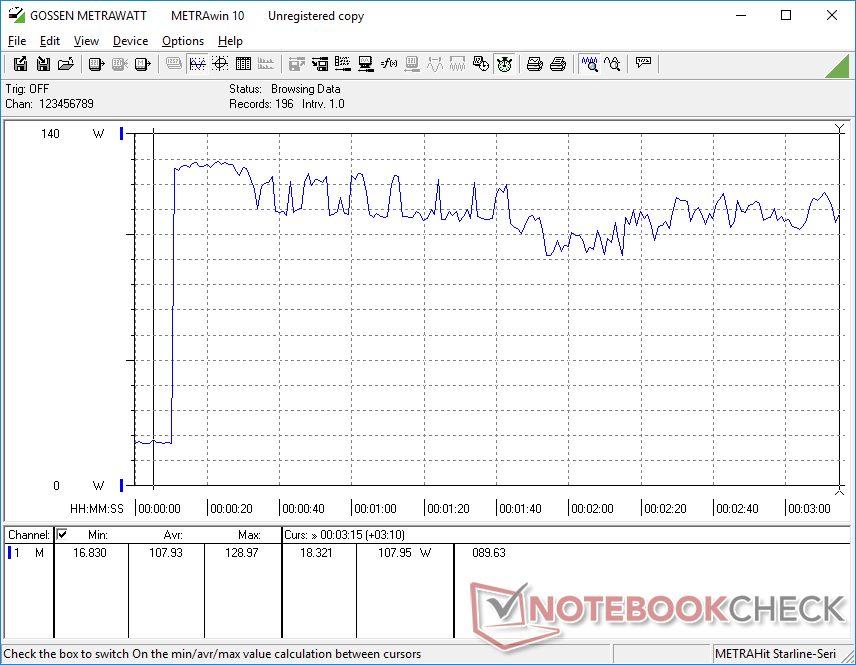
La eficiencia del sistema empieza a brillar cuando se ejecutan cargas más altas como los juegos. Si se ejecuta Witcher 3por ejemplo, consumiría unos 108 W frente a los 143 W del Asus ROG Zephyrus M15 equipado con la GTX 1660 Ti de 12 nm de última generación. El rendimiento por vatio es un poco más alto en nuestro Dell a pesar de que es consistentemente más lento que la mayoría de portátiles GTX 1660 Ti en términos de rendimiento gráfico.
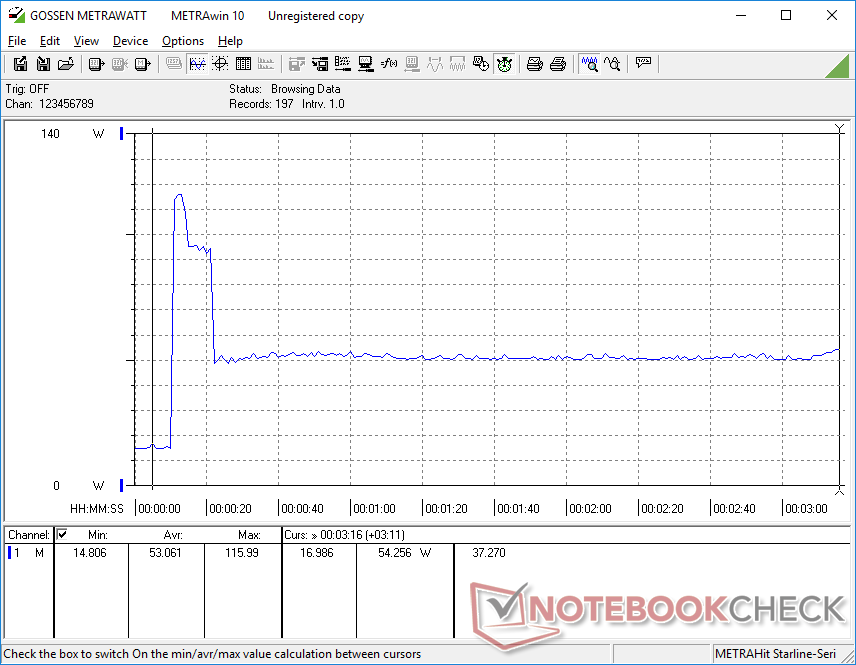
Podemos registrar un consumo máximo de 129 W del adaptador de CA de tamaño medio (~15.3 x 7.5 x 2.6 cm) de 130 W cuando se ejecutan cargas extremas. La tasa es sólo temporal y dura apenas unos segundos como máximo, como muestra el gráfico siguiente. Hay suficiente margen para cargar la batería y ejecutar cargas exigentes simultáneamente.
| Off / Standby | |
| Ocioso | |
| Carga |
|
Clave:
min: | |
| Dell Inspiron 16 Plus 7610 i7-11800H, GeForce RTX 3050 4GB Laptop GPU, Kingston OM3PDP3512B, IPS, 3072x1920, 16" | Asus ROG Zephyrus M16 GU603H i9-11900H, GeForce RTX 3070 Laptop GPU, Samsung PM9A1 MZVL22T0HBLB, IPS, 2560x1600, 16" | LG Gram 16 (2021) i7-1165G7, Iris Xe G7 96EUs, SK Hynix PC601 1TB HFS001TD9TNG, IPS, 2560x1600, 16" | HP Pavilion Gaming 16-a0242ng i5-10300H, GeForce GTX 1650 Ti Mobile, Intel SSD 660p SSDPEKNW512G8, IPS, 1920x1080, 16.1" | Dell Inspiron 15 7000 7506 2-in-1 Black Edition i7-1165G7, Xe MAX, Micron 2300 1TB MTFDHBA1T0TDV, IPS, 3840x2160, 15.6" | |
|---|---|---|---|---|---|
| Power Consumption | -53% | 46% | 19% | 23% | |
| Idle Minimum * (Watt) | 7.7 | 11 -43% | 3.8 51% | 3 61% | 4 48% |
| Idle Average * (Watt) | 10.7 | 20 -87% | 9 16% | 7 35% | 15.5 -45% |
| Idle Maximum * (Watt) | 16.8 | 30 -79% | 11.3 33% | 18 -7% | 16.2 4% |
| Load Average * (Watt) | 100.39 | 111 -11% | 35.2 65% | 86 14% | 49.7 50% |
| Witcher 3 ultra * (Watt) | 108 | 156 -44% | 82 24% | 52.2 52% | |
| Load Maximum * (Watt) | 129 | 197 -53% | 43.5 66% | 144 -12% | 92.7 28% |
* ... más pequeño es mejor
Power Consumption Witcher 3 / Stresstest
Duración de la batería: gran capacidad de 86 Wh
Los tiempos de ejecución son largos con casi 10 horas de uso real de la red WLAN para coincidir con la gran batería de 86 Wh. El LG Gram 16 puede durar varias horas más ya que funciona con un hardware más lento sin GPU Nvidia.
La carga desde el vacío hasta la capacidad total tarda dos horas completas. Los usuarios también pueden cargar con adaptadores USB-C de terceros, pero la velocidad de carga se ralentizará significativamente cuando se compara con el cargador de barril de 130 W propietario que viene con el portátil
| Dell Inspiron 16 Plus 7610 i7-11800H, GeForce RTX 3050 4GB Laptop GPU, 86 Wh | Lenovo Legion 5 Pro 16ACH6H (82JQ001PGE) R7 5800H, GeForce RTX 3070 Laptop GPU, 80 Wh | Asus ROG Zephyrus M16 GU603H i9-11900H, GeForce RTX 3070 Laptop GPU, 90 Wh | LG Gram 16 (2021) i7-1165G7, Iris Xe G7 96EUs, 80 Wh | HP Pavilion Gaming 16-a0242ng i5-10300H, GeForce GTX 1650 Ti Mobile, 52 Wh | Dell Inspiron 15 7000 7506 2-in-1 Black Edition i7-1165G7, Xe MAX, 68 Wh | |
|---|---|---|---|---|---|---|
| Duración de Batería | -55% | -36% | 43% | -25% | -11% | |
| Reader / Idle (h) | 20.5 | 9.1 -56% | 13.3 -35% | 28.6 40% | 16.5 -20% | 25 22% |
| WiFi v1.3 (h) | 9.9 | 7 -29% | 7.7 -22% | 15.7 59% | 8.3 -16% | 9.7 -2% |
| Load (h) | 3.3 | 0.7 -79% | 1.6 -52% | 4.3 30% | 2 -39% | 1.6 -52% |
Pro
Contra
Veredicto - Gran aspecto, mal rendimiento
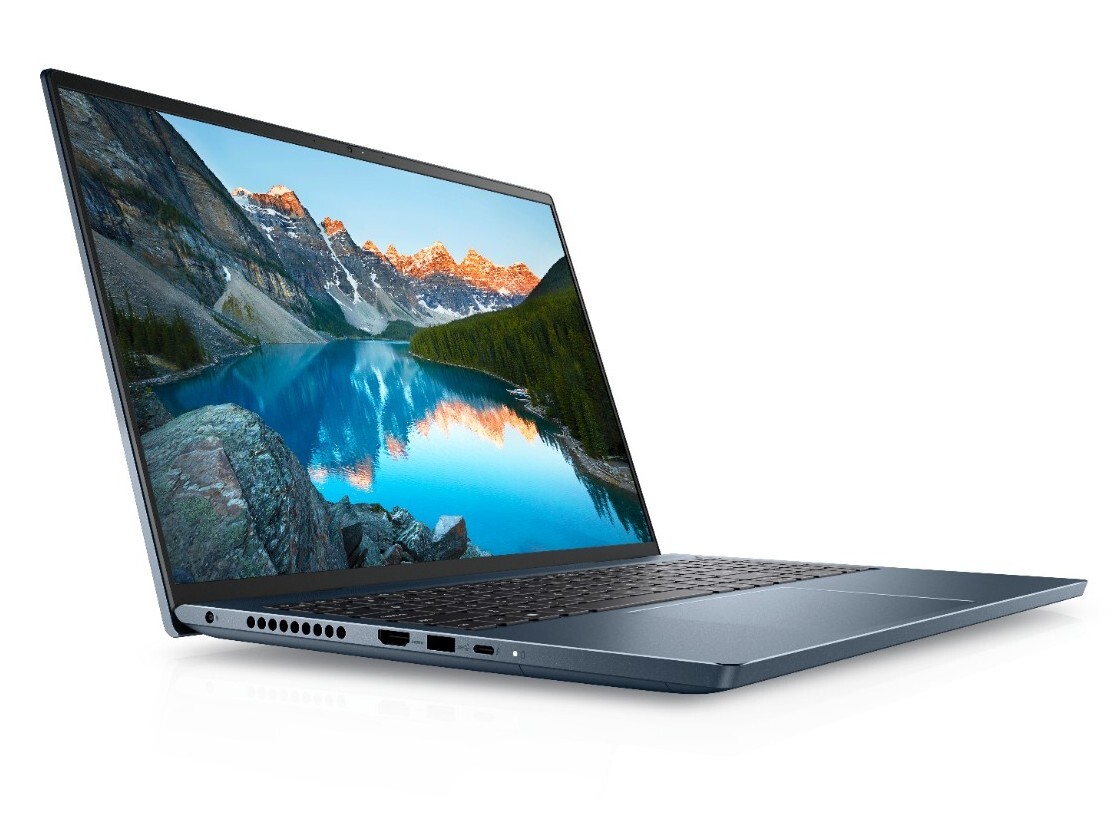
Visualmente, el Inspiron 16 es el modelo más atractivo de su familia. Los biseles son más estrechos de lo esperado teniendo en cuenta los procesadores de gran potencia que lleva dentro, mientras que el pesado chasis de metal ayuda a dar una sensación de calidad táctil que se acerca a la del XPS 15 más caro. Las opciones de puerto son generosas, el mantenimiento es relativamente fácil y la pantalla 3K mate lo remata todo para una primera gran presentación.
El Inspiron 16 Plus 7610 es un sistema de gran apariencia con muchos puertos y opciones de actualización, pero podría utilizar algunos ajustes de rendimiento para los creadores de contenidos y usuarios multimedia que necesitan mucha energía.
Las cosas no parecen tan halagüeñas desde el punto de vista del rendimiento. Tanto el procesador como la GPU no son tan rápidos como esperábamos si los comparamos con otros modelos con opciones iguales o similares. ElAsus TUF F15 con la misma CPU Core i7-11800H es un 25% más rápido, mientras que el MSI Stealth 15M con la antigua RTX 2060 tendrá mejor rendimiento que nuestra RTX 3050 en la mayoría de los escenarios. Incluso la versión de hace dos años de la HP Gaming Pavilion 15 con gráficos GTX 1660 Ti puede igualar o superar a nuestro Dell en potencia gráfica. Una pantalla más brillante para igualar al MacBook Pro 16 o Legion 5 Pro tampoco estaría de más para los usuarios que se desplazan.
Precio y disponibilidad
La disponibilidad en línea es limitada en el momento de escribir este artículo. Amazon ofrece actualmente una sola unidad por 989 dólares. Los usuarios pueden comprar directamente a Dell para obtener más opciones de configuración.
Dell Inspiron 16 Plus 7610
- 08/11/2021 v7 (old)
Allen Ngo
Price comparison

