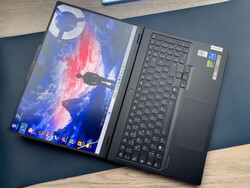
Análisis del Lenovo Legion Pro 7 16 (2024): La flor y nata entre los portátiles RTX 4080
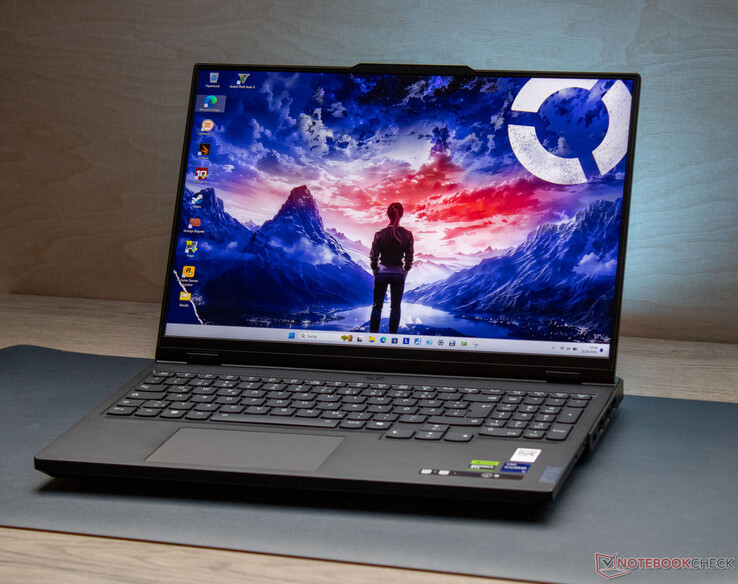
El Legion Pro 7 -un portátil de 16 pulgadas dirigido a jugadores y creadores- se sitúa en el extremo superior del espectro de rendimiento. Y viene con un hardware apropiadamente potente, con un Core i9-14900HX, a GeForce RTX 4080, 32 GB de RAM, y una pantalla IPS de colores brillantes y precisos (cobertura DCI-P3, Dolby Vision, G-Sync) con una relación de aspecto 16:10. El Legion Pro compite con modelos de la talla del MSI Vector 16 HX A14Vel Alienware m16 R1 AMD, el HP Omen 16 (2024).
El Legion Pro 7 16IRX9H es el sucesor del Legion Pro 7 16IRX8H y comparte el mismo diseño exterior. Consulte nuestro análisis del 16IRX8H para más detalles sobre el chasis, las características y los dispositivos de entrada.
Posibles contendientes en la comparación
Valoración | Fecha | Modelo | Peso | Altura | Tamaño | Resolución | Precio |
|---|---|---|---|---|---|---|---|
| 89.5 % v7 (old) | 03/2024 | Lenovo Legion Pro 7 16IRX9H i9-14900HX, GeForce RTX 4080 Laptop GPU | 2.7 kg | 21.95 mm | 16.00" | 2560x1600 | |
| 89.2 % v7 (old) | 08/2023 | Alienware m16 R1 AMD R9 7845HX, GeForce RTX 4080 Laptop GPU | 3.1 kg | 25.4 mm | 16.00" | 2560x1600 | |
| 88 % v7 (old) | 02/2024 | MSI Vector 16 HX A14V i9-14900HX, GeForce RTX 4080 Laptop GPU | 2.7 kg | 28.55 mm | 16.00" | 2560x1600 | |
| 86.7 % v7 (old) | 02/2024 | HP Omen 16 (2024) i9-14900HX, GeForce RTX 4080 Laptop GPU | 2.4 kg | 23.5 mm | 16.10" | 2560x1440 |
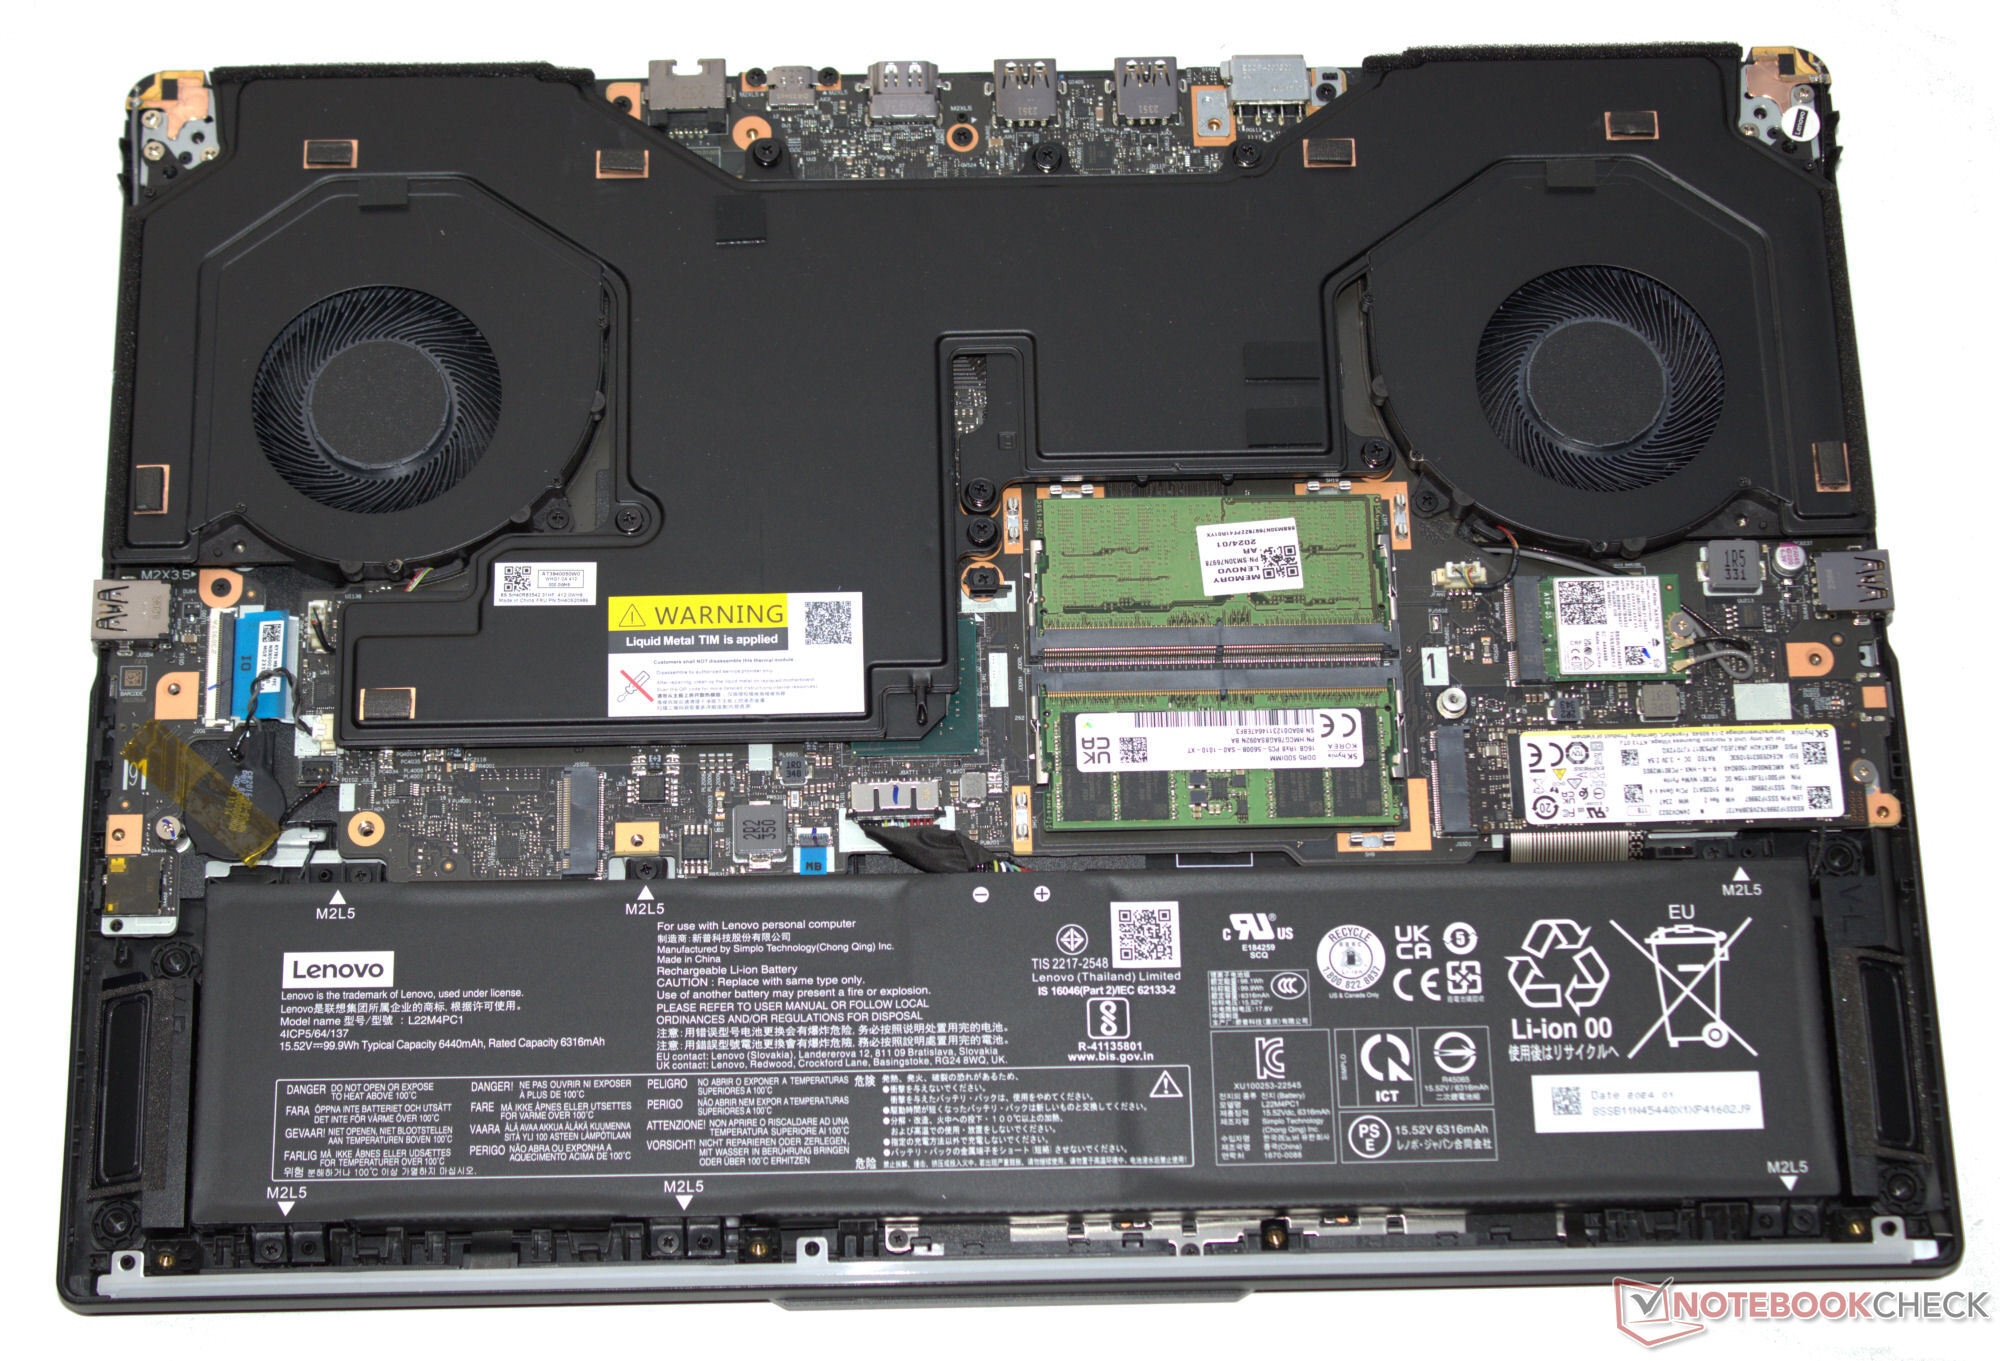
Chasis y especificaciones - Viene con Thunderbolt 4
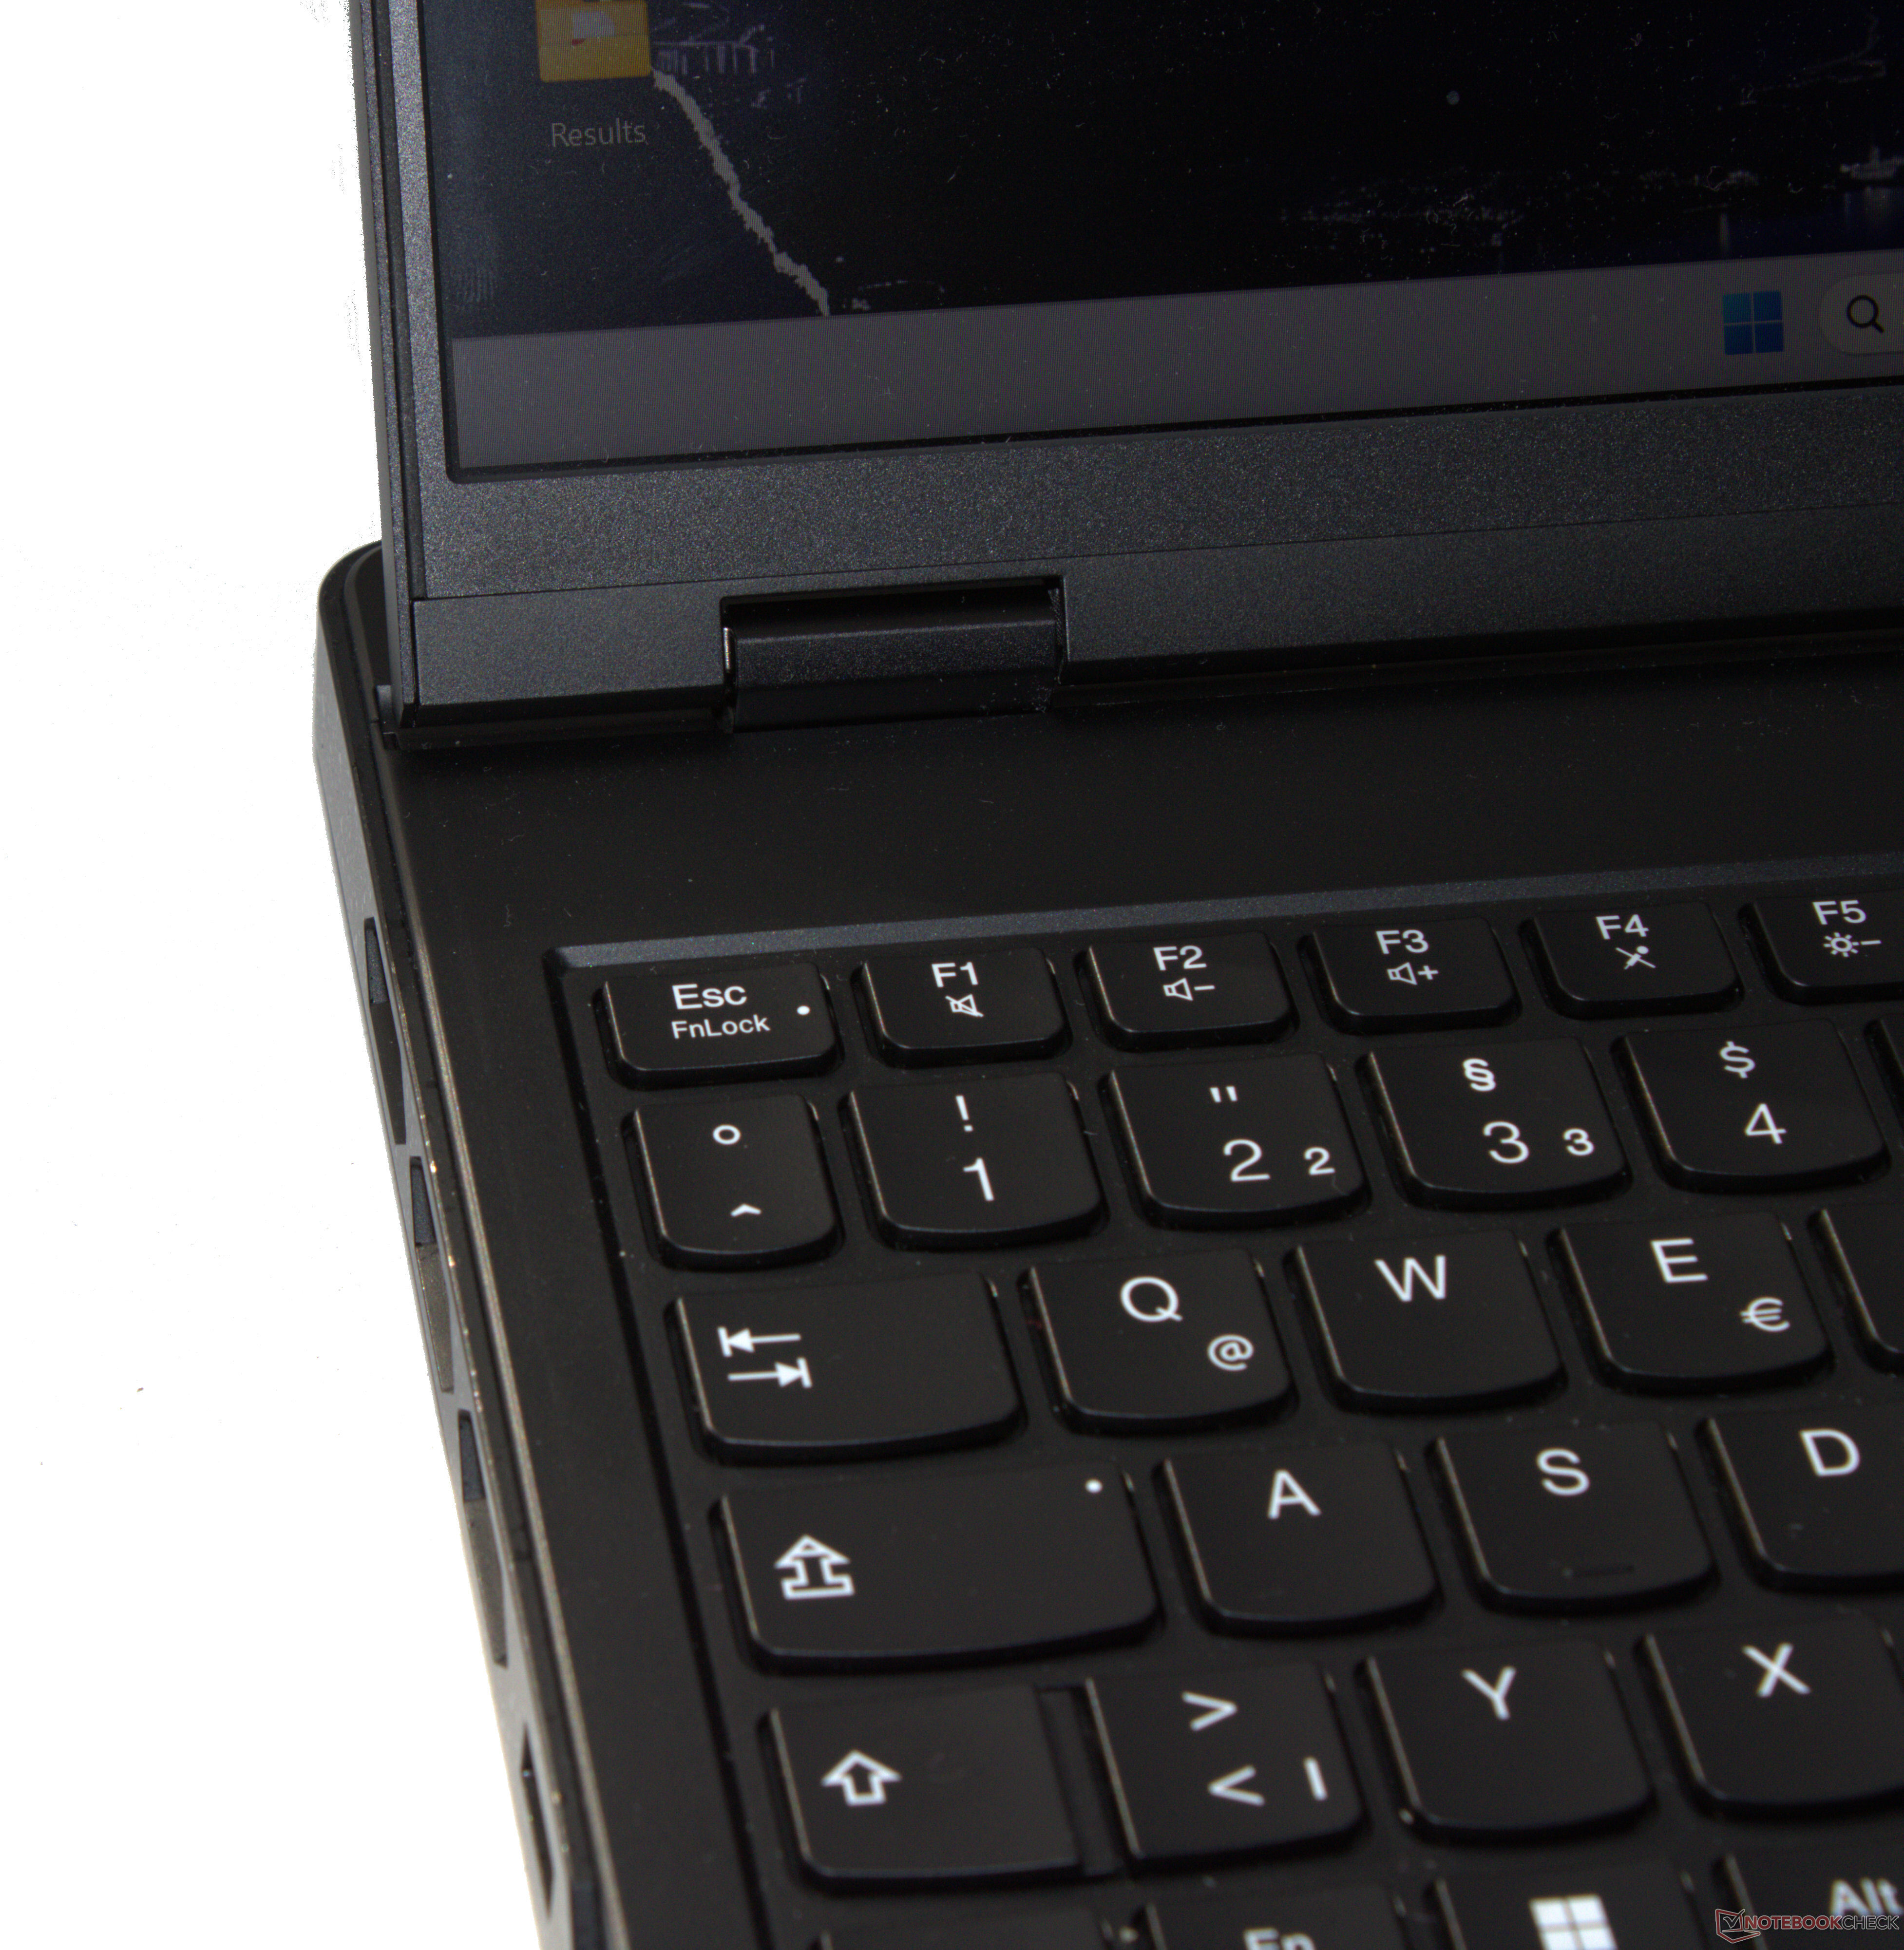
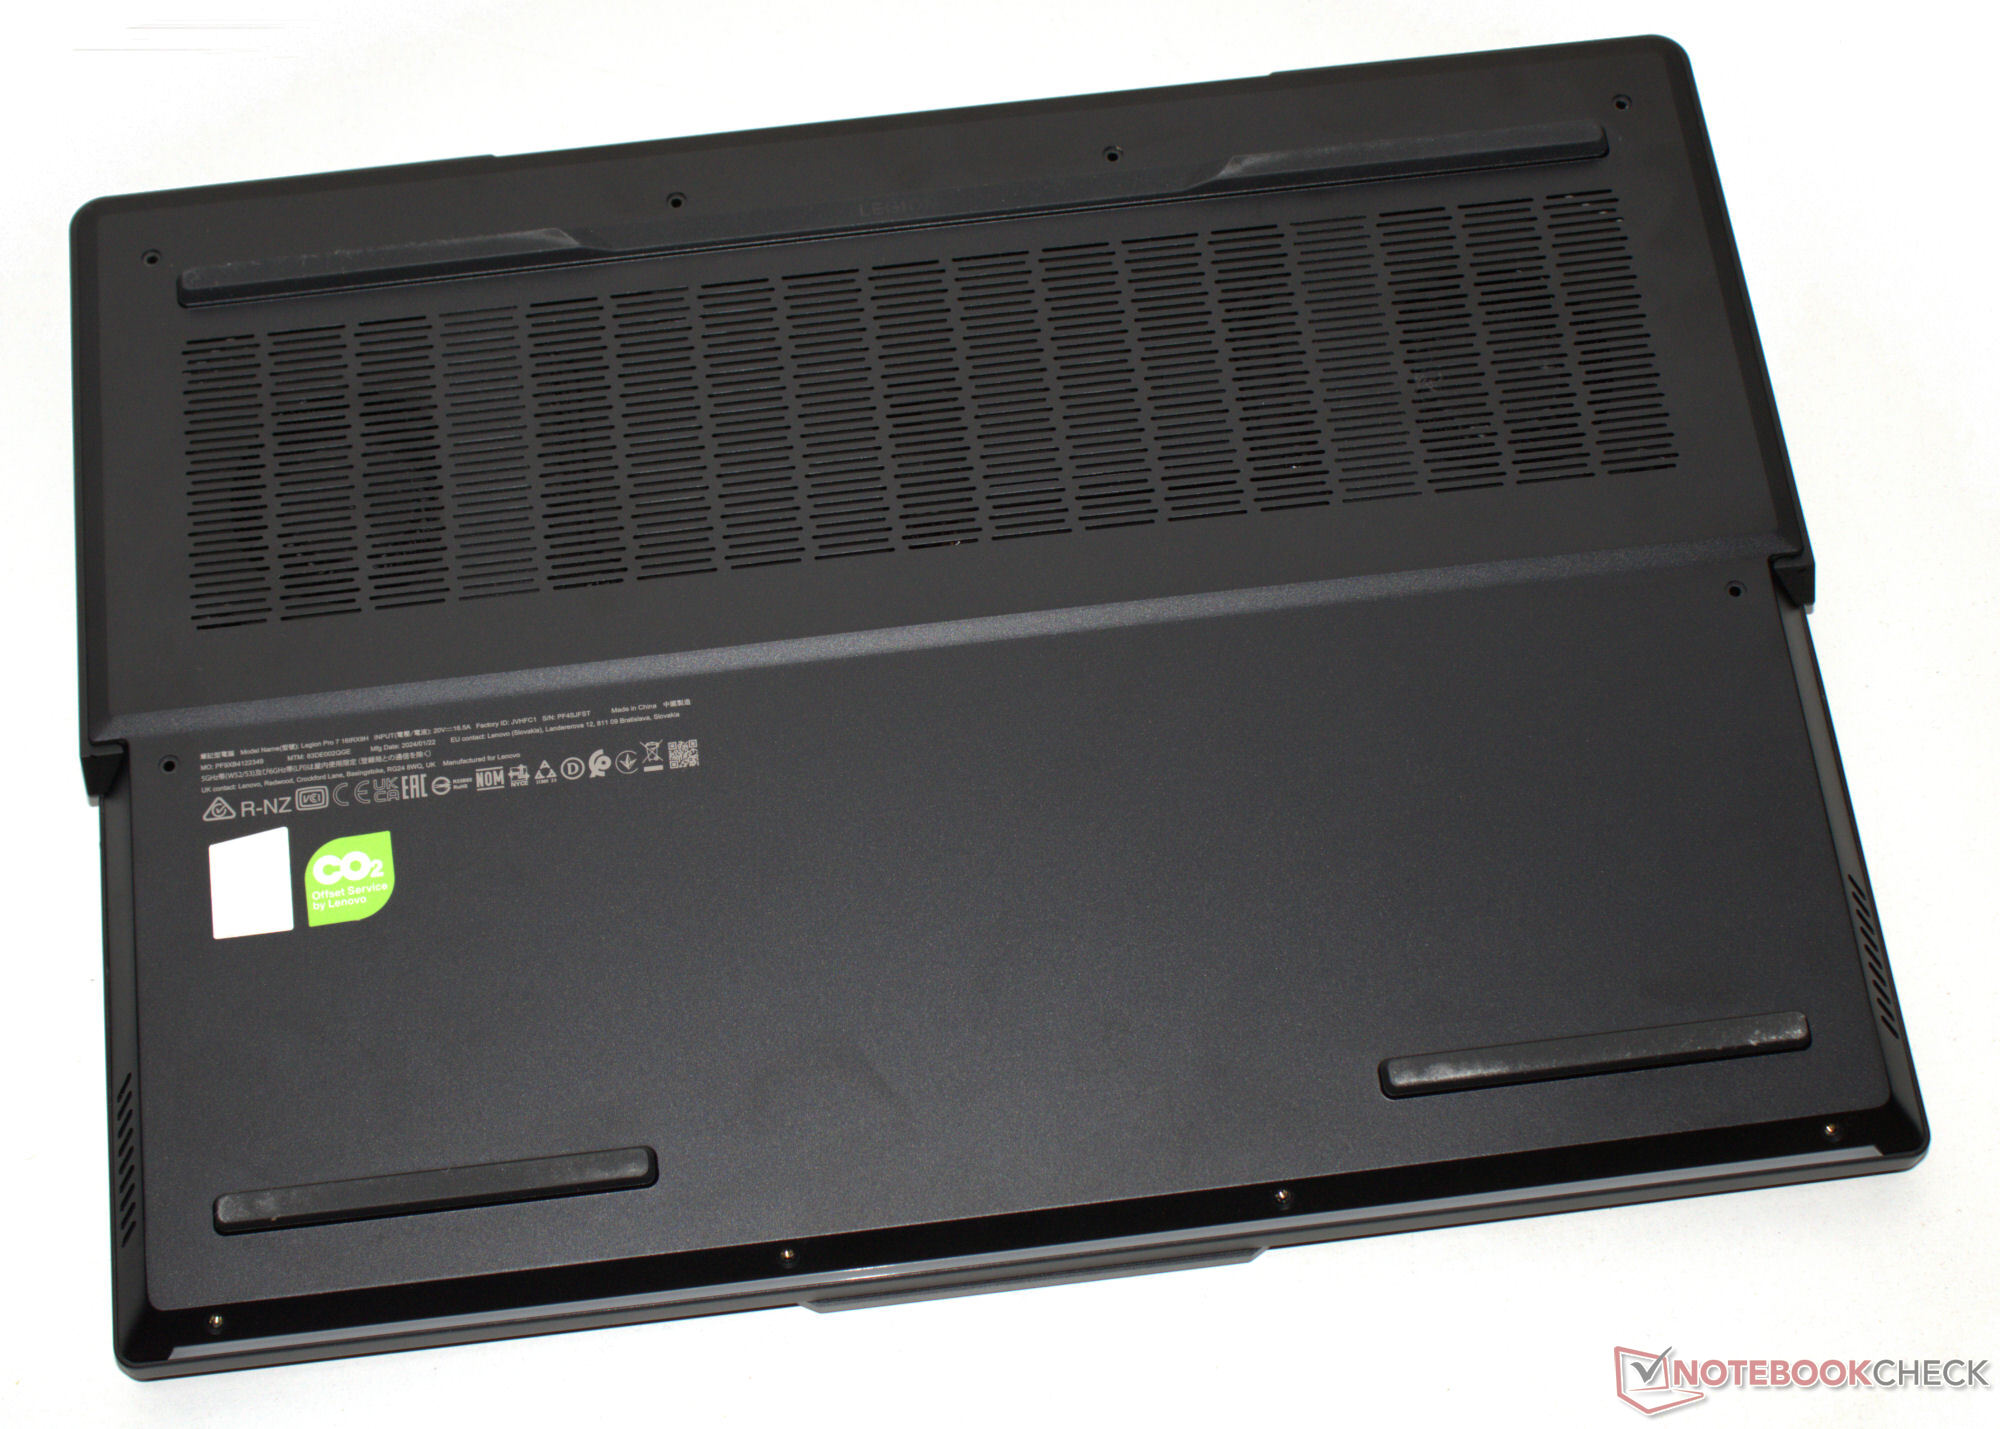
El hardware de la Legionse encuentra dentro de un robusto chasis de aluminio negro mate con una superficie lisa. La retroiluminación del teclado y una tira de LED orientada hacia el usuario añaden un poco de colorido. Las rígidas bisagras con un ángulo máximo de apertura de 180 grados merecen un pulgar hacia arriba. La batería (atornillada, no pegada) y el resto de los componentes internos son accesibles una vez retirada la cubierta inferior.
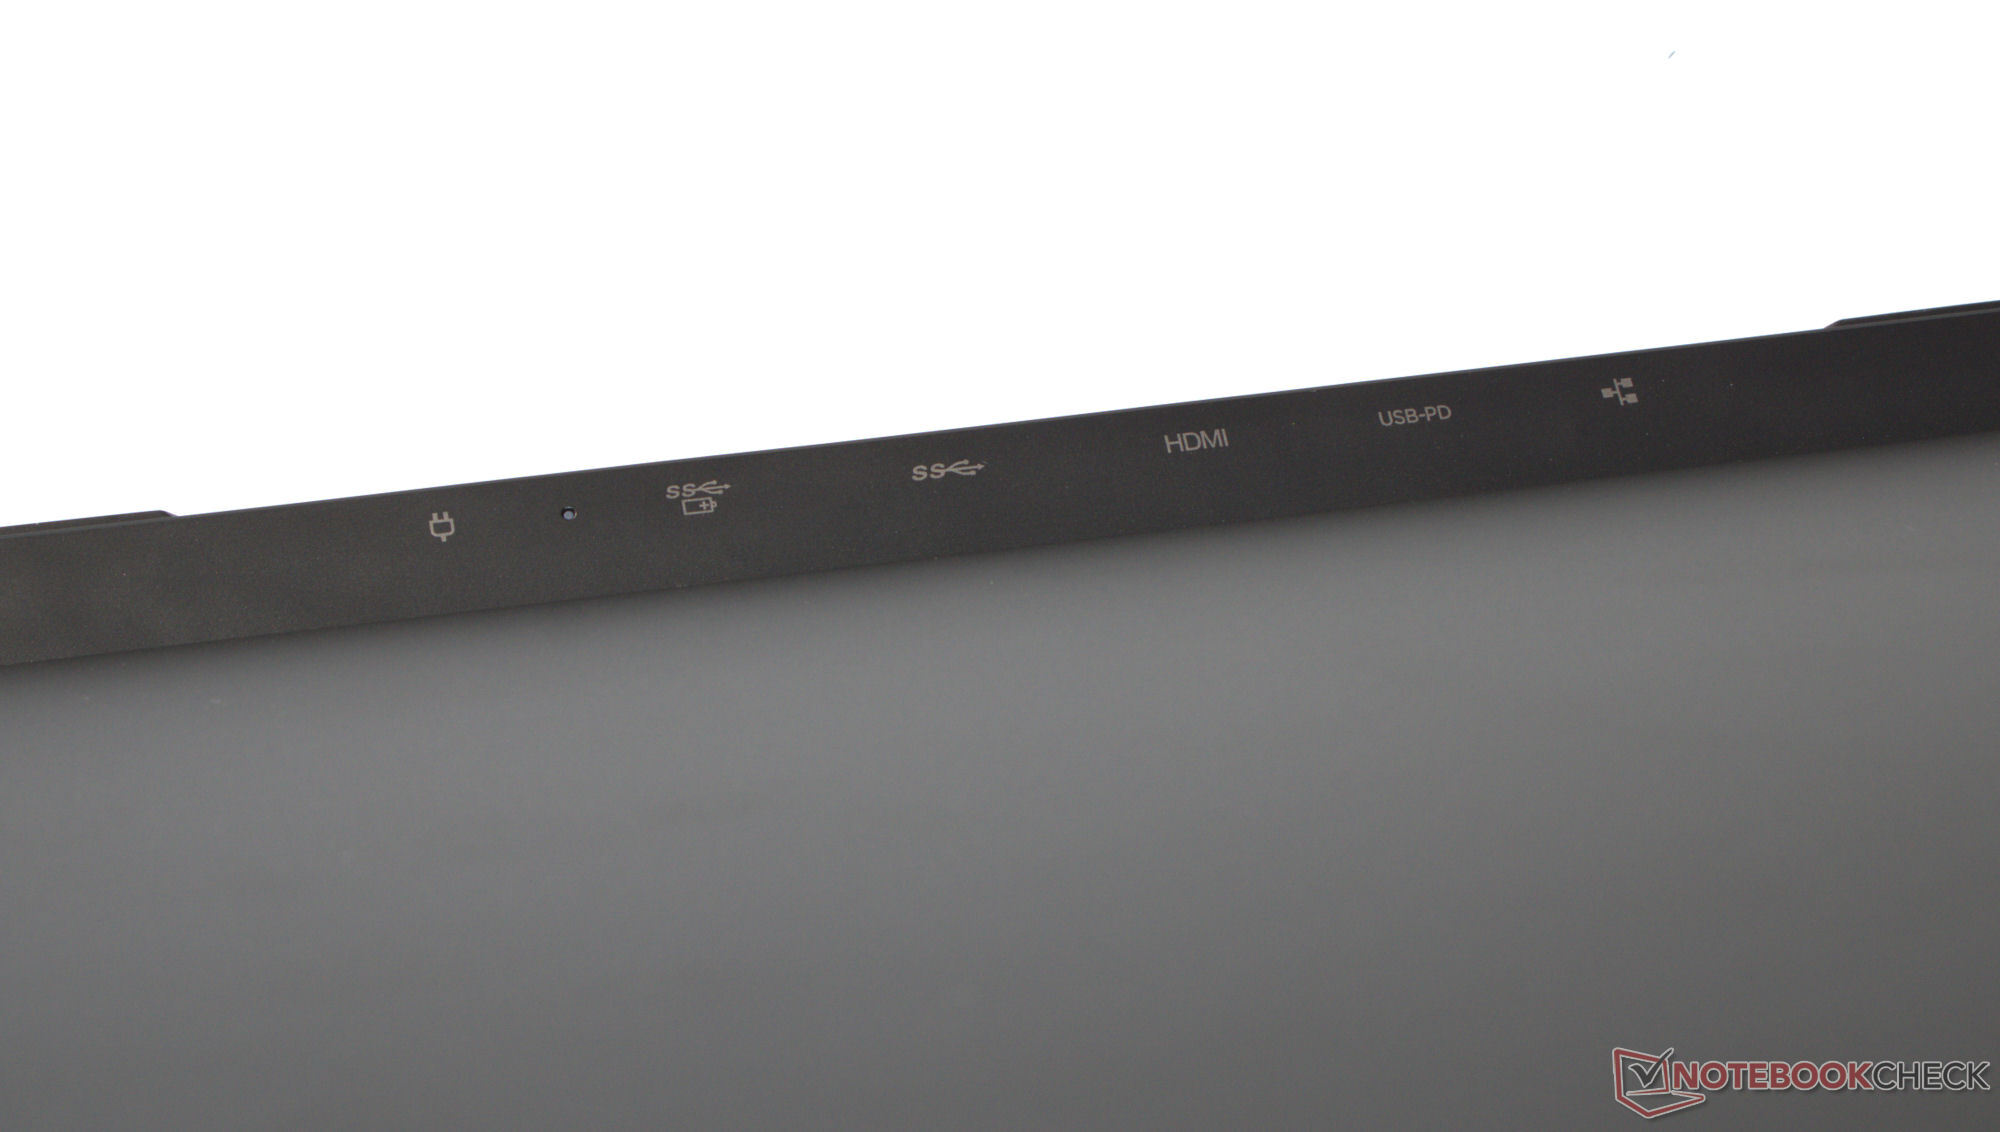
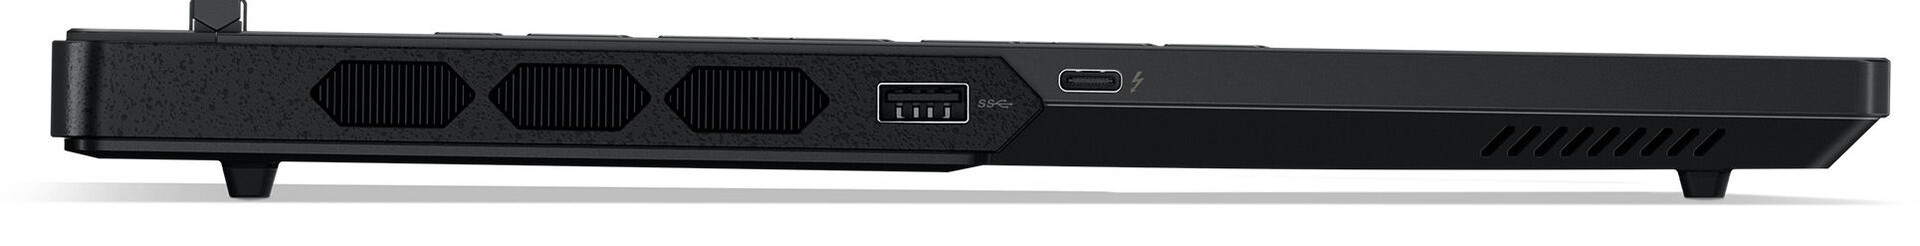
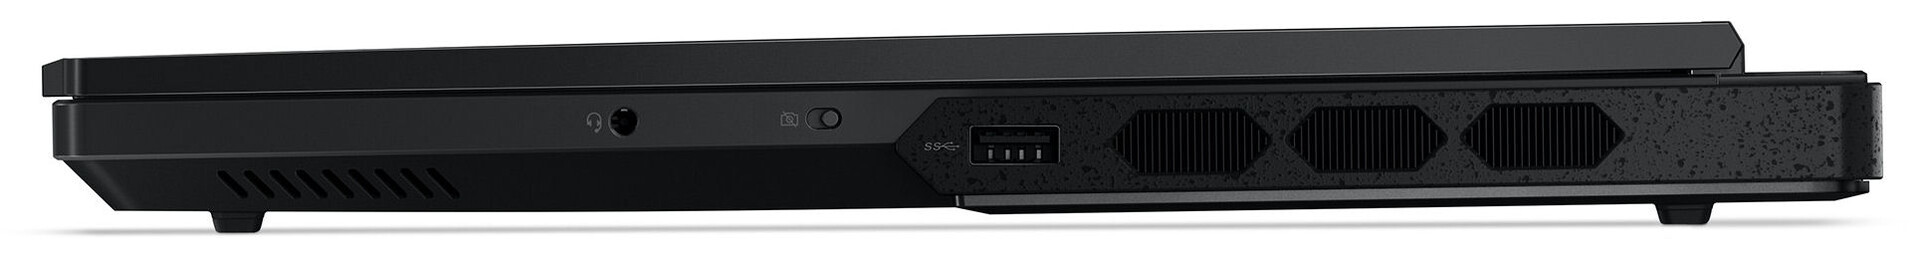
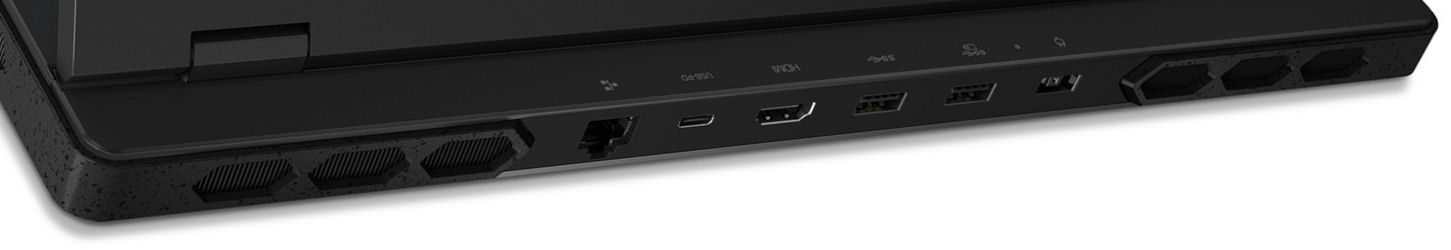
Al portátil no le falta nada en el departamento de E/S, con cuatro puertos USB-A (USB 3.2 Gen 1) y dos puertos USB-C (1x Thunderbolt 4, 1 x USB 3.2 Gen 2; 1x PD, 2x DP). Ofrece un total de tres salidas de vídeo (1x HDMI, 2x DP). La webcam de 2,1MP 1080p está equipada con un obturador de privacidad y produce resultados muy decentes. No hay lector de tarjetas de memoria a bordo.
En condiciones óptimas (es decir, sin otros dispositivos Wi-Fi cerca, corta distancia entre el portátil y el PC servidor), el Legion Pro 7 alcanza unas velocidades de datos Wi-Fi magníficas. El portátil utiliza un chip Killer AX1675i Wi-Fi 6E (también conocido como Intel AX211). La conectividad por cable corre a cargo de un controlador Realtek RTL8168/8111.
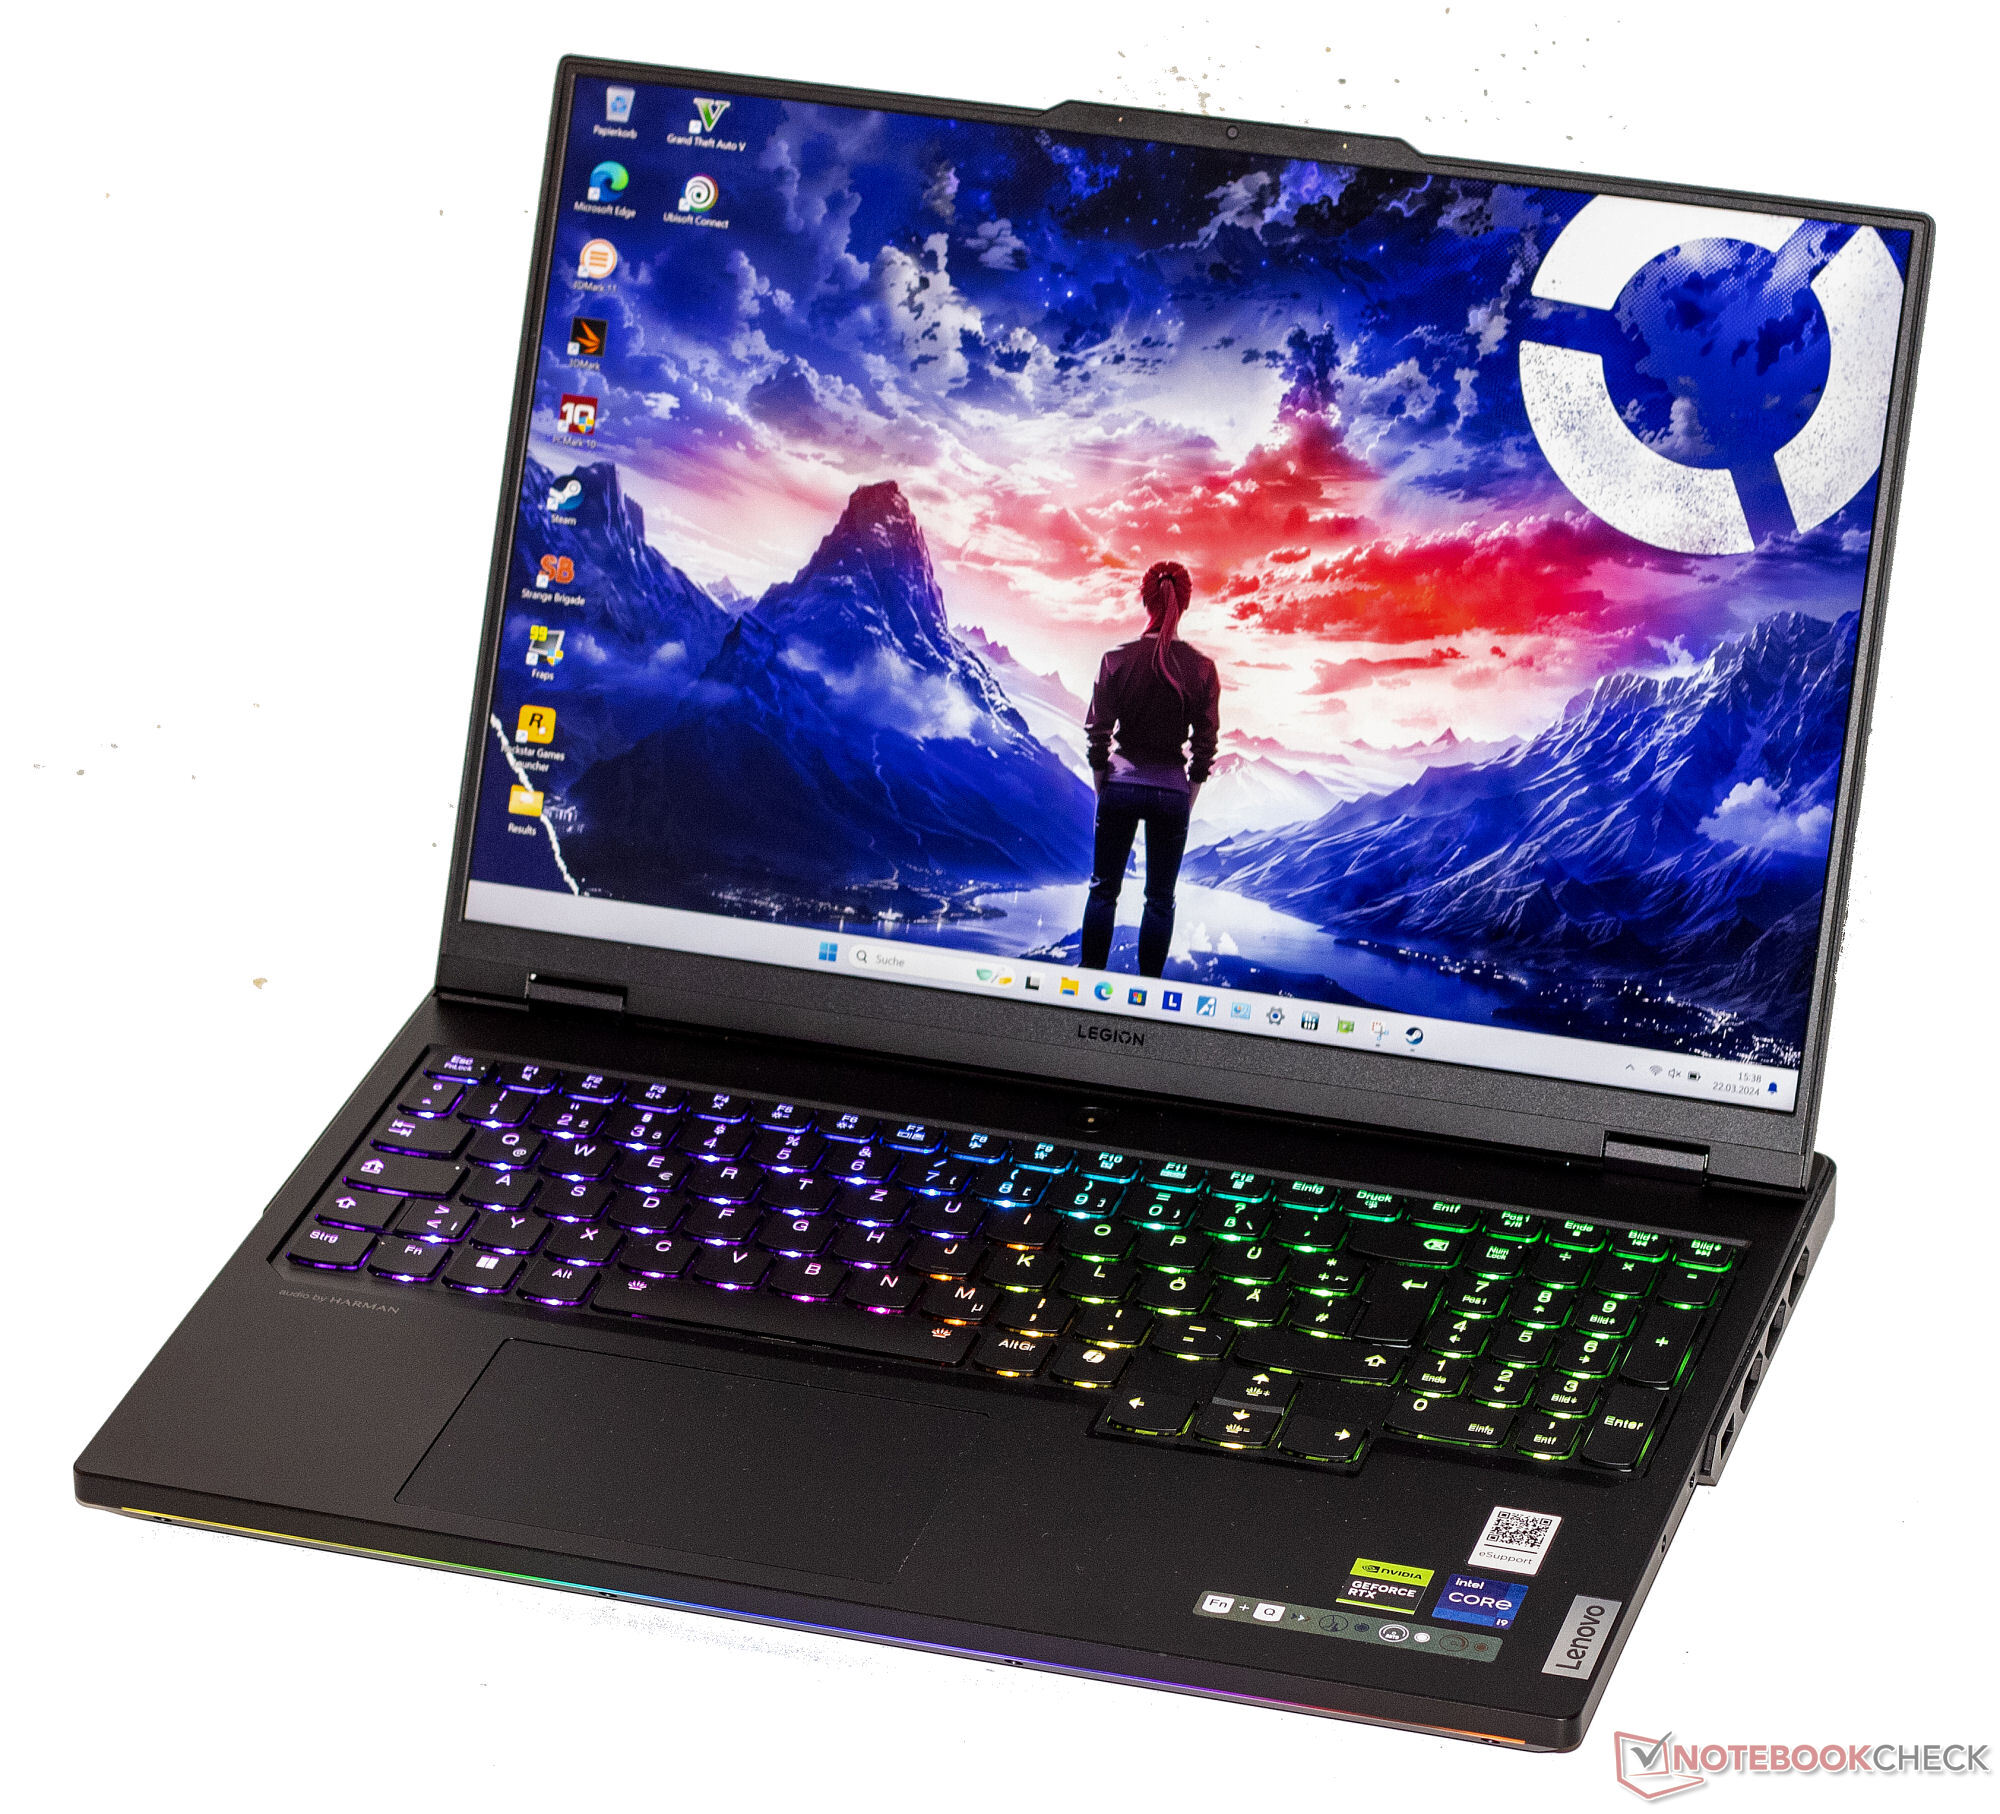
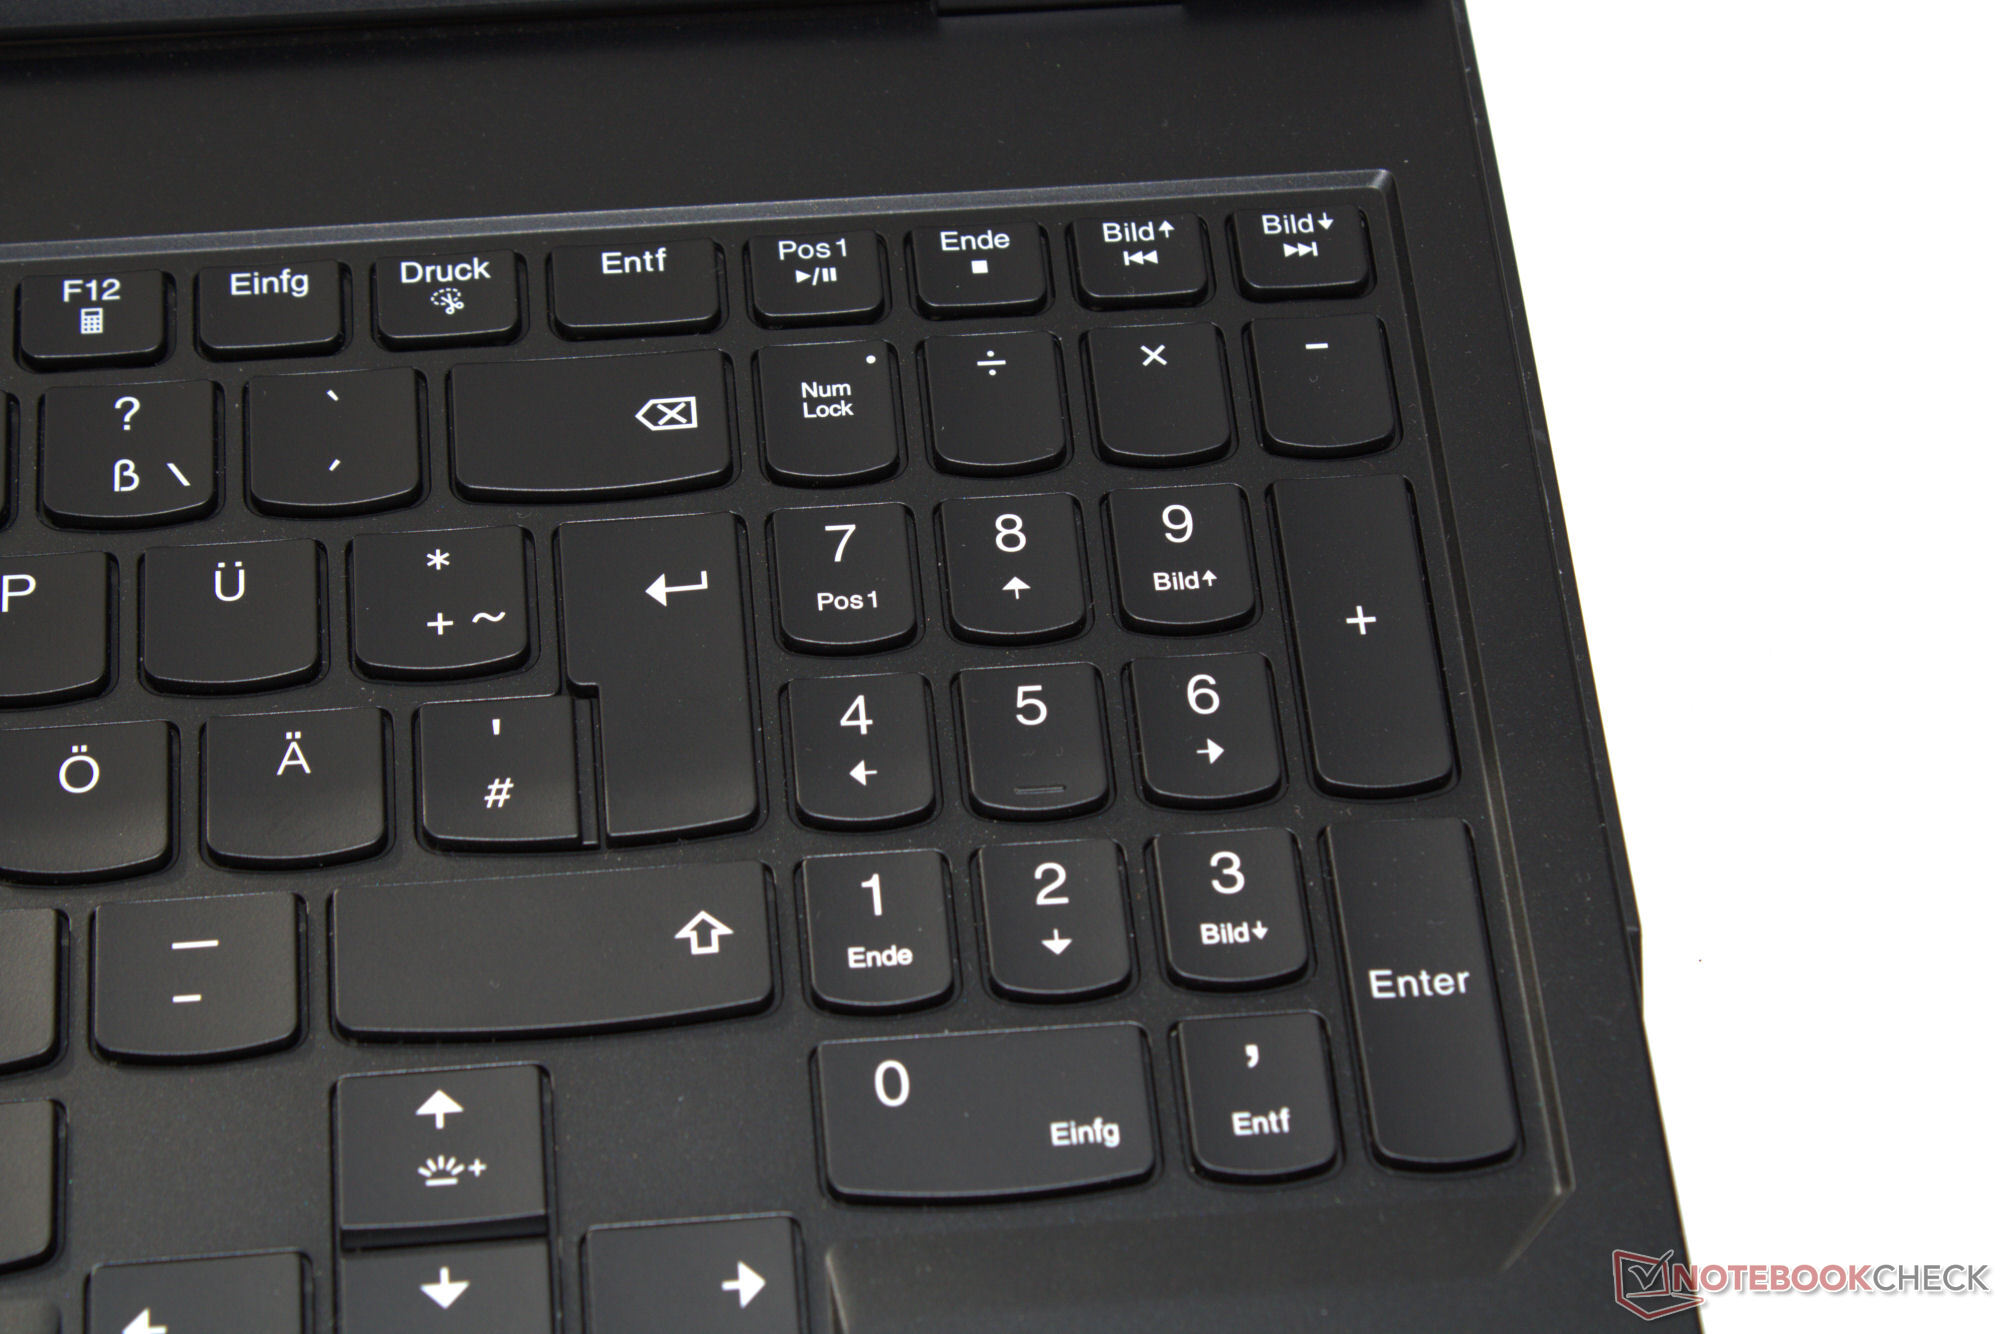
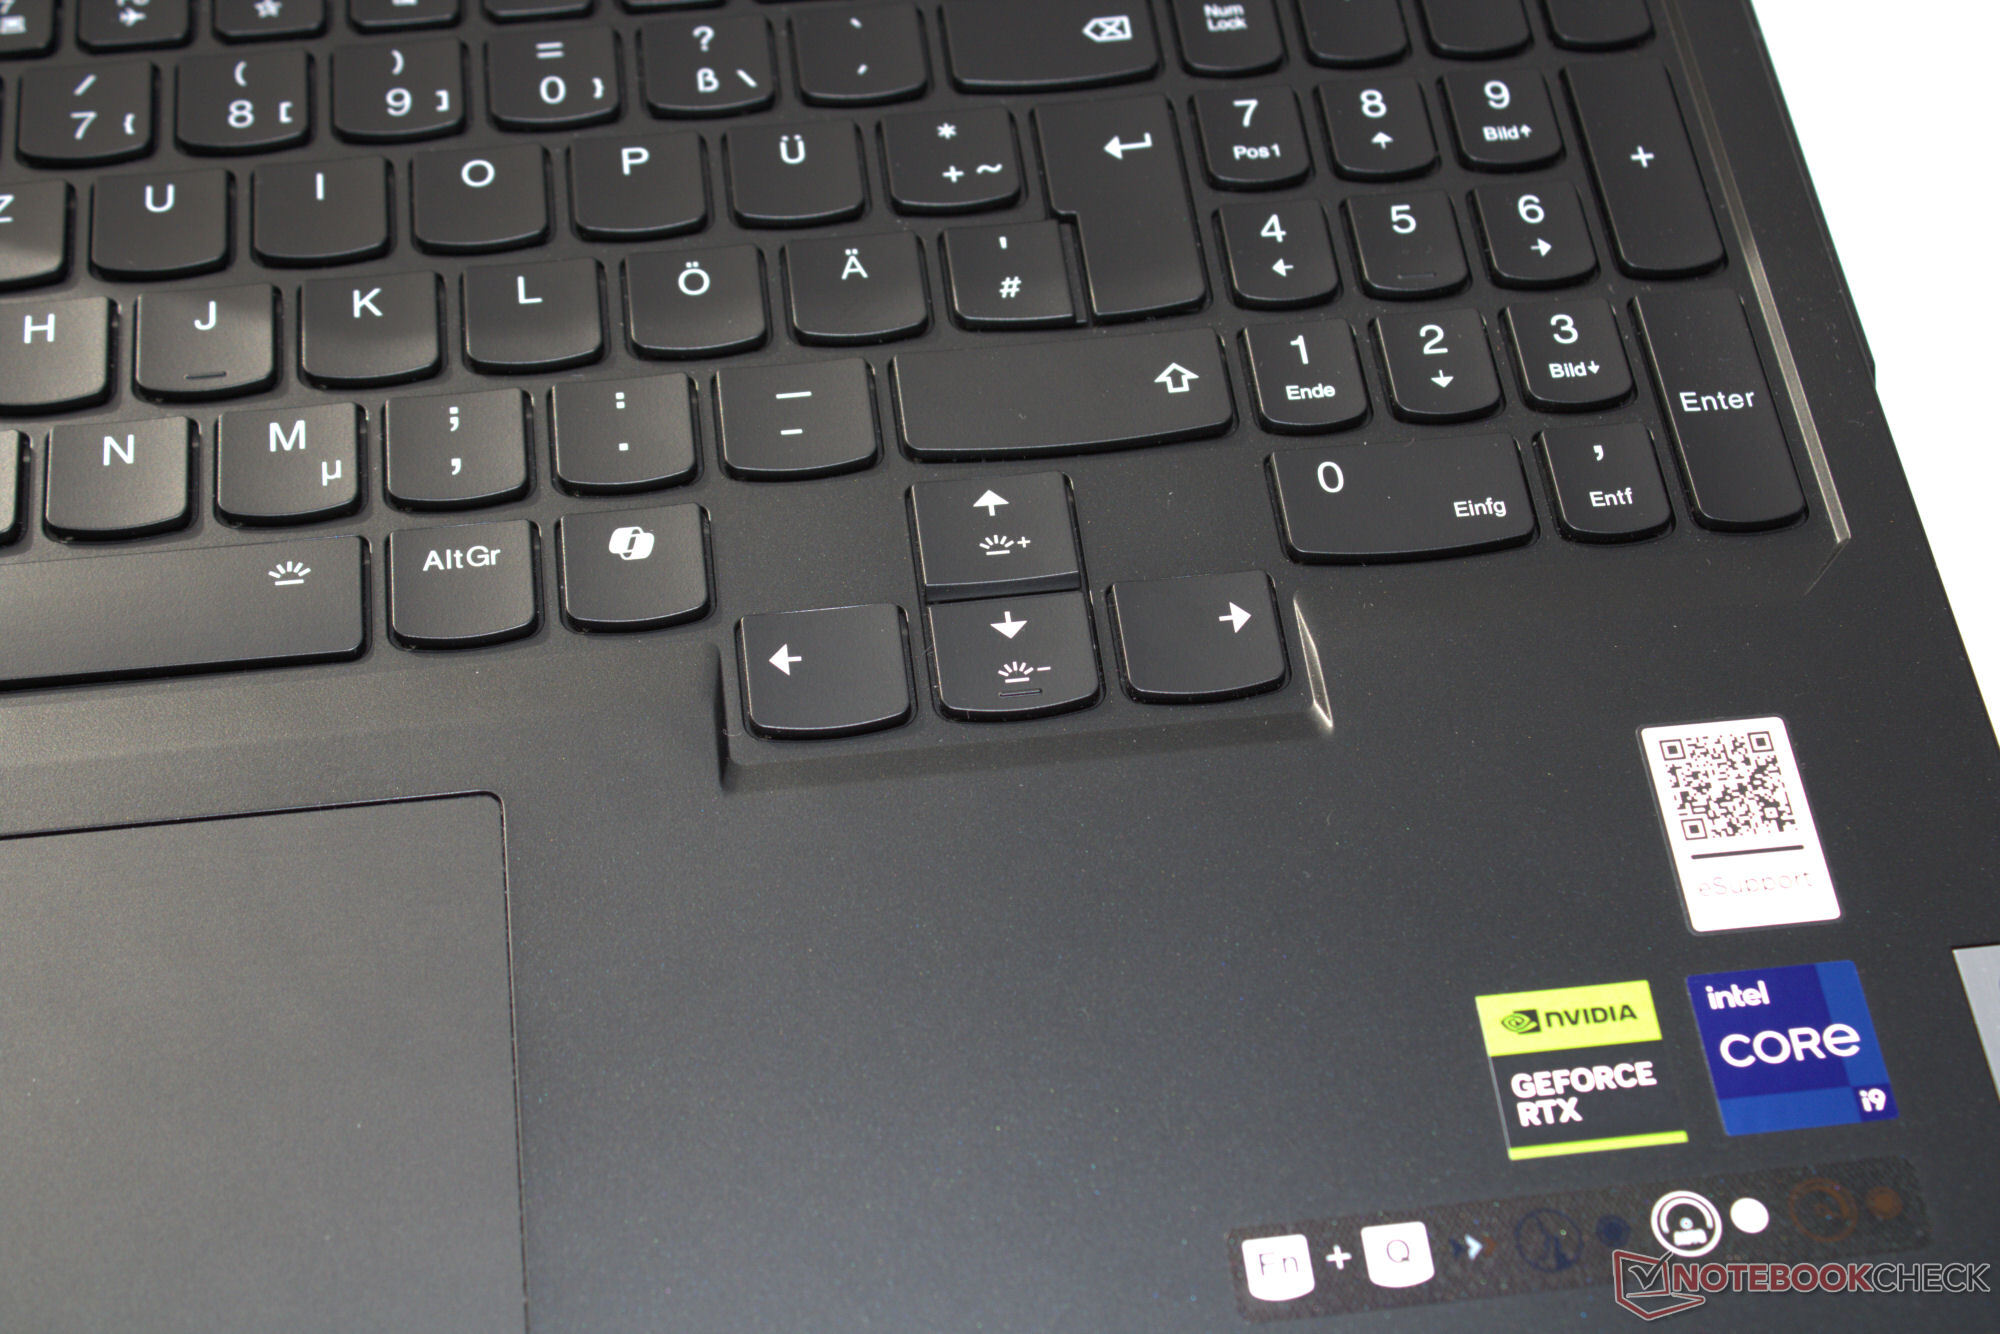
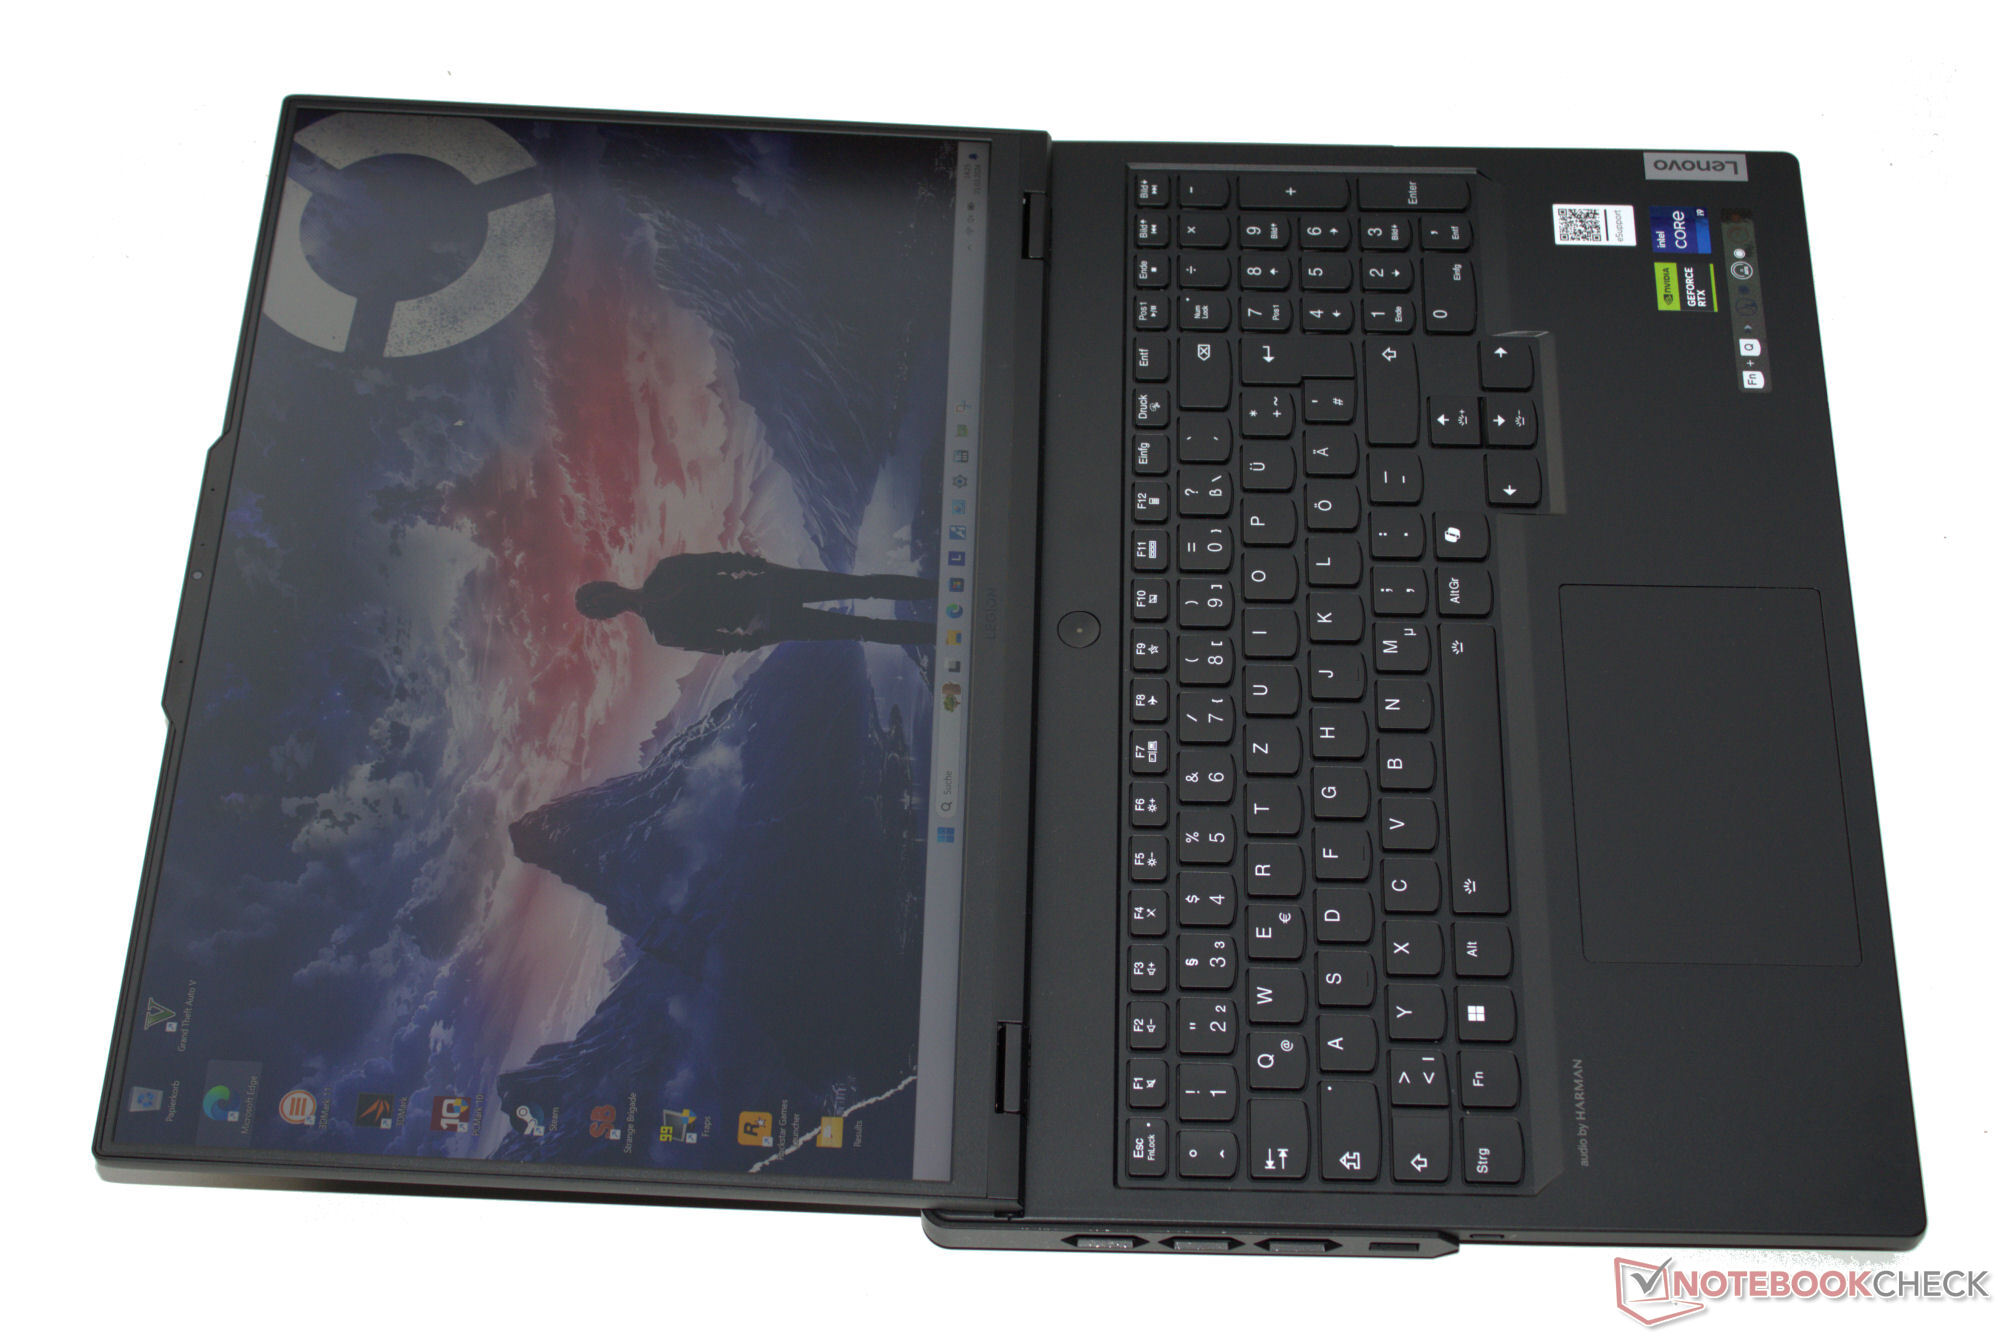


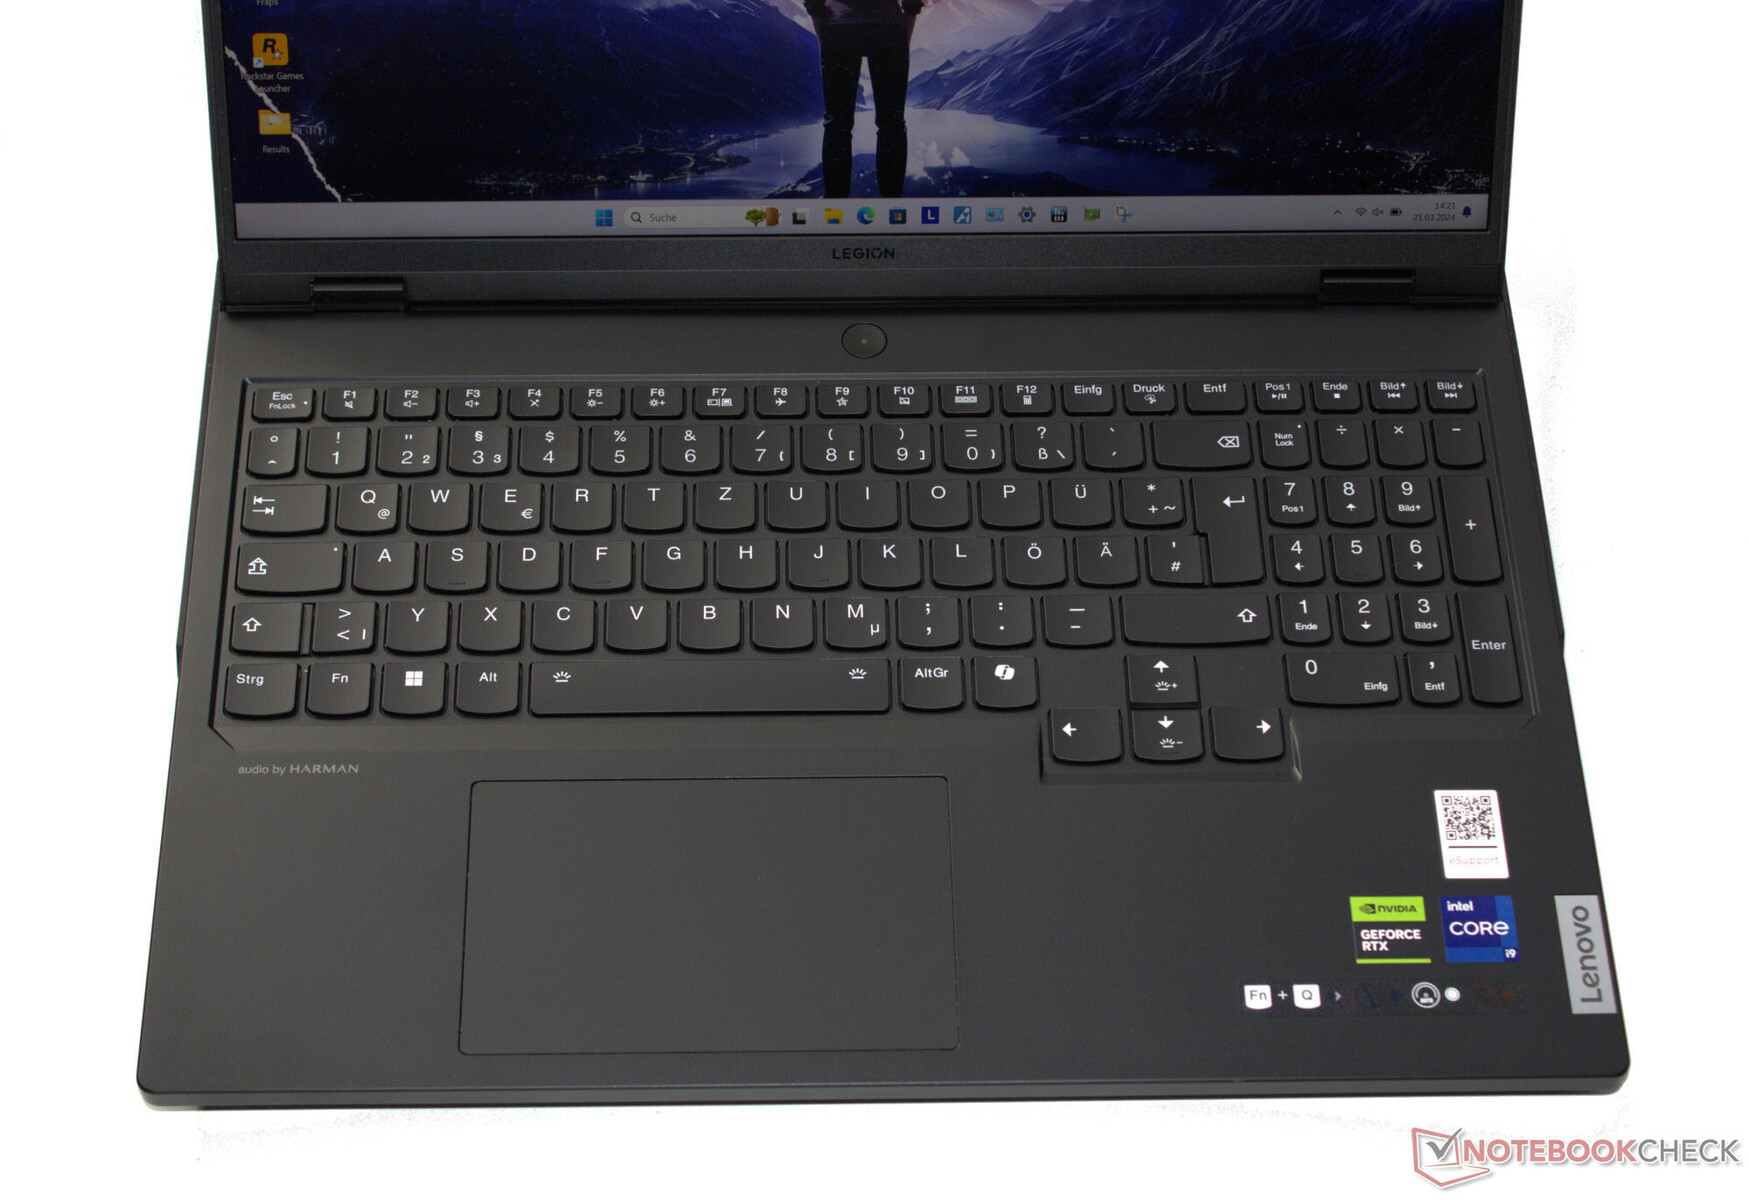
Dispositivos de entrada - Equipado con un teclado nítido
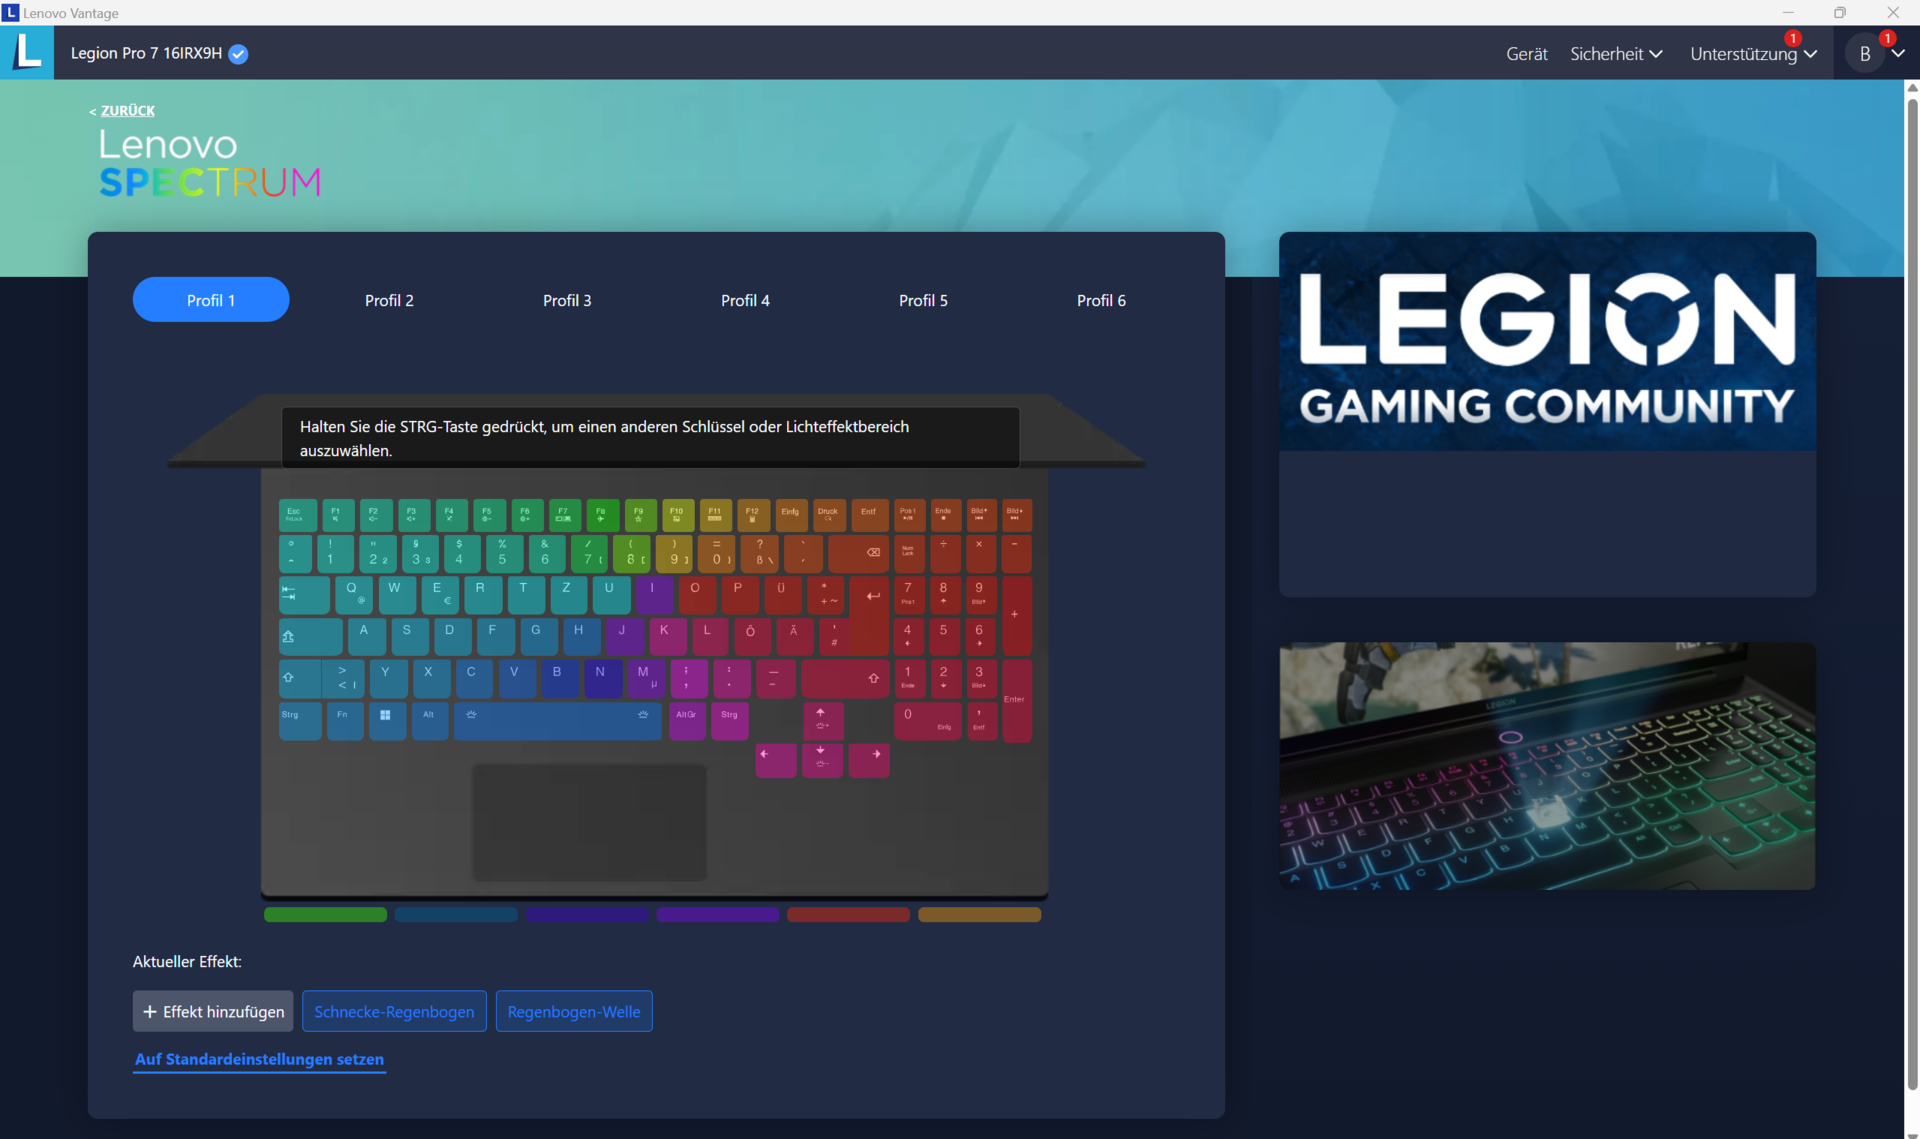
Las teclas chiclet cóncavas con iluminación RGB por tecla tienen una resistencia agradablemente firme y un punto de accionamiento claro. El teclado se flexiona muy ligeramente al escribir, pero esto no afecta a la experiencia de escritura por lo demás. Las teclas de flecha son de tamaño completo. Para el control del ratón, el portátil cuenta con un clickpad multitáctil (que mide aproximadamente 12 x 7,5 cm, o 4,7 x 3,0 pulgadas) con un recorrido corto y un punto de clic claro.
Pantalla - 16:10, DCI-P3, Dolby Vision
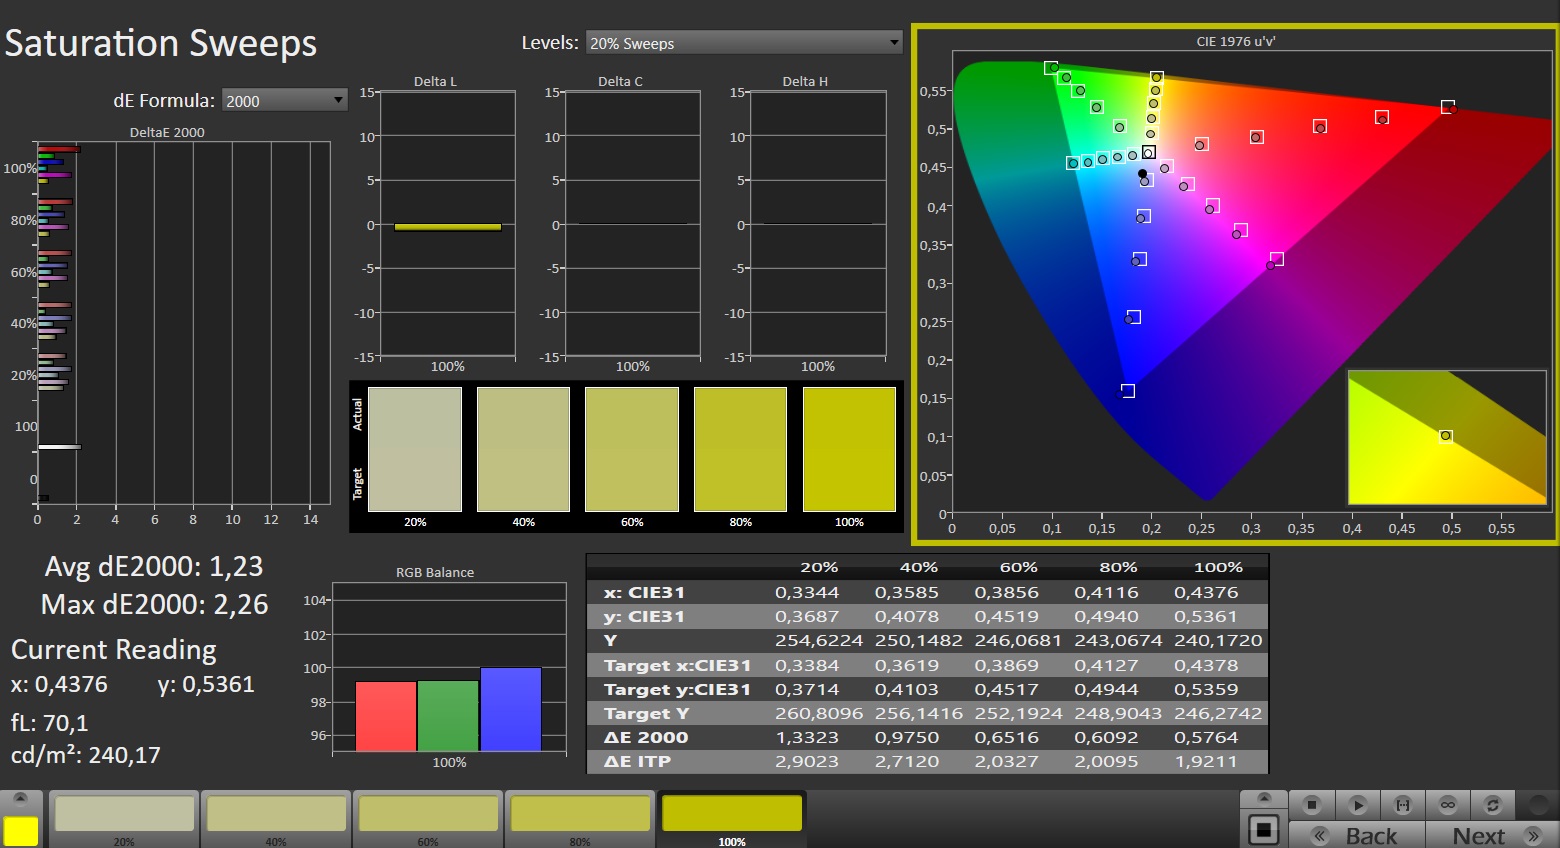
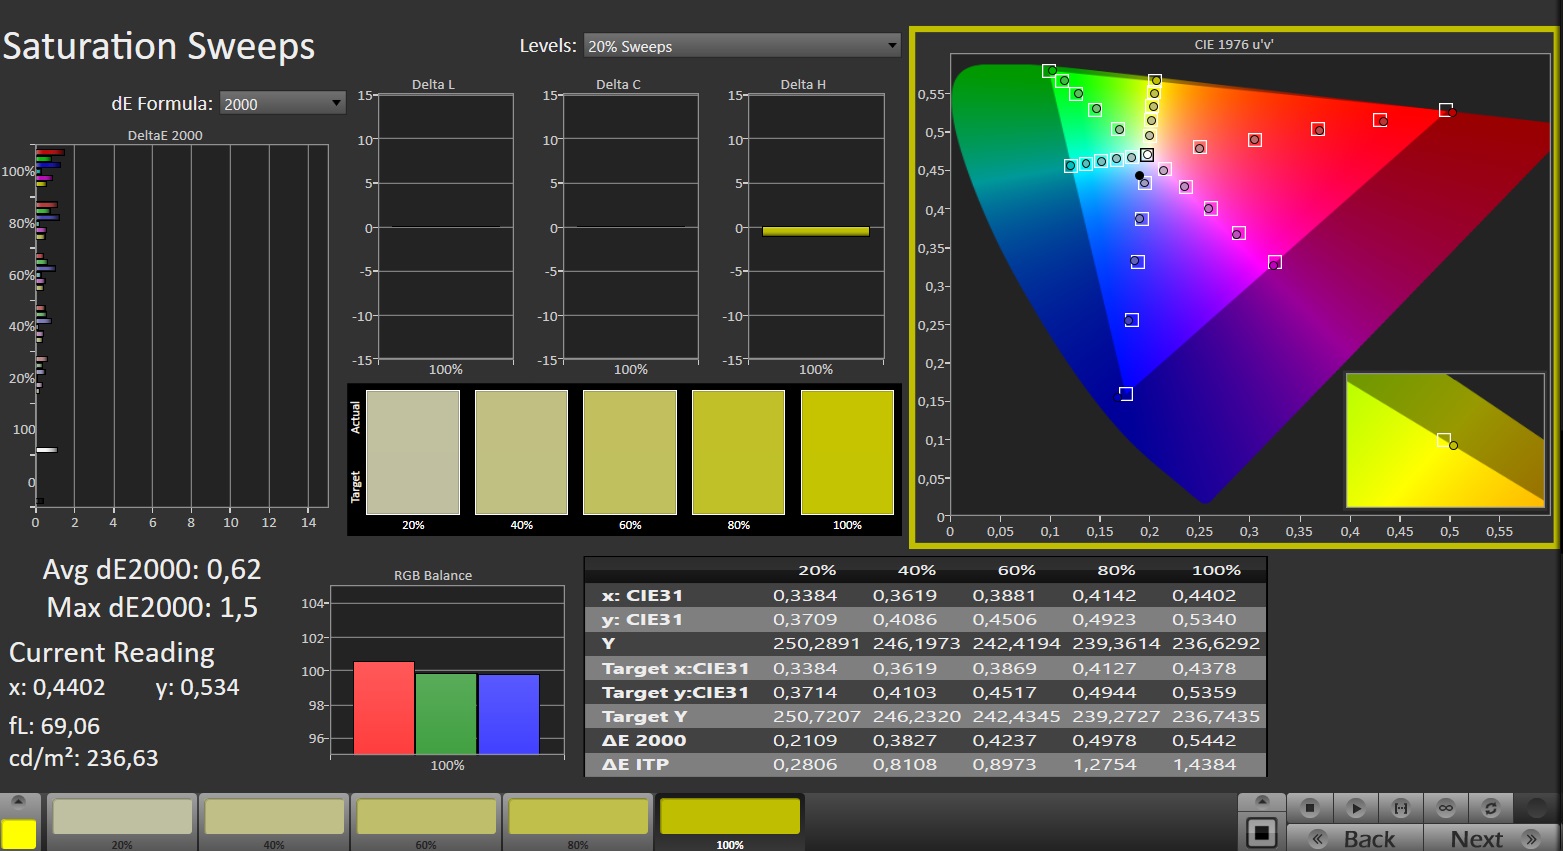
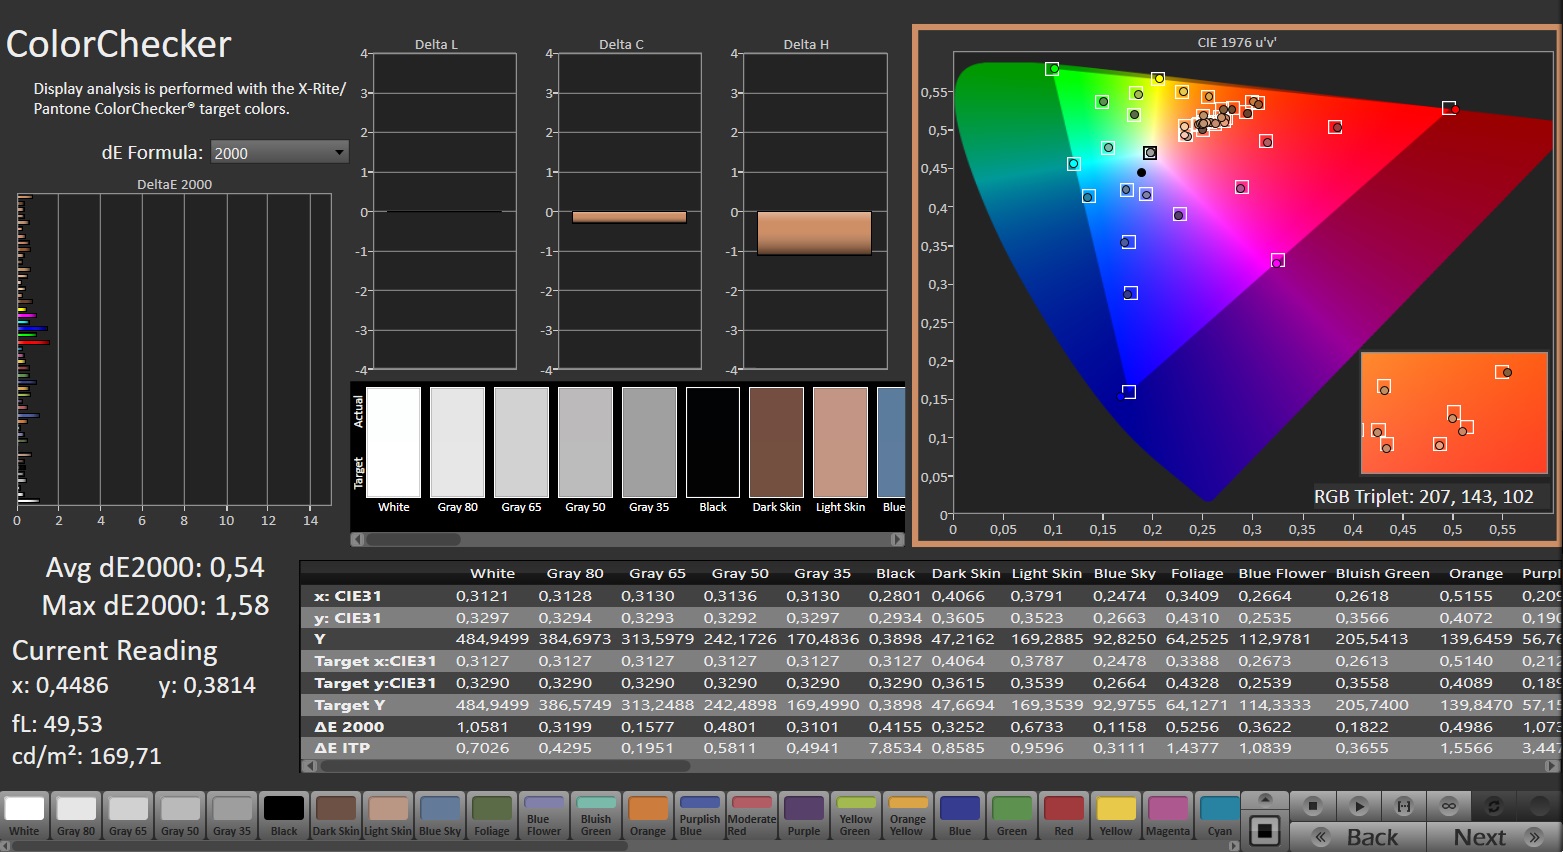
La pantalla IPS mate de 16 pulgadas (resolución 2.560 x 1.600) con una relación de aspecto 16:10 presume de compatibilidad con G-Sync, Dolby Vision, rápido tiempo de respuesta y ausencia de parpadeo PWM. El brillo y el contraste del panel de 240 Hz también alcanzan niveles que pueden considerarse buenos (> 300 cd/m² y 1.000:1 respectivamente). Lenovo no ofrece ninguna otra opción de pantalla.
| |||||||||||||||||||||||||
iluminación: 88 %
Brillo con batería: 487 cd/m²
Contraste: 1160:1 (Negro: 0.42 cd/m²)
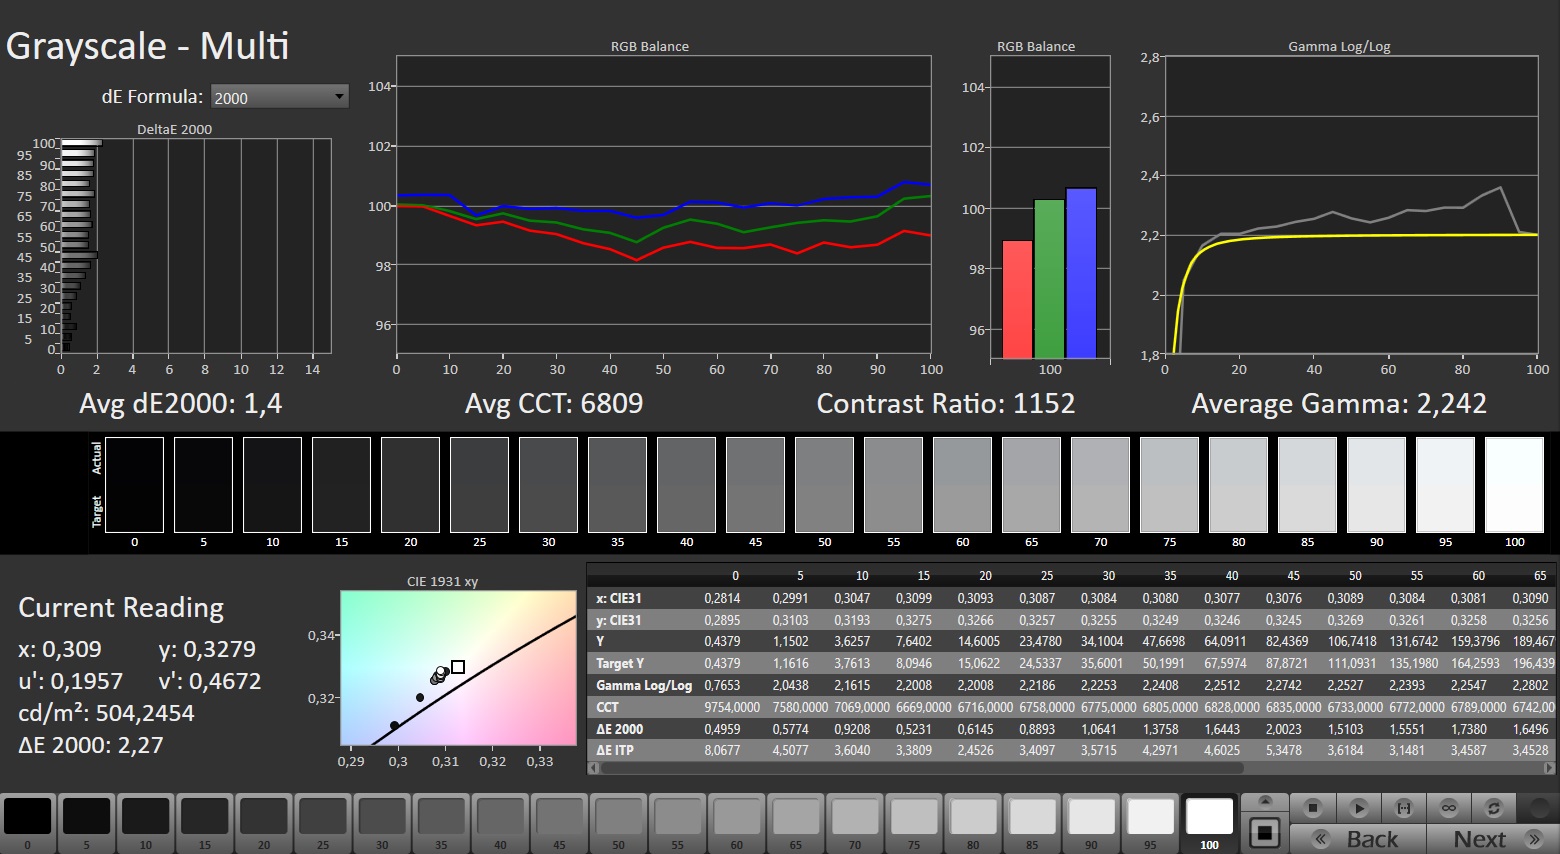
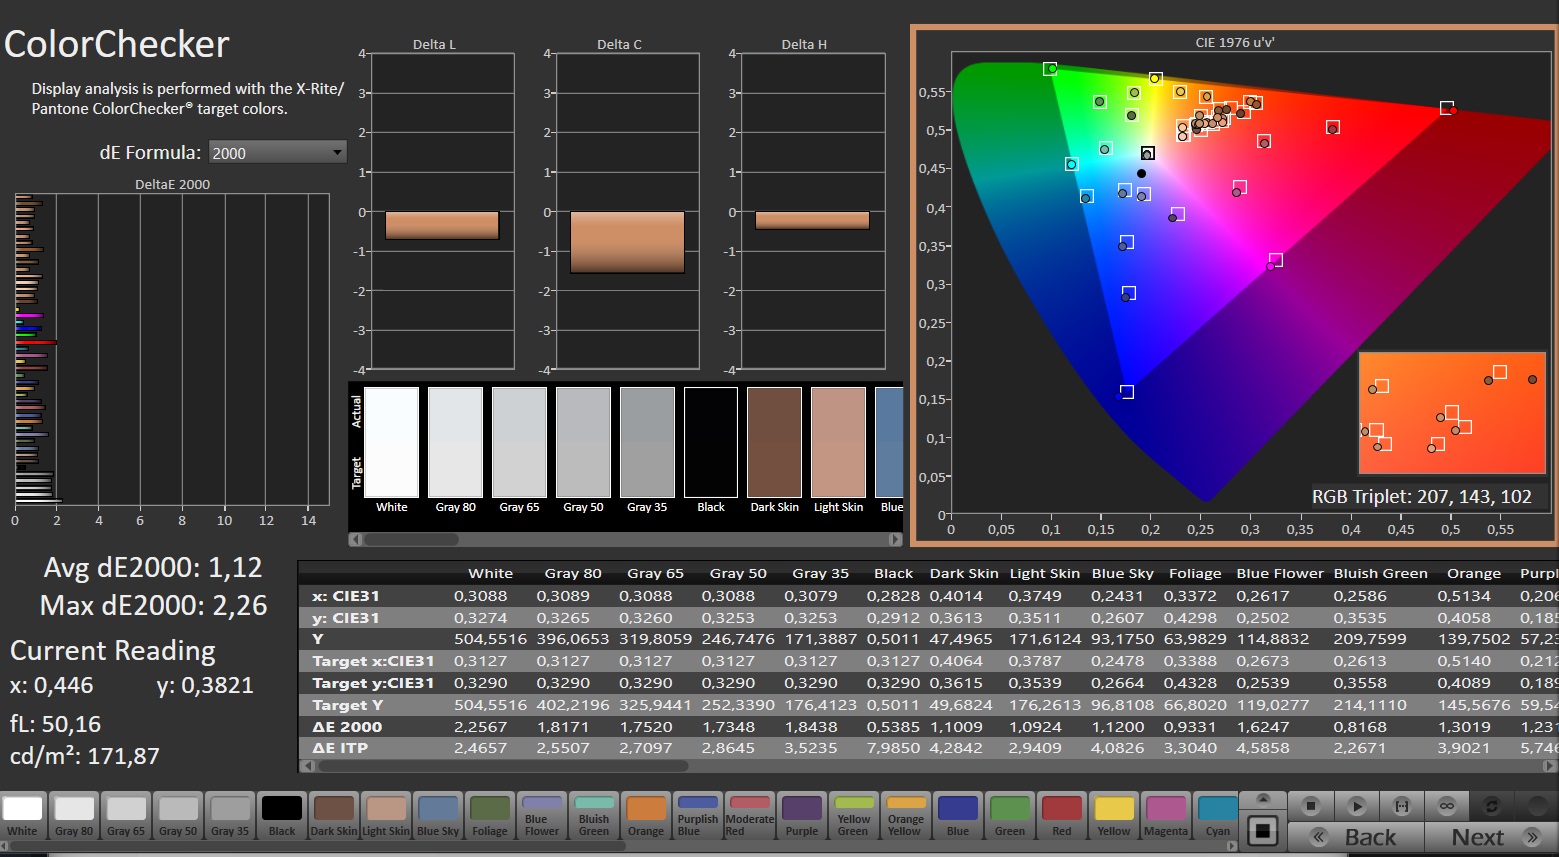
ΔE ColorChecker Calman: 1.12 | ∀{0.5-29.43 Ø4.71}
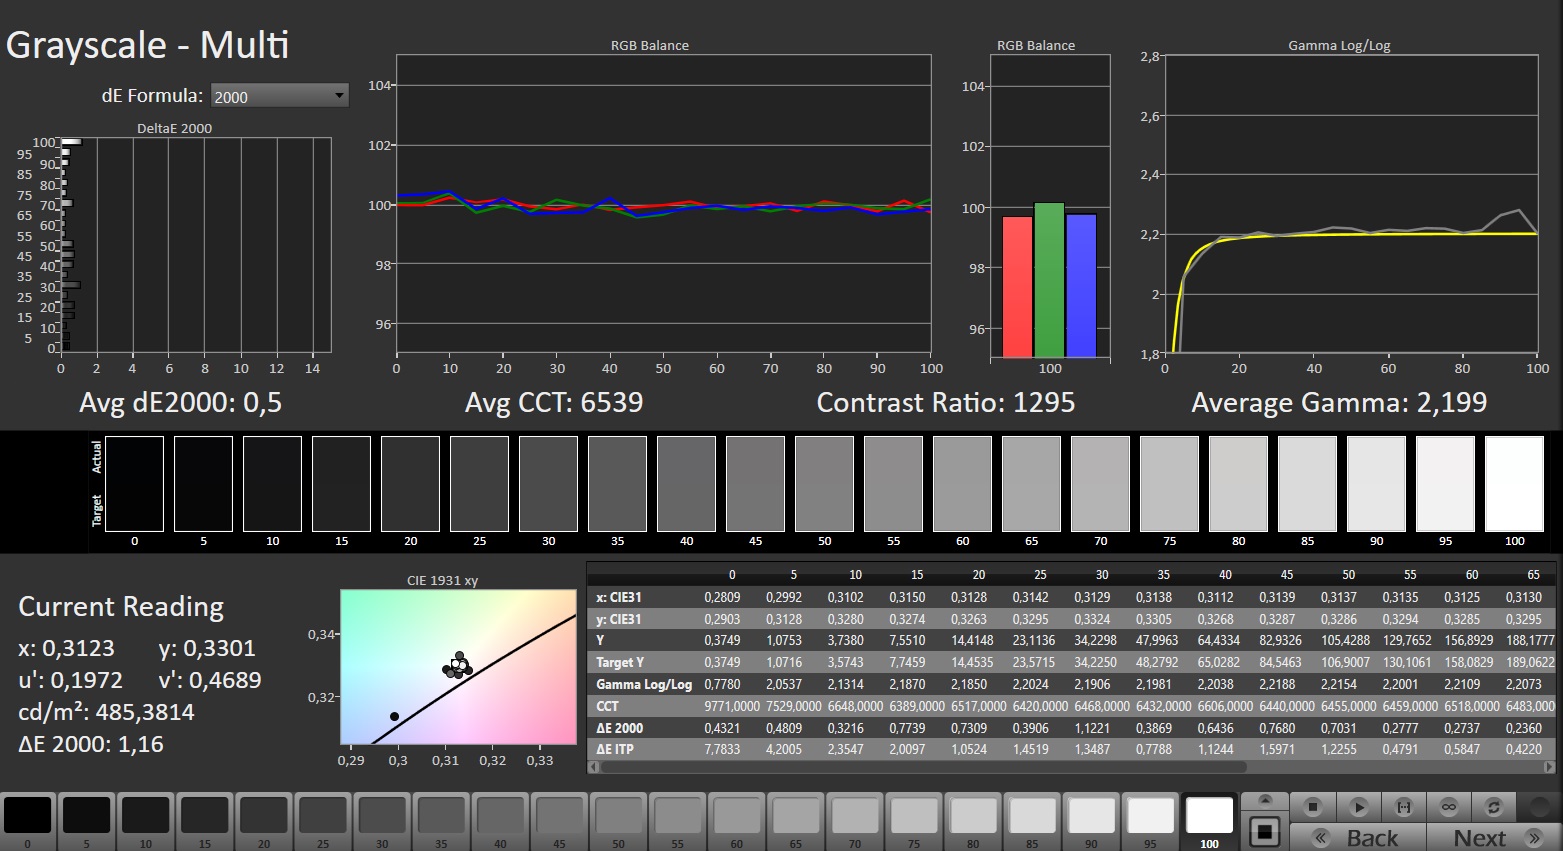
calibrated: 0.54
ΔE Greyscale Calman: 1.4 | ∀{0.09-98 Ø4.96}
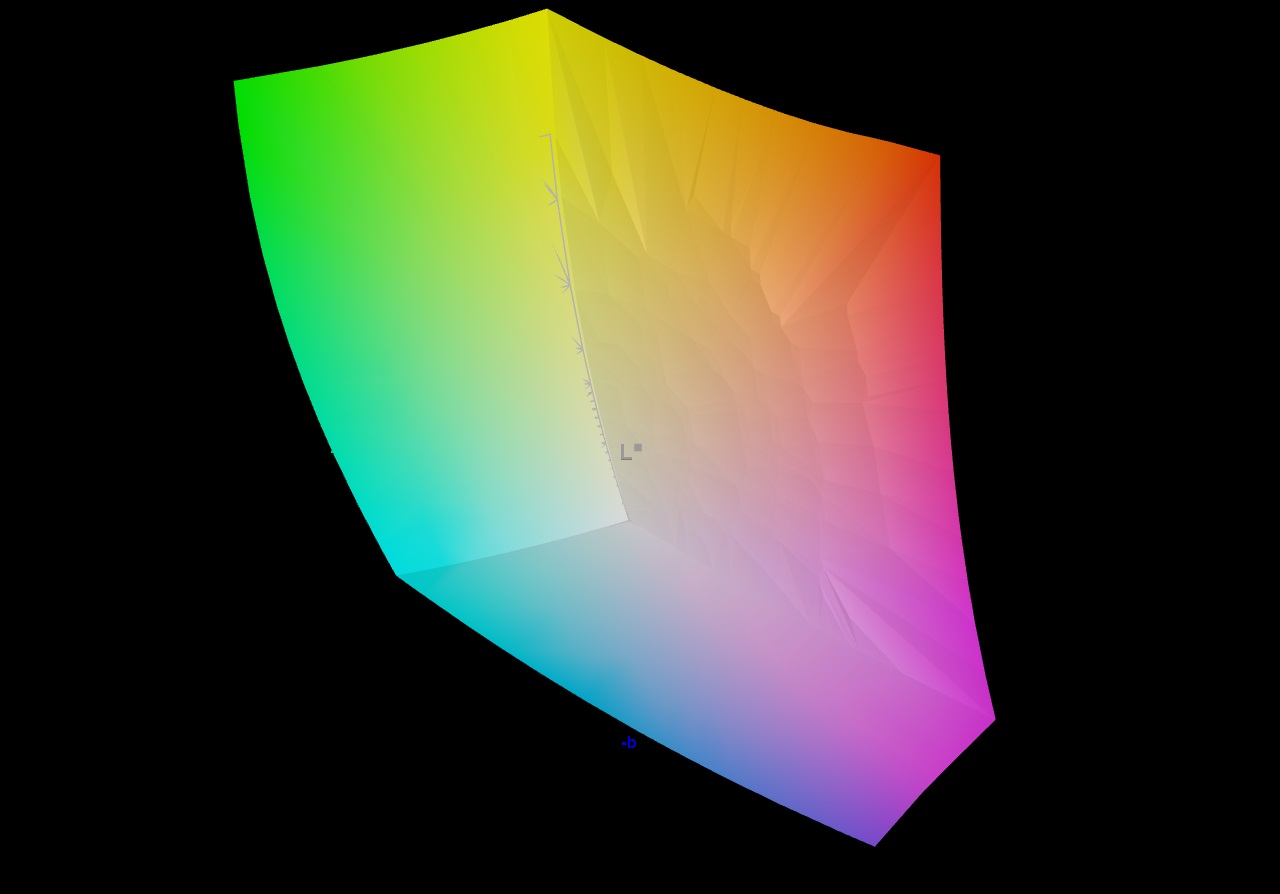
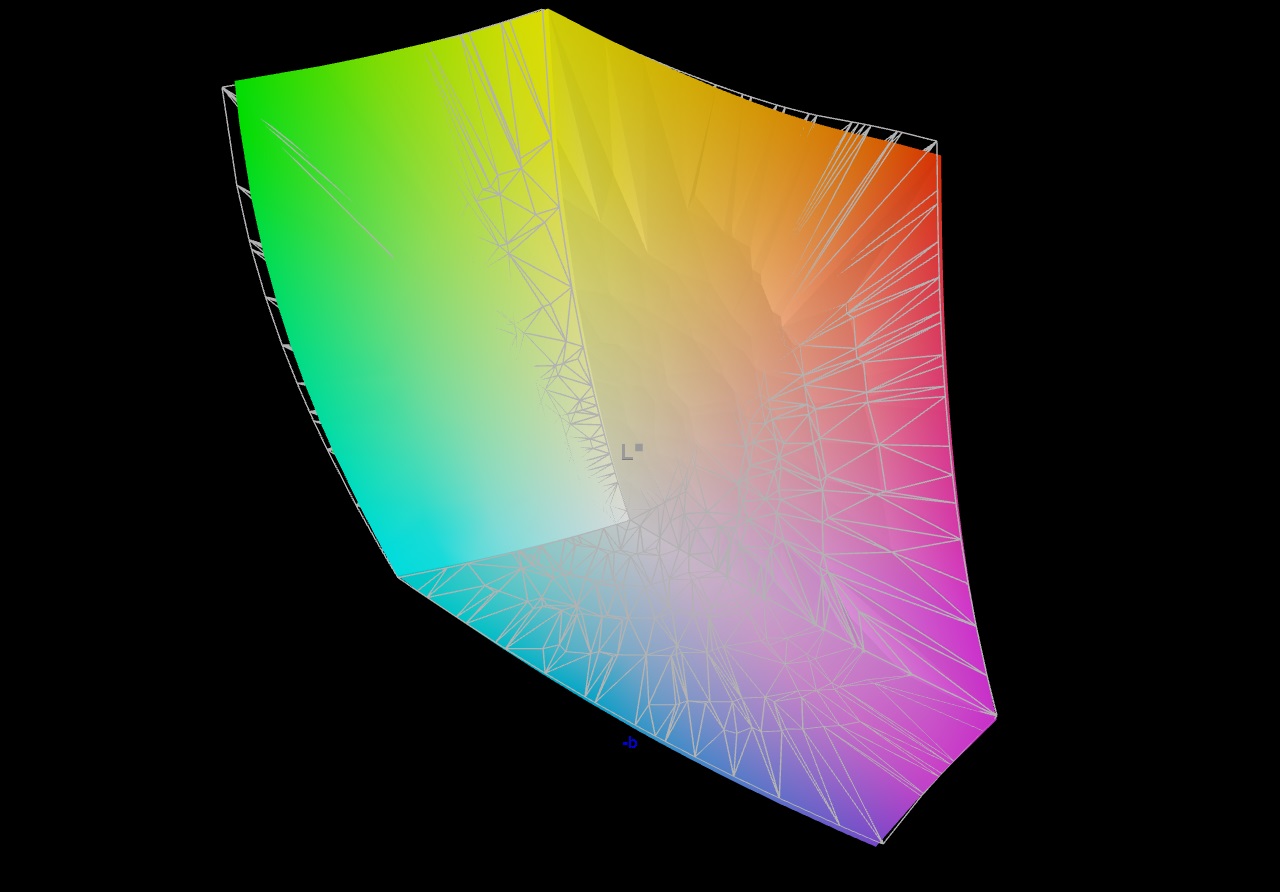
86.7% AdobeRGB 1998 (Argyll 3D)
99.9% sRGB (Argyll 3D)
98.5% Display P3 (Argyll 3D)
Gamma: 2.242
CCT: 6809 K
| Lenovo Legion Pro 7 16IRX9H BOE CQ NE16QDM-NZB, IPS, 2560x1600, 16" | Alienware m16 R1 AMD BOE NE16NZ4, IPS, 2560x1600, 16" | MSI Vector 16 HX A14V Chi Mei N160GME-GTB, IPS, 2560x1600, 16" | HP Omen 16 (2024) BOE BOE0B7D, IPS, 2560x1440, 16.1" | Lenovo Legion Pro 7 16IRX8H MNG007DA2-3 (CSO1628), IPS, 2560x1600, 16" | |
|---|---|---|---|---|---|
| Display | 1% | -1% | -17% | -16% | |
| Display P3 Coverage (%) | 98.5 | 98.6 0% | 95.4 -3% | 68.6 -30% | 69.1 -30% |
| sRGB Coverage (%) | 99.9 | 99.9 0% | 99.7 0% | 98.6 -1% | 99.7 0% |
| AdobeRGB 1998 Coverage (%) | 86.7 | 88.9 3% | 85.4 -1% | 70.6 -19% | 71.2 -18% |
| Response Times | 3% | -21% | -36% | 0% | |
| Response Time Grey 50% / Grey 80% * (ms) | 12.6 ? | 5.1 ? 60% | 5.7 ? 55% | 14.1 ? -12% | 12.3 ? 2% |
| Response Time Black / White * (ms) | 5.8 ? | 9 ? -55% | 11.4 ? -97% | 9.3 ? -60% | 5.9 ? -2% |
| PWM Frequency (Hz) | |||||
| Screen | -109% | -73% | -46% | 3% | |
| Brightness middle (cd/m²) | 487 | 329 -32% | 557.2 14% | 292 -40% | 511 5% |
| Brightness (cd/m²) | 460 | 317 -31% | 506 10% | 291 -37% | 469 2% |
| Brightness Distribution (%) | 88 | 89 1% | 83 -6% | 85 -3% | 86 -2% |
| Black Level * (cd/m²) | 0.42 | 0.32 24% | 0.41 2% | 0.24 43% | 0.4 5% |
| Contrast (:1) | 1160 | 1028 -11% | 1359 17% | 1217 5% | 1278 10% |
| Colorchecker dE 2000 * | 1.12 | 3.71 -231% | 2.91 -160% | 2.36 -111% | 0.95 15% |
| Colorchecker dE 2000 max. * | 2.26 | 7.23 -220% | 5.94 -163% | 4.08 -81% | 2.07 8% |
| Colorchecker dE 2000 calibrated * | 0.54 | 2.82 -422% | 1.63 -202% | 0.93 -72% | 0.91 -69% |
| Greyscale dE 2000 * | 1.4 | 2.2 -57% | 3.8 -171% | 3 -114% | 0.6 57% |
| Gamma | 2.242 98% | 2.3 96% | 2.23 99% | 2.101 105% | 2.176 101% |
| CCT | 6809 95% | 6270 104% | 6408 101% | 5976 109% | 6545 99% |
| Media total (Programa/Opciones) | -35% /
-69% | -32% /
-50% | -33% /
-38% | -4% /
-1% |
* ... más pequeño es mejor
La pantalla ya tenía una fantástica reproducción del color nada más sacarla de la caja. Ofrecía un Delta E de aproximadamente 1,1, cumpliendo el nivel objetivo de menos de 3. Al calibrar la pantalla, la diferencia media de color se redujo a 0,54 y se obtuvo una escala de grises más equilibrada. El panel es capaz de cubrir totalmente las gamas sRGB y DCI-P3, pero no el espacio de color AdobeRGB. Esto es similar a lo que ofrecen las pantallas de la mayoría de portátiles de la competencia.

Tiempos de respuesta del display
| ↔ Tiempo de respuesta de Negro a Blanco | ||
|---|---|---|
| 5.8 ms ... subida ↗ y bajada ↘ combinada | ↗ 2.1 ms subida | 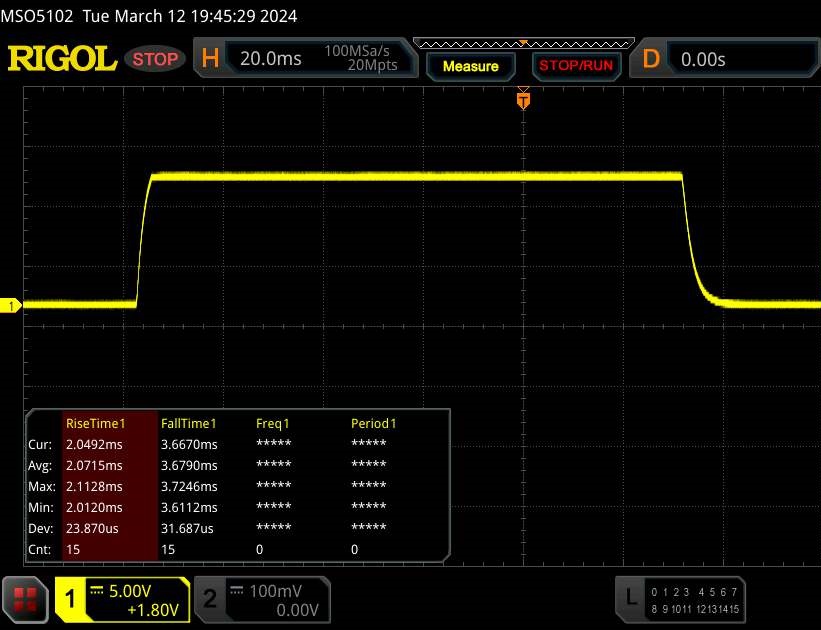 |
| ↘ 3.7 ms bajada | ||
| La pantalla mostró tiempos de respuesta muy rápidos en nuestros tests y debería ser adecuada para juegos frenéticos. En comparación, todos los dispositivos de prueba van de ##min### (mínimo) a 240 (máximo) ms. » 18 % de todos los dispositivos son mejores. Esto quiere decir que el tiempo de respuesta medido es mejor que la media (19.8 ms) de todos los dispositivos testados. | ||
| ↔ Tiempo de respuesta 50% Gris a 80% Gris | ||
| 12.6 ms ... subida ↗ y bajada ↘ combinada | ↗ 6 ms subida | 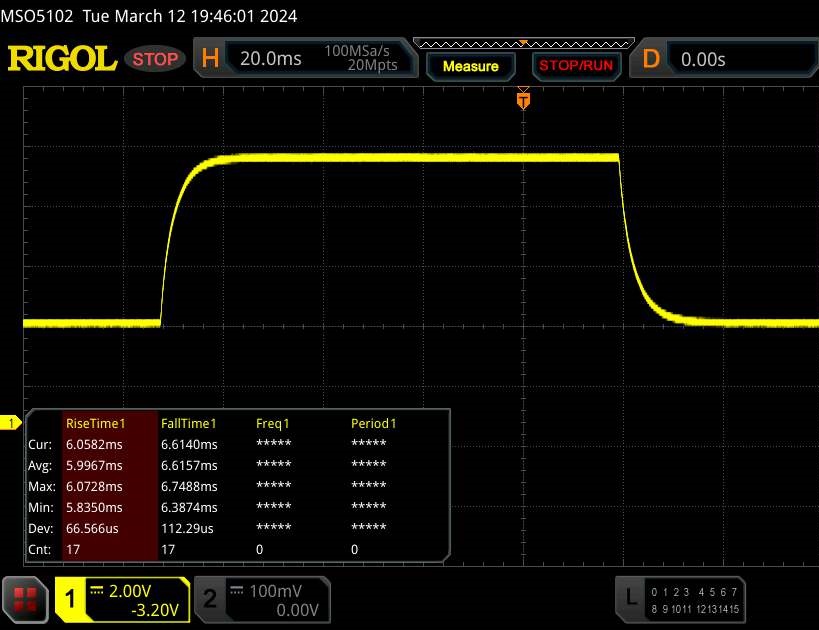 |
| ↘ 6.6 ms bajada | ||
| La pantalla mostró buenos tiempos de respuesta en nuestros tests pero podría ser demasiado lenta para los jugones competitivos. En comparación, todos los dispositivos de prueba van de ##min### (mínimo) a 636 (máximo) ms. » 26 % de todos los dispositivos son mejores. Esto quiere decir que el tiempo de respuesta medido es mejor que la media (31 ms) de todos los dispositivos testados. | ||
Parpadeo de Pantalla / PWM (Pulse-Width Modulation)
| Parpadeo de Pantalla / PWM no detectado | 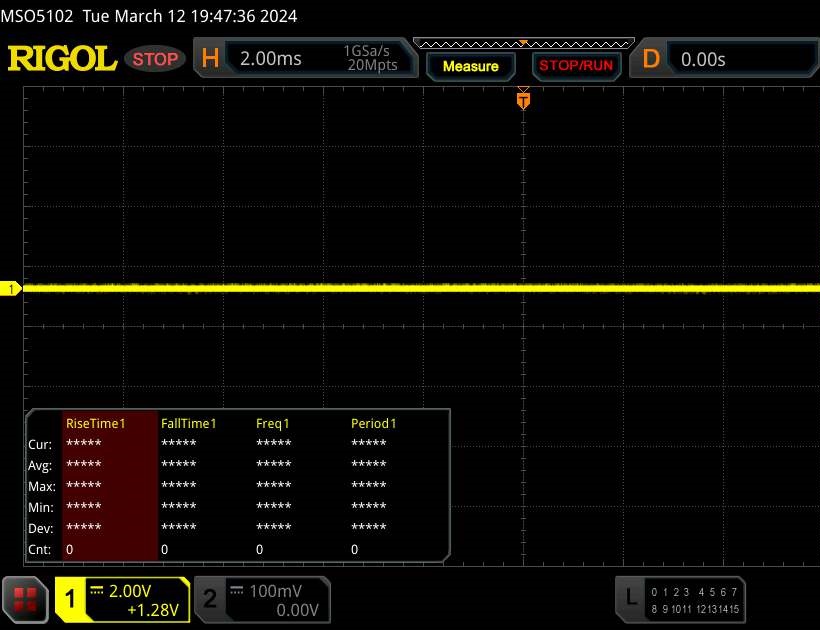 | ||
Comparación: 52 % de todos los dispositivos testados no usaron PWM para atenuar el display. Si se usó, medimos una media de 7757 (mínimo: 5 - máxmo: 343500) Hz. | |||
El panel IPS tiene un amplio ángulo de visión y es legible desde cualquier posición. Es posible utilizar la pantalla en exteriores, siempre que el sol no sea excesivamente brillante.
Leistung - Hardware de gama alta de Intel y Nvidia
El Lenovo Legion Pro 7 es un portátil de 16 pulgadas de alto rendimiento creado para jugadores y creadores. La potencia de cálculo necesaria la proporcionan Raptor Lake y Ada Lovelace. Nuestro modelo de análisis se puede conseguir por algo menos de 3.000 euros (unos 3.245 dólares) con un descuento para educación. No hay otras variantes disponibles en el momento de este análisis.
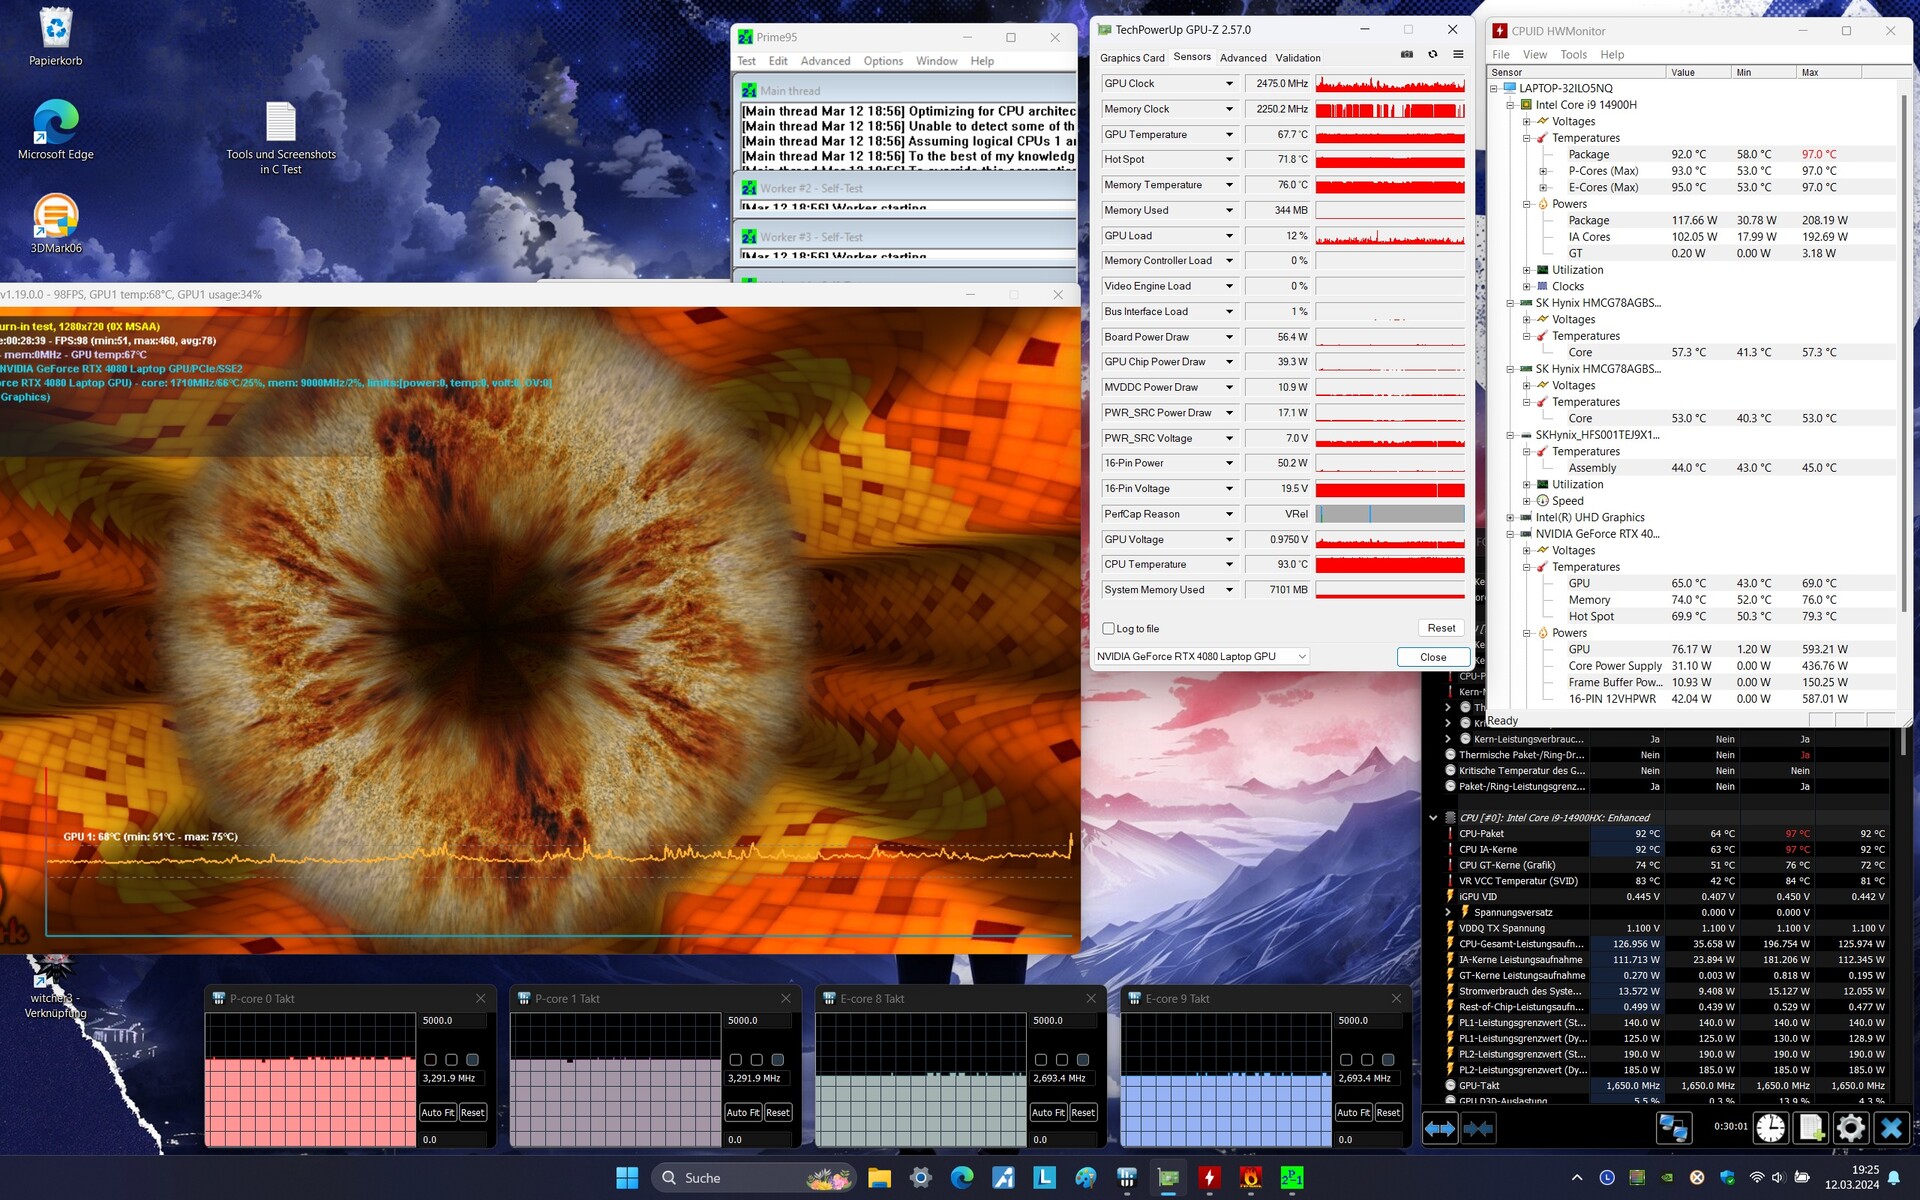
Condiciones de la prueba
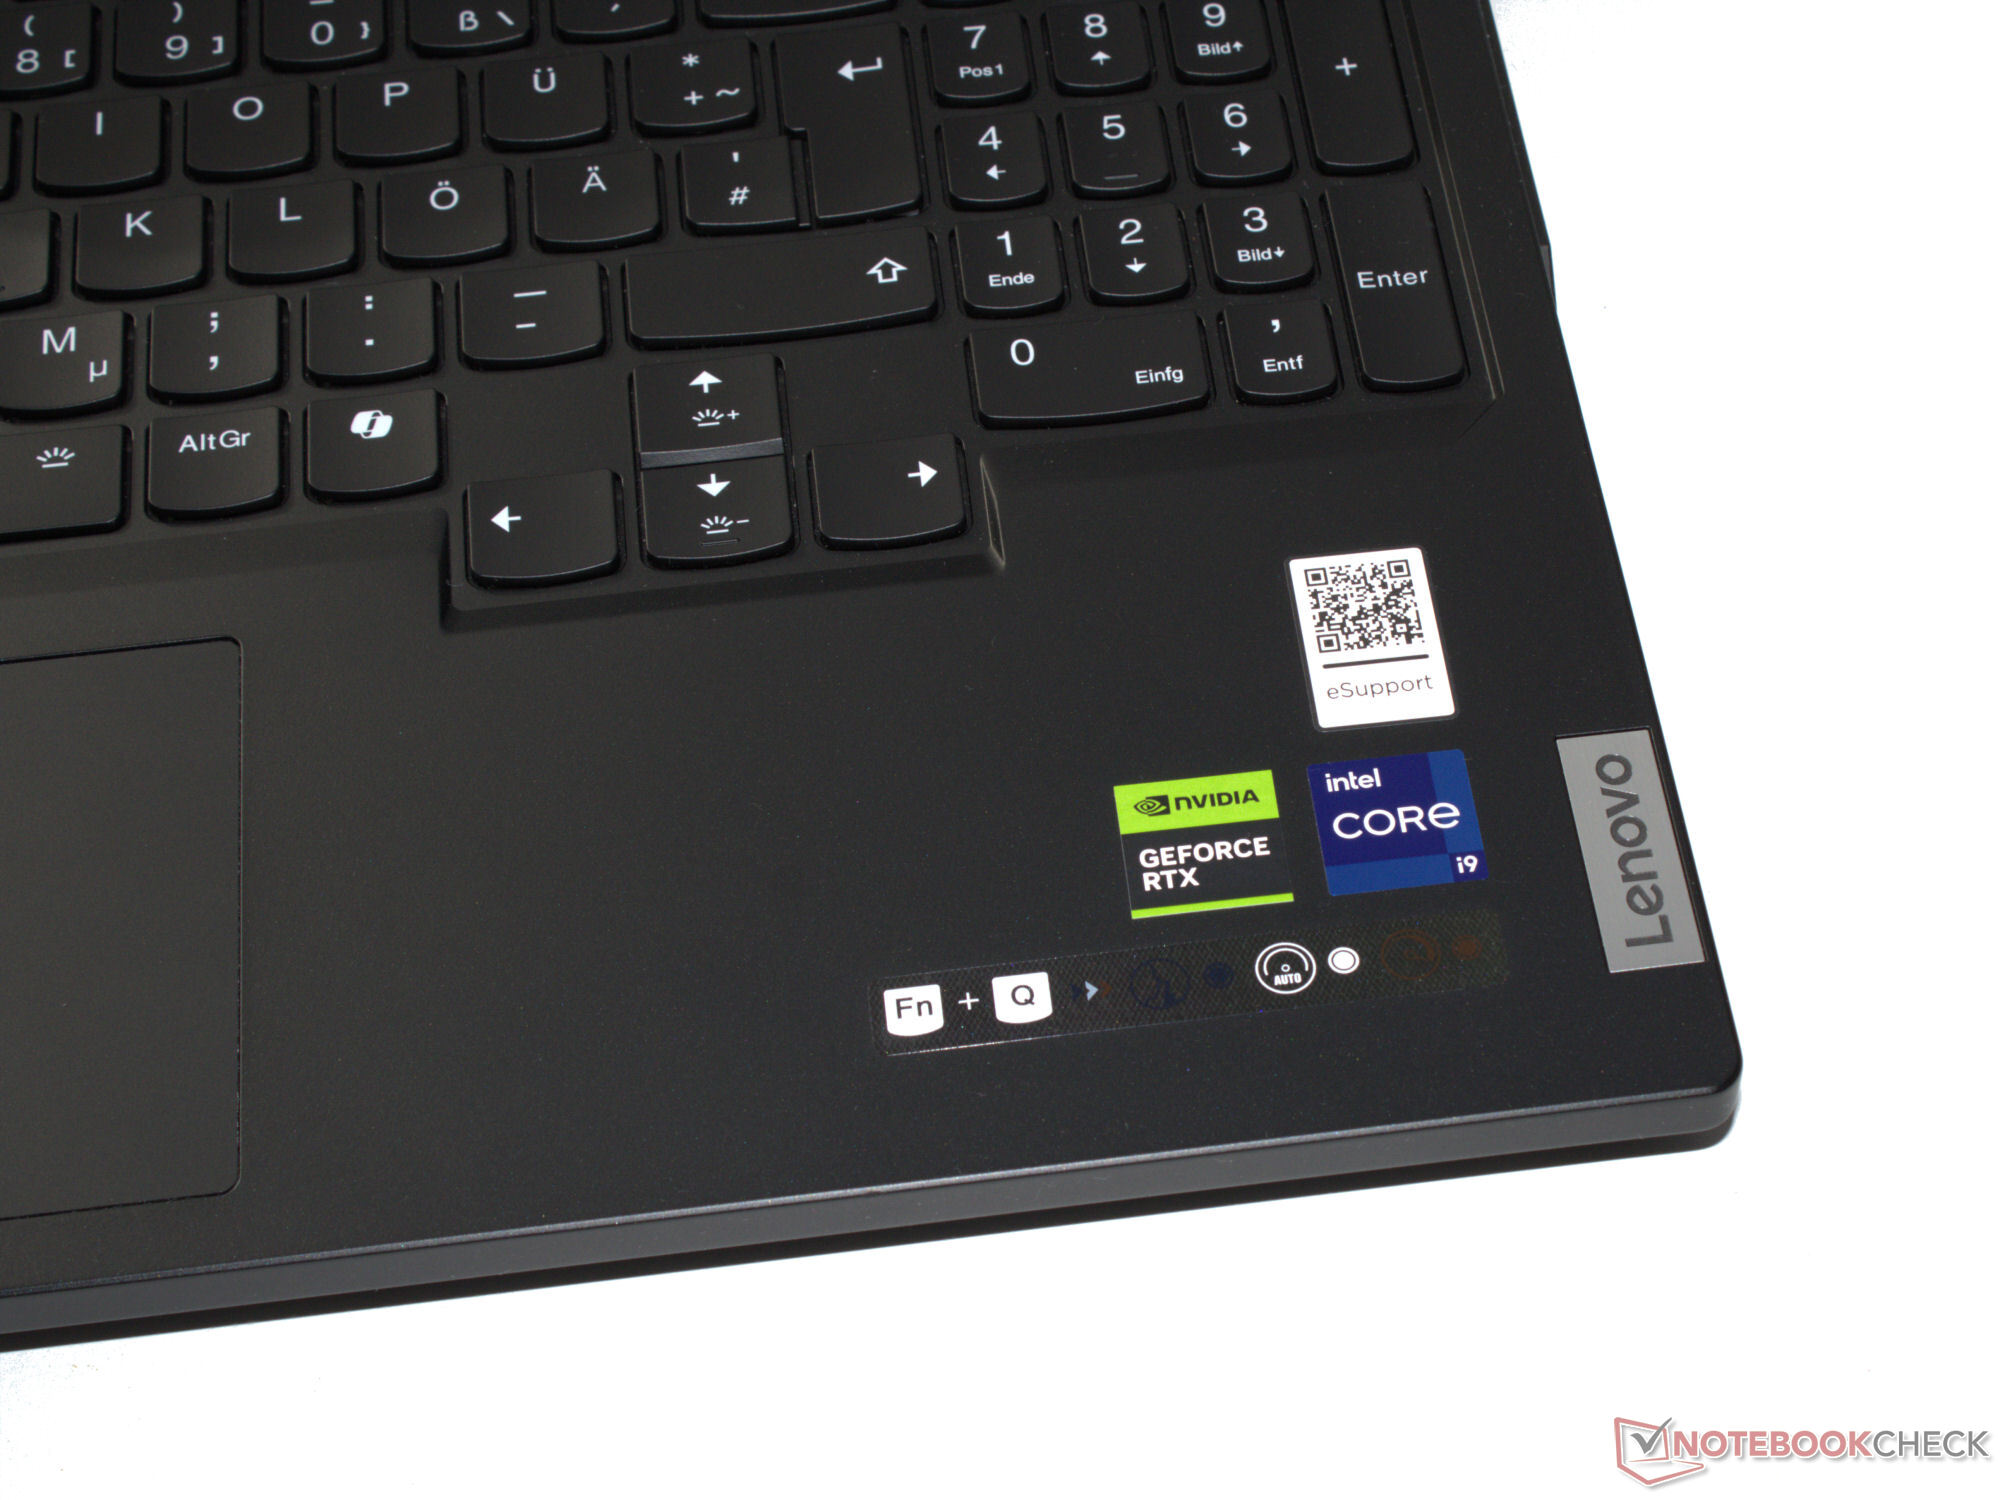
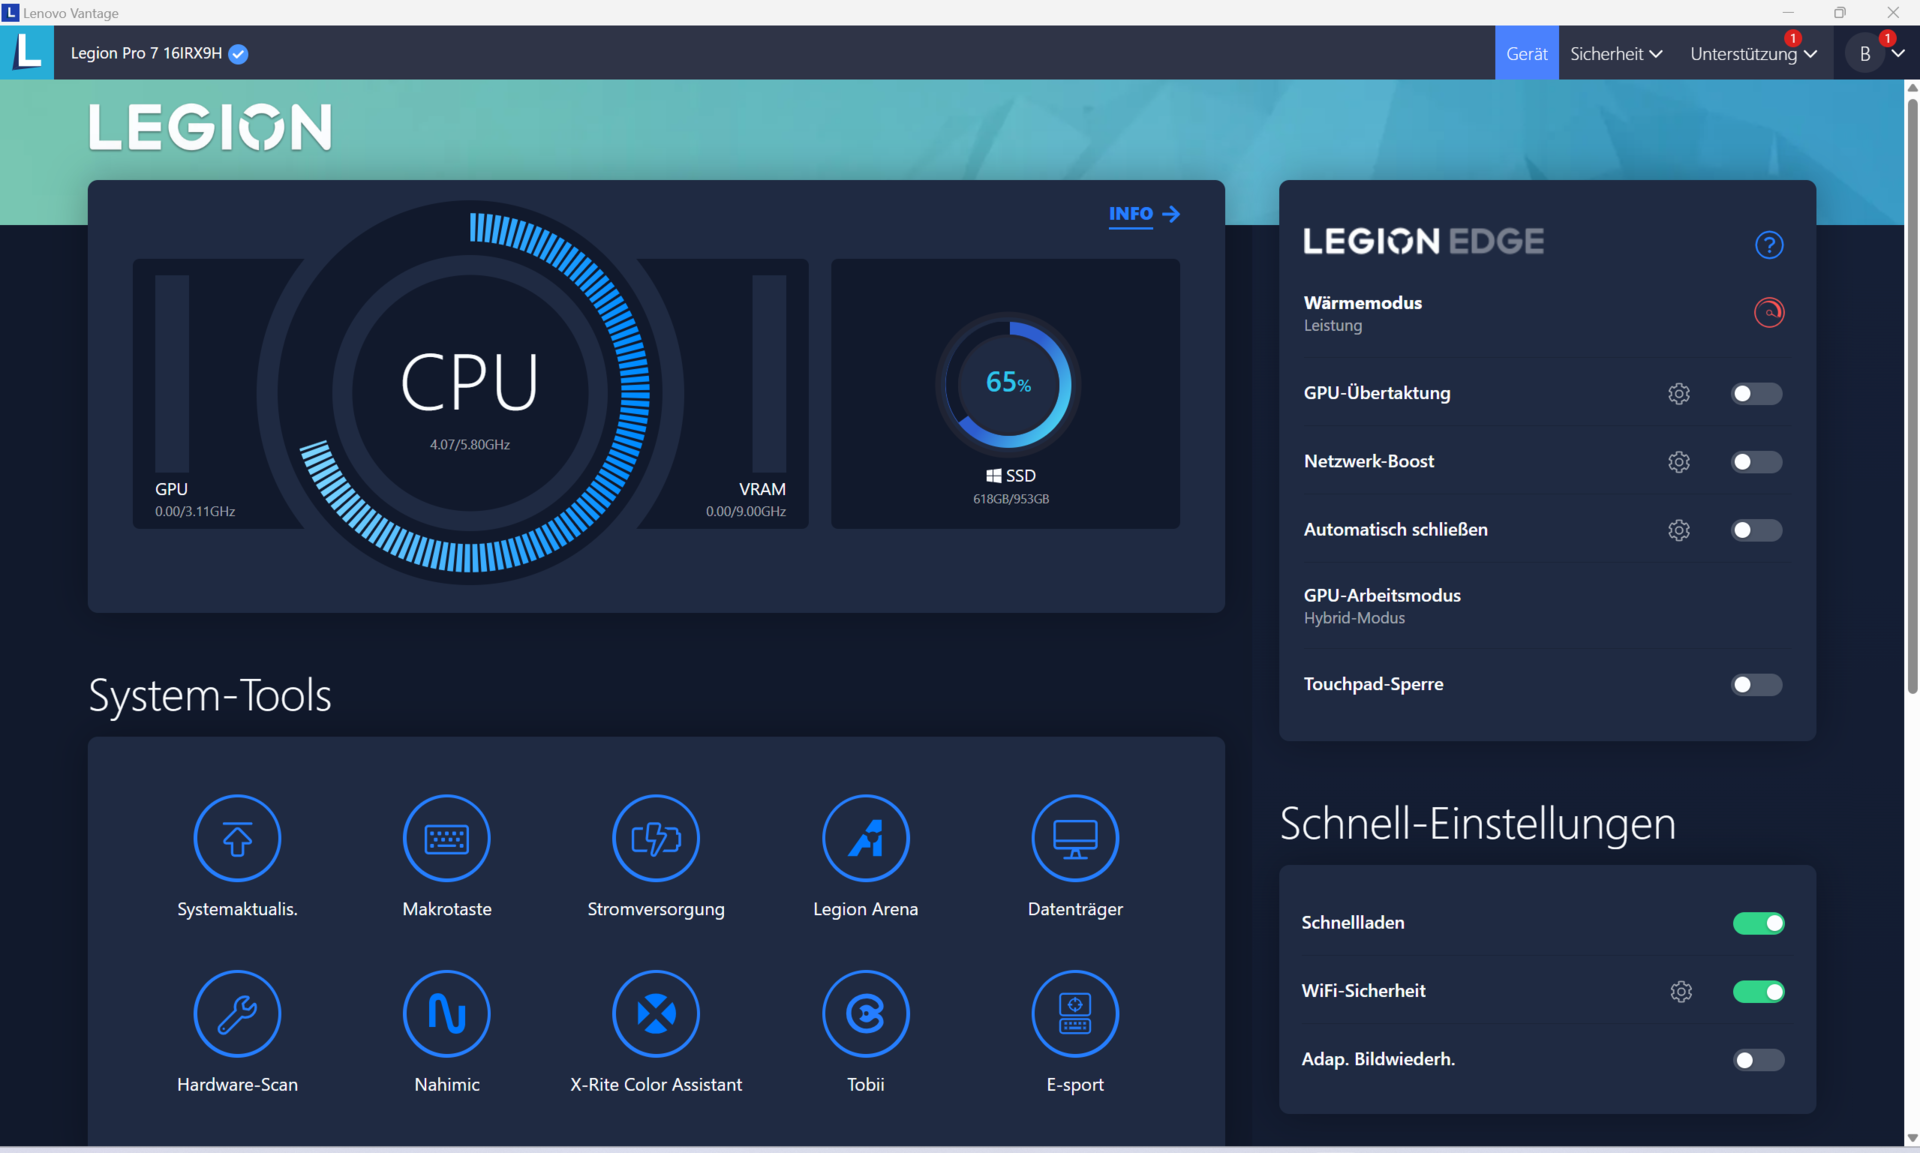
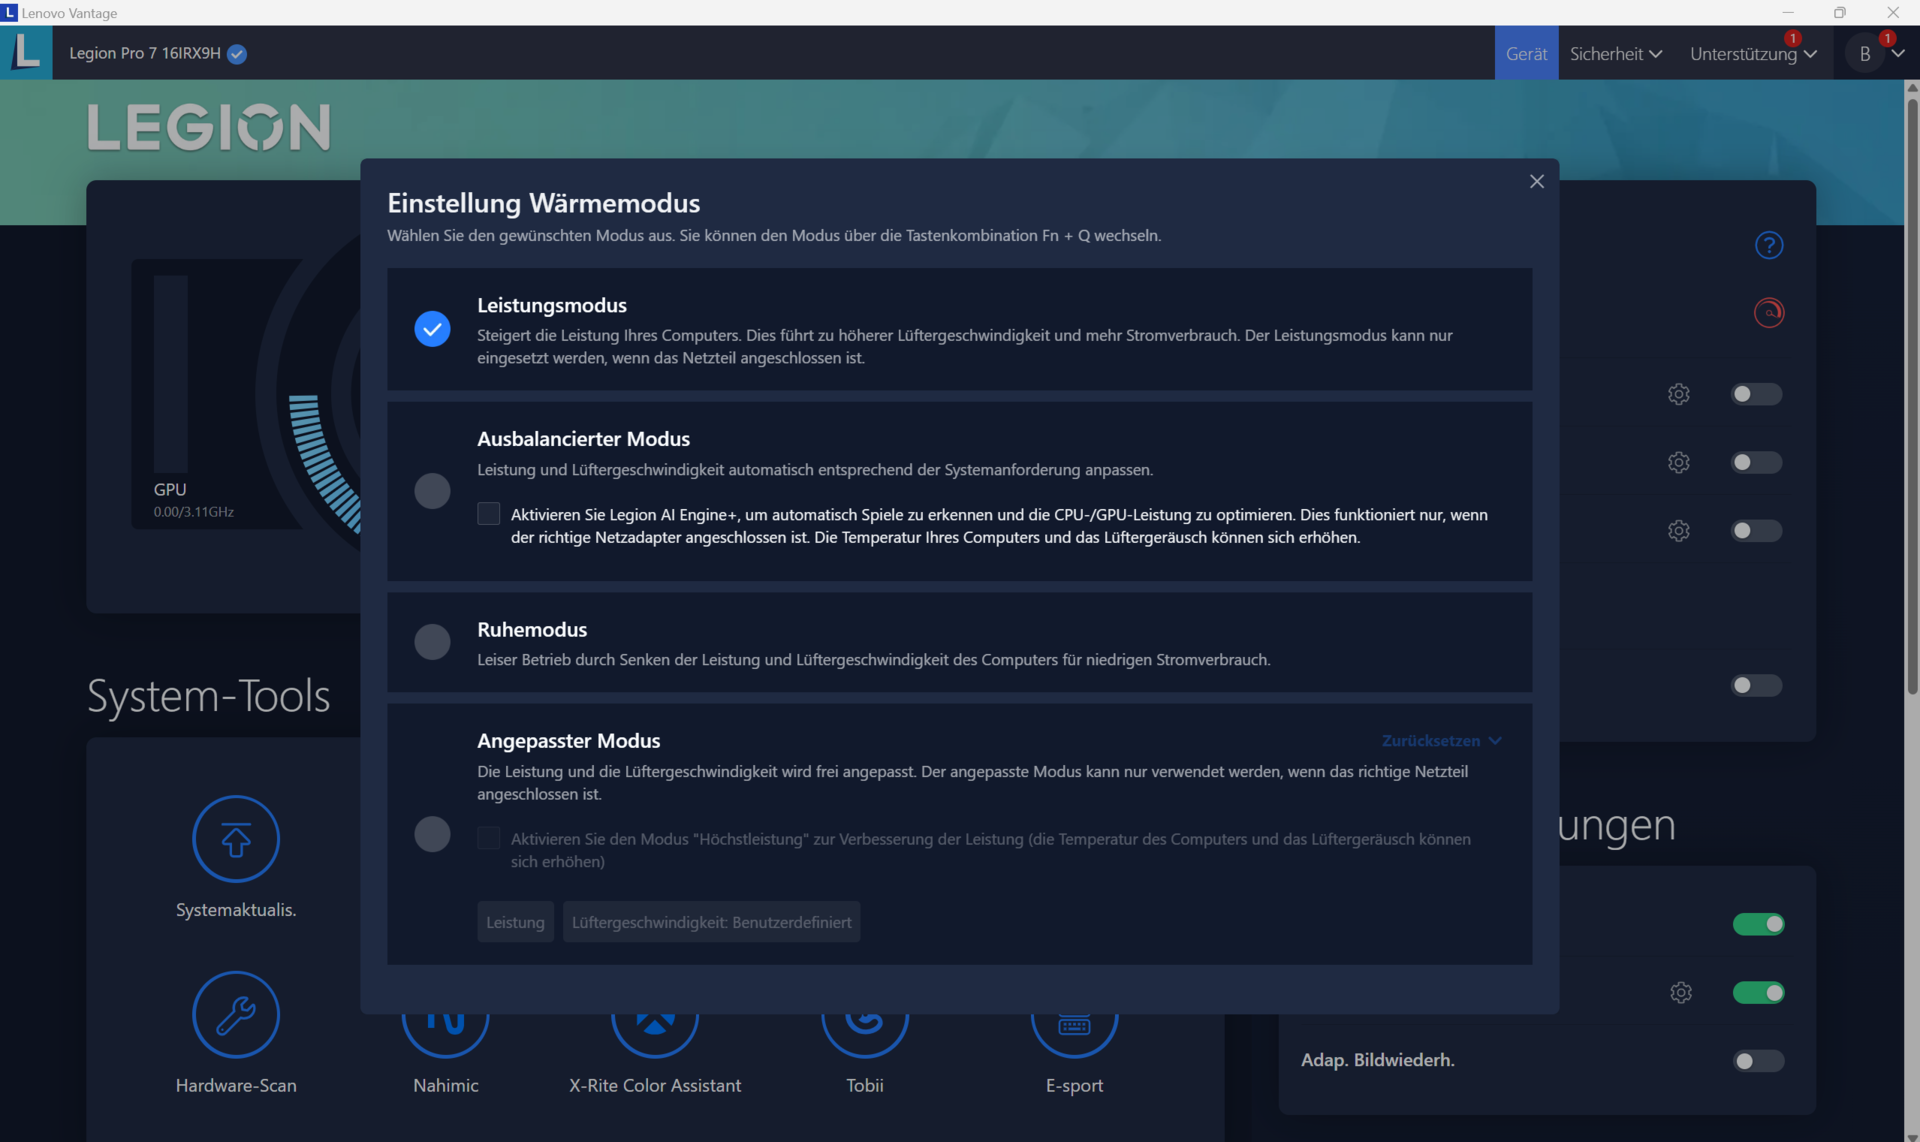
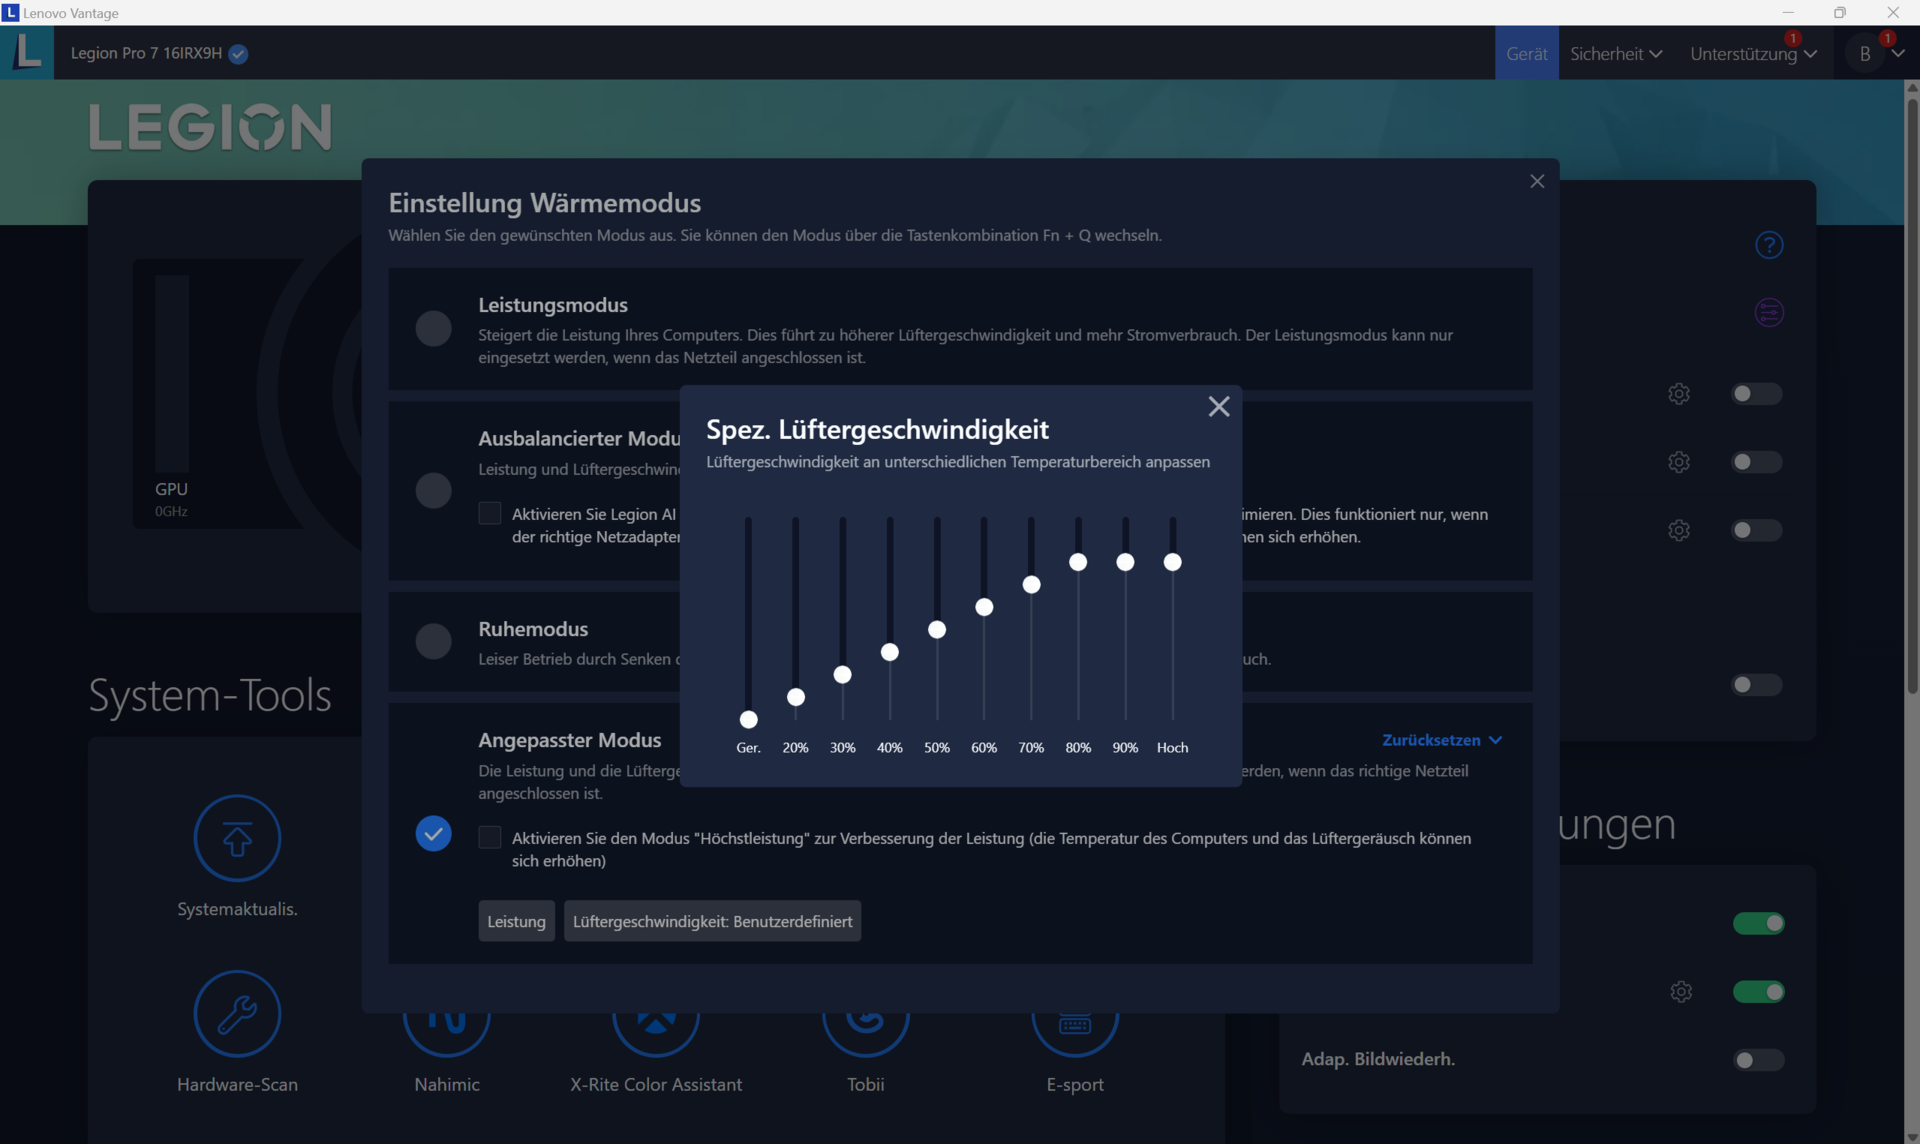
El portátil ofrece tres modos de rendimiento específicos del fabricante (ver tabla). Puede alternar entre ellos mediante la combinación de teclas Fn + Q. Utilizamos los modos Rendimiento y Silencio para nuestros benchmarks y la prueba de batería respectivamente.
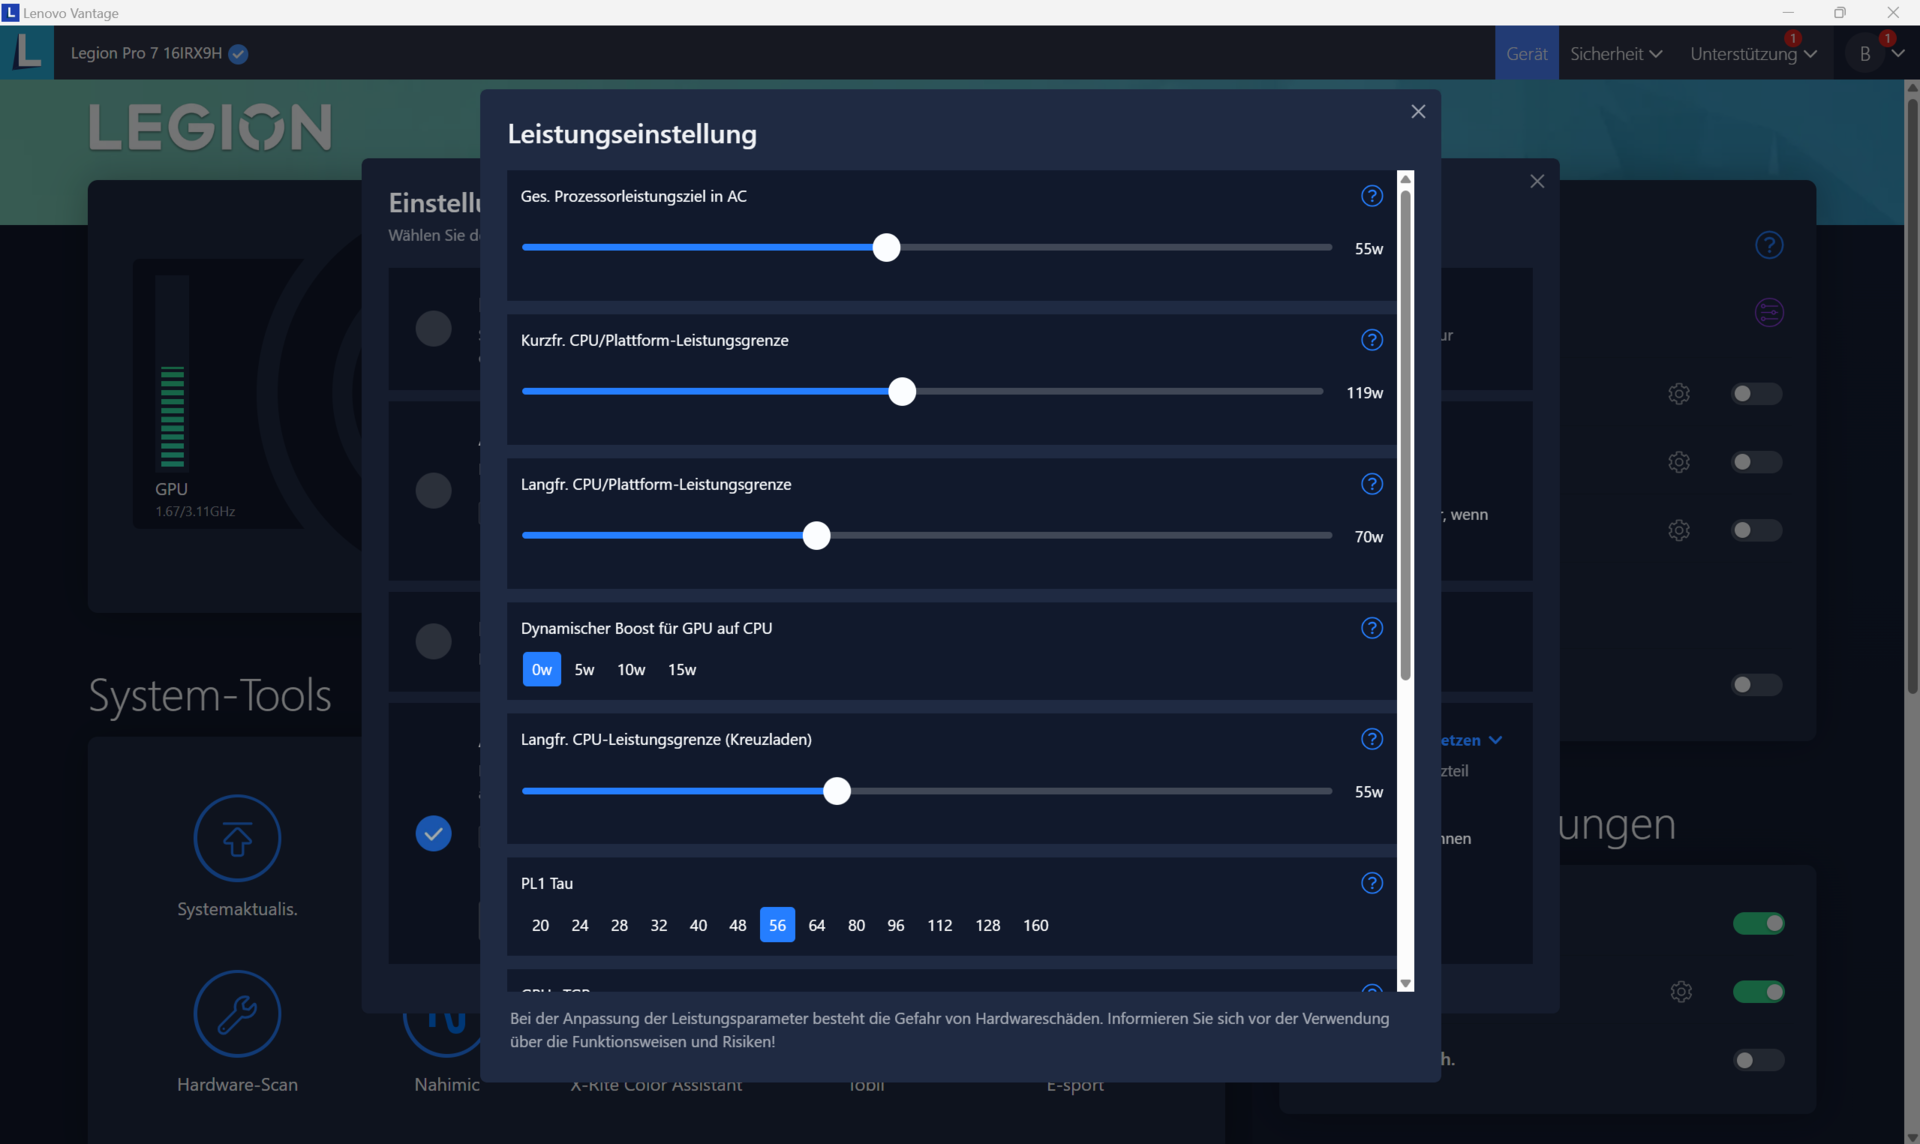
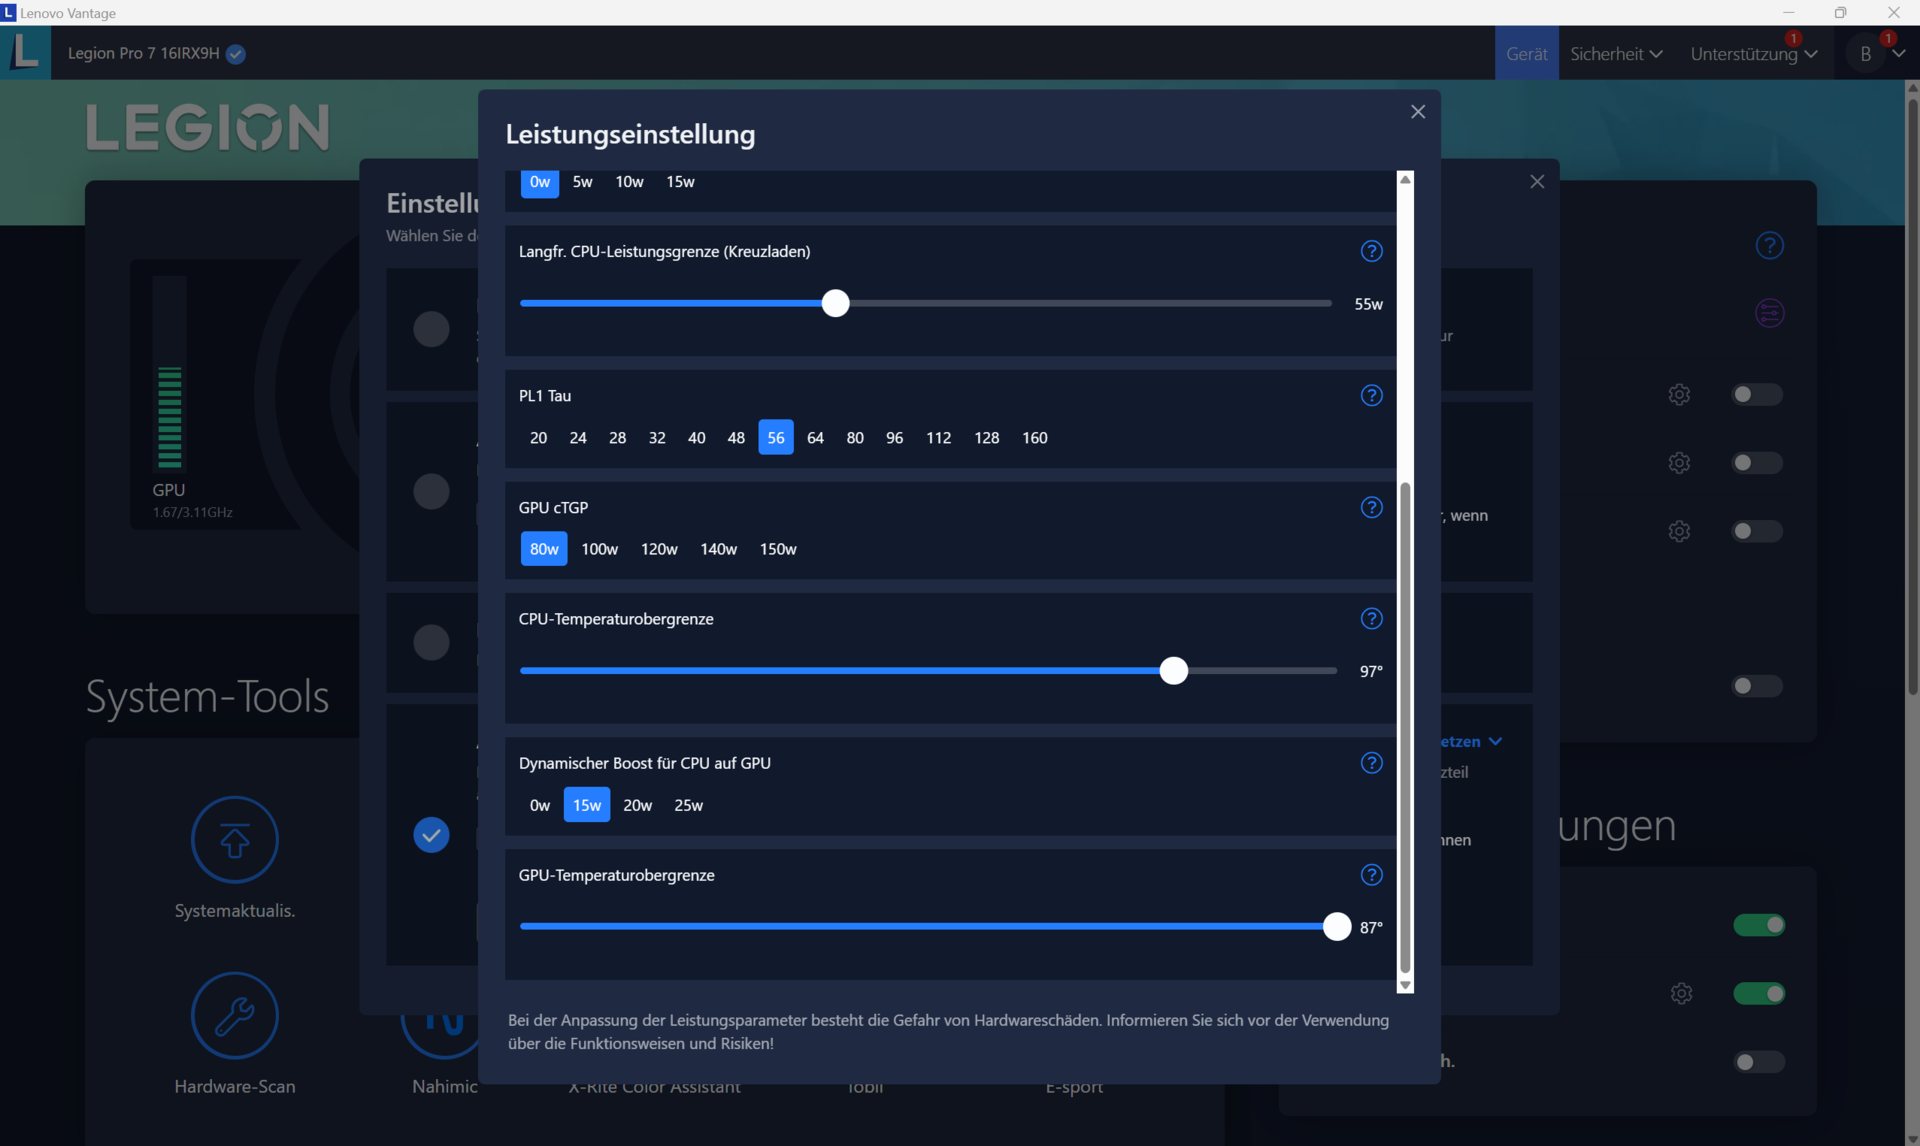
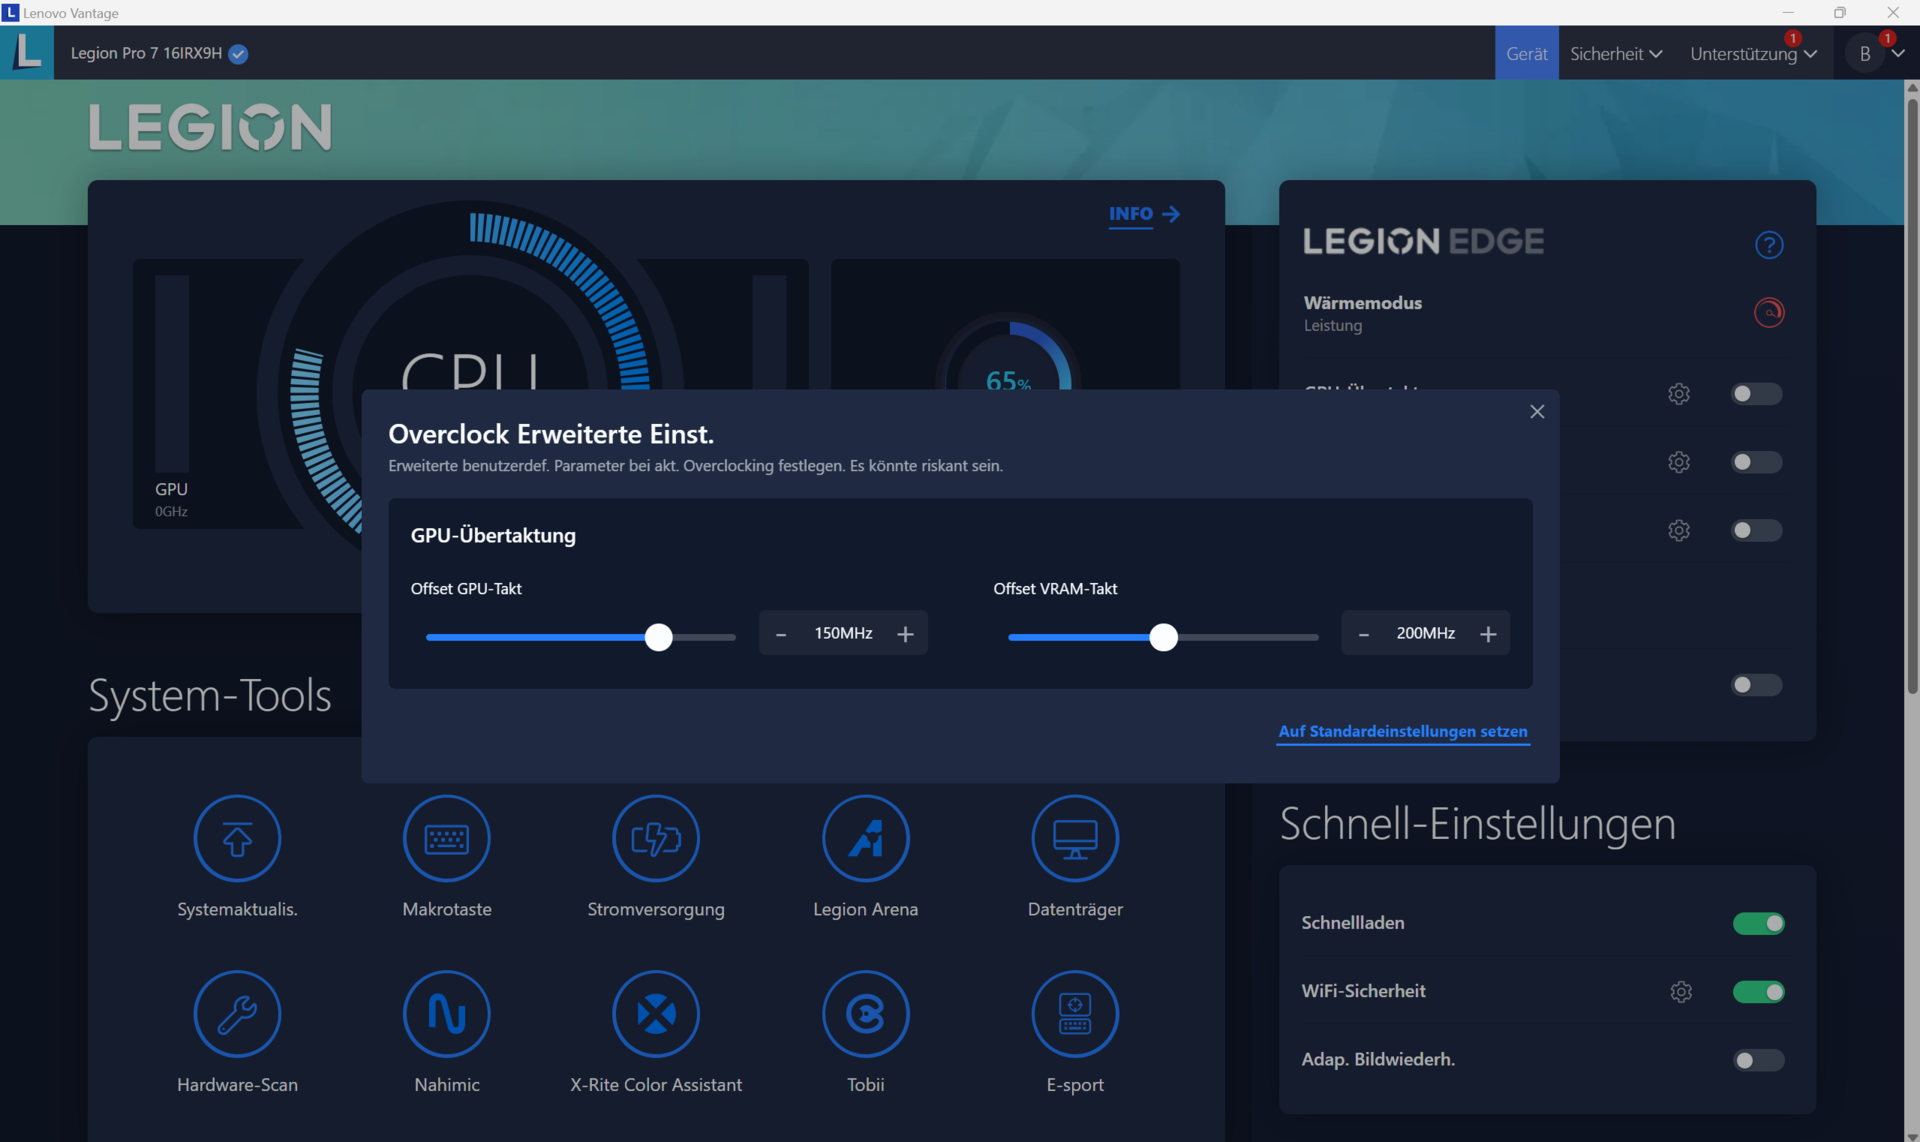
También hay un cuarto modo disponible en Lenovo Vantage (el centro de control del portátil): Modo personalizado. Este modo permite especificar los ajustes de rendimiento del procesador (límite de potencia) y de la tarjeta gráfica (TGP, Dynamic Boost y límite de temperatura), así como ajustar la velocidad del ventilador. Además, es posible overclockear la GPU y la memoria gráfica independientemente del perfil seleccionado.
| Modo rendimiento | Modo equilibrado | Modo silencioso | |
|---|---|---|---|
| Límite de potencia 1 (HWInfo) | 130 vatios | 80 vatios | 55 vatios |
| Límite de potencia 2 (HWInfo) | 185 vatios | 119 vatios | 65 vatios |
| Ruido (Witcher 3) | 54 dB(A) | 45 dB(A) | 33 dB(A) |
| Rendimiento (Witcher 3) | ~184 fps | ~160 fps | 40 fps (bloqueado) |
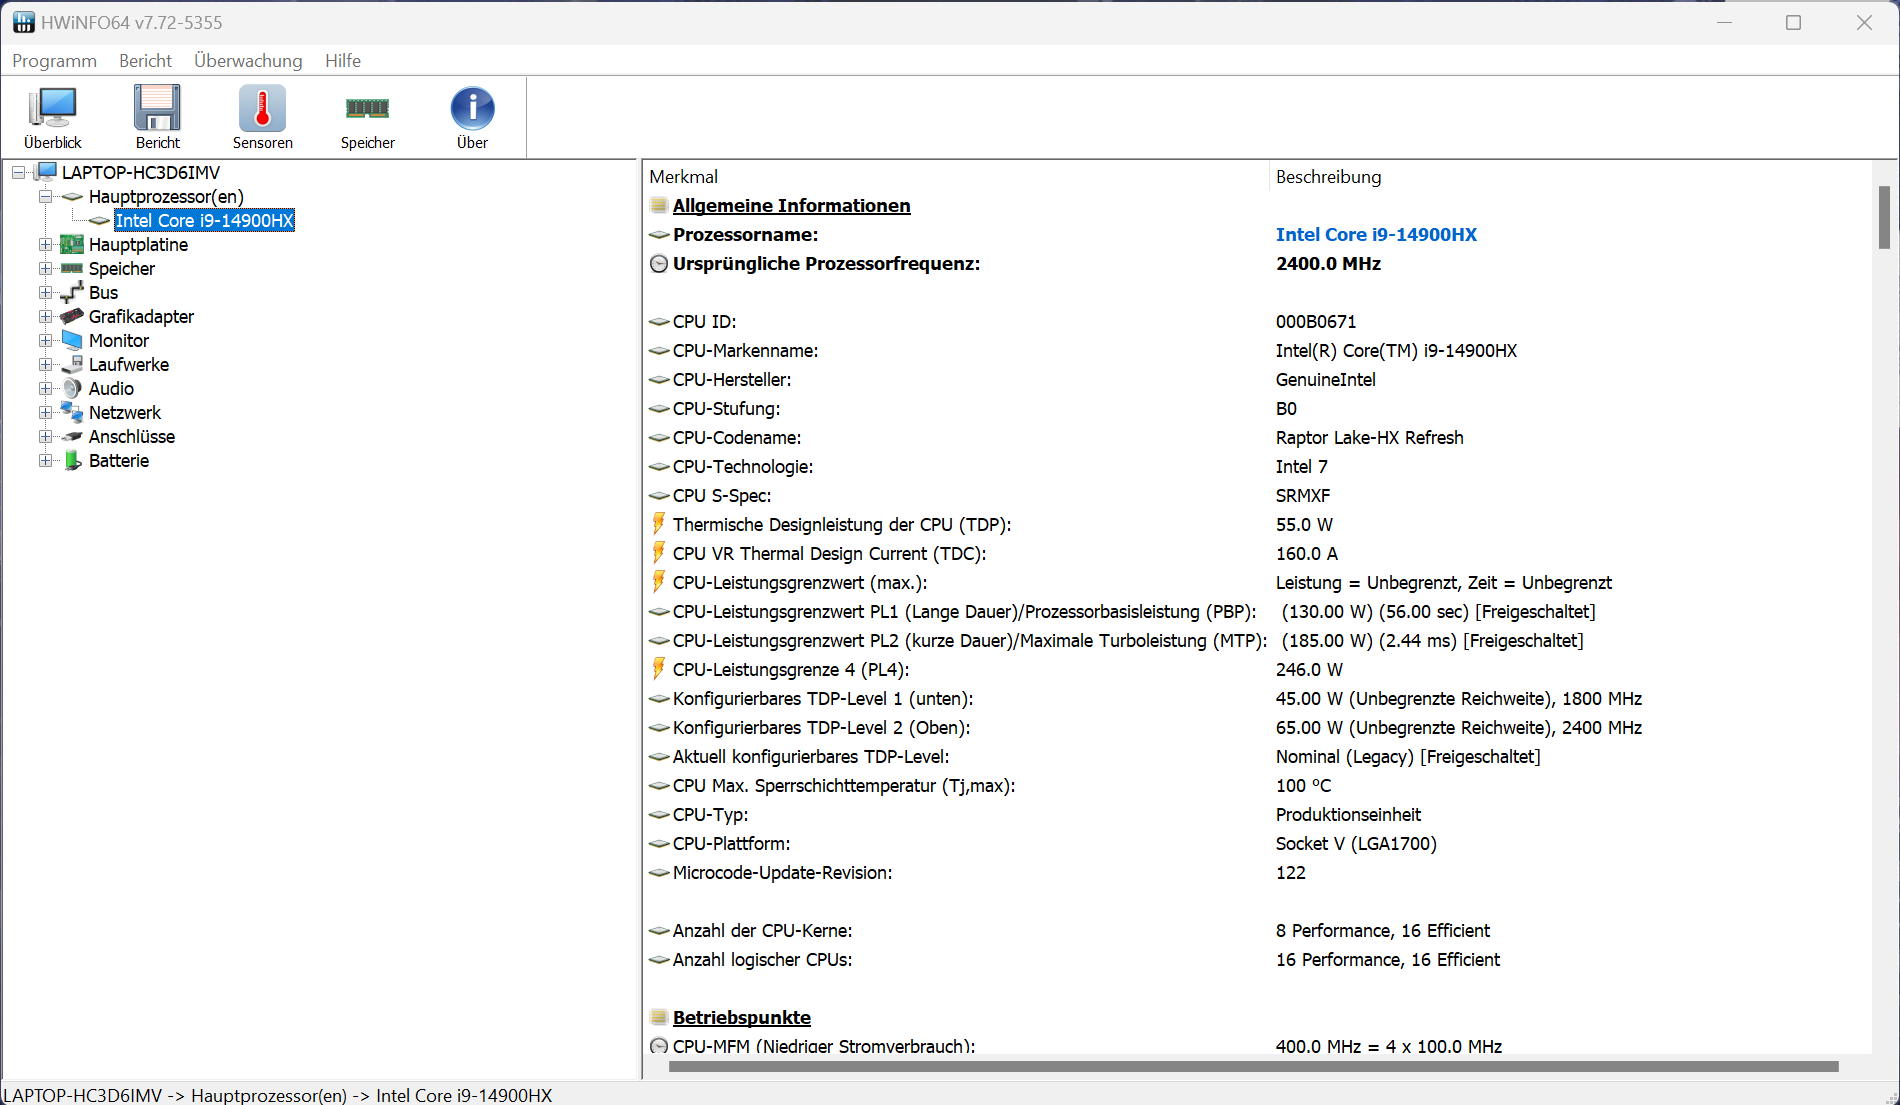
Procesador
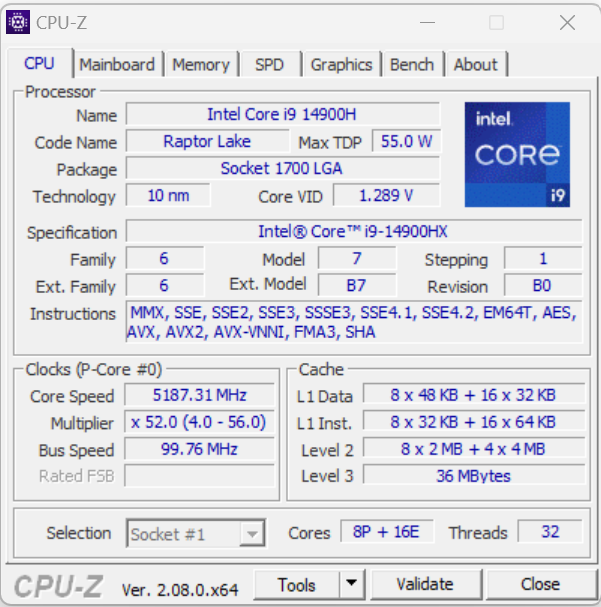
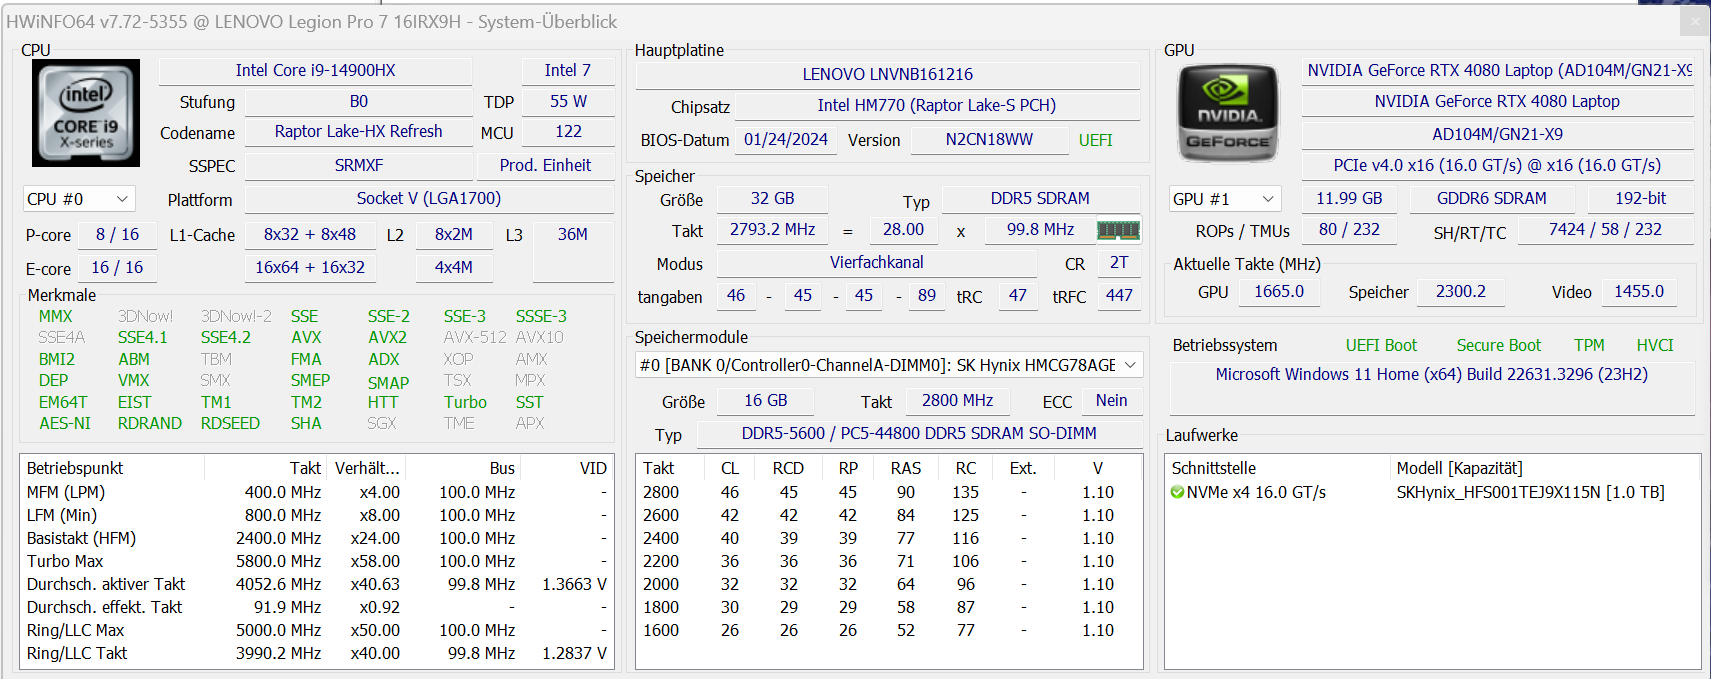
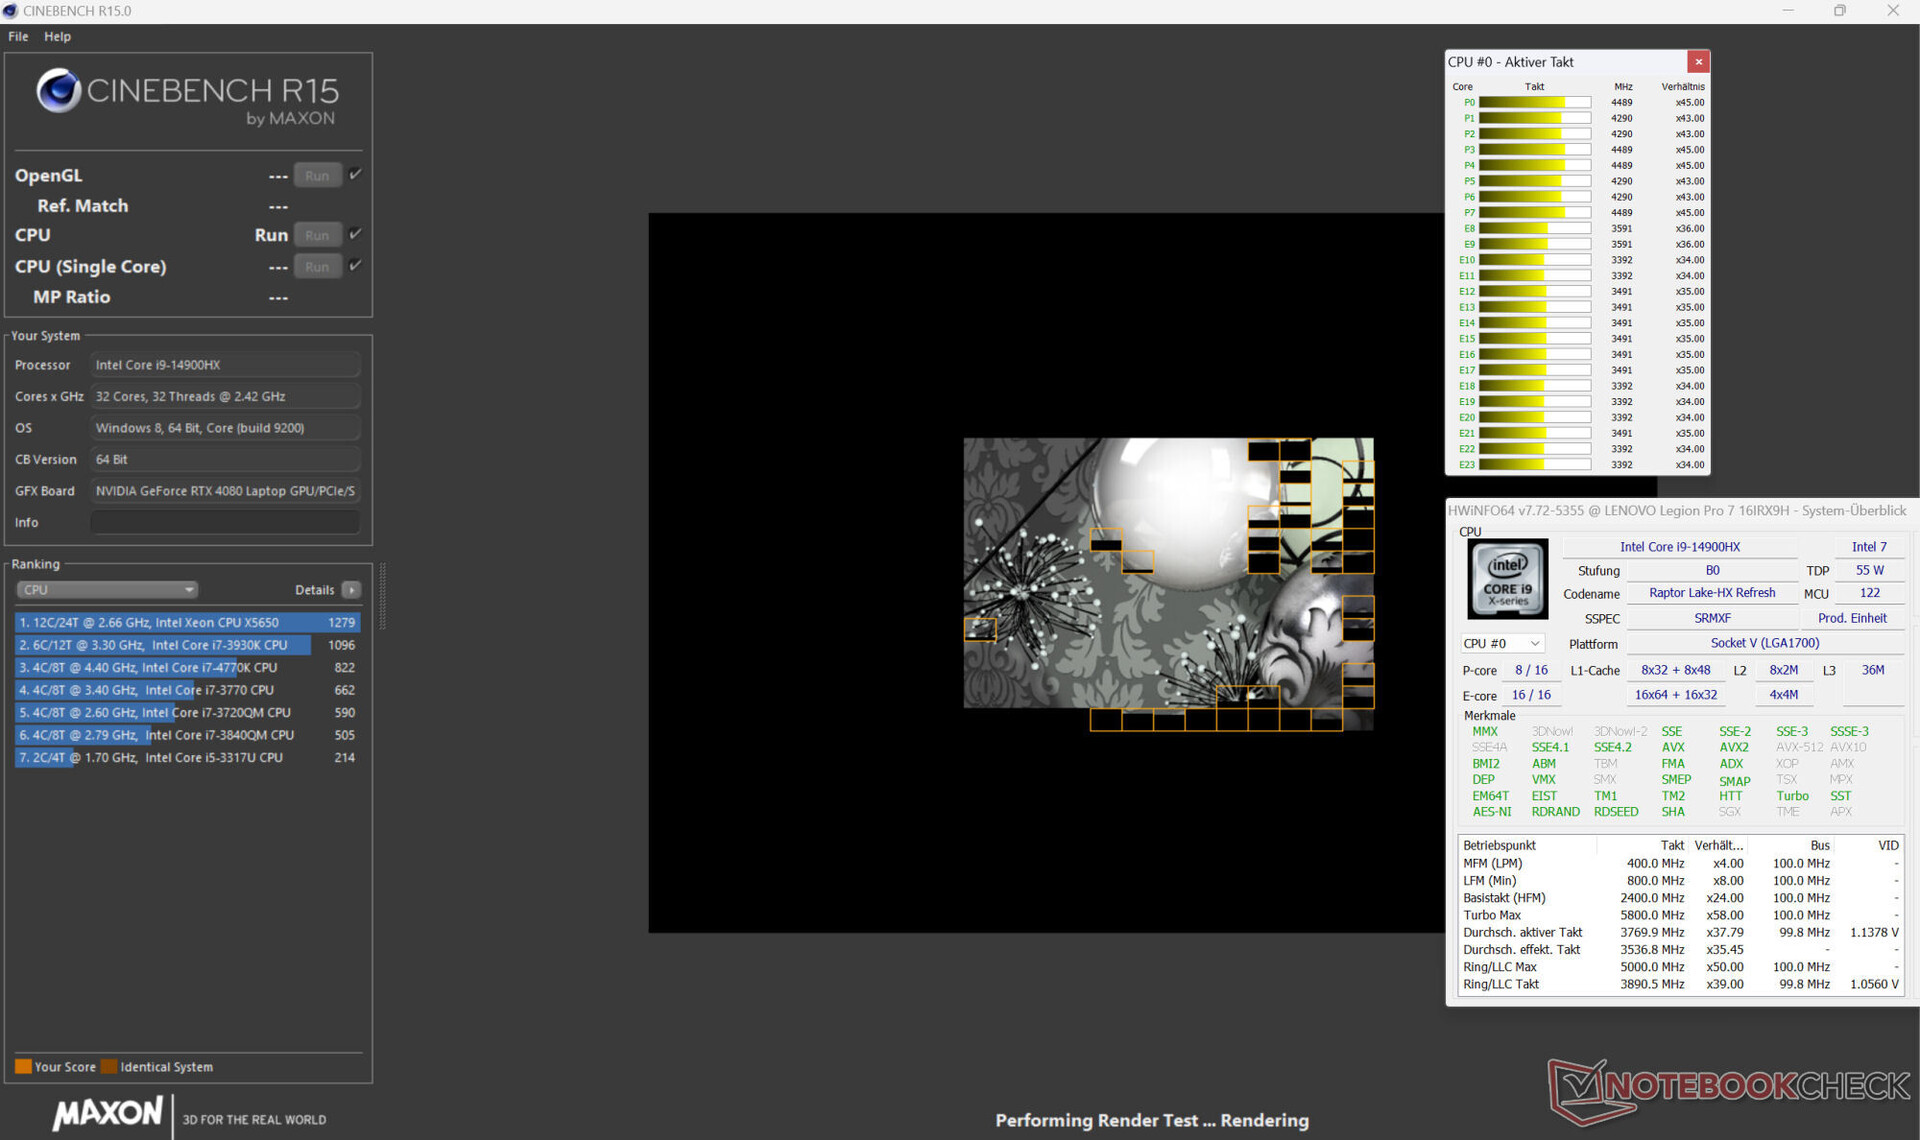
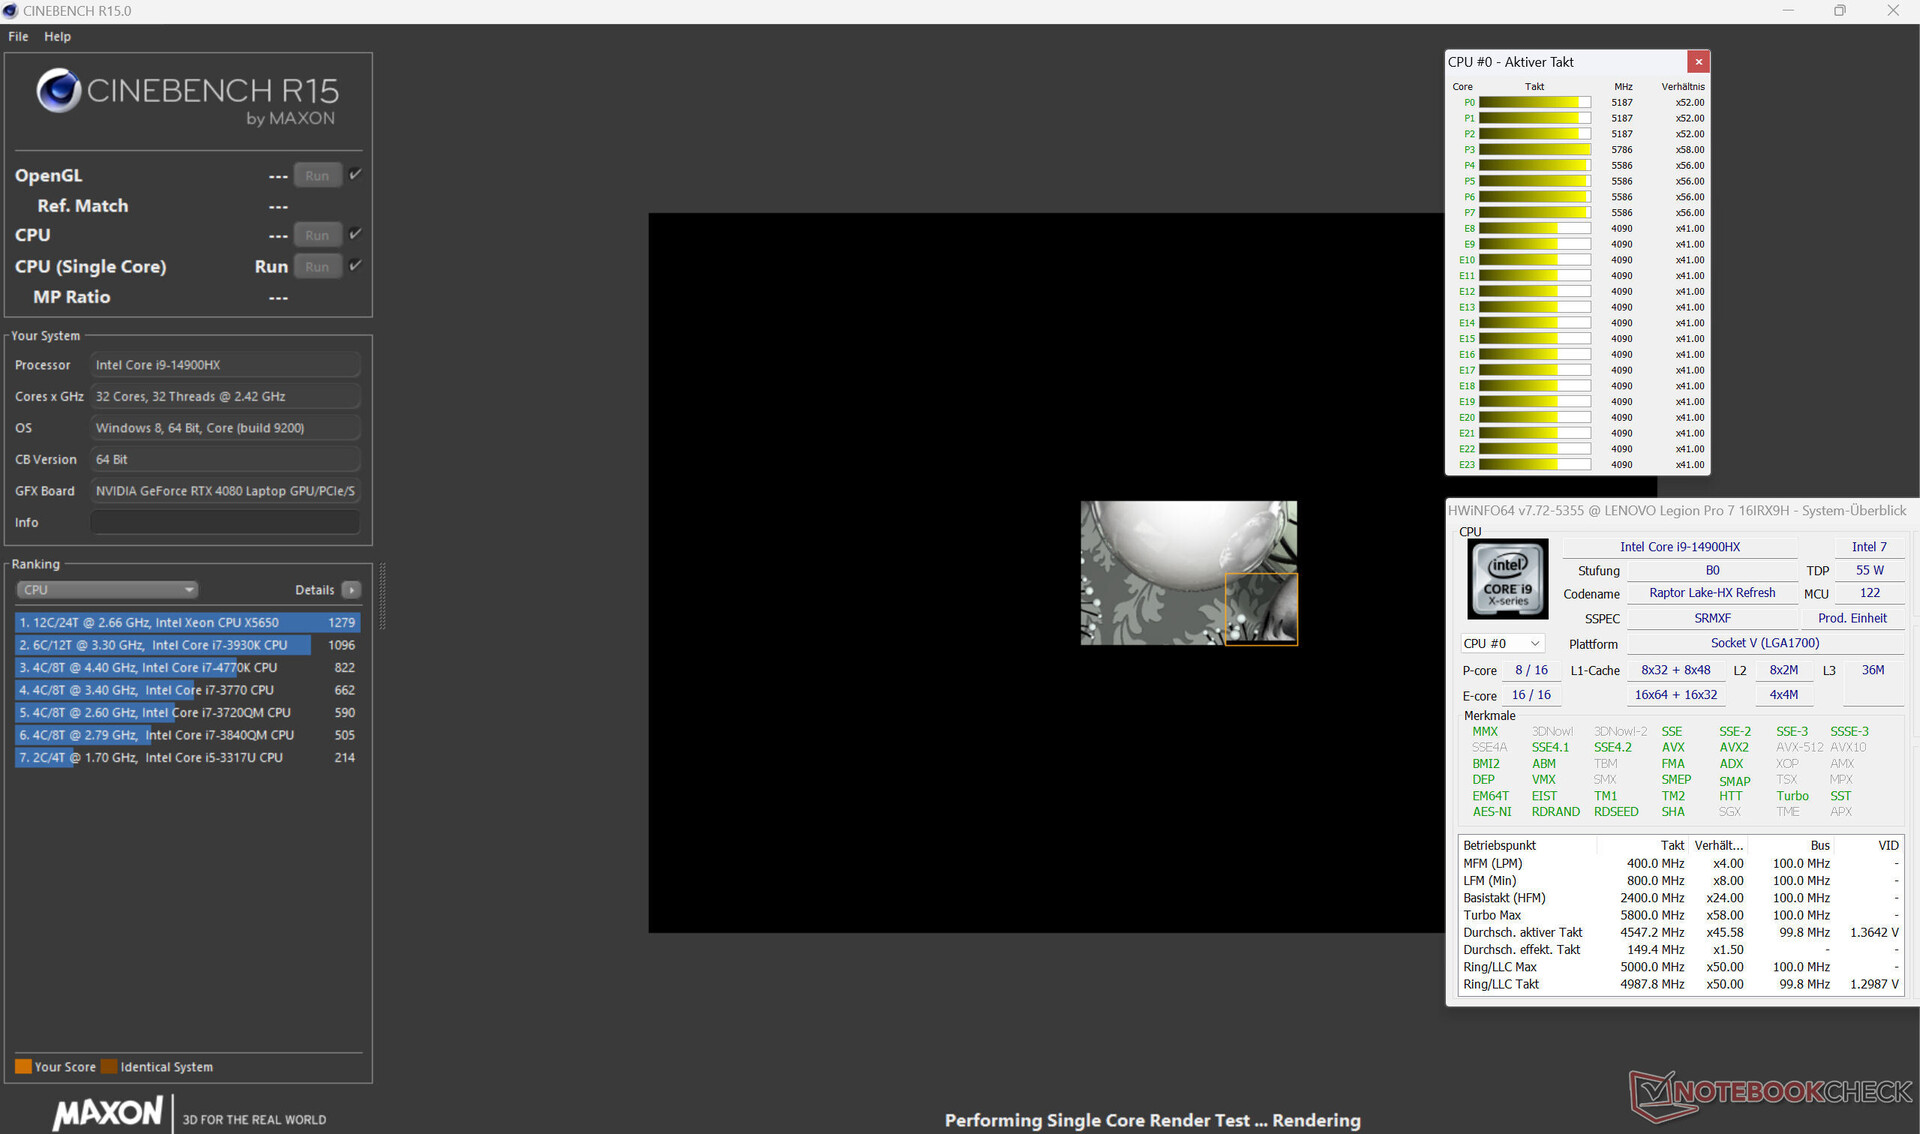
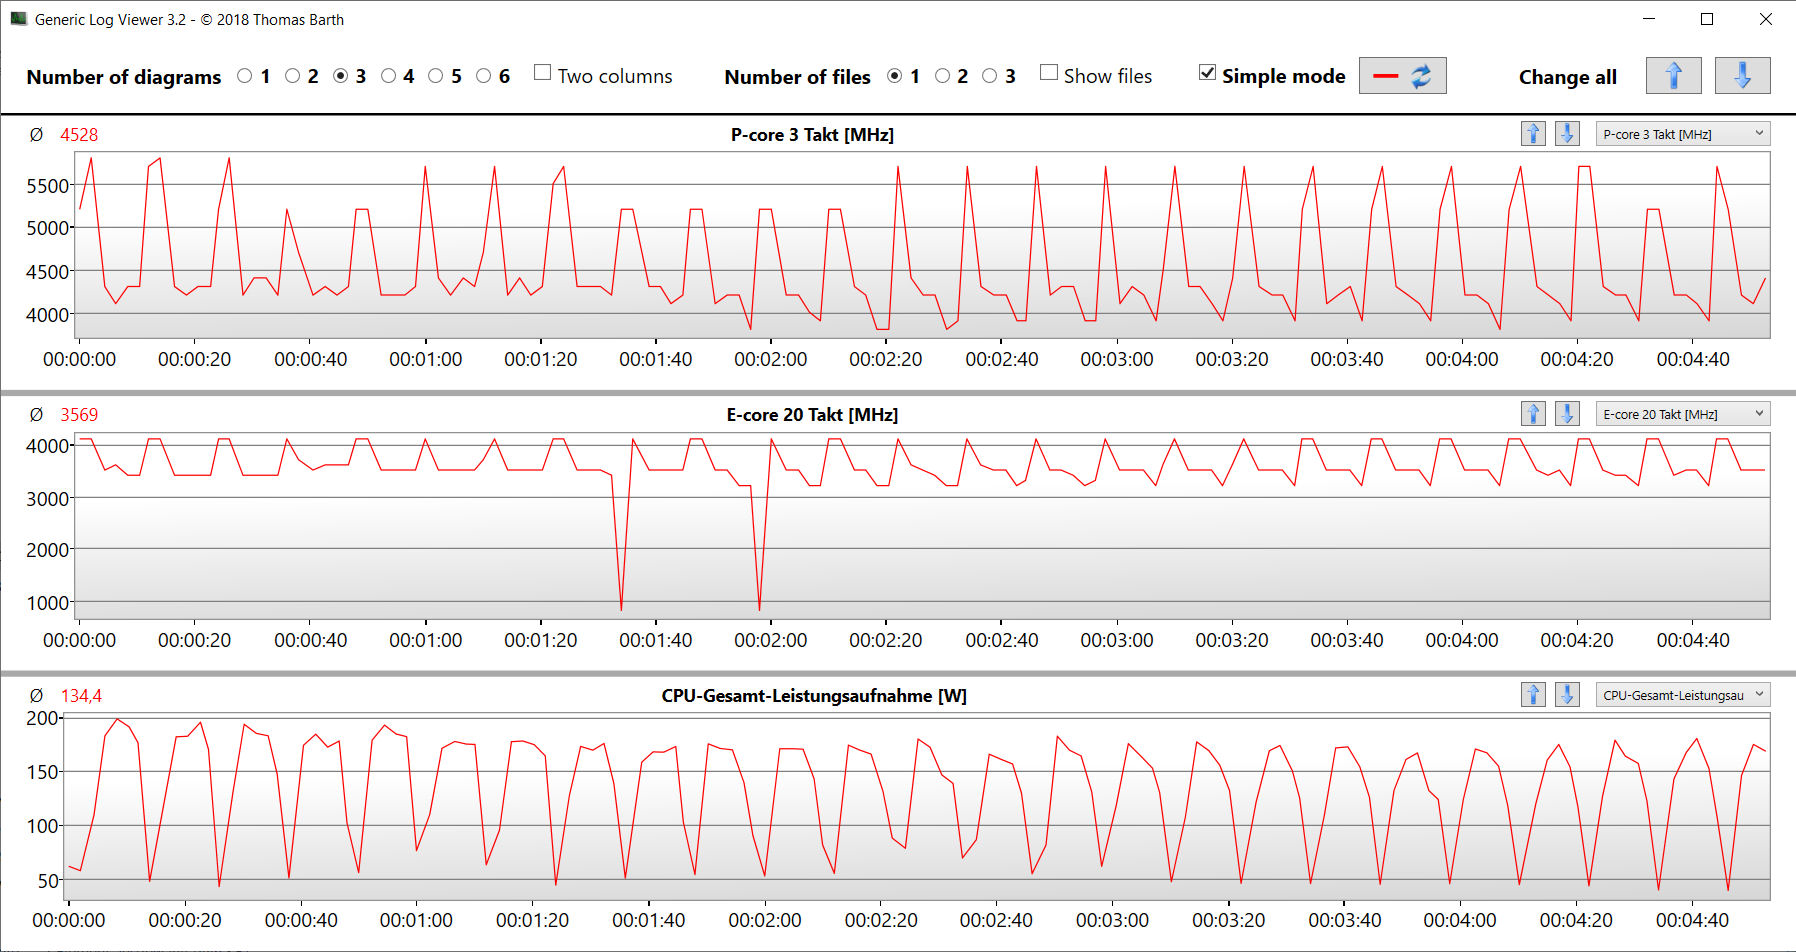
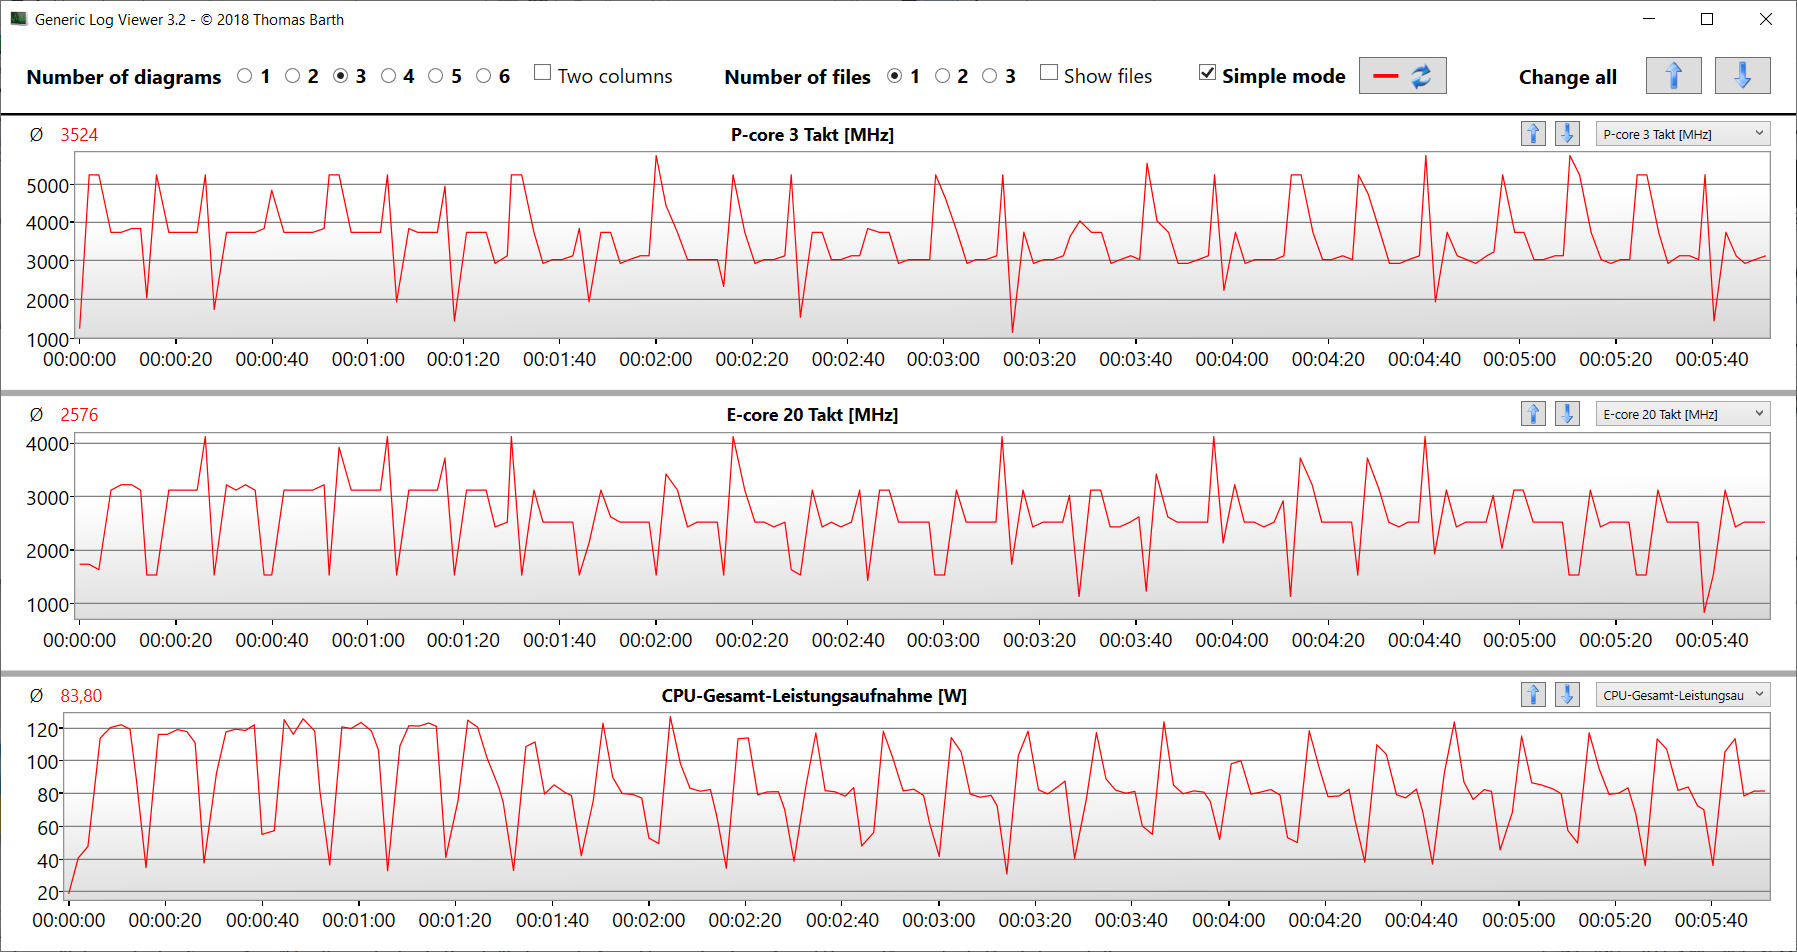
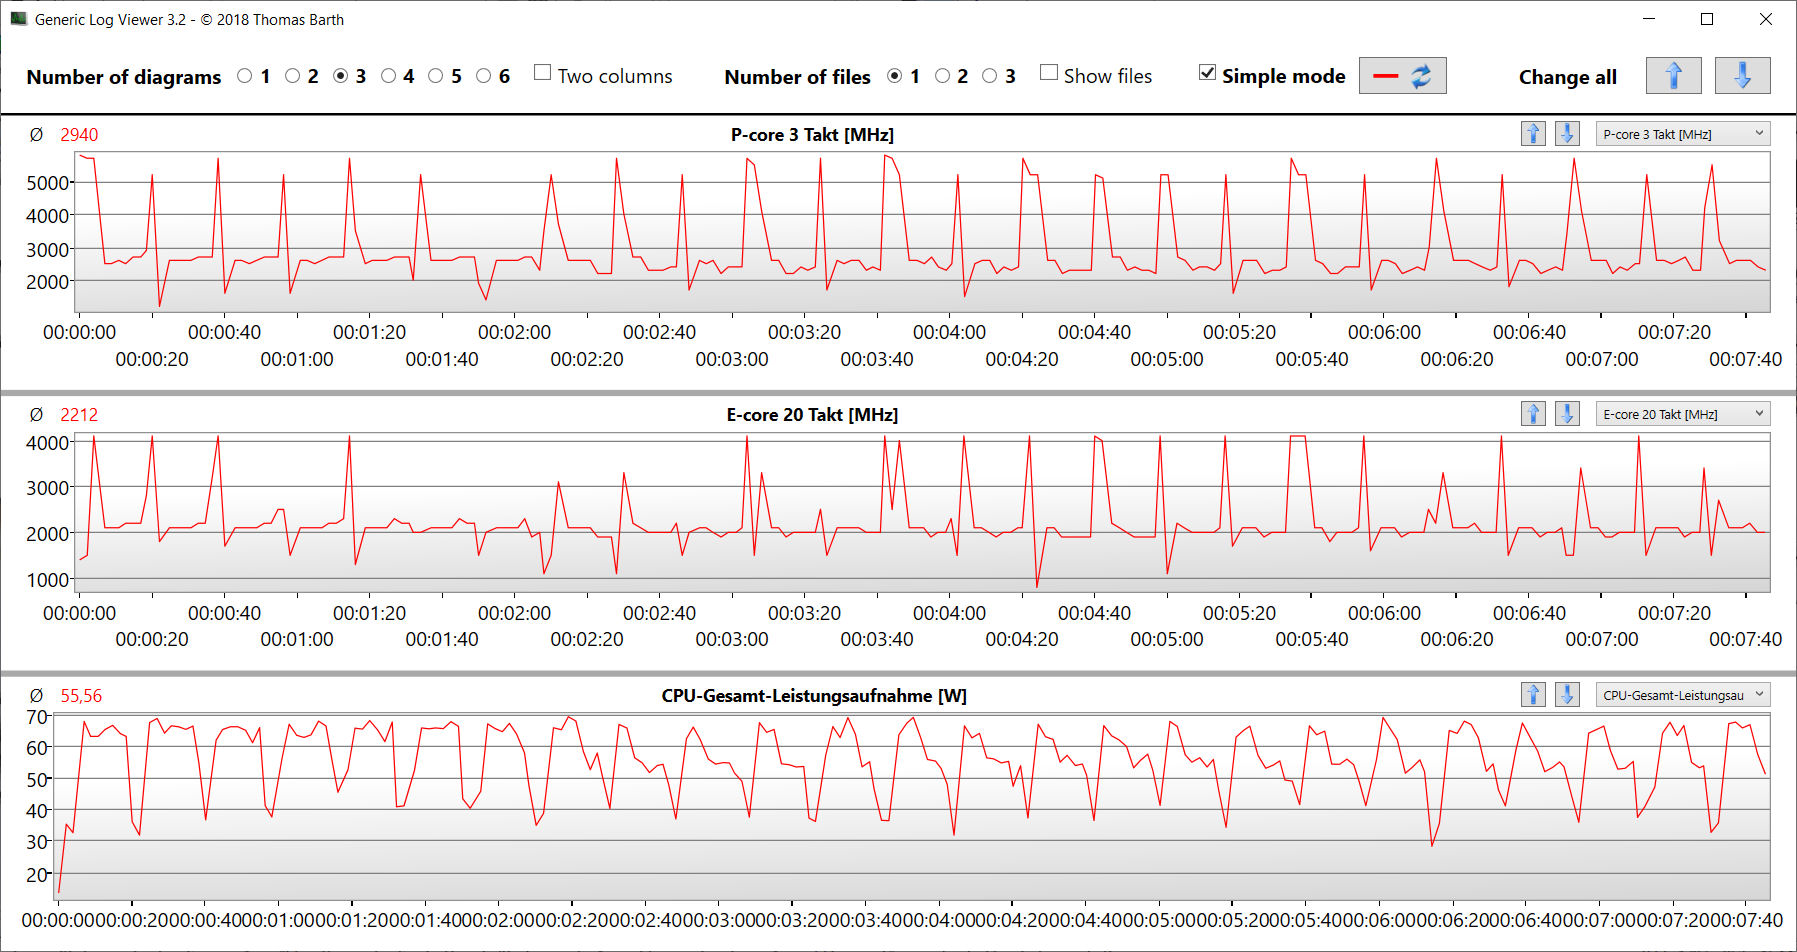
Los 24 núcleos de CPU (8P + 16E = 32 hilos) del Core i9-14900HX (Raptor Lake) alcanzaron velocidades de reloj máximas de 5,8 GHz (P) y 4,1 GHz (E). El procesador manejó una carga multihilo sostenida (ejecutando Cinebench 15 en bucle) a velocidades de reloj consistentemente altas. En el modo Rendimiento, las puntuaciones obtenidas en los benchmarks están por encima de lo que la CPU puede hacer de media. En batería, el rendimiento de un solo subproceso no disminuyó mucho (307 puntos en CB15), pero el rendimiento multihilo sufrió un golpe significativo (2.482 puntos en CB15).
Puede consultar este análisis para obtener más información sobre el Core i9.
Cinebench R15 Multi Sustained load
* ... más pequeño es mejor
AIDA64: FP32 Ray-Trace | FPU Julia | CPU SHA3 | CPU Queen | FPU SinJulia | FPU Mandel | CPU AES | CPU ZLib | FP64 Ray-Trace | CPU PhotoWorxx
| Performance rating | |
| Alienware m16 R1 AMD | |
| MSI Vector 16 HX A14V | |
| Lenovo Legion Pro 7 16IRX9H | |
| Lenovo Legion Pro 7 16IRX8H | |
| Media de la clase Gaming | |
| Medio Intel Core i9-14900HX | |
| HP Omen 16 (2024) | |
| AIDA64 / FP32 Ray-Trace | |
| Alienware m16 R1 AMD | |
| Media de la clase Gaming (10227 - 85542, n=105, últimos 2 años) | |
| MSI Vector 16 HX A14V | |
| Lenovo Legion Pro 7 16IRX9H | |
| Lenovo Legion Pro 7 16IRX8H | |
| Medio Intel Core i9-14900HX (13098 - 33474, n=36) | |
| HP Omen 16 (2024) | |
| AIDA64 / FPU Julia | |
| Alienware m16 R1 AMD | |
| MSI Vector 16 HX A14V | |
| Media de la clase Gaming (51376 - 238426, n=105, últimos 2 años) | |
| Lenovo Legion Pro 7 16IRX9H | |
| Lenovo Legion Pro 7 16IRX8H | |
| Medio Intel Core i9-14900HX (67573 - 166040, n=36) | |
| HP Omen 16 (2024) | |
| AIDA64 / CPU SHA3 | |
| Alienware m16 R1 AMD | |
| Lenovo Legion Pro 7 16IRX9H | |
| MSI Vector 16 HX A14V | |
| Lenovo Legion Pro 7 16IRX8H | |
| Media de la clase Gaming (2180 - 10115, n=105, últimos 2 años) | |
| Medio Intel Core i9-14900HX (3589 - 7979, n=36) | |
| HP Omen 16 (2024) | |
| AIDA64 / CPU Queen | |
| Alienware m16 R1 AMD | |
| Lenovo Legion Pro 7 16IRX9H | |
| MSI Vector 16 HX A14V | |
| Medio Intel Core i9-14900HX (118405 - 148966, n=36) | |
| Lenovo Legion Pro 7 16IRX8H | |
| HP Omen 16 (2024) | |
| Media de la clase Gaming (49785 - 173351, n=90, últimos 2 años) | |
| AIDA64 / FPU SinJulia | |
| Alienware m16 R1 AMD | |
| Lenovo Legion Pro 7 16IRX9H | |
| MSI Vector 16 HX A14V | |
| Lenovo Legion Pro 7 16IRX8H | |
| Medio Intel Core i9-14900HX (10475 - 18517, n=36) | |
| Media de la clase Gaming (4424 - 33636, n=105, últimos 2 años) | |
| HP Omen 16 (2024) | |
| AIDA64 / FPU Mandel | |
| Alienware m16 R1 AMD | |
| Media de la clase Gaming (25115 - 128721, n=105, últimos 2 años) | |
| MSI Vector 16 HX A14V | |
| Lenovo Legion Pro 7 16IRX9H | |
| Lenovo Legion Pro 7 16IRX8H | |
| Medio Intel Core i9-14900HX (32543 - 83662, n=36) | |
| HP Omen 16 (2024) | |
| AIDA64 / CPU AES | |
| Medio Intel Core i9-14900HX (86964 - 241777, n=36) | |
| Lenovo Legion Pro 7 16IRX9H | |
| MSI Vector 16 HX A14V | |
| Lenovo Legion Pro 7 16IRX8H | |
| Alienware m16 R1 AMD | |
| Media de la clase Gaming (39258 - 247074, n=105, últimos 2 años) | |
| HP Omen 16 (2024) | |
| AIDA64 / CPU ZLib | |
| Lenovo Legion Pro 7 16IRX9H | |
| MSI Vector 16 HX A14V | |
| Lenovo Legion Pro 7 16IRX8H | |
| Medio Intel Core i9-14900HX (1054 - 2292, n=36) | |
| Alienware m16 R1 AMD | |
| Media de la clase Gaming (574 - 2531, n=105, últimos 2 años) | |
| HP Omen 16 (2024) | |
| AIDA64 / FP64 Ray-Trace | |
| Alienware m16 R1 AMD | |
| Media de la clase Gaming (5509 - 45446, n=105, últimos 2 años) | |
| MSI Vector 16 HX A14V | |
| Lenovo Legion Pro 7 16IRX9H | |
| Lenovo Legion Pro 7 16IRX8H | |
| Medio Intel Core i9-14900HX (6809 - 18349, n=36) | |
| HP Omen 16 (2024) | |
| AIDA64 / CPU PhotoWorxx | |
| HP Omen 16 (2024) | |
| MSI Vector 16 HX A14V | |
| Lenovo Legion Pro 7 16IRX8H | |
| Lenovo Legion Pro 7 16IRX9H | |
| Medio Intel Core i9-14900HX (23903 - 54702, n=36) | |
| Media de la clase Gaming (12271 - 89891, n=105, últimos 2 años) | |
| Alienware m16 R1 AMD | |
Rendimiento del sistema
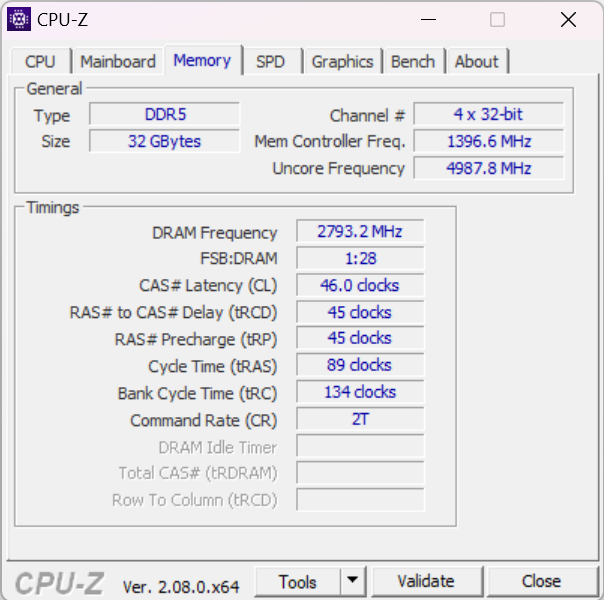
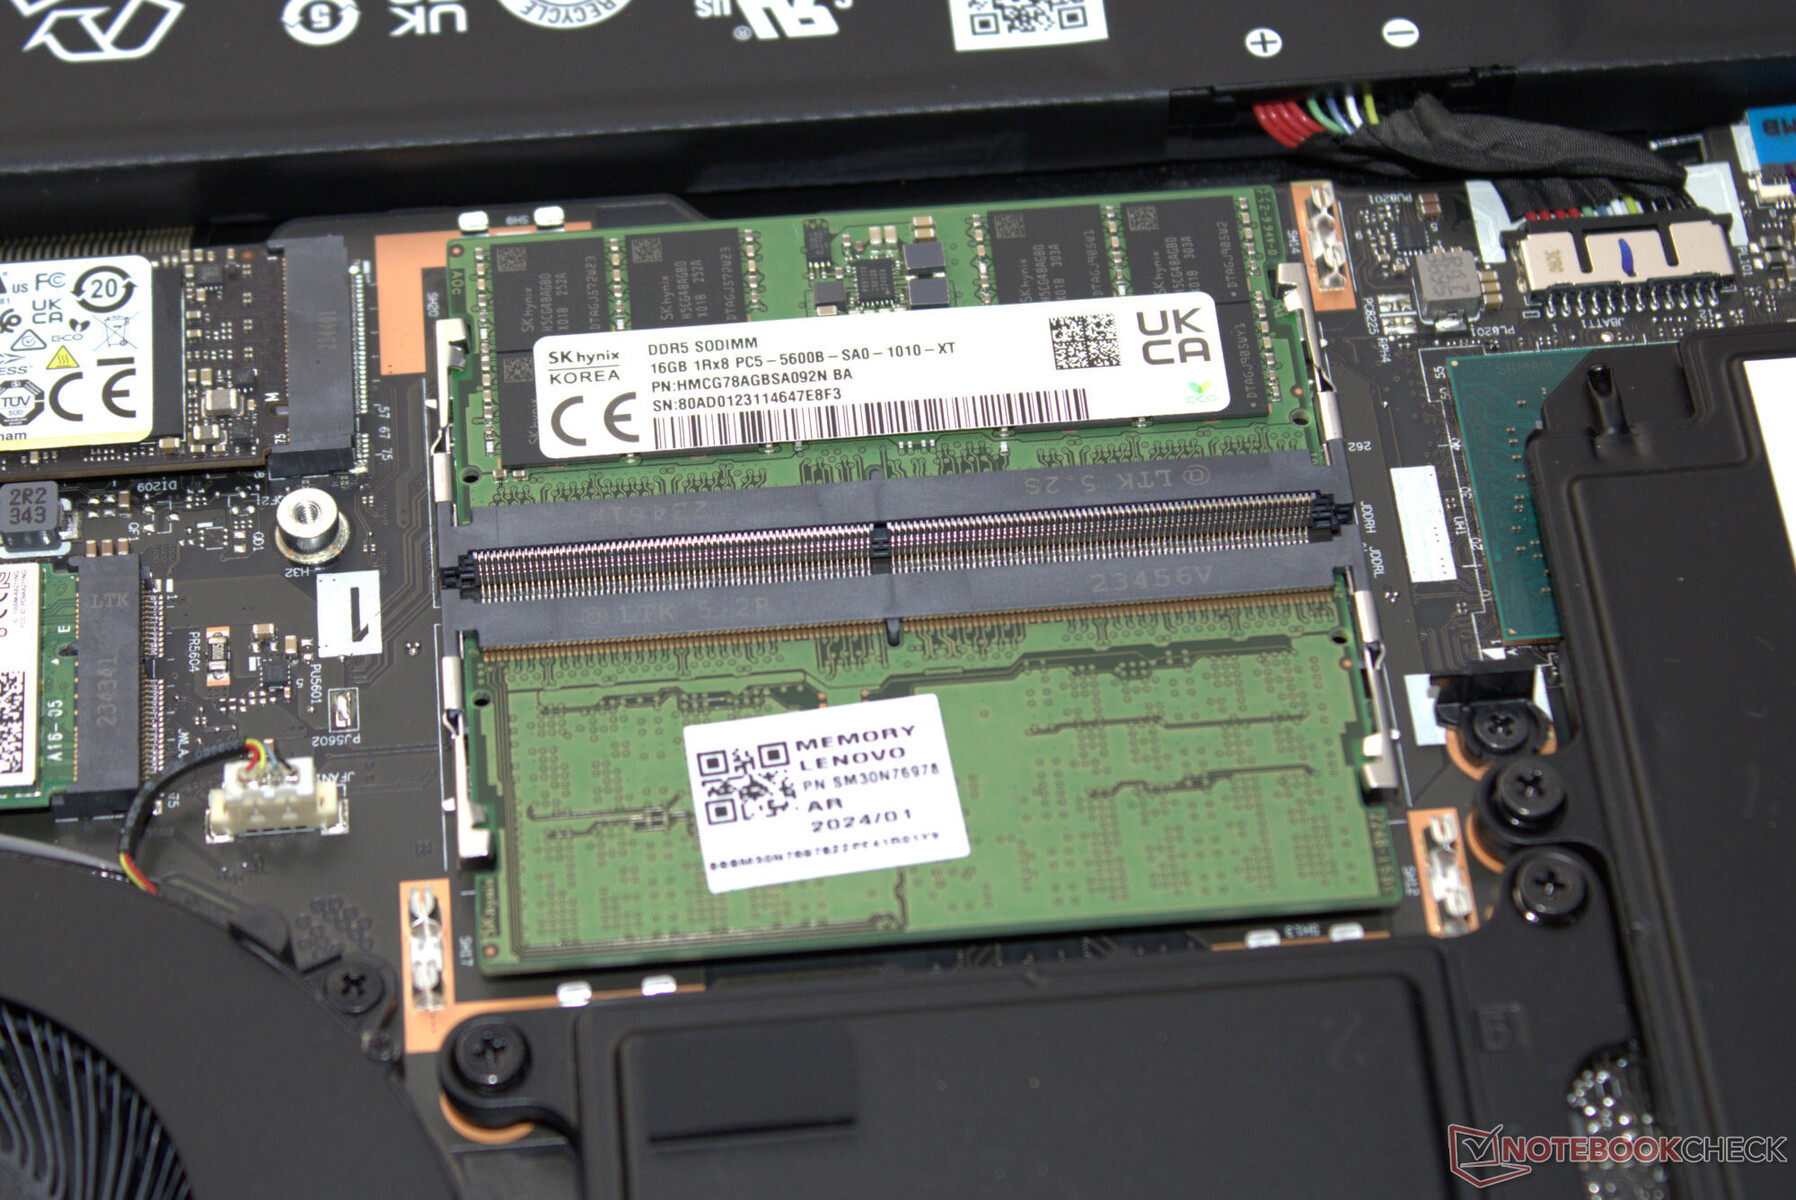
A este sistema de funcionamiento fluido no le falta rendimiento informático. El Legion Pro 7 puede manejar sin esfuerzo cosas como juegos, streaming y renderizado. Las tasas de transferencia de la memoria están a un nivel normal para una RAM DDR5-5600.
CrossMark: Overall | Productivity | Creativity | Responsiveness
WebXPRT 3: Overall
WebXPRT 4: Overall
Mozilla Kraken 1.1: Total
| PCMark 10 / Score | |
| Lenovo Legion Pro 7 16IRX9H | |
| HP Omen 16 (2024) | |
| Alienware m16 R1 AMD | |
| Medio Intel Core i9-14900HX, NVIDIA GeForce RTX 4080 Laptop GPU (7703 - 9223, n=7) | |
| MSI Vector 16 HX A14V | |
| Media de la clase Gaming (5828 - 12414, n=93, últimos 2 años) | |
| Lenovo Legion Pro 7 16IRX8H | |
| PCMark 10 / Essentials | |
| Lenovo Legion Pro 7 16IRX9H | |
| Lenovo Legion Pro 7 16IRX8H | |
| Medio Intel Core i9-14900HX, NVIDIA GeForce RTX 4080 Laptop GPU (11255 - 12600, n=7) | |
| Alienware m16 R1 AMD | |
| MSI Vector 16 HX A14V | |
| HP Omen 16 (2024) | |
| Media de la clase Gaming (8810 - 11935, n=97, últimos 2 años) | |
| PCMark 10 / Productivity | |
| HP Omen 16 (2024) | |
| Lenovo Legion Pro 7 16IRX9H | |
| Media de la clase Gaming (6845 - 25323, n=95, últimos 2 años) | |
| Lenovo Legion Pro 7 16IRX8H | |
| Alienware m16 R1 AMD | |
| Medio Intel Core i9-14900HX, NVIDIA GeForce RTX 4080 Laptop GPU (6662 - 11410, n=7) | |
| MSI Vector 16 HX A14V | |
| PCMark 10 / Digital Content Creation | |
| MSI Vector 16 HX A14V | |
| Alienware m16 R1 AMD | |
| Medio Intel Core i9-14900HX, NVIDIA GeForce RTX 4080 Laptop GPU (14211 - 16246, n=7) | |
| HP Omen 16 (2024) | |
| Lenovo Legion Pro 7 16IRX9H | |
| Media de la clase Gaming (7602 - 19954, n=95, últimos 2 años) | |
| Lenovo Legion Pro 7 16IRX8H | |
| CrossMark / Overall | |
| Lenovo Legion Pro 7 16IRX9H | |
| HP Omen 16 (2024) | |
| MSI Vector 16 HX A14V | |
| Medio Intel Core i9-14900HX, NVIDIA GeForce RTX 4080 Laptop GPU (1992 - 2334, n=7) | |
| Alienware m16 R1 AMD | |
| Media de la clase Gaming (1366 - 2409, n=94, últimos 2 años) | |
| CrossMark / Productivity | |
| Lenovo Legion Pro 7 16IRX9H | |
| HP Omen 16 (2024) | |
| MSI Vector 16 HX A14V | |
| Medio Intel Core i9-14900HX, NVIDIA GeForce RTX 4080 Laptop GPU (1812 - 2204, n=7) | |
| Alienware m16 R1 AMD | |
| Media de la clase Gaming (1386 - 2254, n=94, últimos 2 años) | |
| CrossMark / Creativity | |
| Lenovo Legion Pro 7 16IRX9H | |
| MSI Vector 16 HX A14V | |
| Medio Intel Core i9-14900HX, NVIDIA GeForce RTX 4080 Laptop GPU (2327 - 2500, n=7) | |
| HP Omen 16 (2024) | |
| Media de la clase Gaming (1343 - 2786, n=94, últimos 2 años) | |
| Alienware m16 R1 AMD | |
| CrossMark / Responsiveness | |
| Lenovo Legion Pro 7 16IRX9H | |
| HP Omen 16 (2024) | |
| MSI Vector 16 HX A14V | |
| Medio Intel Core i9-14900HX, NVIDIA GeForce RTX 4080 Laptop GPU (1520 - 2254, n=7) | |
| Alienware m16 R1 AMD | |
| Media de la clase Gaming (1226 - 2334, n=94, últimos 2 años) | |
| WebXPRT 3 / Overall | |
| Lenovo Legion Pro 7 16IRX8H | |
| Lenovo Legion Pro 7 16IRX8H | |
| Alienware m16 R1 AMD | |
| Lenovo Legion Pro 7 16IRX9H | |
| Medio Intel Core i9-14900HX, NVIDIA GeForce RTX 4080 Laptop GPU (310 - 345, n=7) | |
| HP Omen 16 (2024) | |
| MSI Vector 16 HX A14V | |
| Media de la clase Gaming (220 - 532, n=98, últimos 2 años) | |
| WebXPRT 4 / Overall | |
| Lenovo Legion Pro 7 16IRX9H | |
| Medio Intel Core i9-14900HX, NVIDIA GeForce RTX 4080 Laptop GPU (300 - 321, n=7) | |
| HP Omen 16 (2024) | |
| Lenovo Legion Pro 7 16IRX8H | |
| MSI Vector 16 HX A14V | |
| Media de la clase Gaming (165 - 354, n=98, últimos 2 años) | |
| Alienware m16 R1 AMD | |
| Mozilla Kraken 1.1 / Total | |
| Alienware m16 R1 AMD | |
| Media de la clase Gaming (391 - 590, n=100, últimos 2 años) | |
| Lenovo Legion Pro 7 16IRX8H | |
| Lenovo Legion Pro 7 16IRX8H | |
| MSI Vector 16 HX A14V | |
| Medio Intel Core i9-14900HX, NVIDIA GeForce RTX 4080 Laptop GPU (437 - 446, n=7) | |
| Lenovo Legion Pro 7 16IRX9H | |
| HP Omen 16 (2024) | |
* ... más pequeño es mejor
| PCMark 10 Score | 8923 puntos | |
ayuda | ||
| AIDA64 / Memory Copy | |
| HP Omen 16 (2024) | |
| Lenovo Legion Pro 7 16IRX9H | |
| MSI Vector 16 HX A14V | |
| Medio Intel Core i9-14900HX (38028 - 83392, n=36) | |
| Media de la clase Gaming (21750 - 129946, n=105, últimos 2 años) | |
| Alienware m16 R1 AMD | |
| AIDA64 / Memory Read | |
| HP Omen 16 (2024) | |
| Lenovo Legion Pro 7 16IRX9H | |
| MSI Vector 16 HX A14V | |
| Medio Intel Core i9-14900HX (43306 - 87568, n=36) | |
| Media de la clase Gaming (22956 - 118858, n=105, últimos 2 años) | |
| Alienware m16 R1 AMD | |
| AIDA64 / Memory Write | |
| HP Omen 16 (2024) | |
| MSI Vector 16 HX A14V | |
| Media de la clase Gaming (22297 - 135096, n=105, últimos 2 años) | |
| Medio Intel Core i9-14900HX (37146 - 80589, n=36) | |
| Lenovo Legion Pro 7 16IRX9H | |
| Alienware m16 R1 AMD | |
| AIDA64 / Memory Latency | |
| Media de la clase Gaming (75.3 - 259, n=105, últimos 2 años) | |
| Alienware m16 R1 AMD | |
| Medio Intel Core i9-14900HX (76.1 - 105, n=36) | |
| HP Omen 16 (2024) | |
| MSI Vector 16 HX A14V | |
| Lenovo Legion Pro 7 16IRX9H | |
* ... más pequeño es mejor
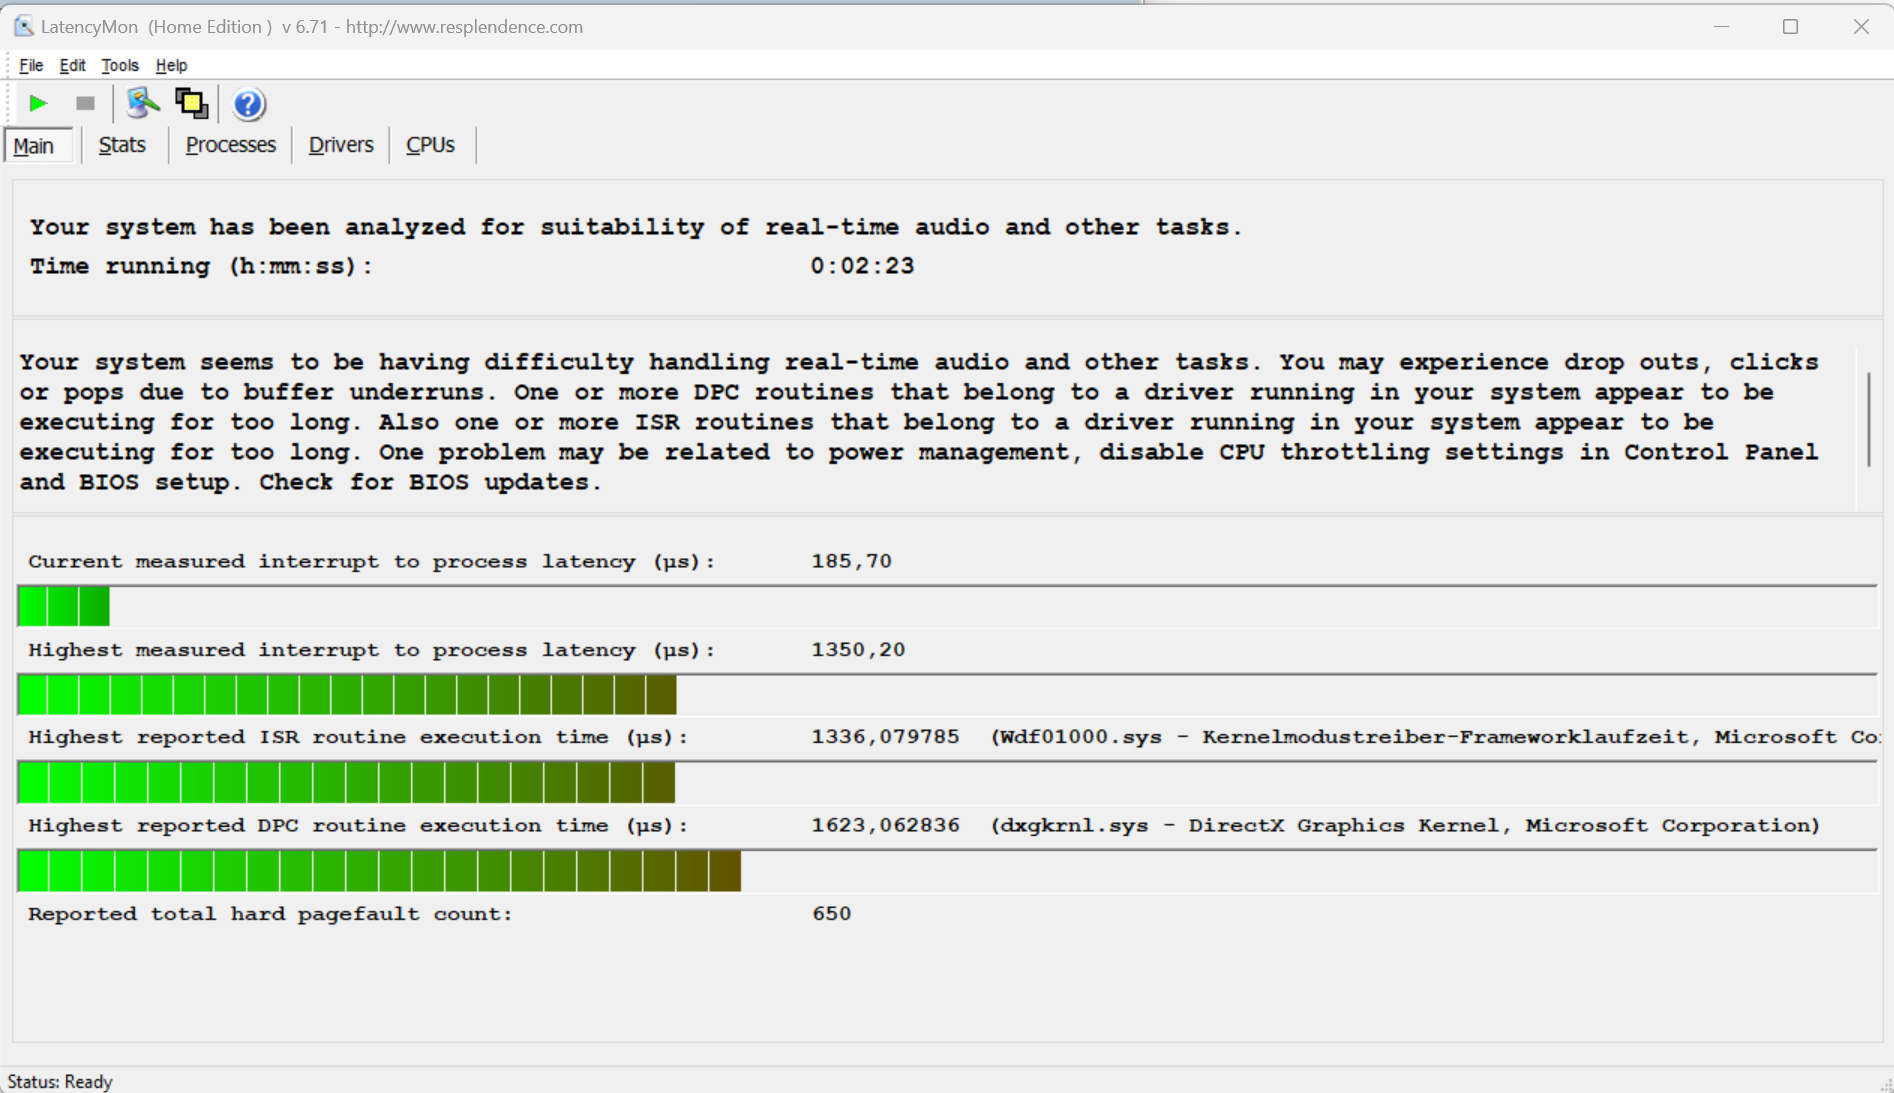
Latencia del CPD
El Monitor de Latencia descubrió algunos problemas durante la prueba de latencia (navegación web, reproducción de vídeo 4K, Prime95 de alta carga). El sistema no parece adecuado para tareas de vídeo y audio en tiempo real. Esperemos que futuras actualizaciones de software puedan mejorar la situación.
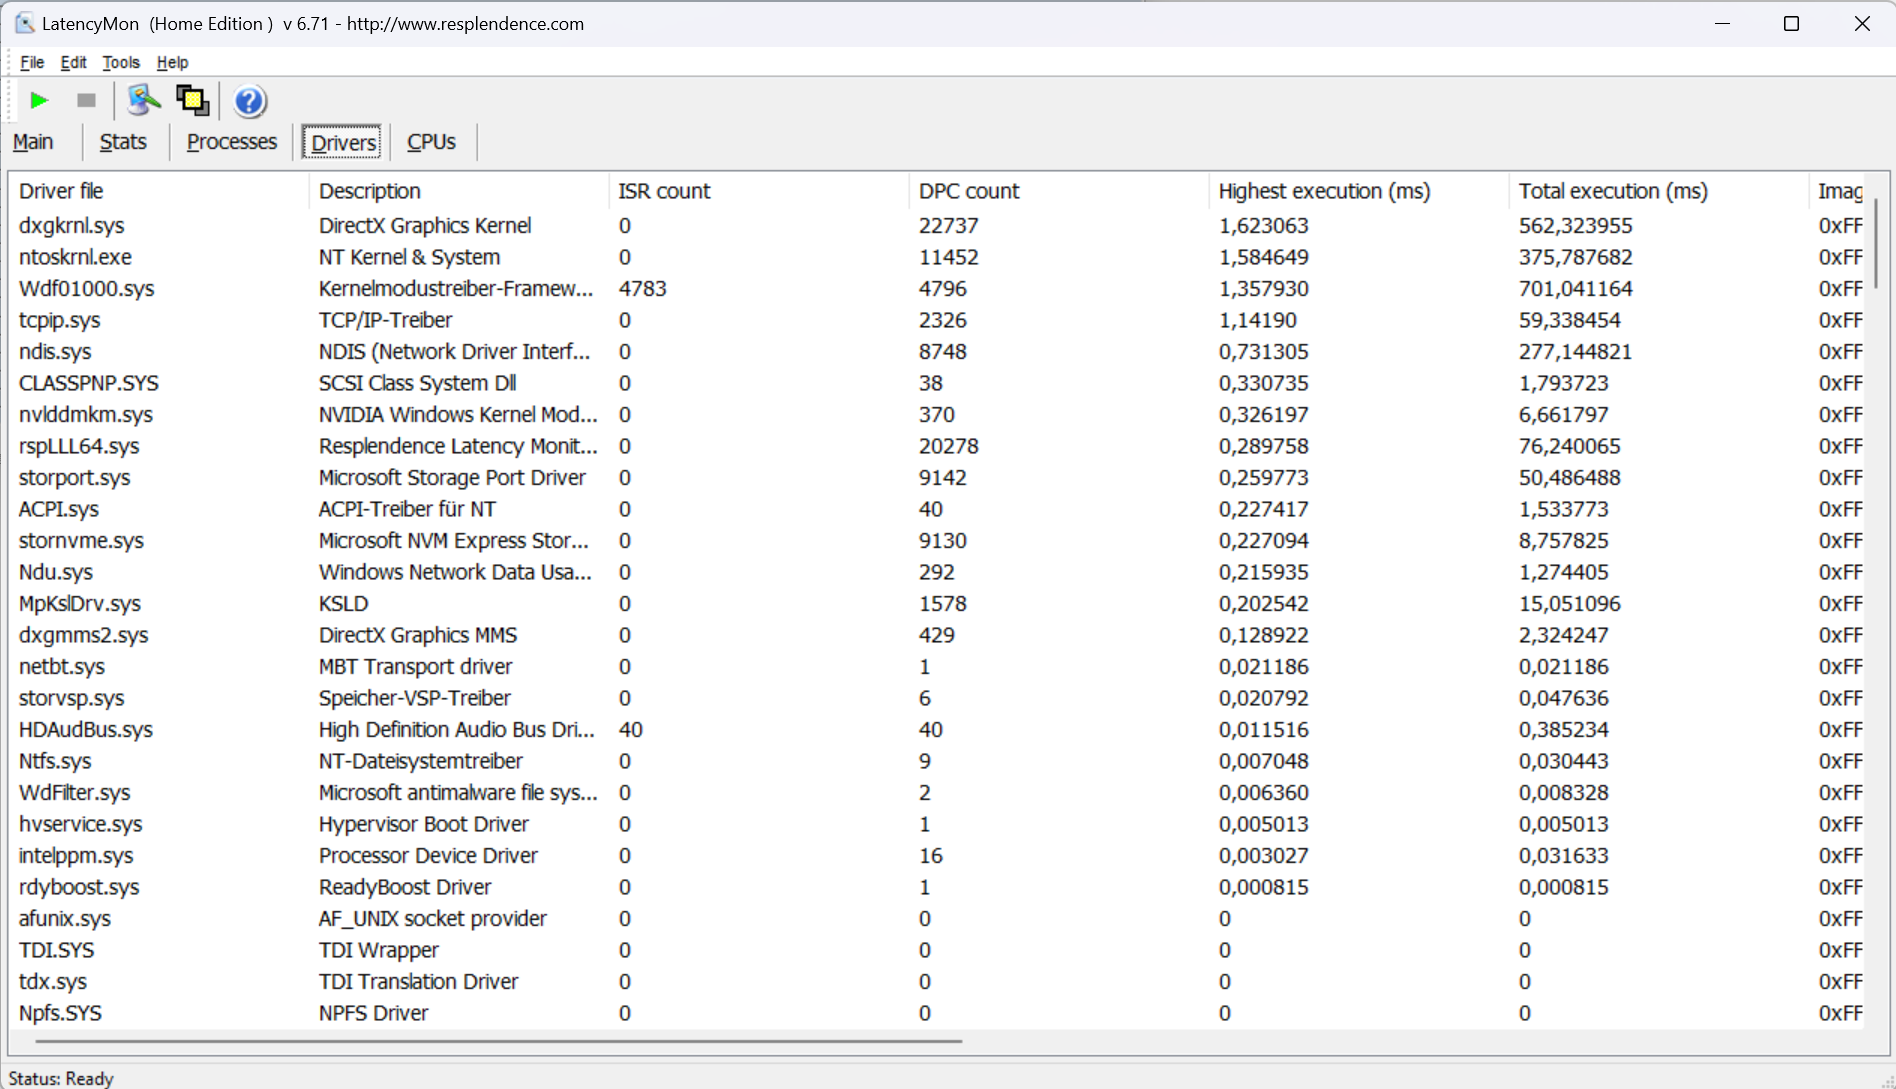
| DPC Latencies / LatencyMon - interrupt to process latency (max), Web, Youtube, Prime95 | |
| Alienware m16 R1 AMD | |
| MSI Vector 16 HX A14V | |
| Lenovo Legion Pro 7 16IRX9H | |
| HP Omen 16 (2024) | |
| Lenovo Legion Pro 7 16IRX8H | |
* ... más pequeño es mejor
Almacenamiento masivo
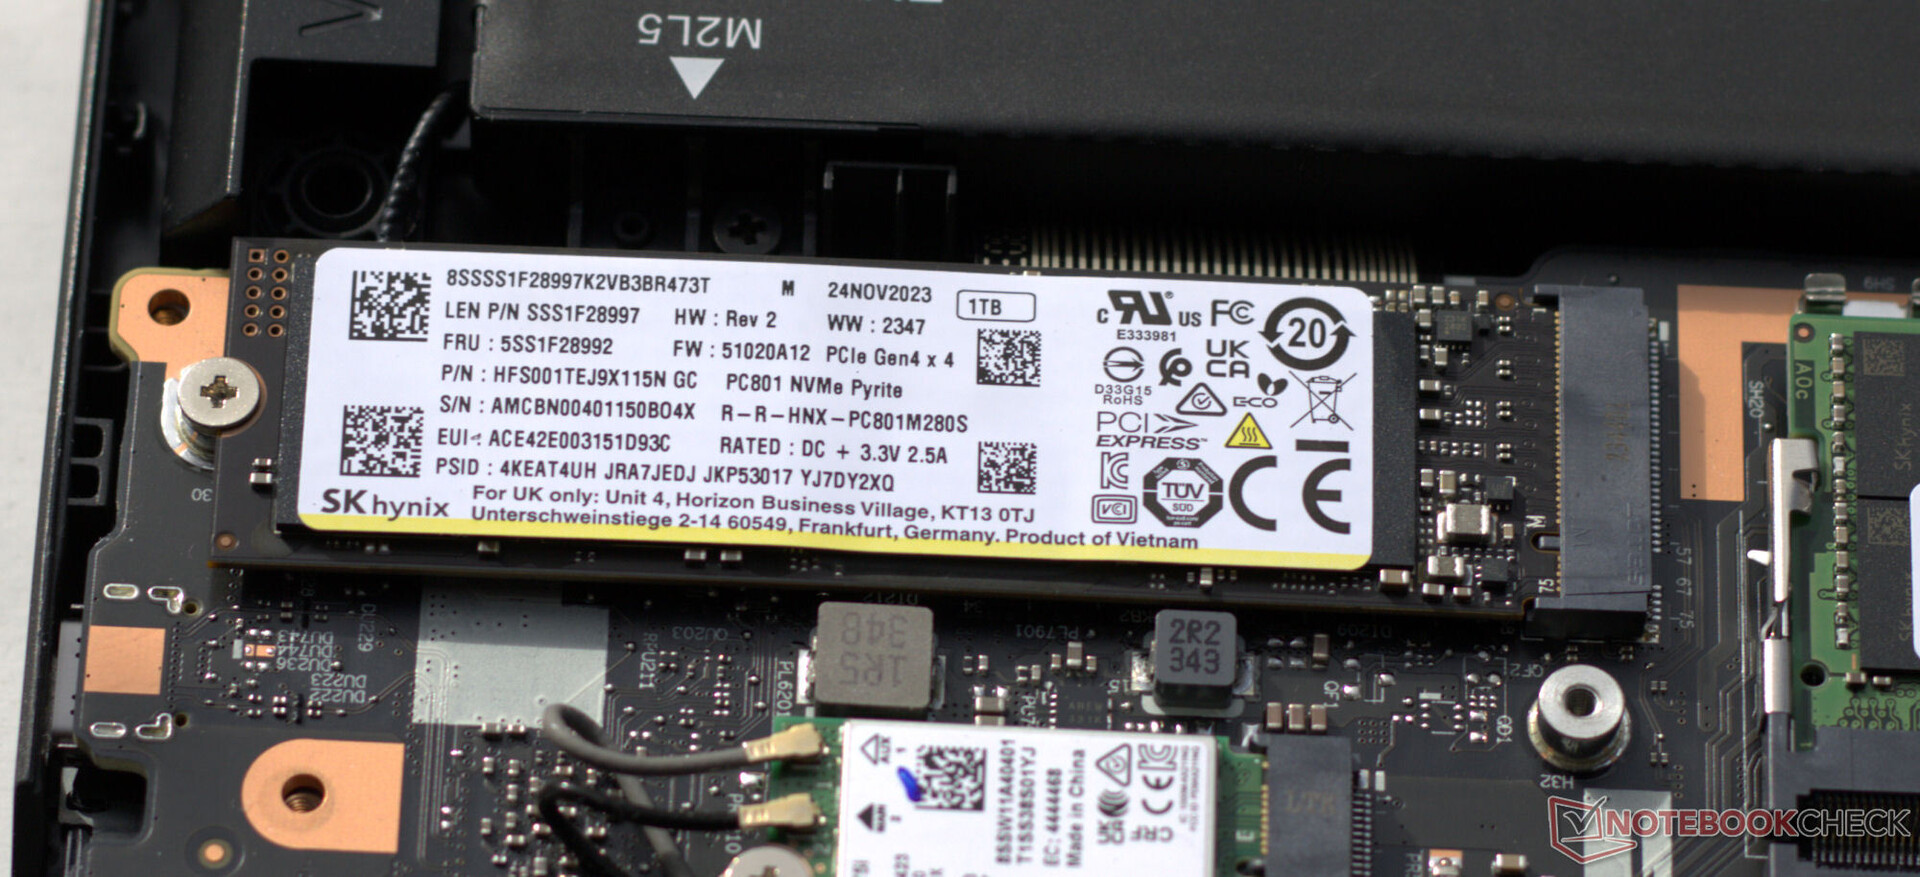
El Legion tiene espacio para un total de dos SSD PCIe 4.0. La unidad SSD SK Hynix M.2 2280 (1 TB) de nuestra unidad de pruebas ofreció unas velocidades de lectura y escritura excelentes. Otra nota positiva es que no se produjo estrangulamiento térmico durante nuestras pruebas.

* ... más pequeño es mejor
Sustained load Read: DiskSpd Read Loop, Queue Depth 8
Tarjeta gráfica
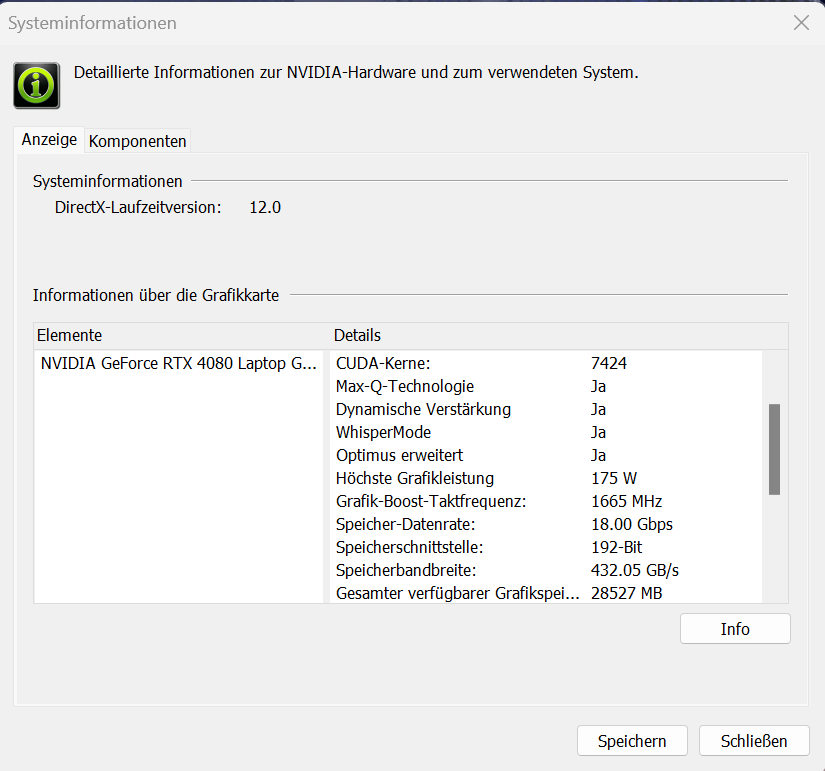
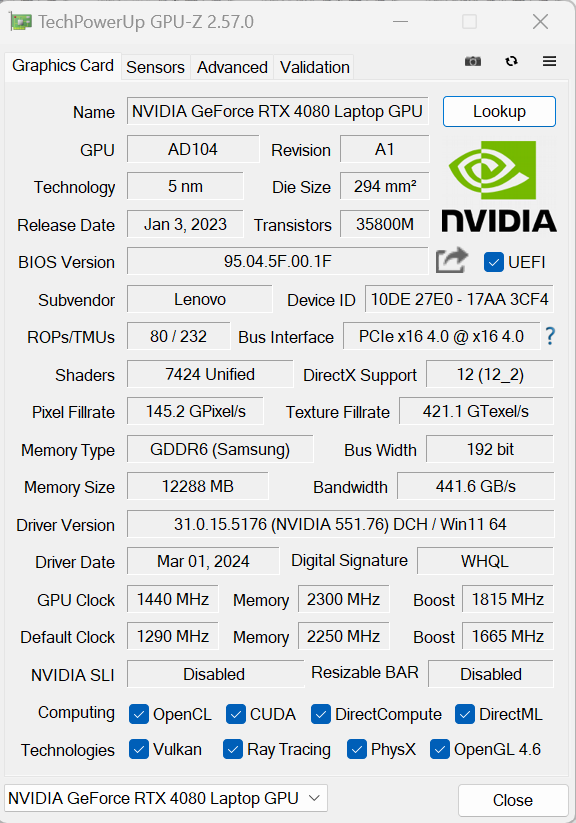
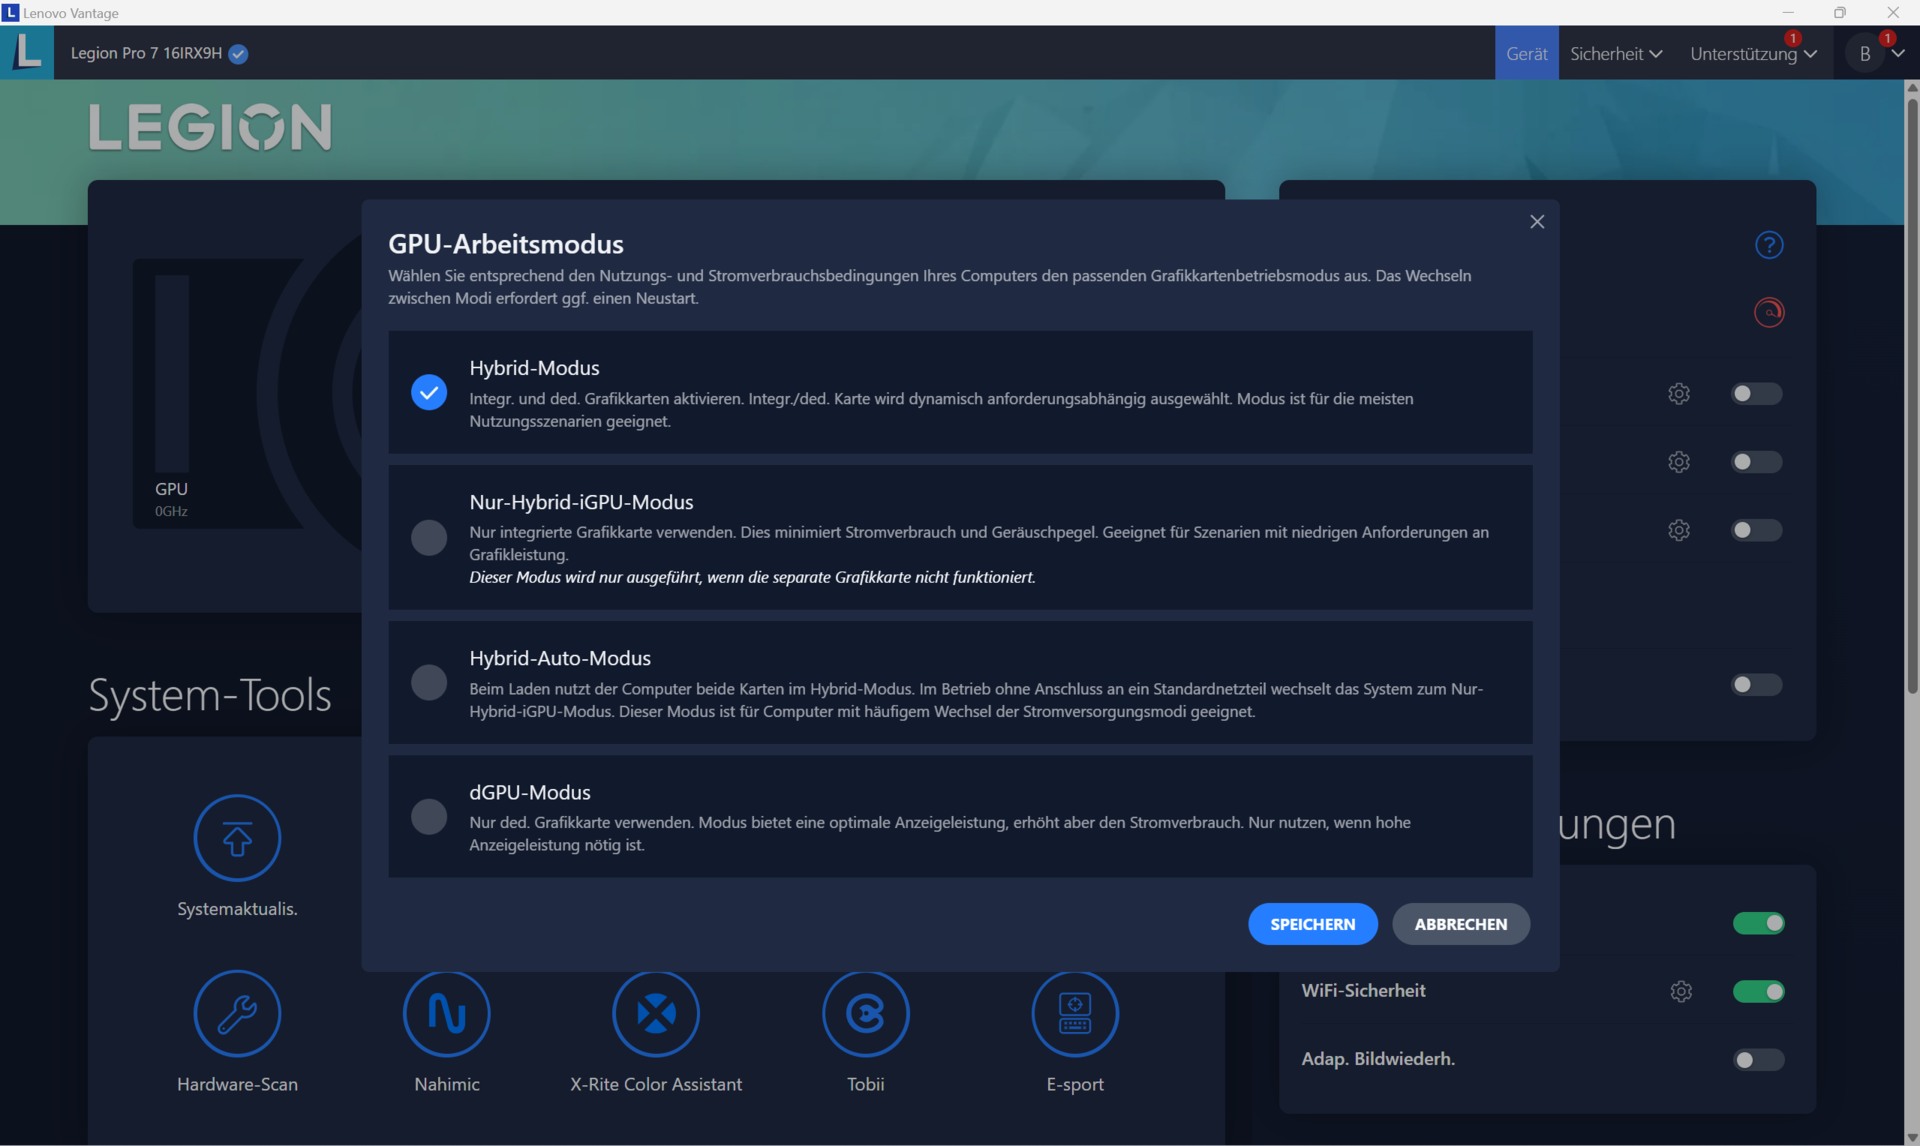
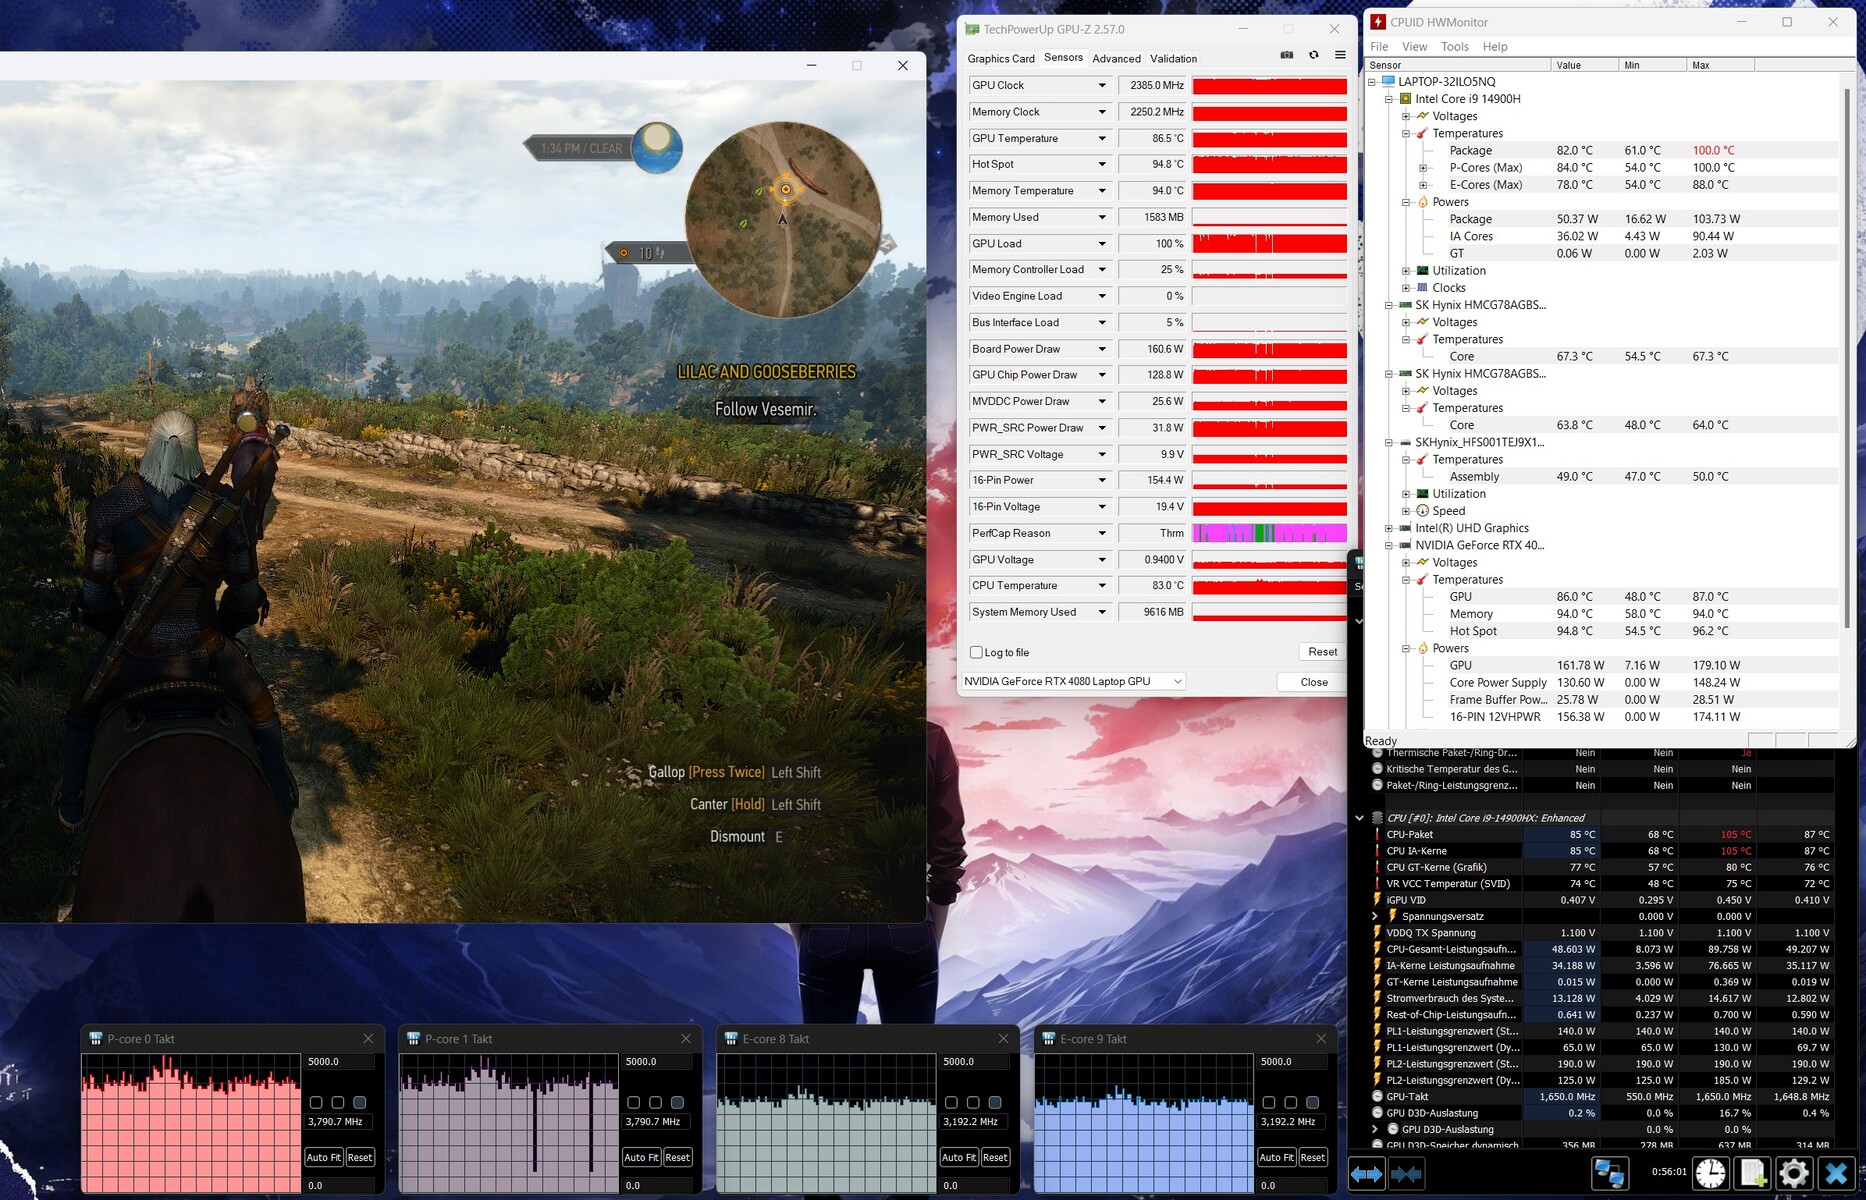
Lenovo ha equipado la Legion Pro 7 con una GeForce RTX 4080 (7.424 unidades de sombreado, un bus de memoria de 192 bits, 12 GB de GDDR6, 175 vatios), que es la actual número dos de la gama de GPU móviles de Nvidia. Las puntuaciones en los benchmarks y las frecuencias de cuadro obtenidas en nuestras pruebas están por encima de lo que la RTX 4080 Laptop puede hacer de media. Algunos de estos resultados son los mejores que hemos visto de una RTX 4080 hasta ahora. El cambio entre el modo dGPU-only y Optimus no requiere un reinicio; Advanced Optimus también es compatible.
La tarjeta gráfica es lo suficientemente potente para juegos QHD con ajustes de altos a máximos. Con la ayuda de DLSS 3 y Frame Generation, también se puede ir a resoluciones más altas en la configuración máxima y con trazado de rayos activado - pero sólo en los juegos que soportan estas características.
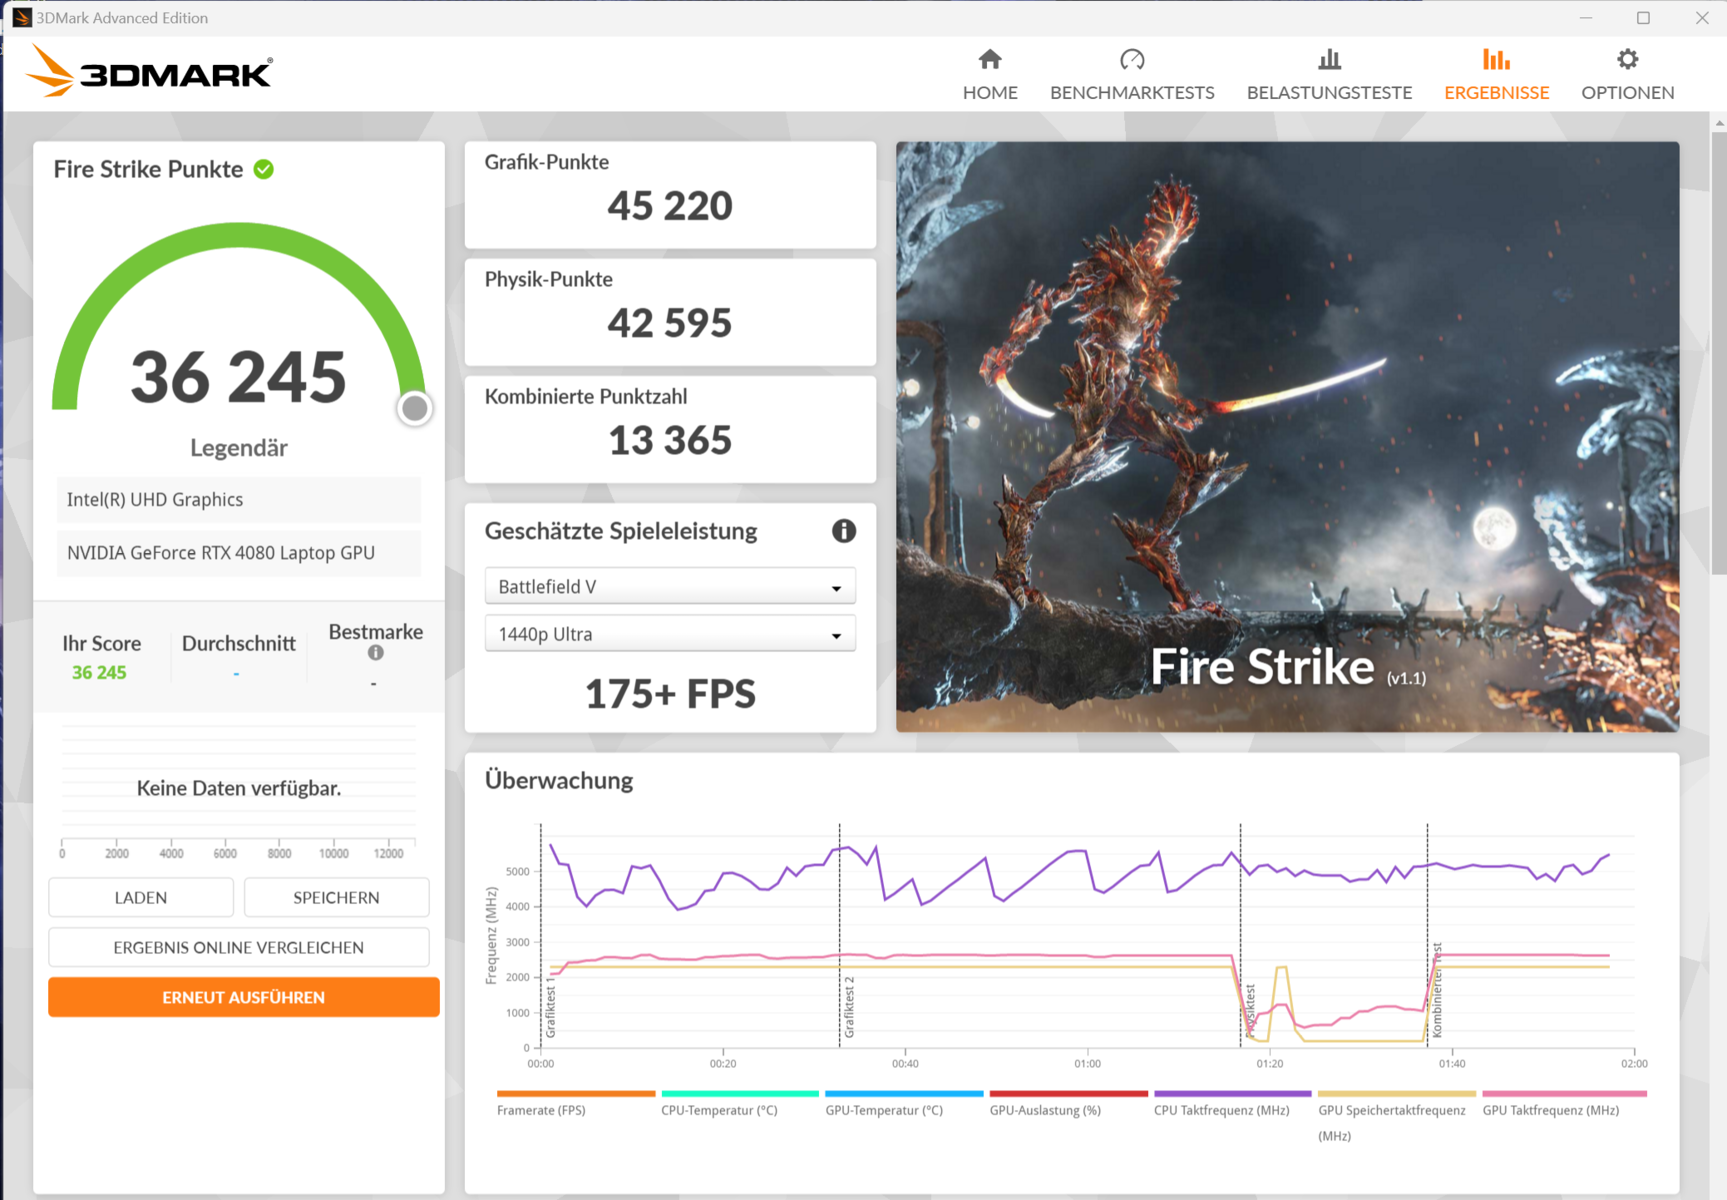
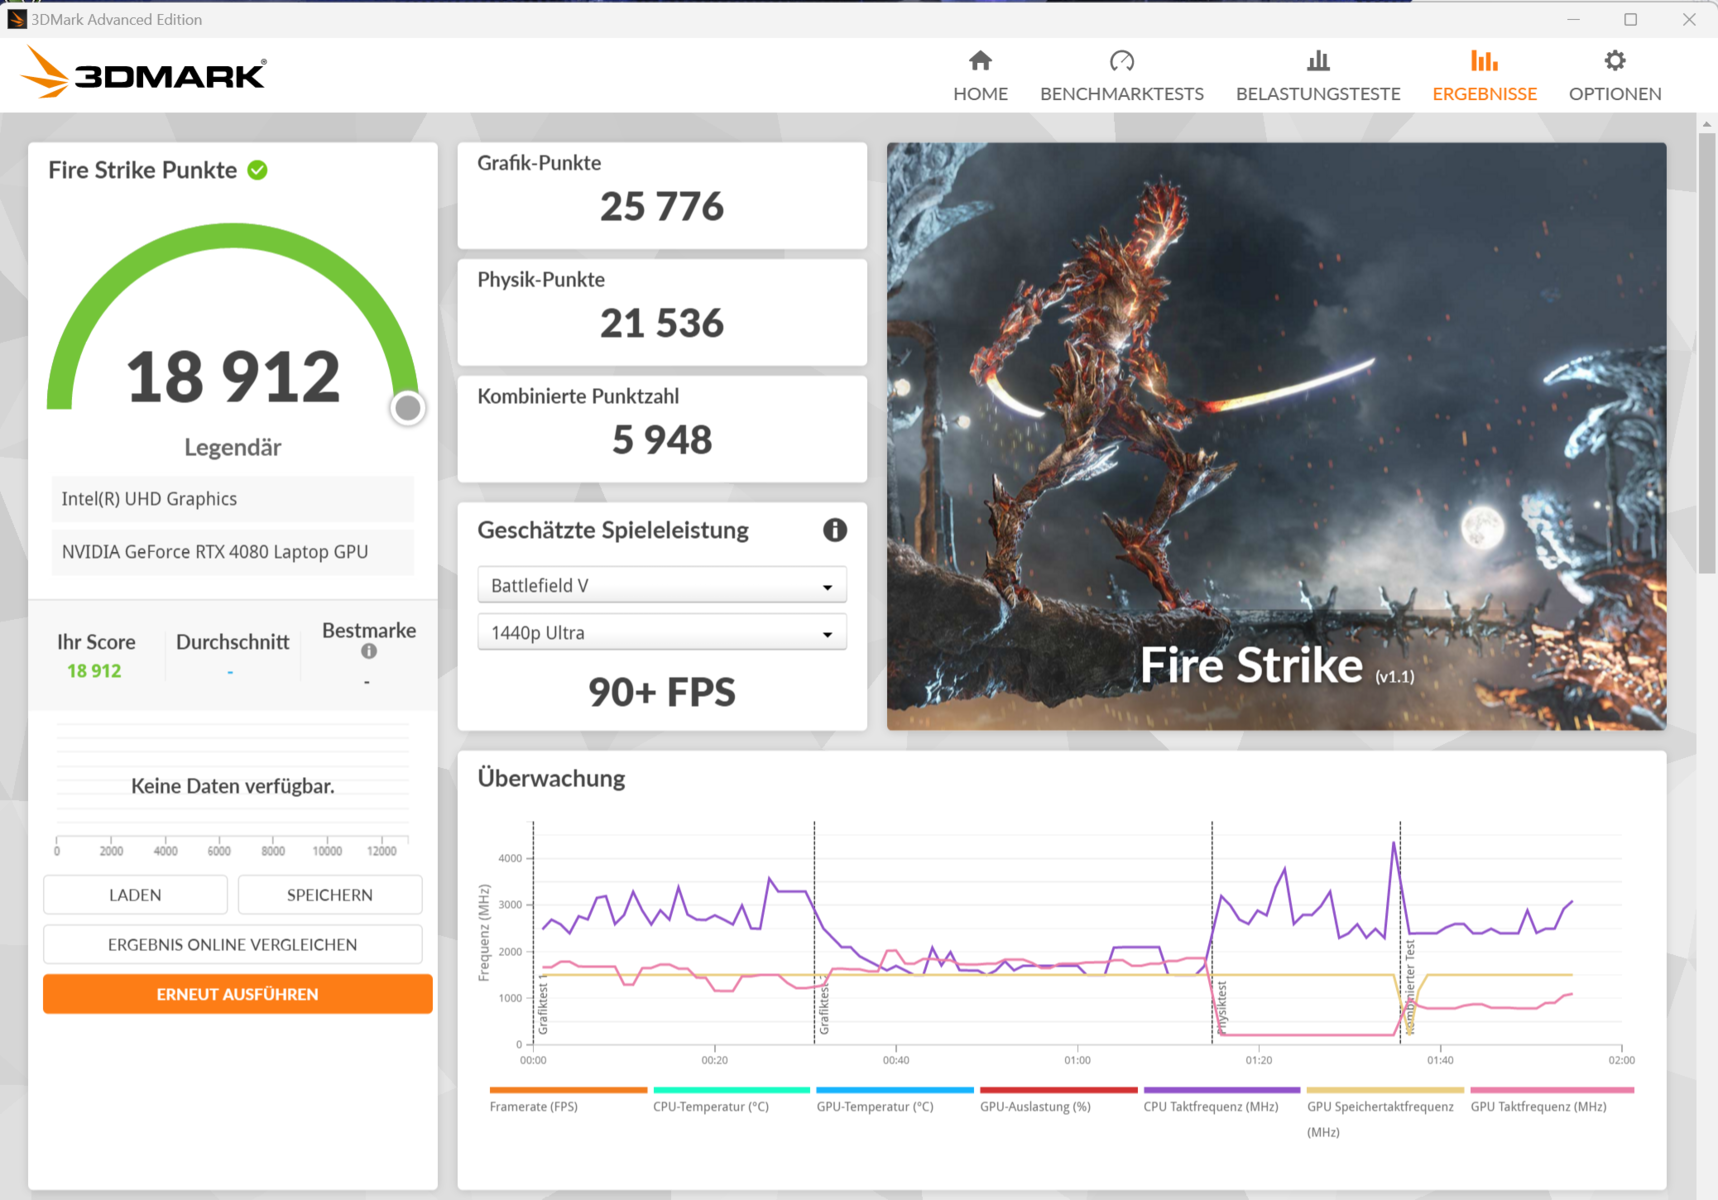
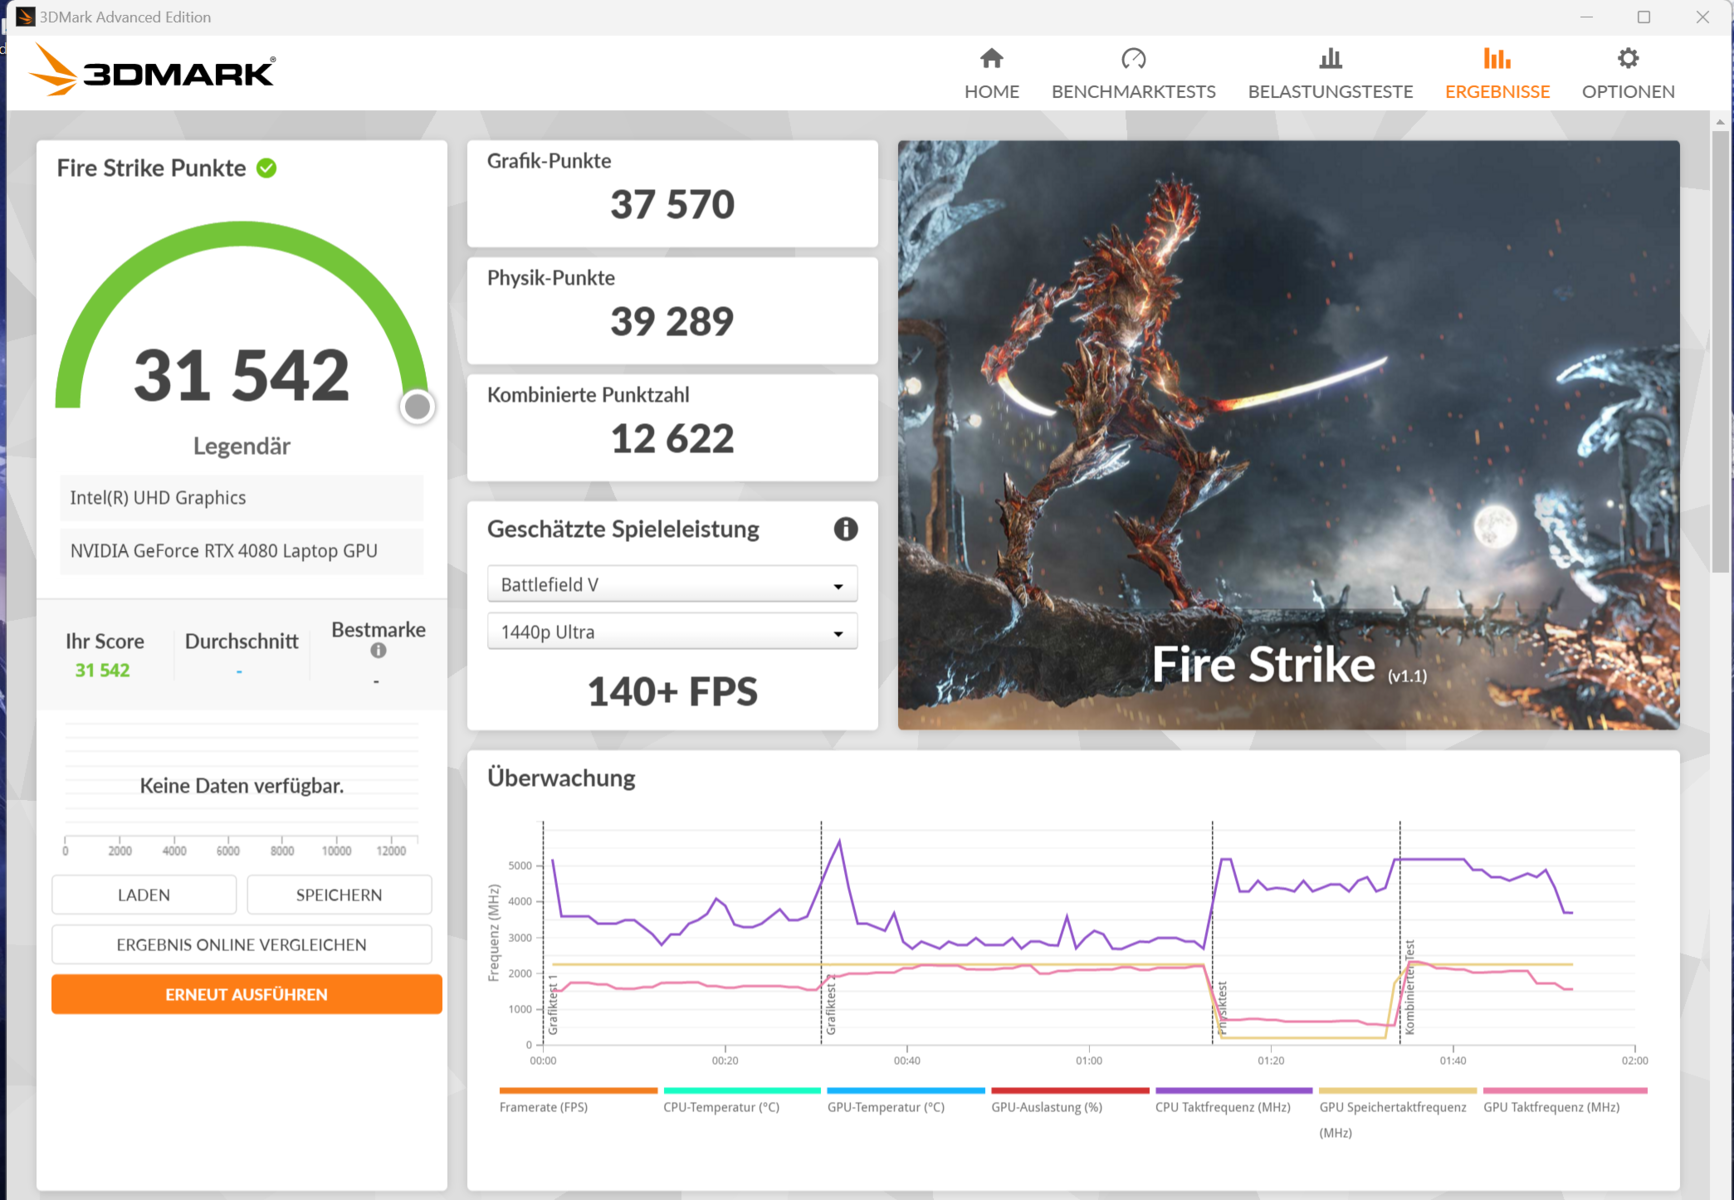
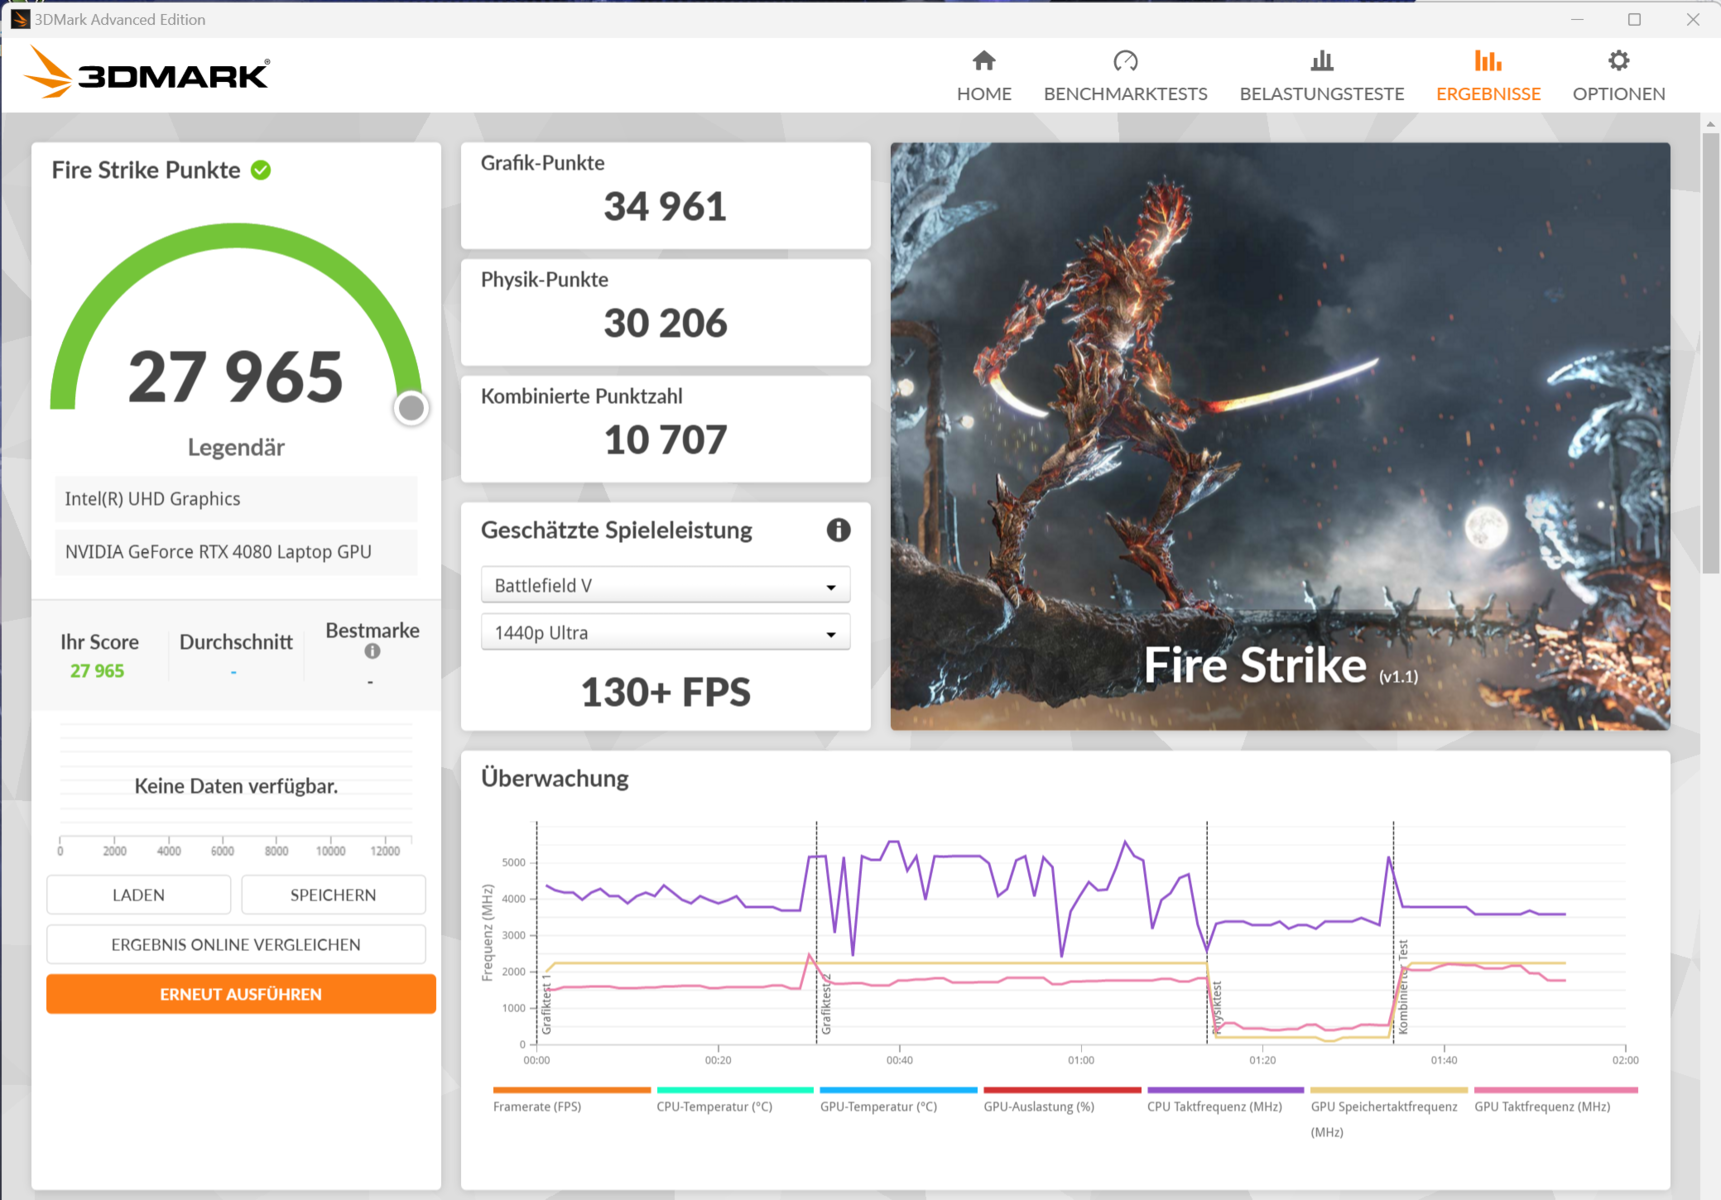
| 3DMark 11 Performance | 46847 puntos | |
| 3DMark Fire Strike Score | 36245 puntos | |
| 3DMark Time Spy Score | 19518 puntos | |
ayuda | ||
* ... más pequeño es mejor
| Performance rating - Percent | |
| Lenovo Legion Pro 7 16IRX9H | |
| MSI Vector 16 HX A14V | |
| Alienware m16 R1 AMD -1! | |
| Medio NVIDIA GeForce RTX 4080 Laptop GPU | |
| Media de la clase Gaming | |
| HP Omen 16 (2024) | |
| The Witcher 3 - 1920x1080 Ultra Graphics & Postprocessing (HBAO+) | |
| Media de la clase Gaming (104.7 - 240, n=7, últimos 2 años) | |
| Lenovo Legion Pro 7 16IRX9H | |
| MSI Vector 16 HX A14V | |
| Alienware m16 R1 AMD | |
| Medio NVIDIA GeForce RTX 4080 Laptop GPU (130.4 - 186.1, n=20) | |
| HP Omen 16 (2024) | |
| GTA V - 1920x1080 Highest AA:4xMSAA + FX AF:16x | |
| Lenovo Legion Pro 7 16IRX9H | |
| MSI Vector 16 HX A14V | |
| Media de la clase Gaming (48.3 - 186.9, n=94, últimos 2 años) | |
| Medio NVIDIA GeForce RTX 4080 Laptop GPU (102.9 - 152.7, n=21) | |
| HP Omen 16 (2024) | |
| Final Fantasy XV Benchmark - 1920x1080 High Quality | |
| MSI Vector 16 HX A14V | |
| Lenovo Legion Pro 7 16IRX9H | |
| Alienware m16 R1 AMD | |
| Medio NVIDIA GeForce RTX 4080 Laptop GPU (129 - 182.1, n=23) | |
| Media de la clase Gaming (41 - 215, n=95, últimos 2 años) | |
| HP Omen 16 (2024) | |
| Strange Brigade - 1920x1080 ultra AA:ultra AF:16 | |
| Alienware m16 R1 AMD | |
| MSI Vector 16 HX A14V | |
| Lenovo Legion Pro 7 16IRX9H | |
| Medio NVIDIA GeForce RTX 4080 Laptop GPU (239 - 357, n=22) | |
| Media de la clase Gaming (76.3 - 458, n=87, últimos 2 años) | |
| HP Omen 16 (2024) | |
| Dota 2 Reborn - 1920x1080 ultra (3/3) best looking | |
| Lenovo Legion Pro 7 16IRX9H | |
| MSI Vector 16 HX A14V | |
| Alienware m16 R1 AMD | |
| Medio NVIDIA GeForce RTX 4080 Laptop GPU (133 - 194.7, n=23) | |
| HP Omen 16 (2024) | |
| Media de la clase Gaming (84.8 - 248, n=107, últimos 2 años) | |
| Cyberpunk 2077 | |
| 1920x1080 Ray Tracing Ultra Preset (DLSS off) | |
| Lenovo Legion Pro 7 16IRX9H | |
| MSI Vector 16 HX A14V | |
| Medio NVIDIA GeForce RTX 4080 Laptop GPU (43.8 - 67.2, n=12) | |
| Media de la clase Gaming (19.1 - 84.9, n=36, últimos 2 años) | |
| HP Omen 16 (2024) | |
| 2560x1440 Ultra Preset (FSR off) | |
| MSI Vector 16 HX A14V | |
| Media de la clase Gaming (24.8 - 122.8, n=93, últimos 2 años) | |
| Lenovo Legion Pro 7 16IRX9H | |
| Medio NVIDIA GeForce RTX 4080 Laptop GPU (56.2 - 86.3, n=15) | |
| HP Omen 16 (2024) | |
| 1920x1080 Ultra Preset (FSR off) | |
| MSI Vector 16 HX A14V | |
| Lenovo Legion Pro 7 16IRX9H | |
| Medio NVIDIA GeForce RTX 4080 Laptop GPU (83.9 - 127.1, n=15) | |
| Media de la clase Gaming (17.7 - 169.9, n=115, últimos 2 años) | |
| HP Omen 16 (2024) | |
| 1920x1080 Ultra Preset (FSR2 on) | |
| Media de la clase Gaming (58 - 173.1, n=7, últimos 2 años) | |
| Lenovo Legion Pro 7 16IRX9H | |
| MSI Vector 16 HX A14V | |
| Medio NVIDIA GeForce RTX 4080 Laptop GPU (94.6 - 128, n=8) | |
| HP Omen 16 (2024) | |
| Call of Duty Modern Warfare 3 2023 - 1920x1080 Extreme Preset | |
| Medio NVIDIA GeForce RTX 4080 Laptop GPU (153 - 171, n=3) | |
| Lenovo Legion Pro 7 16IRX9H | |
| Media de la clase Gaming (27 - 95, n=2, últimos 2 años) | |
| Skull & Bones | |
| 1920x1080 Ultra High Preset AA:T | |
| Lenovo Legion Pro 7 16IRX9H | |
| Medio NVIDIA GeForce RTX 4080 Laptop GPU (96 - 115, n=3) | |
| 2560x1440 Ultra High Preset AA:T | |
| Lenovo Legion Pro 7 16IRX9H | |
| Medio NVIDIA GeForce RTX 4080 Laptop GPU (76 - 91, n=3) | |
| Assassin's Creed Mirage | |
| 1920x1080 Ultra High Preset (Adaptive Quality Off) | |
| Lenovo Legion Pro 7 16IRX9H | |
| Medio NVIDIA GeForce RTX 4080 Laptop GPU (129 - 157, n=3) | |
| 2560x1440 Ultra High Preset (Adaptive Quality Off) | |
| Lenovo Legion Pro 7 16IRX9H | |
| Medio NVIDIA GeForce RTX 4080 Laptop GPU (112 - 136, n=3) | |
| Avatar Frontiers of Pandora | |
| 1920x1080 Ultra Preset AA:T | |
| Medio NVIDIA GeForce RTX 4080 Laptop GPU (87 - 97, n=4) | |
| Lenovo Legion Pro 7 16IRX9H | |
| Media de la clase Gaming (n=1últimos 2 años) | |
| 2560x1440 Ultra Preset AA:T | |
| Medio NVIDIA GeForce RTX 4080 Laptop GPU (59 - 66, n=4) | |
| Lenovo Legion Pro 7 16IRX9H | |
| Media de la clase Gaming (n=1últimos 2 años) | |
| Last Epoch | |
| 1920x1080 Ultra Preset AA:T | |
| Lenovo Legion Pro 7 16IRX9H | |
| Medio NVIDIA GeForce RTX 4080 Laptop GPU (156.5 - 204, n=2) | |
| Media de la clase Gaming (n=1últimos 2 años) | |
| 2560x1440 Ultra Preset AA:T | |
| Lenovo Legion Pro 7 16IRX9H | |
| Medio NVIDIA GeForce RTX 4080 Laptop GPU (127.4 - 139, n=2) | |
| Media de la clase Gaming (n=1últimos 2 años) | |
| Alone in the Dark | |
| 1920x1080 Cinematic Preset | |
| Lenovo Legion Pro 7 16IRX9H | |
| Medio NVIDIA GeForce RTX 4080 Laptop GPU (120 - 176.4, n=2) | |
| 2560x1440 Cinematic Preset | |
| Lenovo Legion Pro 7 16IRX9H | |
| Medio NVIDIA GeForce RTX 4080 Laptop GPU (86 - 91.6, n=2) | |
| Horizon Forbidden West | |
| 1920x1080 Very High Preset AA:T | |
| Lenovo Legion Pro 7 16IRX9H | |
| Medio NVIDIA GeForce RTX 4080 Laptop GPU (89.2 - 103.5, n=2) | |
| Media de la clase Gaming (14.7 - 140.3, n=12, últimos 2 años) | |
| 2560x1440 Very High Preset AA:T | |
| Lenovo Legion Pro 7 16IRX9H | |
| Medio NVIDIA GeForce RTX 4080 Laptop GPU (71 - 83.7, n=2) | |
| Media de la clase Gaming (45.7 - 100.9, n=9, últimos 2 años) | |
Witcher 3 FPS chart
| bajo | medio | alto | ultra | QHD | |
|---|---|---|---|---|---|
| GTA V (2015) | 187.2 | 186.6 | 186.5 | 152 | 135.3 |
| The Witcher 3 (2015) | 628.4 | 518.3 | 342.2 | 186.1 | 142.6 |
| Dota 2 Reborn (2015) | 229 | 211 | 197.3 | 183.5 | |
| Final Fantasy XV Benchmark (2018) | 232 | 211 | 173.1 | 139.3 | |
| X-Plane 11.11 (2018) | 196.4 | 162.3 | 127.5 | ||
| Strange Brigade (2018) | 538 | 446 | 377 | 339 | 243 |
| Cyberpunk 2077 (2023) | 152.3 | 137.2 | 126.7 | 118.3 | 79.1 |
| Assassin's Creed Mirage (2023) | 208 | 207 | 199 | 157 | 136 |
| Call of Duty Modern Warfare 3 2023 (2023) | 224 | 205 | 164 | 153 | 110 |
| Avatar Frontiers of Pandora (2023) | 141 | 130 | 114 | 89 | 59 |
| Skull & Bones (2024) | 161 | 151 | 135 | 112 | 89 |
| Last Epoch (2024) | 248 | 237 | 229 | 204 | 139 |
| Alone in the Dark (2024) | 249 | 230 | 214 | 176.4 | 91.6 |
| Horizon Forbidden West (2024) | 153.3 | 145.5 | 108.1 | 103.5 | 83.7 |
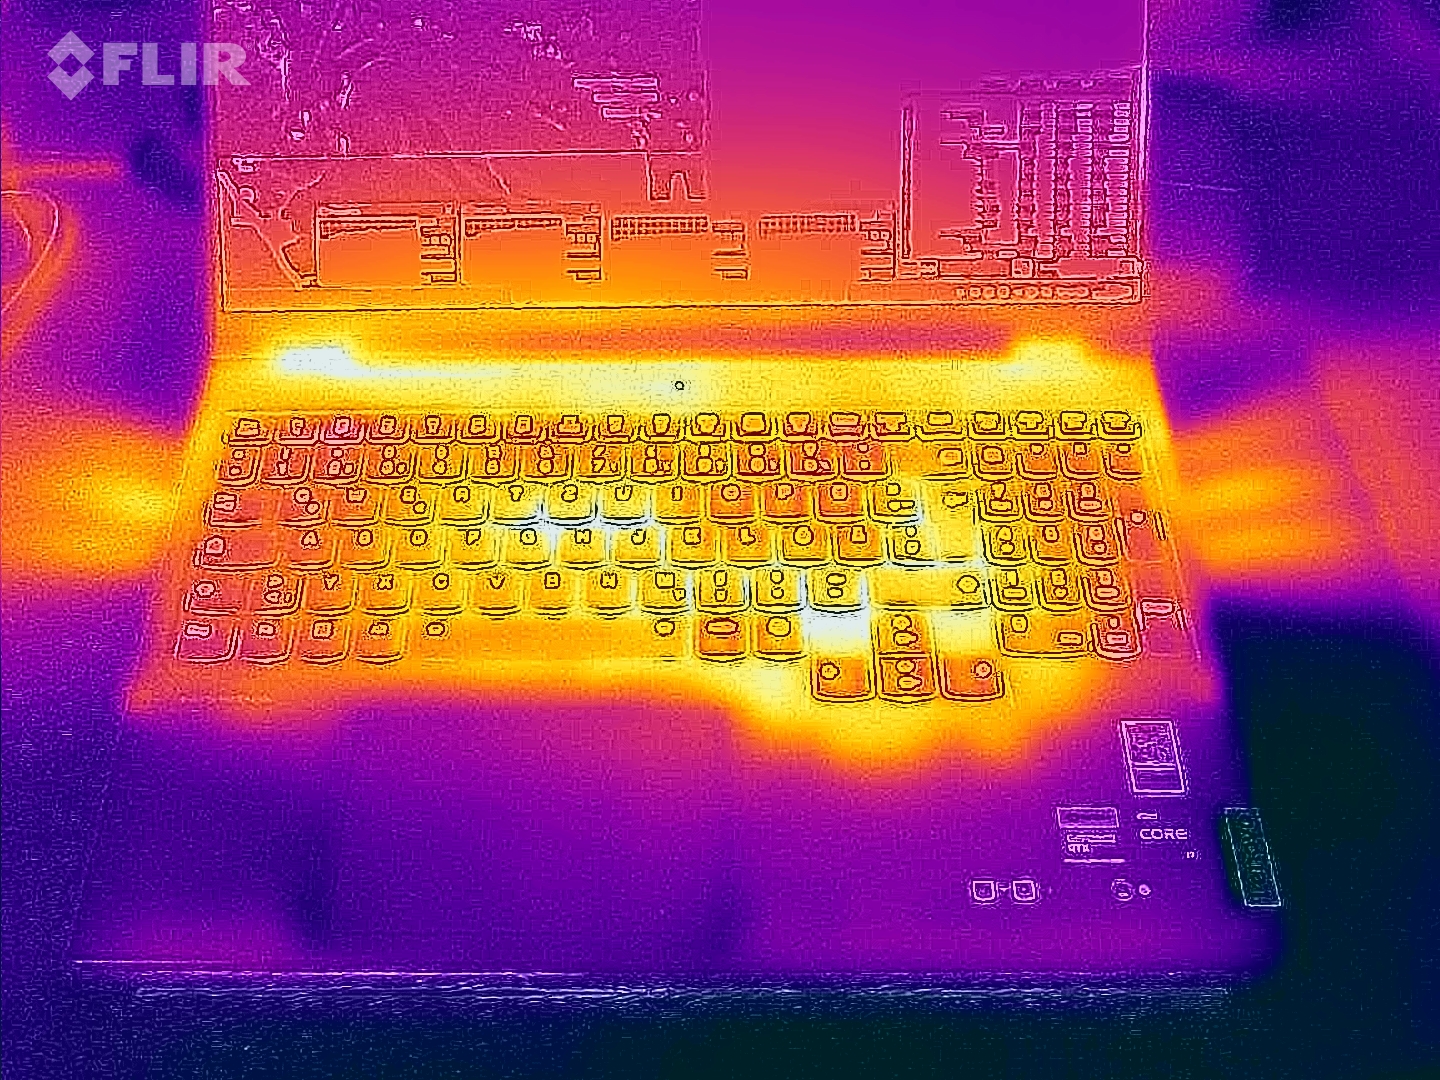
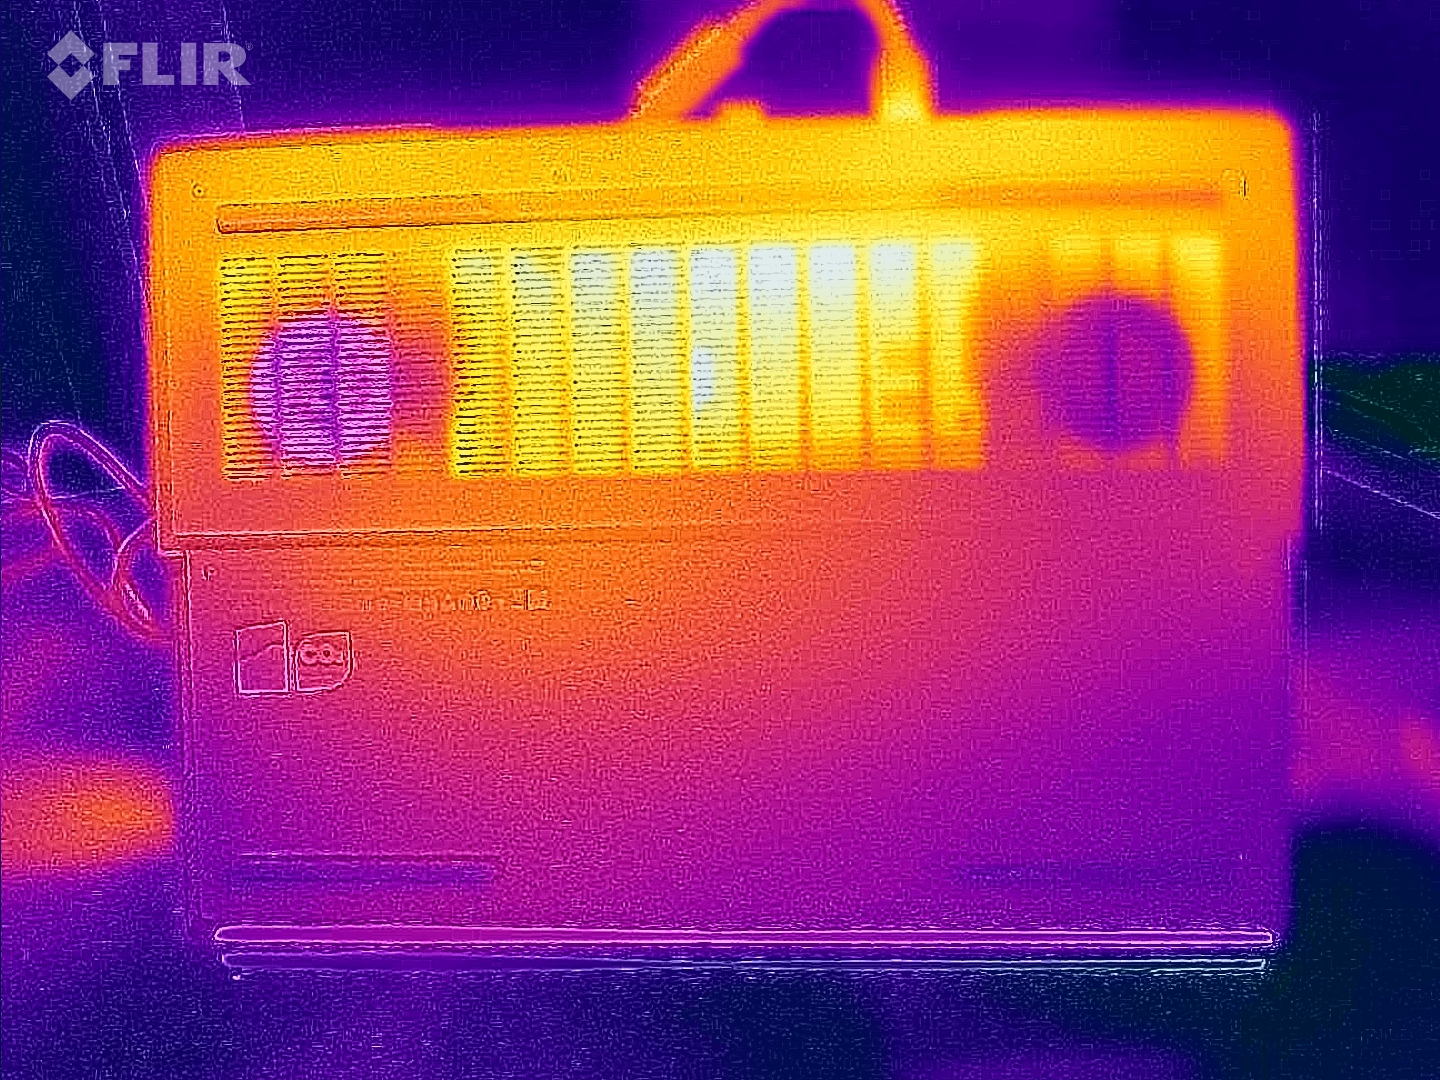
Emisiones y gestión de la energía: el portátil Lenovo puede funcionar de forma silenciosa
Emisiones sonoras
El nivel de ruido alcanzó hasta 56 dB(A) bajo carga en el modo Rendimiento. El modo Equilibrado ofrece un buen equilibrio entre ruido y rendimiento; el modo Silencioso le ahorra nervios pero provoca una caída considerable del rendimiento. Por lo general, el portátil es silencioso y a veces incluso silencioso en reposo y en el uso diario (por ejemplo, aplicaciones ofimáticas, navegación por Internet). Lástima que hayamos notado ocasionalmente un (suave) chirrido electrónico procedente del interior de nuestra unidad de revisión.
Ruido
| Ocioso |
| 25 / 30 / 45 dB(A) |
| Carga |
| 50 / 56 dB(A) |
 | ||
30 dB silencioso 40 dB(A) audible 50 dB(A) ruidosamente alto |
||
min: | ||
| Lenovo Legion Pro 7 16IRX9H i9-14900HX, GeForce RTX 4080 Laptop GPU | Alienware m16 R1 AMD R9 7845HX, GeForce RTX 4080 Laptop GPU | MSI Vector 16 HX A14V i9-14900HX, GeForce RTX 4080 Laptop GPU | HP Omen 16 (2024) i9-14900HX, GeForce RTX 4080 Laptop GPU | Lenovo Legion Pro 7 16IRX8H i9-13900HX, GeForce RTX 4080 Laptop GPU | |
|---|---|---|---|---|---|
| Noise | 13% | -7% | 7% | 4% | |
| apagado / medio ambiente * (dB) | 24 | 22.9 5% | 23.2 3% | 25 -4% | 24 -0% |
| Idle Minimum * (dB) | 25 | 22.9 8% | 33.5 -34% | 29 -16% | 26 -4% |
| Idle Average * (dB) | 30 | 29.7 1% | 33.5 -12% | 30 -0% | 28 7% |
| Idle Maximum * (dB) | 45 | 29.7 34% | 33.5 26% | 31 31% | 34 24% |
| Load Average * (dB) | 50 | 29.8 40% | 52.1 -4% | 46 8% | 47 6% |
| Witcher 3 ultra * (dB) | 54 | 54.7 -1% | 62 -15% | 47 13% | 55 -2% |
| Load Maximum * (dB) | 56 | 54.7 2% | 62 -11% | 47 16% | 56 -0% |
* ... más pequeño es mejor
Temperatura
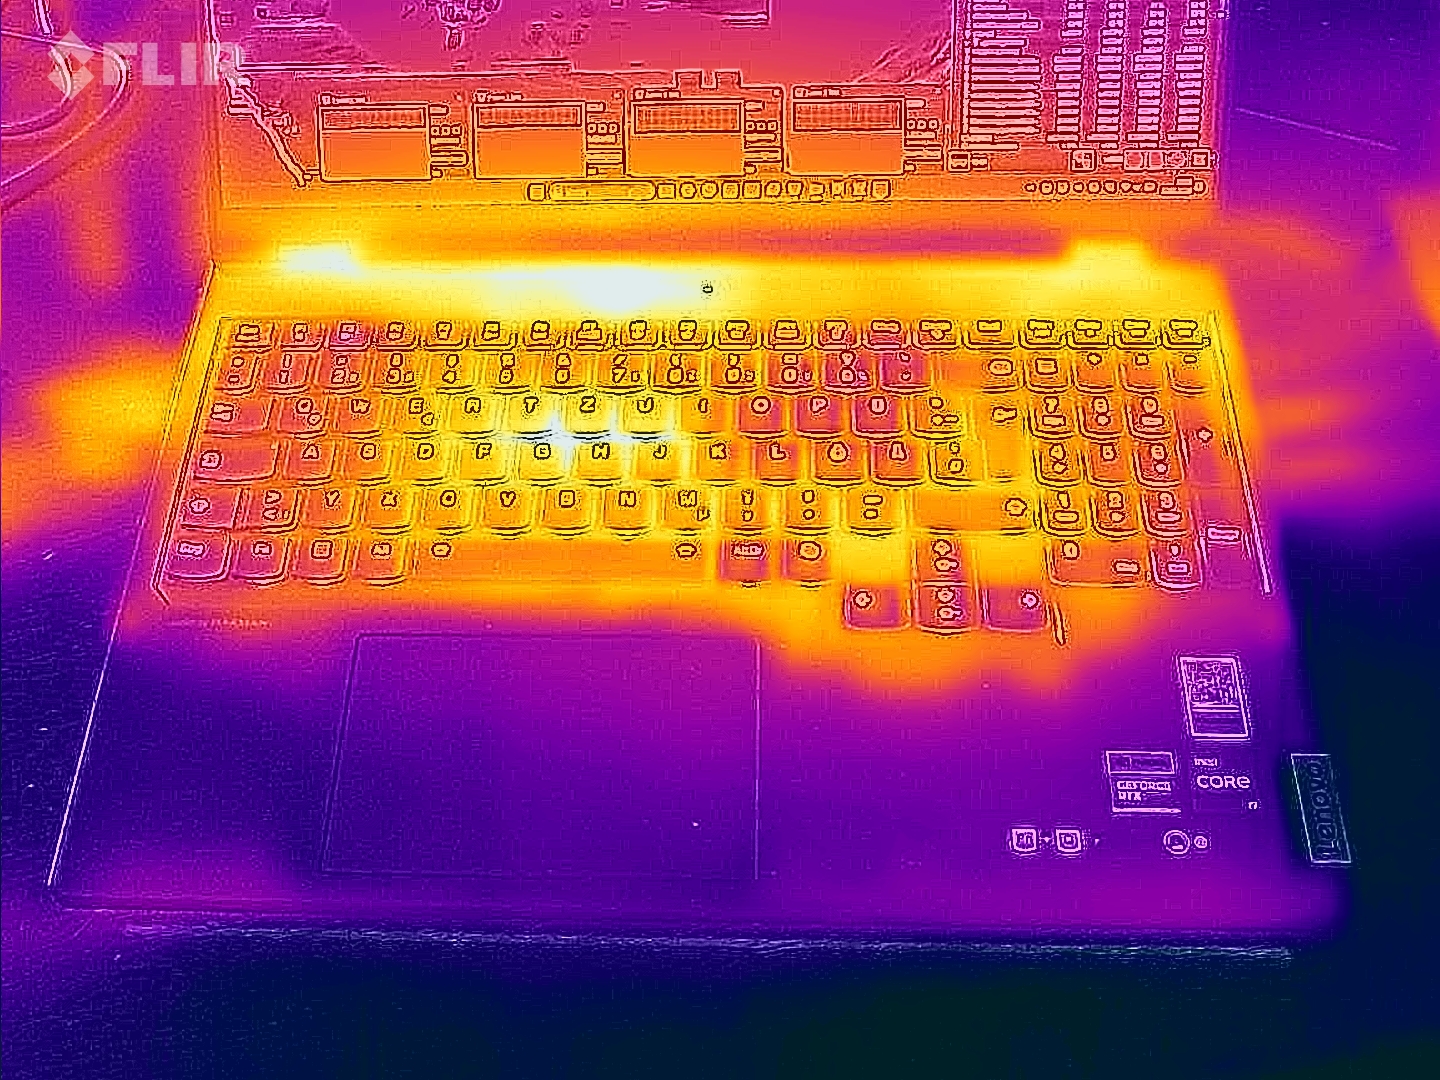
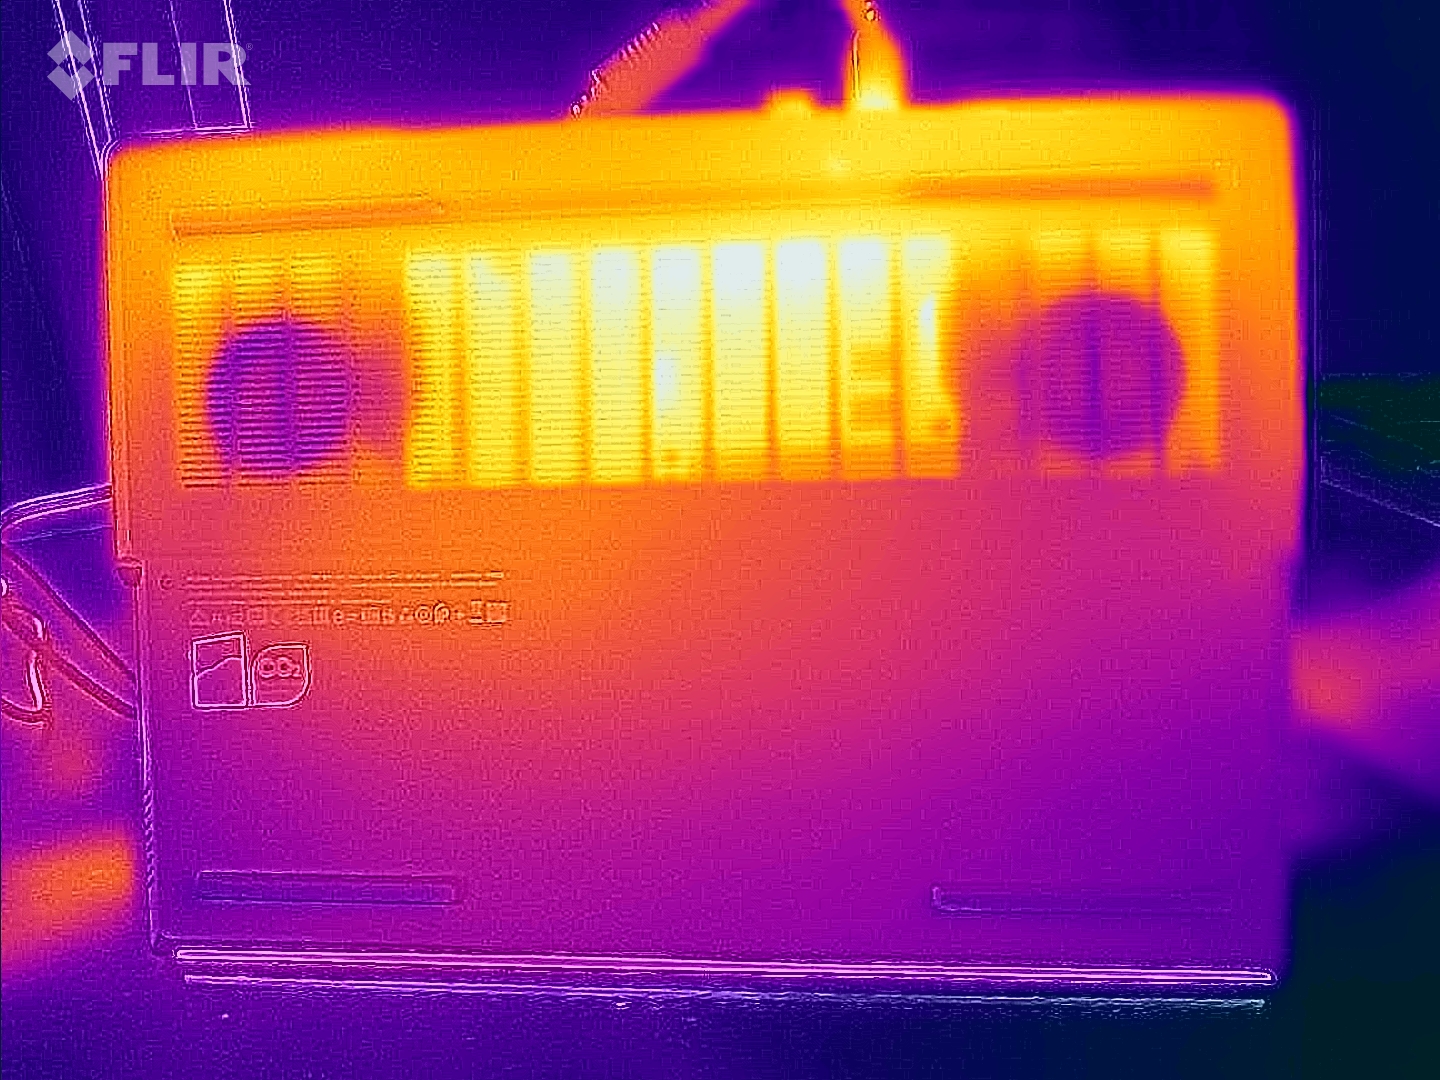
El portátil se calentó notablemente durante la prueba de estrés y la prueba Witcher 3. Algunos puntos del chasis incluso superaron los 50°C (122°F). Las temperaturas del chasis se mantuvieron dentro de un rango confortable en el uso diario, como las aplicaciones ofimáticas y la navegación por Internet.
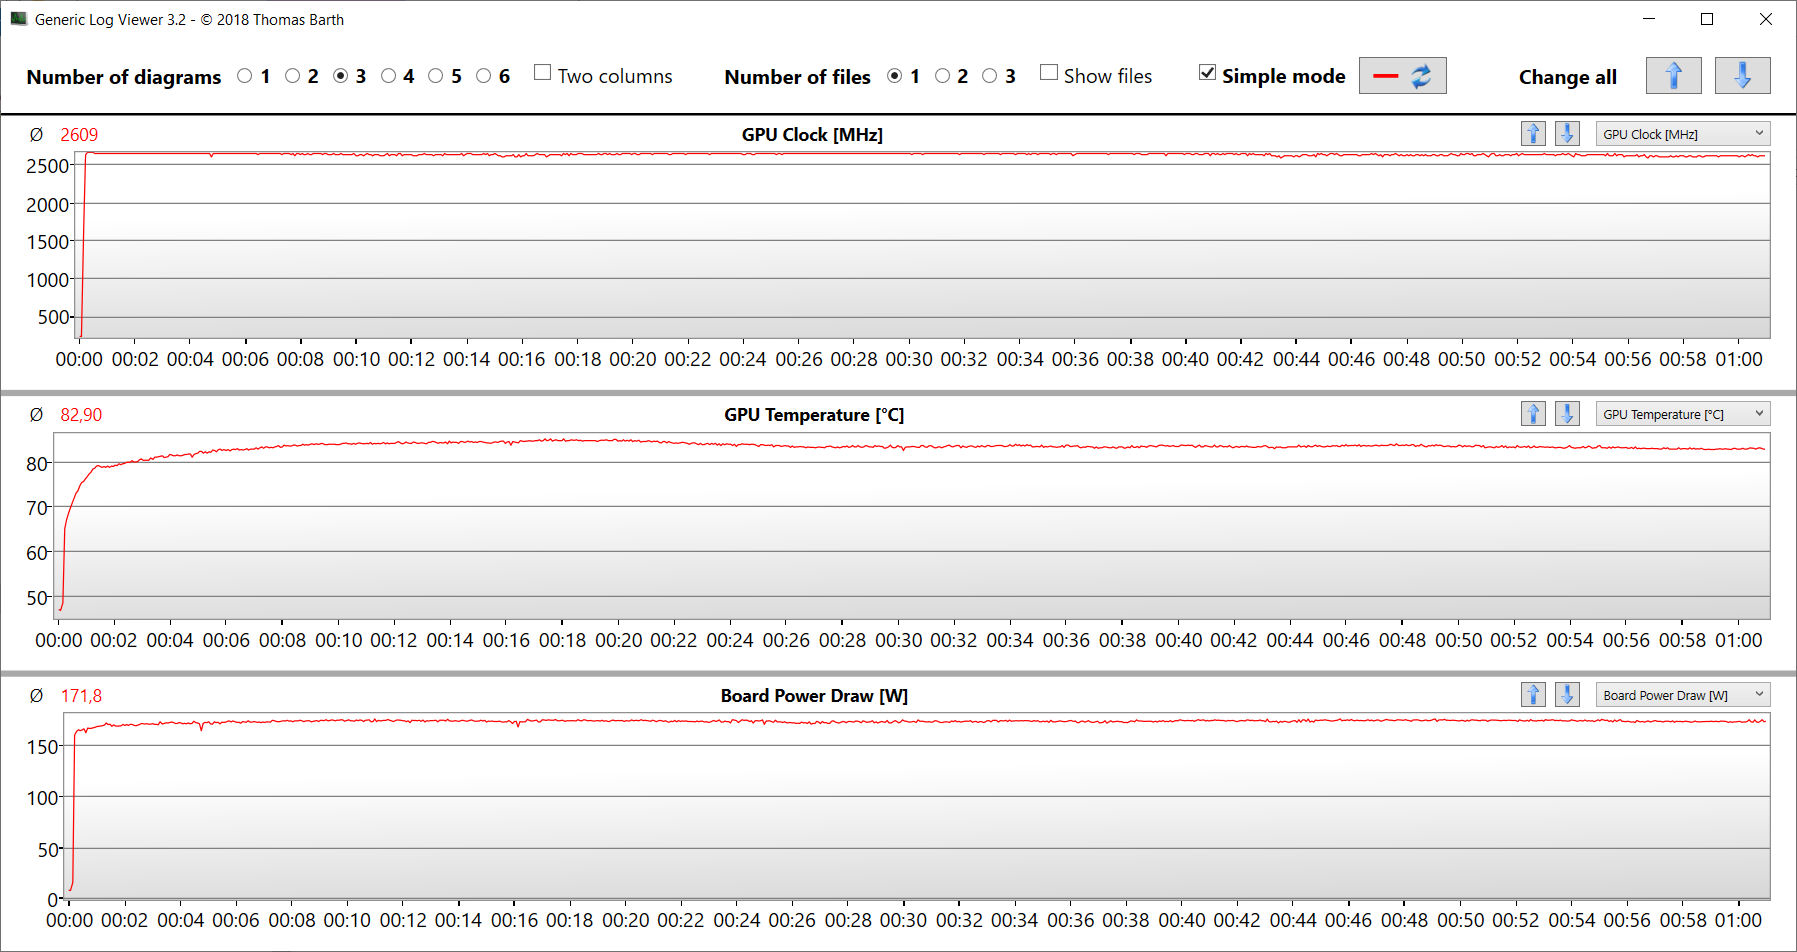
Nuestra prueba de estrés consiste en ejecutar Prime95 y FurMark simultáneamente durante un periodo prolongado y está diseñada para determinar la estabilidad de un sistema a plena carga. Tanto la CPU como la GPU fueron capaces de mantener altas velocidades de reloj durante la prueba.
(-) La temperatura máxima en la parte superior es de 46 °C / 115 F, frente a la media de 40.4 °C / 105 F, que oscila entre 21.2 y 68.8 °C para la clase Gaming.
(-) El fondo se calienta hasta un máximo de 49 °C / 120 F, frente a la media de 43.2 °C / 110 F
(±) En reposo, la temperatura media de la parte superior es de 33.3 °C / 92# F, frente a la media del dispositivo de 33.9 °C / 93 F.
(-) Jugando a The Witcher 3, la temperatura media de la parte superior es de 42.7 °C / 109 F, frente a la media del dispositivo de 33.9 °C / 93 F.
(-) El reposamanos y el touchpad pueden calentarse mucho al tacto con un máximo de 40 °C / 104 F.
(-) La temperatura media de la zona del reposamanos de dispositivos similares fue de 28.8 °C / 83.8 F (-11.2 °C / -20.2 F).
| Lenovo Legion Pro 7 16IRX9H i9-14900HX, GeForce RTX 4080 Laptop GPU | Alienware m16 R1 AMD R9 7845HX, GeForce RTX 4080 Laptop GPU | MSI Vector 16 HX A14V i9-14900HX, GeForce RTX 4080 Laptop GPU | HP Omen 16 (2024) i9-14900HX, GeForce RTX 4080 Laptop GPU | Lenovo Legion Pro 7 16IRX8H i9-13900HX, GeForce RTX 4080 Laptop GPU | |
|---|---|---|---|---|---|
| Heat | 5% | 26% | 12% | 1% | |
| Maximum Upper Side * (°C) | 46 | 48 -4% | 36.4 21% | 47 -2% | 48 -4% |
| Maximum Bottom * (°C) | 49 | 39 20% | 35.6 27% | 57 -16% | 49 -0% |
| Idle Upper Side * (°C) | 38 | 37 3% | 26.6 30% | 25 34% | 40 -5% |
| Idle Bottom * (°C) | 37 | 36.2 2% | 27 27% | 26 30% | 33 11% |
* ... más pequeño es mejor
Altavoces
Los altavoces estéreo producen un gran sonido en general.
Lenovo Legion Pro 7 16IRX9H análisis de audio
(+) | los altavoces pueden reproducir a un volumen relativamente alto (#84 dB)
Graves 100 - 315 Hz
(±) | lubina reducida - en promedio 8.9% inferior a la mediana
(±) | la linealidad de los graves es media (7.4% delta a frecuencia anterior)
Medios 400 - 2000 Hz
(+) | medios equilibrados - a sólo 2.8% de la mediana
(+) | los medios son lineales (4% delta a la frecuencia anterior)
Altos 2 - 16 kHz
(+) | máximos equilibrados - a sólo 3% de la mediana
(+) | los máximos son lineales (5% delta a la frecuencia anterior)
Total 100 - 16.000 Hz
(+) | el sonido global es lineal (8.4% de diferencia con la mediana)
En comparación con la misma clase
» 2% de todos los dispositivos probados de esta clase eran mejores, 1% similares, 97% peores
» El mejor tuvo un delta de 6%, la media fue 18%, el peor fue ###max##%
En comparación con todos los dispositivos probados
» 2% de todos los dispositivos probados eran mejores, 1% similares, 97% peores
» El mejor tuvo un delta de 4%, la media fue 23%, el peor fue ###max##%
HP Omen 16 (2024) análisis de audio
(±) | la sonoridad del altavoz es media pero buena (78 dB)
Graves 100 - 315 Hz
(-) | casi sin bajos - de media 15.2% inferior a la mediana
(±) | la linealidad de los graves es media (14.3% delta a frecuencia anterior)
Medios 400 - 2000 Hz
(+) | medios equilibrados - a sólo 4.8% de la mediana
(+) | los medios son lineales (5% delta a la frecuencia anterior)
Altos 2 - 16 kHz
(+) | máximos equilibrados - a sólo 2% de la mediana
(+) | los máximos son lineales (4.1% delta a la frecuencia anterior)
Total 100 - 16.000 Hz
(+) | el sonido global es lineal (14.7% de diferencia con la mediana)
En comparación con la misma clase
» 29% de todos los dispositivos probados de esta clase eran mejores, 7% similares, 64% peores
» El mejor tuvo un delta de 6%, la media fue 18%, el peor fue ###max##%
En comparación con todos los dispositivos probados
» 19% de todos los dispositivos probados eran mejores, 4% similares, 77% peores
» El mejor tuvo un delta de 4%, la media fue 23%, el peor fue ###max##%
Consumo de energía
No hay sorpresas en lo que se refiere al consumo de energía. Los niveles de uso están en un nivel típico para el hardware que lleva dentro. El Legion Pro 7 completó nuestra prueba Witcher 3 y la prueba de estrés con un nivel consistente de uso de energía. El cargador de 330 vatios incluido es suficientemente potente para el portátil.
| Off / Standby | |
| Ocioso | |
| Carga |
|
Clave:
min: | |
Power consumption Witcher 3 / Stress test
Power consumption with external monitor
Duración de las pilas
El portátil de 16 pulgadas duró 6h 13min en nuestra prueba Wi-Fi realista, que simula una carga accediendo a sitios web mediante un script. El Legion tiene la mejor duración de batería entre todos los dispositivos de nuestra comparativa.
Pro
Contra
Veredicto - Potente portátil de gama alta

Con el Legion Pro 7, Lenovo ha entregado un potente portátil de 16 pulgadas para jugadores y creadores. A bordo del portátil hay una adecuada pantalla QHD+ de 16 pulgadas (2.560 x 1.600 píxeles, DCI-P3, G-Sync, HDR, 240 Hz) con una relación de aspecto 16:10 que facilita el trabajo.
El Lenovo Legion Pro 7 16IRX9H ofrece una gran potencia a un precio razonable.
El GeForce RTX 4080 y Core i9-14900HX en su interior lograron alcanzar sus nuevos mejores resultados en algunas de las pruebas - ambos chips son sin duda capaces de funcionar a pleno rendimiento constantemente. No hay forma de evitar las elevadas cantidades de calor y ruido habituales en esta clase de portátiles. Sin embargo, existe un modo silencioso para aliviarlo - a costa del rendimiento.
Dos puertos USB-C (1x Thunderbolt 4, 1x USB 3.2 Gen 2) facilitan la integración del portátil en una configuración de trabajo existente y abren opciones de expansión (por ejemplo, GPU externa, bases). Ambos puertos son capaces de emitir una señal DisplayPort, y uno de ellos incluso soporta Power Delivery. La duración de la batería es bastante decente.
El MSI Vector 16 HX A14V es una alternativa que merece la pena considerar. Está a la par con el Legion en cuanto a rendimiento, pero tiene una duración de batería ligeramente inferior.
Precio y disponibilidad
En Europa, el modelo Lenovo Legion Pro 7 aquí presentado está disponible a partir de 2.999 euros (3.245 dólares) Campuspoint.de y Notebooksbilliger.de una vez descontados los descuentos especiales para estudiantes y educadores.
Aunque el nuevo Legion Pro 7 aún no está disponible en EE.UU., puede encontrar su predecesor por unos 2.490 dólares en Amazon US. Este modelo en particular tiene un Core i9-13900HX de última generación, pero por lo demás es prácticamente igual.
Lenovo Legion Pro 7 16IRX9H
- 03/25/2024 v7 (old)
Sascha Mölck
Transparencia
La selección de los dispositivos que se van a reseñar corre a cargo de nuestro equipo editorial. La muestra de prueba fue proporcionada al autor en calidad de préstamo por el fabricante o el minorista a los efectos de esta reseña. El prestamista no tuvo ninguna influencia en esta reseña, ni el fabricante recibió una copia de la misma antes de su publicación. No había ninguna obligación de publicar esta reseña. Como empresa de medios independiente, Notebookcheck no está sujeta a la autoridad de fabricantes, minoristas o editores.
Así es como prueba Notebookcheck
Cada año, Notebookcheck revisa de forma independiente cientos de portátiles y smartphones utilizando procedimientos estandarizados para asegurar que todos los resultados son comparables. Hemos desarrollado continuamente nuestros métodos de prueba durante unos 20 años y hemos establecido los estándares de la industria en el proceso. En nuestros laboratorios de pruebas, técnicos y editores experimentados utilizan equipos de medición de alta calidad. Estas pruebas implican un proceso de validación en varias fases. Nuestro complejo sistema de clasificación se basa en cientos de mediciones y puntos de referencia bien fundamentados, lo que mantiene la objetividad.Price comparison

