Análisis del HP Omen 16 (2024): Portátil de juegos QHD con Core i9 y RTX 4080 por 3.200 euros
La última encarnación del Omen 16 -un portátil para juegos de gama alta- comparte el mismo chasis y en gran medida el mismo hardware que el predecesor. La CPU ha sido mejorada: Raptor Lake Refresh sustituye al Raptor Lake original. La GeForce RTX 4080, Core i9-14900HX y 32 GB de RAM elevan el precio del portátil a 3.200 euros (3.446 dólares). El Omen 16 se enfrenta a portátiles para juegos como el MSI Vector 16 HX A14Vel Acer Predator Helios 18 y el Alienware m16 R1.
Posibles contendientes en la comparación
Valoración | Fecha | Modelo | Peso | Altura | Tamaño | Resolución | Precio |
|---|---|---|---|---|---|---|---|
| 86.7 % v7 (old) | 02/2024 | HP Omen 16 (2024) i9-14900HX, GeForce RTX 4080 Laptop GPU | 2.4 kg | 23.5 mm | 16.10" | 2560x1440 | |
| 88 % v7 (old) | 02/2024 | MSI Vector 16 HX A14V i9-14900HX, GeForce RTX 4080 Laptop GPU | 2.7 kg | 28.55 mm | 16.00" | 2560x1600 | |
| 89.2 % v7 (old) | 08/2023 | Alienware m16 R1 AMD R9 7845HX, GeForce RTX 4080 Laptop GPU | 3.1 kg | 25.4 mm | 16.00" | 2560x1600 | |
| 88.3 % v7 (old) | 10/2023 | Acer Predator Helios 18 N23Q2 i9-13900HX, GeForce RTX 4080 Laptop GPU | 3.2 kg | 29.15 mm | 18.00" | 2560x1600 |
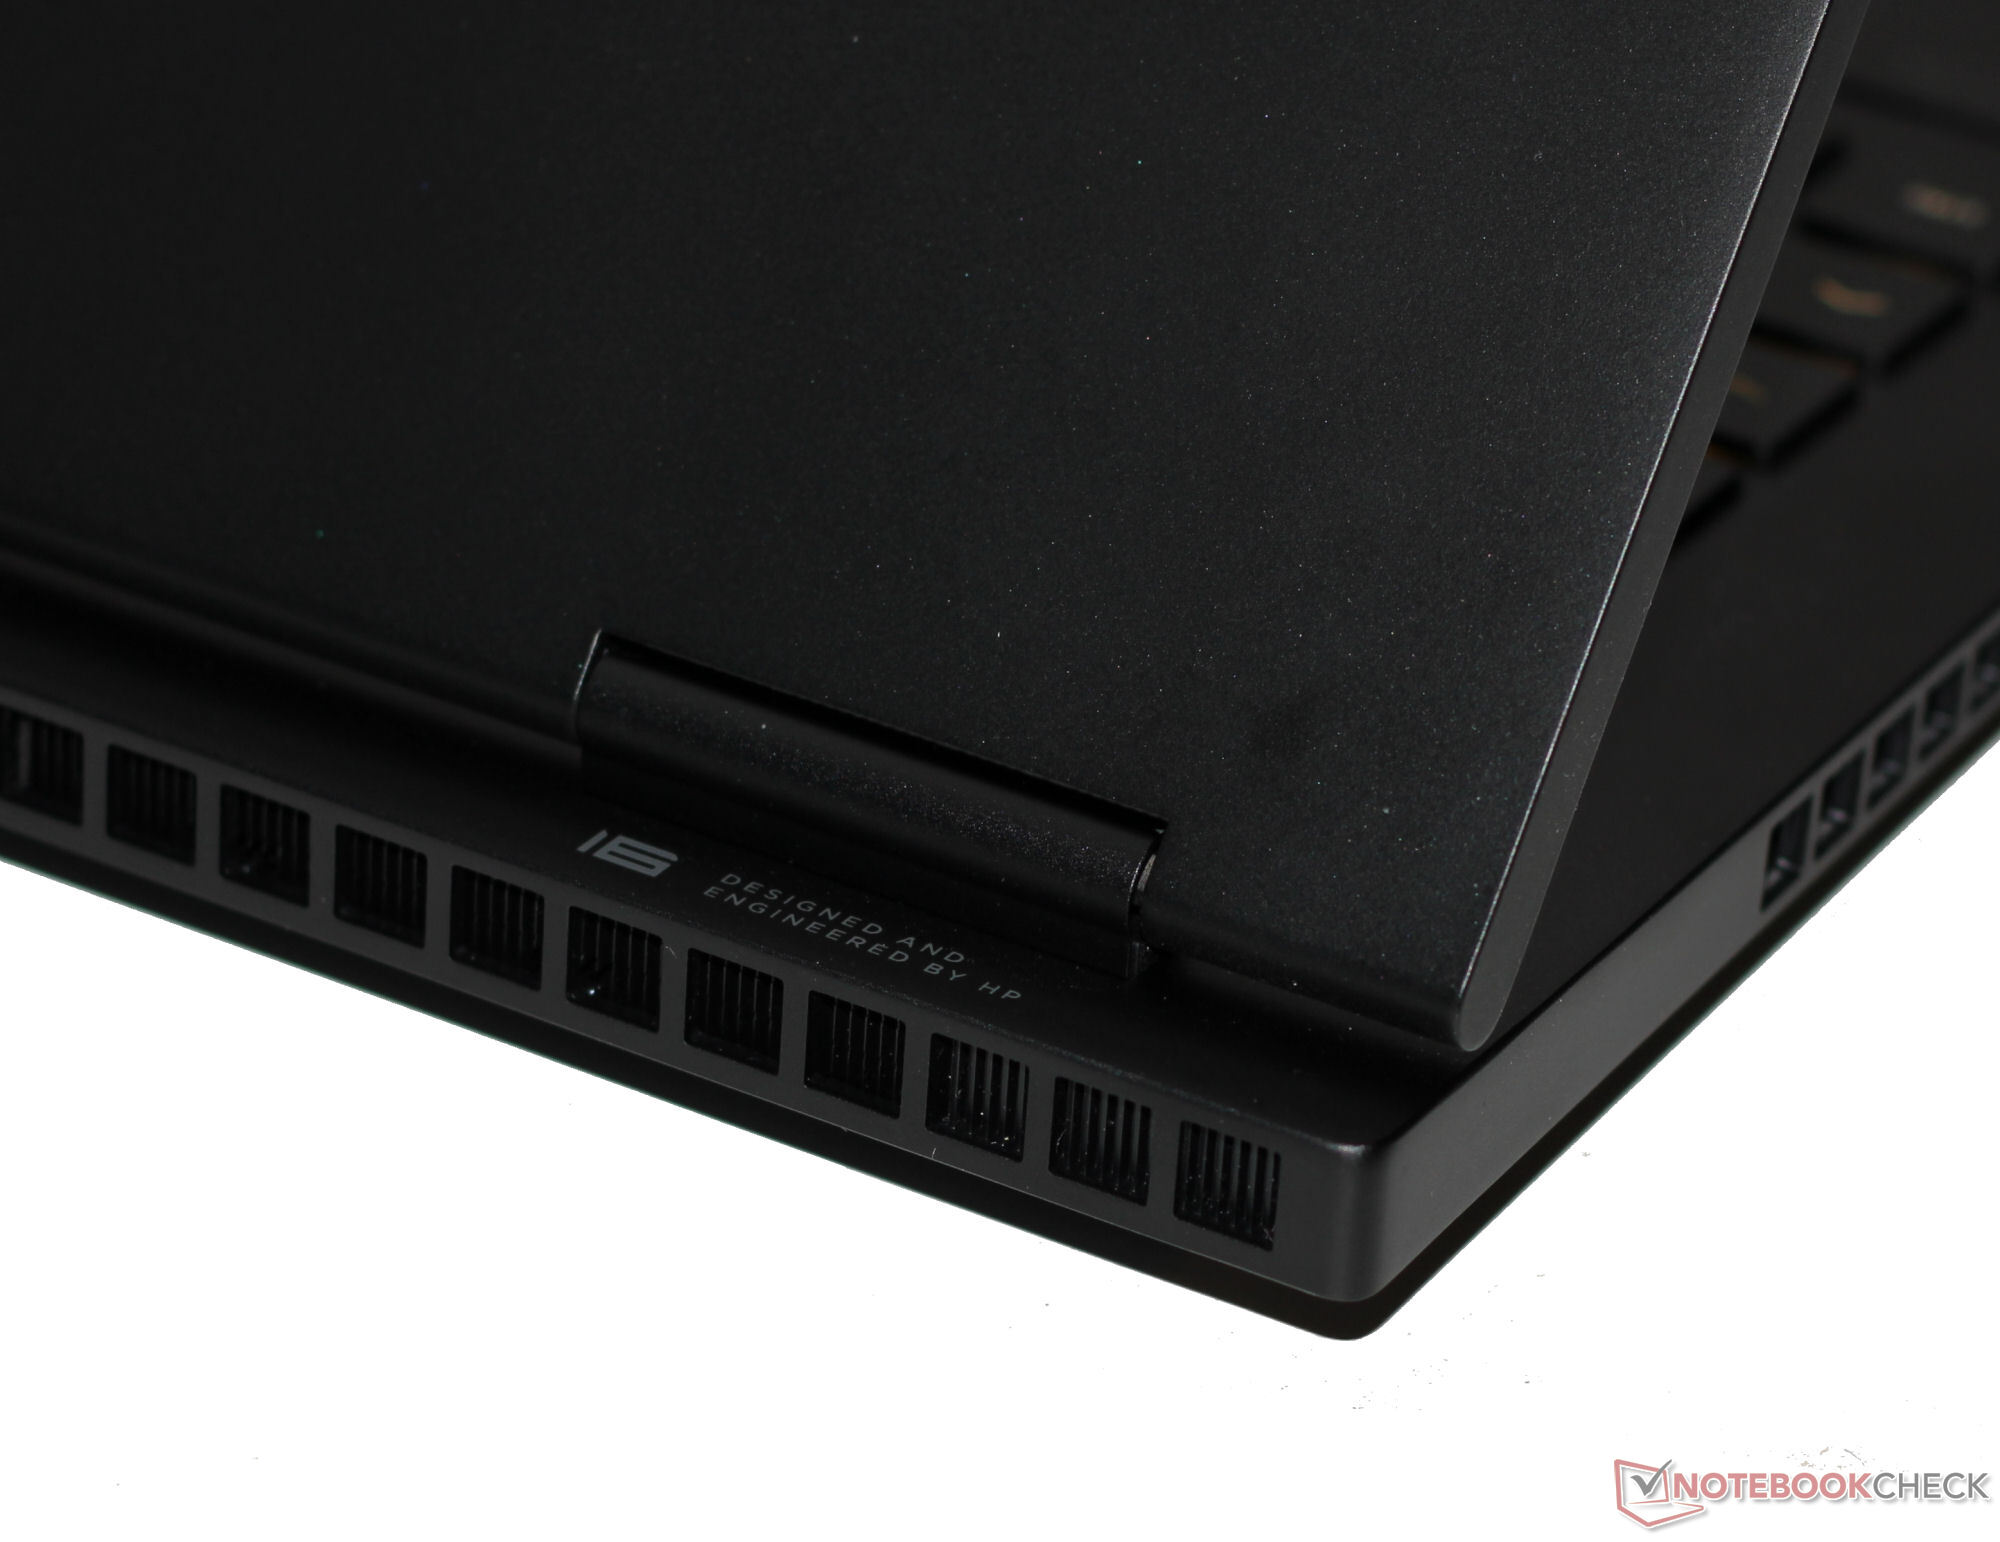
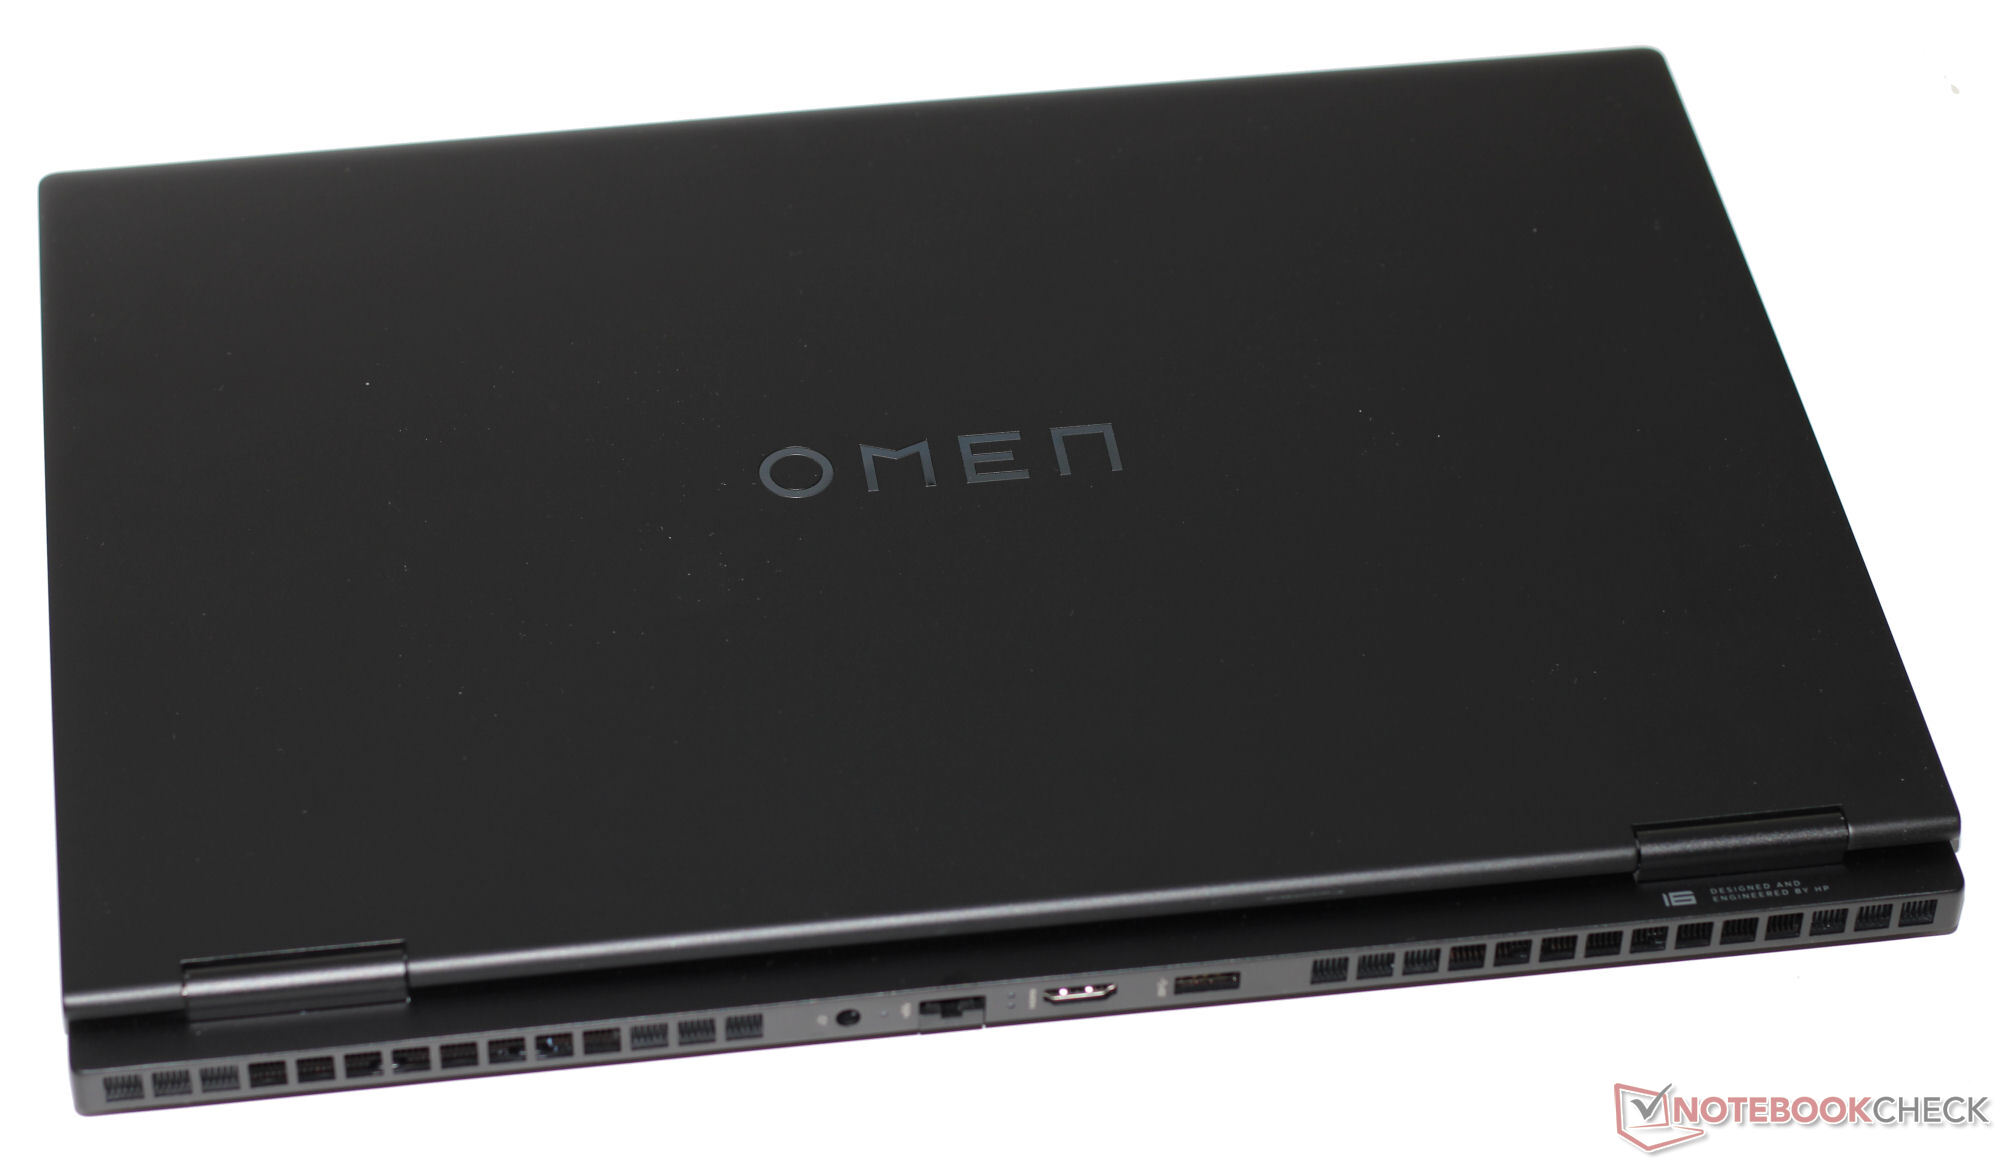
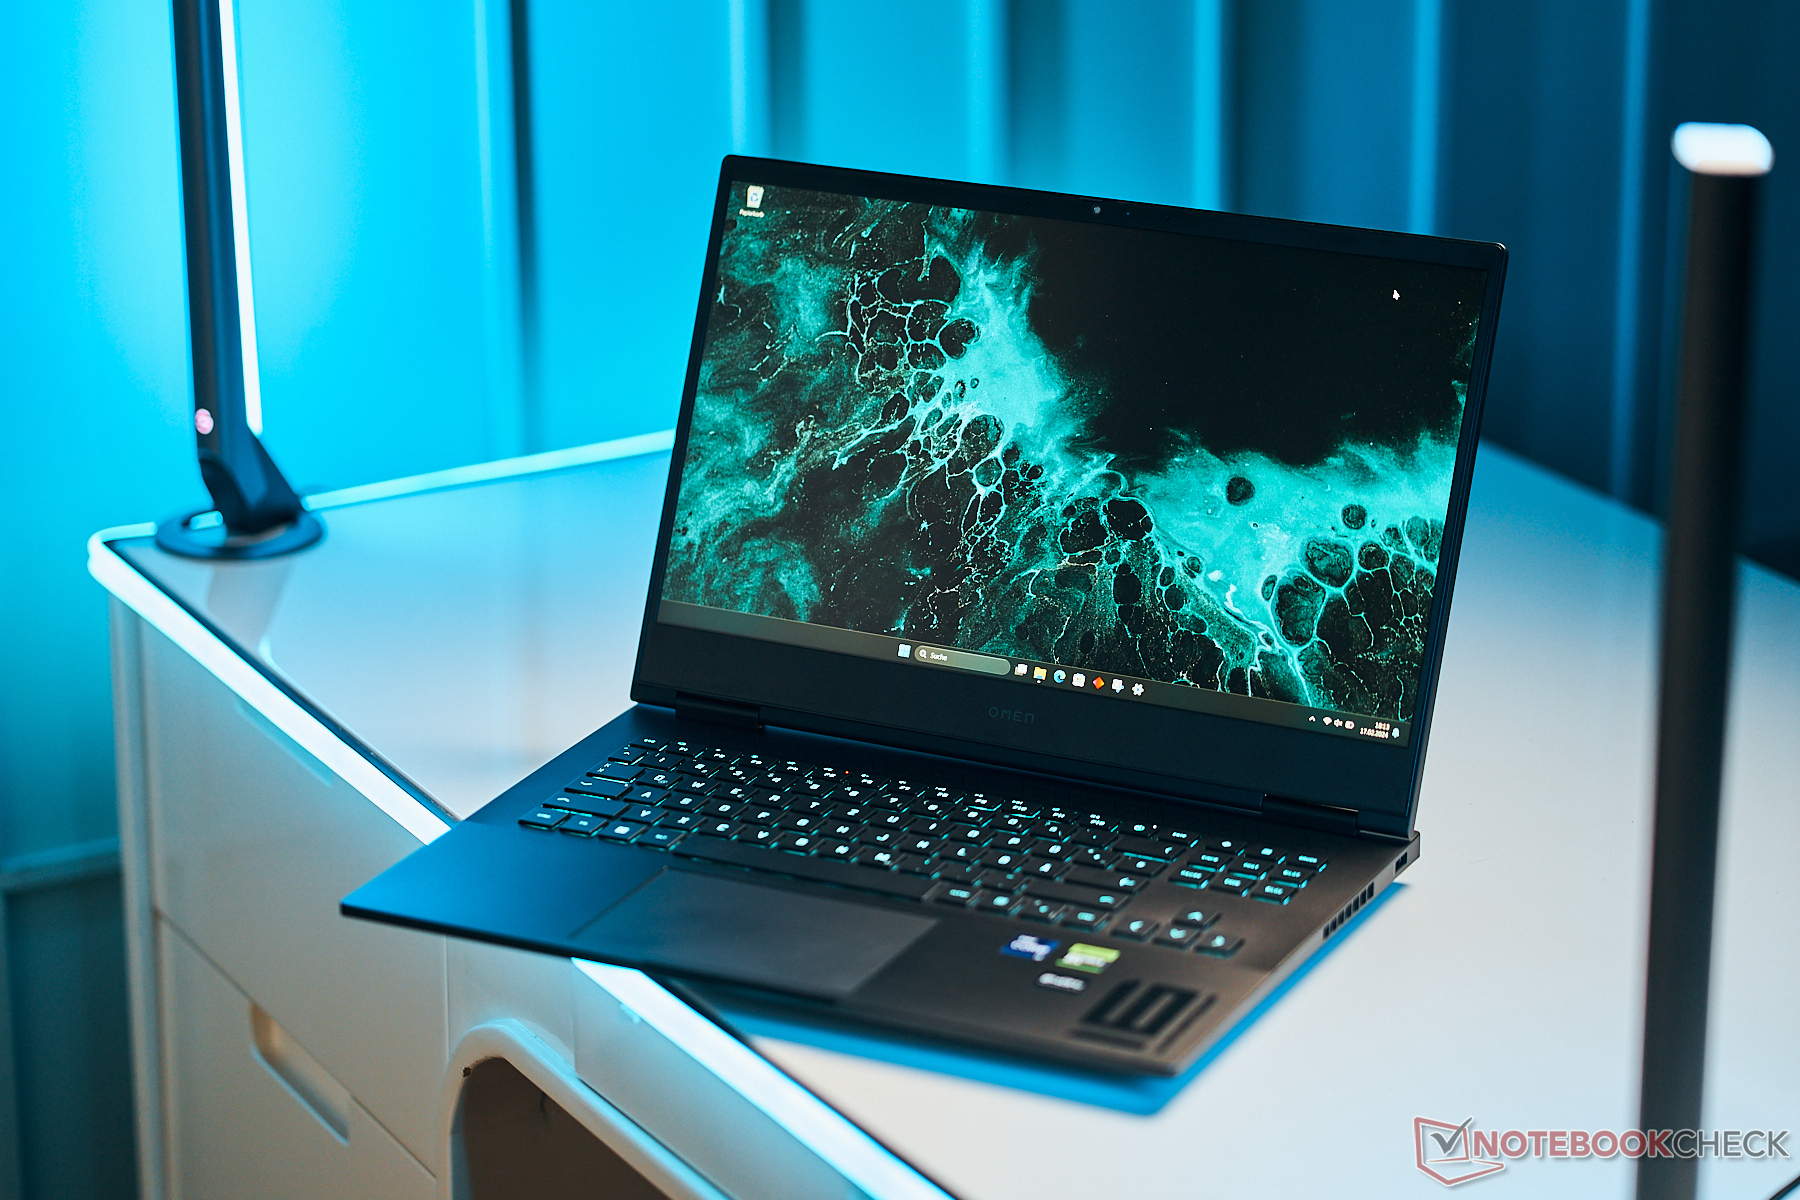
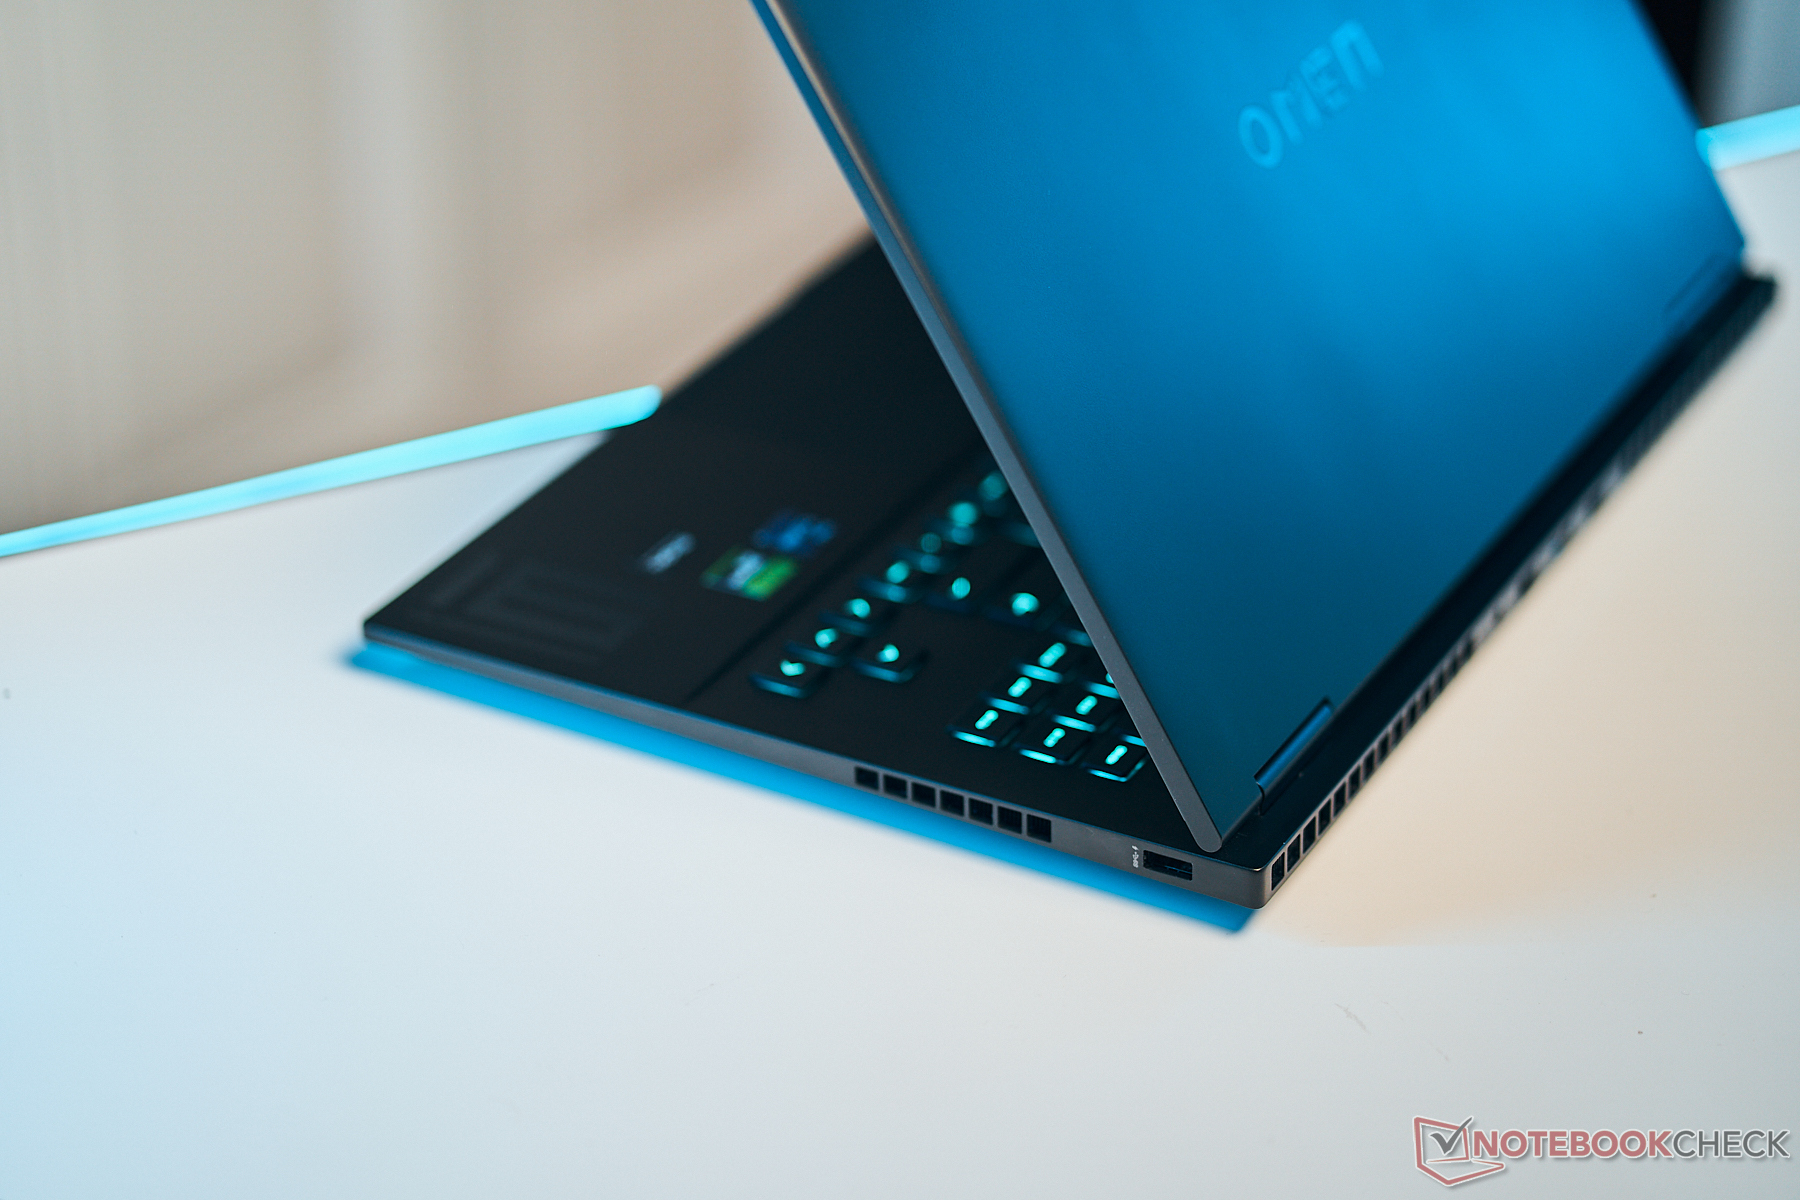
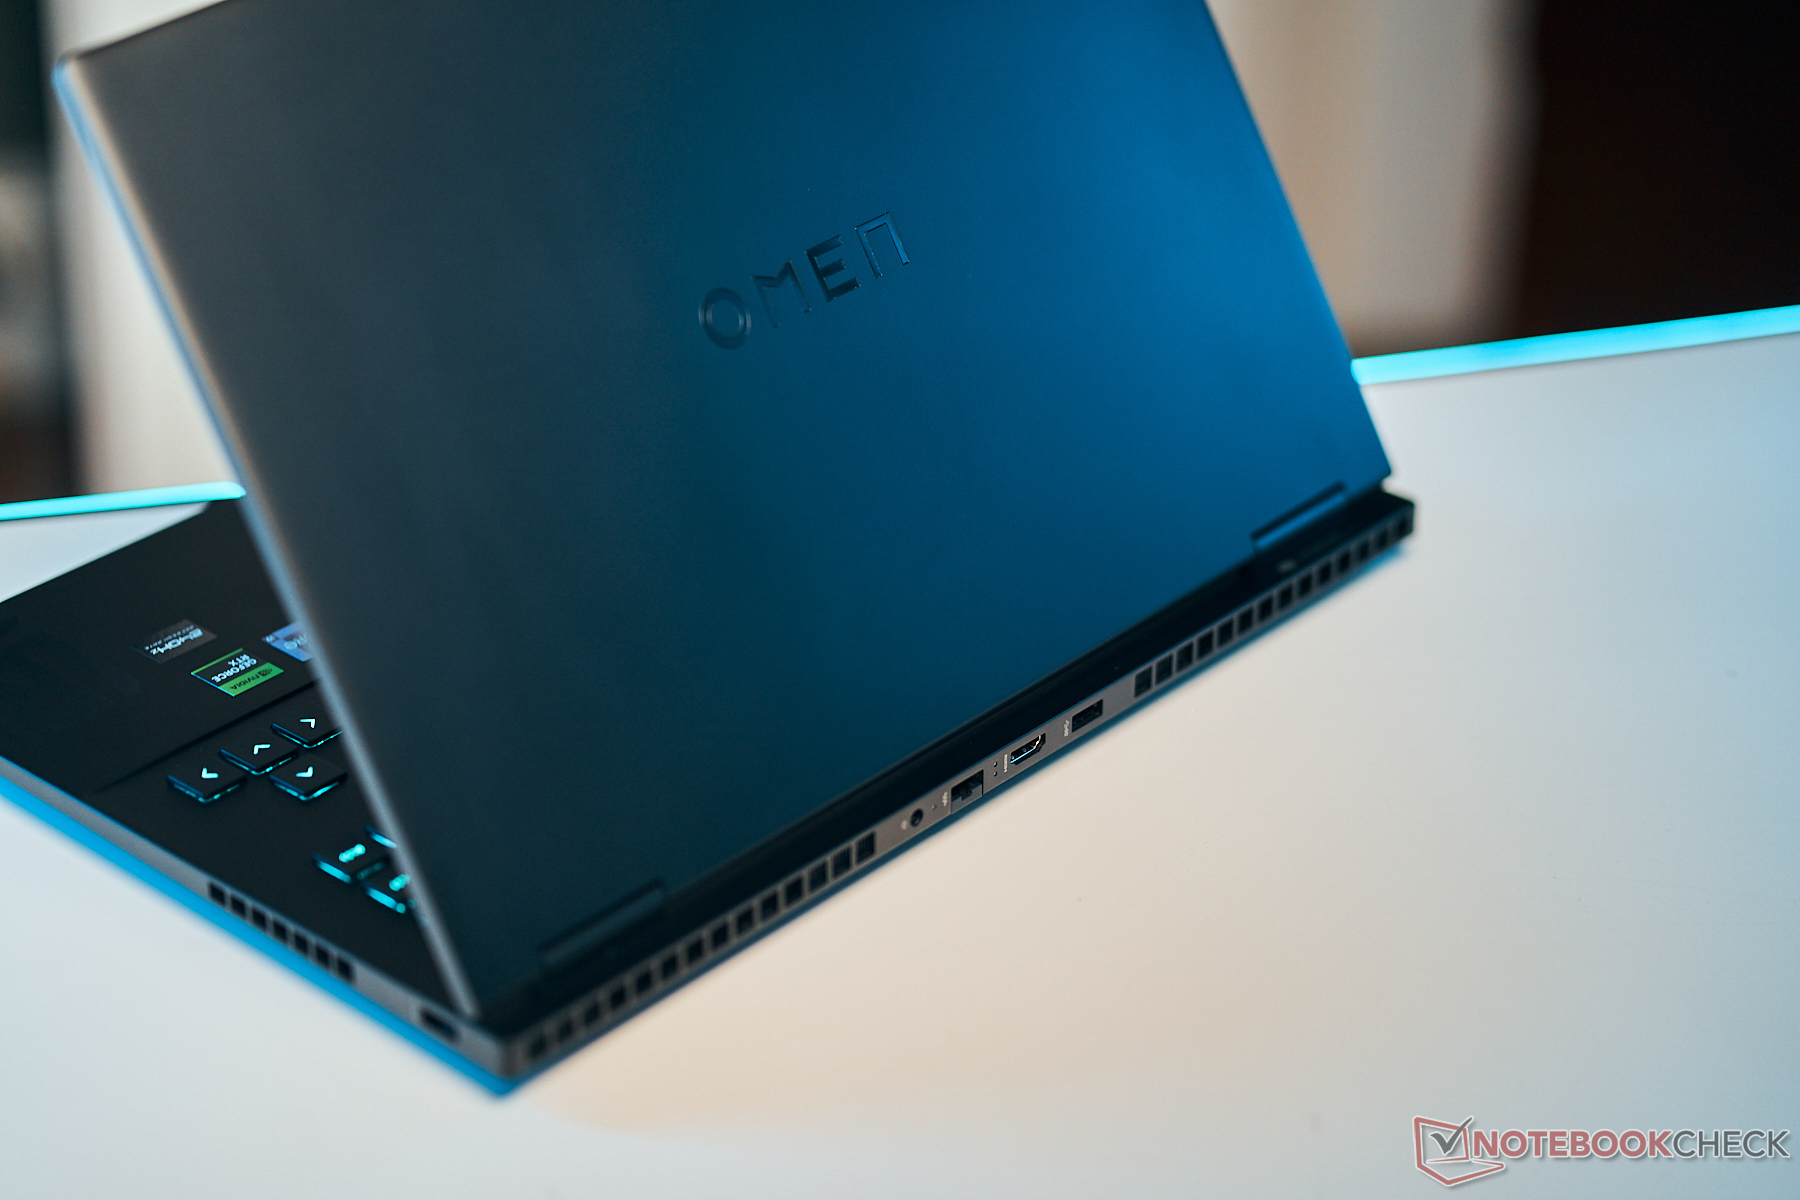
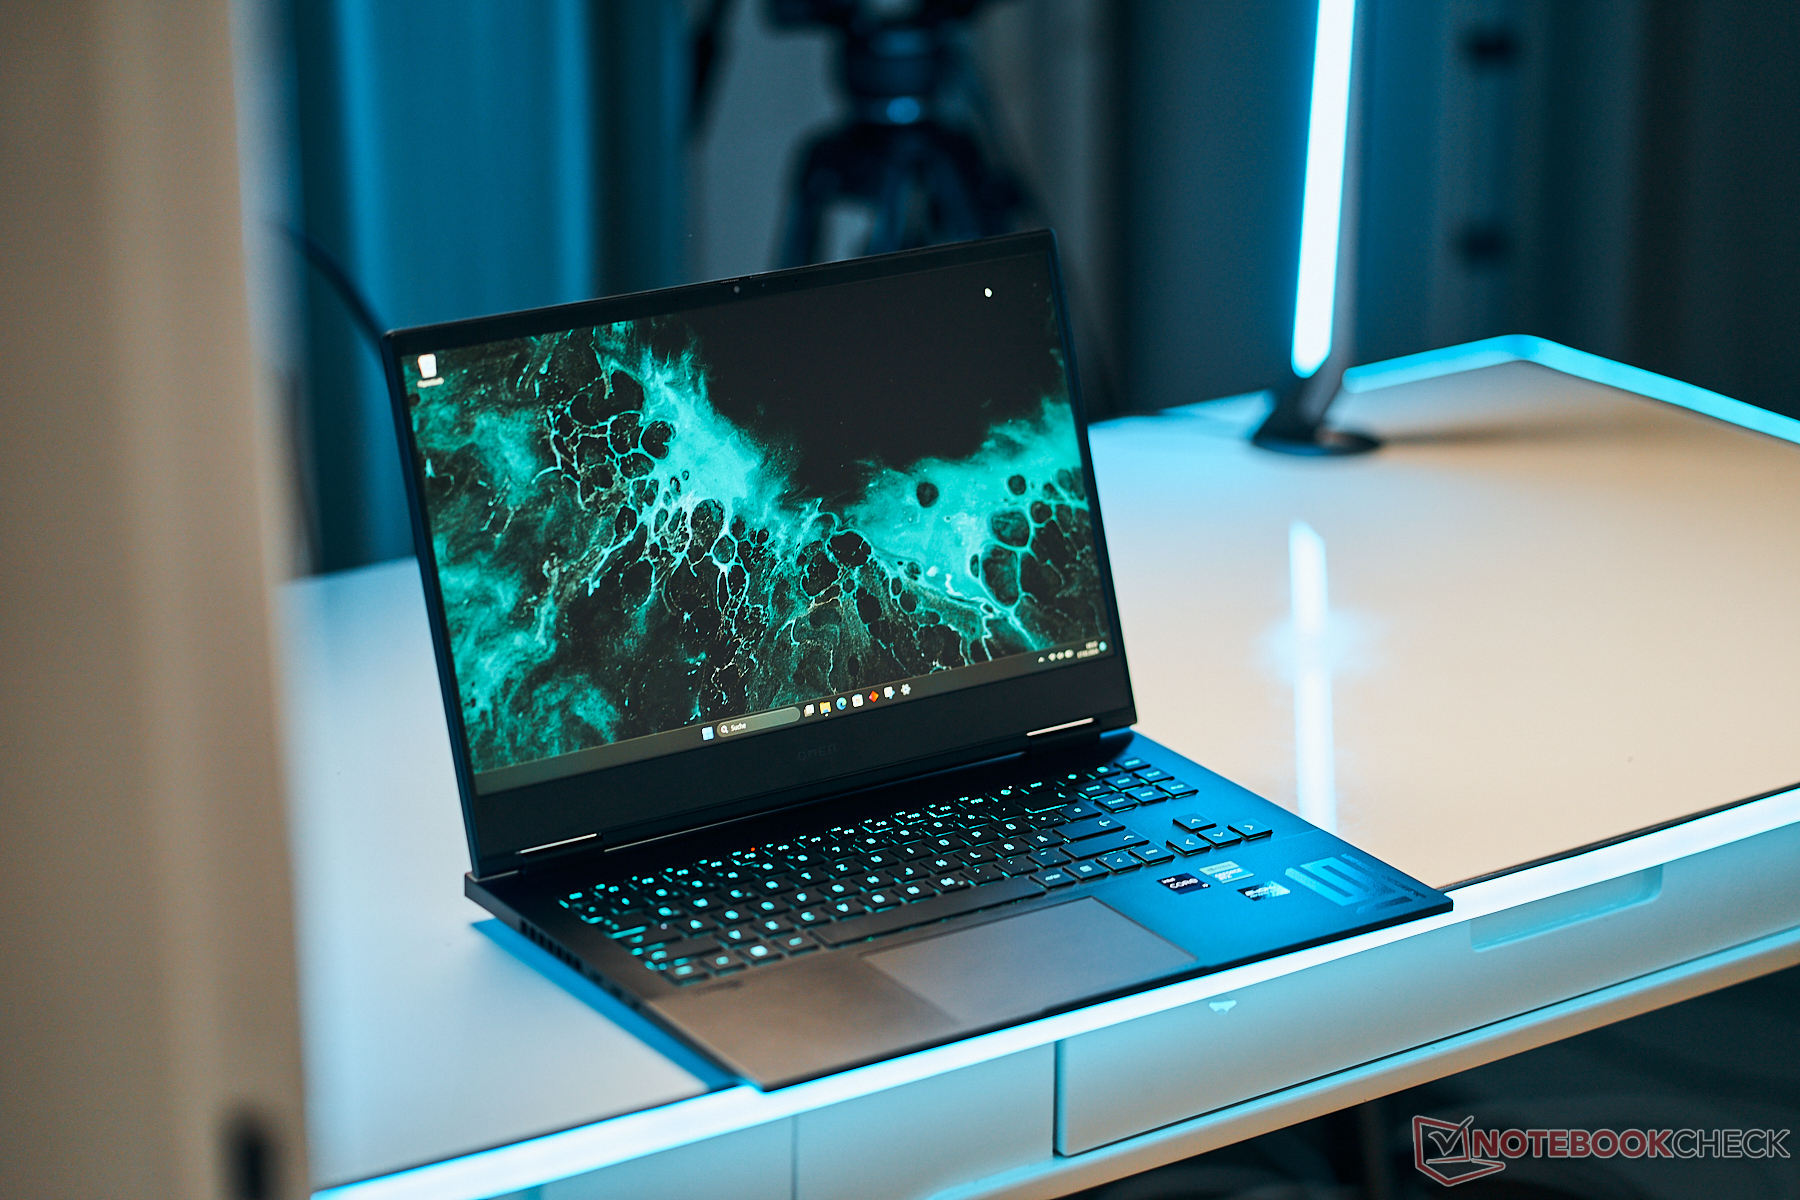
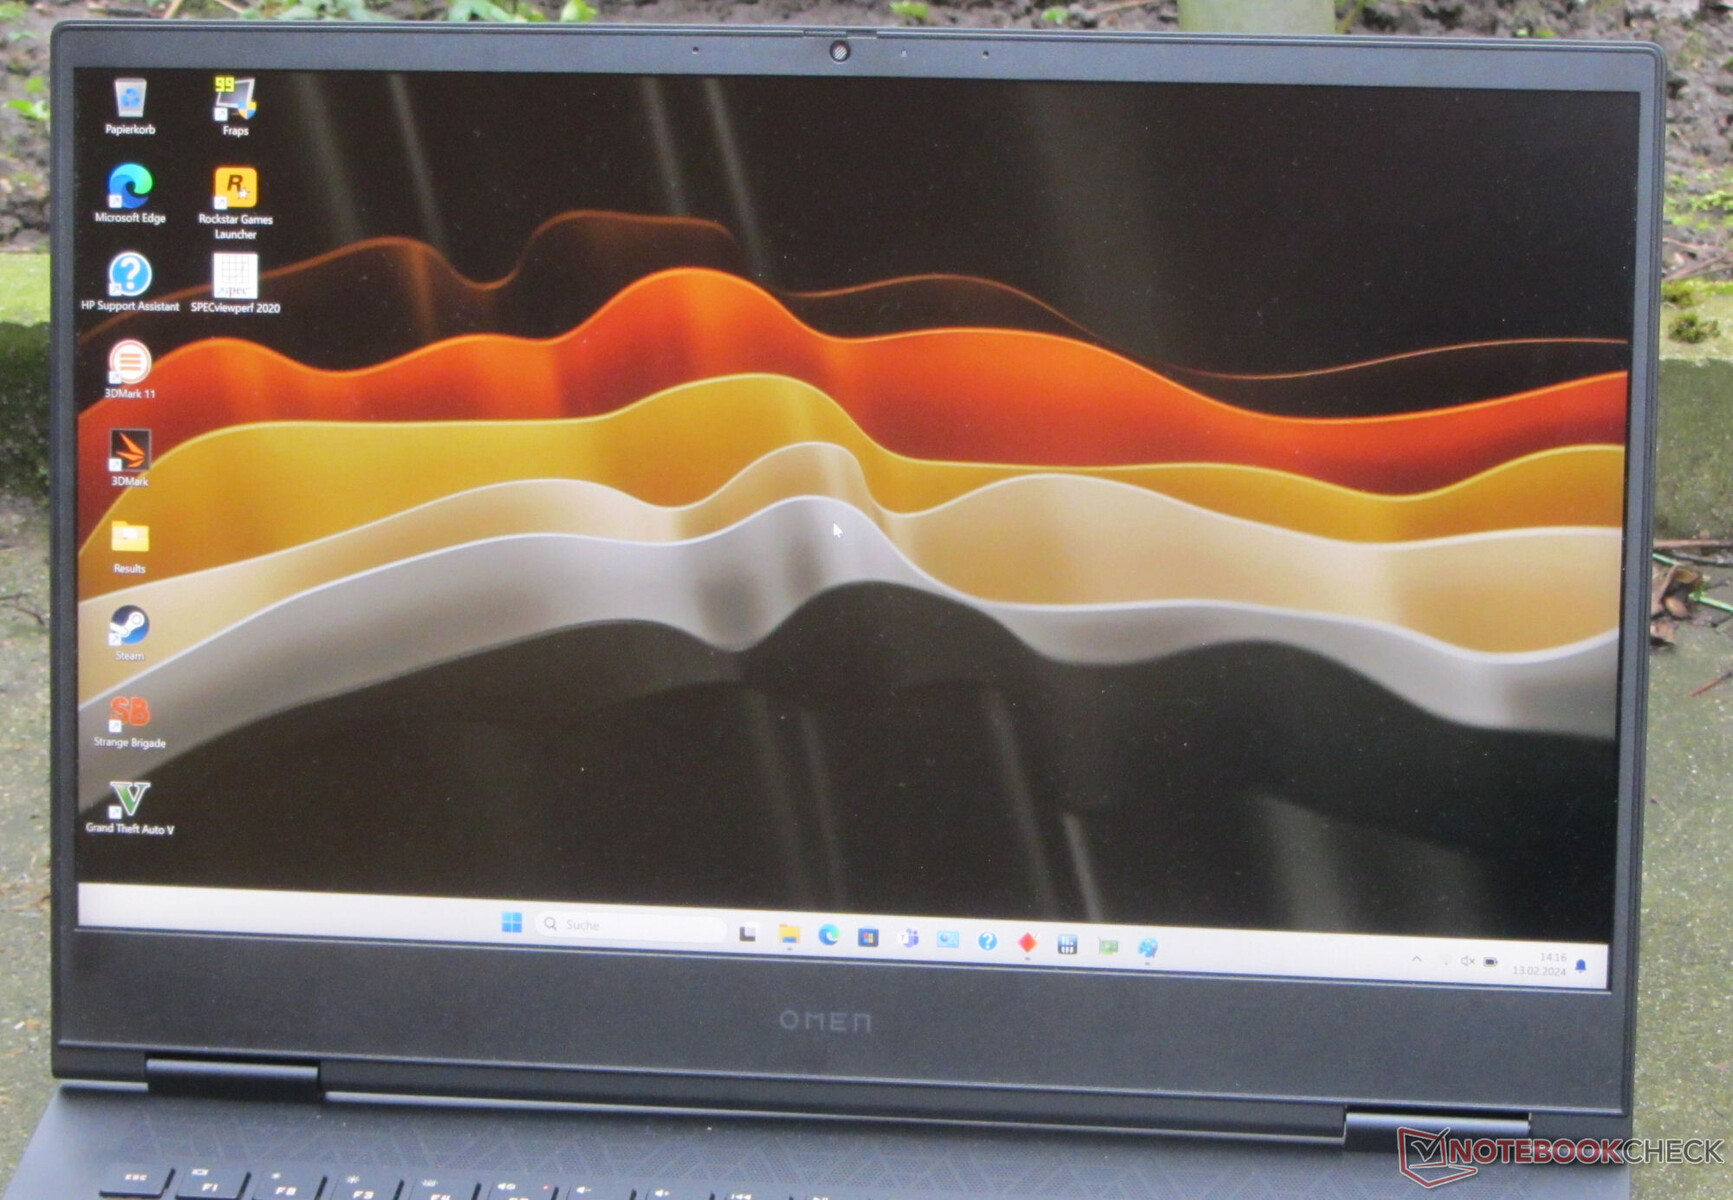
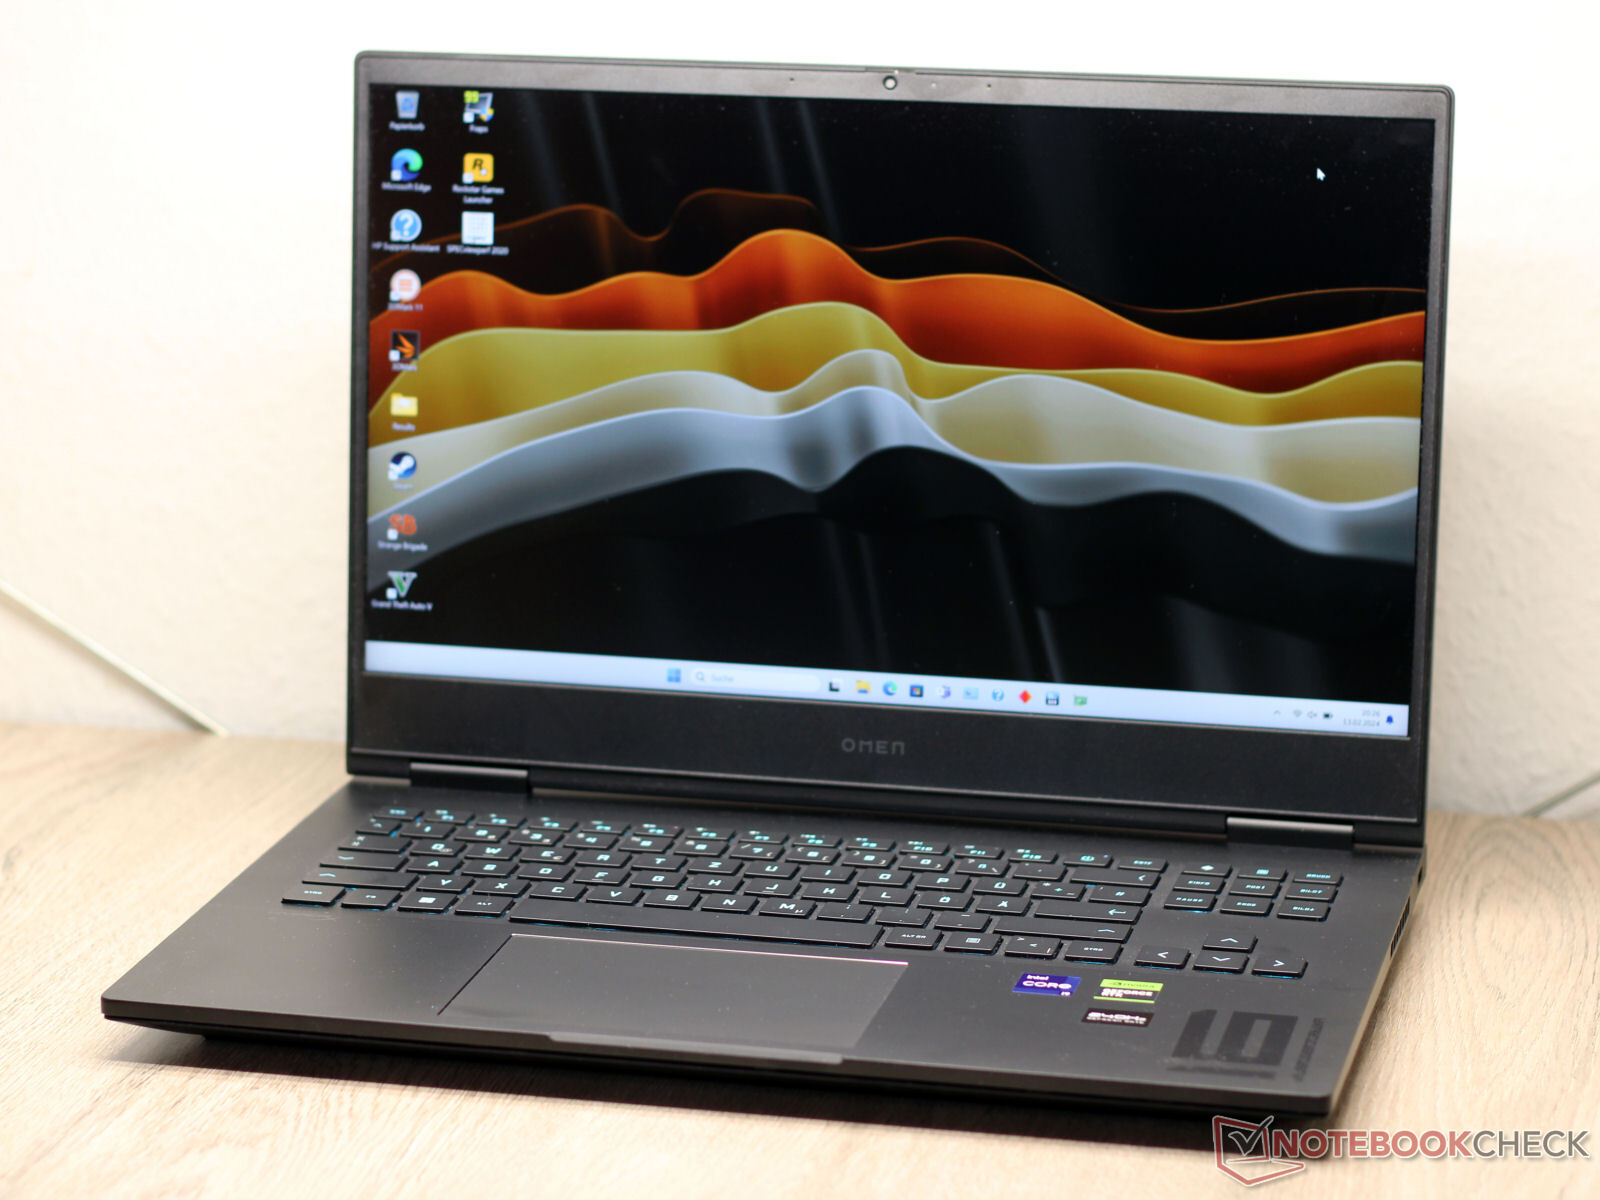
Caja y especificaciones - Portátil HP con Thunderbolt 4
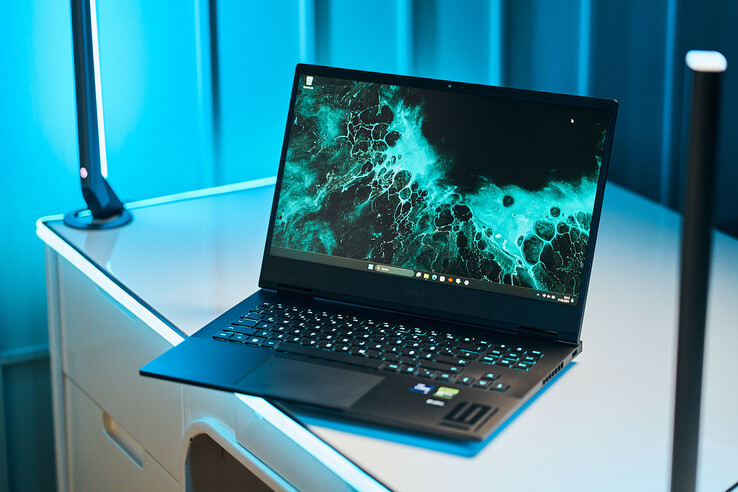
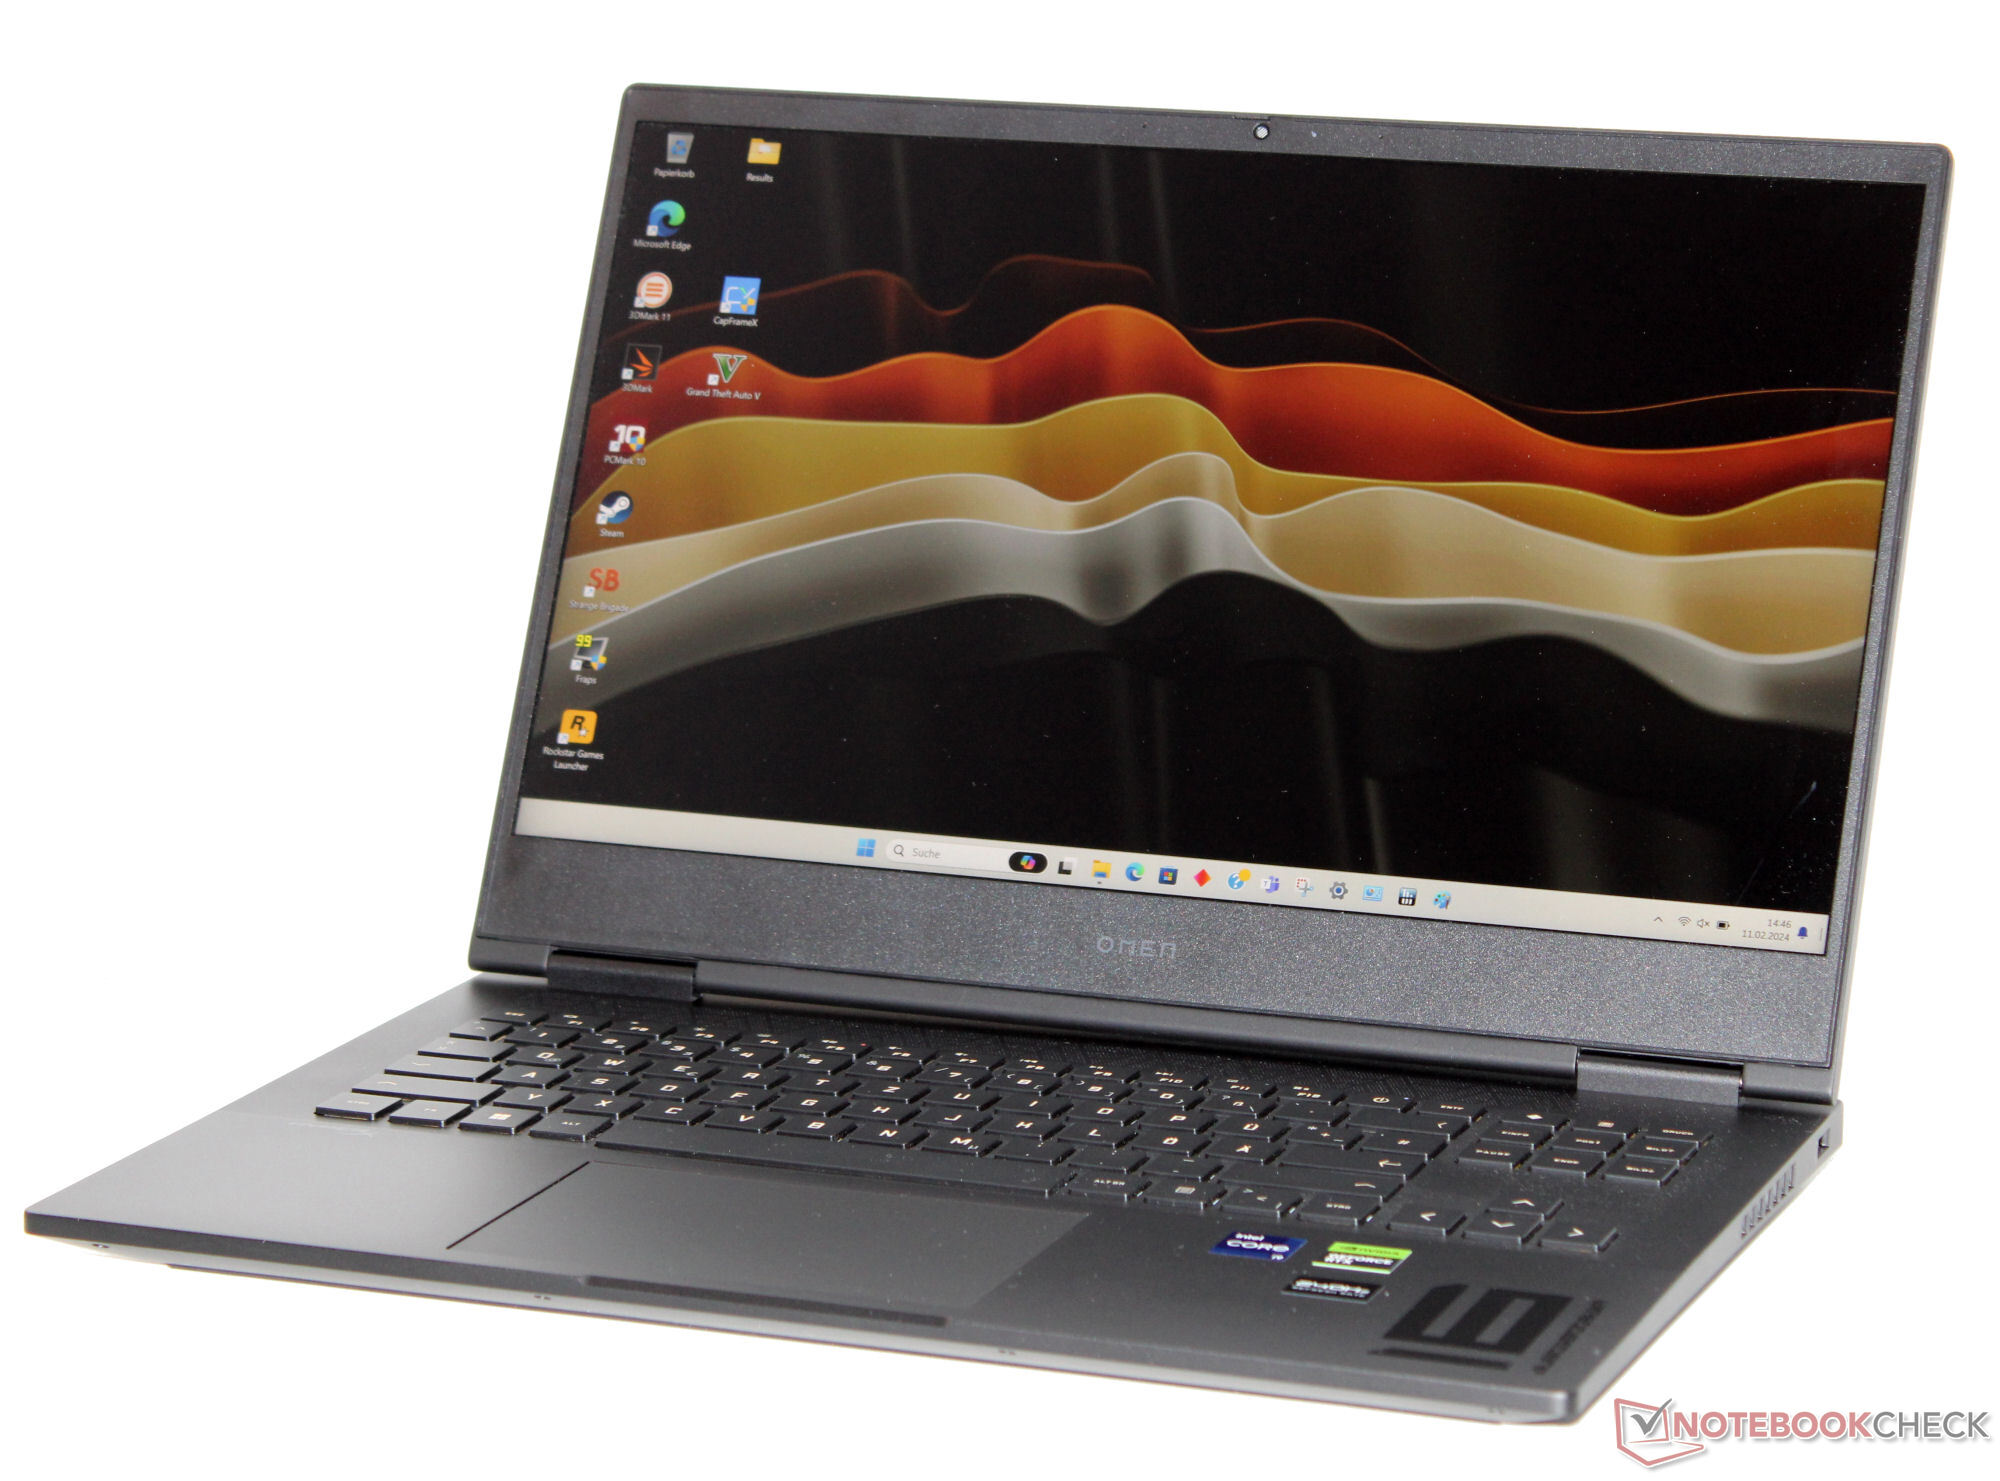
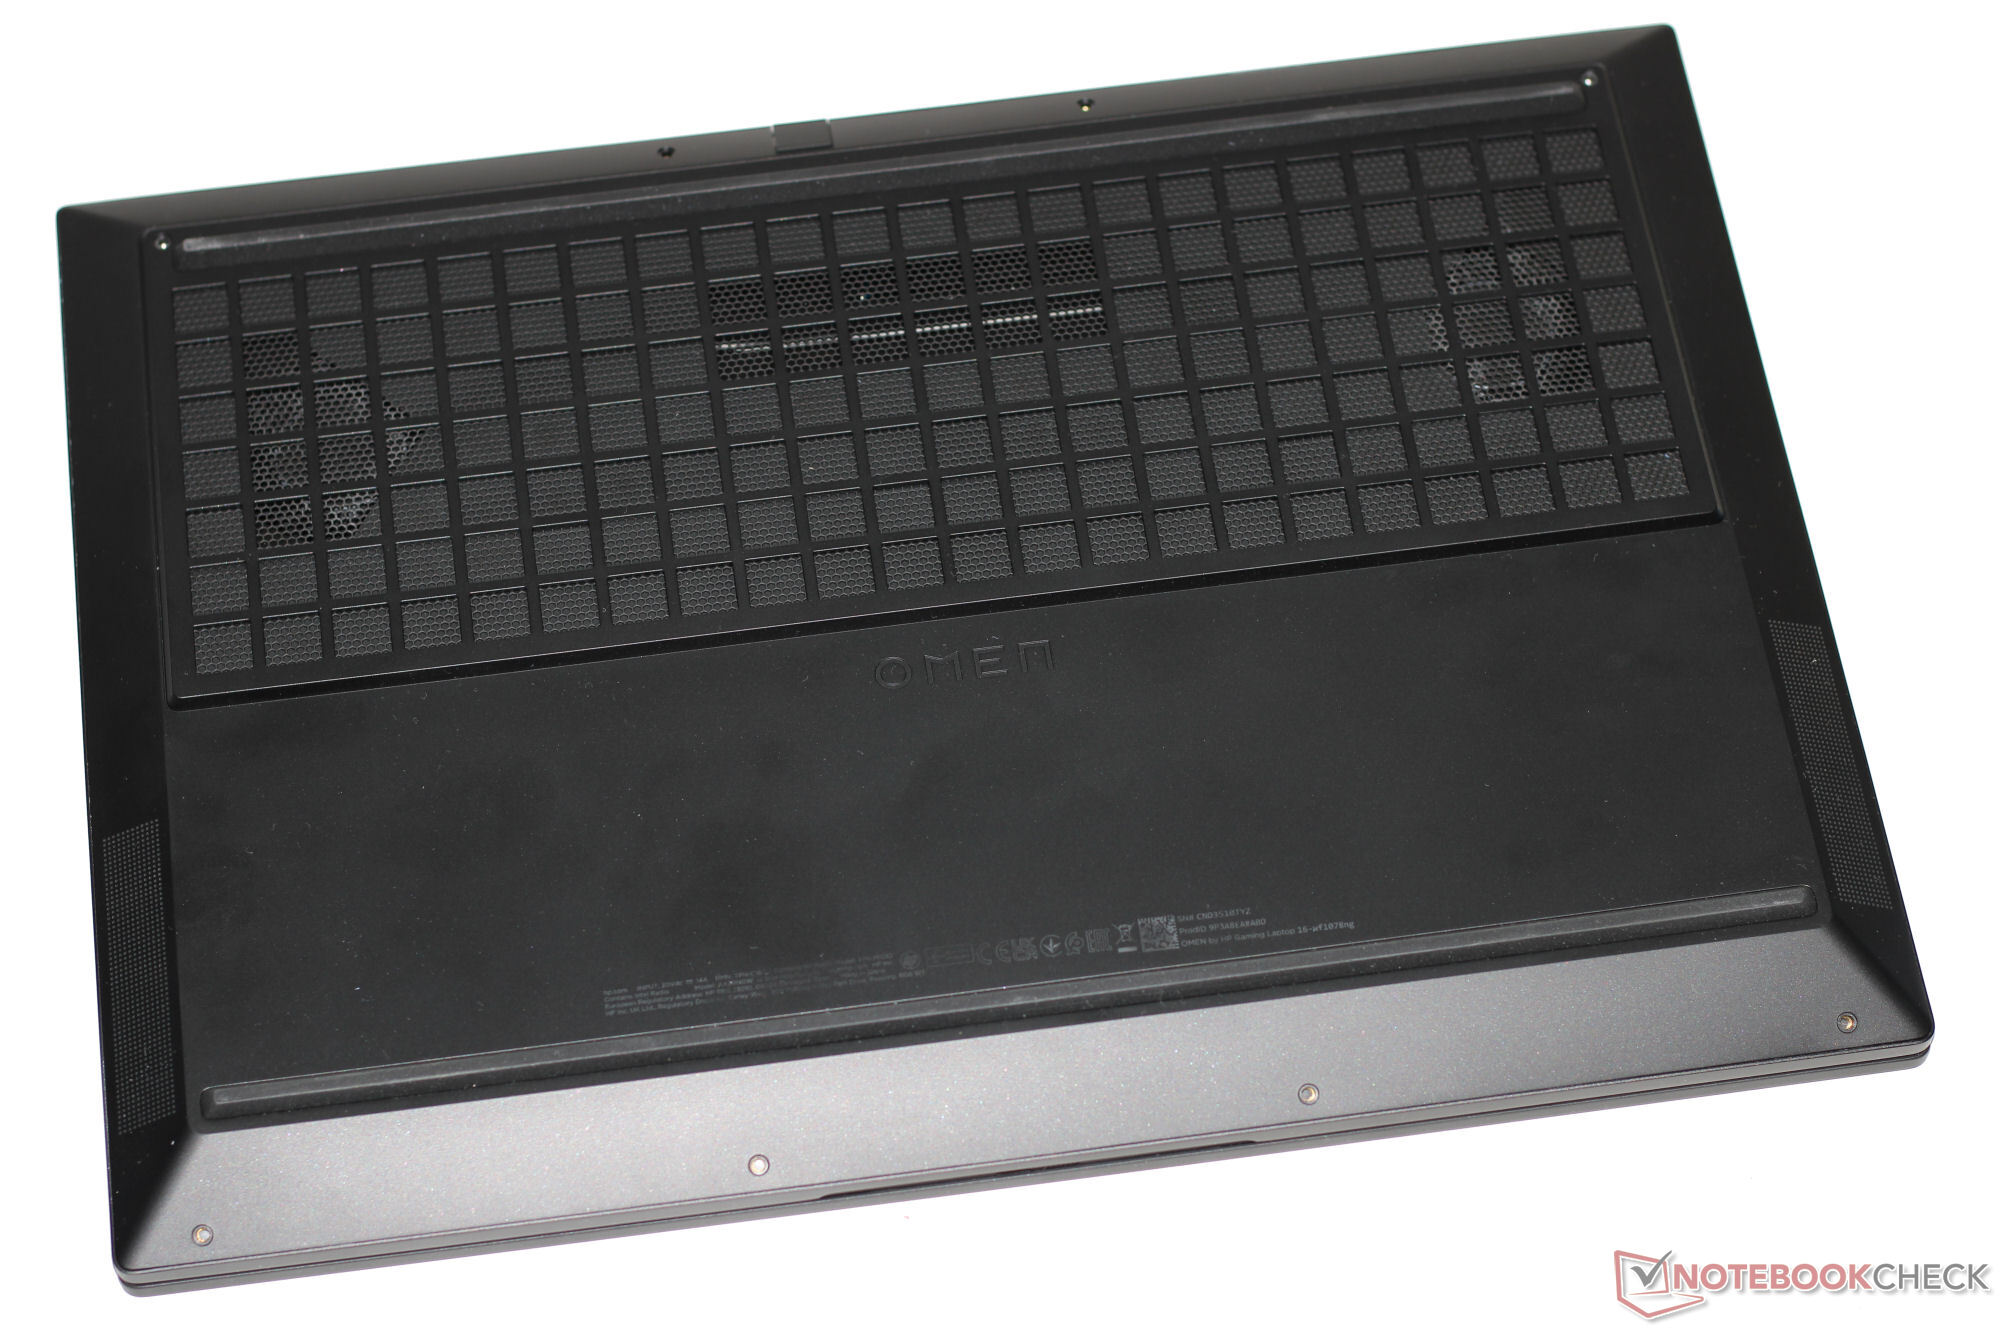
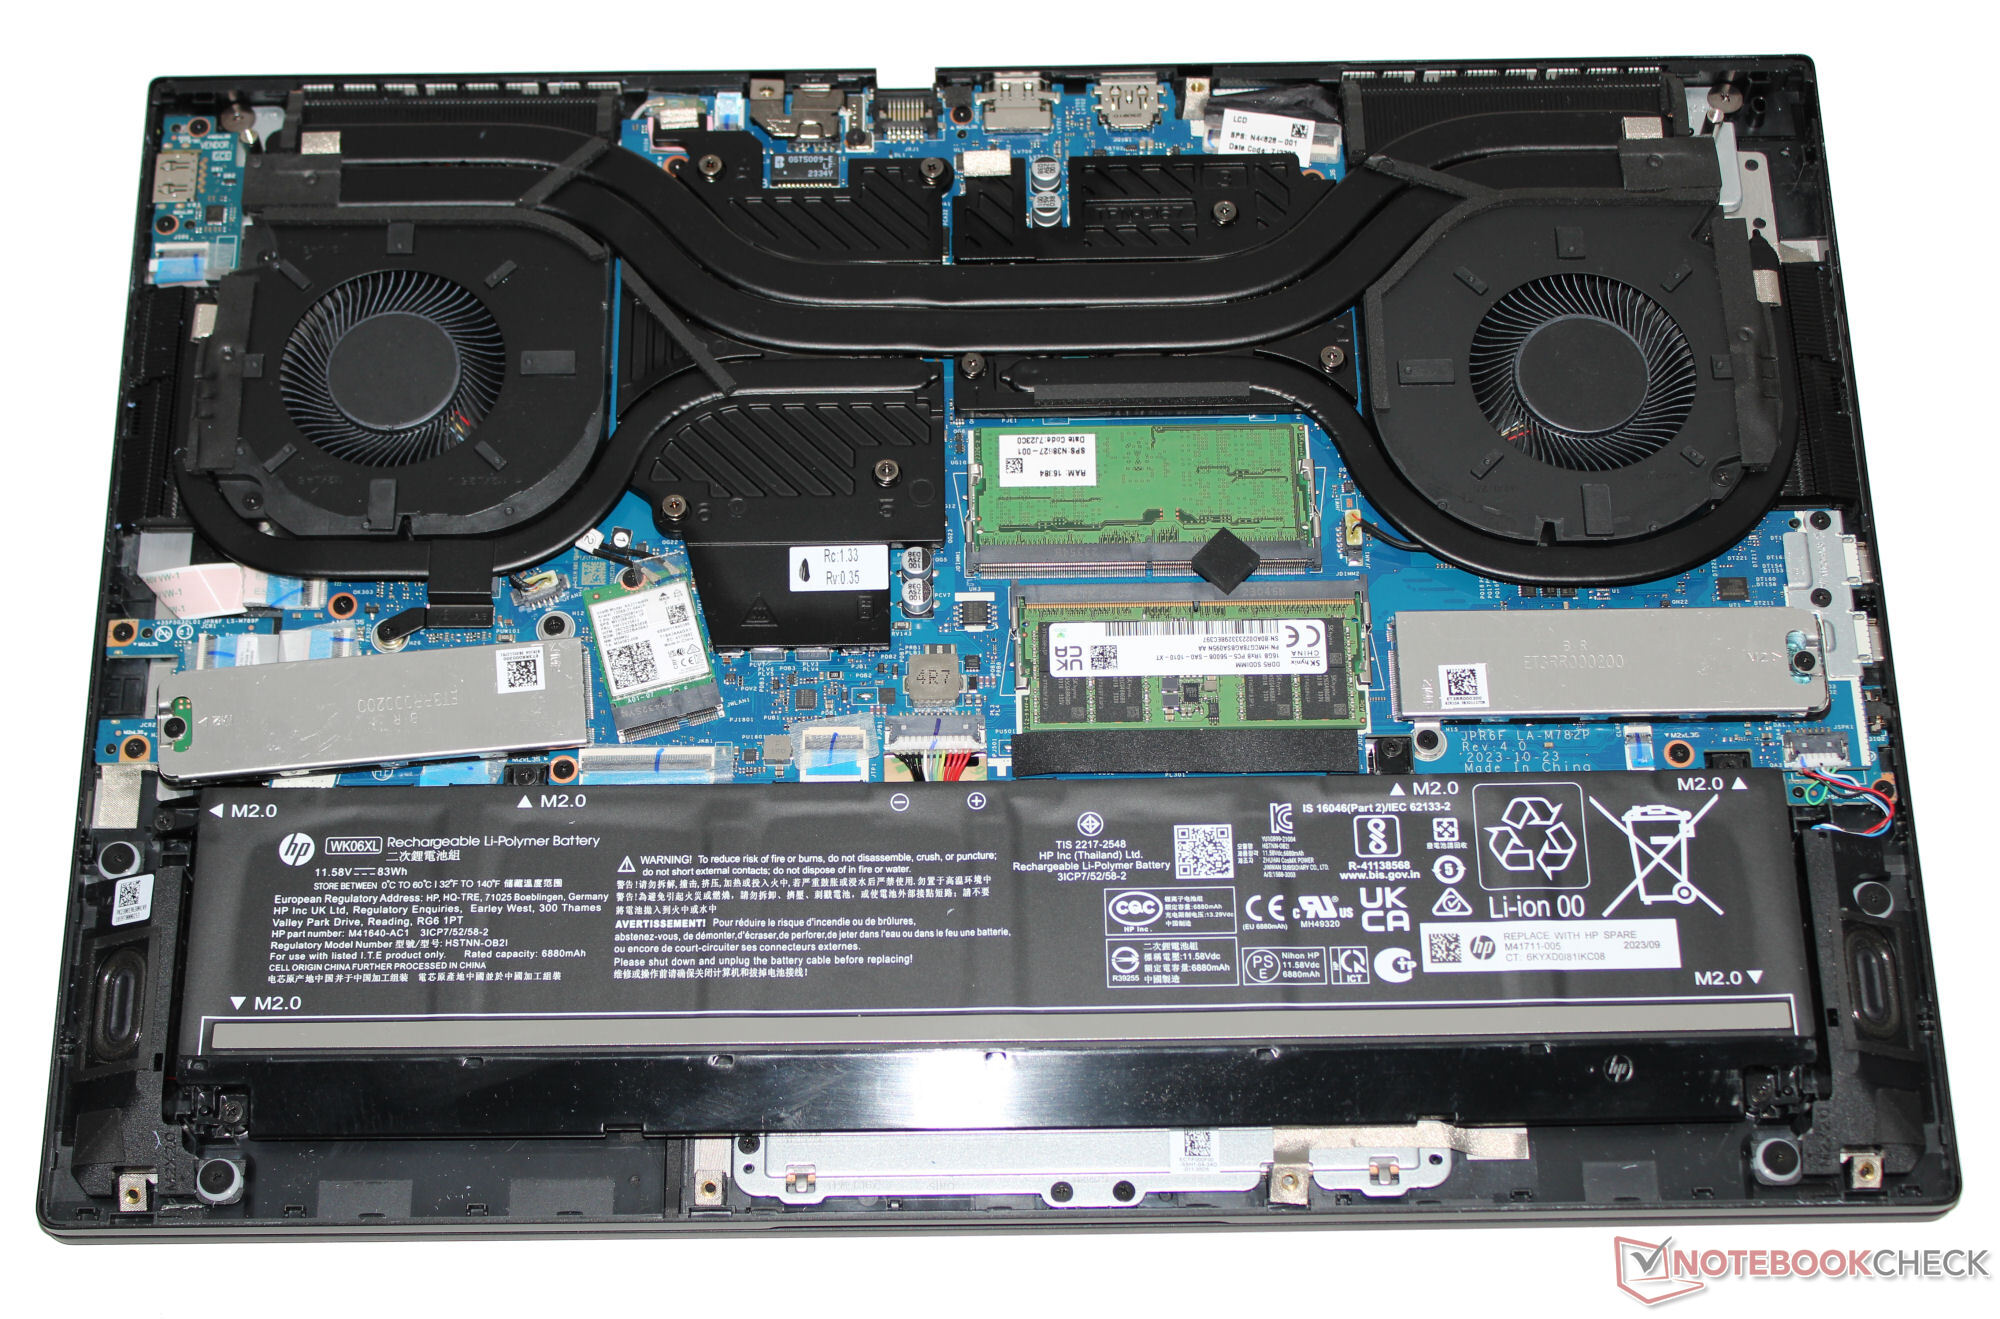
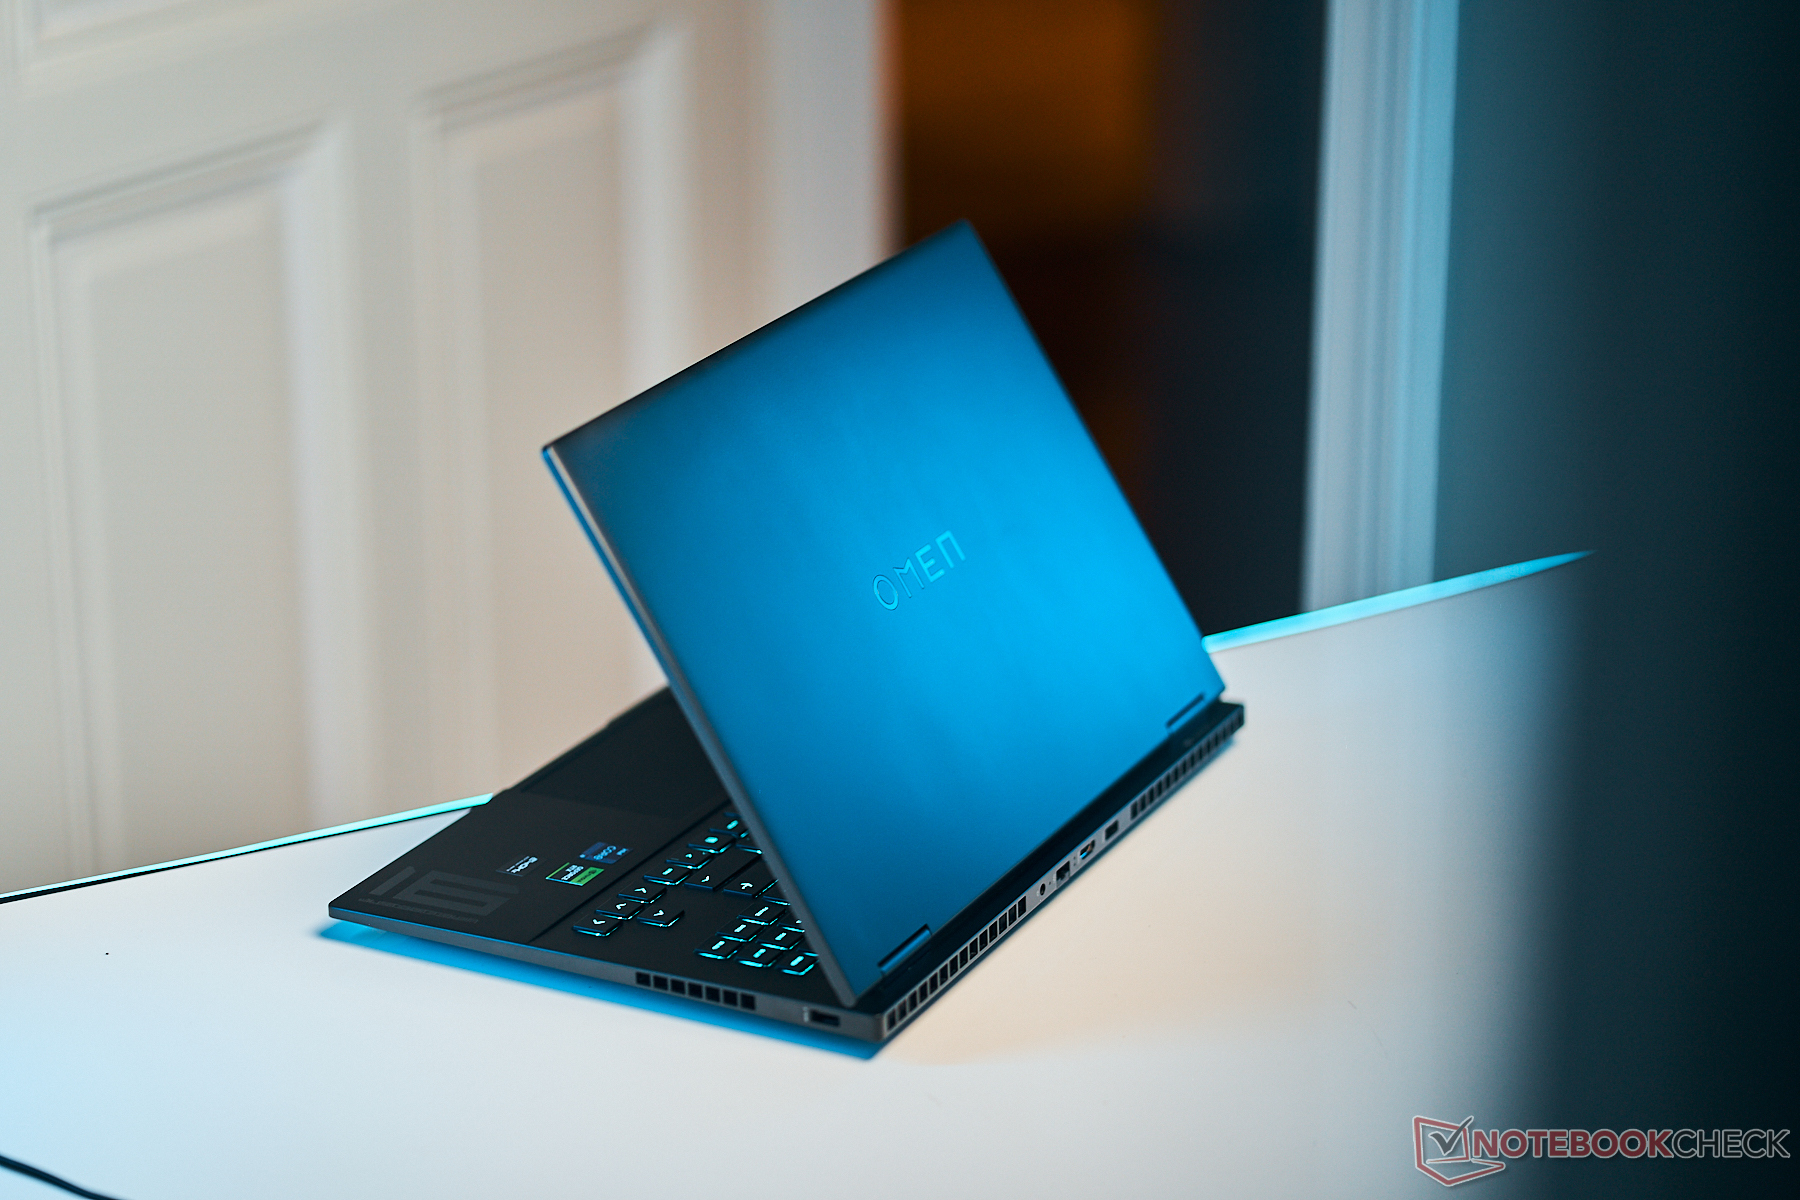
HP mantiene el mismo chasis negro mate con superficies lisas que su predecesora Análisis del portátil HP Omen 16 2023: 145 W GeForce Rendimiento de RTX 4080 . Una tapa de plástico contrasta con una base de aluminio. El chasis no presenta ningún diseño llamativo ni elementos LED, aparte de la iluminación del teclado. La batería (atornillada, no pegada) y el resto del hardware son accesibles una vez retirada la tapa inferior.
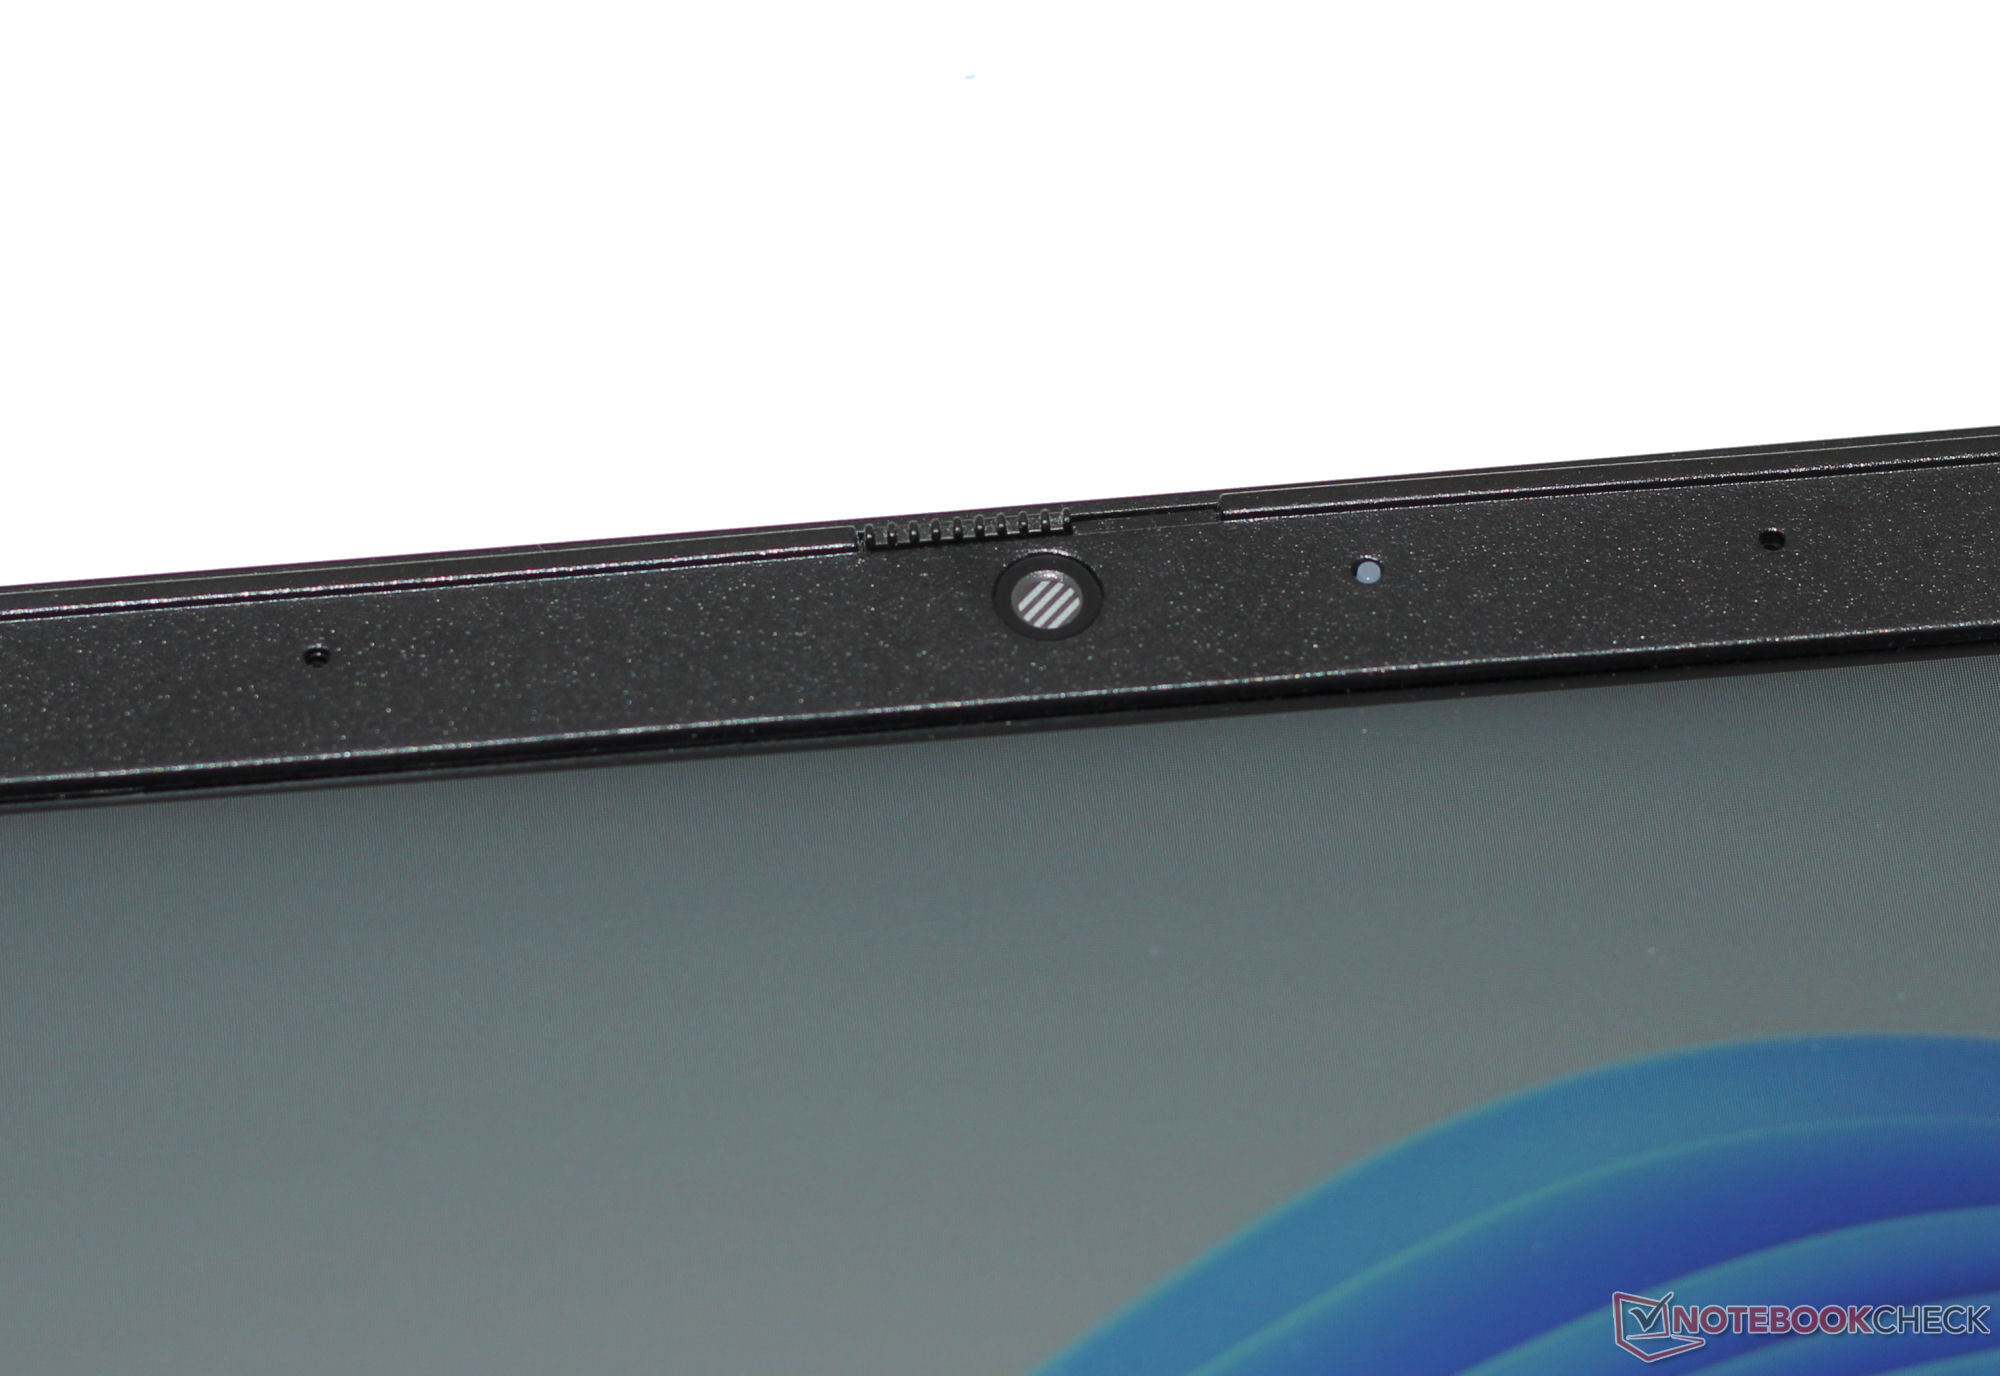
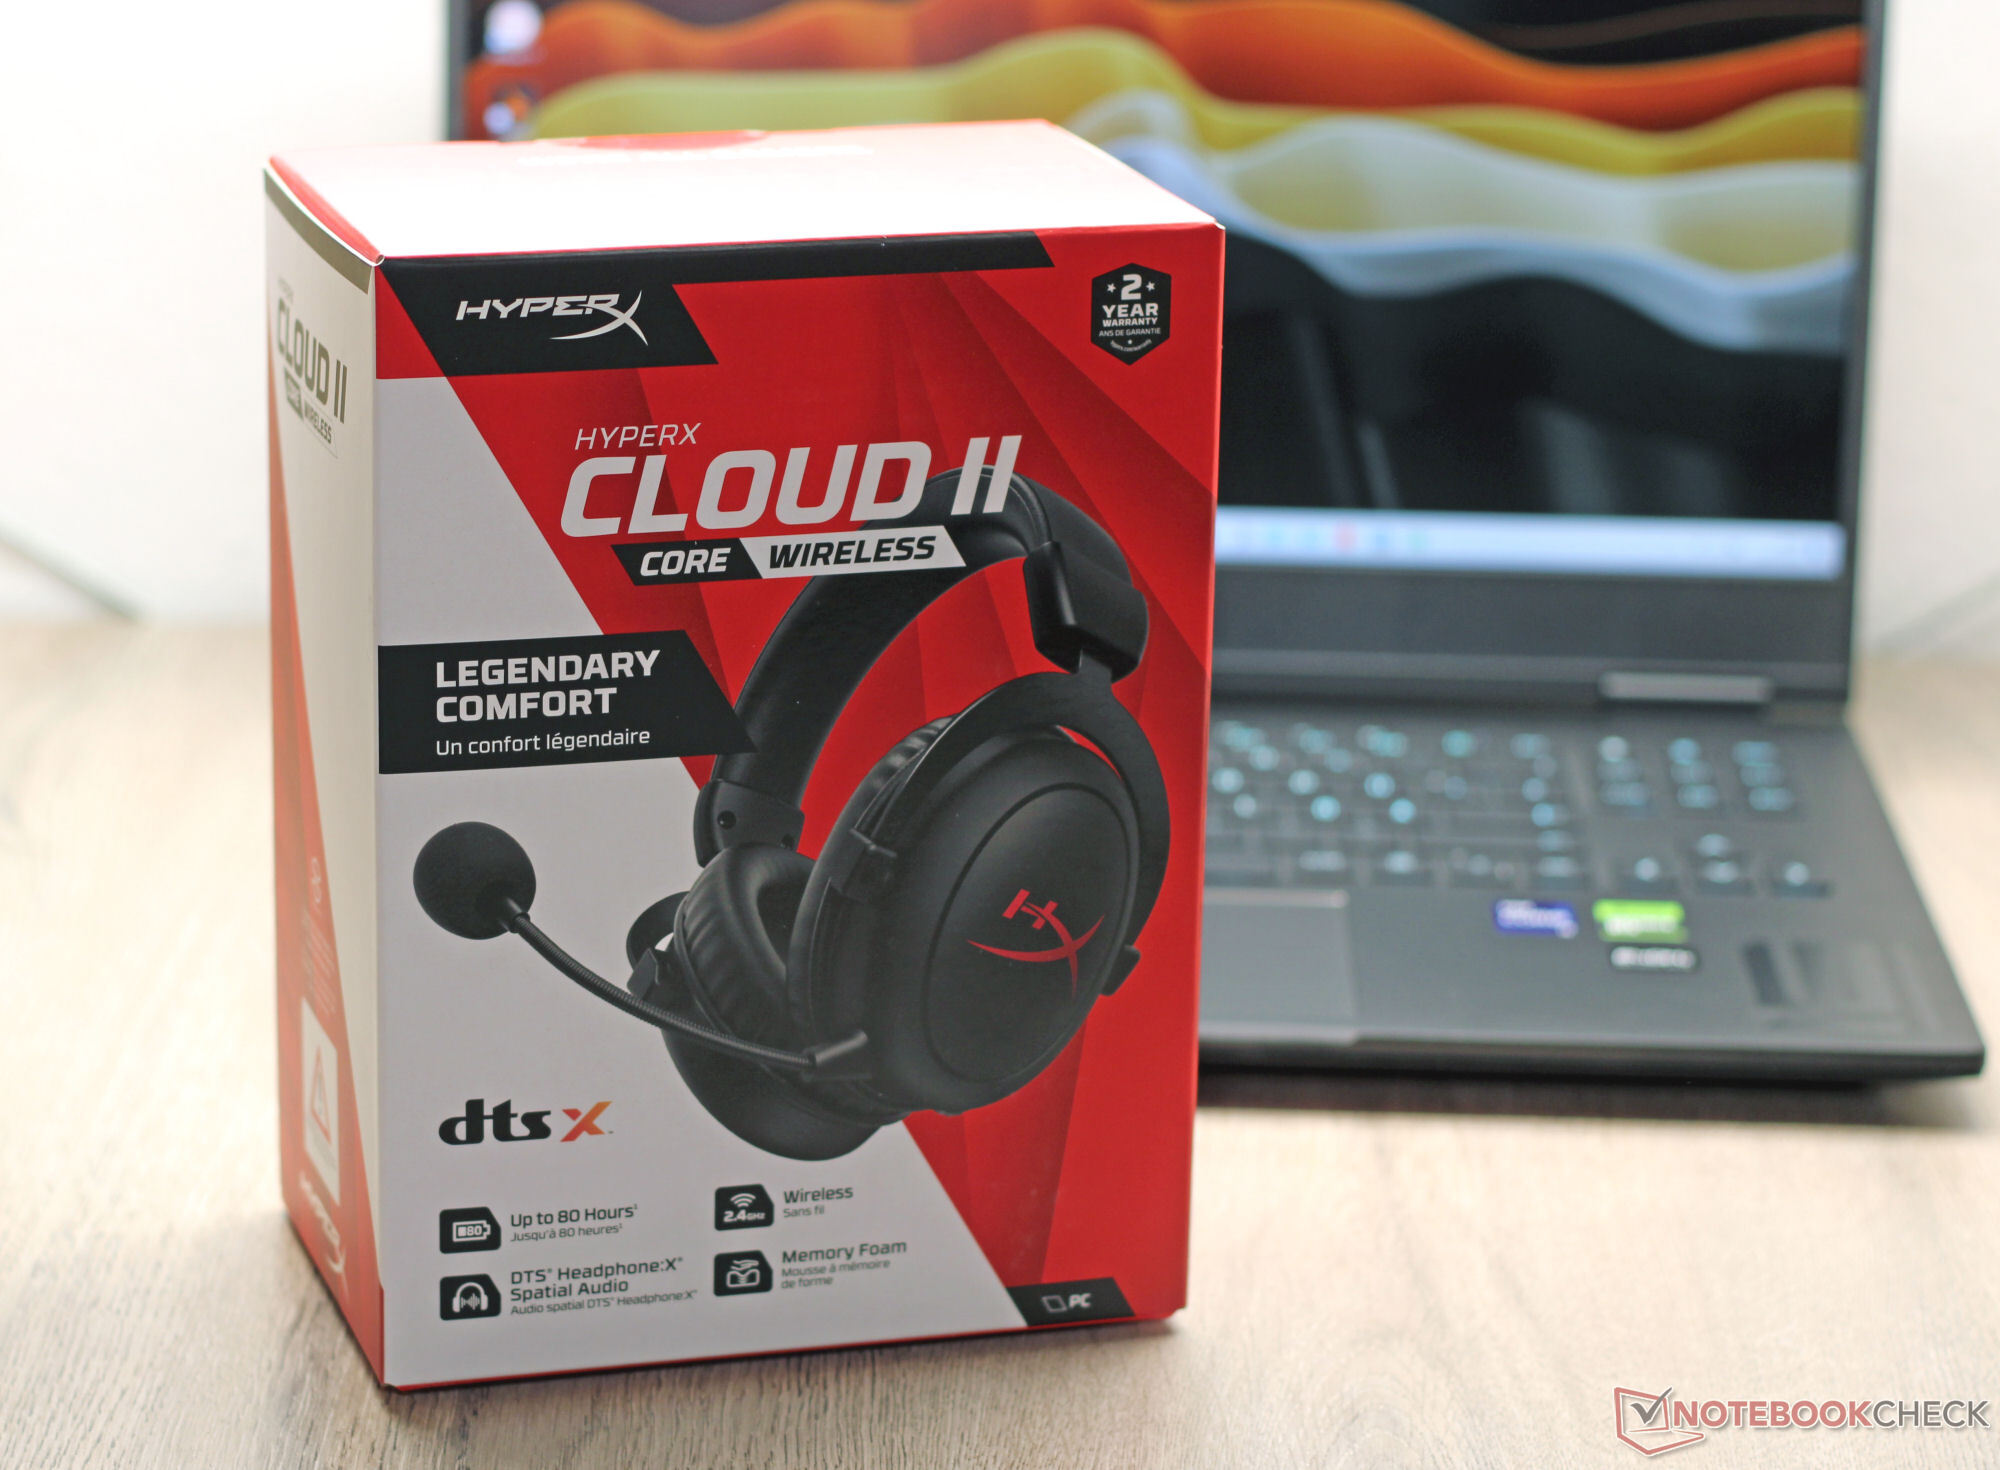
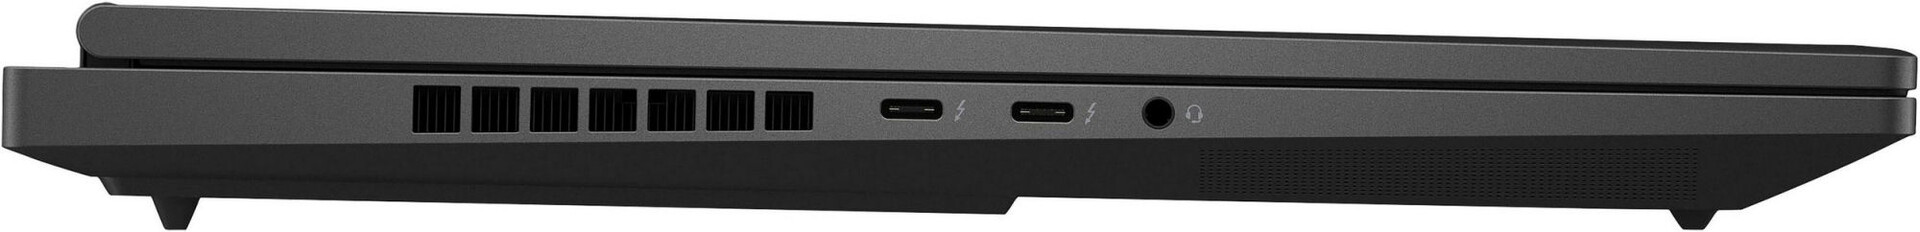
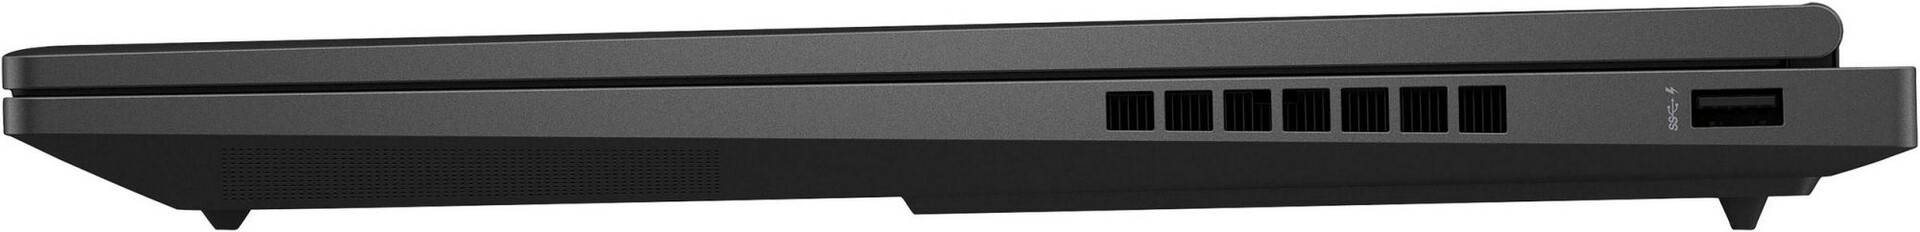
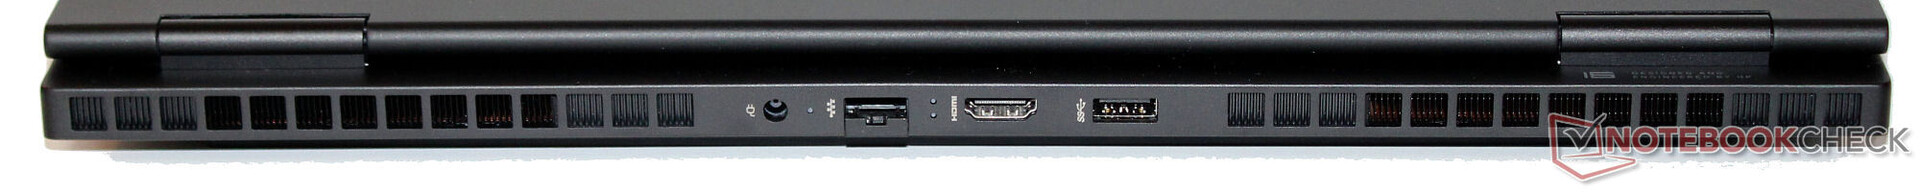
El portátil HP cuenta con dos puertos USB-A (USB 3.2 Gen 1) y dos USB-C (Thunderbolt 4/USB4) a bordo. Estos últimos soportan Power Delivery y pueden emitir una señal DisplayPort. En total, el Omen 16 tiene tres salidas de vídeo (1x HDMI, 2x DP). HP no ha equipado el dispositivo con un lector de tarjetas de memoria. La cámara web (2,1 MP, 1.920 x 1.080 píxeles como máximo, con obturador de privacidad) ofrece una calidad de imagen estándar. Con el portátil se incluyen unos auriculares inalámbricos HyperX Cloud II Core.
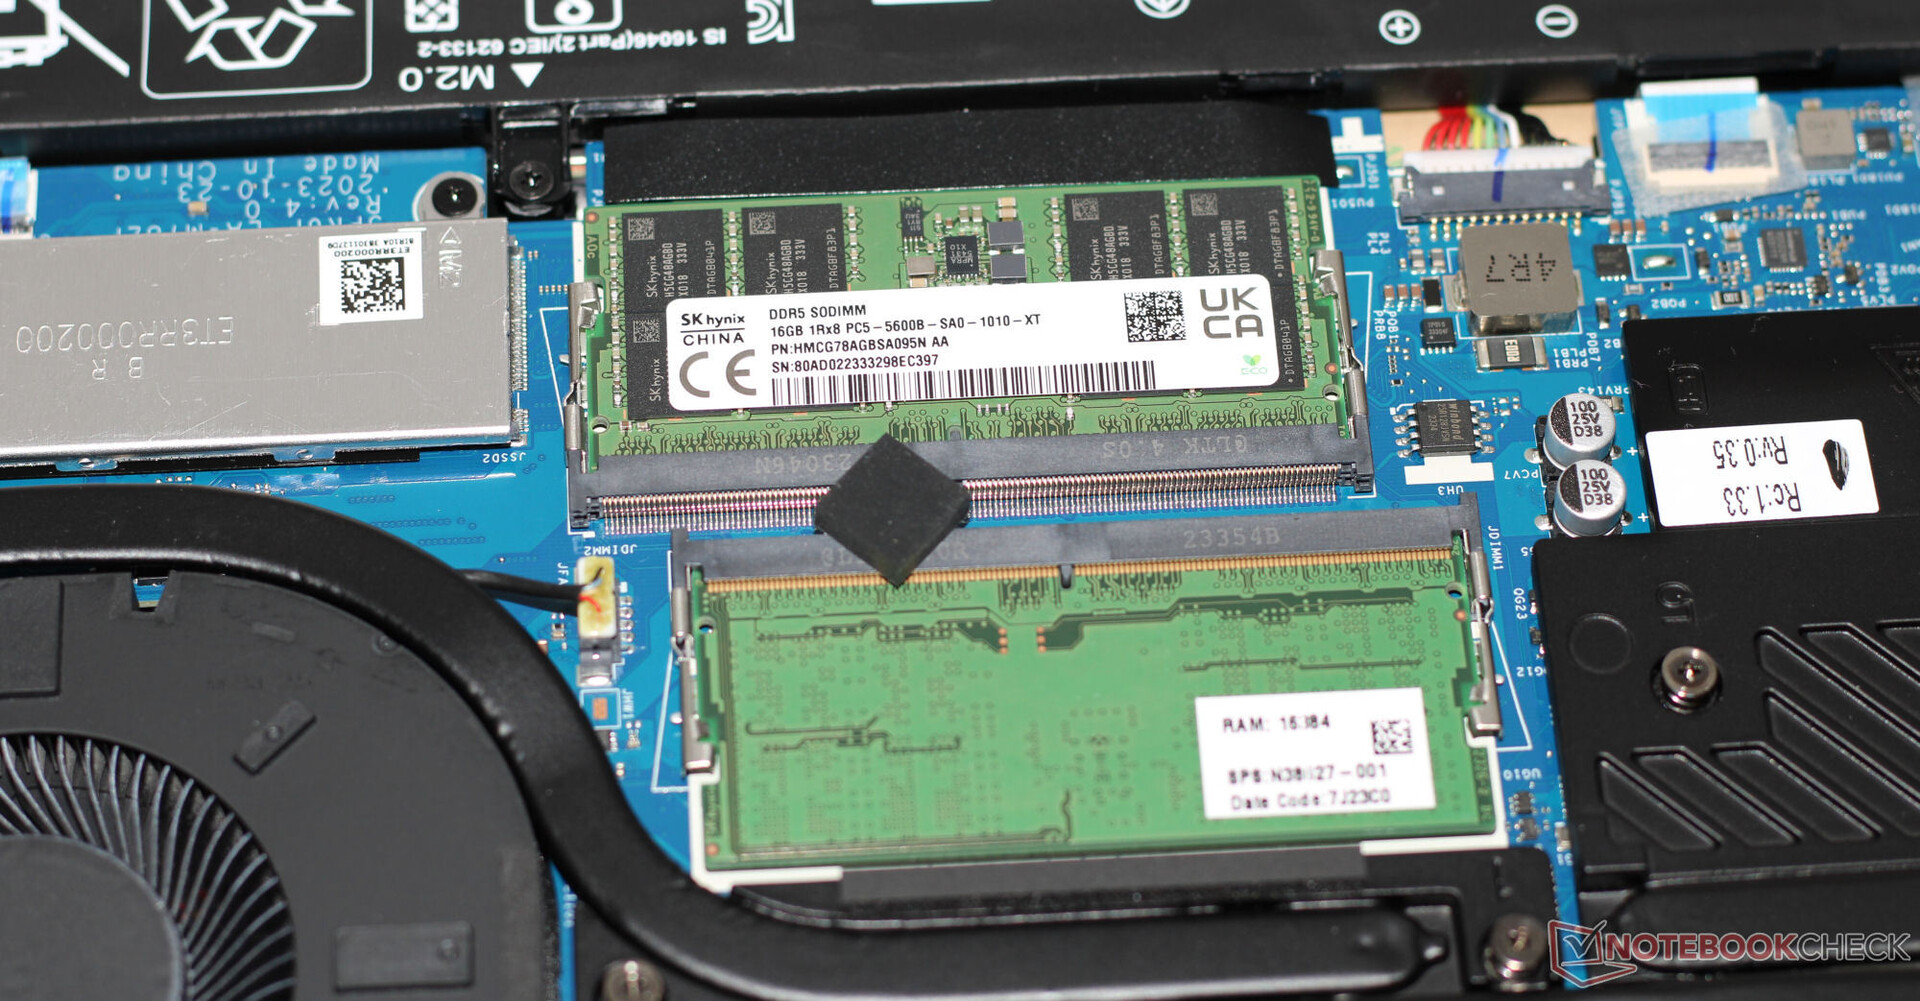
El Omen 16 incorpora un módulo Intel Wi-Fi 6E AX211 y puede alcanzar excelentes velocidades de transferencia Wi-Fi en condiciones óptimas (sin dispositivos Wi-Fi en las inmediaciones, corta distancia entre el portátil y el PC servidor). De las conexiones por cable se encarga un controlador Ethernet Realtek RTL8168/8111 (1 Gbit/s).


 GeForce RTX 4080 Laptop GPU, i9-14900HX, SK hynix PC801 HFS001TEJ9X101N")
 GeForce RTX 4080 Laptop GPU, i9-14900HX, SK hynix PC801 HFS001TEJ9X101N")
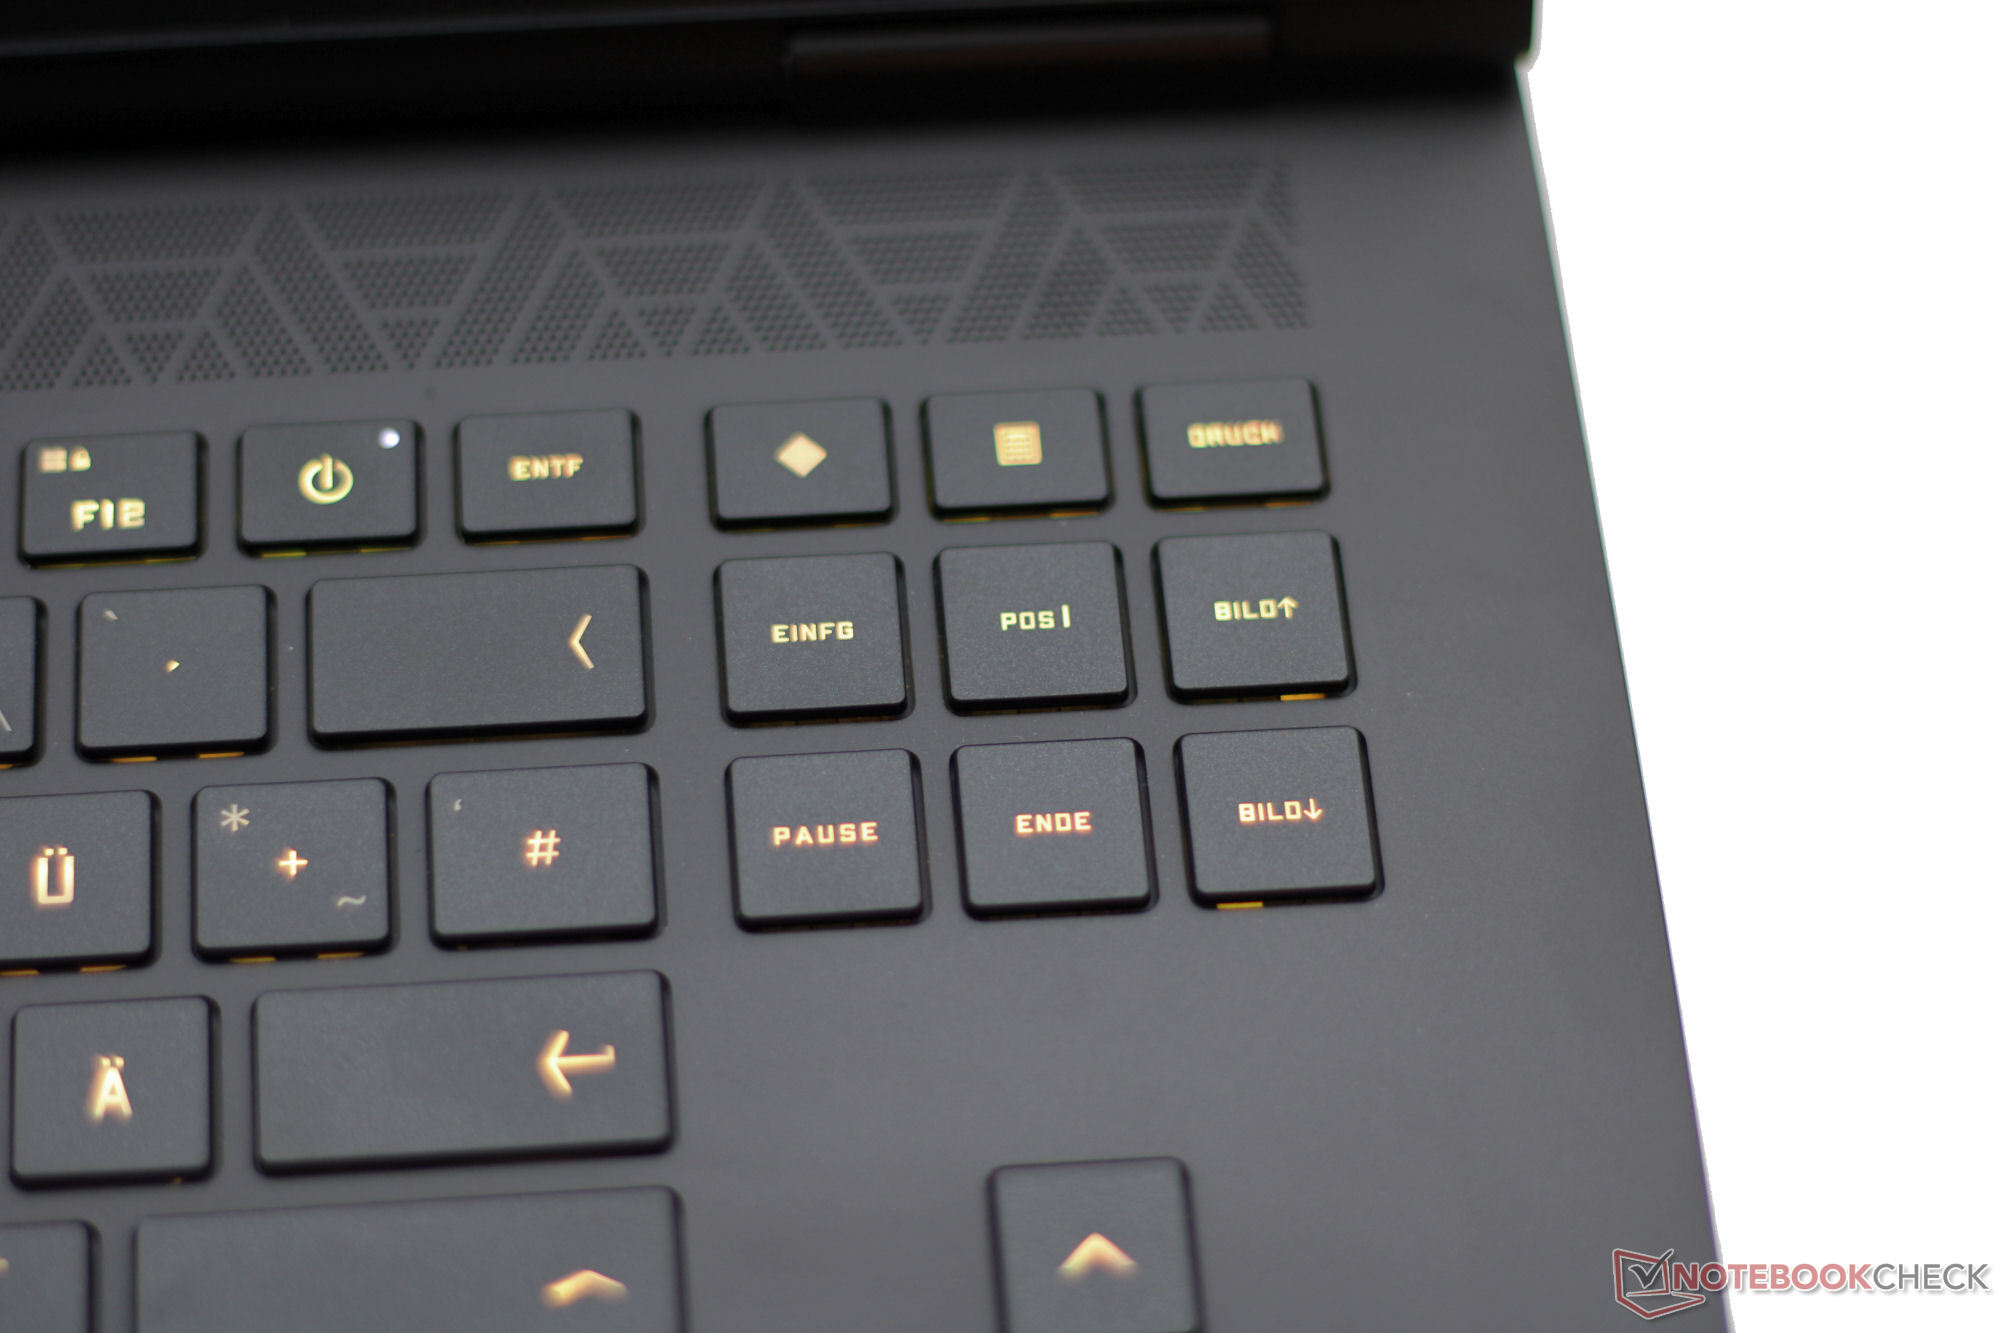
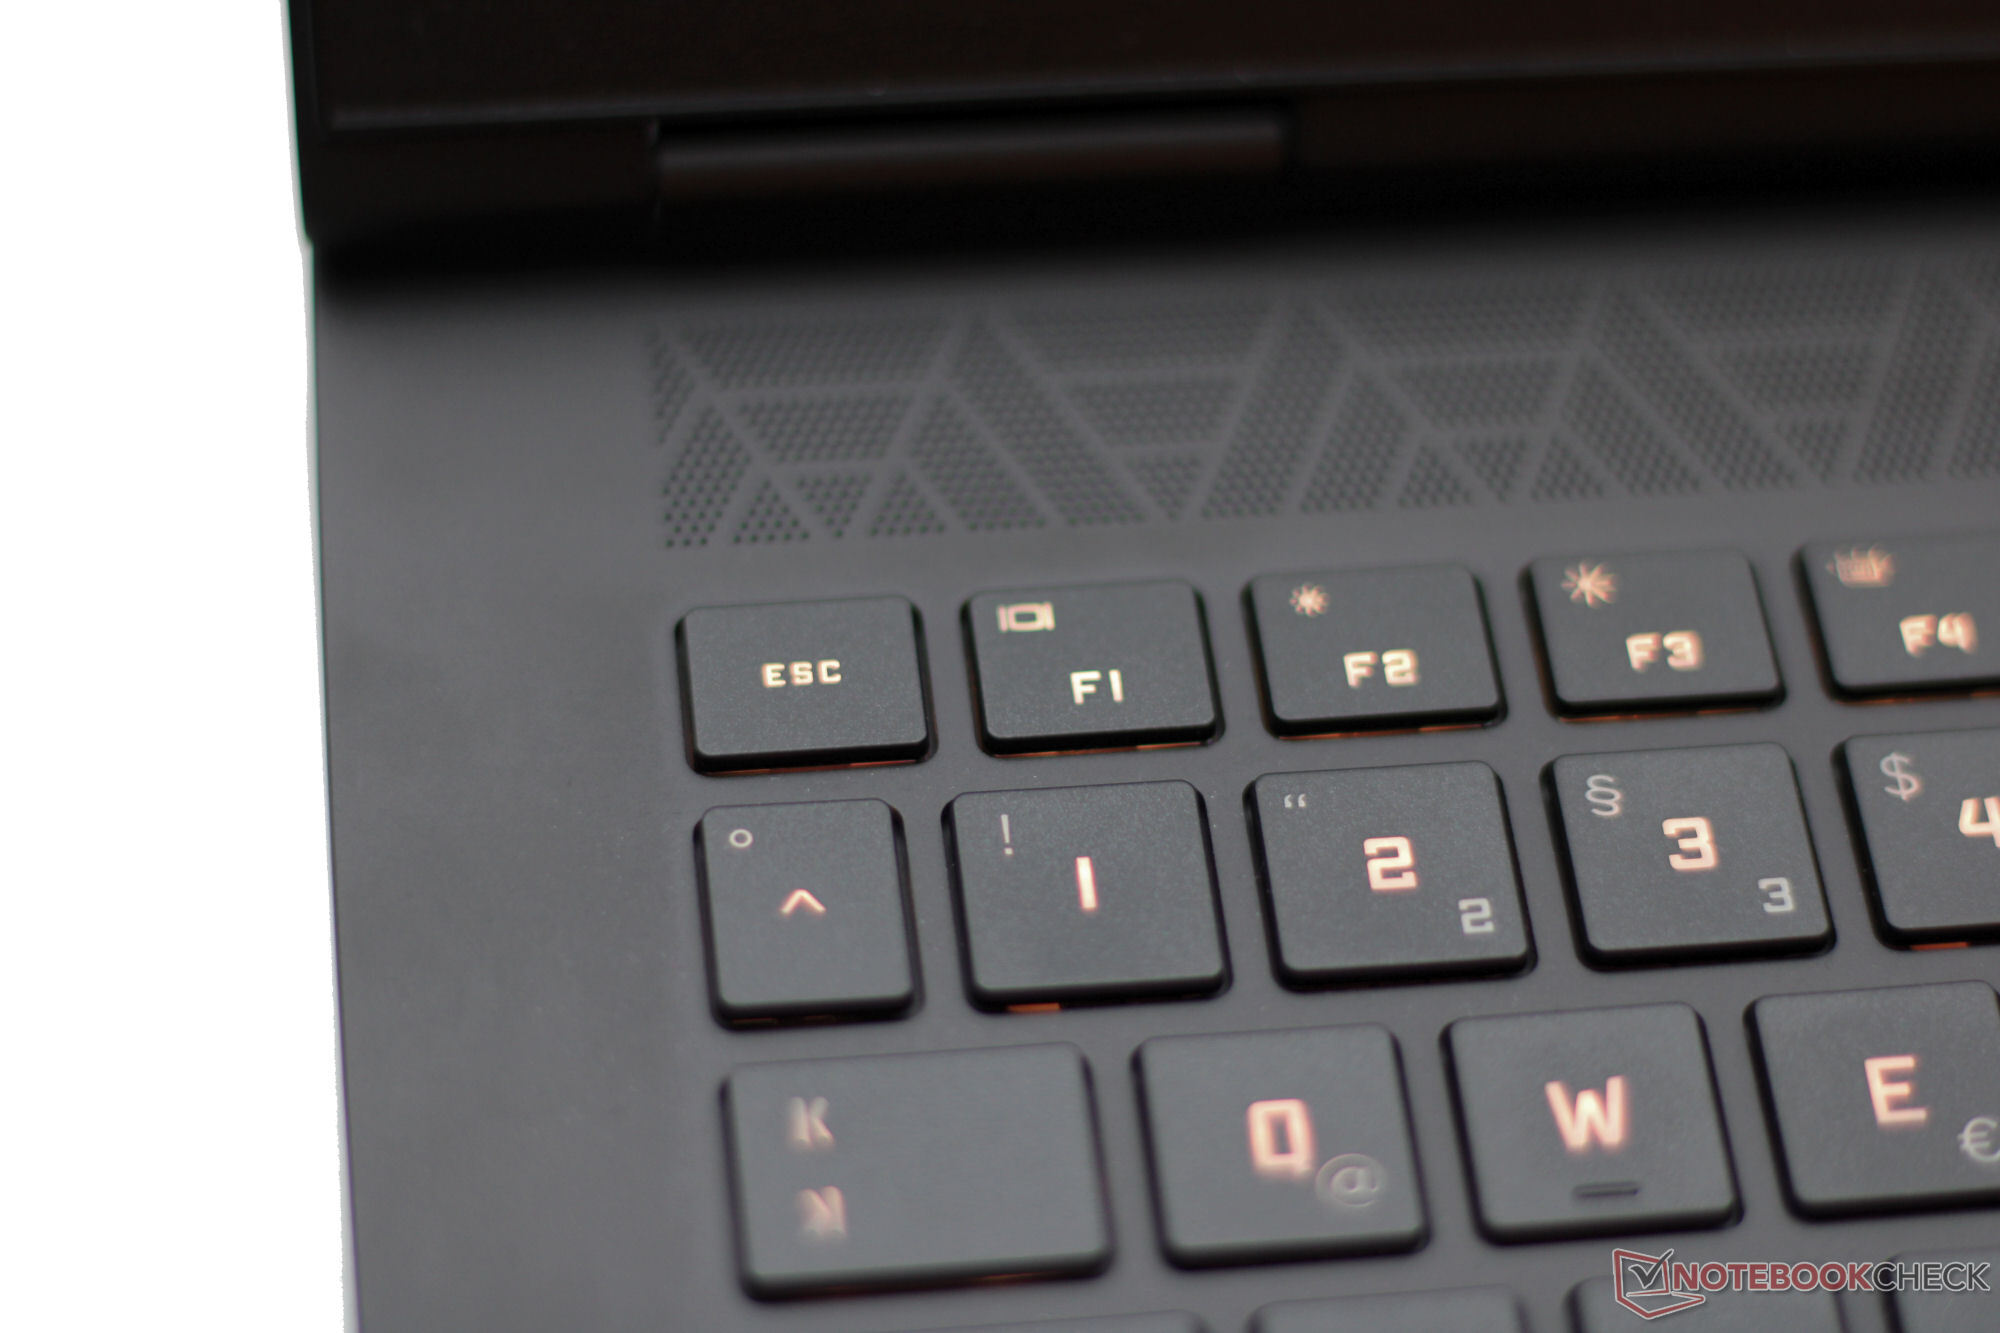
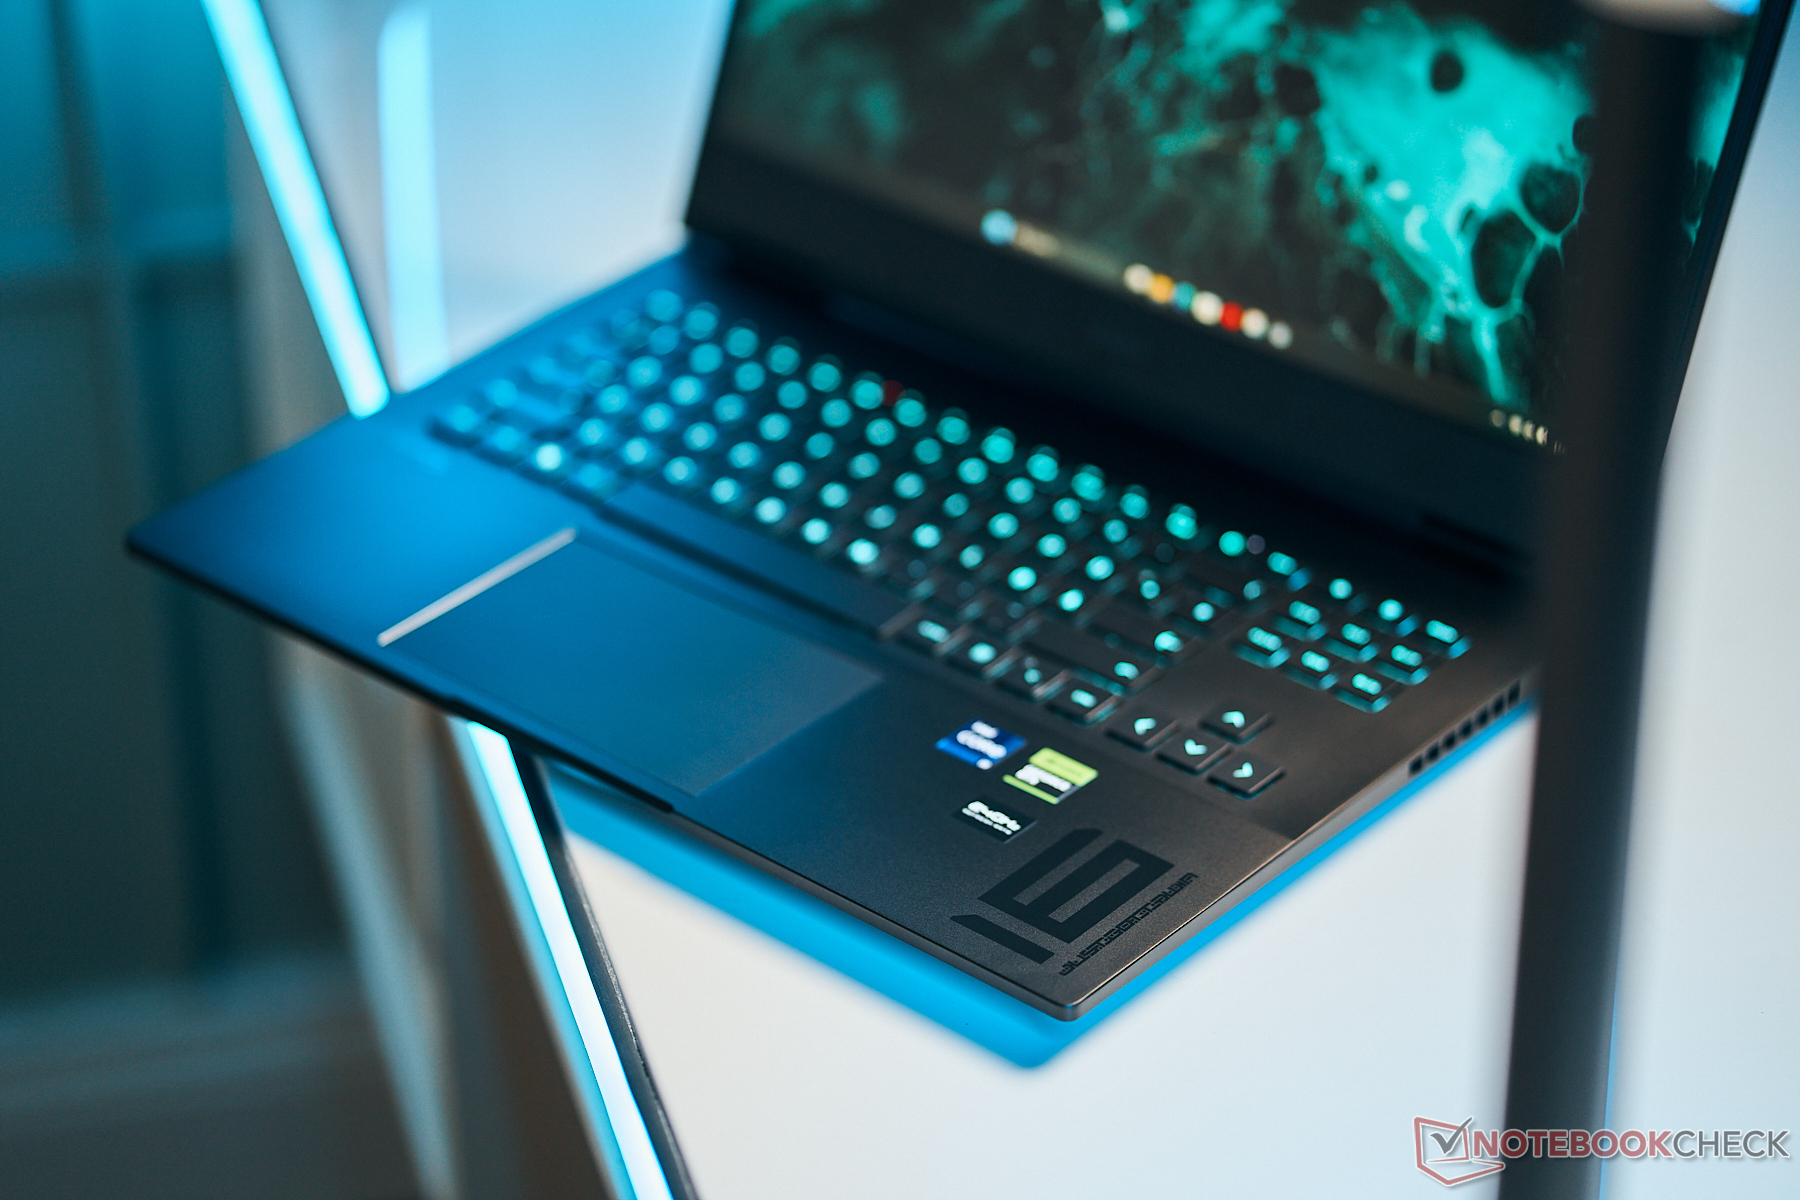
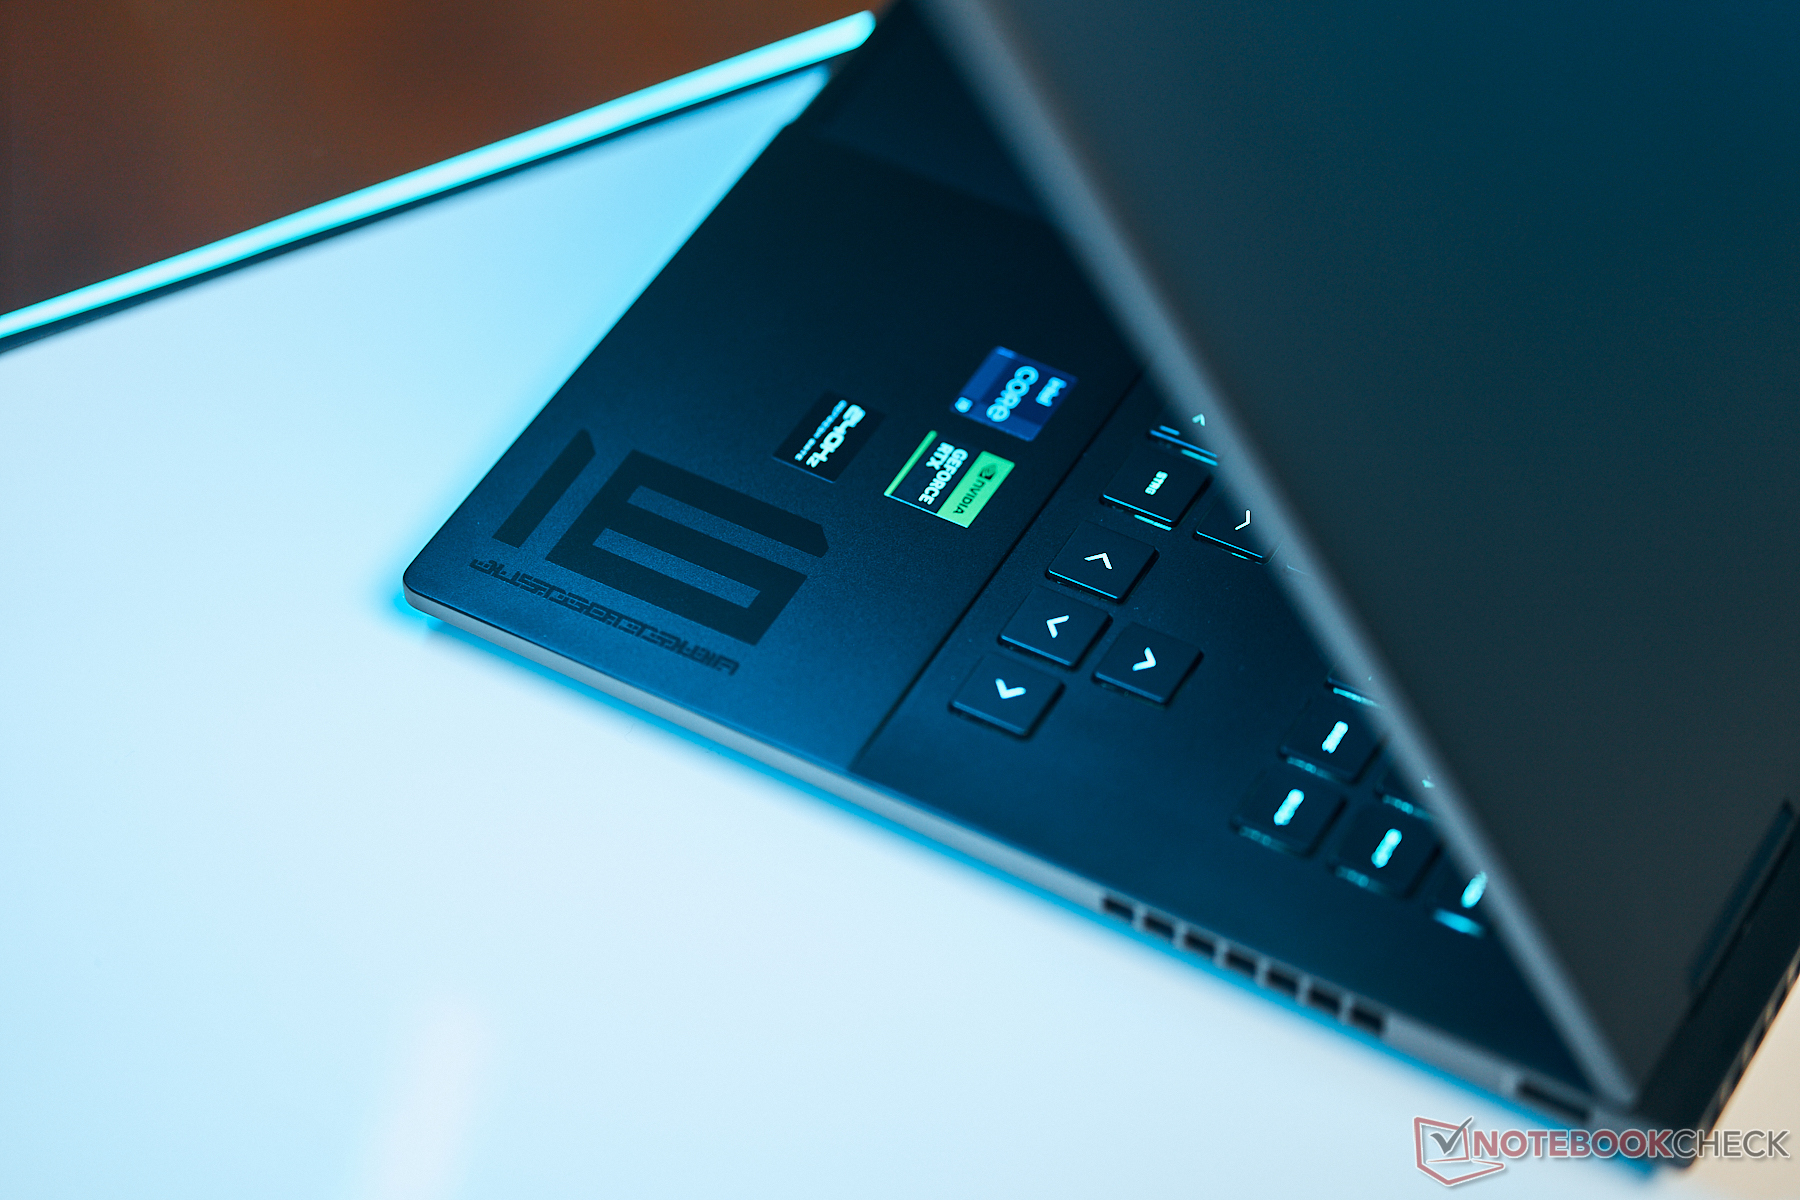
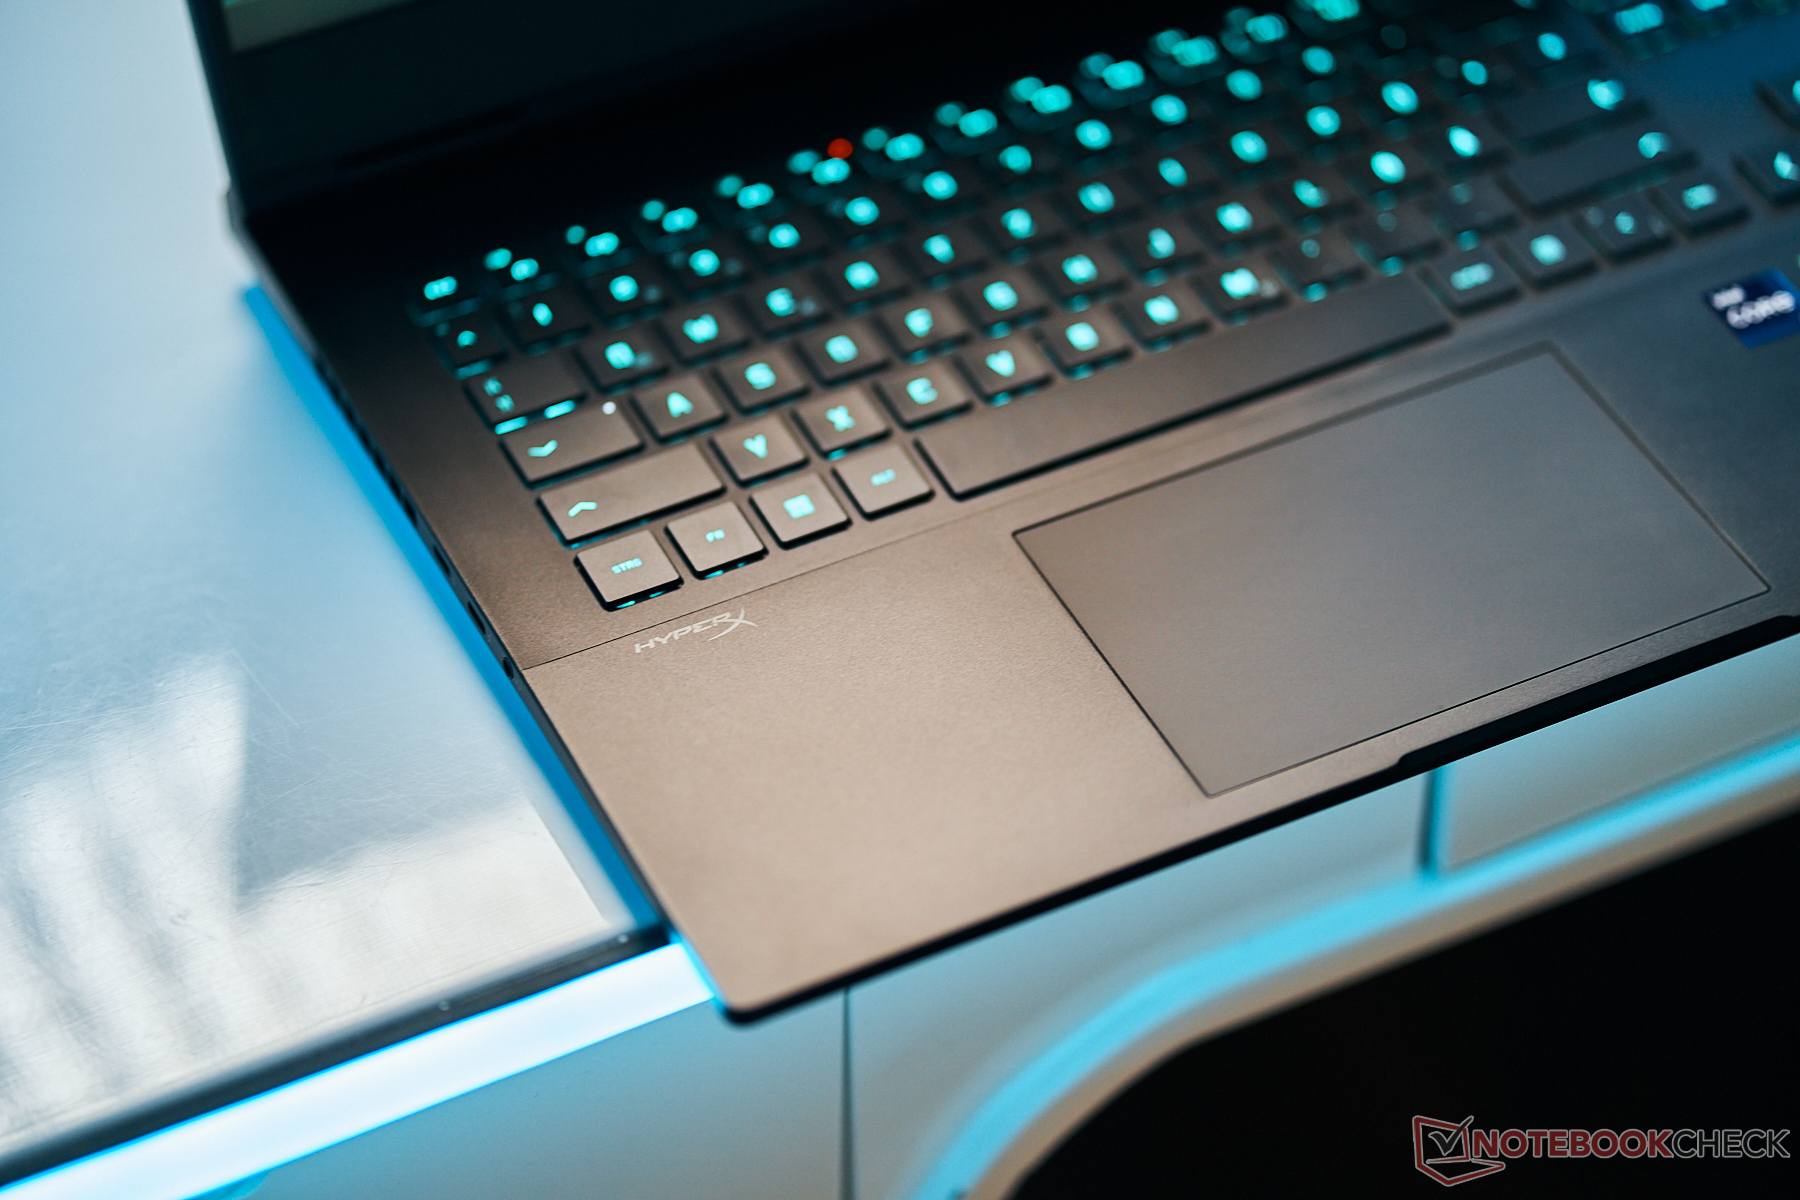
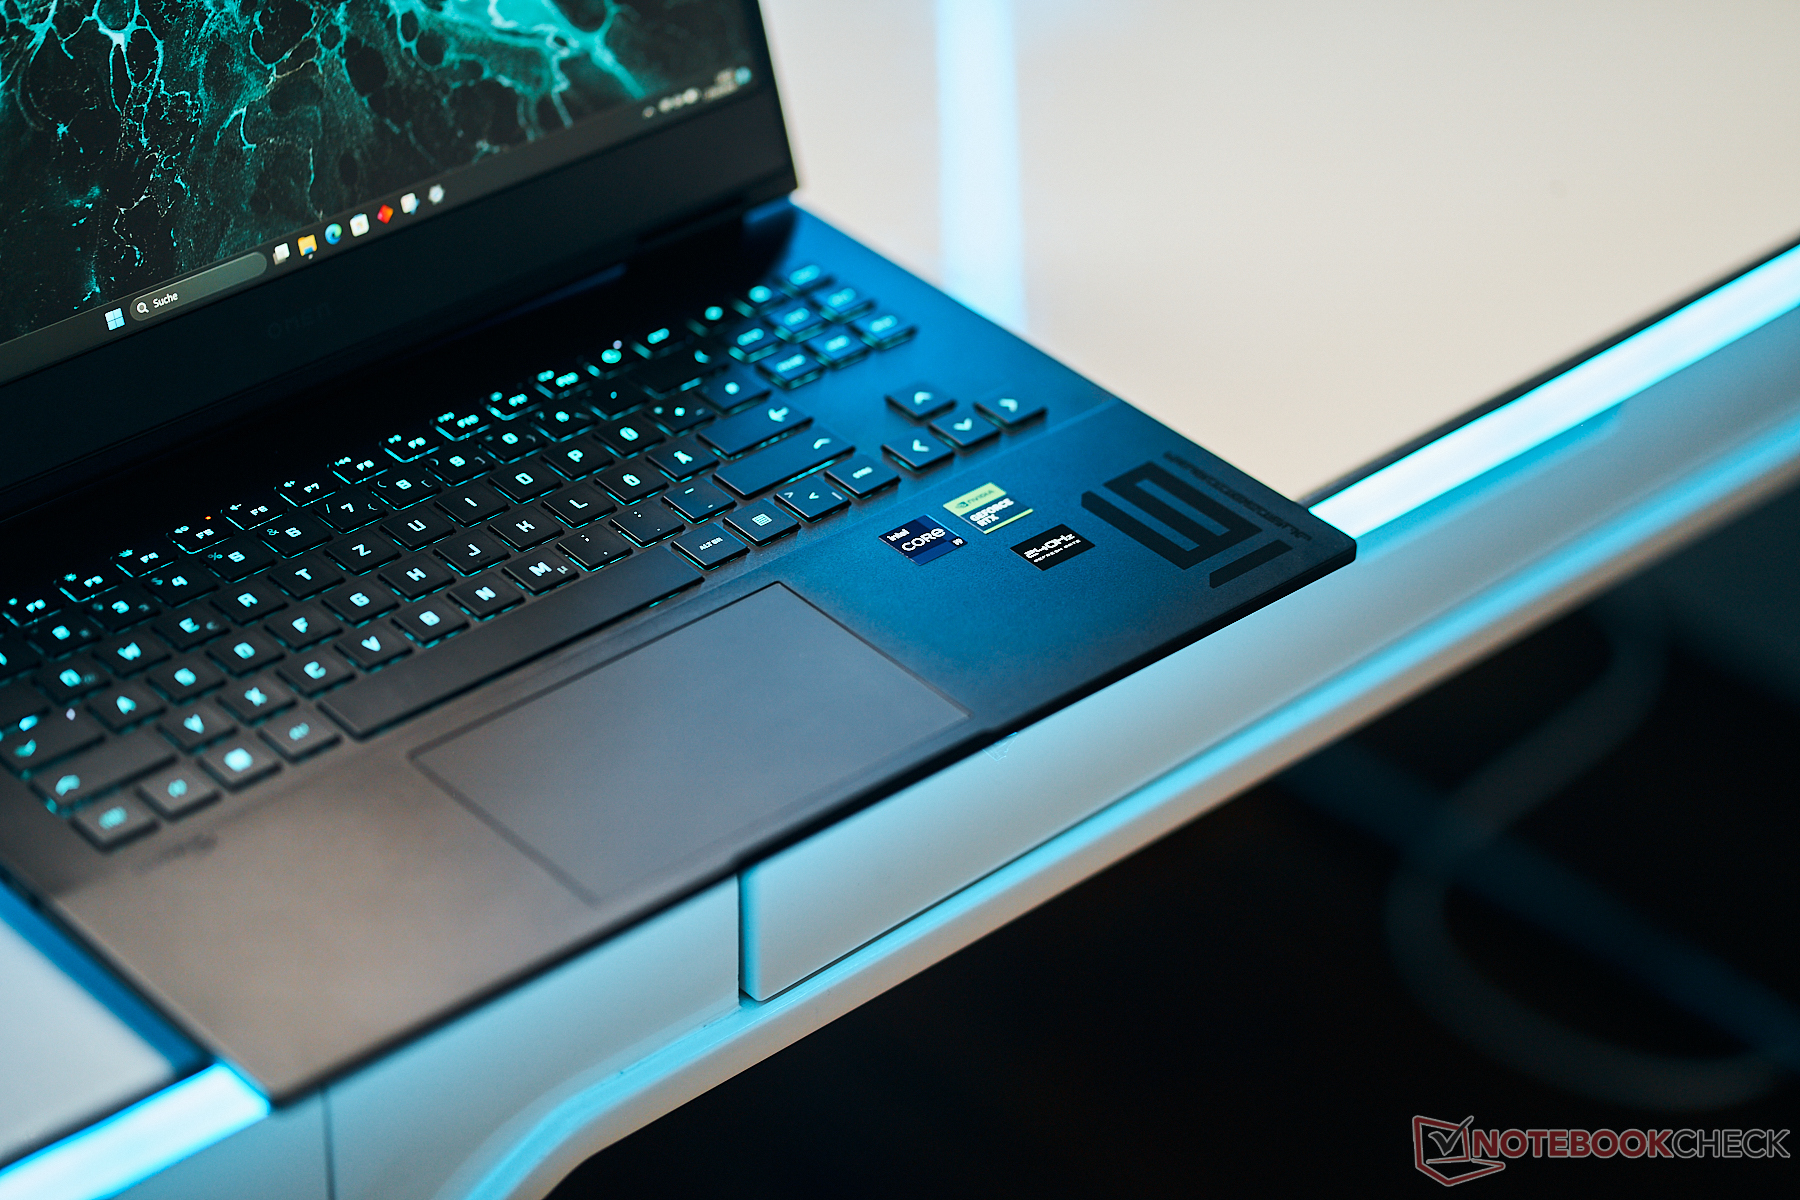
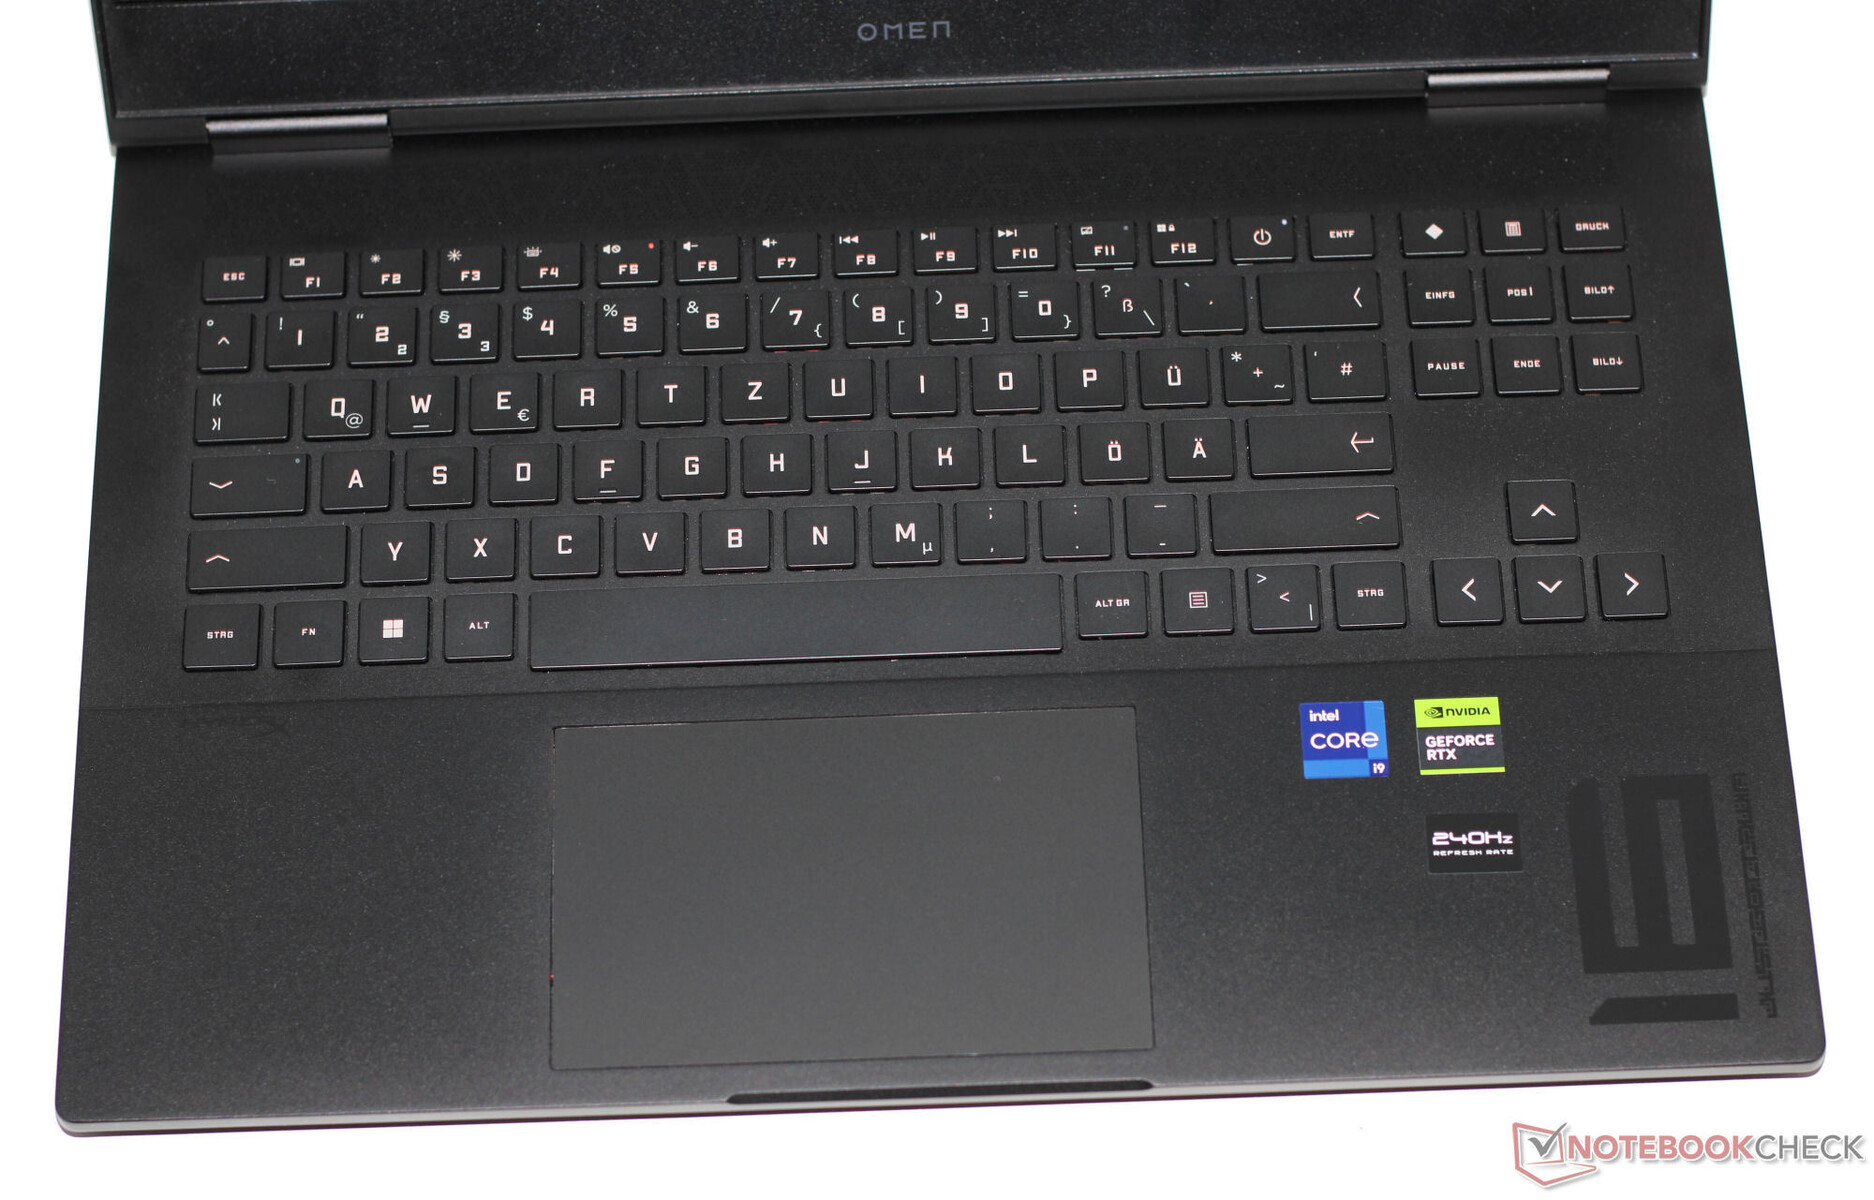
Dispositivos de entrada - Omen ofrece iluminación RGB por tecla
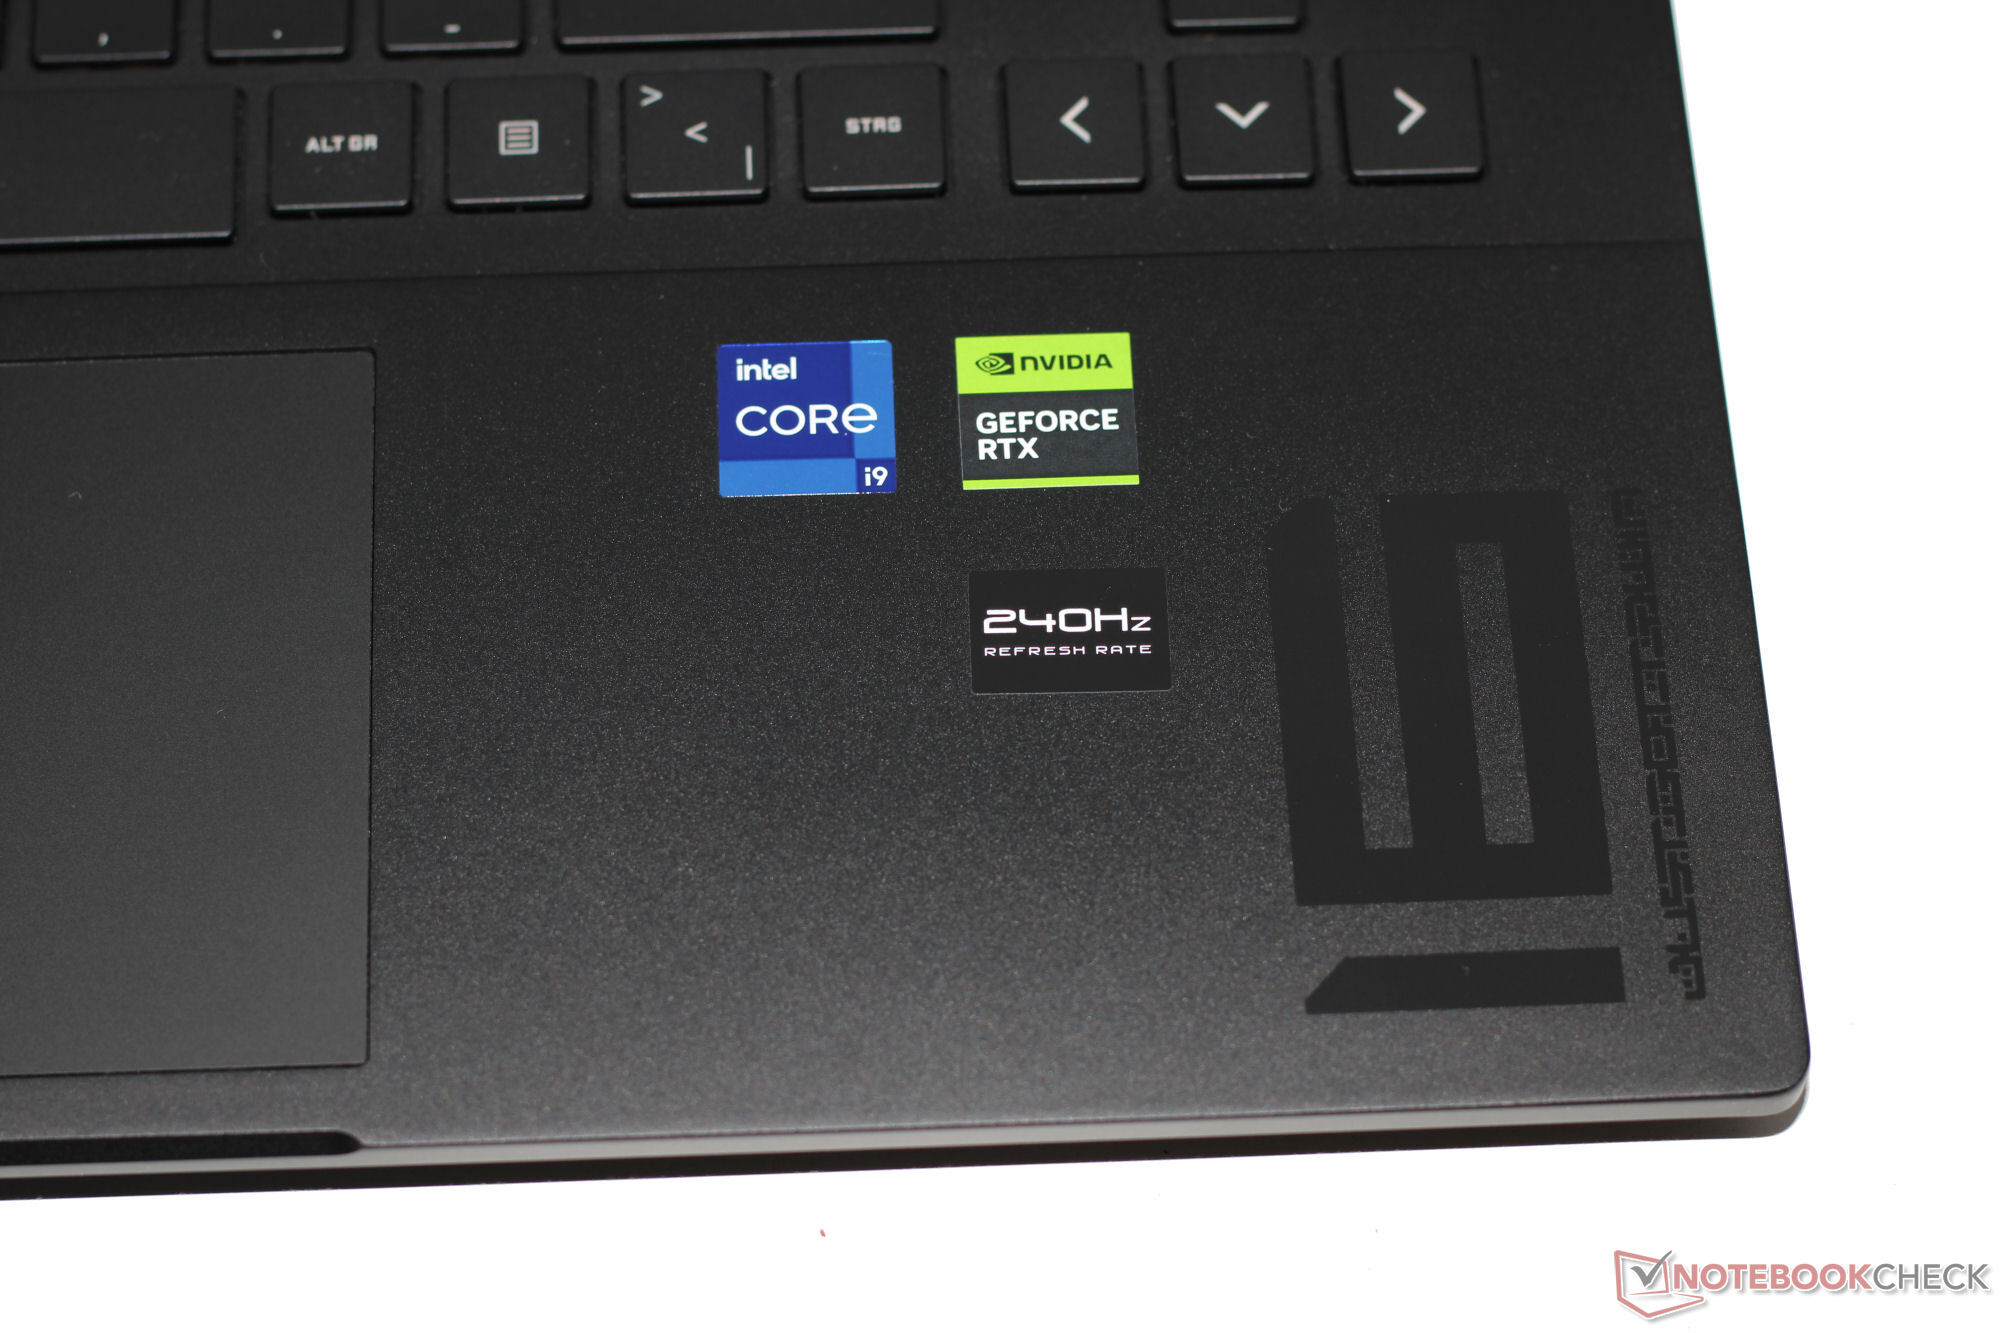
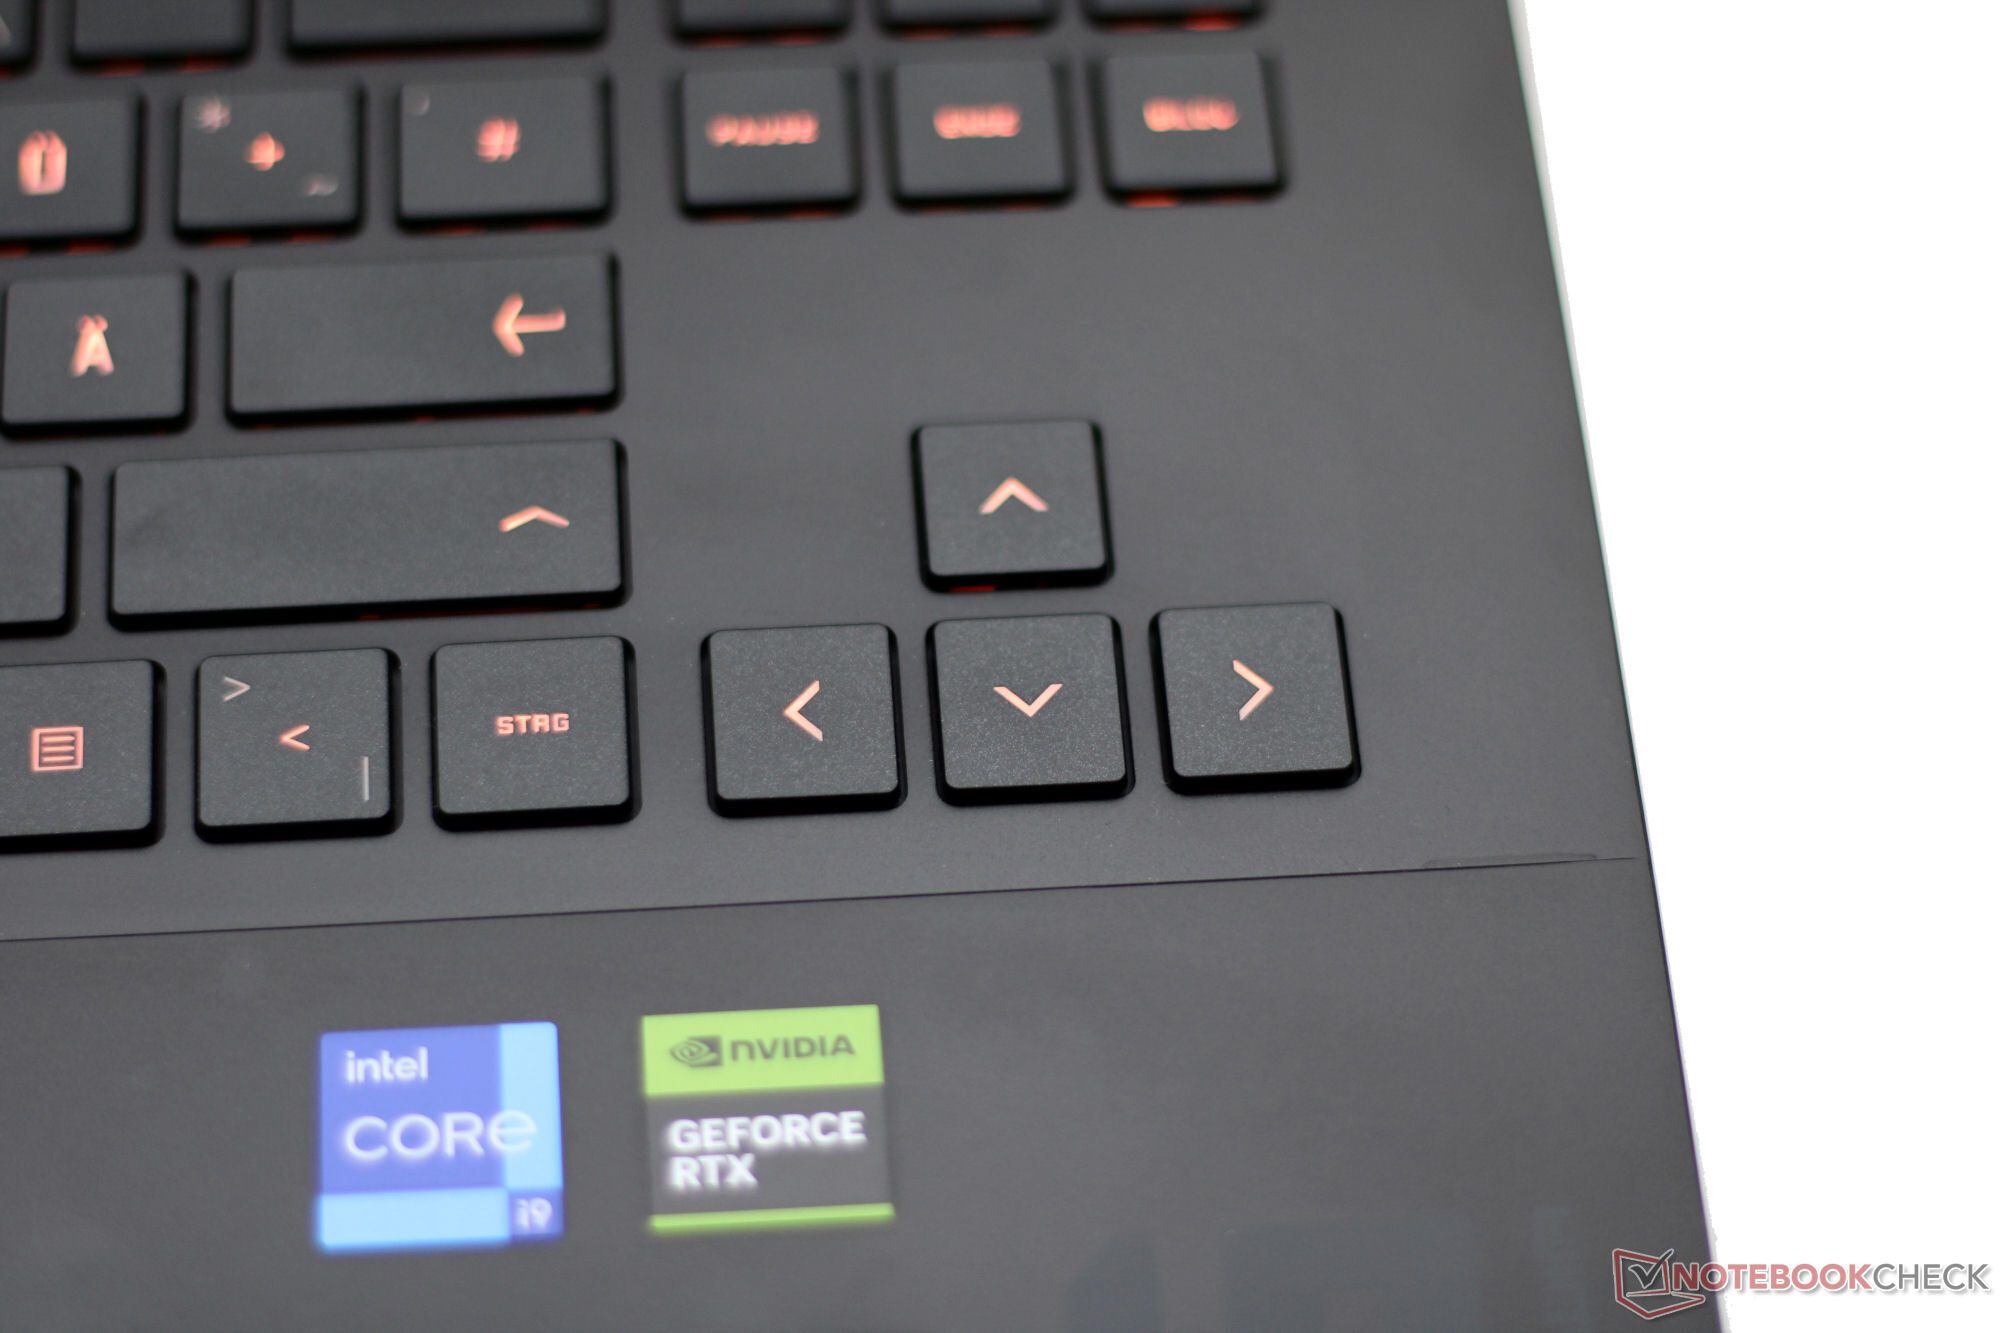
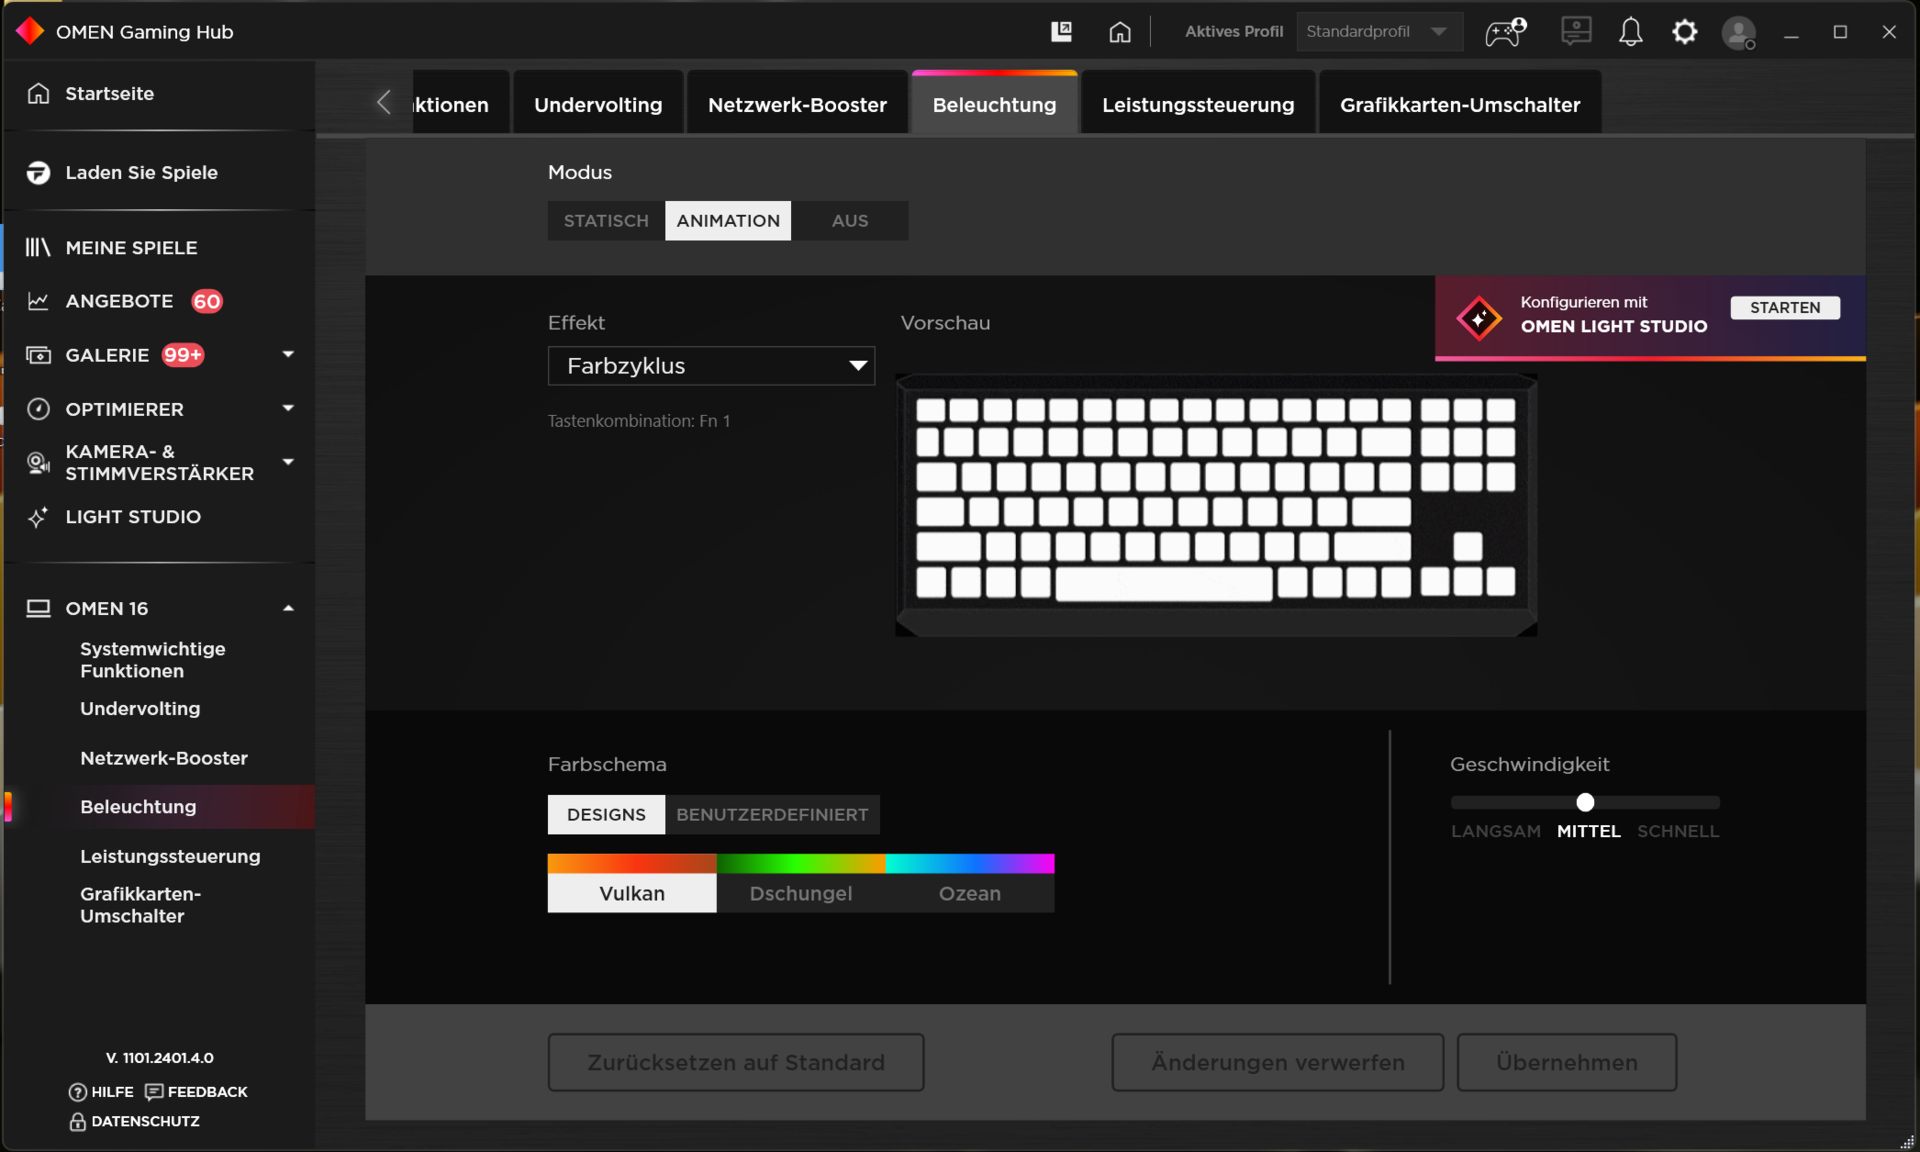
El teclado chiclet retroiluminado RGB del Omen 16 no tiene teclado numérico. El espacio habitualmente destinado a un teclado numérico lo ocupan ahora las teclas de control, así como las teclas de flecha grandes y separadas. Las teclas cóncavas son fáciles de pulsar, ofrecen un recorrido moderado y un punto de accionamiento claro, además de una resistencia decente. Con unas medidas aproximadas de 12,5 x 8 cm, el panel táctil tiene un recorrido corto y un punto de accionamiento claro.
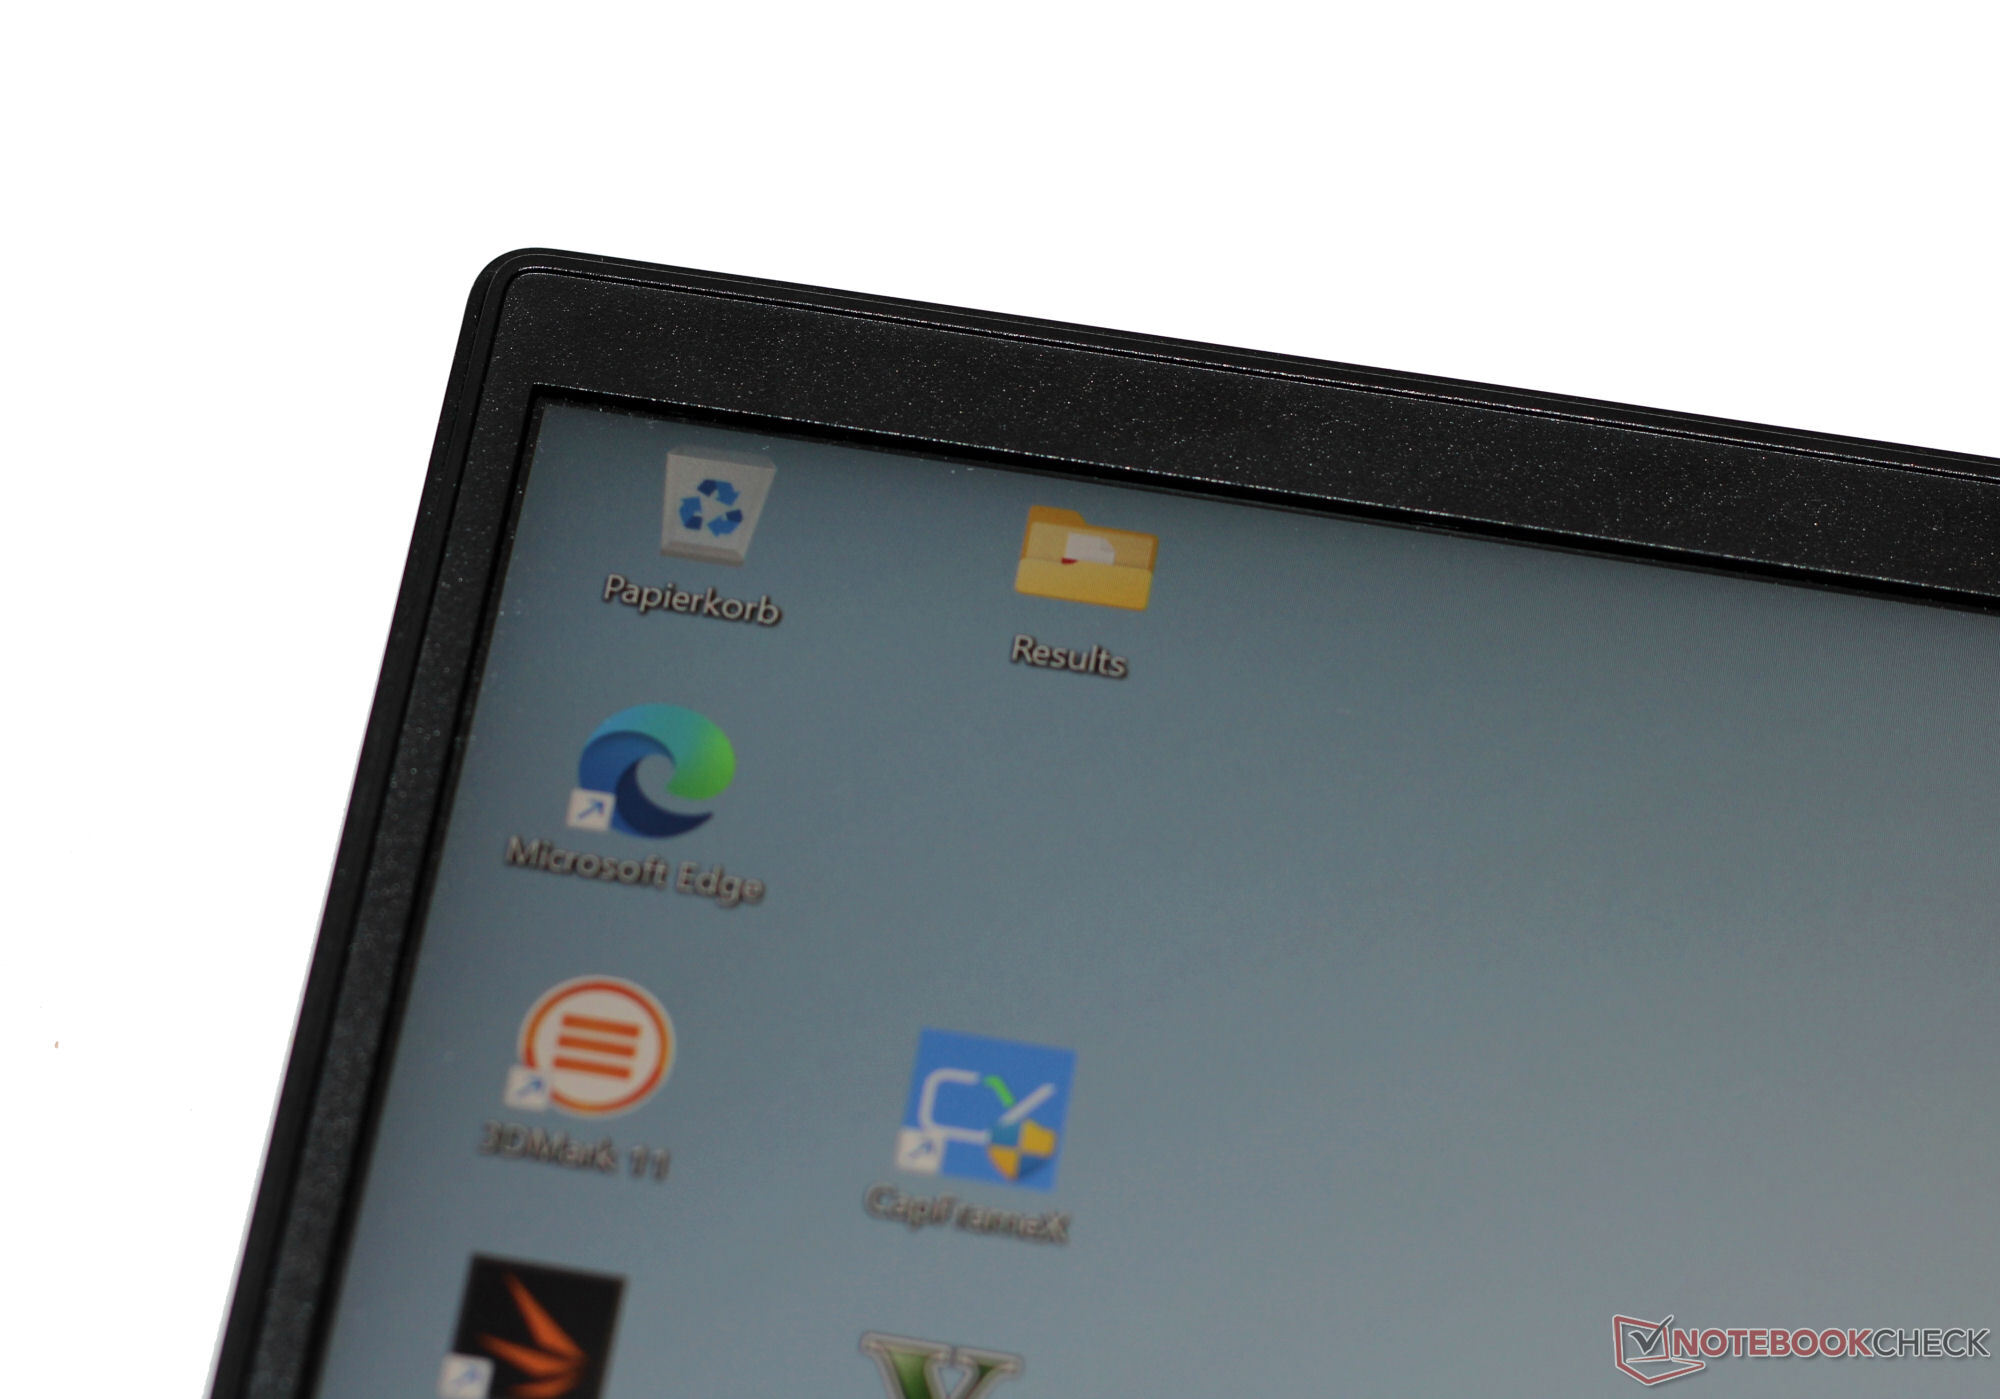
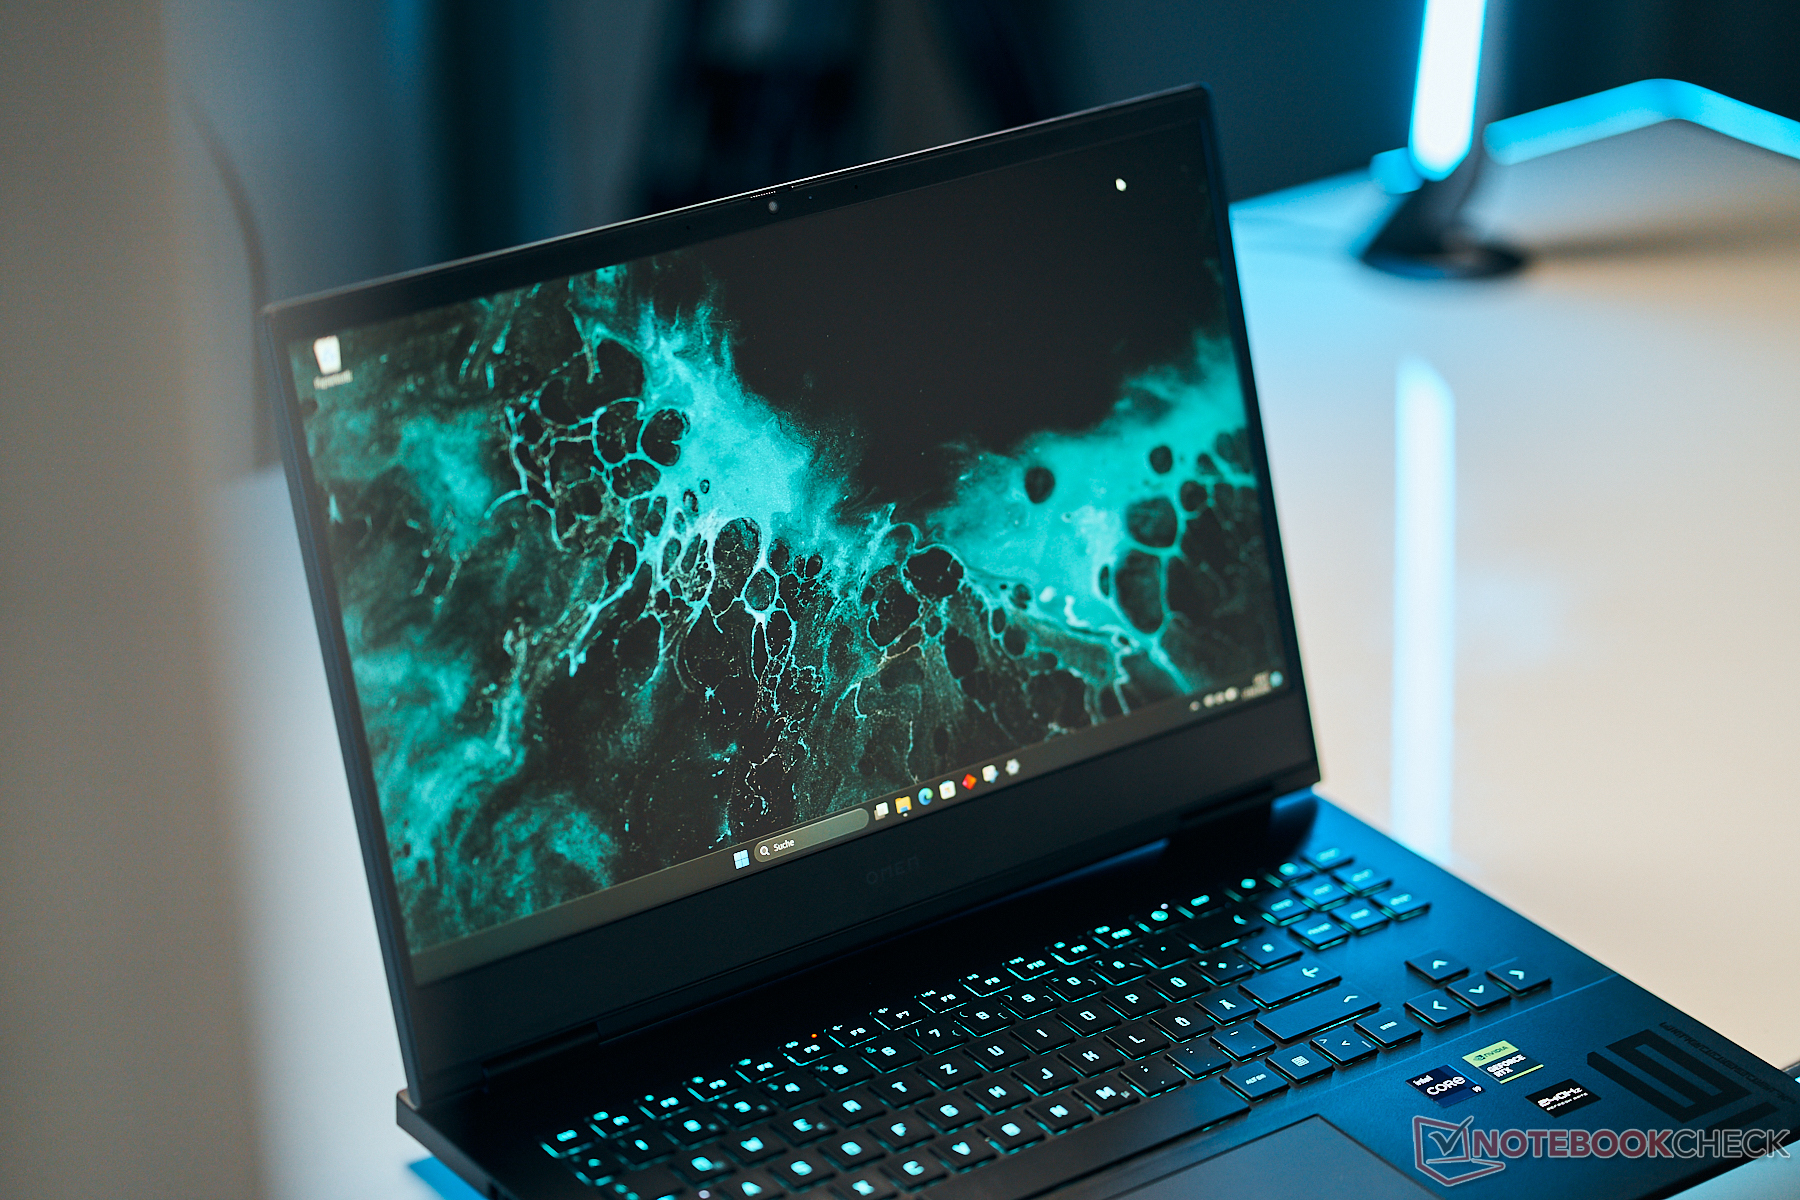
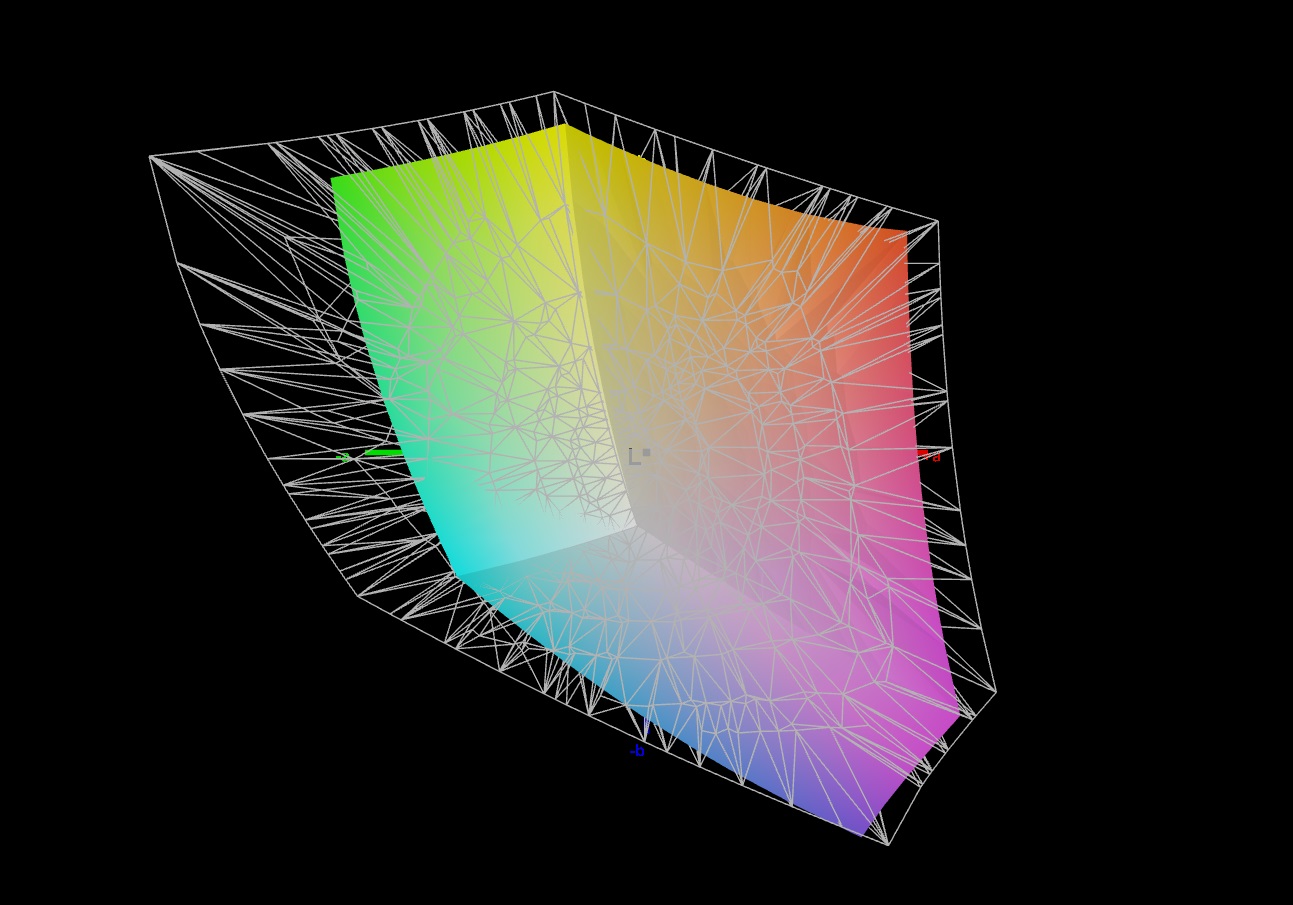
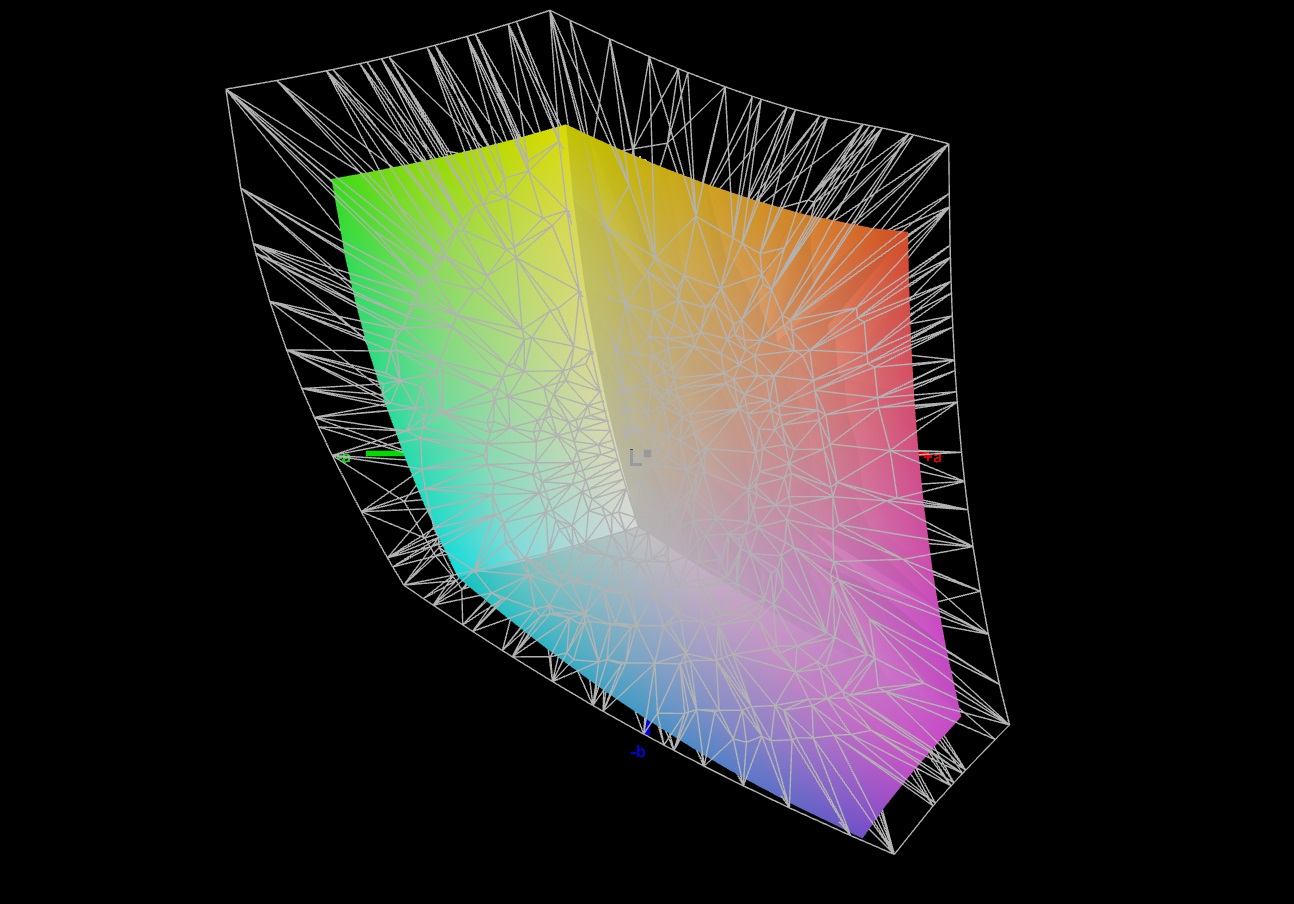
Pantalla - Panel QHD con cobertura sRGB completa
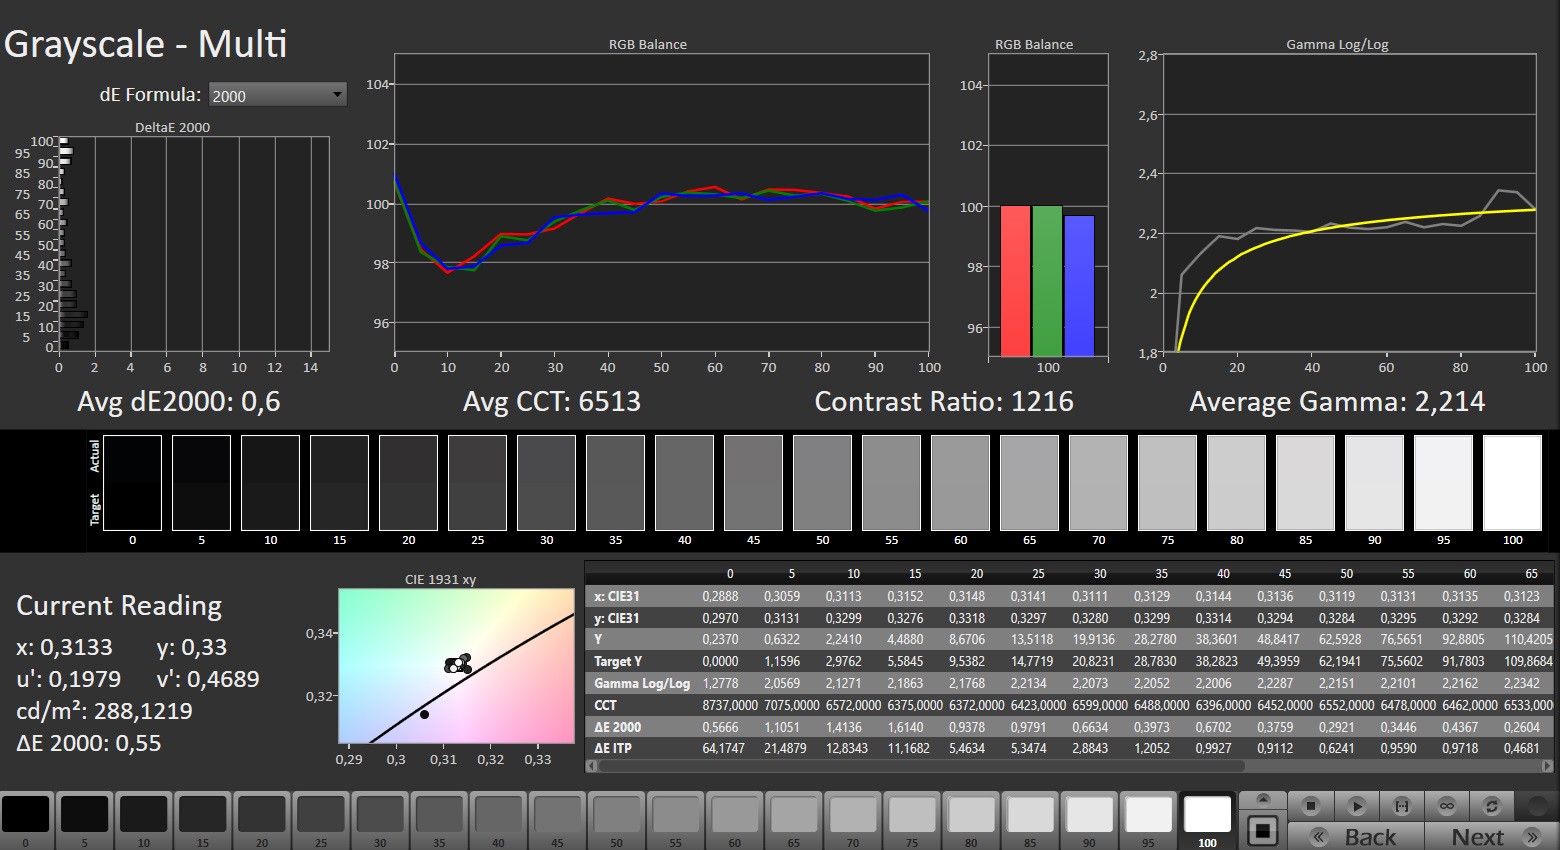
En su haber, la pantalla IPS de 16,1 pulgadas (1440p) con una relación de aspecto 16:9 no muestra parpadeo PWM, es compatible con G-Sync y tiene tiempos de respuesta rápidos. Aunque la relación de contraste de la pantalla es suficientemente buena (> 1.000:1), el brillo máximo está ligeramente por debajo del nivel objetivo (> 300 cd/m²).
| |||||||||||||||||||||||||
iluminación: 85 %
Brillo con batería: 292 cd/m²
Contraste: 1217:1 (Negro: 0.24 cd/m²)
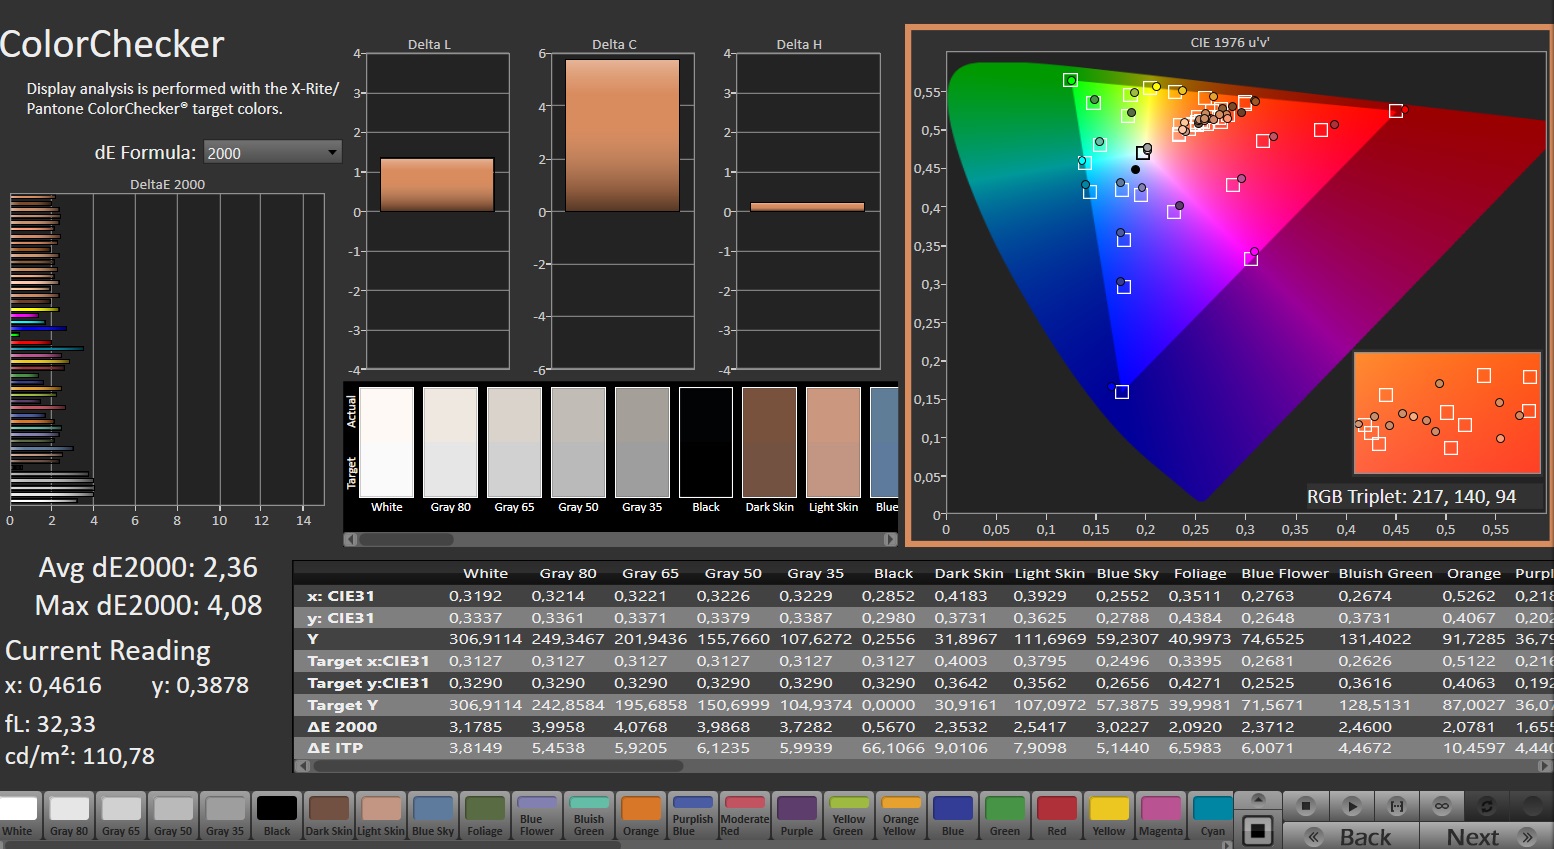
ΔE ColorChecker Calman: 2.36 | ∀{0.5-29.43 Ø4.71}
calibrated: 0.93
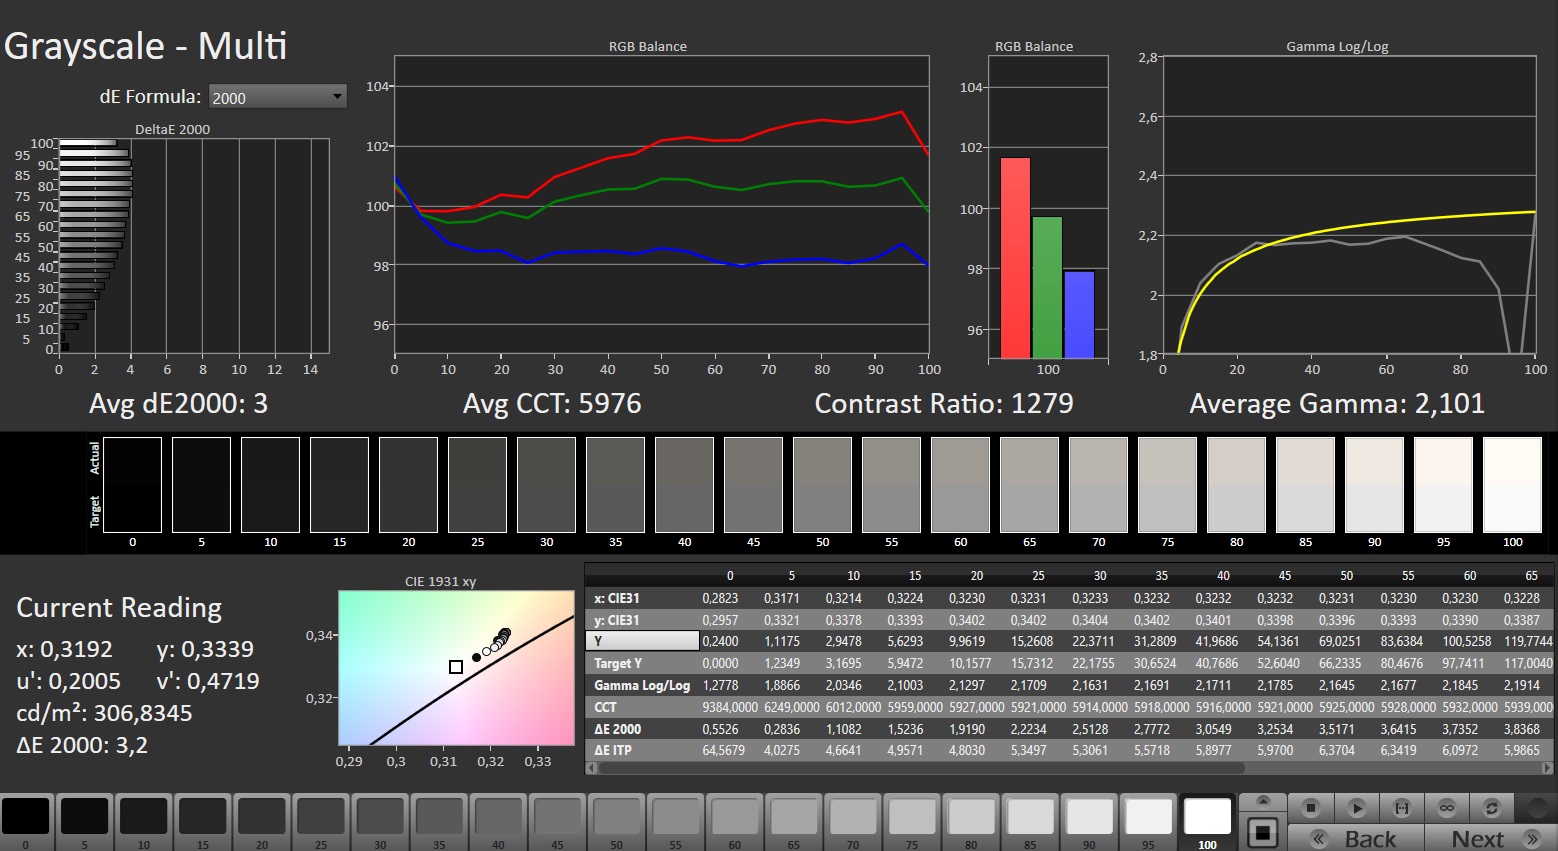
ΔE Greyscale Calman: 3 | ∀{0.09-98 Ø4.96}
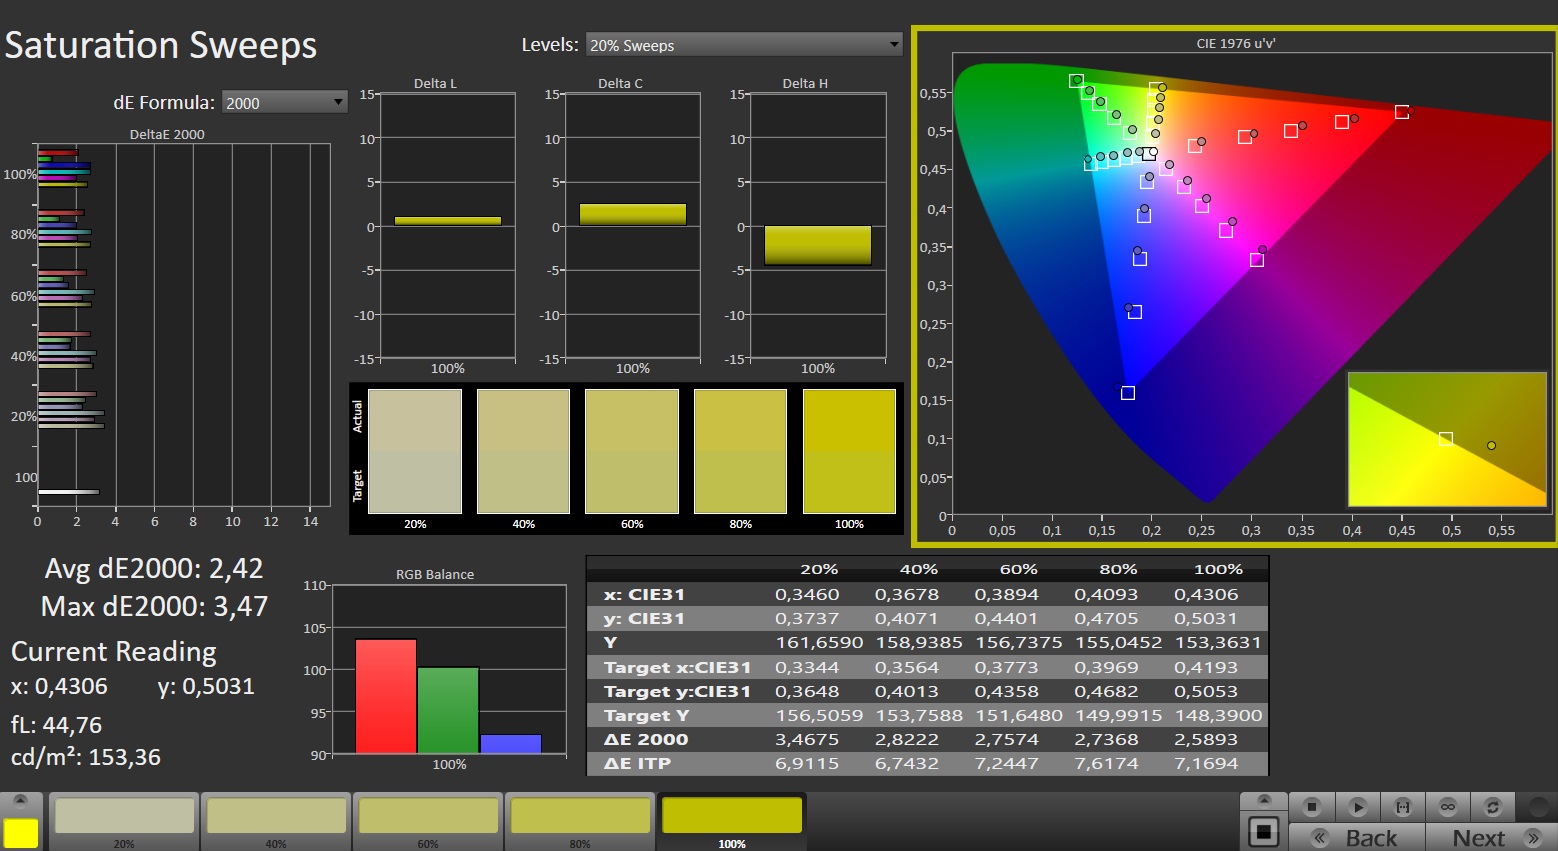
70.6% AdobeRGB 1998 (Argyll 3D)
98.6% sRGB (Argyll 3D)
68.6% Display P3 (Argyll 3D)
Gamma: 2.101
CCT: 5976 K
| HP Omen 16 (2024) BOE BOE0B7D, IPS, 2560x1440, 16.1" | MSI Vector 16 HX A14V Chi Mei N160GME-GTB, IPS, 2560x1600, 16" | Alienware m16 R1 AMD BOE NE16NZ4, IPS, 2560x1600, 16" | Acer Predator Helios 18 N23Q2 AUO45A8 (B180QAN01.2), IPS, 2560x1600, 18" | HP Omen 16-wf000 BOE0B7D, IPS, 2560x1440, 16.1" | |
|---|---|---|---|---|---|
| Display | 20% | 24% | 25% | 1% | |
| Display P3 Coverage (%) | 68.6 | 95.4 39% | 98.6 44% | 99.8 45% | 69 1% |
| sRGB Coverage (%) | 98.6 | 99.7 1% | 99.9 1% | 100 1% | 99.2 1% |
| AdobeRGB 1998 Coverage (%) | 70.6 | 85.4 21% | 88.9 26% | 91.8 30% | 71.2 1% |
| Response Times | 19% | 34% | -23% | 32% | |
| Response Time Grey 50% / Grey 80% * (ms) | 14.1 ? | 5.7 ? 60% | 5.1 ? 64% | 7.6 ? 46% | 4.6 ? 67% |
| Response Time Black / White * (ms) | 9.3 ? | 11.4 ? -23% | 9 ? 3% | 17.8 ? -91% | 9.7 ? -4% |
| PWM Frequency (Hz) | 2509 | ||||
| Screen | -7% | -37% | -27% | 1% | |
| Brightness middle (cd/m²) | 292 | 557.2 91% | 329 13% | 360 23% | 310.9 6% |
| Brightness (cd/m²) | 291 | 506 74% | 317 9% | 355 22% | 296 2% |
| Brightness Distribution (%) | 85 | 83 -2% | 89 5% | 92 8% | 91 7% |
| Black Level * (cd/m²) | 0.24 | 0.41 -71% | 0.32 -33% | 0.21 12% | 0.35 -46% |
| Contrast (:1) | 1217 | 1359 12% | 1028 -16% | 1714 41% | 888 -27% |
| Colorchecker dE 2000 * | 2.36 | 2.91 -23% | 3.71 -57% | 3.82 -62% | 2.18 8% |
| Colorchecker dE 2000 max. * | 4.08 | 5.94 -46% | 7.23 -77% | 7.38 -81% | 3.58 12% |
| Colorchecker dE 2000 calibrated * | 0.93 | 1.63 -75% | 2.82 -203% | 2.24 -141% | 0.52 44% |
| Greyscale dE 2000 * | 3 | 3.8 -27% | 2.2 27% | 5.06 -69% | 2.8 7% |
| Gamma | 2.101 105% | 2.23 99% | 2.3 96% | 2.52 87% | 2.18 101% |
| CCT | 5976 109% | 6408 101% | 6270 104% | 5657 115% | 6002 108% |
| Media total (Programa/Opciones) | 11% /
2% | 7% /
-14% | -8% /
-15% | 11% /
6% |
* ... más pequeño es mejor
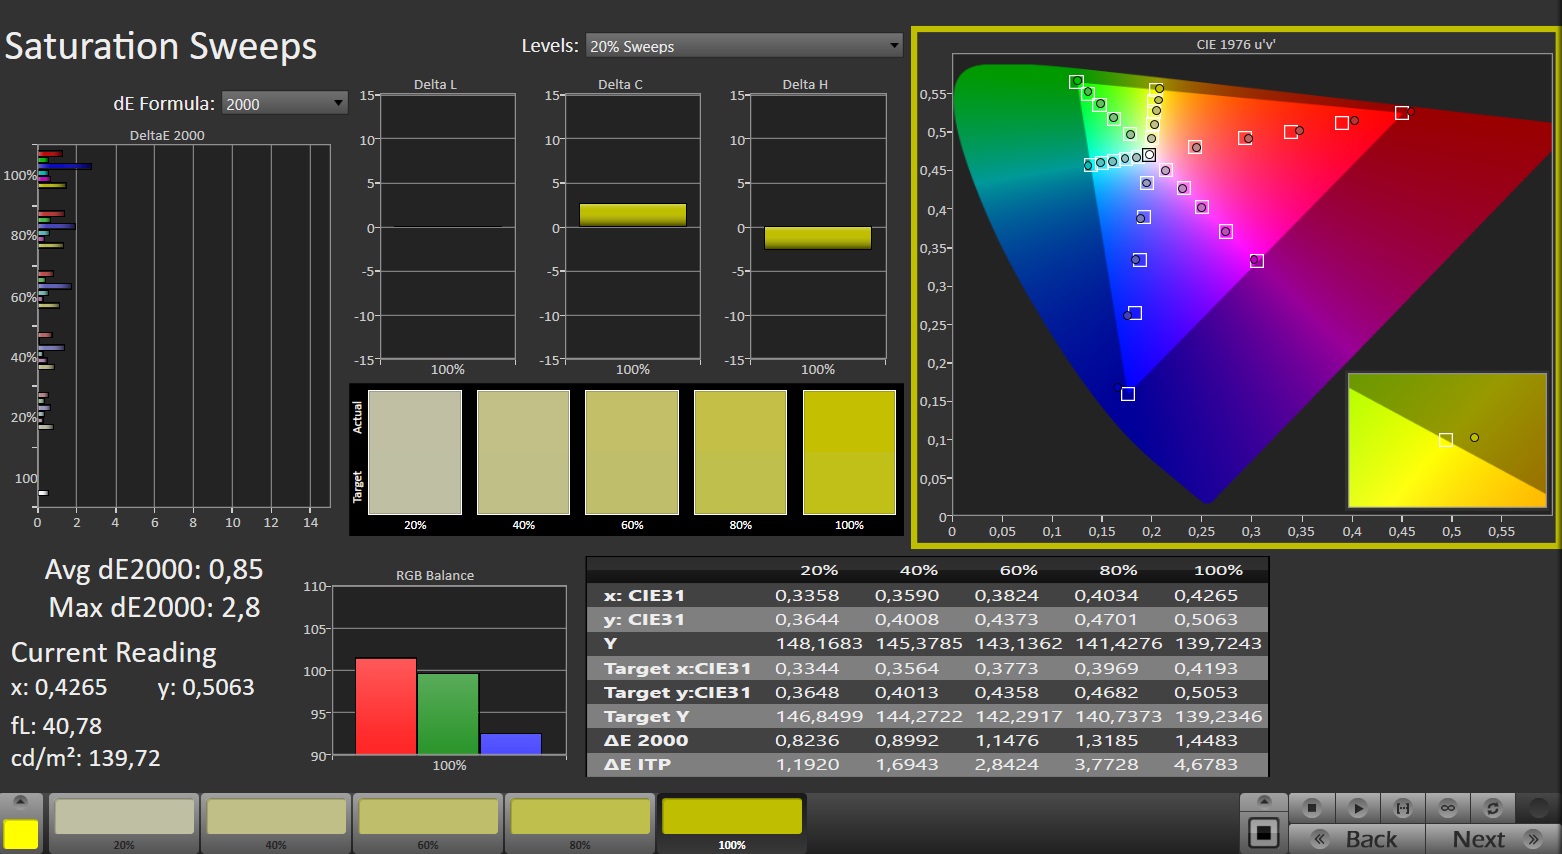
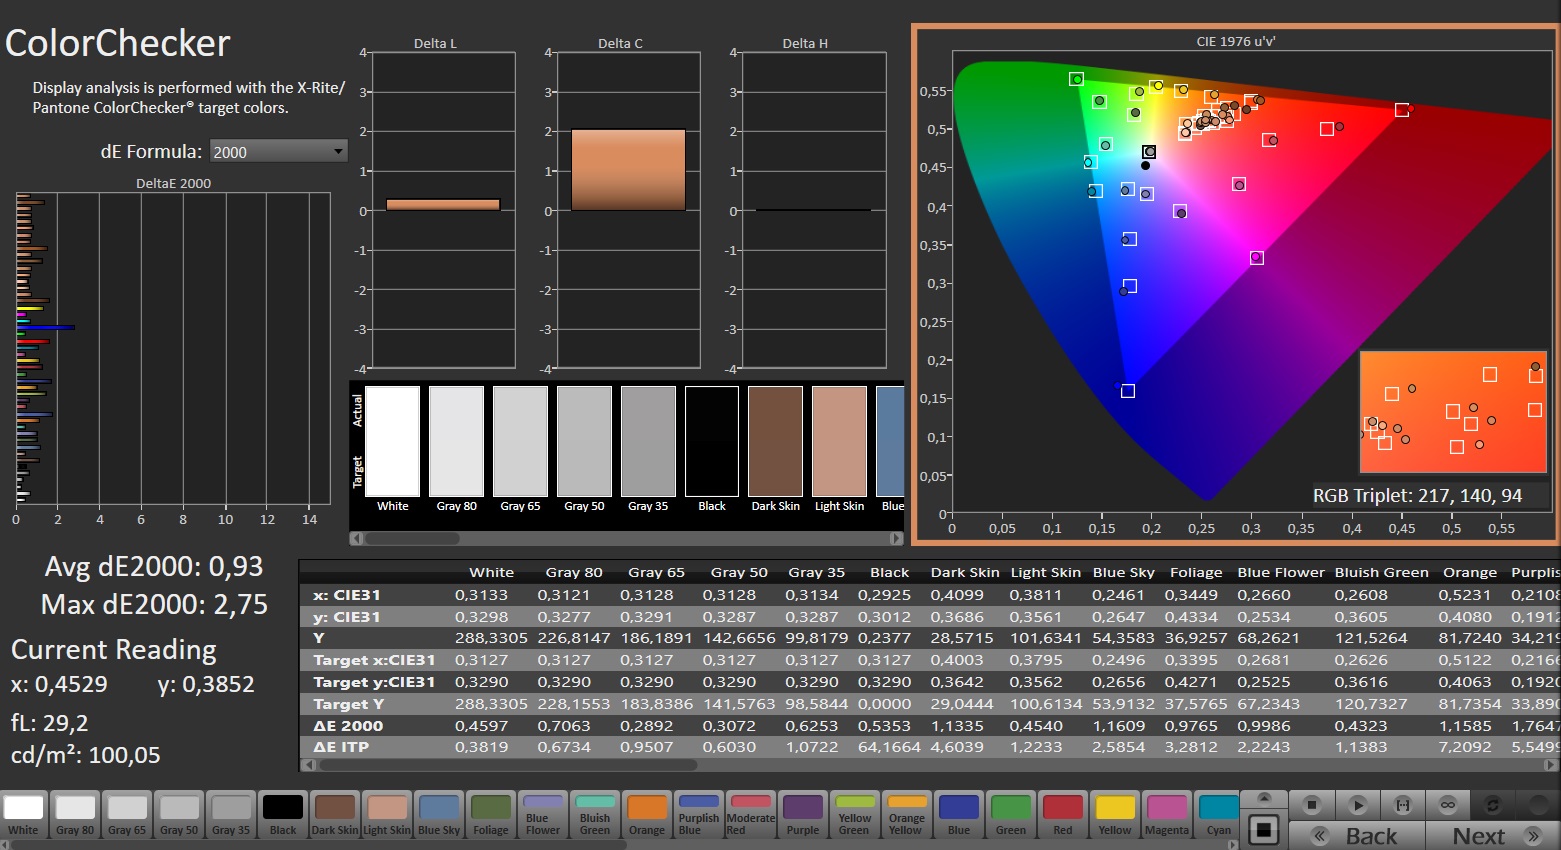
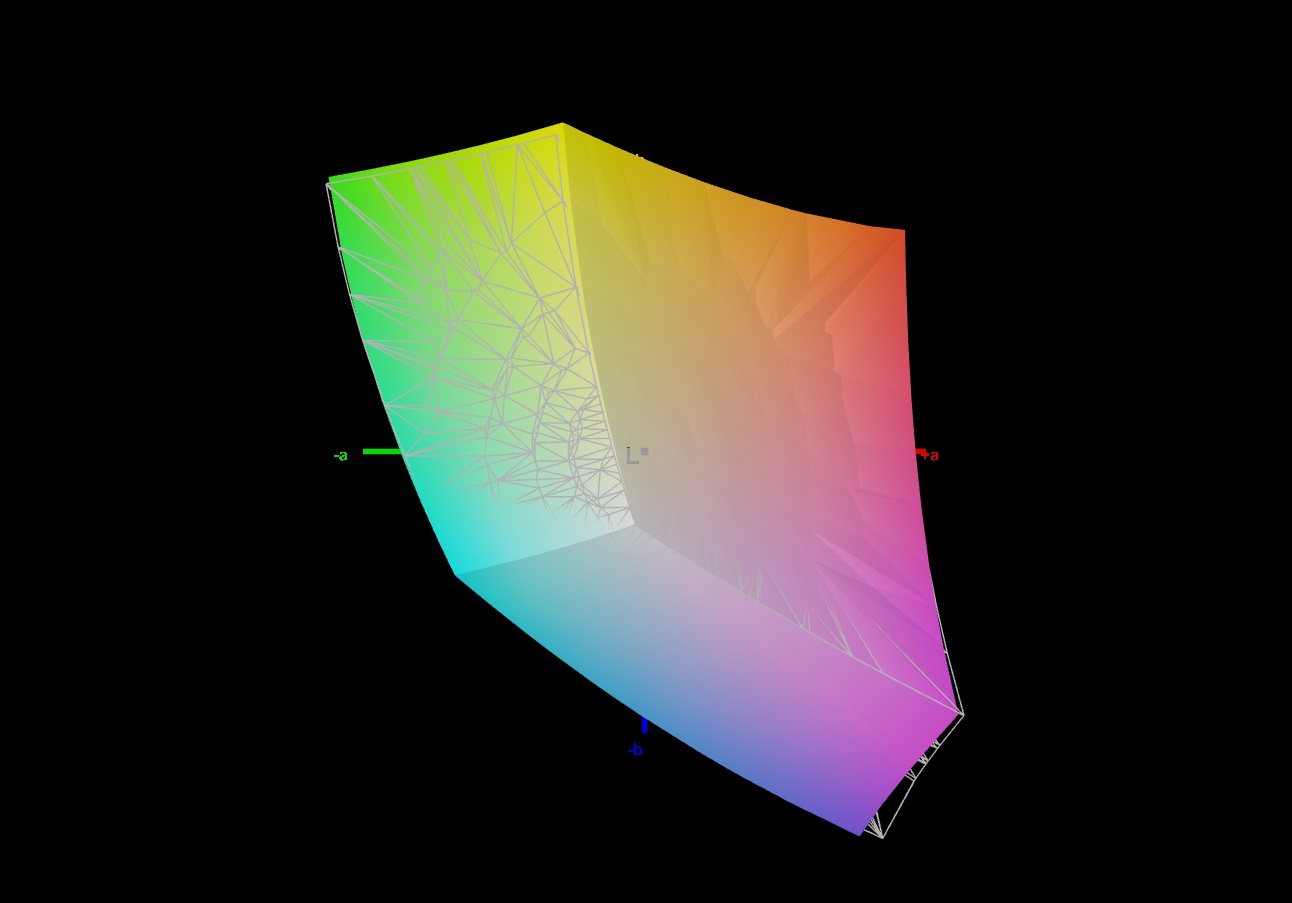
La pantalla tiene una gran reproducción del color nada más sacarla de la caja. Con una diferencia de color media de alrededor de 2,4, se encuentra en un nivel que consideramos bueno (Delta E < 3). Calibrar la pantalla redujo el Delta E medio a 0,93 y dio como resultado una escala de grises más equilibrada. El panel puede reproducir todo el espacio de color sRGB, pero no tiene una cobertura completa de AdobeRGB y DCI-P3. Las pantallas de los dispositivos de la competencia tienen más que ofrecer en este departamento.
Tiempos de respuesta del display
| ↔ Tiempo de respuesta de Negro a Blanco | ||
|---|---|---|
| 9.3 ms ... subida ↗ y bajada ↘ combinada | ↗ 4.6 ms subida | 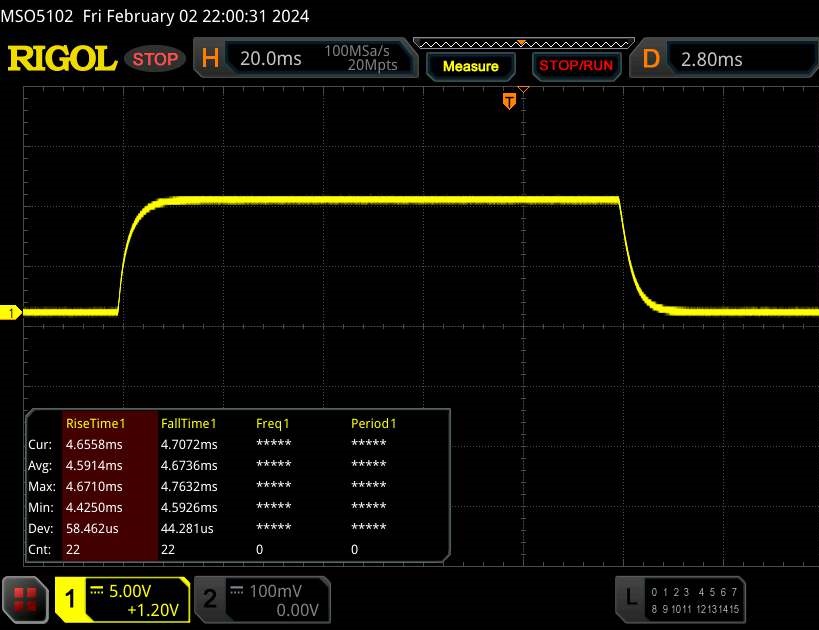 |
| ↘ 4.7 ms bajada | ||
| La pantalla mostró tiempos de respuesta rápidos en nuestros tests y debería ser adecuada para juegos. En comparación, todos los dispositivos de prueba van de ##min### (mínimo) a 240 (máximo) ms. » 26 % de todos los dispositivos son mejores. Esto quiere decir que el tiempo de respuesta medido es mejor que la media (19.8 ms) de todos los dispositivos testados. | ||
| ↔ Tiempo de respuesta 50% Gris a 80% Gris | ||
| 14.1 ms ... subida ↗ y bajada ↘ combinada | ↗ 6.7 ms subida | 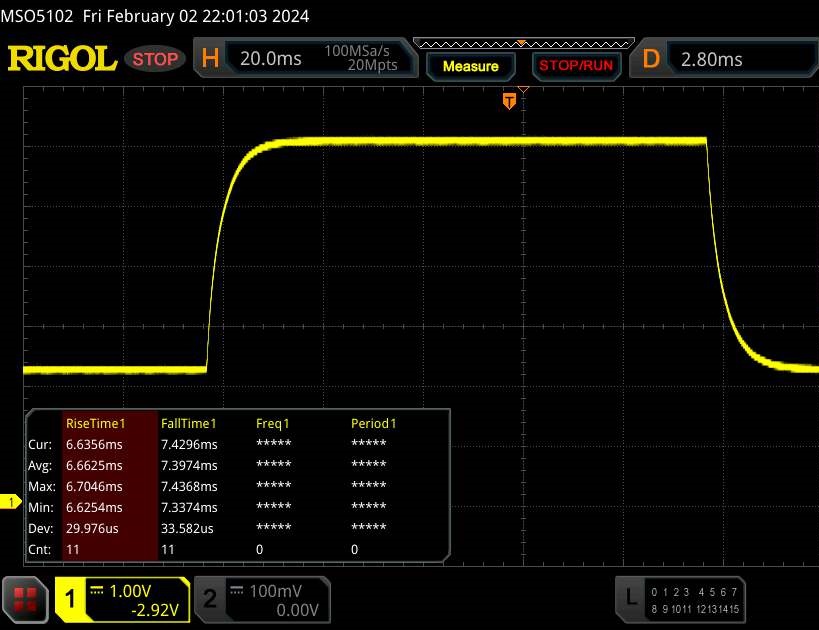 |
| ↘ 7.4 ms bajada | ||
| La pantalla mostró buenos tiempos de respuesta en nuestros tests pero podría ser demasiado lenta para los jugones competitivos. En comparación, todos los dispositivos de prueba van de ##min### (mínimo) a 636 (máximo) ms. » 28 % de todos los dispositivos son mejores. Esto quiere decir que el tiempo de respuesta medido es mejor que la media (31 ms) de todos los dispositivos testados. | ||
Parpadeo de Pantalla / PWM (Pulse-Width Modulation)
| Parpadeo de Pantalla / PWM no detectado |  | ||
Comparación: 52 % de todos los dispositivos testados no usaron PWM para atenuar el display. Si se usó, medimos una media de 7757 (mínimo: 5 - máxmo: 343500) Hz. | |||
Al tener un amplio ángulo de visión, el panel IPS se puede leer desde cualquier posición. También es posible utilizar la pantalla en exteriores, siempre que el sol no sea demasiado brillante.
Rendimiento - Impulsado por Raptor Lake y Ada Lovelace
El HP Omen 16 es un portátil QHD para juegos que también da la talla en otras aplicaciones que exigen un gran rendimiento. La potencia de cálculo necesaria la proporcionan Raptor Lake y Ada Lovelace. El modelo Omen tal y como está especificado cuesta unos 3.200 euros (3.446 dólares). Existen configuraciones más económicas a partir de sólo 1.900 euros (2.760 dólares).
Condiciones de la prueba
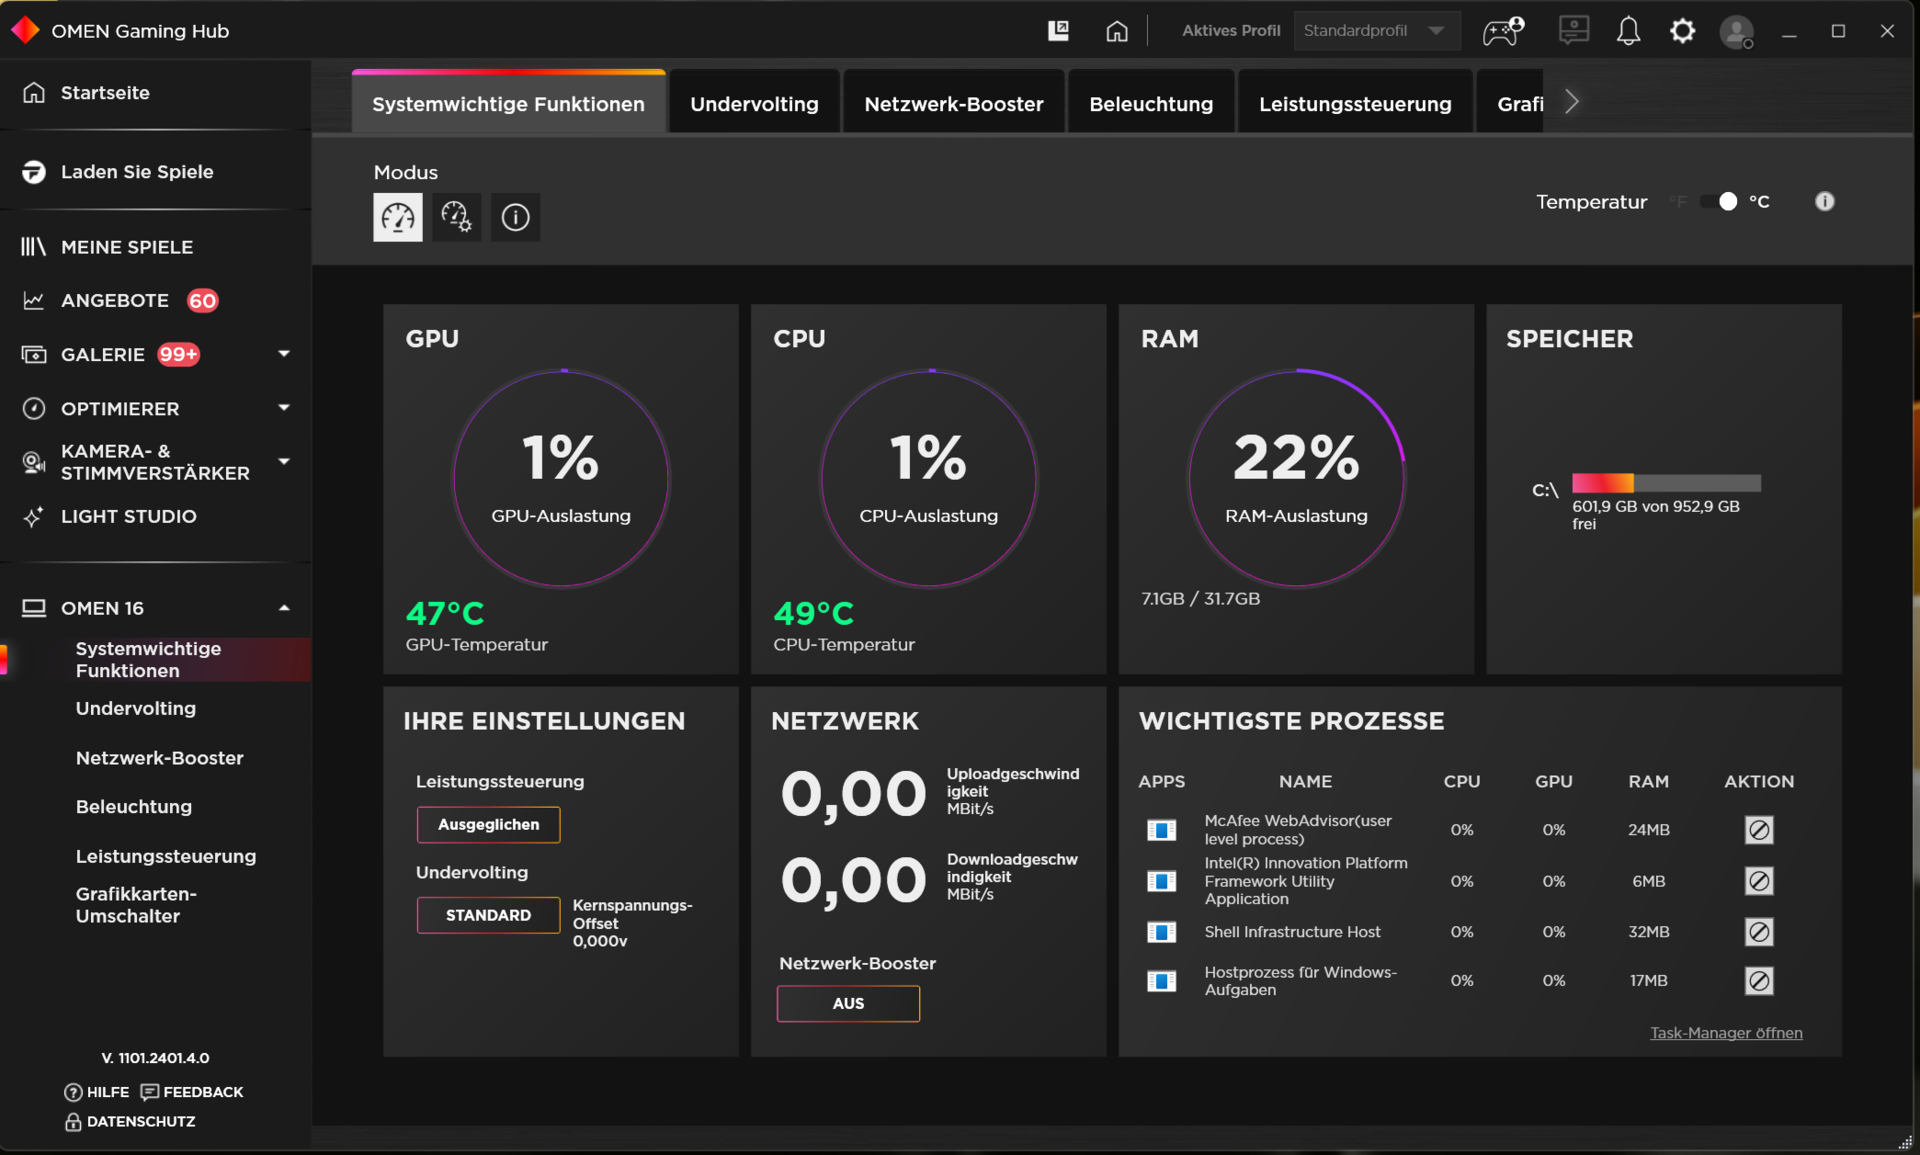
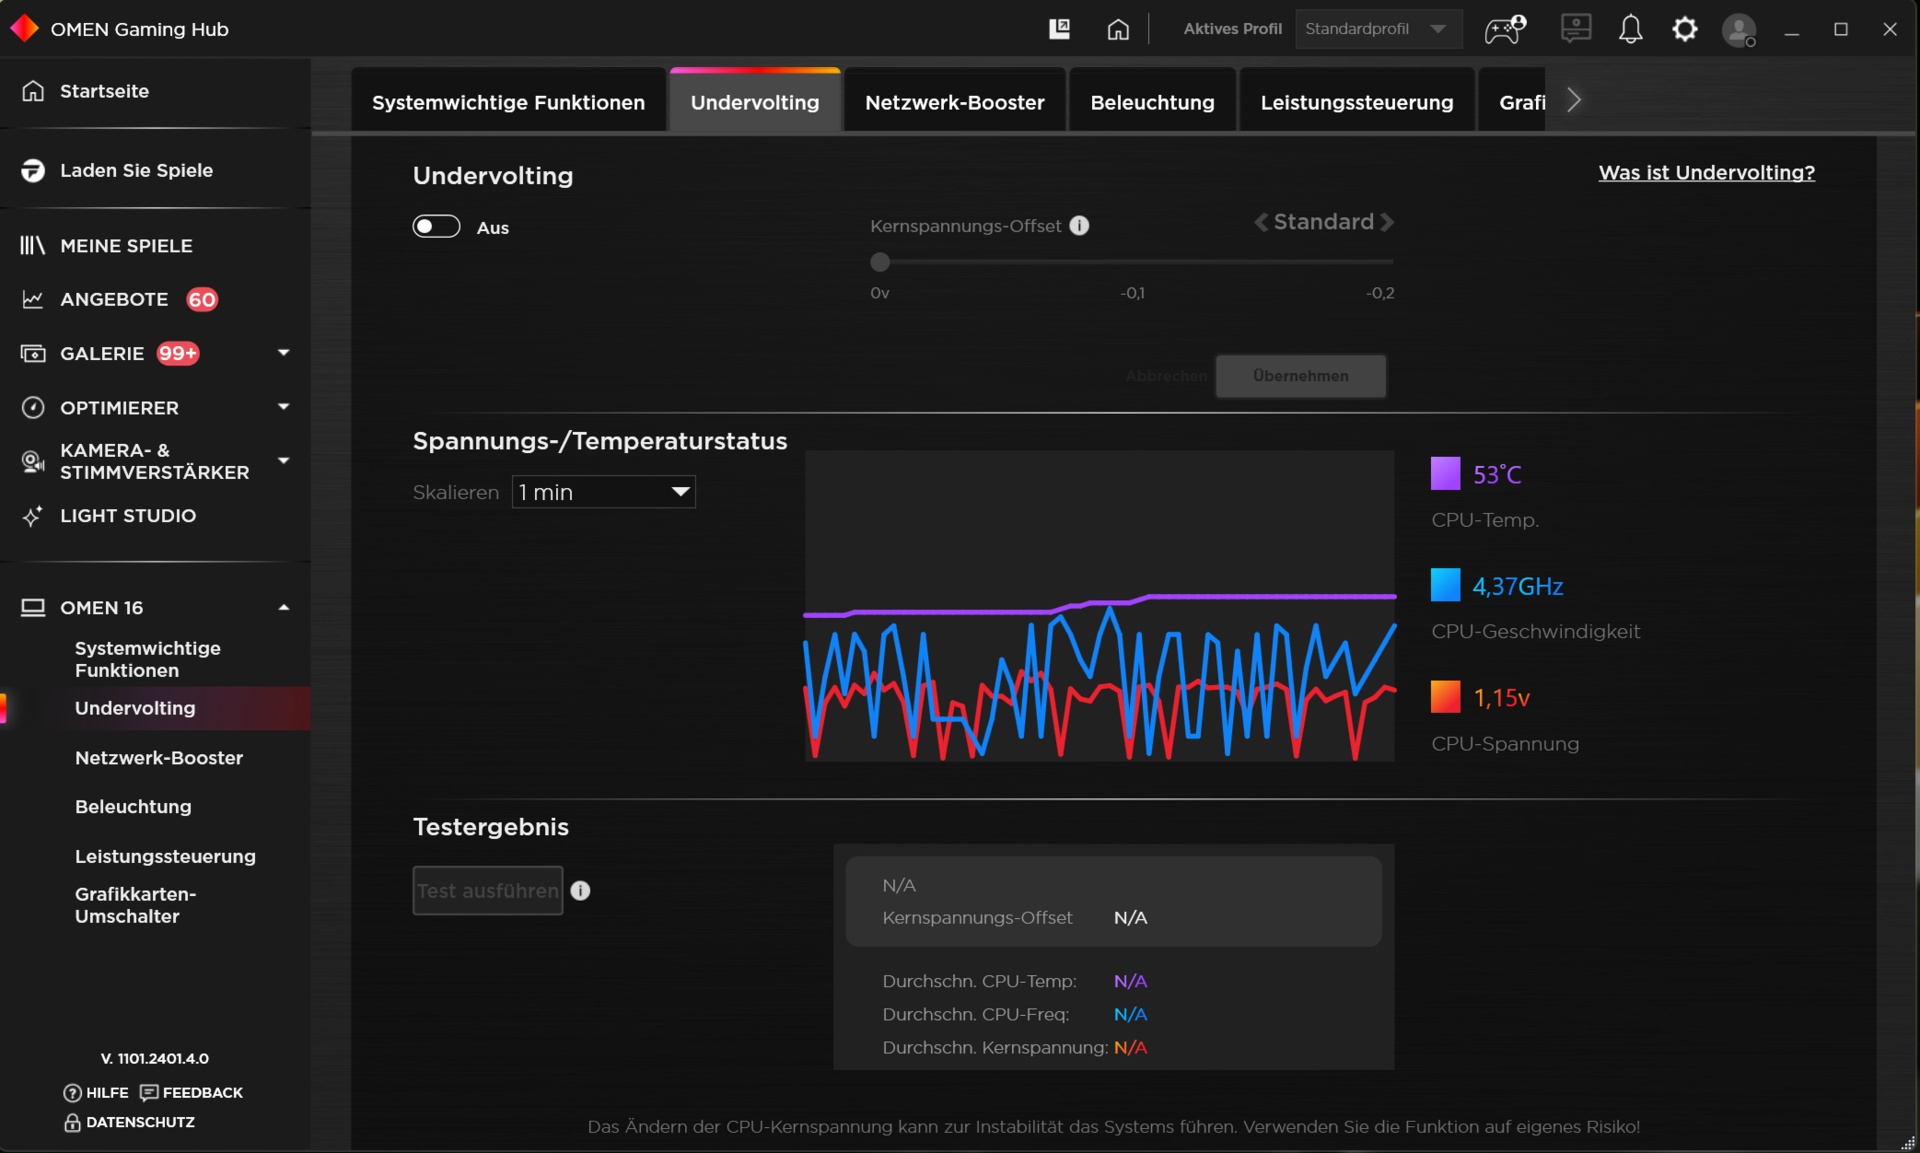
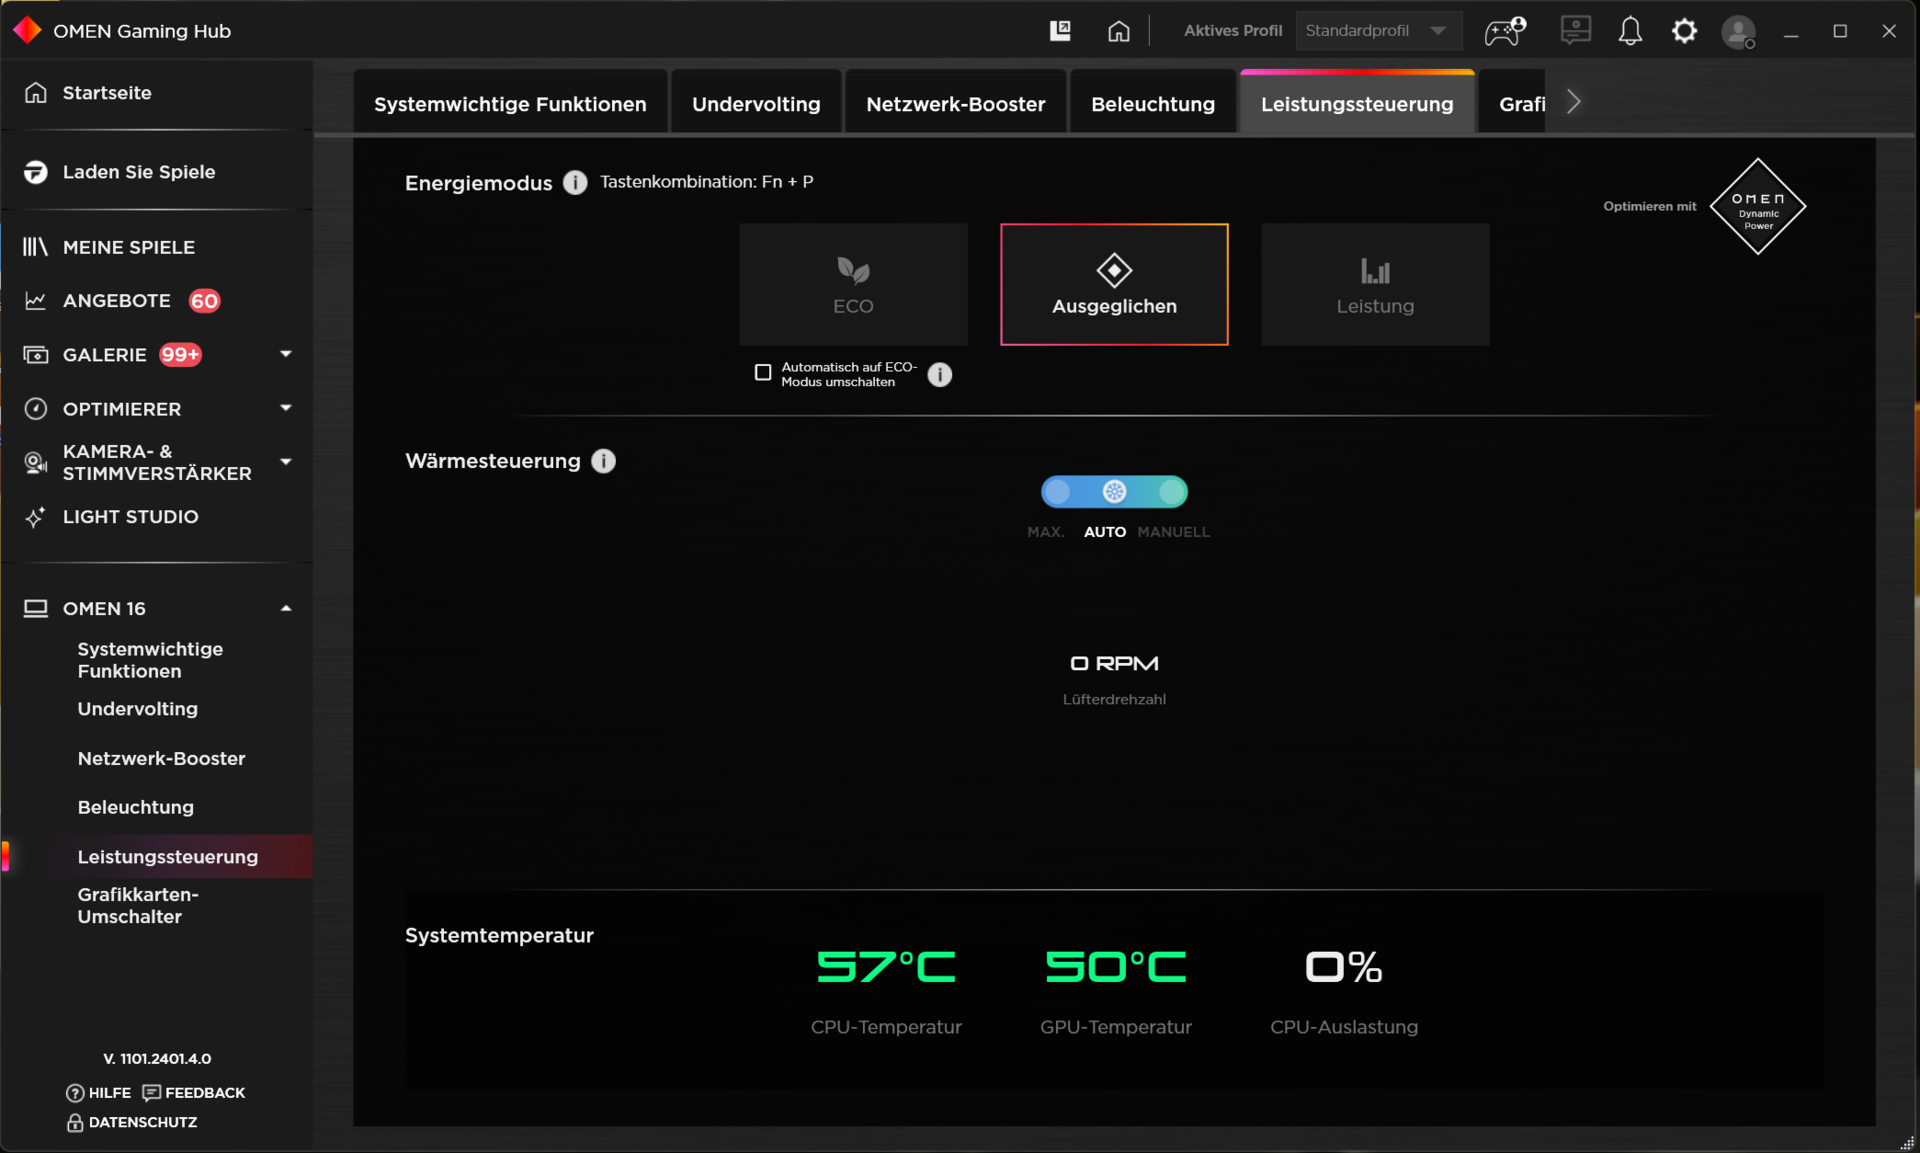
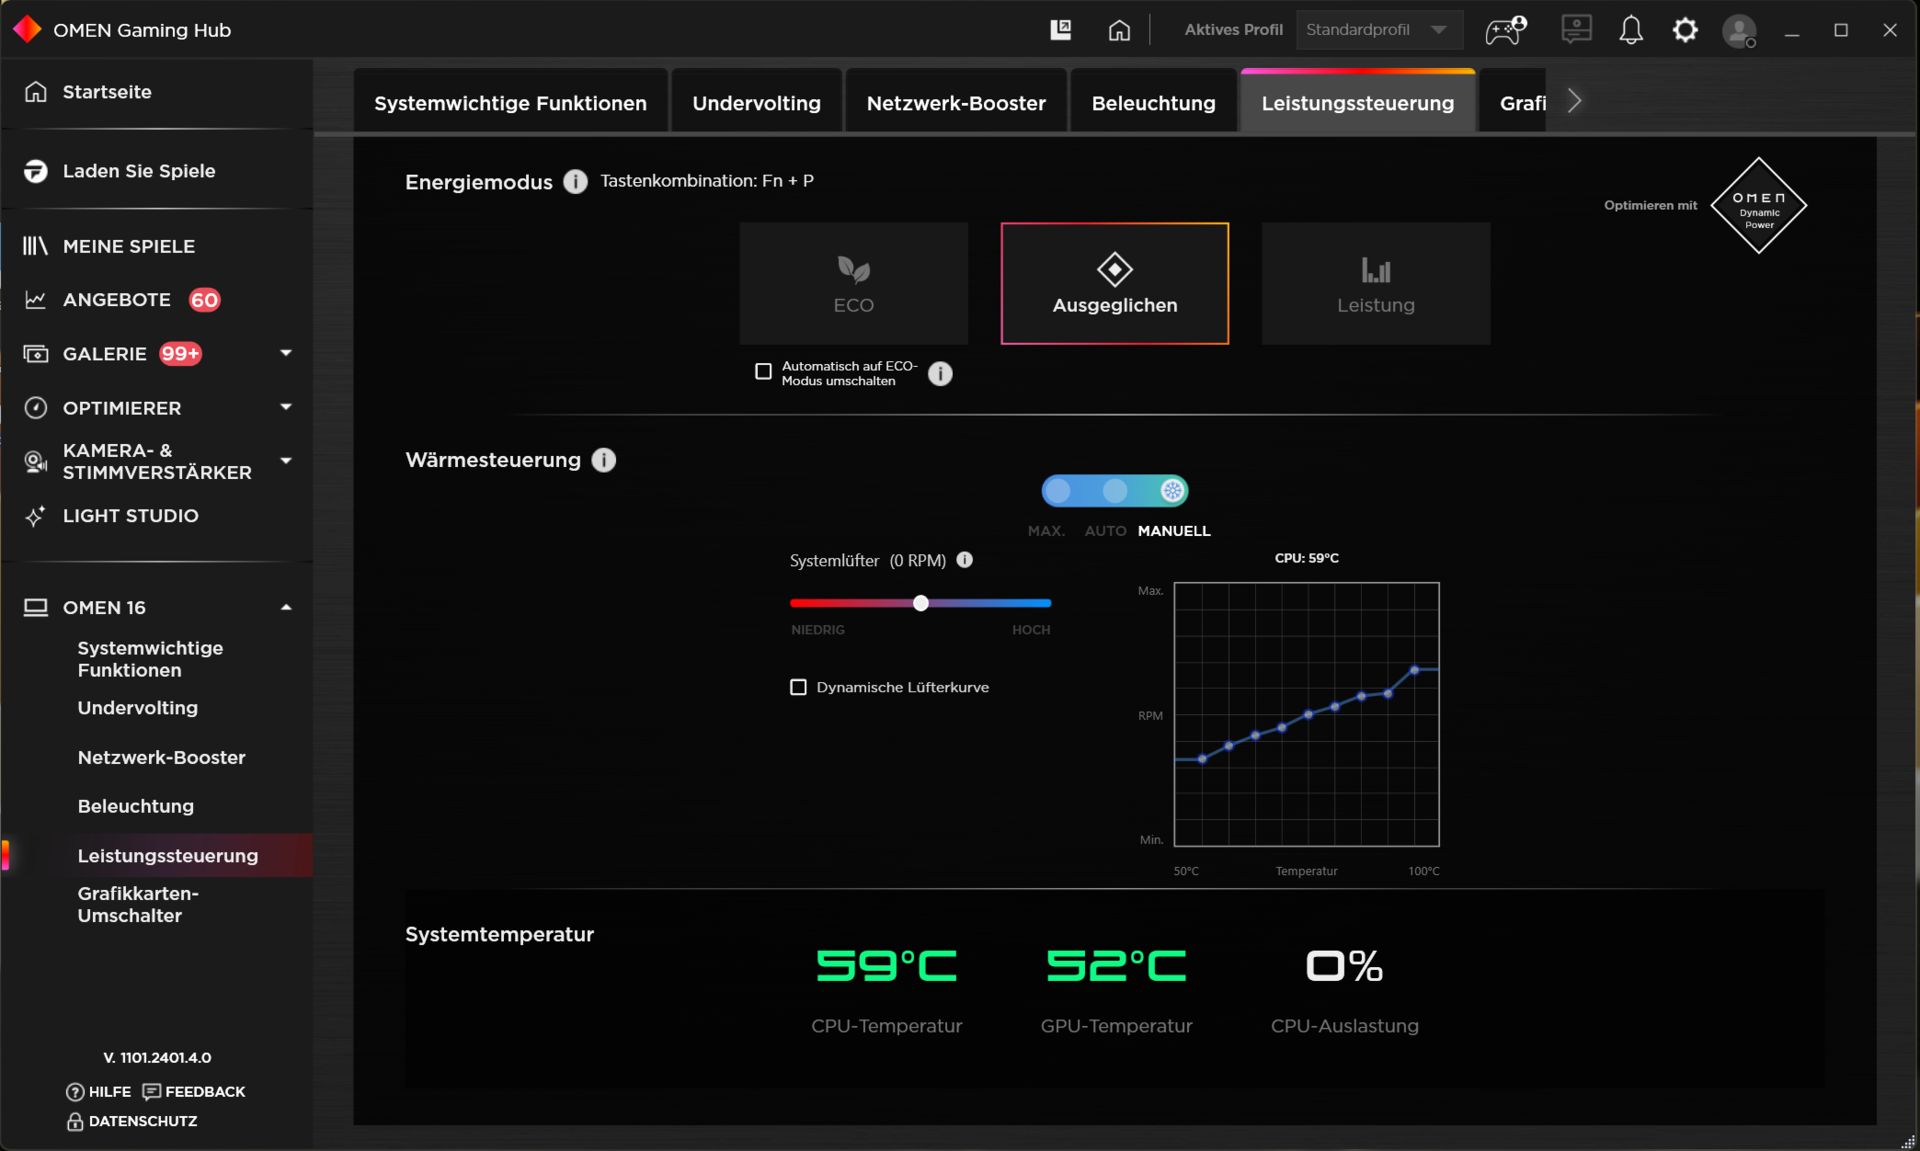
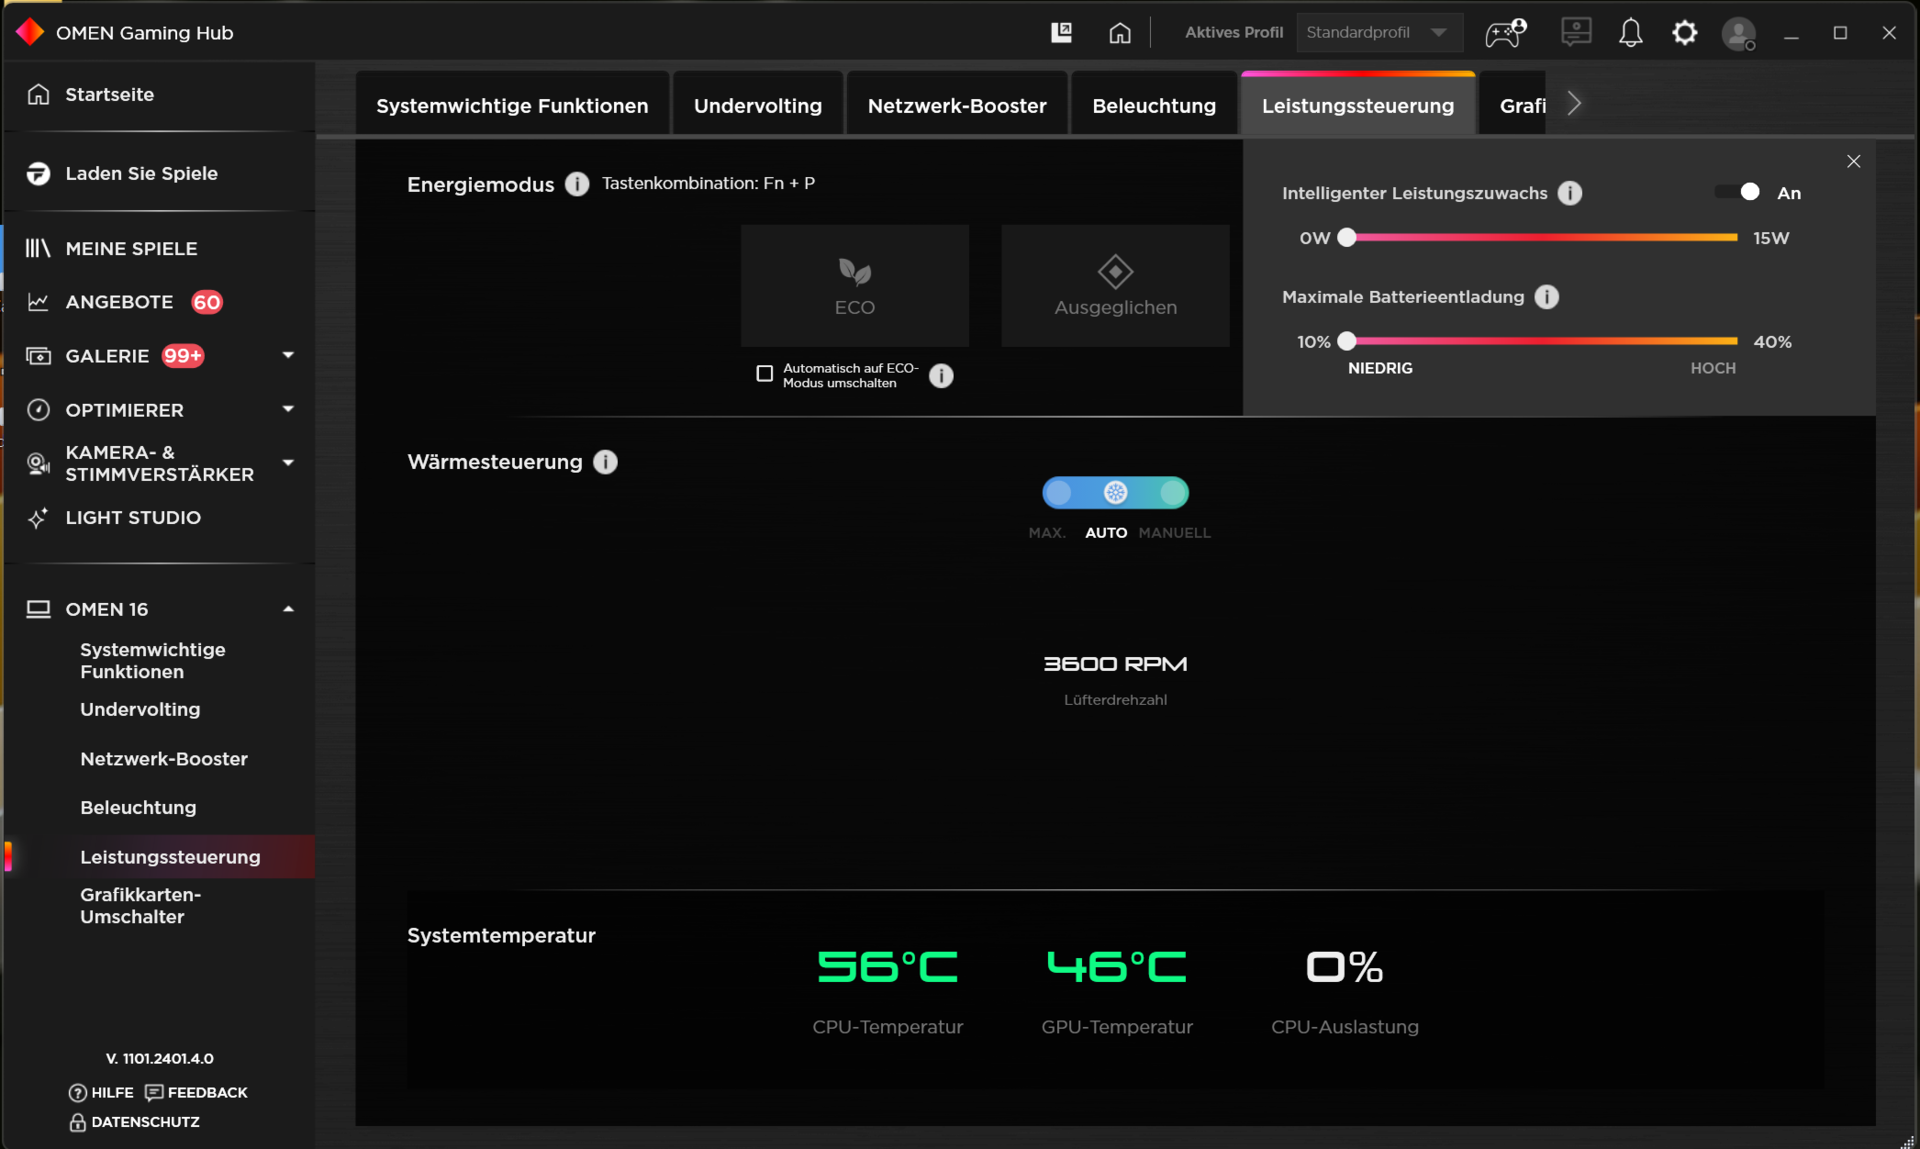
El Omen Gaming Hub preinstalado es el centro de control del portátil. Además de seleccionar un modo de energía (ver tabla), puede utilizar el software para subvoltear la CPU y especificar una curva de ventilador personalizada, entre otras cosas. Pulsando la combinación de teclas Fn + P también se puede cambiar rápidamente entre los tres modos específicos de HP. Los modos equilibrado y ECO se utilizaron para nuestros benchmarks y la prueba de batería respectivamente.
| Rendimiento | Equilibrado | ECO | |
|---|---|---|---|
| Límite de potencia 1 (HWInfo) | 130 vatios | 130 vatios | 130 vatios |
| Límite de potencia 2 (HWInfo) | 130 vatios | 130 vatios | 130 vatios |
| Ruido (Witcher 3) | 58 dB(A) | 47 dB(A) | 39 dB(A) |
| Rendimiento (Witcher 3) | ~ 164 fps | ~ 142 fps | 60 fps (bloqueado) |
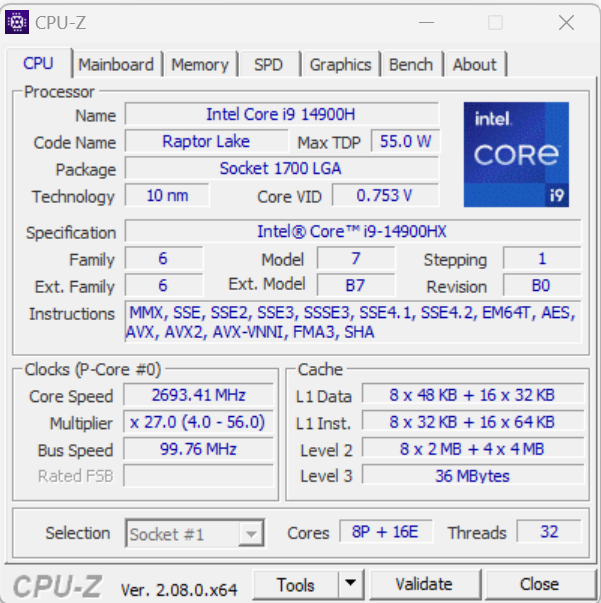
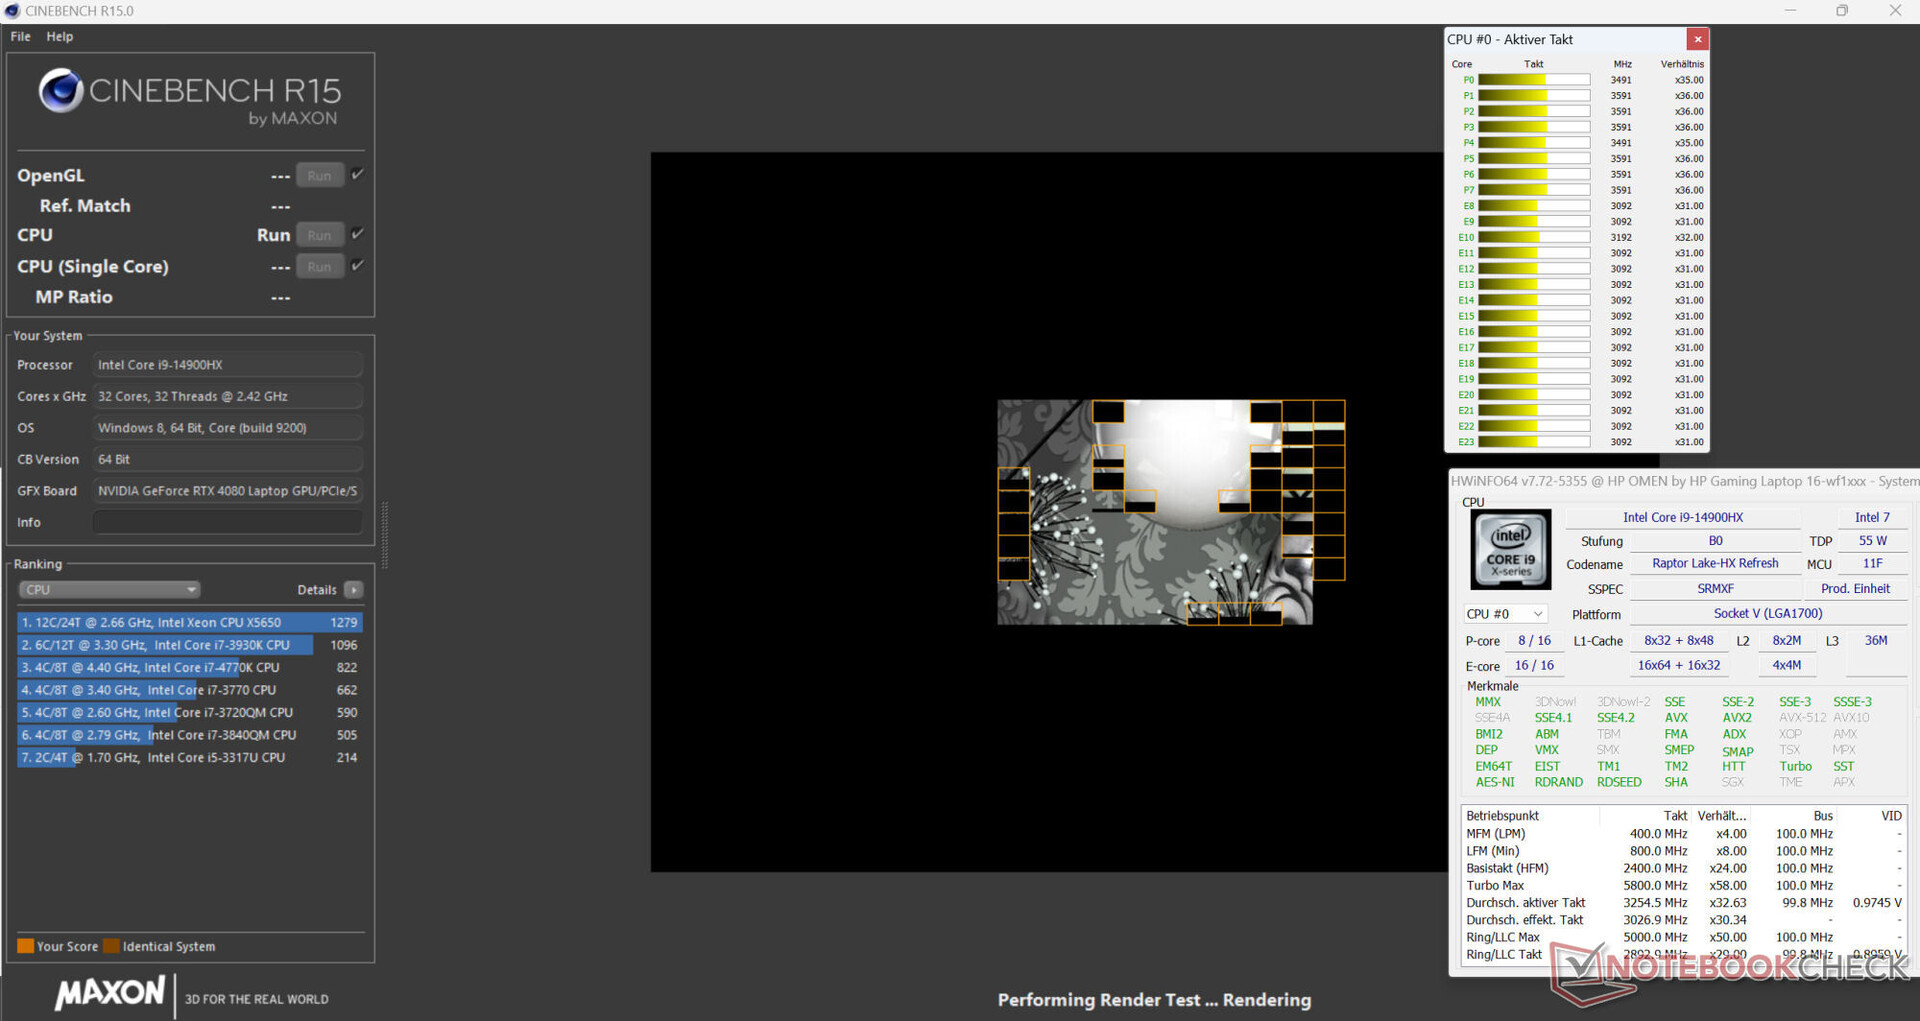
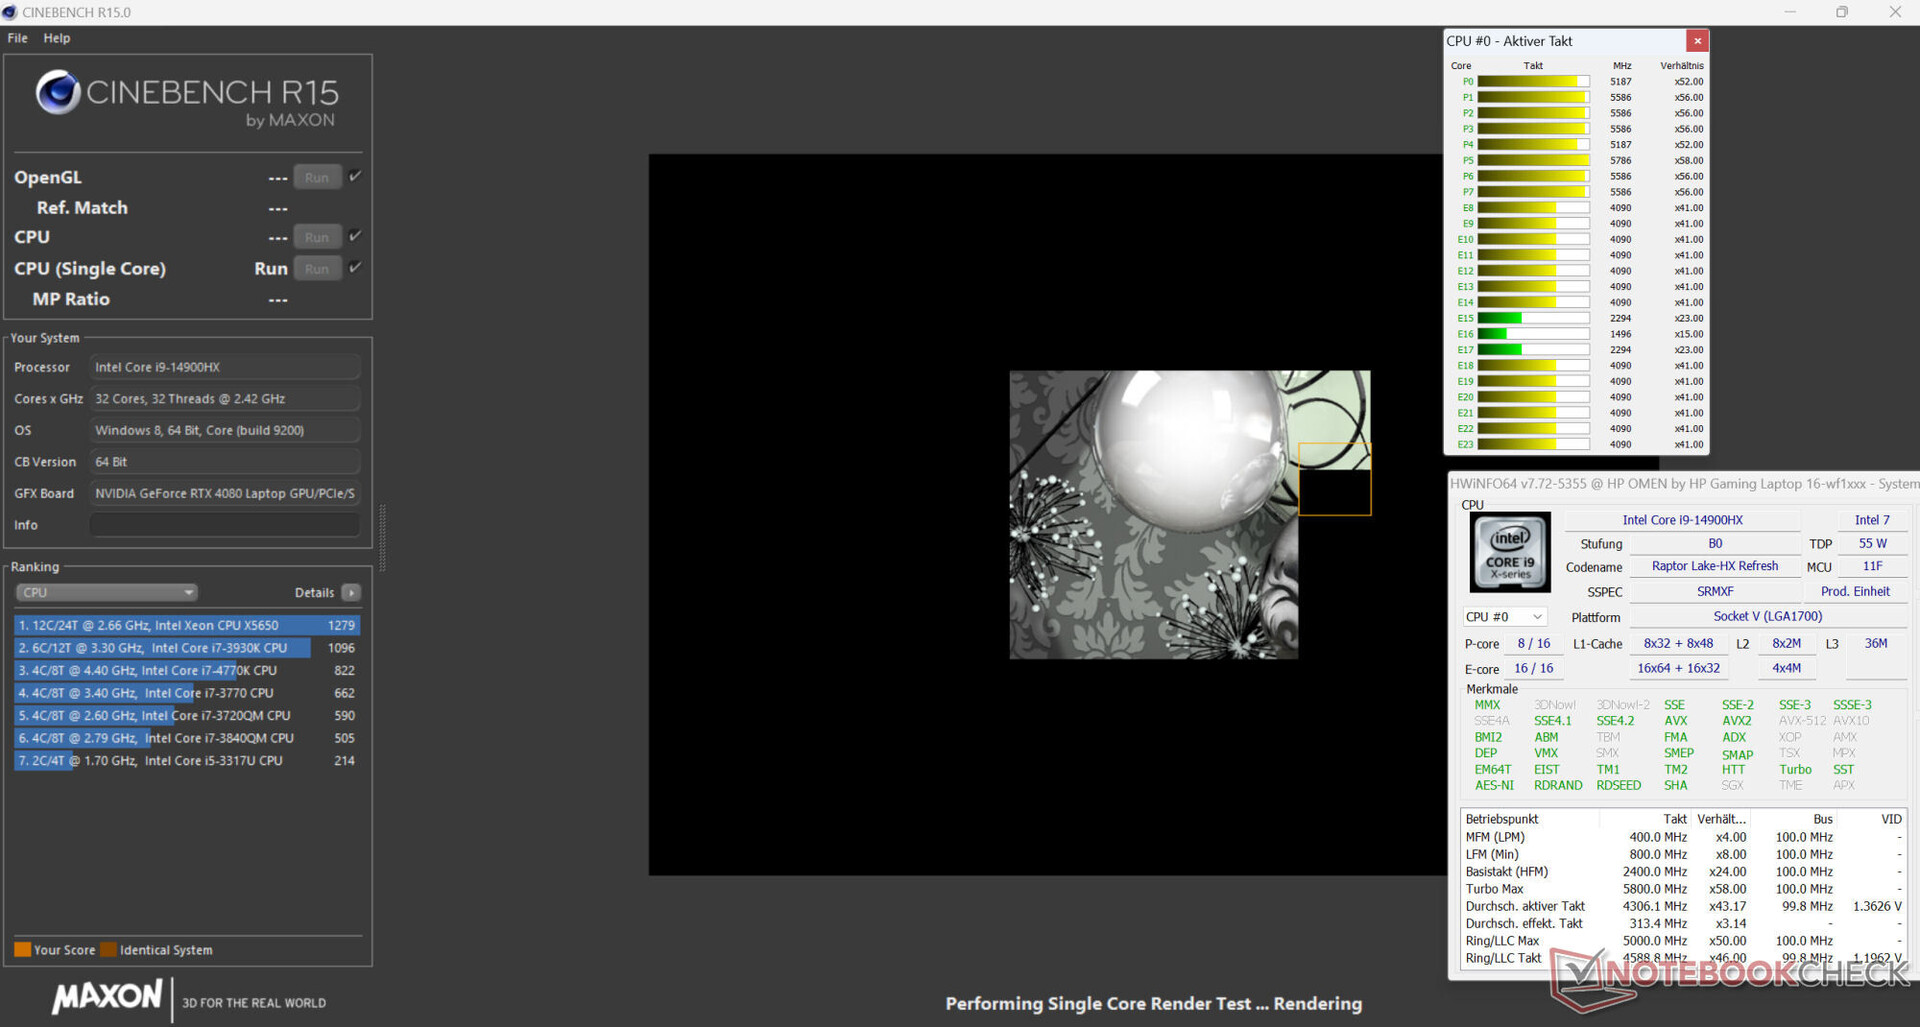
Procesador
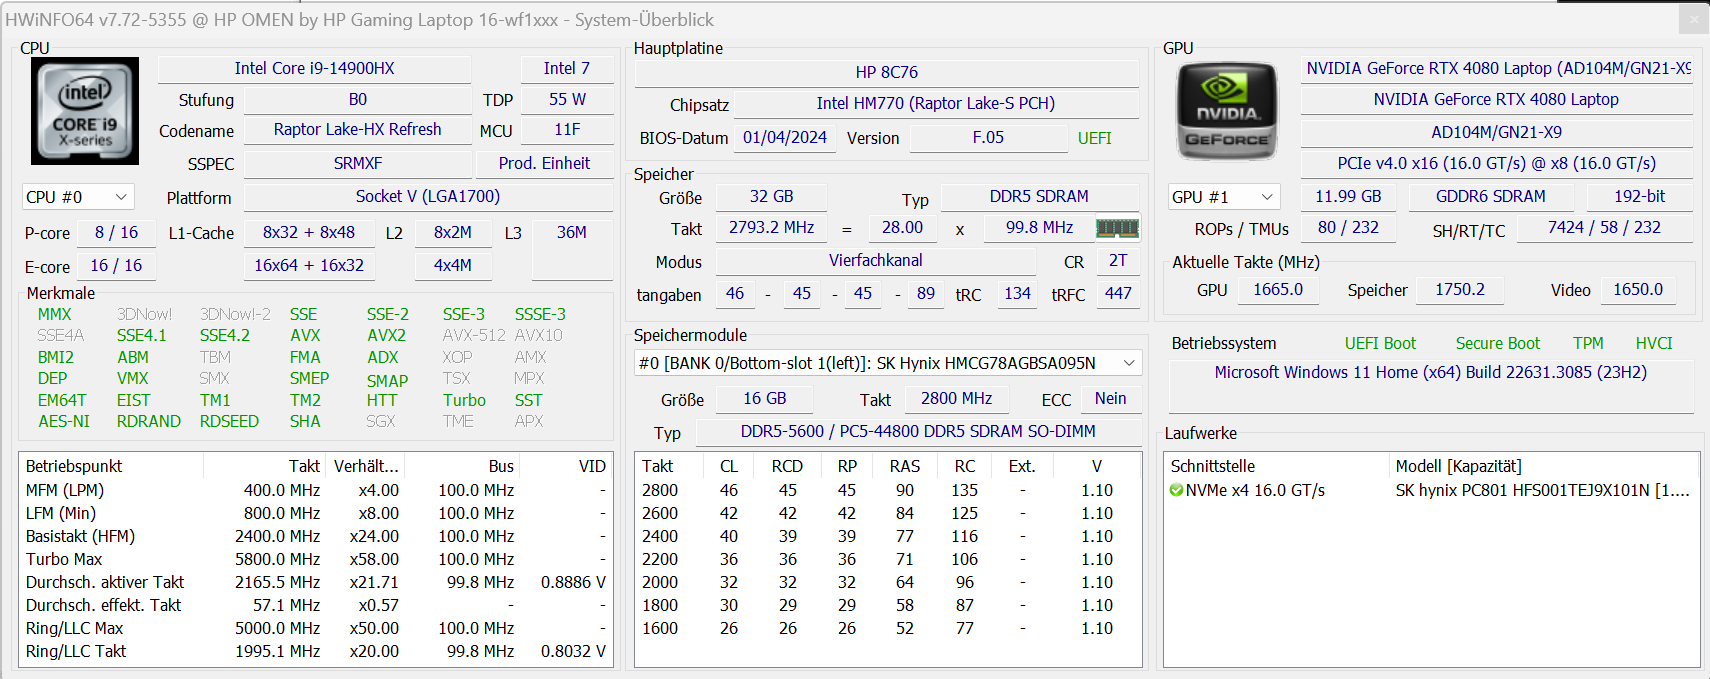
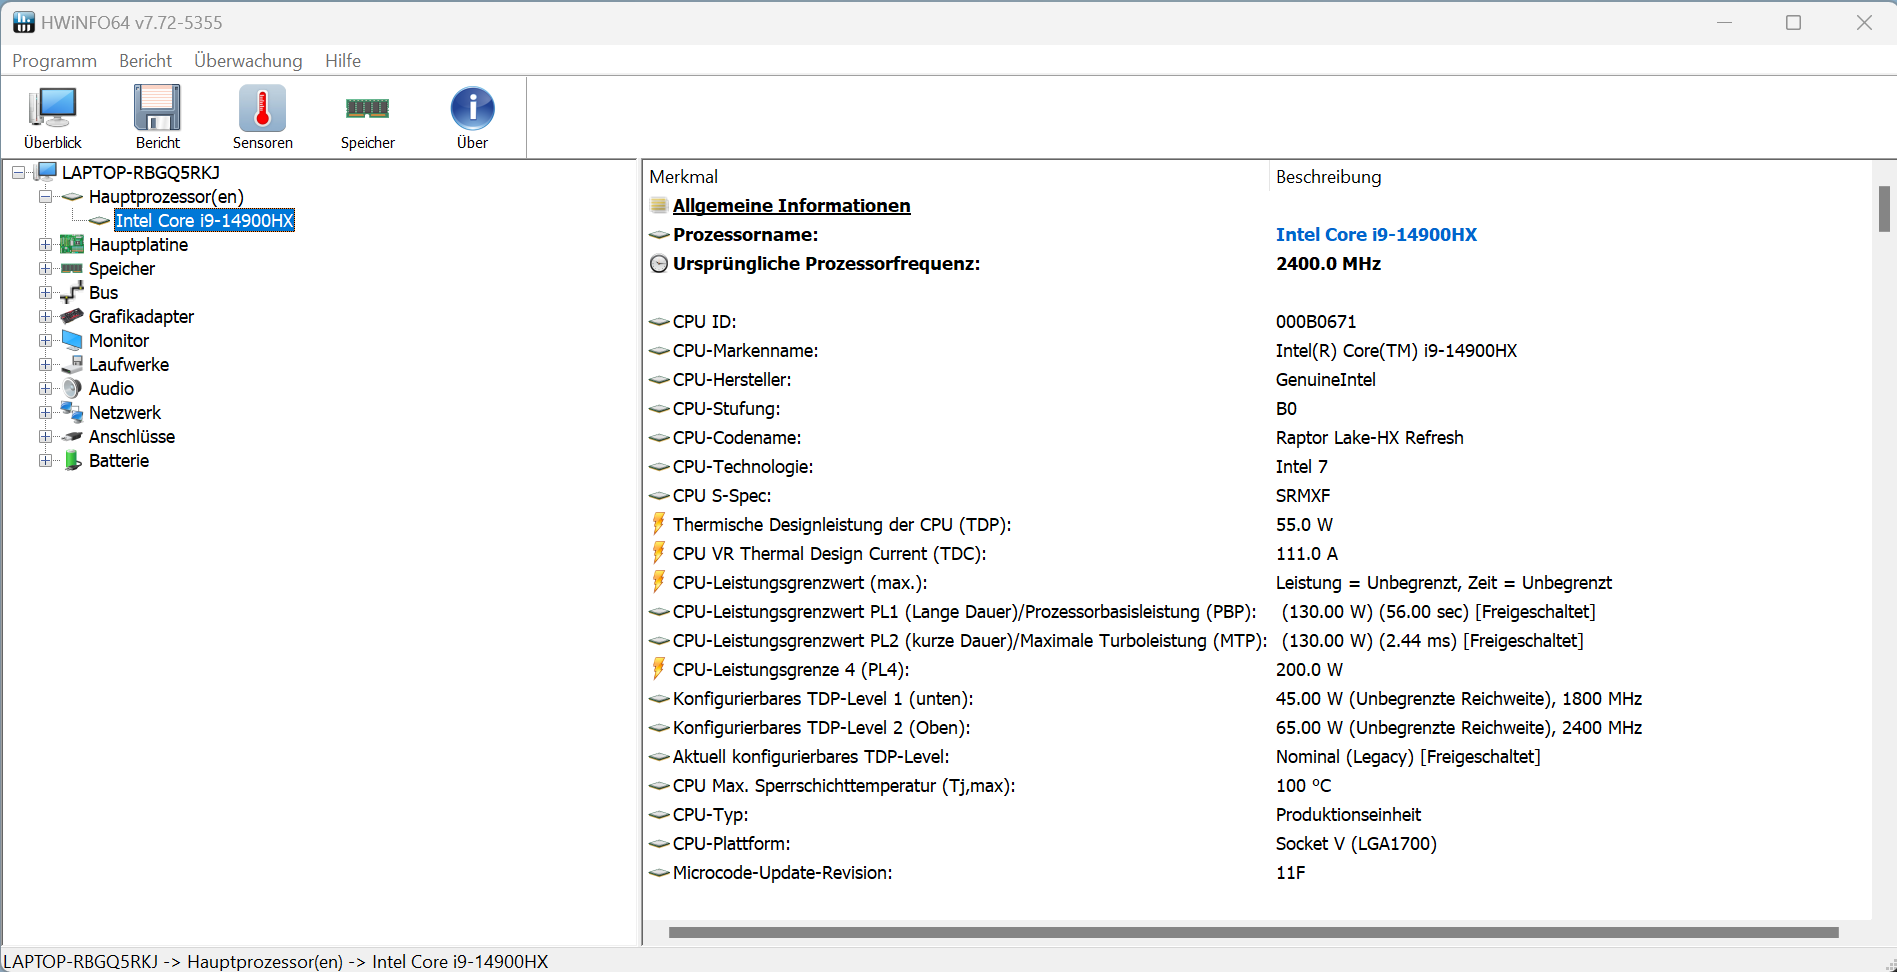
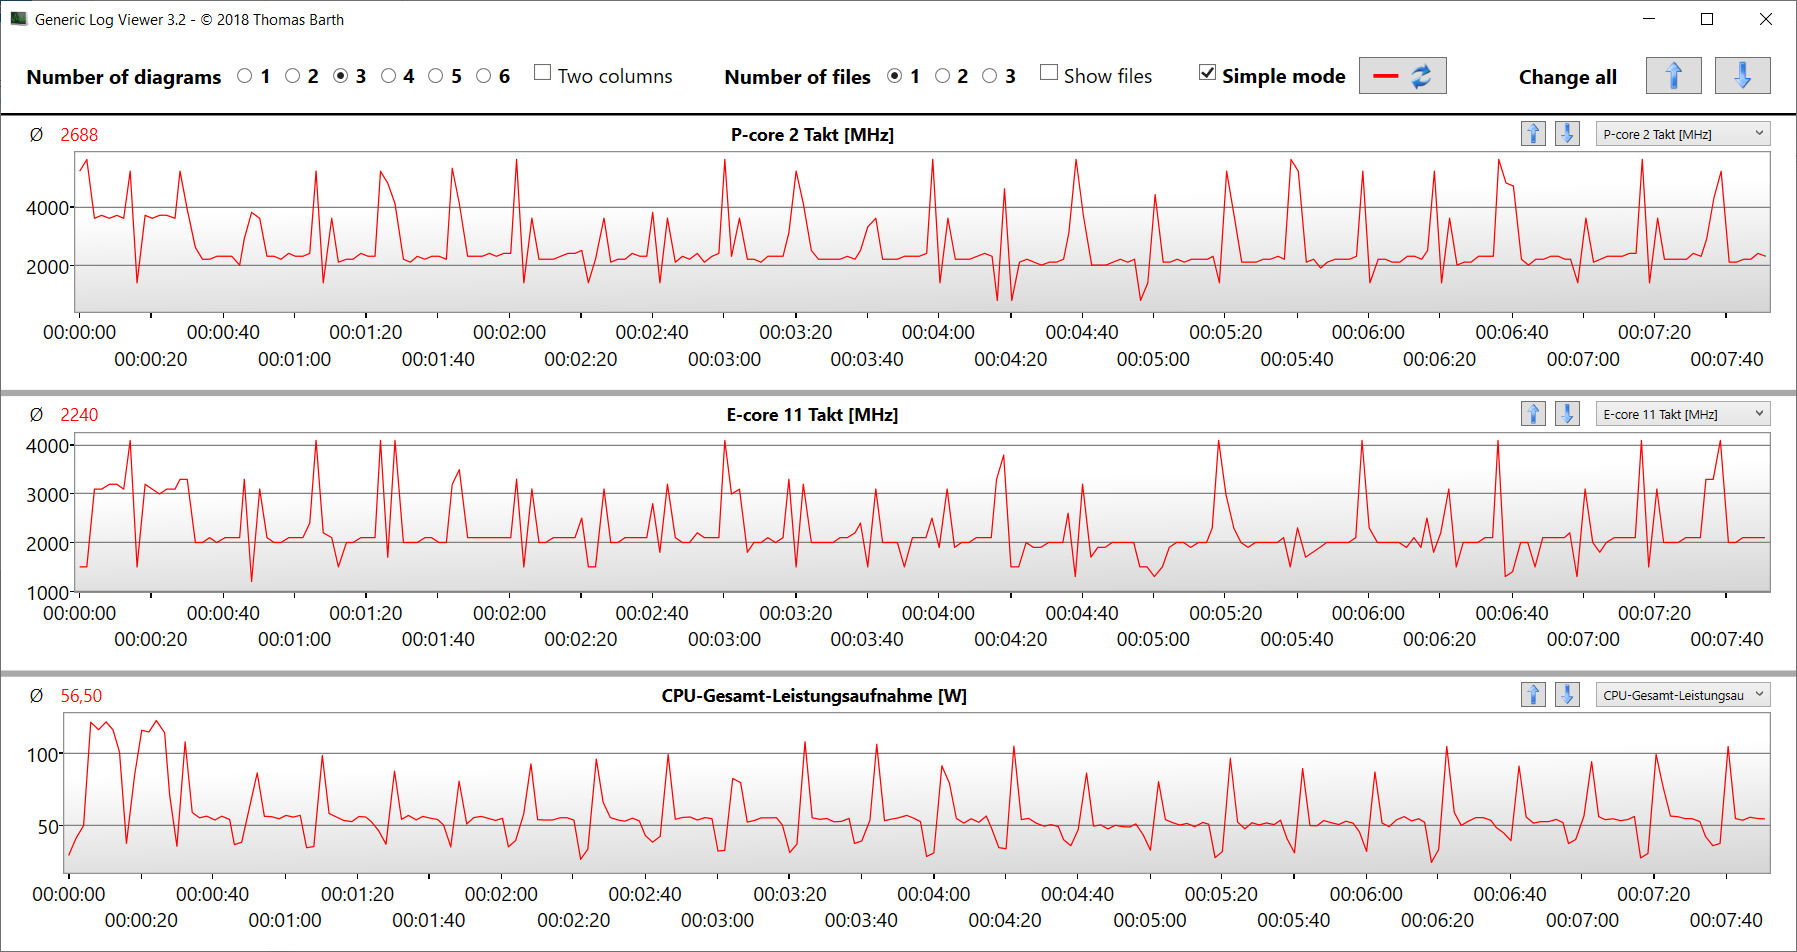
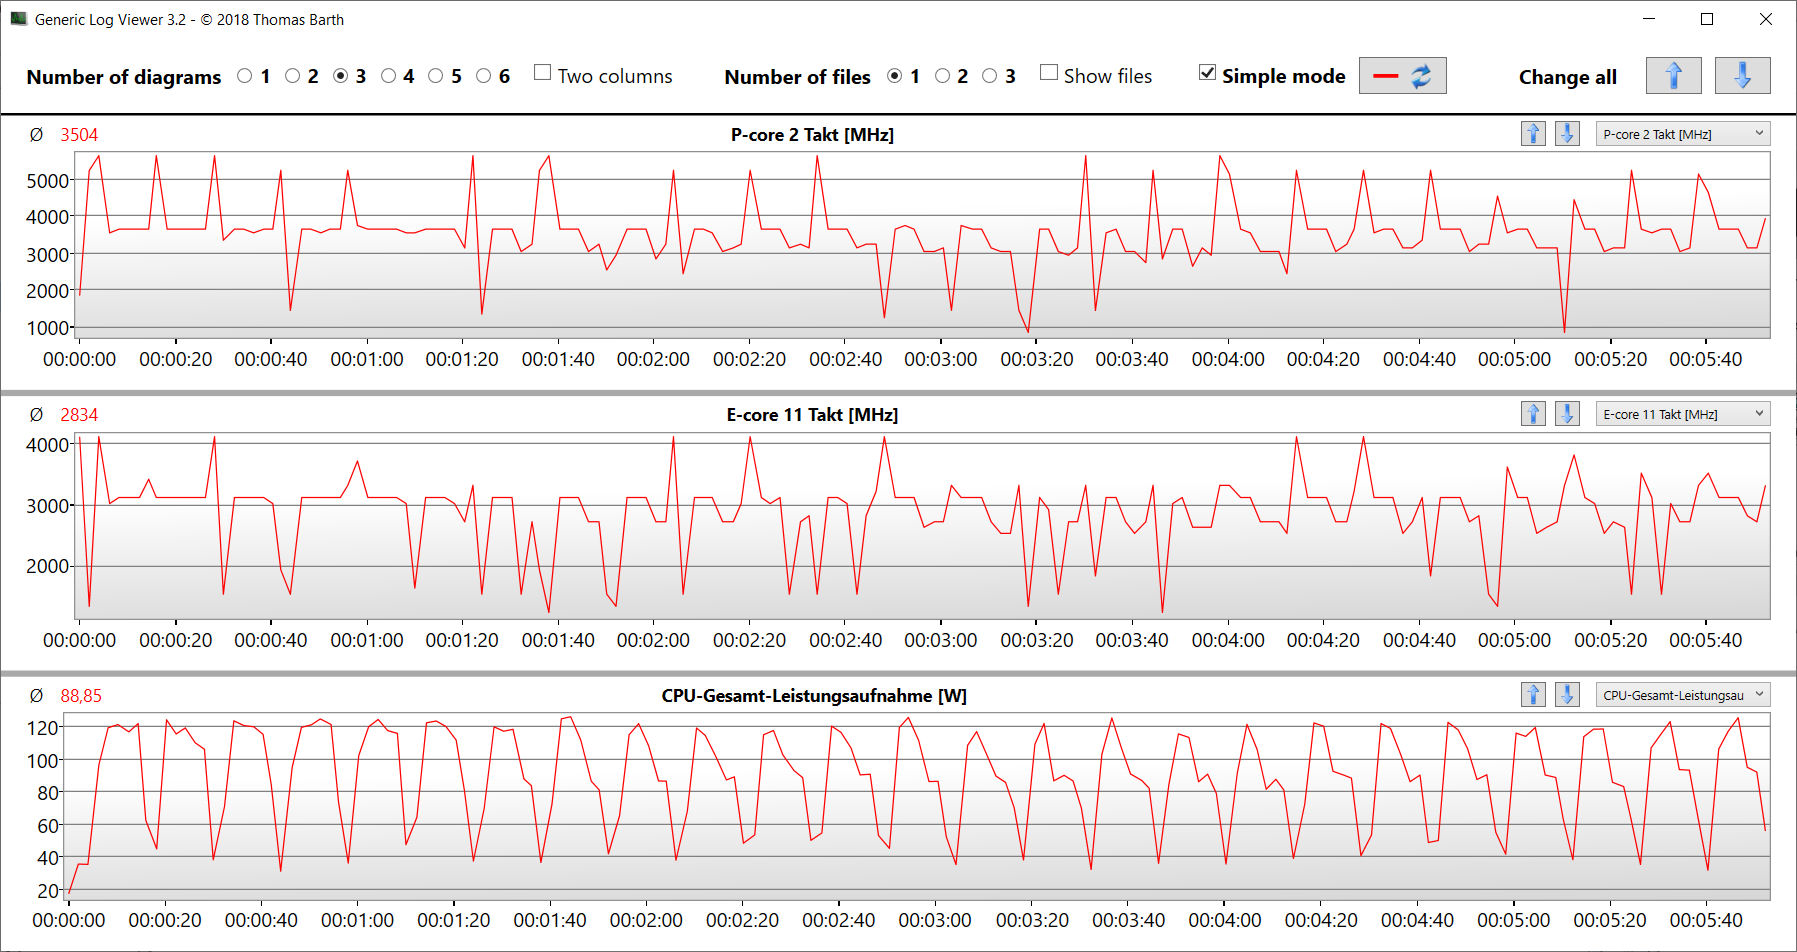
El Core i9-14900HX contiene 8 núcleos P y 16 núcleos E, lo que da un total de 32 hilos. Los núcleos P y E tienen una velocidad de reloj máxima de 5,8 GHz y 4,1 GHz respectivamente. En el modo Equilibrado, las puntuaciones de los benchmarks están por debajo de la media de la CPU. Cambiar al modo Rendimiento sólo proporciona un pequeño impulso.
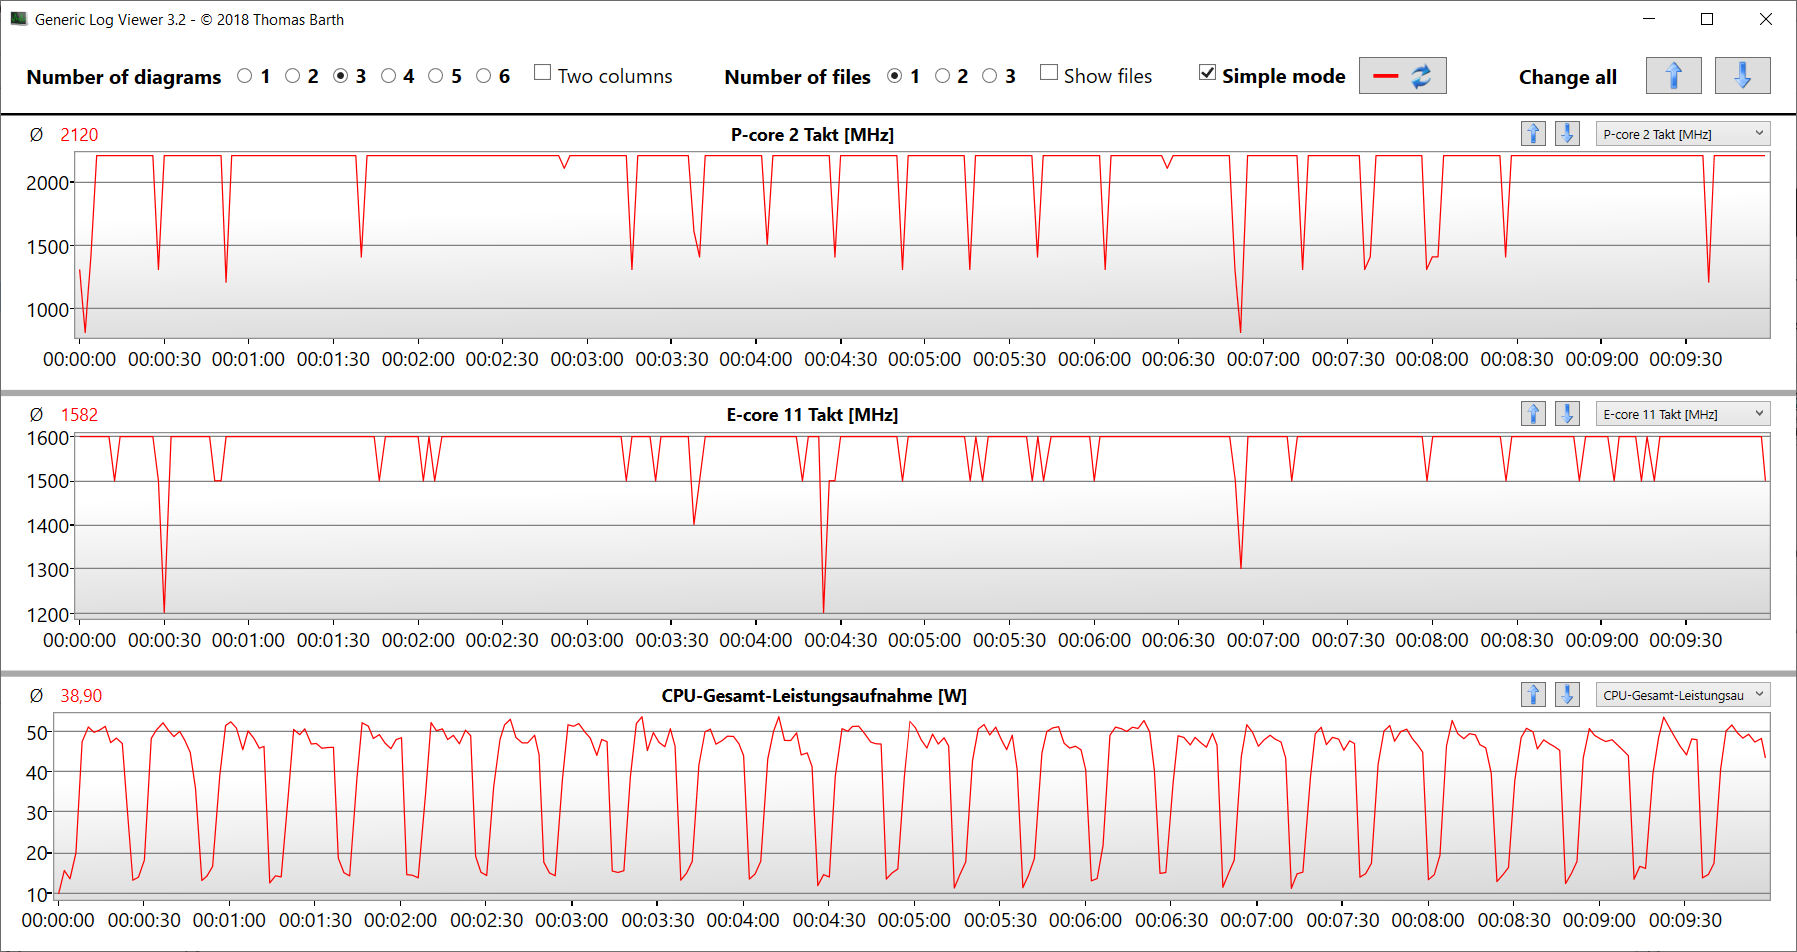
La brecha se amplió bajo carga multihilo sostenida (bucle CB15). Al comienzo de la cuarta ejecución, la velocidad de reloj cayó significativamente antes de establecerse en un nivel relativamente constante durante el resto de la prueba. En el modo Rendimiento, la velocidad del reloj se mantuvo en su nivel inicial. Con batería, la puntuación más relevante de un solo hilo (206 puntos; CB15) disminuyó por un margen menor que la de varios hilos (1.596; CB15).
Consulte nuestro análisis para más información sobre el Core i9.
Cinebench R15 Multi Sustained Load
| CPU Performance rating - Percent | |
| MSI Vector 16 HX A14V | |
| Acer Predator Helios 18 N23Q2 | |
| Medio Intel Core i9-14900HX | |
| HP Omen 16 (2024) | |
| HP Omen 16 (2024) | |
| Alienware m16 R1 AMD | |
| Media de la clase Gaming | |
| HP Omen 16-wf000 -3! | |
| Cinebench R23 | |
| Multi Core | |
| MSI Vector 16 HX A14V | |
| Acer Predator Helios 18 N23Q2 | |
| Medio Intel Core i9-14900HX (17078 - 36249, n=37) | |
| Alienware m16 R1 AMD | |
| HP Omen 16 (2024) | |
| Media de la clase Gaming (10488 - 42661, n=107, últimos 2 años) | |
| HP Omen 16 (2024) (Leistung) | |
| HP Omen 16-wf000 | |
| Single Core | |
| HP Omen 16 (2024) (Leistung) | |
| HP Omen 16 (2024) | |
| MSI Vector 16 HX A14V | |
| Medio Intel Core i9-14900HX (1720 - 2245, n=37) | |
| Acer Predator Helios 18 N23Q2 | |
| Media de la clase Gaming (1166 - 2415, n=107, últimos 2 años) | |
| HP Omen 16-wf000 | |
| Alienware m16 R1 AMD | |
| Cinebench R20 | |
| CPU (Multi Core) | |
| MSI Vector 16 HX A14V | |
| Acer Predator Helios 18 N23Q2 | |
| Medio Intel Core i9-14900HX (6579 - 13832, n=37) | |
| Alienware m16 R1 AMD | |
| Media de la clase Gaming (4029 - 16433, n=106, últimos 2 años) | |
| HP Omen 16 (2024) | |
| HP Omen 16 (2024) (Leistung) | |
| HP Omen 16-wf000 | |
| CPU (Single Core) | |
| HP Omen 16 (2024) (Leistung) | |
| HP Omen 16 (2024) | |
| MSI Vector 16 HX A14V | |
| Medio Intel Core i9-14900HX (657 - 859, n=37) | |
| Acer Predator Helios 18 N23Q2 | |
| Media de la clase Gaming (442 - 913, n=106, últimos 2 años) | |
| HP Omen 16-wf000 | |
| Alienware m16 R1 AMD | |
| Cinebench R15 | |
| CPU Multi 64Bit | |
| Acer Predator Helios 18 N23Q2 | |
| MSI Vector 16 HX A14V | |
| Medio Intel Core i9-14900HX (3263 - 5589, n=38) | |
| Alienware m16 R1 AMD | |
| HP Omen 16 (2024) (Leistung) | |
| Media de la clase Gaming (1578 - 6330, n=105, últimos 2 años) | |
| HP Omen 16 (2024) | |
| HP Omen 16-wf000 | |
| CPU Single 64Bit | |
| HP Omen 16 (2024) (Leistung) | |
| HP Omen 16 (2024) | |
| MSI Vector 16 HX A14V | |
| Medio Intel Core i9-14900HX (247 - 323, n=37) | |
| Media de la clase Gaming (188.8 - 350, n=106, últimos 2 años) | |
| Alienware m16 R1 AMD | |
| Acer Predator Helios 18 N23Q2 | |
| HP Omen 16-wf000 | |
| Blender - v2.79 BMW27 CPU | |
| HP Omen 16 (2024) | |
| Media de la clase Gaming (79 - 330, n=104, últimos 2 años) | |
| HP Omen 16 (2024) (Leistung) | |
| Medio Intel Core i9-14900HX (91 - 206, n=37) | |
| Alienware m16 R1 AMD | |
| Acer Predator Helios 18 N23Q2 | |
| MSI Vector 16 HX A14V | |
| Geekbench 6.7 | |
| Multi-Core | |
| MSI Vector 16 HX A14V (6.2.1) | |
| Acer Predator Helios 18 N23Q2 | |
| Medio Intel Core i9-14900HX (13158 - 19665, n=37) | |
| HP Omen 16 (2024) (6.2.1, Leistung) | |
| HP Omen 16 (2024) (6.2.1) | |
| Media de la clase Gaming (6625 - 22850, n=106, últimos 2 años) | |
| Alienware m16 R1 AMD | |
| Single-Core | |
| HP Omen 16 (2024) (6.2.1) | |
| HP Omen 16 (2024) (6.2.1, Leistung) | |
| MSI Vector 16 HX A14V (6.2.1) | |
| Medio Intel Core i9-14900HX (2419 - 3129, n=37) | |
| Acer Predator Helios 18 N23Q2 | |
| Media de la clase Gaming (1490 - 3259, n=106, últimos 2 años) | |
| Alienware m16 R1 AMD | |
| Geekbench 5.5 | |
| Multi-Core | |
| MSI Vector 16 HX A14V | |
| Acer Predator Helios 18 N23Q2 | |
| Medio Intel Core i9-14900HX (8618 - 23194, n=37) | |
| HP Omen 16 (2024) (Leistung) | |
| HP Omen 16 (2024) | |
| Media de la clase Gaming (6460 - 28263, n=105, últimos 2 años) | |
| Alienware m16 R1 AMD | |
| HP Omen 16-wf000 | |
| Single-Core | |
| HP Omen 16 (2024) (Leistung) | |
| HP Omen 16 (2024) | |
| MSI Vector 16 HX A14V | |
| Medio Intel Core i9-14900HX (1669 - 2210, n=37) | |
| Media de la clase Gaming (986 - 2474, n=105, últimos 2 años) | |
| Acer Predator Helios 18 N23Q2 | |
| Alienware m16 R1 AMD | |
| HP Omen 16-wf000 | |
| HWBOT x265 Benchmark v2.2 - 4k Preset | |
| MSI Vector 16 HX A14V | |
| Acer Predator Helios 18 N23Q2 | |
| Alienware m16 R1 AMD | |
| Medio Intel Core i9-14900HX (16.8 - 38.9, n=37) | |
| Media de la clase Gaming (11.5 - 44.4, n=105, últimos 2 años) | |
| HP Omen 16 (2024) (Leistung) | |
| HP Omen 16 (2024) | |
| HP Omen 16-wf000 | |
| LibreOffice - 20 Documents To PDF | |
| Media de la clase Gaming (33.2 - 88.8, n=105, últimos 2 años) | |
| Acer Predator Helios 18 N23Q2 | |
| MSI Vector 16 HX A14V (6.3.4.2) | |
| HP Omen 16-wf000 | |
| HP Omen 16 (2024) (6.3.4.2) | |
| HP Omen 16 (2024) (6.3.4.2, Leistung) | |
| Medio Intel Core i9-14900HX (19 - 85.1, n=37) | |
| Alienware m16 R1 AMD | |
| R Benchmark 2.5 - Overall mean | |
| HP Omen 16-wf000 | |
| Media de la clase Gaming (0.3439 - 0.759, n=106, últimos 2 años) | |
| Alienware m16 R1 AMD | |
| Acer Predator Helios 18 N23Q2 | |
| Medio Intel Core i9-14900HX (0.3604 - 0.4859, n=37) | |
| MSI Vector 16 HX A14V | |
| HP Omen 16 (2024) (Leistung) | |
| HP Omen 16 (2024) | |
* ... más pequeño es mejor
AIDA64: FP32 Ray-Trace | FPU Julia | CPU SHA3 | CPU Queen | FPU SinJulia | FPU Mandel | CPU AES | CPU ZLib | FP64 Ray-Trace | CPU PhotoWorxx
| Performance rating | |
| Alienware m16 R1 AMD | |
| Acer Predator Helios 18 N23Q2 | |
| MSI Vector 16 HX A14V | |
| Media de la clase Gaming | |
| Medio Intel Core i9-14900HX | |
| HP Omen 16 (2024) | |
| HP Omen 16 (2024) | |
| HP Omen 16-wf000 | |
| AIDA64 / FP32 Ray-Trace | |
| Alienware m16 R1 AMD (v6.85.6300) | |
| Media de la clase Gaming (10227 - 85542, n=105, últimos 2 años) | |
| MSI Vector 16 HX A14V (v6.92.6600) | |
| Acer Predator Helios 18 N23Q2 (v6.85.6300) | |
| Medio Intel Core i9-14900HX (13098 - 33474, n=36) | |
| HP Omen 16 (2024) (v6.92.6600, Leistung) | |
| HP Omen 16-wf000 (v6.85.6300) | |
| HP Omen 16 (2024) (v6.92.6600) | |
| AIDA64 / FPU Julia | |
| Alienware m16 R1 AMD (v6.85.6300) | |
| MSI Vector 16 HX A14V (v6.92.6600) | |
| Media de la clase Gaming (51376 - 238426, n=105, últimos 2 años) | |
| Acer Predator Helios 18 N23Q2 (v6.85.6300) | |
| Medio Intel Core i9-14900HX (67573 - 166040, n=36) | |
| HP Omen 16 (2024) (v6.92.6600, Leistung) | |
| HP Omen 16-wf000 (v6.85.6300) | |
| HP Omen 16 (2024) (v6.92.6600) | |
| AIDA64 / CPU SHA3 | |
| Alienware m16 R1 AMD (v6.85.6300) | |
| MSI Vector 16 HX A14V (v6.92.6600) | |
| Acer Predator Helios 18 N23Q2 (v6.85.6300) | |
| Media de la clase Gaming (2180 - 10115, n=105, últimos 2 años) | |
| Medio Intel Core i9-14900HX (3589 - 7979, n=36) | |
| HP Omen 16 (2024) (v6.92.6600, Leistung) | |
| HP Omen 16 (2024) (v6.92.6600) | |
| HP Omen 16-wf000 (v6.85.6300) | |
| AIDA64 / CPU Queen | |
| Alienware m16 R1 AMD (v6.85.6300) | |
| MSI Vector 16 HX A14V (v6.92.6600) | |
| Medio Intel Core i9-14900HX (118405 - 148966, n=36) | |
| Acer Predator Helios 18 N23Q2 (v6.85.6300) | |
| HP Omen 16 (2024) (v6.92.6600) | |
| HP Omen 16 (2024) (v6.92.6600, Leistung) | |
| Media de la clase Gaming (49785 - 173351, n=90, últimos 2 años) | |
| HP Omen 16-wf000 (v6.85.6300) | |
| AIDA64 / FPU SinJulia | |
| Alienware m16 R1 AMD (v6.85.6300) | |
| MSI Vector 16 HX A14V (v6.92.6600) | |
| Acer Predator Helios 18 N23Q2 (v6.85.6300) | |
| Medio Intel Core i9-14900HX (10475 - 18517, n=36) | |
| Media de la clase Gaming (4424 - 33636, n=105, últimos 2 años) | |
| HP Omen 16 (2024) (v6.92.6600, Leistung) | |
| HP Omen 16 (2024) (v6.92.6600) | |
| HP Omen 16-wf000 (v6.85.6300) | |
| AIDA64 / FPU Mandel | |
| Alienware m16 R1 AMD (v6.85.6300) | |
| Media de la clase Gaming (25115 - 128721, n=105, últimos 2 años) | |
| MSI Vector 16 HX A14V (v6.92.6600) | |
| Acer Predator Helios 18 N23Q2 (v6.85.6300) | |
| Medio Intel Core i9-14900HX (32543 - 83662, n=36) | |
| HP Omen 16 (2024) (v6.92.6600, Leistung) | |
| HP Omen 16-wf000 (v6.85.6300) | |
| HP Omen 16 (2024) (v6.92.6600) | |
| AIDA64 / CPU AES | |
| Acer Predator Helios 18 N23Q2 (v6.85.6300) | |
| Medio Intel Core i9-14900HX (86964 - 241777, n=36) | |
| MSI Vector 16 HX A14V (v6.92.6600) | |
| HP Omen 16 (2024) (v6.92.6600, Leistung) | |
| Alienware m16 R1 AMD (v6.85.6300) | |
| Media de la clase Gaming (39258 - 247074, n=105, últimos 2 años) | |
| HP Omen 16-wf000 (v6.85.6300) | |
| HP Omen 16 (2024) (v6.92.6600) | |
| AIDA64 / CPU ZLib | |
| MSI Vector 16 HX A14V (v6.92.6600) | |
| Acer Predator Helios 18 N23Q2 (v6.85.6300) | |
| Medio Intel Core i9-14900HX (1054 - 2292, n=36) | |
| Alienware m16 R1 AMD (v6.85.6300) | |
| HP Omen 16 (2024) (v6.92.6600, Leistung) | |
| Media de la clase Gaming (574 - 2531, n=105, últimos 2 años) | |
| HP Omen 16-wf000 (v6.85.6300) | |
| HP Omen 16 (2024) (v6.92.6600) | |
| AIDA64 / FP64 Ray-Trace | |
| Alienware m16 R1 AMD (v6.85.6300) | |
| Media de la clase Gaming (5509 - 45446, n=105, últimos 2 años) | |
| MSI Vector 16 HX A14V (v6.92.6600) | |
| Acer Predator Helios 18 N23Q2 (v6.85.6300) | |
| Medio Intel Core i9-14900HX (6809 - 18349, n=36) | |
| HP Omen 16 (2024) (v6.92.6600, Leistung) | |
| HP Omen 16-wf000 (v6.85.6300) | |
| HP Omen 16 (2024) (v6.92.6600) | |
| AIDA64 / CPU PhotoWorxx | |
| Acer Predator Helios 18 N23Q2 (v6.85.6300) | |
| HP Omen 16 (2024) (v6.92.6600, Leistung) | |
| HP Omen 16 (2024) (v6.92.6600) | |
| MSI Vector 16 HX A14V (v6.92.6600) | |
| Medio Intel Core i9-14900HX (23903 - 54702, n=36) | |
| Media de la clase Gaming (12271 - 89891, n=105, últimos 2 años) | |
| HP Omen 16-wf000 (v6.85.6300) | |
| Alienware m16 R1 AMD (v6.85.6300) | |
Rendimiento del sistema
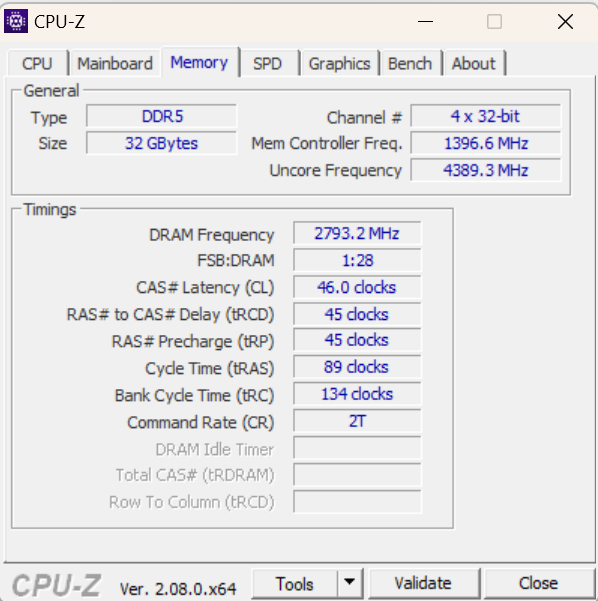
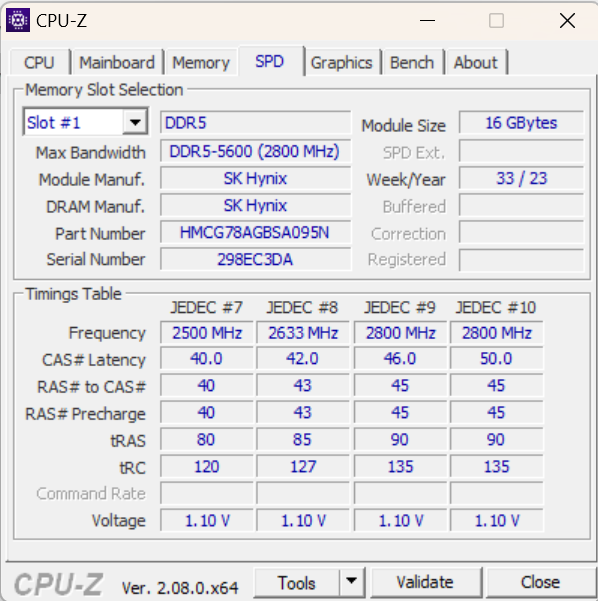
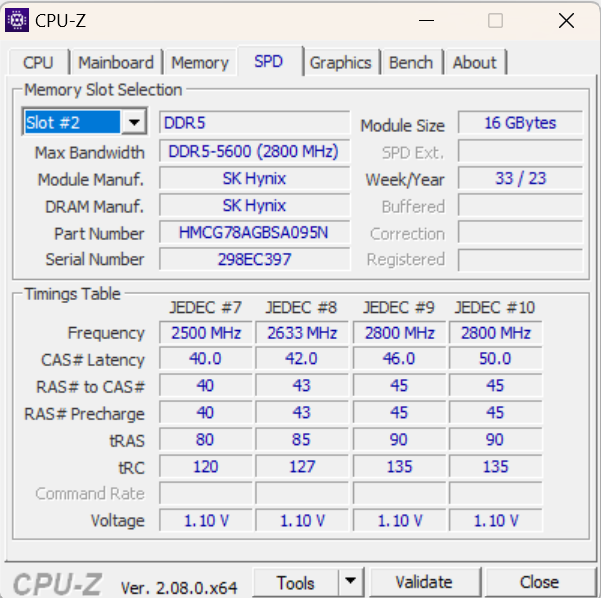
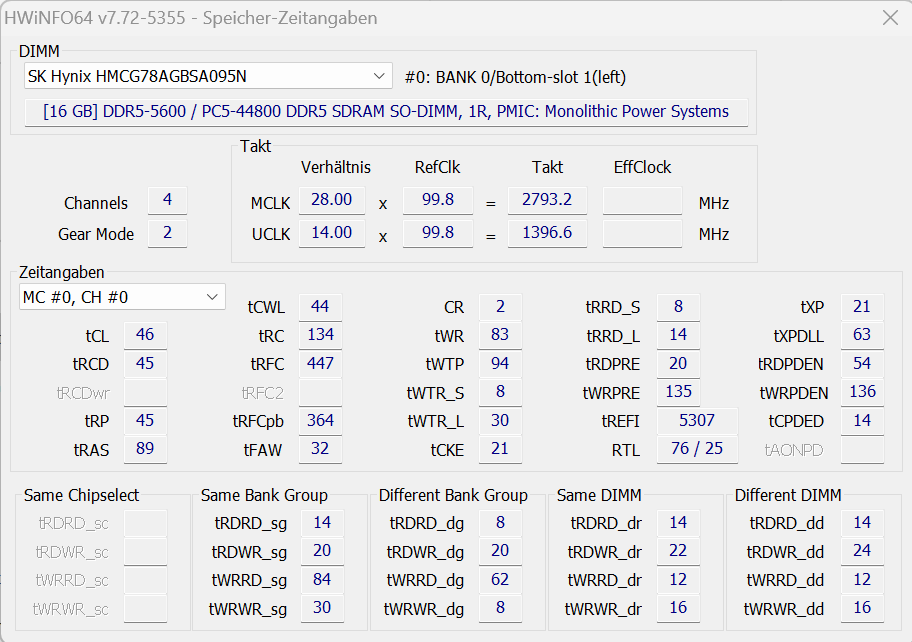
El ágil sistema se caracteriza por una gran potencia de procesamiento. El hardware es capaz de manejar cosas como juegos y renderizado sin esfuerzo. Las velocidades de transferencia de la memoria están a un nivel típico para una RAM DDR5-5600.
CrossMark: Overall | Productivity | Creativity | Responsiveness
WebXPRT 3: Overall
WebXPRT 4: Overall
Mozilla Kraken 1.1: Total
| PCMark 10 / Score | |
| HP Omen 16 (2024) | |
| Alienware m16 R1 AMD | |
| Medio Intel Core i9-14900HX, NVIDIA GeForce RTX 4080 Laptop GPU (7703 - 9223, n=7) | |
| MSI Vector 16 HX A14V | |
| Acer Predator Helios 18 N23Q2 | |
| Media de la clase Gaming (5828 - 12414, n=93, últimos 2 años) | |
| HP Omen 16-wf000 | |
| PCMark 10 / Essentials | |
| Medio Intel Core i9-14900HX, NVIDIA GeForce RTX 4080 Laptop GPU (11255 - 12600, n=7) | |
| Alienware m16 R1 AMD | |
| MSI Vector 16 HX A14V | |
| HP Omen 16 (2024) | |
| Acer Predator Helios 18 N23Q2 | |
| Media de la clase Gaming (8810 - 11935, n=97, últimos 2 años) | |
| HP Omen 16-wf000 | |
| PCMark 10 / Productivity | |
| HP Omen 16 (2024) | |
| Media de la clase Gaming (6845 - 25323, n=95, últimos 2 años) | |
| Acer Predator Helios 18 N23Q2 | |
| Alienware m16 R1 AMD | |
| Medio Intel Core i9-14900HX, NVIDIA GeForce RTX 4080 Laptop GPU (6662 - 11410, n=7) | |
| MSI Vector 16 HX A14V | |
| HP Omen 16-wf000 | |
| PCMark 10 / Digital Content Creation | |
| MSI Vector 16 HX A14V | |
| Alienware m16 R1 AMD | |
| Medio Intel Core i9-14900HX, NVIDIA GeForce RTX 4080 Laptop GPU (14211 - 16246, n=7) | |
| HP Omen 16 (2024) | |
| Acer Predator Helios 18 N23Q2 | |
| Media de la clase Gaming (7602 - 19954, n=95, últimos 2 años) | |
| HP Omen 16-wf000 | |
| CrossMark / Overall | |
| HP Omen 16 (2024) | |
| Acer Predator Helios 18 N23Q2 | |
| MSI Vector 16 HX A14V | |
| Medio Intel Core i9-14900HX, NVIDIA GeForce RTX 4080 Laptop GPU (1992 - 2334, n=7) | |
| Alienware m16 R1 AMD | |
| Media de la clase Gaming (1366 - 2409, n=94, últimos 2 años) | |
| HP Omen 16-wf000 | |
| CrossMark / Productivity | |
| HP Omen 16 (2024) | |
| Acer Predator Helios 18 N23Q2 | |
| MSI Vector 16 HX A14V | |
| Medio Intel Core i9-14900HX, NVIDIA GeForce RTX 4080 Laptop GPU (1812 - 2204, n=7) | |
| Alienware m16 R1 AMD | |
| Media de la clase Gaming (1386 - 2254, n=94, últimos 2 años) | |
| HP Omen 16-wf000 | |
| CrossMark / Creativity | |
| MSI Vector 16 HX A14V | |
| Acer Predator Helios 18 N23Q2 | |
| Medio Intel Core i9-14900HX, NVIDIA GeForce RTX 4080 Laptop GPU (2327 - 2500, n=7) | |
| HP Omen 16 (2024) | |
| Media de la clase Gaming (1343 - 2786, n=94, últimos 2 años) | |
| Alienware m16 R1 AMD | |
| HP Omen 16-wf000 | |
| CrossMark / Responsiveness | |
| HP Omen 16 (2024) | |
| Acer Predator Helios 18 N23Q2 | |
| MSI Vector 16 HX A14V | |
| Medio Intel Core i9-14900HX, NVIDIA GeForce RTX 4080 Laptop GPU (1520 - 2254, n=7) | |
| Alienware m16 R1 AMD | |
| Media de la clase Gaming (1226 - 2334, n=94, últimos 2 años) | |
| HP Omen 16-wf000 | |
| WebXPRT 3 / Overall | |
| Alienware m16 R1 AMD | |
| Medio Intel Core i9-14900HX, NVIDIA GeForce RTX 4080 Laptop GPU (310 - 345, n=7) | |
| HP Omen 16 (2024) | |
| MSI Vector 16 HX A14V | |
| Acer Predator Helios 18 N23Q2 | |
| Media de la clase Gaming (220 - 532, n=98, últimos 2 años) | |
| HP Omen 16-wf000 | |
| WebXPRT 4 / Overall | |
| Medio Intel Core i9-14900HX, NVIDIA GeForce RTX 4080 Laptop GPU (300 - 321, n=7) | |
| HP Omen 16 (2024) | |
| MSI Vector 16 HX A14V | |
| Media de la clase Gaming (165 - 354, n=98, últimos 2 años) | |
| Alienware m16 R1 AMD | |
| HP Omen 16-wf000 | |
| Mozilla Kraken 1.1 / Total | |
| HP Omen 16-wf000 | |
| Alienware m16 R1 AMD | |
| Media de la clase Gaming (391 - 590, n=100, últimos 2 años) | |
| Acer Predator Helios 18 N23Q2 | |
| MSI Vector 16 HX A14V | |
| Medio Intel Core i9-14900HX, NVIDIA GeForce RTX 4080 Laptop GPU (437 - 446, n=7) | |
| HP Omen 16 (2024) | |
* ... más pequeño es mejor
| PCMark 10 Score | 8915 puntos | |
ayuda | ||
| AIDA64 / Memory Copy | |
| HP Omen 16 (2024) | |
| Acer Predator Helios 18 N23Q2 | |
| MSI Vector 16 HX A14V | |
| Medio Intel Core i9-14900HX (38028 - 83392, n=36) | |
| Media de la clase Gaming (21750 - 129946, n=105, últimos 2 años) | |
| HP Omen 16-wf000 | |
| Alienware m16 R1 AMD | |
| AIDA64 / Memory Read | |
| HP Omen 16 (2024) | |
| Acer Predator Helios 18 N23Q2 | |
| MSI Vector 16 HX A14V | |
| Medio Intel Core i9-14900HX (43306 - 87568, n=36) | |
| Media de la clase Gaming (22956 - 118858, n=105, últimos 2 años) | |
| HP Omen 16-wf000 | |
| Alienware m16 R1 AMD | |
| AIDA64 / Memory Write | |
| HP Omen 16 (2024) | |
| MSI Vector 16 HX A14V | |
| Media de la clase Gaming (22297 - 135096, n=105, últimos 2 años) | |
| Acer Predator Helios 18 N23Q2 | |
| Medio Intel Core i9-14900HX (37146 - 80589, n=36) | |
| HP Omen 16-wf000 | |
| Alienware m16 R1 AMD | |
| AIDA64 / Memory Latency | |
| Media de la clase Gaming (75.3 - 259, n=105, últimos 2 años) | |
| Alienware m16 R1 AMD | |
| HP Omen 16-wf000 | |
| Medio Intel Core i9-14900HX (76.1 - 105, n=36) | |
| HP Omen 16 (2024) | |
| Acer Predator Helios 18 N23Q2 | |
| MSI Vector 16 HX A14V | |
* ... más pequeño es mejor
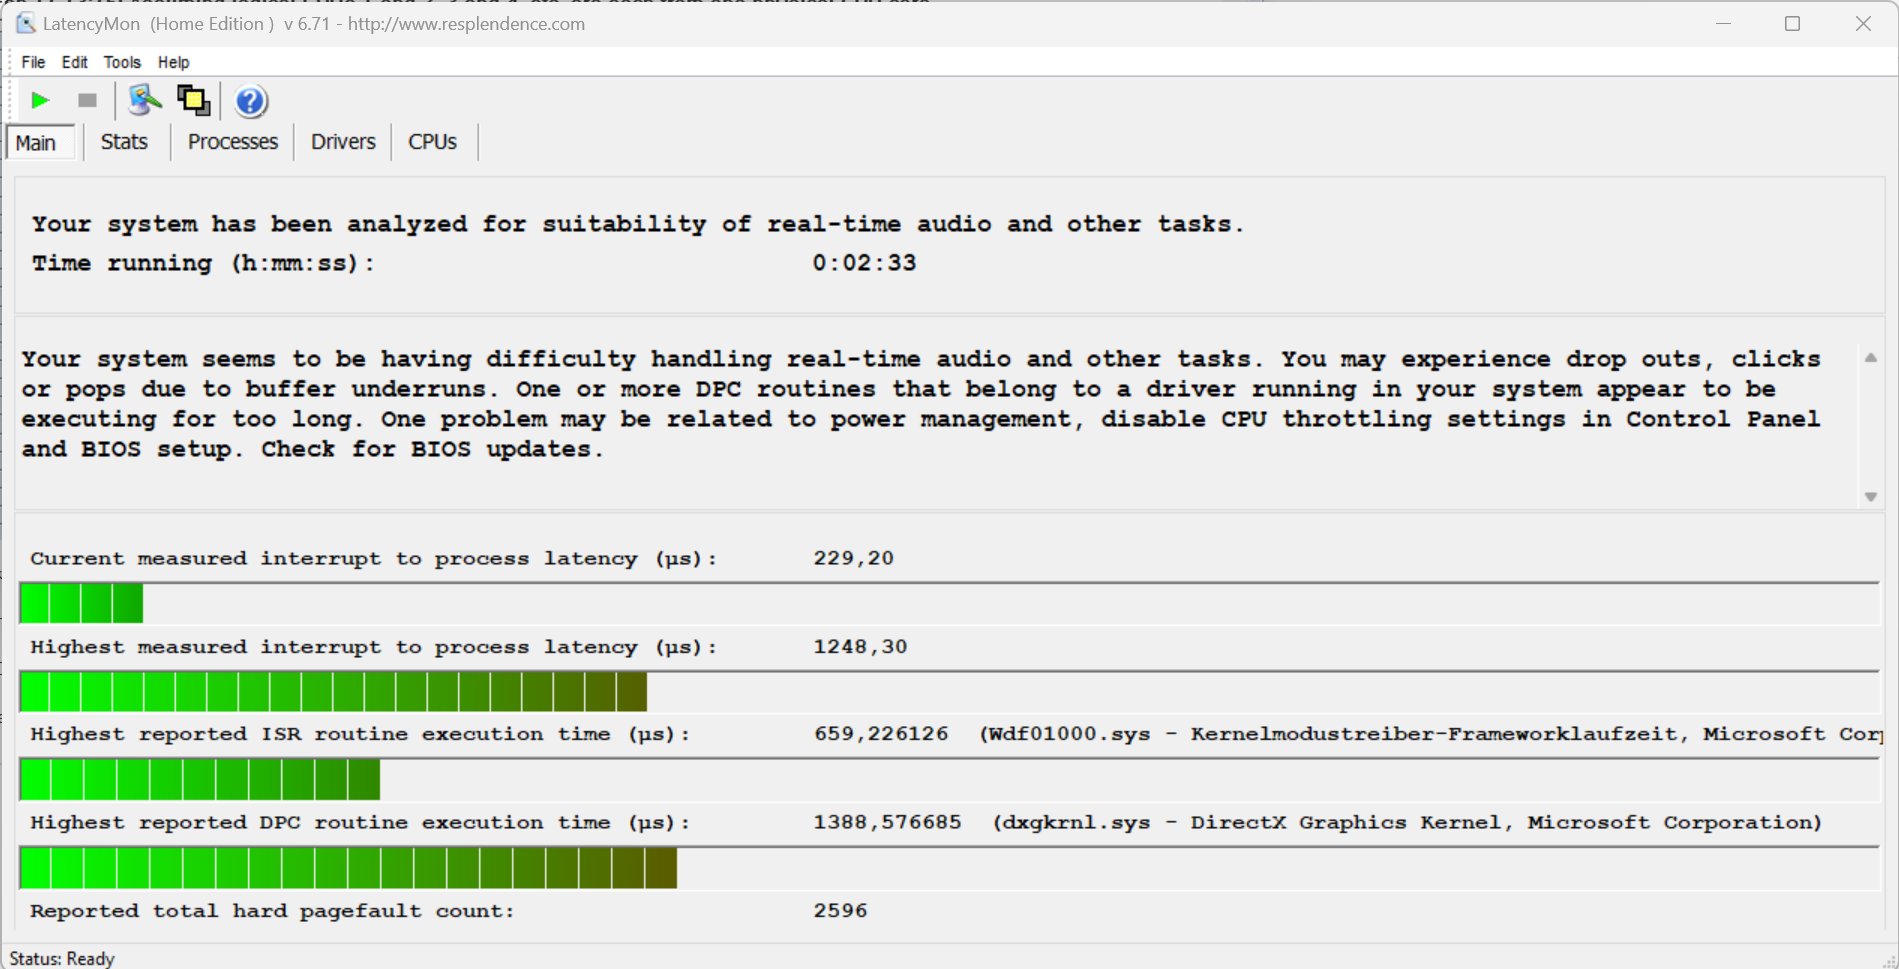
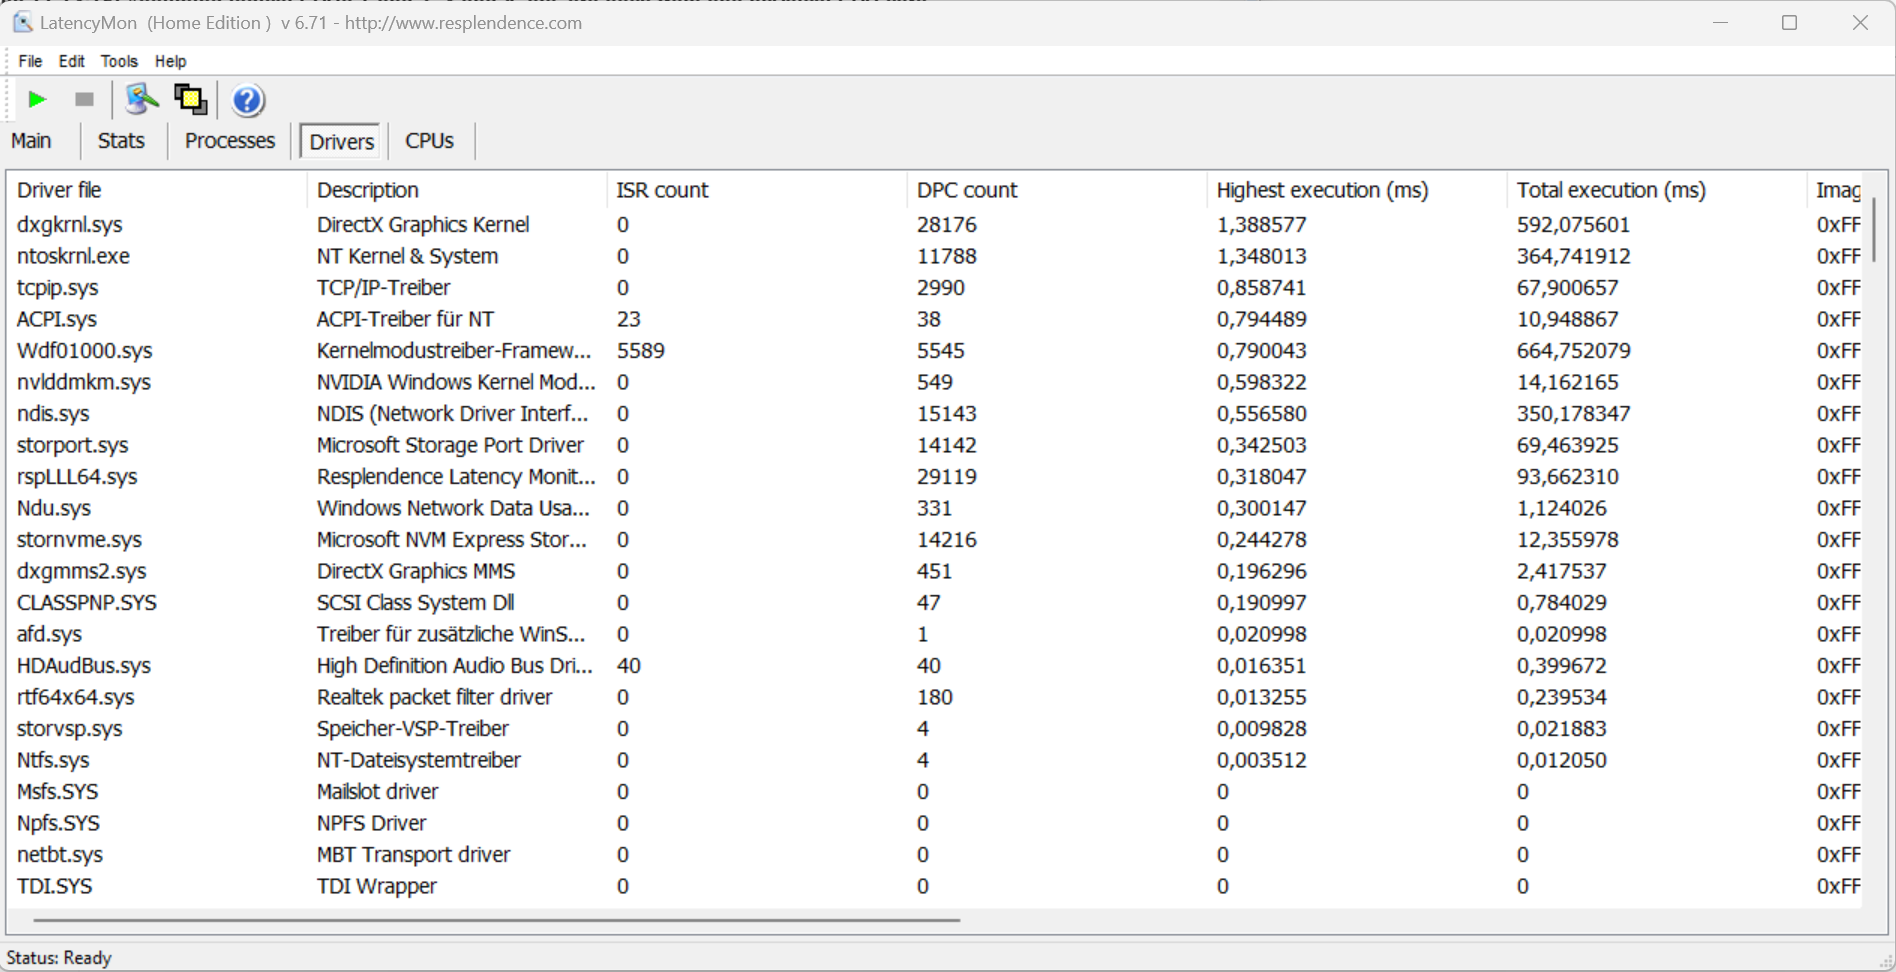
Latencia del CPD
Nuestra prueba estandarizada Latency Monitor (navegación web, reproducción de vídeo 4K y Prime95 High-load) reveló algunos problemas. El sistema no parece adecuado para la edición de vídeo y audio en tiempo real. Esperemos que las futuras actualizaciones de software traigan mejoras.
| DPC Latencies / LatencyMon - interrupt to process latency (max), Web, Youtube, Prime95 | |
| Acer Predator Helios 18 N23Q2 | |
| HP Omen 16-wf000 | |
| Alienware m16 R1 AMD | |
| MSI Vector 16 HX A14V | |
| HP Omen 16 (2024) | |
* ... más pequeño es mejor
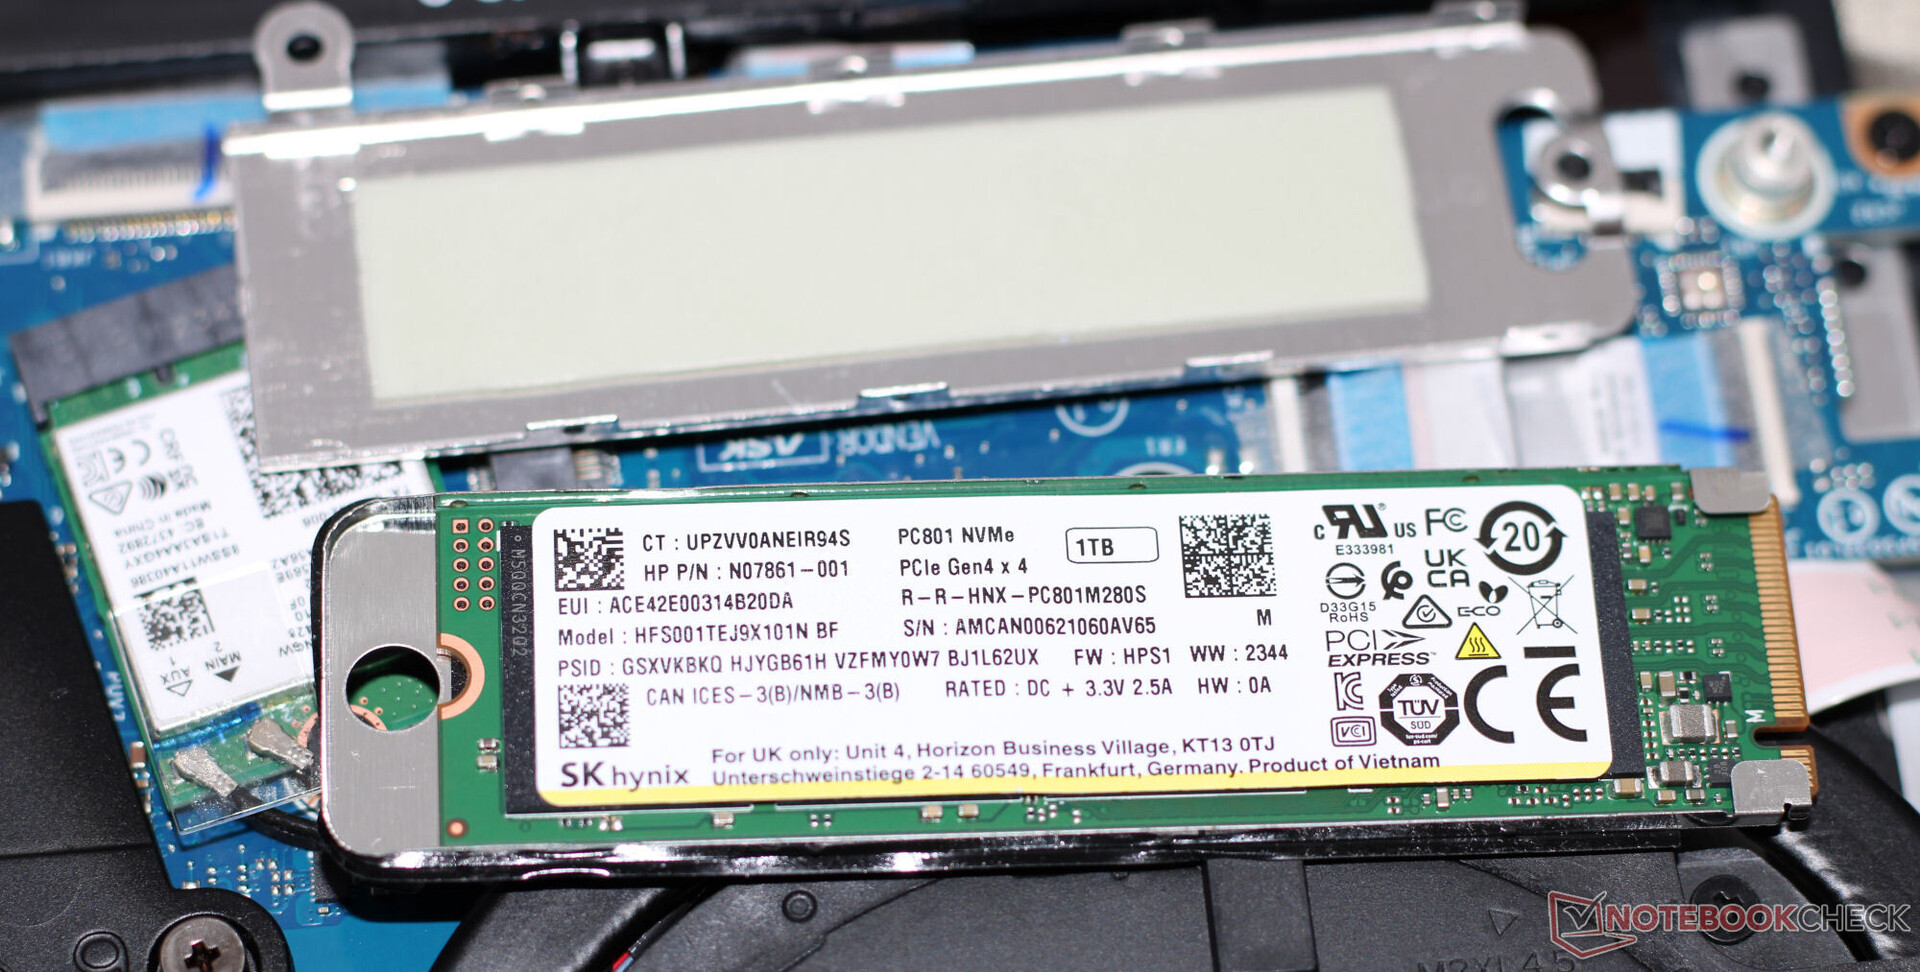
Almacenamiento masivo
La Omen 16 puede alojar un total de dos unidades SSD PCIe 4.0 M.2-2280. La unidad SK Hynix de 1 TB de nuestra unidad de análisis ofrece unas velocidades de transferencia excelentes y no experimentó estrangulamiento térmico en nuestras pruebas.

| Drive Performance rating - Percent | |
| HP Omen 16 (2024) | |
| Acer Predator Helios 18 N23Q2 | |
| Alienware m16 R1 AMD | |
| Media de la clase Gaming | |
| Medio SK hynix PC801 HFS001TEJ9X101N | |
| HP Omen 16-wf000 | |
| MSI Vector 16 HX A14V | |
* ... más pequeño es mejor
Sustained Load Read: DiskSpd Read Loop, Queue Depth 8
Tarjeta gráfica
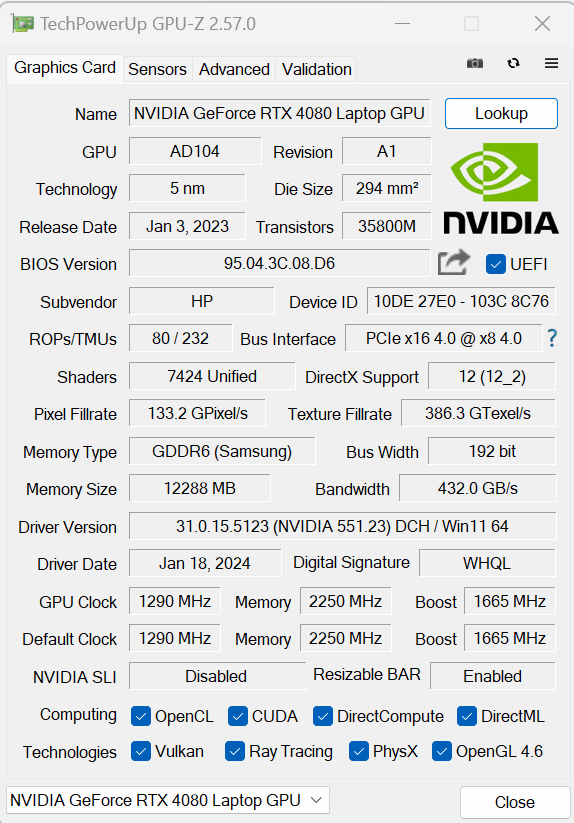
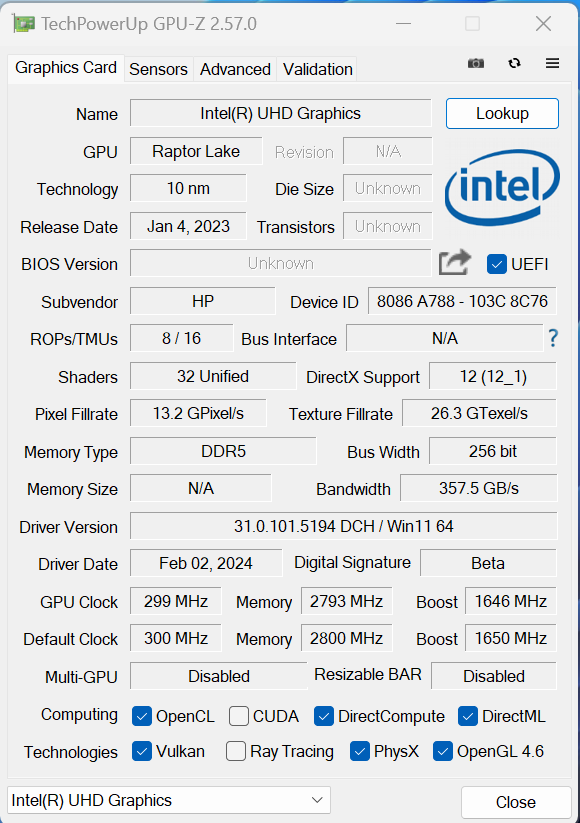
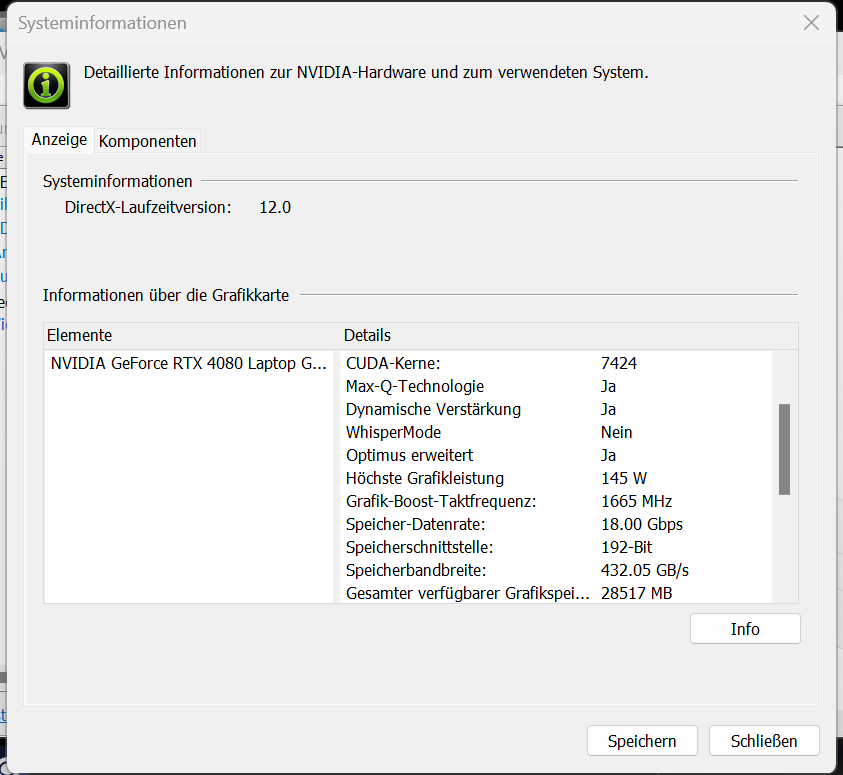
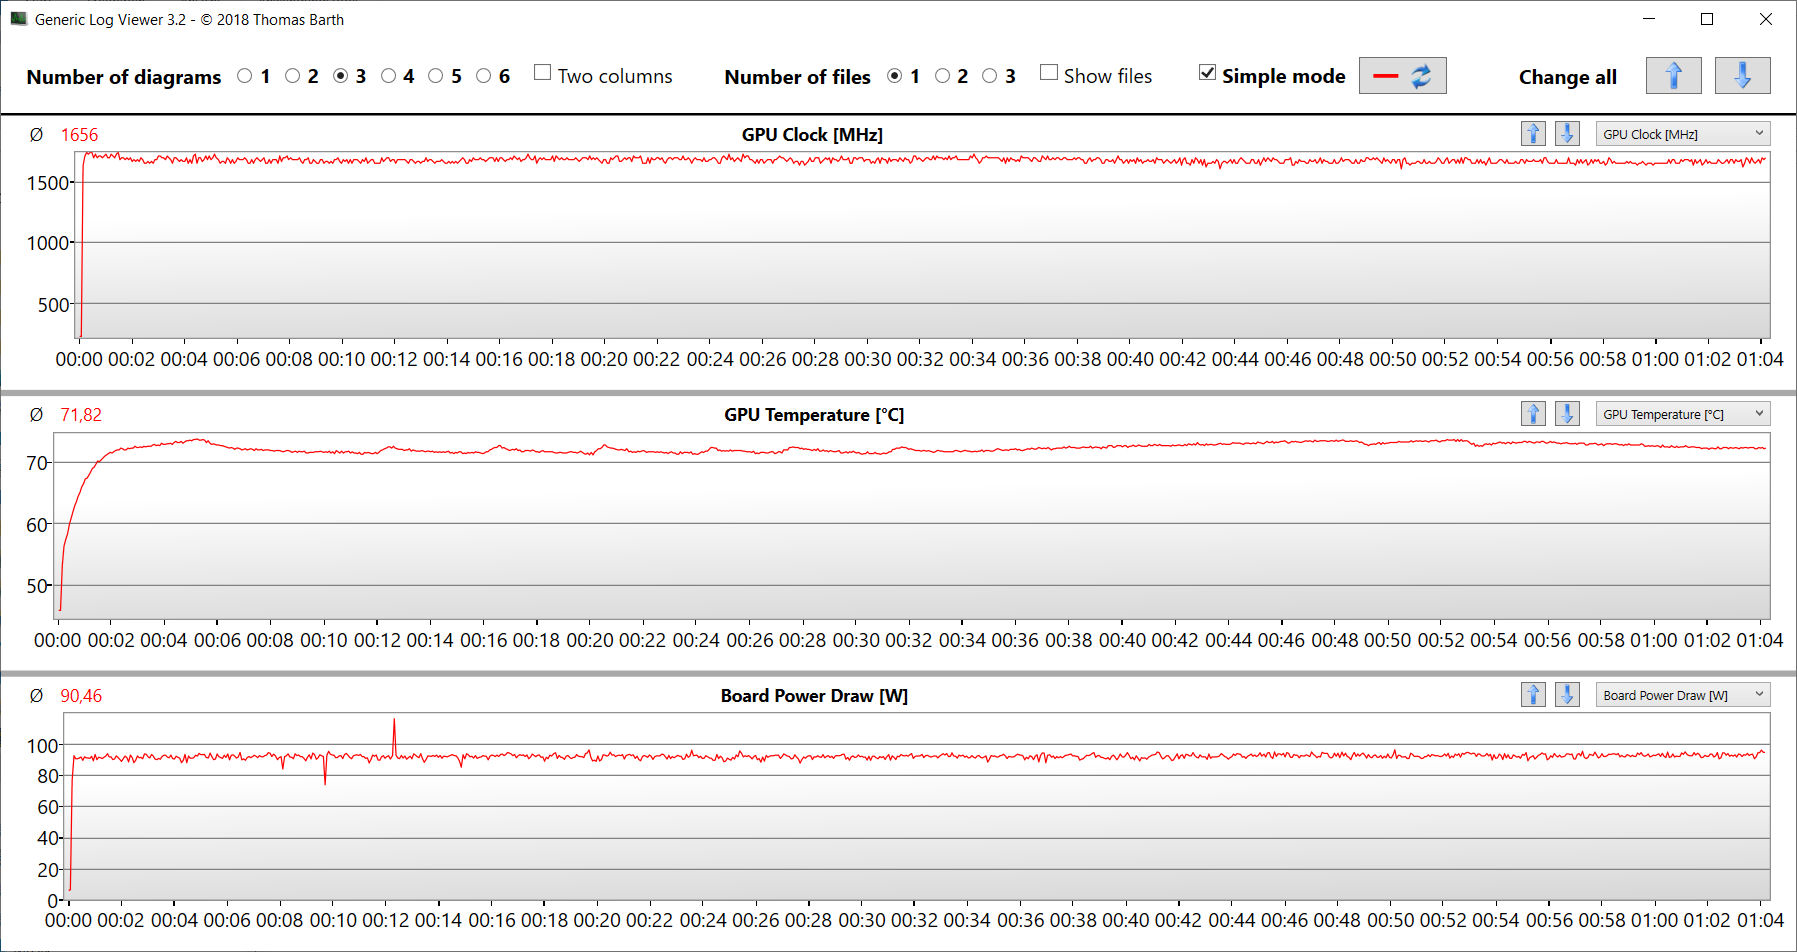
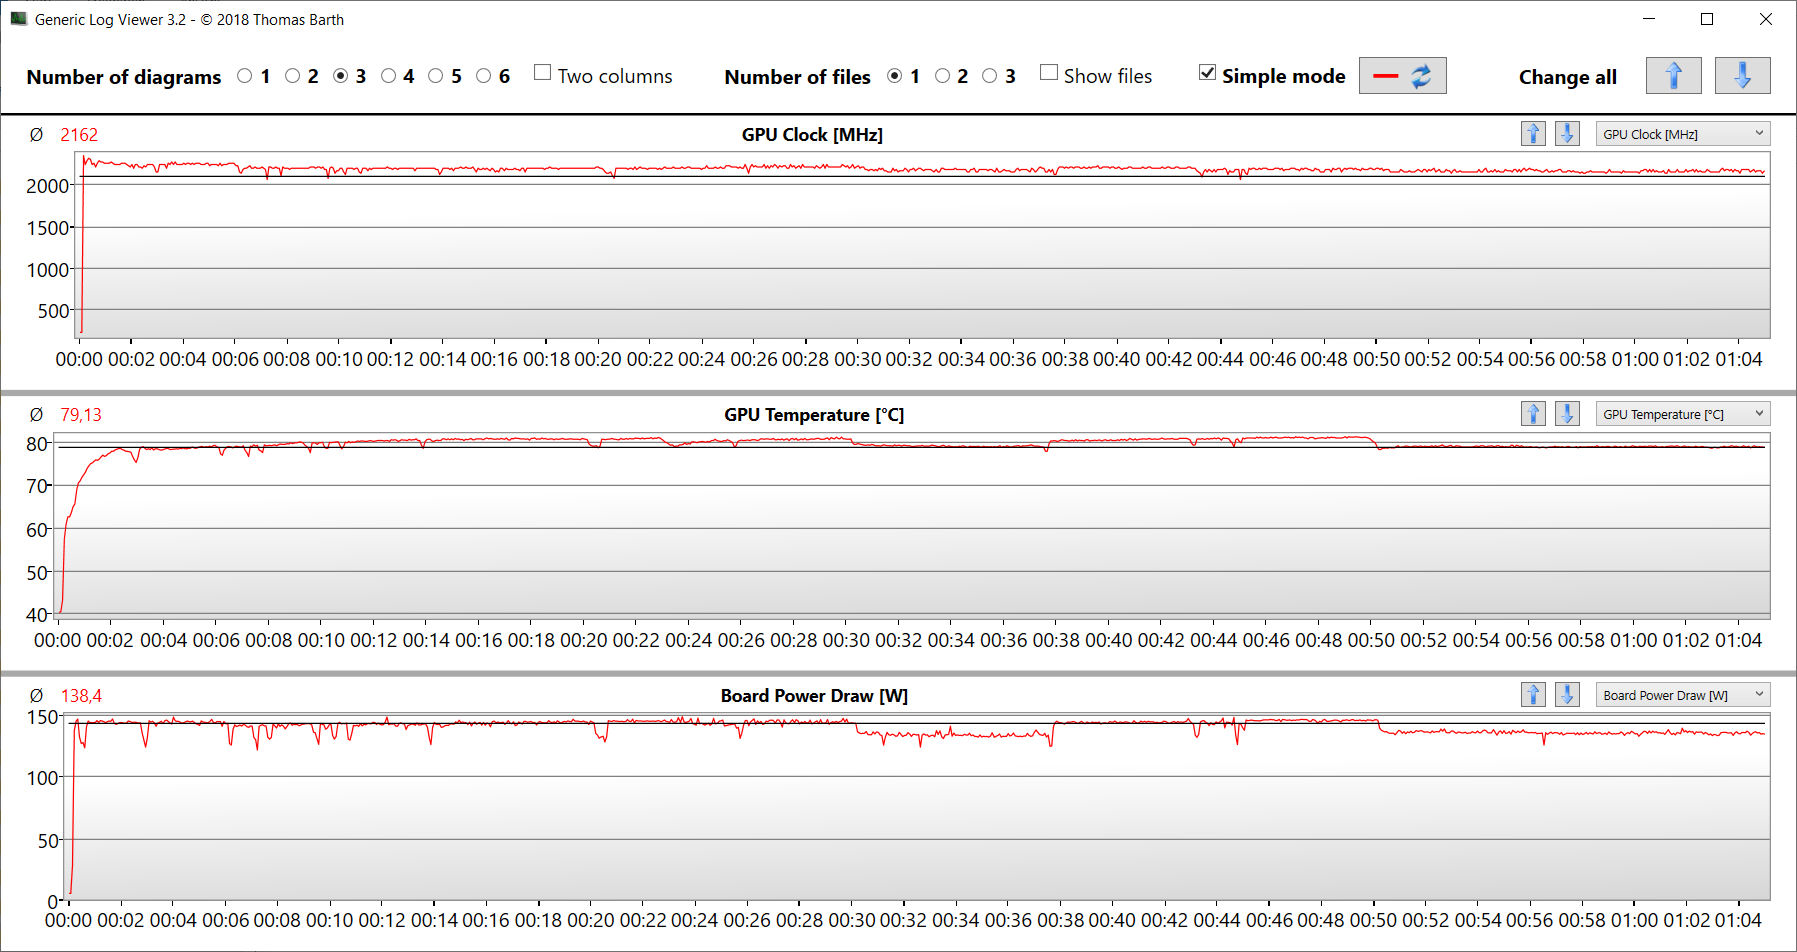
La GeForce RTX 4080 cuenta con 7.424 núcleos CUDA, un bus de memoria de 192 bits y 12.288 MB de memoria GDDR6. HP ha dado a la tarjeta gráfica un TGP de 145 vatios, por debajo del TGP máximo de 175 vatios especificado por Nvidia.
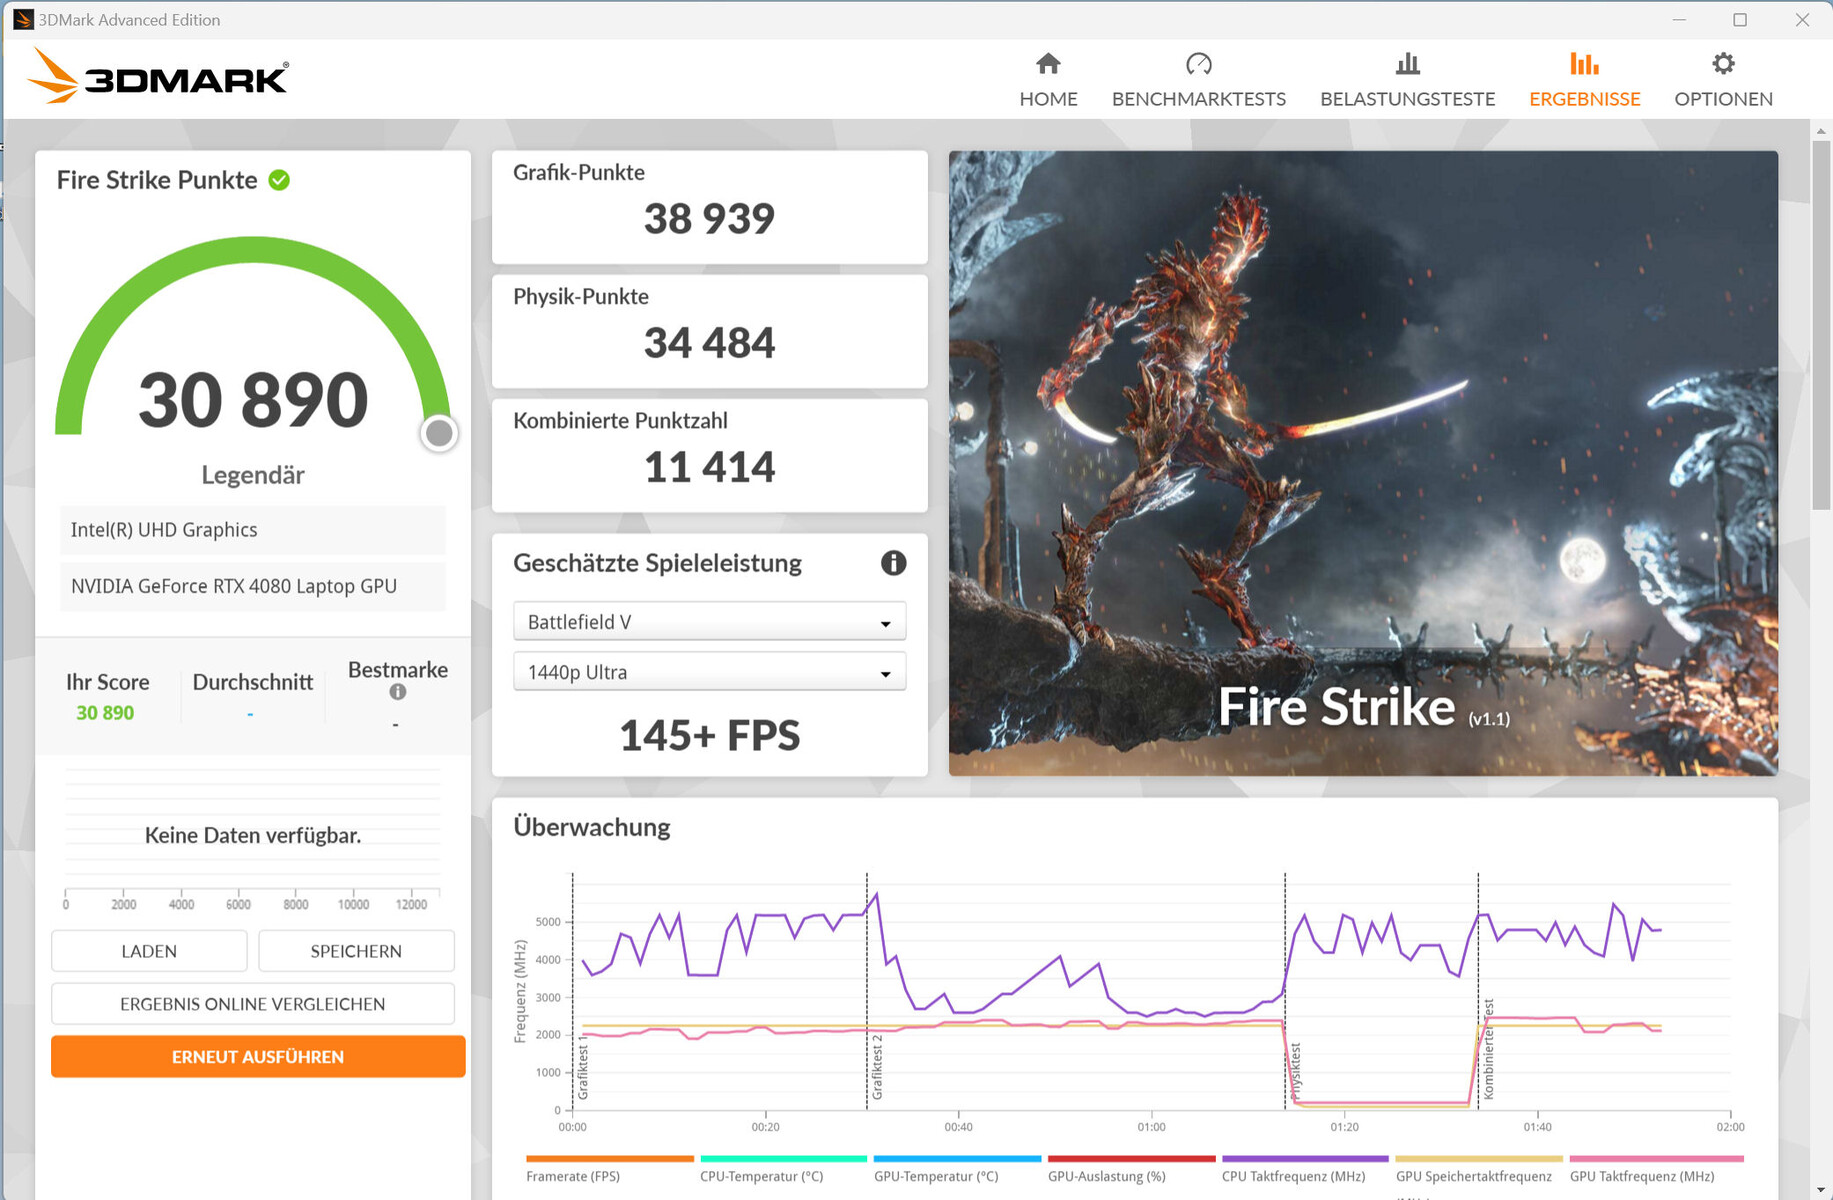
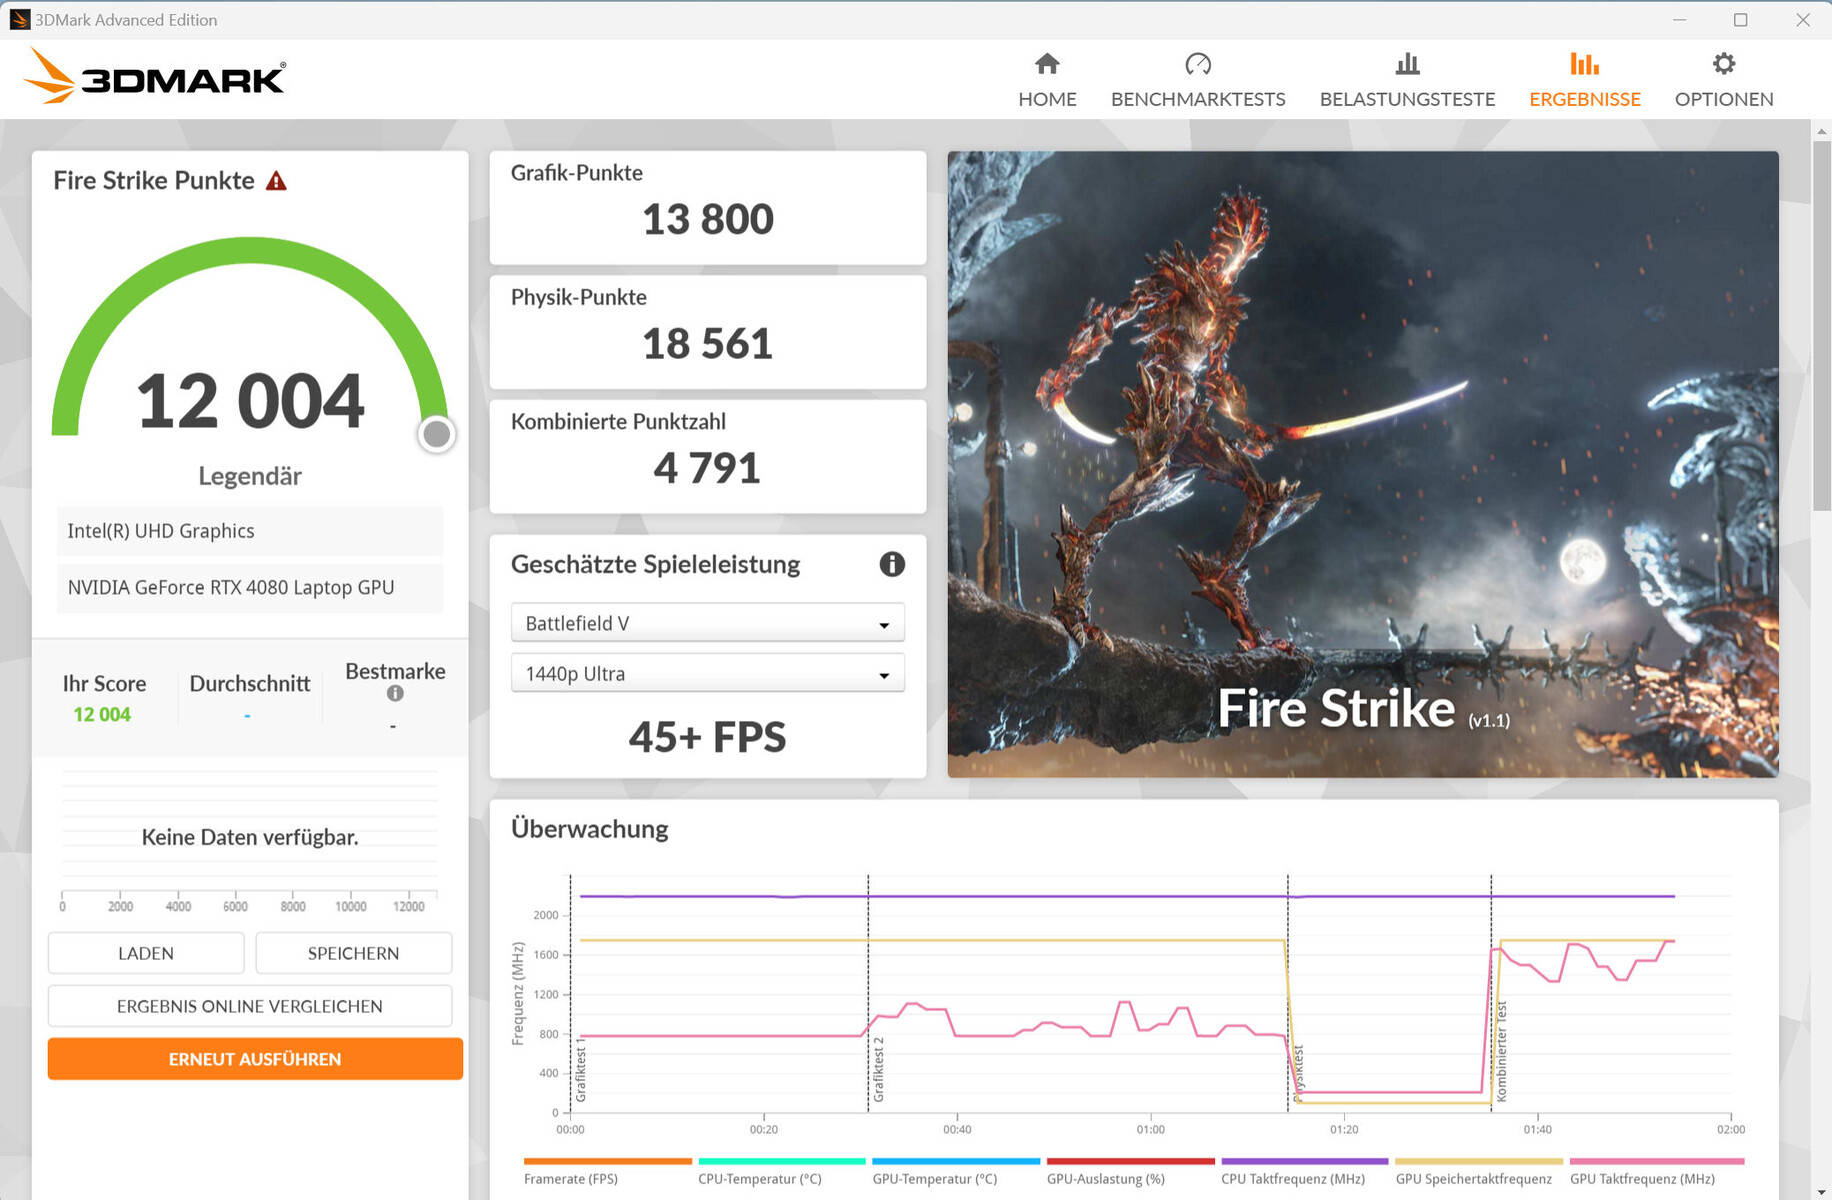
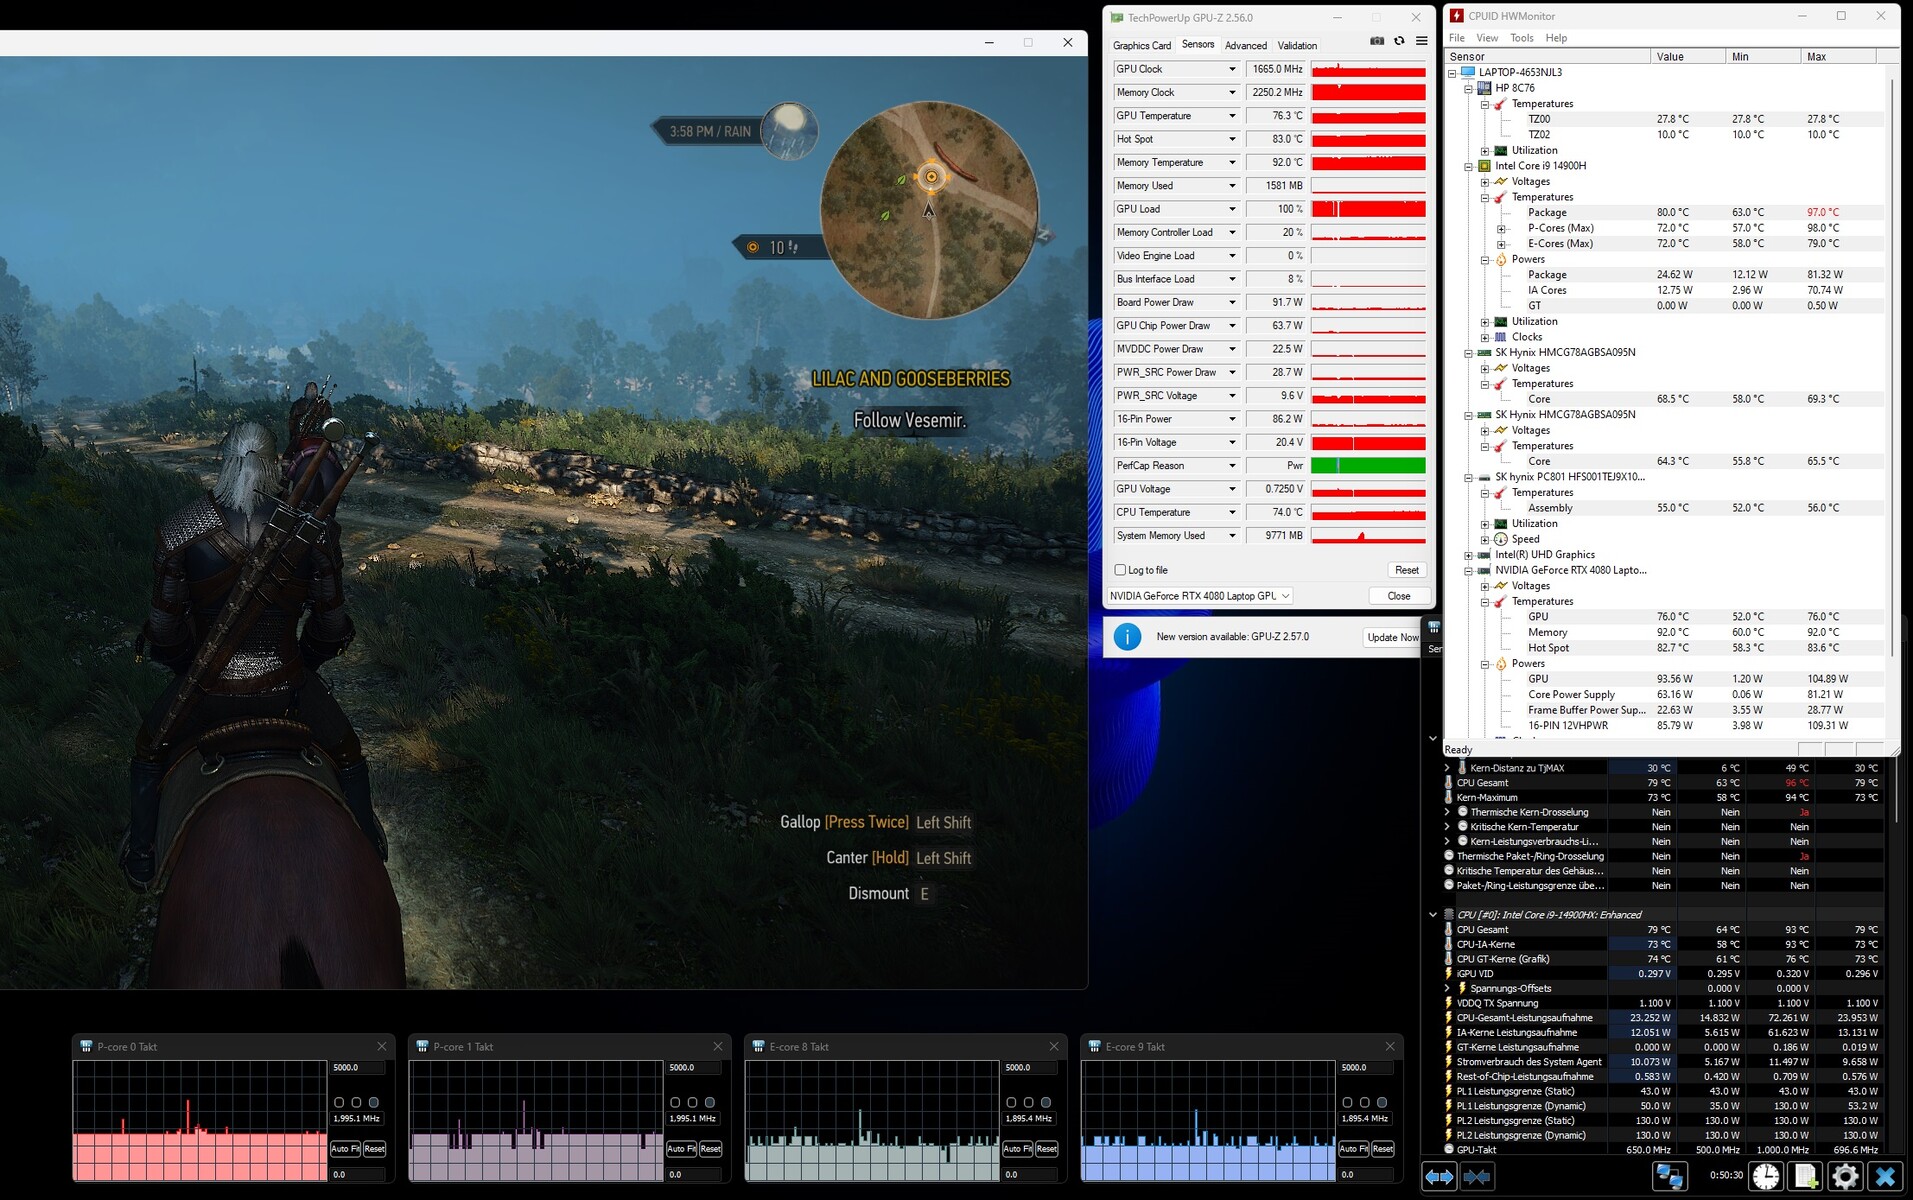
Los resultados de los bancos de pruebas y las velocidades de fotogramas obtenidos con la Omen 16 están por debajo de lo que hemos visto con la RTX 4080 Laptop de media. Si se cambia al modo Rendimiento, el rendimiento mejora. La GPU permite jugar con una resolución QHD y ajustes de altos a máximos. Con la ayuda de DLSS 3 y Frame Generation, también es posible habilitar ajustes máximos y efectos de trazado de rayos adicionales a resoluciones más altas, aunque sólo puede hacerlo en juegos con la compatibilidad adecuada.


| 3DMark Performance rating - Percent | |
| MSI Vector 16 HX A14V | |
| Alienware m16 R1 AMD | |
| Acer Predator Helios 18 N23Q2 | |
| Medio NVIDIA GeForce RTX 4080 Laptop GPU | |
| HP Omen 16-wf000 | |
| HP Omen 16 (2024) | |
| Media de la clase Gaming | |
| HP Omen 16 (2024) | |
| 3DMark 11 - 1280x720 Performance GPU | |
| MSI Vector 16 HX A14V | |
| Acer Predator Helios 18 N23Q2 | |
| Medio NVIDIA GeForce RTX 4080 Laptop GPU (45199 - 63128, n=24) | |
| Alienware m16 R1 AMD | |
| HP Omen 16-wf000 | |
| HP Omen 16 (2024) (Leistung) | |
| Media de la clase Gaming (21841 - 80022, n=104, últimos 2 años) | |
| HP Omen 16 (2024) | |
| 3DMark | |
| 1920x1080 Fire Strike Graphics | |
| Alienware m16 R1 AMD | |
| MSI Vector 16 HX A14V | |
| Acer Predator Helios 18 N23Q2 | |
| Medio NVIDIA GeForce RTX 4080 Laptop GPU (33058 - 45220, n=23) | |
| HP Omen 16 (2024) (Leistung) | |
| Media de la clase Gaming (12242 - 62849, n=115, últimos 2 años) | |
| HP Omen 16-wf000 | |
| HP Omen 16 (2024) | |
| 2560x1440 Time Spy Graphics | |
| MSI Vector 16 HX A14V | |
| Alienware m16 R1 AMD | |
| Acer Predator Helios 18 N23Q2 | |
| Medio NVIDIA GeForce RTX 4080 Laptop GPU (13282 - 19663, n=23) | |
| HP Omen 16-wf000 | |
| HP Omen 16 (2024) (Leistung) | |
| Media de la clase Gaming (5012 - 26212, n=115, últimos 2 años) | |
| HP Omen 16 (2024) | |
| 3DMark 11 Performance | 35380 puntos | |
| 3DMark Cloud Gate Standard Score | 51266 puntos | |
| 3DMark Fire Strike Score | 27191 puntos | |
| 3DMark Time Spy Score | 13636 puntos | |
ayuda | ||
| Blender | |
| v3.3 Classroom OPTIX/RTX | |
| Media de la clase Gaming (9 - 32, n=106, últimos 2 años) | |
| HP Omen 16-wf000 (3.3.3) | |
| HP Omen 16 (2024) (3.3.3) | |
| Alienware m16 R1 AMD (3.3.3) | |
| Medio NVIDIA GeForce RTX 4080 Laptop GPU (13 - 20, n=22) | |
| Acer Predator Helios 18 N23Q2 (3.3.3) | |
| MSI Vector 16 HX A14V (3.3.3) | |
| HP Omen 16 (2024) (3.3.3, Leistung) | |
| v3.3 Classroom CUDA | |
| Media de la clase Gaming (15 - 228, n=106, últimos 2 años) | |
| HP Omen 16 (2024) (3.3.3) | |
| Alienware m16 R1 AMD (3.3.3) | |
| HP Omen 16 (2024) (3.3.3, Leistung) | |
| Medio NVIDIA GeForce RTX 4080 Laptop GPU (21 - 28, n=23) | |
| HP Omen 16-wf000 (3.3.3) | |
| MSI Vector 16 HX A14V (3.3.3) | |
| Acer Predator Helios 18 N23Q2 (3.3.3) | |
| v3.3 Classroom CPU | |
| HP Omen 16-wf000 (3.3.3) | |
| HP Omen 16 (2024) (3.3.3) | |
| Media de la clase Gaming (122 - 565, n=102, últimos 2 años) | |
| Medio NVIDIA GeForce RTX 4080 Laptop GPU (177 - 337, n=23) | |
| HP Omen 16 (2024) (3.3.3, Leistung) | |
| Acer Predator Helios 18 N23Q2 (3.3.3) | |
| Alienware m16 R1 AMD (3.3.3) | |
| MSI Vector 16 HX A14V (3.3.3) | |
| Geekbench 5.5 | |
| OpenCL Score | |
| Alienware m16 R1 AMD | |
| Acer Predator Helios 18 N23Q2 | |
| Medio NVIDIA GeForce RTX 4080 Laptop GPU (146413 - 189320, n=23) | |
| Media de la clase Gaming (80702 - 277970, n=101, últimos 2 años) | |
| HP Omen 16 (2024) (Leistung) | |
| HP Omen 16-wf000 | |
| MSI Vector 16 HX A14V | |
| HP Omen 16 (2024) | |
| Vulkan Score 5.5 | |
| Media de la clase Gaming (18857 - 246759, n=76, últimos 2 años) | |
| HP Omen 16 (2024) (Leistung) | |
| Medio NVIDIA GeForce RTX 4080 Laptop GPU (9296 - 122085, n=15) | |
| HP Omen 16 (2024) | |
| HP Omen 16-wf000 | |
| MSI Vector 16 HX A14V | |
| Geekbench 6.7 | |
| GPU Vulkan | |
| HP Omen 16 (2024) (6.2.1, Leistung) | |
| HP Omen 16 (2024) (6.2.1) | |
| Medio NVIDIA GeForce RTX 4080 Laptop GPU (104581 - 159261, n=11) | |
| Media de la clase Gaming (7562 - 244348, n=59, últimos 2 años) | |
| MSI Vector 16 HX A14V (6.2.1) | |
| GPU OpenCL | |
| Alienware m16 R1 AMD | |
| Acer Predator Helios 18 N23Q2 | |
| HP Omen 16 (2024) (6.2.1, Leistung) | |
| Medio NVIDIA GeForce RTX 4080 Laptop GPU (136770 - 181484, n=15) | |
| HP Omen 16 (2024) (6.2.1) | |
| Media de la clase Gaming (67235 - 253130, n=103, últimos 2 años) | |
| MSI Vector 16 HX A14V (6.2.1) | |
| V-Ray 5 Benchmark | |
| GPU RTX | |
| Media de la clase Gaming (1146 - 4363, n=33, últimos 2 años) | |
| MSI Vector 16 HX A14V (5.0.1) | |
| Alienware m16 R1 AMD (5.0.1) | |
| HP Omen 16 (2024) (5.0.1, Leistung) | |
| HP Omen 16-wf000 (5.0.1) | |
| Medio NVIDIA GeForce RTX 4080 Laptop GPU (2128 - 2843, n=17) | |
| HP Omen 16 (2024) (5.0.1) | |
| GPU CUDA | |
| Media de la clase Gaming (887 - 3288, n=33, últimos 2 años) | |
| Alienware m16 R1 AMD (5.0.1) | |
| MSI Vector 16 HX A14V (5.0.1) | |
| HP Omen 16-wf000 (5.0.1) | |
| Medio NVIDIA GeForce RTX 4080 Laptop GPU (1647 - 2112, n=17) | |
| HP Omen 16 (2024) (5.0.1, Leistung) | |
| HP Omen 16 (2024) | |
| CPU | |
| MSI Vector 16 HX A14V (5.0.1) | |
| Media de la clase Gaming (5864 - 30302, n=32, últimos 2 años) | |
| Alienware m16 R1 AMD (5.0.1) | |
| HP Omen 16 (2024) (5.0.1, Leistung) | |
| Medio NVIDIA GeForce RTX 4080 Laptop GPU (11906 - 21823, n=17) | |
| HP Omen 16 (2024) (5.0.1) | |
| HP Omen 16-wf000 (5.0.1) | |
| V-Ray Benchmark Next 4.10 | |
| GPU | |
| Acer Predator Helios 18 N23Q2 (v4.10.07 ) | |
| Medio NVIDIA GeForce RTX 4080 Laptop GPU (812 - 1036, n=16) | |
| HP Omen 16 (2024) (v4.10.07, Leistung) | |
| MSI Vector 16 HX A14V (v4.10.07 ) | |
| Media de la clase Gaming (427 - 1627, n=99, últimos 2 años) | |
| HP Omen 16 (2024) (v4.10.07 ) | |
| CPU | |
| MSI Vector 16 HX A14V (v4.10.07 ) | |
| Acer Predator Helios 18 N23Q2 (v4.10.07 ) | |
| Medio NVIDIA GeForce RTX 4080 Laptop GPU (19636 - 31653, n=16) | |
| Media de la clase Gaming (10048 - 45327, n=97, últimos 2 años) | |
| HP Omen 16 (2024) (v4.10.07, Leistung) | |
| HP Omen 16 (2024) (v4.10.07 ) | |
* ... más pequeño es mejor
| Performance rating - Percent | |
| Acer Predator Helios 18 N23Q2 | |
| MSI Vector 16 HX A14V | |
| Alienware m16 R1 AMD -1! | |
| HP Omen 16 (2024) | |
| Medio NVIDIA GeForce RTX 4080 Laptop GPU | |
| Media de la clase Gaming | |
| HP Omen 16-wf000 | |
| HP Omen 16 (2024) | |
| The Witcher 3 - 1920x1080 Ultra Graphics & Postprocessing (HBAO+) | |
| Media de la clase Gaming (104.7 - 240, n=7, últimos 2 años) | |
| MSI Vector 16 HX A14V | |
| Acer Predator Helios 18 N23Q2 | |
| Alienware m16 R1 AMD | |
| Medio NVIDIA GeForce RTX 4080 Laptop GPU (130.4 - 186.1, n=20) | |
| HP Omen 16 (2024) (Leistung) | |
| HP Omen 16-wf000 | |
| HP Omen 16 (2024) | |
| GTA V - 1920x1080 Highest AA:4xMSAA + FX AF:16x | |
| Acer Predator Helios 18 N23Q2 | |
| MSI Vector 16 HX A14V | |
| HP Omen 16 (2024) (Leistung) | |
| Media de la clase Gaming (48.3 - 186.9, n=94, últimos 2 años) | |
| Medio NVIDIA GeForce RTX 4080 Laptop GPU (102.9 - 152.7, n=21) | |
| HP Omen 16-wf000 | |
| HP Omen 16 (2024) | |
| Final Fantasy XV Benchmark - 1920x1080 High Quality | |
| Acer Predator Helios 18 N23Q2 (1.3) | |
| MSI Vector 16 HX A14V (1.3) | |
| Alienware m16 R1 AMD (1.3) | |
| HP Omen 16 (2024) (1.3, Leistung) | |
| Medio NVIDIA GeForce RTX 4080 Laptop GPU (129 - 182.1, n=23) | |
| HP Omen 16-wf000 (1.3) | |
| Media de la clase Gaming (41 - 215, n=95, últimos 2 años) | |
| HP Omen 16 (2024) (1.3) | |
| Strange Brigade - 1920x1080 ultra AA:ultra AF:16 | |
| Alienware m16 R1 AMD (1.47.22.14 D3D12) | |
| MSI Vector 16 HX A14V (1.47.22.14 D3D12) | |
| Acer Predator Helios 18 N23Q2 (1.47.22.14 D3D12) | |
| Medio NVIDIA GeForce RTX 4080 Laptop GPU (239 - 357, n=22) | |
| HP Omen 16 (2024) (1.47.22.14 D3D12, Leistung) | |
| HP Omen 16-wf000 (1.47.22.14 D3D12) | |
| Media de la clase Gaming (76.3 - 458, n=87, últimos 2 años) | |
| HP Omen 16 (2024) (1.47.22.14 D3D12) | |
| Dota 2 Reborn - 1920x1080 ultra (3/3) best looking | |
| Acer Predator Helios 18 N23Q2 | |
| MSI Vector 16 HX A14V | |
| HP Omen 16 (2024) (Leistung) | |
| Alienware m16 R1 AMD | |
| Medio NVIDIA GeForce RTX 4080 Laptop GPU (133 - 194.7, n=23) | |
| HP Omen 16 (2024) | |
| HP Omen 16-wf000 | |
| Media de la clase Gaming (84.8 - 248, n=107, últimos 2 años) | |
| X-Plane 11.11 - 1920x1080 high (fps_test=3) | |
| Acer Predator Helios 18 N23Q2 | |
| HP Omen 16 (2024) (Leistung) | |
| MSI Vector 16 HX A14V | |
| HP Omen 16 (2024) | |
| Medio NVIDIA GeForce RTX 4080 Laptop GPU (89.3 - 143.5, n=25) | |
| HP Omen 16-wf000 | |
| Alienware m16 R1 AMD | |
| Media de la clase Gaming (55.5 - 143.5, n=109, últimos 2 años) | |
| Enshrouded | |
| 1920x1080 Max. Quality AA:FX | |
| HP Omen 16 (2024) (Leistung) | |
| Medio NVIDIA GeForce RTX 4080 Laptop GPU (67.6 - 82.6, n=3) | |
| HP Omen 16 (2024) | |
| Media de la clase Gaming (n=1últimos 2 años) | |
| 2560x1440 Max. Quality AA:FX | |
| HP Omen 16 (2024) (Leistung) | |
| Medio NVIDIA GeForce RTX 4080 Laptop GPU (52.8 - 64.5, n=3) | |
| HP Omen 16 (2024) | |
| Ready or Not | |
| 2560x1440 Epic Preset | |
| Medio NVIDIA GeForce RTX 4080 Laptop GPU (102.1 - 128, n=3) | |
| HP Omen 16 (2024) (Leistung) | |
| HP Omen 16 (2024) | |
| 1920x1080 Epic Preset | |
| Medio NVIDIA GeForce RTX 4080 Laptop GPU (118.6 - 202, n=3) | |
| HP Omen 16 (2024) (Leistung) | |
| HP Omen 16 (2024) | |
| Helldivers 2 | |
| 2560x1440 Ultra Preset | |
| Media de la clase Gaming (81.3 - 140.1, n=5, últimos 2 años) | |
| HP Omen 16 (2024) (Leistung) | |
| Medio NVIDIA GeForce RTX 4080 Laptop GPU (85.7 - 106, n=3) | |
| HP Omen 16 (2024) | |
| 1920x1080 Ultra Preset | |
| HP Omen 16 (2024) (Leistung) | |
| Medio NVIDIA GeForce RTX 4080 Laptop GPU (100.8 - 132.3, n=3) | |
| Media de la clase Gaming (18.4 - 153.8, n=5, últimos 2 años) | |
| HP Omen 16 (2024) | |
| The Finals | |
| 1920x1080 Epic Preset + Epic RTX Global Illumination | |
| HP Omen 16 (2024) (Leistung) | |
| Medio NVIDIA GeForce RTX 4080 Laptop GPU (147.8 - 181.5, n=3) | |
| HP Omen 16 (2024) | |
| 2560x1440 Epic Preset | |
| HP Omen 16 (2024) (Leistung) | |
| Medio NVIDIA GeForce RTX 4080 Laptop GPU (104.7 - 128.5, n=3) | |
| HP Omen 16 (2024) | |
| Media de la clase Gaming (n=1últimos 2 años) | |
| 1920x1080 Epic Preset | |
| HP Omen 16 (2024) (Leistung) | |
| Medio NVIDIA GeForce RTX 4080 Laptop GPU (143.9 - 192.5, n=3) | |
| HP Omen 16 (2024) | |
| Media de la clase Gaming (n=1últimos 2 años) | |
Witcher 3 FPS chart
| bajo | medio | alto | ultra | QHD | |
|---|---|---|---|---|---|
| GTA V (2015) | 184.2 | 181.1 | 173.8 | 109.7 | 100 |
| The Witcher 3 (2015) | 485 | 384 | 246 | 142 | 102.5 |
| Dota 2 Reborn (2015) | 215 | 191.6 | 177 | 163.4 | |
| Final Fantasy XV Benchmark (2018) | 183.9 | 152.8 | 129 | 98 | |
| X-Plane 11.11 (2018) | 177.3 | 156.2 | 126.9 | ||
| Strange Brigade (2018) | 382 | 307 | 263 | 239 | 179.5 |
| Cyberpunk 2077 (2023) | 111.3 | 96.4 | 94.1 | 83.9 | 56.2 |
| The Finals (2023) | 188.9 | 179.3 | 170.7 | 143.9 | 104.7 |
| Ready or Not (2023) | 267 | 127.6 | 121.5 | 118.6 | 102.1 |
| Enshrouded (2024) | 103.3 | 90.9 | 77.7 | 67.6 | 52.8 |
| Helldivers 2 (2024) | 110.6 | 110.4 | 103.9 | 100.8 | 85.7 |
Emisiones y energía - El portátil HP tiene una duración de batería decente
Emisiones sonoras
En el modo Equilibrado, el nivel de ruido alcanzó hasta 47 dB(A) a plena carga. El uso del modo Rendimiento dio como resultado un nivel de ruido significativamente superior, de 58 dB(A). El Omen 16 funcionó a un nivel de ruido confortable de 39 dB(A) mientras estaba en modo ECO - a costa del rendimiento.
Los ventiladores giran constantemente, incluso cuando el portátil está en reposo o realizando tareas cotidianas (por ejemplo, aplicaciones ofimáticas y de Internet). Esto se debe a la opción "Ventilador siempre encendido" de HP en la BIOS. Desactivarla permitirá que ambos ventiladores dejen de funcionar ocasionalmente.
Ruido
| Ocioso |
| 29 / 30 / 31 dB(A) |
| Carga |
| 46 / 47 dB(A) |
 | ||
30 dB silencioso 40 dB(A) audible 50 dB(A) ruidosamente alto |
||
min: | ||
| HP Omen 16 (2024) GeForce RTX 4080 Laptop GPU, i9-14900HX, SK hynix PC801 HFS001TEJ9X101N | MSI Vector 16 HX A14V GeForce RTX 4080 Laptop GPU, i9-14900HX, WD PC SN560 SDDPNQE-1T00 | Alienware m16 R1 AMD GeForce RTX 4080 Laptop GPU, R9 7845HX, Kioxia XG8 KXG80ZNV1T02 | Acer Predator Helios 18 N23Q2 GeForce RTX 4080 Laptop GPU, i9-13900HX, Samsung PM9A1 MZVL22T0HBLB | HP Omen 16-wf000 GeForce RTX 4080 Laptop GPU, i7-13700HX, SK hynix PC801 HFS002TEJ9X101N | |
|---|---|---|---|---|---|
| Noise | -15% | 5% | 4% | -1% | |
| apagado / medio ambiente * (dB) | 25 | 23.2 7% | 22.9 8% | 23 8% | 23 8% |
| Idle Minimum * (dB) | 29 | 33.5 -16% | 22.9 21% | 23 21% | 29.6 -2% |
| Idle Average * (dB) | 30 | 33.5 -12% | 29.7 1% | 23 23% | 29.8 1% |
| Idle Maximum * (dB) | 31 | 33.5 -8% | 29.7 4% | 23 26% | 30.4 2% |
| Load Average * (dB) | 46 | 52.1 -13% | 29.8 35% | 45.26 2% | 33.8 27% |
| Witcher 3 ultra * (dB) | 47 | 62 -32% | 54.7 -16% | 59.82 -27% | 57 -21% |
| Load Maximum * (dB) | 47 | 62 -32% | 54.7 -16% | 59.94 -28% | 58.3 -24% |
* ... más pequeño es mejor
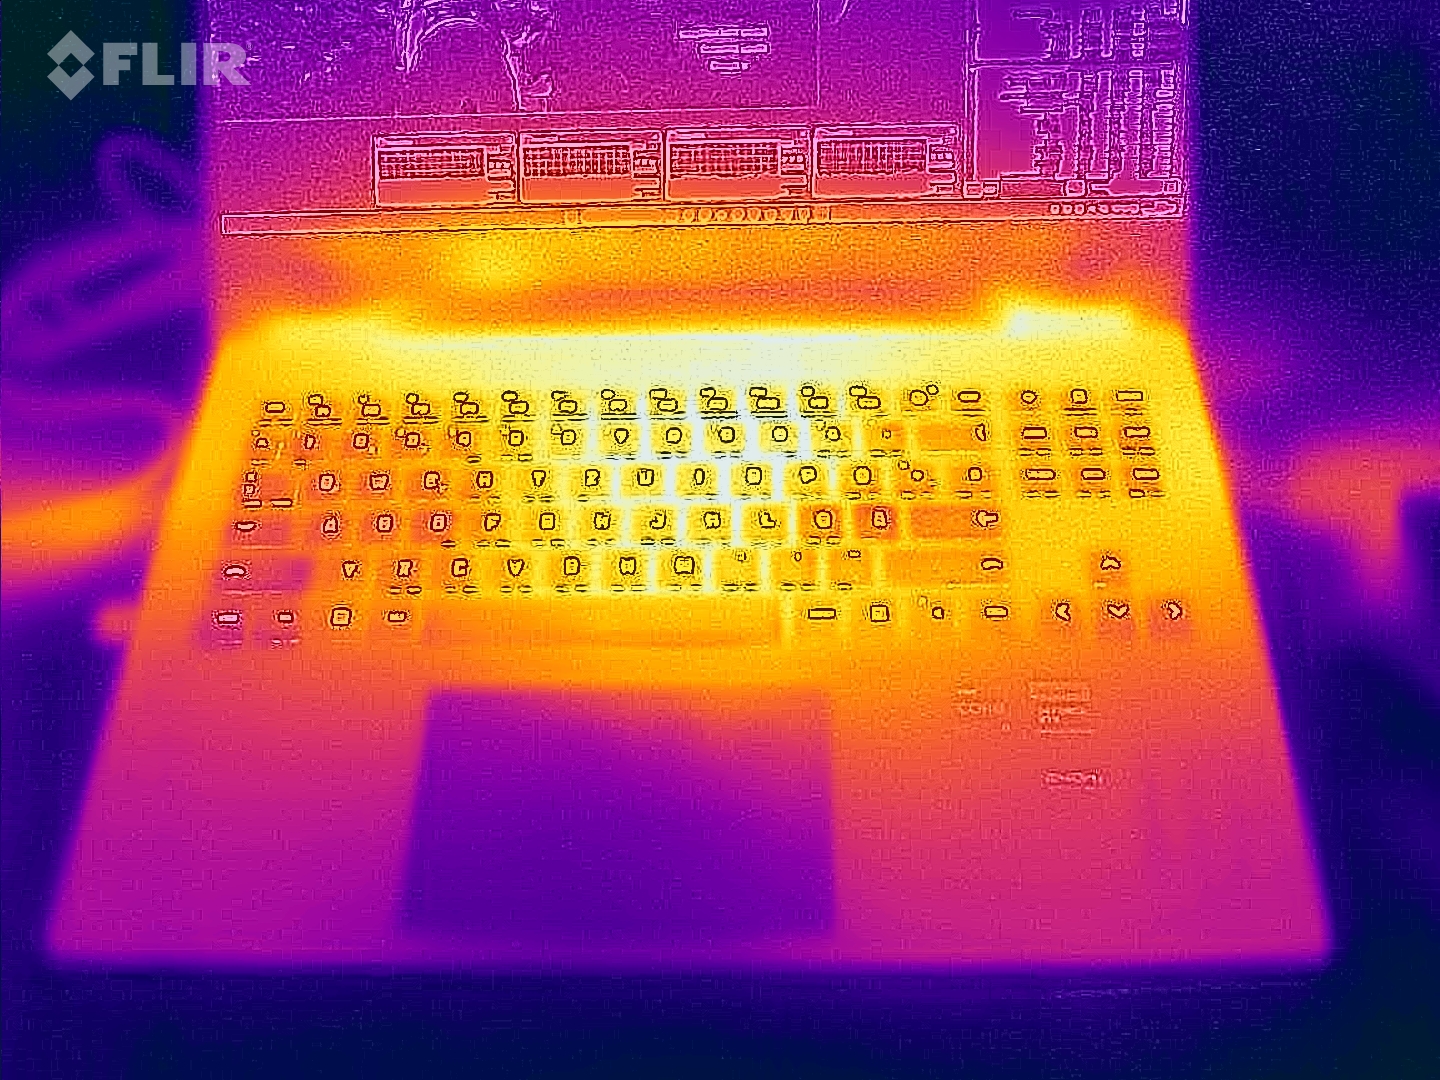
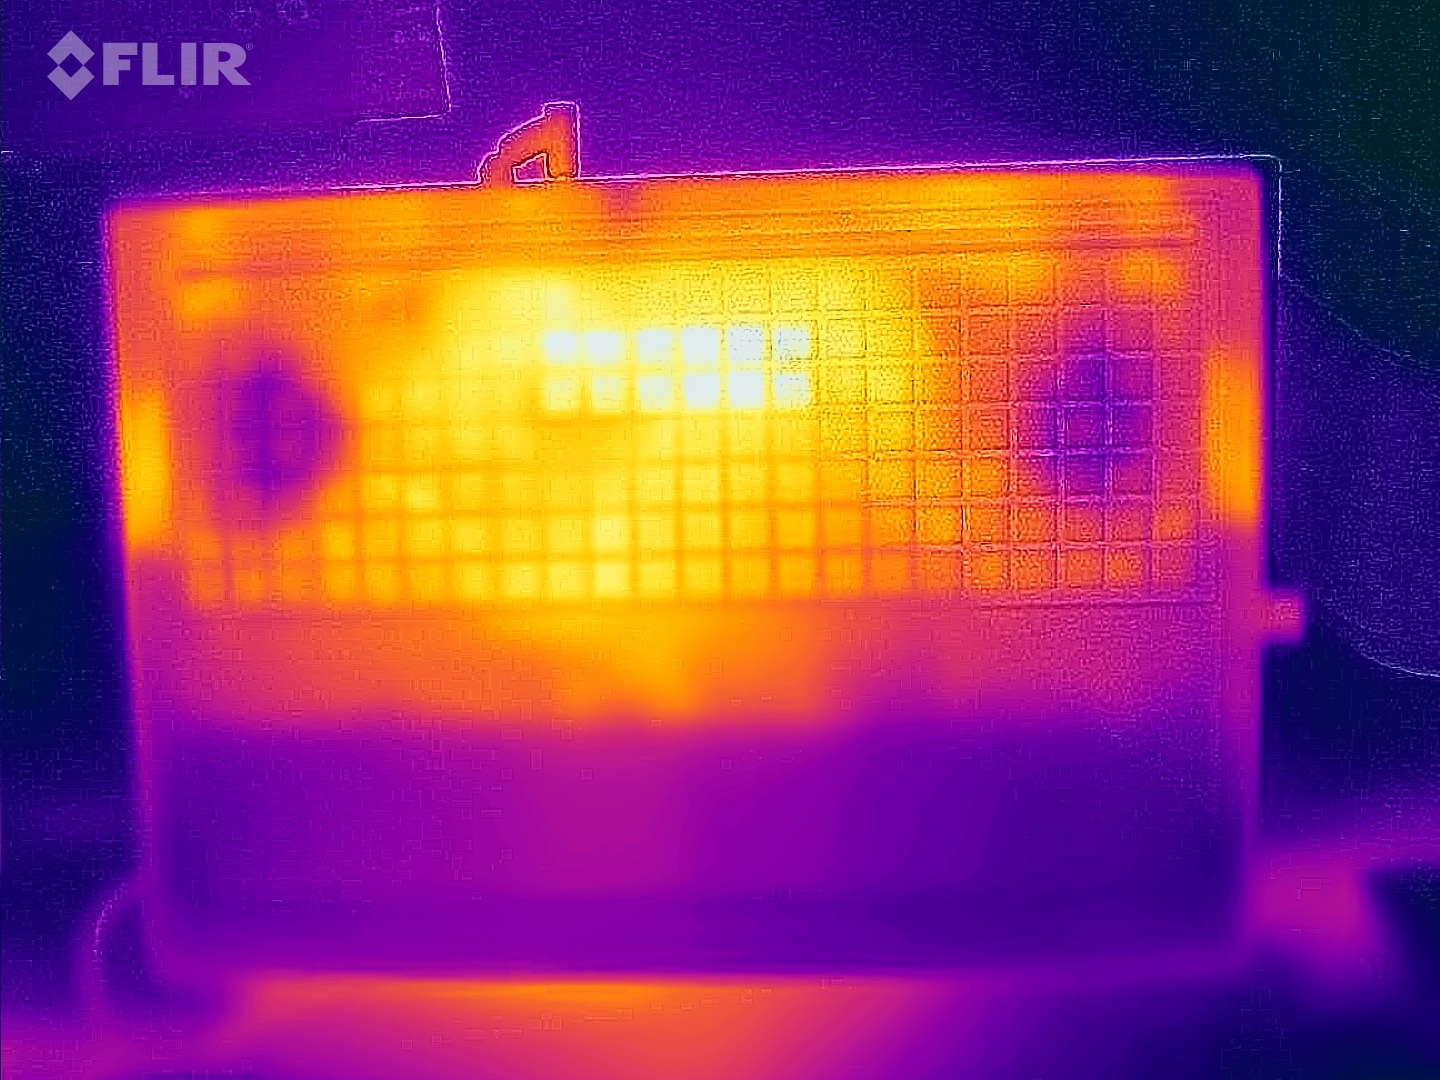
Temperatura
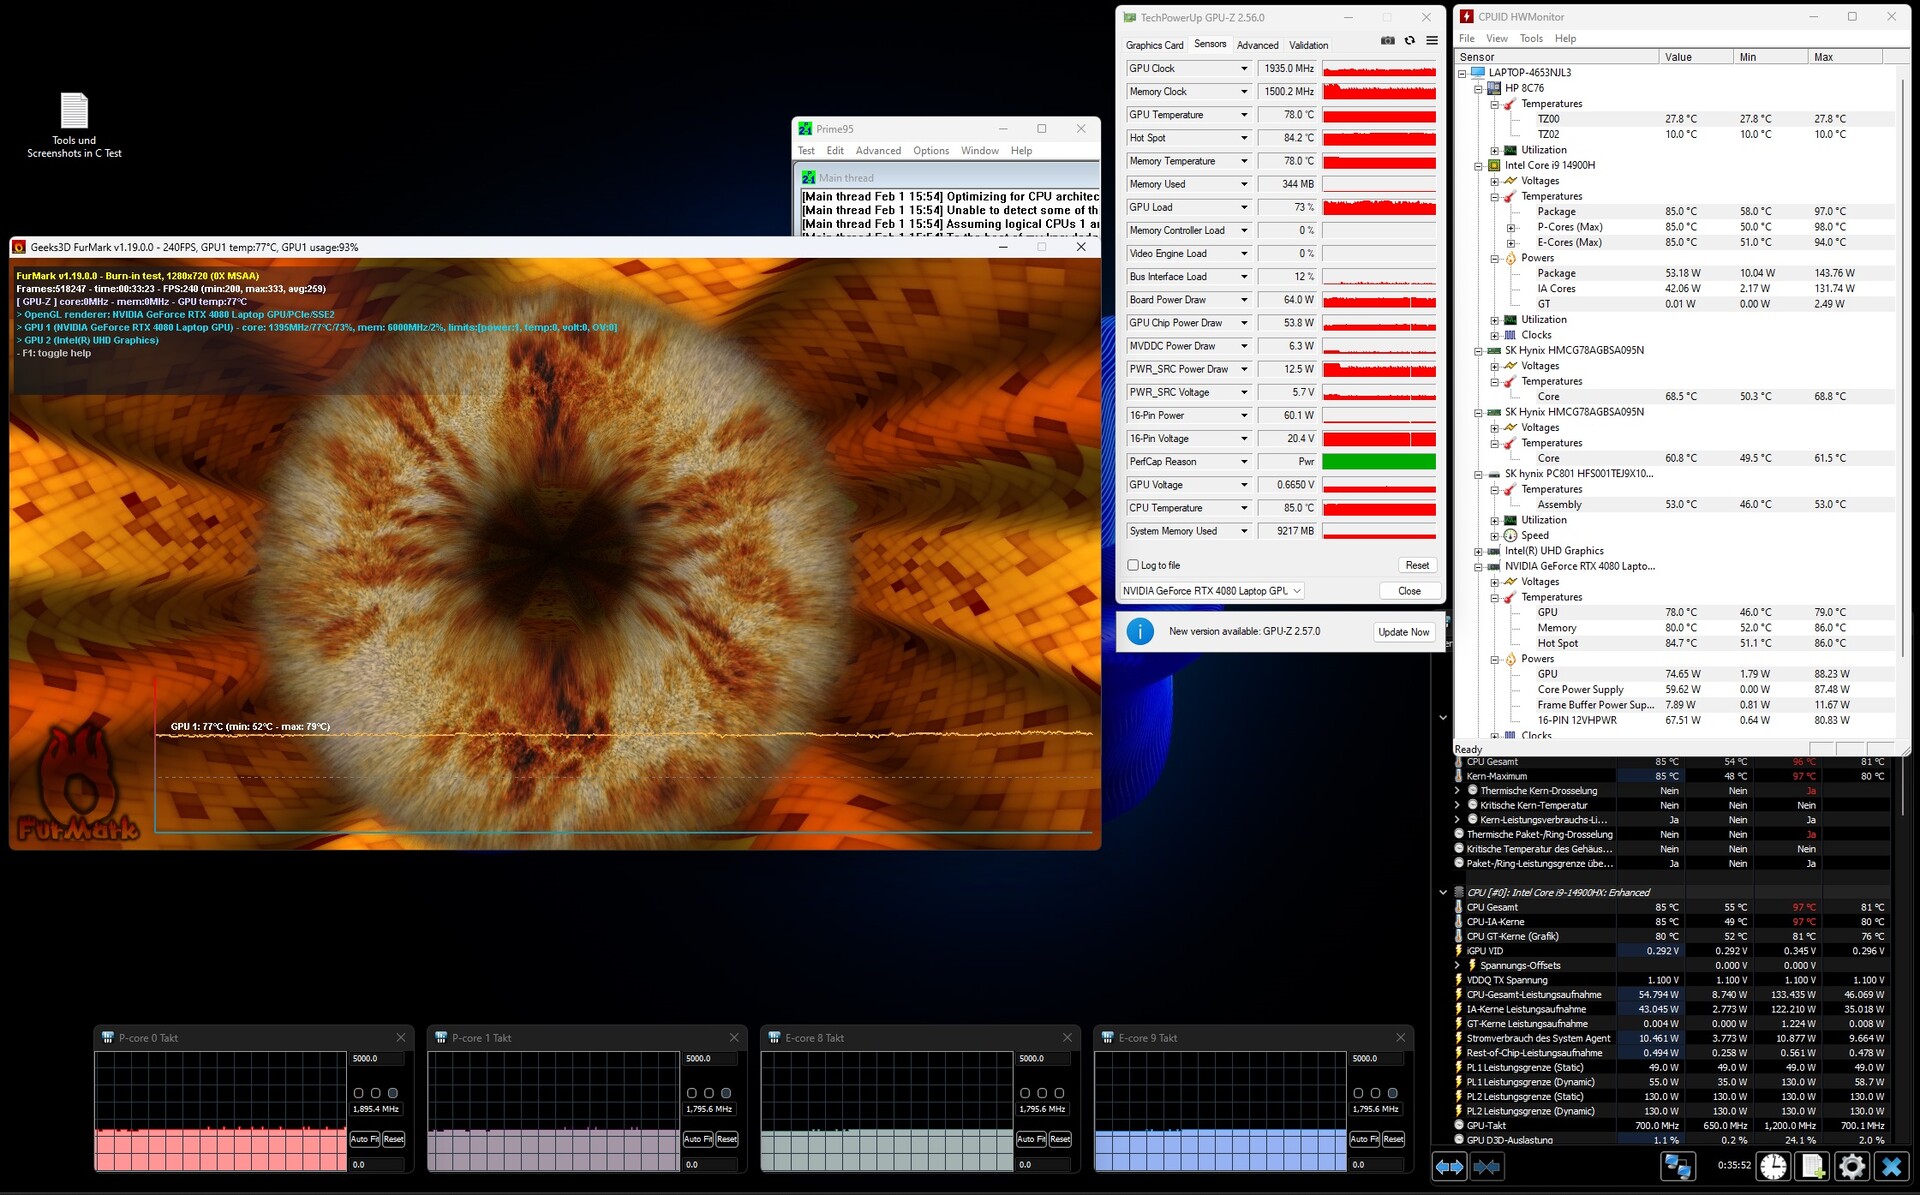
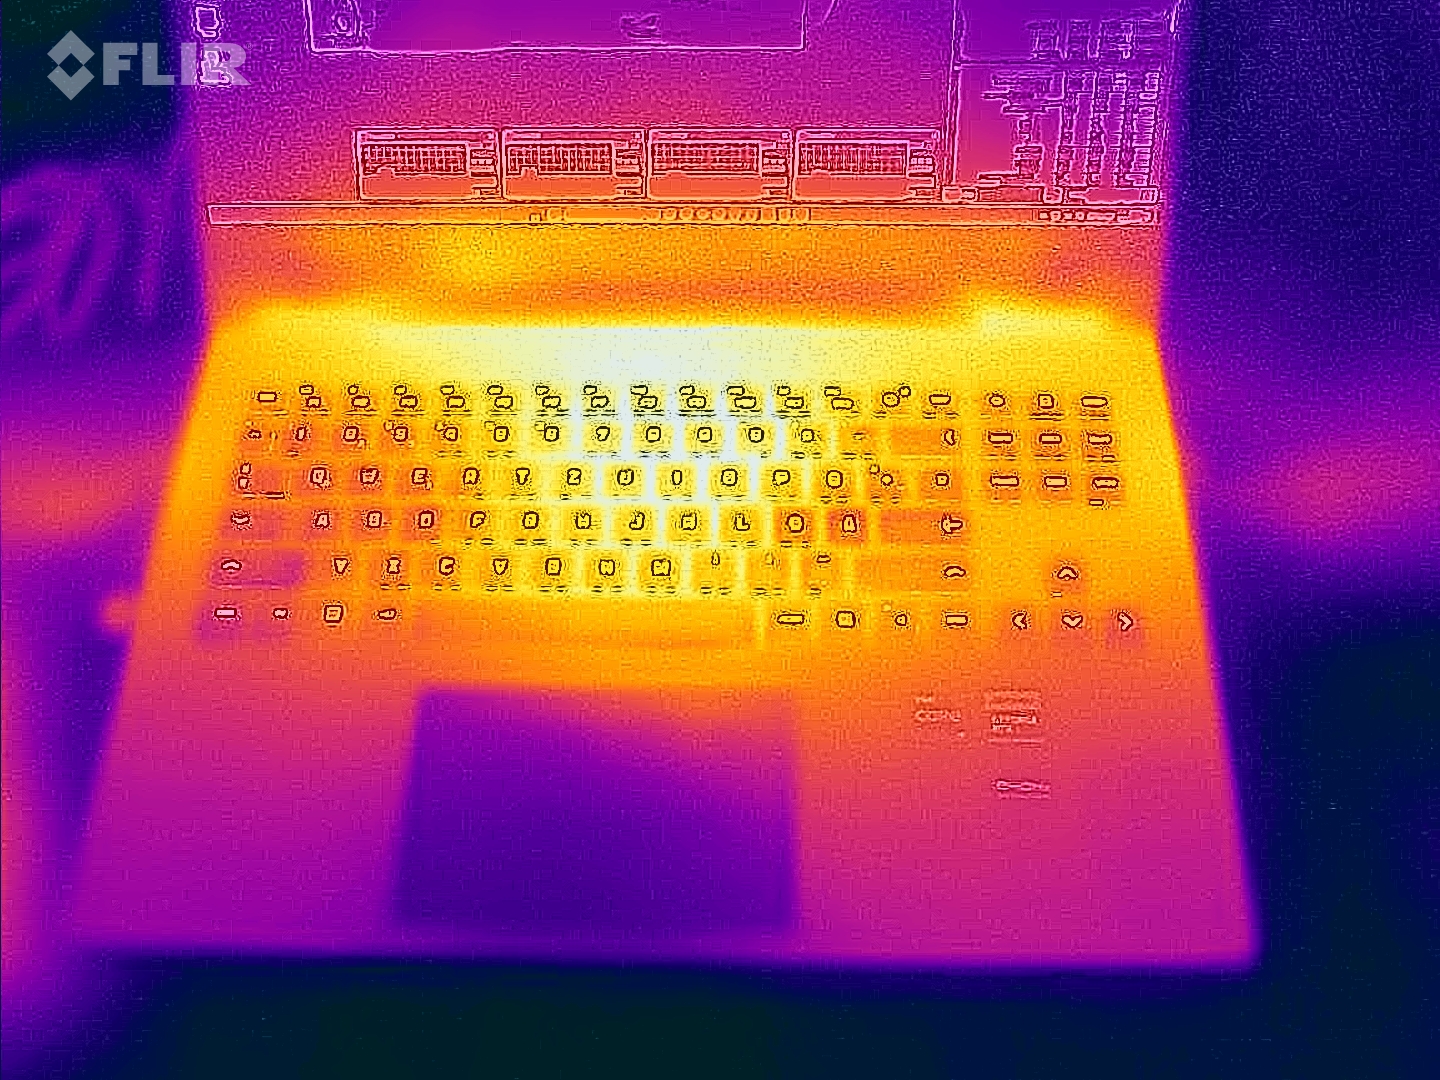
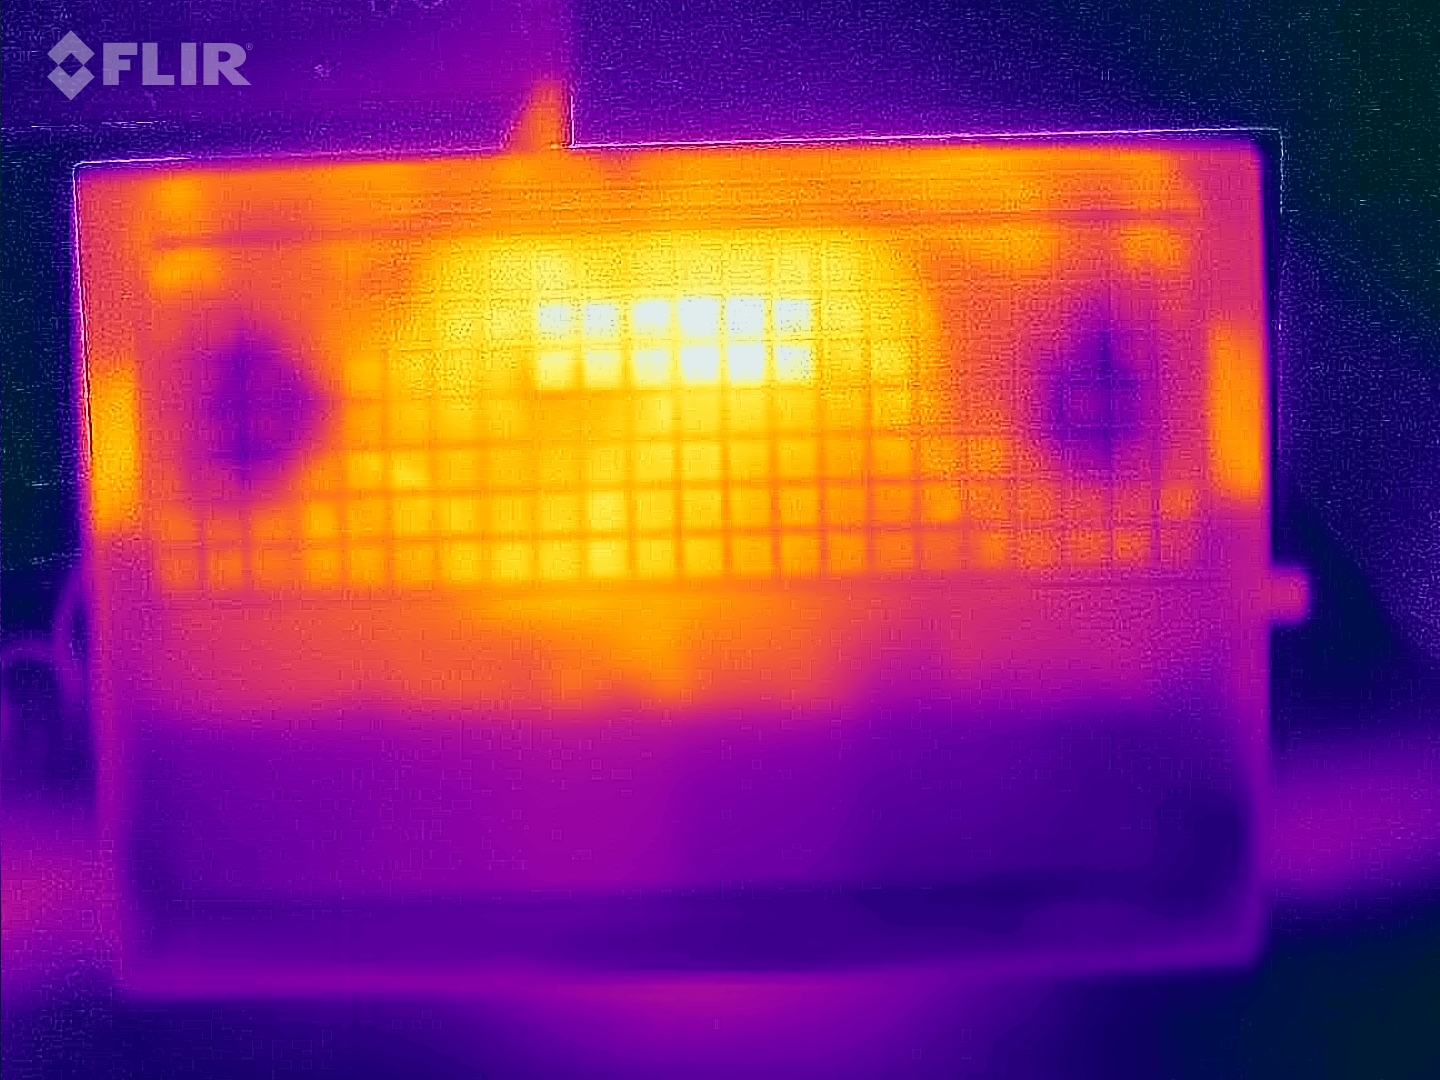
Nuestra prueba de estrés y la prueba Witcher 3 hicieron que el portátil se calentara notablemente, con temperaturas en la piel que superaban los 50°C en algunos puntos. Aunque las temperaturas se mantuvieron dentro de un rango aceptable en el uso diario.
Nuestra prueba de estrés consiste en ejecutar Prime95 y FurMark durante un periodo prolongado y representa un escenario extremo diseñado para evaluar la estabilidad del sistema a plena carga. Las velocidades de reloj de la CPU cayeron en picado con bastante rapidez desde los 3,4 GHz (P) y 2,9 GHz (E) iniciales hasta alrededor de 1,8 a 1,9 GHz (tanto P como E), y luego se mantuvieron en este nivel. La GPU funcionó a velocidades entre 1,9 y 2 GHz.
(-) La temperatura máxima en la parte superior es de 47 °C / 117 F, frente a la media de 40.4 °C / 105 F, que oscila entre 21.2 y 68.8 °C para la clase Gaming.
(-) El fondo se calienta hasta un máximo de 57 °C / 135 F, frente a la media de 43.2 °C / 110 F
(+) En reposo, la temperatura media de la parte superior es de 23.9 °C / 75# F, frente a la media del dispositivo de 33.9 °C / 93 F.
(-) Jugando a The Witcher 3, la temperatura media de la parte superior es de 39.3 °C / 103 F, frente a la media del dispositivo de 33.9 °C / 93 F.
(+) Los reposamanos y el panel táctil alcanzan como máximo la temperatura de la piel (35 °C / 95 F) y, por tanto, no están calientes.
(-) La temperatura media de la zona del reposamanos de dispositivos similares fue de 28.8 °C / 83.8 F (-6.2 °C / -11.2 F).
| HP Omen 16 (2024) Intel Core i9-14900HX, NVIDIA GeForce RTX 4080 Laptop GPU | MSI Vector 16 HX A14V Intel Core i9-14900HX, NVIDIA GeForce RTX 4080 Laptop GPU | Alienware m16 R1 AMD AMD Ryzen 9 7845HX, NVIDIA GeForce RTX 4080 Laptop GPU | Acer Predator Helios 18 N23Q2 Intel Core i9-13900HX, NVIDIA GeForce RTX 4080 Laptop GPU | HP Omen 16-wf000 Intel Core i7-13700HX, NVIDIA GeForce RTX 4080 Laptop GPU | |
|---|---|---|---|---|---|
| Heat | 13% | -14% | -15% | -3% | |
| Maximum Upper Side * (°C) | 47 | 36.4 23% | 48 -2% | 35 26% | 45 4% |
| Maximum Bottom * (°C) | 57 | 35.6 38% | 39 32% | 56 2% | 48.8 14% |
| Idle Upper Side * (°C) | 25 | 26.6 -6% | 37 -48% | 34 -36% | 29.2 -17% |
| Idle Bottom * (°C) | 26 | 27 -4% | 36.2 -39% | 39 -50% | 28.8 -11% |
* ... más pequeño es mejor
Altavoces
Los altavoces estéreo producen un sonido decente en general, pero carecen de graves.
HP Omen 16 (2024) análisis de audio
(±) | la sonoridad del altavoz es media pero buena (78 dB)
Graves 100 - 315 Hz
(-) | casi sin bajos - de media 15.2% inferior a la mediana
(±) | la linealidad de los graves es media (14.3% delta a frecuencia anterior)
Medios 400 - 2000 Hz
(+) | medios equilibrados - a sólo 4.8% de la mediana
(+) | los medios son lineales (5% delta a la frecuencia anterior)
Altos 2 - 16 kHz
(+) | máximos equilibrados - a sólo 2% de la mediana
(+) | los máximos son lineales (4.1% delta a la frecuencia anterior)
Total 100 - 16.000 Hz
(+) | el sonido global es lineal (14.7% de diferencia con la mediana)
En comparación con la misma clase
» 29% de todos los dispositivos probados de esta clase eran mejores, 7% similares, 64% peores
» El mejor tuvo un delta de 6%, la media fue 18%, el peor fue ###max##%
En comparación con todos los dispositivos probados
» 19% de todos los dispositivos probados eran mejores, 4% similares, 77% peores
» El mejor tuvo un delta de 4%, la media fue 23%, el peor fue ###max##%
MSI Vector 16 HX A14V análisis de audio
(+) | los altavoces pueden reproducir a un volumen relativamente alto (#85 dB)
Graves 100 - 315 Hz
(±) | lubina reducida - en promedio 12.7% inferior a la mediana
(+) | el bajo es lineal (6.8% delta a la frecuencia anterior)
Medios 400 - 2000 Hz
(+) | medios equilibrados - a sólo 3% de la mediana
(+) | los medios son lineales (3.6% delta a la frecuencia anterior)
Altos 2 - 16 kHz
(+) | máximos equilibrados - a sólo 3.1% de la mediana
(+) | los máximos son lineales (6.7% delta a la frecuencia anterior)
Total 100 - 16.000 Hz
(+) | el sonido global es lineal (12.6% de diferencia con la mediana)
En comparación con la misma clase
» 16% de todos los dispositivos probados de esta clase eran mejores, 4% similares, 81% peores
» El mejor tuvo un delta de 6%, la media fue 18%, el peor fue ###max##%
En comparación con todos los dispositivos probados
» 11% de todos los dispositivos probados eran mejores, 3% similares, 86% peores
» El mejor tuvo un delta de 4%, la media fue 23%, el peor fue ###max##%
Consumo de energía
El Omen 16 no mostró ningún problema relacionado con el uso de energía, con niveles dentro del rango normal para el hardware que lleva en su interior. El portátil consumió una cantidad constante de energía cuando se sometió a nuestra prueba Witcher 3 y a la prueba de estrés. Con una potencia nominal de 280 vatios, el cargador es lo suficientemente potente para el Omen.
| Off / Standby | |
| Ocioso | |
| Carga |
|
Clave:
min: | |
Power consumption Witcher 3 / Stress test
Power consumption with external monitor
Duración de las pilas
El portátil de 16 pulgadas consiguió durar 5h 52min en nuestra prueba Wi-Fi realista (accediendo a sitios web con un script para simular una carga) - un resultado decente. El Omen ofreció así la mejor duración de batería de nuestra comparativa y superó a su predecesor en 45 minutos.
Pro
Contra
Veredicto - Sólida bestia de los juegos
Juegos, streaming y renderizado son algunas de las cosas en las que el HP Omen 16 es experto. El Core i9-14900HX y GeForce RTX 4080 ofrecen el rendimiento necesario, mientras que la SSD PCIe 4.0 de 1 TB garantiza tiempos de carga cortos. Las emisiones de calor y ruido suelen ser elevadas en esta clase de portátiles. Pero el Omen 16 es capaz de mantenerlas a un nivel moderado, renunciando al rendimiento.
El HP Omen 16 (2024) es un portátil para juegos sólido y potente que se centra en lo esencial.
Desoyendo la tendencia de utilizar pantallas 16:10, HP ha decidido ceñirse a una relación de aspecto 16:9. El panel de 16,1 pulgadas (2.560 x 1.440 píxeles, sRGB, IPS, 240 Hz, G-Sync) deja una gran impresión en general. No obstante, la pantalla de un portátil que cuesta 3.200 euros (3.446 dólares) debería ofrecer más en términos de brillo y cobertura de color.
Los dos puertos USB-C (Thunderbolt 4) facilitan la integración del portátil en configuraciones de estaciones de trabajo existentes y abren opciones de ampliación (por ejemplo, GPU externa, base de acoplamiento). Ambos puertos pueden emitir una señal DisplayPort y admiten Power Delivery. La duración de la batería del portátil también es decente.
El MSI Vector 16 HX A14V es una alternativa potencial al Omen 16. Con la misma combinación de CPU/GPU, el Vector 16 ofrece más rendimiento y tiene una pantalla mucho más brillante y vibrante (DCI-P3, 16:10). Sin embargo, el Vector sólo tiene un puerto Thunderbolt 4 y una pantalla que no soporta G-Sync.
Precio y disponibilidad
En Alemania, el HP Omen 16-wf1078ng está disponible en distribuidores como Office-Partner.de y Otto.de al precio de 3.200 euros (3.446 dólares). También puede encontrar un modelo de especificaciones inferiores con un Core i7-13700HX y RTX 4060 por 1.500 dólares en Amazon US.
HP Omen 16 (2024)
- 02/16/2024 v7 (old)
Sascha Mölck
Transparencia
La selección de los dispositivos que se van a reseñar corre a cargo de nuestro equipo editorial. La muestra de prueba fue proporcionada al autor en calidad de préstamo por el fabricante o el minorista a los efectos de esta reseña. El prestamista no tuvo ninguna influencia en esta reseña, ni el fabricante recibió una copia de la misma antes de su publicación. No había ninguna obligación de publicar esta reseña. Como empresa de medios independiente, Notebookcheck no está sujeta a la autoridad de fabricantes, minoristas o editores.
Así es como prueba Notebookcheck
Cada año, Notebookcheck revisa de forma independiente cientos de portátiles y smartphones utilizando procedimientos estandarizados para asegurar que todos los resultados son comparables. Hemos desarrollado continuamente nuestros métodos de prueba durante unos 20 años y hemos establecido los estándares de la industria en el proceso. En nuestros laboratorios de pruebas, técnicos y editores experimentados utilizan equipos de medición de alta calidad. Estas pruebas implican un proceso de validación en varias fases. Nuestro complejo sistema de clasificación se basa en cientos de mediciones y puntos de referencia bien fundamentados, lo que mantiene la objetividad.Price comparison

