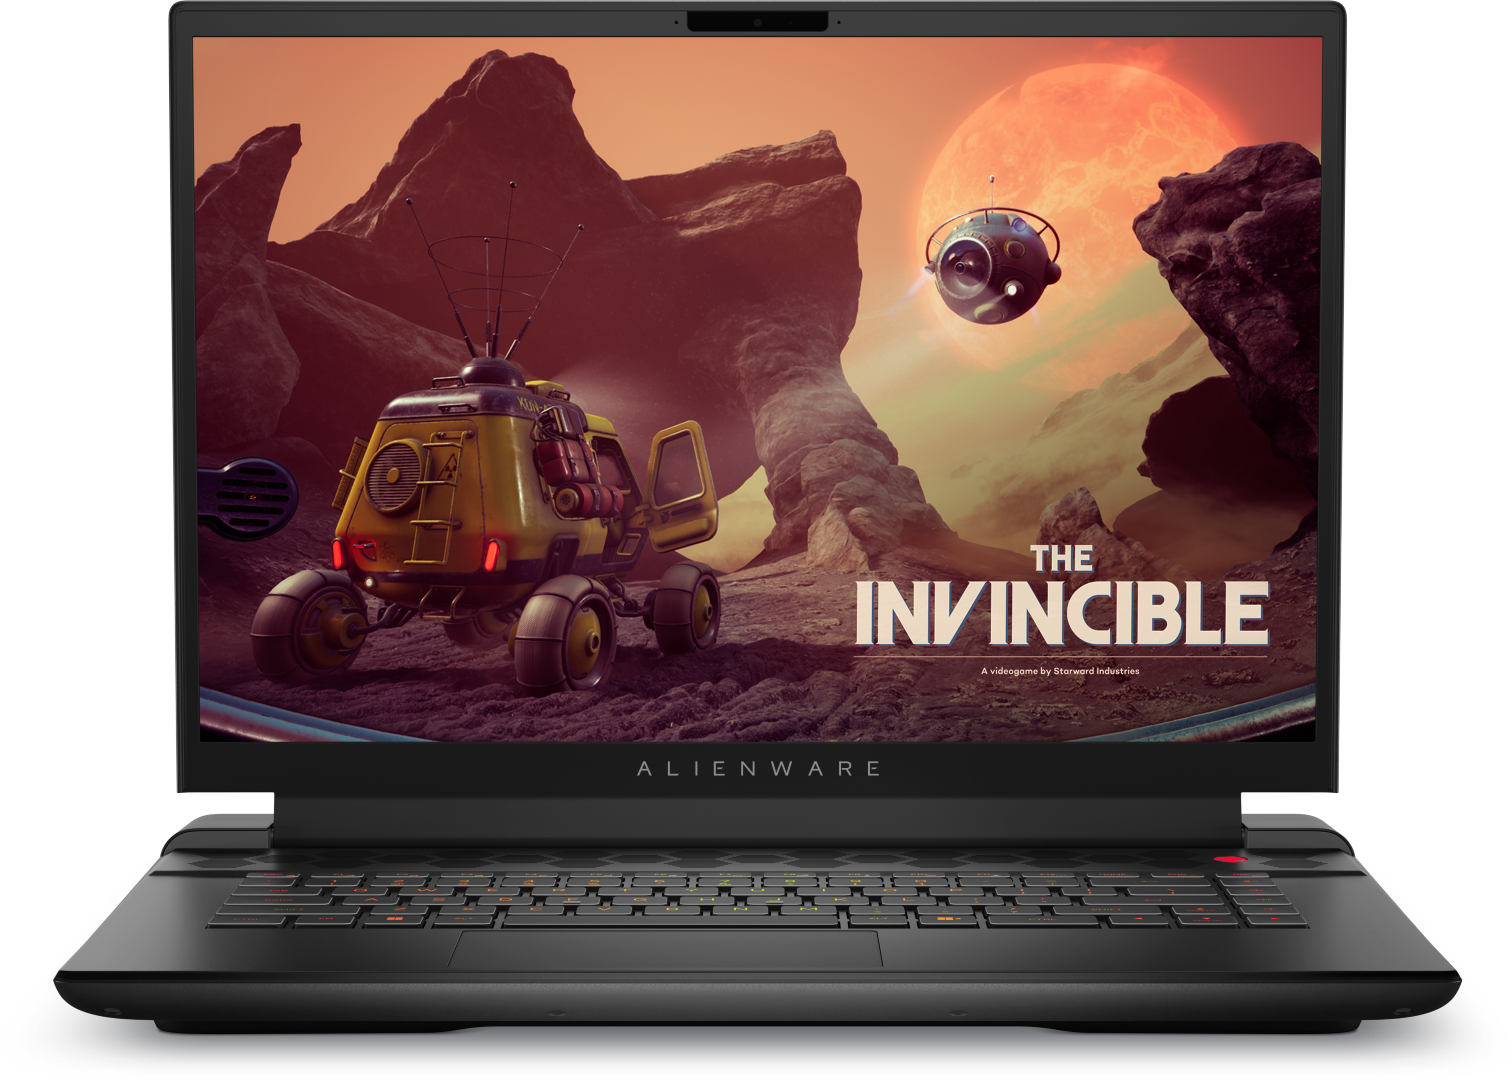
Debut del rendimiento de AMD Ryzen 9 7845HX: Análisis del portátil Alienware m16 R1

Después de haber lanzado el Alienware m15de 17 pulgadas Alienware m17y el Alienware m18dell ya tiene listo el Alienware m16 de 16 pulgadas con las últimas GPU Nvidia Ada Lovelace y la posibilidad de elegir entre procesadores Intel Raptor Lake de 13ª generación o AMD Zen 4. El Alienware m16 es distinto del reciente Alienware x16 que es un modelo aún más delgado con especificaciones y características diferentes.
Nuestra unidad de análisis es una configuración AMD de gama media-alta con Ryzen 9 7845HX, GPU GeForce RTX 4080 de 175 W y pantalla IPS 1600p240 por unos 2350 dólares. Las versiones más económicas vienen equipadas con la CPU Ryzen 7 7745HX y la GPU Radeon RX 7600M por 2150 $, mientras que las más caras con Ryzen 9 7945HX y RTX 4090 pueden superar los 3100 $ en función de las preferencias de RAM y SSD. Por su parte, las versiones Intel vienen con las mismas opciones de pantalla y GPU Nvidia pero con Core i7-13700HX o i9-13900HX.
Entre sus competidores se encuentran otros portátiles para juegos de 16 pulgadas como el HP Omen 16, Lenovo Legion Pro 7 16, Asus ROG Strix G16o el Razer Blade 16.
Más opiniones sobre Dell:
Posibles contendientes en la comparación
Valoración | Fecha | Modelo | Peso | Altura | Tamaño | Resolución | Precio |
|---|---|---|---|---|---|---|---|
| 89.2 % v7 (old) | 08/2023 | Alienware m16 R1 AMD R9 7845HX, GeForce RTX 4080 Laptop GPU | 3.1 kg | 25.4 mm | 16.00" | 2560x1600 | |
| 88.4 % v7 (old) | 06/2023 | Alienware x16 R1 i9-13900HK, GeForce RTX 4080 Laptop GPU | 2.6 kg | 18.57 mm | 16.00" | 2560x1600 | |
| 87.9 % v7 (old) | 08/2023 | HP Omen Transcend 16 i9-13900HX, GeForce RTX 4070 Laptop GPU | 2.3 kg | 19.8 mm | 16.00" | 2560x1600 | |
| 88.8 % v7 (old) | 06/2023 | Lenovo Legion Pro 7 RTX4090 i9-13900HX, GeForce RTX 4090 Laptop GPU | 2.7 kg | 26 mm | 16.00" | 2560x1600 | |
| 88.4 % v7 (old) | 03/2023 | Asus ROG Strix G16 G614JZ i9-13980HX, GeForce RTX 4080 Laptop GPU | 2.4 kg | 30.4 mm | 16.00" | 2560x1600 | |
| 91.2 % v7 (old) | 02/2023 | Razer Blade 16 Early 2023 i9-13950HX, GeForce RTX 4080 Laptop GPU | 2.4 kg | 21.99 mm | 16.00" | 2560x1600 |
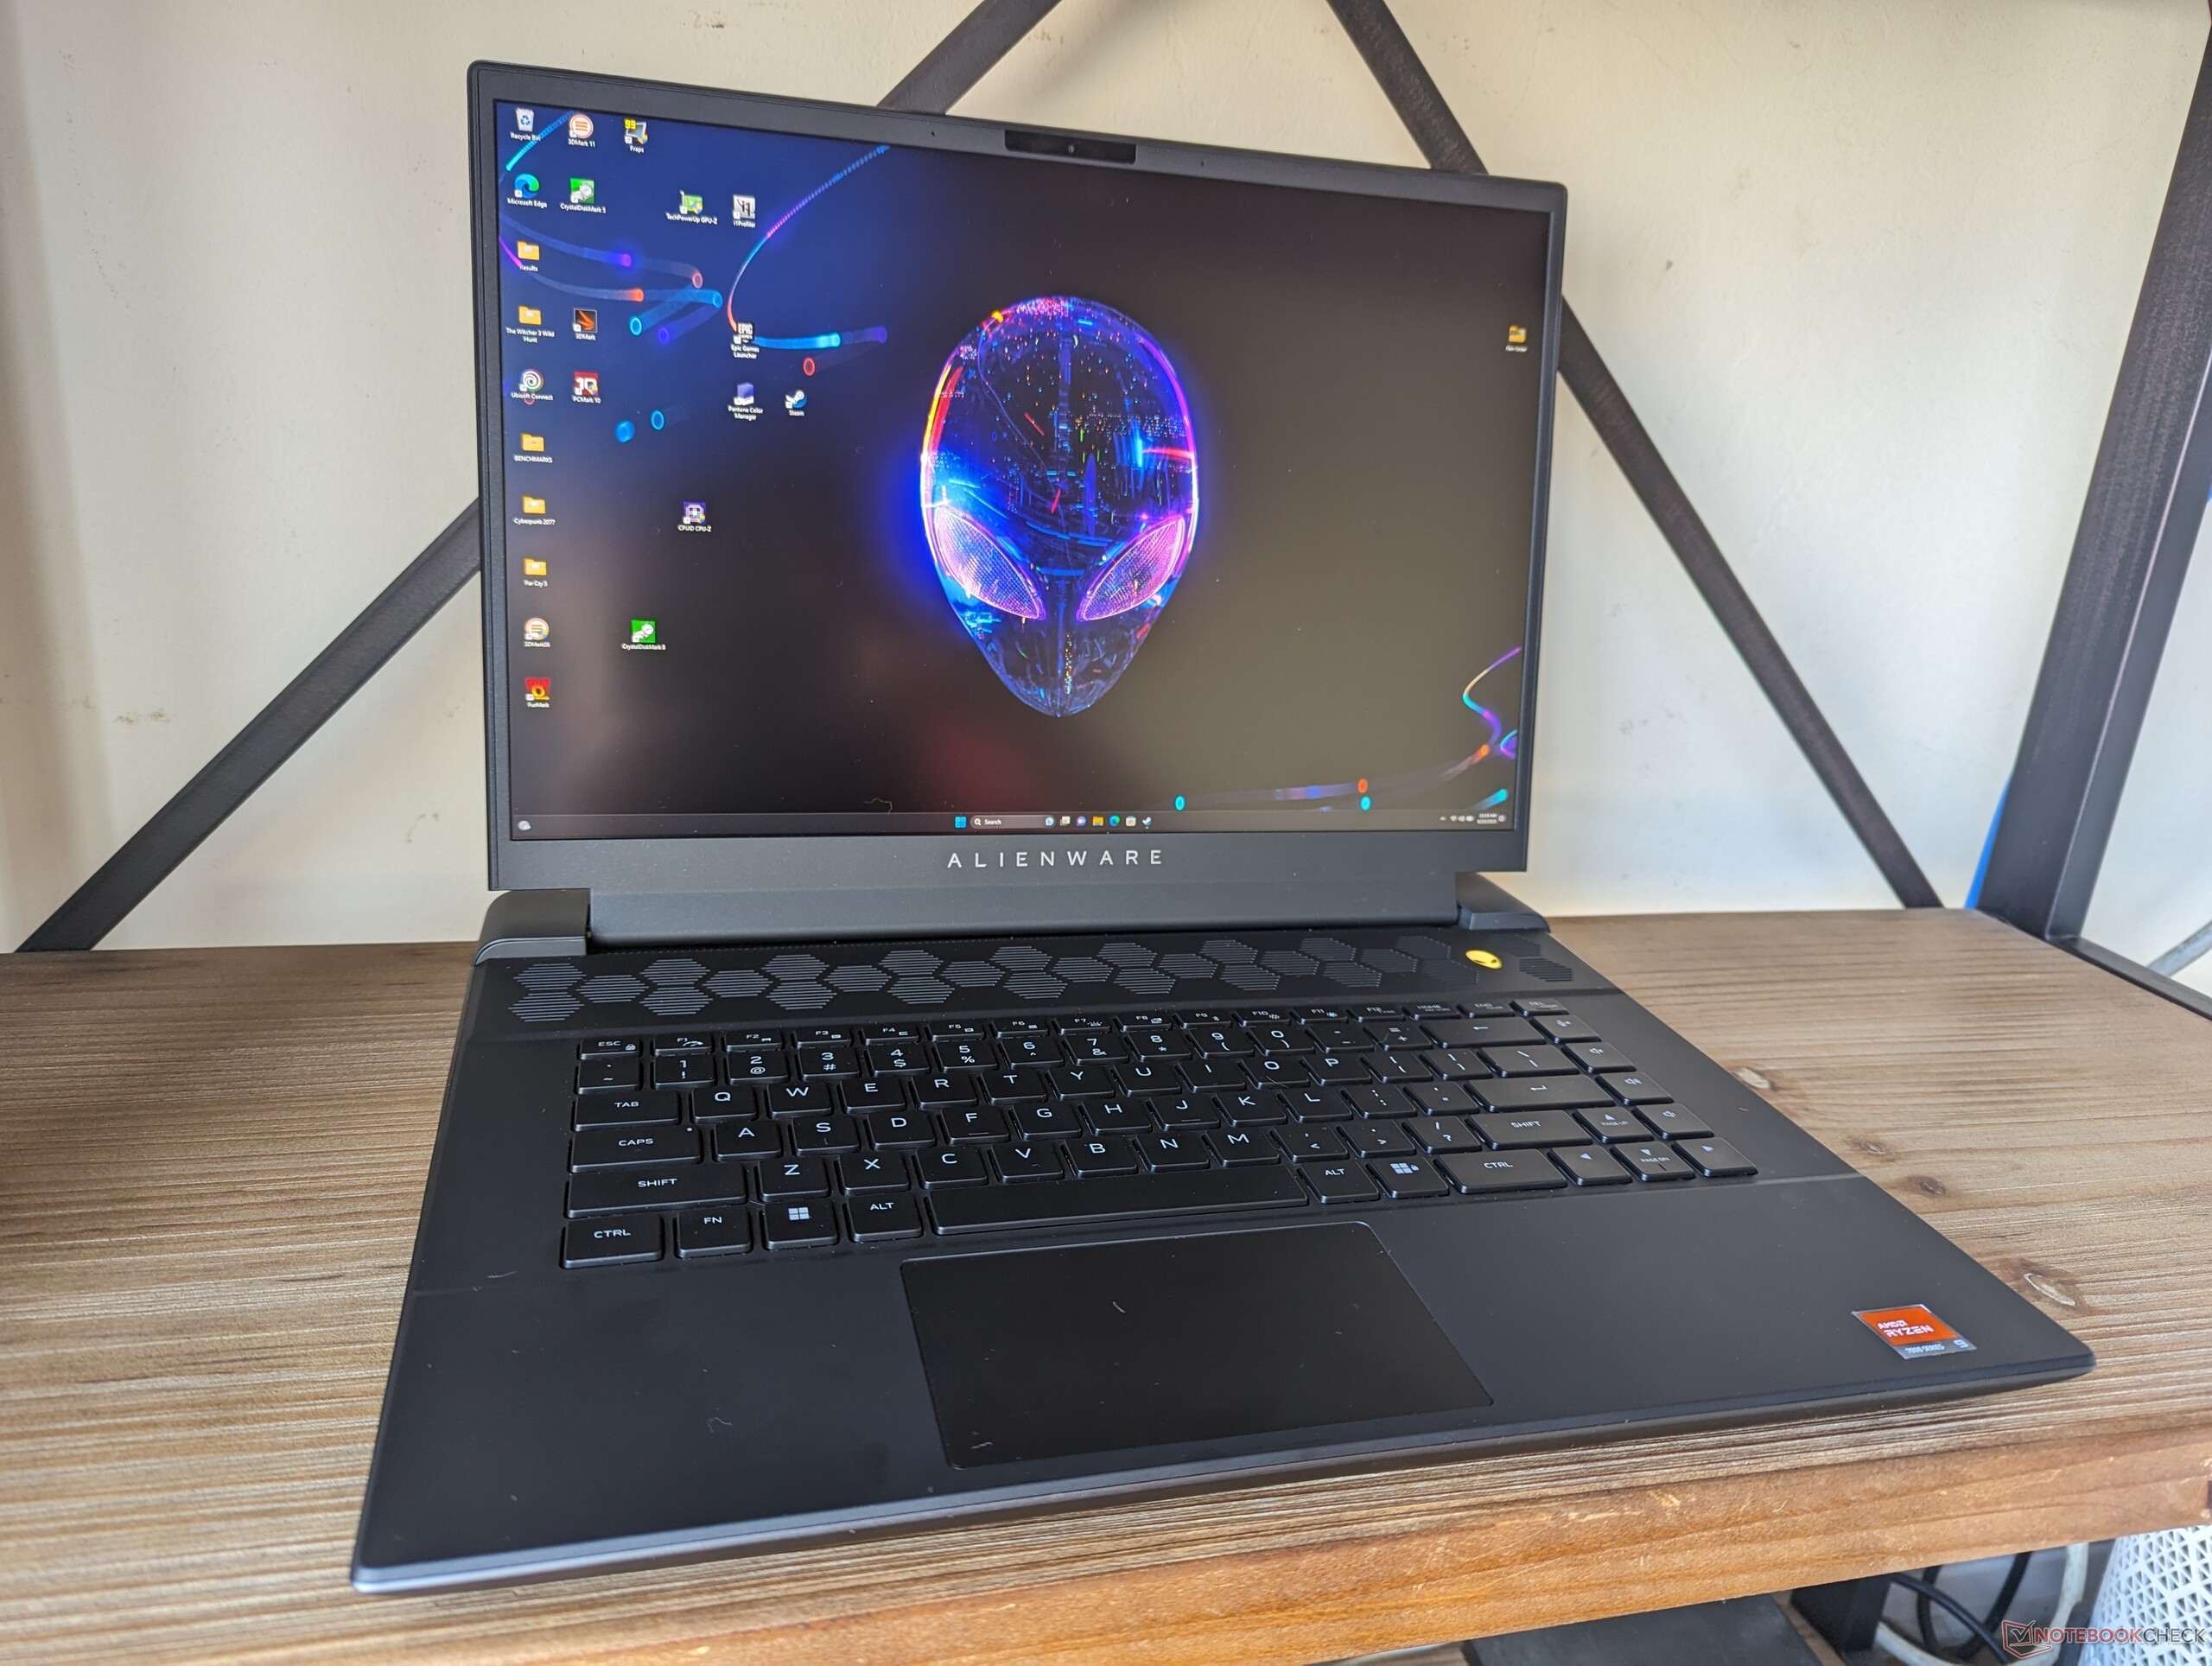
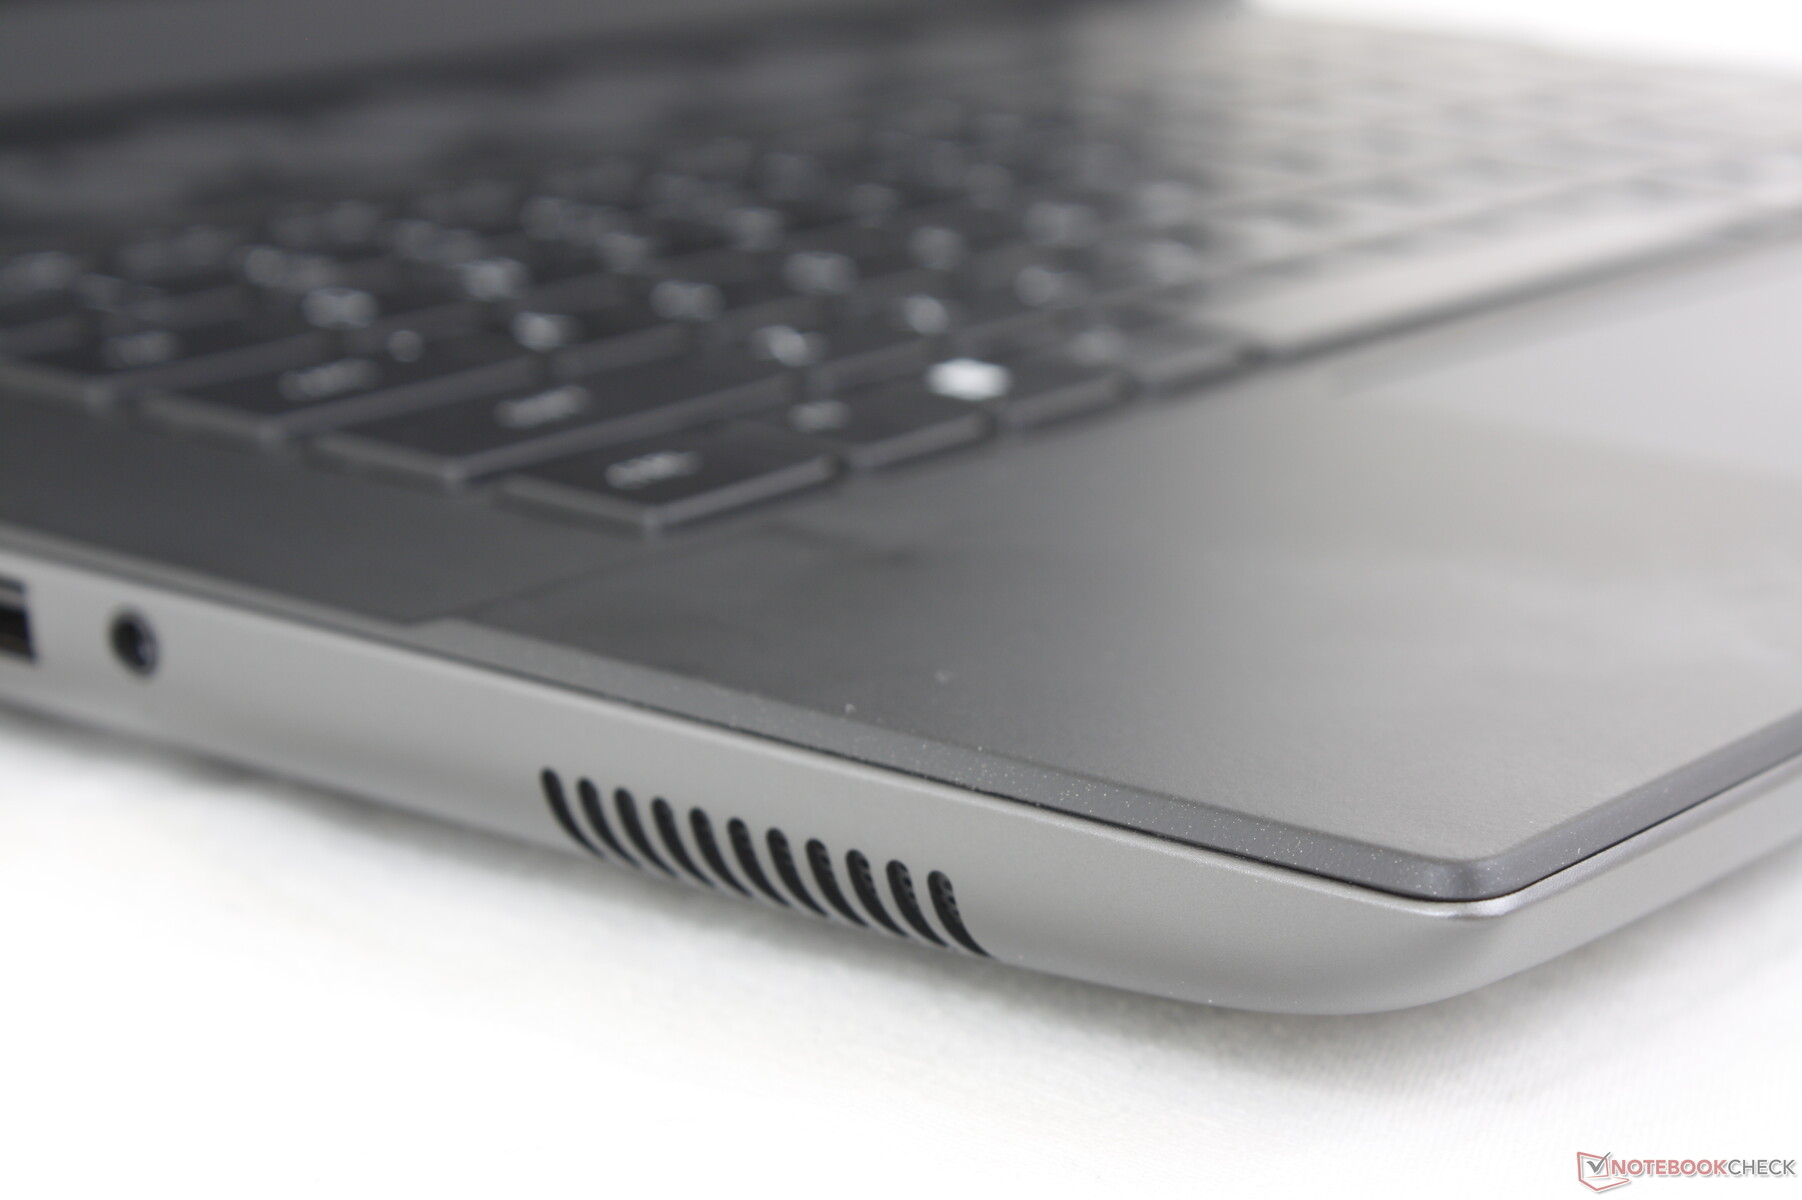
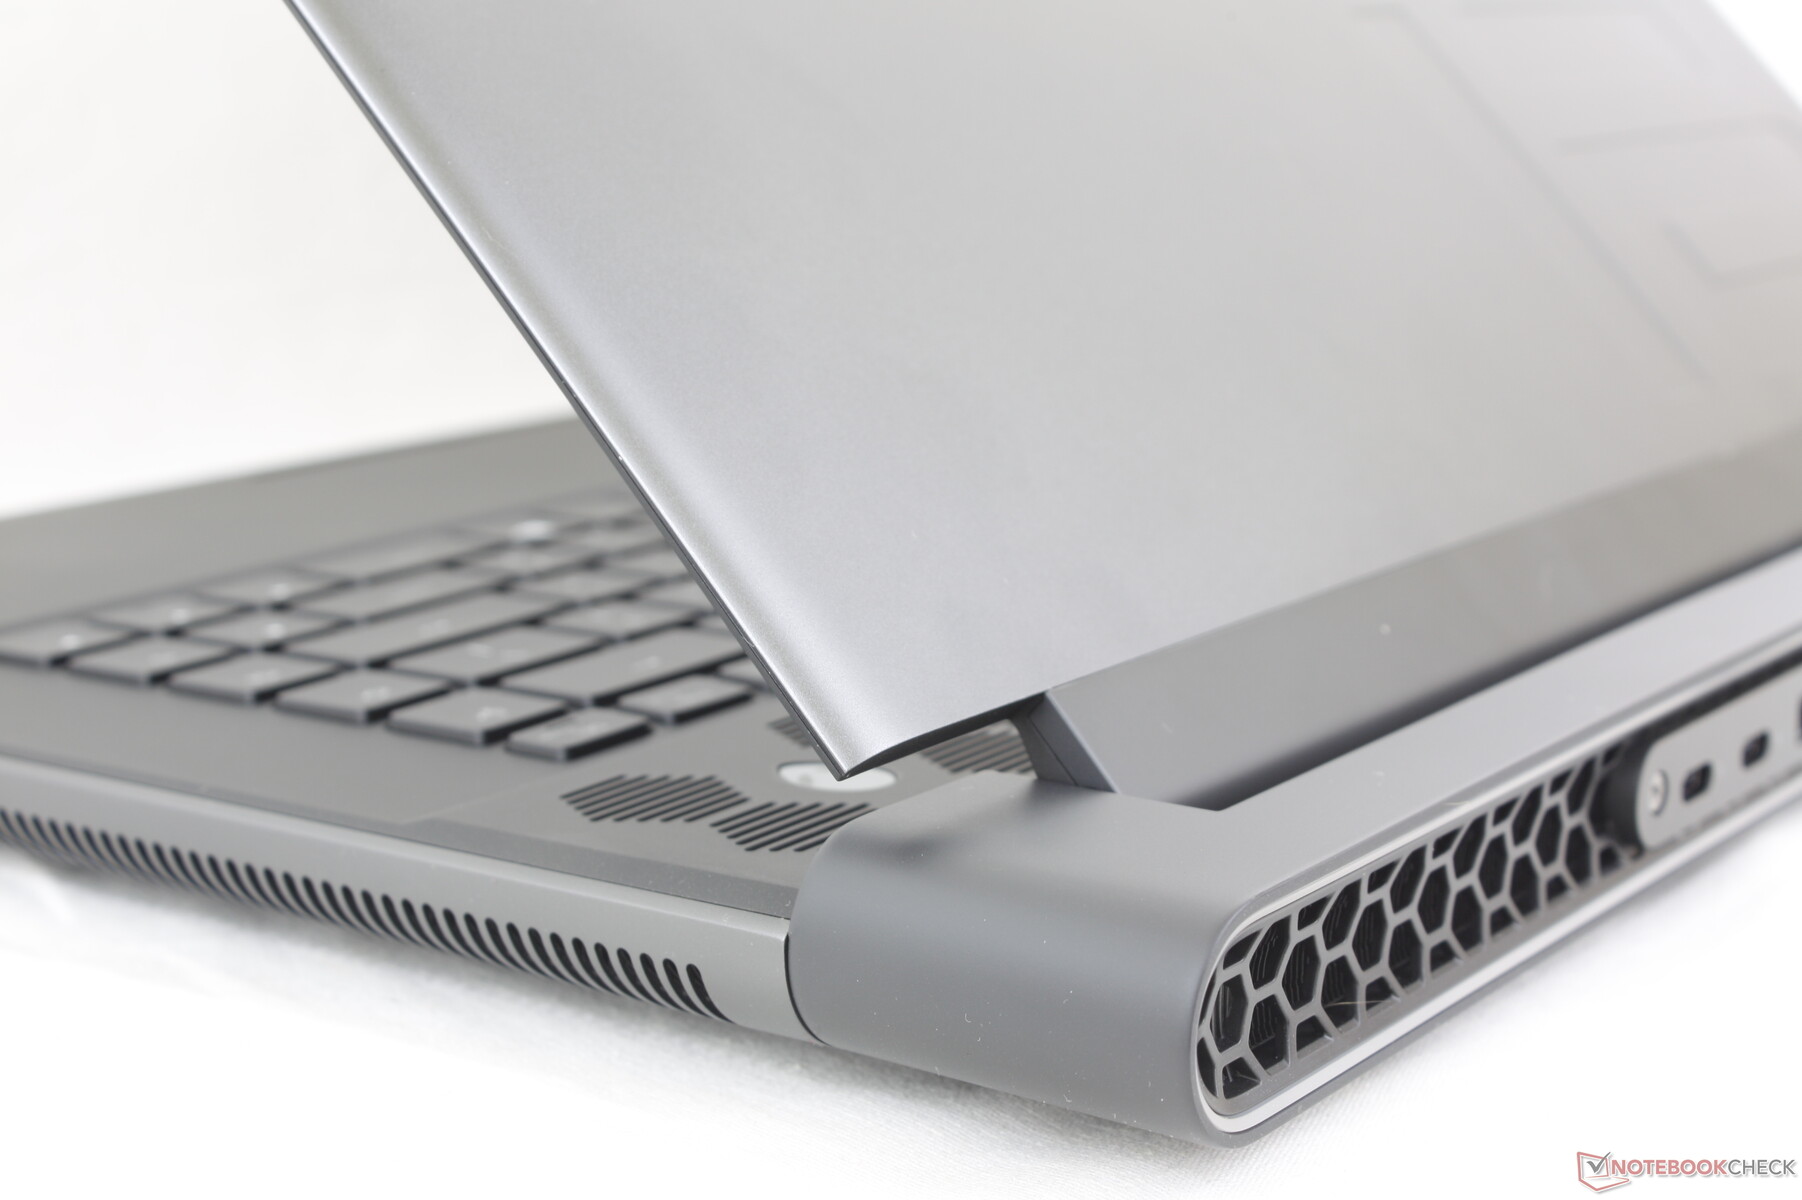
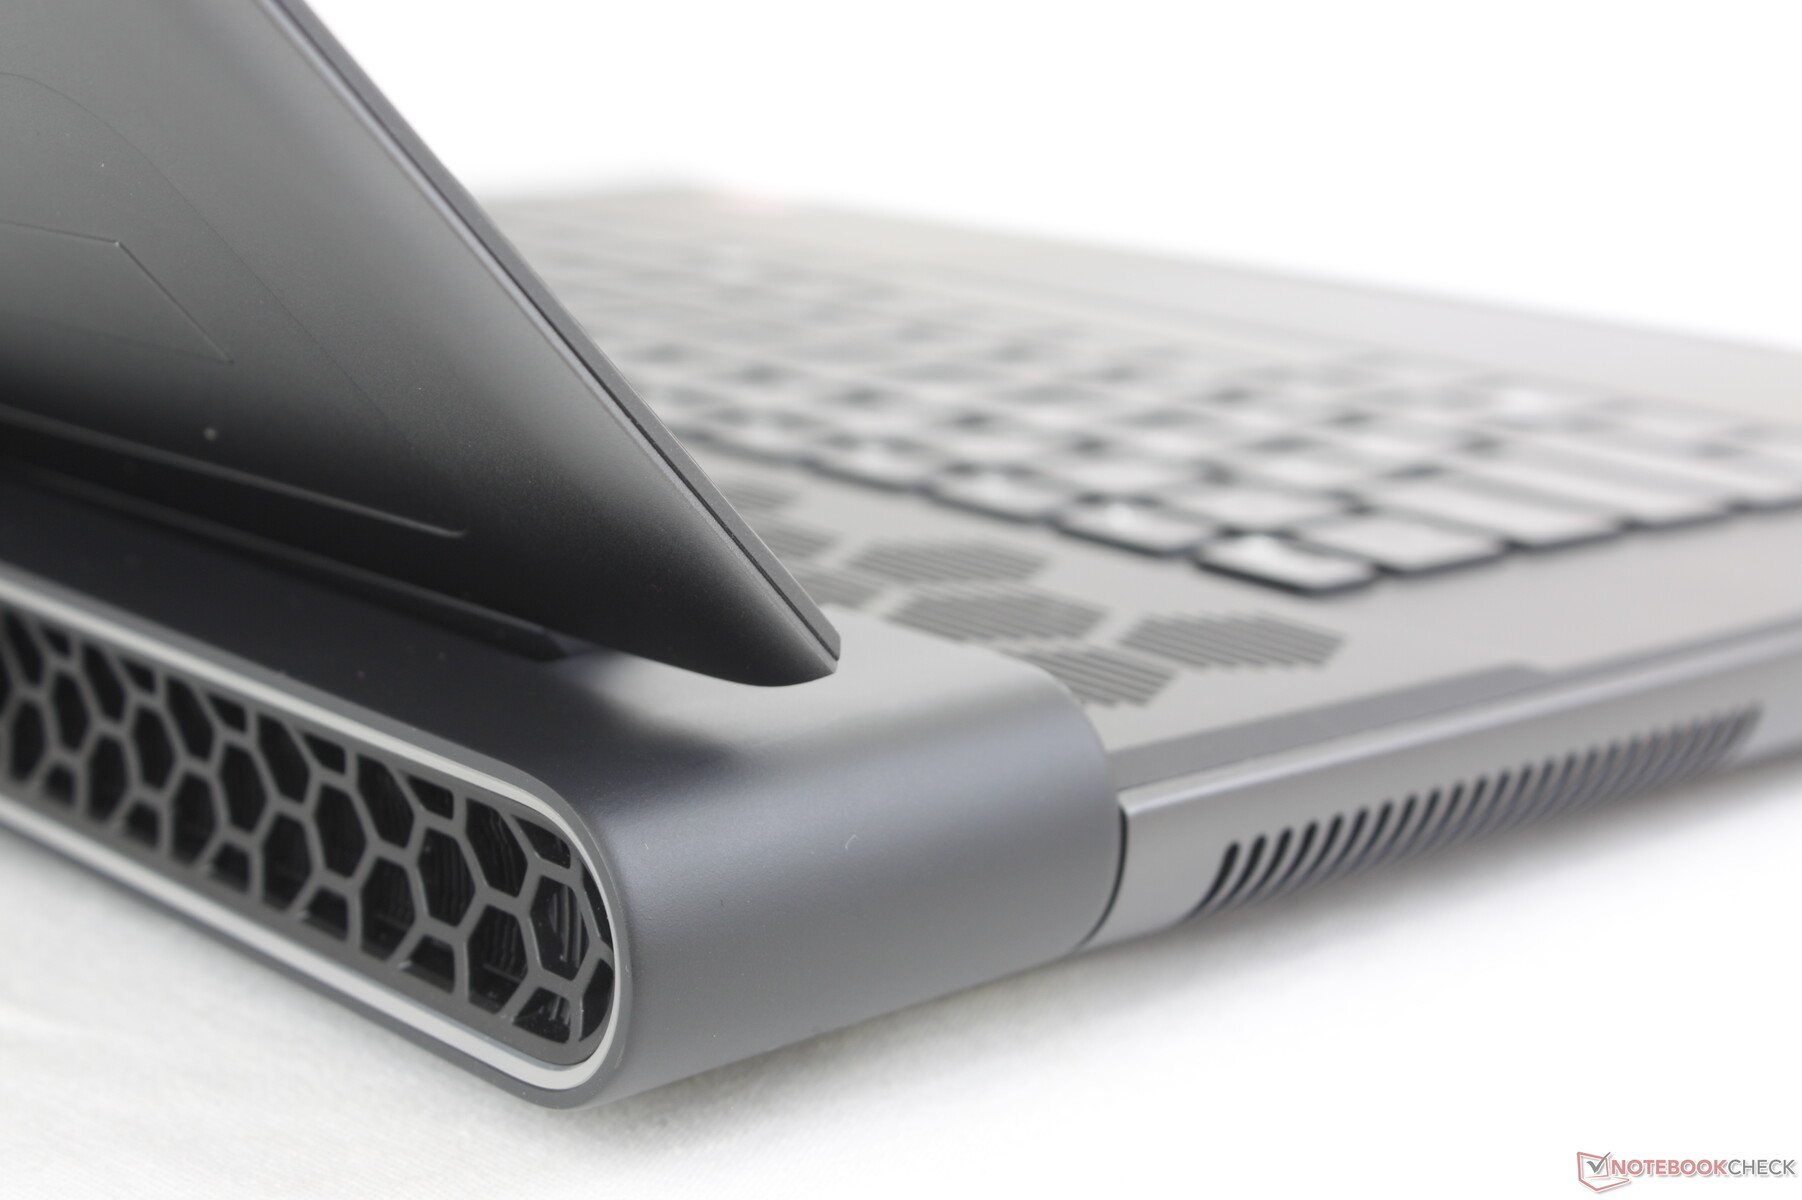
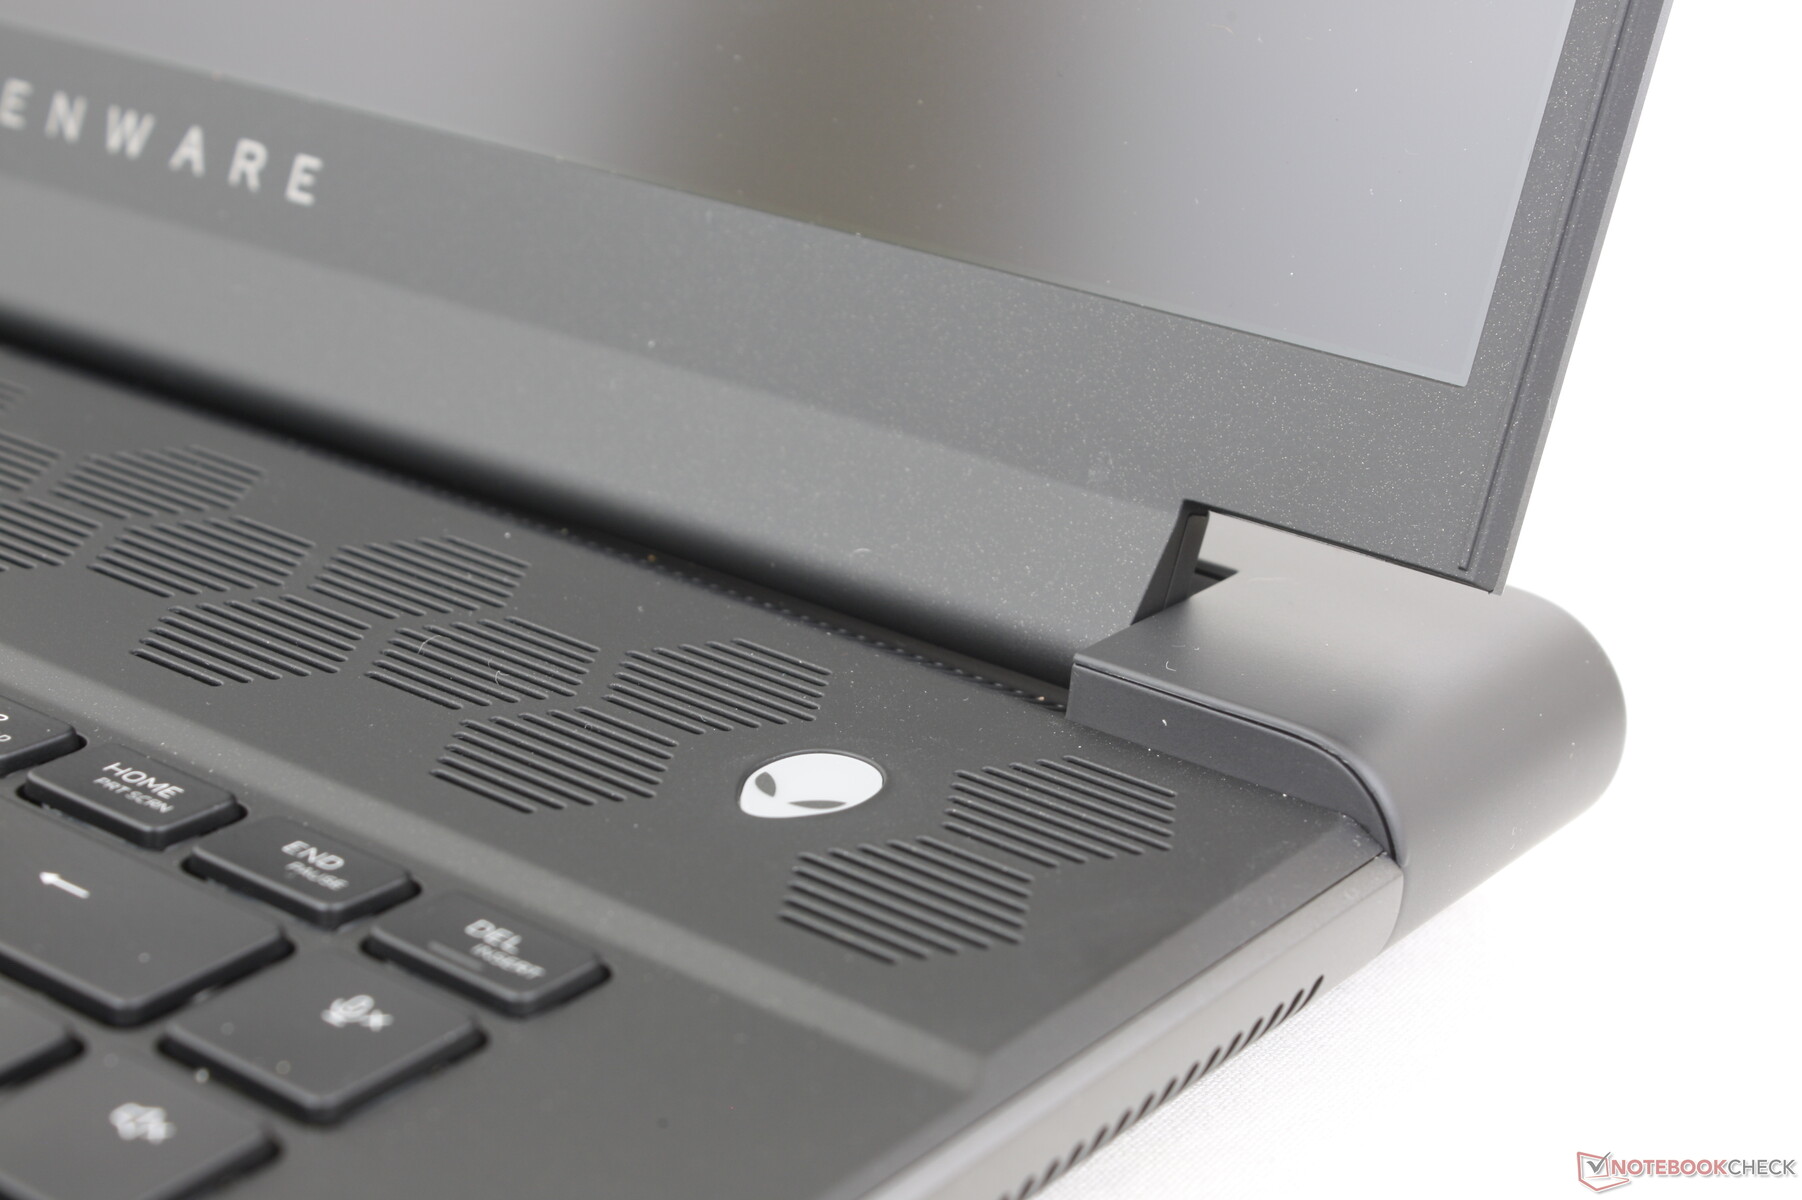
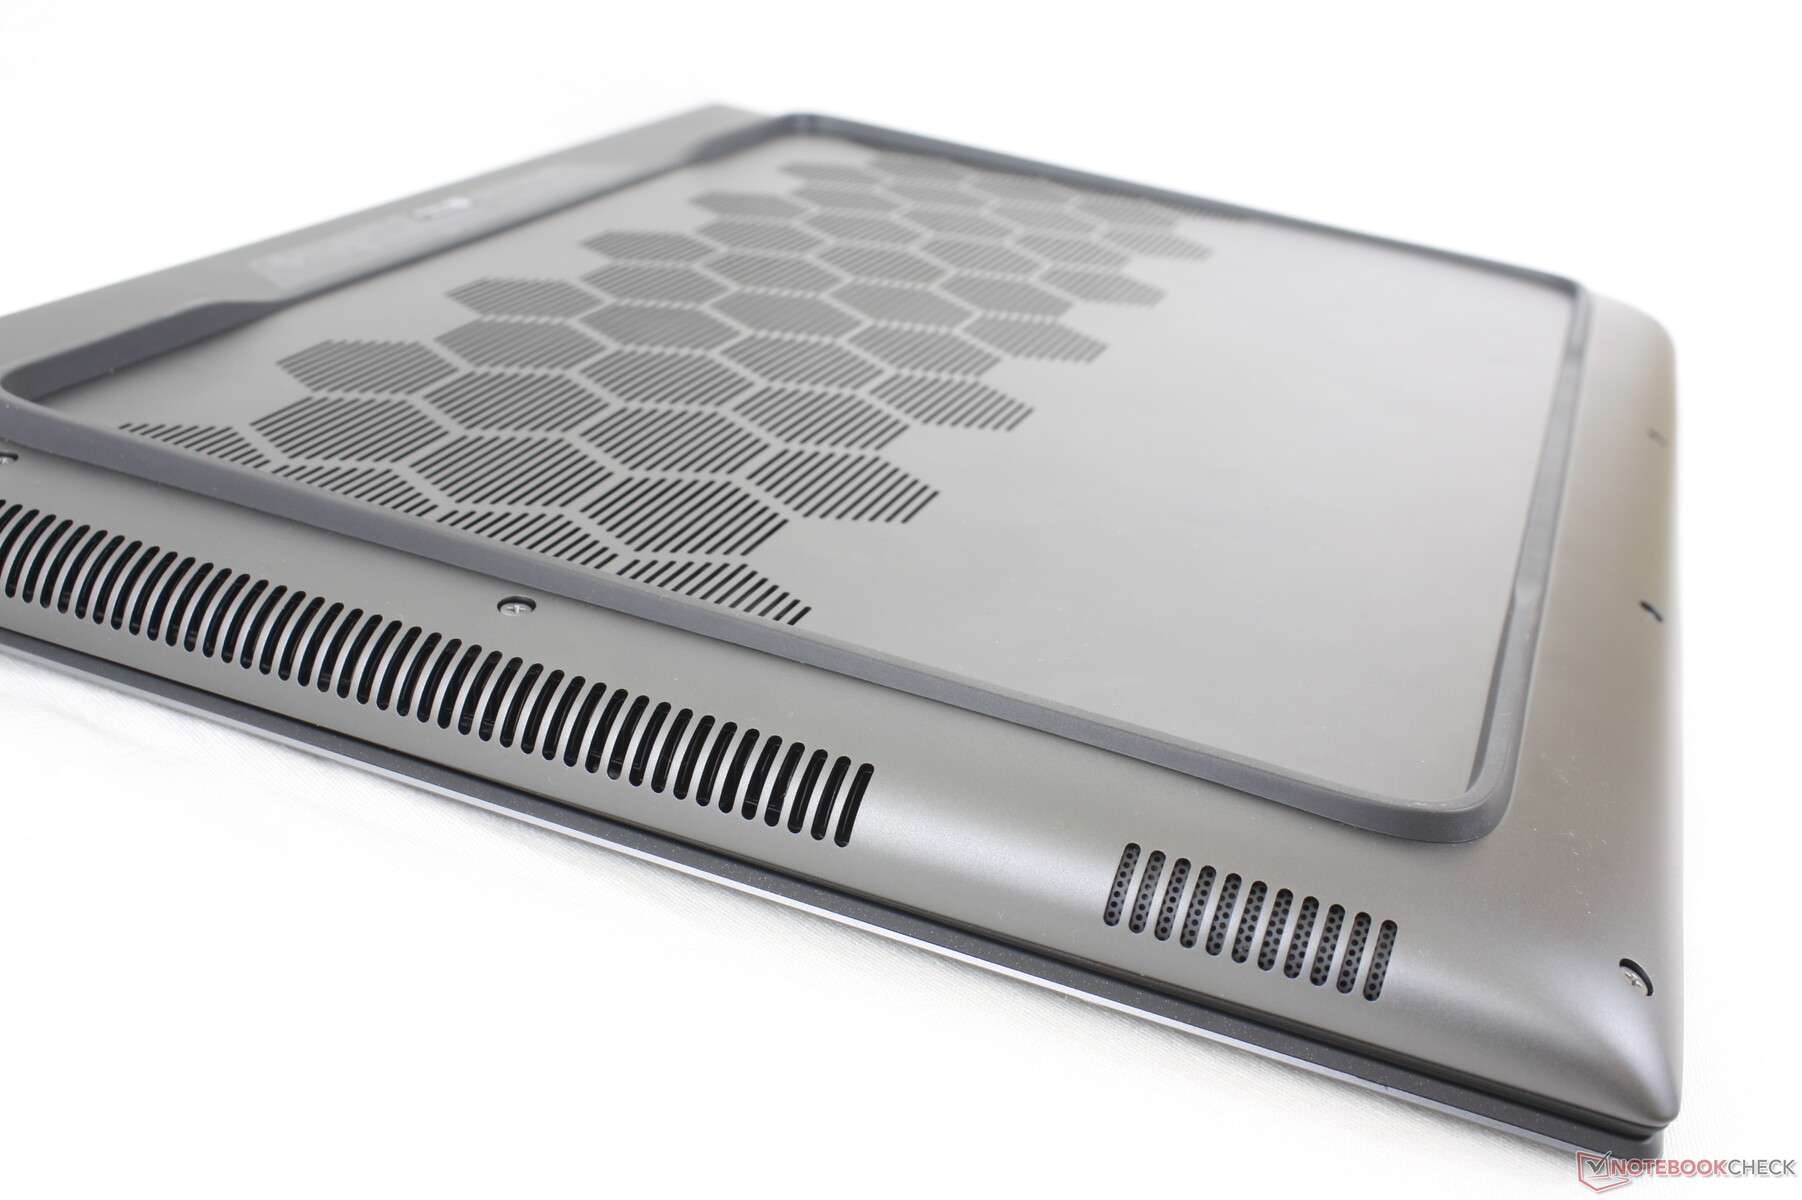
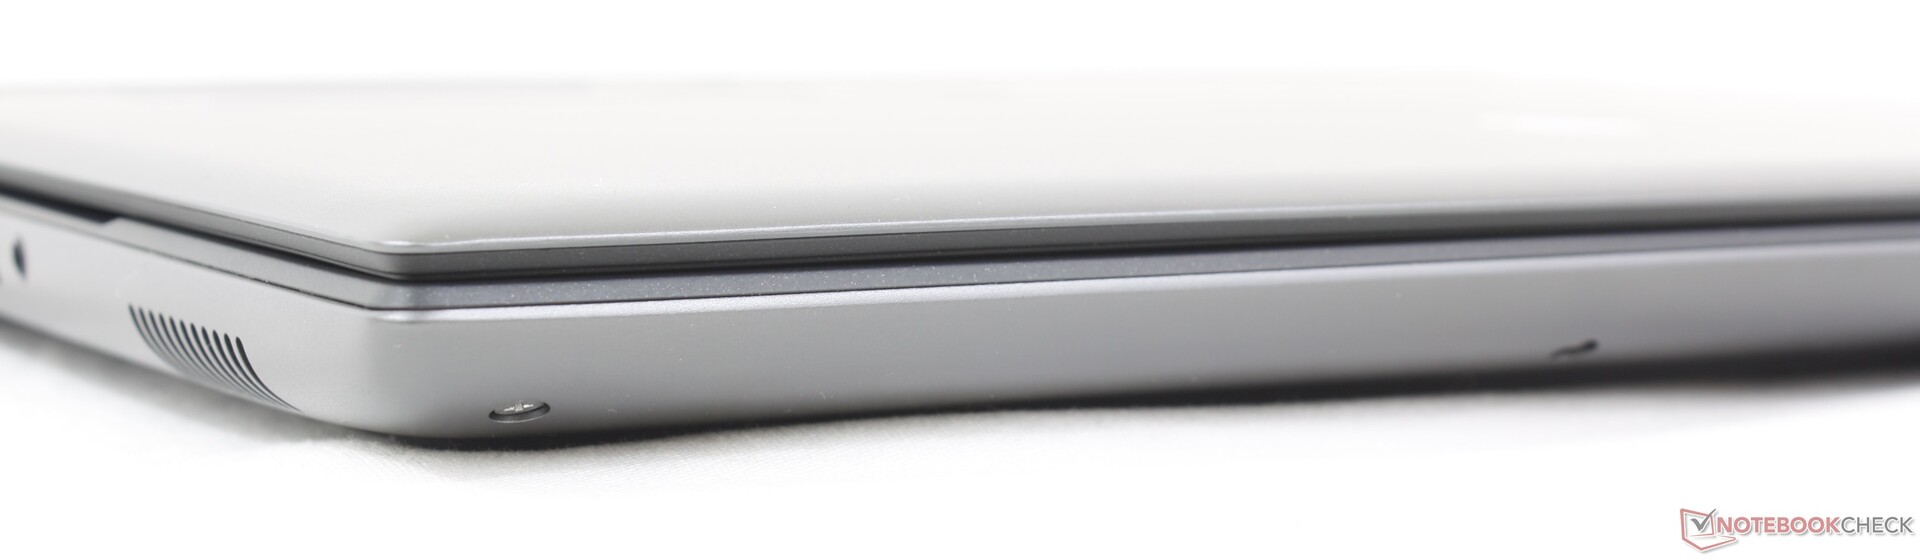
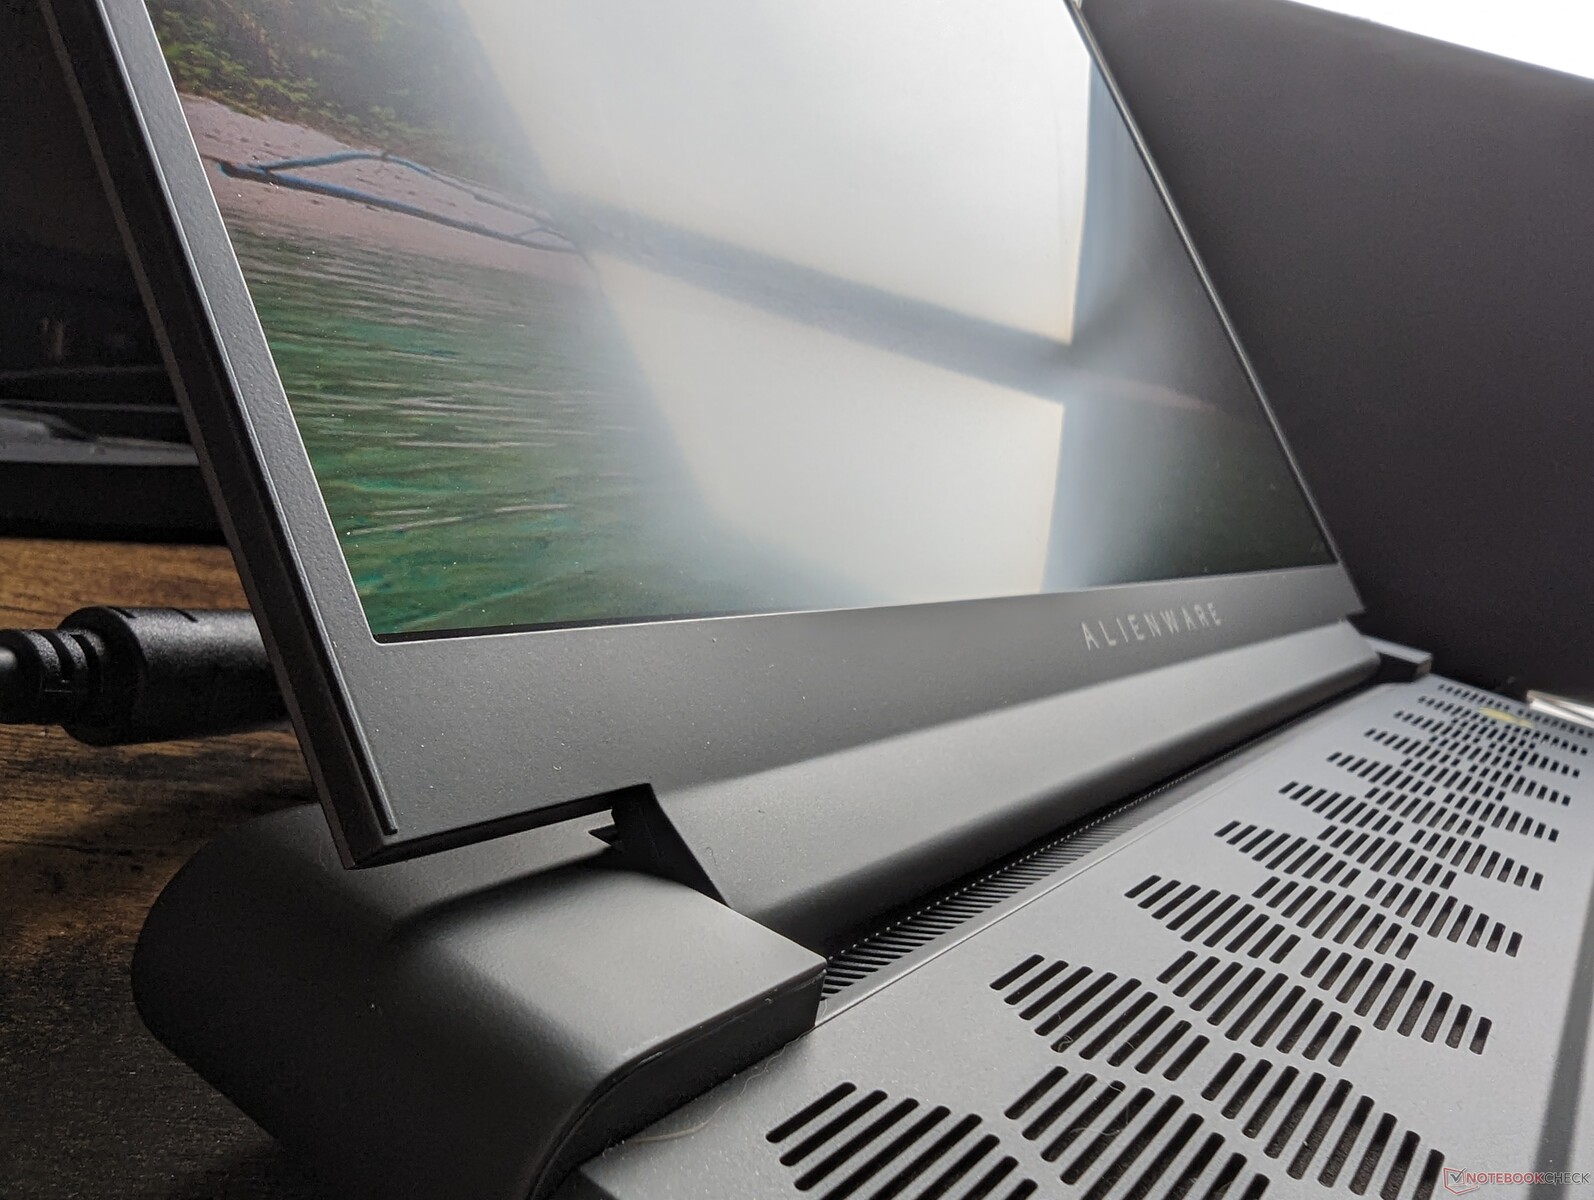
Carcasa - Inconfundiblemente Alienware
El chasis es esencialmente una versión más gruesa del Alienware x16 R1, ya que ambos modelos se basan en el mismo diseño industrial Legend 3.0. El pie perimetral engomado, la tapa exterior de aluminio, las rejillas de ventilación hexagonales, el anillo LED trasero y la cubierta negra mate del teclado son una combinación que no se ve en ningún modelo de la competencia. La base, la tapa y las bisagras son firmes, sin crujidos audibles al intentar torcerlas o doblarlas, para una primera impresión más sólida que un Asus TUF Gaming A16 o Lenovo Legion Pro 7 16.
Los reposamanos negros, el clickpad y las teclas del teclado siguen siendo imanes para las huellas dactilares. Dell no ofrece otras opciones de color más allá del Dark Metallic Moon por el momento.
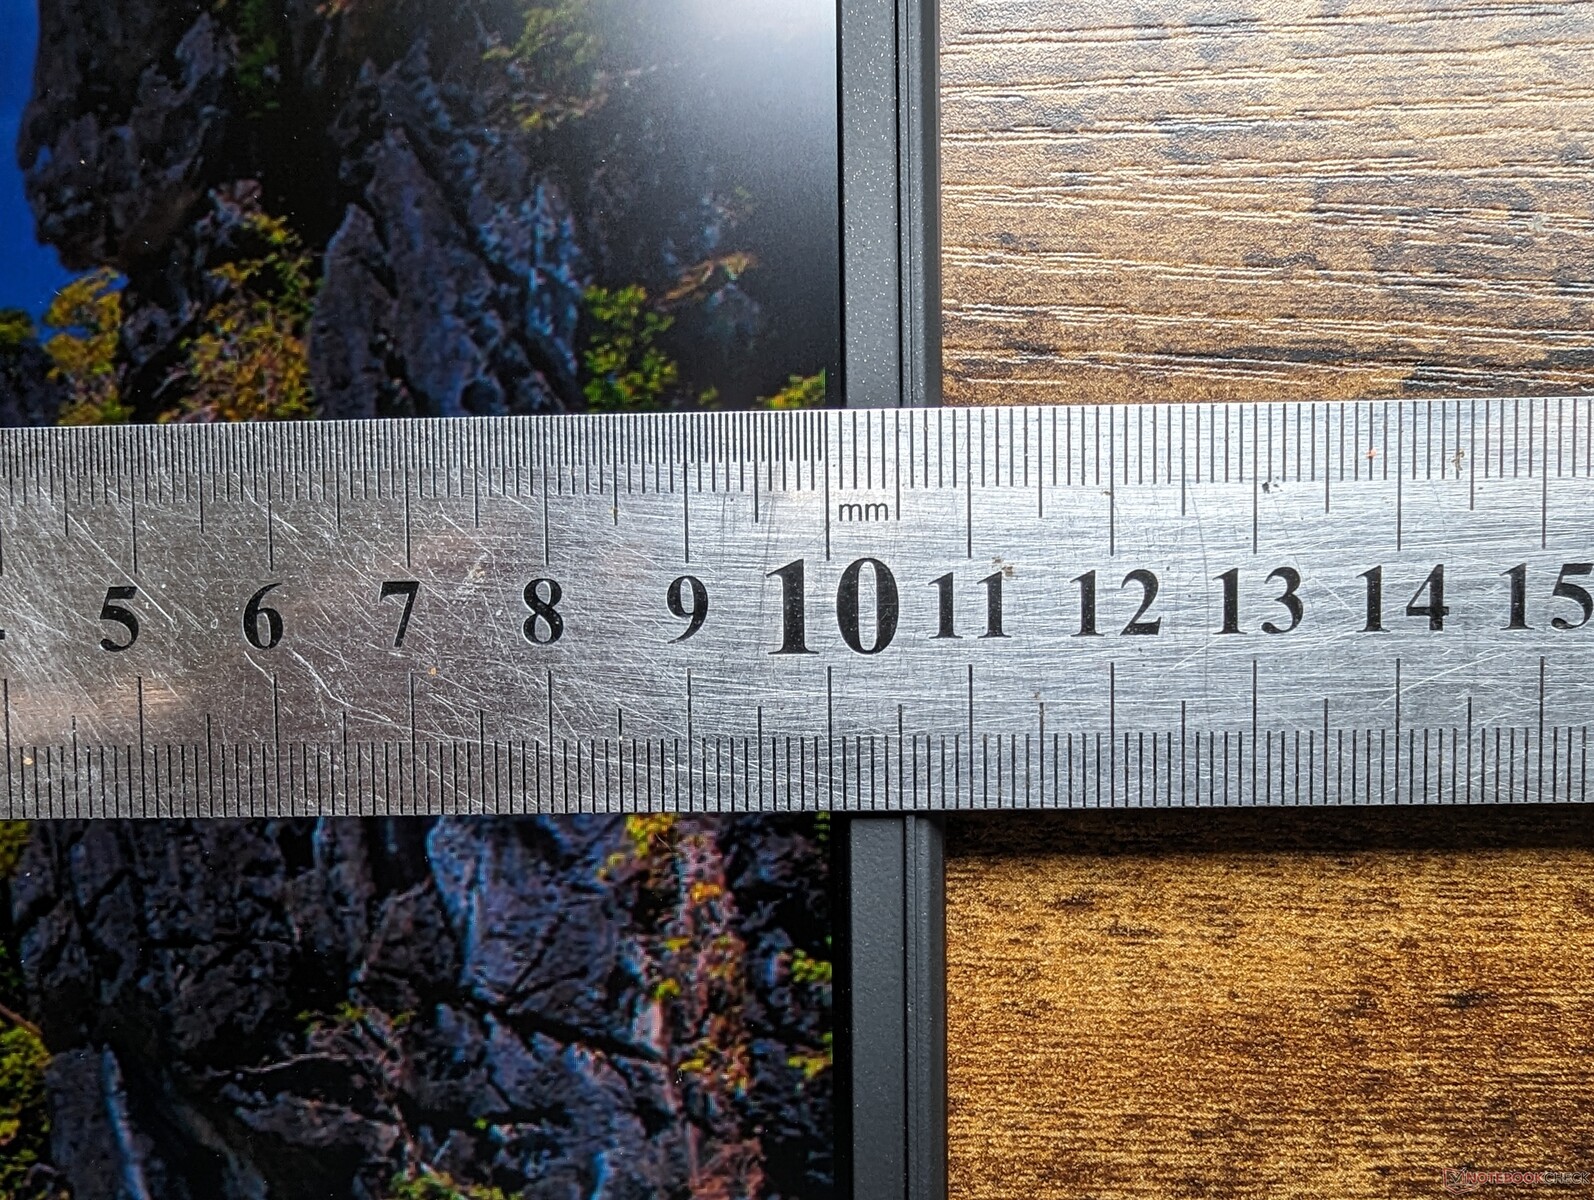
El Alienware m16 R1 es uno de los portátiles para juegos de 16 pulgadas más pesados y también uno de los más grandes en términos de longitud y anchura debido a su parte trasera extendida. Su denso diseño hace que sea muy robusto, aunque a costa de la portabilidad. El Legion Pro 7por ejemplo, es 400 g más ligero y ocupa mucho menos espacio, aunque ofrece CPU de clase HX y GPU de gama alta similares.
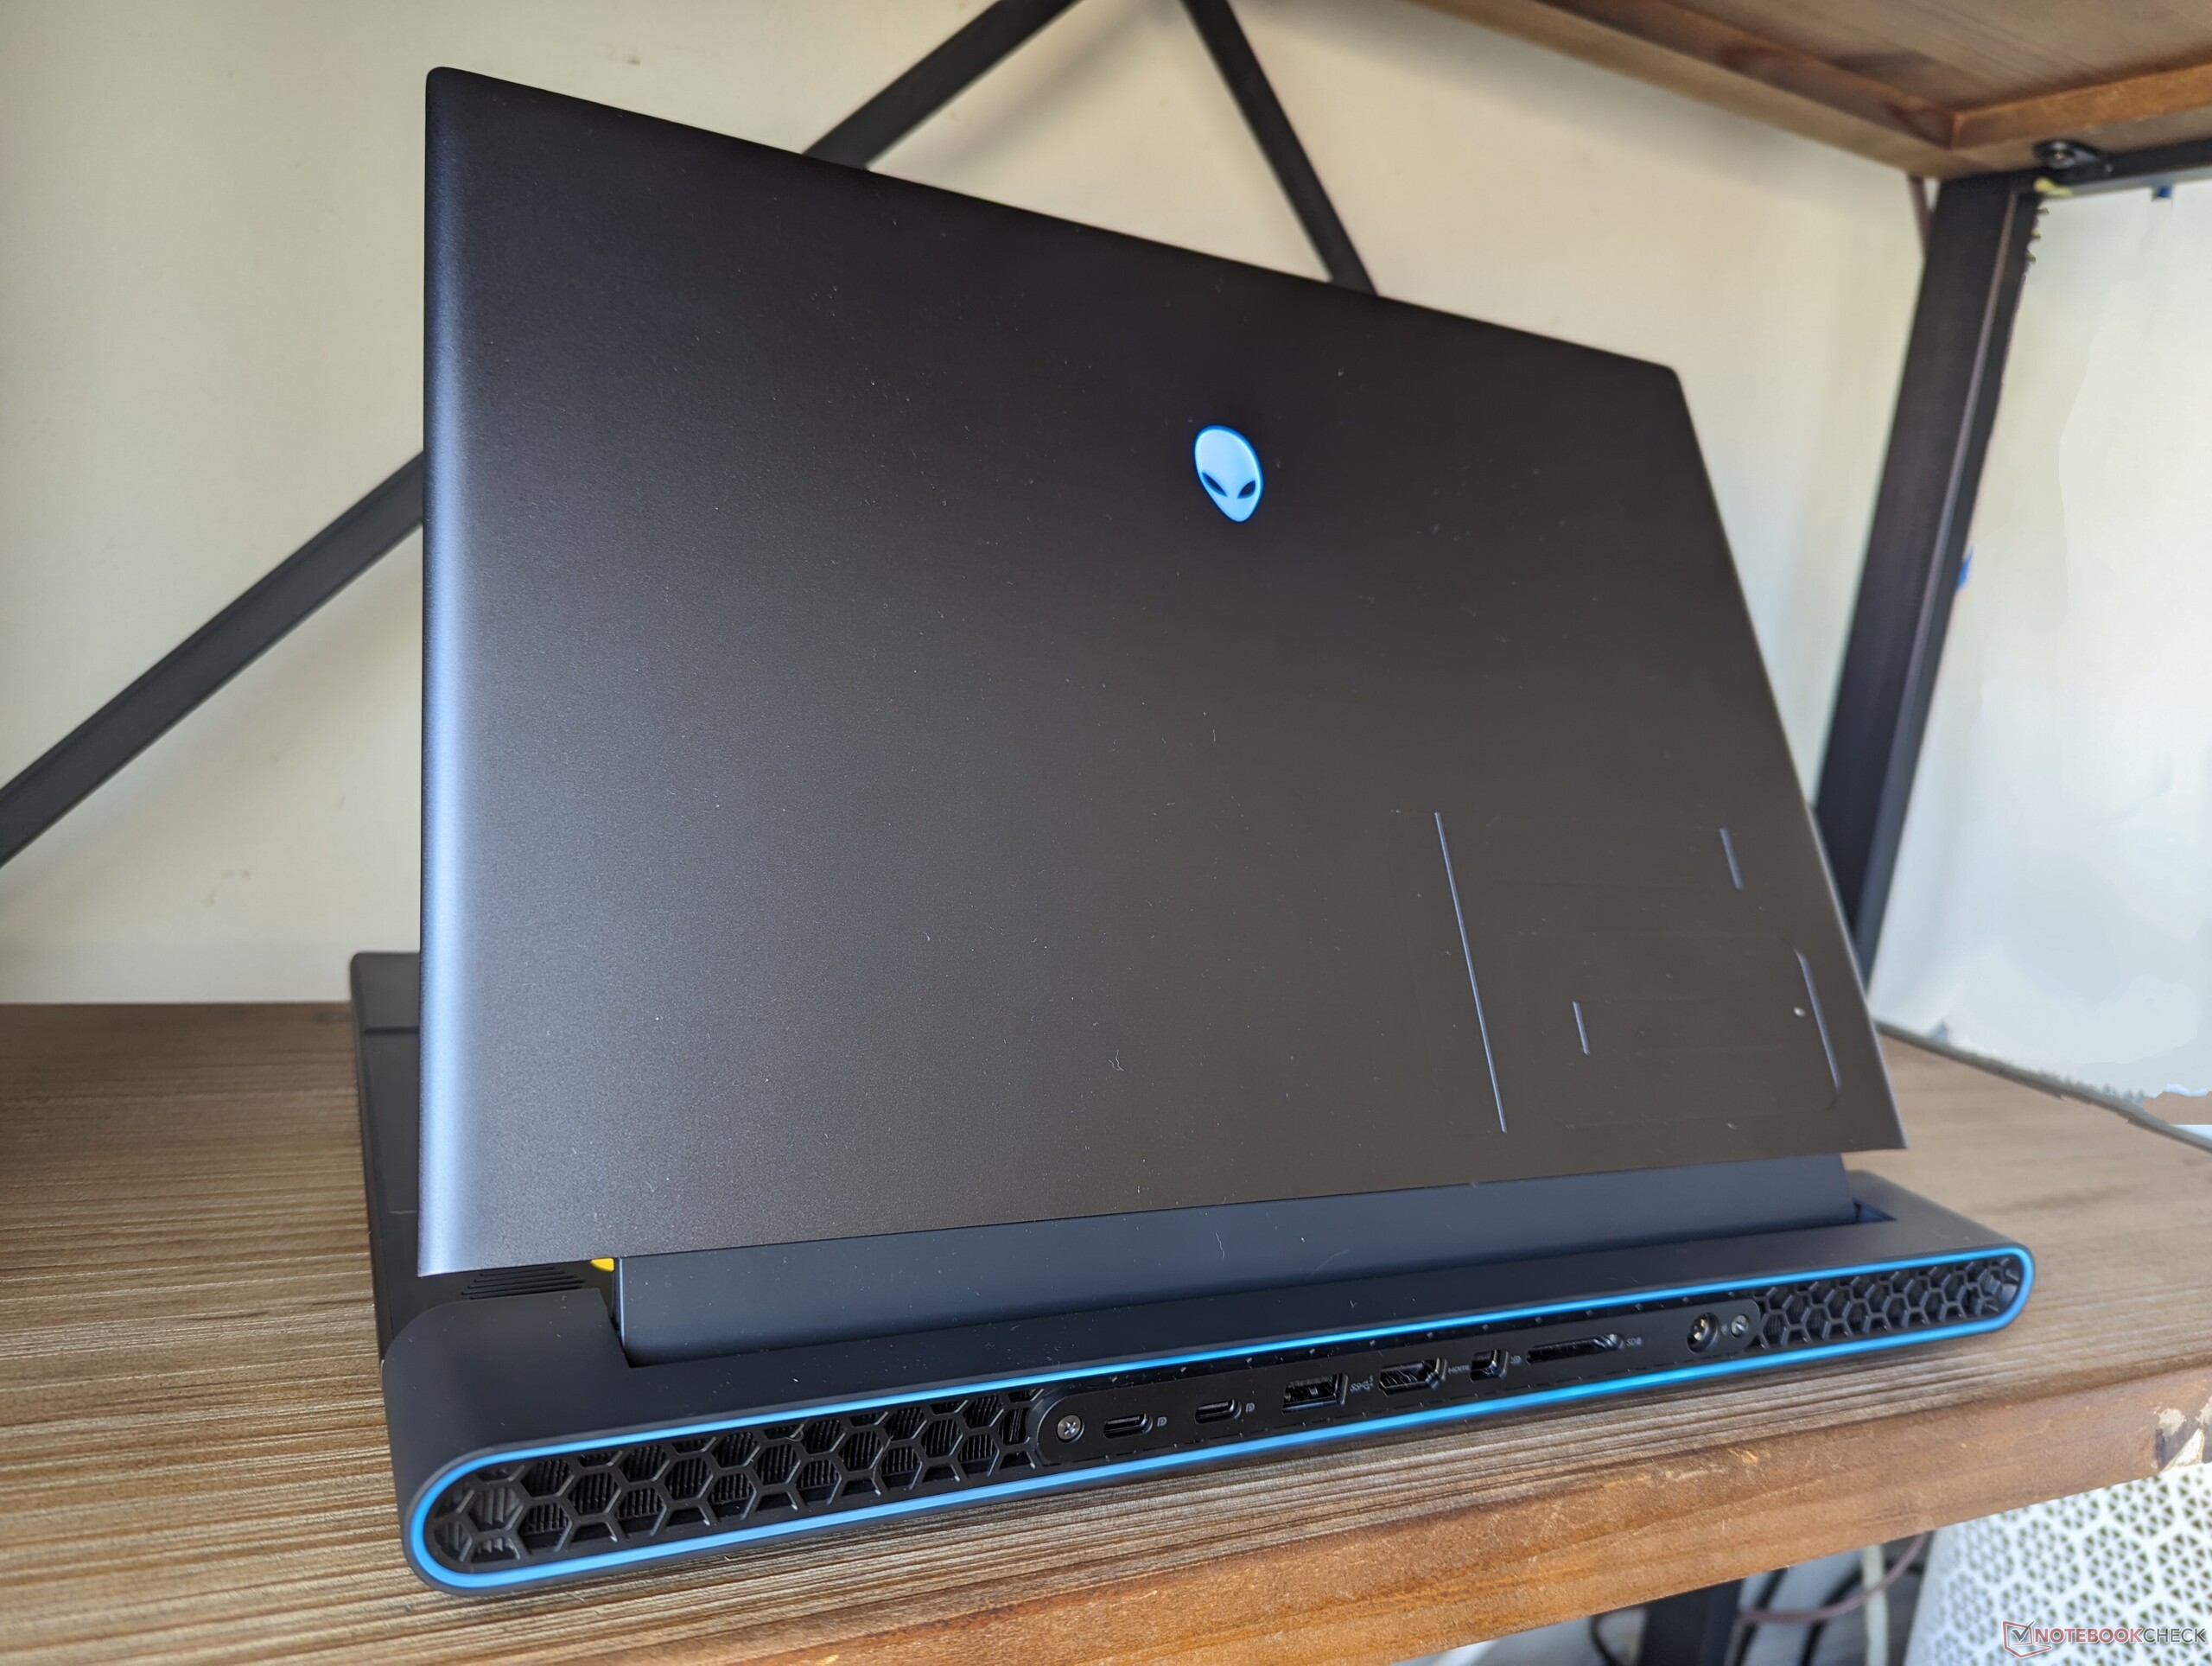
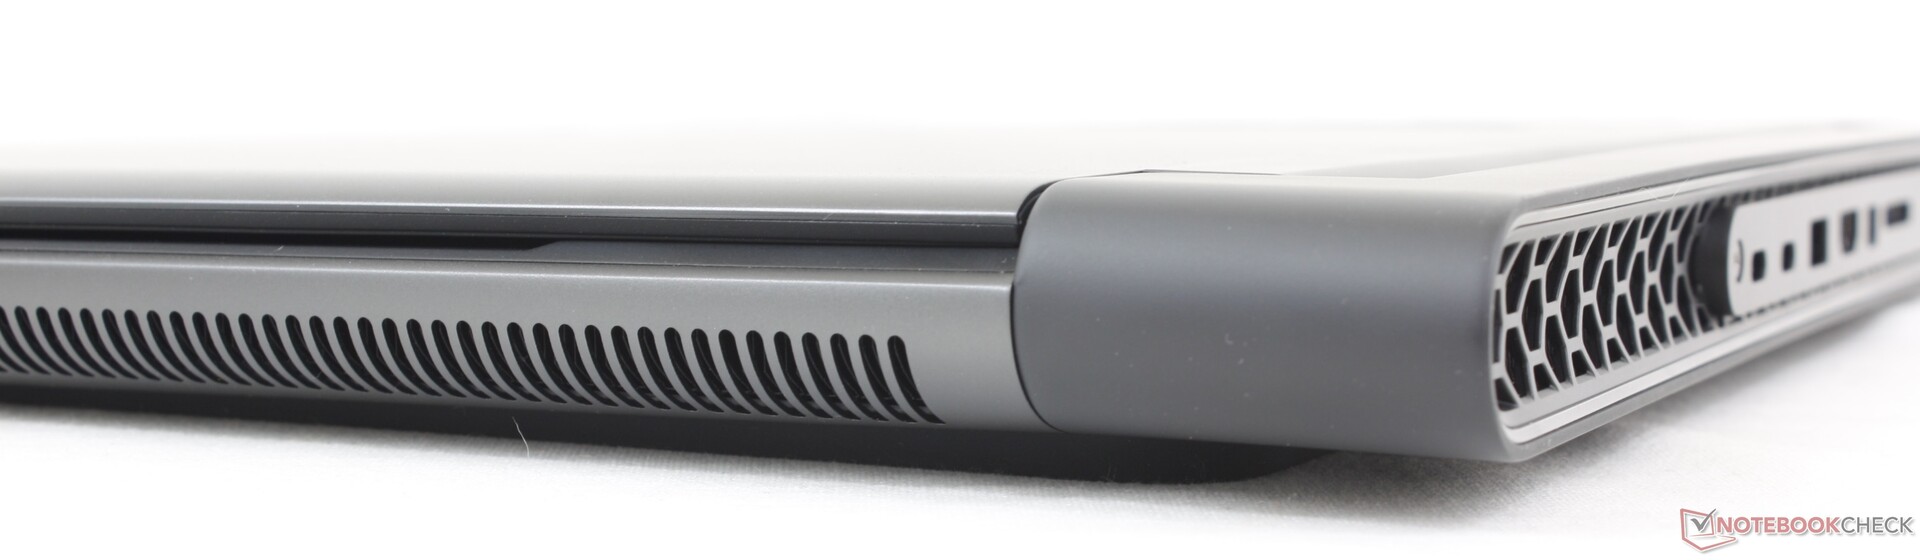
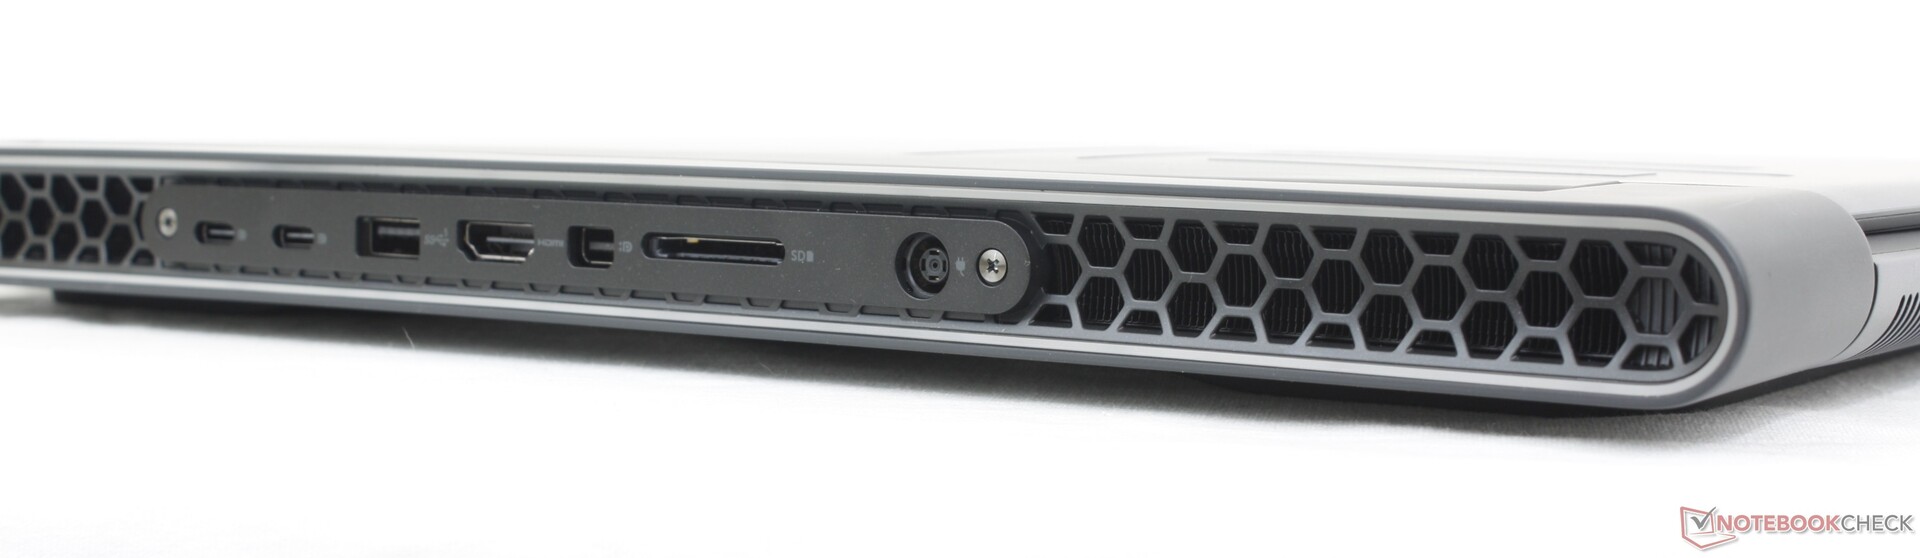
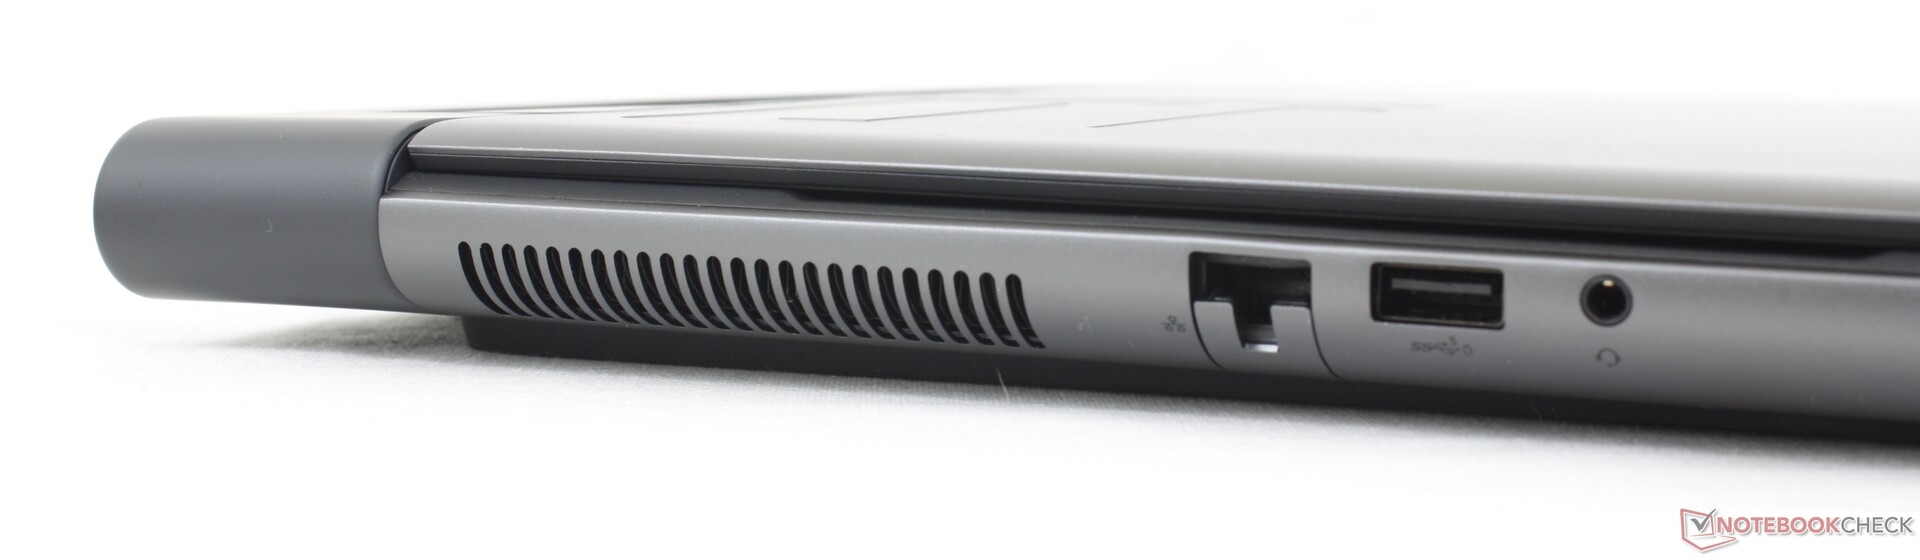
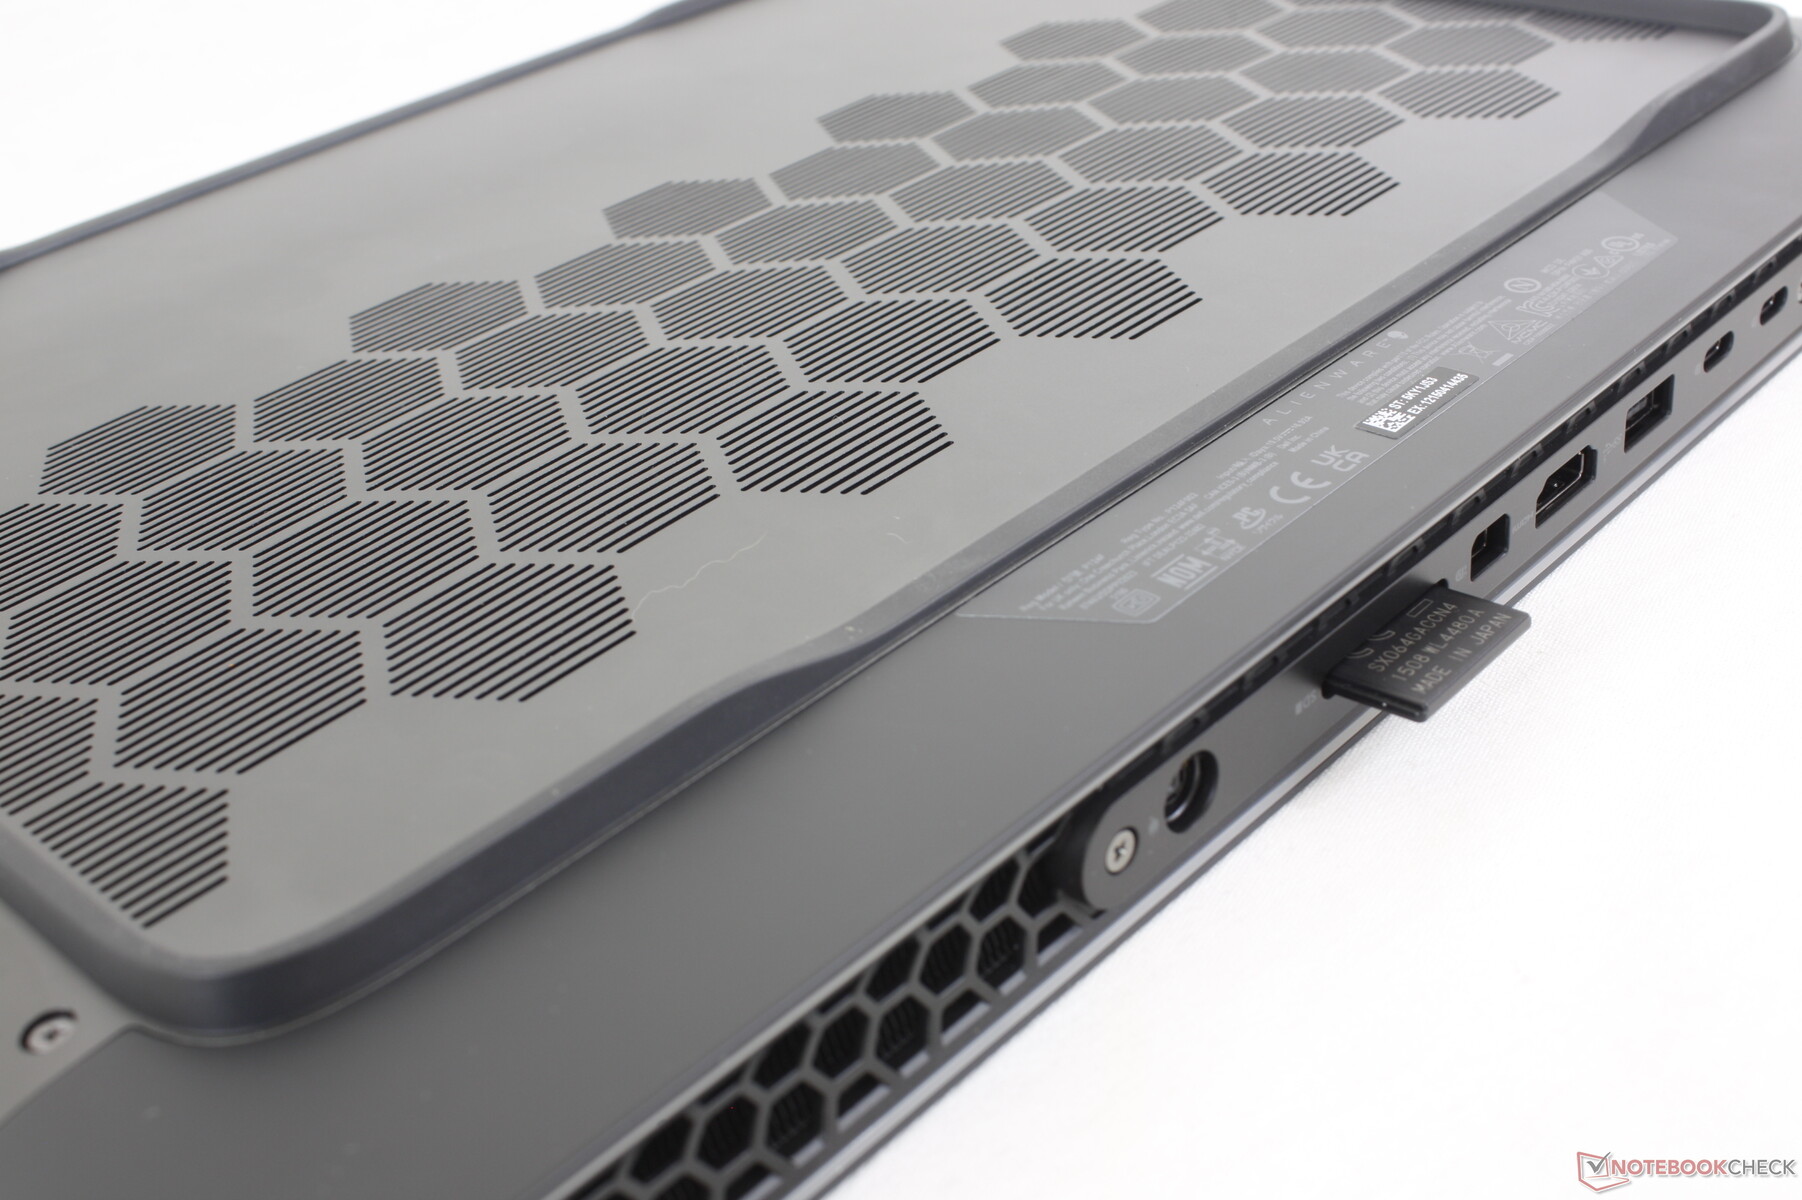
Conectividad - Thunderbolt Sólo para versiones Intel
Las opciones de puerto incluyen todo lo que se encuentra en el Alienware x16 R1 más RJ-45 y un lector SD de tamaño completo en lugar de MicroSD. También se han reubicado algunos puertos en el borde izquierdo, mientras que en el x16 están todos apiñados en la parte trasera. El mini-DisplayPort es notable también ya que es poco común en los nuevos portátiles de juego.
USB4 y Thunderbolt no están soportados en nuestro modelo AMD.
Lector de tarjetas SD
Las velocidades de transferencia desde el lector de tarjetas SD son más rápidas que en la mayoría de portátiles para juegos, lo que debería satisfacer a los creadores de contenidos. Mover 1 GB de fotos desde nuestra tarjeta de pruebas UHS-II al escritorio lleva poco más de 5 segundos.
| SD Card Reader | |
| average JPG Copy Test (av. of 3 runs) | |
| Alienware m16 R1 AMD (Toshiba Exceria Pro SDXC 64 GB UHS-II) | |
| Razer Blade 16 Early 2023 (AV PRO microSD 128 GB V60) | |
| Alienware x16 R1 (AV PRO microSD 128 GB V60) | |
| maximum AS SSD Seq Read Test (1GB) | |
| Alienware x16 R1 (AV PRO microSD 128 GB V60) | |
| Alienware m16 R1 AMD (Toshiba Exceria Pro SDXC 64 GB UHS-II) | |
| Razer Blade 16 Early 2023 (AV PRO microSD 128 GB V60) | |
Comunicación
Los SKU de AMD vienen con el Qualcomm WCN685x, mientras que los SKU de Intel vienen con el Killer AX1675, cada uno con conectividad Wi-Fi 6E. El rendimiento es constante y fiable cuando se conecta a nuestra red de 6 GHz.
| Networking | |
| iperf3 transmit AXE11000 | |
| Lenovo Legion Pro 7 RTX4090 | |
| Asus ROG Strix G16 G614JZ | |
| Alienware m16 R1 AMD | |
| HP Omen Transcend 16 | |
| Razer Blade 16 Early 2023 | |
| Alienware x16 R1 | |
| iperf3 receive AXE11000 | |
| Lenovo Legion Pro 7 RTX4090 | |
| Asus ROG Strix G16 G614JZ | |
| Alienware m16 R1 AMD | |
| HP Omen Transcend 16 | |
| Razer Blade 16 Early 2023 | |
| Alienware x16 R1 | |
| iperf3 transmit AXE11000 6GHz | |
| Alienware m16 R1 AMD | |
| HP Omen Transcend 16 | |
| Razer Blade 16 Early 2023 | |
| Alienware x16 R1 | |
| iperf3 receive AXE11000 6GHz | |
| Alienware m16 R1 AMD | |
| HP Omen Transcend 16 | |
| Razer Blade 16 Early 2023 | |
| Alienware x16 R1 | |
Cámara web
Hay una webcam de 2 MP con IR y sin obturador de privacidad como en el Alienware x16.


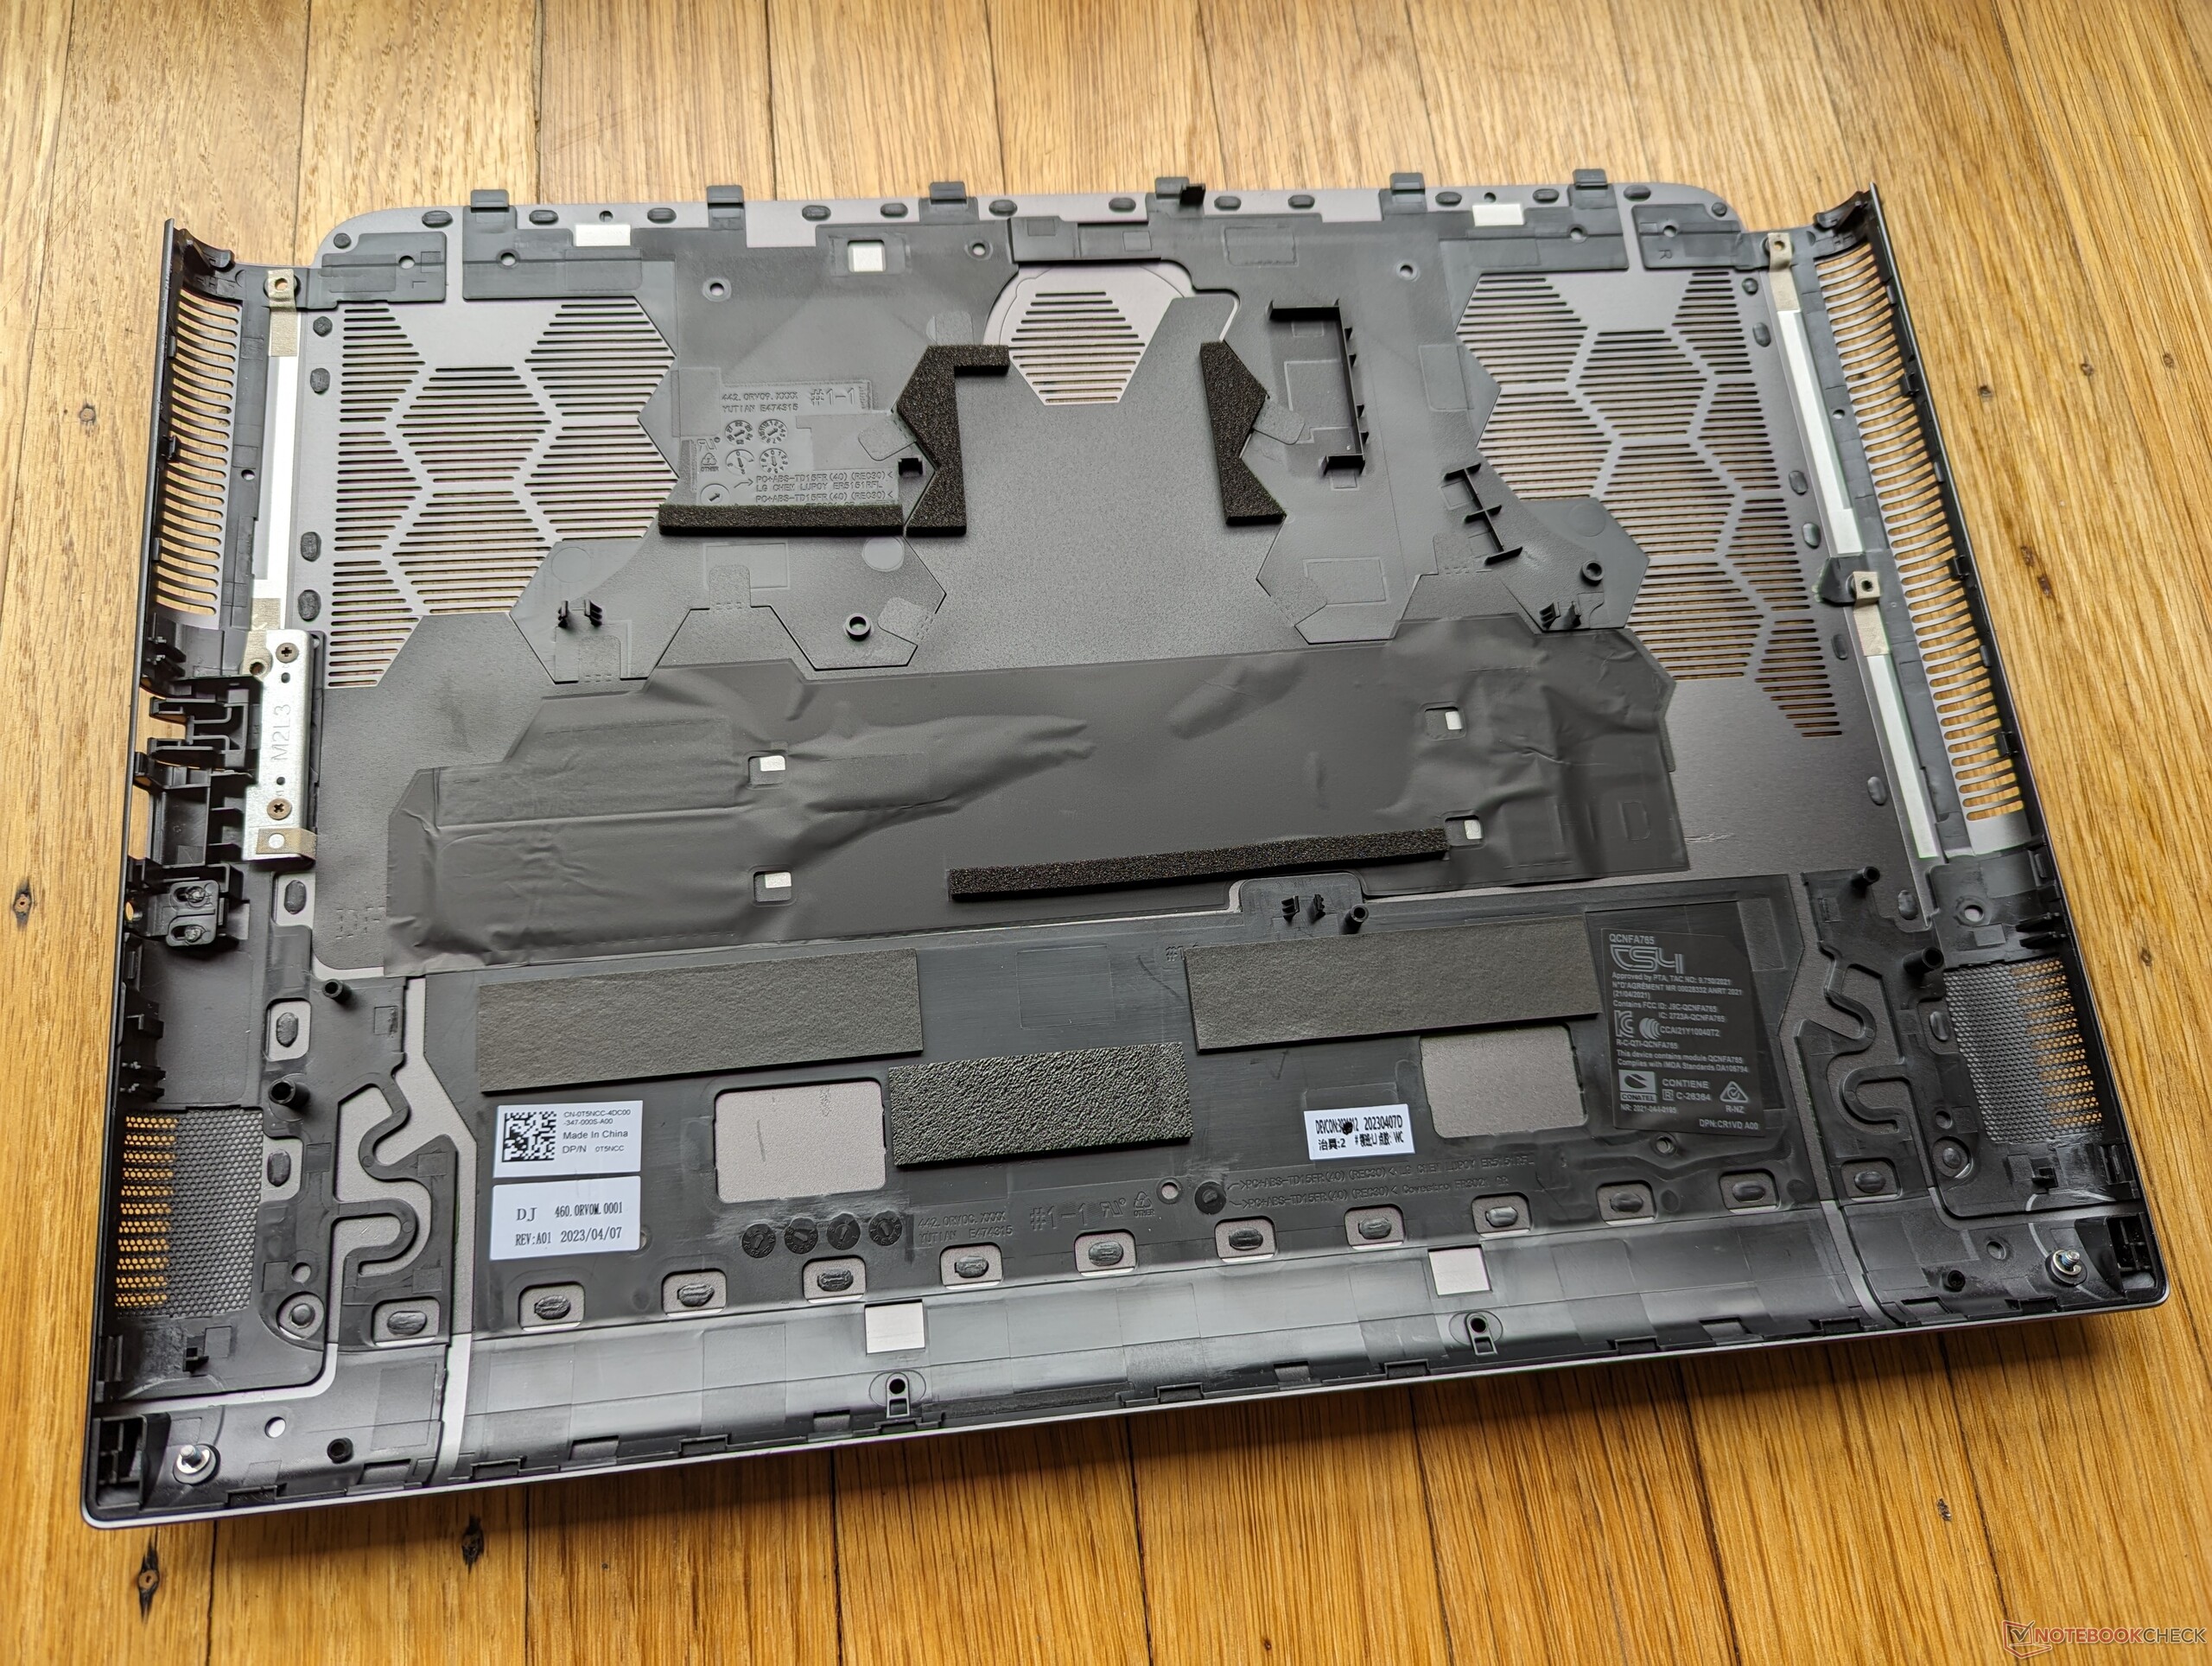
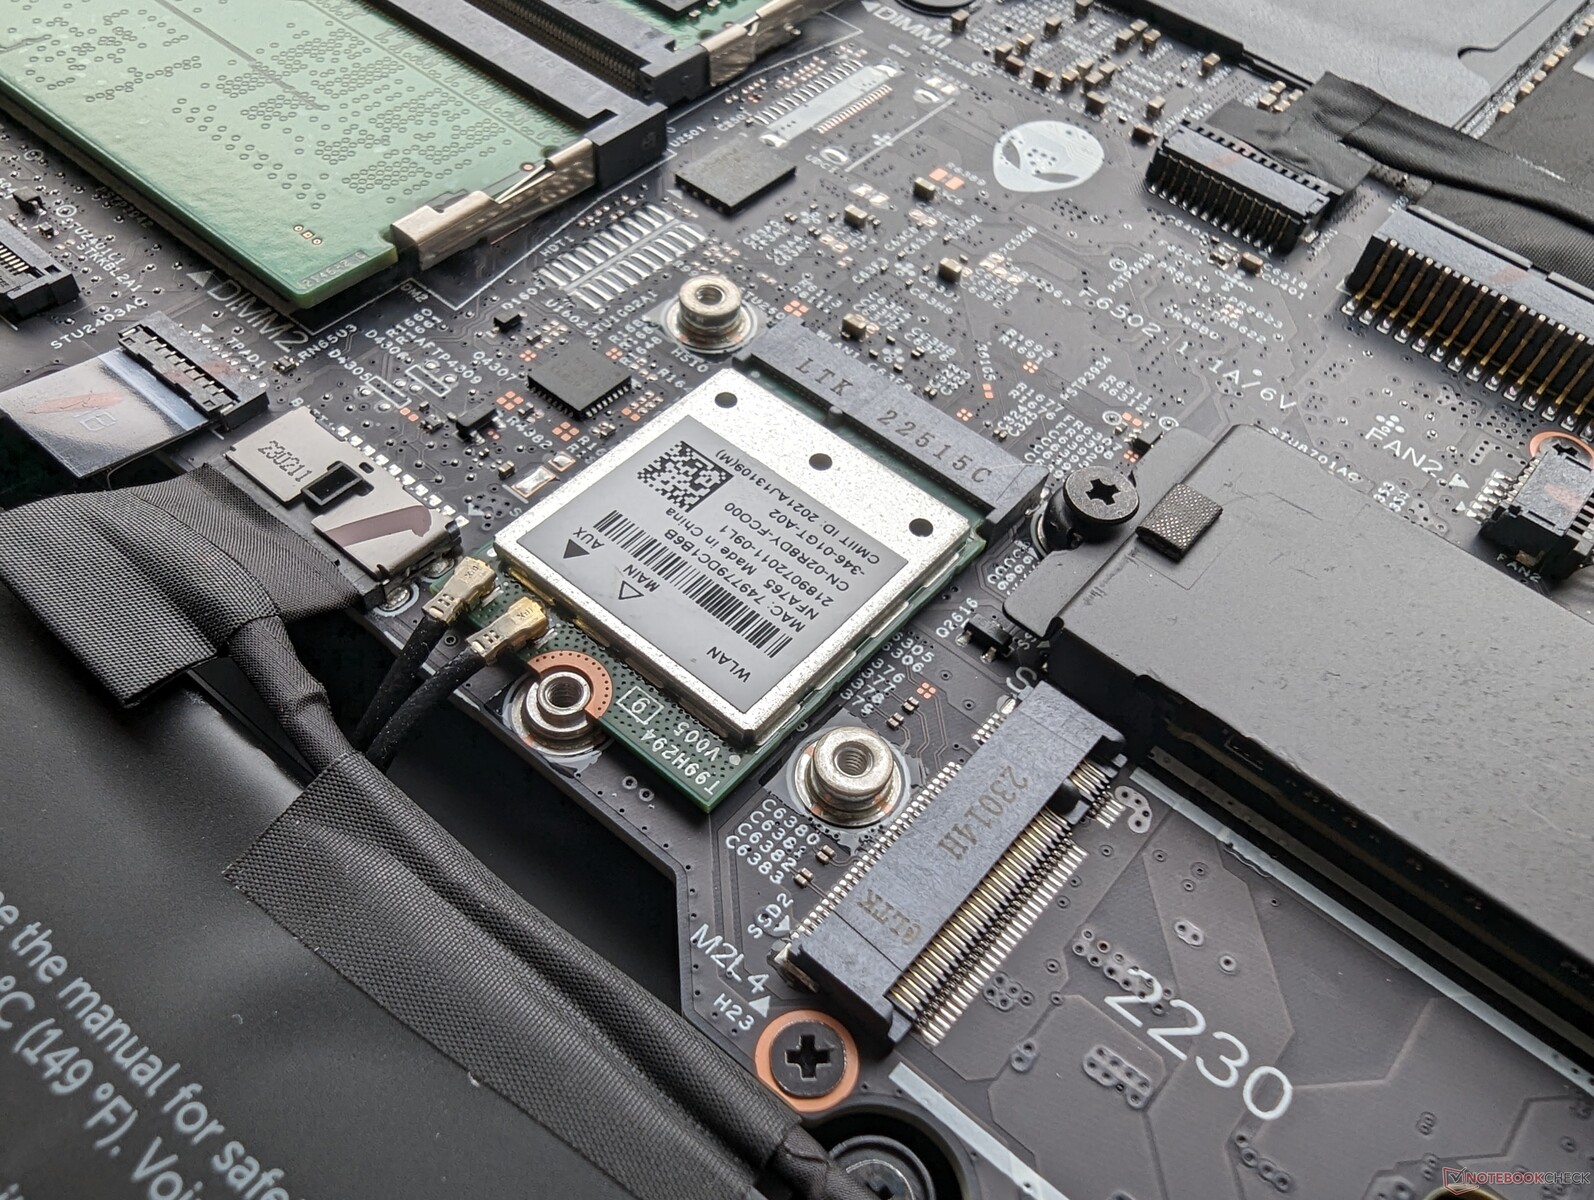
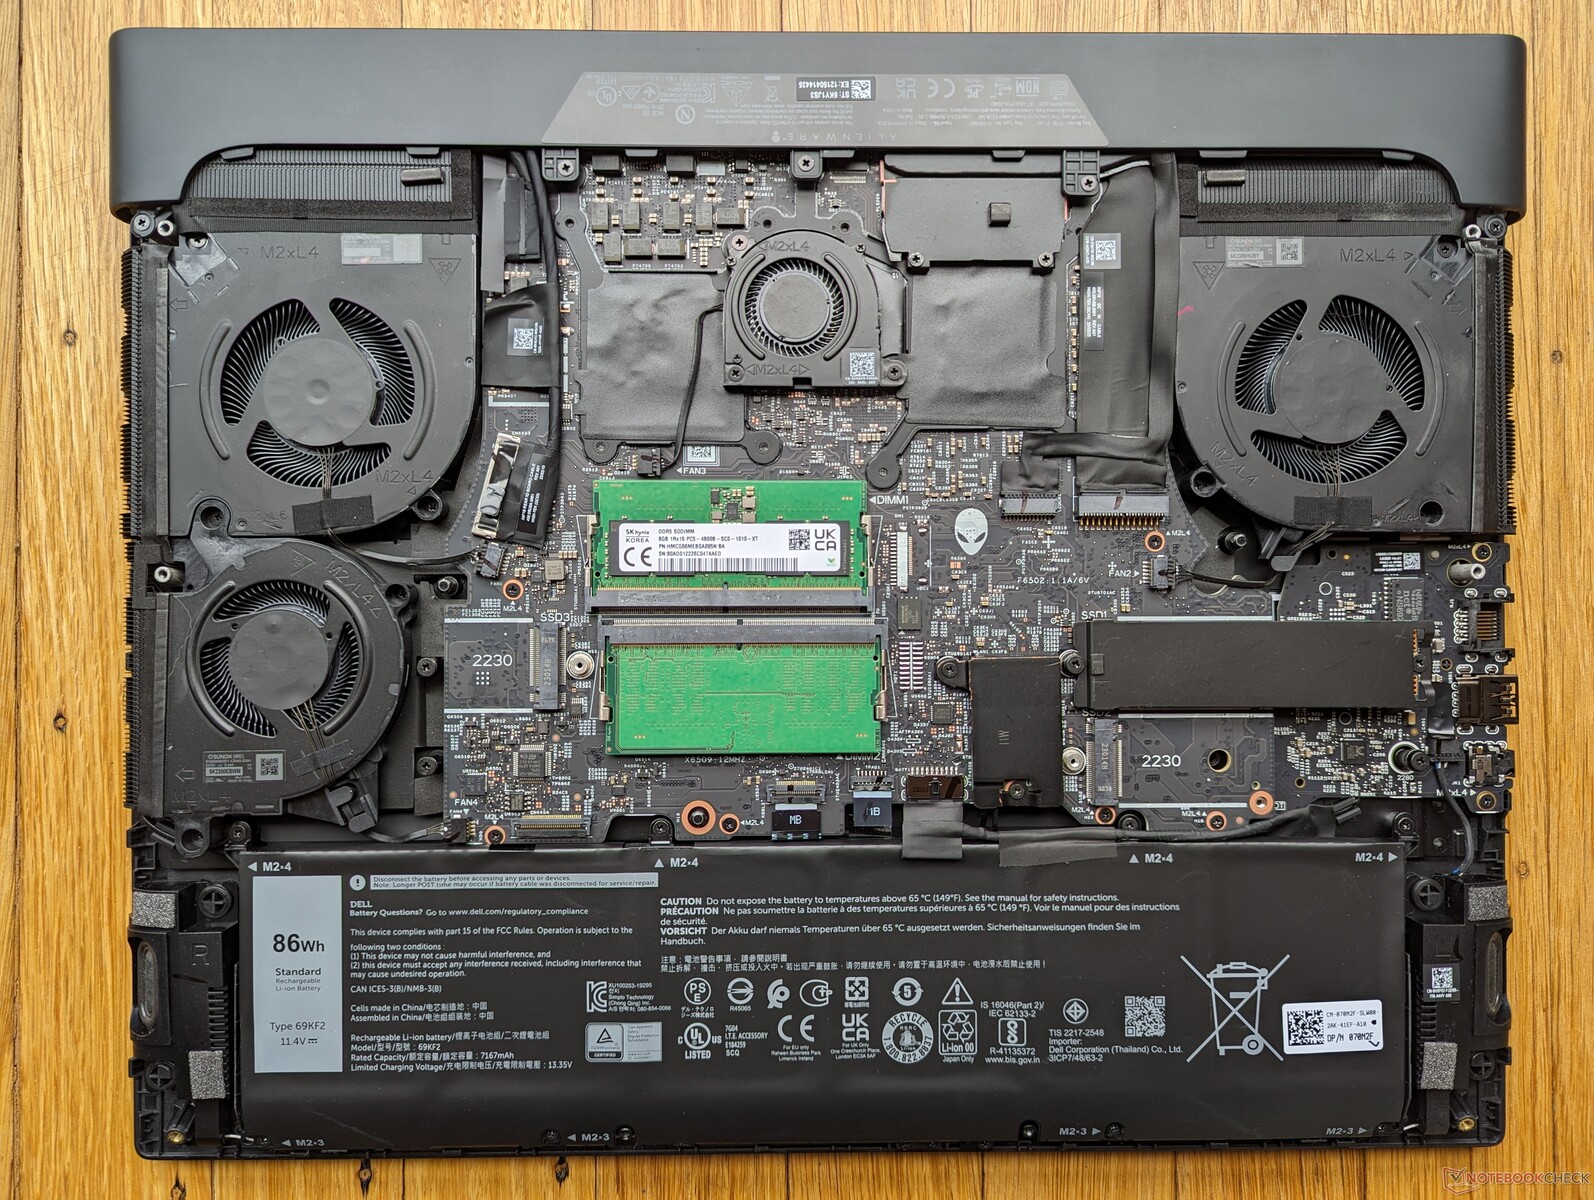
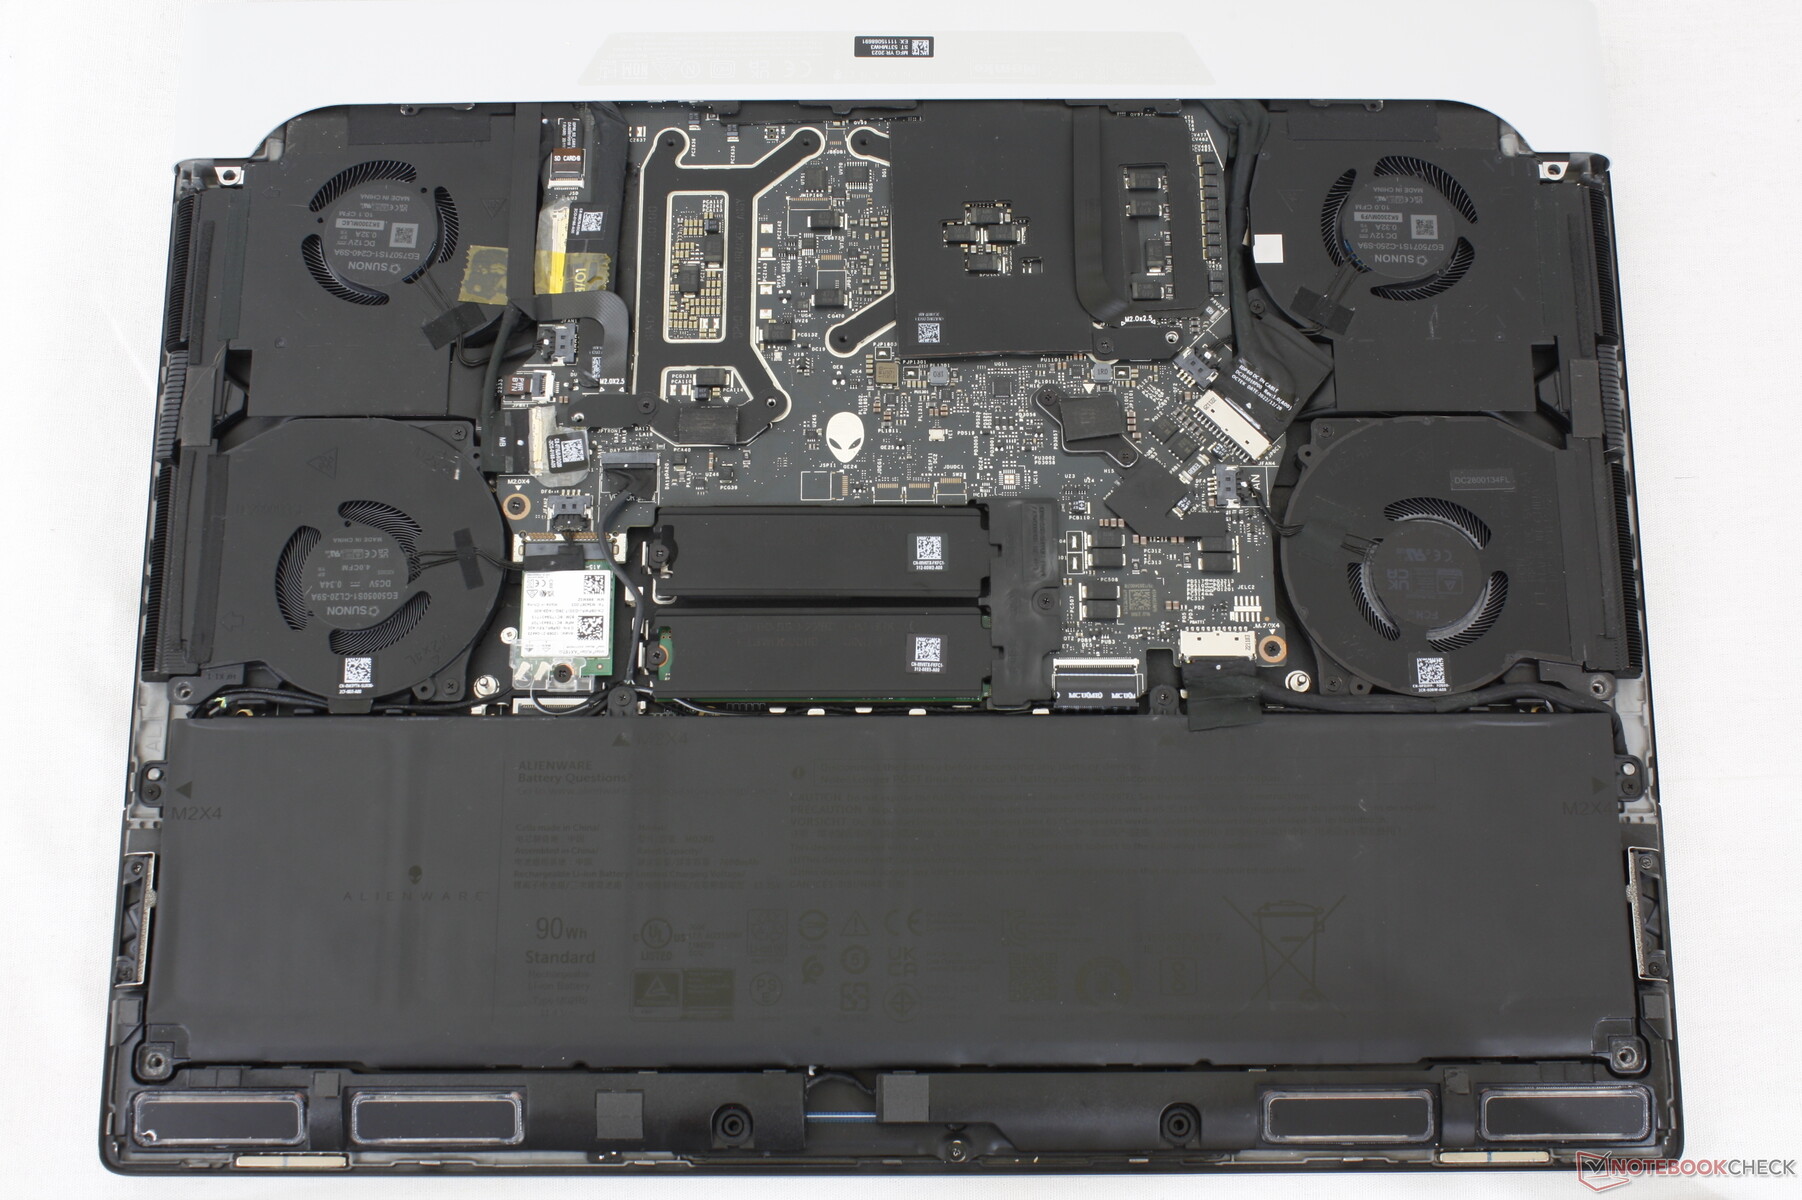
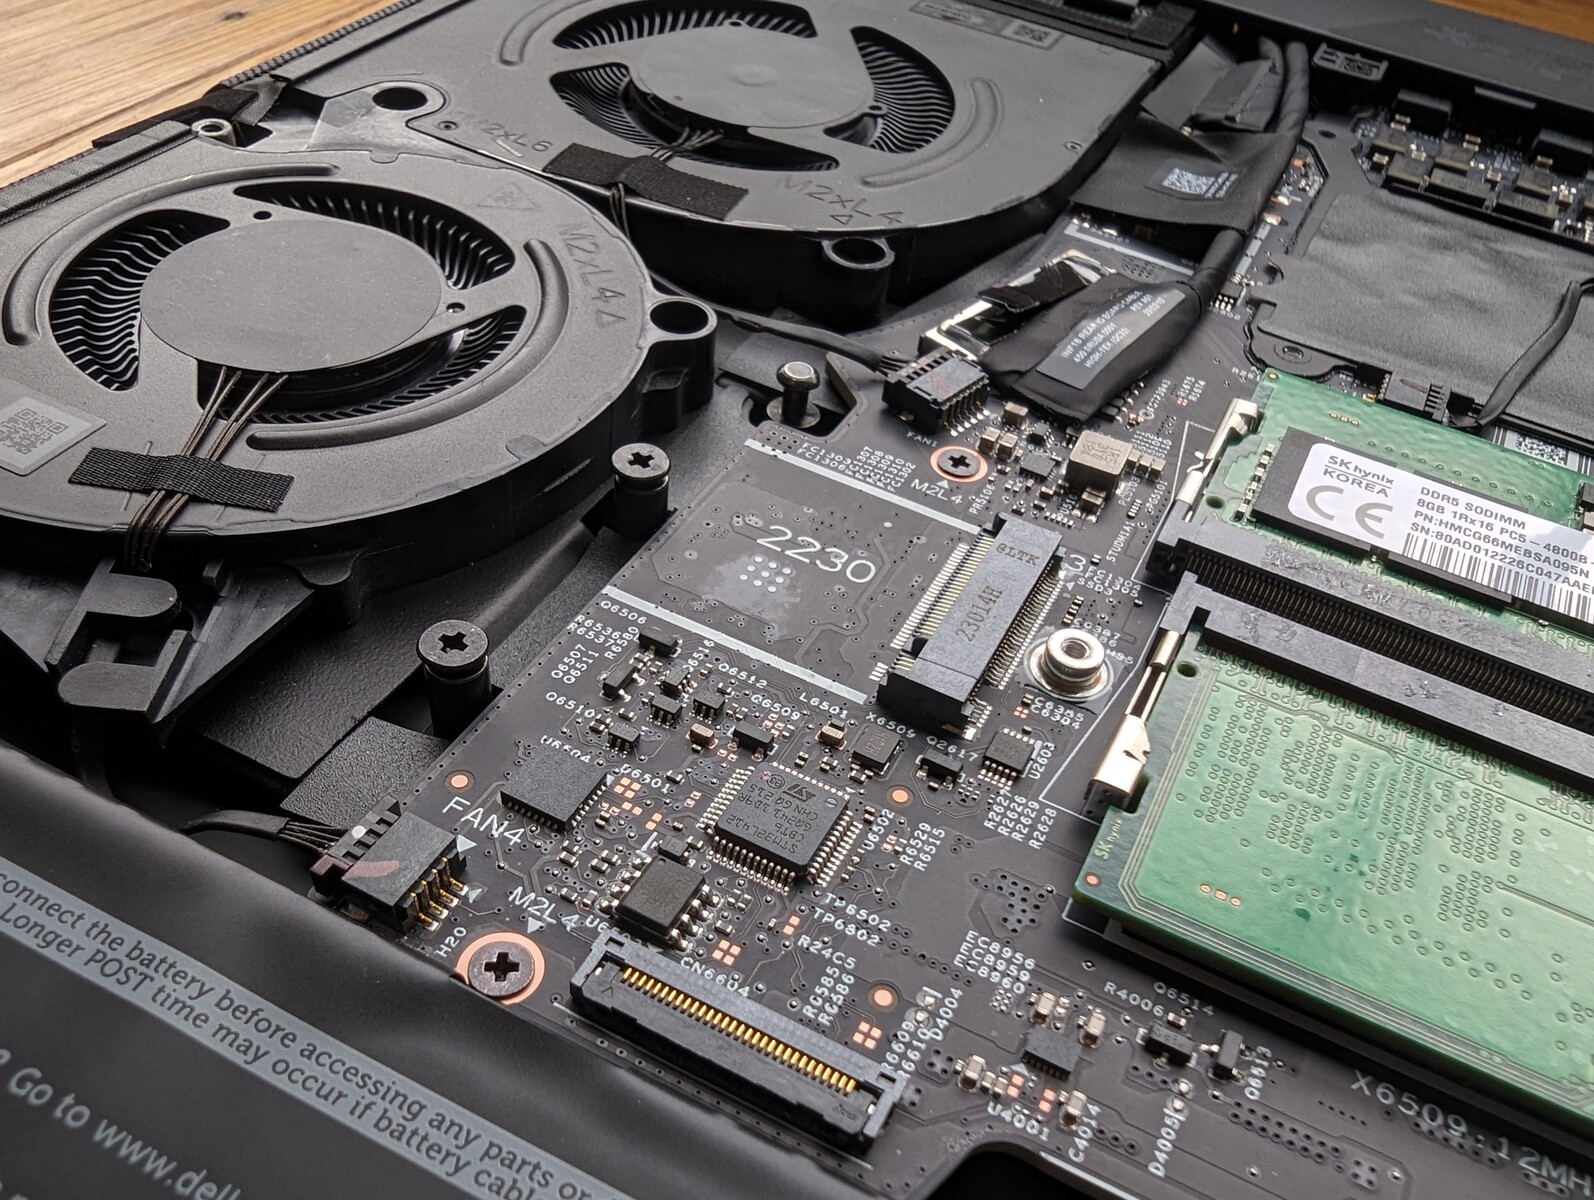
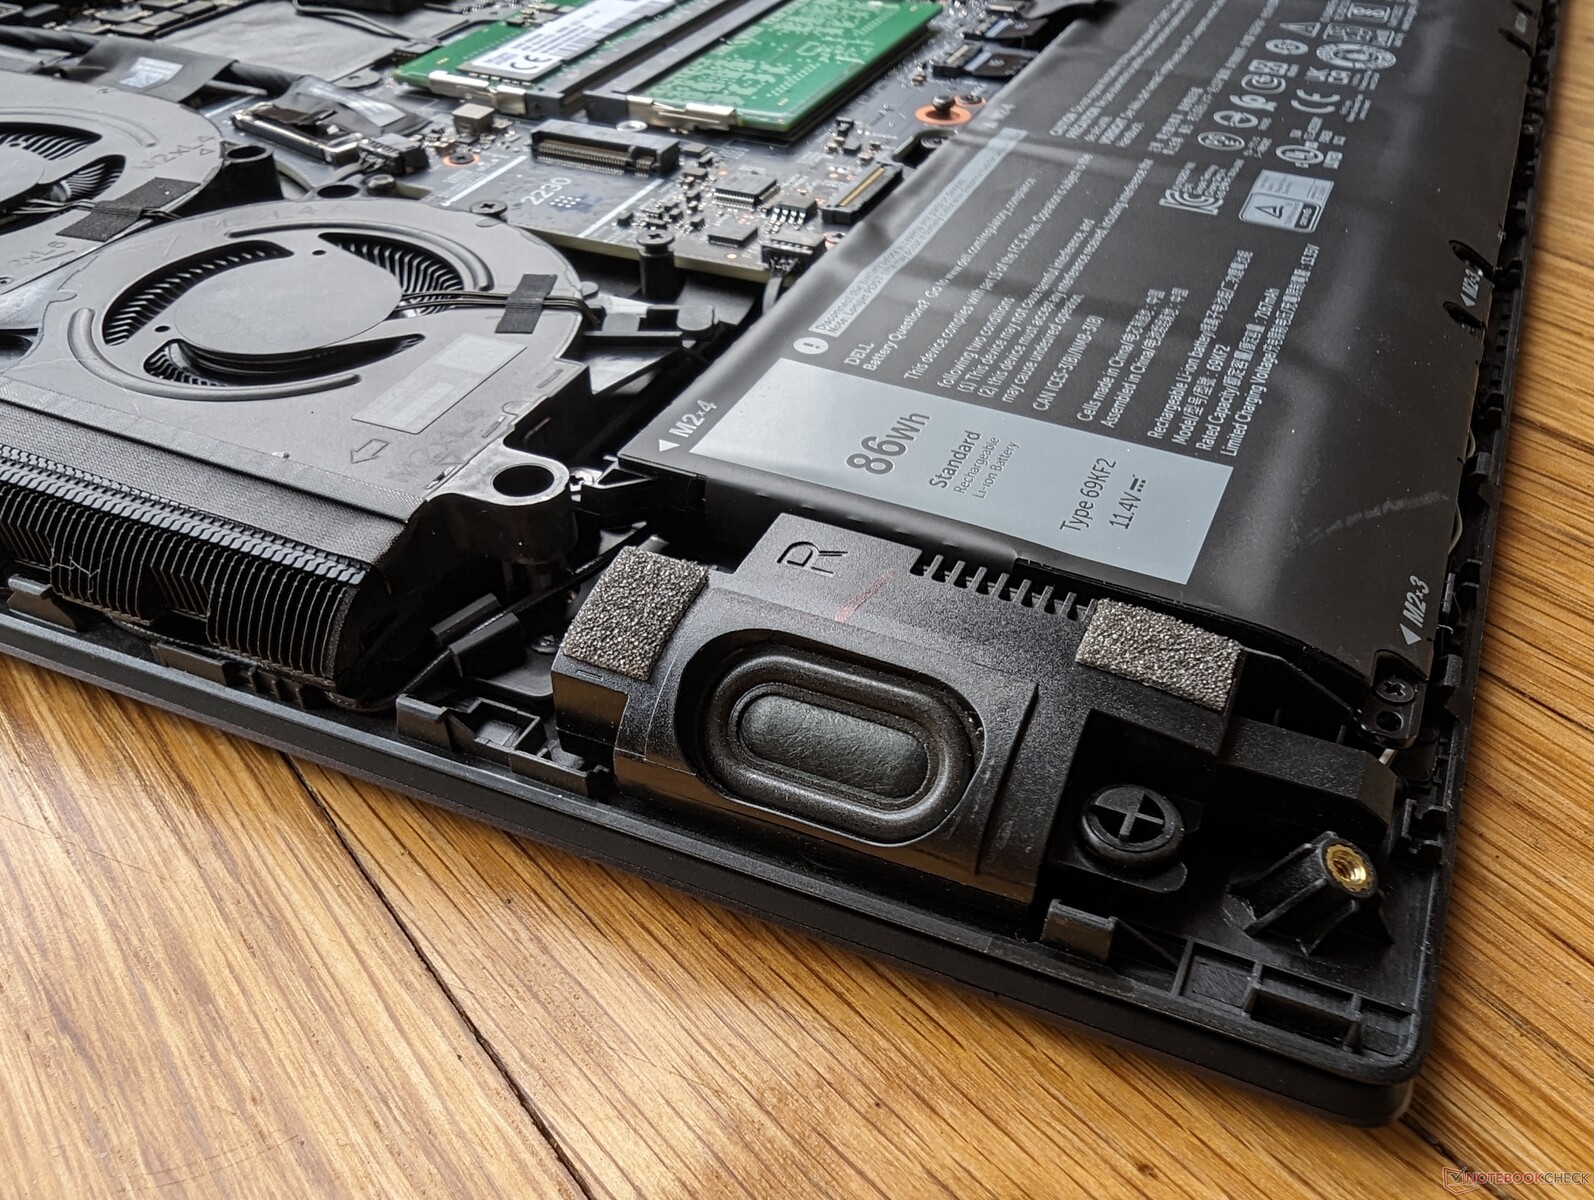
Mantenimiento
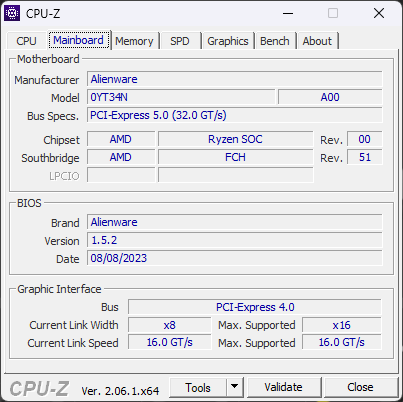
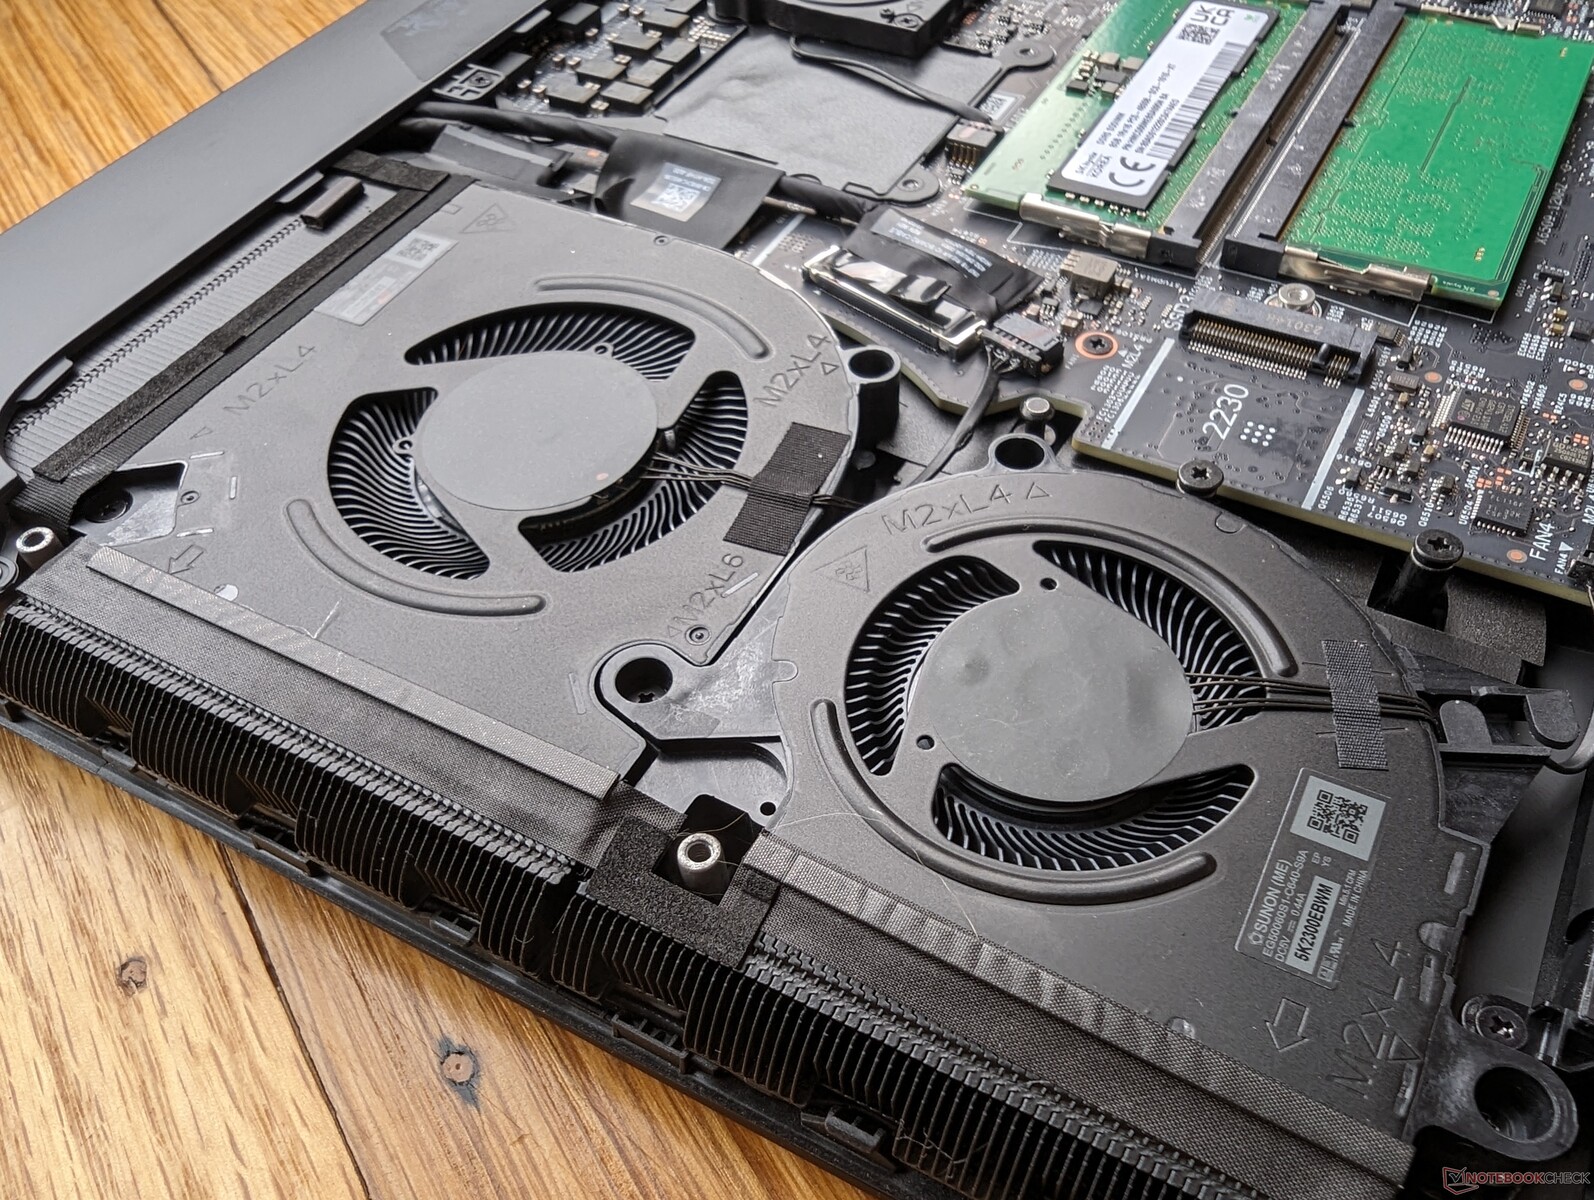
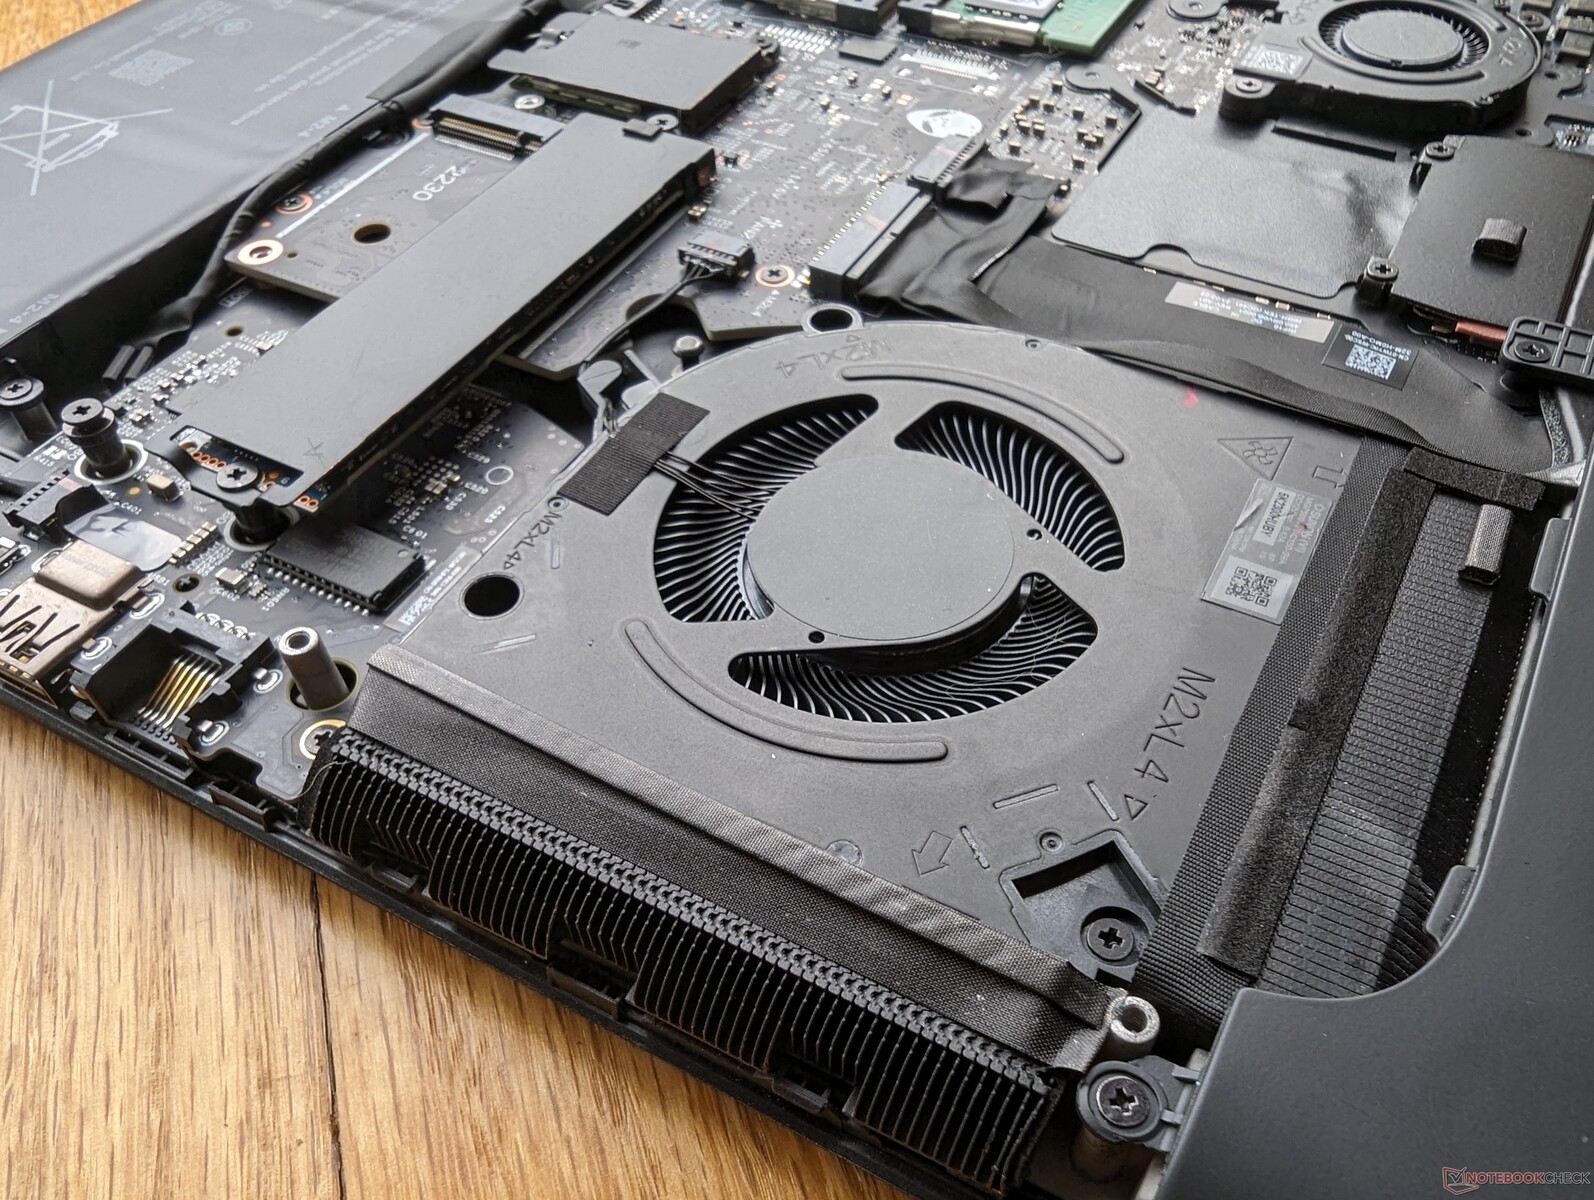
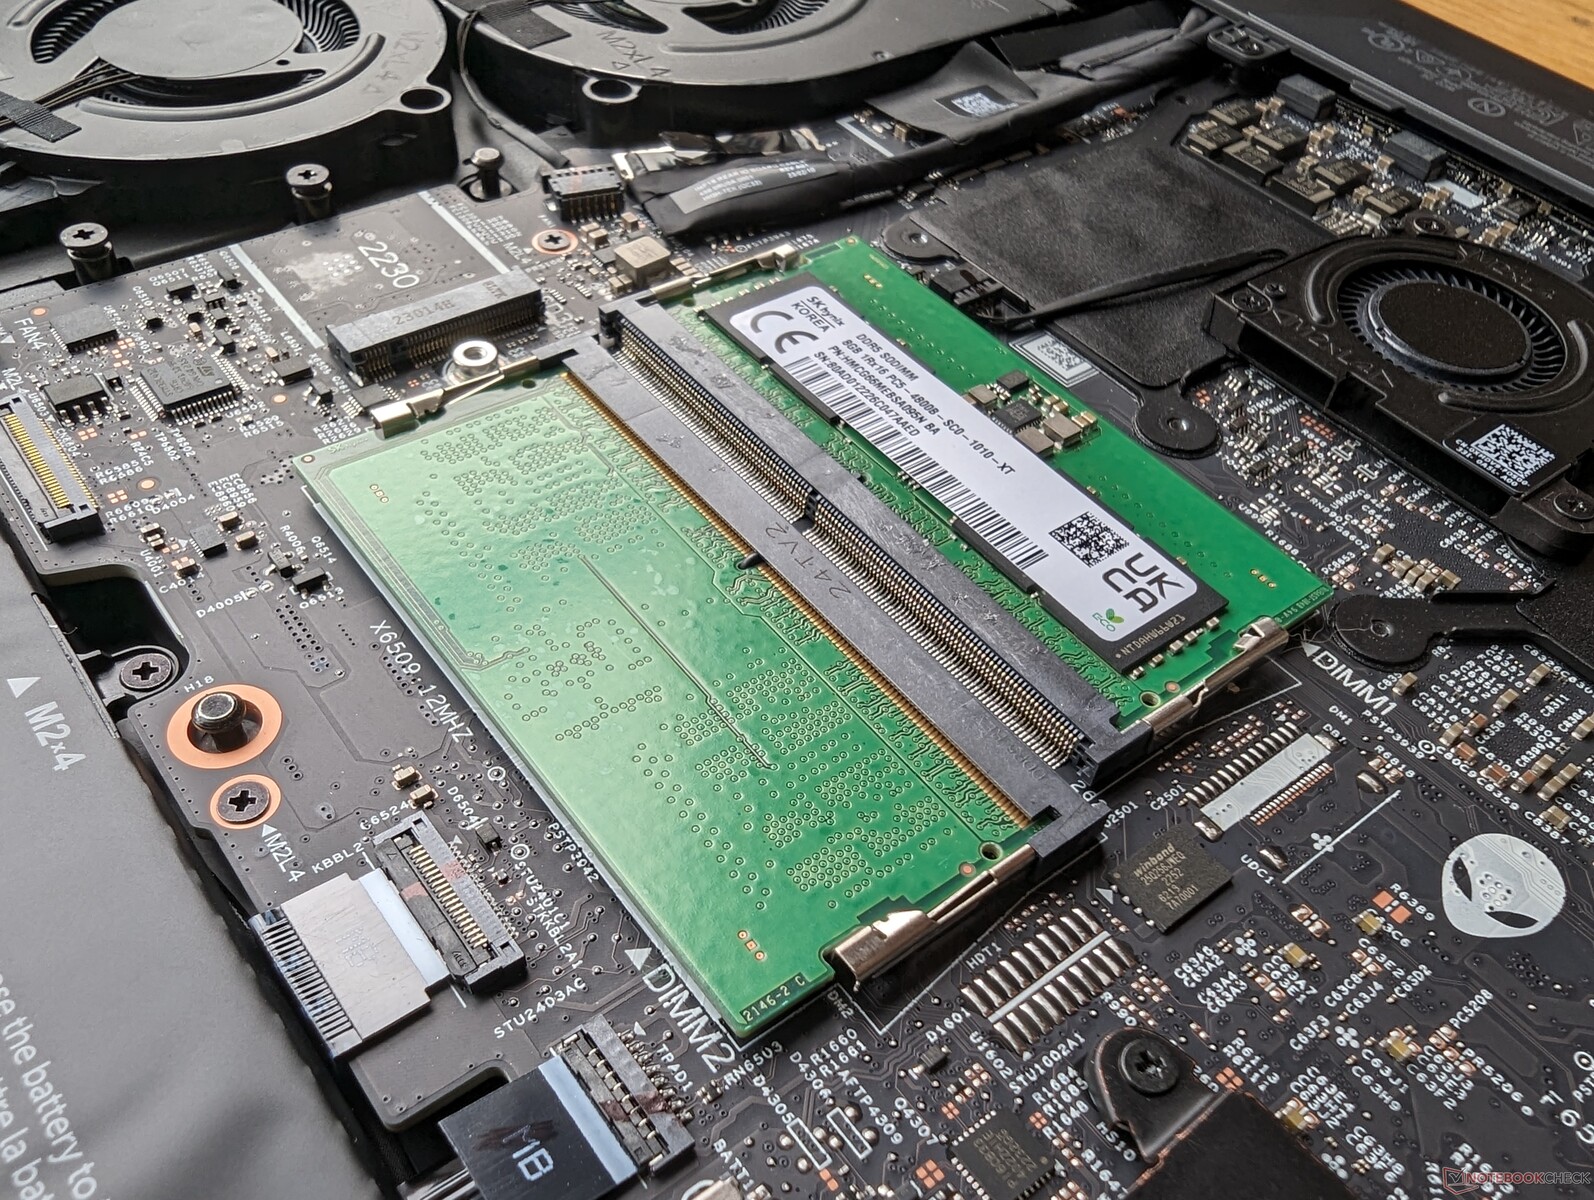
El panel inferior se fija con 8 tornillos Phillips para facilitar el mantenimiento. Los usuarios tienen acceso directo a 3x bahías de almacenamiento, 2x ranuras SODIMM, y el módulo WLAN extraíble. Tenga en cuenta que la placa base está al revés, lo que significa que los procesadores están en el lado opuesto.
El diseño de la placa base es completamente diferente de la Alienware x16 a pesar de que los dos modelos comparten muchas características externas. Es más similar al Alienware m18.
Accesorios y garantía
La caja incluye dos pegatinas con el logotipo de Alienware junto con el adaptador de CA y la documentación habituales. Se aplica una garantía limitada del fabricante de un año si se adquiere en EE.UU.
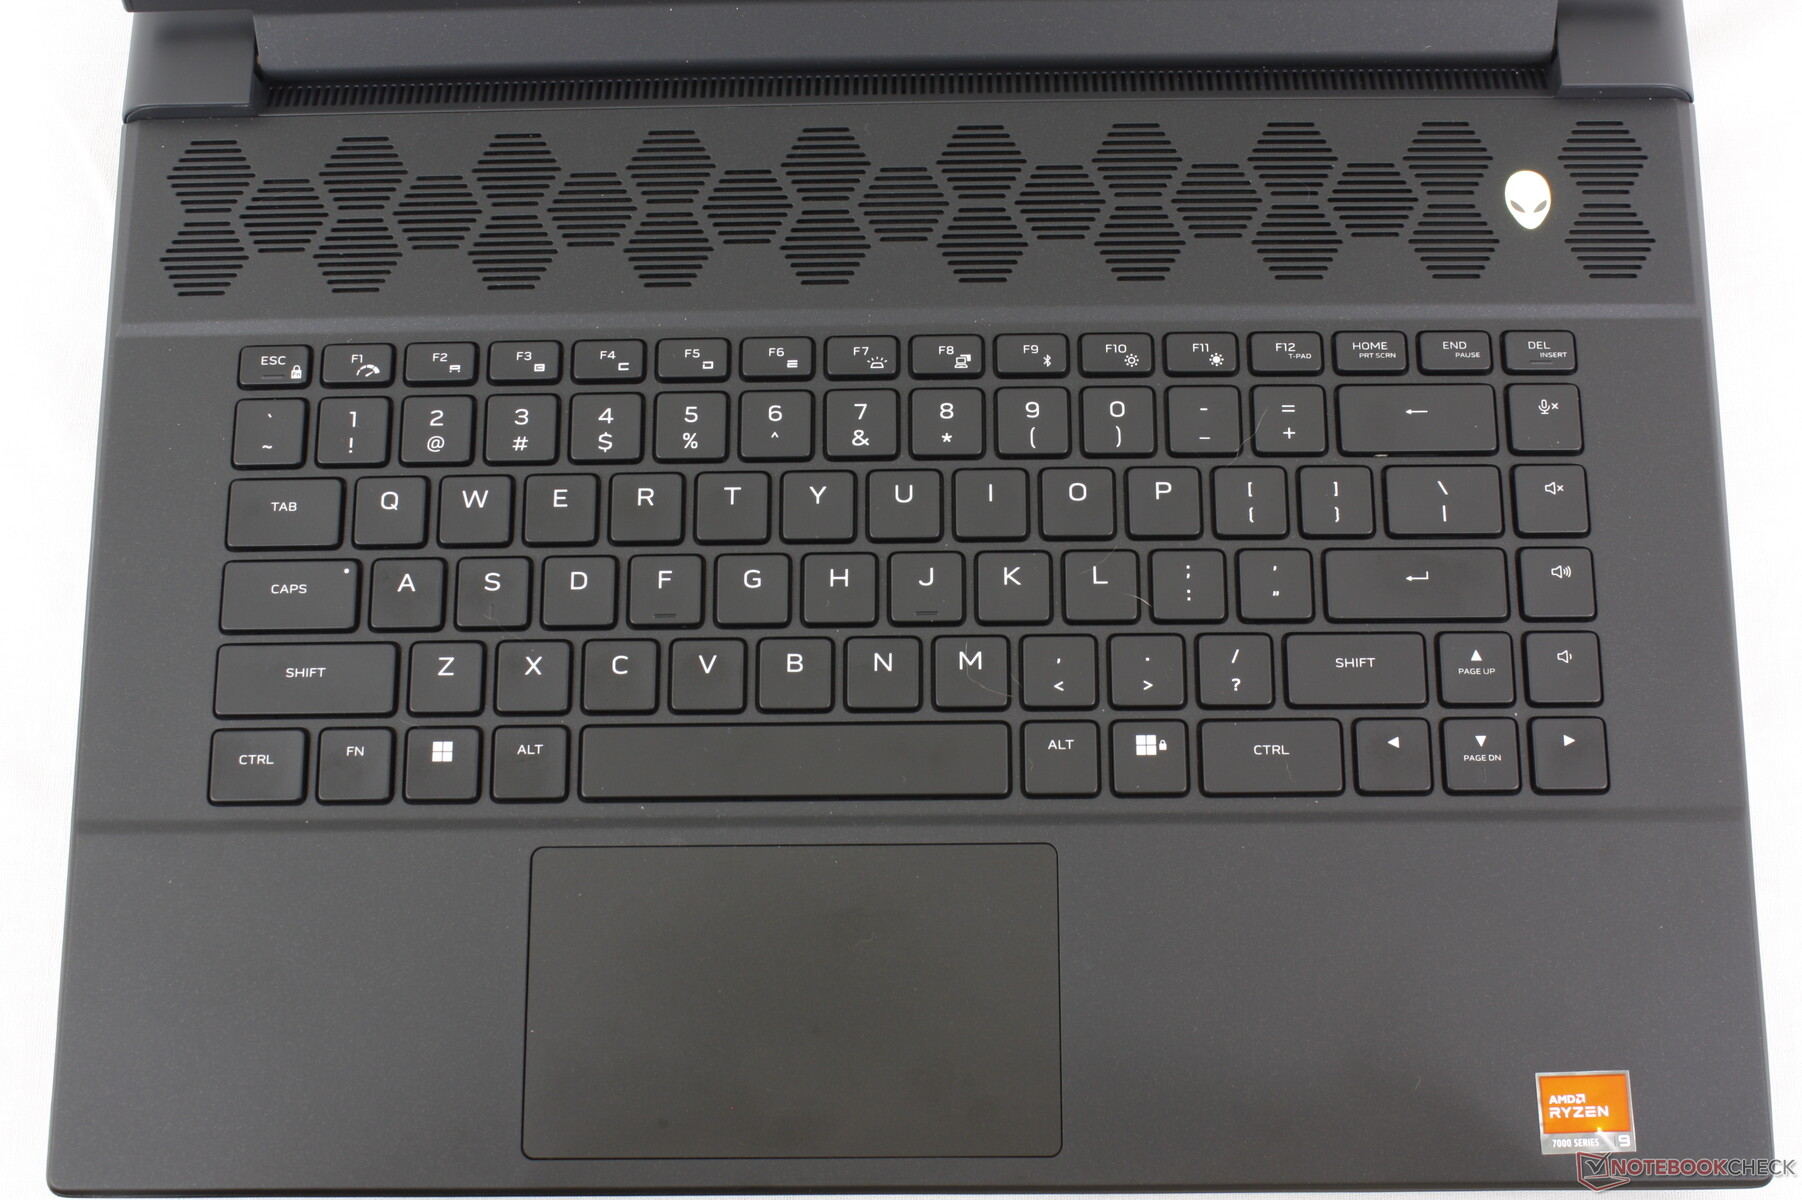
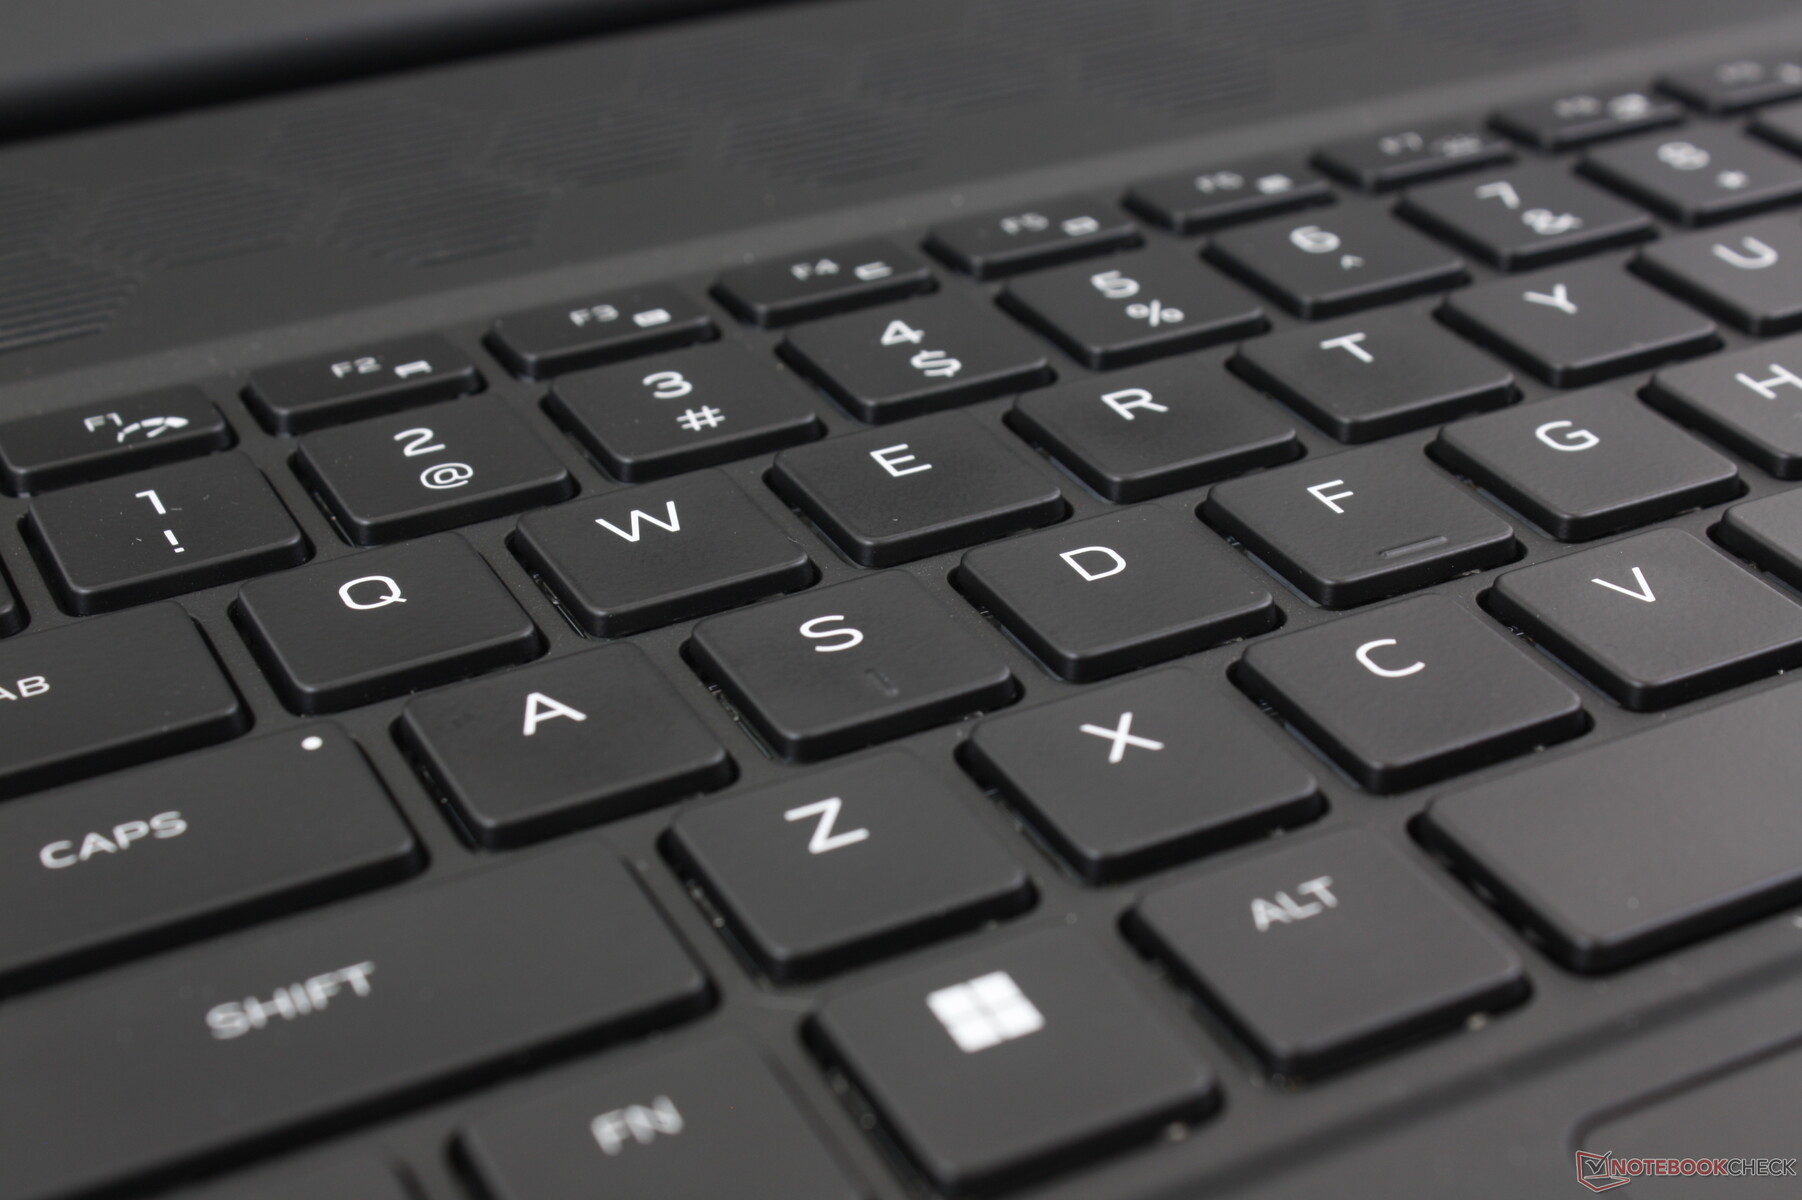
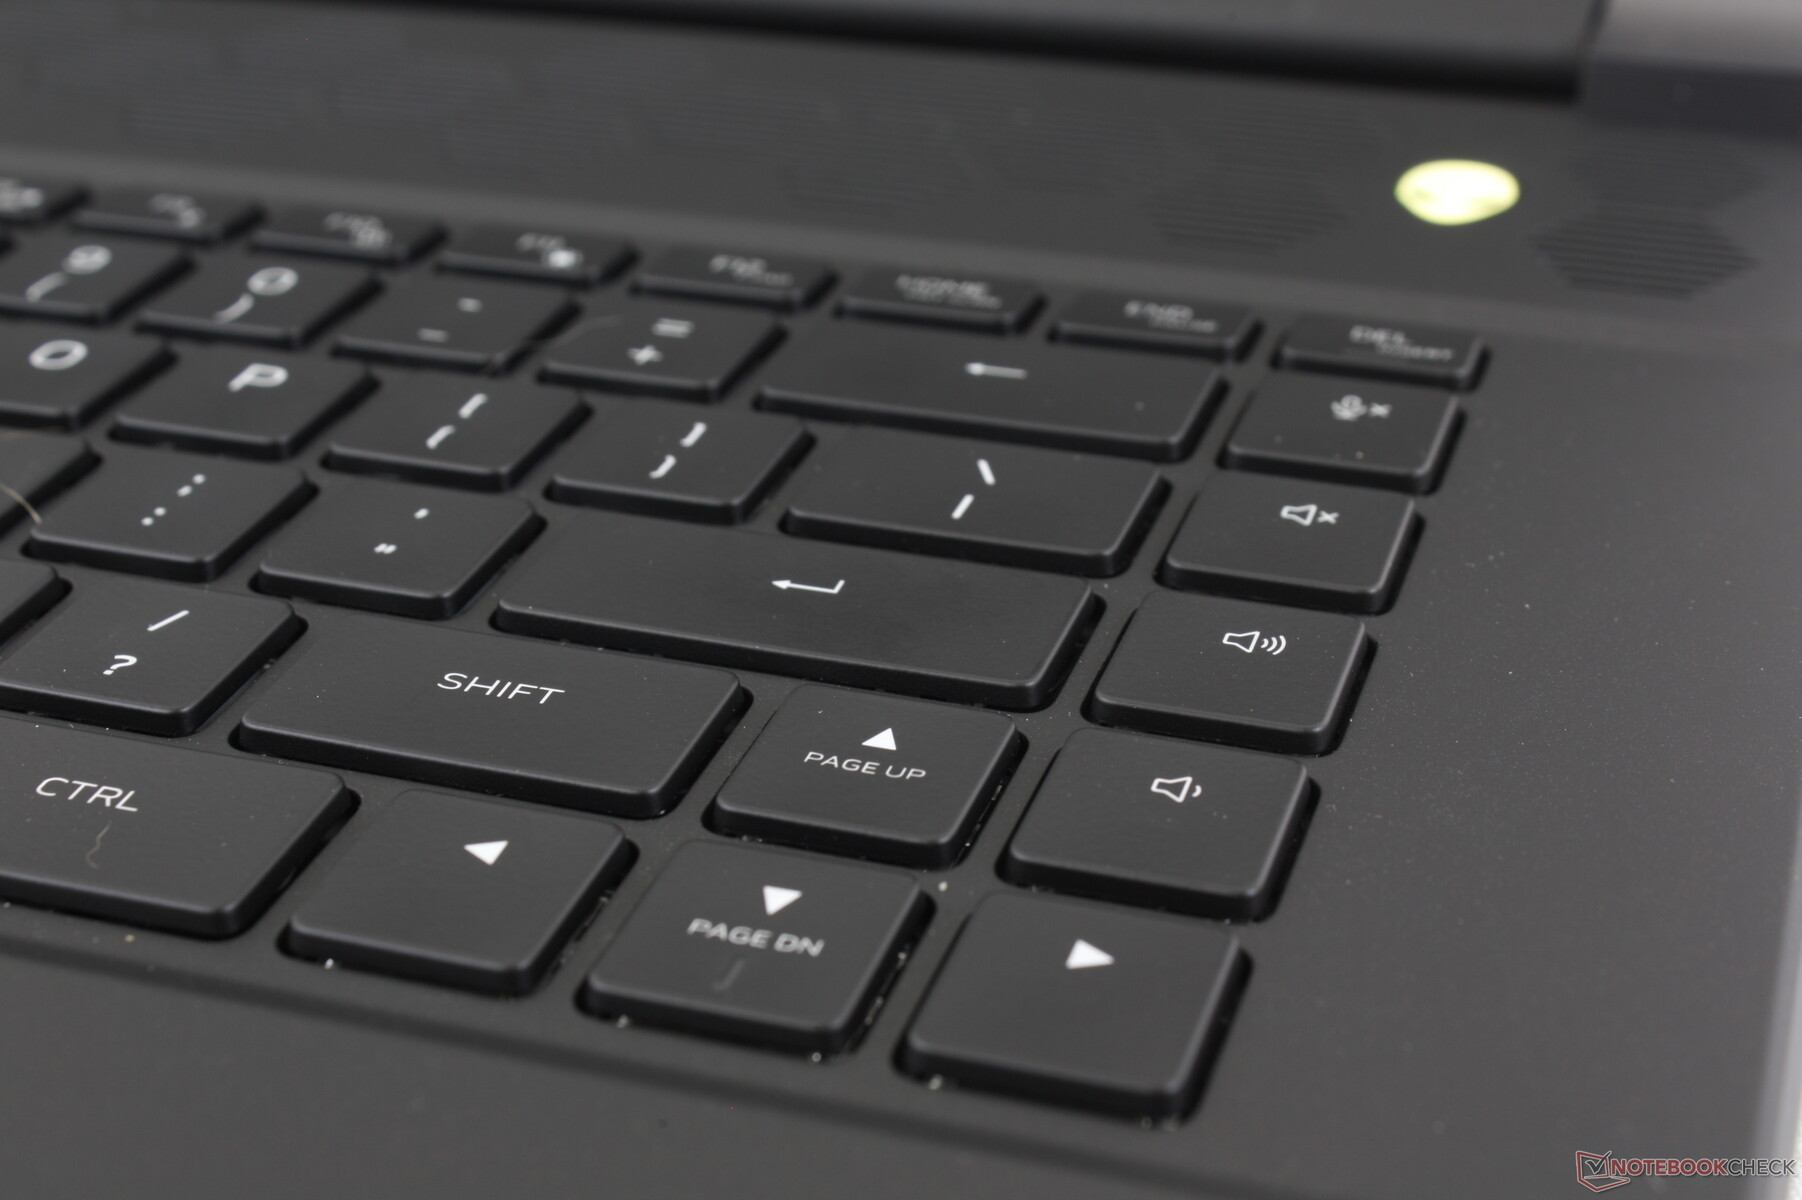
Dispositivos de entrada: mecánicos o estándar disponibles
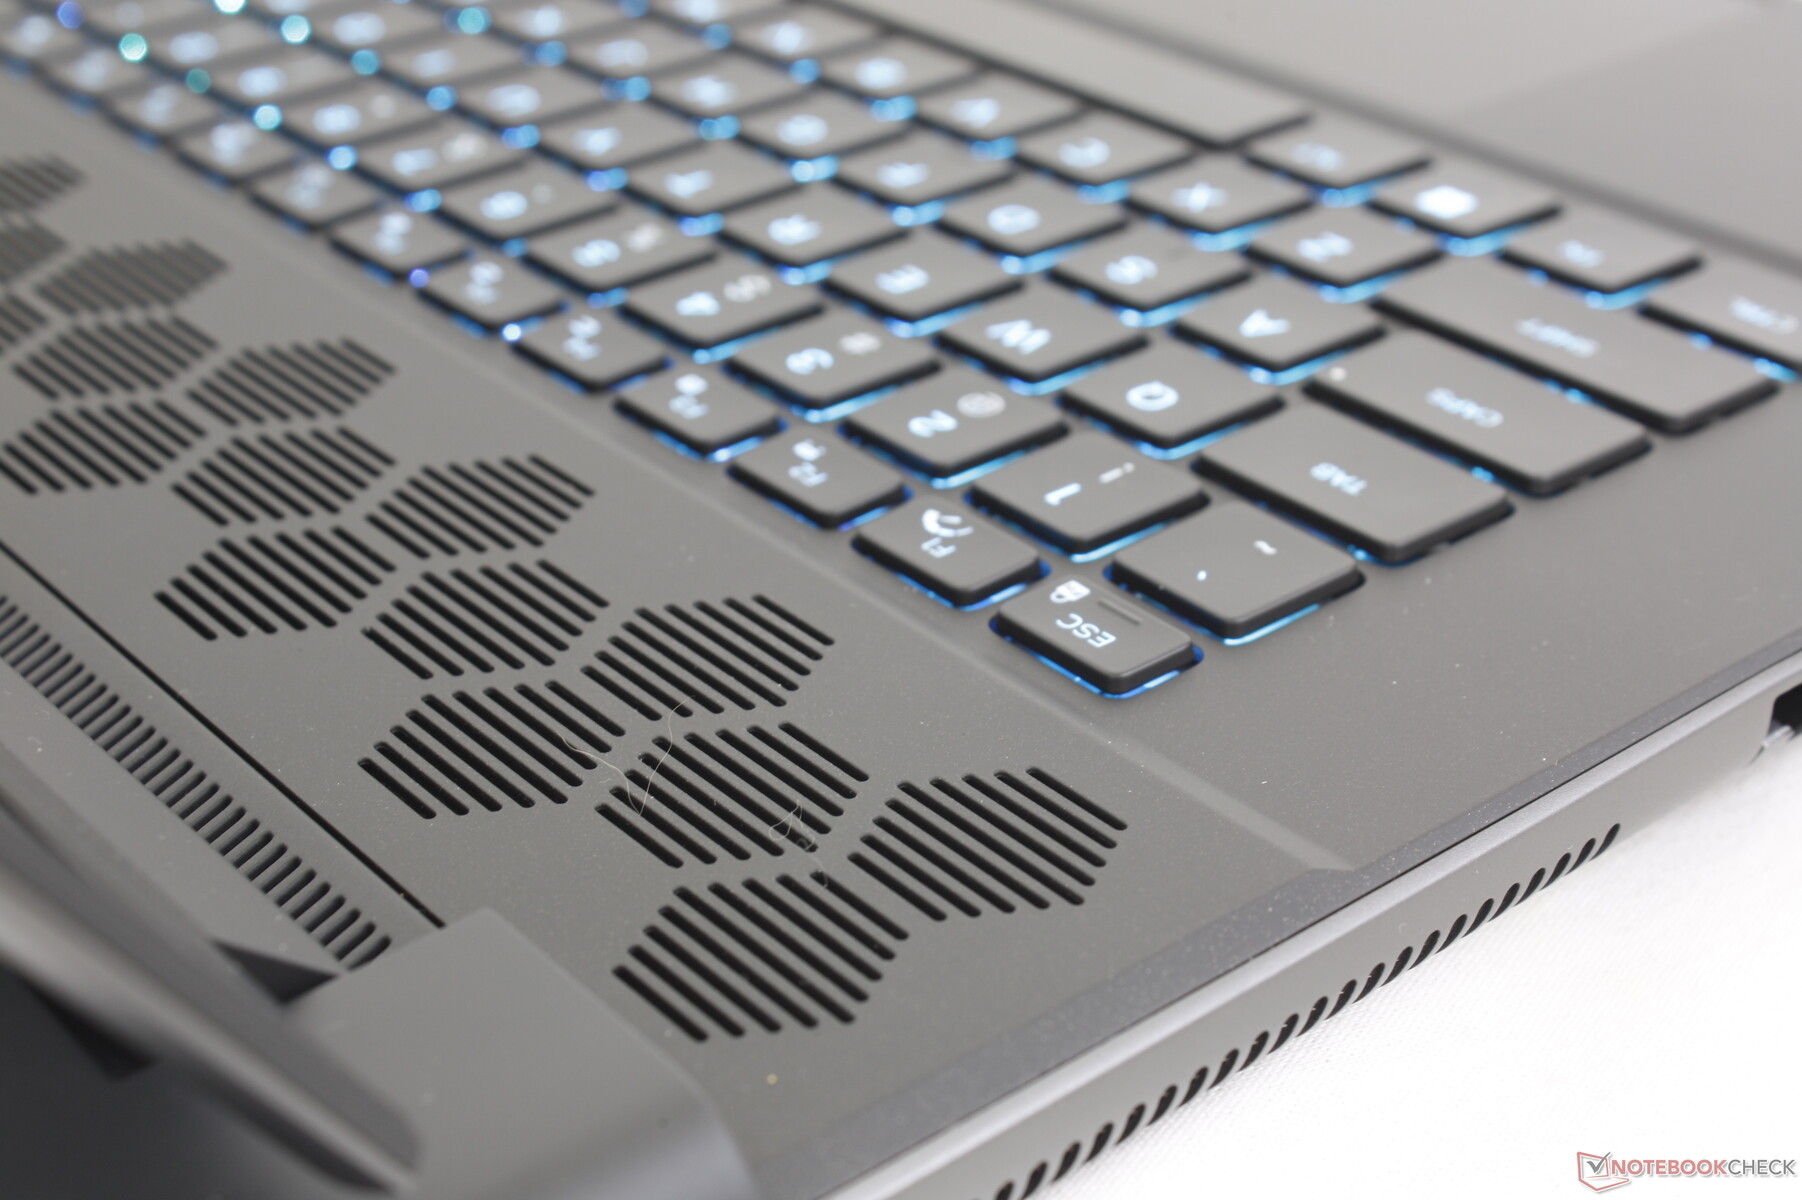
Teclado
Los usuarios pueden configurarlo con un teclado de membrana estándar o con un teclado mecánico de perfil ultrabajo CherryMX con iluminación RGB por tecla. El teclado CherryMX se introdujo hace un par de años en el Alienware x17 R1 y sigue siendo uno de nuestros teclados favoritos en cualquier portátil para juegos por su respuesta clic y su recorrido profundo. El principal inconveniente, por supuesto, es el ruido agudo y muy fuerte. Es posible que desee considerar la opción de teclado estándar en su lugar para entornos sensibles al ruido como bibliotecas, aulas o dormitorios.
La retroiluminación ilumina todas las teclas y símbolos, lo que no ocurría en modelos anteriores en los modelos anteriores.
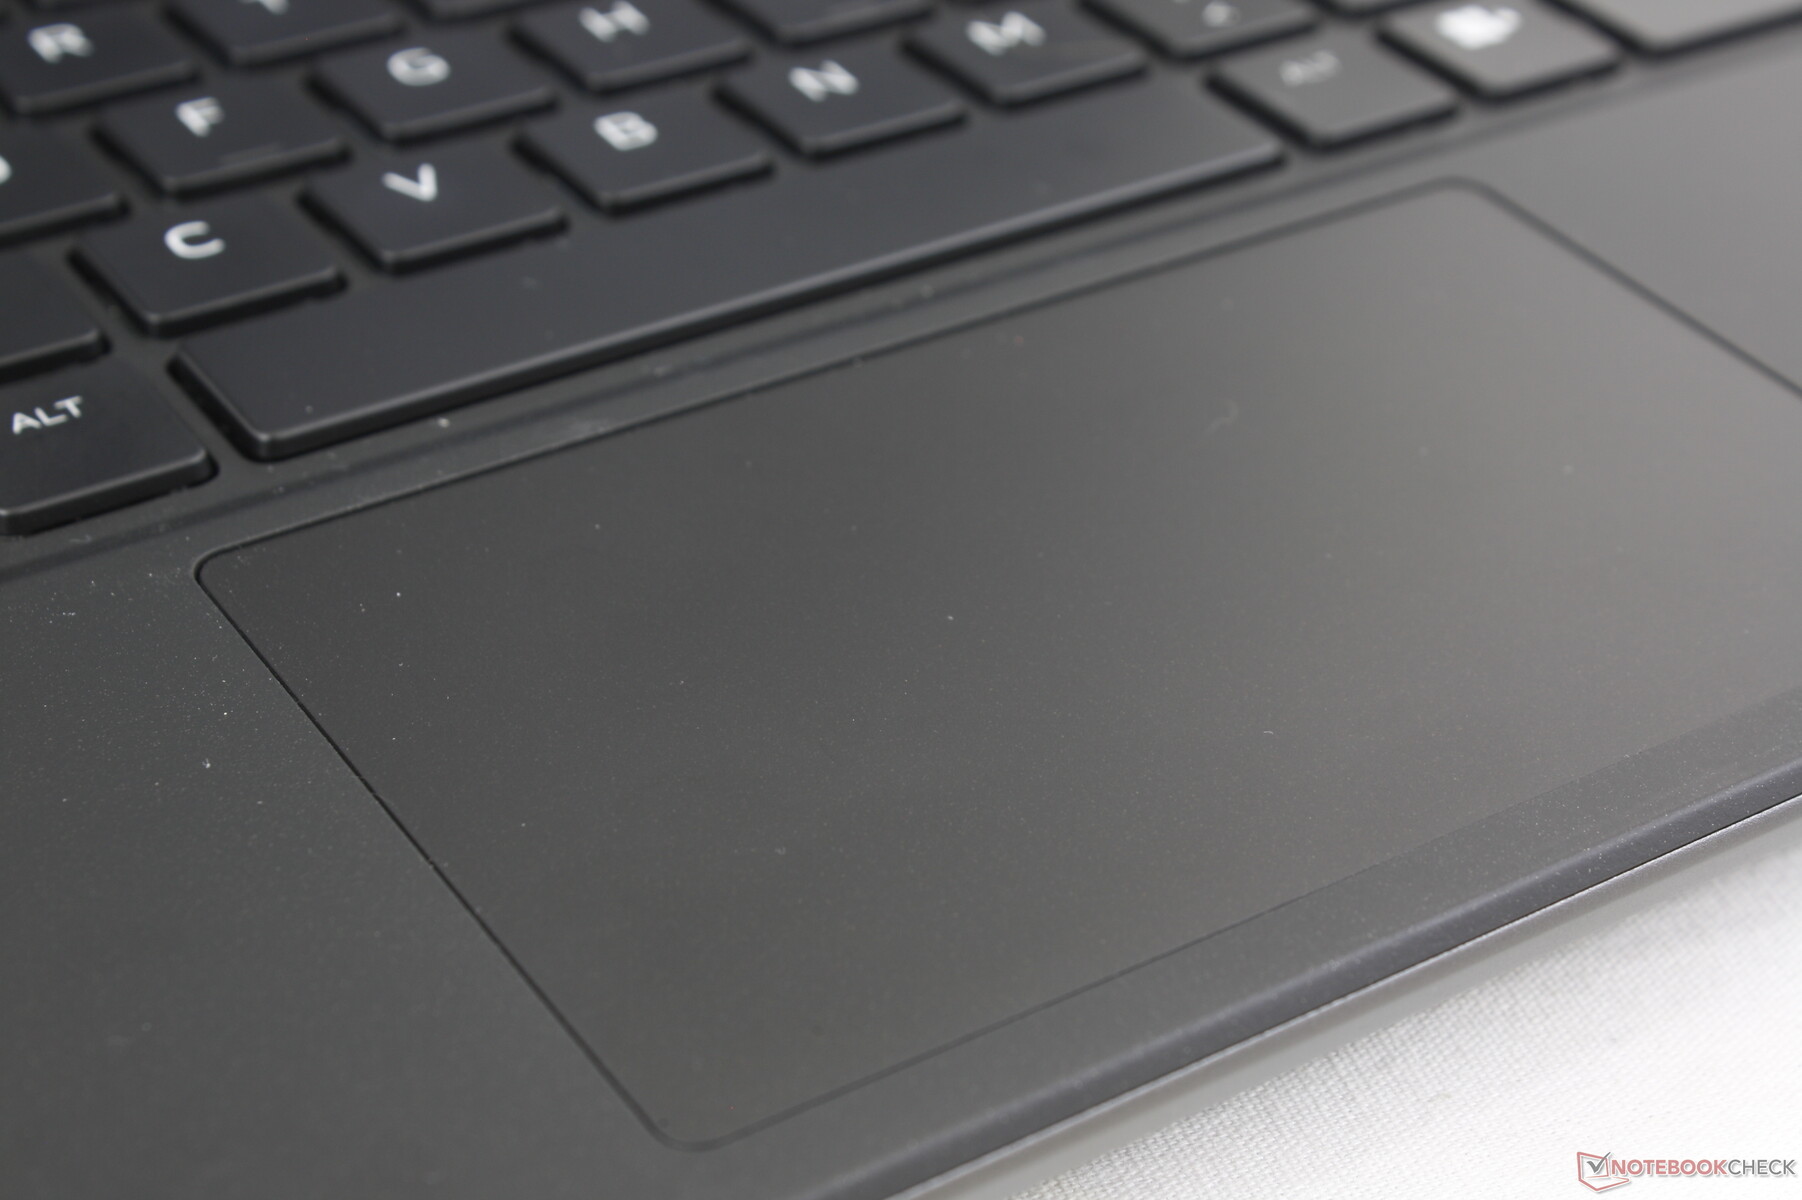
Panel táctil
El clickpad es relativamente pequeño (11,3 x 6,6 cm), ya que gran parte de la cubierta del teclado está ocupada por las grandes rejillas de ventilación. Los clickpads del HP Omen Transcend 16 y Razer Blade 16, por ejemplo, son más espaciosos: 12,5 x 8 cm y 17 x 9,7 cm, respectivamente. Por lo demás, la tracción es suave y la respuesta al pulsar es firme y chasqueante a pesar de la escasa superficie.
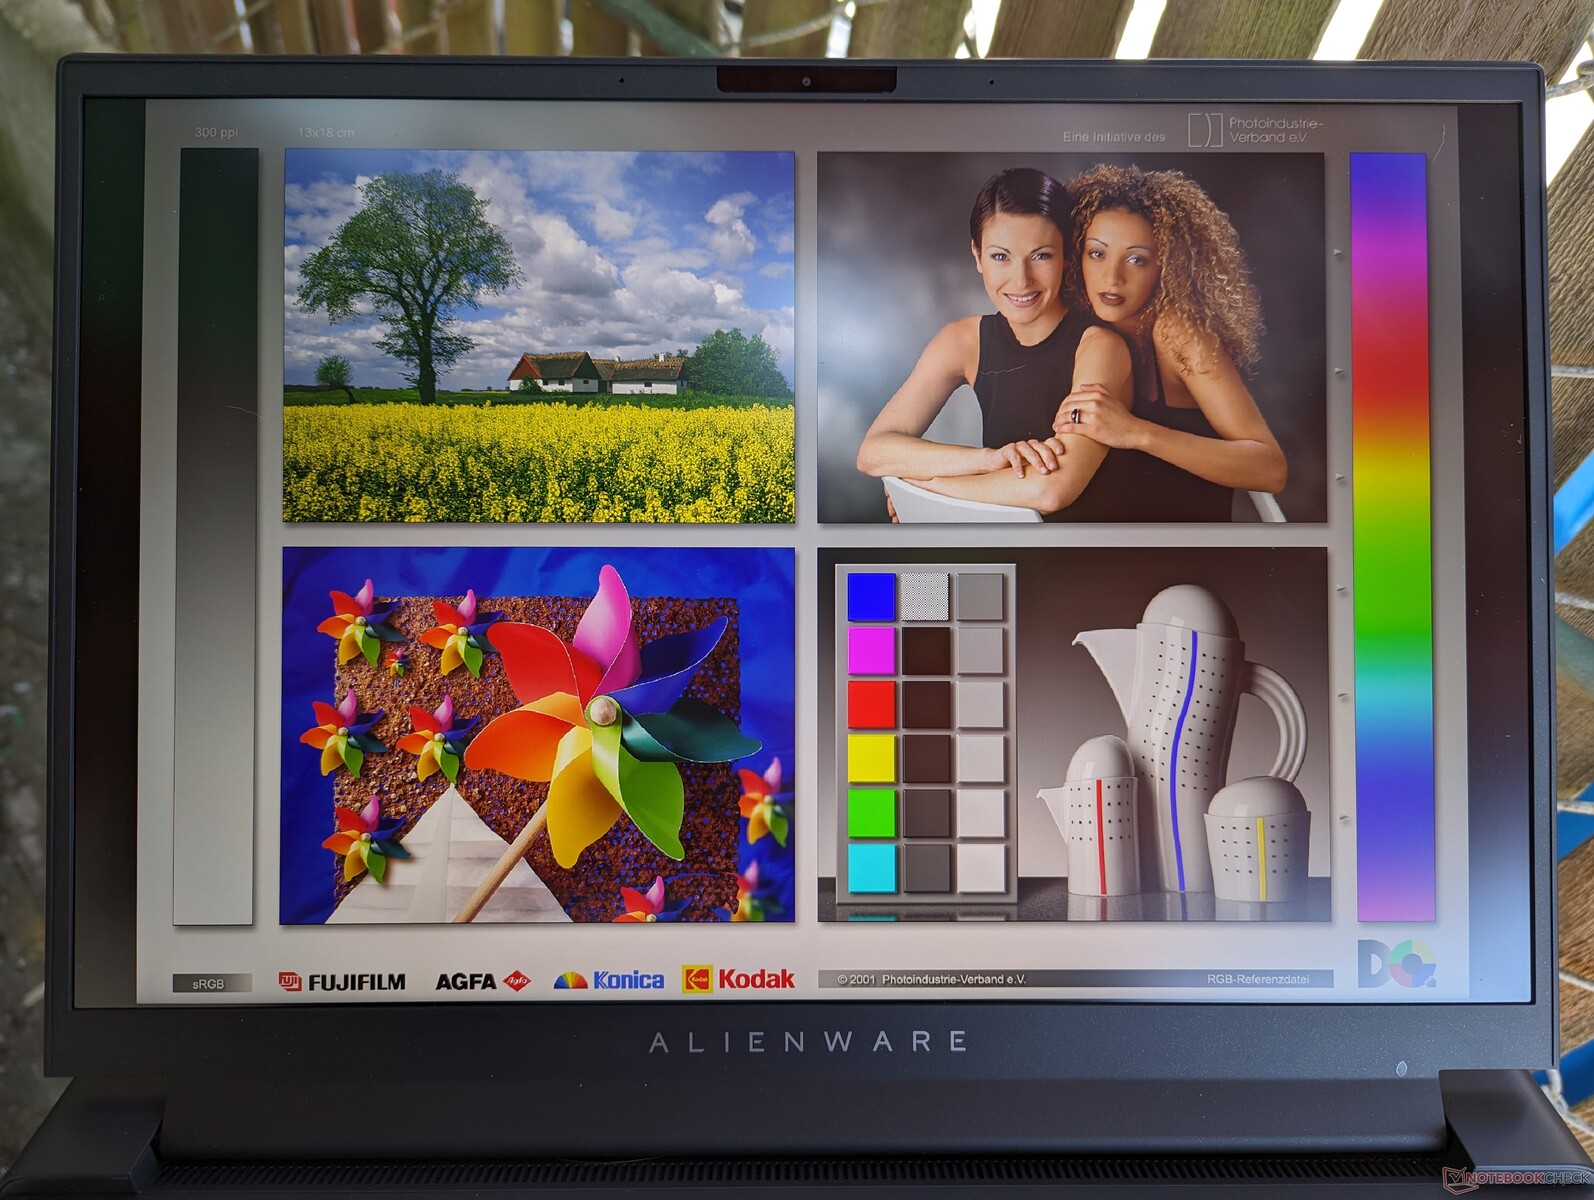
Mostrar
Existen tres opciones de visualización:
- 2560 x 1600, 165 Hz, 3 ms, IPS, 100% sRGB
- 2560 x 1600, 240 Hz, 3 ms, IPS, 100% DCI-P3
- 1920 x 1200, 480 Hz, 3 ms, IPS, 100% DCI-P3
Nuestra unidad está configurada con la opción en negrita de arriba, que creemos que es el punto dulce para el modelo, ya que ofrece todos los colores P3, frecuencias de actualización rápidas, y una alta resolución todo-en-uno. La opción 1200p ofrece frecuencias de actualización aún más rápidas, pero las ventajas son cada vez más marginales a partir de 240 Hz.
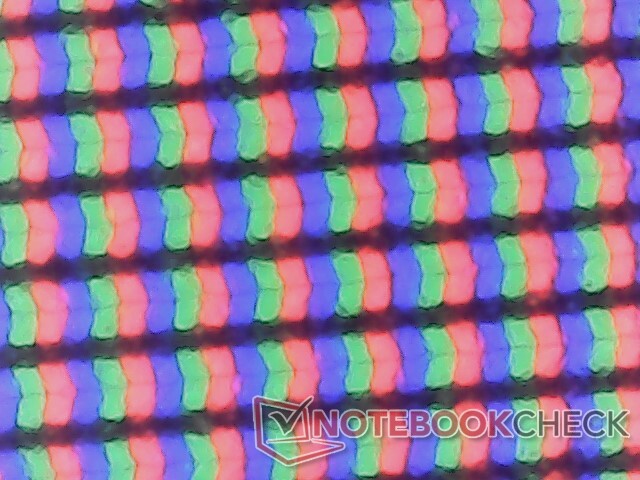
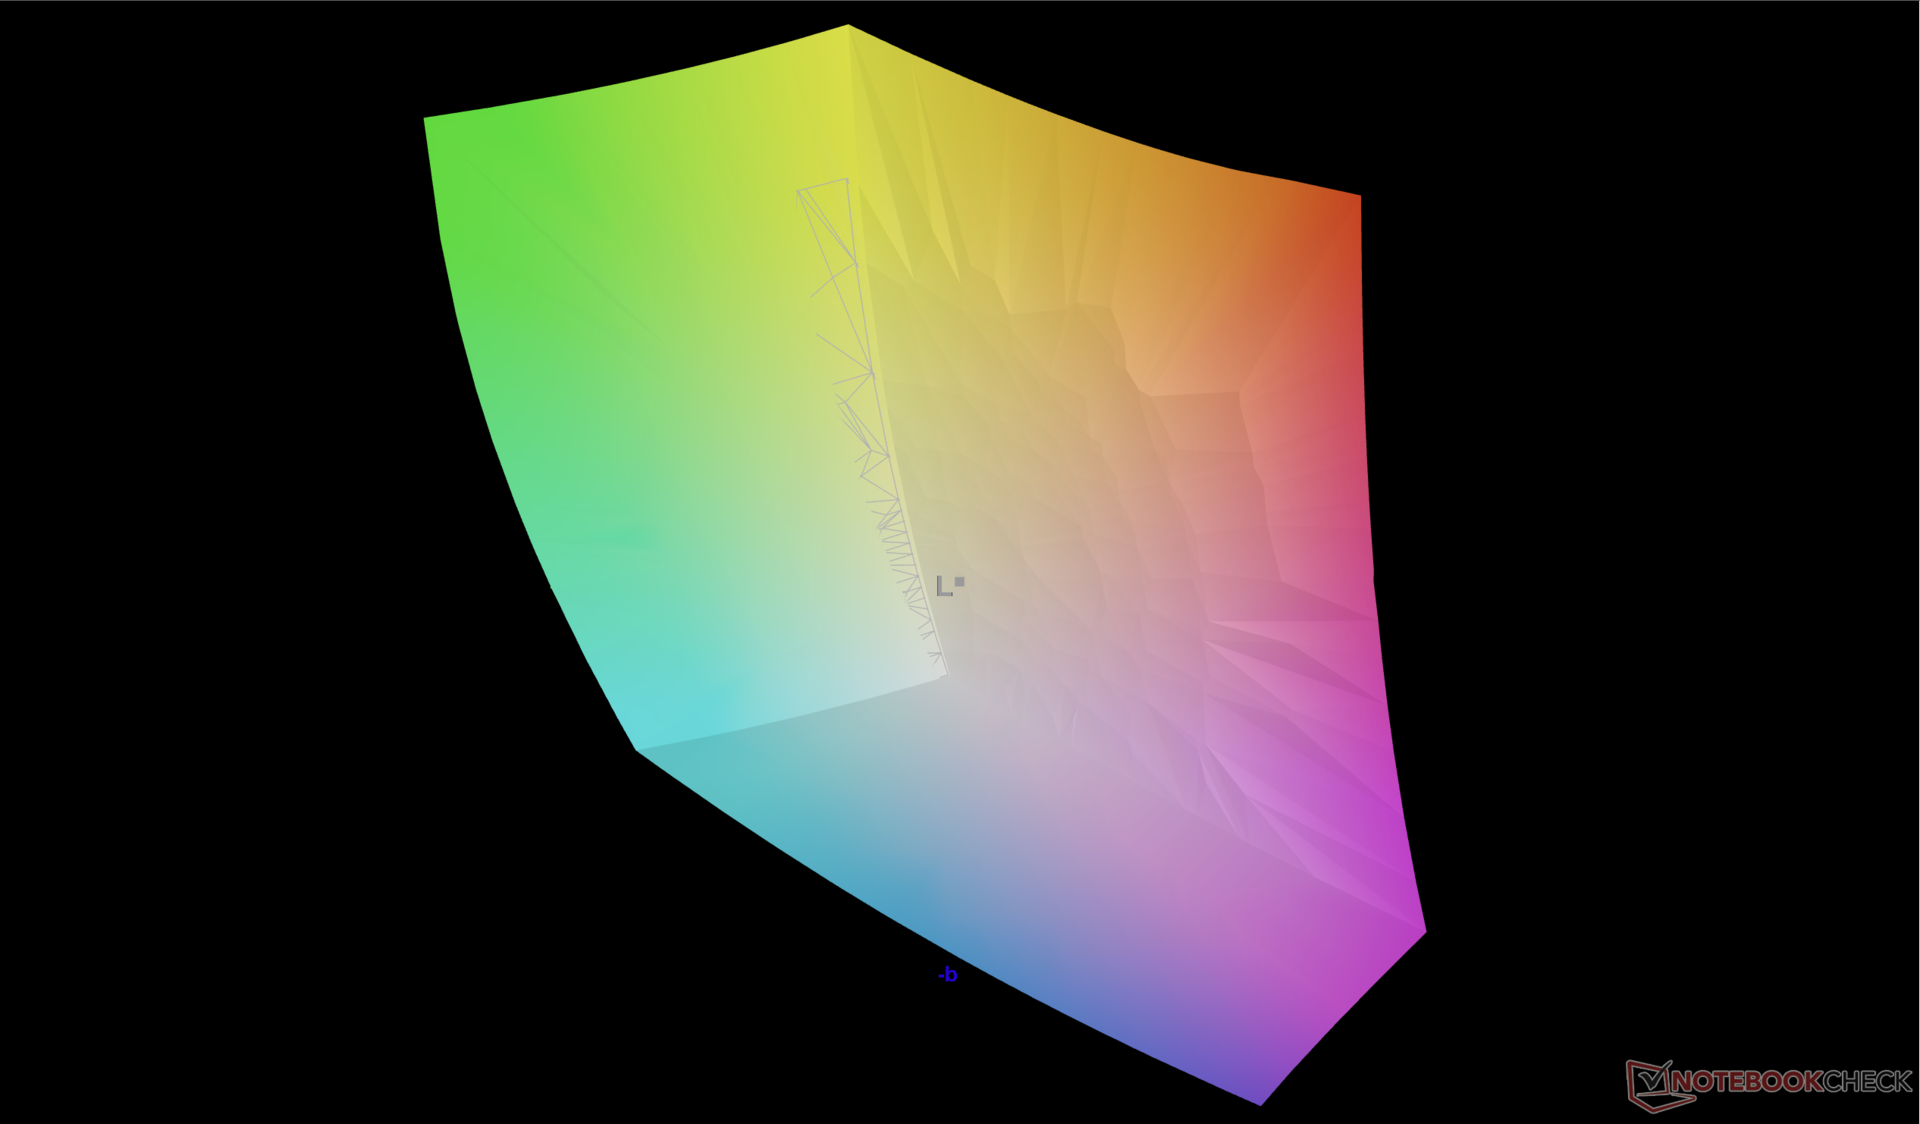
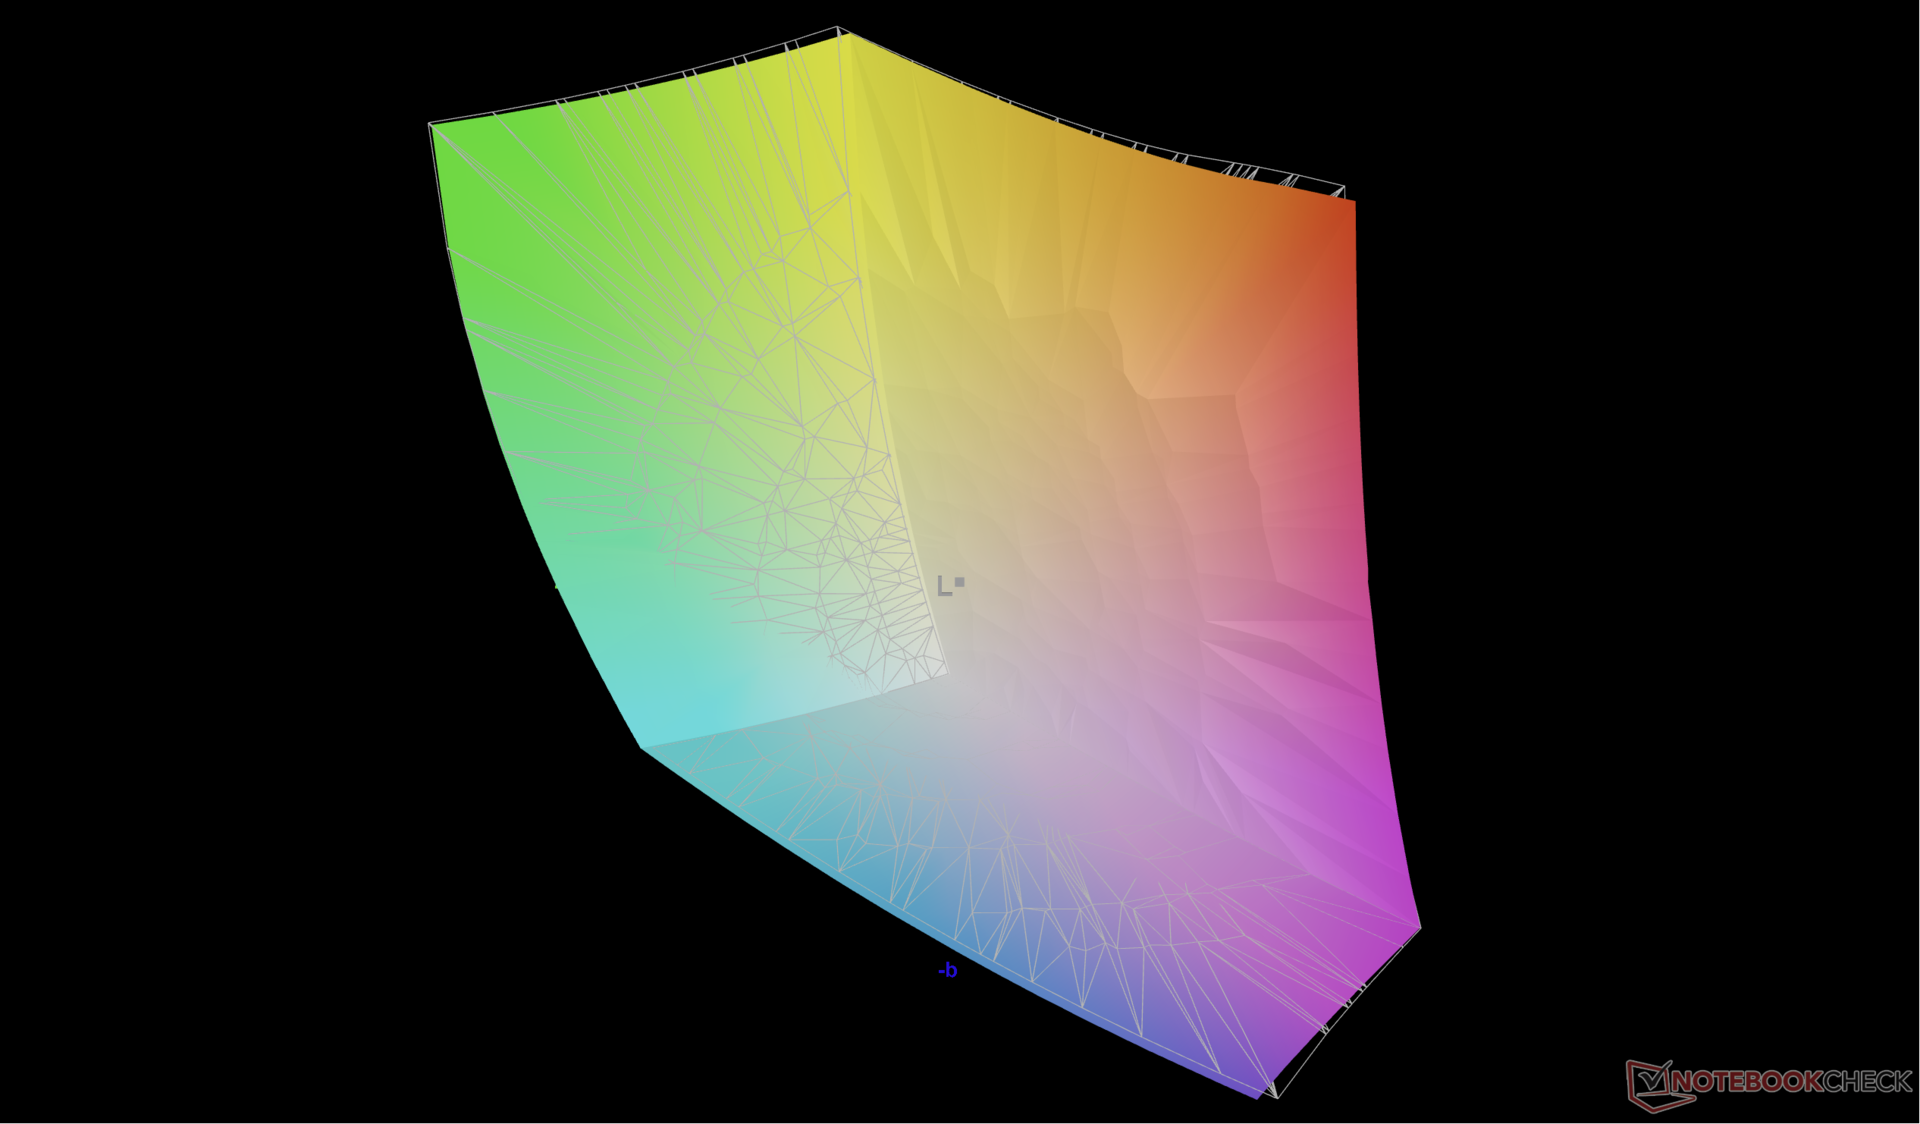
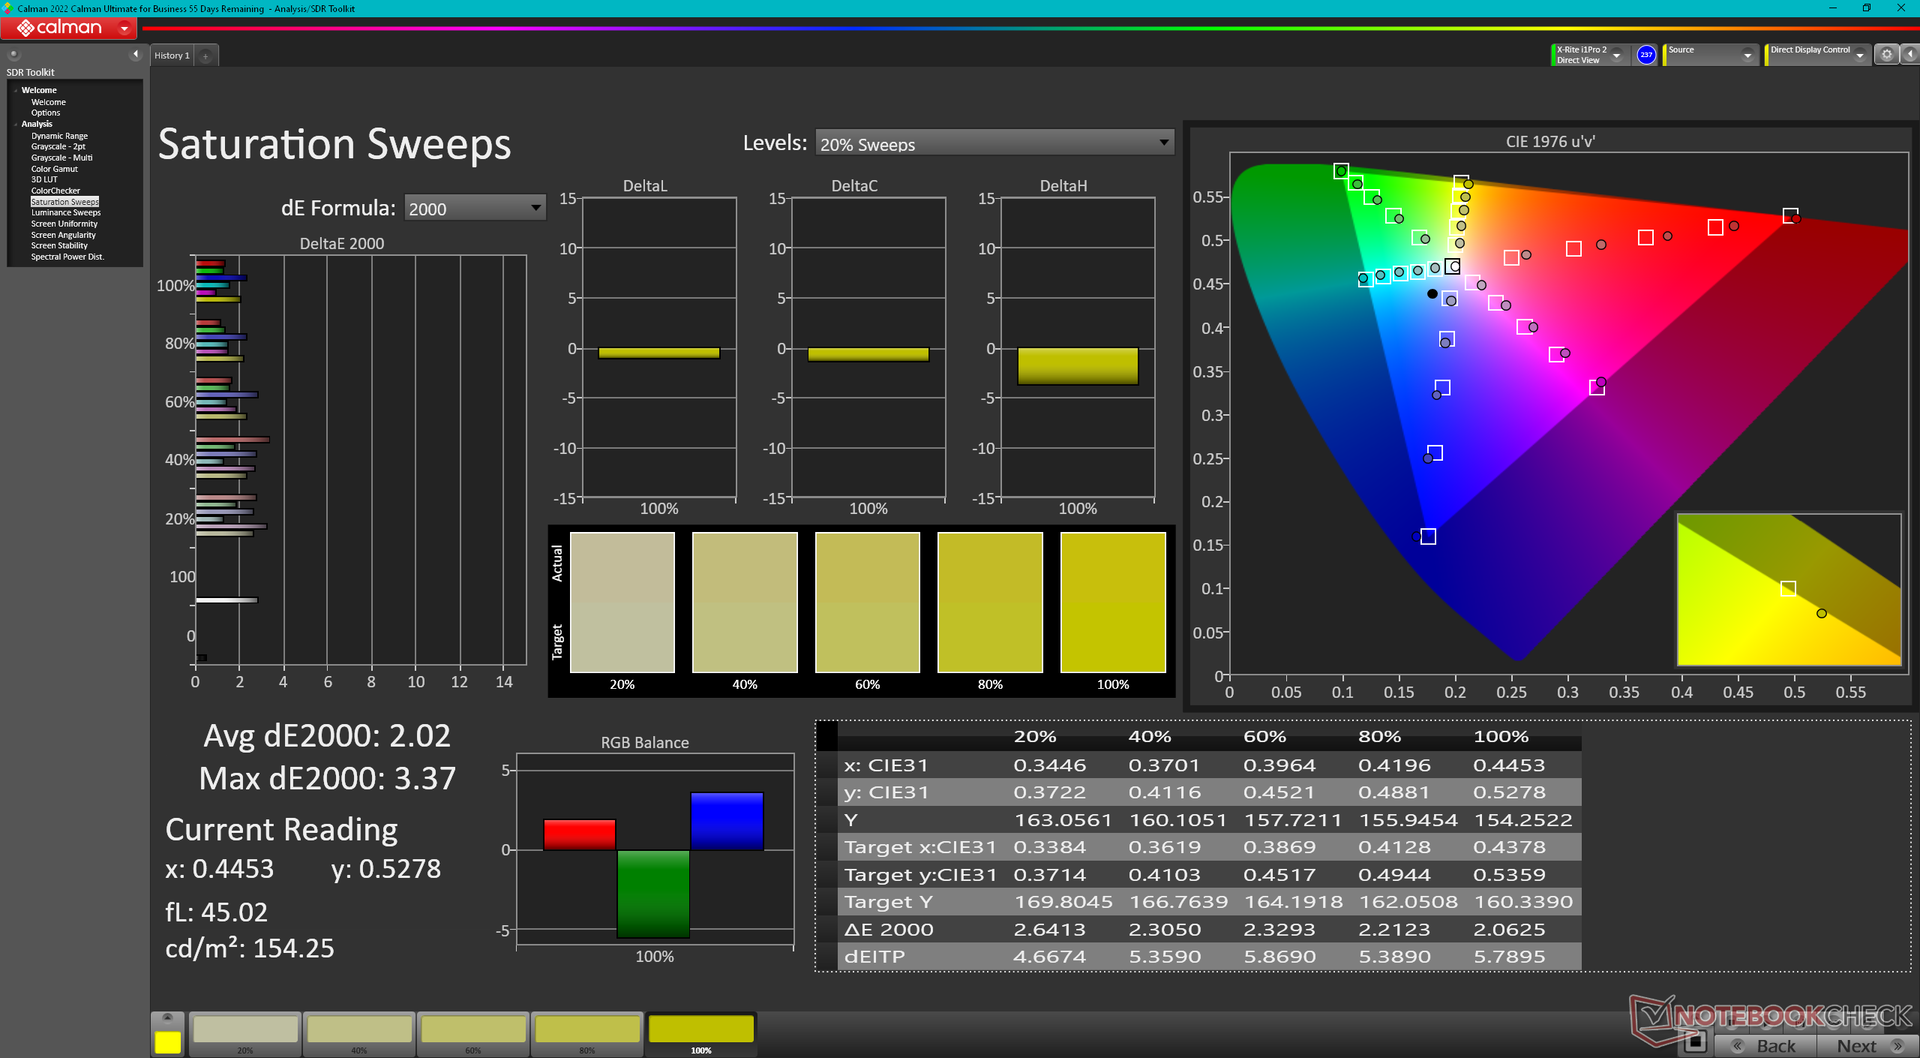
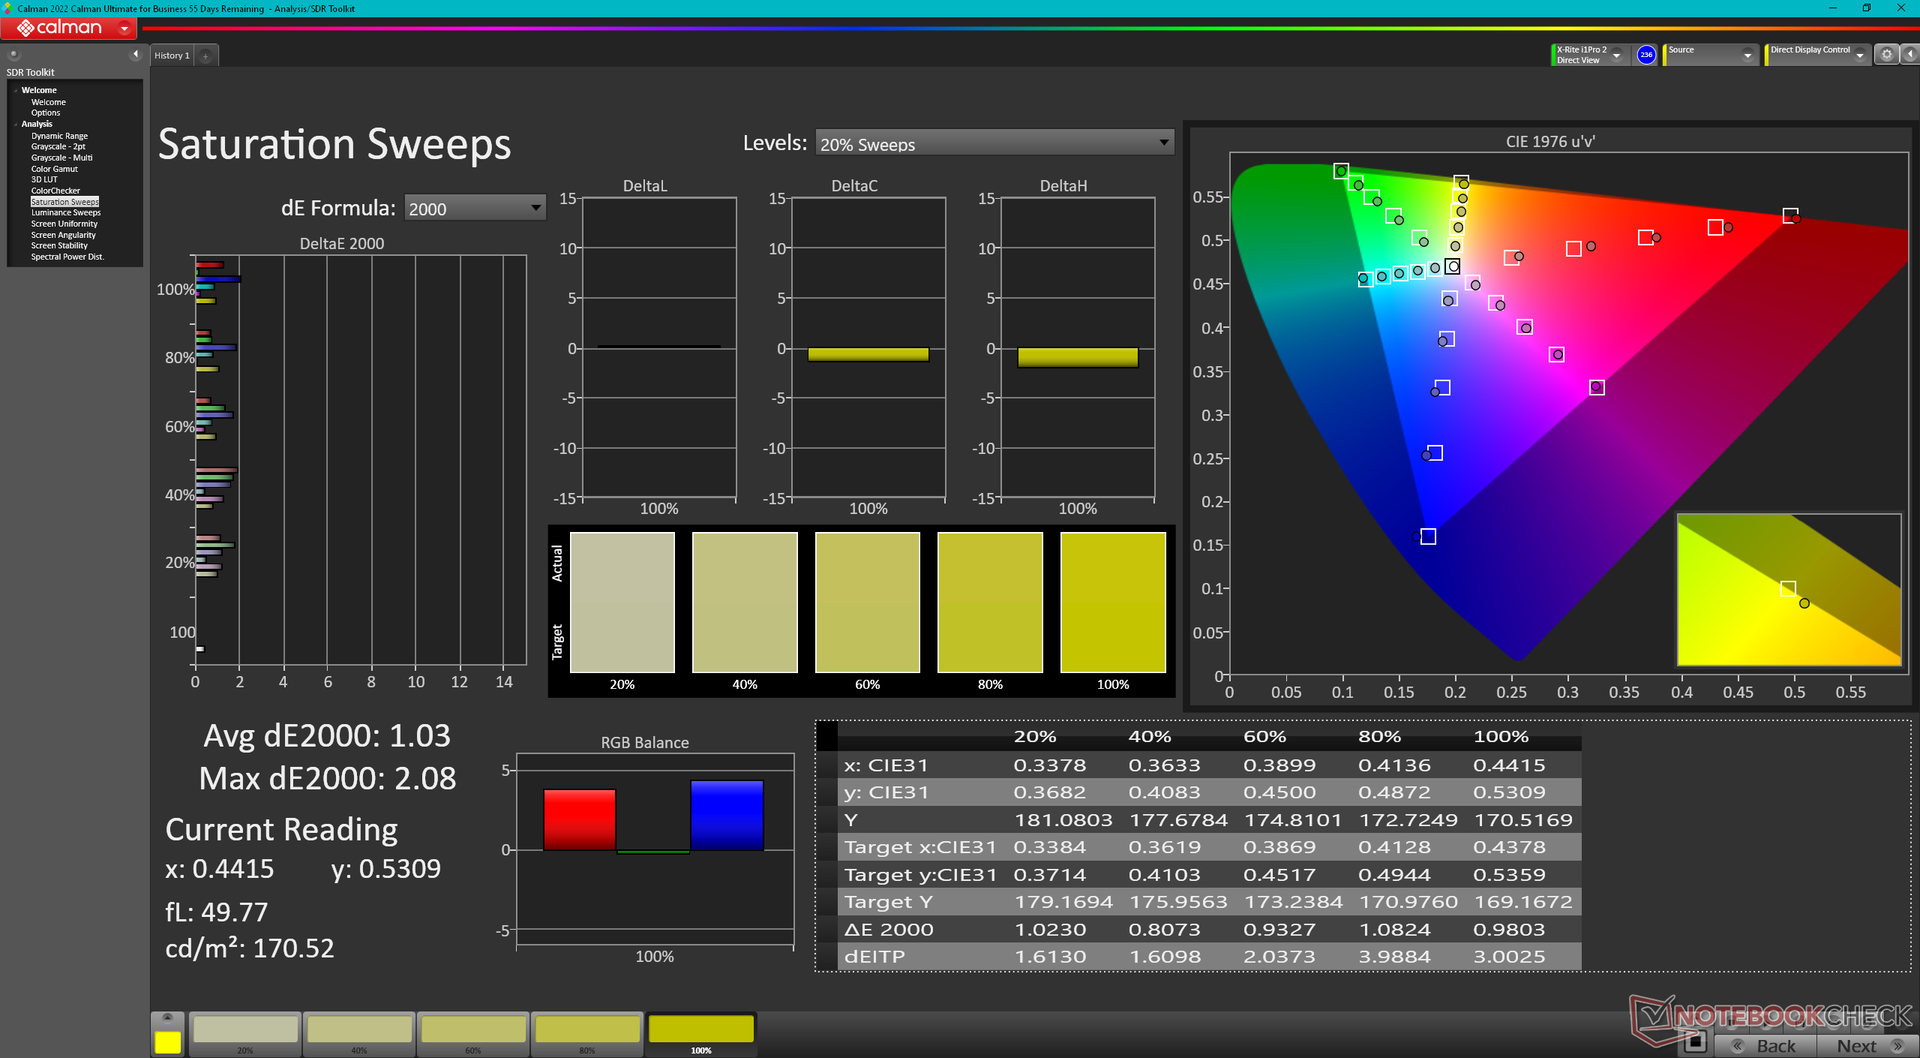
El Alienware m16 R1 utiliza el mismo panel BOE NE16NZ4 que el modeloAlienware x16 R1 por lo que la experiencia de visualización es esencialmente idéntica entre los dos modelos. Este panel de gama alta es apto tanto para juegos como para creación de contenidos, con colores más amplios que el panel MNG007DA2-3 del Legion Pro 7. Sin embargo, las pantallas del Razer Blade 16 Early 2023 o del HP Omen Transcend 16 son notablemente más brillantes, lo que puede venir bien para el contenido HDR.
| |||||||||||||||||||||||||
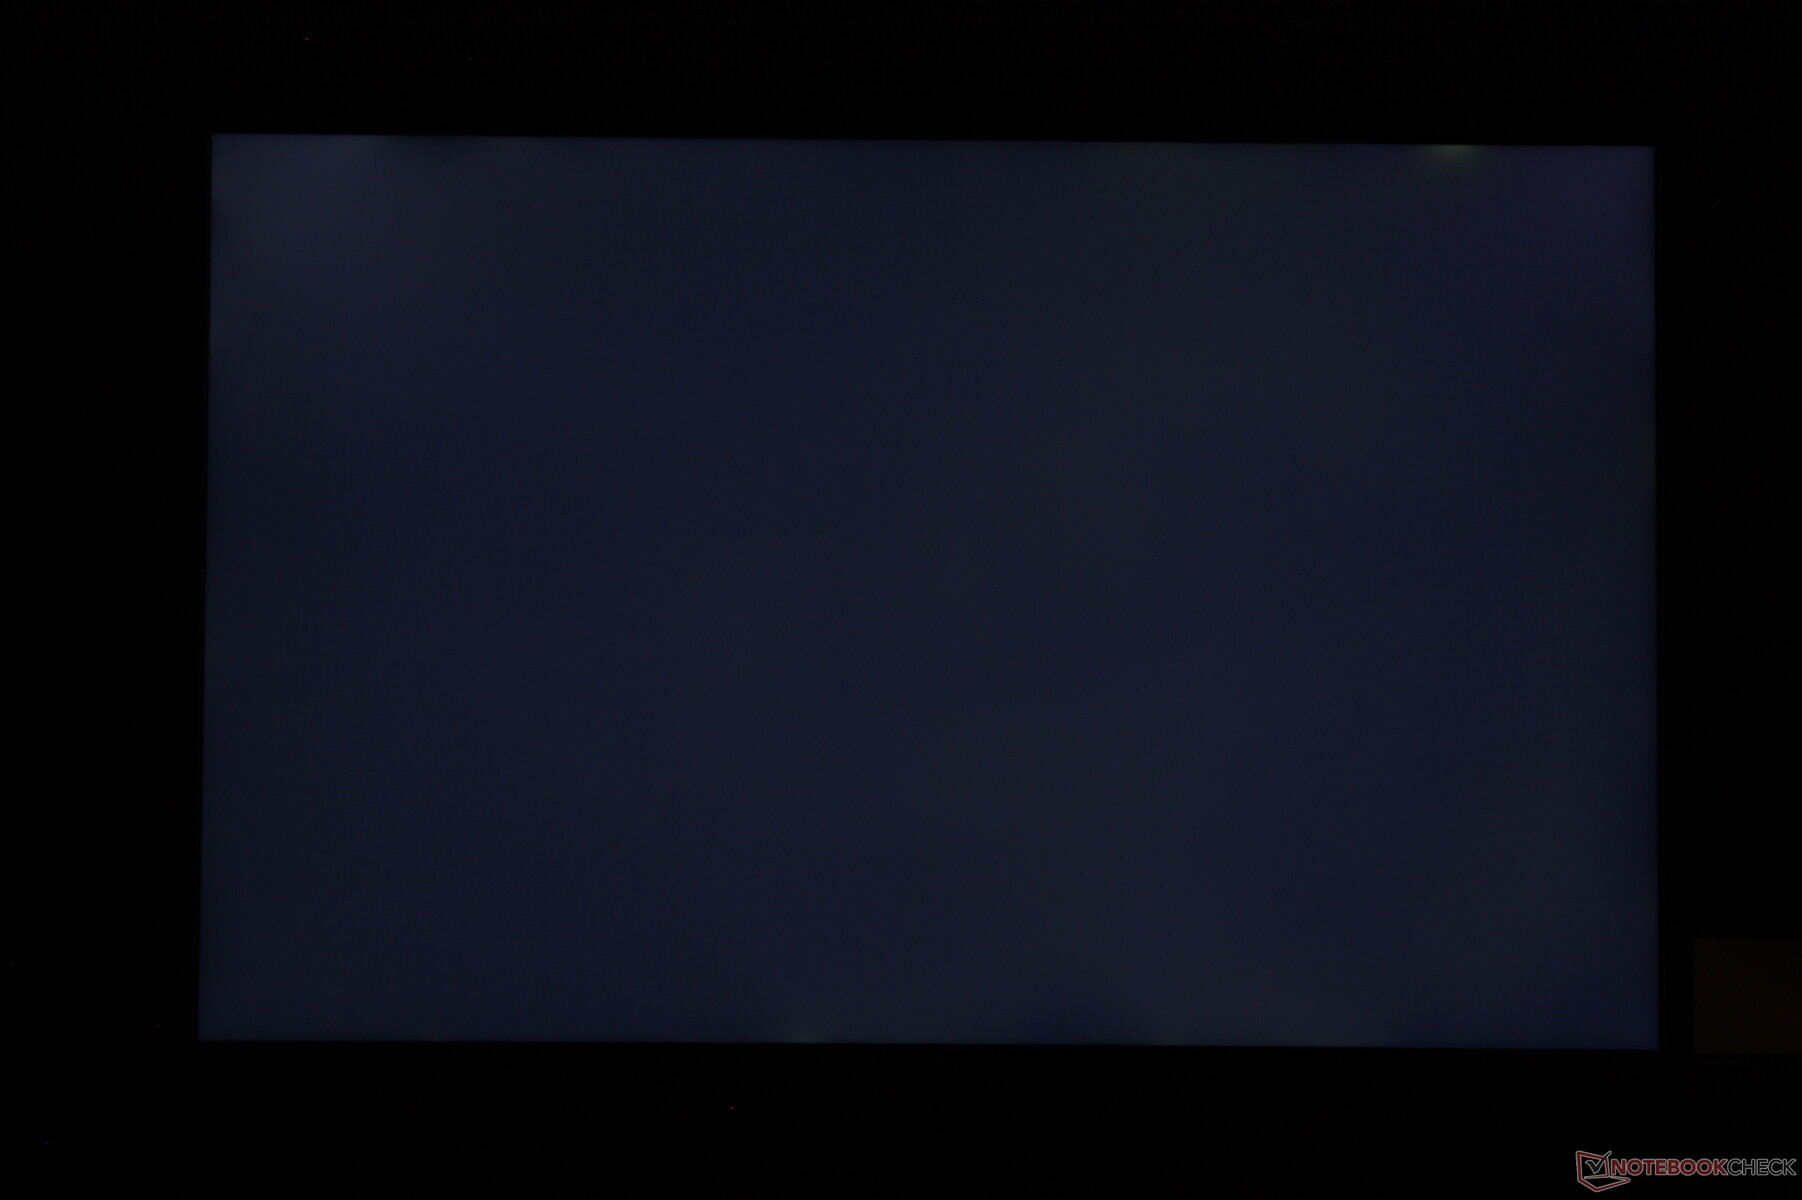
iluminación: 89 %
Brillo con batería: 329 cd/m²
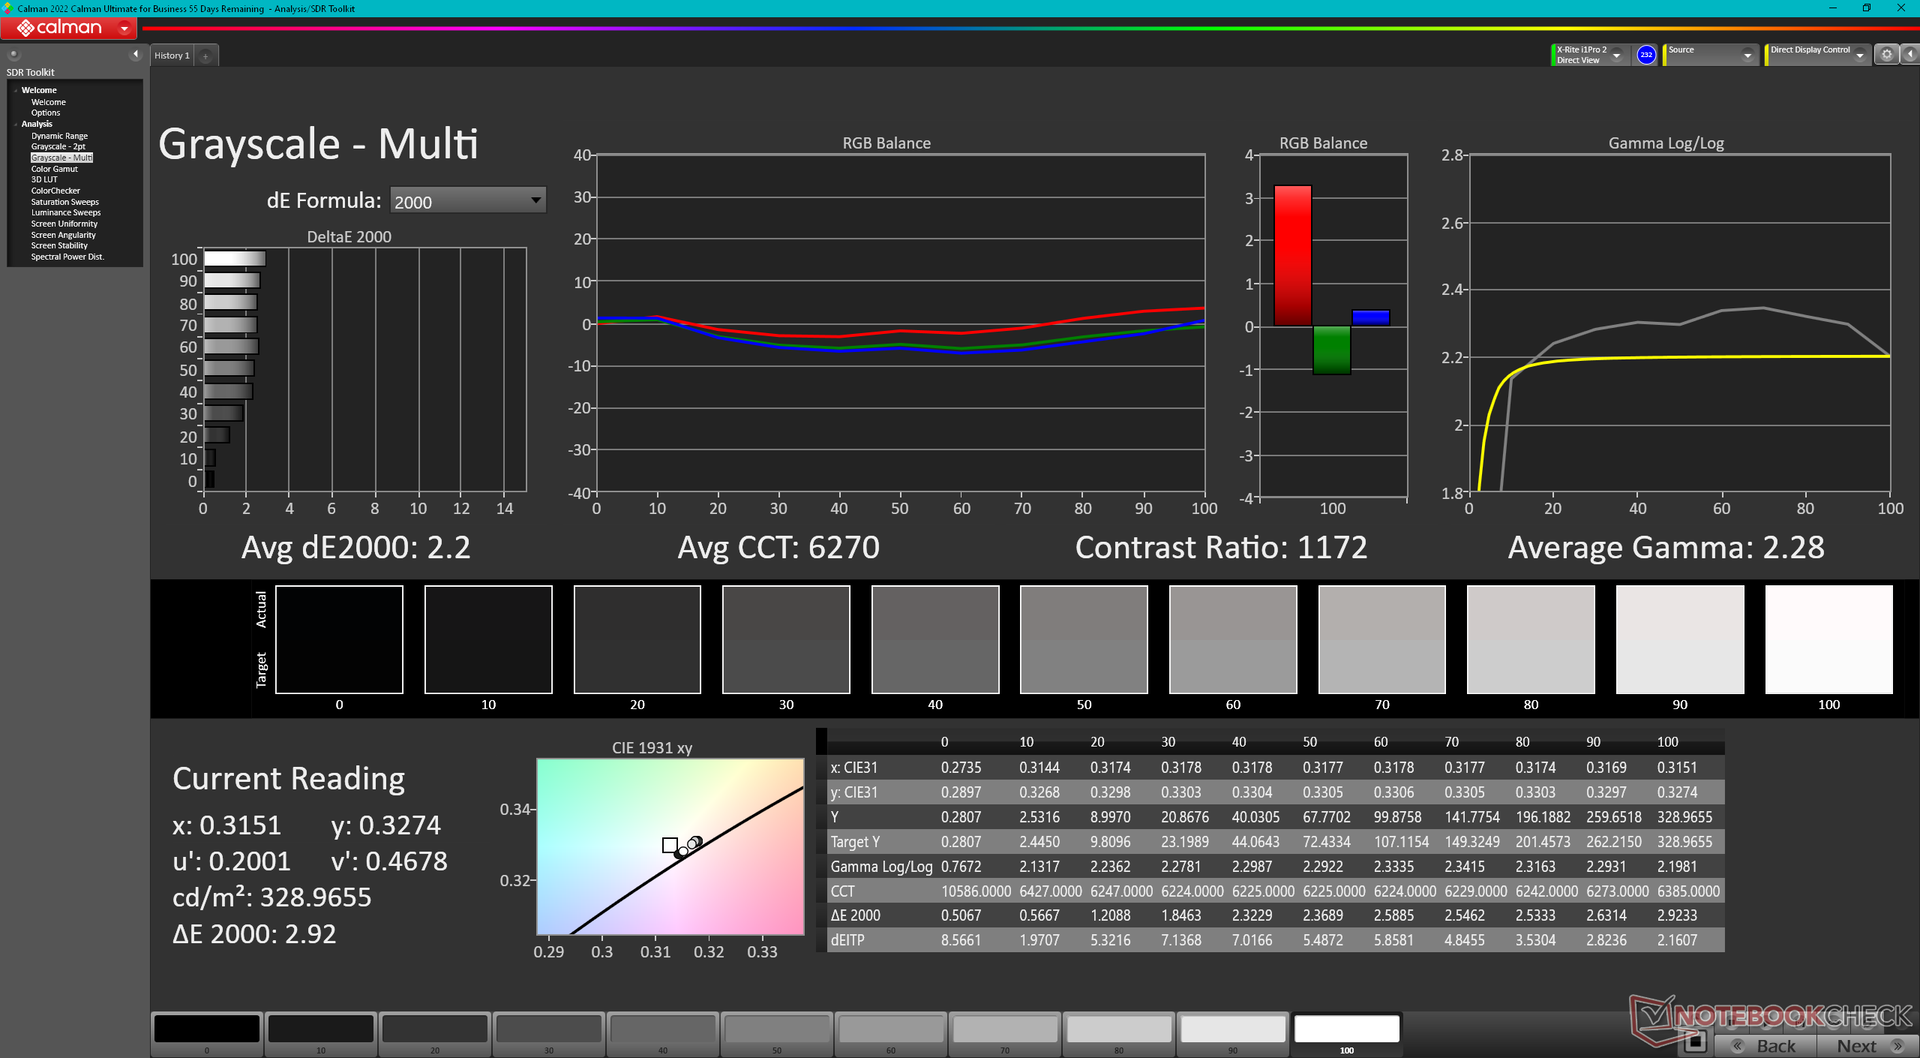
Contraste: 1028:1 (Negro: 0.32 cd/m²)
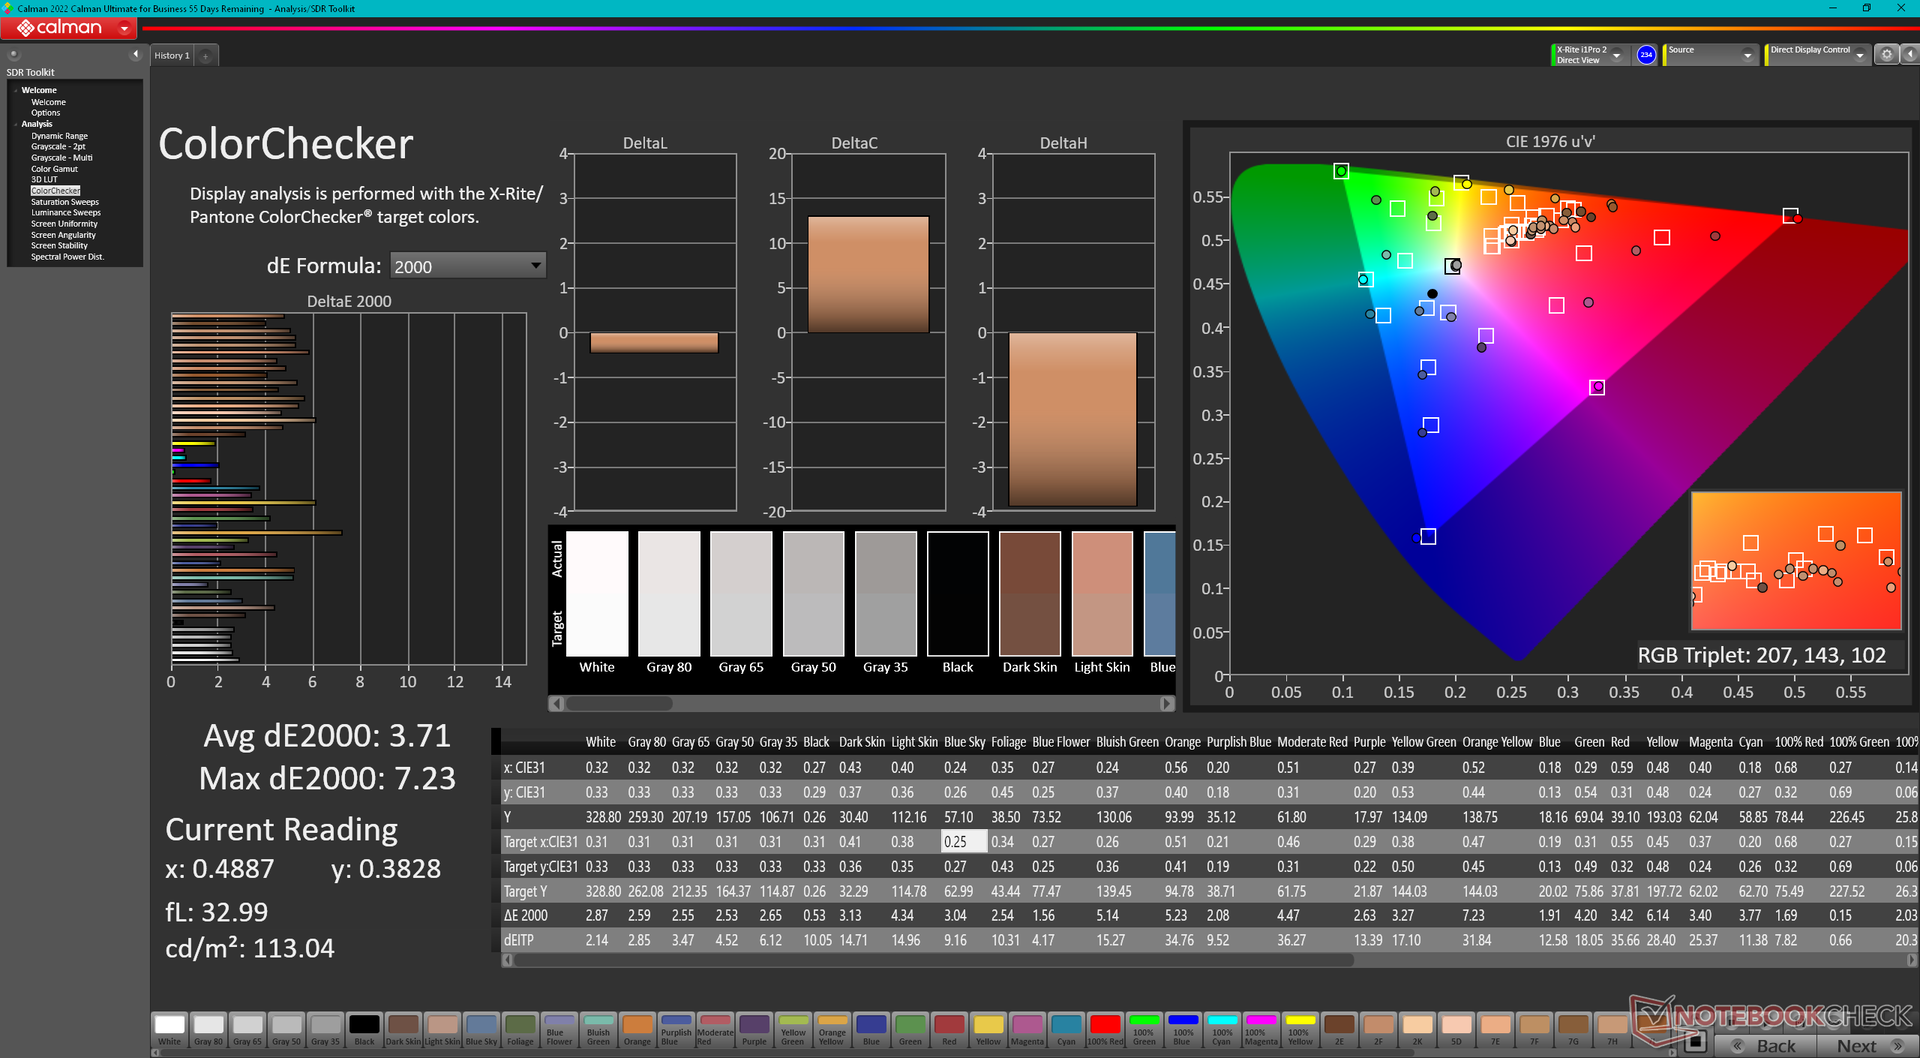
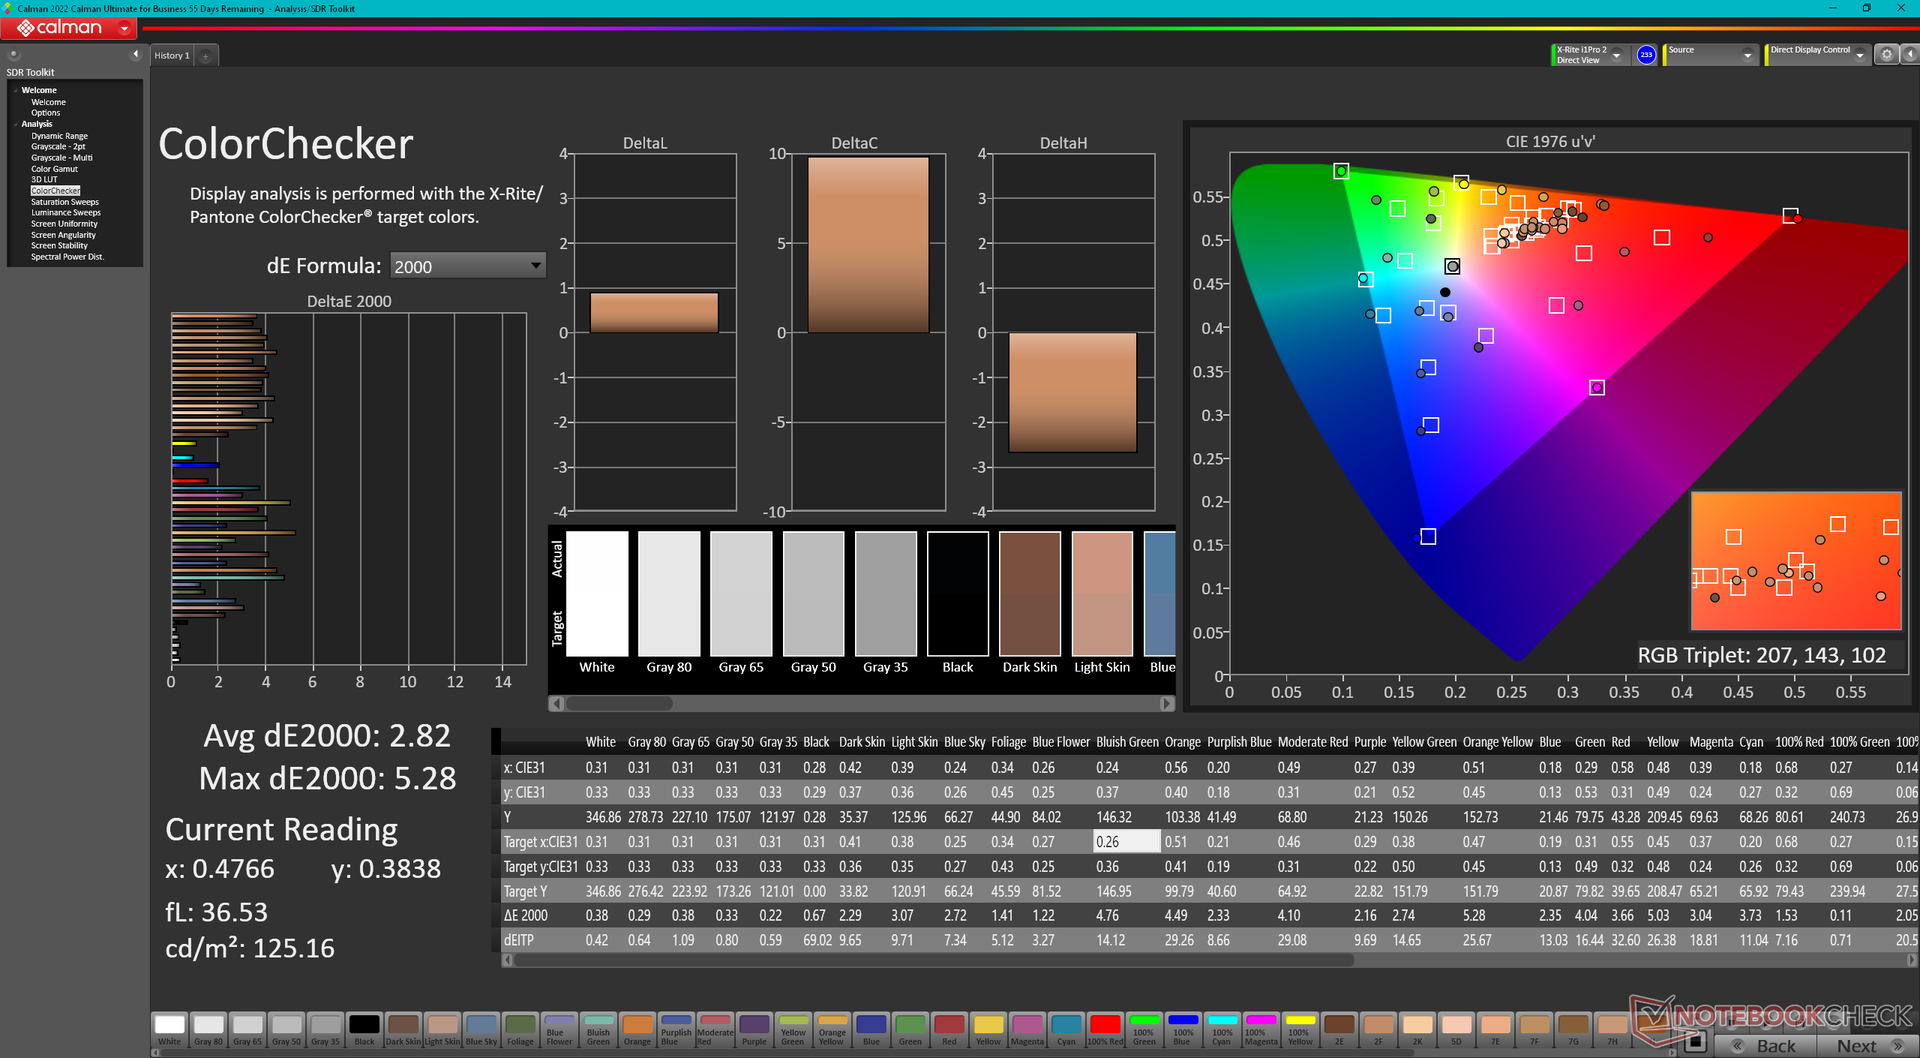
ΔE ColorChecker Calman: 3.71 | ∀{0.5-29.43 Ø4.72}
calibrated: 2.82
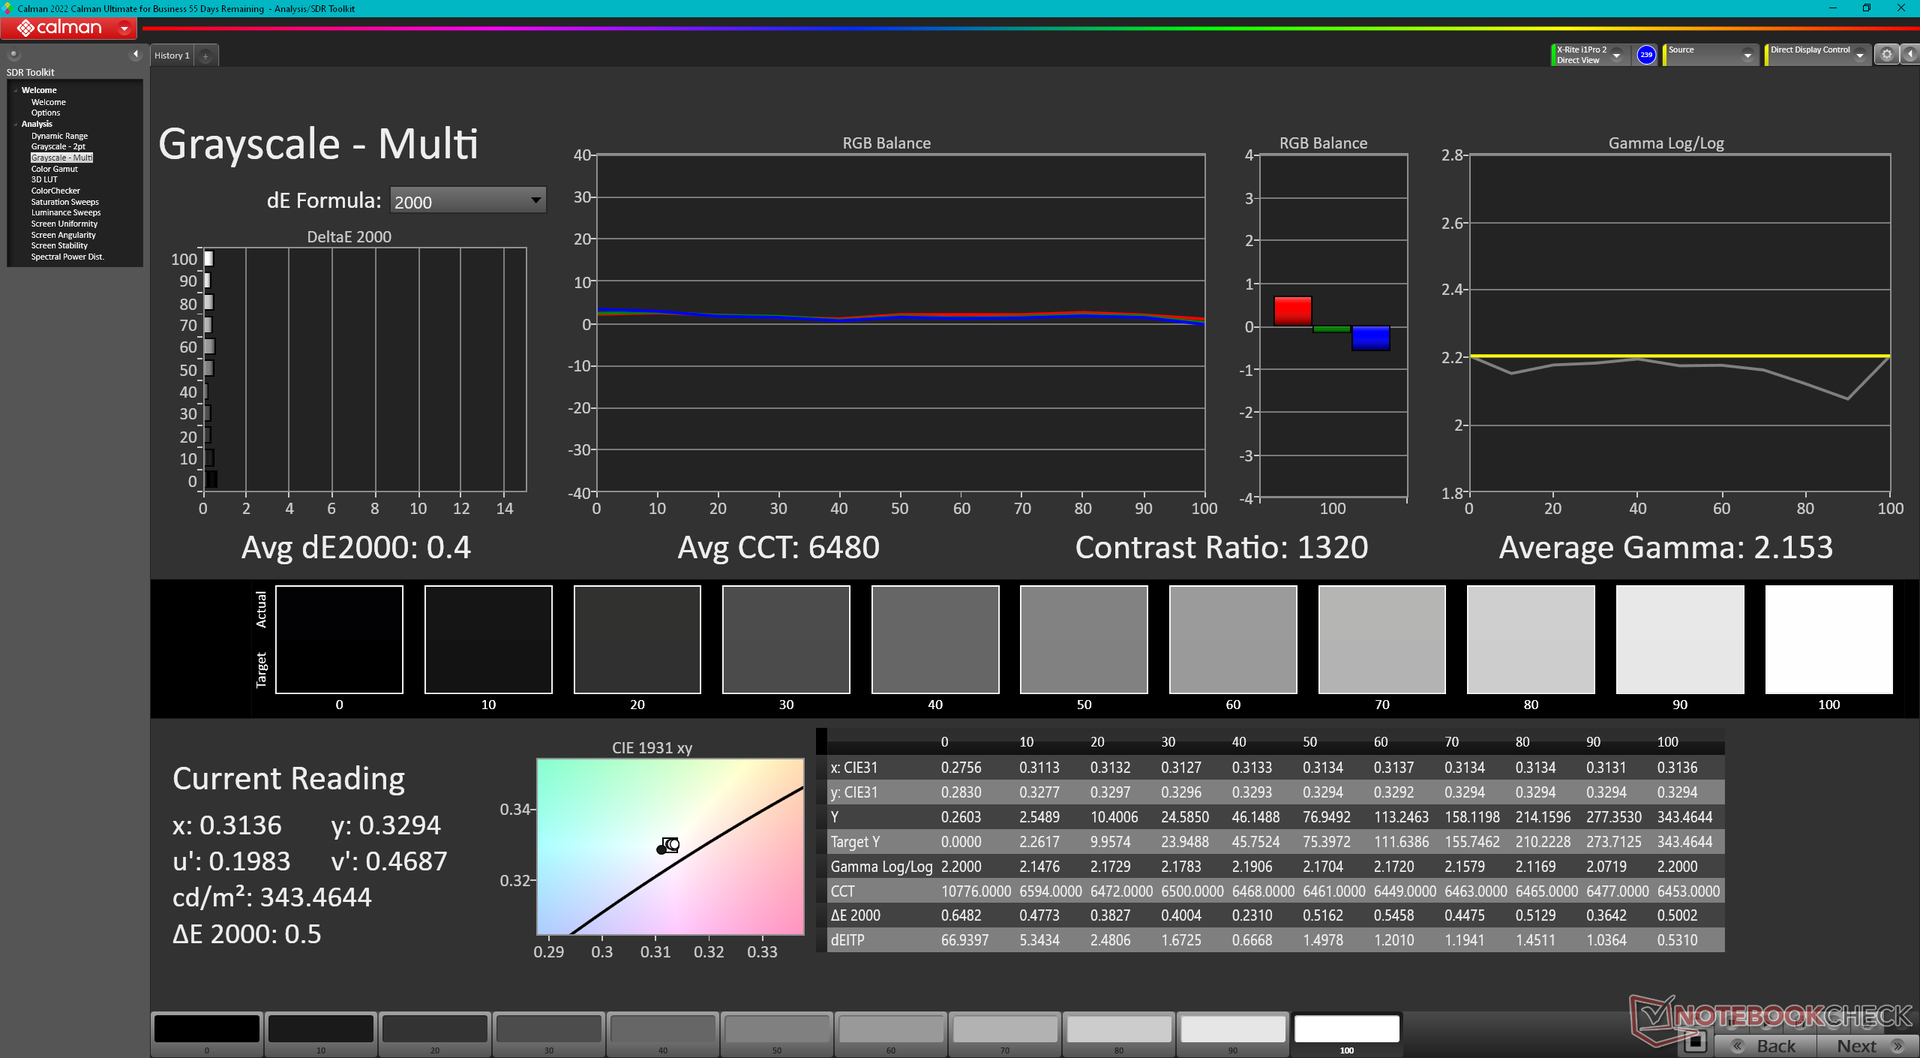
ΔE Greyscale Calman: 2.2 | ∀{0.09-98 Ø4.97}
88.9% AdobeRGB 1998 (Argyll 3D)
99.9% sRGB (Argyll 3D)
98.6% Display P3 (Argyll 3D)
Gamma: 2.3
CCT: 6270 K
| Alienware m16 R1 AMD BOE NE16NZ4, IPS, 2560x1600, 16" | Alienware x16 R1 BOE NE16NZ4, IPS, 2560x1600, 16" | HP Omen Transcend 16 AUOA3A6, Mini-LED, 2560x1600, 16" | Lenovo Legion Pro 7 RTX4090 MNG007DA2-3 (CSO1628), IPS, 2560x1600, 16" | Asus ROG Strix G16 G614JZ TL160ADMP03-0, IPS, 2560x1600, 16" | Razer Blade 16 Early 2023 CSOT T3 MNG007DA4-1, IPS, 2560x1600, 16" | |
|---|---|---|---|---|---|---|
| Display | 0% | 0% | -16% | -2% | 0% | |
| Display P3 Coverage (%) | 98.6 | 99.2 1% | 99.2 1% | 69.5 -30% | 97 -2% | 98.5 0% |
| sRGB Coverage (%) | 99.9 | 100 0% | 100 0% | 99.8 0% | 99.9 0% | 100 0% |
| AdobeRGB 1998 Coverage (%) | 88.9 | 88.6 0% | 87.6 -1% | 71.6 -19% | 84.9 -4% | 89.7 1% |
| Response Times | -7% | -316% | -33% | 14% | -31% | |
| Response Time Grey 50% / Grey 80% * (ms) | 5.1 ? | 5.1 ? -0% | 26.4 ? -418% | 10.9 ? -114% | 5.1 ? -0% | 6.6 ? -29% |
| Response Time Black / White * (ms) | 9 ? | 10.3 ? -14% | 28.2 ? -213% | 4.6 ? 49% | 6.6 ? 27% | 12 ? -33% |
| PWM Frequency (Hz) | 3506 ? | |||||
| Screen | 18% | 224% | 23% | 23% | 18% | |
| Brightness middle (cd/m²) | 329 | 302.2 -8% | 791.1 140% | 491 49% | 470 43% | 456.8 39% |
| Brightness (cd/m²) | 317 | 285 -10% | 800 152% | 472 49% | 459 45% | 437 38% |
| Brightness Distribution (%) | 89 | 89 0% | 95 7% | 91 2% | 93 4% | 83 -7% |
| Black Level * (cd/m²) | 0.32 | 0.26 19% | 0.04 87% | 0.4 -25% | 0.42 -31% | 0.35 -9% |
| Contrast (:1) | 1028 | 1162 13% | 19778 1824% | 1228 19% | 1119 9% | 1305 27% |
| Colorchecker dE 2000 * | 3.71 | 1.63 56% | 4.37 -18% | 1.6 57% | 1.86 50% | 3.7 -0% |
| Colorchecker dE 2000 max. * | 7.23 | 4.13 43% | 10.39 -44% | 5.15 29% | 3.87 46% | 6.42 11% |
| Colorchecker dE 2000 calibrated * | 2.82 | 1.17 59% | 1.04 63% | 0.97 66% | 0.93 67% | 0.66 77% |
| Greyscale dE 2000 * | 2.2 | 2.5 -14% | 6.5 -195% | 3 -36% | 2.7 -23% | 2.6 -18% |
| Gamma | 2.3 96% | 2.23 99% | 2.28 96% | 2.211 100% | 2.246 98% | 2.3 96% |
| CCT | 6270 104% | 6590 99% | 6000 108% | 6979 93% | 6711 97% | 6108 106% |
| Media total (Programa/Opciones) | 4% /
10% | -31% /
99% | -9% /
7% | 12% /
17% | -4% /
7% |
* ... más pequeño es mejor
La pantalla está decentemente calibrada con el estándar P3, con valores DeltaE medios de escala de grises y color de sólo 2,2 y 3,71, respectivamente. Si calibramos la pantalla nosotros mismos con un colorímetro X-Rite, la escala de grises mejorará aún más, con un deltaE medio de sólo 0,4 y colores más precisos en general. Nuestro perfil ICM calibrado está disponible para su descarga gratuita.
Tiempos de respuesta del display
| ↔ Tiempo de respuesta de Negro a Blanco | ||
|---|---|---|
| 9 ms ... subida ↗ y bajada ↘ combinada | ↗ 4.8 ms subida | 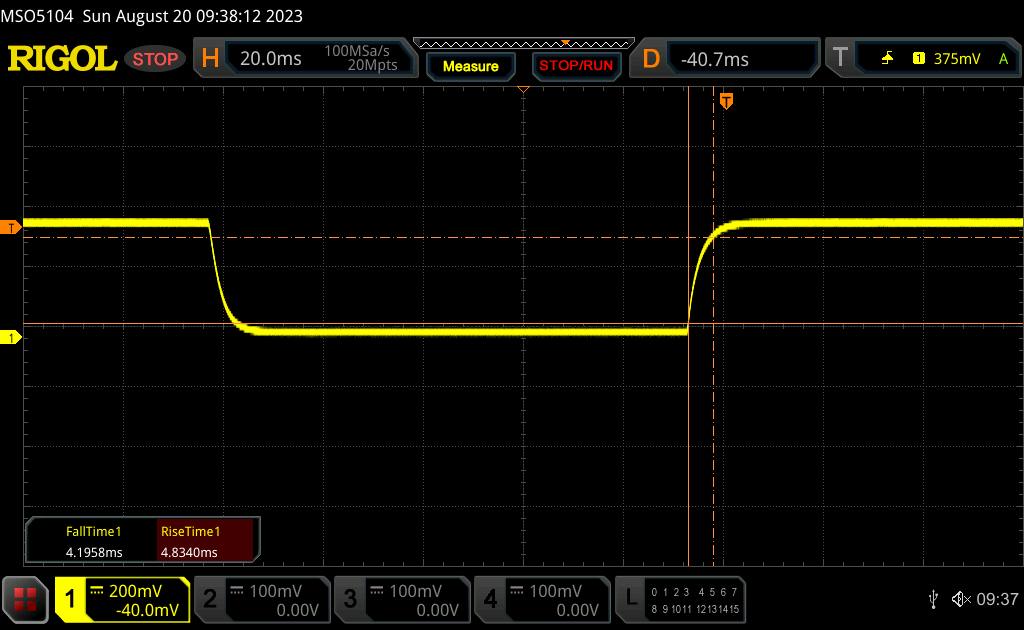 |
| ↘ 4.2 ms bajada | ||
| La pantalla mostró tiempos de respuesta rápidos en nuestros tests y debería ser adecuada para juegos. En comparación, todos los dispositivos de prueba van de ##min### (mínimo) a 240 (máximo) ms. » 25 % de todos los dispositivos son mejores. Esto quiere decir que el tiempo de respuesta medido es mejor que la media (19.8 ms) de todos los dispositivos testados. | ||
| ↔ Tiempo de respuesta 50% Gris a 80% Gris | ||
| 5.1 ms ... subida ↗ y bajada ↘ combinada | ↗ 2.5 ms subida | 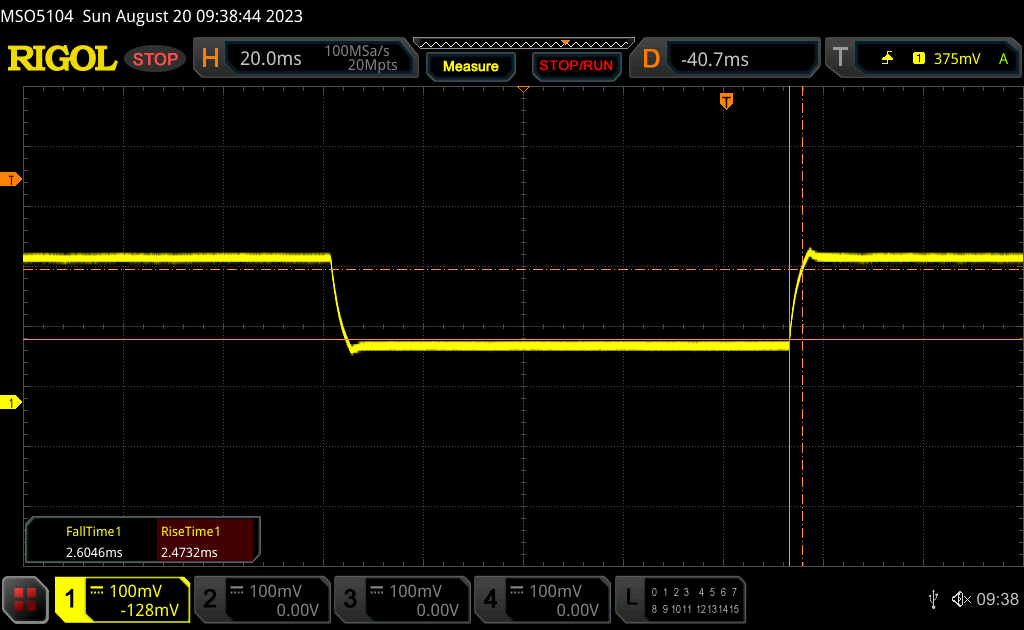 |
| ↘ 2.6 ms bajada | ||
| La pantalla mostró tiempos de respuesta muy rápidos en nuestros tests y debería ser adecuada para juegos frenéticos. En comparación, todos los dispositivos de prueba van de ##min### (mínimo) a 636 (máximo) ms. » 17 % de todos los dispositivos son mejores. Esto quiere decir que el tiempo de respuesta medido es mejor que la media (31 ms) de todos los dispositivos testados. | ||
Parpadeo de Pantalla / PWM (Pulse-Width Modulation)
| Parpadeo de Pantalla / PWM no detectado | 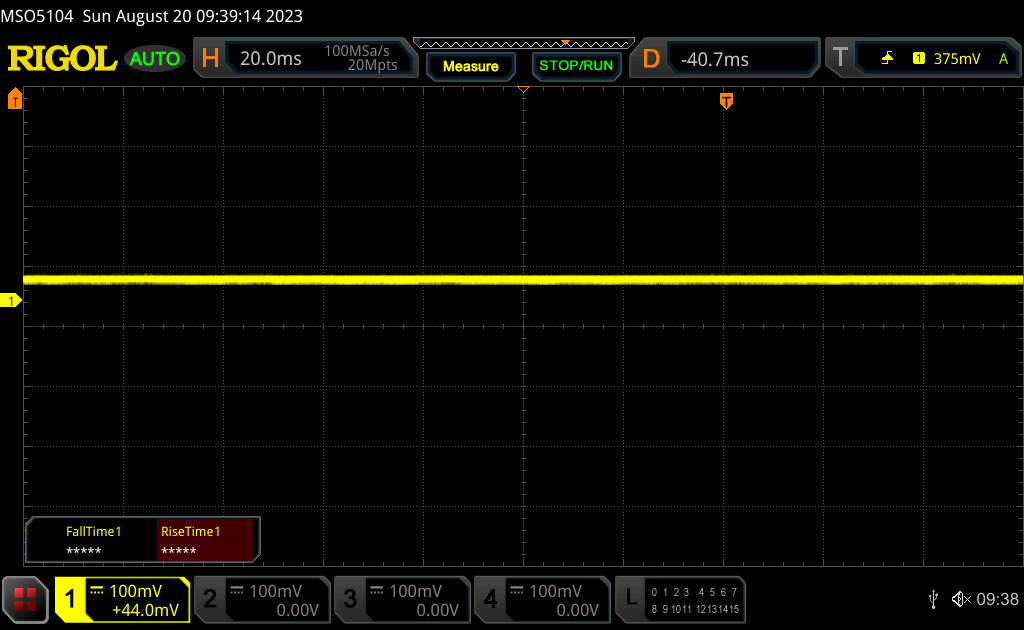 | ||
Comparación: 52 % de todos los dispositivos testados no usaron PWM para atenuar el display. Si se usó, medimos una media de 7778 (mínimo: 5 - máxmo: 343500) Hz. | |||
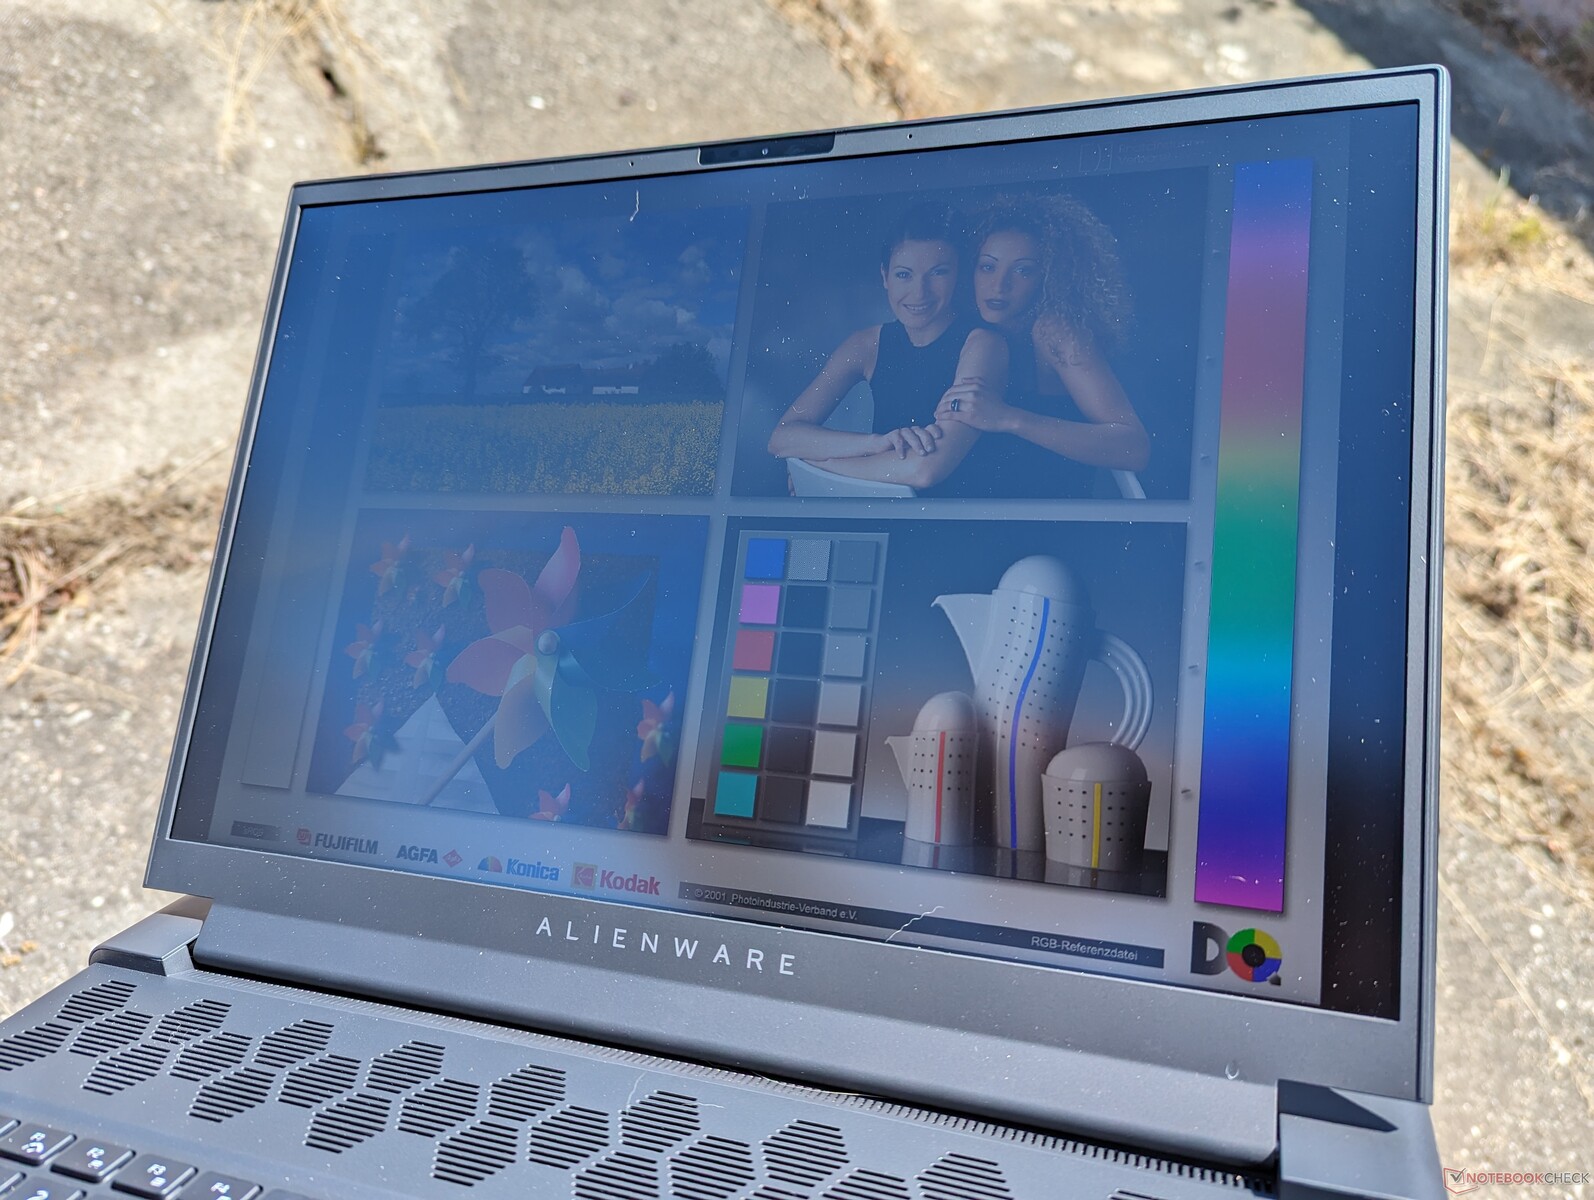
La visibilidad en exteriores es decente sólo cuando está a la sombra. El Omen Transcend 16 y su pantalla mini-LED es 2 veces más brillante si la visibilidad exterior es una preocupación.

Rendimiento: ¿AMD o Intel?

Condiciones de ensayo
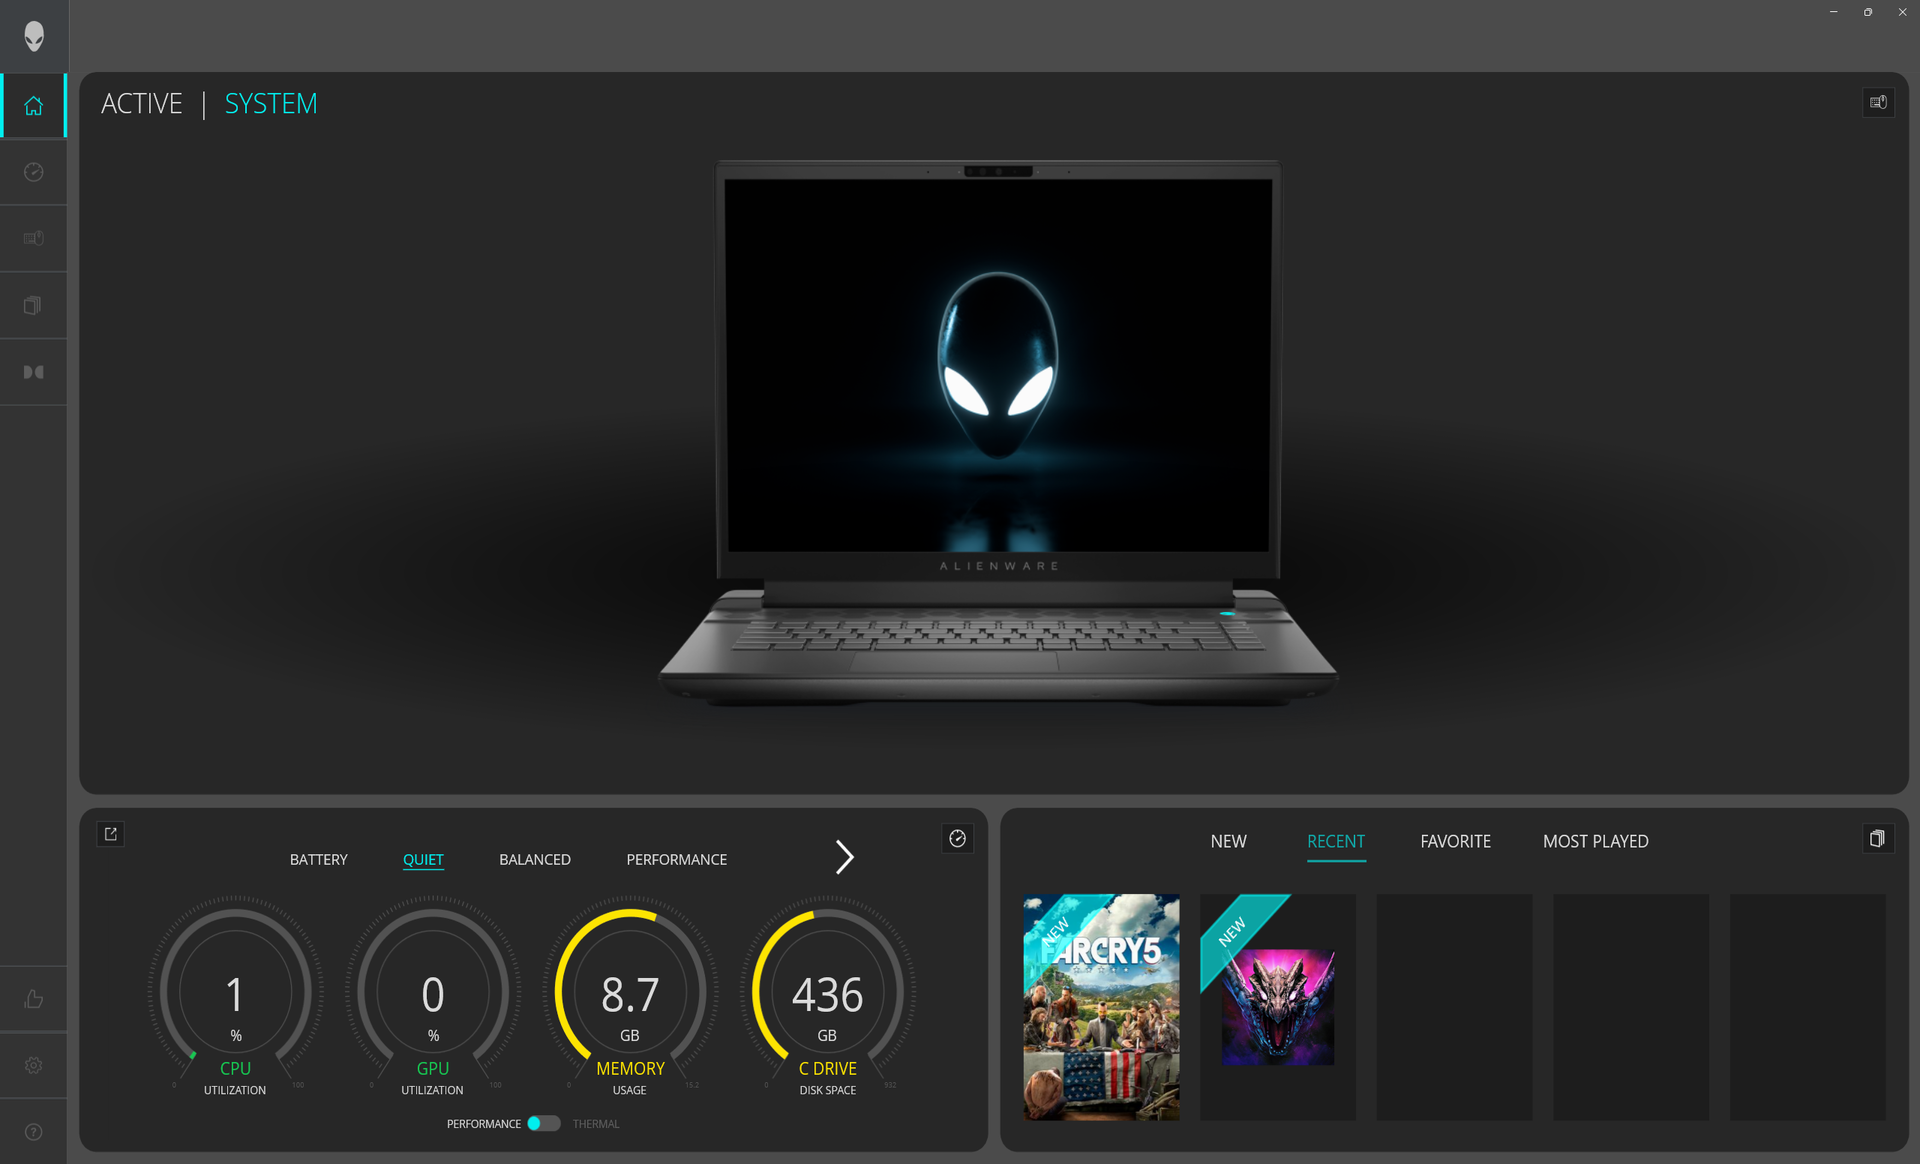
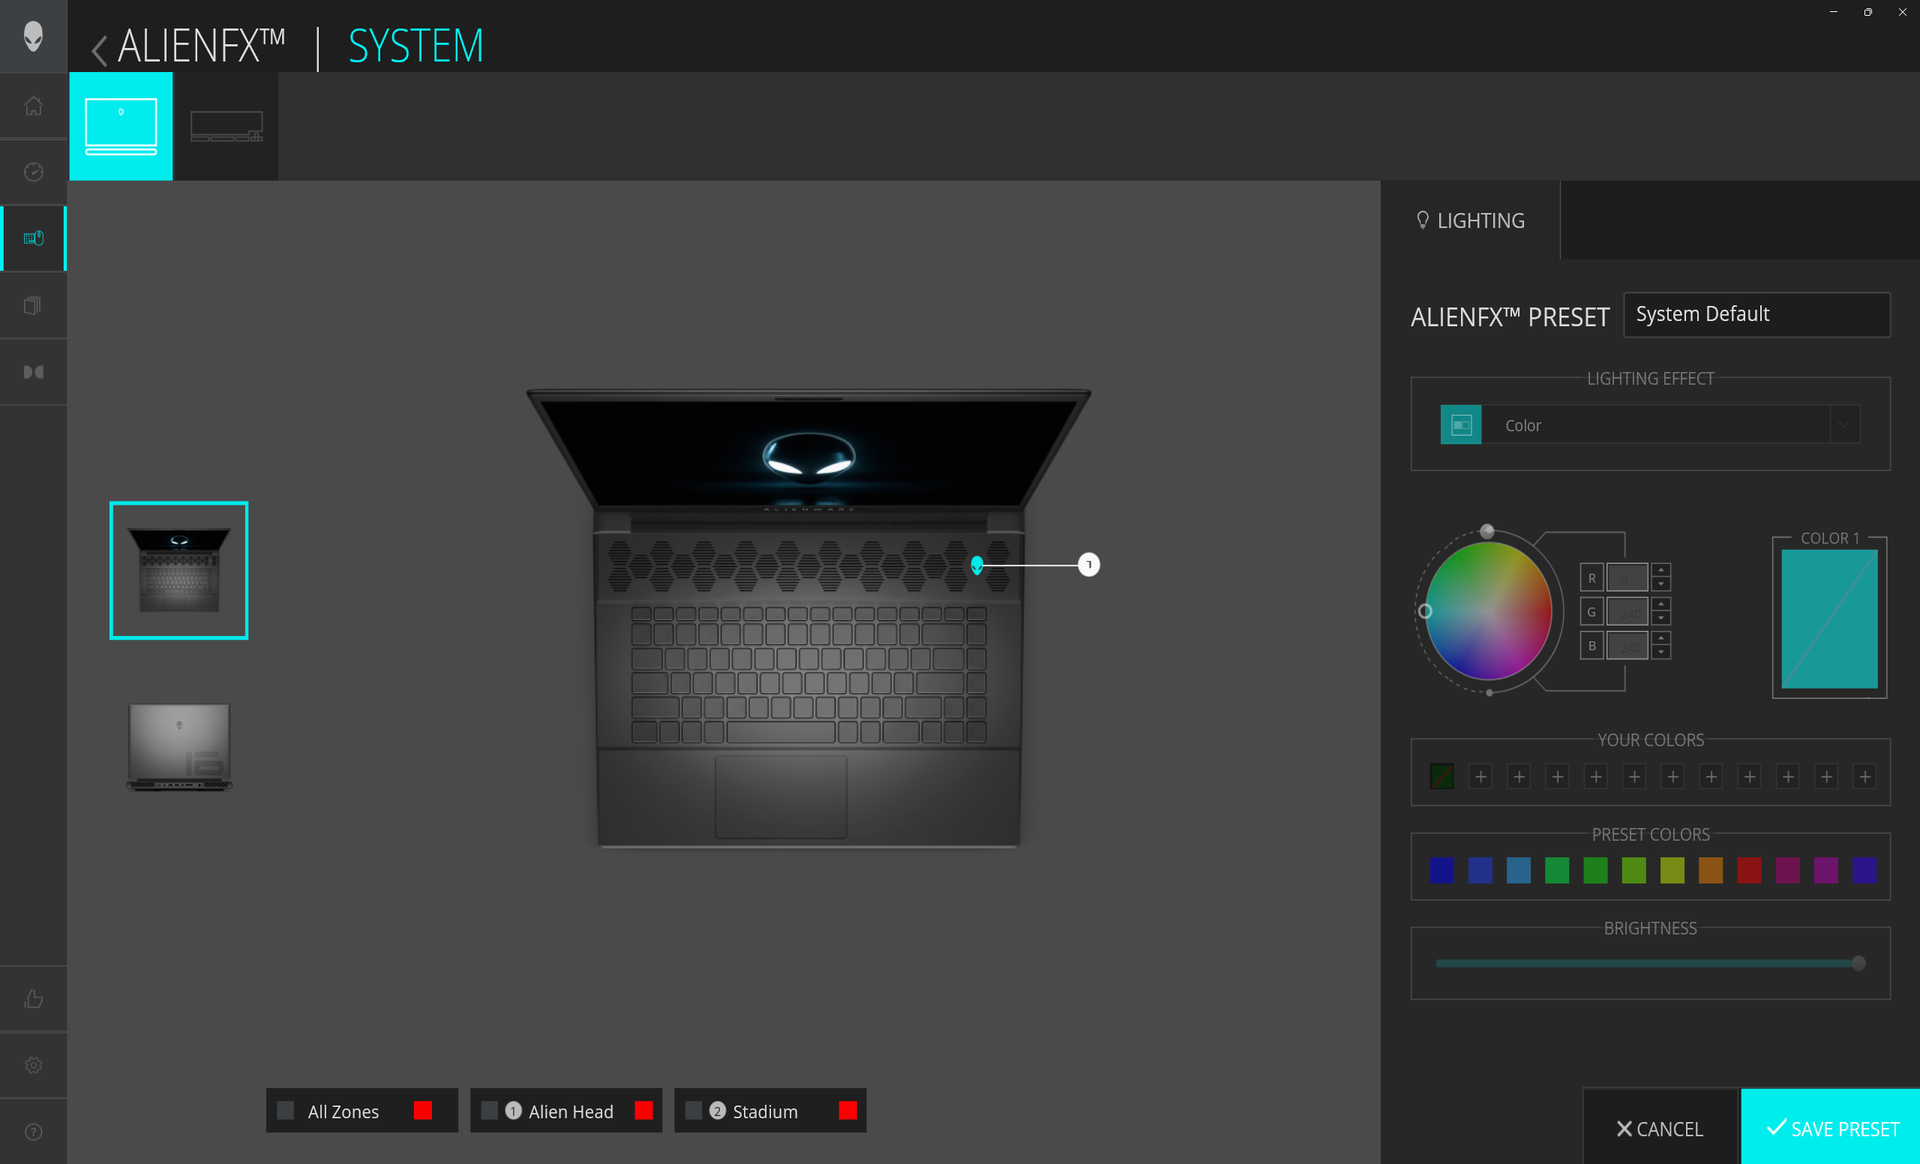
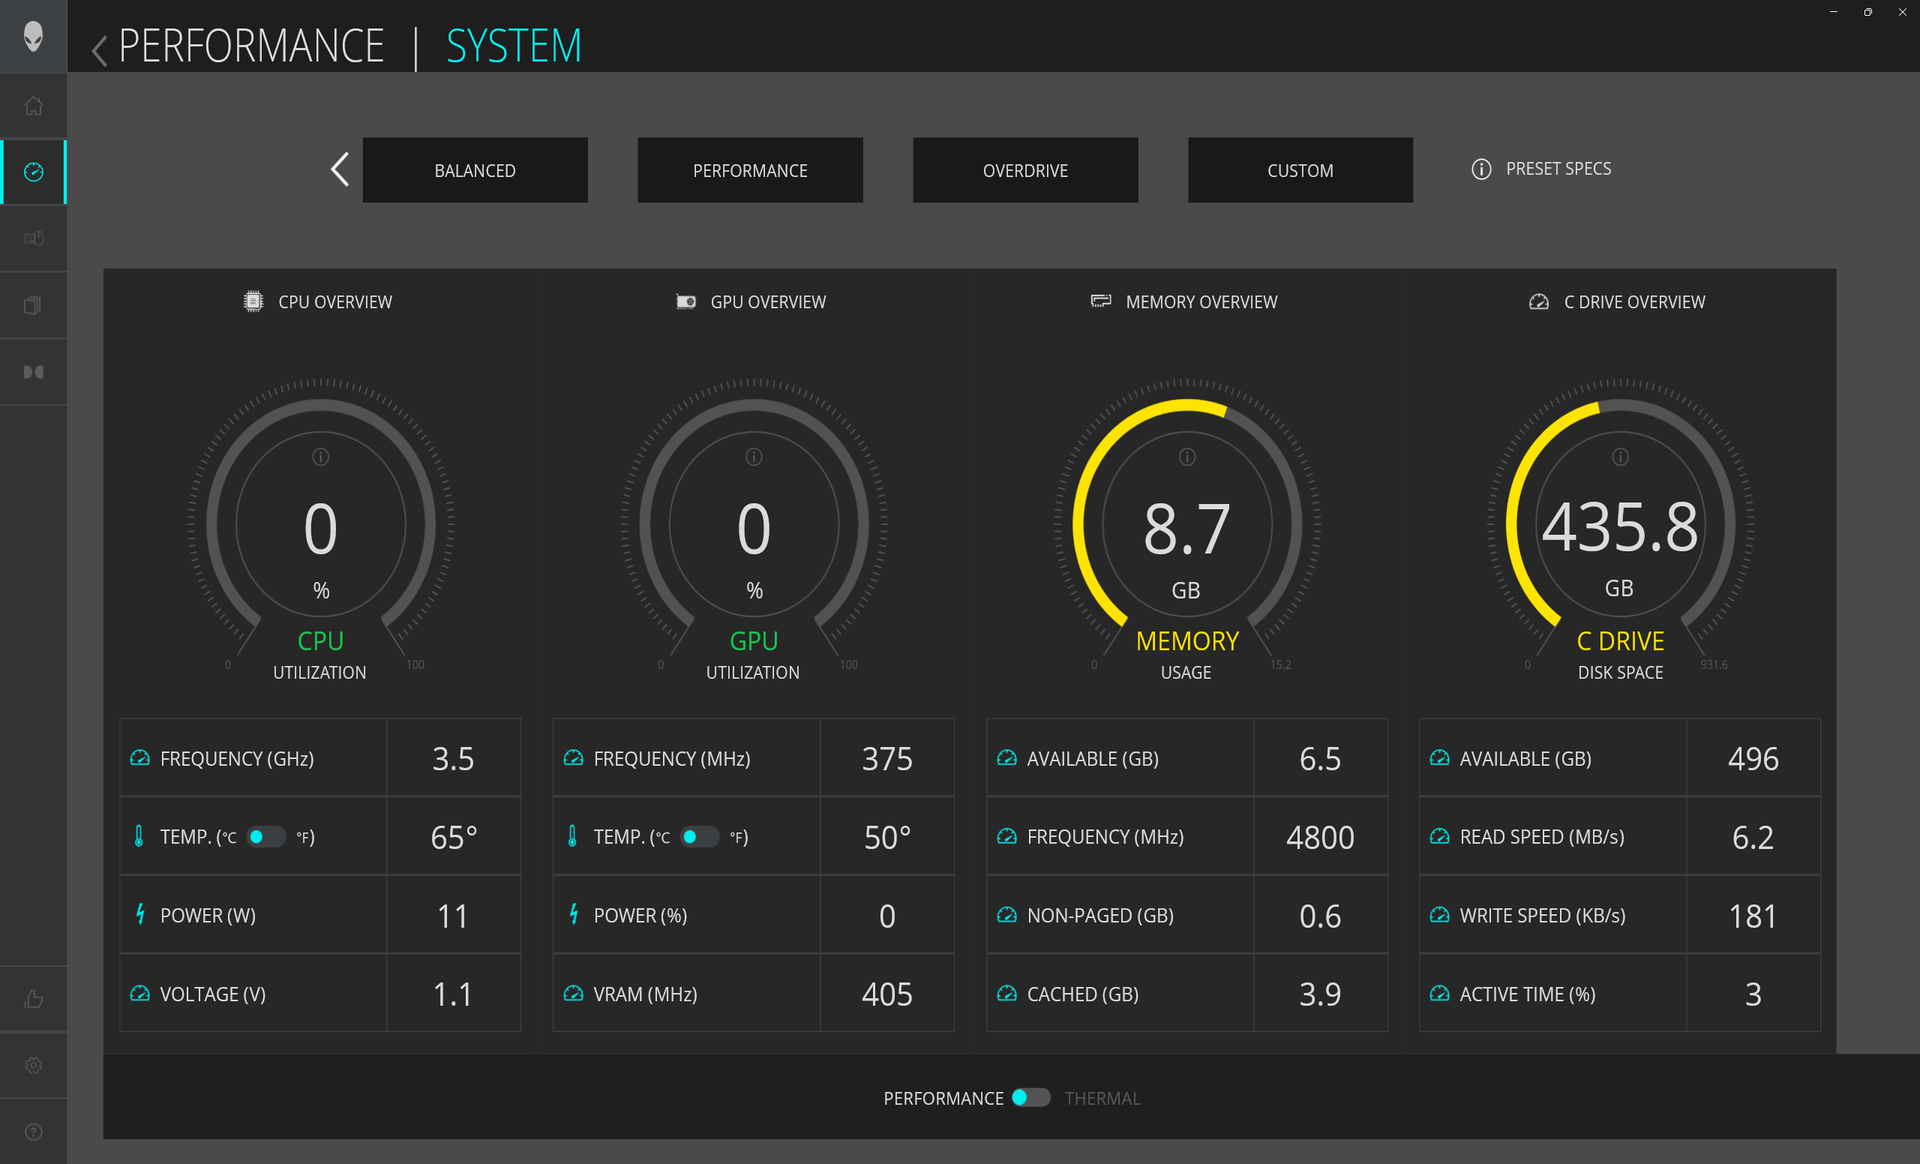
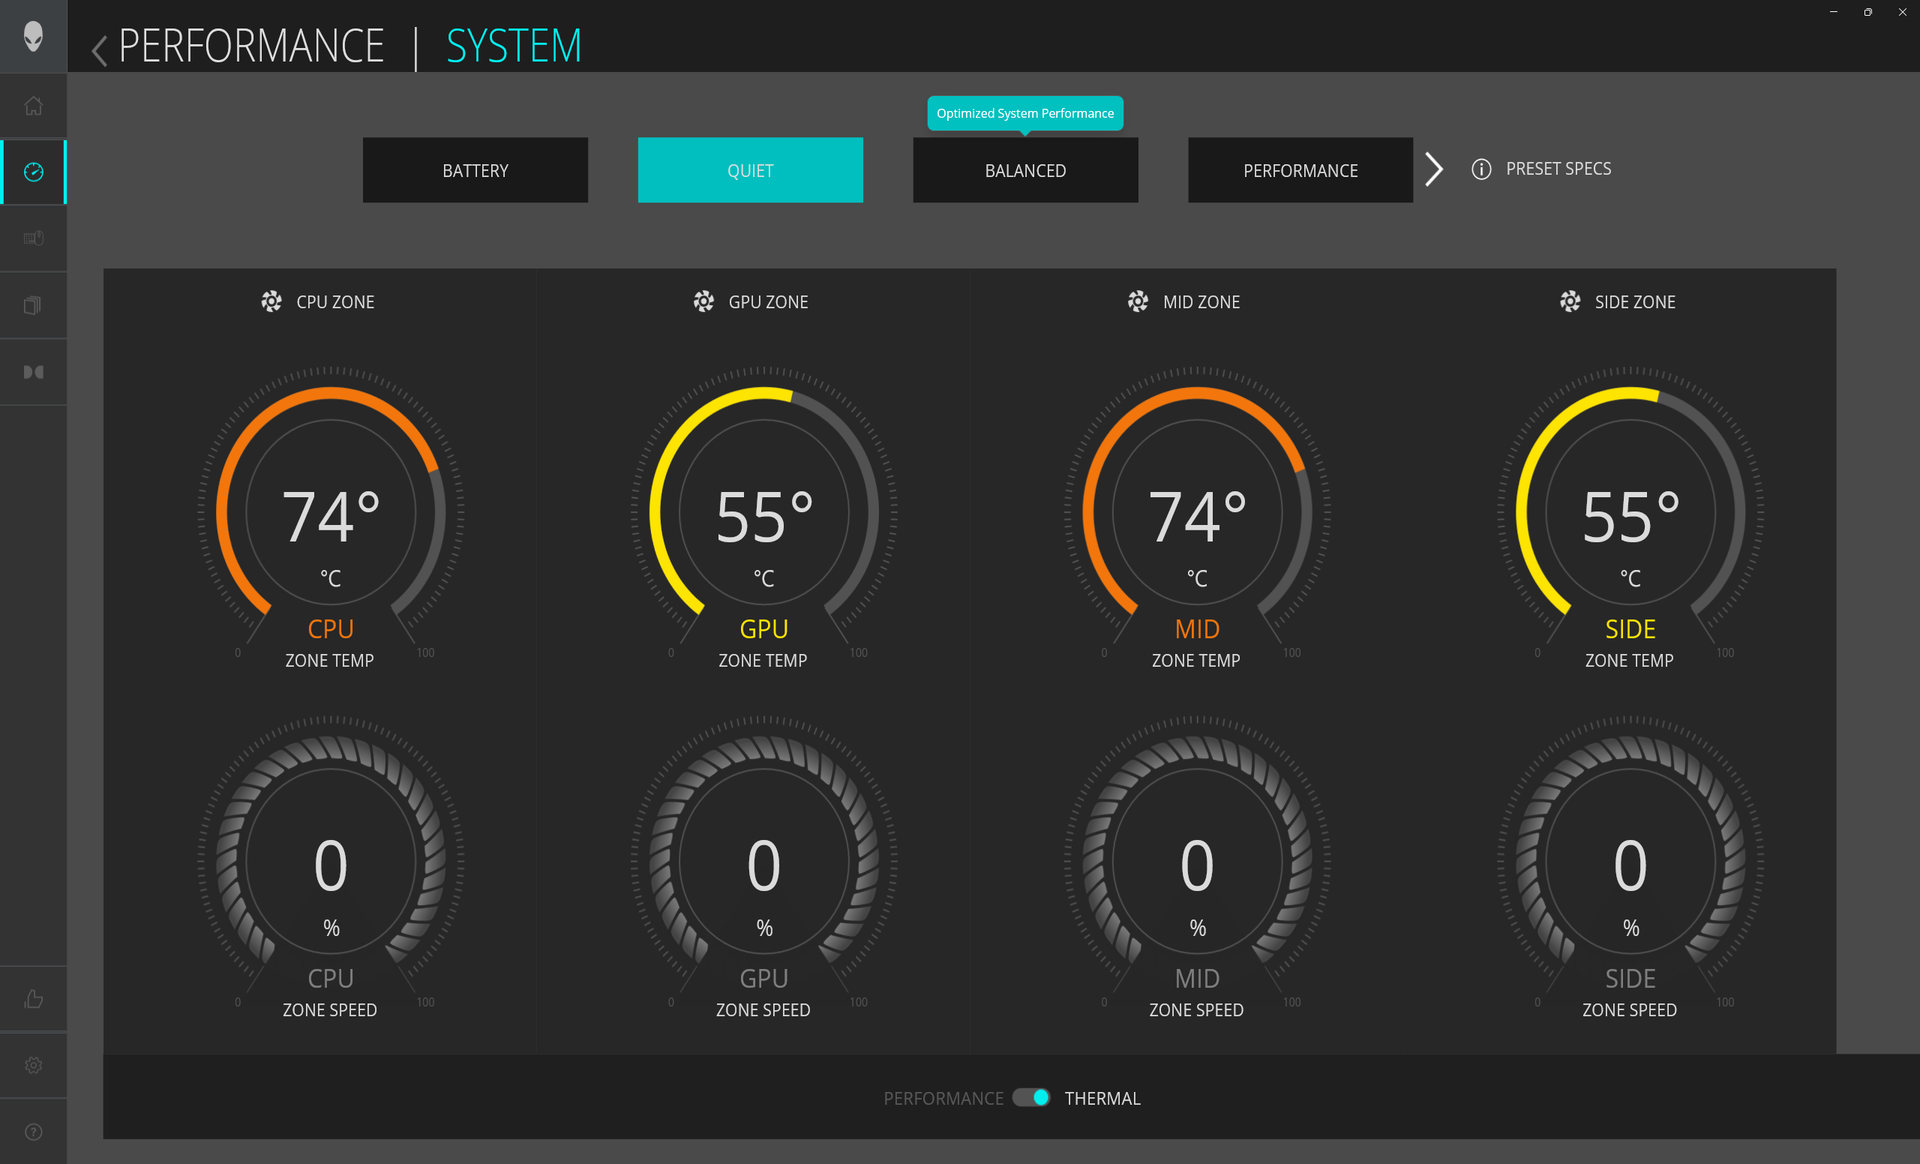
Pusimos nuestra unidad en modo Overdrive a través de Alienware Command Center y la GPU en modo dGPU antes de ejecutar los benchmarks que se muestran a continuación. Los usuarios deben familiarizarse con el Centro de Comando, ya que es el centro de control para las características del sistema relacionadas con el rendimiento, los signos vitales, y la iluminación. Command Center no debe confundirse con My Alienware que es el software de garantía y soporte.
Advanced Optimus o MUX es compatible. G-Sync, sin embargo, no es compatible con la pantalla interna para las versiones AMD del Alienware m16 ya que esa característica es actualmente exclusiva de las versiones Intel. En su lugar, FreeSync es compatible.
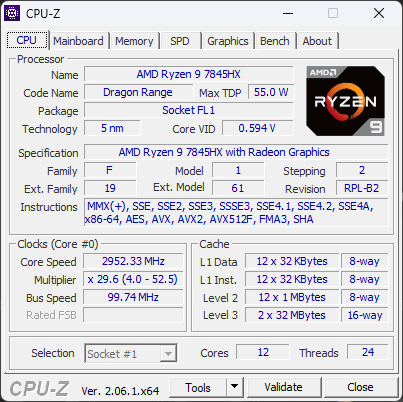
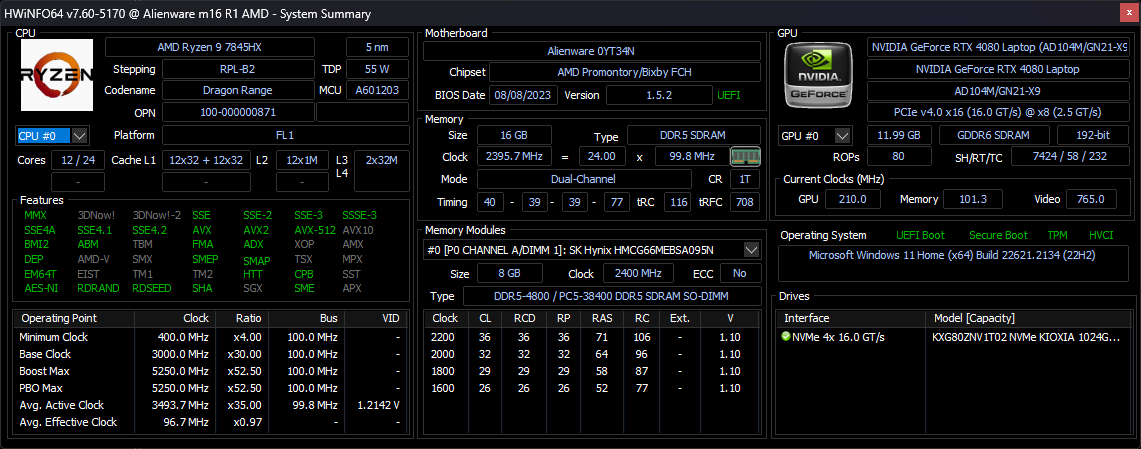
Procesador
El Ryzen 9 7845HX se acerca más al impresionante Ryzen 9 7945HX que al Ryzen 7 7745HX. El rendimiento multihilo es entre un 20 y un 25 por ciento más lento que el del Ryzen 9 7945HX o aproximadamente un 50 por ciento superior al del Ryzen 7 7745HX. Por tanto, la CPU está justo por debajo del competidor Core i9-13900HX pero muy por delante del Core i7-13700HX. El concepto de conformarse con un rendimiento más lento de la CPU optando por AMD en lugar de Intel no se aplica a esta generación.
La sostenibilidad del rendimiento es excelente, como demuestran los resultados estables de Cinebench R15 xT que se muestran a continuación.
Cinebench R15 Multi Loop
Cinebench R23: Multi Core | Single Core
Cinebench R20: CPU (Multi Core) | CPU (Single Core)
Cinebench R15: CPU Multi 64Bit | CPU Single 64Bit
Blender: v2.79 BMW27 CPU
7-Zip 18.03: 7z b 4 | 7z b 4 -mmt1
Geekbench 5.5: Multi-Core | Single-Core
HWBOT x265 Benchmark v2.2: 4k Preset
LibreOffice : 20 Documents To PDF
R Benchmark 2.5: Overall mean
* ... más pequeño es mejor
AIDA64: FP32 Ray-Trace | FPU Julia | CPU SHA3 | CPU Queen | FPU SinJulia | FPU Mandel | CPU AES | CPU ZLib | FP64 Ray-Trace | CPU PhotoWorxx
| Performance rating | |
| Alienware m16 R1 AMD | |
| Medio AMD Ryzen 9 7845HX | |
| Lenovo Legion Pro 7 RTX4090 | |
| Asus ROG Strix G16 G614JZ | |
| HP Omen Transcend 16 | |
| Razer Blade 16 Early 2023 | |
| Alienware x16 R1 | |
| AIDA64 / FP32 Ray-Trace | |
| Alienware m16 R1 AMD | |
| Medio AMD Ryzen 9 7845HX (n=1) | |
| Asus ROG Strix G16 G614JZ | |
| Lenovo Legion Pro 7 RTX4090 | |
| Razer Blade 16 Early 2023 | |
| Razer Blade 16 Early 2023 | |
| Razer Blade 16 Early 2023 | |
| HP Omen Transcend 16 | |
| Alienware x16 R1 | |
| AIDA64 / CPU Queen | |
| Alienware m16 R1 AMD | |
| Medio AMD Ryzen 9 7845HX (n=1) | |
| Asus ROG Strix G16 G614JZ | |
| Lenovo Legion Pro 7 RTX4090 | |
| Razer Blade 16 Early 2023 | |
| Razer Blade 16 Early 2023 | |
| HP Omen Transcend 16 | |
| Alienware x16 R1 | |
| AIDA64 / FPU SinJulia | |
| Alienware m16 R1 AMD | |
| Medio AMD Ryzen 9 7845HX (n=1) | |
| Asus ROG Strix G16 G614JZ | |
| Razer Blade 16 Early 2023 | |
| Razer Blade 16 Early 2023 | |
| Razer Blade 16 Early 2023 | |
| Lenovo Legion Pro 7 RTX4090 | |
| HP Omen Transcend 16 | |
| Alienware x16 R1 | |
| AIDA64 / FPU Mandel | |
| Alienware m16 R1 AMD | |
| Medio AMD Ryzen 9 7845HX (n=1) | |
| Lenovo Legion Pro 7 RTX4090 | |
| Asus ROG Strix G16 G614JZ | |
| Razer Blade 16 Early 2023 | |
| Razer Blade 16 Early 2023 | |
| Razer Blade 16 Early 2023 | |
| HP Omen Transcend 16 | |
| Alienware x16 R1 | |
| AIDA64 / FP64 Ray-Trace | |
| Alienware m16 R1 AMD | |
| Medio AMD Ryzen 9 7845HX (n=1) | |
| Asus ROG Strix G16 G614JZ | |
| Lenovo Legion Pro 7 RTX4090 | |
| Razer Blade 16 Early 2023 | |
| Razer Blade 16 Early 2023 | |
| Razer Blade 16 Early 2023 | |
| HP Omen Transcend 16 | |
| Alienware x16 R1 | |
| AIDA64 / CPU PhotoWorxx | |
| Razer Blade 16 Early 2023 | |
| Razer Blade 16 Early 2023 | |
| Razer Blade 16 Early 2023 | |
| Lenovo Legion Pro 7 RTX4090 | |
| HP Omen Transcend 16 | |
| Alienware x16 R1 | |
| Asus ROG Strix G16 G614JZ | |
| Alienware m16 R1 AMD | |
| Medio AMD Ryzen 9 7845HX (n=1) | |
Rendimiento del sistema
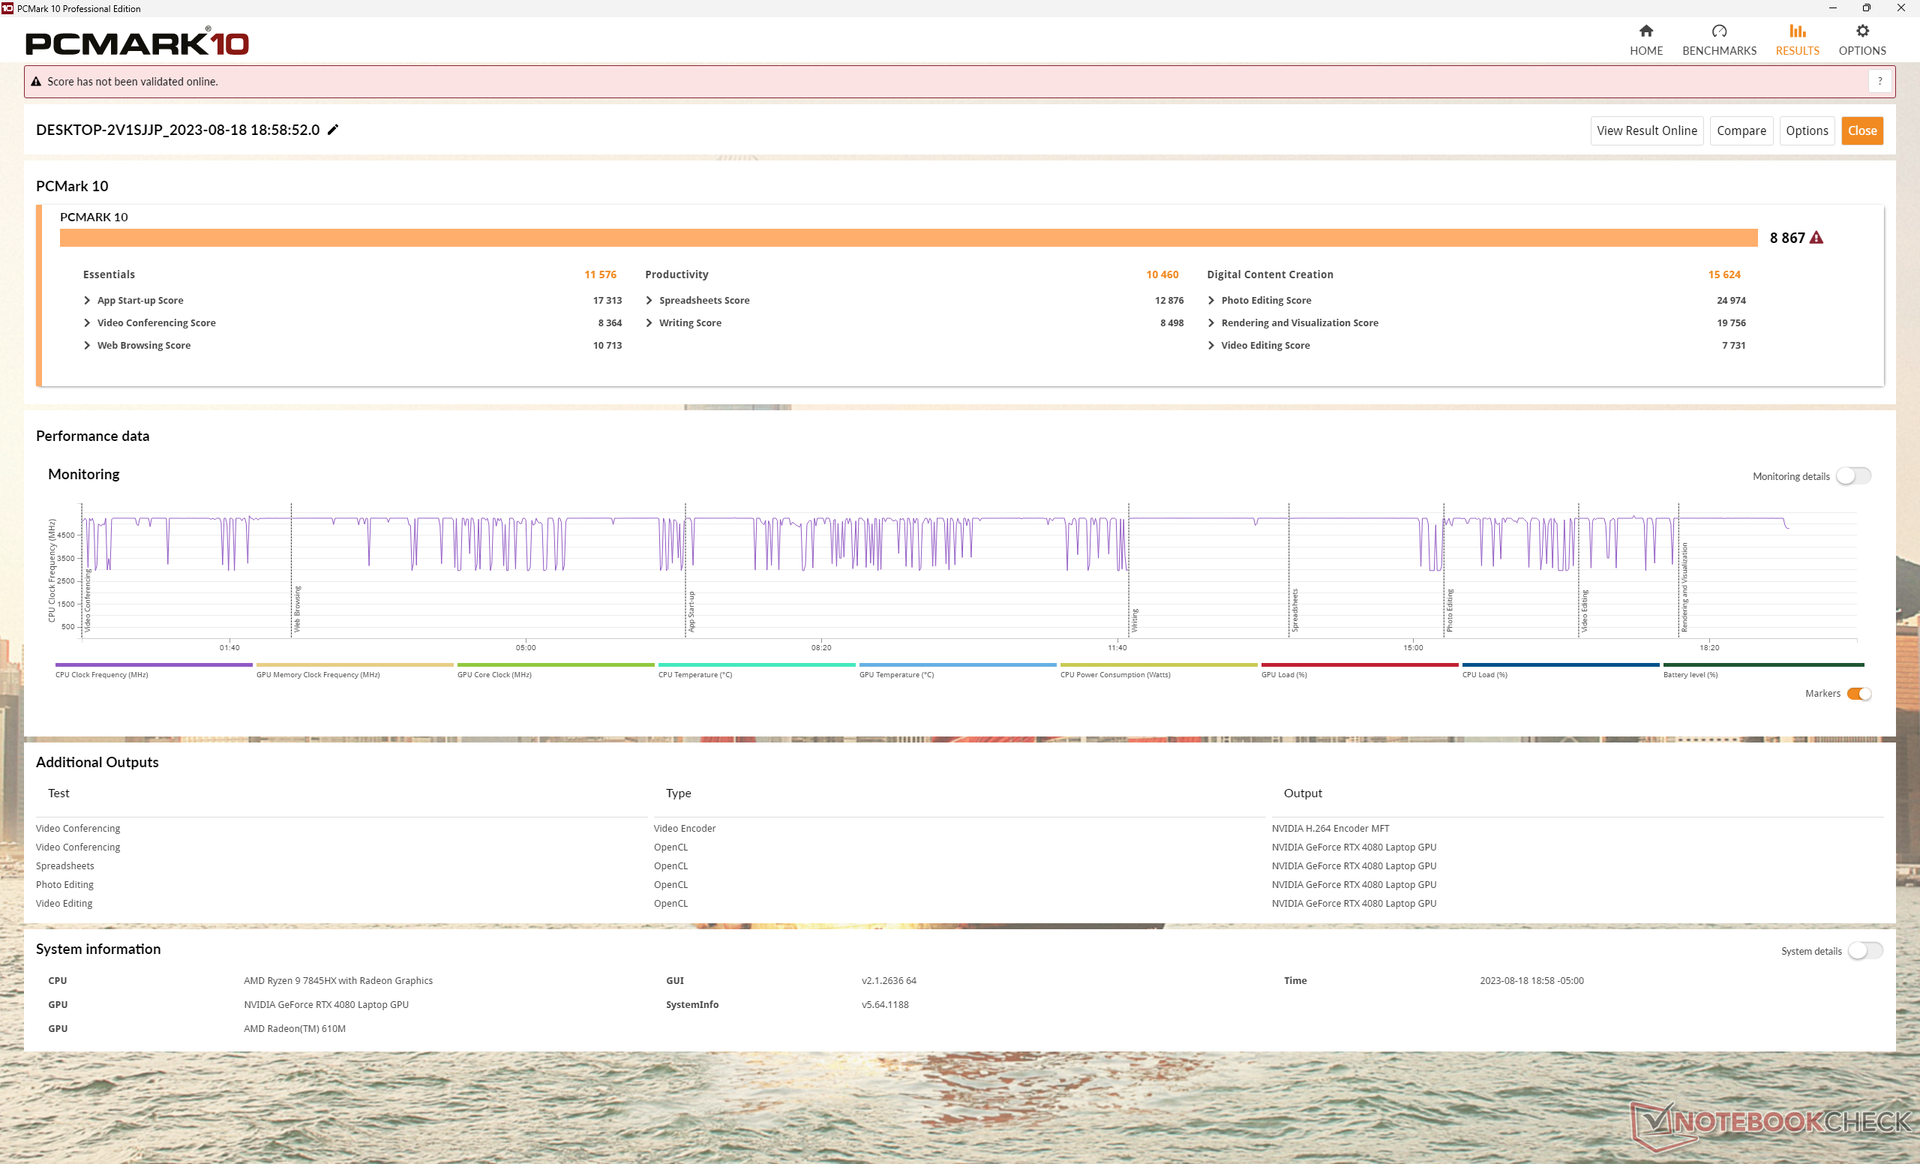
Las puntuaciones PCMark son de las más altas de cualquier portátil para juegos. El margen más amplio está en la subprueba de Productividad, que se centra en el rendimiento de la CPU.
Por desgracia, experimentamos varios problemas al despertar del reposo en nuestra unidad de pruebas. El sistema a veces se reiniciaba sin motivo al abrir la tapa o mostraba la pantalla azul de la muerte incluso tras actualizar a los últimos drivers de Dell y Nvidia en el momento del análisis.
CrossMark: Overall | Productivity | Creativity | Responsiveness
| PCMark 10 / Score | |
| Alienware m16 R1 AMD | |
| Medio AMD Ryzen 9 7845HX, NVIDIA GeForce RTX 4080 Laptop GPU (n=1) | |
| Alienware x16 R1 | |
| Lenovo Legion Pro 7 RTX4090 | |
| HP Omen Transcend 16 | |
| Razer Blade 16 Early 2023 | |
| Asus ROG Strix G16 G614JZ | |
| PCMark 10 / Essentials | |
| Asus ROG Strix G16 G614JZ | |
| Alienware m16 R1 AMD | |
| Medio AMD Ryzen 9 7845HX, NVIDIA GeForce RTX 4080 Laptop GPU (n=1) | |
| HP Omen Transcend 16 | |
| Alienware x16 R1 | |
| Lenovo Legion Pro 7 RTX4090 | |
| Razer Blade 16 Early 2023 | |
| PCMark 10 / Productivity | |
| Alienware m16 R1 AMD | |
| Medio AMD Ryzen 9 7845HX, NVIDIA GeForce RTX 4080 Laptop GPU (n=1) | |
| Alienware x16 R1 | |
| HP Omen Transcend 16 | |
| Lenovo Legion Pro 7 RTX4090 | |
| Razer Blade 16 Early 2023 | |
| Asus ROG Strix G16 G614JZ | |
| PCMark 10 / Digital Content Creation | |
| Alienware m16 R1 AMD | |
| Medio AMD Ryzen 9 7845HX, NVIDIA GeForce RTX 4080 Laptop GPU (n=1) | |
| Lenovo Legion Pro 7 RTX4090 | |
| Razer Blade 16 Early 2023 | |
| Alienware x16 R1 | |
| HP Omen Transcend 16 | |
| Asus ROG Strix G16 G614JZ | |
| CrossMark / Overall | |
| Asus ROG Strix G16 G614JZ | |
| Alienware m16 R1 AMD | |
| Medio AMD Ryzen 9 7845HX, NVIDIA GeForce RTX 4080 Laptop GPU (n=1) | |
| HP Omen Transcend 16 | |
| Alienware x16 R1 | |
| Razer Blade 16 Early 2023 | |
| CrossMark / Productivity | |
| Asus ROG Strix G16 G614JZ | |
| Alienware m16 R1 AMD | |
| Medio AMD Ryzen 9 7845HX, NVIDIA GeForce RTX 4080 Laptop GPU (n=1) | |
| Alienware x16 R1 | |
| HP Omen Transcend 16 | |
| Razer Blade 16 Early 2023 | |
| CrossMark / Creativity | |
| Asus ROG Strix G16 G614JZ | |
| HP Omen Transcend 16 | |
| Alienware m16 R1 AMD | |
| Medio AMD Ryzen 9 7845HX, NVIDIA GeForce RTX 4080 Laptop GPU (n=1) | |
| Alienware x16 R1 | |
| Razer Blade 16 Early 2023 | |
| CrossMark / Responsiveness | |
| Asus ROG Strix G16 G614JZ | |
| Alienware x16 R1 | |
| Alienware m16 R1 AMD | |
| Medio AMD Ryzen 9 7845HX, NVIDIA GeForce RTX 4080 Laptop GPU (n=1) | |
| HP Omen Transcend 16 | |
| Razer Blade 16 Early 2023 | |
| PCMark 10 Score | 8867 puntos | |
ayuda | ||
| AIDA64 / Memory Copy | |
| Razer Blade 16 Early 2023 | |
| Razer Blade 16 Early 2023 | |
| Razer Blade 16 Early 2023 | |
| Lenovo Legion Pro 7 RTX4090 | |
| HP Omen Transcend 16 | |
| Alienware x16 R1 | |
| Asus ROG Strix G16 G614JZ | |
| Alienware m16 R1 AMD | |
| Medio AMD Ryzen 9 7845HX (n=1) | |
| AIDA64 / Memory Read | |
| Lenovo Legion Pro 7 RTX4090 | |
| Razer Blade 16 Early 2023 | |
| Razer Blade 16 Early 2023 | |
| Razer Blade 16 Early 2023 | |
| HP Omen Transcend 16 | |
| Asus ROG Strix G16 G614JZ | |
| Alienware x16 R1 | |
| Alienware m16 R1 AMD | |
| Medio AMD Ryzen 9 7845HX (n=1) | |
| AIDA64 / Memory Write | |
| Alienware x16 R1 | |
| Razer Blade 16 Early 2023 | |
| Razer Blade 16 Early 2023 | |
| Razer Blade 16 Early 2023 | |
| Lenovo Legion Pro 7 RTX4090 | |
| HP Omen Transcend 16 | |
| Asus ROG Strix G16 G614JZ | |
| Alienware m16 R1 AMD | |
| Medio AMD Ryzen 9 7845HX (n=1) | |
| AIDA64 / Memory Latency | |
| Alienware x16 R1 | |
| Razer Blade 16 Early 2023 | |
| Razer Blade 16 Early 2023 | |
| Razer Blade 16 Early 2023 | |
| Alienware m16 R1 AMD | |
| Medio AMD Ryzen 9 7845HX (n=1) | |
| HP Omen Transcend 16 | |
| Asus ROG Strix G16 G614JZ | |
| Lenovo Legion Pro 7 RTX4090 | |
* ... más pequeño es mejor
Latencia del CPD
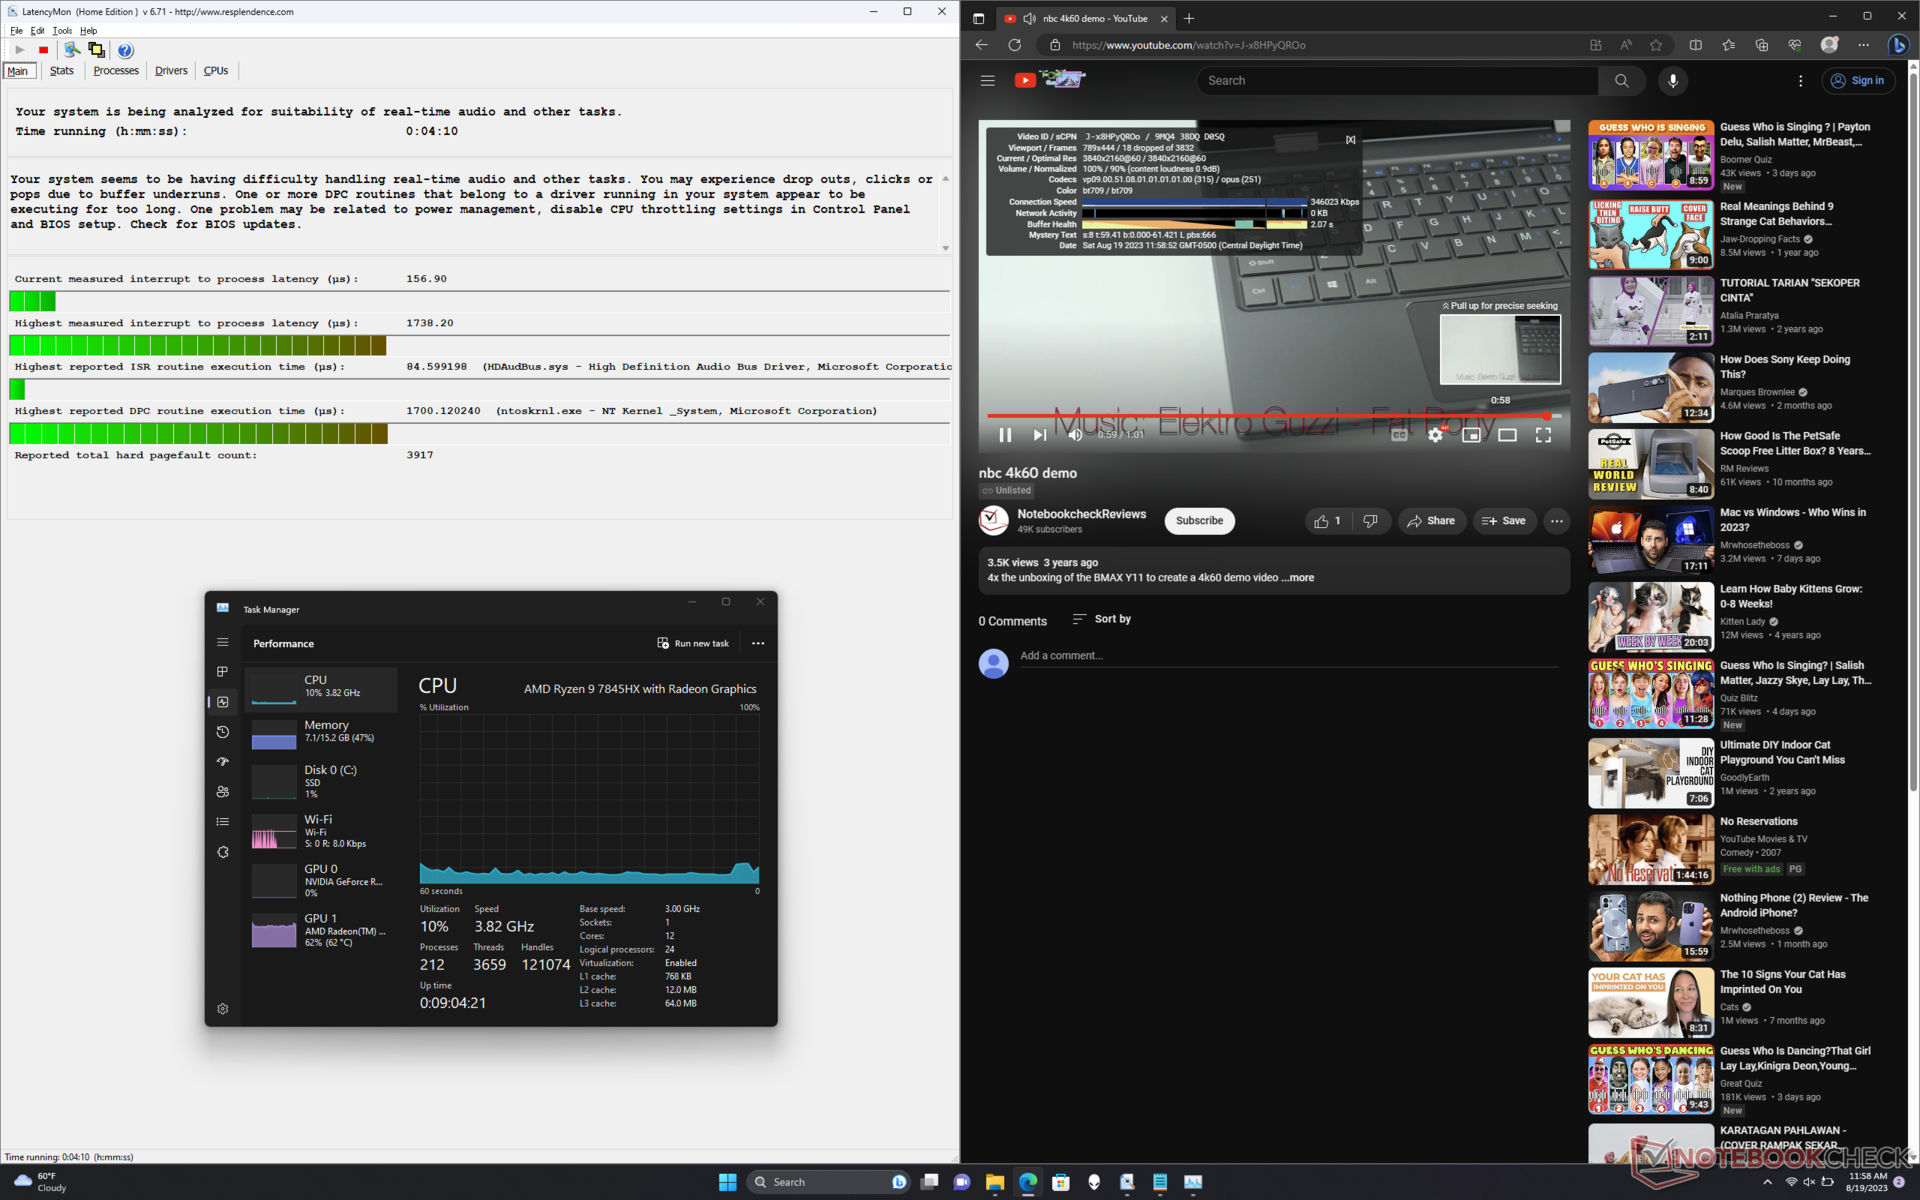
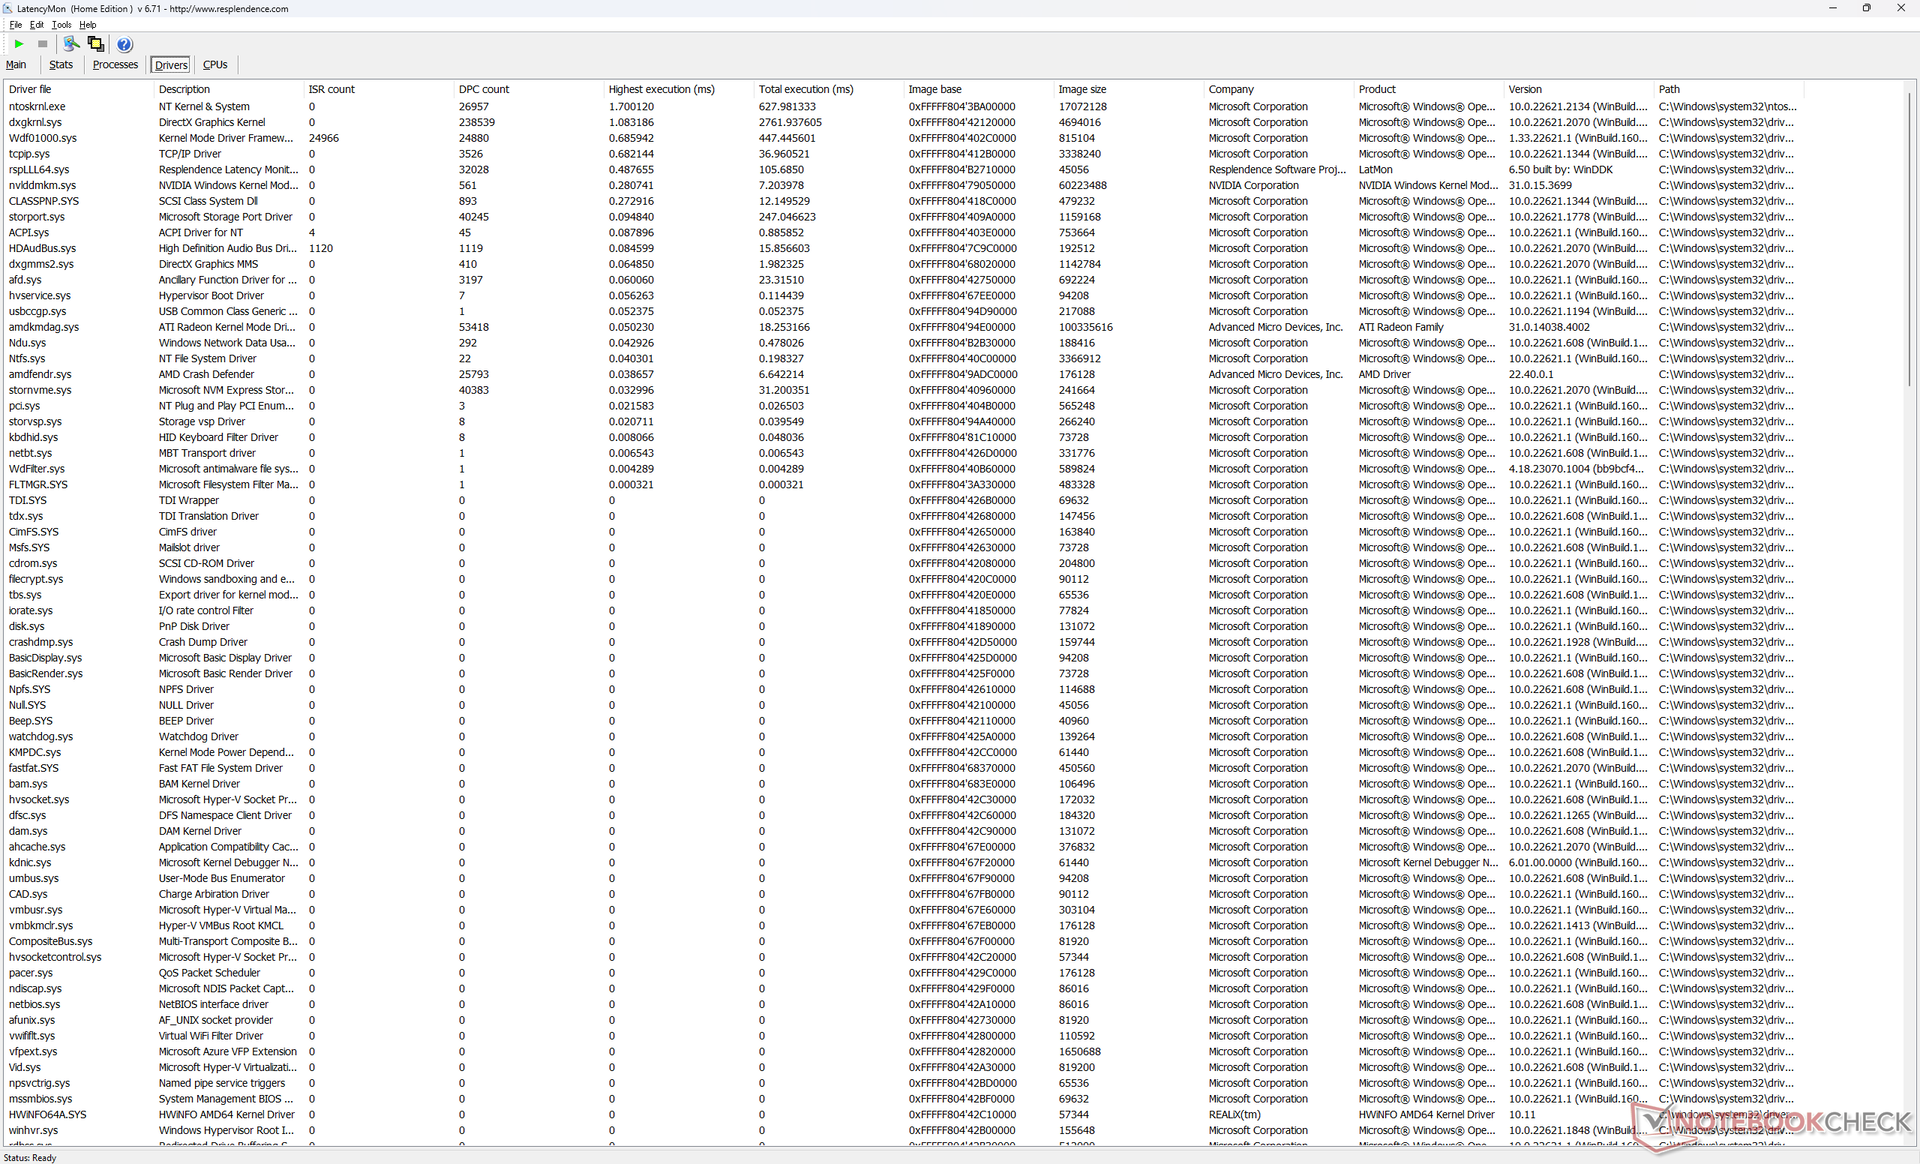
LatencyMon revela ligeros problemas de CPD relacionados con ntoskrnl.exe. Además, la reproducción de vídeo 4K a 60 FPS es imperfecta, con 18 fotogramas perdidos registrados durante una prueba de vídeo de un minuto, lo que sugiere un posible fallo en la aceleración por hardware de AMD. Los resultados no mejoraron ni siquiera tras repetir las pruebas.
| DPC Latencies / LatencyMon - interrupt to process latency (max), Web, Youtube, Prime95 | |
| Lenovo Legion Pro 7 RTX4090 | |
| Asus ROG Strix G16 G614JZ | |
| Razer Blade 16 Early 2023 | |
| Alienware m16 R1 AMD | |
| HP Omen Transcend 16 | |
| Alienware x16 R1 | |
* ... más pequeño es mejor
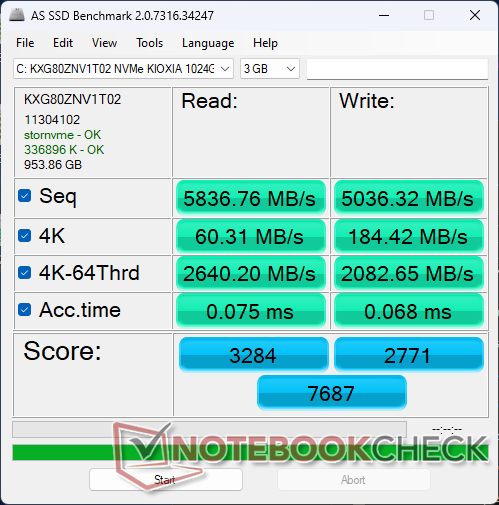
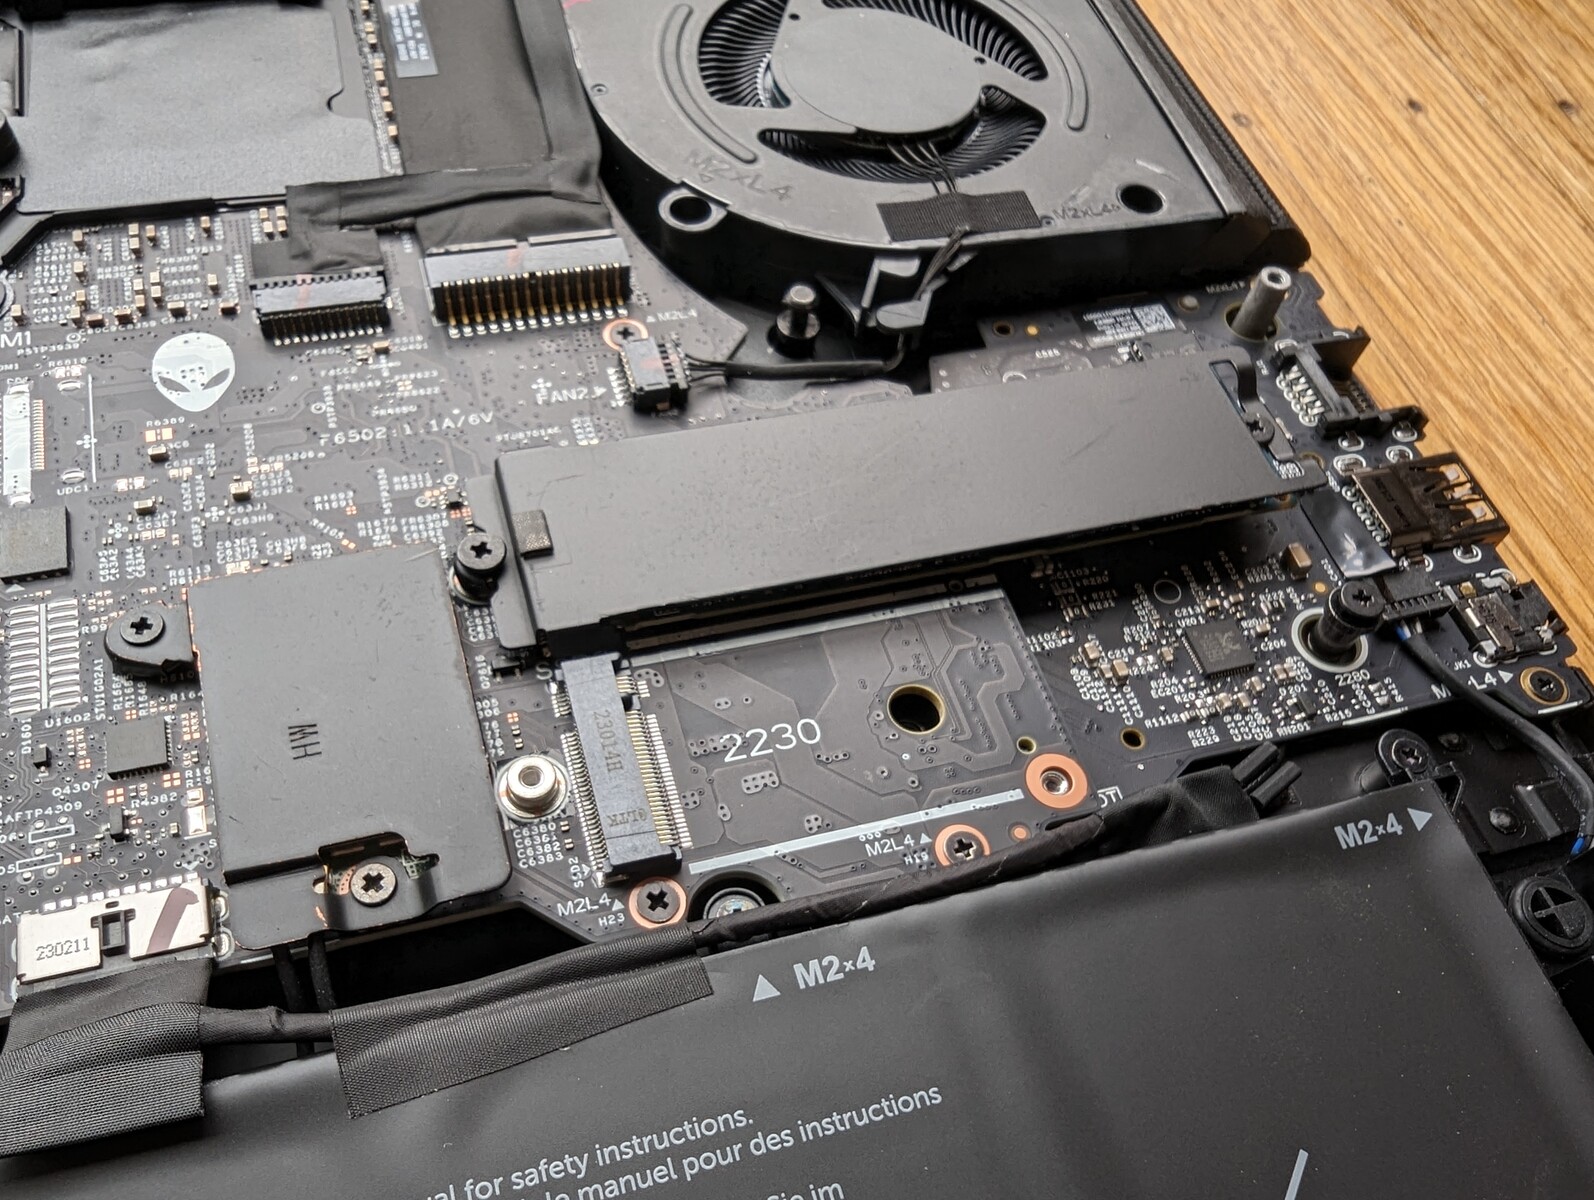
Dispositivos de almacenamiento
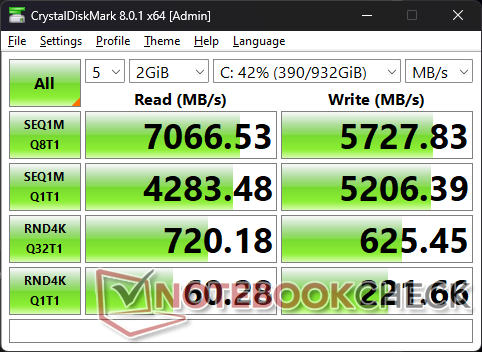
Nuestra unidad se entrega con un Kioxia KXG80ZNV1T02 que ofrece velocidades de lectura y escritura secuenciales de hasta 7.000 MB/s y 5.600 MB/s, respectivamente, según el fabricante. La unidad es capaz de mantener velocidades de transferencia máximas de más de 6500 MB/s durante periodos prolongados sin problemas de ralentización.
Se pueden instalar hasta tres SSD M.2, mientras que el Alienware x16 y el HP Omen 16 sólo admiten dos cada uno. La tercera unidad, sin embargo, debe tener 30 mm de longitud.

| Drive Performance rating - Percent | |
| Alienware x16 R1 | |
| Lenovo Legion Pro 7 RTX4090 | |
| Alienware m16 R1 AMD | |
| Razer Blade 16 Early 2023 | |
| HP Omen Transcend 16 | |
| Asus ROG Strix G16 G614JZ | |
* ... más pequeño es mejor
Disk Throttling: DiskSpd Read Loop, Queue Depth 8
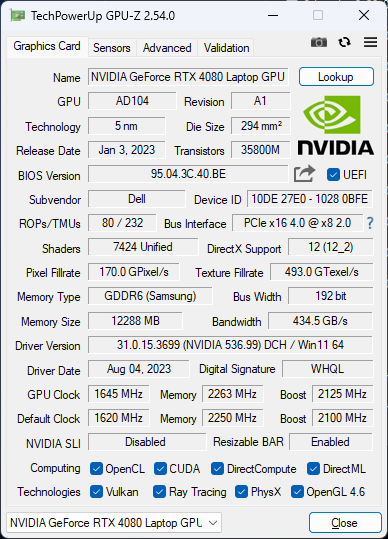
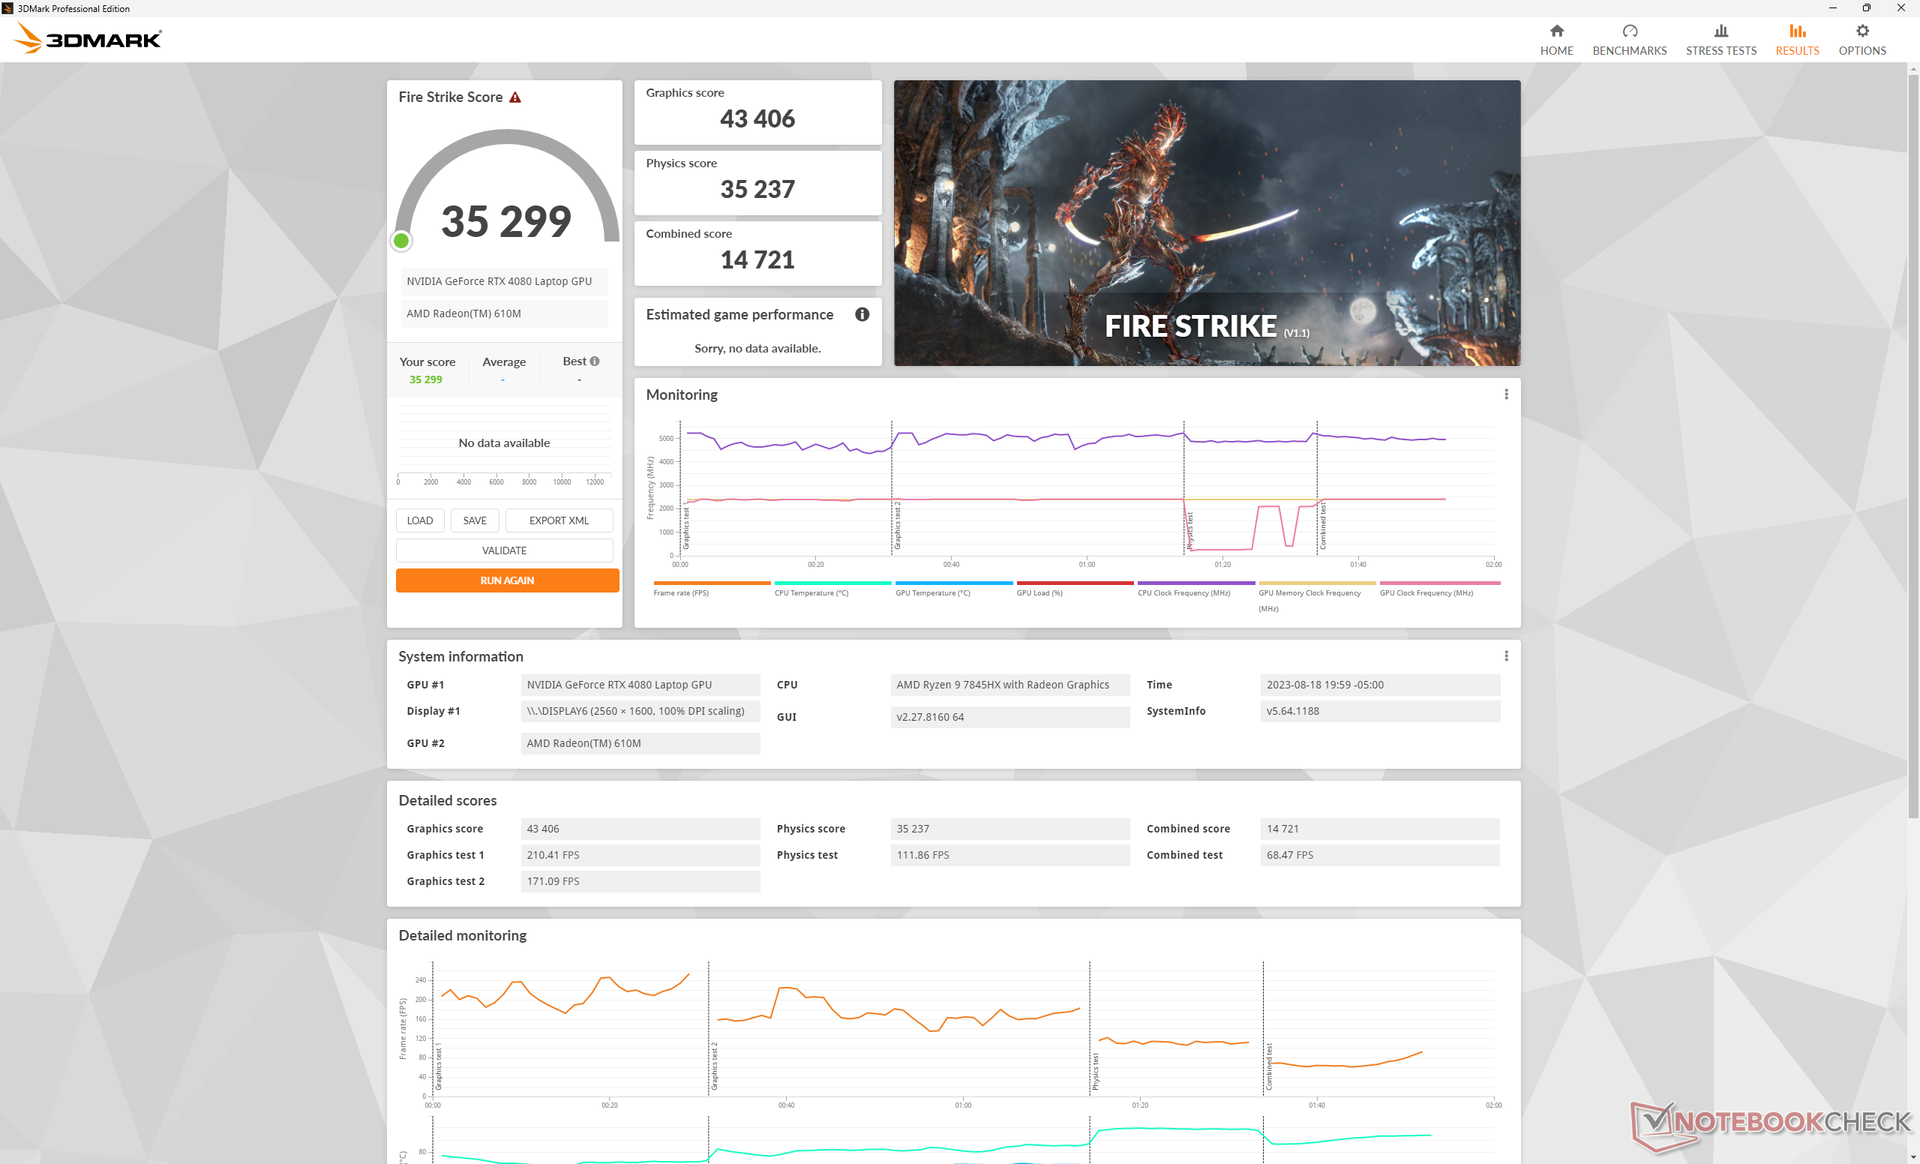
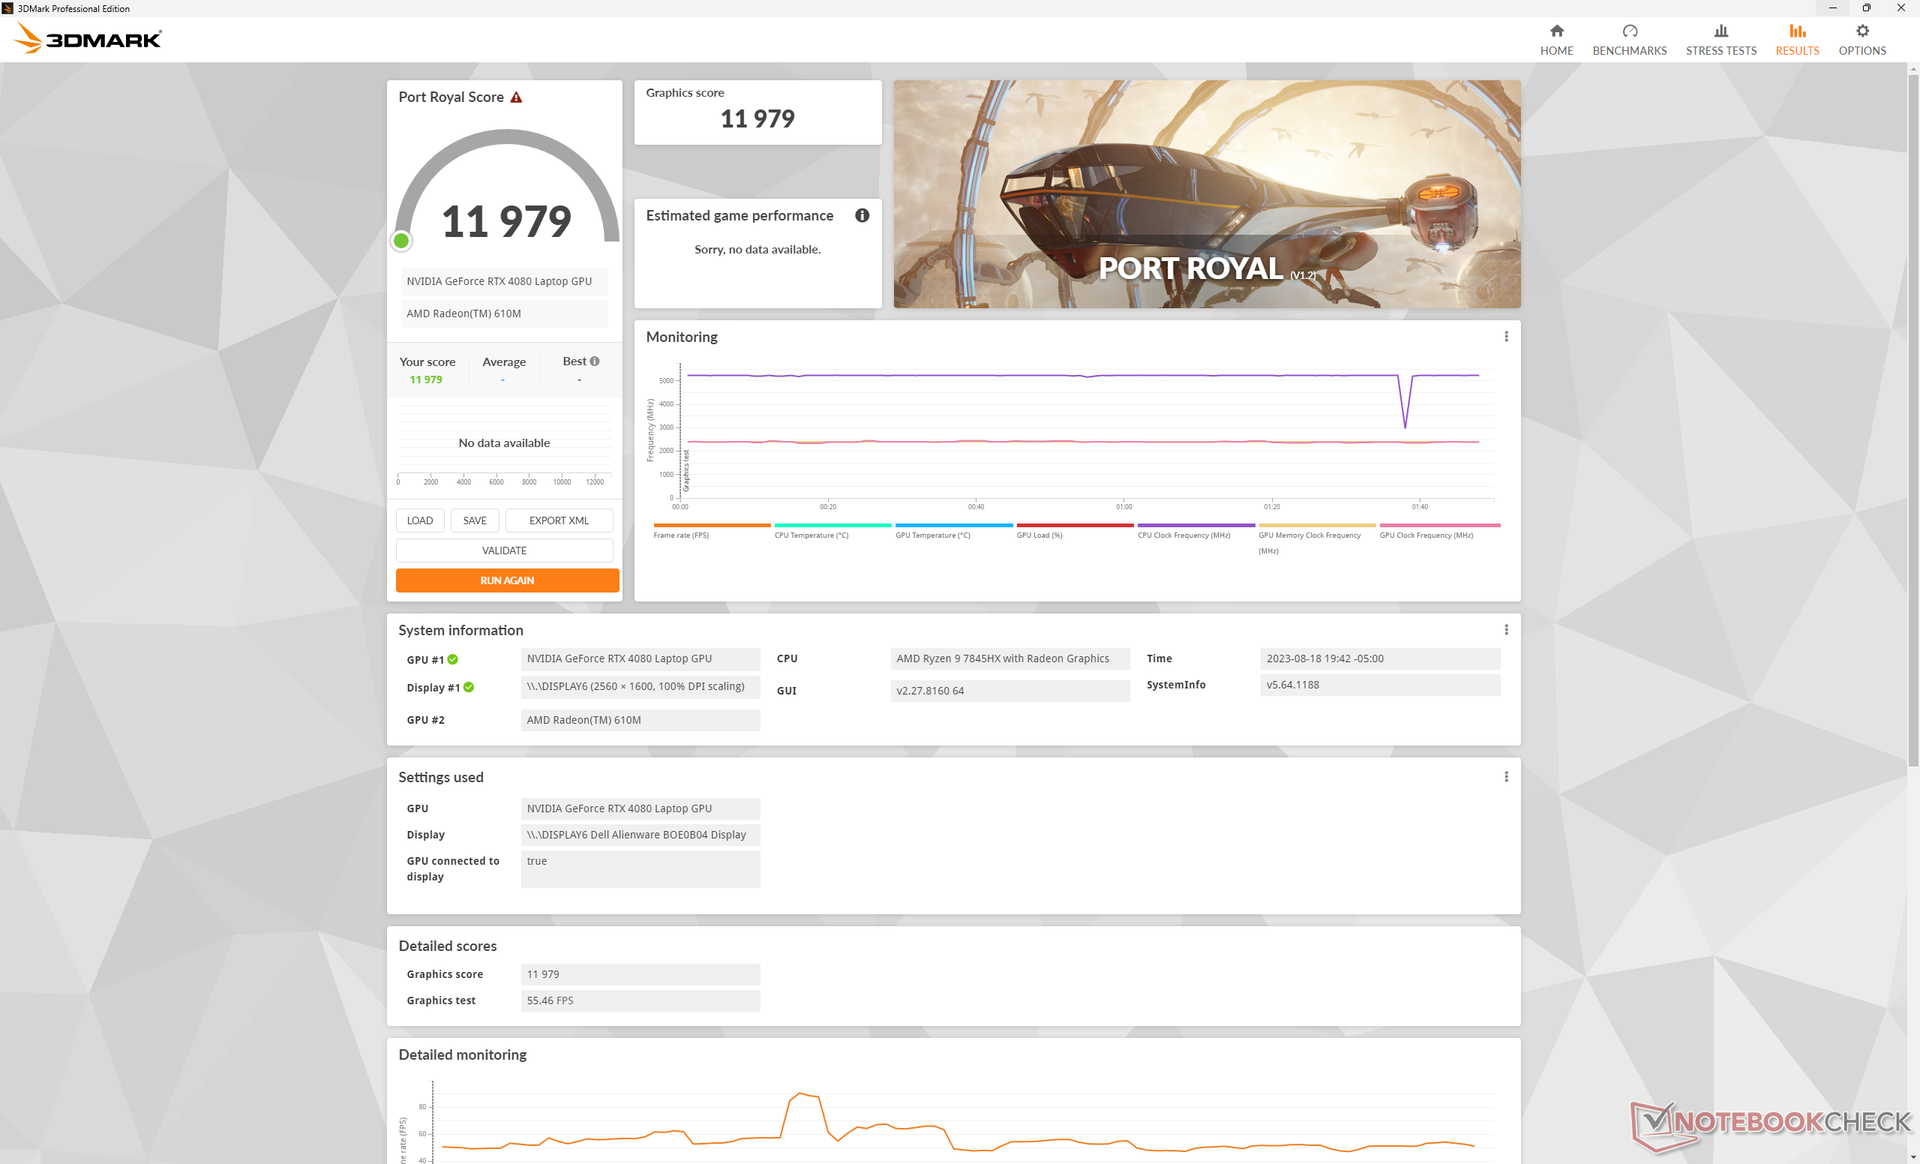
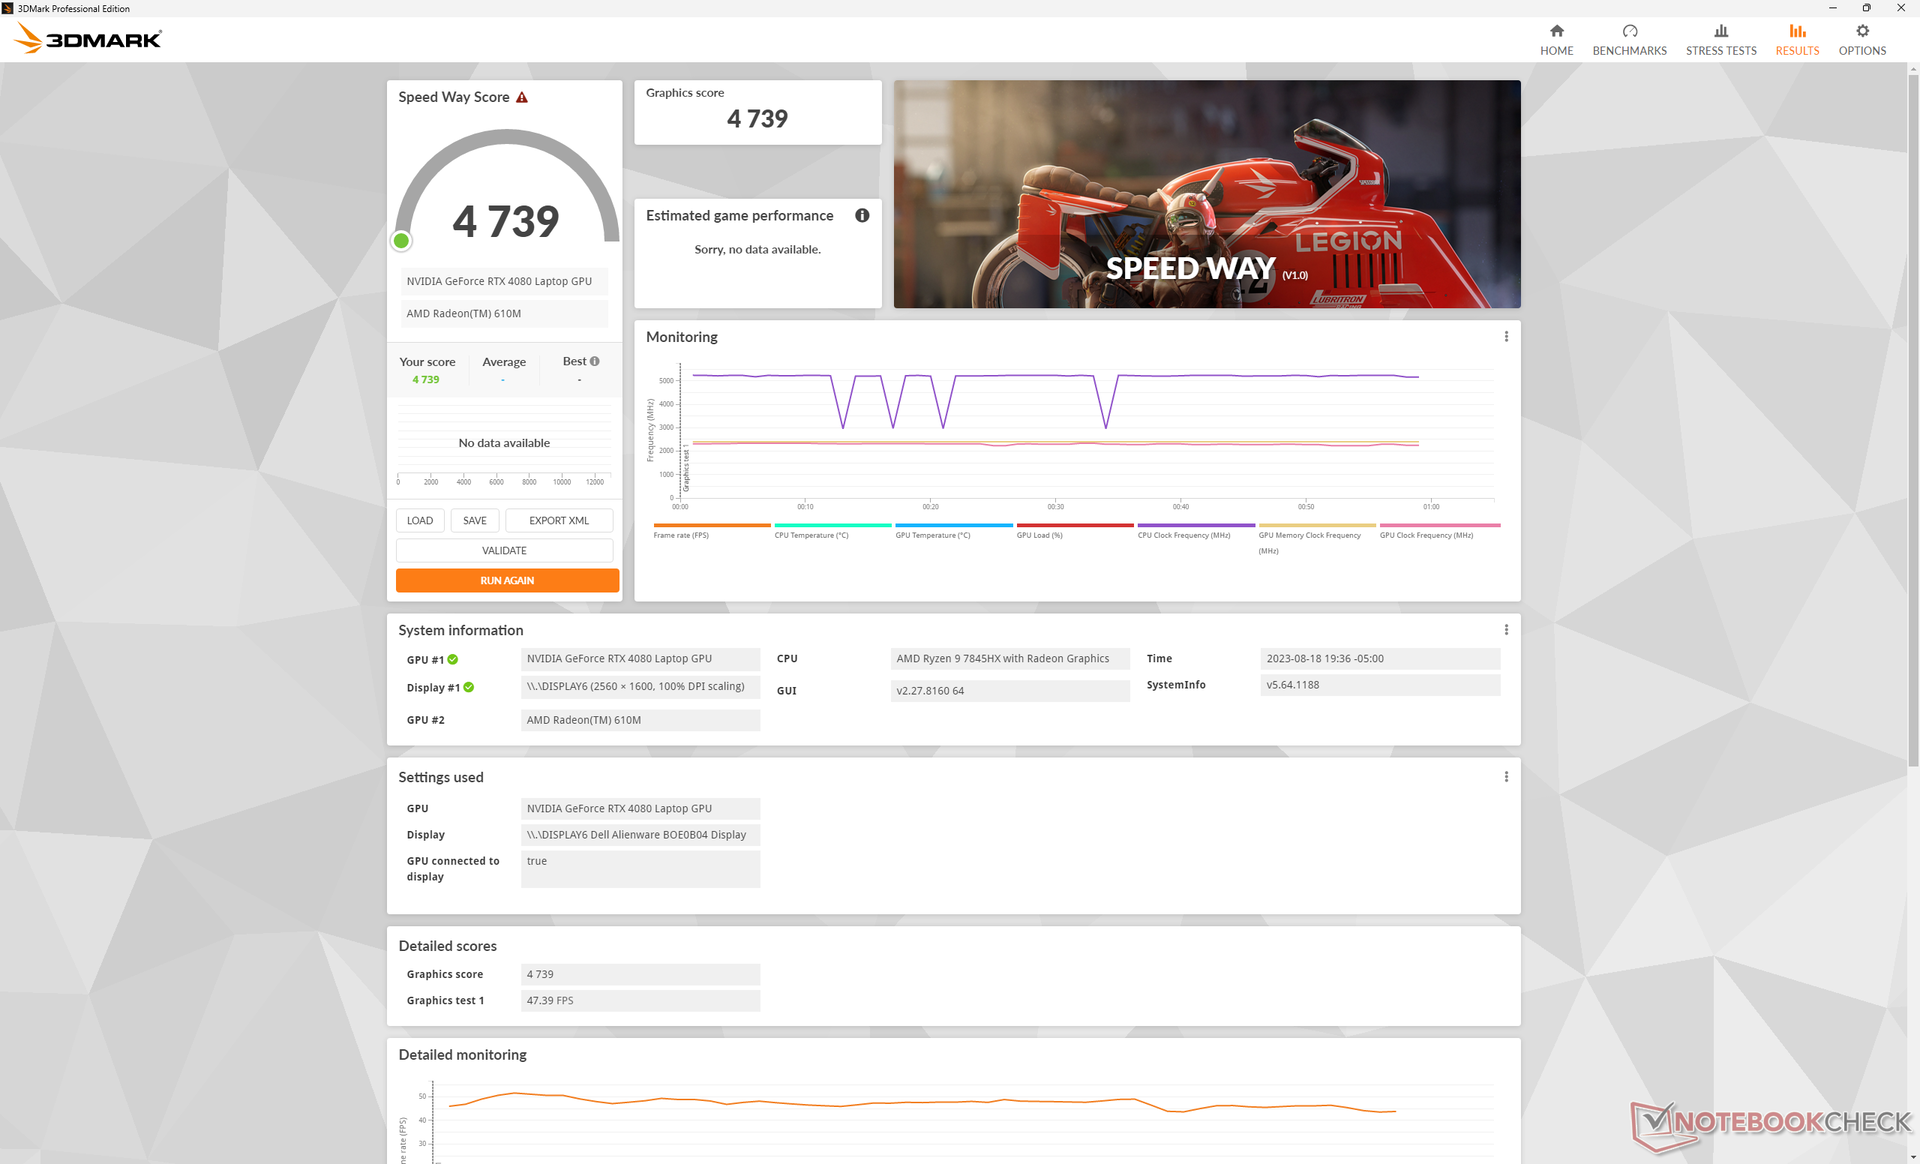
Rendimiento de la GPU - Gráficos TGP de 175 W
El rendimiento gráfico es entre un 5 y un 10 por ciento más rápido que el del portátil para juegos medio de nuestra base de datos equipado con la misma GPU RTX 4080 ya que el Alienware apunta a un TGP relativamente alto de 175 W. De hecho, el rendimiento es sólo un 5 por ciento más lento que el delAsus Zephyrus Duo 16 con la RTX 4090.
Actualizar a la RTX 4090 SKU se espera que aumente el rendimiento en sólo un 10 por ciento sobre nuestra RTX 4080, mientras que la reducción a la RTX 4070 debería disminuir el rendimiento de manera más significativa por hasta 30 a 40 por ciento basado en nuestro tiempo con el HP Omen Transcend 16. Por tanto, los entusiastas deberían considerar las SKU con la RTX 4080 como mínimo.
Curiosamente, sólo hay pequeñas diferencias de rendimiento entre los modos Equilibrado, Rendimiento y Overdrive, como muestran las puntuaciones de Fire Strike en la siguiente tabla. Esto es importante, ya que los modos difieren significativamente en términos de ruido del ventilador.
| Perfil de potencia | Puntuación gráfica | Puntuación física | Puntuación combinada |
| Batería | 22290 (-50%) | 30178 (-17%) | 9109 (-35%) |
| Modo equilibrado | 43406 (-3%) | 35237 (-4%) | 14721 (+5%) |
| Modo Rendimiento | 44306 (-1%) | 36106 (-1%) | 13682 (-3%) |
| Modo Overdrive | 44782 | 36557 | 14045 |

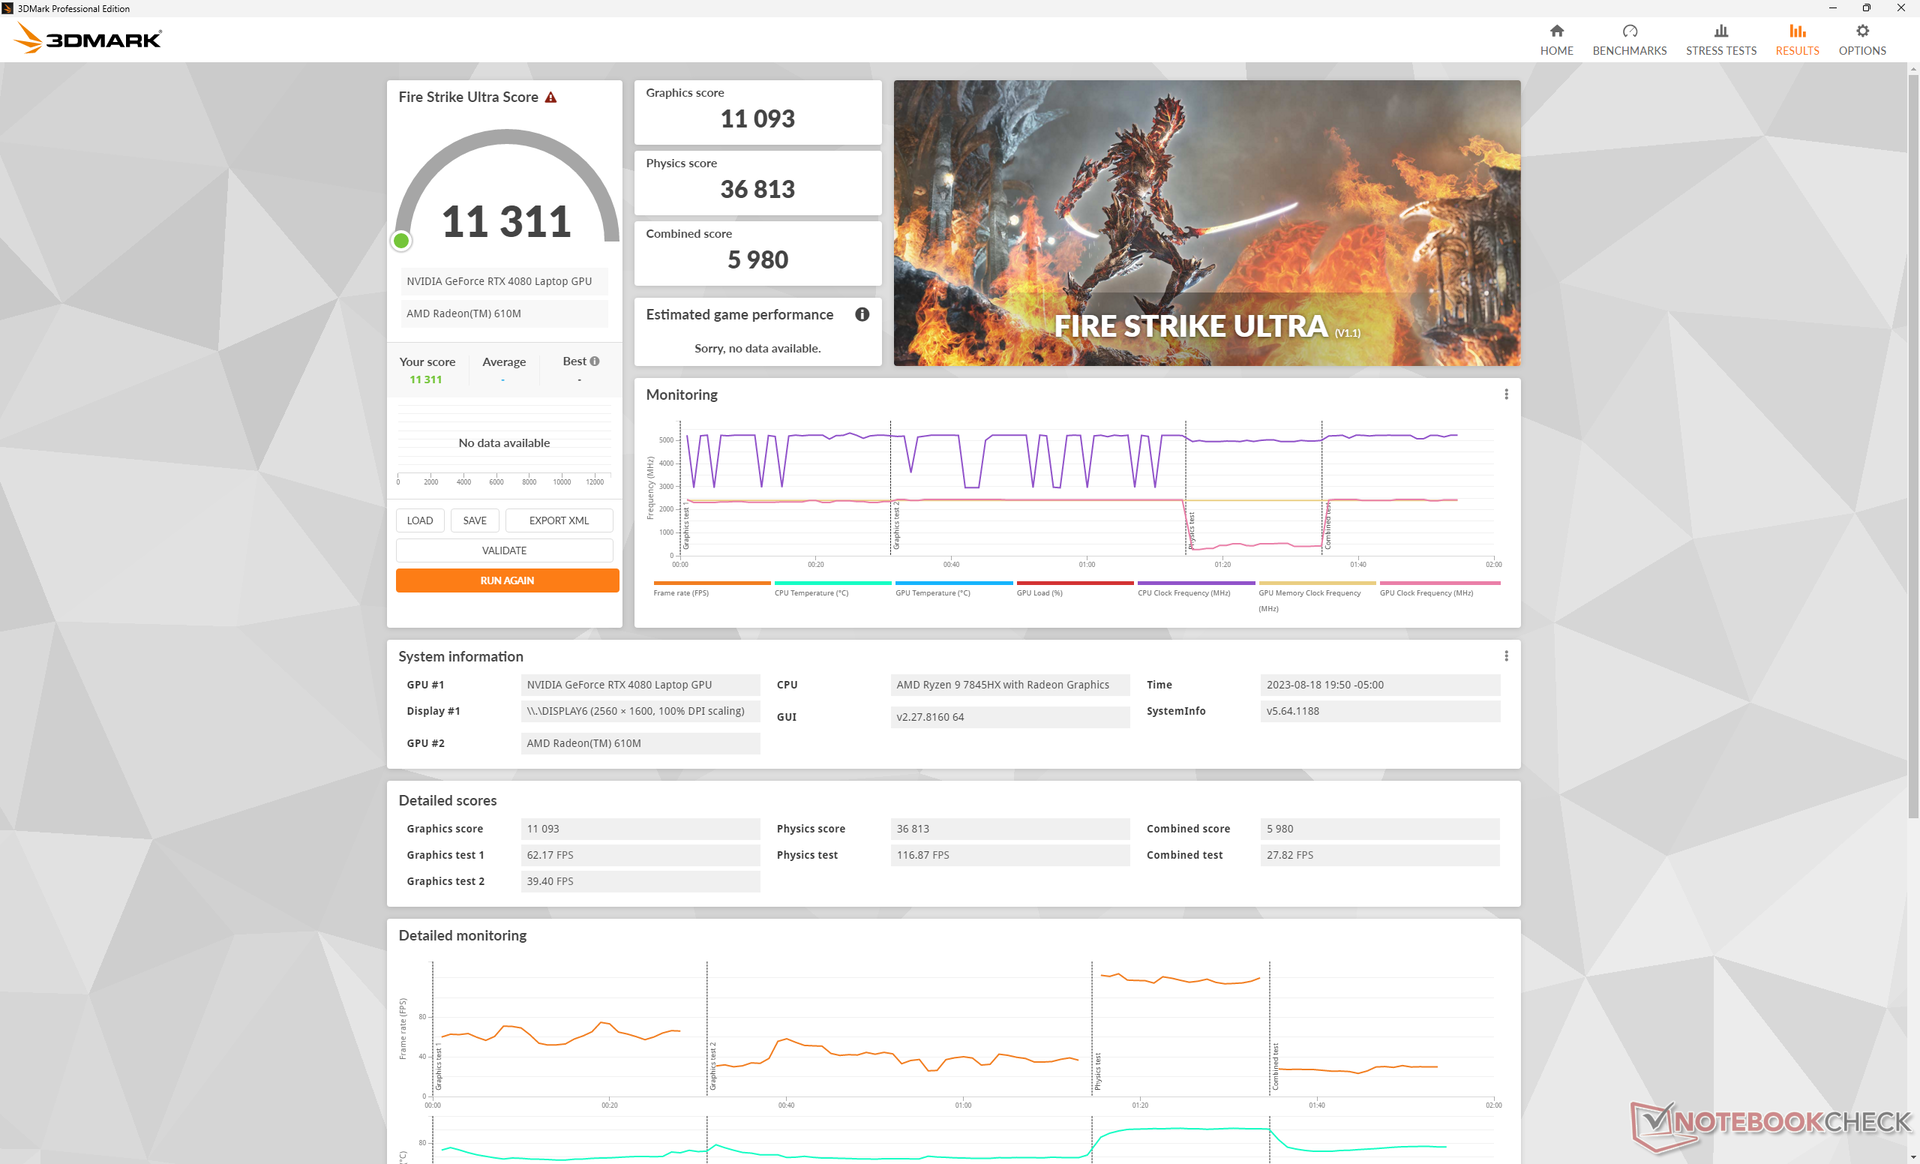
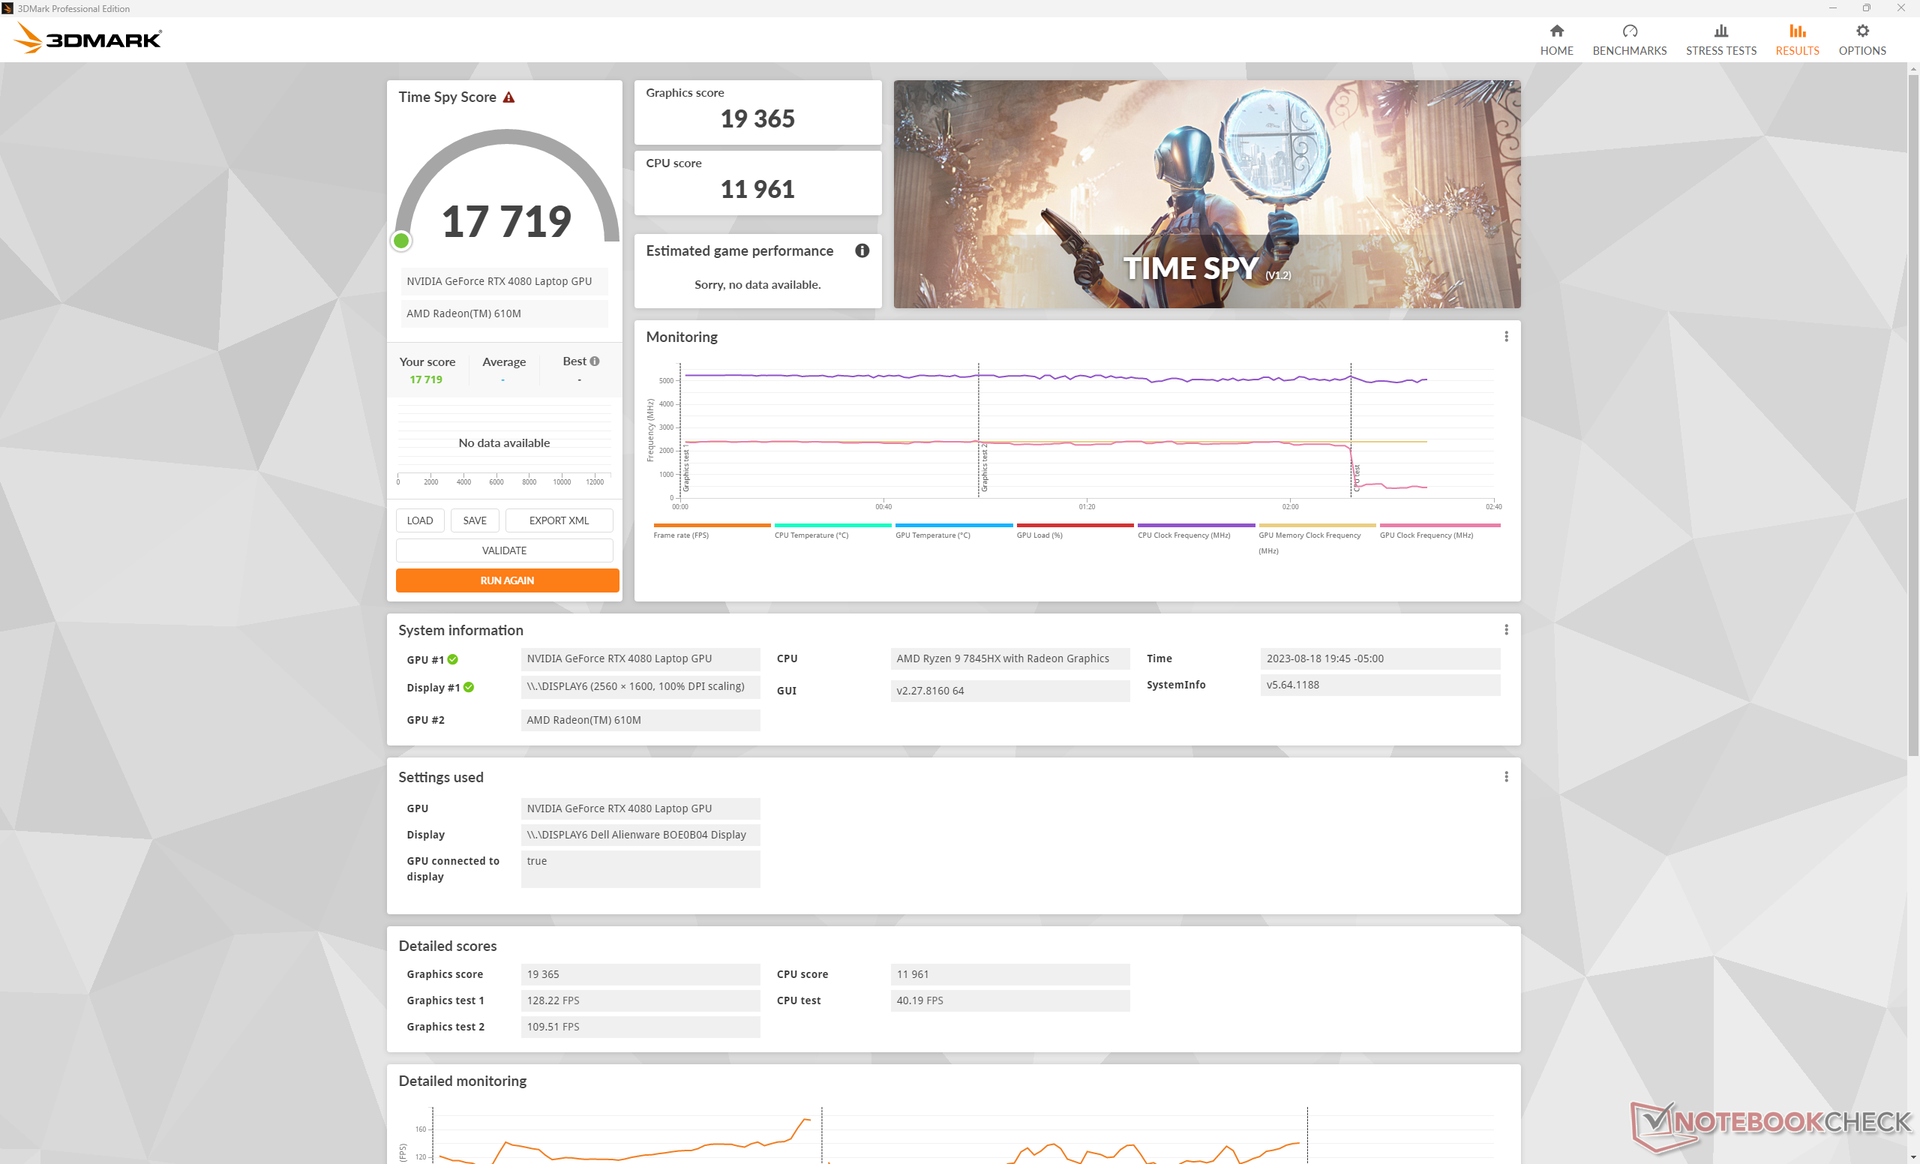
| 3DMark 11 Performance | 40681 puntos | |
| 3DMark Fire Strike Score | 35751 puntos | |
| 3DMark Time Spy Score | 17719 puntos | |
ayuda | ||
* ... más pequeño es mejor
Rendimiento en juegos
El rendimiento en juegos es excelente, con resultados entre un 5 y un 10 por ciento más rápidos que otros portátiles con la misma GPU RTX 4080, tal y como predice 3DMark. Las ventajas se extienden también a los ajustes gráficos más bajos, lo que puede ayudar a los jugadores que prefieren maximizar la velocidad de fotogramas por encima de la resolución. La RTX 4080 portátil es lo suficientemente potente como para jugar a cualquier título actual a la resolución nativa QHD+ a más de 60 FPS aunque sea mucho más débil que una rTX 4080 de sobremesa.
La estabilidad del rendimiento es, por desgracia, imperfecta. En Witcher 3, por ejemplo, las tasas de fotogramas se tambaleaban ocasionalmente hasta los 70 FPS antes de volver al rango de más de 150 FPS, como se muestra en el siguiente gráfico. Esto sugiere una mala optimización de los recursos de fondo que pueden estar interrumpiendo la aplicación en foco.
Witcher 3 FPS Chart
| bajo | medio | alto | ultra | QHD | 4K | |
|---|---|---|---|---|---|---|
| The Witcher 3 (2015) | 573.1 | 452.2 | 349.3 | 169.7 | 121.5 | |
| Dota 2 Reborn (2015) | 229 | 191.8 | 180.4 | 164.7 | 161 | |
| Final Fantasy XV Benchmark (2018) | 230 | 218 | 167.6 | 131.6 | 76.1 | |
| X-Plane 11.11 (2018) | 171.1 | 149 | 113.1 | 95 | ||
| Far Cry 5 (2018) | 160 | 145 | 141 | 136 | 131 | 91 |
| Strange Brigade (2018) | 572 | 461 | 400 | 357 | 248 | 123.1 |
| Cyberpunk 2077 1.6 (2022) | 154 | 151.4 | 137.5 | 128.3 | 84.5 | 39.7 |
| Tiny Tina's Wonderlands (2022) | 317.1 | 265.9 | 201.1 | 160.8 | 112.9 | 59 |
| F1 22 (2022) | 323 | 296 | 285 | 124.2 | 78.1 | 39.5 |
| Returnal (2023) | 128 | 122 | 117 | 107 | 80 | 44 |
Emisiones
Ruido del sistema: grandes diferencias entre perfiles de potencia
Los ventiladores están casi siempre activos a algo menos de 30 dB(A) contra un fondo silencioso de 23 dB(A). Aunque audible, el ruido es al menos constante ya que los ventiladores no pulsan más fuerte cuando se ejecutan cargas poco exigentes como navegadores o vídeo.
El ruido del ventilador al jugar en los modos Equilibrado, Rendimiento u Overdrive puede llegar a 49,4 dB(A), 51 dB(A) y 54,7 dB(A), respectivamente. Dado que la pérdida de rendimiento en modo Equilibrado es tan mínima como se mencionó anteriormente, los usuarios pueden considerar jugar en modo Equilibrado en lugar de Rendimiento u Overdrive por el ruido del ventilador notablemente más silencioso. Otros portátiles de juego de 16 pulgadas como el Razer Blade 16 u Omen Transcend 16 tienden a estabilizarse en el rango bajo-medio de 50 dB(A) cuando se ejecutan juegos.
Ruido
| Ocioso |
| 22.9 / 29.7 / 29.7 dB(A) |
| Carga |
| 29.8 / 54.7 dB(A) |
 | ||
30 dB silencioso 40 dB(A) audible 50 dB(A) ruidosamente alto |
||
min: | ||
| Alienware m16 R1 AMD GeForce RTX 4080 Laptop GPU, R9 7845HX, Kioxia XG8 KXG80ZNV1T02 | Alienware x16 R1 GeForce RTX 4080 Laptop GPU, i9-13900HK, SK hynix PC801 HFS001TEJ9X101N | HP Omen Transcend 16 GeForce RTX 4070 Laptop GPU, i9-13900HX, SK hynix PC801 HFS002TEJ9X101N | Lenovo Legion Pro 7 RTX4090 GeForce RTX 4090 Laptop GPU, i9-13900HX, Samsung PM9A1 MZVL21T0HCLR | Asus ROG Strix G16 G614JZ GeForce RTX 4080 Laptop GPU, i9-13980HX, WD PC SN560 SDDPNQE-1T00 | Razer Blade 16 Early 2023 GeForce RTX 4080 Laptop GPU, i9-13950HX, SSSTC CA6-8D1024 | |
|---|---|---|---|---|---|---|
| Noise | 0% | -11% | -17% | -9% | 4% | |
| apagado / medio ambiente * (dB) | 22.9 | 22.7 1% | 22.9 -0% | 25 -9% | 25 -9% | 23 -0% |
| Idle Minimum * (dB) | 22.9 | 23.1 -1% | 29.1 -27% | 28 -22% | 26 -14% | 23 -0% |
| Idle Average * (dB) | 29.7 | 25.8 13% | 29.1 2% | 30 -1% | 28 6% | 23 23% |
| Idle Maximum * (dB) | 29.7 | 25.8 13% | 29.1 2% | 38 -28% | 30 -1% | 23.6 21% |
| Load Average * (dB) | 29.8 | 39.3 -32% | 45.7 -53% | 48 -61% | 48 -61% | 39 -31% |
| Witcher 3 ultra * (dB) | 54.7 | 49.9 9% | 54.3 1% | 53 3% | 49 10% | 51.6 6% |
| Load Maximum * (dB) | 54.7 | 54.8 -0% | 54.3 1% | 55 -1% | 52 5% | 51.3 6% |
* ... más pequeño es mejor
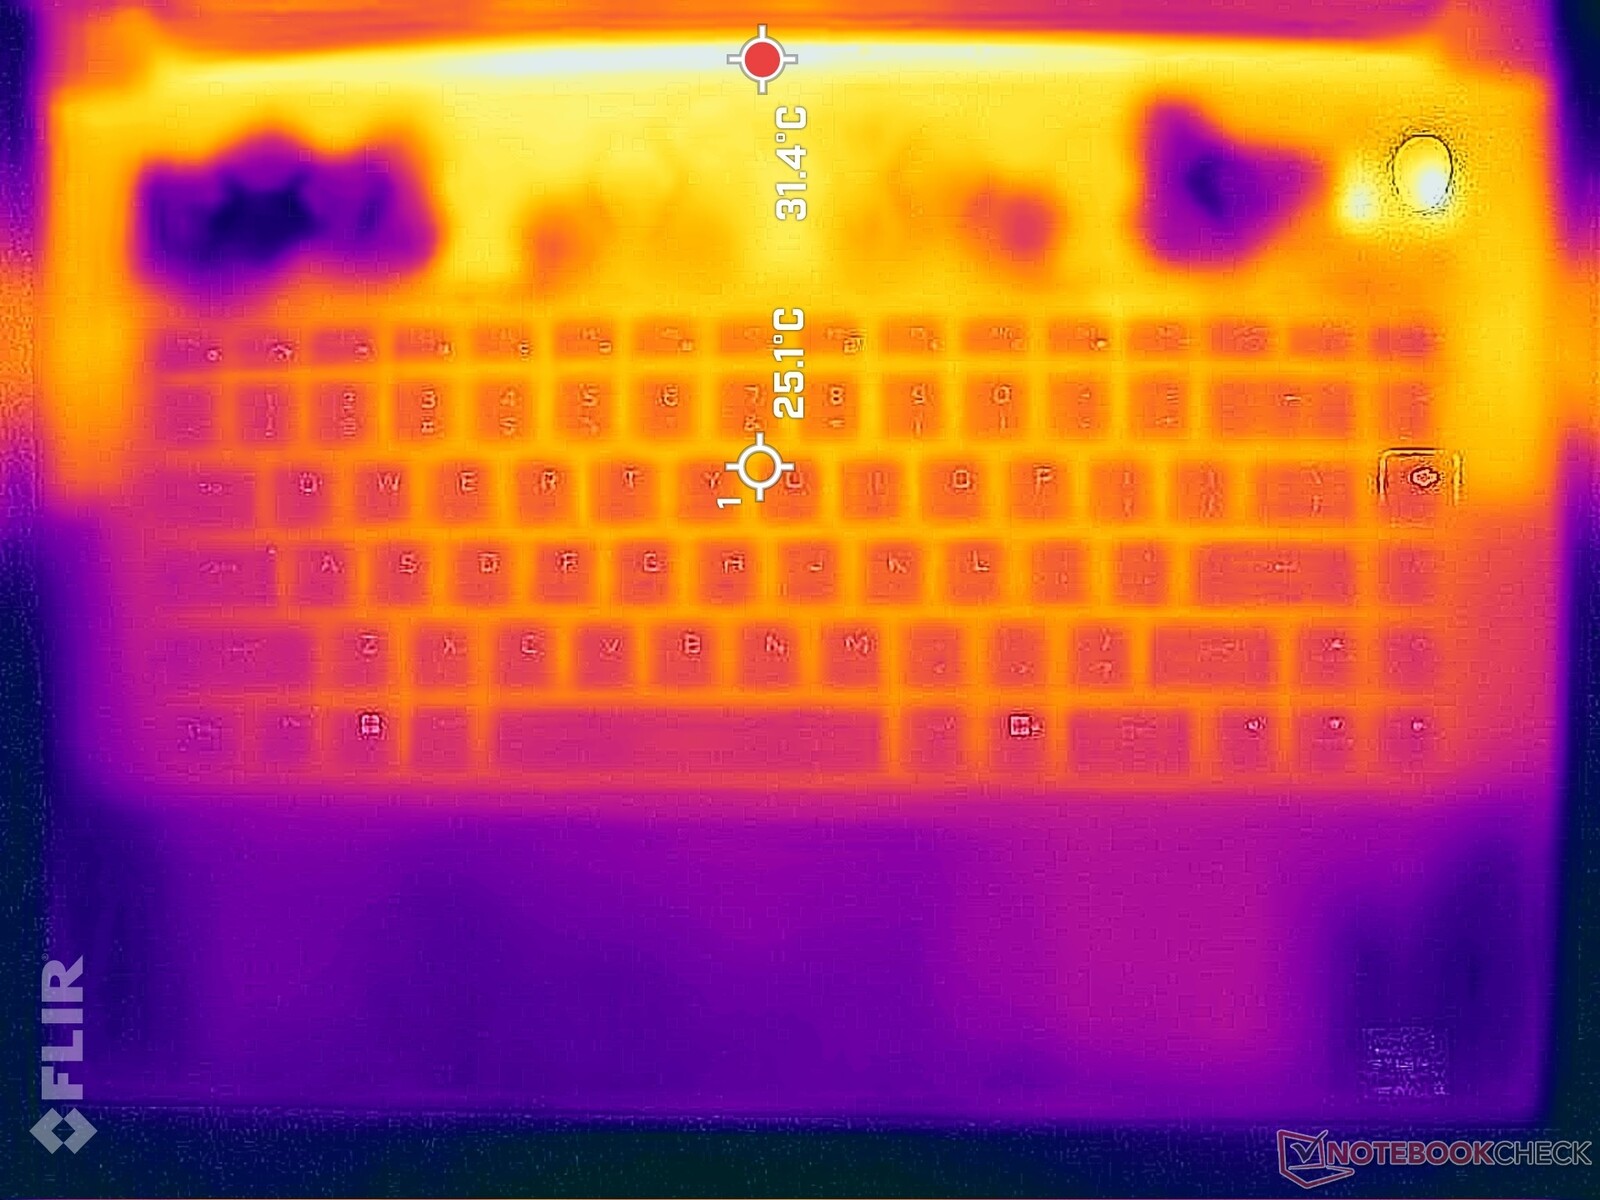
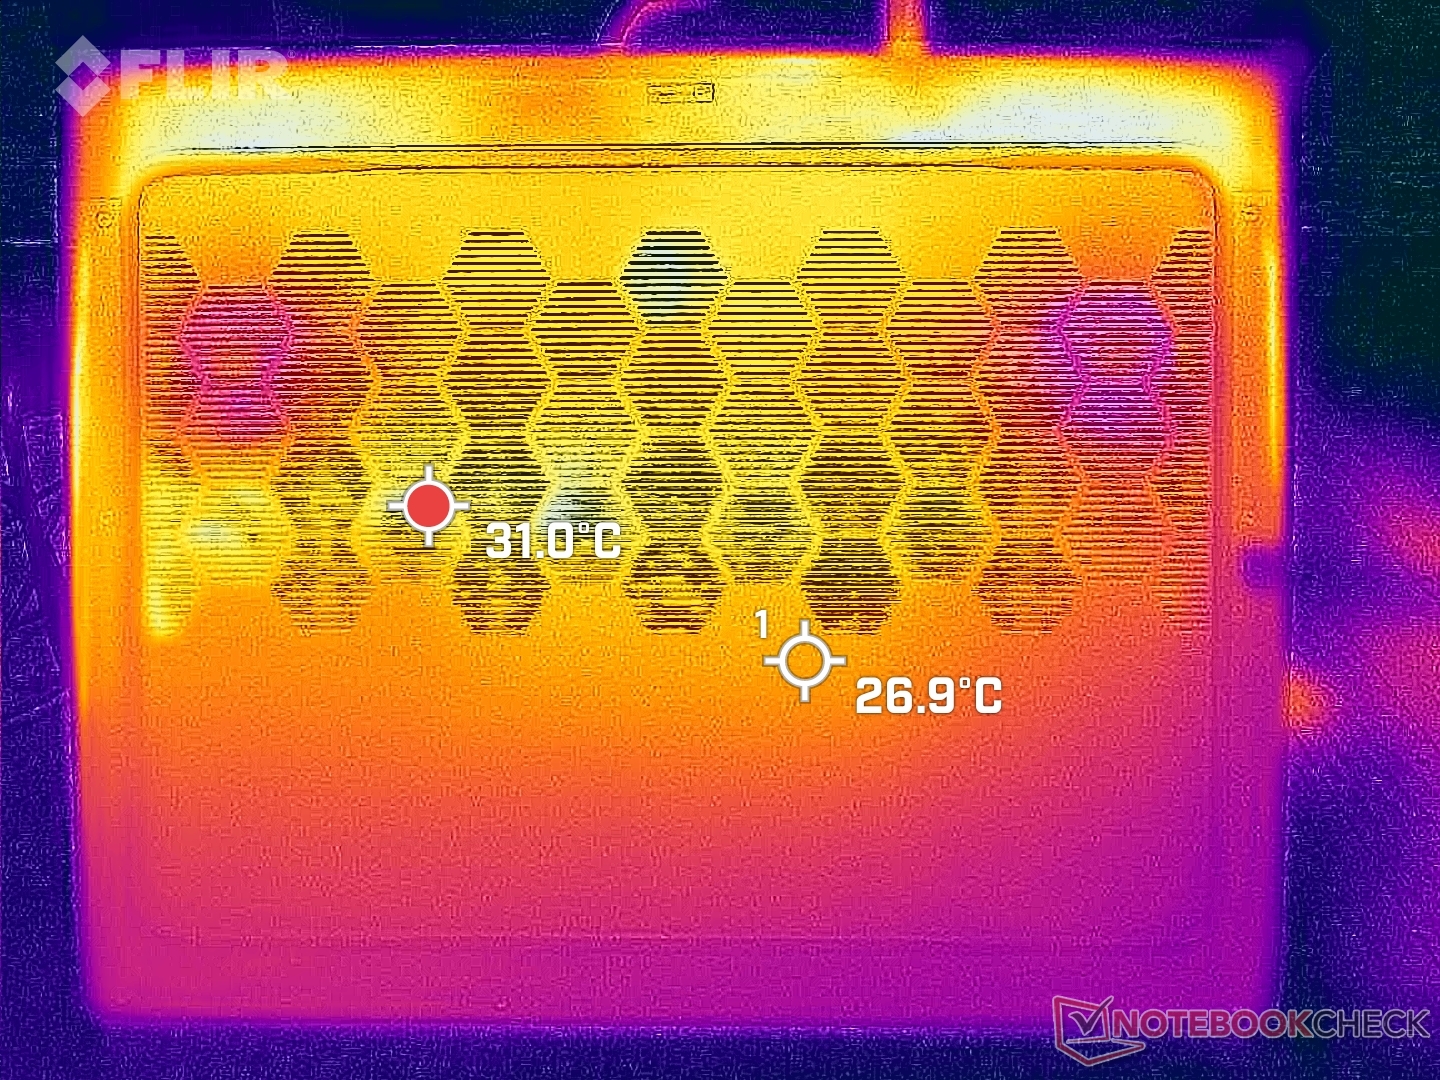
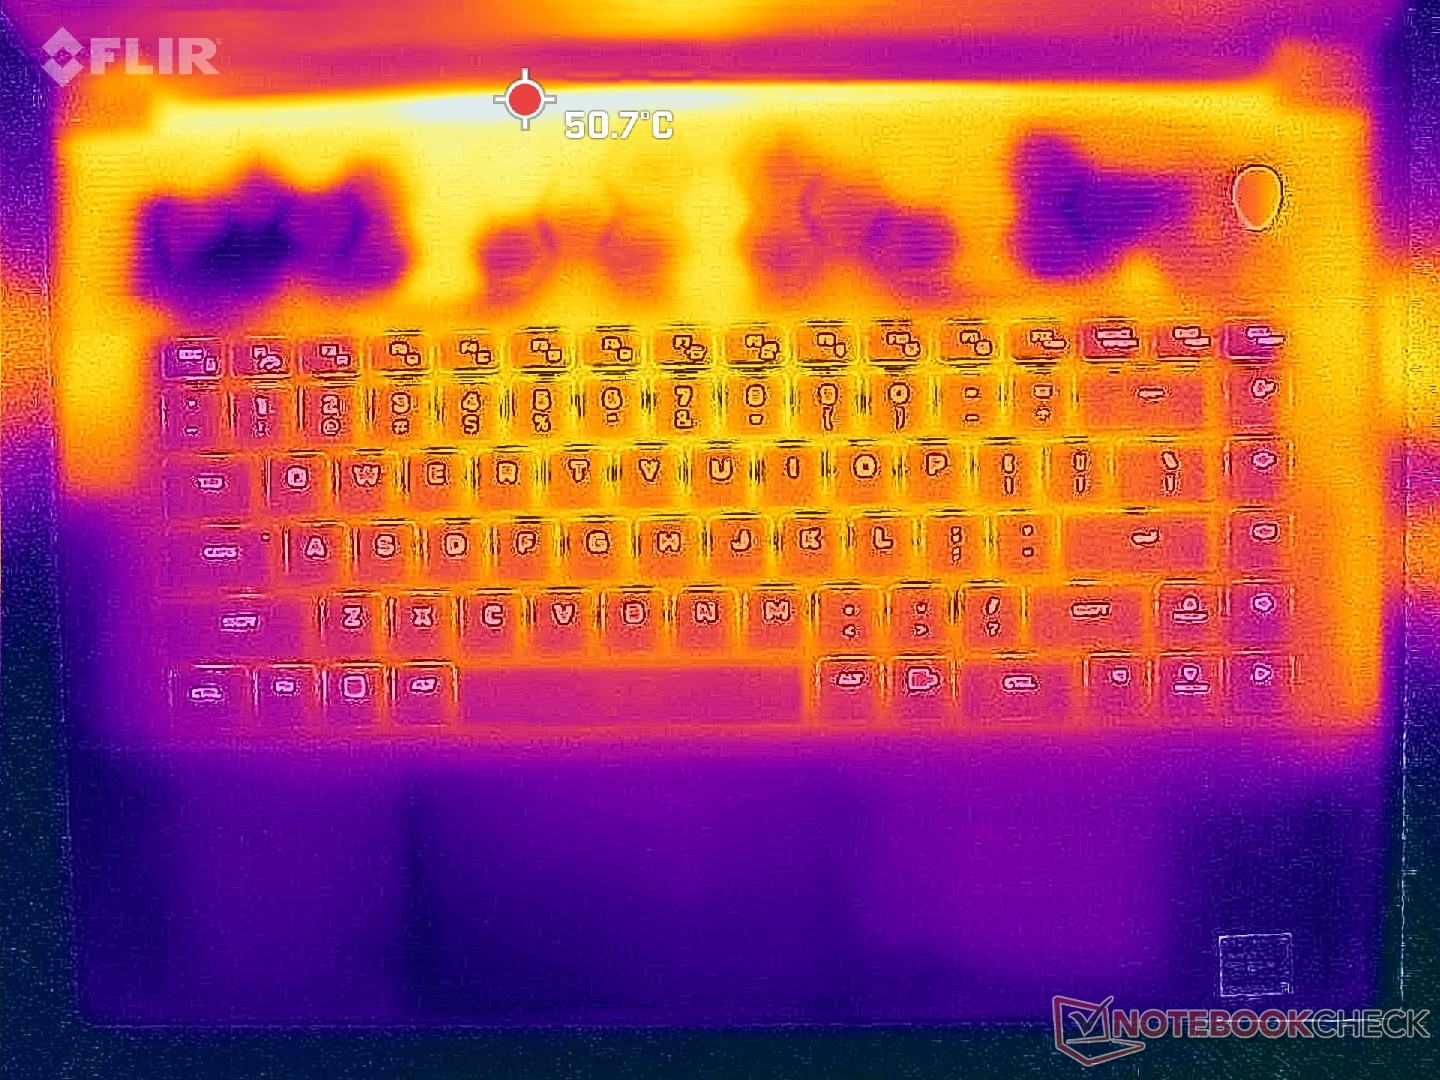
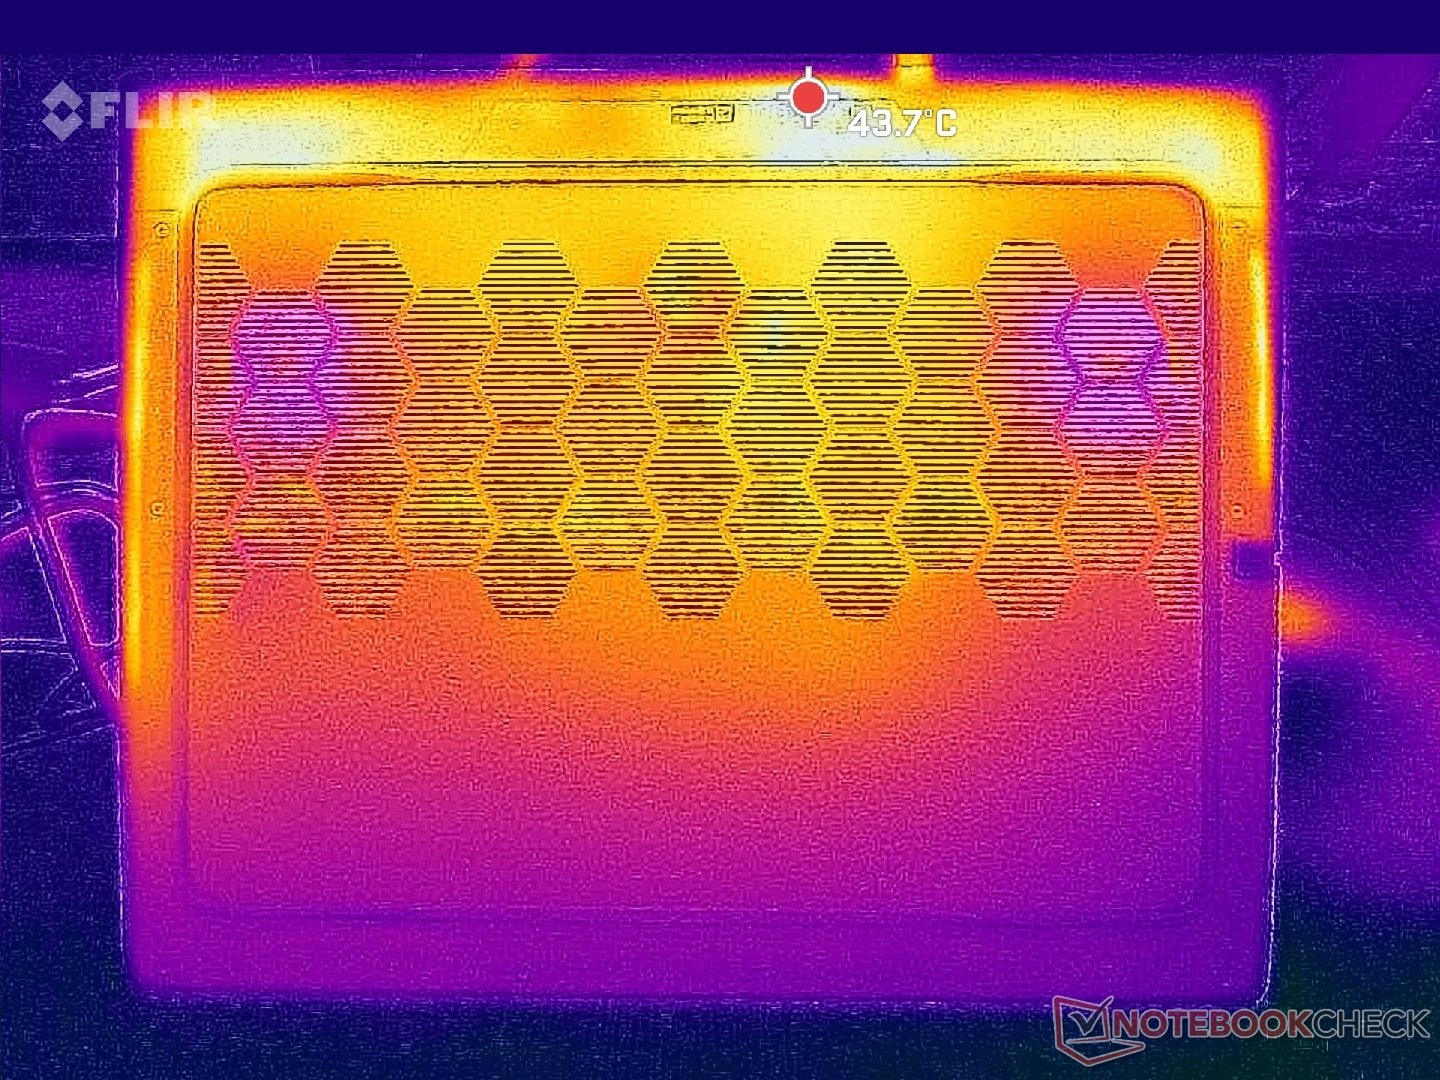
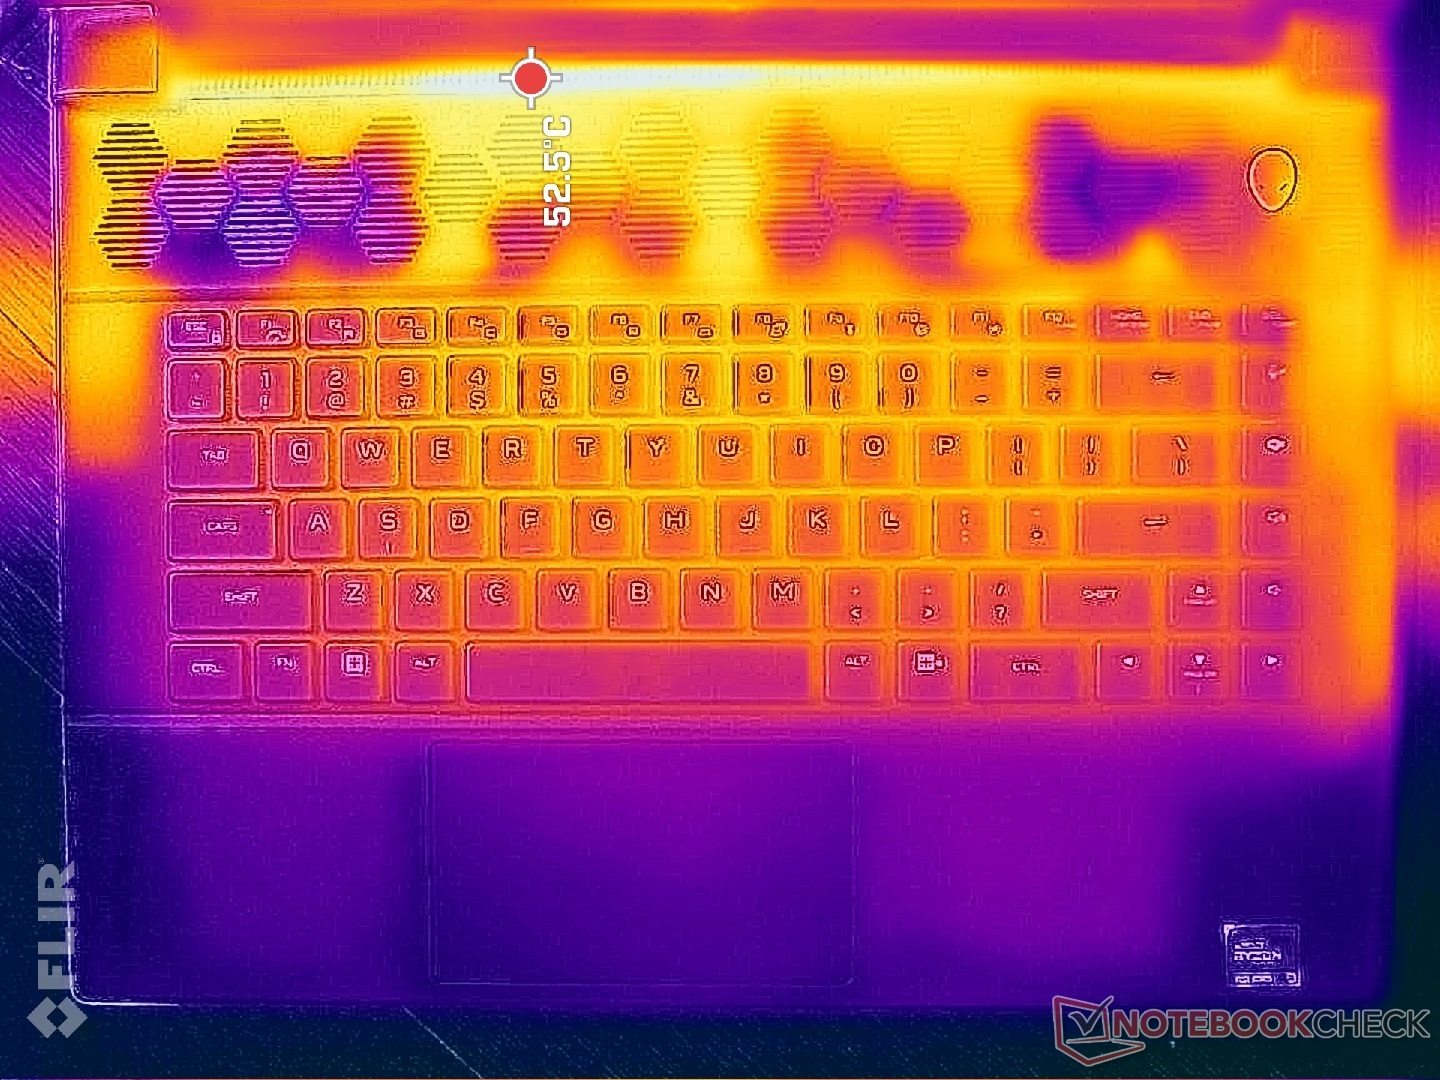
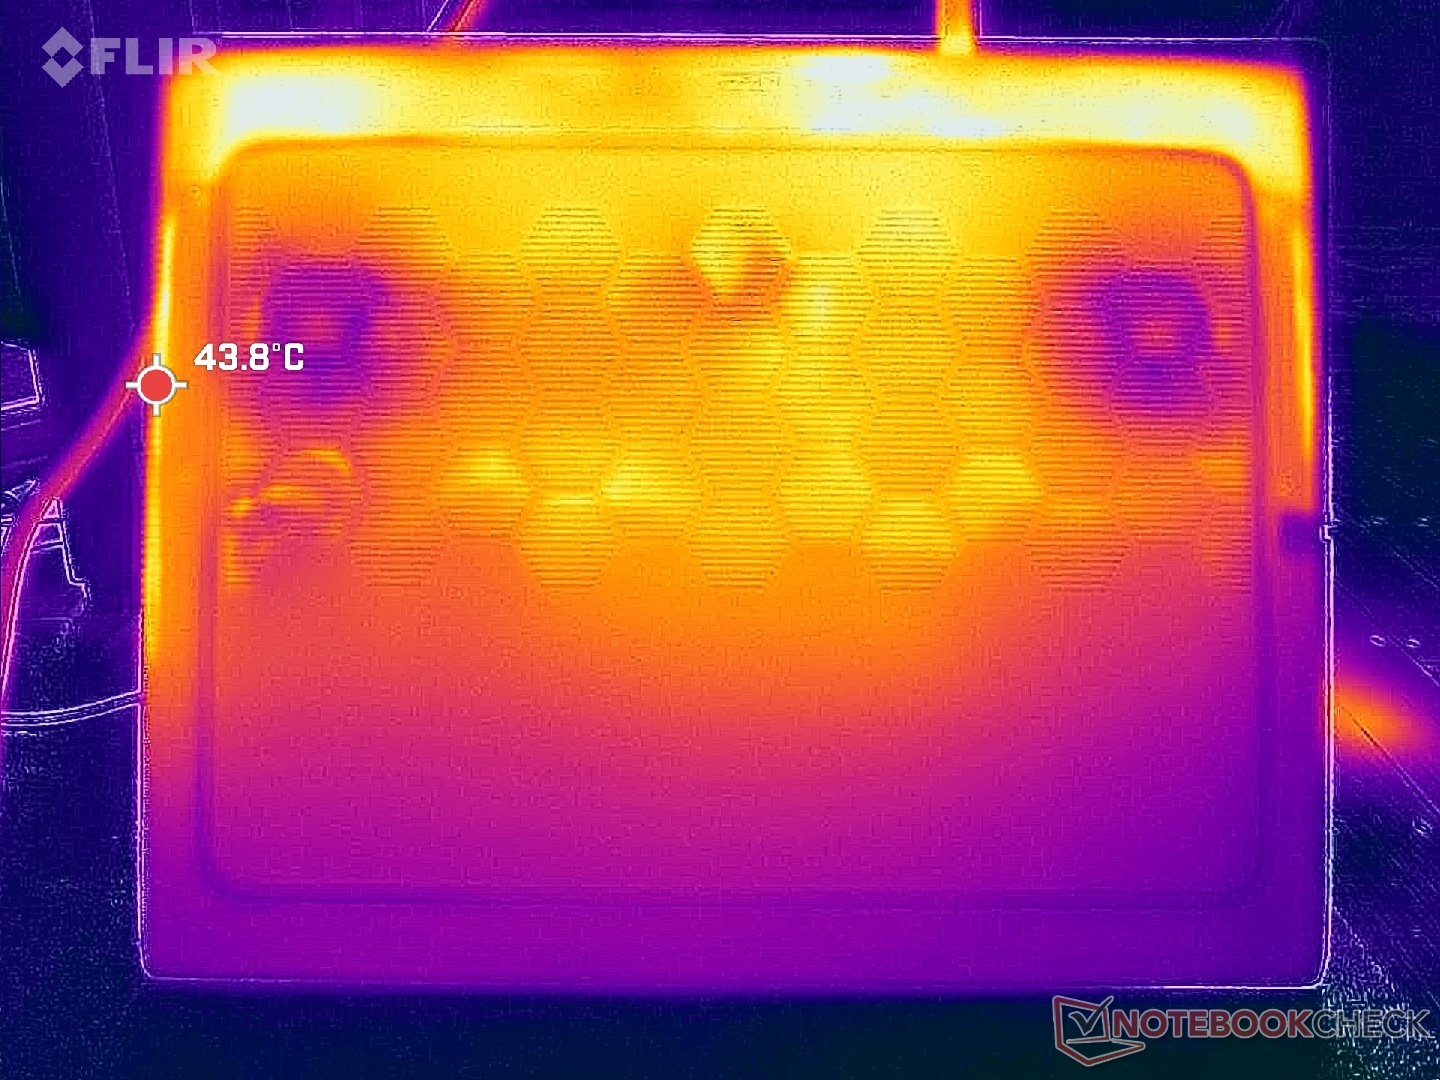
Temperatura
Las temperaturas de la superficie pueden ser muy altas, de hasta 50 C en la parte trasera. Por suerte, los reposamanos y las regiones del teclado permanecen más frías al tacto para una mayor comodidad debido en parte a las amplias rejillas de ventilación. El centro del teclado, por ejemplo, alcanza los 42 C cuando se juega, frente a los 46 C del Lenovo Legion Pro 7 16.
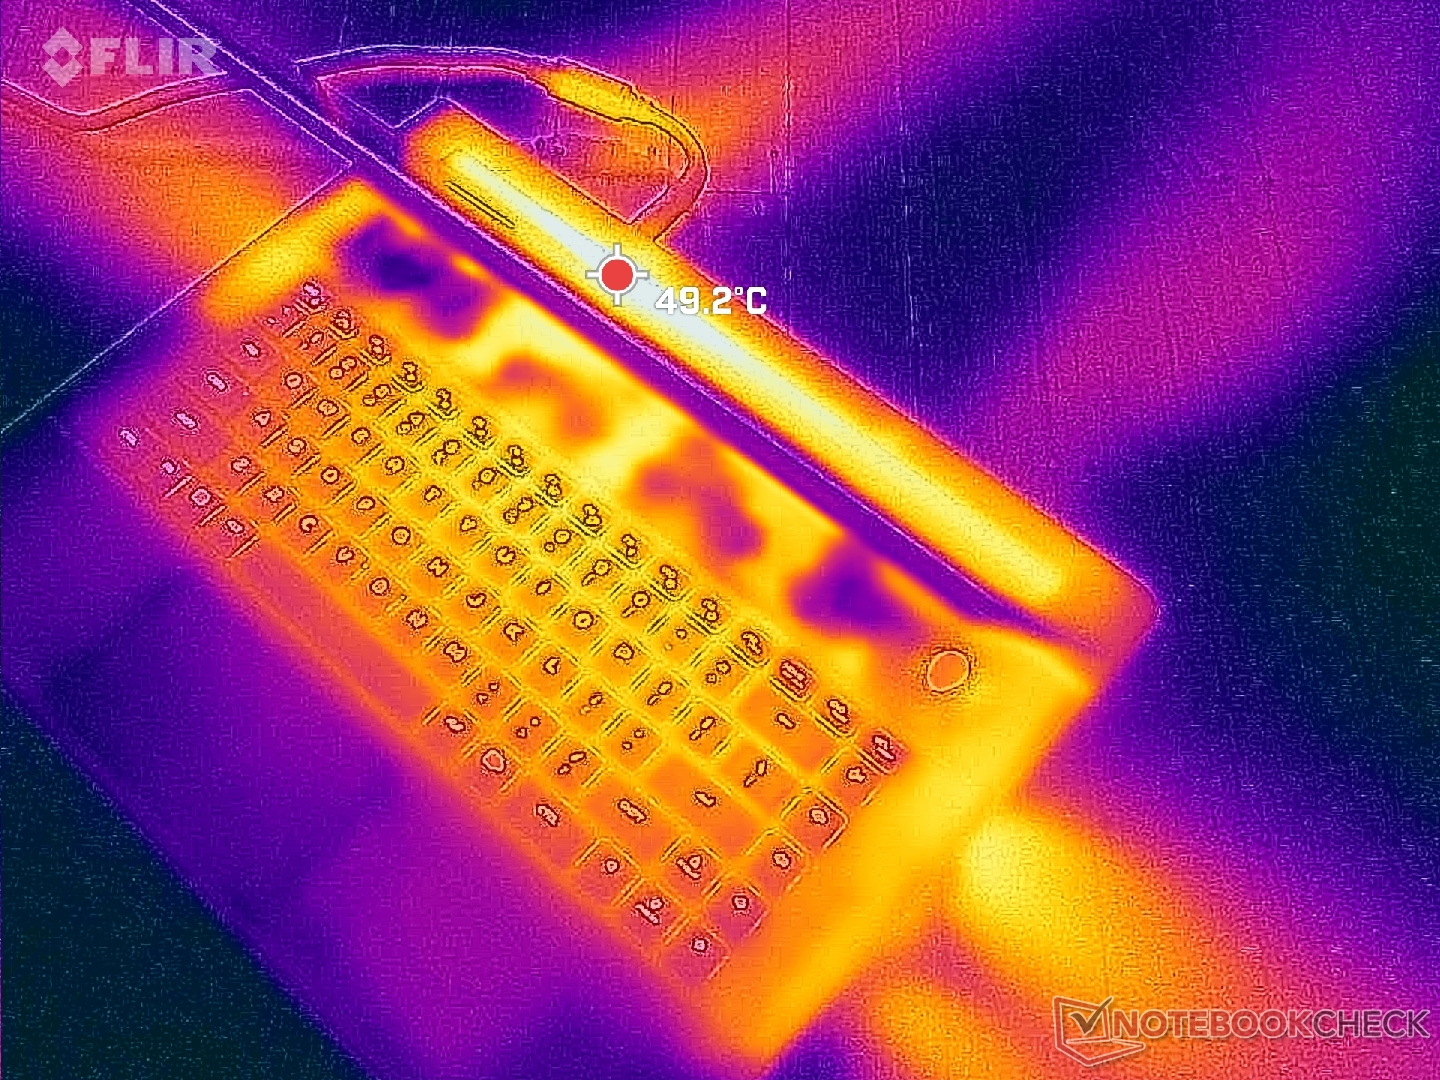
(-) La temperatura máxima en la parte superior es de 48 °C / 118 F, frente a la media de 40.4 °C / 105 F, que oscila entre 21.2 y 68.8 °C para la clase Gaming.
(+) El fondo se calienta hasta un máximo de 39 °C / 102 F, frente a la media de 43.2 °C / 110 F
(±) En reposo, la temperatura media de la parte superior es de 32.2 °C / 90# F, frente a la media del dispositivo de 33.9 °C / 93 F.
(-) Jugando a The Witcher 3, la temperatura media de la parte superior es de 38.1 °C / 101 F, frente a la media del dispositivo de 33.9 °C / 93 F.
(+) El reposamanos y el panel táctil están a una temperatura inferior a la de la piel, con un máximo de 30.4 °C / 86.7 F y, por tanto, son fríos al tacto.
(±) La temperatura media de la zona del reposamanos de dispositivos similares fue de 28.8 °C / 83.8 F (-1.6 °C / -2.9 F).
| Alienware m16 R1 AMD AMD Ryzen 9 7845HX, NVIDIA GeForce RTX 4080 Laptop GPU | Alienware x16 R1 Intel Core i9-13900HK, NVIDIA GeForce RTX 4080 Laptop GPU | HP Omen Transcend 16 Intel Core i9-13900HX, NVIDIA GeForce RTX 4070 Laptop GPU | Lenovo Legion Pro 7 RTX4090 Intel Core i9-13900HX, NVIDIA GeForce RTX 4090 Laptop GPU | Asus ROG Strix G16 G614JZ Intel Core i9-13980HX, NVIDIA GeForce RTX 4080 Laptop GPU | Razer Blade 16 Early 2023 Intel Core i9-13950HX, NVIDIA GeForce RTX 4080 Laptop GPU | |
|---|---|---|---|---|---|---|
| Heat | -5% | 1% | -10% | -6% | 12% | |
| Maximum Upper Side * (°C) | 48 | 47.2 2% | 47.4 1% | 53 -10% | 54 -13% | 40 17% |
| Maximum Bottom * (°C) | 39 | 47.8 -23% | 54.4 -39% | 59 -51% | 55 -41% | 37.6 4% |
| Idle Upper Side * (°C) | 37 | 36.8 1% | 28.4 23% | 34 8% | 29 22% | 32.4 12% |
| Idle Bottom * (°C) | 36.2 | 35.8 1% | 29.2 19% | 32 12% | 33 9% | 31.4 13% |
* ... más pequeño es mejor
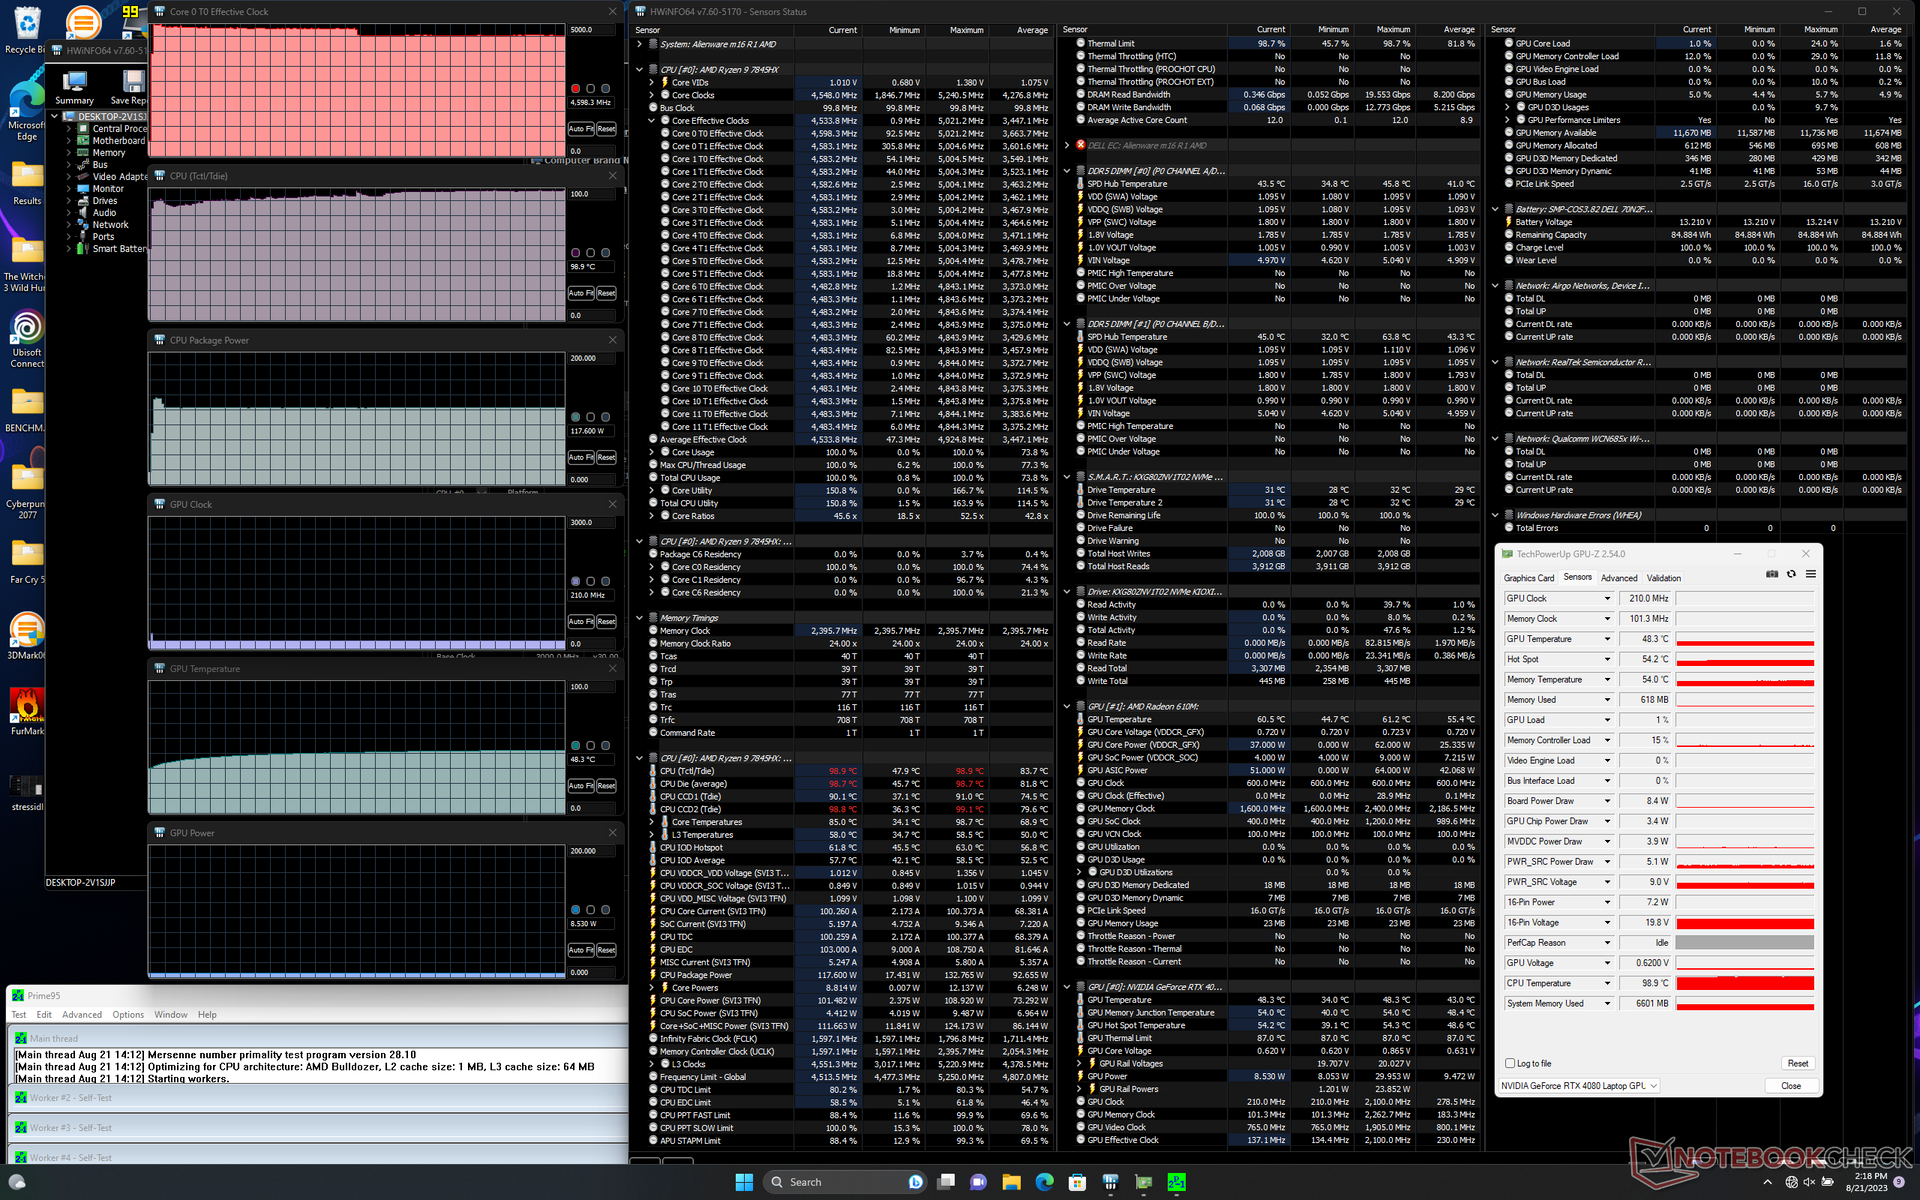
Prueba de resistencia
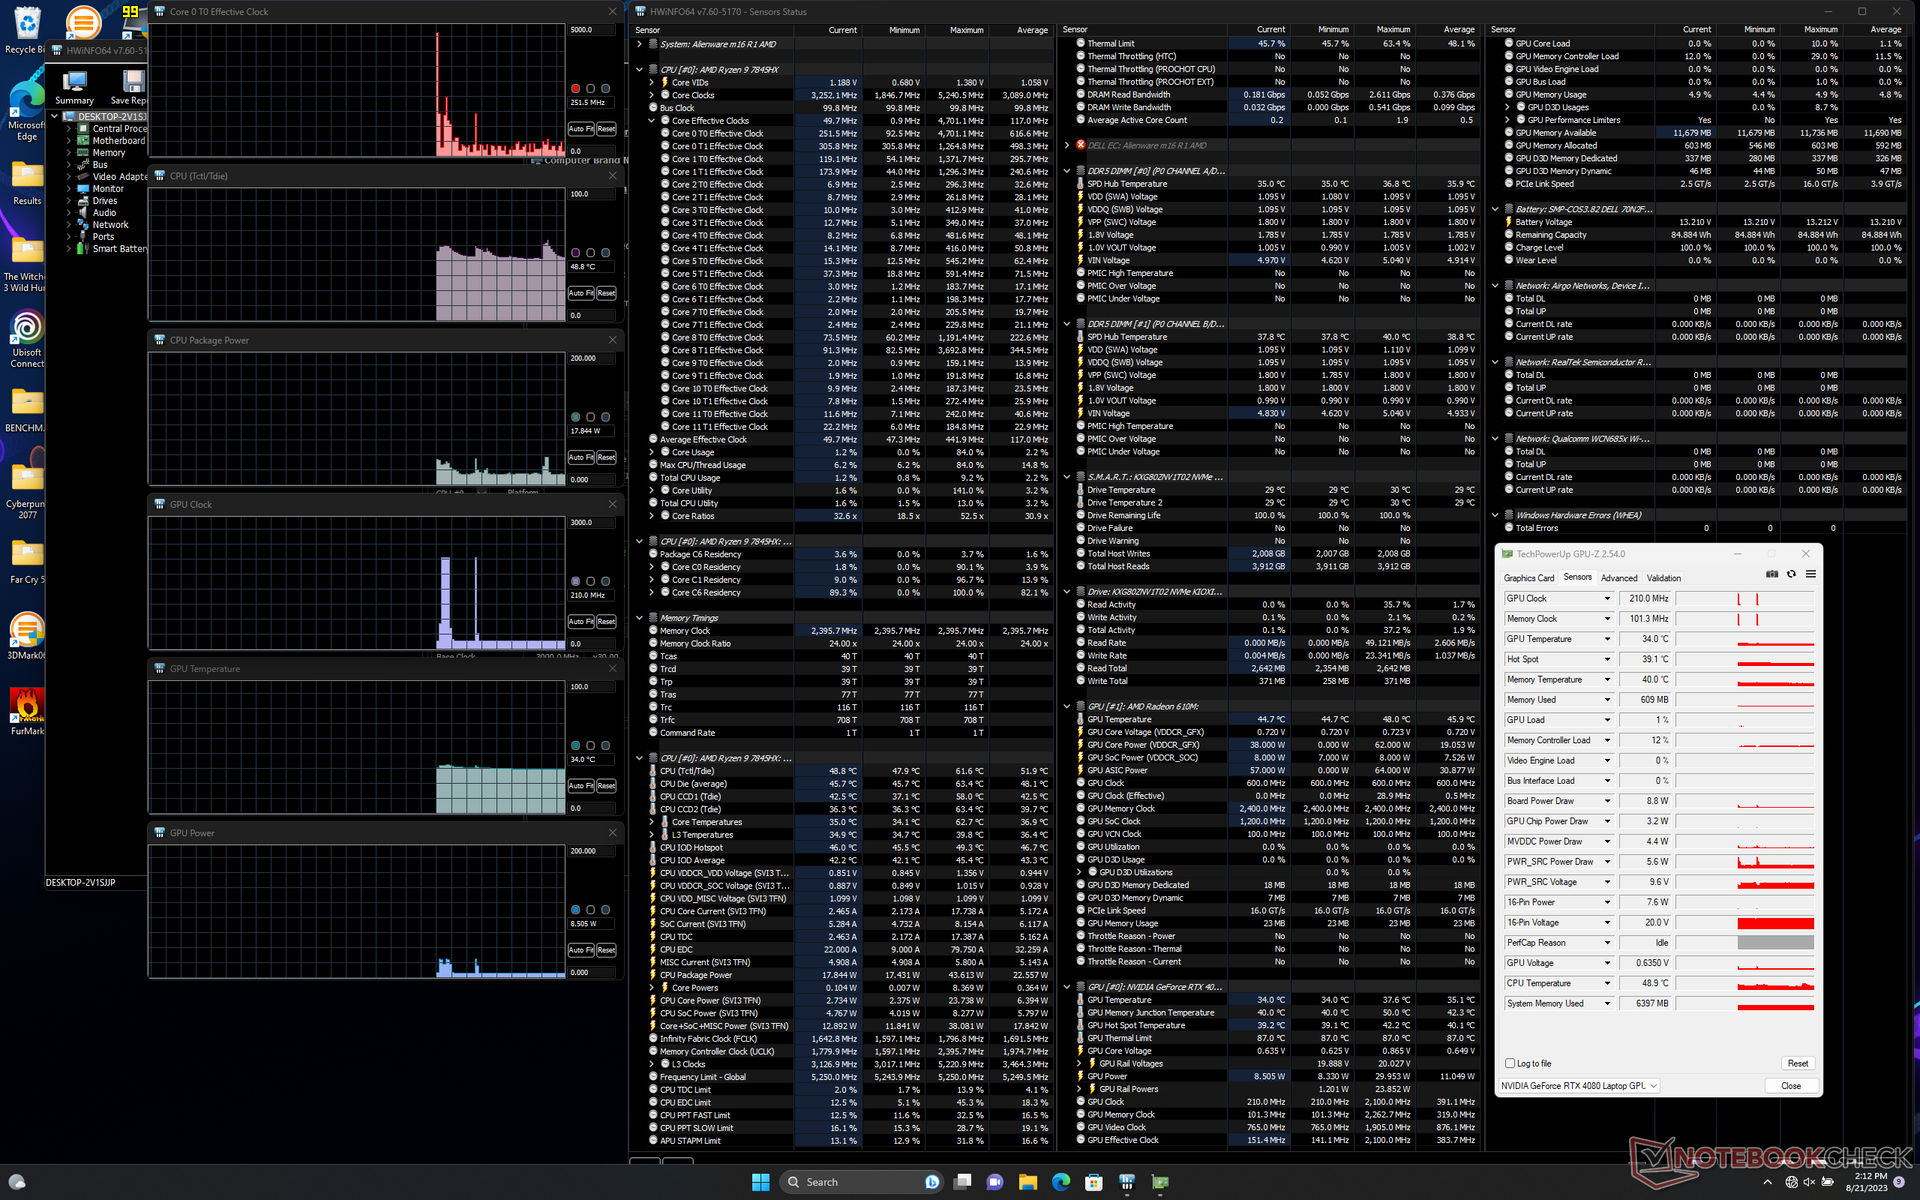
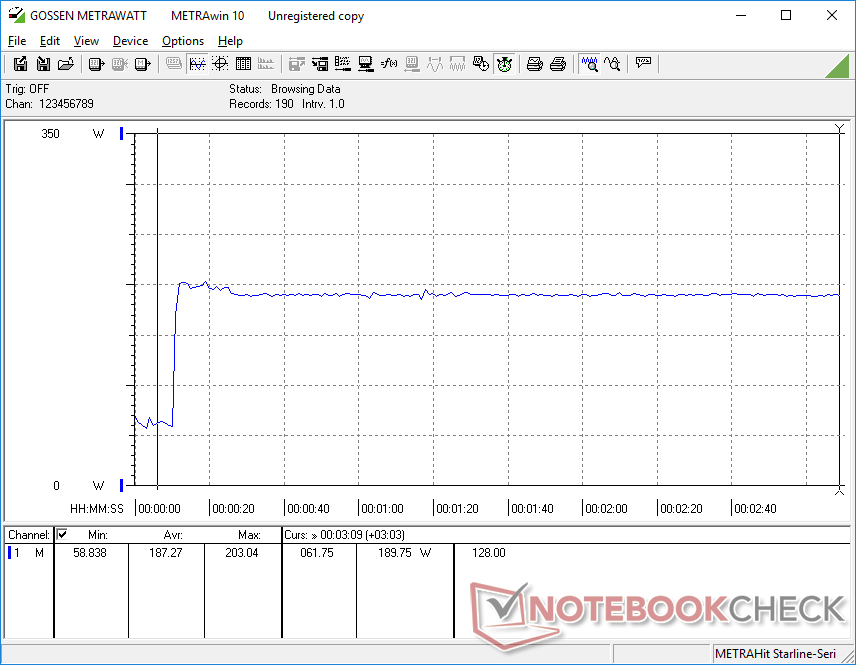
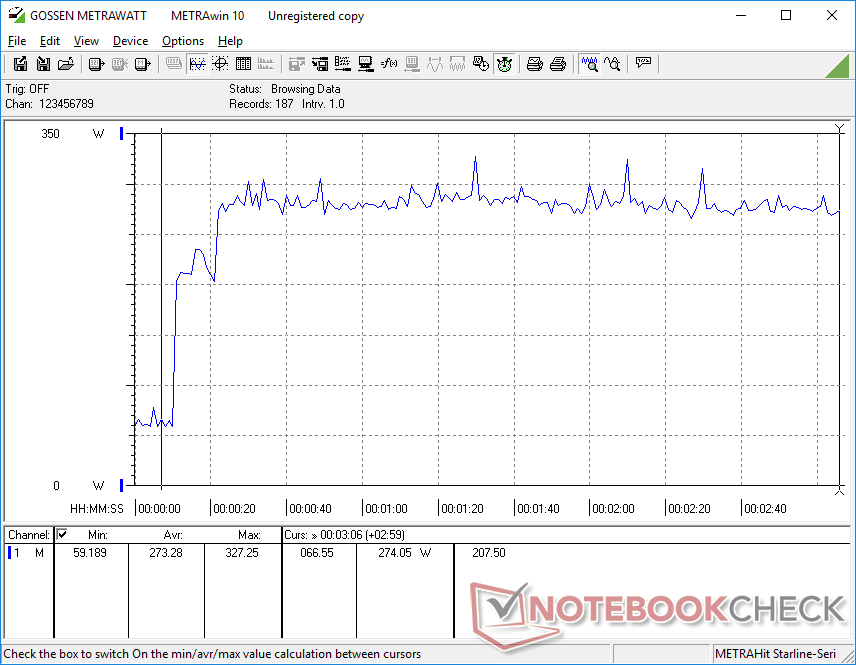
Al iniciar Prime95, la CPU aumenta a 5 GHz, 132 W y 99 C durante varios segundos antes de estabilizarse en 4,6 GHz, 118 W y 85 C.
Si se ejecuta Witcher 3 en modo Overdrive, la GPU se estabilizaría en 2430 MHz de reloj, 2263 MHz de VRAM y 158 W de consumo de energía en la placa, frente a 2415 MHz de reloj, 2250 MHz de VRAM y 156 W en modo Balanced, según GPU-Z. Las escasas diferencias de rendimiento entre los dos modos coinciden con las observaciones de Fire Strike mencionadas anteriormente. La temperatura del núcleo podría ser unos grados más alta en modo equilibrado que en modo Overdrive, ya que los ventiladores son notablemente más silenciosos en modo equilibrado.
Hay que tener en cuenta que, aunque la GPU tiene una potencia nominal de 175 W TGP, en condiciones reales de juego sólo alcanzamos hasta 160 W.
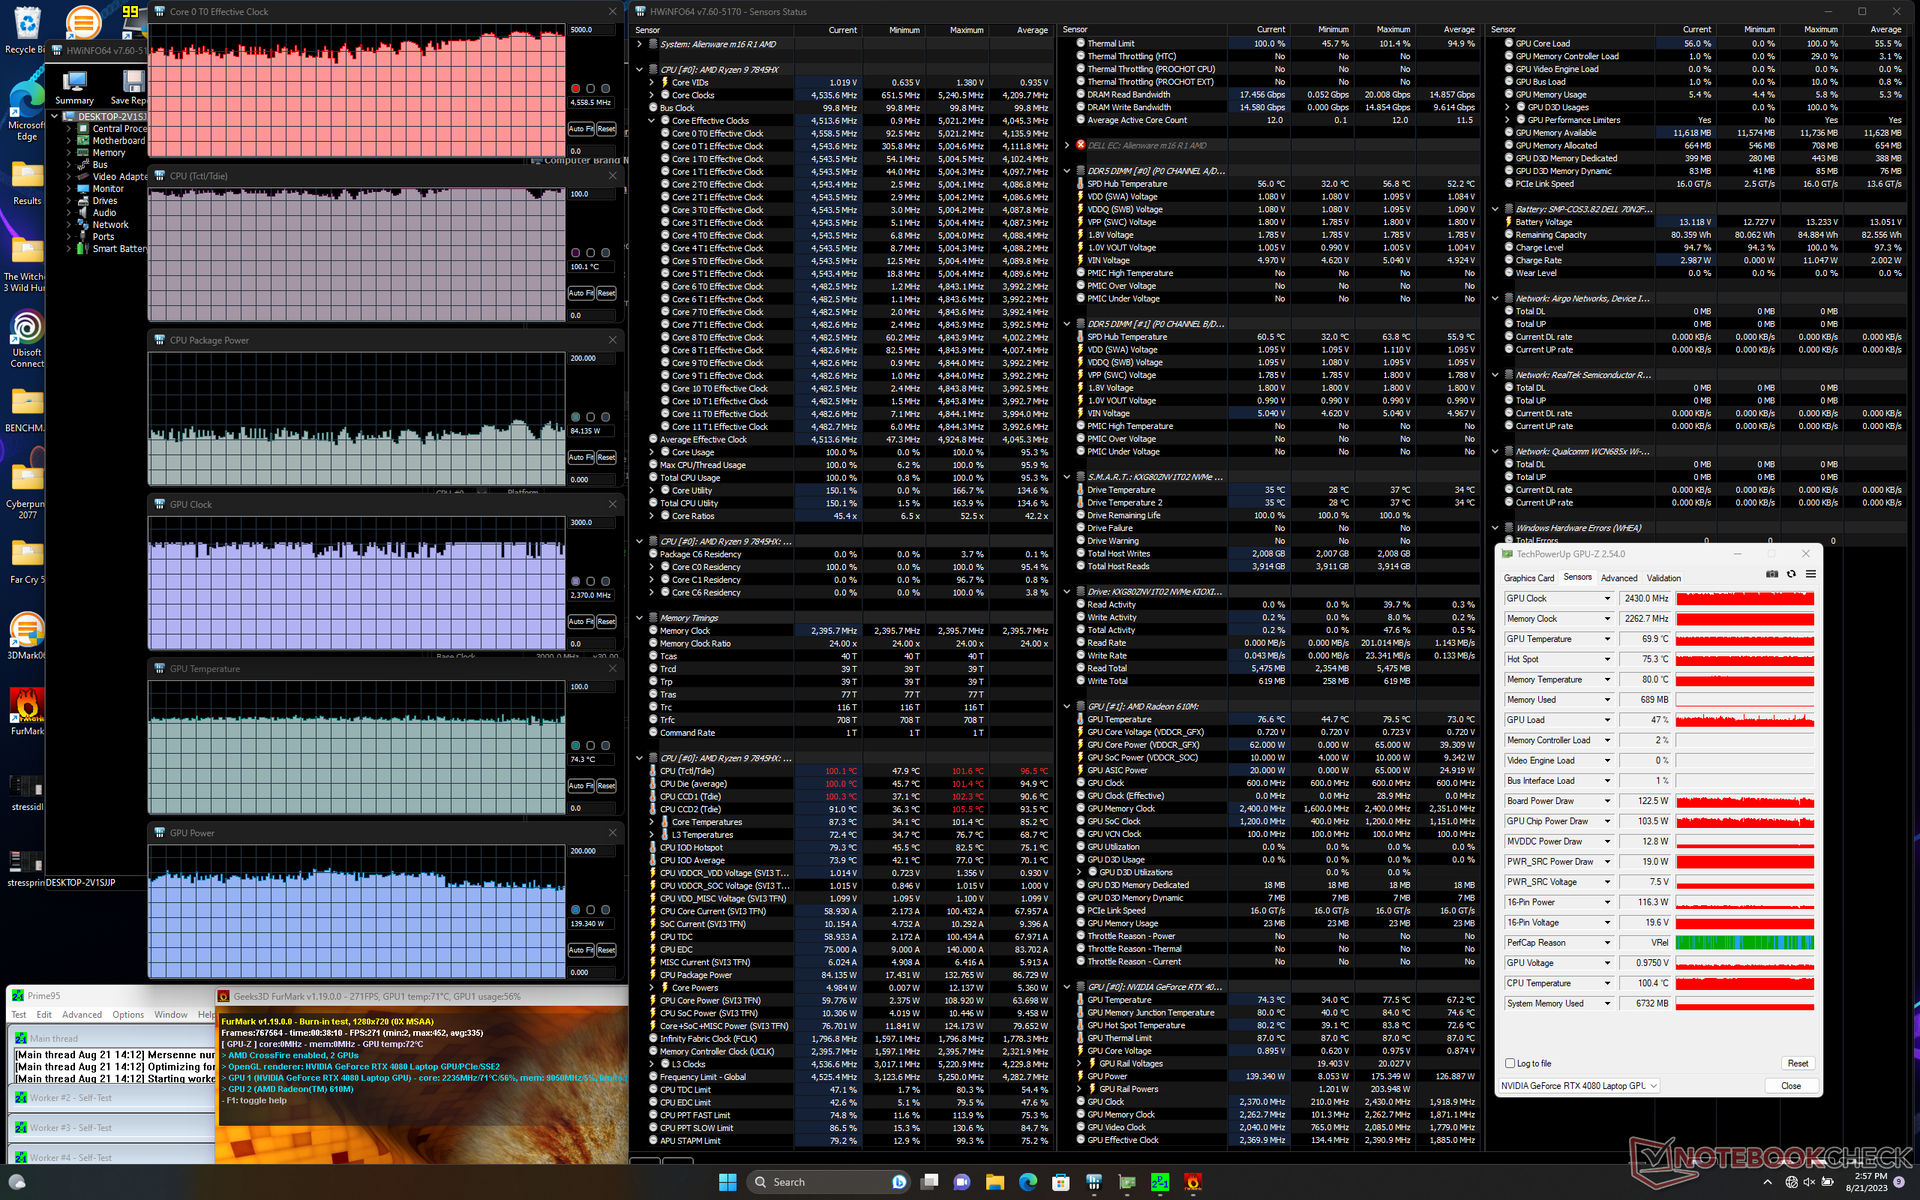
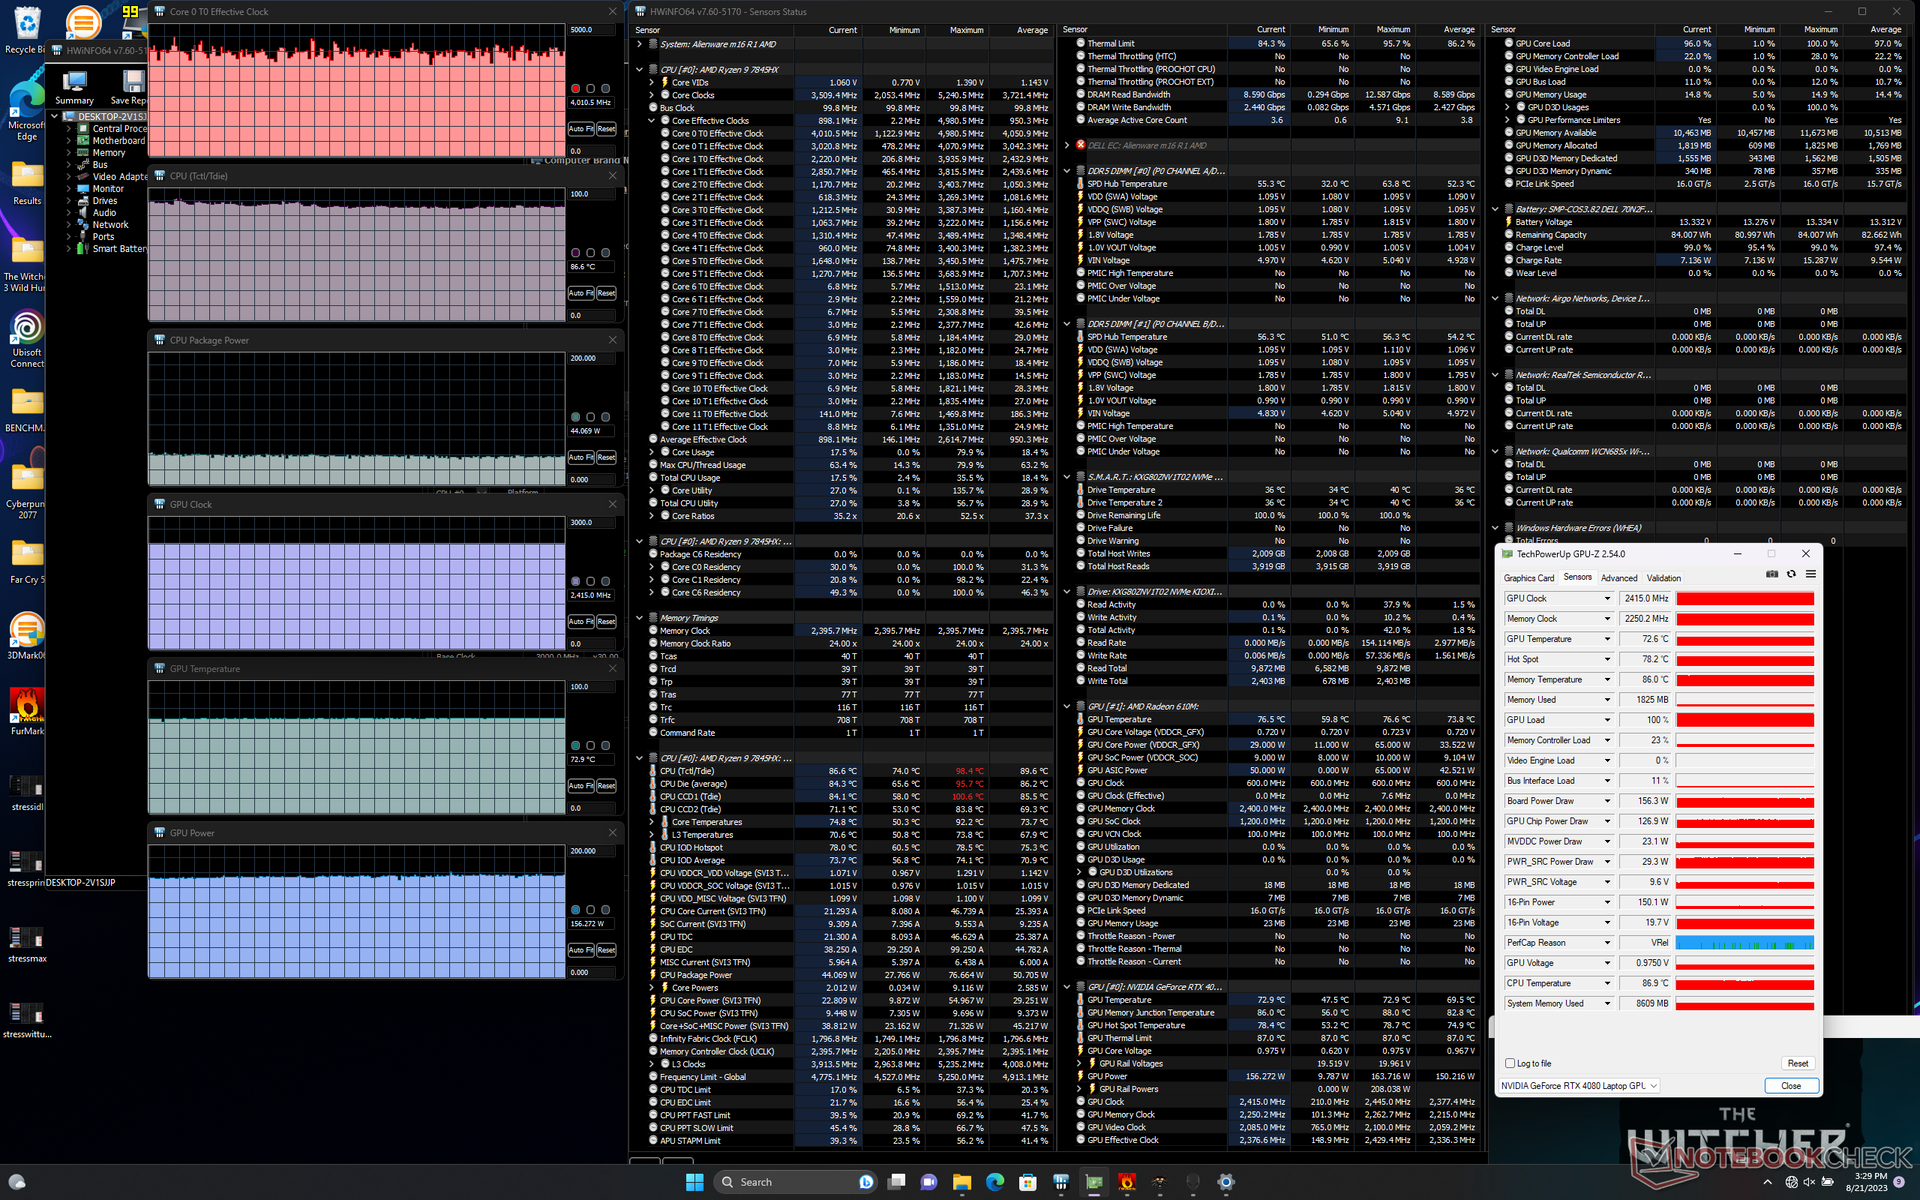
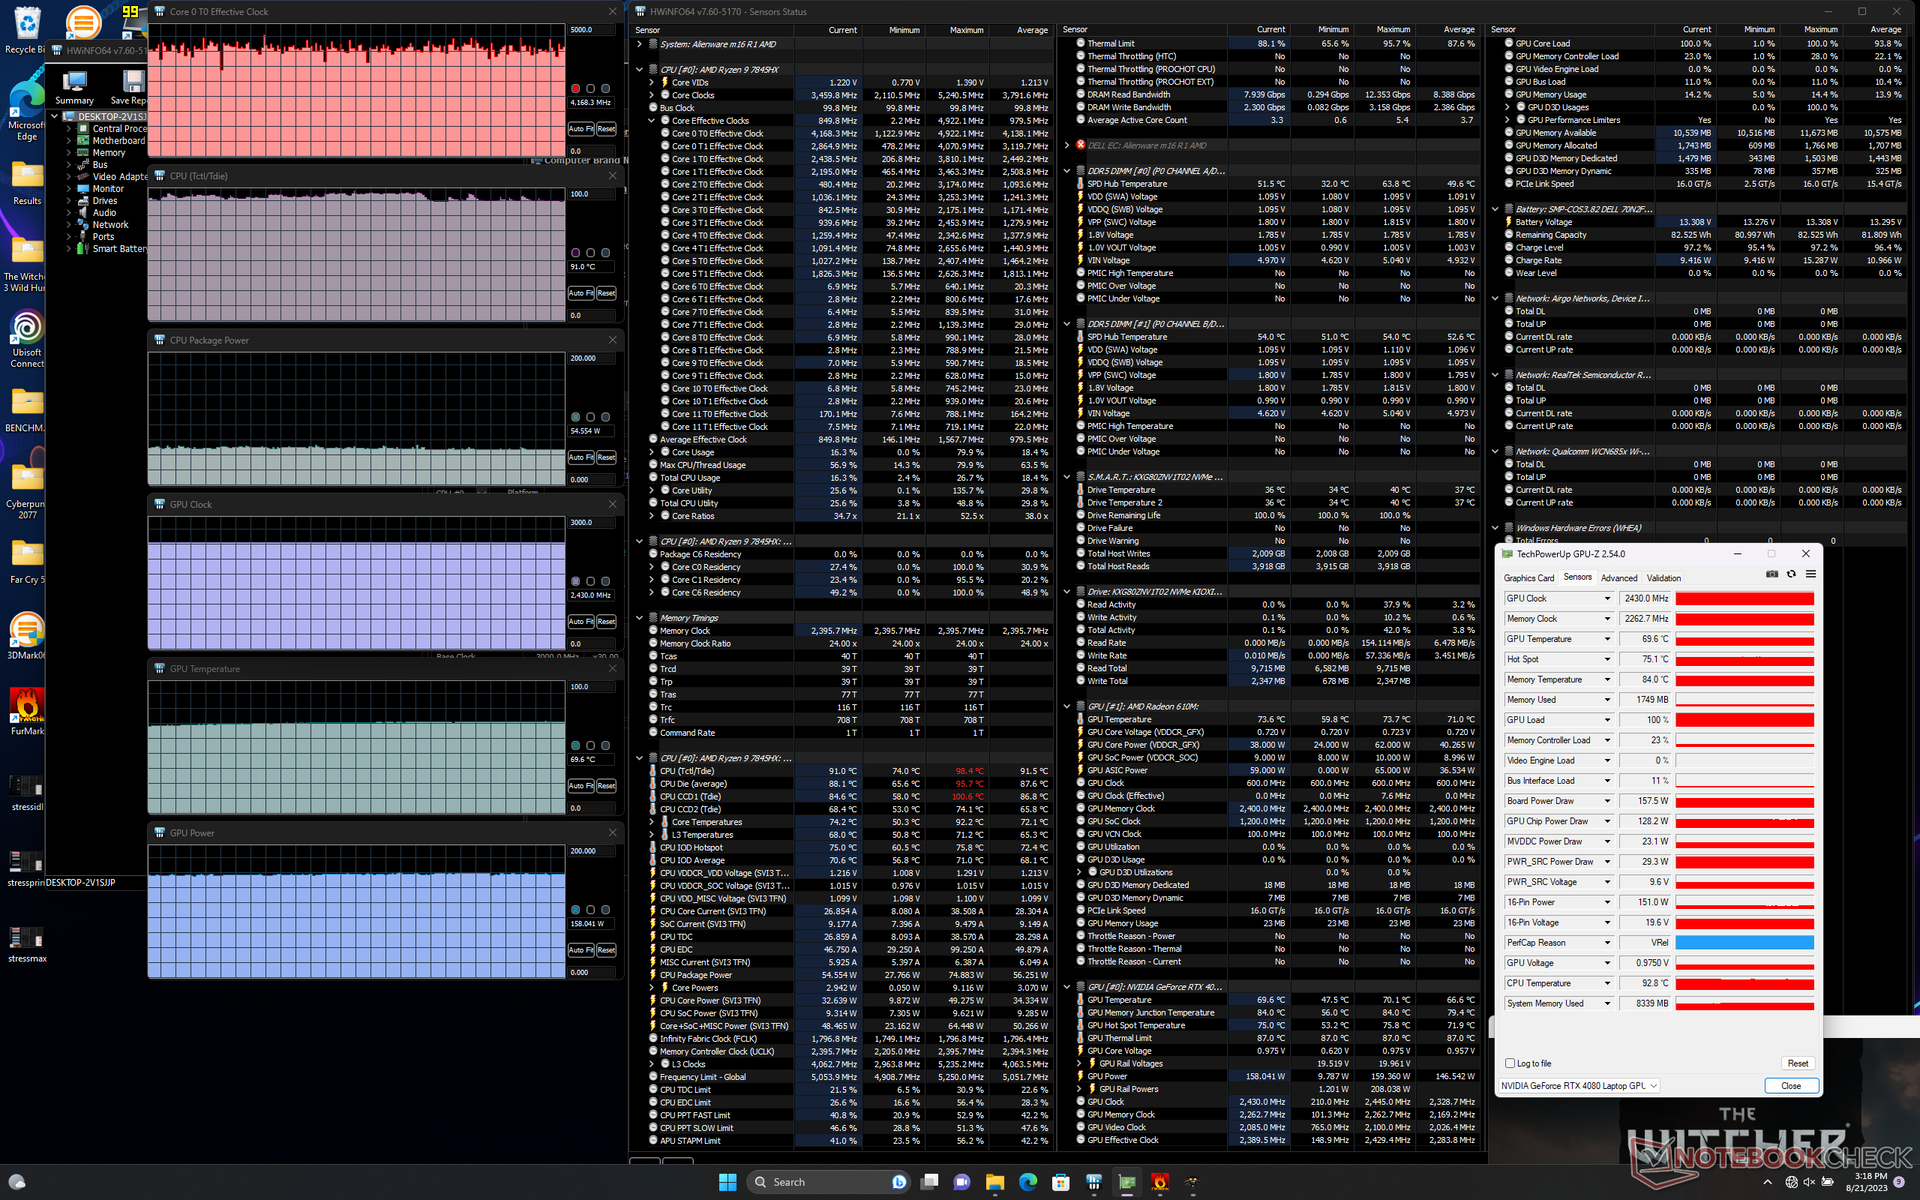
| RelojCPU (GHz) | Reloj GPU (MHz) | Temperatura mediaCPU (°C) | Temperatura media GPU (°C) | |
| Sistema en reposo | -- | - | 49 | 34 |
| Prime95 Stress | 4,6 | -- | 85 | 49 |
| Prime95+ FurMark Estrés | ~4,0 - 4,6 | ~2430 | 87 | 74 |
| Witcher 3 Tensión (modoequilibrado) | ~4,1 | 2415 | 75 | 73 |
| Witcher 3 Estrés (modoOverdrive) | ~4.1 | 2430 | 74 | 70 |
Altavoces
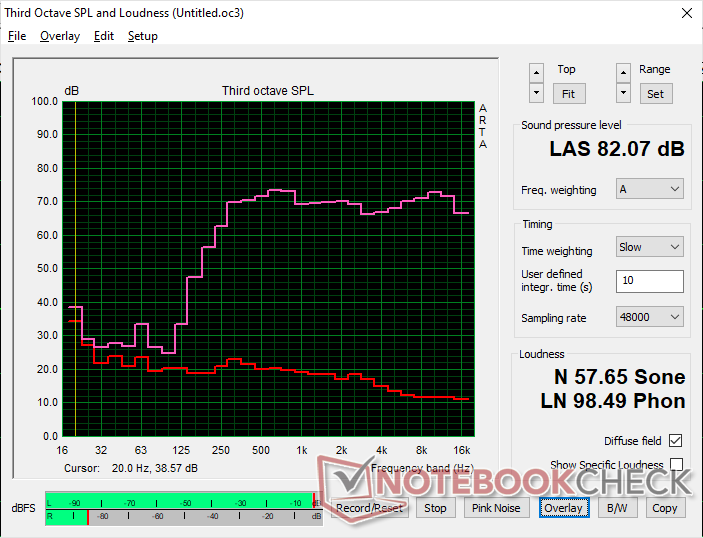
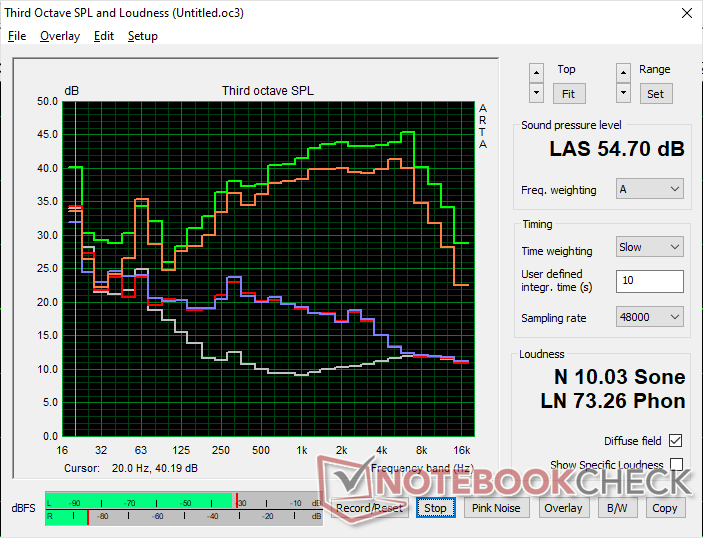
Alienware m16 R1 AMD análisis de audio
(+) | los altavoces pueden reproducir a un volumen relativamente alto (#82.1 dB)
Graves 100 - 315 Hz
(-) | casi sin bajos - de media 20.6% inferior a la mediana
(-) | los graves no son lineales (15.3% delta a la frecuencia anterior)
Medios 400 - 2000 Hz
(+) | medios equilibrados - a sólo 1.4% de la mediana
(+) | los medios son lineales (2.1% delta a la frecuencia anterior)
Altos 2 - 16 kHz
(+) | máximos equilibrados - a sólo 1.9% de la mediana
(+) | los máximos son lineales (2.9% delta a la frecuencia anterior)
Total 100 - 16.000 Hz
(+) | el sonido global es lineal (13.9% de diferencia con la mediana)
En comparación con la misma clase
» 22% de todos los dispositivos probados de esta clase eran mejores, 7% similares, 71% peores
» El mejor tuvo un delta de 6%, la media fue 18%, el peor fue ###max##%
En comparación con todos los dispositivos probados
» 16% de todos los dispositivos probados eran mejores, 4% similares, 80% peores
» El mejor tuvo un delta de 4%, la media fue 24%, el peor fue ###max##%
Apple MacBook Pro 16 2021 M1 Pro análisis de audio
(+) | los altavoces pueden reproducir a un volumen relativamente alto (#84.7 dB)
Graves 100 - 315 Hz
(+) | buen bajo - sólo 3.8% lejos de la mediana
(+) | el bajo es lineal (5.2% delta a la frecuencia anterior)
Medios 400 - 2000 Hz
(+) | medios equilibrados - a sólo 1.3% de la mediana
(+) | los medios son lineales (2.1% delta a la frecuencia anterior)
Altos 2 - 16 kHz
(+) | máximos equilibrados - a sólo 1.9% de la mediana
(+) | los máximos son lineales (2.7% delta a la frecuencia anterior)
Total 100 - 16.000 Hz
(+) | el sonido global es lineal (4.6% de diferencia con la mediana)
En comparación con la misma clase
» 0% de todos los dispositivos probados de esta clase eran mejores, 0% similares, 100% peores
» El mejor tuvo un delta de 5%, la media fue 17%, el peor fue ###max##%
En comparación con todos los dispositivos probados
» 0% de todos los dispositivos probados eran mejores, 0% similares, 100% peores
» El mejor tuvo un delta de 4%, la media fue 24%, el peor fue ###max##%
Gestión de la energía
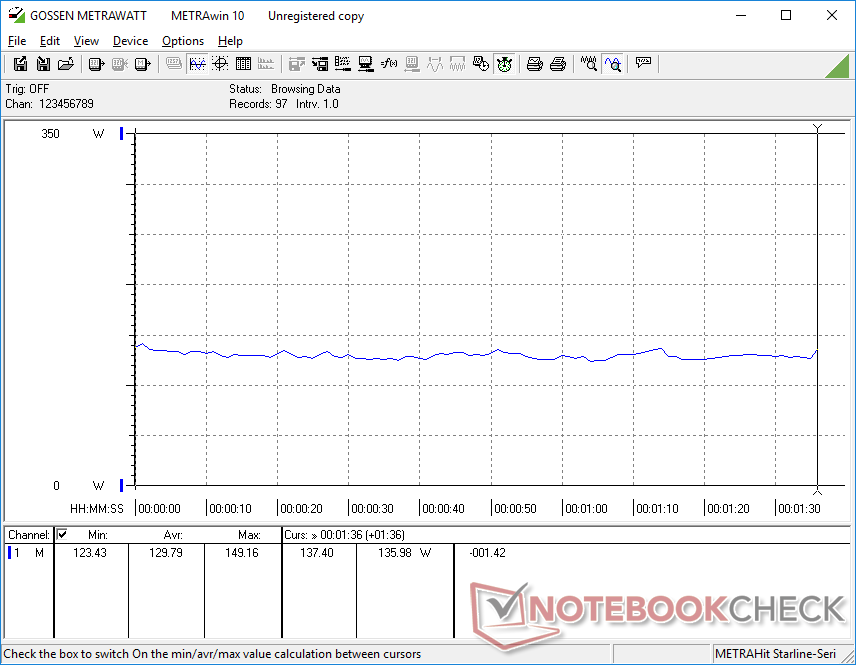
Consumo de energía
Los portátiles Alienware siempre han tenido algunas de las cifras más altas de consumo de energía y nuestro Alienware m16 R1 no es diferente. Simplemente en reposo en el escritorio consumiría entre 39 W y 69 W comparado con menos de la mitad en el Lenovo Legion Pro 7 o el Asus ROG Strix G16. Estos altos niveles de ralentí son probablemente responsables de los decepcionantes resultados de duración de batería de la siguiente sección.
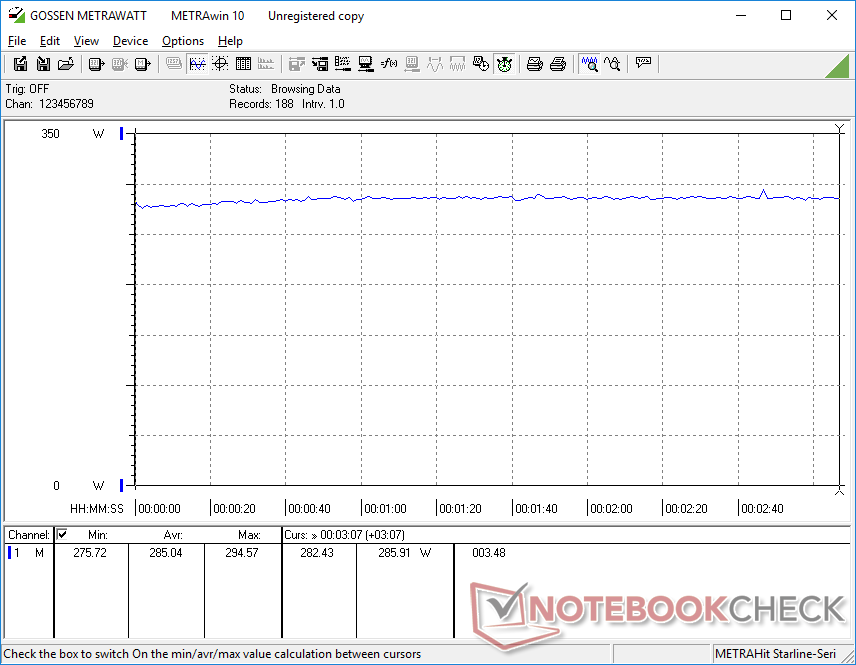
El consumo de energía en juegos es de 285 W de media, de nuevo más que la mayoría de portátiles para juegos, incluido el propio Alienware x16 de Dell.
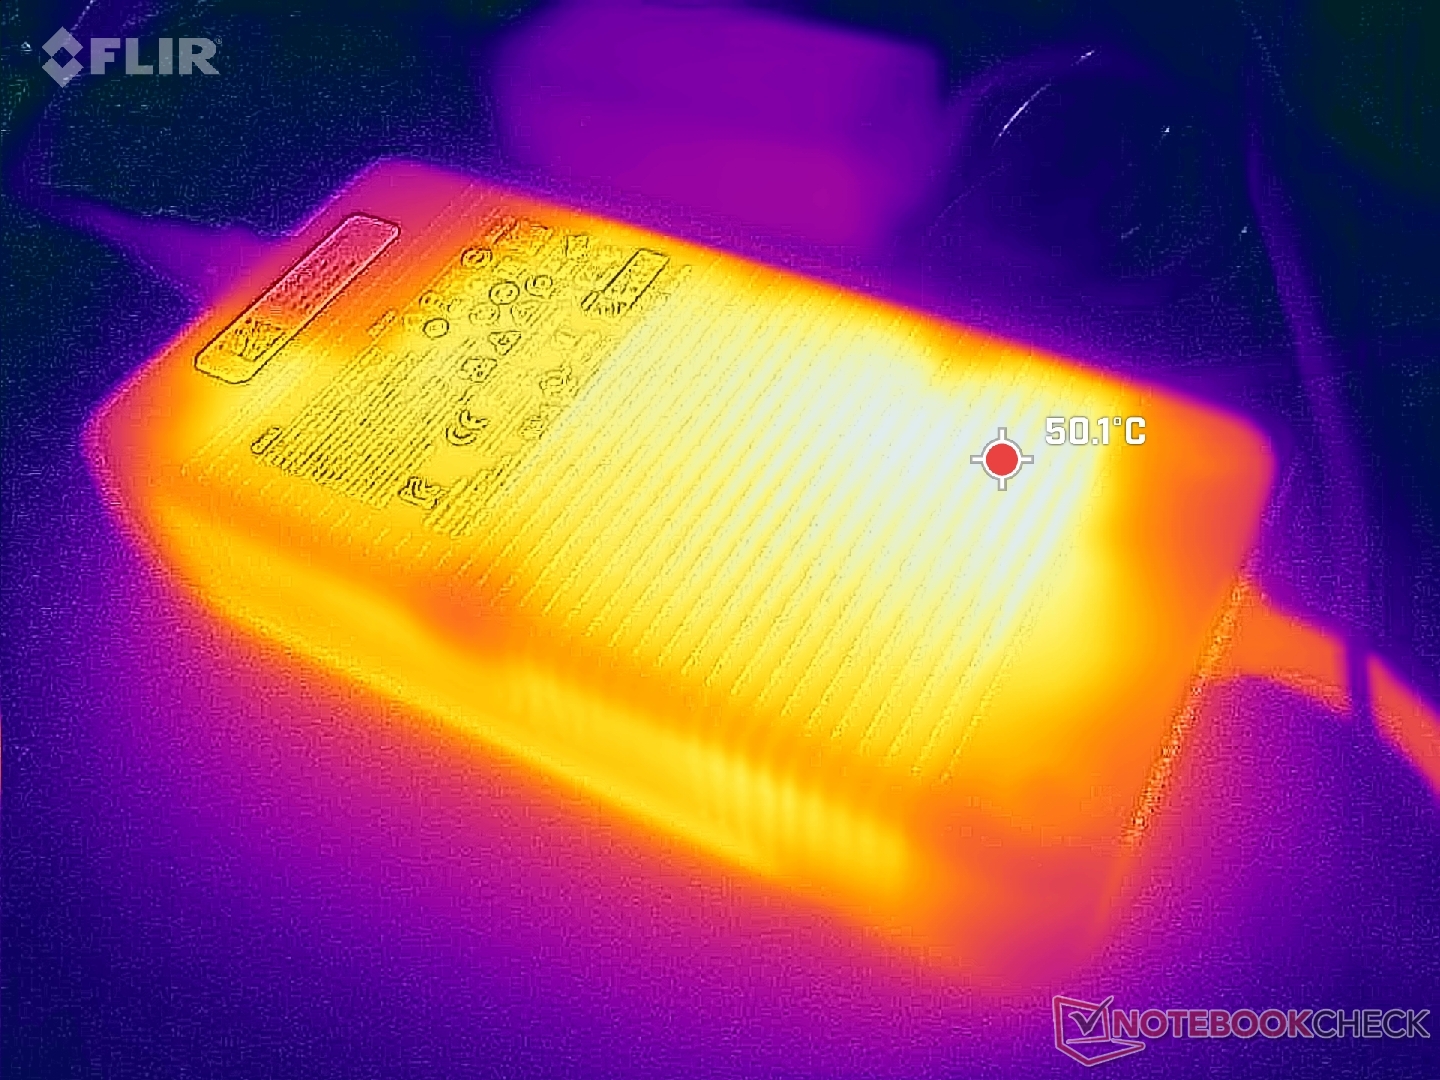
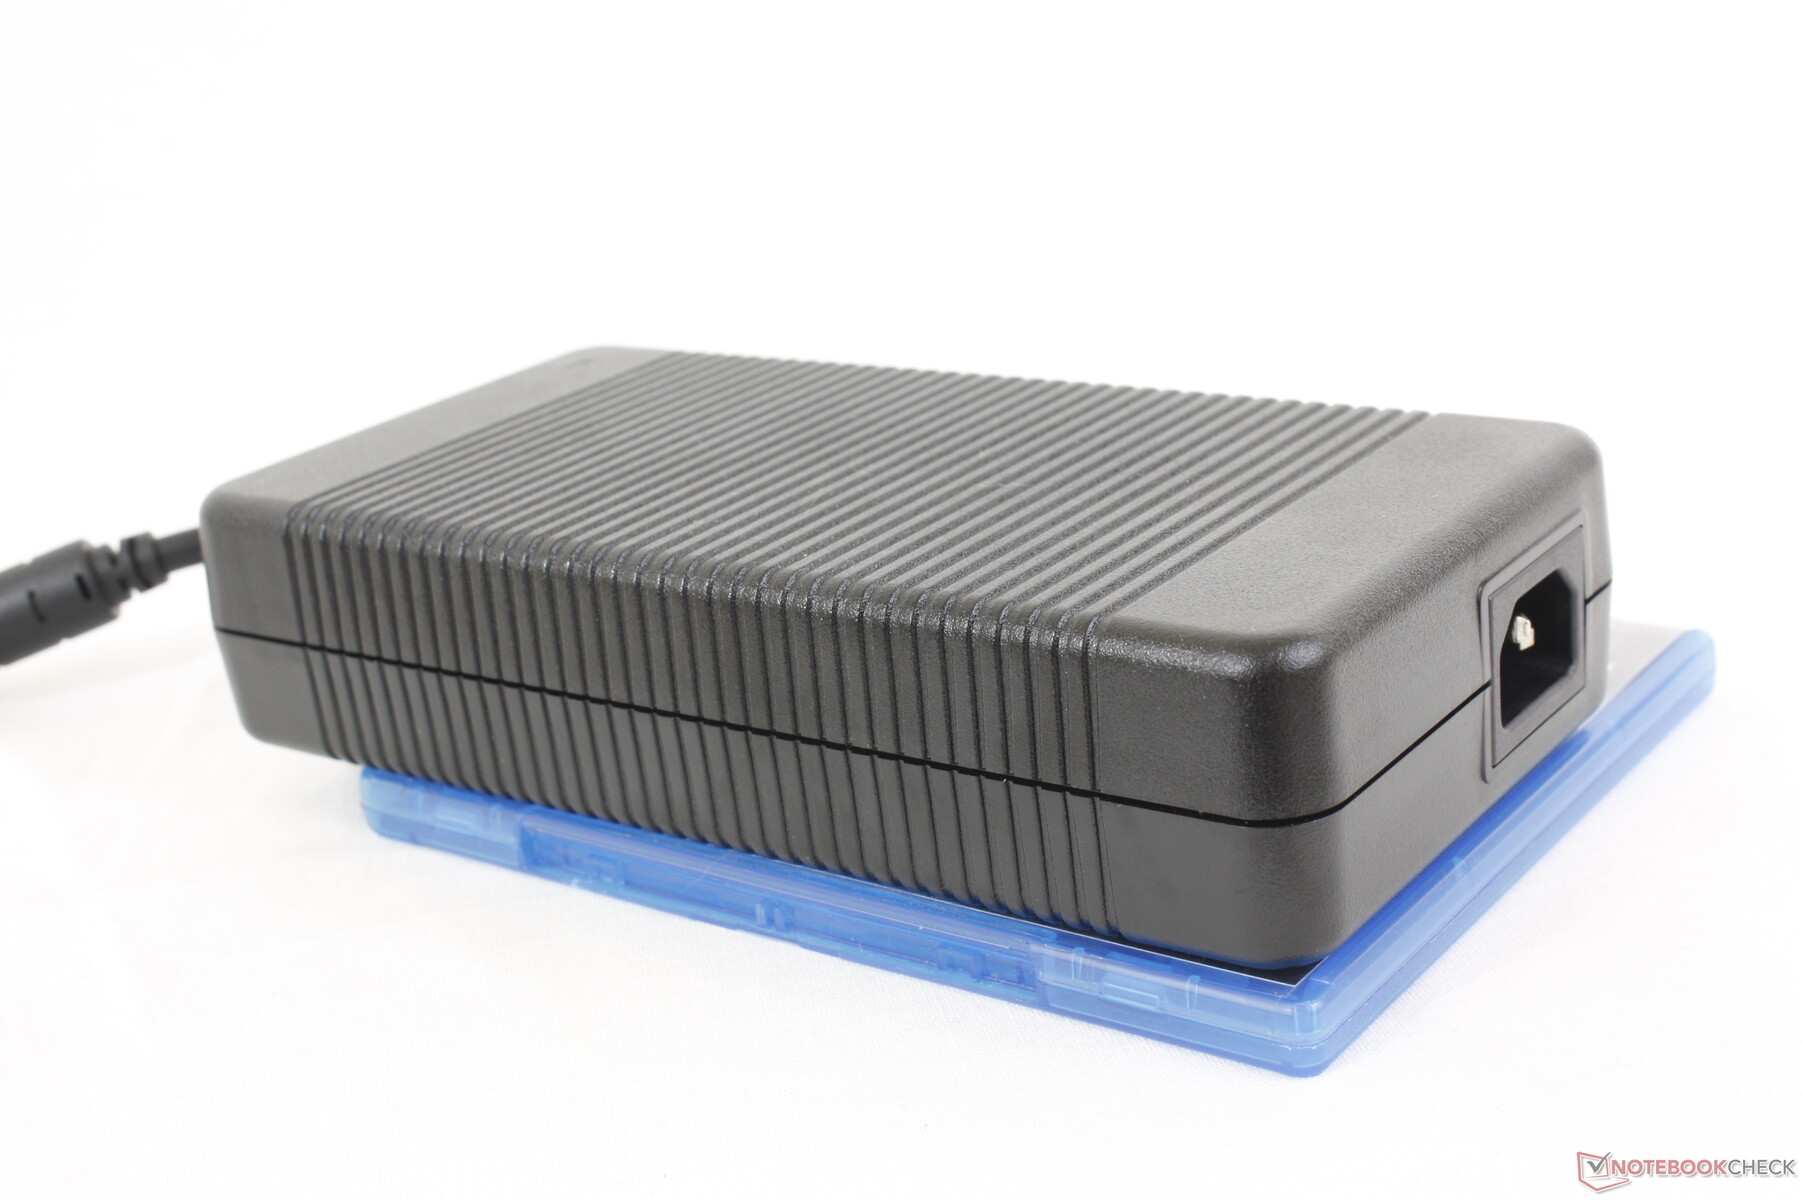
El adaptador de CA de 330 W es grande (~20 x 10 x 4,5 cm) y voluminoso. En comparación, el adaptador de CA GaN de 330 W que se distribuye actualmente con los últimos portátiles Razer es notablemente más portátil.
| Off / Standby | |
| Ocioso | |
| Carga |
|
Clave:
min: | |
| Alienware m16 R1 AMD R9 7845HX, GeForce RTX 4080 Laptop GPU, Kioxia XG8 KXG80ZNV1T02, IPS, 2560x1600, 16" | Alienware x16 R1 i9-13900HK, GeForce RTX 4080 Laptop GPU, SK hynix PC801 HFS001TEJ9X101N, IPS, 2560x1600, 16" | HP Omen Transcend 16 i9-13900HX, GeForce RTX 4070 Laptop GPU, SK hynix PC801 HFS002TEJ9X101N, Mini-LED, 2560x1600, 16" | Lenovo Legion Pro 7 RTX4090 i9-13900HX, GeForce RTX 4090 Laptop GPU, Samsung PM9A1 MZVL21T0HCLR, IPS, 2560x1600, 16" | Asus ROG Strix G16 G614JZ i9-13980HX, GeForce RTX 4080 Laptop GPU, WD PC SN560 SDDPNQE-1T00, IPS, 2560x1600, 16" | Razer Blade 16 Early 2023 i9-13950HX, GeForce RTX 4080 Laptop GPU, SSSTC CA6-8D1024, IPS, 2560x1600, 16" | |
|---|---|---|---|---|---|---|
| Power Consumption | 21% | 27% | 23% | 35% | 29% | |
| Idle Minimum * (Watt) | 39 | 25.2 35% | 19.2 51% | 20 49% | 10 74% | 15.2 61% |
| Idle Average * (Watt) | 44.6 | 29.9 33% | 22.7 49% | 25 44% | 16 64% | 22.8 49% |
| Idle Maximum * (Watt) | 68.1 | 49.8 27% | 55.4 19% | 35 49% | 27 60% | 49.8 27% |
| Load Average * (Watt) | 129.8 | 105.4 19% | 128.4 1% | 136 -5% | 129 1% | 121.2 7% |
| Witcher 3 ultra * (Watt) | 285 | 263 8% | 206 28% | 282 1% | 247 13% | 242 15% |
| Load Maximum * (Watt) | 327.3 | 313.8 4% | 292 11% | 320 2% | 342 -4% | 273.7 16% |
* ... más pequeño es mejor
Power Consumption Witcher 3 / Stresstest
Power Consumption external Monitor
Duración de la batería
La duración de la batería sigue siendo pobre con poco menos de 4 horas de navegación WLAN real cuando se usa el perfil de energía equilibrado con la iGPU activa. Incluso probamos a usar el perfil de energía especial "Batería" a través de Alienware Command Center y nuestros resultados siguieron sin mejorar. Modelos de la competencia como el Lenovo Legion Pro 7 o el Asus ROG Strix G16 son capaces de durar mucho más.
La carga de vacío a plena capacidad tarda poco más de 2 horas. El sistema también se puede recargar por USB-C, aunque a menor velocidad.
| Alienware m16 R1 AMD R9 7845HX, GeForce RTX 4080 Laptop GPU, 86 Wh | Alienware x16 R1 i9-13900HK, GeForce RTX 4080 Laptop GPU, 90 Wh | HP Omen Transcend 16 i9-13900HX, GeForce RTX 4070 Laptop GPU, 97 Wh | Lenovo Legion Pro 7 RTX4090 i9-13900HX, GeForce RTX 4090 Laptop GPU, 99.9 Wh | Asus ROG Strix G16 G614JZ i9-13980HX, GeForce RTX 4080 Laptop GPU, 90 Wh | Razer Blade 16 Early 2023 i9-13950HX, GeForce RTX 4080 Laptop GPU, 95.2 Wh | |
|---|---|---|---|---|---|---|
| Duración de Batería | 13% | 41% | 38% | 100% | 88% | |
| Reader / Idle (h) | 4 | 7.3 83% | 6.3 58% | 8.9 123% | ||
| WiFi v1.3 (h) | 3.7 | 2.5 -32% | 4.2 14% | 5.1 38% | 9.7 162% | 6.1 65% |
| Load (h) | 0.8 | 0.7 -13% | 1.2 50% | 1.1 38% | 1.4 75% |
Pro
Contra
Veredicto - Rápido y repleto de funciones, pero necesita optimizaciones
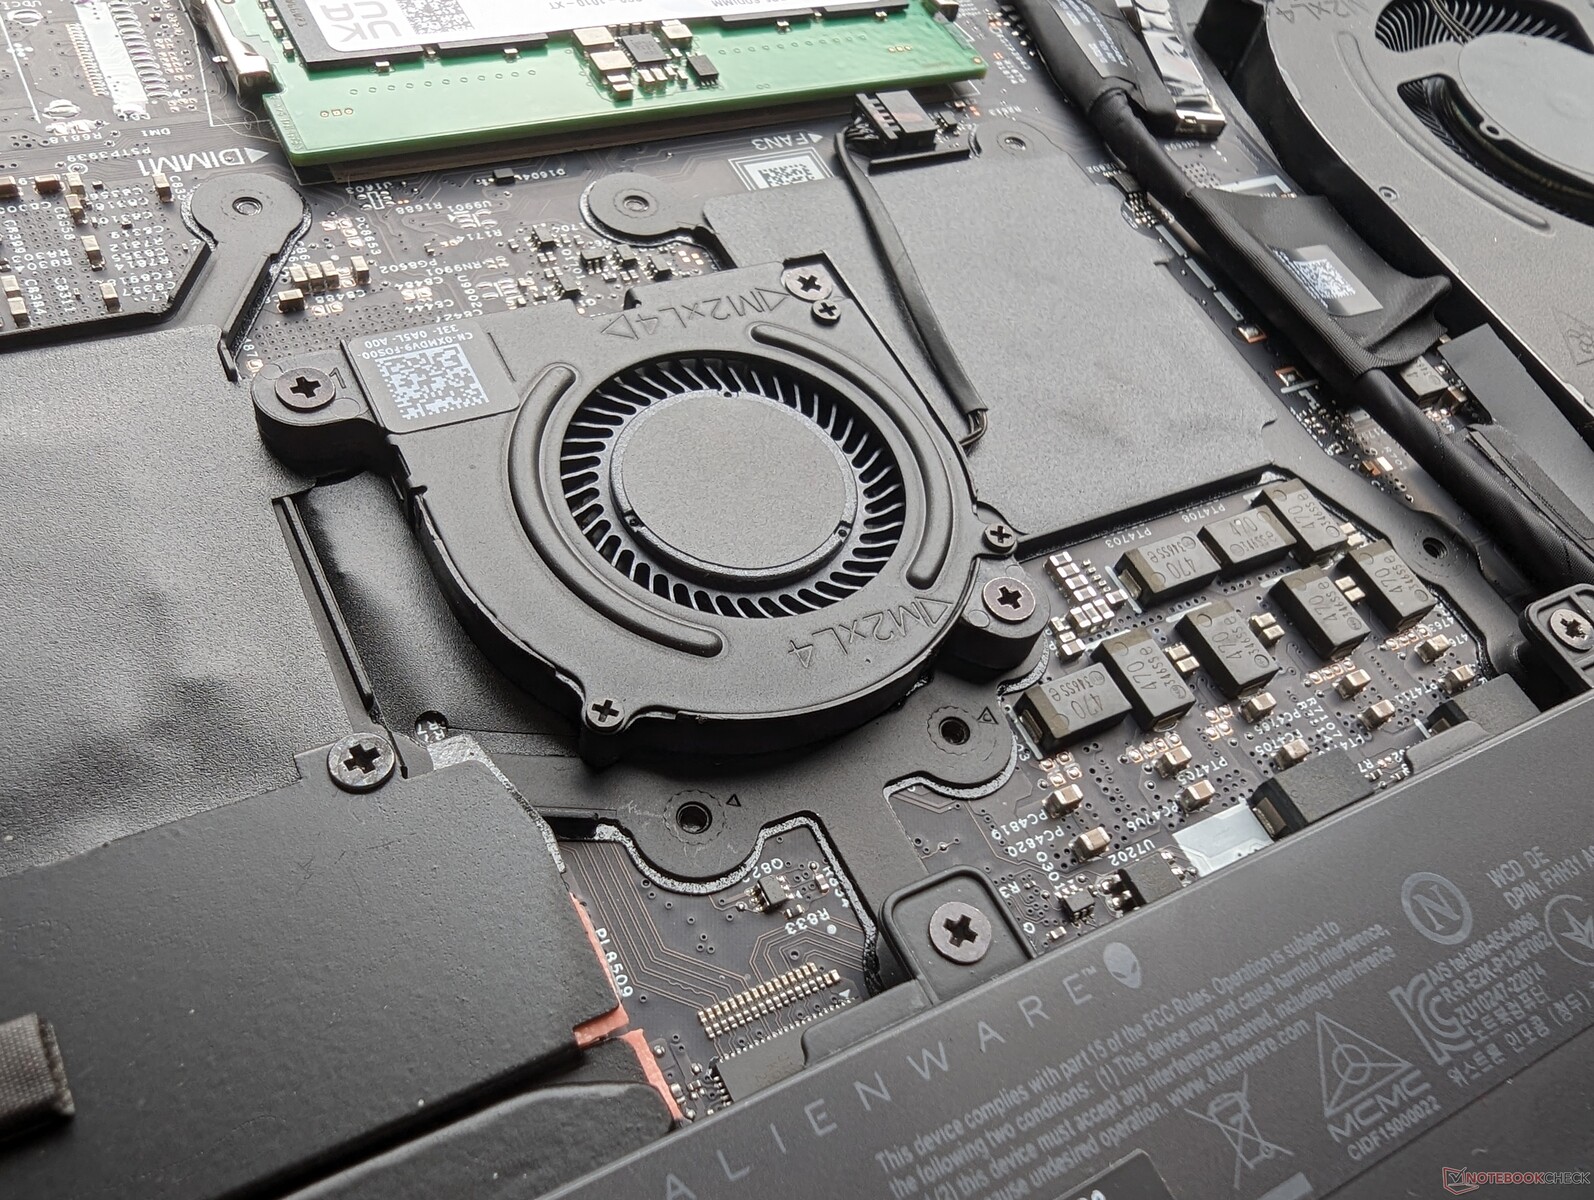
El Alienware m16 R1 incorpora una cantidad insana de potencia y funciones para un portátil de 16 pulgadas. Hablamos de metal líquido, cámara de vapor, cuatro ventiladores, 3 bahías para SSD, teclado mecánico CherryMX, gráficos de 175 W, RAM ampliable e incluso opciones de CPU y GPU tanto de Intel como de AMD. Los modelos para juegos de 16 pulgadas de la competencia, como el HP Omen Transcend 16, Razer Blade 16o el Asus Zephyrus M16 tienen conjuntos comparativamente más pequeños de características y son generalmente más lentos también incluso cuando están configurados con la misma GPU que nuestra configuración de prueba. Los ingenieros de Alienware merecen un montón de crédito teniendo en cuenta lo densamente repleto que está el Alienware m16 R1.
Por otro lado, la larga lista de características integradas también puede jugar en contra del portátil ya que el Alienware m16 es más pesado y más grande que muchas alternativas por amplios márgenes. La duración de la batería en particular sufre bastante sin importar la configuración del perfil de energía. Si valoras la portabilidad, puede que quieras buscar en otra parte. Además, el modelo aún carece de un par de características populares como OLED y mini-LED.
El Alienware m16 R1 es innegablemente rápido y está repleto de características con resultados por encima de la media en general. Sin embargo, las ventajas de rendimiento vienen a costa de un mayor peso y un tamaño más grande.
Los bugs que encontramos durante nuestro análisis merecen una mención. Los saltos de frame durante la reproducción de vídeo 4K, los trastabilles de frame rate al jugar, y los problemas al despertar del sueño son desafortunados de ver considerando que Alienware se supone que es una marca entusiasta. Quizá Dell esté mordiendo más de lo que puede masticar con sus numerosas configuraciones Intel-Nvidia, AMD-Nvidia, y AMD-AMD que pueden complicar bastante la resolución de problemas.
Precio y disponibilidad
Dell ya está comercializando su modelo Alienware m16 en versiones Intel y AMD. La versión AMD comienza en $1700 USD hasta más de $3000 a $4000 si está totalmente configurada.
Alienware m16 R1 AMD
- 08/23/2023 v7 (old)
Allen Ngo
Transparencia
La selección de los dispositivos que se van a reseñar corre a cargo de nuestro equipo editorial. La muestra de prueba fue proporcionada al autor en calidad de préstamo por el fabricante o el minorista a los efectos de esta reseña. El prestamista no tuvo ninguna influencia en esta reseña, ni el fabricante recibió una copia de la misma antes de su publicación. No había ninguna obligación de publicar esta reseña. Como empresa de medios independiente, Notebookcheck no está sujeta a la autoridad de fabricantes, minoristas o editores.
Así es como prueba Notebookcheck
Cada año, Notebookcheck revisa de forma independiente cientos de portátiles y smartphones utilizando procedimientos estandarizados para asegurar que todos los resultados son comparables. Hemos desarrollado continuamente nuestros métodos de prueba durante unos 20 años y hemos establecido los estándares de la industria en el proceso. En nuestros laboratorios de pruebas, técnicos y editores experimentados utilizan equipos de medición de alta calidad. Estas pruebas implican un proceso de validación en varias fases. Nuestro complejo sistema de clasificación se basa en cientos de mediciones y puntos de referencia bien fundamentados, lo que mantiene la objetividad.Price comparison

