Análisis de Lenovo Legion Pro 7 16IRX8H: Rendimiento RTX 4080 de gama alta

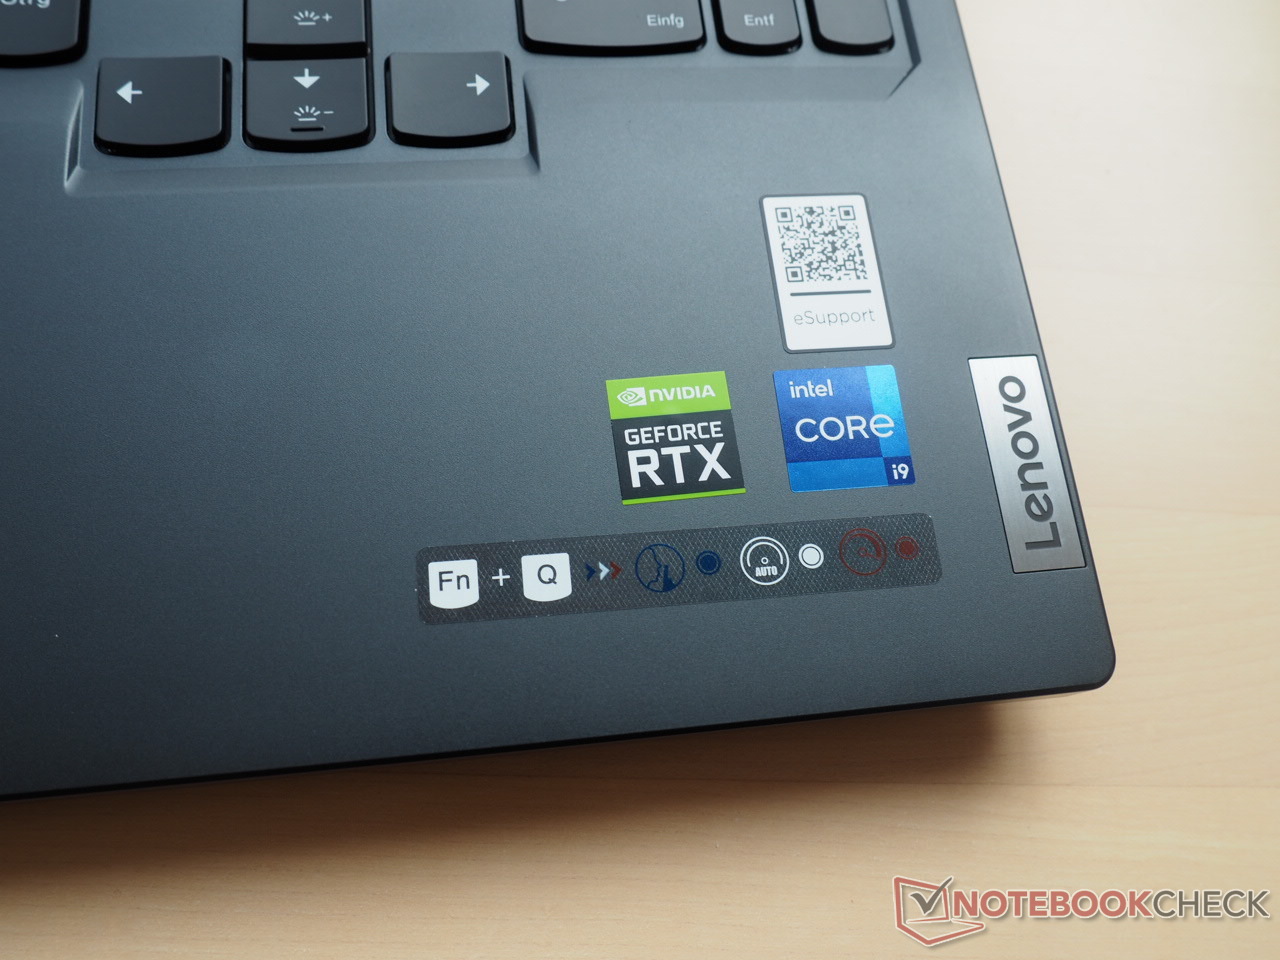
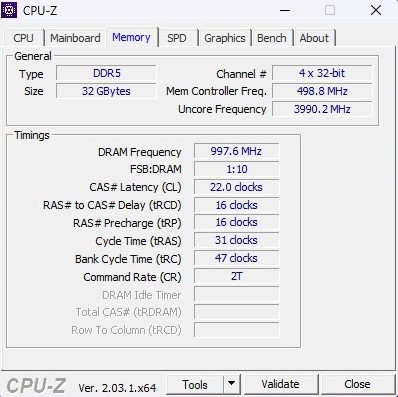
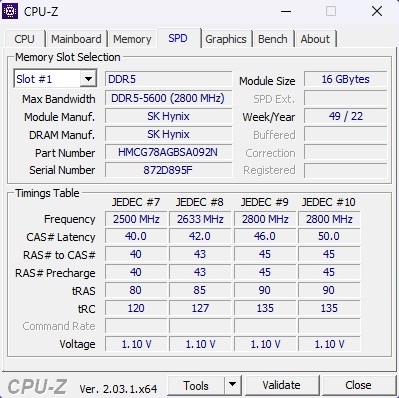
Con un precio de venta al público cercano a los 4.000 euros, el Lenovo Legion Pro 7 16IRX8H, que ahora tenemos para analizar, no puede considerarse realmente una ganga. Sin embargo, este precio te ofrece un Core i9-13900HX32 GB de RAM DDR5-5600 (2x 16 GB) y un SSD PCIe Gen 4x4 NVMe M.2 2280 de 1 TB.
El GPU Nvidia GeForce RTX 4080 para portátilescon 12 GB de VRAM GDDR6 se encarga de las tareas gráficas más exigentes. La pantalla IPS mate en formato 16:10 con una resolución de 2560 x 1600 píxeles está clasificada para alcanzar el 100% sRGB y 500 nits de brillo máximo. Lenovo ha equipado el panel de 240 Hz con soporte para Nvidia G-Sync además de AMD FreeSync, lo que es una buena cosa.
Windows 11 Home viene instalado como sistema operativo elegido.
La principal competencia del Lenovo Legion 7 Pro hasta ahora es elRazer Blade 16 Early 2023aunque también es interesante ver cómo le va al portátil en comparación con la generación anterior. Por tanto, también incluimos SKUs de Legion 7 con las siguientes combinaciones:Core i9-12900HXyRTX 3080 Ti, Ryzen 9 5900HXyRTX 3080y el Ryzen 9 6900HXy RX 6850M XT.
Posibles contendientes en la comparación
Valoración | Fecha | Modelo | Peso | Altura | Tamaño | Resolución | Precio |
|---|---|---|---|---|---|---|---|
| 89.4 % v7 (old) | 02/2023 | Lenovo Legion Pro 7 16IRX8H i9-13900HX, GeForce RTX 4080 Laptop GPU | 2.7 kg | 26 mm | 16.00" | 2560x1600 | |
| 91.2 % v7 (old) | 02/2023 | Razer Blade 16 Early 2023 i9-13950HX, GeForce RTX 4080 Laptop GPU | 2.4 kg | 21.99 mm | 16.00" | 2560x1600 | |
| 88.9 % v7 (old) | 09/2022 | Lenovo Legion 7 16IAX7-82TD004SGE i9-12900HX, GeForce RTX 3080 Ti Laptop GPU | 2.6 kg | 20 mm | 16.00" | 2560x1600 | |
| 88.1 % v7 (old) | 06/2021 | Lenovo Legion 7 16ACHg6 R9 5900HX, GeForce RTX 3080 Laptop GPU | 2.5 kg | 23.5 mm | 16.00" | 2560x1600 | |
| 90.8 % v7 (old) | 09/2022 | Lenovo Legion 7 16ARHA7 R9 6900HX, Radeon RX 6850M XT | 2.6 kg | 19.4 mm | 16.00" | 2560x1600 |
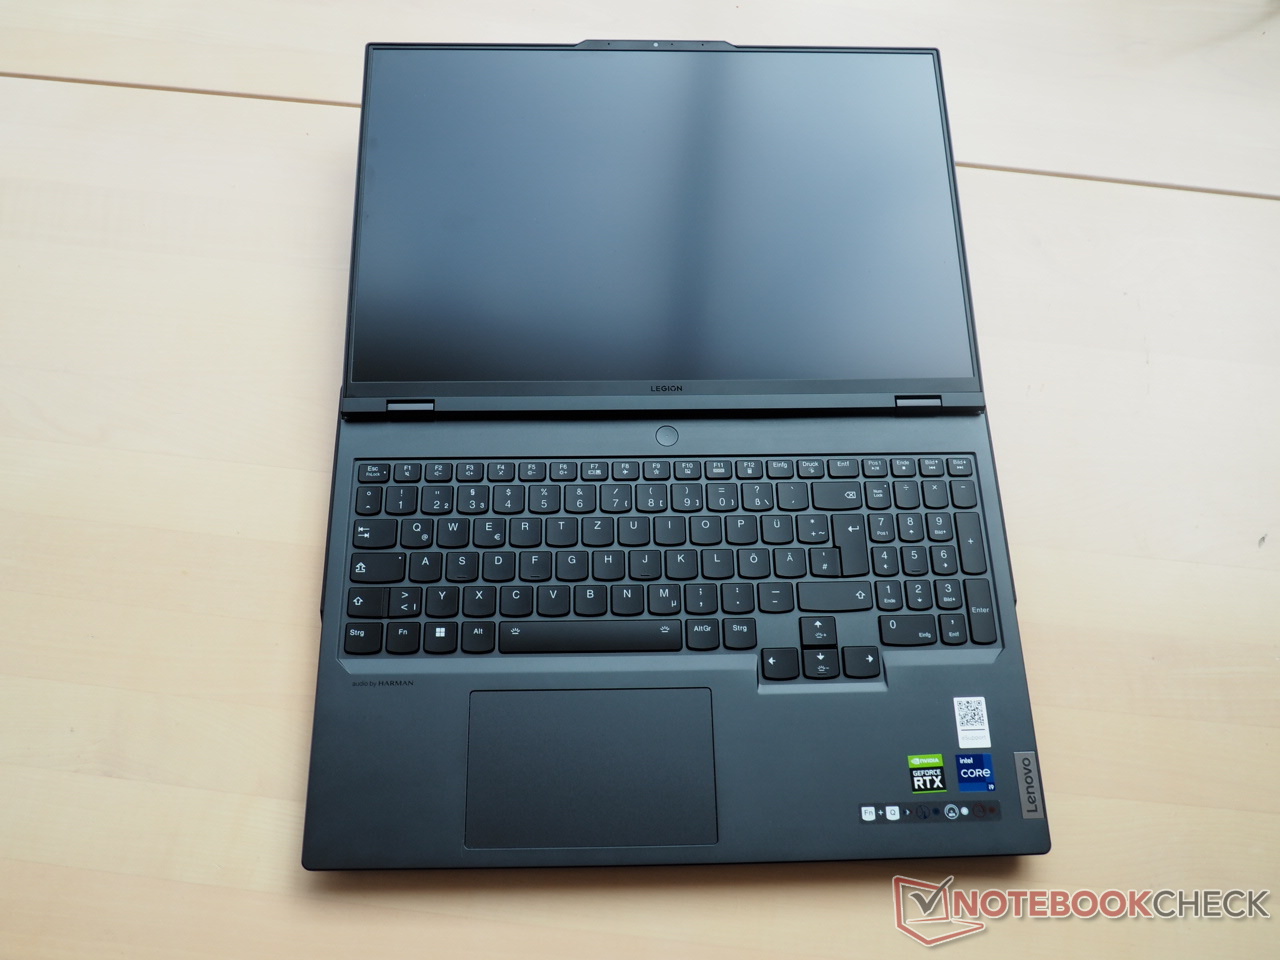
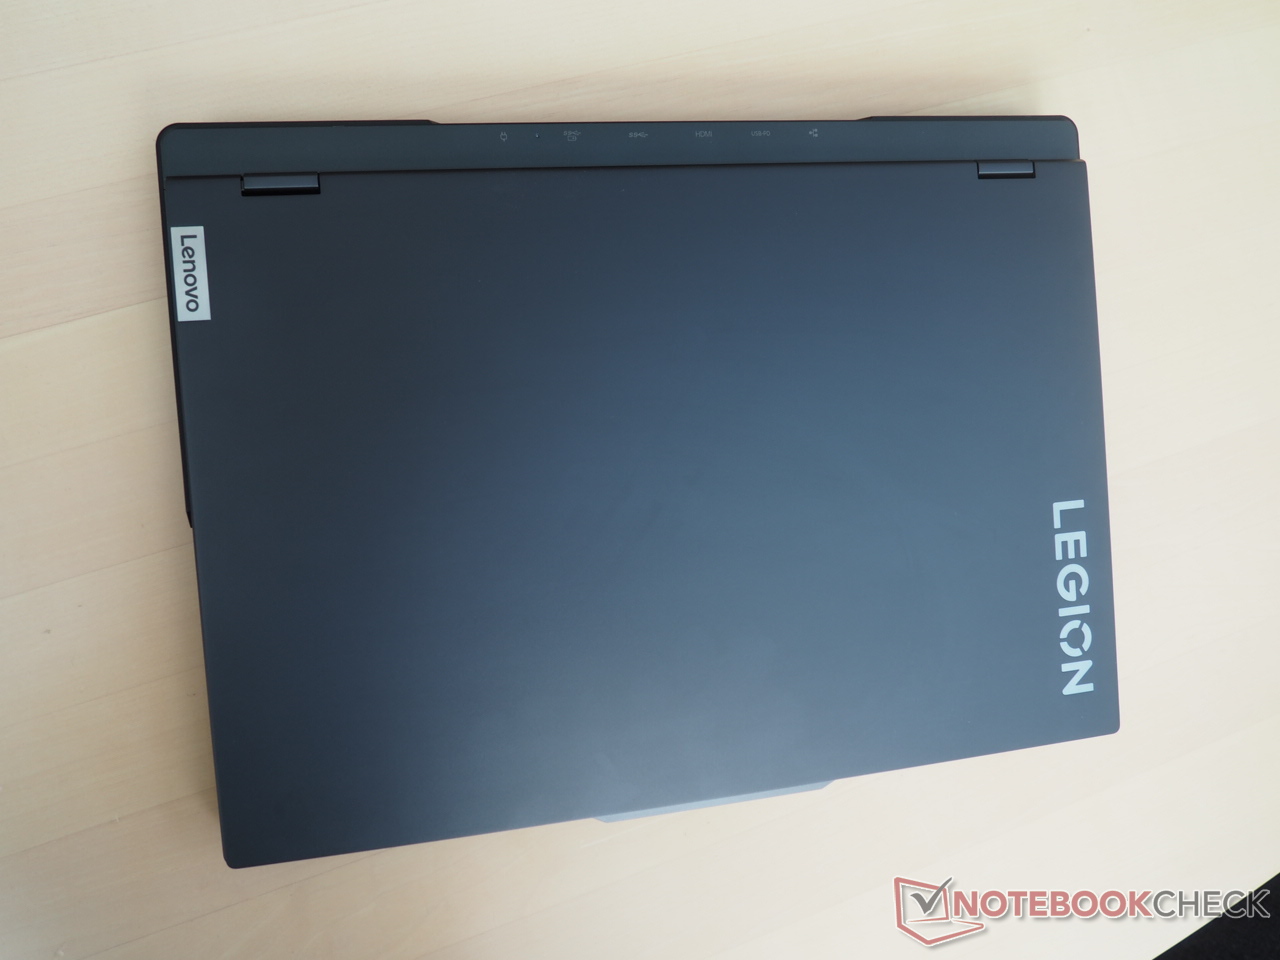
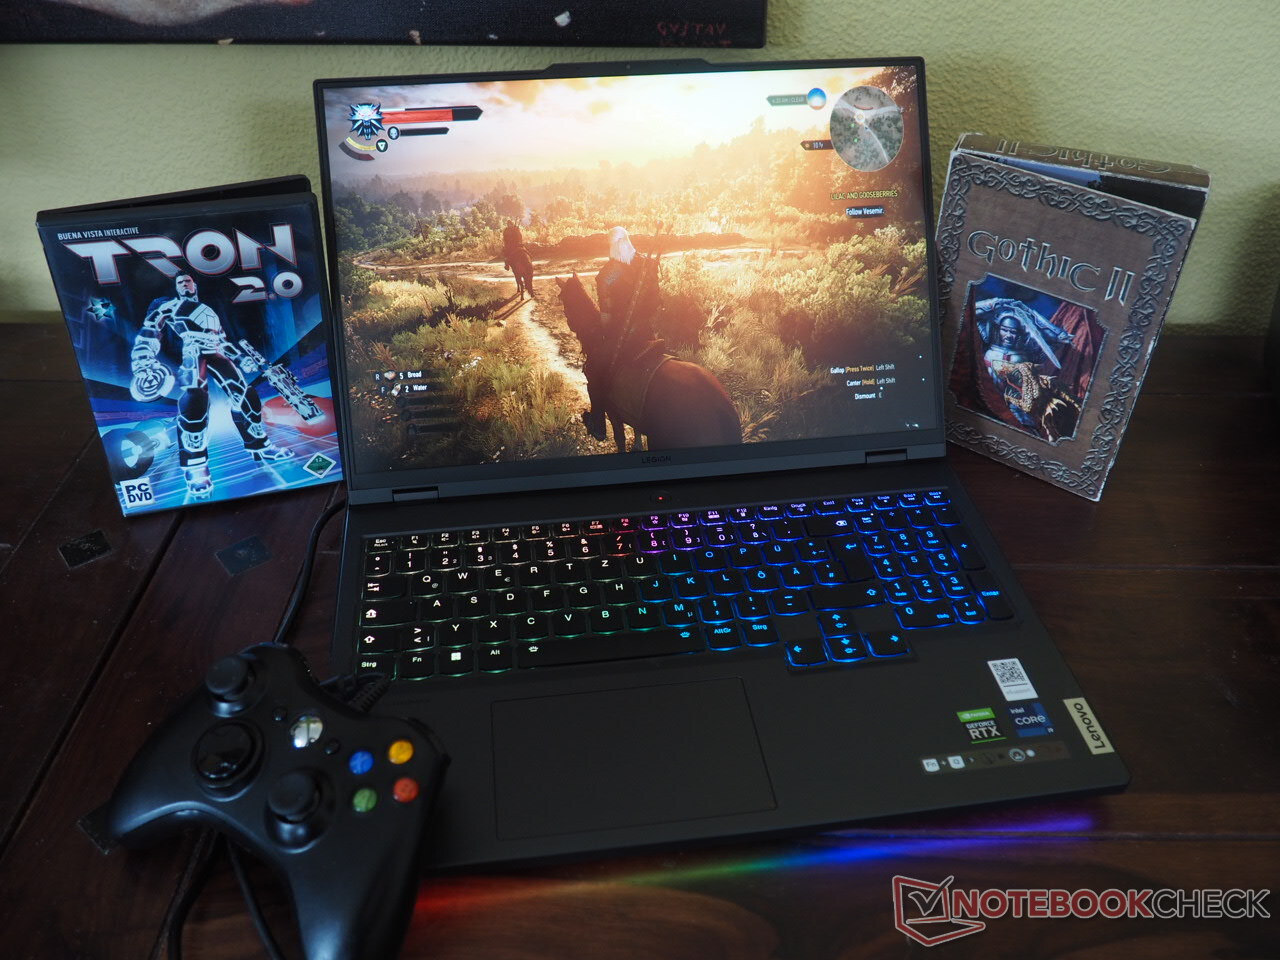
Caja: No muy diferente de su predecesora
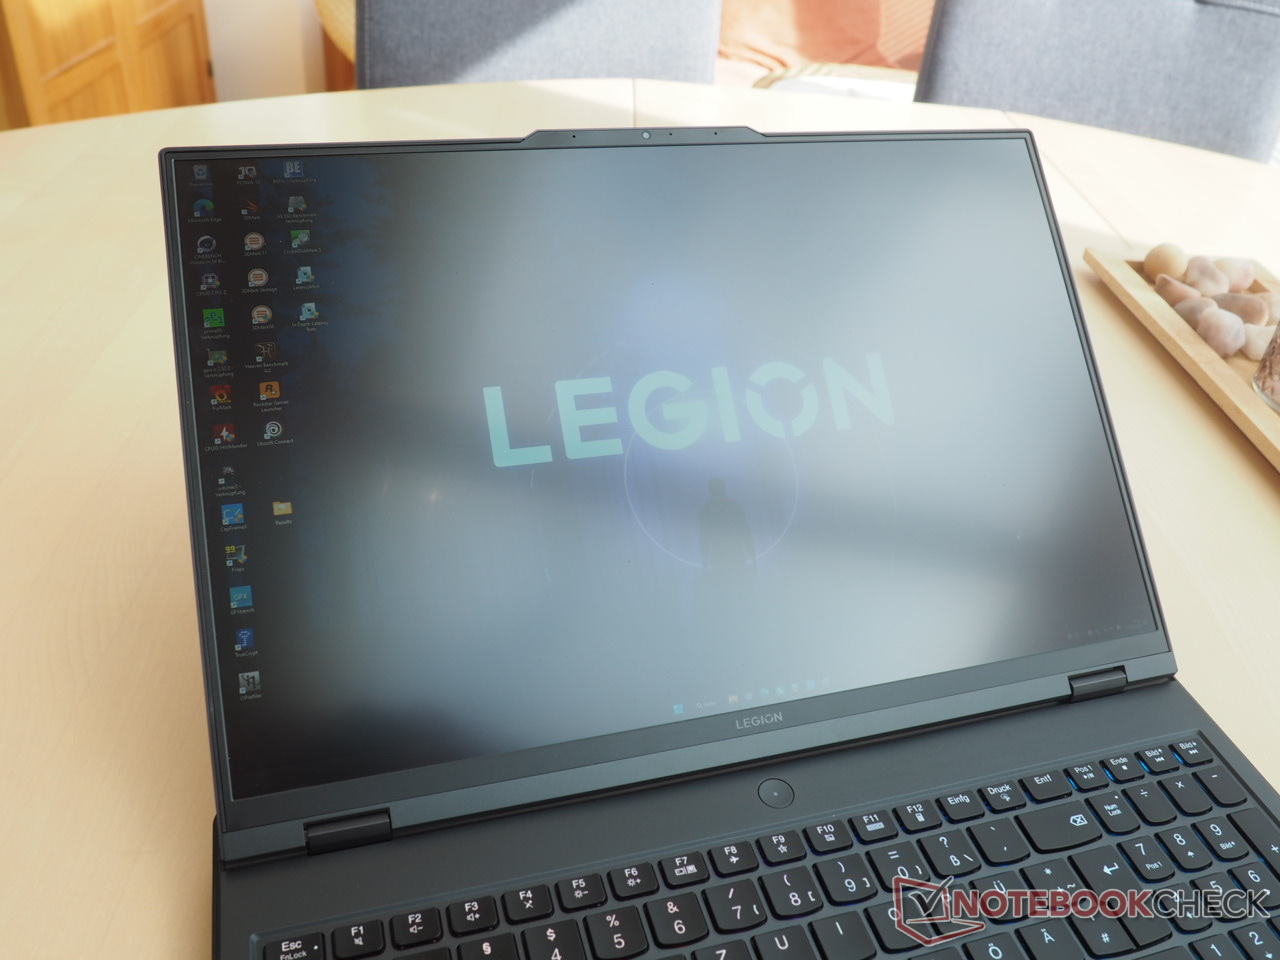
El diseño del chasis es bastante similar al de su predecesor, el Legion 7 16ARHA7con algunos ligeros cambios, como el rediseño de las rejillas de ventilación laterales y traseras. Incluso con estos cambios, el diseño del chasis sigue siendo bueno. La estabilidad y resistencia de las bisagras, que pueden abrirse hasta 180º, también está por encima de la media de su categoría.
La calidad general es excelente. La tapa metálica, en particular, tiene un aspecto elegante, aunque puede convertirse rápidamente en un imán para las huellas dactilares. El aspecto es discreto cuando está apagado, salvo por la marca Legion de la tapa.
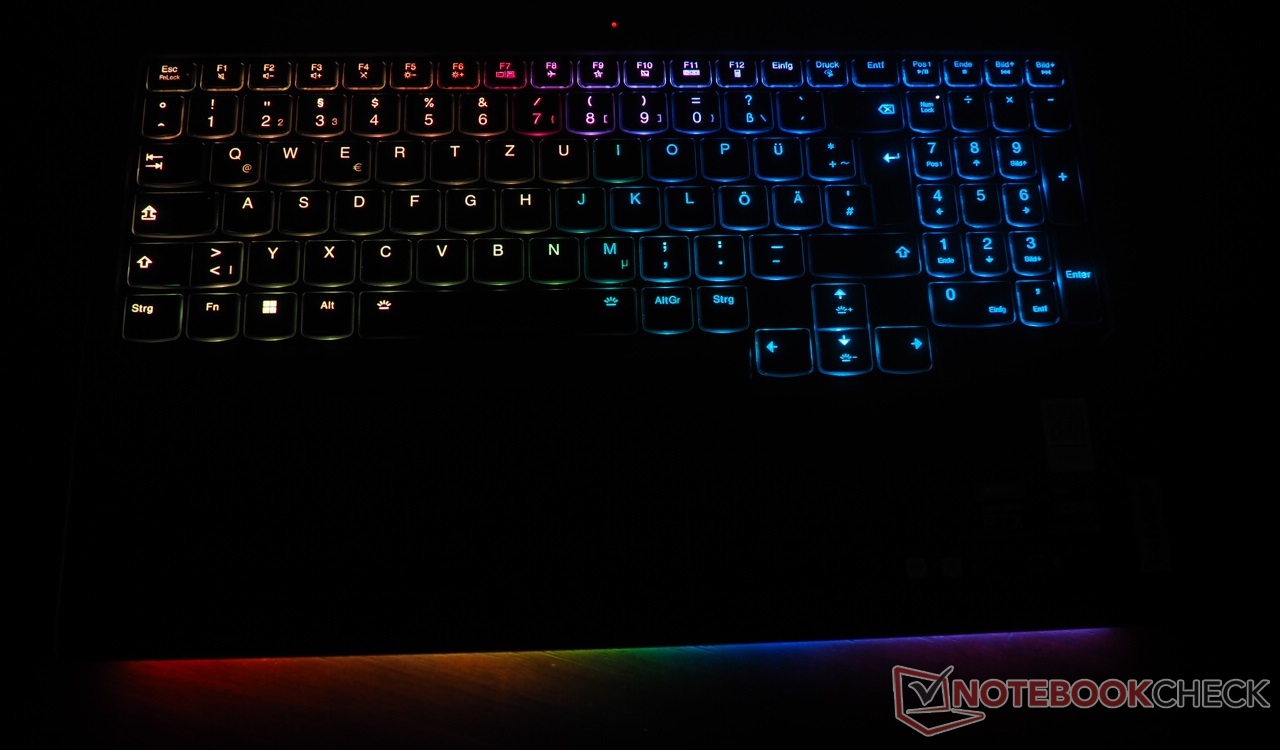
Durante el funcionamiento, sin embargo, el Legion 7 Pro puede ser reconocido inmediatamente como un portátil de juegos debido al teclado iluminado RGB y la tira de LED en la parte delantera.
Con unos 2,7 kg, el Legion 7 Pro de 16 pulgadas tiende a ser uno de los portátiles más pesados de su categoría (el Razer Blade 16 pesa 300 g menos). Del mismo modo, los 2,6 cm de altura son unos 4 mm más que el Blade 16, lo que en teoría debería ayudar a una mejor refrigeración.
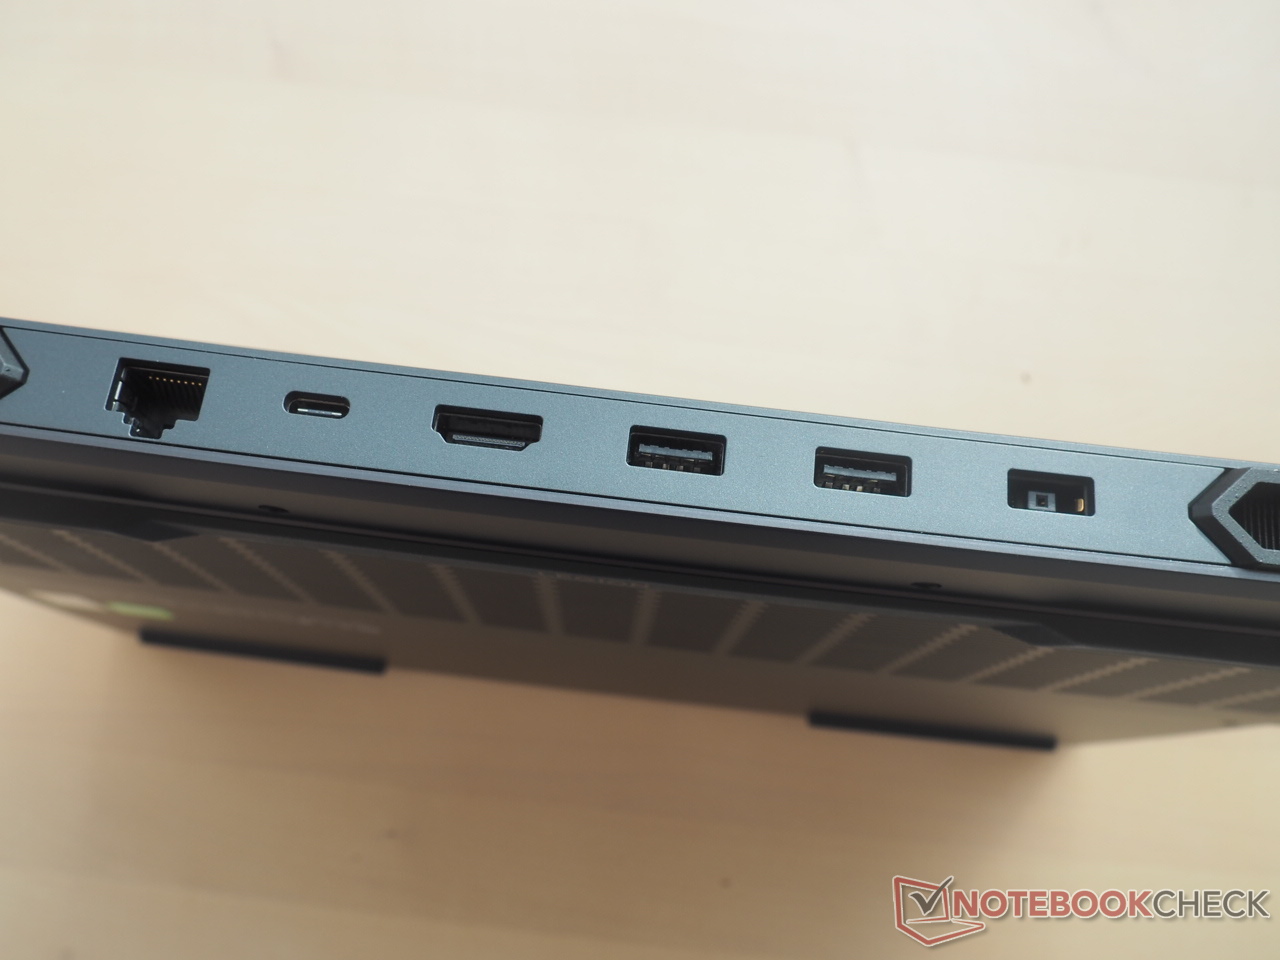
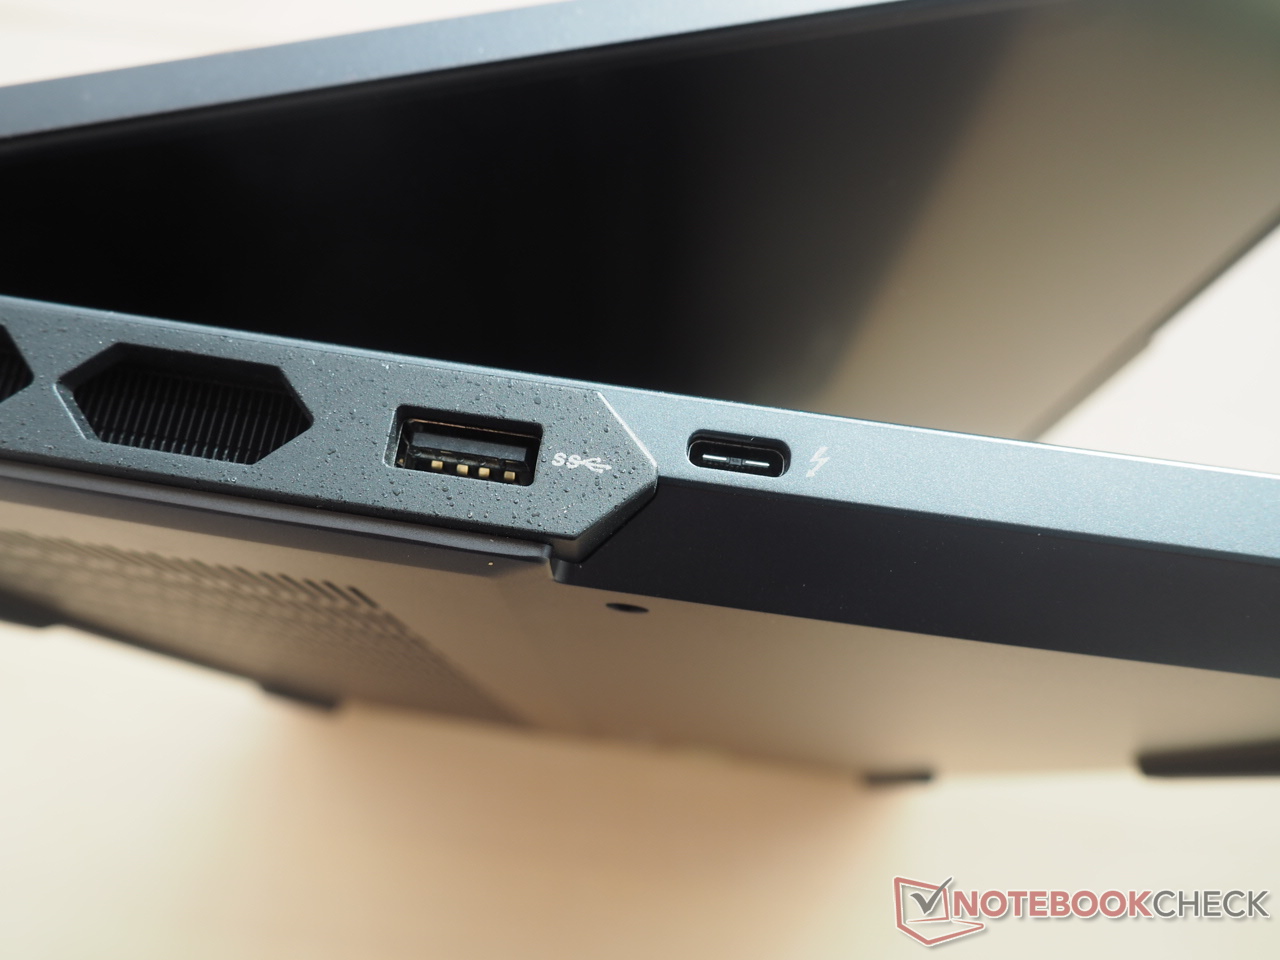
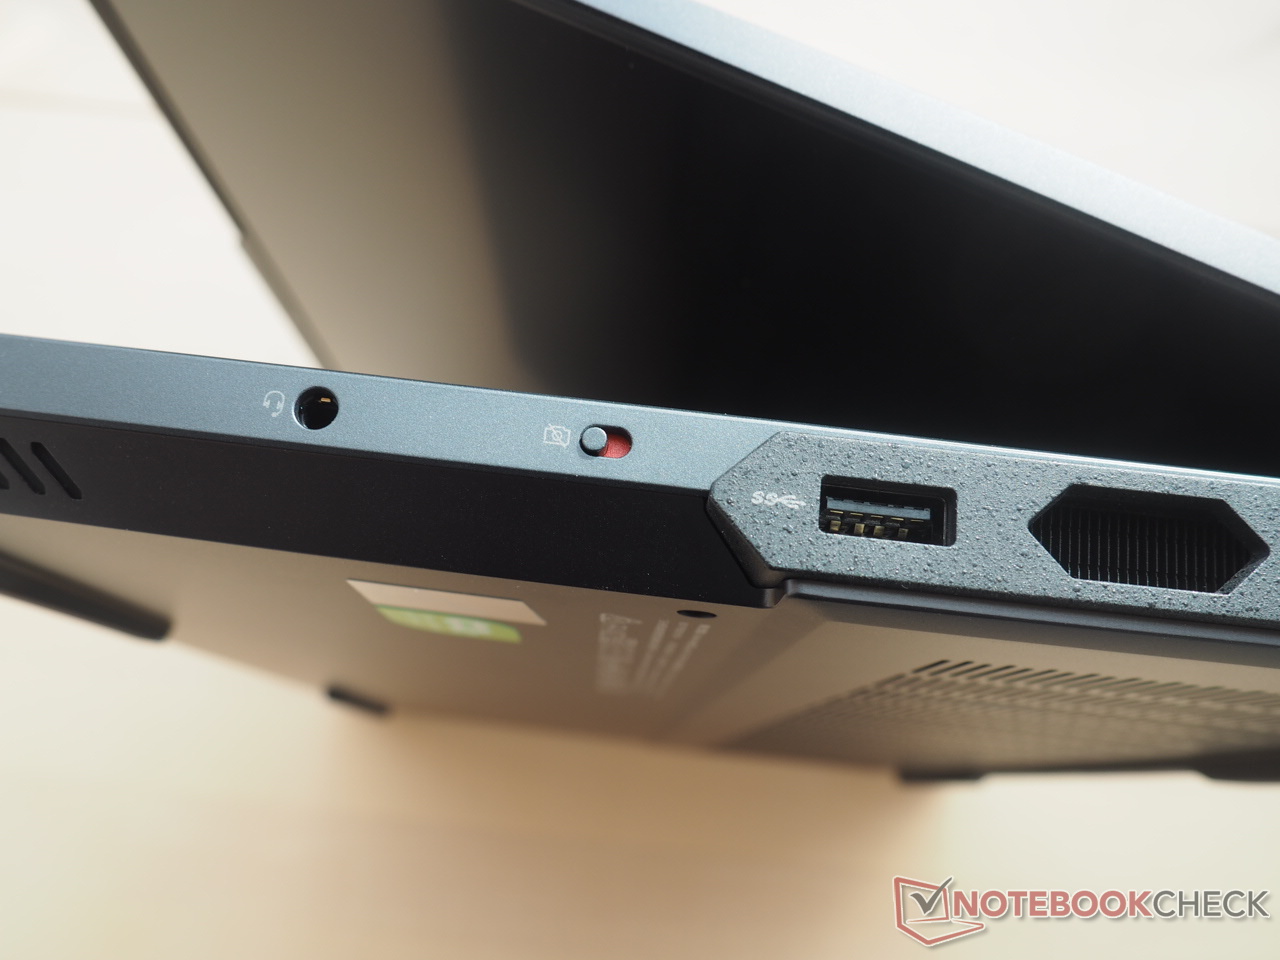
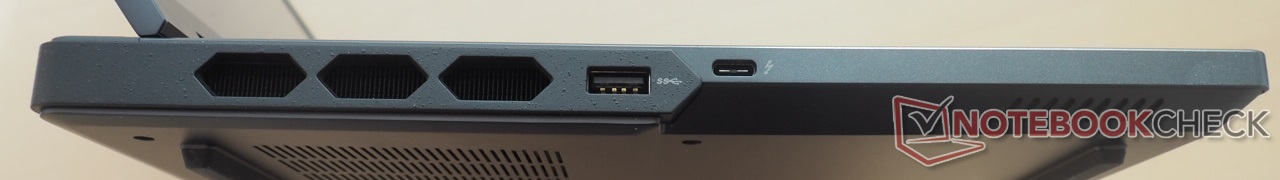
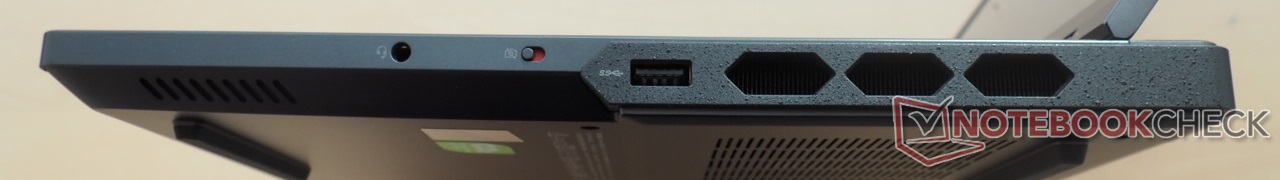
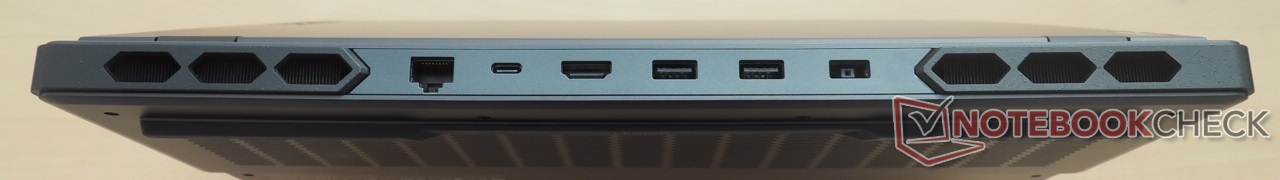
Conectividad: Un montón de puertos USB
Puertos
El Legion 7 Pro impresiona con su abundancia de puertos. Dispone de un total de seis puertos USB (2x Type-C, 4x Type-A), lo que no suele ser habitual ni siquiera en portátiles gaming de gama alta. Se pueden conectar tres pantallas externas gracias a la salida HDMI 2.1 y al soporte DisplayPort-out en los dos puertos USB Type-C. También impresiona la potencia de 140 W por USB Type-C.
Un puerto RJ-45 y una clavija de audio completan la selección de puertos. La presencia de un interruptor de obturador de webcam físico en el lado derecho es un plus. El único inconveniente del Legion 7 Pro es la ausencia de un lector de tarjetas.
Dado que la mayoría de los puertos están situados en la parte trasera del dispositivo, tanto los zurdos como los diestros sacarán partido a su dinero cuando utilicen un ratón de juego con cable.
Comunicación
No encontramos discrepancias en el rendimiento Wi-Fi. El Legion Pro 7 logró un rendimiento de 1.600 Mb/s a una distancia de 1 m de nuestro router de referencia Asus ROG Rapture GT-AXE11000, lo que corresponde a una transmisión y recepción muy buenas. El Razer Blade 16 se conforma con unos 100 Mbps menos de rendimiento.
Cámara web
La calidad de la webcam está algo por encima de la media. La cámara de 2 MP ofrece una nitidez de imagen decente y una precisión de color pasable, lo que es aceptable para un portátil (los estándares aquí son muy pobres, por desgracia).


Accesorios
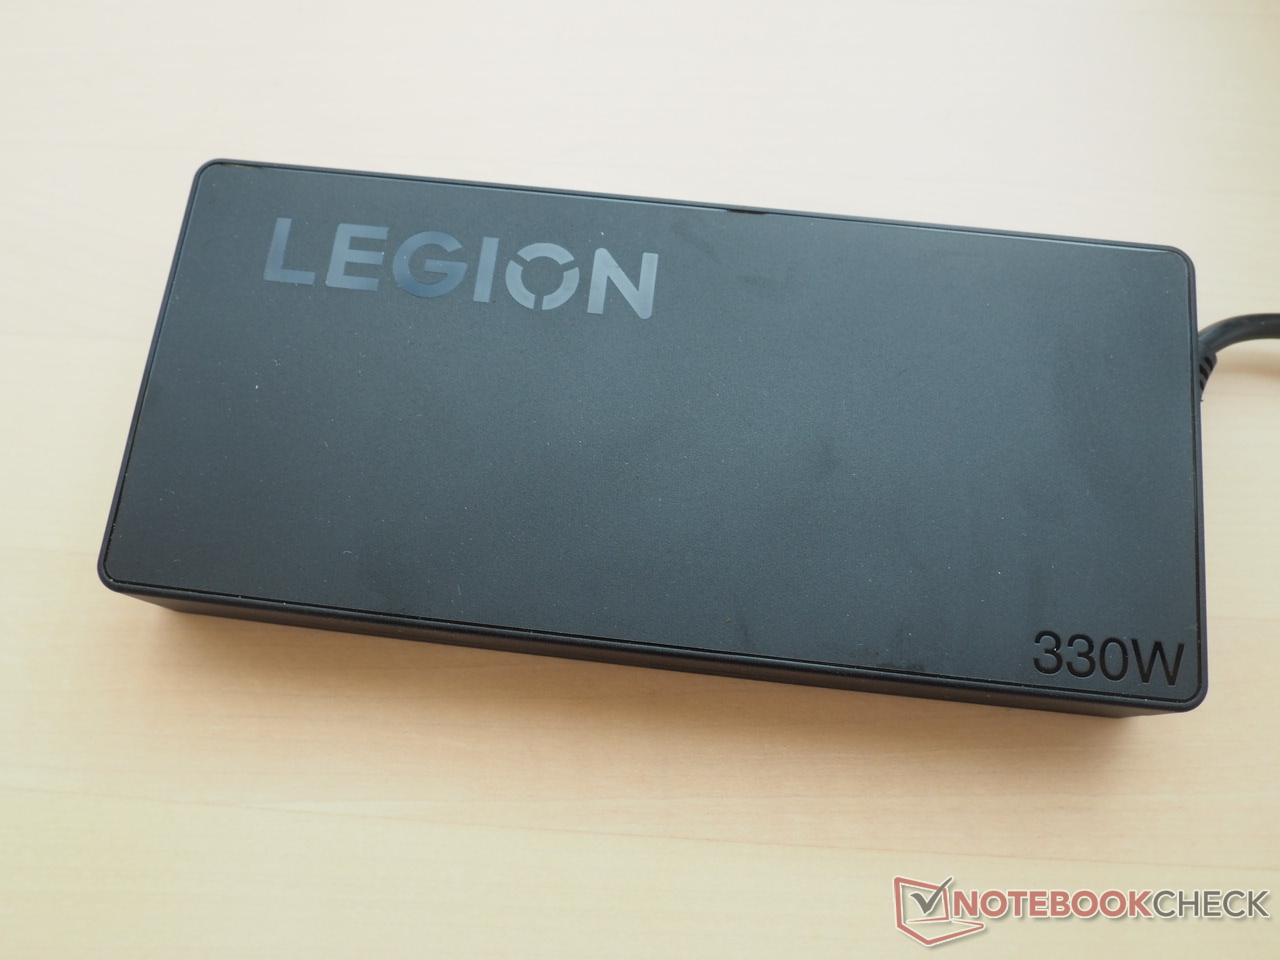
El volumen de suministro incluye una enorme fuente de alimentación de 800 g que mide 18,5 x 8 x 2,5 cm, lo que está en la línea esperada para un modelo de 330 W. También incluye varios folletos informativos.
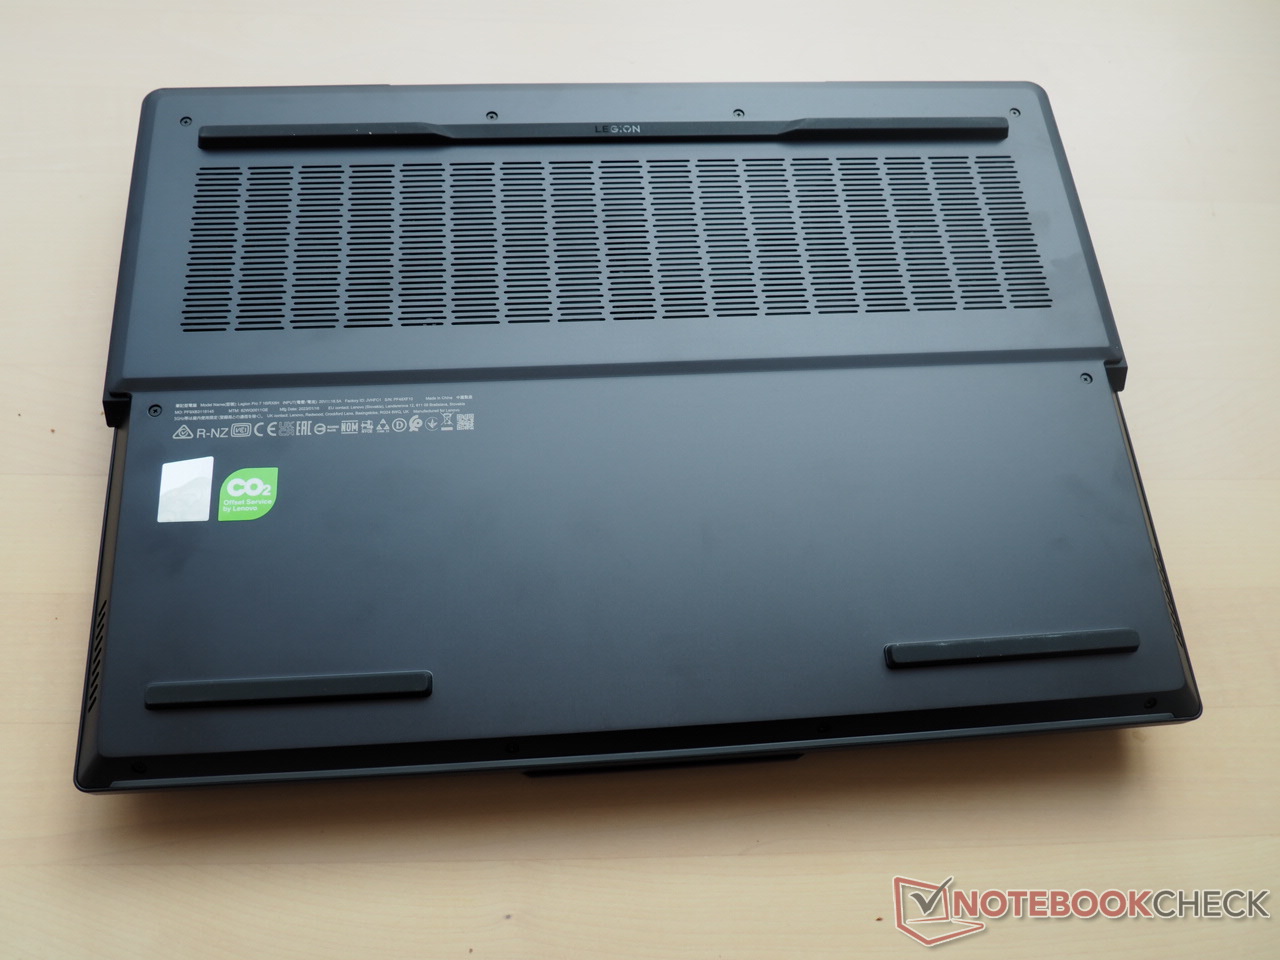
Mantenimiento
Lenovo podría haber hecho el desmontaje del Legion 7 Pro más fácil para el cliente. Incluso después de quitar todos los tornillos de la carcasa, la placa base está tan apretada (especialmente en la parte trasera) que se teme dañar el chasis si se aplica demasiada fuerza.
Por este motivo, y porque se trata de una muestra de la tienda, no intentamos abrir el portátil por seguridad.
Garantía
Según la información del fabricante en Alemania, la garantía de Legion 7 Pro puede ampliarse a más de tres años con Premium Care.
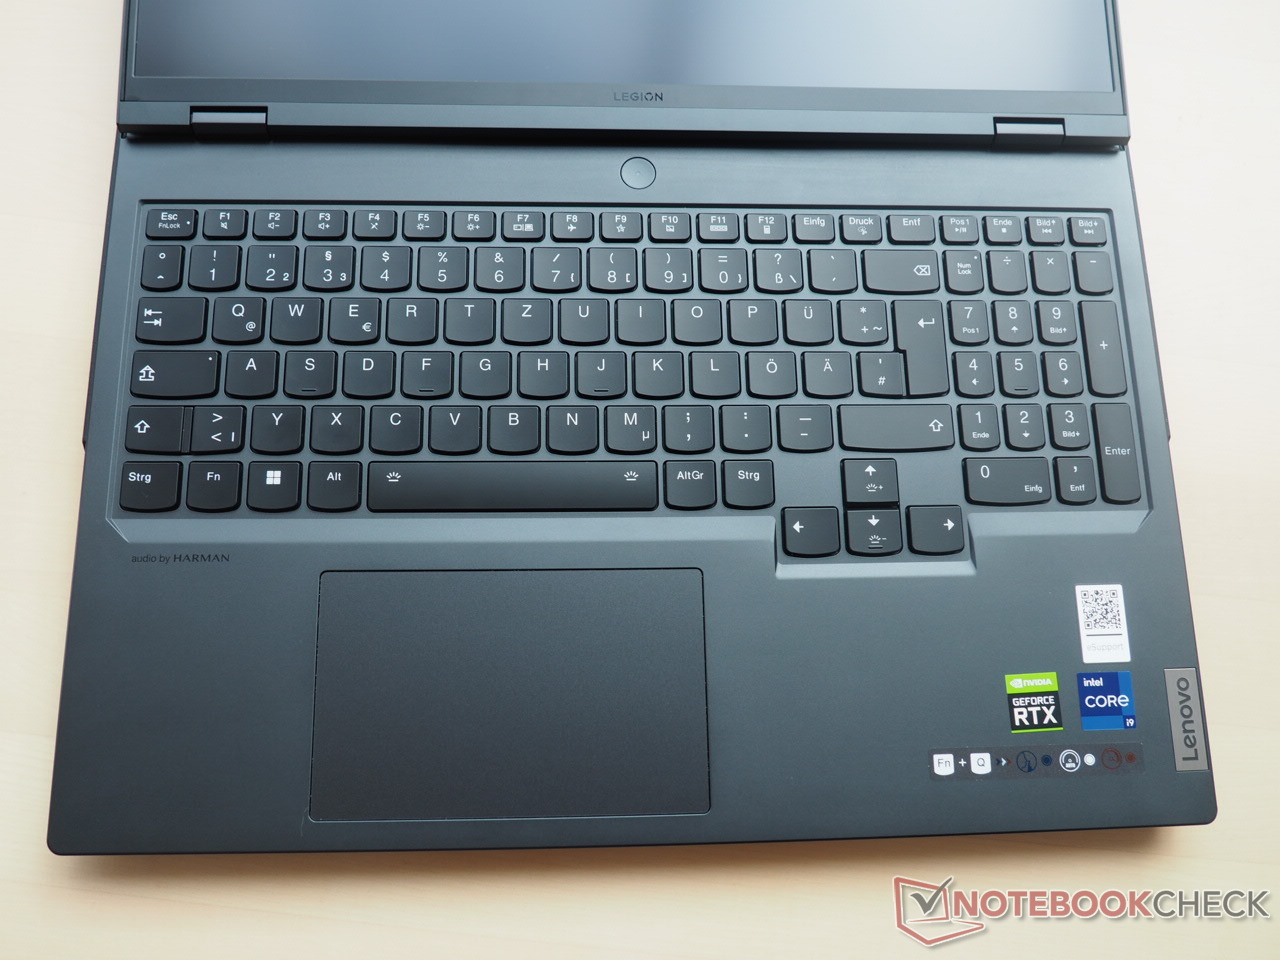
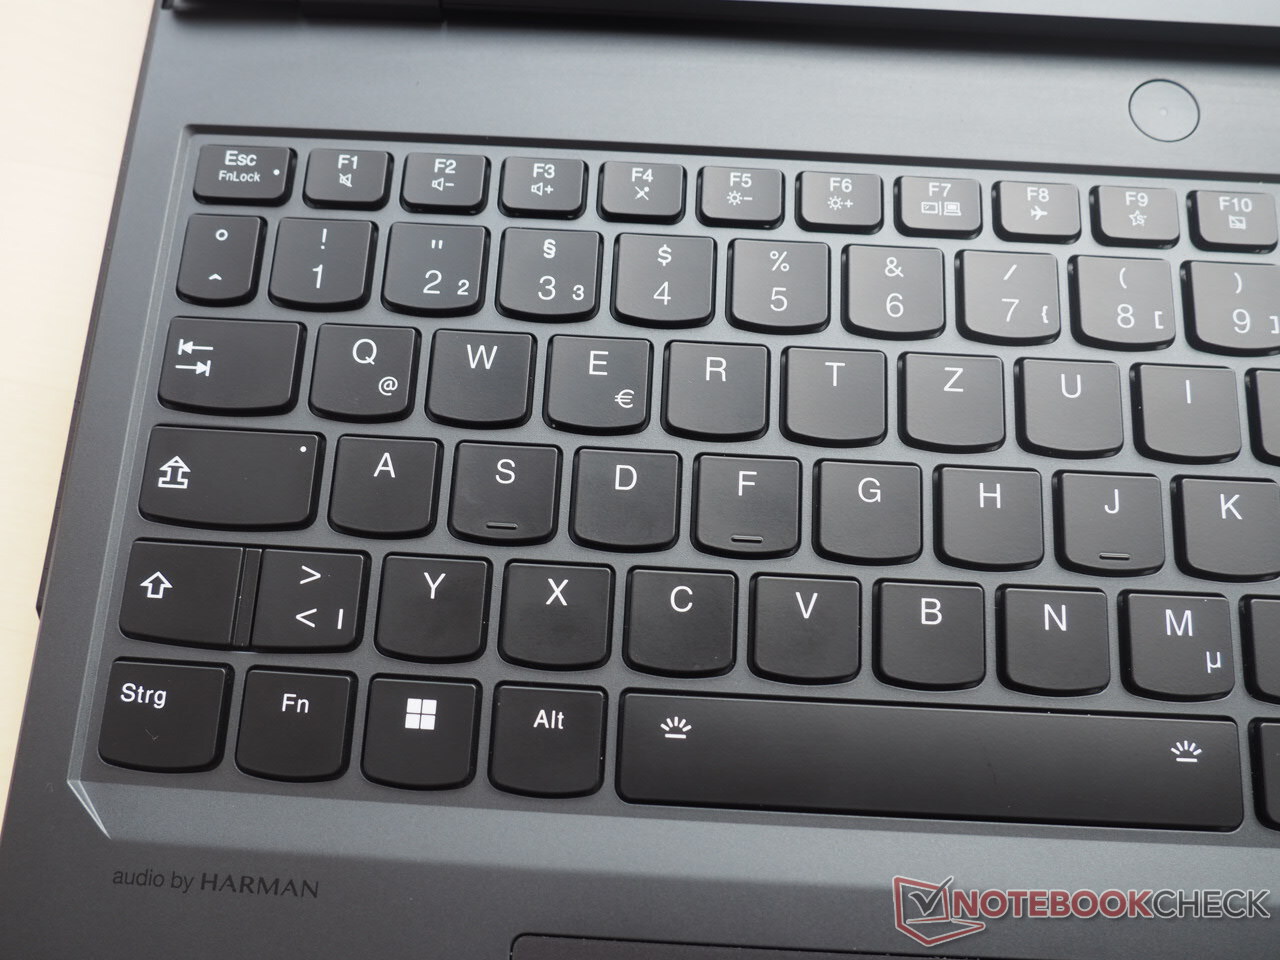
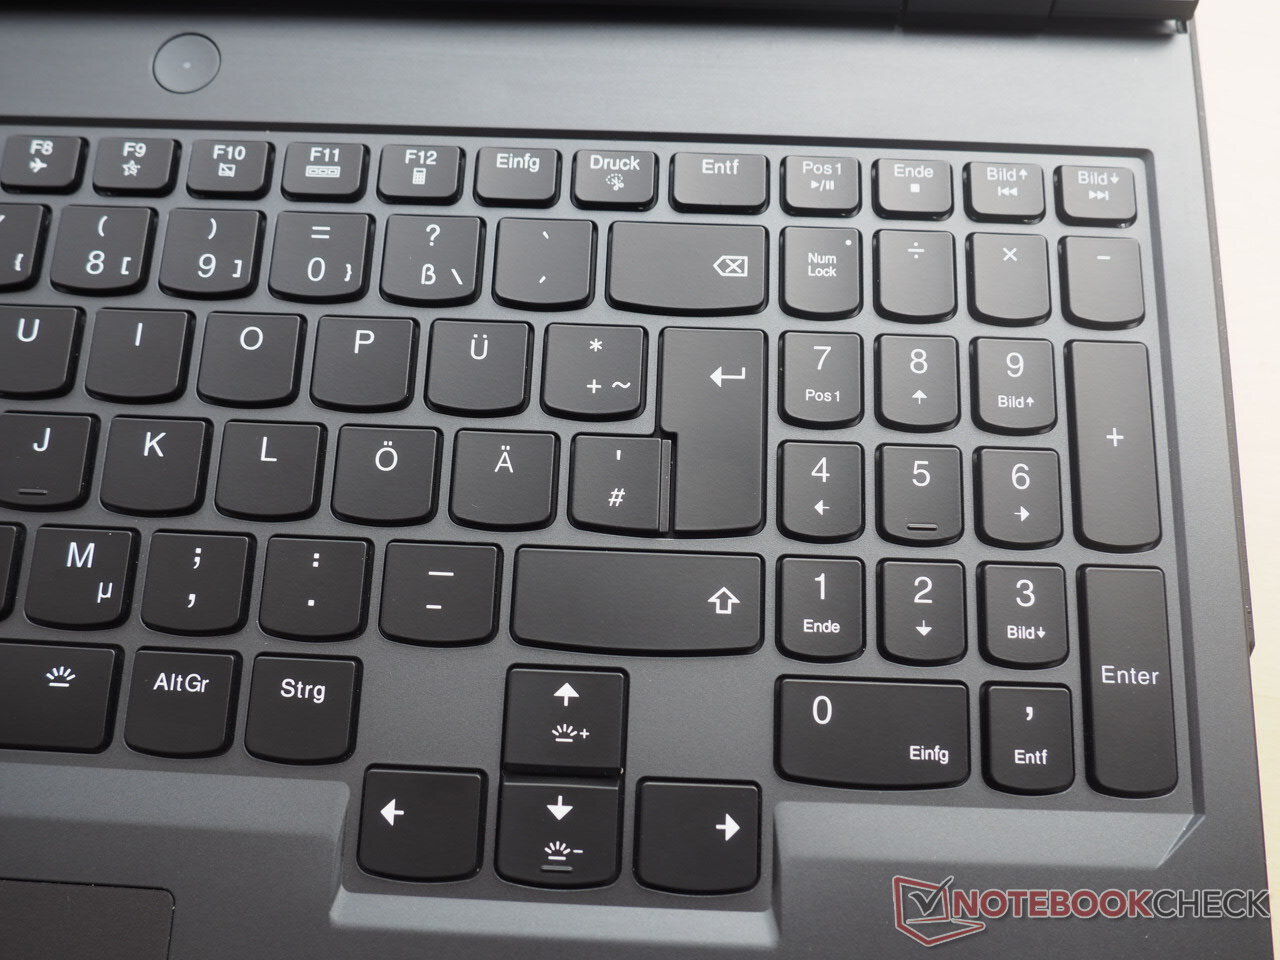
Dispositivos de entrada: No hay mucho de qué quejarse
Teclado
El teclado ofrece poco margen de queja. Las típicas teclas de estilo Lenovo con bordes inferiores curvados garantizan una experiencia de tecleo agradable después de familiarizarse un poco. El accionamiento y el punto de presión son bastante buenos, aunque no se acercan exactamente al nivel de un teclado mecánico.
La distribución del teclado nos parece convincente. Los que confían mucho en las teclas de flecha pueden esperar un dimensionamiento decente. También dispone de un teclado numérico completo. La clara rotulación de las teclas permite apagar la retroiluminación durante el día. Por lo demás, la retroiluminación ofrece una intensidad útil y varios modos de ajuste.
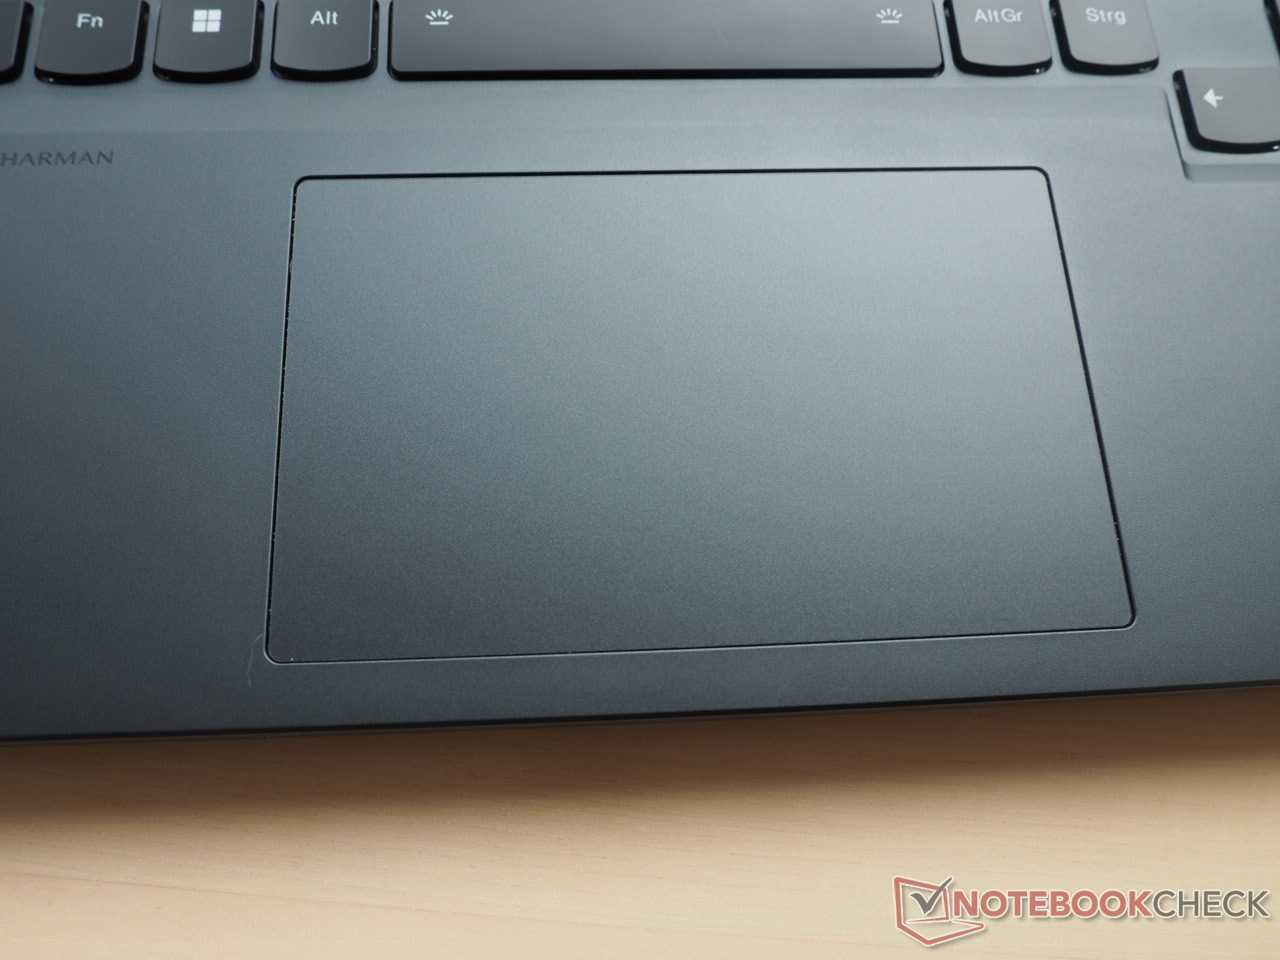
Panel táctil
El suave touchpad de 12 x 7,5 cm parece suficiente para un dispositivo de 16 pulgadas y está situado relativamente a la izquierda. No encontramos problemas de precisión ni de deslizamiento, lo que contribuye a un funcionamiento fluido.
Las áreas de click cerca de la parte inferior son muy estables y pueden activarse fácilmente, pero suenan bastante fuertes y raquíticas.
Pantalla: panel de 240 Hz con altos niveles de brillo y sin PWM
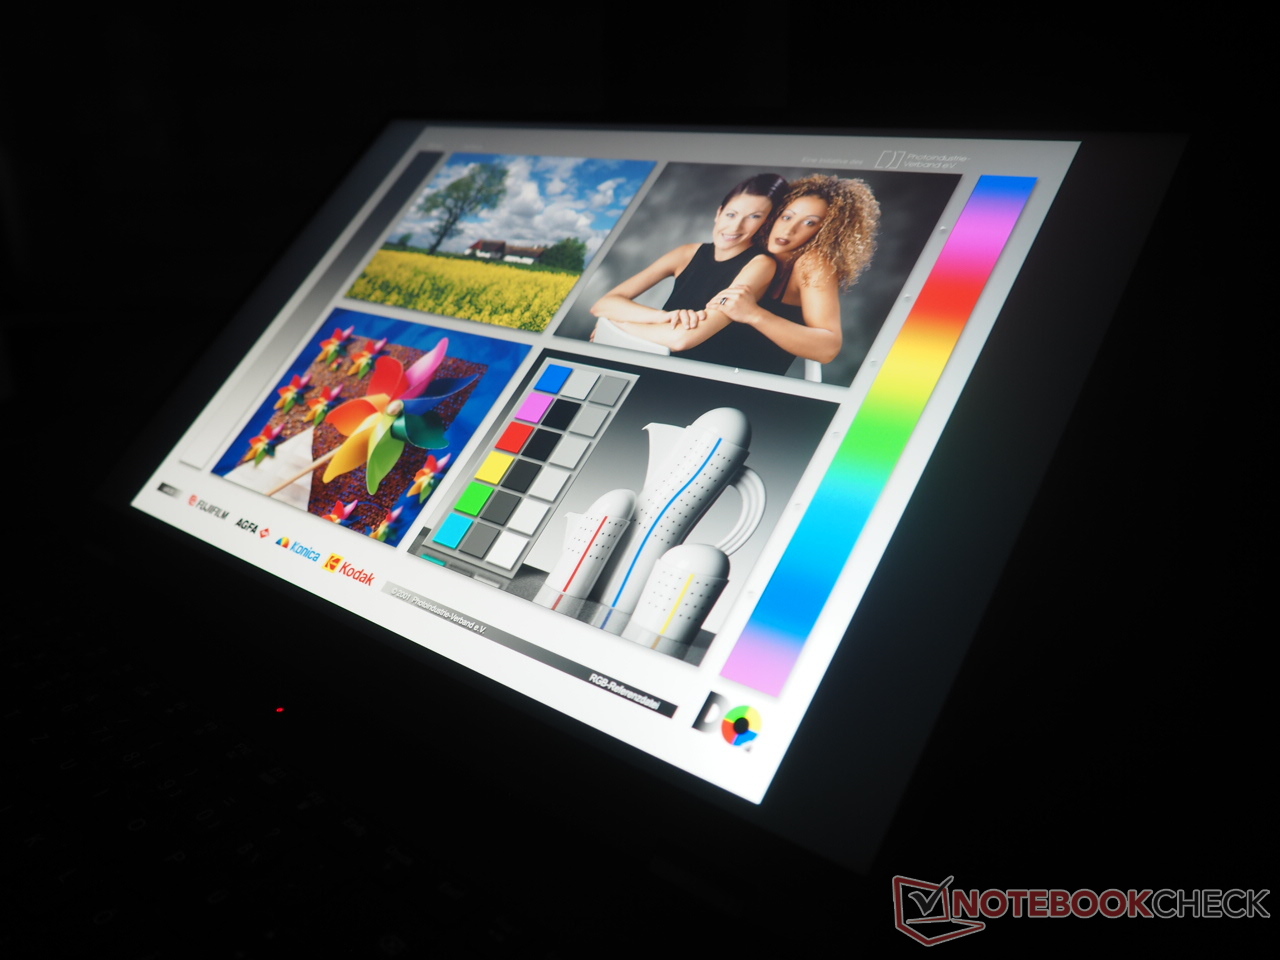
El panel WQXGA de 240 Hz del Legion 7 Pro ofrece una alta luminosidad media de 469 cd/m2, lo que debería ser un buen augurio para la visualización en exteriores. Sin embargo, la competencia también ofrece niveles de brillo similares.
| |||||||||||||||||||||||||
iluminación: 86 %
Brillo con batería: 511 cd/m²
Contraste: 1278:1 (Negro: 0.4 cd/m²)
ΔE ColorChecker Calman: 0.95 | ∀{0.5-29.43 Ø4.71}
calibrated: 0.91
ΔE Greyscale Calman: 0.6 | ∀{0.09-98 Ø4.96}
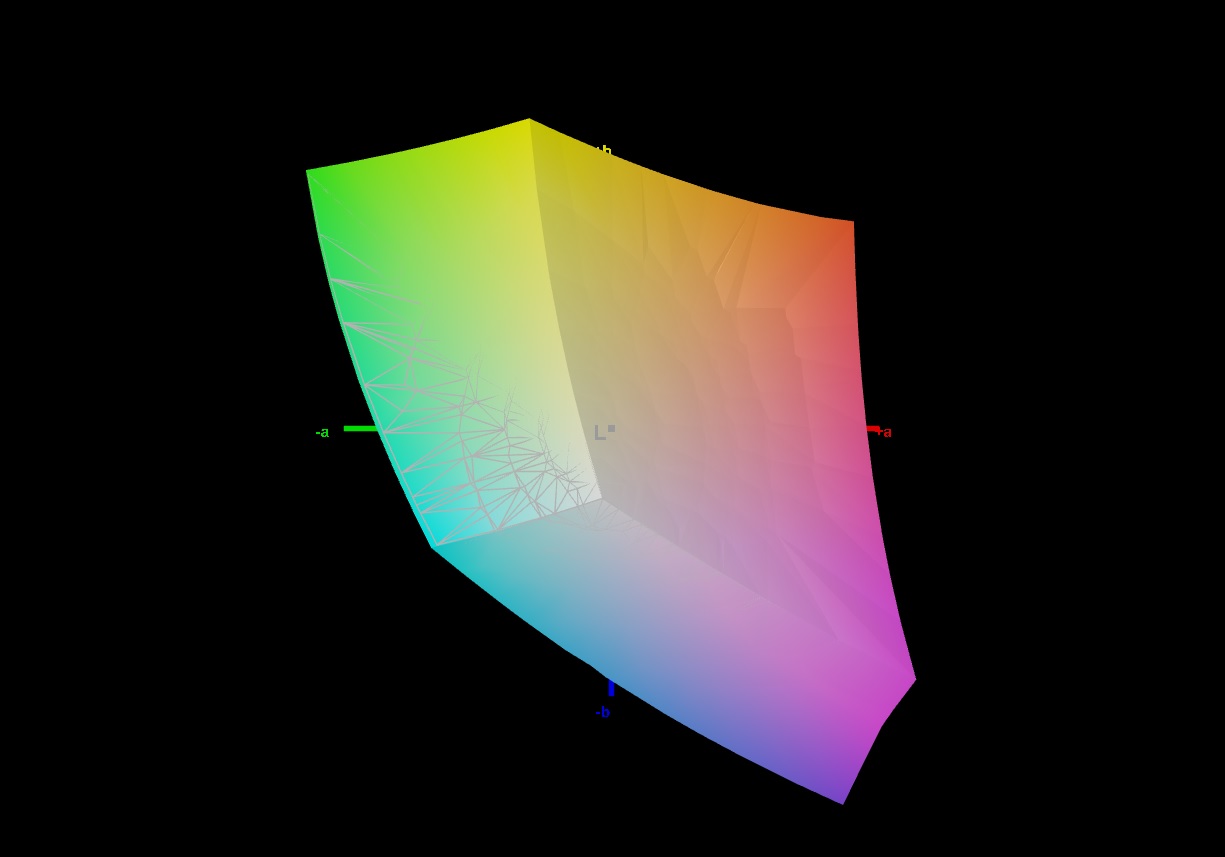
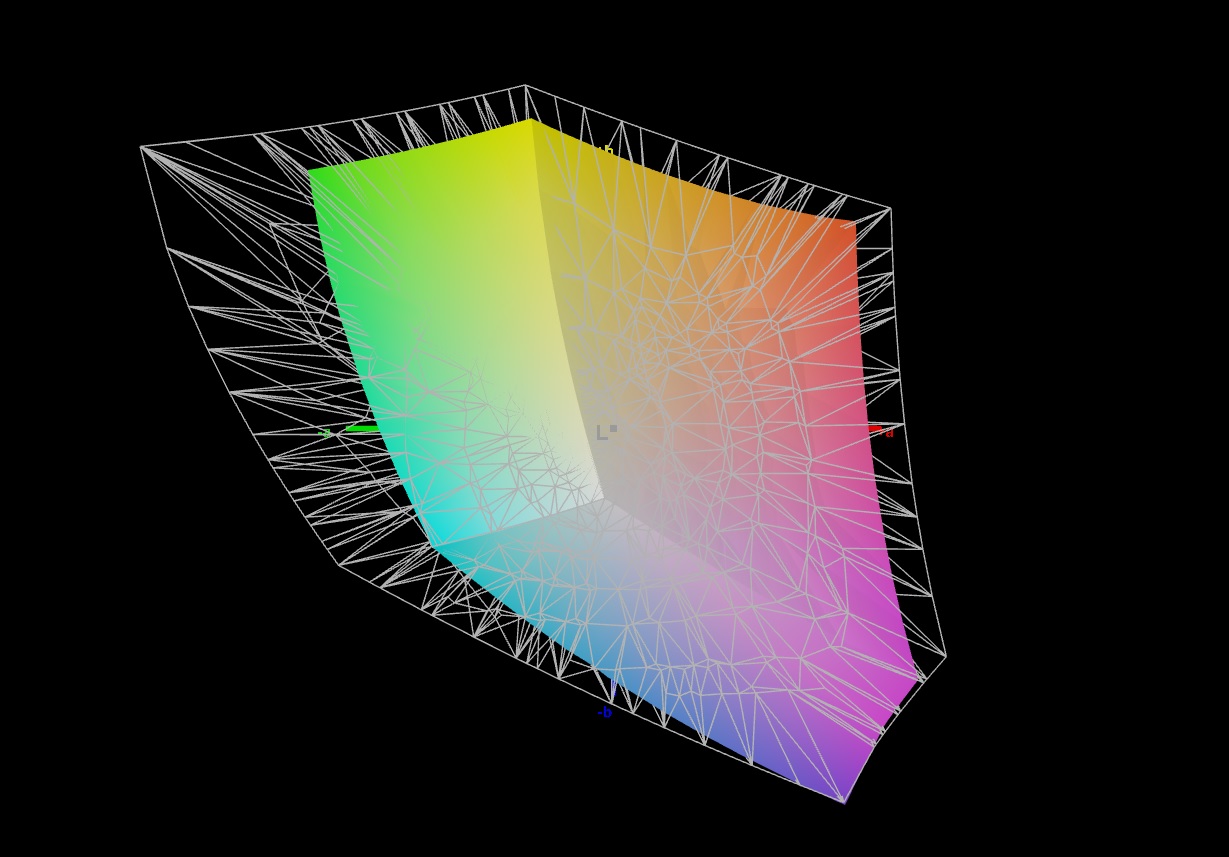
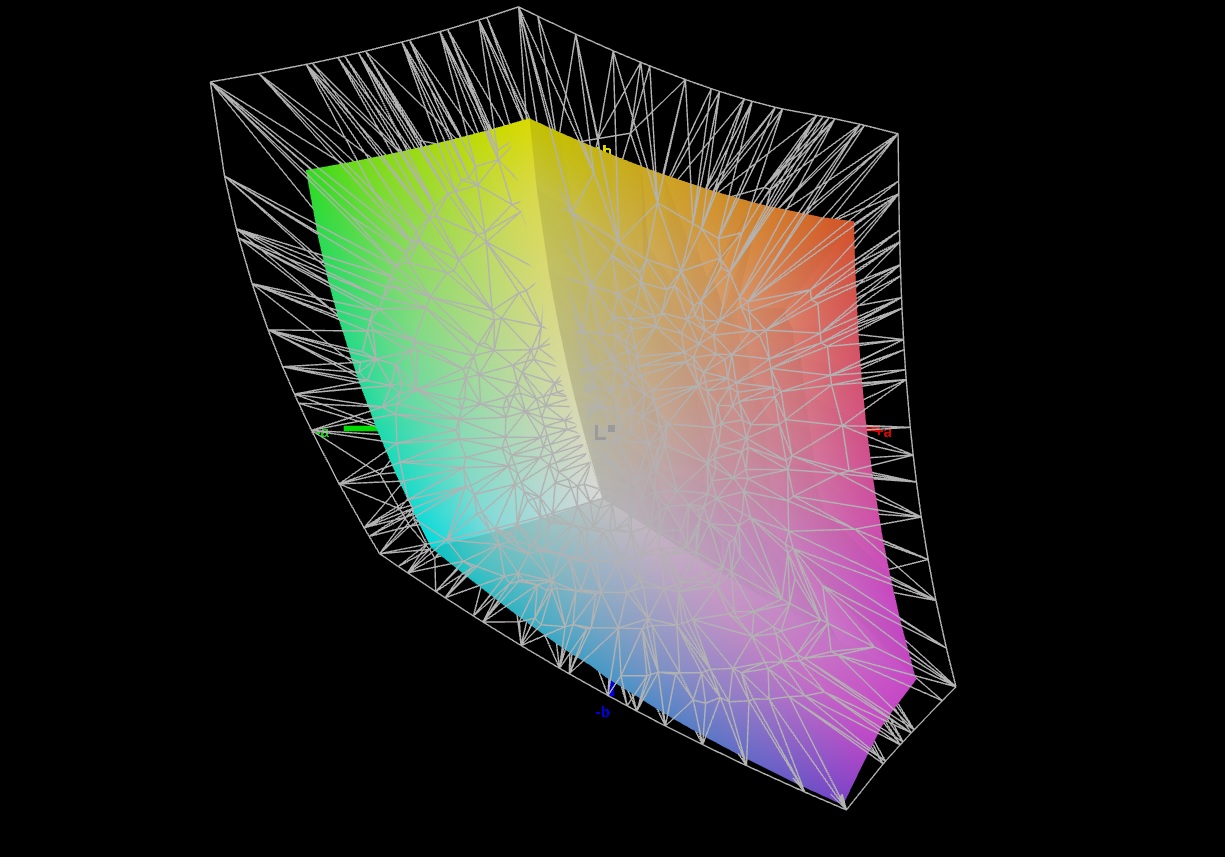
71.2% AdobeRGB 1998 (Argyll 3D)
99.7% sRGB (Argyll 3D)
69.1% Display P3 (Argyll 3D)
Gamma: 2.176
CCT: 6545 K
| Lenovo Legion Pro 7 16IRX8H MNG007DA2-3 (CSO1628), IPS, 2560x1600, 16" | Razer Blade 16 Early 2023 CSOT T3 MNG007DA4-1, IPS, 2560x1600, 16" | Lenovo Legion 7 16IAX7-82TD004SGE NE160QDM-NY1, IPS, 2560x1600, 16" | Lenovo Legion 7 16ACHg6 CSOT T3 MNG007DA1-1, IPS, 2560x1600, 16" | Lenovo Legion 7 16ARHA7 BOE CQ NE160QDM-NY1, IPS, 2560x1600, 16" | |
|---|---|---|---|---|---|
| Display | 23% | -1% | 1% | -7% | |
| Display P3 Coverage (%) | 69.1 | 98.5 43% | 69.3 0% | 70.3 2% | 63.7 -8% |
| sRGB Coverage (%) | 99.7 | 100 0% | 98.2 -2% | 99.4 0% | 95.3 -4% |
| AdobeRGB 1998 Coverage (%) | 71.2 | 89.7 26% | 70.8 -1% | 72.7 2% | 65.7 -8% |
| Response Times | -29% | 2% | -11% | -19% | |
| Response Time Grey 50% / Grey 80% * (ms) | 12.3 ? | 6.6 ? 46% | 12.6 ? -2% | 14 ? -14% | 9.2 ? 25% |
| Response Time Black / White * (ms) | 5.9 ? | 12 ? -103% | 5.6 ? 5% | 6.4 ? -8% | 9.6 ? -63% |
| PWM Frequency (Hz) | |||||
| Screen | -90% | -87% | -27% | -74% | |
| Brightness middle (cd/m²) | 511 | 456.8 -11% | 547 7% | 489 -4% | 478.8 -6% |
| Brightness (cd/m²) | 469 | 437 -7% | 523 12% | 469 0% | 477 2% |
| Brightness Distribution (%) | 86 | 83 -3% | 88 2% | 92 7% | 90 5% |
| Black Level * (cd/m²) | 0.4 | 0.35 13% | 0.44 -10% | 0.38 5% | 0.43 -8% |
| Contrast (:1) | 1278 | 1305 2% | 1243 -3% | 1287 1% | 1113 -13% |
| Colorchecker dE 2000 * | 0.95 | 3.7 -289% | 2.1 -121% | 1.45 -53% | 2.24 -136% |
| Colorchecker dE 2000 max. * | 2.07 | 6.42 -210% | 7 -238% | 2.16 -4% | 4.49 -117% |
| Colorchecker dE 2000 calibrated * | 0.91 | 0.66 27% | 0.9 1% | 1.16 -27% | 1.89 -108% |
| Greyscale dE 2000 * | 0.6 | 2.6 -333% | 3.2 -433% | 1.6 -167% | 2.3 -283% |
| Gamma | 2.176 101% | 2.3 96% | 2.23 99% | 2.197 100% | 2.25 98% |
| CCT | 6545 99% | 6108 106% | 6979 93% | 6377 102% | 6955 93% |
| Color Space (Percent of AdobeRGB 1998) (%) | 73 | ||||
| Color Space (Percent of sRGB) (%) | 94 | ||||
| Media total (Programa/Opciones) | -32% /
-57% | -29% /
-56% | -12% /
-19% | -33% /
-52% |
* ... más pequeño es mejor
La relación de contraste de 1.278:1 es similar a la del Blade 16. Sin embargo, el buque insignia de Razer ofrece una mayor cobertura de la gama de colores. El Legion Pro 7 puede manejar el 100% de sRGB pero se queda corto en lo tocante a Adobe RGB y Display P3.
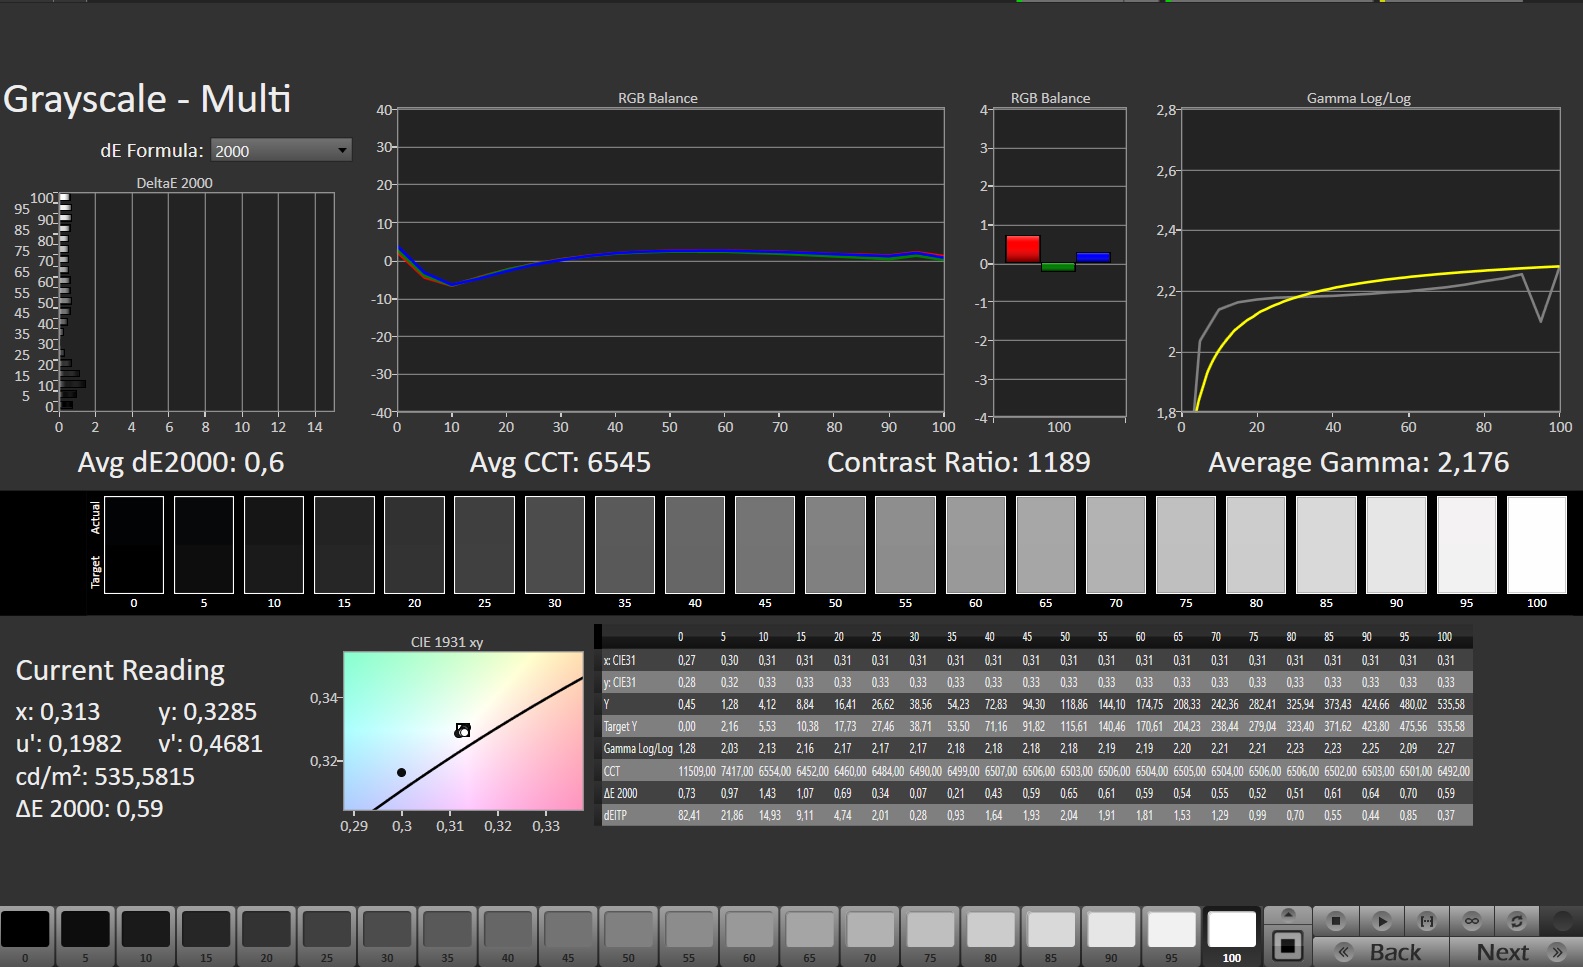
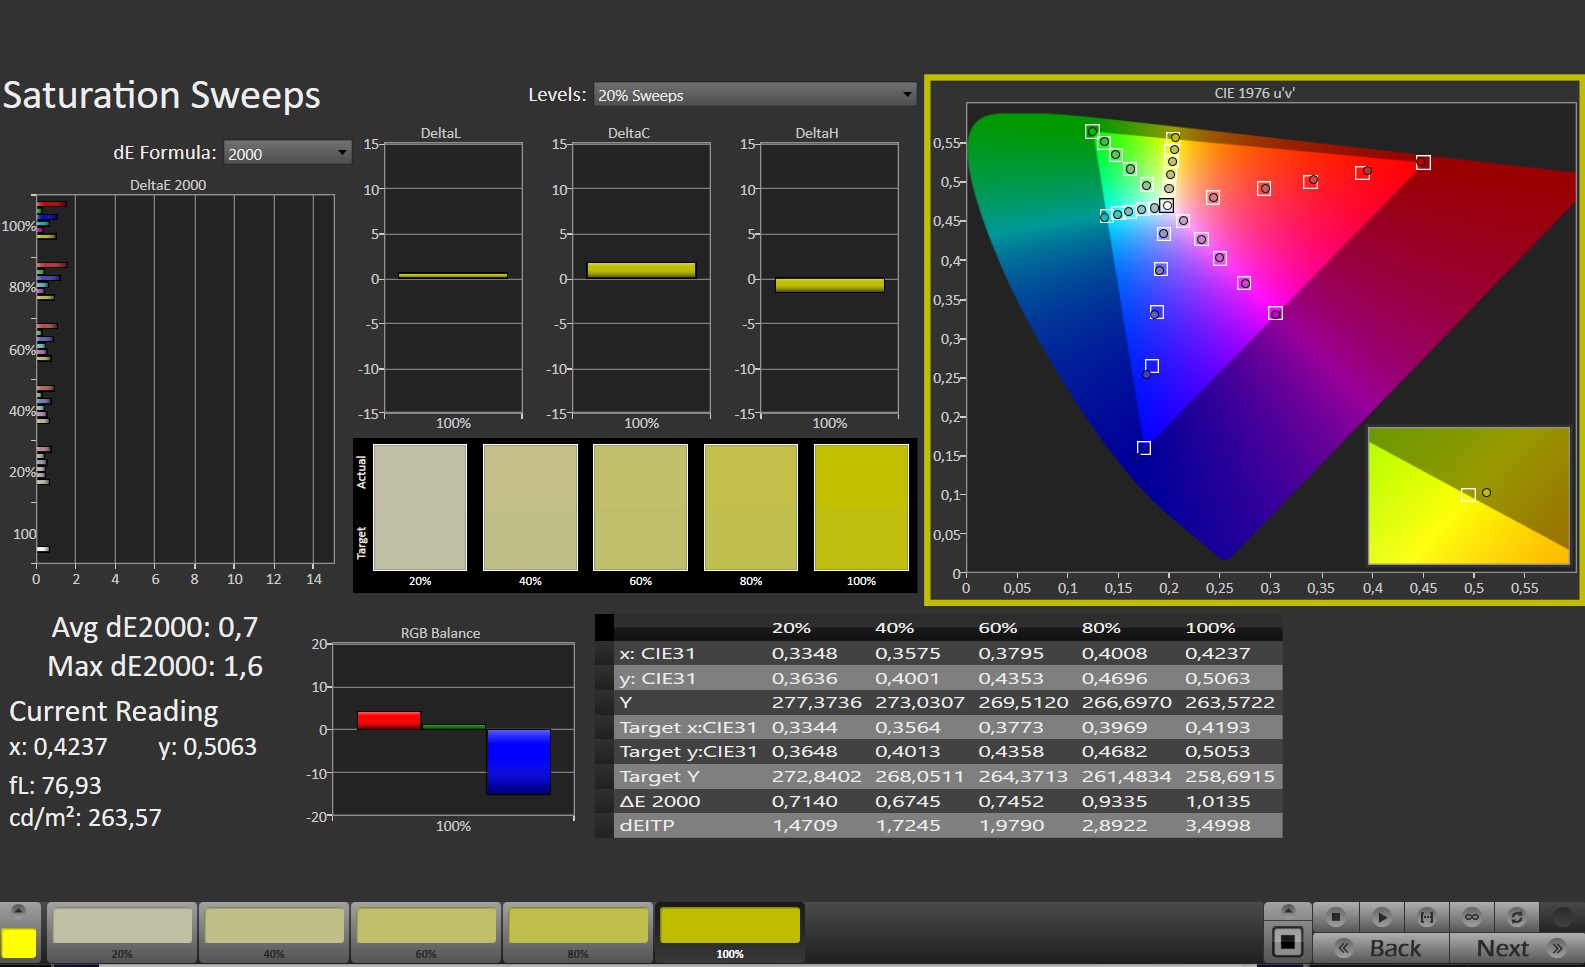

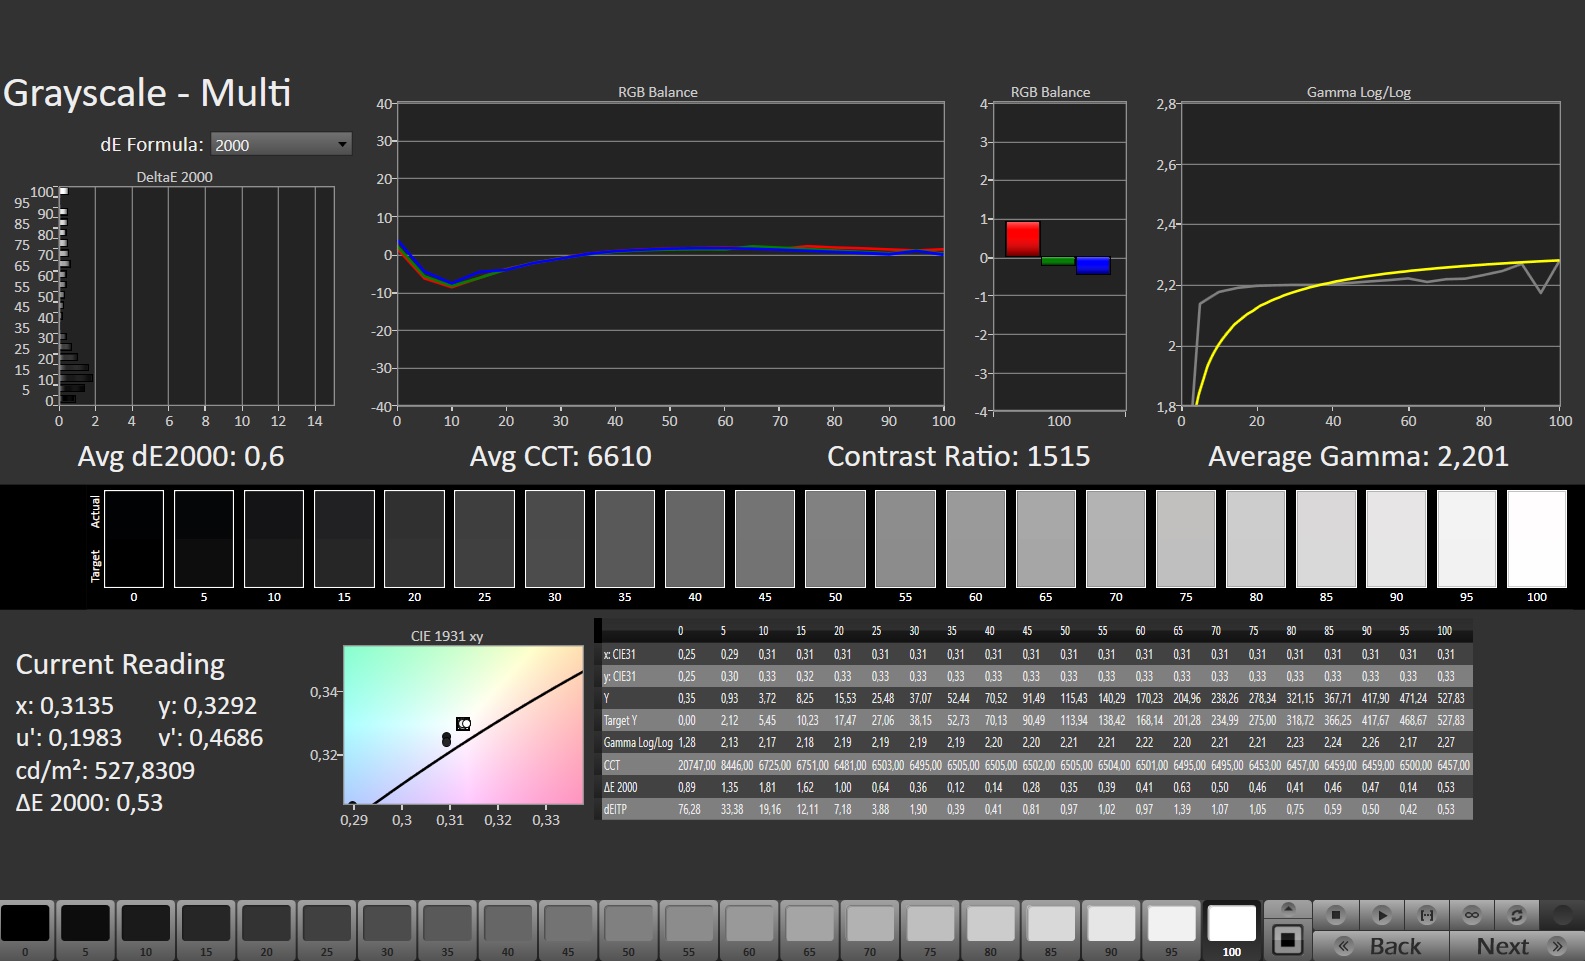
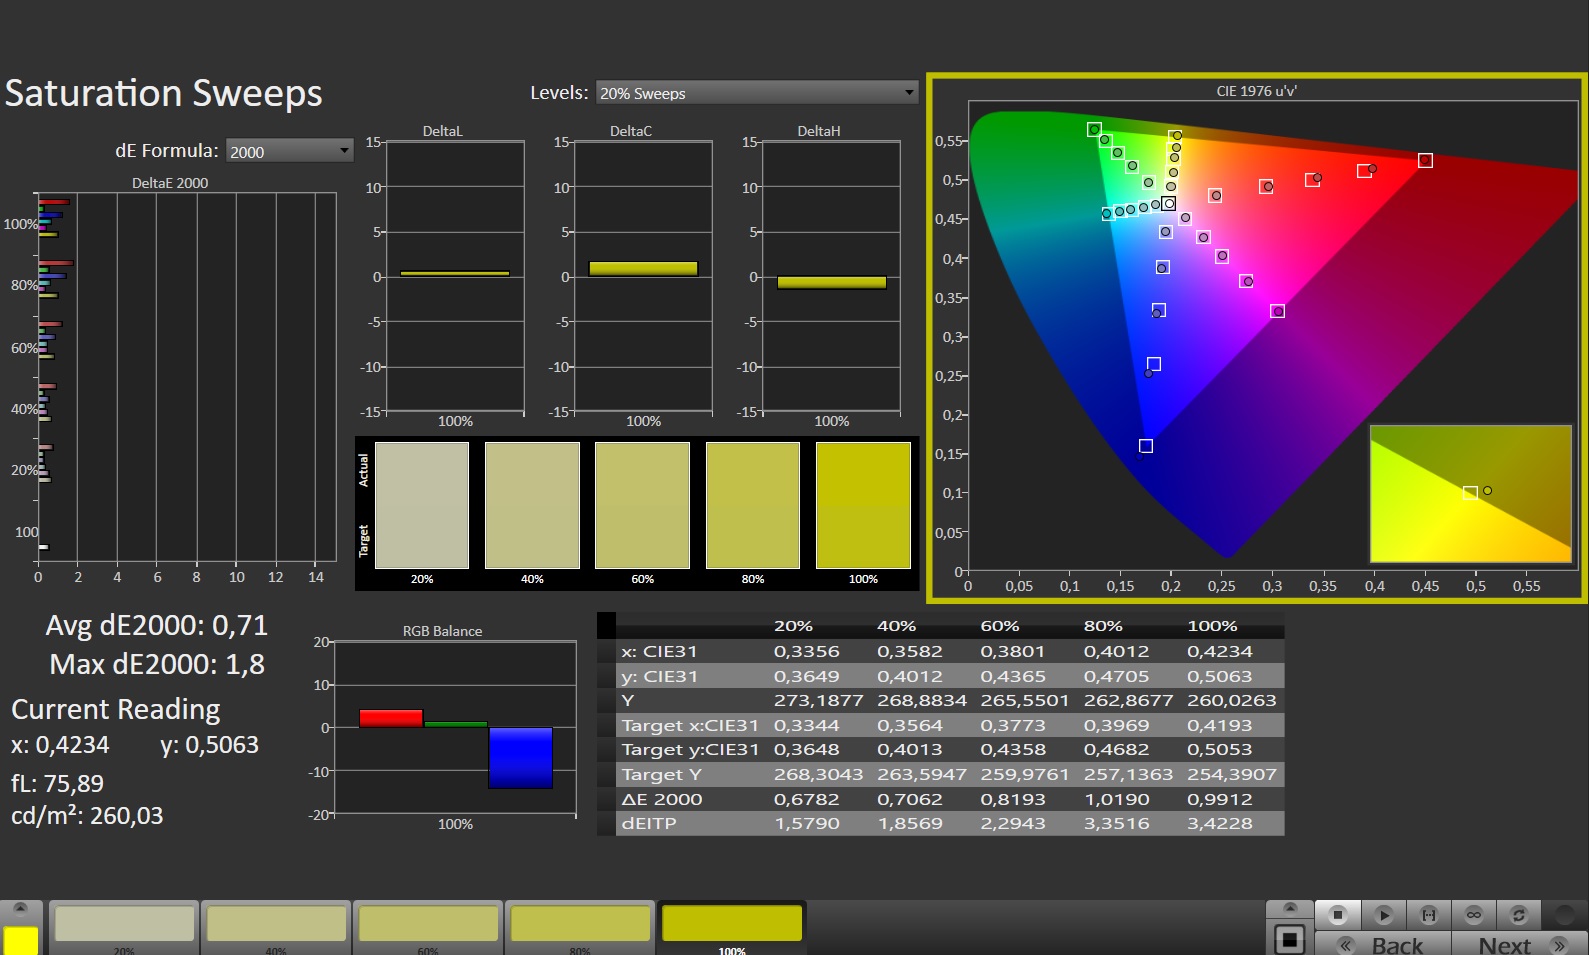
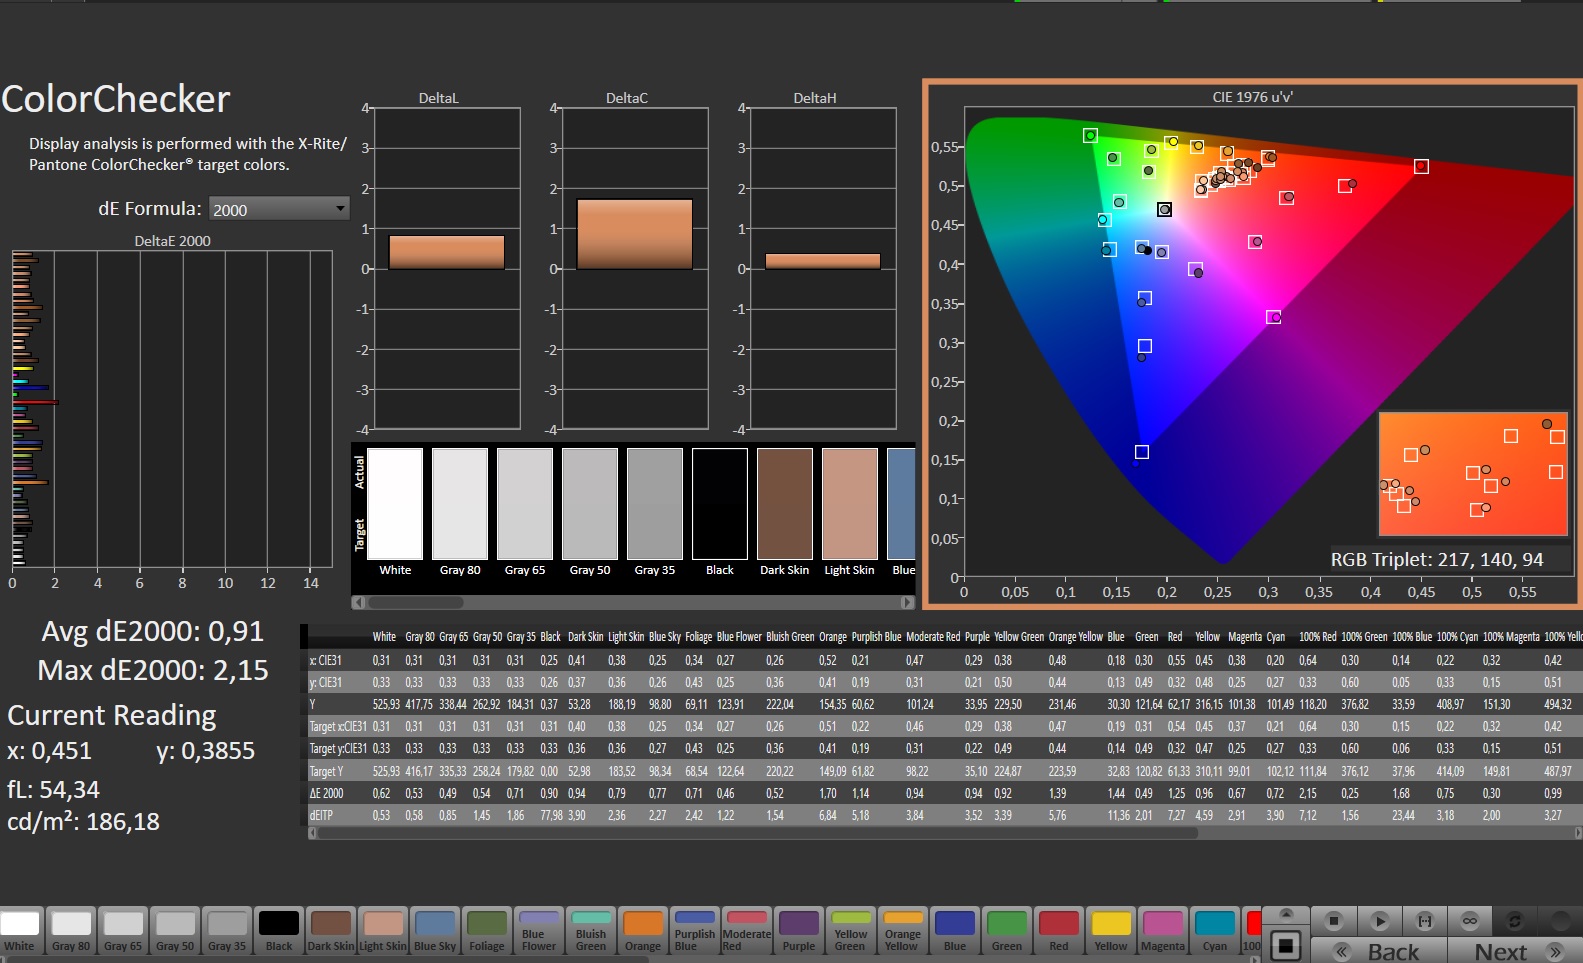
Dicho esto, la Legion Pro 7 ofrece una excelente precisión de color desde el primer momento gracias a la calibración X-Rite Pantone.
Los tiempos de respuesta (~6 ms de negro a blanco) están en la línea de lo esperado. La estabilidad del ángulo de visión suele depender del nivel de IPS, parece ser relativamente buena desde posiciones oblicuas.
Tiempos de respuesta del display
| ↔ Tiempo de respuesta de Negro a Blanco | ||
|---|---|---|
| 5.9 ms ... subida ↗ y bajada ↘ combinada | ↗ 2.2 ms subida | 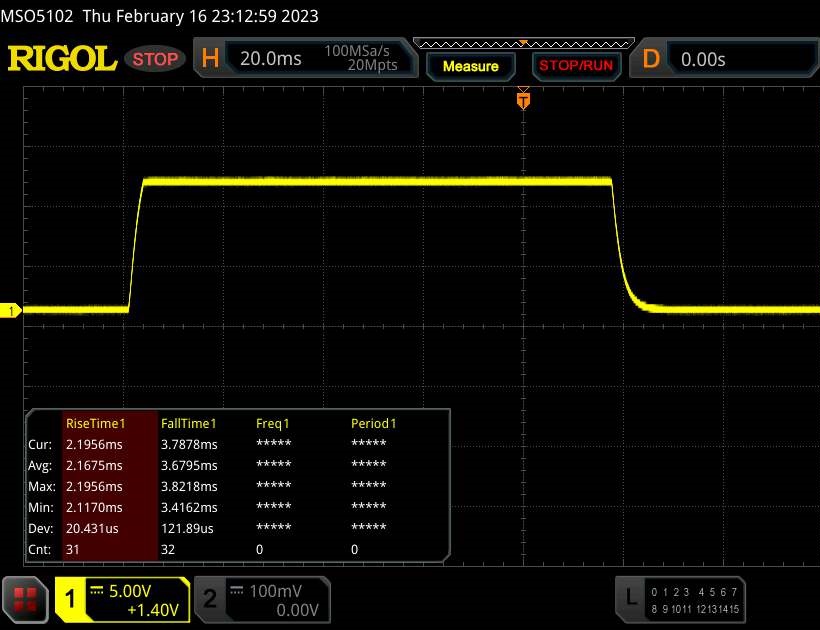 |
| ↘ 3.7 ms bajada | ||
| La pantalla mostró tiempos de respuesta muy rápidos en nuestros tests y debería ser adecuada para juegos frenéticos. En comparación, todos los dispositivos de prueba van de ##min### (mínimo) a 240 (máximo) ms. » 19 % de todos los dispositivos son mejores. Esto quiere decir que el tiempo de respuesta medido es mejor que la media (19.8 ms) de todos los dispositivos testados. | ||
| ↔ Tiempo de respuesta 50% Gris a 80% Gris | ||
| 12.3 ms ... subida ↗ y bajada ↘ combinada | ↗ 5.7 ms subida | 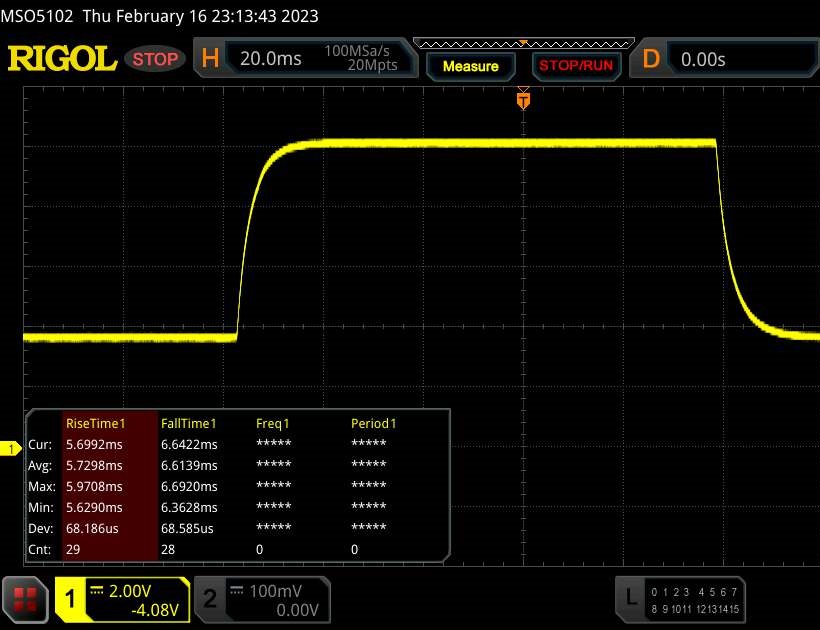 |
| ↘ 6.6 ms bajada | ||
| La pantalla mostró buenos tiempos de respuesta en nuestros tests pero podría ser demasiado lenta para los jugones competitivos. En comparación, todos los dispositivos de prueba van de ##min### (mínimo) a 636 (máximo) ms. » 26 % de todos los dispositivos son mejores. Esto quiere decir que el tiempo de respuesta medido es mejor que la media (31 ms) de todos los dispositivos testados. | ||
Parpadeo de Pantalla / PWM (Pulse-Width Modulation)
| Parpadeo de Pantalla / PWM no detectado |  | ||
Comparación: 52 % de todos los dispositivos testados no usaron PWM para atenuar el display. Si se usó, medimos una media de 7757 (mínimo: 5 - máxmo: 343500) Hz. | |||
Rendimiento: Core i9-13900HX y RTX 4080 encabezan las listas
La configuración actual sitúa al Lenovo Legion Pro 7 en la categoría de gama alta absoluta, lo que significa que tendrás que desembolsar los céntimos correspondientes (no obstante, consideramos que el nivel de precio actual es excesivo).
En cualquier caso, esta configuración ofrece potencia suficiente para navegar a través de todo tipo de cargas de trabajo en los próximos años.
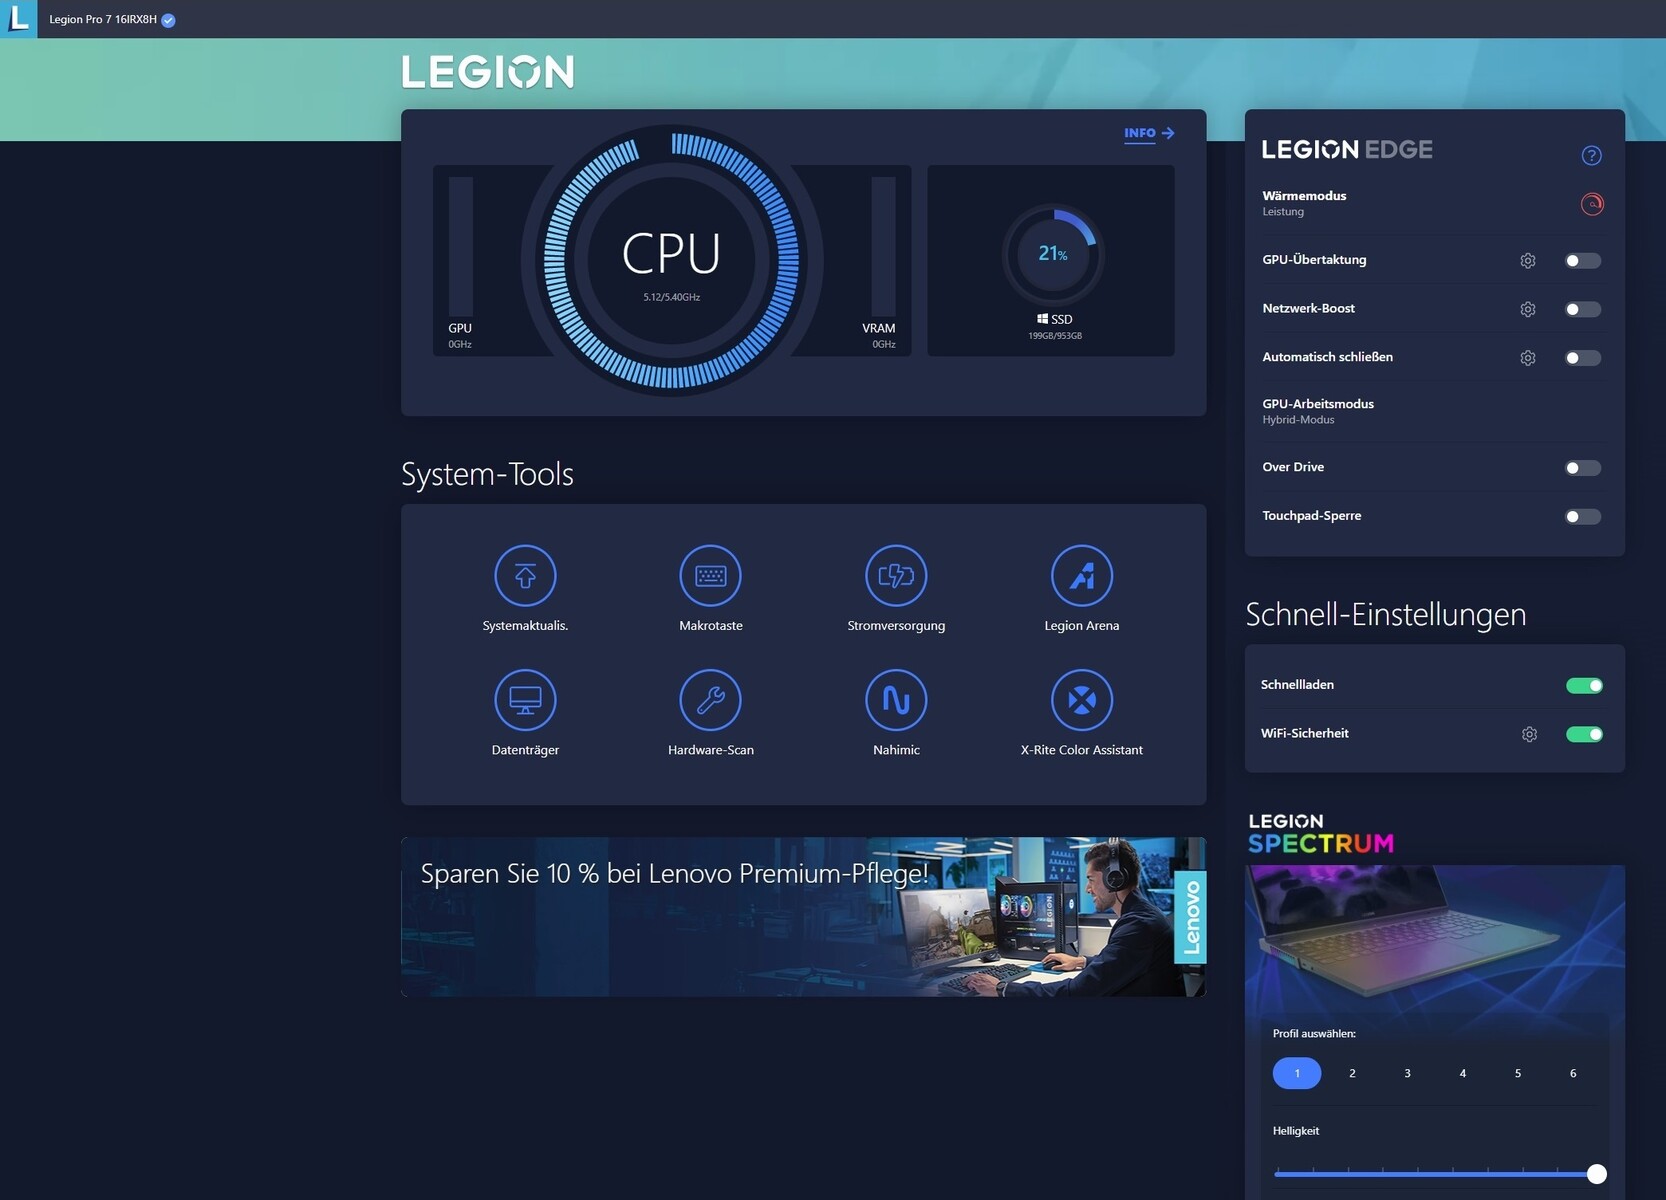
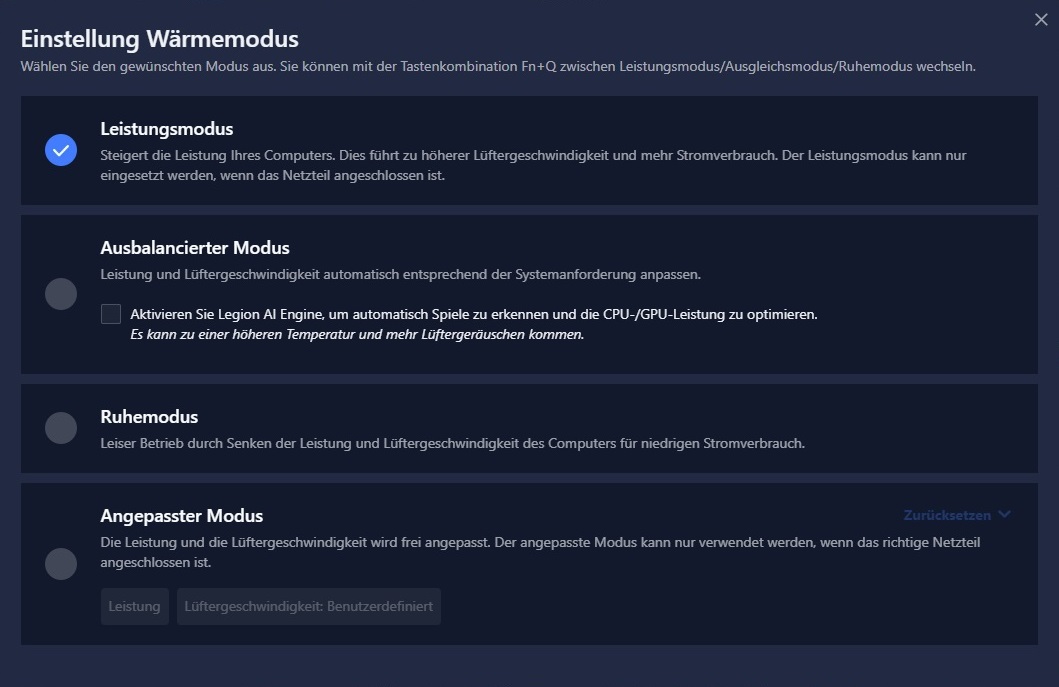
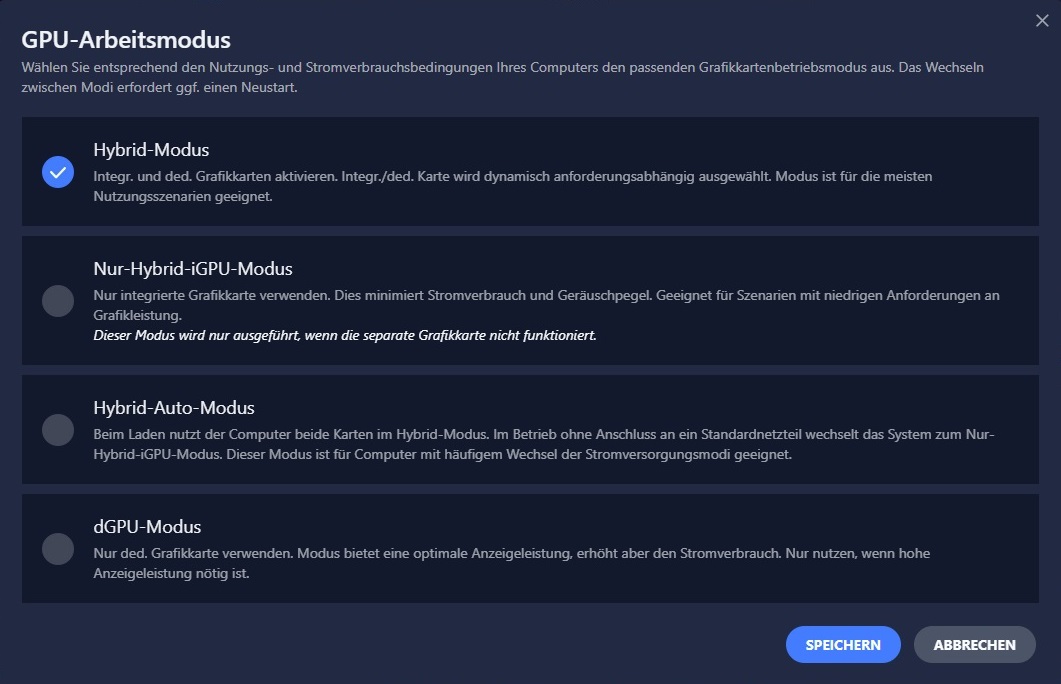
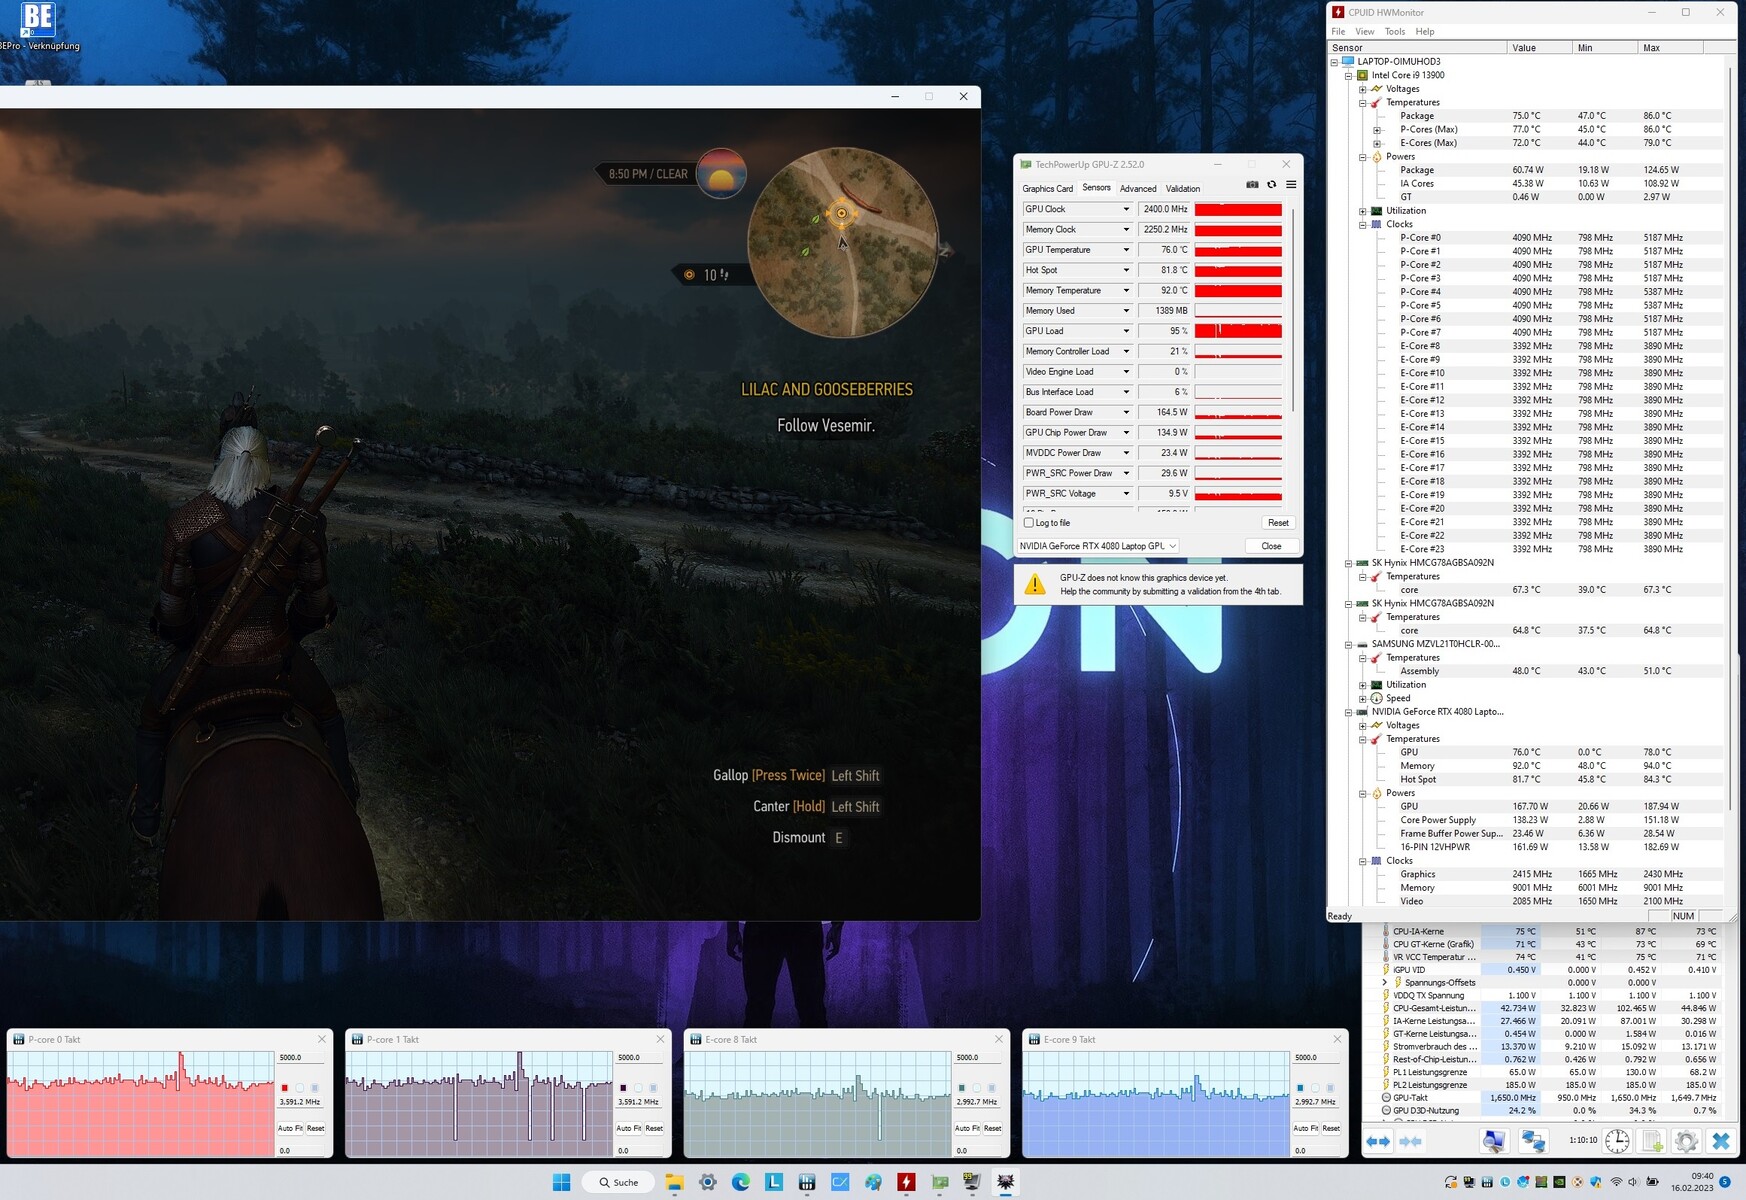
Condiciones de la prueba
La aplicación Lenovo Vantage viene preinstalada dentro de la cual puedes elegir entre varios modos de funcionamiento de rendimiento y GPU. También puedes cambiar los modos de rendimiento mediante el atajo Fn + Q.
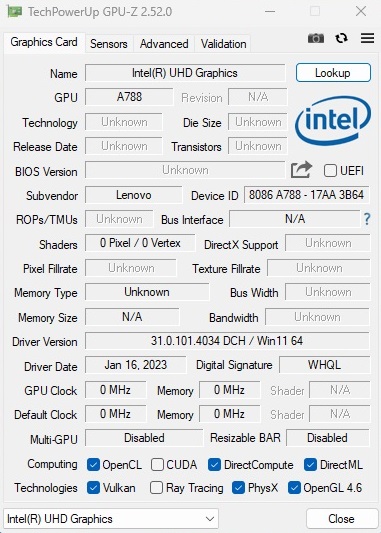
Usamos el modo Rendimiento para todas nuestras mediciones junto con la conmutación gráfica activa que cambia dinámicamente entre la iGPU y la dGPU. También está disponible un modo dGPU puro (ver capturas de pantalla más abajo).
La tabla siguiente ilustra el efecto de los distintos modos de rendimiento sobre los valores PL1/PL2 y el ruido del ventilador.
| Silencioso | Equilibrado | Rendimiento | |
| CPU PL1(HWiNFO) | 55 W | 75 W | 130 W |
| CPU PL2 (HWiNFO) | 65 W | 119 W | 185 W |
| Ruido (El Witcher 3 ) | 39 dB(A) | 43 - 46 dB(A) | 49 - 55 dB(A) |
| Rendimiento (The Witcher 3 ) | 40 fps (Locked) | 150 fps | 180 fps |
Prozessor
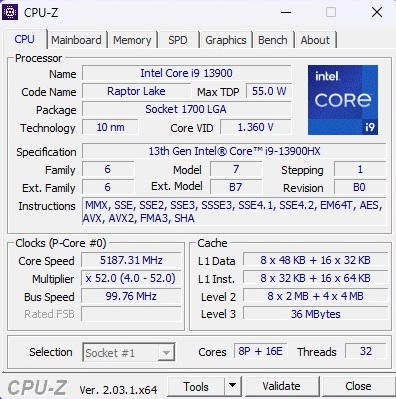
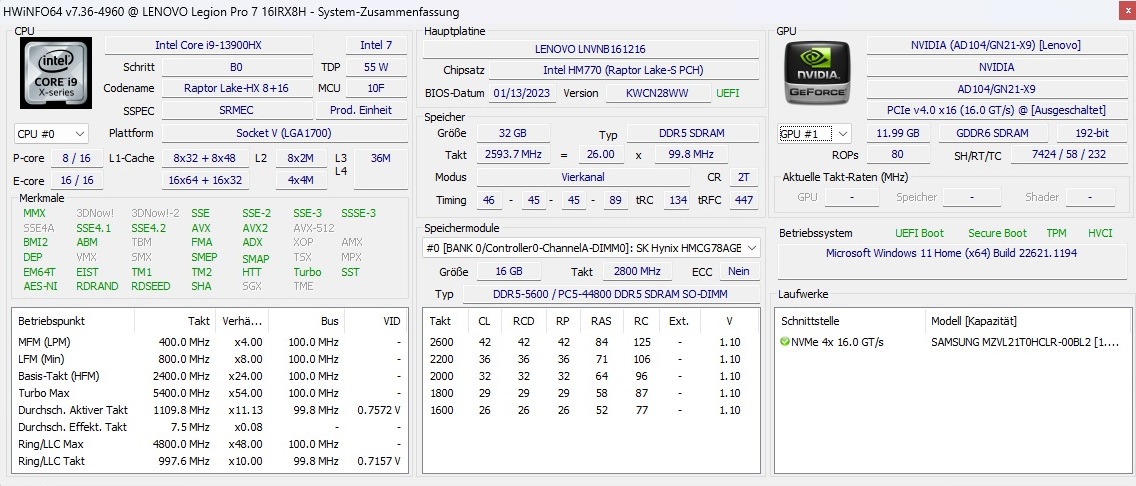
El Intel Core i9-13900HX es un monstruo del rendimiento. La pieza de 10 nm ofrece ocho núcleos de rendimiento con frecuencias de reloj de 2,2 GHz a 5,4 GHz y compatibilidad con hyperthreading junto con 16 núcleos de eficiencia con frecuencias de reloj de 1,6 GHz a 3,9 GHz sin hyperthreading, lo que da un total de 32 hilos en paralelo.
La exuberante caché L3 de 36 MB y el TDP de 55 W reafirman aún más que el Core i9-13900HX es un chip potente.
Cinebench R15 Multi Dauertest
* ... más pequeño es mejor
AIDA64: FP32 Ray-Trace | FPU Julia | CPU SHA3 | CPU Queen | FPU SinJulia | FPU Mandel | CPU AES | CPU ZLib | FP64 Ray-Trace | CPU PhotoWorxx
| Performance rating | |
| Lenovo Legion Pro 7 16IRX8H | |
| Media de la clase Gaming | |
| Medio Intel Core i9-13900HX | |
| Razer Blade 16 Early 2023 | |
| Lenovo Legion 7 16ARHA7 | |
| Lenovo Legion 7 16IAX7-82TD004SGE | |
| Lenovo Legion 7 16ACHg6 | |
| AIDA64 / FP32 Ray-Trace | |
| Media de la clase Gaming (10227 - 85542, n=105, últimos 2 años) | |
| Lenovo Legion Pro 7 16IRX8H | |
| Razer Blade 16 Early 2023 | |
| Razer Blade 16 Early 2023 | |
| Razer Blade 16 Early 2023 | |
| Medio Intel Core i9-13900HX (17589 - 27615, n=22) | |
| Lenovo Legion 7 16ARHA7 | |
| Lenovo Legion 7 16ACHg6 | |
| Lenovo Legion 7 16IAX7-82TD004SGE | |
| AIDA64 / FPU Julia | |
| Media de la clase Gaming (51376 - 238426, n=105, últimos 2 años) | |
| Lenovo Legion Pro 7 16IRX8H | |
| Razer Blade 16 Early 2023 | |
| Razer Blade 16 Early 2023 | |
| Razer Blade 16 Early 2023 | |
| Medio Intel Core i9-13900HX (88686 - 137015, n=22) | |
| Lenovo Legion 7 16ARHA7 | |
| Lenovo Legion 7 16ACHg6 | |
| Lenovo Legion 7 16IAX7-82TD004SGE | |
| AIDA64 / CPU SHA3 | |
| Lenovo Legion Pro 7 16IRX8H | |
| Media de la clase Gaming (2180 - 10115, n=105, últimos 2 años) | |
| Razer Blade 16 Early 2023 | |
| Razer Blade 16 Early 2023 | |
| Razer Blade 16 Early 2023 | |
| Medio Intel Core i9-13900HX (4362 - 7029, n=22) | |
| Lenovo Legion 7 16IAX7-82TD004SGE | |
| Lenovo Legion 7 16ARHA7 | |
| Lenovo Legion 7 16ACHg6 | |
| AIDA64 / CPU Queen | |
| Razer Blade 16 Early 2023 | |
| Razer Blade 16 Early 2023 | |
| Lenovo Legion Pro 7 16IRX8H | |
| Medio Intel Core i9-13900HX (125644 - 141385, n=22) | |
| Media de la clase Gaming (49785 - 173351, n=90, últimos 2 años) | |
| Lenovo Legion 7 16ARHA7 | |
| Lenovo Legion 7 16ACHg6 | |
| Lenovo Legion 7 16IAX7-82TD004SGE | |
| AIDA64 / FPU SinJulia | |
| Razer Blade 16 Early 2023 | |
| Razer Blade 16 Early 2023 | |
| Razer Blade 16 Early 2023 | |
| Lenovo Legion Pro 7 16IRX8H | |
| Medio Intel Core i9-13900HX (12334 - 17179, n=22) | |
| Media de la clase Gaming (4424 - 33636, n=105, últimos 2 años) | |
| Lenovo Legion 7 16IAX7-82TD004SGE | |
| Lenovo Legion 7 16ARHA7 | |
| Lenovo Legion 7 16ACHg6 | |
| AIDA64 / FPU Mandel | |
| Media de la clase Gaming (25115 - 128721, n=105, últimos 2 años) | |
| Lenovo Legion Pro 7 16IRX8H | |
| Razer Blade 16 Early 2023 | |
| Razer Blade 16 Early 2023 | |
| Razer Blade 16 Early 2023 | |
| Medio Intel Core i9-13900HX (43850 - 69202, n=22) | |
| Lenovo Legion 7 16ARHA7 | |
| Lenovo Legion 7 16ACHg6 | |
| Lenovo Legion 7 16IAX7-82TD004SGE | |
| AIDA64 / CPU AES | |
| Razer Blade 16 Early 2023 | |
| Razer Blade 16 Early 2023 | |
| Razer Blade 16 Early 2023 | |
| Lenovo Legion 7 16ARHA7 | |
| Medio Intel Core i9-13900HX (89413 - 237881, n=22) | |
| Lenovo Legion 7 16ACHg6 | |
| Lenovo Legion Pro 7 16IRX8H | |
| Lenovo Legion 7 16IAX7-82TD004SGE | |
| Media de la clase Gaming (39258 - 247074, n=105, últimos 2 años) | |
| AIDA64 / CPU ZLib | |
| Lenovo Legion Pro 7 16IRX8H | |
| Razer Blade 16 Early 2023 | |
| Razer Blade 16 Early 2023 | |
| Razer Blade 16 Early 2023 | |
| Medio Intel Core i9-13900HX (1284 - 1958, n=22) | |
| Media de la clase Gaming (574 - 2531, n=105, últimos 2 años) | |
| Lenovo Legion 7 16IAX7-82TD004SGE | |
| Lenovo Legion 7 16ARHA7 | |
| Lenovo Legion 7 16ACHg6 | |
| AIDA64 / FP64 Ray-Trace | |
| Media de la clase Gaming (5509 - 45446, n=105, últimos 2 años) | |
| Lenovo Legion Pro 7 16IRX8H | |
| Razer Blade 16 Early 2023 | |
| Razer Blade 16 Early 2023 | |
| Razer Blade 16 Early 2023 | |
| Medio Intel Core i9-13900HX (9481 - 15279, n=22) | |
| Lenovo Legion 7 16ARHA7 | |
| Lenovo Legion 7 16ACHg6 | |
| Lenovo Legion 7 16IAX7-82TD004SGE | |
| AIDA64 / CPU PhotoWorxx | |
| Razer Blade 16 Early 2023 | |
| Razer Blade 16 Early 2023 | |
| Razer Blade 16 Early 2023 | |
| Lenovo Legion Pro 7 16IRX8H | |
| Medio Intel Core i9-13900HX (42994 - 51994, n=22) | |
| Media de la clase Gaming (12271 - 89891, n=105, últimos 2 años) | |
| Lenovo Legion 7 16IAX7-82TD004SGE | |
| Lenovo Legion 7 16ARHA7 | |
| Lenovo Legion 7 16ACHg6 | |
Rendimiento del sistema
El rendimiento general del sistema está a la par con el del Blade 16. El Legion Pro 7 obtiene 7.830 puntos en PCMark 10, un resultado excelente que está un 11% por encima de la media de su clase.
CrossMark: Overall | Productivity | Creativity | Responsiveness
| PCMark 10 / Score | |
| Lenovo Legion 7 16IAX7-82TD004SGE | |
| Media de la clase Gaming (5828 - 12414, n=93, últimos 2 años) | |
| Medio Intel Core i9-13900HX, NVIDIA GeForce RTX 4080 Laptop GPU (7609 - 8549, n=3) | |
| Razer Blade 16 Early 2023 | |
| Lenovo Legion Pro 7 16IRX8H | |
| Lenovo Legion 7 16ARHA7 | |
| Lenovo Legion 7 16ACHg6 | |
| PCMark 10 / Essentials | |
| Lenovo Legion Pro 7 16IRX8H | |
| Medio Intel Core i9-13900HX, NVIDIA GeForce RTX 4080 Laptop GPU (10982 - 11824, n=3) | |
| Lenovo Legion 7 16IAX7-82TD004SGE | |
| Razer Blade 16 Early 2023 | |
| Media de la clase Gaming (8810 - 11935, n=97, últimos 2 años) | |
| Lenovo Legion 7 16ARHA7 | |
| Lenovo Legion 7 16ACHg6 | |
| PCMark 10 / Productivity | |
| Media de la clase Gaming (6845 - 25323, n=95, últimos 2 años) | |
| Lenovo Legion 7 16IAX7-82TD004SGE | |
| Lenovo Legion Pro 7 16IRX8H | |
| Medio Intel Core i9-13900HX, NVIDIA GeForce RTX 4080 Laptop GPU (9976 - 10788, n=3) | |
| Lenovo Legion 7 16ACHg6 | |
| Lenovo Legion 7 16ARHA7 | |
| Razer Blade 16 Early 2023 | |
| PCMark 10 / Digital Content Creation | |
| Razer Blade 16 Early 2023 | |
| Lenovo Legion 7 16IAX7-82TD004SGE | |
| Media de la clase Gaming (7602 - 19954, n=95, últimos 2 años) | |
| Medio Intel Core i9-13900HX, NVIDIA GeForce RTX 4080 Laptop GPU (10135 - 14720, n=3) | |
| Lenovo Legion 7 16ARHA7 | |
| Lenovo Legion 7 16ACHg6 | |
| Lenovo Legion Pro 7 16IRX8H | |
| CrossMark / Overall | |
| Lenovo Legion 7 16IAX7-82TD004SGE | |
| Medio Intel Core i9-13900HX, NVIDIA GeForce RTX 4080 Laptop GPU (1991 - 2194, n=2) | |
| Media de la clase Gaming (1366 - 2409, n=94, últimos 2 años) | |
| Lenovo Legion 7 16ARHA7 | |
| Razer Blade 16 Early 2023 | |
| CrossMark / Productivity | |
| Lenovo Legion 7 16IAX7-82TD004SGE | |
| Medio Intel Core i9-13900HX, NVIDIA GeForce RTX 4080 Laptop GPU (1828 - 2059, n=2) | |
| Media de la clase Gaming (1386 - 2254, n=94, últimos 2 años) | |
| Lenovo Legion 7 16ARHA7 | |
| Razer Blade 16 Early 2023 | |
| CrossMark / Creativity | |
| Medio Intel Core i9-13900HX, NVIDIA GeForce RTX 4080 Laptop GPU (2239 - 2411, n=2) | |
| Lenovo Legion 7 16IAX7-82TD004SGE | |
| Media de la clase Gaming (1343 - 2786, n=94, últimos 2 años) | |
| Razer Blade 16 Early 2023 | |
| Lenovo Legion 7 16ARHA7 | |
| CrossMark / Responsiveness | |
| Lenovo Legion 7 16IAX7-82TD004SGE | |
| Medio Intel Core i9-13900HX, NVIDIA GeForce RTX 4080 Laptop GPU (1808 - 1998, n=2) | |
| Media de la clase Gaming (1226 - 2334, n=94, últimos 2 años) | |
| Razer Blade 16 Early 2023 | |
| Lenovo Legion 7 16ARHA7 | |
| PCMark 10 Score | 7830 puntos | |
ayuda | ||
| AIDA64 / Memory Copy | |
| Razer Blade 16 Early 2023 | |
| Razer Blade 16 Early 2023 | |
| Razer Blade 16 Early 2023 | |
| Lenovo Legion Pro 7 16IRX8H | |
| Medio Intel Core i9-13900HX (67716 - 79193, n=22) | |
| Media de la clase Gaming (21750 - 129946, n=105, últimos 2 años) | |
| Lenovo Legion 7 16IAX7-82TD004SGE | |
| Lenovo Legion 7 16ARHA7 | |
| Lenovo Legion 7 16ACHg6 | |
| AIDA64 / Memory Read | |
| Razer Blade 16 Early 2023 | |
| Razer Blade 16 Early 2023 | |
| Razer Blade 16 Early 2023 | |
| Lenovo Legion Pro 7 16IRX8H | |
| Medio Intel Core i9-13900HX (73998 - 88462, n=22) | |
| Media de la clase Gaming (22956 - 118858, n=105, últimos 2 años) | |
| Lenovo Legion 7 16IAX7-82TD004SGE | |
| Lenovo Legion 7 16ARHA7 | |
| Lenovo Legion 7 16ACHg6 | |
| AIDA64 / Memory Write | |
| Razer Blade 16 Early 2023 | |
| Razer Blade 16 Early 2023 | |
| Razer Blade 16 Early 2023 | |
| Media de la clase Gaming (22297 - 135096, n=105, últimos 2 años) | |
| Medio Intel Core i9-13900HX (65472 - 77045, n=22) | |
| Lenovo Legion Pro 7 16IRX8H | |
| Lenovo Legion 7 16IAX7-82TD004SGE | |
| Lenovo Legion 7 16ARHA7 | |
| Lenovo Legion 7 16ACHg6 | |
| AIDA64 / Memory Latency | |
| Media de la clase Gaming (75.3 - 259, n=105, últimos 2 años) | |
| Razer Blade 16 Early 2023 | |
| Razer Blade 16 Early 2023 | |
| Razer Blade 16 Early 2023 | |
| Lenovo Legion 7 16IAX7-82TD004SGE | |
| Medio Intel Core i9-13900HX (75.3 - 91.1, n=22) | |
| Lenovo Legion 7 16ARHA7 | |
| Lenovo Legion Pro 7 16IRX8H | |
| Lenovo Legion 7 16ACHg6 | |
* ... más pequeño es mejor
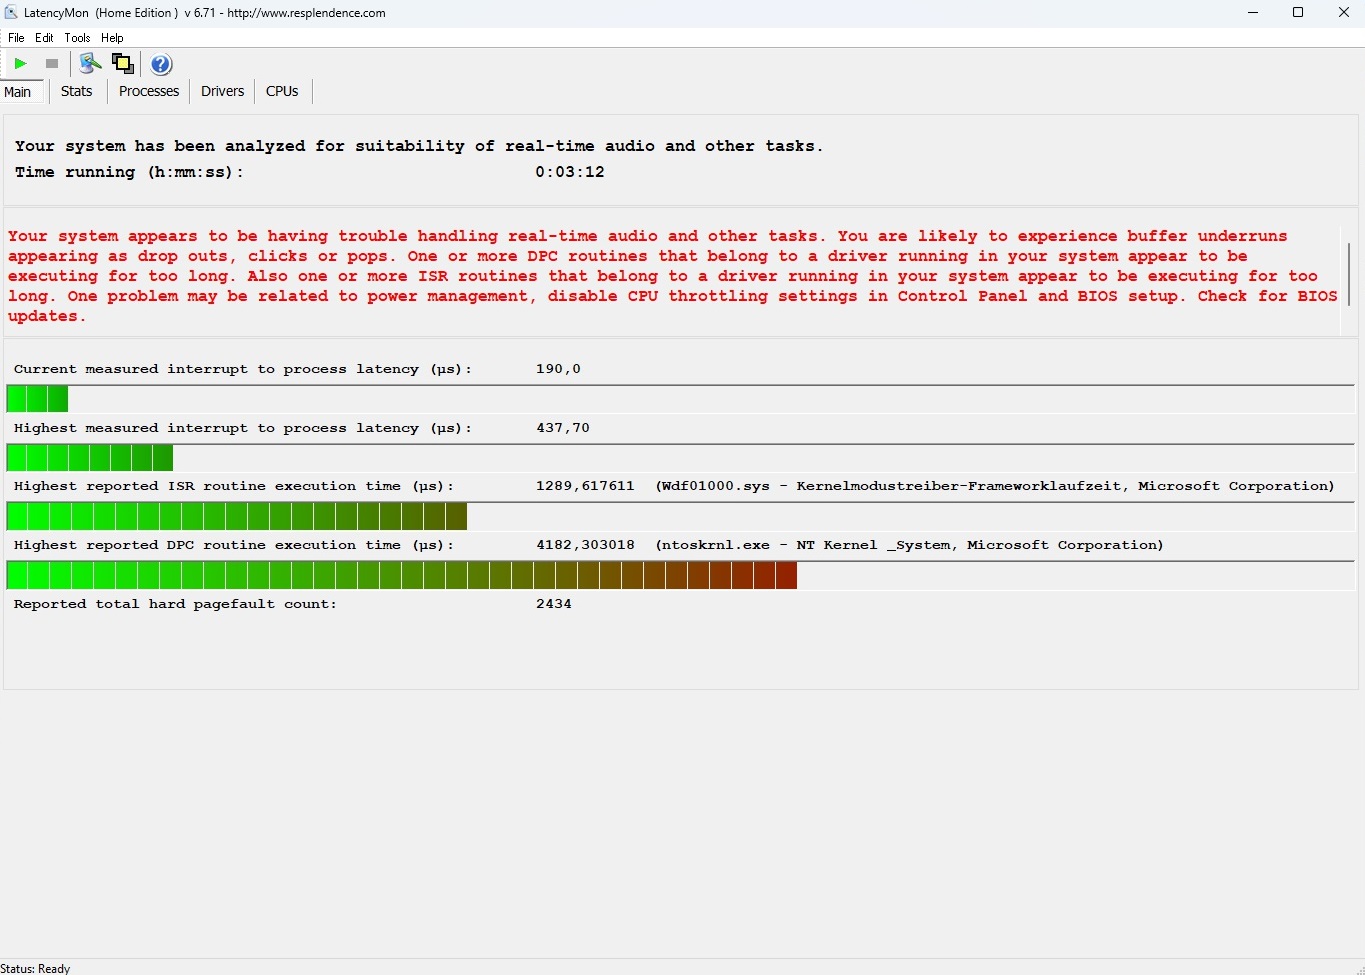
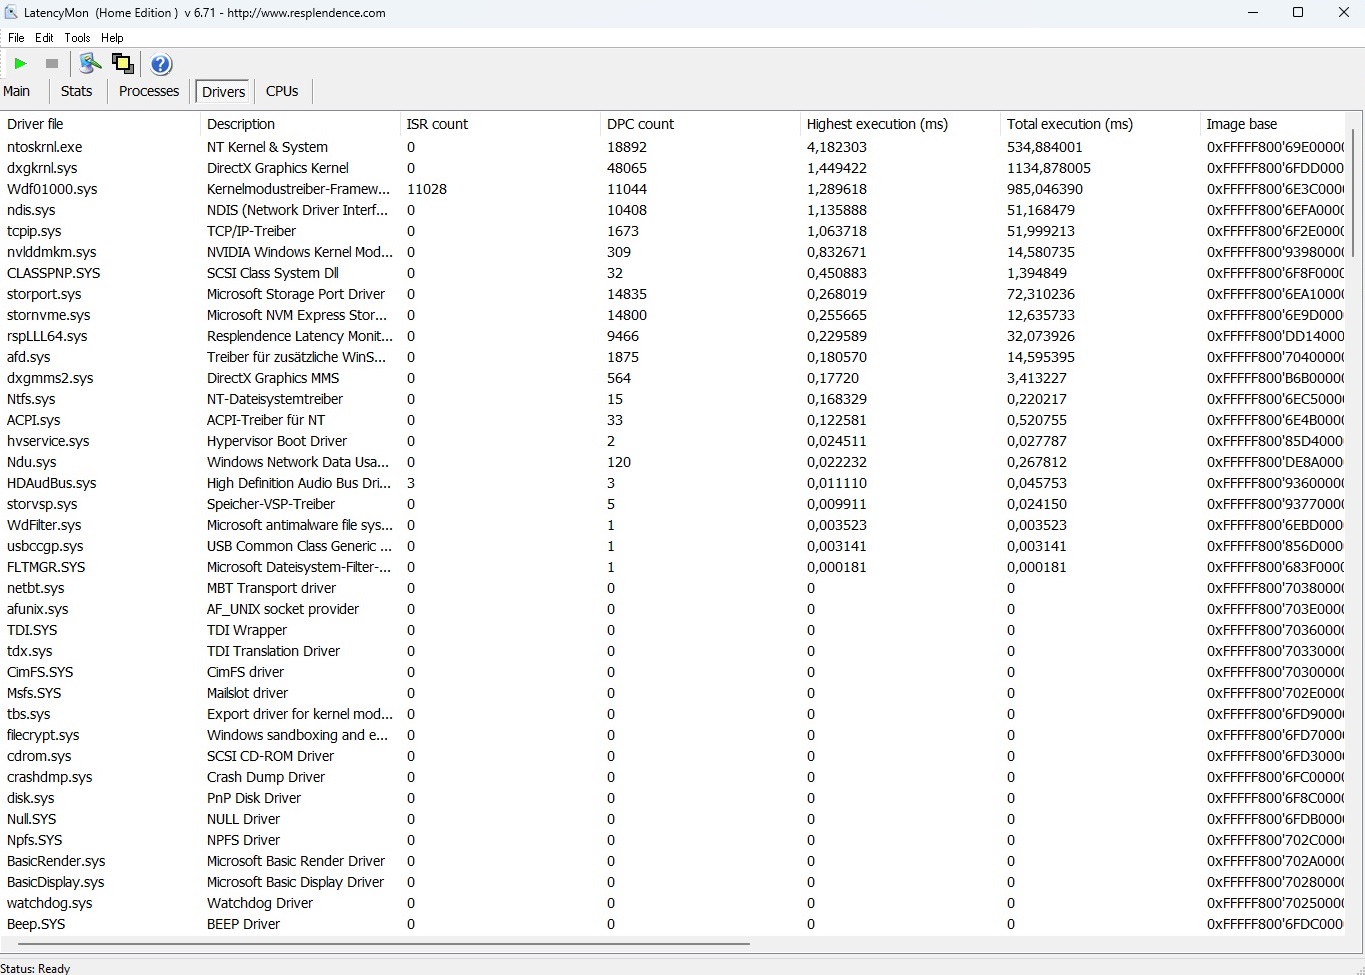
Latencia del CPD
La latencia del CPD vuelve a resultar problemática, aunque esto sólo podría ser relevante para un pequeño subconjunto de usuarios. Según LatencyMon, Legion Pro 7 no es ideal para la edición de audio en tiempo real sin un ajuste más fino.
| DPC Latencies / LatencyMon - interrupt to process latency (max), Web, Youtube, Prime95 | |
| Razer Blade 16 Early 2023 | |
| Lenovo Legion 7 16ARHA7 | |
| Lenovo Legion 7 16IAX7-82TD004SGE | |
| Lenovo Legion 7 16ACHg6 | |
| Lenovo Legion Pro 7 16IRX8H | |
* ... más pequeño es mejor
Dispositivos de almacenamiento
El Legion Pro 7 puntúa bien en el departamento de almacenamiento. Nuestro modelo de pruebas usa un veloz SSD NVMe Samsung PM9A1 de 1 TB, que da la talla en nuestras pruebas. La unidad logra una velocidad de lectura secuencial de unos 5.400 MB/s y de escritura secuencial de más de 4.000 MB/s.
Sin embargo, nuestra prueba en bucle DiskSpd demuestra fuertes fluctuaciones de rendimiento bajo carga continua. La competencia no parece verse afectada por esta fuerte ralentización.

* ... más pequeño es mejor
Disk Throttling: DiskSpd Read Loop, Queue Depth 8
Rendimiento de la GPU
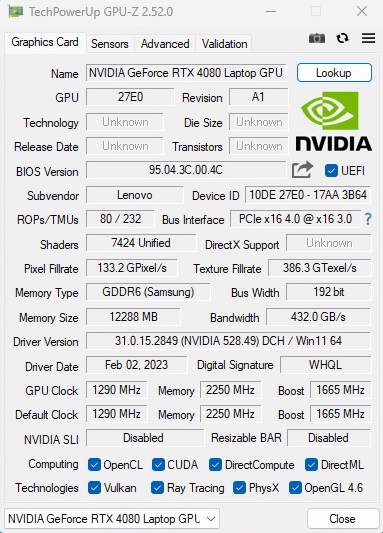
Con un TGP máximo de 175 W incluyendo Dynamic Boost, la GPU RTX 4080 para portátiles es probablemente el componente más interesante de Legion Pro 7 desde la perspectiva de un jugador. Las especificaciones de esta pieza de 4 nm de la generación Ada de Nvidia son impresionantes sobre el papel.
Un total de 7.424 núcleos CUDA prometen un rendimiento excelente. Sin embargo, 12 GB de VRAM GDDR6 en una interfaz de memoria de 192 bits no inspiran mucho en 2023 - 16 GB de VRAM habrían sido más adecuados teniendo en cuenta los requisitos de los juegos actuales y el elevado precio de venta. Puedes encontrar más información y análisis de rendimiento en nuestra sección dedicada a la Análisis de la GPU Nvidia Ada RTX 40.
A pesar de no tener una VRAM especialmente abundante, la GPU RTX 4080 Laptop limpia el suelo con la competencia de AMD y sus predecesores. Tomando todas las puntuaciones 3DMark juntas, la GPU RTX 4080 para portátiles es más de un 30% más rápida que la RTX 3080 Ti para portátiles y la RX 6850M XT de la generación anterior de Legions, que también funcionaban a un TGP alto.
| 3DMark 06 Standard Score | 59578 puntos | |
| 3DMark Vantage P Result | 111294 puntos | |
| 3DMark 11 Performance | 44468 puntos | |
| 3DMark Ice Storm Standard Score | 208555 puntos | |
| 3DMark Cloud Gate Standard Score | 66531 puntos | |
| 3DMark Fire Strike Score | 34434 puntos | |
| 3DMark Time Spy Score | 17928 puntos | |
ayuda | ||
* ... más pequeño es mejor
Rendimiento en juegos
En juegos, la GPU RTX 4080 para portátiles tiene una ventaja aún mayor, como se ve en la clasificación de rendimiento acumulado, especialmente frente a la GPU RTX 3080 para portátiles y la RX 6850M XT. Sin embargo, la CPU sí influye en los framerates a resoluciones 1080p.
Una comparación más significativa se ve cuando el raytracing está activado y a resoluciones QHD y 4K. Elegimos títulos modernos como Spider-Man Miles Morales, Resident Evil Puebloy Guardianes de la Galaxy para ilustrar las proezas de la GPU RTX 4080 para portátiles a resoluciones y ajustes más altos.
En promedio, la GPU RTX 4080 para portátiles es aproximadamente un tercio más rápida que una GPU RTX 3080 Ti para portátiles de 175 W y alrededor de un 60% más rápida que una GPU RTX 3080 para portátiles de 165 W en estas pruebas.
Puedes encontrar comparaciones de rendimiento detalladas en nuestra amplia lista de pruebas de juego Juegos de Ordenador en tarjetas gráficas portátiles .
| Performance rating - Percent | |
| Razer Blade 16 Early 2023 | |
| Lenovo Legion Pro 7 16IRX8H | |
| Media de la clase Gaming | |
| Lenovo Legion 7 16IAX7-82TD004SGE | |
| Lenovo Legion 7 16ACHg6 | |
| Lenovo Legion 7 16ARHA7 | |
| The Witcher 3 - 1920x1080 Ultra Graphics & Postprocessing (HBAO+) | |
| Media de la clase Gaming (104.7 - 240, n=7, últimos 2 años) | |
| Lenovo Legion Pro 7 16IRX8H | |
| Razer Blade 16 Early 2023 | |
| Lenovo Legion 7 16ARHA7 | |
| Lenovo Legion 7 16IAX7-82TD004SGE | |
| Lenovo Legion 7 16ACHg6 | |
| GTA V - 1920x1080 Highest AA:4xMSAA + FX AF:16x | |
| Lenovo Legion Pro 7 16IRX8H | |
| Razer Blade 16 Early 2023 | |
| Media de la clase Gaming (48.3 - 186.9, n=94, últimos 2 años) | |
| Lenovo Legion 7 16IAX7-82TD004SGE | |
| Lenovo Legion 7 16ACHg6 | |
| Lenovo Legion 7 16ARHA7 | |
| Final Fantasy XV Benchmark - 1920x1080 High Quality | |
| Lenovo Legion Pro 7 16IRX8H | |
| Razer Blade 16 Early 2023 | |
| Media de la clase Gaming (41 - 215, n=95, últimos 2 años) | |
| Lenovo Legion 7 16IAX7-82TD004SGE | |
| Lenovo Legion 7 16ARHA7 | |
| Lenovo Legion 7 16ACHg6 | |
| Strange Brigade - 1920x1080 ultra AA:ultra AF:16 | |
| Razer Blade 16 Early 2023 | |
| Lenovo Legion Pro 7 16IRX8H | |
| Media de la clase Gaming (76.3 - 458, n=87, últimos 2 años) | |
| Lenovo Legion 7 16ARHA7 | |
| Lenovo Legion 7 16ACHg6 | |
| Lenovo Legion 7 16IAX7-82TD004SGE | |
| Dota 2 Reborn - 1920x1080 ultra (3/3) best looking | |
| Razer Blade 16 Early 2023 | |
| Lenovo Legion Pro 7 16IRX8H | |
| Lenovo Legion 7 16IAX7-82TD004SGE | |
| Media de la clase Gaming (84.8 - 248, n=107, últimos 2 años) | |
| Lenovo Legion 7 16ACHg6 | |
| Lenovo Legion 7 16ARHA7 | |
| Spider-Man Miles Morales | |
| 1920x0180 Very High Preset + Ray-Tracing AA:T | |
| Lenovo Legion Pro 7 16IRX8H | |
| Medio NVIDIA GeForce RTX 4080 Laptop GPU (n=1) | |
| MSI Raider GE76 12UHS @175 W TGP | |
| XMG Neo 15 @165 W TGP | |
| 2560x1440 Very High Preset AA:T | |
| Lenovo Legion Pro 7 16IRX8H | |
| Medio NVIDIA GeForce RTX 4080 Laptop GPU (n=1) | |
| MSI Raider GE76 12UHS @175 W TGP | |
| XMG Neo 15 @165 W TGP | |
| 3840x2160 Very High Preset AA:T | |
| Lenovo Legion Pro 7 16IRX8H | |
| Medio NVIDIA GeForce RTX 4080 Laptop GPU (n=1) | |
| MSI Raider GE76 12UHS @175 W TGP | |
| XMG Neo 15 @165 W TGP | |
| Resident Evil Village | |
| 1920x1080 Ray Tracing Preset | |
| Lenovo Legion Pro 7 16IRX8H | |
| Medio NVIDIA GeForce RTX 4080 Laptop GPU (n=1) | |
| MSI GE76 Raider | |
| Lenovo Legion 7 16ACHg6 | |
| 2560x1440 Max Preset | |
| Lenovo Legion Pro 7 16IRX8H | |
| Medio NVIDIA GeForce RTX 4080 Laptop GPU (n=1) | |
| MSI GE76 Raider | |
| Lenovo Legion 7 16ACHg6 | |
| 3840x2160 Max Preset | |
| Lenovo Legion Pro 7 16IRX8H | |
| Medio NVIDIA GeForce RTX 4080 Laptop GPU (n=1) | |
| MSI GE76 Raider | |
| Guardians of the Galaxy | |
| 1920x1080 Ultra Preset + Ultra Ray-Tracing | |
| Lenovo Legion Pro 7 16IRX8H | |
| Medio NVIDIA GeForce RTX 4080 Laptop GPU (n=1) | |
| MSI GE76 Raider | |
| XMG Neo 15 @165 W TGP | |
| 2560x1440 Ultra Preset | |
| Lenovo Legion Pro 7 16IRX8H | |
| Medio NVIDIA GeForce RTX 4080 Laptop GPU (n=1) | |
| MSI GE76 Raider | |
| XMG Neo 15 @165 W TGP | |
| Lenovo Legion 7 16ARHA7 | |
| 3840x2160 Ultra Preset | |
| Lenovo Legion Pro 7 16IRX8H | |
| Medio NVIDIA GeForce RTX 4080 Laptop GPU (n=1) | |
| MSI GE76 Raider | |
| XMG Neo 15 @165 W TGP | |
A diferencia del SSD y, en menor medida, de la CPU, la GPU permanece relativamente estable durante un largo periodo de tiempo. No vemos caídas drásticas de la tasa de frames ni inconsistencias en el estrés de 60 minutos conLa Witcher 3a 1080p Ultra.
The Witcher 3 FPS Chart
| bajo | medio | alto | ultra | QHD | 4K | |
|---|---|---|---|---|---|---|
| GTA V (2015) | 187.6 | 185.1 | 145.5 | |||
| The Witcher 3 (2015) | 509 | 325 | 178 | |||
| Dota 2 Reborn (2015) | 206 | 194.4 | 179 | |||
| Final Fantasy XV Benchmark (2018) | 192.1 | 162.4 | ||||
| X-Plane 11.11 (2018) | 167.9 | 131.8 | ||||
| Far Cry 5 (2018) | 179 | 158 | 156 | |||
| Strange Brigade (2018) | 392 | 351 | 318 | |||
| Outriders (2021) | 157.7 | 151.1 | 149.9 | 130.5 | 72.3 | |
| Resident Evil Village (2021) | 239 | 239 | 239 | 193.7 | 100.5 | |
| Days Gone (2021) | 243 | 215 | 171.3 | 125.1 | 70.9 | |
| Deathloop (2021) | 130.5 | 129.4 | 123.5 | 112.8 | 60.7 | |
| Back 4 Blood (2021) | 345 | 295 | 276 | 188.4 | 112 | |
| Guardians of the Galaxy (2021) | 165 | 165 | 163 | 146 | 96 | |
| Riders Republic (2021) | 172 | 169 | 168 | 133 | 76 | |
| Farming Simulator 22 (2021) | 263 | 217 | 194.4 | 191.6 | 145.2 | |
| Halo Infinite (2021) | 239 | 209 | 197.5 | 150.7 | 88.6 | |
| God of War (2022) | 160.6 | 137.7 | 101.4 | 86.7 | 60 | |
| Rainbow Six Extraction (2022) | 278 | 272 | 221 | 172 | 88 | |
| Elden Ring (2022) | 59.9 | 59.8 | 59.8 | 59.6 | 59.3 | |
| Elex 2 (2022) | 118.7 | 118.7 | 118.5 | 114.5 | 63 | |
| Vampire Bloodhunt (2022) | 266 | 239 | 221 | 195.5 | 124.6 | |
| F1 22 (2022) | 247 | 222 | 101 | 72 | 38 | |
| The Quarry (2022) | 206 | 174.1 | 142 | 102.5 | 48.7 | |
| A Plague Tale Requiem (2022) | 110.9 | 97.7 | 86 | 63.4 | 36.1 | |
| Uncharted Legacy of Thieves Collection (2022) | 102.3 | 100.3 | 99.5 | 86.5 | 54.1 | |
| Call of Duty Modern Warfare 2 2022 (2022) | 182 | 149 | 140 | 104 | 67 | |
| Spider-Man Miles Morales (2022) | 115.2 | 103.3 | 101.3 | 94.8 | 68.5 | |
| Need for Speed Unbound (2022) | 101.2 | 94.7 | 83 | 79.7 | 63.6 | |
| High On Life (2023) | 214 | 162.8 | 148.4 | 100.6 | 42.6 | |
| The Witcher 3 v4 (2023) | 161.4 | 144 | 125.3 | 81.1 | 42.8 | |
| Dead Space Remake (2023) | 121.5 | 113.3 | 109.3 | 81.8 | 41.3 |
Emisiones: Mayor temperatura y emisiones de ruido en comparación con el Blade 16
Ruido del sistema
No es de extrañar que los componentes de gama alta que se ofrecen tengan altas emisiones de calor y, en consecuencia, mucho ruido. Aunque el Legion Pro 7 sigue siendo razonablemente silencioso en inactivo con un nivel medio de presión sonora (SPL) de 28 dB(A), las cosas se ponen inquietantemente ruidosas sin auriculares mientras se juega en modo Rendimiento, con un SPL que oscila entre 49 y 55 dB(A).
El modo Equilibrado, que no causa un gran déficit de rendimiento, da como resultado un SPL más soportable de 43 a 46 dB(A). Comparativamente, el Razer Blade 16 sigue siendo más silencioso en todas las condiciones de prueba a pesar de su menor altura y peso.
Ruido
| Ocioso |
| 26 / 28 / 34 dB(A) |
| Carga |
| 47 / 56 dB(A) |
 | ||
30 dB silencioso 40 dB(A) audible 50 dB(A) ruidosamente alto |
||
min: | ||
| Lenovo Legion Pro 7 16IRX8H i9-13900HX, GeForce RTX 4080 Laptop GPU | Razer Blade 16 Early 2023 i9-13950HX, GeForce RTX 4080 Laptop GPU | Lenovo Legion 7 16IAX7-82TD004SGE i9-12900HX, GeForce RTX 3080 Ti Laptop GPU | Lenovo Legion 7 16ACHg6 R9 5900HX, GeForce RTX 3080 Laptop GPU | Lenovo Legion 7 16ARHA7 R9 6900HX, Radeon RX 6850M XT | |
|---|---|---|---|---|---|
| Noise | 14% | 3% | 3% | 16% | |
| apagado / medio ambiente * (dB) | 24 | 23 4% | 24.5 -2% | 26 -8% | 22.8 5% |
| Idle Minimum * (dB) | 26 | 23 12% | 24.5 6% | 26 -0% | 23 12% |
| Idle Average * (dB) | 28 | 23 18% | 30 -7% | 30 -7% | 23 18% |
| Idle Maximum * (dB) | 34 | 23.6 31% | 32.5 4% | 35 -3% | 23 32% |
| Load Average * (dB) | 47 | 39 17% | 43.9 7% | 40 15% | 26.8 43% |
| Witcher 3 ultra * (dB) | 55 | 51.6 6% | 48.8 11% | 46 16% | 54.3 1% |
| Load Maximum * (dB) | 56 | 51.3 8% | 54.2 3% | 50 11% | 54.2 3% |
* ... más pequeño es mejor
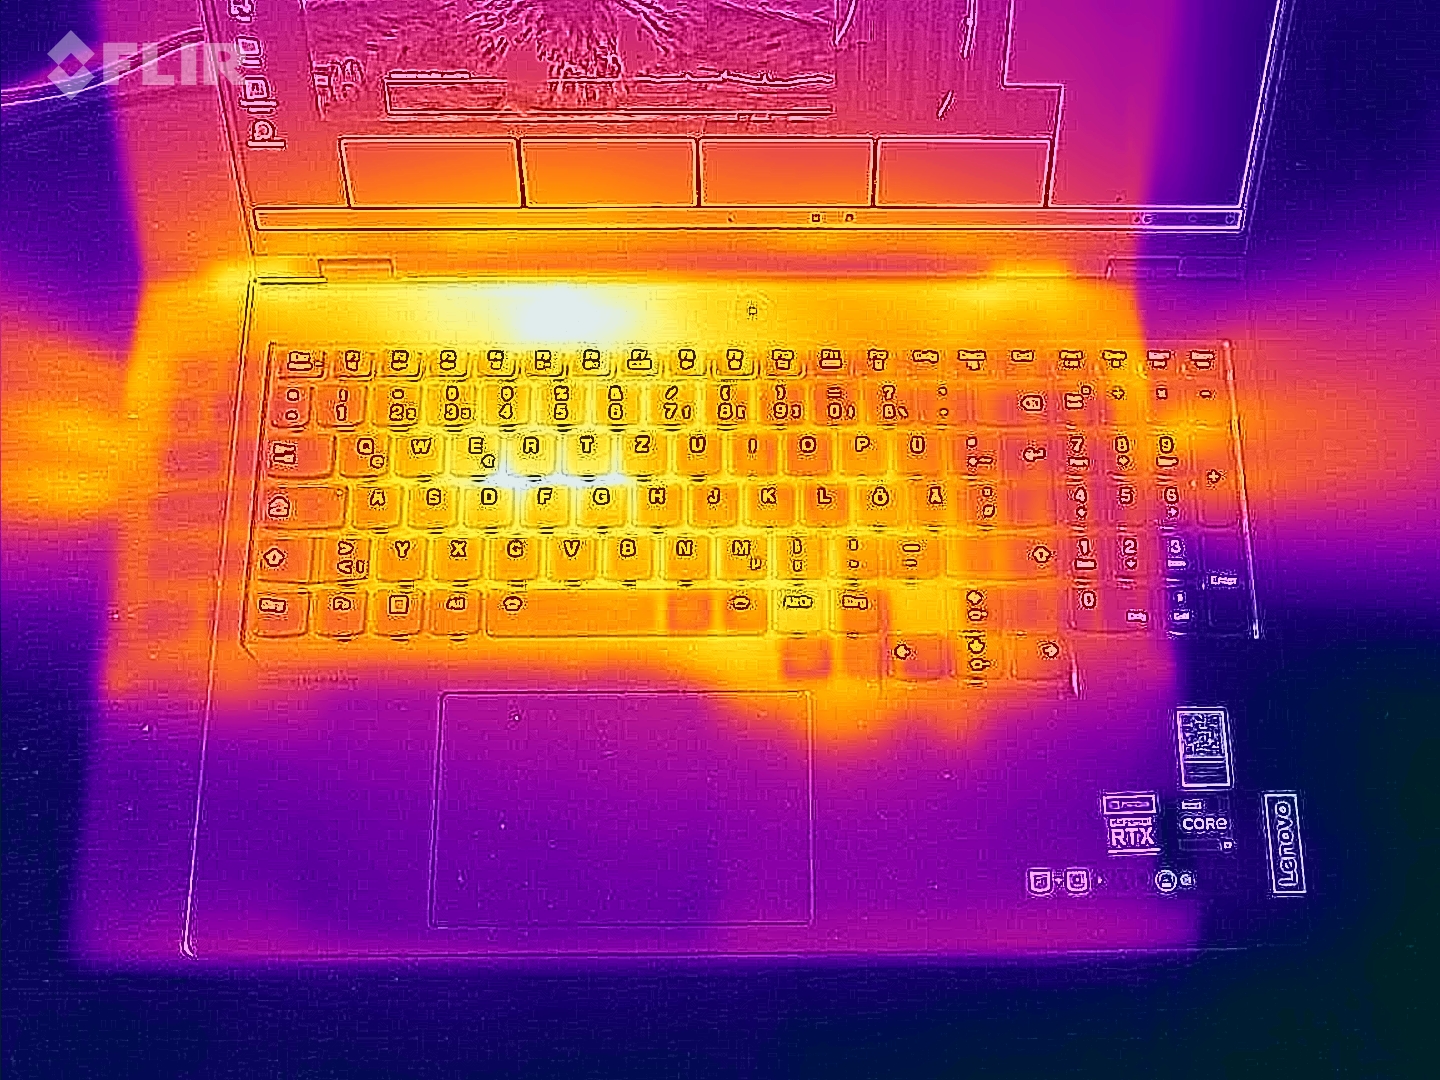
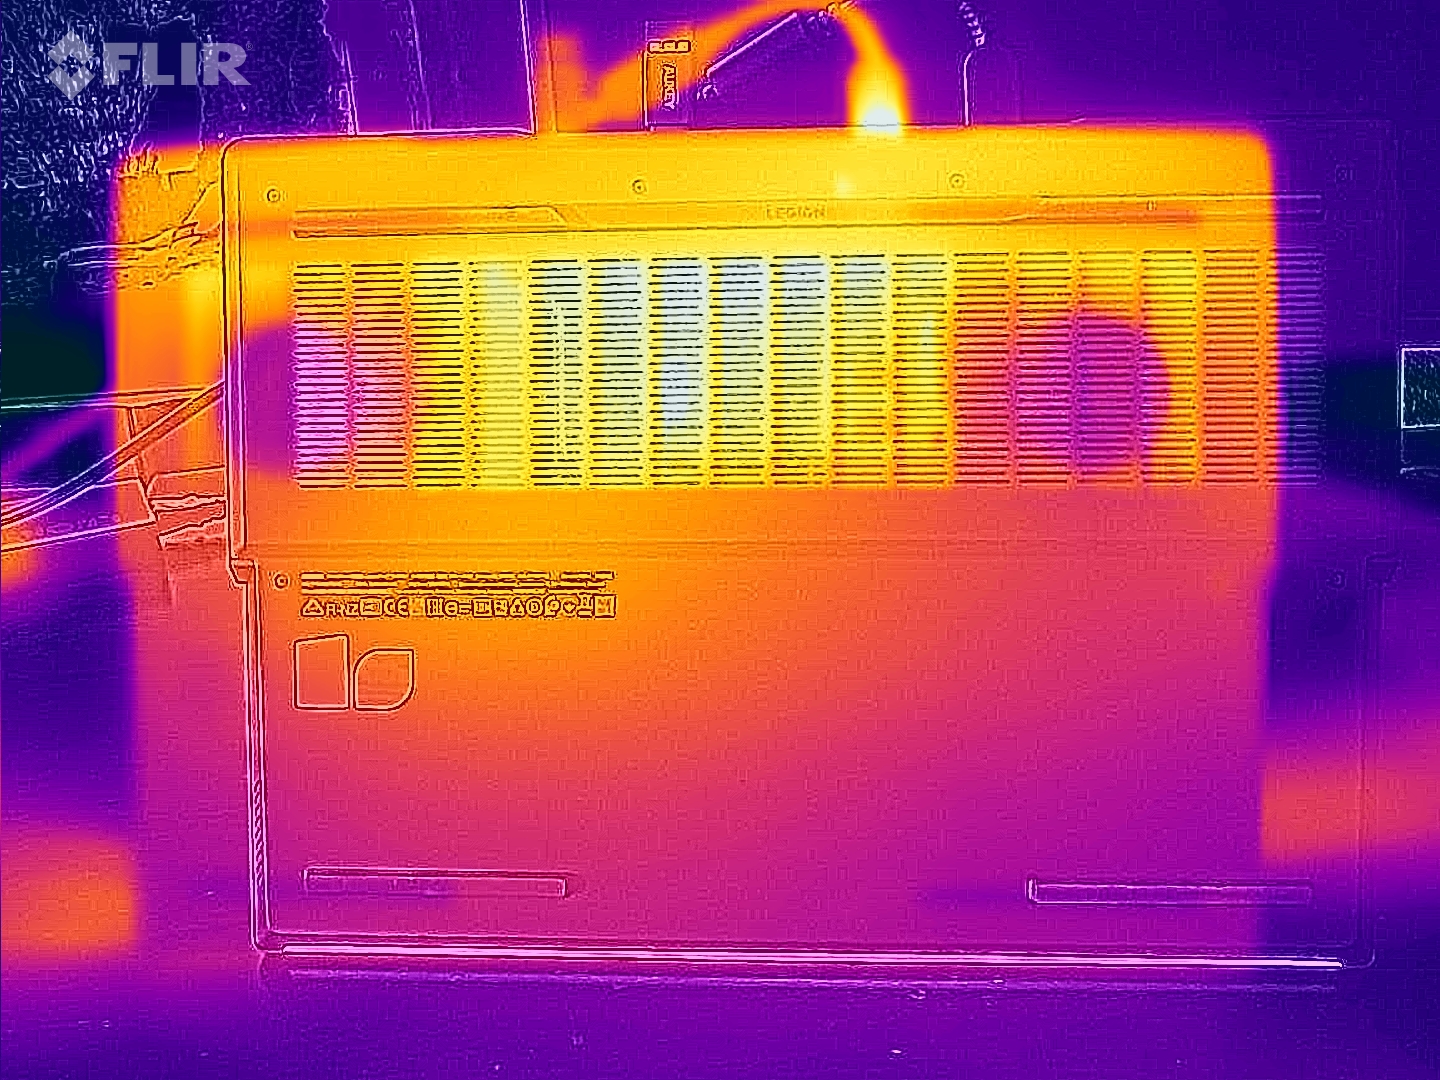
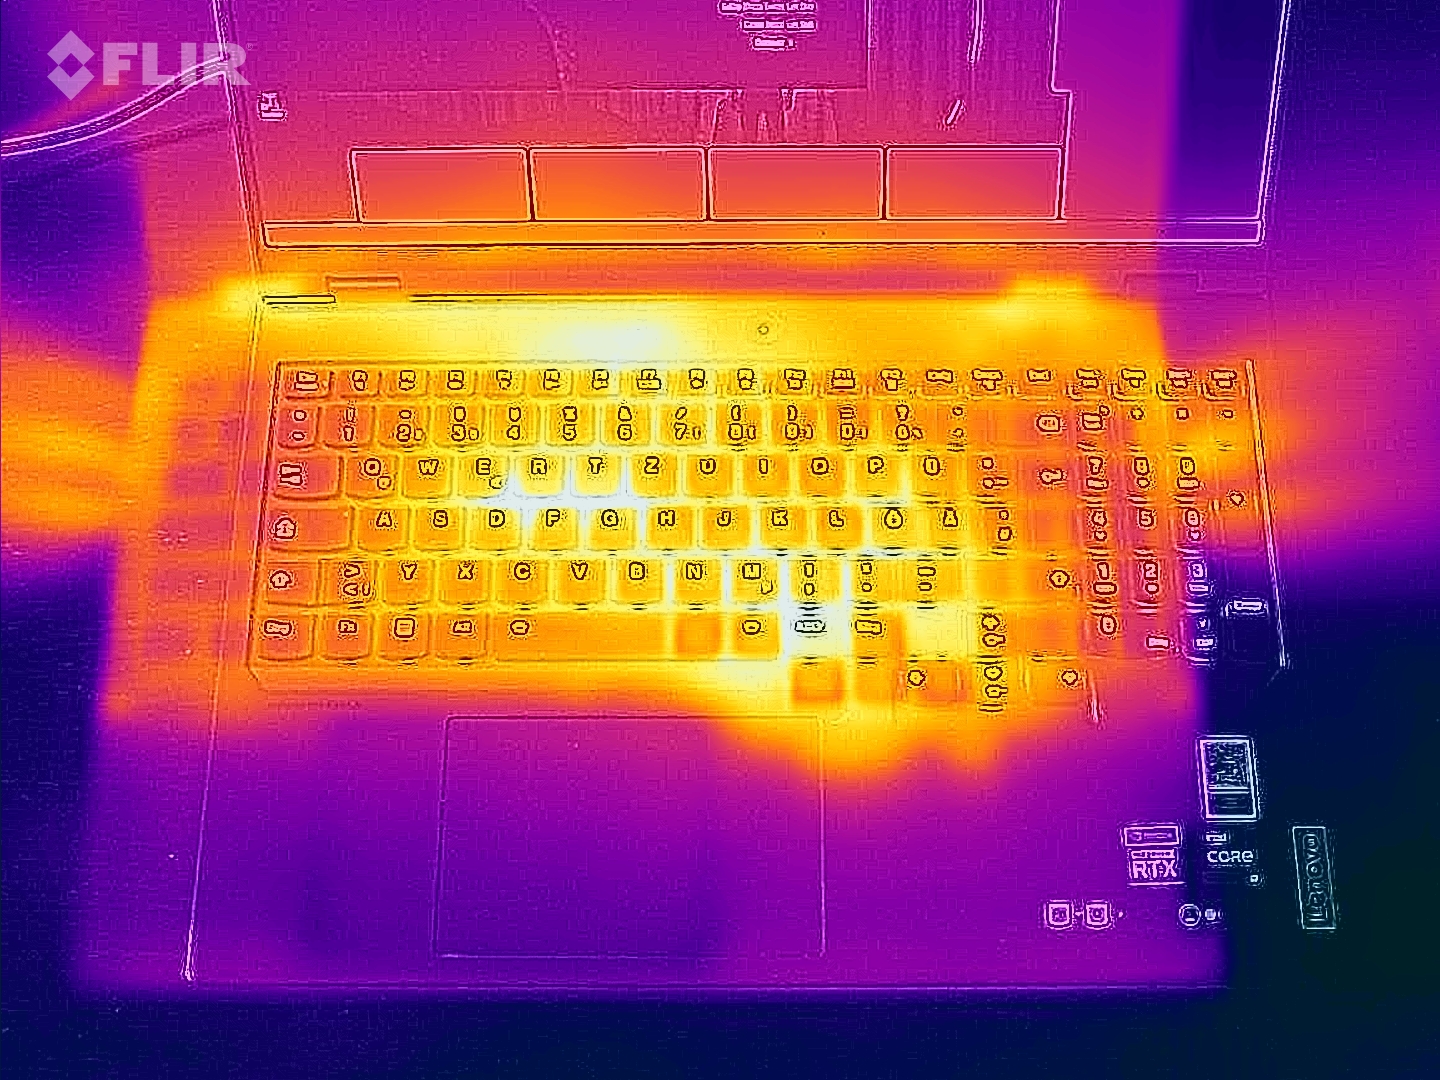
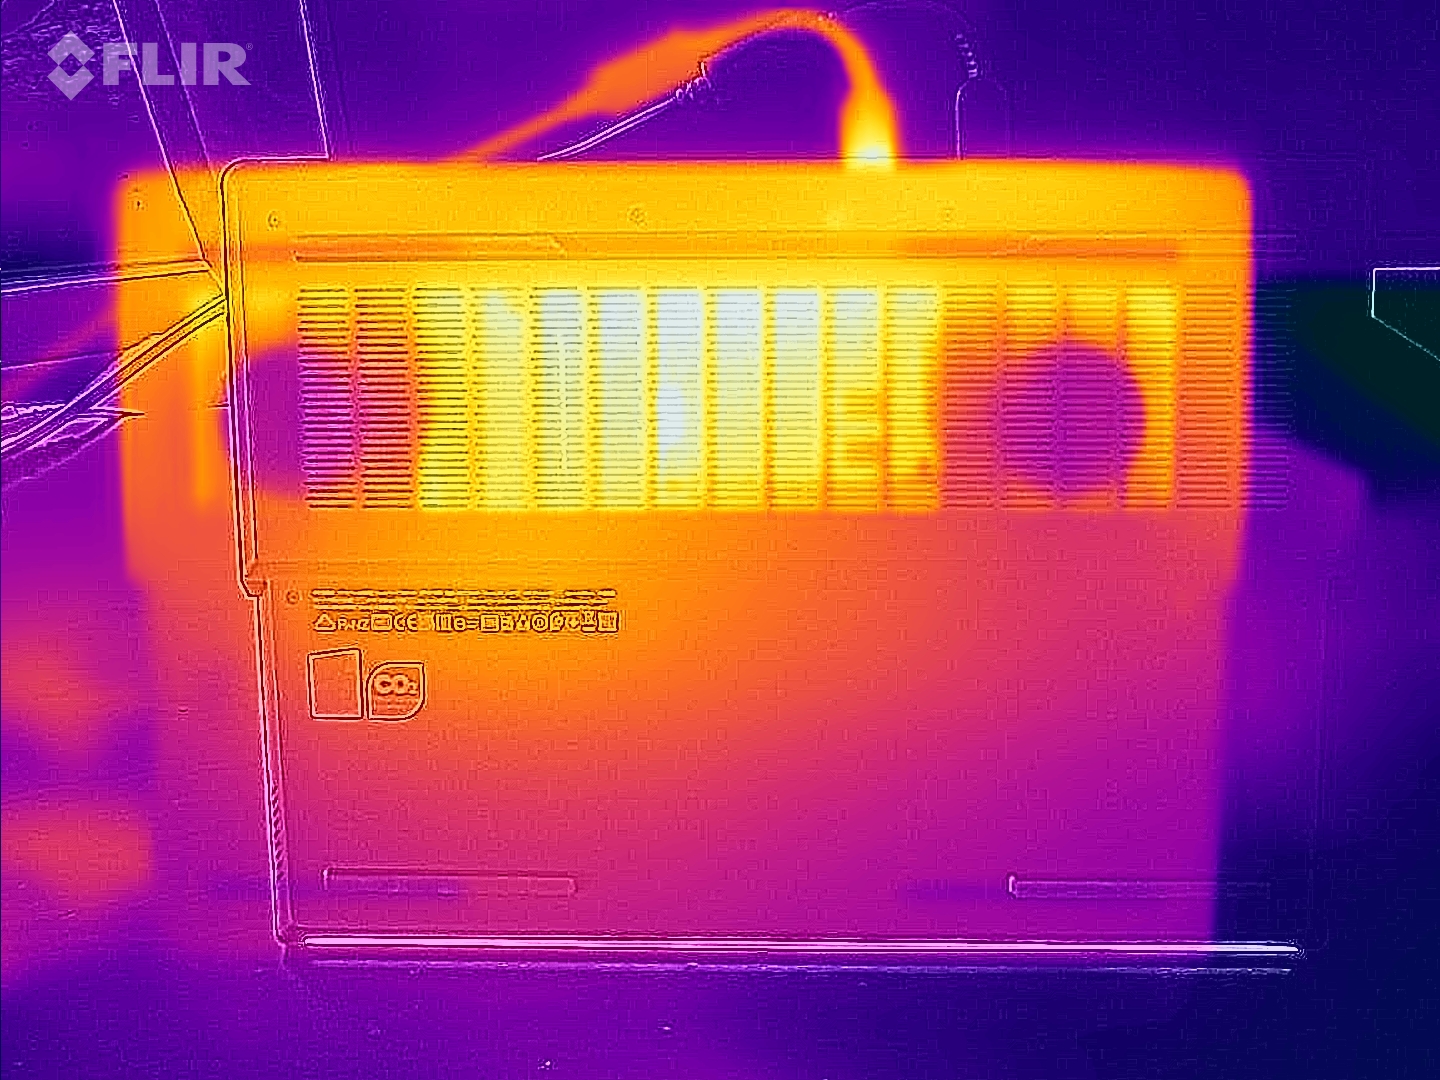
Temperatura
Mientras se estresa con The Witcher 3 a 1080p Ultra, la parte inferior del Legion Pro 7 cruza los 50 °C en algunos puntos, lo que significa que no es adecuado para jugar en el regazo. En inactivo, la parte superior se calienta hasta los 40 °C, lo que es relativamente alto.
Incluso cuando se trata de emisiones de calor, el Razer Blade 16 parece rendir mejor que el Legion Pro 7.
(-) La temperatura máxima en la parte superior es de 48 °C / 118 F, frente a la media de 40.4 °C / 105 F, que oscila entre 21.2 y 68.8 °C para la clase Gaming.
(-) El fondo se calienta hasta un máximo de 49 °C / 120 F, frente a la media de 43.2 °C / 110 F
(±) En reposo, la temperatura media de la parte superior es de 32.7 °C / 91# F, frente a la media del dispositivo de 33.9 °C / 93 F.
(-) Jugando a The Witcher 3, la temperatura media de la parte superior es de 43.3 °C / 110 F, frente a la media del dispositivo de 33.9 °C / 93 F.
(-) El reposamanos y el touchpad pueden calentarse mucho al tacto con un máximo de 42 °C / 107.6 F.
(-) La temperatura media de la zona del reposamanos de dispositivos similares fue de 28.8 °C / 83.8 F (-13.2 °C / -23.8 F).
| Lenovo Legion Pro 7 16IRX8H i9-13900HX, GeForce RTX 4080 Laptop GPU | Razer Blade 16 Early 2023 i9-13950HX, GeForce RTX 4080 Laptop GPU | Lenovo Legion 7 16IAX7-82TD004SGE i9-12900HX, GeForce RTX 3080 Ti Laptop GPU | Lenovo Legion 7 16ACHg6 R9 5900HX, GeForce RTX 3080 Laptop GPU | Lenovo Legion 7 16ARHA7 R9 6900HX, Radeon RX 6850M XT | |
|---|---|---|---|---|---|
| Heat | 16% | -5% | -5% | 13% | |
| Maximum Upper Side * (°C) | 48 | 40 17% | 44.4 7% | 51 -6% | 37.2 22% |
| Maximum Bottom * (°C) | 49 | 37.6 23% | 60.8 -24% | 52 -6% | 43 12% |
| Idle Upper Side * (°C) | 40 | 32.4 19% | 33.8 15% | 37 7% | 34 15% |
| Idle Bottom * (°C) | 33 | 31.4 5% | 38.8 -18% | 38 -15% | 32.8 1% |
* ... más pequeño es mejor
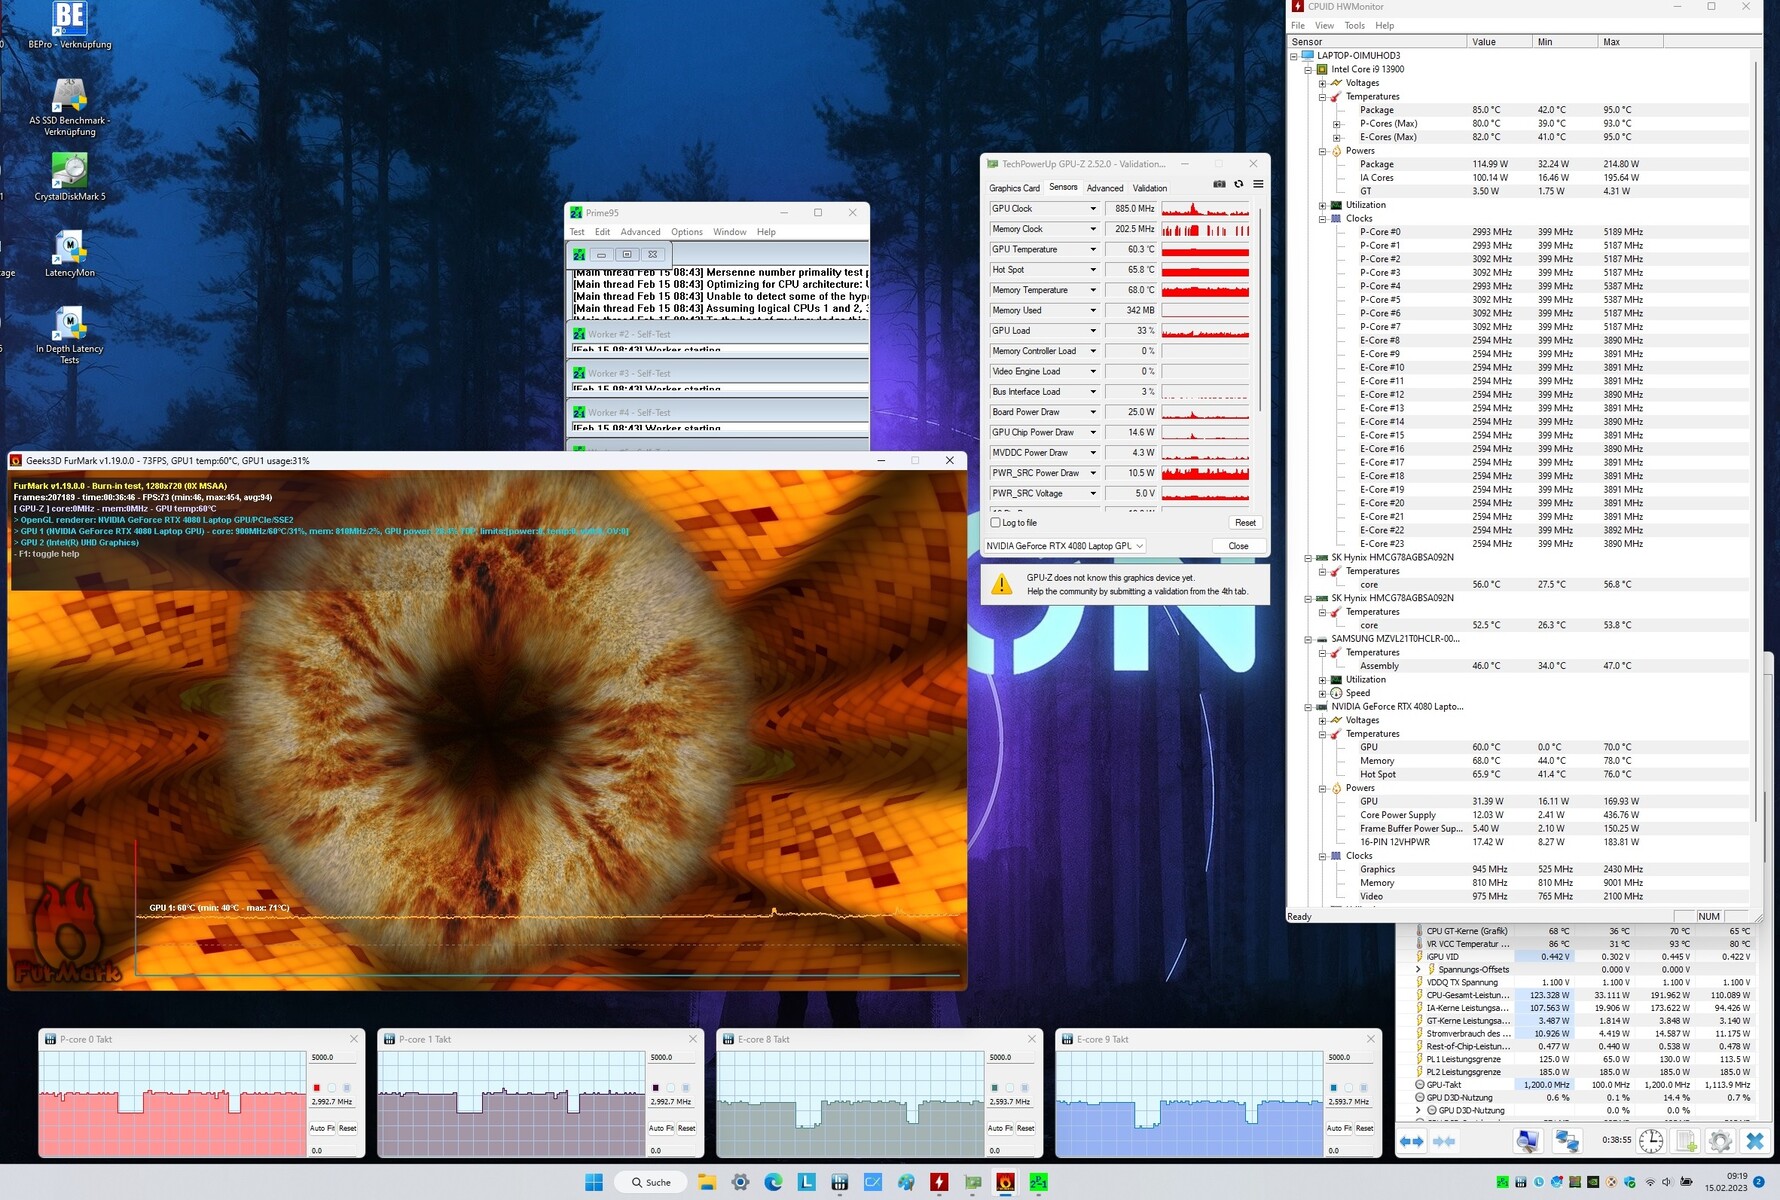
Prueba de esfuerzo
Una prueba de estrés combinada con FurMark y Prime95 no es muy útil, ya que la GPU muestra ralentización. Durante el estrés de The Witcher 3, la CPU y la GPU se calientan a una media de 75 °C, lo que no es problemático.
Altavoces
Un punto fuerte del Legion Pro 7 es la colaboración de Lenovo con Harman, que resulta en altavoces de buen sonido. Nuestro análisis de audio no muestra debilidades flagrantes en ningún rango de frecuencias, lo que es raro en portátiles - el Blade 16 tiene que conformarse con graves más débiles, por ejemplo.
Los altavoces externos o los auriculares no son absolutamente necesarios dado el alto nivel de volumen máximo de 82 dB(A).
Lenovo Legion Pro 7 16IRX8H análisis de audio
(+) | los altavoces pueden reproducir a un volumen relativamente alto (#82 dB)
Graves 100 - 315 Hz
(±) | lubina reducida - en promedio 8.9% inferior a la mediana
(+) | el bajo es lineal (6.4% delta a la frecuencia anterior)
Medios 400 - 2000 Hz
(+) | medios equilibrados - a sólo 2.8% de la mediana
(+) | los medios son lineales (4.2% delta a la frecuencia anterior)
Altos 2 - 16 kHz
(+) | máximos equilibrados - a sólo 2.5% de la mediana
(+) | los máximos son lineales (6% delta a la frecuencia anterior)
Total 100 - 16.000 Hz
(+) | el sonido global es lineal (9.4% de diferencia con la mediana)
En comparación con la misma clase
» 3% de todos los dispositivos probados de esta clase eran mejores, 2% similares, 95% peores
» El mejor tuvo un delta de 6%, la media fue 18%, el peor fue ###max##%
En comparación con todos los dispositivos probados
» 3% de todos los dispositivos probados eran mejores, 1% similares, 96% peores
» El mejor tuvo un delta de 4%, la media fue 23%, el peor fue ###max##%
Razer Blade 16 Early 2023 análisis de audio
(+) | los altavoces pueden reproducir a un volumen relativamente alto (#88.2 dB)
Graves 100 - 315 Hz
(-) | casi sin bajos - de media 16.4% inferior a la mediana
(±) | la linealidad de los graves es media (10.8% delta a frecuencia anterior)
Medios 400 - 2000 Hz
(+) | medios equilibrados - a sólo 2.5% de la mediana
(+) | los medios son lineales (2.4% delta a la frecuencia anterior)
Altos 2 - 16 kHz
(+) | máximos equilibrados - a sólo 4.9% de la mediana
(±) | la linealidad de los máximos es media (7.9% delta a frecuencia anterior)
Total 100 - 16.000 Hz
(+) | el sonido global es lineal (12.6% de diferencia con la mediana)
En comparación con la misma clase
» 16% de todos los dispositivos probados de esta clase eran mejores, 4% similares, 81% peores
» El mejor tuvo un delta de 6%, la media fue 18%, el peor fue ###max##%
En comparación con todos los dispositivos probados
» 11% de todos los dispositivos probados eran mejores, 3% similares, 86% peores
» El mejor tuvo un delta de 4%, la media fue 23%, el peor fue ###max##%
Gestión de la energía: Alto consumo incluso en reposo
Consumo de energía
Como ocurre con los portátiles de juego de gama alta, el Legion Pro 7 tiene un elevado consumo de energía a pesar de la conmutación de gráficos incluso en modo inactivo. Con un consumo de 18 a 32 W (incluyendo picos cortos de carga) en inactivo, el Legion Pro 7 está casi un 20% por encima de la media de su clase.
Registramos un consumo de 130 W bajo carga media (3DMark06) y 320 W bajo estrés máximo. Durante los juegos, puedes esperar que el consumo alcance unos 260 W, que es ligeramente superior al del Blade 16 (242 W).
| Off / Standby | |
| Ocioso | |
| Carga |
|
Clave:
min: | |
| Lenovo Legion Pro 7 16IRX8H i9-13900HX, GeForce RTX 4080 Laptop GPU | Razer Blade 16 Early 2023 i9-13950HX, GeForce RTX 4080 Laptop GPU | Lenovo Legion 7 16IAX7-82TD004SGE i9-12900HX, GeForce RTX 3080 Ti Laptop GPU | Lenovo Legion 7 16ACHg6 R9 5900HX, GeForce RTX 3080 Laptop GPU | Lenovo Legion 7 16ARHA7 R9 6900HX, Radeon RX 6850M XT | Media de la clase Gaming | |
|---|---|---|---|---|---|---|
| Power Consumption | -1% | 1% | -14% | 21% | 21% | |
| Idle Minimum * (Watt) | 18 | 15.2 16% | 19.2 -7% | 31 -72% | 9.9 45% | 13 ? 28% |
| Idle Average * (Watt) | 24 | 22.8 5% | 25.1 -5% | 33 -38% | 22 8% | 19 ? 21% |
| Idle Maximum * (Watt) | 32 | 49.8 -56% | 27.1 15% | 46 -44% | 23.1 28% | 24.6 ? 23% |
| Load Average * (Watt) | 130 | 121.2 7% | 132 -2% | 110 15% | 94.4 27% | 110.7 ? 15% |
| Witcher 3 ultra * (Watt) | 260 | 242 7% | 253 3% | 180 31% | 249 4% | |
| Load Maximum * (Watt) | 320 | 273.7 14% | 308.9 3% | 235 27% | 276 14% | 259 ? 19% |
* ... más pequeño es mejor
Power consumption: The Witcher 3 / Stress test
Power consumption: External Monitor
Duración de la batería
Lenovo equipa el Legion Pro 7 con una potente batería de 99 WHr, que sólo puede ser algo útil debido a la gestión subóptima de la energía. Hasta 6,5 horas de autonomía son posibles en reposo sin ninguna otra tarea en marcha y con el brillo al mínimo. Es un resultado modesto comparado con las 9,5 horas del Blade 16.
En el uso diario, como navegar por internet por Wi-Fi a un brillo reducido de 150 nits, pudimos conseguir 5 horas de autonomía.
| Lenovo Legion Pro 7 16IRX8H i9-13900HX, GeForce RTX 4080 Laptop GPU, 99.9 Wh | Razer Blade 16 Early 2023 i9-13950HX, GeForce RTX 4080 Laptop GPU, 95.2 Wh | Lenovo Legion 7 16IAX7-82TD004SGE i9-12900HX, GeForce RTX 3080 Ti Laptop GPU, 99 Wh | Lenovo Legion 7 16ACHg6 R9 5900HX, GeForce RTX 3080 Laptop GPU, 80 Wh | Lenovo Legion 7 16ARHA7 R9 6900HX, Radeon RX 6850M XT, 99 Wh | Media de la clase Gaming | |
|---|---|---|---|---|---|---|
| Duración de Batería | 9% | -40% | 12% | 2% | 13% | |
| Reader / Idle (h) | 6.4 | 8.9 39% | 8.2 28% | 4.9 -23% | 8.27 ? 29% | |
| WiFi v1.3 (h) | 5.1 | 6.1 20% | 4.5 -12% | 6.8 33% | 7.3 43% | 7.11 ? 39% |
| Load (h) | 2.1 | 1.4 -33% | 0.7 -67% | 1.6 -24% | 1.8 -14% | 1.502 ? -28% |
| H.264 (h) | 5.1 | 6.8 | 8.32 ? | |||
| Witcher 3 ultra (h) | 0.9 |
Pro
Contra
Veredicto: Una potencia de juego impresionante
Los jugadores apasionados que quieran jugar a títulos modernos exigentes con el máximo detalle y no les importe gastarse la pasta encontrarán en el Lenovo Legion 7 Pro 16IRX8H la elección adecuada.
La combinación de un Core i9-13900HX y GeForce RTX 4080 ofrece un impresionante nivel de rendimiento que puede producir fácilmente 40 o incluso 60 fps en la mayoría de los juegos modernos a 4K Ultra
La pantalla brillante, nítida y de colores precisos 16:10 QHD 240 Hz permite disfrutar de una experiencia visual envolvente. El hardware se aloja en un elegante chasis que da la sensación de ser de primera calidad y obtiene buenas puntuaciones en términos de mano de obra y estabilidad. Otros aspectos, como la calidad del sonido, los dispositivos de entrada y la conectividad, también parecen casi perfectos.
Sin embargo, los posibles compradores del Lenovo Legion 7 Pro 16IRX8H tendrán que tener en cuenta las altas emisiones. El portátil de 16 pulgadas se calienta bastante bajo carga a menos que se seleccione el perfil Silencioso - encontramos que el perfil Equilibrado es el mejor compromiso entre rendimiento y emisiones para el uso diario. También nos habría gustado ver tiempos de funcionamiento más largos con la batería de 99 WHr.
Uno de los principales competidores del nuevo Lenovo Legion 7 Pro es elRazer Blade 16que en realidad es más silencioso y más frío, al tiempo que ofrece niveles similares de rendimiento. Además, el Blade 16 es algo más ligero y delgado en comparación.
Dicho esto, el Lenovo Legion 7 Pro 16IRX8H impresiona en general y merece nuestra calificación de "Muy bueno".
Precios y disponibilidad
El Lenovo Legion Pro 7 16IRX8H probado está disponible en campuspoint.depor 3.599 euros. (PVP: 3.999 €).
Lenovo Legion Pro 7 16IRX8H
- 02/21/2023 v7 (old)
Florian Glaser
Transparencia
La selección de los dispositivos que se van a reseñar corre a cargo de nuestro equipo editorial. La muestra de prueba fue proporcionada al autor en calidad de préstamo por el fabricante o el minorista a los efectos de esta reseña. El prestamista no tuvo ninguna influencia en esta reseña, ni el fabricante recibió una copia de la misma antes de su publicación. No había ninguna obligación de publicar esta reseña. Como empresa de medios independiente, Notebookcheck no está sujeta a la autoridad de fabricantes, minoristas o editores.
Así es como prueba Notebookcheck
Cada año, Notebookcheck revisa de forma independiente cientos de portátiles y smartphones utilizando procedimientos estandarizados para asegurar que todos los resultados son comparables. Hemos desarrollado continuamente nuestros métodos de prueba durante unos 20 años y hemos establecido los estándares de la industria en el proceso. En nuestros laboratorios de pruebas, técnicos y editores experimentados utilizan equipos de medición de alta calidad. Estas pruebas implican un proceso de validación en varias fases. Nuestro complejo sistema de clasificación se basa en cientos de mediciones y puntos de referencia bien fundamentados, lo que mantiene la objetividad.Price comparison

