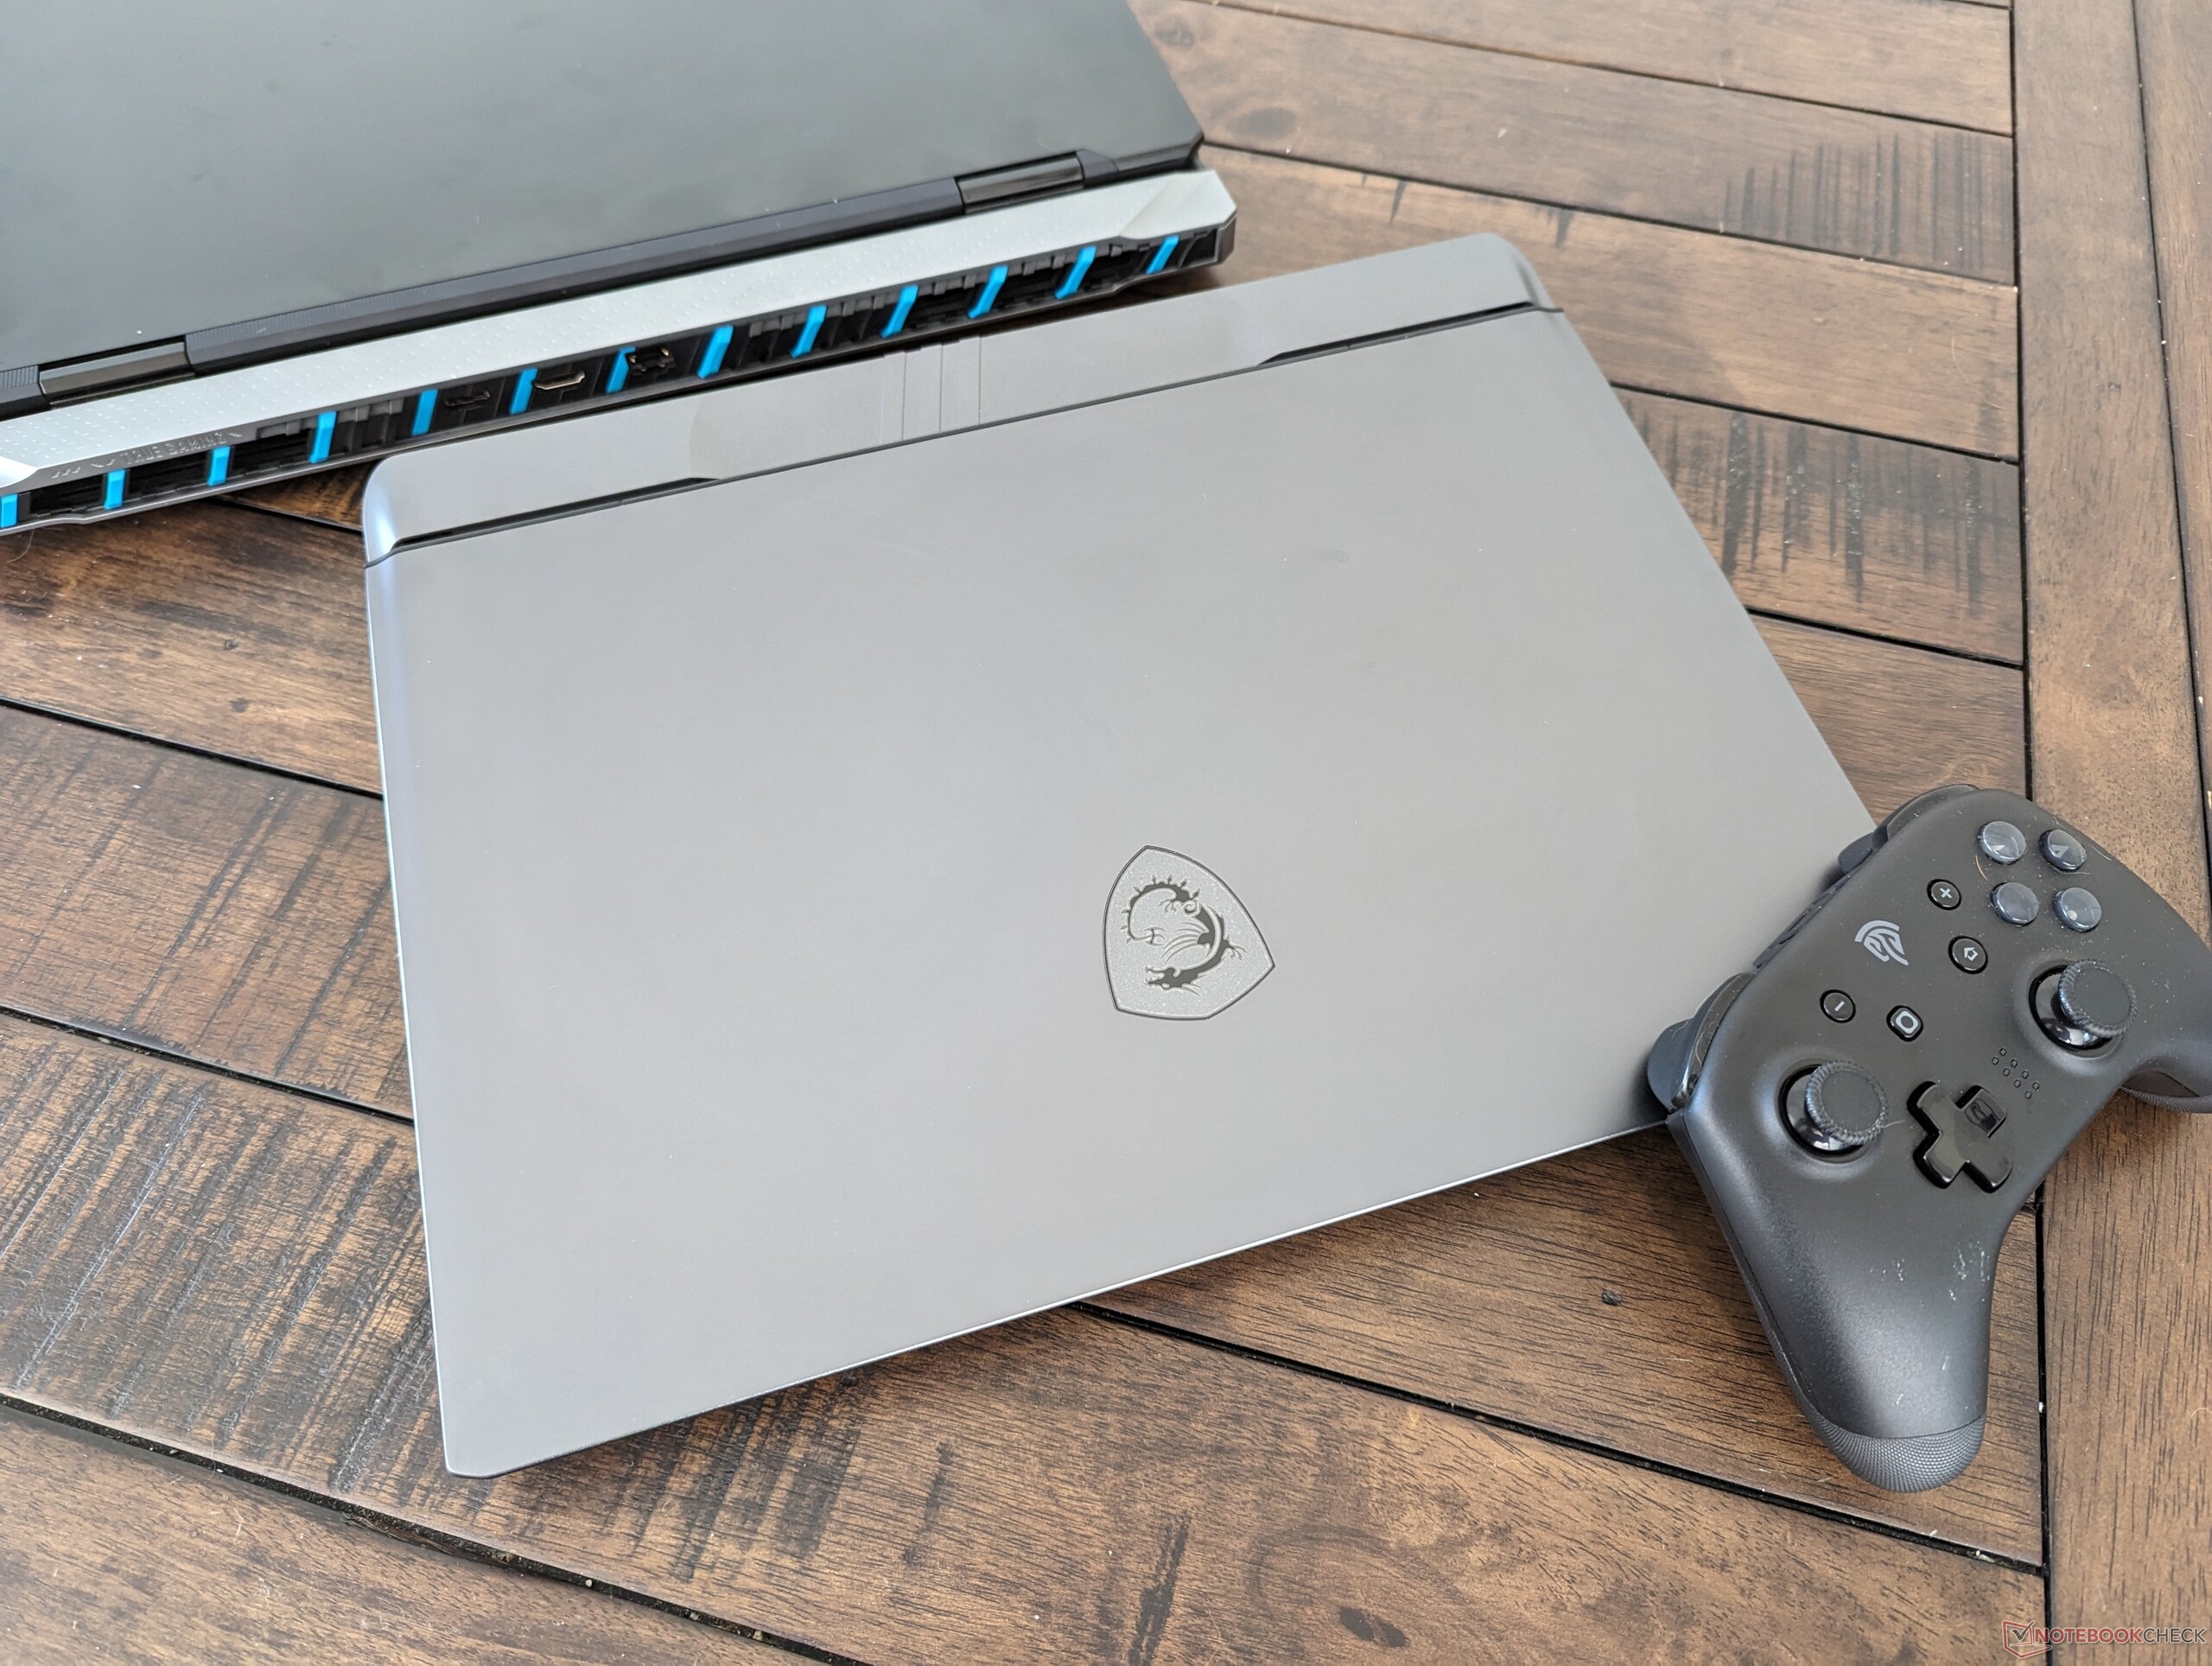
Análisis del portátil MSI Vector 16 HX: Rendimiento Titán sin el precio Titán

No debe confundirse con el desaparecido Maingear Vector, el MSI Vector 16 HX sucede al GP68 del año pasado introduciendo nuevas opciones de CPU Intel Raptor Lake-HX de 14ª generación y un diseño de chasis revisado sobre el vetusto GP66 de 15,6 pulgadas. El modelo hizo su debut a principios de este año en el CES 2024 junto a una serie de otros anuncios como el MSI Claw y el Titan 18 HX.
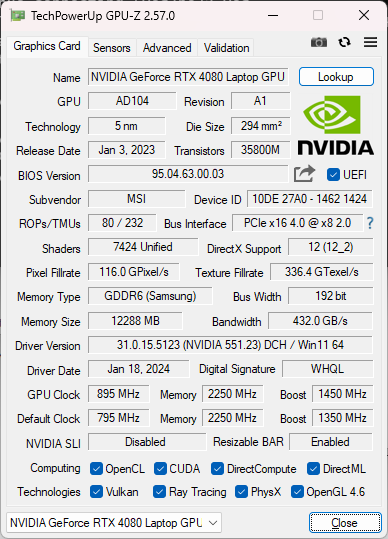
Nuestra unidad de análisis es una configuración de gama alta con la CPU Core i9-14900HX, la GPU RTX 4080 175
GeForce y la pantalla IPS 1600p 240 Hz por aproximadamente 2700 dólares al por menor. Se pueden encontrar otras configuraciones con gráficos RTX 4090, 4070 o 4060 y una pantalla 1200p 144 Hz, pero todas las opciones por el momento incluyen la misma CPU Core i9-14900HX.Las alternativas al Vector 16 HX incluyen otros portátiles para juegos de 16 pulgadas de gama media a alta como el Lenovo Legion 5i 16,Asus TUF Gaming A16 , Alienware m16 R1o HP Omen 16.
Más opiniones sobre MSI:
Posibles contendientes en la comparación
Valoración | Fecha | Modelo | Peso | Altura | Tamaño | Resolución | Precio |
|---|---|---|---|---|---|---|---|
| 88 % v7 (old) | 02/2024 | MSI Vector 16 HX A14V i9-14900HX, GeForce RTX 4080 Laptop GPU | 2.7 kg | 28.55 mm | 16.00" | 2560x1600 | |
| 86.9 % v7 (old) | 03/2022 | MSI Vector GP66 12UGS i9-12900H, GeForce RTX 3070 Ti Laptop GPU | 2.3 kg | 23.4 mm | 15.60" | 1920x1080 | |
| 89.1 % v7 (old) | 02/2024 | Lenovo Legion 5 16IRX G9 i7-14650HX, GeForce RTX 4060 Laptop GPU | 2.4 kg | 25.2 mm | 16.00" | 2560x1600 | |
| 85.1 % v7 (old) | 09/2023 | HP Victus 16-r0077ng i7-13700H, GeForce RTX 4070 Laptop GPU | 2.4 kg | 24 mm | 16.10" | 1920x1080 | |
| 86.9 % v7 (old) | 06/2023 | Asus TUF Gaming A16 FA617XS R9 7940HS, Radeon RX 7600S | 2.2 kg | 22.1 mm | 16.00" | 1920x1200 | |
| 86.1 % v7 (old) | 10/2022 | Dell G16 7620 i7-12700H, GeForce RTX 3060 Laptop GPU | 2.6 kg | 26.9 mm | 16.00" | 2560x1600 |
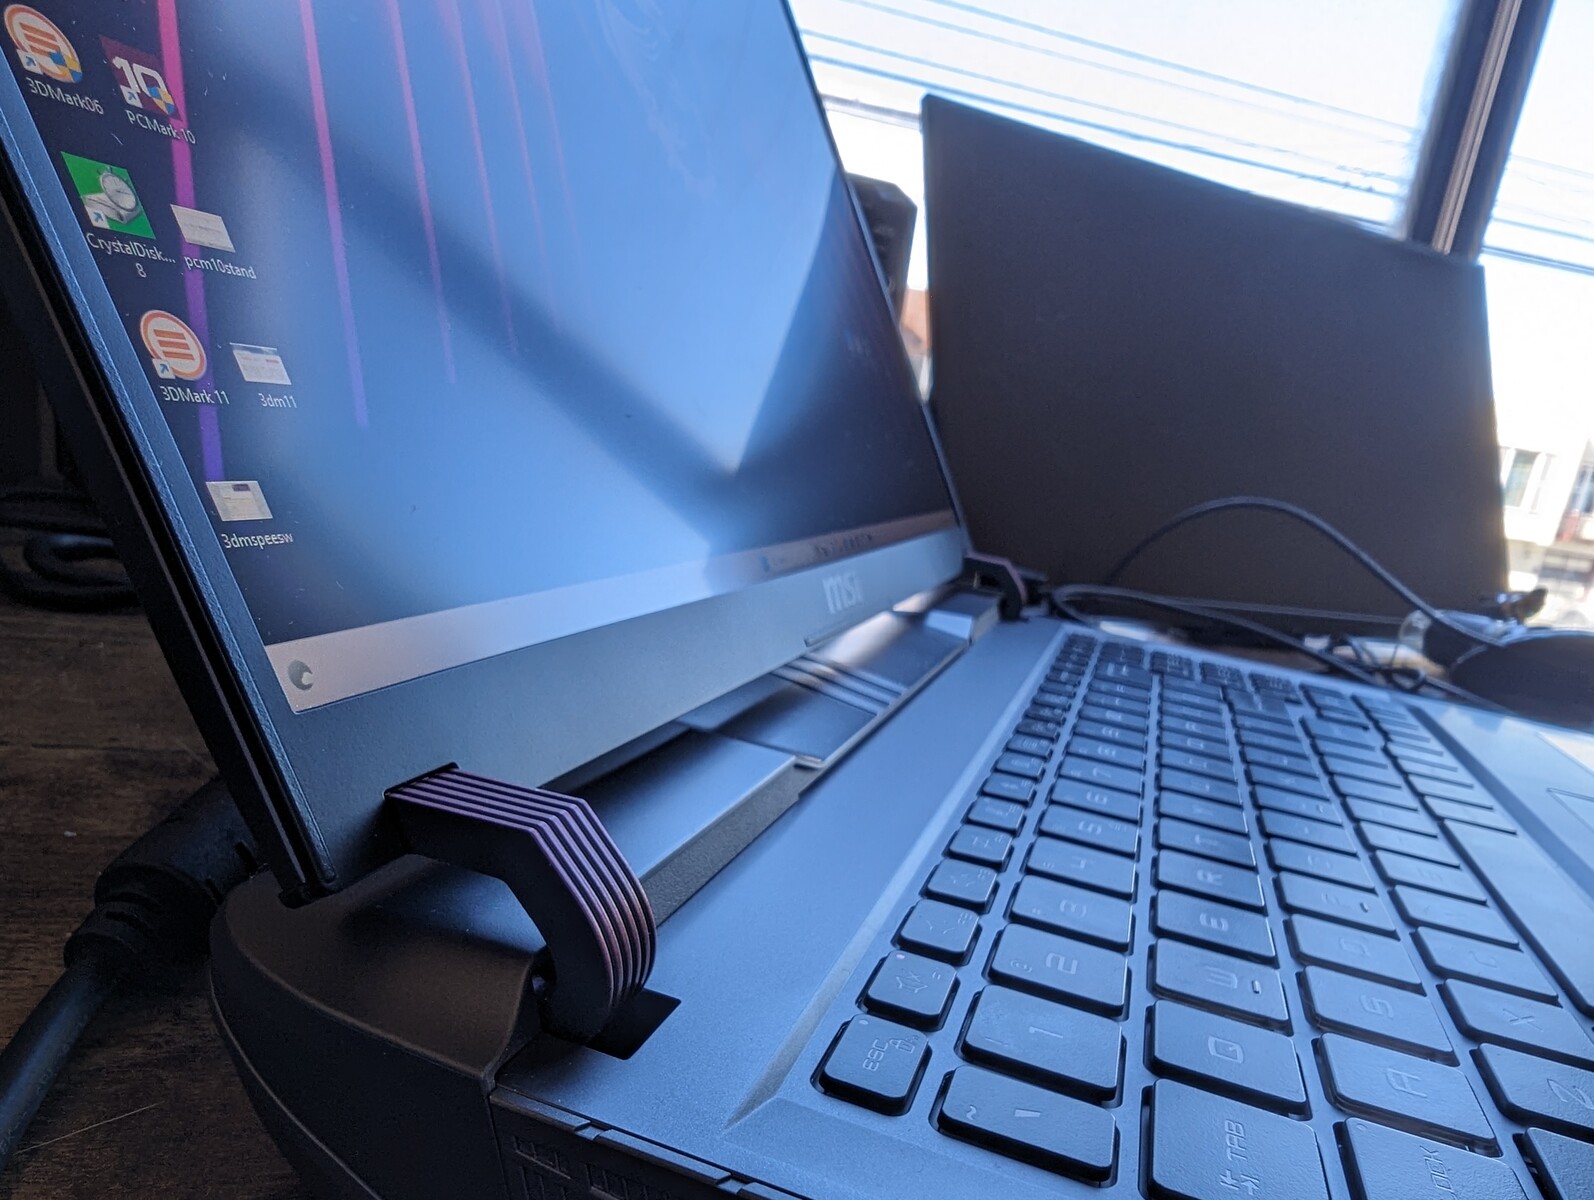
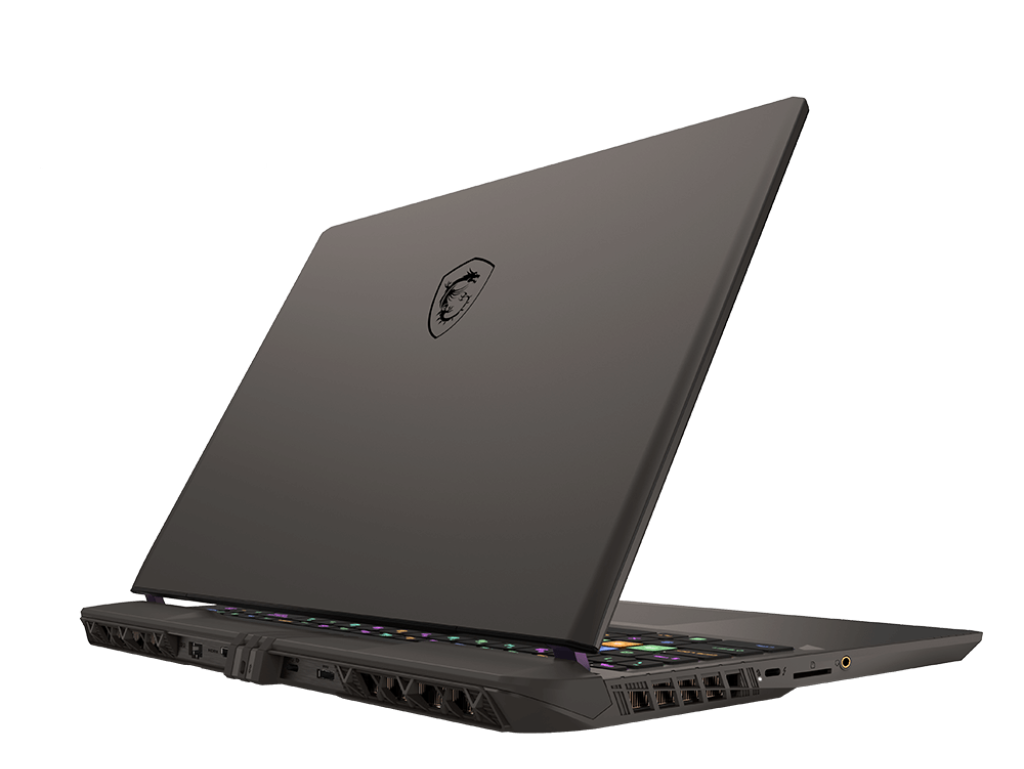
Caja - Fuerte, pero nada del otro mundo
Aparte de la tapa exterior de aleación metálica, la mayor parte de la base es de plástico para una experiencia menos lujosa en comparación con la más cara Titan HX. No se supone que la serie Vector sea de gama alta, pero aun así esperamos un poco más teniendo en cuenta el precio de venta de ~2000 dólares. Su teclado y panel inferior carecen de la sensación premium de alternativas como el Razer Blade 16 o el Alienware m16 R1.
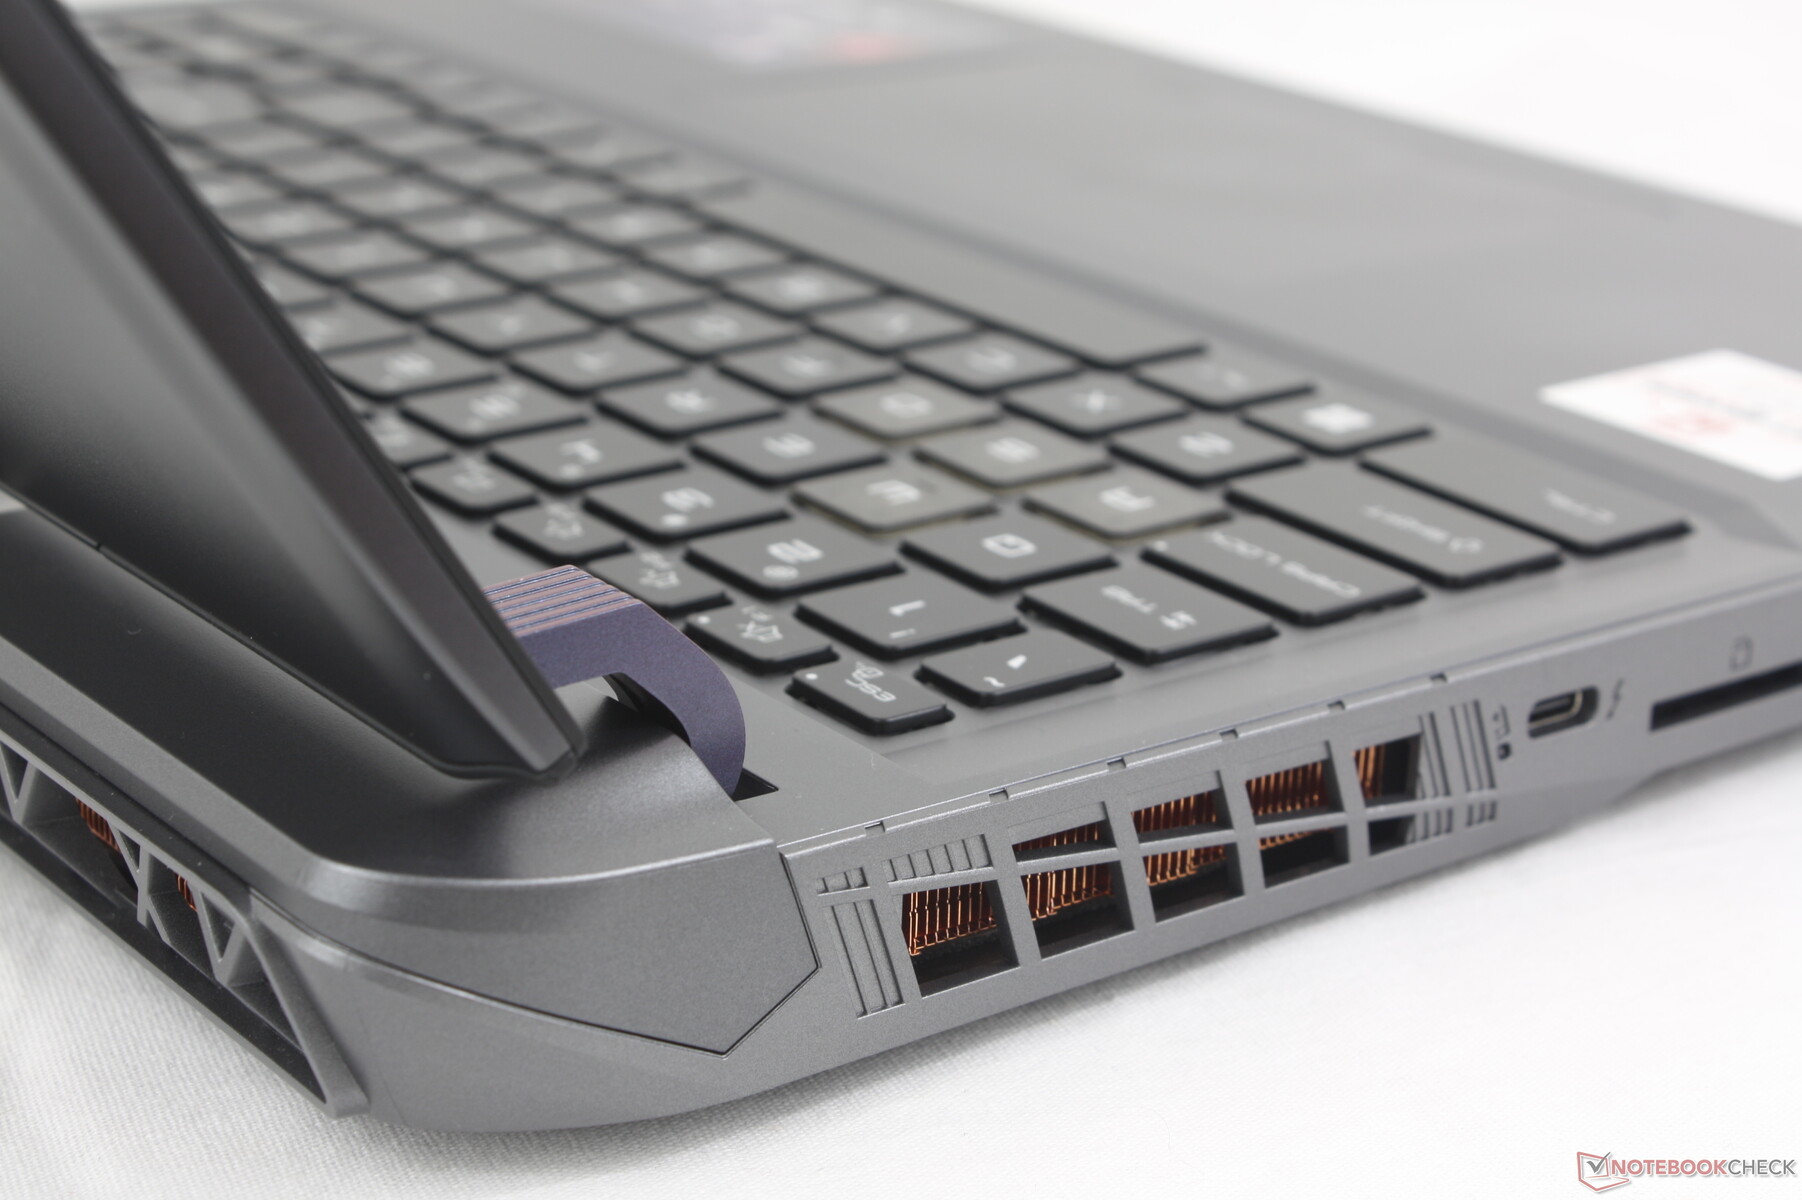
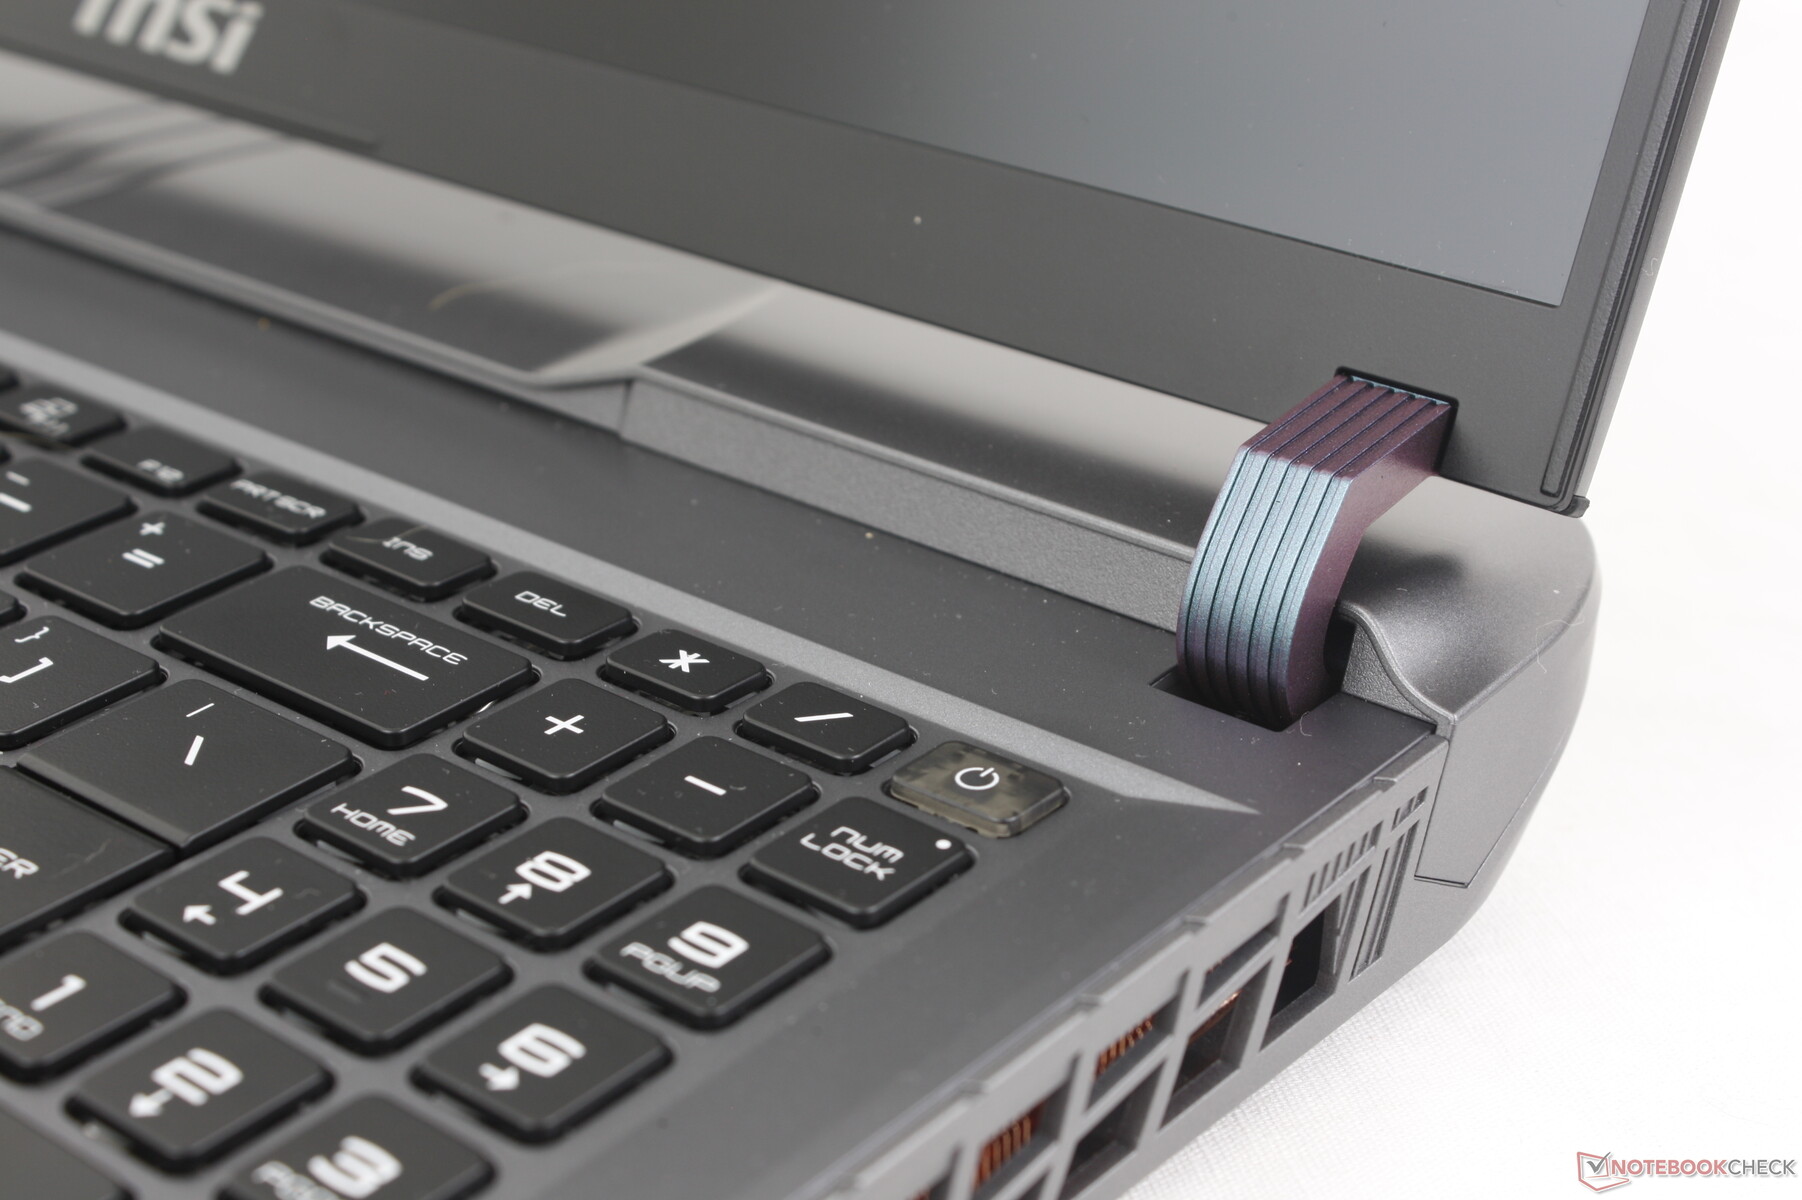
Afortunadamente, la rigidez del chasis es excelente de arriba a abajo, incluida la tapa, donde tiende a ser notablemente más débil en otros portátiles. Las bisagras rediseñadas en particular son ahora mucho más grandes y firmes que antes para recordar a las bisagras del Asus Strix Scar 17. Sin embargo, su curvatura limita el ángulo máximo en el que puede abrir la pantalla a sólo 130 grados.
El Vector 16 HX es un portátil grande y no hay forma de evitarlo. Su ambicioso objetivo de 175 W TGP (o 240 W cuando se combina con la CPU) requiere una solución de refrigeración más robusta y un diseño de chasis más grande que la mayoría de los demás modelos de 16 pulgadas. El MSI es incluso más grande y pesado que el Dell G16 7620 que ya era bastante grande. Afortunadamente no es tan pesado como el Razer Blade 18 de 18 pulgadas o el Asus ROG Strix Scar 18pero tampoco es precisamente portátil.
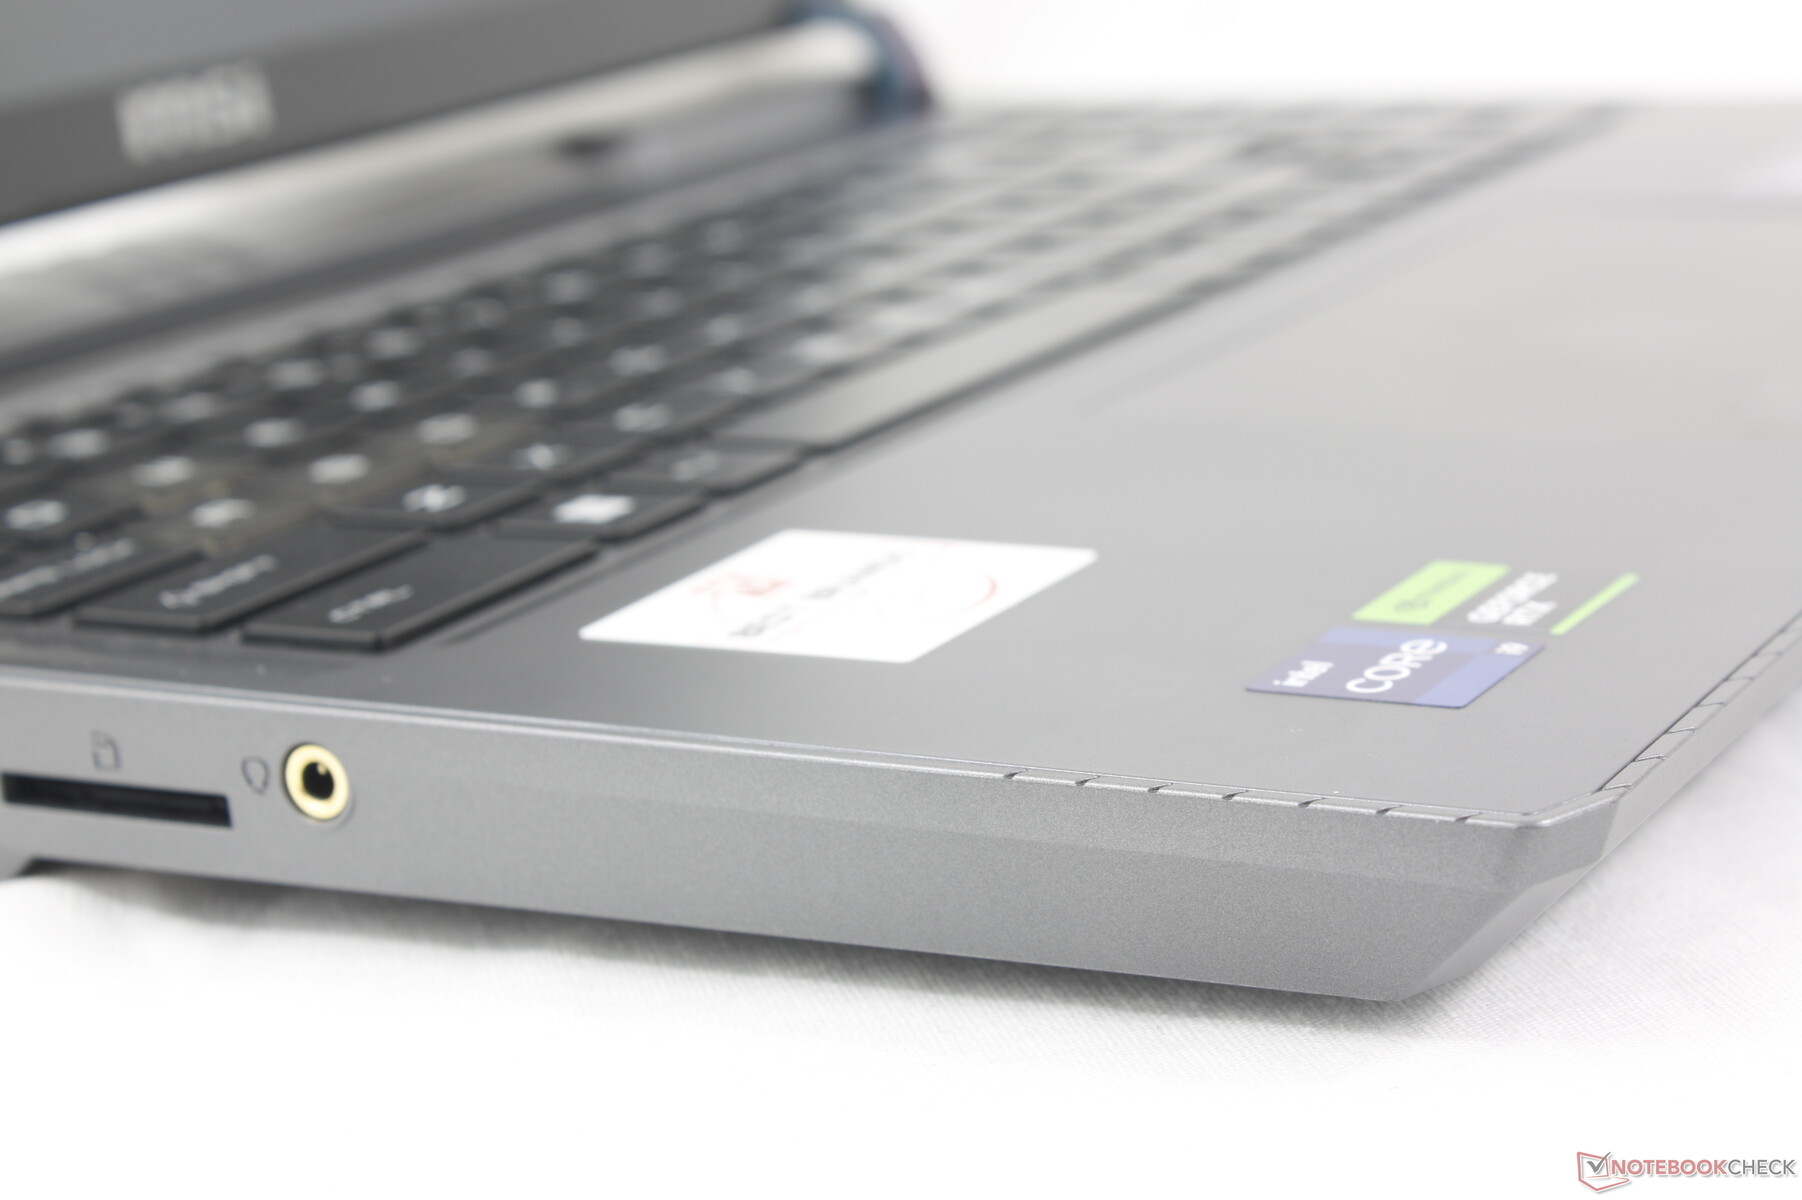
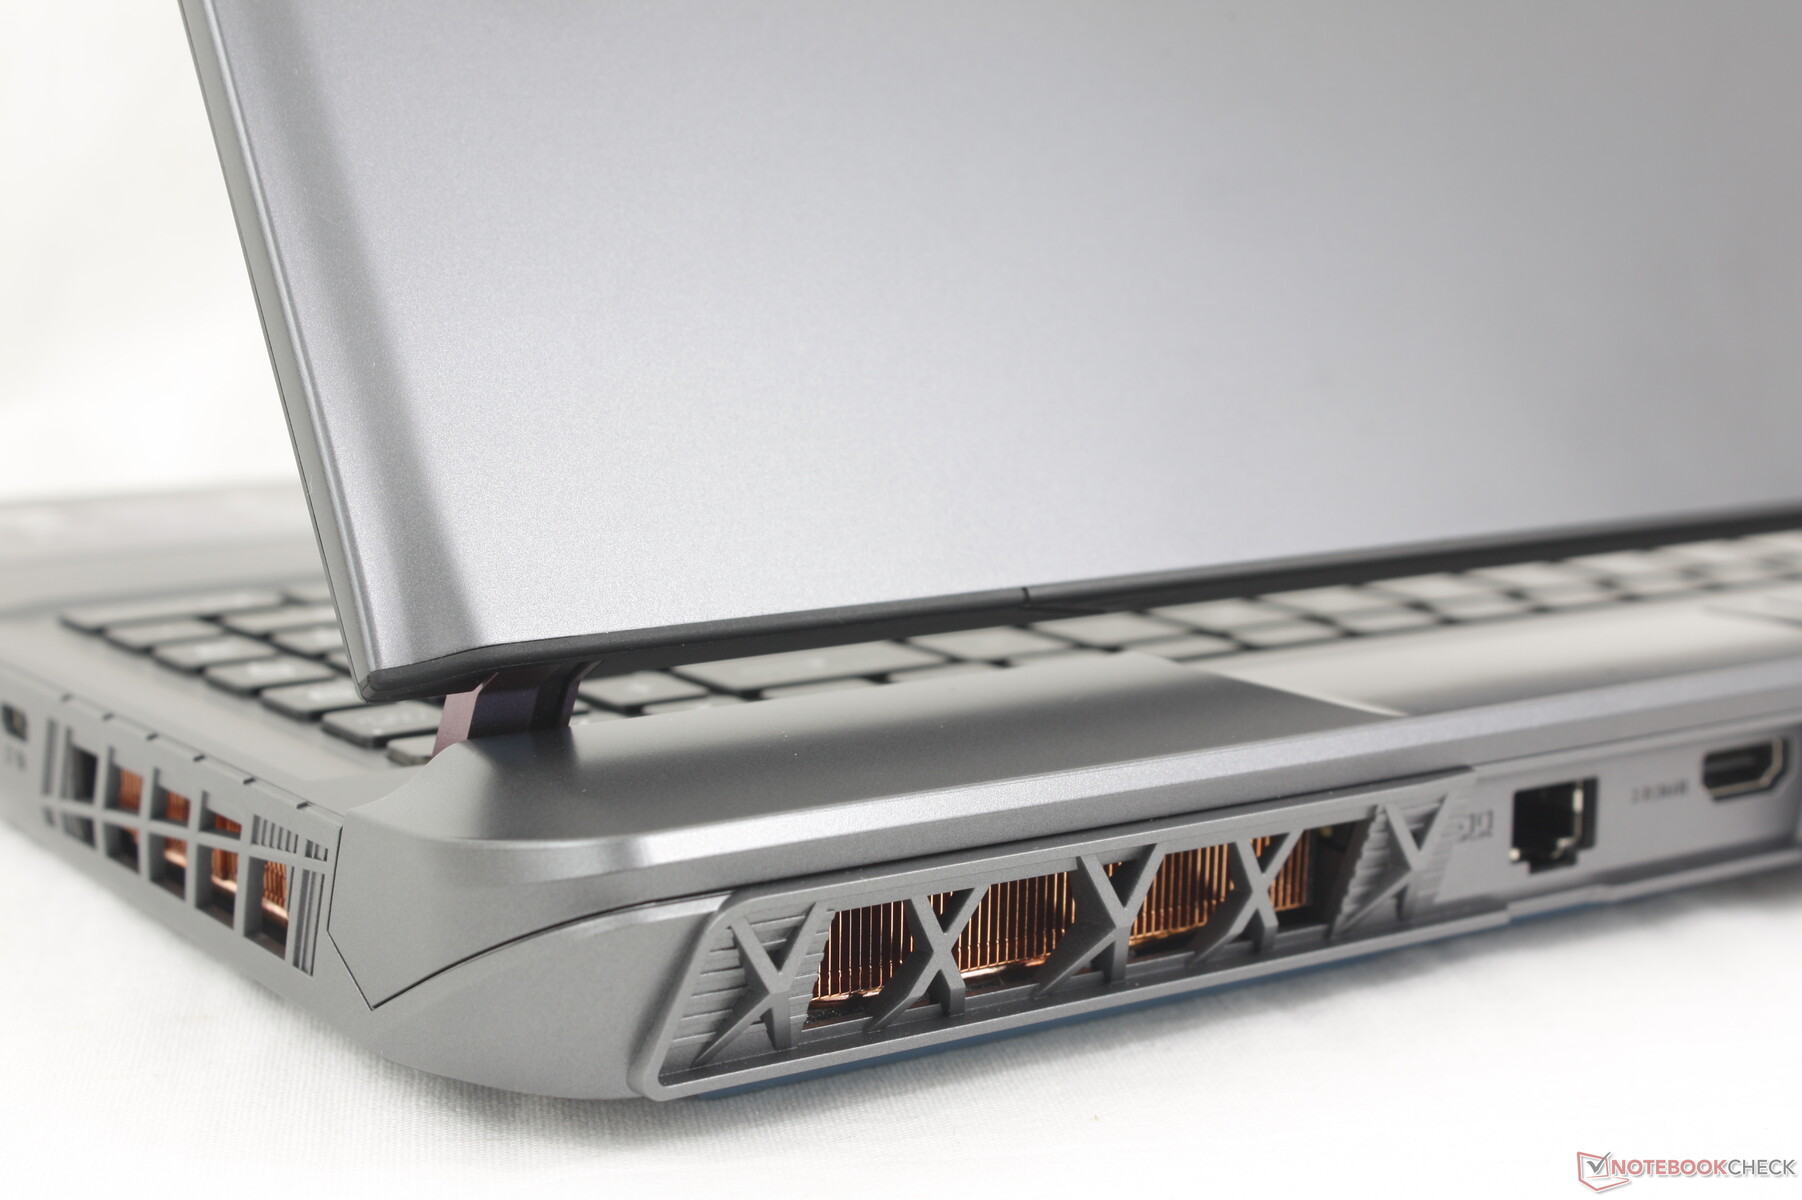
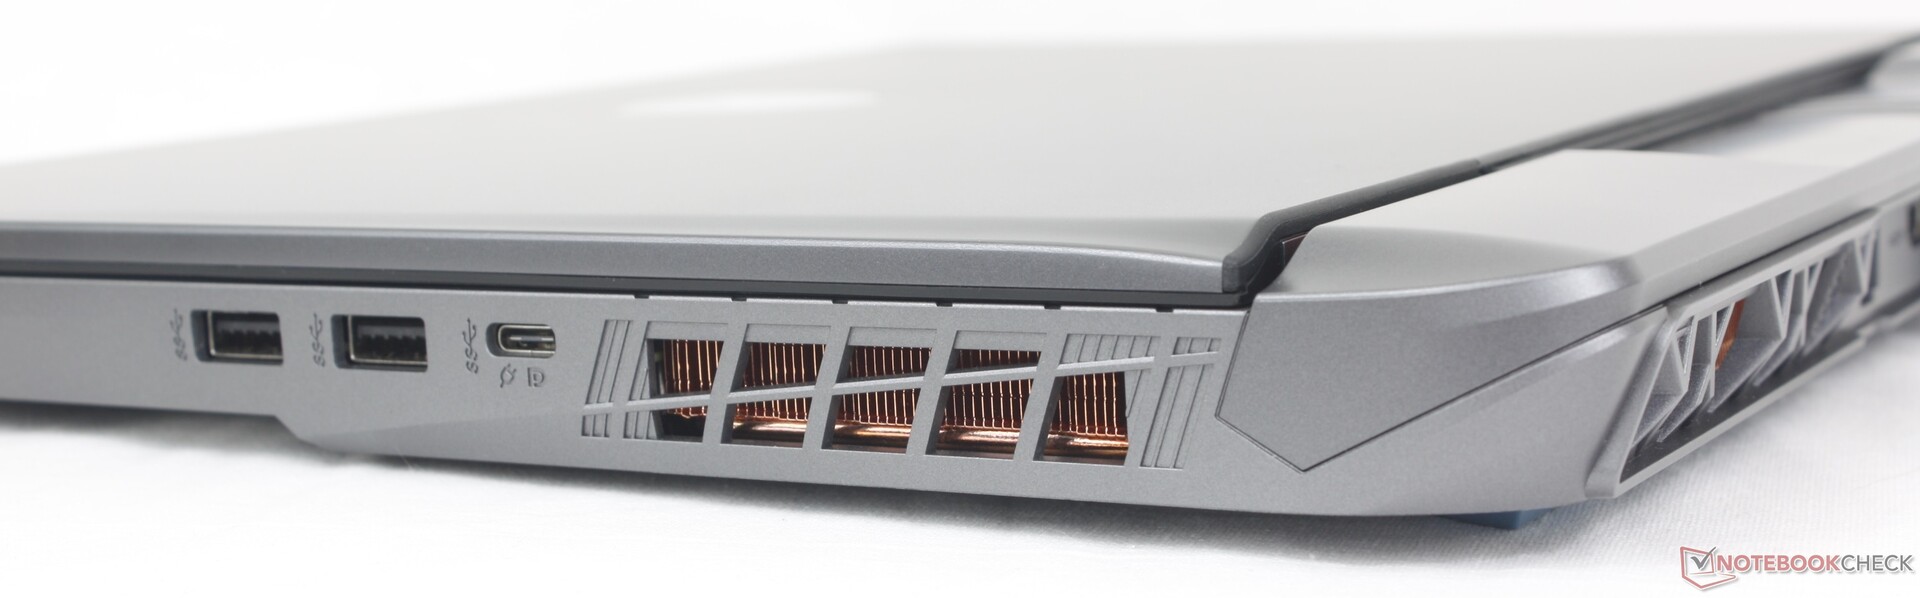
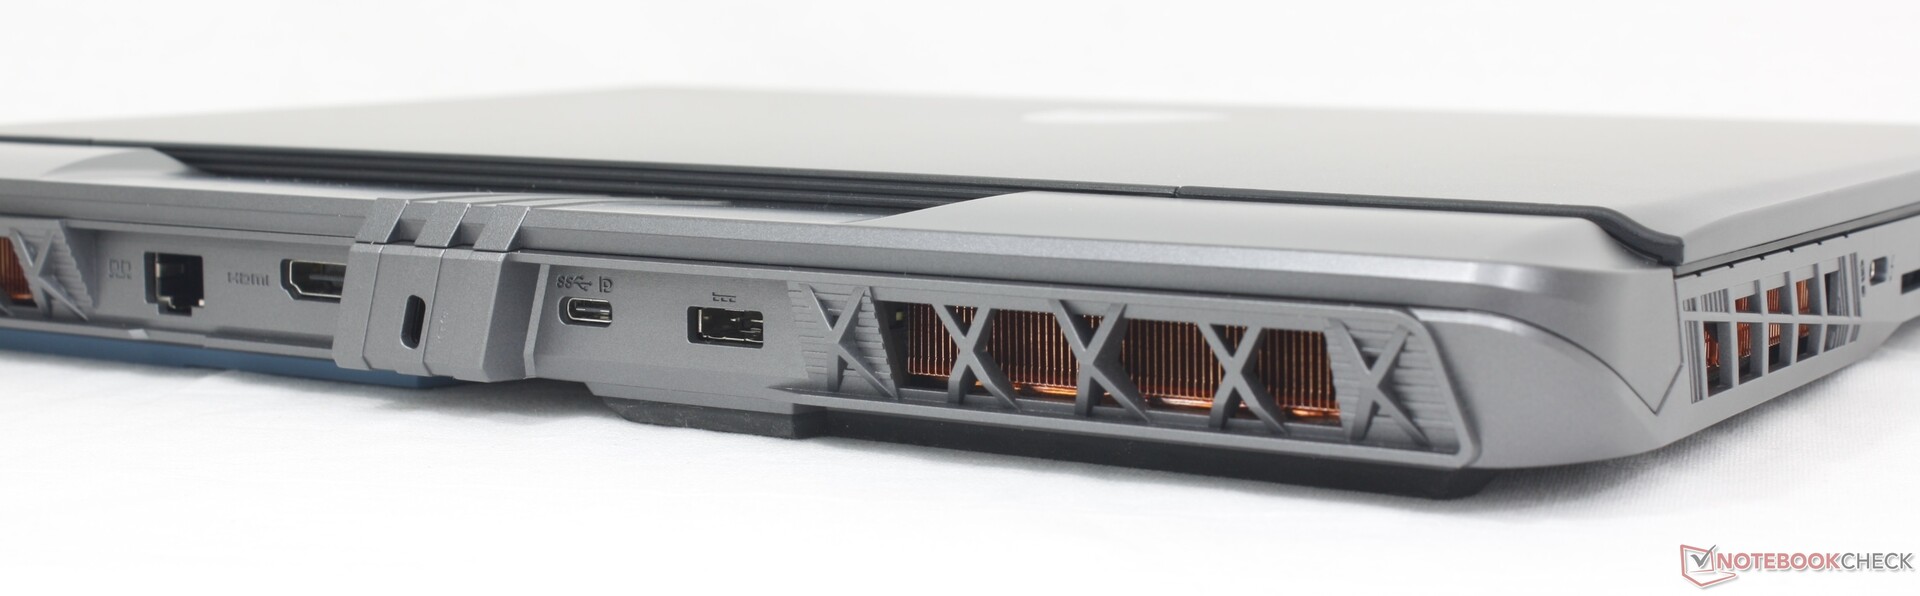
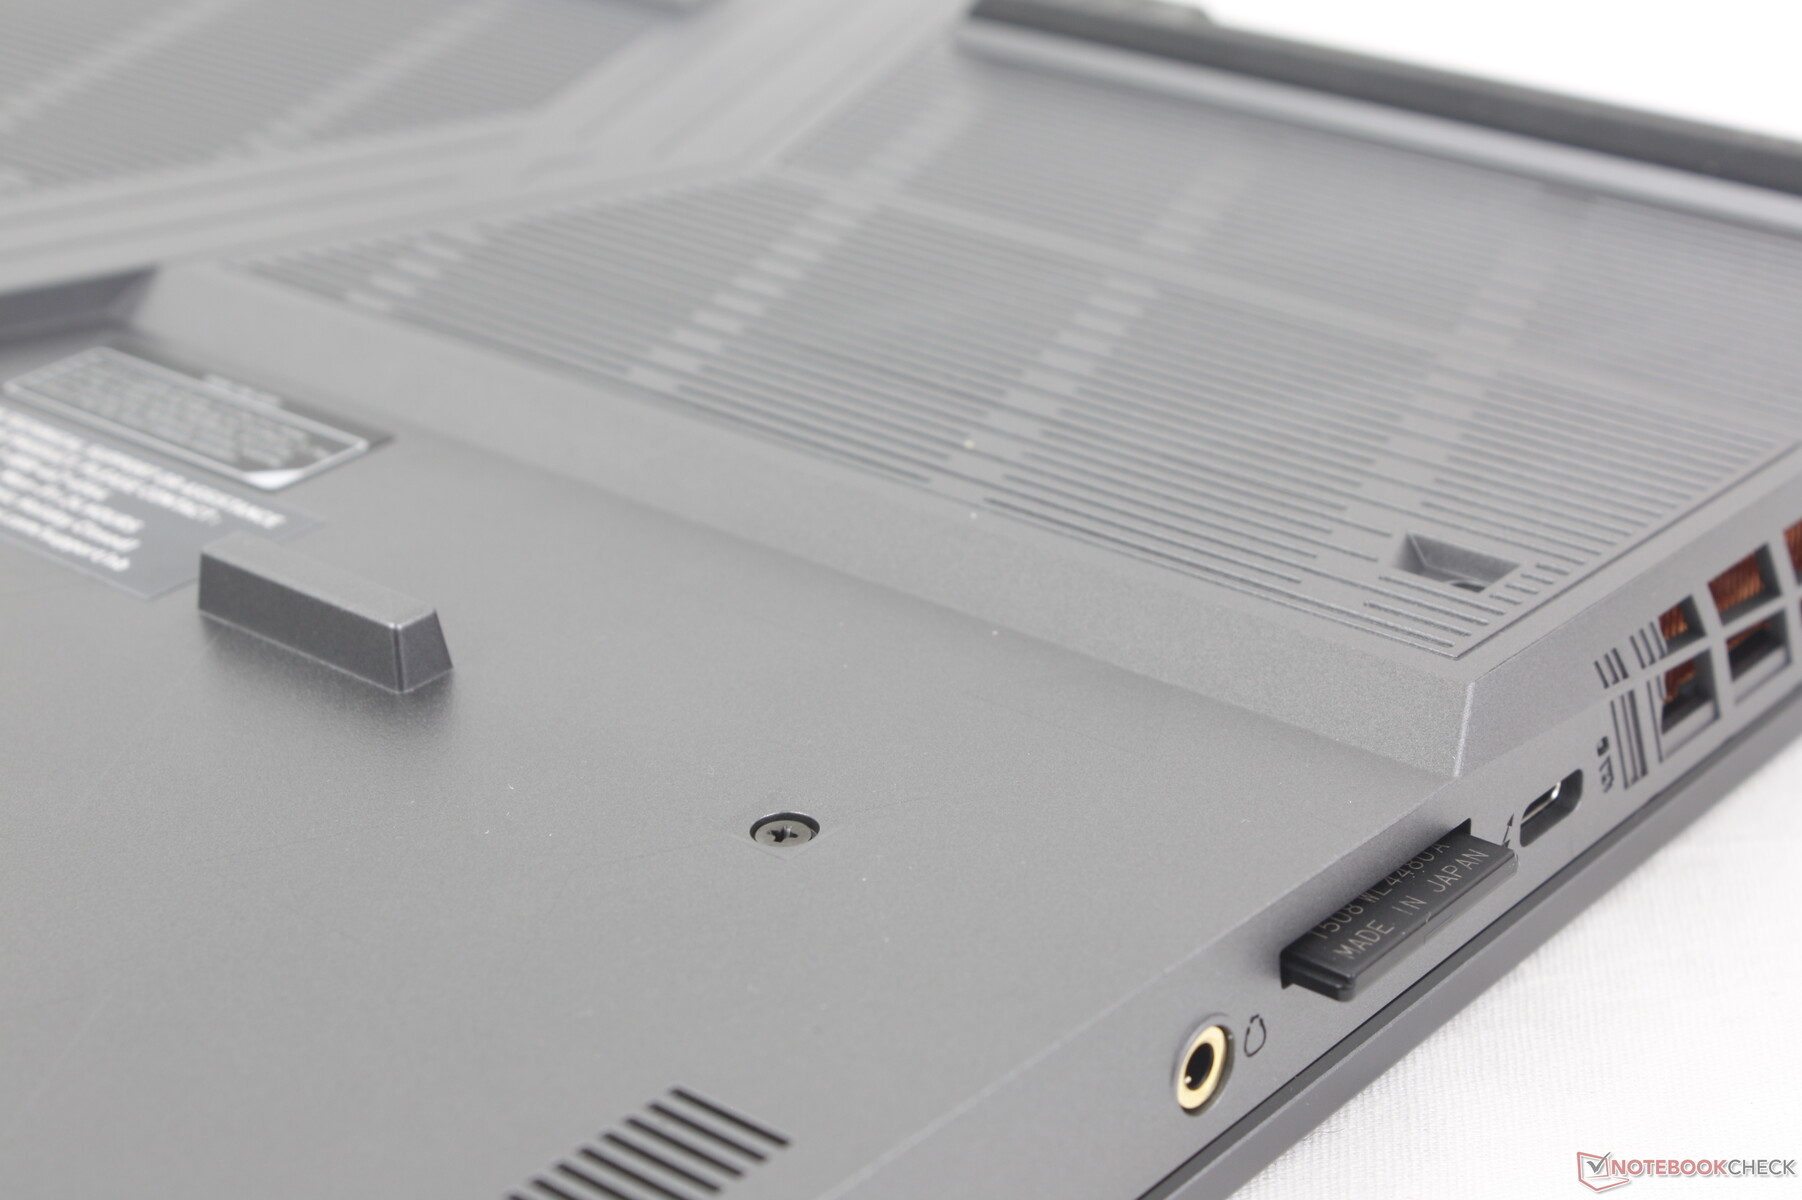
Conectividad
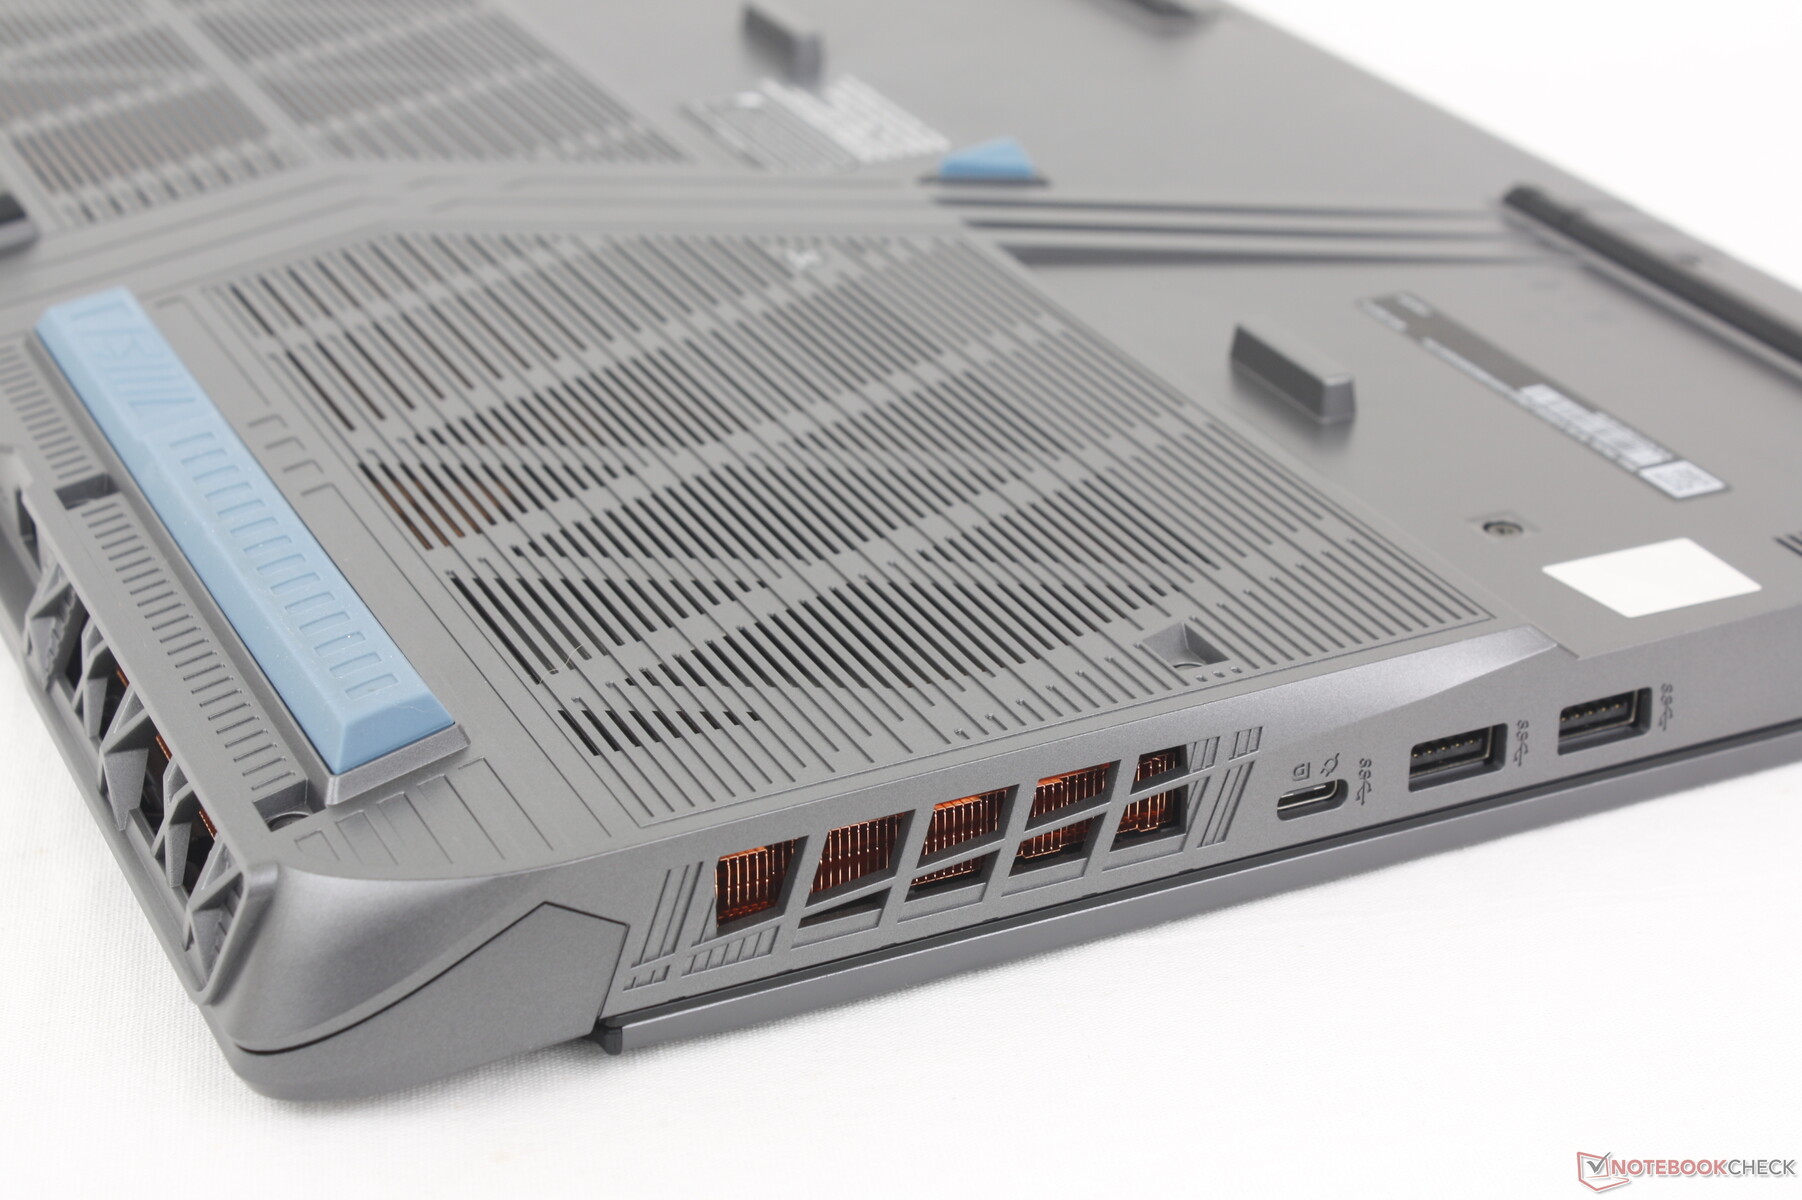
MSI ha revisado los puertos en comparación con el GP66. Las novedades del Vector 16 HX son el lector de tarjetas SD y los puertos USB-C adicionales, ahora con soporte Thunderbolt adecuado. A cambio, sin embargo, el modelo más nuevo tiene menos puertos USB-A y ha prescindido del mini-DisplayPort dedicado. Esto todavía se compara favorablemente con competidores como el Dell G16 o el Asus TUF Gaming A16 que tienen menos puertos USB-C o no tienen lector de tarjetas SD.
Tenga en cuenta que el puerto del adaptador de CA es idéntico al de la Titan 18 HX a pesar de que los tamaños de sus adaptadores de CA pueden ser diferentes.
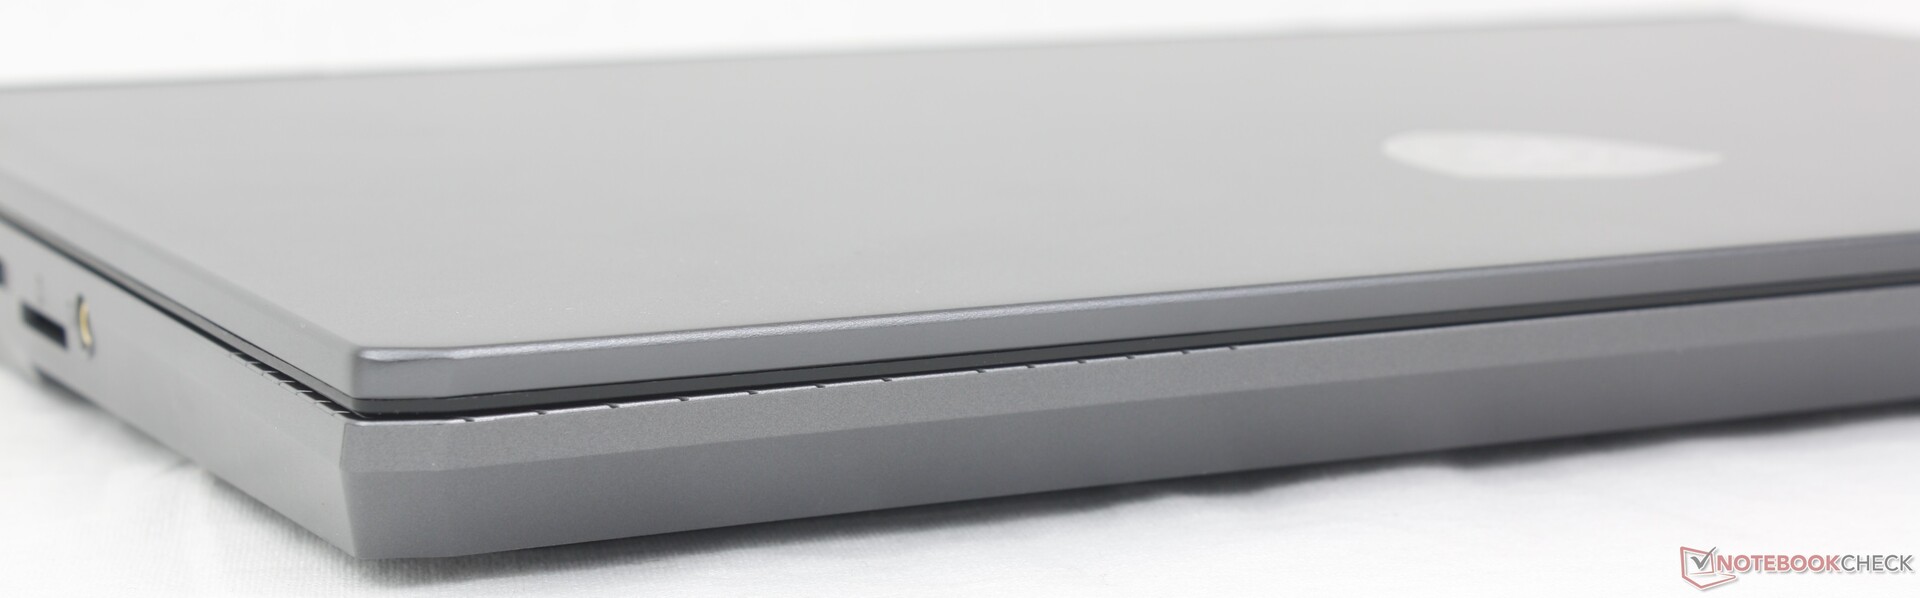
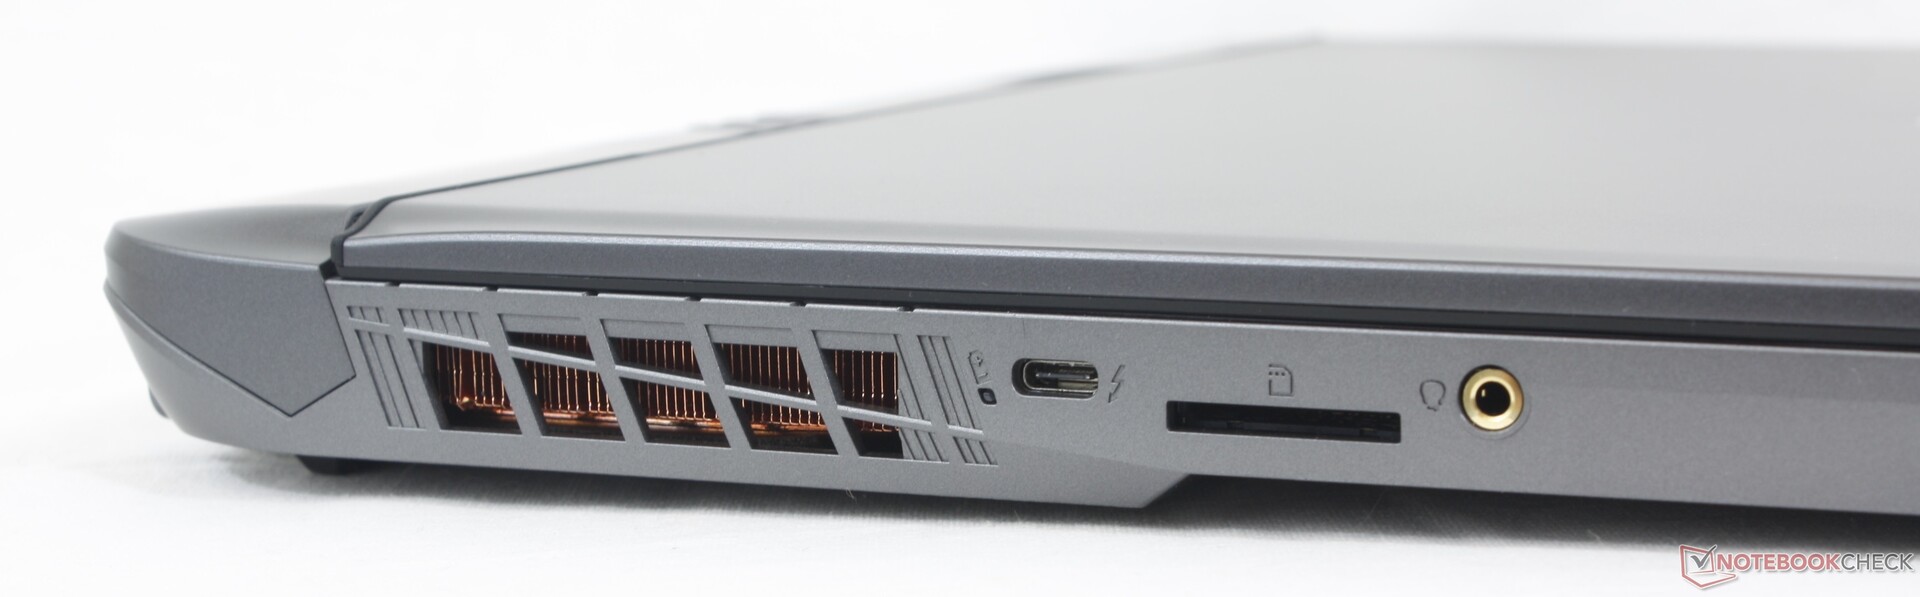
Lector de tarjetas SD
Las velocidades de transferencia del lector de tarjetas SD integrado son decentes, en torno a los 90 MB/s, para ser de 2 a 3 veces más rápidas que el lector de tarjetas que se encuentra en el nuevo Lenovo Legion 5 16. Sin embargo, el lector del MSI no está accionado por resorte, por lo que una tarjeta SD insertada puede resultar difícil de extraer con los dedos grandes.
| SD Card Reader | |
| average JPG Copy Test (av. of 3 runs) | |
| MSI Vector 16 HX A14V (Toshiba Exceria Pro SDXC 64 GB UHS-II) | |
| Lenovo Legion 5 16IRX G9 | |
| maximum AS SSD Seq Read Test (1GB) | |
| MSI Vector 16 HX A14V (Toshiba Exceria Pro SDXC 64 GB UHS-II) | |
| Lenovo Legion 5 16IRX G9 | |
Comunicación
El Killer BE1750x es compatible con Wi-Fi 7 y Bluetooth 5.4 a pesar de que los routers Wi-Fi 7 aún no son la corriente principal. Por lo tanto, su inclusión tiene más que ver con la garantía de futuro, ya que la mayoría de los usuarios actuales no disponen de routers Wi-Fi 7. No obstante, las velocidades de transferencia son constantes y fiables cuando se empareja con nuestro router de prueba Asus AXE11000 Wi-Fi 6E.
| Networking | |
| iperf3 transmit AX12 | |
| MSI Vector GP66 12UGS | |
| iperf3 receive AX12 | |
| MSI Vector GP66 12UGS | |
| iperf3 transmit AXE11000 | |
| Lenovo Legion 5 16IRX G9 | |
| MSI Vector 16 HX A14V | |
| Dell G16 7620 | |
| Asus TUF Gaming A16 FA617XS | |
| HP Victus 16-r0077ng | |
| iperf3 receive AXE11000 | |
| Lenovo Legion 5 16IRX G9 | |
| MSI Vector 16 HX A14V | |
| Dell G16 7620 | |
| Asus TUF Gaming A16 FA617XS | |
| HP Victus 16-r0077ng | |
| iperf3 transmit AXE11000 6GHz | |
| MSI Vector 16 HX A14V | |
| iperf3 receive AXE11000 6GHz | |
| MSI Vector 16 HX A14V | |
Cámara web
La webcam integrada es de un mísero 1 MP, ya que el Vector no está diseñado para videoconferencias frecuentes. Tampoco admite infrarrojos, pero al menos incluye un obturador físico con fines de privacidad.


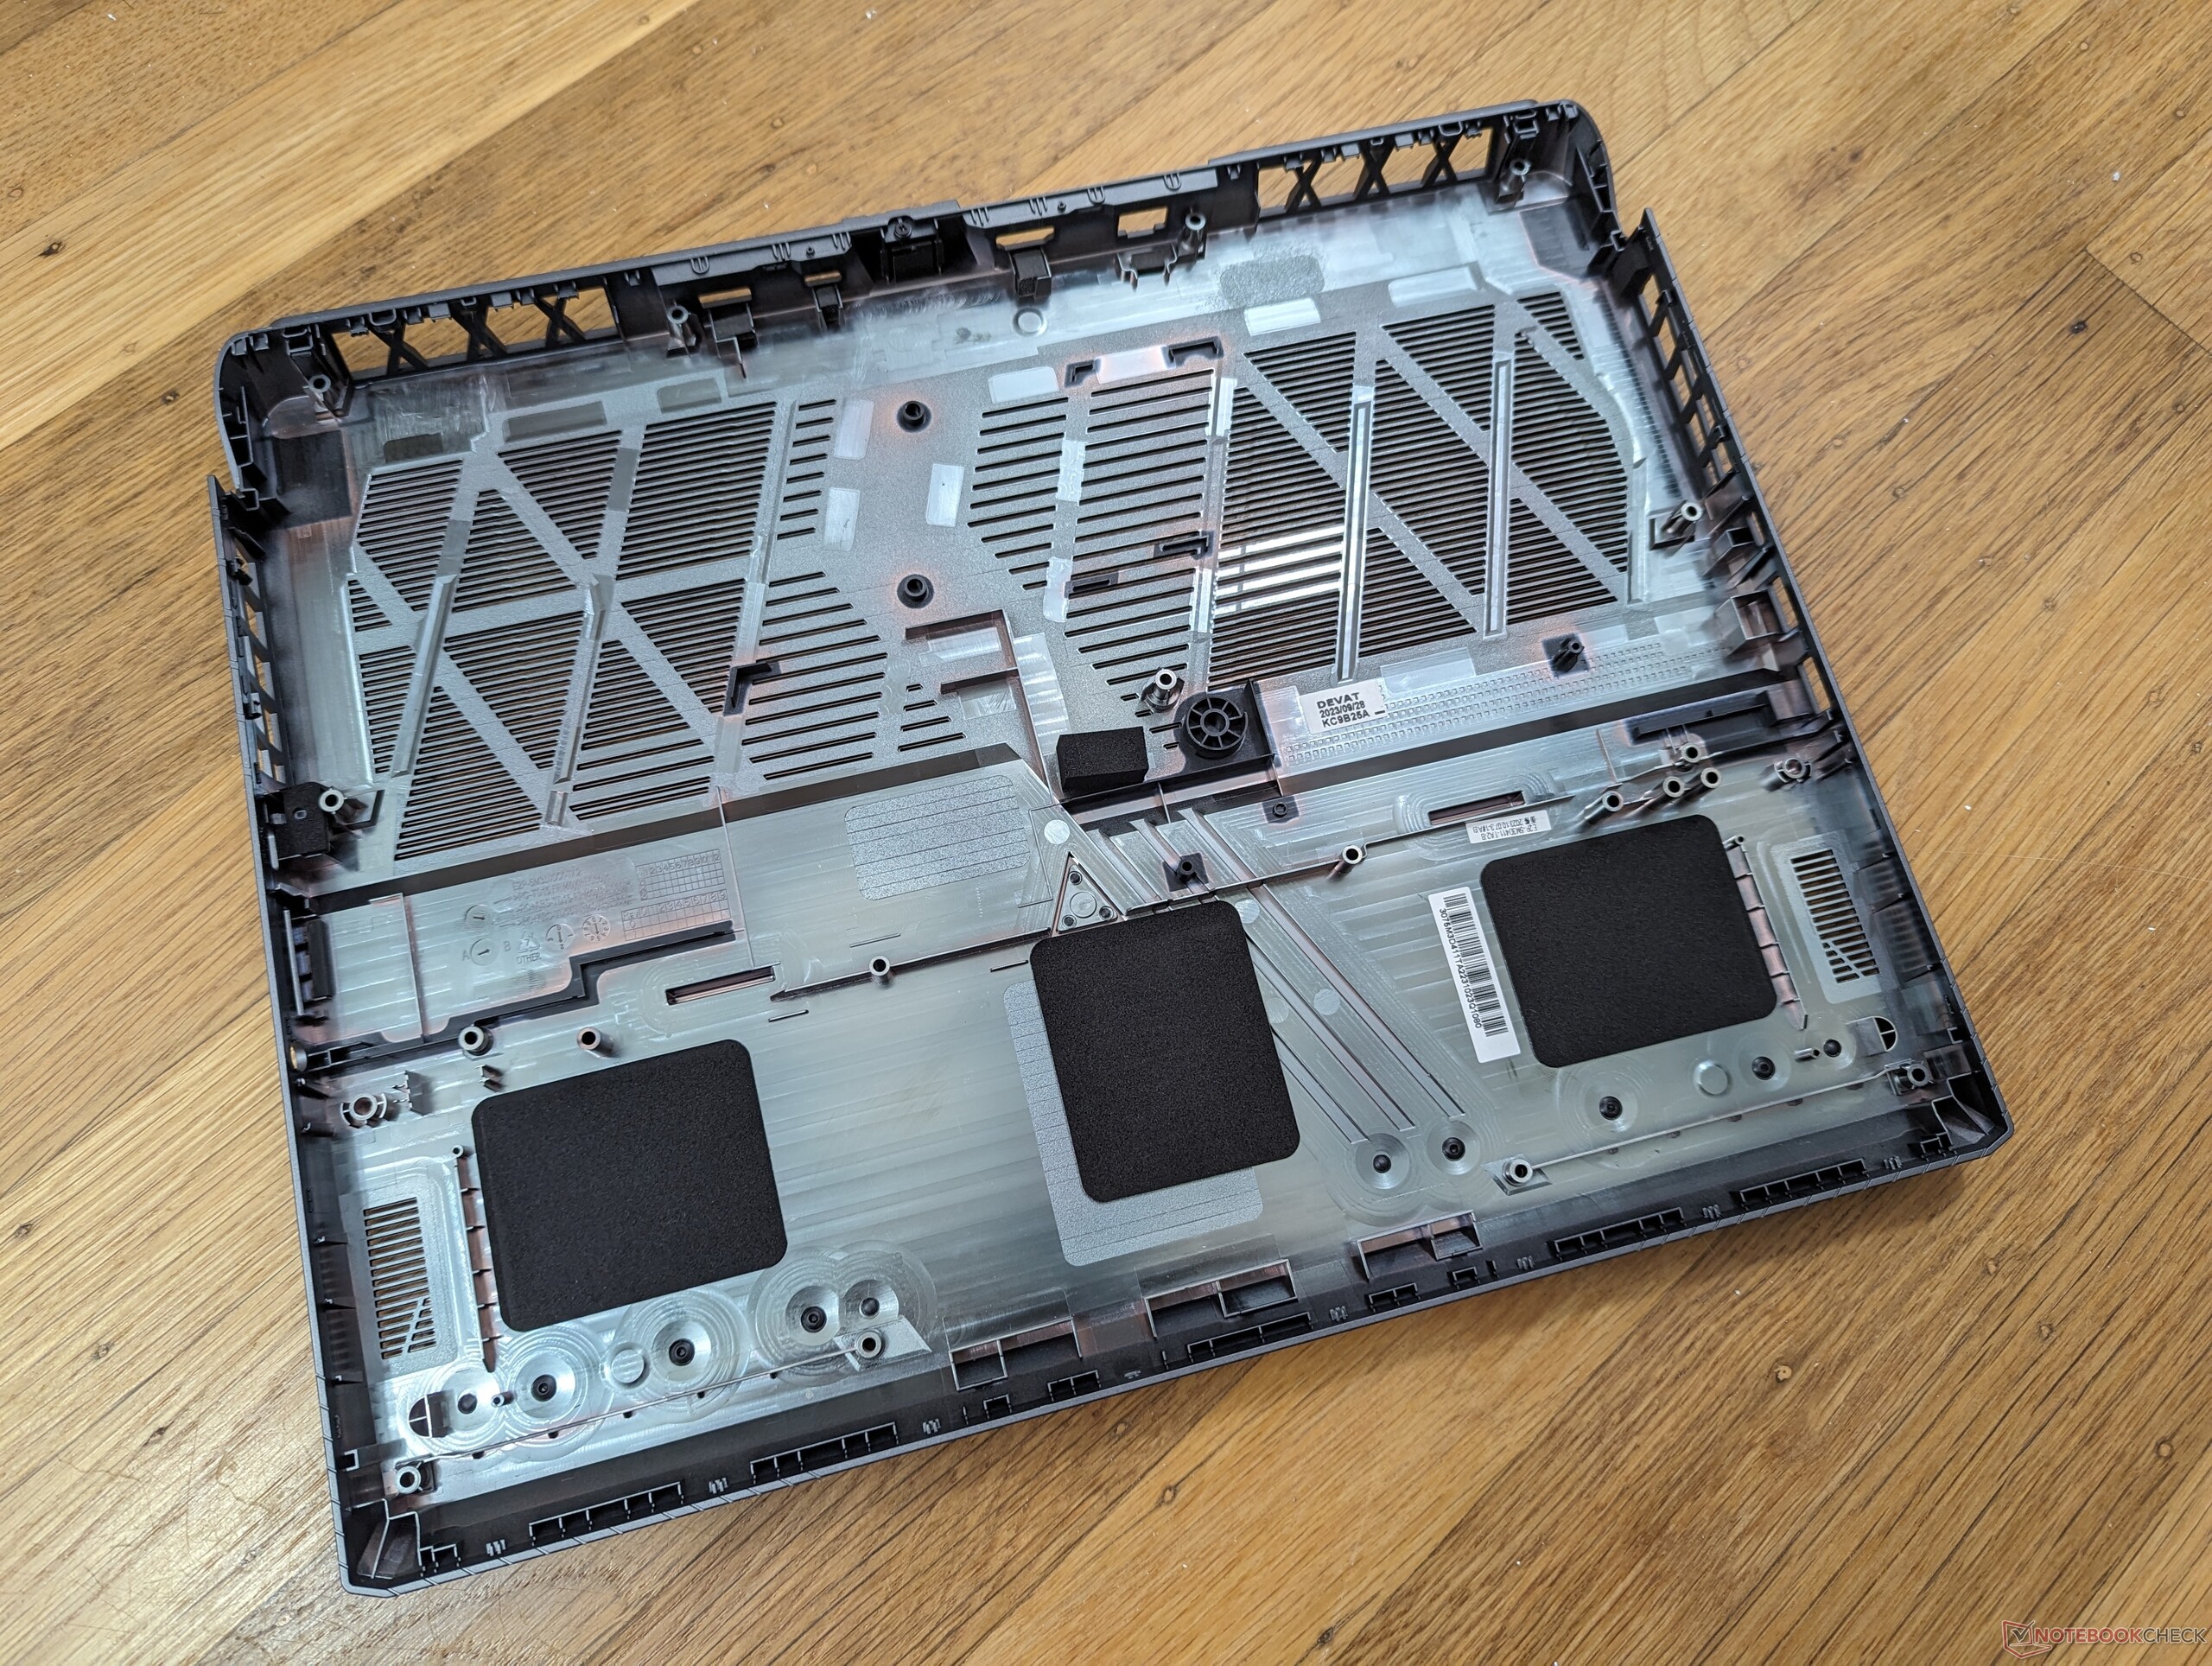
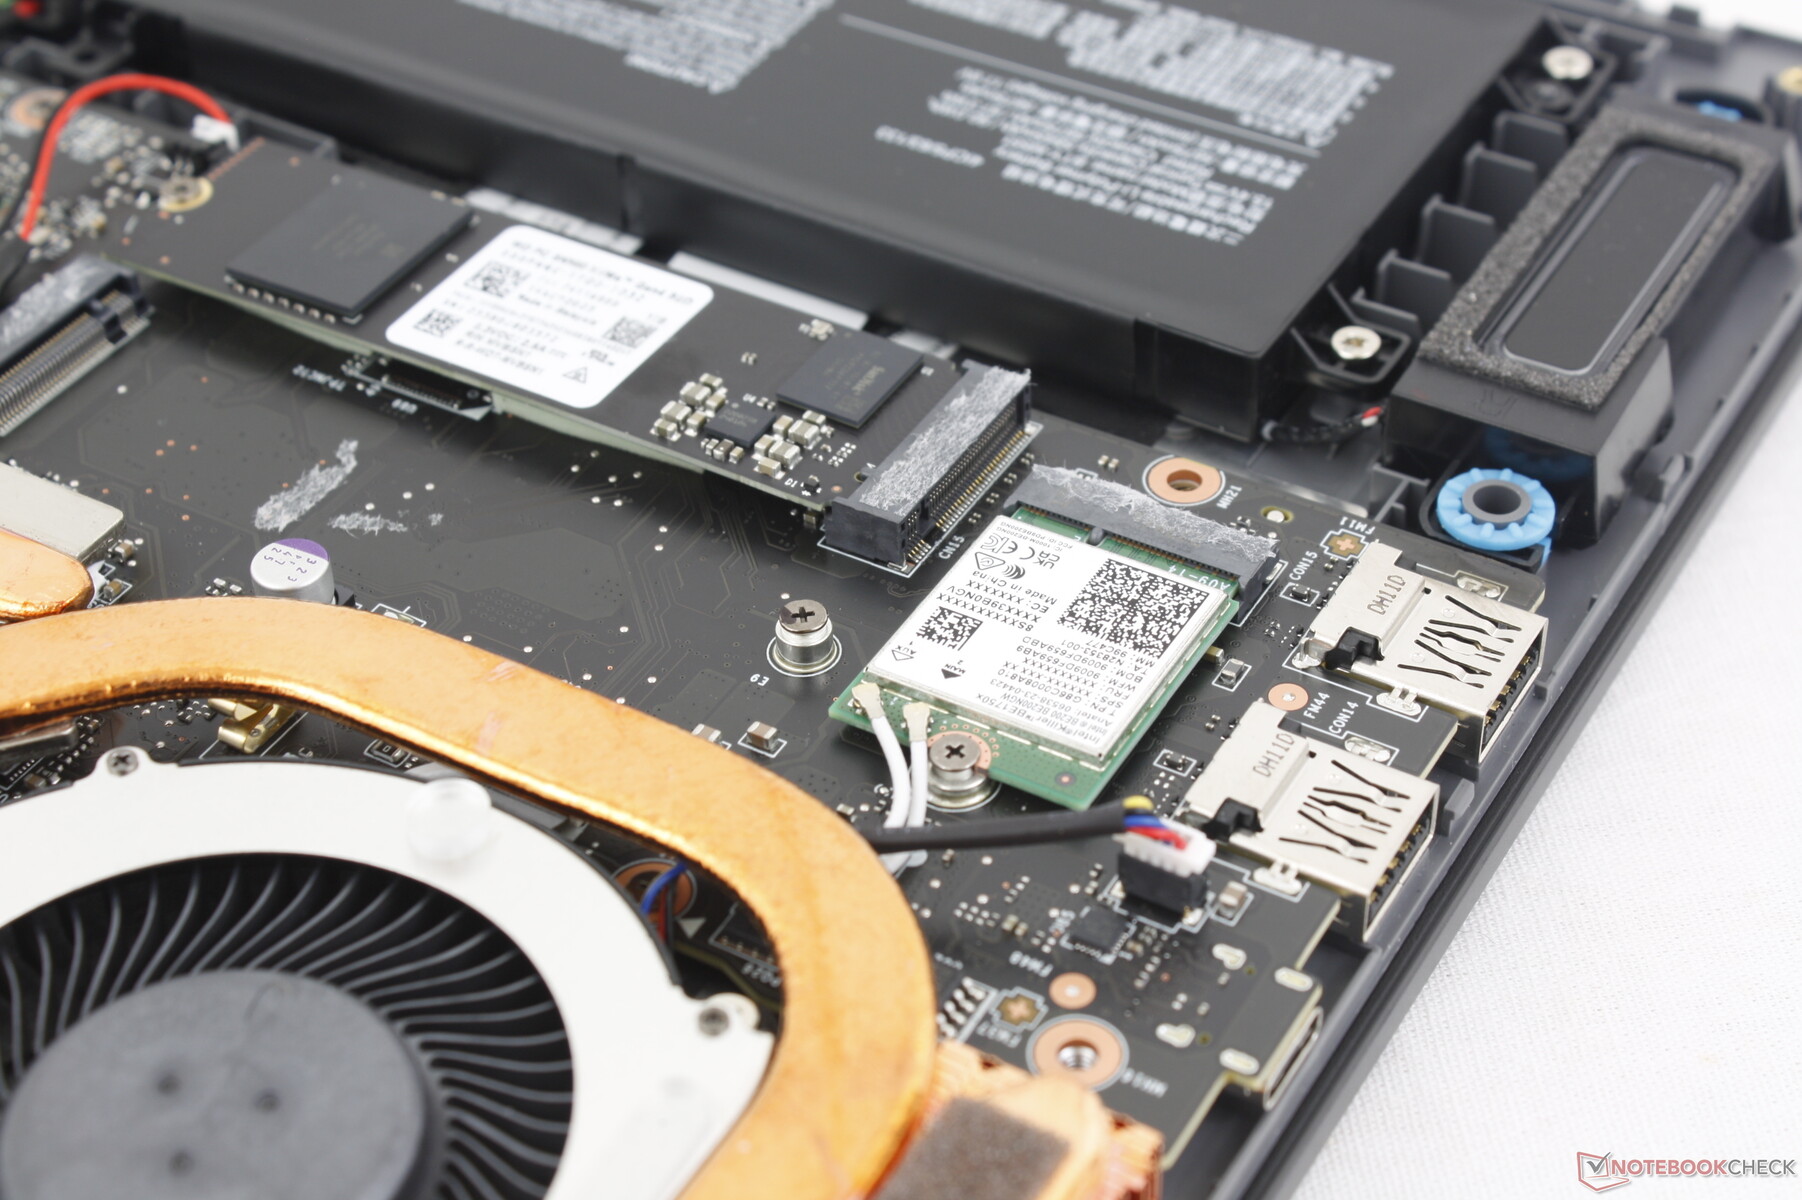
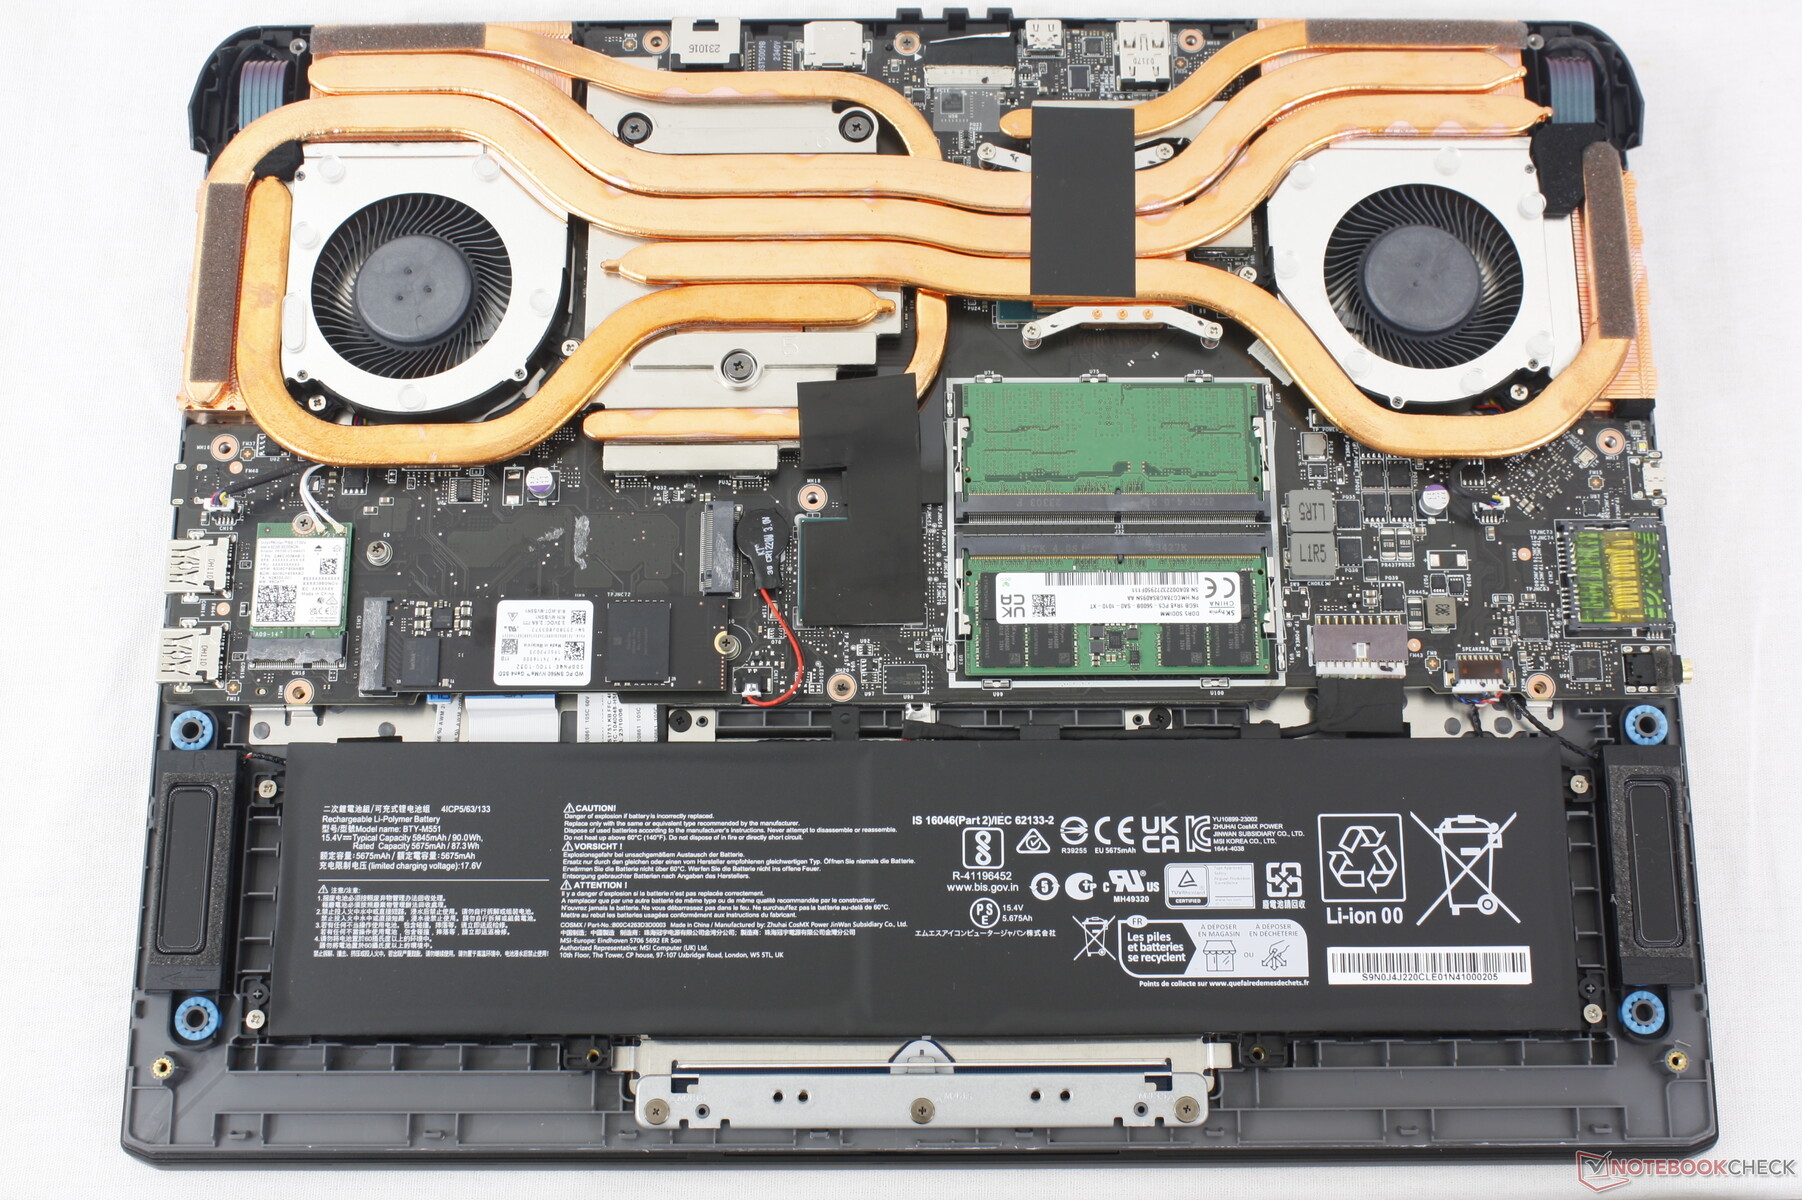
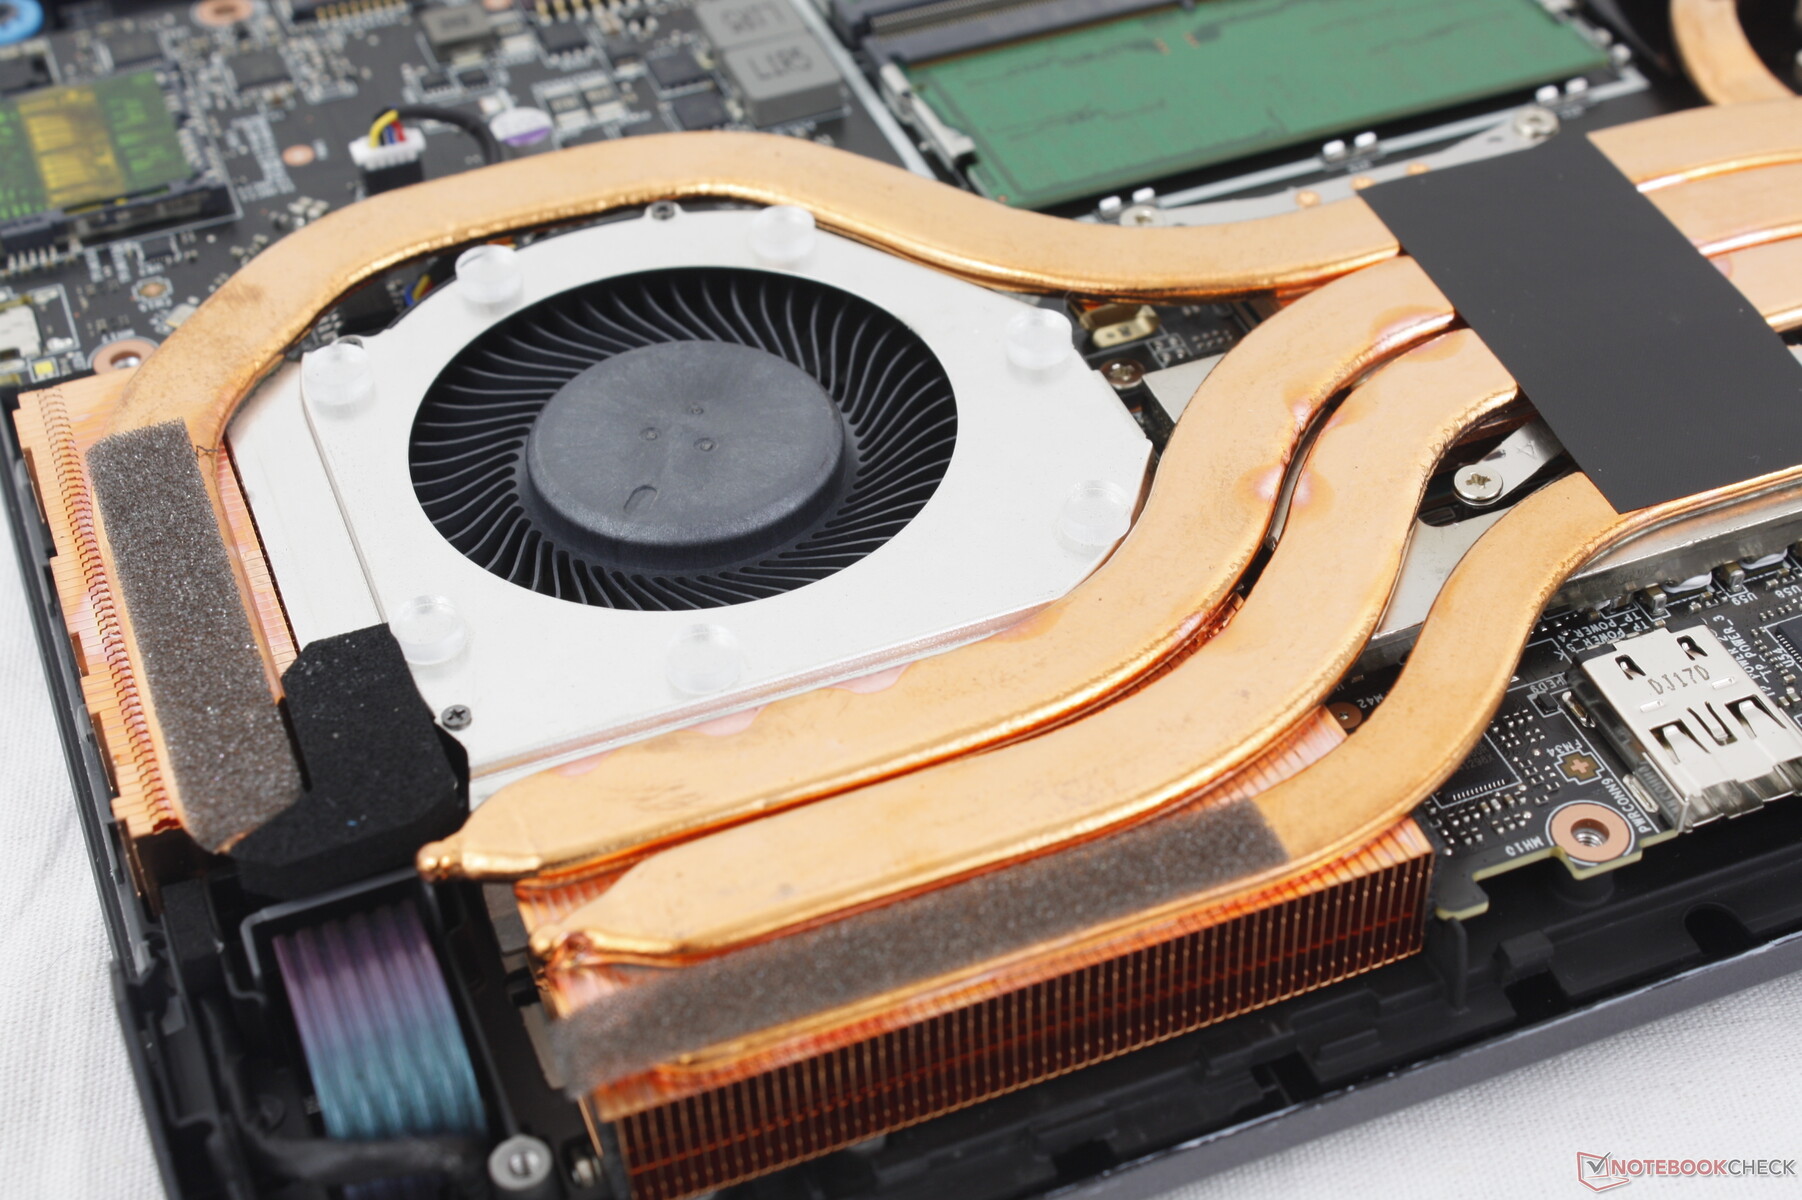
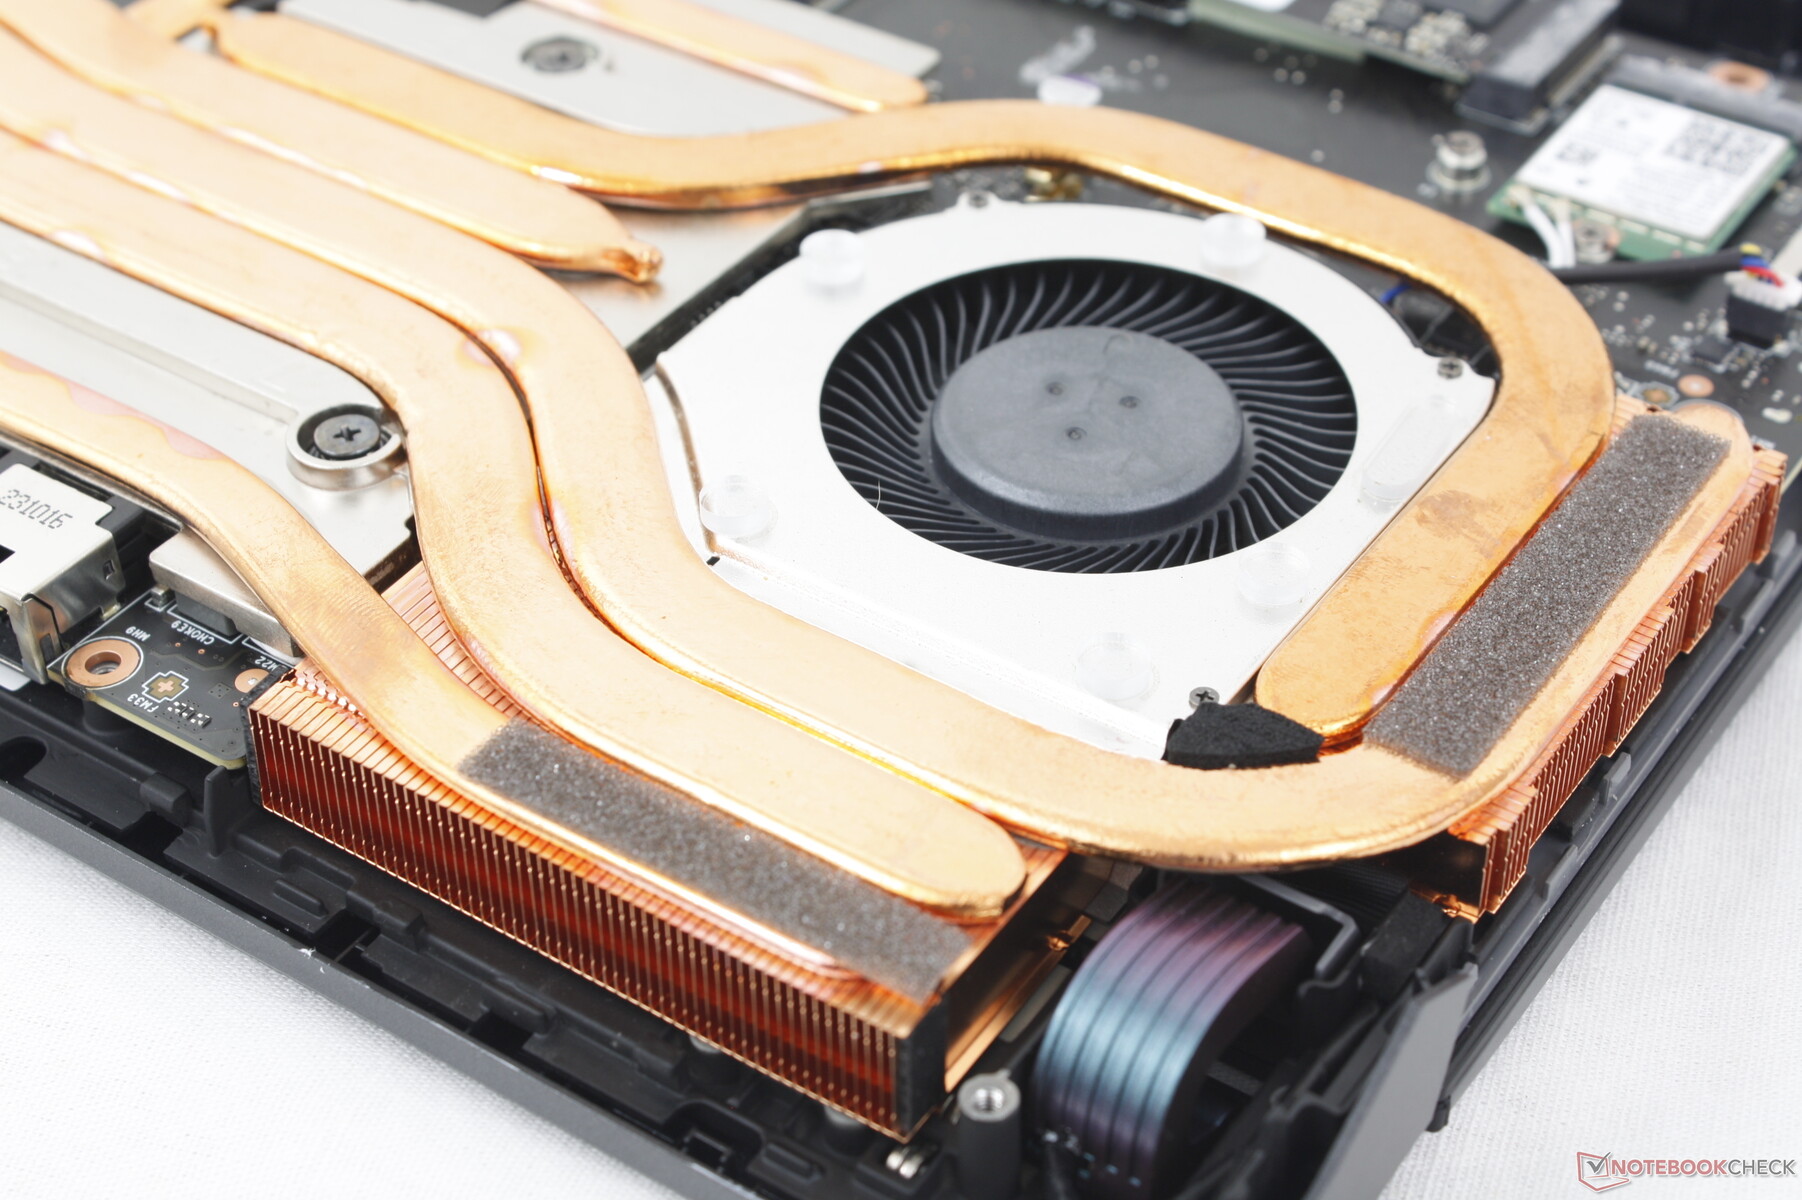
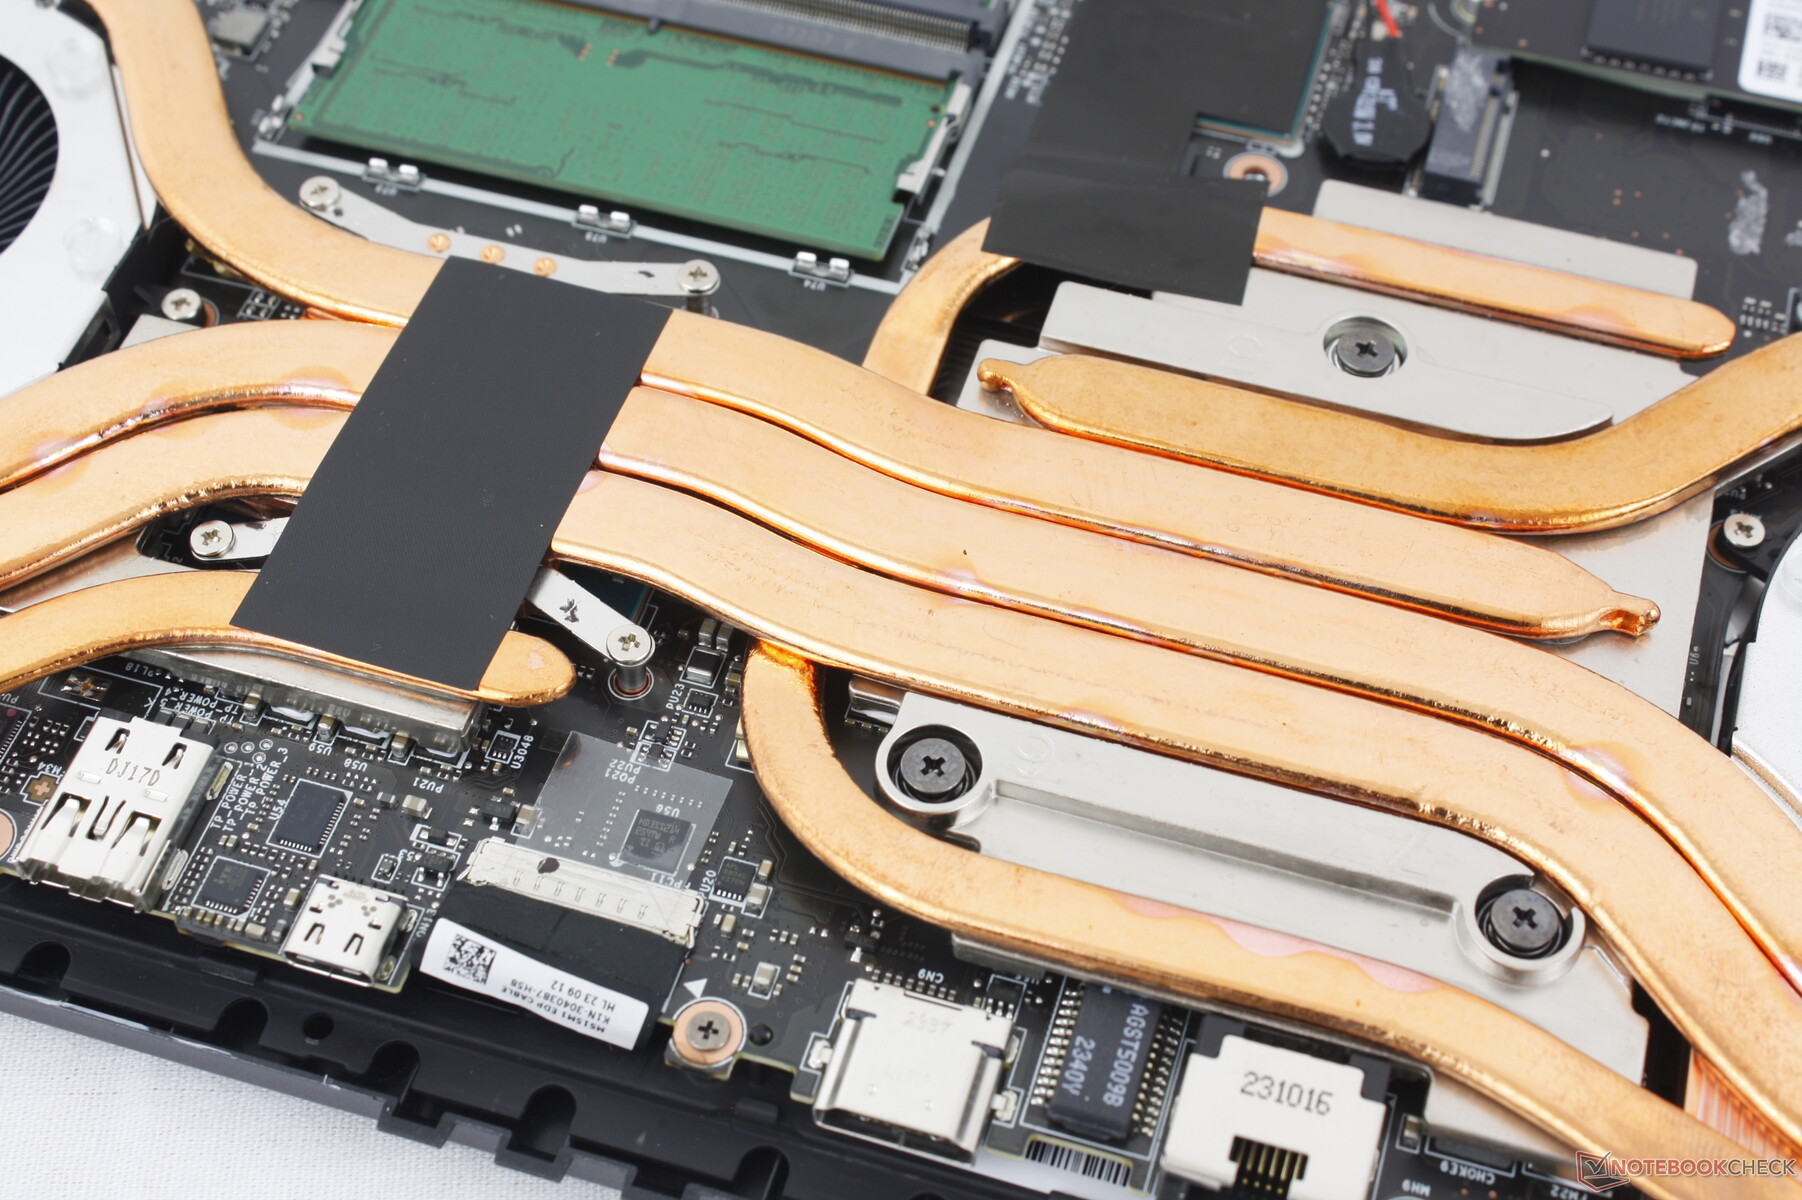
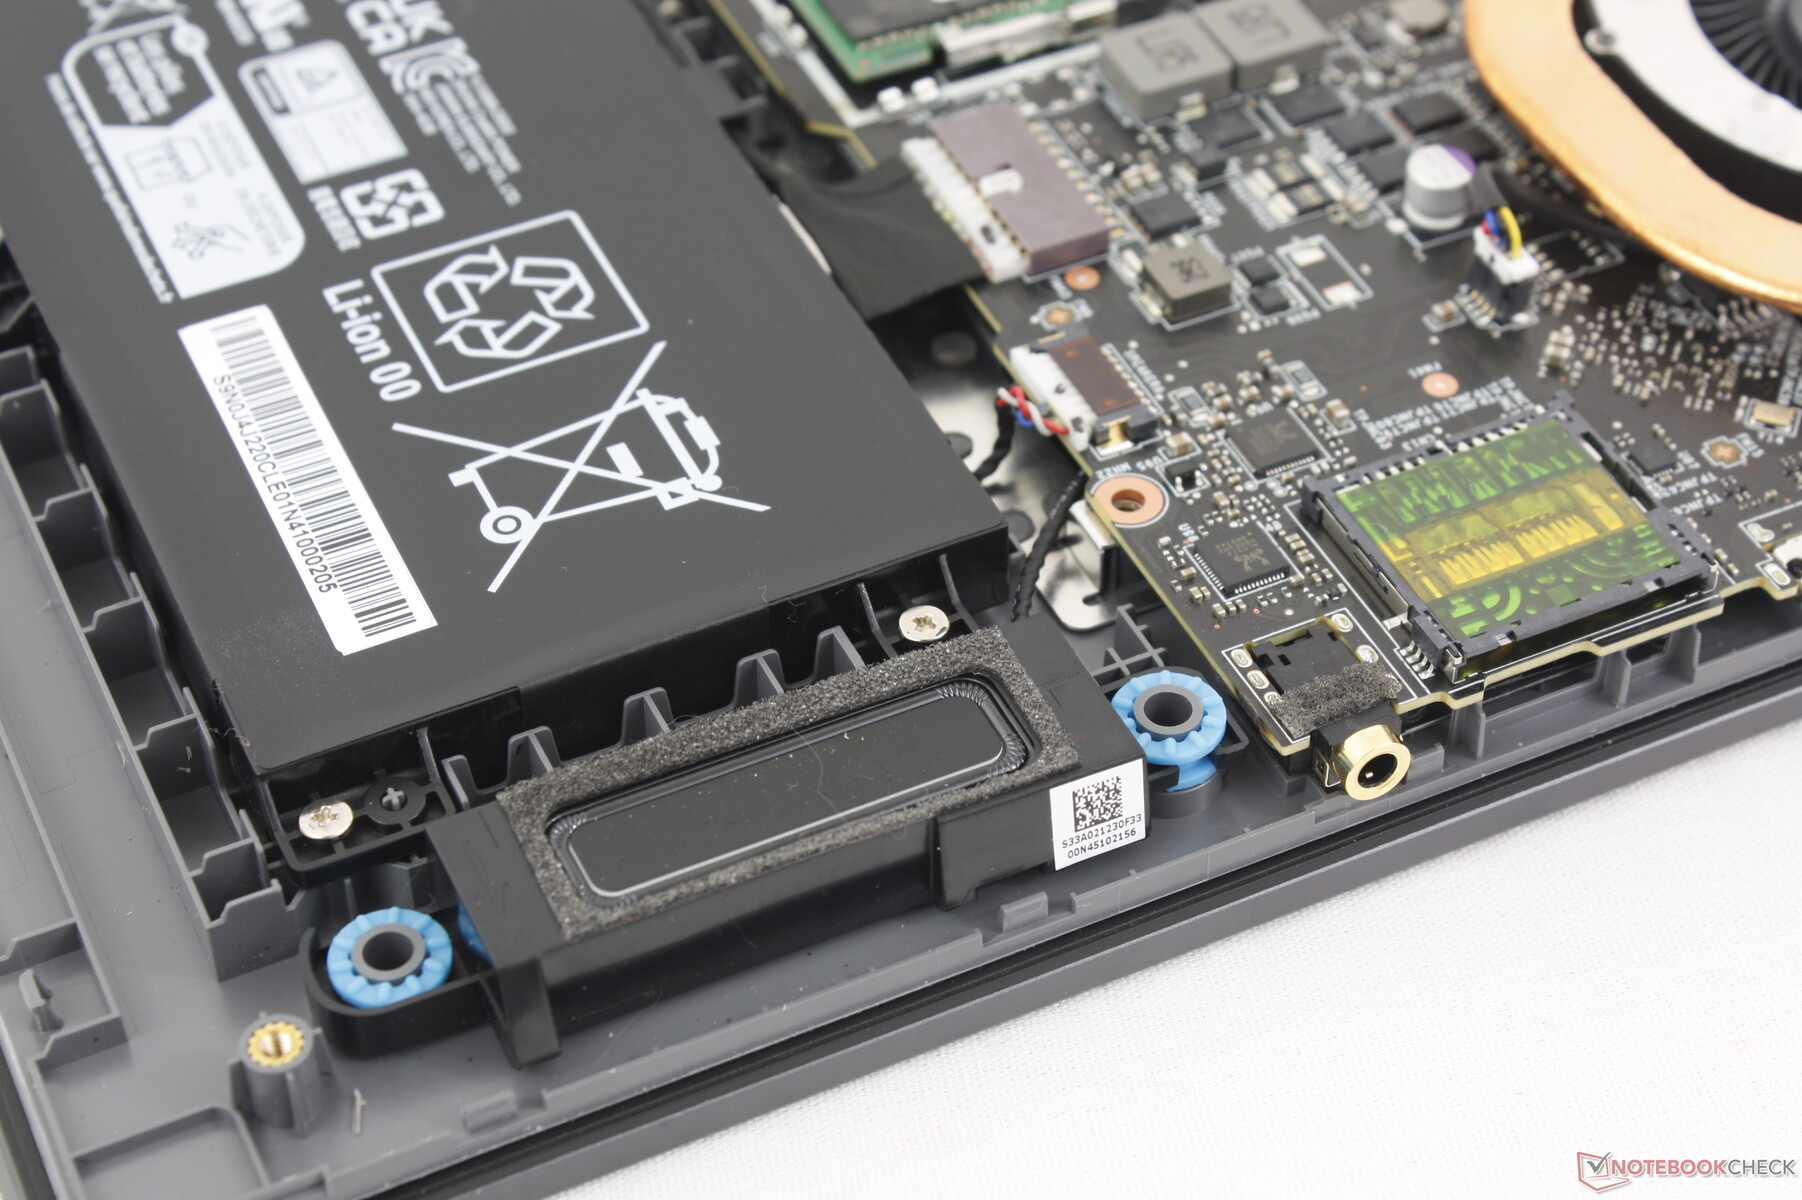
Mantenimiento
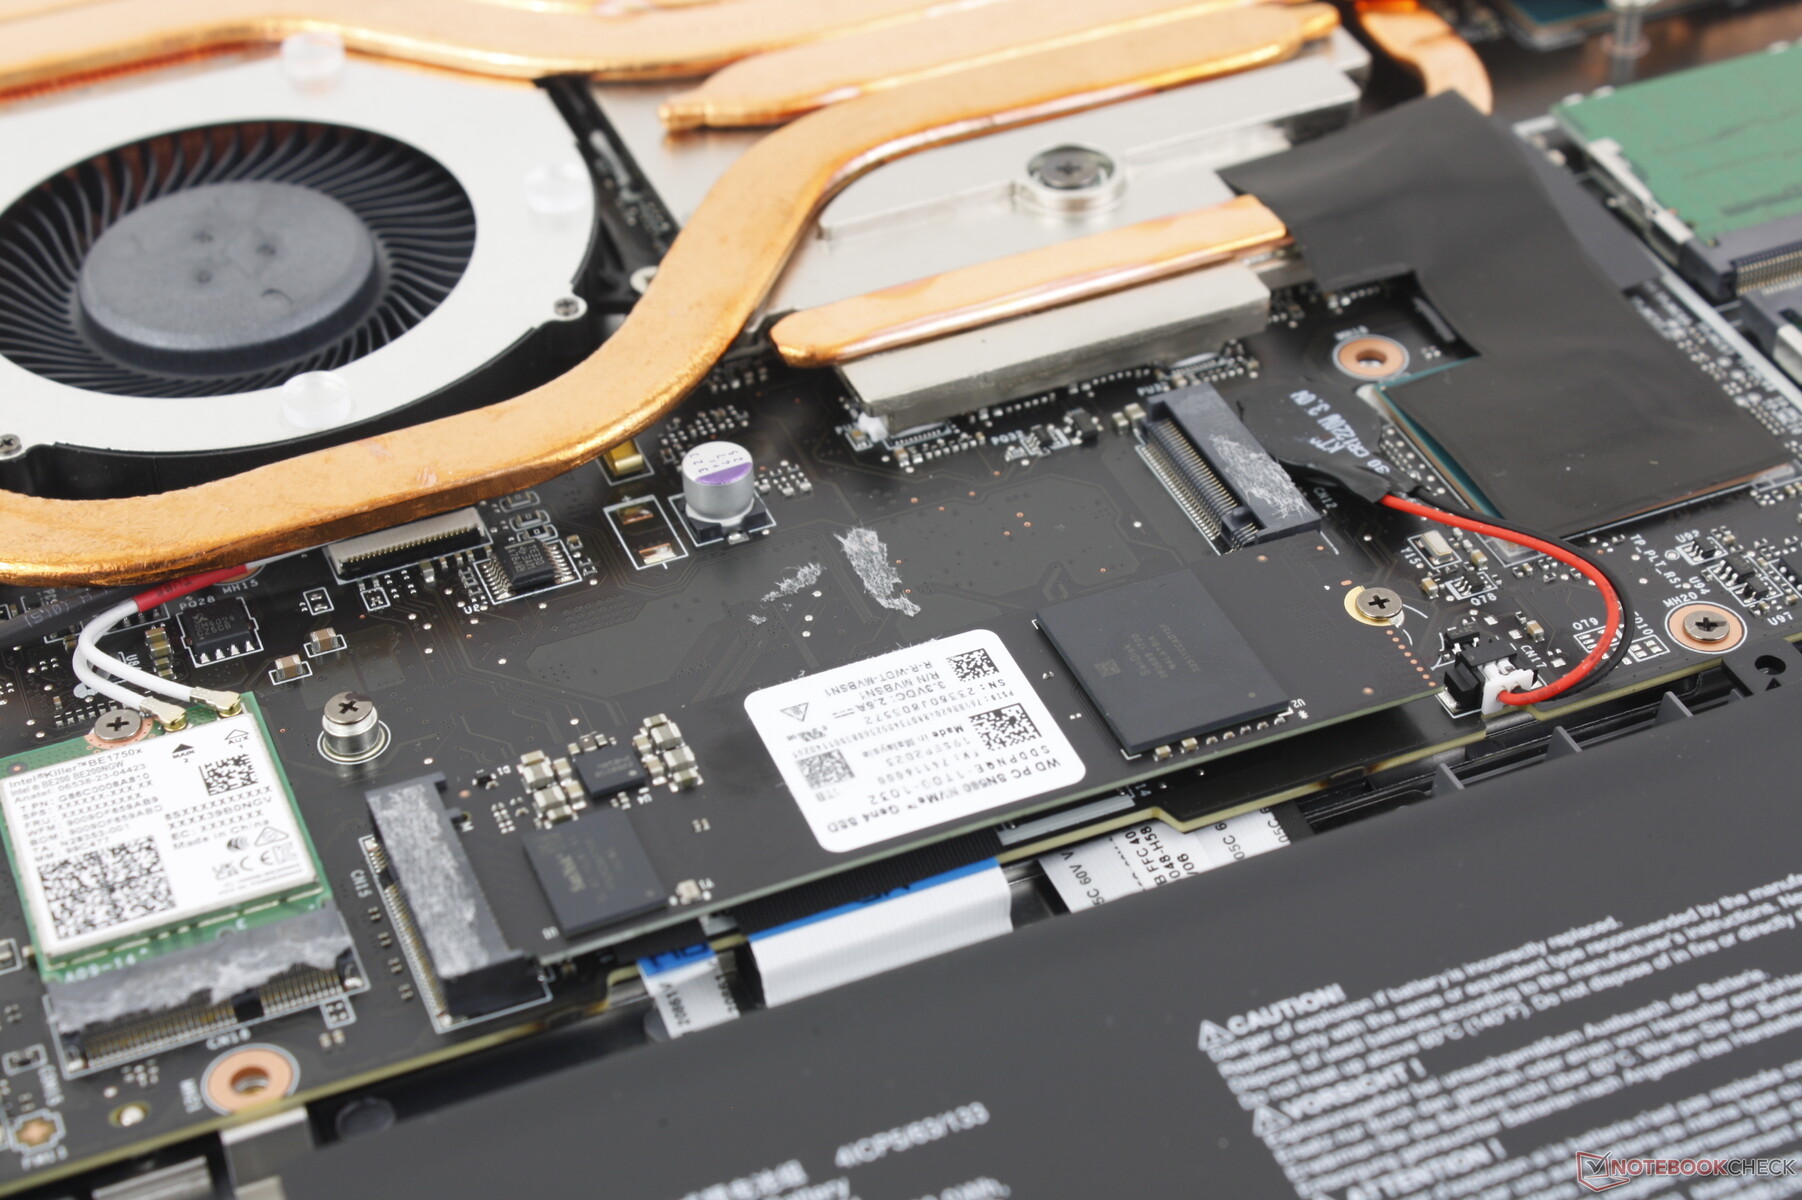
El panel inferior está asegurado por 13 tornillos Phillips. Por desgracia, retirar el panel puede resultar difícil, ya que los bordes y las esquinas tienen curvas significativas que hacen que el proceso sea más molesto de lo necesario. En comparación, el panel inferior del Razer Blade 16 es mucho más plano y con menos pestillos para facilitar su extracción. Se recomienda utilizar un borde plano para realizar el mantenimiento del Vector 16 HX.
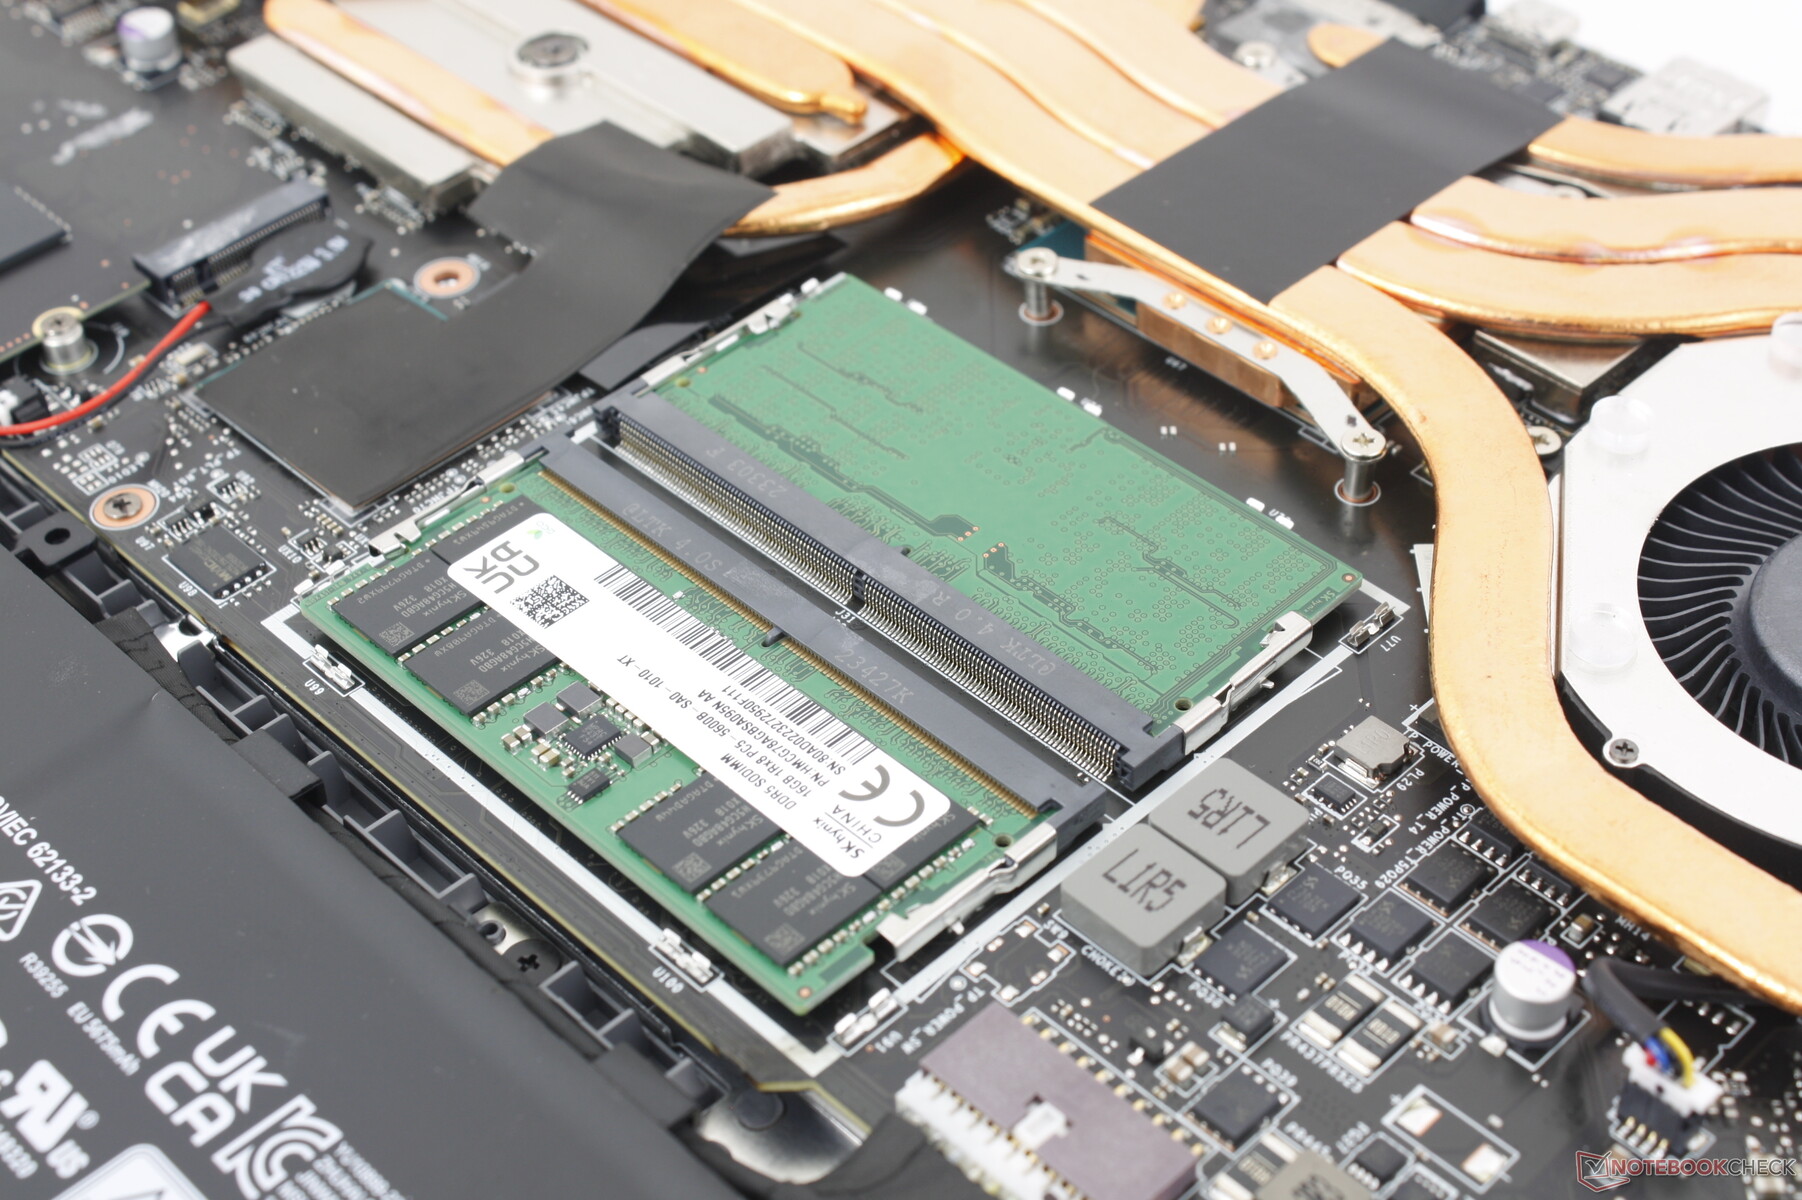
Una vez dentro, los usuarios tendrán acceso a 2 bahías de almacenamiento M.2, 2 ranuras SODIMM, la batería y el módulo WLAN, al igual que en el antiguo diseño Vector GP66.
Accesorios y garantía
En la caja no se incluyen más extras que el adaptador de CA y la documentación. Se aplica la habitual garantía limitada de un año del fabricante si se adquiere en EE.UU.
Dispositivos de entrada: sencillos y funcionales
Teclado
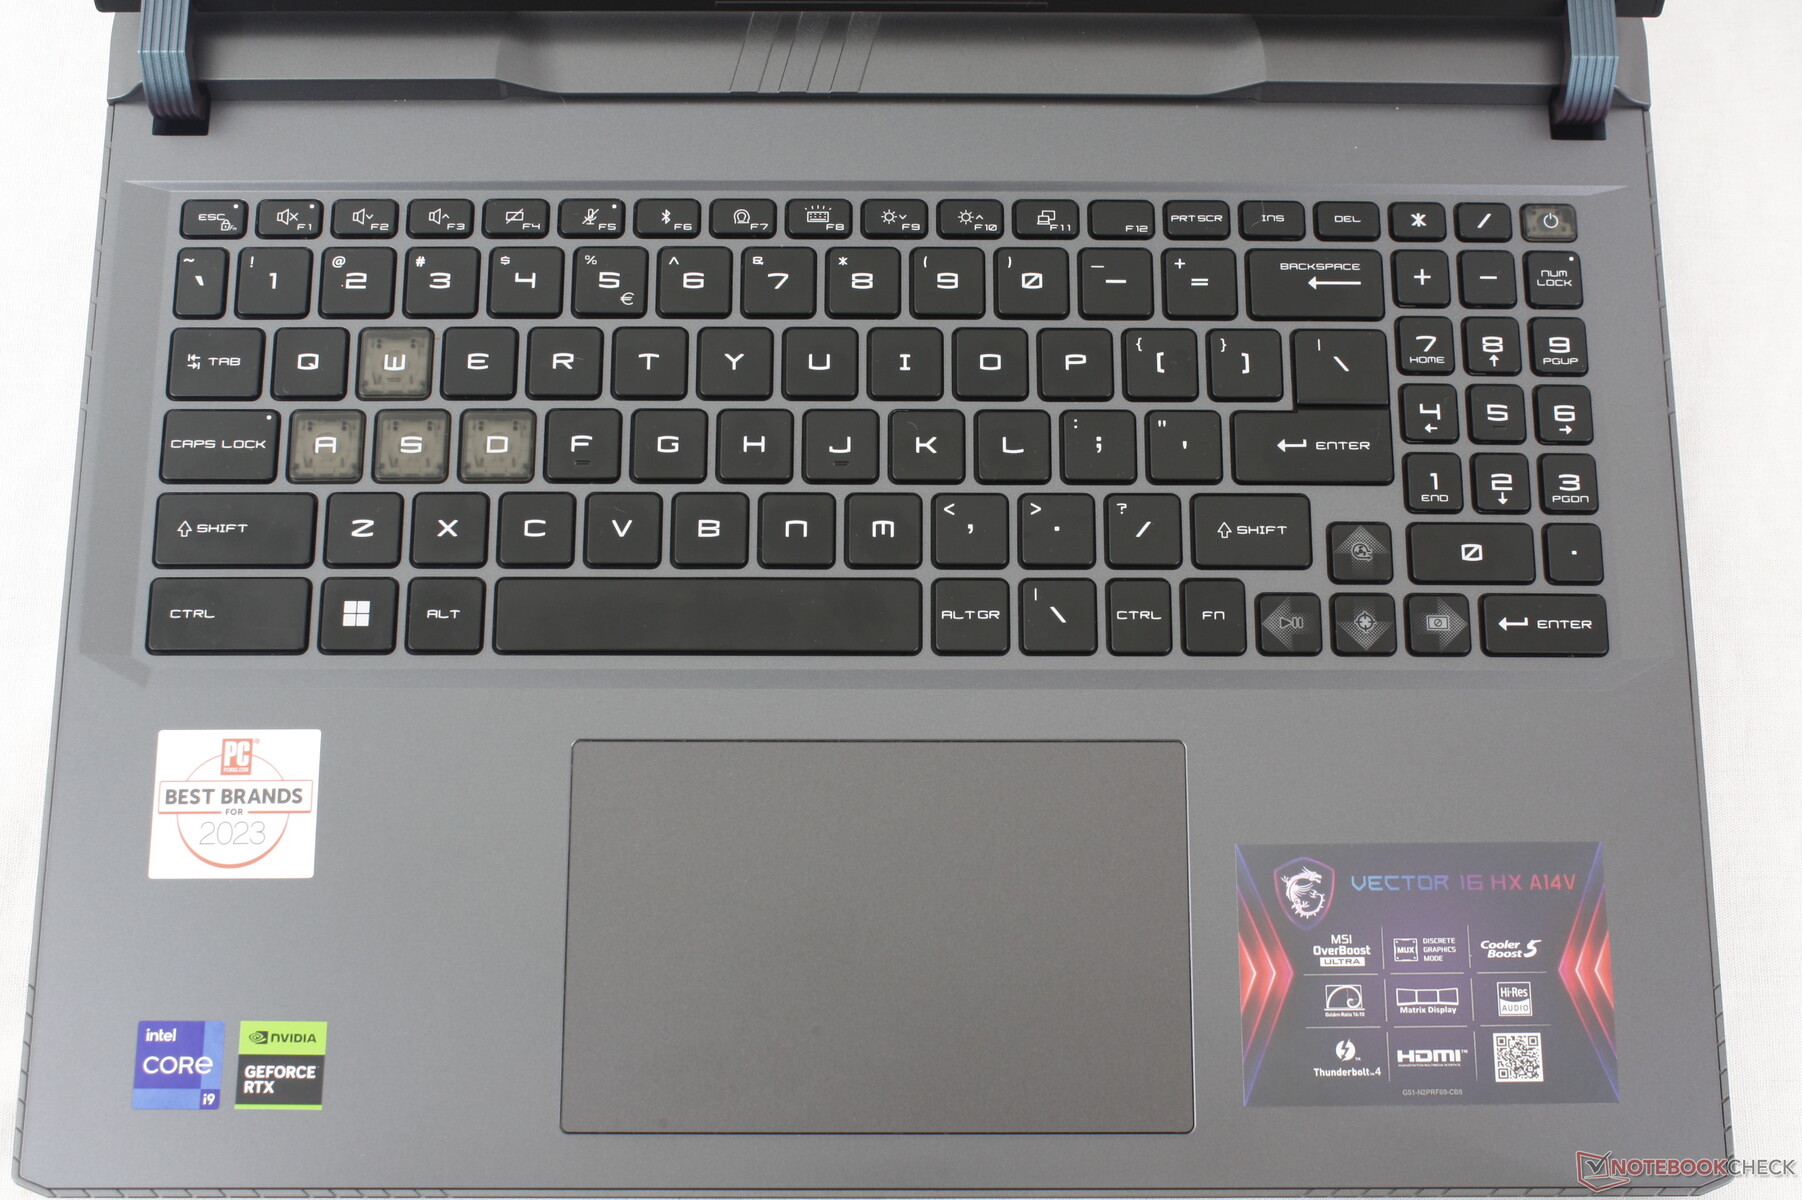
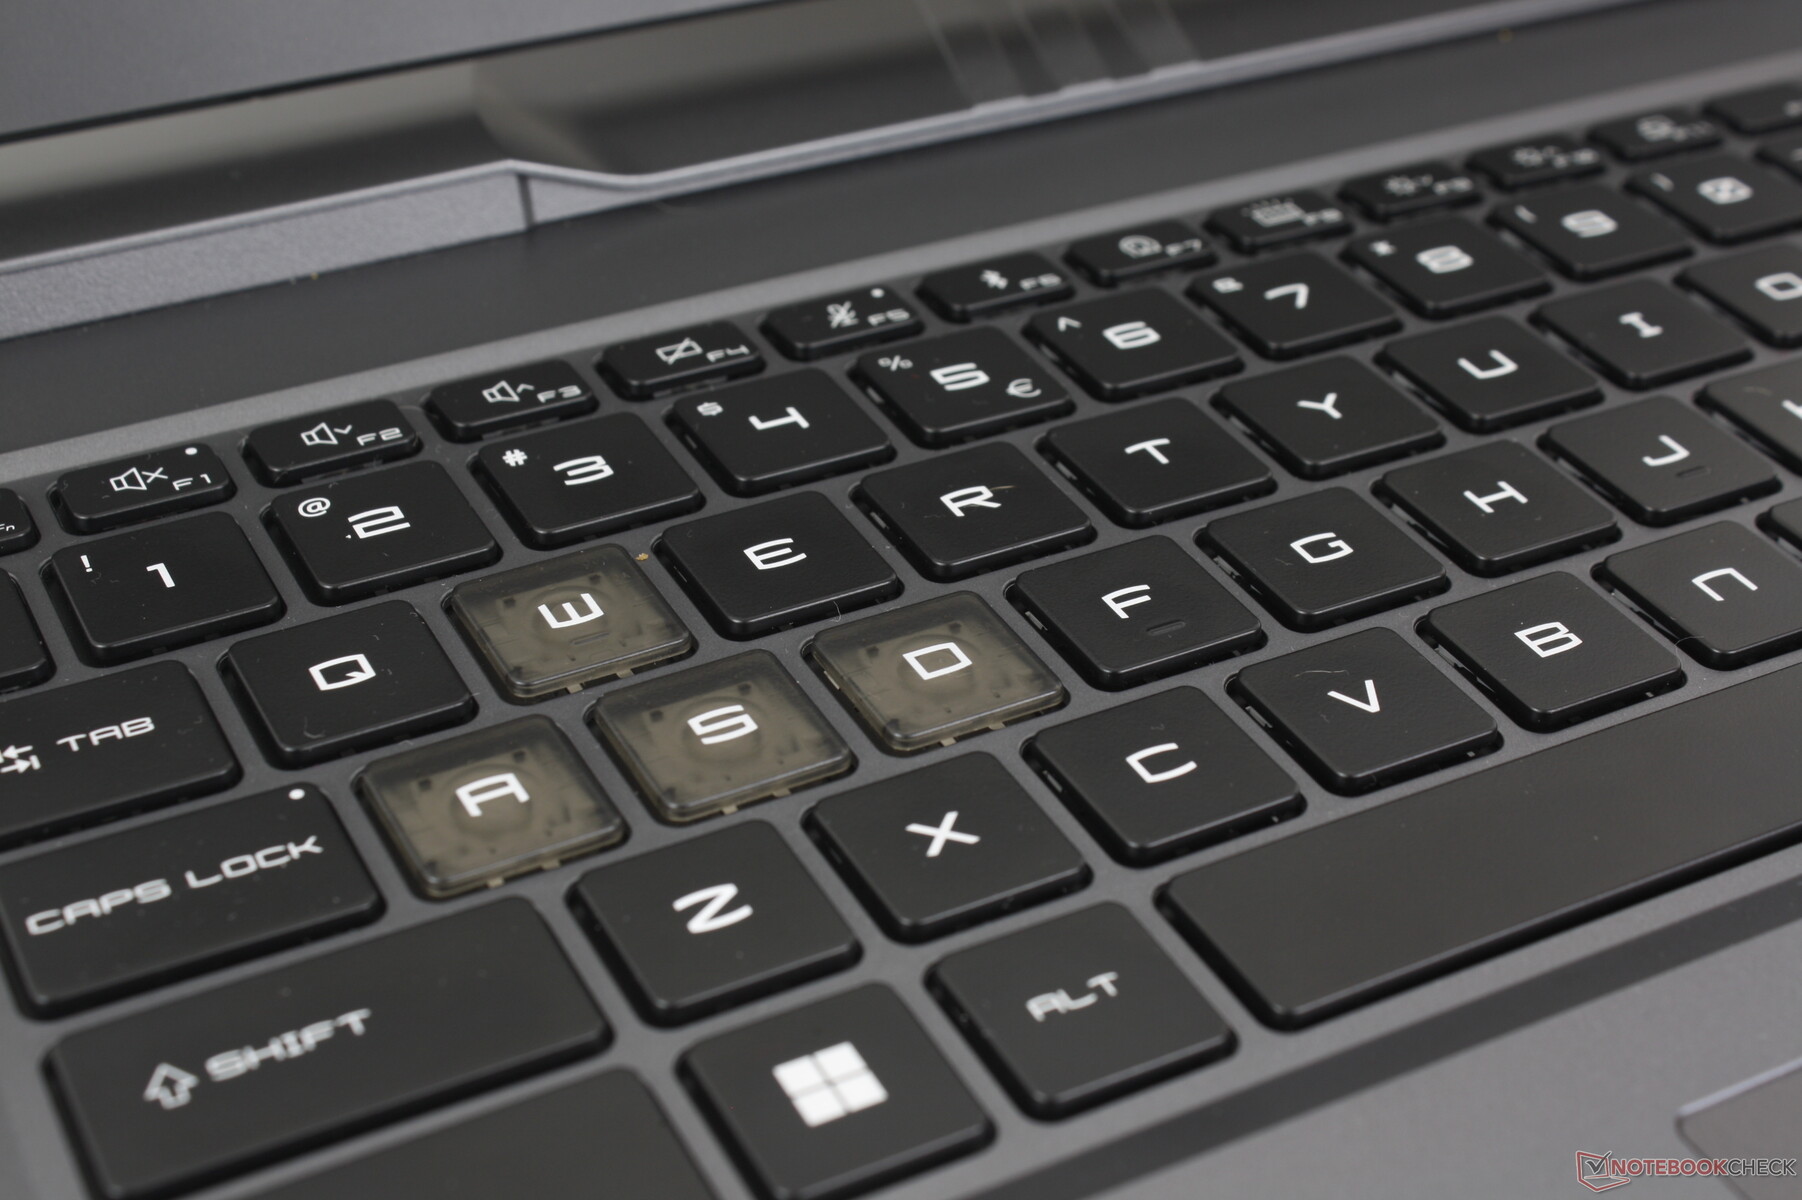
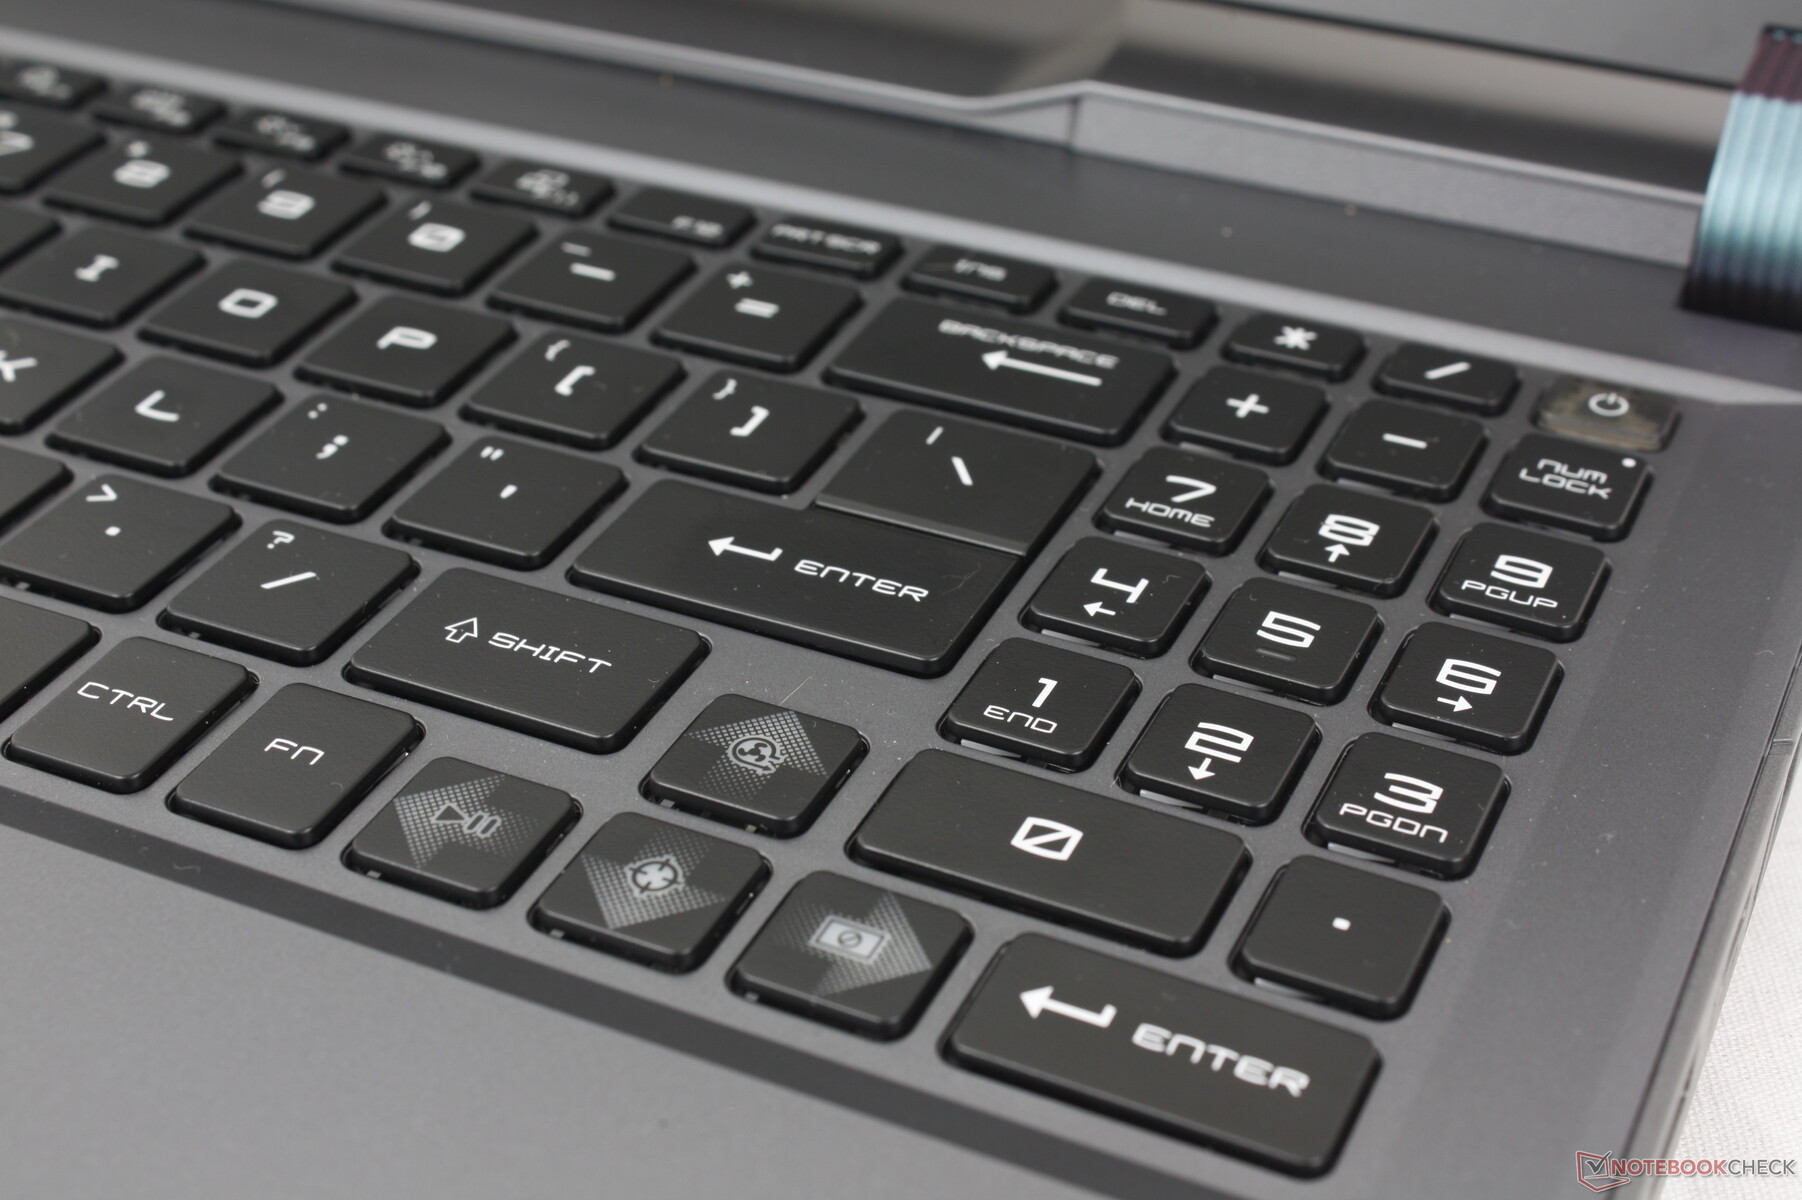
MSI ha renovado la distribución del teclado en comparación con el antiguo Vector GP66 diseño. Las incómodas teclas Fn/Ctrl del GP66 están ahora debidamente separadas y también hay un nuevo teclado numérico, mientras que muchos otros portátiles para juegos suelen omitir el teclado numérico por completo. Por desgracia, las teclas de flecha son más pequeñas que antes, mientras que las estrechas teclas del teclado numérico no son muy cómodas de usar. Por tanto, su implementación parece una ocurrencia tardía en comparación con las teclas QWERTY, que por lo demás son más grandes y cómodas.
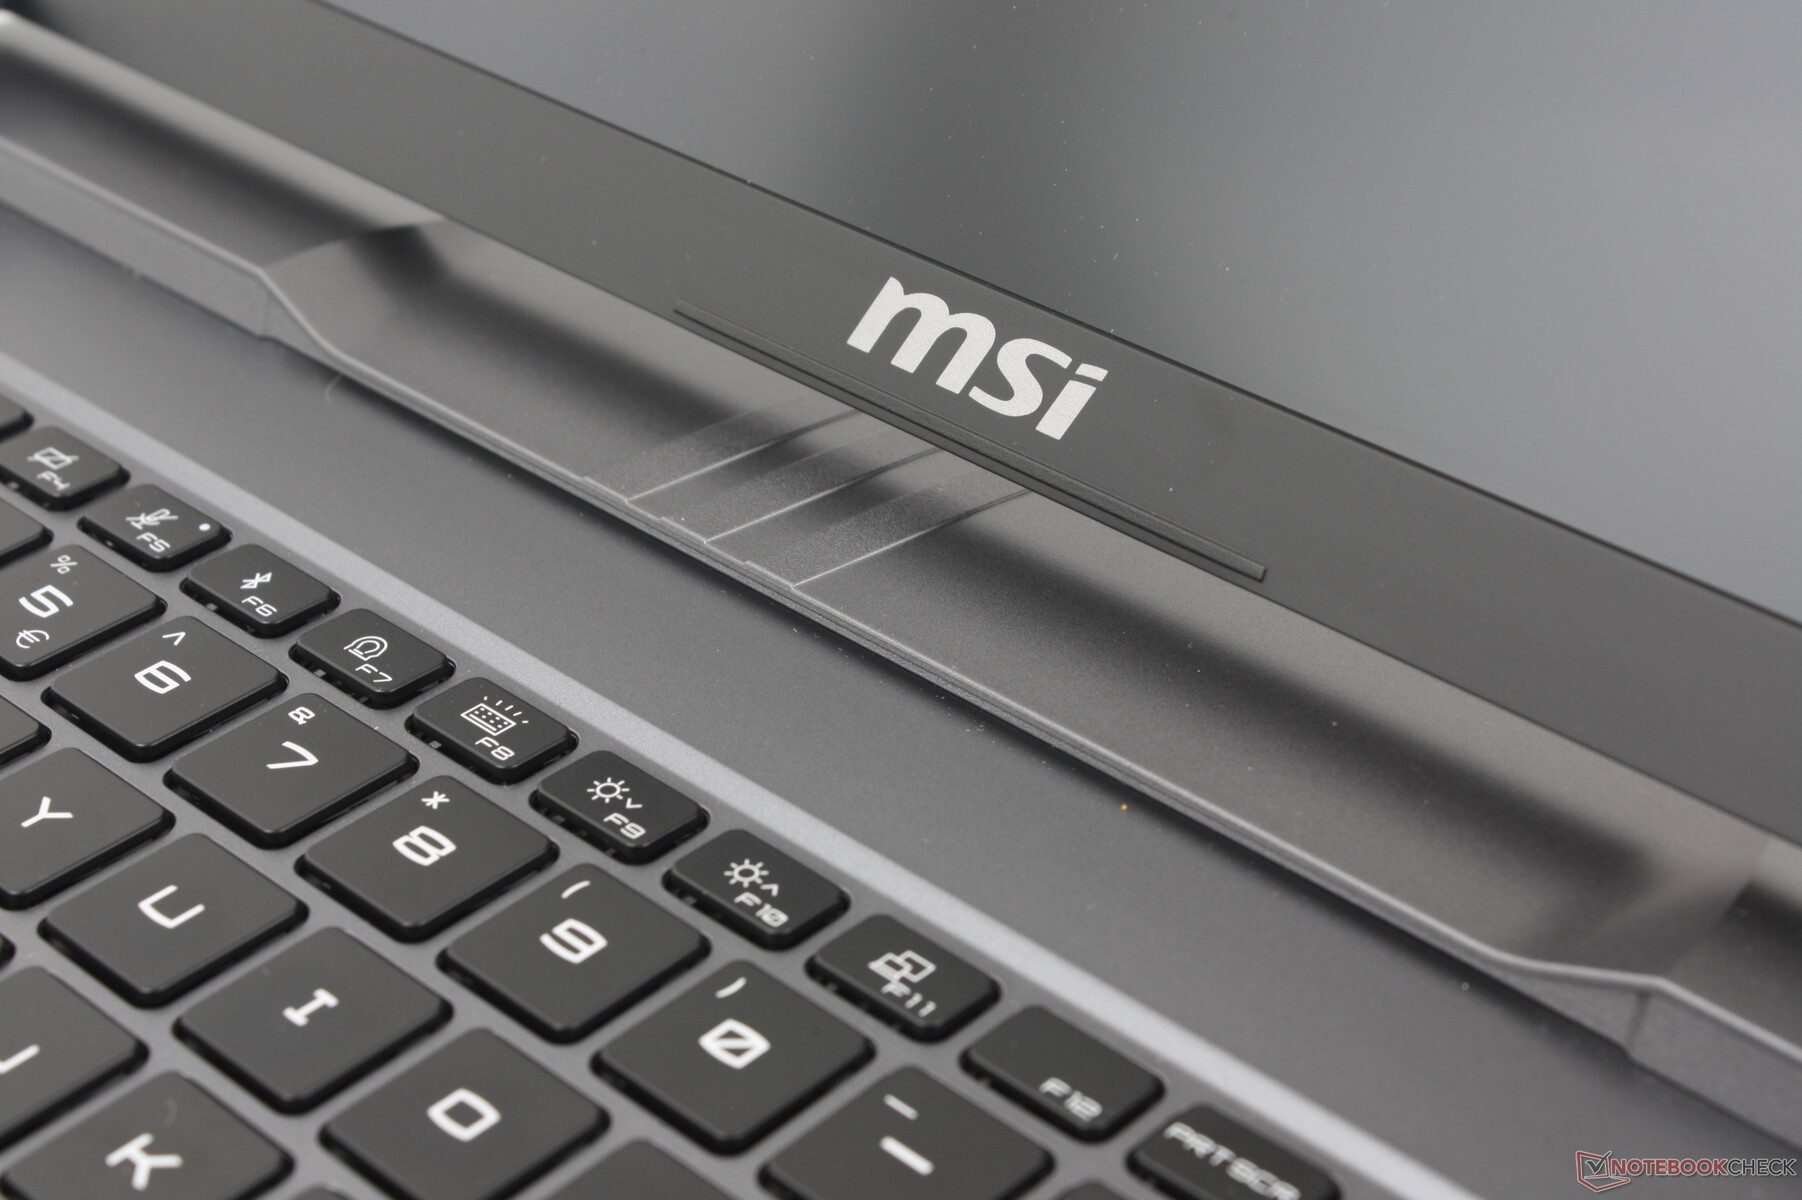
La iluminación RGB por tecla viene de serie para iluminar todas las teclas y símbolos.
Panel táctil
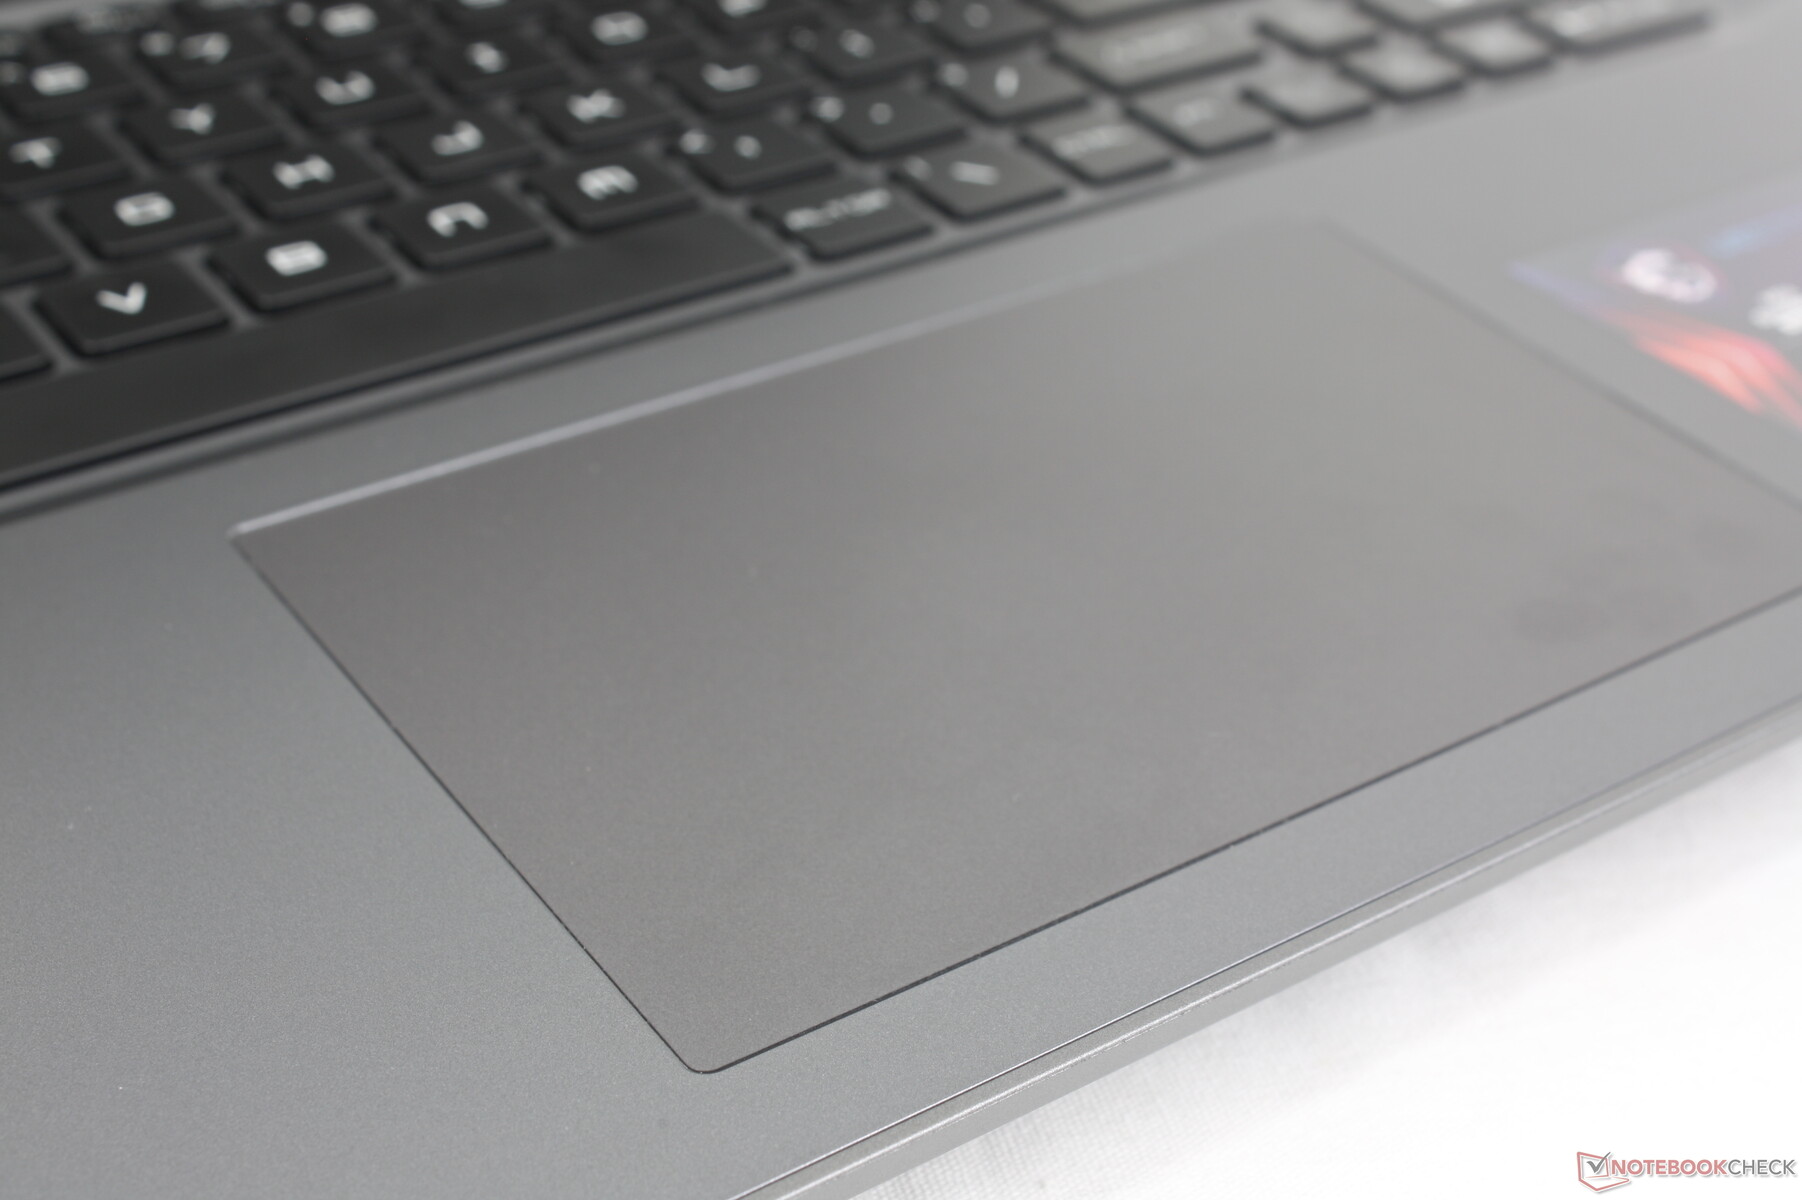
Con aproximadamente 13,2 x 8,2 cm, el clickpad es más espacioso que en el Dell G16 7620 (10,5 x 6 cm) y el antiguo Vector GP66 (10,5 x 6,5 cm). La tracción es muy suave, con sólo una ligera adherencia al deslizarse a velocidades más lentas. La respuesta al pulsar también es bastante firme a pesar del traqueteo relativamente silencioso. Los clickpads suelen ser mediocres en los portátiles para juegos, pero nos alegra ver uno medio decente en el Vector 16 HX.
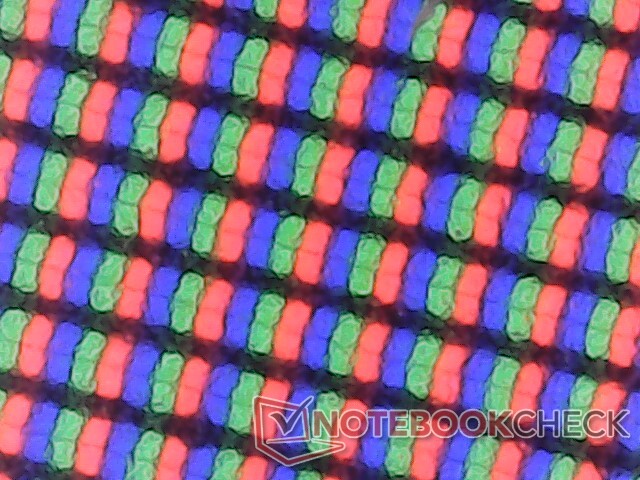
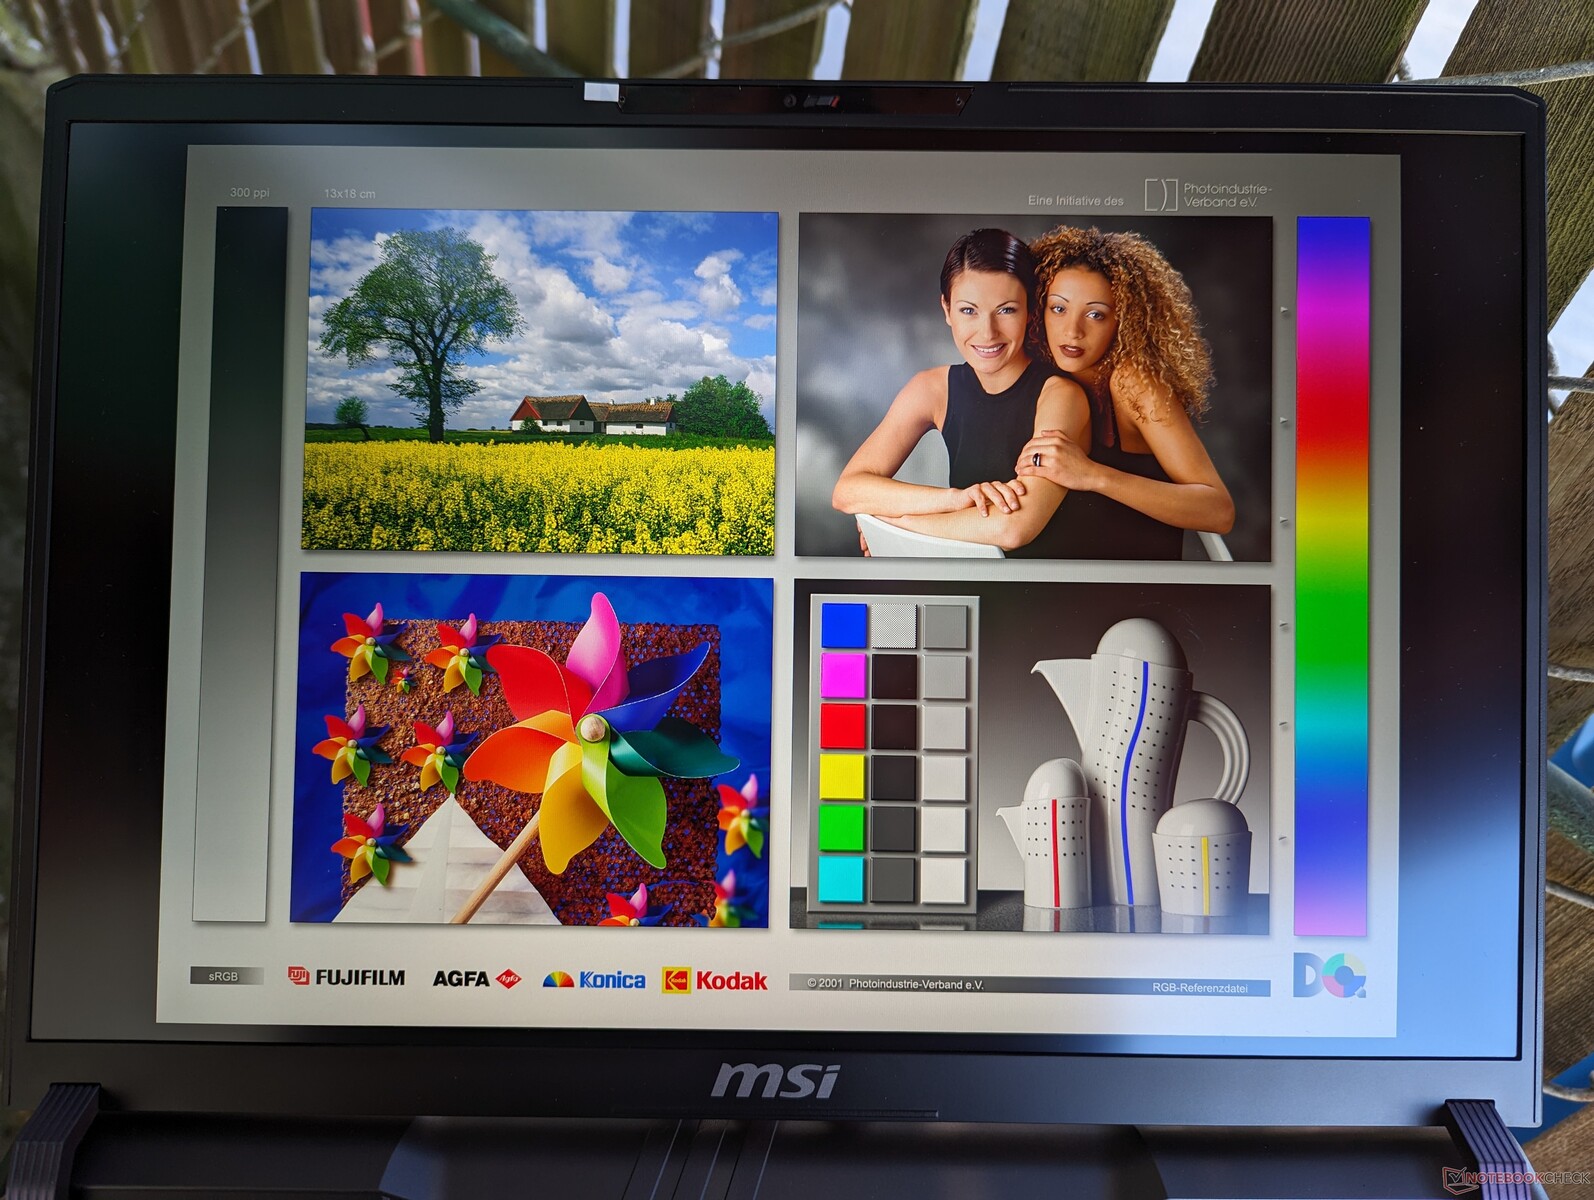
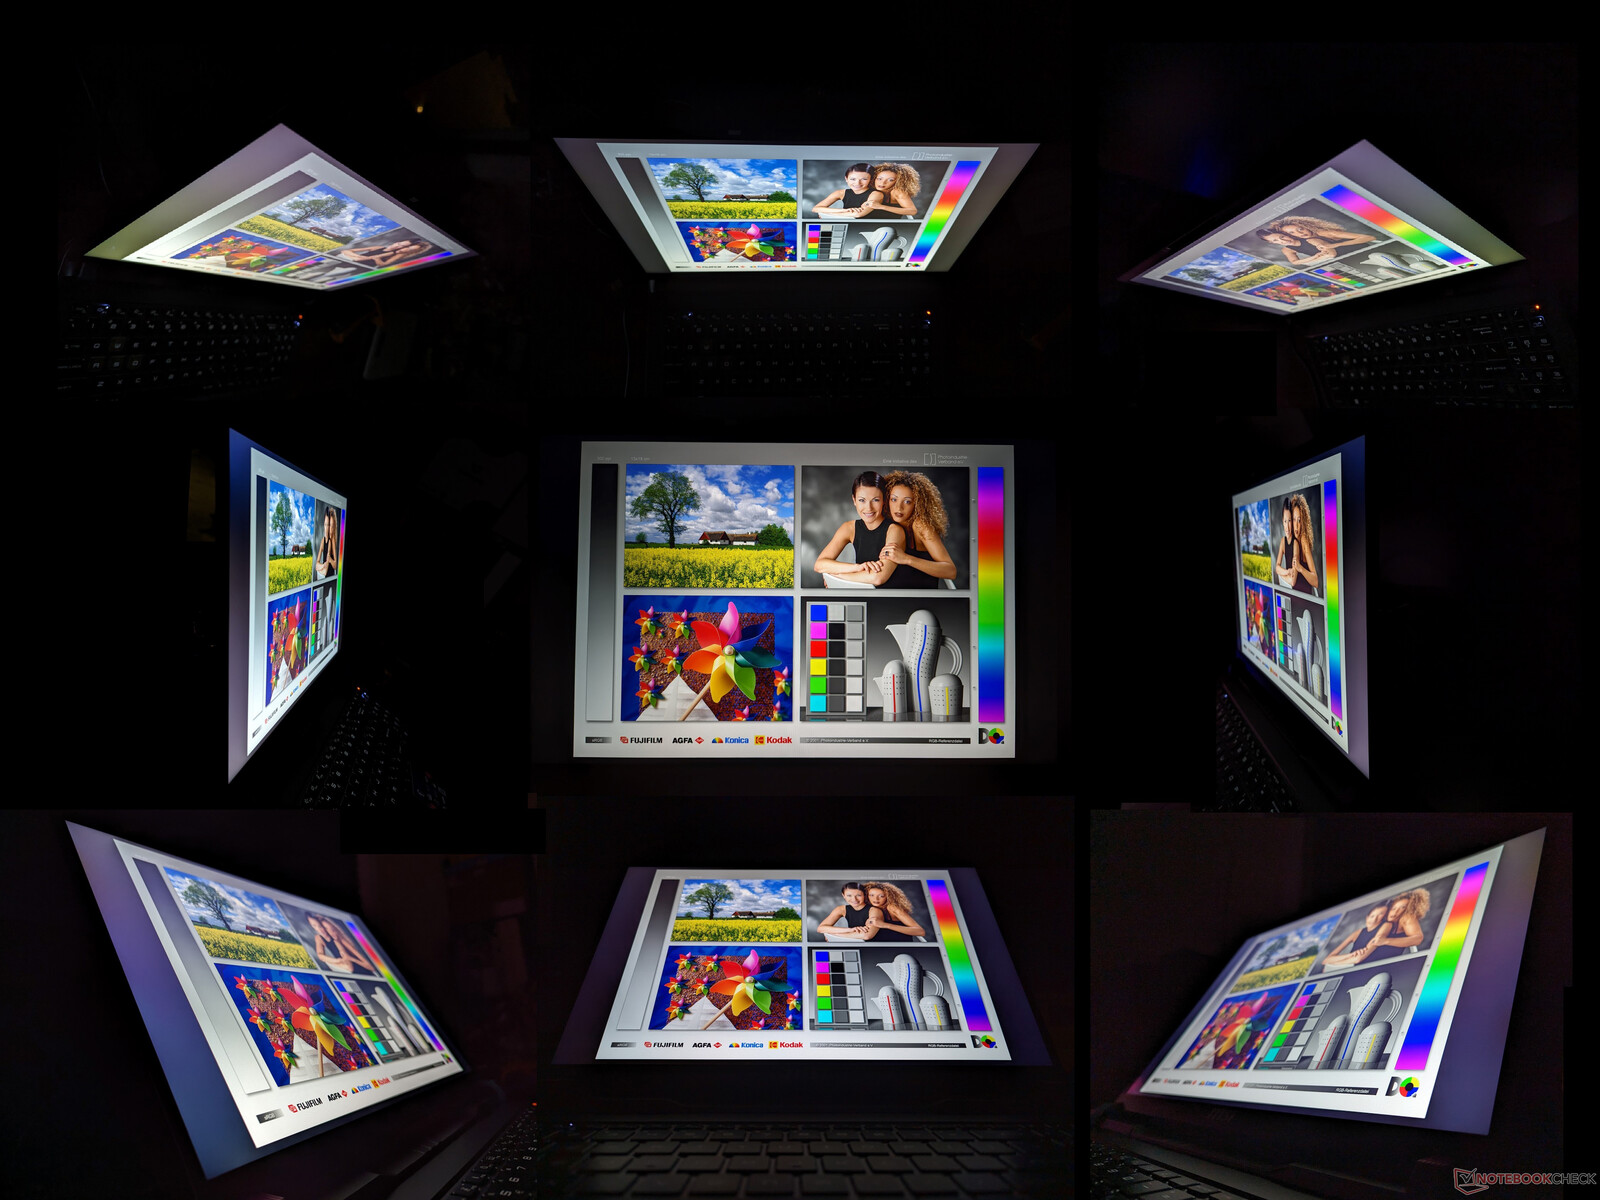
Pantalla - Toda IPS Sin G-Sync
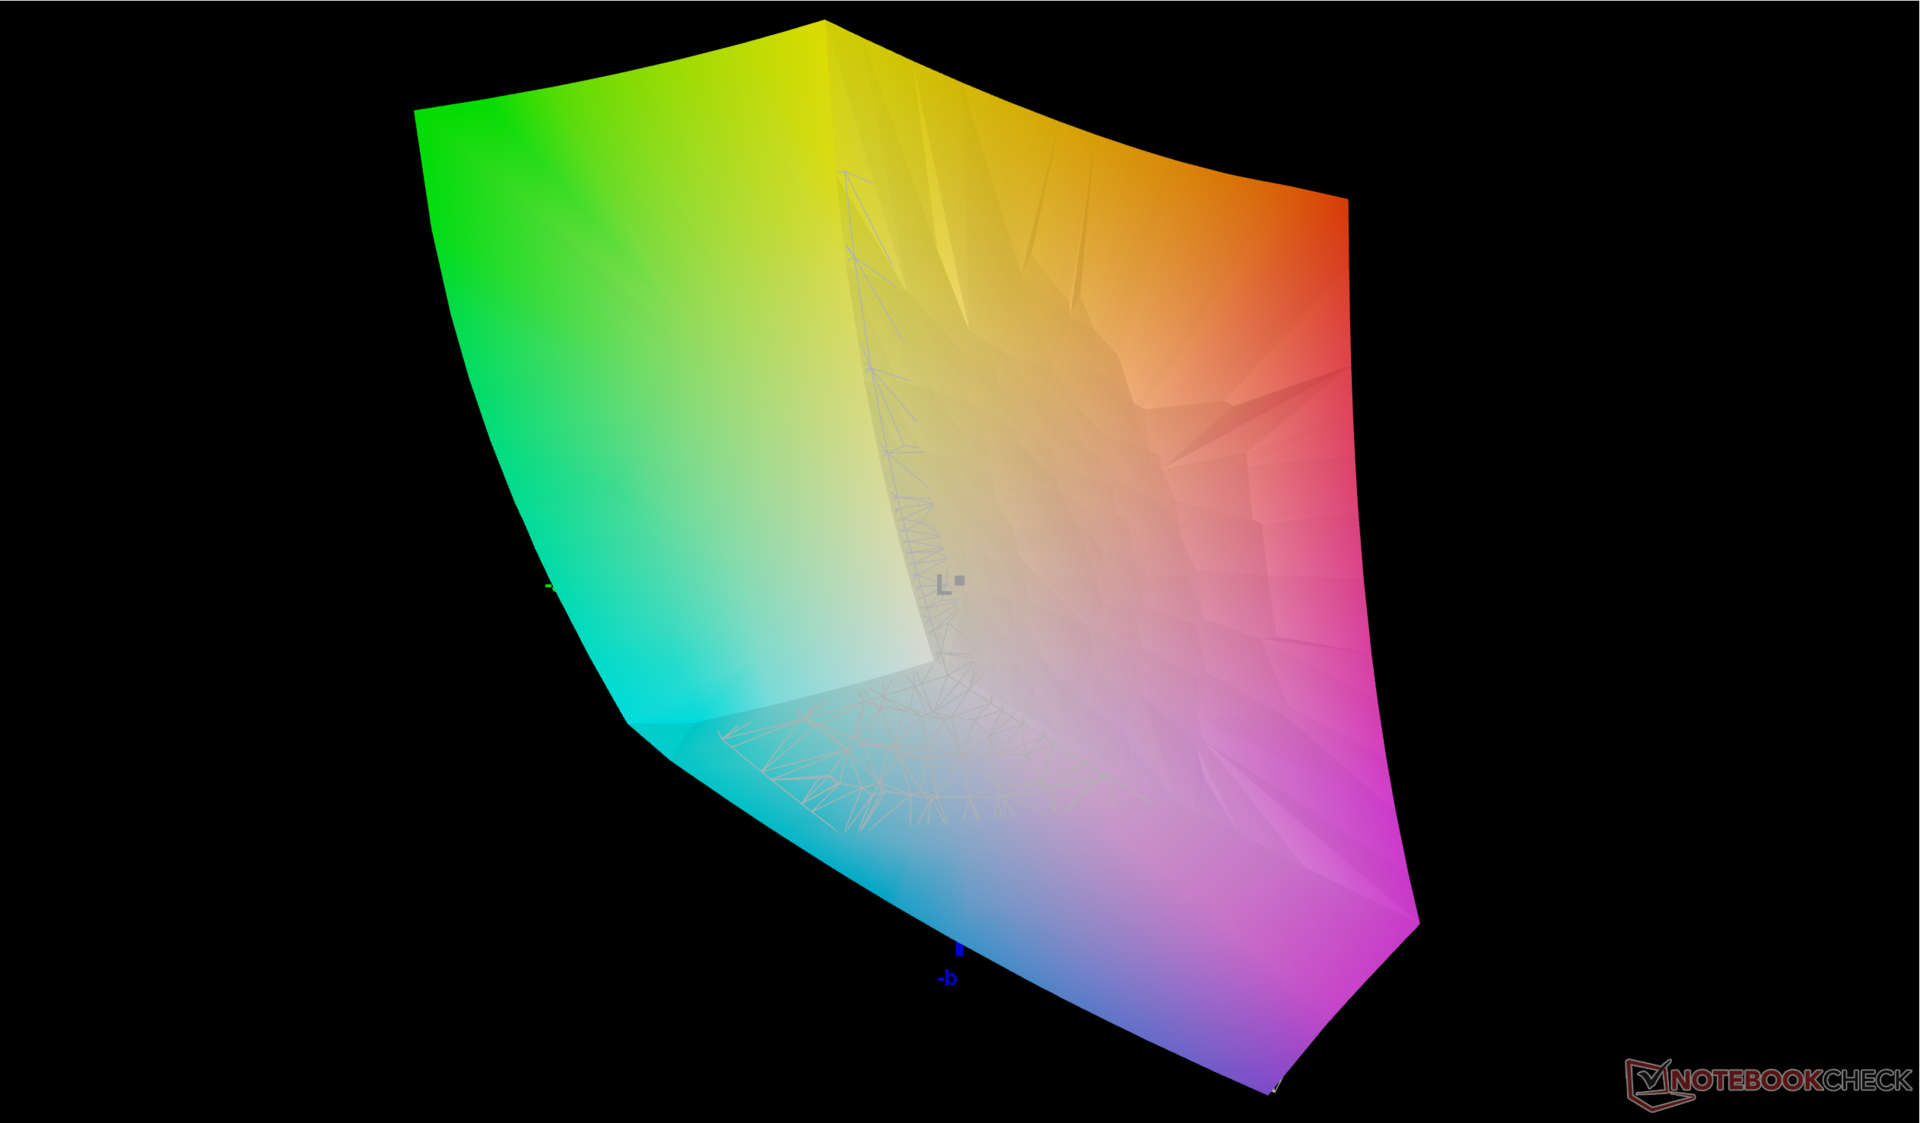
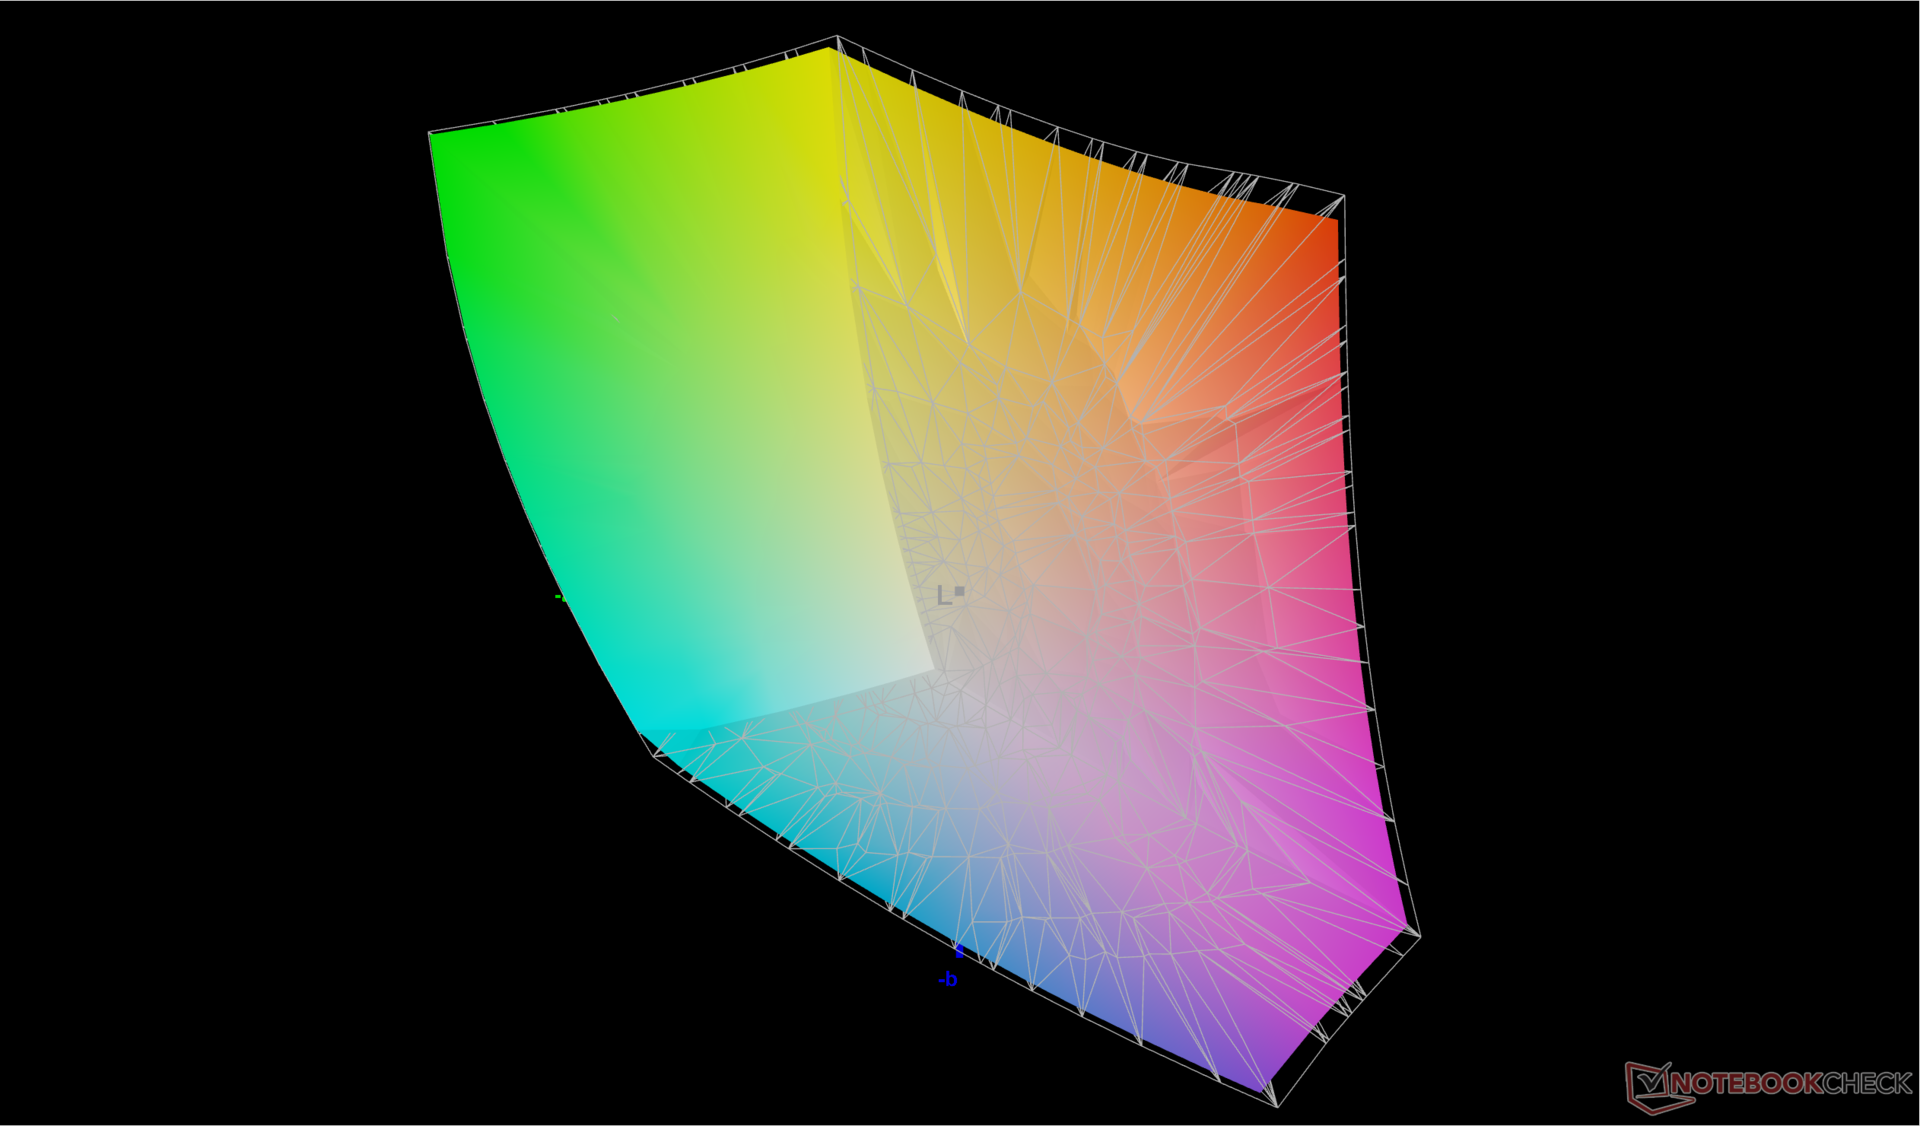
Este es el primer sistema de nuestra base de datos que se suministra con el panel de gama alta Chi Mei N160GME-GTB. Sus propiedades son muy similares a las del NE160QDM-NZ3 que se encuentra en el reciente Lenovo Legion 5 16 pero con una mejora notable: cobertura completa DCI-P3 en lugar de sólo sRGB. Por lo demás, los usuarios pueden esperar la misma rápida frecuencia de actualización nativa de 240 Hz, relación de contraste de ~1300:1 y rápidos tiempos de respuesta que en la máquina de Lenovo.
G-Sync está notablemente ausente en todas las configuraciones actuales del Vector 16 HX. La frecuencia de actualización también es fija a 60 Hz o 240 Hz, mientras que los paneles con frecuencia de actualización variable son cada vez más comunes.
Tenga en cuenta que la configuración menos costosa de 1200p 144 Hz probablemente tendrá atributos diferentes que nuestra configuración de 1600p 240 Hz en términos de brillo, colores y más.
| |||||||||||||||||||||||||
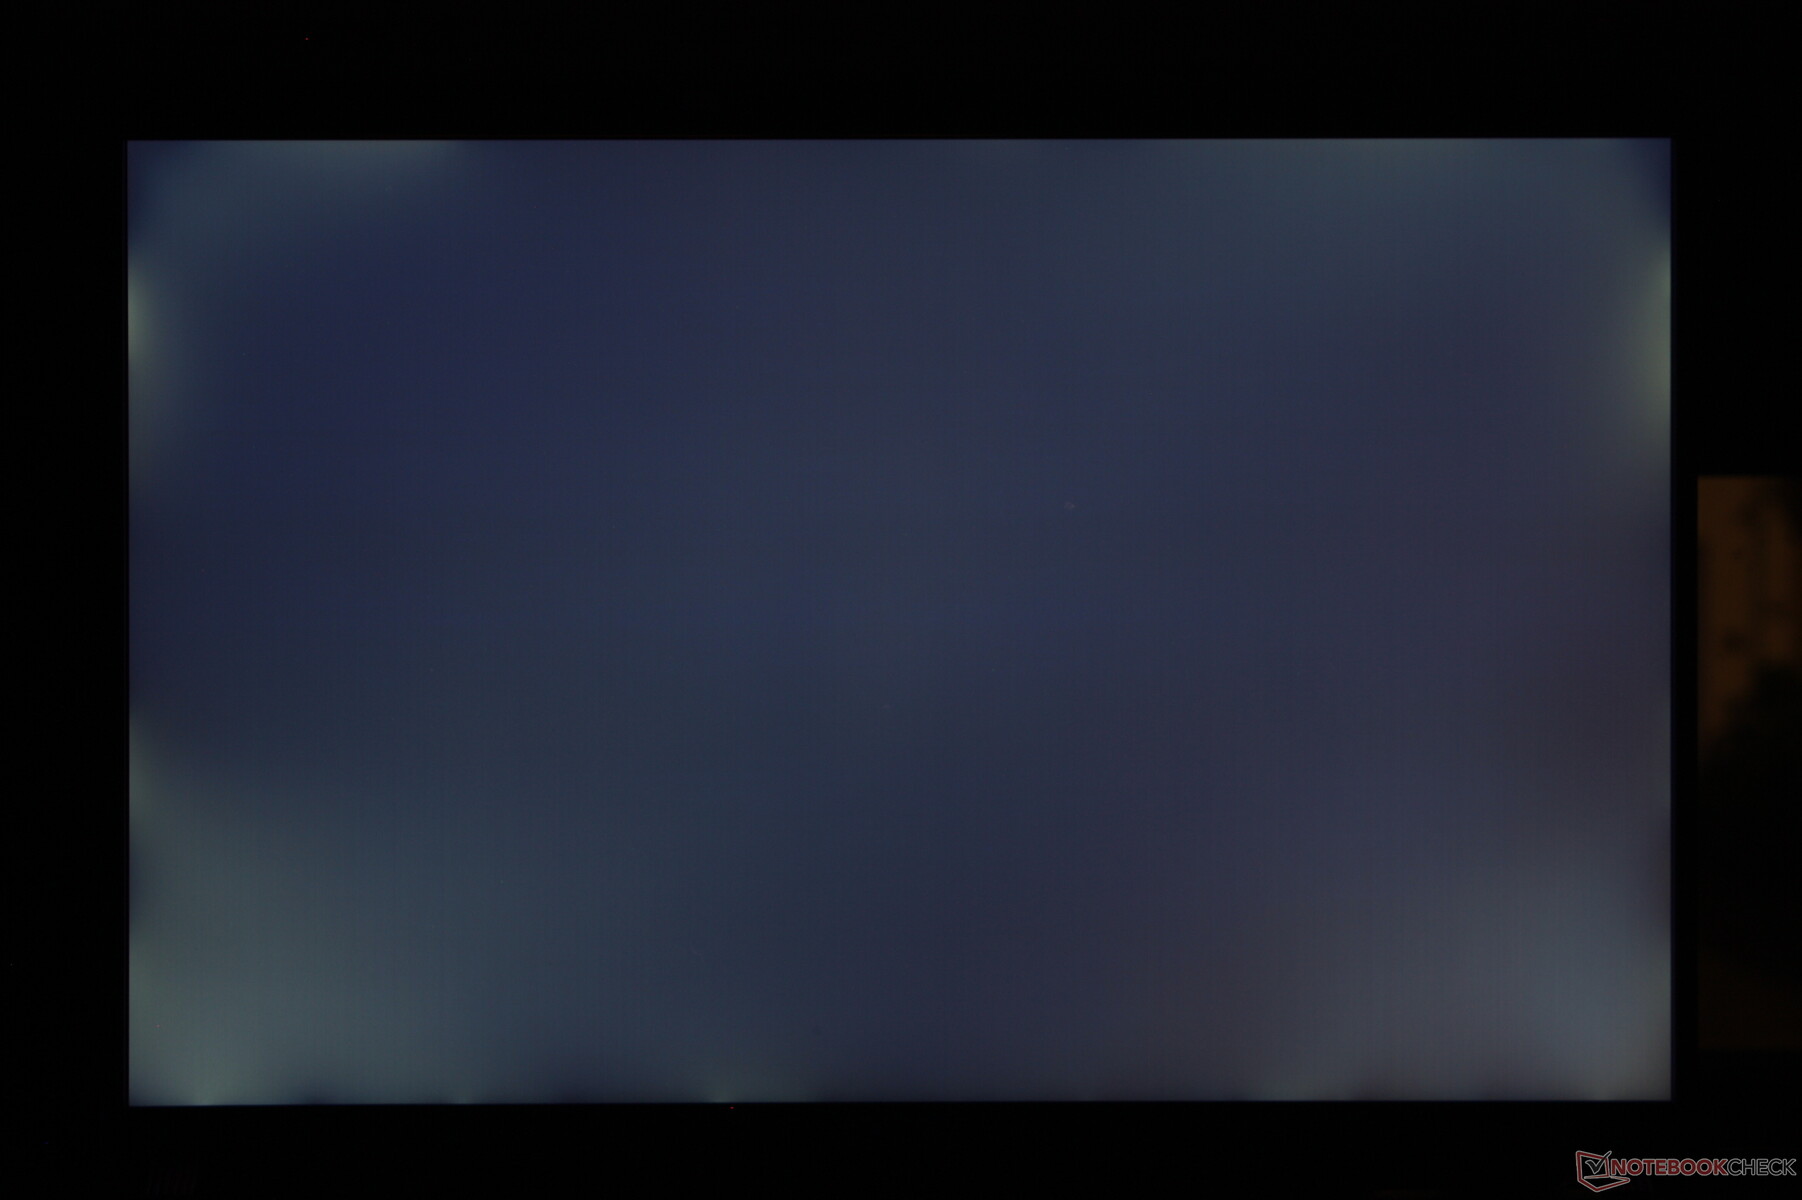
iluminación: 83 %
Brillo con batería: 557.2 cd/m²
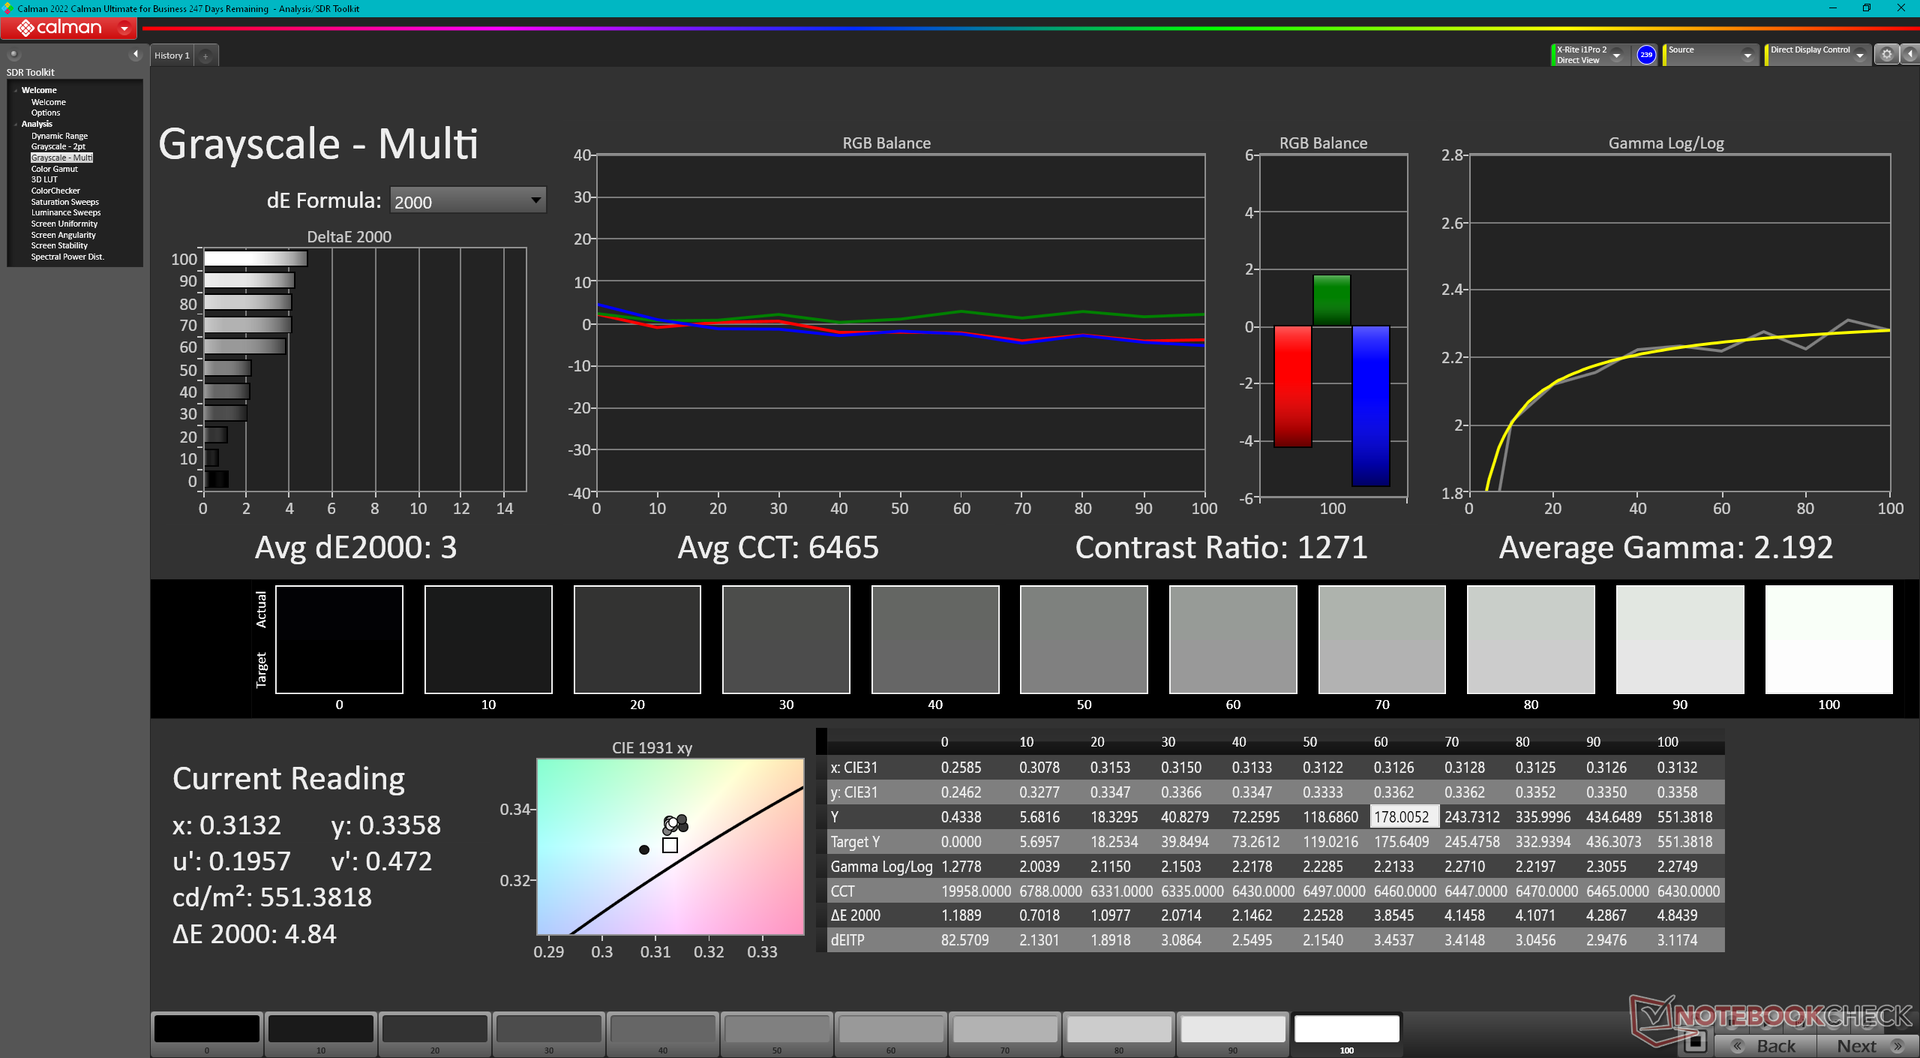
Contraste: 1359:1 (Negro: 0.41 cd/m²)
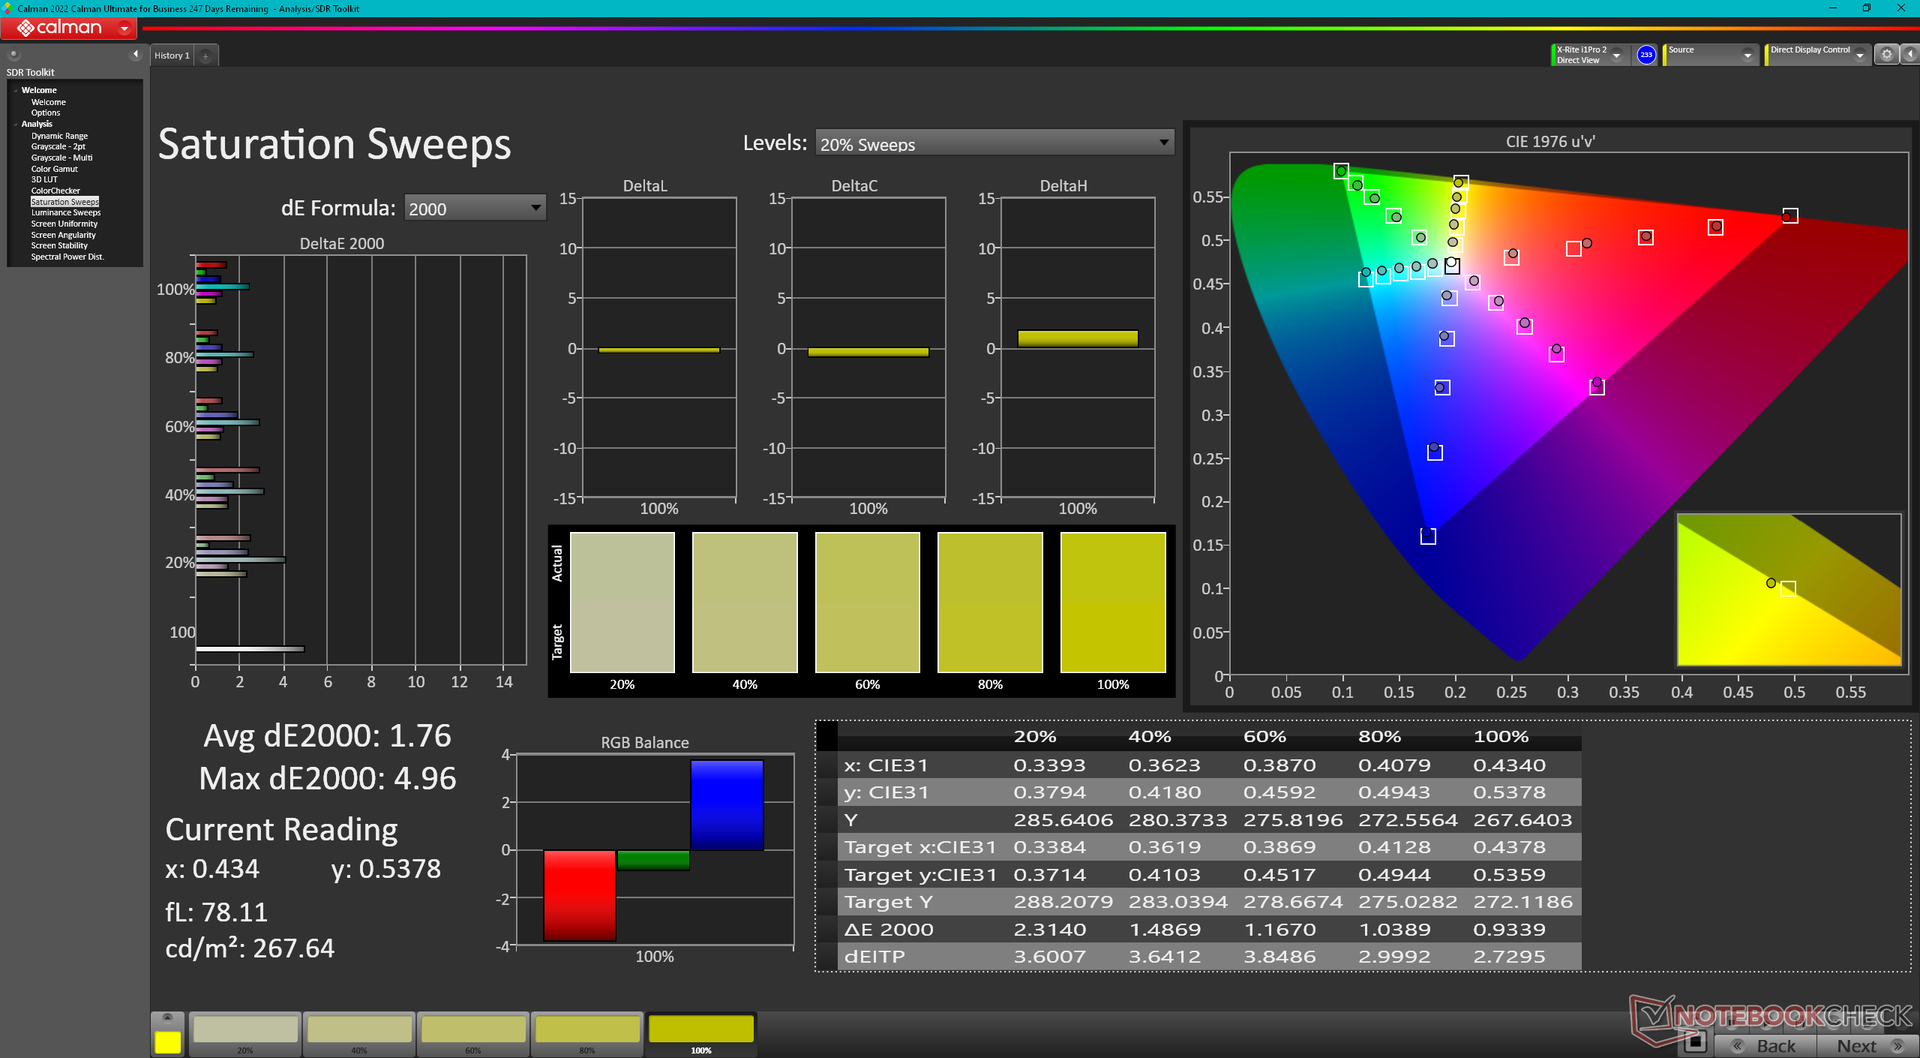
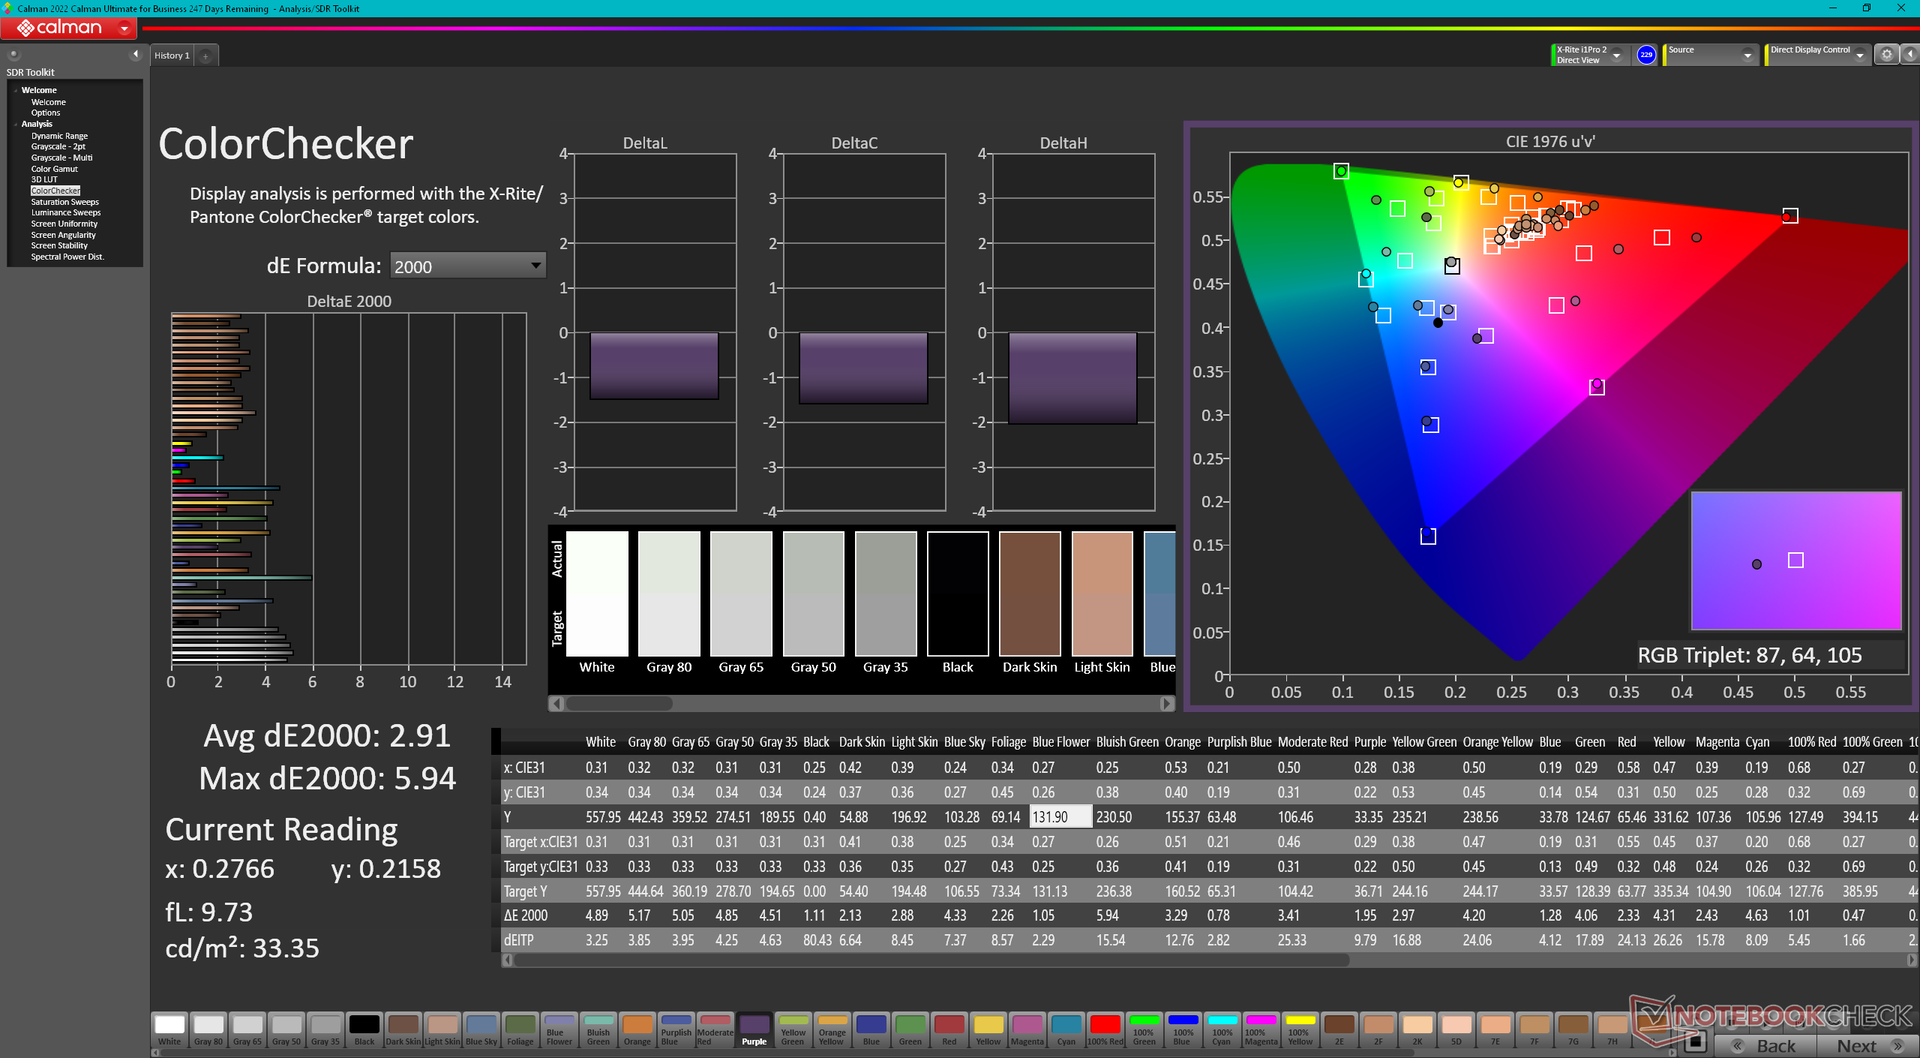
ΔE ColorChecker Calman: 2.91 | ∀{0.5-29.43 Ø4.73}
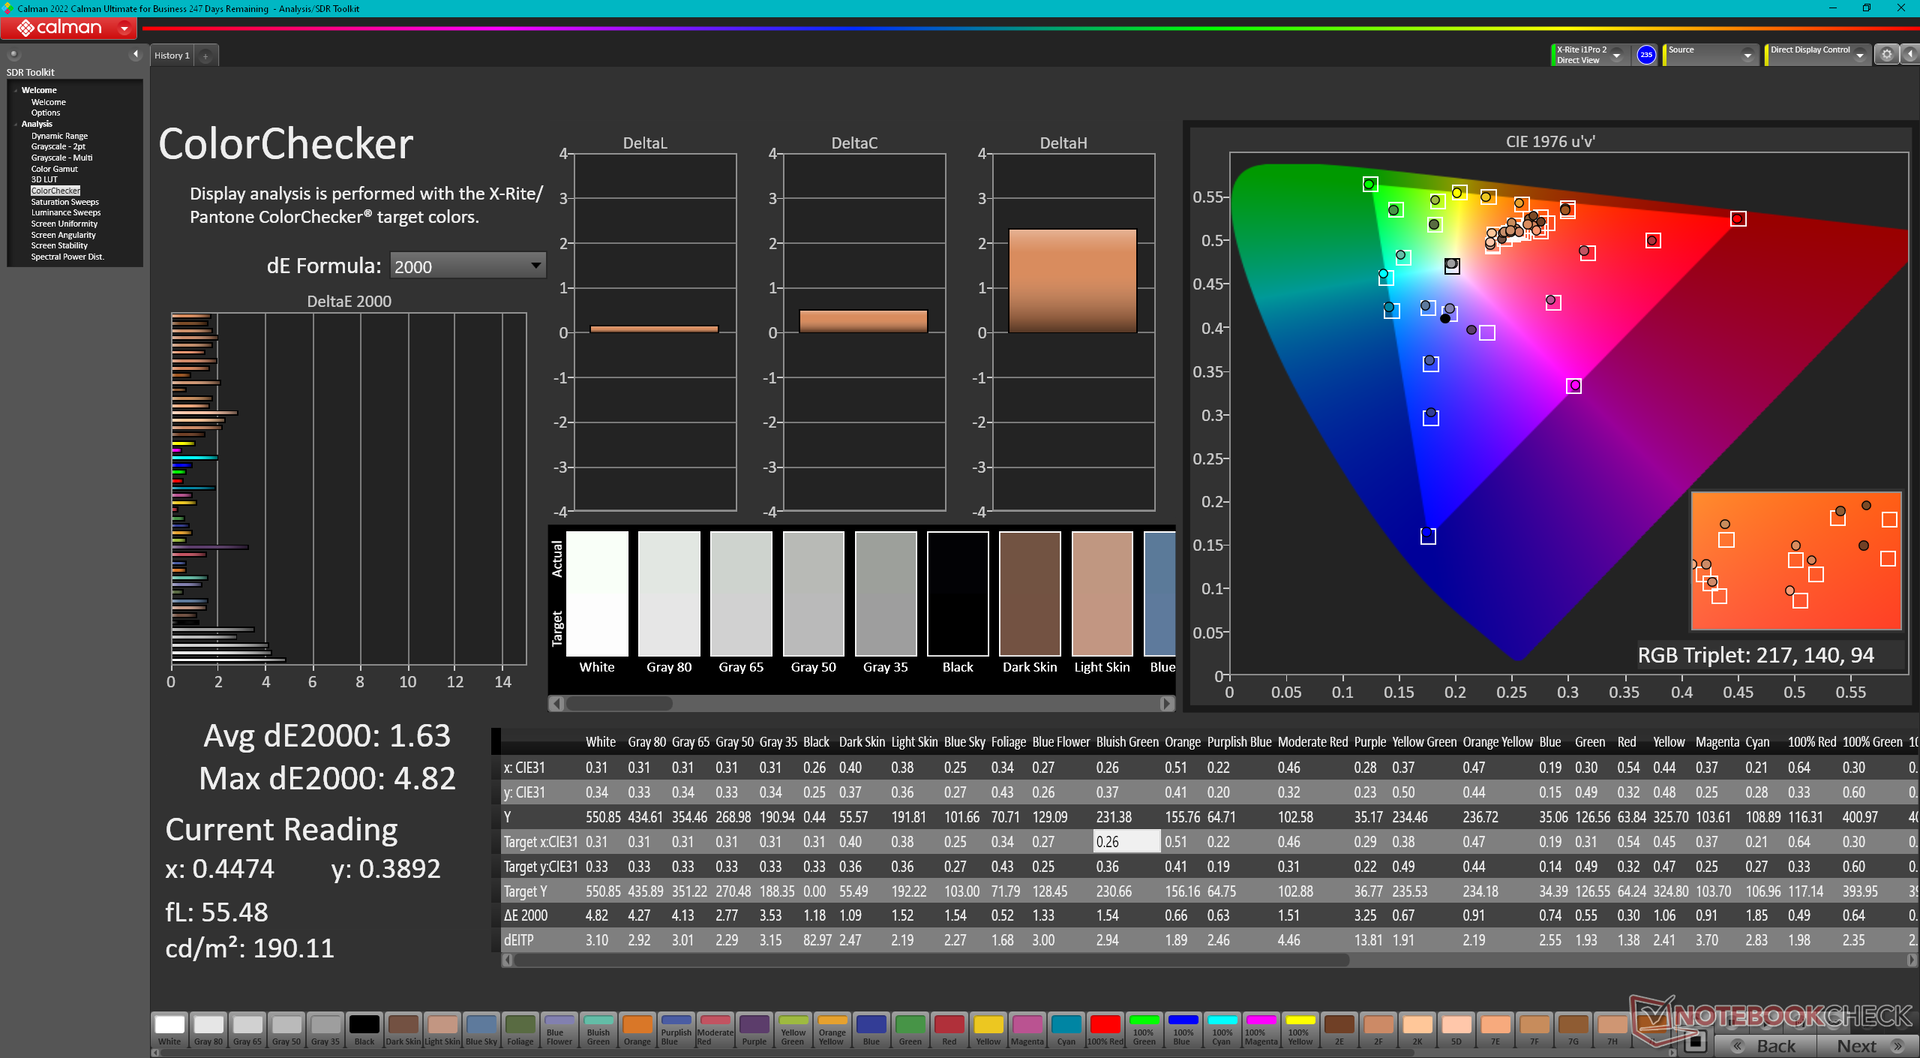
calibrated: 1.63
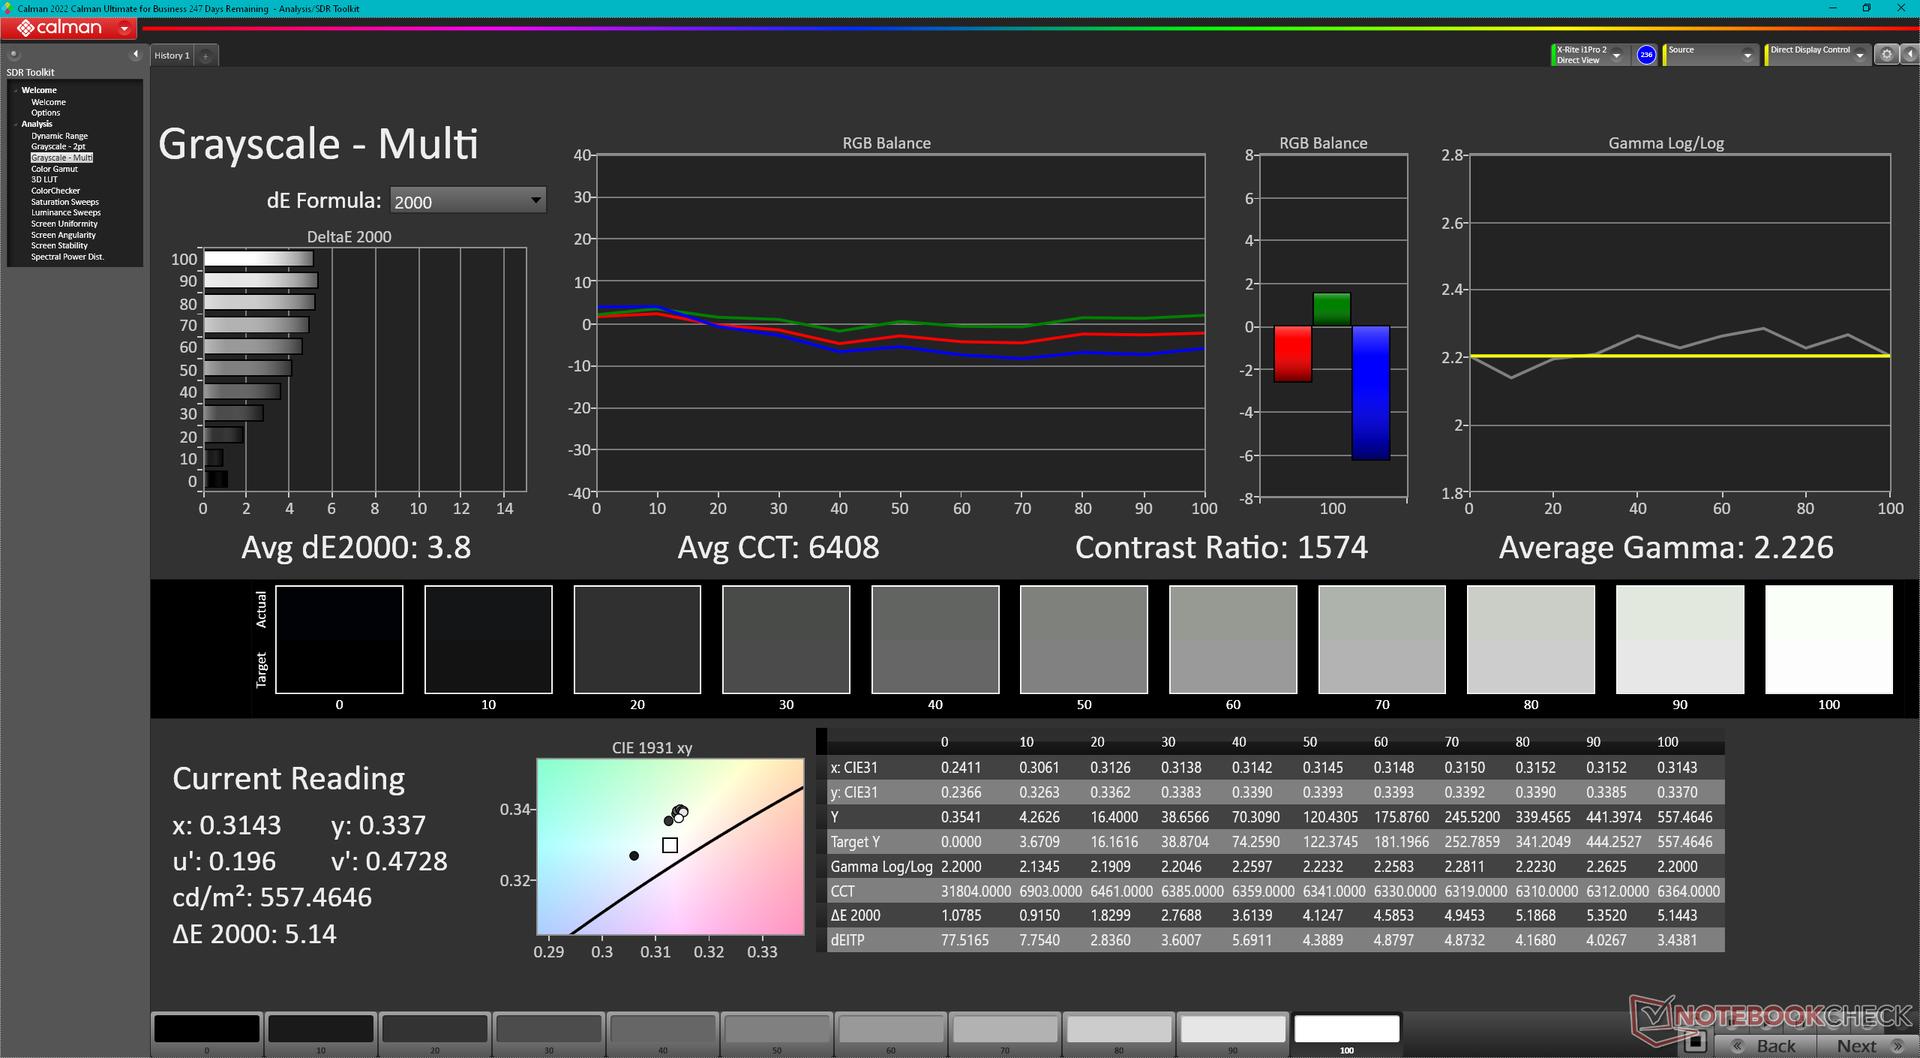
ΔE Greyscale Calman: 3.8 | ∀{0.09-98 Ø4.97}
85.4% AdobeRGB 1998 (Argyll 3D)
99.7% sRGB (Argyll 3D)
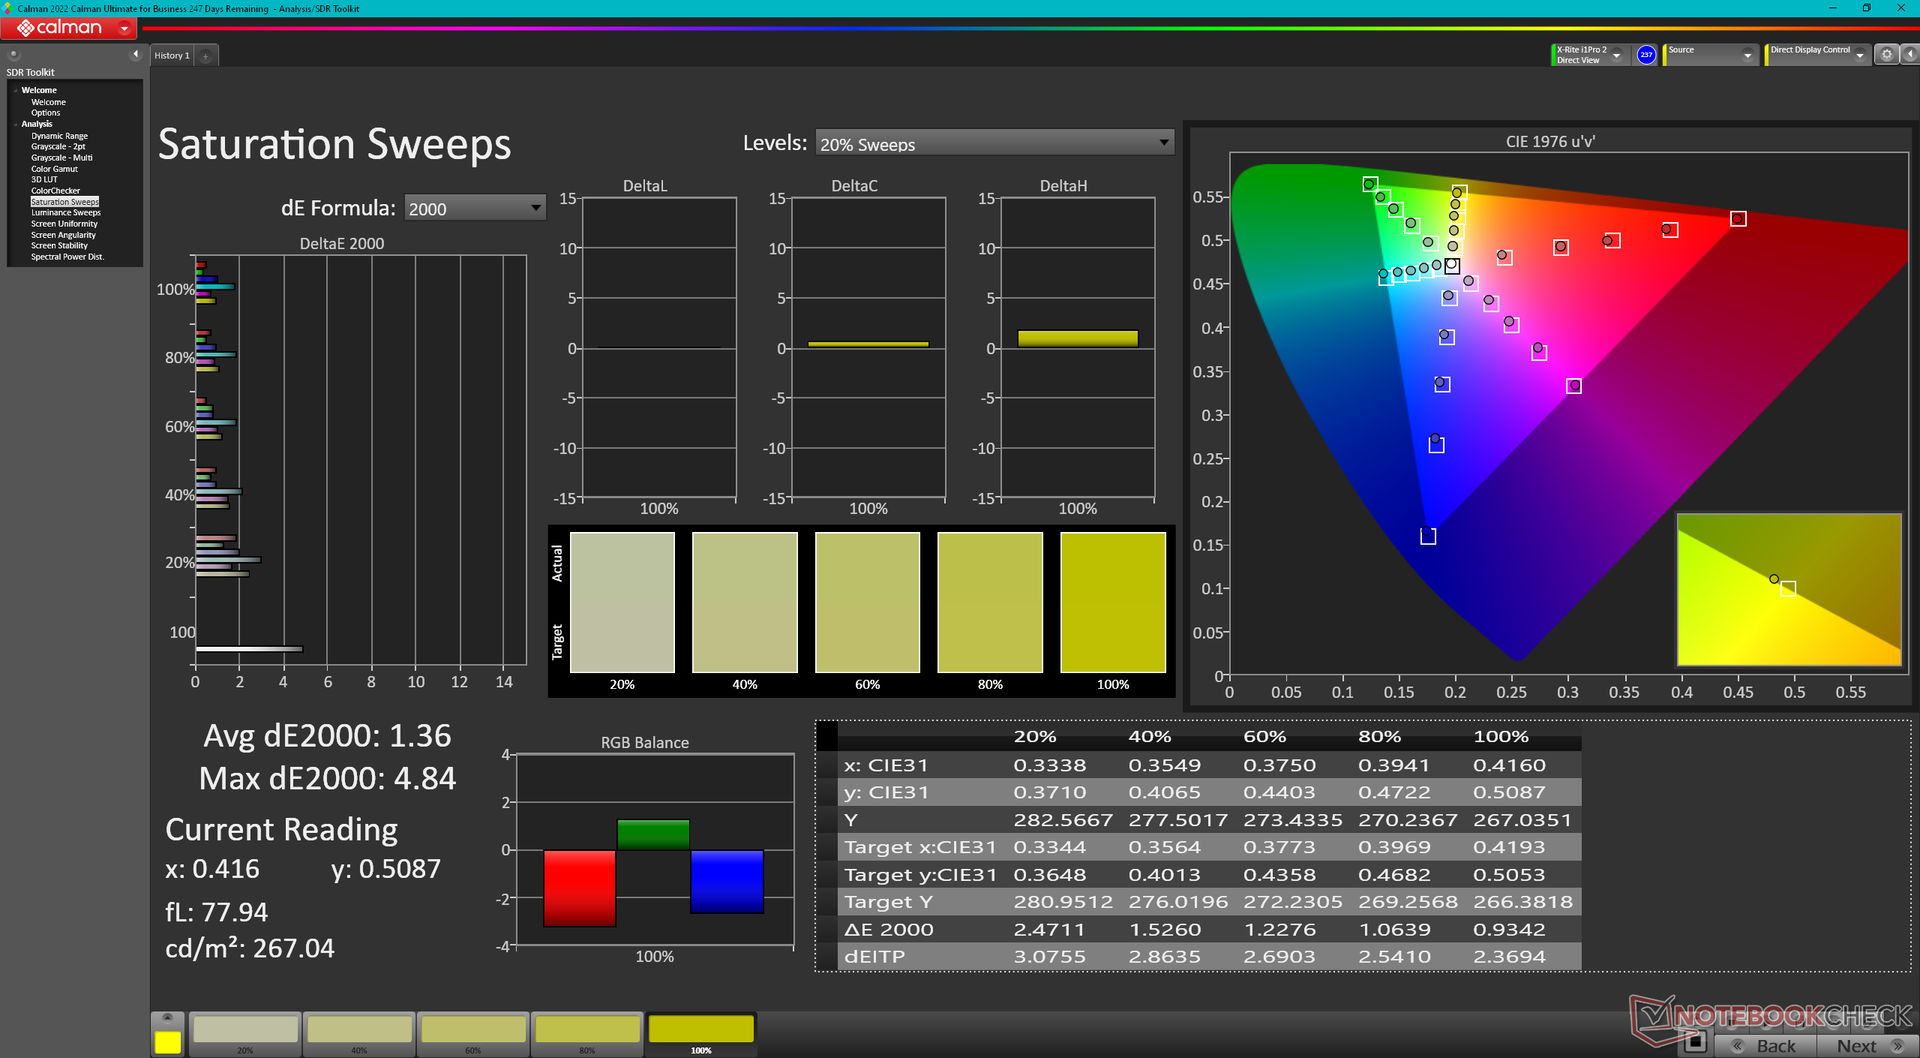
95.4% Display P3 (Argyll 3D)
Gamma: 2.23
CCT: 6408 K
| MSI Vector 16 HX A14V Chi Mei N160GME-GTB, IPS, 2560x1600, 16" | MSI Vector GP66 12UGS BOE NE156FHM-NZ3, IPS, 1920x1080, 15.6" | Lenovo Legion 5 16IRX G9 NE160QDM-NZ3, IPS, 2560x1600, 16" | HP Victus 16-r0077ng CMN162D, IPS, 1920x1080, 16.1" | Asus TUF Gaming A16 FA617XS BOE NE160WUM-NX2, IPS, 1920x1200, 16" | Dell G16 7620 BOE NE16QDM, IPS, 2560x1600, 16" | |
|---|---|---|---|---|---|---|
| Display | -14% | -12% | -17% | -15% | -16% | |
| Display P3 Coverage (%) | 95.4 | 70.1 -27% | 72.4 -24% | 66.7 -30% | 69.3 -27% | 68.3 -28% |
| sRGB Coverage (%) | 99.7 | 99.5 0% | 100 0% | 98 -2% | 97.3 -2% | 98 -2% |
| AdobeRGB 1998 Coverage (%) | 85.4 | 72.1 -16% | 74.1 -13% | 69 -19% | 70.7 -17% | 70.5 -17% |
| Response Times | 7% | -48% | -53% | -81% | -21% | |
| Response Time Grey 50% / Grey 80% * (ms) | 5.7 ? | 5.8 ? -2% | 12.5 ? -119% | 13.3 ? -133% | 15.6 ? -174% | 8.6 ? -51% |
| Response Time Black / White * (ms) | 11.4 ? | 9.6 ? 16% | 8.7 ? 24% | 8.2 ? 28% | 10 ? 12% | 10.4 ? 9% |
| PWM Frequency (Hz) | ||||||
| Screen | -3% | 29% | 17% | 13% | 5% | |
| Brightness middle (cd/m²) | 557.2 | 353.1 -37% | 526 -6% | 308 -45% | 301 -46% | 369.4 -34% |
| Brightness (cd/m²) | 506 | 325 -36% | 500 -1% | 285 -44% | 294 -42% | 348 -31% |
| Brightness Distribution (%) | 83 | 85 2% | 87 5% | 85 2% | 94 13% | 83 0% |
| Black Level * (cd/m²) | 0.41 | 0.38 7% | 0.33 20% | 0.25 39% | 0.21 49% | 0.32 22% |
| Contrast (:1) | 1359 | 929 -32% | 1594 17% | 1232 -9% | 1433 5% | 1154 -15% |
| Colorchecker dE 2000 * | 2.91 | 2.24 23% | 1.2 59% | 1.3 55% | 1.79 38% | 1.78 39% |
| Colorchecker dE 2000 max. * | 5.94 | 5 16% | 2.1 65% | 2.76 54% | 3.48 41% | 4.41 26% |
| Colorchecker dE 2000 calibrated * | 1.63 | 1.02 37% | 1 39% | 0.92 44% | 1.2 26% | 1.22 25% |
| Greyscale dE 2000 * | 3.8 | 4 -5% | 1.3 66% | 1.7 55% | 2.5 34% | 3.2 16% |
| Gamma | 2.23 99% | 2.24 98% | 2.23 99% | 2.167 102% | 2.265 97% | 2.2 100% |
| CCT | 6408 101% | 6864 95% | 6391 102% | 6767 96% | 6157 106% | 6750 96% |
| Media total (Programa/Opciones) | -3% /
-4% | -10% /
9% | -18% /
-0% | -28% /
-6% | -11% /
-3% |
* ... más pequeño es mejor
Aunque la pantalla no viene precalibrada, sus colores ya son relativamente precisos. Los valores medios de deltaE en escala de grises y color son de sólo 3,8 y 2,91, respectivamente, con respecto a la norma P3. Nuestro perfil ICM calibrado está disponible gratuitamente más arriba para mejorar la precisión y acercarla a la norma deltaE <2.
Tiempos de respuesta del display
| ↔ Tiempo de respuesta de Negro a Blanco | ||
|---|---|---|
| 11.4 ms ... subida ↗ y bajada ↘ combinada | ↗ 6.5 ms subida | 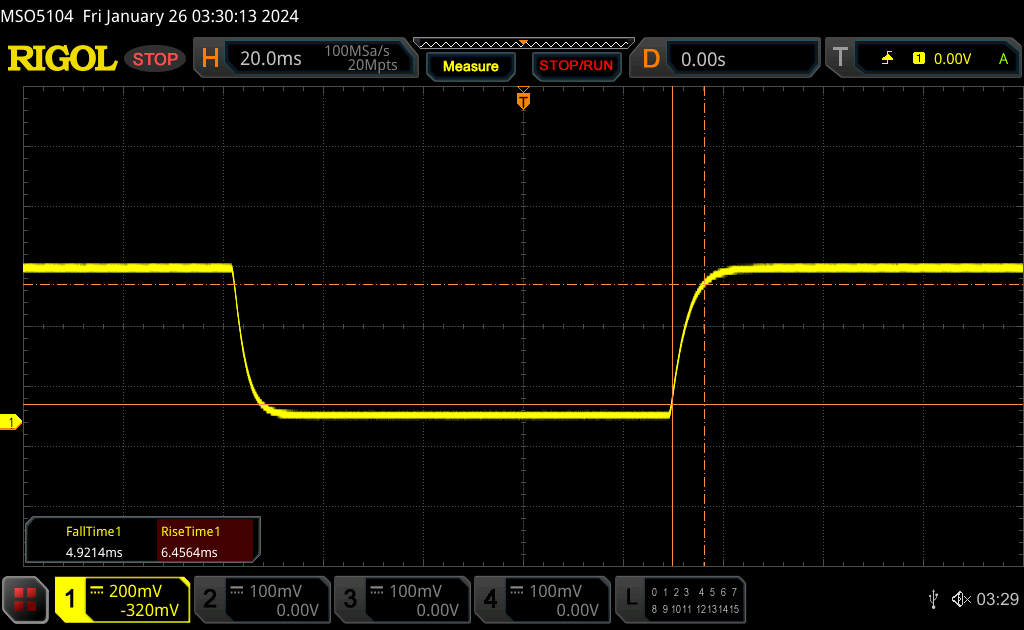 |
| ↘ 4.9 ms bajada | ||
| La pantalla mostró buenos tiempos de respuesta en nuestros tests pero podría ser demasiado lenta para los jugones competitivos. En comparación, todos los dispositivos de prueba van de ##min### (mínimo) a 240 (máximo) ms. » 31 % de todos los dispositivos son mejores. Esto quiere decir que el tiempo de respuesta medido es mejor que la media (19.9 ms) de todos los dispositivos testados. | ||
| ↔ Tiempo de respuesta 50% Gris a 80% Gris | ||
| 5.7 ms ... subida ↗ y bajada ↘ combinada | ↗ 2.8 ms subida | 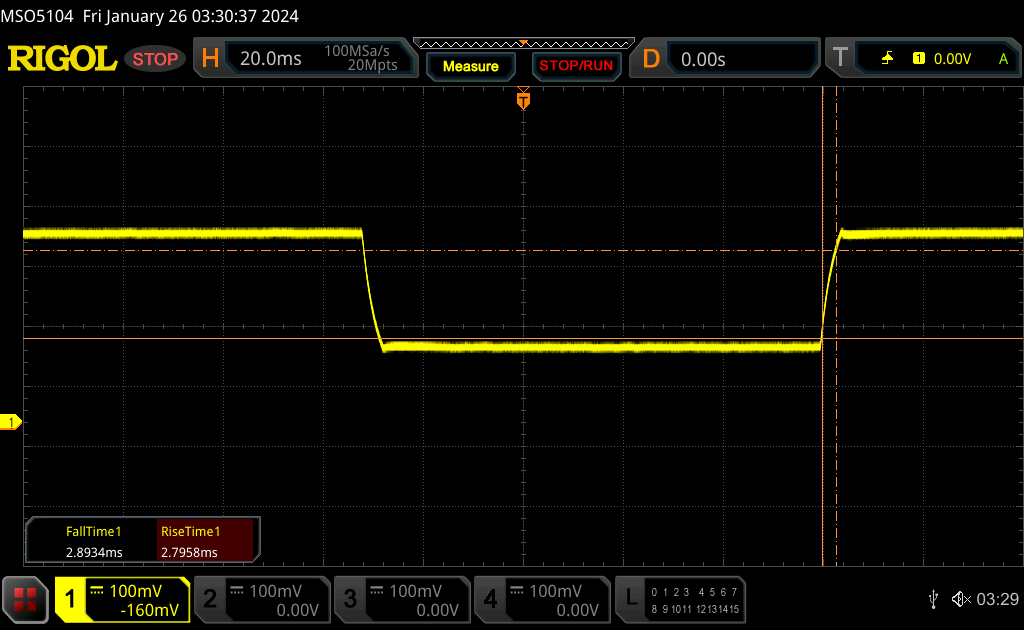 |
| ↘ 2.9 ms bajada | ||
| La pantalla mostró tiempos de respuesta muy rápidos en nuestros tests y debería ser adecuada para juegos frenéticos. En comparación, todos los dispositivos de prueba van de ##min### (mínimo) a 636 (máximo) ms. » 18 % de todos los dispositivos son mejores. Esto quiere decir que el tiempo de respuesta medido es mejor que la media (31.1 ms) de todos los dispositivos testados. | ||
Parpadeo de Pantalla / PWM (Pulse-Width Modulation)
| Parpadeo de Pantalla / PWM no detectado | 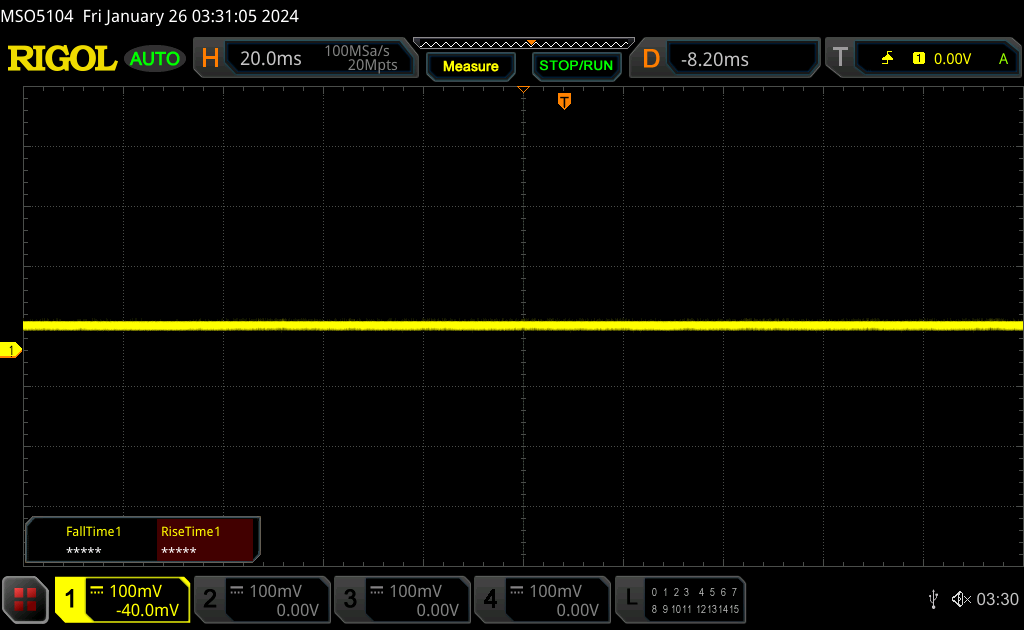 | ||
Comparación: 52 % de todos los dispositivos testados no usaron PWM para atenuar el display. Si se usó, medimos una media de 7798 (mínimo: 5 - máxmo: 343500) Hz. | |||
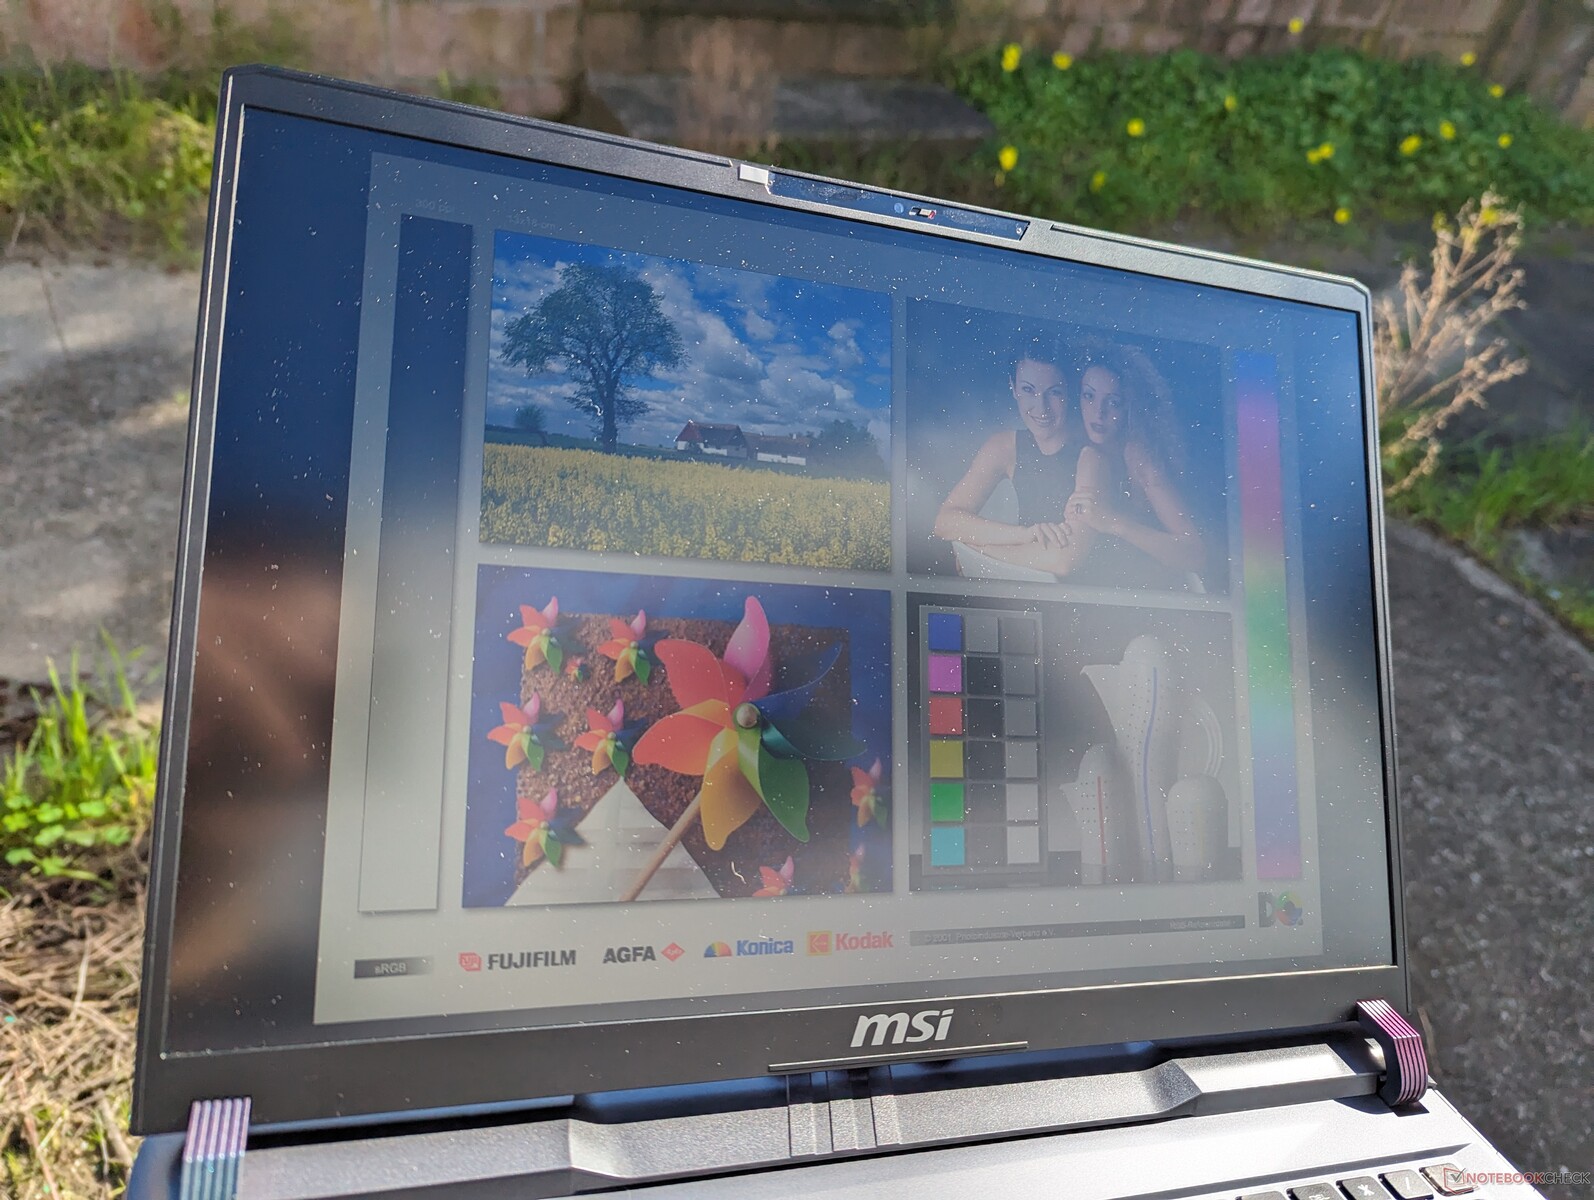
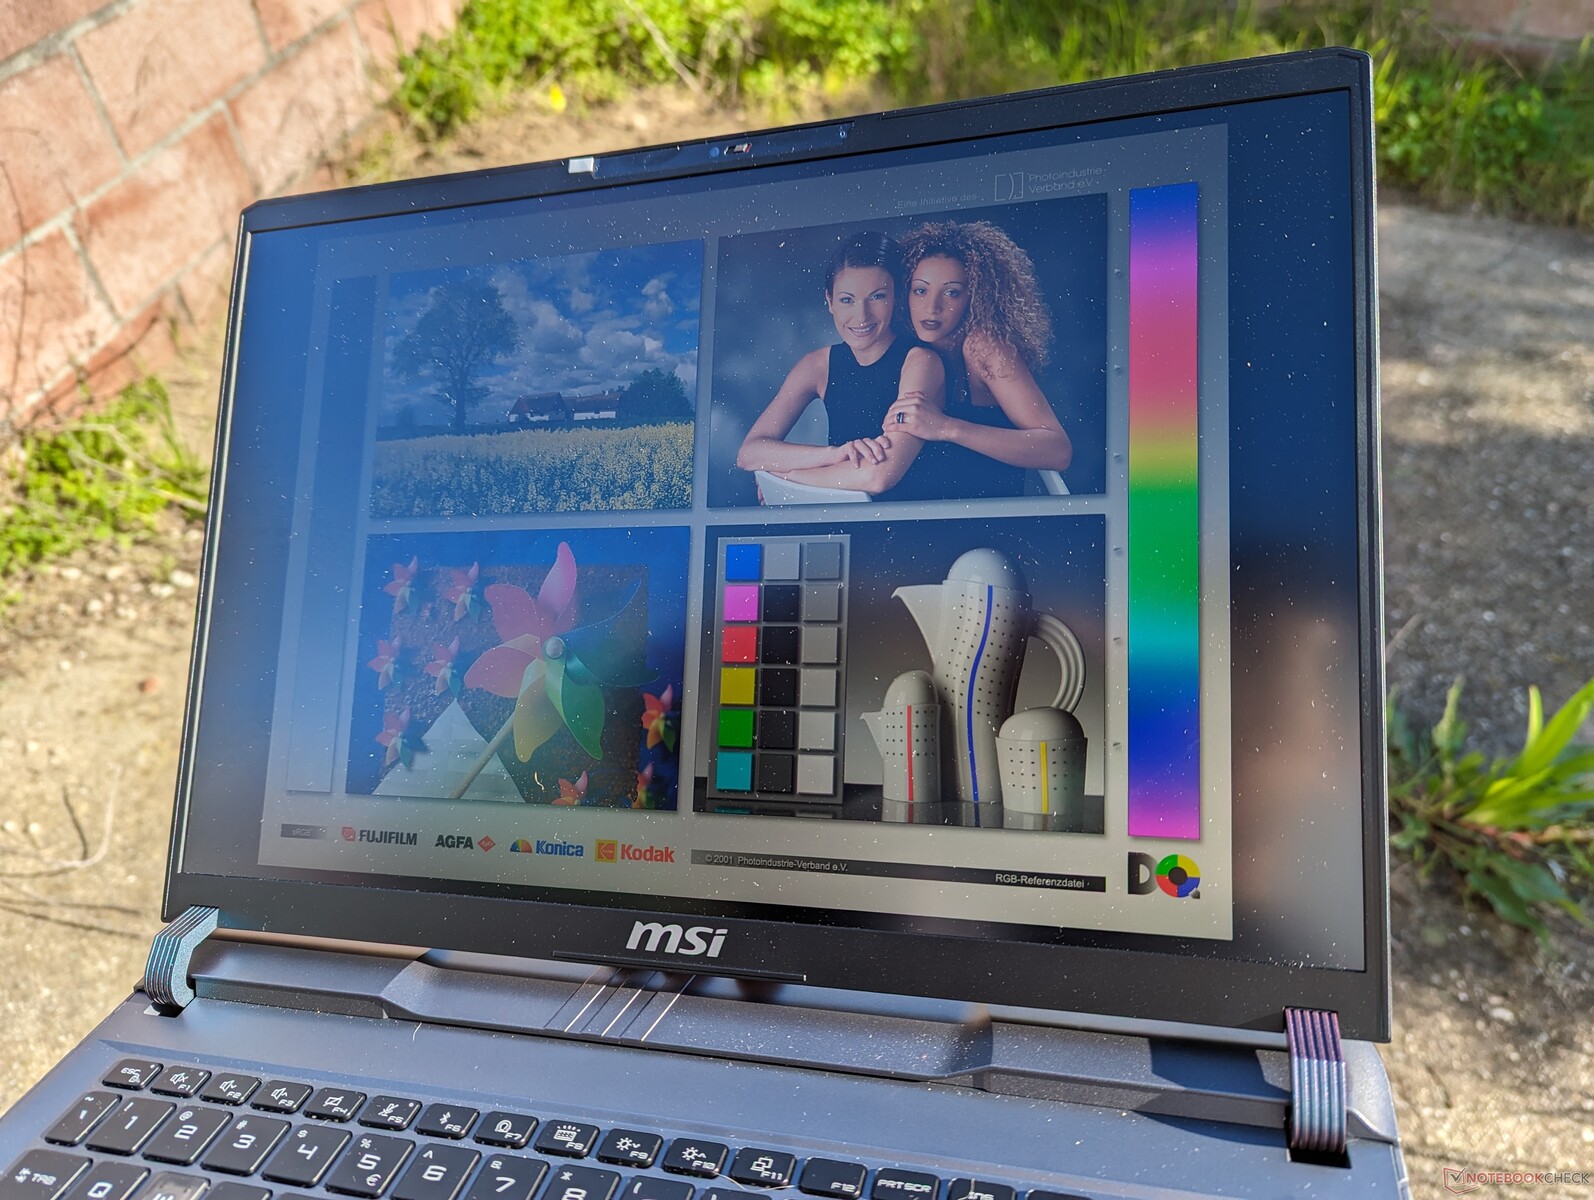
La pantalla mate es relativamente brillante para un panel IPS con unos 550 nits en comparación con los sólo 300 nits del HP Victus 16 o el Asus TUF Gaming A16. La visibilidad es tolerable cuando está a la sombra, pero por lo demás la pantalla sigue siendo demasiado tenue en condiciones exteriores más brillantes.
Rendimiento
Condiciones de prueba
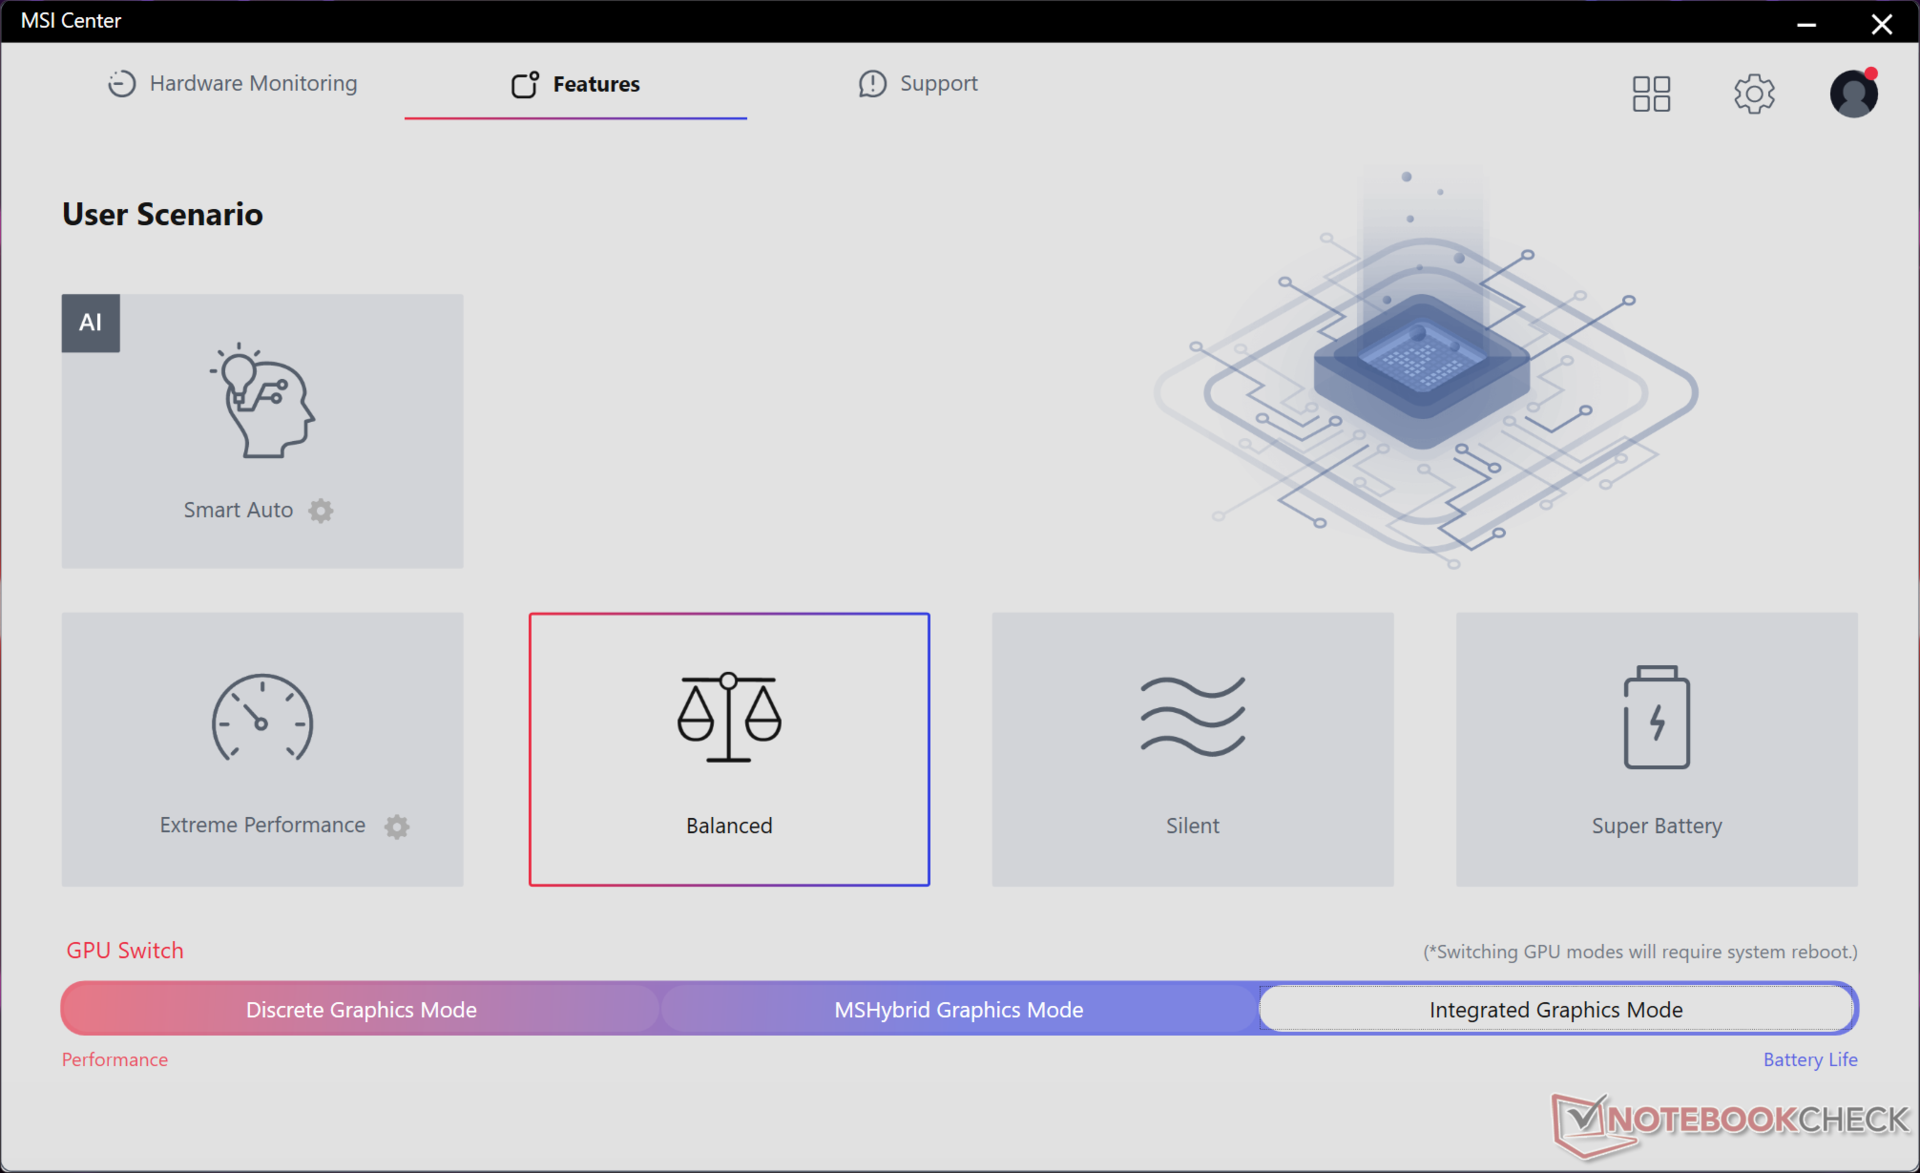
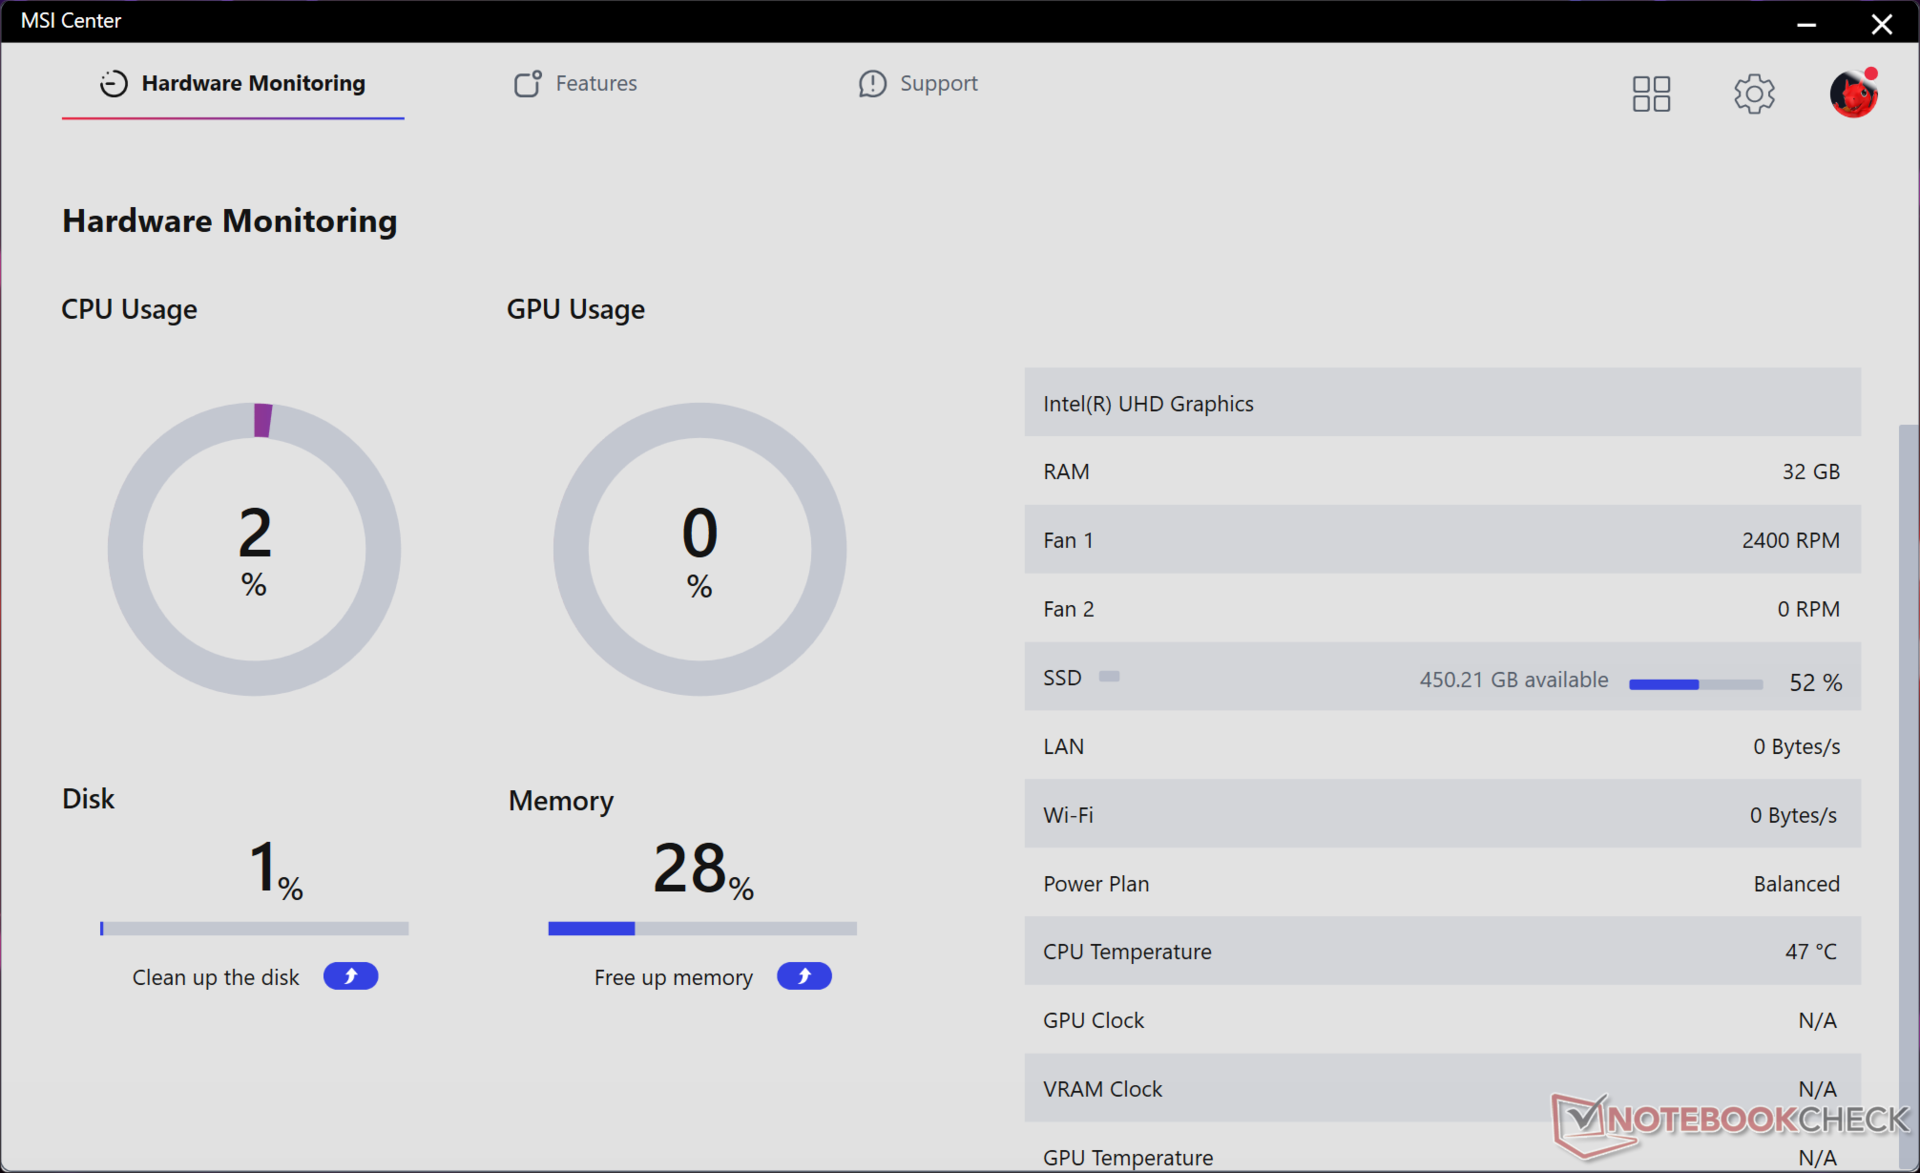
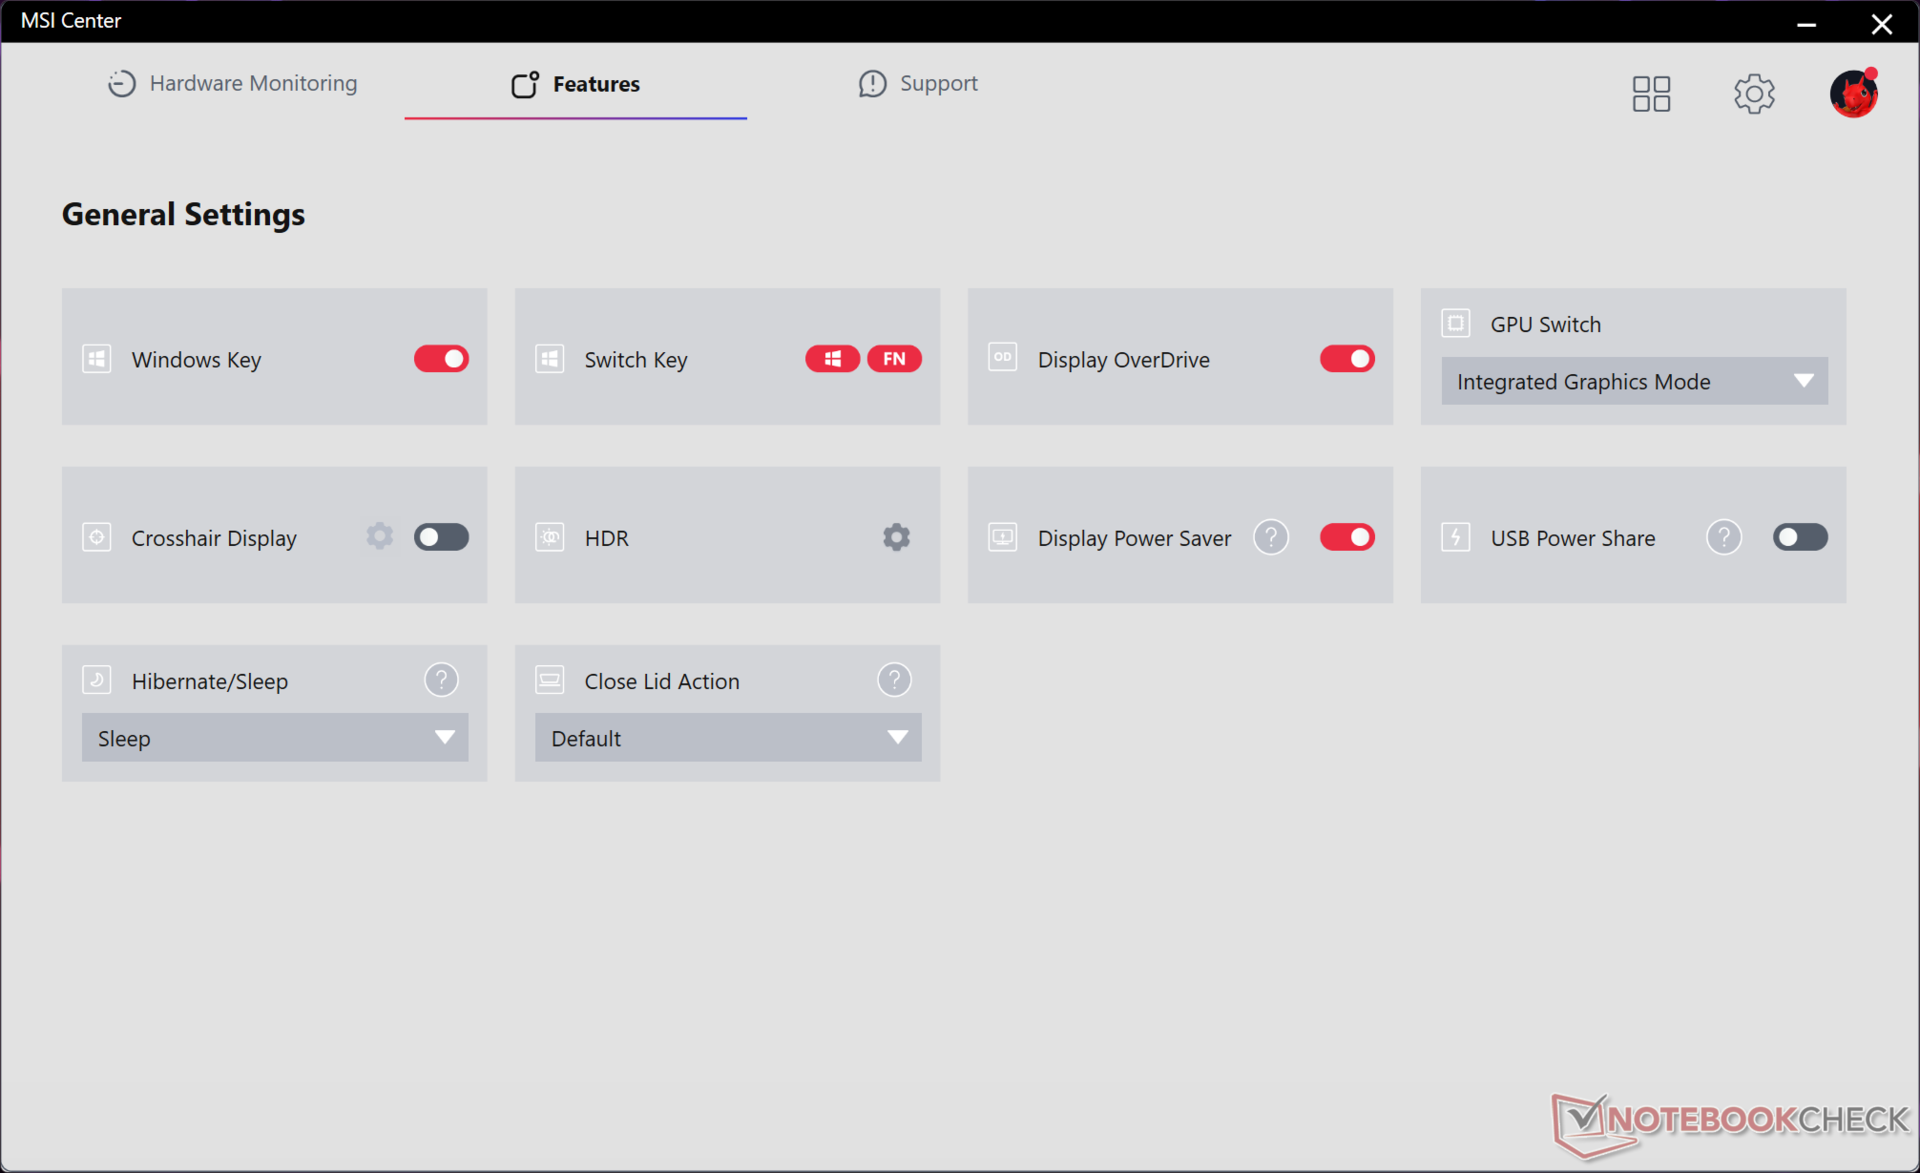
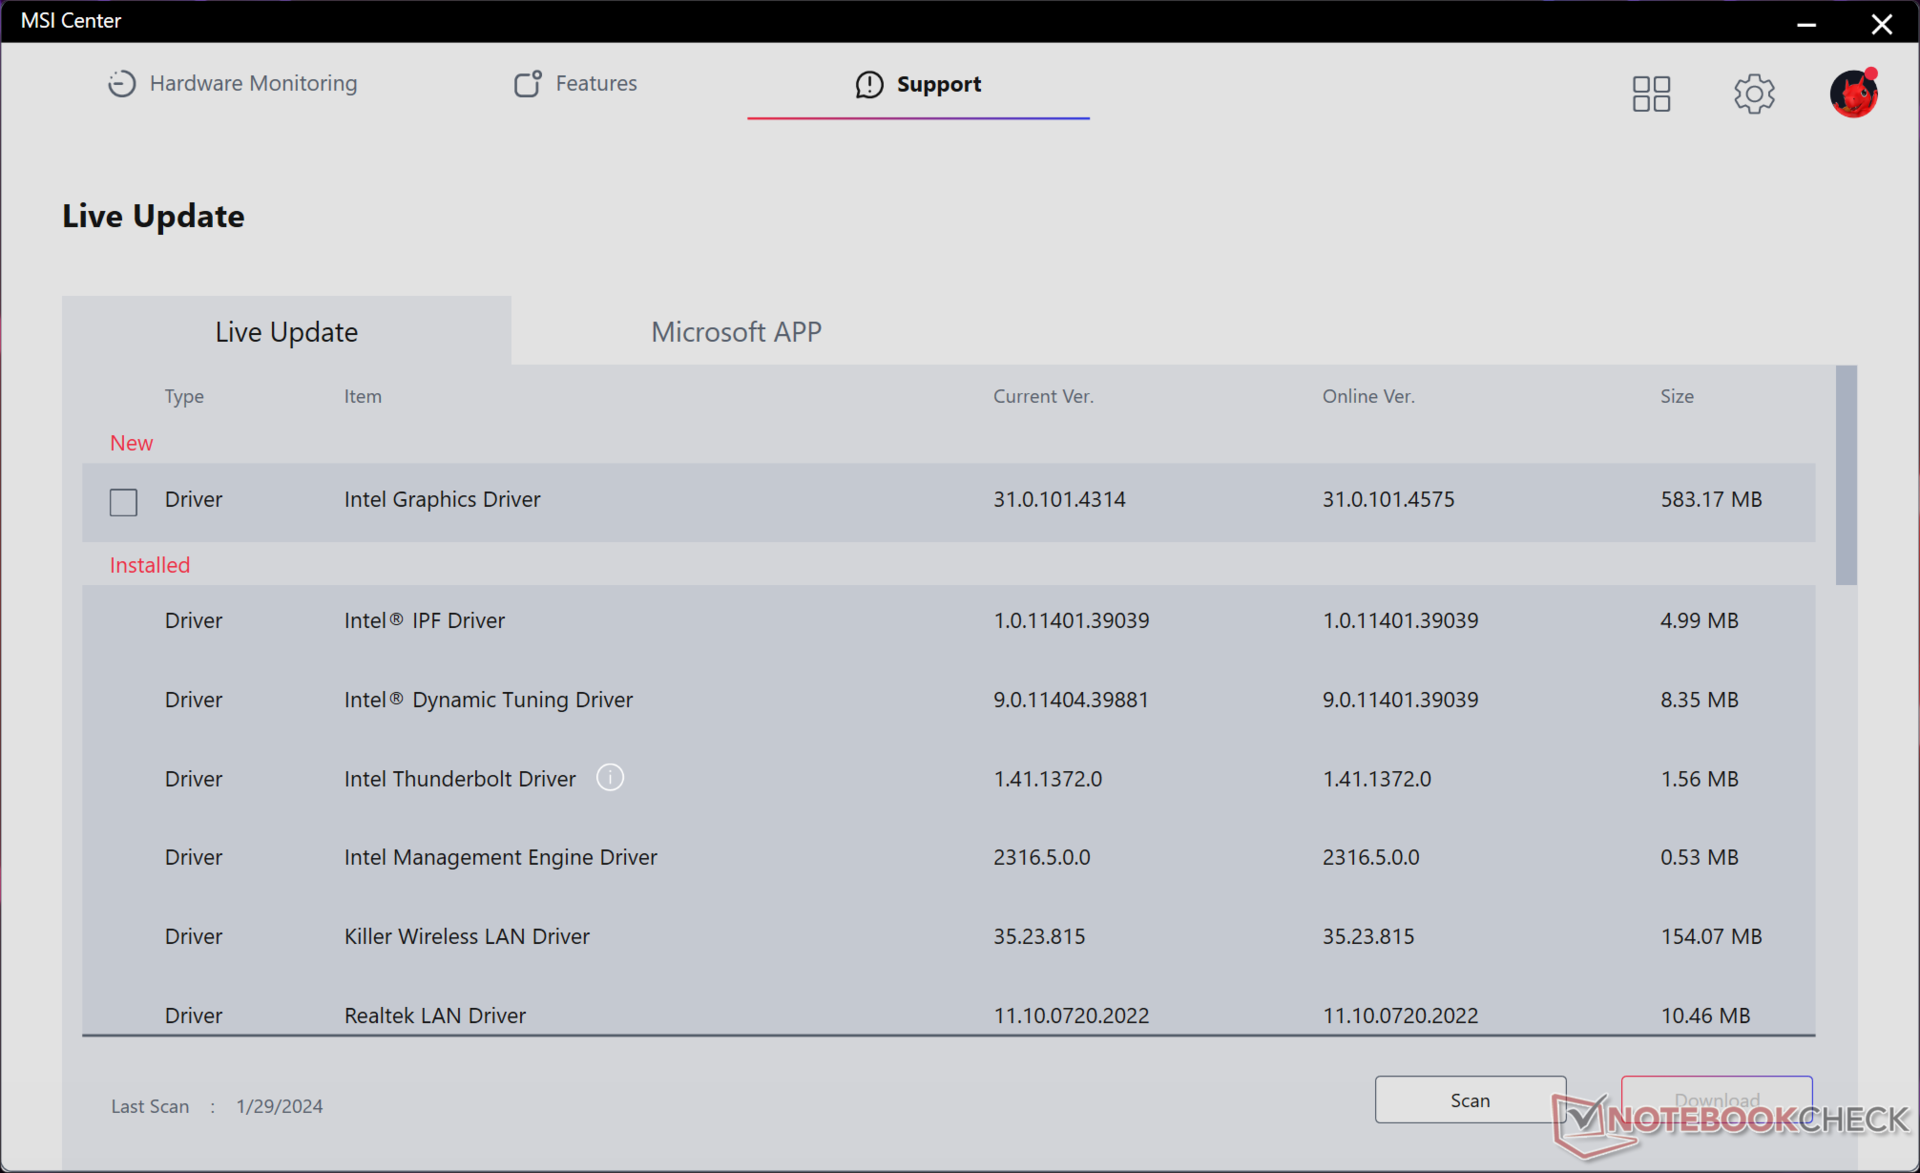
Pusimos nuestra unidad en modo dGPU y en modo Rendimiento Extremo con Cooler Boost activo antes de ejecutar los benchmarks que se muestran a continuación. Los propietarios deben familiarizarse con el software MSI Center preinstalado, ya que es el centro para las actualizaciones del sistema, las constantes vitales del sistema, alternar funciones y ajustar la configuración MUX y los perfiles de energía. El cambio entre los modos dGPU e iGPU requiere un reinicio que puede tardar incluso más que un arranque en frío normal.
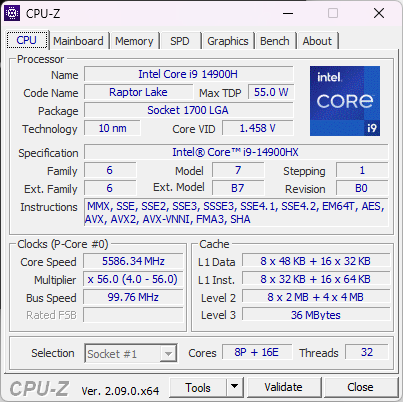
Procesador
Al igual que lo que descubrimos en la Titan 18 HX, el Core i9-14900HX es sólo una mejora menor respecto a la última generación Core i9-13980HX en hasta un 10 por ciento. Por lo tanto, los beneficios interanuales son sólo marginales, especialmente porque la serie de actualización Raptor Lake-HX de 14ª generación carece de la nueva NPU dedicada que se encuentra en la serie Meteor Lake de 14ª generación. Por supuesto, el Core i9-13980HX fue una de las CPU móviles más rápidas de 2023, por lo que el Core i9-14900HX no se queda atrás en absoluto. Los usuarios que actualicen desde portátiles para juegos Intel de 12ª generación o anteriores deberían seguir viendo aumentos de rendimiento significativos.
Cinebench R15 Multi Loop
Cinebench R23: Multi Core | Single Core
Cinebench R20: CPU (Multi Core) | CPU (Single Core)
Cinebench R15: CPU Multi 64Bit | CPU Single 64Bit
Blender: v2.79 BMW27 CPU
7-Zip 18.03: 7z b 4 | 7z b 4 -mmt1
Geekbench 6.7: Multi-Core | Single-Core
Geekbench 5.5: Multi-Core | Single-Core
HWBOT x265 Benchmark v2.2: 4k Preset
LibreOffice : 20 Documents To PDF
R Benchmark 2.5: Overall mean
| CPU Performance rating | |
| MSI Vector 16 HX A14V | |
| Asus Zephyrus Duo 16 GX650PY-NM006W -2! | |
| Medio Intel Core i9-14900HX | |
| Alienware m16 R1 AMD | |
| Lenovo Legion 5 16IRX G9 | |
| Alienware m16 R1 Intel | |
| Lenovo Legion Pro 5 16ARX8 -2! | |
| Asus TUF Gaming A16 FA617XS -2! | |
| MSI Vector GP66 12UGS -2! | |
| Lenovo Legion Slim 7 16APH8 | |
| Lenovo LOQ 16IRH8 | |
| Dell G16 7620 -2! | |
| HP Victus 16-r0077ng | |
| Geekbench 6.7 / Multi-Core | |
| MSI Vector 16 HX A14V | |
| Medio Intel Core i9-14900HX (13158 - 19665, n=37) | |
| Lenovo Legion 5 16IRX G9 | |
| Alienware m16 R1 Intel | |
| Lenovo LOQ 16IRH8 | |
| Lenovo Legion Slim 7 16APH8 | |
| Alienware m16 R1 AMD | |
| HP Victus 16-r0077ng | |
| Geekbench 6.7 / Single-Core | |
| MSI Vector 16 HX A14V | |
| Medio Intel Core i9-14900HX (2419 - 3129, n=37) | |
| Lenovo Legion 5 16IRX G9 | |
| Alienware m16 R1 AMD | |
| Alienware m16 R1 Intel | |
| Lenovo Legion Slim 7 16APH8 | |
| Lenovo LOQ 16IRH8 | |
| HP Victus 16-r0077ng | |
Cinebench R23: Multi Core | Single Core
Cinebench R20: CPU (Multi Core) | CPU (Single Core)
Cinebench R15: CPU Multi 64Bit | CPU Single 64Bit
Blender: v2.79 BMW27 CPU
7-Zip 18.03: 7z b 4 | 7z b 4 -mmt1
Geekbench 6.7: Multi-Core | Single-Core
Geekbench 5.5: Multi-Core | Single-Core
HWBOT x265 Benchmark v2.2: 4k Preset
LibreOffice : 20 Documents To PDF
R Benchmark 2.5: Overall mean
* ... más pequeño es mejor
AIDA64: FP32 Ray-Trace | FPU Julia | CPU SHA3 | CPU Queen | FPU SinJulia | FPU Mandel | CPU AES | CPU ZLib | FP64 Ray-Trace | CPU PhotoWorxx
| Performance rating | |
| MSI Vector 16 HX A14V | |
| Medio Intel Core i9-14900HX | |
| Asus TUF Gaming A16 FA617XS | |
| Lenovo Legion 5 16IRX G9 | |
| Dell G16 7620 | |
| HP Victus 16-r0077ng | |
| MSI Vector GP66 12UGS | |
| AIDA64 / FP32 Ray-Trace | |
| MSI Vector 16 HX A14V | |
| Asus TUF Gaming A16 FA617XS | |
| Medio Intel Core i9-14900HX (13098 - 33474, n=36) | |
| Lenovo Legion 5 16IRX G9 | |
| Dell G16 7620 | |
| HP Victus 16-r0077ng | |
| MSI Vector GP66 12UGS | |
| AIDA64 / FPU Julia | |
| MSI Vector 16 HX A14V | |
| Medio Intel Core i9-14900HX (67573 - 166040, n=36) | |
| Asus TUF Gaming A16 FA617XS | |
| Lenovo Legion 5 16IRX G9 | |
| Dell G16 7620 | |
| HP Victus 16-r0077ng | |
| MSI Vector GP66 12UGS | |
| AIDA64 / CPU SHA3 | |
| MSI Vector 16 HX A14V | |
| Medio Intel Core i9-14900HX (3589 - 7979, n=36) | |
| Asus TUF Gaming A16 FA617XS | |
| Lenovo Legion 5 16IRX G9 | |
| Dell G16 7620 | |
| HP Victus 16-r0077ng | |
| MSI Vector GP66 12UGS | |
| AIDA64 / CPU Queen | |
| MSI Vector 16 HX A14V | |
| Medio Intel Core i9-14900HX (118405 - 148966, n=36) | |
| Asus TUF Gaming A16 FA617XS | |
| MSI Vector GP66 12UGS | |
| Dell G16 7620 | |
| Lenovo Legion 5 16IRX G9 | |
| HP Victus 16-r0077ng | |
| AIDA64 / FPU SinJulia | |
| MSI Vector 16 HX A14V | |
| Asus TUF Gaming A16 FA617XS | |
| Medio Intel Core i9-14900HX (10475 - 18517, n=36) | |
| Lenovo Legion 5 16IRX G9 | |
| Dell G16 7620 | |
| MSI Vector GP66 12UGS | |
| HP Victus 16-r0077ng | |
| AIDA64 / FPU Mandel | |
| MSI Vector 16 HX A14V | |
| Asus TUF Gaming A16 FA617XS | |
| Medio Intel Core i9-14900HX (32543 - 83662, n=36) | |
| Lenovo Legion 5 16IRX G9 | |
| HP Victus 16-r0077ng | |
| Dell G16 7620 | |
| MSI Vector GP66 12UGS | |
| AIDA64 / CPU AES | |
| Medio Intel Core i9-14900HX (86964 - 241777, n=36) | |
| MSI Vector 16 HX A14V | |
| MSI Vector GP66 12UGS | |
| Lenovo Legion 5 16IRX G9 | |
| Asus TUF Gaming A16 FA617XS | |
| Dell G16 7620 | |
| HP Victus 16-r0077ng | |
| AIDA64 / CPU ZLib | |
| MSI Vector 16 HX A14V | |
| Medio Intel Core i9-14900HX (1054 - 2292, n=36) | |
| Lenovo Legion 5 16IRX G9 | |
| Asus TUF Gaming A16 FA617XS | |
| MSI Vector GP66 12UGS | |
| Dell G16 7620 | |
| HP Victus 16-r0077ng | |
| AIDA64 / FP64 Ray-Trace | |
| MSI Vector 16 HX A14V | |
| Asus TUF Gaming A16 FA617XS | |
| Medio Intel Core i9-14900HX (6809 - 18349, n=36) | |
| Lenovo Legion 5 16IRX G9 | |
| Dell G16 7620 | |
| HP Victus 16-r0077ng | |
| MSI Vector GP66 12UGS | |
| AIDA64 / CPU PhotoWorxx | |
| MSI Vector 16 HX A14V | |
| Medio Intel Core i9-14900HX (23903 - 54702, n=36) | |
| HP Victus 16-r0077ng | |
| Dell G16 7620 | |
| Lenovo Legion 5 16IRX G9 | |
| Asus TUF Gaming A16 FA617XS | |
| MSI Vector GP66 12UGS | |
Rendimiento del sistema
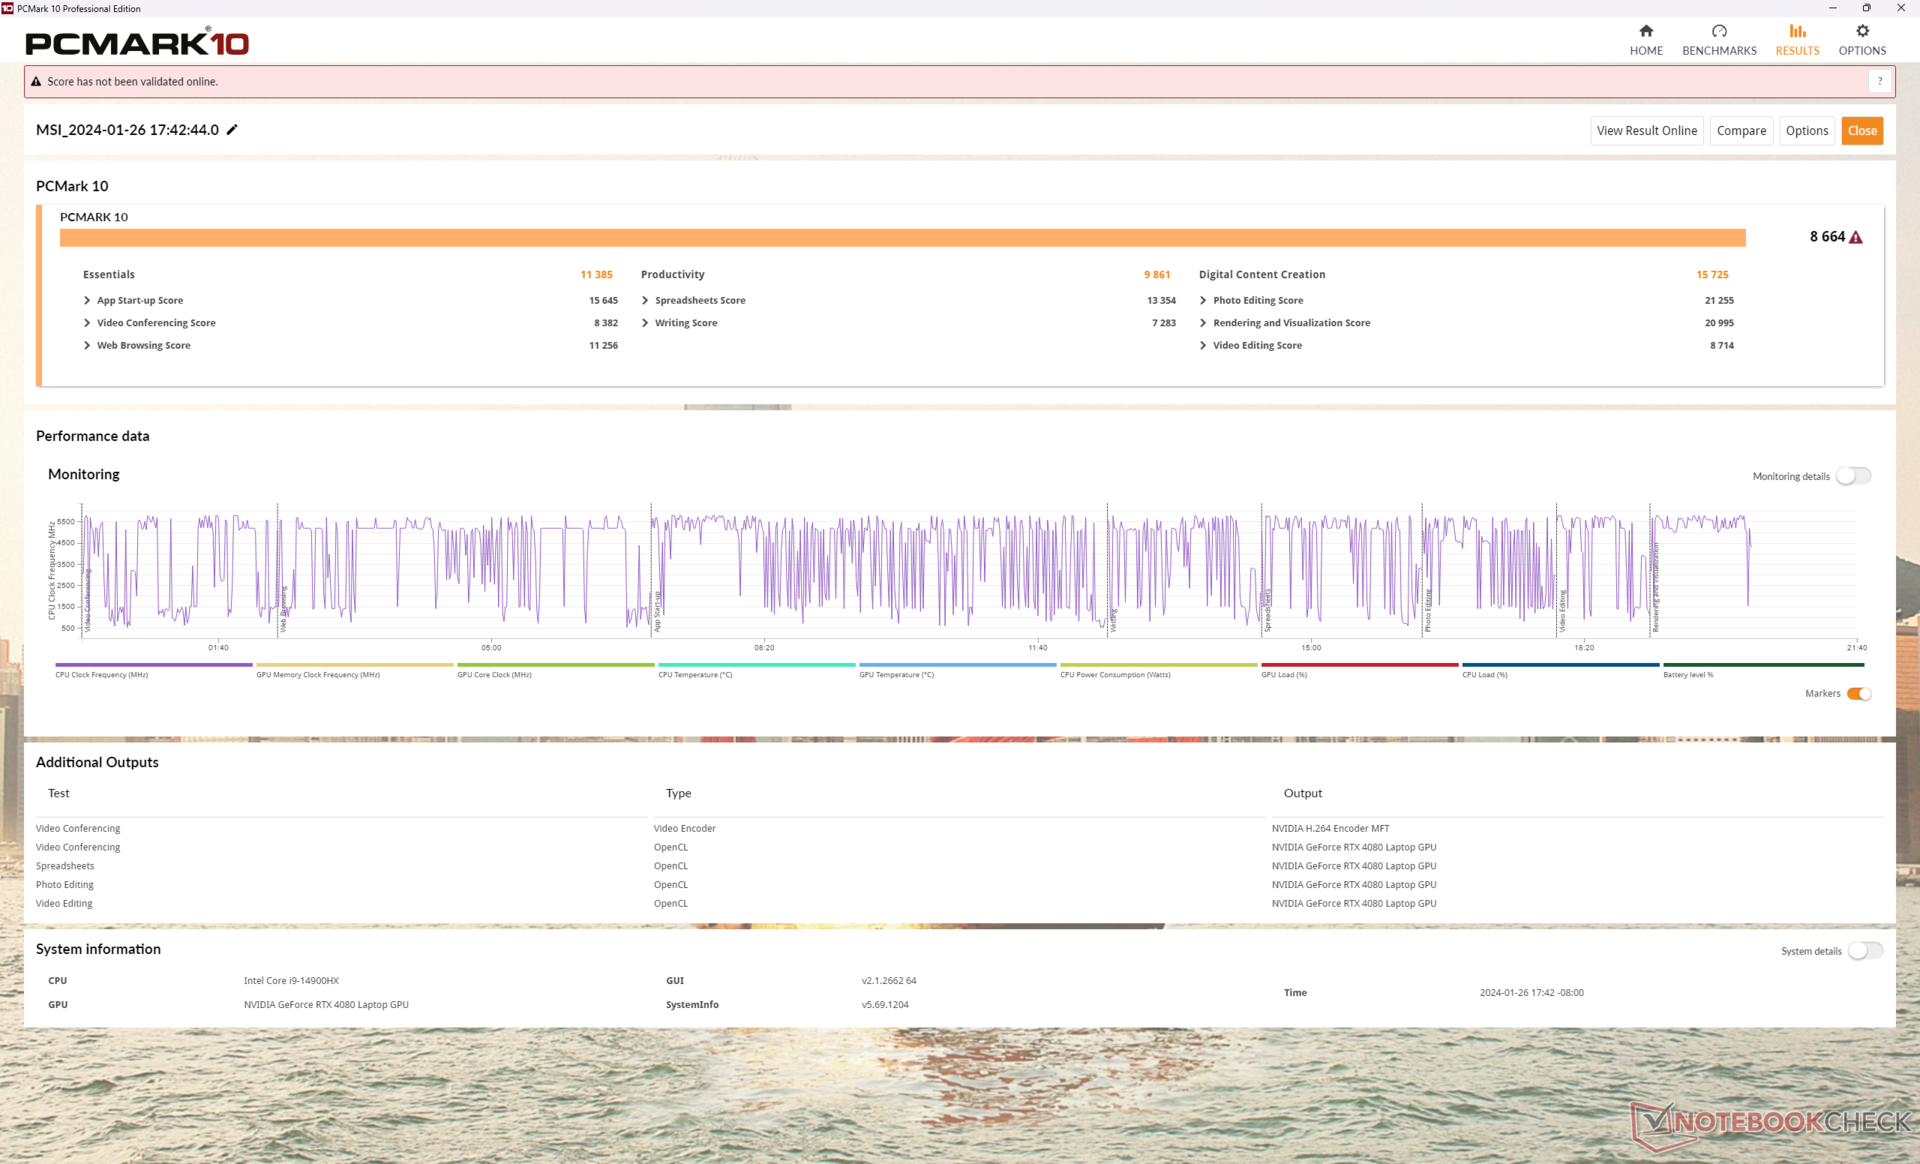
Los resultados de PCMark son de los más altos de cualquier portátil de juegos de gama media-alta gracias a la nueva CPU de 14ª generación y a la GPU GeForce RTX 4080 de 175 W a plena potencia. El rendimiento de la memoria RAM también es más rápido de lo esperado, con velocidades de lectura y escritura que son aproximadamente un 70% más rápidas que en el antiguo diseño Vector GP66.
CrossMark: Overall | Productivity | Creativity | Responsiveness
WebXPRT 3: Overall
WebXPRT 4: Overall
Mozilla Kraken 1.1: Total
| PCMark 10 / Score | |
| Medio Intel Core i9-14900HX, NVIDIA GeForce RTX 4080 Laptop GPU (7703 - 9223, n=7) | |
| MSI Vector 16 HX A14V | |
| MSI Vector GP66 12UGS | |
| Asus TUF Gaming A16 FA617XS | |
| Lenovo Legion 5 16IRX G9 | |
| Dell G16 7620 | |
| HP Victus 16-r0077ng | |
| PCMark 10 / Essentials | |
| Medio Intel Core i9-14900HX, NVIDIA GeForce RTX 4080 Laptop GPU (11255 - 12600, n=7) | |
| MSI Vector 16 HX A14V | |
| MSI Vector GP66 12UGS | |
| Asus TUF Gaming A16 FA617XS | |
| Lenovo Legion 5 16IRX G9 | |
| HP Victus 16-r0077ng | |
| Dell G16 7620 | |
| PCMark 10 / Productivity | |
| Asus TUF Gaming A16 FA617XS | |
| Medio Intel Core i9-14900HX, NVIDIA GeForce RTX 4080 Laptop GPU (6662 - 11410, n=7) | |
| MSI Vector GP66 12UGS | |
| MSI Vector 16 HX A14V | |
| Lenovo Legion 5 16IRX G9 | |
| HP Victus 16-r0077ng | |
| Dell G16 7620 | |
| PCMark 10 / Digital Content Creation | |
| MSI Vector 16 HX A14V | |
| Medio Intel Core i9-14900HX, NVIDIA GeForce RTX 4080 Laptop GPU (14211 - 16246, n=7) | |
| MSI Vector GP66 12UGS | |
| Lenovo Legion 5 16IRX G9 | |
| Asus TUF Gaming A16 FA617XS | |
| Dell G16 7620 | |
| HP Victus 16-r0077ng | |
| CrossMark / Overall | |
| MSI Vector 16 HX A14V | |
| Medio Intel Core i9-14900HX, NVIDIA GeForce RTX 4080 Laptop GPU (1992 - 2334, n=7) | |
| Lenovo Legion 5 16IRX G9 | |
| Dell G16 7620 | |
| Asus TUF Gaming A16 FA617XS | |
| CrossMark / Productivity | |
| MSI Vector 16 HX A14V | |
| Medio Intel Core i9-14900HX, NVIDIA GeForce RTX 4080 Laptop GPU (1812 - 2204, n=7) | |
| Lenovo Legion 5 16IRX G9 | |
| Asus TUF Gaming A16 FA617XS | |
| Dell G16 7620 | |
| CrossMark / Creativity | |
| MSI Vector 16 HX A14V | |
| Medio Intel Core i9-14900HX, NVIDIA GeForce RTX 4080 Laptop GPU (2327 - 2500, n=7) | |
| Lenovo Legion 5 16IRX G9 | |
| Asus TUF Gaming A16 FA617XS | |
| Dell G16 7620 | |
| CrossMark / Responsiveness | |
| MSI Vector 16 HX A14V | |
| Medio Intel Core i9-14900HX, NVIDIA GeForce RTX 4080 Laptop GPU (1520 - 2254, n=7) | |
| Lenovo Legion 5 16IRX G9 | |
| Dell G16 7620 | |
| Asus TUF Gaming A16 FA617XS | |
| WebXPRT 3 / Overall | |
| Medio Intel Core i9-14900HX, NVIDIA GeForce RTX 4080 Laptop GPU (310 - 345, n=7) | |
| MSI Vector 16 HX A14V | |
| Lenovo Legion 5 16IRX G9 | |
| MSI Vector GP66 12UGS | |
| HP Victus 16-r0077ng | |
| HP Victus 16-r0077ng | |
| Dell G16 7620 | |
| WebXPRT 4 / Overall | |
| Medio Intel Core i9-14900HX, NVIDIA GeForce RTX 4080 Laptop GPU (300 - 321, n=7) | |
| MSI Vector 16 HX A14V | |
| Lenovo Legion 5 16IRX G9 | |
| Asus TUF Gaming A16 FA617XS | |
| Dell G16 7620 | |
| HP Victus 16-r0077ng | |
| HP Victus 16-r0077ng | |
| Mozilla Kraken 1.1 / Total | |
| Dell G16 7620 | |
| HP Victus 16-r0077ng | |
| HP Victus 16-r0077ng | |
| MSI Vector GP66 12UGS | |
| Asus TUF Gaming A16 FA617XS | |
| Lenovo Legion 5 16IRX G9 | |
| MSI Vector 16 HX A14V | |
| Medio Intel Core i9-14900HX, NVIDIA GeForce RTX 4080 Laptop GPU (437 - 446, n=7) | |
* ... más pequeño es mejor
| PCMark 10 Score | 8664 puntos | |
ayuda | ||
| AIDA64 / Memory Copy | |
| MSI Vector 16 HX A14V | |
| Medio Intel Core i9-14900HX (38028 - 83392, n=36) | |
| HP Victus 16-r0077ng | |
| Lenovo Legion 5 16IRX G9 | |
| Asus TUF Gaming A16 FA617XS | |
| Dell G16 7620 | |
| MSI Vector GP66 12UGS | |
| AIDA64 / Memory Read | |
| MSI Vector 16 HX A14V | |
| Medio Intel Core i9-14900HX (43306 - 87568, n=36) | |
| Lenovo Legion 5 16IRX G9 | |
| HP Victus 16-r0077ng | |
| Dell G16 7620 | |
| Asus TUF Gaming A16 FA617XS | |
| MSI Vector GP66 12UGS | |
| AIDA64 / Memory Write | |
| MSI Vector 16 HX A14V | |
| Asus TUF Gaming A16 FA617XS | |
| Medio Intel Core i9-14900HX (37146 - 80589, n=36) | |
| HP Victus 16-r0077ng | |
| Dell G16 7620 | |
| Lenovo Legion 5 16IRX G9 | |
| MSI Vector GP66 12UGS | |
| AIDA64 / Memory Latency | |
| Dell G16 7620 | |
| HP Victus 16-r0077ng | |
| MSI Vector GP66 12UGS | |
| Asus TUF Gaming A16 FA617XS | |
| Lenovo Legion 5 16IRX G9 | |
| Medio Intel Core i9-14900HX (76.1 - 105, n=36) | |
| MSI Vector 16 HX A14V | |
* ... más pequeño es mejor
Latencia del CPD
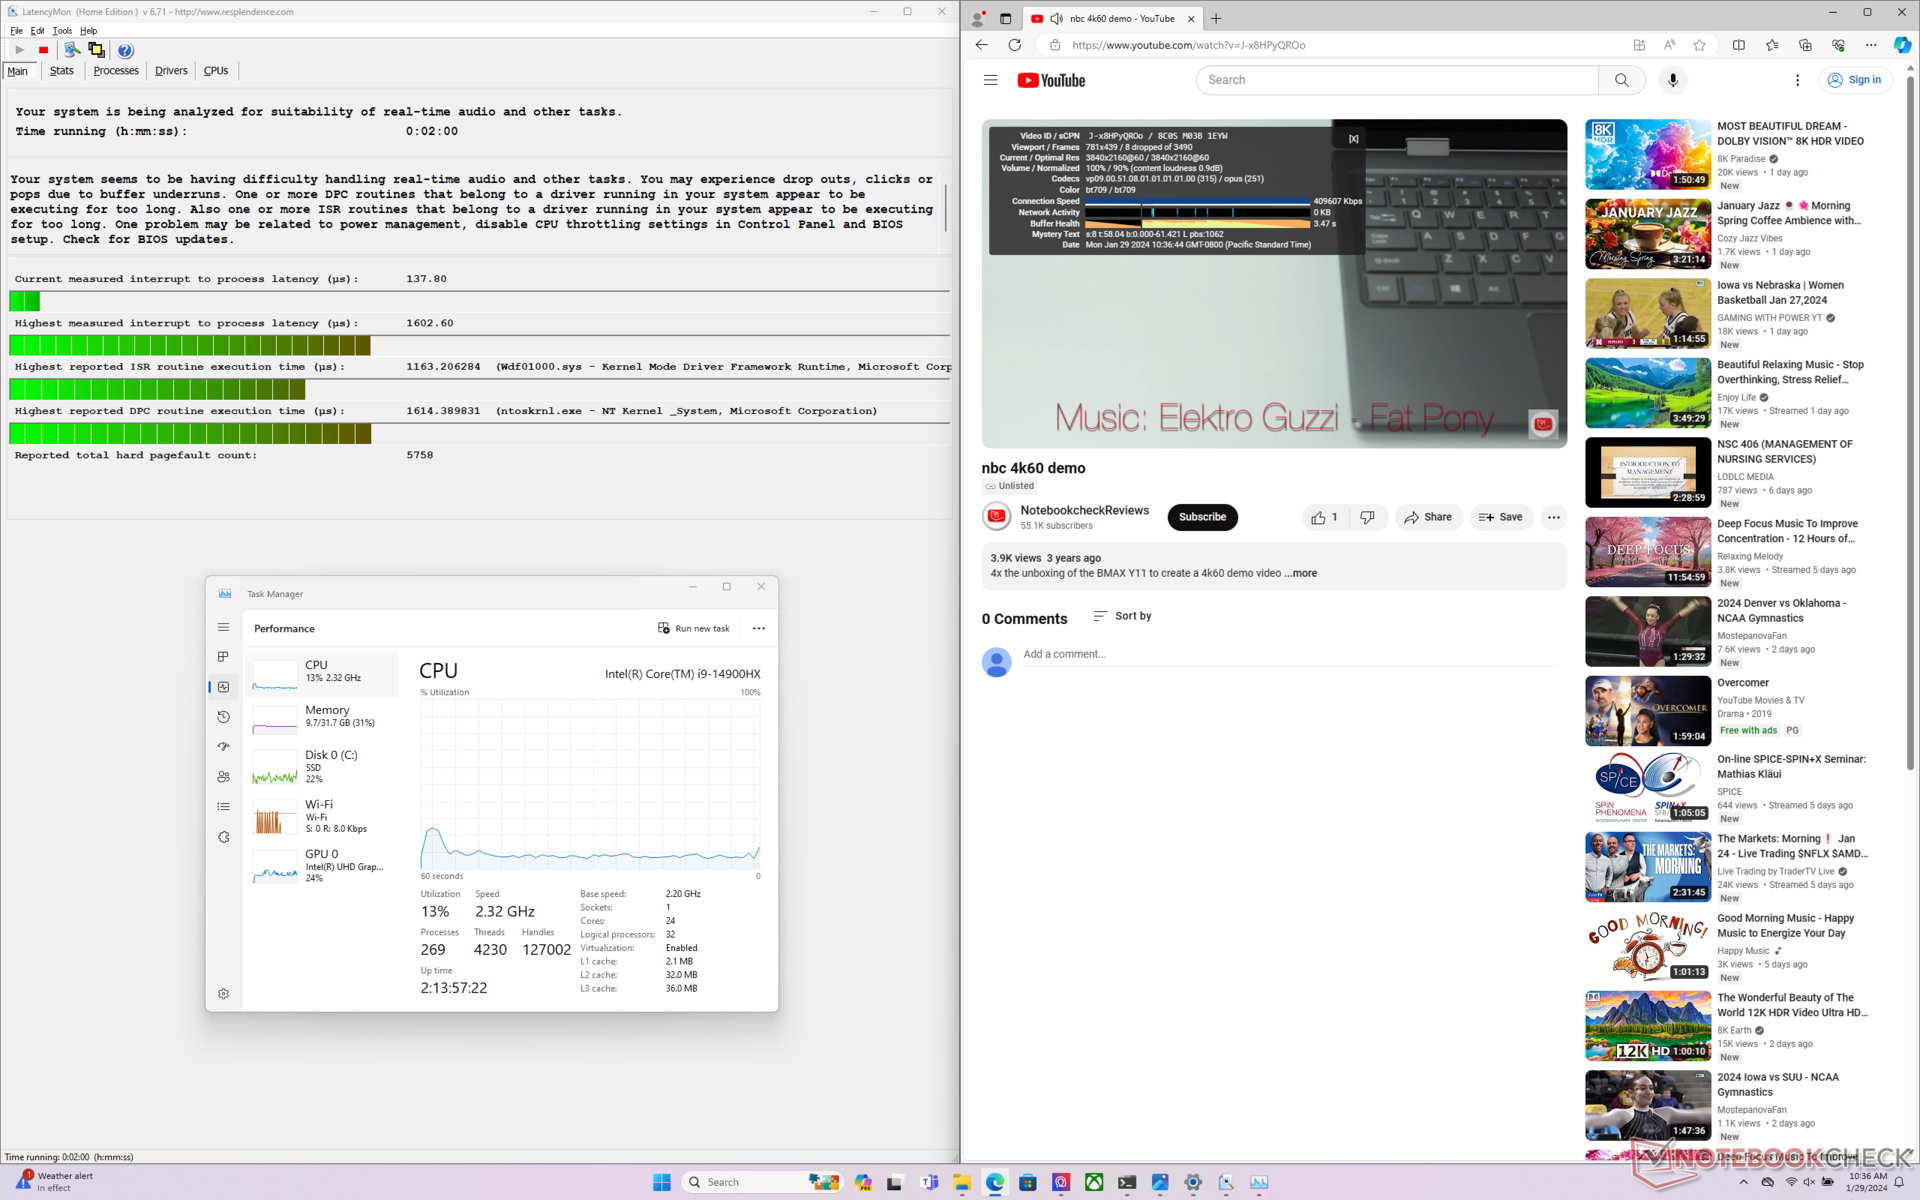
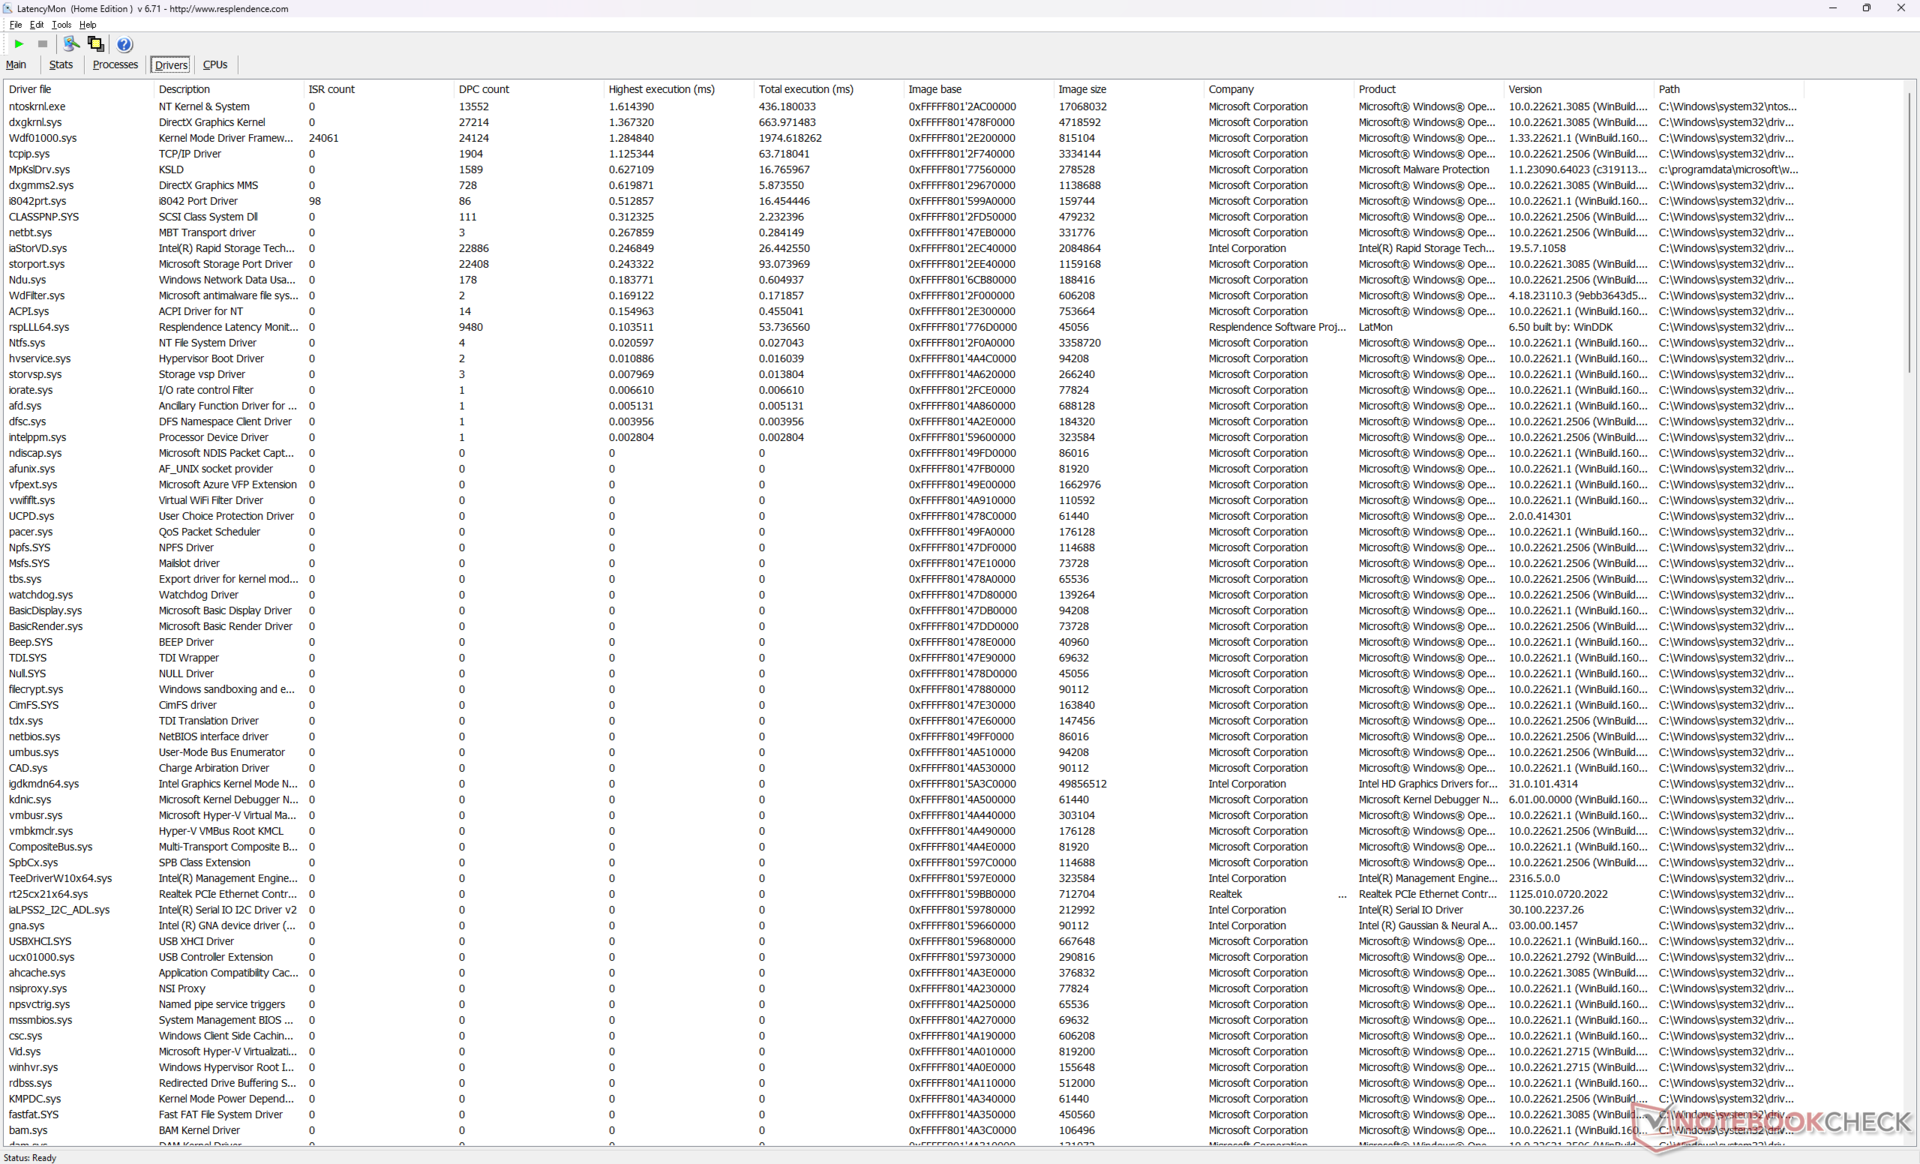
LatencyMon revela problemas de DPC al abrir varias pestañas de nuestra página de inicio, así como 8 fotogramas caídos durante un vídeo de prueba 4K60 de un minuto de duración. Las caídas de fotogramas se producían a intervalos casi regulares, lo que sugiere un problema relacionado con la actividad en segundo plano o con un controlador subyacente.
| DPC Latencies / LatencyMon - interrupt to process latency (max), Web, Youtube, Prime95 | |
| MSI Vector GP66 12UGS | |
| Lenovo Legion 5 16IRX G9 | |
| HP Victus 16-r0077ng | |
| MSI Vector 16 HX A14V | |
| Asus TUF Gaming A16 FA617XS | |
| Dell G16 7620 | |
* ... más pequeño es mejor
Dispositivos de almacenamiento
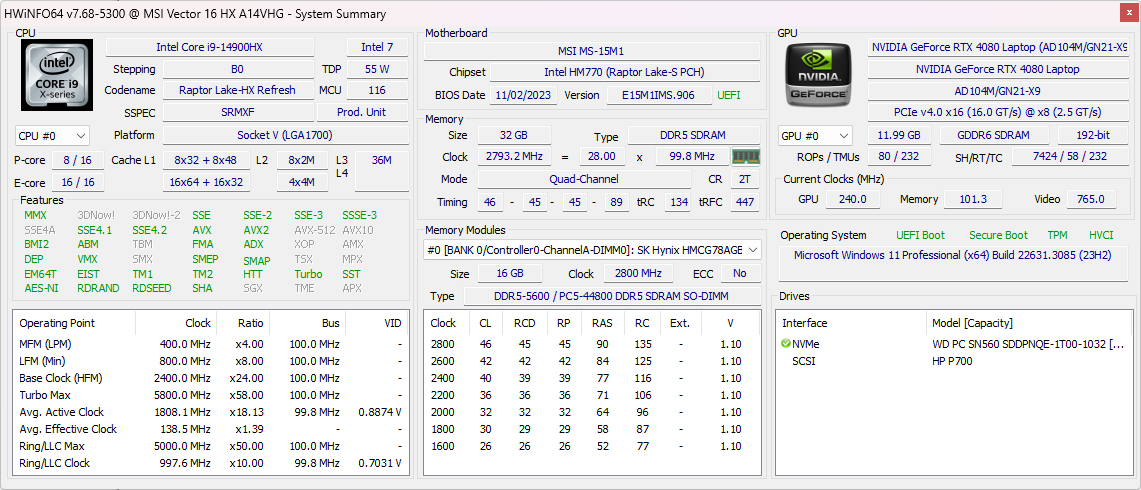
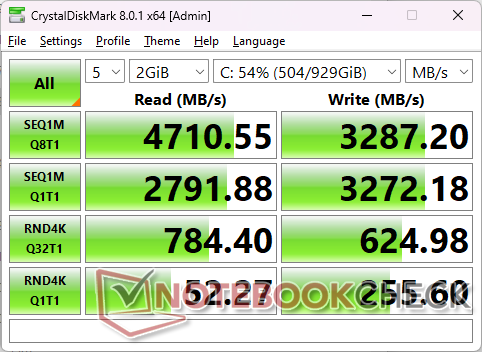
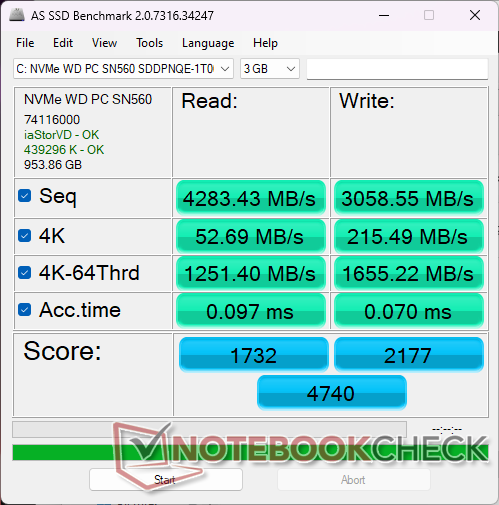
Nuestra unidad de prueba viene configurada con el modelo de gama media de 1 TB Western Digital PC SN560 SSD PCIe4 x4 NVMe para unas tasas de transferencia constantes de unos 4900 MB/s incluso bajo estrés. El modelo también admite unidades SSD PCIe5 x4, al igual que el Titan 18 HX de mayor tamaño, pero la baja disponibilidad de unidades SSD PCIe5 significa que la gran mayoría de las configuraciones disponibles en este momento sólo se suministran con unidades PCIe4.

| Drive Performance rating - Percent | |
| Lenovo Legion 5 16IRX G9 | |
| Dell G16 7620 | |
| MSI Vector GP66 12UGS | |
| HP Victus 16-r0077ng | |
| MSI Vector 16 HX A14V | |
| Asus TUF Gaming A16 FA617XS | |
* ... más pequeño es mejor
Disk Throttling: DiskSpd Read Loop, Queue Depth 8
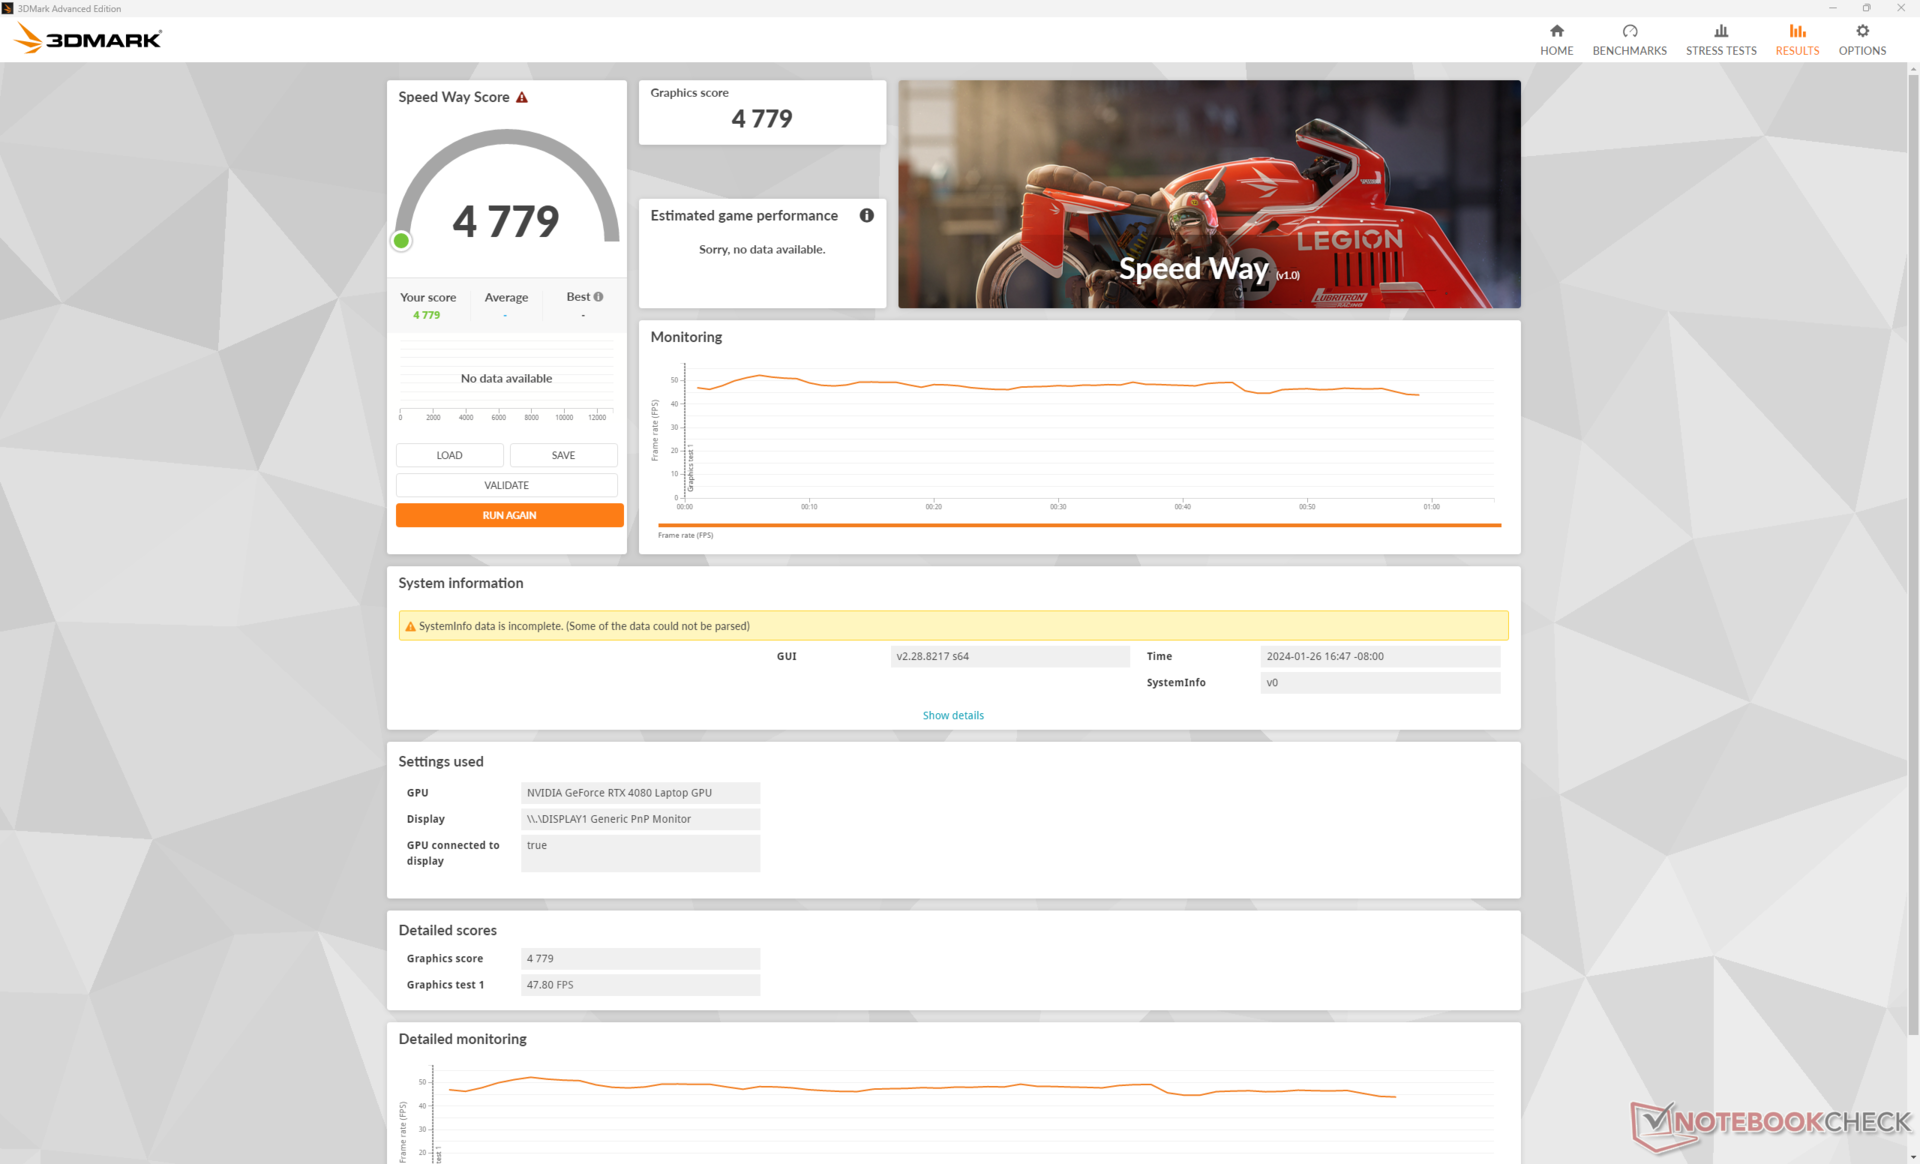
Rendimiento de la GPU: donde brilla el vector
Mientras que la mayoría de los demás portátiles para juegos apuntan a valores de TGP más bajos, incluido el GP66 saliente, el Vector 16 HX apunta al máximo de 175 W para un rendimiento más rápido. En consecuencia, nuestro sistema MSI es entre un 8 y un 10 por ciento más rápido que el portátil medio de nuestra base de datos equipado con la misma GeForce RTX 4080 móvil GPU. No es un margen tan amplio, pero los usuarios avanzados y los jugadores que quieran exprimir al máximo el rendimiento de la GPU de sus máquinas querrán considerar el Vector 16 HX frente a alternativas con las mismas opciones gráficas como el HP Omen 16.
La actualización a la RTX 4090 se espera que aumente el rendimiento gráfico en torno a un 10 por ciento, mientras que bajar a la configuración RTX 4070 y RTX 4060 debería disminuir el rendimiento entre un 30 y un 35 por ciento y entre un 40 y un 45 por ciento, respectivamente.
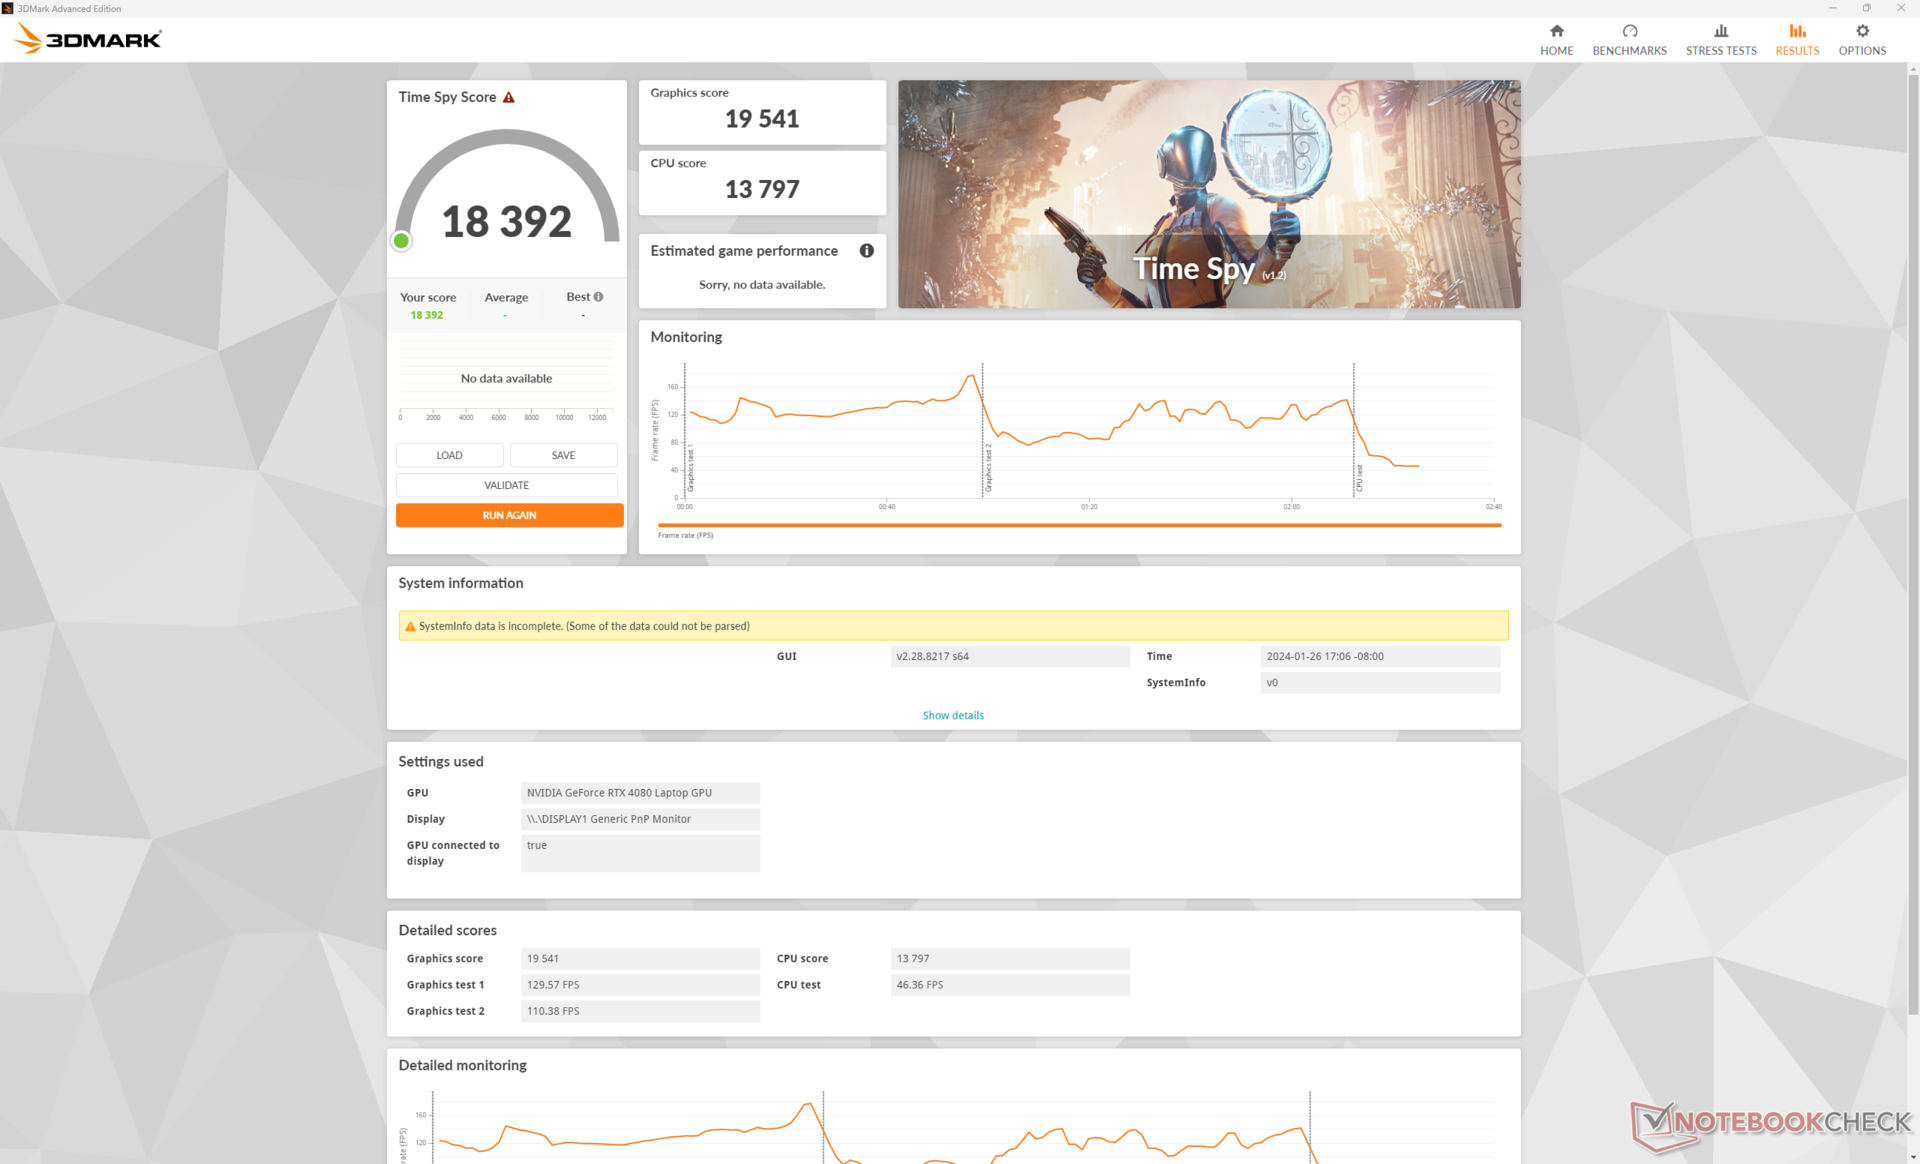
| Perfil de potencia | Puntuación física | Puntuación de gráficos | Puntuación combinada |
| Rendimiento extremo (con Cooler Boost activado) | 13797 | 19541 | 18392 |
| Rendimiento extremo (con Cooler Boost desactivado) | 14118 (-0%) | 19471 (-0%) | 18423 (-0%) |
| Modo equilibrado | 13858 (-0%) | 16466 (-16%) | 16013 (-13%) |
| Batería | 8307 (-40%) | 8955 (-54%) | 8851 (-52%) |
Al igual que en otros portátiles para juegos de MSI con Cooler Boost, el rendimiento parece no verse afectado por la característica siempre que esté en el modo de Rendimiento Extremo, según nuestras puntuaciones de Time Spy en la tabla anterior. Bajar al modo Equilibrado, sin embargo, reducirá el rendimiento gráfico en aproximadamente un 16 por ciento.
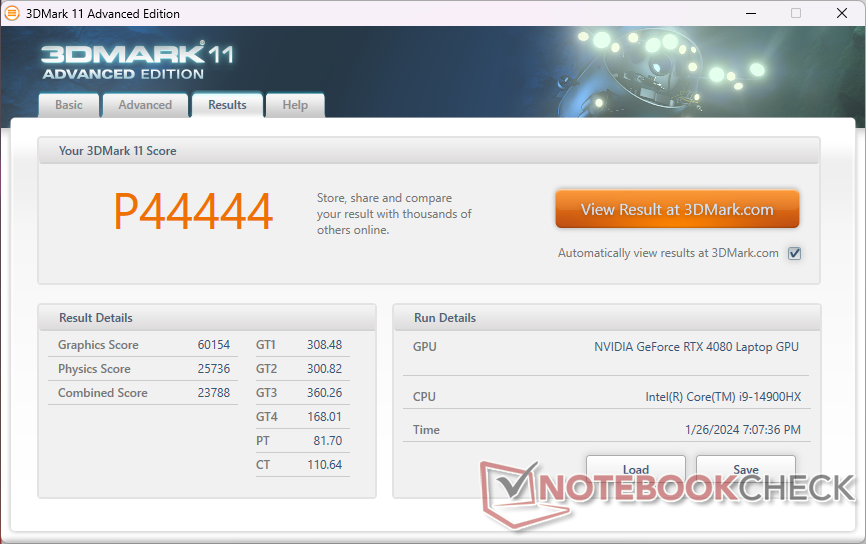
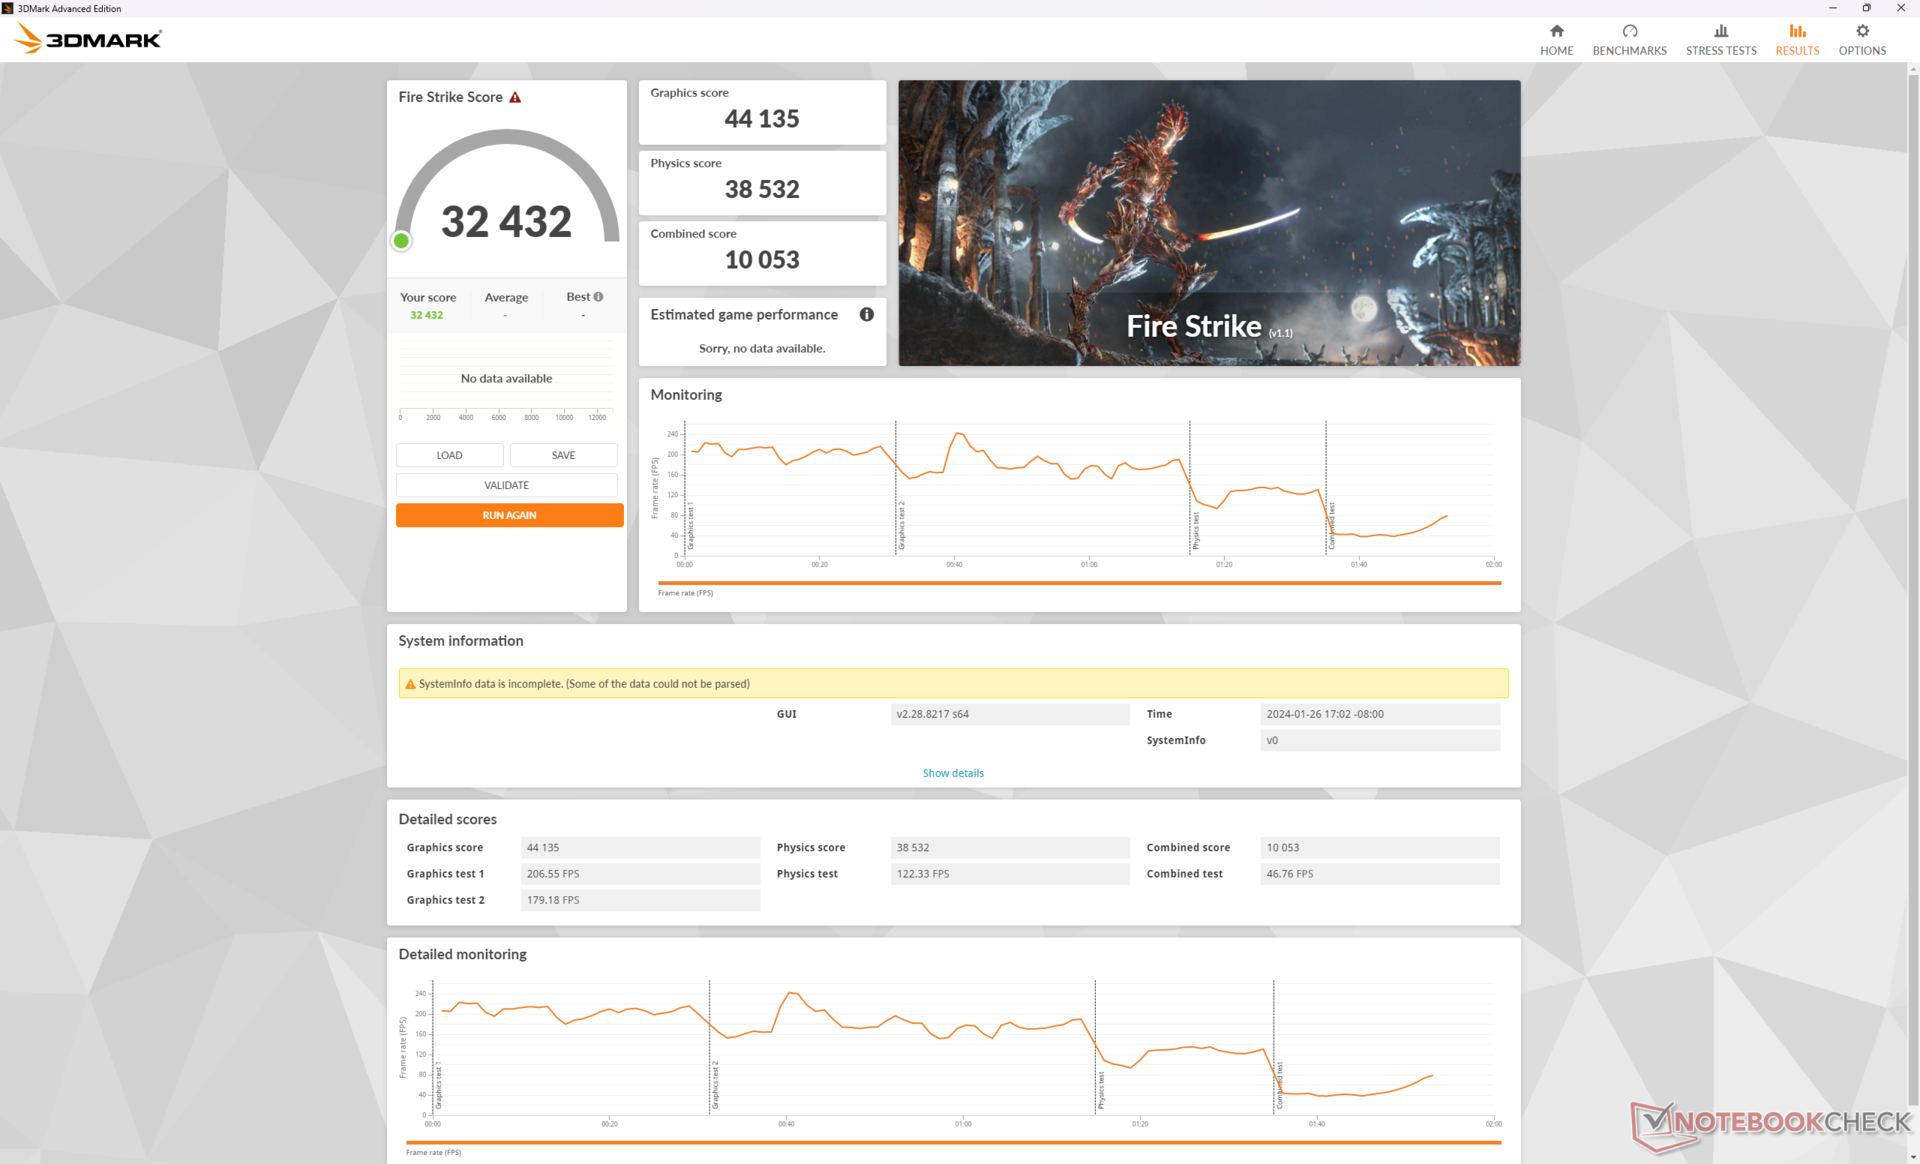
| 3DMark 11 Performance | 44444 puntos | |
| 3DMark Fire Strike Score | 32432 puntos | |
| 3DMark Time Spy Score | 18392 puntos | |
ayuda | ||
* ... más pequeño es mejor
Rendimiento en juegos
Todos los títulos actuales se ejecutan sin problemas a la resolución de pantalla nativa de 1600p con la mayoría de los ajustes al máximo. Sin embargo, es posible que desee considerar la activación de v-sync o limitar la velocidad de fotogramas a 120 debido a la falta de G-Sync. Baldur's Gate, por ejemplo, alcanza una media de 129 FPS a 1440p, lo que puede provocar desgarros de pantalla en la pantalla de 240 Hz si se desbloquean las frecuencias de cuadro.
Se recomienda DLSS si se juega en 4K ya que la RTX 4080 móvil es significativamente más débil que su contraparte de escritorio. Cyberpunk 2077 sólo alcanzaría una media de 18,5 FPS con los ajustes nativos 4K Ultra RT, pero si se activan tanto DLSS Auto como la generación de fotogramas, la media aumentaría hasta los 75,8 FPS.
| Performance rating - Percent | |
| MSI Vector 16 HX A14V | |
| Lenovo Legion 5 16IRX G9 | |
| MSI Vector GP66 12UGS | |
| HP Victus 16-r0077ng | |
| Dell G16 7620 | |
| Asus TUF Gaming A16 FA617XS | |
| The Witcher 3 - 1920x1080 Ultra Graphics & Postprocessing (HBAO+) | |
| MSI Vector 16 HX A14V | |
| MSI Vector GP66 12UGS | |
| HP Victus 16-r0077ng | |
| Asus TUF Gaming A16 FA617XS | |
| Lenovo Legion 5 16IRX G9 | |
| Dell G16 7620 | |
| GTA V - 1920x1080 Highest AA:4xMSAA + FX AF:16x | |
| MSI Vector 16 HX A14V | |
| MSI Vector GP66 12UGS | |
| Lenovo Legion 5 16IRX G9 | |
| HP Victus 16-r0077ng | |
| Dell G16 7620 | |
| Asus TUF Gaming A16 FA617XS | |
| Final Fantasy XV Benchmark - 1920x1080 High Quality | |
| MSI Vector 16 HX A14V | |
| MSI Vector GP66 12UGS | |
| HP Victus 16-r0077ng | |
| Lenovo Legion 5 16IRX G9 | |
| Dell G16 7620 | |
| Asus TUF Gaming A16 FA617XS | |
| Strange Brigade - 1920x1080 ultra AA:ultra AF:16 | |
| MSI Vector 16 HX A14V | |
| MSI Vector GP66 12UGS | |
| Lenovo Legion 5 16IRX G9 | |
| HP Victus 16-r0077ng | |
| Asus TUF Gaming A16 FA617XS | |
| Dell G16 7620 | |
| Dota 2 Reborn - 1920x1080 ultra (3/3) best looking | |
| MSI Vector 16 HX A14V | |
| Lenovo Legion 5 16IRX G9 | |
| MSI Vector GP66 12UGS | |
| Dell G16 7620 | |
| HP Victus 16-r0077ng | |
| Asus TUF Gaming A16 FA617XS | |
| X-Plane 11.11 - 1920x1080 high (fps_test=3) | |
| MSI Vector 16 HX A14V | |
| Lenovo Legion 5 16IRX G9 | |
| MSI Vector GP66 12UGS | |
| Dell G16 7620 | |
| HP Victus 16-r0077ng | |
| Asus TUF Gaming A16 FA617XS | |
| Baldur's Gate 3 | |
| 1920x1080 High Preset AA:T | |
| MSI Vector 16 HX A14V | |
| Medio NVIDIA GeForce RTX 4080 Laptop GPU (122.2 - 183.5, n=4) | |
| Framework Laptop 16 | |
| Lenovo ThinkPad Z16 Gen 2 | |
| 1920x1080 Ultra Preset AA:T | |
| MSI Vector 16 HX A14V | |
| Medio NVIDIA GeForce RTX 4080 Laptop GPU (111.8 - 181.2, n=7) | |
| Framework Laptop 16 | |
| Lenovo ThinkPad Z16 Gen 2 | |
| 2560x1440 Ultra Preset AA:T | |
| MSI Vector 16 HX A14V | |
| Medio NVIDIA GeForce RTX 4080 Laptop GPU (88.3 - 129.3, n=7) | |
| Framework Laptop 16 | |
| Lenovo ThinkPad Z16 Gen 2 | |
| 3840x2160 Ultra Preset AA:T | |
| MSI Vector 16 HX A14V | |
| Medio NVIDIA GeForce RTX 4080 Laptop GPU (48.8 - 68.4, n=5) | |
| Framework Laptop 16 | |
| Cyberpunk 2077 | |
| 1920x1080 High Preset (FSR off) | |
| MSI Vector 16 HX A14V | |
| Medio NVIDIA GeForce RTX 4080 Laptop GPU (94.1 - 141.3, n=9) | |
| Lenovo Legion 5 16IRX G9 | |
| Framework Laptop 16 | |
| Lenovo ThinkPad Z16 Gen 2 | |
| 1920x1080 Ultra Preset (FSR off) | |
| MSI Vector 16 HX A14V | |
| Medio NVIDIA GeForce RTX 4080 Laptop GPU (83.9 - 127.1, n=15) | |
| Lenovo Legion 5 16IRX G9 | |
| Framework Laptop 16 | |
| Lenovo ThinkPad Z16 Gen 2 | |
| 2560x1440 Ultra Preset (FSR off) | |
| MSI Vector 16 HX A14V | |
| Medio NVIDIA GeForce RTX 4080 Laptop GPU (56.2 - 86.3, n=15) | |
| Lenovo Legion 5 16IRX G9 | |
| Framework Laptop 16 | |
| Lenovo ThinkPad Z16 Gen 2 | |
| 3840x2160 Ultra Preset (FSR off) | |
| MSI Vector 16 HX A14V | |
| Medio NVIDIA GeForce RTX 4080 Laptop GPU (25.8 - 39.8, n=8) | |
| Framework Laptop 16 | |
| 1920x1080 Ray Tracing Ultra Preset (DLSS off) | |
| MSI Vector 16 HX A14V | |
| Medio NVIDIA GeForce RTX 4080 Laptop GPU (43.8 - 67.2, n=12) | |
| Framework Laptop 16 | |
| Lenovo ThinkPad Z16 Gen 2 | |
| 3840x2160 Ray Tracing Ultra Preset (DLSS off, no Path Tracing) | |
| MSI Vector 16 HX A14V | |
| Medio NVIDIA GeForce RTX 4080 Laptop GPU (16 - 20, n=5) | |
Witcher 3 FPS Chart
| bajo | medio | alto | ultra | QHD | 4K | |
|---|---|---|---|---|---|---|
| GTA V (2015) | 187.1 | 185.7 | 181.9 | 136.5 | 128.8 | 158.6 |
| The Witcher 3 (2015) | 640 | 513.3 | 384.6 | 183.3 | 121.2 | |
| Dota 2 Reborn (2015) | 217 | 194.8 | 186.7 | 175 | 168.4 | |
| Final Fantasy XV Benchmark (2018) | 232 | 219 | 178.8 | 142 | 79.5 | |
| X-Plane 11.11 (2018) | 204 | 177.4 | 137.7 | 118.1 | ||
| Far Cry 5 (2018) | 180 | 167 | 161 | 154 | 97 | |
| Strange Brigade (2018) | 505 | 405 | 378 | 349 | 248 | 123.2 |
| Tiny Tina's Wonderlands (2022) | 344 | 297.1 | 212.8 | 167.1 | 114.8 | 60.3 |
| F1 22 (2022) | 339 | 324 | 297 | 81.2 | 76.9 | 39.6 |
| Baldur's Gate 3 (2023) | 228.5 | 204.3 | 183.5 | 181.2 | 129.3 | 68.4 |
| Cyberpunk 2077 (2023) | 143.4 | 135.3 | 127.1 | 118.6 | 79.4 | 36.6 |
Emisiones - Alto y orgulloso
Ruido del sistema
El sistema es bastante ruidoso incluso cuando está simplemente en reposo en el escritorio en los perfiles de alimentación Equilibrada o Silenciosa. El ruido del ventilador cuando funciona Witcher 3 en modo Rendimiento extremo se establecería en 62 dB(A) independientemente del ajuste Cooler Boost. El rango de más de 60 dB(A) es el hogar de algunos de los portátiles más ruidosos de nuestra base de datos, hasta el punto de que se recomienda el uso de auriculares para una mejor experiencia de juego.
Jugar en modo equilibrado reducirá el techo de ruido del ventilador significativamente hasta el rango de 54 dB(A). Aunque sigue siendo ruidoso, no es ni de lejos tan malo como en el modo Rendimiento Extremo. Por lo tanto, es posible que los usuarios prefieran jugar en modo Equilibrado en lugar de en modo Rendimiento Extremo, a pesar de que conlleva una caída del 16 por ciento en el rendimiento de la GPU, como se mencionó anteriormente.
Ruido
| Ocioso |
| 33.5 / 33.5 / 33.5 dB(A) |
| Carga |
| 52.1 / 62 dB(A) |
 | ||
30 dB silencioso 40 dB(A) audible 50 dB(A) ruidosamente alto |
||
min: | ||
| MSI Vector 16 HX A14V GeForce RTX 4080 Laptop GPU, i9-14900HX, WD PC SN560 SDDPNQE-1T00 | MSI Vector GP66 12UGS GeForce RTX 3070 Ti Laptop GPU, i9-12900H | Lenovo Legion 5 16IRX G9 GeForce RTX 4060 Laptop GPU, i7-14650HX, Samsung PM9A1 MZVL21T0HCLR | HP Victus 16-r0077ng GeForce RTX 4070 Laptop GPU, i7-13700H, Kioxia XG8 KXG80ZNV1T02 | Asus TUF Gaming A16 FA617XS Radeon RX 7600S, R9 7940HS, Micron 2400 MTFDKBA512QFM | Dell G16 7620 GeForce RTX 3060 Laptop GPU, i7-12700H, WDC PC SN810 512GB | |
|---|---|---|---|---|---|---|
| Noise | 17% | 11% | 14% | 15% | 18% | |
| apagado / medio ambiente * (dB) | 23.2 | 22.9 1% | 24 -3% | 25 -8% | 25 -8% | 23.2 -0% |
| Idle Minimum * (dB) | 33.5 | 23.4 30% | 24 28% | 28 16% | 25 25% | 28.3 16% |
| Idle Average * (dB) | 33.5 | 23.4 30% | 28.8 14% | 29 13% | 26 22% | 28.8 14% |
| Idle Maximum * (dB) | 33.5 | 27.4 18% | 32 4% | 30 10% | 28 16% | 28.9 14% |
| Load Average * (dB) | 52.1 | 36 31% | 45.5 13% | 43 17% | 43 17% | 32.4 38% |
| Witcher 3 ultra * (dB) | 62 | 58.2 6% | 53.1 14% | 46 26% | 51 18% | 48.3 22% |
| Load Maximum * (dB) | 62 | 58 6% | 55.7 10% | 48 23% | 53 15% | 48.1 22% |
* ... más pequeño es mejor
Temperatura
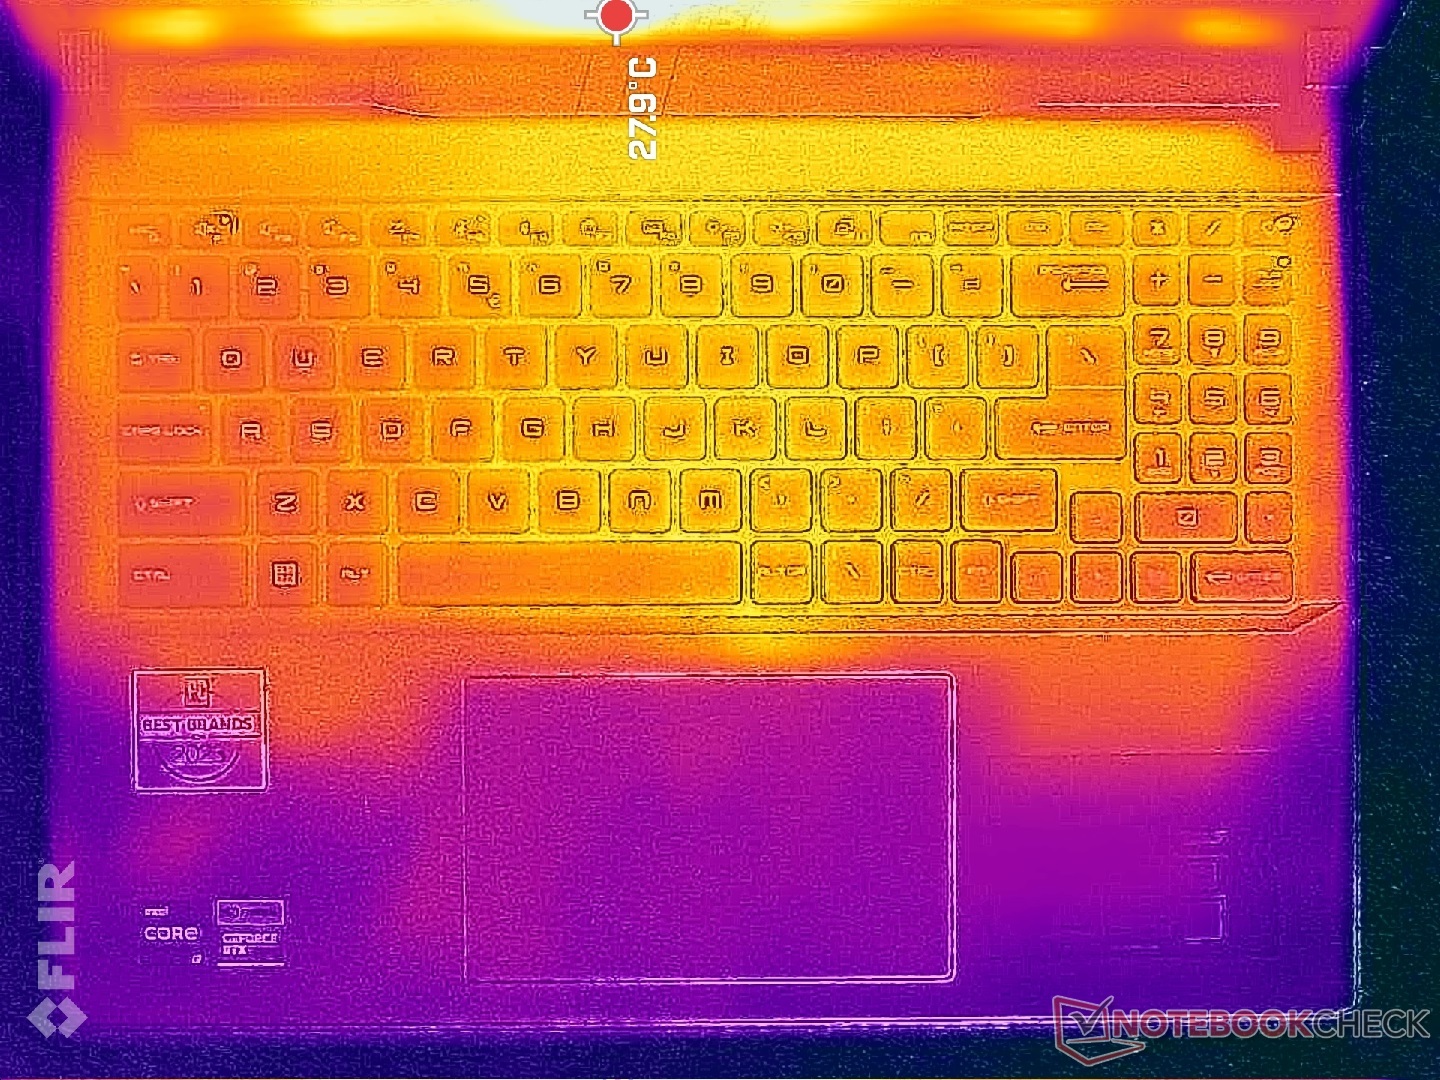
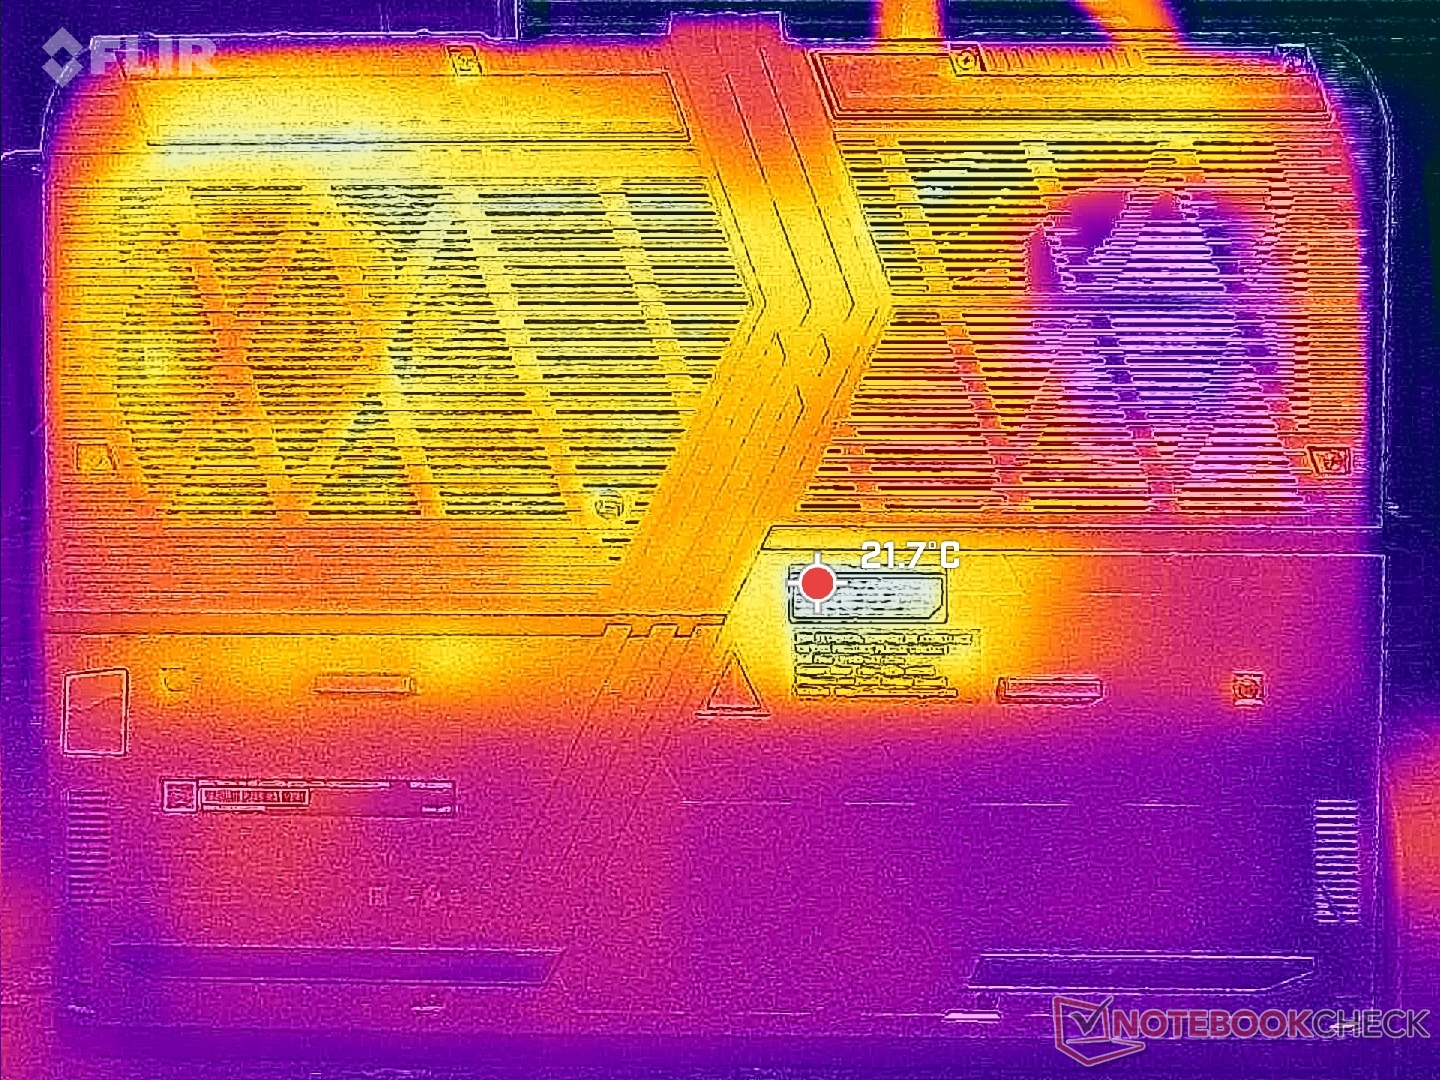
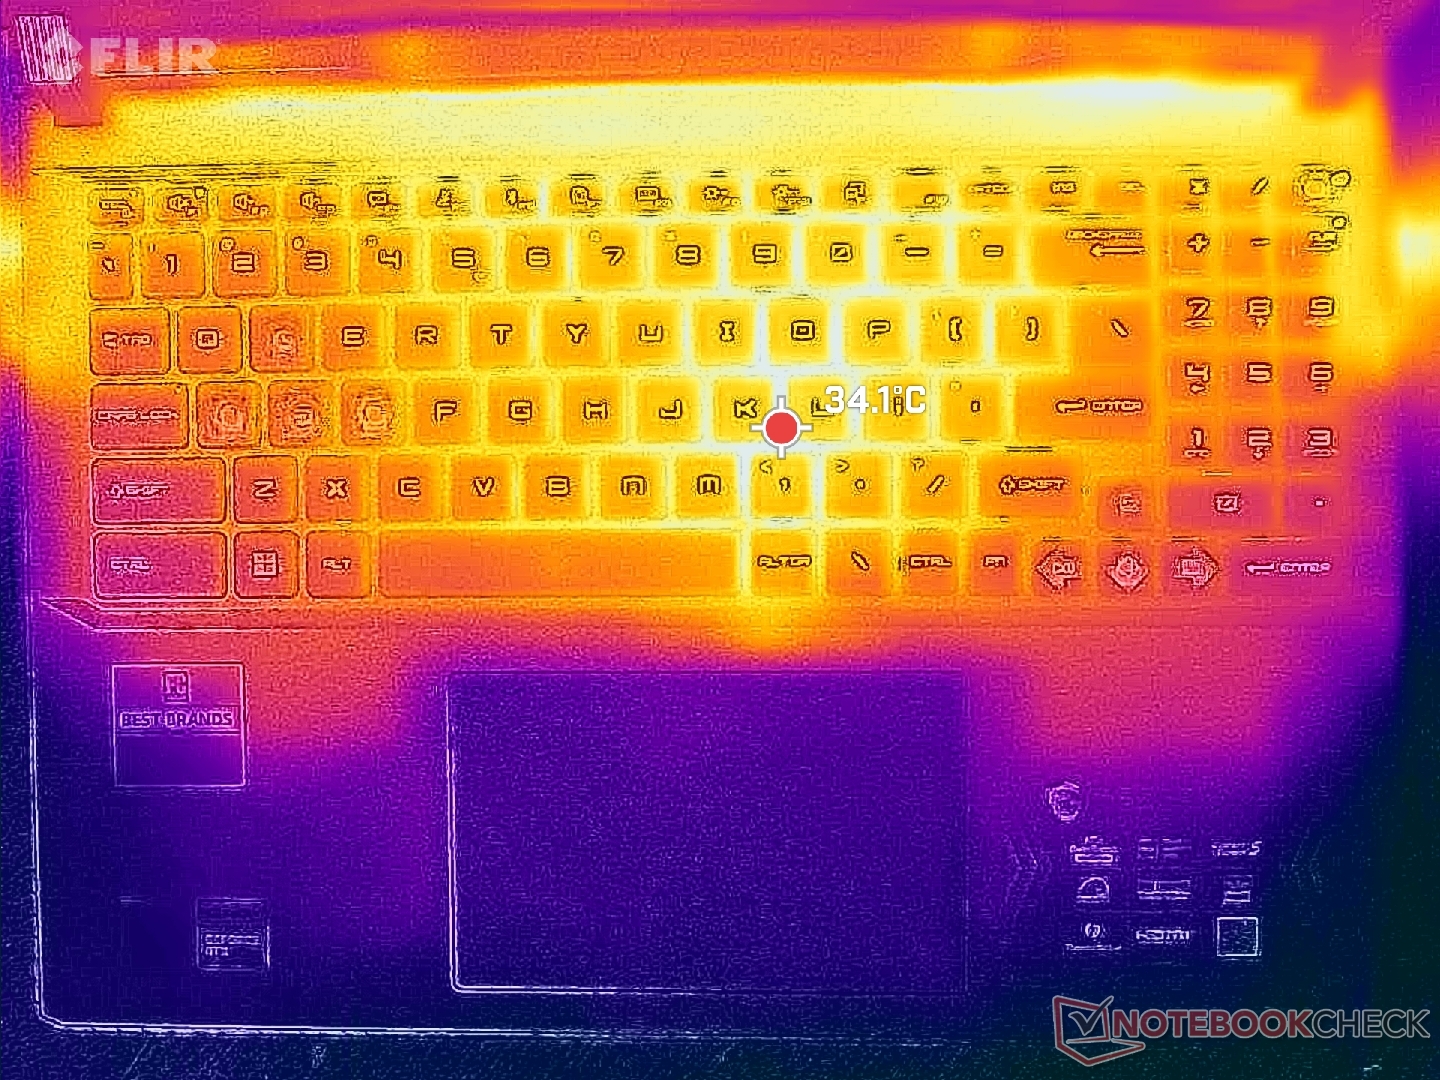
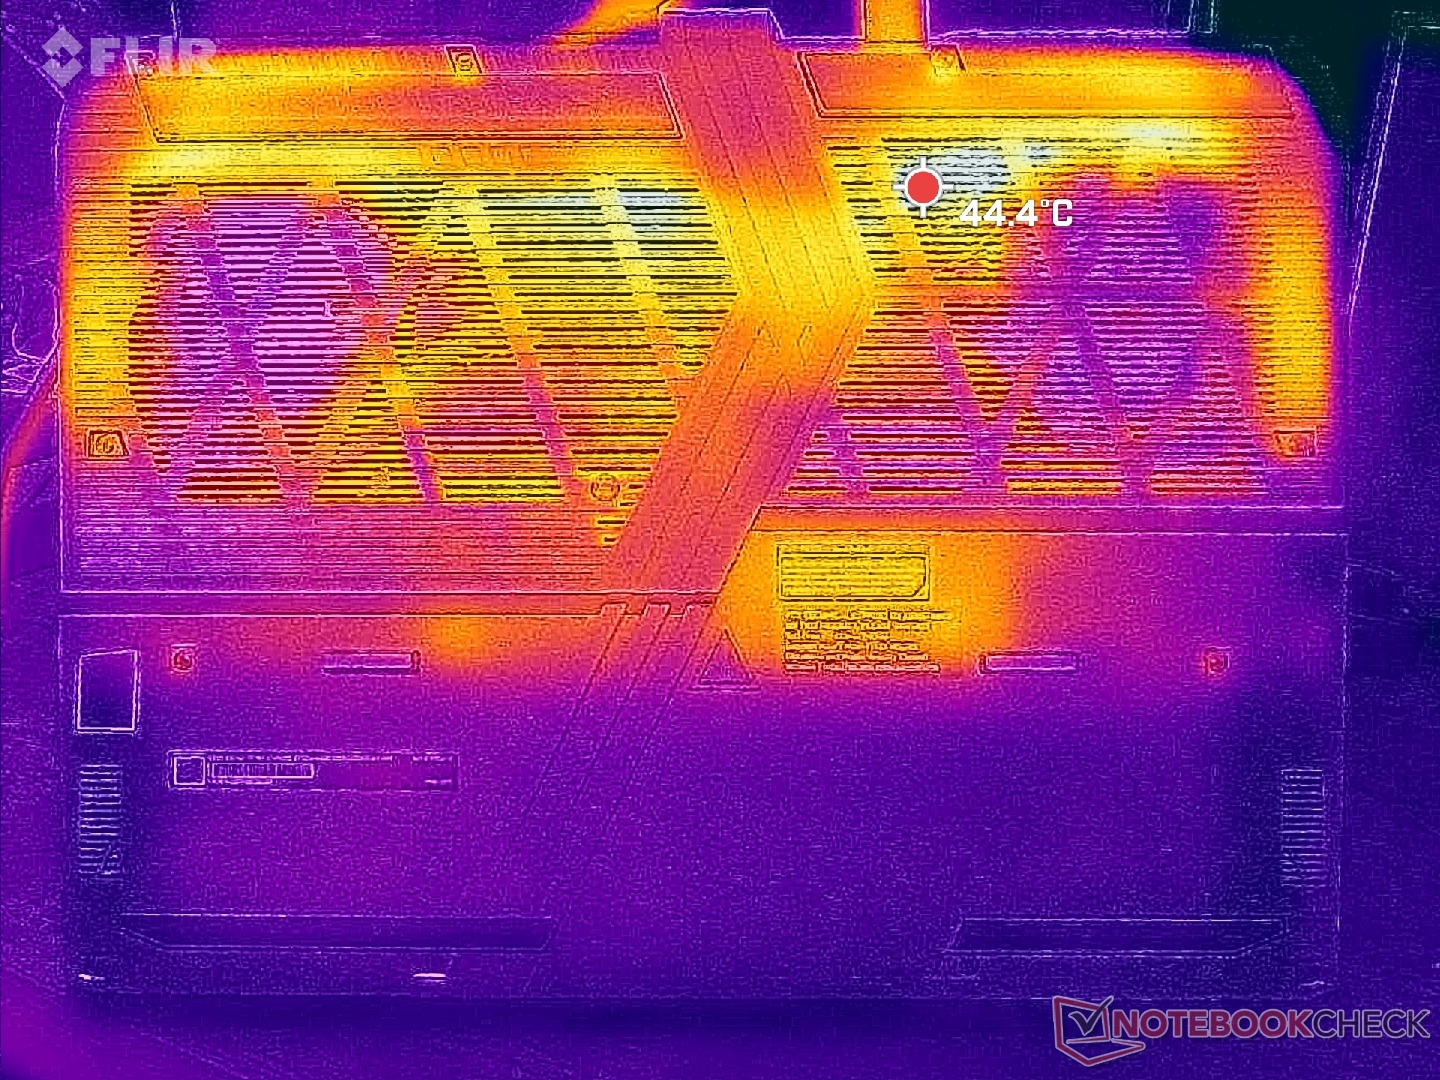
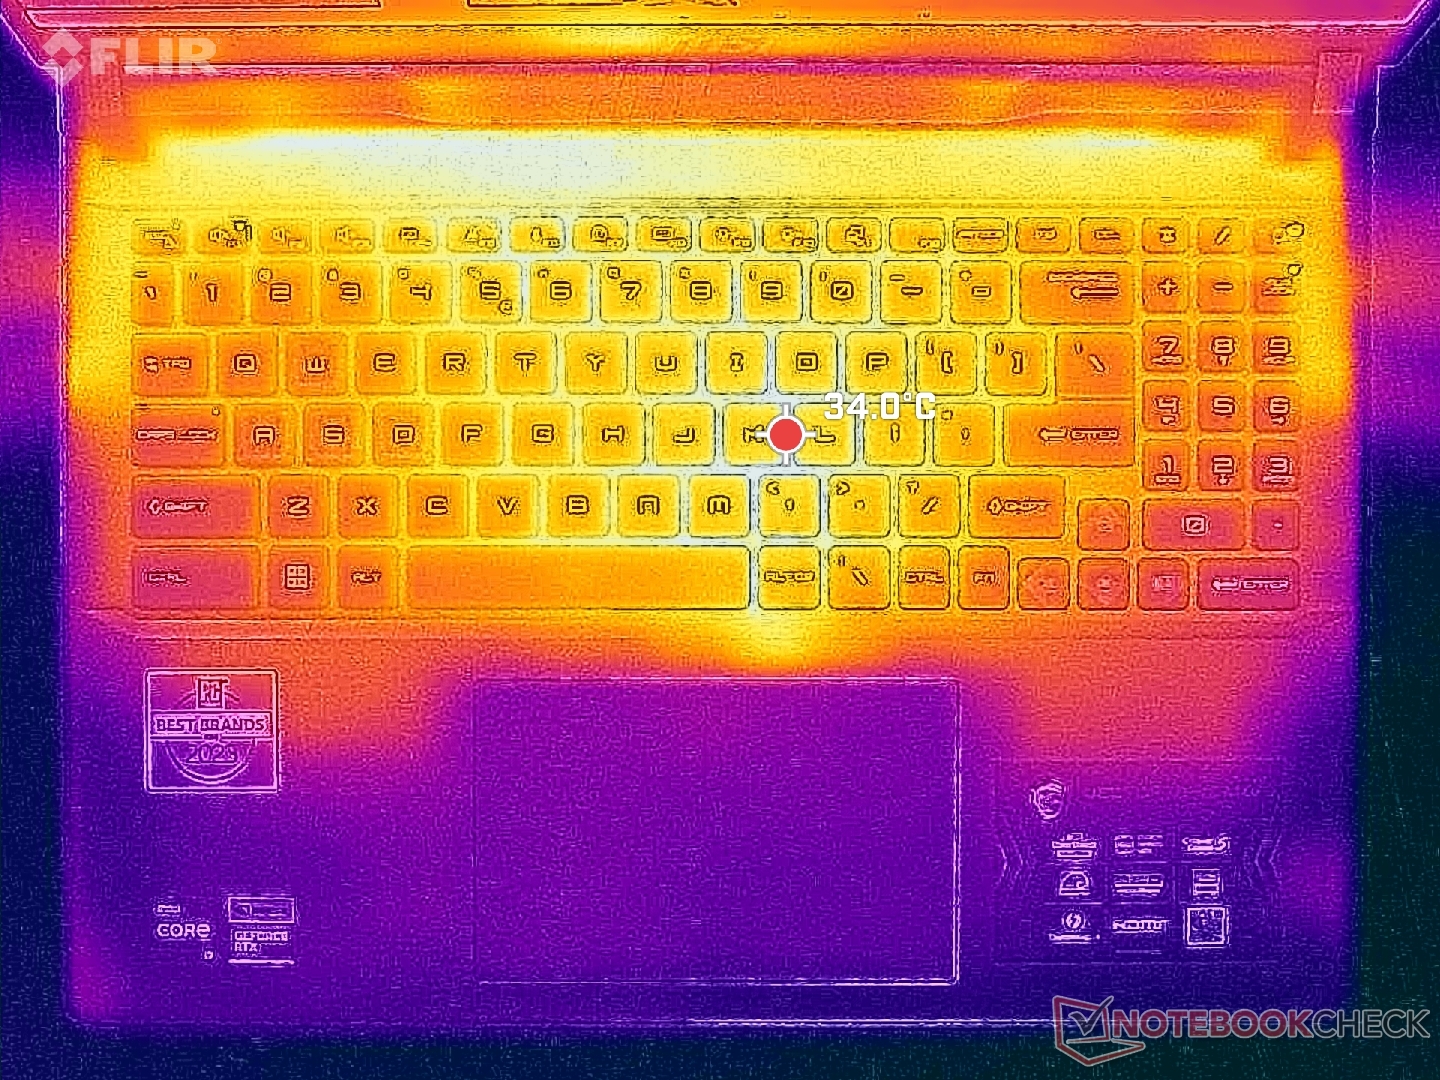
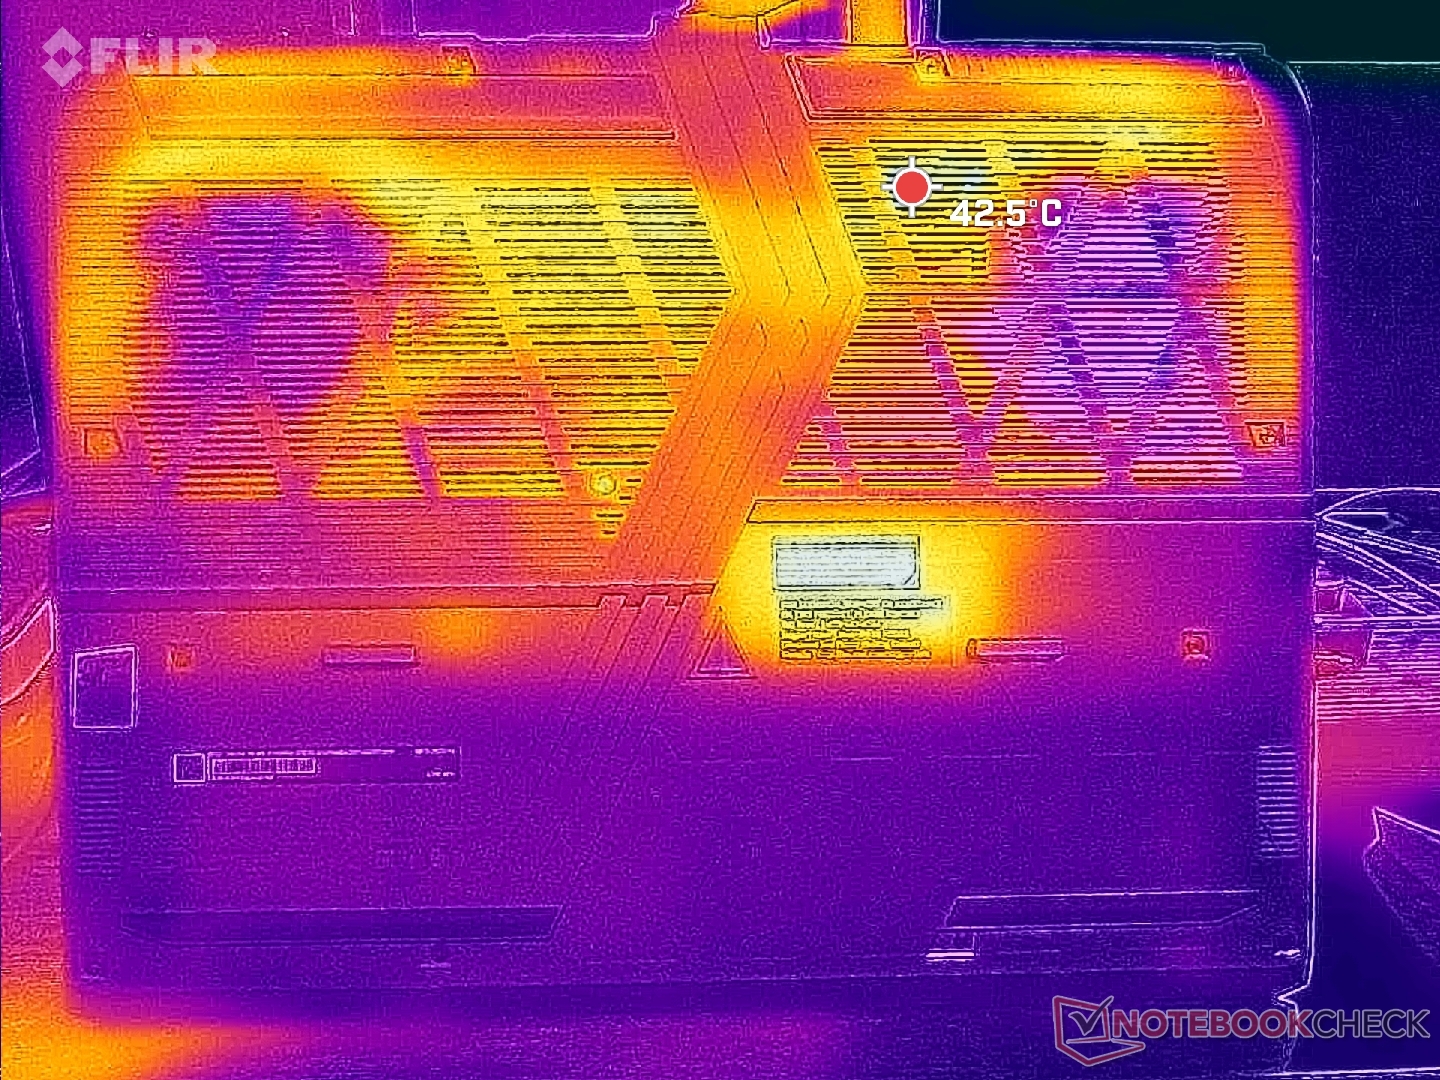
Las temperaturas de la superficie son más frescas que en la mayoría de portátiles para juegos gracias a la base de plástico, las amplias rejillas de ventilación y el grueso diseño del chasis. De hecho, este es uno de los portátiles para juegos más frescos que hemos probado con una RTX 4080. Cuando se ejecuta Witcher 3el punto caliente en el centro del teclado alcanzaba sólo 34 C en comparación con los 39 C del Legion 5i 16 G9 o el antiguo Vector GP66.
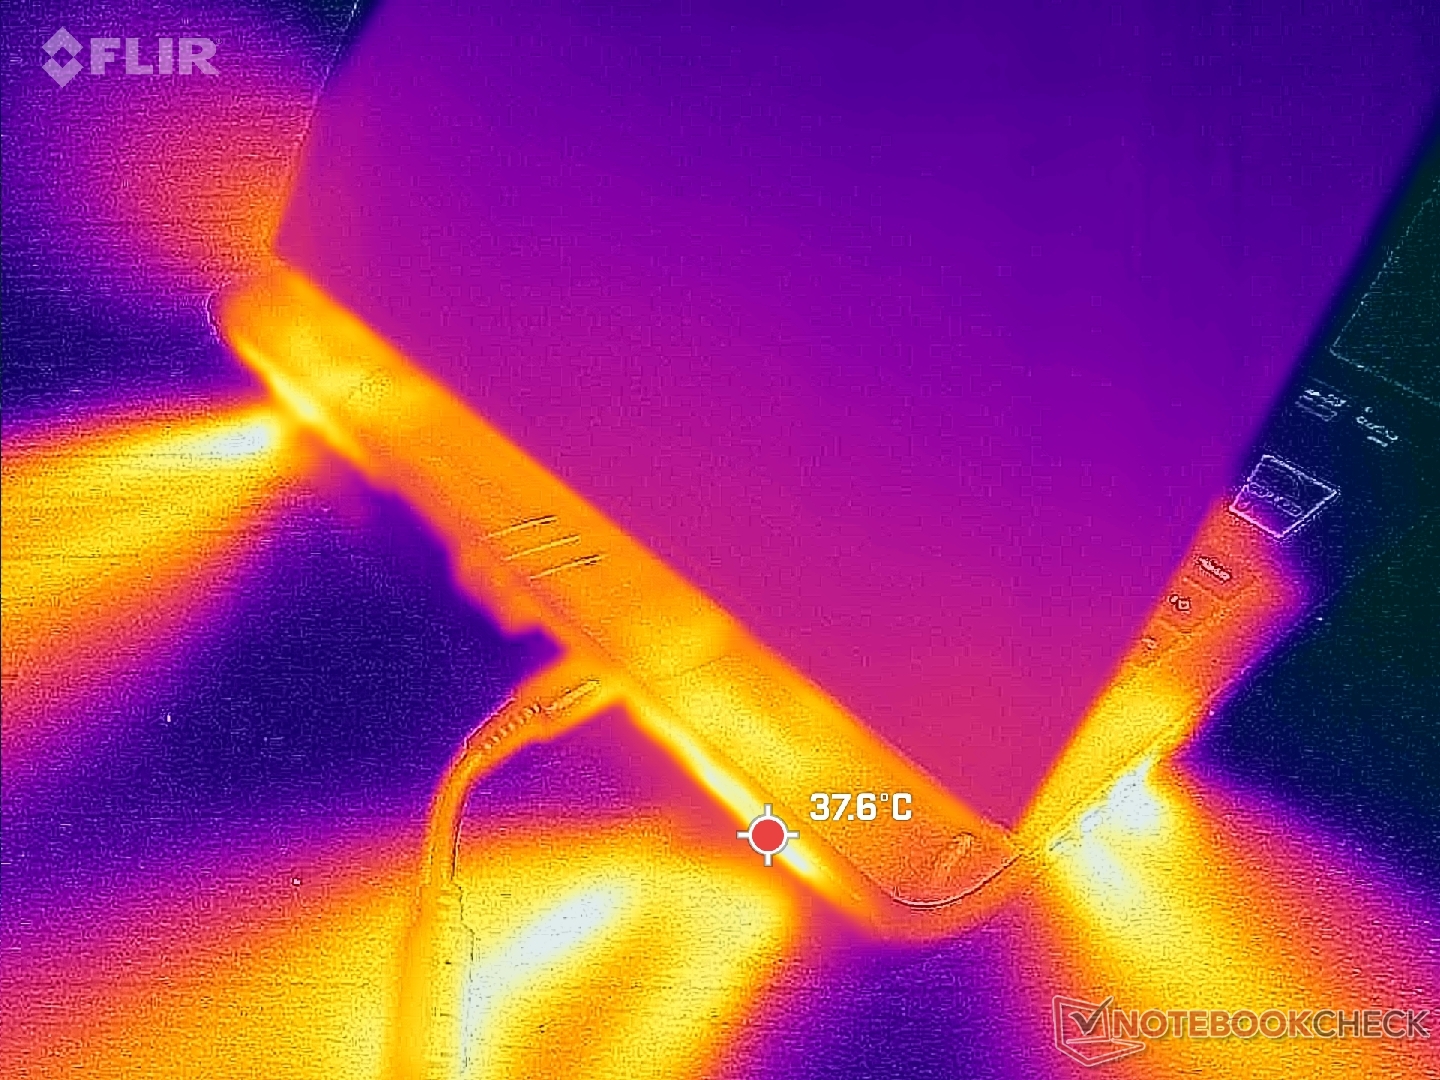
(+) La temperatura máxima en la parte superior es de 36.4 °C / 98 F, frente a la media de 40.4 °C / 105 F, que oscila entre 21.2 y 68.8 °C para la clase Gaming.
(+) El fondo se calienta hasta un máximo de 35.6 °C / 96 F, frente a la media de 43.2 °C / 110 F
(+) En reposo, la temperatura media de la parte superior es de 24.5 °C / 76# F, frente a la media del dispositivo de 33.9 °C / 93 F.
(+) Jugando a The Witcher 3, la temperatura media de la parte superior es de 30.4 °C / 87 F, frente a la media del dispositivo de 33.9 °C / 93 F.
(+) El reposamanos y el panel táctil están a una temperatura inferior a la de la piel, con un máximo de 24 °C / 75.2 F y, por tanto, son fríos al tacto.
(+) La temperatura media de la zona del reposamanos de dispositivos similares fue de 28.8 °C / 83.8 F (+4.8 °C / 8.6 F).
| MSI Vector 16 HX A14V Intel Core i9-14900HX, NVIDIA GeForce RTX 4080 Laptop GPU | MSI Vector GP66 12UGS Intel Core i9-12900H, NVIDIA GeForce RTX 3070 Ti Laptop GPU | Lenovo Legion 5 16IRX G9 Intel Core i7-14650HX, NVIDIA GeForce RTX 4060 Laptop GPU | HP Victus 16-r0077ng Intel Core i7-13700H, NVIDIA GeForce RTX 4070 Laptop GPU | Asus TUF Gaming A16 FA617XS AMD Ryzen 9 7940HS, AMD Radeon RX 7600S | Dell G16 7620 Intel Core i7-12700H, NVIDIA GeForce RTX 3060 Laptop GPU | |
|---|---|---|---|---|---|---|
| Heat | -25% | -20% | -35% | -26% | -15% | |
| Maximum Upper Side * (°C) | 36.4 | 40.2 -10% | 40.4 -11% | 51 -40% | 53 -46% | 47.6 -31% |
| Maximum Bottom * (°C) | 35.6 | 43.8 -23% | 43.8 -23% | 54 -52% | 48 -35% | 54 -52% |
| Idle Upper Side * (°C) | 26.6 | 34.8 -31% | 30.3 -14% | 37 -39% | 30 -13% | 23 14% |
| Idle Bottom * (°C) | 27 | 37 -37% | 35.3 -31% | 29 -7% | 30 -11% | 24.6 9% |
* ... más pequeño es mejor
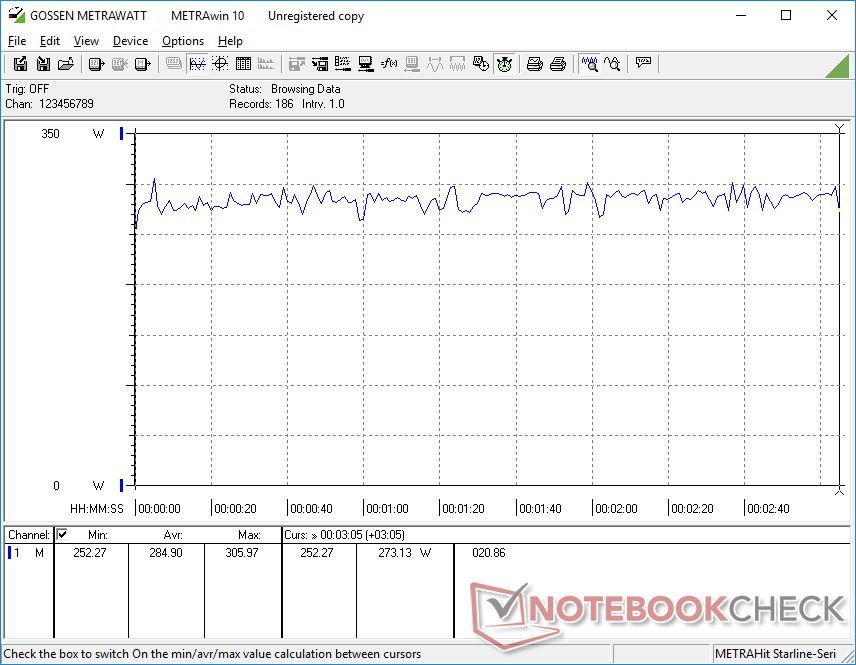
Prueba de estrés
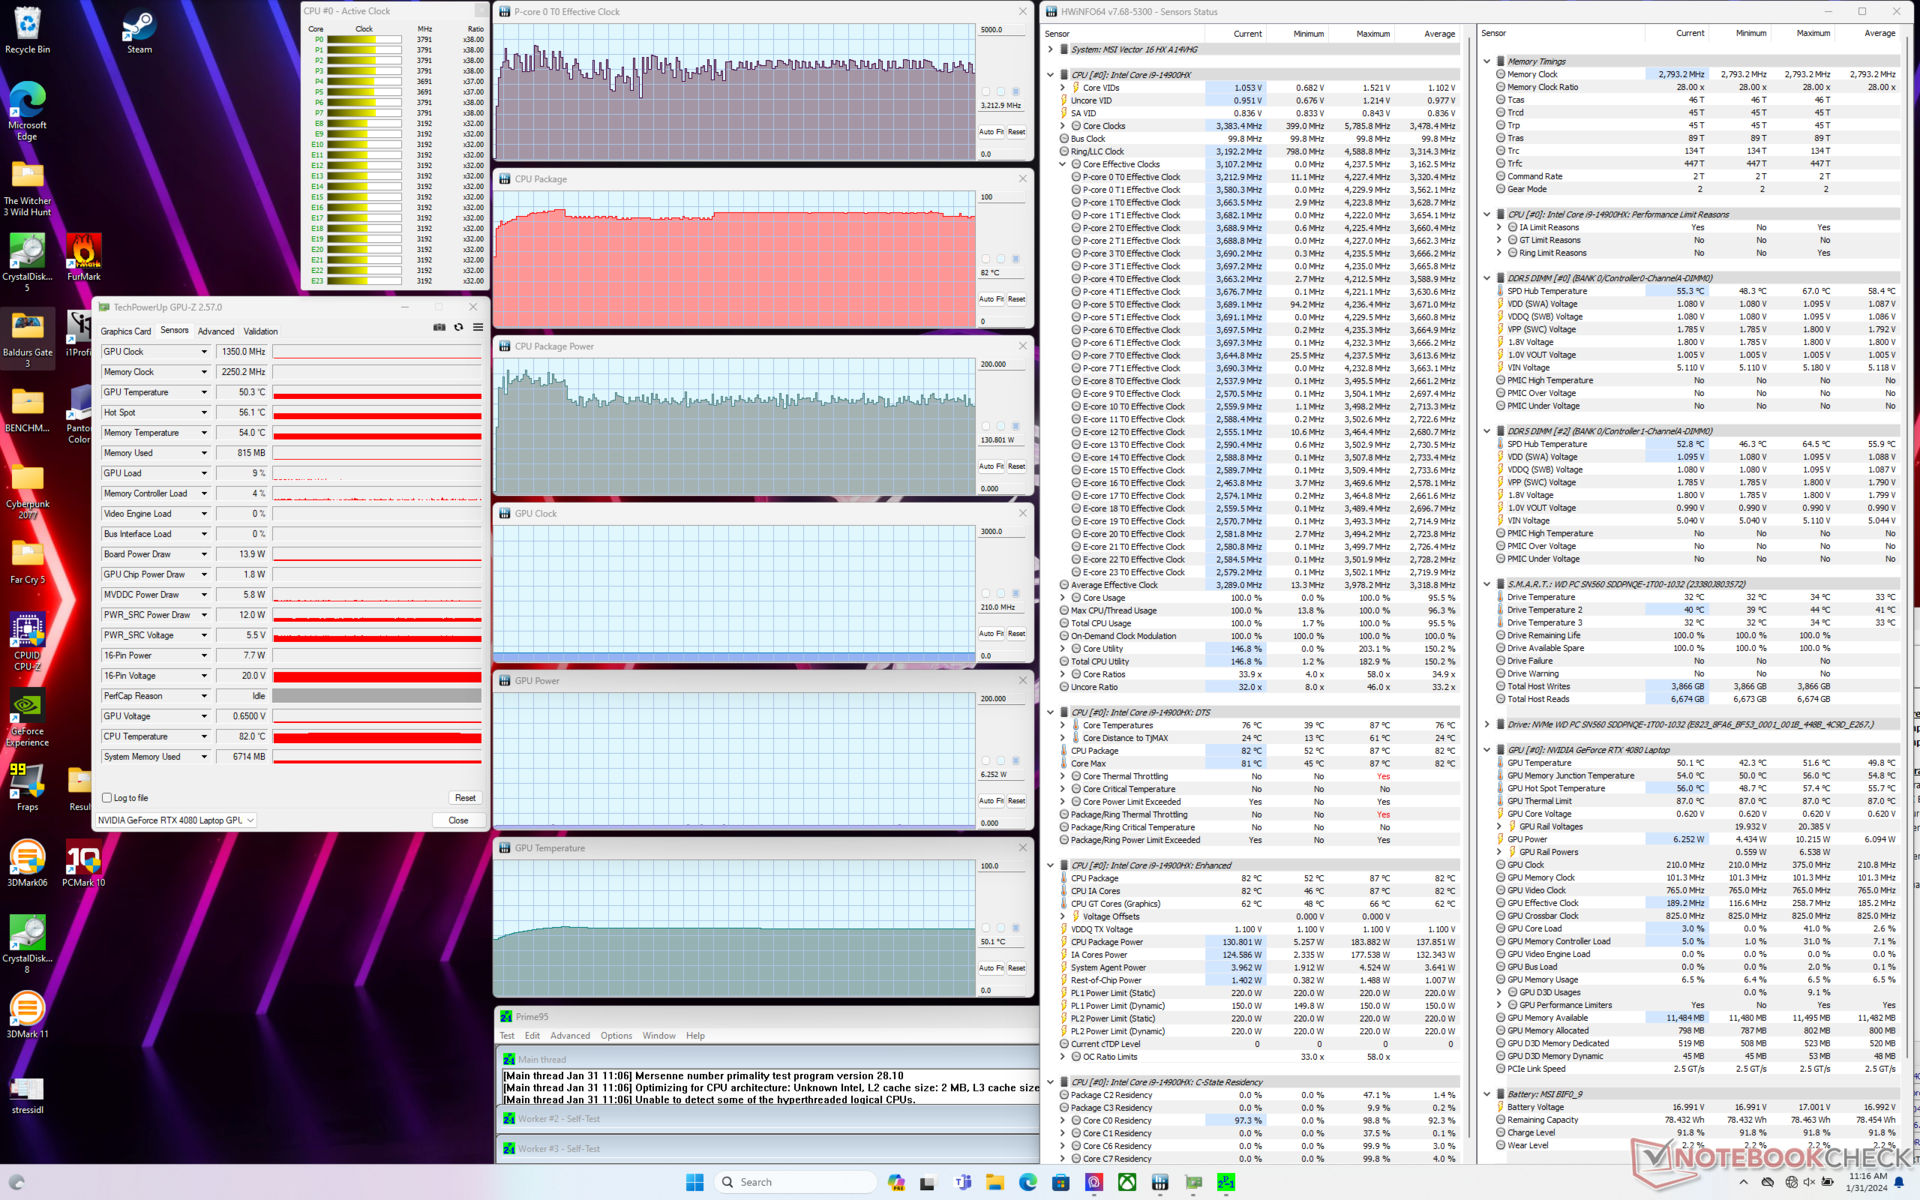
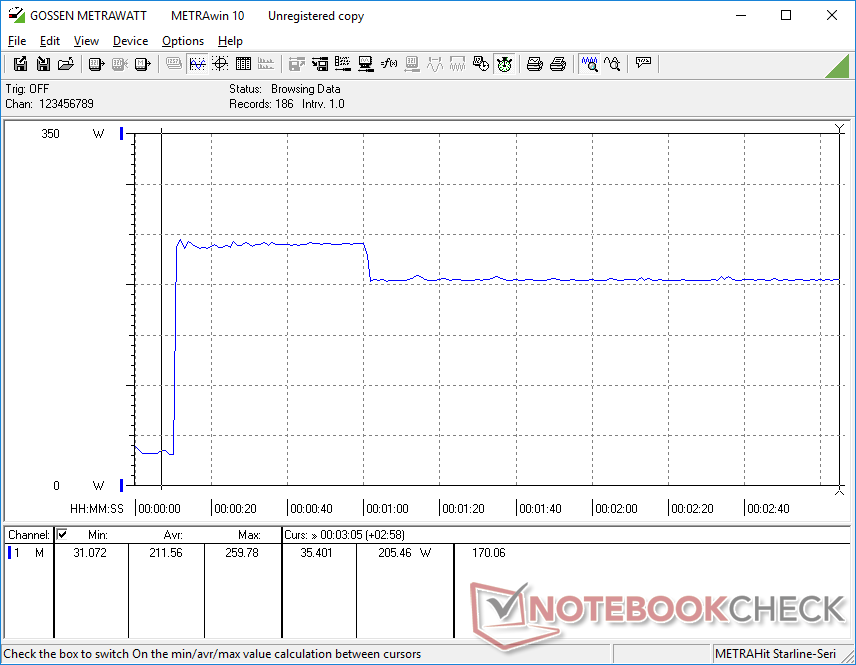
Al iniciar el estrés Prime95, la CPU aumentaría a 4,2 GHz y 180 W hasta que la temperatura del núcleo alcanzara los 87 C aproximadamente un minuto después. A partir de entonces, bajaría a ~3,3 GHz, 140 W y 82 C. Los resultados seguirían siendo los mismos aunque se activara Cooler Boost.
Si se ejecuta Witcher 3 en el modo de rendimiento extremo para representar las cargas típicas de los juegos, se obtendrían unos valores estables de la GPU de 2535 MHz de reloj, 77 C de temperatura del núcleo y 165 W de consumo de energía de la placa según HWiNFO. Los resultados seguirían siendo prácticamente los mismos independientemente del ajuste Cooler Boost. Sin embargo, si pasáramos al modo Equilibrado, más silencioso, el reloj de la GPU y el consumo de energía de la placa se reducirían a sólo 2055 MHz y 120 W, respectivamente, lo que refleja la notable caída del rendimiento mencionada anteriormente en nuestra sección Rendimiento de la GPU.
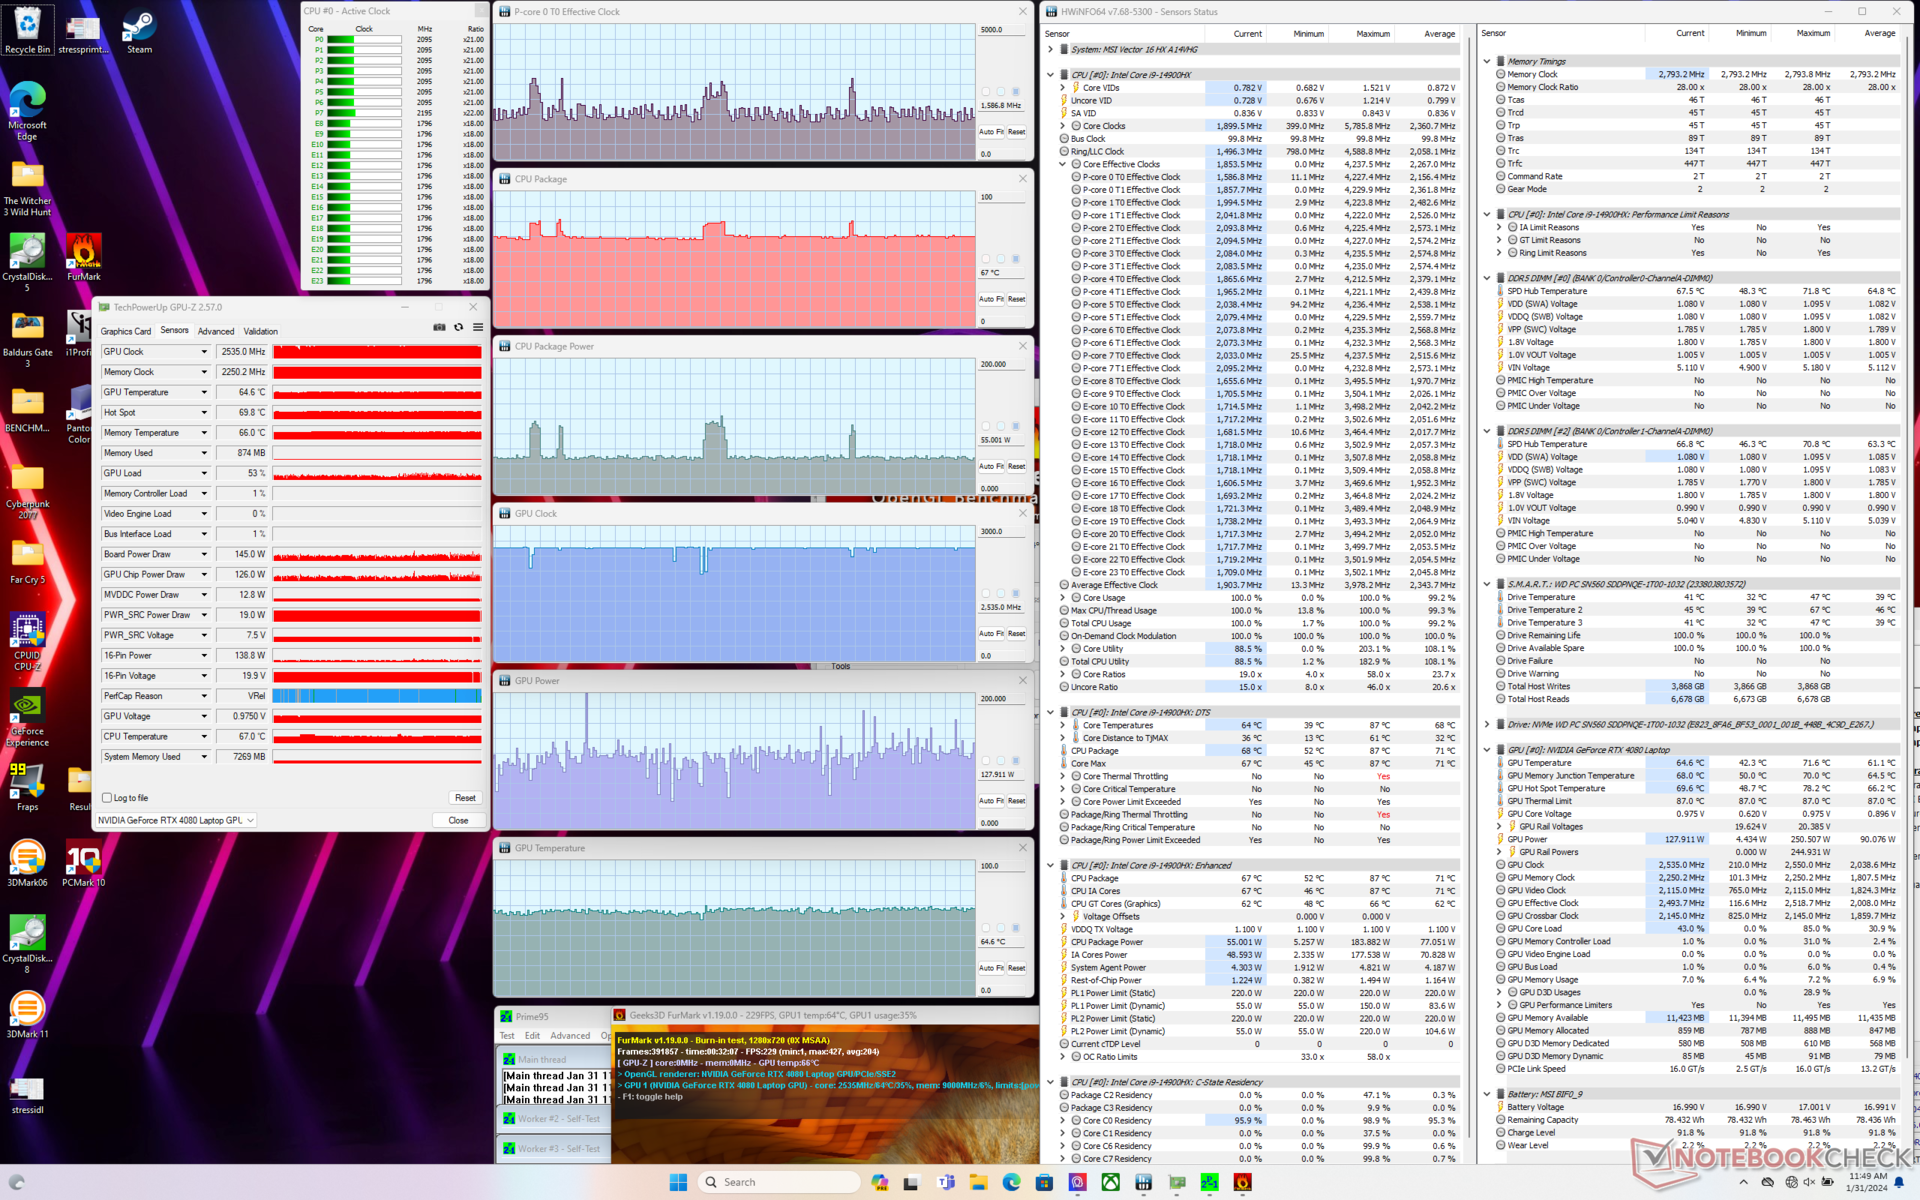
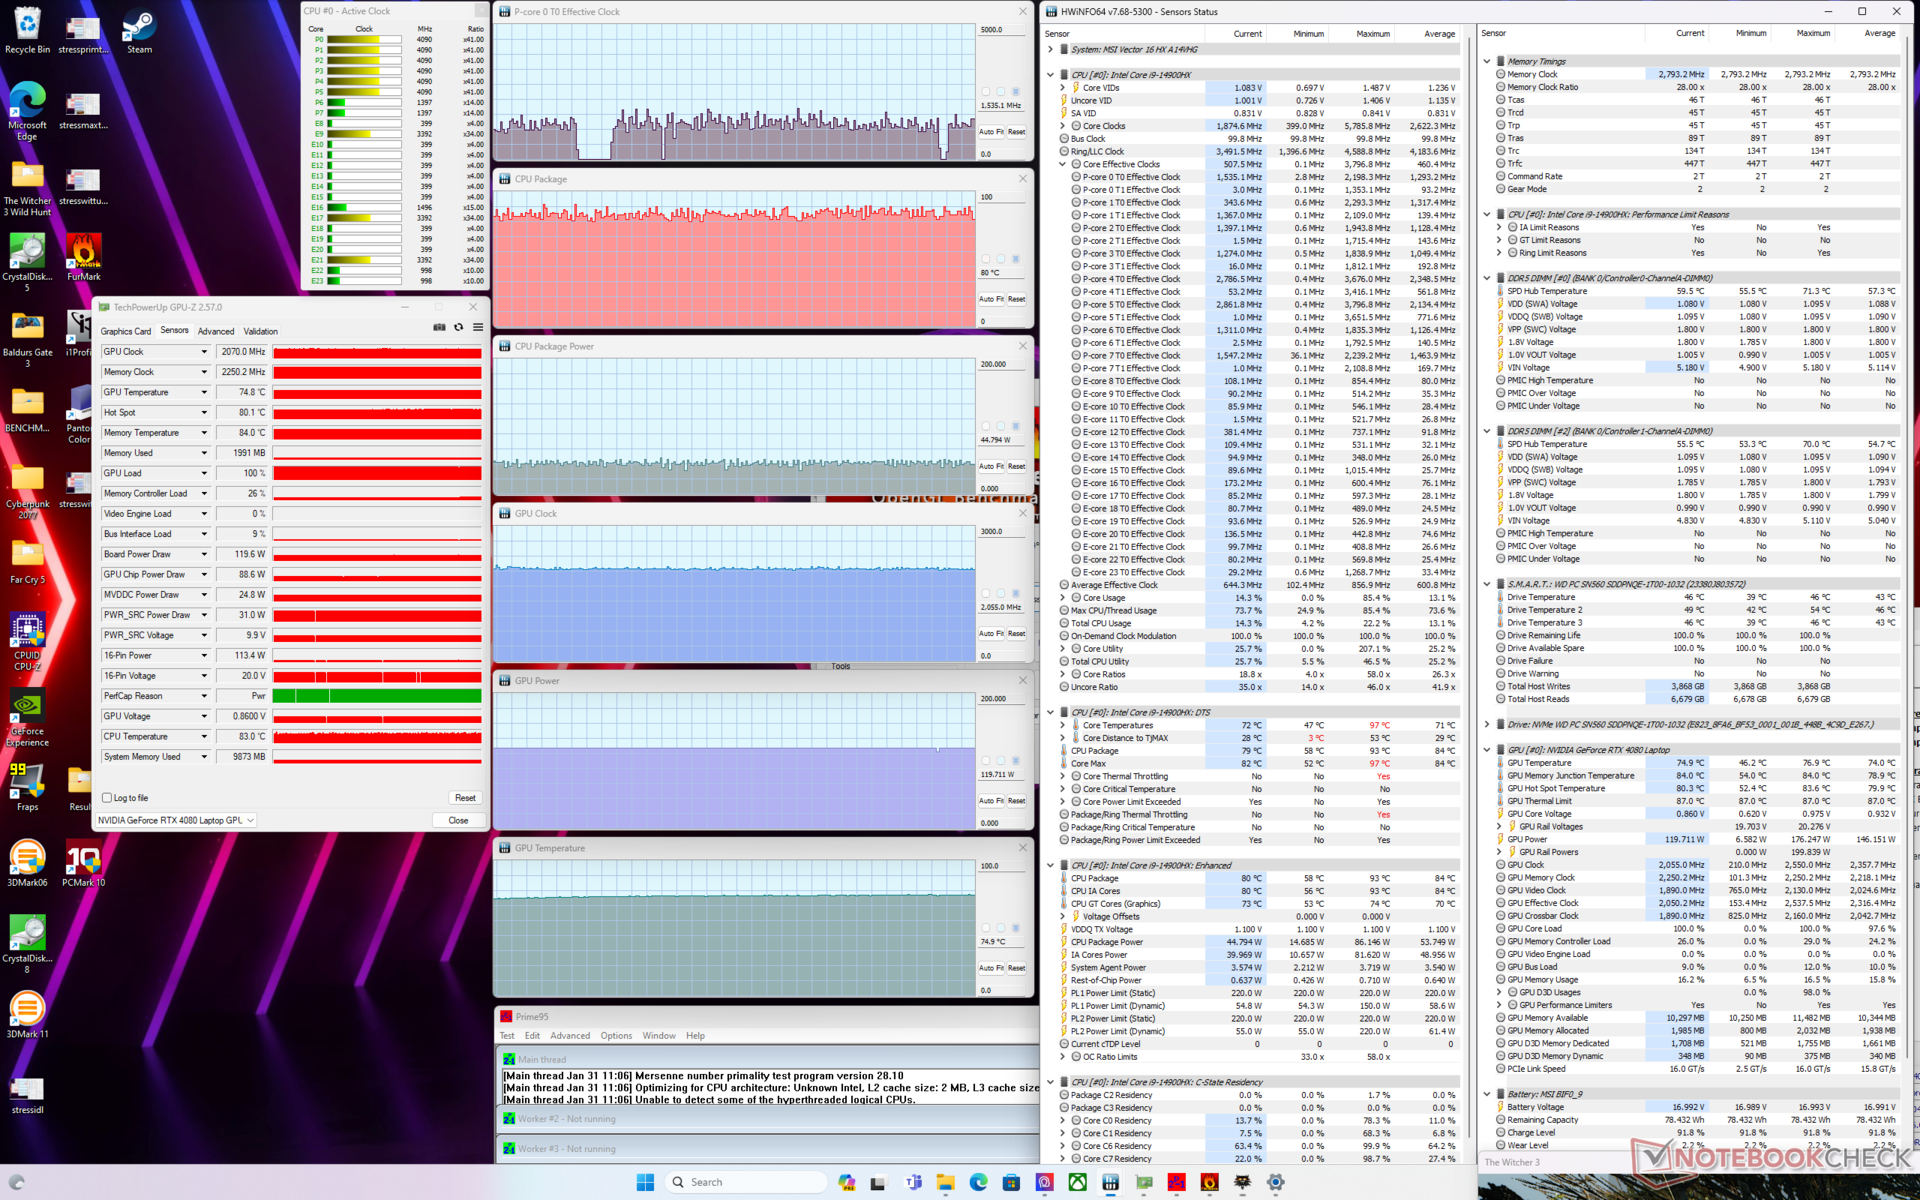
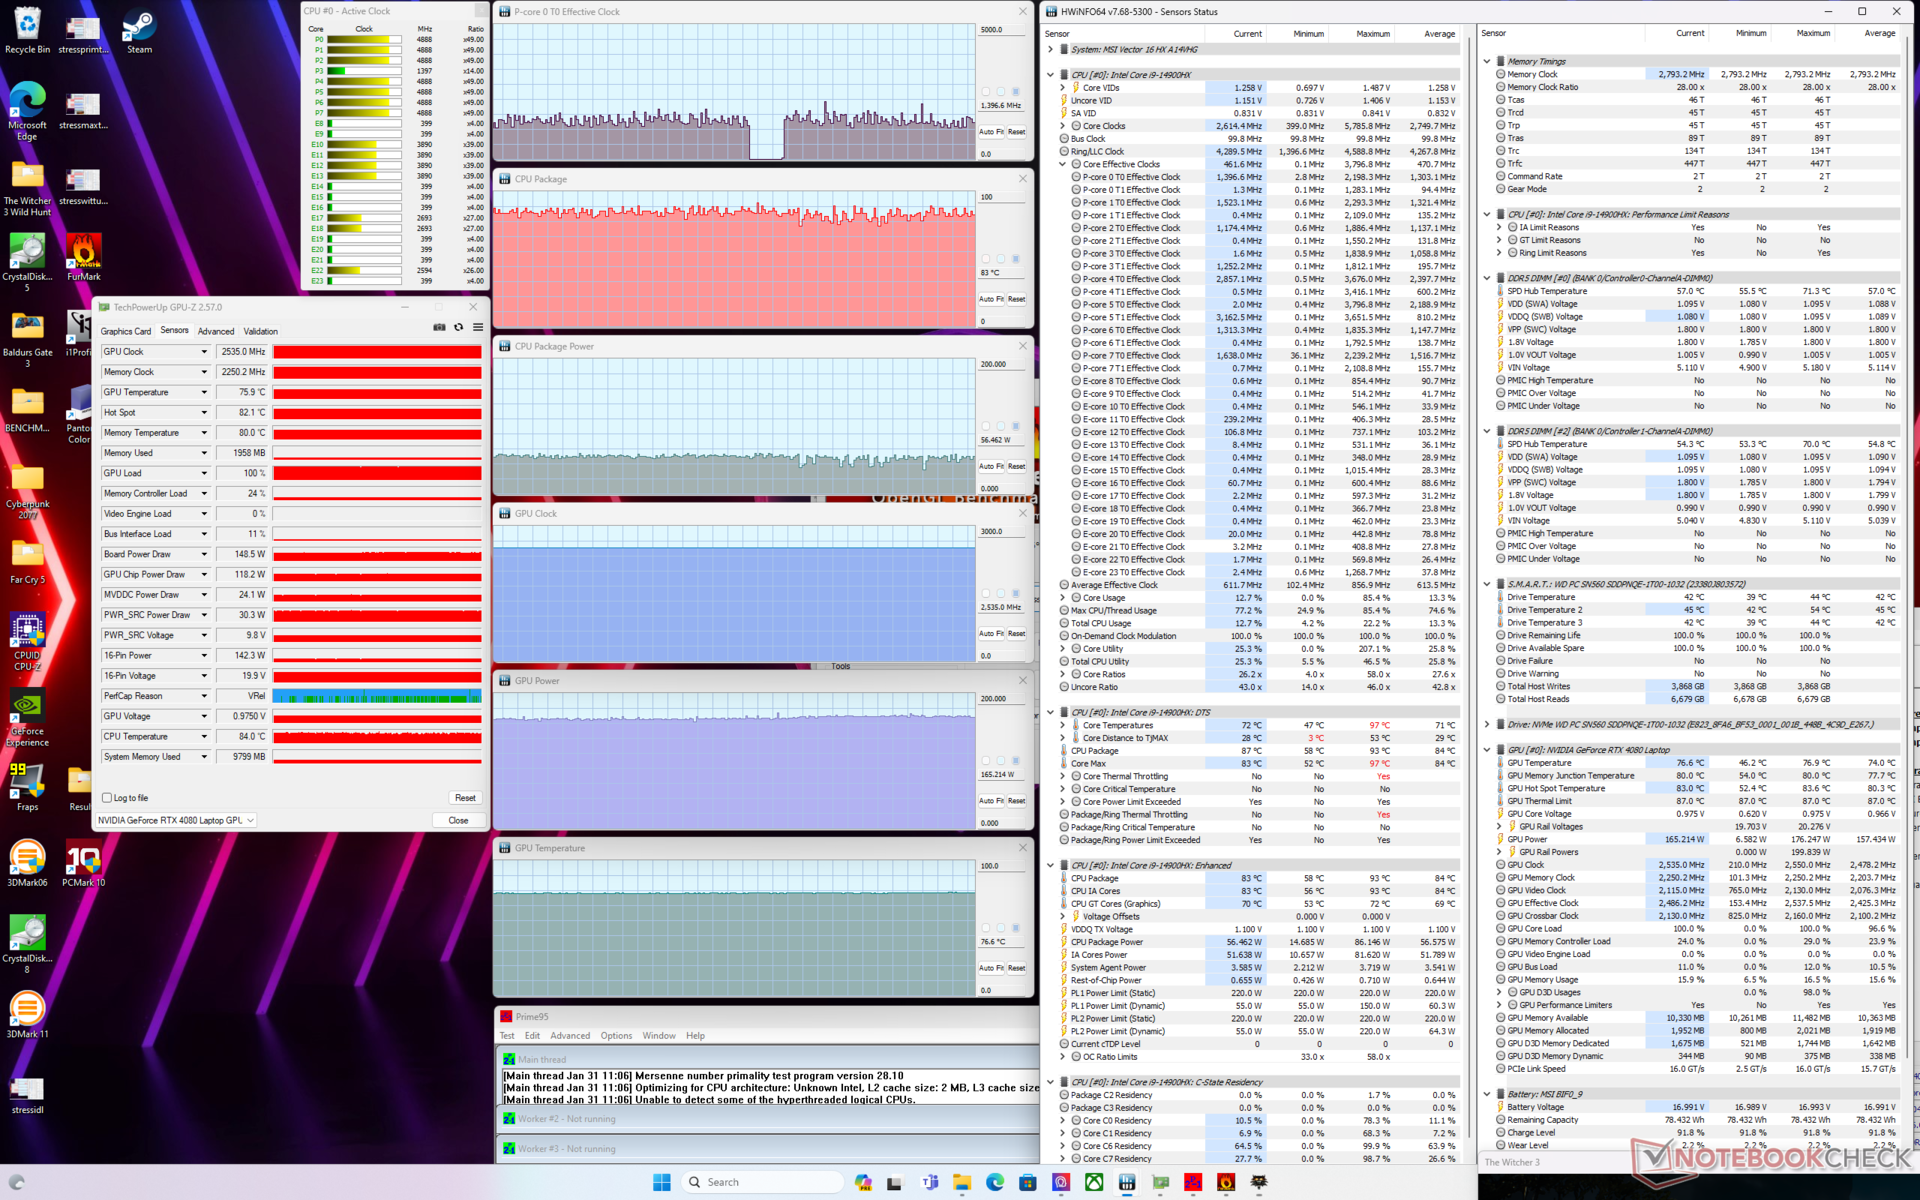
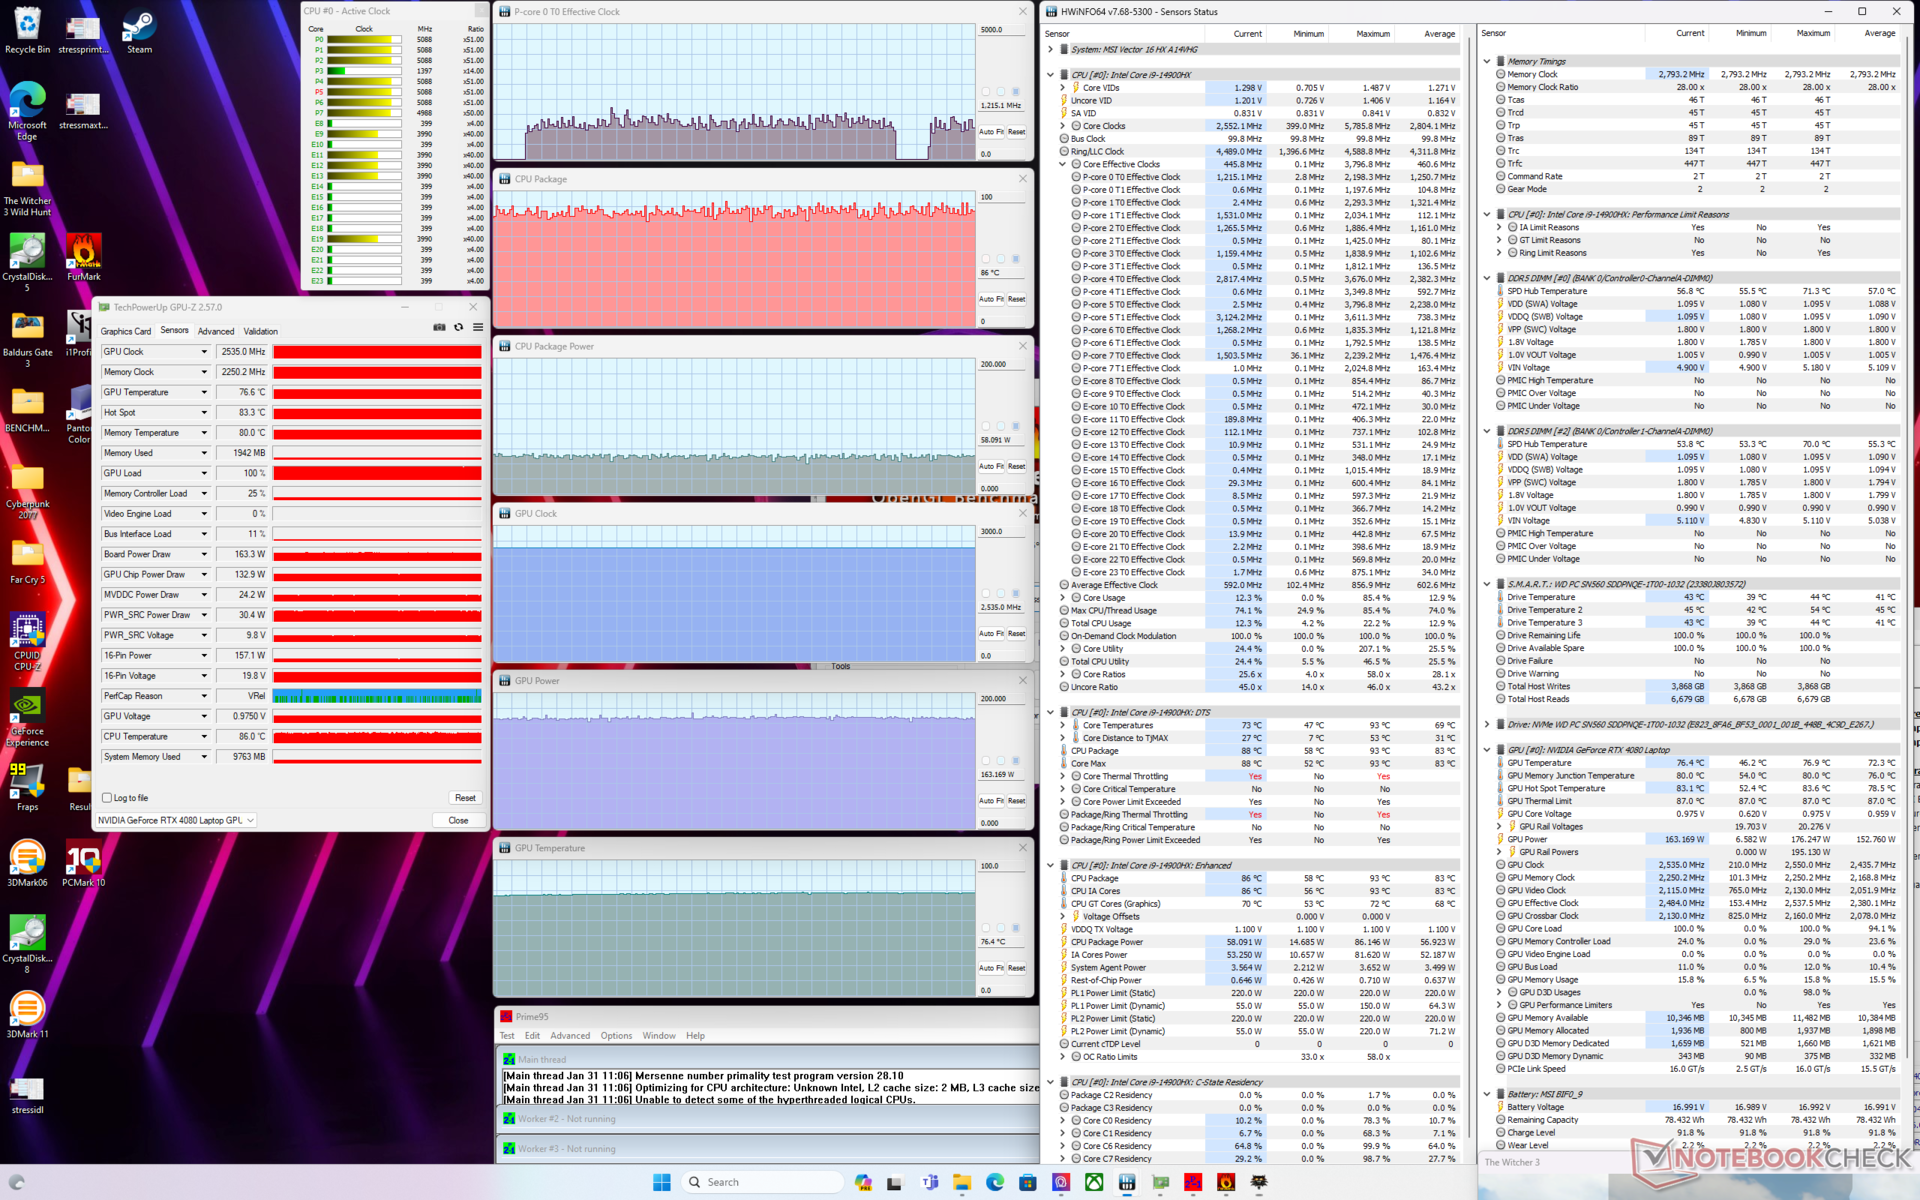
| Reloj de la CPU (GHz) | Reloj de la GPU (MHz) | Temperatura media dela CPU (°C) | Temperatura media de la GPU (°C) | |
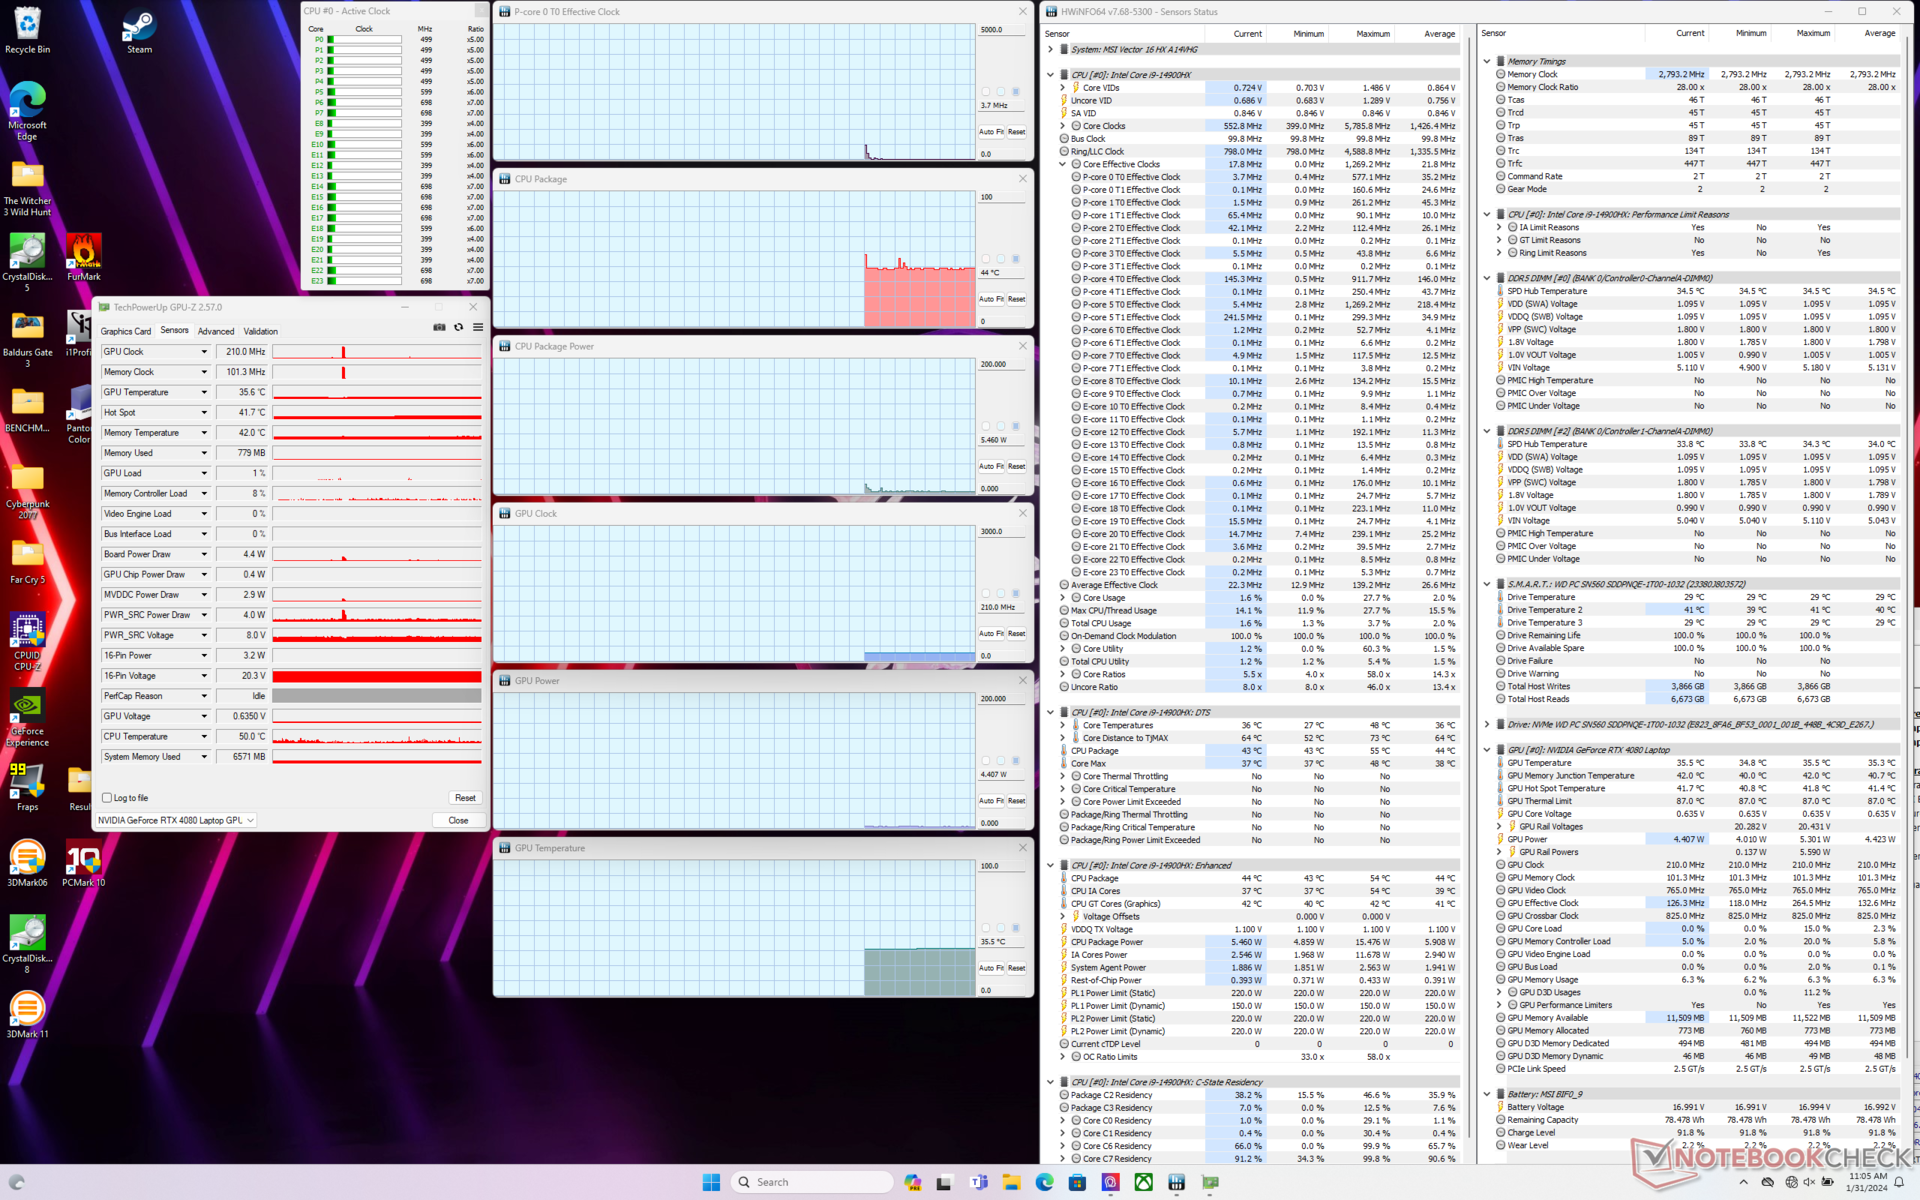
| Sistema en reposo | -- | -- | 44 | 36 |
| EstrésPrime95 | 3,3 | -- | 82 | 50 |
| Estrés Prime95+ FurMark (Rendimiento extremo con Cooler Boost activado) | ~1,7 | 2535 | 67 | 65 |
| Witcher 3 Estrés (modo equilibrado) | ~1,5 | 2055 | 81 | 75 |
| Witcher 3 Estrés (Rendimiento extremo con CoolerBoost desactivado) | ~1,5 | 2535 | 83 | 77 |
| Witcher 3 Estrés (Rendimiento extremo con Cooler Boostactivado) | ~1,5 | 2535 | 85 | 77 |
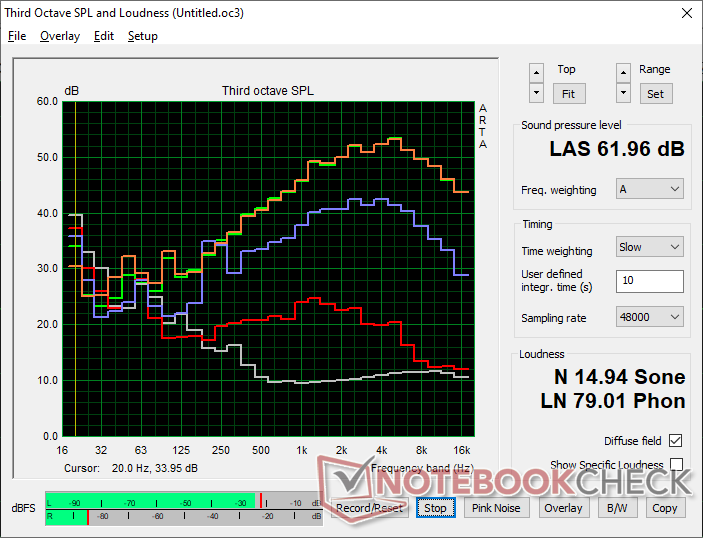
Altavoces
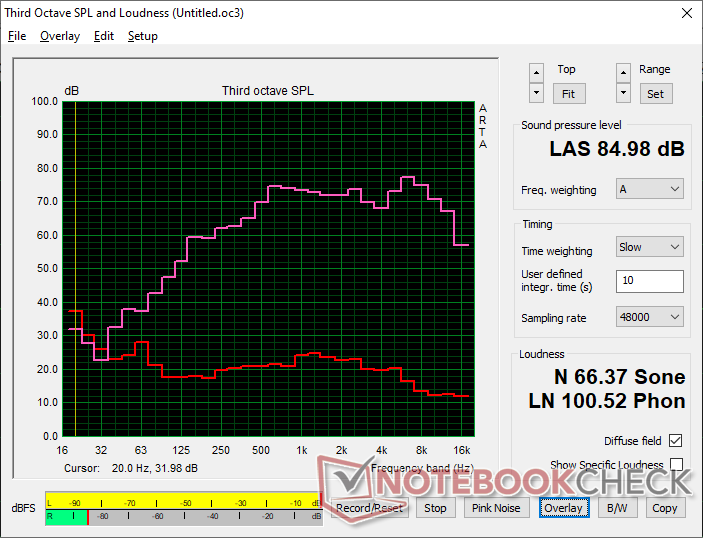
MSI Vector 16 HX A14V análisis de audio
(+) | los altavoces pueden reproducir a un volumen relativamente alto (#85 dB)
Graves 100 - 315 Hz
(±) | lubina reducida - en promedio 12.7% inferior a la mediana
(+) | el bajo es lineal (6.8% delta a la frecuencia anterior)
Medios 400 - 2000 Hz
(+) | medios equilibrados - a sólo 3% de la mediana
(+) | los medios son lineales (3.6% delta a la frecuencia anterior)
Altos 2 - 16 kHz
(+) | máximos equilibrados - a sólo 3.1% de la mediana
(+) | los máximos son lineales (6.7% delta a la frecuencia anterior)
Total 100 - 16.000 Hz
(+) | el sonido global es lineal (12.6% de diferencia con la mediana)
En comparación con la misma clase
» 16% de todos los dispositivos probados de esta clase eran mejores, 3% similares, 81% peores
» El mejor tuvo un delta de 6%, la media fue 18%, el peor fue ###max##%
En comparación con todos los dispositivos probados
» 11% de todos los dispositivos probados eran mejores, 2% similares, 86% peores
» El mejor tuvo un delta de 4%, la media fue 24%, el peor fue ###max##%
Apple MacBook Pro 16 2021 M1 Pro análisis de audio
(+) | los altavoces pueden reproducir a un volumen relativamente alto (#84.7 dB)
Graves 100 - 315 Hz
(+) | buen bajo - sólo 3.8% lejos de la mediana
(+) | el bajo es lineal (5.2% delta a la frecuencia anterior)
Medios 400 - 2000 Hz
(+) | medios equilibrados - a sólo 1.3% de la mediana
(+) | los medios son lineales (2.1% delta a la frecuencia anterior)
Altos 2 - 16 kHz
(+) | máximos equilibrados - a sólo 1.9% de la mediana
(+) | los máximos son lineales (2.7% delta a la frecuencia anterior)
Total 100 - 16.000 Hz
(+) | el sonido global es lineal (4.6% de diferencia con la mediana)
En comparación con la misma clase
» 0% de todos los dispositivos probados de esta clase eran mejores, 0% similares, 100% peores
» El mejor tuvo un delta de 5%, la media fue 17%, el peor fue ###max##%
En comparación con todos los dispositivos probados
» 0% de todos los dispositivos probados eran mejores, 0% similares, 100% peores
» El mejor tuvo un delta de 4%, la media fue 24%, el peor fue ###max##%
Gestión de la energía
Consumo de energía
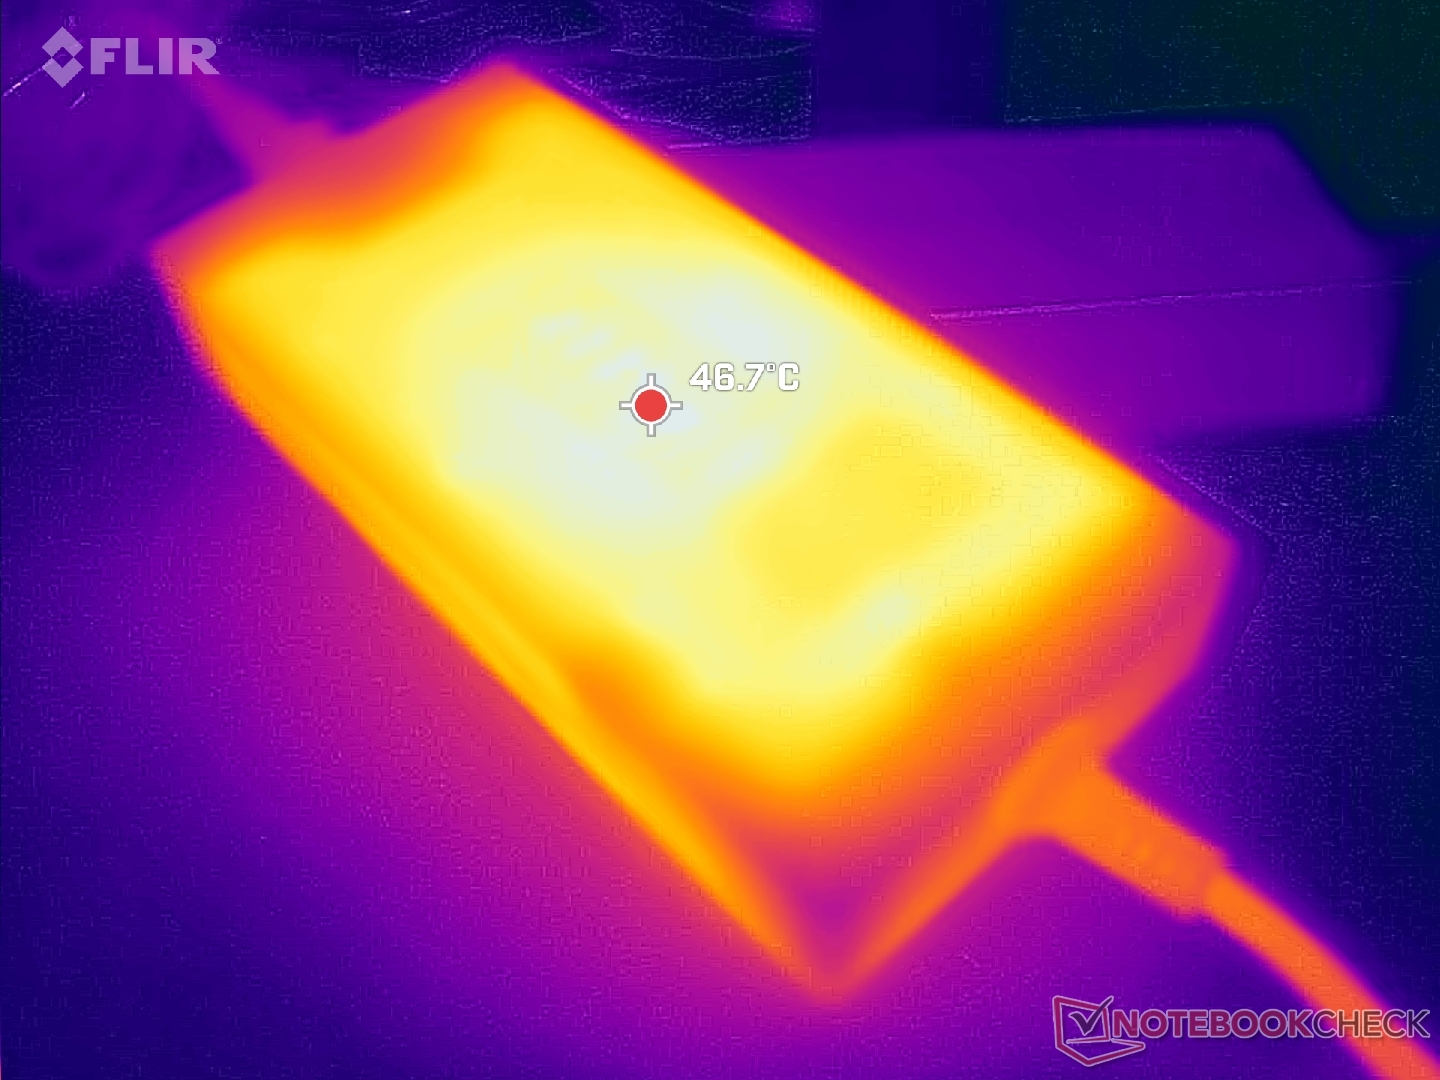
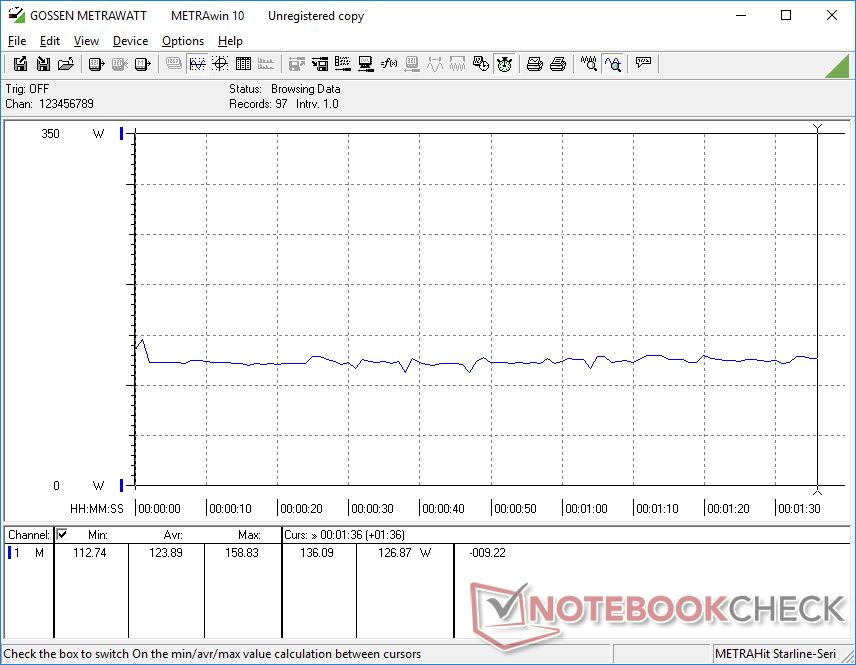
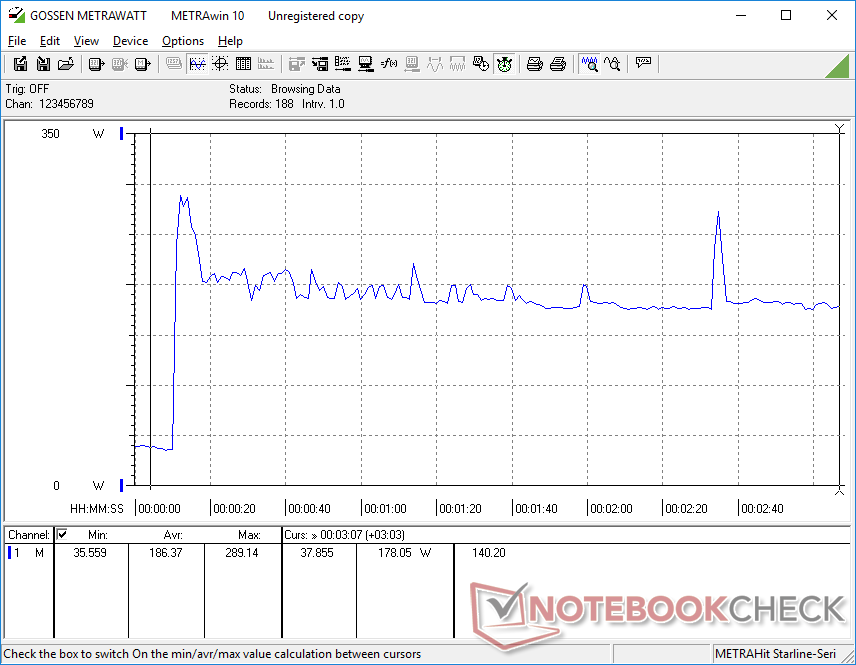
La Vector 16 HX puede ser más rápida que la saliente Vector GP66, pero también consume mucha más potencia. Ejecutar Witcher 3 y Prime95 exige un 27 y un 58 por ciento más de potencia, respectivamente, en comparación con el modelo anterior. Aun así, las ganancias de rendimiento son mucho mayores que las de potencia para obtener un mayor rendimiento por vatio.
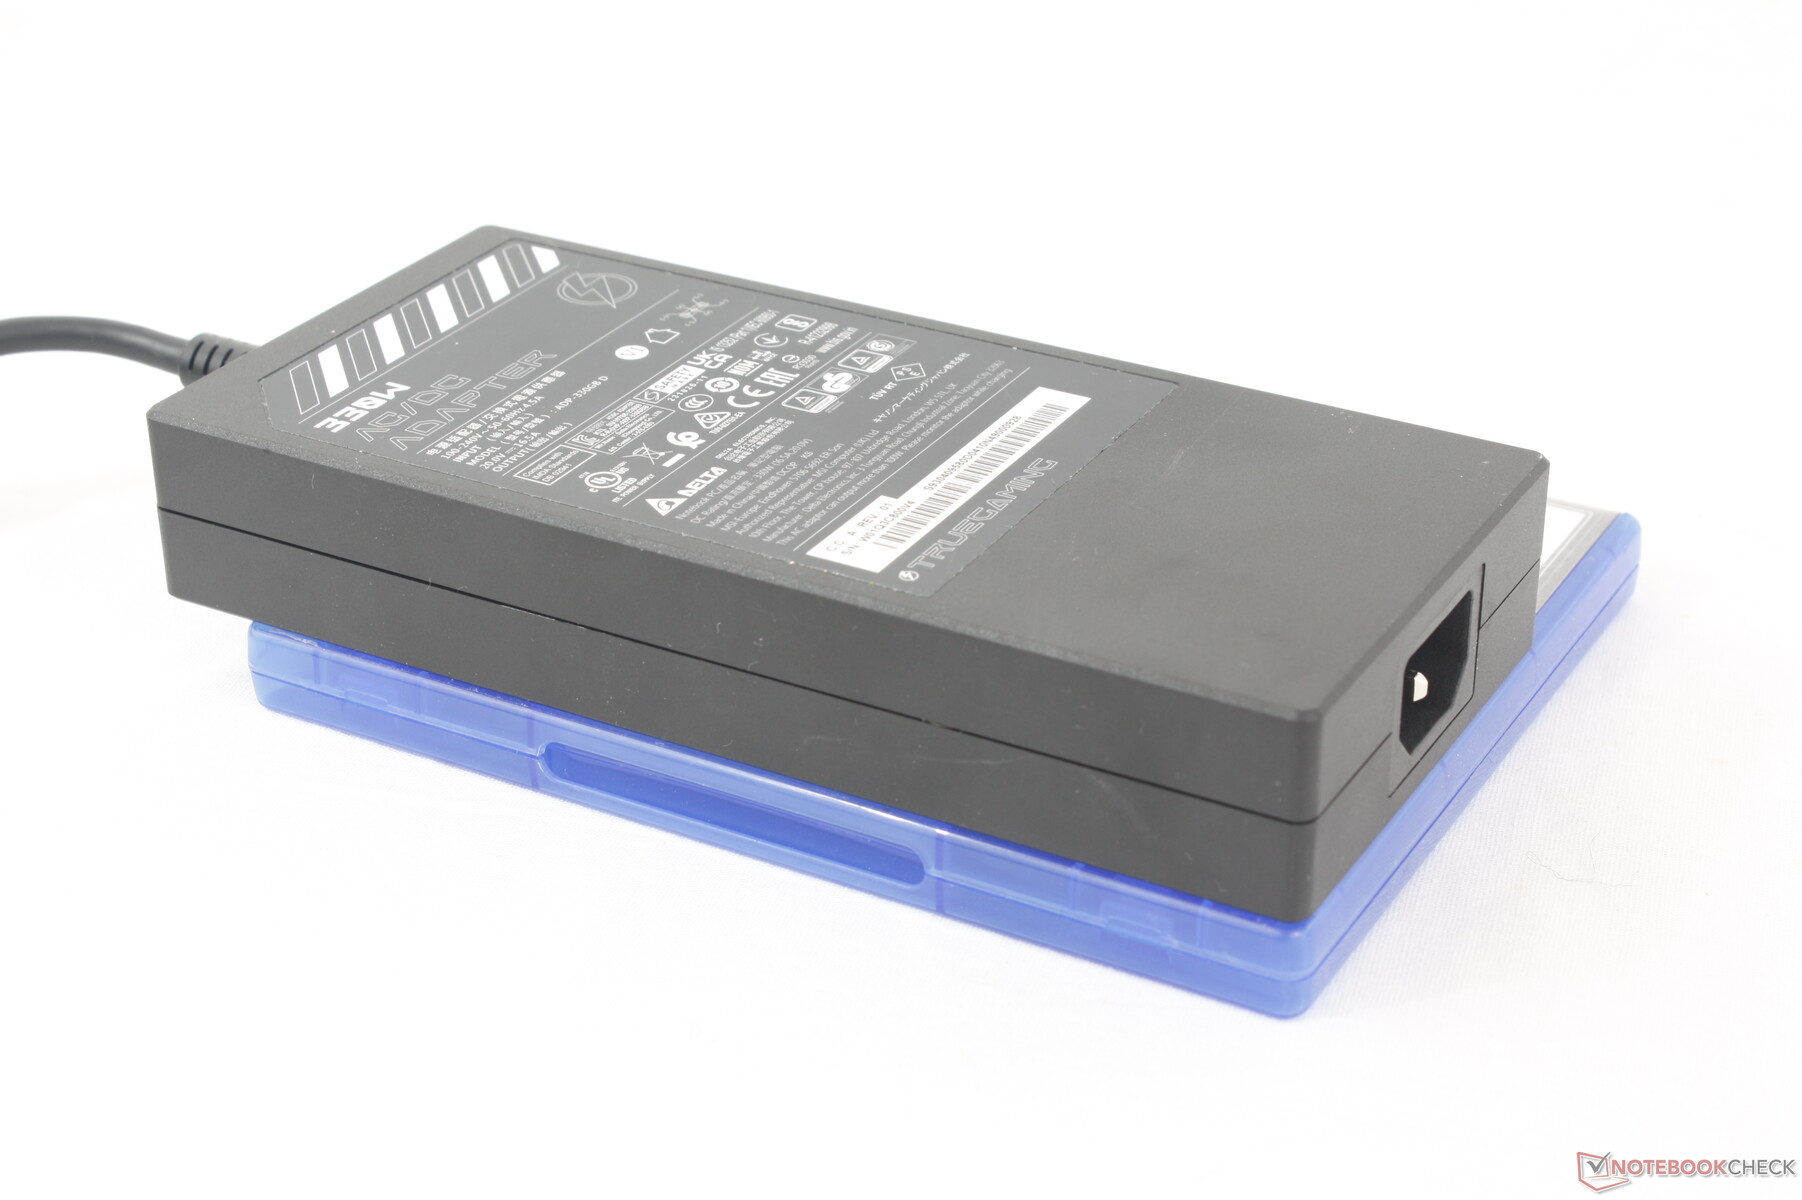
El sistema se entrega con un adaptador de CA de 280 W o 330 W según la configuración. El nuevo adaptador de CA de 330 W es relativamente delgado con unas dimensiones de ~18,5 x 8,5 x 3,2 cm, que es aproximadamente el mismo tamaño que el adaptador de CA de 280 W de ~18 x 8,5 x 3,5 cm de la antigua GP66.
| Off / Standby | |
| Ocioso | |
| Carga |
|
Clave:
min: | |
| MSI Vector 16 HX A14V i9-14900HX, GeForce RTX 4080 Laptop GPU, WD PC SN560 SDDPNQE-1T00, IPS, 2560x1600, 16" | MSI Vector GP66 12UGS i9-12900H, GeForce RTX 3070 Ti Laptop GPU, , IPS, 1920x1080, 15.6" | Lenovo Legion 5 16IRX G9 i7-14650HX, GeForce RTX 4060 Laptop GPU, Samsung PM9A1 MZVL21T0HCLR, IPS, 2560x1600, 16" | HP Victus 16-r0077ng i7-13700H, GeForce RTX 4070 Laptop GPU, Kioxia XG8 KXG80ZNV1T02, IPS, 1920x1080, 16.1" | Asus TUF Gaming A16 FA617XS R9 7940HS, Radeon RX 7600S, Micron 2400 MTFDKBA512QFM, IPS, 1920x1200, 16" | Dell G16 7620 i7-12700H, GeForce RTX 3060 Laptop GPU, WDC PC SN810 512GB, IPS, 2560x1600, 16" | |
|---|---|---|---|---|---|---|
| Power Consumption | -2% | 20% | 38% | 47% | 18% | |
| Idle Minimum * (Watt) | 15.8 | 17.5 -11% | 15.4 3% | 8 49% | 7 56% | 14.4 9% |
| Idle Average * (Watt) | 23.3 | 20.1 14% | 19.7 15% | 13 44% | 10 57% | 17.8 24% |
| Idle Maximum * (Watt) | 30 | 47.3 -58% | 20.7 31% | 22 27% | 15 50% | 31.5 -5% |
| Load Average * (Watt) | 123.9 | 107.3 13% | 102.6 17% | 86 31% | 86 31% | 101.2 18% |
| Witcher 3 ultra * (Watt) | 285 | 225 21% | 191.3 33% | 141.8 50% | 160.6 44% | 176.9 38% |
| Load Maximum * (Watt) | 306 | 277.7 9% | 246.6 19% | 233 24% | 172 44% | 242.9 21% |
* ... más pequeño es mejor
Power Consumption Witcher 3 / Stresstest
Power Consumption external Monitor
Duración de las pilas
Aunque la capacidad de la batería ha aumentado significativamente de 65 Wh a 90 Wh con respecto al antiguo diseño Vector GP66, los tiempos de ejecución reales no lo han hecho. La navegación por WLAN en el perfil de energía equilibrada con la iGPU activa sigue rondando las 5,5 horas antes del apagado automático. Otros sistemas de 16 pulgadas como el Lenovo Legion 5 16 o el HP Victus 16 son capaces de durar cuatro un par de horas más cada uno en comparación.
La carga desde vacío a plena capacidad tarda casi 2,5 horas con el adaptador de CA incluido. El sistema puede recargarse mediante USB-C a través del puerto situado en el borde derecho.
| MSI Vector 16 HX A14V i9-14900HX, GeForce RTX 4080 Laptop GPU, 90 Wh | MSI Vector GP66 12UGS i9-12900H, GeForce RTX 3070 Ti Laptop GPU, 65 Wh | Lenovo Legion 5 16IRX G9 i7-14650HX, GeForce RTX 4060 Laptop GPU, 80 Wh | HP Victus 16-r0077ng i7-13700H, GeForce RTX 4070 Laptop GPU, 83 Wh | Asus TUF Gaming A16 FA617XS R9 7940HS, Radeon RX 7600S, 90 Wh | Dell G16 7620 i7-12700H, GeForce RTX 3060 Laptop GPU, 84 Wh | |
|---|---|---|---|---|---|---|
| Duración de Batería | -17% | -4% | 29% | 60% | -31% | |
| Reader / Idle (h) | 10.7 | 7.9 -26% | 20.3 90% | 7.1 -34% | ||
| WiFi v1.3 (h) | 5.5 | 5.7 4% | 7.4 35% | 7.1 29% | 12.4 125% | 5 -9% |
| Load (h) | 1.4 | 1 -29% | 0.8 -43% | 0.9 -36% | 0.7 -50% | |
| H.264 (h) | 9.6 | 12.4 |
Pro
Contra
Veredicto - Rápido y chungo
Los portátiles para juegos caminan sobre una fina línea entre portabilidad y rendimiento, con la tendencia actual inclinándose hacia la portabilidad. El MSI Vector 16 HX favorece descaradamente el rendimiento aunque ello signifique un sistema más grueso, más grande y más ruidoso. De hecho, es uno de los portátiles para juegos de 16 pulgadas más grandes y ruidosos que existen actualmente en el mercado.
El MSI Vector 16 HX no es tímido cuando se trata del ruido del ventilador o del tamaño. A su vez, supera en rendimiento a otros portátiles para juegos con la misma GPU GeForce RTX 4080 o 4090.
El gran tamaño y los ruidosos ventiladores no son en vano, ya que el modelo destaca cuando se trata de rendimiento. Los 175 W de la GeForce GPU RTX 4080 es un 10% más rápida que la media para estar a la altura incluso de algunos portátiles que llevan la RTX 4090. Este hecho por sí solo probablemente atraerá a los cazadores de rendimiento a los que no les importe sacrificar un poco de portabilidad por esa potencia extra. El ceñido chasis también es rígido y con una tapa resistente, algo que no podemos decir de muchas alternativas más delgadas.
Algunos aspectos podrían ser ciertamente mejores. Si MSI quiere seguir con un diseño grande, debería facilitar el mantenimiento y considerar la refrigeración líquida o la cámara de vapor en un esfuerzo por reducir el ruido del ventilador. El teclado numérico o al menos las teclas de flecha deberían hacerse más grandes al igual que las teclas de flecha del Lenovo Legion 5 16.
Precio y disponibilidad
MSI Vector 16 HX A14V
- 02/03/2024 v7 (old)
Allen Ngo
Transparencia
La selección de los dispositivos que se van a reseñar corre a cargo de nuestro equipo editorial. La muestra de prueba fue proporcionada al autor en calidad de préstamo por el fabricante o el minorista a los efectos de esta reseña. El prestamista no tuvo ninguna influencia en esta reseña, ni el fabricante recibió una copia de la misma antes de su publicación. No había ninguna obligación de publicar esta reseña. Como empresa de medios independiente, Notebookcheck no está sujeta a la autoridad de fabricantes, minoristas o editores.
Así es como prueba Notebookcheck
Cada año, Notebookcheck revisa de forma independiente cientos de portátiles y smartphones utilizando procedimientos estandarizados para asegurar que todos los resultados son comparables. Hemos desarrollado continuamente nuestros métodos de prueba durante unos 20 años y hemos establecido los estándares de la industria en el proceso. En nuestros laboratorios de pruebas, técnicos y editores experimentados utilizan equipos de medición de alta calidad. Estas pruebas implican un proceso de validación en varias fases. Nuestro complejo sistema de clasificación se basa en cientos de mediciones y puntos de referencia bien fundamentados, lo que mantiene la objetividad.Price comparison

