Análisis del MSI Raider GE77 HX 12UHS: portátil para juegos 4K con el máximo rendimiento

El MSI Raider GE77 HX 12UHS está dirigido a jugadores y usuarios creativos. Por ello, nuestra configuración está equipada con el hardware más reciente y potente Core i9-12900HX CPU, GeForce Portátil RTX 3080 Ti GPU, 64 GB de RAM y una pantalla 4K (17,3 pulgadas). Nuestro modelo cuesta unos 5.200 dólares. Con el MSI Raider GE66 12UHShemos analizado recientemente la versión de 15,6 pulgadas. La competencia está formada por portátiles de potencia similar (y caros) como el Alienware x17 R2 P48E, Medion Erazer Beast X30y el Razer Blade 17 (principios de 2022).
Posibles contendientes en la comparación
Valoración | Fecha | Modelo | Peso | Altura | Tamaño | Resolución | Precio |
|---|---|---|---|---|---|---|---|
| 86.8 % v7 (old) | 07/2022 | MSI Raider GE77 HX 12UHS i9-12900HX, GeForce RTX 3080 Ti Laptop GPU | 3.1 kg | 25.9 mm | 17.30" | 3840x2160 | |
| 89.9 % v7 (old) | 07/2022 | Razer Blade 17 Early 2022 i9-12900H, GeForce RTX 3080 Ti Laptop GPU | 2.8 kg | 19.9 mm | 17.30" | 3840x2160 | |
| 89.2 % v7 (old) | 05/2022 | Alienware x17 R2 P48E i9-12900HK, GeForce RTX 3080 Ti Laptop GPU | 3.1 kg | 20.9 mm | 17.30" | 1920x1080 | |
| 86.7 % v7 (old) | 05/2022 | Medion Erazer Beast X30 i9-12900HK, GeForce RTX 3080 Ti Laptop GPU | 2.2 kg | 23 mm | 17.30" | 2560x1440 |
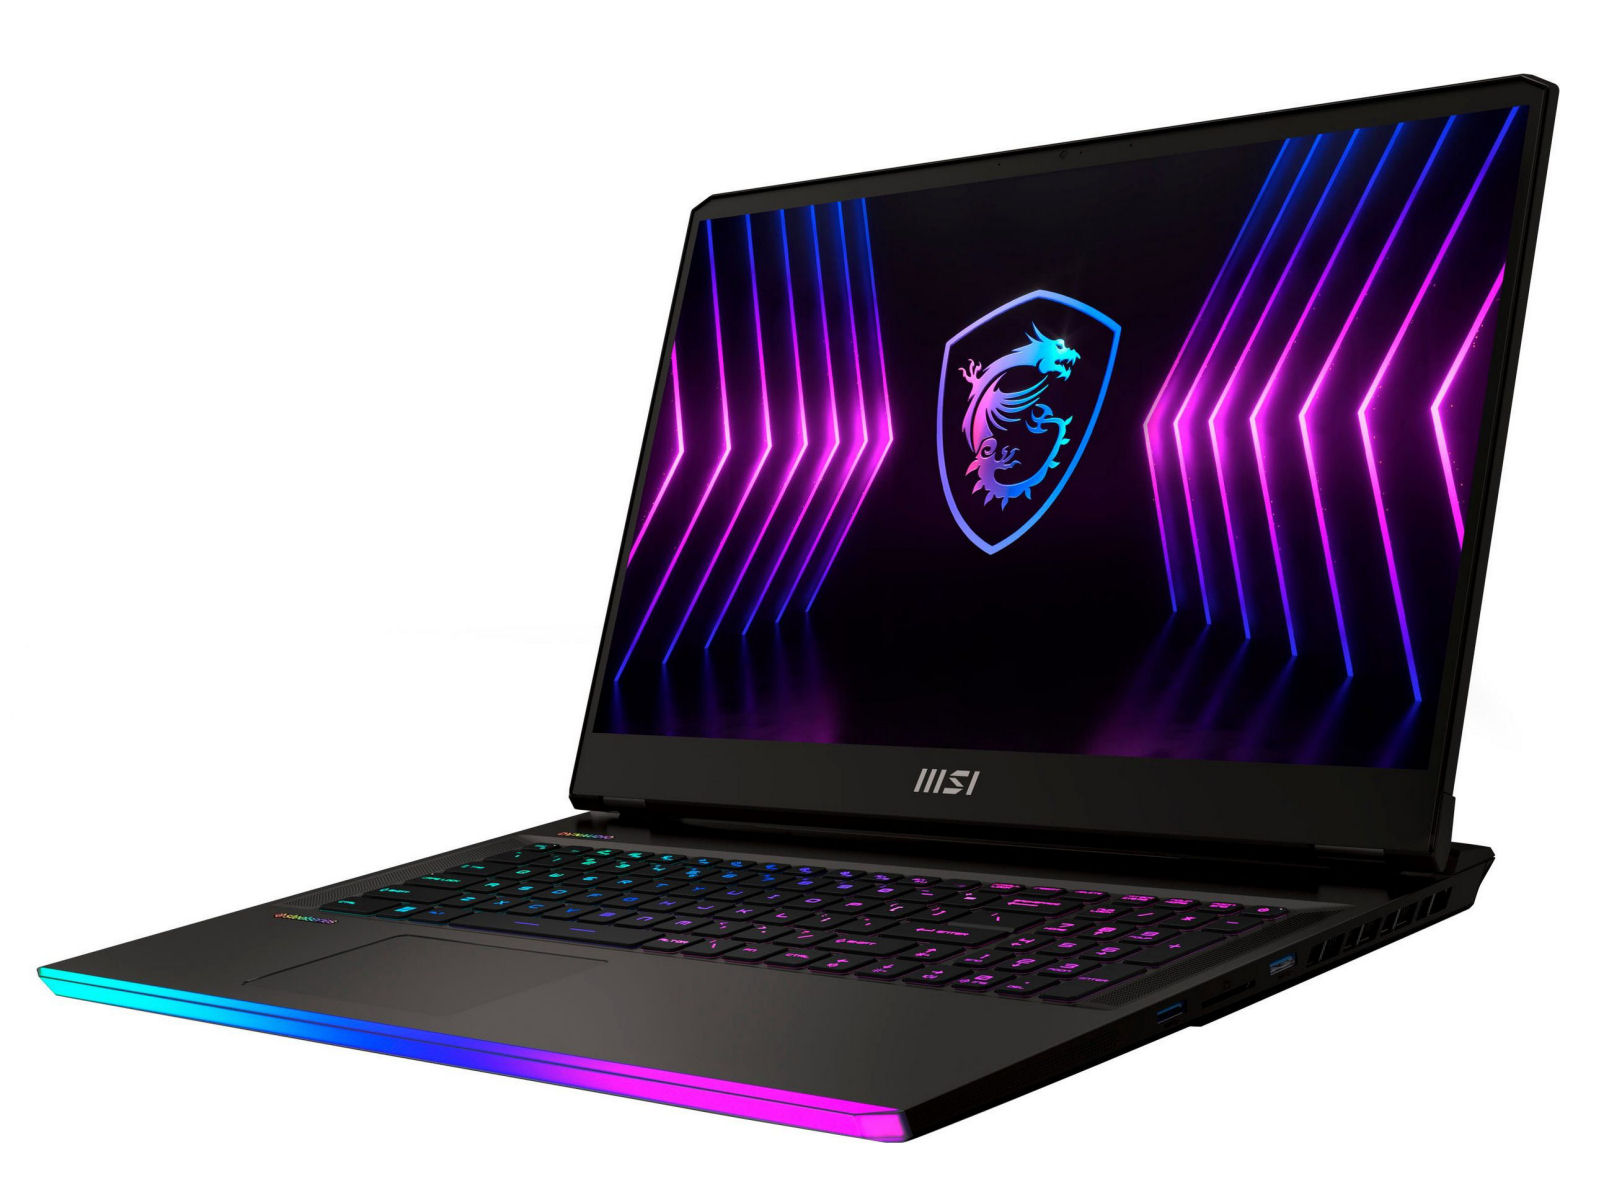
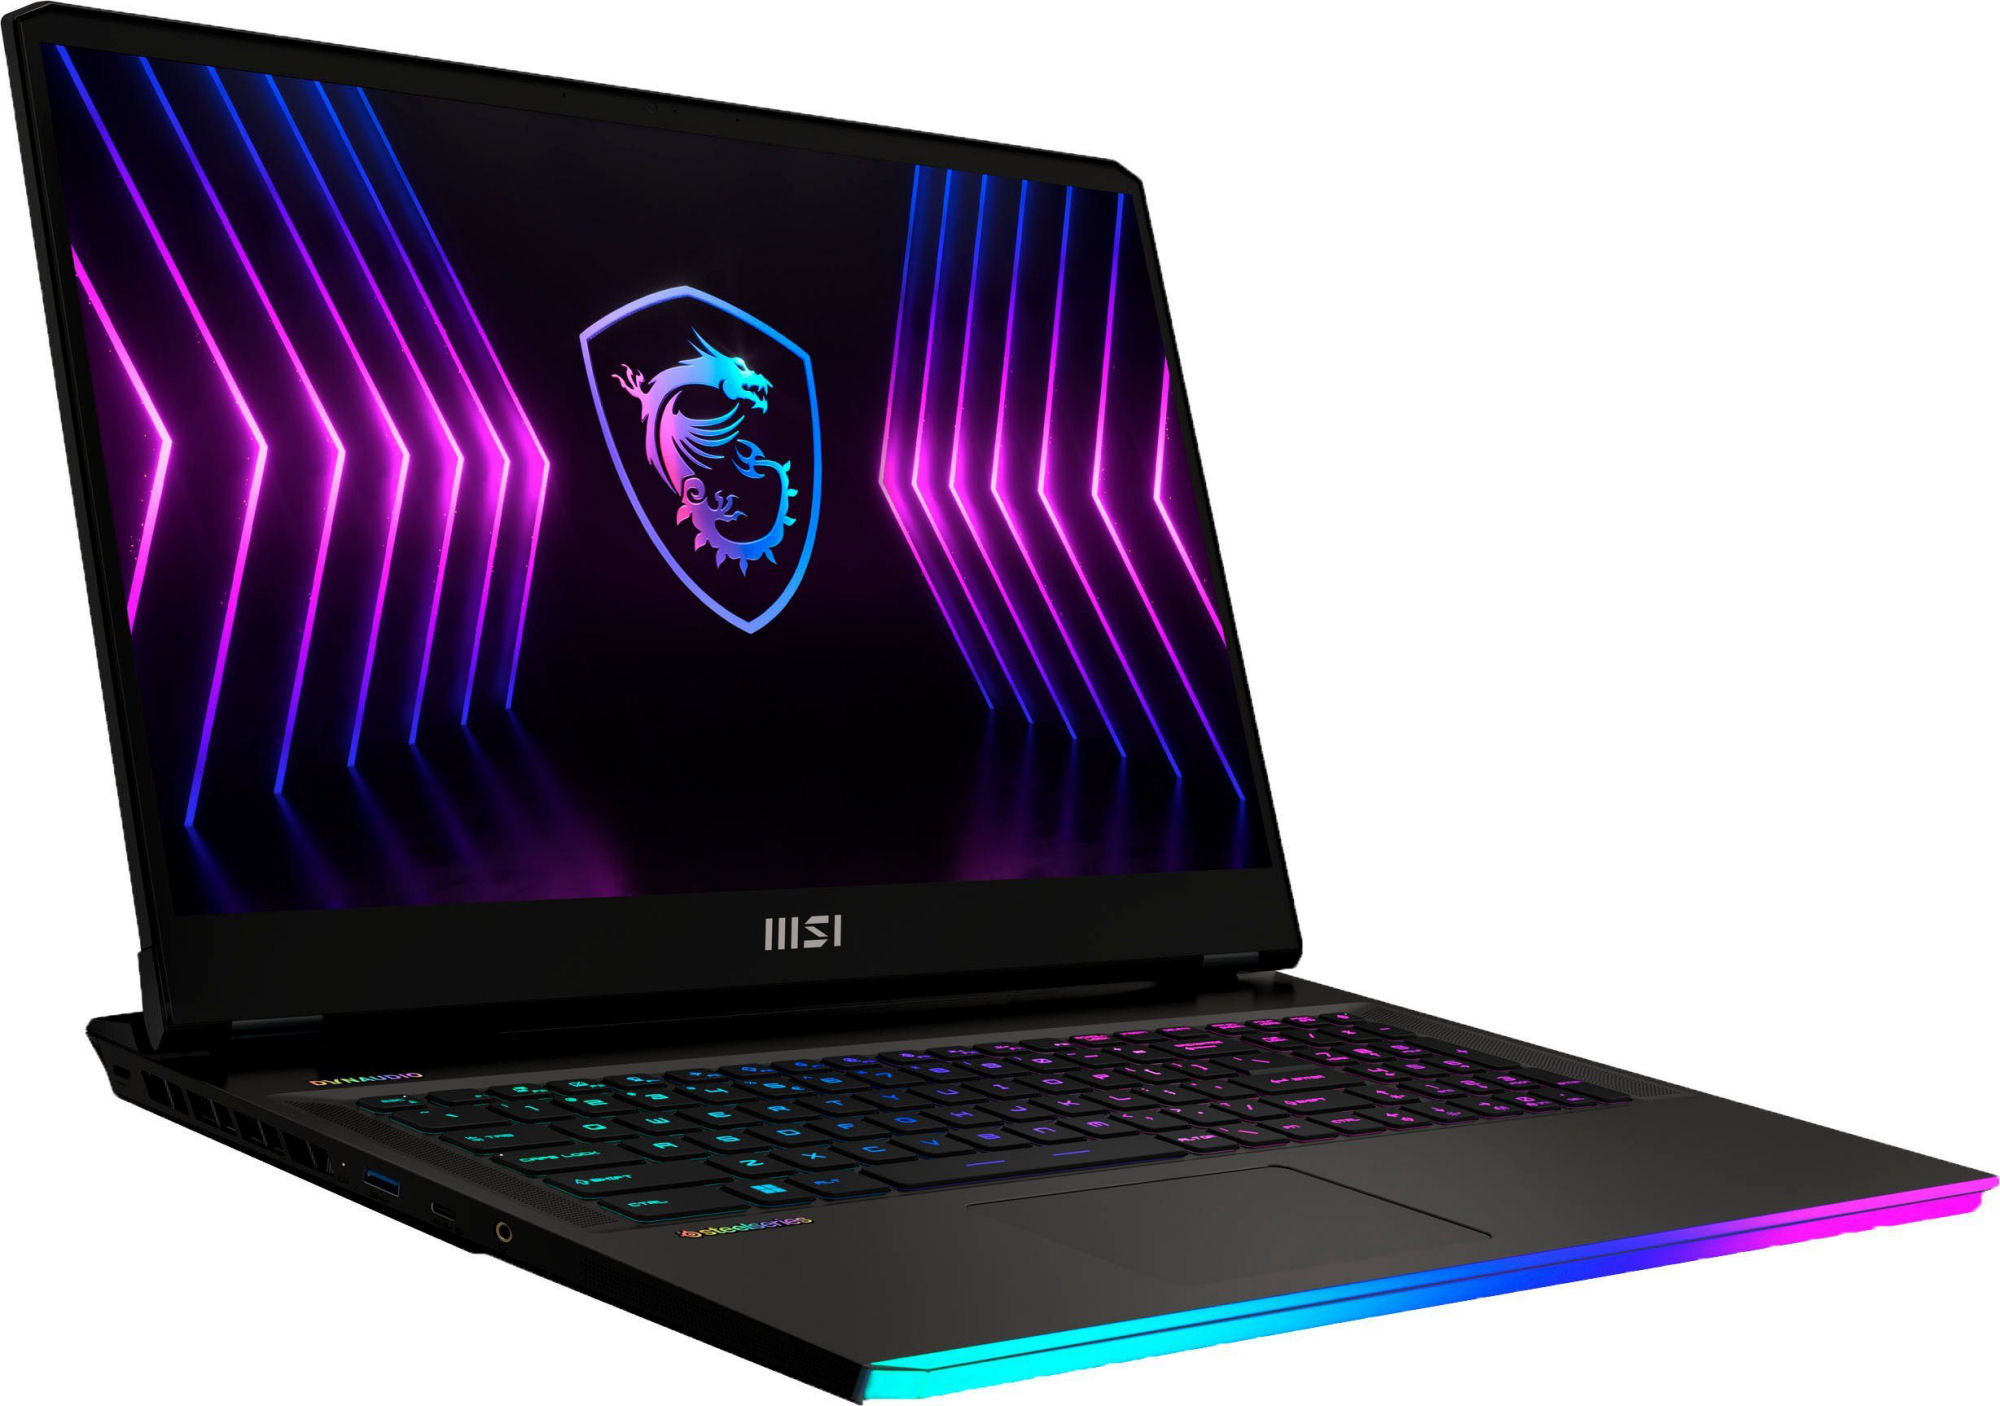
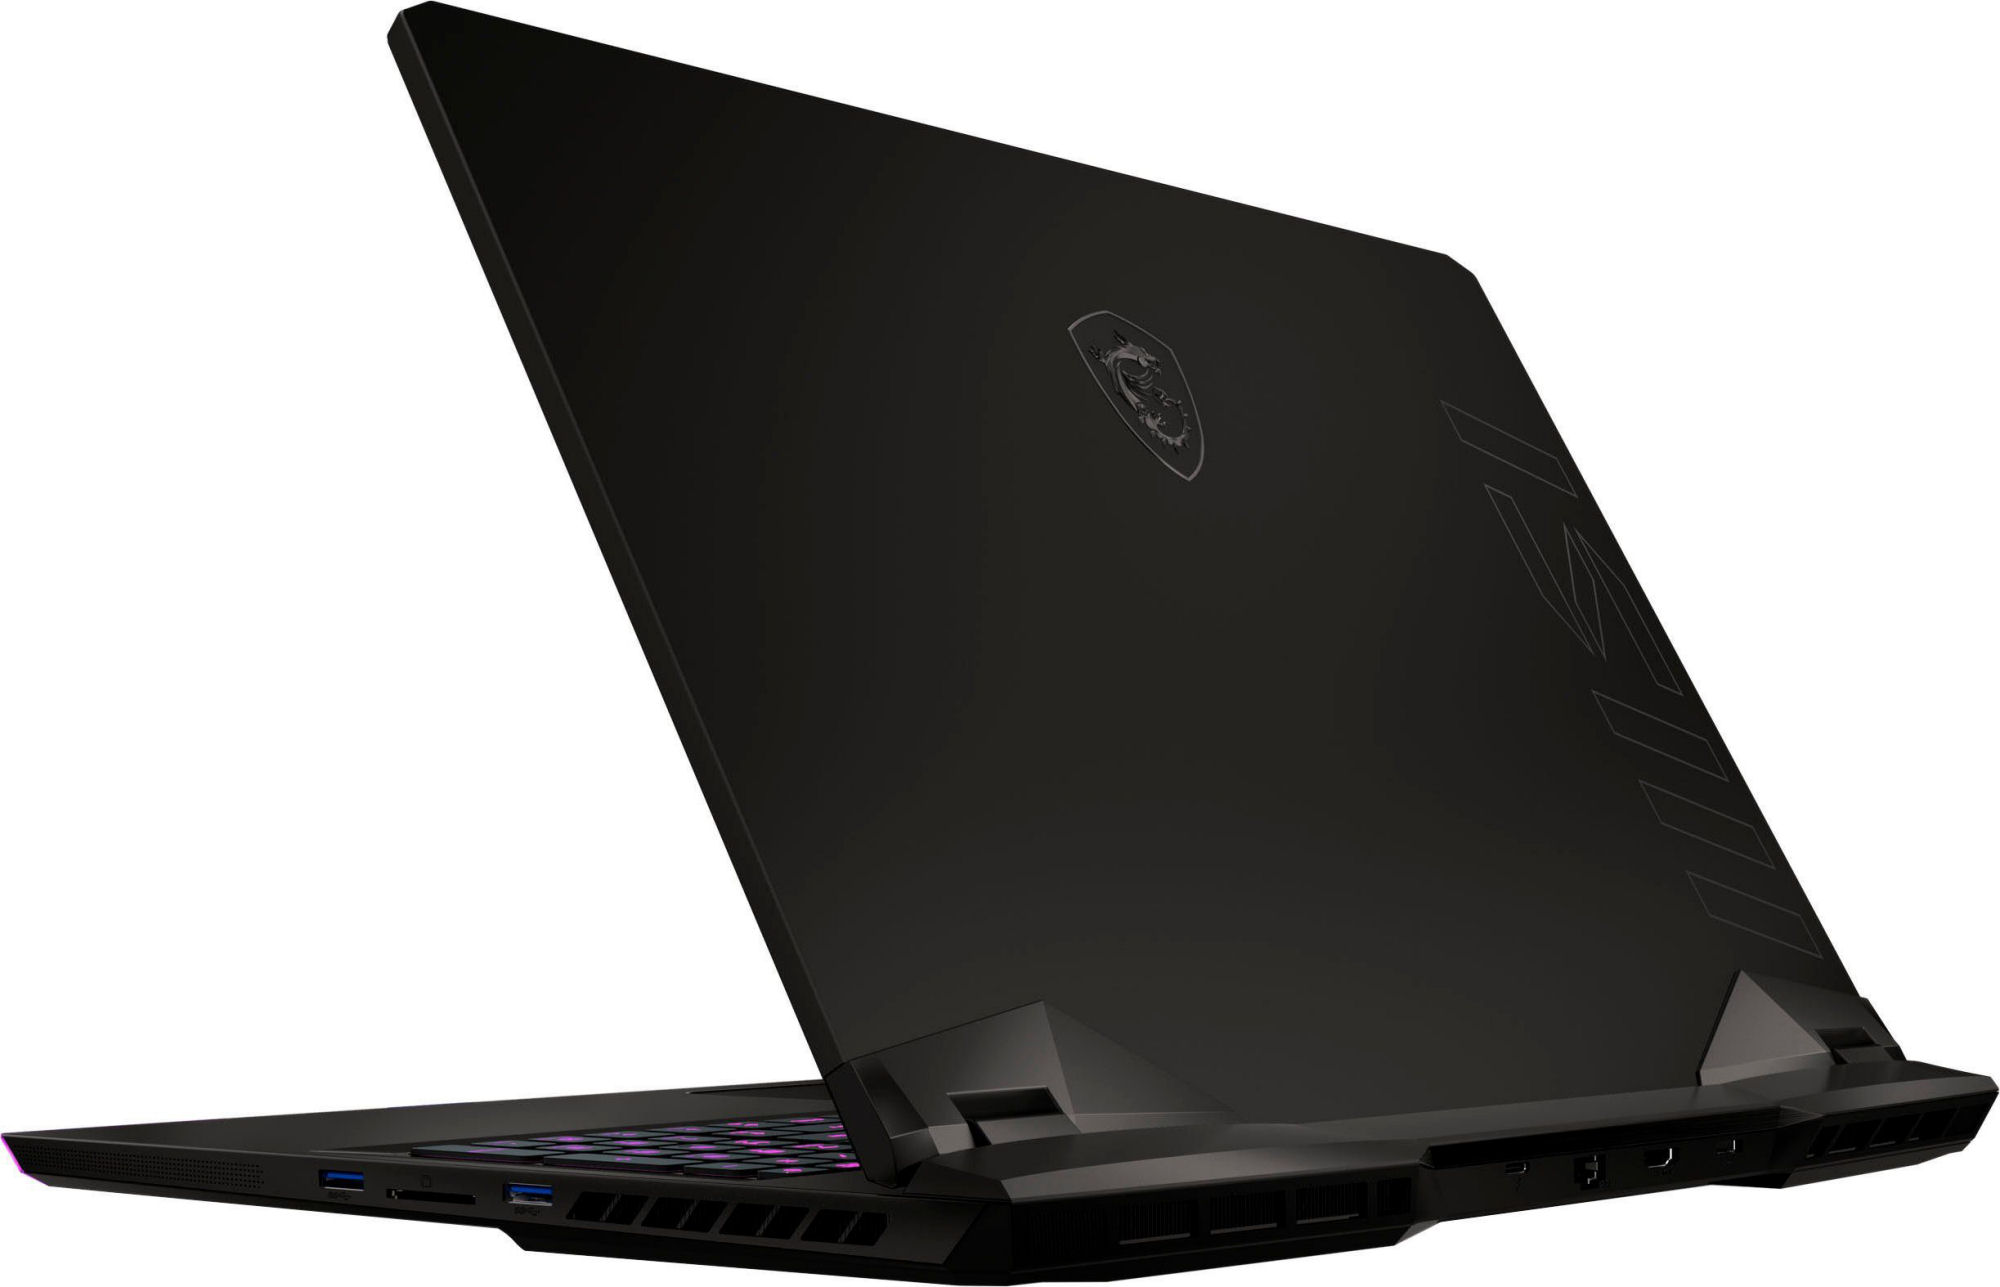
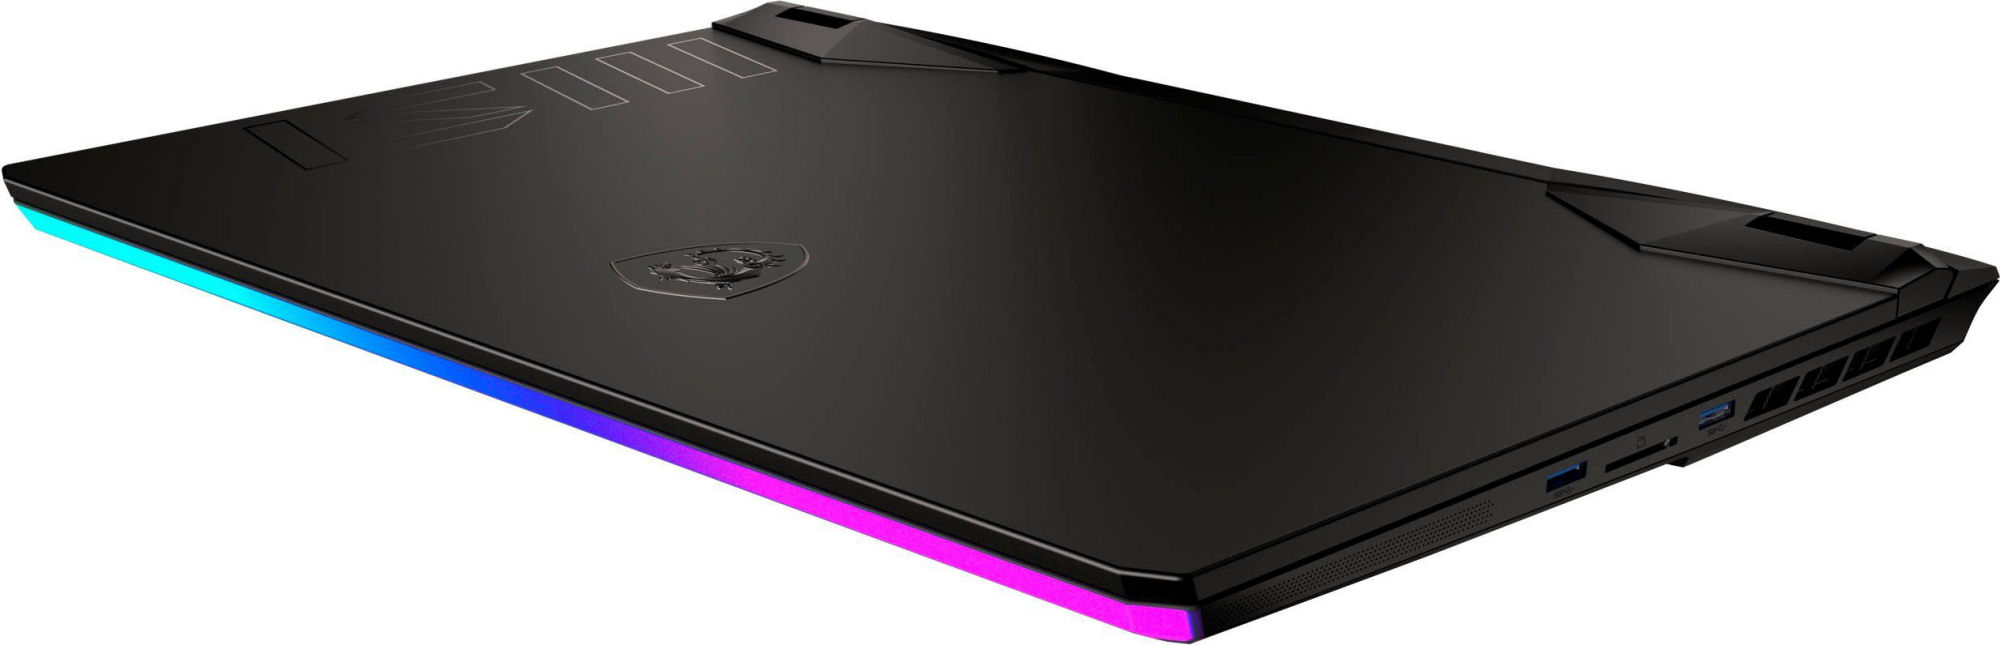
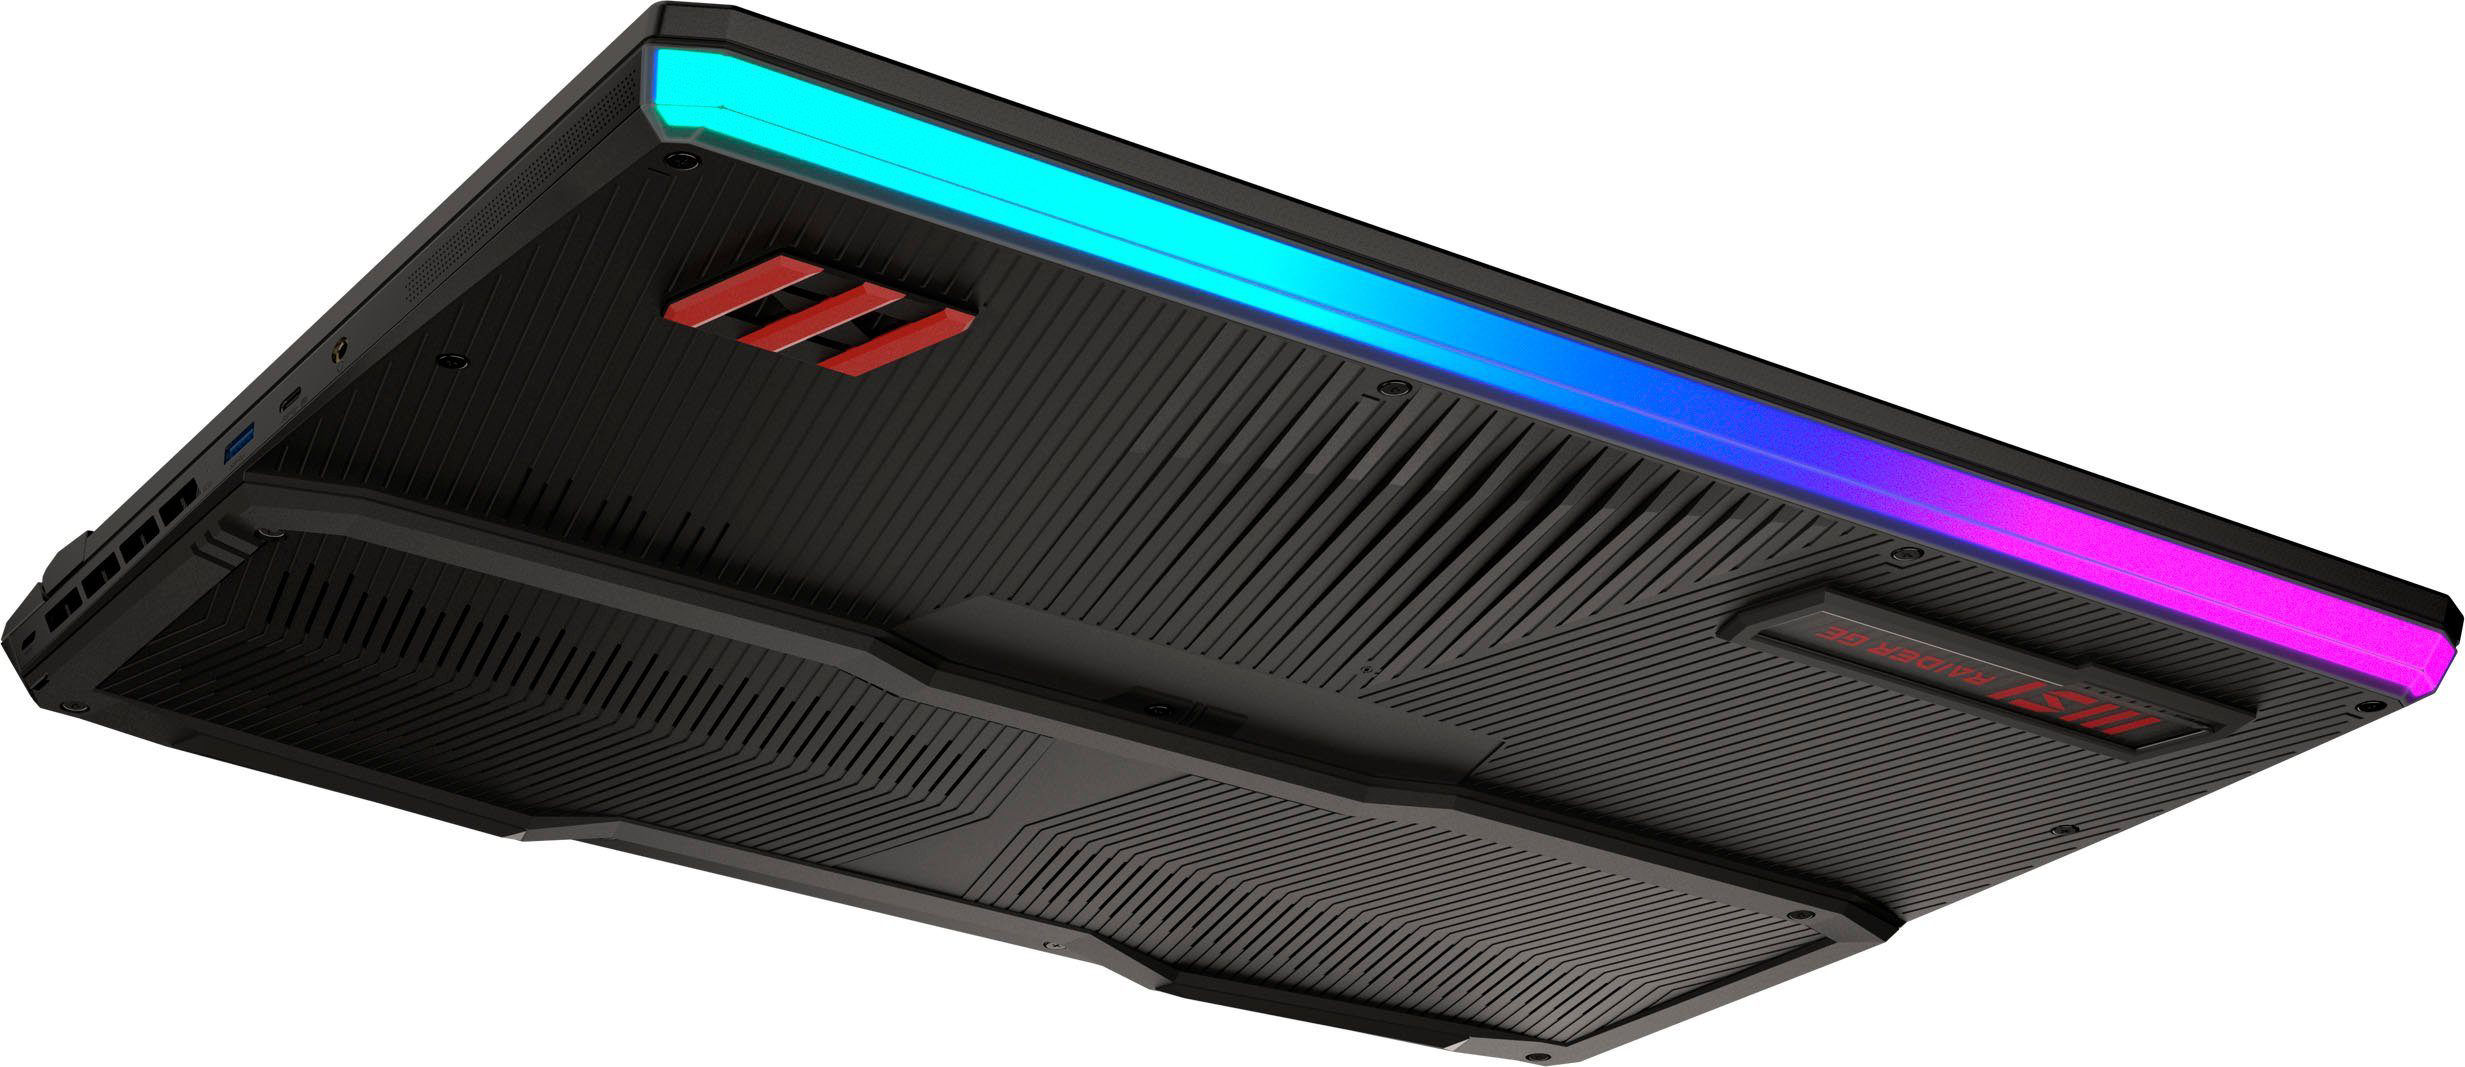
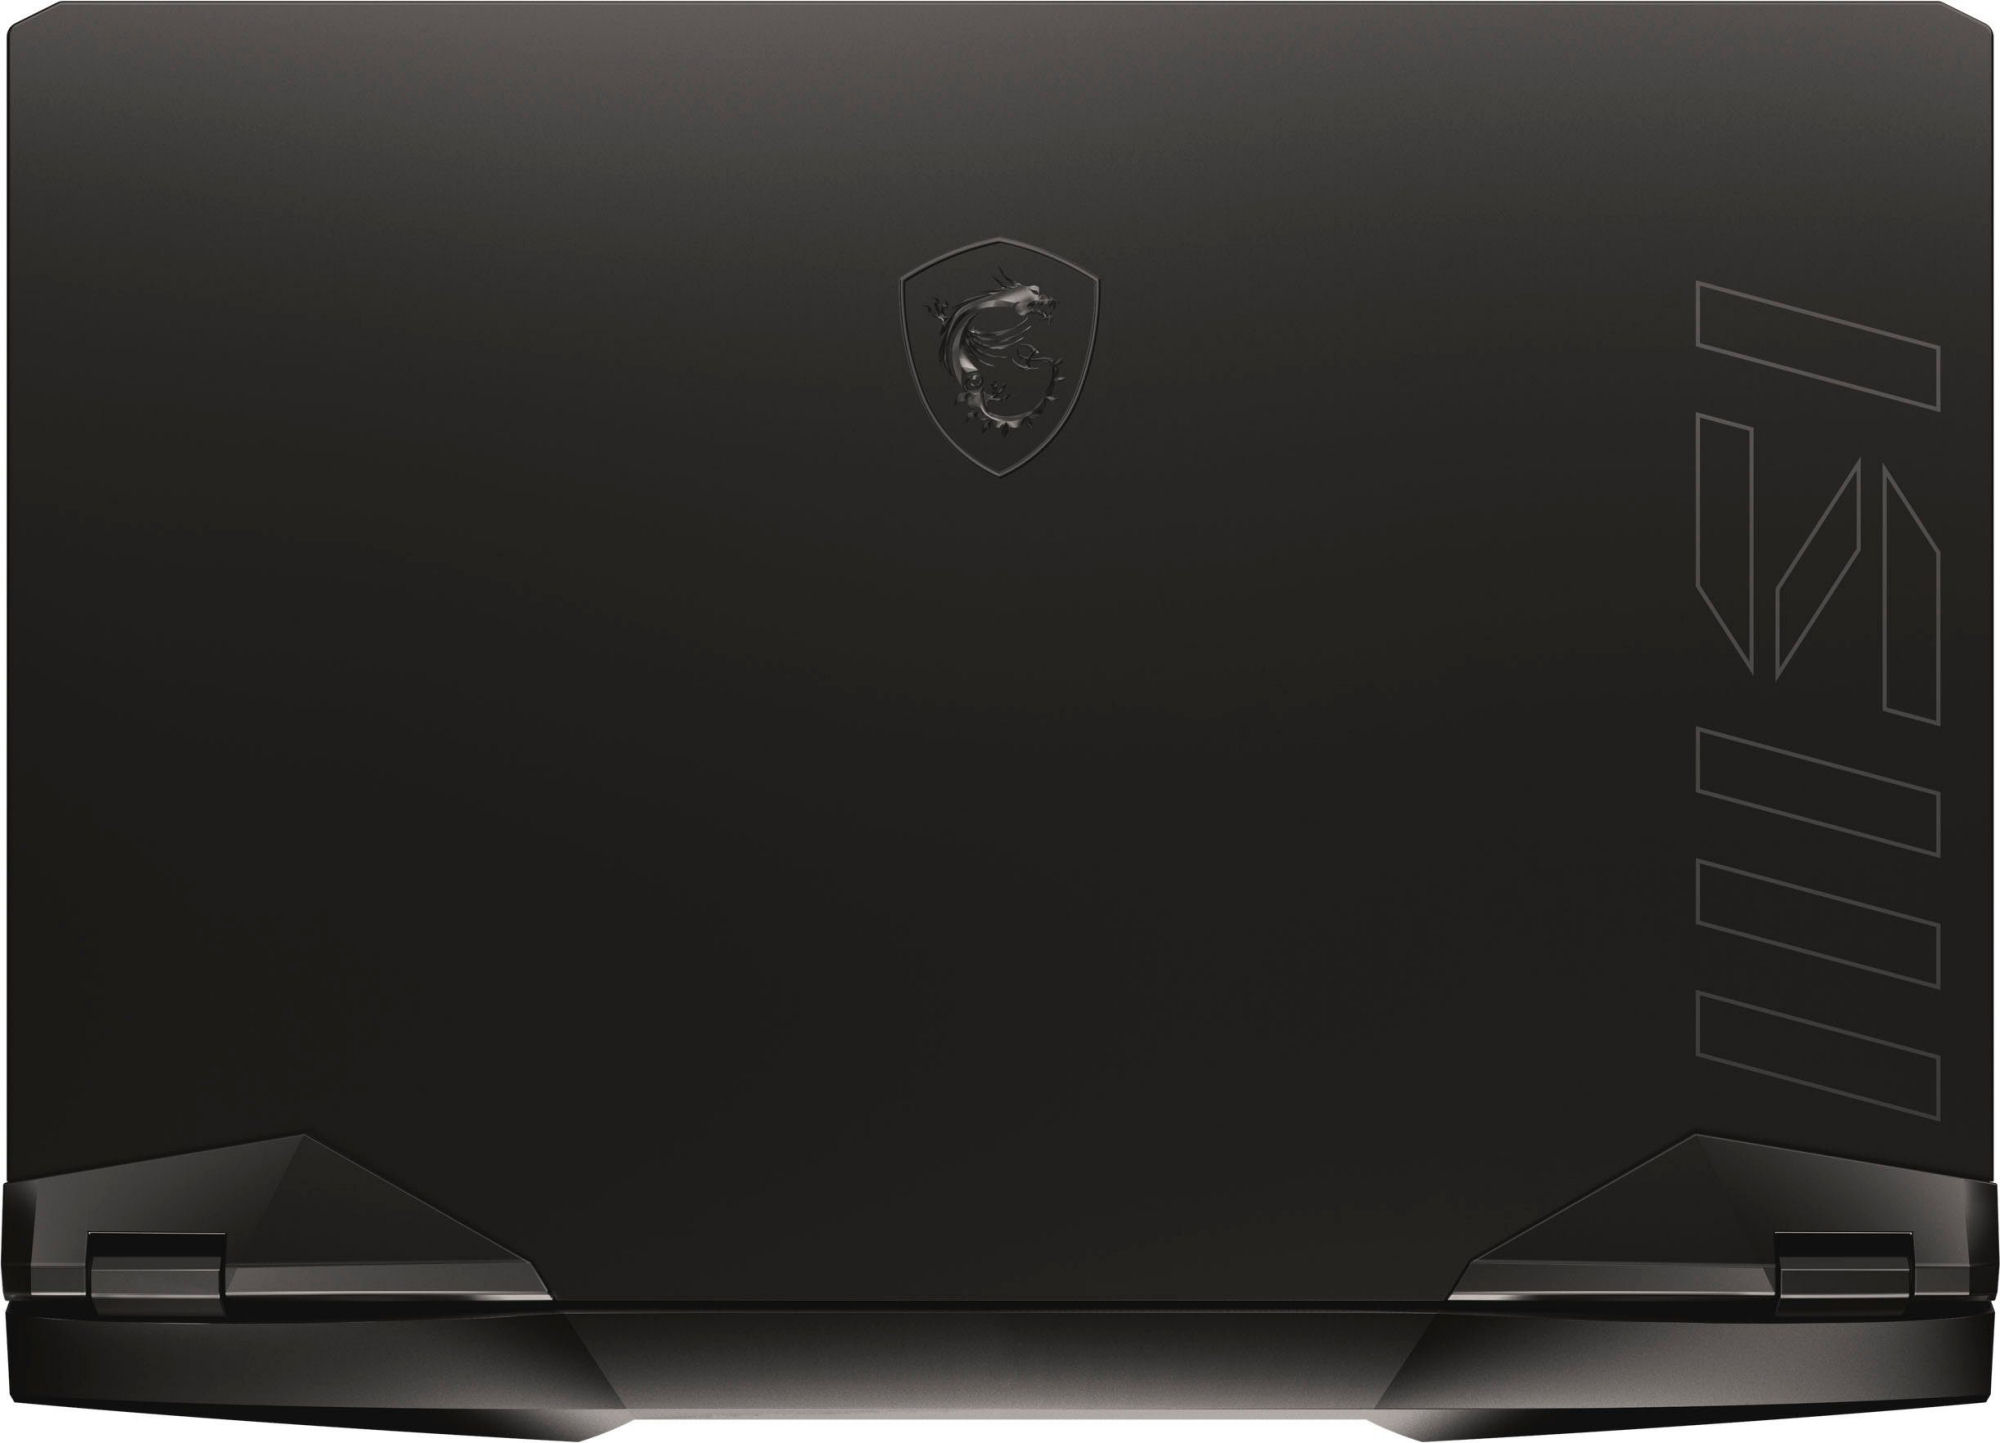
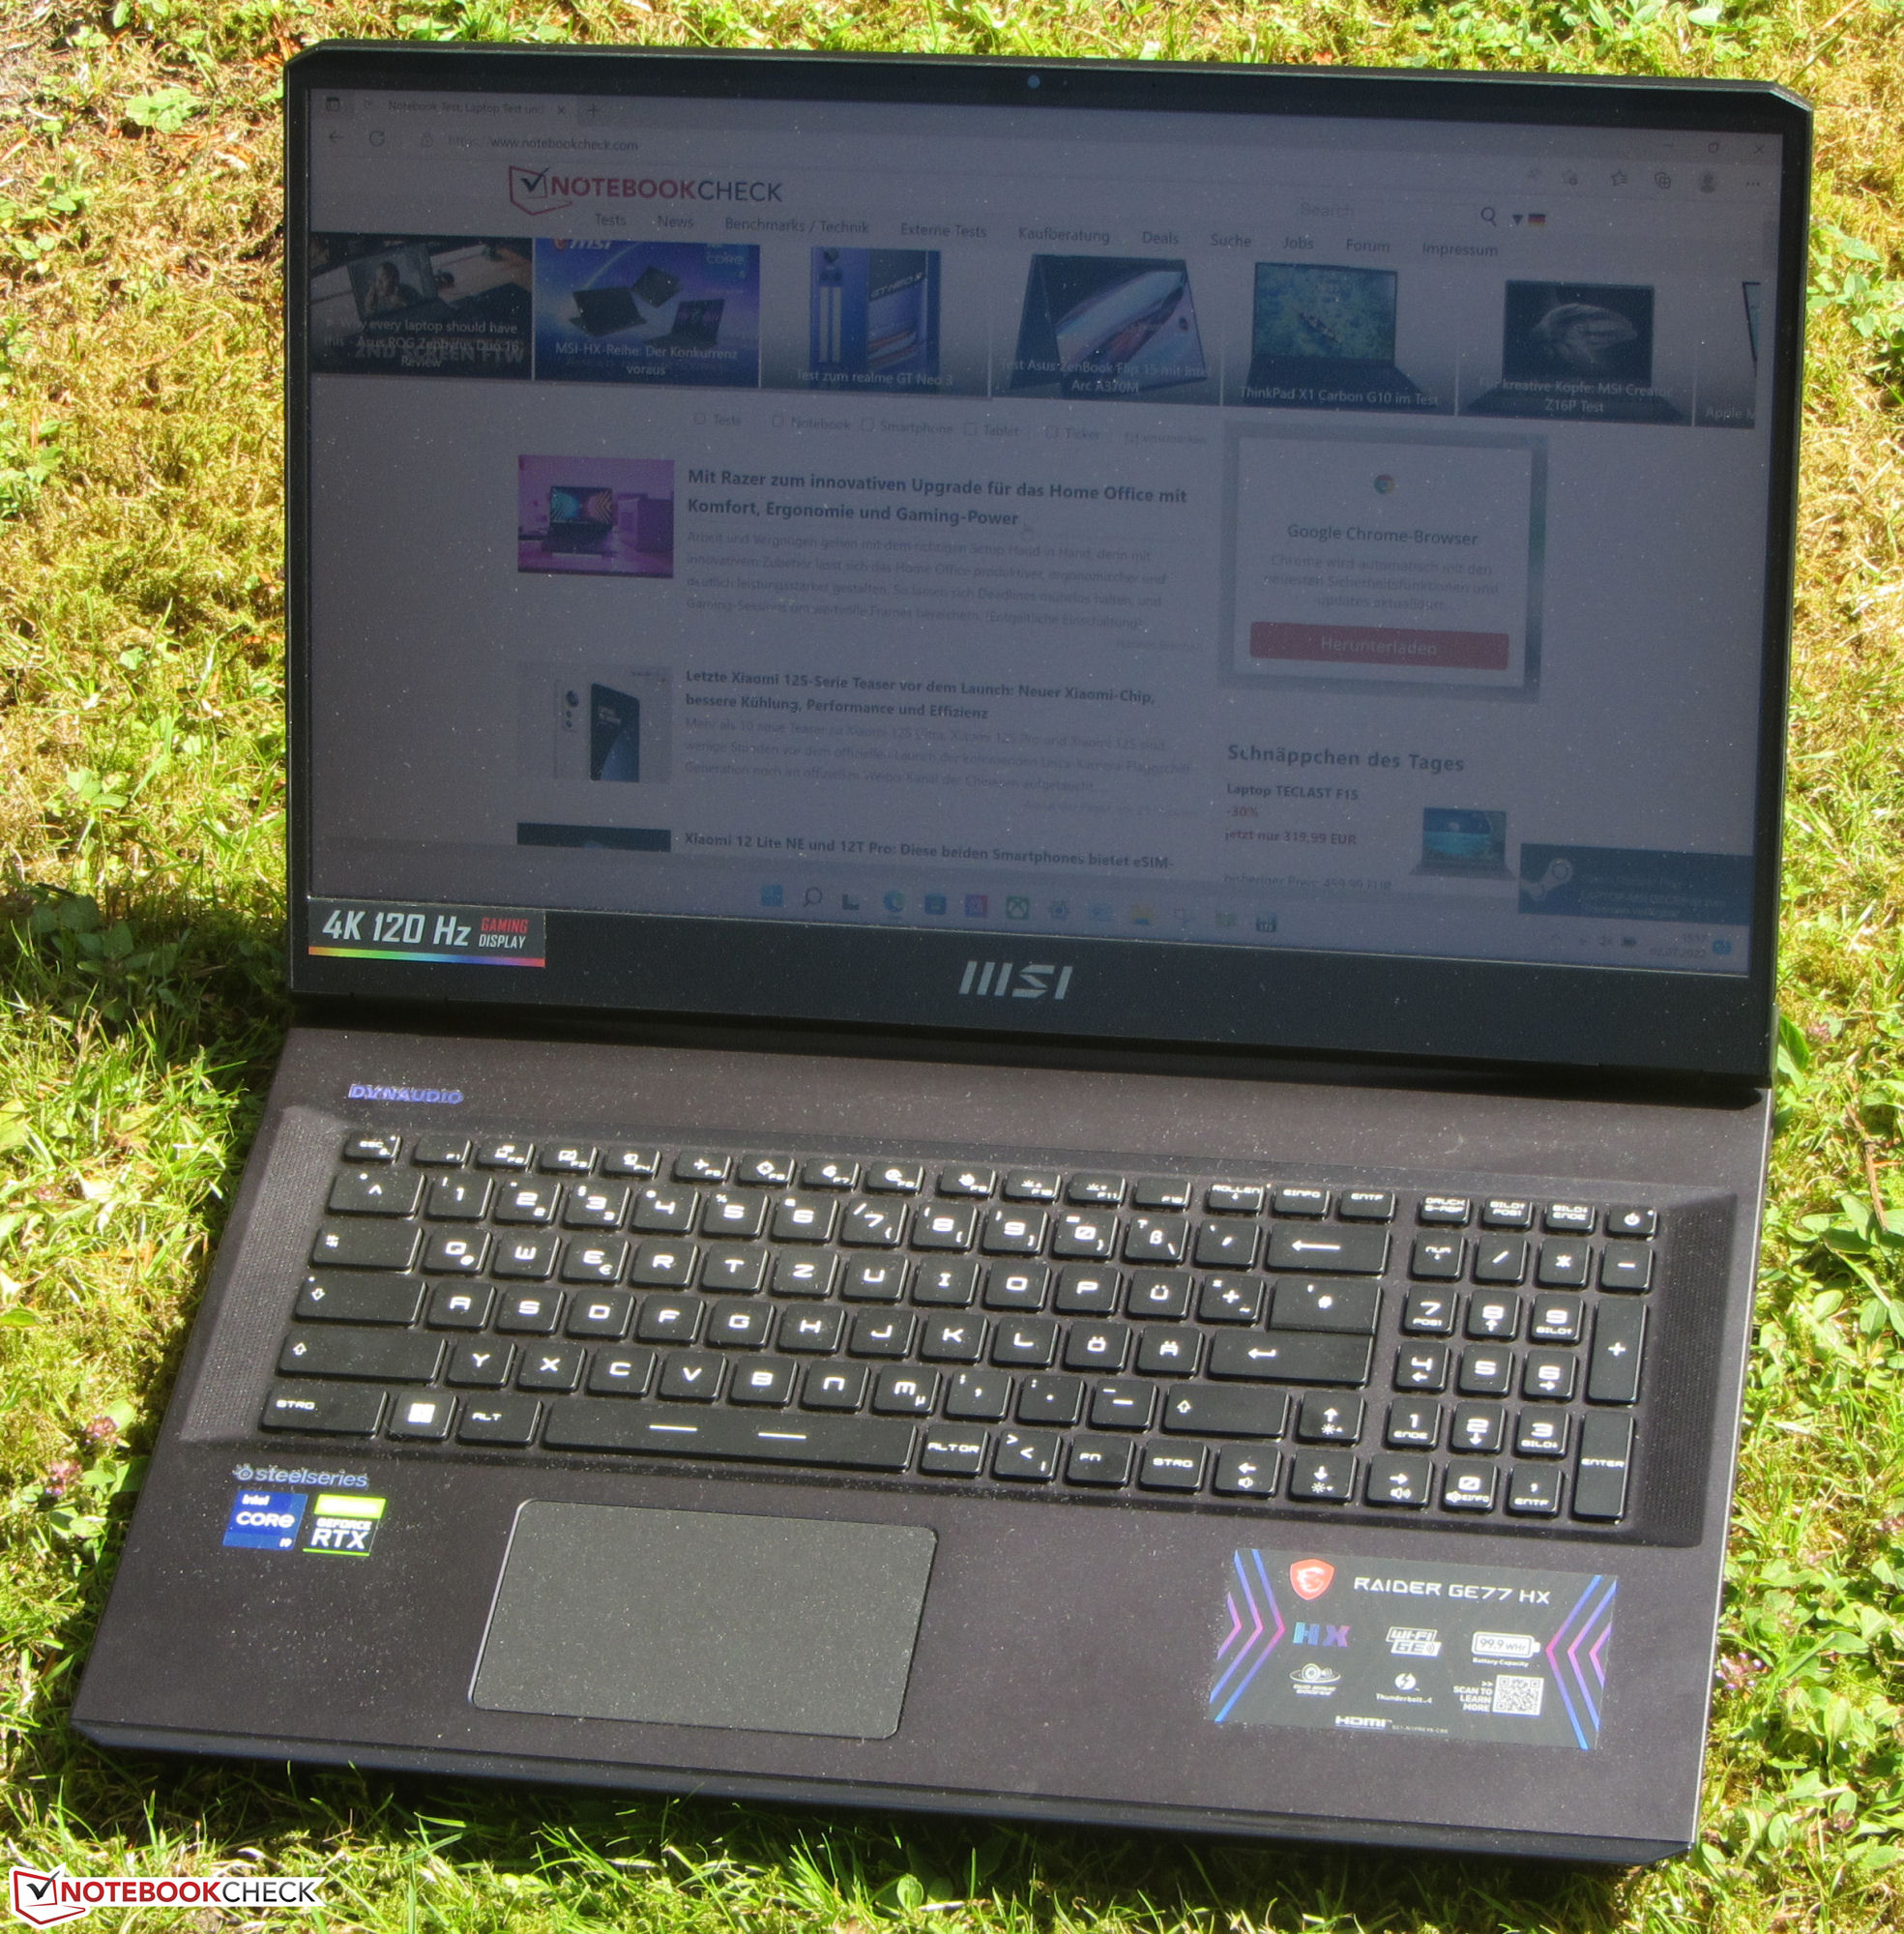
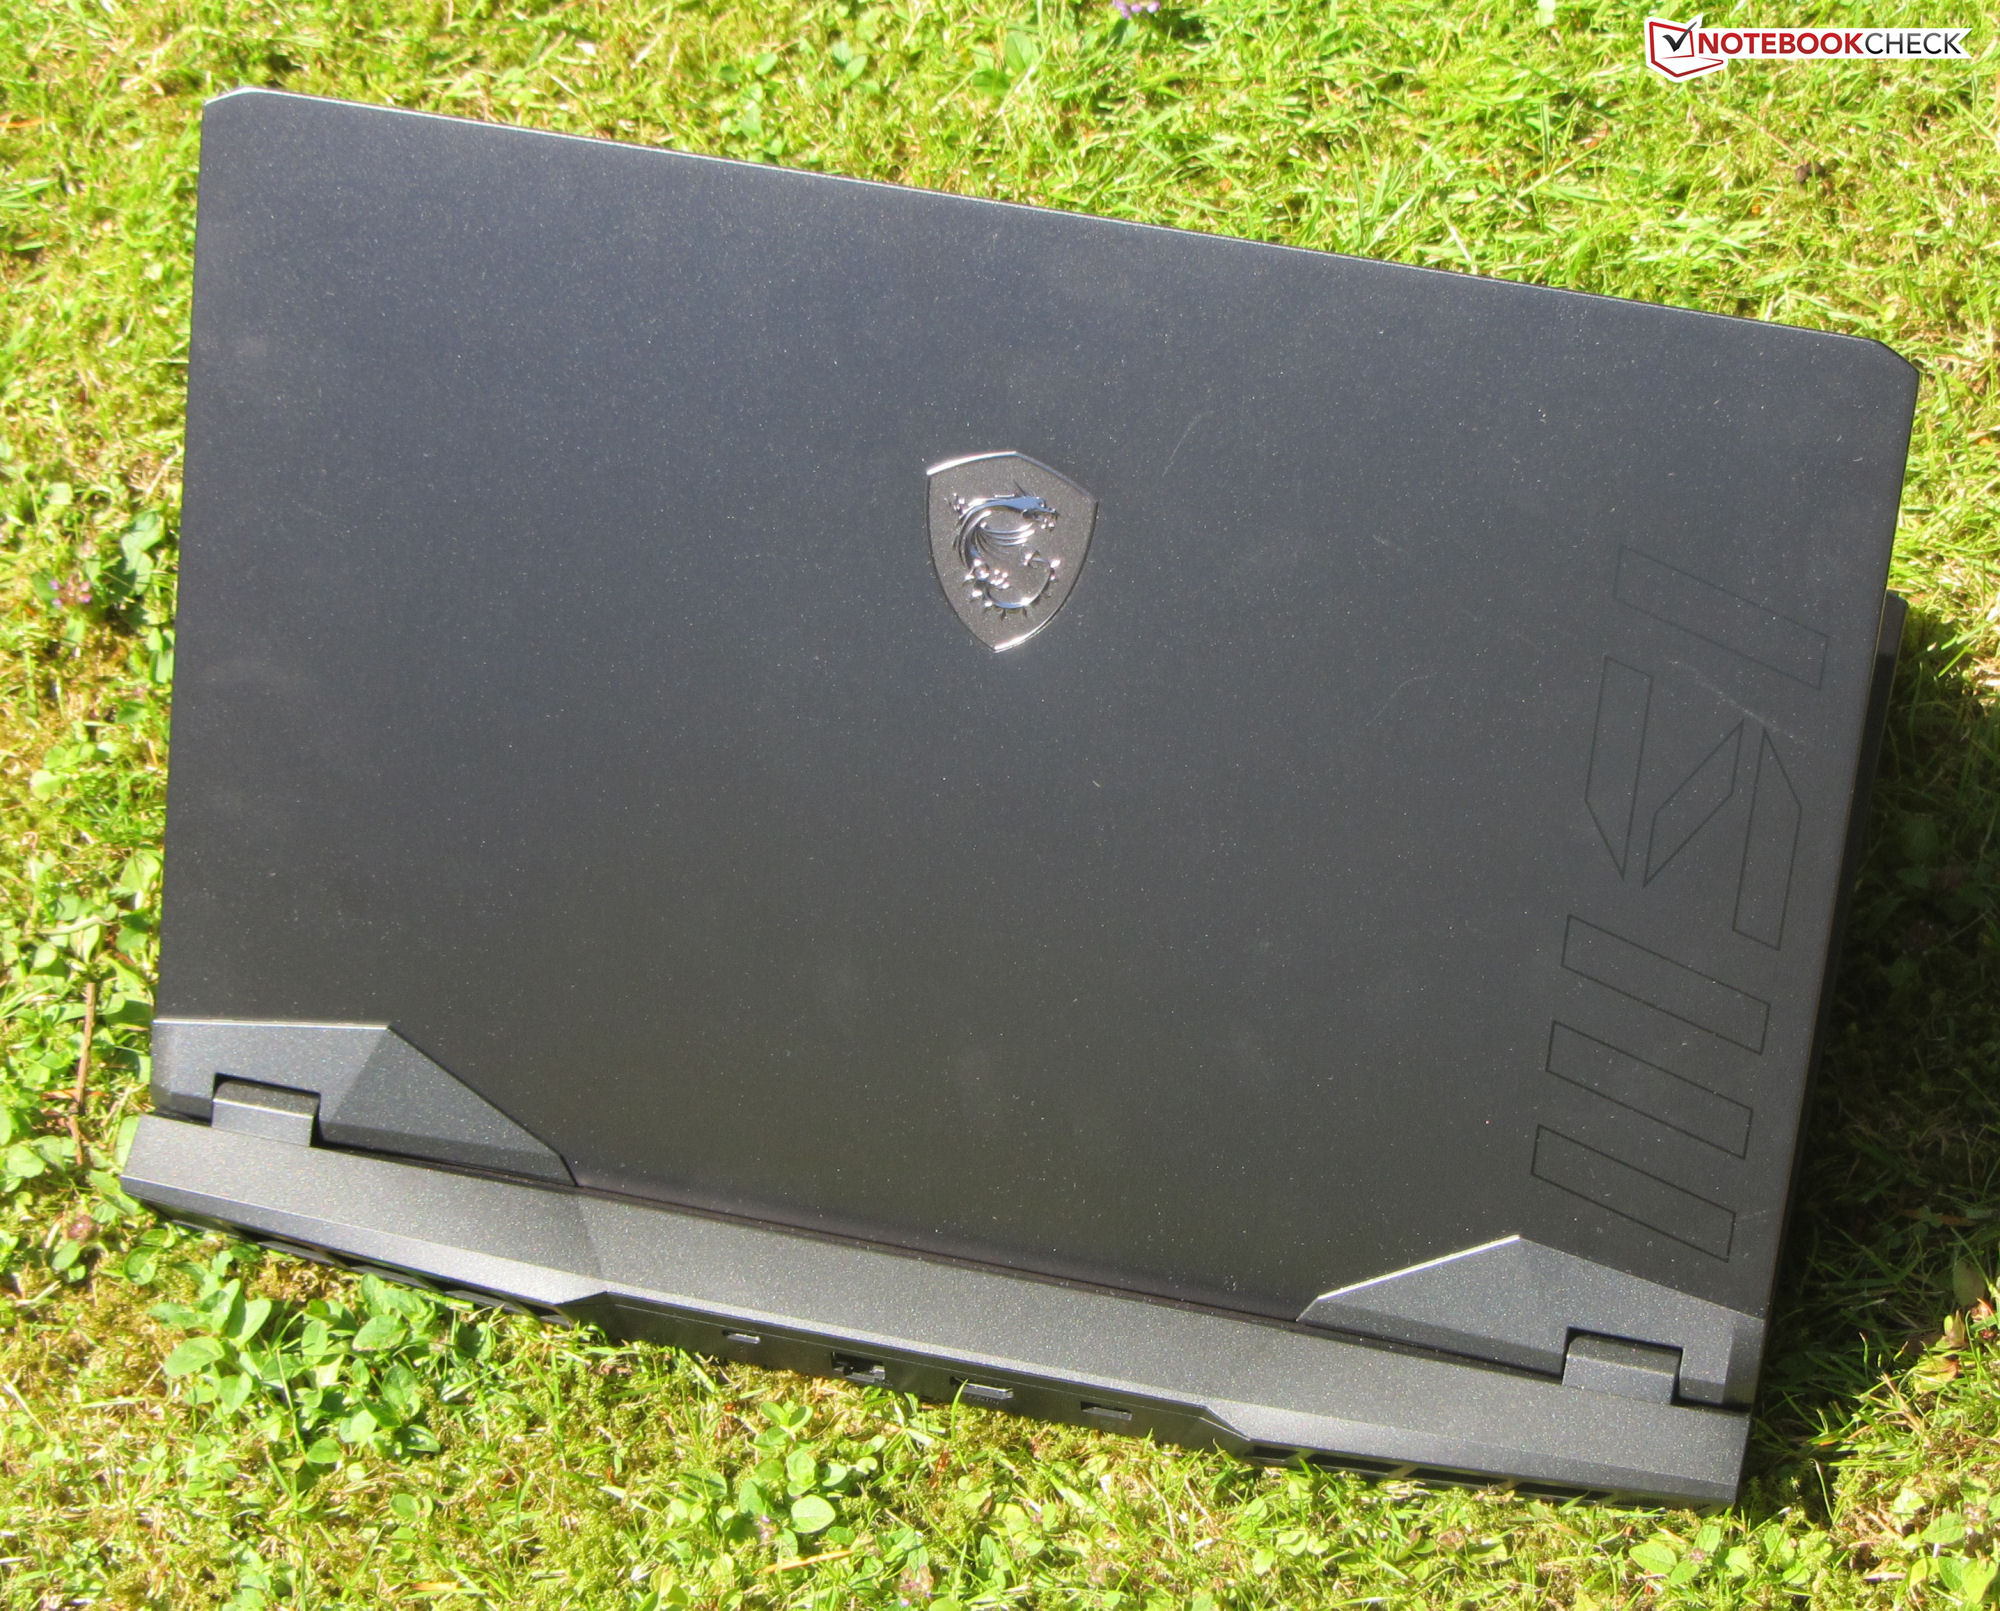
Caja - GE77 con un sutil chasis metálico
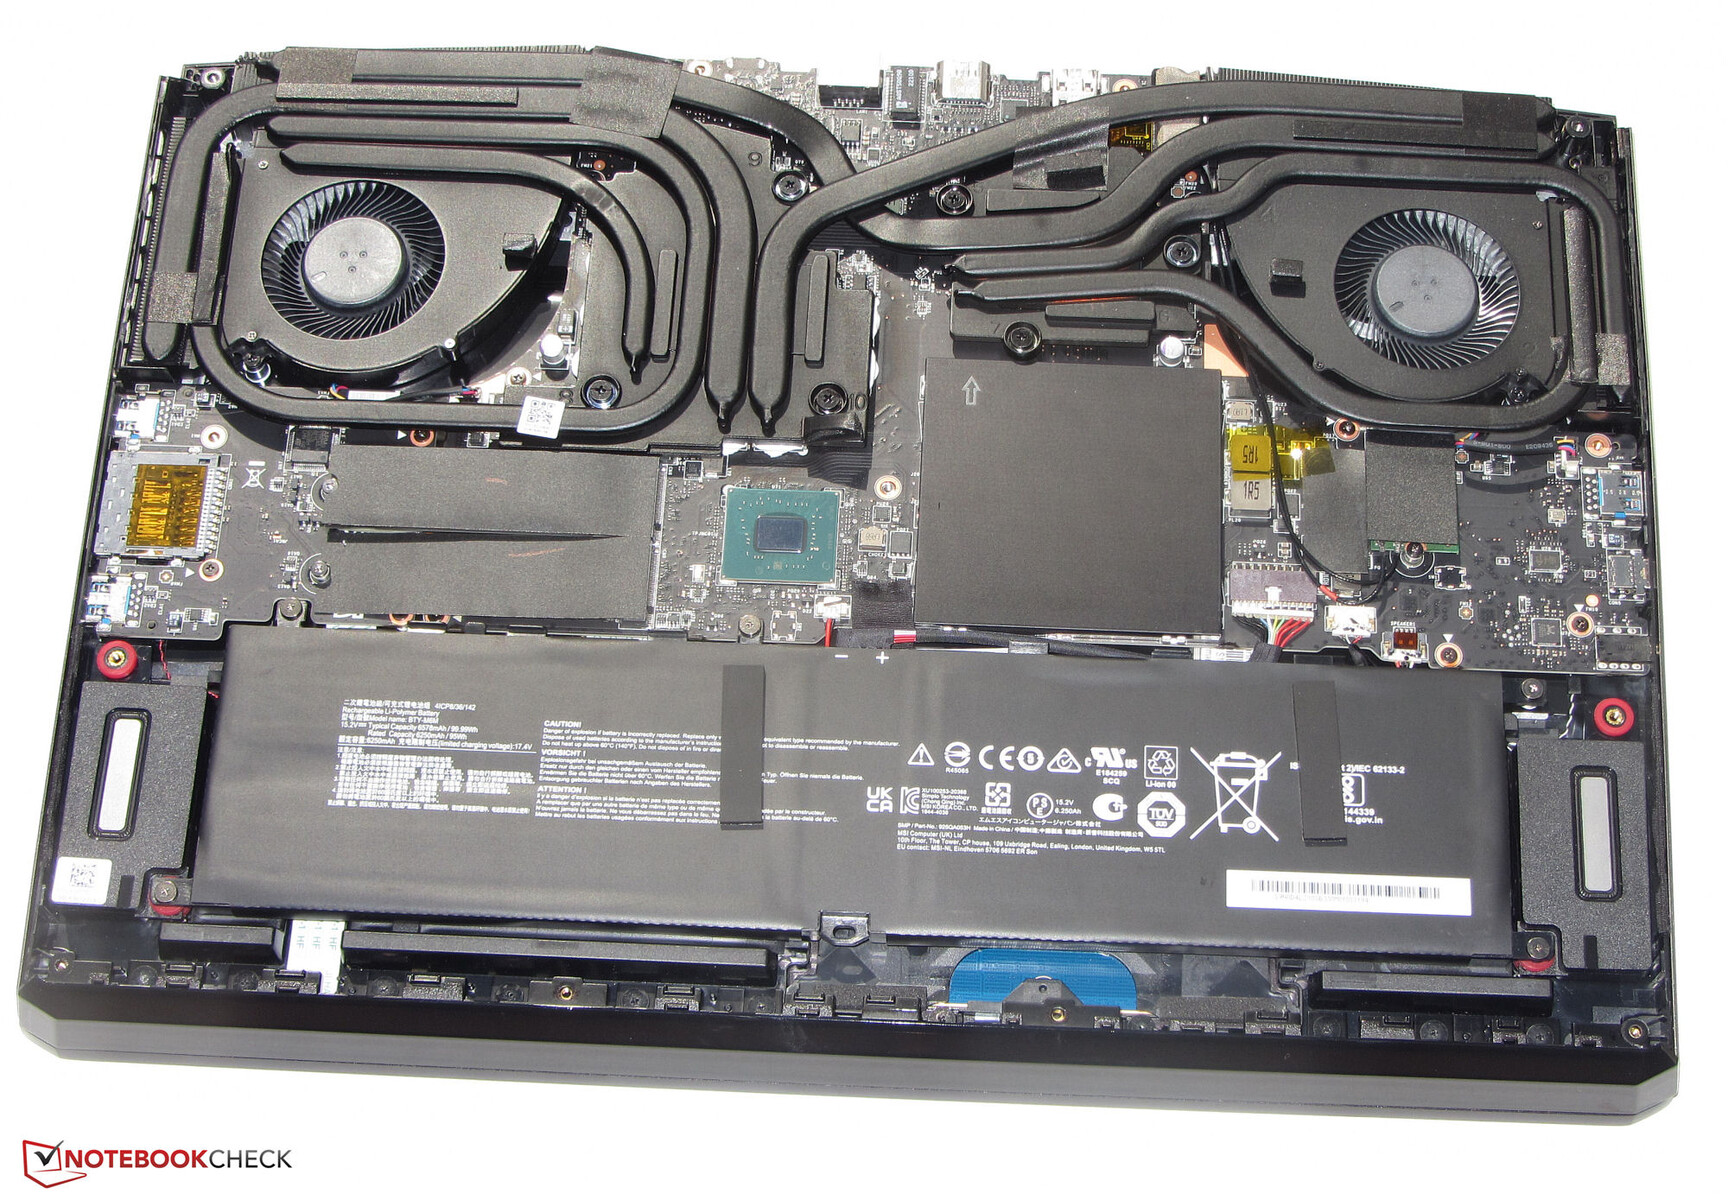
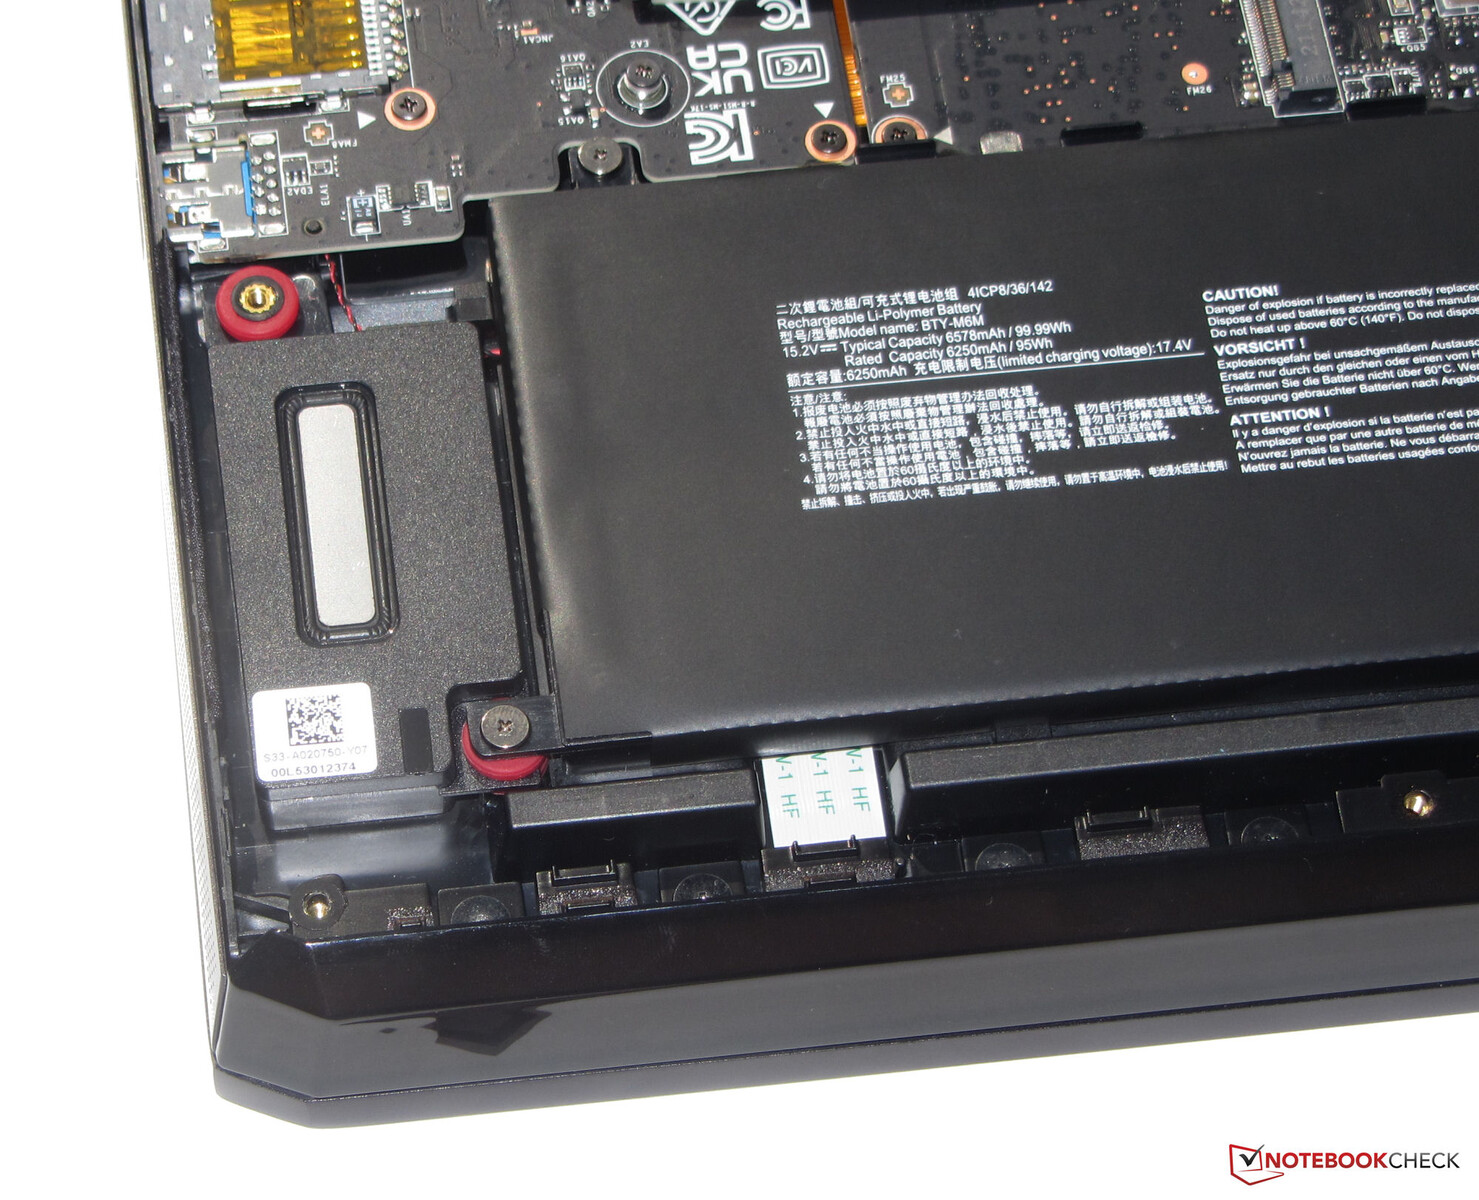
Los componentes de la Raider ocupan un chasis metálico con superficies lisas de color negro mate. Hay una tira de LEDs orientada al usuario que se puede apagar en la unidad base, lo que permite obtener efectos de luz de colores en la carcasa que, por lo demás, carece de acentos coloridos. Así, nada impide a los usuarios utilizar el dispositivo en entornos profesionales. La apariencia del portátil MSI se ve reforzada por unos biseles bastante finos. La batería interna (atornillada, no pegada) así como el resto del hardware son accesibles tras retirar la placa inferior.
No notamos ningún defecto de fabricación en el dispositivo de 17,3 pulgadas. Las holguras son uniformes y no hay salientes de material en exceso. La unidad base es muy resistente a la torsión de las esquinas, mientras que la tapa puede retorcerse ligeramente. Ambas entran dentro de los rangos normales. Las bisagras mantienen la tapa firmemente en su sitio, pero permiten cierto balanceo. La tapa puede abrirse hasta un ángulo máximo de unos 140 grados. También se puede abrir con una sola mano.

En nuestra comparación, el portátil MSI y el Alienware x17 R2 son los dispositivos más pesados. En cuanto a las dimensiones, el GE77 cae en el rango medio - no tan compacto como el Blade y el X30pero significativamente más compacto que el x17.
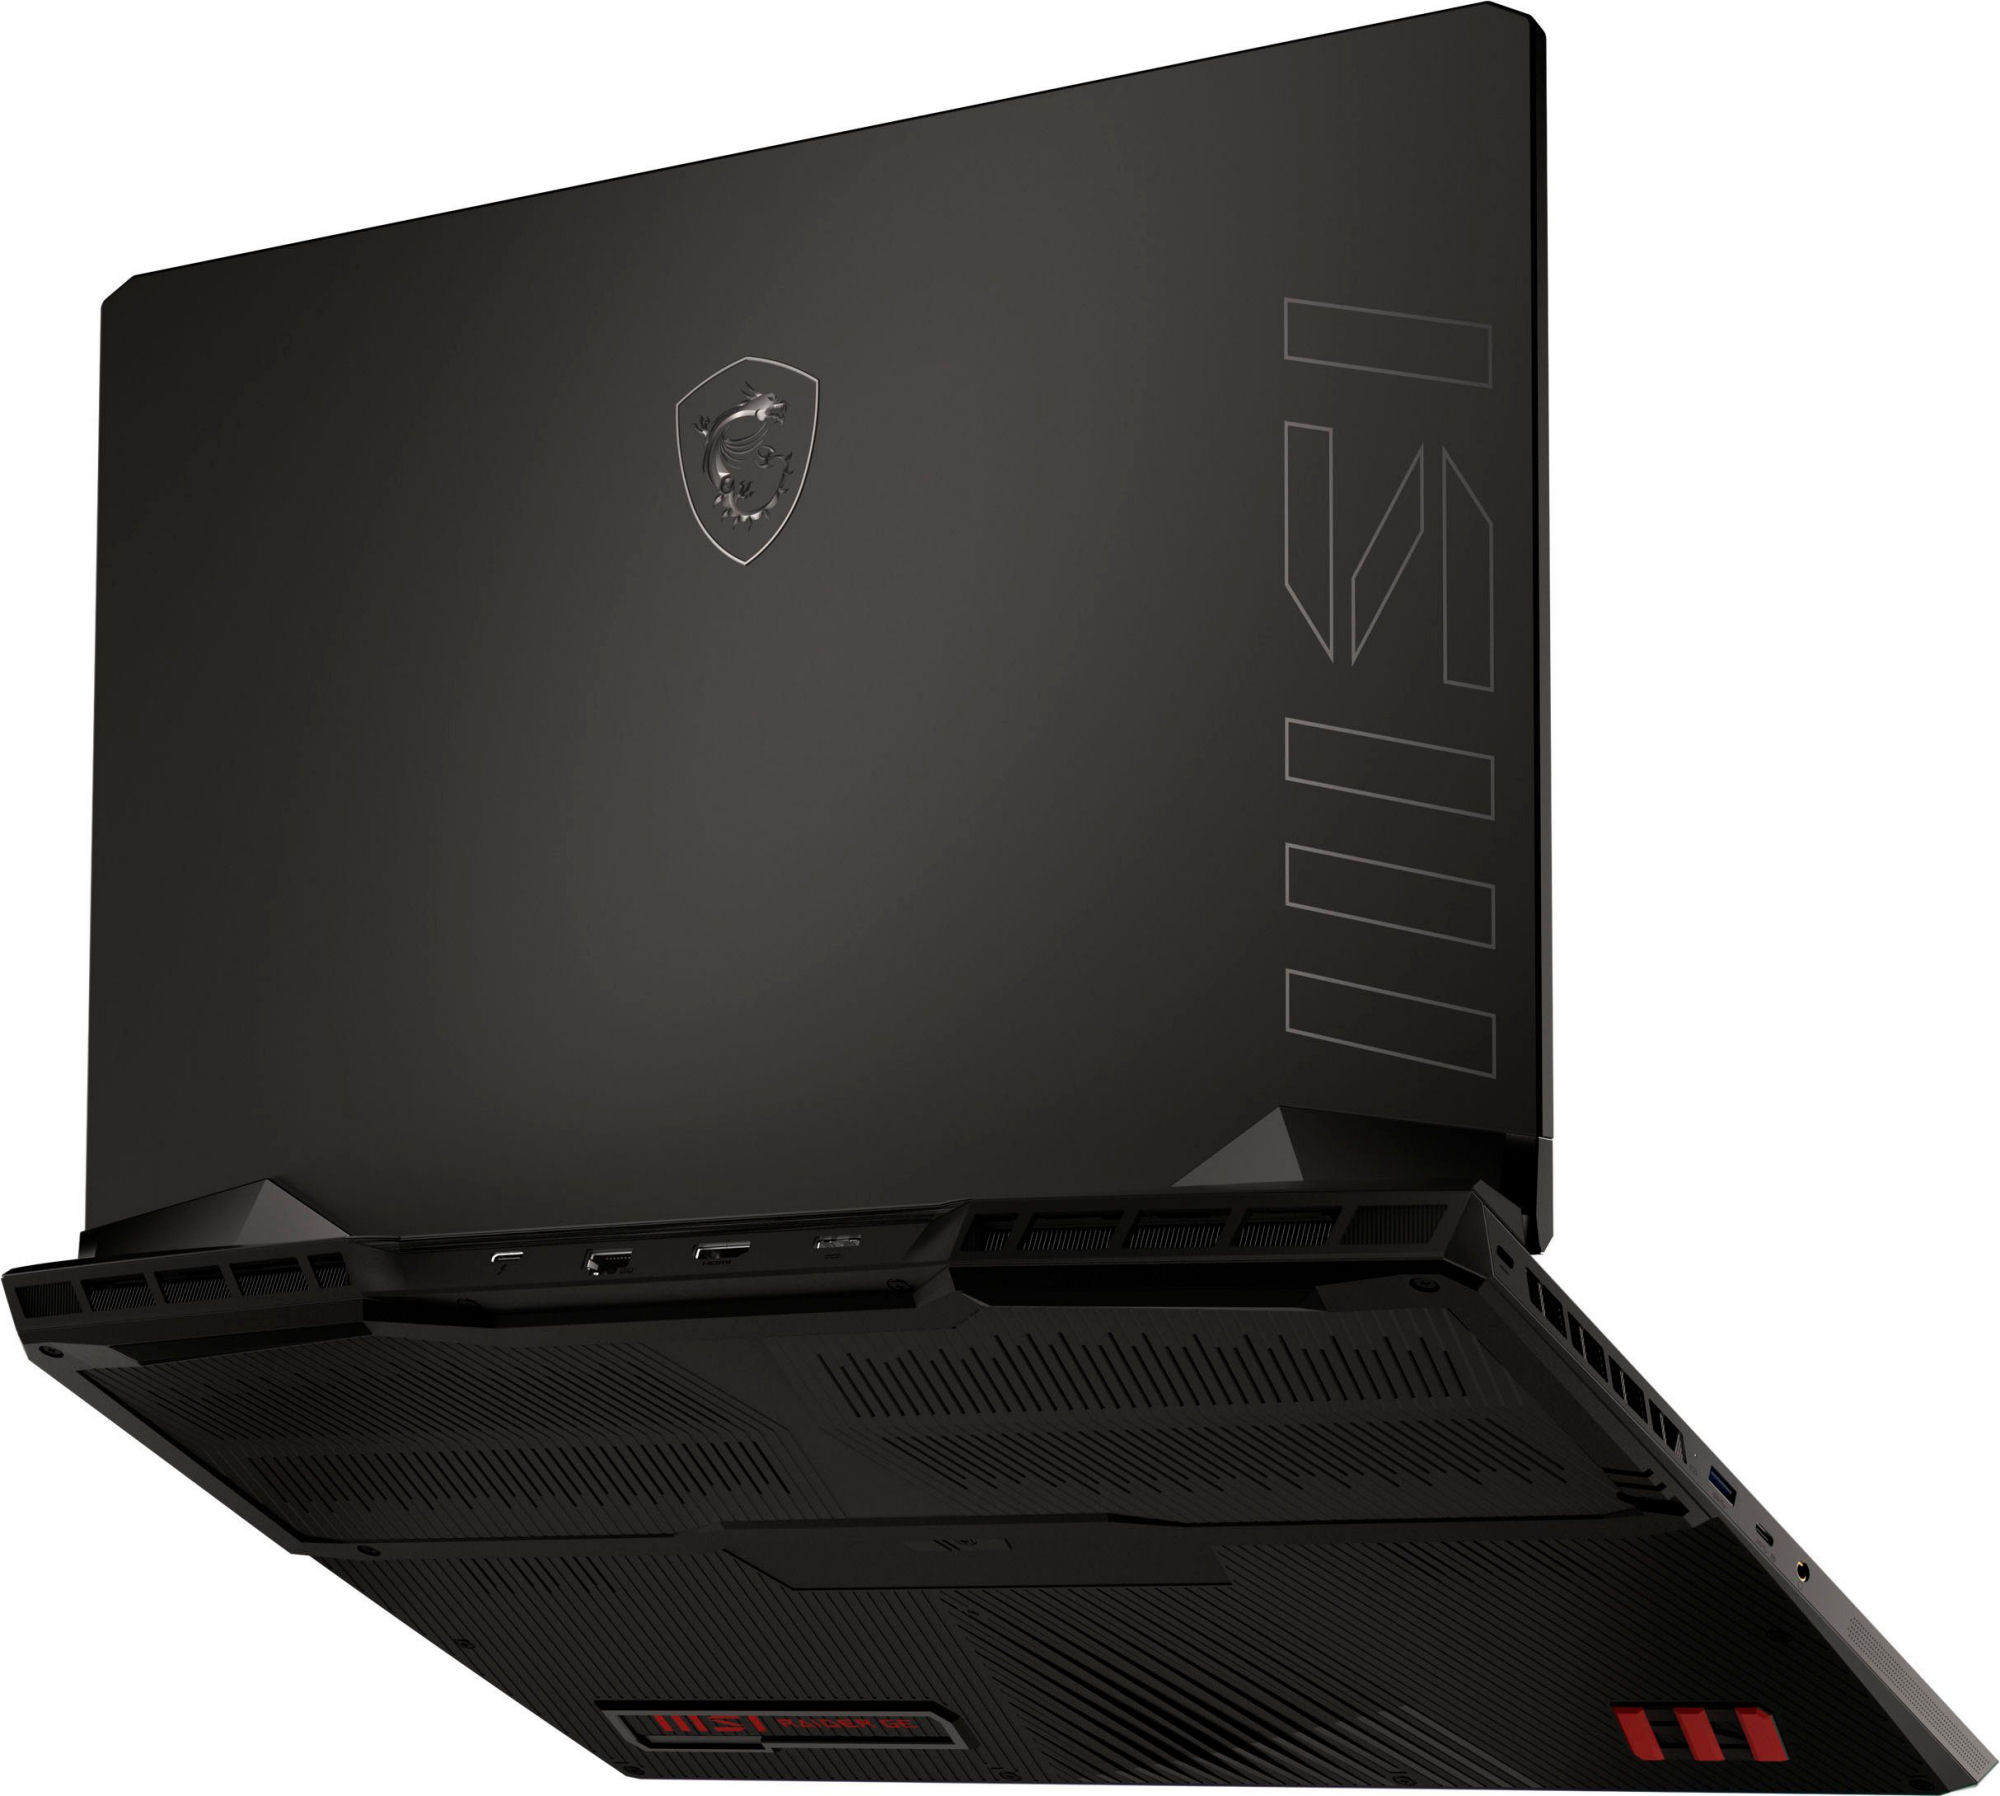
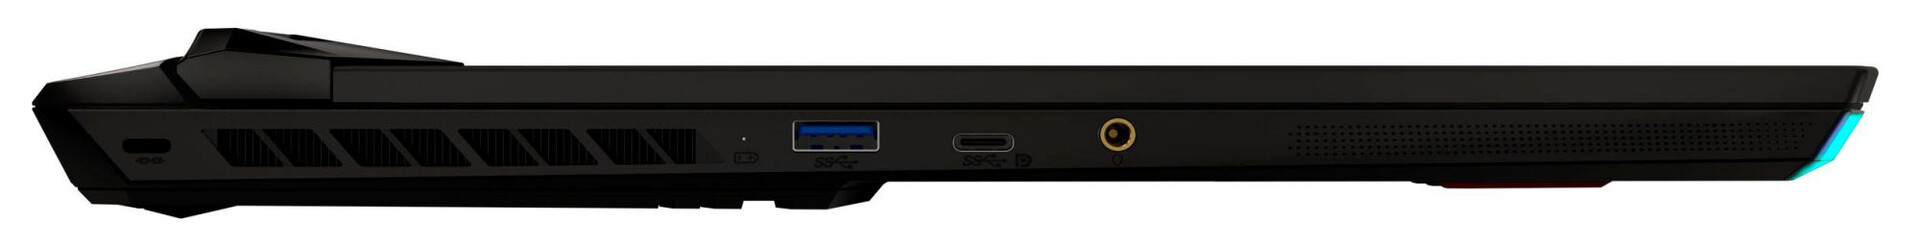
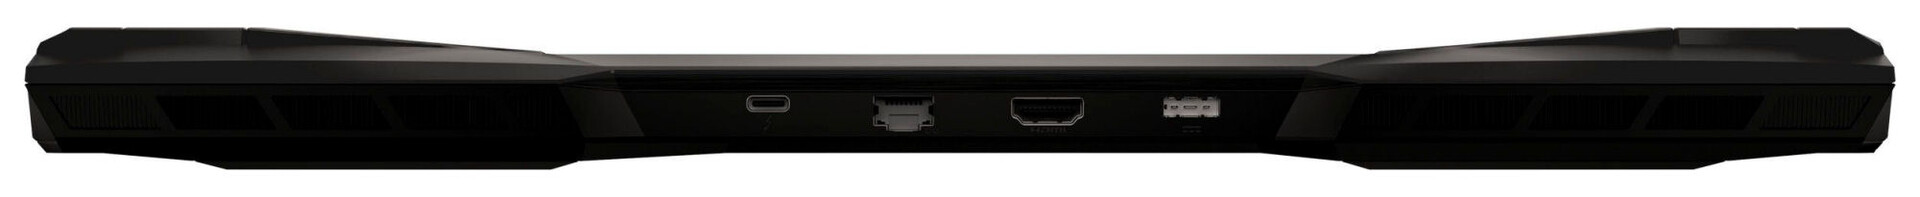
Conectividad - Sistema MSI con Thunderbolt 4
El GE77 viene con tres puertos USB-A (1x USB 3.2 Gen 2, 2x USB 3.2 Gen 1) y dos puertos USB-C (1x Thunderbolt 4, 1x USB 3.2 Gen 2). Estos últimos admiten DisplayPort a través de USB-C, pero no Power Delivery. En total, el sistema tiene tres salidas de vídeo (2x DP, 1x HDMI). Además, hay una toma de audio combinada, un puerto Ethernet de 2,5 Gb/s y un puerto de bloqueo de cables.
Hay puertos en tres lados de la carcasa. Dos salidas de vídeo, el puerto Ethernet y el puerto del adaptador de CA están en la parte posterior de la carcasa. Esto simplifica la gestión de los cables, ya que es menos probable que se interpongan en el camino.
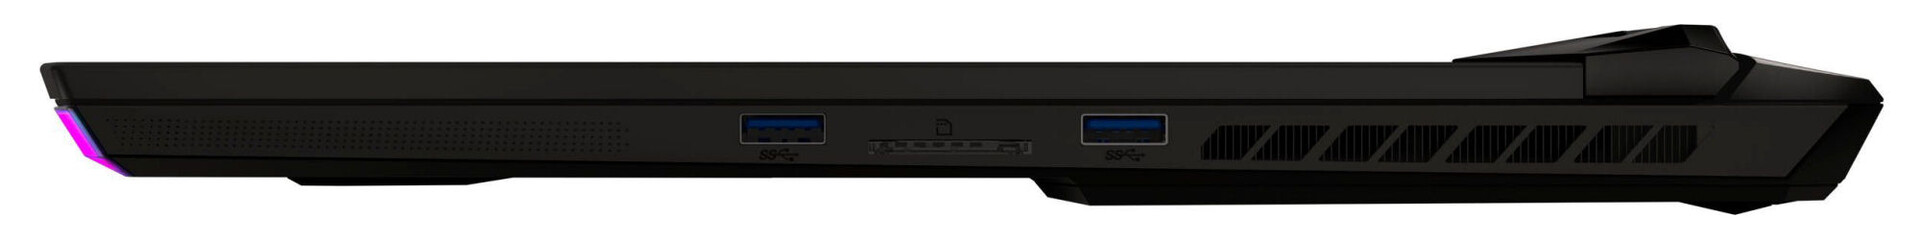
Lector de tarjetas SD
| SD Card Reader - average JPG Copy Test (av. of 3 runs) | |
| Alienware x17 R2 P48E (AV Pro V60) | |
| Razer Blade 17 Early 2022 (AV PRO microSD 128 GB V60) | |
| Media de la clase Gaming (20.9 - 210, n=54, últimos 2 años) | |
| Medion Erazer Beast X30 (AV PRO microSD 128 GB V60) | |
| MSI Raider GE77 HX 12UHS (AV PRO microSD 128 GB V60) | |
Comunicación
Registramos excelentes tasas de transferencia Wi-Fi en condiciones óptimas (sin otros dispositivos Wi-Fi en las proximidades, poca distancia entre el portátil y el servidor) y agotamos las capacidades de los chips Wi-Fi (Killer AX1675i = Intel AX211; 802.11 ax).
También hay un chip Ethernet (Killer E3100G, 2,5 Gb/s) para las comunicaciones por cable.
| Networking - iperf3 receive AXE11000 6GHz | |
| MSI Raider GE77 HX 12UHS | |
| Media de la clase Gaming (975 - 1775, n=35, últimos 2 años) | |
| Medio Killer Wi-Fi 6E AX1675i 160MHz Wireless Network Adapter (1327 - 1788, n=20) | |
Cámara web
La webcam captura imágenes a una resolución máxima de 1920 x 1080. La precisión del color es mediocre. Los colores se desvían de sus valores ideales. No hay cubierta mecánica para la webcam.


Accesorios
El portátil viene con los documentos habituales (guía de inicio rápido, información sobre la garantía).
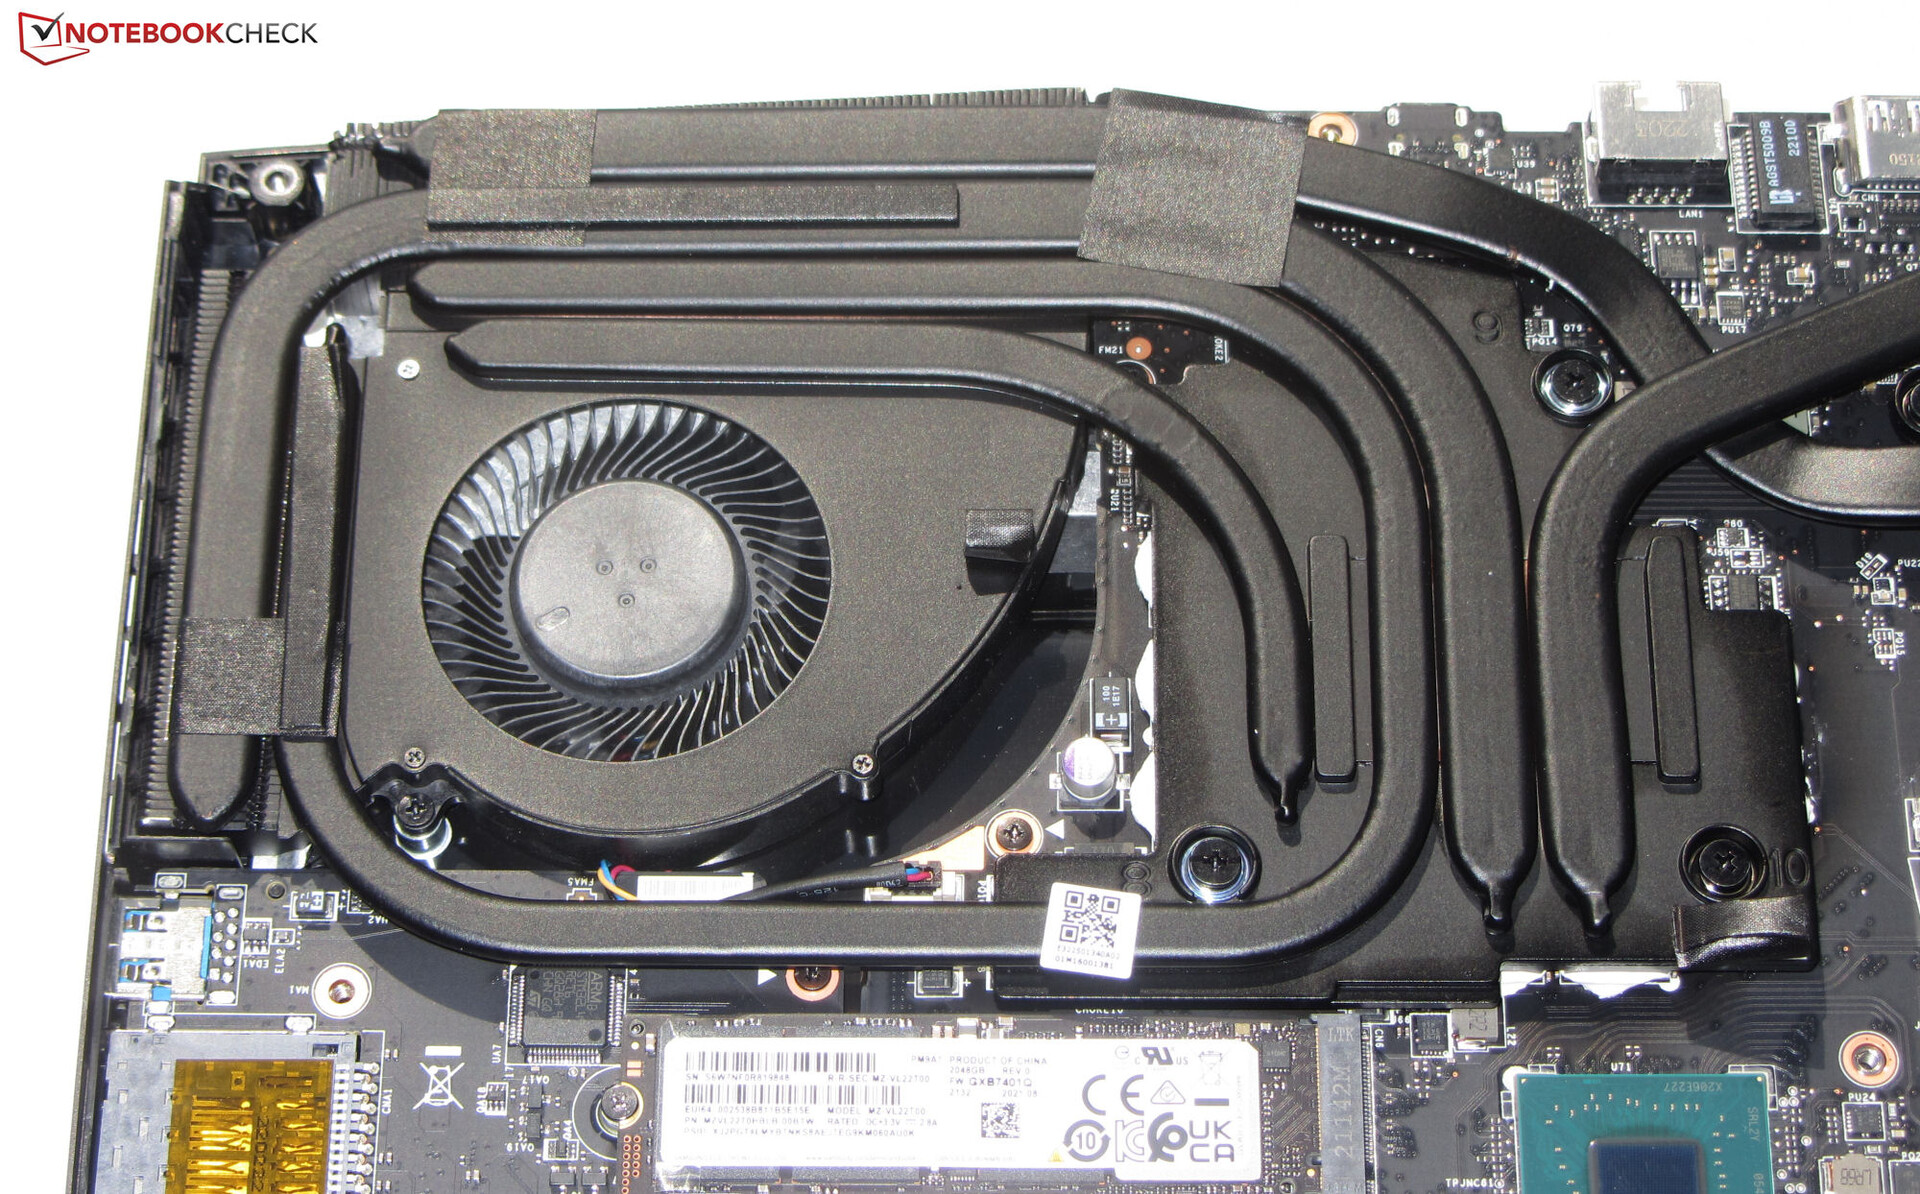
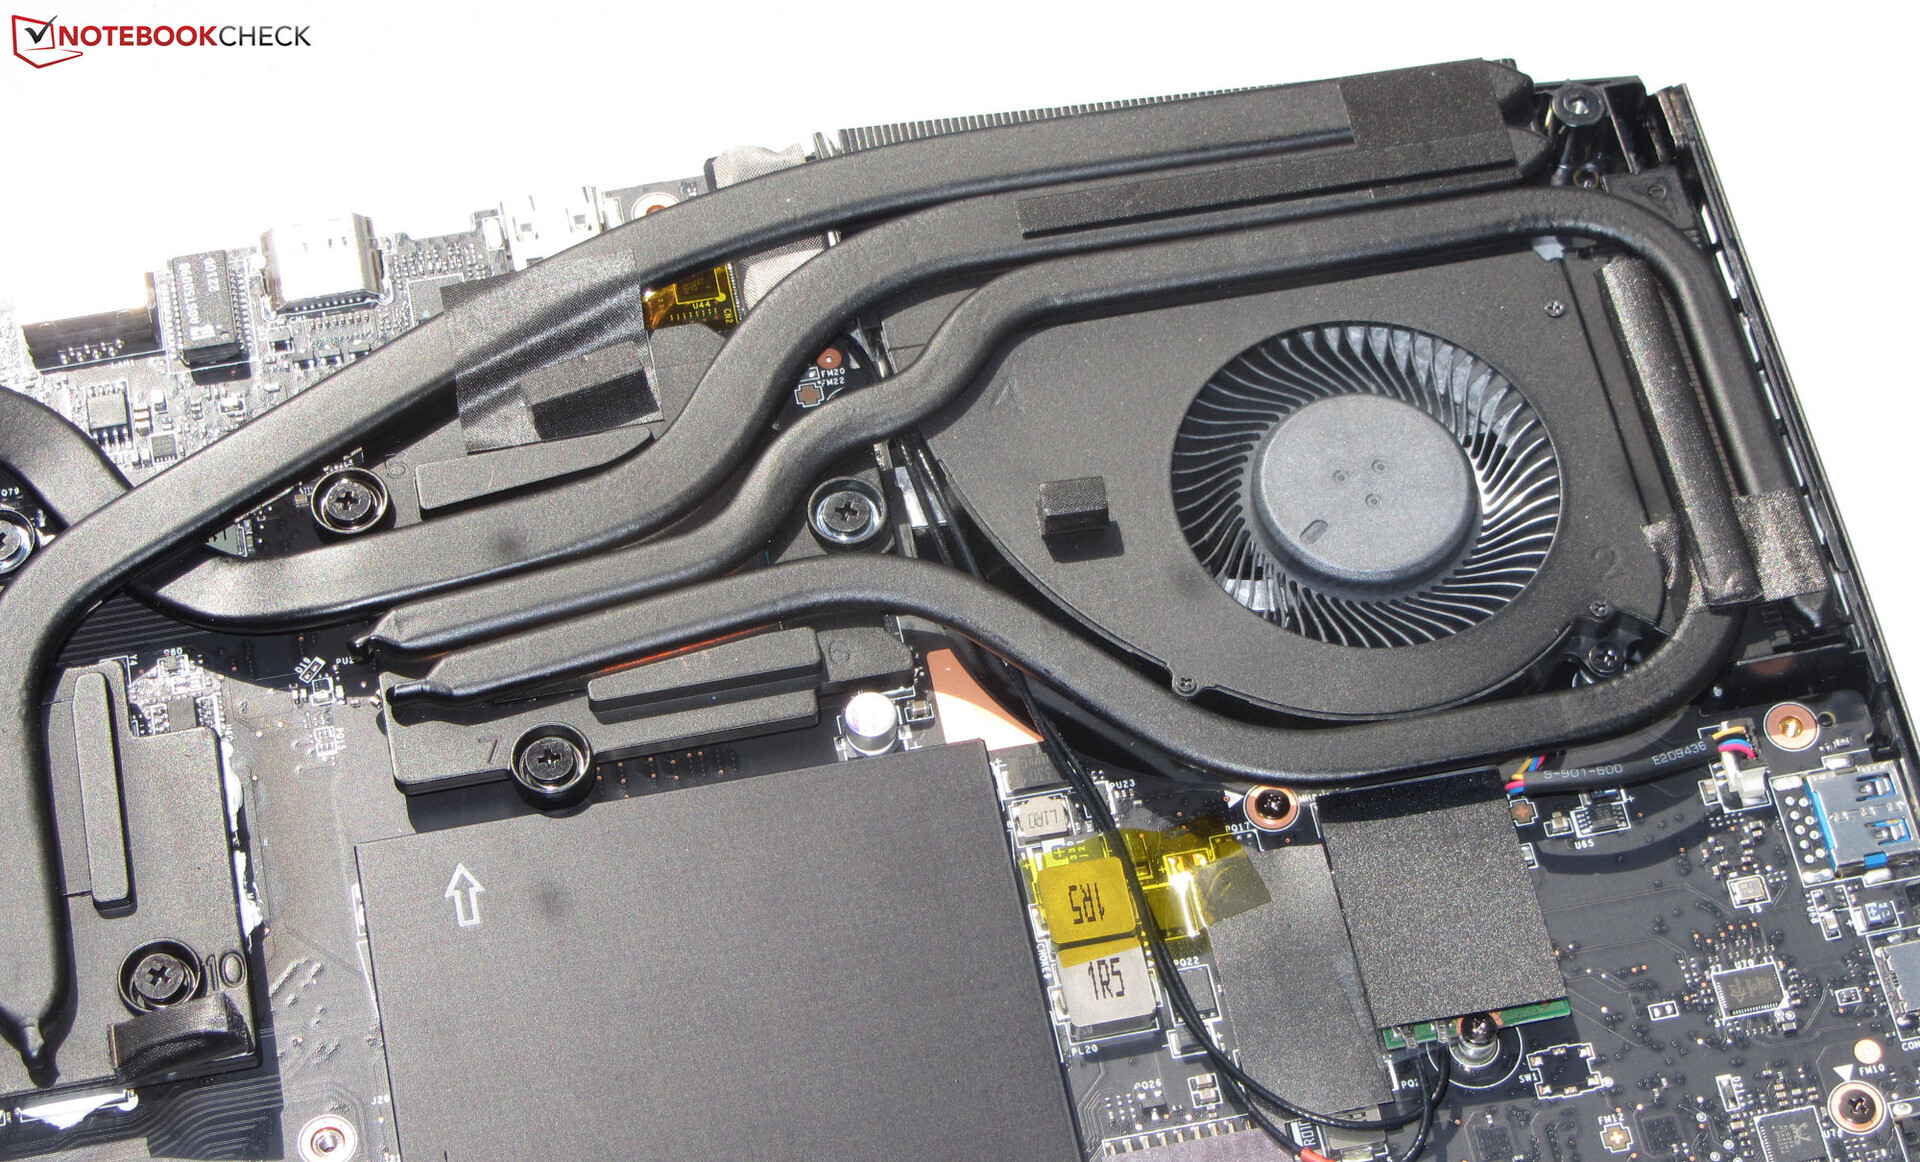
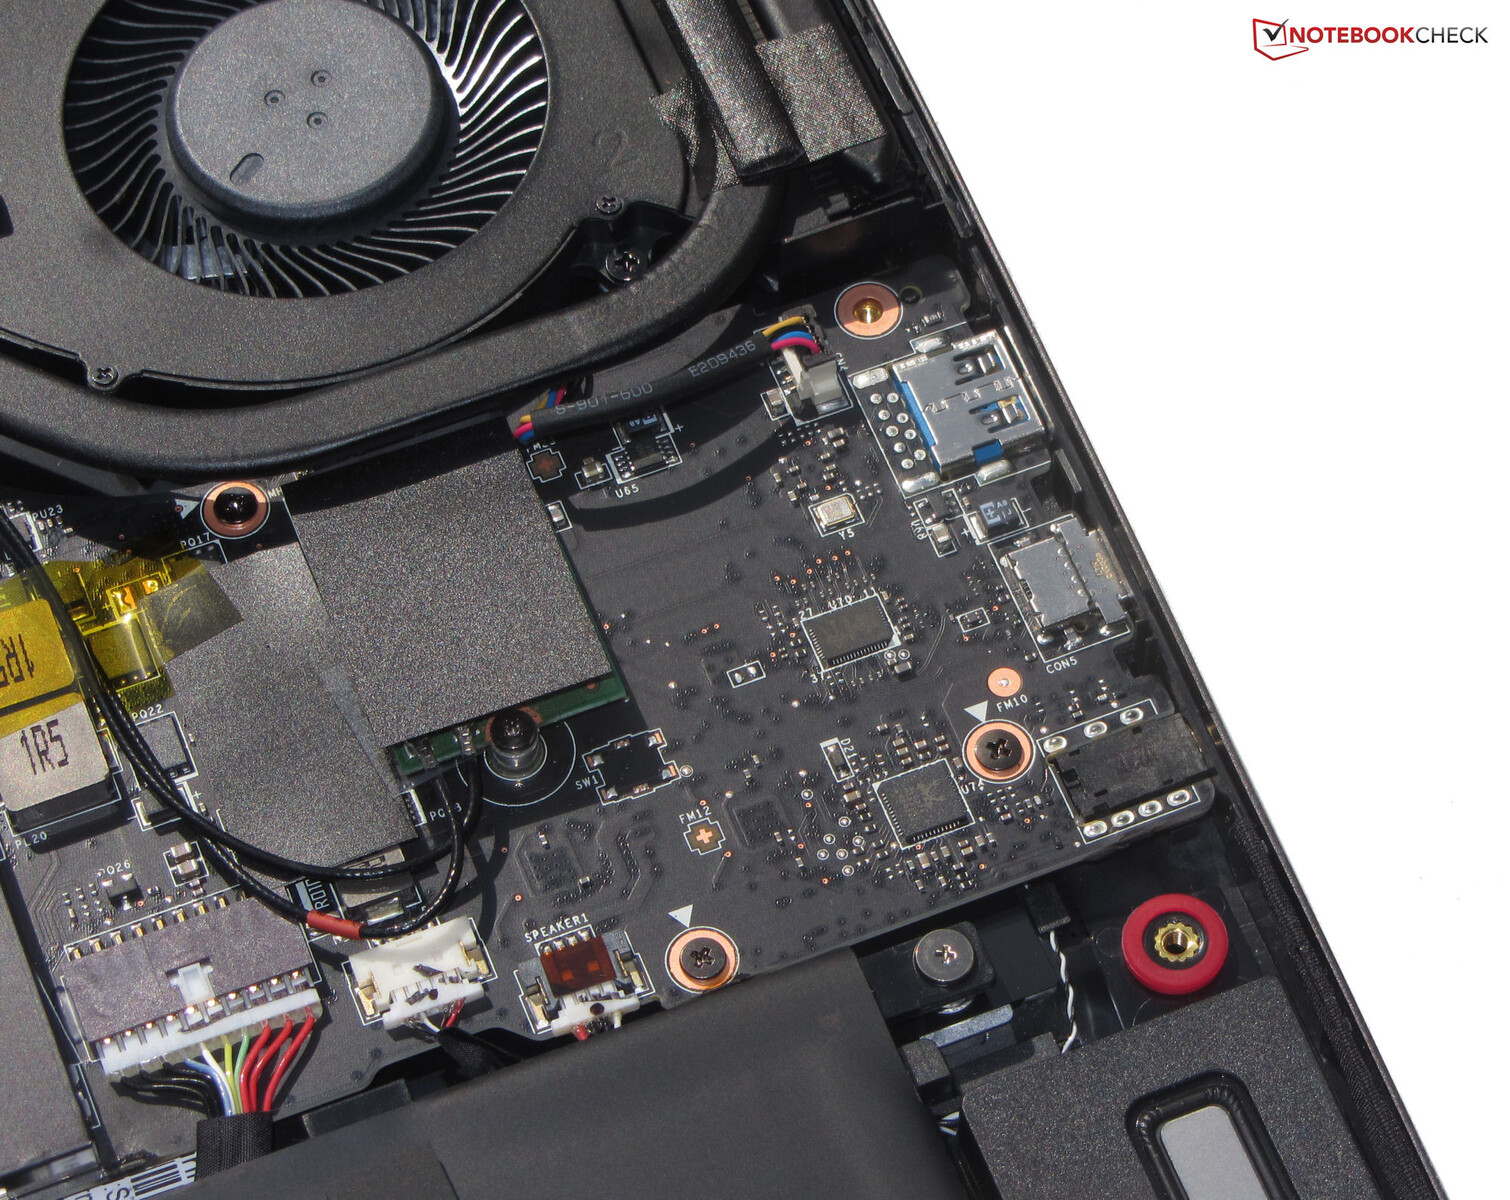
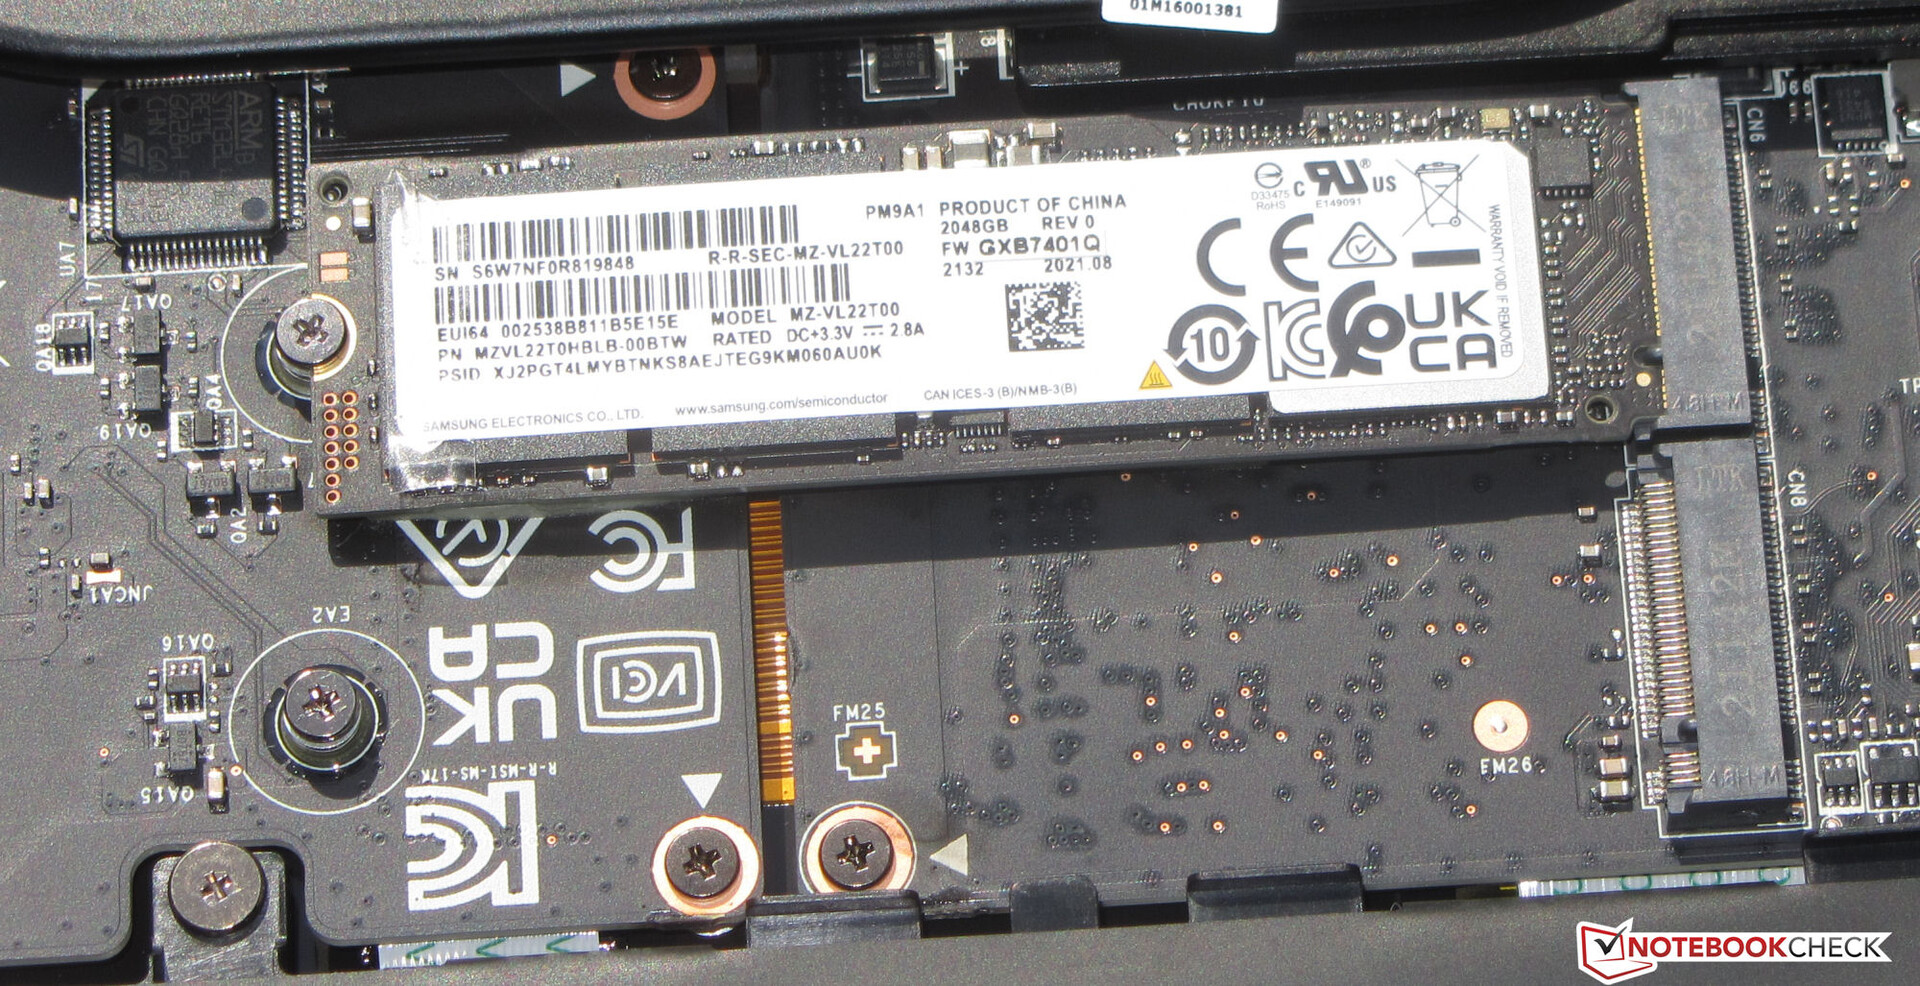
Mantenimiento
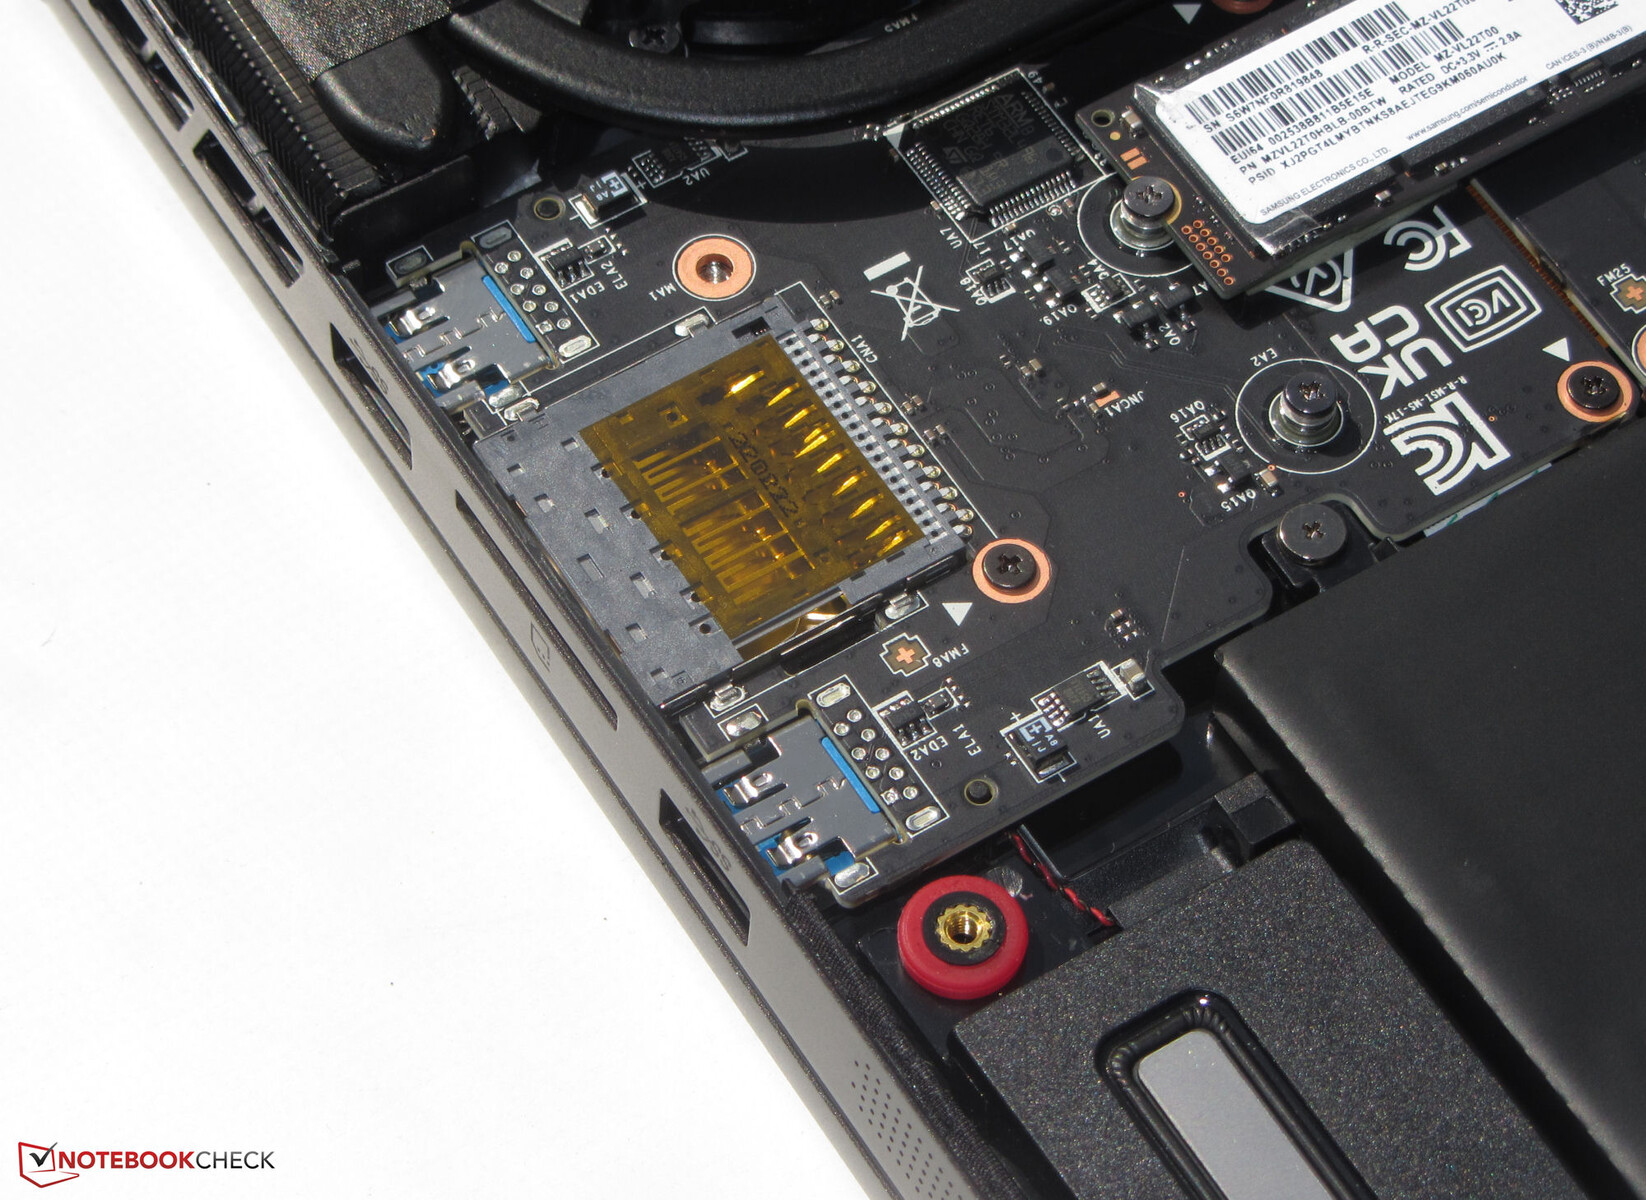
El mantenimiento y las actualizaciones se pueden realizar sin problemas. Tras aflojar todos los tornillos de la parte inferior, la placa inferior se puede sacar con bastante facilidad - un objeto con un borde afilado puede ser útil aquí. Entonces, los usuarios tienen acceso al SSD (PCIe4, M.2-2280), la ranura del SSD secundario (PCIe4, M.2-2280), el módulo Wi-Fi, la batería, la RAM (oculta bajo una cubierta adicional bien adherida), los altavoces y los ventiladores.
Garantía
MSI ofrece una garantía limitada estándar de un año. Las ampliaciones de la garantía a dos y tres años cuestan 80 y 140 dólares, respectivamente.
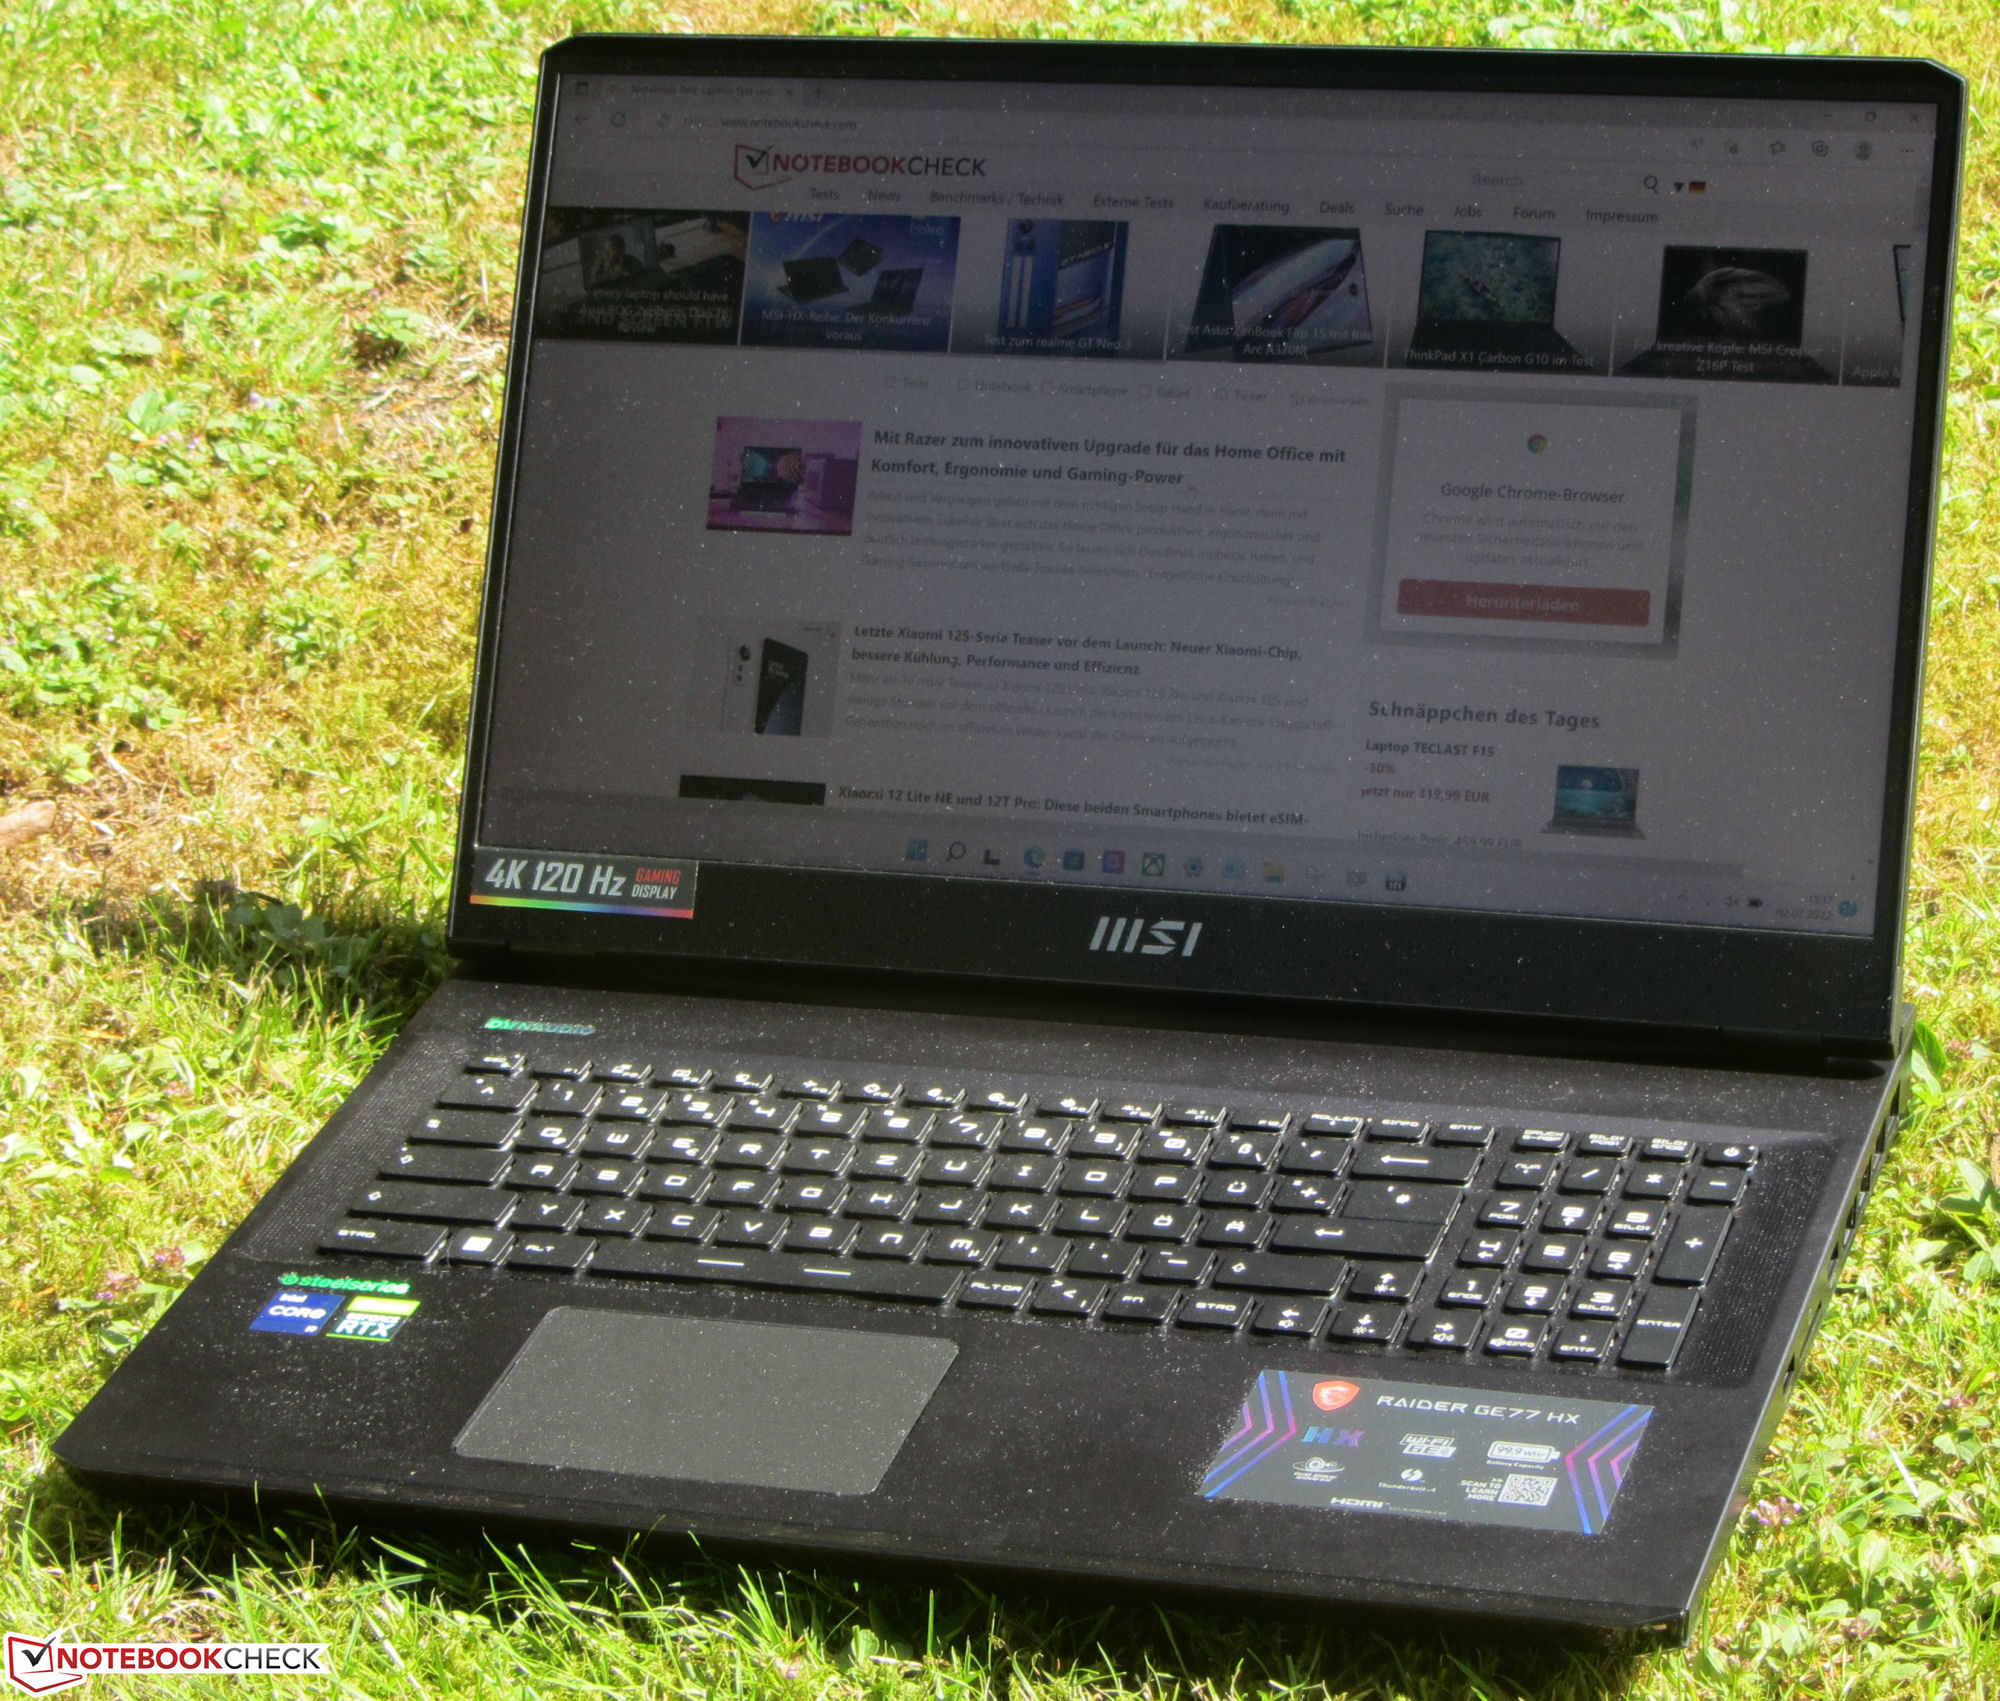
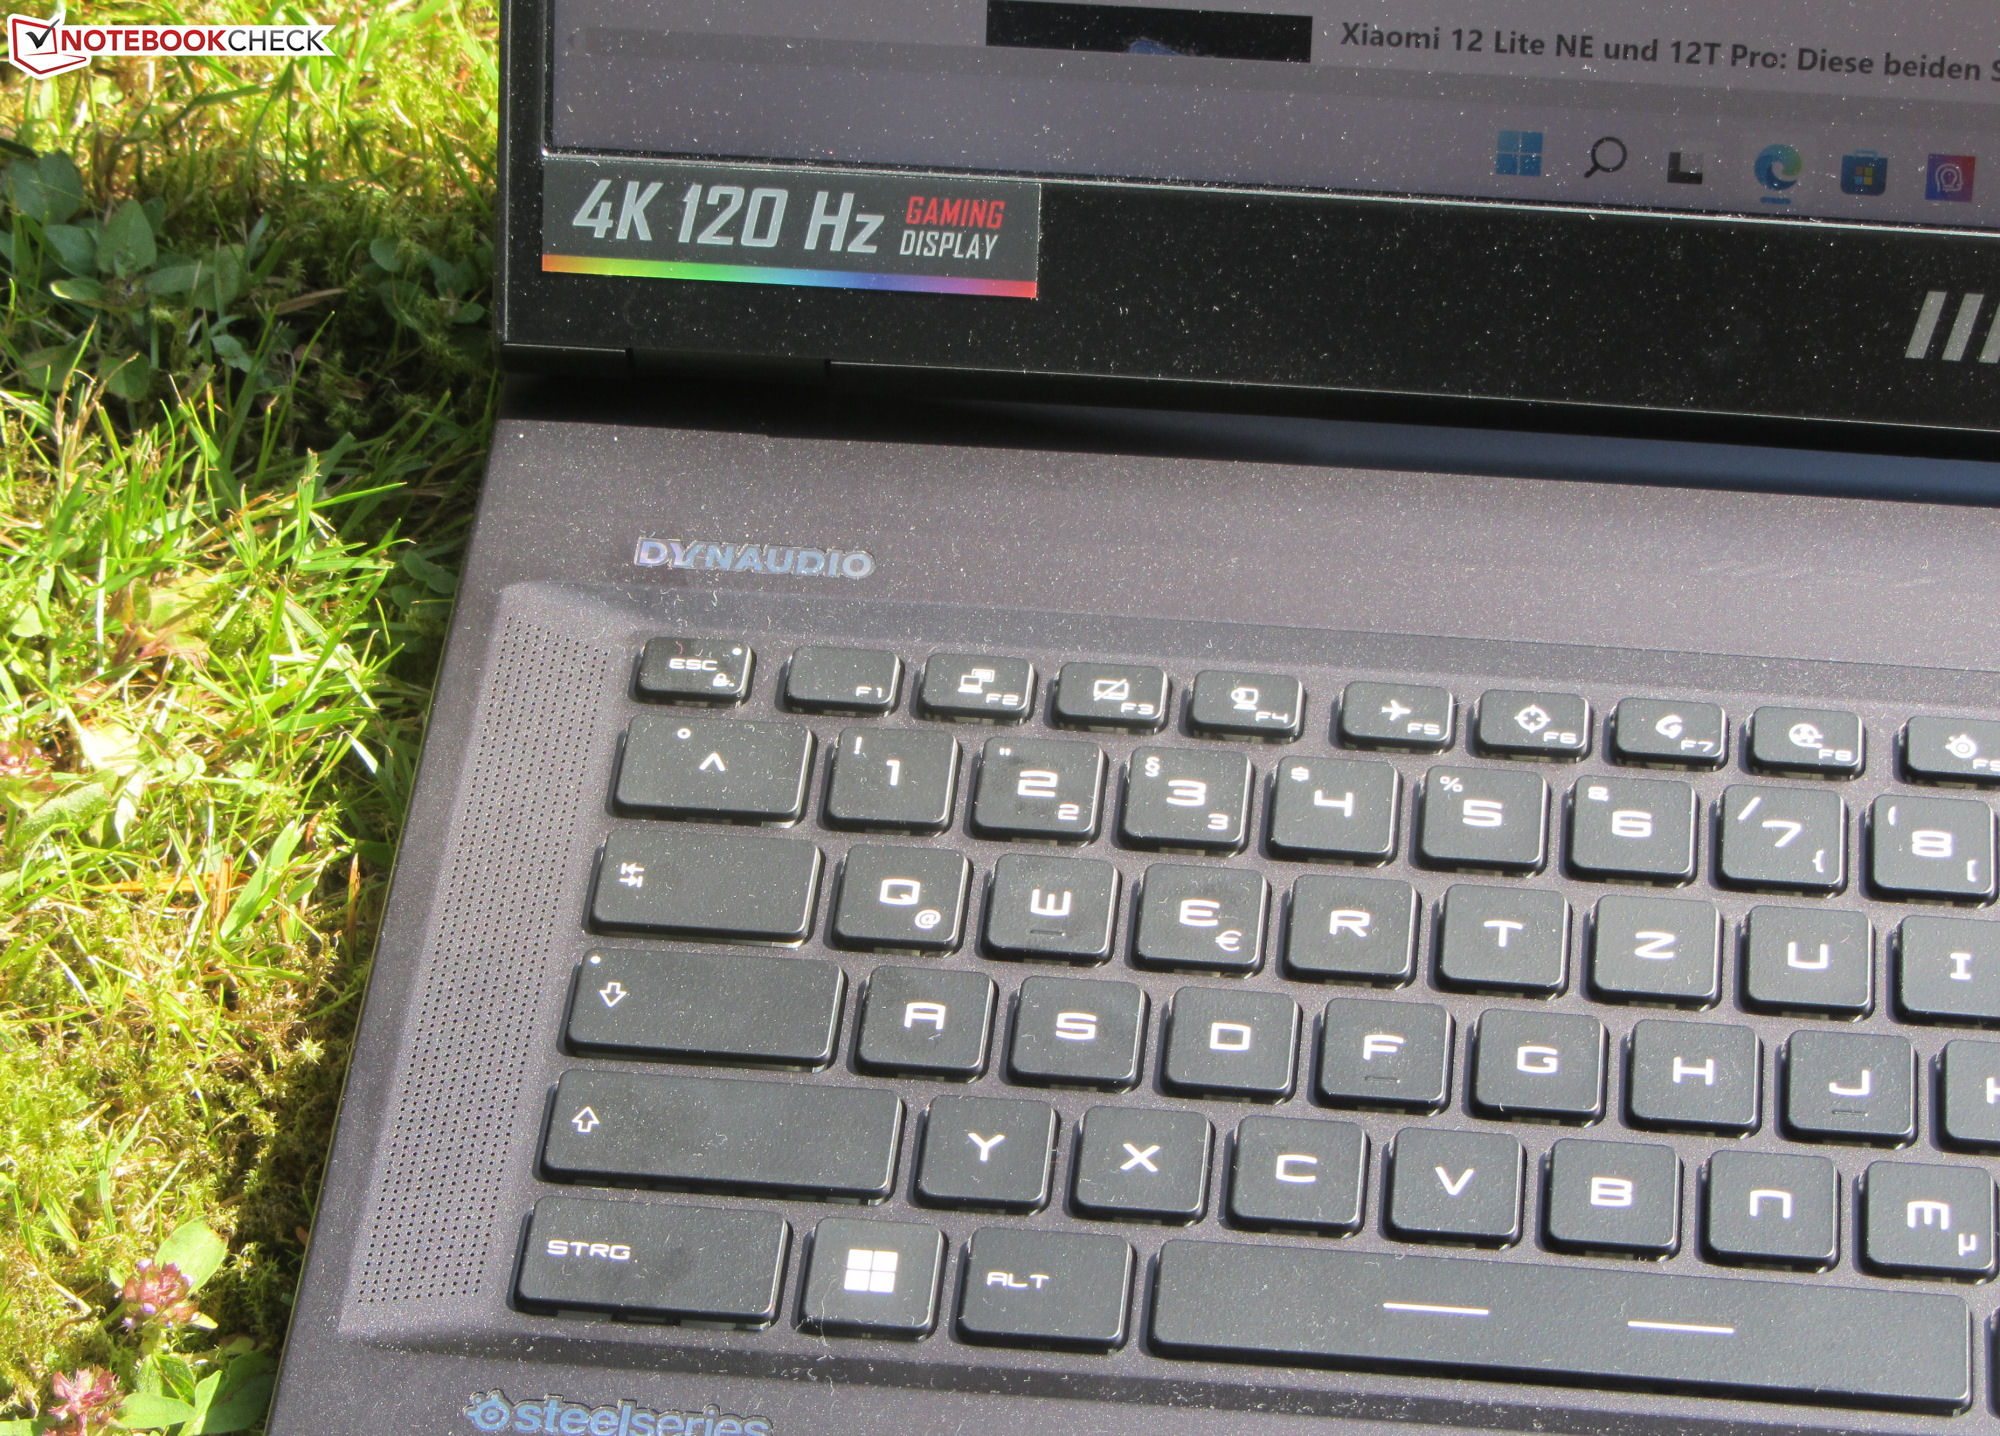
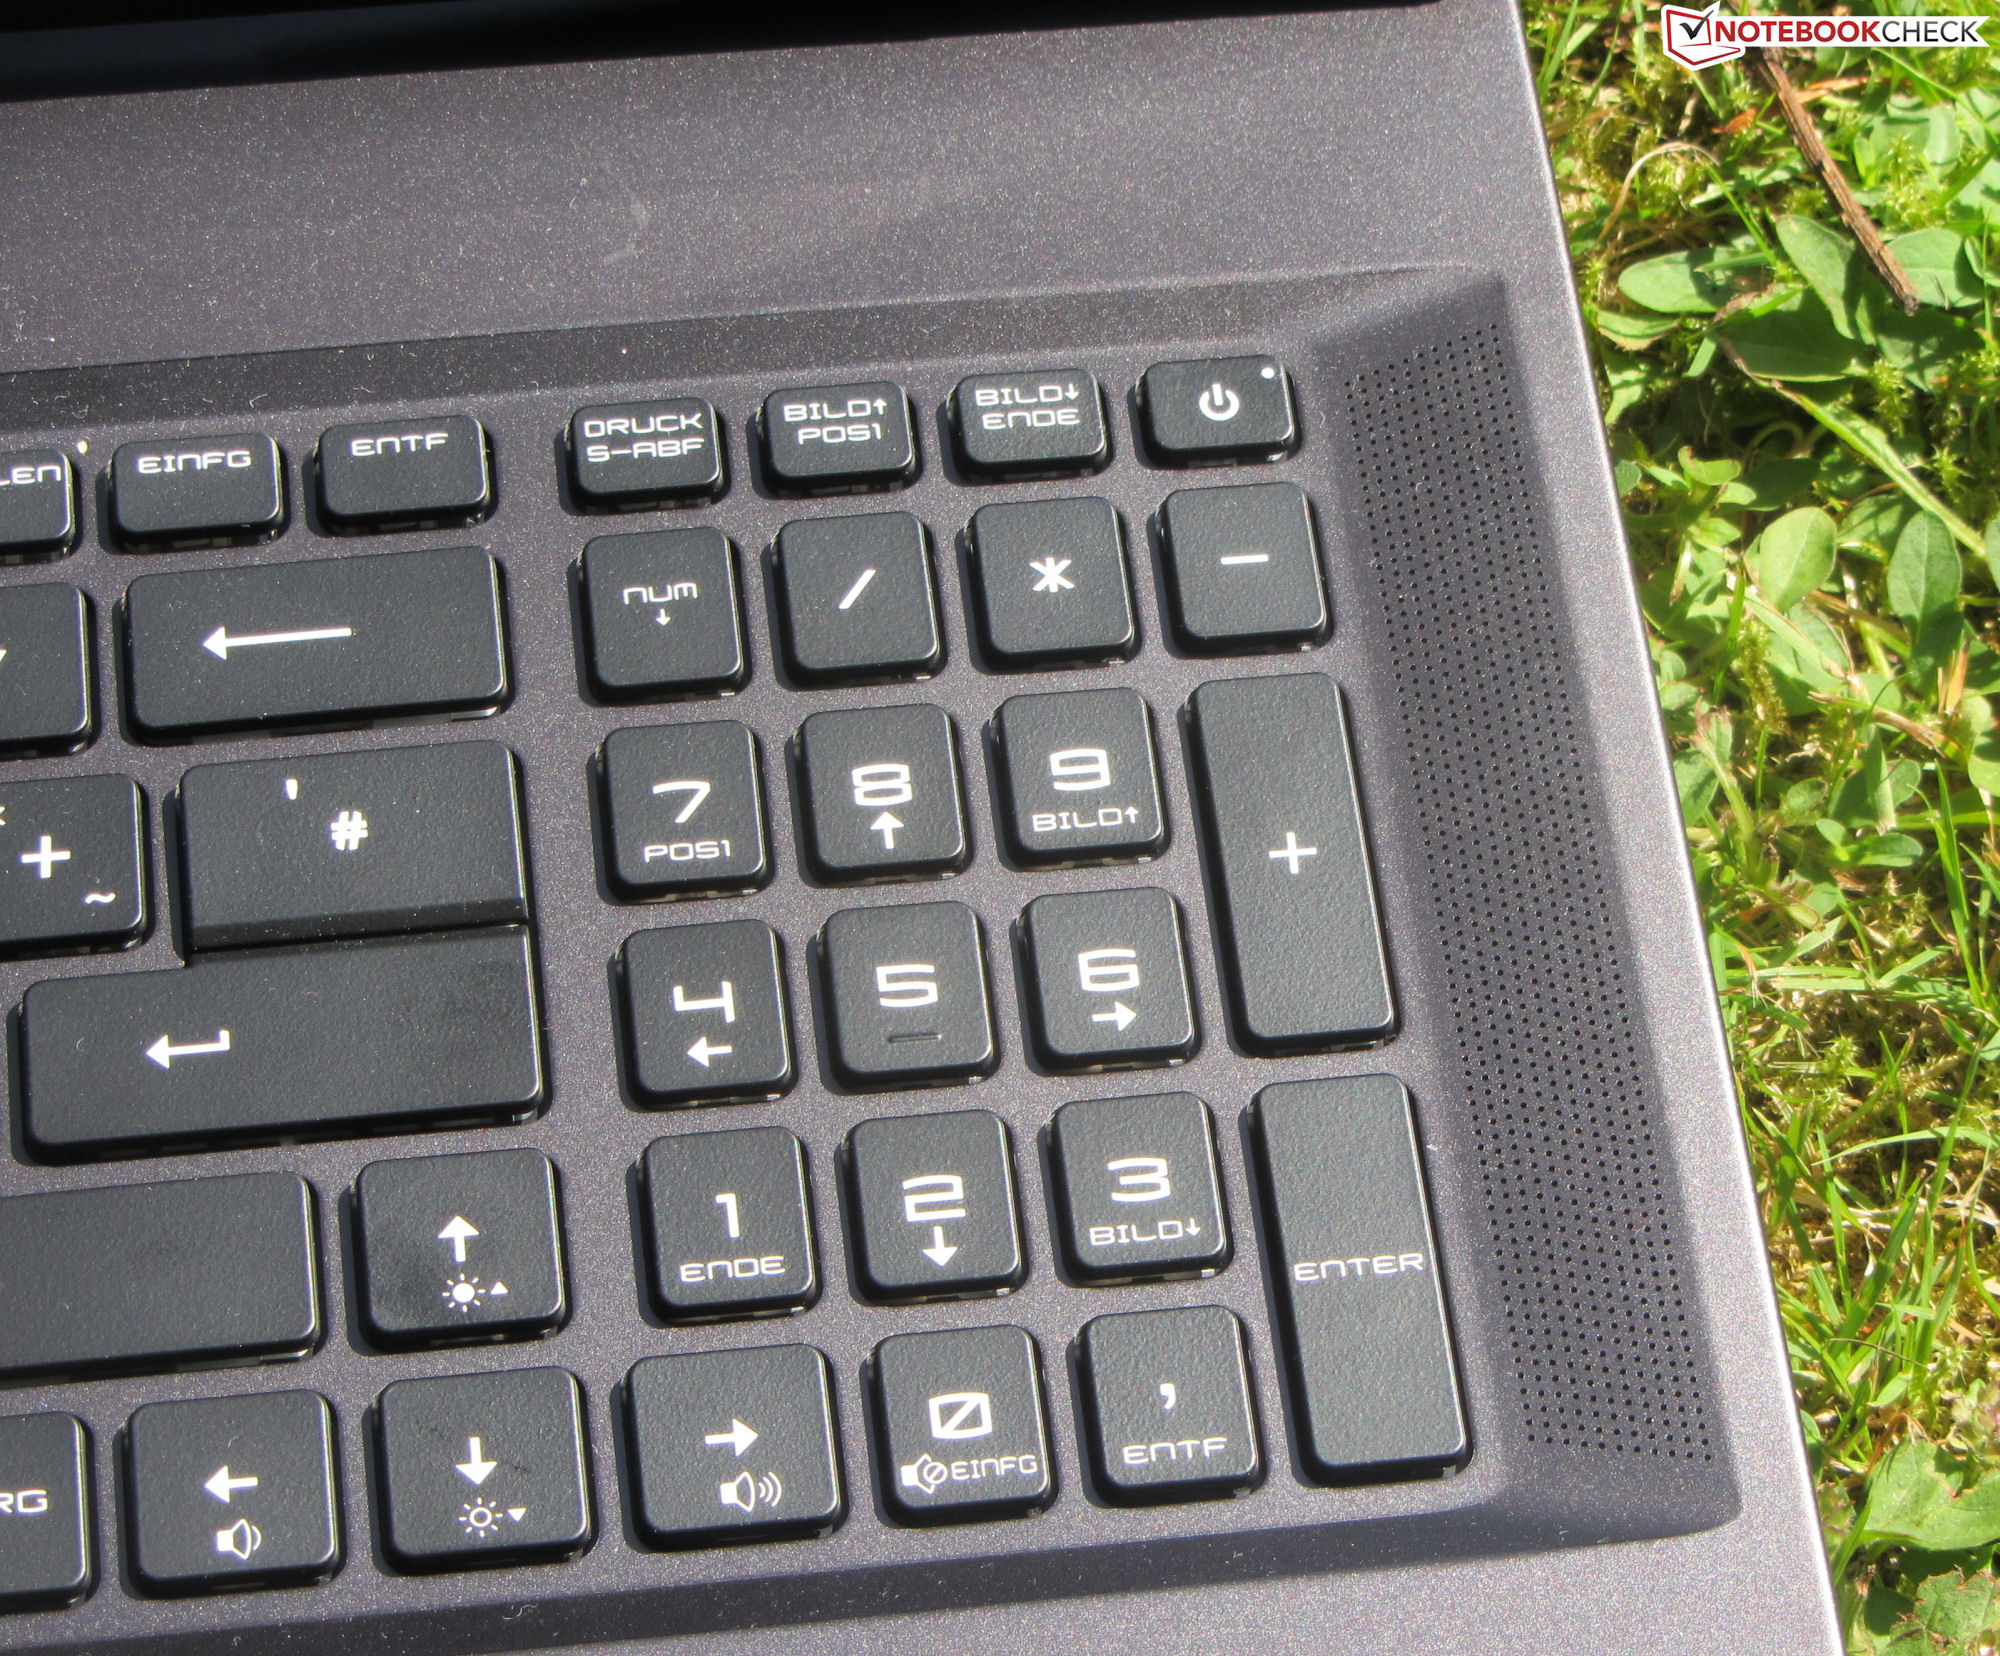
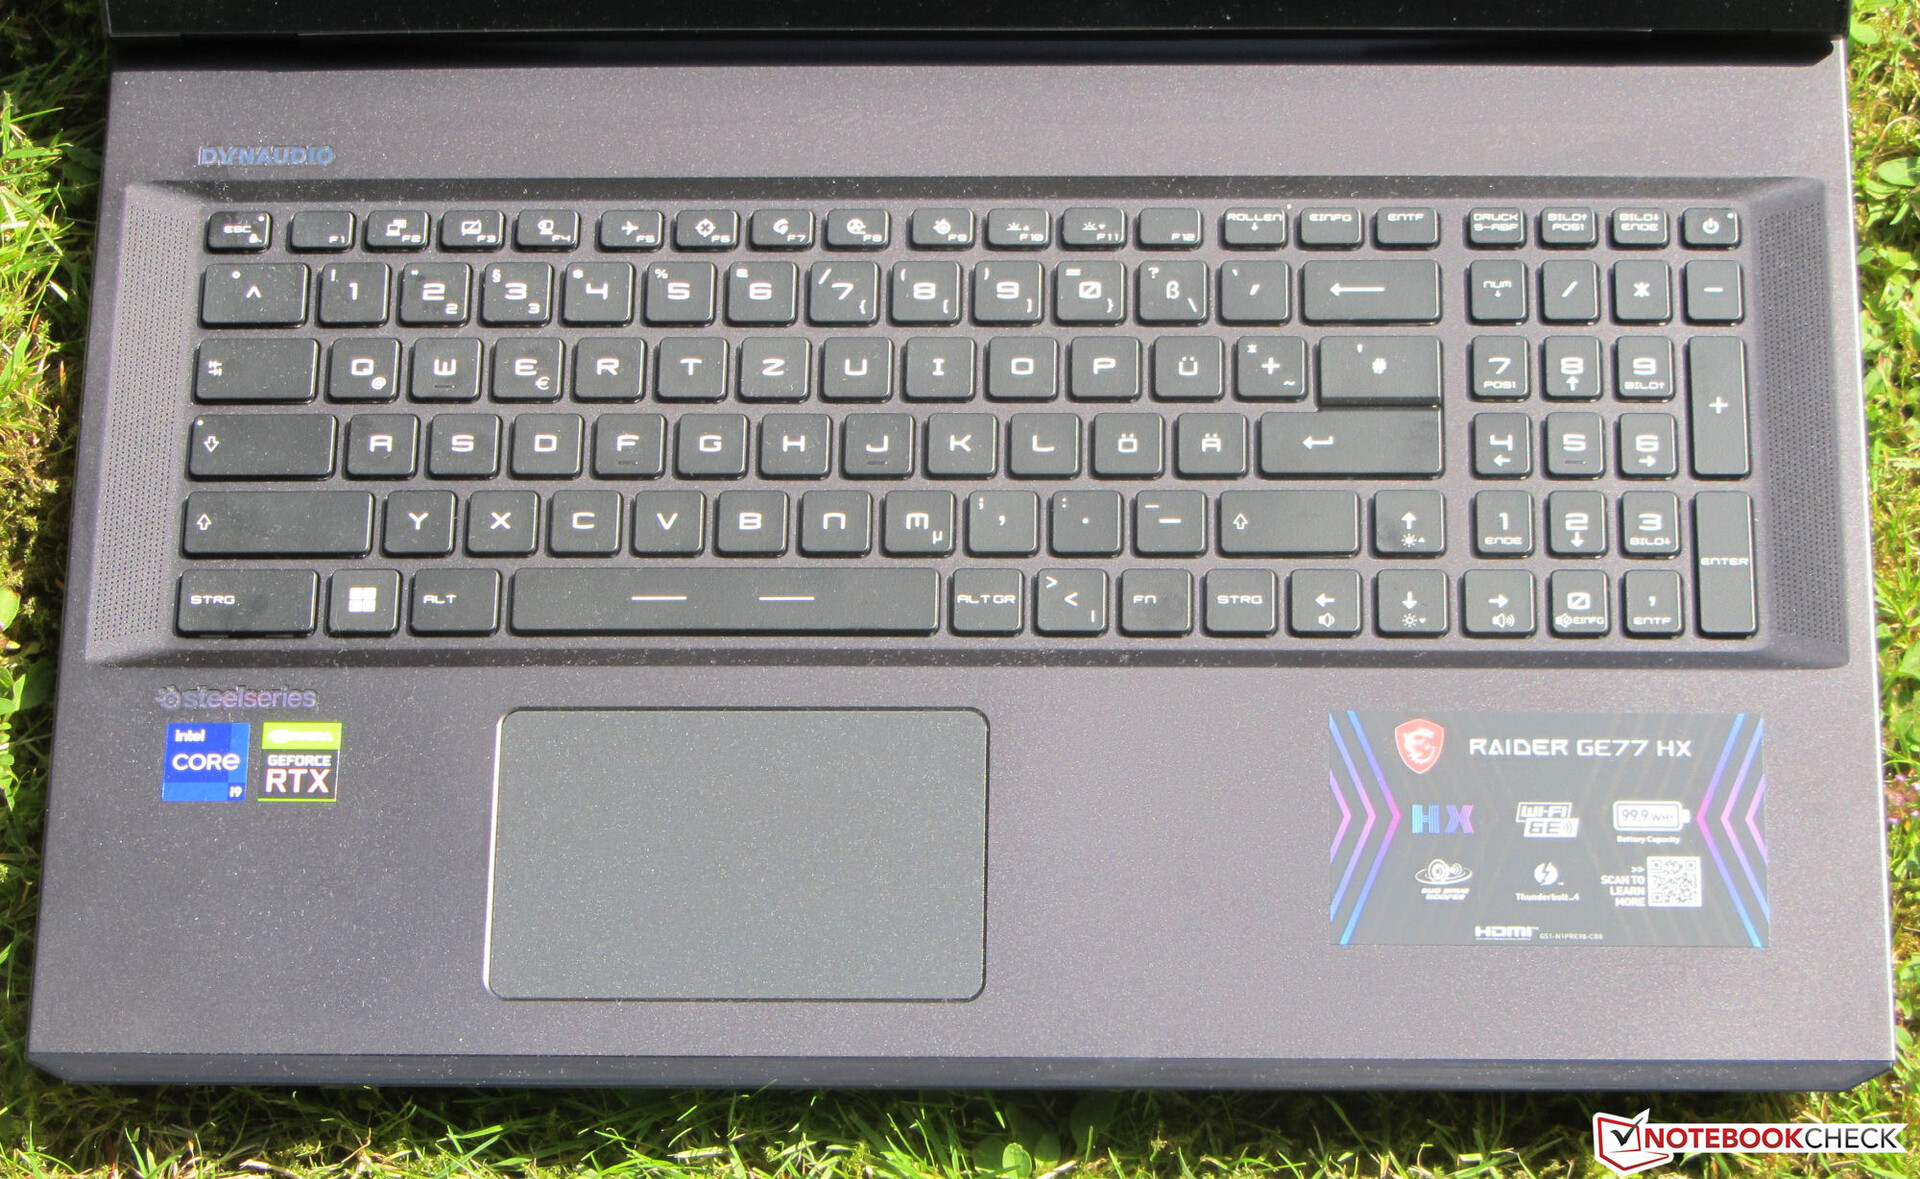
Dispositivos de entrada - Teclado con retroiluminación RGB
Teclado
Las teclas planas y ligeramente rugosas del teclado chiclet retroiluminado ofrecen un recorrido moderado y un punto de accionamiento claro. La respuesta del teclado es decente. Al escribir, el teclado apenas cede. Como es habitual en el diseño de MSI, la tecla "Fn" no está situada donde uno esperaría que estuviera en otros portátiles. La retroiluminación del teclado tiene tres ajustes de brillo, que se pueden controlar a través de dos teclas de función. En general, MSI ofrece un teclado adecuado para el uso diario.
Teclado táctil
La superficie lisa del ClickPad multitáctil (aprox. 10,5 x 6,5 cm o 4,13 x 2,56 pulgadas) tiene buenas propiedades de deslizamiento. El pad responde bien hasta las esquinas. Ofrece un recorrido corto y un punto de accionamiento definido.
Pantalla - Panel IPS
Mientras que el brillo (371.2 nits) de la pantalla mate de 17.3 pulgadas (3840 x 2160 pixeles) excede el mínimo deseado (> 300 nits), el contraste es mediocre (733:1) - esperamos más de un portátil que cuesta 5,200 Euros. Como referencia, consideramos buenos los valores de 1000:1 y superiores. El panel de 120-Hz viene con tiempos de respuesta cortos. Tampoco detectamos ningún parpadeo PWM.
| |||||||||||||||||||||||||
iluminación: 84 %
Brillo con batería: 381 cd/m²
Contraste: 733:1 (Negro: 0.52 cd/m²)
calibrated: 2.53
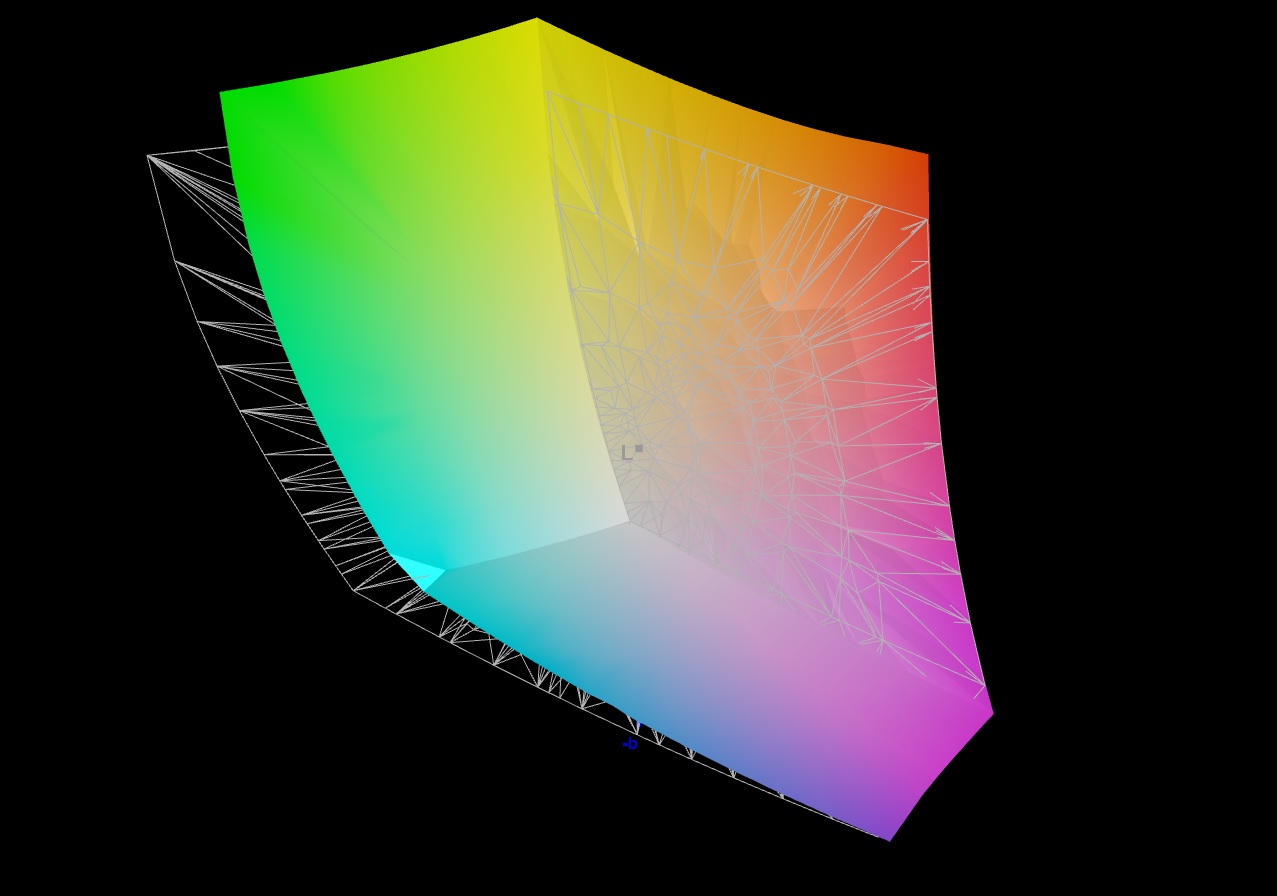
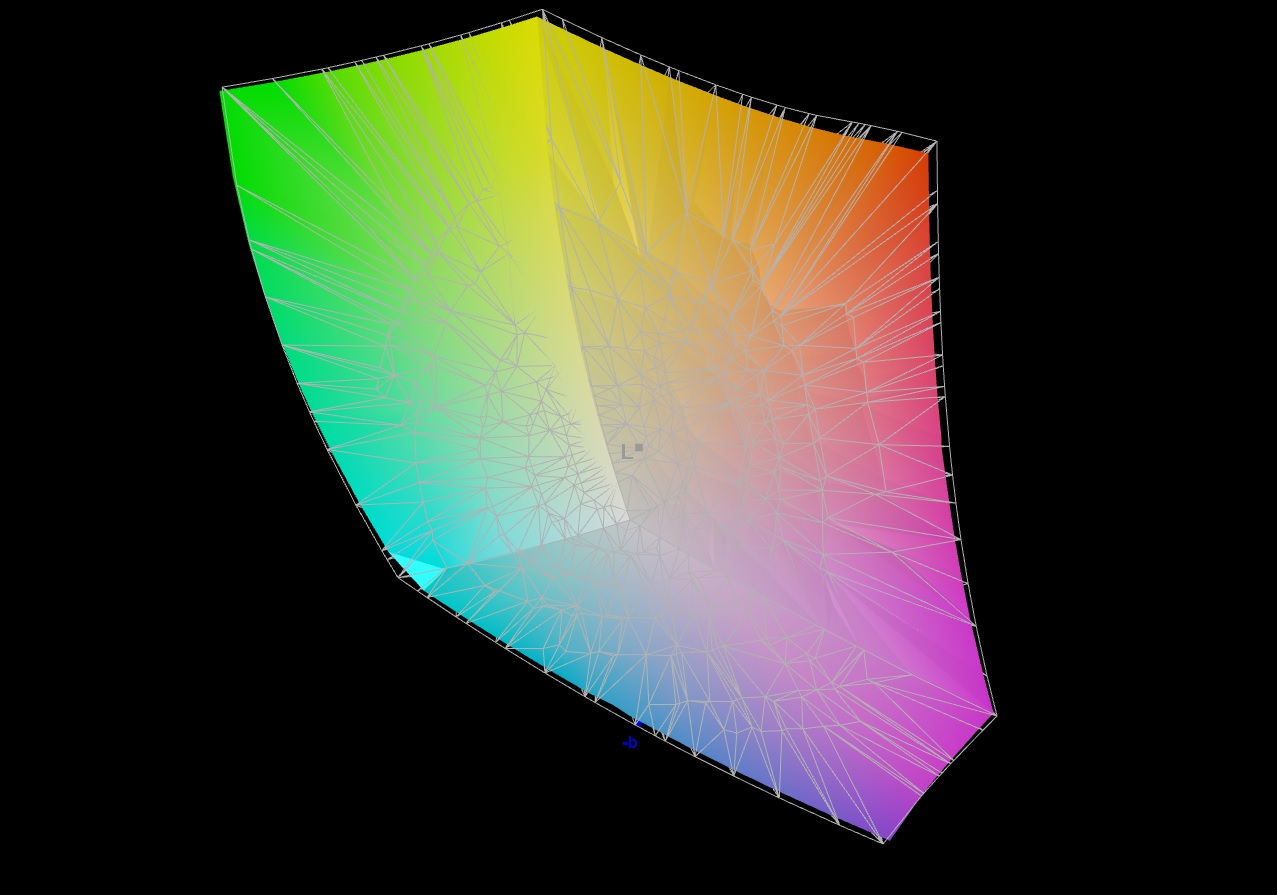
85.8% AdobeRGB 1998 (Argyll 3D)
99.8% sRGB (Argyll 3D)
96.6% Display P3 (Argyll 3D)
| MSI Raider GE77 HX 12UHS AU Optronics B173ZAN06.1, IPS, 3840x2160, 17.3" | Razer Blade 17 Early 2022 AU Optronics B173ZAN06.9, IPS, 3840x2160, 17.3" | Alienware x17 R2 P48E AU Optronics B173HAN, IPS, 1920x1080, 17.3" | Medion Erazer Beast X30 BOE CQ NE173QHM-NZ3, IPS, 2560x1440, 17.3" | |
|---|---|---|---|---|
| Display | 2% | -8% | -17% | |
| Display P3 Coverage (%) | 96.6 | 99.4 3% | 79.2 -18% | 67.7 -30% |
| sRGB Coverage (%) | 99.8 | 100 0% | 99.8 0% | 97.6 -2% |
| AdobeRGB 1998 Coverage (%) | 85.8 | 87.3 2% | 79.6 -7% | 69.2 -19% |
| Response Times | -15% | -89% | -102% | |
| Response Time Grey 50% / Grey 80% * (ms) | 5.8 ? | 7.5 ? -29% | 12.4 ? -114% | 14.7 ? -153% |
| Response Time Black / White * (ms) | 5.6 ? | 5.6 ? -0% | 9.2 ? -64% | 8.4 ? -50% |
| PWM Frequency (Hz) | ||||
| Screen | 35% | 31% | 24% | |
| Brightness middle (cd/m²) | 381 | 503 32% | 365.4 -4% | 377 -1% |
| Brightness (cd/m²) | 371 | 486 31% | 344 -7% | 352 -5% |
| Brightness Distribution (%) | 84 | 84 0% | 85 1% | 86 2% |
| Black Level * (cd/m²) | 0.52 | 0.44 15% | 0.29 44% | 0.32 38% |
| Contrast (:1) | 733 | 1143 56% | 1260 72% | 1178 61% |
| Colorchecker dE 2000 calibrated * | 2.53 | 0.6 76% | 0.51 80% | 1.3 49% |
| Colorchecker dE 2000 * | 1.08 | 3.17 | 2.91 | |
| Colorchecker dE 2000 max. * | 4.54 | 7.69 | 6.78 | |
| Greyscale dE 2000 * | 1.3 | 5.3 | 3.4 | |
| Gamma | 2.151 102% | 2.18 101% | 2.109 104% | |
| CCT | 6541 99% | 5879 111% | 7273 89% | |
| Media total (Programa/Opciones) | 7% /
17% | -22% /
-2% | -32% /
-10% |
* ... más pequeño es mejor
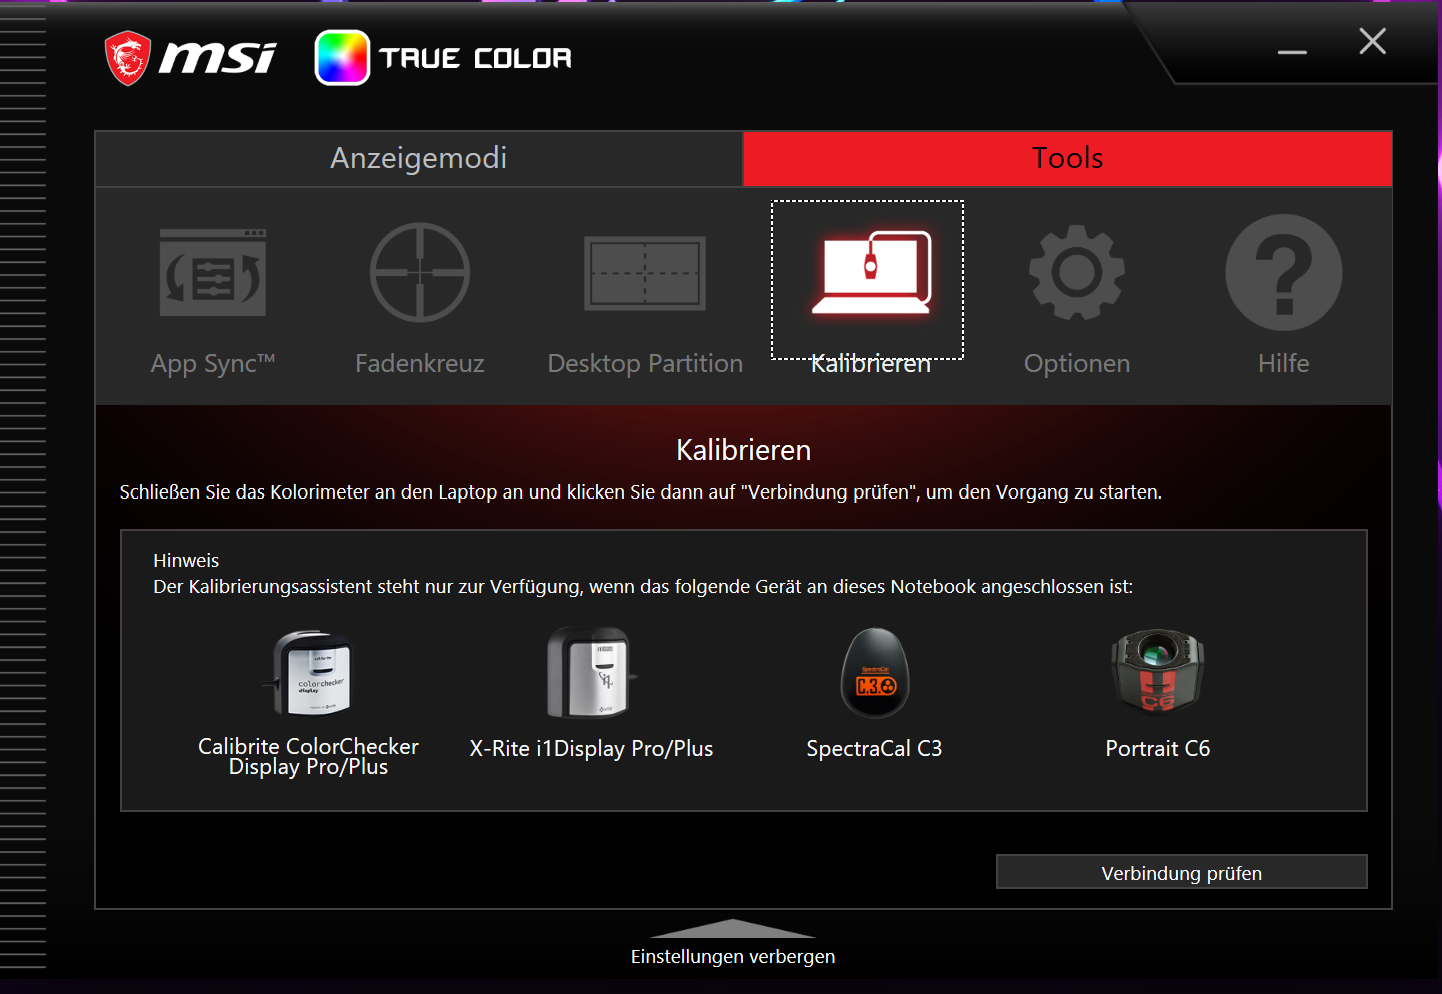
El software MSI True Color preinstalado permite a los usuarios ajustar los colores para un determinado espacio de color o caso de uso. Nosotros usamos el preajuste "Display P3". Sin embargo: La precisión del color es bastante pobre de fábrica - independientemente de la selección del preajuste. Todos los colores parecen exagerados y lechosos con medidas que están completamente fuera de lugar. Esto no puede ser lo que MSI pretendía.
Sospechamos que el software True Color, el perfil de color preinstalado, y/o la iGPU o sus drivers interfieren entre sí. ¿Por qué? En cuanto se activa el modo dGPU (= el portátil usa exclusivamente la GPU GeForce ), la pantalla se ve fantástica y los colores se vuelven precisos. La diferencia se nota inmediatamente.
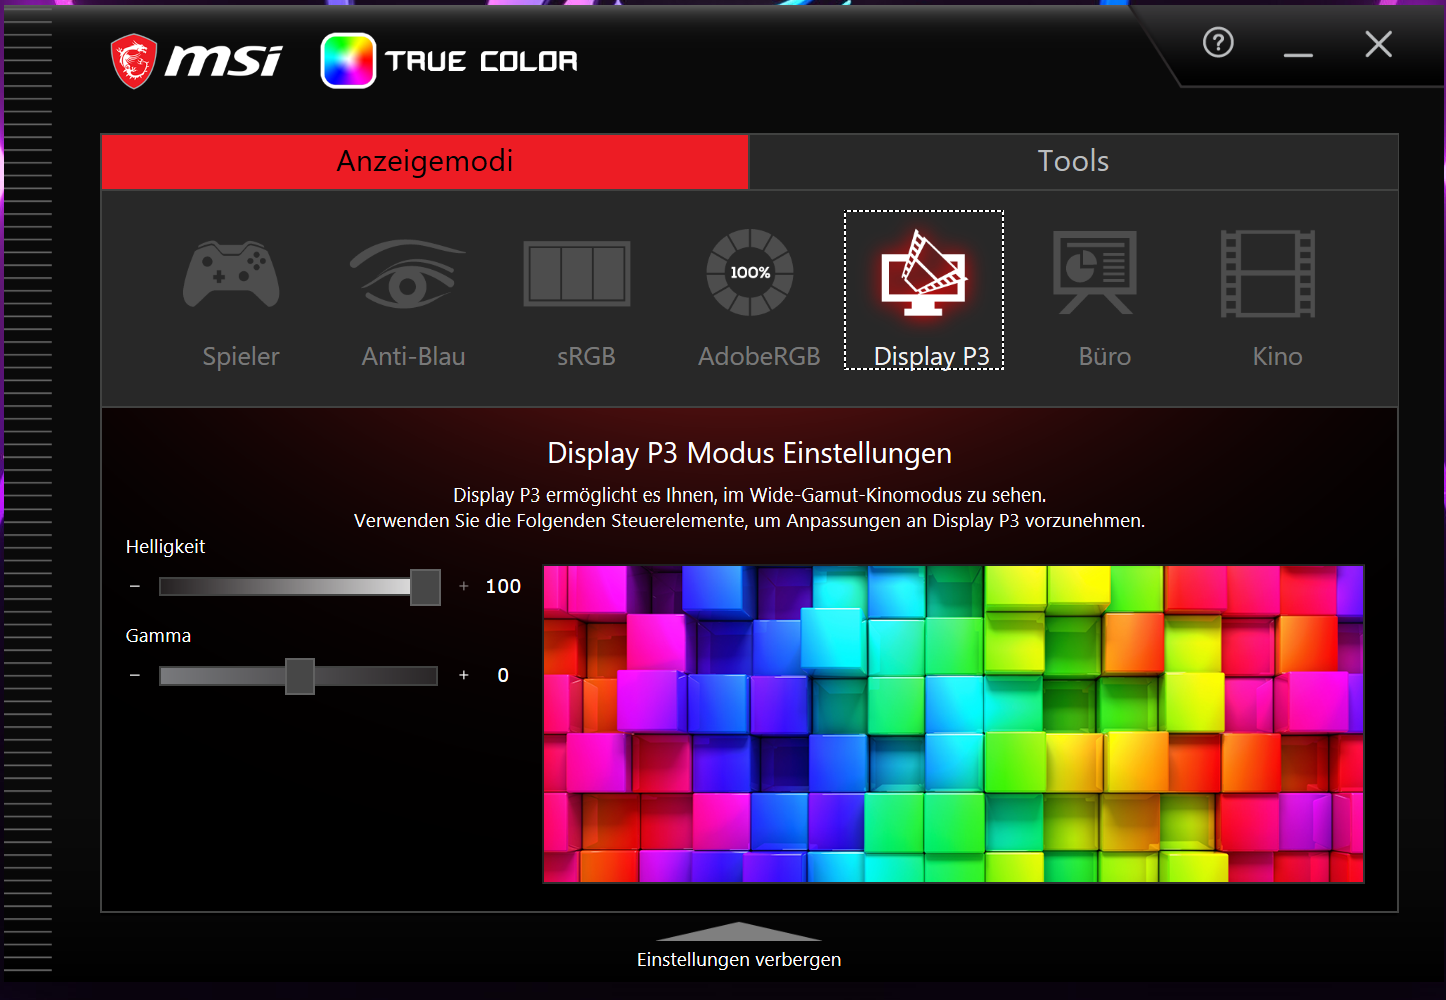
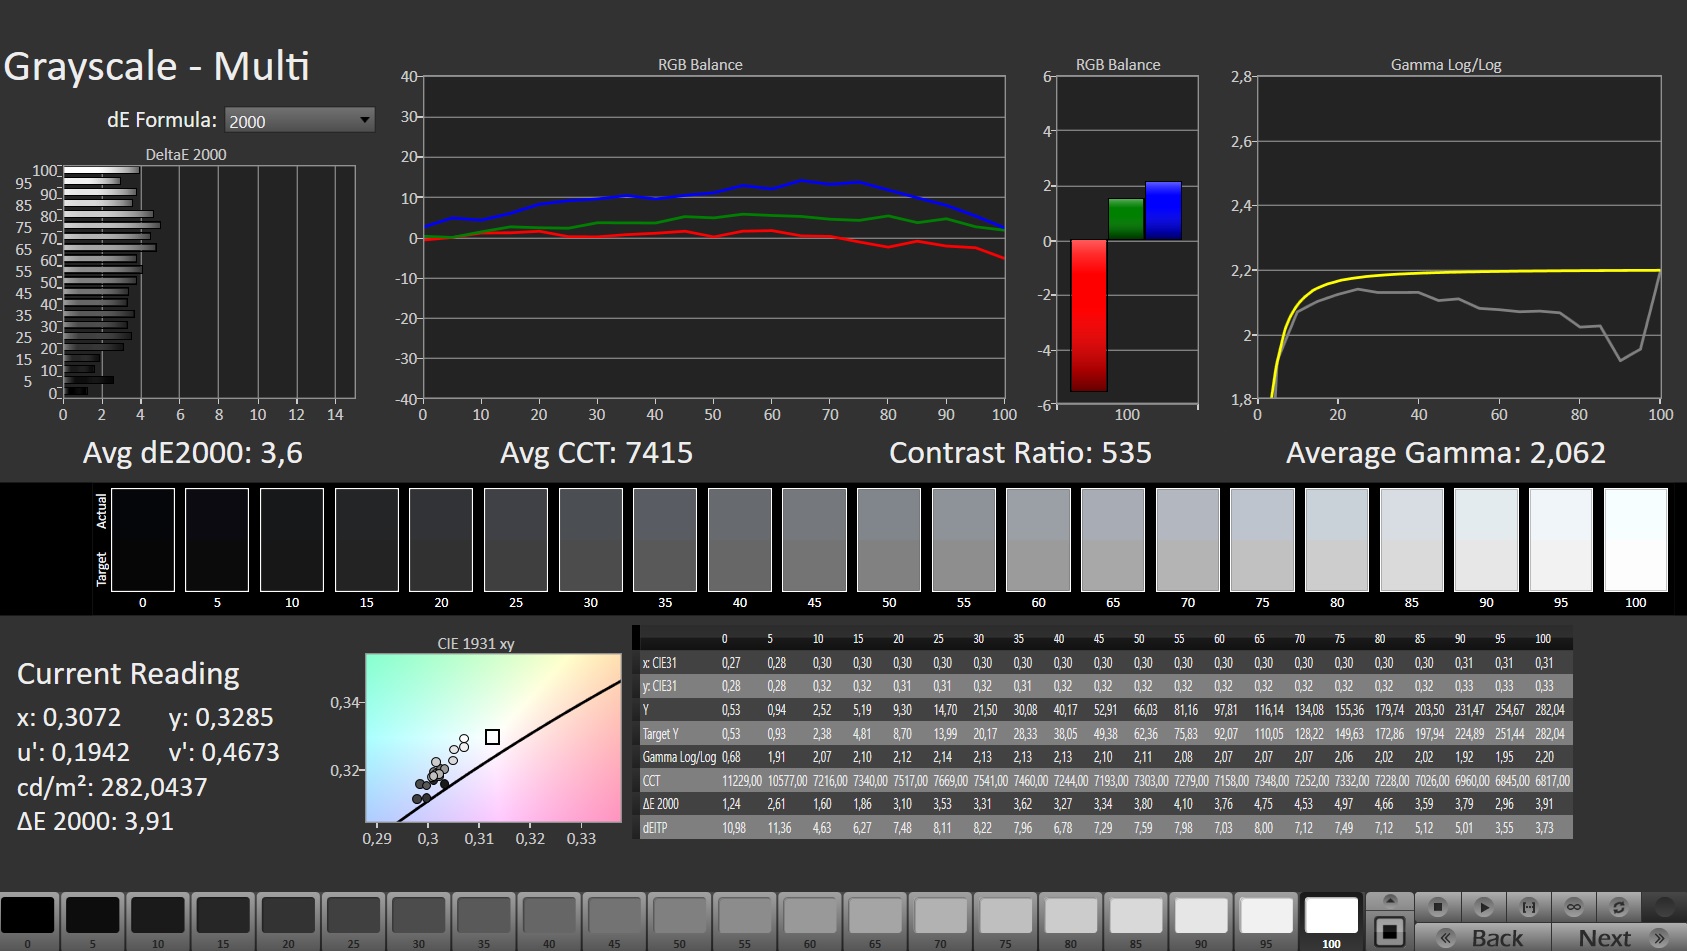
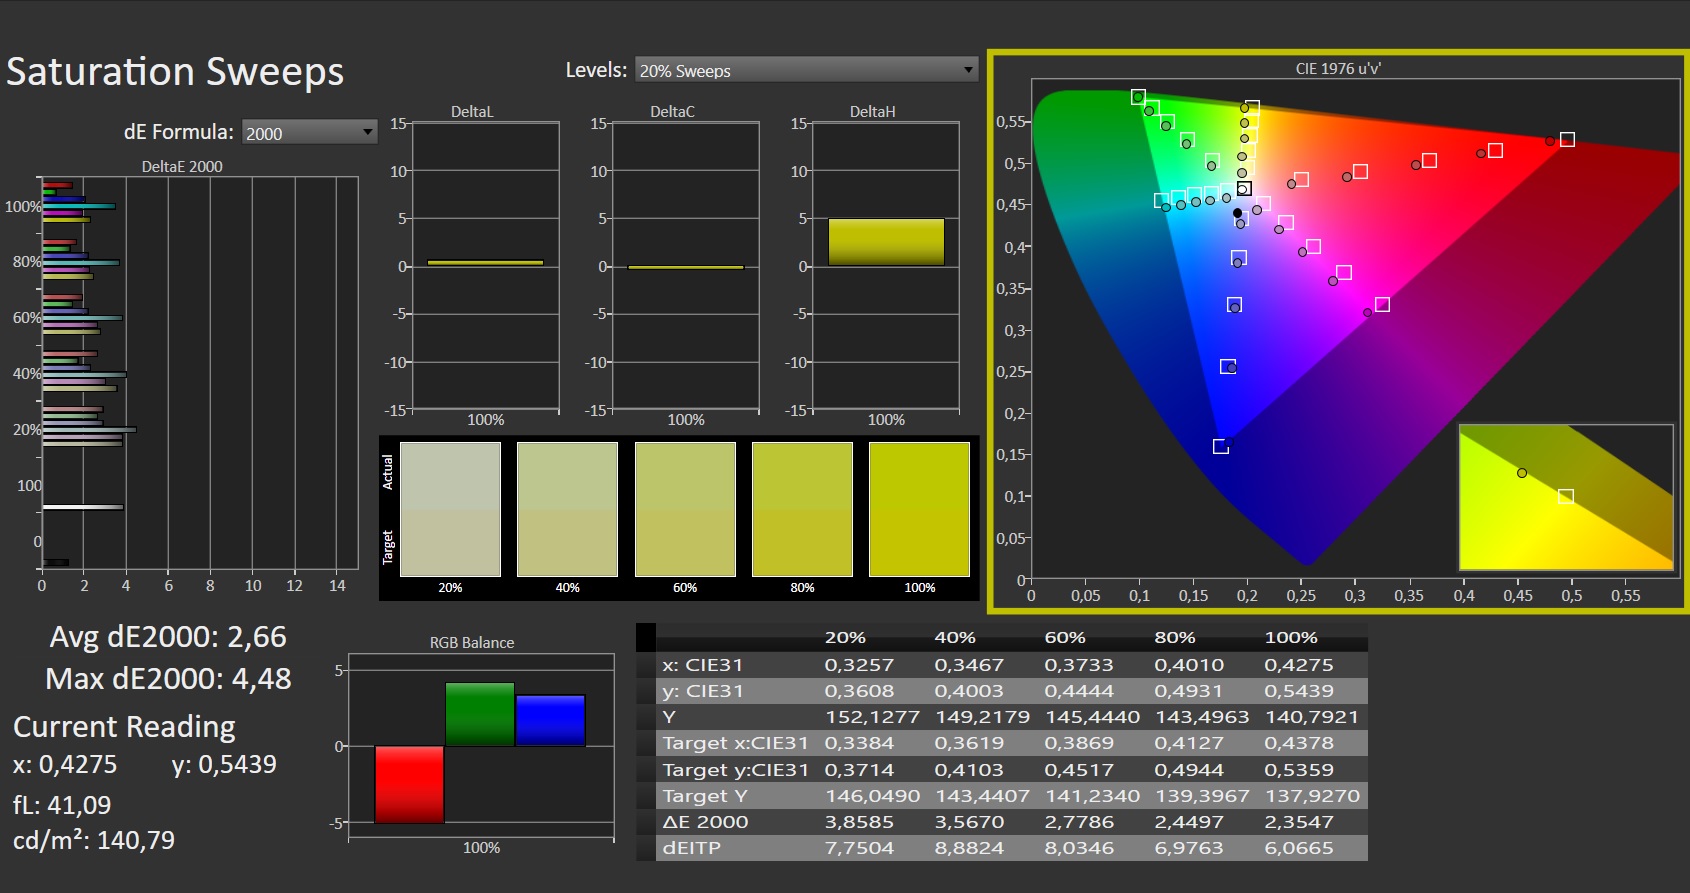
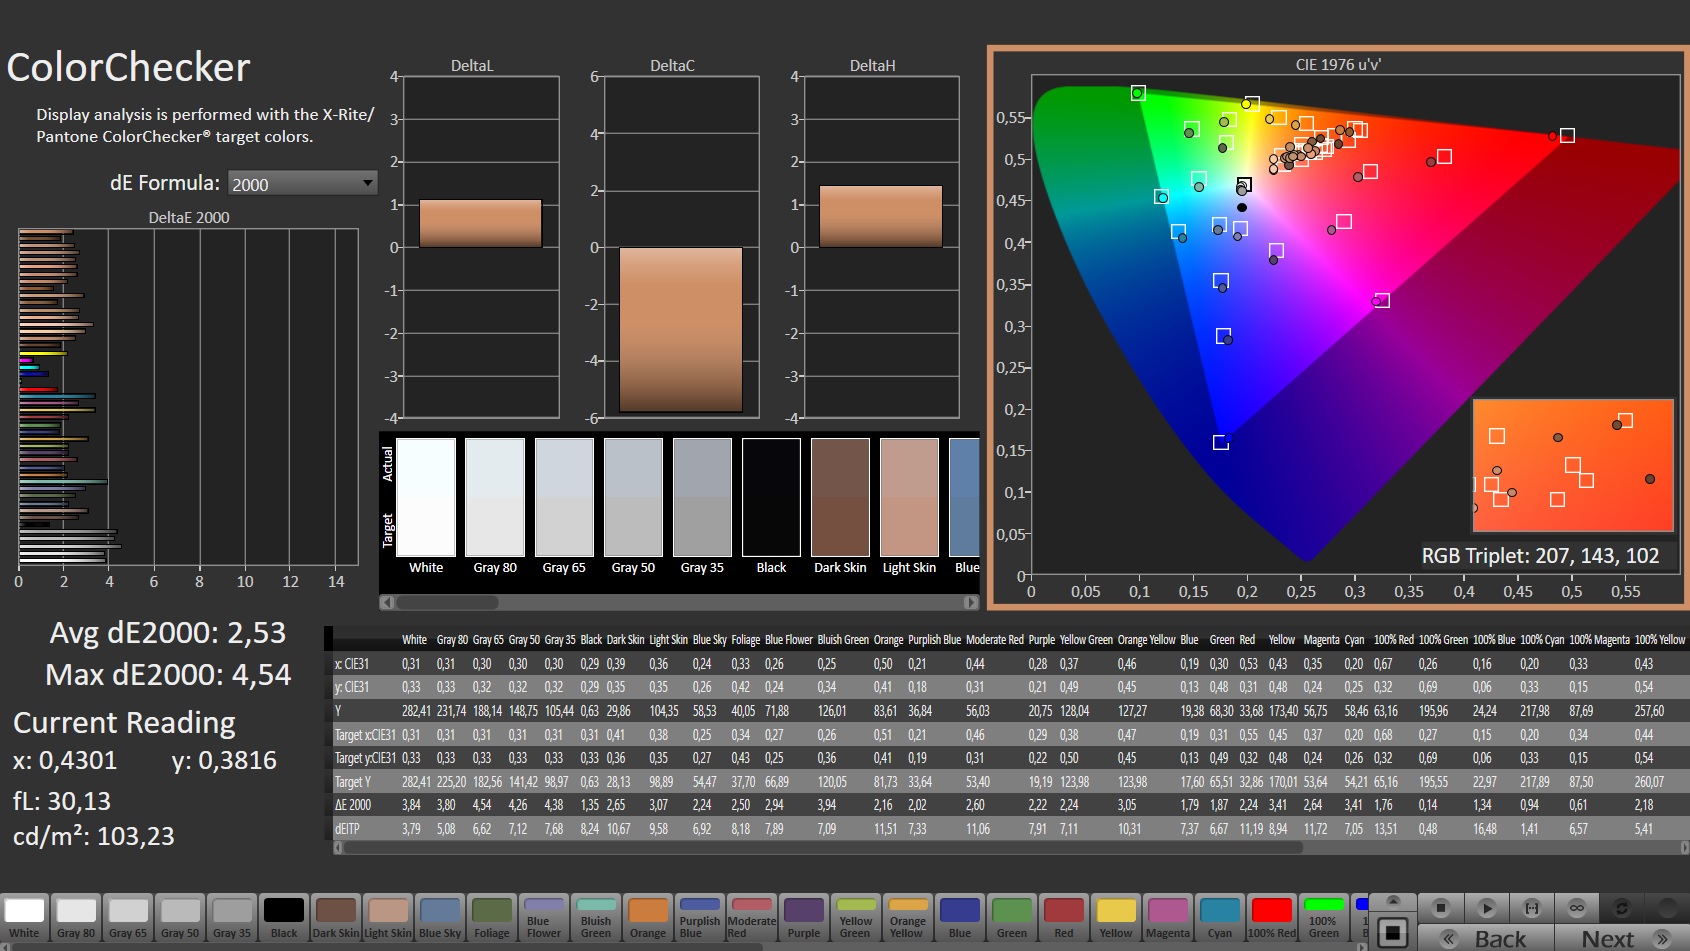
Una calibración de la pantalla (modo Optimus) da lugar a mejoras significativas. La desviación del color entra en el rango deseado (deltaE < 3) y la escala de grises aparece más uniforme. La pantalla es capaz de mostrar los espacios de color sRGB (100 %) y DCI-P3 (97 %) por completo, y casi por completo, respectivamente, así como el 86 % del espacio de color AdobeRGB.
Nota: El perfil de color vinculado cambia los colores según nuestra calibración.

Tiempos de respuesta del display
| ↔ Tiempo de respuesta de Negro a Blanco | ||
|---|---|---|
| 5.6 ms ... subida ↗ y bajada ↘ combinada | ↗ 1.9 ms subida | 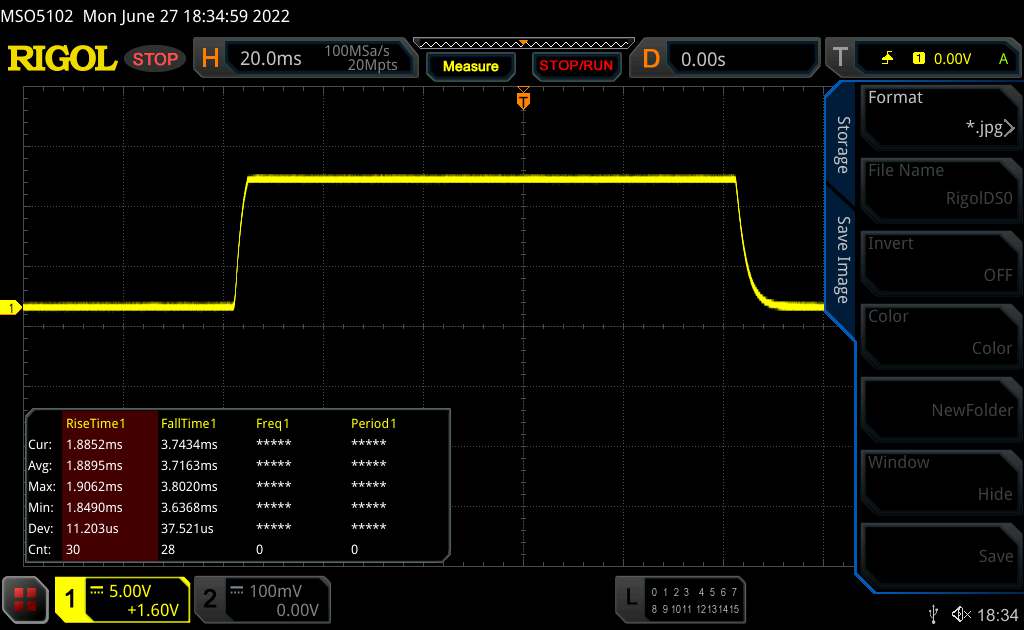 |
| ↘ 3.7 ms bajada | ||
| La pantalla mostró tiempos de respuesta muy rápidos en nuestros tests y debería ser adecuada para juegos frenéticos. En comparación, todos los dispositivos de prueba van de ##min### (mínimo) a 240 (máximo) ms. » 18 % de todos los dispositivos son mejores. Esto quiere decir que el tiempo de respuesta medido es mejor que la media (19.8 ms) de todos los dispositivos testados. | ||
| ↔ Tiempo de respuesta 50% Gris a 80% Gris | ||
| 5.8 ms ... subida ↗ y bajada ↘ combinada | ↗ 1.6 ms subida | 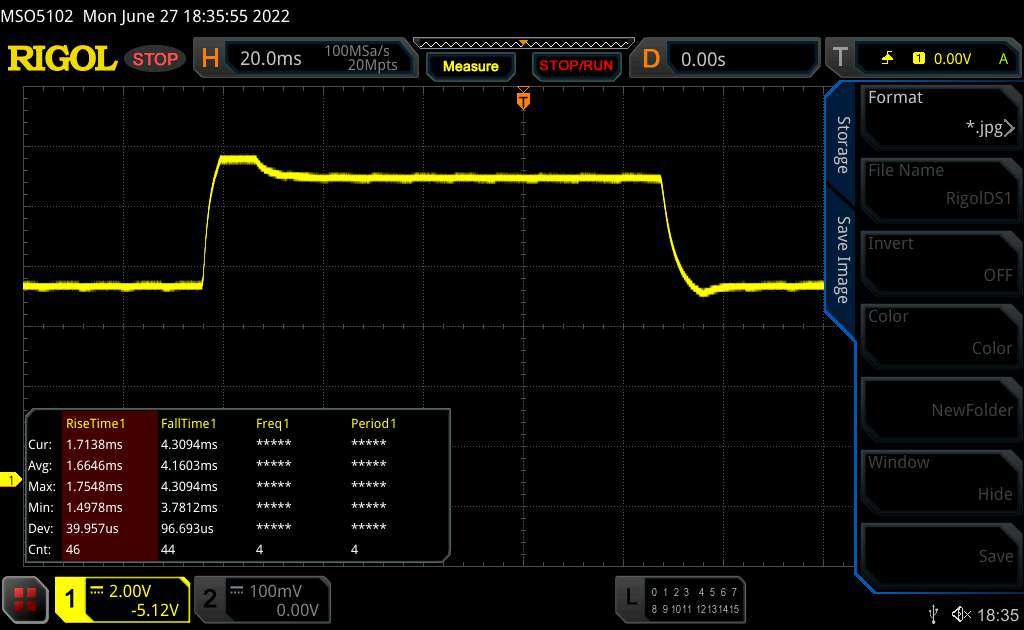 |
| ↘ 4.2 ms bajada | ||
| La pantalla mostró tiempos de respuesta muy rápidos en nuestros tests y debería ser adecuada para juegos frenéticos. En comparación, todos los dispositivos de prueba van de ##min### (mínimo) a 636 (máximo) ms. » 19 % de todos los dispositivos son mejores. Esto quiere decir que el tiempo de respuesta medido es mejor que la media (31 ms) de todos los dispositivos testados. | ||
Parpadeo de Pantalla / PWM (Pulse-Width Modulation)
| Parpadeo de Pantalla / PWM no detectado |  | ||
Comparación: 52 % de todos los dispositivos testados no usaron PWM para atenuar el display. Si se usó, medimos una media de 7754 (mínimo: 5 - máxmo: 343500) Hz. | |||
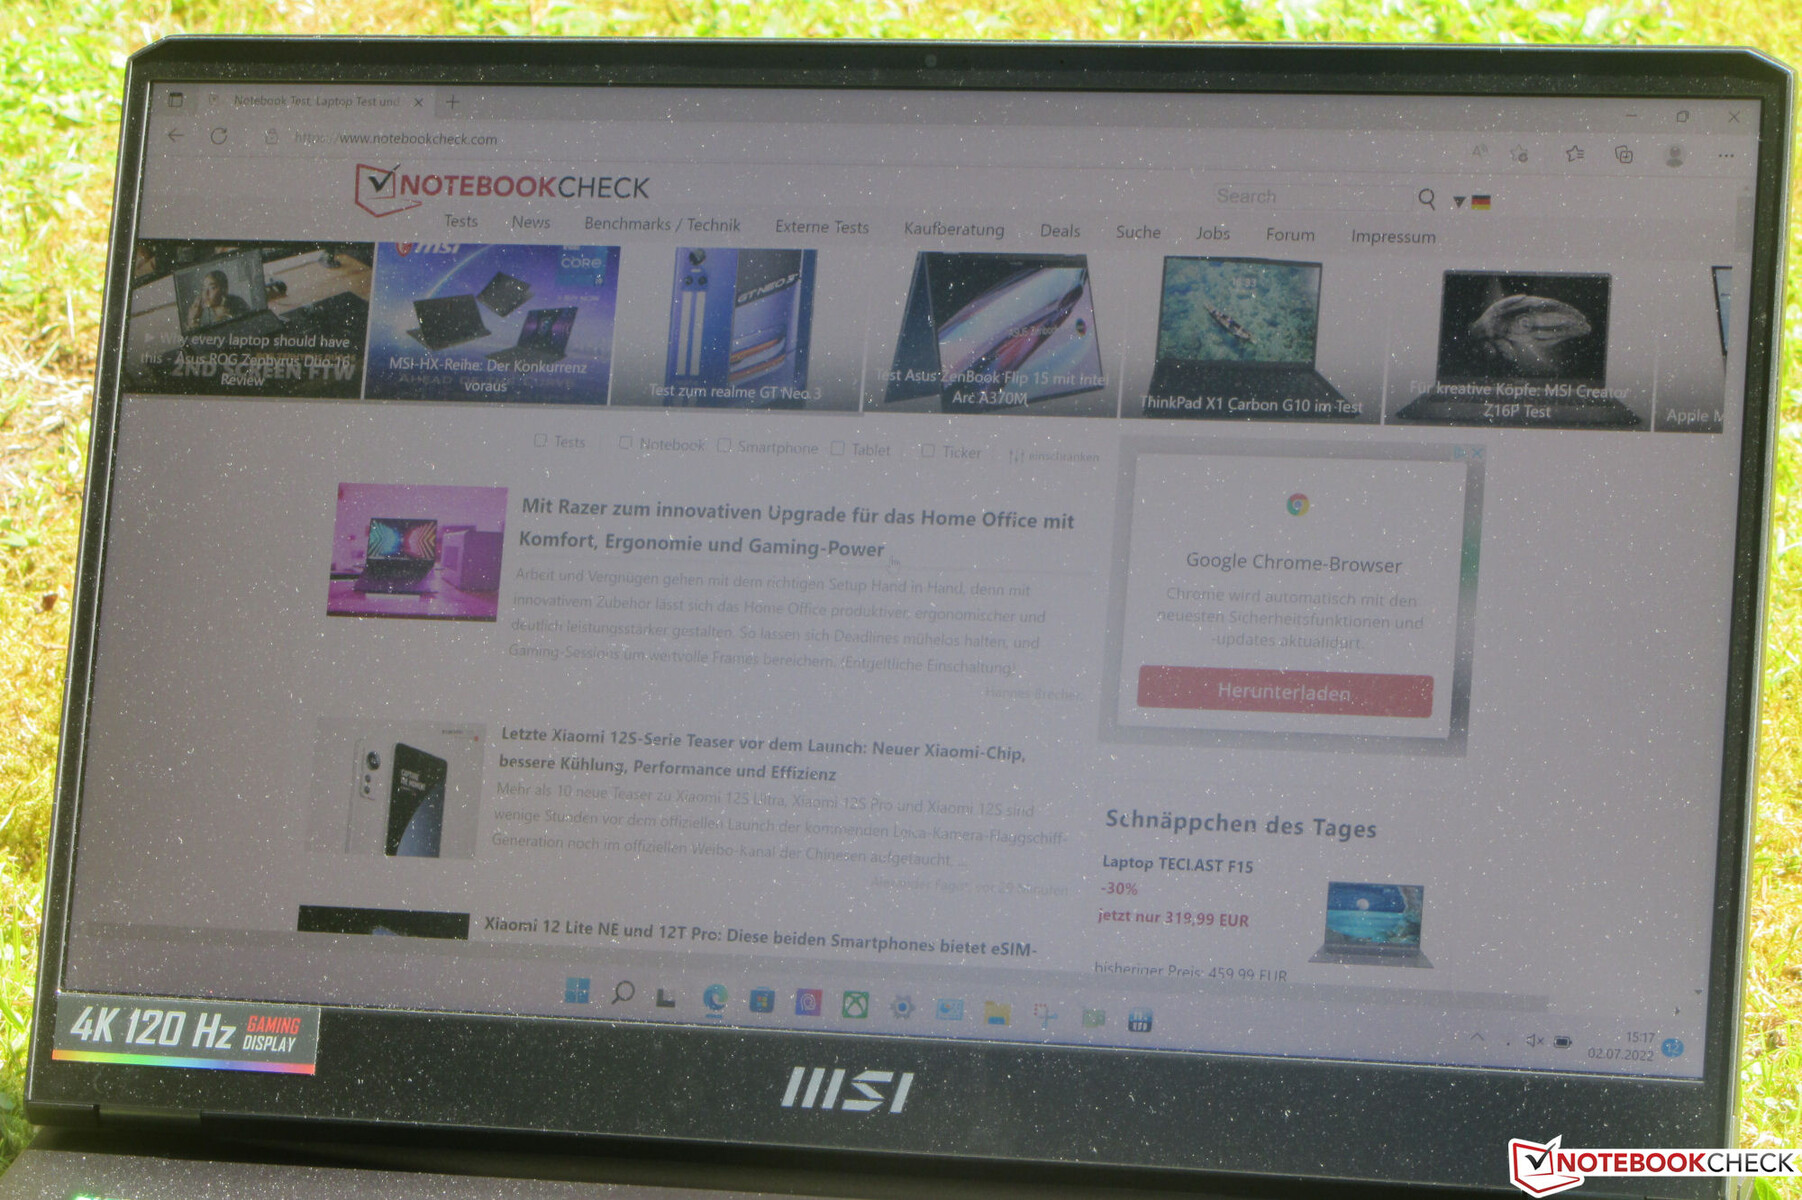
El panel IPS tiene buenos ángulos de visión y sigue siendo legible desde cualquier posición. En exteriores, el contenido de la pantalla se puede leer siempre que el sol no brille demasiado.

Rendimiento - brillo de Ampere y Alder Lake
Con el Raider GE77 HX 12UHS, MSI ofrece un portátil de 17,3 pulgadas de alto rendimiento que cumple todos los requisitos para escenarios exigentes.
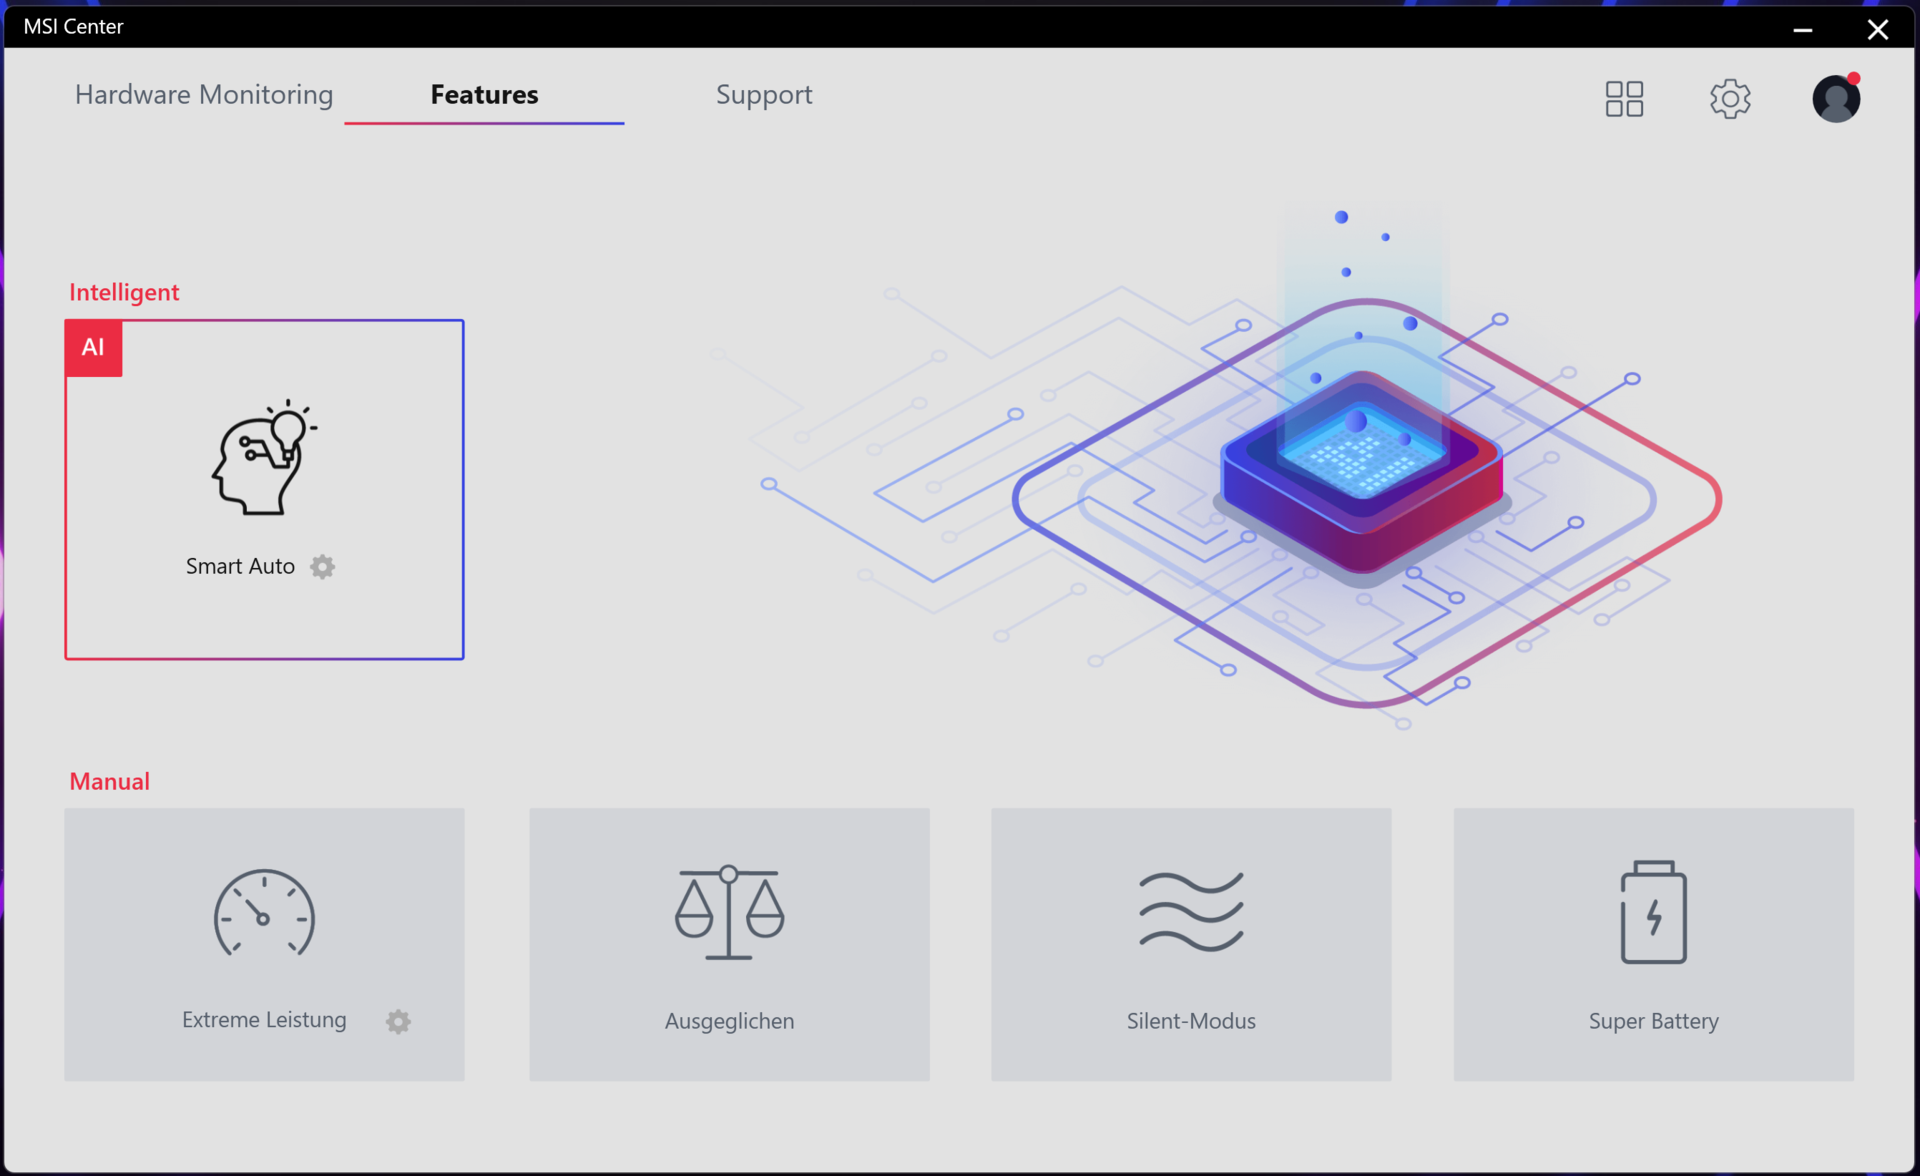
Condiciones de la prueba
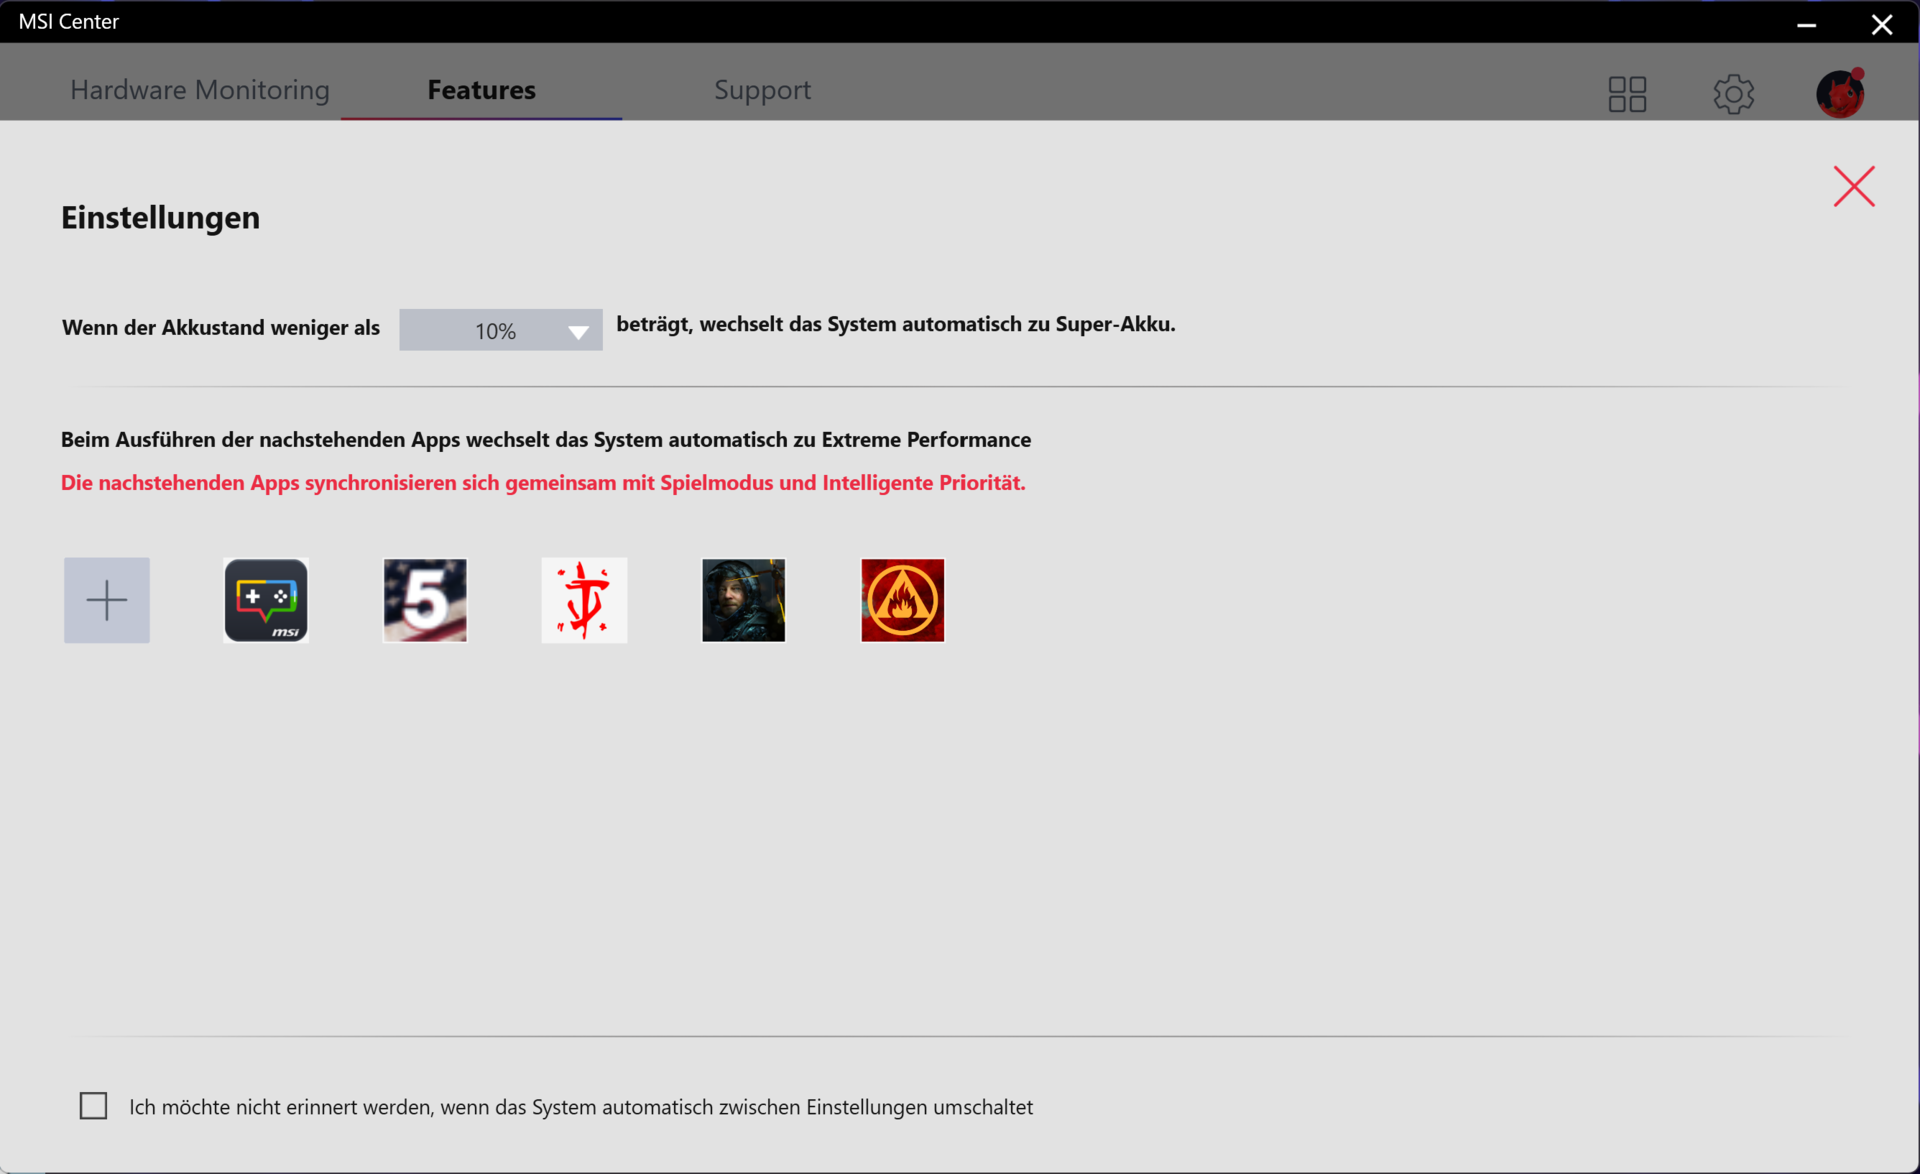
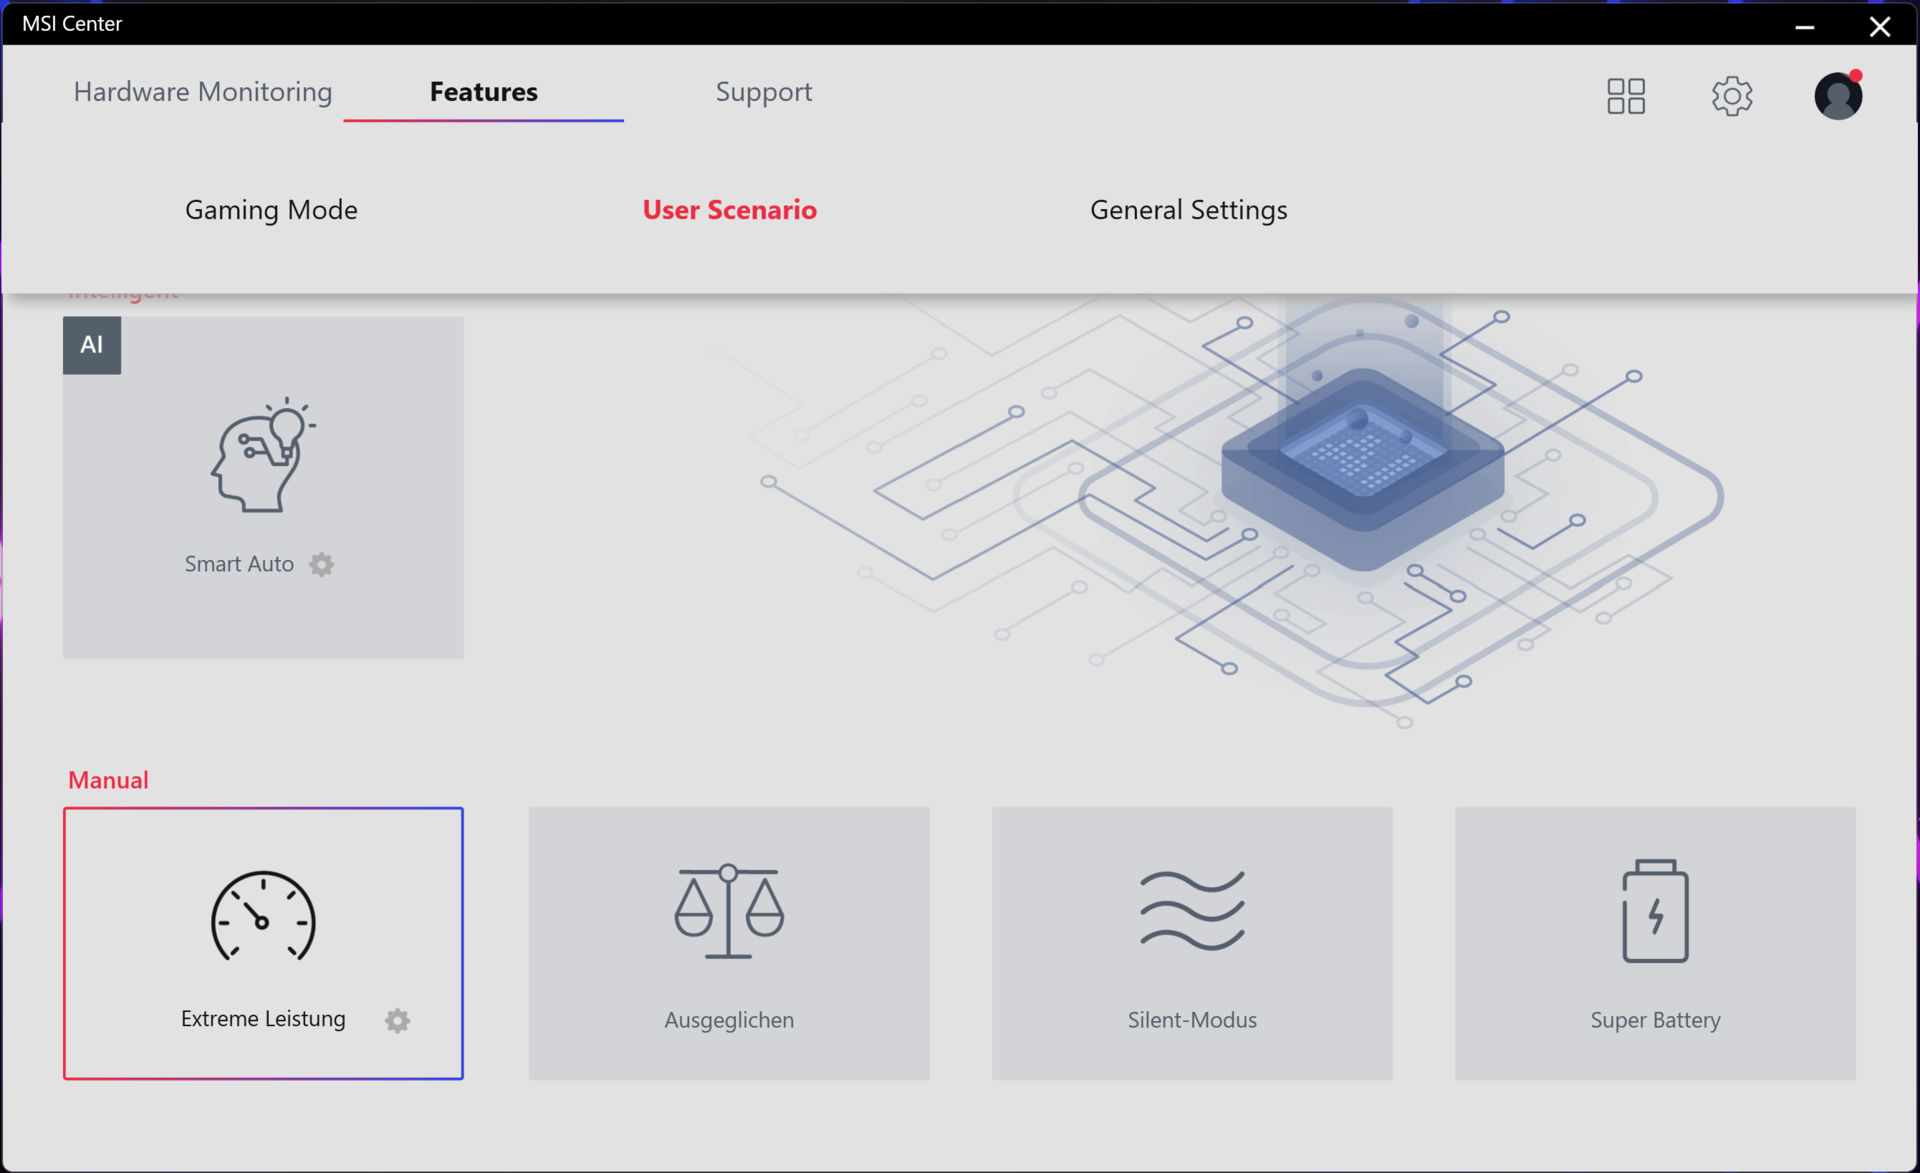
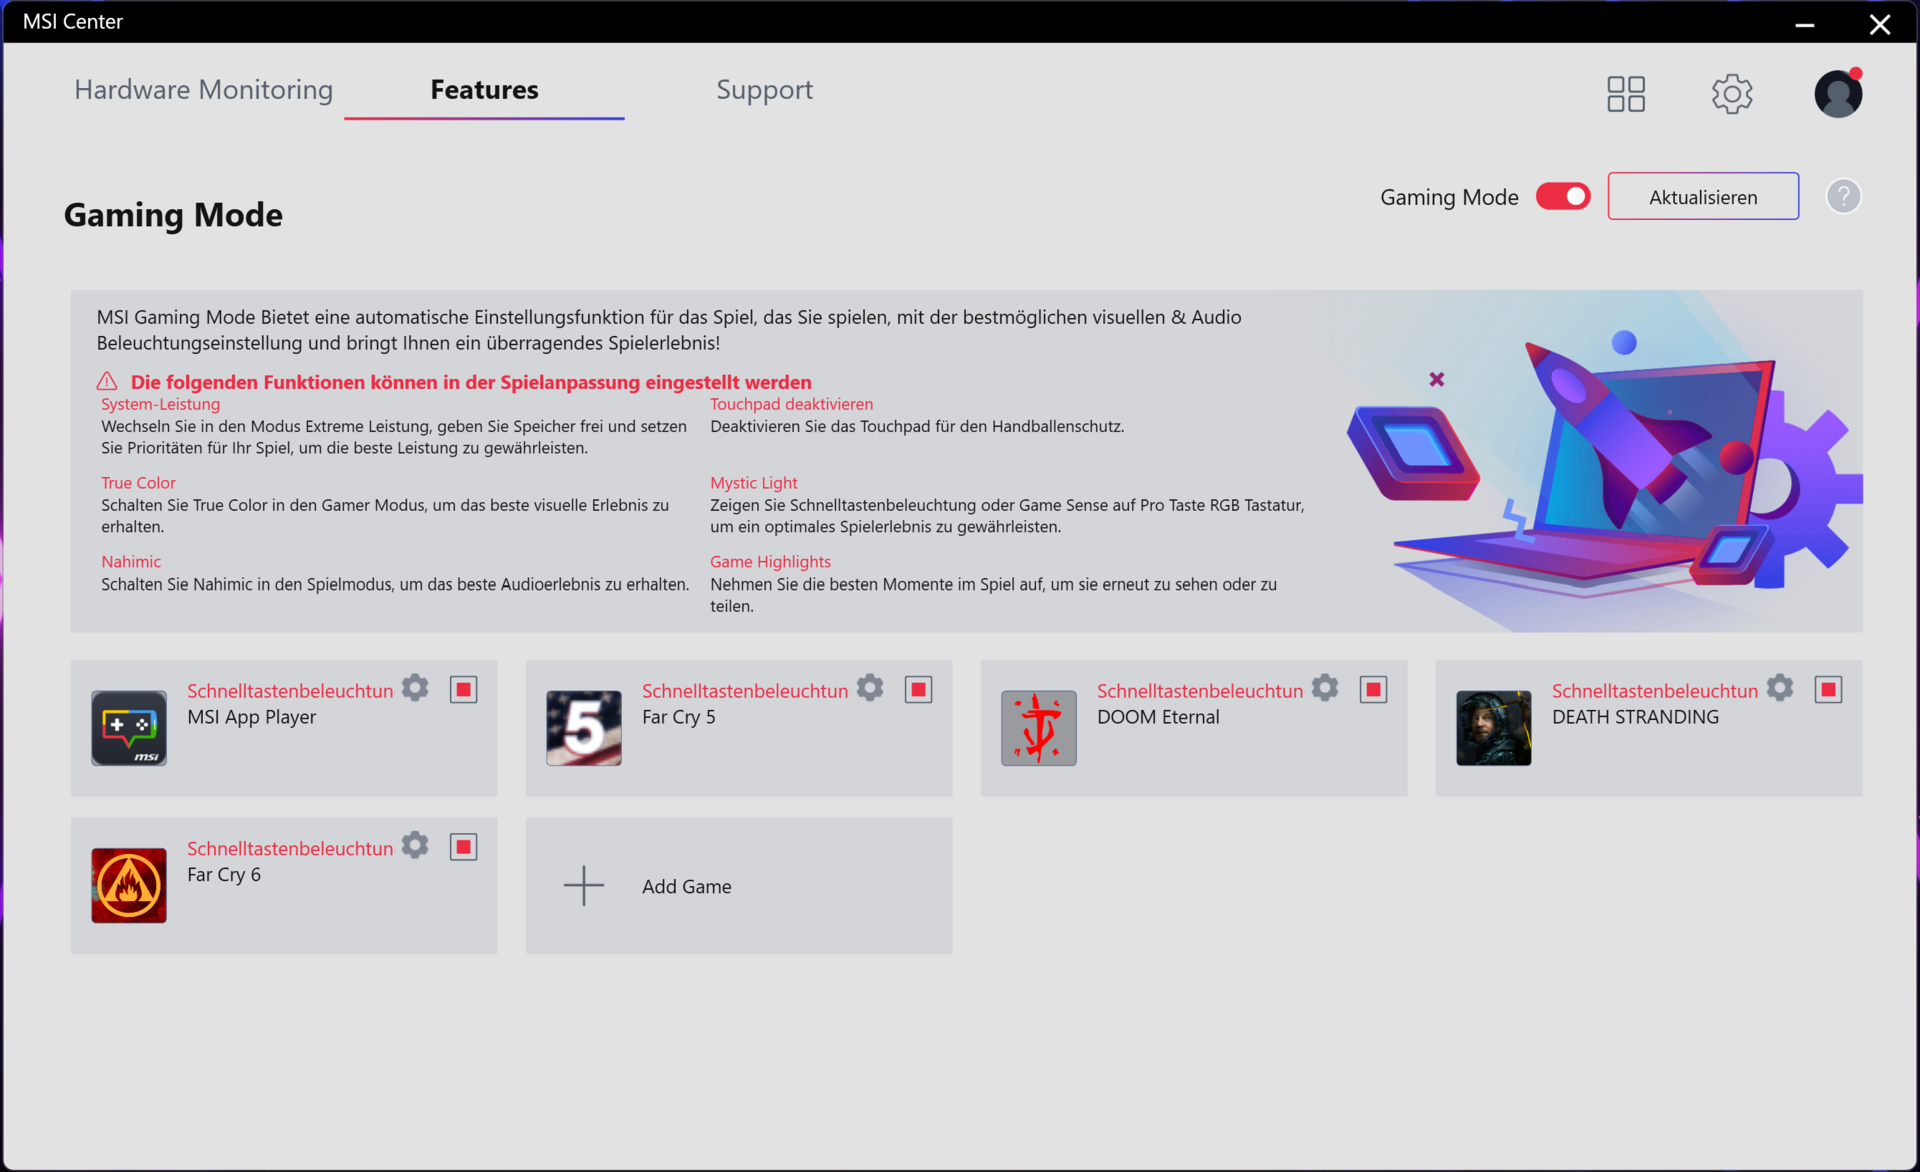
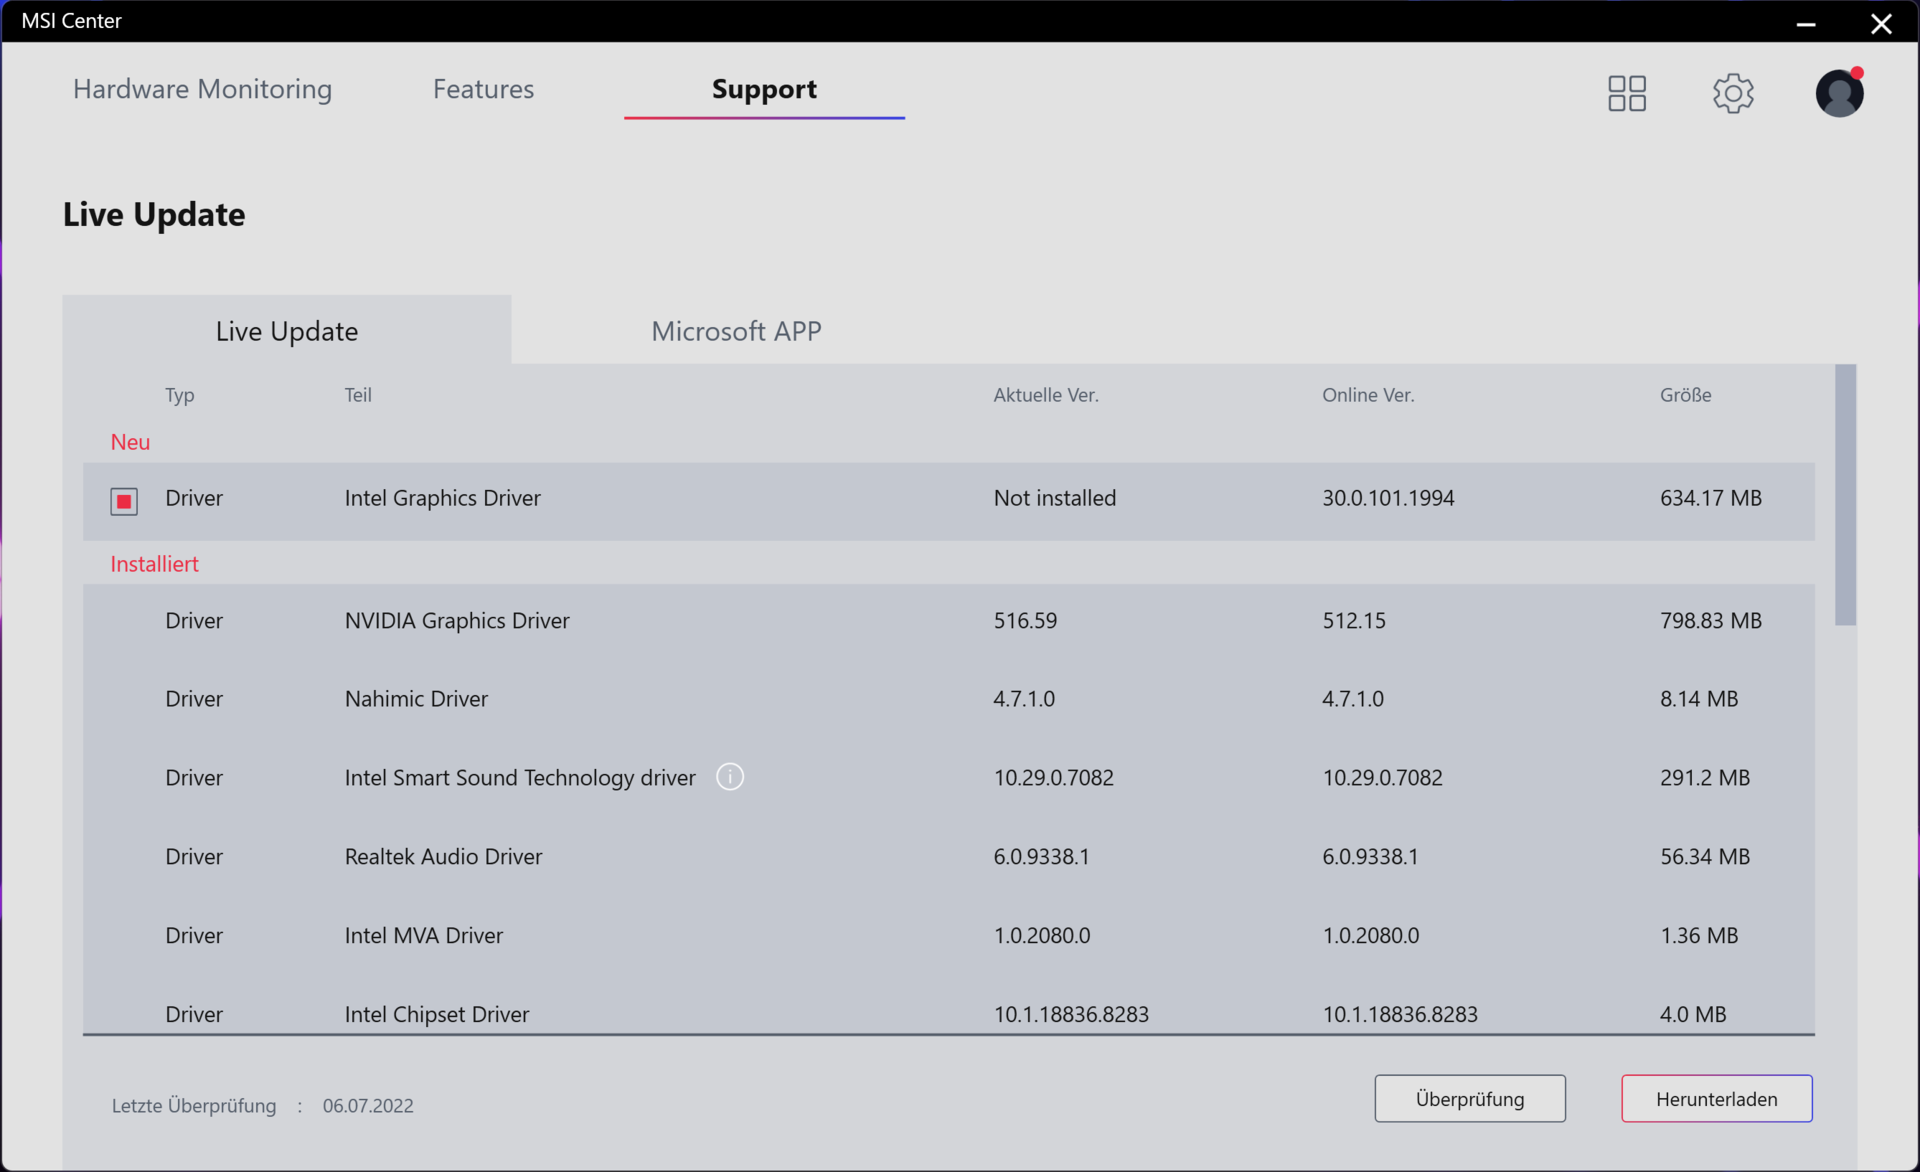
Los usuarios pueden cambiar manualmente entre cuatro perfiles de energía a través del software MSI Center preinstalado. Si se activa -como hicimos nosotros- la función universal "Smart Auto" basada en la IA, el Centro MSI elige automáticamente el perfil en función del escenario actual. Esta función también permite a los usuarios crear una lista de aplicaciones, que activan el perfil "Rendimiento extremo" cuando se inician.
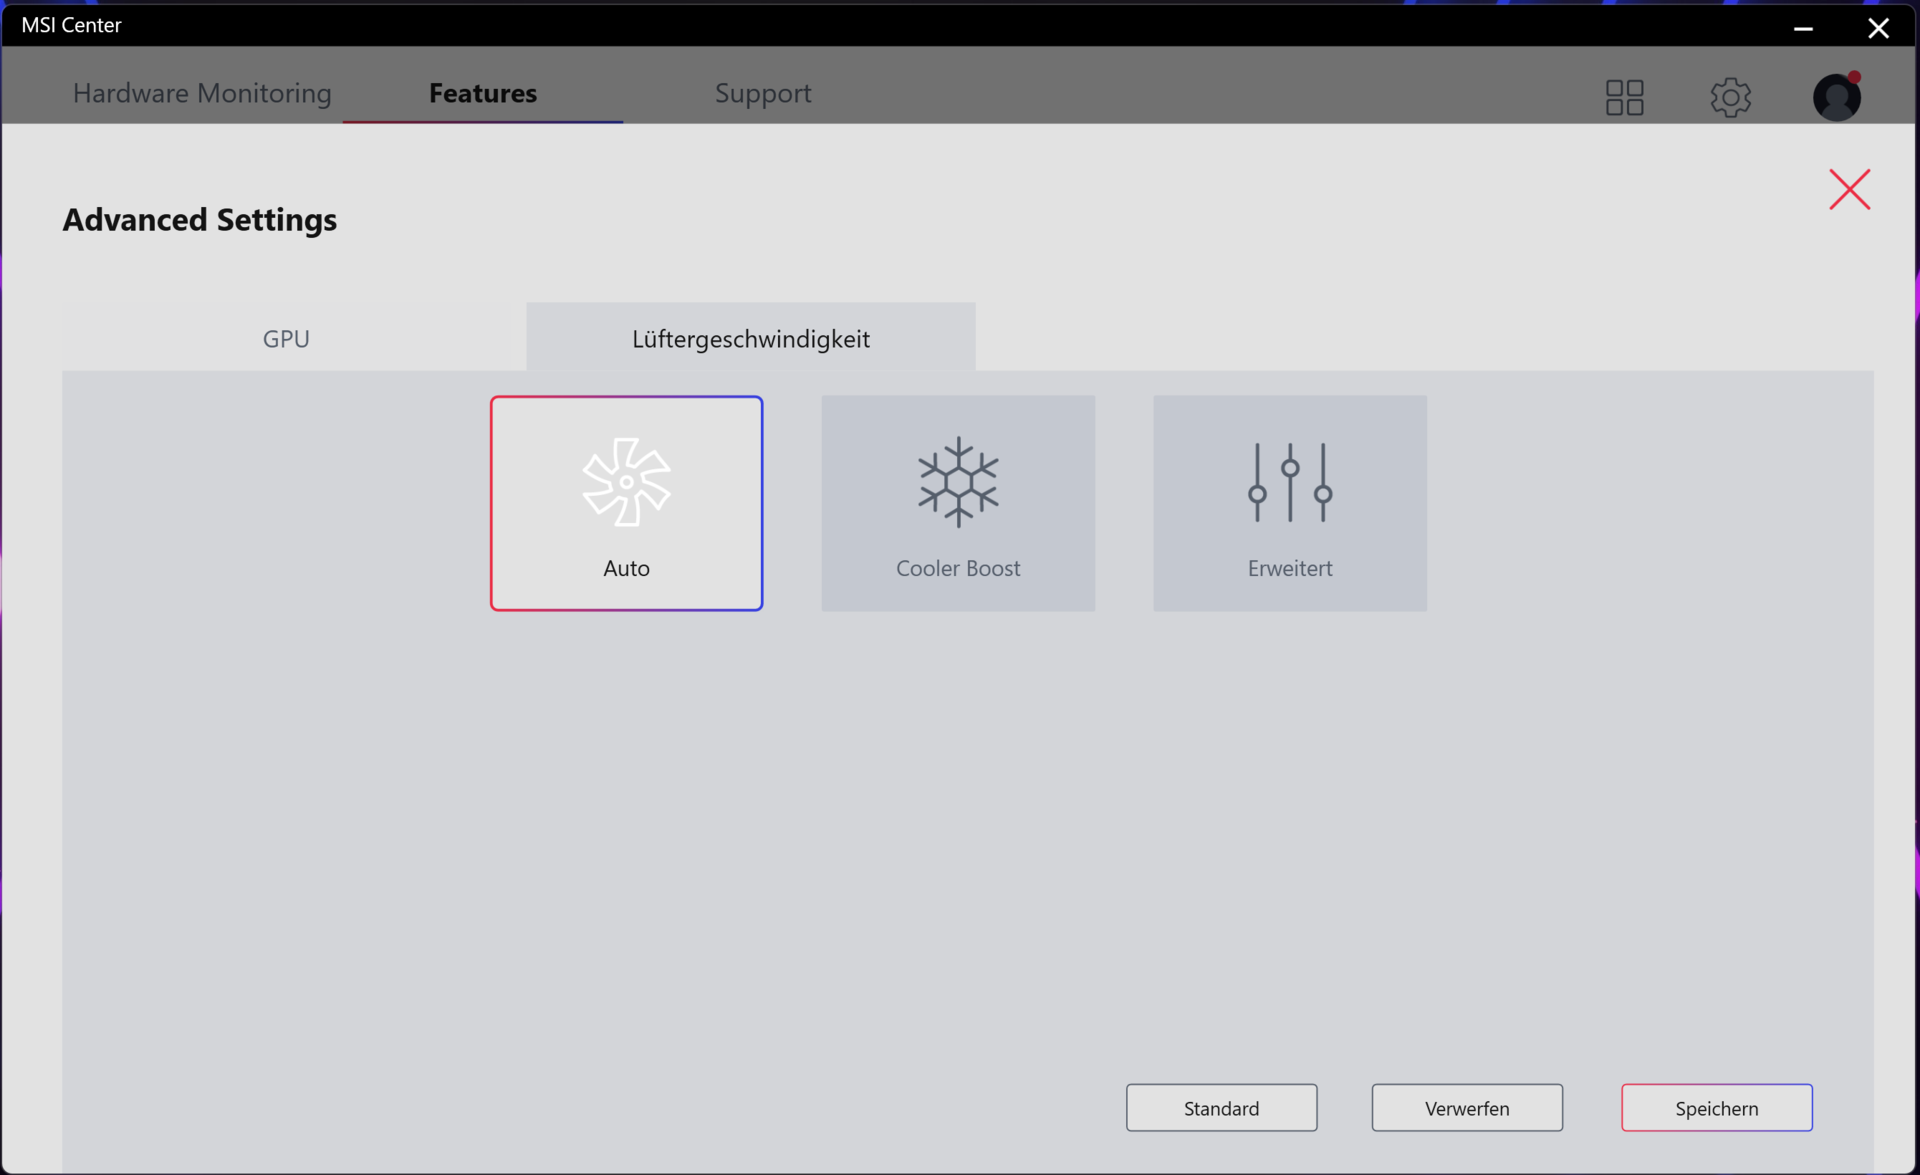
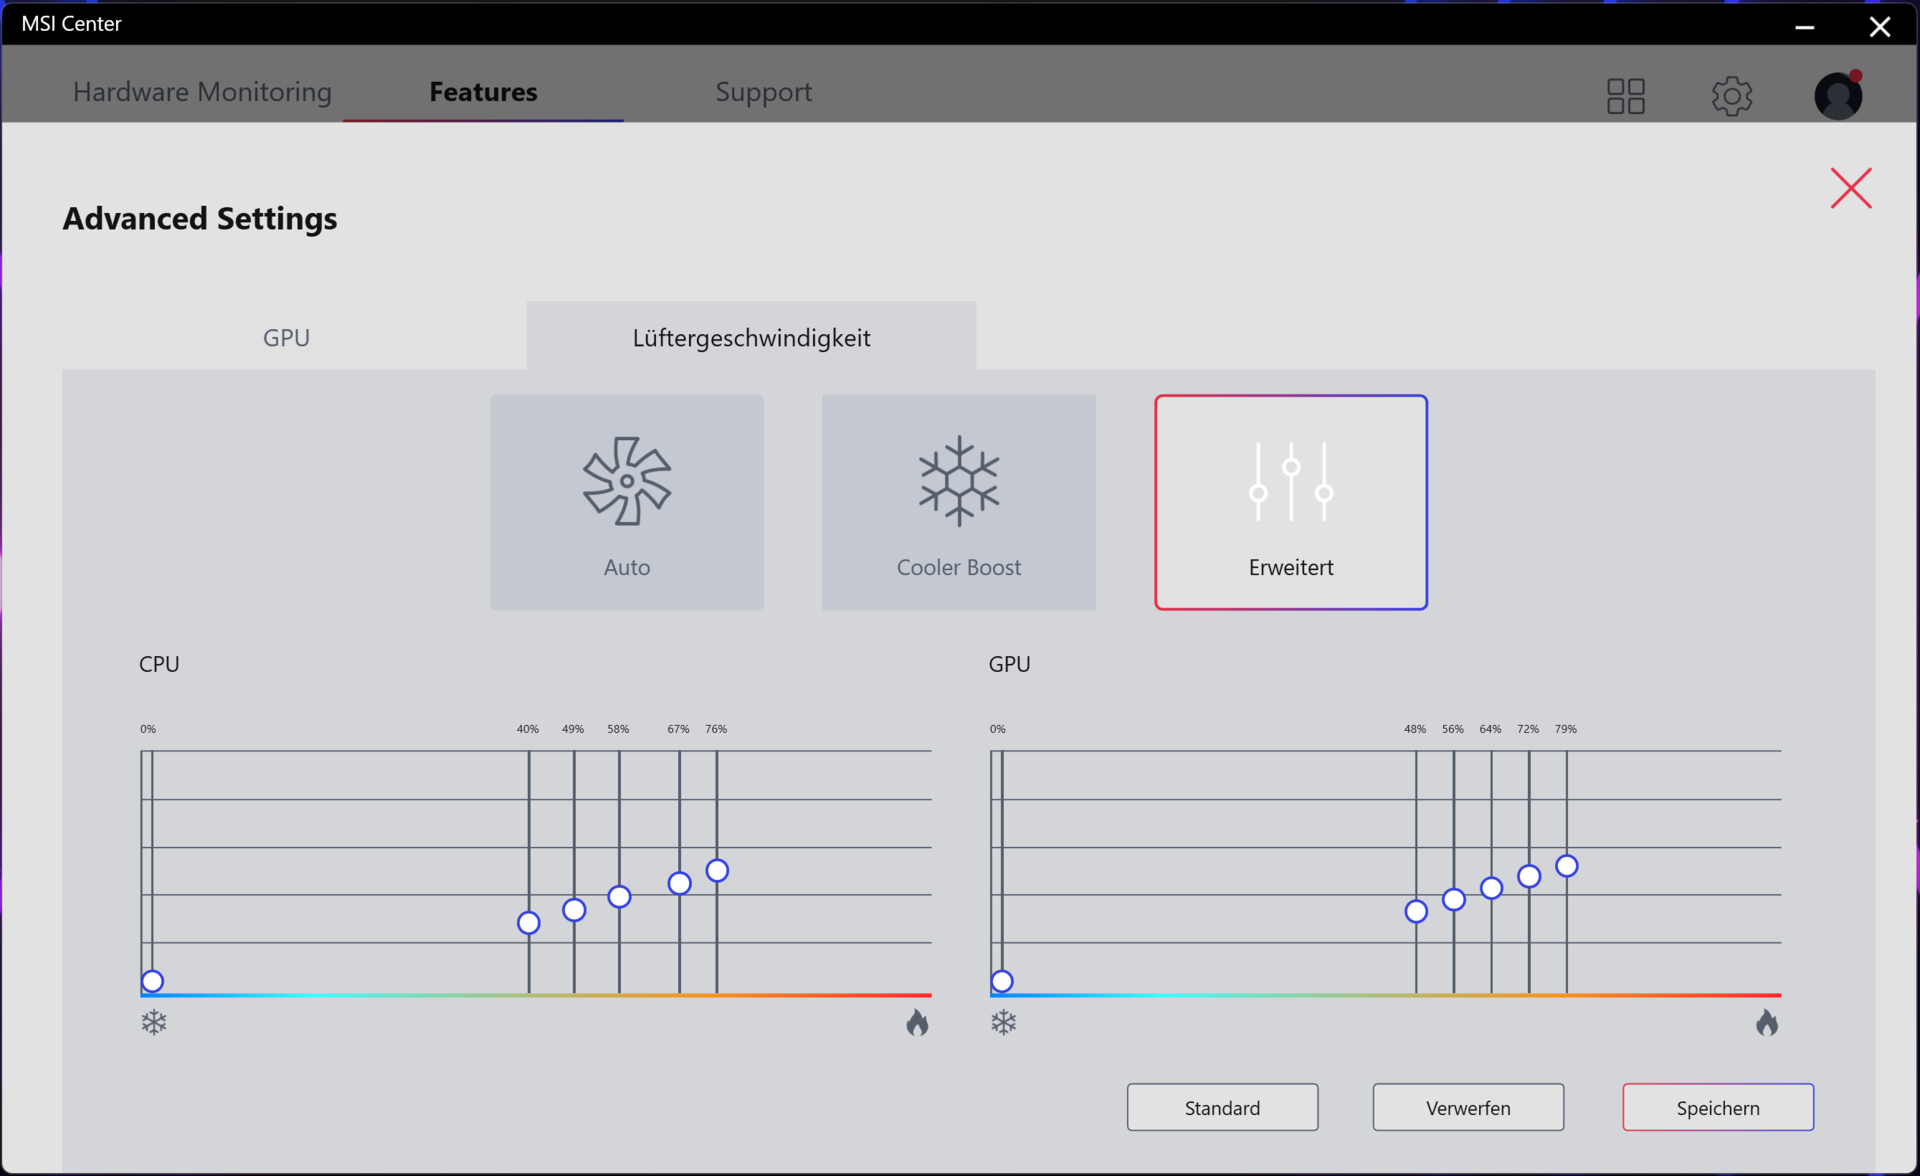
El perfil "Perfil extremo" ofrece varias opciones de ajuste. Por ejemplo, es posible overclockear la GPU y la VRAM. Además, los usuarios tienen acceso a los controles del ventilador. Aquí, las opciones son "Auto", "Cooler Boost" (los ventiladores funcionan a la máxima velocidad), y "Advanced" (curvas de ventilador ajustables).
¿Bug, optimización de benchmark o característica útil? La ejecución de nuestra suite de pruebas produce resultados algo curiosos cuando se utiliza el "modo silencioso": El lanzamiento de ciertos benchmarks hace que el Centro MSI cambie automáticamente al perfil "Rendimiento extremo". Este fue el caso de los benchmarks Cinebench y AIDA64.
| Rendimiento extremo | Equilibrado | Modo silencioso | Super batería | |
|---|---|---|---|---|
| Límite de potencia 1 | 115 vatios | 110 vatios | 30 vatios | 15 vatios |
| Límite de potencia 2 | 180 vatios | 150 vatios | 30 vatios | 15 vatios |

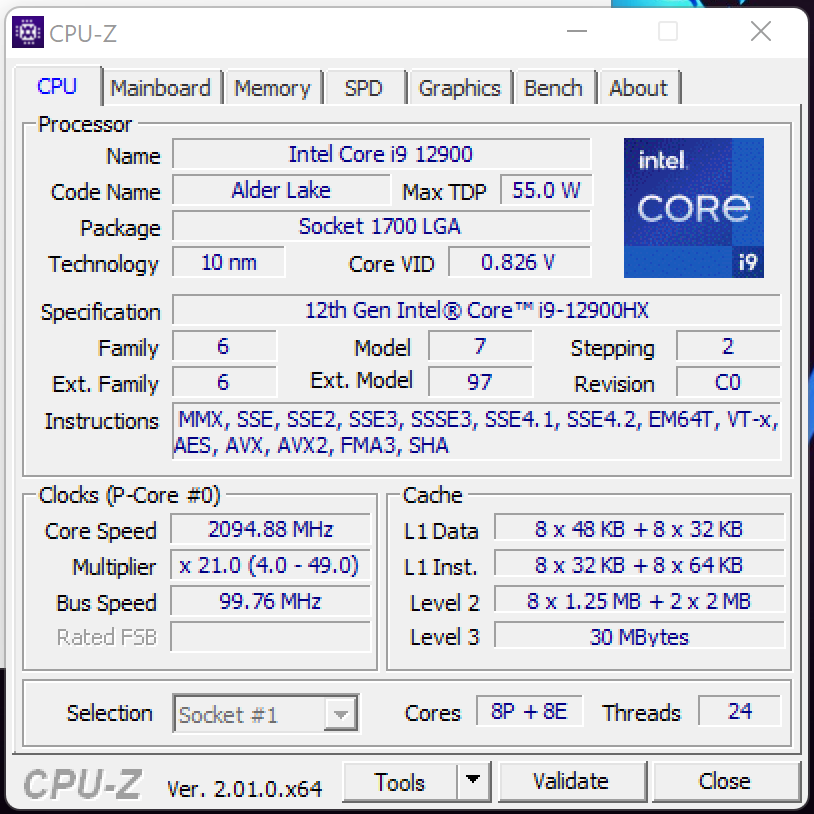
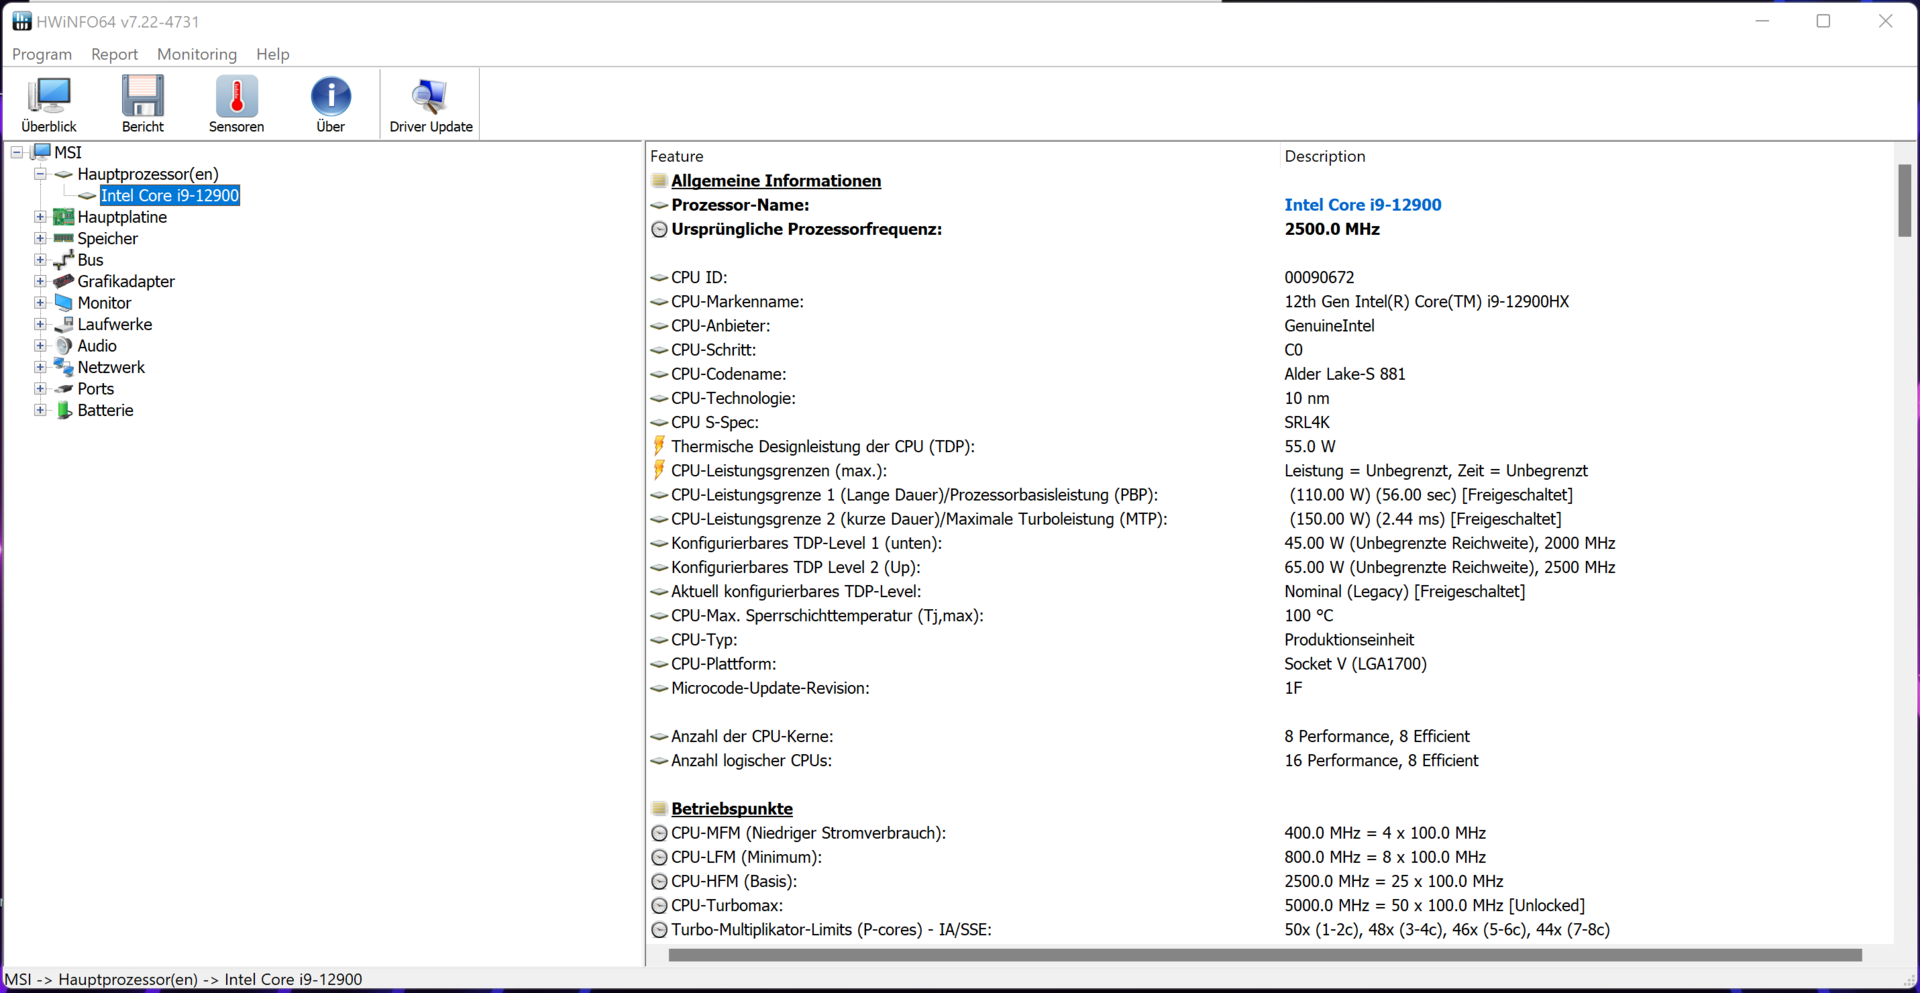
Procesador
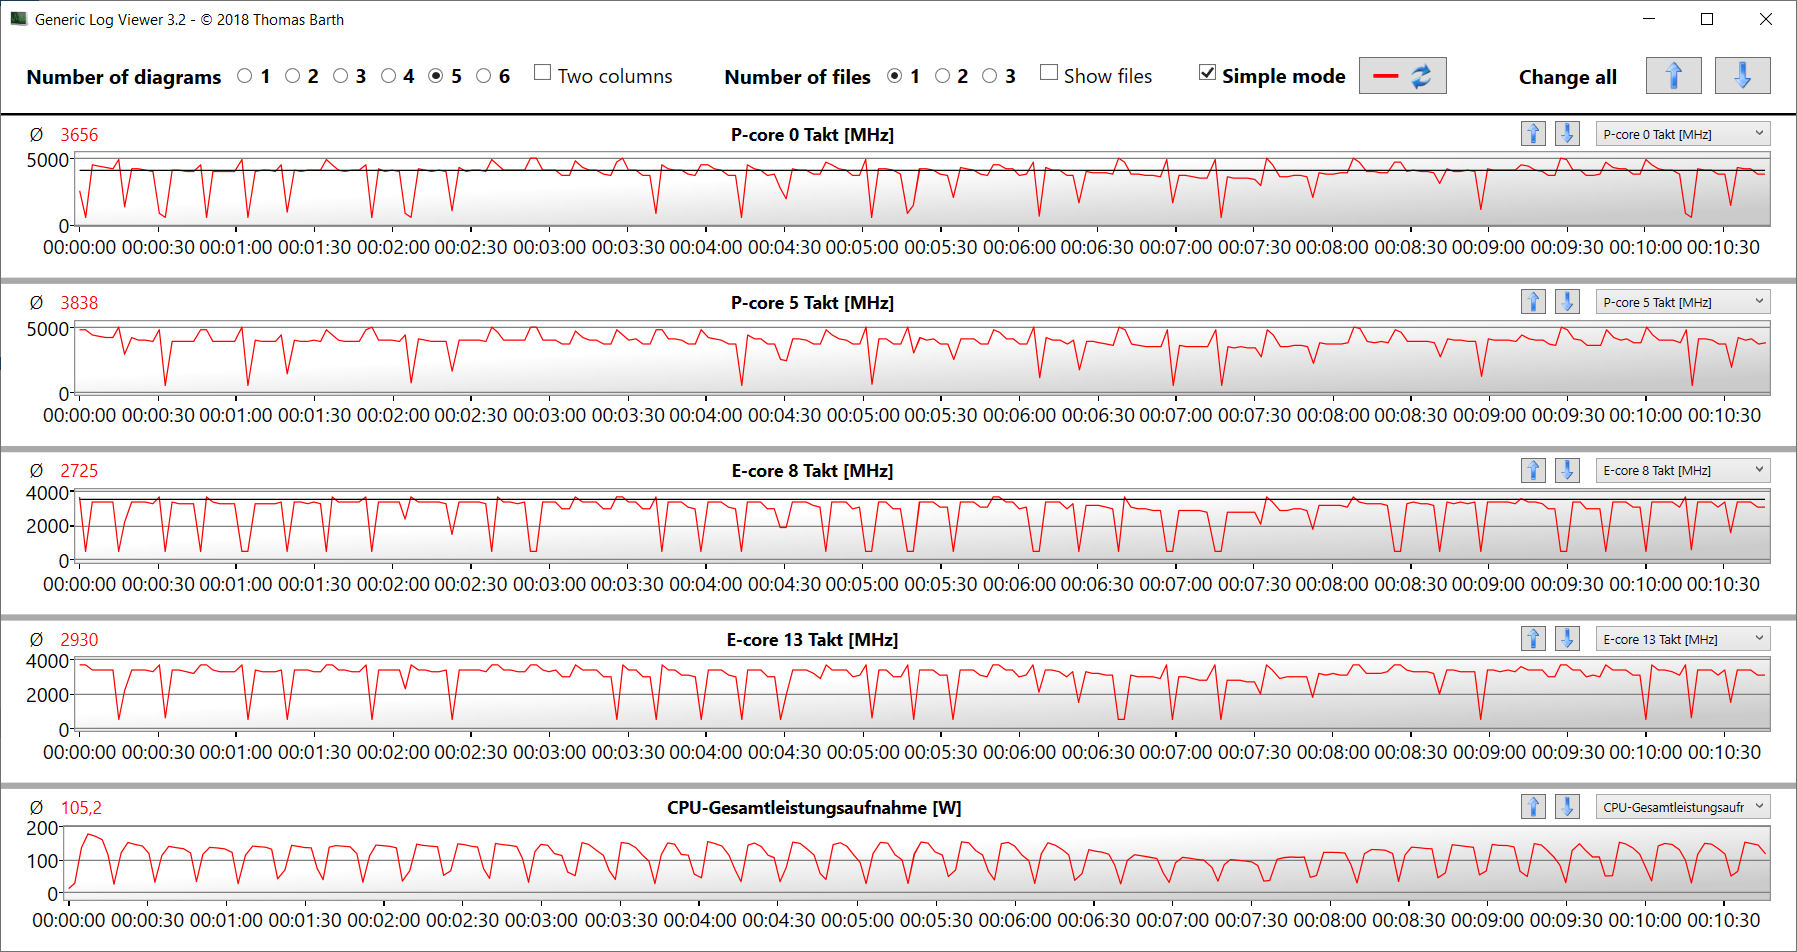
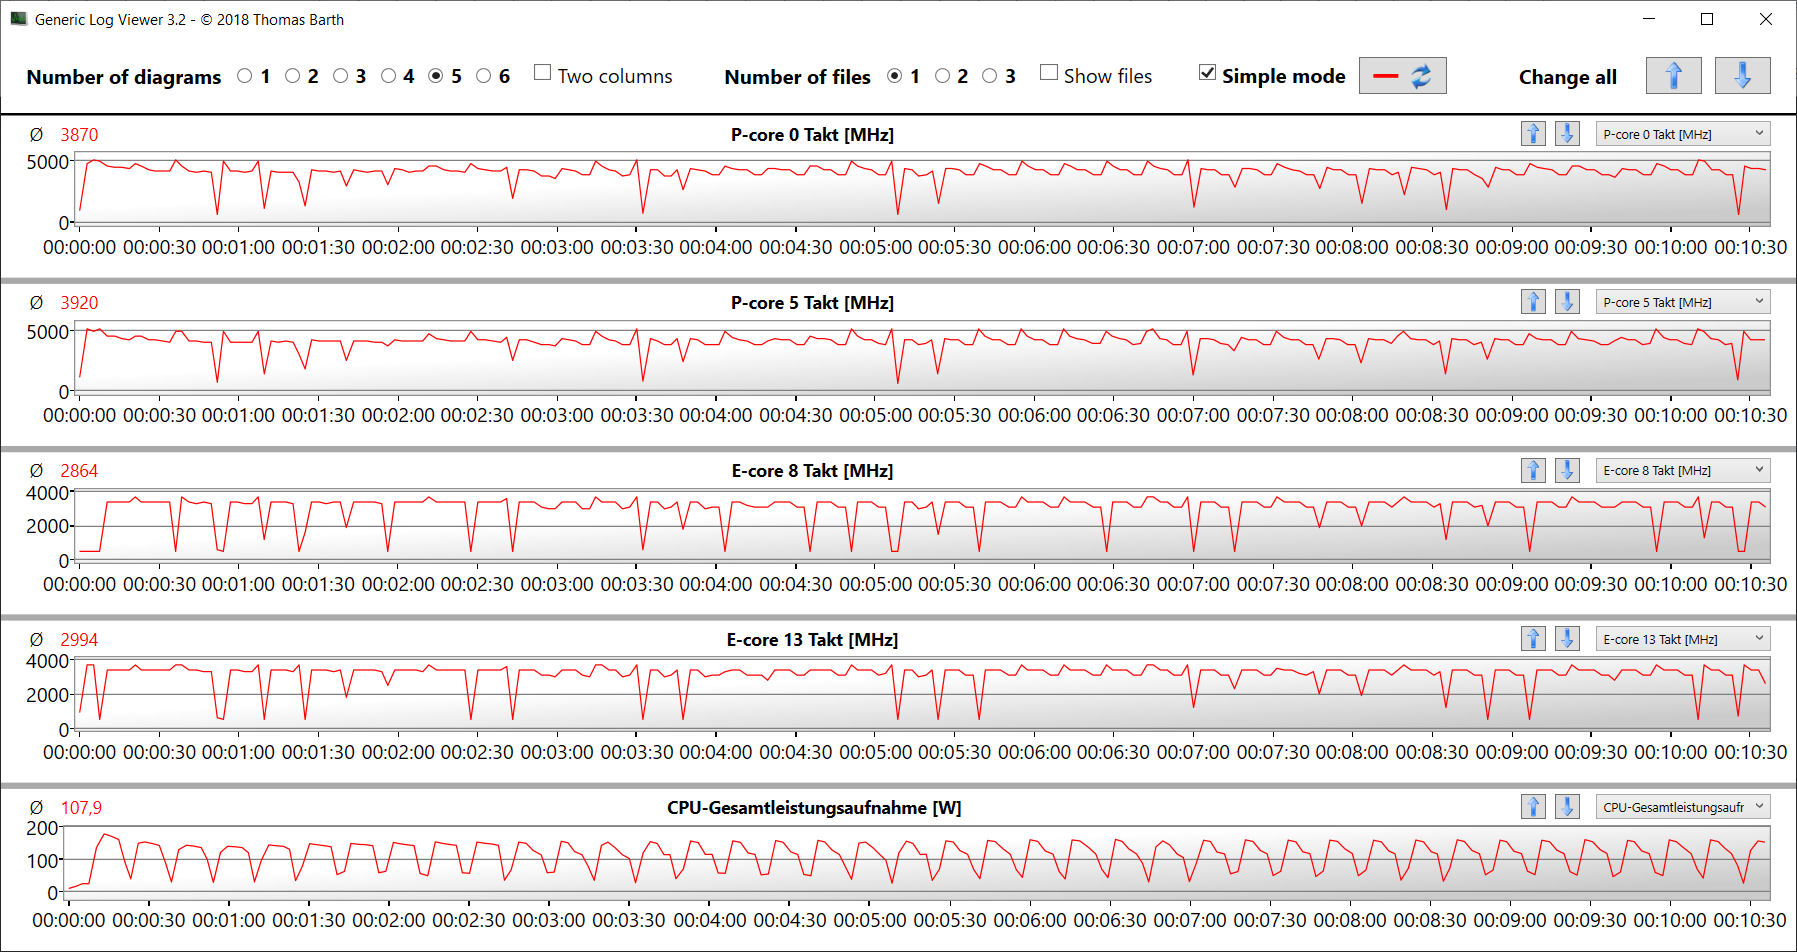
El Core i7-12900HX (Alder Lake) consta de ocho núcleos de rendimiento (Hyper-threading, de 2,3 a 5 GHz) y ocho núcleos de eficiencia (sin Hyper-threading, de 1,7 a 3,6 GHz). En total, hay 24 núcleos lógicos de CPU.
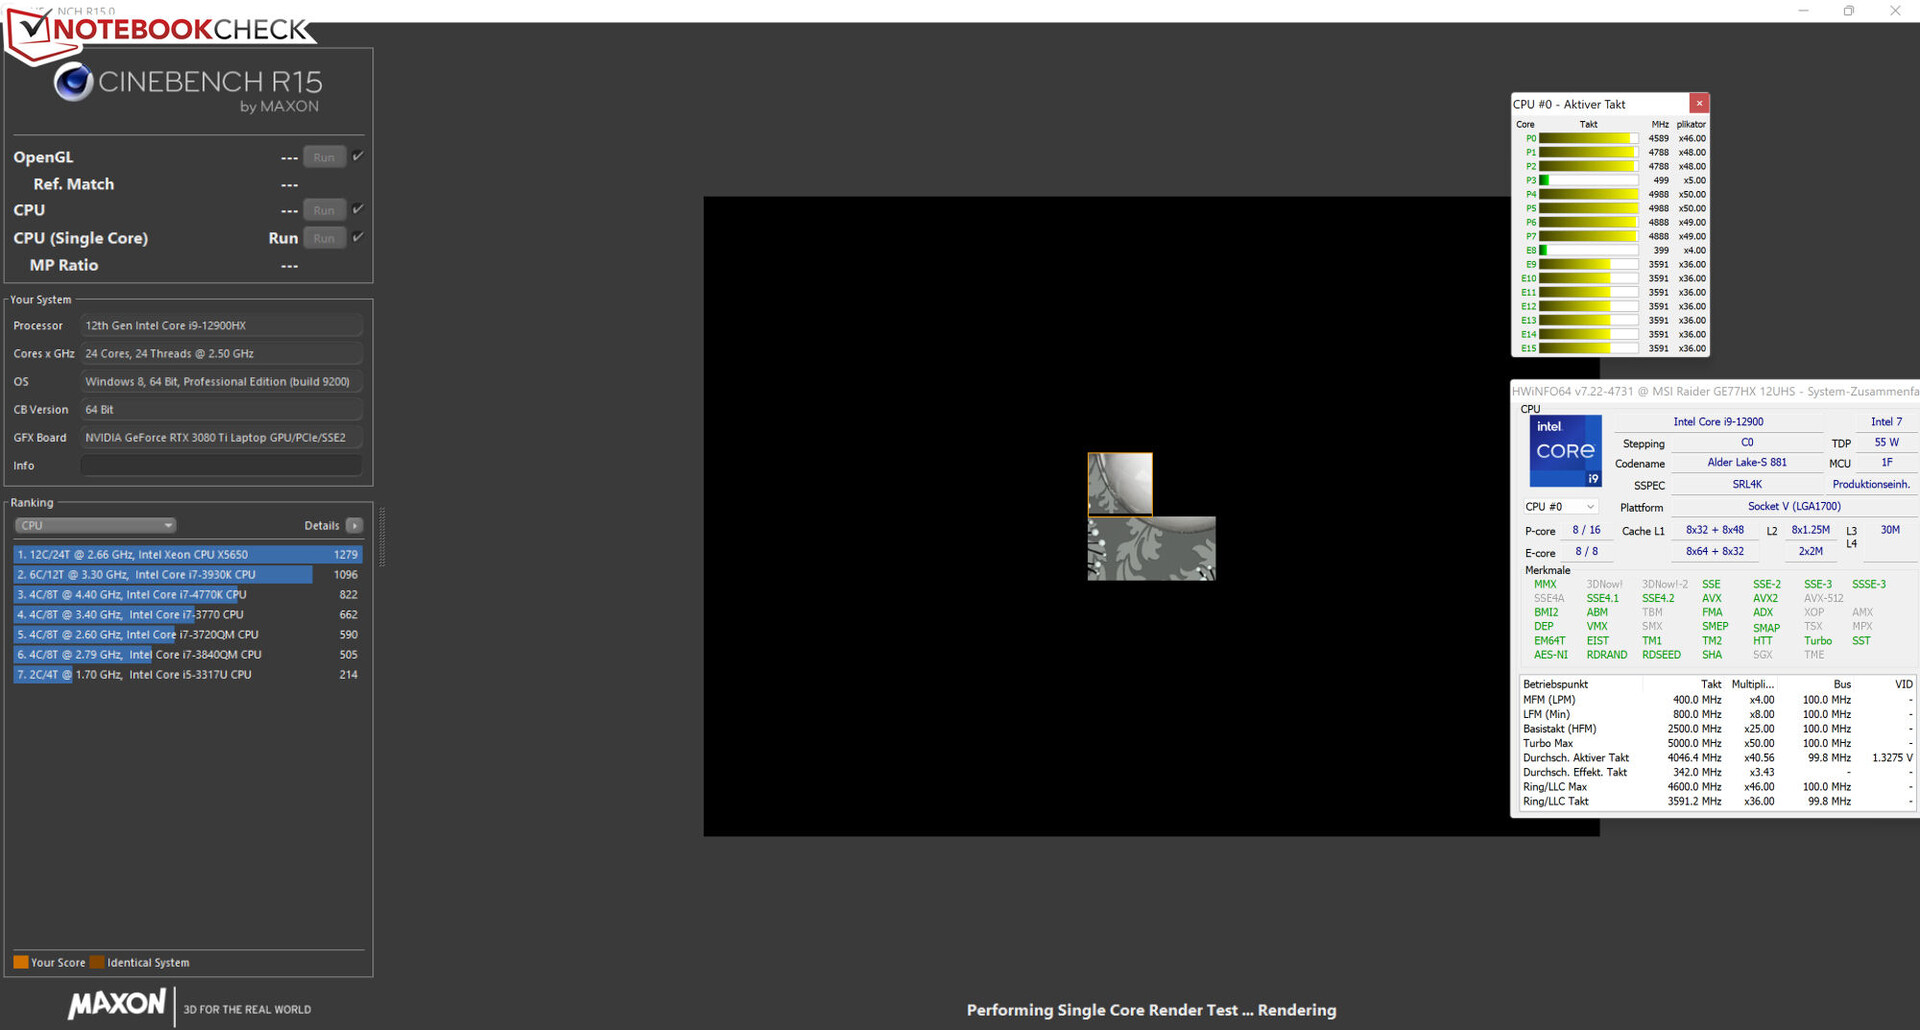
Las velocidades de reloj se mantienen elevadas a lo largo de la prueba Cinebench R15 Multi (núcleos P: 4,4 a 4,5 GHz, núcleos E: 3,3 a 3,4 GHz) y de la prueba monohilo (núcleos P: 500 MHz a 5 GHz, núcleos E: 400 MHz a 3,6 GHz). En modo batería, las velocidades de reloj de un solo hilo son similares (núcleos P: 400 MHz a 4,8 GHz, núcleos E: 400 MHz a 3,6 GHz), mientras que las velocidades de reloj de varios hilos (núcleos P: 1,7 a 2,6 GHz, núcleos E: 1,4 a 2 GHz) no lo son.
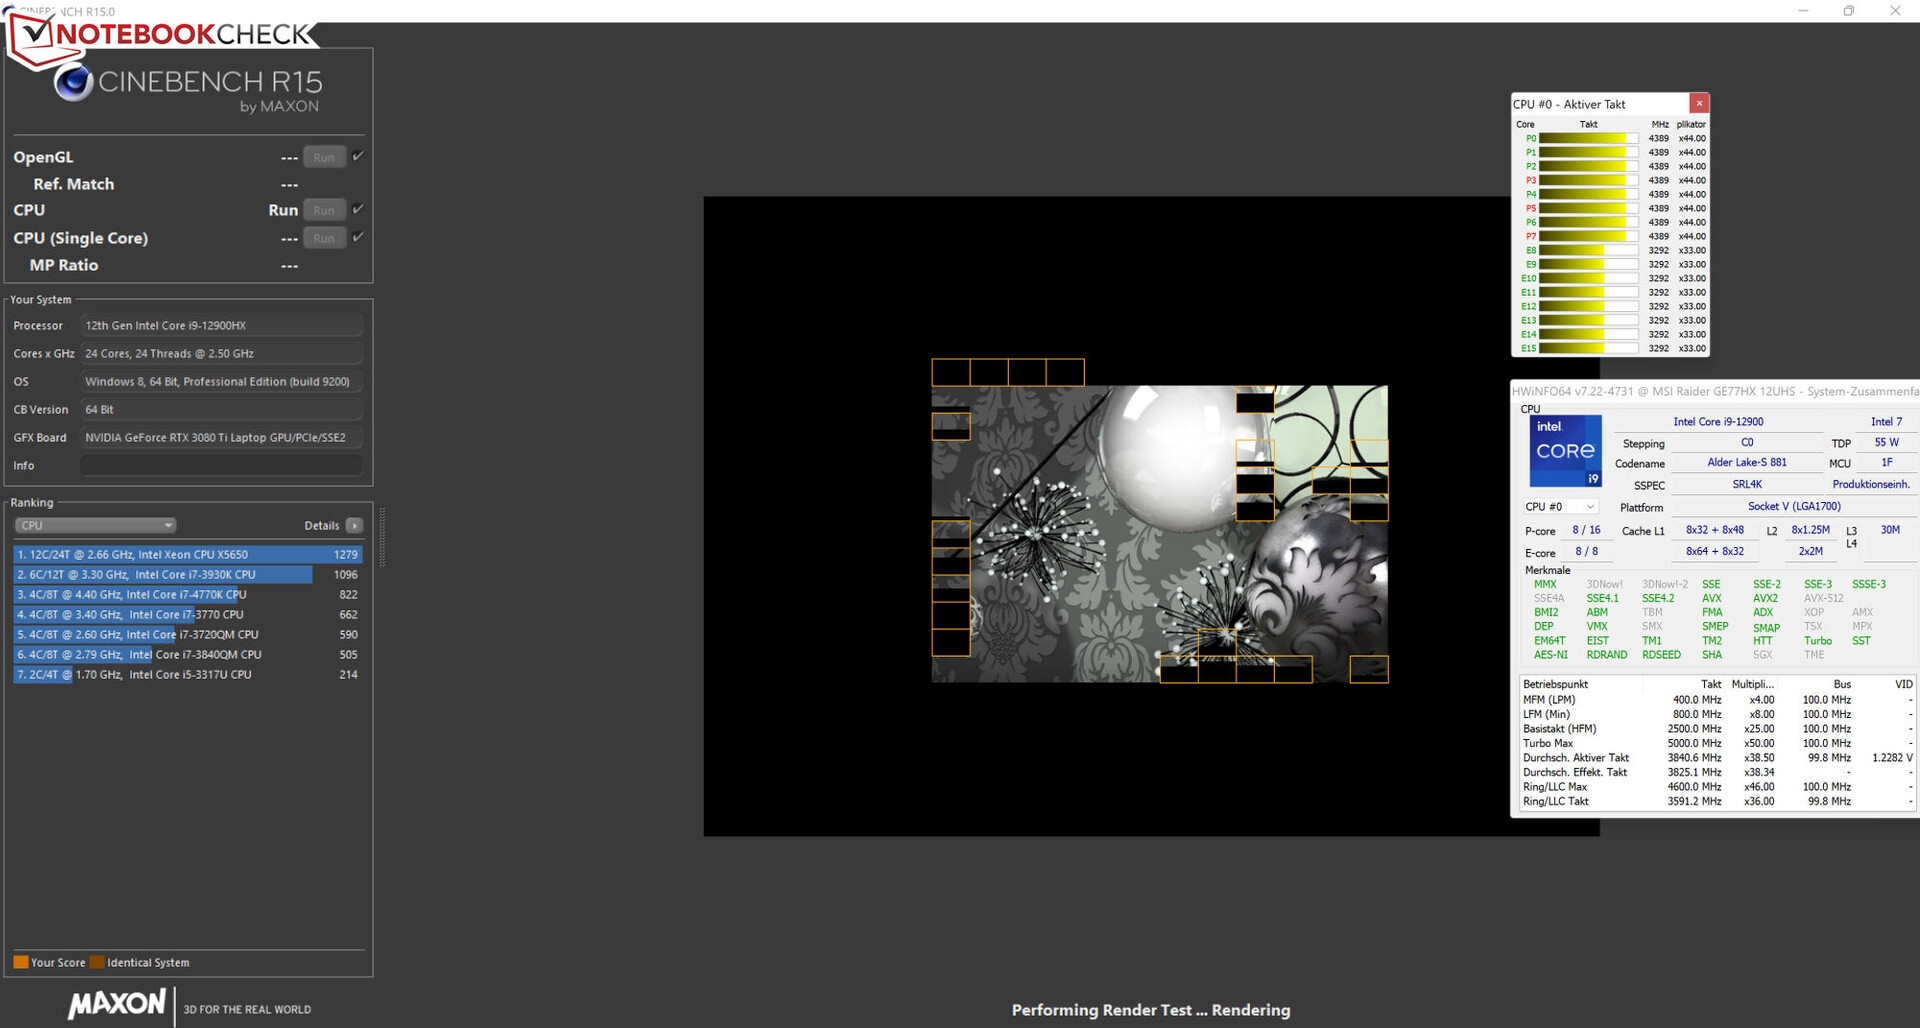
Determinamos si el turbo de la CPU está permanentemente activo mientras está en la red eléctrica ejecutando el benchmark Cinebench R15 Multi en un bucle. Aquí, observamos velocidades de reloj consistentemente altas. El perfil "Rendimiento extremo" resulta en un nivel de rendimiento más uniforme.
Cinebench R15 Multi Loop
| CPU Performance rating - Percent | |
| Media de la clase Gaming | |
| MSI Raider GE77 HX 12UHS | |
| MSI Raider GE77 HX 12UHS | |
| Medio Intel Core i9-12900HX | |
| Alienware x17 R2 P48E | |
| Medion Erazer Beast X30 | |
| Razer Blade 17 Early 2022 | |
| Cinebench R23 | |
| Multi Core | |
| Media de la clase Gaming (10488 - 42661, n=107, últimos 2 años) | |
| MSI Raider GE77 HX 12UHS (Extreme Leistung) | |
| MSI Raider GE77 HX 12UHS | |
| Medio Intel Core i9-12900HX (18337 - 23482, n=8) | |
| Medion Erazer Beast X30 | |
| Alienware x17 R2 P48E | |
| Razer Blade 17 Early 2022 | |
| Single Core | |
| Media de la clase Gaming (1166 - 2415, n=107, últimos 2 años) | |
| Medio Intel Core i9-12900HX (1897 - 1936, n=8) | |
| Razer Blade 17 Early 2022 | |
| MSI Raider GE77 HX 12UHS | |
| Alienware x17 R2 P48E | |
| MSI Raider GE77 HX 12UHS (Extreme Leistung) | |
| Medion Erazer Beast X30 | |
| Cinebench R20 | |
| CPU (Multi Core) | |
| Media de la clase Gaming (4029 - 16433, n=106, últimos 2 años) | |
| MSI Raider GE77 HX 12UHS (Extreme Leistung) | |
| MSI Raider GE77 HX 12UHS | |
| Medio Intel Core i9-12900HX (7037 - 9042, n=8) | |
| Medion Erazer Beast X30 | |
| Alienware x17 R2 P48E | |
| Razer Blade 17 Early 2022 | |
| CPU (Single Core) | |
| Media de la clase Gaming (442 - 913, n=106, últimos 2 años) | |
| MSI Raider GE77 HX 12UHS | |
| Medio Intel Core i9-12900HX (728 - 745, n=8) | |
| MSI Raider GE77 HX 12UHS (Extreme Leistung) | |
| Alienware x17 R2 P48E | |
| Razer Blade 17 Early 2022 | |
| Medion Erazer Beast X30 | |
| Cinebench R15 | |
| CPU Multi 64Bit | |
| Media de la clase Gaming (1578 - 6330, n=105, últimos 2 años) | |
| MSI Raider GE77 HX 12UHS | |
| MSI Raider GE77 HX 12UHS (Extreme Leistung) | |
| Medio Intel Core i9-12900HX (2830 - 3652, n=8) | |
| Alienware x17 R2 P48E | |
| Medion Erazer Beast X30 | |
| Razer Blade 17 Early 2022 | |
| CPU Single 64Bit | |
| Media de la clase Gaming (188.8 - 350, n=106, últimos 2 años) | |
| MSI Raider GE77 HX 12UHS | |
| Medio Intel Core i9-12900HX (274 - 282, n=8) | |
| MSI Raider GE77 HX 12UHS (Extreme Leistung) | |
| Alienware x17 R2 P48E | |
| Razer Blade 17 Early 2022 | |
| Medion Erazer Beast X30 | |
| Blender - v2.79 BMW27 CPU | |
| Razer Blade 17 Early 2022 | |
| Medion Erazer Beast X30 | |
| Alienware x17 R2 P48E | |
| Medio Intel Core i9-12900HX (144 - 201, n=8) | |
| MSI Raider GE77 HX 12UHS | |
| Media de la clase Gaming (79 - 330, n=104, últimos 2 años) | |
| MSI Raider GE77 HX 12UHS (Extreme Leistung) | |
| 7-Zip 18.03 | |
| 7z b 4 | |
| Media de la clase Gaming (33491 - 148086, n=105, últimos 2 años) | |
| MSI Raider GE77 HX 12UHS (Extreme Leistung) | |
| MSI Raider GE77 HX 12UHS | |
| Medio Intel Core i9-12900HX (69778 - 88128, n=7) | |
| Medion Erazer Beast X30 | |
| Alienware x17 R2 P48E | |
| Razer Blade 17 Early 2022 | |
| 7z b 4 -mmt1 | |
| Media de la clase Gaming (4199 - 7436, n=105, últimos 2 años) | |
| MSI Raider GE77 HX 12UHS | |
| Medio Intel Core i9-12900HX (6165 - 6358, n=7) | |
| MSI Raider GE77 HX 12UHS (Extreme Leistung) | |
| Razer Blade 17 Early 2022 | |
| Alienware x17 R2 P48E | |
| Medion Erazer Beast X30 | |
| Geekbench 5.5 | |
| Multi-Core | |
| Media de la clase Gaming (6460 - 28263, n=105, últimos 2 años) | |
| MSI Raider GE77 HX 12UHS (Extreme Leistung) | |
| MSI Raider GE77 HX 12UHS | |
| Medio Intel Core i9-12900HX (15116 - 16925, n=8) | |
| Alienware x17 R2 P48E | |
| Medion Erazer Beast X30 | |
| Razer Blade 17 Early 2022 | |
| Single-Core | |
| Media de la clase Gaming (986 - 2474, n=105, últimos 2 años) | |
| MSI Raider GE77 HX 12UHS | |
| Medio Intel Core i9-12900HX (1874 - 1949, n=8) | |
| MSI Raider GE77 HX 12UHS (Extreme Leistung) | |
| Alienware x17 R2 P48E | |
| Razer Blade 17 Early 2022 | |
| Medion Erazer Beast X30 | |
| HWBOT x265 Benchmark v2.2 - 4k Preset | |
| Media de la clase Gaming (11.5 - 44.4, n=105, últimos 2 años) | |
| MSI Raider GE77 HX 12UHS (Extreme Leistung) | |
| MSI Raider GE77 HX 12UHS | |
| Medio Intel Core i9-12900HX (19.6 - 26.6, n=7) | |
| Alienware x17 R2 P48E | |
| Medion Erazer Beast X30 | |
| Razer Blade 17 Early 2022 | |
| LibreOffice - 20 Documents To PDF | |
| Media de la clase Gaming (33.2 - 88.8, n=105, últimos 2 años) | |
| Medion Erazer Beast X30 | |
| MSI Raider GE77 HX 12UHS | |
| Alienware x17 R2 P48E | |
| Razer Blade 17 Early 2022 | |
| Medio Intel Core i9-12900HX (33.6 - 42.4, n=7) | |
| MSI Raider GE77 HX 12UHS (Extreme Leistung) | |
| R Benchmark 2.5 - Overall mean | |
| Medion Erazer Beast X30 | |
| Razer Blade 17 Early 2022 | |
| Alienware x17 R2 P48E | |
| Media de la clase Gaming (0.3439 - 0.759, n=106, últimos 2 años) | |
| MSI Raider GE77 HX 12UHS | |
| MSI Raider GE77 HX 12UHS (Extreme Leistung) | |
| Medio Intel Core i9-12900HX (0.4159 - 0.4242, n=7) | |
* ... más pequeño es mejor
AIDA64: FP32 Ray-Trace | FPU Julia | CPU SHA3 | CPU Queen | FPU SinJulia | FPU Mandel | CPU AES | CPU ZLib | FP64 Ray-Trace | CPU PhotoWorxx
| Performance rating | |
| Media de la clase Gaming | |
| MSI Raider GE77 HX 12UHS | |
| MSI Raider GE77 HX 12UHS | |
| Medio Intel Core i9-12900HX | |
| Alienware x17 R2 P48E | |
| Medion Erazer Beast X30 | |
| Razer Blade 17 Early 2022 | |
| AIDA64 / FP32 Ray-Trace | |
| Media de la clase Gaming (10227 - 85542, n=105, últimos 2 años) | |
| MSI Raider GE77 HX 12UHS (v6.70.6000, Extreme Leistung) | |
| MSI Raider GE77 HX 12UHS (v6.70.6000) | |
| Medio Intel Core i9-12900HX (11535 - 22183, n=7) | |
| Alienware x17 R2 P48E (v6.50.5800) | |
| Medion Erazer Beast X30 (v6.50.5800) | |
| Razer Blade 17 Early 2022 (v6.50.5800) | |
| AIDA64 / FPU Julia | |
| Media de la clase Gaming (51376 - 238426, n=105, últimos 2 años) | |
| MSI Raider GE77 HX 12UHS (v6.70.6000) | |
| MSI Raider GE77 HX 12UHS (v6.70.6000, Extreme Leistung) | |
| Medio Intel Core i9-12900HX (52916 - 110093, n=7) | |
| Alienware x17 R2 P48E (v6.50.5800) | |
| Medion Erazer Beast X30 (v6.50.5800) | |
| Razer Blade 17 Early 2022 (v6.50.5800) | |
| AIDA64 / CPU SHA3 | |
| Media de la clase Gaming (2180 - 10115, n=105, últimos 2 años) | |
| MSI Raider GE77 HX 12UHS (v6.70.6000) | |
| MSI Raider GE77 HX 12UHS (v6.70.6000, Extreme Leistung) | |
| Medio Intel Core i9-12900HX (3559 - 5123, n=7) | |
| Alienware x17 R2 P48E (v6.50.5800) | |
| Medion Erazer Beast X30 (v6.50.5800) | |
| Razer Blade 17 Early 2022 (v6.50.5800) | |
| AIDA64 / CPU Queen | |
| Media de la clase Gaming (49785 - 173351, n=90, últimos 2 años) | |
| Alienware x17 R2 P48E (v6.50.5800) | |
| Medion Erazer Beast X30 (v6.50.5800) | |
| Medio Intel Core i9-12900HX (101029 - 104457, n=7) | |
| MSI Raider GE77 HX 12UHS (v6.70.6000) | |
| MSI Raider GE77 HX 12UHS (v6.70.6000, Extreme Leistung) | |
| Razer Blade 17 Early 2022 (v6.50.5800) | |
| AIDA64 / FPU SinJulia | |
| Media de la clase Gaming (4424 - 33636, n=105, últimos 2 años) | |
| MSI Raider GE77 HX 12UHS (v6.70.6000, Extreme Leistung) | |
| MSI Raider GE77 HX 12UHS (v6.70.6000) | |
| Medio Intel Core i9-12900HX (10475 - 13062, n=7) | |
| Alienware x17 R2 P48E (v6.50.5800) | |
| Medion Erazer Beast X30 (v6.50.5800) | |
| Razer Blade 17 Early 2022 (v6.50.5800) | |
| AIDA64 / FPU Mandel | |
| Media de la clase Gaming (25115 - 128721, n=105, últimos 2 años) | |
| MSI Raider GE77 HX 12UHS (v6.70.6000, Extreme Leistung) | |
| MSI Raider GE77 HX 12UHS (v6.70.6000) | |
| Medio Intel Core i9-12900HX (31779 - 53628, n=7) | |
| Alienware x17 R2 P48E (v6.50.5800) | |
| Medion Erazer Beast X30 (v6.50.5800) | |
| Razer Blade 17 Early 2022 (v6.50.5800) | |
| AIDA64 / CPU AES | |
| MSI Raider GE77 HX 12UHS (v6.70.6000) | |
| MSI Raider GE77 HX 12UHS (v6.70.6000, Extreme Leistung) | |
| Medio Intel Core i9-12900HX (125268 - 183146, n=7) | |
| Media de la clase Gaming (39258 - 247074, n=105, últimos 2 años) | |
| Alienware x17 R2 P48E (v6.50.5800) | |
| Medion Erazer Beast X30 (v6.50.5800) | |
| Razer Blade 17 Early 2022 (v6.50.5800) | |
| AIDA64 / CPU ZLib | |
| Media de la clase Gaming (574 - 2531, n=105, últimos 2 años) | |
| MSI Raider GE77 HX 12UHS (v6.70.6000) | |
| MSI Raider GE77 HX 12UHS (v6.70.6000, Extreme Leistung) | |
| Medio Intel Core i9-12900HX (990 - 1408, n=7) | |
| Alienware x17 R2 P48E (v6.50.5800) | |
| Medion Erazer Beast X30 (v6.50.5800) | |
| Razer Blade 17 Early 2022 (v6.50.5800) | |
| AIDA64 / FP64 Ray-Trace | |
| Media de la clase Gaming (5509 - 45446, n=105, últimos 2 años) | |
| MSI Raider GE77 HX 12UHS (v6.70.6000, Extreme Leistung) | |
| MSI Raider GE77 HX 12UHS (v6.70.6000) | |
| Medio Intel Core i9-12900HX (6663 - 11913, n=7) | |
| Alienware x17 R2 P48E (v6.50.5800) | |
| Medion Erazer Beast X30 (v6.50.5800) | |
| Razer Blade 17 Early 2022 (v6.50.5800) | |
| AIDA64 / CPU PhotoWorxx | |
| MSI Raider GE77 HX 12UHS (v6.70.6000) | |
| MSI Raider GE77 HX 12UHS (v6.70.6000, Extreme Leistung) | |
| Media de la clase Gaming (12271 - 89891, n=105, últimos 2 años) | |
| Medio Intel Core i9-12900HX (40239 - 47710, n=7) | |
| Medion Erazer Beast X30 (v6.50.5800) | |
| Razer Blade 17 Early 2022 (v6.50.5800) | |
| Alienware x17 R2 P48E (v6.50.5800) | |
Rendimiento del sistema
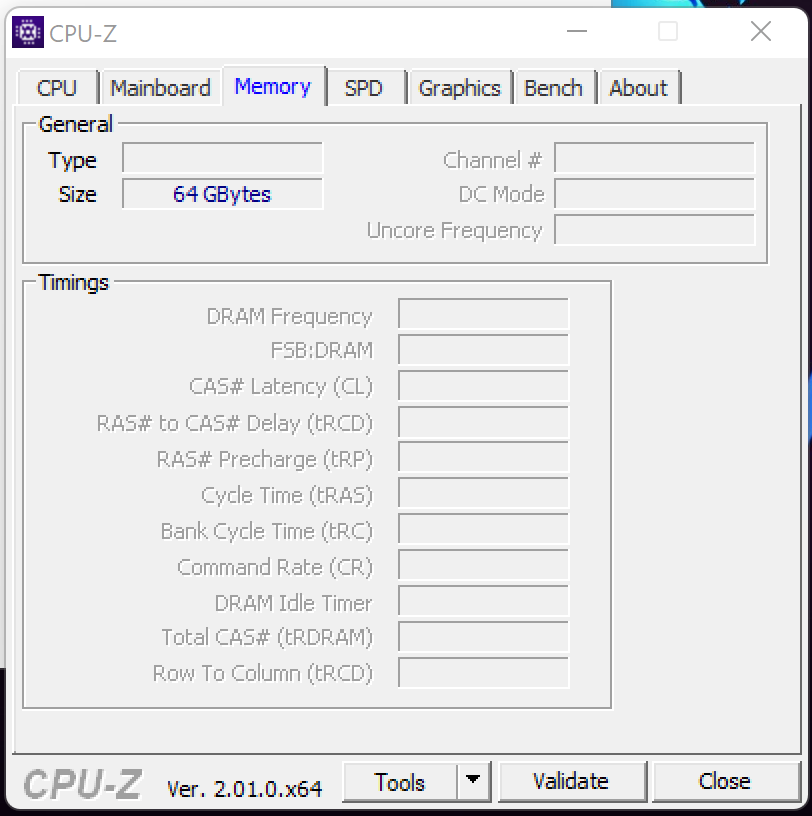
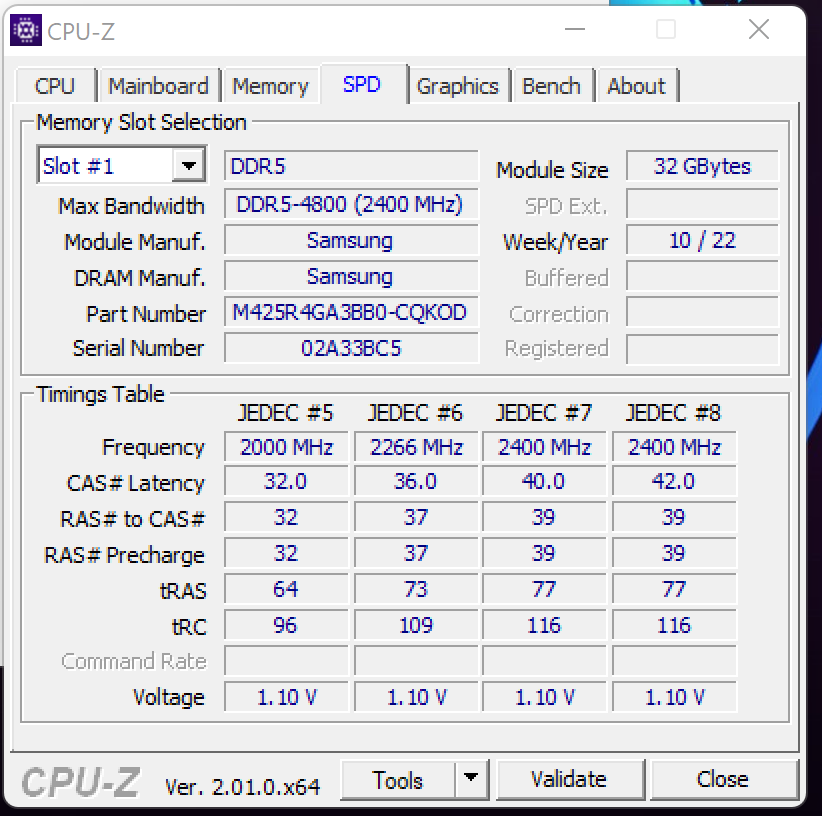
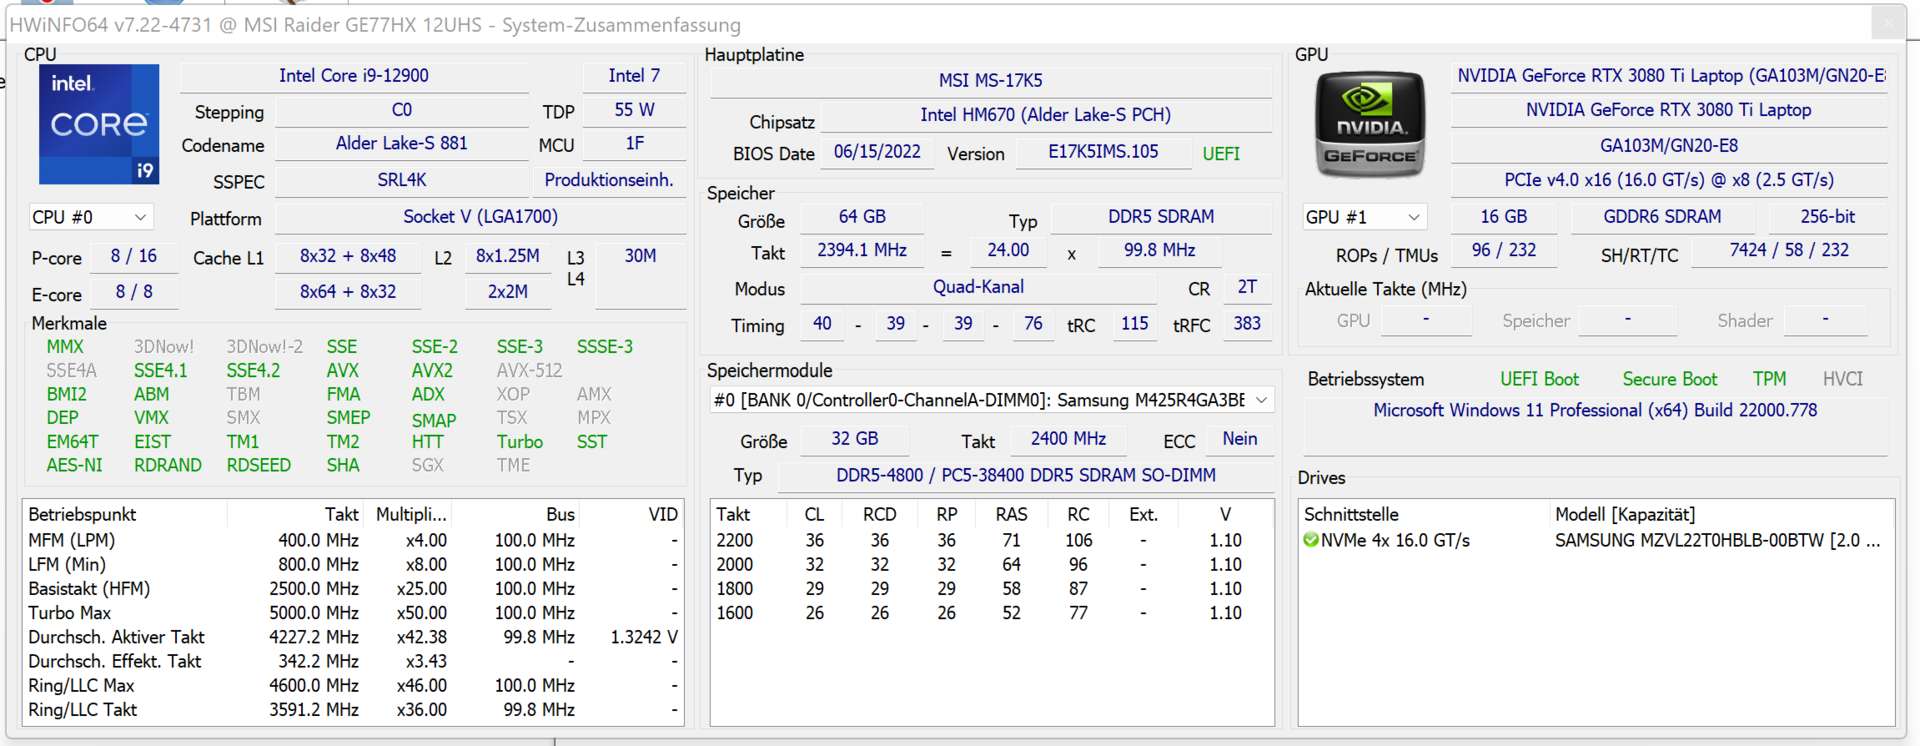
El GE77 es actualmente uno de los portátiles más rápidos del mercado. La combinación de 24 núcleos lógicos de CPU y una GPU RTX 3080 Ti con un TGP máximo hace que el sistema sea apto para cualquier caso de uso exigente, ya sea edición de vídeo, juegos o renderizado. Las tasas de transferencia de la memoria DDR4-4800 están por encima de la media. Esto puede deberse a la caché de la CPU, que es mayor en este modelo en particular en comparación con otros procesadores Intel. Además, el sistema logra buenos resultados en los benchmarks PCMark.
CrossMark: Overall | Productivity | Creativity | Responsiveness
| PCMark 10 / Score | |
| Media de la clase Gaming (5828 - 12414, n=93, últimos 2 años) | |
| MSI Raider GE77 HX 12UHS (dGPU, Extreme Leistung) | |
| Alienware x17 R2 P48E | |
| Medio Intel Core i9-12900HX, NVIDIA GeForce RTX 3080 Ti Laptop GPU (6812 - 8636, n=6) | |
| Medion Erazer Beast X30 | |
| Razer Blade 17 Early 2022 | |
| MSI Raider GE77 HX 12UHS | |
| PCMark 10 / Essentials | |
| Alienware x17 R2 P48E | |
| MSI Raider GE77 HX 12UHS (dGPU, Extreme Leistung) | |
| Media de la clase Gaming (8810 - 11935, n=97, últimos 2 años) | |
| Medio Intel Core i9-12900HX, NVIDIA GeForce RTX 3080 Ti Laptop GPU (9598 - 11192, n=6) | |
| Razer Blade 17 Early 2022 | |
| Medion Erazer Beast X30 | |
| MSI Raider GE77 HX 12UHS | |
| PCMark 10 / Productivity | |
| Media de la clase Gaming (6845 - 25323, n=95, últimos 2 años) | |
| MSI Raider GE77 HX 12UHS (dGPU, Extreme Leistung) | |
| Medio Intel Core i9-12900HX, NVIDIA GeForce RTX 3080 Ti Laptop GPU (9365 - 10932, n=6) | |
| Alienware x17 R2 P48E | |
| MSI Raider GE77 HX 12UHS | |
| Medion Erazer Beast X30 | |
| Razer Blade 17 Early 2022 | |
| PCMark 10 / Digital Content Creation | |
| Media de la clase Gaming (7602 - 19954, n=95, últimos 2 años) | |
| MSI Raider GE77 HX 12UHS (dGPU, Extreme Leistung) | |
| Alienware x17 R2 P48E | |
| Medio Intel Core i9-12900HX, NVIDIA GeForce RTX 3080 Ti Laptop GPU (9543 - 14291, n=6) | |
| Medion Erazer Beast X30 | |
| Razer Blade 17 Early 2022 | |
| MSI Raider GE77 HX 12UHS | |
| CrossMark / Overall | |
| MSI Raider GE77 HX 12UHS | |
| MSI Raider GE77 HX 12UHS (dGPU, Extreme Leistung) | |
| Medio Intel Core i9-12900HX, NVIDIA GeForce RTX 3080 Ti Laptop GPU (2108 - 2170, n=5) | |
| Media de la clase Gaming (1366 - 2409, n=94, últimos 2 años) | |
| Alienware x17 R2 P48E | |
| Razer Blade 17 Early 2022 | |
| Medion Erazer Beast X30 | |
| CrossMark / Productivity | |
| MSI Raider GE77 HX 12UHS | |
| MSI Raider GE77 HX 12UHS (dGPU, Extreme Leistung) | |
| Medio Intel Core i9-12900HX, NVIDIA GeForce RTX 3080 Ti Laptop GPU (1978 - 2047, n=5) | |
| Media de la clase Gaming (1386 - 2254, n=94, últimos 2 años) | |
| Alienware x17 R2 P48E | |
| Razer Blade 17 Early 2022 | |
| Medion Erazer Beast X30 | |
| CrossMark / Creativity | |
| MSI Raider GE77 HX 12UHS | |
| Medio Intel Core i9-12900HX, NVIDIA GeForce RTX 3080 Ti Laptop GPU (2288 - 2366, n=5) | |
| MSI Raider GE77 HX 12UHS (dGPU, Extreme Leistung) | |
| Media de la clase Gaming (1343 - 2786, n=94, últimos 2 años) | |
| Alienware x17 R2 P48E | |
| Medion Erazer Beast X30 | |
| Razer Blade 17 Early 2022 | |
| CrossMark / Responsiveness | |
| MSI Raider GE77 HX 12UHS | |
| Medio Intel Core i9-12900HX, NVIDIA GeForce RTX 3080 Ti Laptop GPU (1991 - 2090, n=5) | |
| MSI Raider GE77 HX 12UHS (dGPU, Extreme Leistung) | |
| Media de la clase Gaming (1226 - 2334, n=94, últimos 2 años) | |
| Alienware x17 R2 P48E | |
| Razer Blade 17 Early 2022 | |
| Medion Erazer Beast X30 | |
| PCMark 8 Home Score Accelerated v2 | 4209 puntos | |
| PCMark 8 Creative Score Accelerated v2 | 6879 puntos | |
| PCMark 8 Work Score Accelerated v2 | 5259 puntos | |
| PCMark 10 Score | 6993 puntos | |
ayuda | ||
| AIDA64 / Memory Copy | |
| Media de la clase Gaming (21750 - 129946, n=105, últimos 2 años) | |
| MSI Raider GE77 HX 12UHS | |
| MSI Raider GE77 HX 12UHS (v6.70.6000, Extreme Leistung) | |
| Medio Intel Core i9-12900HX (62852 - 70863, n=7) | |
| Medion Erazer Beast X30 (v6.50.5800) | |
| Razer Blade 17 Early 2022 (v6.50.5800) | |
| Alienware x17 R2 P48E (v6.50.5800) | |
| AIDA64 / Memory Read | |
| Media de la clase Gaming (22956 - 118858, n=105, últimos 2 años) | |
| MSI Raider GE77 HX 12UHS | |
| MSI Raider GE77 HX 12UHS (v6.70.6000, Extreme Leistung) | |
| Medio Intel Core i9-12900HX (62140 - 72930, n=7) | |
| Medion Erazer Beast X30 (v6.50.5800) | |
| Razer Blade 17 Early 2022 (v6.50.5800) | |
| Alienware x17 R2 P48E (v6.50.5800) | |
| AIDA64 / Memory Write | |
| Media de la clase Gaming (22297 - 135096, n=105, últimos 2 años) | |
| MSI Raider GE77 HX 12UHS (v6.70.6000, Extreme Leistung) | |
| MSI Raider GE77 HX 12UHS (v6.70.6000) | |
| Medion Erazer Beast X30 (v6.50.5800) | |
| Medio Intel Core i9-12900HX (60001 - 68782, n=7) | |
| Razer Blade 17 Early 2022 (v6.50.5800) | |
| Alienware x17 R2 P48E (v6.50.5800) | |
| AIDA64 / Memory Latency | |
| Media de la clase Gaming (75.3 - 259, n=105, últimos 2 años) | |
| Alienware x17 R2 P48E (v6.50.5800) | |
| Medio Intel Core i9-12900HX (83.9 - 93.4, n=7) | |
| MSI Raider GE77 HX 12UHS (v6.70.6000, Extreme Leistung) | |
| MSI Raider GE77 HX 12UHS (v6.70.6000) | |
| Medion Erazer Beast X30 (v6.50.5800) | |
* ... más pequeño es mejor
Latencias del CPD
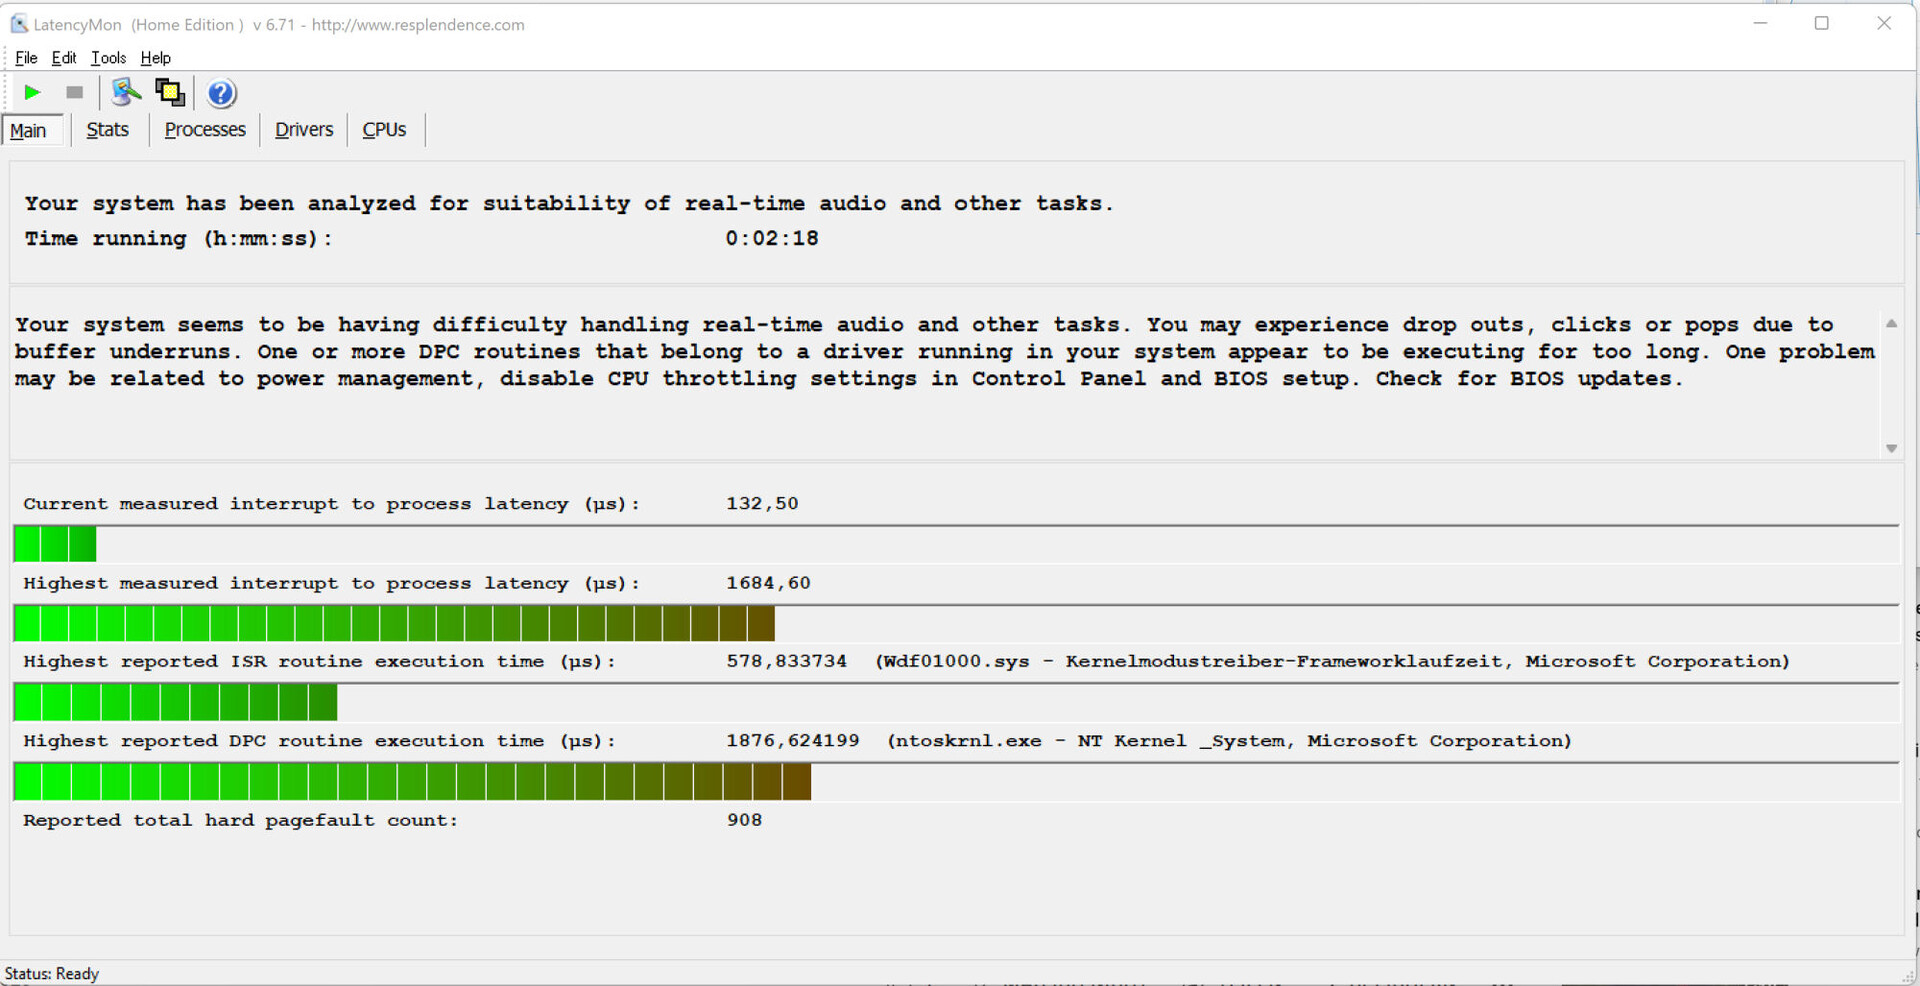
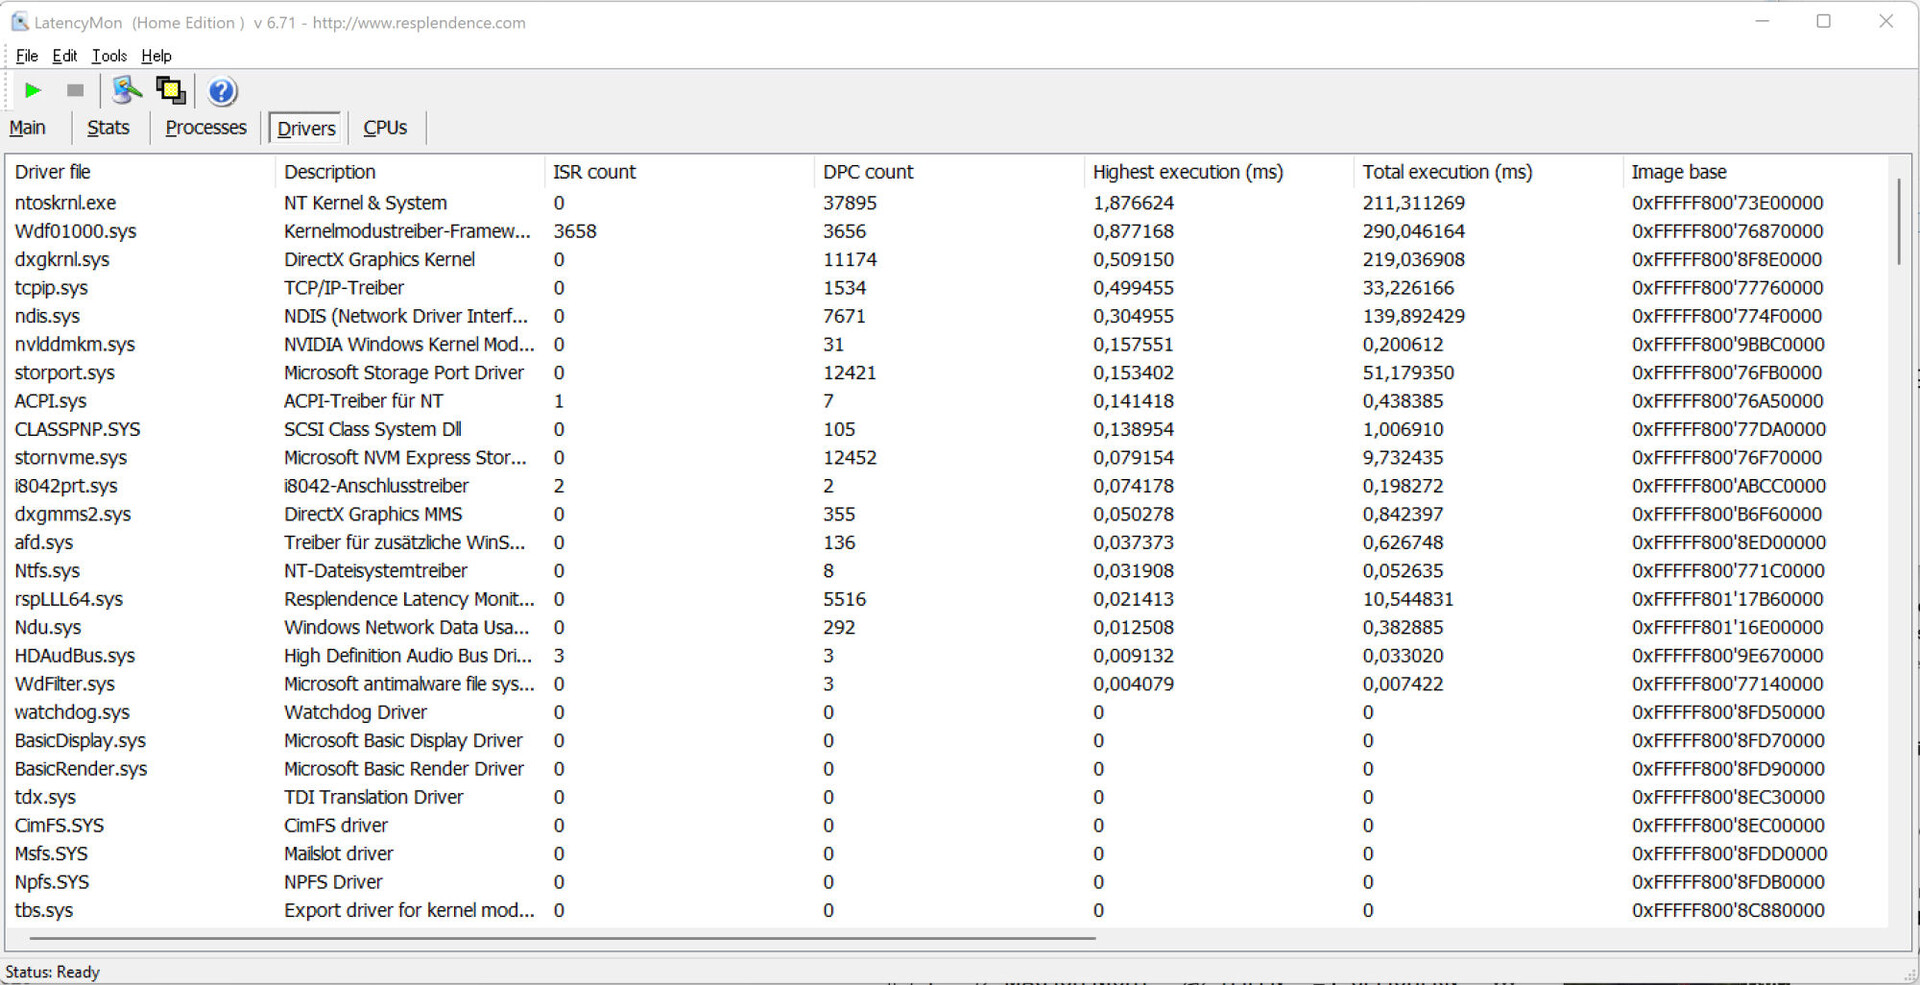
La prueba estandarizada de Latency Monitor (navegación web, reproducción de vídeo 4K, Prime95 de alta carga) muestra latencias DPC algo problemáticas. El sistema no parece adecuado para editar vídeo y audio en tiempo real. Las futuras actualizaciones de software pueden mejorar o agravar la situación.
| DPC Latencies / LatencyMon - interrupt to process latency (max), Web, Youtube, Prime95 | |
| MSI Raider GE77 HX 12UHS | |
| Alienware x17 R2 P48E | |
| Medion Erazer Beast X30 | |
| Razer Blade 17 Early 2022 | |
* ... más pequeño es mejor
Solución de almacenamiento
MSI equipa el Raider con un SSD de 2 TB (PCIe4, M.2-2280) de Samsung con excelentes velocidades de transferencia. Hay espacio para un SSD PCIe4 secundario.

| Drive Performance rating - Percent | |
| MSI Raider GE77 HX 12UHS | |
| Medion Erazer Beast X30 | |
| Razer Blade 17 Early 2022 | |
| Medio Samsung PM9A1 MZVL22T0HBLB | |
| Media de la clase Gaming | |
| Alienware x17 R2 P48E | |
* ... más pequeño es mejor
Disk Throttling: DiskSpd Read Loop, Queue Depth 8
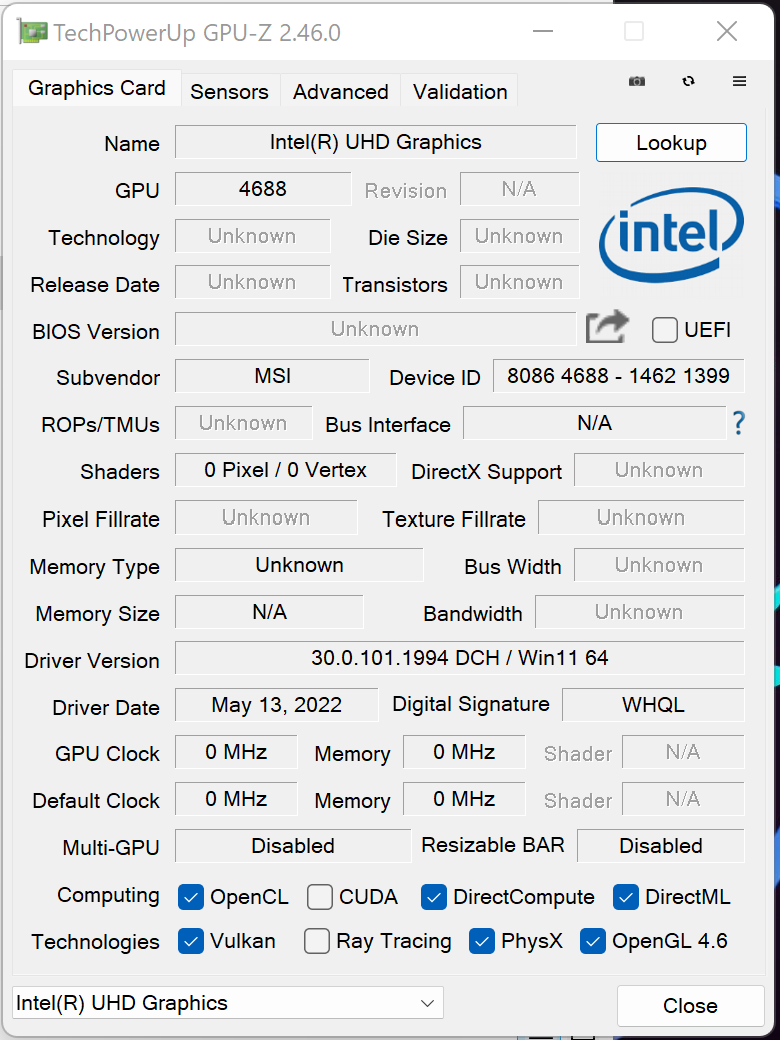
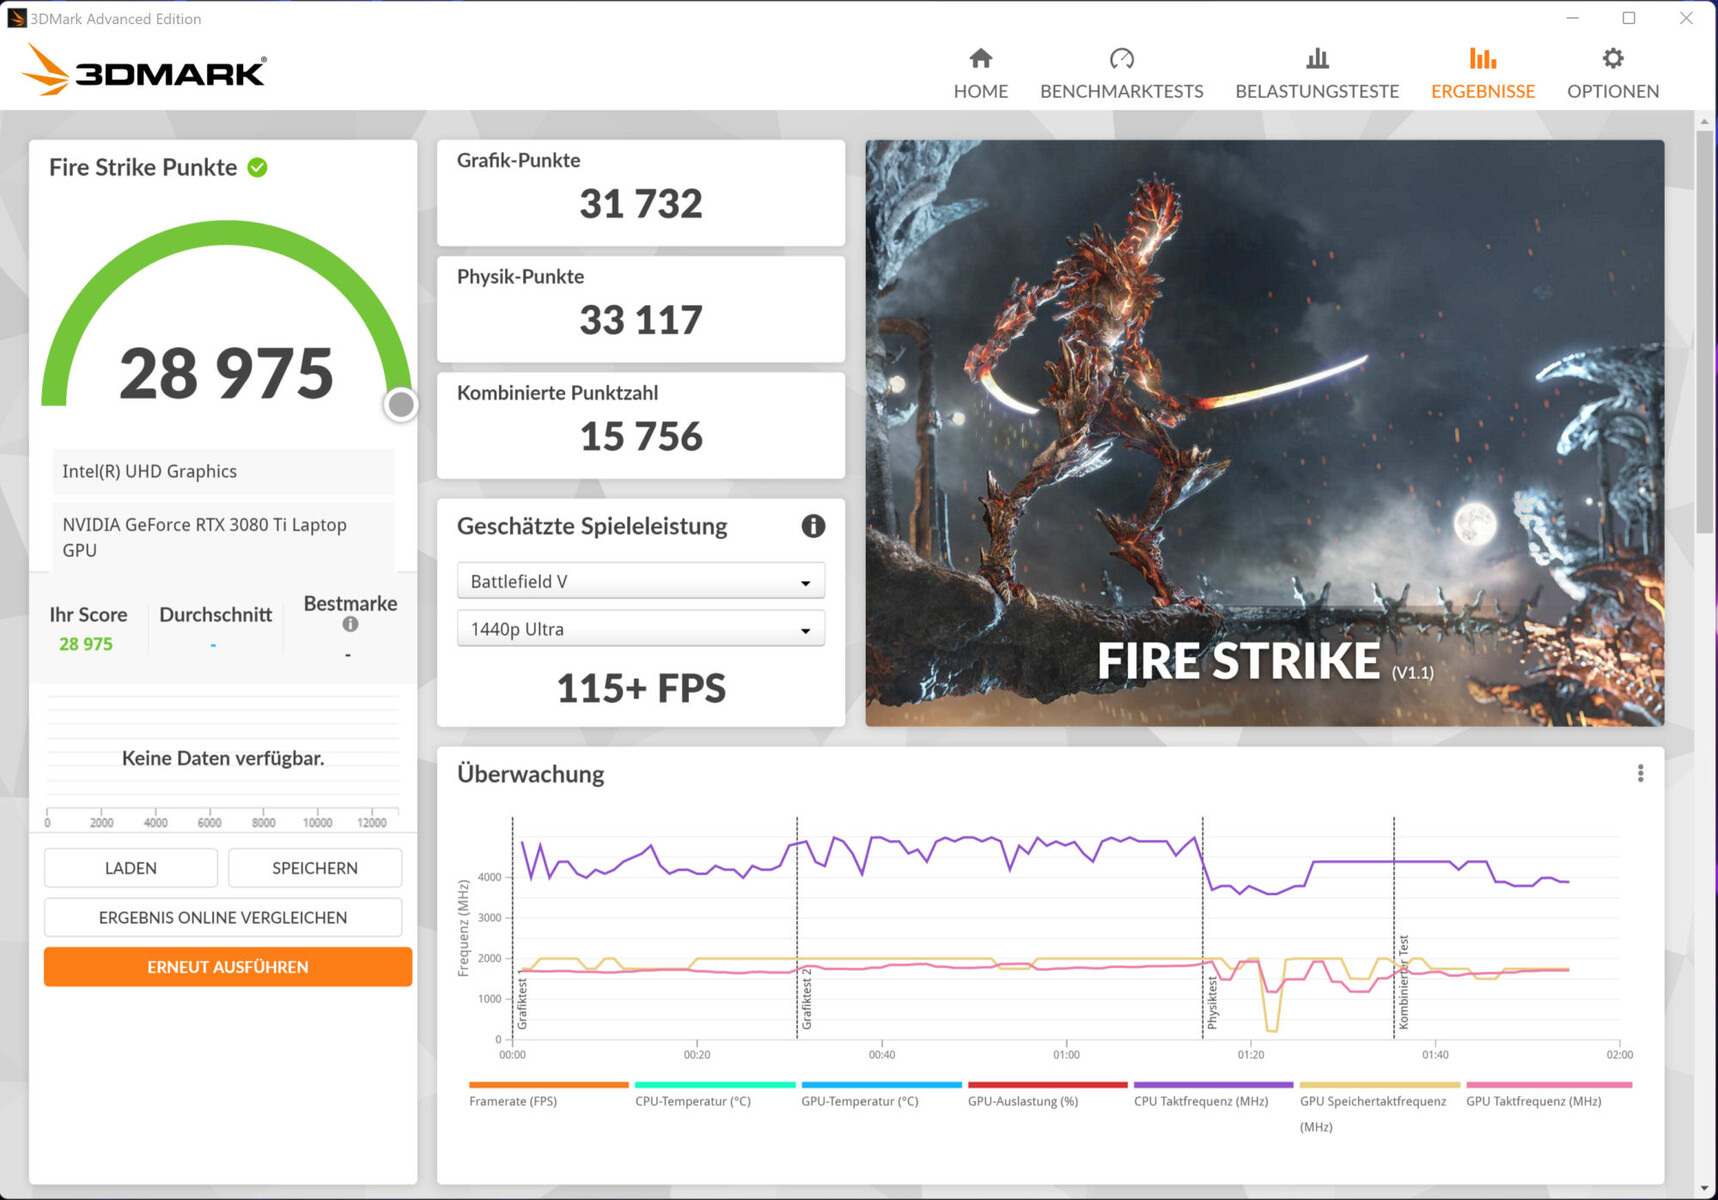
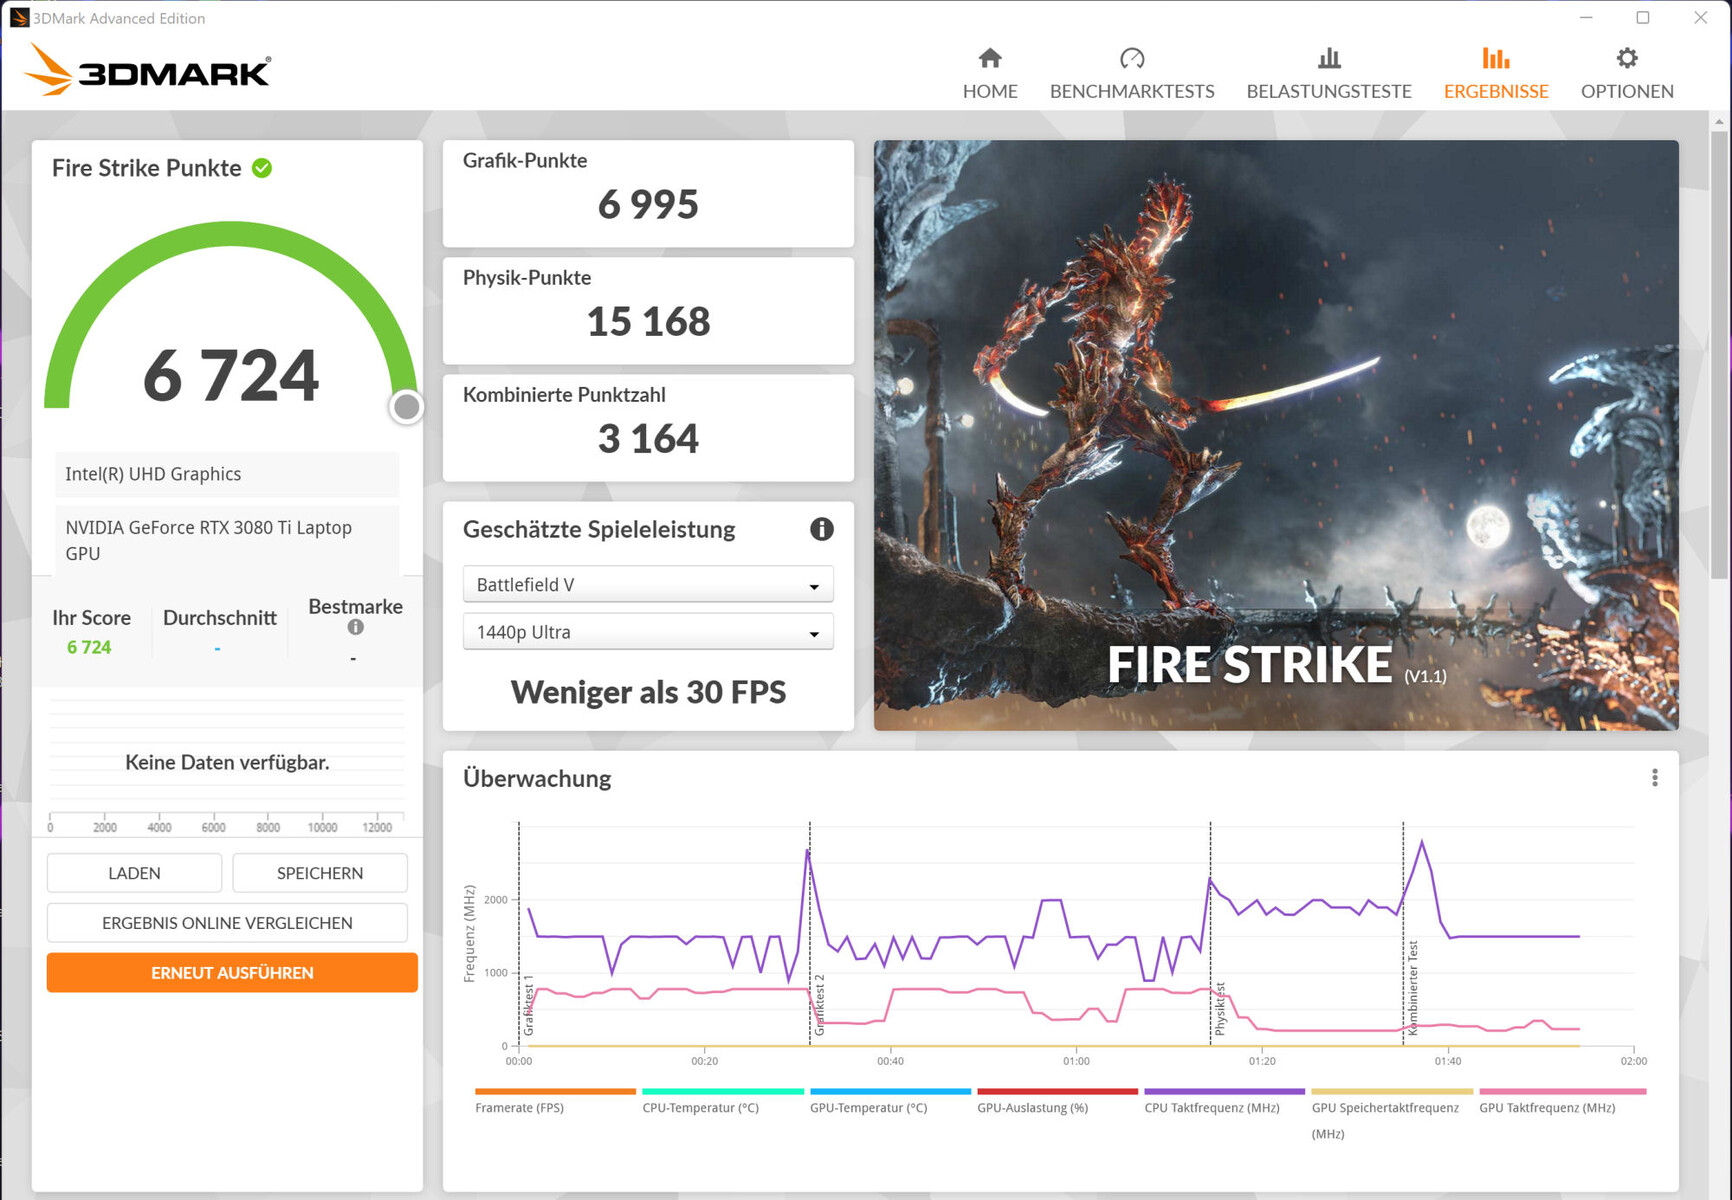
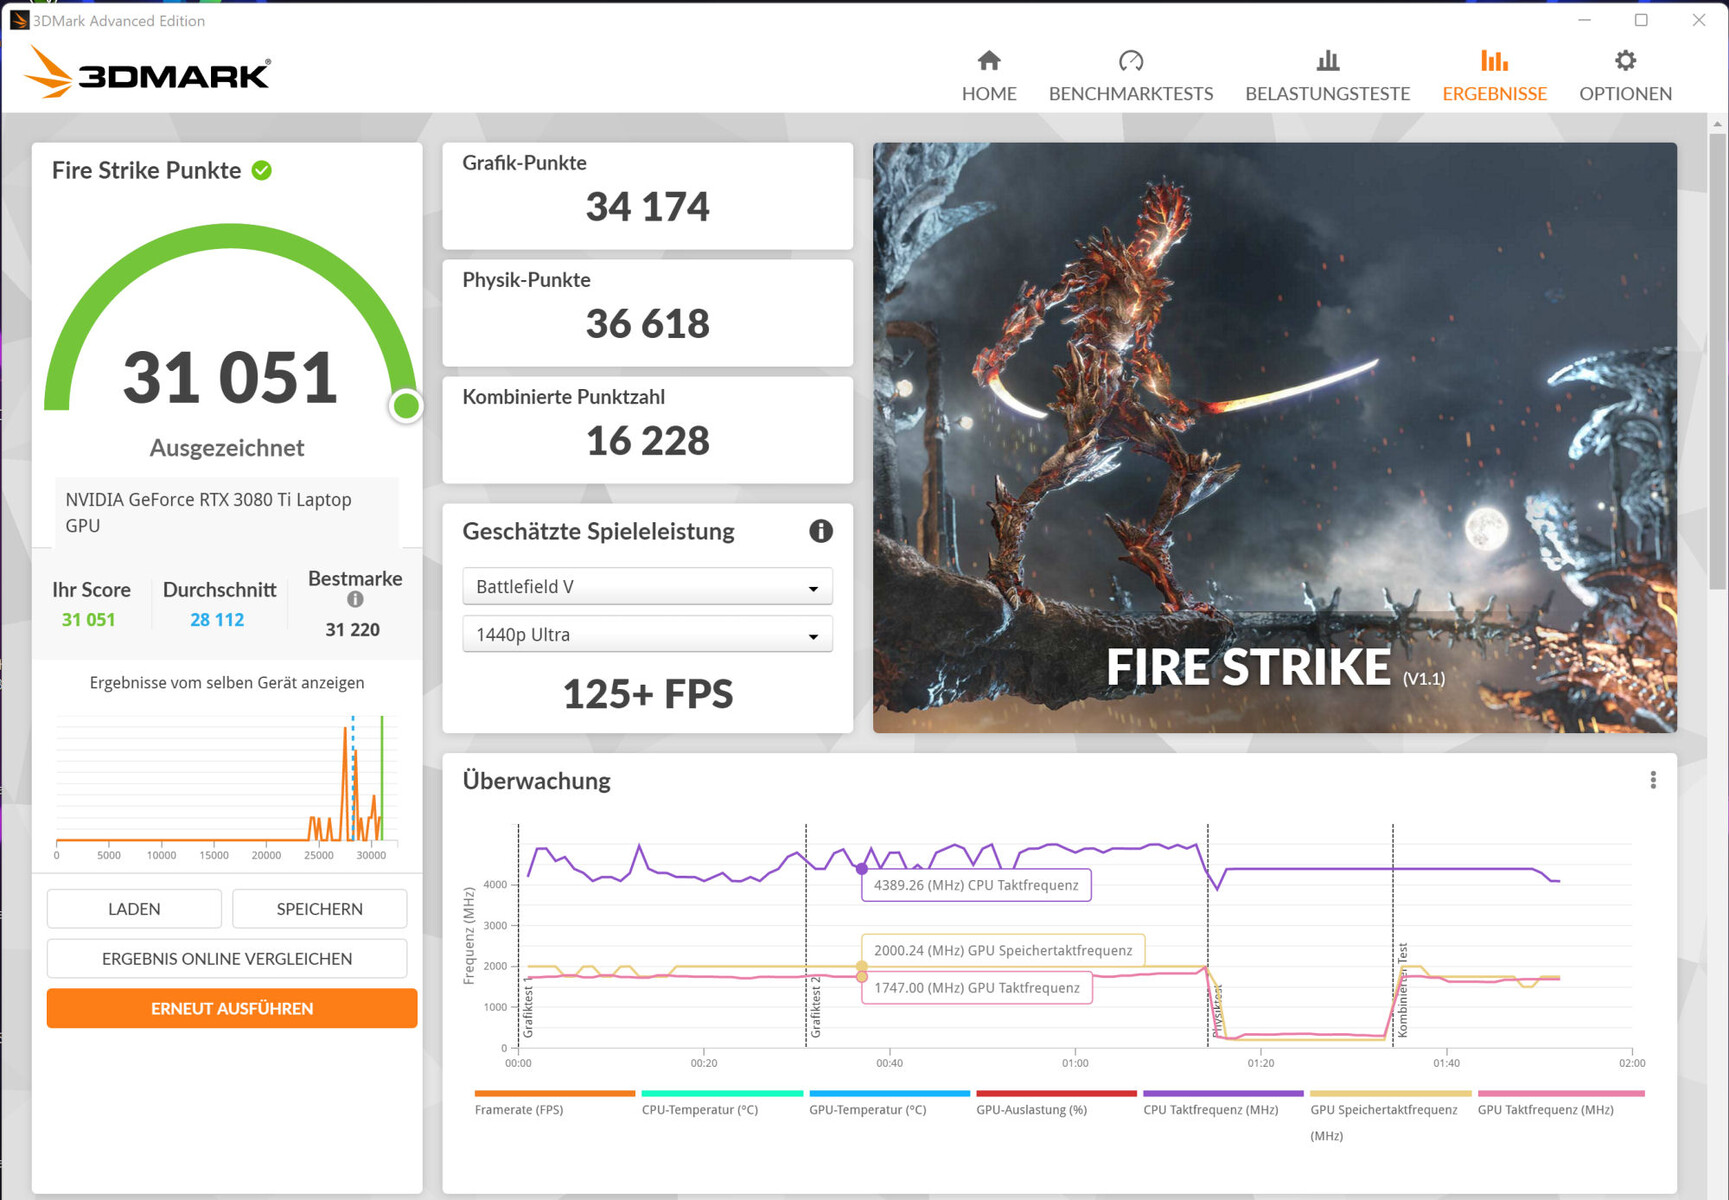
Rendimiento de la GPU
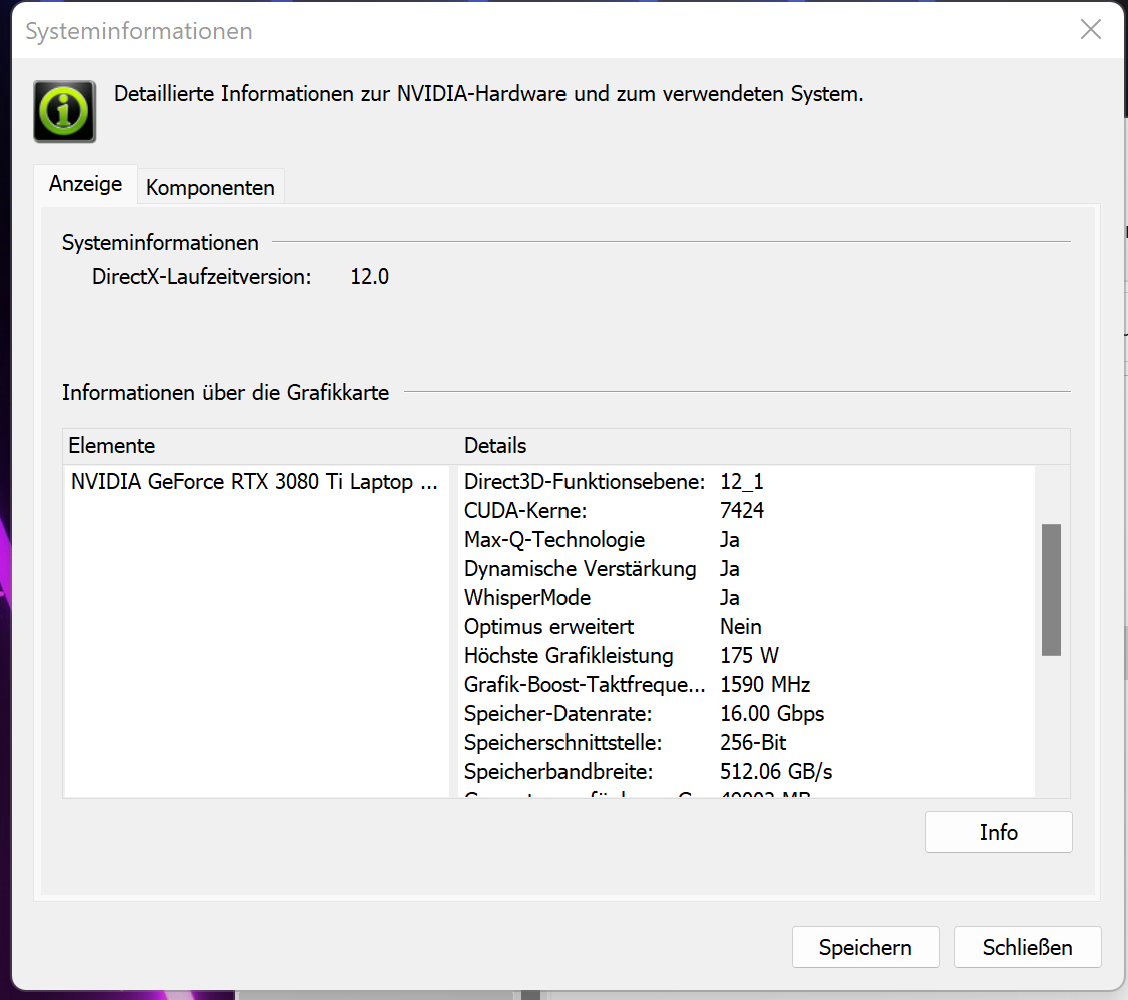
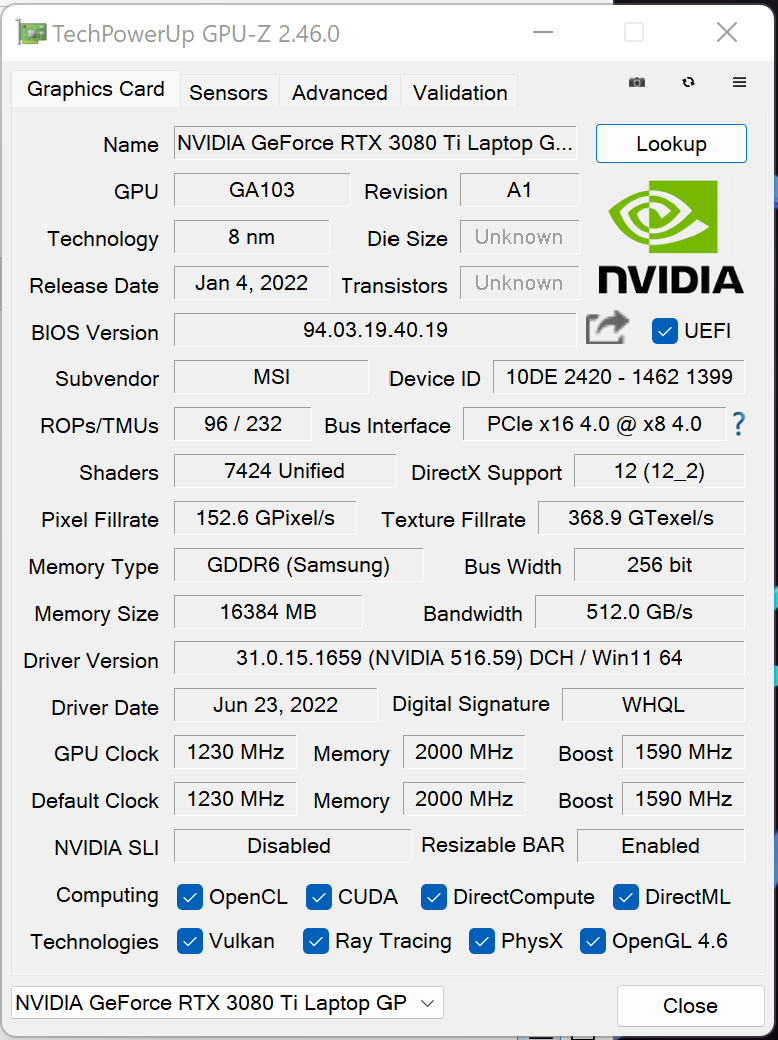
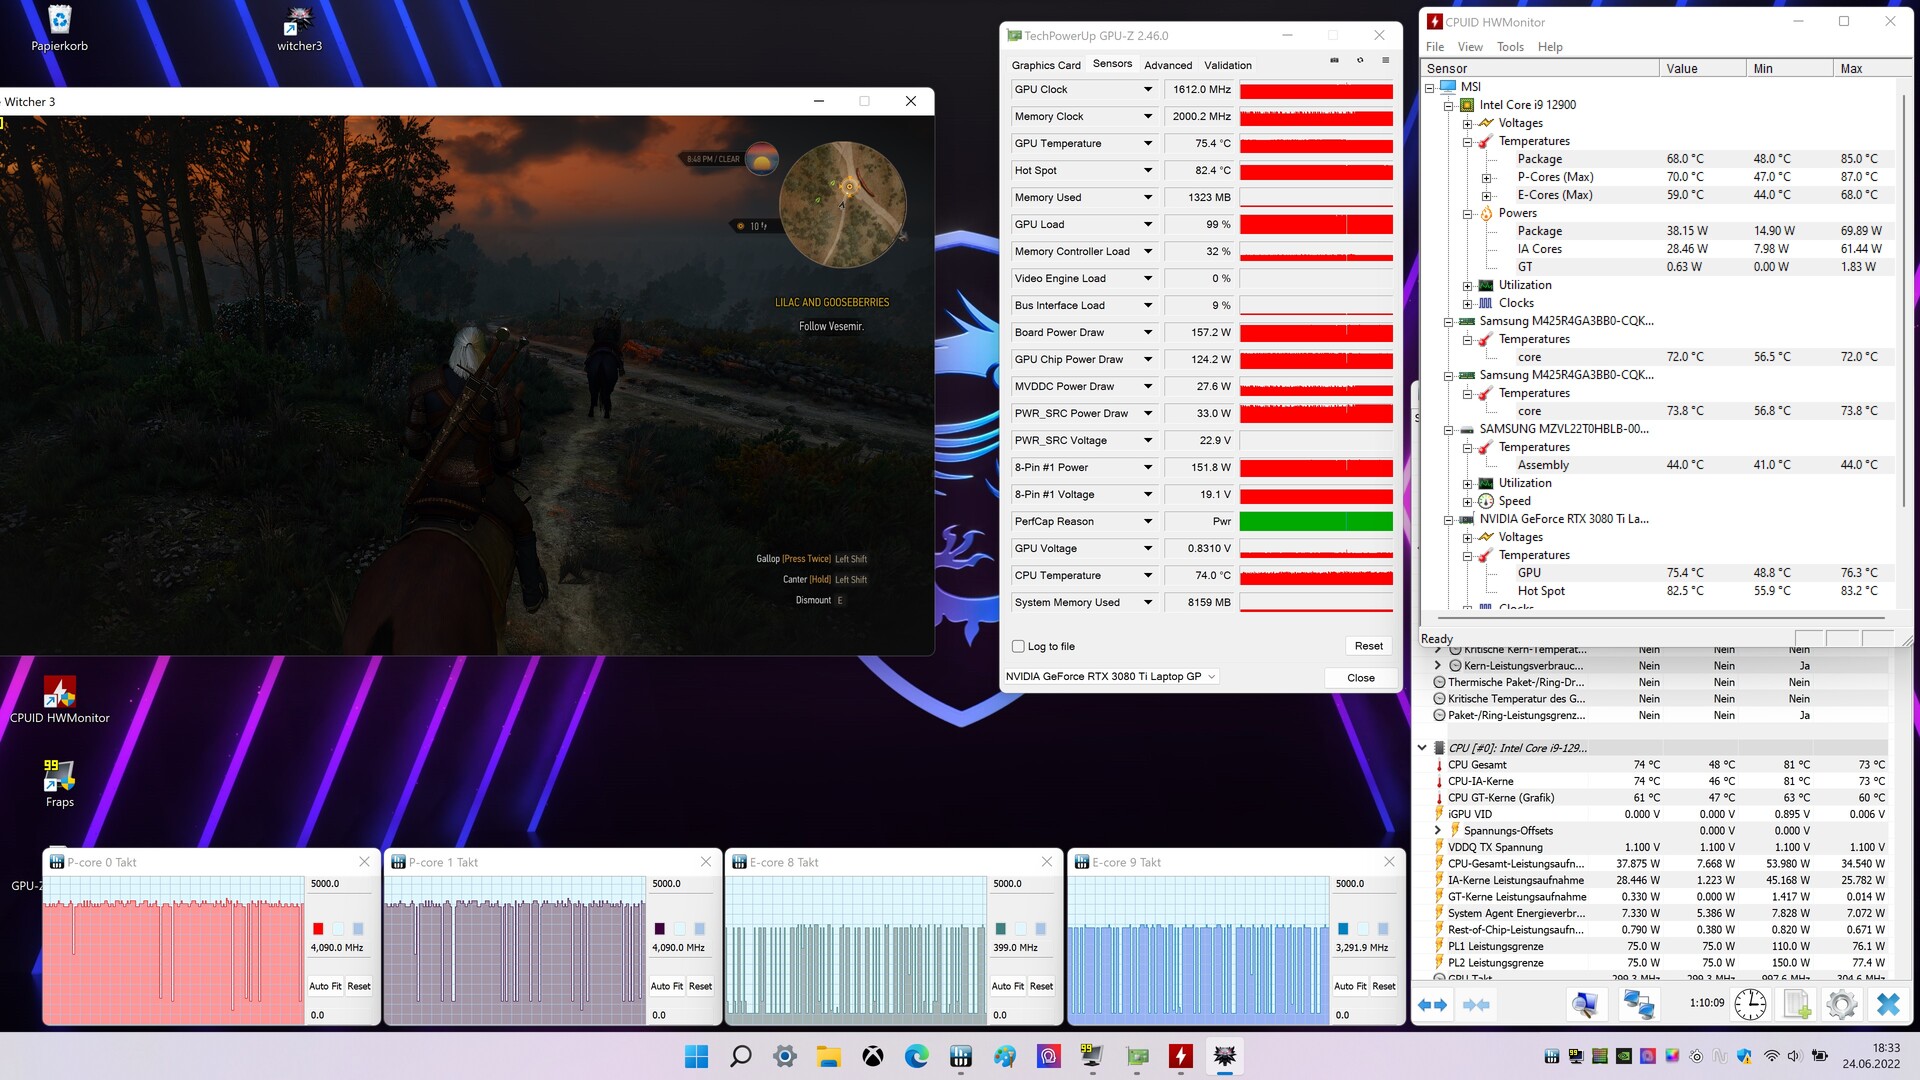
El rendimiento real de una GPU RTX 3000 depende de varios factores: La solución de refrigeración, la configuración de la memoria y el TGP máximo seleccionado por el fabricante dentro de los límites especificados por Nvidia. Para la instalación de la GeForce RTX 3080 Ti instalada en el portátil GPU, MSI establece un TGP máximo de 175 vatios. La GPU tiene acceso a la rápida memoria gráfica GDDR6 (16384 MB).
Los resultados del benchmark superan la media de nuestras anteriores mediciones de la RTX 3080 Ti. Combinando el perfil de potencia "Rendimiento extremo" con la salida directa de vídeo a través de la GPU GeForce, medimos algunas de las puntuaciones más altas que hemos visto de esta GPU. Sin embargo, como muestra nuestro test Witcher 3, la gama TGP no se agota del todo. Advanced Optimus no es compatible. Por tanto, cambiar entre dGPU y Optimus requiere un reinicio.
Sin embargo, la cosa no acaba ahí: El software MSI Center ofrece ajustes de overclocking para la GPU y la VRAM. Por supuesto, los usuarios que decidan hacer overclocking, lo hacen bajo su propio riesgo. Las funciones de overclocking se pueden encontrar en el perfil de potencia "Rendimiento extremo" (Selecciona el perfil y haz clic en la rueda dentada).
| 3DMark Performance rating - Percent | |
| Media de la clase Gaming | |
| MSI Raider GE77 HX 12UHS | |
| Alienware x17 R2 P48E | |
| MSI Raider GE77 HX 12UHS | |
| Razer Blade 17 Early 2022 | |
| Medion Erazer Beast X30 | |
| Medio NVIDIA GeForce RTX 3080 Ti Laptop GPU | |
| 3DMark 11 - 1280x720 Performance GPU | |
| Media de la clase Gaming (21841 - 80022, n=104, últimos 2 años) | |
| MSI Raider GE77 HX 12UHS | |
| Alienware x17 R2 P48E | |
| MSI Raider GE77 HX 12UHS (dGPU, Extreme Leistung) | |
| Razer Blade 17 Early 2022 | |
| Medion Erazer Beast X30 | |
| Medio NVIDIA GeForce RTX 3080 Ti Laptop GPU (13920 - 45841, n=45) | |
| 3DMark | |
| 1920x1080 Fire Strike Graphics | |
| Media de la clase Gaming (12242 - 62849, n=115, últimos 2 años) | |
| MSI Raider GE77 HX 12UHS (dGPU, Extreme Leistung) | |
| Alienware x17 R2 P48E | |
| MSI Raider GE77 HX 12UHS | |
| Medion Erazer Beast X30 | |
| Razer Blade 17 Early 2022 | |
| Medio NVIDIA GeForce RTX 3080 Ti Laptop GPU (6928 - 34439, n=43) | |
| 2560x1440 Time Spy Graphics | |
| Media de la clase Gaming (5012 - 26212, n=115, últimos 2 años) | |
| Alienware x17 R2 P48E | |
| MSI Raider GE77 HX 12UHS (dGPU, Extreme Leistung) | |
| MSI Raider GE77 HX 12UHS | |
| Razer Blade 17 Early 2022 | |
| Medion Erazer Beast X30 | |
| Medio NVIDIA GeForce RTX 3080 Ti Laptop GPU (4921 - 13835, n=43) | |
| 2560x1440 Port Royal Graphics | |
| Media de la clase Gaming (4395 - 17286, n=71, últimos 2 años) | |
| MSI Raider GE77 HX 12UHS (dGPU, Extreme Leistung) | |
| Alienware x17 R2 P48E | |
| MSI Raider GE77 HX 12UHS | |
| Razer Blade 17 Early 2022 | |
| Medio NVIDIA GeForce RTX 3080 Ti Laptop GPU (6423 - 8462, n=28) | |
| Medion Erazer Beast X30 | |
V-Ray Benchmark Next 4.10: GPU | CPU
Geekbench 5.5: OpenCL Score
SPECviewperf 13: Solidworks (sw-04) | Siemens NX (snx-03) | Showcase (showcase-02) | Medical (medical-02) | Maya (maya-05) | Energy (energy-02) | Creo (creo-02) | Catia (catia-05) | 3ds Max (3dsmax-06)
| V-Ray 5 Benchmark / GPU RTX | |
| Media de la clase Gaming (1146 - 4363, n=33, últimos 2 años) | |
| MSI Raider GE77 HX 12UHS (5.0.1, Extreme Leistung) | |
| MSI Raider GE77 HX 12UHS (5.0.1) | |
| Razer Blade 17 Early 2022 (5.0.1) | |
| MSI Raider GE77 HX 12UHS (5.0.1, dGPU, Extreme Leistung) | |
| Medion Erazer Beast X30 (5.0.1) | |
| Medio NVIDIA GeForce RTX 3080 Ti Laptop GPU (1225 - 1915, n=19) | |
| V-Ray 5 Benchmark / GPU CUDA | |
| Media de la clase Gaming (887 - 3288, n=33, últimos 2 años) | |
| MSI Raider GE77 HX 12UHS (5.0.1, Extreme Leistung) | |
| Razer Blade 17 Early 2022 (5.0.1) | |
| MSI Raider GE77 HX 12UHS (5.0.1) | |
| MSI Raider GE77 HX 12UHS (5.0.1, dGPU, Extreme Leistung) | |
| Medion Erazer Beast X30 (5.0.1) | |
| Medio NVIDIA GeForce RTX 3080 Ti Laptop GPU (846 - 1384, n=20) | |
| V-Ray 5 Benchmark / CPU | |
| Media de la clase Gaming (5864 - 30302, n=32, últimos 2 años) | |
| MSI Raider GE77 HX 12UHS (5.0.1, dGPU, Extreme Leistung) | |
| MSI Raider GE77 HX 12UHS (5.0.1) | |
| MSI Raider GE77 HX 12UHS (5.0.1, Extreme Leistung) | |
| Alienware x17 R2 P48E (5.0.1) | |
| Medio NVIDIA GeForce RTX 3080 Ti Laptop GPU (3692 - 15811, n=25) | |
| Medion Erazer Beast X30 (5.0.1) | |
| Razer Blade 17 Early 2022 (5.0.1) | |
| V-Ray Benchmark Next 4.10 / GPU | |
| Media de la clase Gaming (427 - 1627, n=99, últimos 2 años) | |
| MSI Raider GE77 HX 12UHS (v4.10.07 ) | |
| Medion Erazer Beast X30 (v4.10.07 ) | |
| MSI Raider GE77 HX 12UHS (v4.10.07, Extreme Leistung) | |
| MSI Raider GE77 HX 12UHS (v4.10.07, dGPU, Extreme Leistung) | |
| Medio NVIDIA GeForce RTX 3080 Ti Laptop GPU (311 - 552, n=35) | |
| Razer Blade 17 Early 2022 (v4.10.07 ) | |
| V-Ray Benchmark Next 4.10 / CPU | |
| Media de la clase Gaming (10048 - 45327, n=97, últimos 2 años) | |
| MSI Raider GE77 HX 12UHS (v4.10.07, Extreme Leistung) | |
| MSI Raider GE77 HX 12UHS (v4.10.07, dGPU, Extreme Leistung) | |
| MSI Raider GE77 HX 12UHS (v4.10.07 ) | |
| Medion Erazer Beast X30 (v4.10.07 ) | |
| Medio NVIDIA GeForce RTX 3080 Ti Laptop GPU (5564 - 23947, n=35) | |
| Razer Blade 17 Early 2022 (v4.10.07 ) | |
| Geekbench 5.5 / OpenCL Score | |
| Media de la clase Gaming (80702 - 277970, n=101, últimos 2 años) | |
| MSI Raider GE77 HX 12UHS | |
| MSI Raider GE77 HX 12UHS (Extreme Leistung) | |
| Alienware x17 R2 P48E | |
| Medion Erazer Beast X30 | |
| Medio NVIDIA GeForce RTX 3080 Ti Laptop GPU (88580 - 151633, n=41) | |
| Razer Blade 17 Early 2022 | |
| SPECviewperf 13 / Solidworks (sw-04) | |
| Razer Blade 17 Early 2022 (dGPU, 175W) | |
| MSI Raider GE77 HX 12UHS | |
| Medio NVIDIA GeForce RTX 3080 Ti Laptop GPU (62.9 - 133.4, n=8) | |
| Media de la clase Gaming (n=1últimos 2 años) | |
| SPECviewperf 13 / Siemens NX (snx-03) | |
| MSI Raider GE77 HX 12UHS | |
| Razer Blade 17 Early 2022 (dGPU, 175W) | |
| Medio NVIDIA GeForce RTX 3080 Ti Laptop GPU (18.3 - 25.3, n=8) | |
| Media de la clase Gaming (n=1últimos 2 años) | |
| SPECviewperf 13 / Showcase (showcase-02) | |
| Razer Blade 17 Early 2022 (dGPU, 175W) | |
| MSI Raider GE77 HX 12UHS | |
| Medio NVIDIA GeForce RTX 3080 Ti Laptop GPU (110 - 175, n=8) | |
| Media de la clase Gaming (n=1últimos 2 años) | |
| SPECviewperf 13 / Medical (medical-02) | |
| Razer Blade 17 Early 2022 (dGPU, 175W) | |
| MSI Raider GE77 HX 12UHS | |
| Medio NVIDIA GeForce RTX 3080 Ti Laptop GPU (65.3 - 79.1, n=8) | |
| Media de la clase Gaming (n=1últimos 2 años) | |
| SPECviewperf 13 / Maya (maya-05) | |
| Razer Blade 17 Early 2022 (dGPU, 175W) | |
| Medio NVIDIA GeForce RTX 3080 Ti Laptop GPU (212 - 430, n=8) | |
| MSI Raider GE77 HX 12UHS | |
| Media de la clase Gaming (n=1últimos 2 años) | |
| SPECviewperf 13 / Energy (energy-02) | |
| MSI Raider GE77 HX 12UHS | |
| Razer Blade 17 Early 2022 (dGPU, 175W) | |
| Medio NVIDIA GeForce RTX 3080 Ti Laptop GPU (19.3 - 27.3, n=8) | |
| Media de la clase Gaming (n=1últimos 2 años) | |
| SPECviewperf 13 / Creo (creo-02) | |
| Razer Blade 17 Early 2022 (dGPU, 175W) | |
| MSI Raider GE77 HX 12UHS | |
| Medio NVIDIA GeForce RTX 3080 Ti Laptop GPU (177.4 - 311, n=8) | |
| Media de la clase Gaming (n=1últimos 2 años) | |
| SPECviewperf 13 / Catia (catia-05) | |
| Razer Blade 17 Early 2022 (dGPU, 175W) | |
| MSI Raider GE77 HX 12UHS | |
| Medio NVIDIA GeForce RTX 3080 Ti Laptop GPU (130.4 - 190.3, n=8) | |
| Media de la clase Gaming (n=1últimos 2 años) | |
| SPECviewperf 13 / 3ds Max (3dsmax-06) | |
| Razer Blade 17 Early 2022 (dGPU, 175W) | |
| MSI Raider GE77 HX 12UHS | |
| Medio NVIDIA GeForce RTX 3080 Ti Laptop GPU (161 - 260, n=8) | |
| Media de la clase Gaming (n=1últimos 2 años) | |
| 3DMark 06 Standard Score | 58305 puntos | |
| 3DMark 11 Performance | 36734 puntos | |
| 3DMark Cloud Gate Standard Score | 61721 puntos | |
| 3DMark Fire Strike Score | 28975 puntos | |
| 3DMark Time Spy Score | 13320 puntos | |
ayuda | ||
Rendimiento de los juegos
El hardware permite jugar a 4K con ajustes altos y máximos. Las tasas de frames están por encima de la media de una RTX 3080 Ti. Al cambiar a la salida de vídeo directa a través de la GPU GeForce se produce un aumento de los valores. A menudo, la GE77 produce entonces algunas de las tasas de fotogramas más altas que hemos visto con esta GPU.
| The Witcher 3 - 1920x1080 Ultra Graphics & Postprocessing (HBAO+) | |
| Media de la clase Gaming (104.7 - 240, n=7, últimos 2 años) | |
| MSI Raider GE77 HX 12UHS (dGPU, Extreme Leistung) | |
| Alienware x17 R2 P48E | |
| MSI Raider GE77 HX 12UHS | |
| Razer Blade 17 Early 2022 | |
| Medion Erazer Beast X30 | |
| Medio NVIDIA GeForce RTX 3080 Ti Laptop GPU (30 - 130.6, n=43) | |
| Dota 2 Reborn | |
| 3840x2160 ultra (3/3) best looking | |
| Media de la clase Gaming (114.9 - 199.2, n=32, últimos 2 años) | |
| MSI Raider GE77 HX 12UHS (dGPU, Extreme Leistung) | |
| MSI Raider GE77 HX 12UHS (Extreme Leistung) | |
| MSI Raider GE77 HX 12UHS | |
| Medio NVIDIA GeForce RTX 3080 Ti Laptop GPU (70.8 - 155.6, n=19) | |
| Razer Blade 17 Early 2022 | |
| 1920x1080 ultra (3/3) best looking | |
| MSI Raider GE77 HX 12UHS (Extreme Leistung) | |
| MSI Raider GE77 HX 12UHS (dGPU, Extreme Leistung) | |
| MSI Raider GE77 HX 12UHS | |
| Alienware x17 R2 P48E | |
| Media de la clase Gaming (84.8 - 248, n=107, últimos 2 años) | |
| Medion Erazer Beast X30 | |
| Medio NVIDIA GeForce RTX 3080 Ti Laptop GPU (29.9 - 170.5, n=45) | |
| Razer Blade 17 Early 2022 | |
| X-Plane 11.11 | |
| 3840x2160 high (fps_test=3) | |
| MSI Raider GE77 HX 12UHS (dGPU, Extreme Leistung) | |
| MSI Raider GE77 HX 12UHS | |
| MSI Raider GE77 HX 12UHS (Extreme Leistung) | |
| Media de la clase Gaming (60 - 124.1, n=32, últimos 2 años) | |
| Medio NVIDIA GeForce RTX 3080 Ti Laptop GPU (32.9 - 109.5, n=20) | |
| Razer Blade 17 Early 2022 | |
| 1920x1080 high (fps_test=3) | |
| MSI Raider GE77 HX 12UHS (dGPU, Extreme Leistung) | |
| MSI Raider GE77 HX 12UHS | |
| MSI Raider GE77 HX 12UHS (Extreme Leistung) | |
| Alienware x17 R2 P48E | |
| Medio NVIDIA GeForce RTX 3080 Ti Laptop GPU (32.6 - 127, n=45) | |
| Medion Erazer Beast X30 | |
| Media de la clase Gaming (55.5 - 143.5, n=109, últimos 2 años) | |
| Razer Blade 17 Early 2022 | |
| Final Fantasy XV Benchmark | |
| 3840x2160 High Quality | |
| Media de la clase Gaming (49.1 - 111.8, n=33, últimos 2 años) | |
| MSI Raider GE77 HX 12UHS (1.3, dGPU, Extreme Leistung) | |
| MSI Raider GE77 HX 12UHS (1.3, Extreme Leistung) | |
| MSI Raider GE77 HX 12UHS (1.3) | |
| Razer Blade 17 Early 2022 (1.3) | |
| Medio NVIDIA GeForce RTX 3080 Ti Laptop GPU (35.1 - 61.2, n=18) | |
| 1920x1080 High Quality | |
| Media de la clase Gaming (41 - 215, n=95, últimos 2 años) | |
| MSI Raider GE77 HX 12UHS (1.3, dGPU, Extreme Leistung) | |
| MSI Raider GE77 HX 12UHS (1.3, Extreme Leistung) | |
| MSI Raider GE77 HX 12UHS (1.3) | |
| Alienware x17 R2 P48E (1.3) | |
| Medio NVIDIA GeForce RTX 3080 Ti Laptop GPU (30.7 - 140.6, n=42) | |
| Razer Blade 17 Early 2022 (1.3) | |
| Medion Erazer Beast X30 (1.3) | |
| GTA V | |
| 1920x1080 Highest AA:4xMSAA + FX AF:16x | |
| MSI Raider GE77 HX 12UHS (Extreme Leistung) | |
| MSI Raider GE77 HX 12UHS (dGPU, Extreme Leistung) | |
| MSI Raider GE77 HX 12UHS | |
| Media de la clase Gaming (48.3 - 186.9, n=94, últimos 2 años) | |
| Alienware x17 R2 P48E | |
| Medio NVIDIA GeForce RTX 3080 Ti Laptop GPU (30 - 139.2, n=42) | |
| Medion Erazer Beast X30 | |
| Razer Blade 17 Early 2022 | |
| 3840x2160 Highest AA:4xMSAA + FX AF:16x | |
| Media de la clase Gaming (53.9 - 123.2, n=25, últimos 2 años) | |
| MSI Raider GE77 HX 12UHS (Extreme Leistung) | |
| MSI Raider GE77 HX 12UHS (dGPU, Extreme Leistung) | |
| MSI Raider GE77 HX 12UHS | |
| Razer Blade 17 Early 2022 | |
| Medio NVIDIA GeForce RTX 3080 Ti Laptop GPU (37.7 - 67.2, n=14) | |
| Strange Brigade | |
| 3840x2160 ultra AA:ultra AF:16 | |
| Media de la clase Gaming (83 - 187.2, n=34, últimos 2 años) | |
| MSI Raider GE77 HX 12UHS (1.47.22.14 D3D12, dGPU, Extreme Leistung) | |
| MSI Raider GE77 HX 12UHS (1.47.22.14 D3D12, Extreme Leistung) | |
| MSI Raider GE77 HX 12UHS (1.47.22.14 D3D12) | |
| Razer Blade 17 Early 2022 (1.47.22.14 D3D12) | |
| Medio NVIDIA GeForce RTX 3080 Ti Laptop GPU (61.7 - 100.7, n=15) | |
| 1920x1080 ultra AA:ultra AF:16 | |
| Media de la clase Gaming (76.3 - 458, n=87, últimos 2 años) | |
| MSI Raider GE77 HX 12UHS (1.47.22.14 D3D12, dGPU, Extreme Leistung) | |
| Alienware x17 R2 P48E (1.47.22.14 D3D12) | |
| MSI Raider GE77 HX 12UHS (1.47.22.14 D3D12, Extreme Leistung) | |
| MSI Raider GE77 HX 12UHS (1.47.22.14 D3D12) | |
| Razer Blade 17 Early 2022 (1.47.22.14 D3D12) | |
| Medion Erazer Beast X30 (1.47.22.14 D3D12) | |
| Medio NVIDIA GeForce RTX 3080 Ti Laptop GPU (42.3 - 224, n=41) | |
| F1 2021 | |
| 1920x1080 Ultra High Preset + Raytracing AA:T AF:16x | |
| MSI Raider GE77 HX 12UHS (874931, dGPU, Extreme Leistung) | |
| MSI Raider GE77 HX 12UHS (874931) | |
| MSI Raider GE77 HX 12UHS (874931, Extreme Leistung) | |
| Razer Blade 17 Early 2022 (874931) | |
| Medion Erazer Beast X30 (874931) | |
| Medio NVIDIA GeForce RTX 3080 Ti Laptop GPU (30.2 - 160.6, n=30) | |
| 3840x2160 Ultra High Preset + Raytracing AA:T AF:16x | |
| MSI Raider GE77 HX 12UHS (874931, dGPU, Extreme Leistung) | |
| MSI Raider GE77 HX 12UHS (874931, Extreme Leistung) | |
| MSI Raider GE77 HX 12UHS (874931) | |
| Razer Blade 17 Early 2022 (874931) | |
| Medio NVIDIA GeForce RTX 3080 Ti Laptop GPU (41.1 - 70.2, n=18) | |
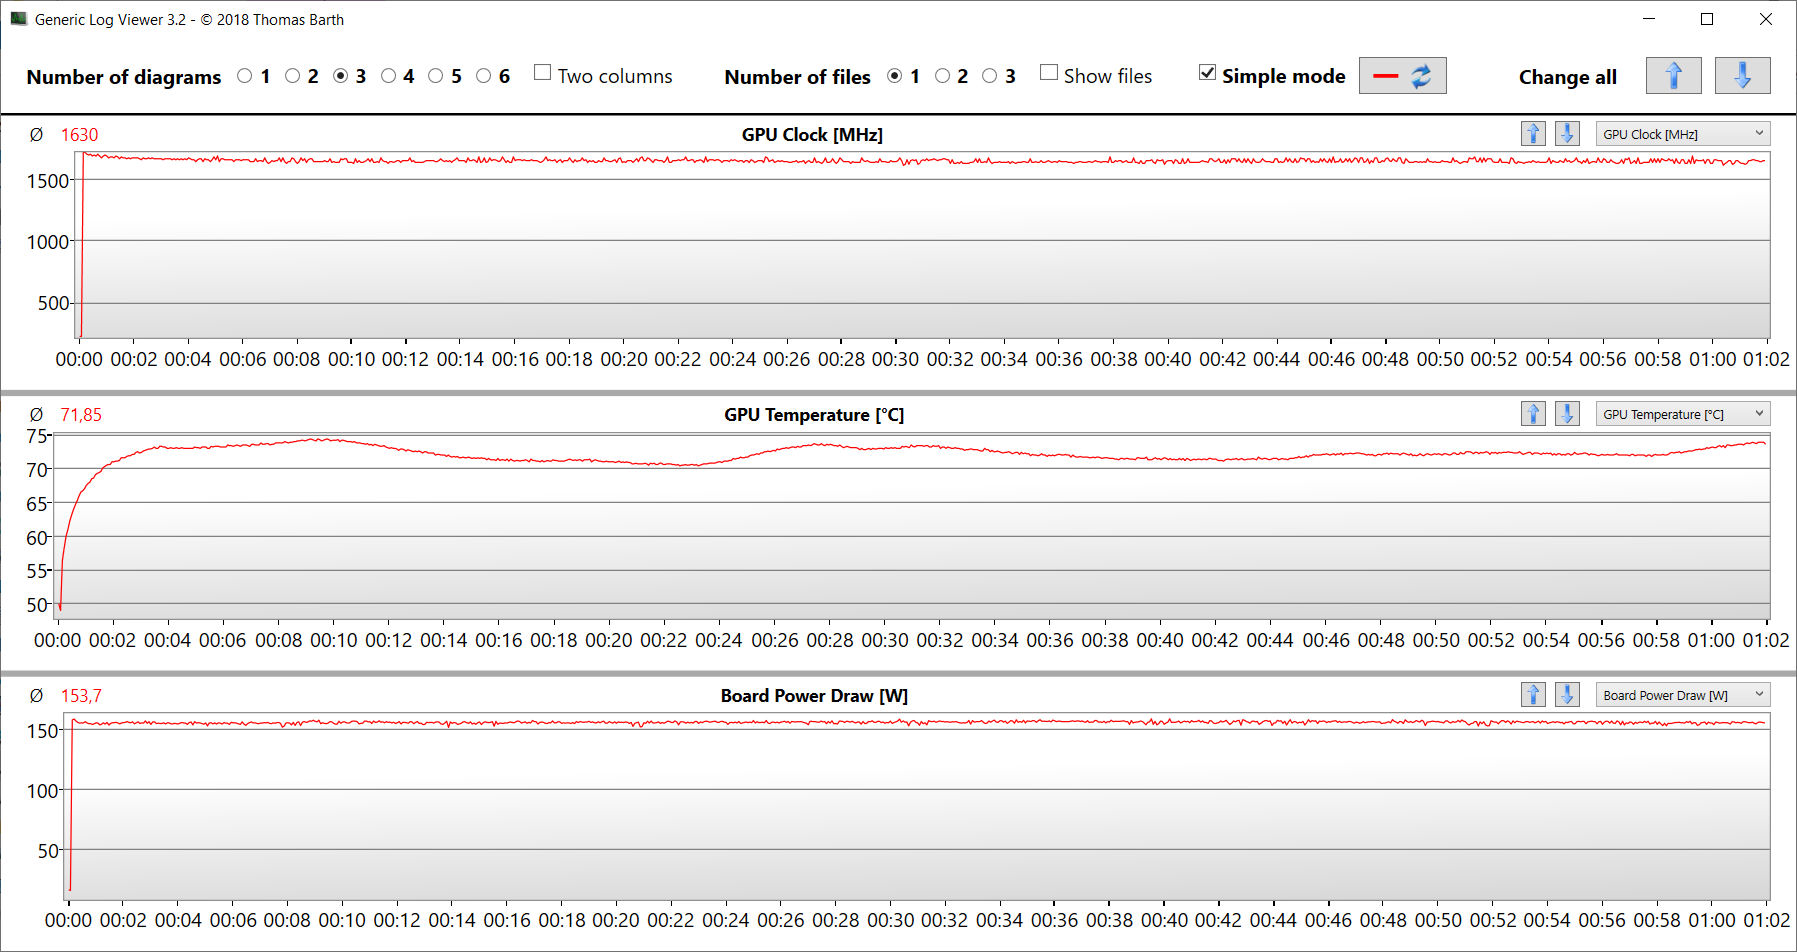
Para determinar si las velocidades de fotogramas se mantienen constantes durante un largo periodo de tiempo, ejecutamos el juego "The Witcher 3" durante 60 minutos a resolución Full HD y con los ajustes de máxima calidad. El personaje no se mueve durante toda la prueba. No notamos ninguna caída de la velocidad de fotogramas.
Witcher 3 FPS Chart
| bajo | medio | alto | ultra | QHD | 4K | |
|---|---|---|---|---|---|---|
| GTA V (2015) | 186.8 | 187 | 184.3 | 136 | 121.1 | 122 |
| The Witcher 3 (2015) | 498 | 392 | 249 | 126.7 | 62.1 | |
| Dota 2 Reborn (2015) | 203 | 184 | 174.8 | 165.7 | 144.7 | |
| Final Fantasy XV Benchmark (2018) | 217 | 175.6 | 132 | 98.6 | 57.9 | |
| X-Plane 11.11 (2018) | 172.8 | 152.3 | 121.1 | 103 | ||
| Far Cry 5 (2018) | 214 | 176 | 167 | 156 | 131 | 73 |
| Strange Brigade (2018) | 505 | 291 | 234 | 209 | 159.9 | 96.6 |
| F1 2021 (2021) | 354 | 243 | 207 | 133.8 | 104.3 | 64 |
Emisiones - El sistema MSI se vuelve ruidoso bajo carga
Ruido del sistema
Incluso en ralentí y con poca carga, el control de los ventiladores no funciona del todo bien. Por ejemplo, los ventiladores se quedan quietos a veces para una experiencia completamente silenciosa; otras veces, se hacen muy notables (hasta 46 dB(A)). Bajo carga, el portátil MSI produce niveles de ruido máximos muy altos de hasta 55 dB(A) (Witcher 3 test) o 57 dB(A) (test de estrés).
Para un funcionamiento silencioso, se recomienda utilizar el "modo silencioso". El sistema es entonces más silencioso, pero no del todo - al mismo tiempo el rendimiento se reduce significativamente.
Ruido
| Ocioso |
| 26 / 34 / 46 dB(A) |
| Carga |
| 50 / 57 dB(A) |
 | ||
30 dB silencioso 40 dB(A) audible 50 dB(A) ruidosamente alto |
||
min: | ||
| MSI Raider GE77 HX 12UHS Intel Core i9-12900HX, NVIDIA GeForce RTX 3080 Ti Laptop GPU | Razer Blade 17 Early 2022 Intel Core i9-12900H, NVIDIA GeForce RTX 3080 Ti Laptop GPU | Alienware x17 R2 P48E Intel Core i9-12900HK, NVIDIA GeForce RTX 3080 Ti Laptop GPU | Medion Erazer Beast X30 Intel Core i9-12900HK, NVIDIA GeForce RTX 3080 Ti Laptop GPU | |
|---|---|---|---|---|
| Noise | 10% | 22% | 8% | |
| apagado / medio ambiente * (dB) | 26 | 26 -0% | 22.7 13% | 26 -0% |
| Idle Minimum * (dB) | 26 | 26 -0% | 23.1 11% | 27 -4% |
| Idle Average * (dB) | 34 | 27 21% | 23.1 32% | 29 15% |
| Idle Maximum * (dB) | 46 | 32 30% | 23.1 50% | 34 26% |
| Load Average * (dB) | 50 | 50 -0% | 31.9 36% | 48 4% |
| Witcher 3 ultra * (dB) | 55 | 51 7% | 52.5 5% | 51 7% |
| Load Maximum * (dB) | 57 | 51 11% | 52.5 8% | 53 7% |
* ... más pequeño es mejor
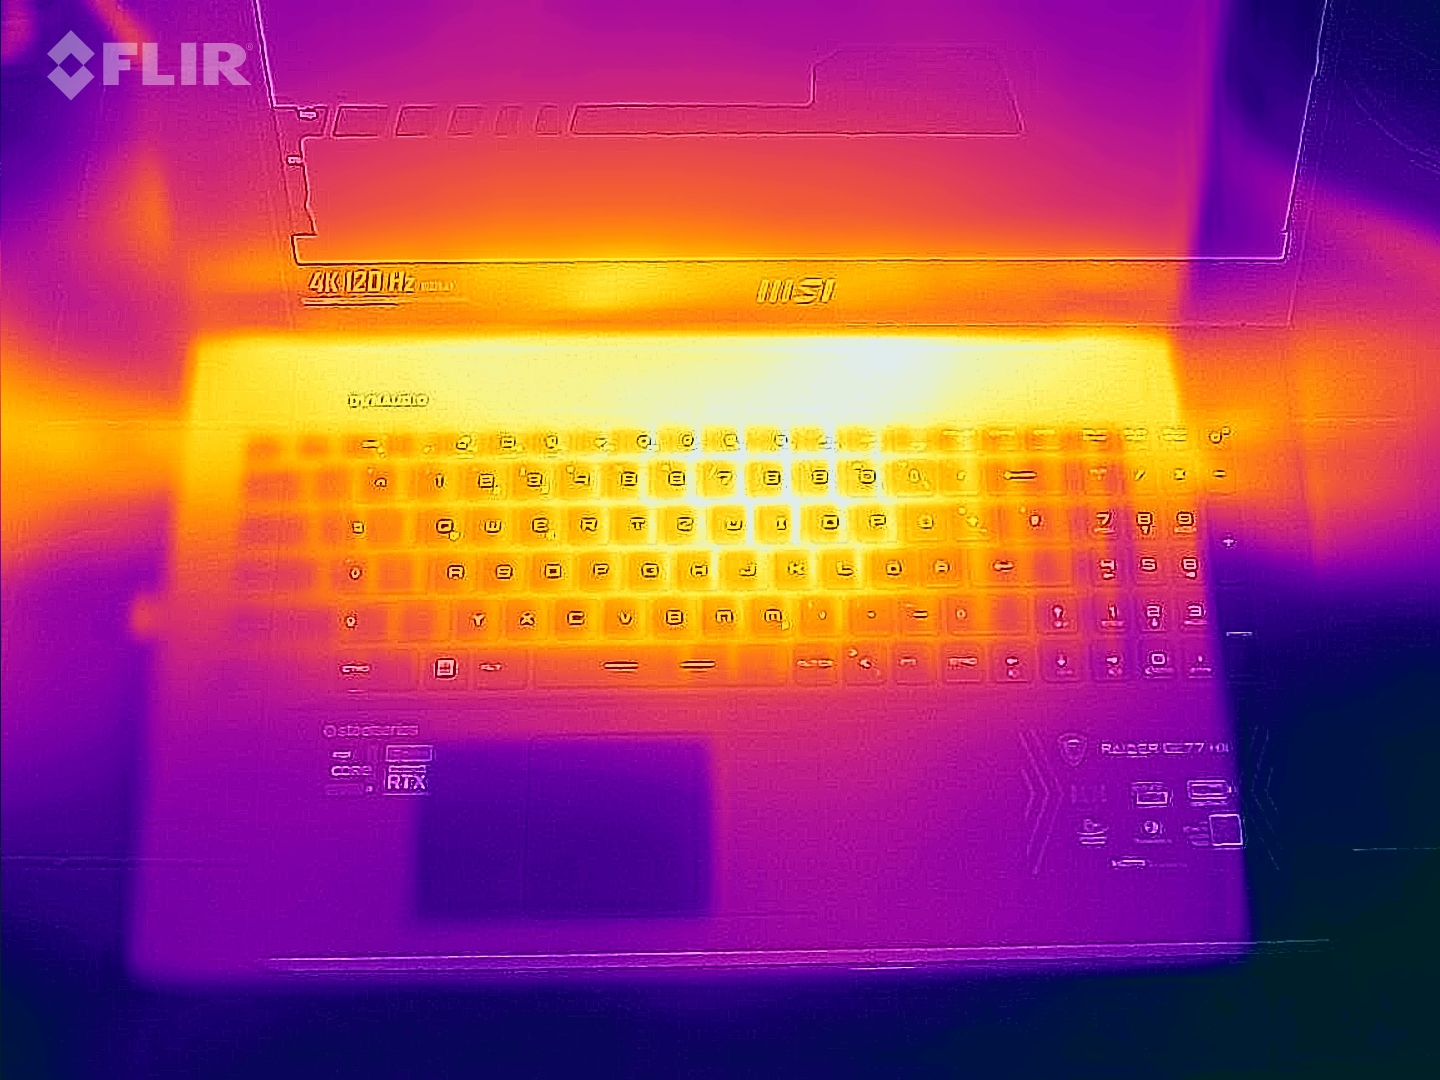
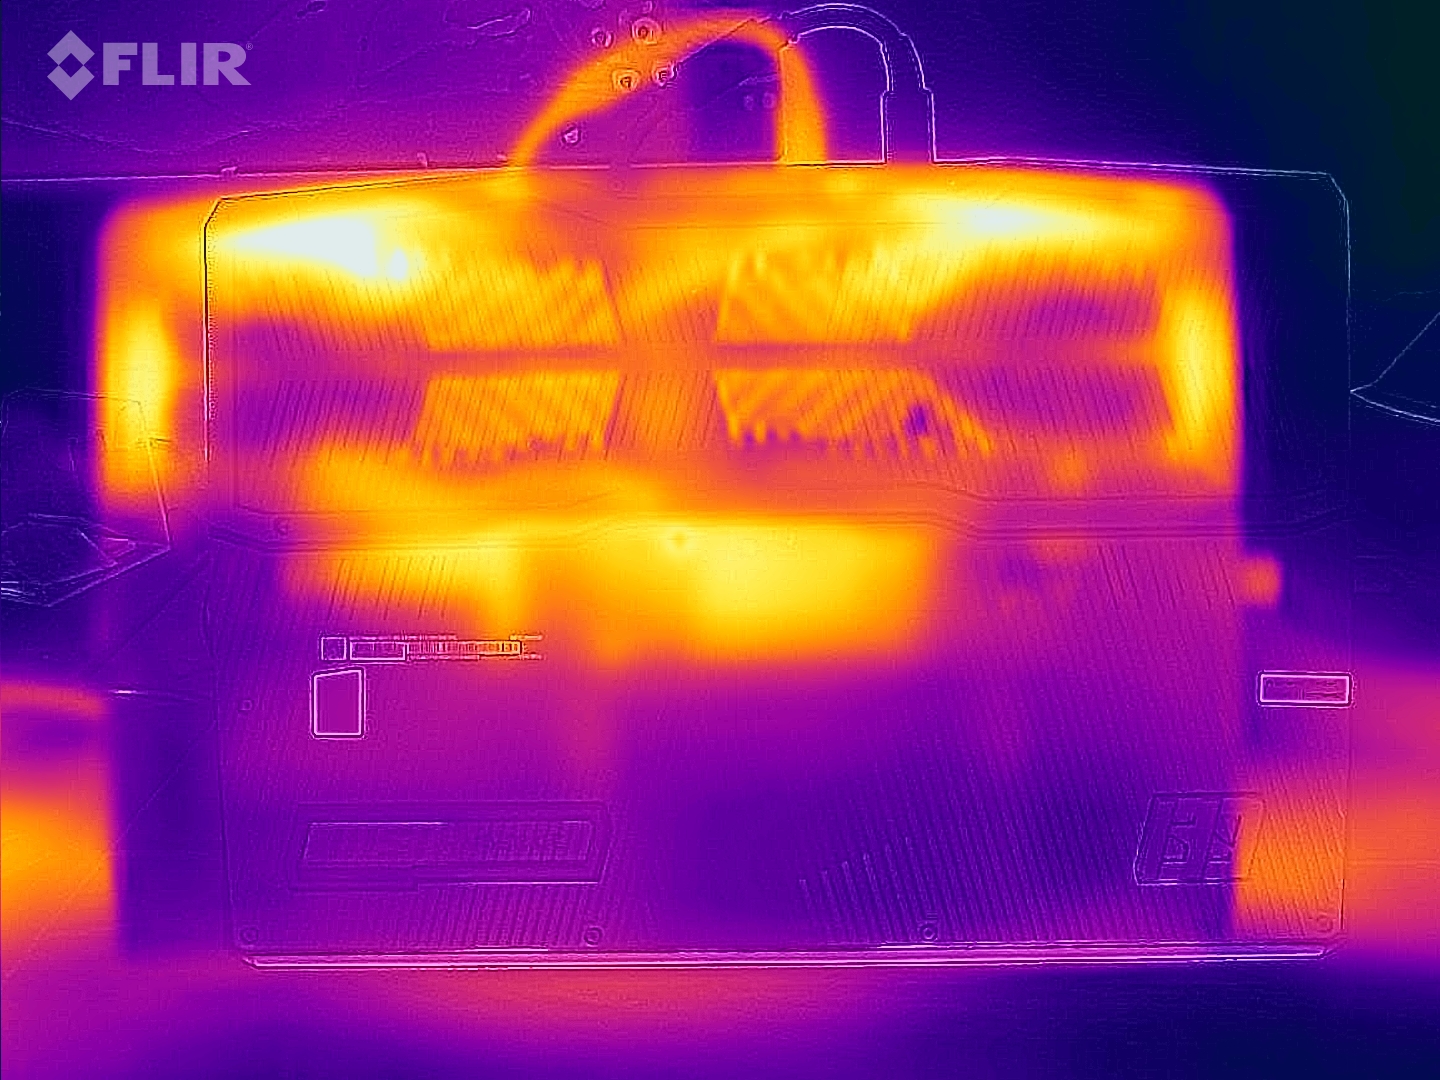
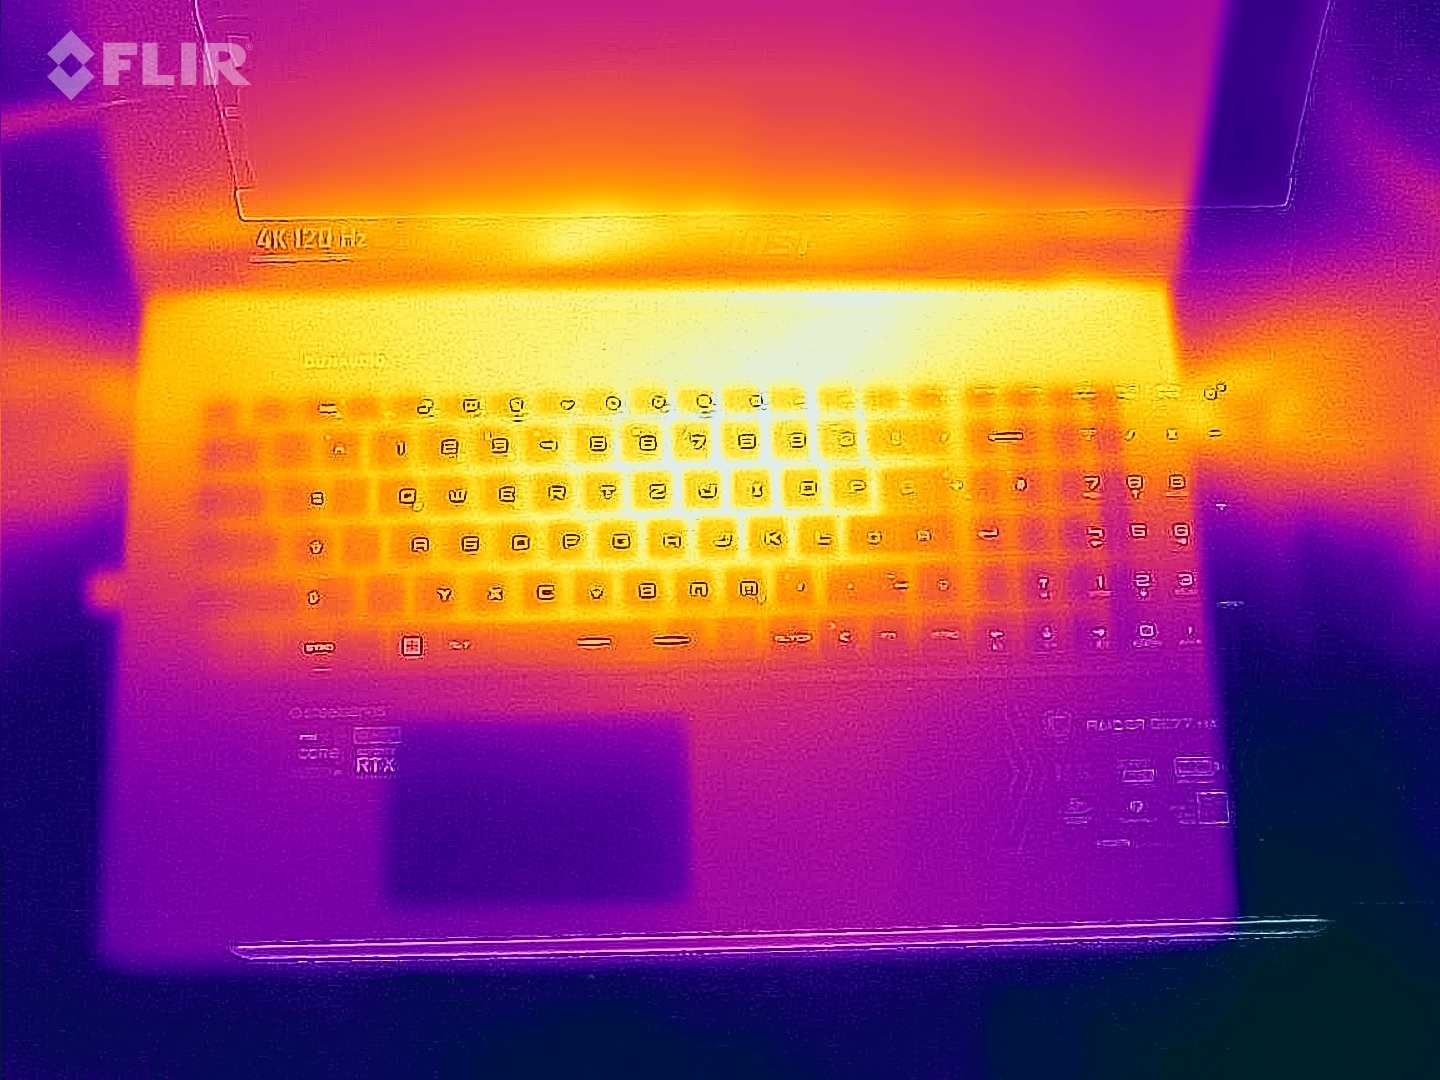
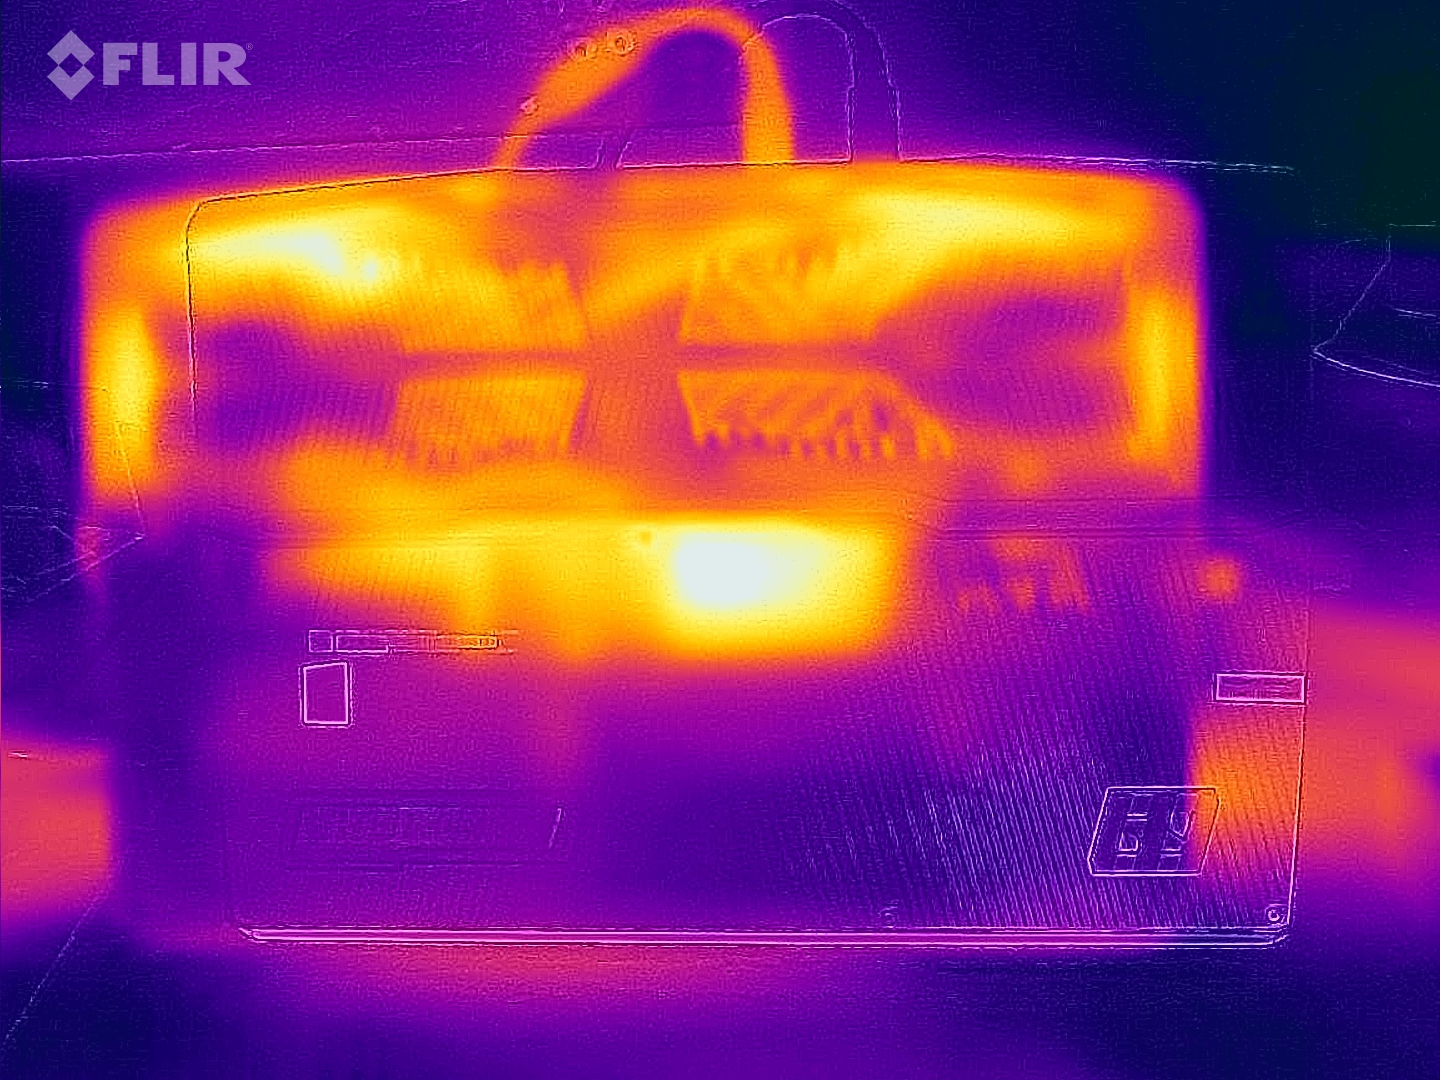
Temperatura
Durante el uso diario (oficina, web) las temperaturas superficiales se mantienen dentro de un rango aceptable. Bajo carga (test de estrés, Witcher 3 test), el portátil se calienta significativamente, pero no en exceso. Los usuarios tampoco tendrán que preocuparse por las temperaturas de la CPU.
(-) La temperatura máxima en la parte superior es de 53 °C / 127 F, frente a la media de 40.4 °C / 105 F, que oscila entre 21.2 y 68.8 °C para la clase Gaming.
(-) El fondo se calienta hasta un máximo de 58 °C / 136 F, frente a la media de 43.2 °C / 110 F
(±) En reposo, la temperatura media de la parte superior es de 34.8 °C / 95# F, frente a la media del dispositivo de 33.9 °C / 93 F.
(-) Jugando a The Witcher 3, la temperatura media de la parte superior es de 44.1 °C / 111 F, frente a la media del dispositivo de 33.9 °C / 93 F.
(+) Los reposamanos y el panel táctil alcanzan como máximo la temperatura de la piel (35 °C / 95 F) y, por tanto, no están calientes.
(-) La temperatura media de la zona del reposamanos de dispositivos similares fue de 28.8 °C / 83.8 F (-6.2 °C / -11.2 F).
| MSI Raider GE77 HX 12UHS Intel Core i9-12900HX, NVIDIA GeForce RTX 3080 Ti Laptop GPU | Razer Blade 17 Early 2022 Intel Core i9-12900H, NVIDIA GeForce RTX 3080 Ti Laptop GPU | Alienware x17 R2 P48E Intel Core i9-12900HK, NVIDIA GeForce RTX 3080 Ti Laptop GPU | Medion Erazer Beast X30 Intel Core i9-12900HK, NVIDIA GeForce RTX 3080 Ti Laptop GPU | |
|---|---|---|---|---|
| Heat | 7% | 21% | 5% | |
| Maximum Upper Side * (°C) | 53 | 50 6% | 49.6 6% | 55 -4% |
| Maximum Bottom * (°C) | 58 | 56 3% | 42.4 27% | 62 -7% |
| Idle Upper Side * (°C) | 38 | 36 5% | 29.2 23% | 32 16% |
| Idle Bottom * (°C) | 43 | 38 12% | 32 26% | 36 16% |
* ... más pequeño es mejor
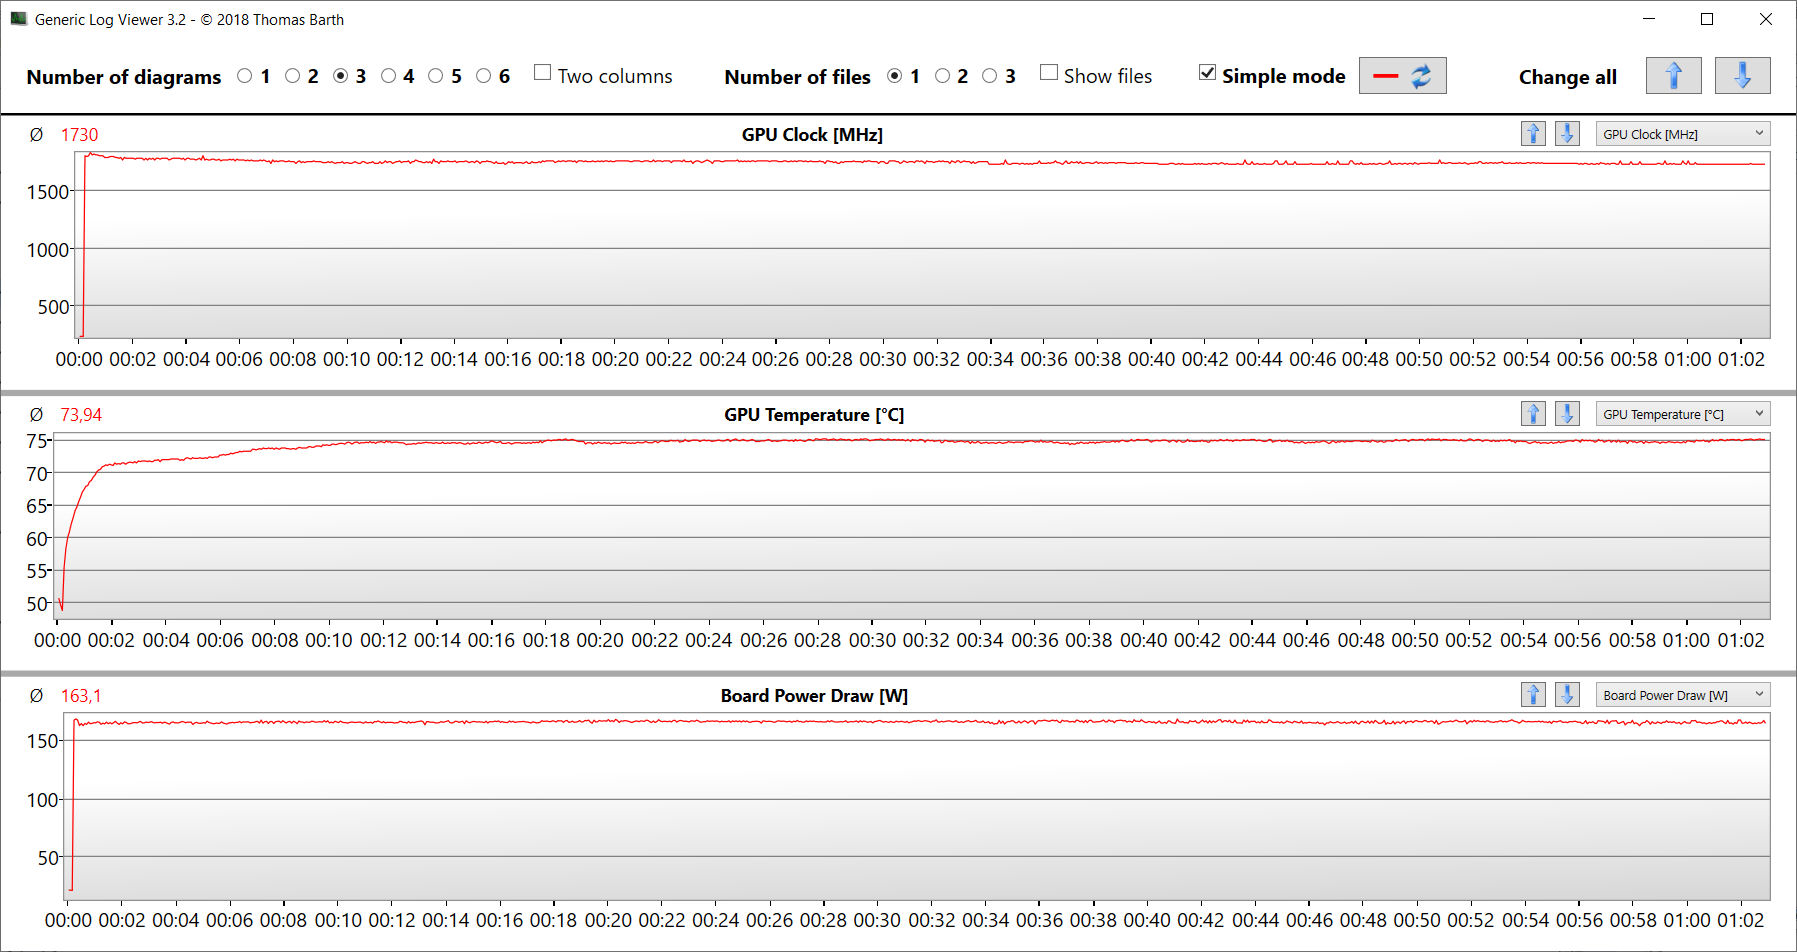
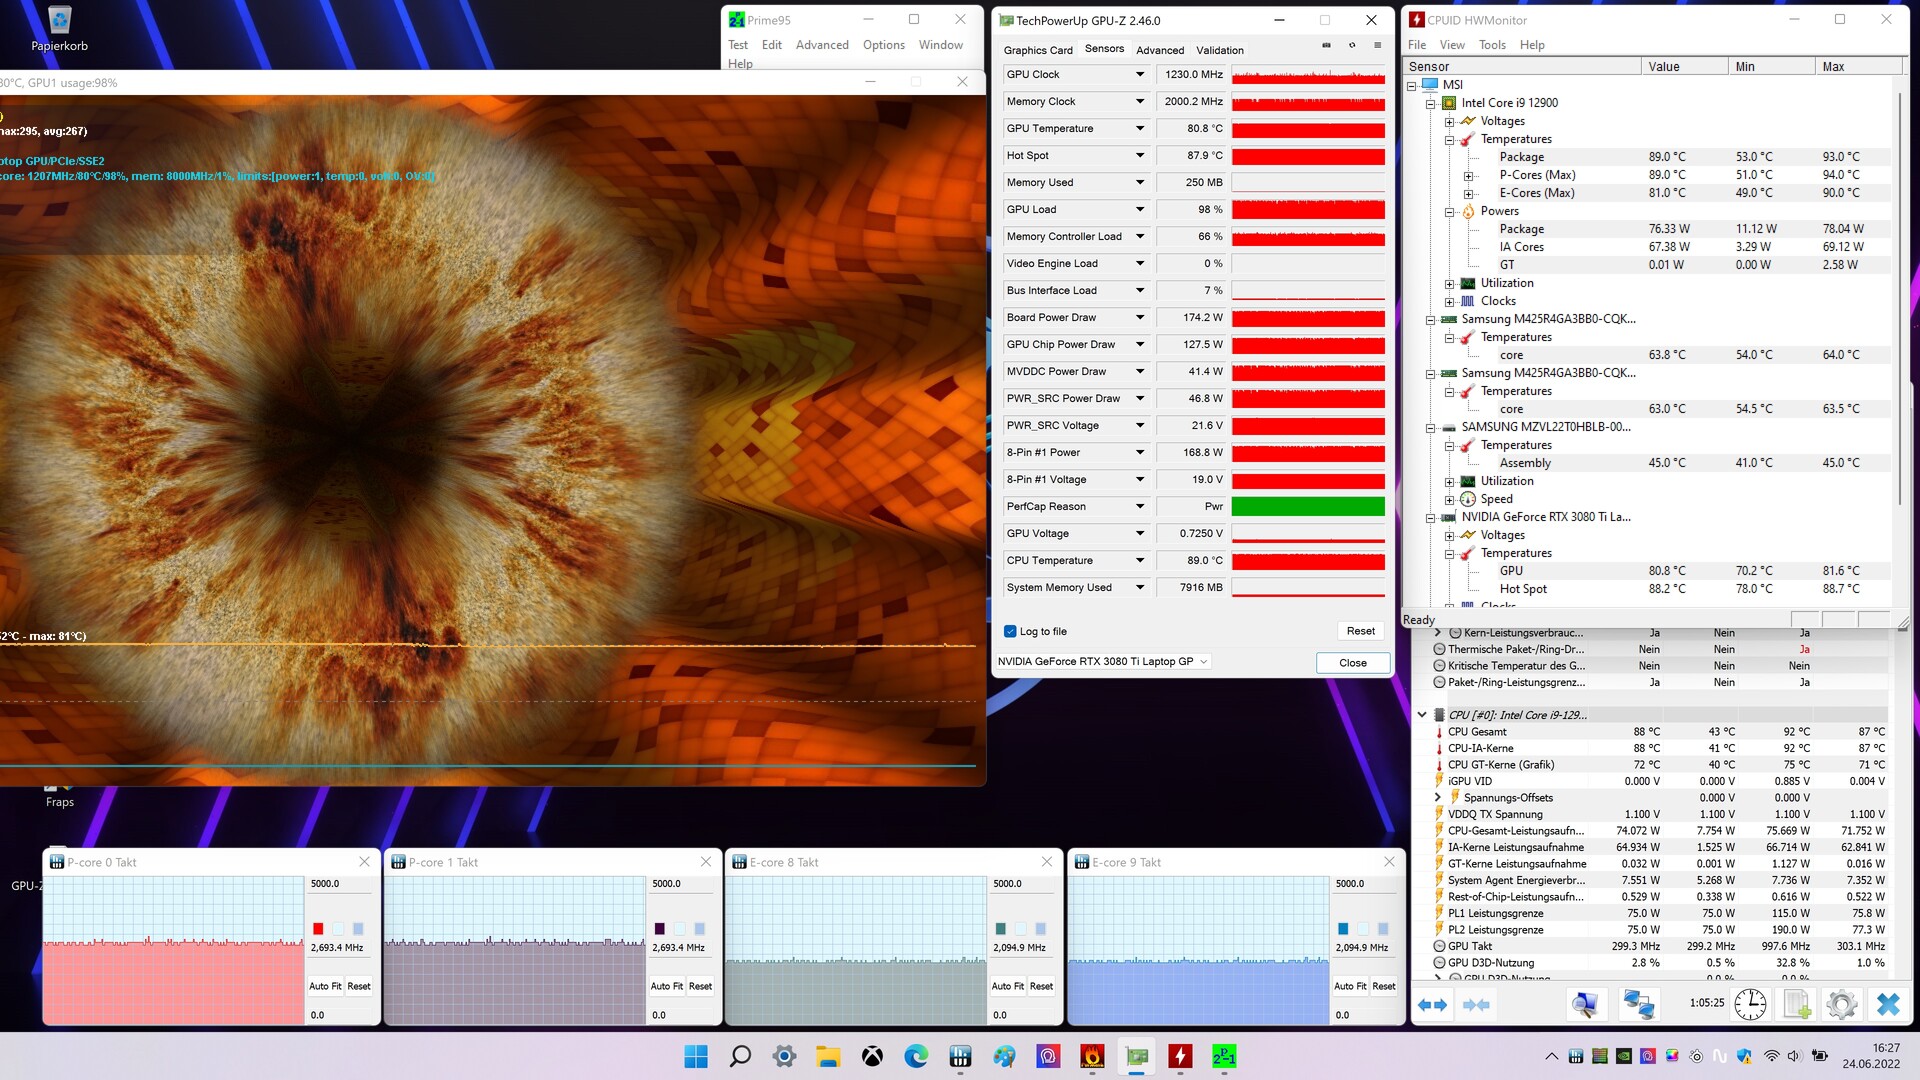
Prueba de esfuerzo
Al principio de la prueba de estrés (ejecutando Prime95 y FurMark durante al menos una hora), tanto la CPU como la GPU funcionan a altas velocidades. Posteriormente, las velocidades de reloj caen a 1,3 (CPU) y 1100 MHz (GPU). La prueba de estrés representa un escenario extremo. Utilizamos esta prueba para determinar si el sistema se mantiene estable a plena carga.
Altavoces
El portátil viene con dos altavoces y dos woofers, que juntos producen un sonido decente - aunque un poco más de graves no vendría mal. Para una mejor experiencia de sonido, se recomiendan auriculares o altavoces externos.
MSI Raider GE77 HX 12UHS análisis de audio
(+) | los altavoces pueden reproducir a un volumen relativamente alto (#85 dB)
Graves 100 - 315 Hz
(±) | lubina reducida - en promedio 11% inferior a la mediana
(±) | la linealidad de los graves es media (11.3% delta a frecuencia anterior)
Medios 400 - 2000 Hz
(+) | medios equilibrados - a sólo 4.3% de la mediana
(+) | los medios son lineales (3.2% delta a la frecuencia anterior)
Altos 2 - 16 kHz
(+) | máximos equilibrados - a sólo 2.3% de la mediana
(+) | los máximos son lineales (5% delta a la frecuencia anterior)
Total 100 - 16.000 Hz
(+) | el sonido global es lineal (11% de diferencia con la mediana)
En comparación con la misma clase
» 7% de todos los dispositivos probados de esta clase eran mejores, 3% similares, 89% peores
» El mejor tuvo un delta de 6%, la media fue 18%, el peor fue ###max##%
En comparación con todos los dispositivos probados
» 6% de todos los dispositivos probados eran mejores, 2% similares, 92% peores
» El mejor tuvo un delta de 4%, la media fue 23%, el peor fue ###max##%
Razer Blade 17 Early 2022 análisis de audio
(+) | los altavoces pueden reproducir a un volumen relativamente alto (#83 dB)
Graves 100 - 315 Hz
(±) | lubina reducida - en promedio 7.4% inferior a la mediana
(±) | la linealidad de los graves es media (9.7% delta a frecuencia anterior)
Medios 400 - 2000 Hz
(+) | medios equilibrados - a sólo 3% de la mediana
(+) | los medios son lineales (3.7% delta a la frecuencia anterior)
Altos 2 - 16 kHz
(+) | máximos equilibrados - a sólo 2.5% de la mediana
(+) | los máximos son lineales (6.1% delta a la frecuencia anterior)
Total 100 - 16.000 Hz
(+) | el sonido global es lineal (9.2% de diferencia con la mediana)
En comparación con la misma clase
» 3% de todos los dispositivos probados de esta clase eran mejores, 1% similares, 96% peores
» El mejor tuvo un delta de 6%, la media fue 18%, el peor fue ###max##%
En comparación con todos los dispositivos probados
» 3% de todos los dispositivos probados eran mejores, 1% similares, 96% peores
» El mejor tuvo un delta de 4%, la media fue 23%, el peor fue ###max##%
Gestión de la energía - Portátil para juegos con una duración decente de la batería
Consumo de energía
El consumo de energía en reposo coincide con nuestras expectativas para el hardware instalado. Durante las pruebas de Witcher 3 y las pruebas de estrés, el consumo de energía se eleva a una media de 247 vatios y 352 vatios, respectivamente; este último valor representa un pico temporal. Mientras que el consumo de energía se mantiene estable durante toda la prueba Witcher 3 prueba, fluctúa durante la prueba de estrés. El adaptador de CA de 330 vatios incluido está suficientemente dimensionado.
| Off / Standby | |
| Ocioso | |
| Carga |
|
Clave:
min: | |
| MSI Raider GE77 HX 12UHS Intel Core i9-12900HX, NVIDIA GeForce RTX 3080 Ti Laptop GPU | Razer Blade 17 Early 2022 Intel Core i9-12900H, NVIDIA GeForce RTX 3080 Ti Laptop GPU | Alienware x17 R2 P48E Intel Core i9-12900HK, NVIDIA GeForce RTX 3080 Ti Laptop GPU | Medion Erazer Beast X30 Intel Core i9-12900HK, NVIDIA GeForce RTX 3080 Ti Laptop GPU | Medio NVIDIA GeForce RTX 3080 Ti Laptop GPU | Media de la clase Gaming | |
|---|---|---|---|---|---|---|
| Power Consumption | -3% | -38% | 16% | -5% | 13% | |
| Idle Minimum * (Watt) | 13 | 17 -31% | 24.1 -85% | 12 8% | 17.2 ? -32% | 13 ? -0% |
| Idle Average * (Watt) | 19 | 23 -21% | 28.5 -50% | 16 16% | 23.3 ? -23% | 19 ? -0% |
| Idle Maximum * (Watt) | 29 | 34 -17% | 60 -107% | 22 24% | 30.8 ? -6% | 24.6 ? 15% |
| Load Average * (Watt) | 143 | 120 16% | 128.7 10% | 118 17% | 121.2 ? 15% | 110.7 ? 23% |
| Witcher 3 ultra * (Watt) | 247 | 229 7% | 254 -3% | 223 10% | ||
| Load Maximum * (Watt) | 352 | 243 31% | 323 8% | 290 18% | 276 ? 22% | 259 ? 26% |
* ... más pequeño es mejor
Consumption Witcher 3 / Stress Test
Consumption external Monitor
Duración de la batería
El portátil de 17,3 pulgadas alcanza una duración de 5:24 h y 6:29 h en nuestra prueba de Wi-Fi (accediendo periódicamente a sitios web mediante un script) y de vídeo (cortometraje Big Buck Bunny (códec H.264, FHD)). Las funciones de ahorro de energía del portátil están desactivadas para ambas pruebas y el brillo de la pantalla está ajustado a 150 nits. Para la prueba de vídeo, también se desactivaron los módulos inalámbricos.
| MSI Raider GE77 HX 12UHS i9-12900HX, GeForce RTX 3080 Ti Laptop GPU, 99.99 Wh | Razer Blade 17 Early 2022 i9-12900H, GeForce RTX 3080 Ti Laptop GPU, 82 Wh | Alienware x17 R2 P48E i9-12900HK, GeForce RTX 3080 Ti Laptop GPU, 87 Wh | Medion Erazer Beast X30 i9-12900HK, GeForce RTX 3080 Ti Laptop GPU, 91.2 Wh | Media de la clase Gaming | |
|---|---|---|---|---|---|
| Duración de Batería | -25% | -61% | 1% | 5% | |
| Reader / Idle (h) | 9.8 | 7.1 -28% | 3.9 -60% | 7.7 -21% | 8.27 ? -16% |
| H.264 (h) | 6.5 | 4.8 -26% | 6.4 -2% | 8.32 ? 28% | |
| WiFi v1.3 (h) | 5.4 | 3.8 -30% | 2 -63% | 5.7 6% | 7.11 ? 32% |
| Load (h) | 2 | 1.7 -15% | 0.8 -60% | 2.4 20% | 1.502 ? -25% |
Pro
Contra
Veredicto - Mucha potencia por mucho dinero
Para nuestra configuración del Raider GE77, MSI pide unos 5.200 dólares. Por ese precio, los compradores reciben un portátil muy potente para aplicaciones exigentes como la edición de vídeo, el renderizado y los juegos 4K.
El MSI Raider GE77 HX 12 UHS es uno de los portátiles más potentes disponibles actualmente.
Los componentes principales consisten en un Core i9-12900HX CPU, una GeForce Portátil RTX 3080 Ti (175 vatios TGP, 16 GB de VRAM), y 64 GB de RAM, lo que hace que el nivel de rendimiento general sea alto. La GPU GeForce, en particular, obtiene algunas de las puntuaciones más altas que hemos visto en este chip.
Tanto la CPU como la GPU son capaces de funcionar a velocidades de reloj continuamente altas. Las emisiones de calor y ruido relativamente altas coinciden con nuestras expectativas para esta clase de dispositivo. Con aproximadamente 5.5 a 6.5 horas, la duración de la batería es buena para un potente portátil 4K. El puerto Thunderbolt 4 permite una expansión adicional a través de una GPU externa o una solución de acoplamiento.
La pantalla mate 4K (IPS, 120 Hz) ofrece suficiente brillo máximo, tiempos de respuesta cortos y una buena cobertura del espacio de color. Sin embargo, le falta contraste. Aunque la precisión del color estaba apagada de fábrica, esto puede arreglarse con una calibración. Sospechamos un conflicto entre el software MSI True Color, el perfil de color preinstalado y/o la iGPU o sus drivers. Esto es inaceptable para un portátil de esta categoría de precio.
ElRazer Blade 17 (principios de 2022) es una alternativa potencial al GE77. Aunque ofrece un nivel de rendimiento general inferior al del sistema de MSI, es más compacto y ligero. En términos de duración de la batería, no puede competir con el Raider.
Precio y disponibilidad
Varias configuraciones del MSI Raider GE77 HX 12UHS están disponibles en la tienda oficial de MSI https://us-store.msi.com/Raider-GE77HX-12UHS-074?utm_source=hatch&utm_campaign=MSI+Systems&utm_content=s1657617933395q1wqa52417 (Core i9-12800HX, RTX 3080 Ti, FHD 360 Hz, 1 TB SSD) y en tiendas online como Xotic PC (Core i9-12900HX, RTX 3080 Ti, QHD 240 Hz, 1 TB SSD) por unos 3000 USD y 3700 USD, respectivamente.
MSI Raider GE77 HX 12UHS
- 07/12/2022 v7 (old)
Sascha Mölck
Price comparison

