Análisis del portátil MSI Raider GE66 12UHS: Aprueba con creces
MSI sigue ampliando su repertorio de portátiles para juegos de gama alta. Con el GE66 12UHS, la compañía taiwanesa pretende aprovechar la potencia delIntel Core i9 12900HK y la Nvidia RTX 3080 Ti con la ayuda de un "Phase-Change Liquid Metal Pad" en la CPU, así como un disipador mejorado. Aunque el diseño general ha cambiado poco en comparación con el predecesor (el MSI GE66 10SFS), el fabricante ha hecho muchos ajustes bajo el capó
En el siguiente análisis, descubrimos si el dispositivo puede seguir el ritmo de la competencia en forma de Razer Blade 15 Advanced Early 2022y el Schenker XMG Neo 15 Early 2022 y el Lenovo Legion 5 Pro 16 G7.
Posibles contendientes en la comparación
Valoración | Fecha | Modelo | Peso | Altura | Tamaño | Resolución | Precio |
|---|---|---|---|---|---|---|---|
| 87.4 % v7 (old) | 06/2022 | MSI Raider GE66 12UHS i9-12900HK, GeForce RTX 3080 Ti Laptop GPU | 2.4 kg | 23.4 mm | 15.60" | 3840x2160 | |
| 84.6 % v7 (old) | 12/2020 | MSI GE66 Raider 10SFS i9-10980HK, GeForce RTX 2070 Super Mobile | 2.4 kg | 23 mm | 15.60" | 1920x1080 | |
| 89.1 % v7 (old) | 03/2022 | Razer Blade 15 2022 i7-12800H, GeForce RTX 3080 Ti Laptop GPU | 2.1 kg | 16.99 mm | 15.60" | 2560x1440 | |
v (old) | 03/2022 | Schenker XMG Neo 15 E22 (Early 2022, RTX 3080 Ti) i7-12700H, GeForce RTX 3080 Ti Laptop GPU | 2.2 kg | 26.6 mm | 15.60" | 2560x1440 | |
| 88 % v7 (old) | 03/2022 | Lenovo Legion 5 Pro 16 G7 i7 RTX 3070Ti i7-12700H, GeForce RTX 3070 Ti Laptop GPU | 2.6 kg | 26.6 mm | 16.00" | 2560x1600 |
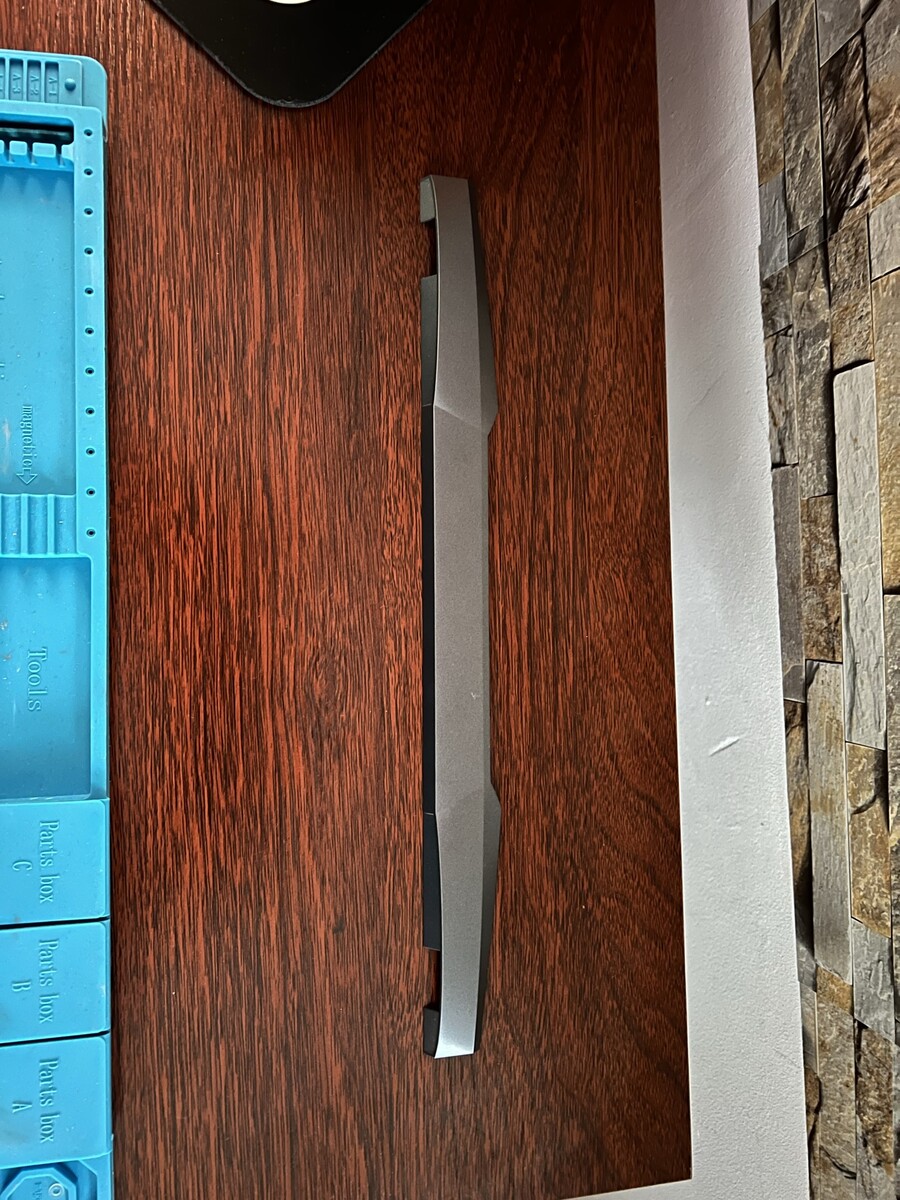
Maletín: Portátil MSI con apariencia ligeramente alterada
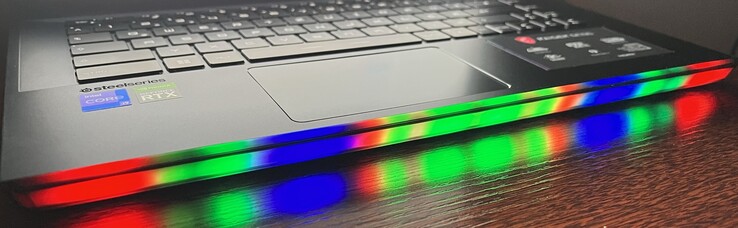
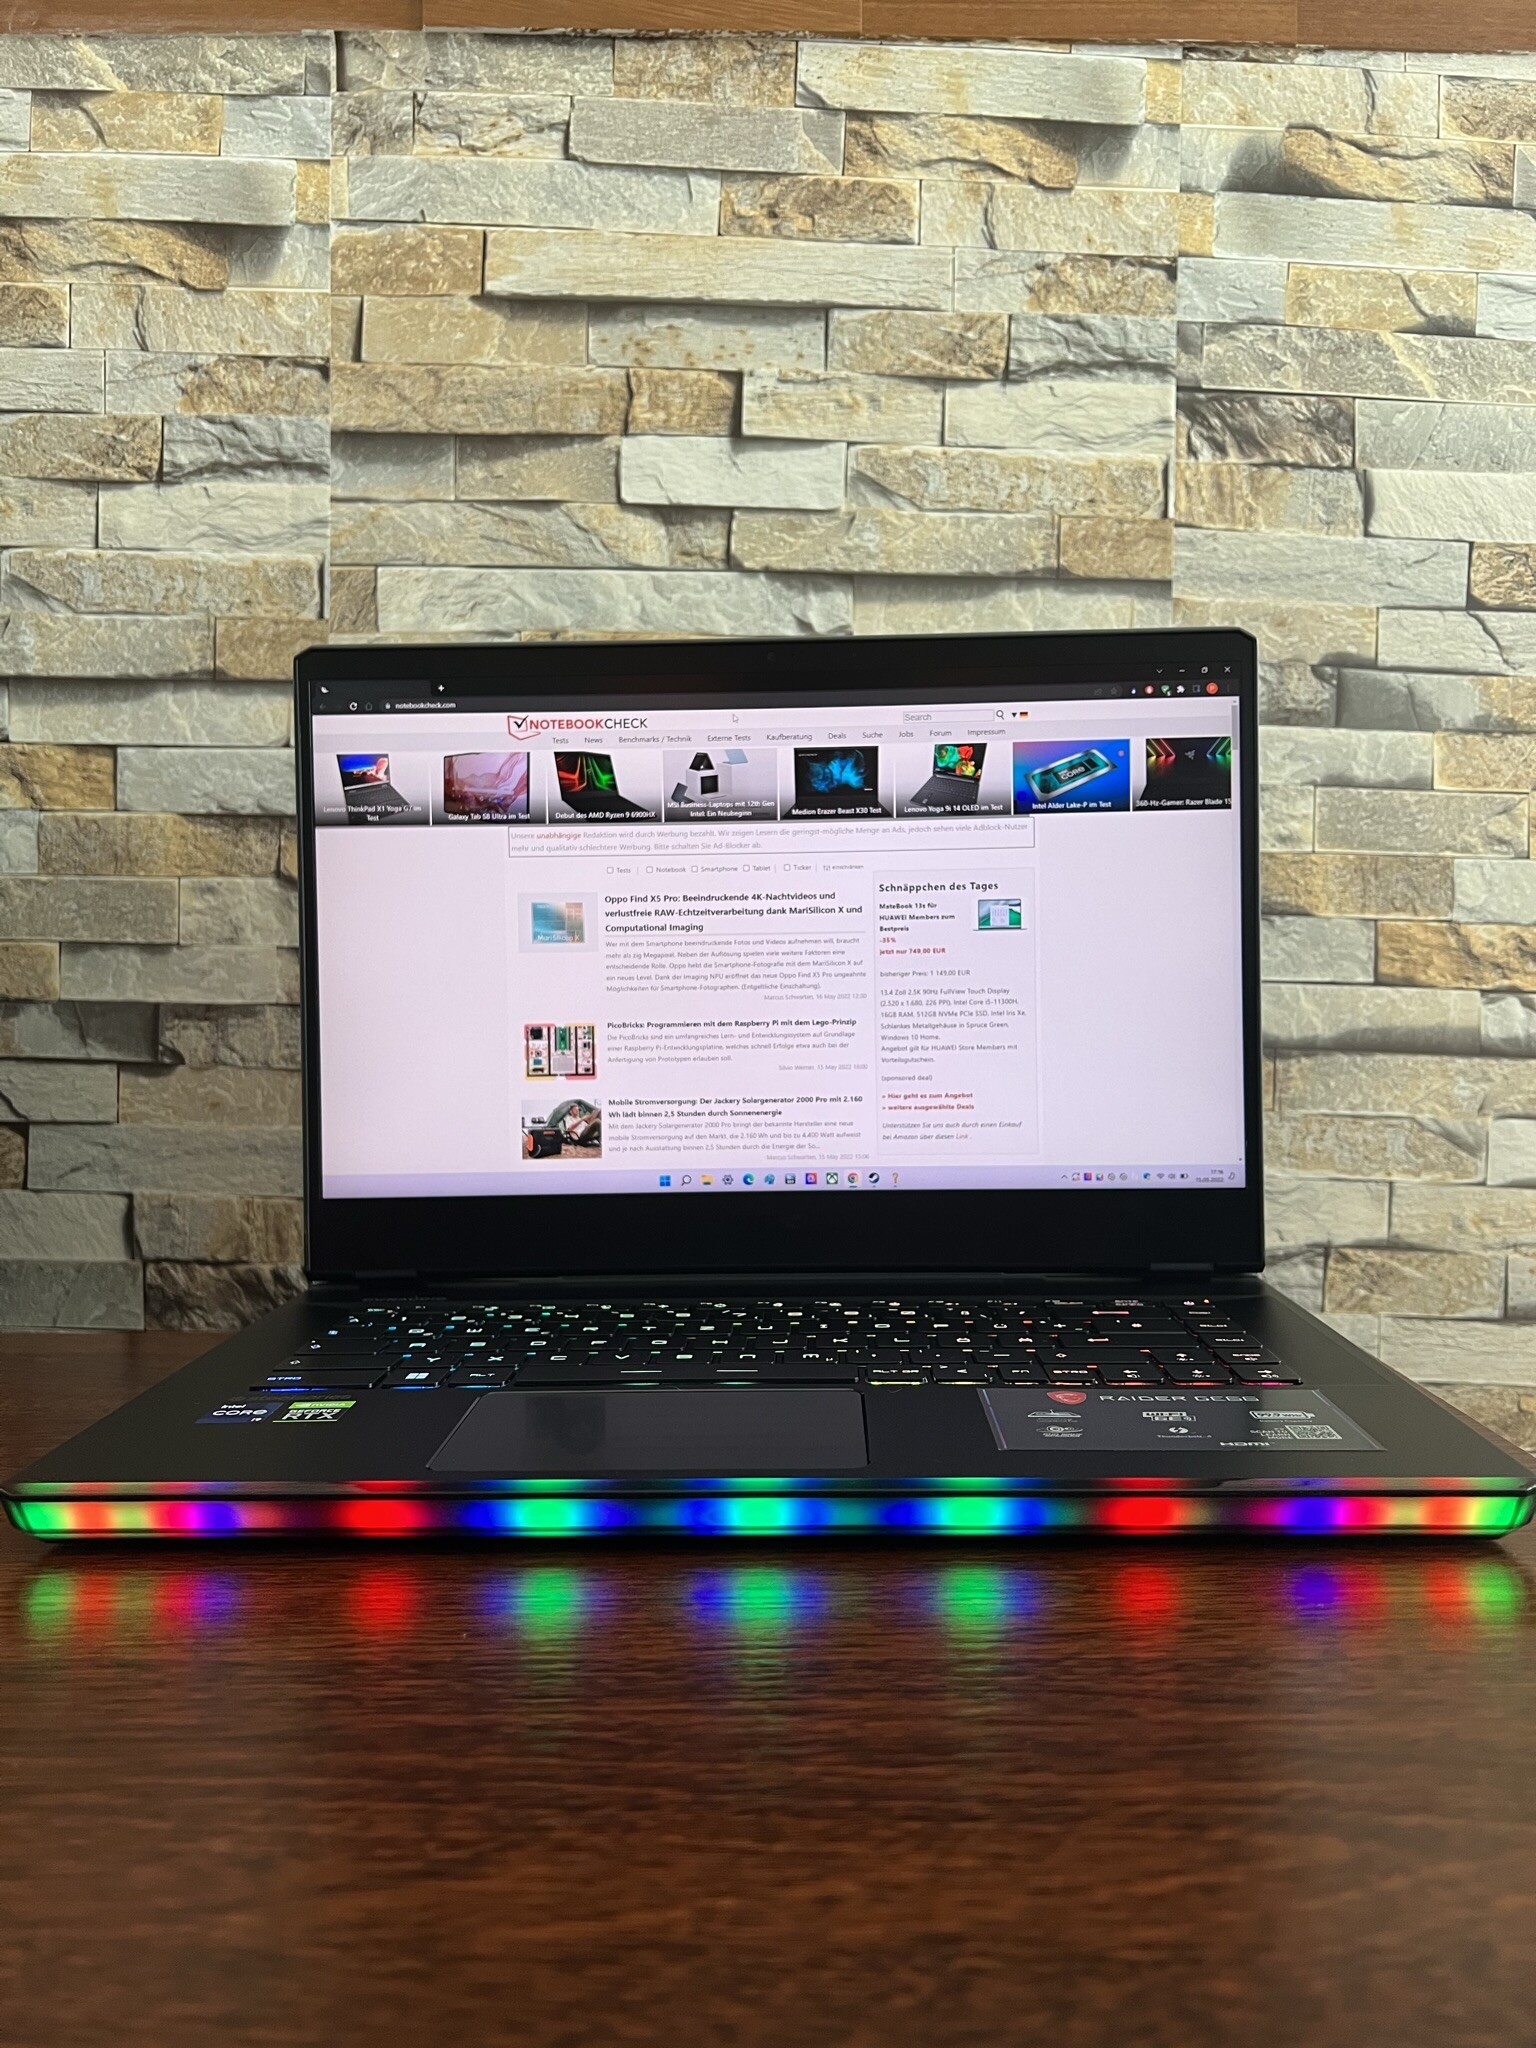
La carcasa y el diseño del MSI Raider GE66 12 UHS no han cambiado en comparación con el predecesor, excepto por una barra de luz más agradable y de mayor calidad en la parte frontal. Por lo tanto, le remitimos al análisis del predecesor para obtener más detalles sobre la carcasa:MSI GE66 10SFS.
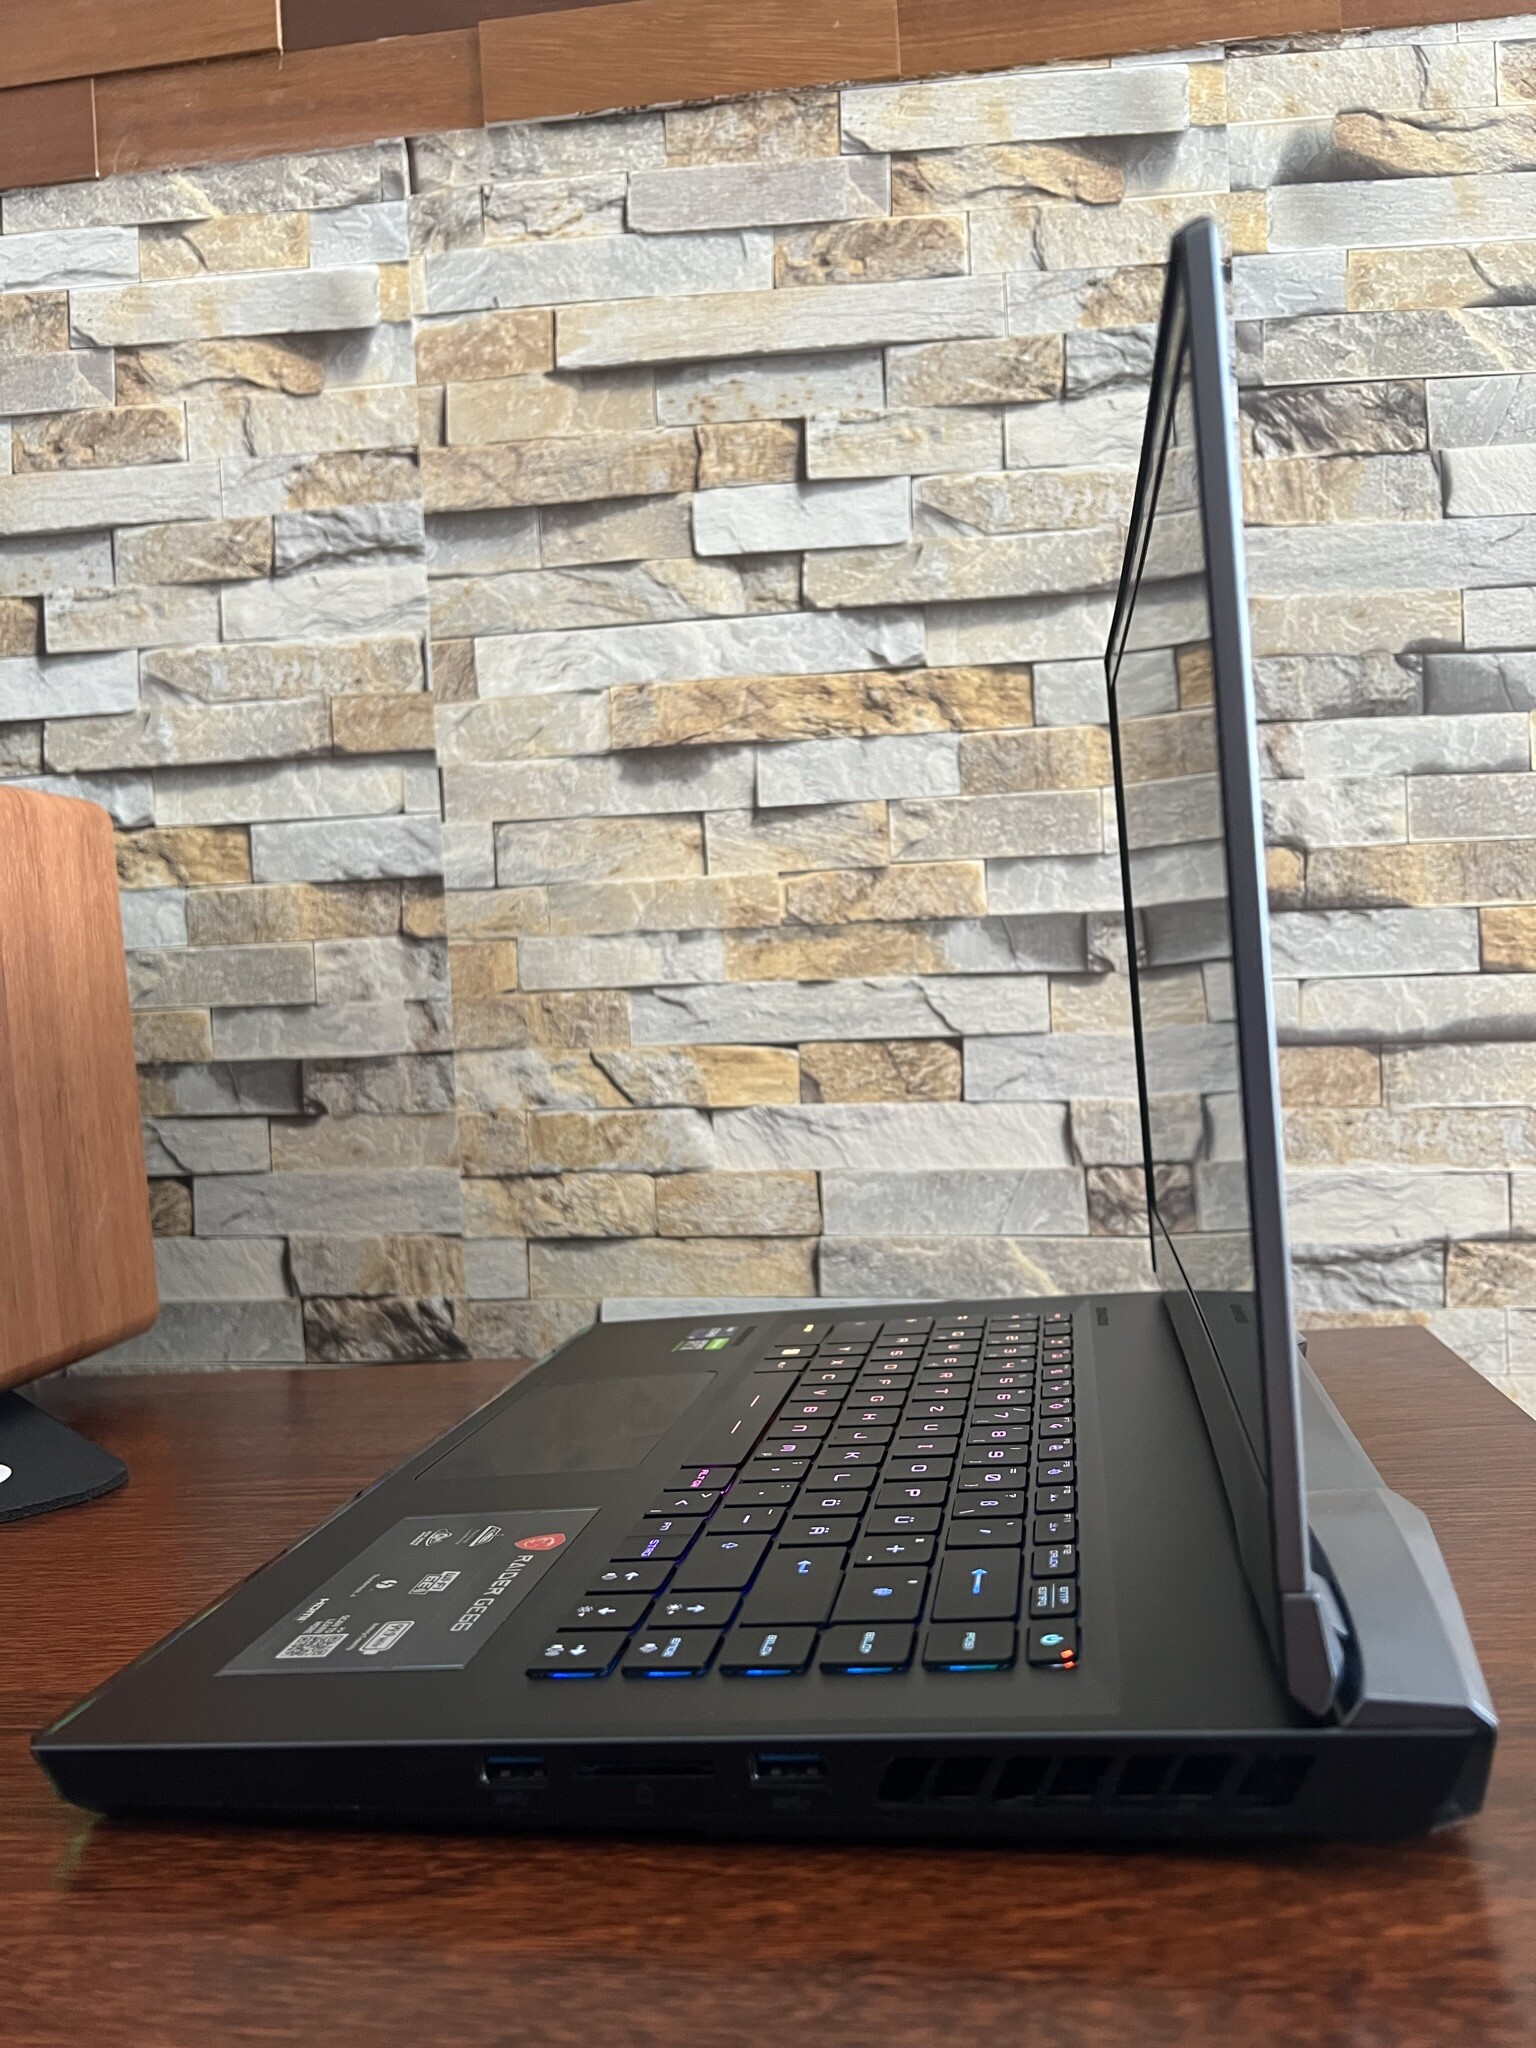
En comparación con otros portátiles para juegos, nuestro dispositivo de análisis tiene el segundo mayor peso (2,4 kg). En términos de tamaño, el GE66 es más bien un portátil gigante. El Razer Blade demuestra lo que es posible en términos de movilidad.
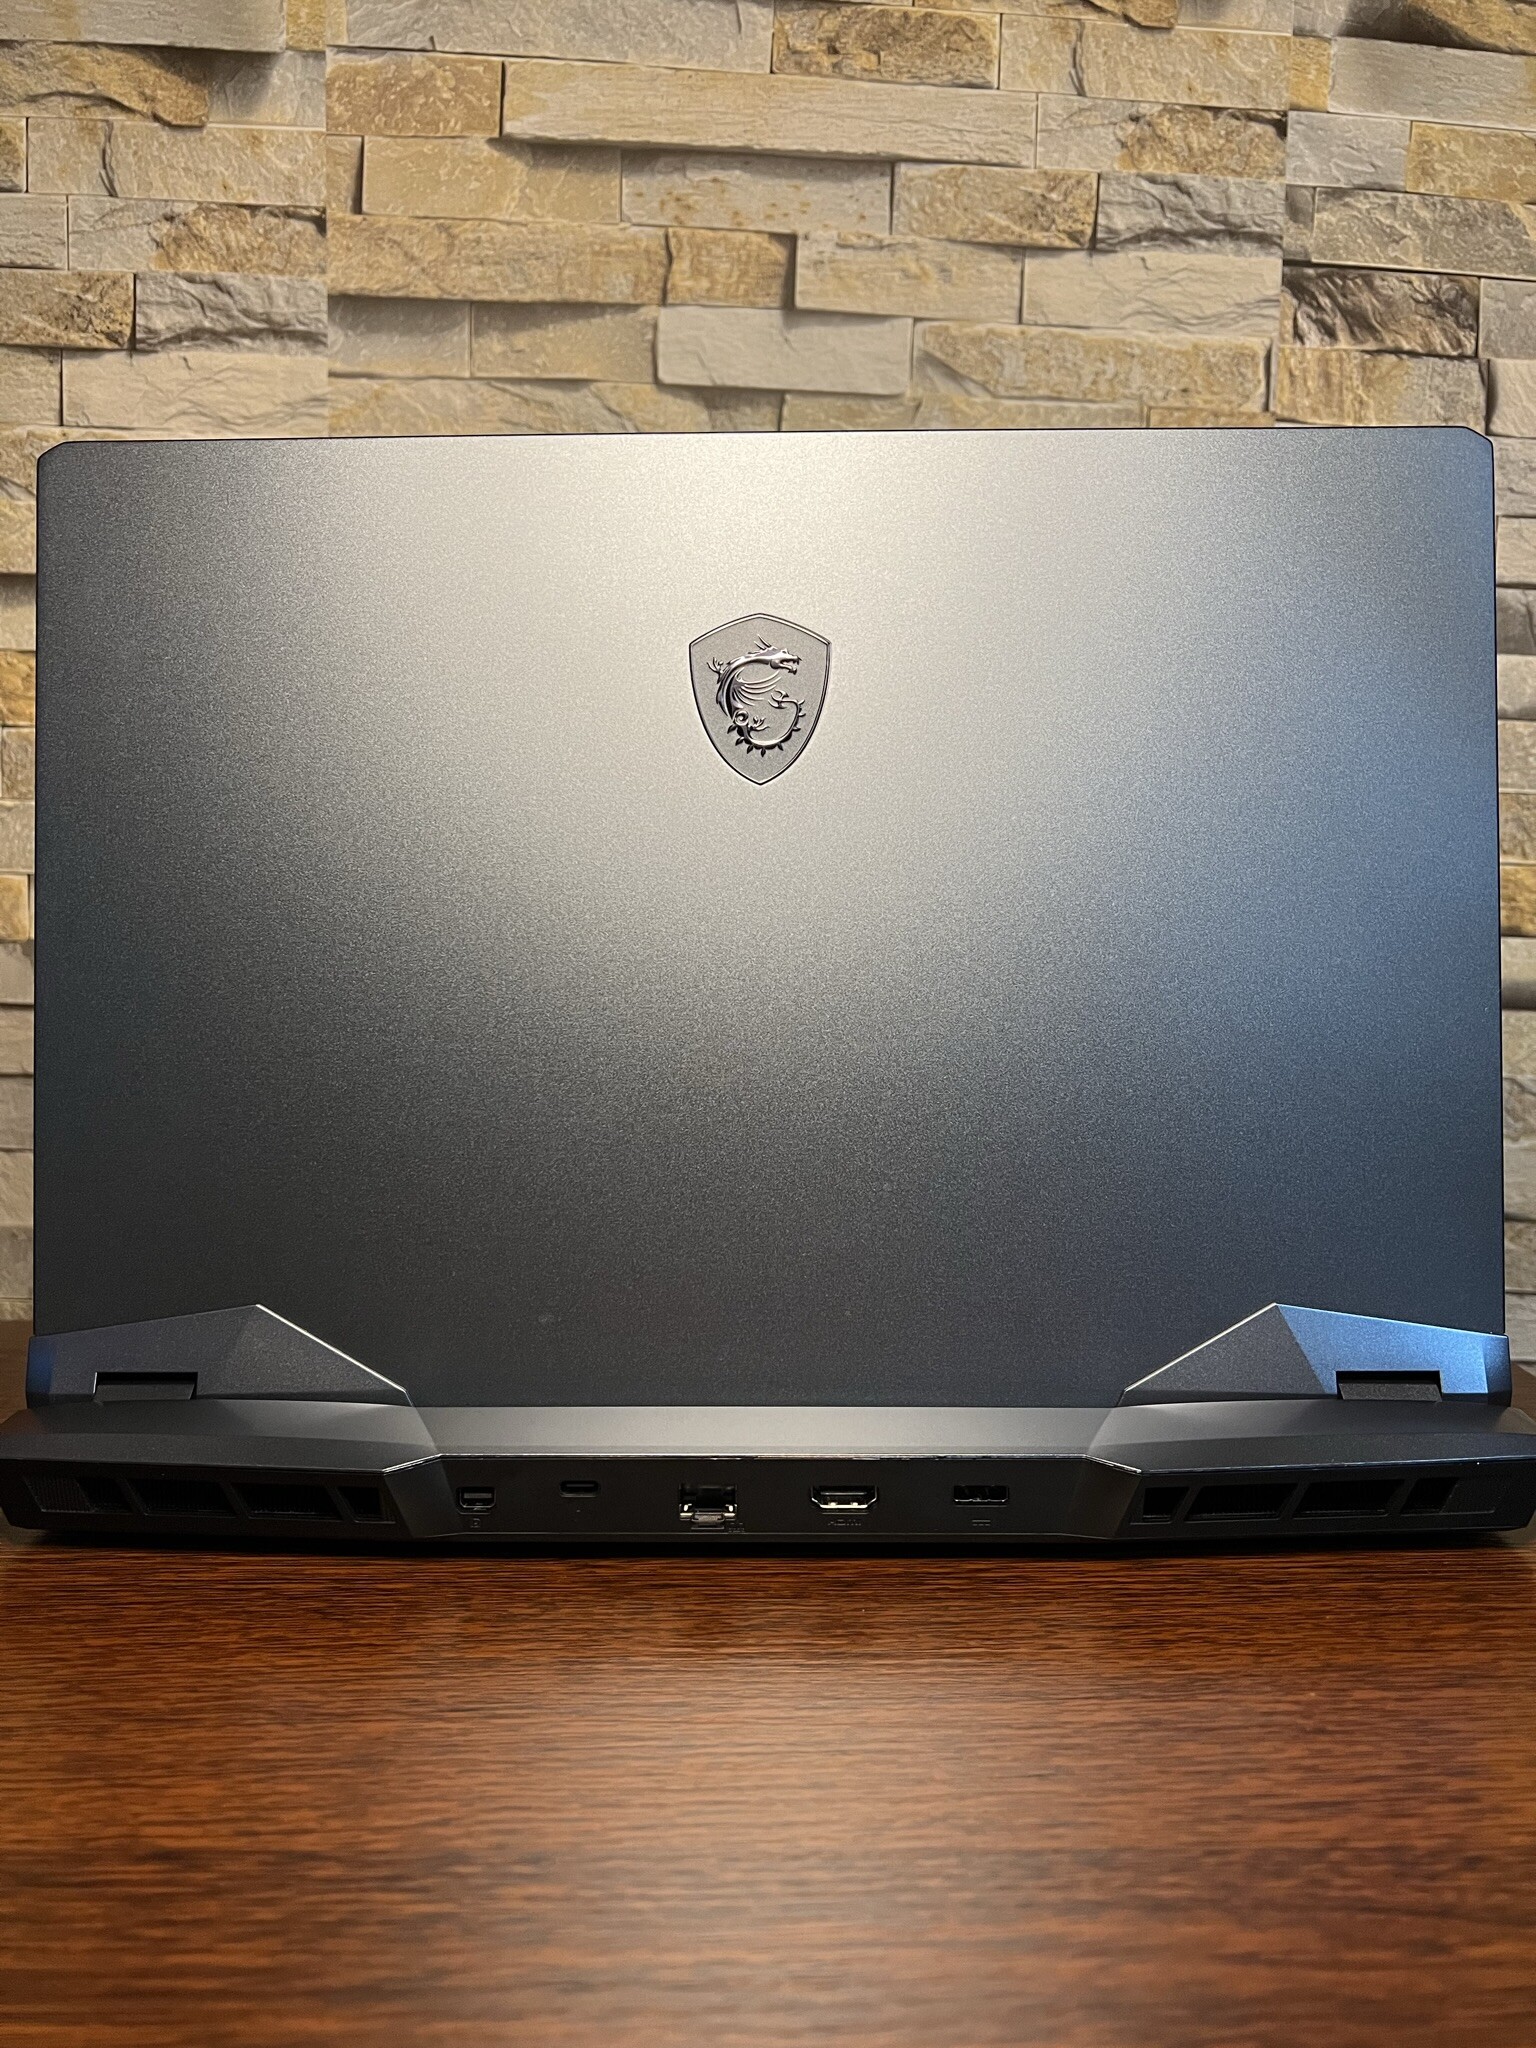
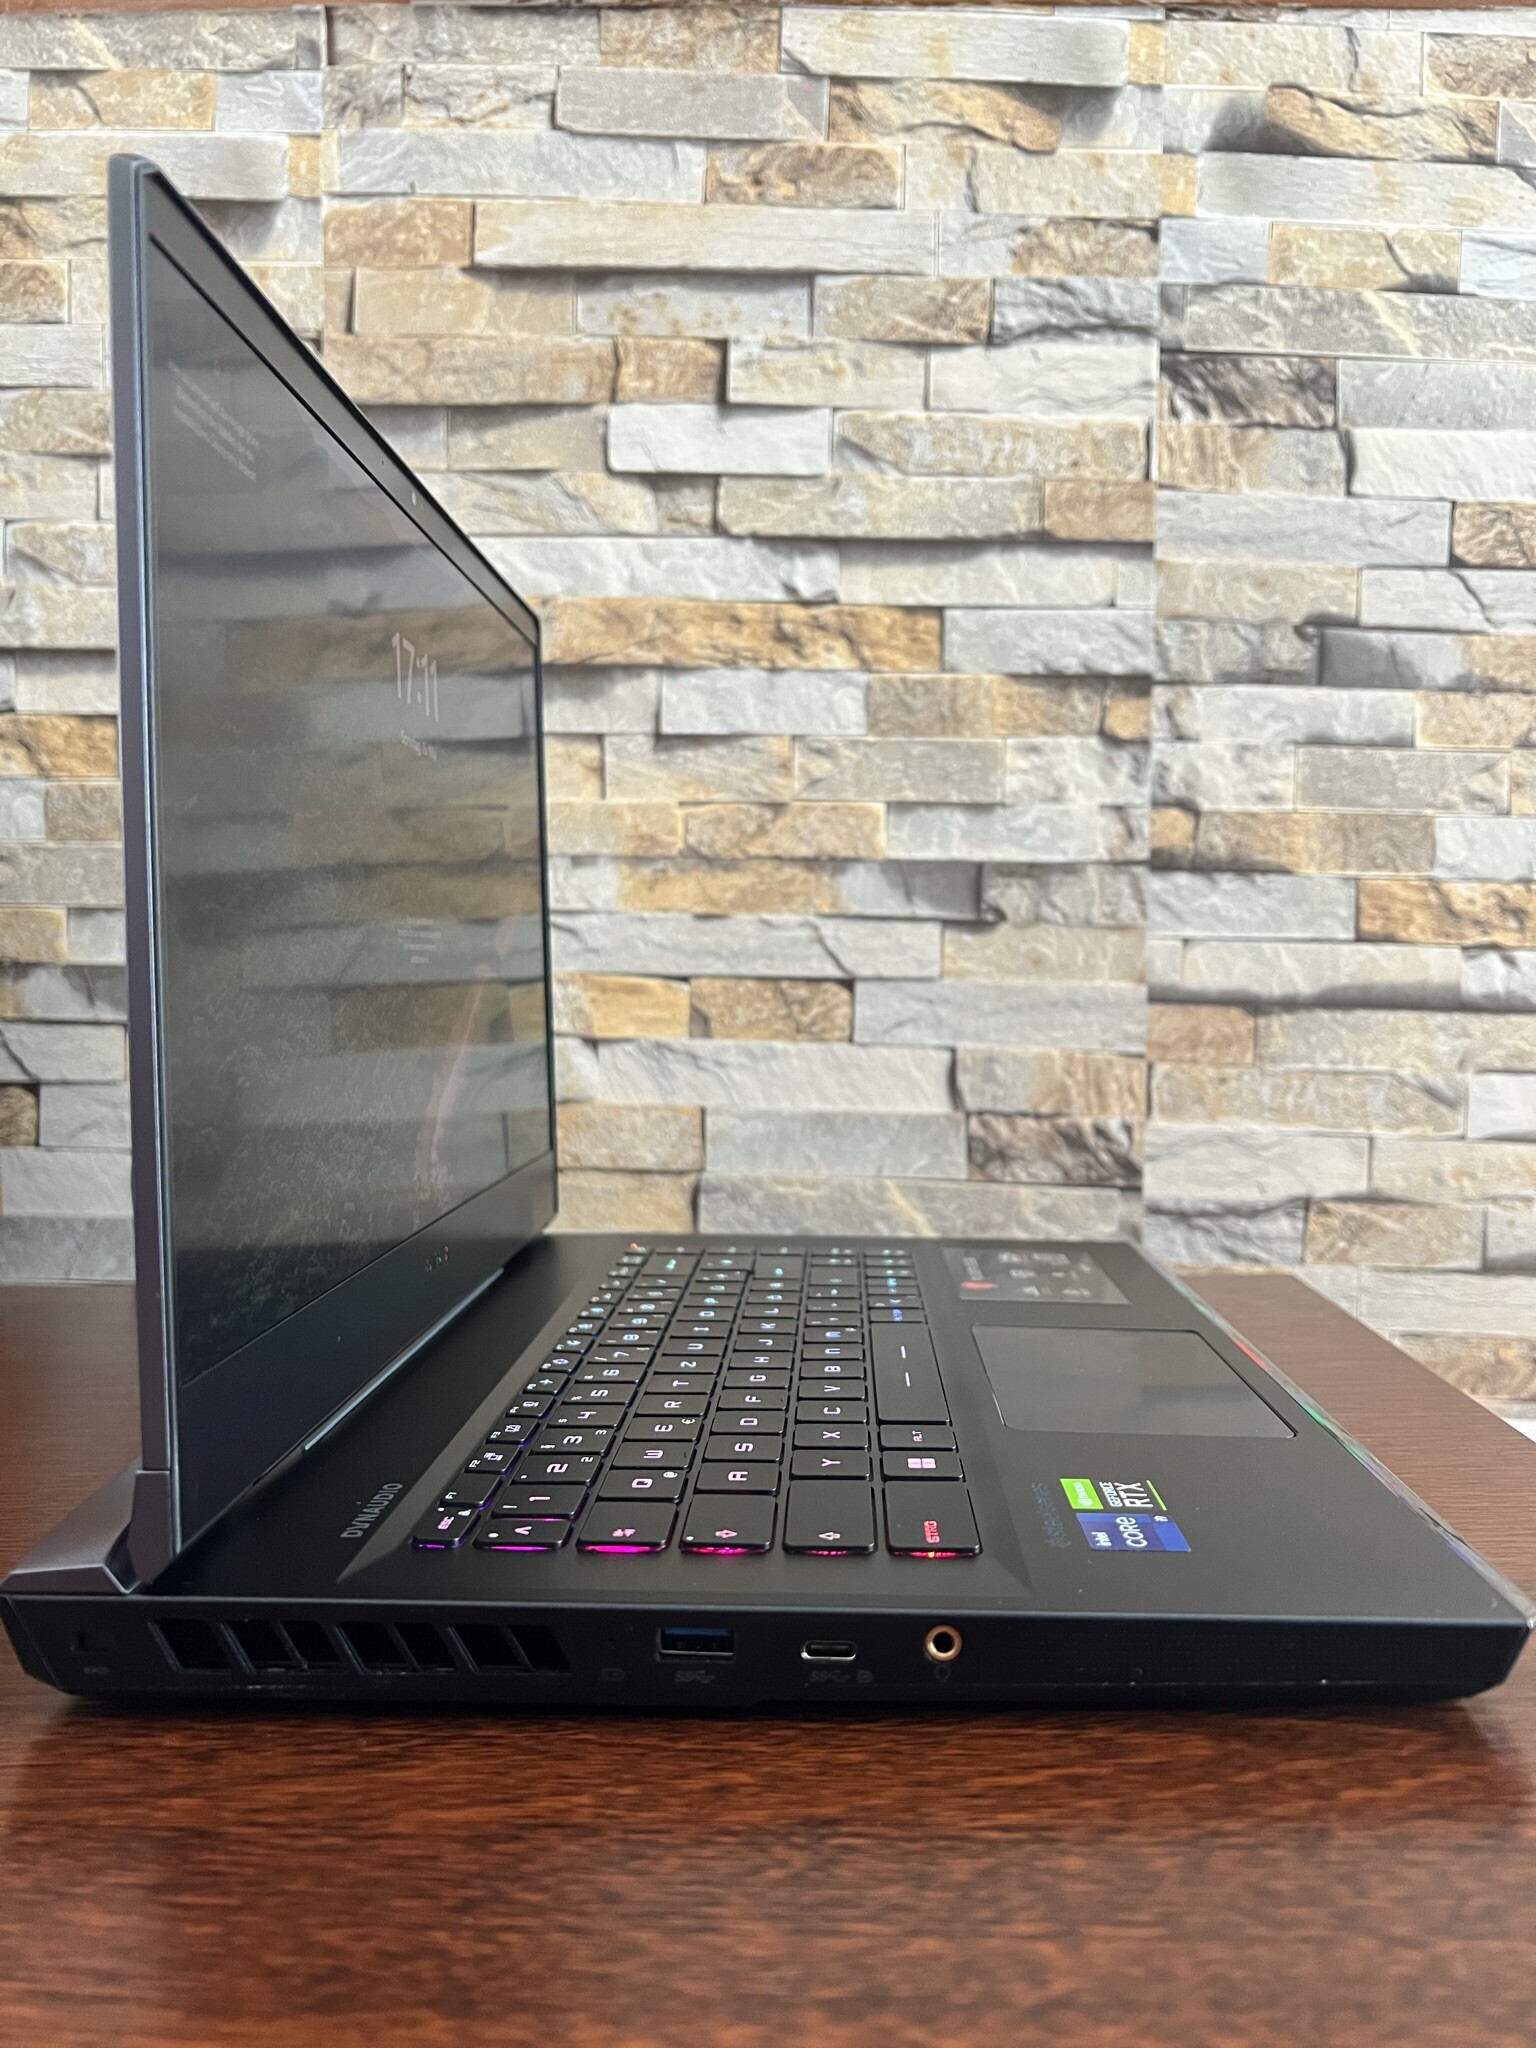
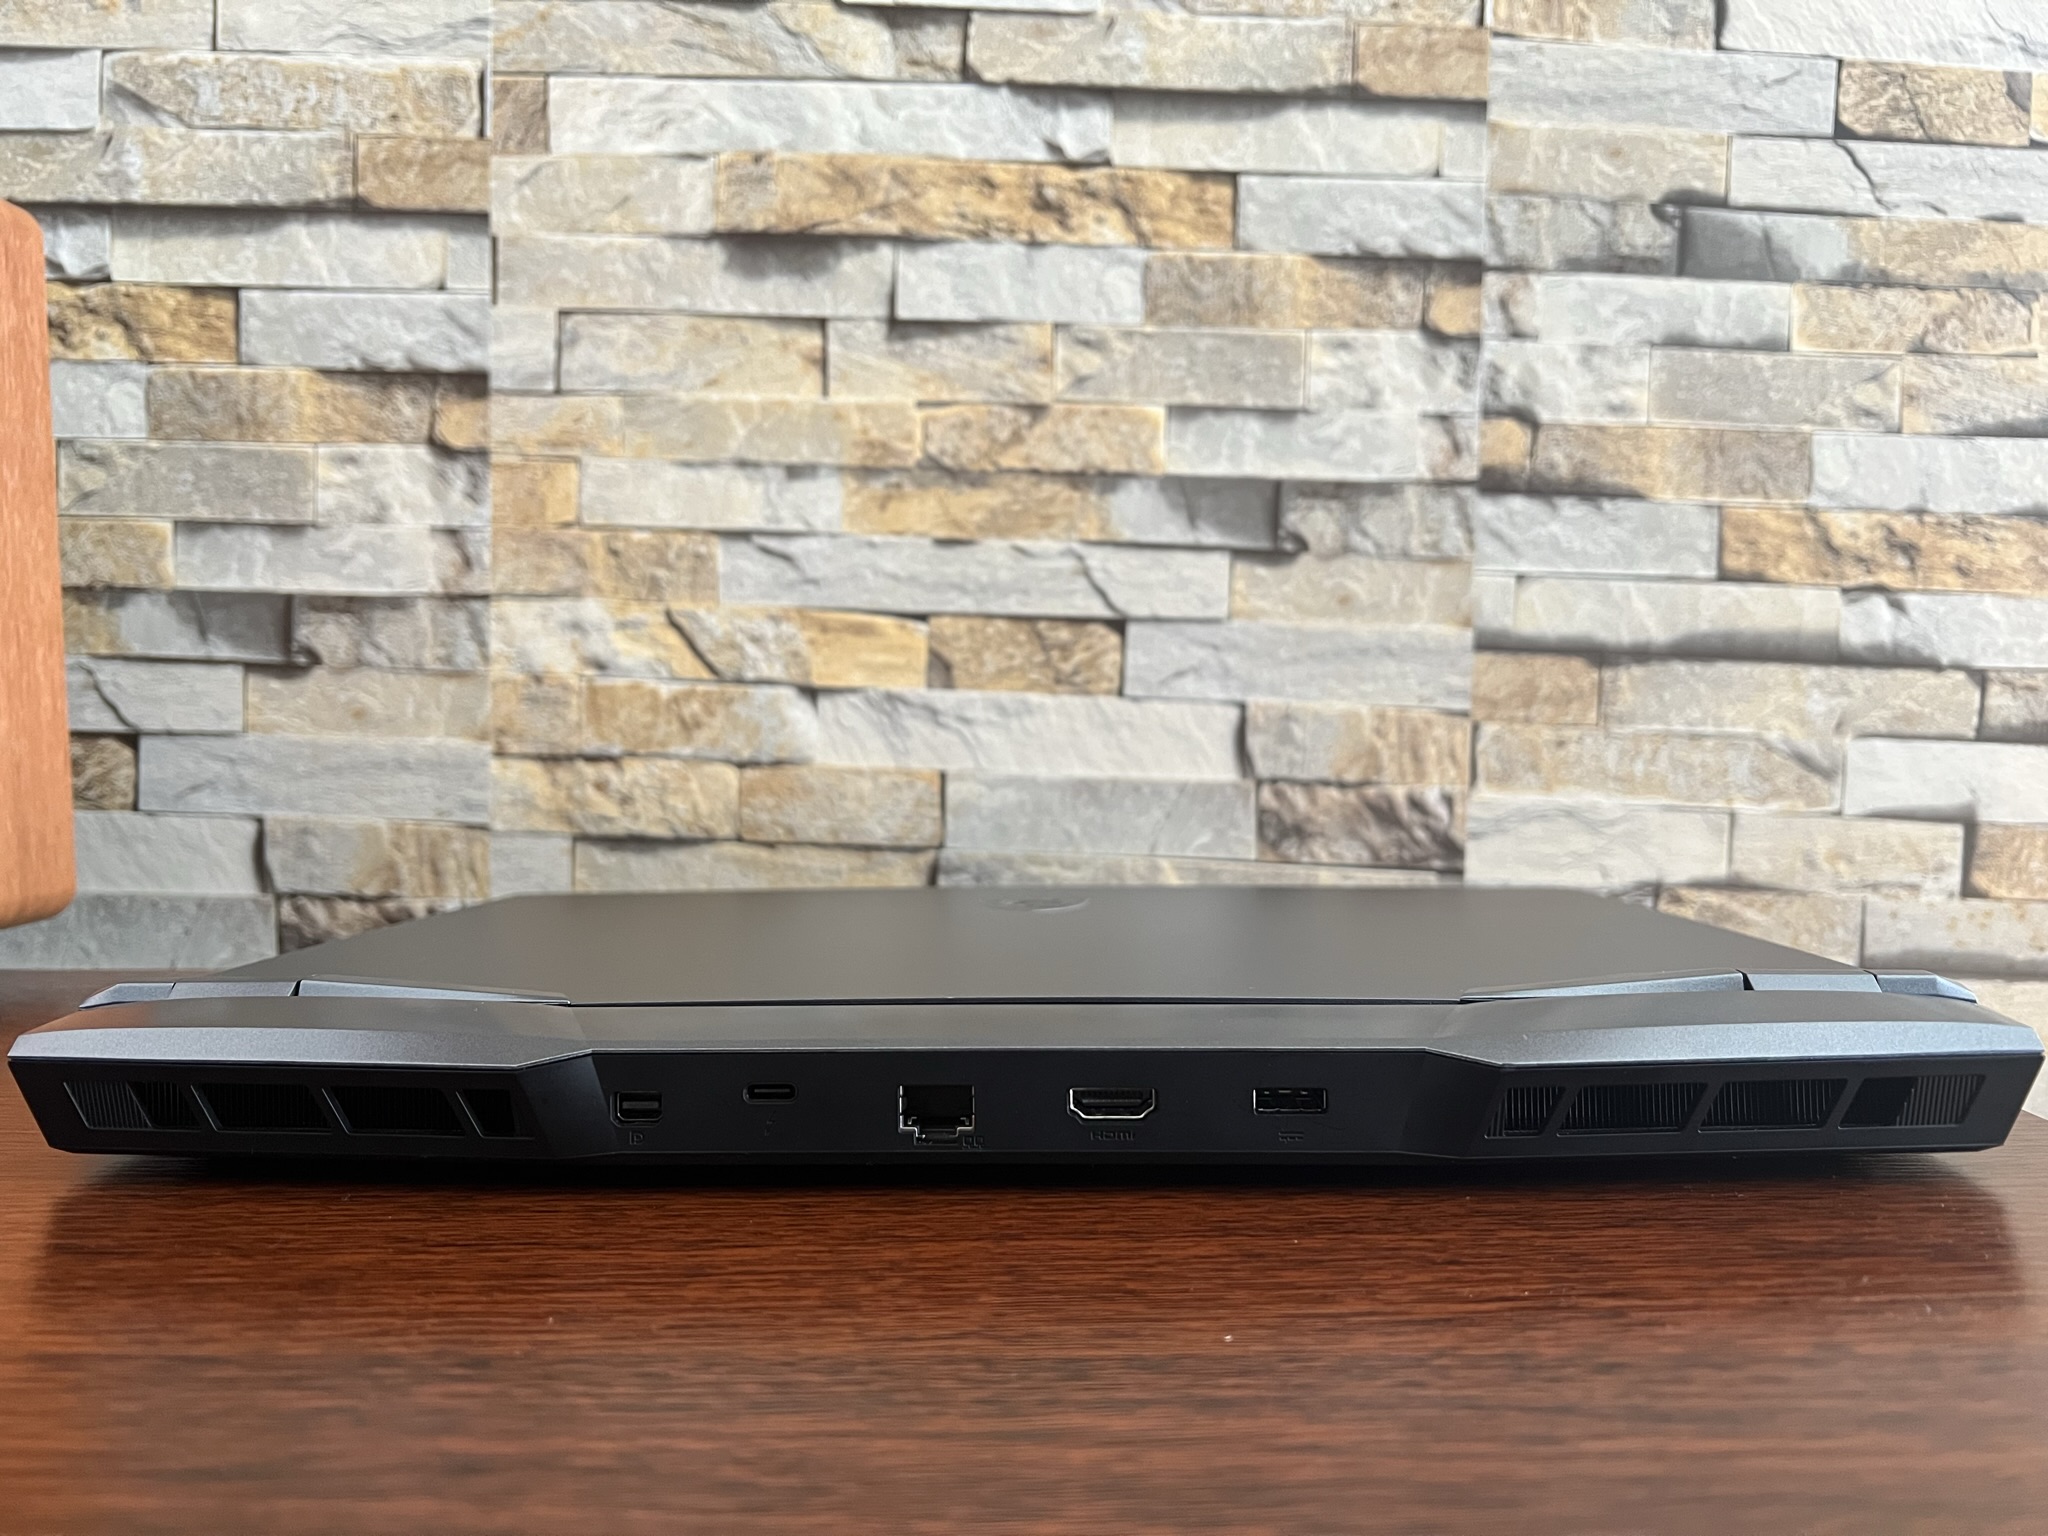
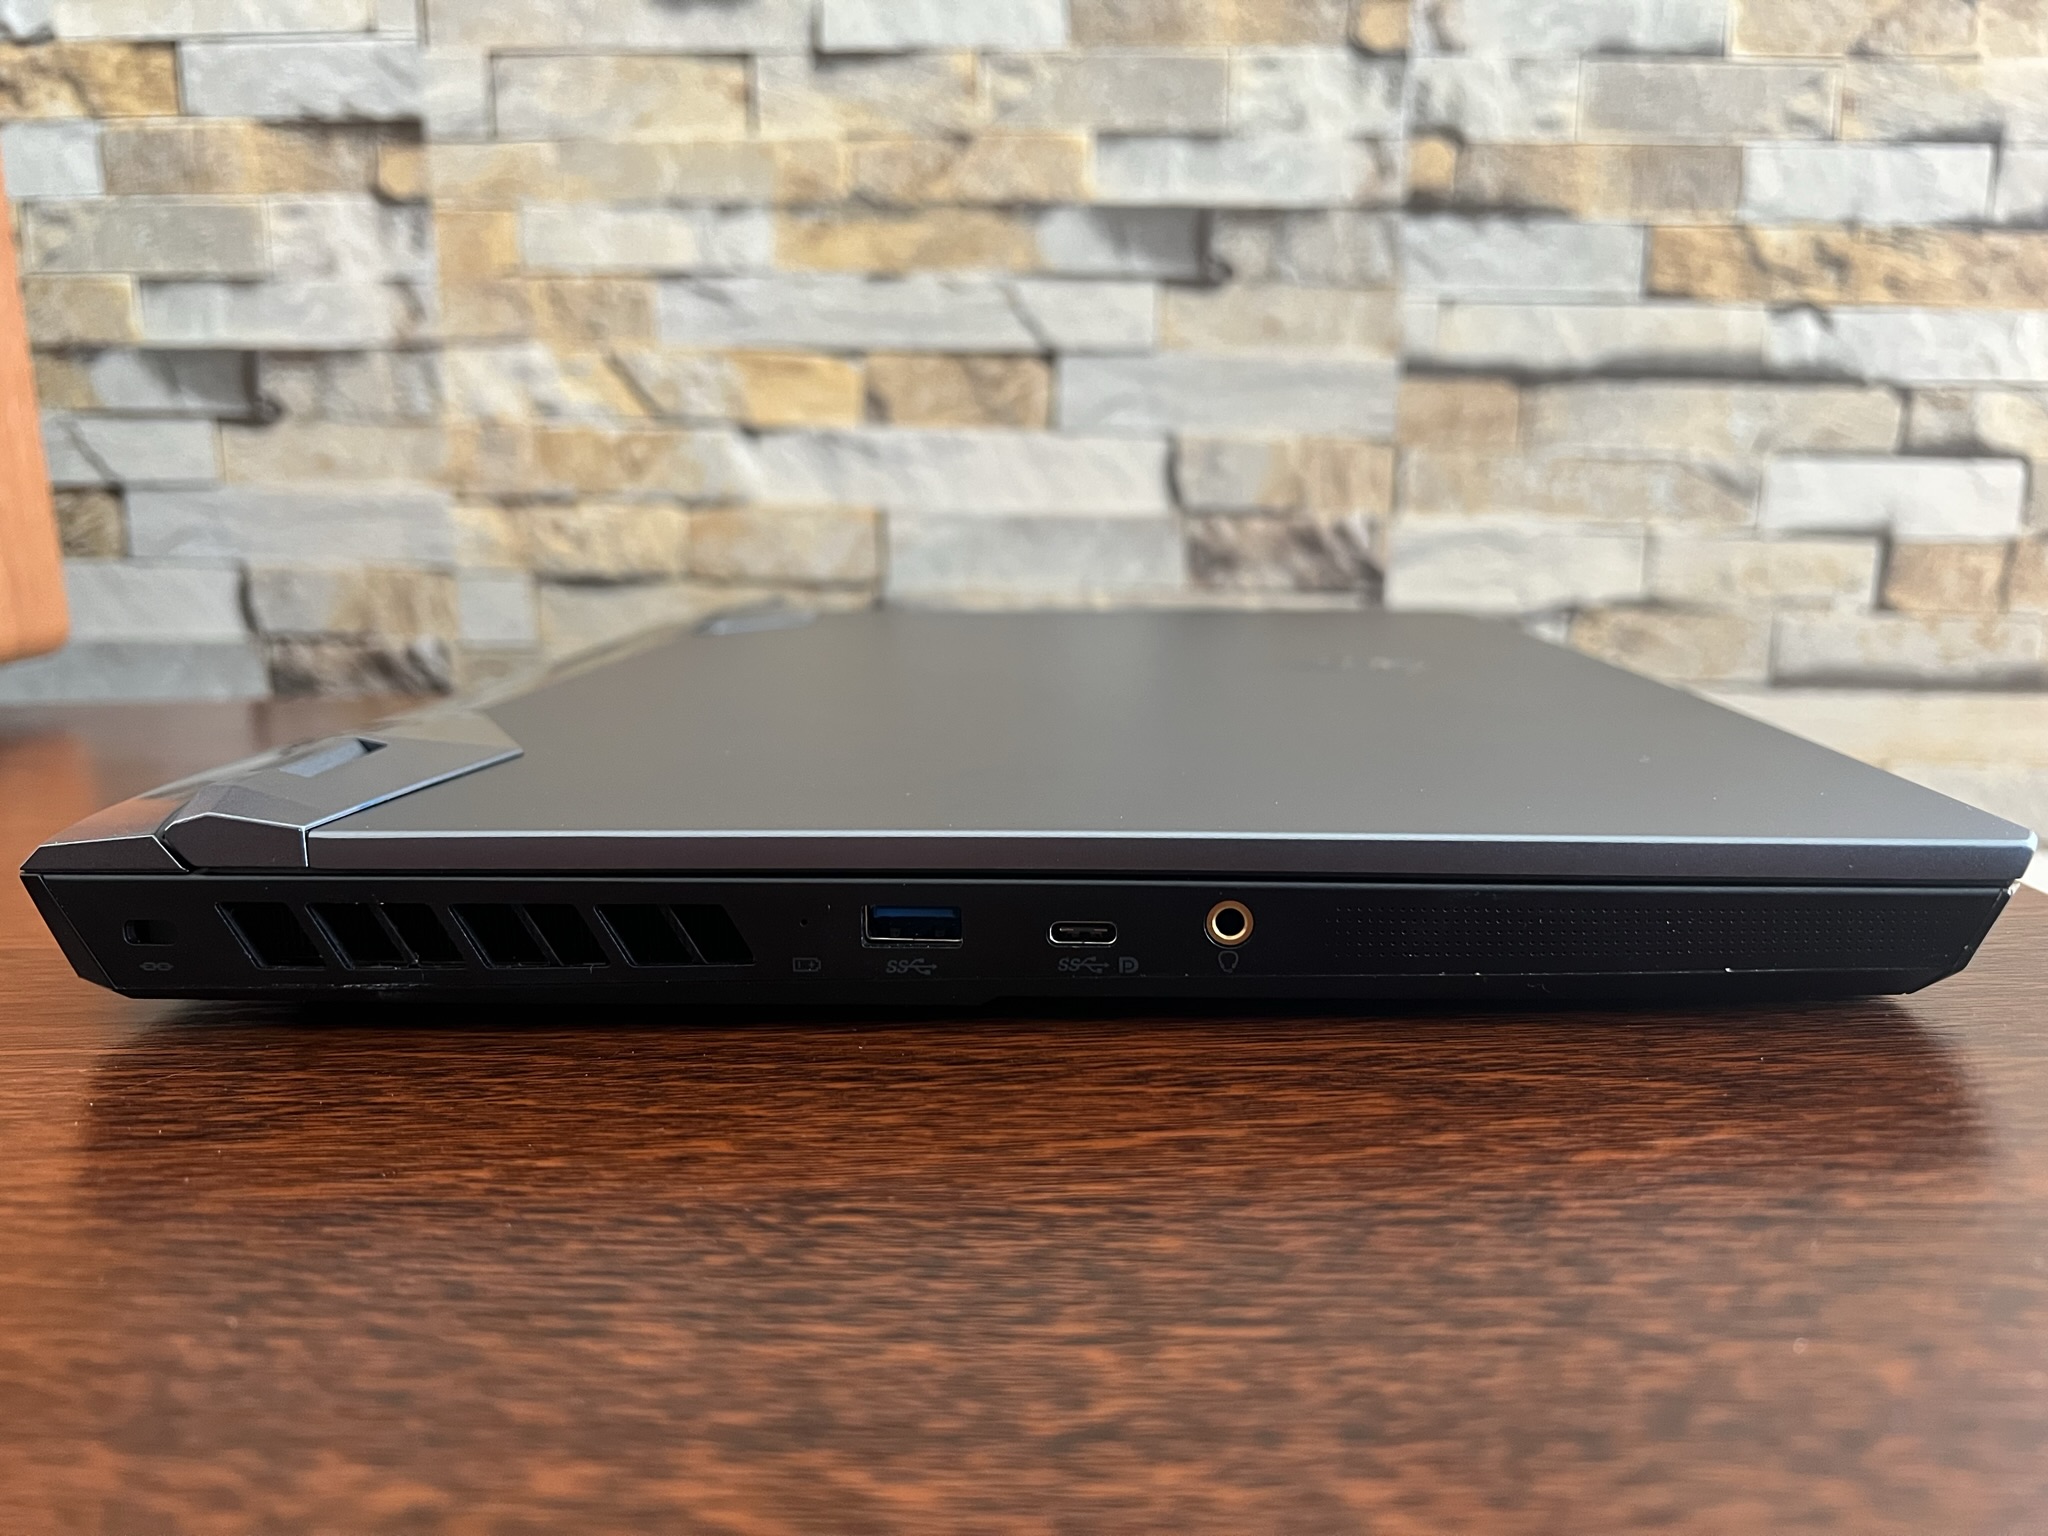
Conectividad: Actualizada con puertos modernos
Todas las posiciones de los puertos también se mantuvieron sin cambios en relación con elMSI GE66 10SFSsólo el puerto USB-C de la parte trasera se ha actualizado a Thunderbolt 4, y el puerto USB-C 3.2 del lado izquierdo ahora soporta la función DisplayPort.
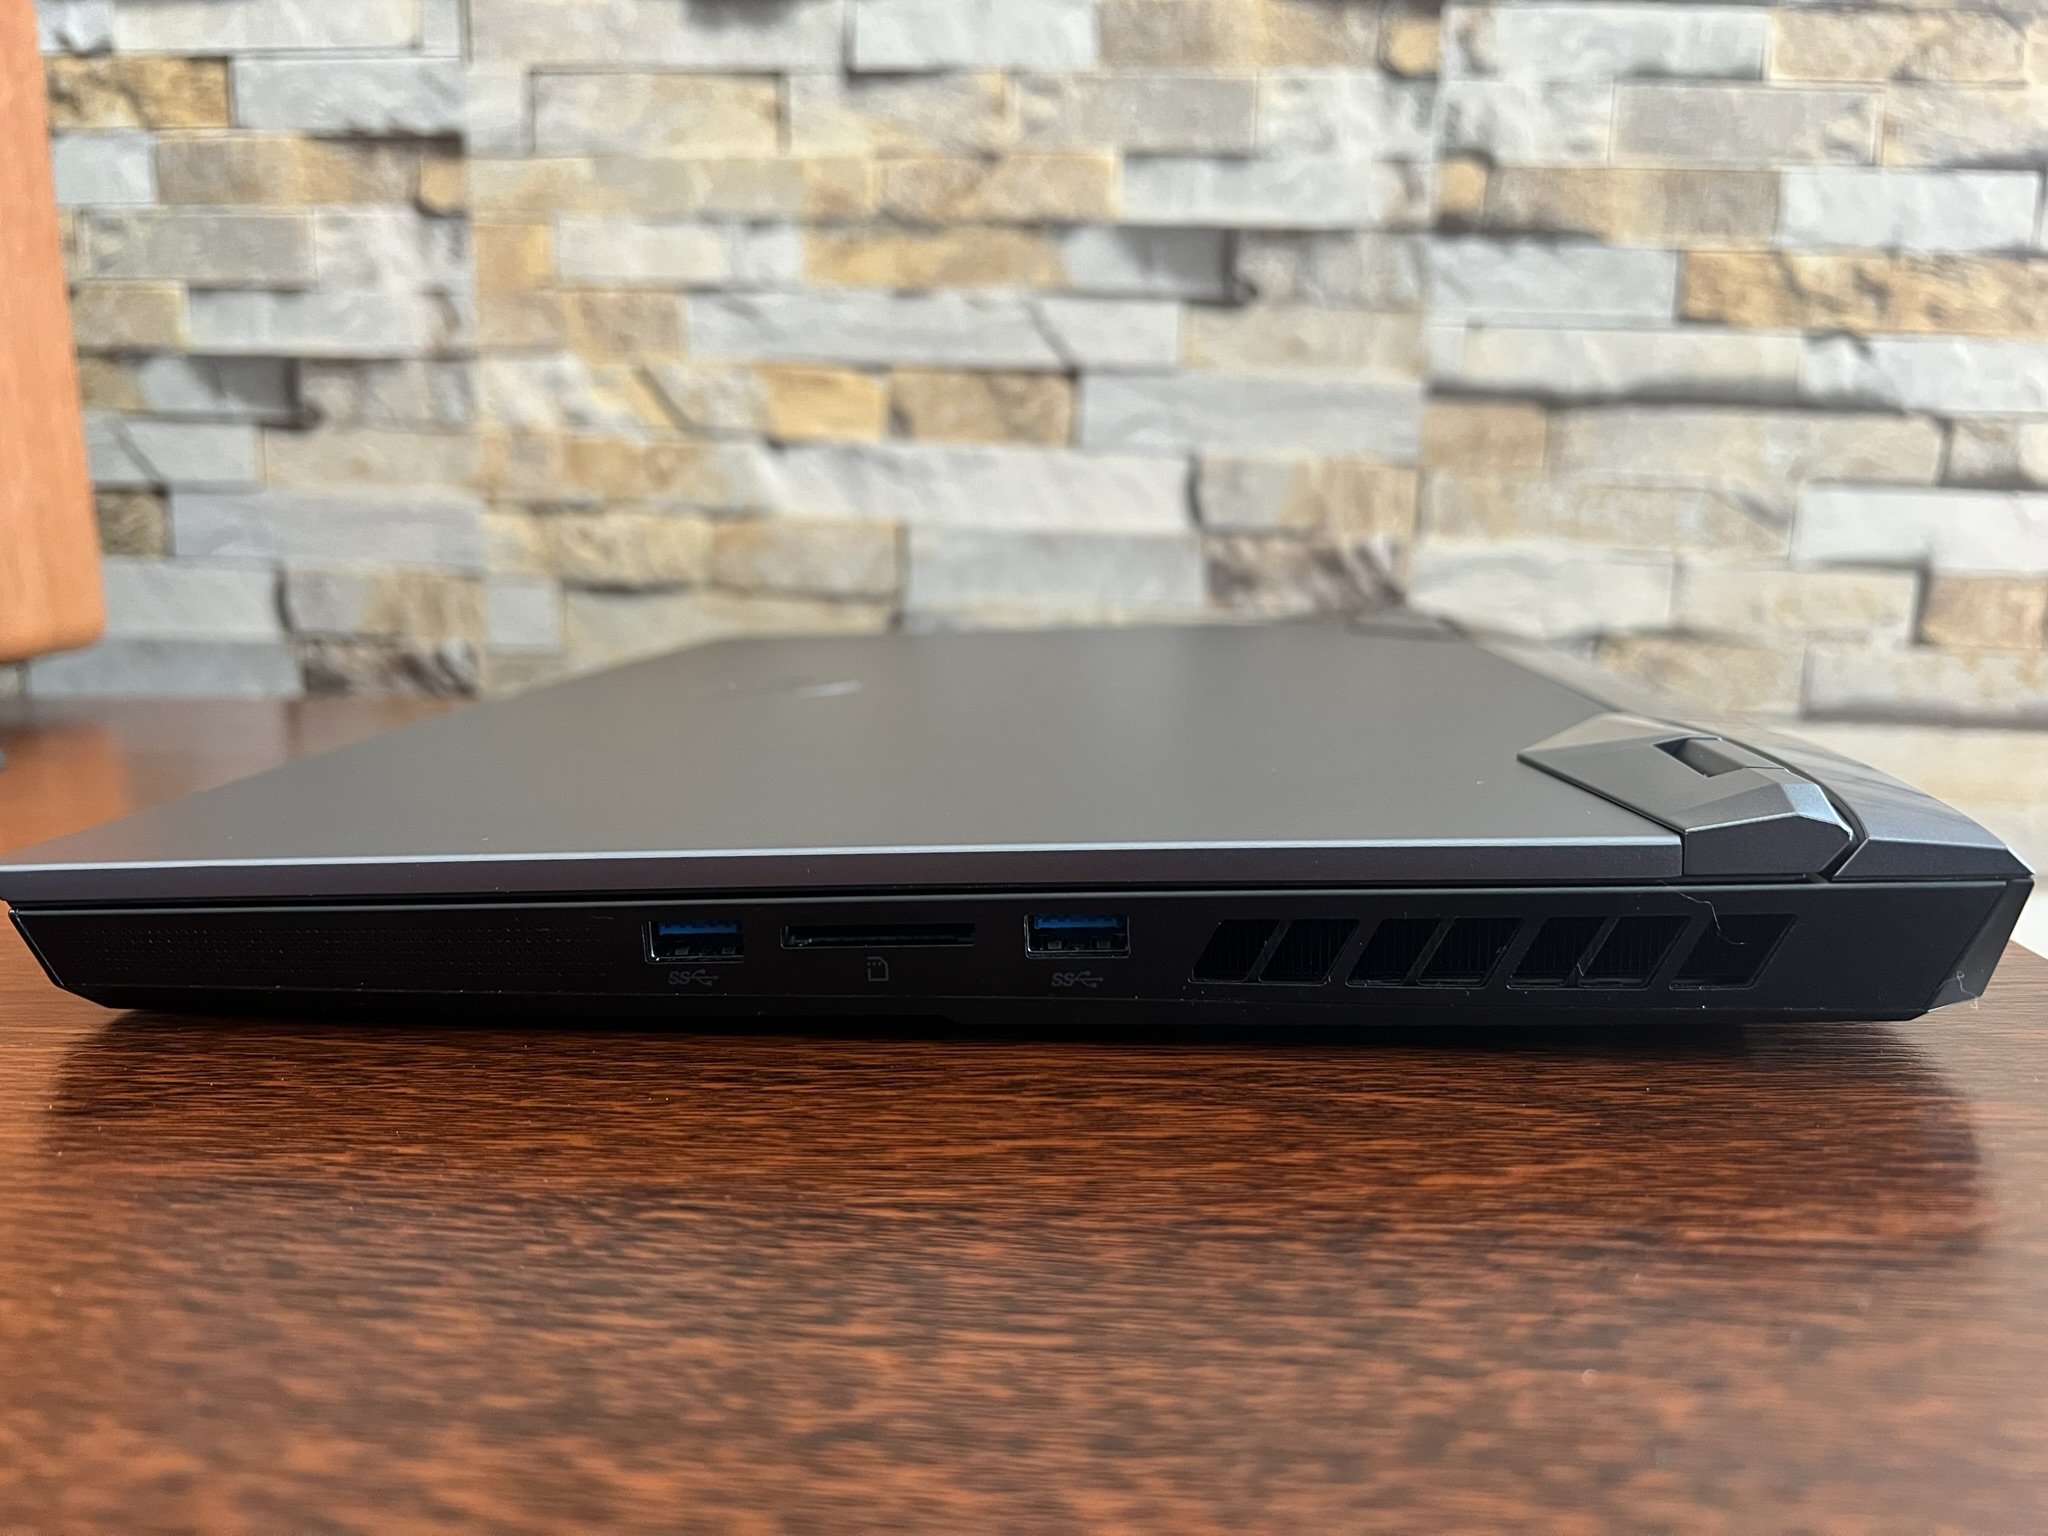
Lector de tarjetas SD
El rendimiento del lector de tarjetas SD no está a la altura de las expectativas en las pruebas realizadas con nuestra tarjeta microSD de referencia AV PRO V60. Sólo el Schenker XMG Neo 15 Early 2022 obtiene peores resultados en el campo de la comparación.
| SD Card Reader - average JPG Copy Test (av. of 3 runs) | |
| MSI GE66 Raider 10SFS (Toshiba Exceria Pro SDXC 64 GB UHS-II) | |
| Razer Blade 15 2022 (Toshiba Exceria Pro SDXC 64 GB UHS-II) | |
| Media de la clase Gaming (20.9 - 210, n=55, últimos 2 años) | |
| MSI Raider GE66 12UHS (AV PRO microSD 128 GB V60) | |
| Schenker XMG Neo 15 E22 (Early 2022, RTX 3080 Ti) | |
Comunicación
Nuestro dispositivo de revisión sale en la parte superior en el rendimiento Wi-Fi y muestra excelentes tasas que sólo son superadas por elRazer Blade 15 Advanced de principios de 2022.
Cámara web
La webcam ofrece Full HD y ofrece imágenes decentes para una webcam de portátil. Aunque tienden a ser ruidosas y borrosas en condiciones de poca luz, la calidad general de la imagen debería ser suficiente para las tareas cotidianas como las videoconferencias


Accesorios
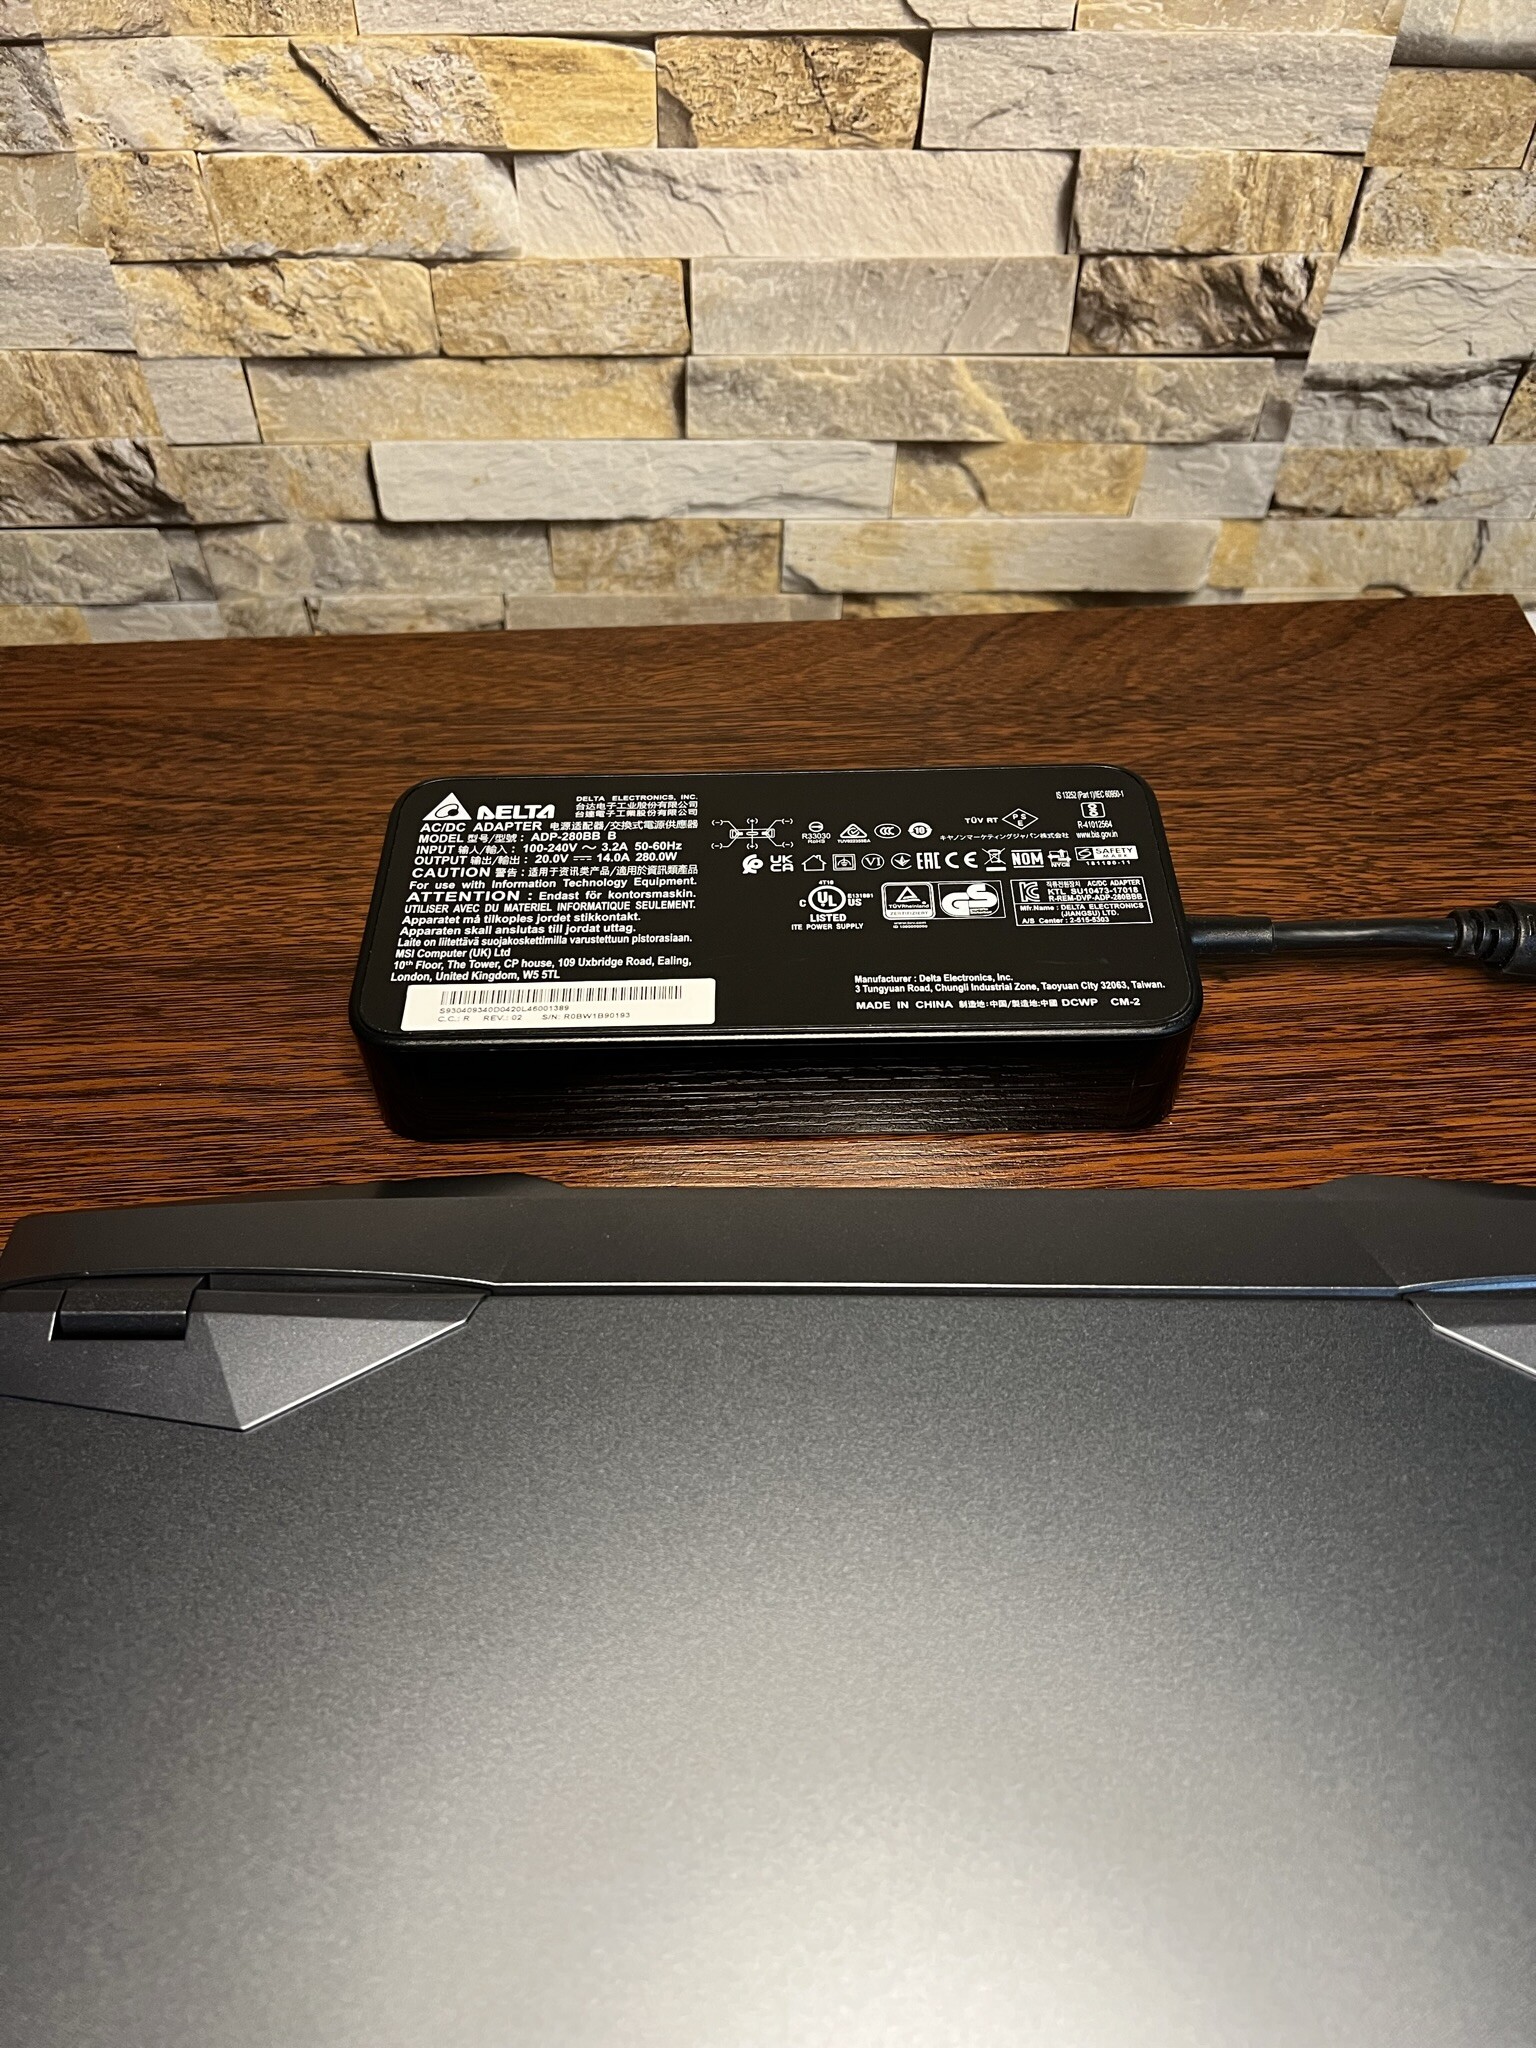
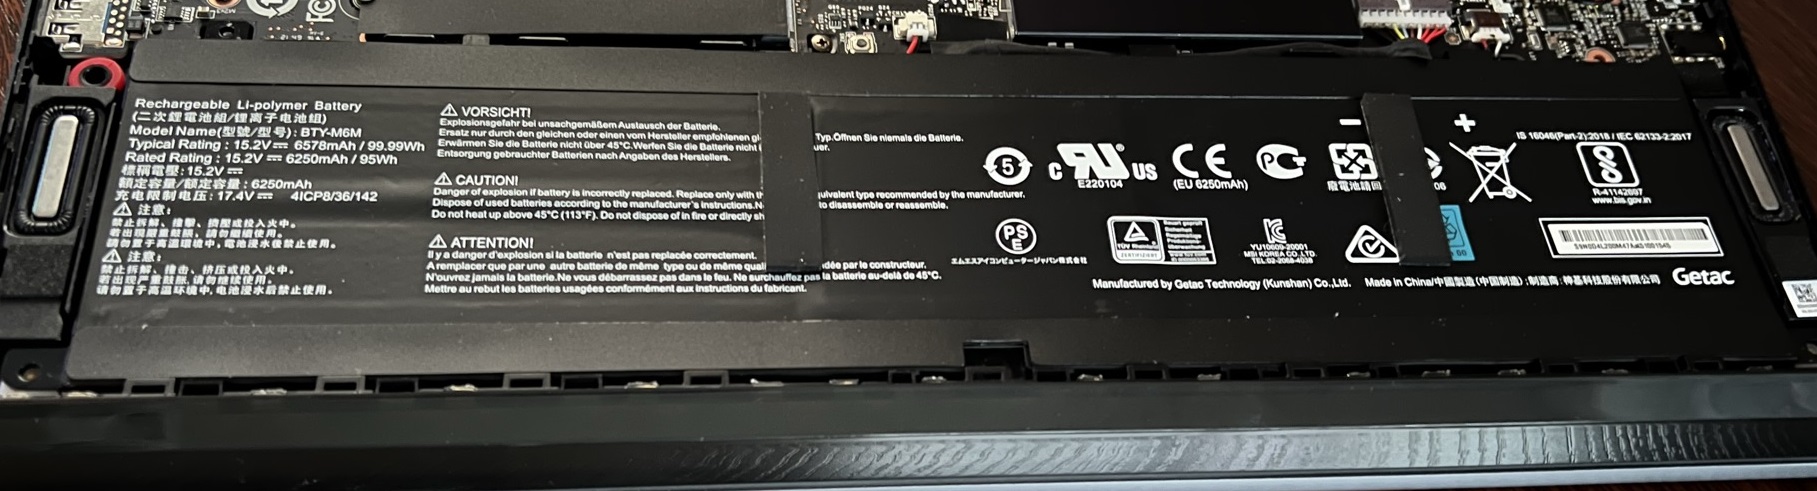
Excluyendo el portátil, el volumen de entrega incluye la documentación necesaria para el dispositivo, así como el adaptador de corriente. Al igual que los 280 vatios de su predecesor, la fuente de alimentación no modificada sigue proporcionando suficiente energía para el hardware instalado.
Mantenimiento
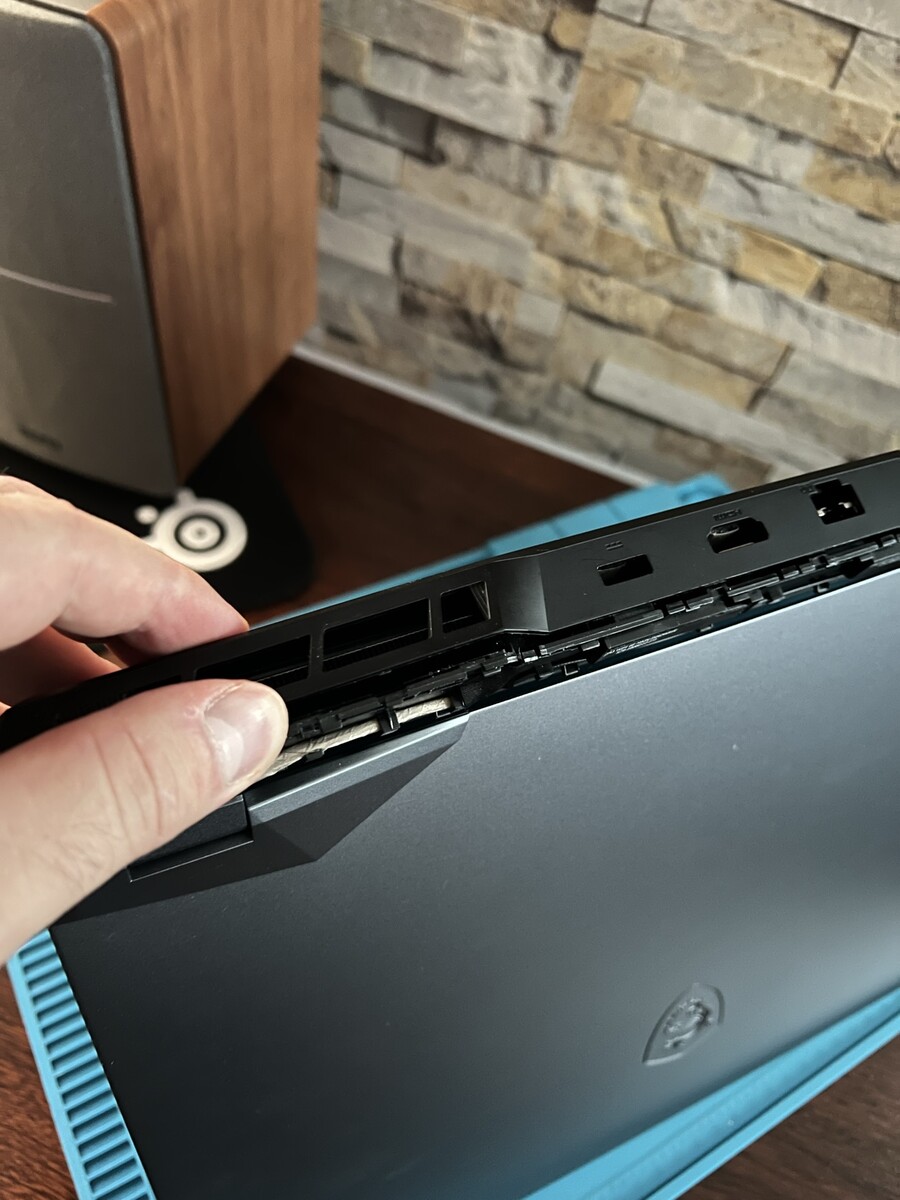
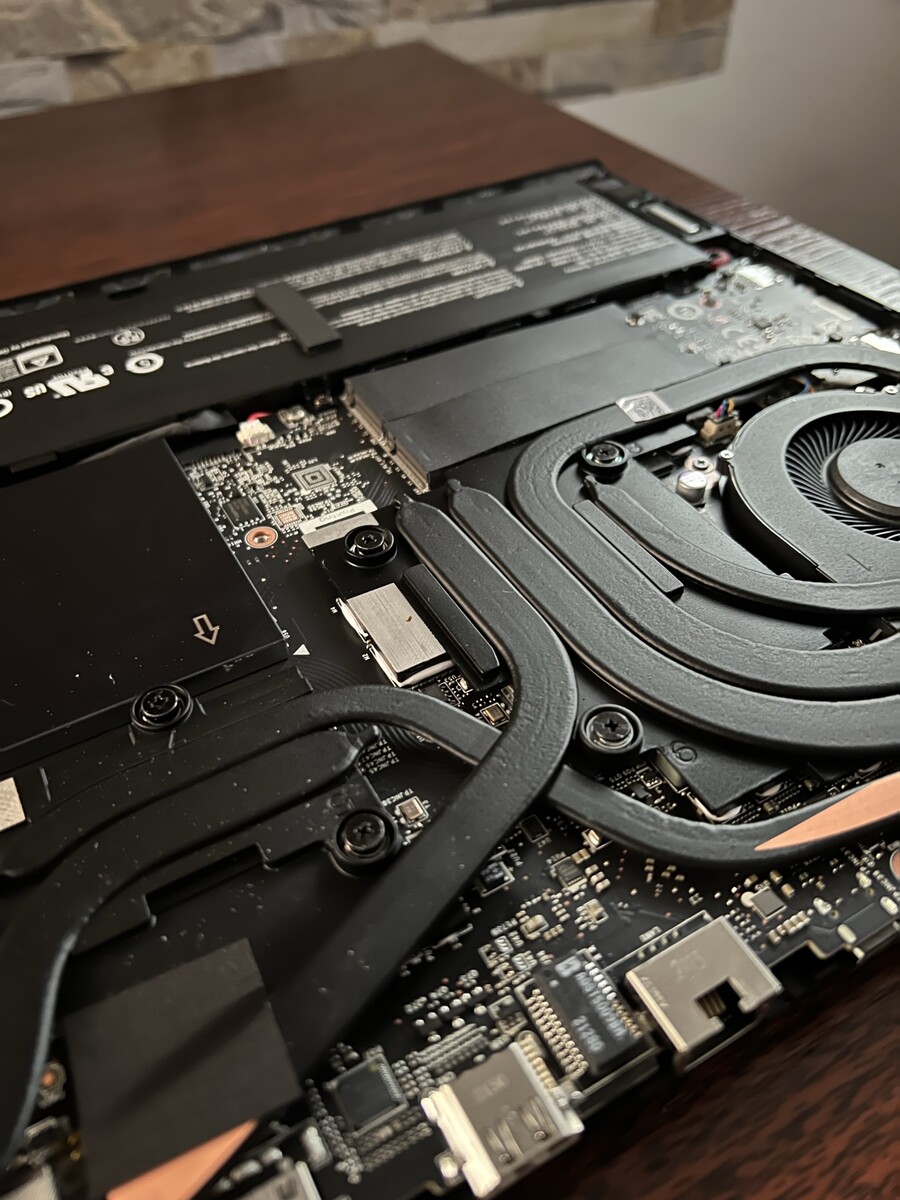
En 2022, el servicio de asistencia técnica no siempre es un hecho para todos los dispositivos. Algunos fabricantes dificultan deliberadamente a los usuarios que quieren mantener sus dispositivos por sí mismos. Dell, por ejemplo, instala la placa base de atrás hacia adelante en sus portátiles Alienware (el ventilador y el disipador de calor están directamente debajo del teclado y son de difícil acceso). Por lo tanto, los que quieren sustituir las almohadillas o la pasta de conducción del calor se enfrentan a un procedimiento engorroso.
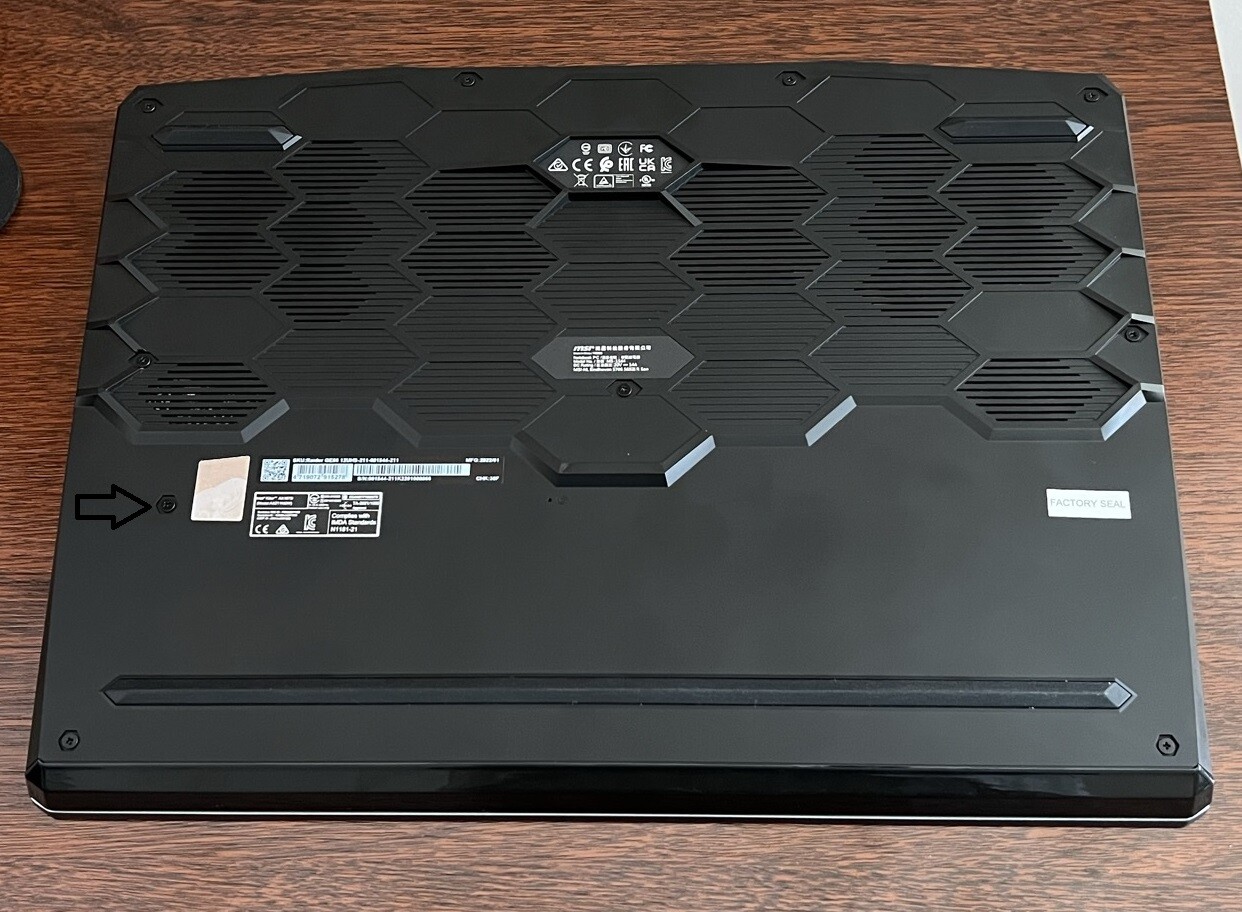
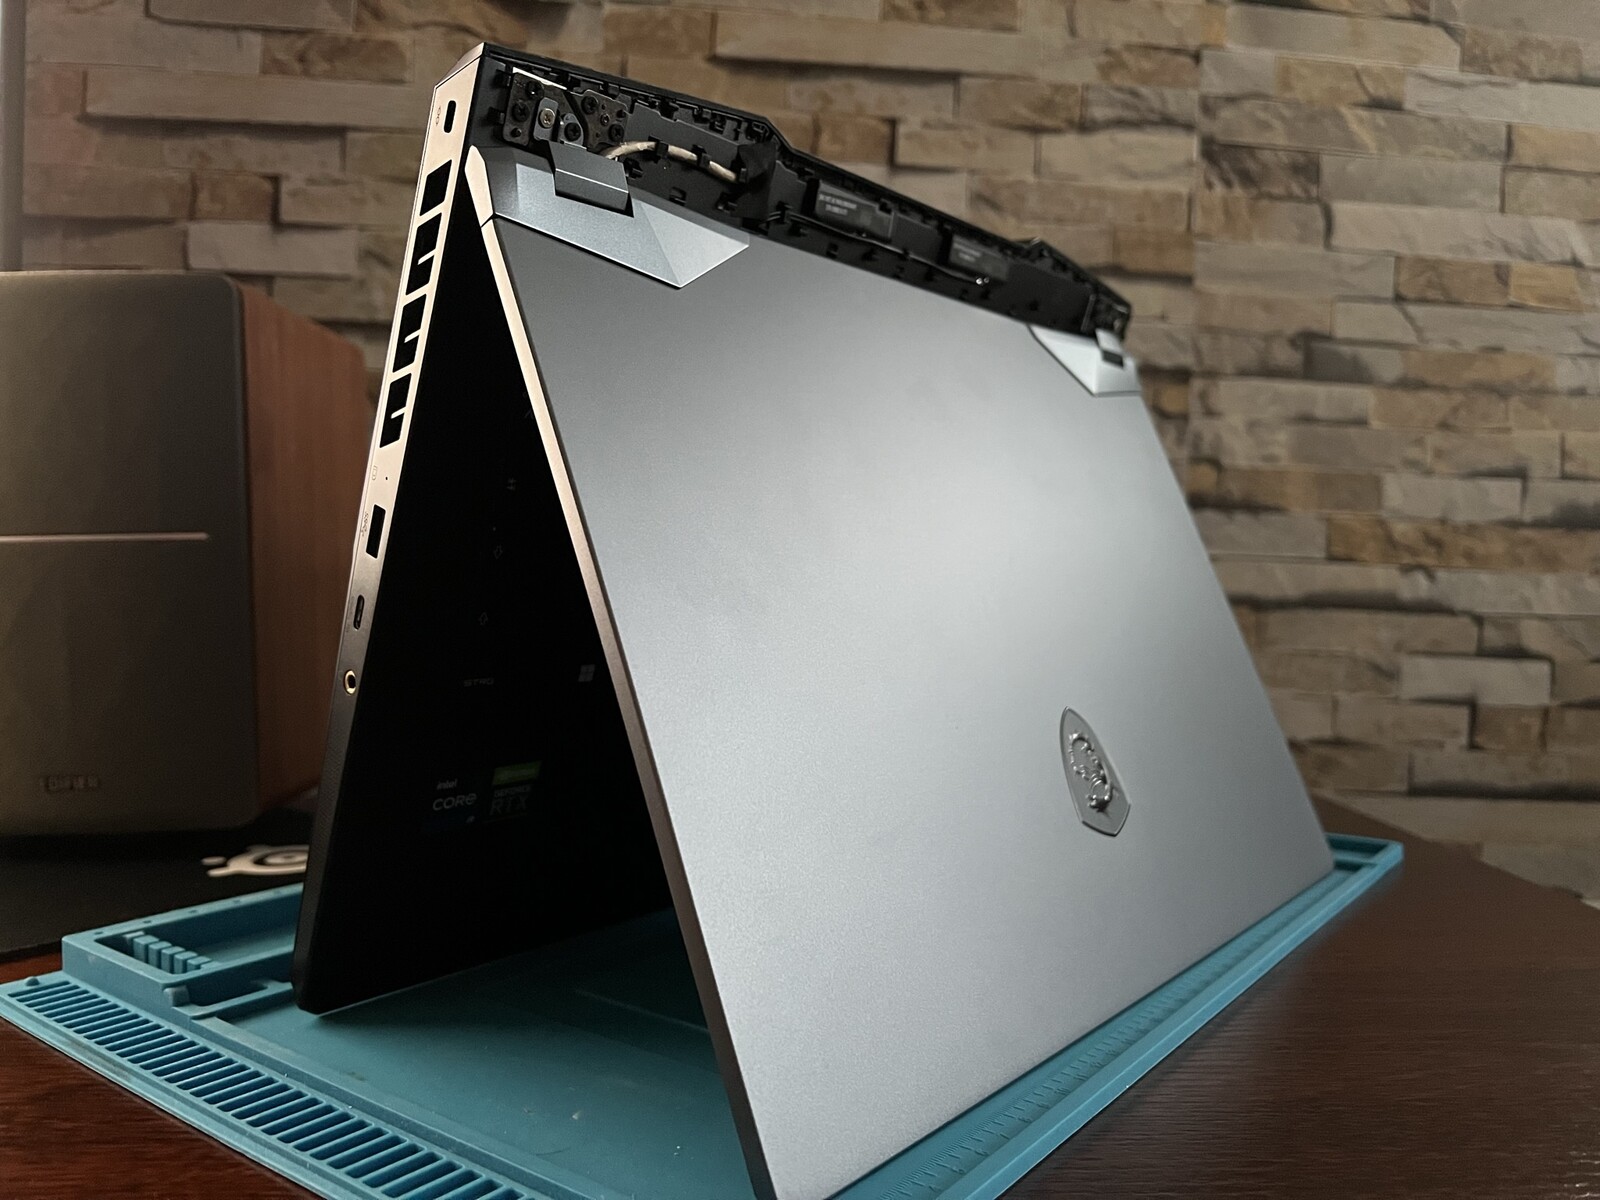
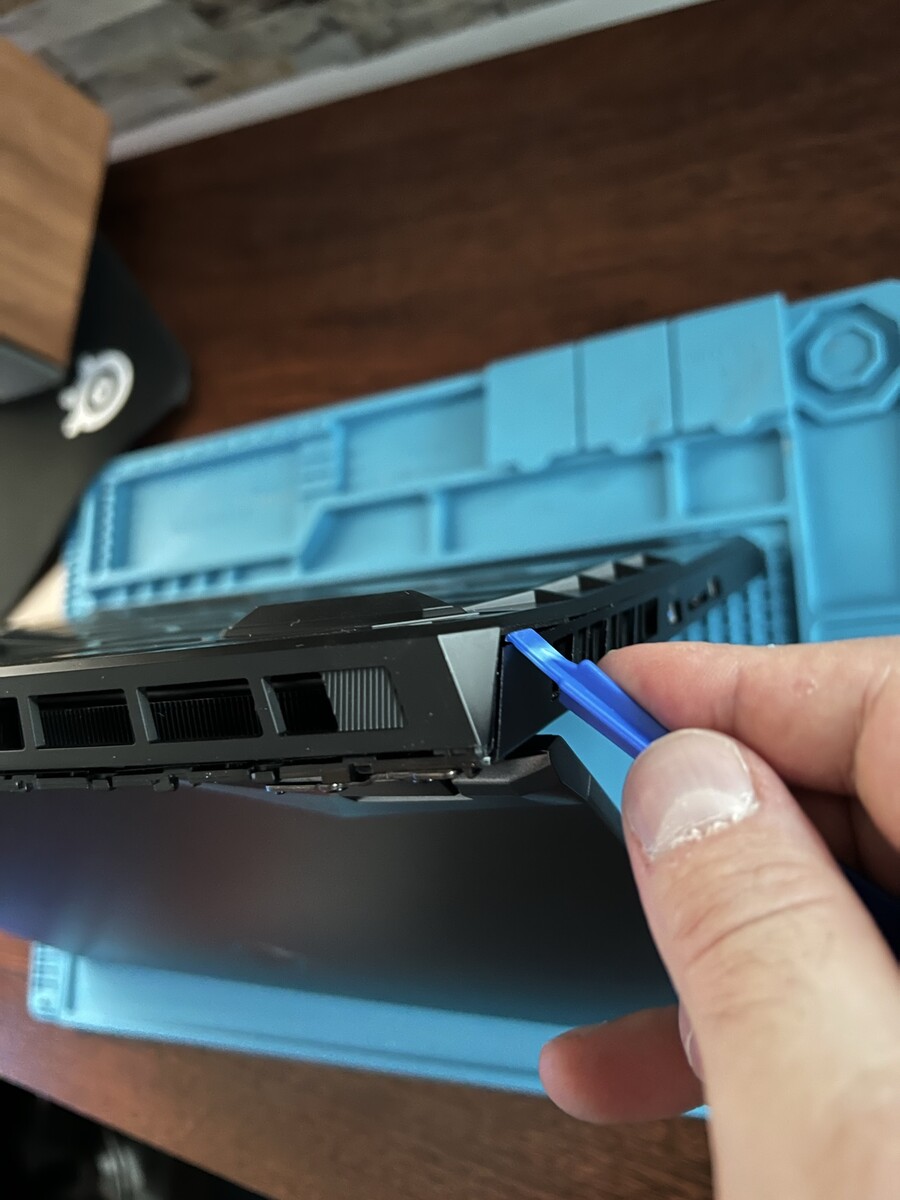
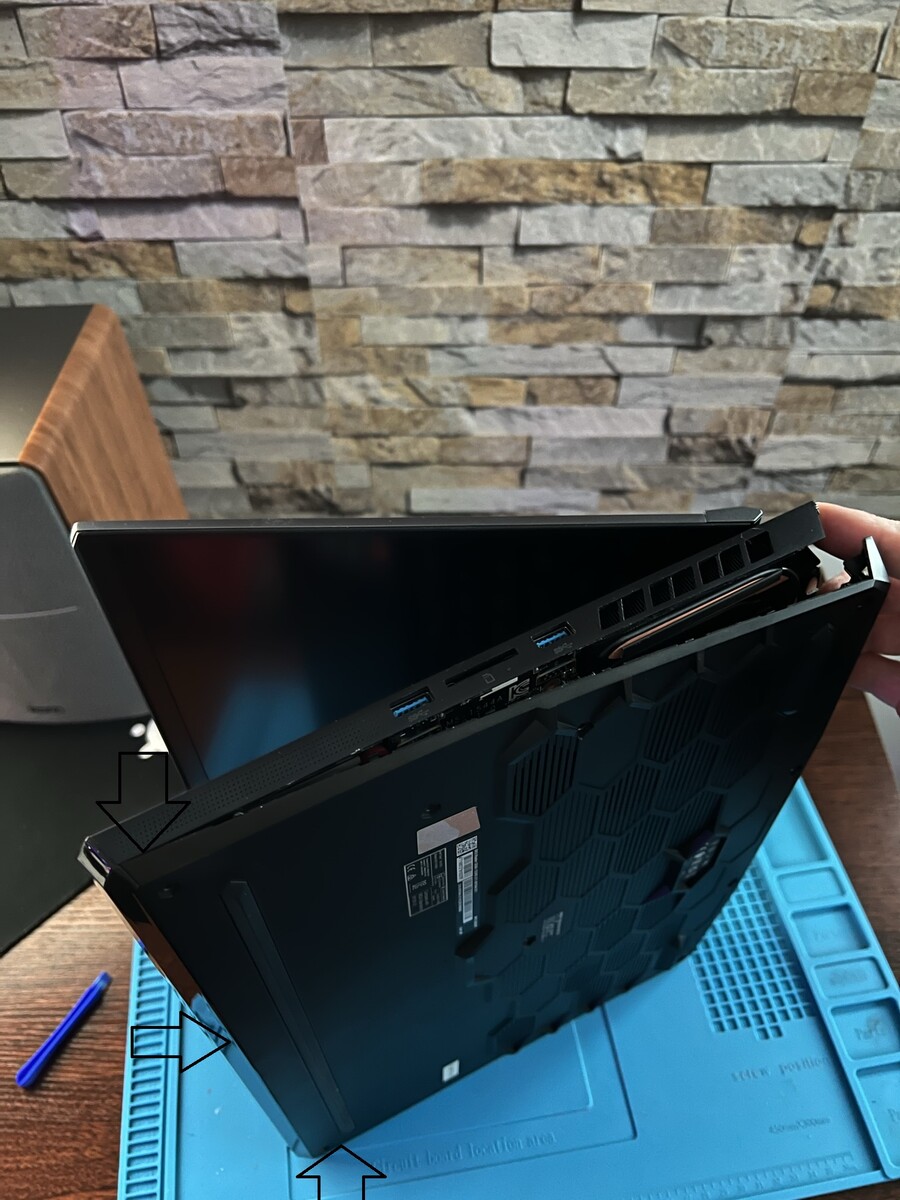
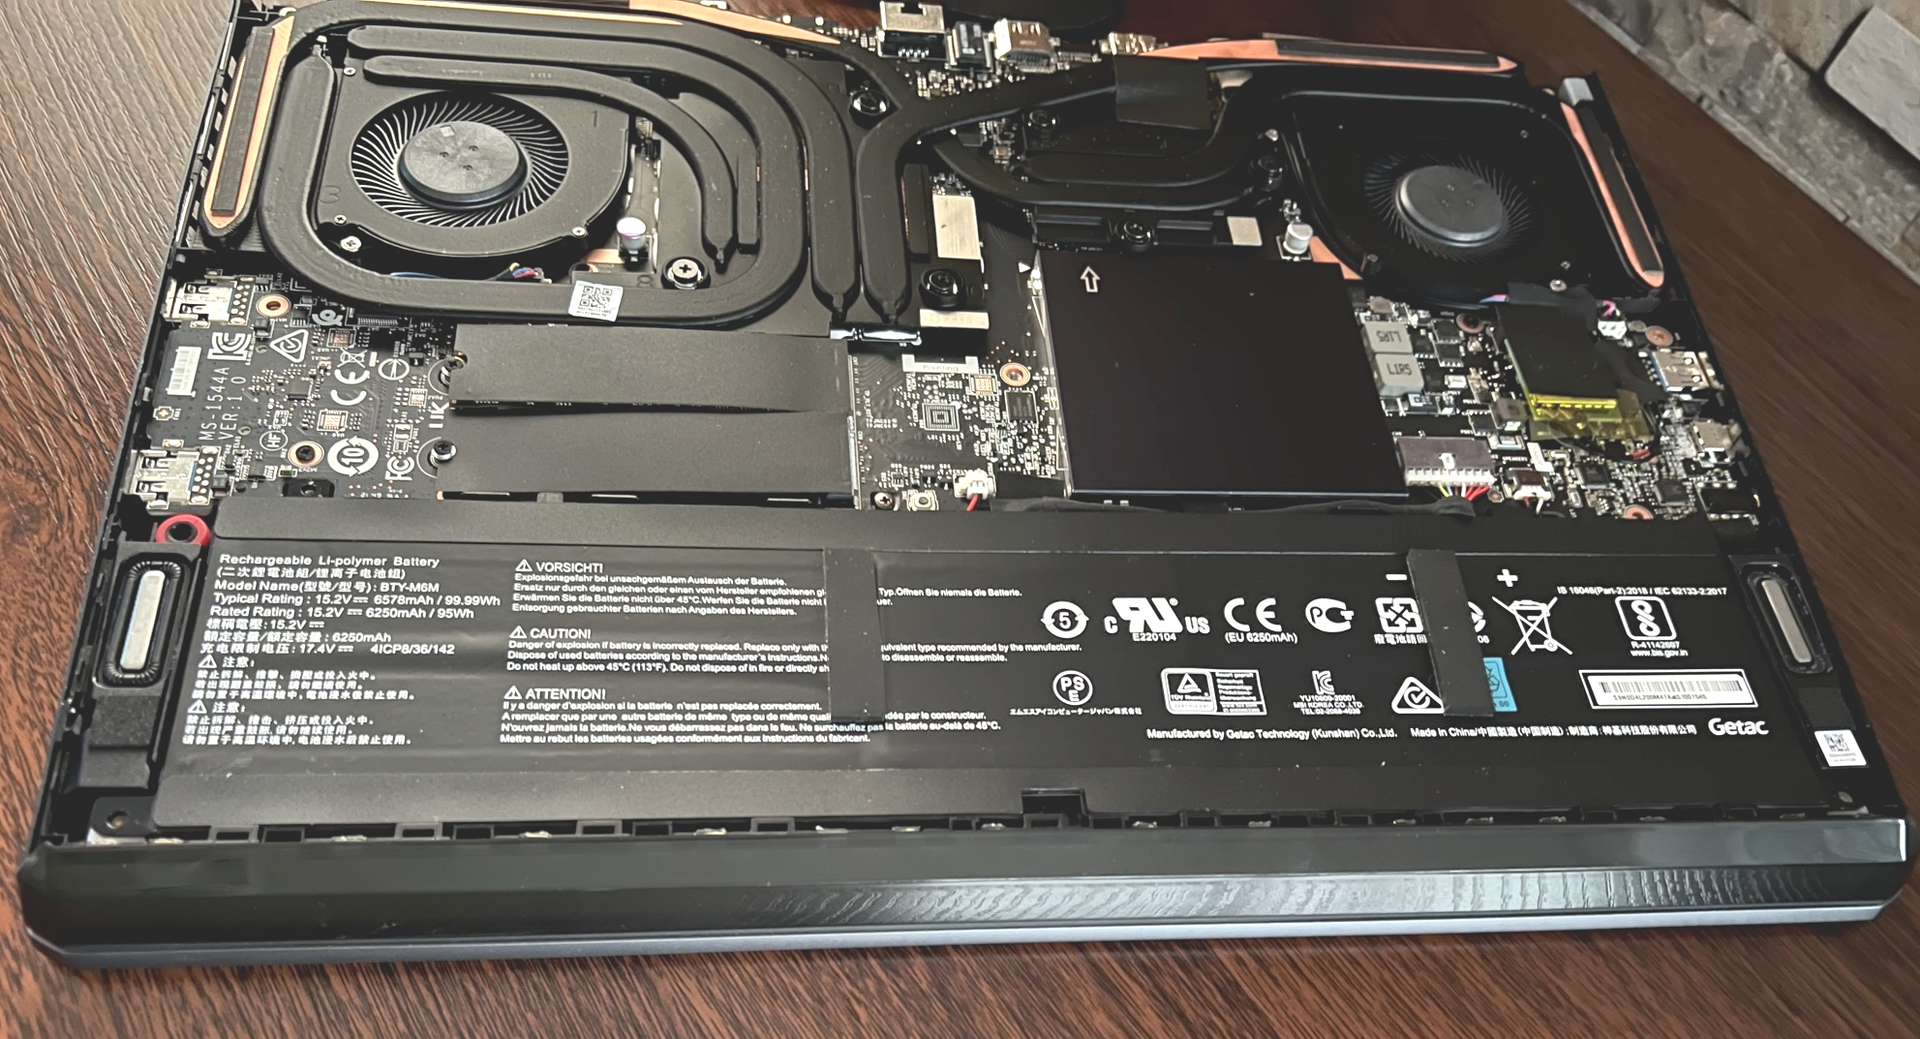
No es el caso de nuestro MSI Raider GE66 12 UHS, donde la única tarea remotamente difícil consiste en retirar 11 tornillos Phillips para separar la placa base. Esto también se aplica a la cubierta de plástico detrás de la pantalla. Para los interesados, hay una pequeña serie de fotos a continuación que muestran cómo acceder al funcionamiento interno del MSI Raider GE66 12 UHS sin dañar las partes de plástico sensibles.
Una vez que hayas retirado la cubierta superior y la carcasa inferior, tendrás acceso directo a las dos ranuras PCI Gen 4. También puedes sustituir la tarjeta Wi-Fi, limpiar los ventiladores y, si es necesario, sustituir el sistema de refrigeración y los módulos SO-DIMM, que se encuentran debajo de un bloque de refrigeración pasiva.
Garantía
Como en el caso del predecesor, MSI concede al Raider GE66 una garantía de 24 meses con servicio de recogida y devolución. Esto se aplica sólo a Alemania, por lo que la política de garantía puede diferir en otros países. Es importante tener en cuenta que el sello de garantía no es relevante para los países de habla alemana en la medida en que el usuario puede abrir el dispositivo para su actualización y mantenimiento sin que la garantía quede anulada. Sin embargo, esto sólo se aplica bajo la condición de que el trabajo se lleve a cabo de forma profesional. Si los daños o defectos indican que el trabajo no se ha realizado de forma profesional, la garantía puede quedar invalidada. Además, el dispositivo debe ser restaurado a su configuración original si se requiere un servicio de mantenimiento, ya que es posible que haya que sustituir piezas para la reparación y MSI requiere las piezas originales.
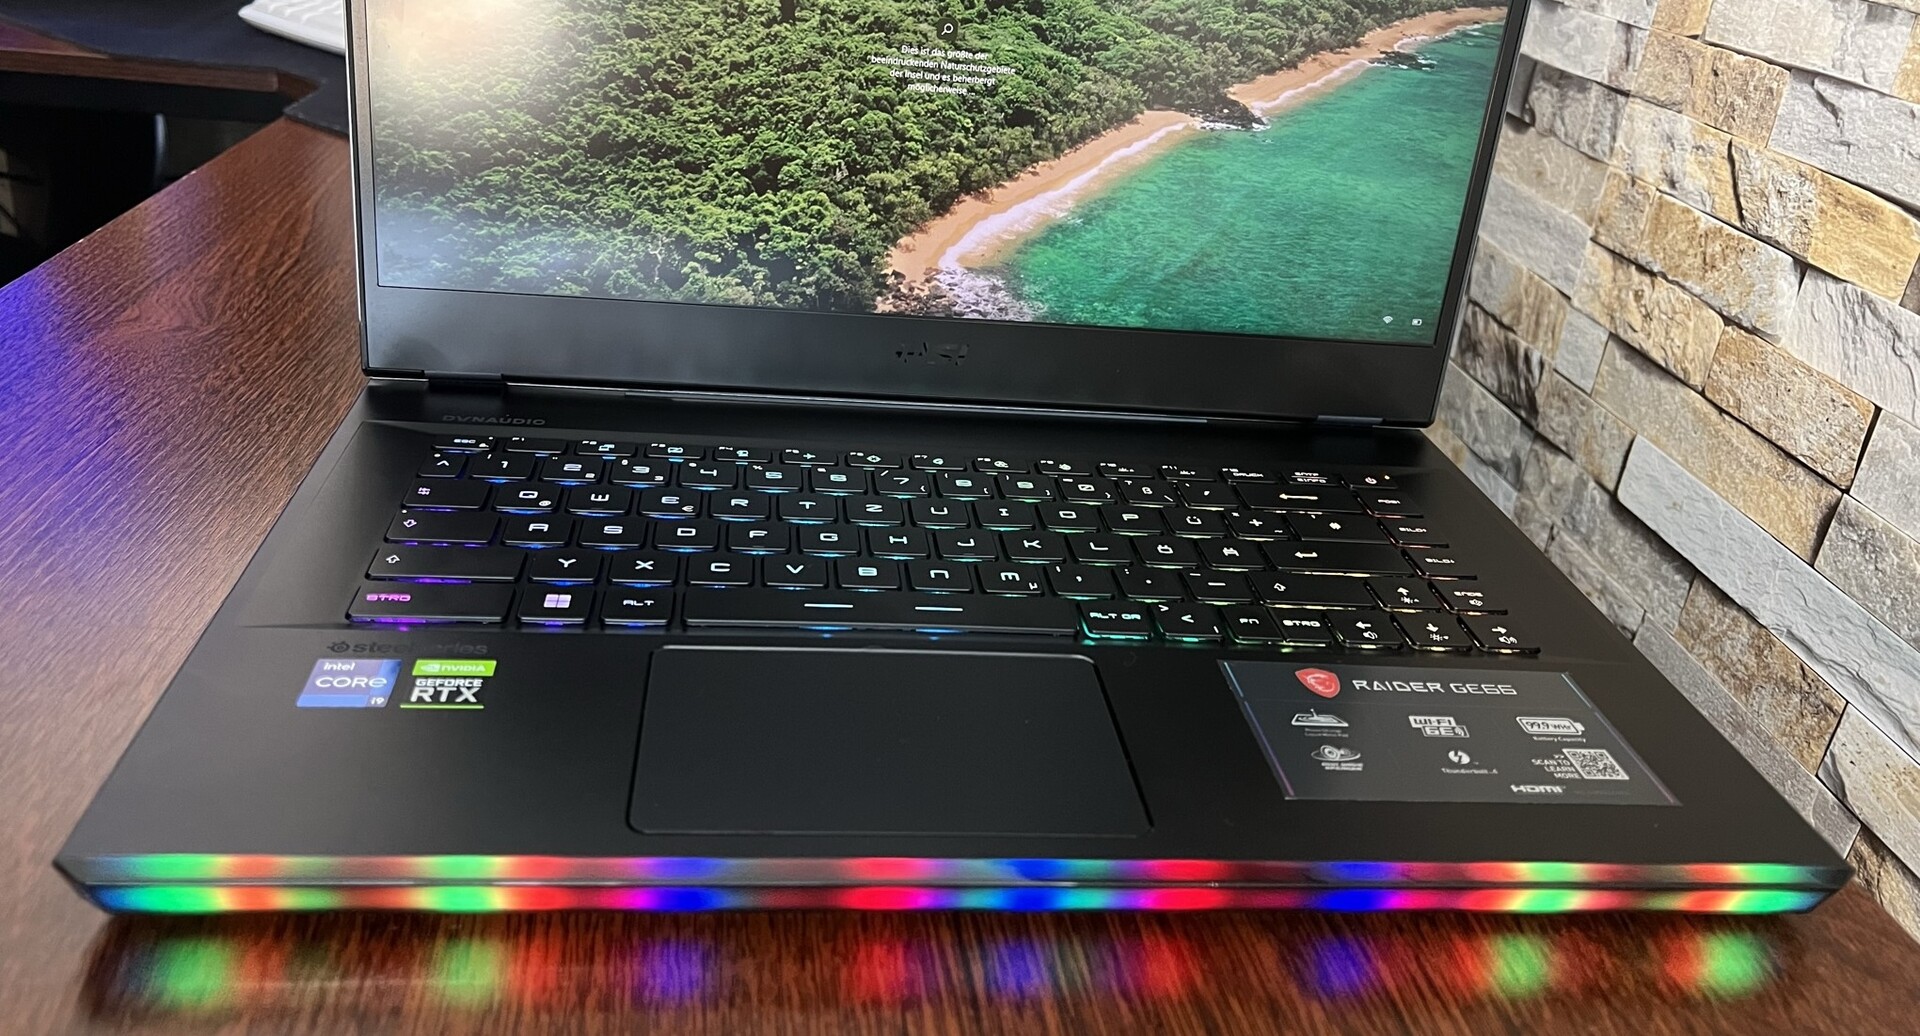
Dispositivos de entrada: Gran teclado para juegos con una elegante barra luminosa
El teclado y la distribución, así como el touchpad, no han cambiado en comparación con el MSI GE66 10SFS. Por lo tanto, nos remitimos de nuevo a la revisión del predecesor del modelo anterior.
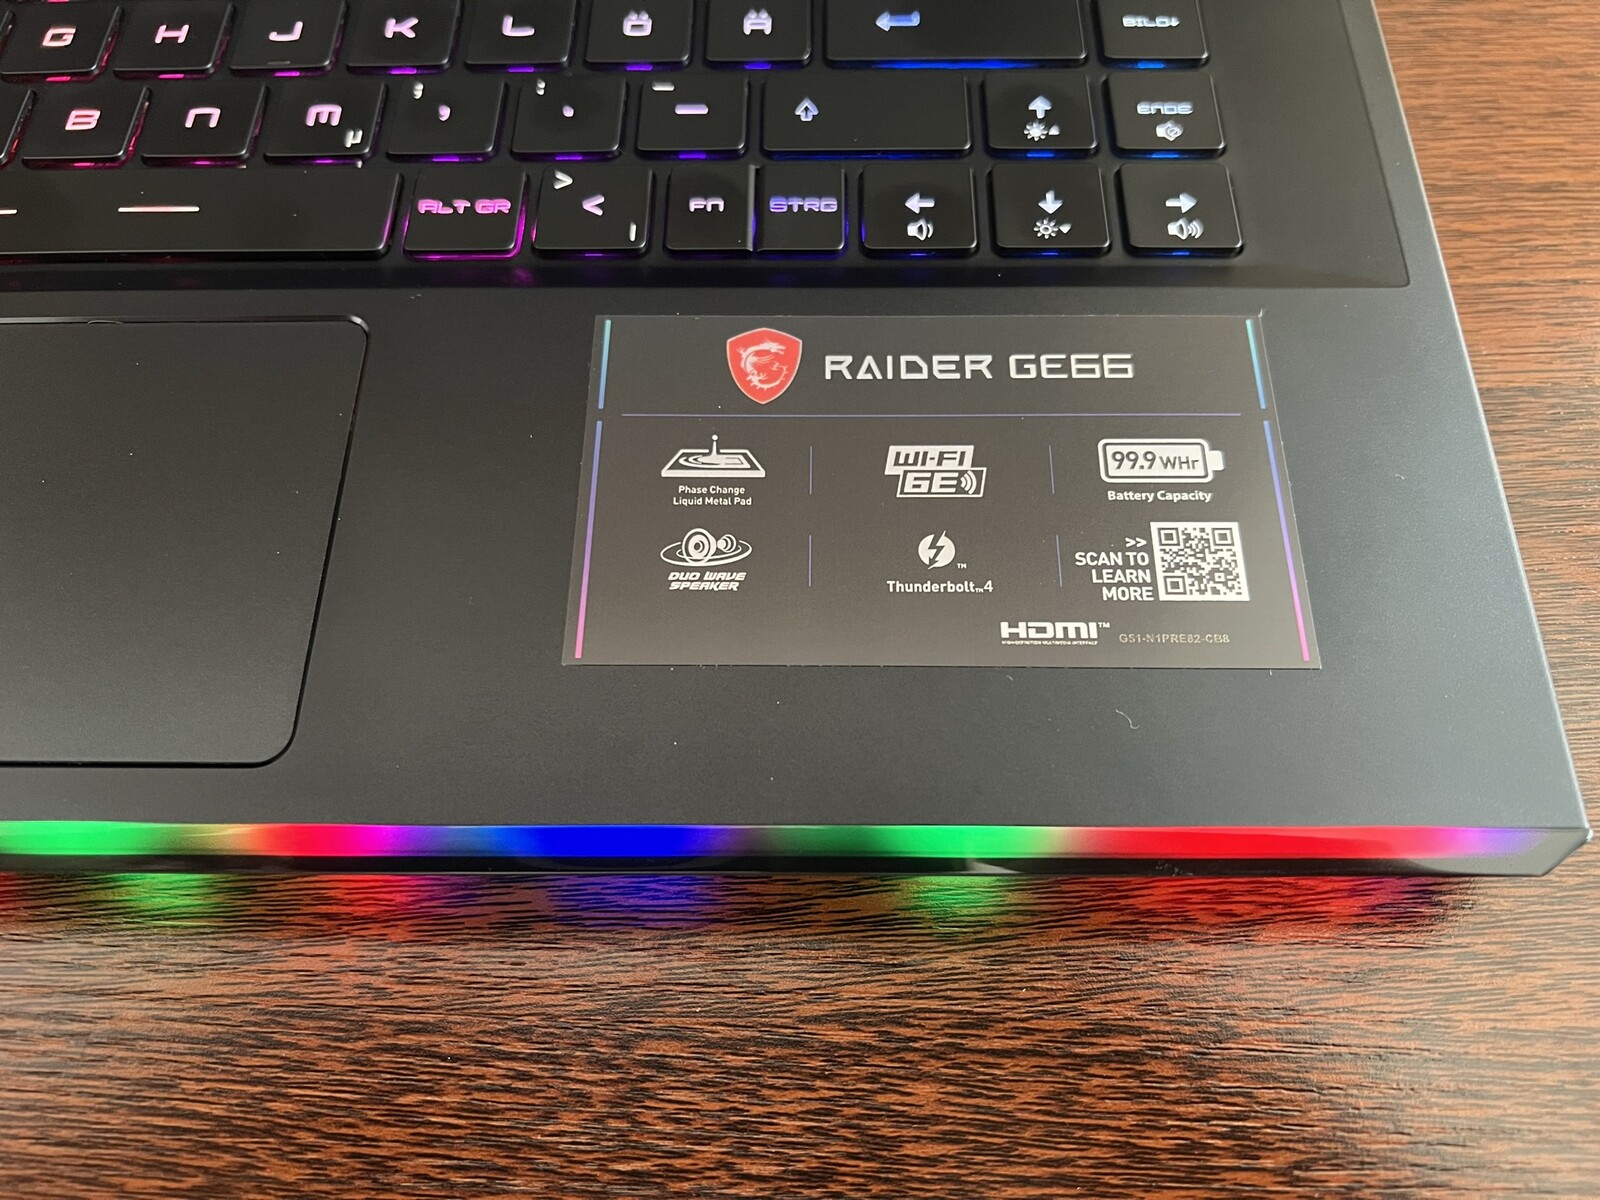
Un punto que merece la pena mencionar es la barra de luces, que se ha ampliado y ofrece aún más iluminación en el chasis y el frontal para los ventiladores RGB. La iluminación también parece más agradable y de mayor calidad.
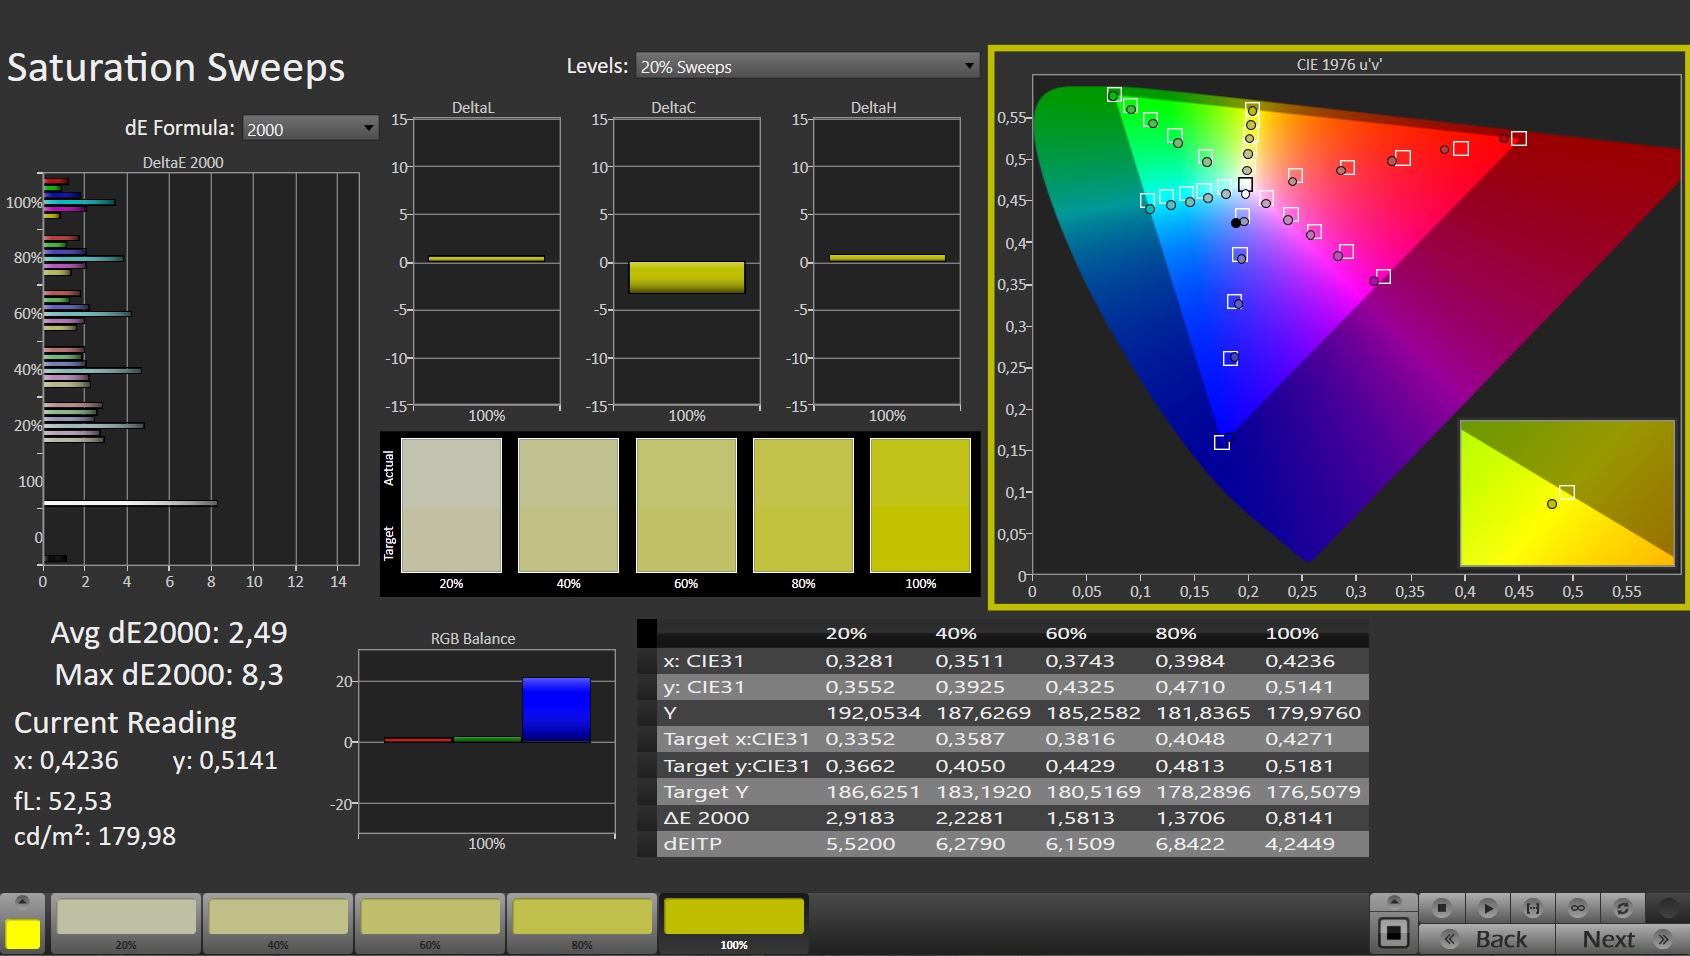
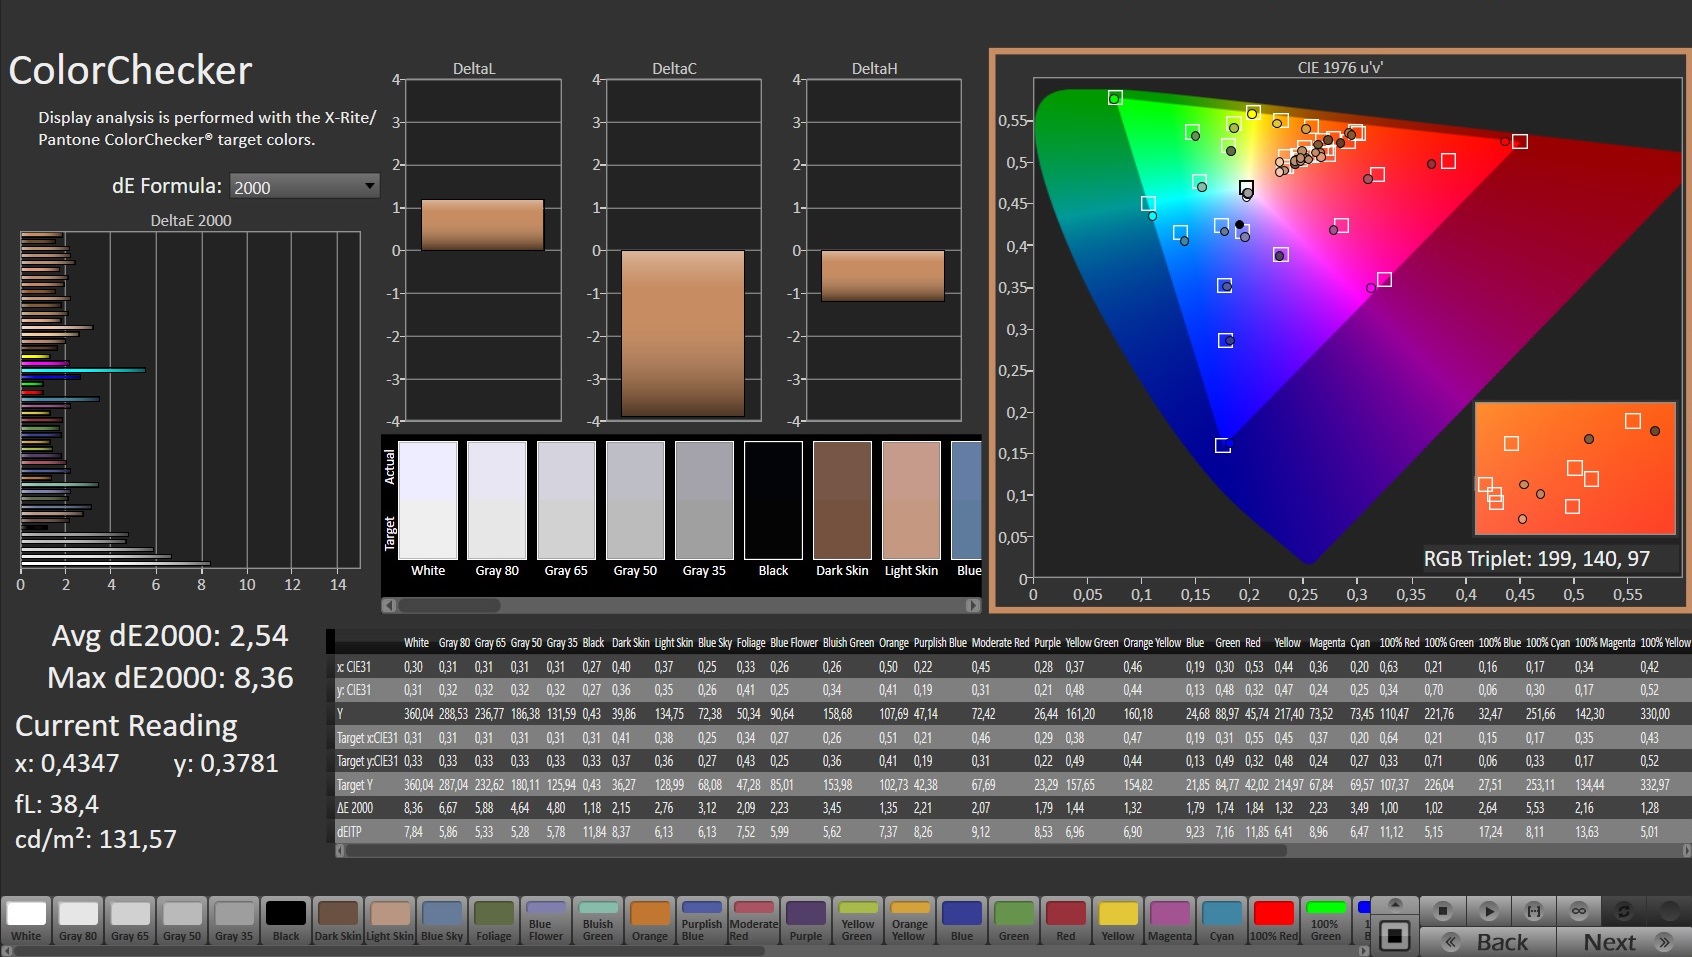
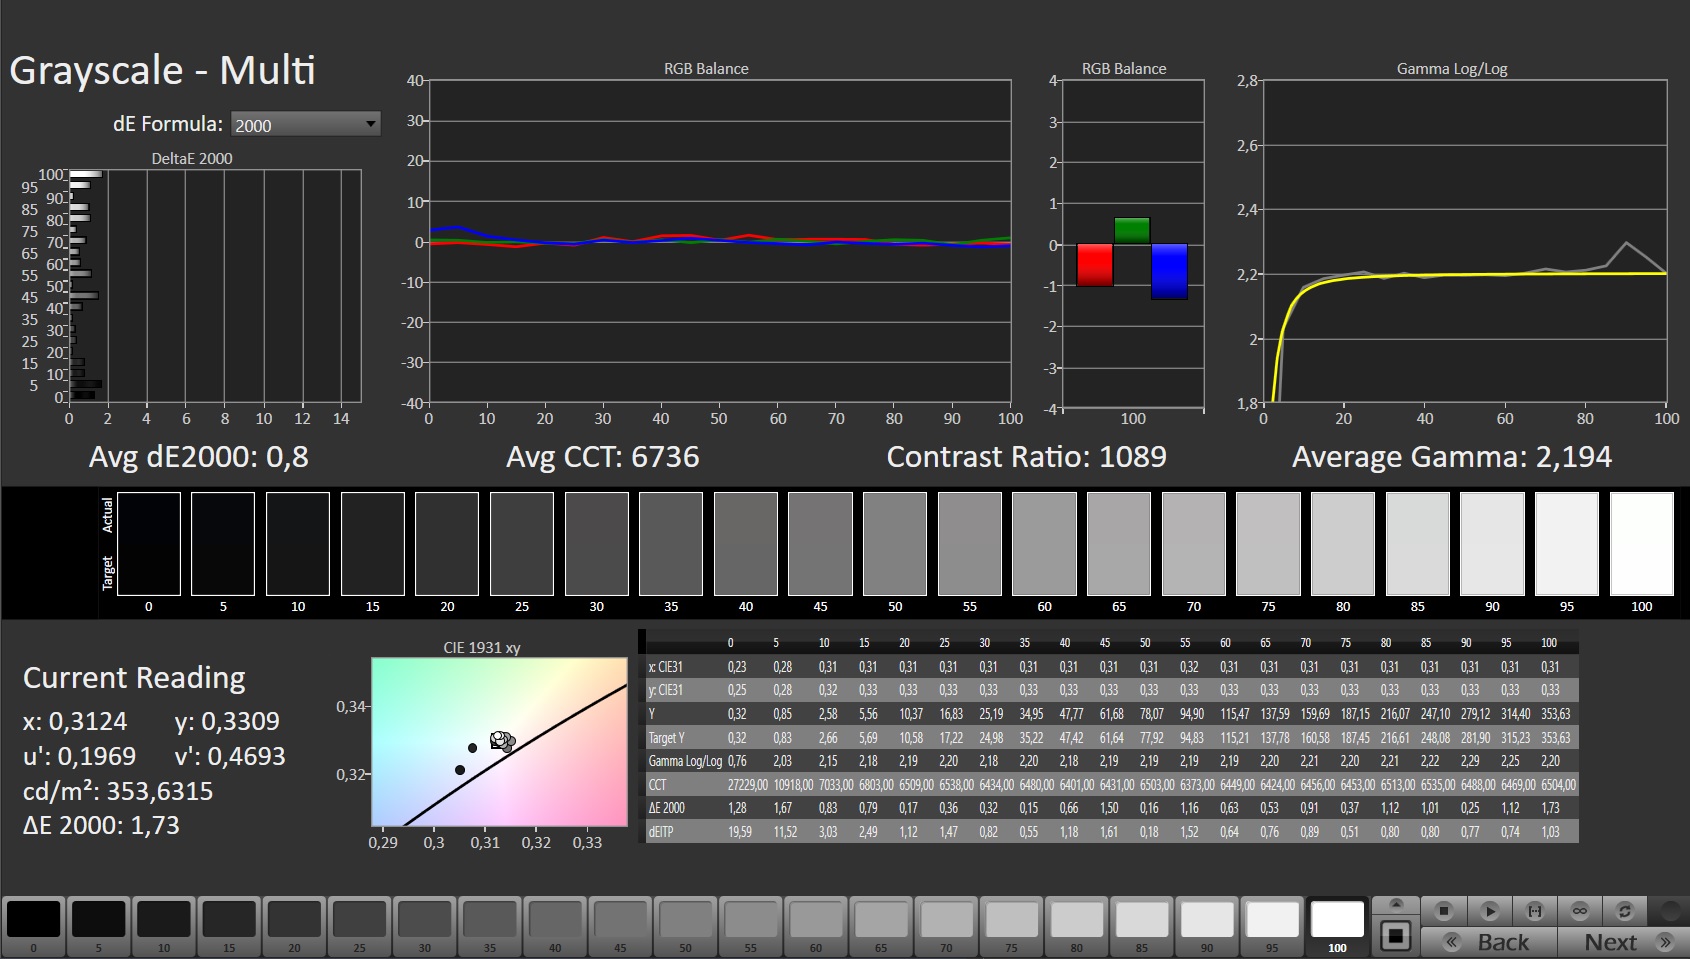
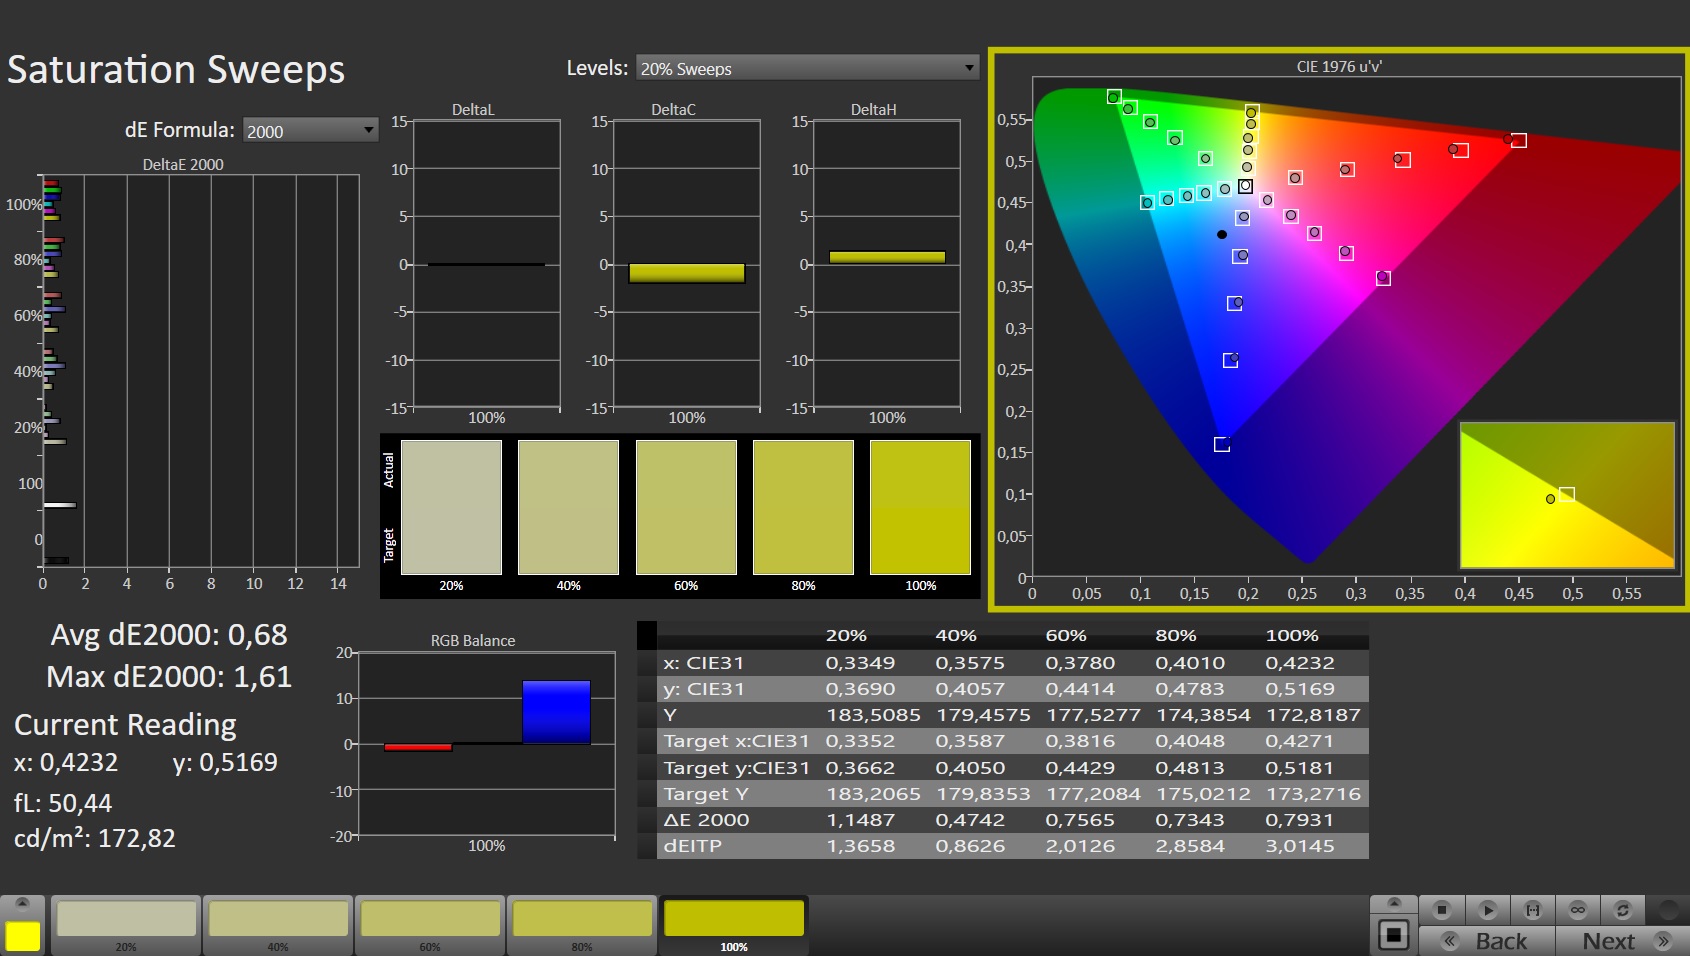
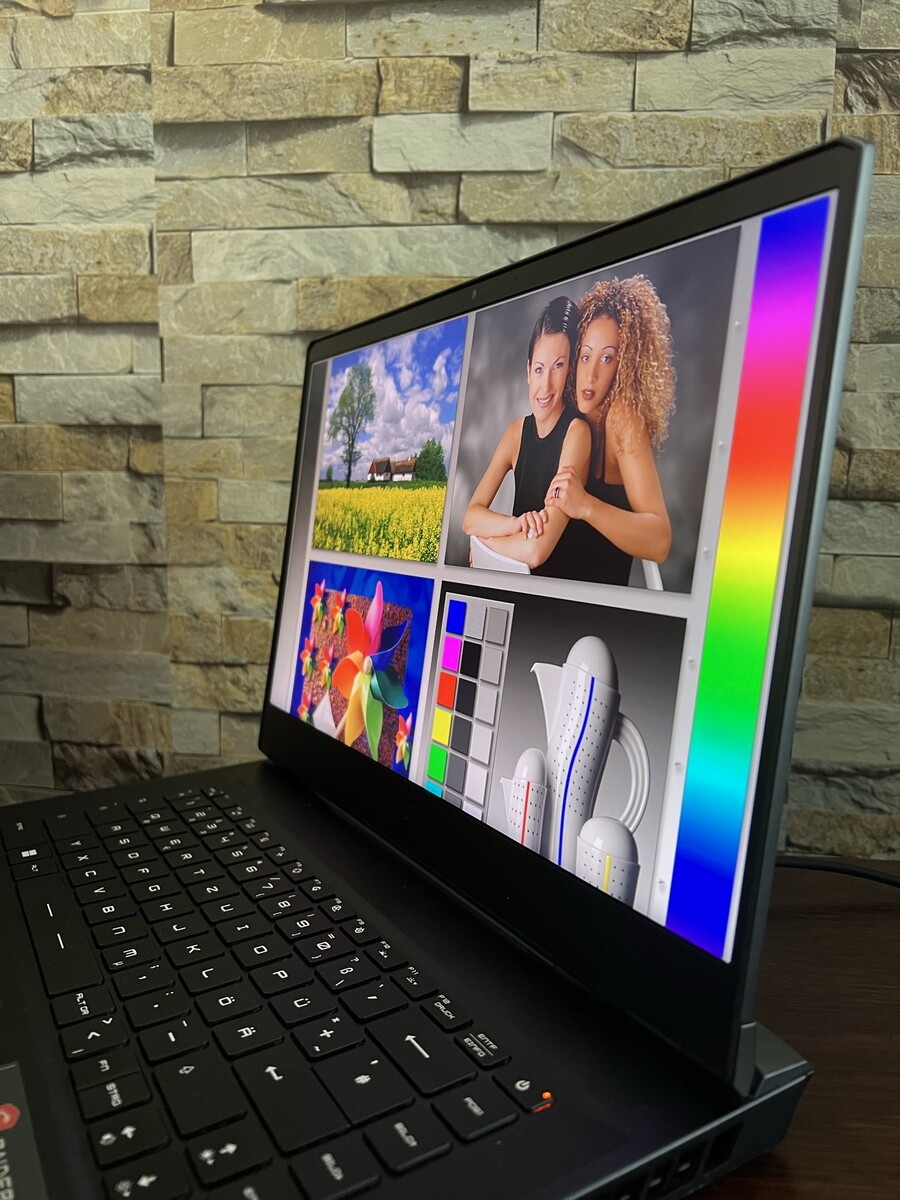
Pantalla: panel 4K con 120 Hz

MSI ha instalado un panel IPS no reflectante con una tasa de refresco de 120 Hz en el Raider GE66 12UHS, que tiene resolución 4K y subjetivamente tiene un aspecto excelente. Si un panel 4K es adecuado para un portátil de 15 pulgadas es discutible: definitivamente es una ventaja para los usuarios profesionales que también se dedican a los juegos. Más allá de eso, el hardware instalado cae en la gama alta absoluta y está definitivamente configurado para ejecutar juegos sin problemas en resolución 4K. MSI también ofrece alternativas, empezando por un panel QHD con 240 Hz o 165 Hz (y 100% de cobertura DCI-P3 en cada caso), hasta un panel Full HD con 360 Hz.
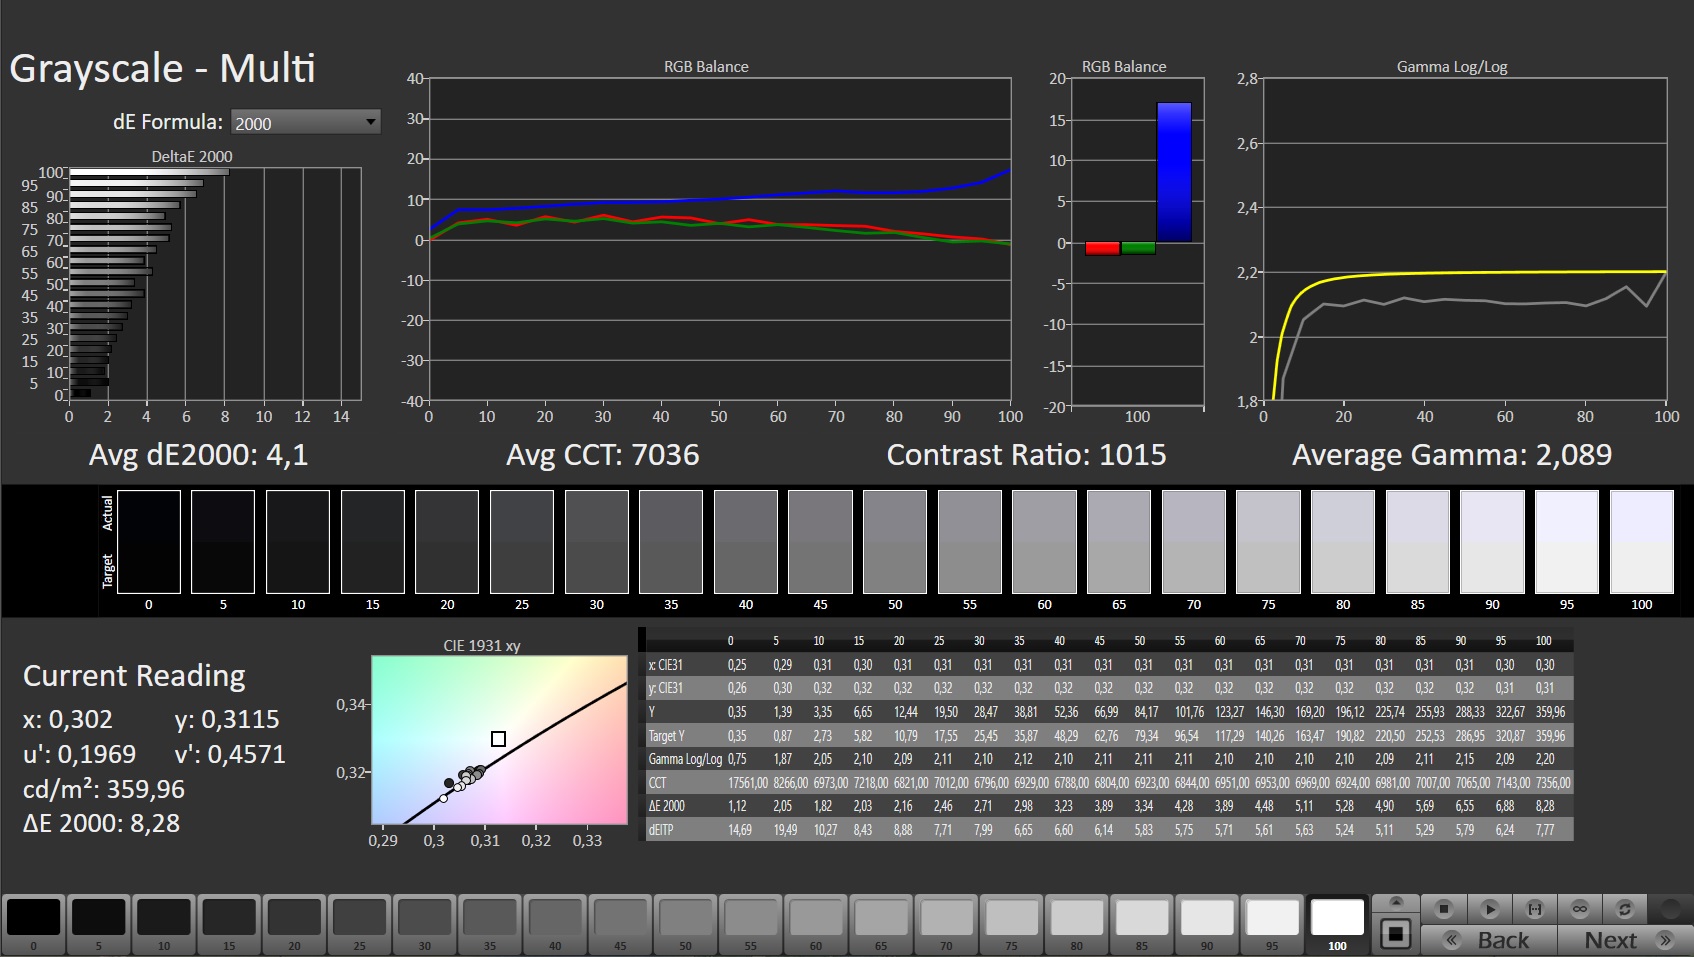
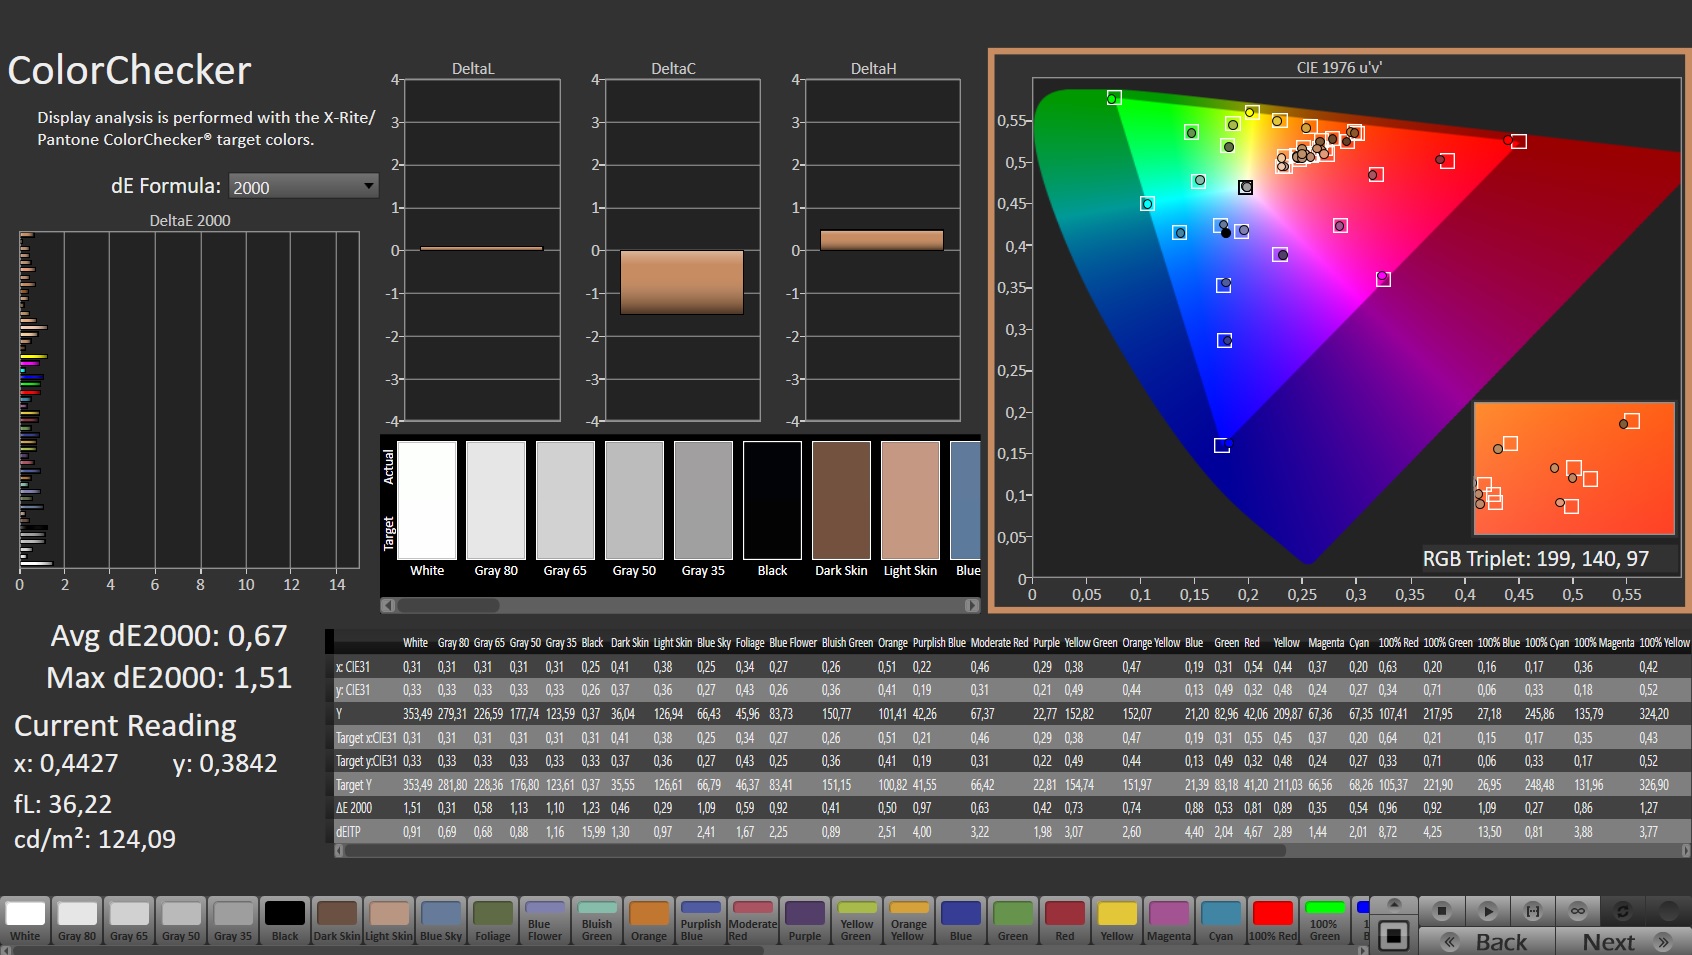
Comparando los valores del display 4K del dispositivo de pruebas con los del panel FHD (240 Hz) del predecesor, surge la siguiente imagen: El GE66 12UHS con su panel 4K es un 20% más brillante con 347 cd/m² y ofrece una mayor cobertura del espacio de color con un 80.4% de DCI-P3 frente al 68% así como un 94.7% de AdobeRGB frente al 69.8%. El dispositivo de pruebas con su pantalla 4K no usa PWM, aunque el predecesor lo tenía a una frecuencia muy alta. Sin embargo, también hay desventajas, como tiempos de respuesta más altos y valores de negro y contraste más pobres.
| |||||||||||||||||||||||||
iluminación: 90 %
Brillo con batería: 351 cd/m²
Contraste: 1003:1 (Negro: 0.35 cd/m²)
ΔE ColorChecker Calman: 2.54 | ∀{0.5-29.43 Ø4.73}
calibrated: 0.67
ΔE Greyscale Calman: 4.1 | ∀{0.09-98 Ø4.97}
94.7% AdobeRGB 1998 (Argyll 3D)
98.4% sRGB (Argyll 3D)
80.4% Display P3 (Argyll 3D)
Gamma: 2.089
CCT: 7036 K
| MSI Raider GE66 12UHS AUO51EB, IPS, 3840x2160, 15.6" | MSI GE66 Raider 10SFS Sharp LQ156M1JW03 (SHP14C5), IPS-Level, 1920x1080, 15.6" | Razer Blade 15 2022 Sharp LQ156T1JW03, IPS, 2560x1440, 15.6" | Schenker XMG Neo 15 E22 (Early 2022, RTX 3080 Ti) BOE0A67 (BOE CQ NE156QHM-NZ1), IPS, 2560x1440, 15.6" | Lenovo Legion 5 Pro 16 G7 i7 RTX 3070Ti NE160QDM-NY1, IPS, 2560x1600, 16" | |
|---|---|---|---|---|---|
| Display | -13% | 6% | -14% | ||
| Display P3 Coverage (%) | 80.4 | 68 -15% | 99.1 23% | 68.7 -15% | |
| sRGB Coverage (%) | 98.4 | 99 1% | 99.9 2% | 97.6 -1% | |
| AdobeRGB 1998 Coverage (%) | 94.7 | 69.8 -26% | 86.8 -8% | 70.9 -25% | |
| Response Times | 16% | 16% | 20% | 24% | |
| Response Time Grey 50% / Grey 80% * (ms) | 18.8 ? | 16.4 ? 13% | 14.4 ? 23% | 14.4 ? 23% | 17.6 ? 6% |
| Response Time Black / White * (ms) | 12.8 ? | 10.4 ? 19% | 11.6 ? 9% | 10.8 ? 16% | 7.6 ? 41% |
| PWM Frequency (Hz) | 23580 ? | ||||
| Screen | 23% | -19% | 4% | 9% | |
| Brightness middle (cd/m²) | 351 | 291 -17% | 286 -19% | 295 -16% | 502 43% |
| Brightness (cd/m²) | 347 | 278 -20% | 271 -22% | 277 -20% | 491 41% |
| Brightness Distribution (%) | 90 | 91 1% | 89 -1% | 62 -31% | 91 1% |
| Black Level * (cd/m²) | 0.35 | 0.25 29% | 0.25 29% | 0.28 20% | 0.37 -6% |
| Contrast (:1) | 1003 | 1164 16% | 1144 14% | 1054 5% | 1357 35% |
| Colorchecker dE 2000 * | 2.54 | 1.19 53% | 2.74 -8% | 2.36 7% | 2.7 -6% |
| Colorchecker dE 2000 max. * | 8.36 | 3.04 64% | 5.21 38% | 4.24 49% | 4.5 46% |
| Colorchecker dE 2000 calibrated * | 0.67 | 2.52 -276% | 1.4 -109% | ||
| Greyscale dE 2000 * | 4.1 | 1.9 54% | 1.1 73% | 3.43 16% | 2.7 34% |
| Gamma | 2.089 105% | 2.216 99% | 2.2 100% | 2.44 90% | 2.44 90% |
| CCT | 7036 92% | 7018 93% | 6408 101% | 6266 104% | 6326 103% |
| Color Space (Percent of AdobeRGB 1998) (%) | 70 | ||||
| Color Space (Percent of sRGB) (%) | 92 | ||||
| Media total (Programa/Opciones) | 9% /
13% | 1% /
-9% | 12% /
7% | 6% /
6% |
* ... más pequeño es mejor
La precisión del color de los trabajos de visualización puede mejorarse, especialmente la escala de grises. Tras la calibración con el fotoespectrómetro, conseguimos unos valores medios de escala de grises y color DeltaE muy buenos, de 0,8 y 0,67, respectivamente. El perfil ICC de nuestra calibración está disponible para descargar aquí.
Tiempos de respuesta del display
| ↔ Tiempo de respuesta de Negro a Blanco | ||
|---|---|---|
| 12.8 ms ... subida ↗ y bajada ↘ combinada | ↗ 6.8 ms subida | 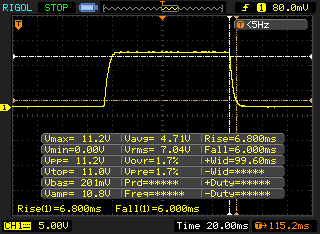 |
| ↘ 6 ms bajada | ||
| La pantalla mostró buenos tiempos de respuesta en nuestros tests pero podría ser demasiado lenta para los jugones competitivos. En comparación, todos los dispositivos de prueba van de ##min### (mínimo) a 240 (máximo) ms. » 33 % de todos los dispositivos son mejores. Esto quiere decir que el tiempo de respuesta medido es mejor que la media (19.9 ms) de todos los dispositivos testados. | ||
| ↔ Tiempo de respuesta 50% Gris a 80% Gris | ||
| 18.8 ms ... subida ↗ y bajada ↘ combinada | ↗ 9.2 ms subida | 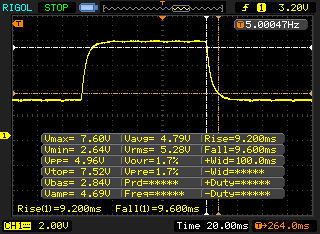 |
| ↘ 9.6 ms bajada | ||
| La pantalla mostró buenos tiempos de respuesta en nuestros tests pero podría ser demasiado lenta para los jugones competitivos. En comparación, todos los dispositivos de prueba van de ##min### (mínimo) a 636 (máximo) ms. » 32 % de todos los dispositivos son mejores. Esto quiere decir que el tiempo de respuesta medido es mejor que la media (31.1 ms) de todos los dispositivos testados. | ||
Parpadeo de Pantalla / PWM (Pulse-Width Modulation)
| Parpadeo de Pantalla / PWM no detectado | 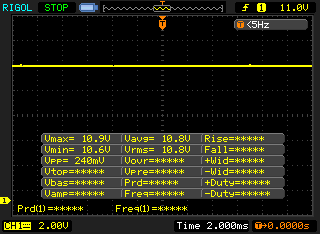 | ||
Comparación: 52 % de todos los dispositivos testados no usaron PWM para atenuar el display. Si se usó, medimos una media de 7798 (mínimo: 5 - máxmo: 343500) Hz. | |||
Incluso con una pantalla no reflectante y un brillo de 347 cd/m², no podemos recomendar el Raider GE66 12UHS para su uso bajo luz solar directa, al menos cuando trabajamos sin MSI True Color. Con esta herramienta y sus diversos ajustes, la legibilidad del contenido de la pantalla puede mejorar algo. Pero en términos de uso general en exteriores, deberías buscar un lugar con sombra para obtener condiciones óptimas
El panel IPS integrado de nuestro dispositivo de pruebas mantiene un ángulo de visión estable incluso cuando se mira desde ángulos extremadamente amplios. El brillo no cambia y los colores tampoco se distorsionan.
Rendimiento: Solución inteligente de refrigeración por metal líquido para el MSI GE66 12UHS
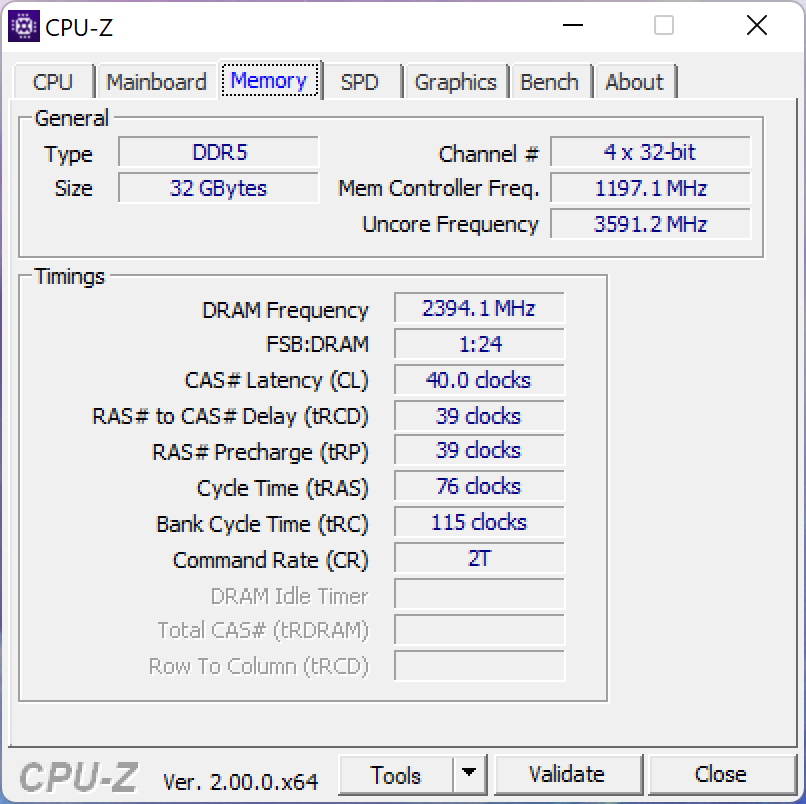
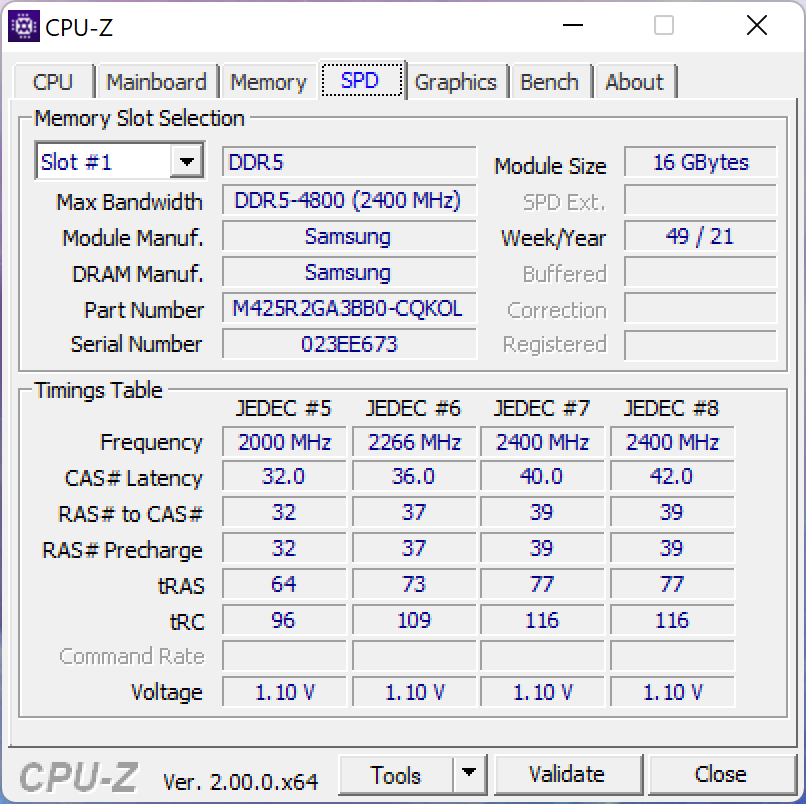
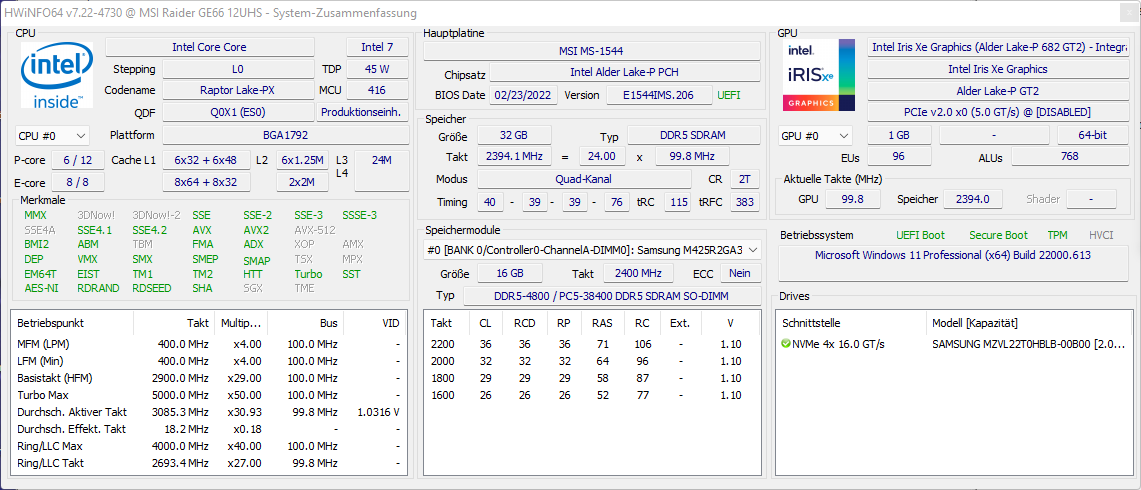
El MSI GE66 12UHS está disponible en varias configuraciones. Así, puede adquirir el sistema con un Intel Core i7 12700Hen lugar del Intel Core i9 12900HK. En cuanto a la configuración de la GPU, el sistema está disponible con la RTX 3080 con 8 GB de VRAM y 150 vatios de TDP (potencia dinámica total) o con la RTX 3080 Ti, que está equipada con 16 GB de VRAM y también tiene un TDP de 150 vatios. Ambas configuraciones utilizan 16 GB de RAM DDR5 a 4.800 MHz o 32 GB de RAM DDR5 a la misma velocidad de reloj, cada una de ellas funcionando en modo de doble canal. Los SSD se instalan en tamaño de 1 TB o 2 TB.
Nuestro dispositivo de análisis es la versión de gama alta con el Intel Core i9 12900HKla RTX 3080 Ti y 32 GB de RAM DDR5, completada con un SSD de 2 TB.
Condiciones de la prueba
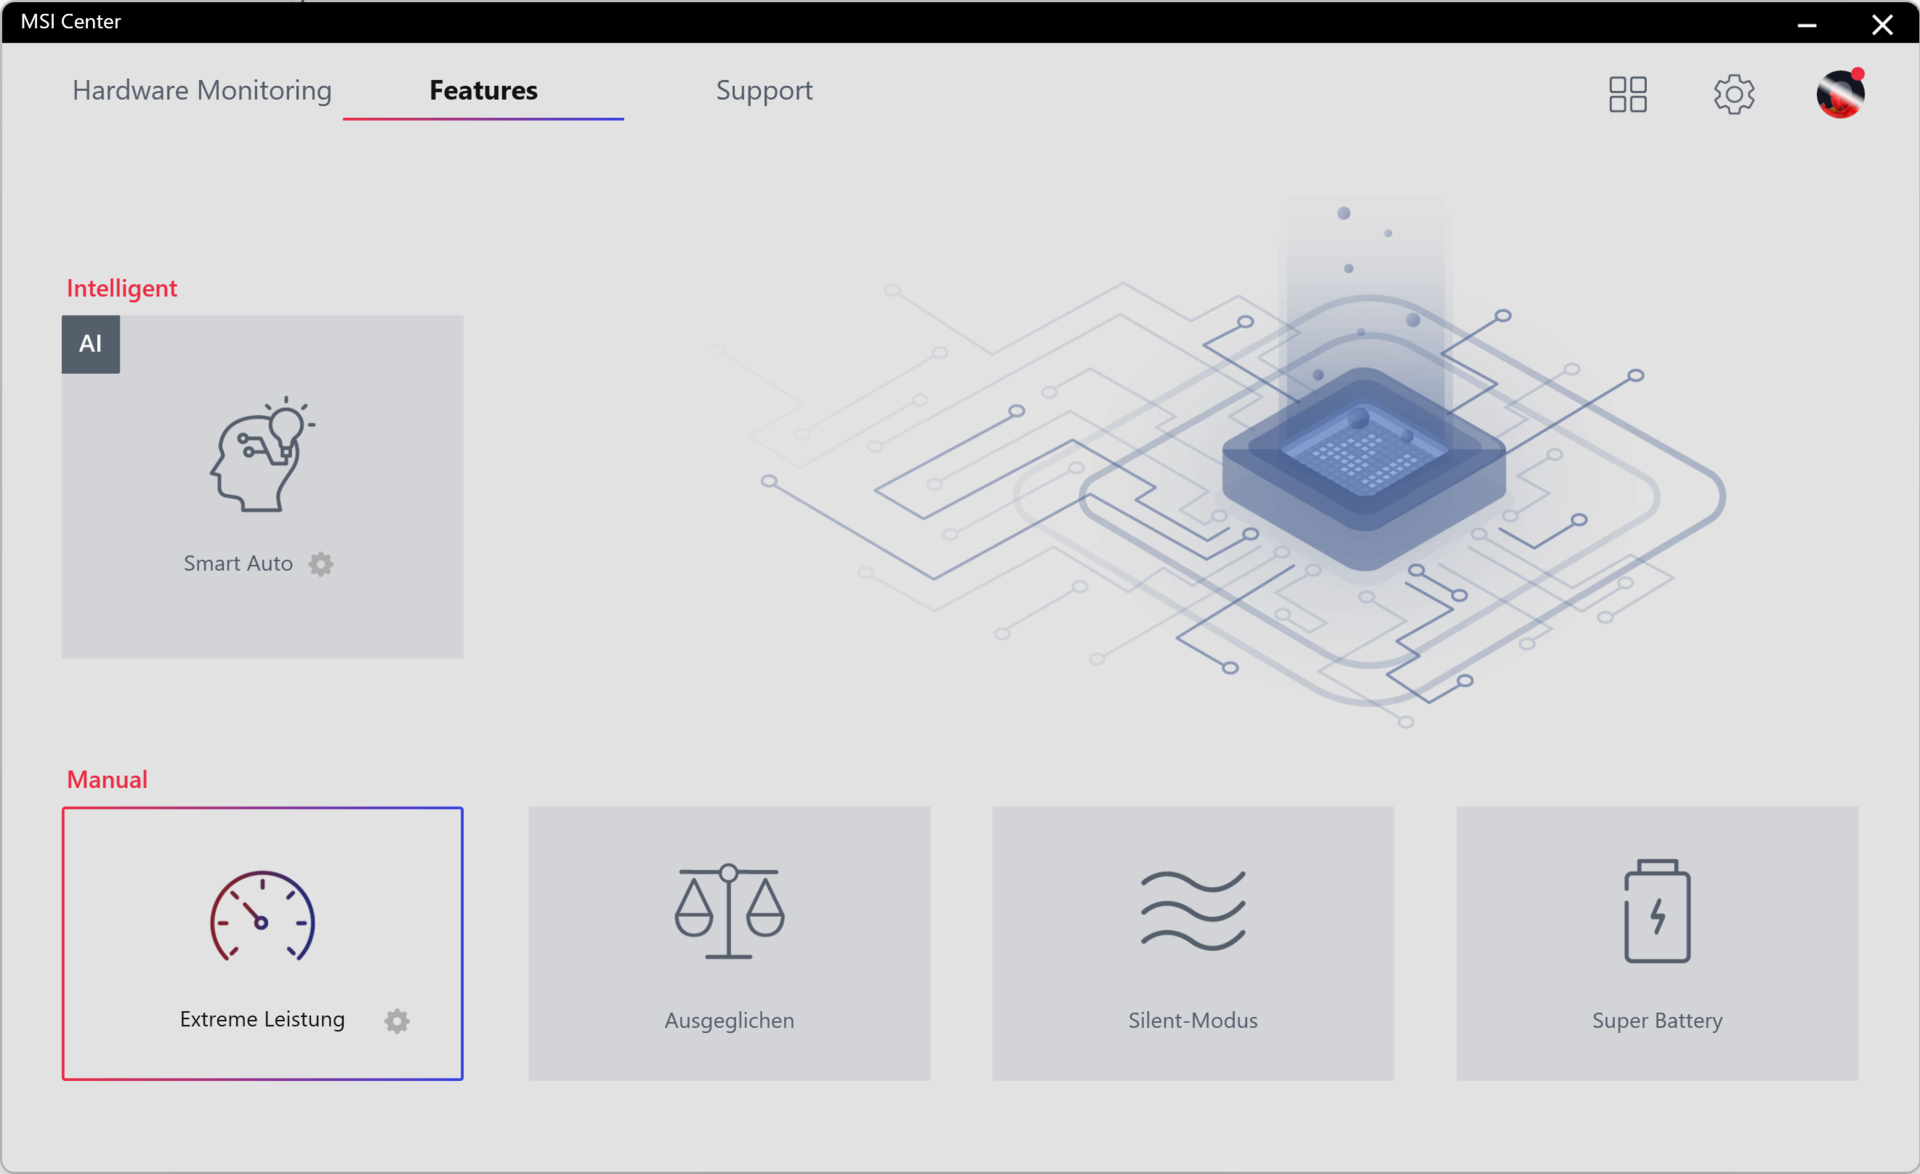
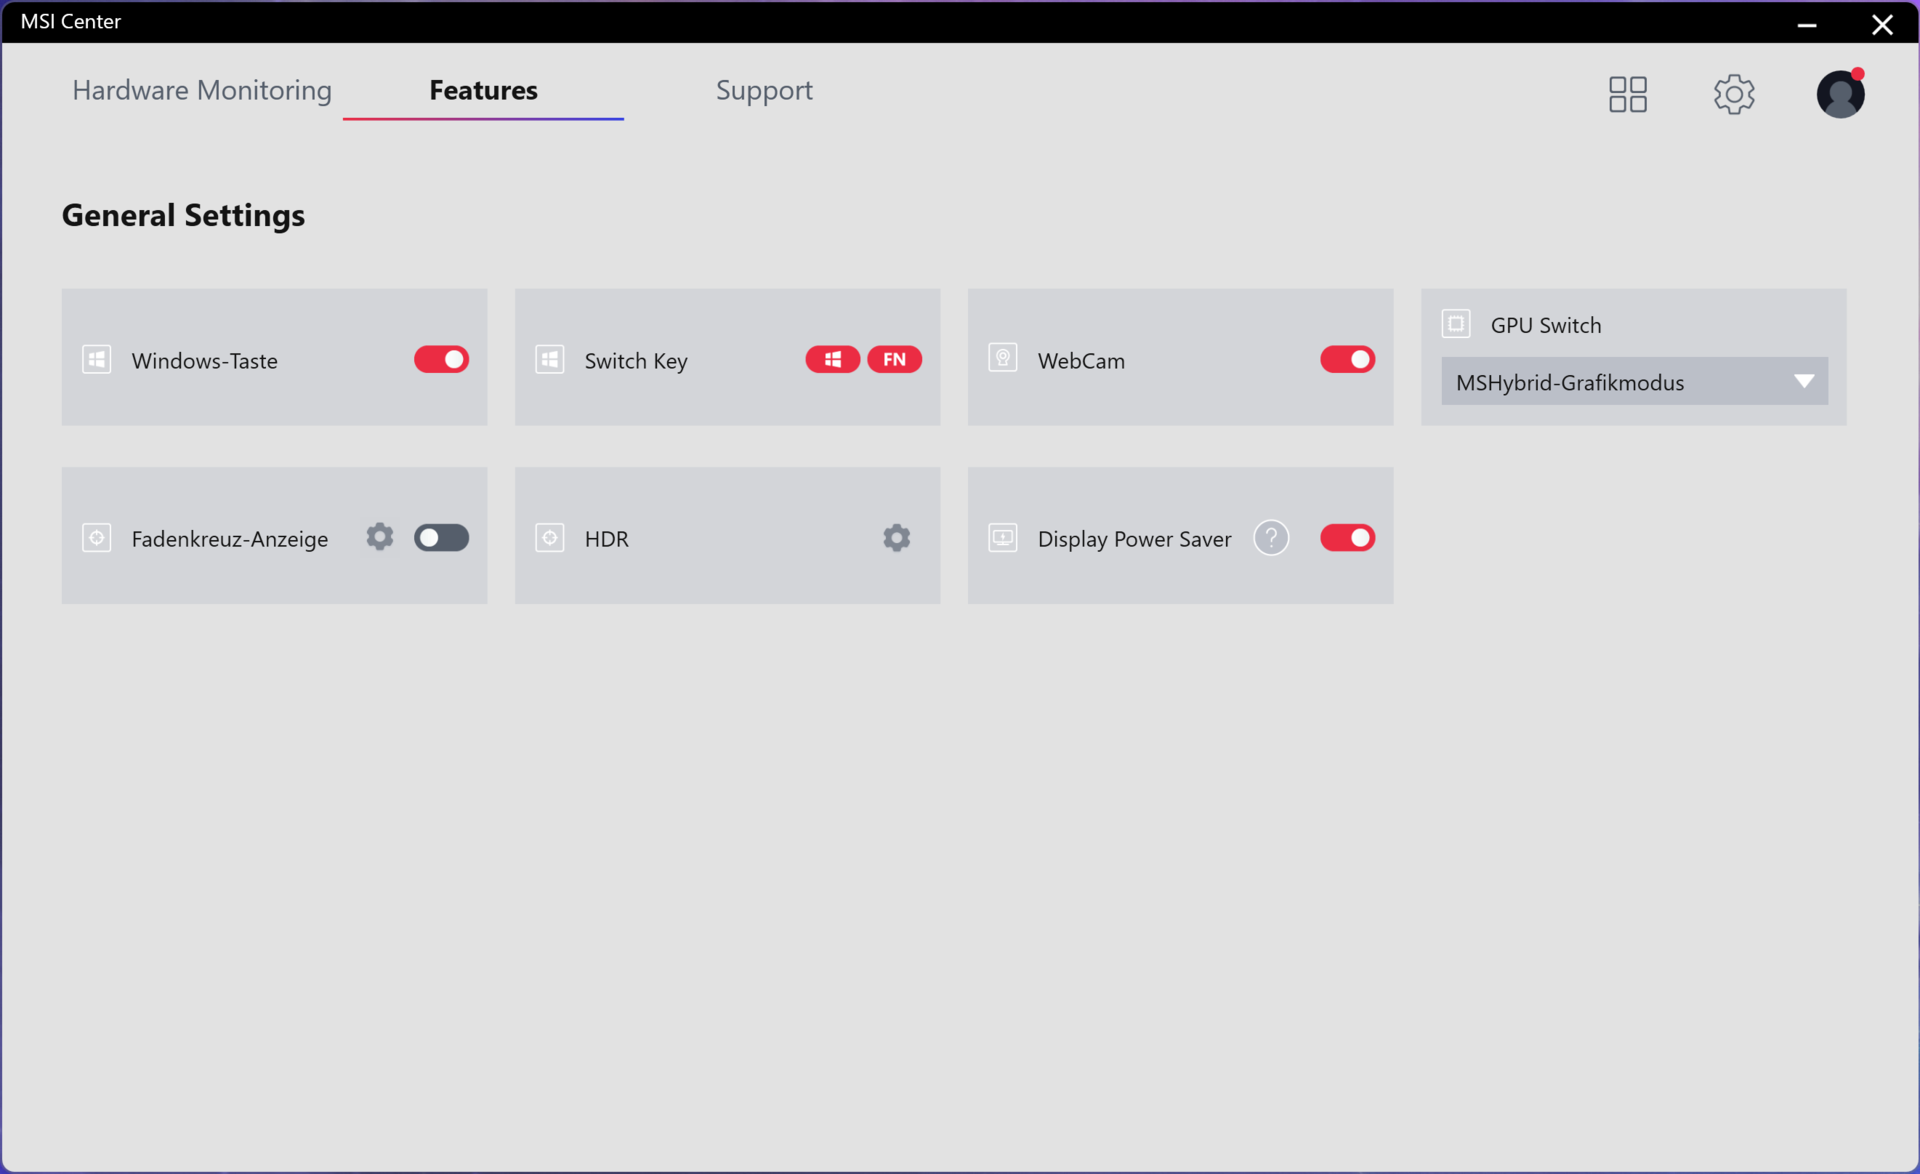
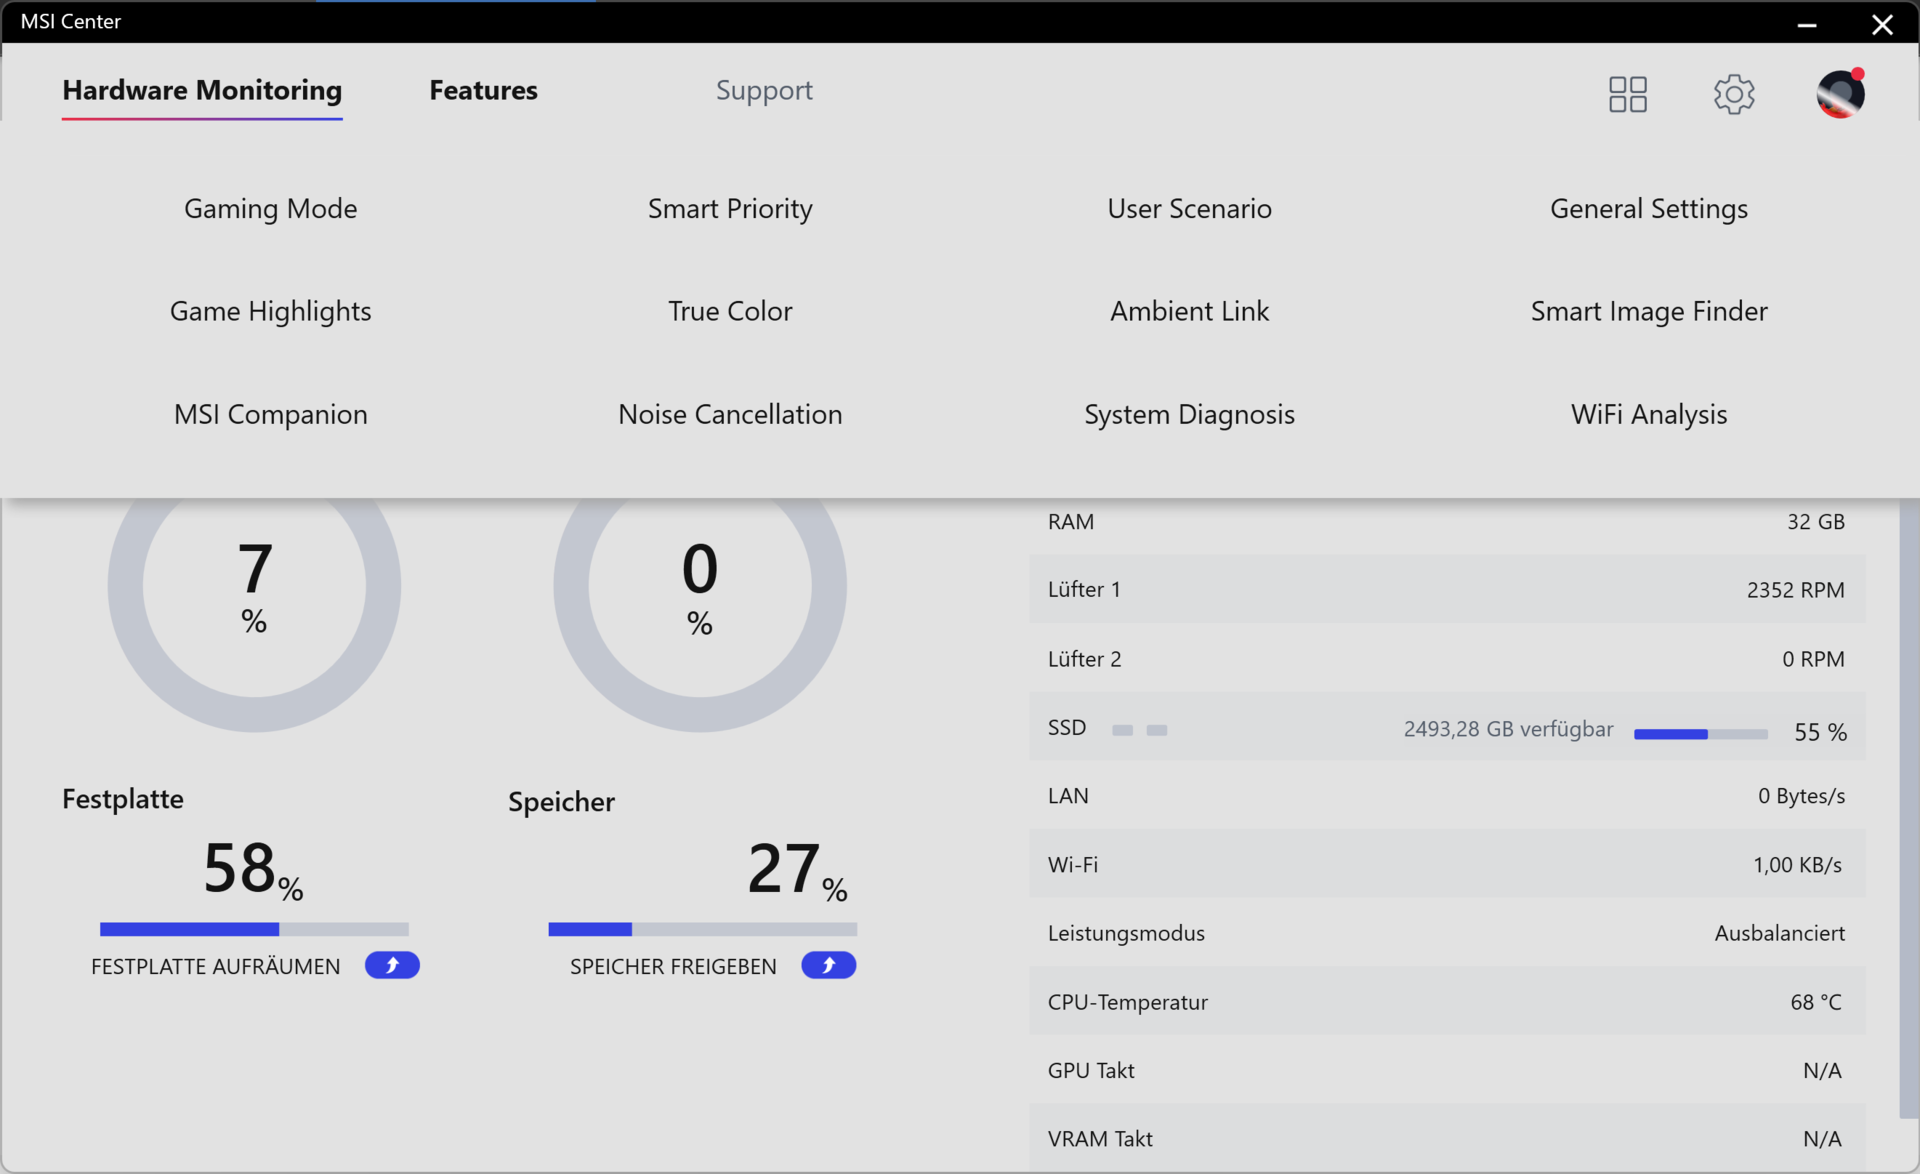
Para obtener unos resultados óptimos en los benchmarks, pusimos nuestro portátil en modo "Rendimiento Extremo" a través del Centro MSI (si no es así, ponlo en "Smart Auto" como configuración por defecto). Muchas configuraciones importantes del sistema pueden ajustarse a través de la plataforma (no es necesario crear una cuenta). Entre ellos se encuentran los perfiles de los ventiladores, así como los ajustes generales y otras funciones como "Live Update" para encontrar los últimos controladores del sistema. Por desgracia, no todos los controladores se pueden instalar automáticamente y algunos tienen que instalarse manualmente. También nos gustó la opción de ejecutar la GPU en "Modo Gráfico Discreto" (sólo RTX 3080 Ti) o en "Modo Gráfico MSHybrid" (Advanced-Optimus) para no sólo ahorrar batería sino también para poder usar la salida de vídeo Thunderbolt 4, ya que está desactivada en "Modo Gráfico Discreto". Es necesario reiniciar el sistema en cada caso.
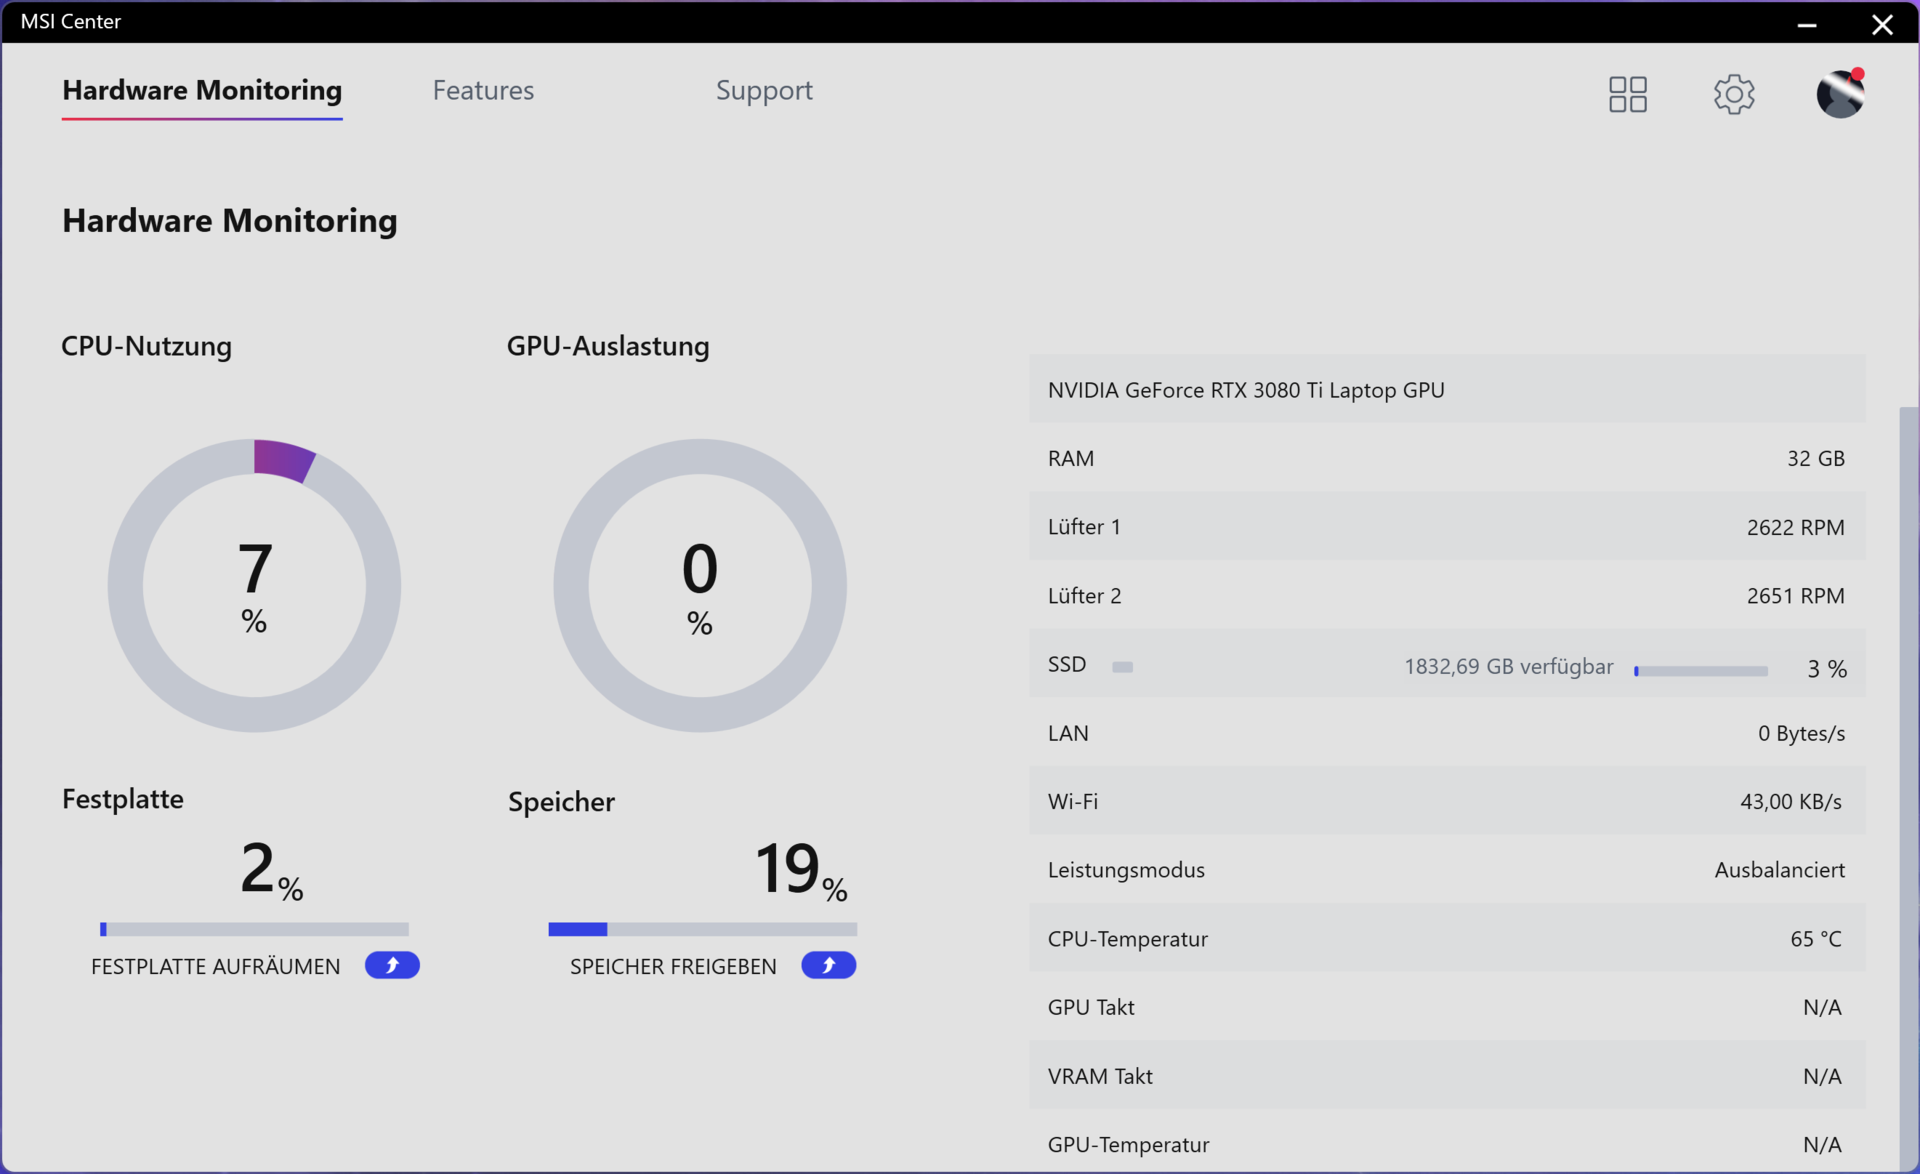
Se observaron varios defectos en forma de tiempos de espera ocasionalmente largos durante el arranque del MSI Center, que también se colgó frecuentemente sin razón aparente, y la congelación constante de la herramienta "Hardware Monitoring" en nuestro dispositivo de pruebas.
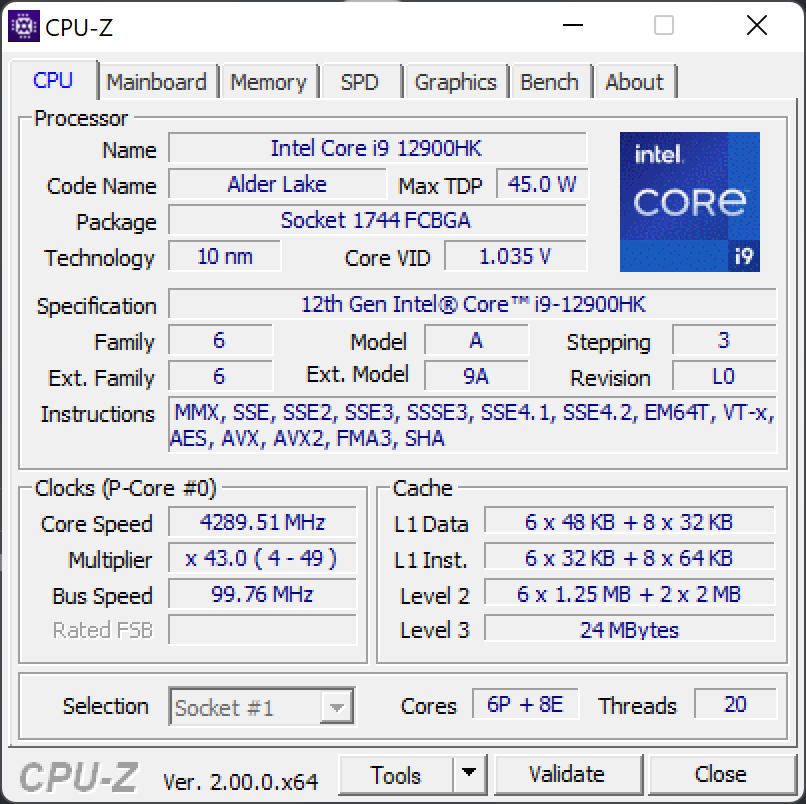
Procesador
Nuestro dispositivo de revisión utiliza unIntel Core i9 12900HK, una de las CPUs móviles más potentes de Intel, junto con el pronto lanzamiento del Intel Core i9 12950HXel Intel Core i9 12900HK tiene 14 núcleos (20 hilos), 6 de rendimiento y 8 de eficiencia, que ofrecen un Turbo Boost de hasta 5 GHz y 24 MB de caché L3.
En el benchmark Cinebench R23 con control automático del ventilador, así como en el perfil "Rendimiento Extremo", la CPU consume brevemente 86 vatios antes de ser estrangulada térmicamente. La puntuación máxima en este escenario es de 16.236 puntos en el benchmark multinúcleo. Esta puntuación cae a 12.729 puntos en modo batería bajo las mismas condiciones. Si dejas el rendimiento y el control del ventilador en manos de la IA (inteligencia artificial) en el "Modo Automático Inteligente", la puntuación aumenta sólo marginalmente a 16.533 puntos y la CPU consume brevemente 90 vatios en lugar de 86. Si cambias el modo del ventilador a "Cooler Boost" en el perfil "Rendimiento Extremo", alcanzas casi 17.000 puntos y una carga máxima de 92 vatios, pero tienes que aguantar niveles de ruido considerablemente más altos.
MSI equipa el procesador instalado con un "Phase-Change Liquid Metal Pad", cuya función es actuar como una almohadilla de conducción de calor en forma sólida hasta que se funde a 58 grados Celsius y se convierte en metal líquido, lo que se supone que mejora significativamente la conductividad térmica a altas temperaturas
Los resultados de nuestras pruebas: Incluso con el metal líquido, el 15 pulgadas no agota por completo el potencial de su Intel Core i9 12900HK e incluso es superado por elIntel Core i7 12700Hde ciertos dispositivos de la comparación. El hermano mayor del MSI GE66 12UHS, el GE76 12UHStambién consigue "sólo" 2.722 puntos en nuestro test de carga multi sostenida Cinebench R15 con la misma CPU. El Lenovo Legion 5 Pro 16 G7 y el Schenker Neo 15, ambos con procesadores 12700H, superan tanto al GE66 como al mayor MSI GE76 12UHS. En comparación con el predecesor con el Intel Core i9 10980HKnuestro dispositivo de pruebas logra, no obstante, un notable aumento de rendimiento de más del 50%.
Cinebench R15 Multi Sustained Load
* ... más pequeño es mejor
AIDA64: FP32 Ray-Trace | FPU Julia | CPU SHA3 | CPU Queen | FPU SinJulia | FPU Mandel | CPU AES | CPU ZLib | FP64 Ray-Trace | CPU PhotoWorxx
| Performance rating | |
| Media de la clase Gaming | |
| Lenovo Legion 5 Pro 16 G7 i7 RTX 3070Ti | |
| MSI Raider GE66 12UHS | |
| Schenker XMG Neo 15 E22 (Early 2022, RTX 3080 Ti) | |
| Medio Intel Core i9-12900HK | |
| MSI GE66 Raider 10SFS | |
| Razer Blade 15 2022 | |
| AIDA64 / FP32 Ray-Trace | |
| Media de la clase Gaming (10227 - 85542, n=110, últimos 2 años) | |
| MSI GE66 Raider 10SFS | |
| Medio Intel Core i9-12900HK (2677 - 13948, n=15) | |
| Lenovo Legion 5 Pro 16 G7 i7 RTX 3070Ti | |
| Schenker XMG Neo 15 E22 (Early 2022, RTX 3080 Ti) | |
| MSI Raider GE66 12UHS | |
| Razer Blade 15 2022 | |
| AIDA64 / FPU Julia | |
| Media de la clase Gaming (51376 - 238426, n=110, últimos 2 años) | |
| MSI GE66 Raider 10SFS | |
| Medio Intel Core i9-12900HK (12762 - 70764, n=15) | |
| Schenker XMG Neo 15 E22 (Early 2022, RTX 3080 Ti) | |
| Lenovo Legion 5 Pro 16 G7 i7 RTX 3070Ti | |
| MSI Raider GE66 12UHS | |
| Razer Blade 15 2022 | |
| AIDA64 / CPU SHA3 | |
| Media de la clase Gaming (2180 - 9817, n=110, últimos 2 años) | |
| Lenovo Legion 5 Pro 16 G7 i7 RTX 3070Ti | |
| Schenker XMG Neo 15 E22 (Early 2022, RTX 3080 Ti) | |
| MSI Raider GE66 12UHS | |
| Medio Intel Core i9-12900HK (841 - 3504, n=15) | |
| MSI GE66 Raider 10SFS | |
| Razer Blade 15 2022 | |
| AIDA64 / CPU Queen | |
| Media de la clase Gaming (49785 - 173351, n=101, últimos 2 años) | |
| MSI Raider GE66 12UHS | |
| Lenovo Legion 5 Pro 16 G7 i7 RTX 3070Ti | |
| Schenker XMG Neo 15 E22 (Early 2022, RTX 3080 Ti) | |
| Medio Intel Core i9-12900HK (60202 - 107161, n=15) | |
| MSI GE66 Raider 10SFS | |
| Razer Blade 15 2022 | |
| AIDA64 / FPU SinJulia | |
| Media de la clase Gaming (4424 - 33636, n=110, últimos 2 años) | |
| MSI GE66 Raider 10SFS | |
| Schenker XMG Neo 15 E22 (Early 2022, RTX 3080 Ti) | |
| Lenovo Legion 5 Pro 16 G7 i7 RTX 3070Ti | |
| MSI Raider GE66 12UHS | |
| Razer Blade 15 2022 | |
| Medio Intel Core i9-12900HK (3225 - 10402, n=15) | |
| AIDA64 / FPU Mandel | |
| Media de la clase Gaming (25115 - 128721, n=110, últimos 2 años) | |
| MSI GE66 Raider 10SFS | |
| Lenovo Legion 5 Pro 16 G7 i7 RTX 3070Ti | |
| Schenker XMG Neo 15 E22 (Early 2022, RTX 3080 Ti) | |
| Medio Intel Core i9-12900HK (7417 - 34233, n=15) | |
| MSI Raider GE66 12UHS | |
| Razer Blade 15 2022 | |
| AIDA64 / CPU AES | |
| Media de la clase Gaming (39258 - 247074, n=110, últimos 2 años) | |
| Lenovo Legion 5 Pro 16 G7 i7 RTX 3070Ti | |
| MSI Raider GE66 12UHS | |
| Medio Intel Core i9-12900HK (32382 - 112498, n=15) | |
| Schenker XMG Neo 15 E22 (Early 2022, RTX 3080 Ti) | |
| Razer Blade 15 2022 | |
| MSI GE66 Raider 10SFS | |
| AIDA64 / CPU ZLib | |
| Media de la clase Gaming (574 - 2531, n=110, últimos 2 años) | |
| Lenovo Legion 5 Pro 16 G7 i7 RTX 3070Ti | |
| Schenker XMG Neo 15 E22 (Early 2022, RTX 3080 Ti) | |
| MSI Raider GE66 12UHS | |
| Medio Intel Core i9-12900HK (314 - 1209, n=15) | |
| Razer Blade 15 2022 | |
| MSI GE66 Raider 10SFS | |
| AIDA64 / FP64 Ray-Trace | |
| Media de la clase Gaming (5509 - 45446, n=110, últimos 2 años) | |
| MSI GE66 Raider 10SFS | |
| Lenovo Legion 5 Pro 16 G7 i7 RTX 3070Ti | |
| Schenker XMG Neo 15 E22 (Early 2022, RTX 3080 Ti) | |
| Medio Intel Core i9-12900HK (1501 - 7616, n=15) | |
| MSI Raider GE66 12UHS | |
| Razer Blade 15 2022 | |
| AIDA64 / CPU PhotoWorxx | |
| Media de la clase Gaming (12271 - 89891, n=110, últimos 2 años) | |
| Razer Blade 15 2022 | |
| MSI Raider GE66 12UHS | |
| Schenker XMG Neo 15 E22 (Early 2022, RTX 3080 Ti) | |
| Medio Intel Core i9-12900HK (24446 - 42462, n=15) | |
| Lenovo Legion 5 Pro 16 G7 i7 RTX 3070Ti | |
| MSI GE66 Raider 10SFS | |
Rendimiento del sistema
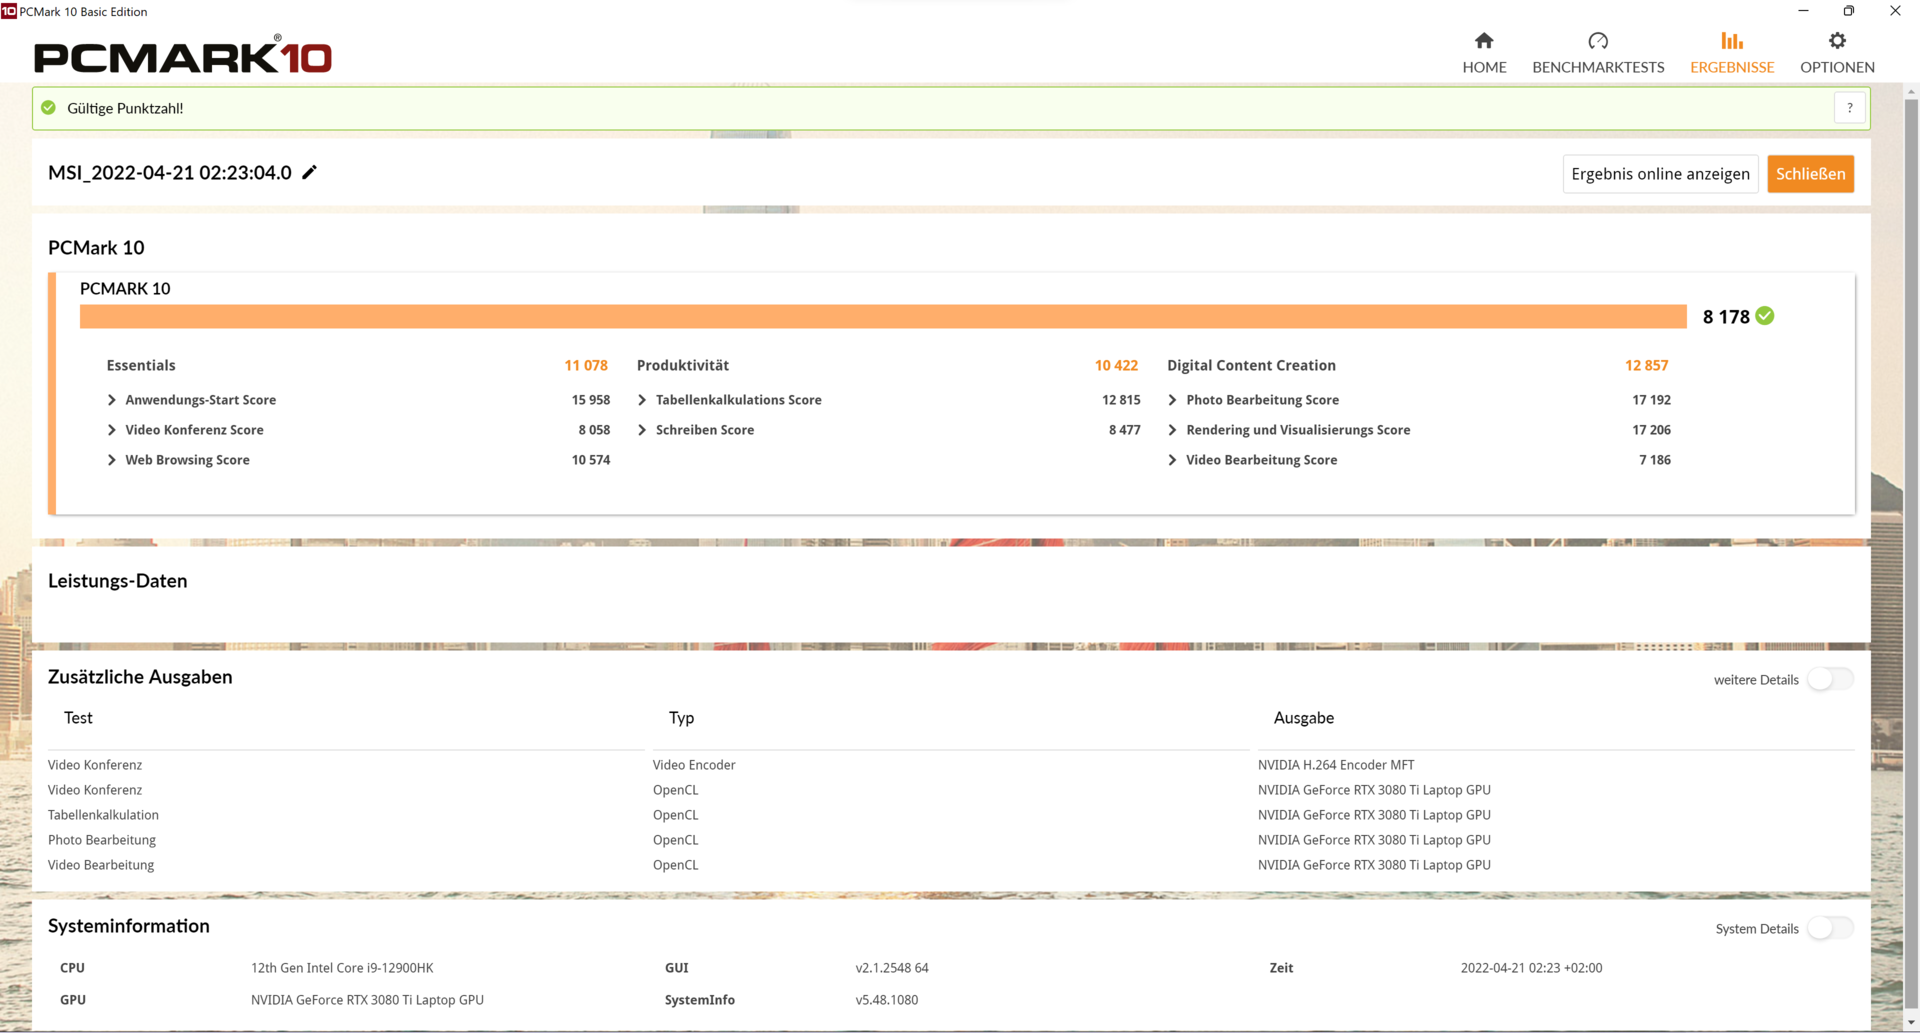
Como se esperaba, el rendimiento del sistema resulta ser alto. Nuestro MSI GE66 12UHS limpia el suelo con la competencia y muestra un excelente rendimiento en todas las categorías probadas
CrossMark: Overall | Productivity | Creativity | Responsiveness
| PCMark 10 / Score | |
| Media de la clase Gaming (5828 - 11574, n=96, últimos 2 años) | |
| MSI Raider GE66 12UHS | |
| Medio Intel Core i9-12900HK, NVIDIA GeForce RTX 3080 Ti Laptop GPU (7149 - 8186, n=5) | |
| Razer Blade 15 2022 | |
| Lenovo Legion 5 Pro 16 G7 i7 RTX 3070Ti | |
| Schenker XMG Neo 15 E22 (Early 2022, RTX 3080 Ti) | |
| MSI GE66 Raider 10SFS | |
| PCMark 10 / Essentials | |
| MSI Raider GE66 12UHS | |
| Medio Intel Core i9-12900HK, NVIDIA GeForce RTX 3080 Ti Laptop GPU (9870 - 11205, n=5) | |
| Razer Blade 15 2022 | |
| Media de la clase Gaming (8810 - 12600, n=100, últimos 2 años) | |
| Schenker XMG Neo 15 E22 (Early 2022, RTX 3080 Ti) | |
| Lenovo Legion 5 Pro 16 G7 i7 RTX 3070Ti | |
| MSI GE66 Raider 10SFS | |
| PCMark 10 / Productivity | |
| Media de la clase Gaming (6845 - 18766, n=98, últimos 2 años) | |
| MSI Raider GE66 12UHS | |
| Medio Intel Core i9-12900HK, NVIDIA GeForce RTX 3080 Ti Laptop GPU (9173 - 10422, n=5) | |
| Lenovo Legion 5 Pro 16 G7 i7 RTX 3070Ti | |
| Razer Blade 15 2022 | |
| Schenker XMG Neo 15 E22 (Early 2022, RTX 3080 Ti) | |
| MSI GE66 Raider 10SFS | |
| PCMark 10 / Digital Content Creation | |
| Media de la clase Gaming (7602 - 19657, n=98, últimos 2 años) | |
| MSI Raider GE66 12UHS | |
| Medio Intel Core i9-12900HK, NVIDIA GeForce RTX 3080 Ti Laptop GPU (10951 - 13098, n=5) | |
| Razer Blade 15 2022 | |
| Lenovo Legion 5 Pro 16 G7 i7 RTX 3070Ti | |
| Schenker XMG Neo 15 E22 (Early 2022, RTX 3080 Ti) | |
| MSI GE66 Raider 10SFS | |
| CrossMark / Overall | |
| Media de la clase Gaming (1366 - 2409, n=98, últimos 2 años) | |
| Lenovo Legion 5 Pro 16 G7 i7 RTX 3070Ti | |
| Medio Intel Core i9-12900HK, NVIDIA GeForce RTX 3080 Ti Laptop GPU (970 - 2138, n=5) | |
| CrossMark / Productivity | |
| Lenovo Legion 5 Pro 16 G7 i7 RTX 3070Ti | |
| Media de la clase Gaming (1386 - 2254, n=98, últimos 2 años) | |
| Medio Intel Core i9-12900HK, NVIDIA GeForce RTX 3080 Ti Laptop GPU (921 - 2038, n=5) | |
| CrossMark / Creativity | |
| Media de la clase Gaming (1343 - 2729, n=98, últimos 2 años) | |
| Lenovo Legion 5 Pro 16 G7 i7 RTX 3070Ti | |
| Medio Intel Core i9-12900HK, NVIDIA GeForce RTX 3080 Ti Laptop GPU (1007 - 2210, n=5) | |
| CrossMark / Responsiveness | |
| Lenovo Legion 5 Pro 16 G7 i7 RTX 3070Ti | |
| Medio Intel Core i9-12900HK, NVIDIA GeForce RTX 3080 Ti Laptop GPU (1012 - 2234, n=5) | |
| Media de la clase Gaming (1226 - 2334, n=98, últimos 2 años) | |
| PCMark 10 Score | 8178 puntos | |
ayuda | ||
| AIDA64 / Memory Copy | |
| Media de la clase Gaming (21750 - 129946, n=110, últimos 2 años) | |
| Schenker XMG Neo 15 E22 (Early 2022, RTX 3080 Ti) | |
| MSI Raider GE66 12UHS | |
| Razer Blade 15 2022 | |
| Medio Intel Core i9-12900HK (42967 - 62959, n=15) | |
| Lenovo Legion 5 Pro 16 G7 i7 RTX 3070Ti | |
| MSI GE66 Raider 10SFS | |
| AIDA64 / Memory Read | |
| Media de la clase Gaming (22956 - 118858, n=110, últimos 2 años) | |
| MSI Raider GE66 12UHS | |
| Schenker XMG Neo 15 E22 (Early 2022, RTX 3080 Ti) | |
| Razer Blade 15 2022 | |
| Medio Intel Core i9-12900HK (44419 - 66989, n=15) | |
| Lenovo Legion 5 Pro 16 G7 i7 RTX 3070Ti | |
| MSI GE66 Raider 10SFS | |
| AIDA64 / Memory Write | |
| Media de la clase Gaming (22297 - 135096, n=110, últimos 2 años) | |
| Razer Blade 15 2022 | |
| Schenker XMG Neo 15 E22 (Early 2022, RTX 3080 Ti) | |
| MSI Raider GE66 12UHS | |
| Lenovo Legion 5 Pro 16 G7 i7 RTX 3070Ti | |
| Medio Intel Core i9-12900HK (42144 - 65268, n=15) | |
| MSI GE66 Raider 10SFS | |
| AIDA64 / Memory Latency | |
| Media de la clase Gaming (75.3 - 259, n=110, últimos 2 años) | |
| Lenovo Legion 5 Pro 16 G7 i7 RTX 3070Ti | |
| MSI Raider GE66 12UHS | |
| Medio Intel Core i9-12900HK (79.9 - 109, n=15) | |
| MSI GE66 Raider 10SFS | |
| Schenker XMG Neo 15 E22 (Early 2022, RTX 3080 Ti) | |
| Razer Blade 15 2022 | |
* ... más pequeño es mejor
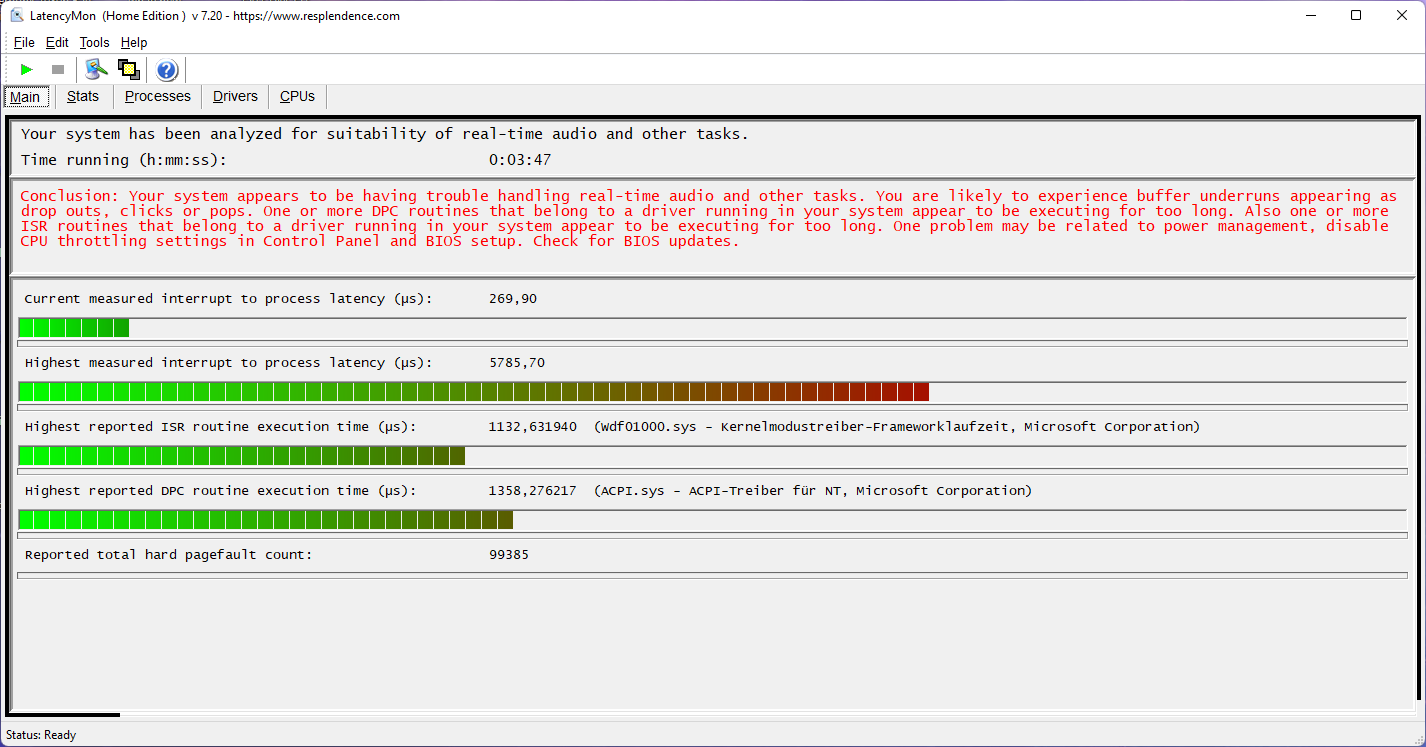
Latencias del CPD
Las pruebas de las latencias del CPD revelan que nuestro dispositivo de pruebas no es adecuado para el procesamiento de vídeo en tiempo real con los controladores y el software del sistema actuales. Se detectaron problemas de latencia tanto en el vídeo 4K de YouTube como en el procesamiento de audio en tiempo real
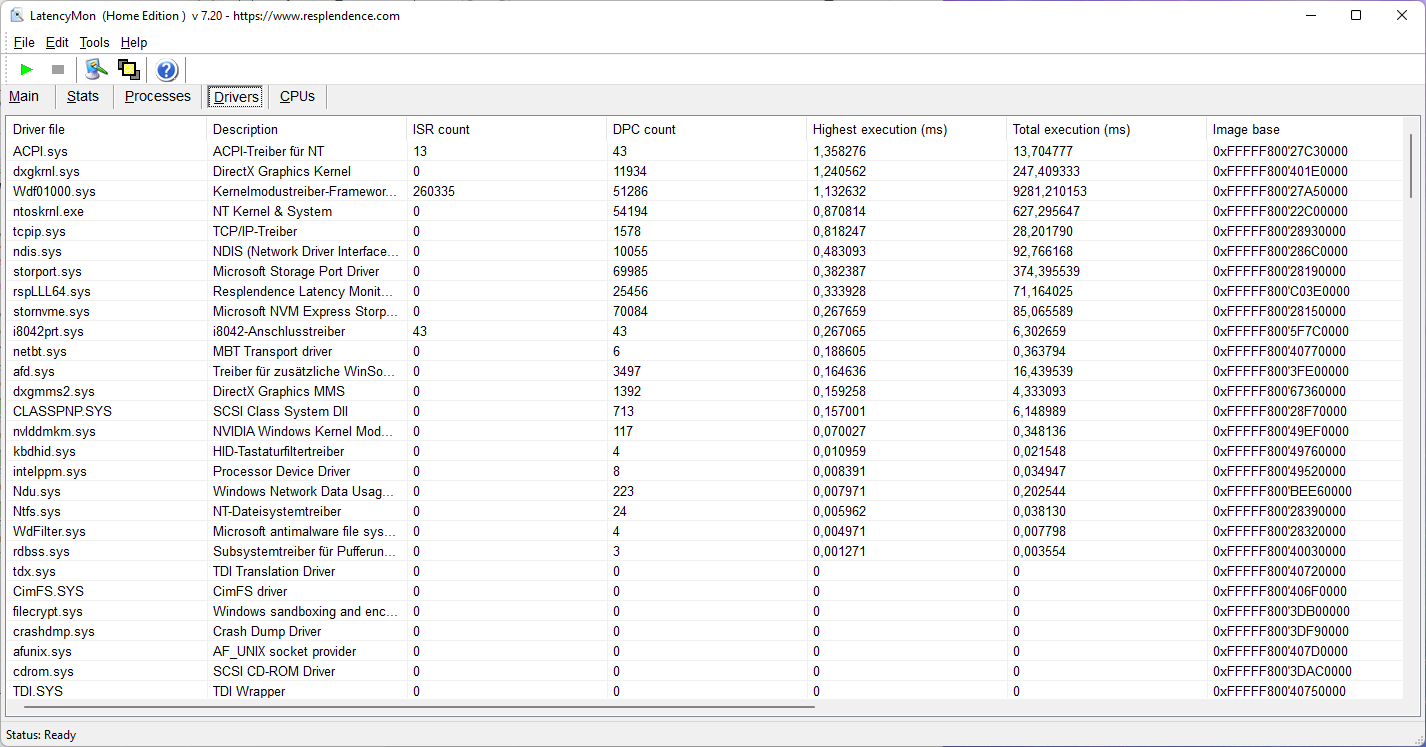
| DPC Latencies / LatencyMon - interrupt to process latency (max), Web, Youtube, Prime95 | |
| MSI Raider GE66 12UHS | |
| Razer Blade 15 2022 | |
| MSI GE66 Raider 10SFS | |
| Schenker XMG Neo 15 E22 (Early 2022, RTX 3080 Ti) | |
| Lenovo Legion 5 Pro 16 G7 i7 RTX 3070Ti | |
* ... más pequeño es mejor
Dispositivos de almacenamiento
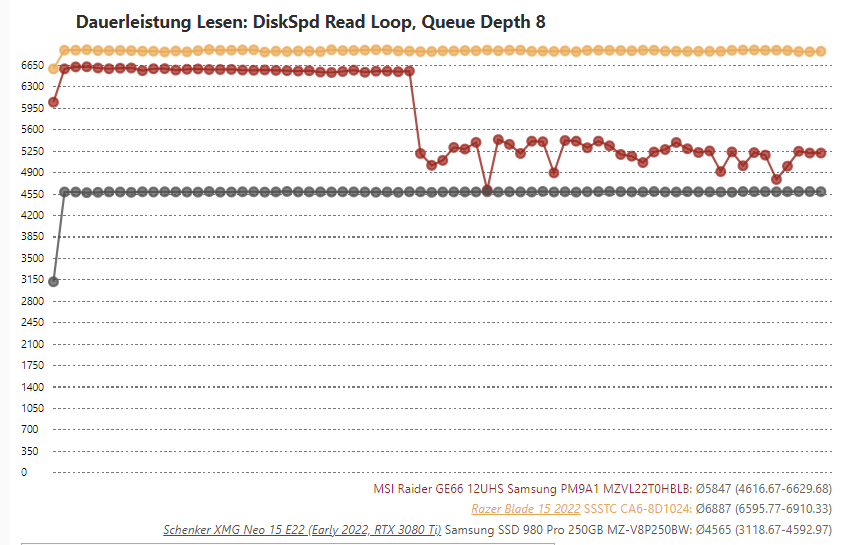
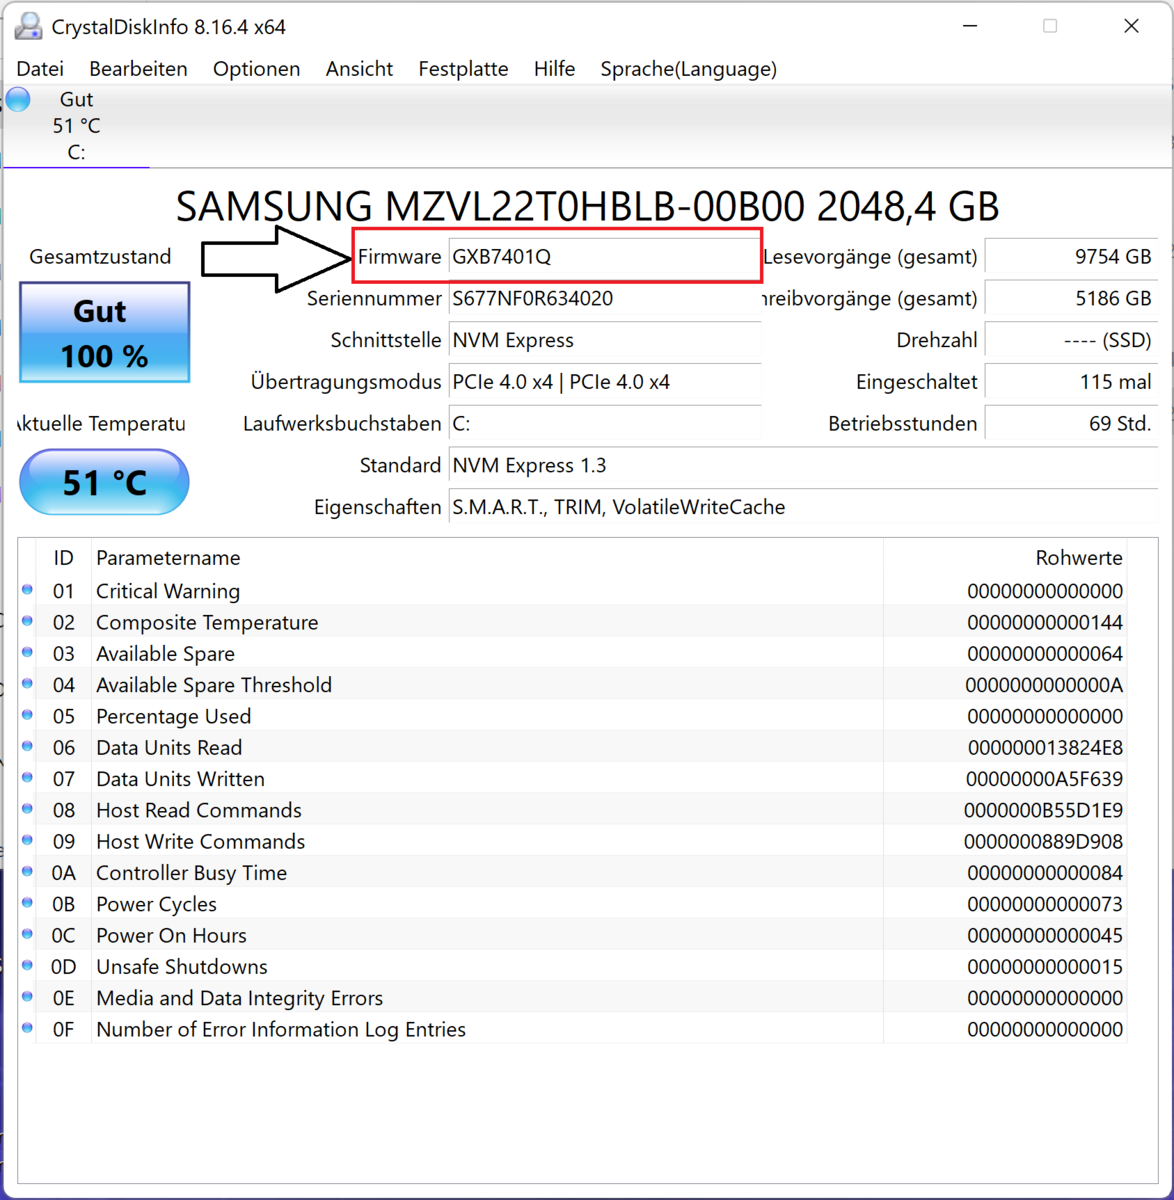
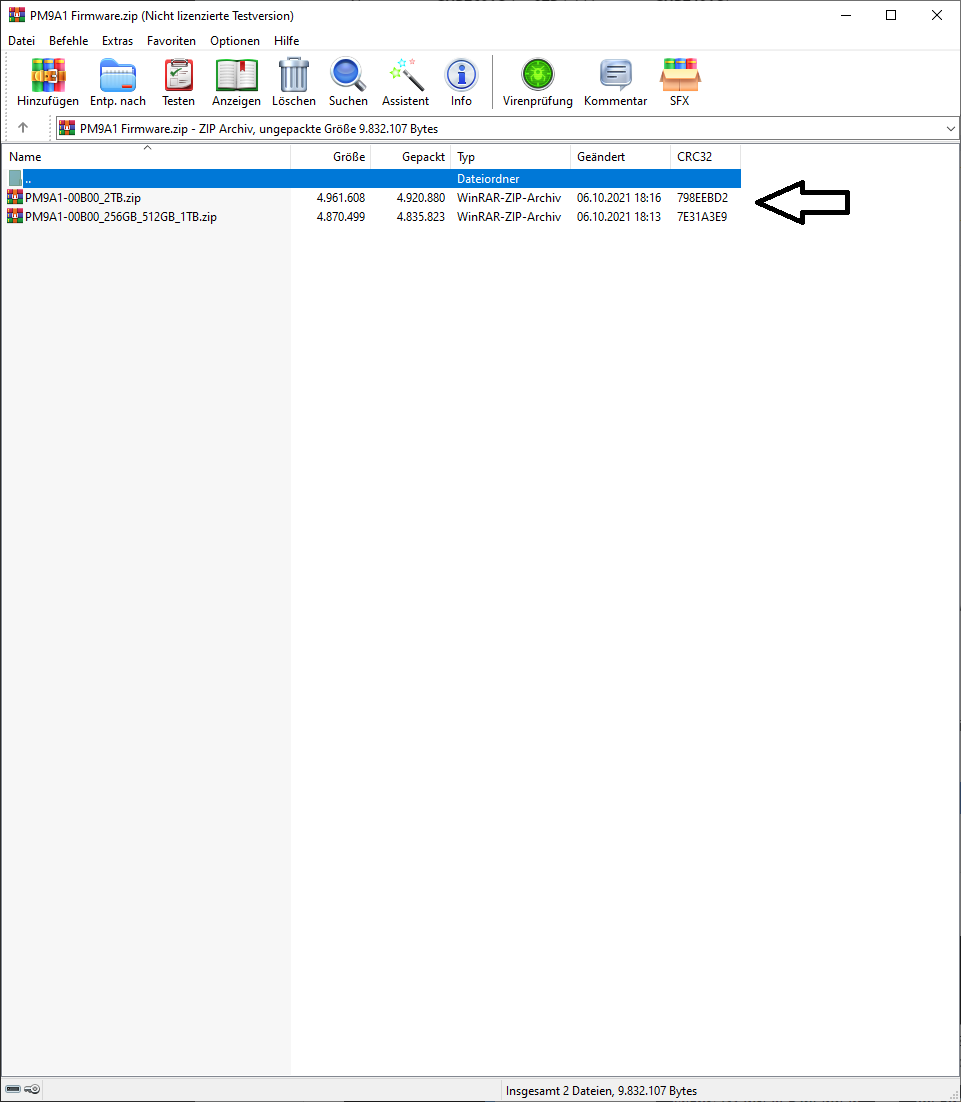
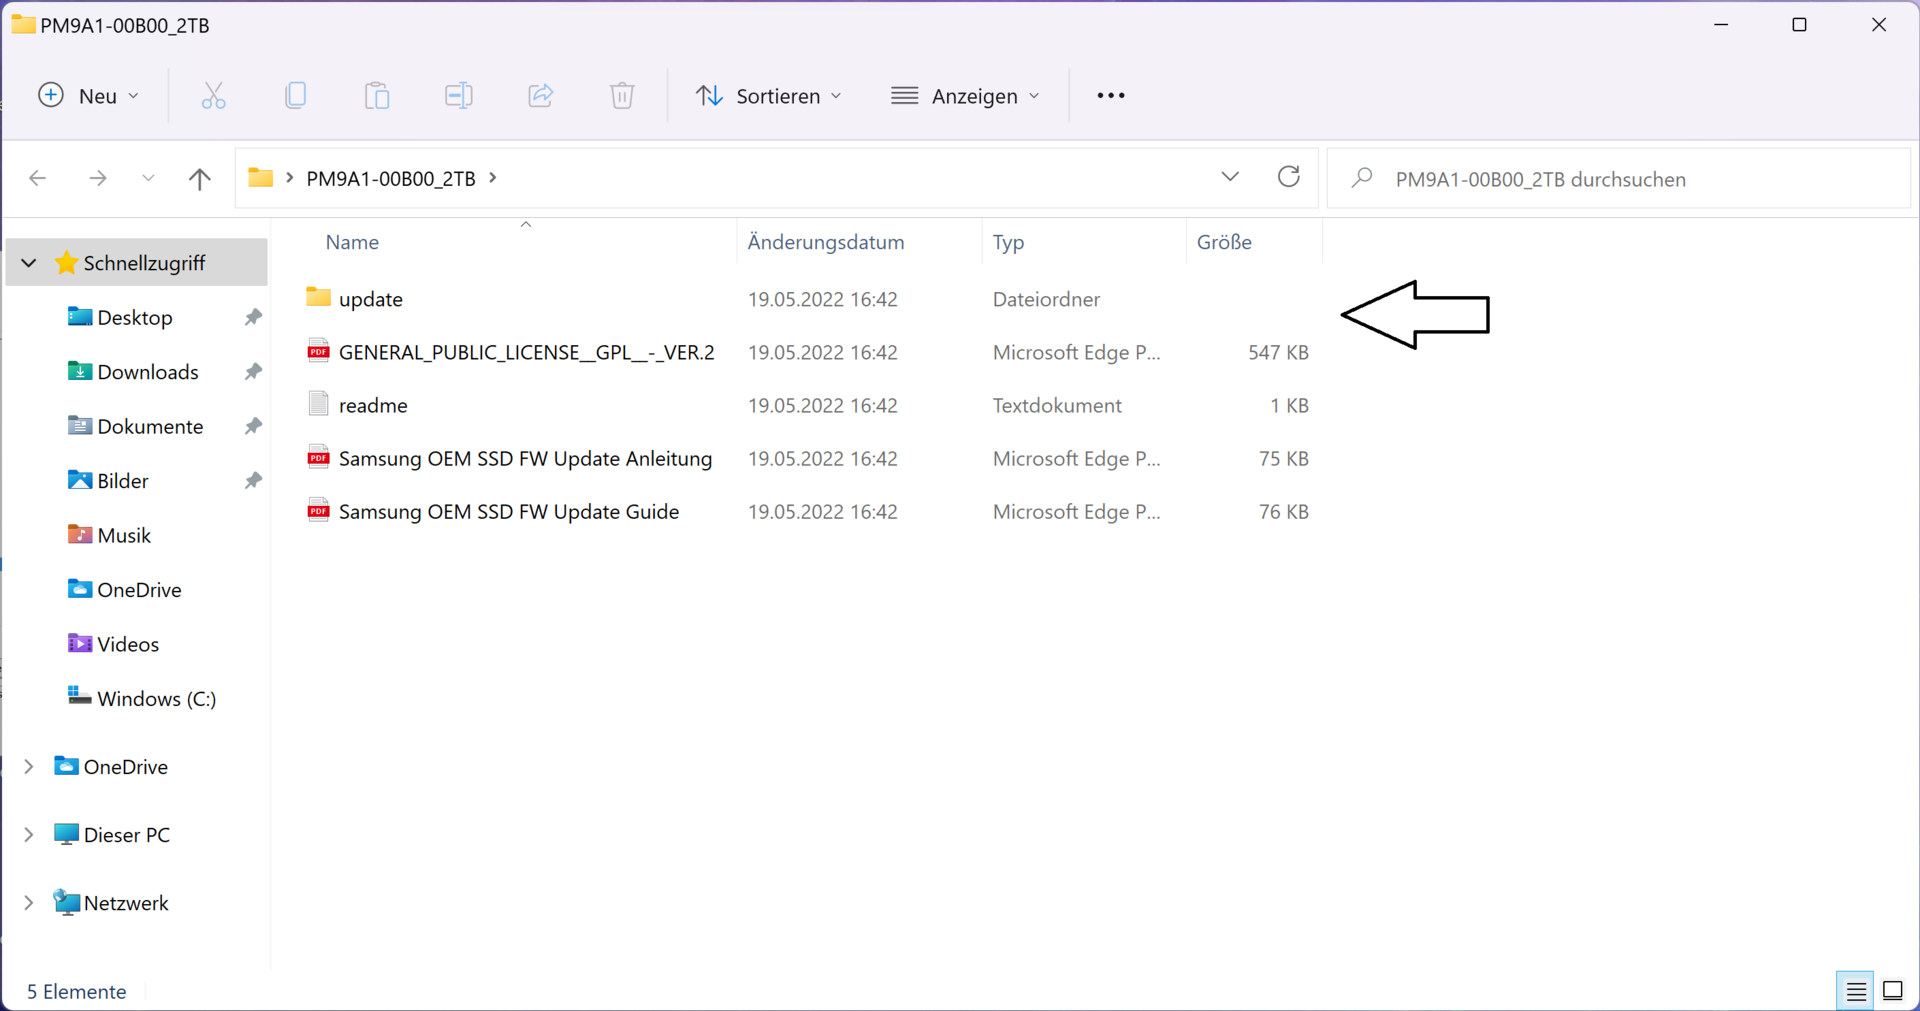
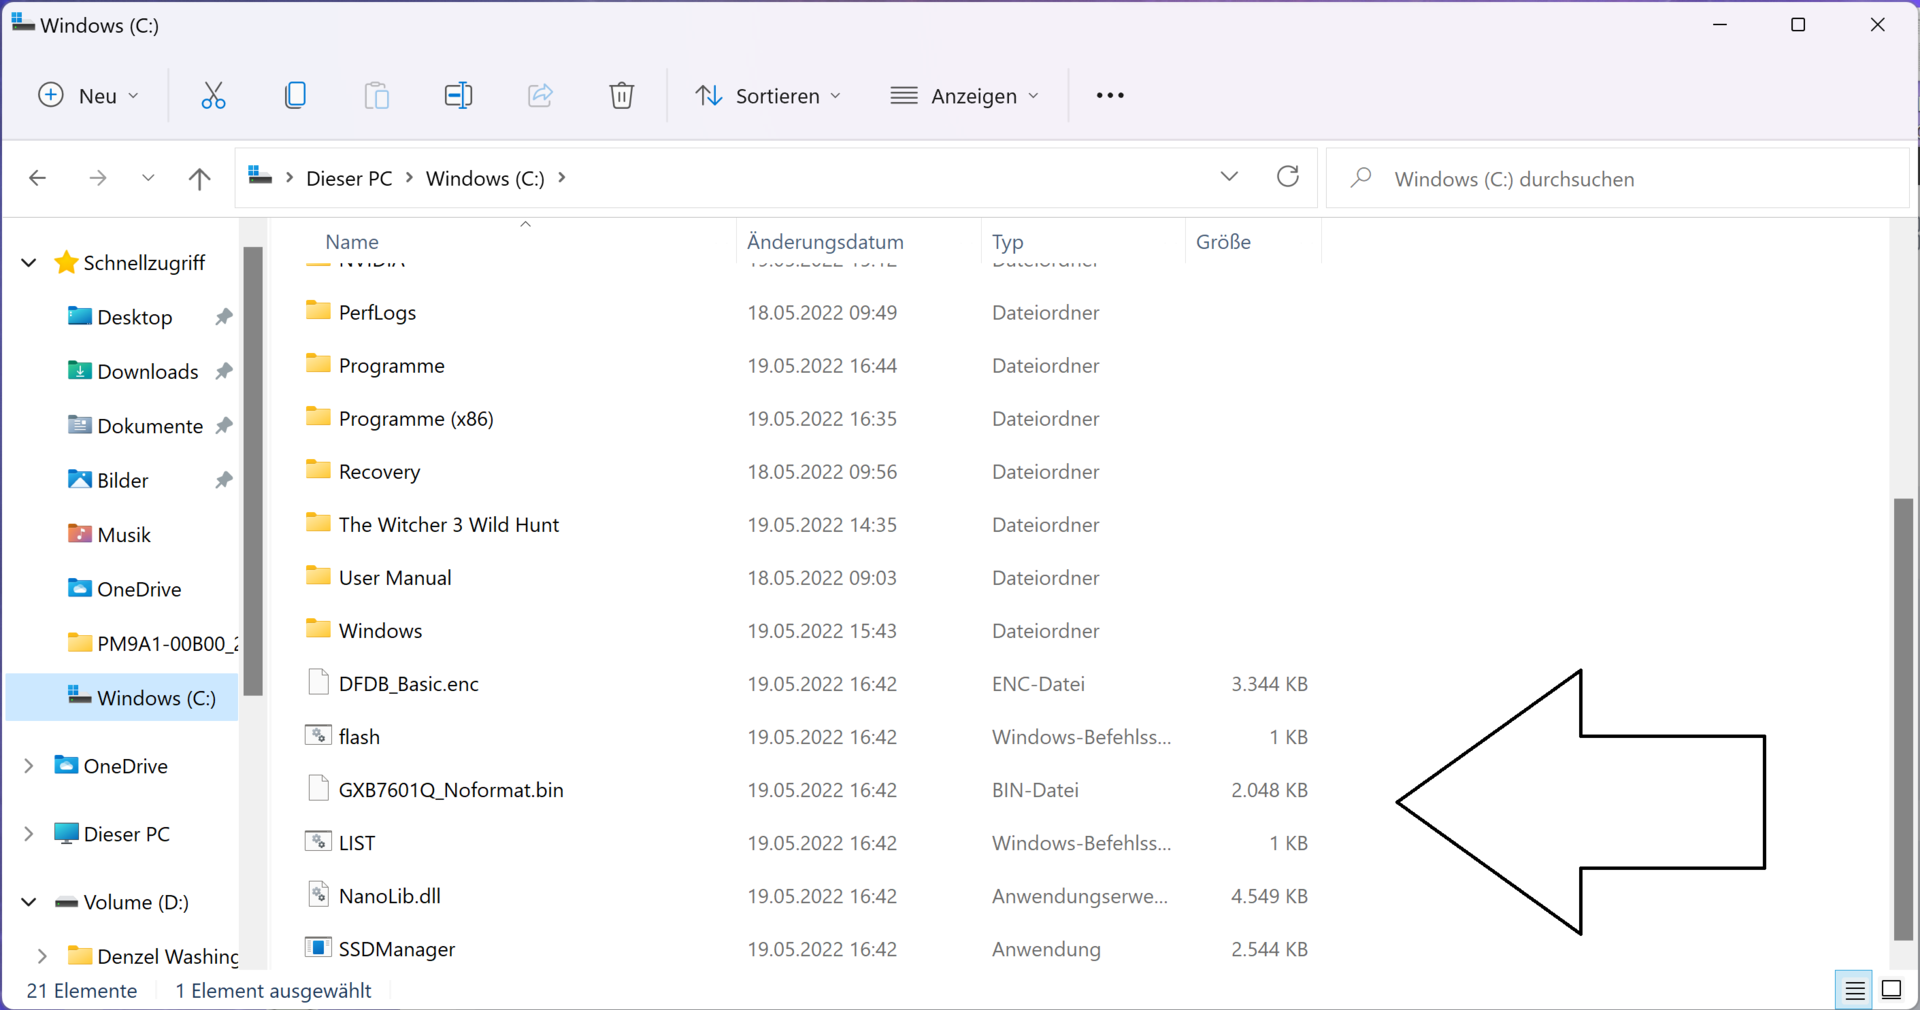
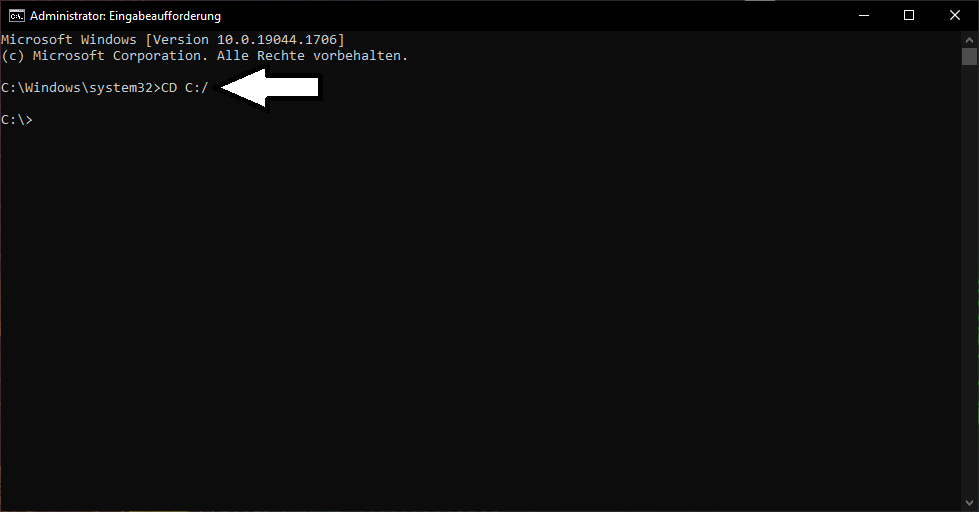
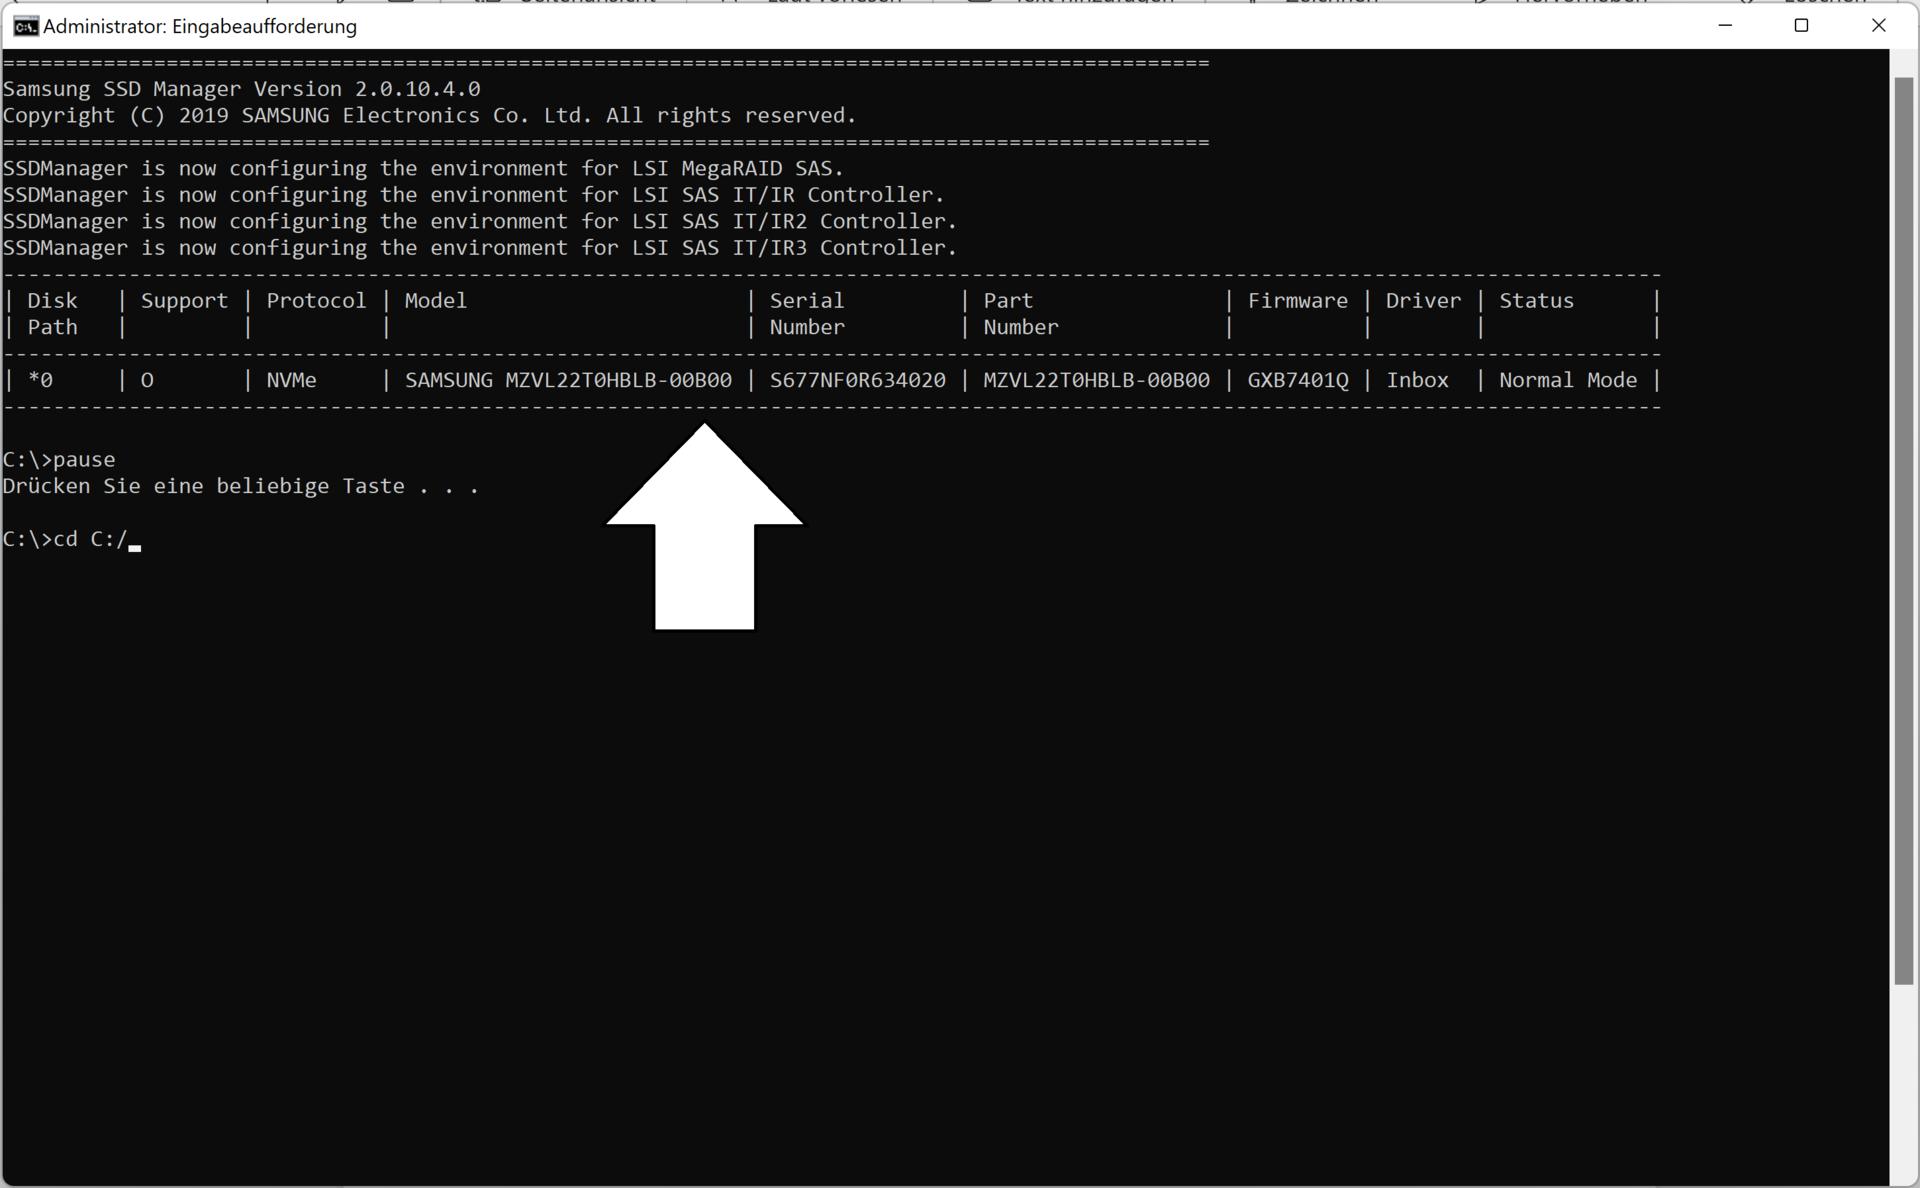
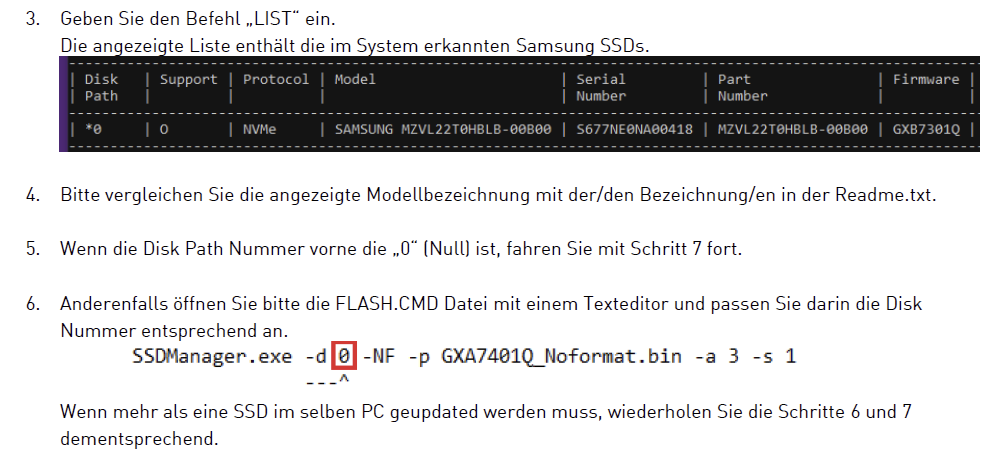
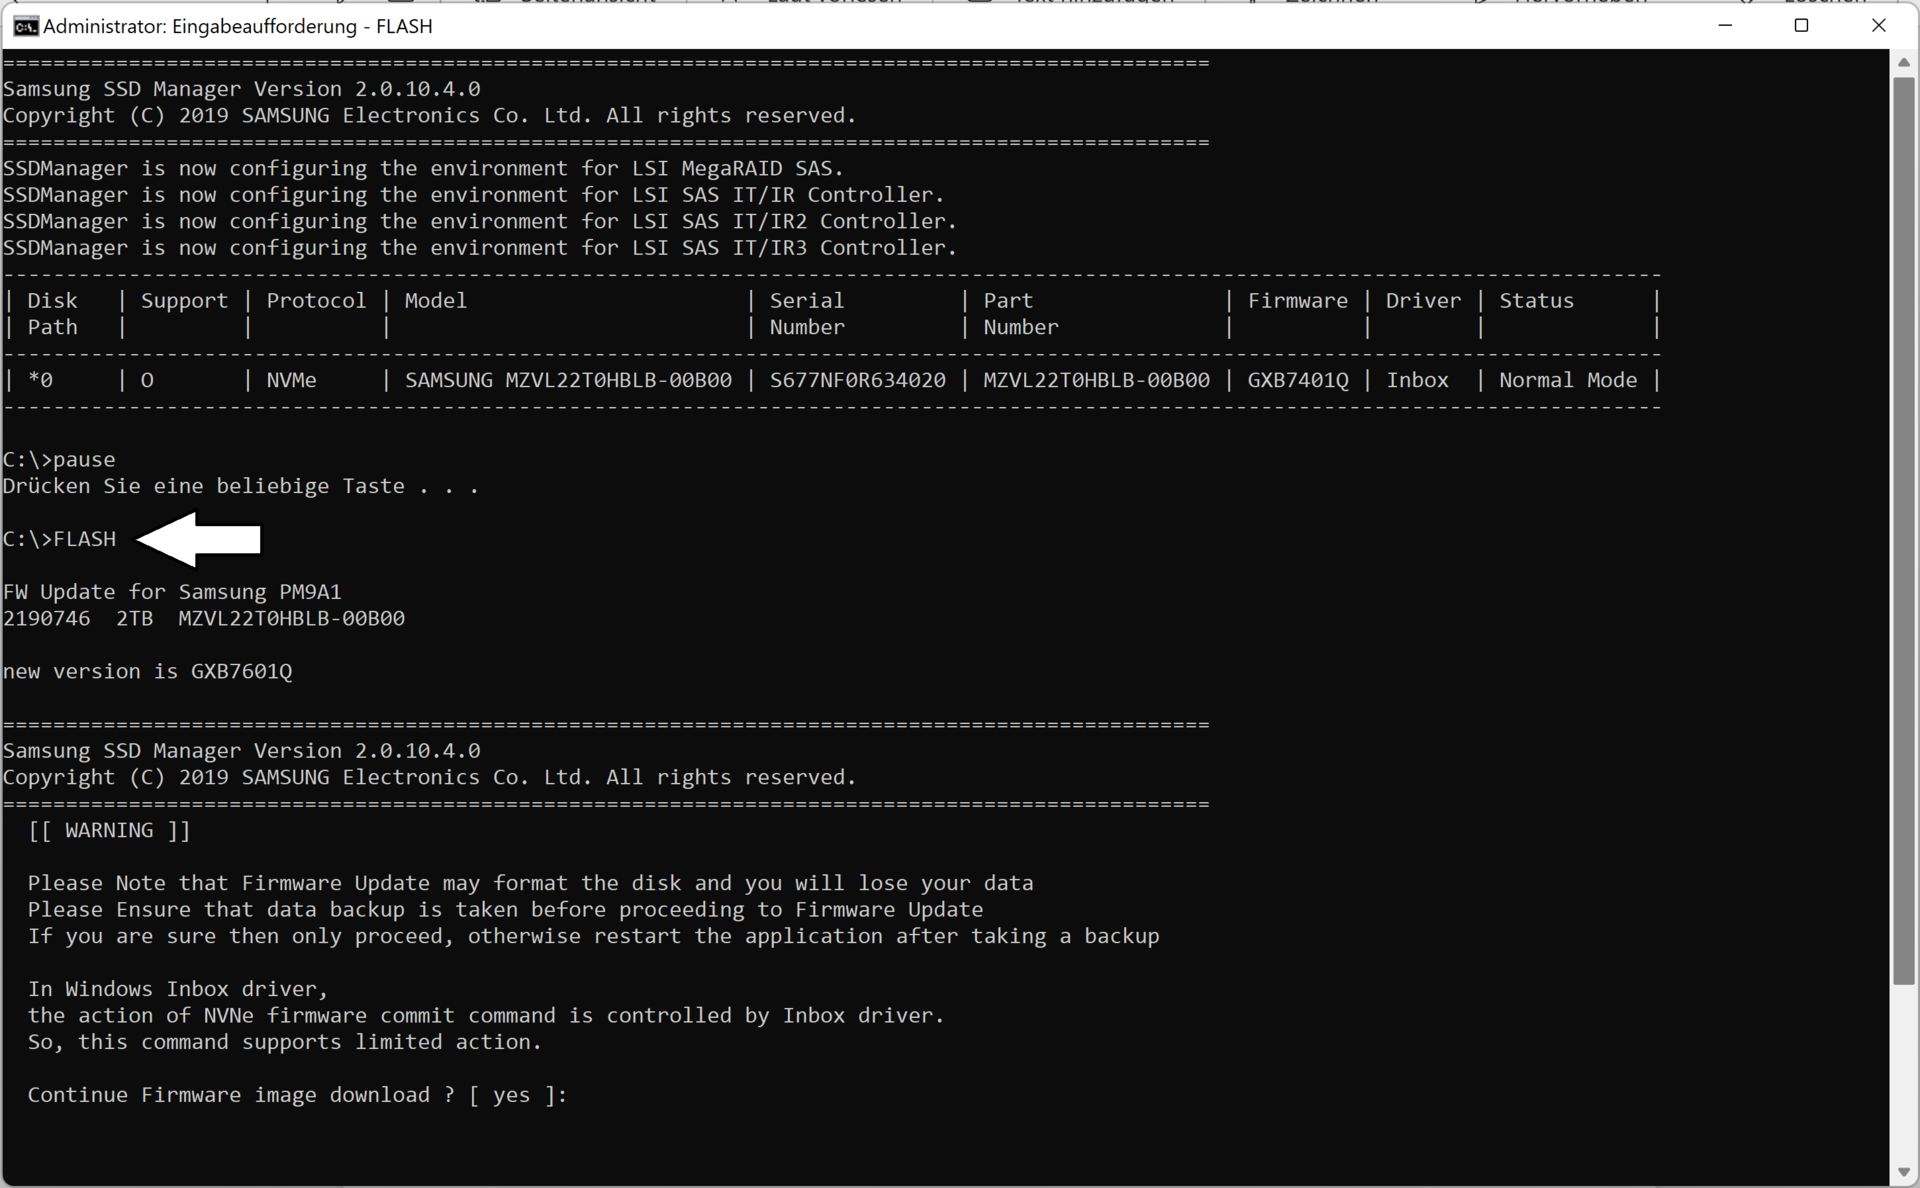
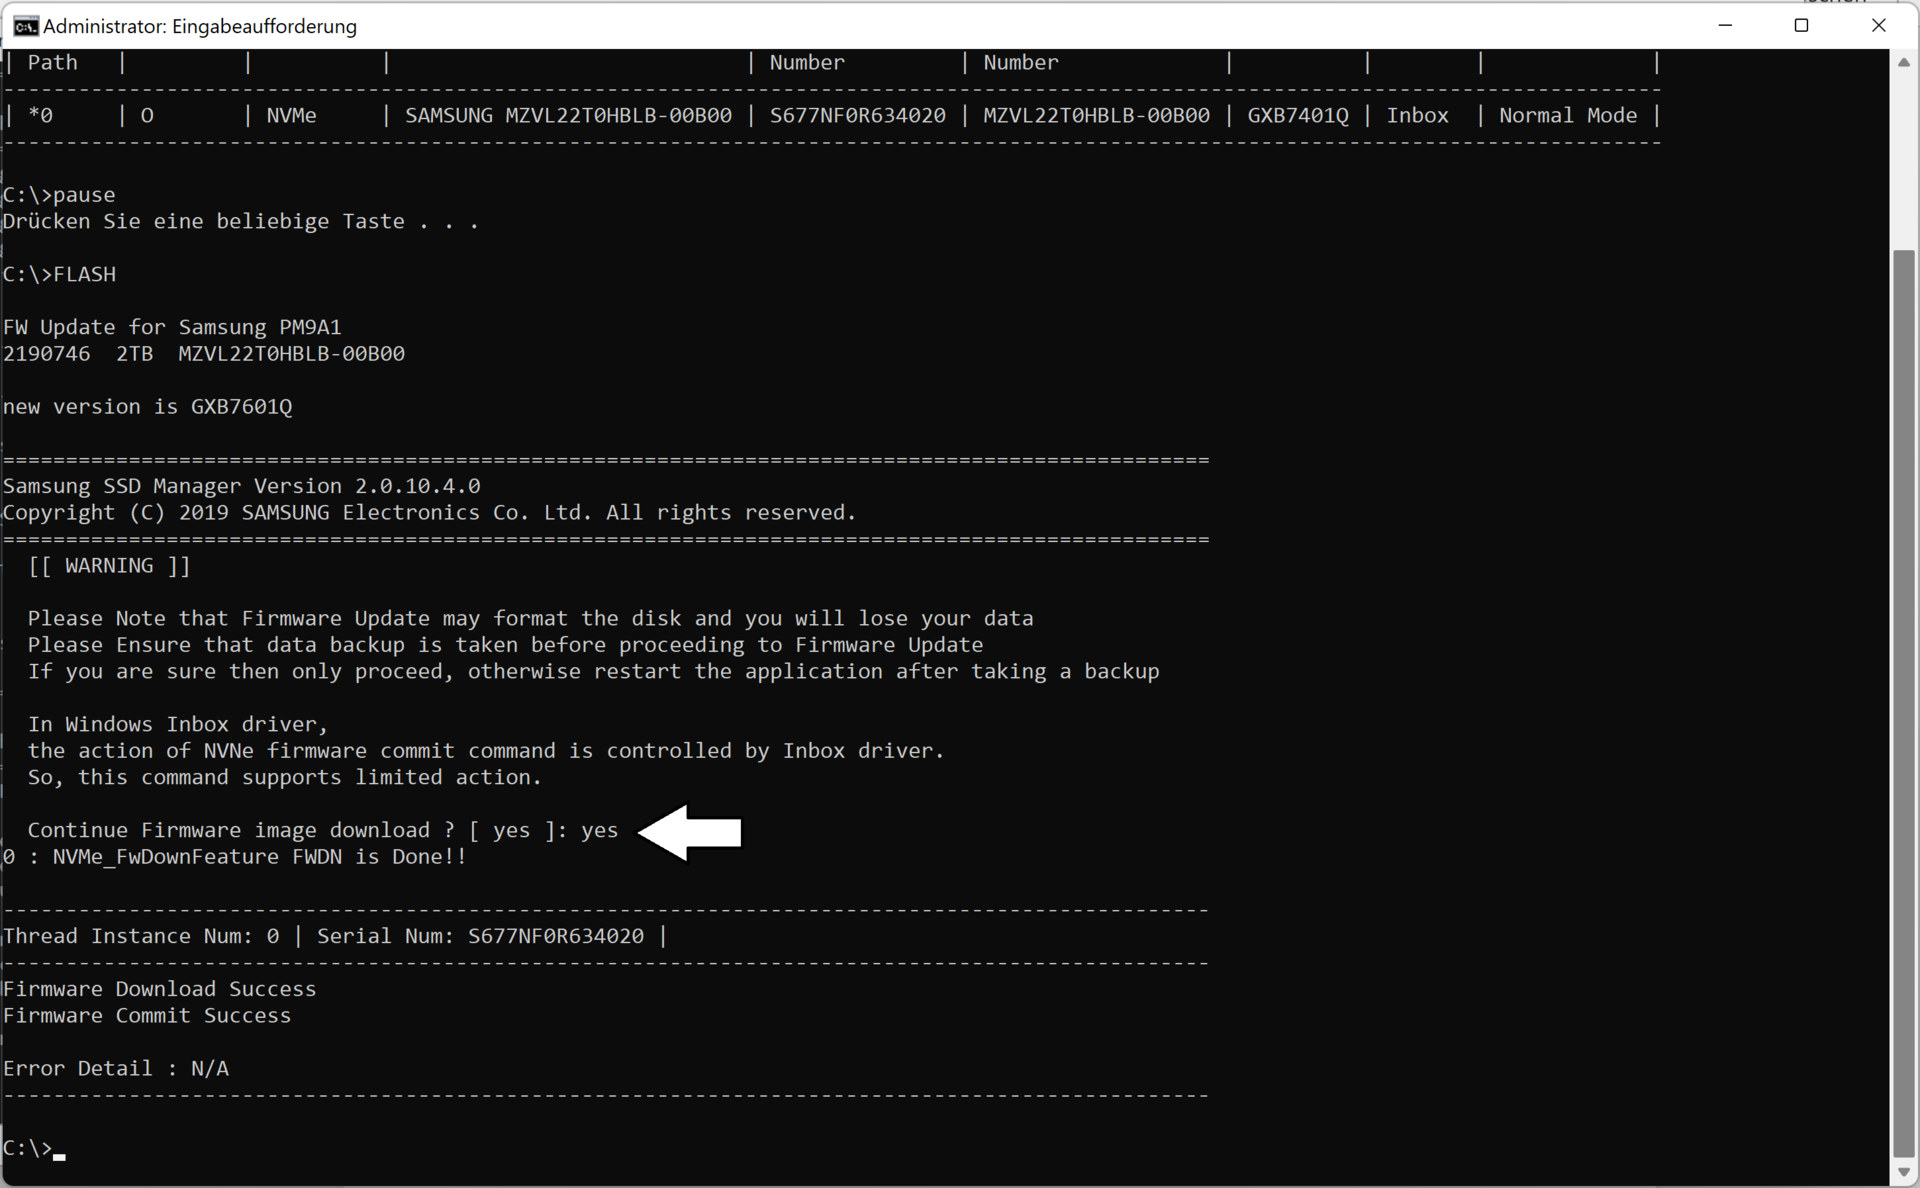
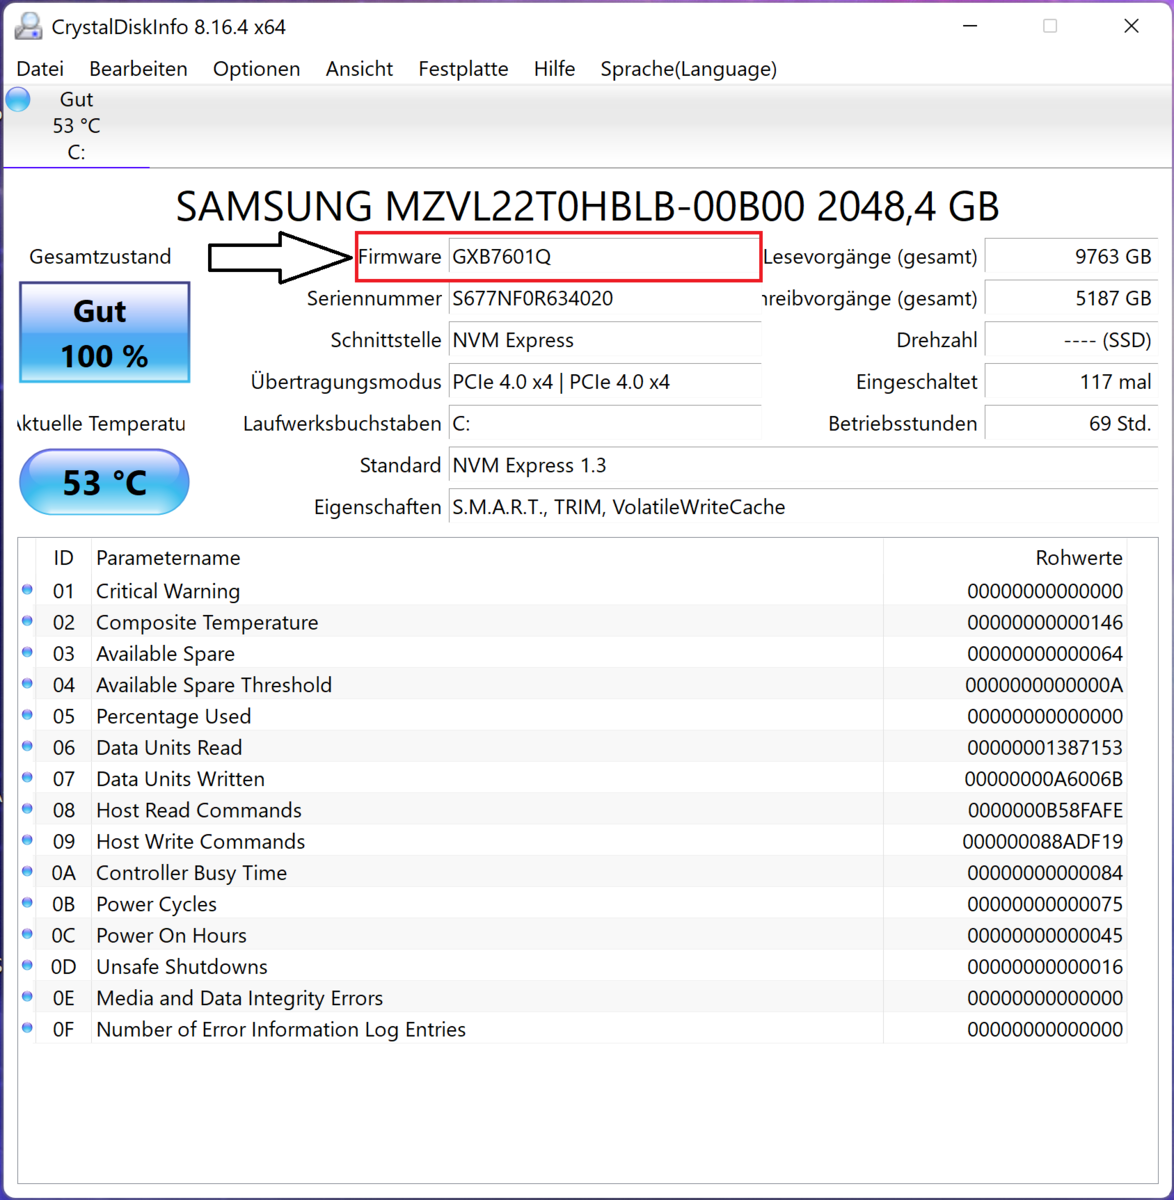
El SSD de 2 TB (designación PM9A1, homólogo OEM del Samsung Evo 980 Pro) instalado en nuestro sistema ofrece un rendimiento muy bueno y sólo es superado por la versión de 1 TB del mismo SSD, que también está instalado enLenovo Legion 5 Pro 16 G7. Sin embargo, nuestra prueba de velocidad de disco mostró una enorme caída de rendimiento que persistió durante todo el periodo de prueba. También observamos el mismo problema en nuestro análisis del Asus ROG Strix Scar 15 G533ZWequipado con el mismo SSD. MSI ha sido informada del problema.
Dos razones para los pobres valores: la principal es un problema con el firmware que no puede resolverse automáticamente a través de Windows o a través de la página de soporte de MSI. Para el firmware obsoleto (versión: GXB7401Q), ahora hay una solución con la que se puede actualizar a la versión actual (GXB7601Q) a través del símbolo del sistema. Lamentablemente, el controlador no se puede instalar a través del administrador de dispositivos. Una investigación más profunda reveló que este es un problema bien conocido del Samsung PM9A1 en los formatos de 256 GB, 512 GB, 1 TB y 2 TB.
La segunda causa de la caída del rendimiento del SDD durante cargas sostenidas más largas se debe a su refrigeración pasiva. No se puede refrigerar lo suficiente ni siquiera en el "Cooler Boost Mode", por lo que el controlador Samsung Elpis S4LV003, que es el corazón del SSD, empieza a ralentizarse a partir de los 74 grados Celsius. Los usuarios experimentados que tengan la suficiente confianza como para abrir su dispositivo podrán remediar el problema colocando una buena almohadilla térmica para SSDs debajo de la placa de refrigeración pasiva.
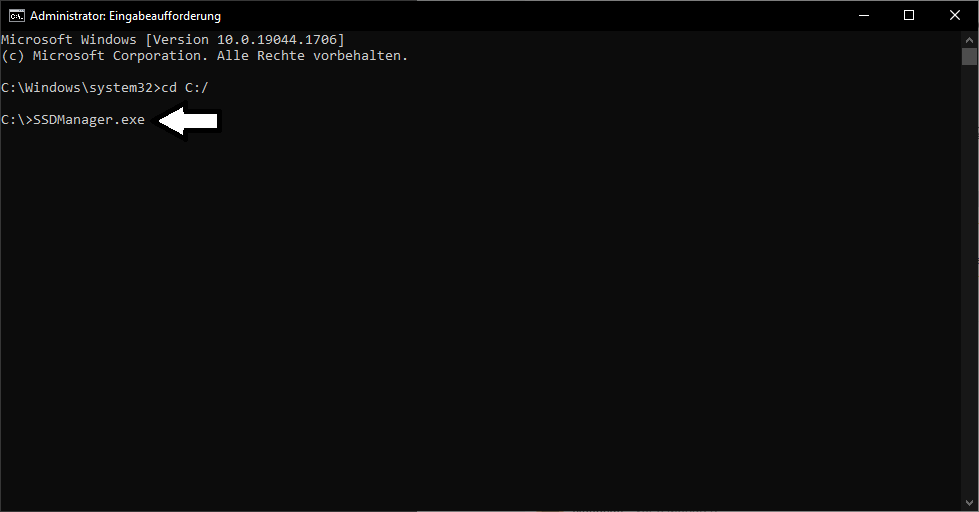
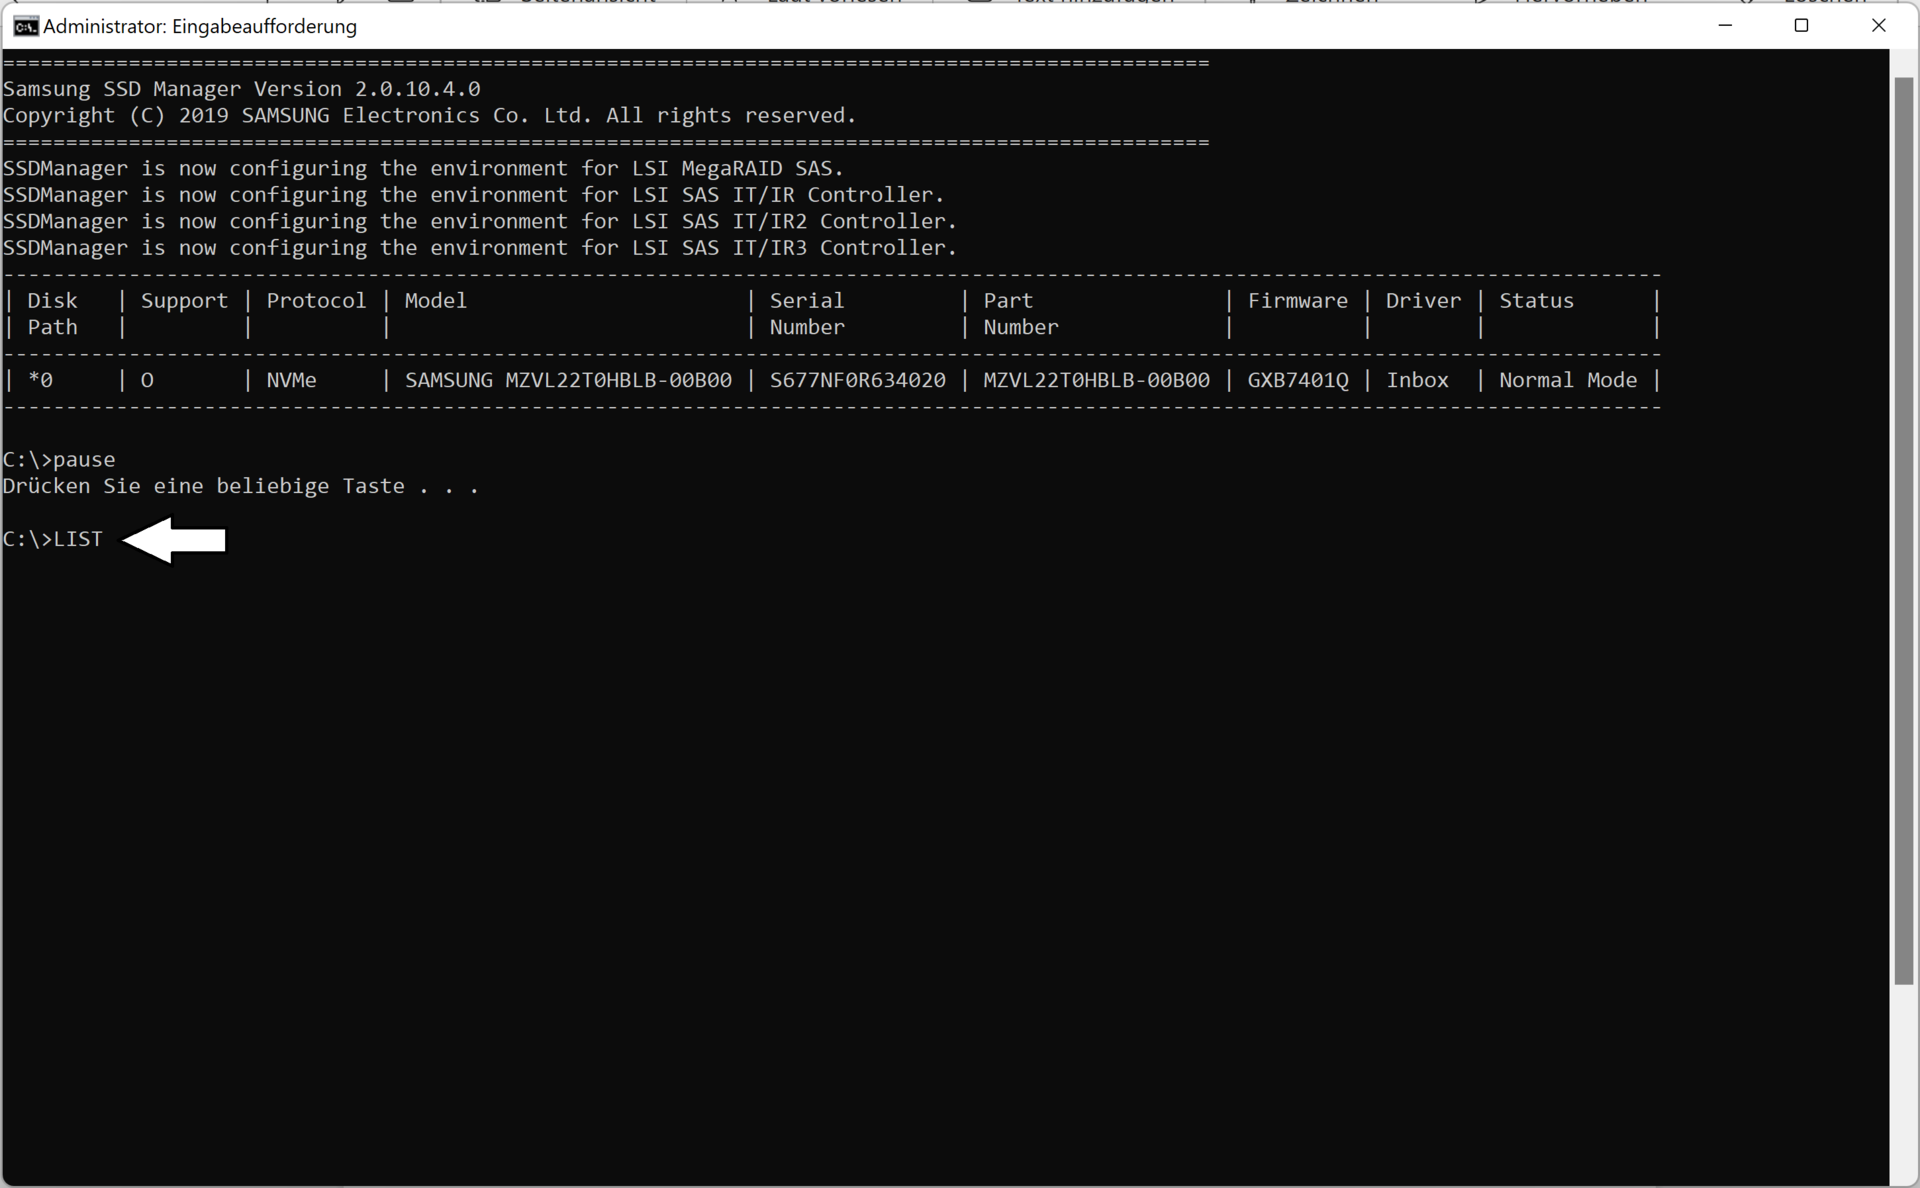
En la siguiente serie de imágenes, le mostramos cómo instalar la actualización sin pérdida de datos. El firmware se puede descargaraquí (fuente: Reddit)
. Precaución: El flasheo del firmware se realiza bajo su propio riesgo.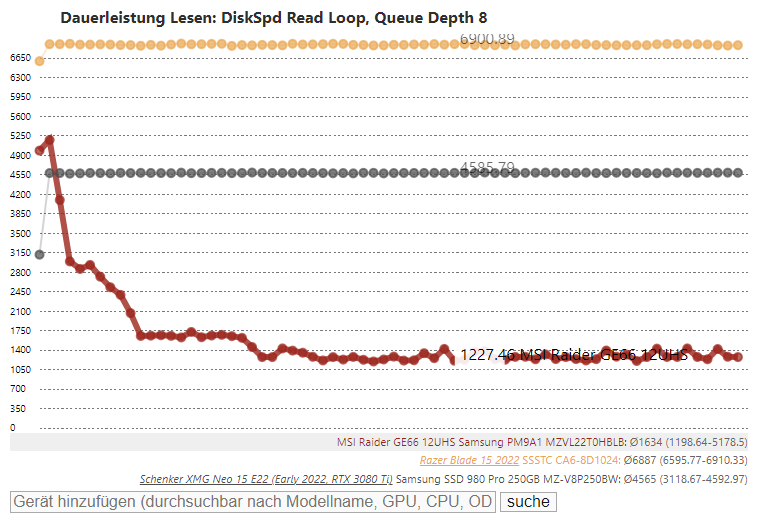

* ... más pequeño es mejor
Lectura sostenida antes de la actualización: bucle de lectura DiskSpd, profundidad de cola 8
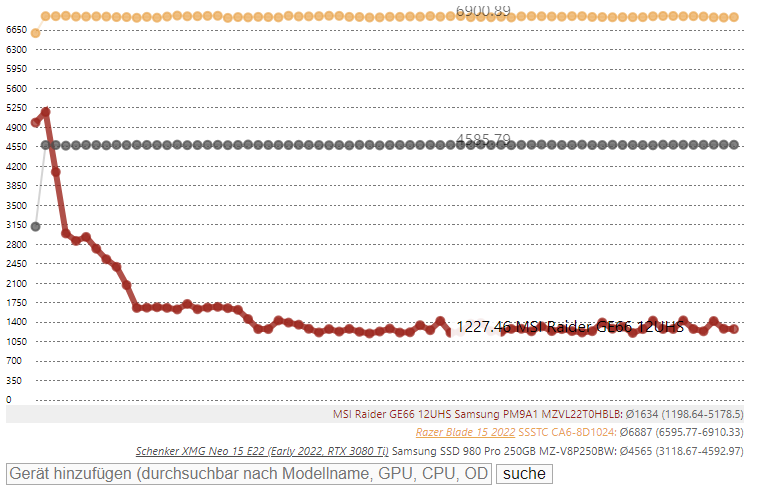
Sustained Read after the update: DiskSpd Read Loop, Queue Depth 8
Tarjeta gráfica
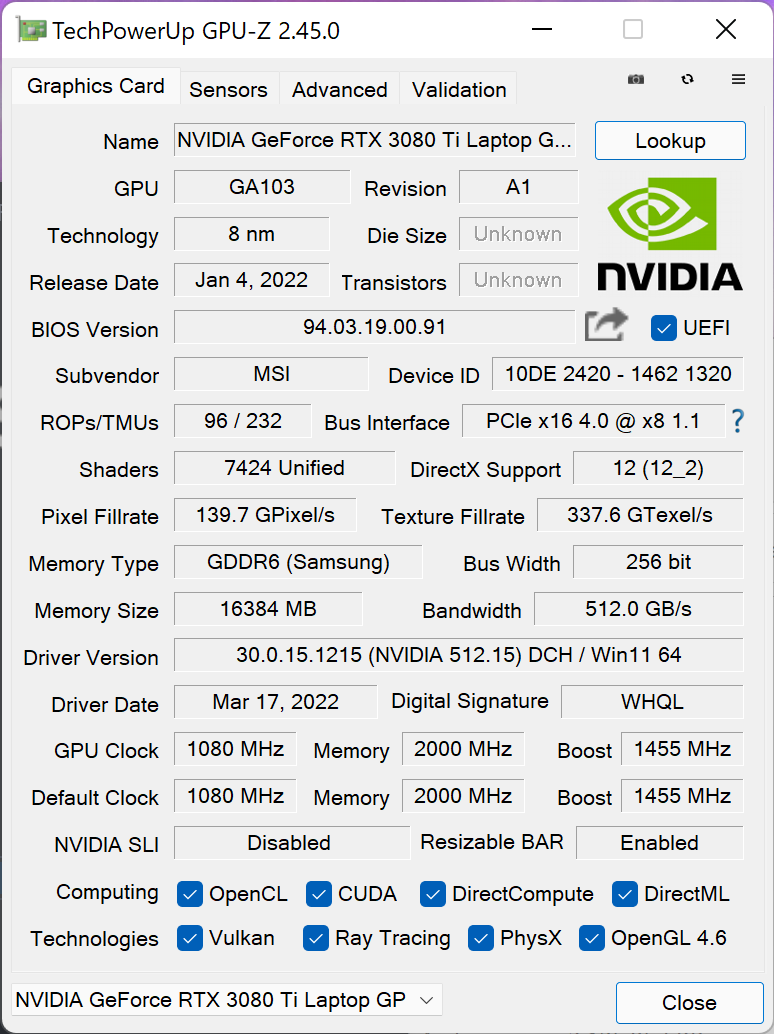
MSI usa la solución gráfica móvil más potente disponible actualmente en nuestro dispositivo de pruebas: la Nvidia Geforce RTX 3080 Ti, que viene con 16 GB de memoria GDDR6 y una potencia gráfica máxima de 150 watts.
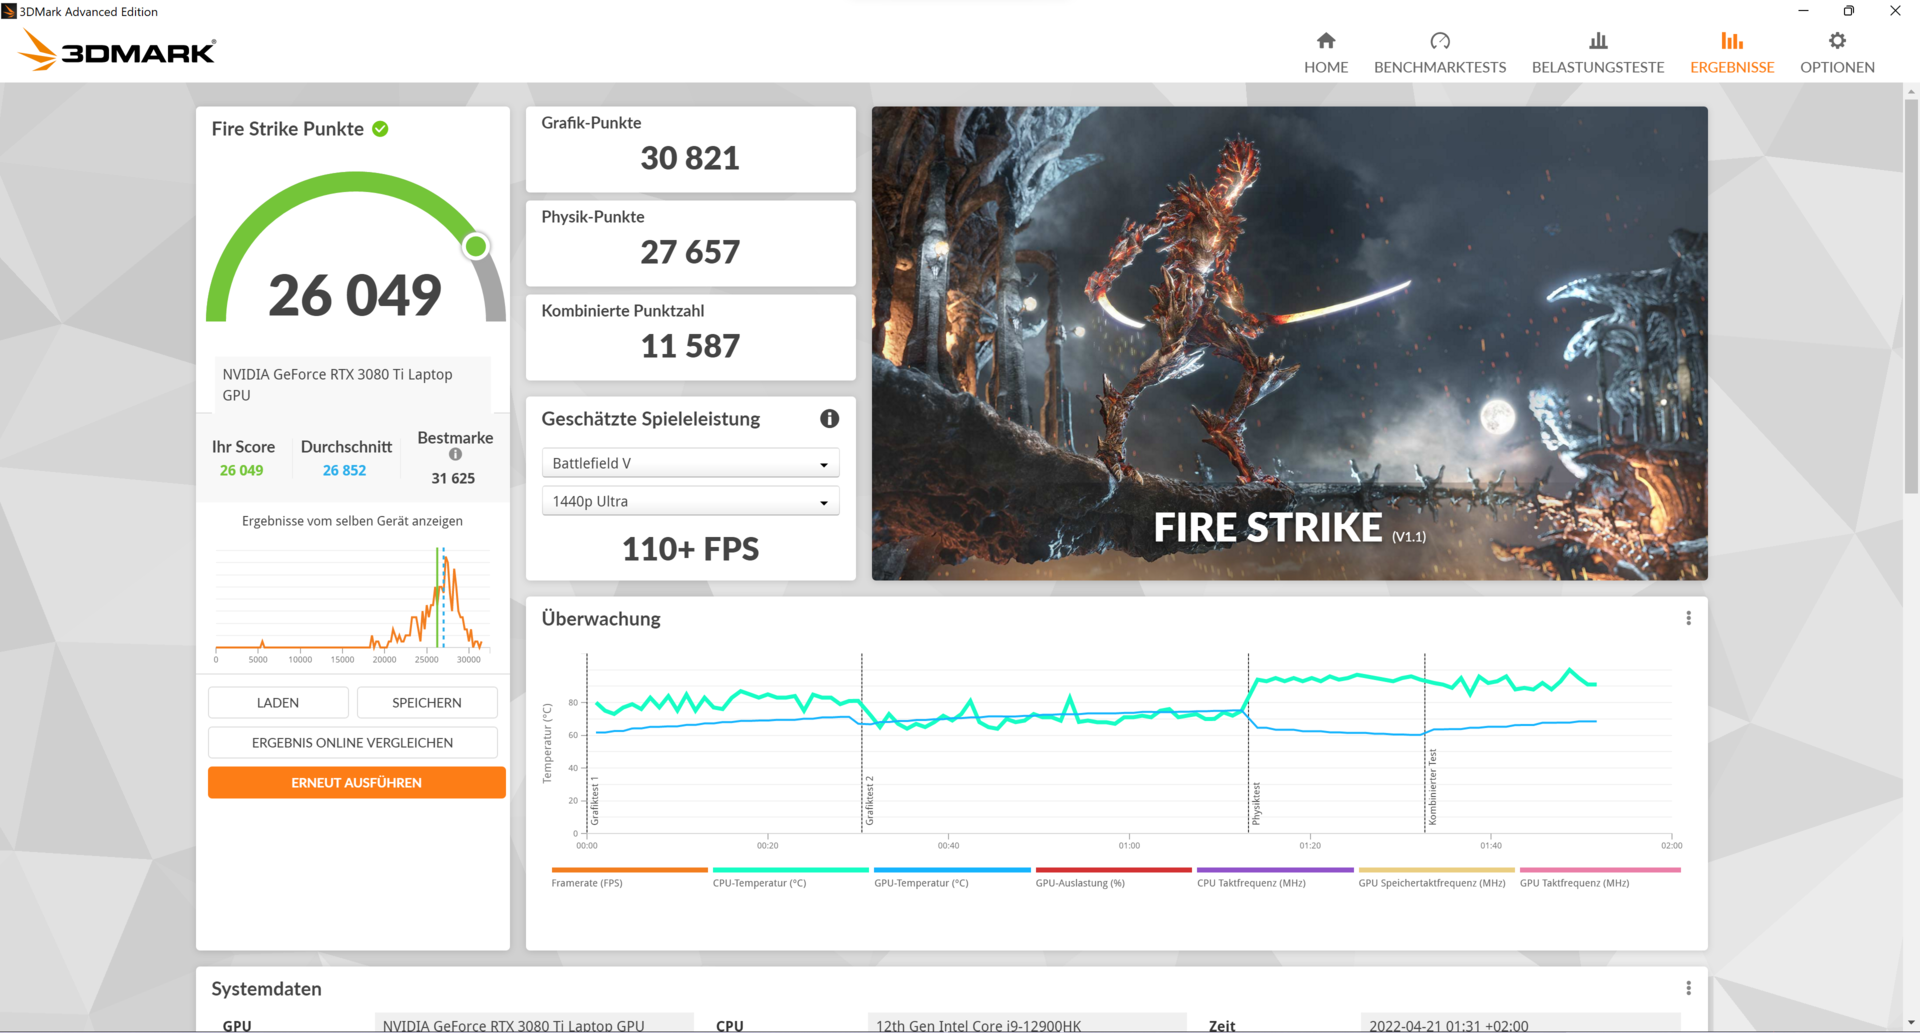
La especificación de MSI de 150 vatios también se alcanza en nuestros benchmarks, lo que se refleja en los excelentes resultados. Nuestro MSI GE66 12UHS supera a toda la competencia en las pruebas sintéticas. Una excepción es el Schenker XMG Neo 15 Early 2022(i7-12700H y RTX 3080 Ti) con un TDP de 175 vatios, que supera a nuestro dispositivo de pruebas en un 6% en la prueba 3DMark Fire Strike. Por otro lado, el MSI GE66 vence al Neo 15 en todas las demás pruebas sintéticas.
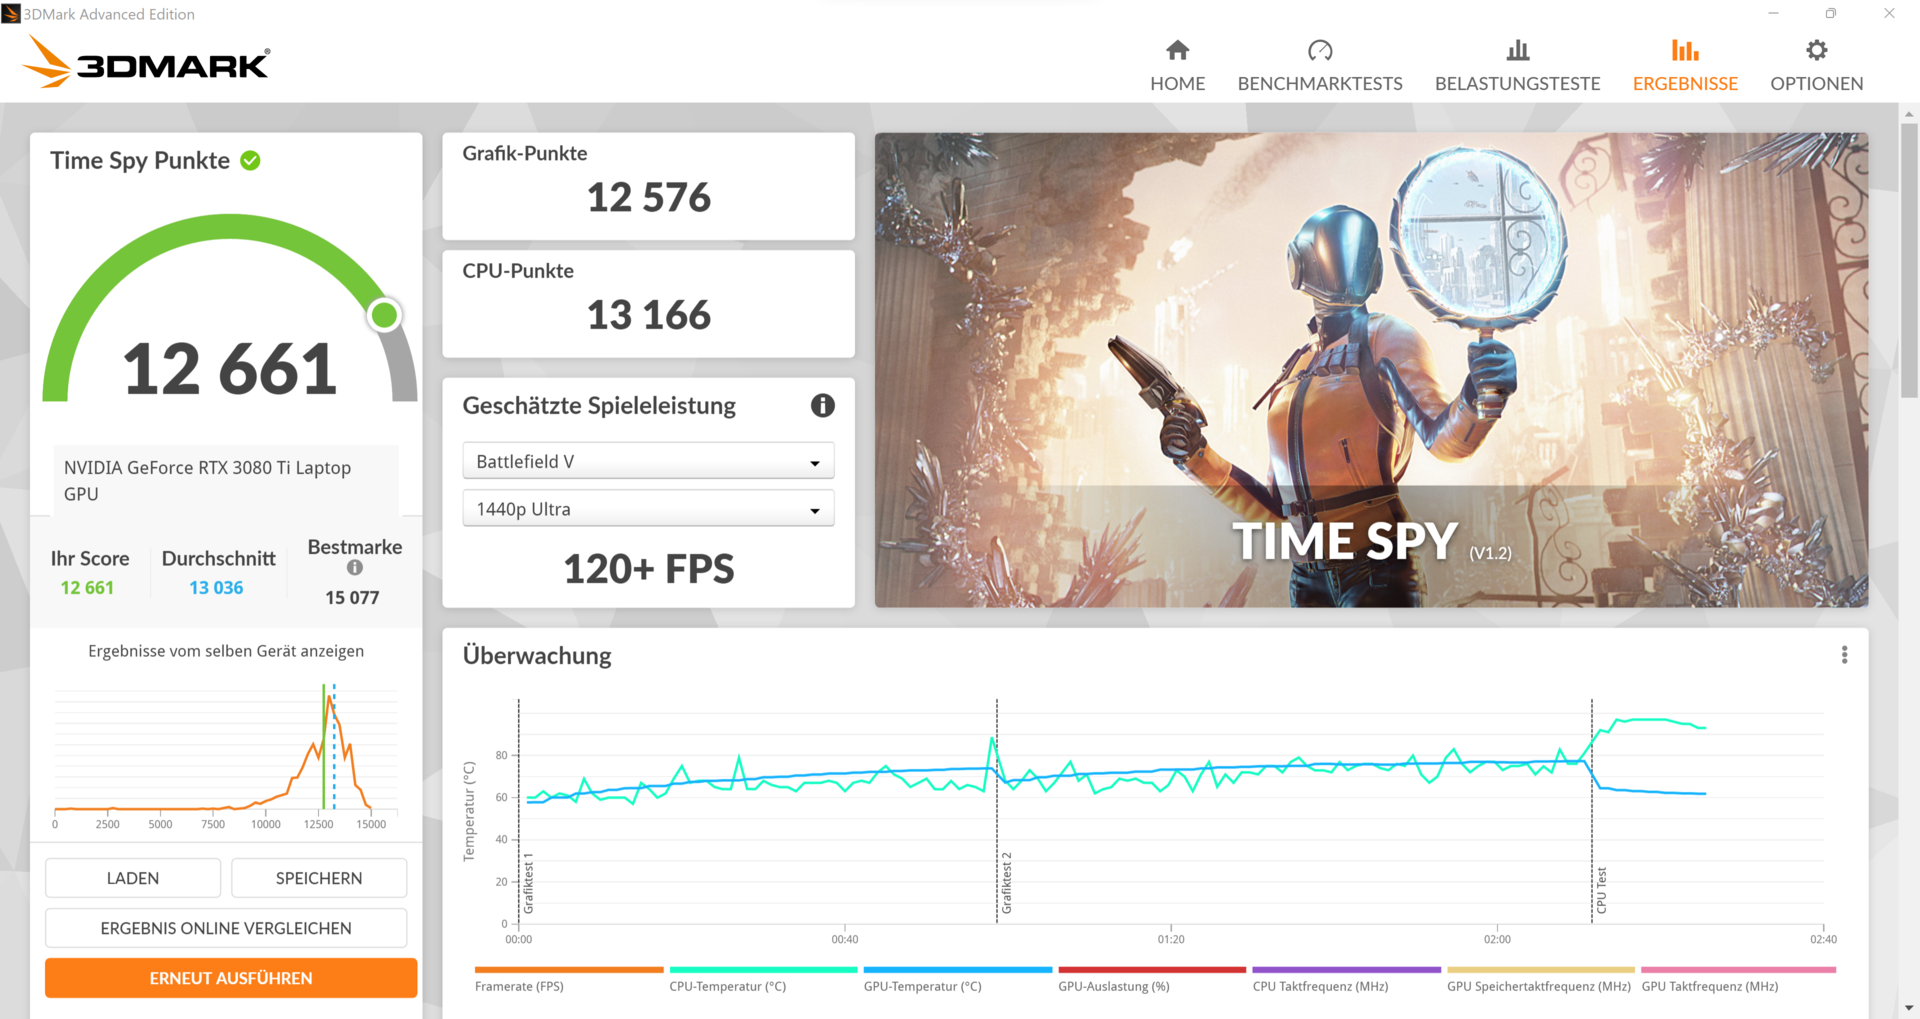
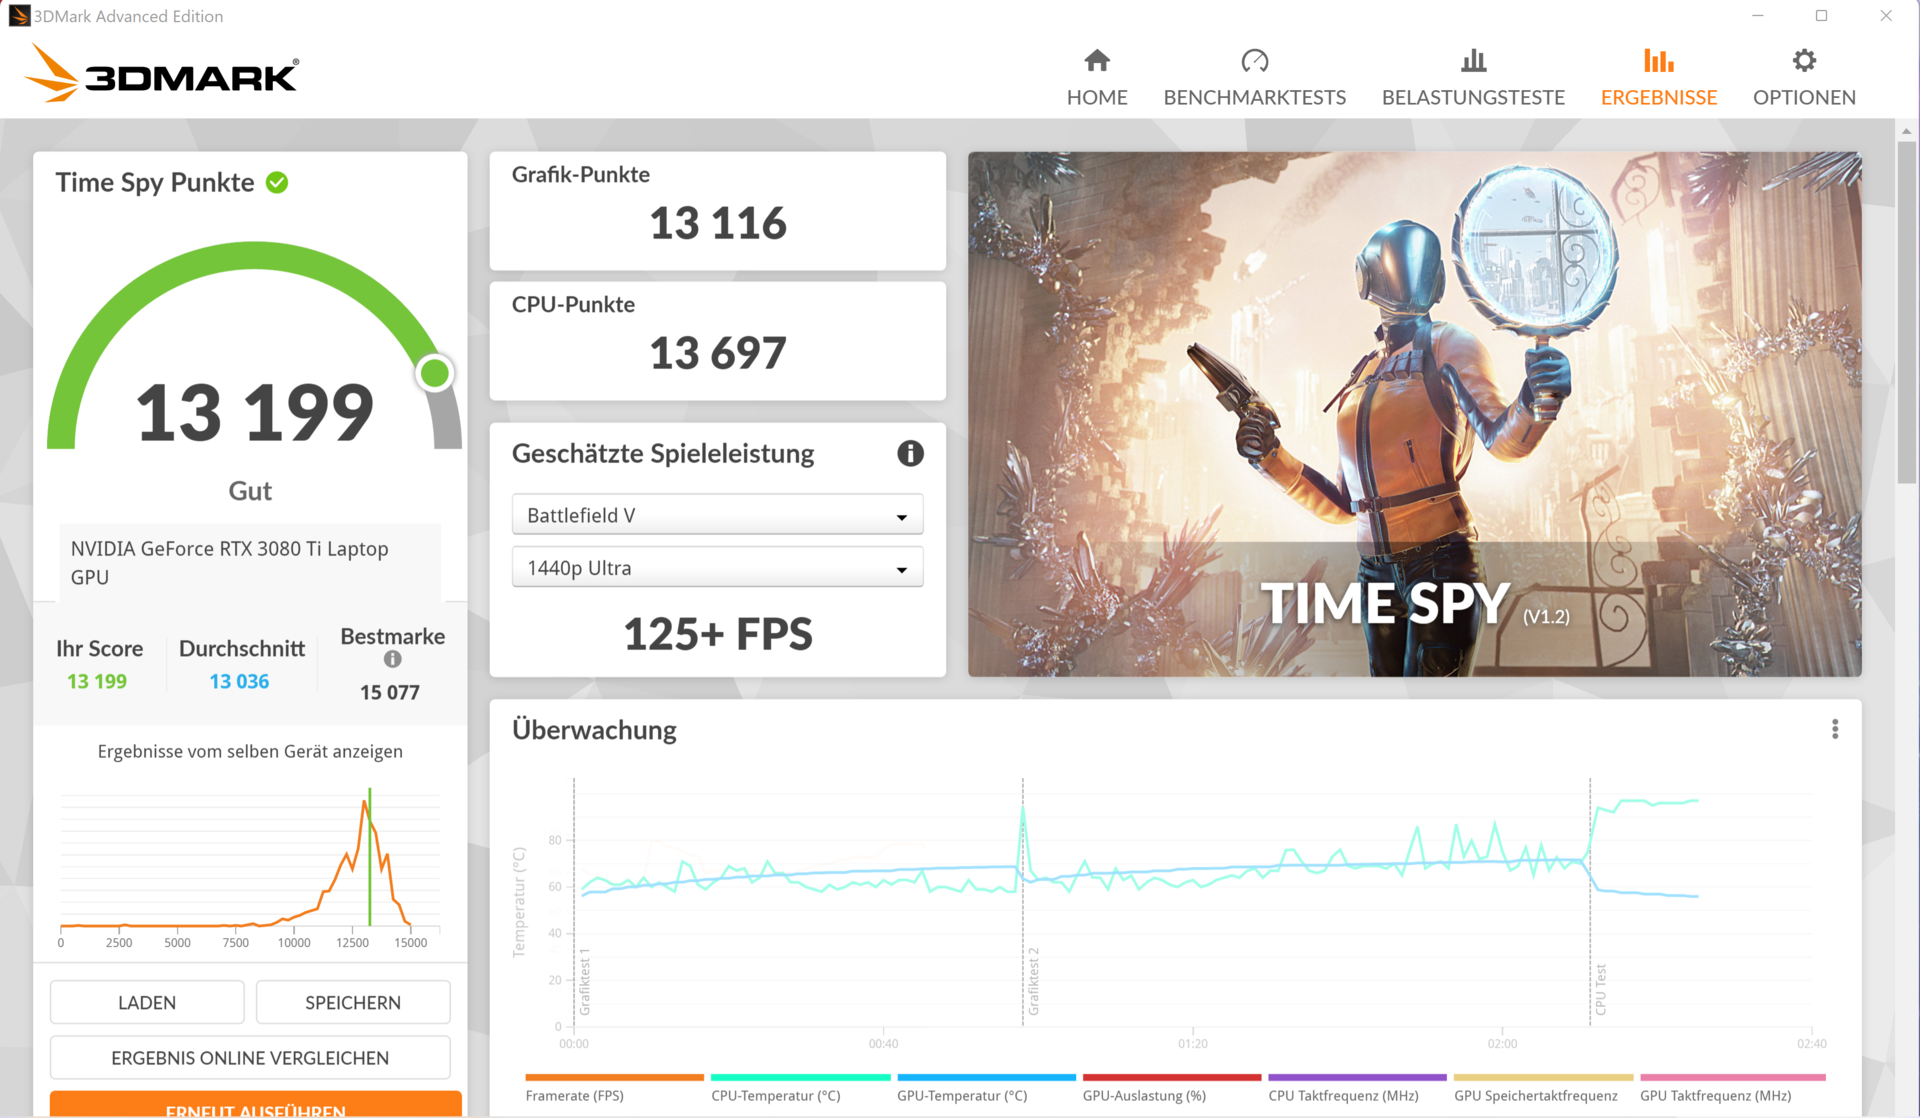
Si cambiamos nuestra GE66 12UHS del modo "MSHybrid" a "Discrete Graphics" a través del interruptor de GPU en el MSI Center, vemos una ganancia de rendimiento de más de 500 puntos en el benchmark 3DMark Time Spy. Sin embargo, si desenchufamos la fuente de alimentación, vemos que el rendimiento cae un 80%. Por tanto, jugar con la batería no debería estar en la lista de deseos.
| 3DMark Performance rating - Percent | |
| Media de la clase Gaming | |
| Schenker XMG Neo 15 E22 (Early 2022, RTX 3080 Ti) -2! | |
| MSI Raider GE66 12UHS | |
| Medio NVIDIA GeForce RTX 3080 Ti Laptop GPU | |
| Razer Blade 15 2022 -1! | |
| Lenovo Legion 5 Pro 16 G7 i7 RTX 3070Ti -3! | |
| MSI GE66 Raider 10SFS -1! | |
| 3DMark 11 Performance | 35599 puntos | |
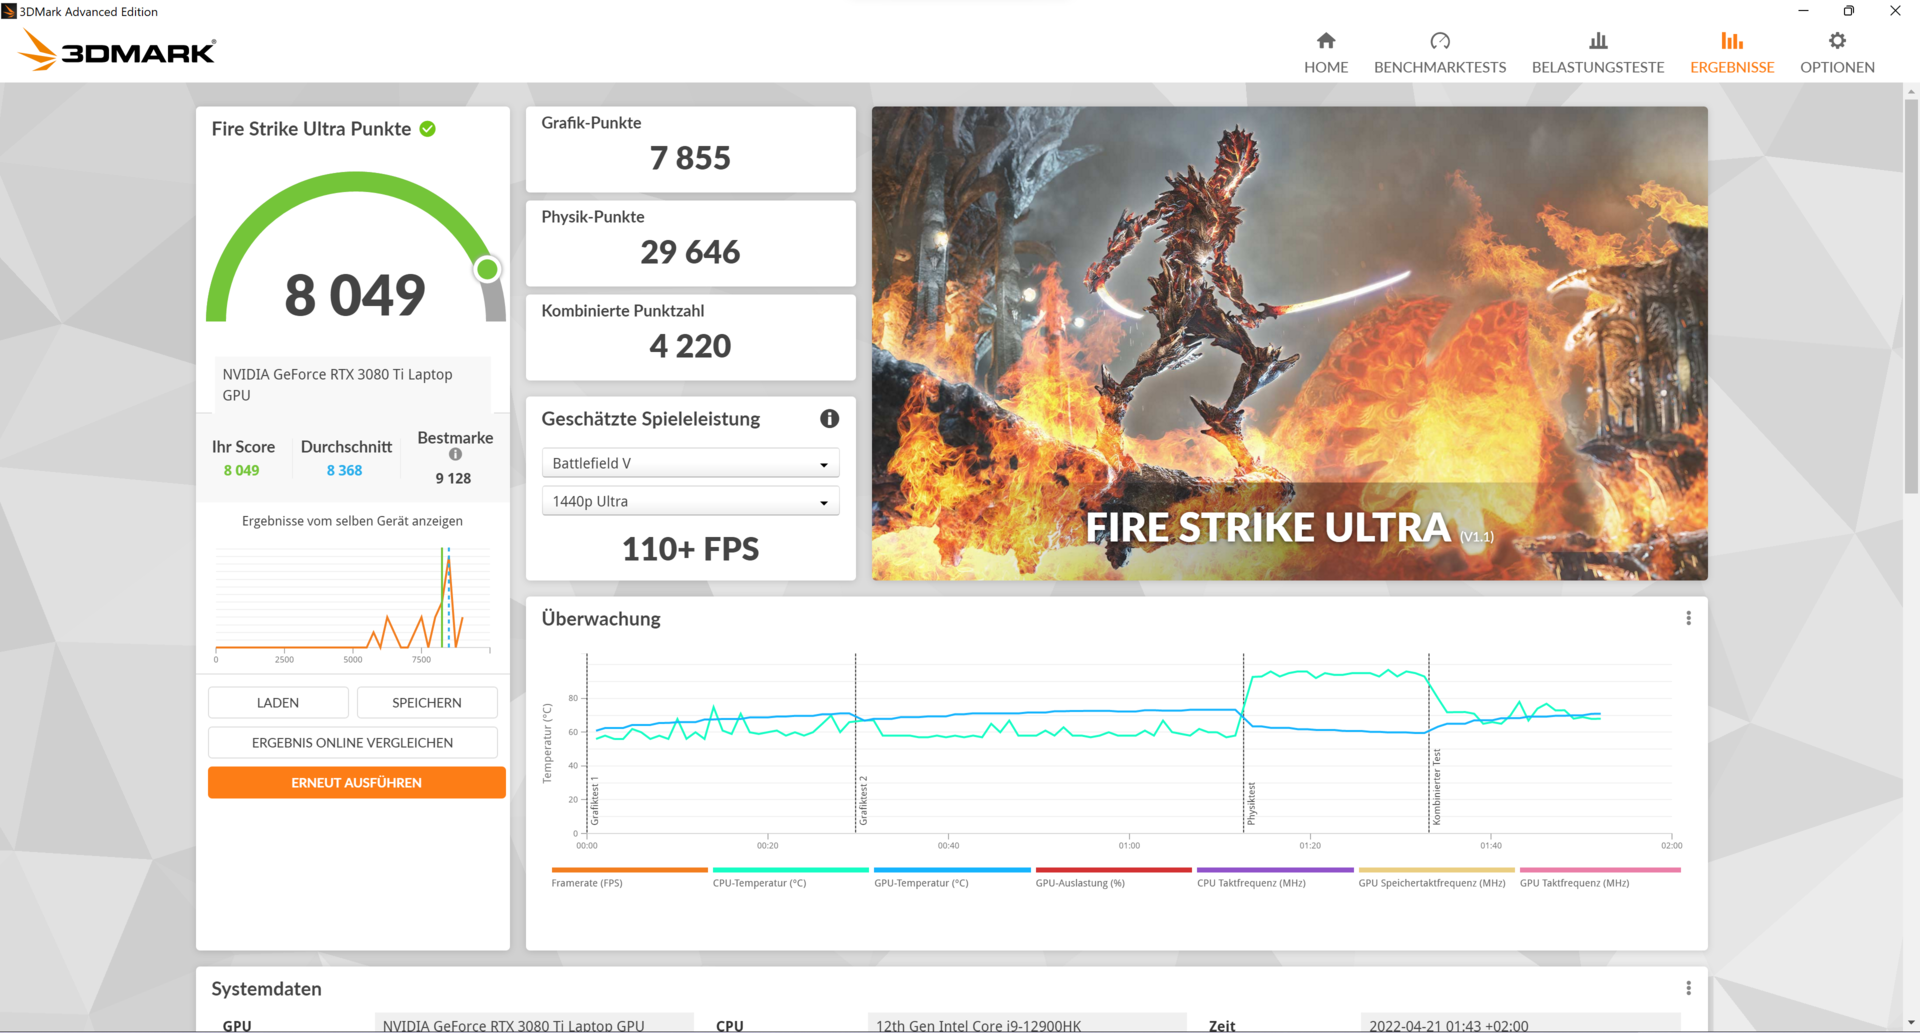
| 3DMark Cloud Gate Standard Score | 65582 puntos | |
| 3DMark Fire Strike Score | 26049 puntos | |
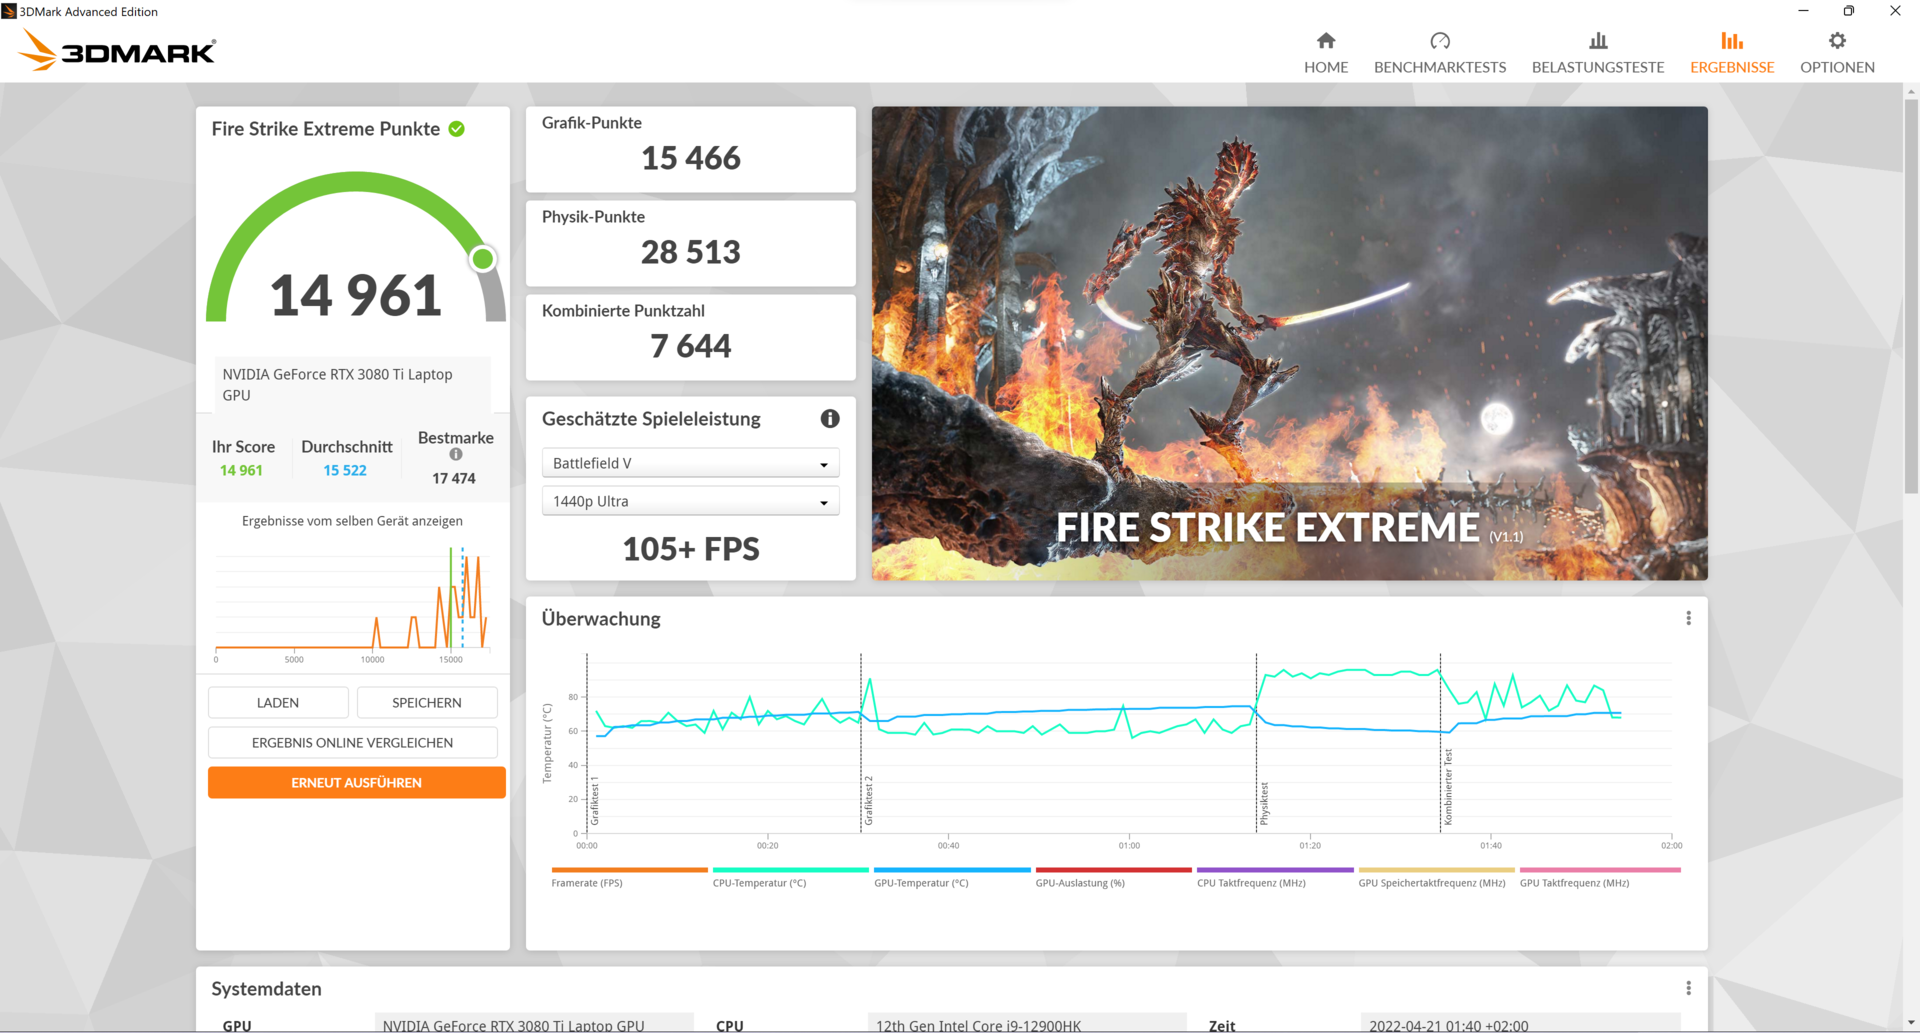
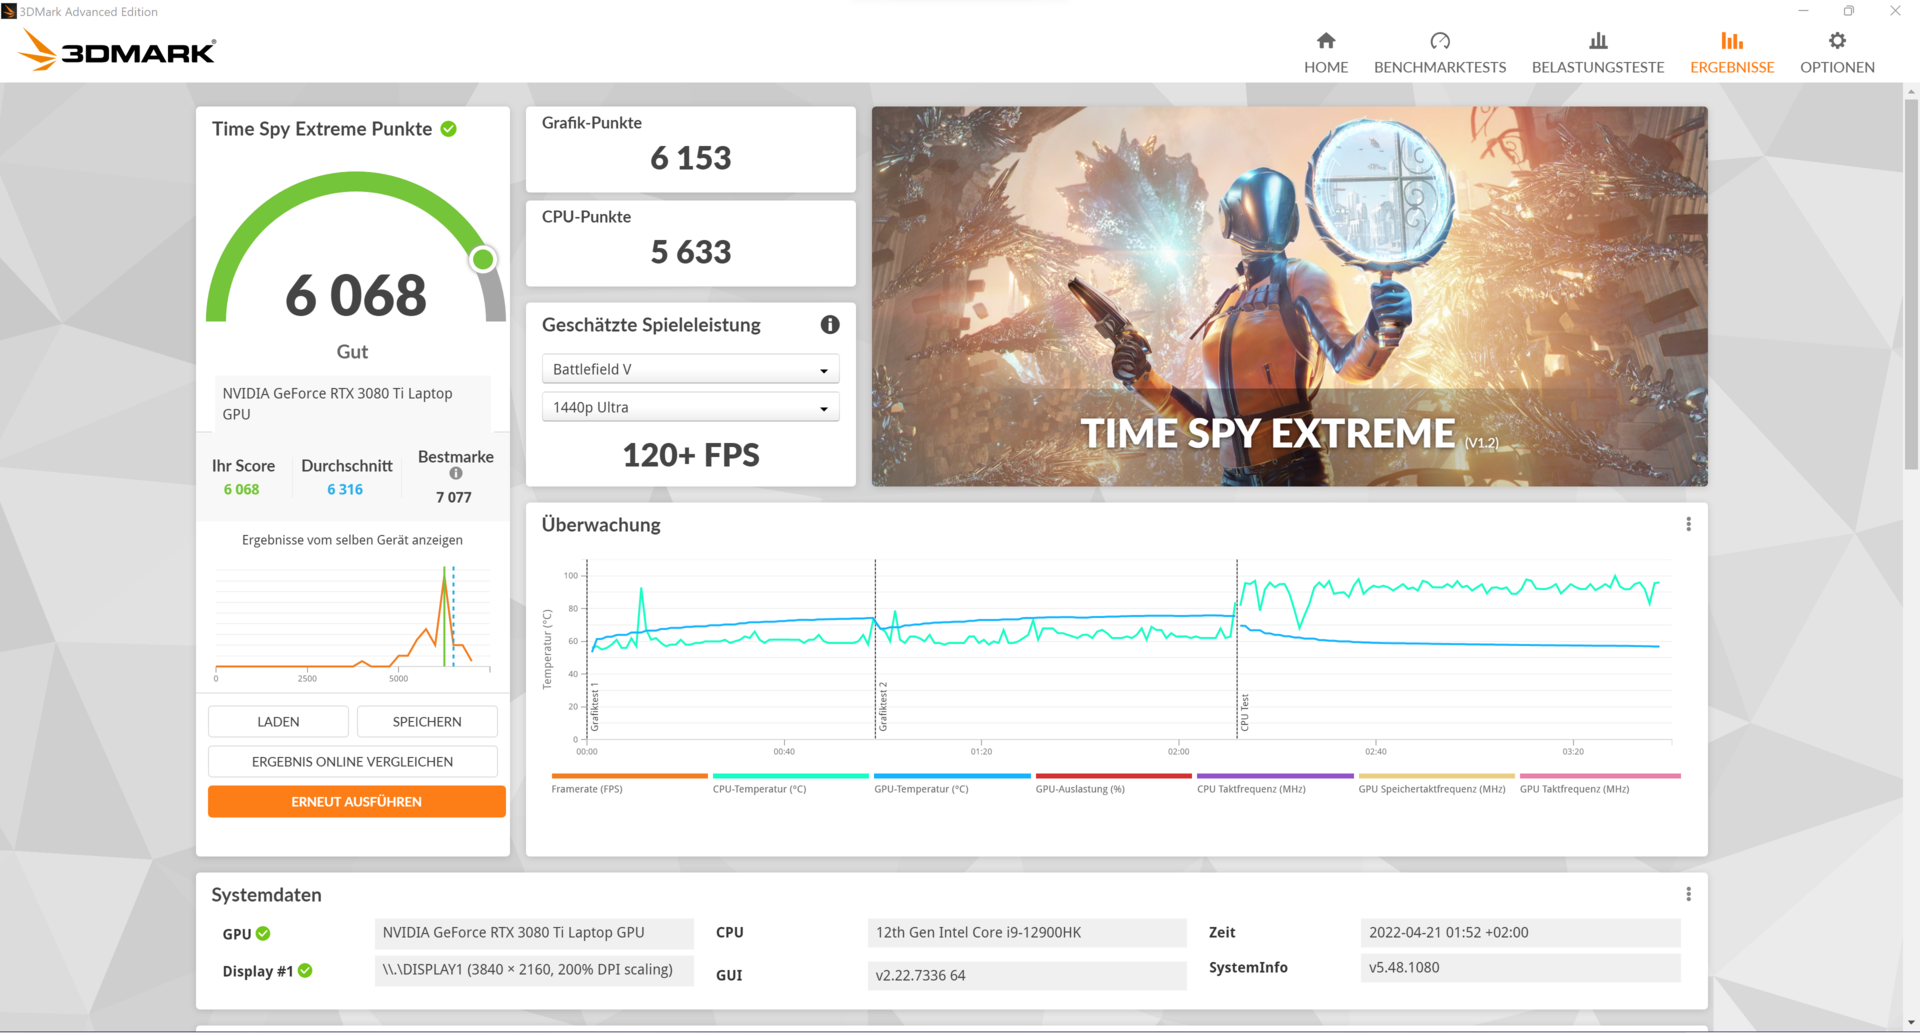
| 3DMark Fire Strike Extreme Score | 14961 puntos | |
| 3DMark Time Spy Score | 12848 puntos | |
ayuda | ||
Rendimiento de los juegos
El rendimiento gaming del MSI GE66 12 UHS en la prueba práctica es excelente. MSI lo saca todo de la RTX 3080 Ti instalada con su asignación máxima de 150 vatios e incluso supera a dispositivos como el Schenker XMG Neo 15, cuya RTX 3080 Ti tiene incluso 25 vatios adicionales a su disposición.
| The Witcher 3 | |
| 3840x2160 High Graphics & Postprocessing (Nvidia HairWorks Off) | |
| Media de la clase Gaming (114 - 169.8, n=3, últimos 2 años) | |
| Medio NVIDIA GeForce RTX 3080 Ti Laptop GPU (62.1 - 94.3, n=8) | |
| MSI Raider GE66 12UHS | |
| MSI GE66 Raider 10SFS | |
| 1920x1080 Ultra Graphics & Postprocessing (HBAO+) | |
| Media de la clase Gaming (95 - 240, n=8, últimos 2 años) | |
| Schenker XMG Neo 15 E22 (Early 2022, RTX 3080 Ti) | |
| Medio NVIDIA GeForce RTX 3080 Ti Laptop GPU (30 - 130.6, n=43) | |
| MSI Raider GE66 12UHS | |
| Razer Blade 15 2022 | |
| Lenovo Legion 5 Pro 16 G7 i7 RTX 3070Ti | |
| MSI GE66 Raider 10SFS | |
| F1 2021 | |
| 2560x1440 Ultra High Preset + Raytracing AA:T AF:16x | |
| Lenovo Legion 5 Pro 16 G7 i7 RTX 3070Ti | |
| Medio NVIDIA GeForce RTX 3080 Ti Laptop GPU (30 - 120.1, n=19) | |
| 1920x1080 Ultra High Preset + Raytracing AA:T AF:16x | |
| MSI Raider GE66 12UHS | |
| Lenovo Legion 5 Pro 16 G7 i7 RTX 3070Ti | |
| Medio NVIDIA GeForce RTX 3080 Ti Laptop GPU (30.2 - 160.6, n=30) | |
| F1 2020 - 1920x1080 Ultra High Preset AA:T AF:16x | |
| Medio NVIDIA GeForce RTX 3080 Ti Laptop GPU (190.4 - 197.9, n=2) | |
| MSI Raider GE66 12UHS | |
| Horizon Zero Dawn | |
| 3840x2160 Ultimate Quality | |
| Medio NVIDIA GeForce RTX 3080 Ti Laptop GPU (56 - 61, n=2) | |
| MSI Raider GE66 12UHS | |
| 2560x1440 Ultimate Quality | |
| Medio NVIDIA GeForce RTX 3080 Ti Laptop GPU (98 - 109, n=3) | |
| MSI Raider GE66 12UHS | |
| 1920x1080 Ultimate Quality | |
| Medio NVIDIA GeForce RTX 3080 Ti Laptop GPU (118 - 128, n=3) | |
| MSI Raider GE66 12UHS | |
| 1920x1080 Favor Quality | |
| MSI Raider GE66 12UHS | |
| Medio NVIDIA GeForce RTX 3080 Ti Laptop GPU (130 - 141, n=3) | |
| Far Cry 6 | |
| 1920x1080 Ultra Graphics Quality + HD Textures + DXR AA:T | |
| Media de la clase Gaming (n=1últimos 2 años) | |
| MSI Raider GE66 12UHS | |
| Medio NVIDIA GeForce RTX 3080 Ti Laptop GPU (91 - 92, n=3) | |
| 3840x2160 Ultra Graphics Quality + HD Textures AA:T | |
| MSI Raider GE66 12UHS | |
| Medio NVIDIA GeForce RTX 3080 Ti Laptop GPU (46.2 - 57, n=4) | |
| Media de la clase Gaming (n=1últimos 2 años) | |
| 2560x1440 Ultra Graphics Quality + HD Textures AA:T | |
| Media de la clase Gaming (74.5 - 116.7, n=2, últimos 2 años) | |
| MSI Raider GE66 12UHS | |
| Medio NVIDIA GeForce RTX 3080 Ti Laptop GPU (75.2 - 93, n=5) | |
| 1920x1080 Ultra Graphics Quality + HD Textures AA:T | |
| Media de la clase Gaming (96.3 - 135.7, n=3, últimos 2 años) | |
| MSI Raider GE66 12UHS | |
| Medio NVIDIA GeForce RTX 3080 Ti Laptop GPU (71.3 - 114, n=6) | |
| Assassin´s Creed Valhalla | |
| 3840x2160 Ultra High Preset | |
| Medio NVIDIA GeForce RTX 3080 Ti Laptop GPU (45 - 50, n=2) | |
| MSI Raider GE66 12UHS | |
| 2560x1440 Ultra High Preset | |
| Medio NVIDIA GeForce RTX 3080 Ti Laptop GPU (68 - 74, n=3) | |
| MSI Raider GE66 12UHS | |
| 1920x1080 Ultra High Preset | |
| Medio NVIDIA GeForce RTX 3080 Ti Laptop GPU (85 - 93, n=3) | |
| MSI Raider GE66 12UHS | |
| 1920x1080 High Preset | |
| Medio NVIDIA GeForce RTX 3080 Ti Laptop GPU (99 - 103, n=3) | |
| MSI Raider GE66 12UHS | |
En otras pruebas de rendimiento bajo carga continua, registramos una caída en el rendimiento de los juegos de hasta el 12%. En el perfil "Rendimiento Extremo" con control automático de los ventiladores, éstos están limitados a un máximo de 5.100 RPM (vueltas por minuto), lo que fue claramente insuficiente para mantener la CPU y la GPU adecuadamente refrigeradas durante los periodos de juego más largos, por lo que se produjo un eventual estrangulamiento. Repetimos todo bajo el mismo perfil y activamos el "Cooler Boost Mode" (ventiladores funcionando a 6.000 RPM). El resultado: el calor residual de los componentes se disipó suficientemente en estas condiciones y ya no observamos ninguna reducción de los FPS durante el periodo de prueba.
Witcher 3 FPS Chart
| bajo | medio | alto | ultra | QHD | 4K | |
|---|---|---|---|---|---|---|
| GTA V (2015) | 187 | 181 | 172.6 | 109.4 | ||
| The Witcher 3 (2015) | 411 | 344 | 223 | 110 | 77.49 | |
| Dota 2 Reborn (2015) | 187.4 | 170.8 | 166.9 | 156.8 | 142.3 | |
| Final Fantasy XV Benchmark (2018) | 212 | 160.3 | 119.6 | 89.5 | 52.1 | |
| X-Plane 11.11 (2018) | 170 | 149.6 | 117.5 | 102.1 | ||
| Far Cry 5 (2018) | 164 | 153 | 144 | 124 | 70 | |
| Strange Brigade (2018) | 490 | 284 | 224 | 199.8 | 146.9 | 86.9 |
| F1 2020 (2020) | 345 | 303 | 270 | 190.4 | ||
| Horizon Zero Dawn (2020) | 168 | 156 | 141 | 122 | 98 | 56 |
| Assassin´s Creed Valhalla (2020) | 115 | 100 | 87 | 70 | 45 | |
| F1 2021 (2021) | 394 | 351 | 292 | 142.7 | ||
| Far Cry 6 (2021) | 143 | 126 | 114 | 92 | 54 | |
| Cyberpunk 2077 1.6 (2022) | 158.75 | 159.68 | 145.61 | 144.08 | 56.83 | 27.62 |
Emisiones: El GE66 logra un buen equilibrio entre rendimiento y volumen
Ruido
Para el hardware instalado, el MSI GE 66 12UHS da una imagen equilibrada en general en términos de ruido de los ventiladores. Durante el uso diario, los ventiladores se aceleran ocasionalmente dependiendo de la actividad y el perfil del ventilador. Bajo carga, el control de los ventiladores reacciona rápidamente para evitar caídas de rendimiento debido a que las temperaturas suben demasiado rápido. Incluso en "Rendimiento extremo", ambos ventiladores están limitados a un máximo de 5.100 RPM, aunque es posible alcanzar un máximo de 6.000 RPM, pero esto se reserva para el modo "Cooler Boost". Dicho esto, los usuarios también pueden crear un perfil de ventilador personalizado para la CPU y la GPU y así ajustar el volumen a sus necesidades. Además, existe la posibilidad de gestionar el control de los ventiladores automáticamente a través de la IA. Esto funcionó bastante bien en el uso cotidiano, pero los ventiladores reaccionaron a veces con demasiada lentitud ante aumentos rápidos de temperatura y cargas elevadas. En general, incluso los 45 dB a 5.100 RPM parecen tolerables cuando se juega. Esto se debe en parte al hecho de que los ventiladores instalados no tienden a emitir ruidos de alta frecuencia o silbidos de bobina.
Ruido
| Ocioso |
| 27 / 30 / 39 dB(A) |
| Carga |
| 45 / 47 dB(A) |
 | ||
30 dB silencioso 40 dB(A) audible 50 dB(A) ruidosamente alto |
||
min: | ||
| MSI Raider GE66 12UHS Intel Core i9-12900HK, NVIDIA GeForce RTX 3080 Ti Laptop GPU | MSI GE66 Raider 10SFS Intel Core i9-10980HK, NVIDIA GeForce RTX 2070 Super Mobile | Razer Blade 15 2022 Intel Core i7-12800H, NVIDIA GeForce RTX 3080 Ti Laptop GPU | Schenker XMG Neo 15 E22 (Early 2022, RTX 3080 Ti) Intel Core i7-12700H, NVIDIA GeForce RTX 3080 Ti Laptop GPU | Lenovo Legion 5 Pro 16 G7 i7 RTX 3070Ti Intel Core i7-12700H, NVIDIA GeForce RTX 3070 Ti Laptop GPU | |
|---|---|---|---|---|---|
| Noise | -16% | 5% | 7% | -1% | |
| apagado / medio ambiente * (dB) | 26 | 30 -15% | 25.4 2% | 24 8% | 24.6 5% |
| Idle Minimum * (dB) | 27 | 30 -11% | 26.2 3% | 24 11% | 28.4 -5% |
| Idle Average * (dB) | 30 | 35 -17% | 26.2 13% | 24 20% | 28.4 5% |
| Idle Maximum * (dB) | 39 | 44 -13% | 28.4 27% | 27.76 29% | 28.4 27% |
| Load Average * (dB) | 45 | 53 -18% | 44.7 1% | 38.81 14% | 49.4 -10% |
| Witcher 3 ultra * (dB) | 45 | 53 -18% | 44.7 1% | 54.2 -20% | 49.4 -10% |
| Load Maximum * (dB) | 47 | 55 -17% | 51.9 -10% | 54.18 -15% | 54.7 -16% |
* ... más pequeño es mejor
Temperatura
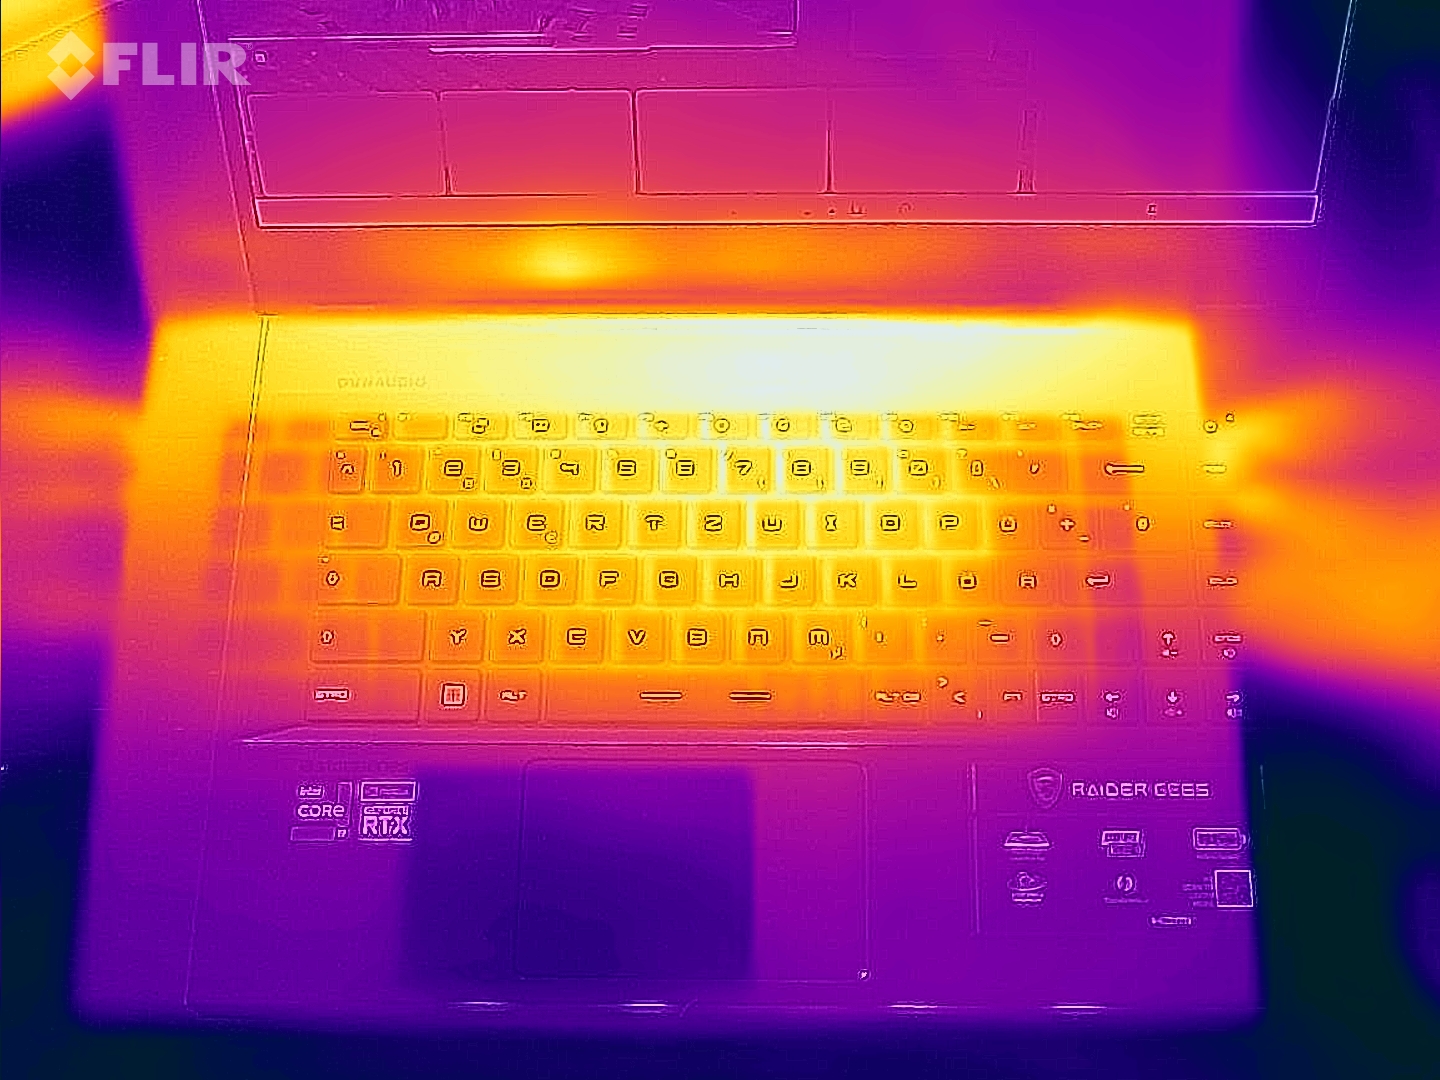
Durante el trabajo diario, como la navegación por la web, el trabajo con Office o la reproducción de medios, el trackpad y el reposamanos siempre permanecen agradablemente frescos. El teclado, por otro lado, se calienta ligeramente, pero esto no afecta a la experiencia de escritura. Incluso es posible operar sobre el regazo en temperaturas de verano en este escenario, aunque esto es bastante improbable debido al tamaño y peso del portátil. Entre otras cosas, el control del ventilador asegura que la parte inferior del dispositivo se calienta sólo ligeramente durante tareas poco exigentes.
Bajo carga (test de estrés, Witcher 3 test), el portátil se calienta considerablemente. La parte inferior se calienta hasta una media de 52 grados Celsius y muestra índices máximos de 62 a 65 grados Celsius. Registramos una temperatura media de 45 grados Celsius en la parte superior, con la mayor parte del calor residual concentrado en la zona trasera así como en el teclado. Las teclas también se calientan, pero pueden seguir utilizándose sin molestias. Se midió una media de sólo 34 grados Celsius en los reposamanos y el touchpad, incluso bajo alta carga.
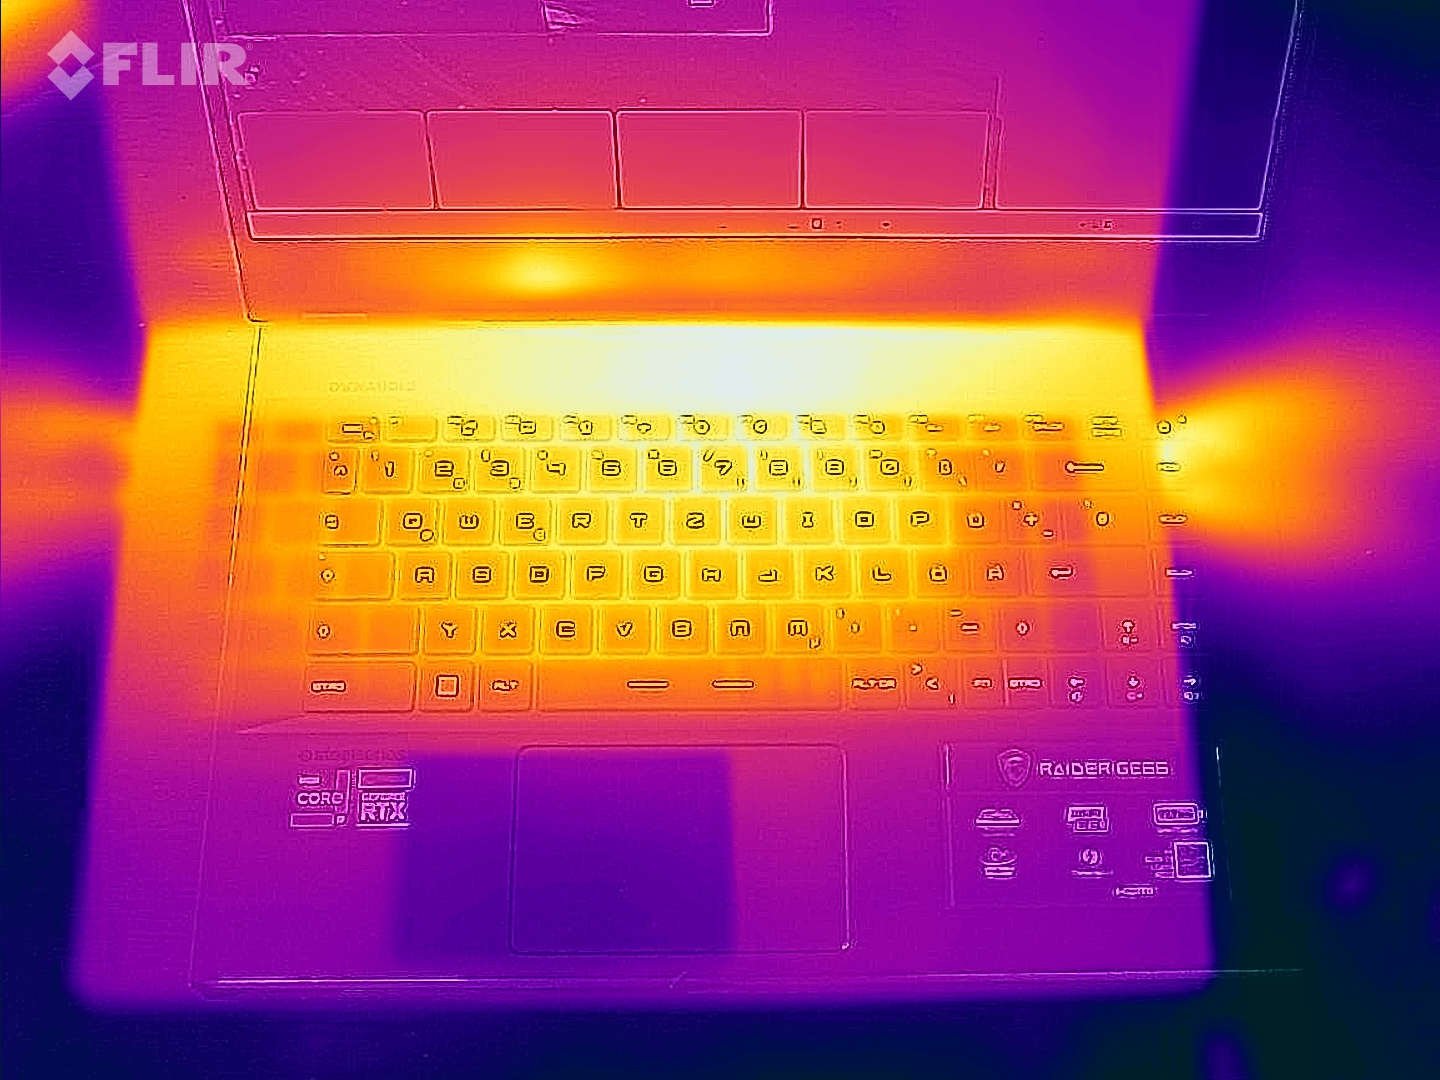
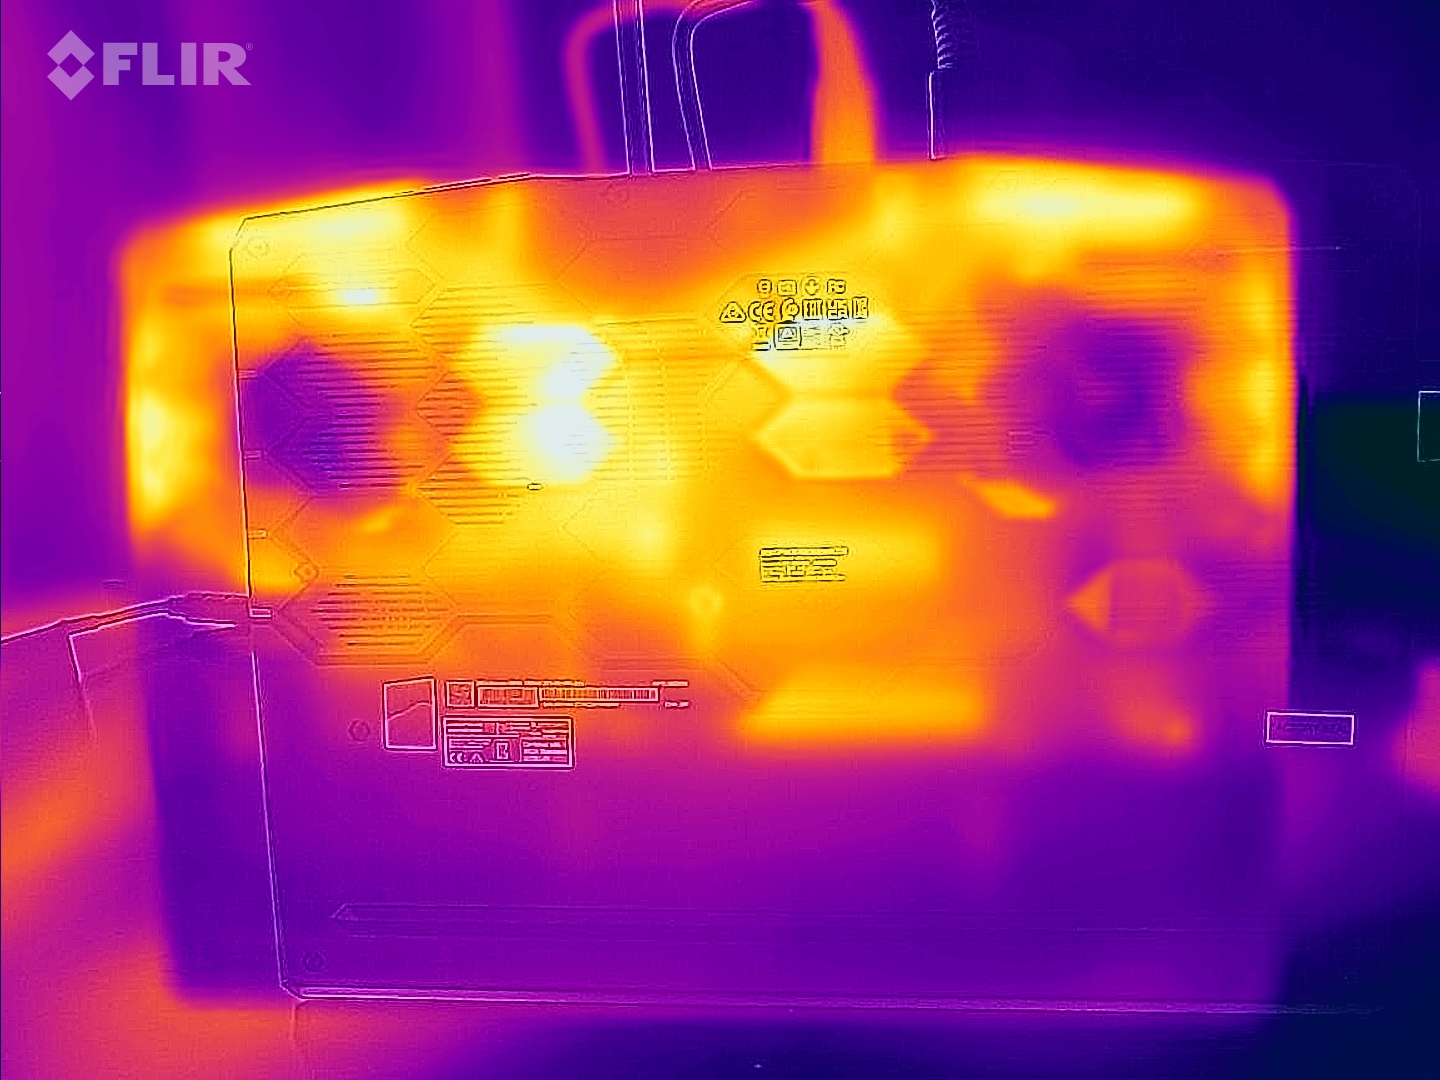
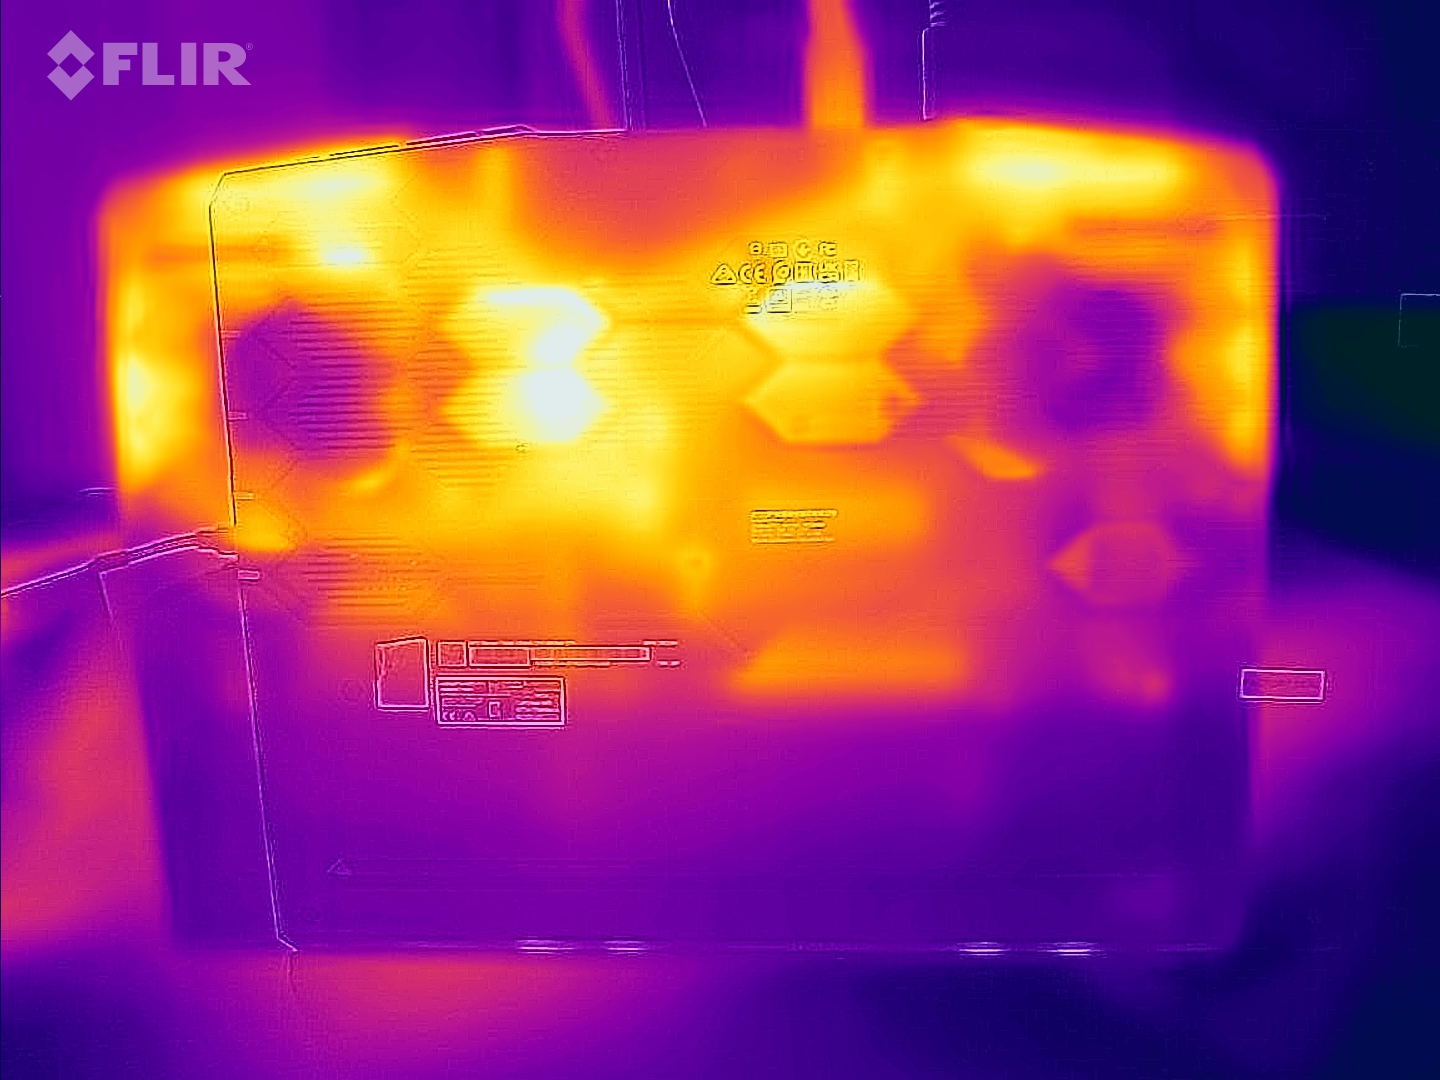
(-) La temperatura máxima en la parte superior es de 54 °C / 129 F, frente a la media de 40.4 °C / 105 F, que oscila entre 21.2 y 68.8 °C para la clase Gaming.
(-) El fondo se calienta hasta un máximo de 65 °C / 149 F, frente a la media de 43.2 °C / 110 F
(+) En reposo, la temperatura media de la parte superior es de 28.7 °C / 84# F, frente a la media del dispositivo de 33.9 °C / 93 F.
(-) Jugando a The Witcher 3, la temperatura media de la parte superior es de 45.4 °C / 114 F, frente a la media del dispositivo de 33.9 °C / 93 F.
(±) El reposamanos y el touchpad pueden calentarse mucho al tacto con un máximo de 36 °C / 96.8 F.
(-) La temperatura media de la zona del reposamanos de dispositivos similares fue de 28.8 °C / 83.8 F (-7.2 °C / -13 F).
| MSI Raider GE66 12UHS Intel Core i9-12900HK, NVIDIA GeForce RTX 3080 Ti Laptop GPU | MSI GE66 Raider 10SFS Intel Core i9-10980HK, NVIDIA GeForce RTX 2070 Super Mobile | Razer Blade 15 2022 Intel Core i7-12800H, NVIDIA GeForce RTX 3080 Ti Laptop GPU | Schenker XMG Neo 15 E22 (Early 2022, RTX 3080 Ti) Intel Core i7-12700H, NVIDIA GeForce RTX 3080 Ti Laptop GPU | Lenovo Legion 5 Pro 16 G7 i7 RTX 3070Ti Intel Core i7-12700H, NVIDIA GeForce RTX 3070 Ti Laptop GPU | |
|---|---|---|---|---|---|
| Heat | 8% | 0% | -3% | 9% | |
| Maximum Upper Side * (°C) | 54 | 49 9% | 50 7% | 52 4% | 45.3 16% |
| Maximum Bottom * (°C) | 65 | 52 20% | 47 28% | 68 -5% | 61.2 6% |
| Idle Upper Side * (°C) | 30 | 30 -0% | 37.4 -25% | 32 -7% | 28.6 5% |
| Idle Bottom * (°C) | 35 | 34 3% | 38.4 -10% | 36 -3% | 31.4 10% |
* ... más pequeño es mejor
Prueba de esfuerzo
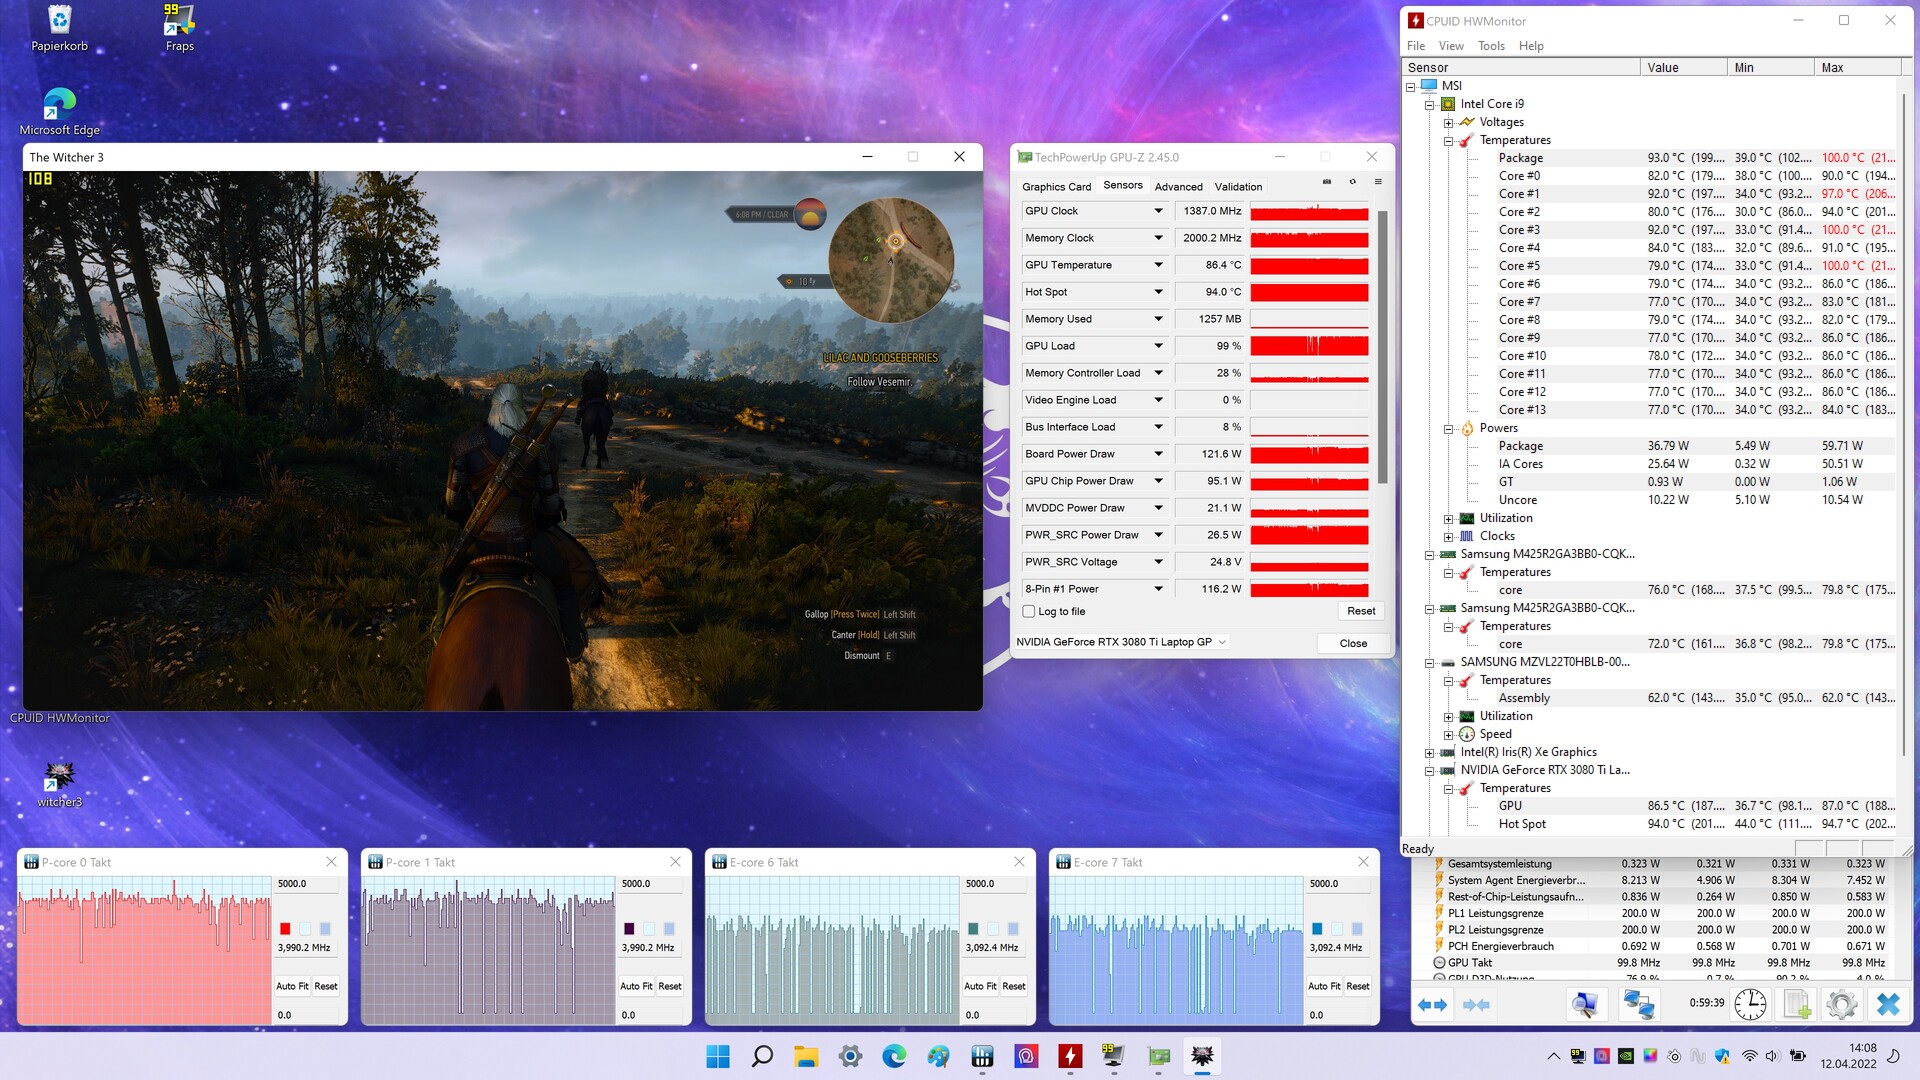
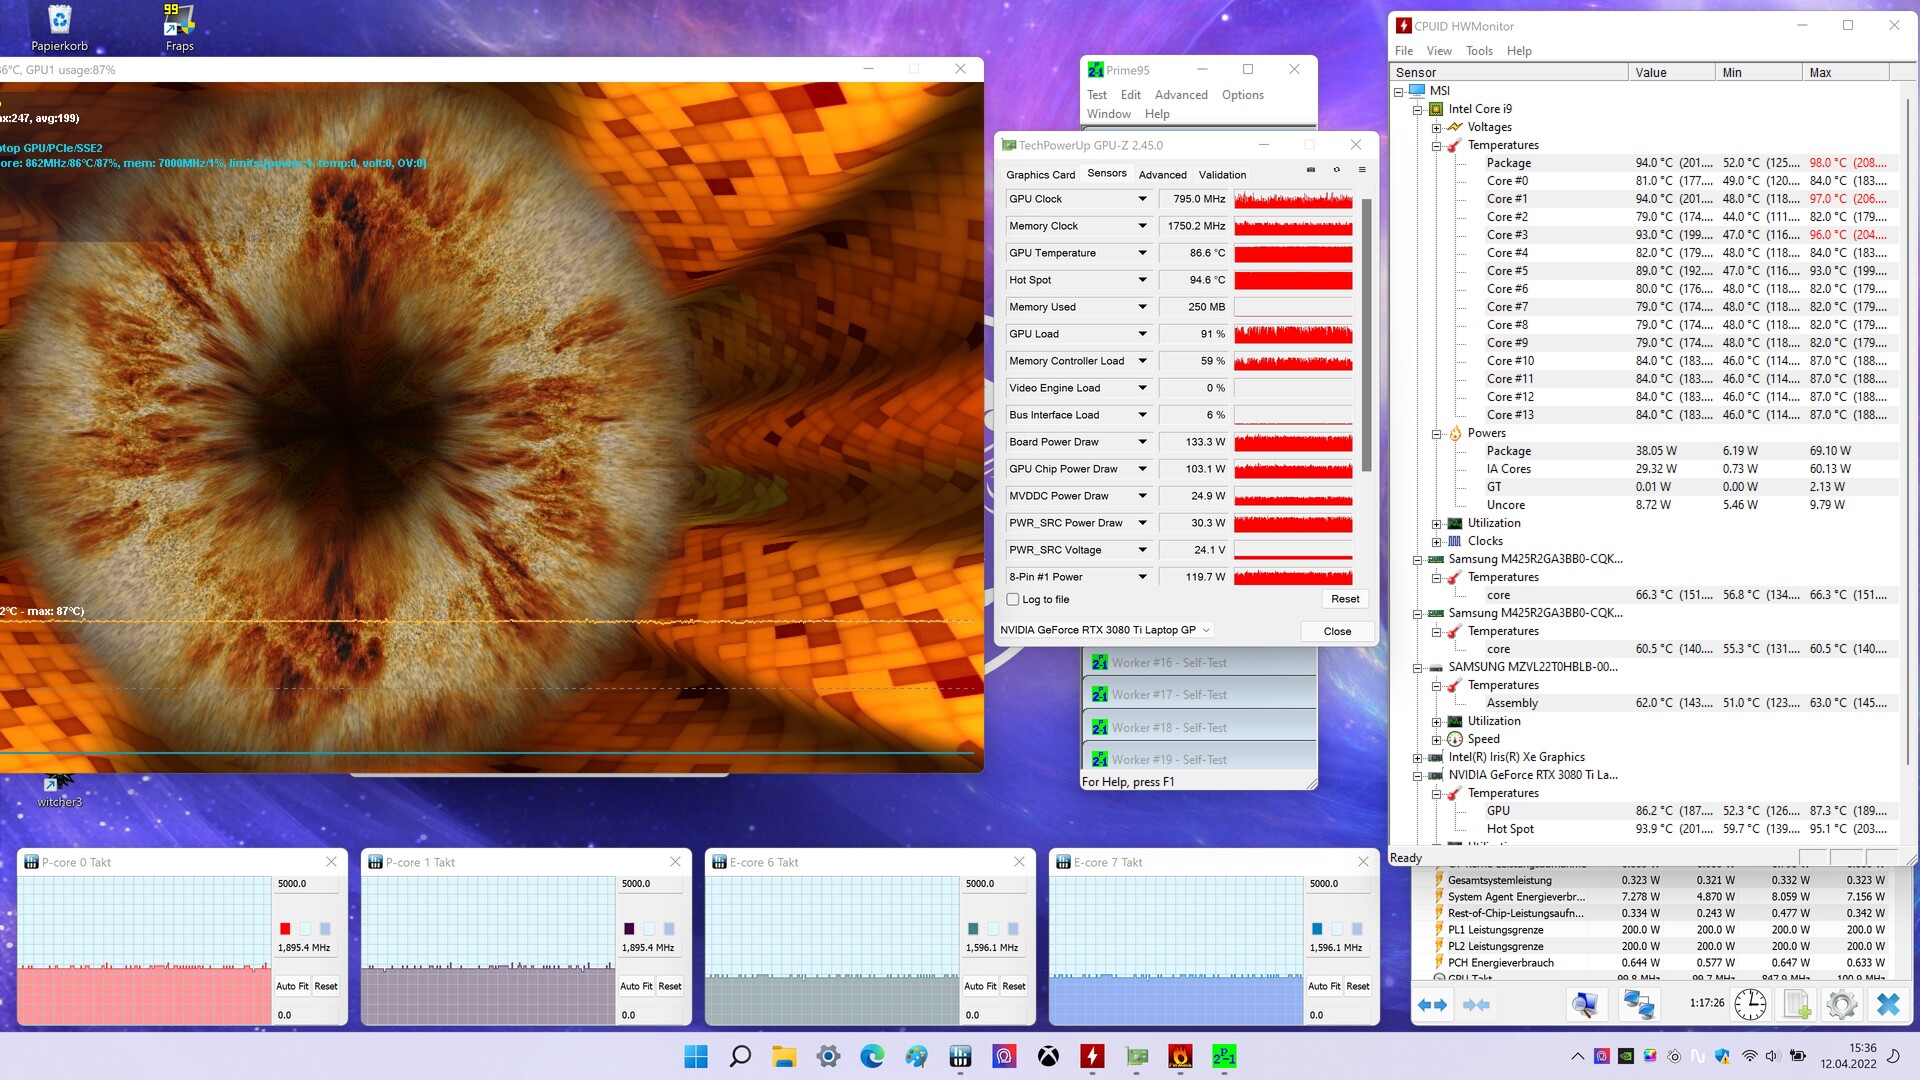
En la prueba Witcher 3, el sistema es capaz de descargar un máximo de unos 160 vatios simultáneamente. Esto se divide en 122 vatios de potencia de la GPU y 37 vatios para la CPU. Las temperaturas en este escenario alcanzan una media de 93 grados centígrados en el lado de la CPU, con valores máximos que llegan a los 100 grados centígrados. En el caso de la tarjeta gráfica, las temperaturas medias son de 86 grados centígrados. El reloj de la CPU funciona inicialmente a 4.800 MHz en los núcleos P antes de establecerse en 3.990 MHz. Los núcleos E funcionan brevemente a 3.800 MHz antes de bajar a 3.100 MHz. La velocidad media de la tarjeta gráfica fue de 1.387 MHz.
En la prueba de estrés con Furmark y Prime 95 ejecutándose al mismo tiempo, el dispositivo se trata con 133 vatios de potencia de la GPU. La CPU consume 38 vatios, por lo que el sistema de pruebas es capaz de disipar algo más de 170 vatios con el sistema de refrigeración. Al contrario que en la prueba de Witcher 3, la temperatura del procesador aumenta hasta un máximo de 98 grados Celsius antes de establecerse en 94 grados Celsius. Los valores de temperatura de la tarjeta gráfica se establecieron de nuevo en una media de 86 grados Celsius. El reloj de la CPU funcionó inicialmente a las mismas velocidades del primer escenario antes de estabilizarse en 1.900 MHz para los núcleos P y 1.600 MHz para los núcleos E. La velocidad de reloj de la RTX 3080 Ti cae a 795 MHz. Los dos ventiladores funcionaron a un máximo de 5.100 RPM en la prueba de estrés. El ventilador de la GPU se comportó de forma dinámica a pesar de las condiciones extremas y se movió entre 4.000 RPM y 5.100 RPM durante el periodo de prueba.
Altavoces
Los altavoces duo-wave instalados por MSI tienen más bajos, medios más equilibrados y tonos altos en relación con el predecesor, lo que los hace adecuados para el consumo de medios de todo tipo y resulta en una buena cantidad de volumen. Sin embargo, encontramos los bajos un poco escasos al jugar y escuchar música.
MSI Raider GE66 12UHS análisis de audio
(+) | los altavoces pueden reproducir a un volumen relativamente alto (#84 dB)
Graves 100 - 315 Hz
(-) | casi sin bajos - de media 17% inferior a la mediana
(±) | la linealidad de los graves es media (11% delta a frecuencia anterior)
Medios 400 - 2000 Hz
(±) | medias más altas - de media 5.6% más altas que la mediana
(+) | los medios son lineales (3.9% delta a la frecuencia anterior)
Altos 2 - 16 kHz
(+) | máximos equilibrados - a sólo 4.6% de la mediana
(+) | los máximos son lineales (6.3% delta a la frecuencia anterior)
Total 100 - 16.000 Hz
(±) | la linealidad del sonido global es media (17.1% de diferencia con la mediana)
En comparación con la misma clase
» 46% de todos los dispositivos probados de esta clase eran mejores, 12% similares, 43% peores
» El mejor tuvo un delta de 6%, la media fue 18%, el peor fue ###max##%
En comparación con todos los dispositivos probados
» 31% de todos los dispositivos probados eran mejores, 8% similares, 61% peores
» El mejor tuvo un delta de 4%, la media fue 24%, el peor fue ###max##%
MSI GE66 Raider 10SFS análisis de audio
(+) | los altavoces pueden reproducir a un volumen relativamente alto (#84 dB)
Graves 100 - 315 Hz
(-) | casi sin bajos - de media 32.4% inferior a la mediana
(+) | el bajo es lineal (5.9% delta a la frecuencia anterior)
Medios 400 - 2000 Hz
(±) | medias más altas - de media 7.4% más altas que la mediana
(±) | la linealidad de los medios es media (8.9% delta respecto a la frecuencia anterior)
Altos 2 - 16 kHz
(±) | máximos más altos - de media 5.3% más altos que la mediana
(±) | la linealidad de los máximos es media (8.9% delta a frecuencia anterior)
Total 100 - 16.000 Hz
(±) | la linealidad del sonido global es media (26.7% de diferencia con la mediana)
En comparación con la misma clase
» 93% de todos los dispositivos probados de esta clase eran mejores, 1% similares, 6% peores
» El mejor tuvo un delta de 6%, la media fue 18%, el peor fue ###max##%
En comparación con todos los dispositivos probados
» 82% de todos los dispositivos probados eran mejores, 4% similares, 14% peores
» El mejor tuvo un delta de 4%, la media fue 24%, el peor fue ###max##%
Gestión de la energía: Buenos tiempos de ejecución
Consumo de energía
El consumo de energía del MSI GE66 12UHS es aceptable en modo inactivo, bajo carga y en el test de estrés Witcher 3. Aunque nuestro dispositivo consume más energía que su predecesor, también tiene instalado un hardware considerablemente más potente. La capacidad máxima de la fuente de alimentación de 280 vatios no se agota con un consumo máximo registrado de 242 vatios. En la prueba Witcher 3, el consumo de 202 vatios está mayormente por debajo de los valores de la competencia. ElLenovo Legion con el Intel Core i7 12700H y la RTX 3070 Ti consume 227 vatios, un 12% más que nuestro dispositivo de pruebas con el Intel Core i9 12900HK y la RTX 3080 Ti.
| Off / Standby | |
| Ocioso | |
| Carga |
|
Clave:
min: | |
| MSI Raider GE66 12UHS Intel Core i9-12900HK, | MSI GE66 Raider 10SFS Intel Core i9-10980HK, | Razer Blade 15 2022 Intel Core i7-12800H, | Schenker XMG Neo 15 E22 (Early 2022, RTX 3080 Ti) Intel Core i7-12700H, | Lenovo Legion 5 Pro 16 G7 i7 RTX 3070Ti Intel Core i7-12700H, | Media de la clase Gaming | |
|---|---|---|---|---|---|---|
| Power Consumption | 14% | -38% | -0% | 8% | 4% | |
| Idle Minimum * (Watt) | 16 | 6 62% | 33.2 -108% | 14 12% | 8.6 46% | 13.3 ? 17% |
| Idle Average * (Watt) | 19 | 14 26% | 36.4 -92% | 18 5% | 17.6 7% | 19 ? -0% |
| Idle Maximum * (Watt) | 26 | 25 4% | 37.6 -45% | 19 27% | 18.5 29% | 24.5 ? 6% |
| Load Average * (Watt) | 110 | 108 2% | 116.7 -6% | 115 -5% | 110 -0% | 108.1 ? 2% |
| Witcher 3 ultra * (Watt) | 202 | 195 3% | 172 15% | 228 -13% | 227 -12% | |
| Load Maximum * (Watt) | 242 | 280 -16% | 228.6 6% | 307 -27% | 294.6 -22% | 254 ? -5% |
* ... más pequeño es mejor
Power Consumption Witcher 3 / Stress Test
Use with an external monitor
Duración de la batería
En comparación con el MSI GE66 10SFSnuestro dispositivo de pruebas ofrece una duración ligeramente inferior en el test Wi-Fi con mucho mejor rendimiento y la misma capacidad de batería. El Razer Blade 15 2022 y el Lenovo Legion 5 Procon su hardware nominalmente más débil son superados por nuestro MSI GE66 12UHS. Sólo el Schenker XMG Neo 15 Early 2022 con una batería más pequeña y un procesador más débil logra superar a nuestro modelo de pruebas en un 20%.
| MSI Raider GE66 12UHS i9-12900HK, GeForce RTX 3080 Ti Laptop GPU, 99 Wh | MSI GE66 Raider 10SFS i9-10980HK, GeForce RTX 2070 Super Mobile, 99.99 Wh | Razer Blade 15 2022 i7-12800H, GeForce RTX 3080 Ti Laptop GPU, 80 Wh | Schenker XMG Neo 15 E22 (Early 2022, RTX 3080 Ti) i7-12700H, GeForce RTX 3080 Ti Laptop GPU, 93 Wh | Lenovo Legion 5 Pro 16 G7 i7 RTX 3070Ti i7-12700H, GeForce RTX 3070 Ti Laptop GPU, 80 Wh | Media de la clase Gaming | |
|---|---|---|---|---|---|---|
| Duración de Batería | 7% | -14% | 46% | -27% | 8% | |
| H.264 (h) | 7.1 | 6.9 -3% | 6.3 -11% | 8.26 ? 16% | ||
| WiFi v1.3 (h) | 5.7 | 6.1 7% | 4.9 -14% | 6.7 18% | 5.4 -5% | 7.01 ? 23% |
| Load (h) | 1.7 | 1.8 6% | 3.8 124% | 0.6 -65% | 1.47 ? -14% | |
| Reader / Idle (h) | 7.6 | 8.71 ? |
Pro
Contra
Veredicto: portátil de gama alta con un gran rendimiento
Comparado con su predecesor, el MSI GE66 10SFS, encontramos que el MSI GE66 12UHS es visualmente idéntico aparte de la barra de luz modificada. El teclado y el trackpad siguen siendo muy buenos y puntúan bien con entradas precisas así como con una alta calidad de construcción. Gracias a una nueva solución de refrigeración de metal líquido, el Intel Core i9 12900HK trae un aumento de rendimiento de alrededor del 50 por ciento sobre el predecesor Intel Core i9 10980HK. La tarjeta gráfica instalada en nuestro dispositivo ofrece hasta un 30 por ciento más de velocidad de fotogramas que la RTX 2070 Super del MSI GE66 10SFS. Abrir el portátil, sin embargo, sigue sin ser fácil. Otro pequeño inconveniente es que si se juega durante varias horas, las teclas en particular se calientan notablemente. Nuestro dispositivo de pruebas ofreció buenas tasas con su panel IPS 4K de 120 Hz. La posibilidad de actualizar a RAM DDR5 y la opción de conectar dos SSDs NVMe a través de la interfaz PCI Gen 4 aseguran la viabilidad futura del dispositivo.
El rendimiento en juegos del MSI GE66 12UHS es sobresaliente. Todos los títulos de nuestro análisis se ejecutaron sin problemas en resolución 4K con detalles altos o máximos
Otro aspecto positivo es el sistema de refrigeración mejorado. El control automático del ventilador, soportado por la IA, ofrece un buen compromiso entre rendimiento y ruido. Por desgracia, el sistema es incapaz de disipar el calor generado con suficiente rapidez durante las sesiones de juego más largas, lo que lleva a caídas de rendimiento de alrededor del 10%. De nuevo, este problema puede resolverse ajustando manualmente los ventiladores a máxima velocidad (Cooler Boost). El Centro MSI puede usarse para controlar muchas de las funciones principales del portátil y ofrece al usuario útiles características adicionales. Sin embargo, el Centro MSI sigue siendo propenso a los errores, fallando aleatoriamente en nuestras pruebas y restableciendo los perfiles de rendimiento previamente establecidos. También observamos pérdidas de rendimiento de hasta el 80% en el SSD Samsung PM9A1 instalado bajo carga continua
Precio y disponibilidad
MSI Raider GE66 12UHS
- 05/30/2022 v7 (old)
Patrick Schüdzig
Price comparison

