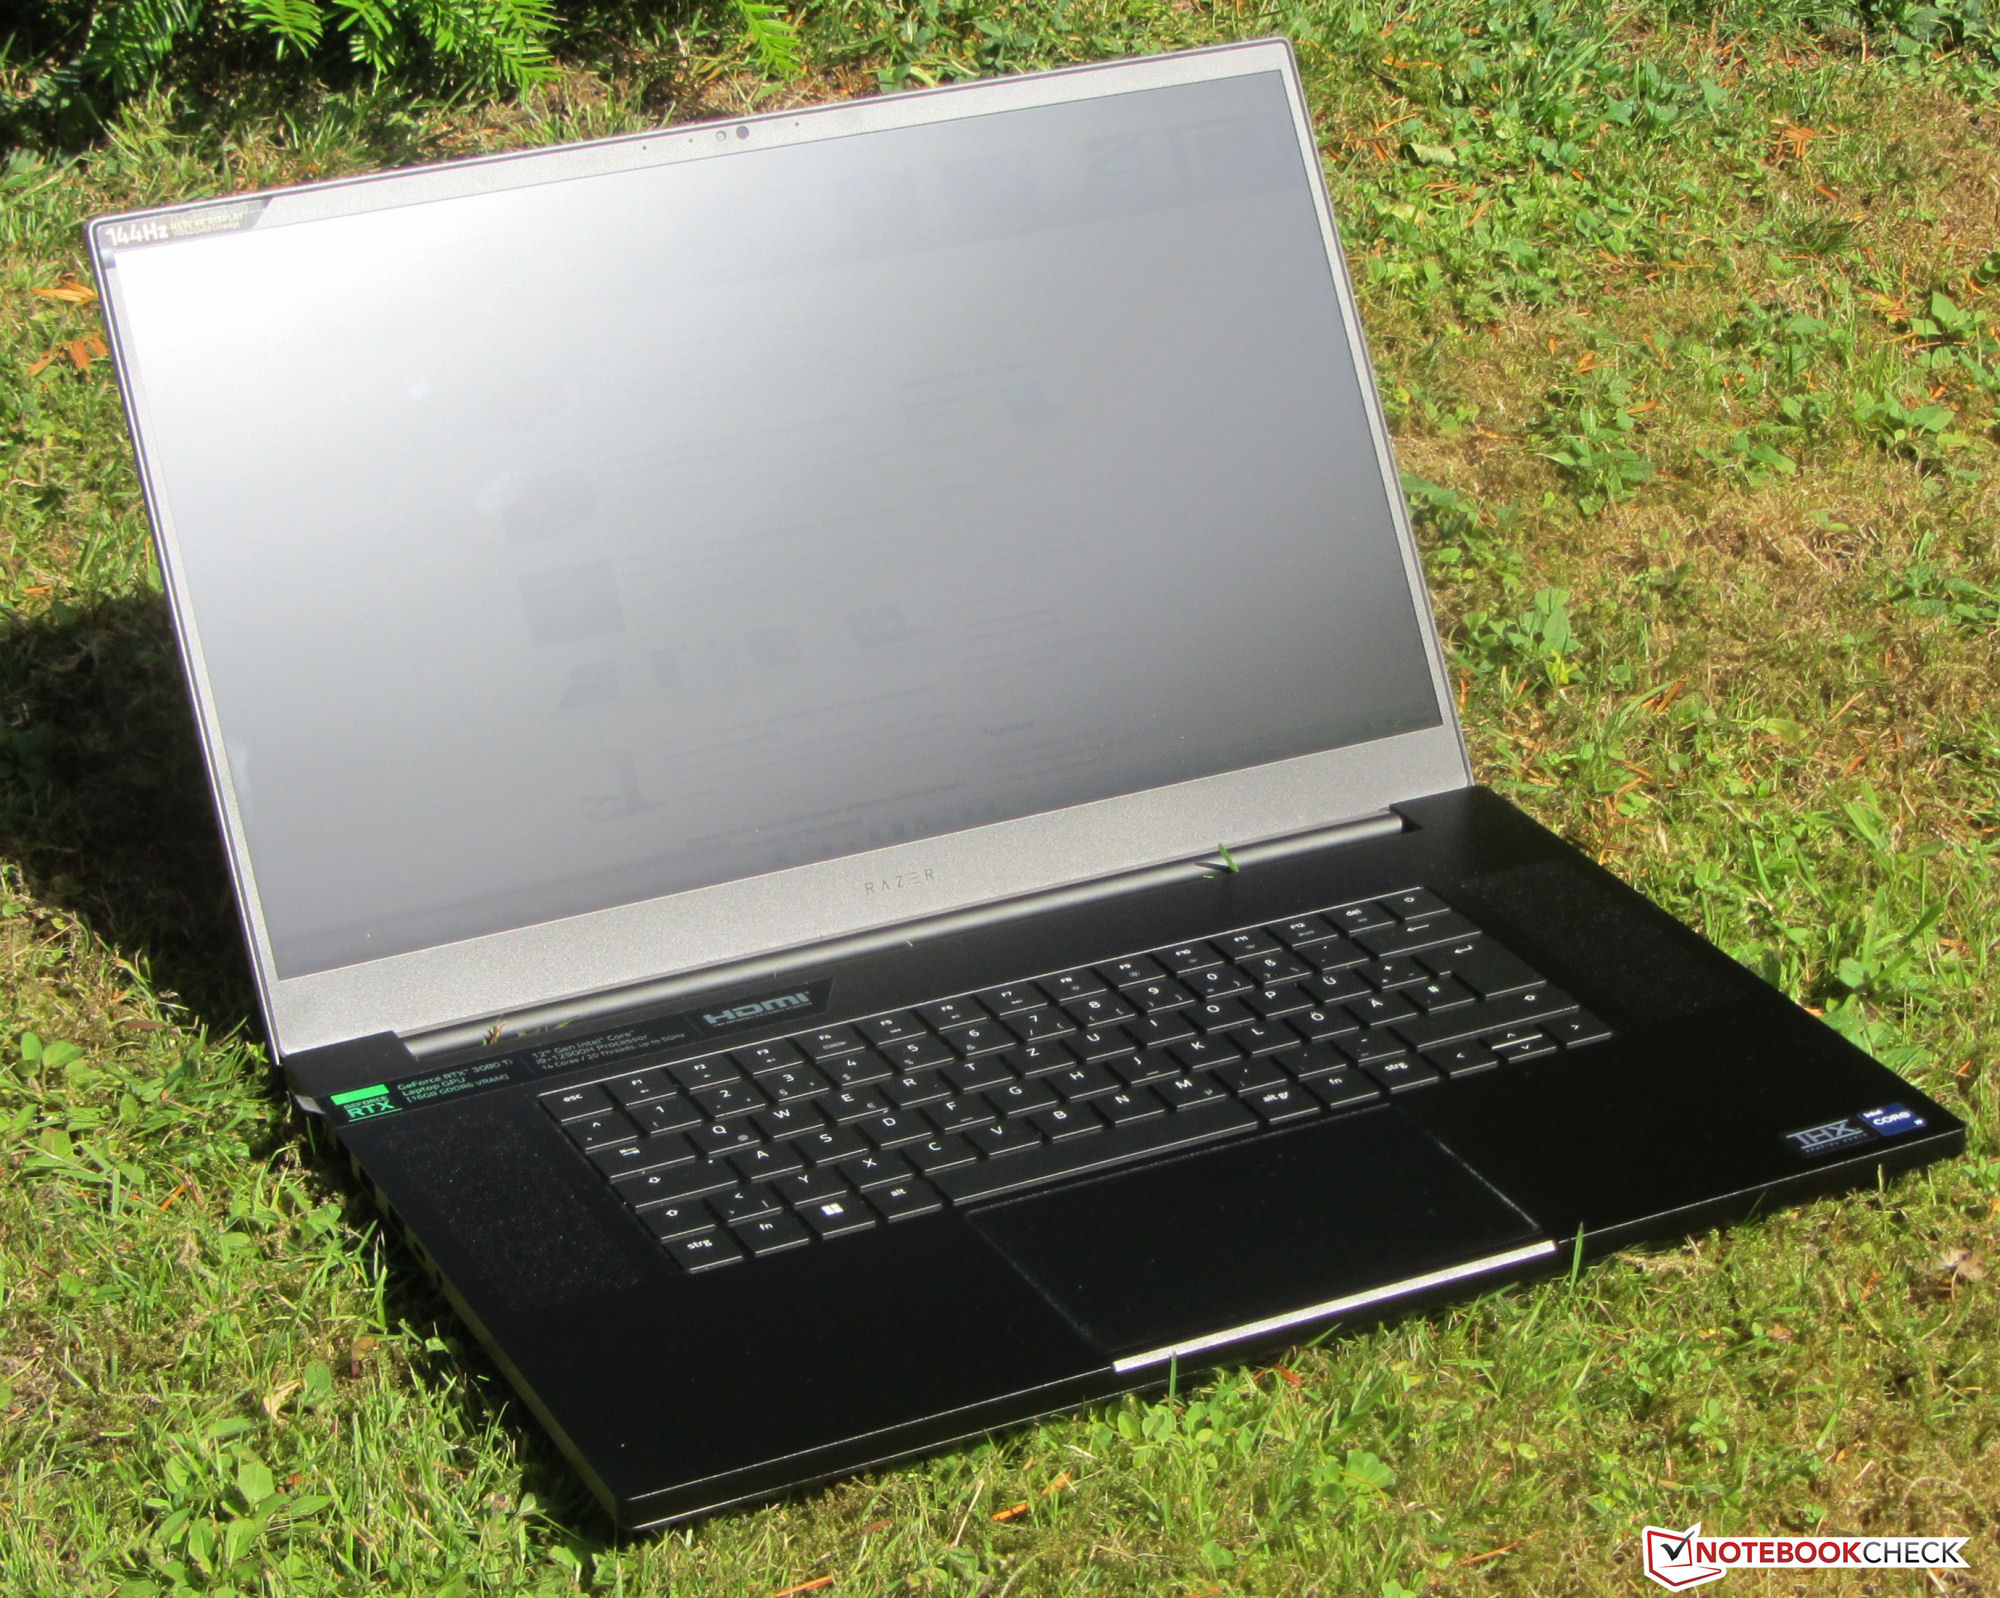
Análisis del Razer Blade 17 (principios de 2022): Elegante portátil para juegos 4k con una pantalla brillante
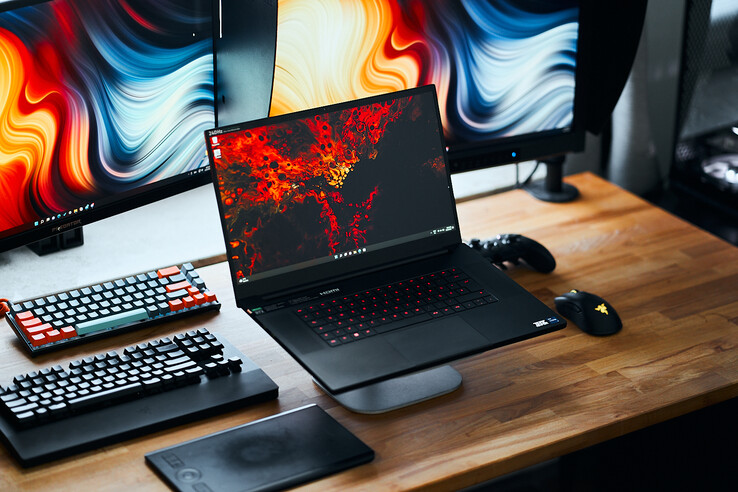
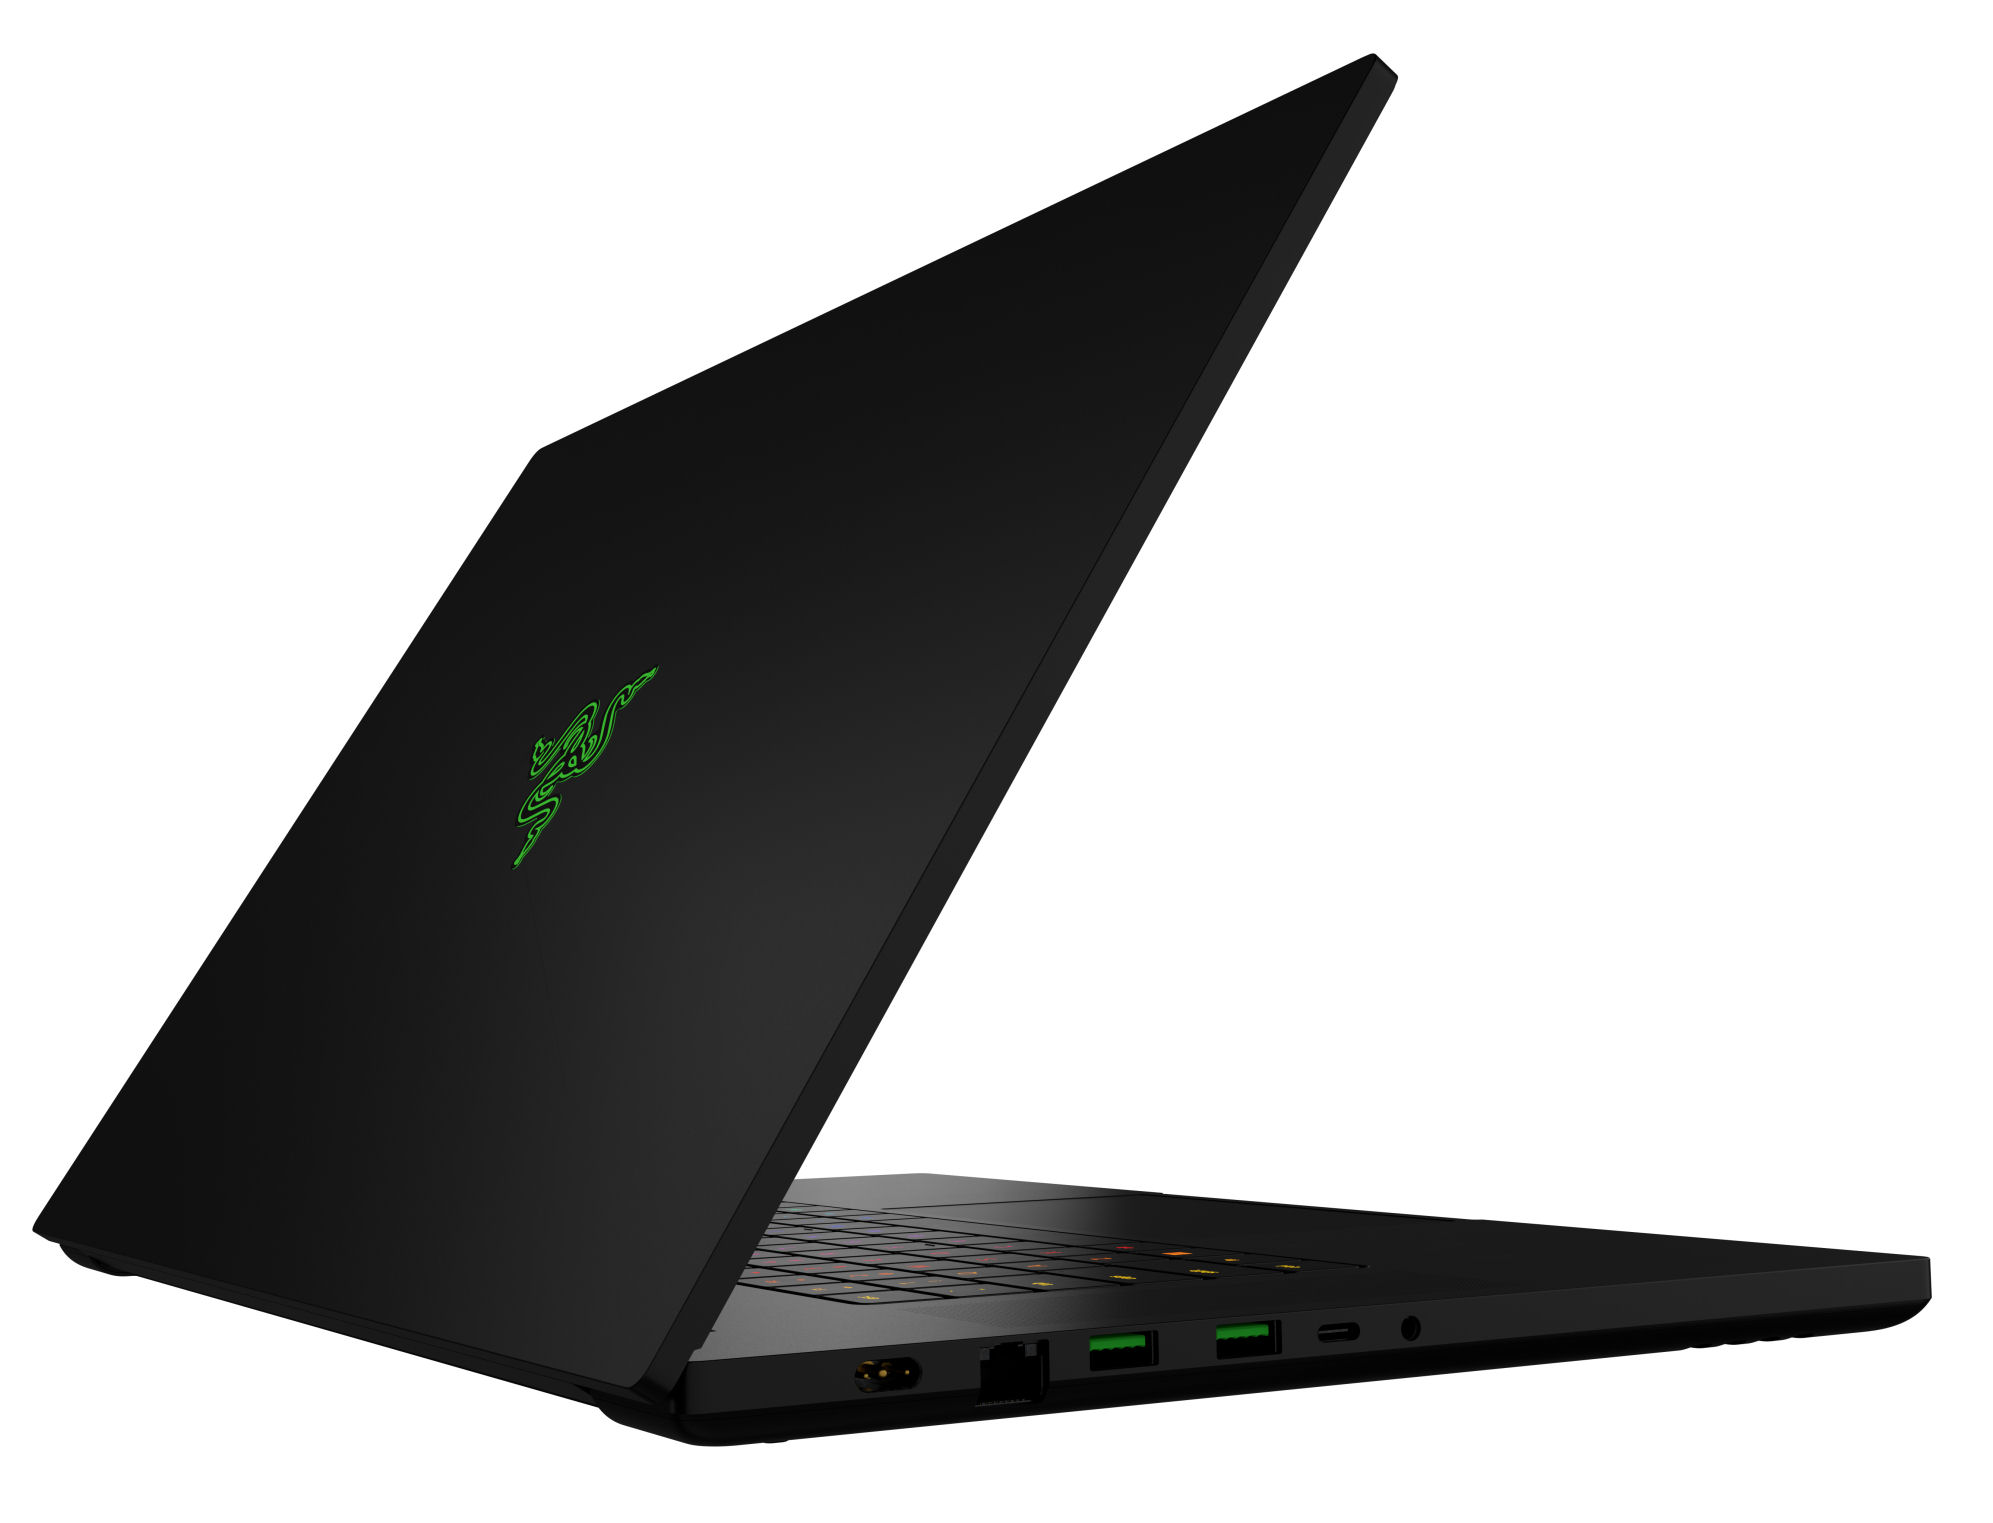
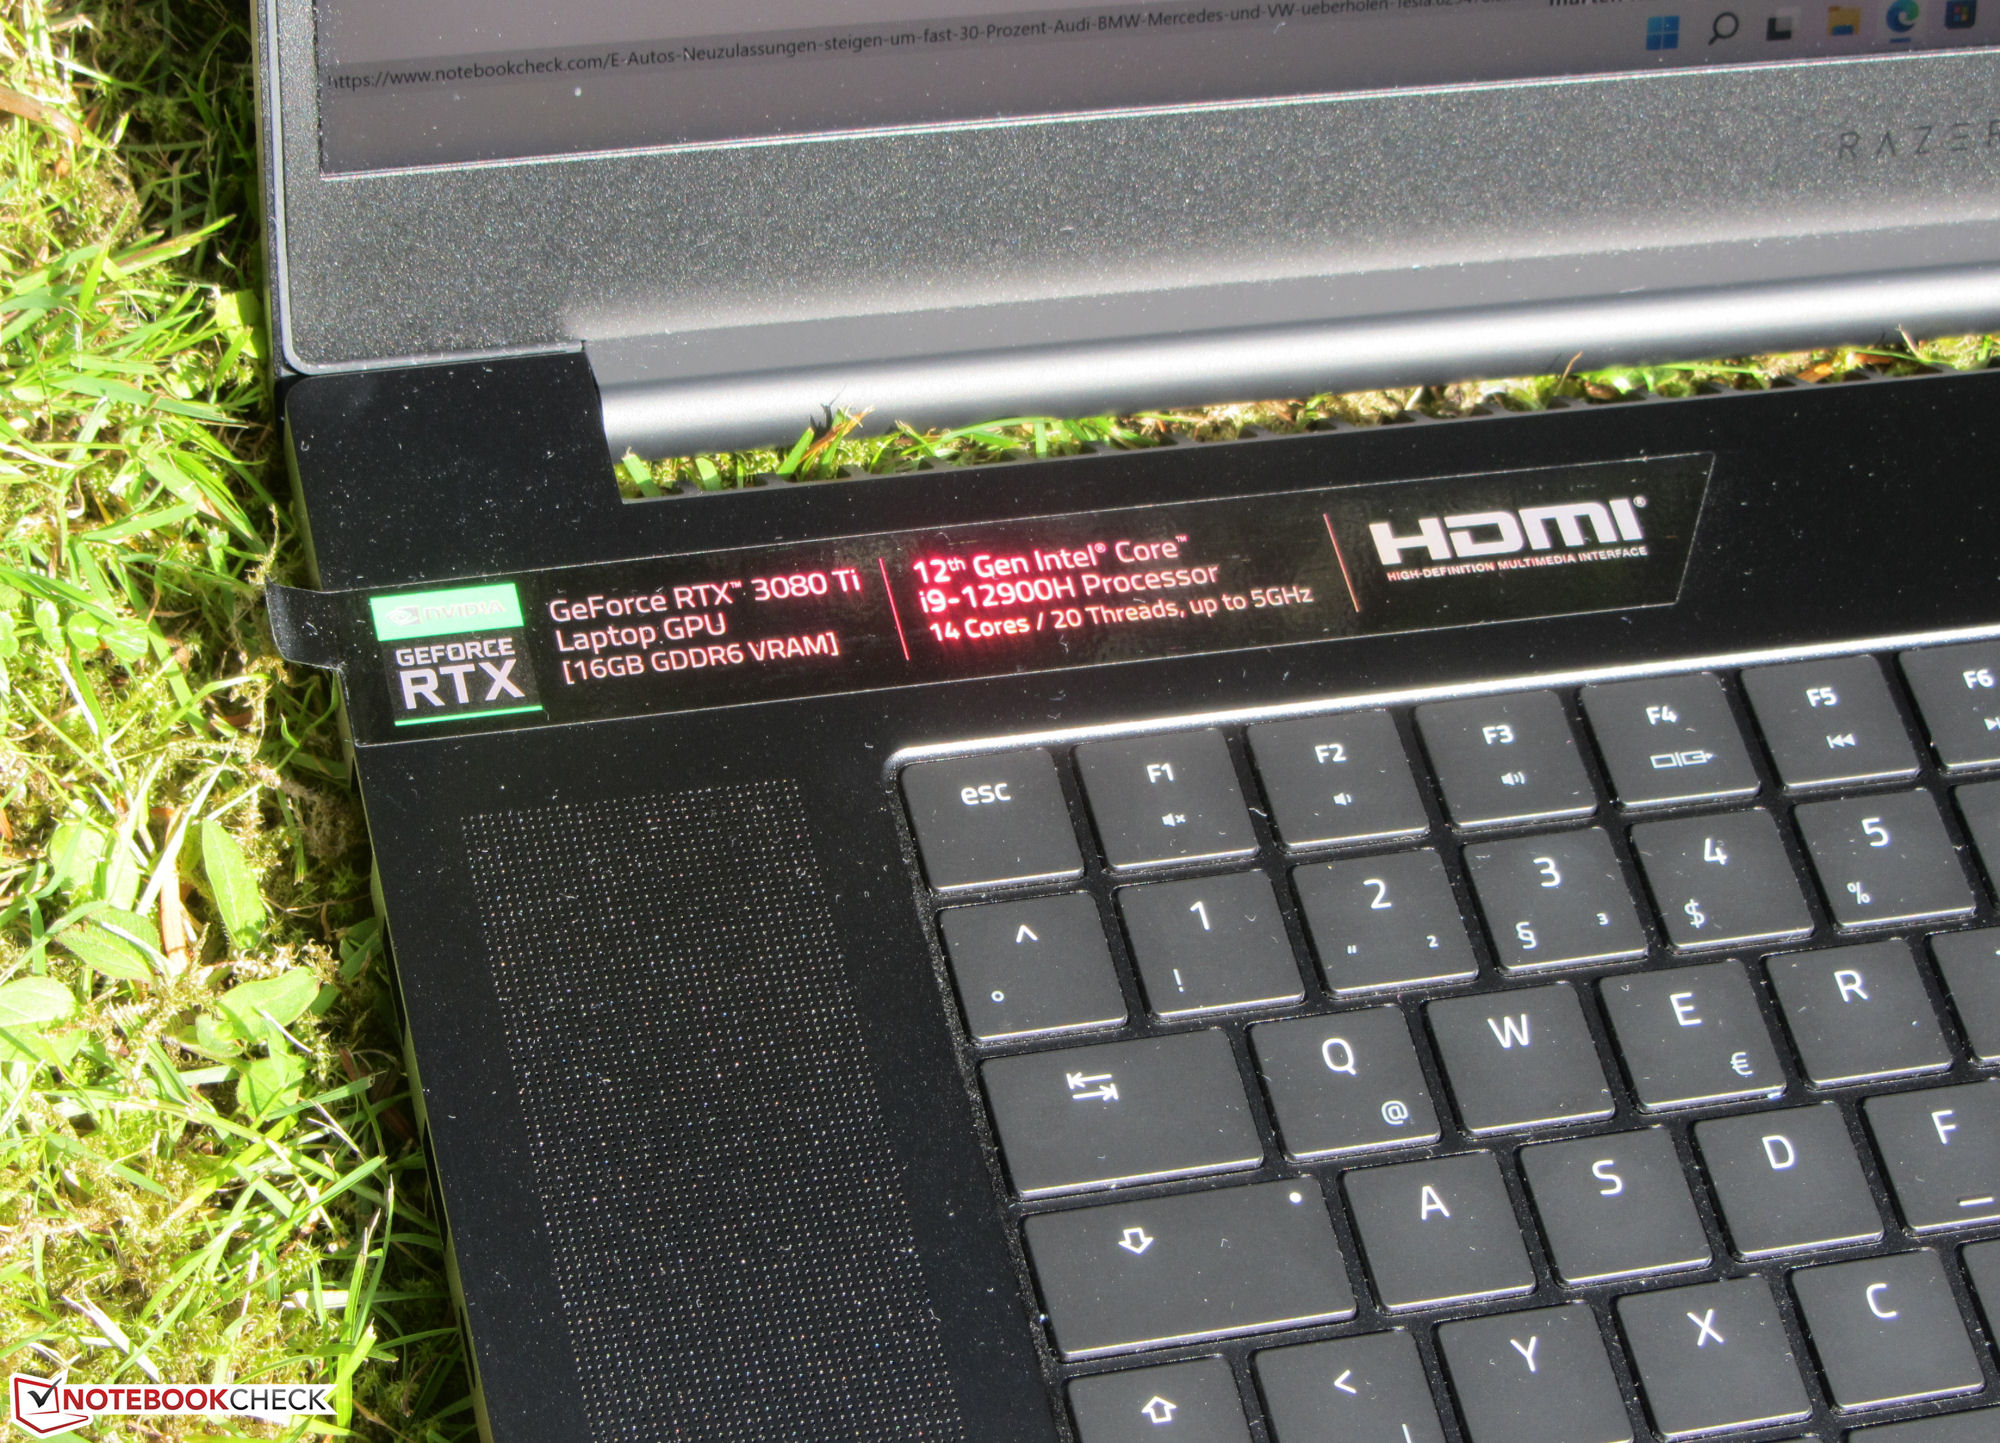
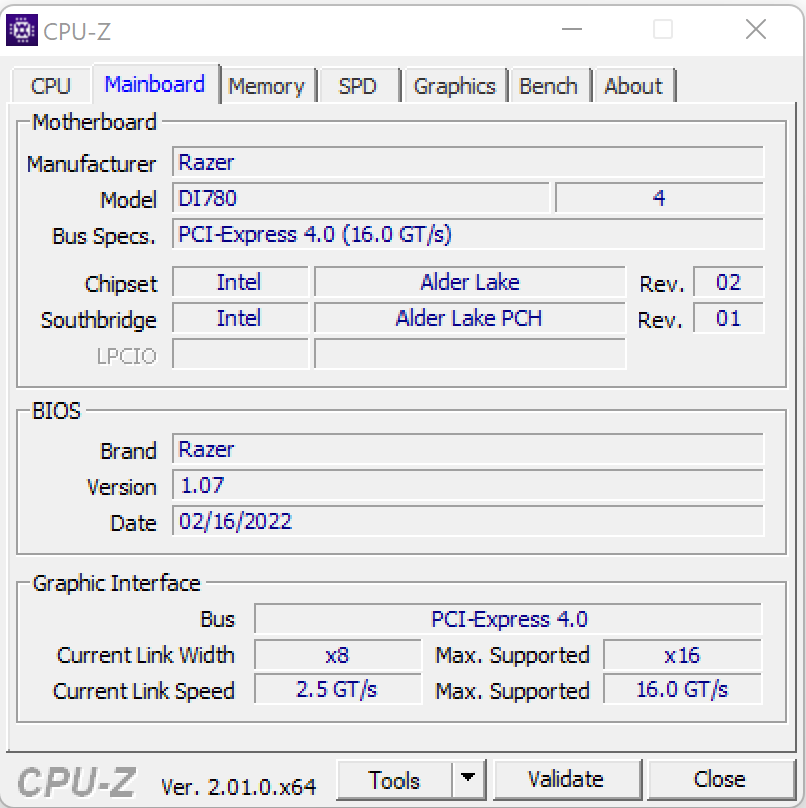
El Razer Blade 17 está dirigido a jugadores y profesionales creativos - particularmente en nuestra configuración de gama alta probada con una CPU Core i9-12900H, GPU GeForce RTX 3080 Ti Laptop, y pantalla 4k de 17.3 pulgadas con colores precisos. El precio ronda los 4.700 euros. Además de la RTX 3080 Ti, su Hermano estadounidenseque ya probamos tenía una CPU Core i7-12800H y un panel QHD (240 Hz). Entre los competidores se encuentran portátiles extremadamente potentes como el Alienware x17 R2 P48E, elMedion Erazer Beast X30y elMSI Stealth GS77 12UHS.
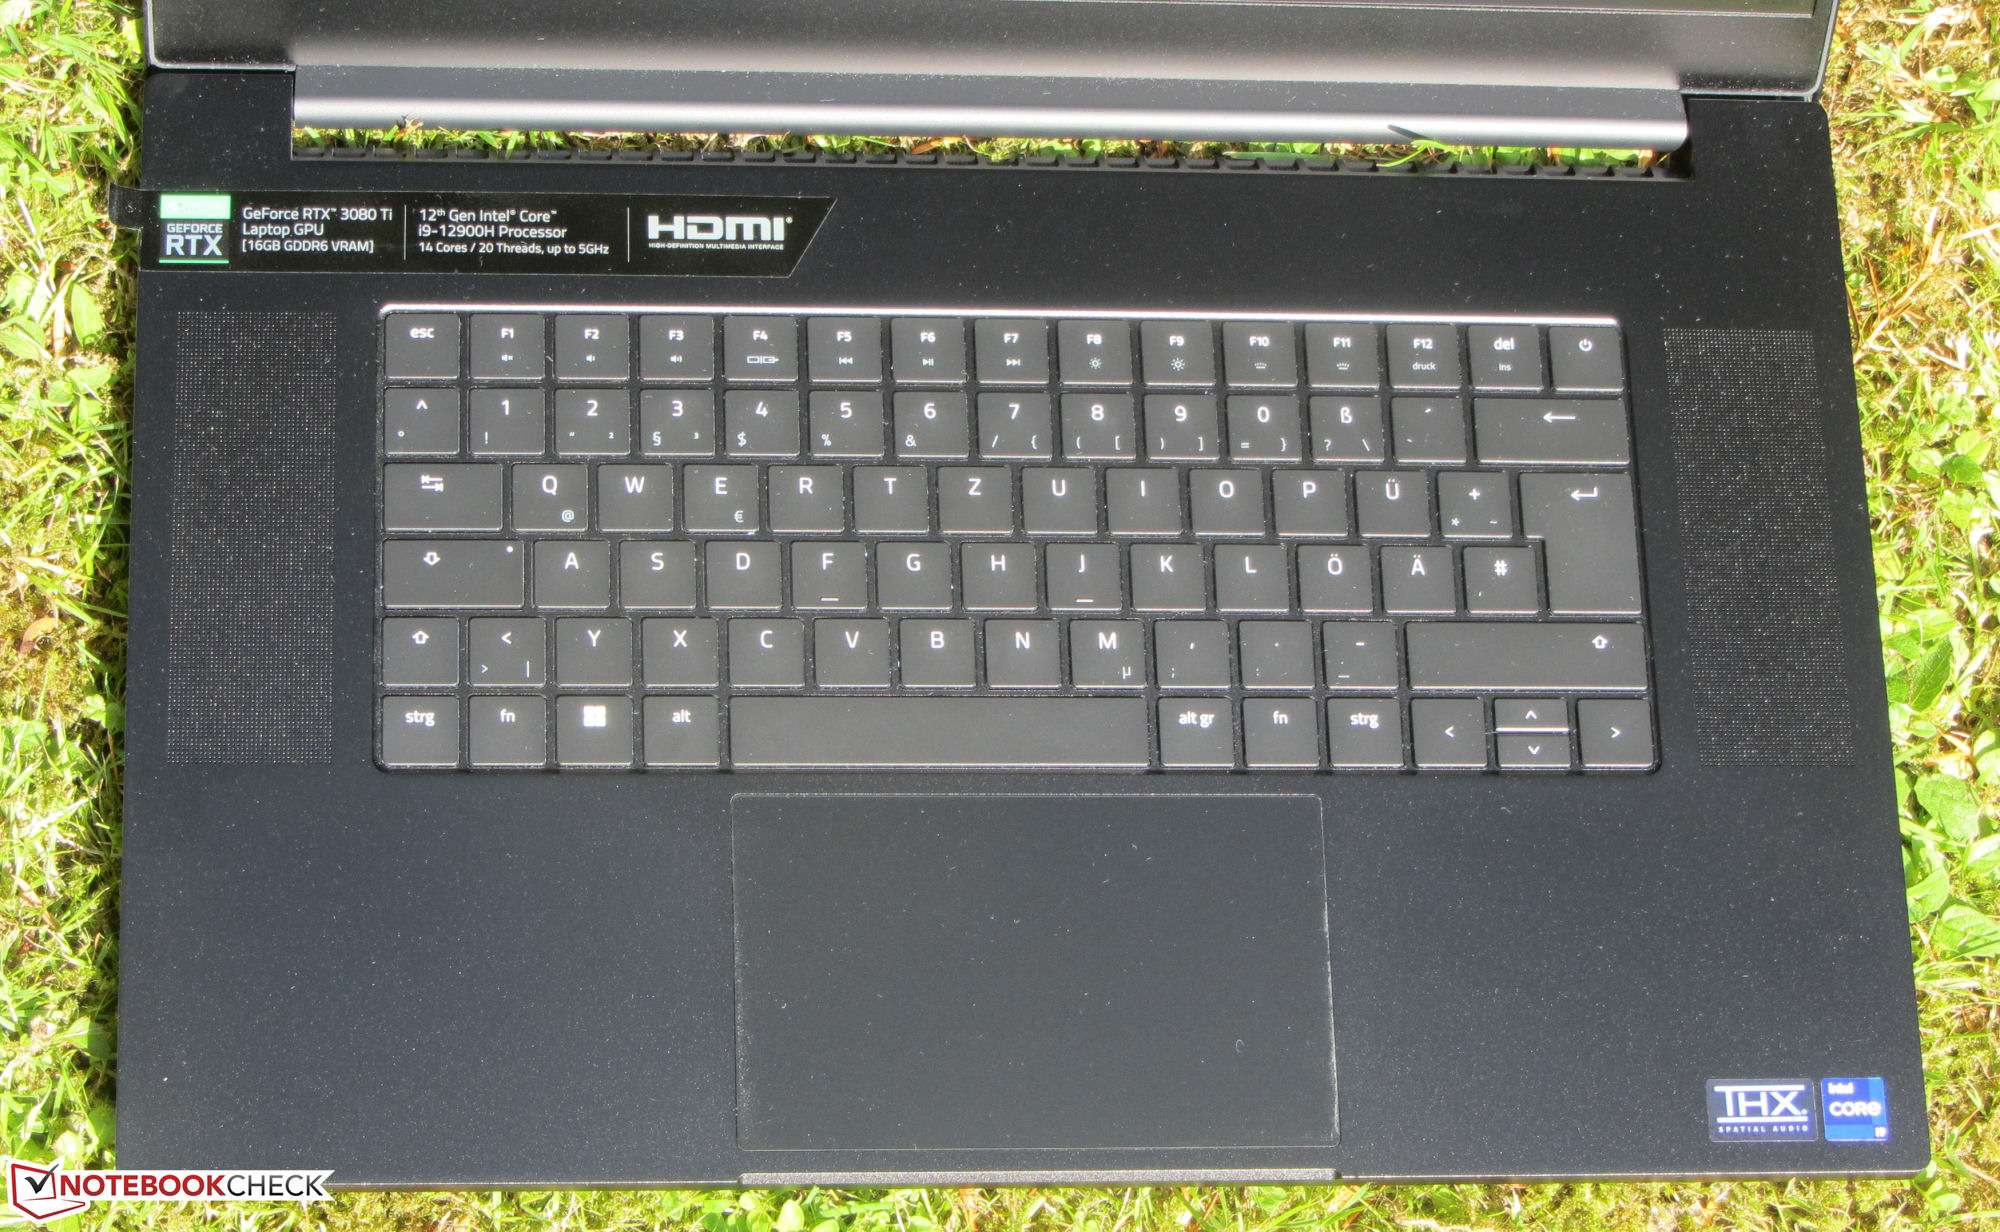
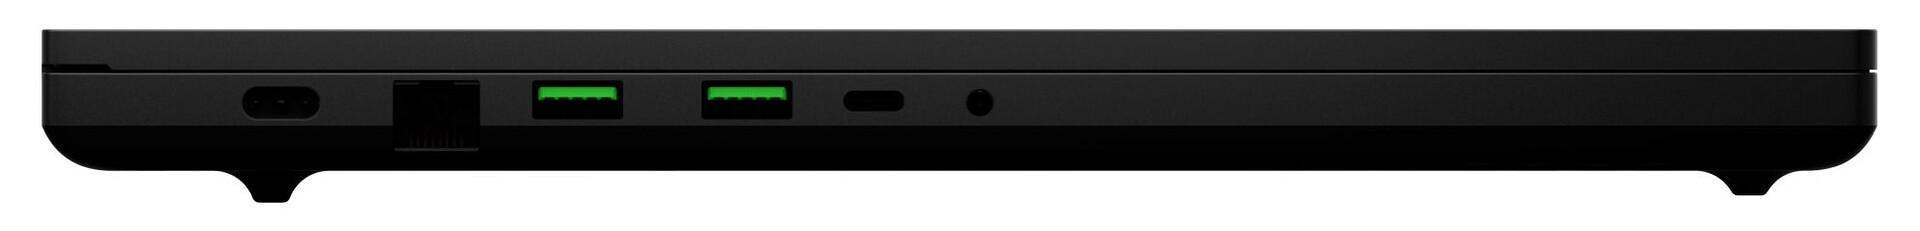
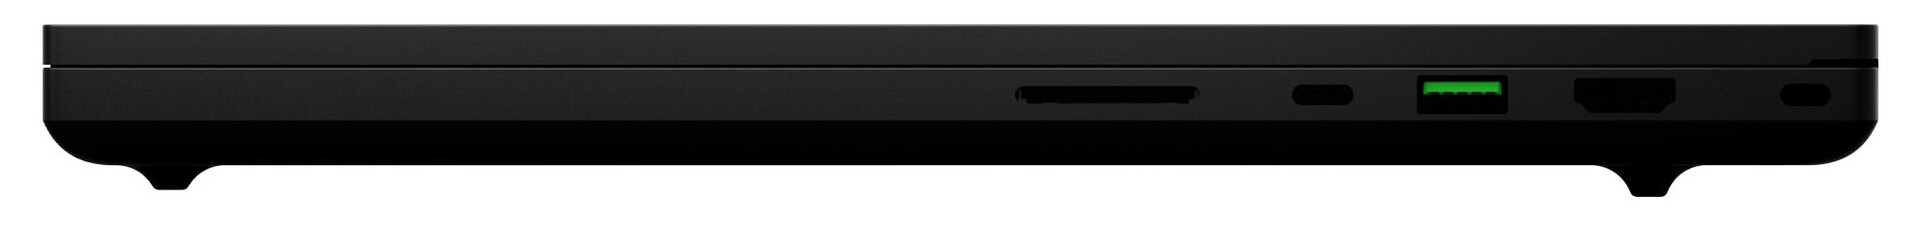
Puede encontrar información sobre la carcasa, el equipo de conexión, los dispositivos de entrada y los altavoces en nuestro análisis del Blade 17 2022 de idéntica construcción (Core i7, QHD).
Posibles contendientes en la comparación
Valoración | Fecha | Modelo | Peso | Altura | Tamaño | Resolución | Precio |
|---|---|---|---|---|---|---|---|
| 89.9 % v7 (old) | 07/2022 | Razer Blade 17 Early 2022 i9-12900H, GeForce RTX 3080 Ti Laptop GPU | 2.8 kg | 19.9 mm | 17.30" | 3840x2160 | |
| 89.2 % v7 (old) | 05/2022 | Alienware x17 R2 P48E i9-12900HK, GeForce RTX 3080 Ti Laptop GPU | 3.1 kg | 20.9 mm | 17.30" | 1920x1080 | |
| 86.7 % v7 (old) | 05/2022 | Medion Erazer Beast X30 i9-12900HK, GeForce RTX 3080 Ti Laptop GPU | 2.2 kg | 23 mm | 17.30" | 2560x1440 | |
| 87.2 % v7 (old) | 04/2022 | MSI Stealth GS77 12UHS-083US i7-12700H, GeForce RTX 3080 Ti Laptop GPU | 2.9 kg | 20.8 mm | 17.30" | 2560x1440 |
| SD Card Reader | |
| average JPG Copy Test (av. of 3 runs) | |
| Alienware x17 R2 P48E (AV Pro V60) | |
| Razer Blade 17 Early 2022 (AV PRO microSD 128 GB V60) | |
| Razer Blade 17 RTX 3080 Ti (AV Pro V60) | |
| Media de la clase Gaming (20.9 - 210, n=54, últimos 2 años) | |
| MSI Stealth GS77 12UHS-083US (AV Pro V60) | |
| Medion Erazer Beast X30 (AV PRO microSD 128 GB V60) | |
| maximum AS SSD Seq Read Test (1GB) | |
| Alienware x17 R2 P48E (AV Pro V60) | |
| Razer Blade 17 RTX 3080 Ti (AV Pro V60) | |
| Media de la clase Gaming (25.5 - 261, n=51, últimos 2 años) | |
| Medion Erazer Beast X30 (AV PRO microSD 128 GB V60) | |
| MSI Stealth GS77 12UHS-083US (AV Pro V60) | |
| Networking - iperf3 receive AXE11000 | |
| Medion Erazer Beast X30 | |
| Razer Blade 17 Early 2022 | |
| Media de la clase Gaming (680 - 1745, n=88, últimos 2 años) | |
| Medio Killer Wi-Fi 6E AX1690i 160MHz (917 - 1727, n=9) | |


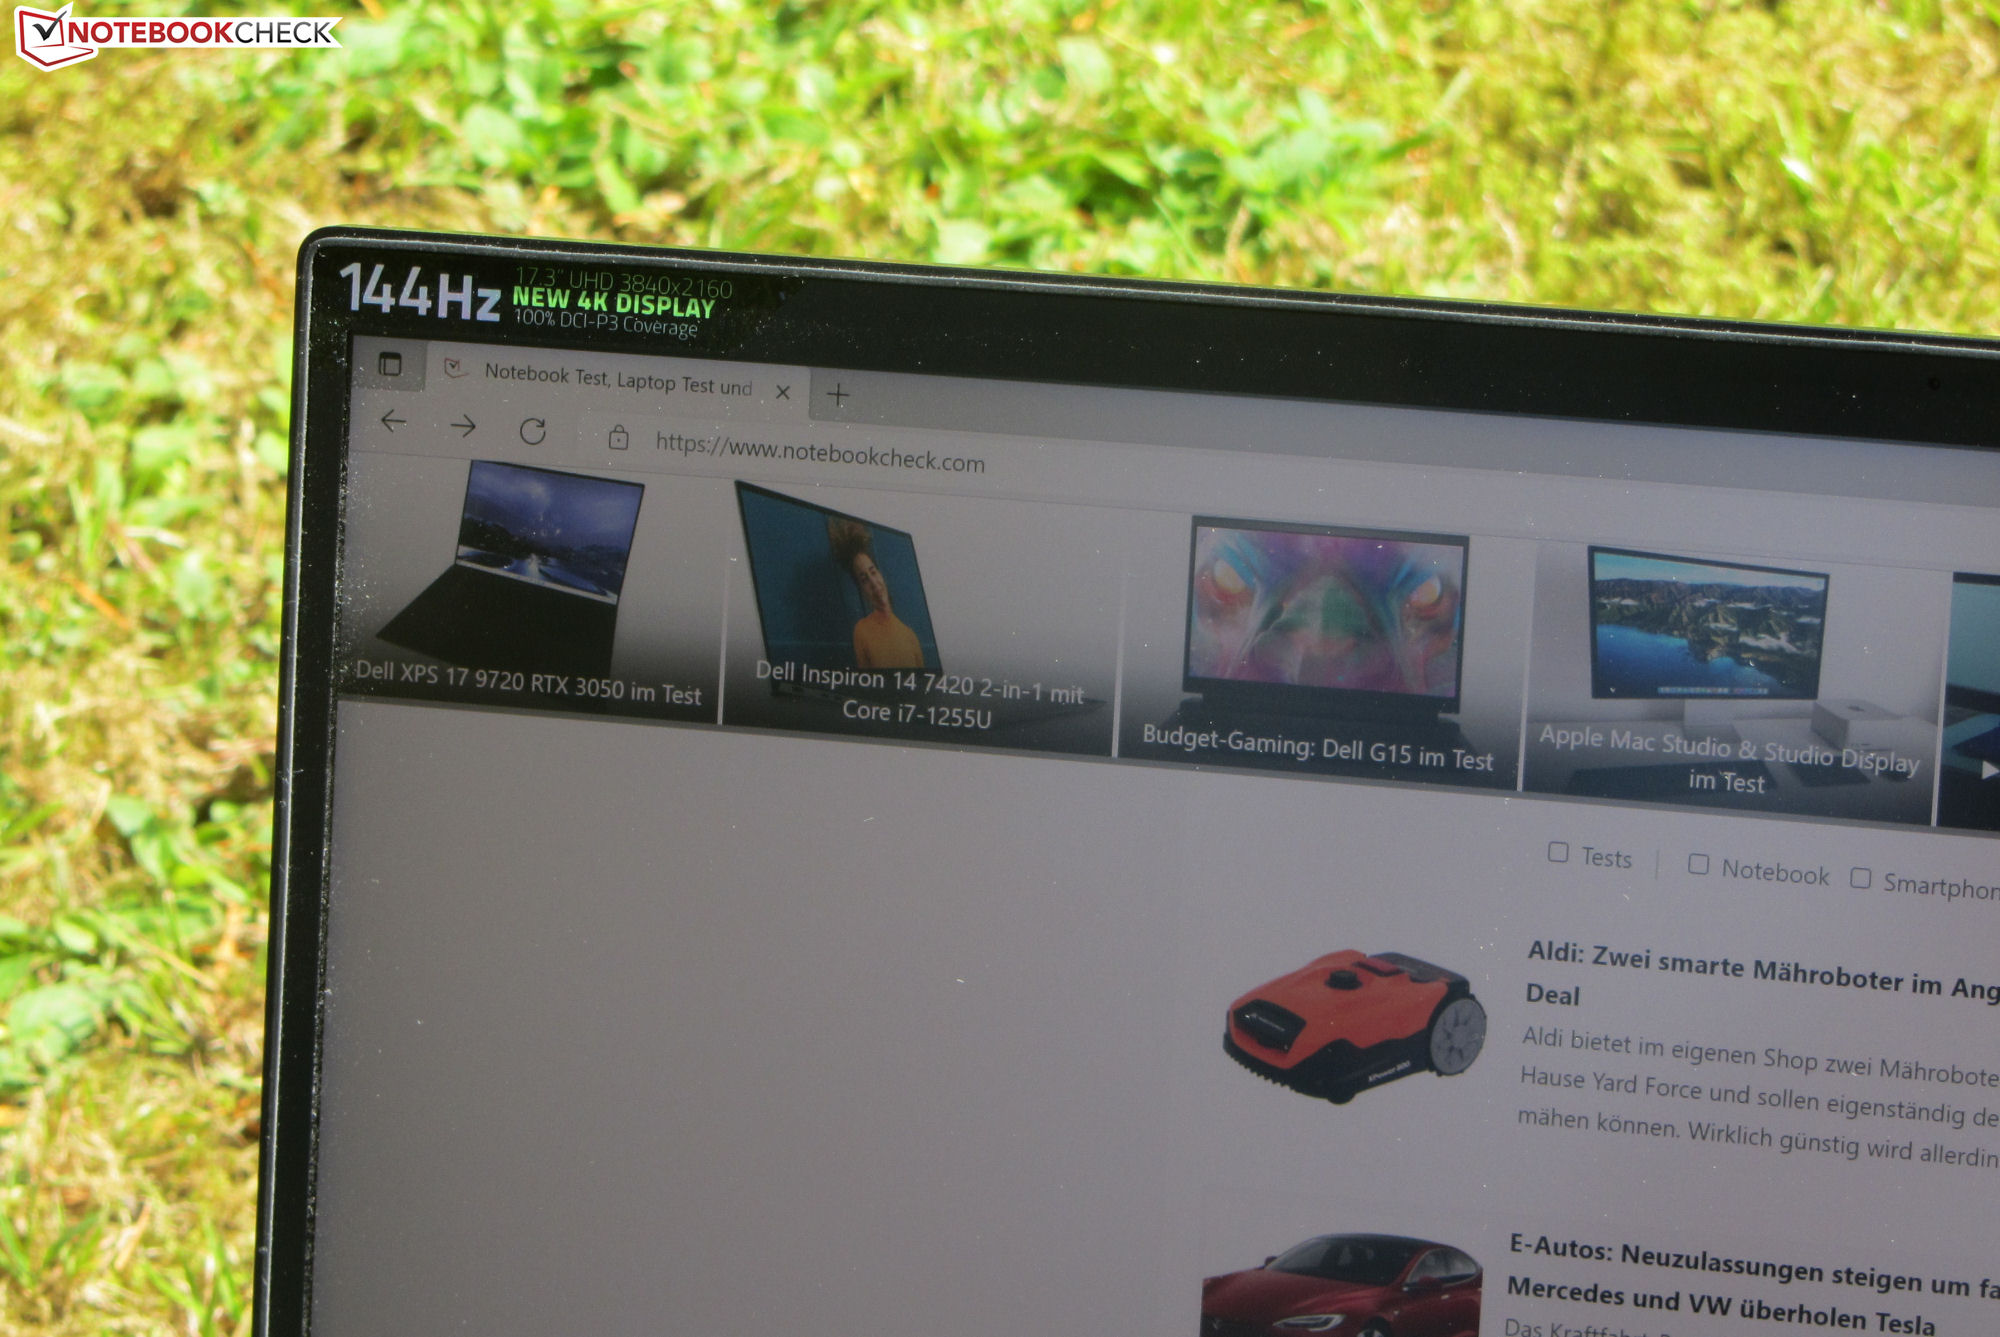
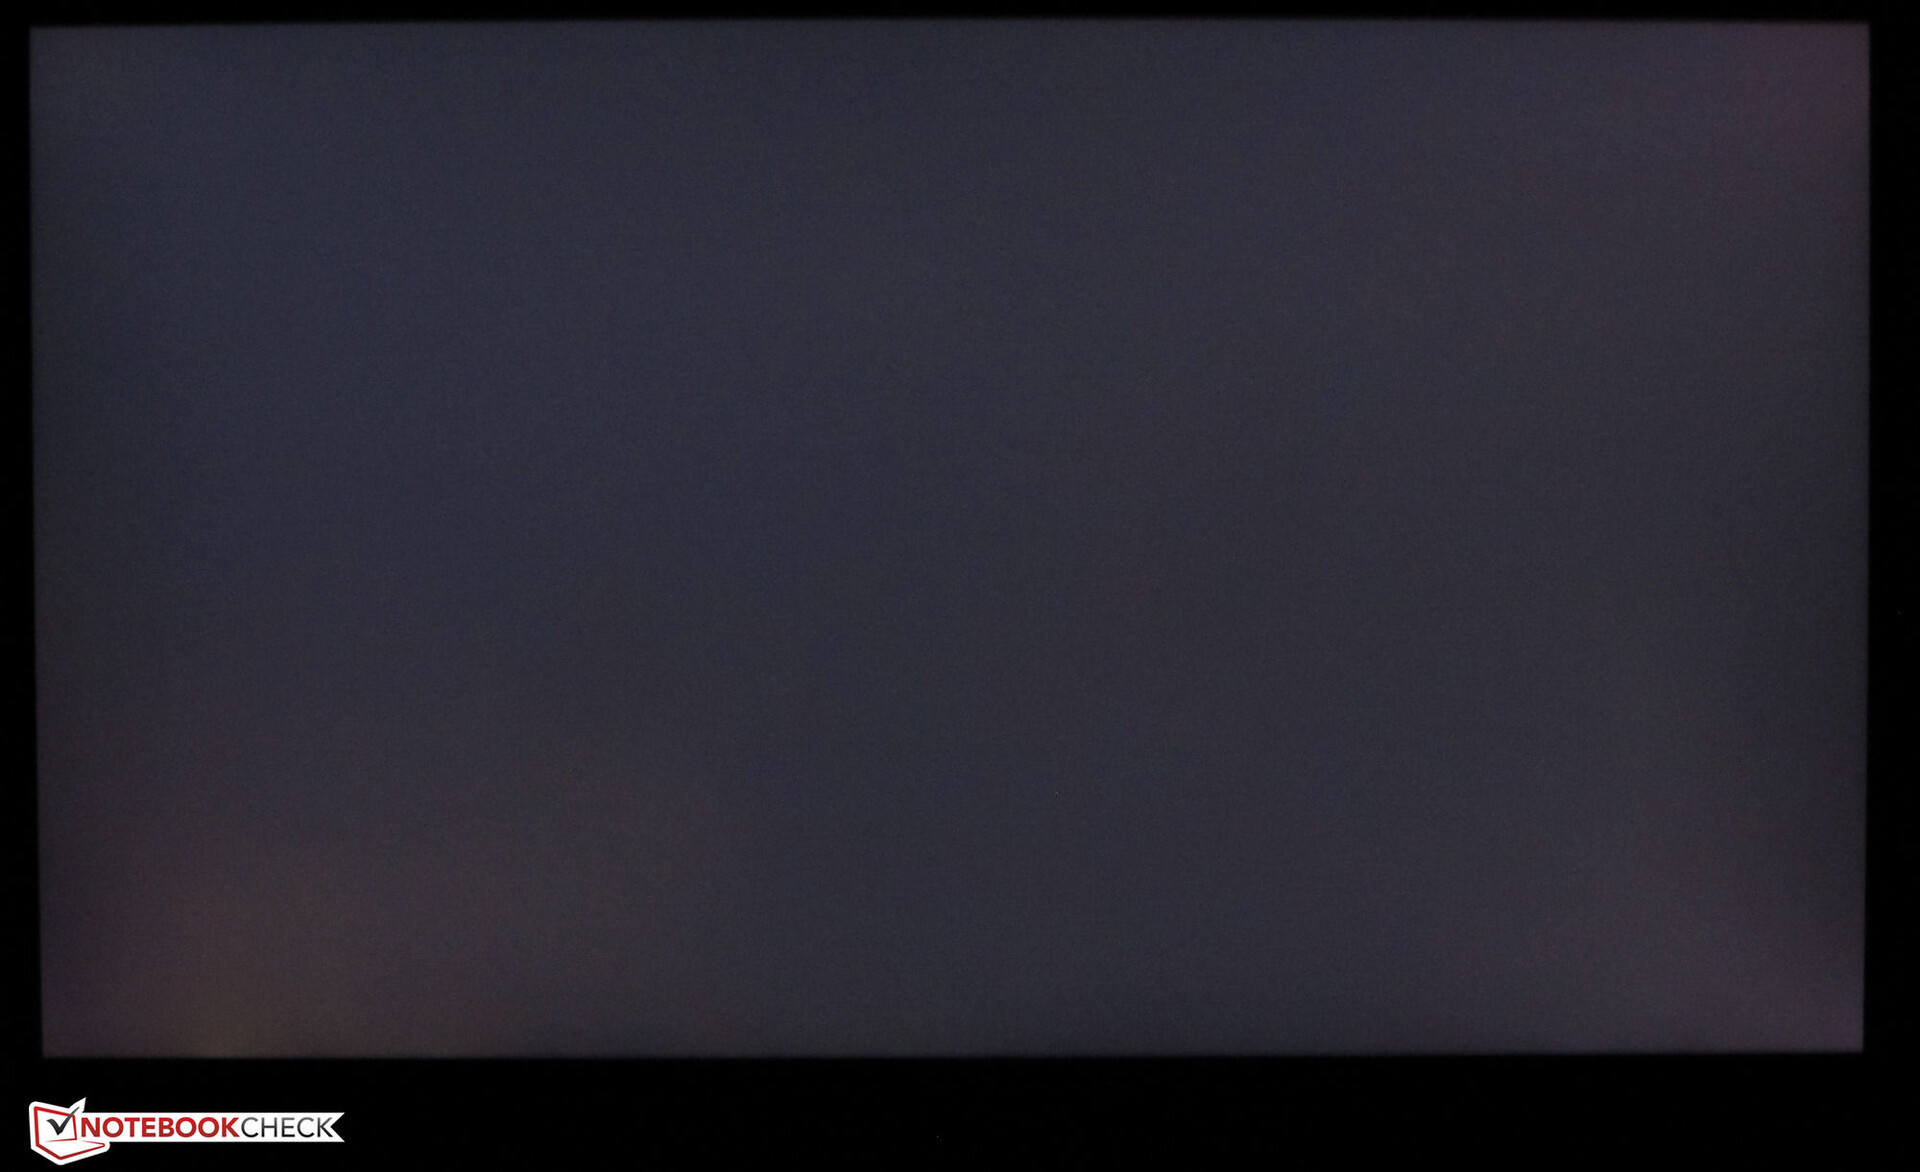
Pantalla - Brillante y con colores precisos
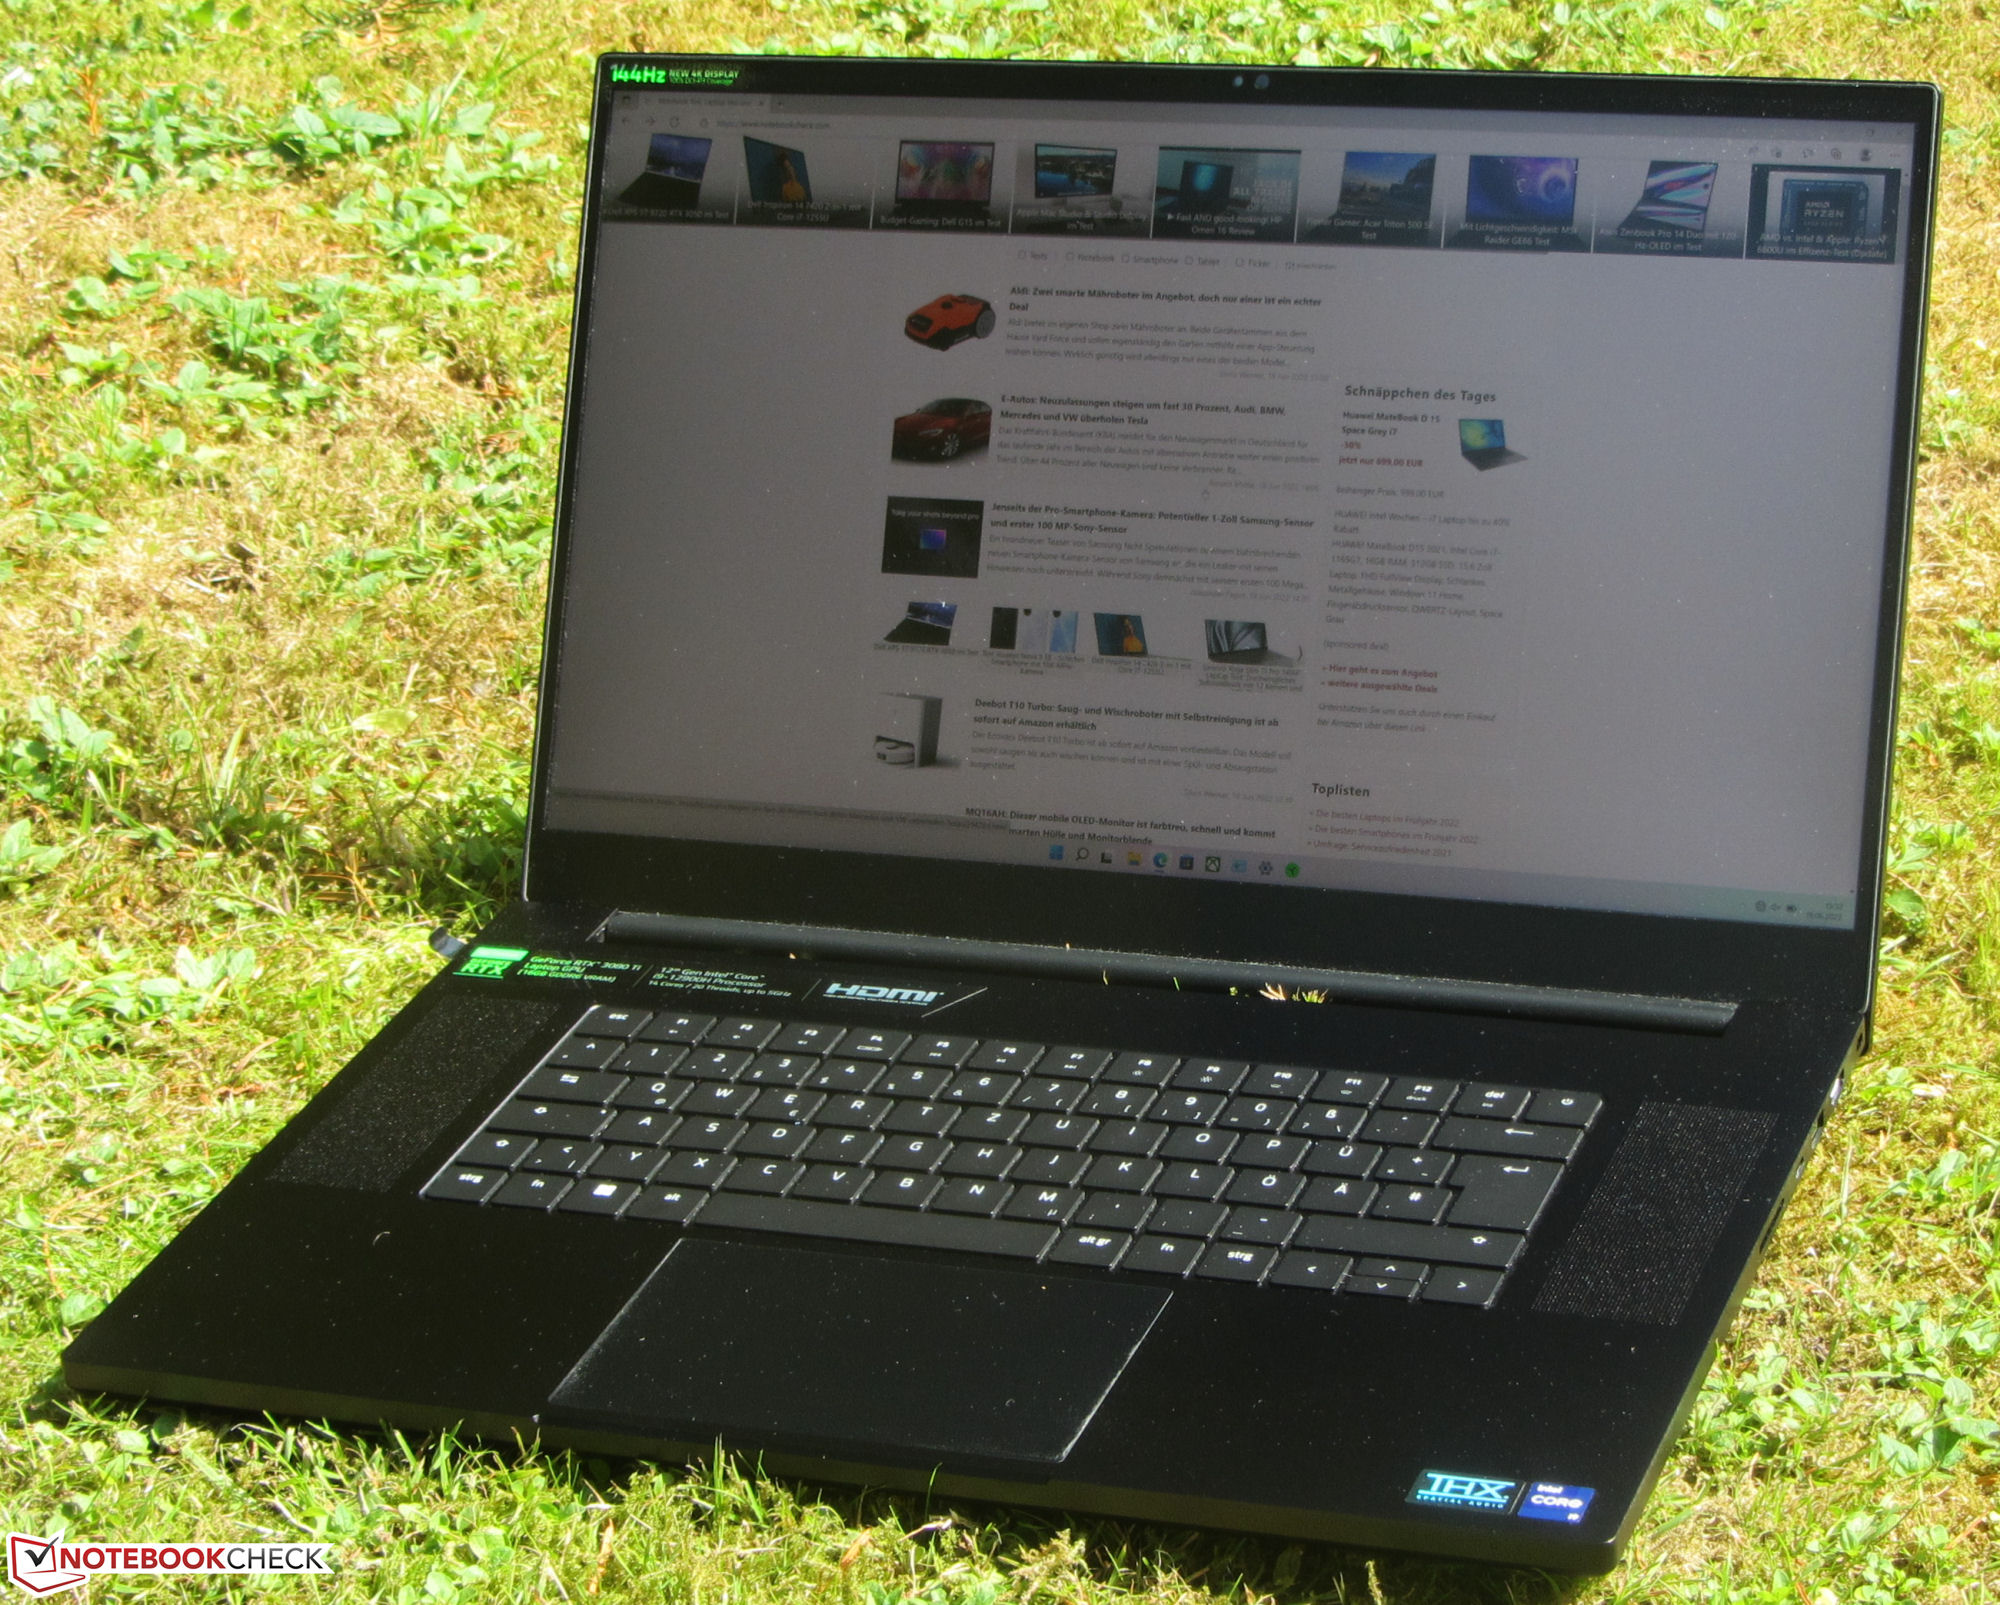
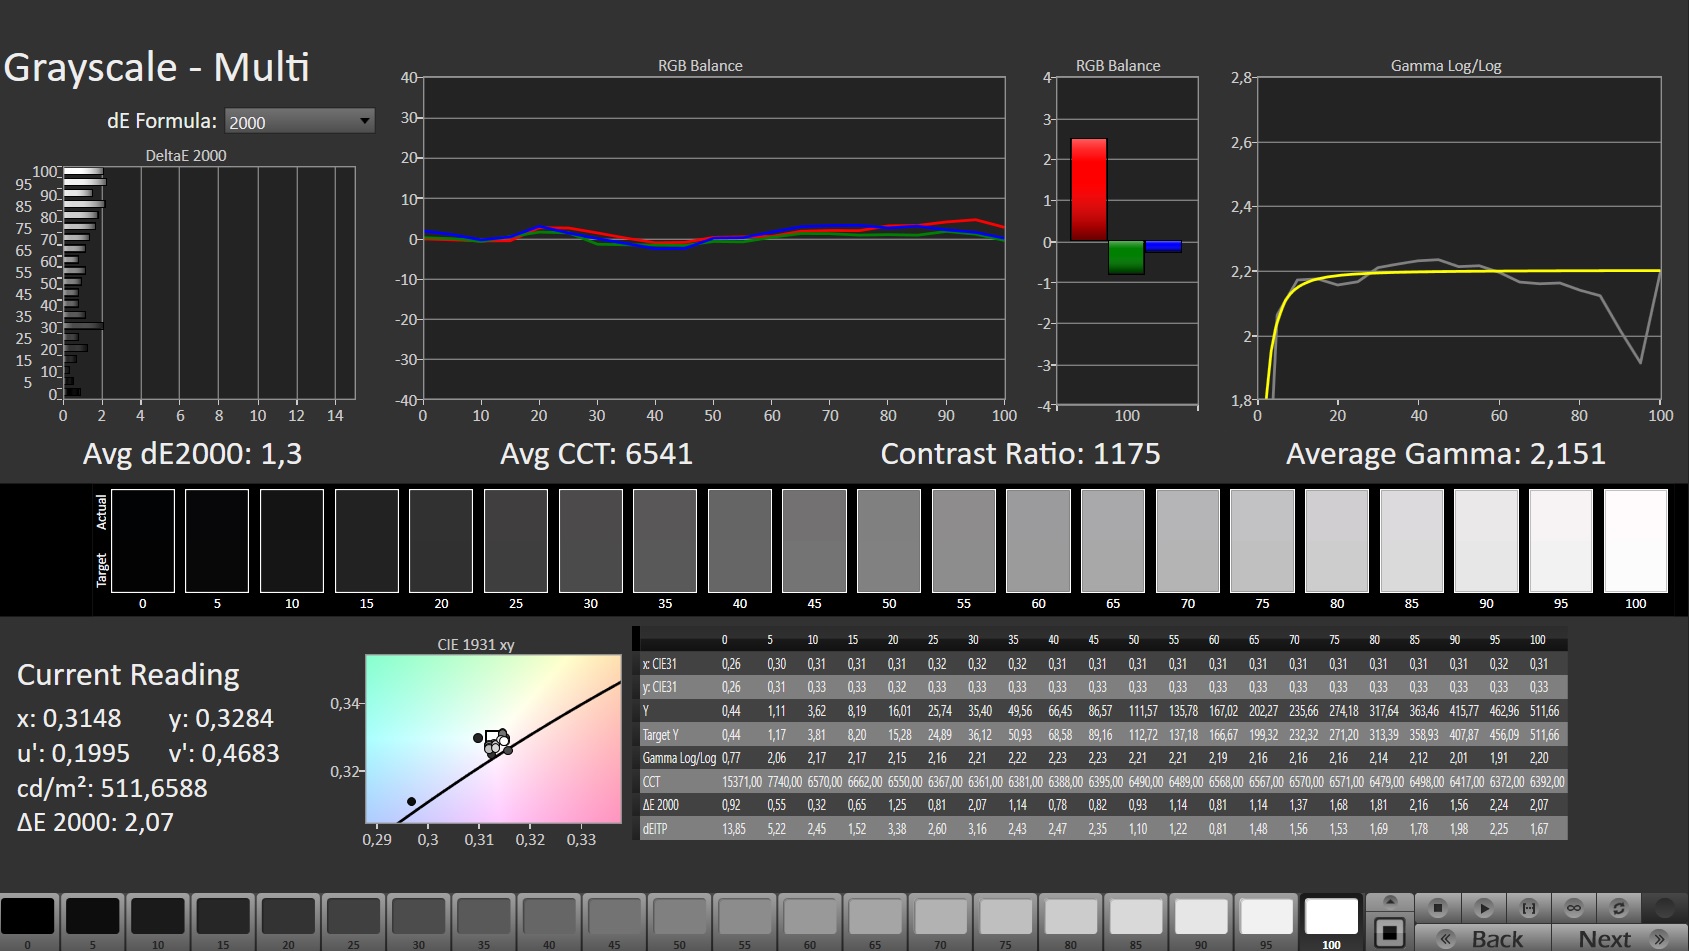
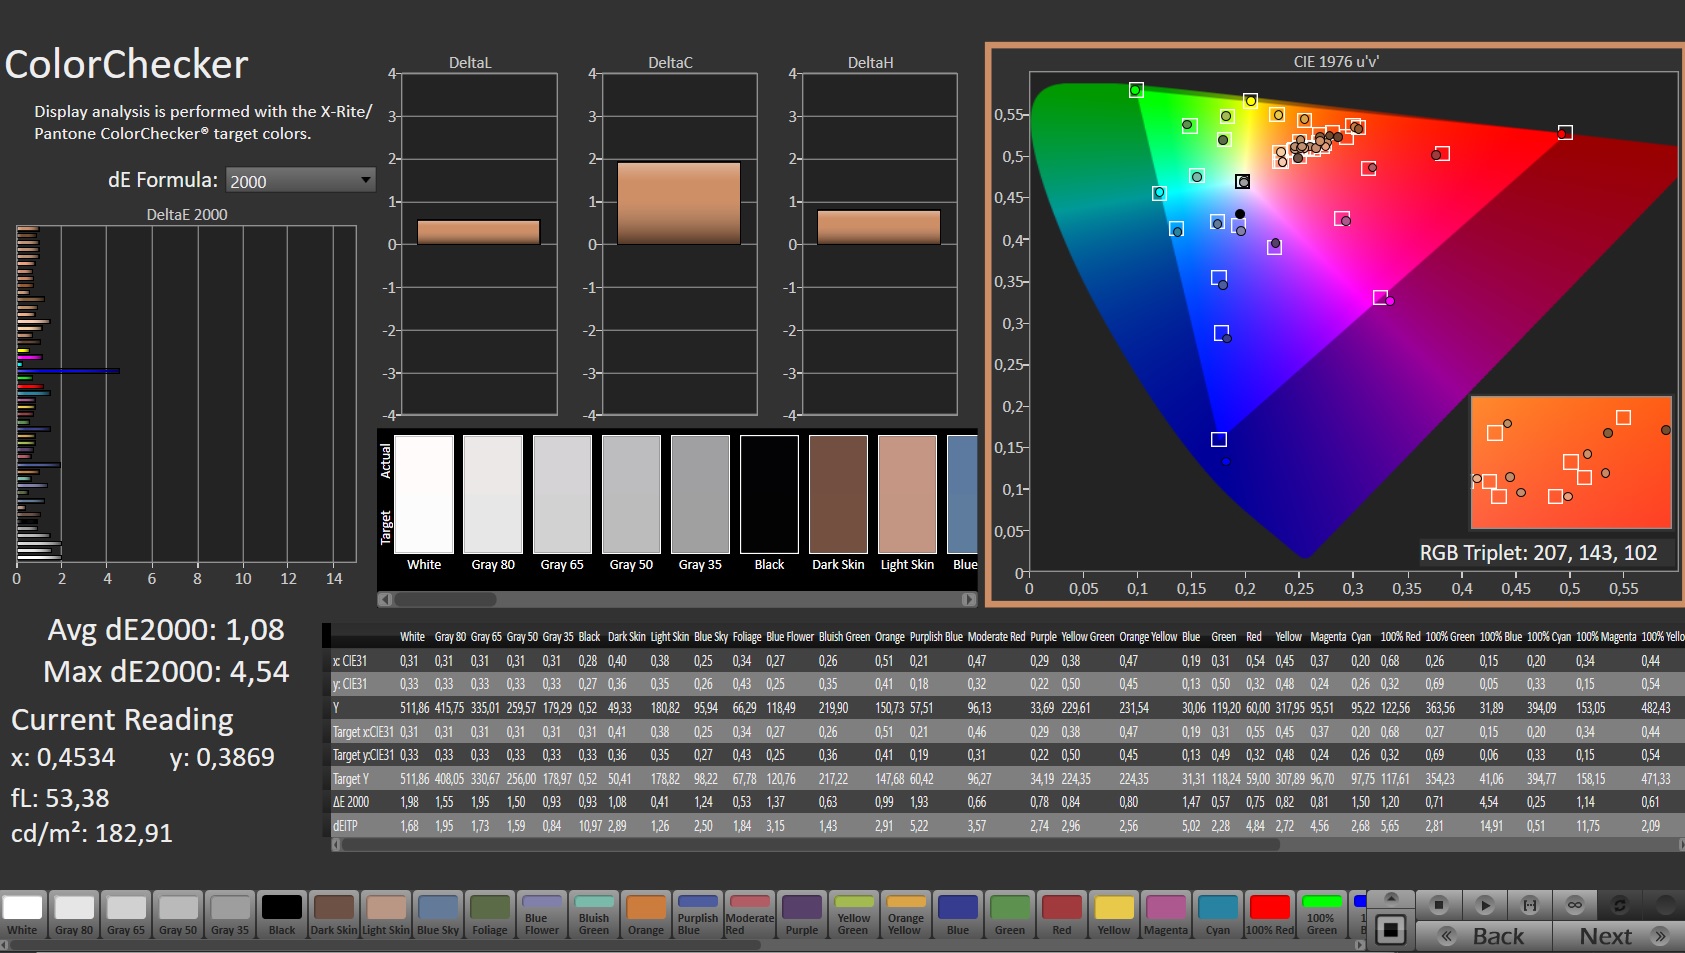
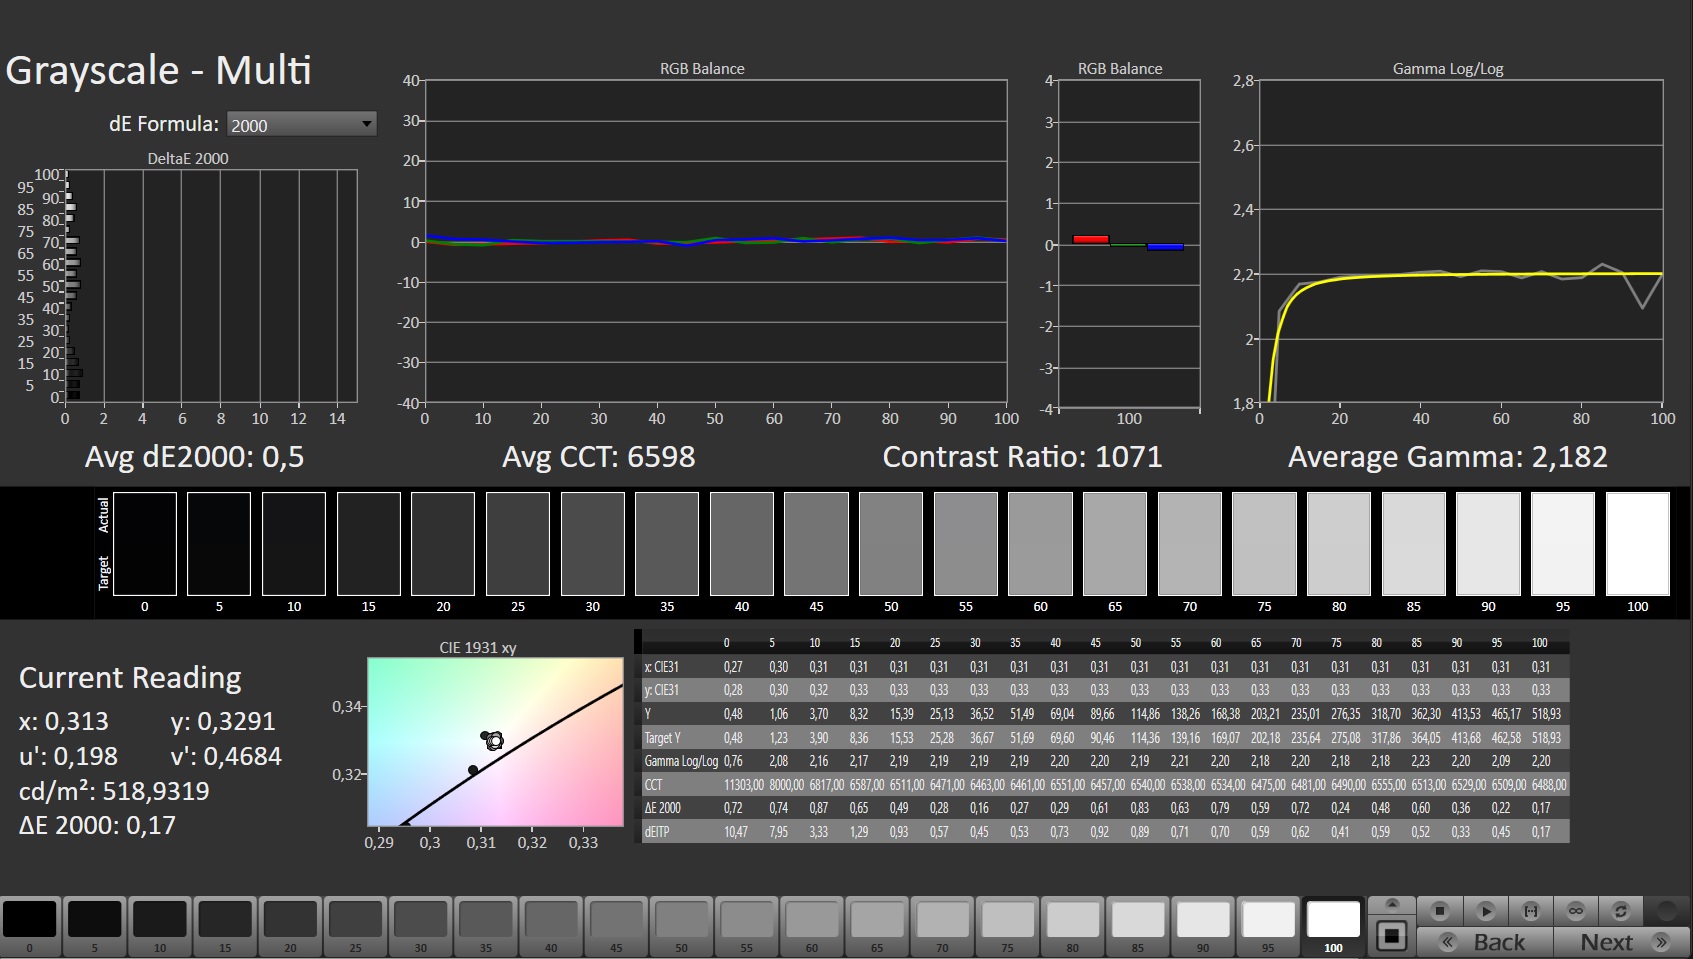
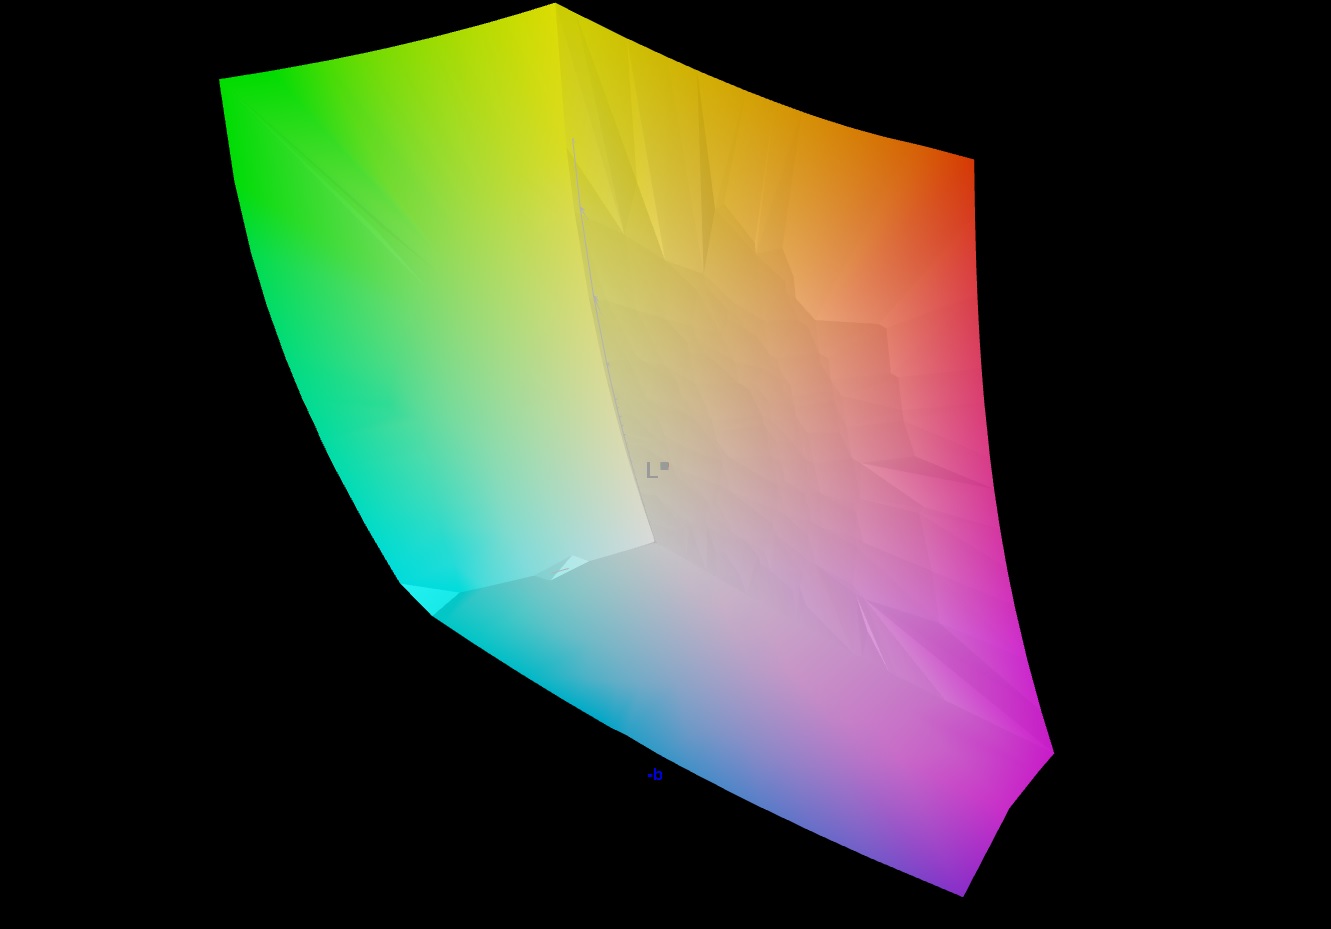
En nuestra unidad de pruebas, Razer usa una impresionante pantalla de 17.3 pulgadas con una resolución 4K (3840 x 2160 pixeles) y una tasa de refresco de 144 Hz que ofrece un mayor brillo (486.3 cd/m²) y tiempos de respuesta más cortos que las pantallas de los competidores. Esto también vale para la comparación con el panel QHD del Modelo hermano estadounidense que ya probamos. El contraste de 1,143:1 también está a un alto nivel, y no observamos ningún parpadeo PWM durante nuestras mediciones.
| |||||||||||||||||||||||||
iluminación: 84 %
Brillo con batería: 503 cd/m²
Contraste: 1143:1 (Negro: 0.44 cd/m²)
ΔE ColorChecker Calman: 1.08 | ∀{0.5-29.43 Ø4.71}
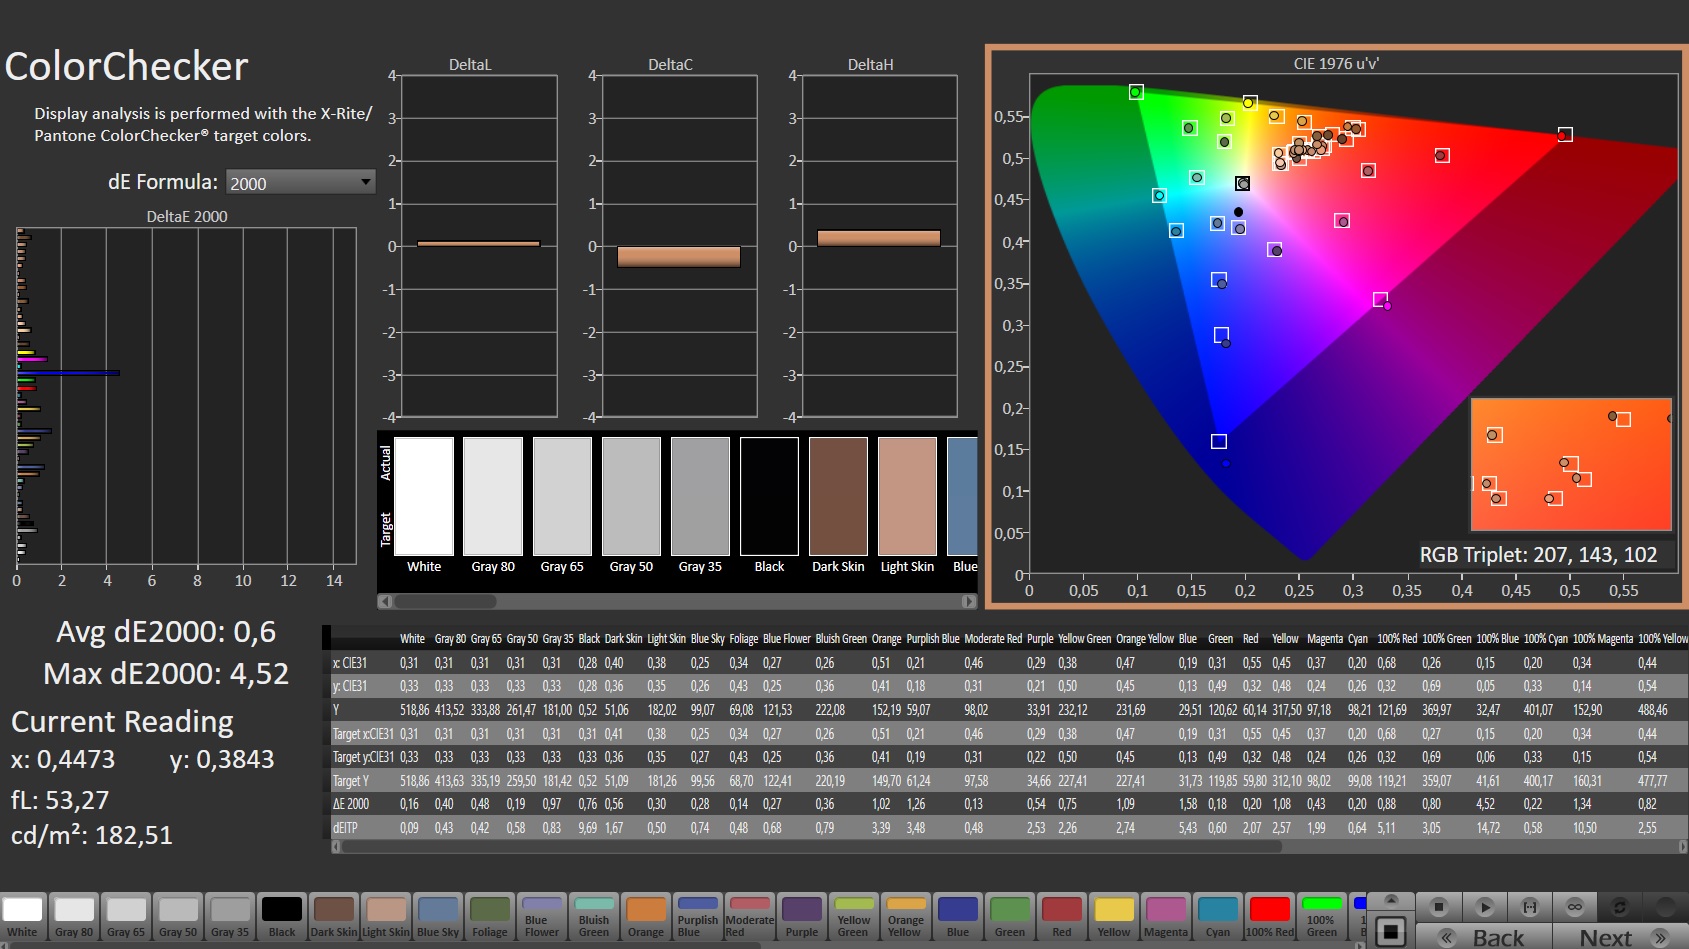
calibrated: 0.6
ΔE Greyscale Calman: 1.3 | ∀{0.09-98 Ø4.96}
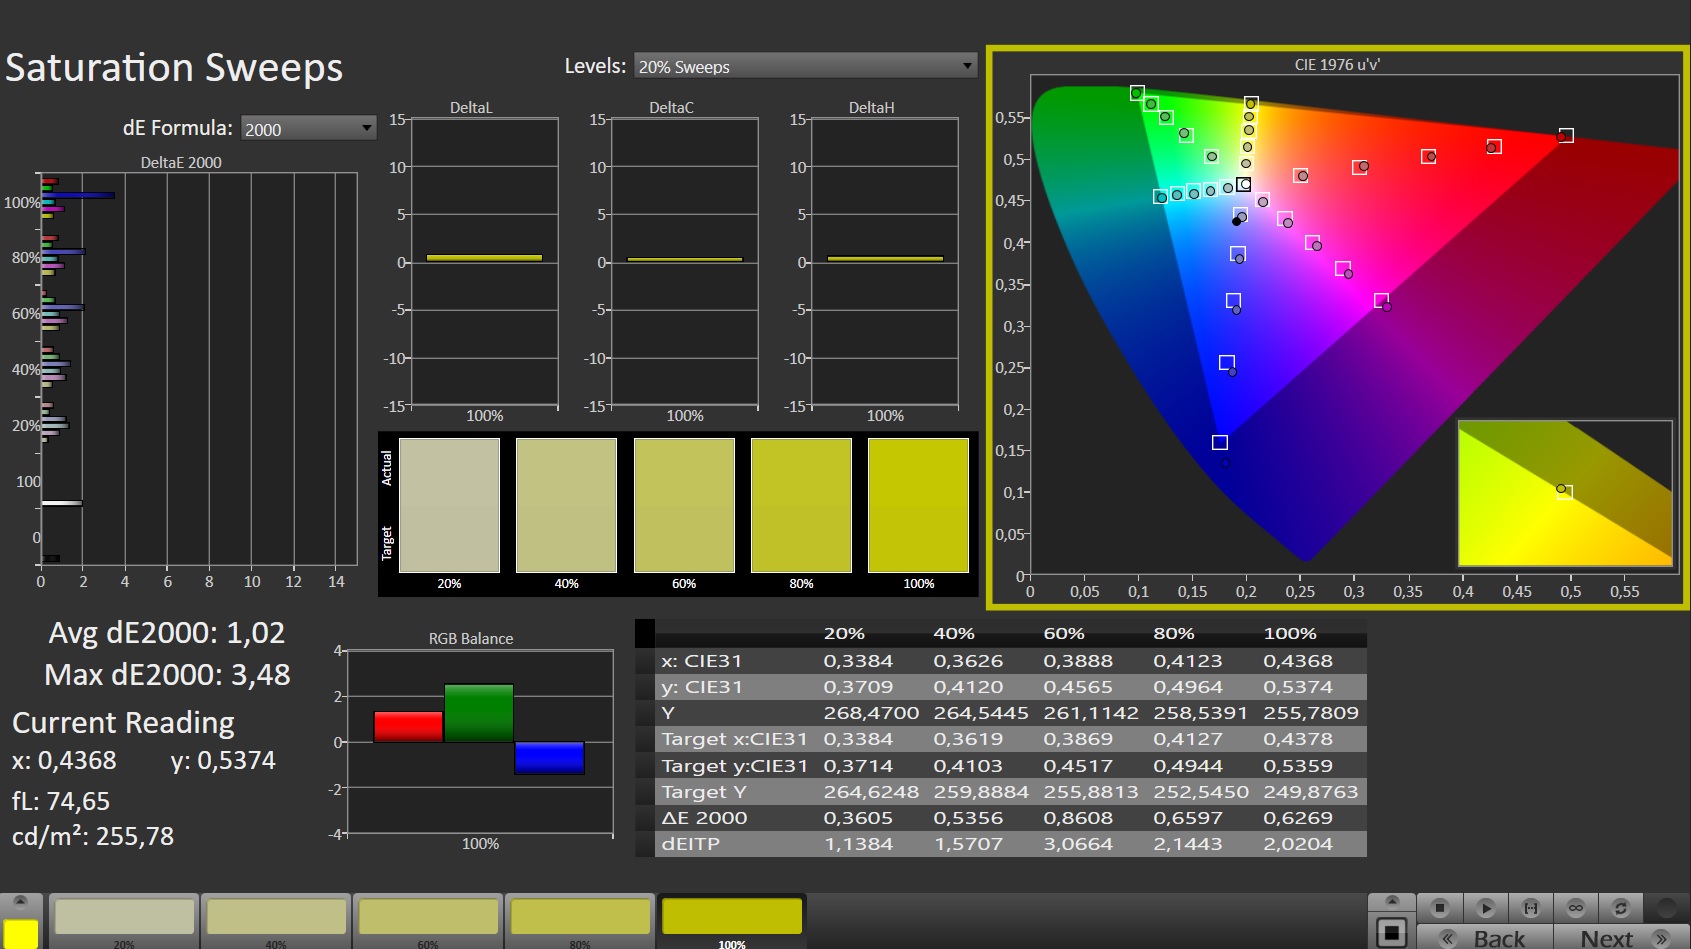
87.3% AdobeRGB 1998 (Argyll 3D)
100% sRGB (Argyll 3D)
99.4% Display P3 (Argyll 3D)
Gamma: 2.151
CCT: 6541 K
| Razer Blade 17 Early 2022 AU Optronics B173ZAN06.9, IPS, 3840x2160, 17.3" | Alienware x17 R2 P48E AU Optronics B173HAN, IPS, 1920x1080, 17.3" | Medion Erazer Beast X30 BOE CQ NE173QHM-NZ3, IPS, 2560x1440, 17.3" | MSI Stealth GS77 12UHS-083US BOE NE173QHM-NZ1, IPS, 2560x1440, 17.3" | Razer Blade 17 RTX 3080 Ti BOE NE173QHM-NZ1, IPS, 2560x1440, 17.3" | |
|---|---|---|---|---|---|
| Display | -10% | -18% | -2% | -1% | |
| Display P3 Coverage (%) | 99.4 | 79.2 -20% | 67.7 -32% | 96.2 -3% | 98.7 -1% |
| sRGB Coverage (%) | 100 | 99.8 0% | 97.6 -2% | 99.7 0% | 99.9 0% |
| AdobeRGB 1998 Coverage (%) | 87.3 | 79.6 -9% | 69.2 -21% | 85.8 -2% | 86.2 -1% |
| Response Times | -65% | -73% | -132% | -120% | |
| Response Time Grey 50% / Grey 80% * (ms) | 7.5 ? | 12.4 ? -65% | 14.7 ? -96% | 17.6 ? -135% | 17.6 ? -135% |
| Response Time Black / White * (ms) | 5.6 ? | 9.2 ? -64% | 8.4 ? -50% | 12.8 ? -129% | 11.4 ? -104% |
| PWM Frequency (Hz) | |||||
| Screen | -63% | -58% | -92% | -37% | |
| Brightness middle (cd/m²) | 503 | 365.4 -27% | 377 -25% | 334.8 -33% | 335.9 -33% |
| Brightness (cd/m²) | 486 | 344 -29% | 352 -28% | 305 -37% | 294 -40% |
| Brightness Distribution (%) | 84 | 85 1% | 86 2% | 79 -6% | 75 -11% |
| Black Level * (cd/m²) | 0.44 | 0.29 34% | 0.32 27% | 0.34 23% | 0.38 14% |
| Contrast (:1) | 1143 | 1260 10% | 1178 3% | 985 -14% | 884 -23% |
| Colorchecker dE 2000 * | 1.08 | 3.17 -194% | 2.91 -169% | 4.1 -280% | 2.82 -161% |
| Colorchecker dE 2000 max. * | 4.54 | 7.69 -69% | 6.78 -49% | 7.28 -60% | 5.04 -11% |
| Colorchecker dE 2000 calibrated * | 0.6 | 0.51 15% | 1.3 -117% | ||
| Greyscale dE 2000 * | 1.3 | 5.3 -308% | 3.4 -162% | 5.6 -331% | 1.7 -31% |
| Gamma | 2.151 102% | 2.18 101% | 2.109 104% | 2.16 102% | 2.14 103% |
| CCT | 6541 99% | 5879 111% | 7273 89% | 6314 103% | 6382 102% |
| Media total (Programa/Opciones) | -46% /
-52% | -50% /
-51% | -75% /
-77% | -53% /
-41% |
* ... más pequeño es mejor
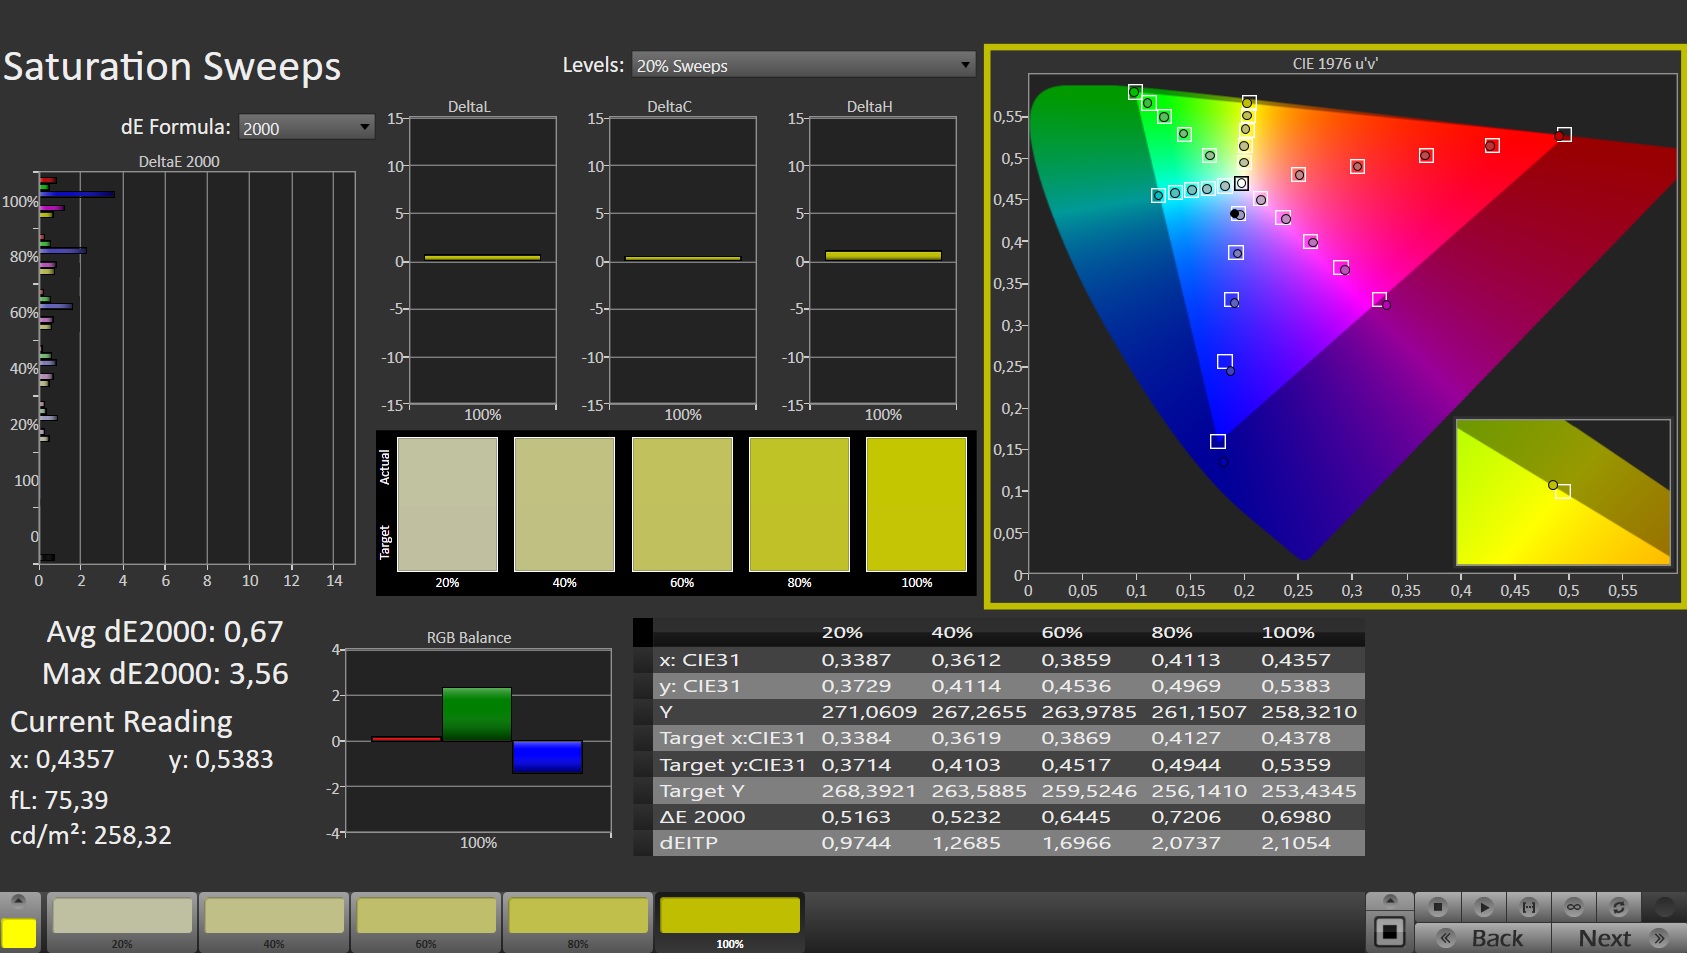
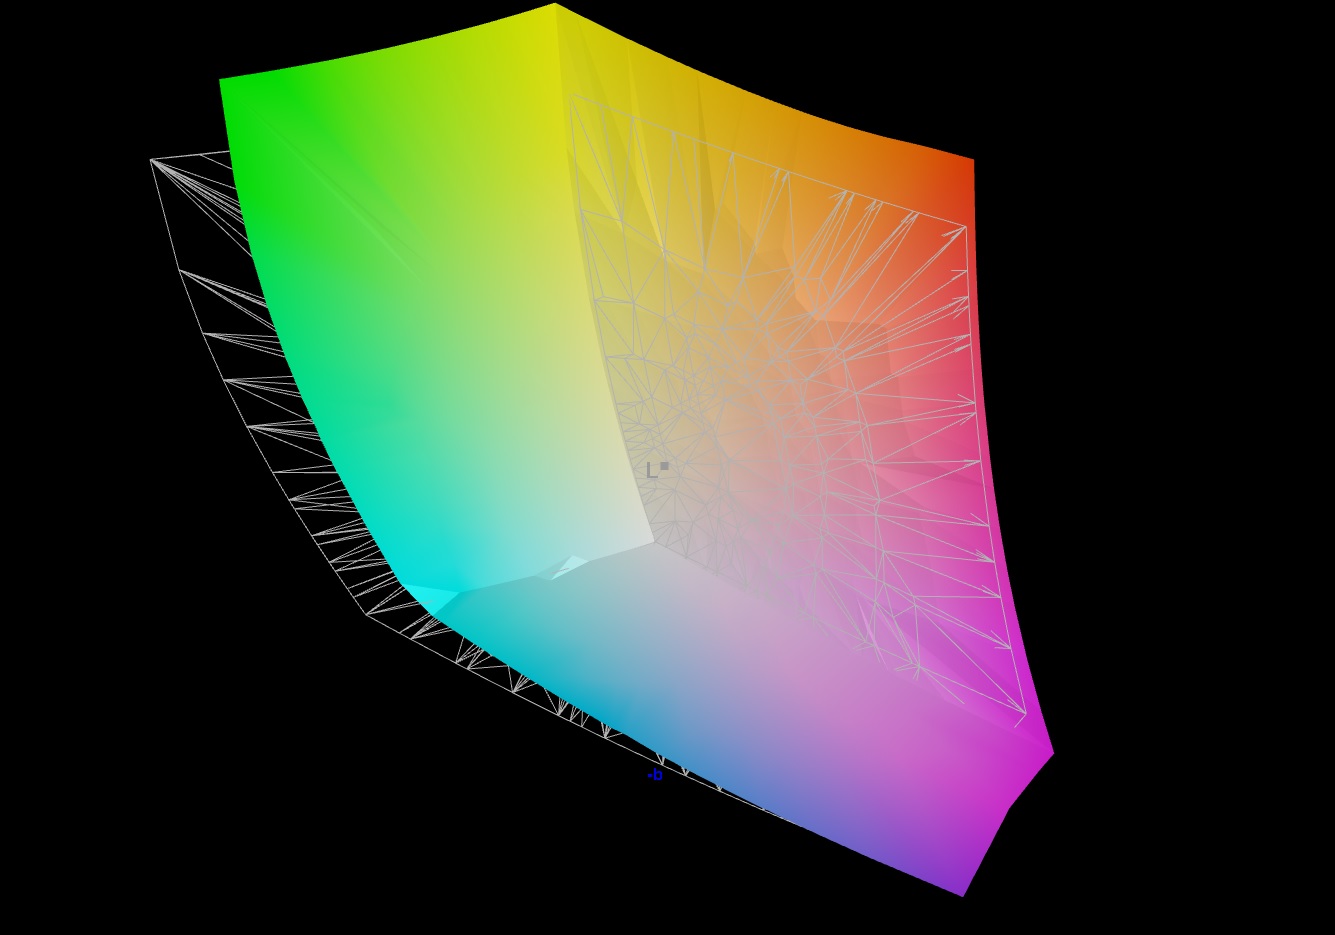
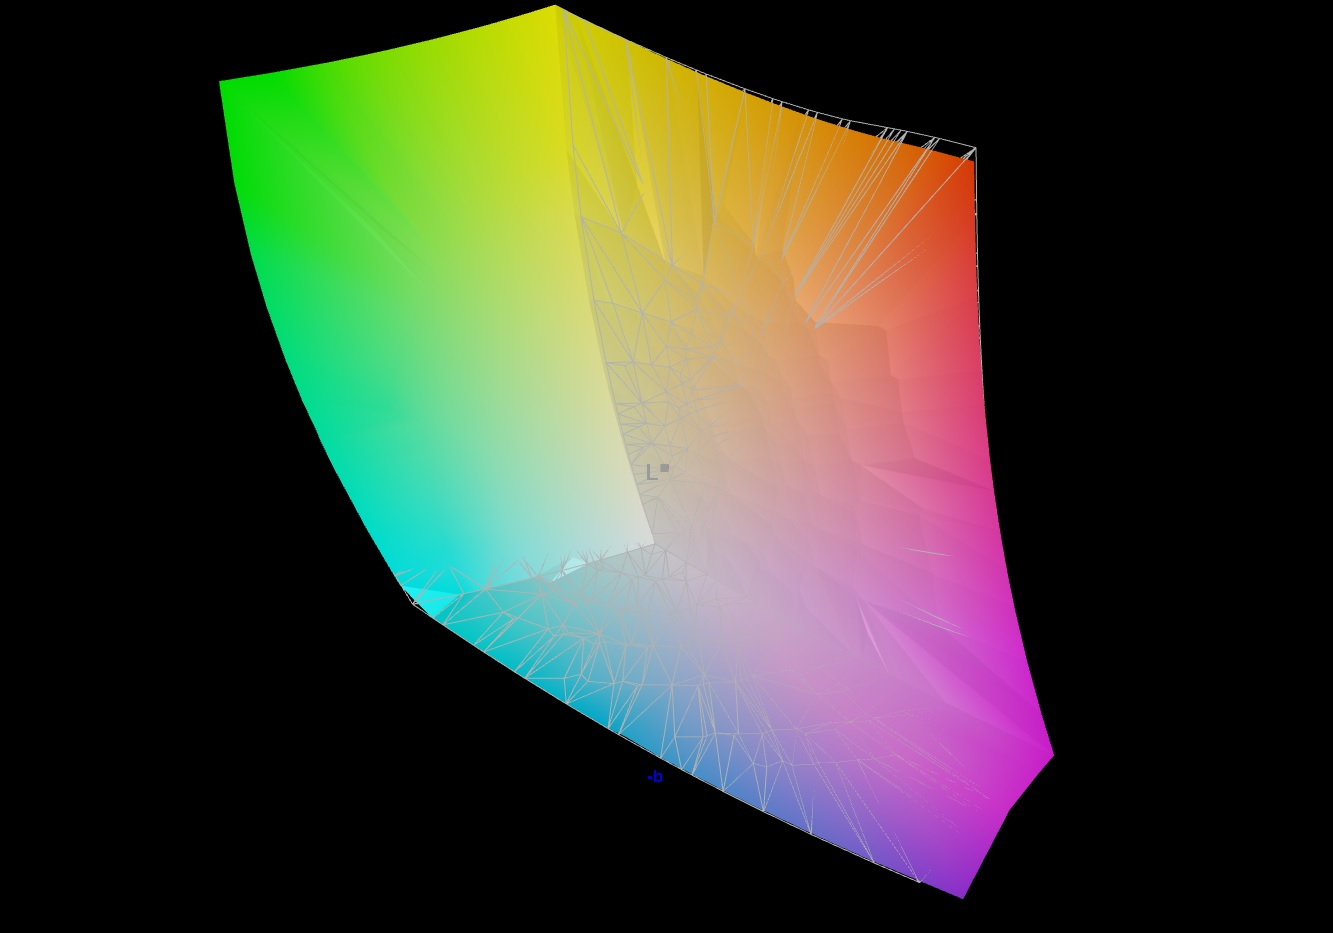
En cuanto a la reproducción del color y la cobertura del espacio de color, el panel 4K y el panel QHD del modelo hermano son similares, y ambos modelos ofrecen buenos valores de niveles casi idénticos ya en el estado de entrega. Las desviaciones de color medias se mantienen dentro del rango objetivo de DeltaE < 3. Una calibración aporta más mejoras, y nuestro archivo de perfil está enlazado en la ventana de información de la pantalla de arriba para su descarga gratuita. Sin embargo, el panel 4K muestra cierta debilidad en los tonos azules incluso después del calibrado. Ambas pantallas son capaces de cubrir completamente los espacios de color sRGB y DCI-P3, y el espacio de color AdobeRGB se cubre al menos en un 86 y 87% respectivamente.
Tiempos de respuesta del display
| ↔ Tiempo de respuesta de Negro a Blanco | ||
|---|---|---|
| 5.6 ms ... subida ↗ y bajada ↘ combinada | ↗ 1.6 ms subida | 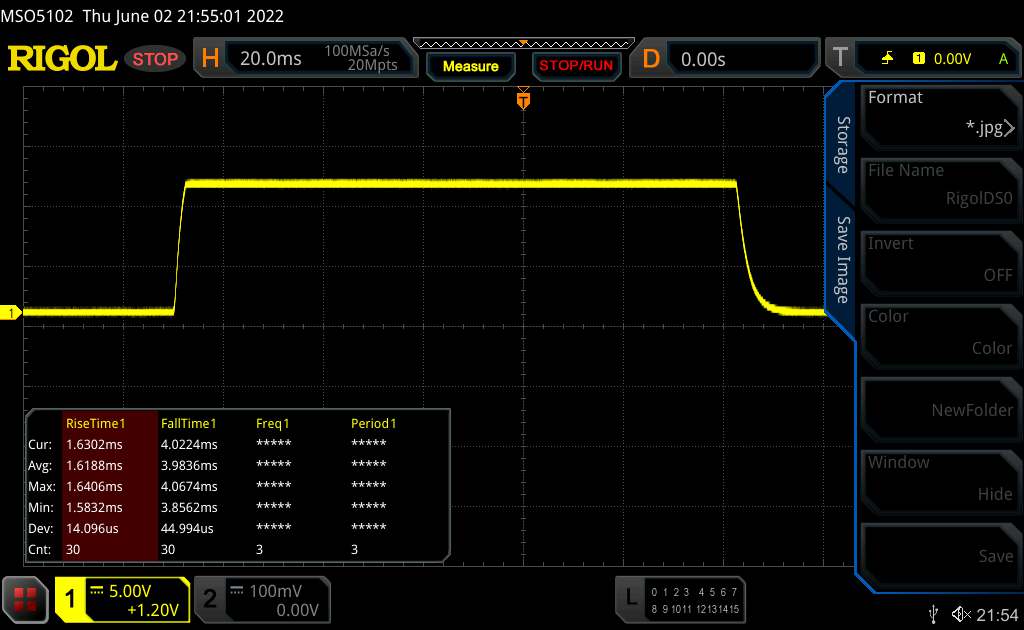 |
| ↘ 4 ms bajada | ||
| La pantalla mostró tiempos de respuesta muy rápidos en nuestros tests y debería ser adecuada para juegos frenéticos. En comparación, todos los dispositivos de prueba van de ##min### (mínimo) a 240 (máximo) ms. » 18 % de todos los dispositivos son mejores. Esto quiere decir que el tiempo de respuesta medido es mejor que la media (19.8 ms) de todos los dispositivos testados. | ||
| ↔ Tiempo de respuesta 50% Gris a 80% Gris | ||
| 7.5 ms ... subida ↗ y bajada ↘ combinada | ↗ 2.1 ms subida | 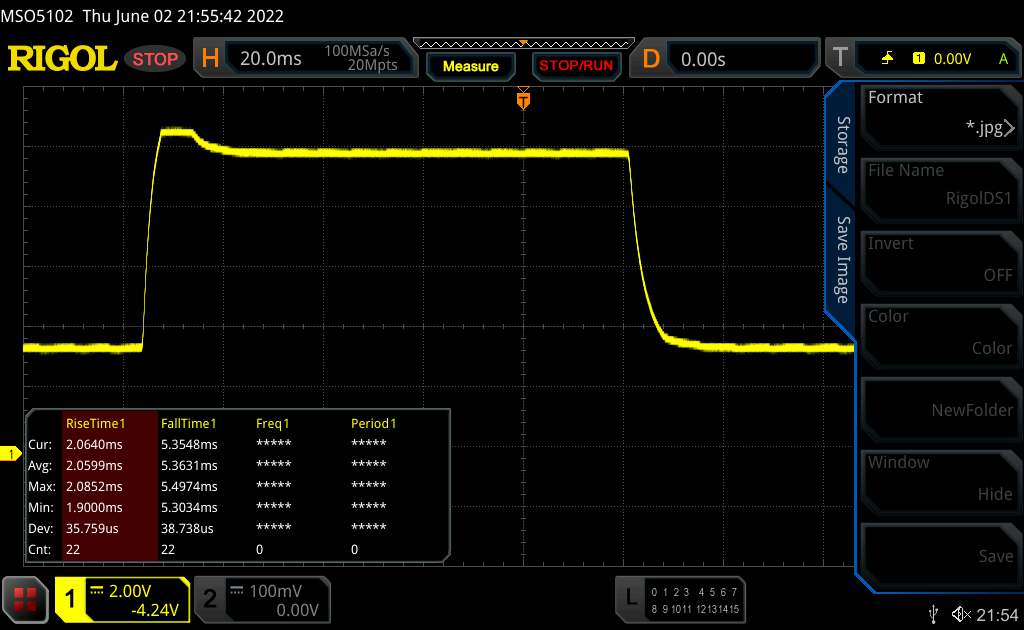 |
| ↘ 5.4 ms bajada | ||
| La pantalla mostró tiempos de respuesta muy rápidos en nuestros tests y debería ser adecuada para juegos frenéticos. En comparación, todos los dispositivos de prueba van de ##min### (mínimo) a 636 (máximo) ms. » 20 % de todos los dispositivos son mejores. Esto quiere decir que el tiempo de respuesta medido es mejor que la media (31 ms) de todos los dispositivos testados. | ||
Parpadeo de Pantalla / PWM (Pulse-Width Modulation)
| Parpadeo de Pantalla / PWM no detectado | 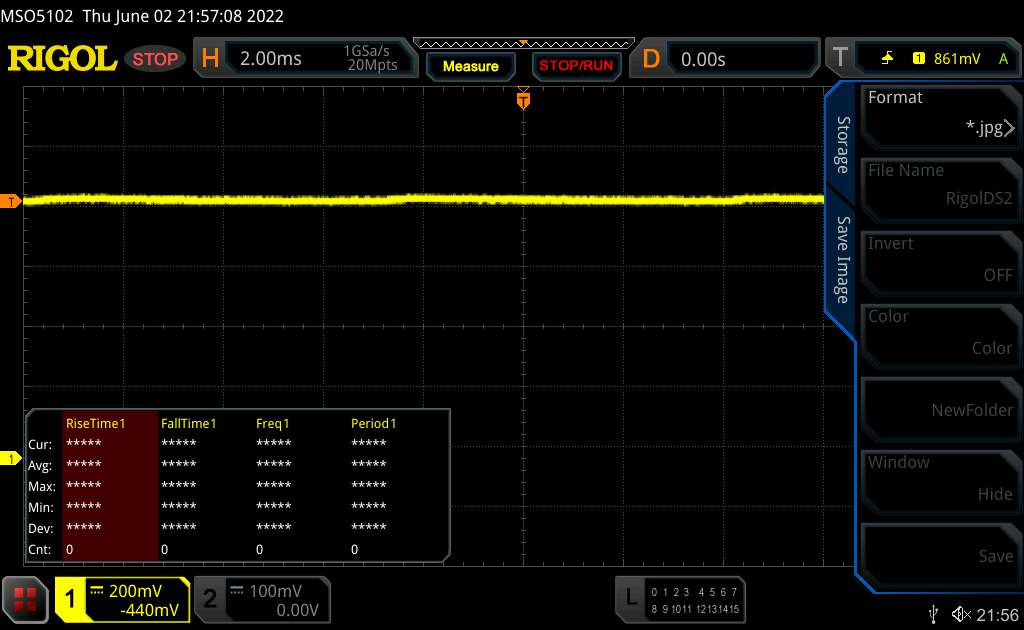 | ||
Comparación: 52 % de todos los dispositivos testados no usaron PWM para atenuar el display. Si se usó, medimos una media de 7754 (mínimo: 5 - máxmo: 343500) Hz. | |||
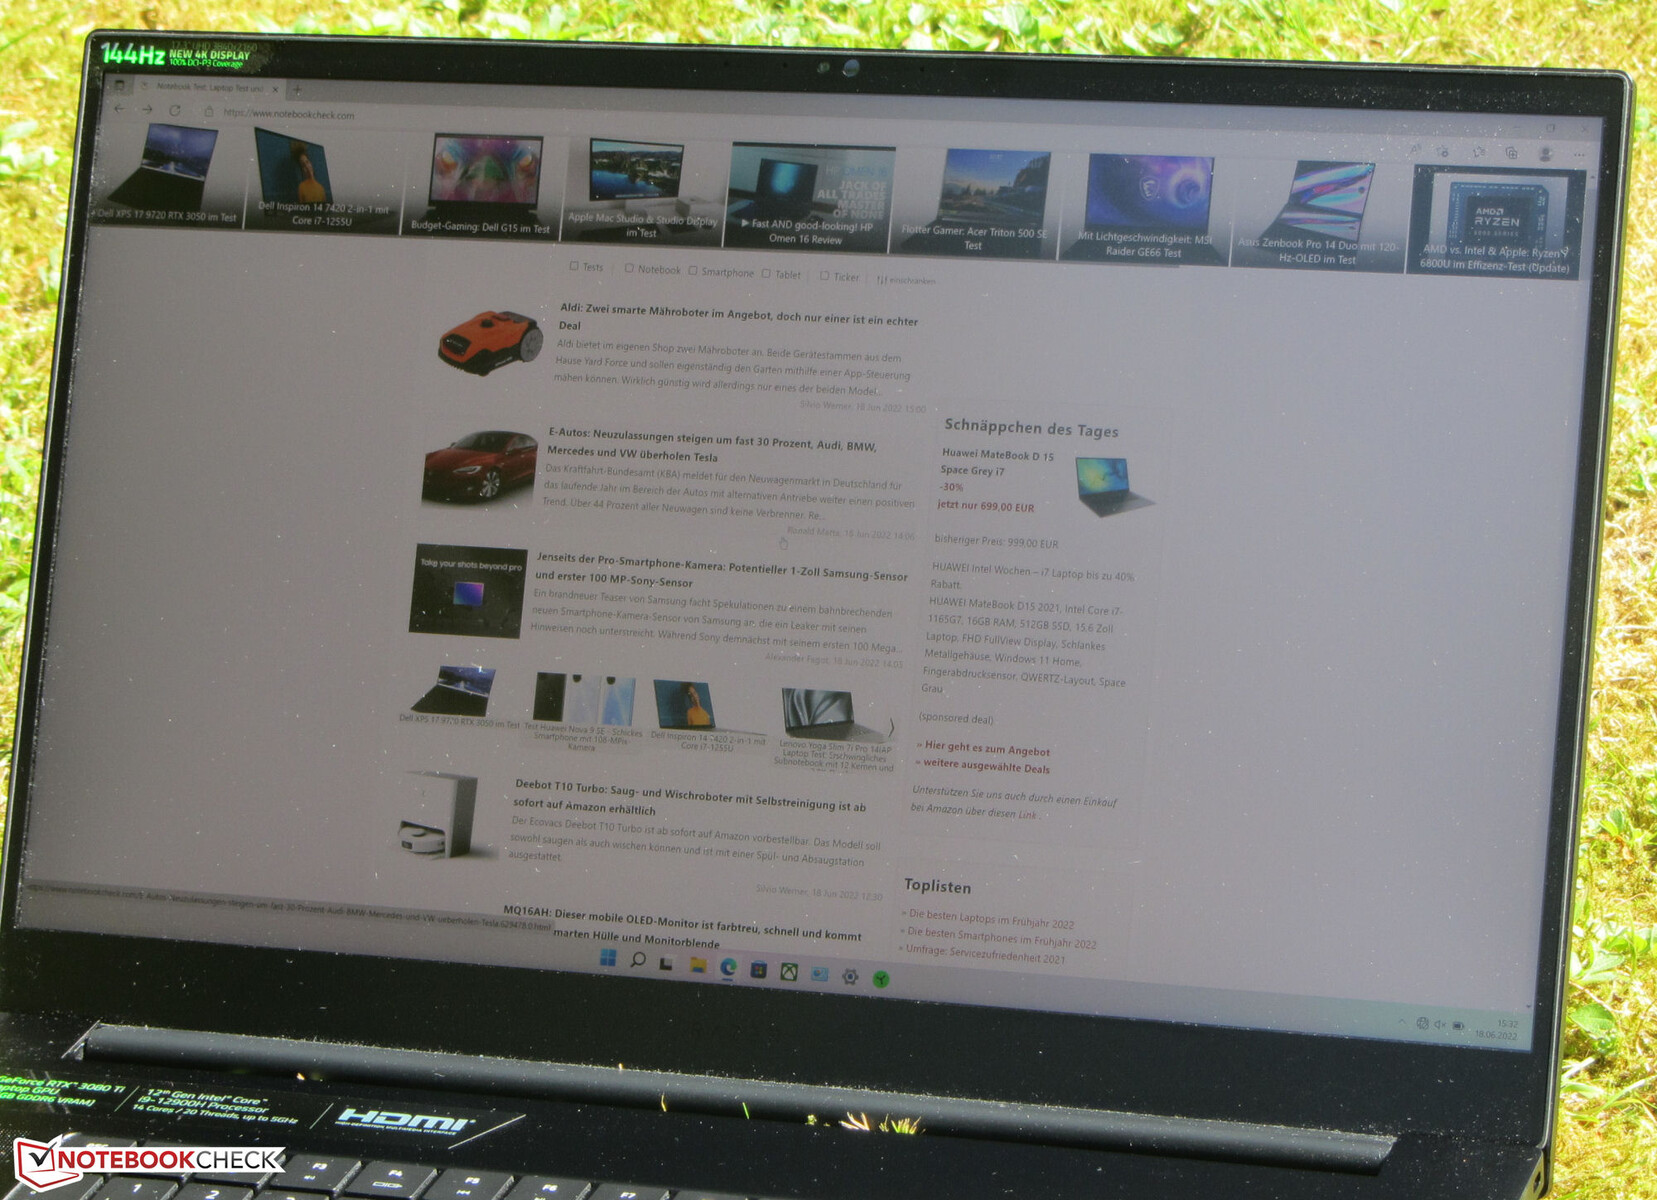
El panel IPS ofrece ángulos de visión estables y se puede leer desde cualquier ángulo. Gracias al brillo bastante alto de la pantalla, también puedes leer su contenido fácilmente en exteriores.

Rendimiento - El portátil Razer utiliza Alder Lake y Ampere
Con el Blade 17, Razer ofrece un portátil para juegos de 17,3 pulgadas que es capaz de llevar todos los juegos actuales a la pantalla sin problemas.
Condiciones de la prueba
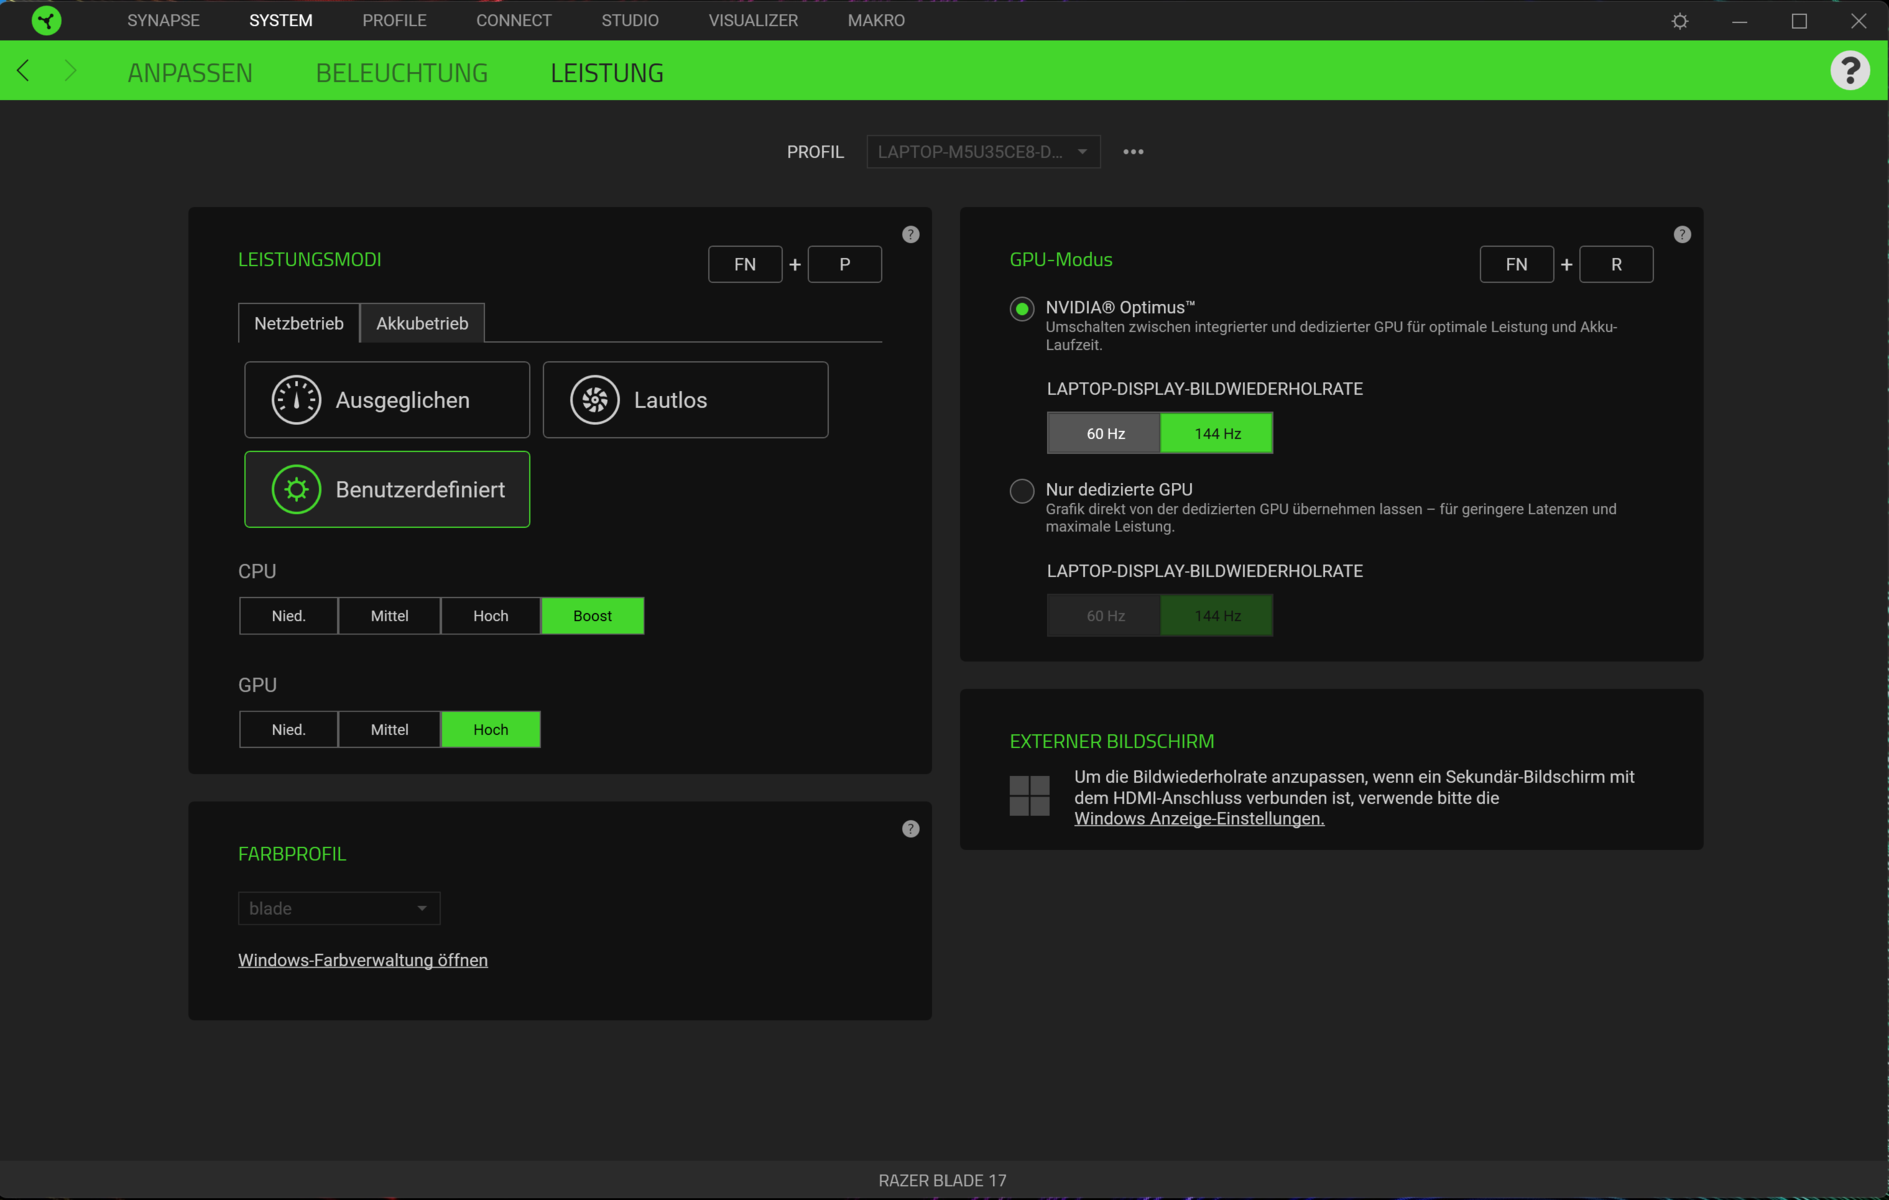
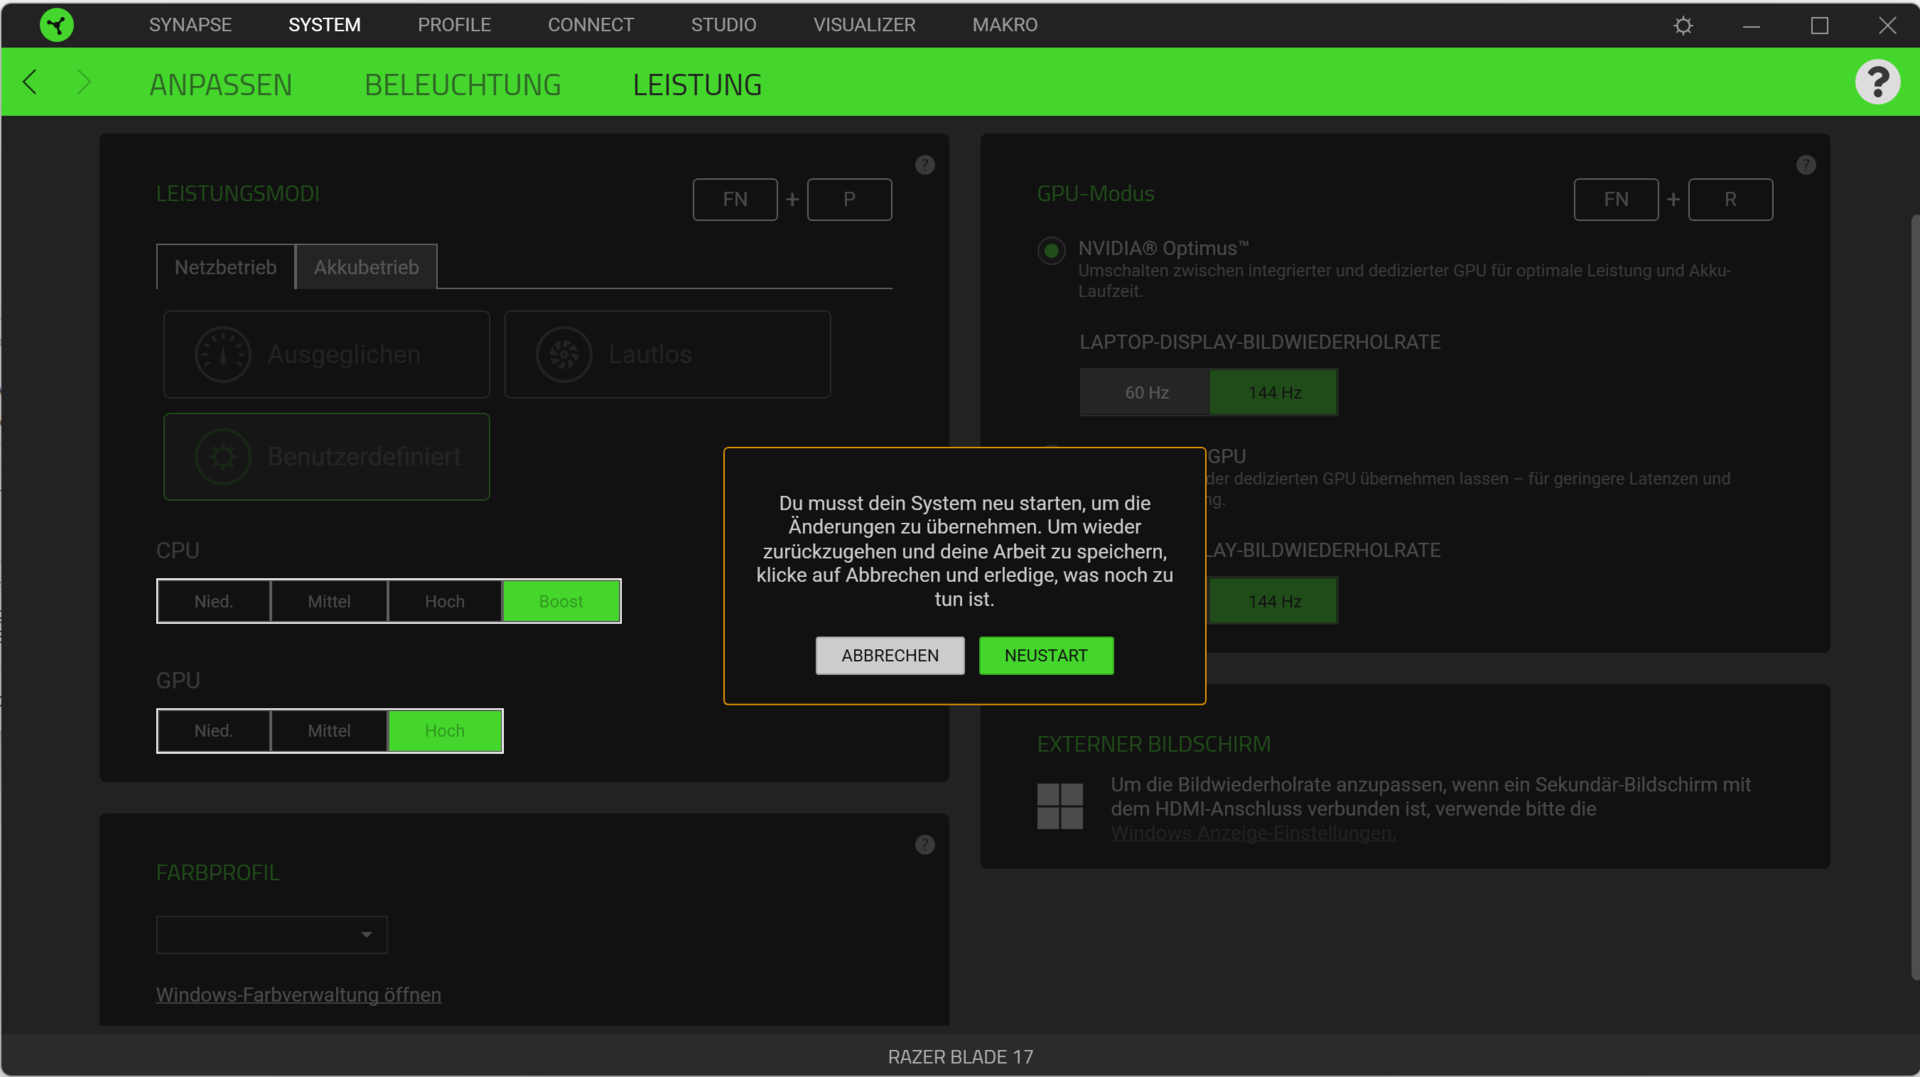
Puedes cambiar entre los tres perfiles de rendimiento disponibles ("Equilibrado", "Silencioso" y "Definido por el usuario") utilizando la combinación de teclas "Fn" + "P". El perfil "Definido por el usuario" permite configurar los sub-ajustes para la CPU ("Bajo", "Medio", "Alto" y "Boost") y la GPU ("Bajo", "Medio" y "Alto") a través del software Razer Synapse. En funcionamiento con batería, el único perfil disponible es "Equilibrado"
Durante nuestra prueba, utilizamos el perfil "Definido por el usuario" con los subconjuntos "Medio" (CPU) y "Alto" (GPU), que es la configuración por defecto en el estado de entrega. Además, ejecutamos varios benchmarks utilizando el perfil "Silent", al máximo rendimiento (CPU: "Boost", GPU: "High"), y en el modo dGPU. Puedes encontrar los resultados en los gráficos de abajo.
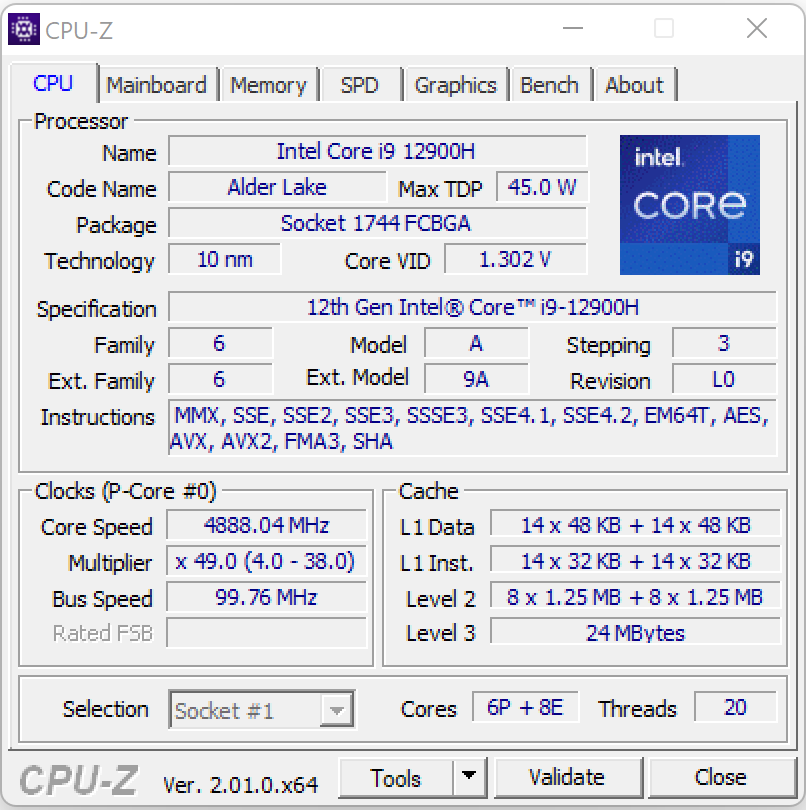
Procesador
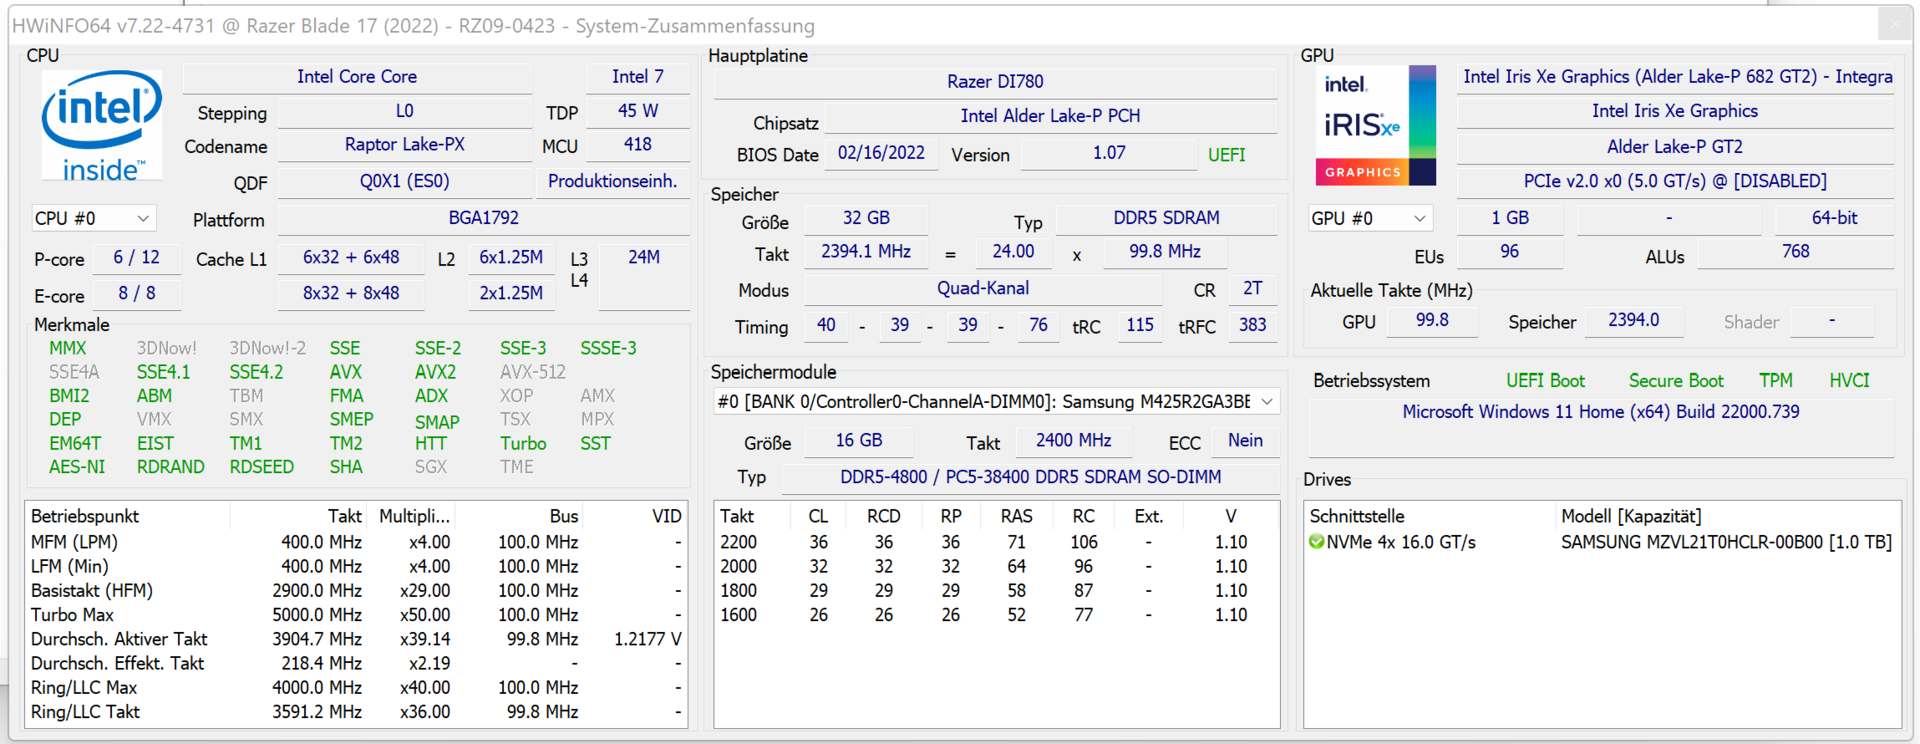
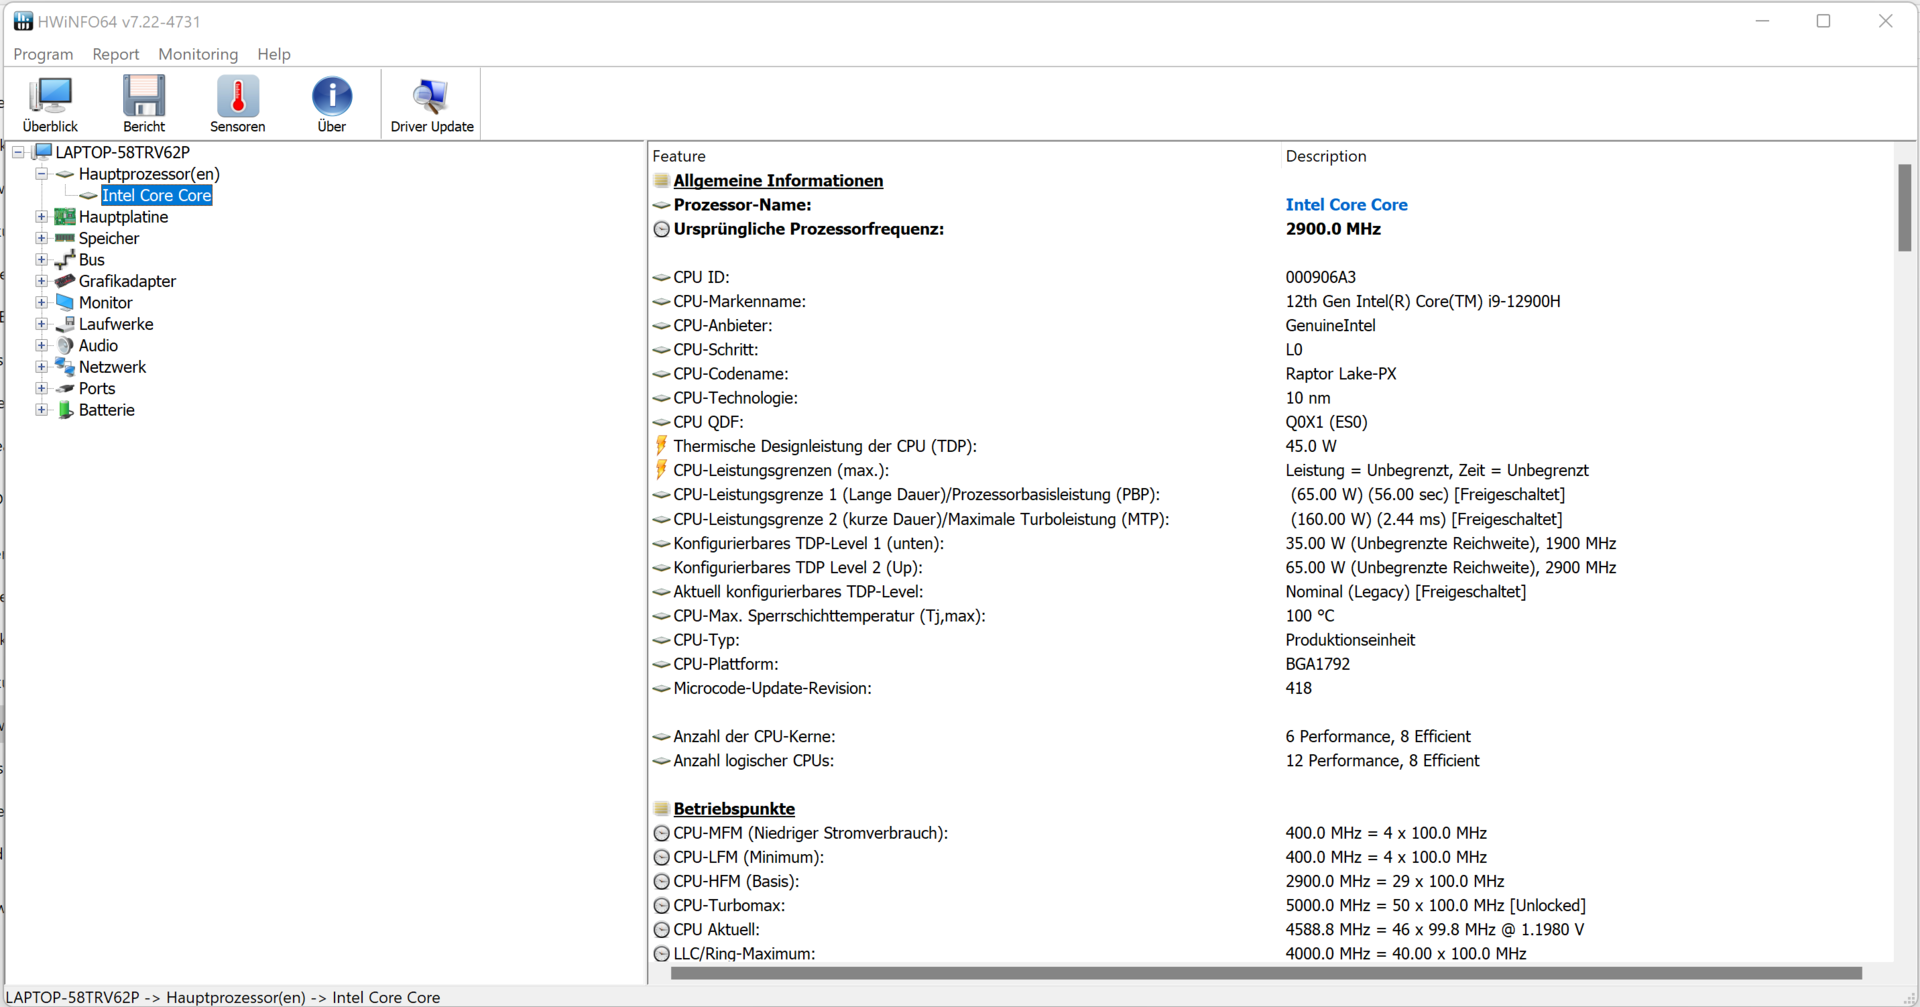
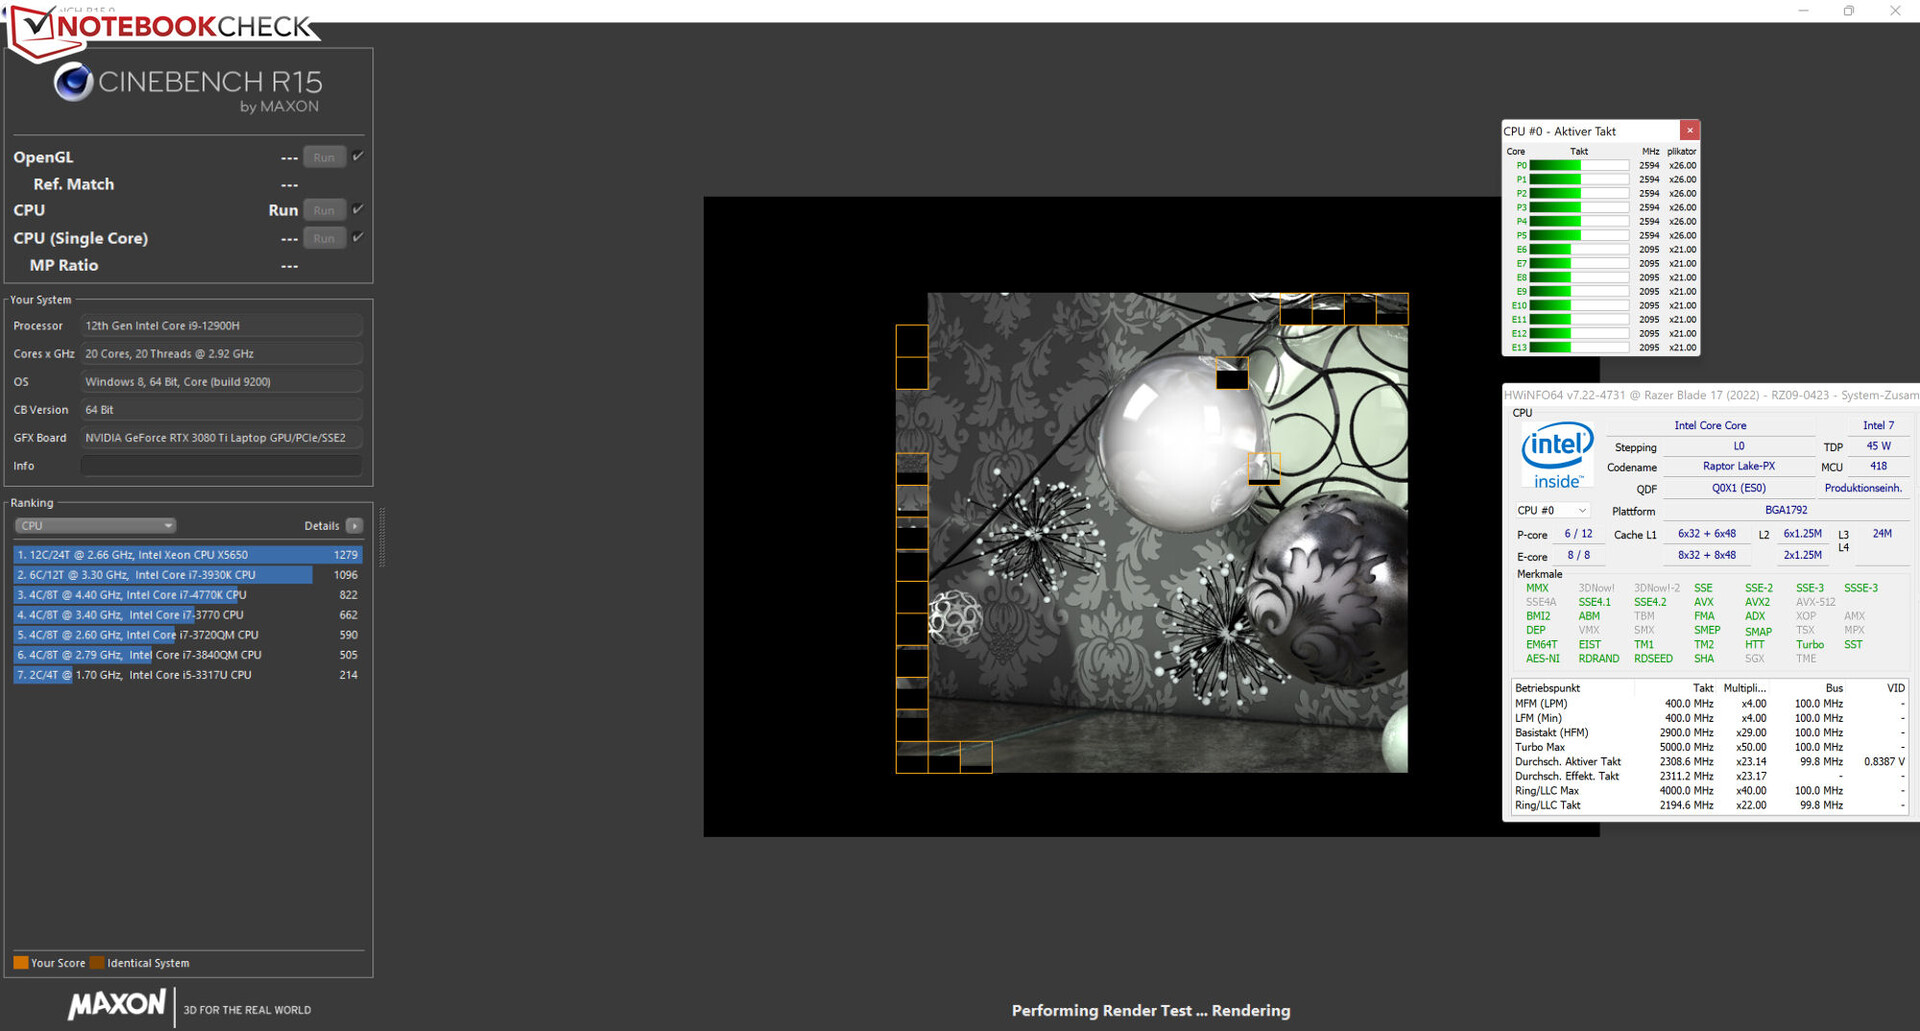
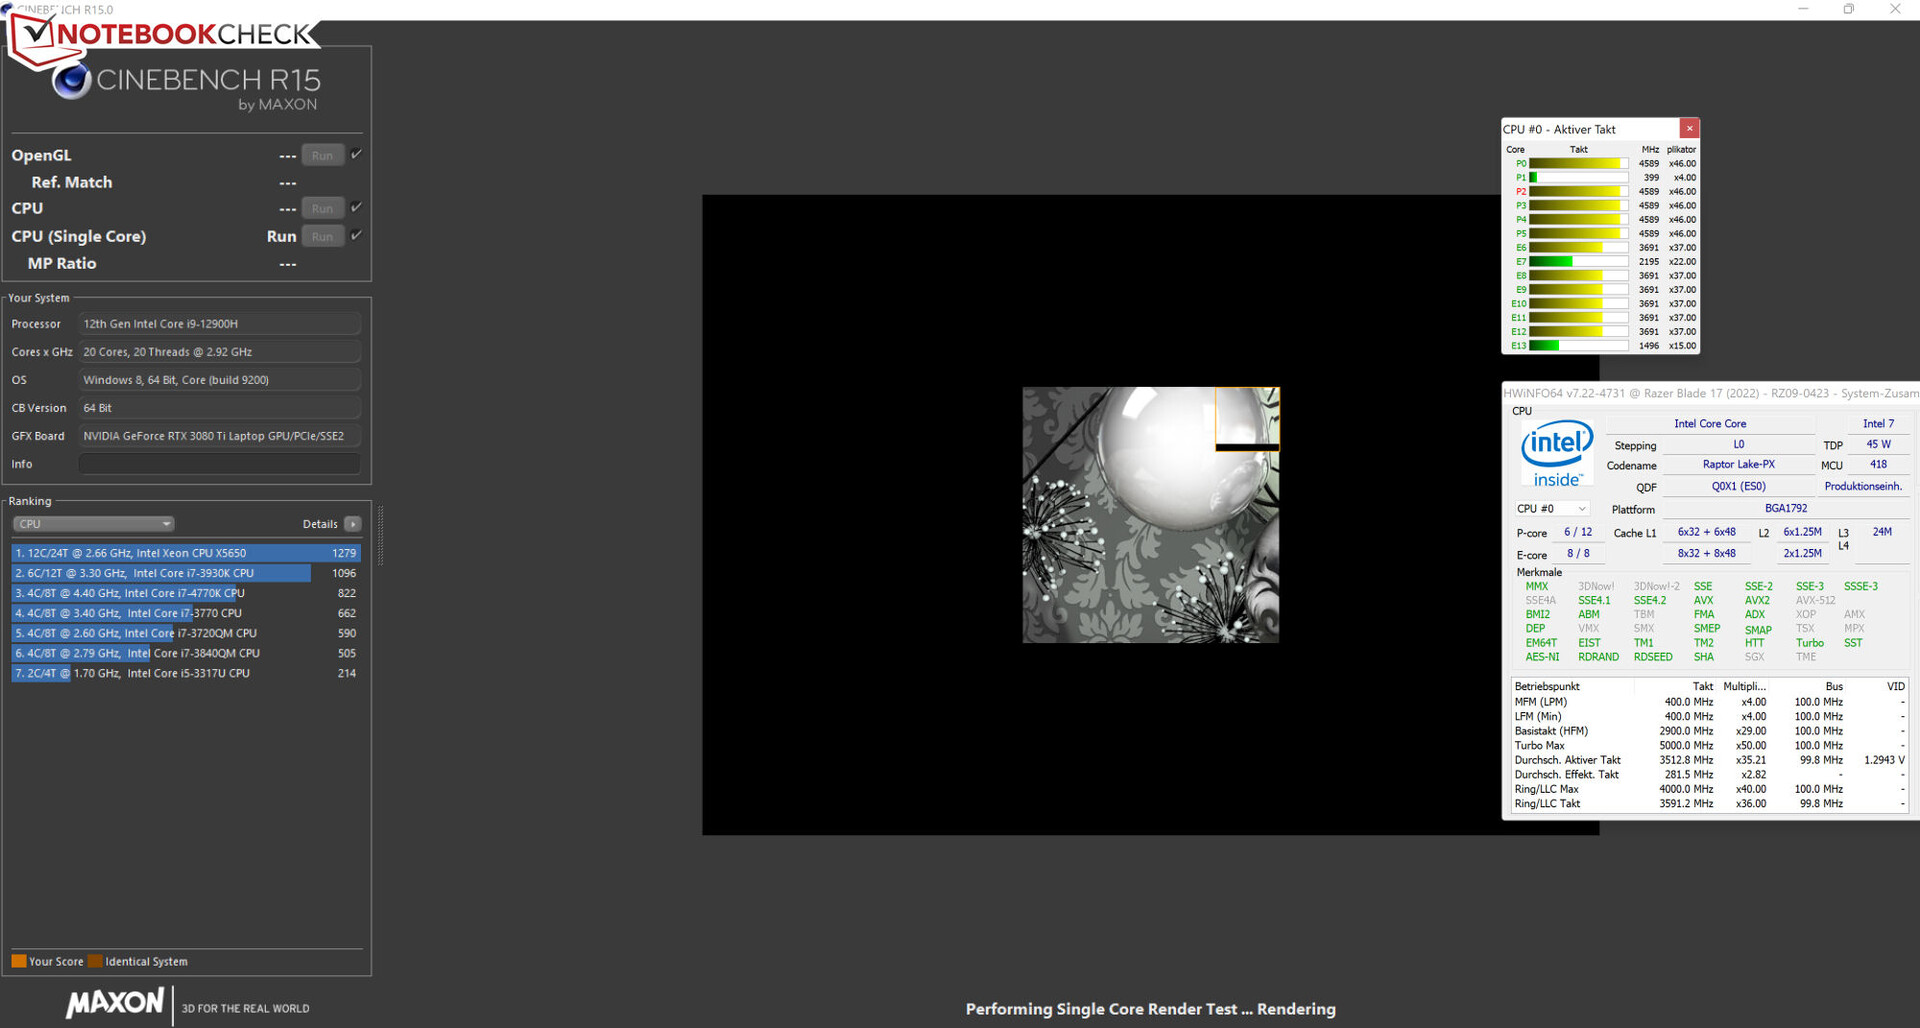
ElCore i9-12900H(Alder Lake) consta de seis núcleos de rendimiento (Hyperthreading, de 2,5 a 5 GHz) y ocho núcleos de eficiencia (sin Hyperthreading, de 1,8 a 3,8 GHz). En total, esto da lugar a 20 núcleos lógicos de CPU.
Durante el test CB15 Multi Thread, el sub-preset de CPU "Medio" asegura velocidades (núcleos P: 2,6 a 2,7 GHz, núcleos E: 2,1 GHz) justo por encima de la velocidad de reloj básica. La prueba de hilo único se completa con velocidades de reloj altas (núcleos P: 4 a 4,6 GHz, núcleos E: 2,1 a 3,7 GHz). En funcionamiento en batería, los valores son significativamente más bajos.
Usando los mismos preajustes de CPU, el Core i9 sólo ofrece una ligera ventaja de rendimiento en los picos comparado con el Core i7-12800Hdel modelo hermano. Esto no es sorprendente, ya que ambas CPUs ofrecen la misma cantidad de núcleos y el Core i9 ofrece una velocidad máxima ligeramente superior (5 GHz frente a 4,8 GHz)
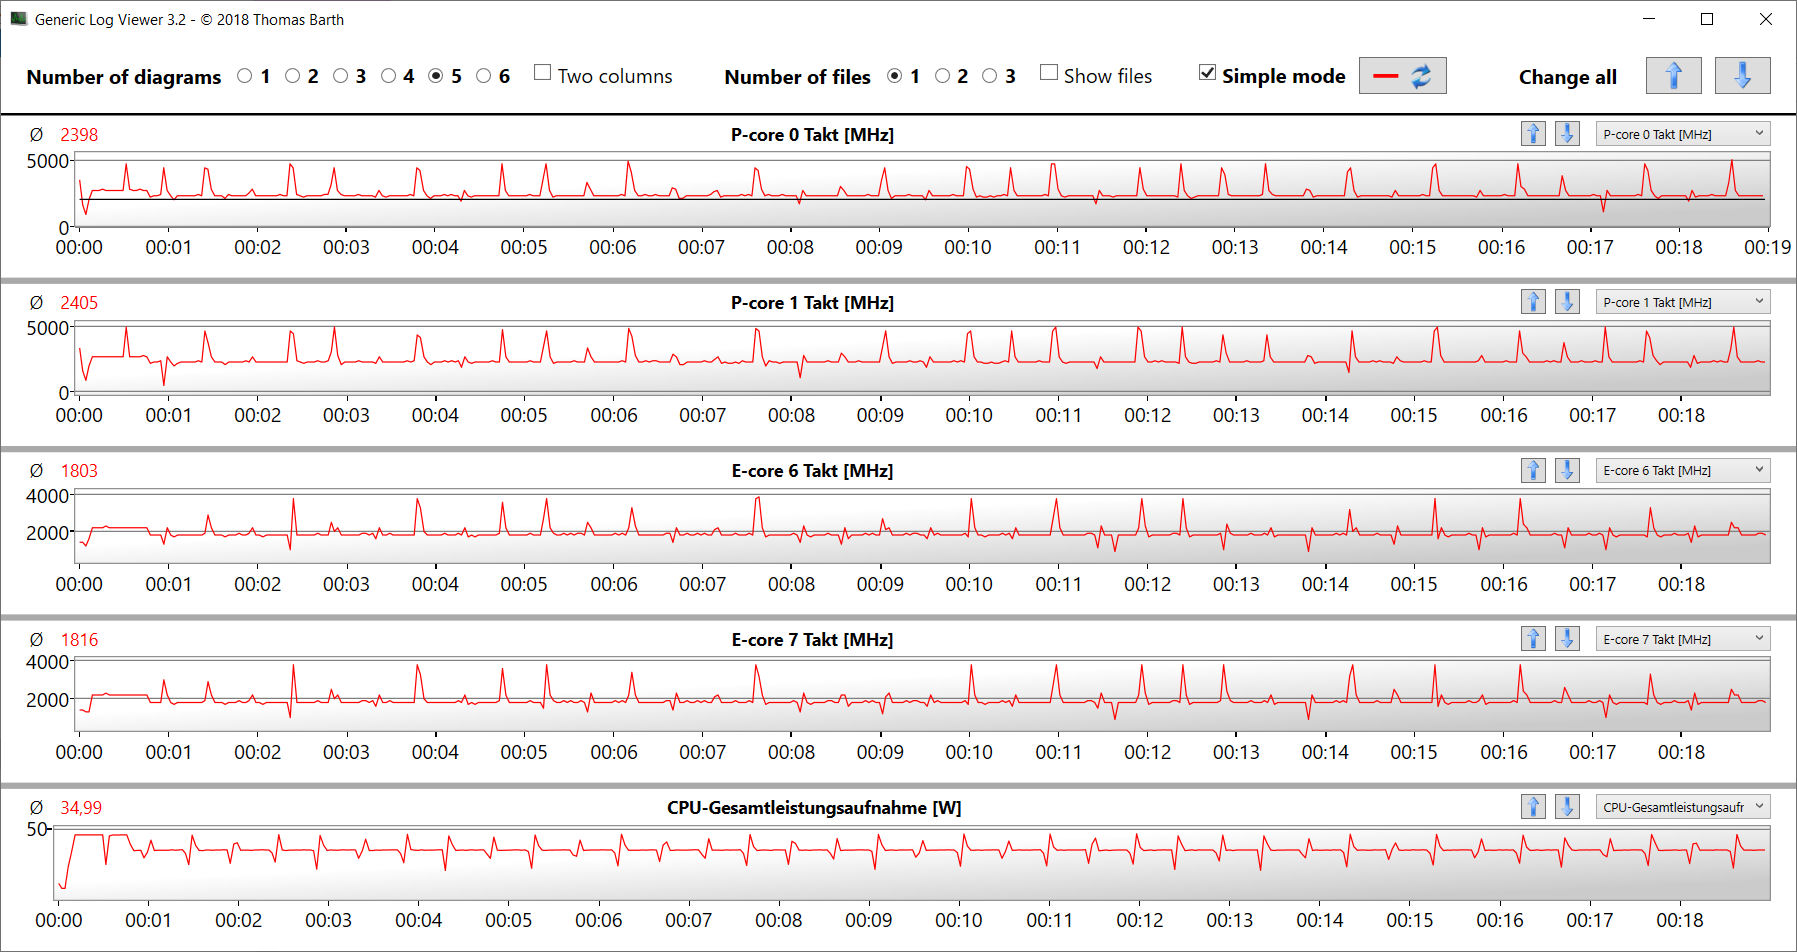
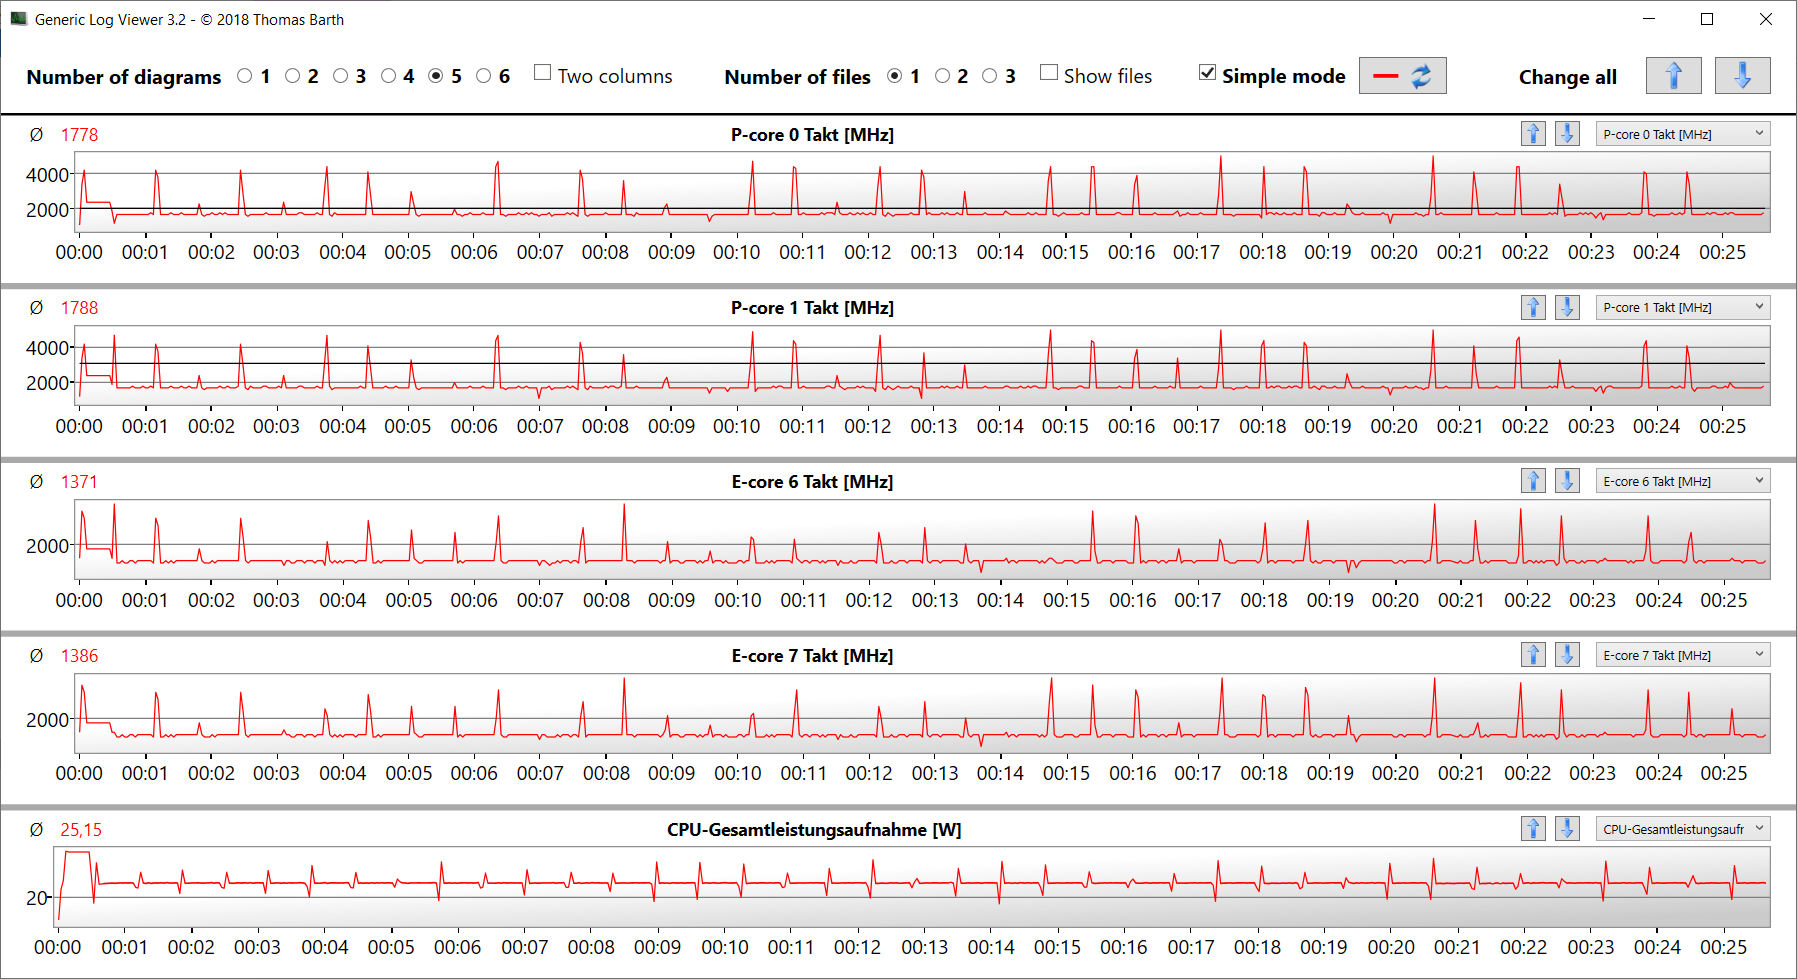
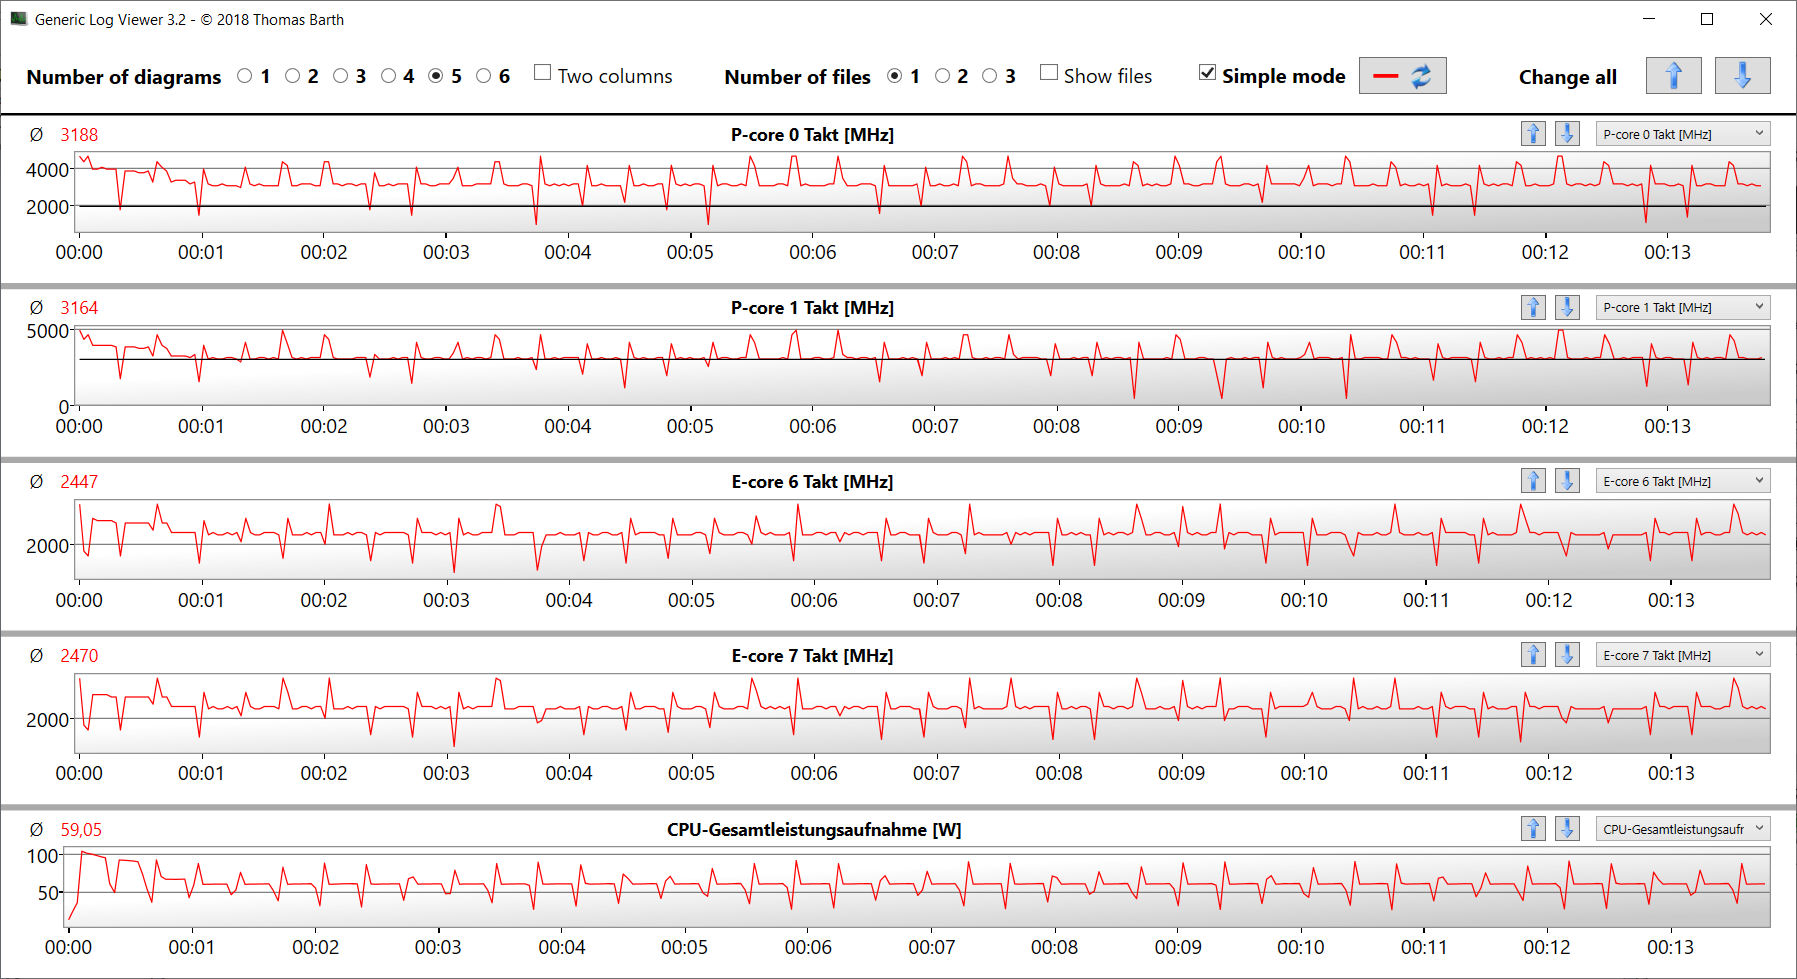
En el funcionamiento multihilo, la intensidad del uso del Turbo depende mucho del sub-preset de la CPU seleccionado. En todos los casos, la CPU es capaz de funcionar constantemente a una velocidad de reloj uniforme, lo que se demuestra en la prueba de bucle CB15. Se nota que la velocidad de reloj de la CPU cae ligeramente de la primera a la segunda/tercera ejecución, independientemente del preajuste seleccionado. La CPU i9 sólo aportará una ventaja notable al usuario en comparación con la CPU i7 en algunos picos de carga breves. Bajo cargas más largas, la brecha de rendimiento entre ambos procesadores se reduce, y terminan muy cerca el uno del otro.
Cinebench R15 Multi Constant Load Test
| CPU Performance rating - Percent | |
| Media de la clase Gaming | |
| Alienware x17 R2 P48E | |
| MSI Stealth GS77 12UHS-083US | |
| Razer Blade 17 Early 2022 | |
| Medion Erazer Beast X30 | |
| Medio Intel Core i9-12900H | |
| Razer Blade 17 RTX 3080 Ti | |
| Razer Blade 17 Early 2022 | |
| Razer Blade 17 Early 2022 | |
| Cinebench R23 | |
| Multi Core | |
| Media de la clase Gaming (10488 - 42661, n=107, últimos 2 años) | |
| Medion Erazer Beast X30 | |
| Alienware x17 R2 P48E | |
| MSI Stealth GS77 12UHS-083US | |
| Razer Blade 17 Early 2022 (Max.) | |
| Razer Blade 17 RTX 3080 Ti | |
| Medio Intel Core i9-12900H (7359 - 19648, n=28) | |
| Razer Blade 17 Early 2022 | |
| Razer Blade 17 Early 2022 (Lautlos) | |
| Single Core | |
| Media de la clase Gaming (1166 - 2415, n=107, últimos 2 años) | |
| Razer Blade 17 Early 2022 | |
| Alienware x17 R2 P48E | |
| Razer Blade 17 Early 2022 (Max.) | |
| Razer Blade 17 RTX 3080 Ti | |
| Medio Intel Core i9-12900H (1634 - 1930, n=28) | |
| MSI Stealth GS77 12UHS-083US | |
| Razer Blade 17 Early 2022 (Lautlos) | |
| Medion Erazer Beast X30 | |
| Cinebench R20 | |
| CPU (Multi Core) | |
| Media de la clase Gaming (4029 - 16433, n=106, últimos 2 años) | |
| Medion Erazer Beast X30 | |
| Alienware x17 R2 P48E | |
| MSI Stealth GS77 12UHS-083US | |
| Razer Blade 17 Early 2022 (Max.) | |
| Razer Blade 17 RTX 3080 Ti | |
| Medio Intel Core i9-12900H (2681 - 7471, n=28) | |
| Razer Blade 17 Early 2022 | |
| Razer Blade 17 Early 2022 (Lautlos) | |
| CPU (Single Core) | |
| Media de la clase Gaming (442 - 913, n=106, últimos 2 años) | |
| Alienware x17 R2 P48E | |
| Razer Blade 17 Early 2022 (Max.) | |
| Razer Blade 17 RTX 3080 Ti | |
| Medio Intel Core i9-12900H (624 - 738, n=28) | |
| Razer Blade 17 Early 2022 | |
| MSI Stealth GS77 12UHS-083US | |
| Razer Blade 17 Early 2022 (Lautlos) | |
| Medion Erazer Beast X30 | |
| Cinebench R15 | |
| CPU Multi 64Bit | |
| Media de la clase Gaming (1578 - 6330, n=105, últimos 2 años) | |
| Alienware x17 R2 P48E | |
| Medion Erazer Beast X30 | |
| Razer Blade 17 Early 2022 (Max.) | |
| MSI Stealth GS77 12UHS-083US | |
| Medio Intel Core i9-12900H (1395 - 3077, n=28) | |
| Razer Blade 17 RTX 3080 Ti | |
| Razer Blade 17 Early 2022 | |
| Razer Blade 17 Early 2022 (Lautlos) | |
| CPU Single 64Bit | |
| Media de la clase Gaming (188.8 - 350, n=106, últimos 2 años) | |
| Alienware x17 R2 P48E | |
| Razer Blade 17 Early 2022 (Max.) | |
| Razer Blade 17 RTX 3080 Ti | |
| Medio Intel Core i9-12900H (235 - 277, n=29) | |
| MSI Stealth GS77 12UHS-083US | |
| Razer Blade 17 Early 2022 | |
| Razer Blade 17 Early 2022 (Lautlos) | |
| Medion Erazer Beast X30 | |
| Blender - v2.79 BMW27 CPU | |
| Razer Blade 17 Early 2022 (Lautlos) | |
| Razer Blade 17 Early 2022 | |
| Medio Intel Core i9-12900H (160 - 451, n=28) | |
| Razer Blade 17 RTX 3080 Ti | |
| Razer Blade 17 Early 2022 (Max.) | |
| MSI Stealth GS77 12UHS-083US | |
| Medion Erazer Beast X30 | |
| Alienware x17 R2 P48E | |
| Media de la clase Gaming (79 - 330, n=104, últimos 2 años) | |
| 7-Zip 18.03 | |
| 7z b 4 | |
| Media de la clase Gaming (33491 - 148086, n=105, últimos 2 años) | |
| Medion Erazer Beast X30 | |
| Alienware x17 R2 P48E | |
| MSI Stealth GS77 12UHS-083US | |
| Razer Blade 17 Early 2022 (Max.) | |
| Razer Blade 17 RTX 3080 Ti | |
| Medio Intel Core i9-12900H (34684 - 76677, n=28) | |
| Razer Blade 17 Early 2022 | |
| Razer Blade 17 Early 2022 (Lautlos) | |
| 7z b 4 -mmt1 | |
| Media de la clase Gaming (4199 - 7436, n=105, últimos 2 años) | |
| Razer Blade 17 Early 2022 | |
| Medio Intel Core i9-12900H (5302 - 6289, n=28) | |
| Razer Blade 17 RTX 3080 Ti | |
| Alienware x17 R2 P48E | |
| Razer Blade 17 Early 2022 (Max.) | |
| MSI Stealth GS77 12UHS-083US | |
| Razer Blade 17 Early 2022 (Lautlos) | |
| Medion Erazer Beast X30 | |
| Geekbench 5.5 | |
| Multi-Core | |
| Media de la clase Gaming (6460 - 28263, n=105, últimos 2 años) | |
| Alienware x17 R2 P48E | |
| Razer Blade 17 Early 2022 (Max.) | |
| MSI Stealth GS77 12UHS-083US | |
| Razer Blade 17 RTX 3080 Ti | |
| Medion Erazer Beast X30 | |
| Medio Intel Core i9-12900H (8519 - 14376, n=31) | |
| Razer Blade 17 Early 2022 | |
| Razer Blade 17 Early 2022 (Lautlos) | |
| Single-Core | |
| Media de la clase Gaming (986 - 2474, n=105, últimos 2 años) | |
| Alienware x17 R2 P48E | |
| Medio Intel Core i9-12900H (1631 - 1897, n=31) | |
| Razer Blade 17 Early 2022 | |
| Razer Blade 17 Early 2022 (Max.) | |
| Razer Blade 17 Early 2022 (Lautlos) | |
| Razer Blade 17 RTX 3080 Ti | |
| MSI Stealth GS77 12UHS-083US | |
| Medion Erazer Beast X30 | |
| HWBOT x265 Benchmark v2.2 - 4k Preset | |
| Media de la clase Gaming (11.5 - 44.4, n=105, últimos 2 años) | |
| Alienware x17 R2 P48E | |
| Medion Erazer Beast X30 | |
| MSI Stealth GS77 12UHS-083US | |
| Razer Blade 17 Early 2022 (Max.) | |
| Medio Intel Core i9-12900H (8.05 - 22.5, n=28) | |
| Razer Blade 17 RTX 3080 Ti | |
| Razer Blade 17 Early 2022 | |
| Razer Blade 17 Early 2022 (Lautlos) | |
| LibreOffice - 20 Documents To PDF | |
| Media de la clase Gaming (33.2 - 88.8, n=105, últimos 2 años) | |
| Medion Erazer Beast X30 | |
| Razer Blade 17 Early 2022 (Lautlos) | |
| Razer Blade 17 RTX 3080 Ti | |
| Razer Blade 17 Early 2022 (Max.) | |
| MSI Stealth GS77 12UHS-083US | |
| Medio Intel Core i9-12900H (36.8 - 59.8, n=28) | |
| Alienware x17 R2 P48E | |
| Razer Blade 17 Early 2022 | |
| R Benchmark 2.5 - Overall mean | |
| Medion Erazer Beast X30 | |
| Razer Blade 17 Early 2022 (Lautlos) | |
| MSI Stealth GS77 12UHS-083US | |
| Razer Blade 17 RTX 3080 Ti | |
| Medio Intel Core i9-12900H (0.4218 - 0.506, n=28) | |
| Razer Blade 17 Early 2022 (Max.) | |
| Razer Blade 17 Early 2022 | |
| Alienware x17 R2 P48E | |
| Media de la clase Gaming (0.3439 - 0.759, n=106, últimos 2 años) | |
* ... más pequeño es mejor
AIDA64: FP32 Ray-Trace | FPU Julia | CPU SHA3 | CPU Queen | FPU SinJulia | FPU Mandel | CPU AES | CPU ZLib | FP64 Ray-Trace | CPU PhotoWorxx
| Performance rating | |
| Media de la clase Gaming | |
| Alienware x17 R2 P48E | |
| Medion Erazer Beast X30 | |
| Medio Intel Core i9-12900H | |
| MSI Stealth GS77 12UHS-083US | |
| Razer Blade 17 Early 2022 | |
| Razer Blade 17 RTX 3080 Ti | |
| Razer Blade 17 Early 2022 | |
| Razer Blade 17 Early 2022 | |
| AIDA64 / FP32 Ray-Trace | |
| Media de la clase Gaming (10227 - 85542, n=105, últimos 2 años) | |
| Medio Intel Core i9-12900H (4074 - 18289, n=29) | |
| Alienware x17 R2 P48E (v6.50.5800) | |
| Medion Erazer Beast X30 (v6.50.5800) | |
| MSI Stealth GS77 12UHS-083US (v6.50.5800) | |
| Razer Blade 17 Early 2022 (v6.50.5800, Max.) | |
| Razer Blade 17 RTX 3080 Ti (v6.50.5800) | |
| Razer Blade 17 Early 2022 (v6.50.5800) | |
| Razer Blade 17 Early 2022 (v6.50.5800, Lautlos) | |
| AIDA64 / FPU Julia | |
| Media de la clase Gaming (51376 - 238426, n=105, últimos 2 años) | |
| Medio Intel Core i9-12900H (22307 - 93236, n=29) | |
| Alienware x17 R2 P48E (v6.50.5800) | |
| Medion Erazer Beast X30 (v6.50.5800) | |
| MSI Stealth GS77 12UHS-083US (v6.50.5800) | |
| Razer Blade 17 Early 2022 (v6.50.5800, Max.) | |
| Razer Blade 17 RTX 3080 Ti (v6.50.5800) | |
| Razer Blade 17 Early 2022 (v6.50.5800) | |
| Razer Blade 17 Early 2022 (v6.50.5800, Lautlos) | |
| AIDA64 / CPU SHA3 | |
| Media de la clase Gaming (2180 - 10115, n=105, últimos 2 años) | |
| Alienware x17 R2 P48E (v6.50.5800) | |
| Medion Erazer Beast X30 (v6.50.5800) | |
| MSI Stealth GS77 12UHS-083US (v6.50.5800) | |
| Medio Intel Core i9-12900H (1378 - 4215, n=29) | |
| Razer Blade 17 Early 2022 (v6.50.5800, Max.) | |
| Razer Blade 17 RTX 3080 Ti (v6.50.5800) | |
| Razer Blade 17 Early 2022 (v6.50.5800) | |
| Razer Blade 17 Early 2022 (v6.50.5800, Lautlos) | |
| AIDA64 / CPU Queen | |
| Media de la clase Gaming (49785 - 173351, n=90, últimos 2 años) | |
| Alienware x17 R2 P48E (v6.50.5800) | |
| Razer Blade 17 Early 2022 (v6.50.5800, Max.) | |
| Medion Erazer Beast X30 (v6.50.5800) | |
| Razer Blade 17 RTX 3080 Ti (v6.50.5800) | |
| Medio Intel Core i9-12900H (78172 - 111241, n=28) | |
| MSI Stealth GS77 12UHS-083US (v6.50.5800) | |
| Razer Blade 17 Early 2022 (v6.50.5800) | |
| Razer Blade 17 Early 2022 (v6.50.5800, Lautlos) | |
| AIDA64 / FPU SinJulia | |
| Media de la clase Gaming (4424 - 33636, n=105, últimos 2 años) | |
| Alienware x17 R2 P48E (v6.50.5800) | |
| Medion Erazer Beast X30 (v6.50.5800) | |
| MSI Stealth GS77 12UHS-083US (v6.50.5800) | |
| Razer Blade 17 Early 2022 (v6.50.5800, Max.) | |
| Razer Blade 17 RTX 3080 Ti (v6.50.5800) | |
| Medio Intel Core i9-12900H (5709 - 10410, n=29) | |
| Razer Blade 17 Early 2022 (v6.50.5800) | |
| Razer Blade 17 Early 2022 (v6.50.5800, Lautlos) | |
| AIDA64 / FPU Mandel | |
| Media de la clase Gaming (25115 - 128721, n=105, últimos 2 años) | |
| Medio Intel Core i9-12900H (11257 - 45581, n=29) | |
| Alienware x17 R2 P48E (v6.50.5800) | |
| Medion Erazer Beast X30 (v6.50.5800) | |
| MSI Stealth GS77 12UHS-083US (v6.50.5800) | |
| Razer Blade 17 Early 2022 (v6.50.5800, Max.) | |
| Razer Blade 17 RTX 3080 Ti (v6.50.5800) | |
| Razer Blade 17 Early 2022 (v6.50.5800) | |
| Razer Blade 17 Early 2022 (v6.50.5800, Lautlos) | |
| AIDA64 / CPU AES | |
| Media de la clase Gaming (39258 - 247074, n=105, últimos 2 años) | |
| Alienware x17 R2 P48E (v6.50.5800) | |
| MSI Stealth GS77 12UHS-083US (v6.50.5800) | |
| Medio Intel Core i9-12900H (31935 - 151546, n=29) | |
| Medion Erazer Beast X30 (v6.50.5800) | |
| Razer Blade 17 Early 2022 (v6.50.5800, Max.) | |
| Razer Blade 17 RTX 3080 Ti (v6.50.5800) | |
| Razer Blade 17 Early 2022 (v6.50.5800) | |
| Razer Blade 17 Early 2022 (v6.50.5800, Lautlos) | |
| AIDA64 / CPU ZLib | |
| Media de la clase Gaming (574 - 2531, n=105, últimos 2 años) | |
| Alienware x17 R2 P48E (v6.50.5800) | |
| Medion Erazer Beast X30 (v6.50.5800) | |
| MSI Stealth GS77 12UHS-083US (v6.50.5800) | |
| Razer Blade 17 Early 2022 (v6.50.5800, Max.) | |
| Medio Intel Core i9-12900H (449 - 1193, n=29) | |
| Razer Blade 17 RTX 3080 Ti (v6.50.5800) | |
| Razer Blade 17 Early 2022 (v6.50.5800) | |
| Razer Blade 17 Early 2022 (v6.50.5800, Lautlos) | |
| AIDA64 / FP64 Ray-Trace | |
| Media de la clase Gaming (5509 - 45446, n=105, últimos 2 años) | |
| Medio Intel Core i9-12900H (2235 - 10511, n=29) | |
| Alienware x17 R2 P48E (v6.50.5800) | |
| Medion Erazer Beast X30 (v6.50.5800) | |
| MSI Stealth GS77 12UHS-083US (v6.50.5800) | |
| Razer Blade 17 Early 2022 (v6.50.5800, Max.) | |
| Razer Blade 17 RTX 3080 Ti (v6.50.5800) | |
| Razer Blade 17 Early 2022 (v6.50.5800) | |
| Razer Blade 17 Early 2022 (v6.50.5800, Lautlos) | |
| AIDA64 / CPU PhotoWorxx | |
| Media de la clase Gaming (12271 - 89891, n=105, últimos 2 años) | |
| Razer Blade 17 RTX 3080 Ti (v6.50.5800) | |
| Razer Blade 17 Early 2022 (v6.50.5800, Max.) | |
| Medion Erazer Beast X30 (v6.50.5800) | |
| MSI Stealth GS77 12UHS-083US (v6.50.5800) | |
| Razer Blade 17 Early 2022 (v6.50.5800) | |
| Medio Intel Core i9-12900H (20960 - 48269, n=30) | |
| Razer Blade 17 Early 2022 (v6.50.5800, Lautlos) | |
| Alienware x17 R2 P48E (v6.50.5800) | |
Rendimiento del sistema
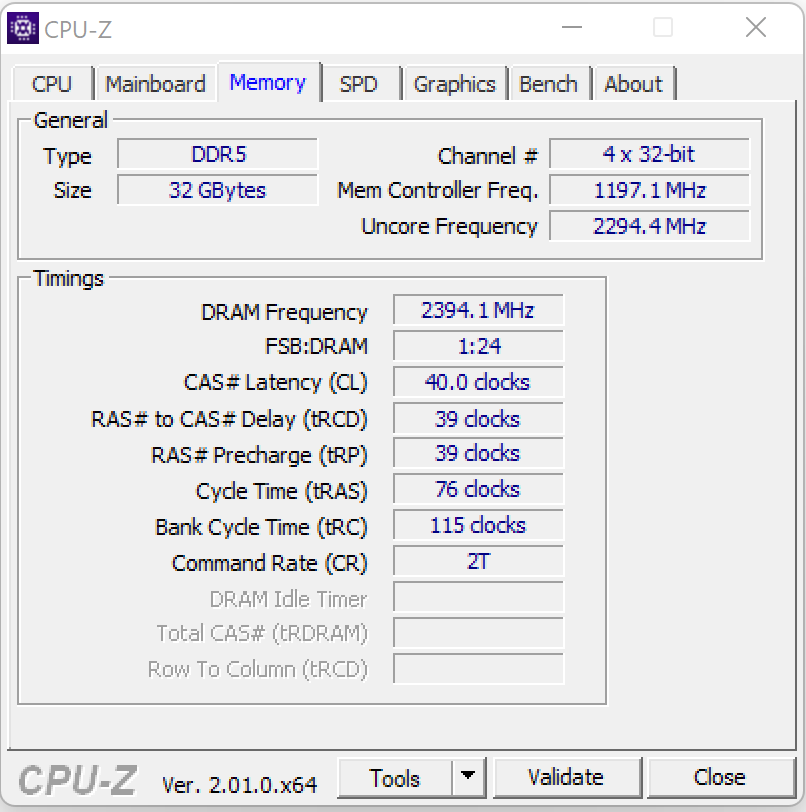
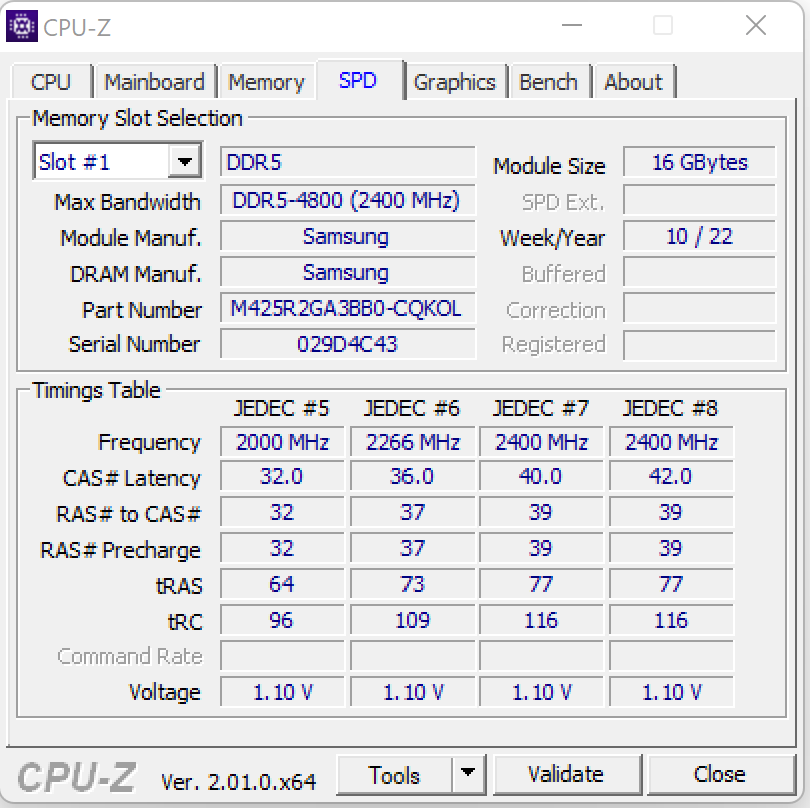
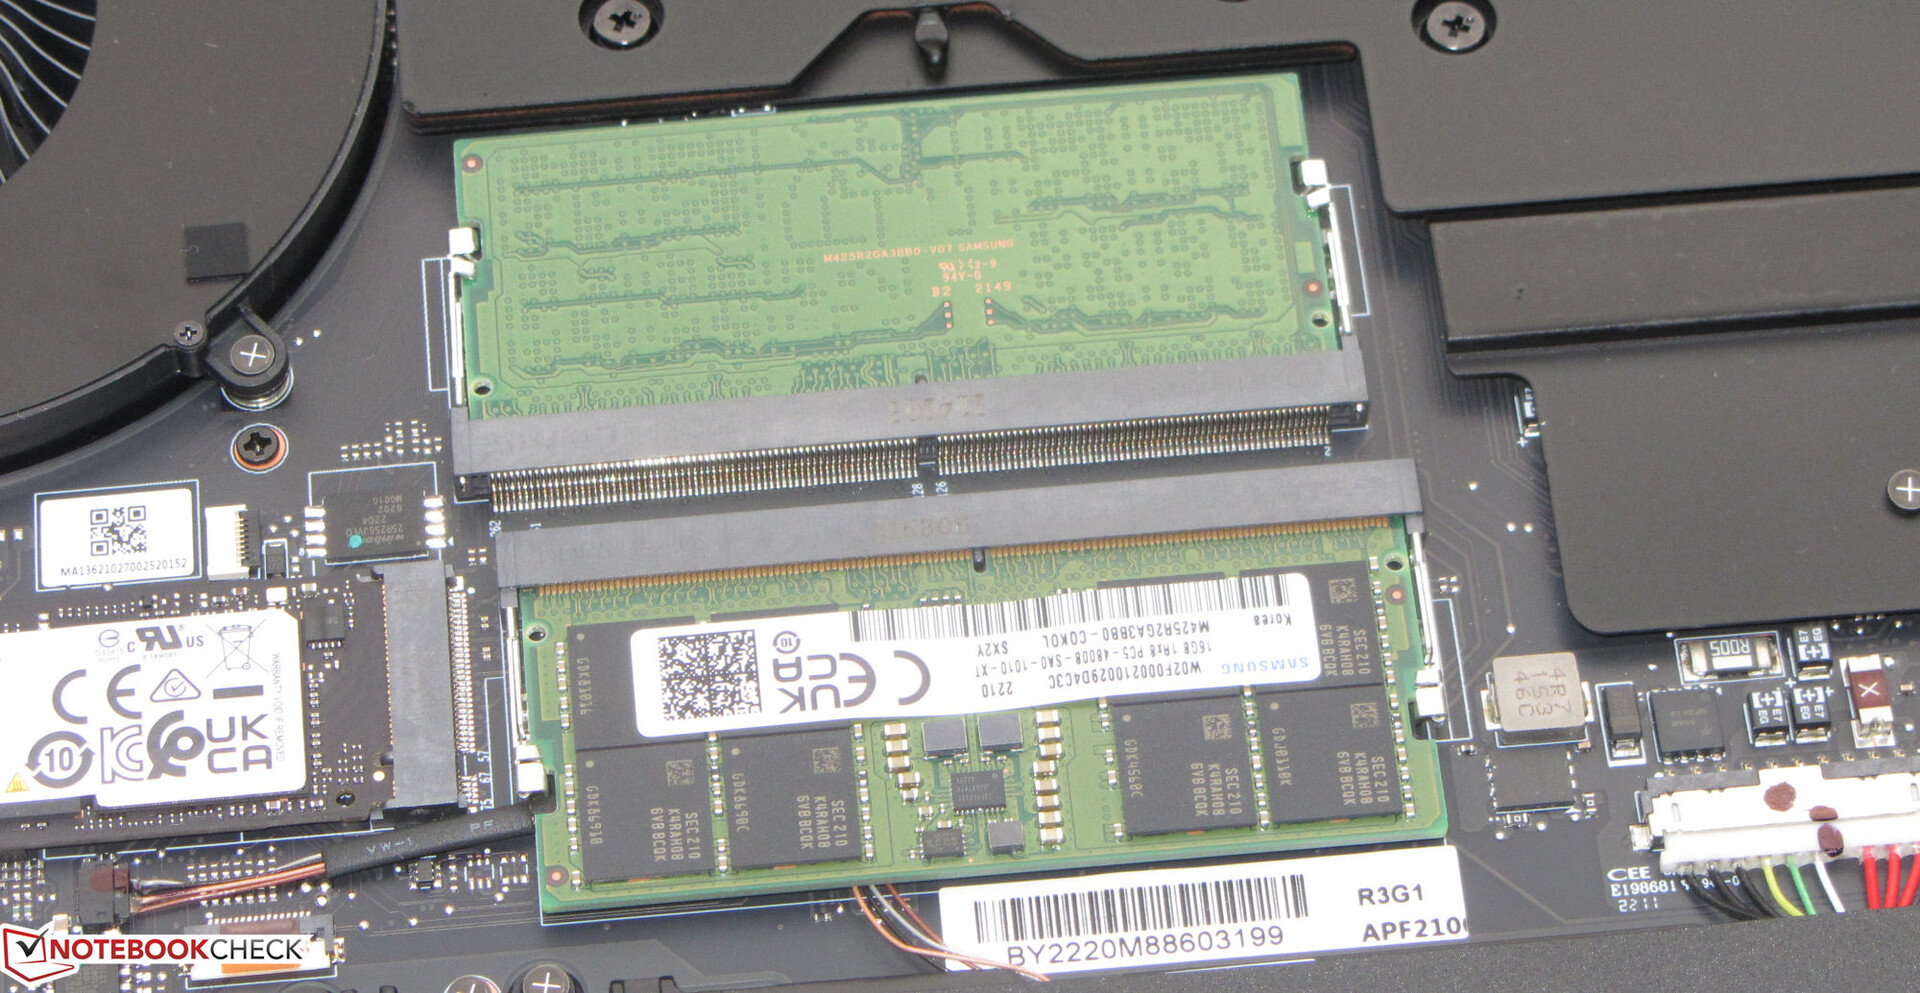
El hardware del sistema, que funciona sin problemas, ofrece un rendimiento informático más que suficiente para los juegos, el corte de vídeo y el renderizado. Las tasas de transferencia de la memoria de trabajo se sitúan en niveles normales para el almacenamiento DDR5-4800. Van acompañadas de buenos resultados de PC Mark.
CrossMark: Overall | Productivity | Creativity | Responsiveness
| PCMark 10 / Score | |
| Media de la clase Gaming (5828 - 12414, n=93, últimos 2 años) | |
| Alienware x17 R2 P48E | |
| Razer Blade 17 RTX 3080 Ti | |
| Medio Intel Core i9-12900H, NVIDIA GeForce RTX 3080 Ti Laptop GPU (7139 - 8083, n=6) | |
| MSI Stealth GS77 12UHS-083US | |
| Medion Erazer Beast X30 | |
| Razer Blade 17 Early 2022 | |
| PCMark 10 / Essentials | |
| Alienware x17 R2 P48E | |
| Razer Blade 17 RTX 3080 Ti | |
| Medio Intel Core i9-12900H, NVIDIA GeForce RTX 3080 Ti Laptop GPU (10254 - 11178, n=6) | |
| Media de la clase Gaming (8810 - 11935, n=97, últimos 2 años) | |
| MSI Stealth GS77 12UHS-083US | |
| Razer Blade 17 Early 2022 | |
| Medion Erazer Beast X30 | |
| PCMark 10 / Productivity | |
| Media de la clase Gaming (6845 - 25323, n=95, últimos 2 años) | |
| Alienware x17 R2 P48E | |
| Medio Intel Core i9-12900H, NVIDIA GeForce RTX 3080 Ti Laptop GPU (9102 - 11186, n=6) | |
| MSI Stealth GS77 12UHS-083US | |
| Razer Blade 17 RTX 3080 Ti | |
| Medion Erazer Beast X30 | |
| Razer Blade 17 Early 2022 | |
| PCMark 10 / Digital Content Creation | |
| Media de la clase Gaming (7602 - 19954, n=95, últimos 2 años) | |
| Alienware x17 R2 P48E | |
| Razer Blade 17 RTX 3080 Ti | |
| Medio Intel Core i9-12900H, NVIDIA GeForce RTX 3080 Ti Laptop GPU (9847 - 12627, n=6) | |
| MSI Stealth GS77 12UHS-083US | |
| Medion Erazer Beast X30 | |
| Razer Blade 17 Early 2022 | |
| CrossMark / Overall | |
| Media de la clase Gaming (1366 - 2409, n=94, últimos 2 años) | |
| Alienware x17 R2 P48E | |
| Medio Intel Core i9-12900H, NVIDIA GeForce RTX 3080 Ti Laptop GPU (1696 - 1965, n=3) | |
| Razer Blade 17 Early 2022 | |
| Medion Erazer Beast X30 | |
| CrossMark / Productivity | |
| Media de la clase Gaming (1386 - 2254, n=94, últimos 2 años) | |
| Alienware x17 R2 P48E | |
| Medio Intel Core i9-12900H, NVIDIA GeForce RTX 3080 Ti Laptop GPU (1622 - 1870, n=3) | |
| Razer Blade 17 Early 2022 | |
| Medion Erazer Beast X30 | |
| CrossMark / Creativity | |
| Media de la clase Gaming (1343 - 2786, n=94, últimos 2 años) | |
| Alienware x17 R2 P48E | |
| Medion Erazer Beast X30 | |
| Medio Intel Core i9-12900H, NVIDIA GeForce RTX 3080 Ti Laptop GPU (1855 - 2135, n=3) | |
| Razer Blade 17 Early 2022 | |
| CrossMark / Responsiveness | |
| Media de la clase Gaming (1226 - 2334, n=94, últimos 2 años) | |
| Alienware x17 R2 P48E | |
| Razer Blade 17 Early 2022 | |
| Medio Intel Core i9-12900H, NVIDIA GeForce RTX 3080 Ti Laptop GPU (1483 - 1777, n=3) | |
| Medion Erazer Beast X30 | |
| PCMark 8 Home Score Accelerated v2 | 4671 puntos | |
| PCMark 8 Creative Score Accelerated v2 | 6358 puntos | |
| PCMark 8 Work Score Accelerated v2 | 5464 puntos | |
| PCMark 10 Score | 7139 puntos | |
ayuda | ||
| AIDA64 / Memory Copy | |
| Media de la clase Gaming (21750 - 129946, n=105, últimos 2 años) | |
| Razer Blade 17 RTX 3080 Ti (v6.50.5800) | |
| MSI Stealth GS77 12UHS-083US (v6.50.5800) | |
| Medion Erazer Beast X30 (v6.50.5800) | |
| Razer Blade 17 Early 2022 (v6.50.5800, Max.) | |
| Razer Blade 17 Early 2022 (v6.50.5800, Lautlos) | |
| Razer Blade 17 Early 2022 (v6.50.5800) | |
| Medio Intel Core i9-12900H (34438 - 74264, n=29) | |
| Alienware x17 R2 P48E (v6.50.5800) | |
| AIDA64 / Memory Read | |
| Media de la clase Gaming (22956 - 118858, n=105, últimos 2 años) | |
| Razer Blade 17 RTX 3080 Ti (v6.50.5800) | |
| Medion Erazer Beast X30 (v6.50.5800) | |
| Razer Blade 17 Early 2022 (v6.50.5800, Max.) | |
| MSI Stealth GS77 12UHS-083US (v6.50.5800) | |
| Razer Blade 17 Early 2022 (v6.50.5800, Lautlos) | |
| Razer Blade 17 Early 2022 (v6.50.5800) | |
| Medio Intel Core i9-12900H (36365 - 74642, n=29) | |
| Alienware x17 R2 P48E (v6.50.5800) | |
| AIDA64 / Memory Write | |
| Media de la clase Gaming (22297 - 135096, n=105, últimos 2 años) | |
| Razer Blade 17 RTX 3080 Ti (v6.50.5800) | |
| MSI Stealth GS77 12UHS-083US (v6.50.5800) | |
| Razer Blade 17 Early 2022 (v6.50.5800, Max.) | |
| Medion Erazer Beast X30 (v6.50.5800) | |
| Razer Blade 17 Early 2022 (v6.50.5800, Lautlos) | |
| Medio Intel Core i9-12900H (32276 - 67858, n=29) | |
| Razer Blade 17 Early 2022 (v6.50.5800) | |
| Alienware x17 R2 P48E (v6.50.5800) | |
| AIDA64 / Memory Latency | |
| Media de la clase Gaming (75.3 - 259, n=105, últimos 2 años) | |
| Alienware x17 R2 P48E (v6.50.5800) | |
| MSI Stealth GS77 12UHS-083US (v6.50.5800) | |
| Medio Intel Core i9-12900H (74.7 - 118.1, n=28) | |
| Razer Blade 17 RTX 3080 Ti (v6.50.5800) | |
| Medion Erazer Beast X30 (v6.50.5800) | |
| Razer Blade 17 Early 2022 (v6.50.5800, Max.) | |
| Razer Blade 17 Early 2022 (v6.50.5800, Lautlos) | |
* ... más pequeño es mejor
Latencias del CPD
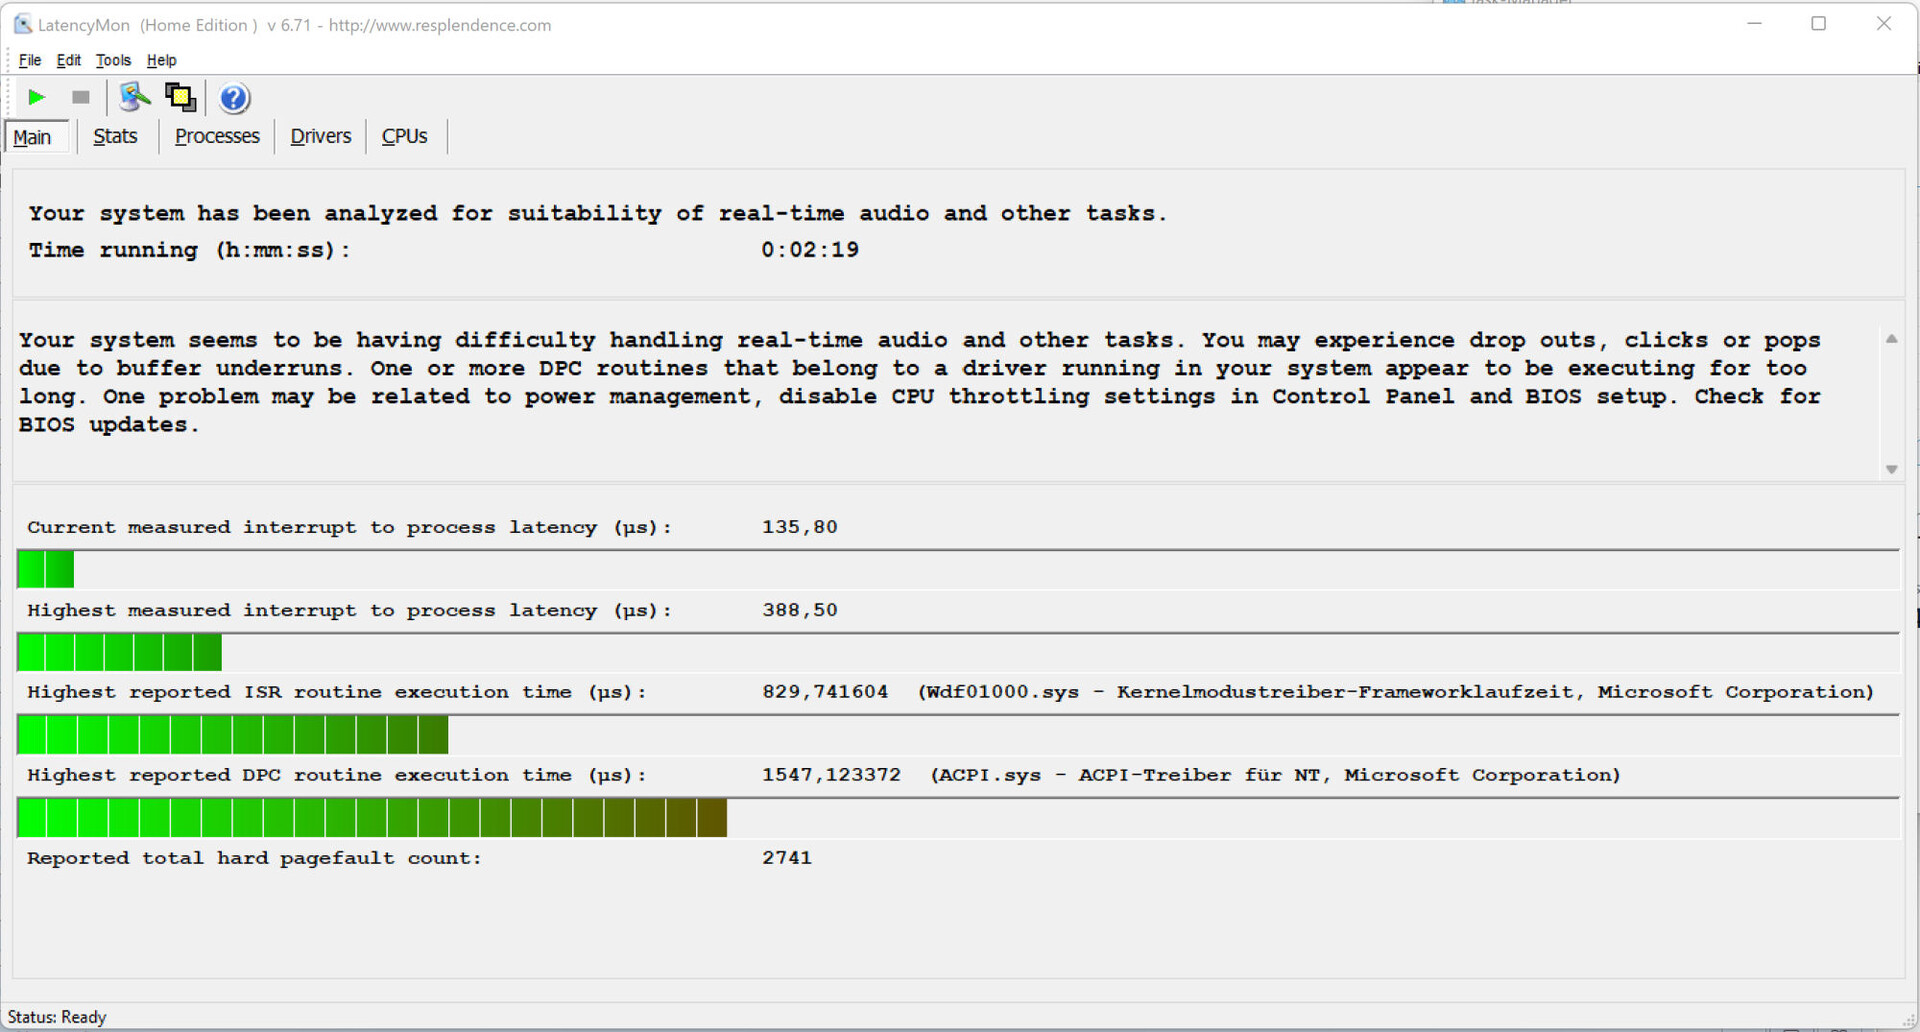
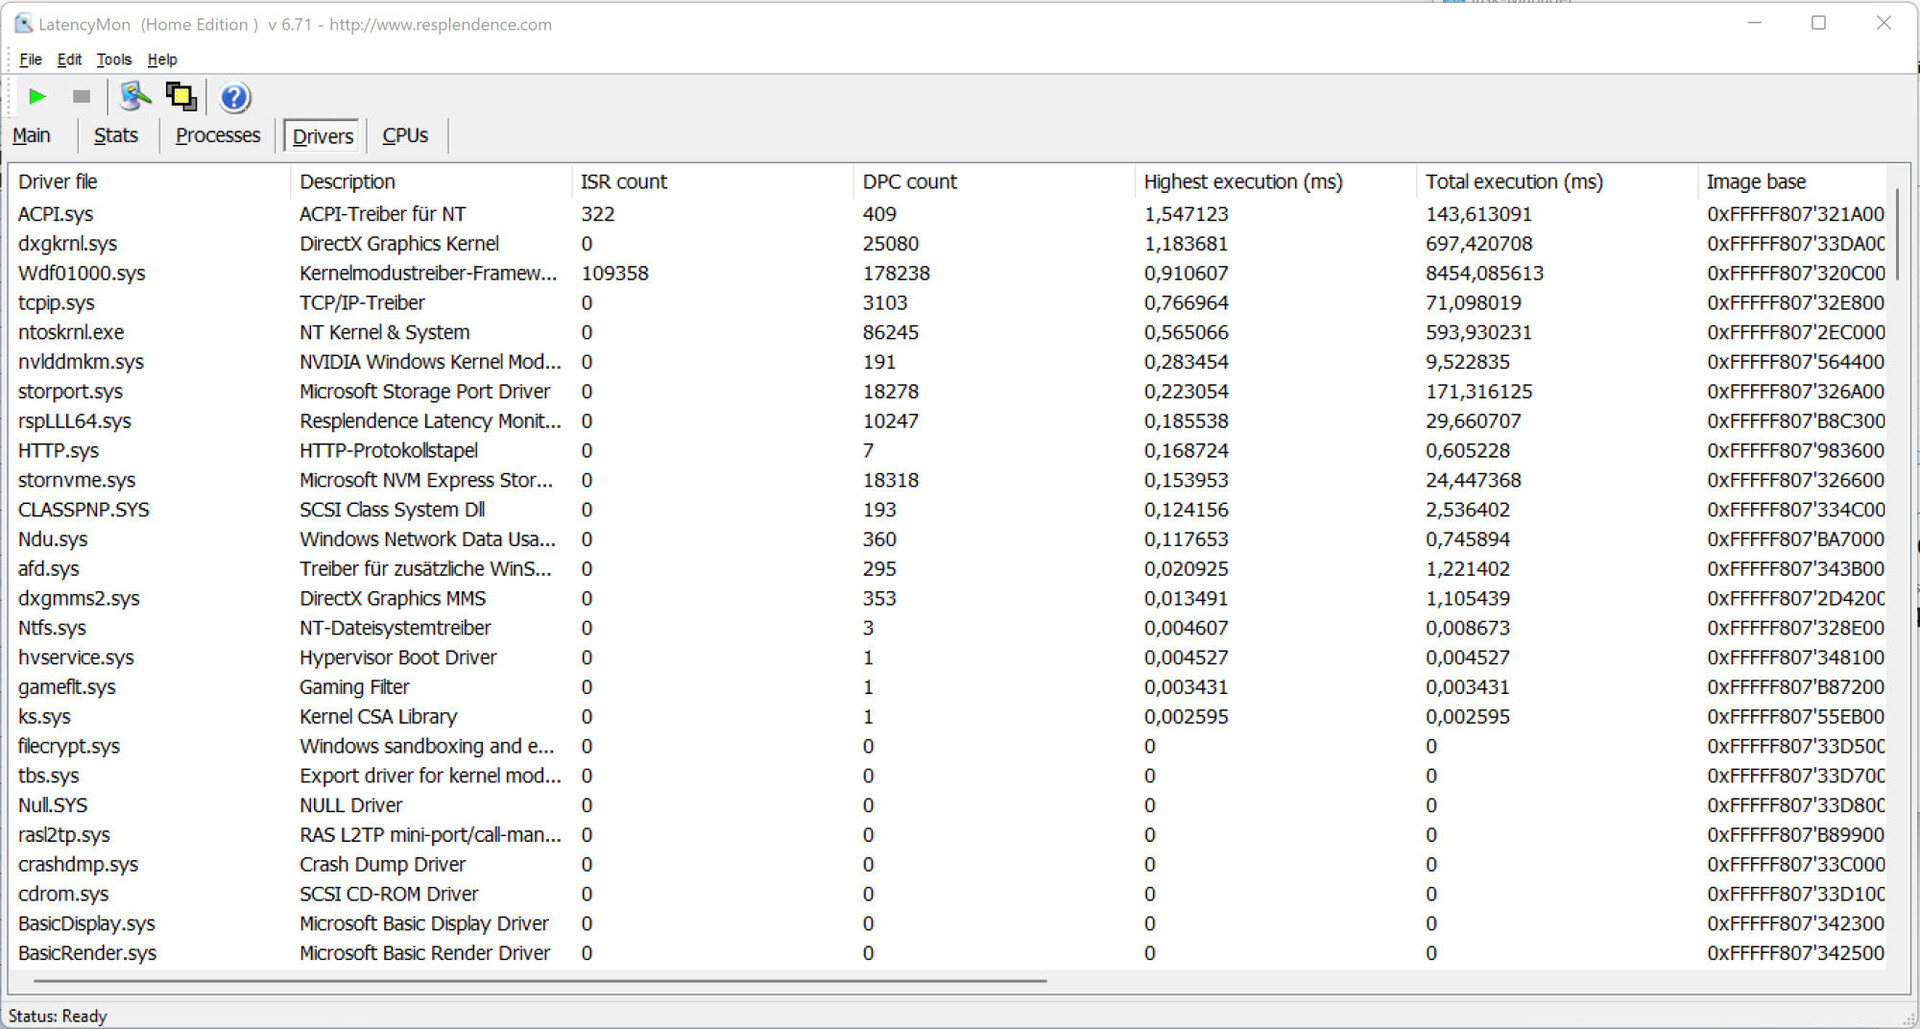
La prueba estandarizada de Latency Monitor (navegación web, reproducción de vídeo 4k, Prime95 High Load) reveló un comportamiento llamativo en las latencias del CPD. El sistema no parece ser adecuado para el procesamiento de vídeo y audio en tiempo real. Las futuras actualizaciones de software podrían suponer mejoras o incluso empeorar las cosas.
| DPC Latencies / LatencyMon - interrupt to process latency (max), Web, Youtube, Prime95 | |
| MSI Stealth GS77 12UHS-083US | |
| Alienware x17 R2 P48E | |
| Razer Blade 17 RTX 3080 Ti | |
| Medion Erazer Beast X30 | |
| Razer Blade 17 Early 2022 | |
* ... más pequeño es mejor
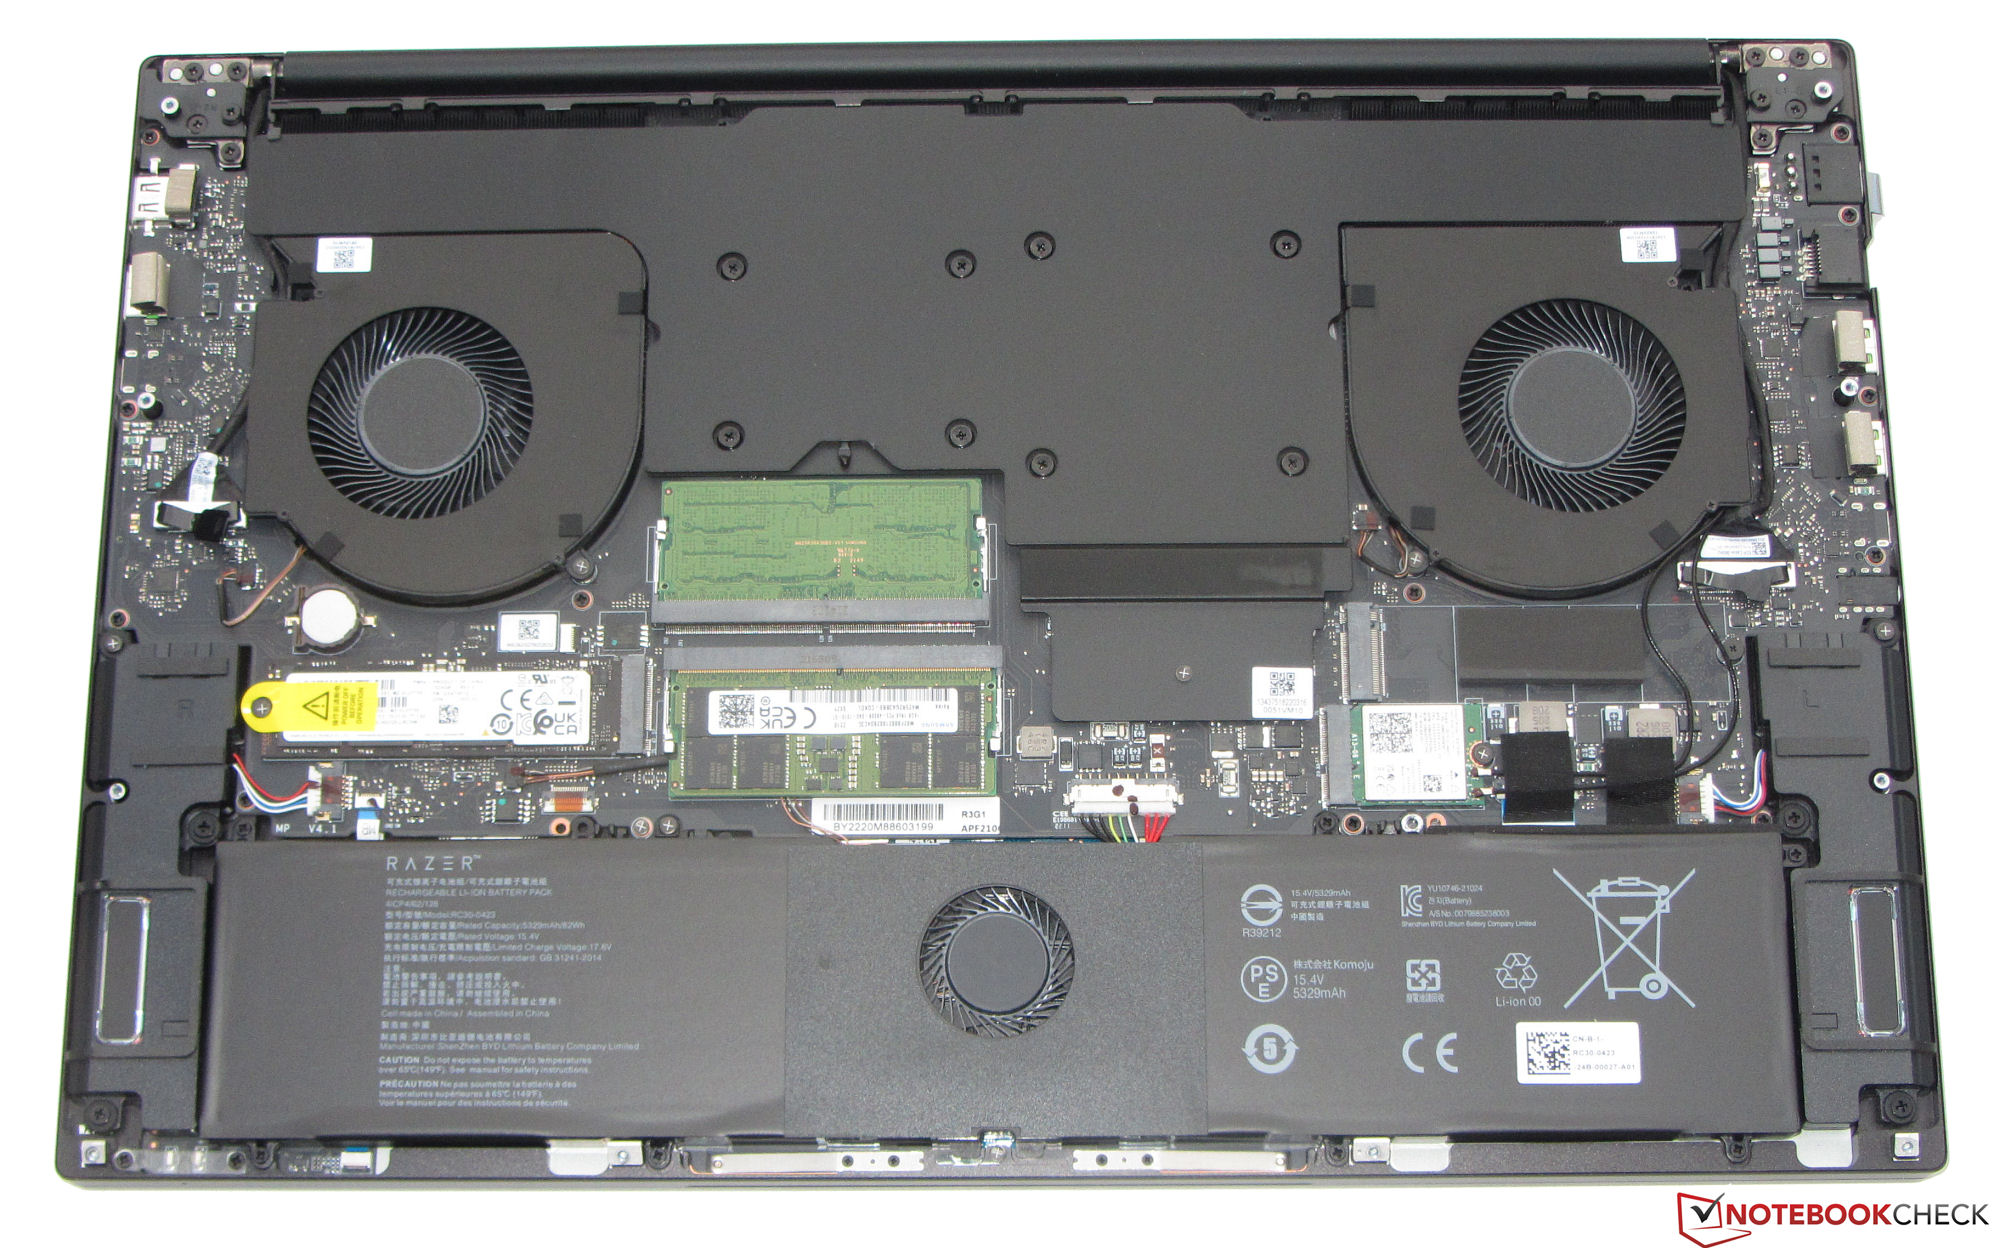
Solución de almacenamiento
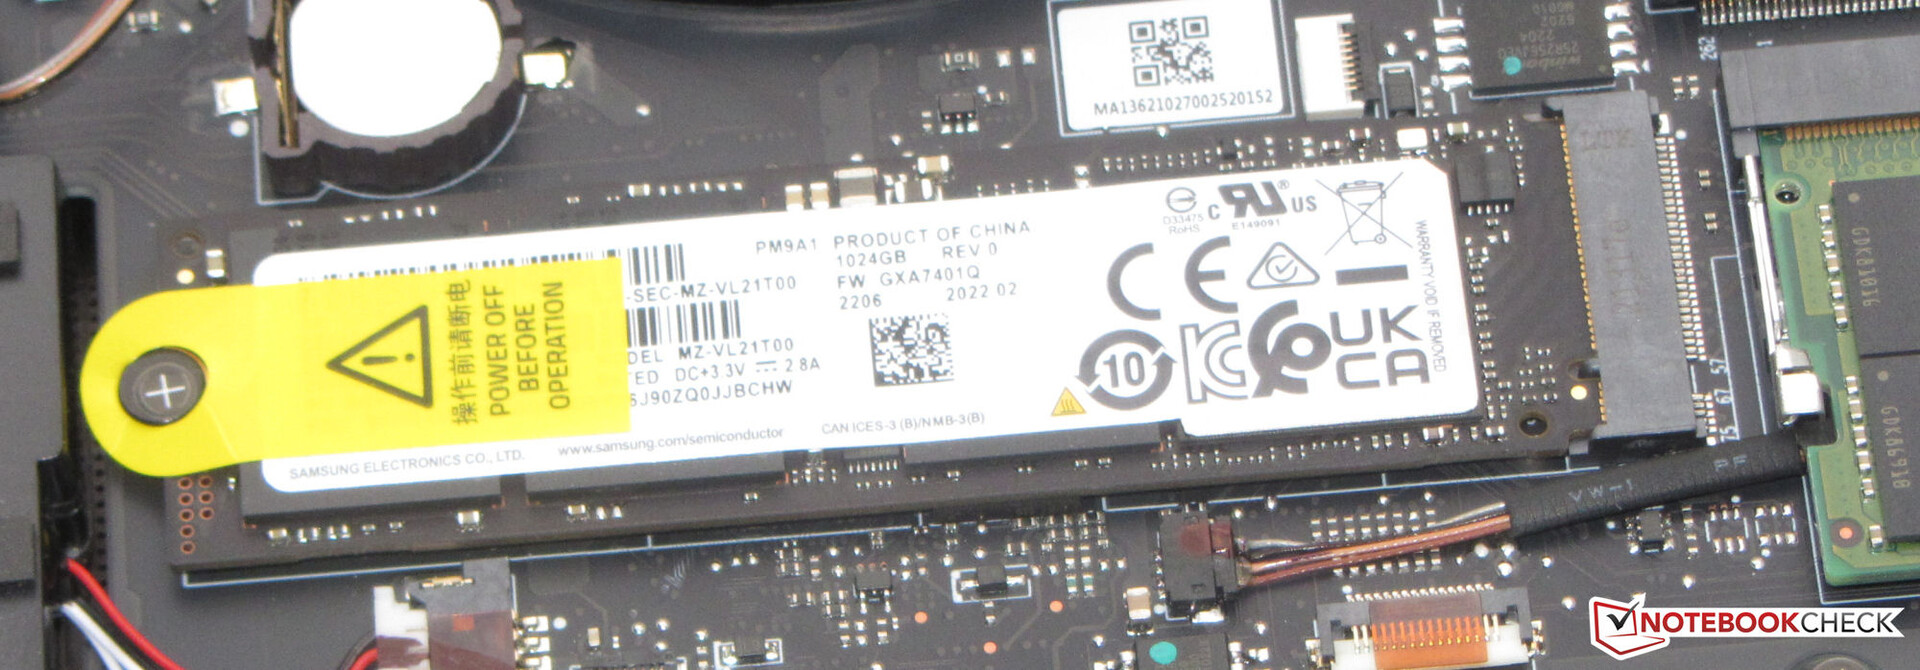
Razer ha equipado el Blade con un SSD de 1 TB (PCIe 4, M.2-2280) de Samsung que ofrece muy buenas tasas de transferencia. Además, el portátil ofrece espacio para un segundo SSD (PCIe 4, M.2-2280).

* ... más pequeño es mejor
Constant Performance Reading: DiskSpd Read Loop, Queue Depth 8
Tarjeta gráfica
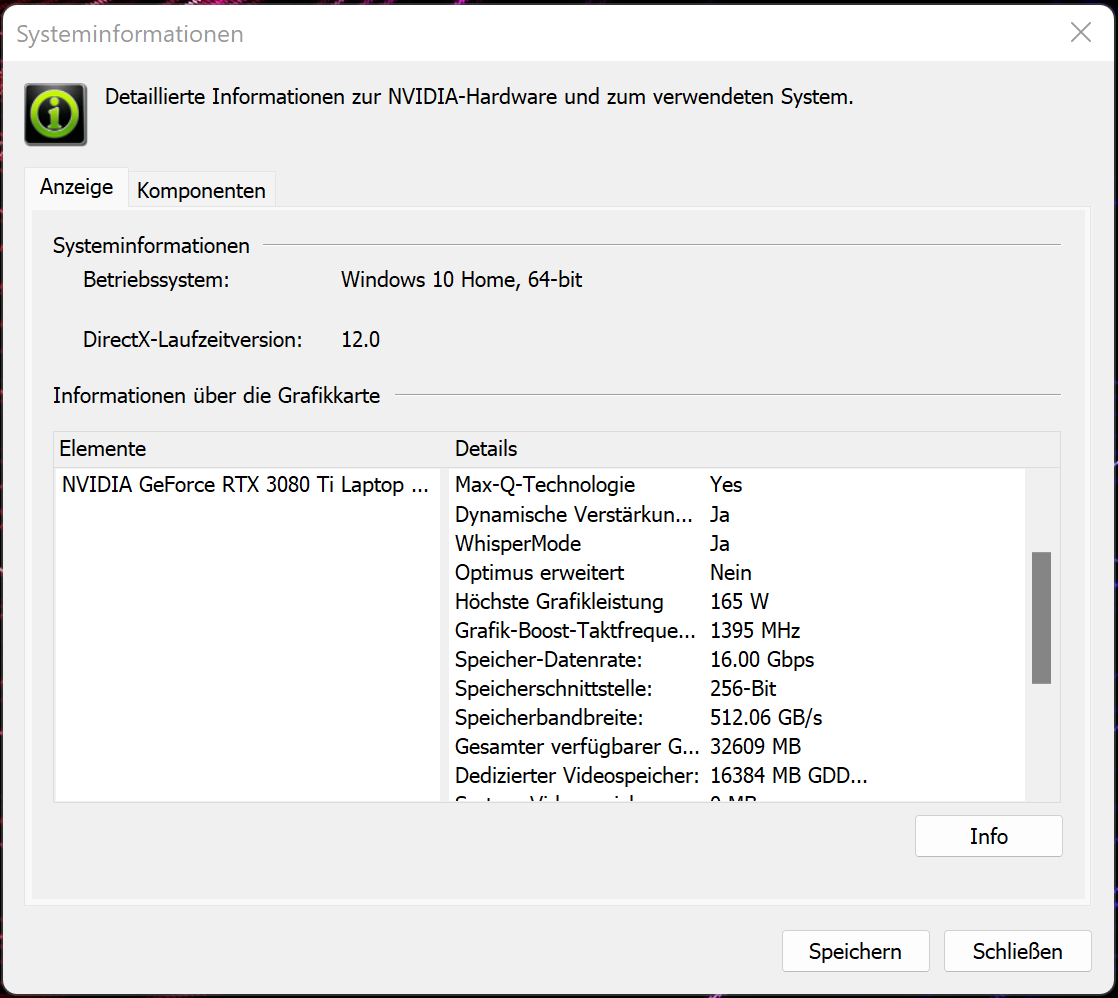
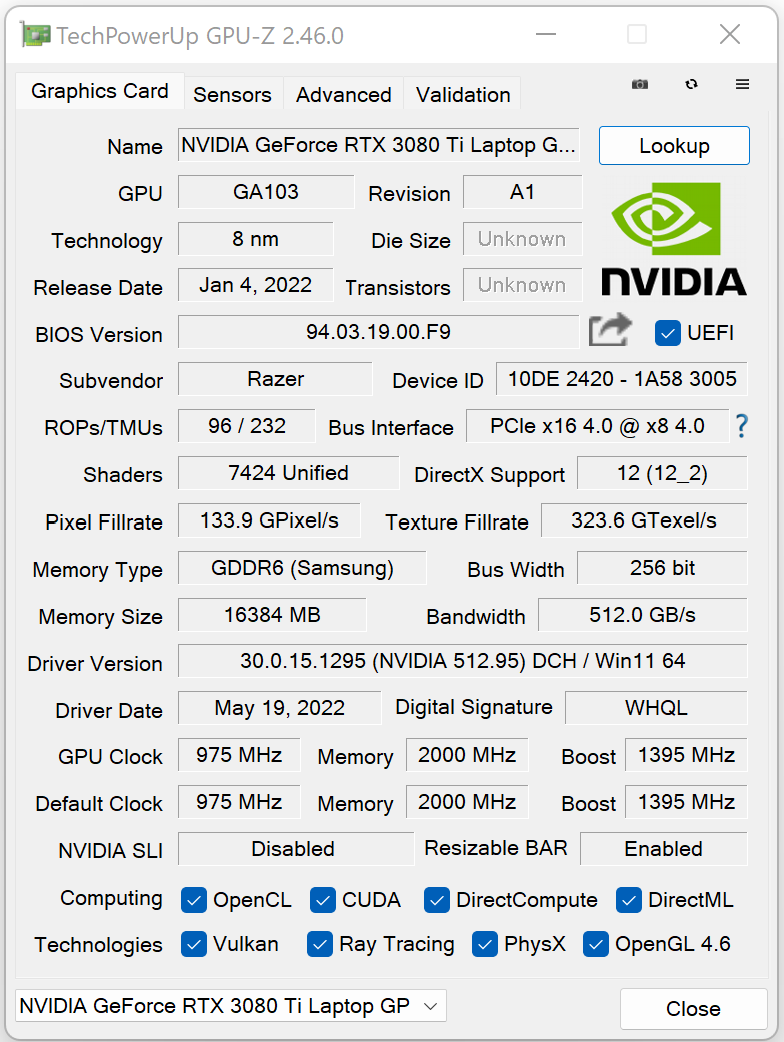
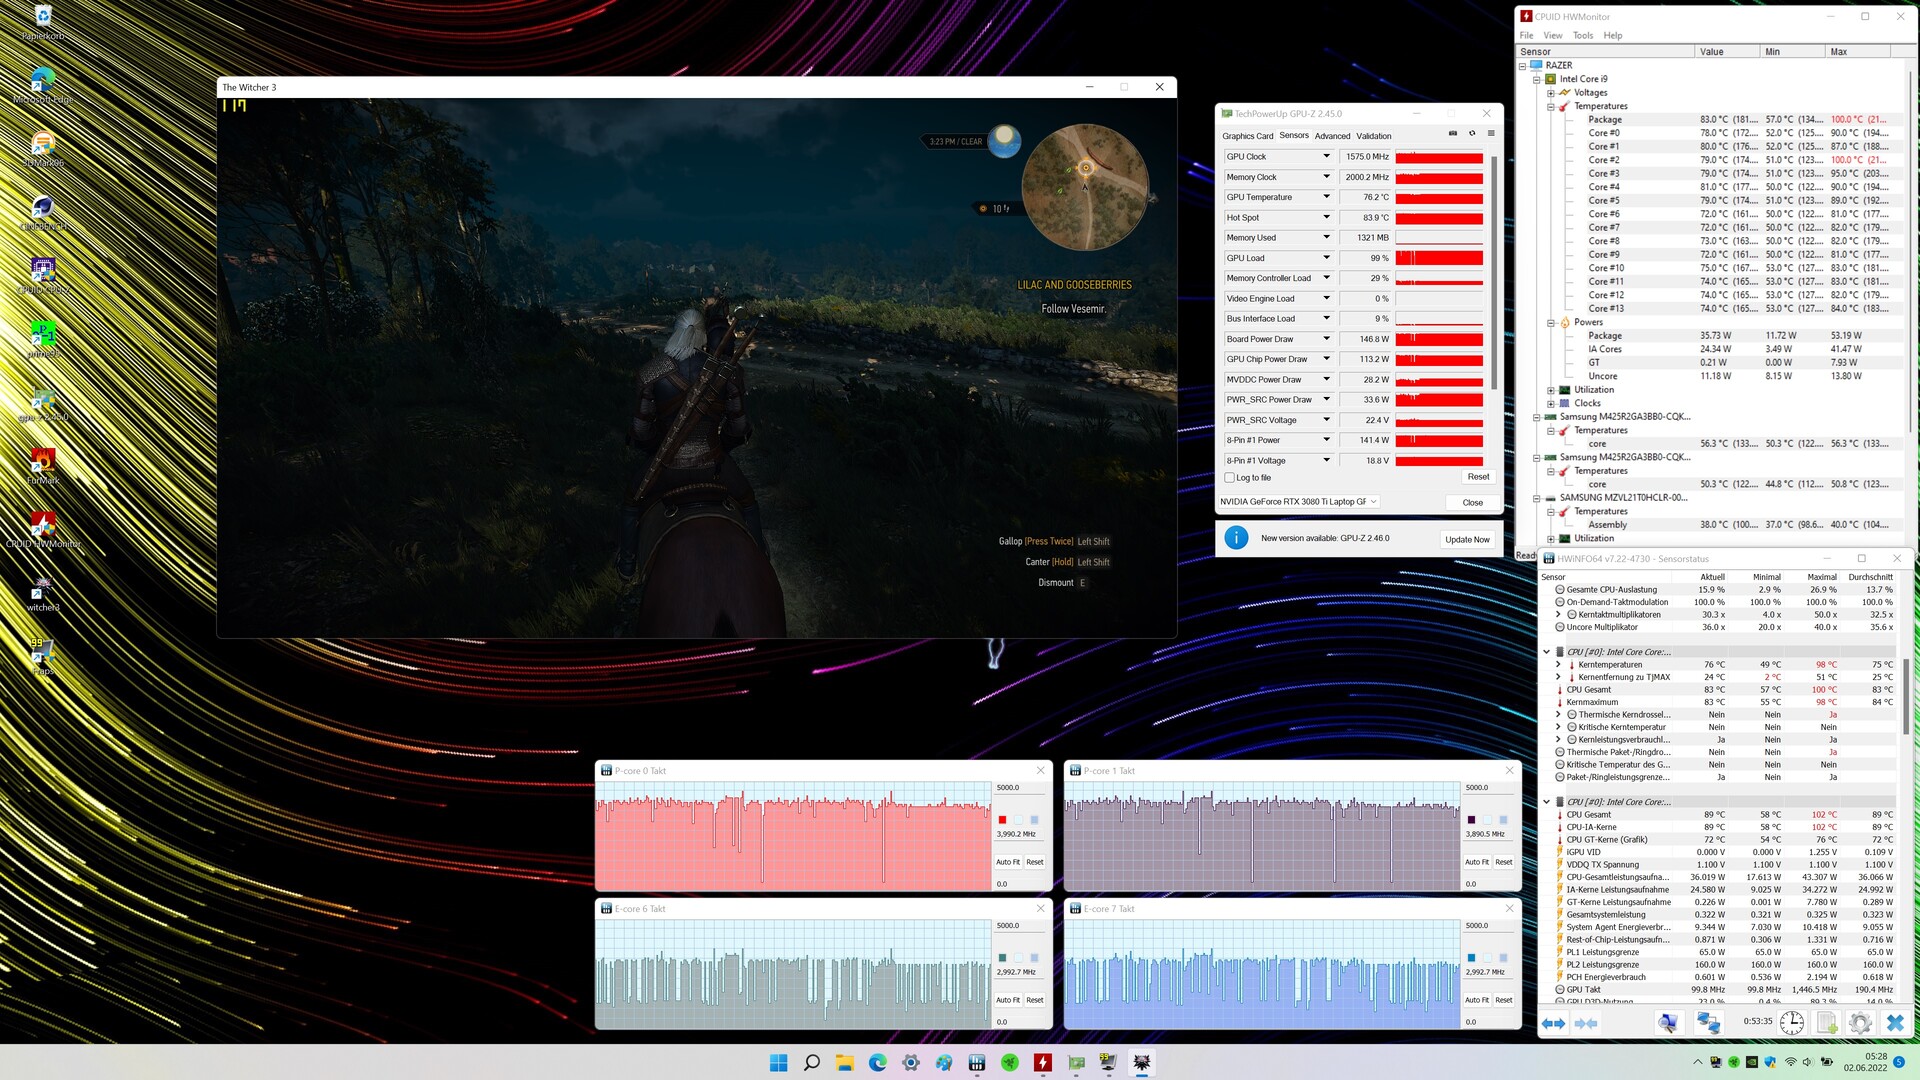
Una actualización de la BIOS de junio de 2022 aumenta el TGP de la GeForce RTX 3080 Ti para portátilesgPU (VRAM: 16,384 MB GDDR6) de 165 a 175 vatios - sin mostrar ningún efecto en los resultados del benchmark. Sin embargo, en todos los casos, los resultados siguen estando por encima de la media de la RTX 3080 Ti que determinamos previamente. El TGP no se aprovecha del todo, lo que se demuestra en nuestra prueba The Witcher 3. El rendimiento gráfico puede aumentar sin una actualización de la BIOS, ya que el portátil ofrece la opción de salida de imagen directa a través de la GPU GeForce.

| 3DMark Performance rating - Percent | |
| Media de la clase Gaming -2! | |
| Alienware x17 R2 P48E -25! | |
| Razer Blade 17 RTX 3080 Ti -25! | |
| Razer Blade 17 Early 2022 -2! | |
| Razer Blade 17 Early 2022 -25! | |
| Razer Blade 17 Early 2022 -25! | |
| Medion Erazer Beast X30 -25! | |
| Medio NVIDIA GeForce RTX 3080 Ti Laptop GPU | |
| Asus ROG Zephyrus Duo 16 GX650RX -2! | |
| Razer Blade 17 Early 2022 -25! | |
| MSI Stealth GS77 12UHS-083US -25! | |
| Gigabyte Aero 16 YE5 -1! | |
| 3DMark 11 - 1280x720 Performance GPU | |
| Media de la clase Gaming (21841 - 80022, n=104, últimos 2 años) | |
| Alienware x17 R2 P48E | |
| Razer Blade 17 Early 2022 (Max.) | |
| Razer Blade 17 Early 2022 | |
| Razer Blade 17 RTX 3080 Ti | |
| Medion Erazer Beast X30 | |
| Razer Blade 17 Early 2022 (dGPU, 175W) | |
| Asus ROG Zephyrus Duo 16 GX650RX | |
| Medio NVIDIA GeForce RTX 3080 Ti Laptop GPU (13920 - 45841, n=45) | |
| Razer Blade 17 Early 2022 (Lautlos) | |
| MSI Stealth GS77 12UHS-083US | |
| Gigabyte Aero 16 YE5 | |
| 3DMark 11 Performance | 30538 puntos | |
| 3DMark Cloud Gate Standard Score | 42346 puntos | |
| 3DMark Fire Strike Score | 24291 puntos | |
| 3DMark Time Spy Score | 11457 puntos | |
| 3DMark Steel Nomad Score | 3076 puntos | |
ayuda | ||
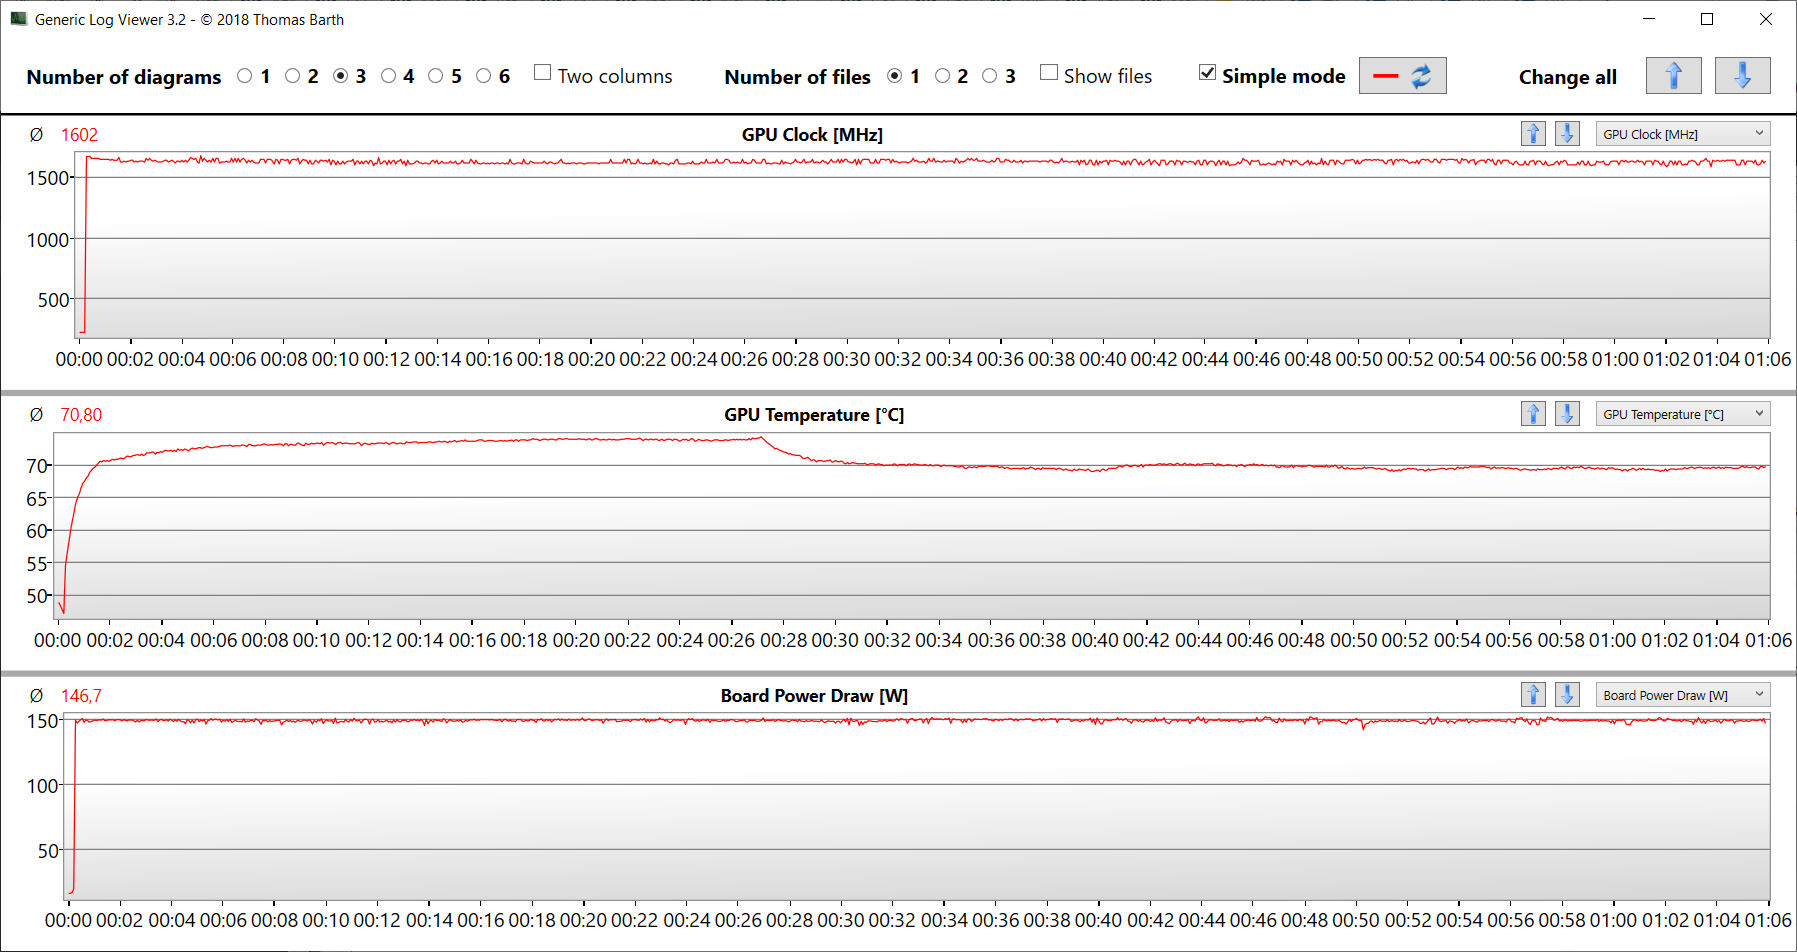
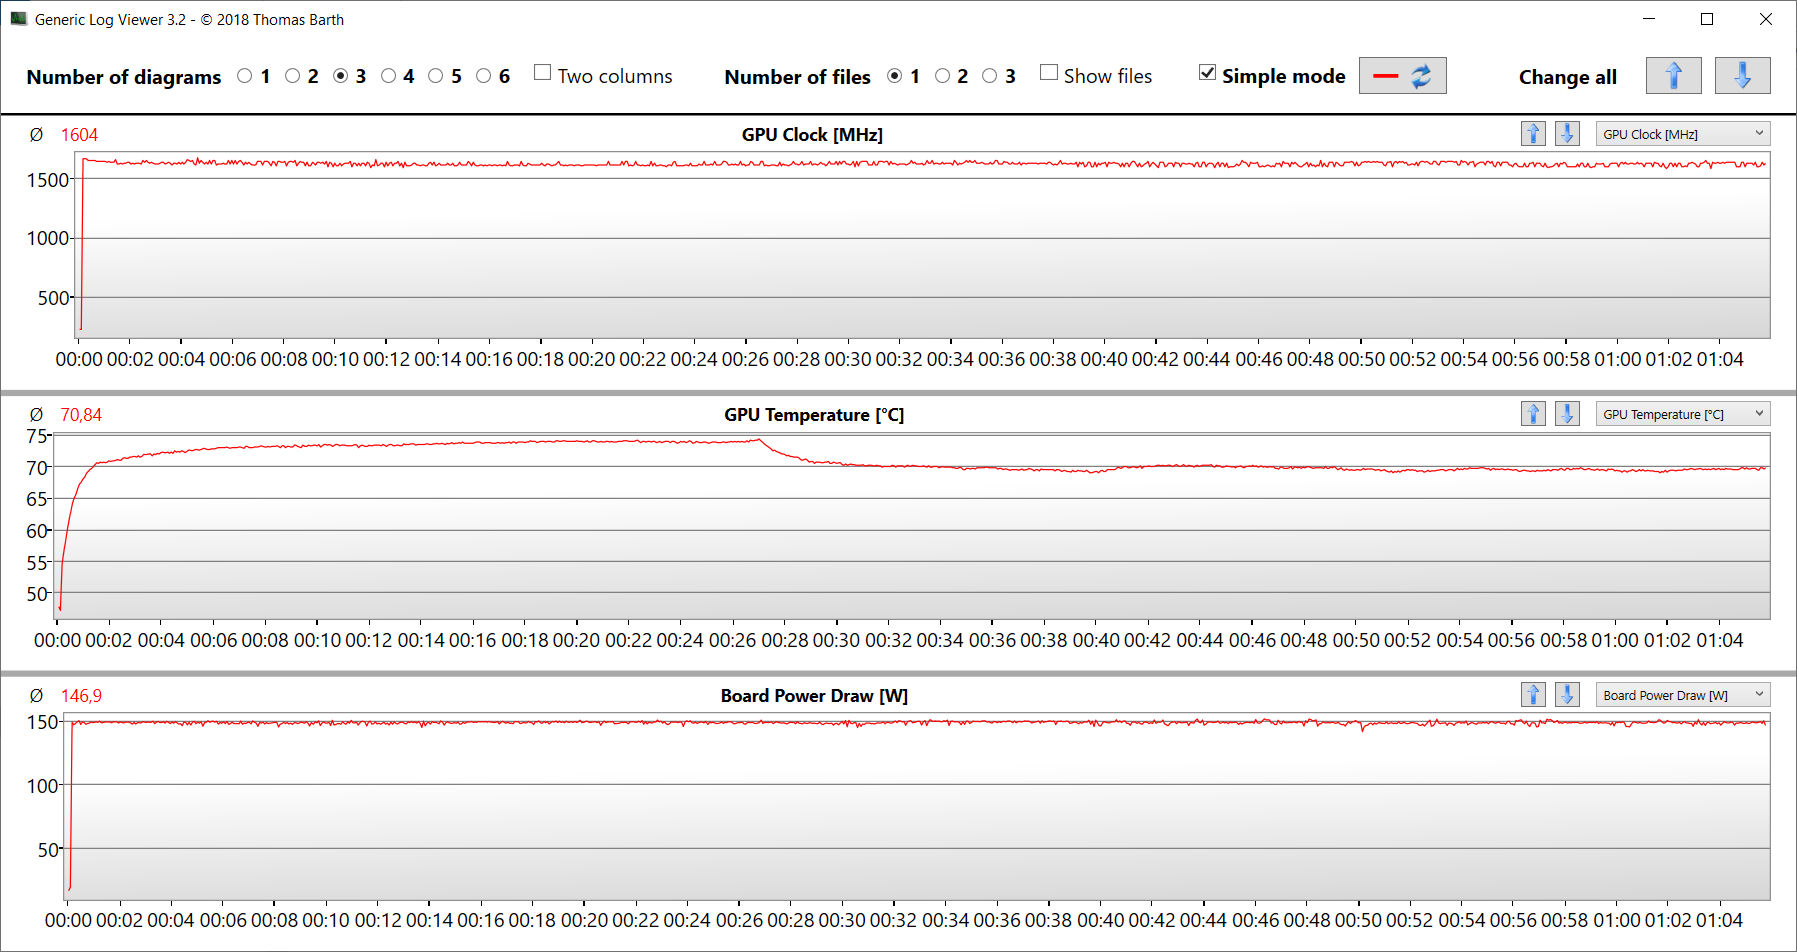
Rendimiento de los juegos
El hardware permite jugar a 4k con ajustes altos y máximos. Normalmente, las velocidades de fotogramas se sitúan por encima de la media de la RTX 3080 Ti. La salida de imagen directa a través de la GPU GeForce lleva a un aumento a veces significativo de los valores. Con ajustes de rendimiento similares, el modelo hermano produce valores a un nivel idéntico. Las velocidades de fotogramas se mantienen a un nivel constante incluso durante un periodo de tiempo más largo, lo que se demuestra en nuestra prueba The Witcher 3 (FHD, ajustes máximos, 60 min. de ejecución).
| The Witcher 3 - 1920x1080 Ultra Graphics & Postprocessing (HBAO+) | |
| Media de la clase Gaming (104.7 - 240, n=7, últimos 2 años) | |
| Alienware x17 R2 P48E | |
| Razer Blade 17 RTX 3080 Ti | |
| Razer Blade 17 Early 2022 (dGPU, 175W) | |
| Razer Blade 17 Early 2022 (Max.) | |
| Razer Blade 17 Early 2022 | |
| Medion Erazer Beast X30 | |
| Razer Blade 17 Early 2022 (Lautlos) | |
| Medio NVIDIA GeForce RTX 3080 Ti Laptop GPU (30 - 130.6, n=43) | |
| MSI Stealth GS77 12UHS-083US | |
| Dota 2 Reborn | |
| 1920x1080 ultra (3/3) best looking | |
| Alienware x17 R2 P48E | |
| Razer Blade 17 RTX 3080 Ti | |
| MSI Stealth GS77 12UHS-083US | |
| Media de la clase Gaming (84.8 - 248, n=107, últimos 2 años) | |
| Razer Blade 17 Early 2022 (Max.) | |
| Razer Blade 17 Early 2022 (dGPU, 175W) | |
| Medion Erazer Beast X30 | |
| Medio NVIDIA GeForce RTX 3080 Ti Laptop GPU (29.9 - 170.5, n=45) | |
| Razer Blade 17 Early 2022 | |
| Razer Blade 17 Early 2022 (Lautlos) | |
| 3840x2160 ultra (3/3) best looking | |
| Media de la clase Gaming (114.9 - 199.2, n=32, últimos 2 años) | |
| Razer Blade 17 Early 2022 (dGPU, 175W) | |
| Razer Blade 17 Early 2022 (Max.) | |
| Medio NVIDIA GeForce RTX 3080 Ti Laptop GPU (70.8 - 155.6, n=19) | |
| Razer Blade 17 Early 2022 | |
| Razer Blade 17 Early 2022 (Lautlos) | |
| X-Plane 11.11 | |
| 3840x2160 high (fps_test=3) | |
| Razer Blade 17 Early 2022 (dGPU, 175W) | |
| Media de la clase Gaming (60 - 124.1, n=32, últimos 2 años) | |
| Razer Blade 17 Early 2022 (Max.) | |
| Medio NVIDIA GeForce RTX 3080 Ti Laptop GPU (32.9 - 109.5, n=20) | |
| Razer Blade 17 Early 2022 | |
| Razer Blade 17 Early 2022 (Lautlos) | |
| 1920x1080 high (fps_test=3) | |
| Alienware x17 R2 P48E | |
| Razer Blade 17 Early 2022 (dGPU, 175W) | |
| Razer Blade 17 RTX 3080 Ti | |
| Razer Blade 17 Early 2022 (Max.) | |
| MSI Stealth GS77 12UHS-083US | |
| Medio NVIDIA GeForce RTX 3080 Ti Laptop GPU (32.6 - 127, n=45) | |
| Medion Erazer Beast X30 | |
| Media de la clase Gaming (55.5 - 143.5, n=109, últimos 2 años) | |
| Razer Blade 17 Early 2022 | |
| Razer Blade 17 Early 2022 (Lautlos) | |
| Final Fantasy XV Benchmark | |
| 3840x2160 High Quality | |
| Media de la clase Gaming (49.1 - 111.8, n=33, últimos 2 años) | |
| Razer Blade 17 Early 2022 (1.3, dGPU, 175W) | |
| Razer Blade 17 Early 2022 (1.3, Max.) | |
| Razer Blade 17 Early 2022 (1.3) | |
| Medio NVIDIA GeForce RTX 3080 Ti Laptop GPU (35.1 - 61.2, n=18) | |
| Razer Blade 17 Early 2022 (1.3, Lautlos) | |
| 1920x1080 High Quality | |
| Media de la clase Gaming (41 - 215, n=95, últimos 2 años) | |
| Alienware x17 R2 P48E (1.3) | |
| Razer Blade 17 Early 2022 (1.3, dGPU, 175W) | |
| Razer Blade 17 RTX 3080 Ti (1.3) | |
| Razer Blade 17 Early 2022 (1.3, Max.) | |
| Medio NVIDIA GeForce RTX 3080 Ti Laptop GPU (30.7 - 140.6, n=42) | |
| Razer Blade 17 Early 2022 (1.3) | |
| MSI Stealth GS77 12UHS-083US (1.3) | |
| Medion Erazer Beast X30 (1.3) | |
| Razer Blade 17 Early 2022 (1.3, Lautlos) | |
| GTA V | |
| 1920x1080 Highest AA:4xMSAA + FX AF:16x | |
| Media de la clase Gaming (48.3 - 186.9, n=94, últimos 2 años) | |
| Alienware x17 R2 P48E | |
| Razer Blade 17 Early 2022 (Max.) | |
| Razer Blade 17 Early 2022 (dGPU, 175W) | |
| Razer Blade 17 RTX 3080 Ti | |
| MSI Stealth GS77 12UHS-083US | |
| Medio NVIDIA GeForce RTX 3080 Ti Laptop GPU (30 - 139.2, n=42) | |
| Medion Erazer Beast X30 | |
| Razer Blade 17 Early 2022 | |
| Razer Blade 17 Early 2022 (Lautlos) | |
| 3840x2160 Highest AA:4xMSAA + FX AF:16x | |
| Media de la clase Gaming (53.9 - 123.2, n=25, últimos 2 años) | |
| Razer Blade 17 Early 2022 (Max.) | |
| Razer Blade 17 Early 2022 | |
| Razer Blade 17 Early 2022 (dGPU, 175W) | |
| Medio NVIDIA GeForce RTX 3080 Ti Laptop GPU (37.7 - 67.2, n=14) | |
| Razer Blade 17 Early 2022 (Lautlos) | |
| Strange Brigade | |
| 3840x2160 ultra AA:ultra AF:16 | |
| Media de la clase Gaming (83 - 187.2, n=34, últimos 2 años) | |
| Razer Blade 17 Early 2022 (1.47.22.14 D3D12, dGPU, 175W) | |
| Razer Blade 17 Early 2022 (1.47.22.14 D3D12) | |
| Medio NVIDIA GeForce RTX 3080 Ti Laptop GPU (61.7 - 100.7, n=15) | |
| Razer Blade 17 Early 2022 (1.47.22.14 D3D12, Lautlos) | |
| 1920x1080 ultra AA:ultra AF:16 | |
| Media de la clase Gaming (76.3 - 458, n=87, últimos 2 años) | |
| Razer Blade 17 RTX 3080 Ti (1.47.22.14 D3D12) | |
| Razer Blade 17 Early 2022 (1.47.22.14 D3D12, dGPU, 175W) | |
| Alienware x17 R2 P48E (1.47.22.14 D3D12) | |
| Razer Blade 17 Early 2022 (1.47.22.14 D3D12) | |
| Medion Erazer Beast X30 (1.47.22.14 D3D12) | |
| Medio NVIDIA GeForce RTX 3080 Ti Laptop GPU (42.3 - 224, n=41) | |
| Razer Blade 17 Early 2022 (1.47.22.14 D3D12, Lautlos) | |
| MSI Stealth GS77 12UHS-083US (1.47.22.14 D3D12) | |
| F1 2021 | |
| 3840x2160 Ultra High Preset + Raytracing AA:T AF:16x | |
| Razer Blade 17 Early 2022 (874931, dGPU, 175W) | |
| Razer Blade 17 Early 2022 (874931, Max.) | |
| Razer Blade 17 Early 2022 (874931) | |
| Medio NVIDIA GeForce RTX 3080 Ti Laptop GPU (41.1 - 70.2, n=18) | |
| Razer Blade 17 Early 2022 (874931, Lautlos) | |
| 1920x1080 Ultra High Preset + Raytracing AA:T AF:16x | |
| Razer Blade 17 Early 2022 (874931, dGPU, 175W) | |
| Razer Blade 17 Early 2022 (874931, Max.) | |
| Razer Blade 17 Early 2022 (874931) | |
| Medion Erazer Beast X30 (874931) | |
| Medio NVIDIA GeForce RTX 3080 Ti Laptop GPU (30.2 - 160.6, n=30) | |
| Razer Blade 17 Early 2022 (874931, Lautlos) | |
| Far Cry 5 | |
| 3840x2160 Ultra Preset AA:T | |
| Media de la clase Gaming (n=1últimos 2 años) | |
| Razer Blade 17 Early 2022 | |
| Razer Blade 17 Early 2022 (dGPU, 175W) | |
| Medio NVIDIA GeForce RTX 3080 Ti Laptop GPU (45 - 76, n=9) | |
| 1920x1080 Ultra Preset AA:T | |
| Medio NVIDIA GeForce RTX 3080 Ti Laptop GPU (111 - 162, n=24) | |
| Medion Erazer Beast X30 | |
| MSI Stealth GS77 12UHS-083US | |
| Razer Blade 17 RTX 3080 Ti | |
| Razer Blade 17 Early 2022 (dGPU, 175W) | |
| Razer Blade 17 Early 2022 | |
| Media de la clase Gaming (70 - 151, n=6, últimos 2 años) | |
The Witcher 3 FPS Chart
| bajo | medio | alto | ultra | QHD | 4K | |
|---|---|---|---|---|---|---|
| GTA V (2015) | 179.4 | 175.2 | 166 | 106 | 102.7 | 118 |
| The Witcher 3 (2015) | 328 | 289 | 218 | 119.6 | 89.6 | |
| Dota 2 Reborn (2015) | 176.1 | 149.2 | 140 | 131.9 | 117.3 | |
| Final Fantasy XV Benchmark (2018) | 155.9 | 139.3 | 112.2 | 90.8 | 55.2 | |
| X-Plane 11.11 (2018) | 127.9 | 115.5 | 95.6 | 82.1 | ||
| Far Cry 5 (2018) | 148 | 127 | 122 | 116 | 110 | 70 |
| Strange Brigade (2018) | 382 | 272 | 229 | 204 | 152.7 | 91.1 |
| F1 2021 (2021) | 295 | 255 | 219 | 132.8 | 104.3 | 62.5 |
| Baldur's Gate 3 (2023) | 117.7 | 84.4 | 46 | |||
| Cyberpunk 2077 (2023) | 91.43 | 57.12 | 25.46 |
Emisiones - El Blade 17 no se calienta en exceso
Emisiones acústicas
En el funcionamiento diario (oficina, Internet), el portátil no produce un ruido excesivo. En ocasiones, los ventiladores incluso permanecen completamente apagados y hay silencio. Bajo carga, puede llegar a ser ruidoso con un nivel máximo de ruido de hasta 51 dB(A) (test de estrés, The Witcher 3 test).
El perfil de rendimiento "Silencioso" se ofrece para el funcionamiento diario. Aunque el portátil no funciona en silencio, produce menos ruido y calor. El reducido rendimiento informático también es suficiente para los juegos.
Ruido
| Ocioso |
| 26 / 27 / 32 dB(A) |
| Carga |
| 50 / 51 dB(A) |
 | ||
30 dB silencioso 40 dB(A) audible 50 dB(A) ruidosamente alto |
||
min: | ||
| Razer Blade 17 Early 2022 GeForce RTX 3080 Ti Laptop GPU, i9-12900H, Samsung PM9A1 MZVL21T0HCLR | Alienware x17 R2 P48E GeForce RTX 3080 Ti Laptop GPU, i9-12900HK, 2x Samsung PM9A1 1TB (RAID 0) | Medion Erazer Beast X30 GeForce RTX 3080 Ti Laptop GPU, i9-12900HK, Samsung PM9A1 MZVL21T0HCLR | MSI Stealth GS77 12UHS-083US GeForce RTX 3080 Ti Laptop GPU, i7-12700H, Micron 3400 1TB MTFDKBA1T0TFH | Razer Blade 17 RTX 3080 Ti GeForce RTX 3080 Ti Laptop GPU, i7-12800H, Samsung PM9A1 MZVL21T0HCLR | |
|---|---|---|---|---|---|
| Noise | 14% | -2% | 8% | 11% | |
| apagado / medio ambiente * (dB) | 26 | 22.7 13% | 26 -0% | 24.5 6% | 23.3 10% |
| Idle Minimum * (dB) | 26 | 23.1 11% | 27 -4% | 24.5 6% | 23.3 10% |
| Idle Average * (dB) | 27 | 23.1 14% | 29 -7% | 24.5 9% | 23.3 14% |
| Idle Maximum * (dB) | 32 | 23.1 28% | 34 -6% | 30.8 4% | 26.3 18% |
| Load Average * (dB) | 50 | 31.9 36% | 48 4% | 34.6 31% | 38.2 24% |
| Witcher 3 ultra * (dB) | 51 | 52.5 -3% | 51 -0% | 46.2 9% | 50.9 -0% |
| Load Maximum * (dB) | 51 | 52.5 -3% | 53 -4% | 56.8 -11% | 49.1 4% |
* ... más pequeño es mejor
Temperaturas
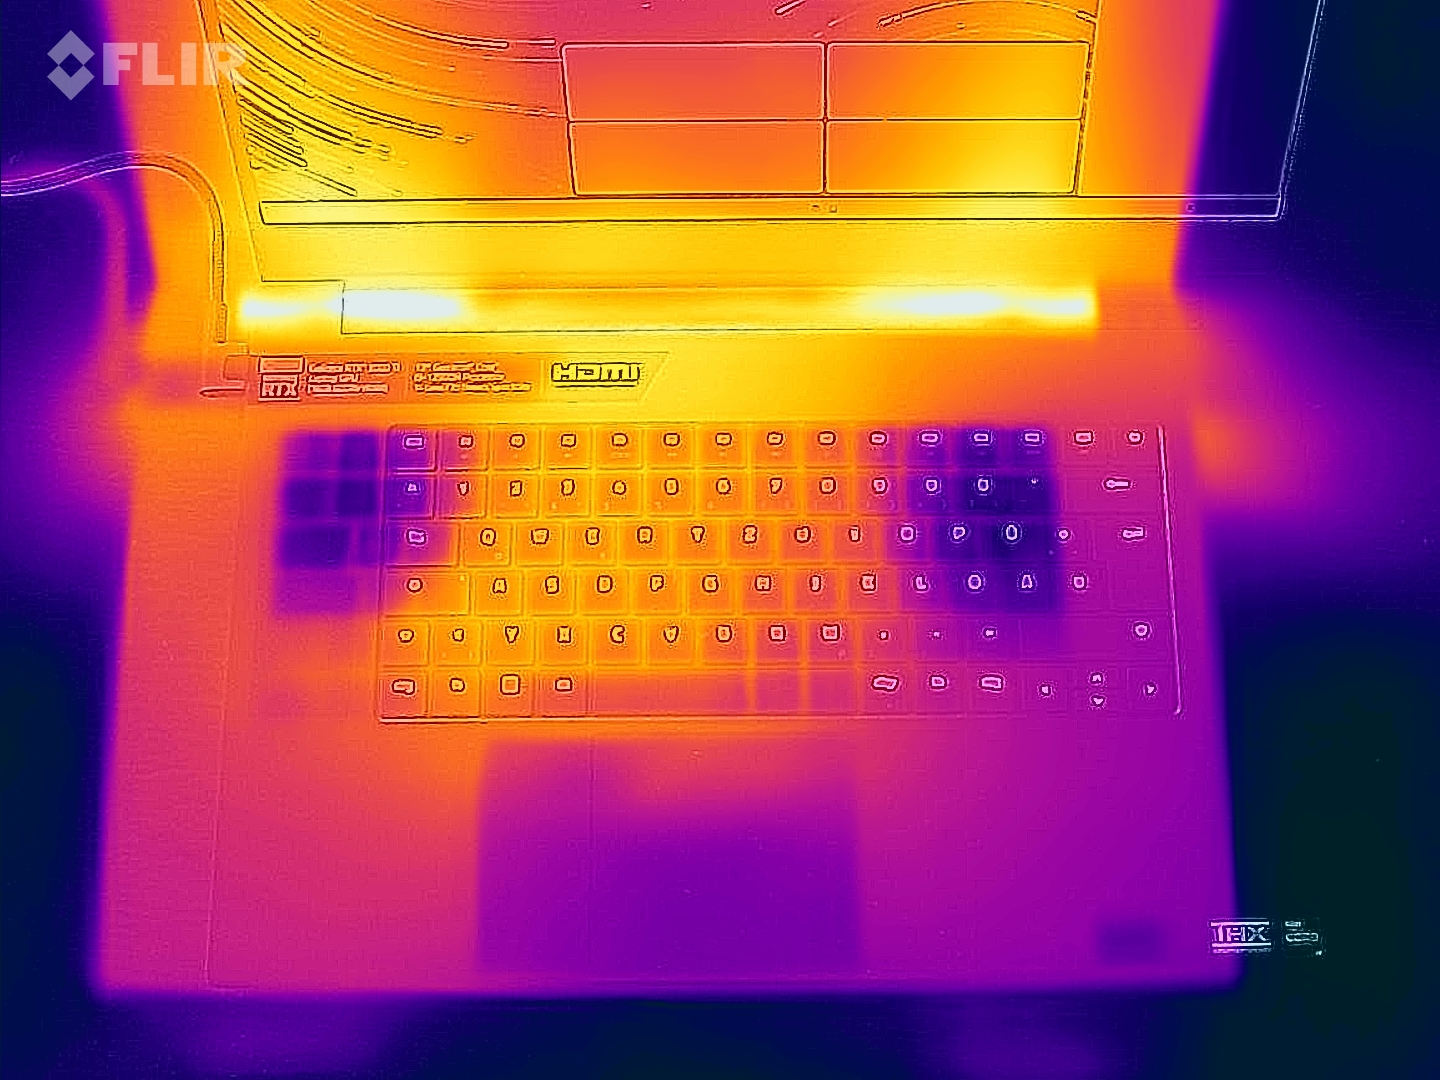
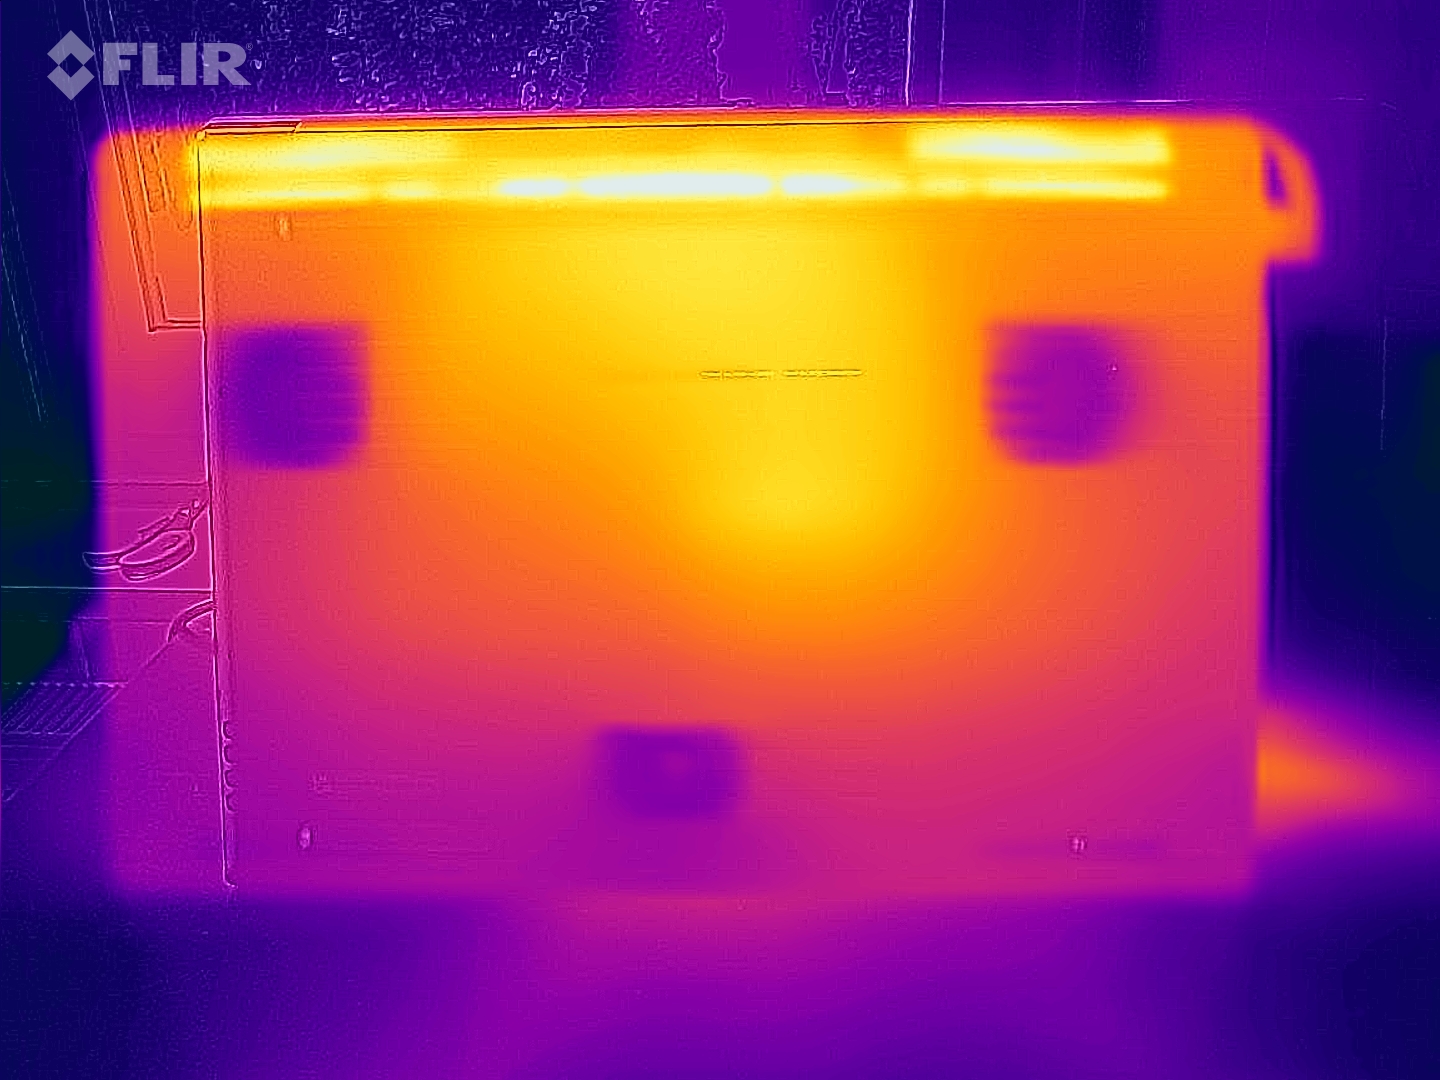
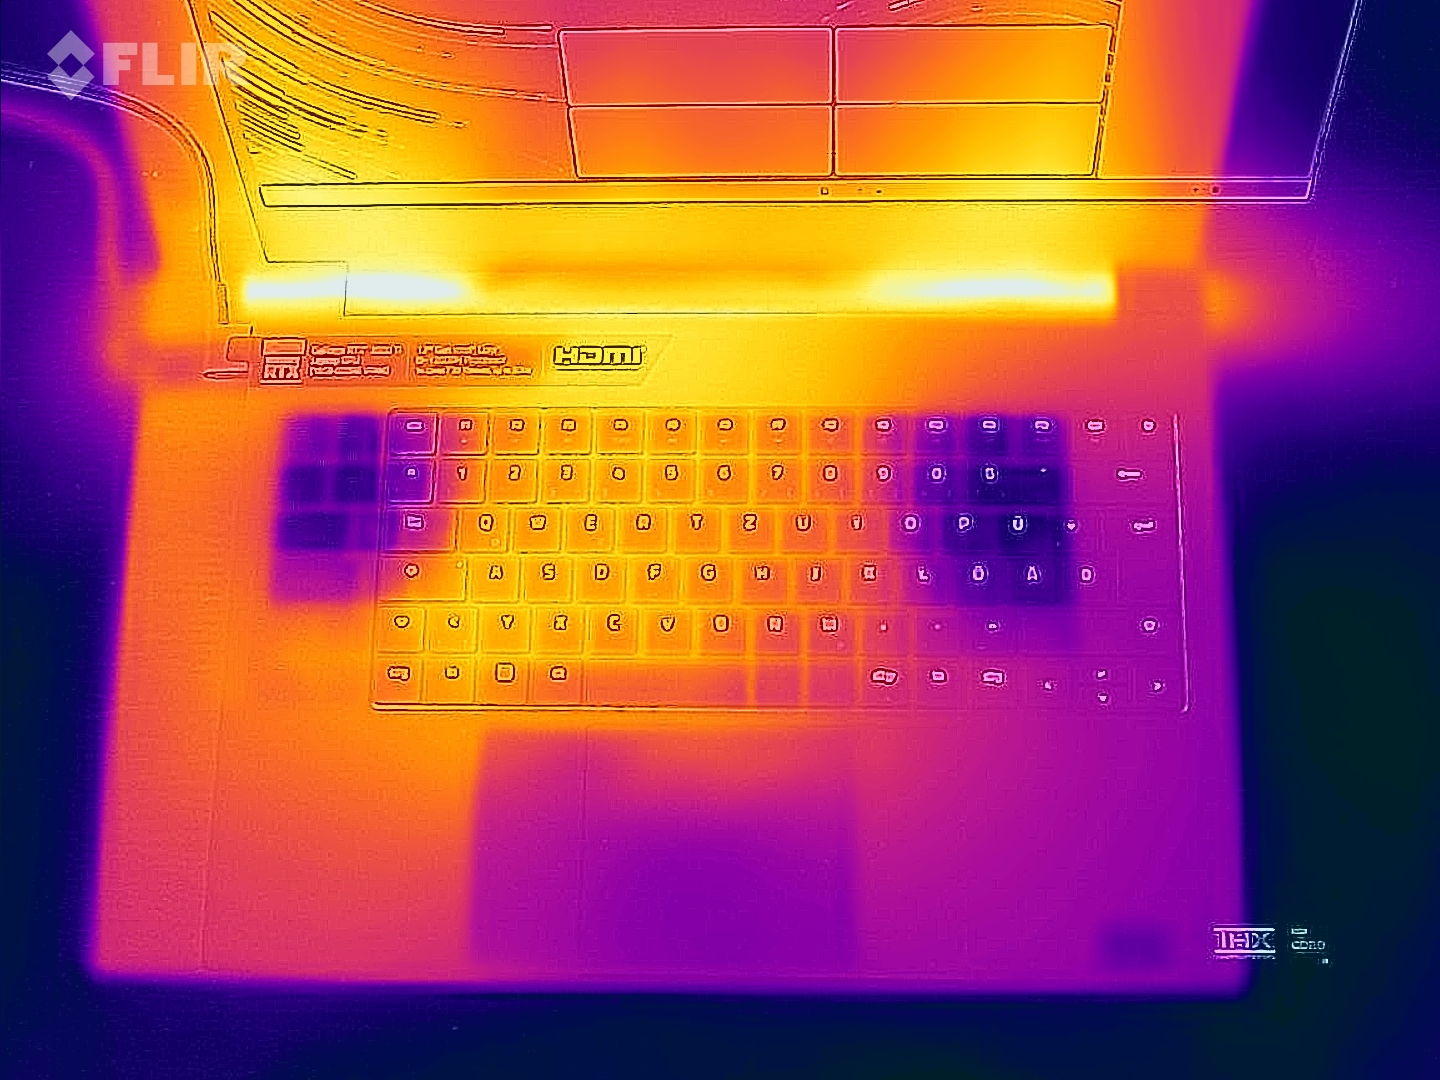
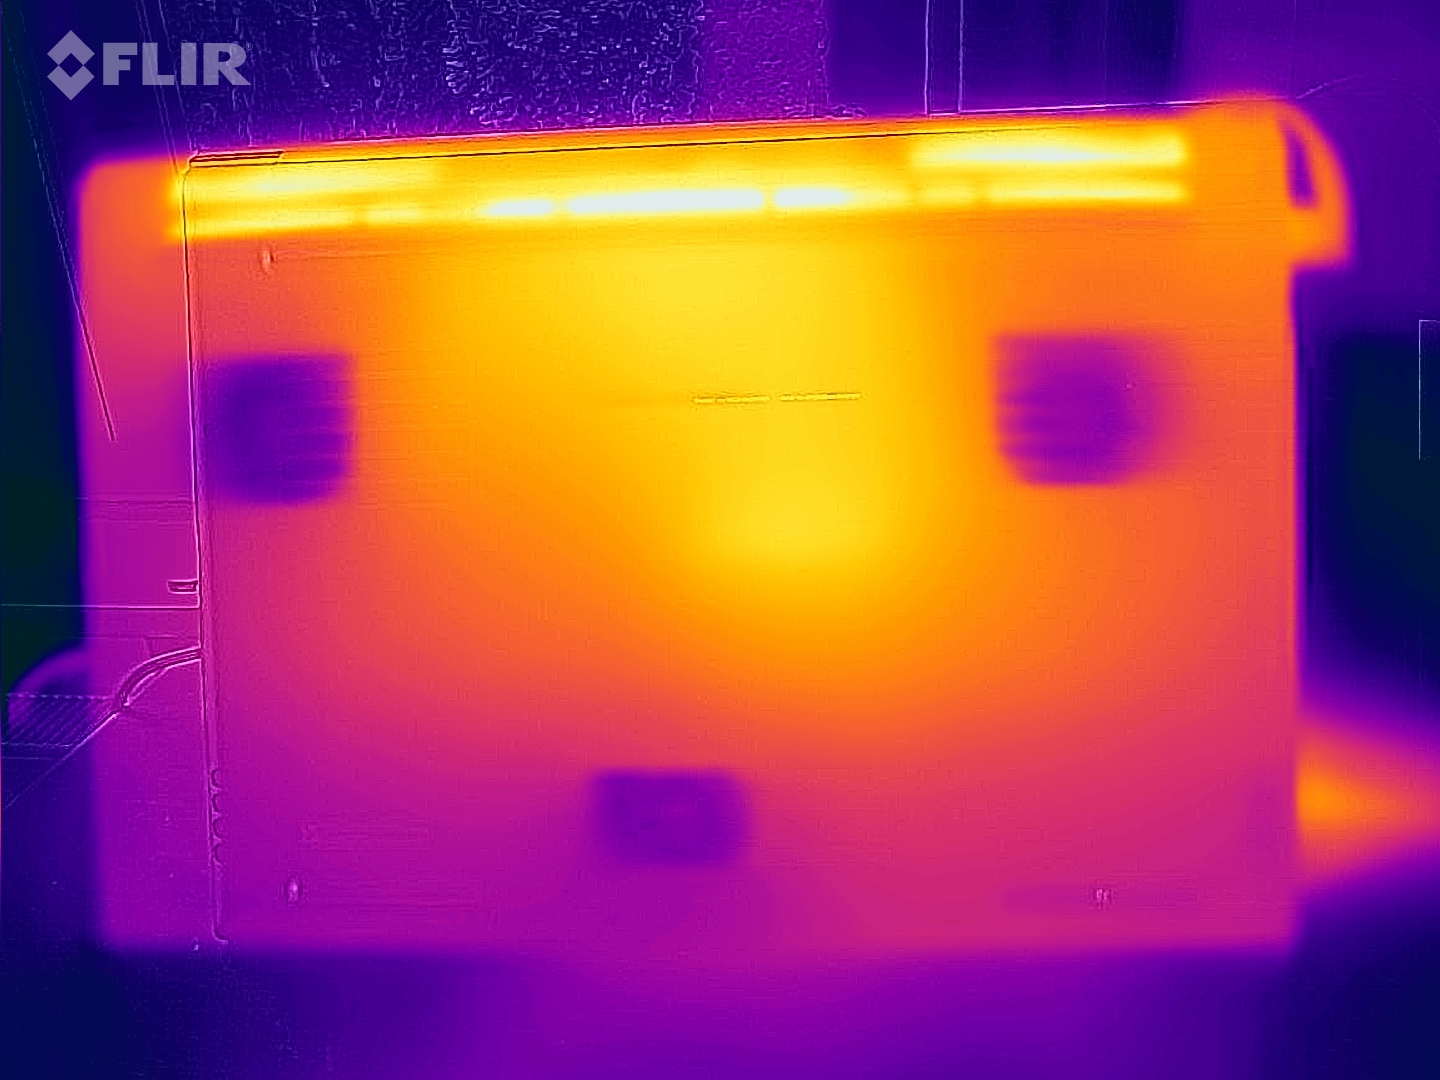
En el funcionamiento diario (oficina, Internet), las temperaturas de la carcasa se mantienen dentro de un rango verde. Aunque el portátil se calienta notablemente bajo carga (test de estrés, The Witcher 3 test), el desarrollo de calor sigue estando dentro de los límites aceptables. Sin embargo, las temperaturas de la CPU pueden alcanzar el rango rojo a veces.
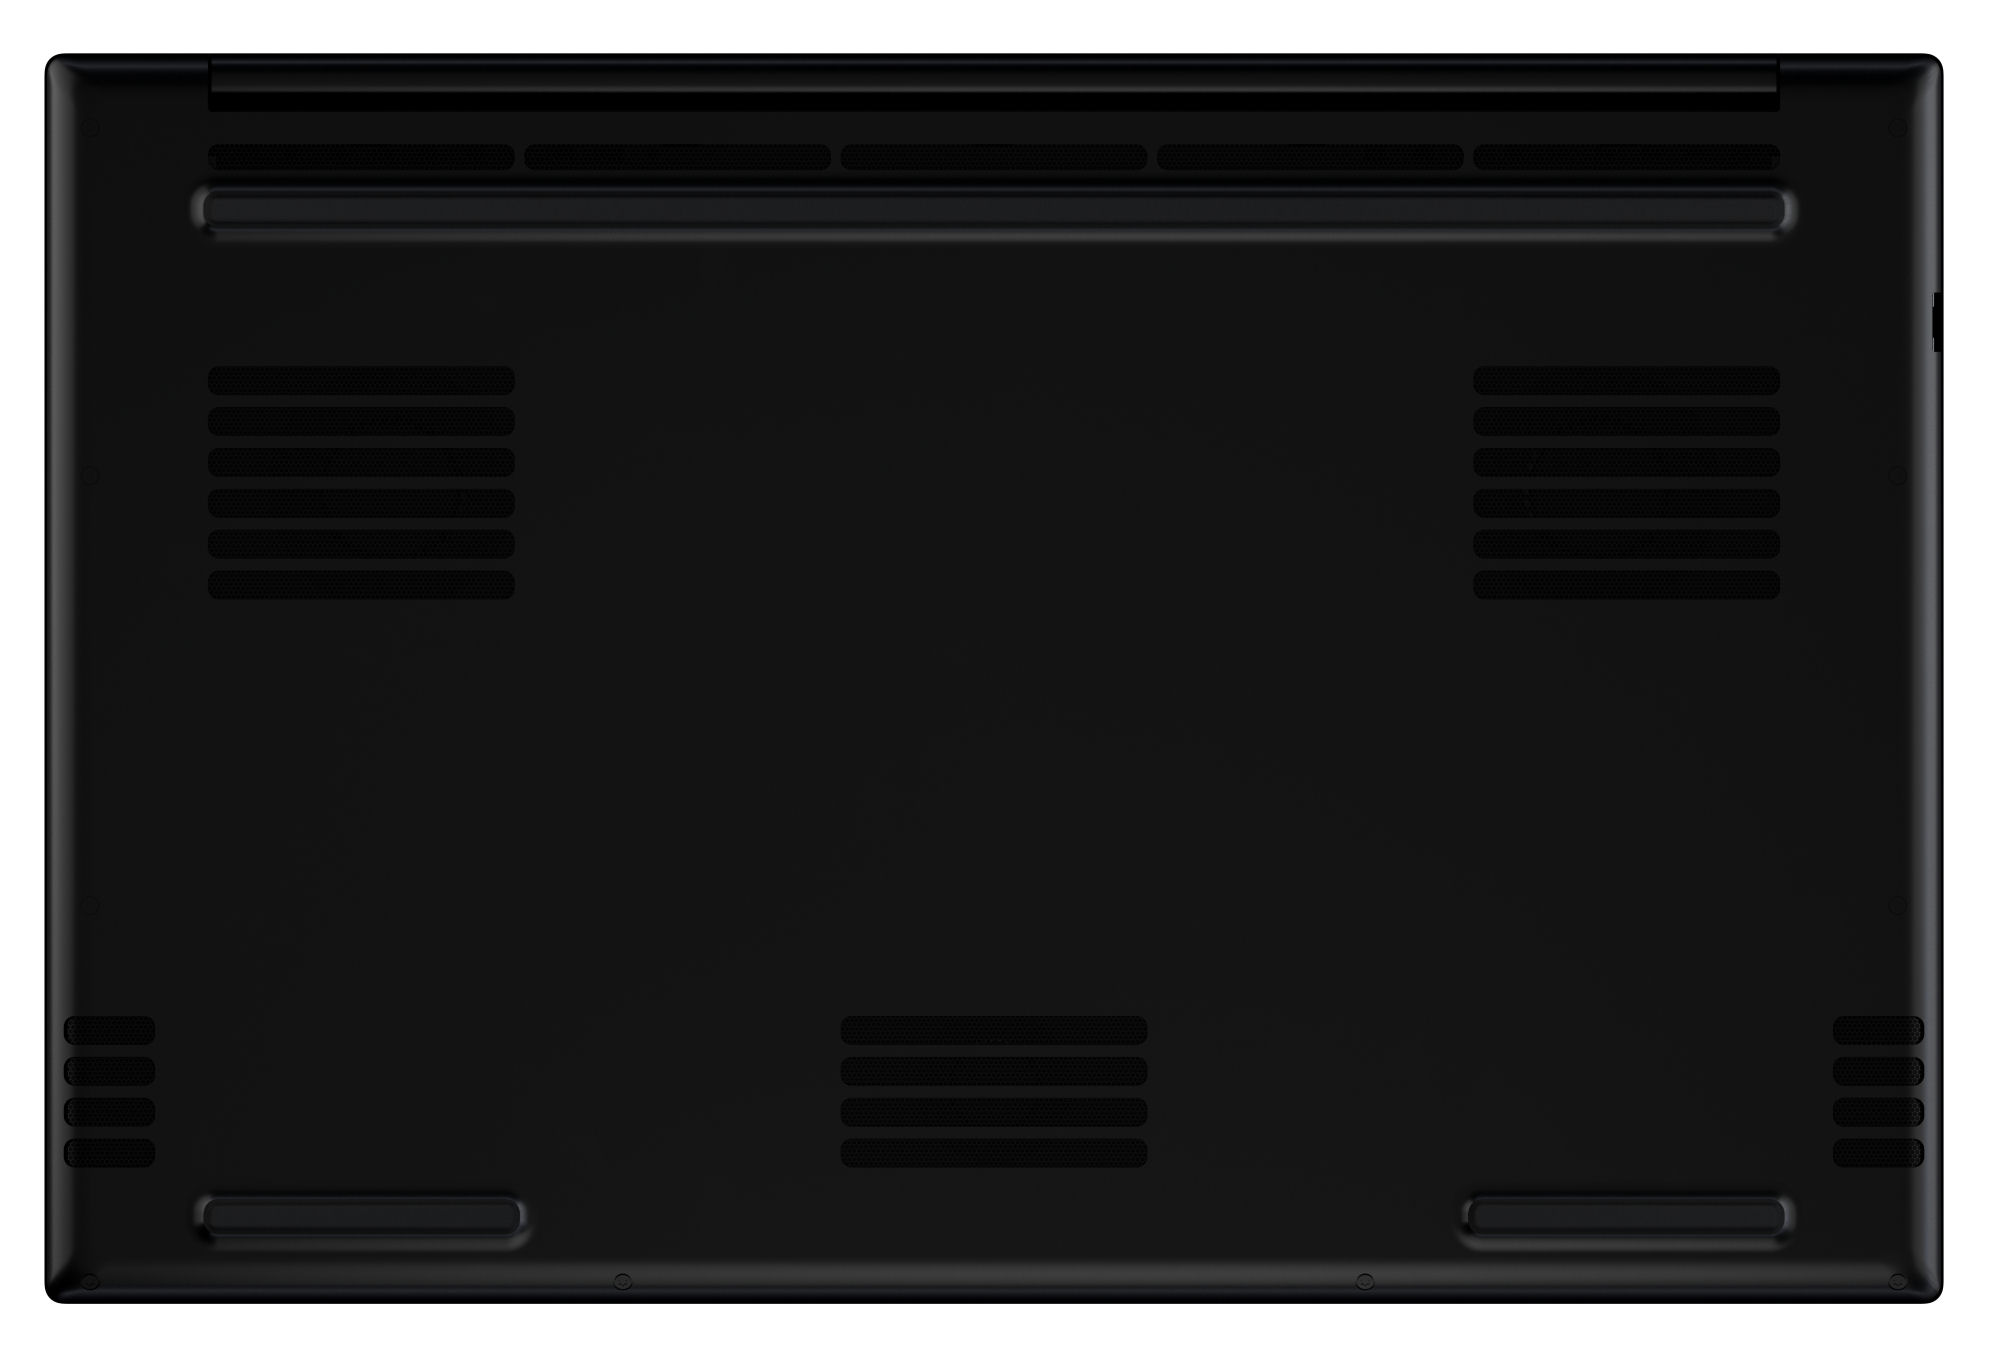
(-) La temperatura máxima en la parte superior es de 50 °C / 122 F, frente a la media de 40.4 °C / 105 F, que oscila entre 21.2 y 68.8 °C para la clase Gaming.
(-) El fondo se calienta hasta un máximo de 56 °C / 133 F, frente a la media de 43.2 °C / 110 F
(±) En reposo, la temperatura media de la parte superior es de 33 °C / 91# F, frente a la media del dispositivo de 33.9 °C / 93 F.
(-) Jugando a The Witcher 3, la temperatura media de la parte superior es de 42.7 °C / 109 F, frente a la media del dispositivo de 33.9 °C / 93 F.
(-) El reposamanos y el touchpad pueden calentarse mucho al tacto con un máximo de 42 °C / 107.6 F.
(-) La temperatura media de la zona del reposamanos de dispositivos similares fue de 28.8 °C / 83.8 F (-13.2 °C / -23.8 F).
| Razer Blade 17 Early 2022 Intel Core i9-12900H, NVIDIA GeForce RTX 3080 Ti Laptop GPU | Alienware x17 R2 P48E Intel Core i9-12900HK, NVIDIA GeForce RTX 3080 Ti Laptop GPU | Medion Erazer Beast X30 Intel Core i9-12900HK, NVIDIA GeForce RTX 3080 Ti Laptop GPU | MSI Stealth GS77 12UHS-083US Intel Core i7-12700H, NVIDIA GeForce RTX 3080 Ti Laptop GPU | Razer Blade 17 RTX 3080 Ti Intel Core i7-12800H, NVIDIA GeForce RTX 3080 Ti Laptop GPU | |
|---|---|---|---|---|---|
| Heat | 15% | -1% | 3% | 5% | |
| Maximum Upper Side * (°C) | 50 | 49.6 1% | 55 -10% | 50.6 -1% | 46 8% |
| Maximum Bottom * (°C) | 56 | 42.4 24% | 62 -11% | 59.6 -6% | 46.8 16% |
| Idle Upper Side * (°C) | 36 | 29.2 19% | 32 11% | 30 17% | 36.2 -1% |
| Idle Bottom * (°C) | 38 | 32 16% | 36 5% | 37.4 2% | 38.6 -2% |
* ... más pequeño es mejor
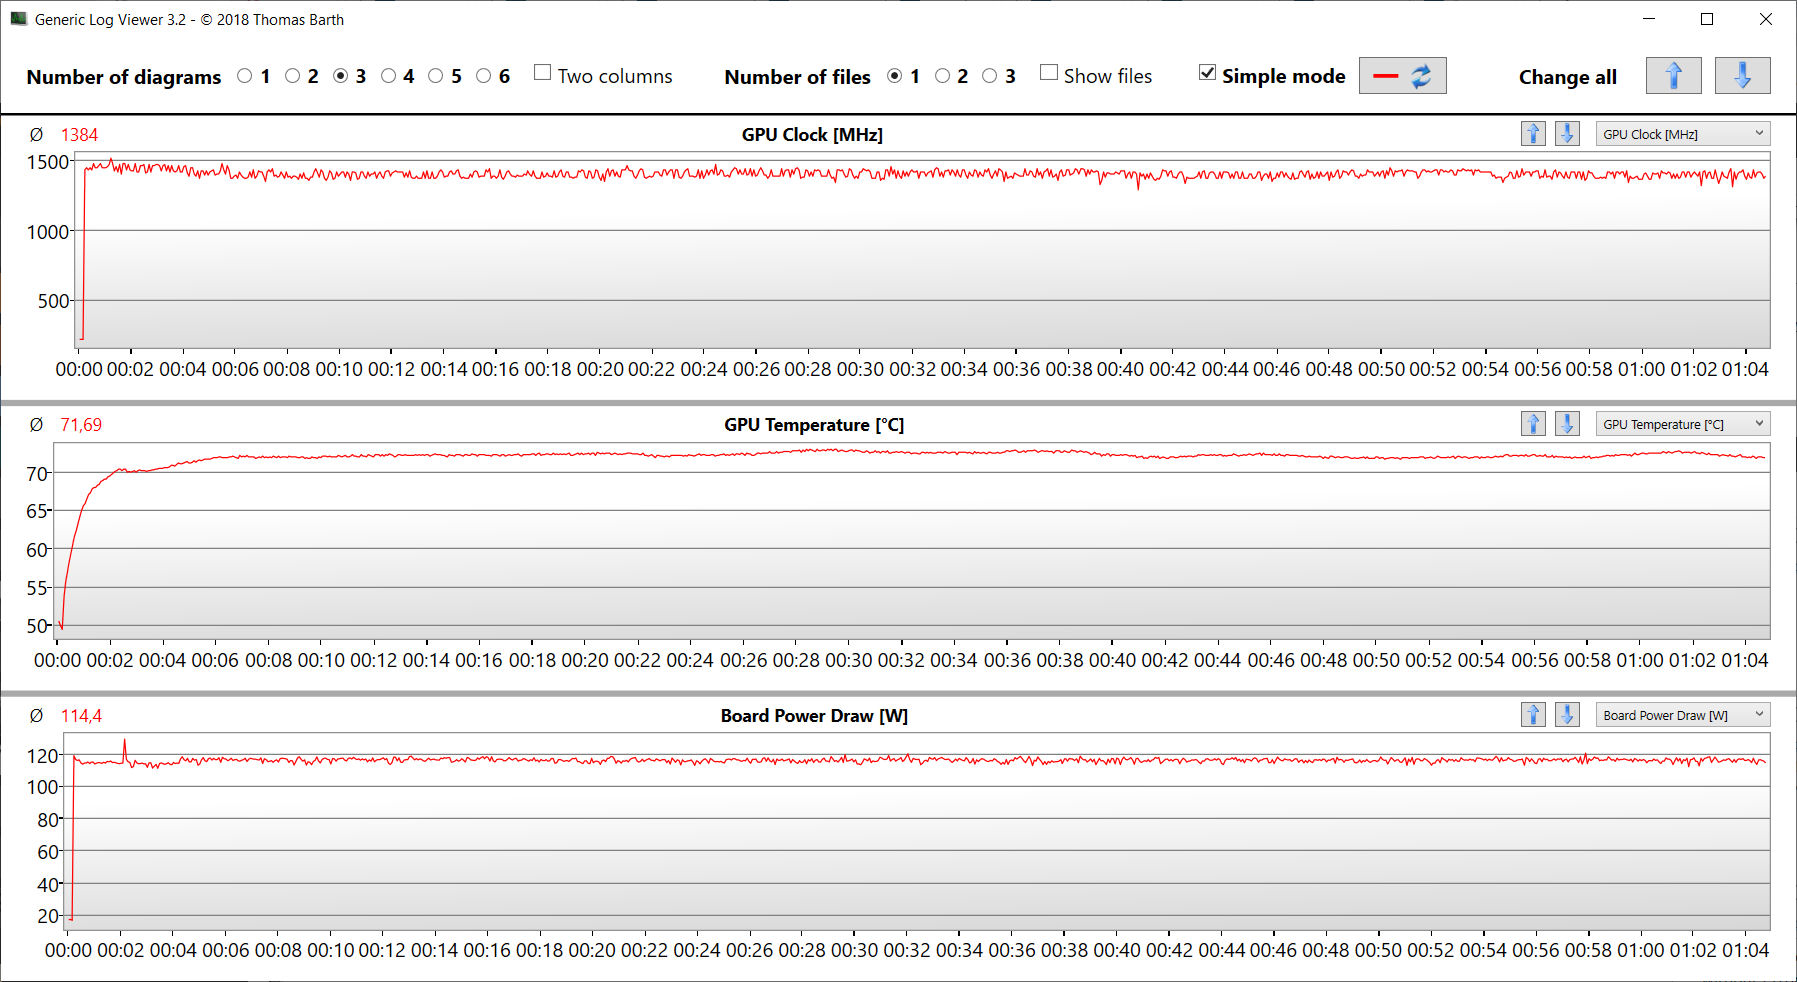
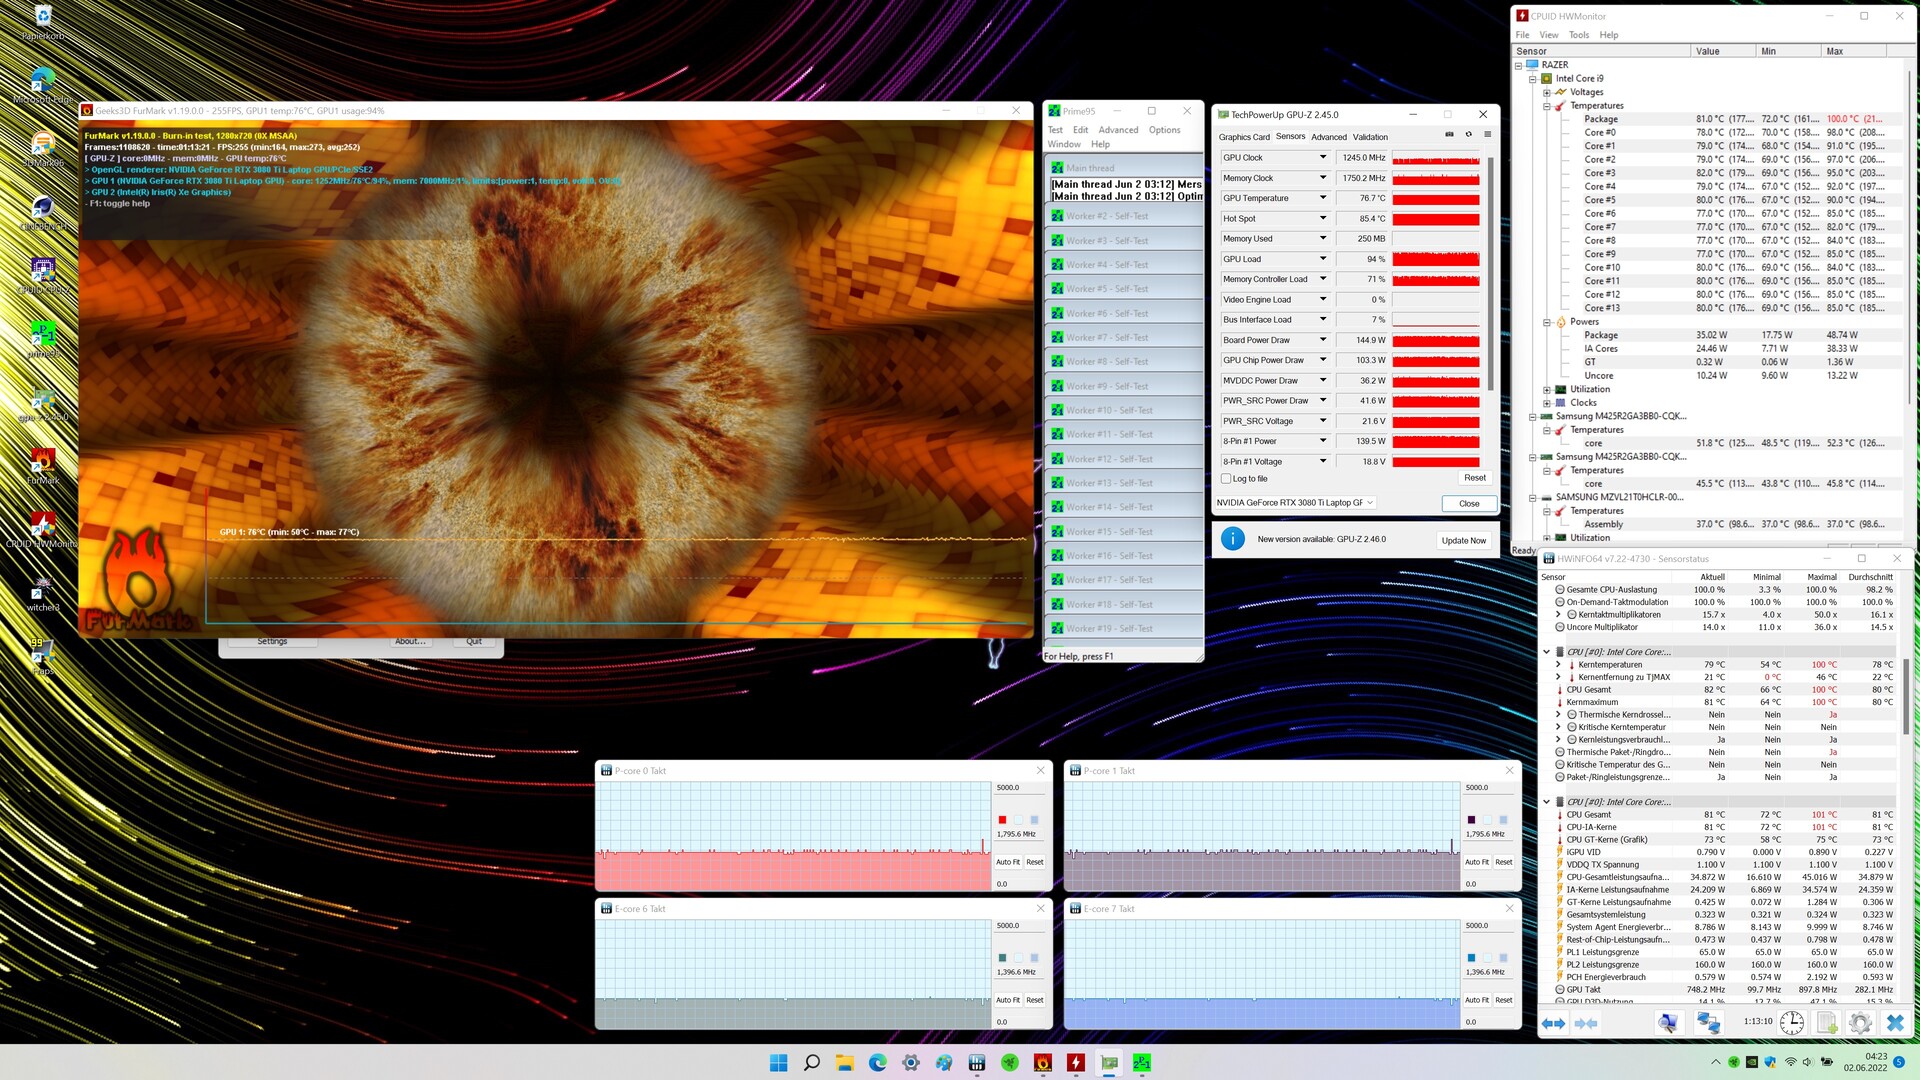
Prueba de esfuerzo
Ya al principio de la prueba de estrés (con Prime95 y Furmark funcionando durante al menos una hora), la CPU funciona a bajas velocidades de reloj (núcleos P: 2,1 a 2,2 GHz; núcleos E: 1,6 a 1,7 GHz). A continuación, los valores bajan a 1,8 GHz para los núcleos P y a 1,4 GHz para los núcleos E. La velocidad de reloj de la GPU cae de unos 1500 MHz a unos 1250 MHz. La prueba de estrés representa un escenario extremo, y la utilizamos para evaluar si el sistema se mantiene estable a plena carga.
Altavoces
Razer Blade 17 Early 2022 análisis de audio
(+) | los altavoces pueden reproducir a un volumen relativamente alto (#83 dB)
Graves 100 - 315 Hz
(±) | lubina reducida - en promedio 7.4% inferior a la mediana
(±) | la linealidad de los graves es media (9.7% delta a frecuencia anterior)
Medios 400 - 2000 Hz
(+) | medios equilibrados - a sólo 3% de la mediana
(+) | los medios son lineales (3.7% delta a la frecuencia anterior)
Altos 2 - 16 kHz
(+) | máximos equilibrados - a sólo 2.5% de la mediana
(+) | los máximos son lineales (6.1% delta a la frecuencia anterior)
Total 100 - 16.000 Hz
(+) | el sonido global es lineal (9.2% de diferencia con la mediana)
En comparación con la misma clase
» 3% de todos los dispositivos probados de esta clase eran mejores, 1% similares, 96% peores
» El mejor tuvo un delta de 6%, la media fue 18%, el peor fue ###max##%
En comparación con todos los dispositivos probados
» 3% de todos los dispositivos probados eran mejores, 1% similares, 96% peores
» El mejor tuvo un delta de 4%, la media fue 23%, el peor fue ###max##%
MSI Stealth GS77 12UHS-083US análisis de audio
(+) | los altavoces pueden reproducir a un volumen relativamente alto (#84.8 dB)
Graves 100 - 315 Hz
(±) | lubina reducida - en promedio 9.4% inferior a la mediana
(±) | la linealidad de los graves es media (9.8% delta a frecuencia anterior)
Medios 400 - 2000 Hz
(±) | medias más altas - de media 7% más altas que la mediana
(+) | los medios son lineales (4.9% delta a la frecuencia anterior)
Altos 2 - 16 kHz
(±) | máximos más altos - de media 5.8% más altos que la mediana
(±) | la linealidad de los máximos es media (7.9% delta a frecuencia anterior)
Total 100 - 16.000 Hz
(±) | la linealidad del sonido global es media (15.9% de diferencia con la mediana)
En comparación con la misma clase
» 38% de todos los dispositivos probados de esta clase eran mejores, 7% similares, 56% peores
» El mejor tuvo un delta de 6%, la media fue 18%, el peor fue ###max##%
En comparación con todos los dispositivos probados
» 25% de todos los dispositivos probados eran mejores, 5% similares, 70% peores
» El mejor tuvo un delta de 4%, la media fue 23%, el peor fue ###max##%
Gestión de la energía - El portátil Razer ofrece una escasa duración de la batería
Consumo de energía
Durante el funcionamiento en vacío, el consumo de energía resulta relativamente alto, hasta 34 vatios, y algunos de los competidores son más eficientes en este aspecto. Bajo carga alta, el consumo del Blade está en un nivel similar al de los competidores, y a veces incluso más bajo. El Alienware x17 R2 P48Erepresenta un valor atípico hacia la parte superior. Mientras que consume significativamente más energía, generalmente también produce los mejores resultados de benchmark. La fuente de alimentación de 280 vatios incluida es suficientemente grande.
Nota: El modelo hermano QHD se probó con la configuración "Boost" de la CPU y el modo dGPU activado. Esto explica su mayor consumo durante el funcionamiento en reposo y bajo cargas bajas
| Off / Standby | |
| Ocioso | |
| Carga |
|
Clave:
min: | |
| Razer Blade 17 Early 2022 i9-12900H, GeForce RTX 3080 Ti Laptop GPU, Samsung PM9A1 MZVL21T0HCLR, IPS, 3840x2160, 17.3" | Alienware x17 R2 P48E i9-12900HK, GeForce RTX 3080 Ti Laptop GPU, 2x Samsung PM9A1 1TB (RAID 0), IPS, 1920x1080, 17.3" | Medion Erazer Beast X30 i9-12900HK, GeForce RTX 3080 Ti Laptop GPU, Samsung PM9A1 MZVL21T0HCLR, IPS, 2560x1440, 17.3" | MSI Stealth GS77 12UHS-083US i7-12700H, GeForce RTX 3080 Ti Laptop GPU, Micron 3400 1TB MTFDKBA1T0TFH, IPS, 2560x1440, 17.3" | Razer Blade 17 RTX 3080 Ti i7-12800H, GeForce RTX 3080 Ti Laptop GPU, Samsung PM9A1 MZVL21T0HCLR, IPS, 2560x1440, 17.3" | Medio NVIDIA GeForce RTX 3080 Ti Laptop GPU | Media de la clase Gaming | |
|---|---|---|---|---|---|---|---|
| Power Consumption | -32% | 13% | 9% | -41% | -2% | 14% | |
| Idle Minimum * (Watt) | 17 | 24.1 -42% | 12 29% | 20 -18% | 29.8 -75% | 17.2 ? -1% | 13 ? 24% |
| Idle Average * (Watt) | 23 | 28.5 -24% | 16 30% | 21.4 7% | 37.1 -61% | 23.3 ? -1% | 19 ? 17% |
| Idle Maximum * (Watt) | 34 | 60 -76% | 22 35% | 27 21% | 60.8 -79% | 30.8 ? 9% | 24.6 ? 28% |
| Load Average * (Watt) | 120 | 128.7 -7% | 118 2% | 100.5 16% | 135.3 -13% | 121.2 ? -1% | 110.7 ? 8% |
| Witcher 3 ultra * (Watt) | 229 | 254 -11% | 223 3% | 165 28% | 243 -6% | ||
| Load Maximum * (Watt) | 243 | 323 -33% | 290 -19% | 247.1 -2% | 273.1 -12% | 276 ? -14% | 259 ? -7% |
* ... más pequeño es mejor
Power Consumption The Witcher 3 / Stress Test
Power Consumption With External Monitor
Duración de la batería
En la prueba WLAN (carga de sitios web mediante script) y la prueba de vídeo (reproducción del cortometraje Big Buck Bunny (codificación H.264, FHD) en un bucle constante), el portátil de 17,3 pulgadas logra tiempos de ejecución de 3:49 h y 4:50 h respectivamente. Debido a la menor resolución de la pantalla del QHD Bladeno es de extrañar que pueda lograr una mayor duración de la batería utilizando la misma batería de 82 Wh.
| Razer Blade 17 Early 2022 i9-12900H, GeForce RTX 3080 Ti Laptop GPU, 82 Wh | Alienware x17 R2 P48E i9-12900HK, GeForce RTX 3080 Ti Laptop GPU, 87 Wh | Medion Erazer Beast X30 i9-12900HK, GeForce RTX 3080 Ti Laptop GPU, 91.2 Wh | MSI Stealth GS77 12UHS-083US i7-12700H, GeForce RTX 3080 Ti Laptop GPU, 99 Wh | Razer Blade 17 RTX 3080 Ti i7-12800H, GeForce RTX 3080 Ti Laptop GPU, 82 Wh | Media de la clase Gaming | |
|---|---|---|---|---|---|---|
| Duración de Batería | -48% | 33% | 32% | 8% | 41% | |
| Reader / Idle (h) | 7.1 | 3.9 -45% | 7.7 8% | 10.8 52% | 8 13% | 8.27 ? 16% |
| H.264 (h) | 4.8 | 6.4 33% | 8.32 ? 73% | |||
| WiFi v1.3 (h) | 3.8 | 2 -47% | 5.7 50% | 6.2 63% | 5.5 45% | 7.11 ? 87% |
| Load (h) | 1.7 | 0.8 -53% | 2.4 41% | 1.4 -18% | 1.1 -35% | 1.502 ? -12% |
Pro
Contra
Veredicto - Muchas prestaciones en un maletín compacto
Nuestra configuración de prueba del Blade 17 está dirigida a jugadores y profesionales creativos. Un procesador Core i9-12900H, la GPU GeForce RTX 3080 Ti Laptop (175 vatios TGP tras la actualización de la BIOS, 16 GB de VRAM), y 32 GB de memoria de trabajo equipan al portátil para el procesamiento de vídeo, el renderizado y los juegos 4k al más alto nivel. Además, un rápido SSD PCIe-4 (1 TB) garantiza tiempos de carga y almacenamiento cortos.
Con el Blade 17 (principios de 2022), Razer ofrece un dispositivo de trabajo exitoso y potente para los profesionales creativos. Pero esto también tiene su precio.
La CPU y la GPU son capaces de funcionar constantemente a altas velocidades de reloj. Como es habitual en esta clase de dispositivos, el ruido y el desarrollo de calor están a un nivel alto. Una duración de batería realista de entre 4 y 5 horas sigue estando bien para un potente portátil 4K. Lo más destacado es el brillante y receptivo display de 17.3 pulgadas (4K, IPS, 144 Hz) con una precisa reproducción del color (DCI-P3: 100%).
El Blade cuesta unos 4,650 Euros, lo que supone unos 400 Euros más que el Modelo QHD. ¿Merece la pena? El Core i9 apenas ofrece potencia adicional comparado con el Core i7 del modelo hermano, particularmente bajo carga constante. Y el hermano ofrece una mejor duración de la batería. Otro punto a favor del modelo QHD que probamos anteriormente es el soporte de Advanced Optimus. El Blade 4k no ofrece esto.
La pantalla 4K ofrece un brillo significativamente mayor y tiempos de respuesta más cortos que el panel QHD. Si además de la mayor resolución, estos criterios no son los factores decisivos, puedes elegir con seguridad un Blade QHD. Los paneles QHD y 4K son igual de buenos en cuanto a la reproducción del color y la cobertura del espacio de color.
Como alternativa al Blade 17, también podrías adquirir el Medion Erazer Beast X30. Tiene casi las mismas dimensiones pero aporta menos peso a la balanza. En cuanto al rendimiento gráfico, queda ligeramente por detrás del portátil de Razer.
Precio y disponibilidad
El Razer Blade 17 en una configuración similar (Core i9-12900H, GeForce RTX 3080 Ti Laptop, 32 GB de RAM, 1 TB SSD, pantalla 4k) está disponible por 4.300 dólares en Amazony también en Razer directamente por el mismo precio.
Razer Blade 17 Early 2022
- 07/05/2022 v7 (old)
Sascha Mölck
Price comparison

